|
Exhibit 99 
|
Leucadia National Corporation 2016 Investor Meeting
October 5, 2016
Note on Forward Looking Statements
This document contains “forward looking statements” within the meaning of the safe harbor provisions of Section 27A of the Securities Act of 1933 and Section 21E of the Securities Exchange Act of 1934. Forward looking statements include statements about our future and statements that are not historical facts. These forward looking statements are usually preceded by the words “should,” “expect,” “intend,” “may,” “will,” or similar expressions. Forward looking statements may contain expectations regarding revenues, earnings, operations, and other results, and may include statements of future performance, plans, and objectives. Forward looking statements also include statements pertaining to our strategies for future development of our business and products. Forward looking statements represent only our belief regarding future events, many of which by their nature are inherently uncertain. It is possible that the actual results may differ, possibly materially, from the anticipated results indicated in these forward-looking statements. Information regarding important factors, including our Risk Factors, that could cause actual results to differ, perhaps materially, from those in our forward looking statements is contained in reports we file with the SEC. You should read and interpret any forward looking statement together with reports we file with the SEC.
i
Leucadia’s Momentum
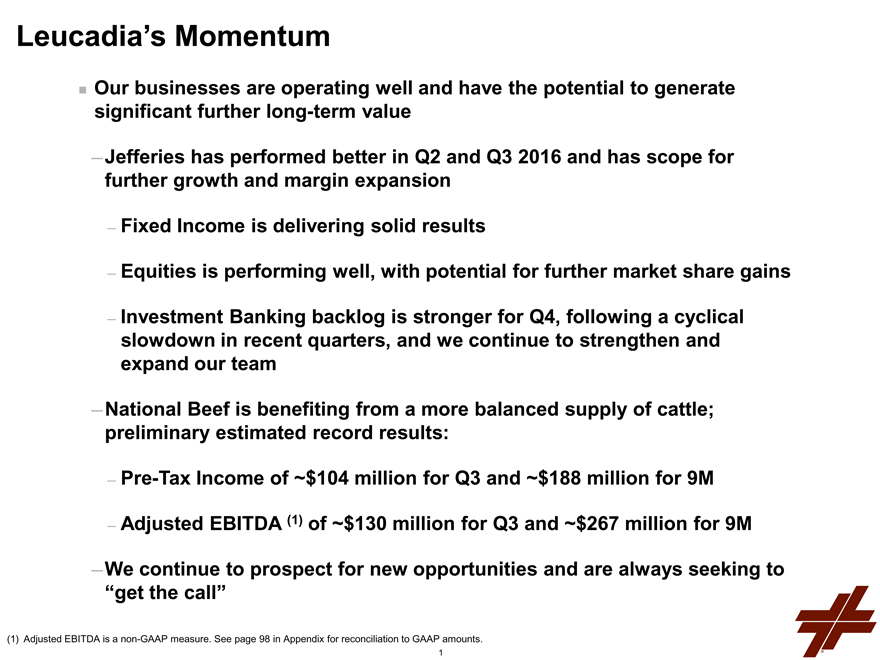
Our businesses are operating well and have the potential to generate significant further long-term value
— Jefferies has performed better in Q2 and Q3 2016 and has scope for further growth and margin expansion
— Fixed Income is delivering solid results
— Equities is performing well, with potential for further market share gains
— Investment Banking backlog is stronger for Q4, following a cyclical slowdown in recent quarters, and we continue to strengthen and expand our team
National Beef is benefiting from a more balanced supply of cattle; preliminary estimated record results:
Pre-Tax Income of ~$104 million for Q3 and ~$188 million for 9M
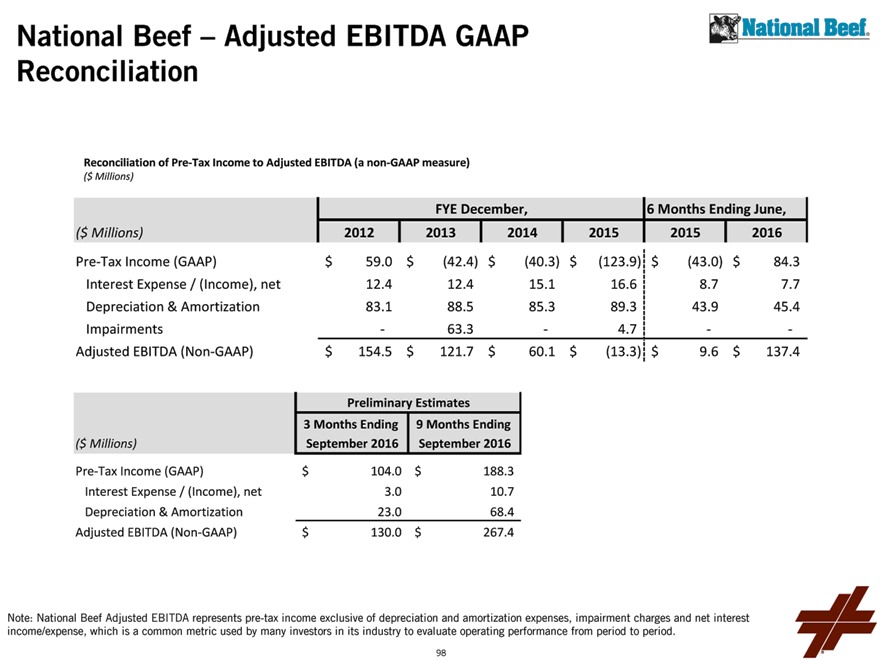
Adjusted EBITDA (1) of ~$130 million for Q3 and ~$267 million for 9M
We continue to prospect for new opportunities and are always seeking to “get the call”
(1) Adjusted EBITDA is a non-GAAP measure. See page 98 in Appendix for reconciliation to GAAP amounts.
1
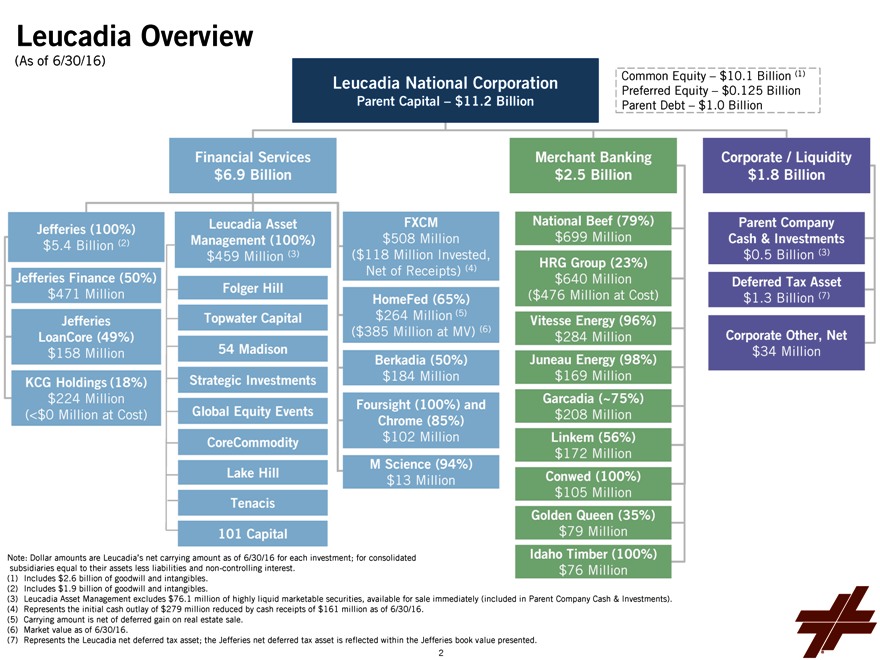
Leucadia Overview
(As of 6/30/16)
Leucadia National Corporation
Parent Capital – $11.2 Billion
Common Equity – $10.1 Billion (1) Preferred Equity – $0.125 Billion Parent Debt – $1.0 Billion
Financial Services $6.9 Billion
Jefferies (100%)
$5.4 Billion (2)
Jefferies Finance (50%) $471 Million
Jefferies LoanCore (49%) $158 Million
KCG Holdings (18%) $224 Million
(<$0 Million at Cost)
Leucadia Asset Management (100%) $459 Million (3)
Folger Hill
Topwater Capital
54 Madison Strategic Investments Global Equity Events CoreCommodity Lake Hill Tenacis 101 Capital
FXCM $508 Million
($118 Million Invested, Net of Receipts) (4)
HomeFed (65%) $264 Million (5)
($385 Million at MV) (6)
Berkadia (50%) $184 Million
Foursight (100%) and Chrome (85%) $102 Million
M Science (94%)
$13 Million
Merchant Banking
$2.5 Billion
National Beef (79%) $699 Million
HRG Group (23%) $640 Million
($476 Million at Cost)
Vitesse Energy (96%) $284 Million
Juneau Energy (98%) $169 Million
Garcadia (~75%) $208 Million
Linkem (56%) $172 Million
Conwed (100%) $105 Million
Golden Queen (35%)
$79 Million
Idaho Timber (100%)
$76 Million
Corporate / Liquidity
$1.8 Billion
Parent Company Cash & Investments
$0.5 Billion (3)
Deferred Tax Asset
$1.3 Billion (7)
Corporate Other, Net
$34 Million
Note: Dollar amounts are Leucadia’s net carrying amount as of 6/30/16 for each investment; for consolidated subsidiaries equal to their assets less liabilities and non-controlling interest.
(1) Includes $2.6 billion of goodwill and intangibles.
(2) Includes $1.9 billion of goodwill and intangibles.
(3) Leucadia Asset Management excludes $76.1 million of highly liquid marketable securities, available for sale immediately (included in Parent Company Cash & Investments).
(4) Represents the initial cash outlay of $279 million reduced by cash receipts of $161 million as of 6/30/16.
(5) Carrying amount is net of deferred gain on real estate sale.
(6) Market value as of 6/30/16.
(7) Represents the Leucadia net deferred tax asset; the Jefferies net deferred tax asset is reflected within the Jefferies book value presented.
2
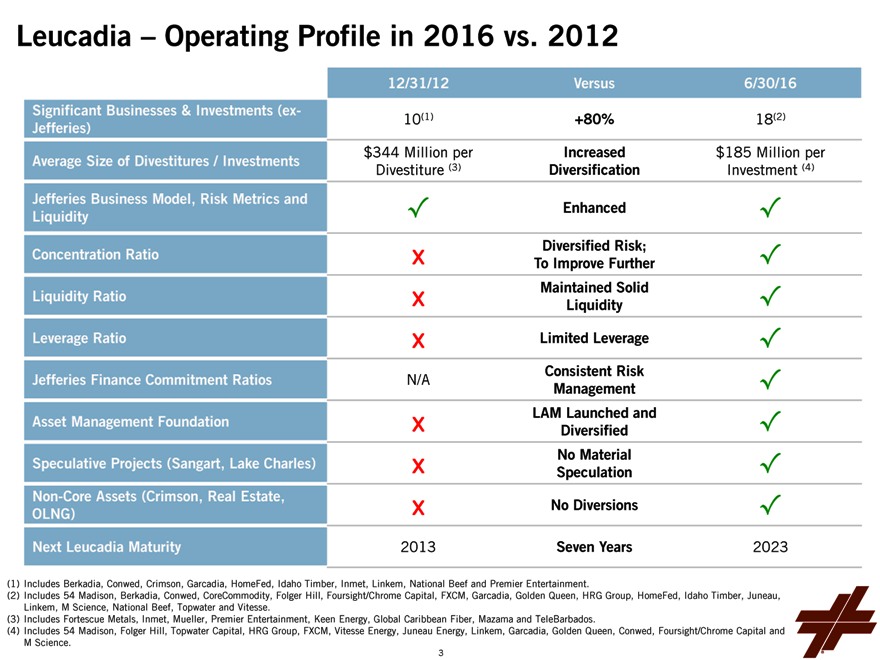
Leucadia – Operating Profile in 2016 vs. 2012
Significant Businesses & Investments (ex-Jefferies)
Average Size of Divestitures / Investments
Jefferies Business Model, Risk Metrics and Liquidity
Concentration Ratio Liquidity Ratio Leverage Ratio
Jefferies Finance Commitment Ratios Asset Management Foundation Speculative Projects (Sangart, Lake Charles)
Non-Core Assets (Crimson, Real Estate, OLNG)
Next Leucadia Maturity
12/31/12
10(1)
$344 Million per Divestiture (3)
? x x x
N/A
x x x
2013
Versus
+80%
Increased Diversification
Enhanced
Diversified Risk; To Improve Further Maintained Solid Liquidity
Limited Leverage
Consistent Risk Management LAM Launched and Diversified No Material Speculation
No Diversions
Seven Years
6/30/16
18(2)
$185 Million per Investment (4)
? ? ? ? ? ? ? ?
2023
(1) Includes Berkadia, Conwed, Crimson, Garcadia, HomeFed, Idaho Timber, Inmet, Linkem, National Beef and Premier Entertainment.
(2) Includes 54 Madison, Berkadia, Conwed, CoreCommodity, Folger Hill, Foursight/Chrome Capital, FXCM, Garcadia, Golden Queen, HRG Group, HomeFed, Idaho Timber, Juneau, Linkem, M Science, National Beef, Topwater and Vitesse.
(3) Includes Fortescue Metals, Inmet, Mueller, Premier Entertainment, Keen Energy, Global Caribbean Fiber, Mazama and TeleBarbados.
(4) Includes 54 Madison, Folger Hill, Topwater Capital, HRG Group, FXCM, Vitesse Energy, Juneau Energy, Linkem, Garcadia, Golden Queen, Conwed, Foursight/Chrome Capital and M Science.
3
Leucadia Business Highlights
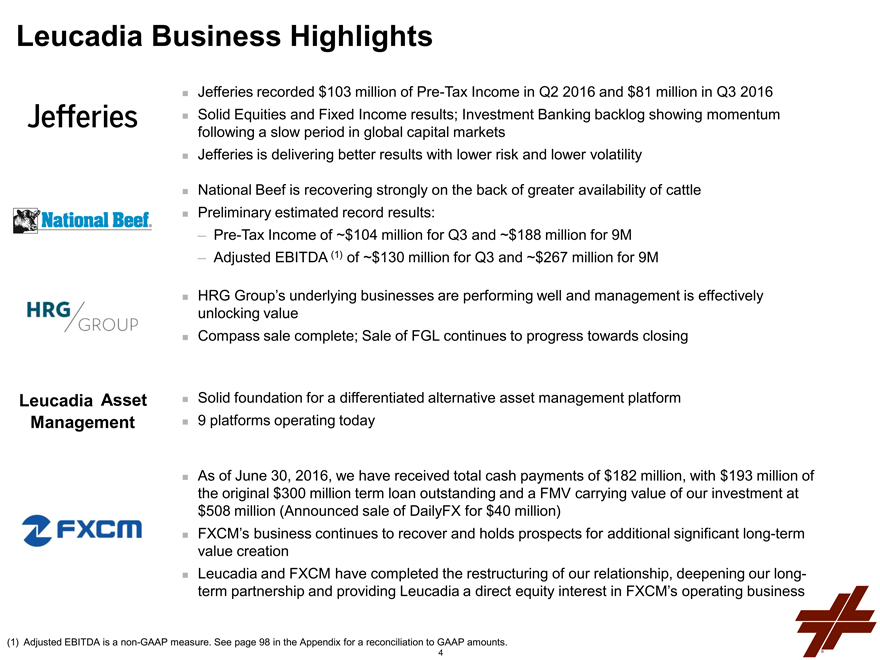
Jefferies
Jefferies recorded $103 million of Pre-Tax Income in Q2 2016 and $81 million in Q3 2016 Solid Equities and Fixed Income results; Investment Banking backlog showing momentum following a slow period in global capital markets Jefferies is delivering better results with lower risk and lower volatility
National Beef
National Beef is recovering strongly on the back of greater availability of cattle
Preliminary estimated record results:
Pre-Tax Income of ~$104 million for Q3 and ~$188 million for 9M
Adjusted EBITDA (1) of ~$130 million for Q3 and ~$267 million for 9M
HRG Group’s underlying businesses are performing well and management is effectively unlocking value Compass sale complete; Sale of FGL continues to progress towards closing
Leucadia Asset Management
Solid foundation for a differentiated alternative asset management platform 9 platforms operating today
FXCM
As of June 30, 2016, we have received total cash payments of $182 million, with $193 million of the original $300 million term loan outstanding and a FMV carrying value of our investment at $508 million (Announced sale of DailyFX for $40 million) FXCM’s business continues to recover and holds prospects for additional significant long-term value creation Leucadia and FXCM have completed the restructuring of our relationship, deepening our long-term partnership and providing Leucadia a direct equity interest in FXCM’s operating business
(1) Adjusted EBITDA is a non-GAAP measure. See page 98 in the Appendix for a reconciliation to GAAP amounts.
4
Leucadia Business Highlights (Continued)
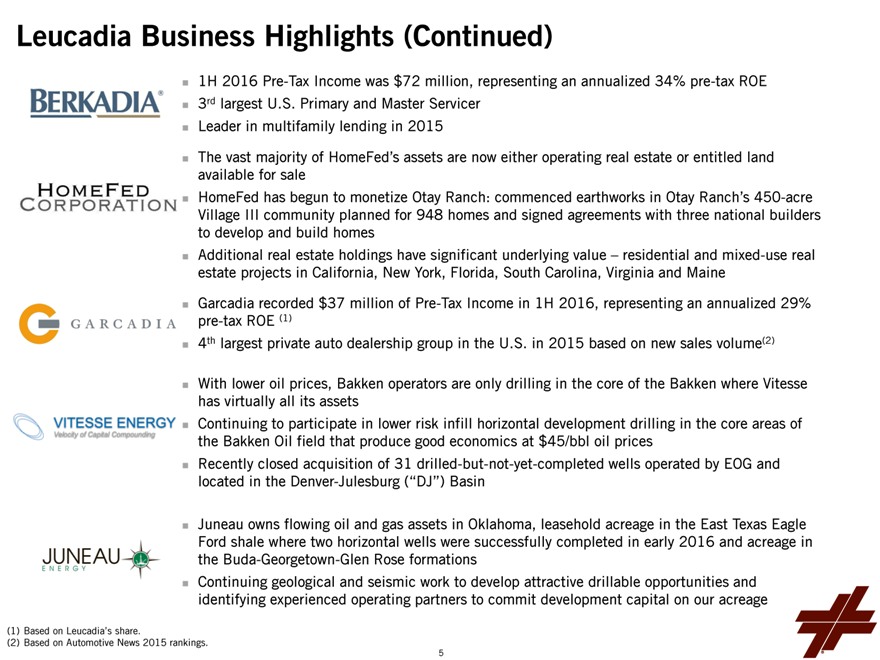
1H 2016 Pre-Tax Income was $72 million, representing an annualized 34% pre-tax ROE
3rd largest U.S. Primary and Master Servicer Leader in multifamily lending in 2015
The vast majority of HomeFed’s assets are now either operating real estate or entitled land available for sale HomeFed has begun to monetize Otay Ranch: commenced earthworks in Otay Ranch’s 450-acre Village III community planned for 948 homes and signed agreements with three national builders to develop and build homes Additional real estate holdings have significant underlying value – residential and mixed-use real estate projects in California, New York, Florida, South Carolina, Virginia and Maine Garcadia recorded $37 million of Pre-Tax Income in 1H 2016, representing an annualized 29% pre-tax ROE (1) 4th largest private auto dealership group in the U.S. in 2015 based on new sales volume(2)
With lower oil prices, Bakken operators are only drilling in the core of the Bakken where Vitesse has virtually all its assets Continuing to participate in lower risk infill horizontal development drilling in the core areas of the Bakken Oil field that produce good economics at $45/bbl oil prices Recently closed acquisition of 31 drilled-but-not-yet-completed wells operated by EOG and located in the Denver-Julesburg (“DJ”) Basin
Juneau owns flowing oil and gas assets in Oklahoma, leasehold acreage in the East Texas Eagle Ford shale where two horizontal wells were successfully completed in early 2016 and acreage in the Buda-Georgetown-Glen Rose formations Continuing geological and seismic work to develop attractive drillable opportunities and identifying experienced operating partners to commit development capital on our acreage
(1) Based on Leucadia’s share.
(2) Based on Automotive News 2015 rankings.
5
Leucadia Business Highlights (Continued)
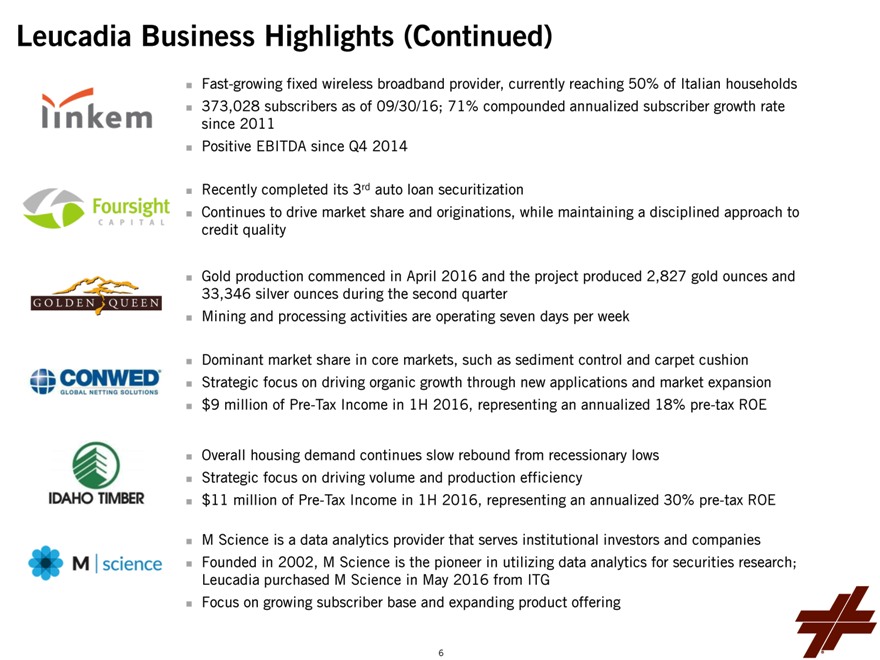
Fast-growing fixed wireless broadband provider, currently reaching 50% of Italian households 373,028 subscribers as of 09/30/16; 71% compounded annualized subscriber growth rate since 2011 Positive EBITDA since Q4 2014
Recently completed its 3rd auto loan securitization
Continues to drive market share and originations, while maintaining a disciplined approach to credit quality
Gold production commenced in April 2016 and the project produced 2,827 gold ounces and 33,346 silver ounces during the second quarter Mining and processing activities are operating seven days per week
Dominant market share in core markets, such as sediment control and carpet cushion Strategic focus on driving organic growth through new applications and market expansion $9 million of Pre-Tax Income in 1H 2016, representing an annualized 18% pre-tax ROE
Overall housing demand continues slow rebound from recessionary lows Strategic focus on driving volume and production efficiency $11 million of Pre-Tax Income in 1H 2016, representing an annualized 30% pre-tax ROE
M Science is a data analytics provider that serves institutional investors and companies Founded in 2002, M Science is the pioneer in utilizing data analytics for securities research; Leucadia purchased M Science in May 2016 from ITG
Focus on growing subscriber base and expanding product offering
6
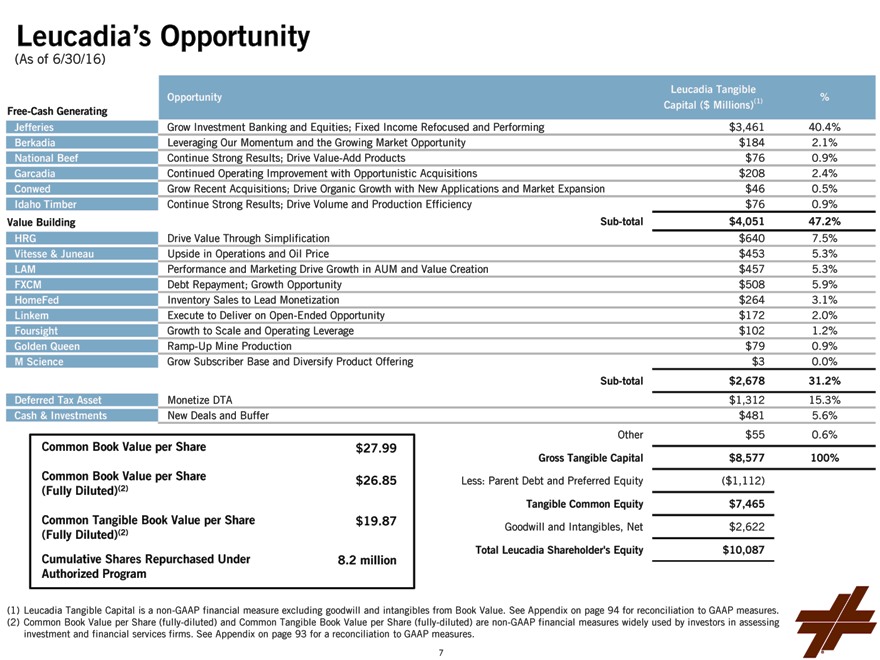
Leucadia’s Opportunity
(As of 6/30/16)
Free-Cash Generating Opportunity Leucadia Tangible Capital ($ Millions)(1)%
Jefferies Grow Investment Banking and Equities; Fixed Income Refocused and Performing $3,46140.4%
Berkadia Leveraging Our Momentum and the Growing Market Opportunity $1842.1%
National Beef Continue Strong Results; Drive Value-Add Products $760.9%
Garcadia Continued Operating Improvement with Opportunistic Acquisitions $2082.4%
Conwed Grow Recent Acquisitions; Drive Organic Growth with New Applications and Market Expansion $460.5%
Idaho Timber Continue Strong Results; Drive Volume and Production Efficiency $760.9%
Value Building Sub-total $4,05147.2%
HRG Drive Value Through Simplification $6407.5%
Vitesse & Juneau Upside in Operations and Oil Price $4535.3%
LAM Performance and Marketing Drive Growth in AUM and Value Creation $4575.3%
FXCM Debt Repayment; Growth Opportunity $5085.9%
HomeFed Inventory Sales to Lead Monetization $2643.1%
Linkem Execute to Deliver on Open-Ended Opportunity $1722.0%
Foursight Growth to Scale and Operating Leverage $1021.2%
Golden Queen Ramp-Up Mine Production $790.9%
M Science Grow Subscriber Base and Diversify Product Offering $30.0%
Sub-total$2,67831.2%
Deferred Tax Asset Monetize DTA $1,31215.3%
Cash & Investments New Deals and Buffer $4815.6%
Other$550.6%
Common Book Value per Share $ 27.99
Gross Tangible Capital$8,577100%
Common Book Value per Share $ 26.85 Less: Parent Debt and Preferred Equity($1,112)
(Fully Diluted)(2)
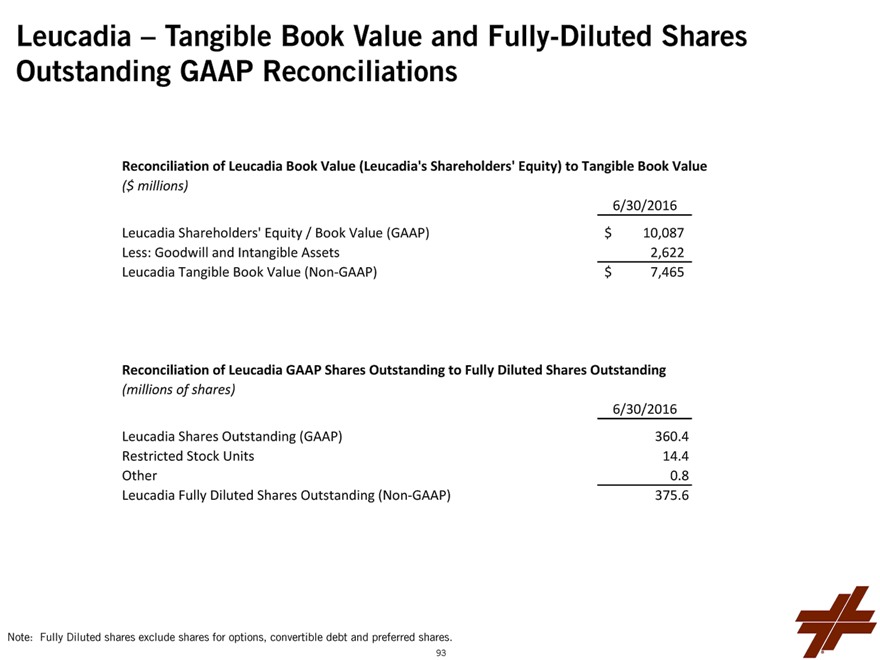
Tangible Common Equity$7,465
Common Tangible Book Value per Share $ 19.87 Goodwill and Intangibles, Net$2,622
(Fully Diluted)(2)
Total Leucadia Shareholder’s Equity$10,087
Cumulative Shares Repurchased Under 8.2 million
Authorized Program
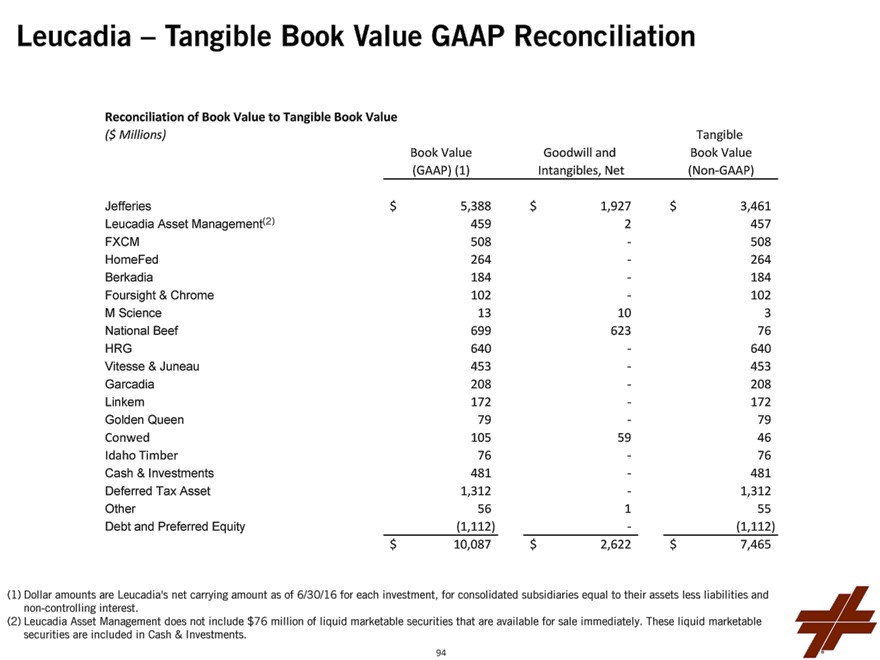
(1) Leucadia Tangible Capital is a non-GAAP financial measure excluding goodwill and intangibles from Book Value. See Appendix on page 94 for reconciliation to GAAP measures. (2) Common Book Value per Share (fully-diluted) and Common Tangible Book Value per Share (fully-diluted) are non-GAAP financial measures widely used by investors in assessing investment and financial services firms. See Appendix on page 93 for a reconciliation to GAAP measures.
7
Two Q & A’s – IRQuestions@Leucadia.com
Jefferies
8
Note on Adjusted Financials
Note on the Use of Non-GAAP Financial Measures to Show Results Exclusive of the Bache Futures Business:
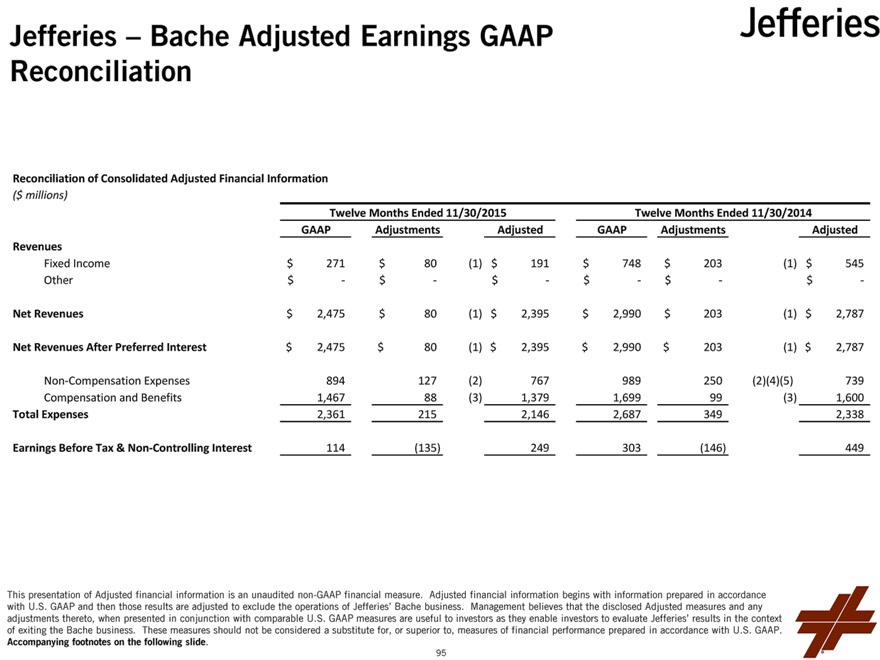
In 2015, Jefferies exited its Bache futures business. Jefferies has supplemented certain of its financial disclosures to show results that exclude the Bache futures business. These supplemental financial measures begin with information prepared in accordance with U.S. GAAP and are adjusted to exclude the operations of the Bache futures business. These adjusted financial measures are non-GAAP financial measures. Management believes such measures, when presented in conjunction with comparable U.S. GAAP measures, provide meaningful information as it enables investors to evaluate results in the context of the announced exit of the Bache futures business. These measures should not be considered a substitute for, or superior to, financial information prepared in accordance with U.S. GAAP.
Reconciliations of these non-GAAP financial measures to U.S. GAAP financial measures are contained throughout this presentation and on pages 95-97 of the Appendix.
9
Jefferies Overview
10
Jefferies Update
We continue to build the leading, client-focused global investment banking firm, seeking to provide clients with the best ideas, expertise and execution Our competitive position has strengthened further, as several major competitors face a near-term inflection point, which may lead to further industry consolidation, creating additional market share growth opportunities for Jefferies Fixed Income is now delivering meaningfully improved performance, with increased capital efficiency and lower risk, after successful efforts to enhance the team, refocus the business and reduce risk, balance sheet and capital utilization (firm-wide assets of $38.1 billion as of August 31, 2016, down from $42.8 billion as of August 31, 2015) Equities is recording growth in market share and net revenues that should accelerate Investment Banking backlog is stronger for Q4, following a cyclical slowdown in recent quarters, and we continue to strengthen and expand our team Our priorities are margin expansion, earnings growth and maintaining our discipline around liquidity and risk management
11
Jefferies’ Focus Today
Drive growth in Investment Banking, with an emphasis on the U.S., by expanding into new sub-sectors and enhancing our team, taking advantage of challenges at competing banks
Continue to grow market share in Equities and Fixed Income, driving margin expansion
Drive European growth, leveraging investments across Investment Banking, Equities and Research
12
Jefferies Operating Results
13
Jefferies Earnings Overview (GAAP)
FYE Nov. 30, Quarter Ended
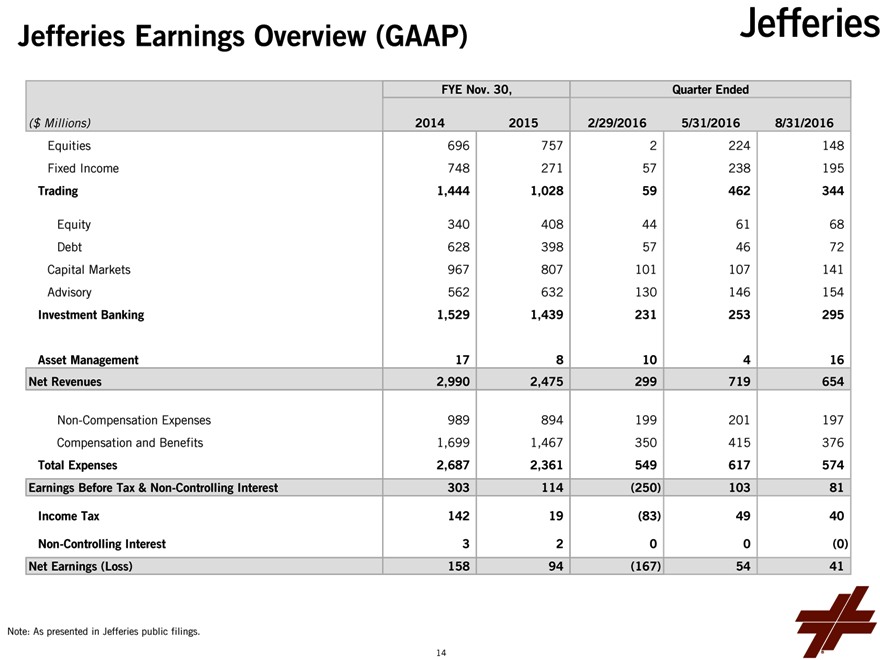
($ Millions) 2014 20152/29/20165/31/20168/31/2016
Equities 696 7572224148
Fixed Income 748 27157238195
Trading 1,444 1,02859462344
Equity 340 408446168
Debt 628 398574672
Capital Markets 967 807101107141
Advisory 562 632130146154
Investment Banking 1,529 1,439231253295
Asset Management 17 810416
Net Revenues 2,990 2,475299719654
Non-Compensation Expenses 989 894199201197
Compensation and Benefits 1,699 1,467350415376
Total Expenses 2,687 2,361549617574
Earnings Before Tax & Non-Controlling Interest 303 114(250)10381
Income Tax 142 19(83)4940
Non-Controlling Interest 3 200(0)
Net Earnings (Loss) 158 94(167)5441
Note: As presented in Jefferies public filings.
14
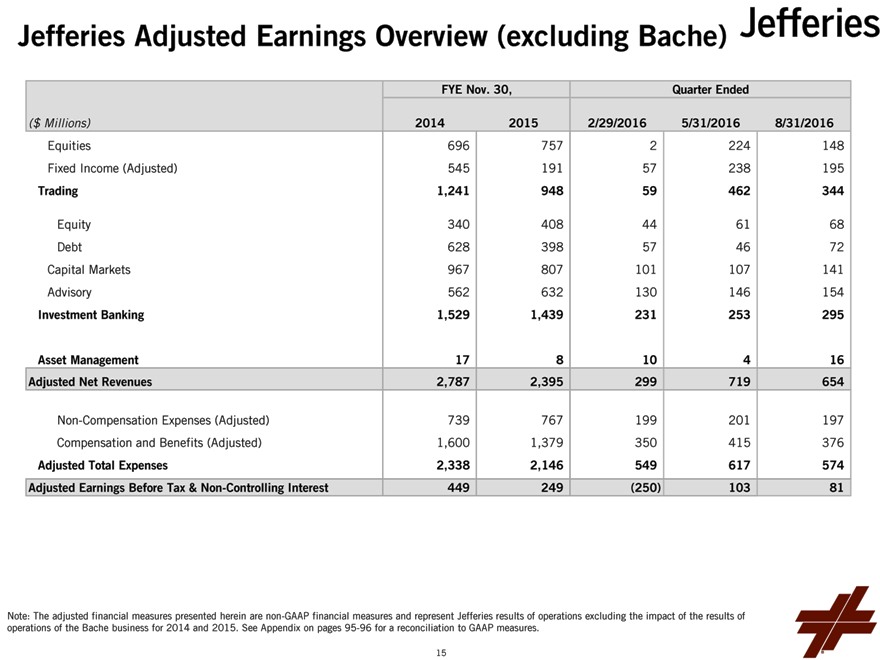
Jefferies Adjusted Earnings Overview (excluding Bache)
FYE Nov. 30, Quarter Ended
($ Millions) 2014 20152/29/20165/31/20168/31/2016
Equities 696 7572224148
Fixed Income (Adjusted) 545 19157238195
Trading 1,241 94859462344
Equity 340 408446168
Debt 628 398574672
Capital Markets 967 807101107141
Advisory 562 632130146154
Investment Banking 1,529 1,439231253295
Asset Management 17 810416
Adjusted Net Revenues 2,787 2,395299719654
Non-Compensation Expenses (Adjusted) 739 767199201197
Compensation and Benefits (Adjusted) 1,600 1,379350415376
Adjusted Total Expenses 2,338 2,146549617574
Adjusted Earnings Before Tax & Non-Controlling Interest 449 249(250)10381
Note: The adjusted financial measures presented herein are non-GAAP financial measures and represent Jefferies results of operations excluding the impact of the results of operations of the Bache business for 2014 and 2015. See Appendix on pages 95-96 for a reconciliation to GAAP measures.
15
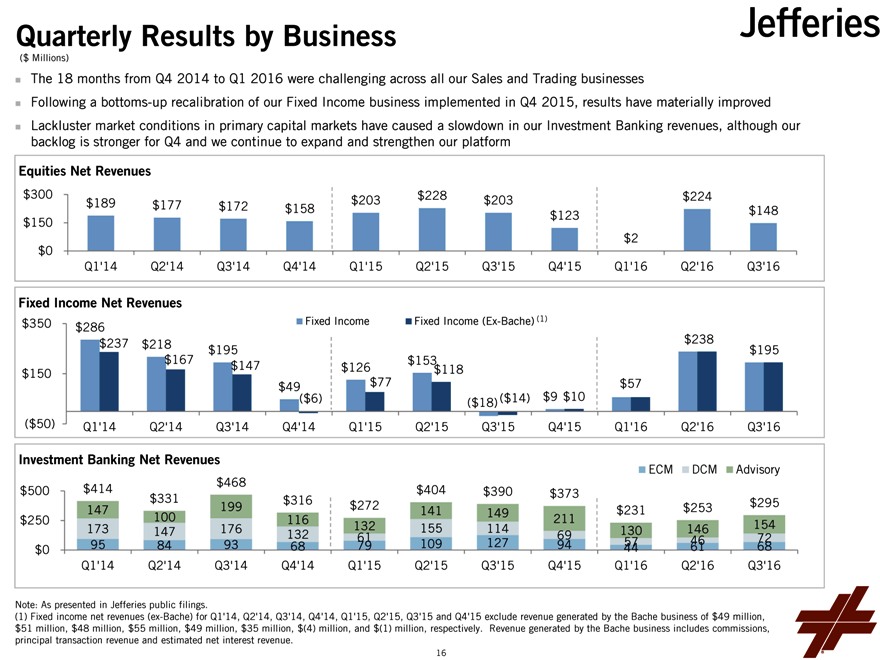
Quarterly Results by Business
($ Millions)
The 18 months from Q4 2014 to Q1 2016 were challenging across all our Sales and Trading businesses
Following a bottoms-up recalibration of our Fixed Income business implemented in Q4 2015, results have materially improved Lackluster market conditions in primary capital markets have caused a slowdown in our Investment Banking revenues, although our backlog is stronger for Q4 and we continue to expand and strengthen our platform
Equities Net Revenues $300 $203 $228 $203 $224 $189 $177 $172 $158 $150 $123 $148 $2 $0 Q1’14 Q2’14 Q3’14 Q4’14 Q1’15 Q2’15 Q3’15 Q4’15 Q1’16 Q2’16 Q3’16
Fixed Income Net Revenues $350 Fixed Income Fixed Income (Ex-Bache) (1) $286 $238 $237 $218 $195 $195 $167 $153 $147 $126 $118 $150
$49 $77 $57
($6) ($14) $9 $10
($18)
($50) Q1’14 Q2’14 Q3’14 Q4’14 Q1’15 Q2’15 Q3’15 Q4’15 Q1’16 Q2’16 Q3’16
Investment Banking Net Revenues
ECM DCM Advisory $468 $500 $414 $404 $390 $373 $331 $316 $295 147 199 $272 141 $231 $253 100 149 211 $250 116 154 173 147 176 132 155 114 130 146 132 61 69 72
95 84 93 79 109 127 94 57 46
$0 68 44 61 68 Q1’14 Q2’14 Q3’14 Q4’14 Q1’15 Q2’15 Q3’15 Q4’15 Q1’16 Q2’16 Q3’16
Note: As presented in Jefferies public filings.
(1) Fixed income net revenues (ex-Bache) for Q1’14, Q2’14, Q3’14, Q4’14, Q1’15, Q2’15, Q3’15 and Q4’15 exclude revenue generated by the Bache business of $49 million, $51 million, $48 million, $55 million, $49 million, $35 million, $(4) million, and $(1) million, respectively. Revenue generated by the Bache business includes commissions, principal transaction revenue and estimated net interest revenue.
16
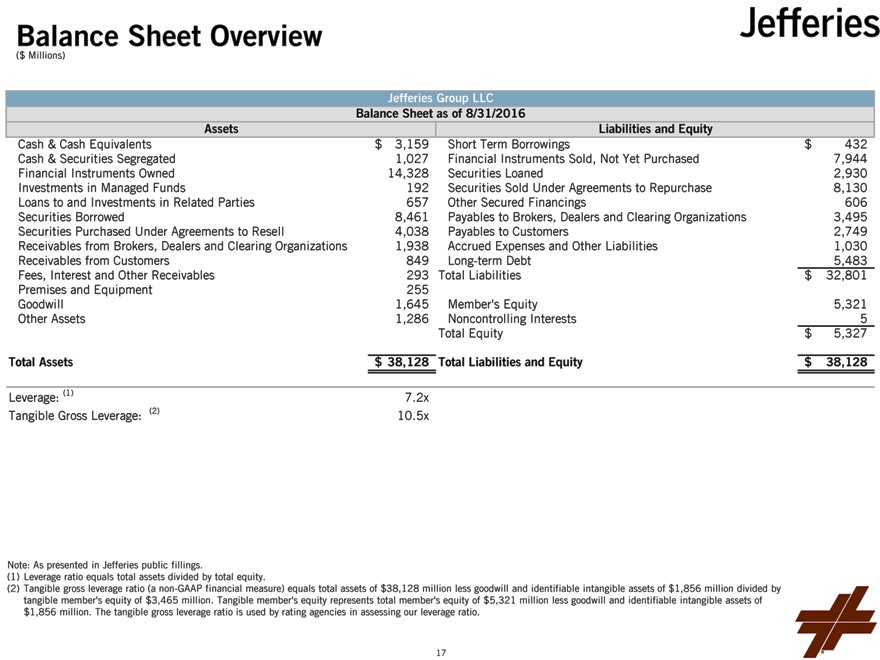
Balance Sheet Overview
($ Millions)
Jefferies Group LLC Balance Sheet as of 8/31/2016
Assets
Cash & Cash Equivalents $3,159
Cash & Securities Segregated 1,027
Financial Instruments Owned 14,328
Investments in Managed Funds 192
Loans to and Investments in Related Parties 657
Securities Borrowed 8,461
Securities Purchased Under Agreements to Resell 4,038
Receivables from Brokers, Dealers and Clearing Organizations 1,938
Receivables from Customers 849
Fees, Interest and Other Receivables 293
Premises and Equipment 255
Goodwill 1,645
Other Assets 1,286
Total Assets $38,128
Leverage: (1) 7.2x
Tangible Gross Leverage: (2) 10.5x
Liabilities and Equity
Short Term Borrowings $432
Financial Instruments Sold, Not Yet Purchased 7,944
Securities Loaned 2,930
Securities Sold Under Agreements to Repurchase 8,130
Other Secured Financings 606
Payables to Brokers, Dealers and Clearing Organizations 3,495
Payables to Customers 2,749
Accrued Expenses and Other Liabilities 1,030
Long-term Debt 5,483
Total Liabilities $32,801
Member’s Equity 5,321
Noncontrolling Interests 5
Total Equity $5,327
Total Liabilities and Equity $38,128
Note: As presented in Jefferies public fillings.
(1) Leverage ratio equals total assets divided by total equity.
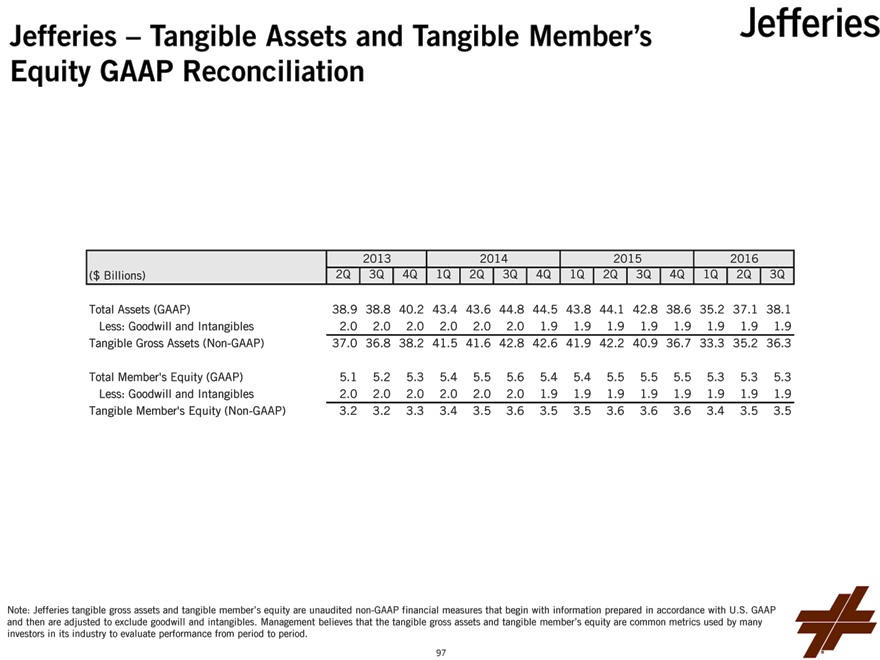
(2) Tangible gross leverage ratio (a non-GAAP financial measure) equals total assets of $38,128 million less goodwill and identifiable intangible assets of $1,856 million divided by tangible member’s equity of $3,465 million. Tangible member’s equity represents total member’s equity of $5,321 million less goodwill and identifiable intangible assets of $1,856 million. The tangible gross leverage ratio is used by rating agencies in assessing our leverage ratio.
17
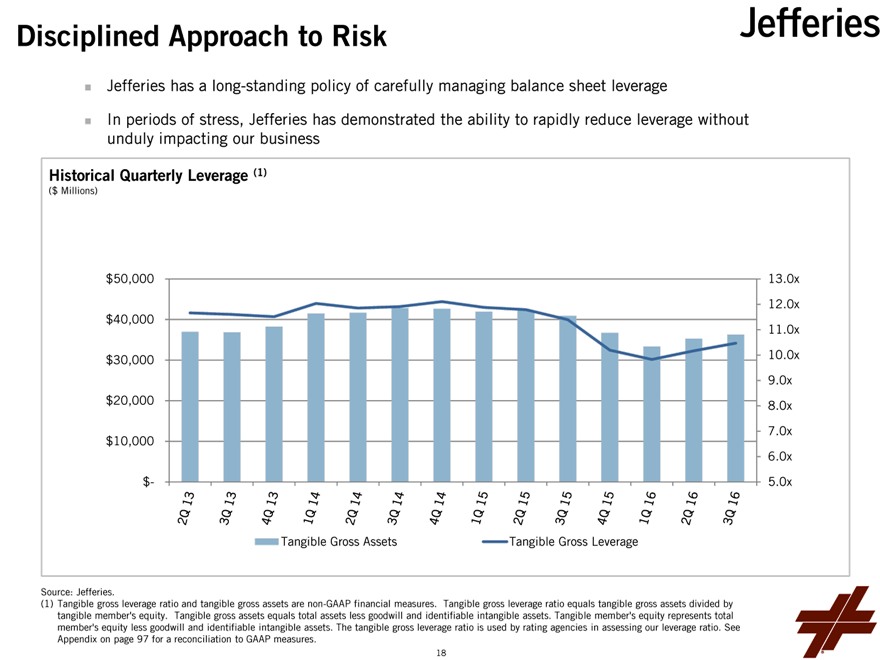
Disciplined Approach to Risk
Jefferies has a long-standing policy of carefully managing balance sheet leverage
In periods of stress, Jefferies has demonstrated the ability to rapidly reduce leverage without unduly impacting our business
Historical Quarterly Leverage (1)
($ Millions)
$50,000 13.0x 12.0x $40,000 11.0x $30,000 10.0x
9.0x $20,000 8.0x
7.0x $10,000
6.0x
$- 5.0x
Tangible Gross Assets Tangible Gross Leverage
Source: Jefferies.
(1) Tangible gross leverage ratio and tangible gross assets are non-GAAP financial measures. Tangible gross leverage ratio equals tangible gross assets divided by tangible member’s equity. Tangible gross assets equals total assets less goodwill and identifiable intangible assets. Tangible member’s equity represents total member’s equity less goodwill and identifiable intangible assets. The tangible gross leverage ratio is used by rating agencies in assessing our leverage ratio. See Appendix on page 97 for a reconciliation to GAAP measures.
18
Disciplined Approach to Risk (Continued)
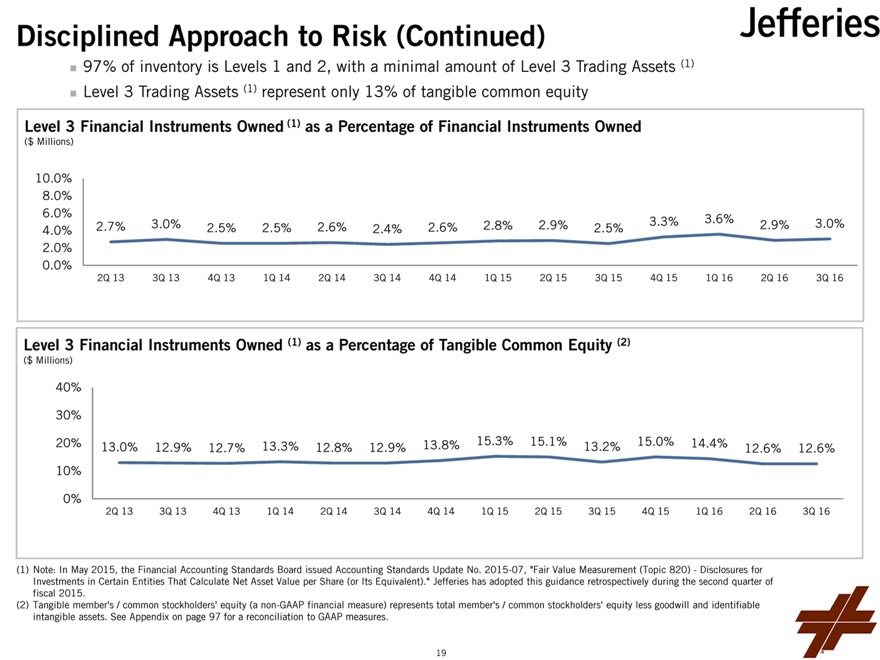
inventory is Levels 1 and 2, with a minimal amount of Level 3 Trading Assets (1) 97% of Level 3 Trading Assets (1) represent only 13% of tangible common equity
Level 3 Financial Instruments Owned (1) as a Percentage of Financial Instruments Owned
($ Millions)
10.0% 8.0% 6.0% 4.0% 2.0% 0.0%
3.0% 3.3% 3.6% 3.0%
2.7% 2.5% 2.5% 2.6% 2.4% 2.6% 2.8% 2.9% 2.5% 2.9%
2Q 13 3Q 13 4Q 13 1Q 14 2Q 14 3Q 14 4Q 14 1Q 15 2Q 15 3Q 15 4Q 15 1Q 16 2Q 16 3Q 16
Level 3 Financial Instruments Owned (1) as a Percentage of Tangible Common Equity (2)
($ Millions)
40% 30% 20% 10% 0%
13.3% 13.8% 15.3% 15.1% 13.2% 15.0% 14.4%
13.0% 12.9% 12.7% 12.8% 12.9% 12.6% 12.6%
2Q 13 3Q 13 4Q 13 1Q 14 2Q 14 3Q 14 4Q 14 1Q 15 2Q 15 3Q 15 4Q 15 1Q 16 2Q 16 3Q 16
(1) Note: In May 2015, the Financial Accounting Standards Board issued Accounting Standards Update No. 2015-07, “Fair Value Measurement (Topic 820)—Disclosures for Investments in Certain Entities That Calculate Net Asset Value per Share (or Its Equivalent).” Jefferies has adopted this guidance retrospectively during the second quarter of fiscal 2015.
(2) Tangible member’s / common stockholders’ equity (a non-GAAP financial measure) represents total member’s / common stockholders’ equity less goodwill and identifiable intangible assets. See Appendix on page 97 for a reconciliation to GAAP measures.
19
Jefferies Business Review
20
Investment Banking
21
Investment Banking Overview
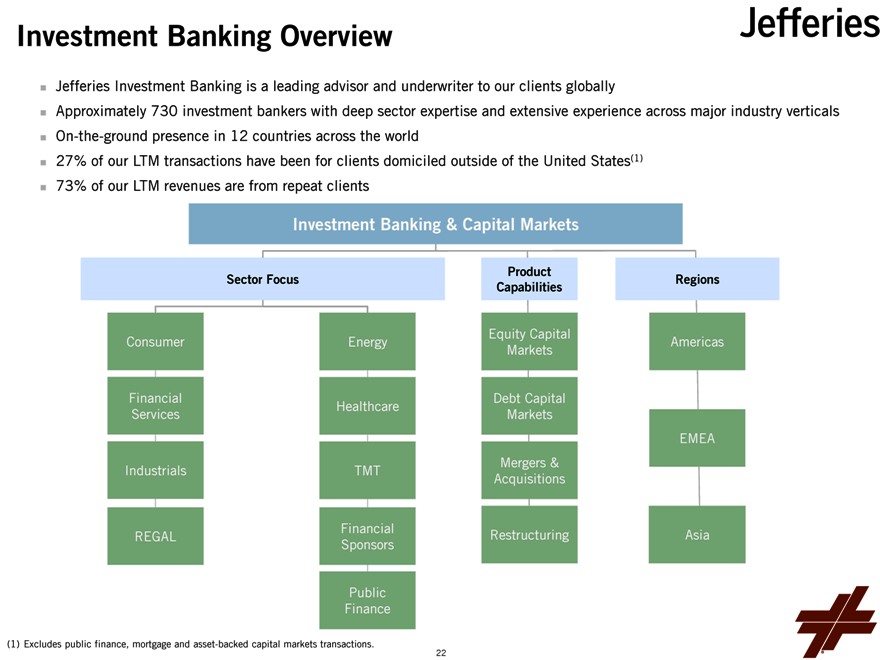
Jefferies Investment Banking is a leading advisor and underwriter to our clients globally
Approximately 730 investment bankers with deep sector expertise and extensive experience across major industry verticals On-the-ground presence in 12 countries across the world been for clients domiciled outside of the United States(1) 27% of our LTM transactions have 73% of our LTM revenues are from repeat clients
Investment Banking & Capital Markets
Product
Sector Focus Regions Capabilities
Equity Capital
Consumer Energy Americas Markets
Financial Debt Capital Healthcare Services Markets
EMEA Mergers & Industrials TMT
Acquisitions
Financial
REGAL Restructuring Asia Sponsors
Public Finance
(1) Excludes public finance, mortgage and asset-backed capital markets transactions. 22
Expansion of Our Sector and Regional Footprint
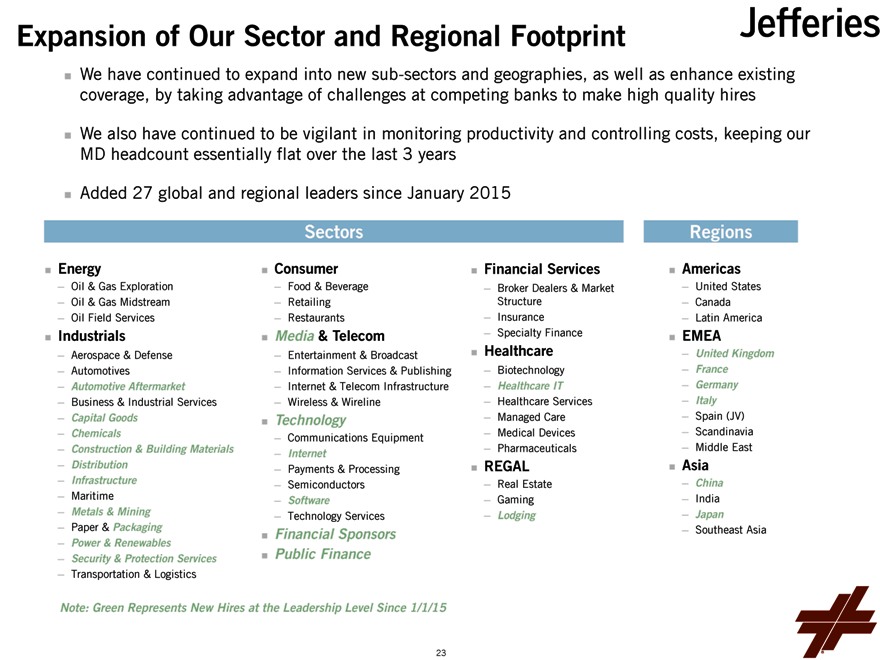
We have continued to expand into new sub-sectors and geographies, as well as enhance existing coverage, by taking advantage of challenges at competing banks to make high quality hires
We also have continued to be vigilant in monitoring productivity and controlling costs, keeping our MD headcount essentially flat over the last 3 years
Added 27 global and regional leaders since January 2015
Sectors
Energy
— Oil & Gas Exploration
— Oil & Gas Midstream
— Oil Field Services
Industrials
— Aerospace & Defense
— Automotives
— Automotive Aftermarket
— Business & Industrial Services
— Capital Goods
— Chemicals
— Construction & Building Materials
— Distribution
— Infrastructure
— Maritime
— Metals & Mining
— Paper & Packaging
— Power & Renewables
— Security & Protection Services
— Transportation & Logistics
Consumer
— Food & Beverage
— Retailing
— Restaurants
Media & Telecom
— Entertainment & Broadcast
— Information Services & Publishing
— Internet & Telecom Infrastructure
— Wireless & Wireline
Technology
— Communications Equipment
— Internet
— Payments & Processing
— Semiconductors
— Software
— Technology Services
Financial Sponsors Public Finance
Financial Services
— Broker Dealers & Market Structure
— Insurance
— Specialty Finance
Healthcare
— Biotechnology
— Healthcare IT
— Healthcare Services
— Managed Care
— Medical Devices
— Pharmaceuticals
REGAL
— Real Estate
— Gaming
— Lodging
Regions
Americas
— United States
— Canada
— Latin America
EMEA
— United Kingdom
— France
— Germany
— Italy
— Spain (JV)
— Scandinavia
— Middle East
Asia
— China
— India
— Japan
— Southeast Asia
Note: Green Represents New Hires at the Leadership Level Since 1/1/15
23
Investment Banking – Performance and Market Update
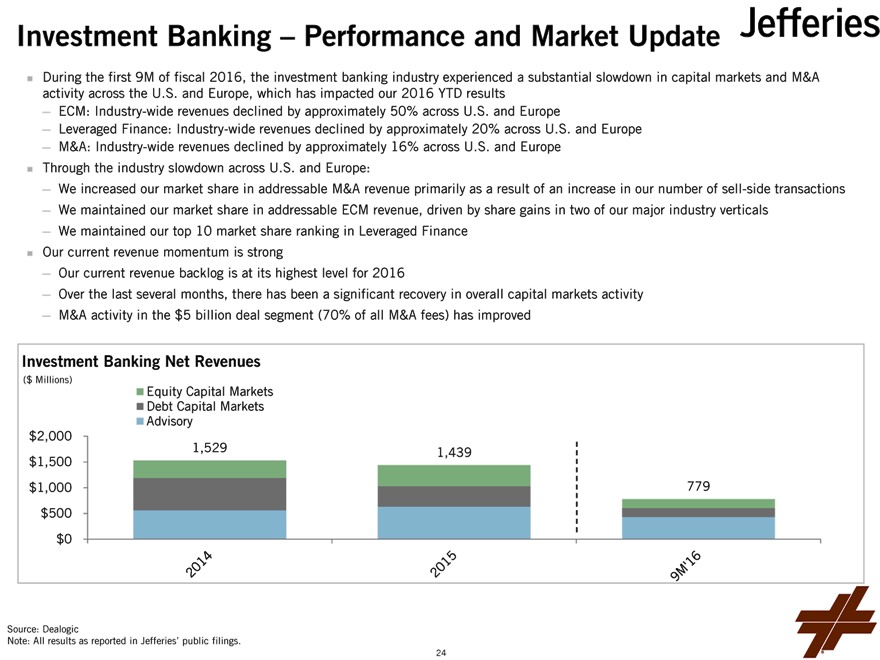
During the first 9M of fiscal 2016, the investment banking industry experienced a substantial slowdown in capital markets and M&A activity across the U.S. and Europe, which has impacted our 2016 YTD results
— ECM: Industry-wide revenues declined by approximately 50% across U.S. and Europe
— Leveraged Finance: Industry-wide revenues declined by approximately 20% across U.S. and Europe
— M&A: Industry-wide revenues declined by approximately 16% across U.S. and Europe Through the industry slowdown across U.S. and Europe:
— We increased our market share in addressable M&A revenue primarily as a result of an increase in our number of sell-side transactions
— We maintained our market share in addressable ECM revenue, driven by share gains in two of our major industry verticals
— We maintained our top 10 market share ranking in Leveraged Finance Our current revenue momentum is strong
— Our current revenue backlog is at its highest level for 2016
— Over the last several months, there has been a significant recovery in overall capital markets activity
— M&A activity in the $5 billion deal segment (70% of all M&A fees) has improved
Investment Banking Net Revenues
($ Millions) Equity Capital Markets Debt Capital Markets Advisory $2,000 1,529
1,439 $1,500 $1,000 779 $500 $0
Source: Dealogic
Note: All results as reported in Jefferies’ public filings.
24
Investment Banking – Strategic Priorities
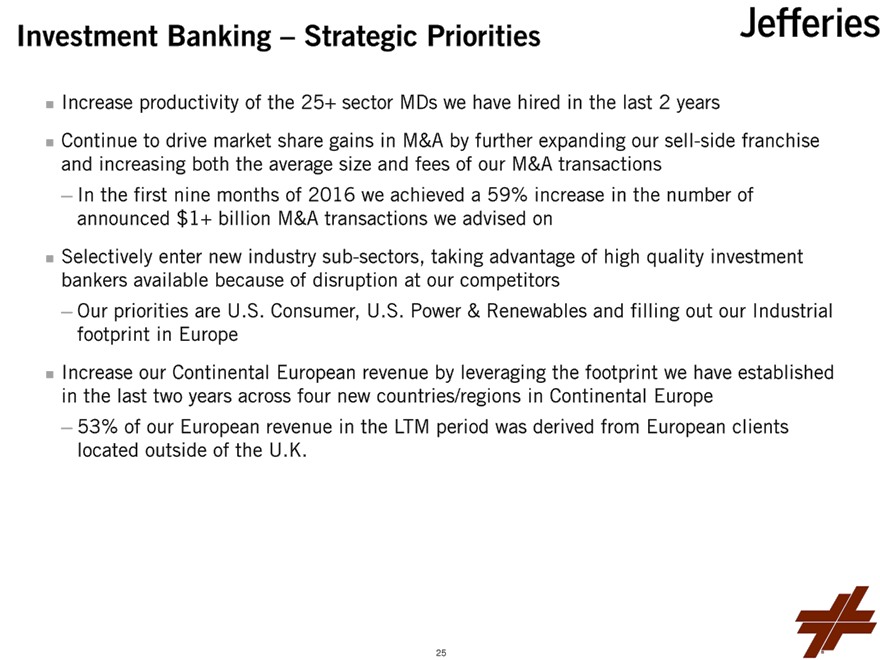
Increase productivity of the 25+ sector MDs we have hired in the last 2 years
Continue to drive market share gains in M&A by further expanding our sell-side franchise and increasing both the average size and fees of our M&A transactions
— In the first nine months of 2016 we achieved a 59% increase in the number of announced $1+ billion M&A transactions we advised on Selectively enter new industry sub-sectors, taking advantage of high quality investment bankers available because of disruption at our competitors
— Our priorities are U.S. Consumer, U.S. Power & Renewables and filling out our Industrial footprint in Europe Increase our Continental European revenue by leveraging the footprint we have established in the last two years across four new countries/regions in Continental Europe
— 53% of our European revenue in the LTM period was derived from European clients located outside of the U.K.
25
Equities
26
Equities – Overview
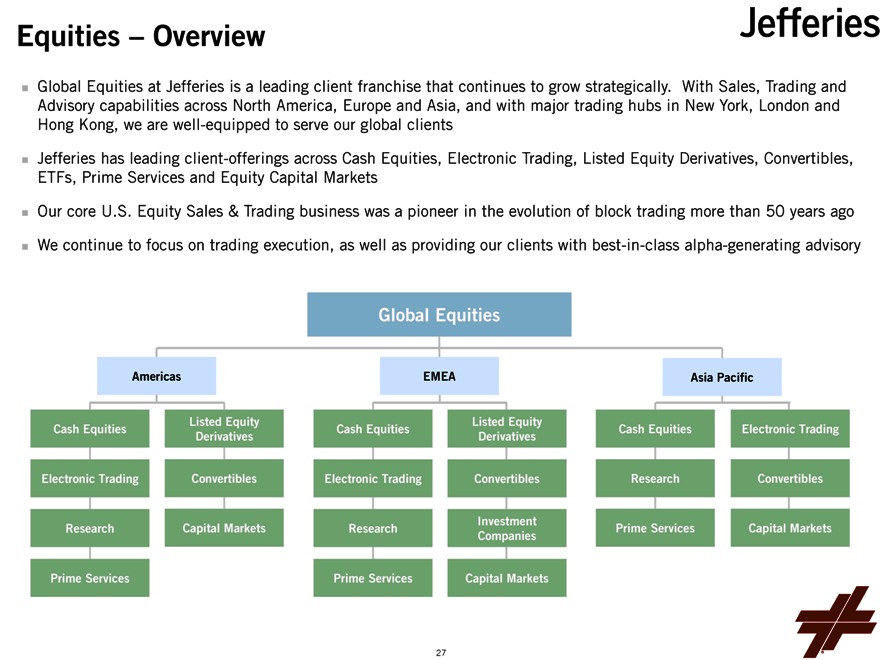
Global Equities at Jefferies is a leading client franchise that continues to grow strategically. With Sales, Trading and Advisory capabilities across North America, Europe and Asia, and with major trading hubs in New York, London and Hong Kong, we are well-equipped to serve our global clients Jefferies has leading client-offerings across Cash Equities, Electronic Trading, Listed Equity Derivatives, Convertibles, ETFs, Prime Services and Equity Capital Markets Our core U.S. Equity Sales & Trading business was a pioneer in the evolution of block trading more than 50 years ago We continue to focus on trading execution, as well as providing our clients with best-in-class alpha-generating advisory
Global Equities
Americas EMEAAsia Pacific
Listed Equity Listed Equity
Cash Equities Cash Equities Cash Equities Electronic Trading
Derivatives Derivatives
Electronic Trading Convertibles Electronic Trading Convertibles Research Convertibles
Investment
Research Capital Markets Research Prime Services Capital Markets
Companies
Prime Services Prime Services Capital Markets
27
Equities – Market Share Growth
Advisory
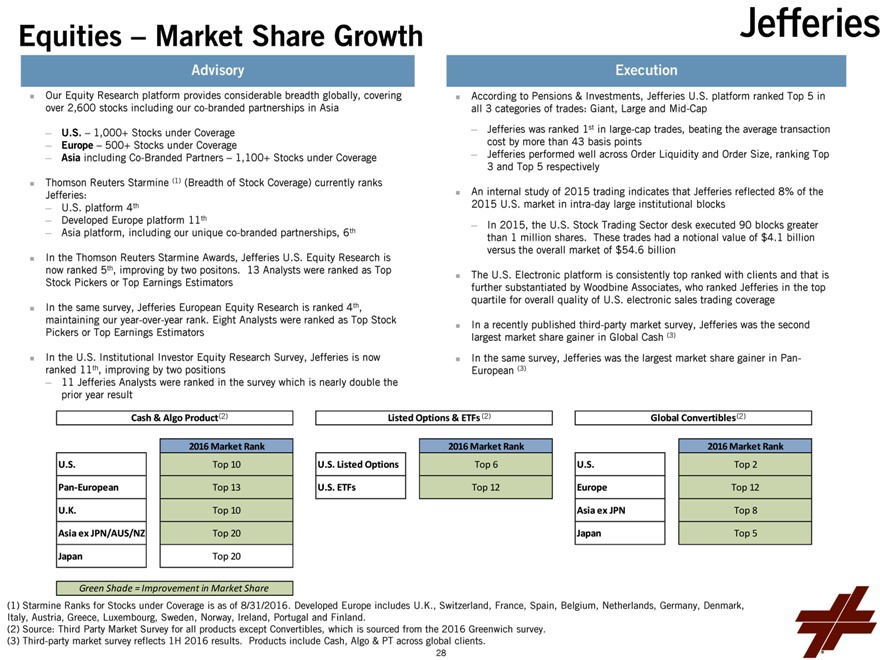
Our Equity Research platform provides considerable breadth globally, covering over 2,600 stocks including our co-branded partnerships in Asia
— U.S. – 1,000+ Stocks under Coverage
— Europe – 500+ Stocks under Coverage
— Asia including Co-Branded Partners – 1,100+ Stocks under Coverage
(1)
Thomson Reuters Starmine (Breadth of Stock Coverage) currently ranks Jefferies:
— U.S. platform 4th
— Developed Europe platform 11th
— Asia platform, including our unique co-branded partnerships, 6th
In the Thomson Reuters Starmine Awards, Jefferies U.S. Equity Research is now ranked 5th, improving by two positons. 13 Analysts were ranked as Top Stock Pickers or Top Earnings Estimators
In the same survey, Jefferies European Equity Research is ranked 4th, maintaining our year-over-year rank. Eight Analysts were ranked as Top Stock Pickers or Top Earnings Estimators
In the U.S. Institutional Investor Equity Research Survey, Jefferies is now ranked 11th, improving by two positions
— 11 Jefferies Analysts were ranked in the survey which is nearly double the prior year result
Execution
According to Pensions & Investments, Jefferies U.S. platform ranked Top 5 in all 3 categories of trades: Giant, Large and Mid-Cap
— Jefferies was ranked 1st in large-cap trades, beating the average transaction cost by more than 43 basis points
— Jefferies performed well across Order Liquidity and Order Size, ranking Top 3 and Top 5 respectively
An internal study of 2015 trading indicates that Jefferies reflected 8% of the 2015 U.S. market in intra-day large institutional blocks
— In 2015, the U.S. Stock Trading Sector desk executed 90 blocks greater than 1 million shares. These trades had a notional value of $4.1 billion versus the overall market of $54.6 billion
The U.S. Electronic platform is consistently top ranked with clients and that is further substantiated by Woodbine Associates, who ranked Jefferies in the top quartile for overall quality of U.S. electronic sales trading coverage
In a recently published third-party market survey, Jefferies was the second largest market share gainer in Global Cash (3) In the same survey, Jefferies was the largest market share gainer in Pan-European (3)
Cash & Algo Product(2)
2016 Market Rank
U.S. Top 10
Pan-European Top 13
U.K. Top 10
Asia ex JPN/AUS/NZ Top 20
Japan Top 20
Listed Options & ETFs (2)
2016 Market Rank
U.S. Listed Options Top 6
U.S. ETFs Top 12
Global Convertibles(2)
2016 Market Rank
U.S. Top 2
Europe Top 12
Asia ex JPN Top 8
Japan Top 5
Green Shade = Improvement in Market Share
(1) Starmine Ranks for Stocks under Coverage is as of 8/31/2016. Developed Europe includes U.K., Switzerland, France, Spain, Belgium, Netherlands, Germany, Denmark, Italy, Austria, Greece, Luxembourg, Sweden, Norway, Ireland, Portugal and Finland.
(2) Source: Third Party Market Survey for all products except Convertibles, which is sourced from the 2016 Greenwich survey. (3) Third-party market survey reflects 1H 2016 results. Products include Cash, Algo & PT across global clients.
28
Equities – Performance Update
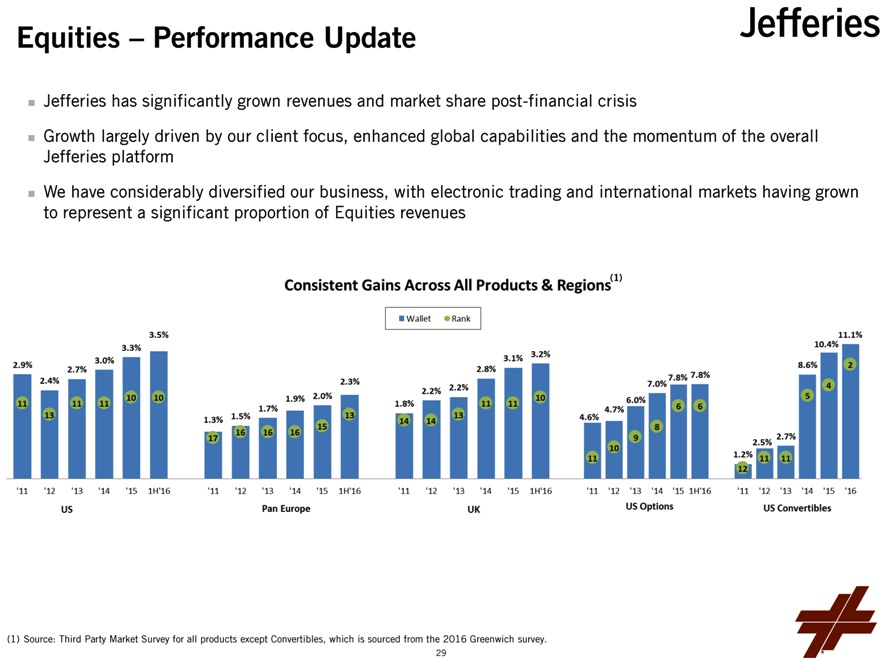
Jefferies has significantly grown revenues and market share post-financial crisis
Growth largely driven by our client focus, enhanced global capabilities and the momentum of the overall Jefferies platform We have considerably diversified our business, with electronic trading and international markets having grown to represent a significant proportion of Equities revenues
(1) Source: Third Party Market Survey for all products except Convertibles, which is sourced from the 2016 Greenwich survey. 29
Equities – Strategic Priorities
Growing Non-Cash Businesses
Our focus is on product and revenue diversification by cross-selling, client penetration and leveraging client relationships across Electronics, Listed Derivatives, ETFs, Prime Brokerage and Securities Finance
— Electronics: Increase the breadth of clients, as well as expand penetration with existing clients globally
— Listed Derivatives: Continue to maintain top market standing and improve client penetration
— Prime Brokerage: Capitalize on U.S. opportunities to serve mid-sized prime brokerage clients that are increasingly underserved by the large bank holding companies
Continued Enhancement of Our Alpha-Generating Research Offering
Focus on enhancing our Equity Research product by collaborating on unique and evolving strategies for increasing the intellectual value of our research
30
Fixed Income
31
Fixed Income Overview
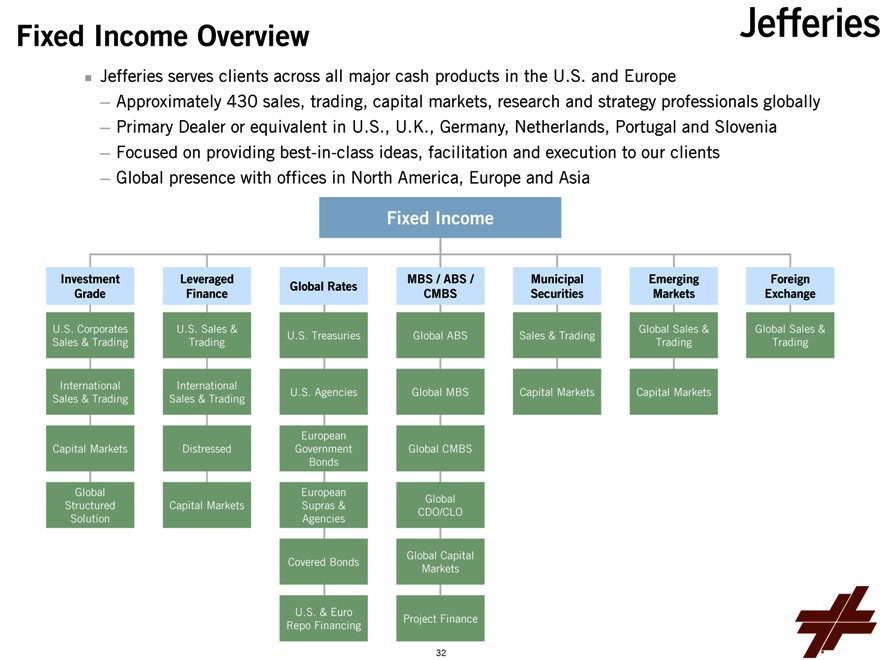
Jefferies serves clients across all major cash products in the U.S. and Europe
— Approximately 430 sales, trading, capital markets, research and strategy professionals globally
— Primary Dealer or equivalent in U.S., U.K., Germany, Netherlands, Portugal and Slovenia
— Focused on providing best-in-class ideas, facilitation and execution to our clients
— Global presence with offices in North America, Europe and Asia
Fixed Income
Investment Leveraged MBS / ABS /Municipal Emerging Foreign
Global Rates
Grade Finance CMBS Securities Markets Exchange
U.S. Corporates U.S. Sales & Global Sales &Global Sales &
U.S. Treasuries Global ABS Sales & Trading
Sales & Trading Trading Trading Trading
International International U.S. Agencies Global MBS Capital Markets Capital Markets
Sales & Trading Sales & Trading
European
Capital Markets Distressed Government Global CMBS
Bonds
Global European
Structured Capital Markets Supras &Global
Solution AgenciesCDO/CLO
Global Capital
Covered BondsMarkets
U.S. & Euro
Repo FinancingProject Finance
32
Business Realignment Overview
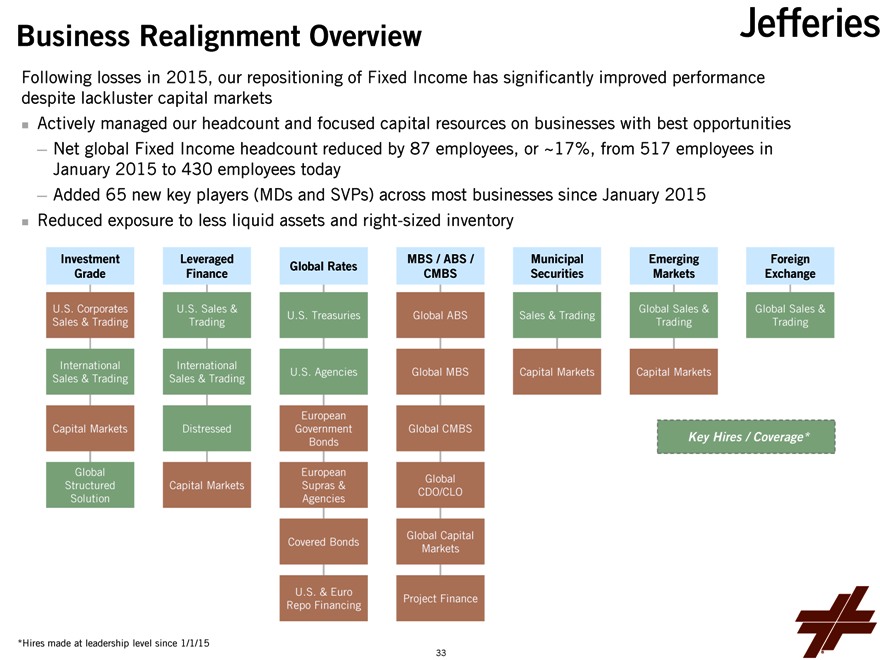
Following losses in 2015, our repositioning of Fixed Income has significantly improved performance despite lackluster capital markets
Actively managed our headcount and focused capital resources on businesses with best opportunities
— Net global Fixed Income headcount reduced by 87 employees, or ~17%, from 517 employees in January 2015 to 430 employees today
— Added 65 new key players (MDs and SVPs) across most businesses since January 2015 Reduced exposure to less liquid assets and right-sized inventory
Investment Grade Leveraged Finance Global Rates MBS / ABS / CMBS Municipal Securities Emerging Markets Foreign Exchange
U.S. Corporates U.S. Sales & Global Sales &Global Sales &
U.S. Treasuries Global ABSSales & Trading
Sales & Trading Trading Trading Trading
International International U.S. Agencies Global MBS Capital Markets Capital Markets
Sales & Trading Sales & Trading
European
Capital Markets Distressed Government Global CMBS
Bonds Key Hires / Coverage*
Global European
Structured Capital Markets Supras &Global
Solution Agencies CDO/CLO
Global Capital
Covered Bonds Markets
U.S. & Euro
Repo Financing Project Finance
*Hires made at leadership level since 1/1/15
33
Fixed Income – Performance Update
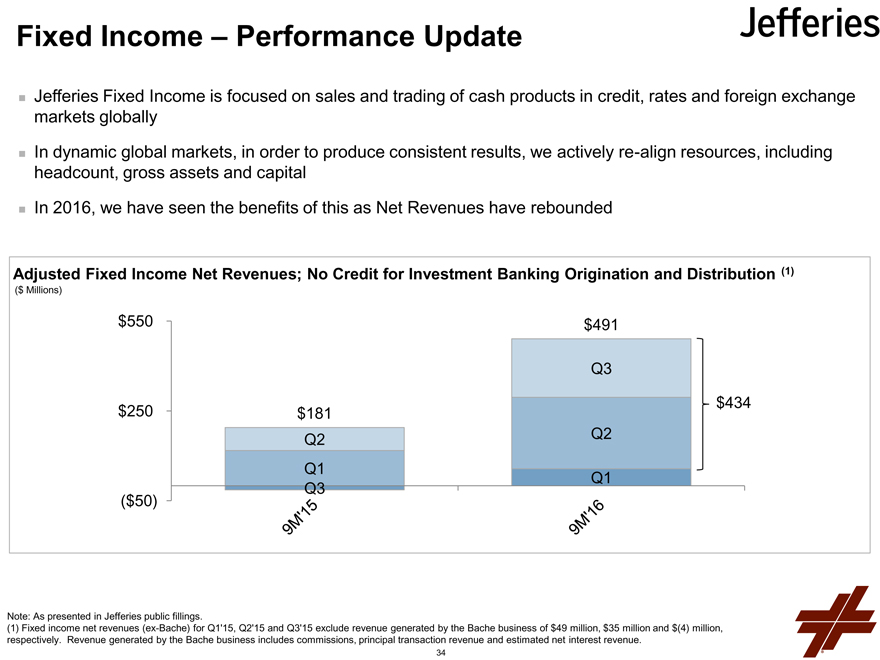
Jefferies Fixed Income is focused on sales and trading of cash products in credit, rates and foreign exchange markets globally In dynamic global markets, in order to produce consistent results, we actively re-align resources, including headcount, gross assets and capital In 2016, we have seen the benefits of this as Net Revenues have rebounded
Adjusted Fixed Income Net Revenues; No Credit for Investment Banking Origination and Distribution (1)
($ Millions)
$550 $491
Q3 $434 $250 $181 Q3 Q2 Q2 Q1 Q1
($50)
Note: As presented in Jefferies public fillings.
(1) Fixed income net revenues (ex-Bache) for Q1’15, Q2’15 and Q3’15 exclude revenue generated by the Bache business of $49 million, $35 million and $(4) million, respectively. Revenue generated by the Bache business includes commissions, principal transaction revenue and estimated net interest revenue.
34
Fixed Income – Strategic Priorities
Drive consistent results by continuing to emphasize our long-standing client centric strategy
Make our balance sheet as productive as possible, with emphasis on high turnover inventory
Invest in technology that levers business productivity and enhances client service
Relentlessly focus on capital efficiency and cost containment
35
Risk Management
36
Risk Principles
Jefferies’ comprehensive risk management framework has been a foundation for our success across market cycles Culture
— We are all Partners at our firm, collectively building for the long-term on a foundation established over 50+ years
Hands-on
— Our senior management and Board are deeply involved in the “nuts and bolts” of how and where we are taking risks across the firm
Integrated
— Our independent risk management group and our business leaders are deeply integrated into our trading desks, ensuring a clear and comprehensive view of the firm’s risk
Asset Quality
— Jefferies is dedicated to serving our clients in liquid, transparent products. We limit illiquid assets and derivatives to ensure the overall liquidity and health of our balance sheet
37
Risk Management Summary Framework
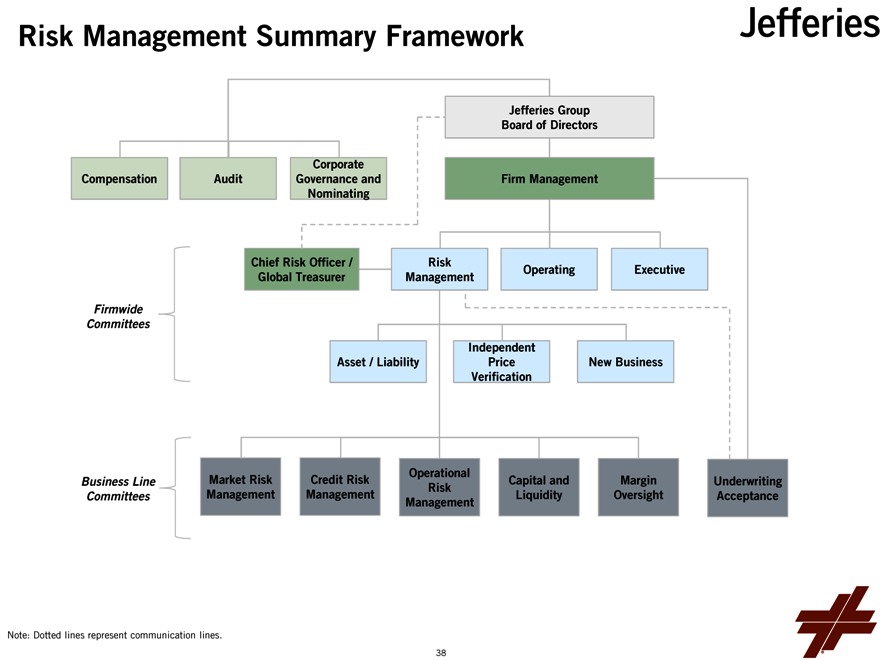
Jefferies Group Board of Directors
Corporate
Compensation Audit Governance and Firm Management Nominating
Chief Risk Officer / Risk
Operating Executive Global Treasurer Management
Firmwide Committees
Independent
Asset / Liability Price New Business Verification
Operational
Business Line Market Risk Credit Risk Capital and Margin Underwriting Risk Committees Management Management Liquidity Oversight Acceptance Management
Note: Dotted lines represent communication lines.
38
VaR Report
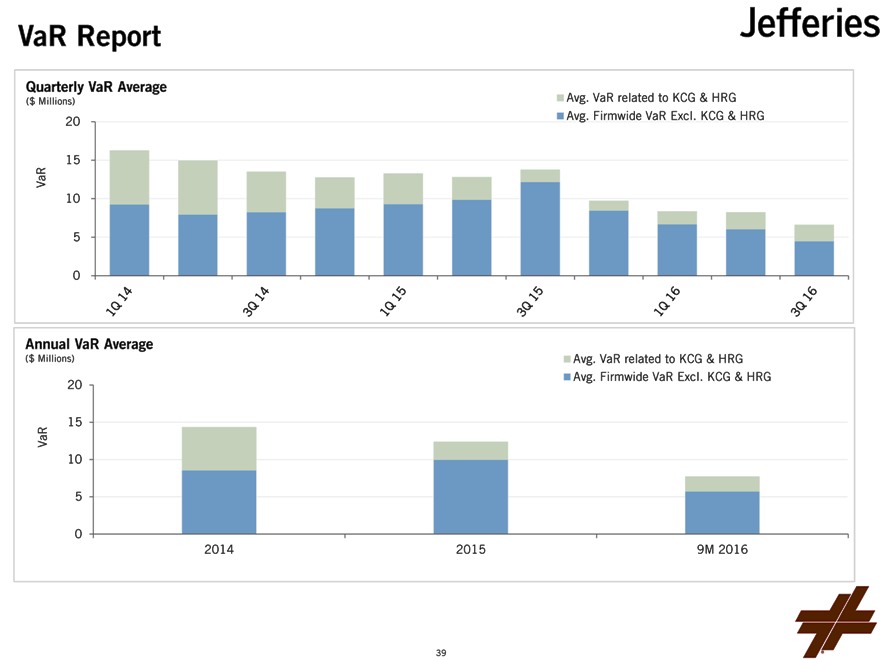
Quarterly VaR Average
($ Millions) Avg. VaR related to KCG & HRG
20 Avg. Firmwide VaR Excl. KCG & HRG
15 VaR
10 5 0
Annual VaR Average
($ Millions) Avg. VaR related to KCG & HRG
Avg. Firmwide VaR Excl. KCG & HRG 20
VaR 15 10
5
0
2014 2015 9M 2016
39
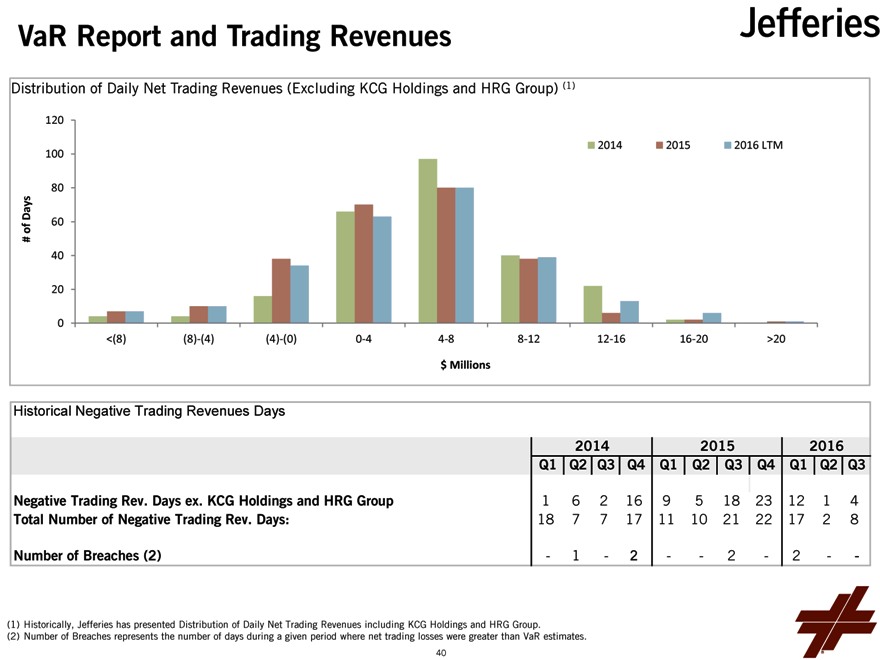
VaR Report and Trading Revenues
Distribution of Daily Net Trading Revenues (Excluding KCG Holdings and HRG Group) (1)
120
100 2014 2015 2016 LTM
80
Days of 60 #
40
20
0
<(8) (8)-(4) (4)-(0) 0-4 4-8 8-12 12-16 16-20 >20
$ Millions
Historical Negative Trading Revenues Days
2014 2015 2016 Q1 Q2 Q3 Q4 Q1 Q2 Q3 Q4 Q1 Q2 Q3
Negative Trading Rev. Days ex. KCG Holdings and HRG Group 1 6 2 16 9 5 18 23 12 1 4 Total Number of Negative Trading Rev. Days: 18 7 7 17 11 10 21 22 17 2 8
Number of Breaches (2)—1—2 — 2—2 —
(1) Historically, Jefferies has presented Distribution of Daily Net Trading Revenues including KCG Holdings and HRG Group.
(2) Number of Breaches represents the number of days during a given period where net trading losses were greater than VaR estimates.
40
Capital and Liquidity Management
41
Liquidity and Funding Principles
Jefferies’ long-standing liquidity and funding principles have maintained the strength and soundness of our platform across market cycles
Owning inventory that is composed of liquid assets that turn over regularly, with Level 3 assets at ~3% of inventory Maintaining a sound, long-term capital base and reasonable leverage relative to our business activity No material reliance on short-term unsecured funding or customer balances. No commercial paper program Short-term secured funding that is readily and consistently available through clearing houses, or fixed for periods of time that exceed the expected tenure of the inventory they are funding Assessing capital reserves and maintaining liquidity to withstand adverse changes in the trading or financing markets and a firm specific idiosyncratic stress Where appropriate, entering into partnerships and joint ventures with complementary long-term partners to pursue business opportunities that otherwise may exceed our capital capacity or risk tolerance (Jefferies Finance, Jefferies LoanCore)
42
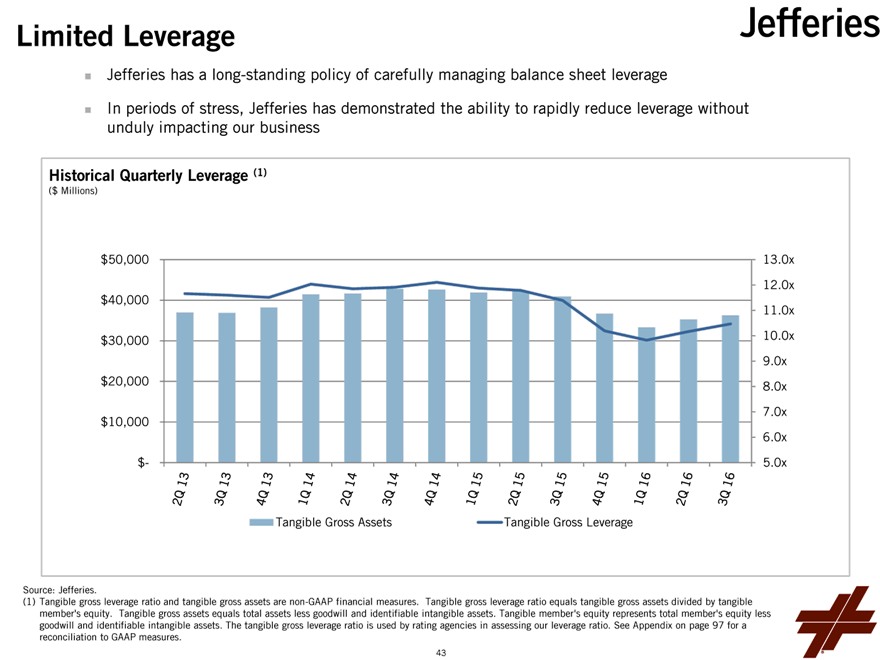
Limited Leverage
Jefferies has a long-standing policy of carefully managing balance sheet leverage
In periods of stress, Jefferies has demonstrated the ability to rapidly reduce leverage without unduly impacting our business
Historical Quarterly Leverage (1)
($ Millions)
$50,000 13.0x 12.0x $40,000 11.0x $30,000 10.0x 9.0x $20,000 8.0x 7.0x $10,000 6.0x
$- 5.0x Tangible Gross Assets Tangible Gross Leverage
Source: Jefferies.
(1) Tangible gross leverage ratio and tangible gross assets are non-GAAP financial measures. Tangible gross leverage ratio equals tangible gross assets divided by tangible member’s equity. Tangible gross assets equals total assets less goodwill and identifiable intangible assets. Tangible member’s equity represents total member’s equity less goodwill and identifiable intangible assets. The tangible gross leverage ratio is used by rating agencies in assessing our leverage ratio. See Appendix on page 97 for a reconciliation to GAAP measures.
43
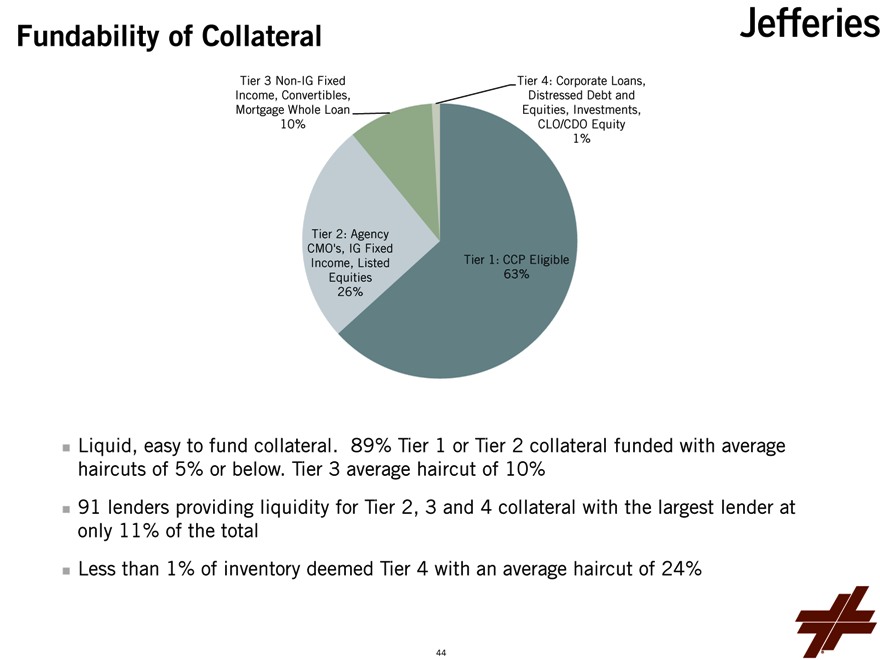
Fundability of Collateral
Tier 3 Non-IG Fixed Tier 4: Corporate Loans, Income, Convertibles, Distressed Debt and Mortgage Whole Loan Equities, Investments, 10% CLO/CDO Equity 1%
Tier 2: Agency
CMO’s, IG Fixed Tier 1: CCP Eligible Income, Listed 63% Equities 26%
Liquid, easy to fund collateral. 89% Tier 1 or Tier 2 collateral funded with average haircuts of 5% or below. Tier 3 average haircut of 10% 91 lenders providing liquidity for Tier 2, 3 and 4 collateral with the largest lender at only 11% of the total Less than 1% of inventory deemed Tier 4 with an average haircut of 24%
44
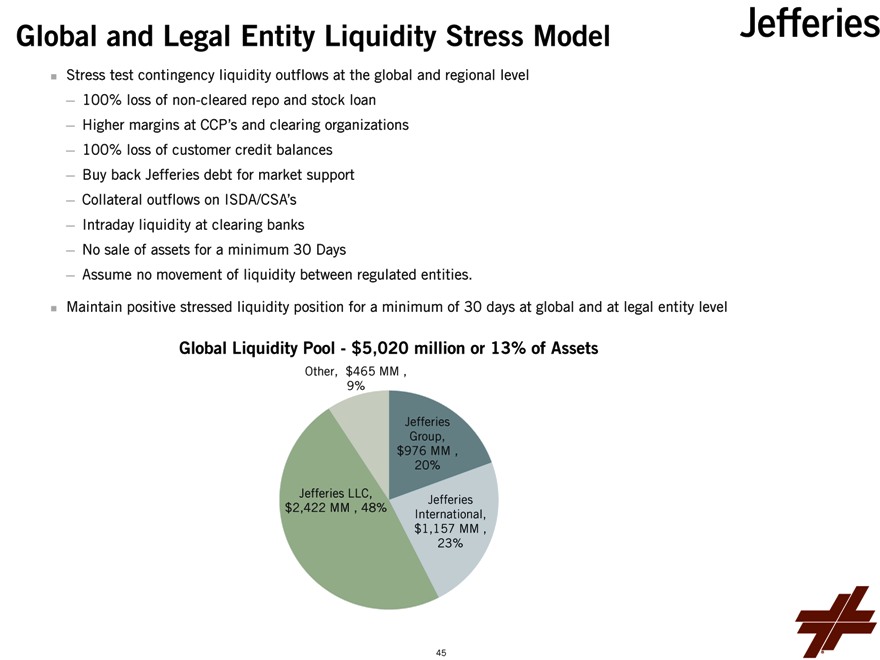
Global and Legal Entity Liquidity Stress Model
Stress test contingency liquidity outflows at the global and regional level
— 100% loss of non-cleared repo and stock loan
— Higher margins at CCP’s and clearing organizations
— 100% loss of customer credit balances
— Buy back Jefferies debt for market support
— Collateral outflows on ISDA/CSA’s
— Intraday liquidity at clearing banks
— No sale of assets for a minimum 30 Days
— Assume no movement of liquidity between regulated entities.
Maintain positive stressed liquidity position for a minimum of 30 days at global and at legal entity level
Global Liquidity Pool—$5,020 million or 13% of Assets
Other, $465 MM , 9%
Jefferies Group, $976 MM , 20%
Jefferies LLC,
Jefferies $2,422 MM , 48% International, $1,157 MM , 23%
45
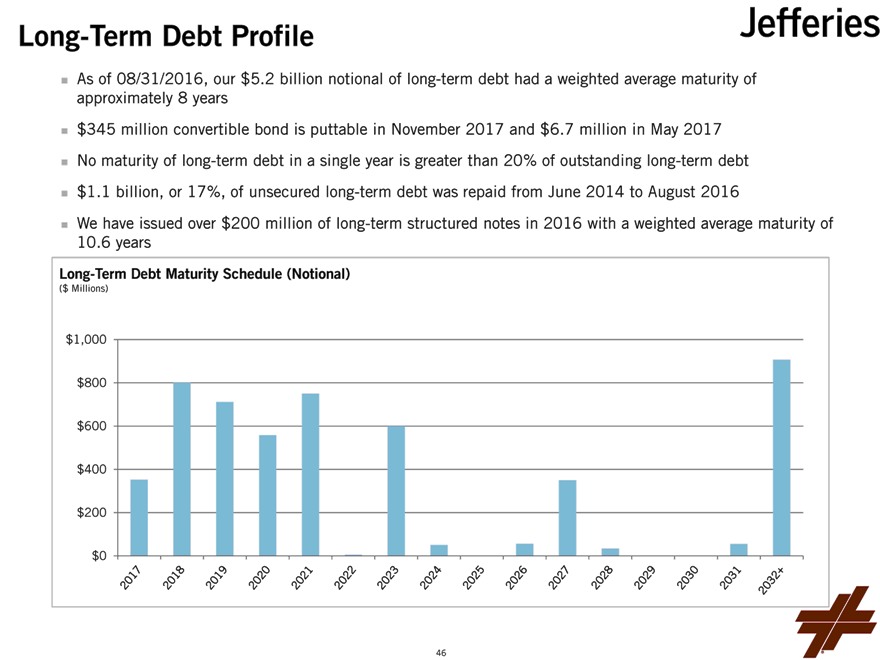
Long-Term Debt Profile
As of 08/31/2016, our $5.2 billion notional of long-term debt had a weighted average maturity of approximately 8 years $345 million convertible bond is puttable in November 2017 and $6.7 million in May 2017 No maturity of long-term debt in a single year is greater than 20% of outstanding long-term debt $1.1 billion, or 17%, of unsecured long-term debt was repaid from June 2014 to August 2016
We have issued over $200 million of long-term structured notes in 2016 with a weighted average maturity of 10.6 years
Long-Term Debt Maturity Schedule (Notional)
($ Millions)
$1,000 $800 $600 $400 $200 $0
46
Q & A’s – IRQuestions@Leucadia.com
Leucadia Asset Management
47
Overview & Strategy Leucadia Asset Management
Diversified alternative asset management platform – supporting and developing focused funds managed by distinct management teams Compelling edge – leverage Jefferies to source, and Leucadia to capitalize and market Fee-generating assets; prospect of long-term stable cash flows; ability to recycle seed capital ~$535 million Leucadia book value in LAM products as of June 30, 2016 – this does not reflect any potential value of the management companies executing these strategies Goal of growing third party AUM, while earning a reasonable return on our invested capital
— Expanding LAM-level marketing & IR function Manage platforms to minimize cost and mitigate risk
— Leverage Jefferies back office to minimize launch costs and operating expenses
— Strict controls to manage and limit risk
— Cut losses when necessary at pre-determined levels; low cost to exit investments Continue to seek new platforms/partners Aggregate Regulatory AUM of $10.2 billion ($5.2 billion in CoreCommodity) as of June 30, 2016
48
Platform and Strategies Leucadia Asset Management
Strategic Investments Division (Quantitative Strategies)
— Systematic strategy with a multi-quant approach across asset classes, geographies and time horizons
— Structured Alpha B, Managed Futures, Grouper (equity market neutral) Folger Hill Asset Management (Multi-Manager)
— Multi-manager discretionary long/short equity hedge fund platform Topwater Capital (Multi-Manager / First-loss)
— First-loss, scalable multi-manager and multi-strategy liquid securities fund Global Equity Events Opportunity Fund (Event-Driven Strategies)
— Event driven strategy investing in merger arbitrage, relative value and stock loan arbitrage
49
Platform and Strategies (Continued) Leucadia Asset Management
Tenacis (Quantitative Strategies)
— Systematic macro fund encompassing equities, credit, FX, rates and volatility Lake Hill
— Electronic trading of listed options and futures across asset classes 101 Capital
— Discretionary Macro
CoreCommodity Management (Commodity Strategies)
— Active strategies designed to provide enhanced commodity exposure 54 Madison (Real Estate)
— Long-term, opportunistic real estate private equity fund providing equity capital for hotel, timeshare, resort, residential and specialty retail real estate development projects
50
National Beef
50
Company Overview
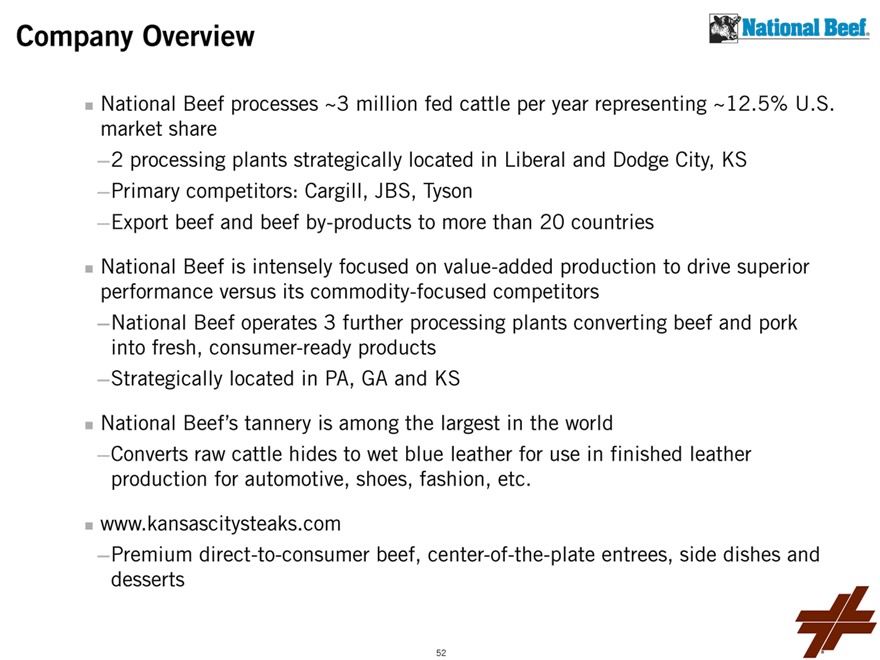
National Beef processes ~3 million fed cattle per year representing ~12.5% U.S. market share
—2 processing plants strategically located in Liberal and Dodge City, KS
—Primary competitors: Cargill, JBS, Tyson
—Export beef and beef by-products to more than 20 countries
National Beef is intensely focused on value-added production to drive superior performance versus its commodity-focused competitors
—National Beef operates 3 further processing plants converting beef and pork into fresh, consumer-ready products
—Strategically located in PA, GA and KS
National Beef’s tannery is among the largest in the world
—Converts raw cattle hides to wet blue leather for use in finished leather production for automotive, shoes, fashion, etc.
www.kansascitysteaks.com
—Premium direct-to-consumer beef, center-of-the-plate entrees, side dishes and desserts
52
Industry Update
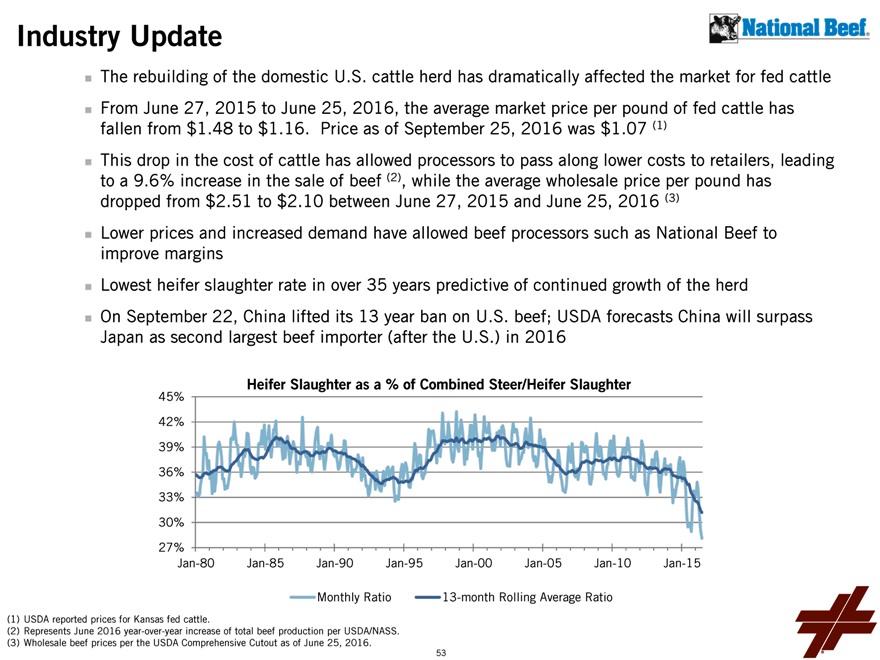
The rebuilding of the domestic U.S. cattle herd has dramatically affected the market for fed cattle From June 27, 2015 to June 25, 2016, the average market price per pound of fed cattle has fallen from $1.48 to $1.16. Price as of September 25, 2016 was $1.07 (1) This drop in the cost of cattle has allowed processors to pass along lower costs to retailers, leading to a 9.6% increase in the sale of beef (2), while the average wholesale price per pound has dropped from $2.51 to $2.10 between June 27, 2015 and June 25, 2016 (3) Lower prices and increased demand have allowed beef processors such as National Beef to improve margins Lowest heifer slaughter rate in over 35 years predictive of continued growth of the herd On September 22, China lifted its 13 year ban on U.S. beef; USDA forecasts China will surpass Japan as second largest beef importer (after the U.S.) in 2016
45% Heifer Slaughter as a % of Combined Steer/Heifer Slaughter
42% 39% 36% 33% 30% 27%
Jan-80 Jan-85 Jan-90 Jan-95 Jan-00 Jan-05 Jan-10 Jan-15
Monthly Ratio 13-month Rolling Average Ratio
(1) USDA reported prices for Kansas fed cattle.
(2) Represents June 2016 year-over-year increase of total beef production per USDA/NASS. (3) Wholesale beef prices per the USDA Comprehensive Cutout as of June 25, 2016.
53
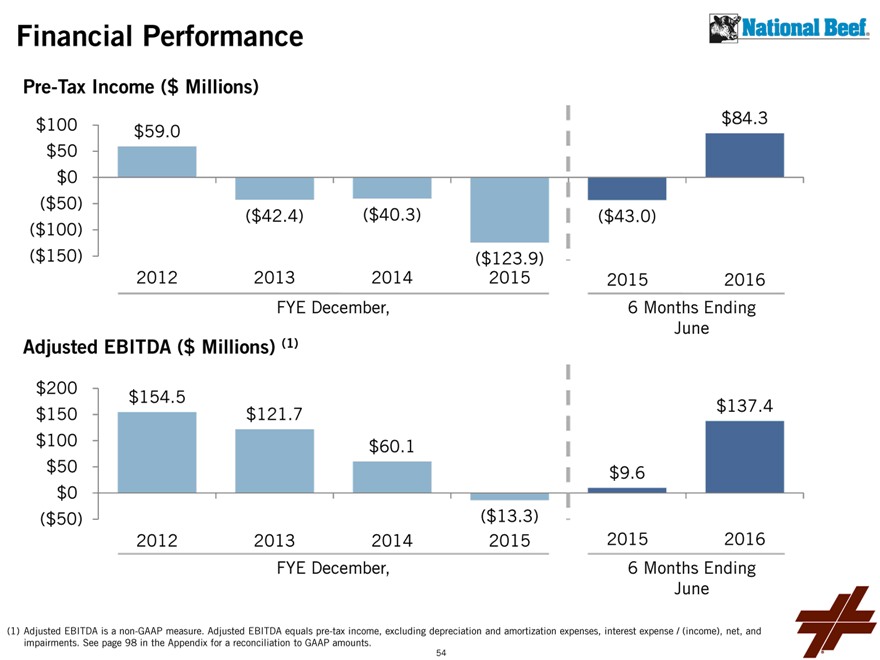
Financial Performance
Pre-Tax Income ($ Millions)
$100 $84.3 $59.0 $50 $0
($50)
($42.4) ($40.3) ($43.0)
($100)
($150) ($123.9)
2012 2013 2014 2015 2015 2016 FYE December, 6 Months Ending June
Adjusted EBITDA ($ Millions) (1)
$200 $154.5 $137.4 $150 $121.7 $100 $60.1
$50 $9.6 $0
($50) ($13.3)
2012 2013 2014 2015 2015 2016 FYE December, 6 Months Ending June
(1) Adjusted EBITDA is a non-GAAP measure. Adjusted EBITDA equals pre-tax income, excluding depreciation and amortization expenses, interest expense / (income), net, and impairments. See page 98 in the Appendix for a reconciliation to GAAP amounts.
54
2016 Update
More normal operating environment due to drop in cattle prices and additional availability of cattle
Gross margin improved to 5.0% in the first half of 2016, compared to 1.1% in the prior year period
— Lower prices and increased cattle available allowed National Beef to sell more volume at higher margins
Additional volume also allows for higher capacity utilization and operating efficiencies
Sales efforts are driving demand from new and existing customers for our consumer-ready products
Our tannery continues to ramp up production and to seek the optimal product and grade mix
55
Strategic Priorities
Focus on additional value-added production
— As capacity utilization increases, seek margin enhancement opportunities
— Ongoing dialogue with retailers and food service providers regarding consumer-ready, portion-controlled and other value-added product lines
Manage for growth and enhanced profitability
— Capture benefits of the rebound in cattle herd size
— Continue to drive efficiencies and operational improvements
— Focus on export opportunities (now including China) to capitalize on long-term secular growth in global protein consumption
Drive volume and margin at tannery
— Provide the highest quality, wet blue hides from one of the largest and most technologically advanced facilities in the world
Execute on strategic plan for significant growth and brand development of Kansas City Steak Company
56
57
BERKADIA
Company Overview
Berkadia is a full-service mortgage banking firm that provides clients best of class middle market services and products in mortgage finance, advisory and servicing
Business Lines:
— Permanent and construction loans
— Investment Sales
— Bridge Loans
— Master/Primary Servicing
Largest GSE commercial real estate lender by $ volume in 2015
Largest FHA commercial real estate lender by $ of commitments from HUD FY 2016 to date
2nd
largest FHLMC commercial real estate lender by $ volume in 2015
3rd
largest FNMA commercial real estate lender by $ volume in 2015
3rd
largest servicer of U.S. commercial real estate loans by $ volume as of June 30, 2016
58
Industry Update
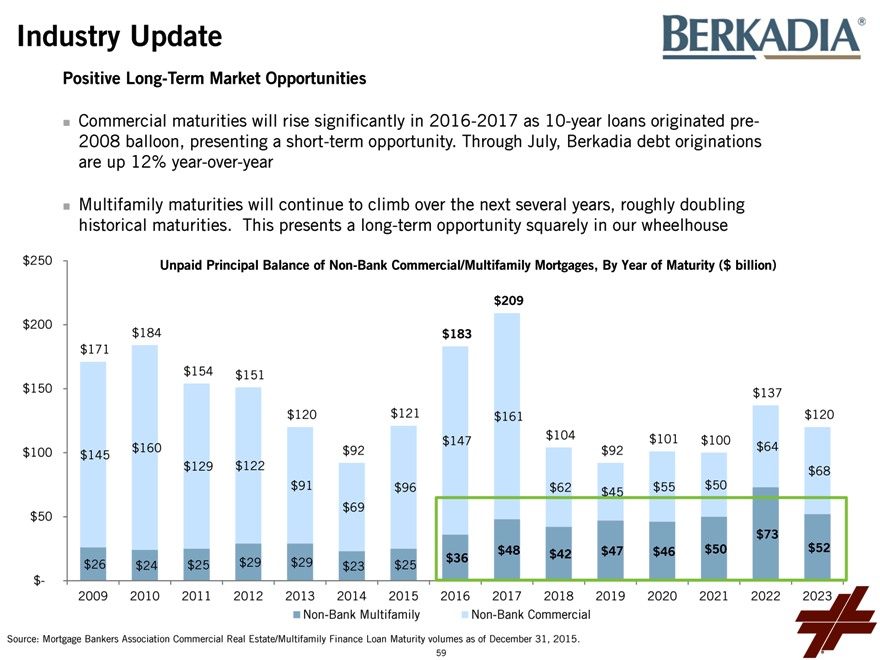
Positive Long-Term Market Opportunities
Commercial maturities will rise significantly in 2016-2017 as 10-year loans originated pre-2008 balloon, presenting a short-term opportunity. Through July, Berkadia debt originations are up 12% year-over-year
Multifamily maturities will continue to climb over the next several years, roughly doubling historical maturities. This presents a long-term opportunity squarely in our wheelhouse
$250 Unpaid Principal Balance of Non-Bank Commercial/Multifamily Mortgages, By Year of Maturity ($ billion)
$209 $200 $184 $183 $171 $154 $151 $150 $137 $120 $121 $161 $120 $147 $104 $101 $100 $64 $100 $160 $92 $92 $145 $129 $122 $68
$91 $96 $62 $55 $50 $45 $69 $50 $73
$48 $47 $46 $50 $52
$36 $42
$26 $24 $25 $29 $29 $23 $25 $-
2009 2010 2011 2012 2013 2014 2015 2016 2017 2018 2019 2020 2021 2022 2023 Non-Bank Multifamily Non-Bank Commercial
Source: Mortgage Bankers Association Commercial Real Estate/Multifamily Finance Loan Maturity volumes as of December 31, 2015.
59
Financial Performance
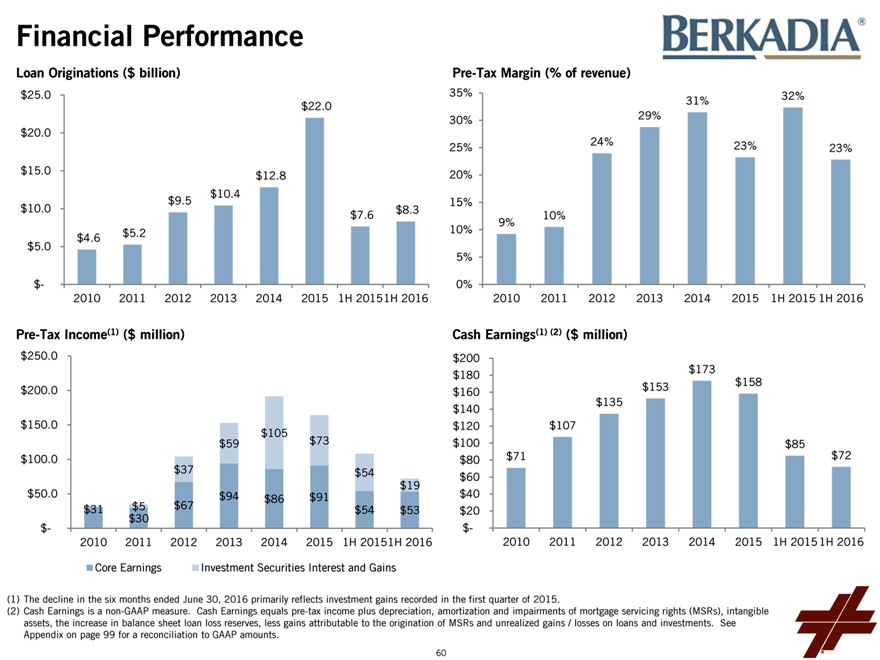
Loan Originations ($ billion) Pre-Tax Margin (% of revenue) $25.0 35% 32% 31% $22.0 30% 29% $20.0 24% 23%
25% 23% $15.0 $12.8 20% $10.4
$9.5 15% $10.0 $8.3
$7.6 10% 9%
$5.2 10%
$4.6
$5.0 5%
$- 0%
2010 2011 2012 2013 2014 2015 1H 20151H 2016 2010 2011 2012 2013 2014 2015 1H 2015 1H 2016
Pre-Tax Income(1) ($ million) Cash Earnings(1) (2) ($ million) $250.0 $200 $173 $180 $153 $158 $200.0 $160 $135 $140 $150.0 $120 $107 $105
$59 $73 $100 $85 $100.0 $80 $71 $72
$37 $54 $60 $19 $50.0 $94 $91 $40 $86
$31 $5 $67 $54 $53 $20 $30
$- $-
2010 2011 2012 2013 2014 2015 1H 20151H 2016 2010 2011 2012 2013 2014 2015 1H 2015 1H 2016
Core Earnings Investment Securities Interest and Gains
(1) The decline in the six months ended June 30, 2016 primarily reflects investment gains recorded in the first quarter of 2015.
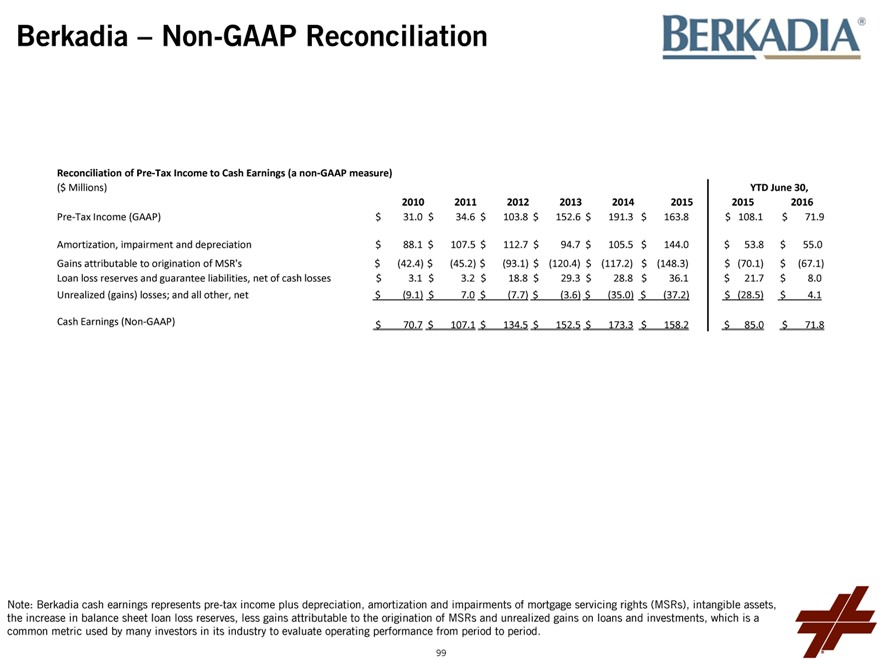
(2) Cash Earnings is a non-GAAP measure. Cash Earnings equals pre-tax income plus depreciation, amortization and impairments of mortgage servicing rights (MSRs), intangible assets, the increase in balance sheet loan loss reserves, less gains attributable to the origination of MSRs and unrealized gains / losses on loans and investments. See Appendix on page 99 for a reconciliation to GAAP amounts.
60
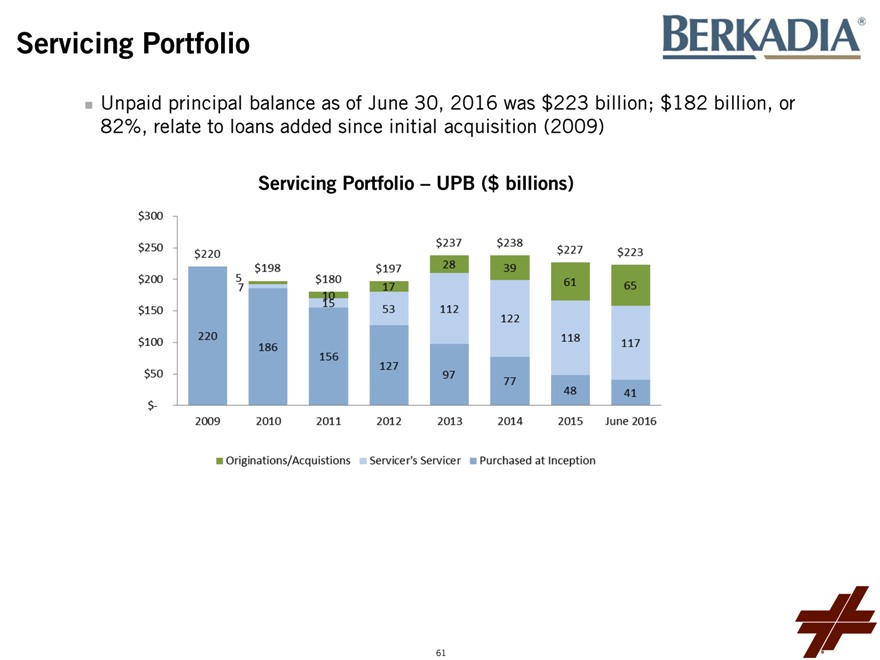
Servicing Portfolio
Unpaid principal balance as of June 30, 2016 was $223 billion; $182 billion, or 82%, relate to loans added since initial acquisition (2009)
Servicing Portfolio – UPB ($ billions)
61
2016 Update
Berkadia’s results were impacted in 1H of 2016 by reduction in Investment Securities of ~$300 million and increased 3rd party financing facility usage of ~$400 million Recruiting success
— Recruited 16 new Mortgage Bankers. Our MB team is currently 138 professionals
— Recruited 15 new Investment Sales advisors. Our IS team is currently 119 professionals. Profitability from these and our 2H 2015 recruits expected after ~12 month pipeline replenishment period
— Upgraded productivity of Bankers / Sales advisors. Average volume per MB increased to $123 million in 2015 from $98 million in 2014, a 25% increase (excludes a single $5 billion portfolio financed in 2015)
Integration
— 19 out of 54 total Mortgage Banking and Investment Sales locations are co-locations of both business lines Up from 13 at same point last year Round trips, where we act as both sales advisor and debt originator, increased from negligible levels in 2014 to 16% in 1H 2015. We have increased this to 20% in 1H of 2016
62
2016-2017 Strategic Priorities
Increase Business with Existing Clients
— Unique ideas, proprietary databases and solutions
— Leverage big data
— Speed
Expand Client Reach
— Rifle-shot recruiting
— Continued integration of offices / team approach
Drive Profitability and Cash Flow
— Market share and revenue growth
— Process and technology improvements, agile technology methods
Relentless
63
FXCM
64
Note on Forward Looking Statements
Certain statements contained herein may constitute “forward-looking statements” within the meaning of Section 27A of the Securities Act of 1933, Section 21E of the Securities Exchange Act of 1934 and/or the Private Securities Litigation Reform Act of 1995, which reflect FXCM’s current views with respect to, among other things, its operations and financial performance in the future. These forward-looking statements are not historical facts and are based on current expectations, estimates and projections about FXCM’s industry, management’s beliefs and certain assumptions made by management, many of which, by their nature, are inherently uncertain and beyond our control. Accordingly, readers are cautioned that any such forward-looking statements are not guarantees of future performance and are subject to certain risks, uncertainties and assumptions that are difficult to predict including, without limitation, risks associated with the events that took place in the currency markets on January 15, 2015 and their impact on FXCM’s capital structure, risks associated with FXCM’s ability to recover all or a portion of any capital losses, risks relating to the ability of FXCM to satisfy the terms and conditions of or make payments pursuant to the terms of the credit agreement with Leucadia, risks related to FXCM’s dependence on FX market makers, market conditions, and those other risks described under “Risk Factors” in FXCM Inc.‘s Annual Report on Form 10-K and other reports or documents FXCM files with, or furnishes to, the SEC from time to time, which are accessible on the SEC website at sec.gov. This information should also be read in conjunction with FXCM’s Consolidated Financial Statements and the Notes thereto contained in FXCM’s Annual Report on Form 10-K, and in other reports or documents the FXCM files with, or furnishes to, the SEC from time to time, which are accessible on the SEC website at sec.gov.
65
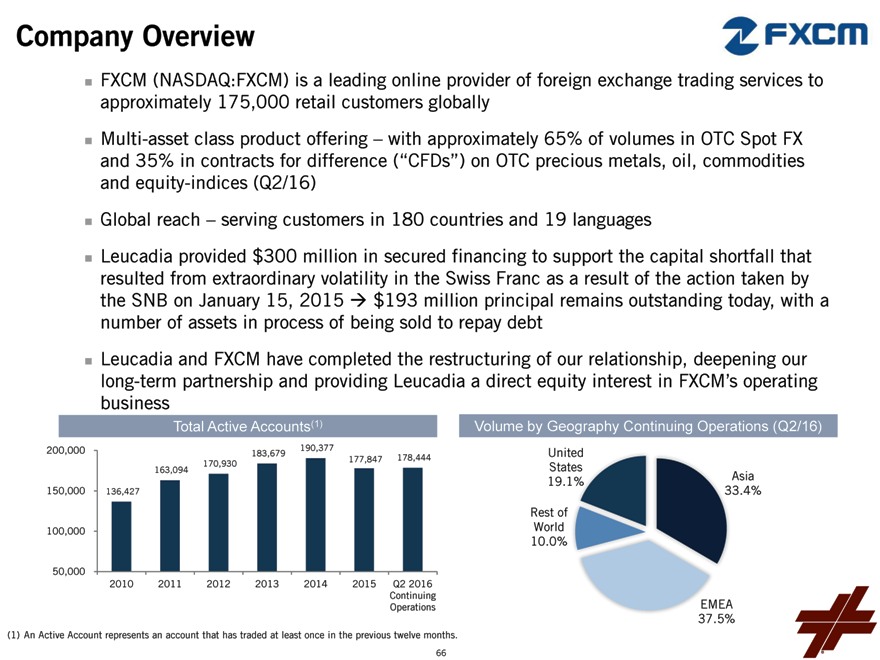
Company Overview
FXCM (NASDAQ:FXCM) is a leading online provider of foreign exchange trading services to approximately 175,000 retail customers globally Multi-asset class product offering – with approximately 65% of volumes in OTC Spot FX and 35% in contracts for difference (“CFDs”) on OTC precious metals, oil, commodities and equity-indices (Q2/16) Global reach – serving customers in 180 countries and 19 languages Leucadia provided $300 million in secured financing to support the capital shortfall that resulted from extraordinary volatility in the Swiss Franc as a result of the action taken by the SNB on January 15, 2015 ? $193 million principal remains outstanding today, with a number of assets in process of being sold to repay debt Leucadia and FXCM have completed the restructuring of our relationship, deepening our long-term partnership and providing Leucadia a direct equity interest in FXCM’s operating business
Total Active Accounts(1)
200,000 190,377
183,679
177,847 178,444 170,930 163,094
150,000 136,427
100,000
50,000
2010 2011 2012 2013 2014 2015 Q2 2016 Continuing Operations
Volume by Geography Continuing Operations (Q2/16)
United States
19.1% Asia 33.4% Rest of World 10.0%
EMEA 37.5%
(1) An Active Account represents an account that has traded at least once in the previous twelve months.
66
Industry Update
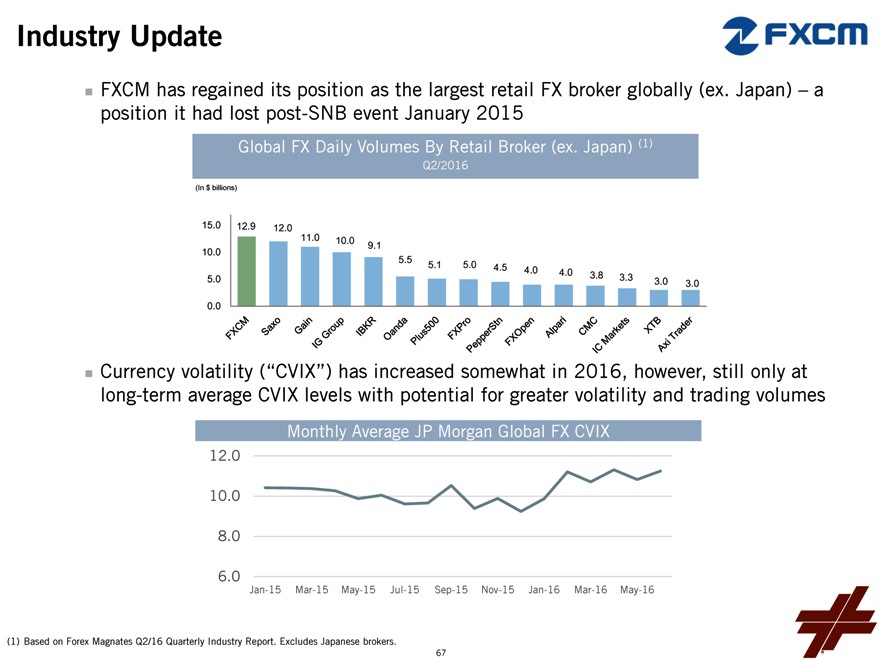
FXCM has regained its position as the largest retail FX broker globally (ex. Japan) – a position it had lost post-SNB event January 2015
Global FX Daily Volumes By Retail Broker (ex. Japan) (1)
Q2/2016
(In $ billions)
15.0 12.9
12.0
11.0 10.0 9.1 10.0
5.5 5.1 5.0
4.5 4.0 4.0
5.0 3.8 3.3
3.0 3.0 0.0
Currency volatility (“CVIX”) has increased somewhat in 2016, however, still only at long-term average CVIX levels with potential for greater volatility and trading volumes
Monthly Average JP Morgan Global FX CVIX
12.0 10.0
8.0 6.0
Jan-15 Mar-15 May-15 Jul-15 Sep-15 Nov-15 Jan-16 Mar-16 May-16
(1) Based on Forex Magnates Q2/16 Quarterly Industry Report. Excludes Japanese brokers.
67
Financial Performance
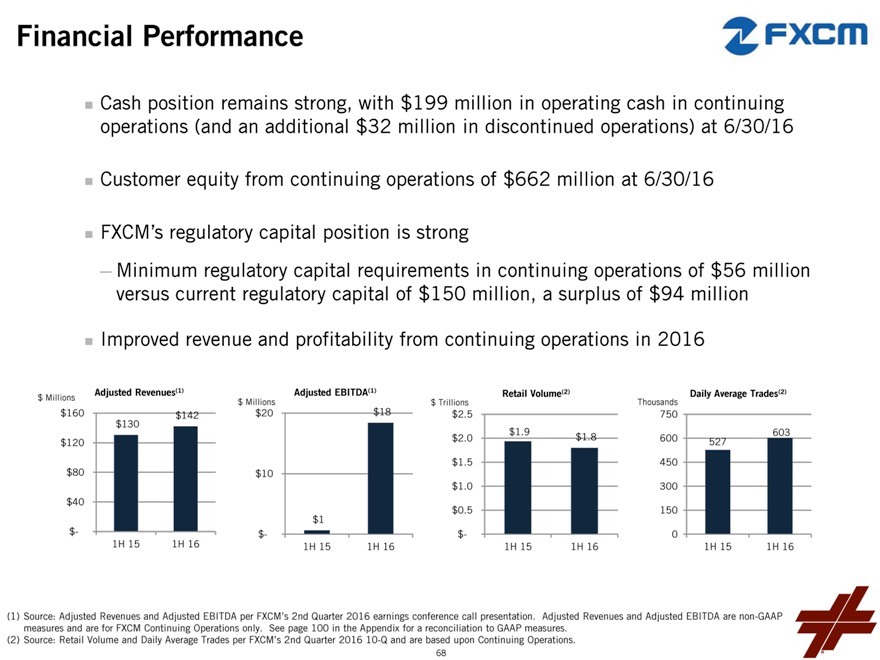
Cash position remains strong, with $199 million in operating cash in continuing operations (and an additional $32 million in discontinued operations) at 6/30/16
Customer equity from continuing operations of $662 million at 6/30/16
FXCM’s regulatory capital position is strong
— Minimum regulatory capital requirements in continuing operations of $56 million versus current regulatory capital of $150 million, a surplus of $94 million
Improved revenue and profitability from continuing operations in 2016
Adjusted Revenues(1) Adjusted EBITDA(1) (2) (2) $ Millions $ Millions $ Trillions Retail Volume Thousands Daily Average Trades $160 $142 $20 $18 $2.5 750 $130 $1.9 603 $2.0 $1.8 600 $120 527 $1.5 450
$80 $10 $1.0 300 $40
$1 $0.5 150
$- $- $- 0
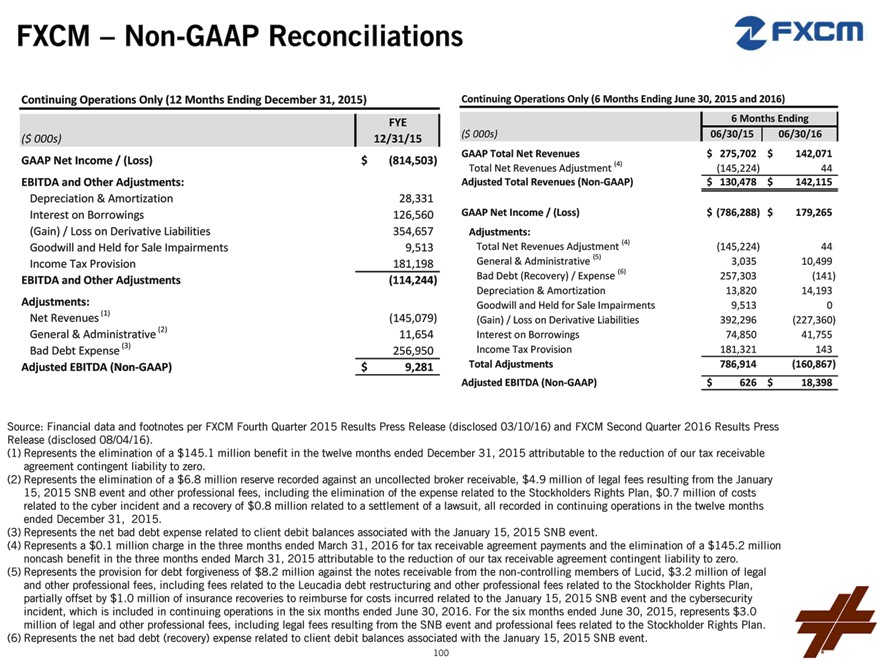
1H 15 1H 16 1H 15 1H 16 1H 15 1H 16 1H 15 1H 16
(1) Source: Adjusted Revenues and Adjusted EBITDA per FXCM’s 2nd Quarter 2016 earnings conference call presentation. Adjusted Revenues and Adjusted EBITDA are non-GAAP measures and are for FXCM Continuing Operations only. See page 100 in the Appendix for a reconciliation to GAAP measures.
(2) Source: Retail Volume and Daily Average Trades per FXCM’s 2nd Quarter 2016 10-Q and are based upon Continuing Operations.
68
2016 Developments
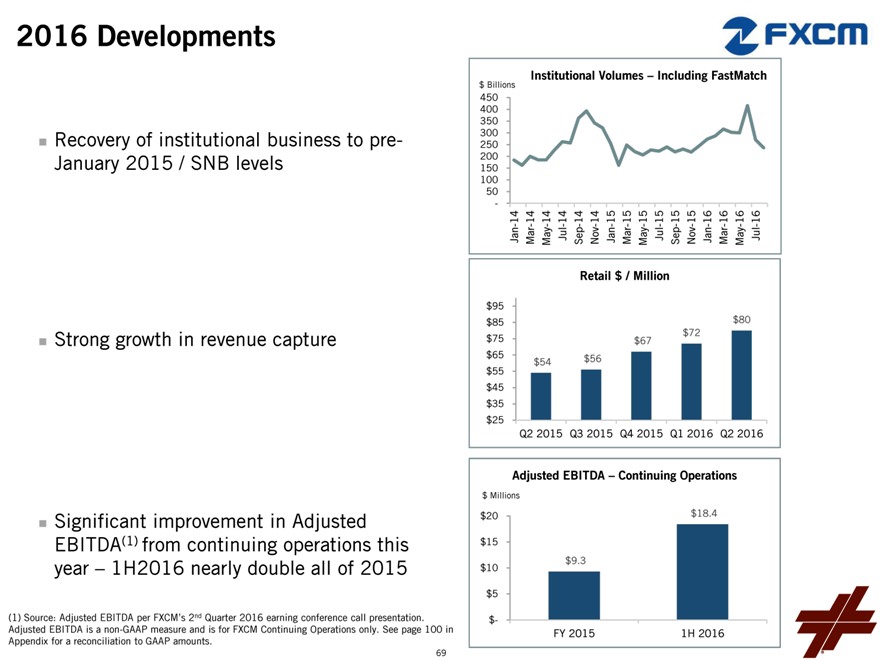
Recovery of institutional business to pre-January 2015 / SNB levels
Strong growth in revenue capture
Significant improvement in Adjusted EBITDA(1) from continuing operations this year – 1H2016 nearly double all of 2015
(1) Source: Adjusted EBITDA per FXCM’s 2nd Quarter 2016 earning conference call presentation. Adjusted EBITDA is a non-GAAP measure and is for FXCM Continuing Operations only. See page 100 in Appendix for a reconciliation to GAAP amounts.
69
$ Billions Institutional Volumes – Including FastMatch
450 400 350 300 250 200 150 100 50 -
- 14—14 14—14—14 — 14—15 15—15—15—15 — 15—16—16 16—16 -Jan Mar May Jul Sep Nov Jan Mar May Jul Sep Nov Jan Mar May Jul
Retail $ / Million
$95
$85 $80 $72
$75 $67
$65 $56
$55 $54 $45 $35 $25
Q2 2015 Q3 2015 Q4 2015 Q1 2016 Q2 2016
Adjusted EBITDA – Continuing Operations
$ Millions
$20 $18.4
$15
$9.3 $10
$5
$-
FY 2015 1H 2016
Strategic Priorities
Repay Leucadia debt / complete asset sales
— DailyFX – announced sale for $40 million
— Lucid
— V3
— FastMatch
Recently closed revised arrangement with Leucadia taking a direct stake in FXCM
— Should be a major factor in regaining large FX traders, a segment where FXCM was traditionally strong pre-SNB event
Further improve our unique agency offering in CFDs with new market makers coming onto platform with improved liquidity and pricing for clients
Continue roll-out of dealing desk execution to small clients in FX
— Dealing desk execution for small clients now is 21% of total Q2 2016 retail volume from nil pre-SNB has been a significant factor in improved revenue per million
Additionally, FXCM considerably levered to interest rate increases
— Each 100bps in Fed Funds rate potentially adds ~$40-50 million in Adjusted EBITDA
70
71
GACRADIA
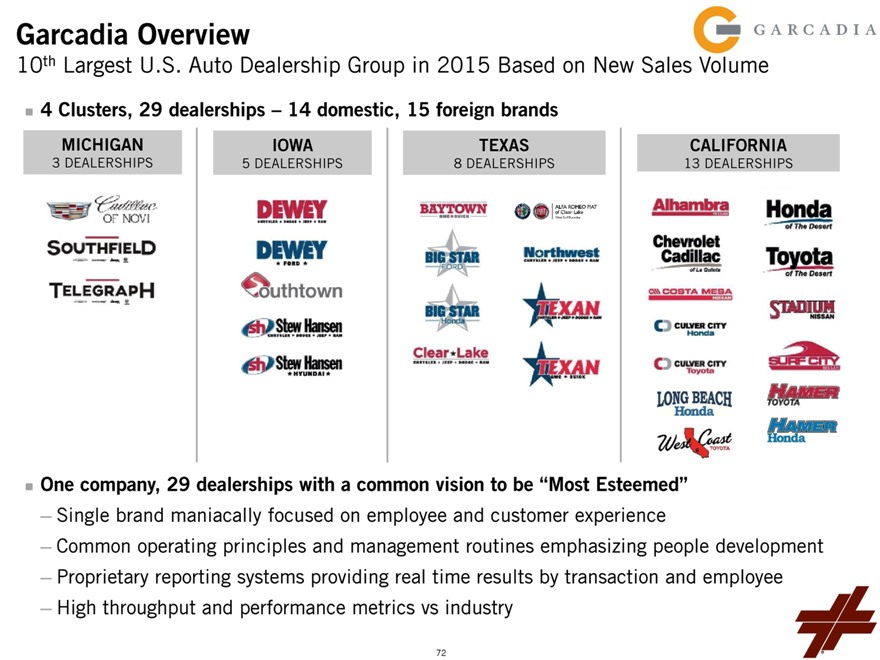
Garcadia Overview
10th Largest U.S. Auto Dealership Group in 2015 Based on New Sales Volume
4 Clusters, 29 dealerships – 14 domestic, 15 foreign brands
MICHIGAN IOWA TEXAS CALIFORNIA
3 DEALERSHIPS 5 DEALERSHIPS 8 DEALERSHIPS 13 DEALERSHIPS
One company, 29 dealerships with a common vision to be “Most Esteemed”
— Single brand maniacally focused on employee and customer experience
— Common operating principles and management routines emphasizing people development
— Proprietary reporting systems providing real time results by transaction and employee
— High throughput and performance metrics vs industry
72
Industry Update – Key Indicators Remain Positive
AVG. Age of All U.S. Light Vehicles² NADA—Yearly Fixed Ops Growth³
12 11.7 Yrs.
10.0%
11 5.7%
4.9% 5.4%
4.8%
4.2%
10 5.0% 3.6%
1.9%
Years 9 0.0%
8 -1.0% -1.8%
-5.0%
7
-6.9%
6 -10.0%
5 7 9 1 3 5 7 9 1 3 5 . st
9 99 9 0 0 00 0 0 1 01 1 e 016
19 1 19 20 20 2 20 20 20 2 207 2007 2008 2009 2010 2011 2012 2013 2014 2015 2
1 2
2 0 Q
(1) WardsAuto.
(2) IHS Automotive – 2016 Annual Study. (3) Q2 2016 The Haig Report.
73
Financial Performance
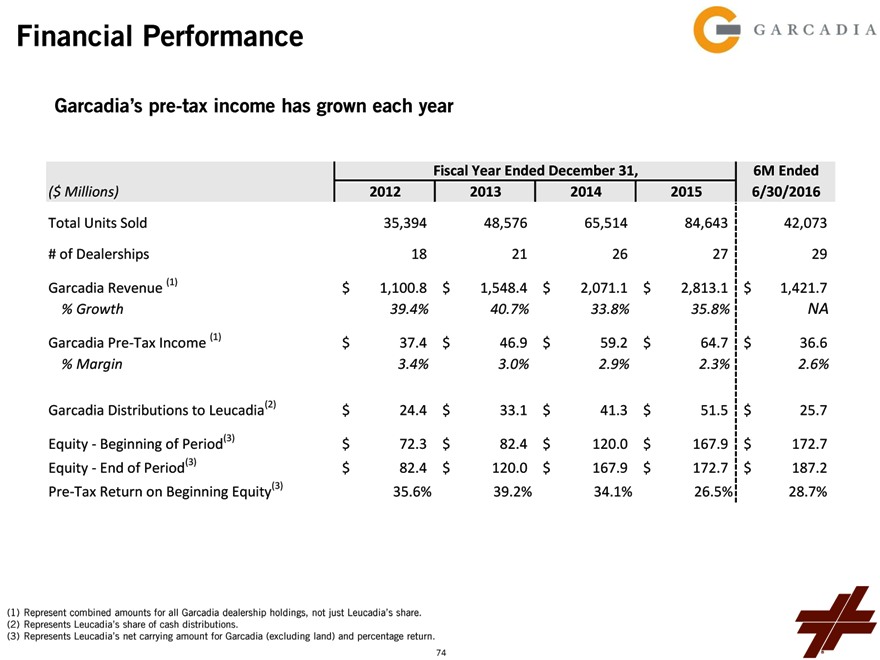
Garcadia’s pre-tax income has grown each year
Fiscal Year Ended December 31, 6M Ended
Fiscal Year Ended December 31,6M Ended
($ Millions) 20122013201420156/30/2016
Total Units Sold 35,39448,57665,51484,64342,073
# of Dealerships 1821262729
Garcadia Revenue (1) $1,100.8$1,548.4$2,071.1$2,813.1$1,421.7
% Growth 39.4%40.7%33.8%35.8%NA
Garcadia Pre-Tax Income (1) $37.4$46.9$59.2$64.7$36.6
% Margin 3.4%3.0%2.9%2.3%2.6%
Garcadia Distributions to Leucadia(2) $24.4$33.1$41.3$51.5$25.7
Equity—Beginning of Period(3) $72.3$82.4$120.0$167.9$172.7
Equity—End of Period(3) $82.4$120.0$167.9$172.7$187.2
Pre-Tax Return on Beginning Equity(3) 35.6%39.2%34.1%26.5%28.7%
(1) Represent combined amounts for all Garcadia dealership holdings, not just Leucadia’s share. (2) Represents Leucadia’s share of cash distributions.
(3) Represents Leucadia’s net carrying amount for Garcadia (excluding land) and percentage return.
74
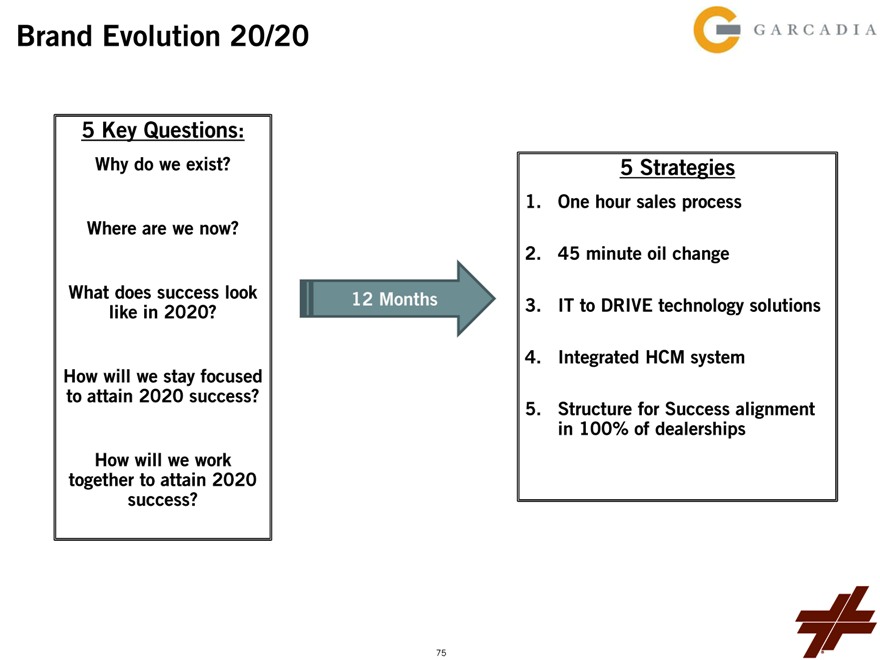
Brand Evolution 20/20
5 Key Questions:
Why do we exist
Where are we now
What does success look 12 Months like in 2020
How will we stay focused to attain 2020 success
How will we work together to attain 2020 success
5 Strategies
1. One hour sales process
2. 45 minute oil change
3. IT to DRIVE technology solutions
4. Integrated HCM system
5. Structure for Success alignment in 100% of dealerships
75
VITESSE ENERGY
Velocity of Capital Compounding
76
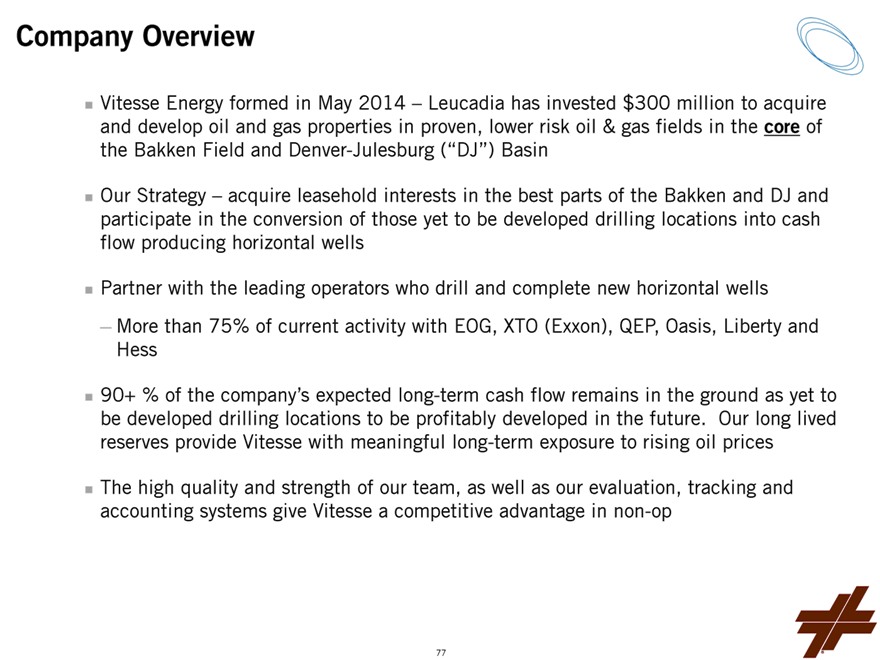
Company Overview
Vitesse Energy formed in May 2014 – Leucadia has invested $300 million to acquire and develop oil and gas properties in proven, lower risk oil & gas fields in the core of the Bakken Field and Denver-Julesburg (“DJ”) Basin
Our Strategy – acquire leasehold interests in the best parts of the Bakken and DJ and participate in the conversion of those yet to be developed drilling locations into cash flow producing horizontal wells
Partner with the leading operators who drill and complete new horizontal wells
— More than 75% of current activity with EOG, XTO (Exxon), QEP, Oasis, Liberty and Hess
90+ % of the company’s expected long-term cash flow remains in the ground as yet to be developed drilling locations to be profitably developed in the future. Our long lived reserves provide Vitesse with meaningful long-term exposure to rising oil prices
The high quality and strength of our team, as well as our evaluation, tracking and accounting systems give Vitesse a competitive advantage in non-op
77
Financial Performance
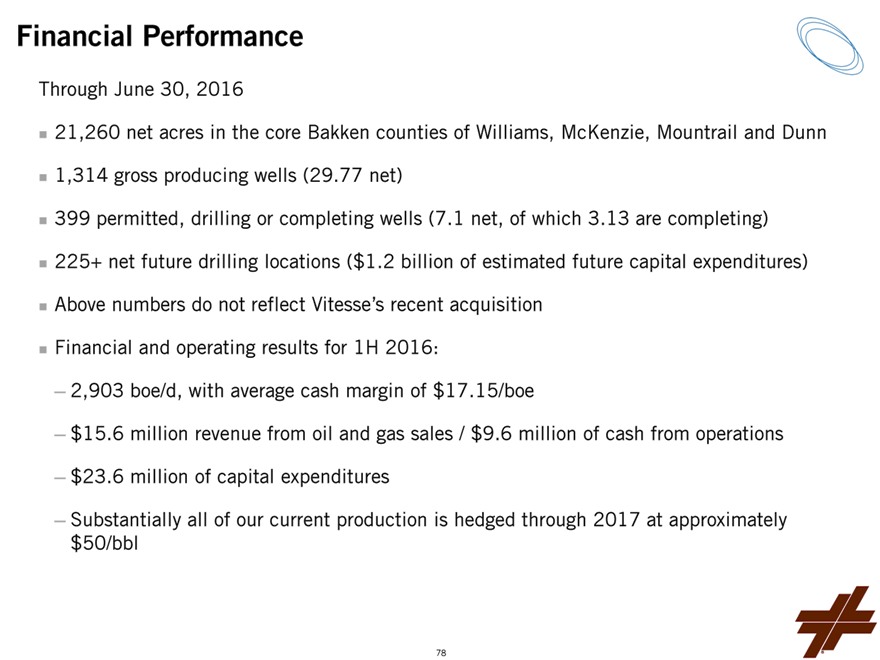
Through June 30, 2016
21,260 net acres in the core Bakken counties of Williams, McKenzie, Mountrail and Dunn 1,314 gross producing wells (29.77 net) 399 permitted, drilling or completing wells (7.1 net, of which 3.13 are completing) 225+ net future drilling locations ($1.2 billion of estimated future capital expenditures) Above numbers do not reflect Vitesse’s recent acquisition Financial and operating results for 1H 2016:
— 2,903 boe/d, with average cash margin of $17.15/boe
— $15.6 million revenue from oil and gas sales / $9.6 million of cash from operations
— $23.6 million of capital expenditures
— Substantially all of our current production is hedged through 2017 at approximately $50/bbl
78
Case Study: Deeper / Denser / Cheaper / Better
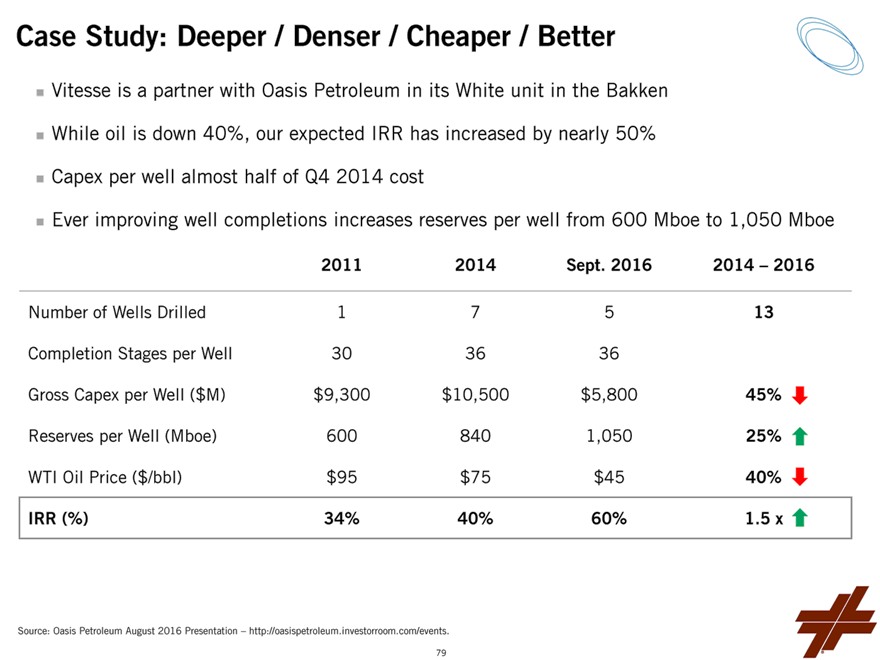
Vitesse is a partner with Oasis Petroleum in its White unit in the Bakken While oil is down 40%, our expected IRR has increased by nearly 50% Capex per well almost half of Q4 2014 cost
Ever improving well completions increases reserves per well from 600 Mboe to 1,050 Mboe
2011 2014 Sept. 2016 2014 – 2016
Number of Wells Drilled 1 7 5 13 Completion Stages per Well 30 36 36 Gross Capex per Well ($M) $9,300 $10,500 $5,800 45% Reserves per Well (Mboe) 600 840 1,050 25% WTI Oil Price ($/bbl) $95 $75 $45 40%
IRR (%) 34% 40% 60% 1.5 x
Source: Oasis Petroleum August 2016 Presentation – http://oasispetroleum.investorroom.com/events.
79
Quantifying Deeper / Denser / Cheaper / Better
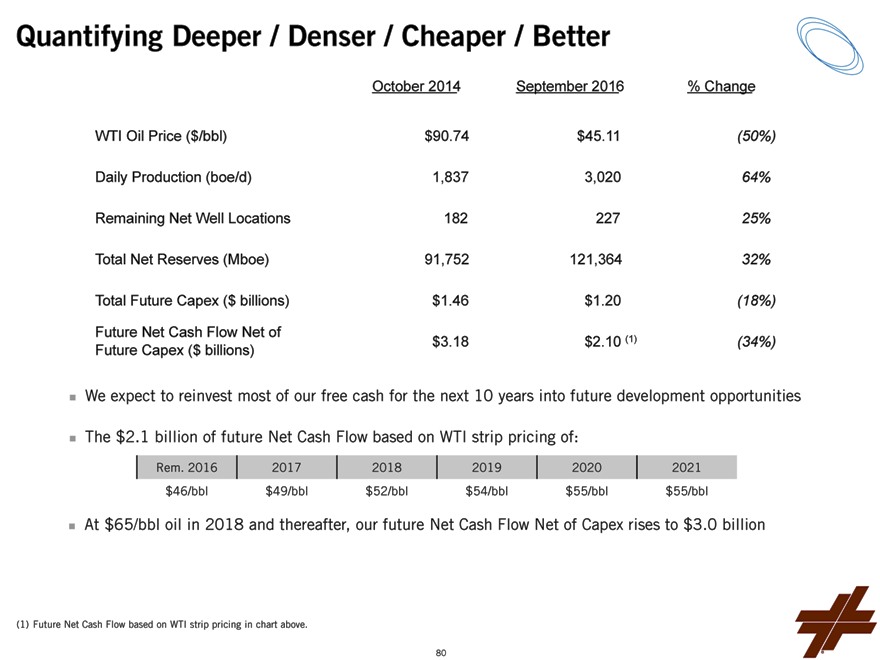
October 2014 September 2016 % Change WTI Oil Price ($/bbl) $90.74 $45.11 (50%) Daily Production (boe/d) 1,837 3,020 64% Remaining Net Well Locations 182 227 25% Total Net Reserves (Mboe) 91,752 121,364 32%
Total Future Capex ($ billions) $1.46 $1.20 (18%)
Future Net Cash Flow Net of
Future Capex ($ billions) $3.18 $2.10 (1) (34%)
We expect to reinvest most of our free cash for the next 10 years into future development opportunities
The $2.1 billion of future Net Cash Flow based on WTI strip pricing of:
Rem. 2016 2017 2018 2019 2020 2021 $46/bbl $49/bbl $52/bbl $54/bbl $55/bbl $55/bbl
At $65/bbl oil in 2018 and thereafter, our future Net Cash Flow Net of Capex rises to $3.0 billion
(1) Future Net Cash Flow based on WTI strip pricing in chart above.
80
Strategic Priorities
Optimize our assets
— Reinvest and compound cash flow into future horizontal wells
— Increase our exposure in areas in Bakken and DJ with highest rates of return
Leverage our best in class evaluation, tracking and accounting systems to evaluate what appear to be management or consolidation opportunities from other non-op owners
Add assets opportunistically at compelling valuations
— Recently closed acquisition of 31 drilled-but-not-yet-completed wells operated by EOG and located in the Denver-Julesburg Basin; represents a compelling investment expected to accelerate value creation by nearly doubling Vitesse’s near-term production and cash flow in 2017 and 2018
81
JUNEAU
ENERGY
82
Company Overview
Juneau Energy (“JE”) is a Houston & Denver-based oil and gas company now also led by Bob Gerrity, CEO of Vitesse Energy, and his team
JE owns leasehold acreage to be developed in three areas in Texas and Oklahoma:
— A development joint venture (JV) with AEXCO Petroleum in the horizontal and vertical Mississippi Lime in Alfalfa and Kay counties, Oklahoma
— In Brazos, Burleson, Lee and Grimes Counties in East Texas we have Eagle Ford Shale and Austin Chalk acreage
— In Houston and Leon Counties, Texas we own acreage with Buda-Georgetown-Glen Rose potential
— Book value as of 6/30/16 is $169 million
83
2016 Developments
JE seeks attractive JVs with partners to participate in development of our acreage
In August JE formed a JV with Lonestar Resources (NASDAQ:LONE) to help develop some of our East Texas Eagle Ford acreage
— JE invested $25 million of cash in LONE in return for $25 million principal amount 12% Secured Second Lien Notes and warrants for 500,000 shares of LONE stock at $5.00 per share
— JE also sold 50% of our two Eagle Ford wells to Lonestar for 500,227 shares of stock. In return, LONE will develop at least 2 new Eagle Ford wells in the area as our partner and seeks further development in the area
In Houston County we are in the process of negotiating JVs with established operators in the area
Evaluating sale of JE’s cash flowing assets at a modest gain, which could return some capital and reduce our investment
84
85
Company Overview
Fast-growing fixed wireless broadband internet provider in Italy
— 373,028 subscribers as of 9/30/16
— 71% annualized subscriber growth rate since Leucadia’s initial investment in 2011
— Offers pre- and post-paid subscribers a simple product at a compelling price point: unlimited broadband services with speeds up to 30 Mbps for €25/month
Nationwide network deployment with base stations, fiber exchange points, points of sale and customers in every region of Italy
— As of 9/30/16, over 1,700 base stations deployed reaching 50% of the population
— Network expected to approach 100% LTE-enabled in the first quarter 2017
— 340+ fiber points of presence
— 2,900 indirect sales and distribution points
84MHz of 3.5 GHz spectrum covering 82% of the population and at least 42 MHz in the remaining 18%
65% national brand awareness
86
Industry Update
The Italian broadband market continues to be dominated by low-speed ADSL
— Over the coming years, ADSL will be replaced by both wireless and fiber solutions
— With a comparable service to fiber, significantly lower capex and an unmatched speed of deployment, Linkem is poised to become an integral component of Italy’s broadband solution
Major U.S. and Asian telecom operators and equipment manufacturers are increasingly focused on fixed wireless networks and the potential of higher frequency spectrum, including Linkem’s 3.5GHz, garnering front-page news
— In the U.S., AT&T and Verizon have already tested 3.5 GHz service and plan to deploy once the frequency is released by the government
— Google Fiber has been testing a fixed wireless network in Kansas City utilizing 3.5 GHz and recently acquired a fixed wireless specialist to help with future fixed wireless deployments
Milan-based fiber carrier Metroweb was acquired in a deal valued at €814 million
— Metroweb stated it needs to spend €3.7 billion to cover 9.5 million households over the next five years, highlighting the comparatively high cost of fiber deployment
Hutchison and VimpleCom, who are combining their Italian mobile operations, agreed to sell spectrum and telecom towers to French operator Iliad to satisfy antitrust concerns
87
Italian Market Potential
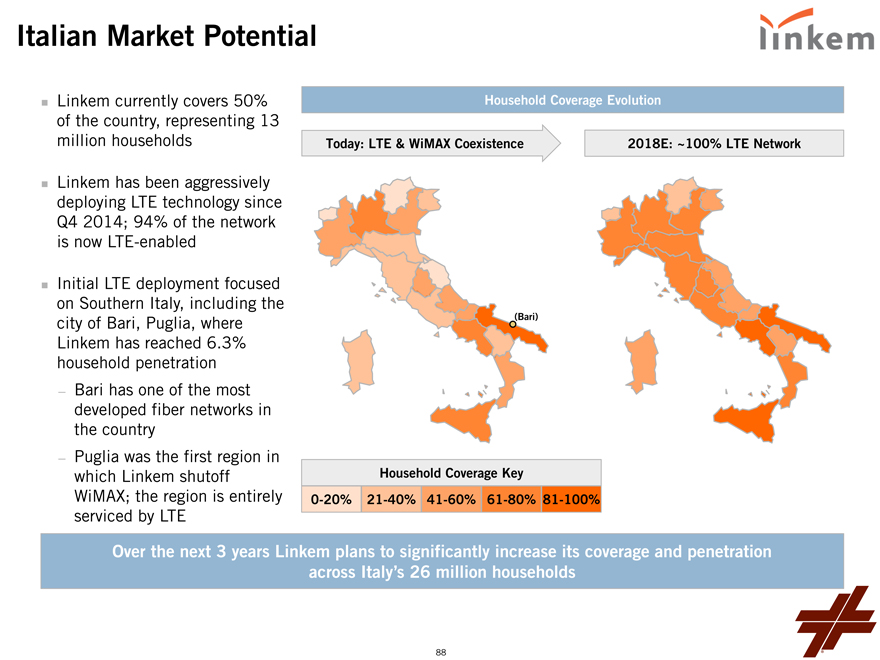
Linkem currently covers 50% of the country, representing 13 million households
Linkem has been aggressively deploying LTE technology since Q4 2014; 94% of the network is now LTE-enabled
Initial LTE deployment focused on Southern Italy, including the city of Bari, Puglia, where Linkem has reached 6.3% household penetration
— Bari has one of the most developed fiber networks in the country
— Puglia was the first region in which Linkem shutoff WiMAX; the region is entirely serviced by LTE
Household Coverage Evolution
Today: LTE & WiMAX Coexistence 2018E: ~100% LTE Network
(Bari)
Household Coverage Key
0-20% 21-40% 41-60% 61-80% 81-100%
Over the next 3 years Linkem plans to significantly increase its coverage and penetration across Italy’s 26 million households
88
Subscriber and Network Growth
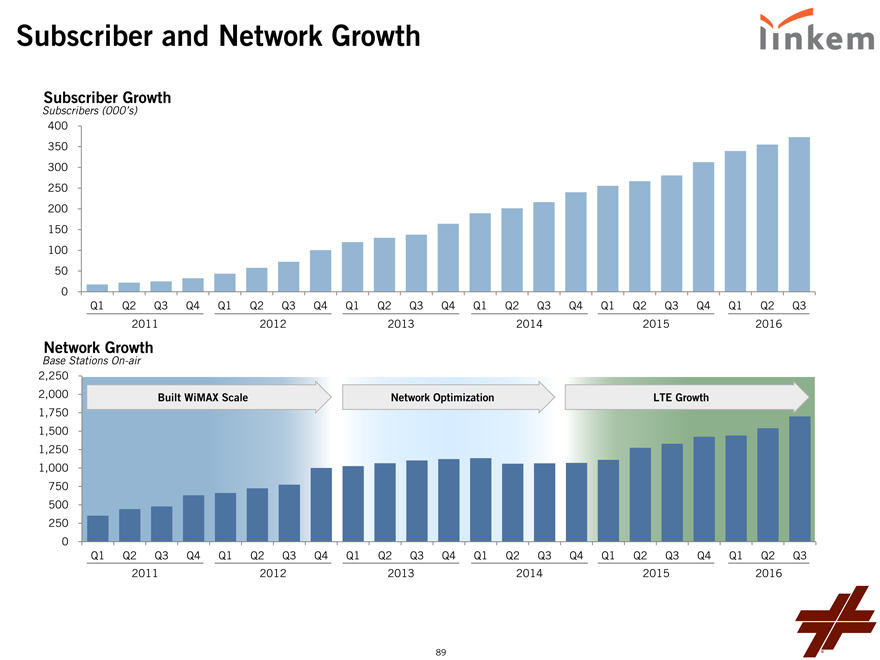
Subscriber Growth
Subscribers (000’s)
400 350 300 250 200 150 100 50 0
Q1 Q2 Q3 Q4 Q1 Q2 Q3 Q4 Q1 Q2 Q3 Q4 Q1 Q2 Q3 Q4 Q1 Q2 Q3 Q4 Q1 Q2 Q3 2011 2012 2013 2014 2015 2016
Network Growth
Base Stations On-air
2,250
2,000 Built WiMAX Scale Network Optimization LTE Growth
1,750 1,500 1,250 1,000 750 500 250 0
Q1 Q2 Q3 Q4 Q1 Q2 Q3 Q4 Q1 Q2 Q3 Q4 Q1 Q2 Q3 Q4 Q1 Q2 Q3 Q4 Q1 Q2 Q3 2011 2012 2013 2014 2015 2016
89
2016 Update
Significant expansion of Linkem’s geographic coverage, including initial deployments in Rome, Naples, Genoa, Bologna, Florence and Venice
— By year end, Linkem expects to have launched service in 18 of the top 20 cities in Italy
Completing network migration to LTE from legacy WiMax technology
— The company ended September 2016 with 688 greenfield LTE base stations and 913 LTE overlay antennae on-air
— The company’s network is now 94% LTE-enabled
— With LTE, customers are experiencing peak speeds up to 30 mbps, versus average ADSL speeds of 5 mbps
— Our prices remain below the national average, creating strong incentives for new customers to switch to Linkem and providing significant value to existing customers
At February’s Mobile World Conference in Barcelona, Linkem announced a partnership with ZTE to launch the first fixed wireless broadband network in Rome, which formally launched in September
Linkem has been EBITDA positive since Q4 2014
90
Strategic Priorities
Increase coverage through LTE network deployment, including the rollout to Italy’s major municipalities
— Long-term goal of 80%+ Italian household coverage Maintain subscriber growth on the existing footprint
Maintain excellent operating metrics and customer satisfaction
Continue to develop value enhancing products and services, such as offerings to business subscribers
— Revenue for initial business customers has averaged over €1,000/month
— Linkem’s simple enterprise products are perfect in a market in which 90%+ of
Italy’s 4.5 million businesses have fewer than 10 employees
91
Q & A’s – IRQuestions@Leucadia.com
Appendix
92
Leucadia – Tangible Book Value and Fully-Diluted Shares Outstanding GAAP Reconciliations
Reconciliation of Leucadia Book Value (Leucadia’s Shareholders’ Equity) to Tangible Book Value
($ millions)
6/30/2016
Leucadia Shareholders’ Equity / Book Value (GAAP) $ 10,087 Less: Goodwill and Intangible Assets 2,622 Leucadia Tangible Book Value (Non-GAAP) $ 7,465
Reconciliation of Leucadia GAAP Shares Outstanding to Fully Diluted Shares Outstanding
(millions of shares)
6/30/2016
Leucadia Shares Outstanding (GAAP) 360.4 Restricted Stock Units 14.4 Other 0.8 Leucadia Fully Diluted Shares Outstanding (Non-GAAP) 375.6
Note: Fully Diluted shares exclude shares for options, convertible debt and preferred shares.
93
Leucadia – Tangible Book Value GAAP Reconciliation
Reconciliation of Book Value to Tangible Book Value
($ Millions) Tangible Book Value Goodwill and Book Value (GAAP) (1) Intangibles, Net (Non-GAAP)
Jefferies $ 5,388 $ 1,927 $ 3,461 Leucadia Asset Management(2) 459 2 457 FXCM 508 — 508 HomeFed 264 — 264 Berkadia 184 — 184 Foursight & Chrome 102 — 102 M Science 13 10 3 National Beef 699 623 76 HRG 640 — 640 Vitesse & Juneau 453 — 453 Garcadia 208 — 208 Linkem 172 — 172 Golden Queen 79 — 79 Conwed 105 59 46 Idaho Timber 76 — 76 Cash & Investments 481 — 481 Deferred Tax Asset 1,312 — 1,312 Other 56 1 55 Debt and Preferred Equity (1,112) — (1,112) $ 10,087 $ 2,622 $ 7,465
(1) Dollar amounts are Leucadia’s net carrying amount as of 6/30/16 for each investment, for consolidated subsidiaries equal to their assets less liabilities and non-controlling interest.
(2) Leucadia Asset Management does not include $76 million of liquid marketable securities that are available for sale immediately. These liquid marketable securities are included in Cash & Investments.
94
Jefferies – Bache Adjusted Earnings GAAP Reconciliation
Reconciliation of Consolidated Adjusted Financial Information
($ millions)
Twelve Months Ended 11/30/2015 Twelve Months Ended 11/30/2014
GAAP AdjustmentsAdjustedGAAPAdjustmentsAdjusted
Revenues
Fixed Income $ 271 $80(1)$191$ 748$203(1)$545
Other $-$-$-$-$-$ -
Net Revenues $ 2,475 $80(1)$2,395$ 2,990$203(1)$2,787
Net Revenues After Preferred Interest $ 2,475 $80(1)$2,395$ 2,990$203(1)$2,787
Non-Compensation Expenses 894 127(2)767989250(2)(4)(5)739
Compensation and Benefits 1,467 88(3)1,3791,69999(3)1,600
Total Expenses 2,361 2152,1462,6873492,338
Earnings Before Tax & Non-Controlling Interest 114 (135)249303(146)449
This presentation of Adjusted financial information is an unaudited non-GAAP financial measure. Adjusted financial information begins with information prepared in accordance with U.S. GAAP and then those results are adjusted to exclude the operations of Jefferies’ Bache business. Management believes that the disclosed Adjusted measures and any adjustments thereto, when presented in conjunction with comparable U.S. GAAP measures are useful to investors as they enable investors to evaluate Jefferies’ results in the context of exiting the Bache business. These measures should not be considered a substitute for, or superior to, measures of financial performance prepared in accordance with U.S. GAAP.
Accompanying footnotes on the following slide.
95
Jefferies – Bache Adjusted Earnings GAAP Reconciliation (continued)
(1) Revenues generated by the Bache business, including commissions, principal transaction revenues and estimated net interest revenue, for the presented period have been classified as a reduction of revenue in the presentation of Adjusted financial information.
(2) Expenses directly related to the operations of the Bache business for the presented periods have been excluded from Adjusted non-compensation expenses. These expenses include floor brokerage and clearing fees, amortization of capitalized software used directly by the Bache business in conducting its business activities, technology and occupancy expenses directly related to conducting Bache business operations and business development and professional services incurred by the Bache business as part of its client sales and trading activities, including estimates of certain support costs dedicated to the Bache business.
Estimates of certain support costs were derived based on direct support costs for the presented period in relationship to the average head count of corporate support personnel with responsibilities associated with operating the Bache business.
(3) Compensation expense and benefits, including salaries, benefits, cash bonuses, commissions, annual cash compensation awards and the amortization of certain share-based and cash compensation awards, recognized during the presented period for employees whose sole responsibilities pertained to the activities of the Bache business, including front office personnel and dedicated support personnel, have been classified as a reduction of Compensation and benefits expense in the presentation of Adjusted financial information. In addition, compensation and benefits for other corporate support personnel with duties specific to the Bache operations included in this adjustment were estimated based on an average per person cost applied to the average head count for this employee population type across the presented periods.
(4) Non-compensation expense includes amortization expense during the presented periods of intangible assets, which arose in connection with the purchase accounting associated with the Leucadia transaction in the second quarter of fiscal 2013, which has been classified as a reduction of Non-compensation expense in the presentation of Adjusted financial information. (5) Non-compensation expense for the purpose of the Adjusted financial information is adjusted for goodwill and intangible asset impairment losses of $59.5 million related to the Bache business.
96
Jefferies – Tangible Assets and Tangible Member’s Equity GAAP Reconciliation
2013201420152016
($ Billions) 2Q 3Q4Q1Q2Q3Q4Q1Q2Q3Q4Q1Q2Q3Q
Total Assets (GAAP) 38.9 38.840.243.443.644.844.543.844.142.838.635.237.138.1
Less: Goodwill and Intangibles 2.0 2.02.02.02.02.01.91.91.91.91.91.91.91.9
Tangible Gross Assets (Non-GAAP) 37.0 36.838.241.541.642.842.641.942.240.936.733.335.236.3
Total Member’s Equity (GAAP) 5.1 5.25.35.45.55.65.45.45.55.55.55.35.35.3
Less: Goodwill and Intangibles 2.0 2.02.02.02.02.01.91.91.91.91.91.91.91.9
Tangible Member’s Equity (Non-GAAP) 3.2 3.23.33.43.53.63.53.53.63.63.63.43.53.5
Note: Jefferies tangible gross assets and tangible member’s equity are unaudited non-GAAP financial measures that begin with information prepared in accordance with U.S. GAAP and then are adjusted to exclude goodwill and intangibles. Management believes that the tangible gross assets and tangible member’s equity are common metrics used by many investors in its industry to evaluate performance from period to period.
97
National Beef – Adjusted EBITDA GAAP Reconciliation
Reconciliation of Pre-Tax Income to Adjusted EBITDA (a non-GAAP measure)
($ Millions)
FYE December,6 Months Ending June,
($ Millions) 201220132014201520152016
Pre-Tax Income (GAAP) $59.0$(42.4)$(40.3)$(123.9)$(43.0)$84.3
Interest Expense / (Income), net 12.412.415.116.68.77.7
Depreciation & Amortization 83.188.585.389.343.945.4
Impairments -63.3-4.7--
Adjusted EBITDA (Non-GAAP) $154.5$121.7$60.1$(13.3)$9.6$137.4
Preliminary Estimates
3 Months Ending 9 Months Ending
($ Millions) September 2016 September 2016
Pre-Tax Income (GAAP) $104.0$188.3
Interest Expense / (Income), net 3.010.7
Depreciation & Amortization 23.068.4
Adjusted EBITDA (Non-GAAP) $130.0$267.4
Note: National Beef Adjusted EBITDA represents pre-tax income exclusive of depreciation and amortization expenses, impairment charges and net interest income/expense, which is a common metric used by many investors in its industry to evaluate operating performance from period to period.
98
Berkadia – Non-GAAP Reconciliation
Reconciliation of Pre-Tax Income to Cash Earnings (a non-GAAP measure)
($ Millions) YTD June 30,
20102011201220132014201520152016
Pre-Tax Income (GAAP) $31.0$34.6$103.8$152.6$191.3$163.8$ 108.1$71.9
Amortization, impairment and depreciation $88.1$107.5$112.7$94.7$105.5$144.0$ 53.8$55.0
Gains attributable to origination of MSR’s $(42.4) $(45.2) $(93.1)$(120.4)$(117.2)$(148.3)$ (70.1)$(67.1)
Loan loss reserves and guarantee liabilities, net of cash losses $3.1$3.2$18.8$29.3$28.8$36.1$ 21.7$8.0
Unrealized (gains) losses; and all other, net $(9.1) $7.0 $(7.7) $(3.6) $(35.0)$(37.2)$ (28.5)$4.1
Cash Earnings (Non-GAAP) $70.7$107.1$134.5$152.5$173.3$158.2$ 85.0$71.8
Note: Berkadia cash earnings represents pre-tax income plus depreciation, amortization and impairments of mortgage servicing rights (MSRs), intangible assets, the increase in balance sheet loan loss reserves, less gains attributable to the origination of MSRs and unrealized gains on loans and investments, which is a common metric used by many investors in its industry to evaluate operating performance from period to period.
99
FXCM – Non-GAAP Reconciliations
Continuing Operations Only (12 Months Ending December 31, 2015)
FYE
($ 000s) 12/31/15
GAAP Net Income / (Loss) $(814,503)
EBITDA and Other Adjustments:
Depreciation & Amortization 28,331
Interest on Borrowings 126,560
(Gain) / Loss on Derivative Liabilities 354,657
Goodwill and Held for Sale Impairments 9,513
Income Tax Provision 181,198
EBITDA and Other Adjustments (114,244)
Adjustments:
Net Revenues (1) (145,079)
General & Administrative (2) 11,654
Bad Debt Expense (3) 256,950
Adjusted EBITDA (Non-GAAP) $9,281
Continuing Operations Only (6 Months Ending June 30, 2015 and 2016)
6 Months Ending
($ 000s) 06/30/15 06/30/16
GAAP Total Net Revenues $275,702$142,071
Total Net Revenues Adjustment (4) (145,224)44
Adjusted Total Revenues (Non-GAAP) $130,478$142,115
GAAP Net Income / (Loss) $(786,288)$179,265
Adjustments:
Total Net Revenues Adjustment (4) (145,224)44
General & Administrative (5) 3,03510,499
Bad Debt (Recovery) / Expense (6) 257,303(141)
Depreciation & Amortization 13,82014,193
Goodwill and Held for Sale Impairments 9,5130
(Gain) / Loss on Derivative Liabilities 392,296(227,360)
Interest on Borrowings 74,85041,755
Income Tax Provision 181,321143
Total Adjustments 786,914(160,867)
Adjusted EBITDA (Non-GAAP) $626$18,398
Source: Financial data and footnotes per FXCM Fourth Quarter 2015 Results Press Release (disclosed 03/10/16) and FXCM Second Quarter 2016 Results Press Release (disclosed 08/04/16).
(1) Represents the elimination of a $145.1 million benefit in the twelve months ended December 31, 2015 attributable to the reduction of our tax receivable agreement contingent liability to zero.
(2) Represents the elimination of a $6.8 million reserve recorded against an uncollected broker receivable, $4.9 million of legal fees resulting from the January 15, 2015 SNB event and other professional fees, including the elimination of the expense related to the Stockholders Rights Plan, $0.7 million of costs related to the cyber incident and a recovery of $0.8 million related to a settlement of a lawsuit, all recorded in continuing operations in the twelve months ended December 31, 2015.
(3) Represents the net bad debt expense related to client debit balances associated with the January 15, 2015 SNB event.
(4) Represents a $0.1 million charge in the three months ended March 31, 2016 for tax receivable agreement payments and the elimination of a $145.2 million noncash benefit in the three months ended March 31, 2015 attributable to the reduction of our tax receivable agreement contingent liability to zero.
(5) Represents the provision for debt forgiveness of $8.2 million against the notes receivable from the non-controlling members of Lucid, $3.2 million of legal and other professional fees, including fees related to the Leucadia debt restructuring and other professional fees related to the Stockholder Rights Plan, partially offset by $1.0 million of insurance recoveries to reimburse for costs incurred related to the January 15, 2015 SNB event and the cybersecurity incident, which is included in continuing operations in the six months ended June 30, 2016. For the six months ended June 30, 2015, represents $3.0 million of legal and other professional fees, including legal fees resulting from the SNB event and professional fees related to the Stockholder Rights Plan. (6) Represents the net bad debt (recovery) expense related to client debit balances associated with the January 15, 2015 SNB event.
100