Management’s Discussion and Analysis
Table of Contents
| | |
| 25 | | Forward-looking statements |
| 26 | | Financial highlights |
|
| Overview |
| 27 | | Financial results |
| 27 | | Outlook |
| 28 | | Shareholder returns |
| 29 | | Impact of foreign currency translation |
| 29 | | Impact of acquisitions |
| 29 | | Non-GAAP measures |
|
| Group Financial Performance |
| 30 | | Total revenue |
| 30 | | Net interest income |
| 31 | | Other income |
| 33 | | Non-interest expenses |
| 34 | | Provision for income taxes |
| 34 | | Credit quality |
| 38 | | Fourth quarter review |
| 40 | | Summary of quarterly results |
|
| Group Financial Condition |
| 41 | | Balance sheet |
| 42 | | Capital management |
| 47 | | Changing regulatory landscape |
| 47 | | Off-balance sheet arrangements |
| 50 | | Financial instruments |
| 51 | | Selected credit instruments |
| | |
| Business Lines |
| 53 | | Overview |
| 54 | | Canadian Banking |
| 56 | | International Banking |
| 58 | | Global Wealth Management |
| 60 | | Scotia Capital |
| 62 | | Other |
|
| Risk Management |
| 63 | | Overview |
| 66 | | Credit risk |
| 70 | | Market risk |
| 73 | | Liquidity risk |
| 75 | | Operational risk |
| 76 | | Reputational risk |
| 77 | | Environmental risk |
|
| Controls and Accounting Policies |
| 78 | | Controls and procedures |
| 78 | | Critical accounting estimates |
| 82 | | Changes in accounting policies |
| 83 | | Transition to International Financial Reporting Standards (IFRS) |
| 90 | | Related party transactions |
|
| Supplementary Data |
| 91 | | Geographic information |
| 93 | | Credit risk |
| 98 | | Revenues and expenses |
| 98 | | Other information |
| 100 | | Eleven-year statistical review |
24 2011 Scotiabank Annual Report
MANAGEMENT’S DISCUSSION AND ANALYSIS | OVERVIEW
FORWARD-LOOKING STATEMENTS
Our public communications often include oral or written forward-looking statements. Statements of this type are included in this document, and may be included in other filings with Canadian securities regulators or the United States Securities and Exchange Commission, or in other communications. All such statements are made pursuant to the “safe harbour” provisions of the United States Private Securities Litigation Reform Act of 1995 and any applicable Canadian securities legislation. Forward-looking statements may include comments with respect to the Bank’s objectives, strategies to achieve those objectives, expected financial results (including those in the area of risk management), and the outlook for the Bank’s businesses and for the Canadian, United States and global economies. Such statements are typically identified by words or phrases such as “believe,” “expect,” “anticipate,” “intent,” “estimate,” “plan,” “may increase,” “may fluctuate,” and similar expressions of future or conditional verbs, such as “will,” “should,” “would” and “could.”
By their very nature, forward-looking statements involve numerous assumptions, inherent risks and uncertainties, both general and specific, and the risk that predictions and other forward-looking statements will not prove to be accurate. Do not unduly rely on forward-looking statements, as a number of important factors, many of which are beyond our control, could cause actual results to differ materially from the estimates and intentions expressed in such forward-looking statements. These factors include, but are not limited to: the economic and financial conditions in Canada and globally; fluctuations in interest rates and currency values; liquidity; significant market volatility and interruptions; the failure of third parties to comply with their obligations to us and our affiliates; the effect of changes in monetary policy; legislative and regulatory developments in Canada and elsewhere, including changes in tax laws; the effect of changes to our credit ratings; amendments to, and interpretations of, risk-based capital guidelines and reporting instructions and liquidity regulatory guidance; operational and reputational risks; the risk that the Bank’s risk management models may not take into account all relevant factors; the accuracy and completeness of information the Bank receives on customers and counterparties; the timely development and introduction of new products and services in receptive markets; the Bank’s ability to expand existing distribution channels and to develop and realize revenues from new distribution channels; the Bank’s ability to complete and integrate acquisitions and its other growth strategies; changes in accounting policies and methods the Bank uses to report its financial condition and the results of its operations, including uncertainties associated with critical accounting assumptions and
estimates; the effect of applying future accounting changes, including International Financial Reporting Standards; global capital markets activity; the Bank’s ability to attract and retain key executives; reliance on third parties to provide components of the Bank’s business infrastructure; unexpected changes in consumer spending and saving habits; technological developments; fraud by internal or external parties, including the use of new technologies in unprecedented ways to defraud the Bank or its customers; consolidation in the Canadian financial services sector; competition, both from new entrants and established competitors; judicial and regulatory proceedings; acts of God, such as earthquakes and hurricanes; the possible impact of international conflicts and other developments, including terrorist acts and war on terrorism; the effects of disease or illness on local, national or international economies; disruptions to public infrastructure, including transportation, communication, power and water; and the Bank’s anticipation of and success in managing the risks implied by the foregoing. A substantial amount of the Bank’s business involves making loans or otherwise committing resources to specific companies, industries or countries. Unforeseen events affecting such borrowers, industries or countries could have a material adverse effect on the Bank’s financial results, businesses, financial condition or liquidity. These and other factors may cause the Bank’s actual performance to differ materially from that contemplated by forward-looking statements. For more information, see the discussion starting on page 63 of the MD&A.
The preceding list of important factors is not exhaustive. When relying on forward-looking statements to make decisions with respect to the Bank and its securities, investors and others should carefully consider the preceding factors, other uncertainties and potential events. The Bank does not undertake to update any forward-looking statements, whether written or oral, that may be made from time to time by or on its behalf.
The “Outlook” sections in this document are based on the Bank’s views and the actual outcome is uncertain. Readers should consider the above-noted factors when reviewing these sections.
Additional information relating to the Bank, including the Bank’s Annual Information Form, can be located on the SEDAR website at www.sedar.com and on the EDGAR section of the SEC’s website at www.sec.gov.
December 2, 2011
Scotiabank Annual Report 2011 25
MANAGEMENT’S DISCUSSION AND ANALYSIS
T1 Financial Highlights
| | | | | | | | | | | | | | | | | | | | |
| | | | | |
| As at and for the years ended October 31 | | 2011 | | | 2010 | | | 2009 | | | 2008 | | | 2007 | |
Operating results($ millions) | | | | | | | | | | | | | | | | | | | | |
Net interest income | | | 9,270 | | | | 8,621 | | | | 8,328 | | | | 7,574 | | | | 7,098 | |
Net interest income (TEB(1)) | | | 9,557 | | | | 8,907 | | | | 8,616 | | | | 7,990 | | | | 7,629 | |
Total revenue | | | 17,288 | | | | 15,505 | | | | 14,457 | | | | 11,876 | | | | 12,490 | |
Total revenue (TEB(1)) | | | 17,575 | | | | 15,791 | | | | 14,745 | | | | 12,292 | | | | 13,021 | |
Provision for credit losses | | | 1,046 | | | | 1,239 | | | | 1,744 | | | | 630 | | | | 270 | |
Non-interest expenses | | | 9,564 | | | | 8,182 | | | | 7,919 | | | | 7,296 | | | | 6,994 | |
Provision for income taxes | | | 1,410 | | | | 1,745 | | | | 1,133 | | | | 691 | | | | 1,063 | |
Provision for income taxes (TEB(1)) | | | 1,697 | | | | 2,031 | | | | 1,421 | | | | 1,107 | | | | 1,594 | |
Net income(2) | | | 5,268 | | | | 4,339 | | | | 3,661 | | | | 3,259 | | | | 4,163 | |
Net income attributable to common shareholders | | | 4,959 | | | | 4,038 | | | | 3,361 | | | | 3,033 | | | | 3,994 | |
Operating performance | | | | | | | | | | | | | | | | | | | | |
Basic earnings per share ($) | | | 4.62 | | | | 3.91 | | | | 3.32 | | | | 3.07 | | | | 4.04 | |
Diluted earnings per share ($) | | | 4.62 | | | | 3.91 | | | | 3.31 | | | | 3.05 | | | | 4.01 | |
Diluted cash earnings per share(1) ($) | | | 4.71 | | | | 3.97 | | | | 3.37 | | | | 3.11 | | | | 4.05 | |
Return on equity(1) (%) | | | 18.8 | | | | 18.3 | | | | 16.7 | | | | 16.7 | | | | 22.0 | |
Productivity ratio (%) (TEB(1)) | | | 54.4 | | | | 51.8 | | | | 53.7 | | | | 59.4 | | | | 53.7 | |
Net interest margin on total average assets (%) (TEB(1)) | | | 1.68 | | | | 1.73 | | | | 1.68 | | | | 1.75 | | | | 1.89 | |
Balance sheet information($ millions) | | | | | | | | | | | | | | | | | | | | |
Cash resources and securities | | | 174,344 | | | | 162,590 | | | | 160,572 | | | | 125,353 | | | | 118,030 | |
Loans and acceptances | | | 306,874 | | | | 291,840 | | | | 275,885 | | | | 300,649 | | | | 238,685 | |
Total assets | | | 575,256 | | | | 526,657 | | | | 496,516 | | | | 507,625 | | | | 411,510 | |
Deposits | | | 396,376 | | | | 361,650 | | | | 350,419 | | | | 346,580 | | | | 288,458 | |
Preferred shares | | | 4,384 | | | | 3,975 | | | | 3,710 | | | | 2,860 | | | | 1,635 | |
Common shareholders’ equity | | | 28,376 | | | | 23,656 | | | | 21,062 | | | | 18,782 | | | | 17,169 | |
Assets under administration(1) | | | 325,334 | | | | 243,817 | | | | 215,097 | | | | 203,147 | | | | 195,095 | |
Assets under management(1)(3) | | | 103,020 | | | | 53,532 | | | | 46,304 | | | | 40,460 | | | | 36,092 | |
Capital measures(4) | | | | | | | | | | | | | | | | | | | | |
Tier 1 capital ratio (%) | | | 12.2 | | | | 11.8 | | | | 10.7 | | | | 9.3 | | | | 9.3 | |
Total capital ratio (%) | | | 13.9 | | | | 13.8 | | | | 12.9 | | | | 11.1 | | | | 10.5 | |
Tangible common equity to risk-weighted assets(1)(5) (%) | | | 9.6 | | | | 9.7 | | | | 8.3 | | | | 6.6 | | | | 7.4 | |
Assets-to-capital multiple | | | 16.6 | | | | 17.0 | | | | 16.6 | | | | 18.0 | | | | 18.2 | |
Risk-weighted assets ($ millions) | | | 233,970 | | | | 215,034 | | | | 221,656 | | | | 250,591 | | | | 218,337 | |
Credit quality | | | | | | | | | | | | | | | | | | | | |
Net impaired loans(6) ($ millions) | | | 2,623 | | | | 3,044 | | | | 2,563 | | | | 1,191 | | | | 601 | |
General allowance for credit losses ($ millions) | | | 1,352 | | | | 1,410 | | | | 1,450 | | | | 1,323 | | | | 1,298 | |
Sectoral allowance ($ millions) | | | – | | | | – | | | | 44 | | | | – | | | | – | |
Net impaired loans as a % of loans and acceptances(6) | | | 0.85 | | | | 1.04 | | | | 0.93 | | | | 0.40 | | | | 0.25 | |
Specific provision for credit losses as a % of average loans and acceptances | | | 0.38 | | | | 0.48 | | | | 0.54 | | | | 0.24 | | | | 0.13 | |
Common share information | | | | | | | | | | | | | | | | | | | | |
Share price ($) | | | | | | | | | | | | | | | | | | | | |
High | | | 61.28 | | | | 55.76 | | | | 49.19 | | | | 54.00 | | | | 54.73 | |
Low | | | 49.00 | | | | 44.12 | | | | 23.99 | | | | 35.25 | | | | 46.70 | |
Close | | | 52.53 | | | | 54.67 | | | | 45.25 | | | | 40.19 | | | | 53.48 | |
Shares outstanding (millions) | | | | | | | | | | | | | | | | | | | | |
Average – Basic | | | 1,072 | | | | 1,032 | | | | 1,013 | | | | 987 | | | | 989 | |
Average – Diluted | | | 1,074 | | | | 1,034 | | | | 1,016 | | | | 993 | | | | 997 | |
End of period | | | 1,089 | | | | 1,043 | | | | 1,025 | | | | 992 | | | | 984 | |
Dividends per share ($) | | | 2.05 | | | | 1.96 | | | | 1.96 | | | | 1.92 | | | | 1.74 | |
Dividend yield (%)(7) | | | 3.7 | | | | 3.9 | | | | 5.4 | | | | 4.3 | | | | 3.4 | |
Market capitalization ($ millions) | | | 57,204 | | | | 57,016 | | | | 46,379 | | | | 39,865 | | | | 52,612 | |
Book value per common share ($) | | | 26.06 | | | | 22.68 | | | | 20.55 | | | | 18.94 | | | | 17.45 | |
Market value to book value multiple | | | 2.0 | | | | 2.4 | | | | 2.2 | | | | 2.1 | | | | 3.1 | |
Price to earnings multiple | | | 11.3 | | | | 14.0 | | | | 13.6 | | | | 13.1 | | | | 13.2 | |
Other information | | | | | | | | | | | | | | | | | | | | |
Employees | | | 75,362 | | | | 70,772 | | | | 67,802 | | | | 69,049 | | | | 58,113 | |
Branches and offices | | | 2,926 | | | | 2,784 | | | | 2,686 | | | | 2,672 | | | | 2,331 | |
| (1) | Non-GAAP measure. Refer to the non-GAAP measures on page 29. |
| (2) | Refer to Note 1 of the Consolidated Financial Statements for the impact of the new accounting standards adopted effective November 1, 2010. Prior period information has been reclassified to conform with current period presentation. |
| (3) | Prior period amounts have been restated to reflect the updated definition of assets under management. Refer to page 29 for a discussion on non-GAAP measures. |
| (4) | Effective November 1, 2007, regulatory capital, risk-weighted assets and capital ratios are determined in accordance with Basel II rules. Comparative amounts for 2007 were determined in accordance with Basel I rules. |
| (5) | Amounts have been restated to reflect the revised definition of tangible common equity to risk-weighted assets. Refer to page 29 for a discussion of non-GAAP measures. |
| (6) | Net impaired loans are impaired loans less the specific allowance for credit losses. |
| (7) | Based on the average of the high and low common share price for the year. |
26 2011 Scotiabank Annual Report
MANAGEMENT’S DISCUSSION AND ANALYSIS | OVERVIEW
MD&A Overview
Financial Results
Scotiabank had record results in 2011 and met or exceeded all of its financial objectives. Net income was $5,268 million, $929 million or 21% higher than last year. Diluted earnings per share (EPS) were $4.62, up 18% from $3.91 in 2010. The negative impact of foreign currency translation was $107 million relative to 2010, reducing EPS by 10 cents. Return on equity of 18.8% remains strong.
Total revenues increased 11% from last year to $17,575 million on a taxable equivalent basis (TEB), including the negative impact of foreign currency translation of $232 million and the $286 million acquisition-related gains.
Net interest income (TEB) rose $650 million to $9,557 million in 2011, notwithstanding the negative impact of foreign currency translation of $138 million. The increase was mainly from volume growth in Canadian Banking, higher contributions across International Banking, including acquisitions, and the lower cost of long-term wholesale funding.
Other income was $8,018 million, up $1,134 million or 16% from last year or 18% excluding the negative impact of foreign currency translation. The increase reflected $286 million acquisition-related gains and contribution from acquisitions of $744 million, offset by the significant decline in trading revenues year over year. There were also increases in securitization income, credit fees, card revenues and deposit-based fees, as well as, organic growth in mutual fund and brokerage revenues.
The provision for credit losses was $1,046 million for the year, down $193 million from the previous year, primarily from reduction of specific provisions of $217 million. Last year’s provision included a reversal of the sectoral allowance of $44 million and a reduction of $40 million in the general allowance, while there was a $60 million reduction in the general allowance this year.
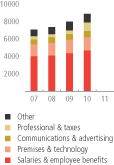
Non-interest expenses were $9,564 million in 2011, an increase of $1,382 million or 17% from 2010. This includes the favourable impact of foreign currency translation of $87 million. Acquisitions contributed $651 million to the increase. The remaining growth was primarily in remuneration related expenses. Salary expenses were up from annual merit increases and ongoing growth initiatives. Pension and benefits rose primarily from changes in actuarial assumptions and plan asset values. Growth in advertising, premises, and technology reflects the Bank’s investment in expansion initiatives.
The overall tax rate was 21.1% in 2011, down from 28.7% last year, due mainly to the non-taxable acquisition-related gains, a drop in the Canadian statutory tax rate, lower taxes in foreign subsidiaries and higher tax exempt income, partially offset by a future tax asset valuation allowance recorded this year.
Tier 1 capital ratio at 12.2% and the total capital ratio at 13.9% remained well above the regulatory minimum and were strong by international standards.
Outlook
Global prospects are being pressured again by the recurring financial market volatility resulting from the euro zone’s sovereign debt crisis and the political delay in finalizing the United States’ deficit-reduction plan.
In contrast, Canada and the emerging economies remain on a faster growth trajectory. Canada, and the Asia-Pacific and Latin American regions should continue to benefit from ongoing strength in domestic spending, foreign investment, and much more supportive economic and fiscal fundamentals. The widening performance differential between the advanced and emerging economies will likely persist, particularly with the pace of activity in the euro zone and the United States set to moderate as governments join households in reducing their debt.
The Bank is very fortunate to be well positioned in all Business Lines to benefit from growth in these markets. The Bank’s exposures are very limited in the areas of concern and its focus is on client-driven businesses and adding customers, particularly in the higher growth markets. As a result, Scotiabank expects continued growth through this business cycle and beyond.
| | | | |
| | CHANGE IN ACCOUNTING STANDARDS Effective November 1, 2010, the Bank adopted new Canadian accounting standards on Business Combinations, Consolidated Financial Statements and Non-Controlling Interests. The adoption of these standards resulted in the recognition of acquisition-related gains of $286 million. The gains arose substantially from the accounting for the Bank’s acquisition of an additional ownership interest in DundeeWealth Inc. This additional investment was considered a step-acquisition and accounted for on a fair value basis. A gain of $260 million was recognized on the revaluation of the Bank’s original 18% investment in DundeeWealth. The remaining $26 million gain related to accounting for another acquisition, which was purchased at a price lower than fair value. The new standards require negative goodwill to be recognized in income without first reducing non-monetary assets, resulting in a higher gain in income under the new standards. Under prior Canadian GAAP, $26 million would have been recorded as negative goodwill. With the change, the total negative goodwill recognized for the acquisition was $52 million. | | |
| | | | |
| | | |
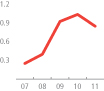
| | | C1 Earnings per share (diluted) 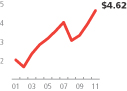
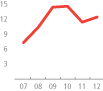
C2Closing common share price as at October 31 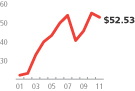
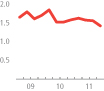
C3Return on equity 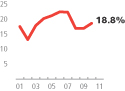
| | |
Scotiabank Annual Report 2011 27
MANAGEMENT’S DISCUSSION AND ANALYSIS
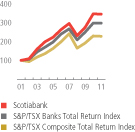
C4Return to common shareholders
Share price appreciation plus dividends reinvested, 2001 = 100
Shareholder Returns
A turbulent global economic environment weighed on investors’ sentiments in 2011, resulting in total shareholder return for the Bank of negative 0.4%, a substantial decrease from positive 25.7% in 2010, as shown in Table 2.
The total compounded annual shareholder return on the Bank’s shares over the past five years was 5.4% and 13.1% over the past 10 years. This exceeded the total return of the S&P/TSX Composite Index of 2.7% over the past five years and 8.5% over the last ten years, as shown in Chart 4.
Quarterly dividends were raised 6% in the second quarter. Dividends per share totaled $2.05 for the year, up 5% from 2010. The Bank was within its target payout ratio of 40-50%, at 44% for the year.
The Bank’s Return on Equity was 18.8% for fiscal 2011, an increase from 18.3% in the previous year.
T2 Shareholder returns
| | | | | | | | | | | | | | | | | | | | | | | | |
| | | | | | |
| For the years ended October 31 | | 2011 | | | 2010 | | | 2009 | | | 2008 | | | 2007 | | | 5-yr CAGR(1) | |
Closing market price per common share ($) | | | 52.53 | | | | 54.67 | | | | 45.25 | | | | 40.19 | | | | 53.48 | | | | 1.3 | % |
Dividends paid ($ per share) | | | 2.05 | | | | 1.96 | | | | 1.96 | | | | 1.92 | | | | 1.74 | | | | 6.5 | % |
Dividends paid (%) | | | 3.7 | | | | 4.3 | | | | 4.9 | | | | 3.6 | | | | 3.5 | | | | | |
Increase (decrease) in share price (%) | | | (3.9 | ) | | | 20.8 | | | | 12.6 | | | | (24.9 | ) | | | 8.5 | | | | | |
Total annual shareholder return (%)(2) | | | (0.4 | ) | | | 25.7 | | | | 18.8 | | | | (21.6 | ) | | | 12.2 | | | | | |
| (1) | Compound annual growth rate (CAGR) |
| (2) | Total annual shareholder return assumes reinvestment of quarterly dividends, and therefore may not equal the sum of dividend and share price returns in the table. |
T3 Impact of foreign currency translation
| | | | | | | | | | | | |
| | | |
| Average exchange rate | | 2011 | | | 2010 | | | 2009 | |
U.S. dollar/Canadian dollar | | | 1.013 | | | | 0.963 | | | | 0.855 | |
| | | |
| Impact on income ($ millions except EPS) | | 2011
vs. 2010 | | | 2010
vs. 2009 | | | 2009
vs. 2008 | |
Net interest income | | $ | (138 | ) | | $ | (413 | ) | | $ | 235 | |
Other income | | | (94 | ) | | | (306 | ) | | | 111 | |
Non-interest expenses | | | 87 | | | | 252 | | | | (55 | ) |
Other items (net of tax) | | | 38 | | | | 165 | | | | (79 | ) |
Net income | | $ | (107 | ) | | $ | (302 | ) | | $ | 212 | |
Earnings per share (diluted) | | $ | (0.10 | ) | | $ | (0.29 | ) | | $ | 0.21 | |
Impact by business line ($ millions) | | | | | | | | | | | | |
International Banking | | $ | (53 | ) | | $ | (107 | ) | | $ | 69 | |
Scotia Capital | | $ | (22 | ) | | $ | (91 | ) | | $ | 103 | |
Global Wealth Management | | $ | (15 | ) | | $ | (35 | ) | | $ | 18 | |
Canadian Banking | | $ | (5 | ) | | $ | (13 | ) | | $ | 16 | |
Other | | $ | (12 | ) | | $ | (56 | ) | | $ | 6 | |
| | $ | (107 | ) | | $ | (302 | ) | | $ | 212 | |
T4 Impact of acquisitions(1)
| | | | | | | | |
| | |
| ($ millions) | | 2011 | | | 2010 | |
Net interest income | | $ | 331 | | | $ | 125 | |
Other income | | | 1,064 | | | | 34 | |
Non-interest expenses | | | (709 | ) | | | (58 | ) |
Other items (net of tax) | | | (137 | ) | | | (40 | ) |
Net income | | $ | 549 | | | $ | 61 | |
| (1) | Includes acquisitions and investments in associated corporations made in 2010 and 2011, excluding funding costs. |
28 2011 Scotiabank Annual Report
MANAGEMENT’S DISCUSSION AND ANALYSIS | OVERVIEW
Impact of foreign currency translation
The foreign currency average exchange rates had a negative impact on the Bank’s earnings in 2011. On average, the Canadian dollar appreciated 5% over the U.S. dollar, 3% against the Peruvian sol, and against many other currencies in which the Bank conducts its business. The movement in the average exchange rates impacted net income, as seen in Table 3.
Impact of acquisitions
The Bank made a number of acquisitions in 2010 and 2011, which contributed to growth mainly in Global Wealth Management and International Banking operations. The impact on selected income statement categories is shown in Table 4.
Non-GAAP measures
The Bank uses a number of financial measures to assess its performance. Some of these measures are not calculated in accordance with Generally Accepted Accounting Principles (GAAP), are not defined by GAAP and do not have standardized meanings that would ensure consistency and comparability between companies using these measures. These non-GAAP measures are used throughout this report and defined below.
Taxable equivalent basis
The Bank analyzes net interest income and total revenues on a taxable equivalent basis (TEB). This methodology grosses up tax-exempt income earned on certain securities reported in net interest income to an equivalent before tax basis. A corresponding increase is made to the provision for income taxes; hence, there is no impact on net income. Management believes that this basis for measurement provides a uniform comparability of net interest income arising from both taxable and non-taxable sources and facilitates a consistent basis of measurement. While other banks also use TEB, their methodology may not be comparable to the Bank’s methodology. The TEB gross-up to net interest income and to the provision for income taxes for 2011 was $287 million versus $286 million in 2010.
For purposes of segmented reporting, a segment’s net interest income and provision for income taxes are grossed up by the taxable equivalent amount. The elimination of the TEB gross up is recorded in the “Other” segment.
Diluted cash earnings per share
The diluted cash earnings per share is calculated by adjusting the diluted earnings per share to add back the non-cash after–tax amortization of intangible assets.
Productivity Ratio (TEB)
Management uses the productivity ratio as a measure of the Bank’s efficiency. This ratio represents non-interest expenses as a percentage of total revenue on a taxable equivalent basis.
Net interest margin on total average assets (TEB)
This ratio represents net interest income on a taxable equivalent basis as a percentage of total average assets.
Operating leverage
The Bank defines operating leverage as the rate of growth in total revenue, on a taxable equivalent basis, less the rate of growth in expenses.
Return on equity
Return on equity is a profitability measure that presents the net income attributable to common shareholders as a percentage of common shareholders’ equity. The Bank calculates its return on equity using average common shareholders’ equity.
Economic equity and Return on economic equity
For internal reporting purposes, the Bank attributes capital to its business segments based on their risk profile and uses a methodology that considers credit, market, operational and other risks inherent in each business segment. The amount of risk capital attributed is commonly referred to as economic equity. Commencing this year, return on economic equity for the business segments is calculated as a ratio of Adjusted Net Income of the business segment and the economic equity attributed. Adjusted Net Income is net income available to common shareholders grossed up for the incremental cost of non-common equity capital instruments. Return on economic equity for the business segments has been restated for the comparative periods.
Tangible common equity to risk-weighted assets
Tangible common equity to risk-weighted assets is an important financial measure for rating agencies and the investing community. Tangible common equity is total common shareholders’ equity plus non-controlling interest in subsidiaries, less goodwill and unamortized intangible assets (net of taxes). Tangible common equity is presented as a percentage of risk-weighted assets. Regulatory capital ratios, such as Tier 1 and Total Capital ratios, have standardized meanings as defined by the Office of the Superintendent of Financial Institutions Canada (OSFI).
Assets Under Administration (AUA)
AUA are assets administered by the Bank which are beneficially owned by clients and therefore not reported on the Bank’s balance sheet. Services provided for AUA are of an administrative nature, such as trusteeship, custodial, safekeeping, income collection and distribution; securities trade settlements, customer reporting, and other similar services.
Assets Under Management (AUM)
AUM are assets managed by the Bank on a discretionary basis and in respect of which the Bank earns investment management fees. AUM are beneficially owned by clients and are therefore not reported on the Bank’s balance sheet. Some AUM are also administered assets and are included in assets under administration.
Scotiabank Annual Report 2011 29
MANAGEMENT’S DISCUSSION AND ANALYSIS
C5Net interest income by business line(1)
Taxable equivalent basis, $ millions
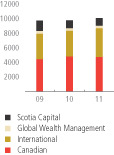
| (1) | Excludes Other segment |
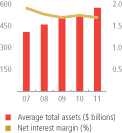
C6 Average total assets and net interest margin
Taxable equivalent basis, $ millions
C7 Other income by business line(1)
Taxable equivalent basis, $ millions
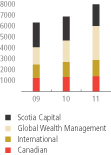
| (1) | Excludes Other segment |
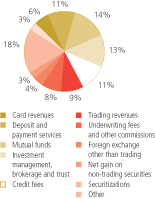
C8 Many sources of other income
GROUP FINANCIAL PERFORMANCE
Total revenue
Total revenue on a taxable equivalent basis was $17,575 million in 2011, an increase of $1,784 million or 11% from the prior year, notwithstanding a $232 million or 1% negative impact from foreign currency translation arising from a stronger Canadian dollar. Both net interest income and other income rose in 2011 although the rate of increase in other income was more than double that of net interest income.
The increase in net interest income was due to growth in average earning assets and the positive impact of changes in the fair value of financial instruments used for asset/liability management purposes, which were partially offset by a lower margin.
Other income was up a substantial $1,134 million or 16%, including acquisition-related gains of $286 million. The remaining growth was primarily from the contributions of acquisitions and higher mutual fund fees and revenues from existing investment management, brokerage and trust services. In addition, transaction-based fees and securitization revenues were up year over year. These increases more than offset significantly lower trading revenues and lower net gains on securities.
Canadian Banking revenues were relatively flat compared to the previous year as lower net interest income was offset by higher other income. The reduction in net interest income reflected a narrower margin as average earning assets grew by 6%. The main components of the increase in other income were higher fees from deposit and payment services, and growth in acceptance and card revenues.
In International Banking, total revenues were up 9%, notwithstanding the $128 million negative impact from foreign currency translation. Net interest income rose $372 million or 10% from both growth in average earning assets and a wider margin. Retail and commercial lending grew significantly with increases throughout the regions. The wider margin was a reflection of higher earnings from associated corporations as well as wider spreads in the Pacific region. The increase in other income was mainly from the contribution of acquisitions and higher credit-related activity in Peru. In addition, 2010 included a devaluation loss on the investment in a Venezuelan affiliate, while this year’s results included $79 million of negative goodwill related to recent acquisitions.
Total revenues in Global Wealth Management were up a substantial 51%, almost entirely in other income from the contribution of acquisitions. While the inclusion of revenues from DundeeWealth was the major component of this increase, fees were also higher in ScotiaFunds, Mexico and Chile and full service brokerage and there was growth in insurance revenues.
Scotia Capital’s total revenues fell $219 million or 7% from 2010, most of which was in other income. Net interest income fell $27 million, due primarily to the negative impact of foreign currency translation. The reduction in other income was mainly in trading revenues due to challenging market conditions in the latter half of the year. The decline was partially offset by stronger precious metals and foreign exchange trading, higher net gains on securities and increased investment banking revenues and credit fees.
Net interest income
Net interest income on a taxable equivalent basis was $9,557 million in 2011, an increase of $650 million or 7% over the prior year. This included a negative impact from foreign currency translation of $138 million.
Average assets grew by $53 billion to $569 billion, with growth in every major category. Securities purchased under resale agreements rose $10 billion or 44%, residential mortgages grew $10 billion or 9%, securities were up $9 billion or 8%. In addition, deposits with banks rose $8 billion or 16% and business and government lending grew $5 billion or 6%. Non-earning assets were up $10 billion or 17%.
Canadian Banking’s average earning assets grew by $12 billion or 6% to $210 billion, primarily in residential mortgages, consumer auto loans and commercial lending.
International Banking’s average earning assets were up $8 billion or 9% to $92 billion. Personal lending grew in Puerto Rico, from the acquisition of R-G Premier Bank, and in Chile and Peru. Business and government lending rose in Peru and Mexico.
Global Wealth Management’s average earning assets were up $1 billion or 8% to $9 billion, primarily in personal lending and residential mortgages.
30 2011 Scotiabank Annual Report
MANAGEMENT’S DISCUSSION AND ANALYSIS | GROUP FINANCIAL PERFORMANCE
Scotia Capital’s earning assets rose $21 billion or 15% to $160 billion. Securities purchased under resale agreements and trading securities increased significantly in global capital markets. Corporate lending volumes fell in the United States and Europe and to a lesser extent in Canada.
The Bank’s net interest margin was 1.68%, a five basis points reduction from last year, primarily from higher levels of low-spread securities in Scotia Capital. The margin also narrowed from higher volumes of non-earning assets, growth in low spread deposits with banks, and narrower spreads on the Canadian dollar fixed rate asset portfolio. These factors were partially offset by a favourable change in the fair value of financial instruments used for asset/liability management purposes, the contributions from acquisitions in International Banking, and a lower cost of wholesale long-term funding.
Canadian Banking’s margin fell due to consumer preferences for lower yielding floating rate mortgages, competitive pricing pressures and higher short term wholesale funding rates used for transfer pricing.
International Banking’s margin widened year over year from higher earnings from associated corporations as well as wider spreads in the Pacific.
Global Wealth Management’s margin compressed slightly.
Scotia Capital’s margin fell during the year from a changing business mix as an increasing proportion of narrower spread capital market assets more than offset wider corporate loan spreads.
Outlook
The Bank’s net interest income is expected to increase in 2012, driven by moderate asset growth as well as the full year impact of acquisitions made in 2011. The margin is expected to largely remain at current levels due to the continuing low interest rate environment and competitive pricing, offset by the run-off of higher-cost long-term funding.
Other income
Other Income was a record $8,018 million in 2011, an increase of $1,134 million or 16% from the prior year, notwithstanding a negative impact of $94 million from foreign currency translation. This increase was primarily from higher mutual fund fees, investment management and trust fees and acquisition-related gains of $286 million.
T5 Net interest income and margin(1)
| | | | | | | | | | | | | | | | | | | | |
| | | | | |
($ millions, except percentage amounts) | | 2011 | | | 2010 | | | 2009 | | | 2008 | | | 2007 | |
Average assets | | | 568,859 | | | | 515,991 | | | | 513,149 | | | | 455,539 | | | | 403,475 | |
Net interest income(1) | | | 9,557 | | | | 8,907 | | | | 8,616 | | | | 7,990 | | | | 7,629 | |
Net interest margin | | | 1.68 | % | | | 1.73 | % | | | 1.68 | % | | | 1.75 | % | | | 1.89 | % |
| (1) | Taxable equivalent basis. Refer to the non-GAAP measures on page 29. |
T6 Average balance sheet(1) and interest margin
| | | | | | | | | | | | | | | | |
| | |
| | | 2011 | | | 2010 | |
| | | | |
Taxable equivalent basis(2) For the fiscal years ($ billions) | | Average balance | | | Average rate | | | Average balance | | | Average rate | |
Assets | | | | | | | | | | | | | | | | |
Deposits with banks | | $ | 60.4 | | | | 0.57 | % | | $ | 52.2 | | | | 0.56 | % |
Securities | | | 126.7 | | | | 4.08 | | | | 117.6 | | | | 3.84 | |
Securities purchased under resale agreements | | | 34.0 | | | | 1.11 | | | | 23.6 | | | | 0.85 | |
Loans: | | | | | | | | | | | | | | | | |
Residential mortgages | | | 121.4 | | | | 4.04 | | | | 111.6 | | | | 3.97 | |
Personal and credit cards | | | 60.8 | | | | 7.05 | | | | 60.5 | | | | 6.80 | |
Business and government | | | 97.6 | | | | 4.01 | | | | 92.1 | | | | 3.94 | |
| | | 279.8 | | | | 4.68 | | | | 264.2 | | | | 4.61 | |
Total earning assets | | | 501.0 | | | | 3.79 | | | | 457.6 | | | | 3.75 | |
Customers’ liability under acceptances | | | 7.9 | | | | – | | | | 8.1 | | | | – | |
Other assets | | | 60.0 | | | | – | | | | 50.3 | | | | – | |
Total assets | | $ | 568.9 | | | | 3.34 | % | | $ | 516.0 | | | | 3.33 | % |
Liabilities and shareholders’ equity | | | | | | | | | | | | | | | | |
Deposits: | | | | | | | | | | | | | | | | |
Personal | | $ | 129.3 | | | | 1.88 | % | | $ | 124.4 | | | | 2.04 | % |
Business and government | | | 239.0 | | | | 2.10 | | | | 212.9 | | | | 1.93 | |
Banks | | | 24.0 | | | | 0.64 | | | | 23.2 | | | | 0.54 | |
| | | 392.3 | | | | 1.94 | | | | 360.5 | | | | 1.88 | |
Obligations related to securities
sold under repurchase agreements | | | 45.1 | | | | 1.07 | | | | 40.3 | | | | 0.72 | |
Subordinated debentures | | | 5.9 | | | | 5.32 | | | | 5.9 | | | | 4.87 | |
Capital instrument liabilities | | | 0.1 | | | | 6.22 | | | | 0.5 | | | | 7.34 | |
Other interest-bearing liabilities | | | 41.2 | | | | 2.52 | | | | 33.7 | | | | 2.63 | |
Total interest-bearing liabilities | | | 484.6 | | | | 1.95 | | | | 440.9 | | | | 1.88 | |
Other liabilities including acceptances | | | 53.1 | | | | – | | | | 48.6 | | | | – | |
Shareholders’ equity(3) | | | 31.2 | | | | – | | | | 26.5 | | | | – | |
Total liabilities and equity | | $ | 568.9 | | | | 1.66 | % | | $ | 516.0 | | | | 1.60 | % |
Net interest margin | | | | | | | 1.68 | % | | | | | | | 1.73 | % |
| (1) | Average of daily balances. |
| (2) | Refer to the non-GAAP measures on page 29. |
| (3) | Includes non-controlling interests of $0.6 billion in 2010 and 2011. |
T7 Trading revenue
Taxable equivalent basis(1)
| | | | | | | | | | | | |
| | | |
| For the fiscal years ($ millions) | | 2011 | | | 2010 | | | 2009 | |
Reported in: | | | | | | | | | | | | |
Other income | | $ | 740 | | | $ | 1,016 | | | $ | 1,057 | |
Net interest income | | | 375 | | | | 405 | | | | 423 | |
Total trading revenue | | $ | 1,115 | | | $ | 1,421 | | | $ | 1,480 | |
By trading products: | | | | | | | | | | | | |
Interest rate and credit | | $ | 257 | | | $ | 534 | | | $ | 498 | |
Equities | | | 291 | | | | 379 | | | | 365 | |
Precious metals and commodities | | | 335 | | | | 270 | | | | 260 | |
Foreign exchange | | | 243 | | | | 233 | | | | 285 | |
Other | | | (11 | ) | | | 5 | | | | 72 | |
Total trading revenue | | $ | 1,115 | | | $ | 1,421 | | | $ | 1,480 | |
% of total revenues | | | | | | | | | | | | |
(net interest income plus other income) | | | 6 | % | | | 9 | % | | | 10 | % |
| (1) | Refer to the non-GAAP measures on page 29. |
Scotiabank Annual Report 2011 31
MANAGEMENT’S DISCUSSION AND ANALYSIS
C9 Expenses well controlled
$ millions
C10 Productivity
non-interest expenses as a % of revenue (TEB)
(Source: published financial data)
Card revenues of $469 million were $43 million higher than last year. Canadian Banking revenues were up 12% (the second year of double digit growth) mainly from higher interchange fees related to growth in credit card payment volumes. Increases in International Banking reflected the two acquisitions in Uruguay.
Revenues from deposit and payment services earned from retail, commercial and corporate customers of $922 million were $39 million or 4% higher than 2010. Canadian Banking revenues were 5% above the previous year. International Banking fees were 2% above last year as higher fees in the Caribbean more than offset lower ABM fees in Mexico due to regulatory-driven reductions.
Mutual funds fees rose a substantial $518 million or 89% to $1,100 million, with the acquisition of DundeeWealth contributing $469 million of the increase. Higher average assets under management in ScotiaFunds, and higher fees in Mexico and Chile were the main components of the remaining increase. Earnings from associated corporations fell year-over-year.
Revenues from investment management, brokerage and trust services were up a substantial $232 million or 30% year over year, primarily from the acquisition of DundeeWealth. In addition, full service brokerage fees grew 11% from a combination of higher fee-based revenues and increased trading volumes. Discount brokerage fees were up slightly as higher trading volumes offset a reduction in average commission per trade following the introduction of lower pricing.
Credit fees were $37 million or 4% higher than the previous year. Acceptances fees increased 23% in Canadian Banking from both higher stamping fees and higher volumes but were slightly lower in Scotia Capital. Commitment and credit fees were higher in the United States, Europe and Canada.
Trading revenues of $740 million were $276 million below the prior year. Global fixed income and institutional equity businesses accounted for most of this reduction, reflecting challenging market conditions. Foreign exchange trading was up modestly from 2010 while precious metals revenue rose 23% to record levels from growing investor demand and commodity volatility.
Underwriting fees and commissions rose $63 million or 11% to $624 million. Both institutional brokerage commissions and fees earned by Scotia Waterous were up significantly from the previous year. Equity underwriting fees also grew compared to 2010. Non-trading foreign exchange revenues increased $31 million or 9% with higher revenues in International Banking, primarily in Mexico and Chile, Canadian Banking and Global Wealth Management.
| | | | | | | | | | | | | | | | | | | | | | | | |
| | | | | | |
T8 Other income For the fiscal years ($ millions) | | 2011 | | | 2010 | | | 2009 | | | 2008 | | | 2007 | | | 2011
versus
2010 | |
Card revenues | | $ | 469 | | | $ | 426 | | | $ | 424 | | | $ | 397 | | | $ | 366 | | | | 10 | % |
Deposit and payment services | | | | | | | | | | | | | | | | | | | | | | | | |
Deposit services | | | 710 | | | | 686 | | | | 707 | | | | 675 | | | | 652 | | | | 4 | |
Other payment services | | | 212 | | | | 197 | | | | 198 | | | | 187 | | | | 165 | | | | 8 | |
| | | 922 | | | | 883 | | | | 905 | | | | 862 | | | | 817 | | | | 4 | |
Mutual funds | | | 1,100 | | | | 582 | | | | 371 | | | | 317 | | | | 296 | | | | 89 | |
Investment management, brokerage and trust services | | | | | | | | | | | | | | | | | | | | | | | | |
Retail brokerage | | | 733 | | | | 541 | | | | 507 | | | | 538 | | | | 553 | | | | 35 | |
Investment management and custody | | | 133 | | | | 106 | | | | 94 | | | | 96 | | | | 87 | | | | 25 | |
Personal and corporate trust | | | 147 | | | | 134 | | | | 127 | | | | 126 | | | | 120 | | | | 10 | |
| | | 1,013 | | | | 781 | | | | 728 | | | | 760 | | | | 760 | | | | 30 | |
Credit fees | | | | | | | | | | | | | | | | | | | | | | | | |
Commitment and other credit fees | | | 680 | | | | 652 | | | | 658 | | | | 436 | | | | 403 | | | | 4 | |
Acceptance fees | | | 188 | | | | 179 | | | | 208 | | | | 143 | | | | 127 | | | | 5 | |
| | | 868 | | | | 831 | | | | 866 | | | | 579 | | | | 530 | | | | 4 | |
Trading revenues | | | 740 | | | | 1,016 | | | | 1,057 | | | | 188 | | | | 450 | | | | (27 | ) |
Underwriting fees and other commissions | | | 624 | | | | 561 | | | | 620 | | | | 402 | | | | 498 | | | | 11 | |
Foreign exchange, other than trading | | | 368 | | | | 337 | | | | 373 | | | | 314 | | | | 239 | | | | 9 | |
Net gain (loss) on securities, other than trading | | | 239 | | | | 355 | | | | (412 | ) | | | (374 | ) | | | 488 | | | | (33 | ) |
Securitization revenues | | | 236 | | | | 124 | | | | 409 | | | | 130 | | | | 34 | | | | 90 | |
Other | | | 1,439 | | | | 988 | | | | 788 | | | | 727 | | | | 914 | | | | 46 | |
Total other income | | $ | 8,018 | | | $ | 6,884 | | | $ | 6,129 | | | $ | 4,302 | | | $ | 5,392 | | | | 16 | % |
Percentage increase (decrease) over previous year | | | 16 | % | | | 12 | % | | | 42 | % | | | (20 | )% | | | 12 | % | | | | |
32 2011 Scotiabank Annual Report
MANAGEMENT’S DISCUSSION AND ANALYSIS | GROUP FINANCIAL PERFORMANCE
Net gains on securities were $239 million, compared to $355 million in 2010, with lower gains in International Banking being partly offset by higher gains in Group Treasury. Securitization revenues almost doubled year over year to $236 million from higher volumes of mortgages securitized, partly offset by a slightly lower spread.
Other revenues of $1,439 million were $451 million higher than last year, due primarily to the acquisition-related gains of $286 million and the recognition of negative goodwill on recent acquisitions.
Outlook
The ongoing challenging global market conditions will temper growth in some other income categories. However, the Bank expects increases in most other income categories in 2012, from the full year impact of acquisitions, and higher customer activity.
Non-interest expenses
Non-interest expenses were $9,564 million in 2011, an increase of $1,382 million or 17% from last year, notwithstanding the positive impact of foreign currency translation of $87 million. Recent acquisitions accounted for $651 million or 47% of the growth in non-interest expenses.
Salaries and employee benefits were $5,399 million in 2011, up $752 million or 16% from last year. Salaries increased by $267 million or 10%, reflecting the impact of acquisitions, annual pay increases, and increased staffing to support growth initiatives. Performance-based compensation was up $261 million or 24% from last year. Excluding the impact of acquisitions and foreign currency translation, performance-based compensation was up $114 million. Stock-based compensation increased by $52 million or 25%, largely in Scotia Capital and from acquisitions. Pensions and other employee benefit costs rose by $172 million or 29%, due mainly to an increase in payroll taxes from higher staffing, and growth in pension costs. The latter increase was due in part to changes in actuarial assumptions and plan asset values, partially offset by a gain on the wind up of a subsidiary’s pension plan during the year.
C11 Direct and indirect taxes
$ millions
| (1) | Includes taxable-equivalent adjustment |
T9 Non-interest expenses and productivity
| | | | | | | | | | | | | | | | | | | | | | | | |
| | | | | | |
| For the fiscal years ($ millions) | | 2011 | | | 2010 | | | 2009 | | | 2008 | | | 2007 | | | 2011
versus
2010 | |
Salaries and employee benefits | | | | | | | | | | | | | | | | | | | | | | | | |
Salaries | | $ | 3,018 | | | $ | 2,751 | | | $ | 2,676 | | | $ | 2,549 | | | $ | 2,315 | | | | 10 | % |
Performance-based compensation | | | 1,349 | | | | 1,088 | | | | 1,035 | | | | 913 | | | | 1,017 | | | | 24 | |
Stock-based compensation | | | 257 | | | | 205 | | | | 79 | | | | 89 | | | | 133 | | | | 25 | |
Pensions and other employee benefits | | | 775 | | | | 603 | | | | 554 | | | | 558 | | | | 518 | | | | 29 | |
| | | 5,399 | | | | 4,647 | | | | 4,344 | | | | 4,109 | | | | 3,983 | | | | 16 | |
Premises and technology | | | | | | | | | | | | | | | | | | | | | | | | |
Net premises rent | | | 276 | | | | 243 | | | | 243 | | | | 217 | | | | 197 | | | | 13 | |
Premises repairs and maintenance | | | 90 | | | | 85 | | | | 87 | | | | 83 | | | | 75 | | | | 6 | |
Property taxes | | | 75 | | | | 73 | | | | 72 | | | | 65 | | | | 65 | | | | 3 | |
Computer equipment, software and data processing | | | 760 | | | | 685 | | | | 687 | | | | 650 | | | | 603 | | | | 11 | |
Depreciation | | | 274 | | | | 236 | | | | 234 | | | | 208 | | | | 203 | | | | 16 | |
Other premises costs | | | 244 | | | | 204 | | | | 220 | | | | 194 | | | | 192 | | | | 20 | |
| | | 1,719 | | | | 1,526 | | | | 1,543 | | | | 1,417 | | | | 1,335 | | | | 13 | |
Communications | | | | | | | | | | | | | | | | | | | | | | | | |
Telecommunications | | | 82 | | | | 79 | | | | 80 | | | | 79 | | | | 73 | | | | 5 | |
Stationery, postage and courier | | | 262 | | | | 261 | | | | 266 | | | | 247 | | | | 227 | | | | – | |
| | | 344 | | | | 340 | | | | 346 | | | | 326 | | | | 300 | | | | 1 | |
Advertising and business development | | | | | | | | | | | | | | | | | | | | | | | | |
Advertising and promotion | | | 284 | | | | 250 | | | | 202 | | | | 206 | | | | 193 | | | | 14 | |
Travel and business development | | | 145 | | | | 114 | | | | 105 | | | | 114 | | | | 118 | | | | 27 | |
| | | 429 | | | | 364 | | | | 307 | | | | 320 | | | | 311 | | | | 18 | |
Professional | | | 262 | | | | 224 | | | | 216 | | | | 227 | | | | 227 | | | | 17 | |
Business and capital taxes | | | | | | | | | | | | | | | | | | | | | | | | |
Business taxes | | | 154 | | | | 125 | | | | 129 | | | | 90 | | | | 107 | | | | 23 | |
Capital taxes | | | 29 | | | | 46 | | | | 48 | | | | 26 | | | | 36 | | | | (37 | ) |
| | | 183 | | | | 171 | | | | 177 | | | | 116 | | | | 143 | | | | 7 | |
Other | | | | | | | | | | | | | | | | | | | | | | | | |
Employee training | | | 45 | | | | 39 | | | | 26 | | | | 43 | | | | 53 | | | | 16 | |
Amortization of goodwill and other intangibles | | | 137 | | | | 98 | | | | 96 | | | | 83 | | | | 64 | | | | 40 | |
Other | | | 1,046 | | | | 773 | | | | 864 | | | | 655 | | | | 578 | | | | 35 | |
| | | 1,228 | | | | 910 | | | | 986 | | | | 781 | | | | 695 | | | | 35 | |
Total non-interest expenses | | $ | 9,564 | | | $ | 8,182 | | | $ | 7,919 | | | $ | 7,296 | | | $ | 6,994 | | | | 17 | % |
Productivity ratio (TEB)(1) | | | 54.4 | % | | | 51.8 | % | | | 53.7 | % | | | 59.4 | % | | | 53.7 | % | | | | |
| (1) | Taxable equivalent basis. Refer to the Non-GAAP measures on page 29. |
Scotiabank Annual Report 2011 33
MANAGEMENT’S DISCUSSION AND ANALYSIS
Premises and technology expenses were $1,719 million in 2011, an increase of $193 million or 13% from last year. The higher premises costs reflected the impact of acquisitions, branch expansion in International operations and Canada, and higher depreciation costs. Technology expenses increased $75 million or 11%, as the Bank continued to invest in new and ongoing technology projects.
Advertising and business development expenses were $429 million in 2011, an increase of $65 million or 18% over last year, due mainly to the impact of acquisitions and various advertising campaigns and sponsorships in Canada, Mexico, and the Caribbean.
Professional expenses rose $38 million or 17% to $262 million, as a result of project-related spending and the impact of acquisitions.
Other expenses were $1,228 million in 2011, an increase of $318 million or 35% from last year. Excluding the impact of acquisitions and foreign currency translation, other expenses were up $104 million due to increases in volume-related securitization expenses, loyalty reward point costs, amortization of intangibles and employee training.
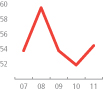
The productivity ratio of 54.4% for 2011, increased from a record low of 51.8% last year.
Outlook
Expense control is a key strength of the Bank, and will be an area of even greater focus in 2012. Expenses are expected to increase in 2012, reflecting the full-year impact of acquisitions, and technology, regulatory and business growth initiatives to be undertaken in 2012. Notwithstanding, we expect the productivity ratio to remain below 58%.
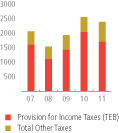
Provision for income taxes
The provision for income taxes was $1,410 million in 2011, a decrease from $1,745 million last year. The Bank’s overall effective tax rate for
the year was 21.1%, down from 28.7% last year. This decrease was due primarily to a reduction in the statutory tax rate in Canada, higher tax-exempt income, lower taxes in foreign subsidiaries and reduced future tax adjustments. In addition, the current year’s rate benefitted from the non-taxable acquisition-related gains of $286 million. These items were partially offset by a valuation allowance recorded against a future tax asset related to a loss on disposal of subsidiary operations in a prior year.
Outlook
The Bank’s consolidated effective tax rate is expected to be in the range of 20 to 24% in 2012.
Credit quality
Provision for credit losses
The total provision for credit losses was $1,046 million in 2011, down $193 million or 16% from $1,239 million last year. The total provision for credit losses was net of a reduction of the general provision of $60 million in 2011 and $40 million in 2010 as well as reversal in 2010 of the sectoral provision of $44 million that was established for the automotive sector in 2009.
The total specific provision for credit losses was $1,106 million, a decrease of $217 million or 16% from 2010.
The specific provision for credit losses in Canadian Banking was $590 million, a decrease of $122 million from $712 million last year, with lower retail and commercial provisions. The prior year included a reversal of $7 million of the sectoral allowance specific to the automotive sector.
T10 Impaired loans by business line
| | | | | | | | | | | | | | | | | | | | | | | | | | | | | | | | | | | | |
| | | Net impaired
loans | | | Specific Allowance
for credit losses | | | Gross impaired loans | |
| | | | | | | | | |
| As at October 31 ($ millions) | | 2011 | | | 2010 | | | 2011 | | | 2010 | | | 2011 | | | 2010 | | | 2009 | | | 2008 | | | 2007 | |
Canadian Banking | | | | | | | | | | | | | | | | | | | | | | | | | | | | | | | | | | | | |
Retail | | $ | 374 | | | $ | 424 | | | $ | (452 | ) | | $ | (451 | ) | | $ | 826 | | | $ | 875 | | | $ | 869 | | | $ | 523 | | | $ | 391 | |
Commercial | | | 88 | | | | 184 | | | | (217 | ) | | | (157 | ) | | | 305 | | | | 341 | | | | 302 | | | | 238 | | | | 197 | |
| | | 462 | | | | 608 | | | | (669 | ) | | | (608 | ) | | | 1,131 | | | | 1,216 | | | | 1,171 | | | | 761 | | | | 588 | |
International Banking | | | | | | | | | | | | | | | | | | | | | | | | | | | | | | | | | | | | |
Mexico | | | 61 | | | | 110 | | | | (98 | ) | | | (140 | ) | | | 159 | | | | 250 | | | | 238 | | | | 216 | | | | 188 | |
Caribbean and Central America | | | 1,321 | | | | 1,502 | | | | (287 | ) | | | (188 | ) | | | 1,608 | | | | 1,690 | | | | 931 | | | | 560 | | | | 397 | |
Latin America | | | 546 | | | | 588 | | | | (324 | ) | | | (346 | ) | | | 870 | | | | 934 | | | | 1,015 | | | | 801 | | | | 285 | |
Asia and Europe | | | 2 | | | | 9 | | | | (38 | ) | | | (31 | ) | | | 40 | | | | 40 | | | | 83 | | | | 32 | | | | 27 | |
| | | 1,930 | | | | 2,209 | | | | (747 | ) | | | (705 | ) | | | 2,677 | | | | 2,914 | | | | 2,267 | | | | 1,609 | | | | 897 | |
Global Wealth Management | | | 11 | | | | N/A | | | | (2 | ) | | | N/A | | | | 13 | | | | N/A | | | | N/A | | | | N/A | | | | N/A | |
Scotia Capital | | | | | | | | | | | | | | | | | | | | | | | | | | | | | | | | | | | | |
Canada | | | 39 | | | | 34 | | | | (12 | ) | | | (26 | ) | | | 51 | | | | 60 | | | | 87 | | | | – | | | | 18 | |
United States | | | 115 | | | | 154 | | | | (10 | ) | | | (25 | ) | | | 125 | | | | 179 | | | | 408 | | | | 107 | | | | 11 | |
Europe | | | 66 | | | | 39 | | | | (25 | ) | | | (13 | ) | | | 91 | | | | 52 | | | | 6 | | | | 17 | | | | 30 | |
| | | 220 | | | | 227 | | | | (47 | ) | | | (64 | ) | | | 267 | | | | 291 | | | | 501 | | | | 124 | | | | 59 | |
Gross impaired loans | | | | | | | | | | | | | | | | | | $ | 4,088 | | | $ | 4,421 | | | $ | 3,939 | | | $ | 2,494 | | | $ | 1,544 | |
Specific allowance for credit losses | | | | | | | | | | $ | (1,465 | ) | | $ | (1,377 | ) | | | | | | | | | | $ | (1,376 | ) | | $ | (1,303 | ) | | $ | (943 | ) |
Net impaired loans(1) | | $ | 2,623 | | | $ | 3,044 | | | | | | | | | | | | | | | | | | | $ | 2,563 | | | $ | 1,191 | | | $ | 601 | |
General allowance for credit losses | | | (1,352 | ) | | | (1,410 | ) | | | | | | | | | | | | | | | | | | | (1,450 | ) | | | (1,323 | ) | | | (1,298 | ) |
Sectoral allowance | | | – | | | | – | | | | | | | | | | | | | | | | | | | | (44 | ) | | | – | | | | – | |
Net impaired loans after general and sectoral allowances | | $ | 1,271 | | | $ | 1,634 | | | | | | | | | | | | | | | | | | | $ | 1,069 | | | $ | (132 | ) | | $ | (697 | ) |
Gross impaired loans as a % of total allowance for credit losses and shareholders’ equity(2) | | | 11.3 | % | | | 14.3 | % | | | | | | | | | | | | | | | | | | | 14.0 | % | | | 10.1 | % | | | 7.2 | % |
Net impaired loans(1) as a % of loans and acceptances | | | 0.85 | % | | | 1.04 | % | | | | | | | | | | | | | | | | | | | 0.93 | % | | | 0.40 | % | | | 0.25 | % |
Specific allowance for credit losses as a % of gross impaired loans | | | 36 | % | | | 31 | % | | | | | | | | | | | | | | | | | | | 35 | % | | | 52 | % | | | 61 | % |
| (1) | Net impaired loans after deducting specific allowance for credit losses. |
| (2) | Refer to Note 1 of the Consolidated Financial Statements for the impact of the new accounting standards adopted effective November 1, 2010 on shareholders’ equity. Prior period information has been restated to conform with current period presentation. |
34 2011 Scotiabank Annual Report
MANAGEMENT’S DISCUSSION AND ANALYSIS | GROUP FINANCIAL PERFORMANCE
T11 Specific provisions for credit losses by business line
| | | | | | | | | | | | | | | | | | | | |
| | | | | |
For the fiscal years
($ millions) | | 2011 | | | 2010 | | | 2009 | | | 2008 | | | 2007 | |
Canadian Banking | | | | | | | | | | | | | | | | | | | | |
Retail(1) | | $ | 466 | | | $ | 573 | | | $ | 542 | | | $ | 316 | | | $ | 274 | |
Commercial | | | 124 | | | | 139 | | | | 151 | | | | 83 | | | | 21 | |
| | | 590 | | | | 712 | | | | 693 | | | | 399 | | | | 295 | |
International Banking | | | | | | | | | | | | | | | | | | | | |
Mexico | | | 137 | | | | 168 | | | | 185 | | | | 141 | | | | 68 | |
Caribbean and Central America(1) | | | 202 | | | | 243 | | | | 149 | | | | 89 | | | | 48 | |
Latin America | | | 142 | | | | 193 | | | | 202 | | | | – | | | | (11 | ) |
Asia and Europe | | | 4 | | | | 12 | | | | 40 | | | | 6 | | | | (4 | ) |
| | | 485 | | | | 616 | | | | 576 | | | | 236 | | | | 101 | |
Global Wealth Management(1) | | | 2 | | | | 1 | | | | 3 | | | | N/A | | | | N/A | |
Scotia Capital | | | | | | | | | | | | | | | | | | | | |
Canada | | | 27 | | | | (1 | ) | | | 109 | | | | (11 | ) | | | – | |
United States | | | (13 | ) | | | (13 | ) | | | 192 | | | | 16 | | | | (91 | ) |
Europe | | | 15 | | | | 8 | | | | – | | | | (10 | ) | | | (10 | ) |
| | | 29 | | | | (6 | ) | | | 301 | | | | (5 | ) | | | (101 | ) |
Total | | $ | 1,106 | | | $ | 1,323 | | | $ | 1,573 | | | $ | 630 | | | $ | 295 | |
| (1) | 2009 and 2010 amounts have been restated for changes in business line structure effective 2011. |
T12 Provisions for credit losses as a percentage of average loans and acceptances
| | | | | | | | | | | | | | | | | | | | |
| | | | | |
| For the fiscal years (%) | | 2011 | | | 2010 | | | 2009 | | | 2008 | | | 2007 | |
Canadian Banking(1) | | | | | | | | | | | | | | | | | | | | |
Retail | | | 0.25 | % | | | 0.33 | % | | | 0.34 | % | | | 0.22 | % | | | 0.22 | % |
Commercial | | | 0.49 | | | | 0.58 | | | | 0.61 | | | | 0.31 | | | | 0.09 | |
| | | 0.28 | | | | 0.36 | | | | 0.37 | | | | 0.23 | | | | 0.19 | |
International Banking(1) | | | | | | | | | | | | | | | | | | | | |
Retail | | | 1.88 | | | | 2.17 | | | | 2.34 | | | | 1.74 | | | | 1.13 | |
Commercial | | | 0.03 | | | | 0.30 | | | | 0.13 | | | | (0.24 | ) | | | (0.25 | ) |
| | | 0.72 | | | | 1.00 | | | | 0.90 | | | | 0.44 | | | | 0.25 | |
Scotia Capital(2) | | | 0.10 | | | | (0.02 | ) | | | 0.60 | | | | (0.01 | ) | | | (0.33 | ) |
Weighted subtotal – specific provisions | | | 0.38 | | | | 0.48 | | | | 0.54 | | | | 0.24 | | | | 0.13 | |
General and sectoral provisions | | | (0.02 | ) | | | (0.03 | ) | | | 0.06 | | | | – | | | | (0.01 | ) |
Weighted total | | | 0.36 | % | | | 0.45 | % | | | 0.60 | % | | | 0.24 | % | | | 0.12 | % |
| (1) | 2007 and 2008 ratios for Canadian Banking and International Banking have not been restated for changes in business line structure effective 2011. |
| (2) | Corporate Banking only. |
T13 Net charge-offs(1) as a percentage of average loans and acceptances
| | | | | | | | | | | | | | | | | | | | |
| | | | | |
| For the fiscal years (%) | | 2011 | | | 2010 | | | 2009 | | | 2008 | | | 2007 | |
Canadian Banking(2) | | | | | | | | | | | | | | | | | | | | |
Retail | | | 0.24 | % | | | 0.31 | % | | | 0.28 | % | | | 0.20 | % | | | 0.20 | % |
Commercial | | | 0.23 | | | | 0.61 | | | | 0.52 | | | | 0.23 | | | | 0.25 | |
| | | 0.24 | | | | 0.34 | | | | 0.31 | | | | 0.20 | | | | 0.21 | |
International Banking(2) | | | | | | | | | | | | | | | | | | | | |
Retail | | | 1.61 | | | | 2.21 | | | | 2.52 | | | | 1.54 | | | | 1.14 | |
Commercial | | | 0.07 | | | | 0.36 | | | | 0.09 | | | | – | | | | 0.15 | |
| | | 0.64 | | | | 1.06 | | | | 0.94 | | | | 0.53 | | | | 0.51 | |
Scotia Capital(3) | | | 0.13 | | | | (0.01 | ) | | | 0.53 | | | | 0.03 | | | | (0.05 | ) |
Weighted total | | | 0.34 | % | | | 0.49 | % | | | 0.49 | % | | | 0.24 | % | | | 0.23 | % |
| (1) | Write-offs net of recoveries. |
| (2) | 2007 and 2008 ratios for Canadian Banking and International Banking have not been restated for changes in business line structure effective 2011. |
| (3) | Corporate Banking only. |
The specific provision for credit losses in International Banking was $485 million in 2011, a decrease of $131 million from $616 million last year. The lower provisions were primarily attributable to commercial portfolios in the Caribbean and Peru, and lower retail provisions in Mexico and Chile, partially offset by higher retail provisions in the Caribbean.
The provision for credit losses in Global Wealth Management was $2 million in 2011, an increase of $1 million from last year.
The specific provision for credit losses for Scotia Capital was $29 million in 2011, versus a net recovery of $6 million in 2010. The specific provisions this year were primarily in Canada and Europe, somewhat offset by net recoveries in the United States. The prior year included a $37 million reversal of the sectoral allowance.
Allowance for credit losses
The total allowance for credit losses increased to $2,825 million as at October 31, 2011 from $2,796 million last year. The $29 million increment was attributable primarily to the $88 million increase in the specific allowance, partially offset by $58 million reduction in the general allowance during the year.
Specific allowances in Canadian Banking increased by $61 million, primarily in the commercial portfolios, where new provisions exceeded loan write-offs.
In International Banking, specific allowances increased by $42 million to $747 million, mainly in the Caribbean, Peru and Other Latin America regions, partially offset by decrease in Mexico, Chile and Central America.
Scotia Capital’s specific allowances declined to $47 million from $64 million, with a decline in the United States and Canadian portfolios, offsetting increases in the European portfolio.
The general allowance for credit losses decreased by $58 million in 2011 due to improved credit quality. This compared to a decrease of $40 million in 2010.
Impaired loans
Gross impaired loans decreased to $4,088 million as at October 31, 2011 from $4,421 million last year.
Impaired loans in Canadian Banking fell by $85 million, attributable to retail and commercial portfolios.
In International Banking, impaired loans decreased by $237 million largely due to declines in the Caribbean, Chile, Peru, Central America, and Mexico’s commercial portfolio.
In Global Wealth Management impaired loans increased to $13 million due to minor new formations in Canadian and International portfolios.
Scotia Capital’s impaired loans decreased by $24 million, attributable primarily to the United States and Canadian portfolios, partially offset by increases in impaired loans in the European portfolio.
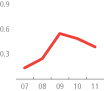
Net impaired loans, after deducting the specific allowance for credit losses, were $2,623 million as at October 31, 2011, a decrease of $421 million from a year ago.
As shown in Chart 13, net impaired loans as a percentage of loans and acceptances were 0.85% as at October 31, 2011, an improvement from 1.04% a year ago.
Scotiabank Annual Report 2011 35
MANAGEMENT’S DISCUSSION AND ANALYSIS
C12 Credit losses
specific provisions as a % of average loans & acceptances
C13Net impaired loan ratio
as a % of loans & acceptances, as at October 31
C14Gross impaired loans
as a % of equity & allowances for credit losses
C15Low delinquency in Canadian retail portfolio
delinquent loans as a % of total loans
Portfolio review
Canadian Banking
The overall credit quality of the consumer portfolio in Canada improved year over year. Reportable delinquency decreased 16 basis points to 1.43%. The specific provisions for credit losses in the Canadian retail portfolio were $466 million, down $107 million or 19% from last year. The specific provisions for credit losses as a percentage of average loans was 0.25%, compared to 0.33% last year.
Gross impaired loans in the retail portfolio improved from 2010, decreasing by 6% or $49 million. Portfolio quality continued to benefit from high secured lending, with 92% of total retail loans being secured by an underlying asset such as a house or an automobile. This high level of secured lending reflects the growth in Scotia Total Equity Plan, where all products, including lines of credit and credit cards, are secured by residential real estate. Currently, 63% of the ScotiaLine line of credit and ScotiaLine VISA portfolios are secured.
The specific provision for credit losses in the Canadian commercial loan portfolio was $124 million, down $15 million or 11% from last year. Gross impaired loans decreased by $36 million to $305 million.
International Banking
Retail credit quality stabilized in most regions with the exception of the Caribbean, where economic conditions remained weak. In retail, gross impaired loans increased by $7 million to $1,582 million during the year with an increase attributable to Caribbean, Peru and Central America. The growth was partially offset by decreases in Mexico and Chile.
The specific provision for credit losses in the retail portfolio declined to $471 million from $502 million last year, with lower provisions in Mexico, Chile and Peru, partially offset by higher provisions in the Caribbean and Central America. Total reported delinquency improved year over year, primarily related to Mexico, and to a lesser extent in Peru and Chile.
In commercial banking, gross impaired loans were $1,095 million, a decrease of $244 million over the prior year, with declines in all areas except certain Latin American countries.
The specific provision for credit losses in the commercial portfolio was $14 million in 2011 versus $114 million in 2010. The decrease was attributable to lower provisions in all areas except certain Latin American countries and Mexico. The specific provisions for credit losses as a percentage of average loans was 0.03% compared to 0.30% last year.
Global Wealth Management
Global Wealth Management overall credit quality was strong in 2011. The specific provision for credit losses was $2 million in the Canadian portfolio. Gross impaired loans of $13 million due to minor new formations in Canadian and International portfolios.
Scotia Capital
The specific provision for credit losses was $29 million in 2011, versus a net recovery of $6 million in 2010. The specific provisions this year were primarily in Canada and Europe, somewhat offset by net recoveries in the United States. The prior year benefited from a $37 million reversal of the sectoral allowance specific to the automotive sector.
Gross impaired loans in Scotia Capital declined by $24 million in 2011 to $267 million. Most of the decline was attributable to the United States portfolio, where impaired loans decreased by $54 million year over year to $125 million. Impaired loans in the Canadian portfolio declined by $9 million to $51 million, while impaired loans in the Europe portfolio increased by $39 million to $91 million.
Risk diversification
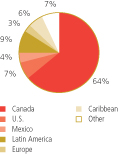
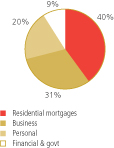
The Bank’s exposures to various countries and types of borrowers are well diversified. (See Charts 16 and 17; Tables 39 and 44 on pages 91 and 93). Chart 16 shows loans and acceptances by geography. Ontario represents the largest Canadian exposure, at 35% of the total. Latin America has 9% of the total exposure and the United States has 7%.
Chart 17 shows loans and acceptances by type of borrower. Excluding loans to households, the largest industry exposures were in financial services, 7.2%; wholesale and retail, 3.7%, and real estate, 3.5%.
36 2011 Scotiabank Annual Report
MANAGEMENT’S DISCUSSION AND ANALYSIS | GROUP FINANCIAL PERFORMANCE
Sovereign credit risk
As a result of the Bank’s broad international operations, the Bank has sovereign credit risk exposure to a number of countries. The Bank actively manages this sovereign risk, including the use of risk limits calibrated to the credit worthiness of the sovereign exposure.
European Exposures – Greece, Ireland, Italy, Portugal, Spain
The Bank’s exposure to certain European countries that have come under recent focus – Greece, Ireland, Italy, Portugal and Spain (GIIPS) – is not significant. As at October 31, 2011, the Bank’s funded exposure to the GIIPS sovereign entities, as well as banks and non-bank financial institutions and corporations domiciled in these countries, totaled approximately $2.15 billion. The Bank believes that these exposures are manageable. The current funded exposure is provided below:
As at October 31, 2011 ($ millions)
| | | | | | | | | | | | | | | | |
| Country | | Sovereign | | | Bank | | | Corporate(1) | | | Current Funded Exposures(2) | |
Greece | | $ | – | | | $ | – | | | $ | 340 | | | $ | 340 | |
Ireland | | | 114 | | | | 46 | | | | 25 | | | | 185 | |
Italy | | | – | | | | 976 | | | | 66 | | | | 1,042 | |
Portugal | | | – | | | | 103 | | | | – | | | | 103 | |
Spain | | | – | | | | 113 | | | | 367 | | | | 480 | |
Total | | $ | 114 | | | $ | 1,238 | | | $ | 798 | | | $ | 2,150 | (3) |
| (1) | Corporate includes financial institutions that are not banks. |
| (2) | Risk exposures exclude trading securities. |
| (3) | The majority of the funded credit exposure is in the form of funded loans which are recorded on an accrual basis. Funded credit exposures related to derivatives, repurchase agreements, and securities lending and borrowing transactions are reported net of collateral. |
The Bank does not use credit default swaps (CDS) as a risk mitigation technique to reduce its sovereign exposures. With respect to banks and non-bank financial institutions and corporations, the Bank may on occasion use CDS to partially offset its exposures. As at October 31, 2011, the Bank had CDS protection on the funded exposure on only one account, a Spanish corporation.
As at October 31, 2011, the Bank’s only direct sovereign exposure is to Ireland in the amount of $114 million in the form of central bank deposits arising from regulatory reserves requirements to support the Bank’s operations in Ireland. The Bank had exposures to Italian banks of $976 million, primarily related to short-term precious metals trading and lending activities.
Total unfunded commitments were $375 million as follows:
As at October 31, 2011 ($ millions)
| | | | | | | | | | | | |
| Country | | Bank | | | Corporate | | | Unfunded Commitments(1) | |
Greece | | $ | – | | | $ | 76 | | | $ | 76 | |
Ireland | | | – | | | | 43 | | | | 43 | |
Italy | | | 18 | | | | 33 | | | | 51 | |
Portugal | | | 2 | | | | – | | | | 2 | |
Spain | | | 53 | | | | 150 | | | | 203 | |
Total | | $ | 73 | | | $ | 302 | | | $ | 375 | |
| (1) | There are no unfunded commitments to sovereigns. |
The Bank’s net trading securities exposure is not significant. The Bank’s exposure for trading securities is on a fair value basis. As at October 31, 2011 the Bank was net long sovereign securities of Italy ($50 million), Spain ($31 million); and the Bank had no sovereign
securities holdings of Greece or Portugal. The Bank was net short Irish sovereign securities of $55 million. With respect to bank bonds held in the trading portfolio, the Bank held $69 million of Irish bank securities.
Like other banks, Scotiabank also provides settlement and clearing facilities for a variety of clients in these countries and actively monitors and manages these intra-day exposures. However, Scotiabank has no funded exposure in these countries to retail customers or small businesses.
Other European Exposures
In addition to the specific European countries mentioned above, the Bank also has funded credit exposures to sovereign entities, banks (including those that are systemically important) and non-bank financial institutions and corporations domiciled in other European countries. Below is the funded credit exposures related to other European countries. The Bank believes that these exposures are manageable.
C16Well diversified in Canada and internationally…
loans and acceptances, September 2011
C17 … and in household and business lending
loans & acceptances
Scotiabank Annual Report 2011 37
MANAGEMENT’S DISCUSSION AND ANALYSIS
As at October 31, 2011 ($ millions)
| | | | | | | | | | | | | | | | |
| | | | |
| Country | | Sovereign | | | Bank | | | Corporate | | | Total(1) | |
United Kingdom(2) | | $ | 1,202 | | | $ | 2,483 | | | $ | 2,845 | | | $ | 6,530 | |
Germany | | | 417 | | | | 1,161 | | | | 1,231 | | | | 2,809 | |
France | | | 248 | | | | 690 | | | | 570 | | | | 1,508 | |
Netherlands | | | 179 | | | | 741 | | | | 458 | | | | 1,378 | |
Switzerland | | | – | | | | 626 | | | | 703 | | | | 1,329 | |
Other(3) | | | 186 | | | | 342 | | | | 1,097 | | | | 1,625 | |
Total | | $ | 2,232 | | | $ | 6,043 | | | $ | 6,904 | | | $ | 15,179 | |
| (1) | Risk exposures exclude trading securities. |
| (2) | Sovereign exposure includes $844 million in short-term deposits with the Bank of England. Bank exposure includes $898 million in short-term deposits with banks. |
| (3) | Remaining European exposure is distributed across 15 countries, each of which has a net exposure below $1 billion as at October 31, 2011. |
Total unfunded loan commitments to corporations in the above-noted countries was $4.3 billion as at October 31, 2011. As well, as part of its lending activities to its corporate customers, the Bank may issue letters of credit on behalf of other banks in a syndicated bank lending arrangement. As at October 31, 2011, these unfunded commitments amounted to $3.4 billion.
The Bank had trading securities of $1.1 billion of certain European sovereigns and banks, predominately related to issuers in the United Kingdom, Germany and France. Substantially all holdings have strong market liquidity.
Risk mitigation
To mitigate exposures in its performing corporate portfolios, the Bank uses loan sales and credit derivatives. In 2011, loan sales totaled $412 million, compared to $192 million in 2010. The largest volume of loans sales in 2011 related to loans in the mining industry.
At October 31, 2011, credit derivatives used to mitigate exposures in the portfolios totaled $92 million (notional amount), compared to $61 million at October 31, 2010.
The Bank actively monitors industry and country concentrations. As is the case with all industry exposures, the Bank continues to closely follow developing trends and takes additional steps to mitigate risk as warranted. Forestry, gaming, hotels, media and shipping are being closely managed, along with the Caribbean hospitality portfolio in light of a relatively weak tourism recovery.
Outlook
The Bank’s balance sheet will remain strong reflecting the absence of any significant troubled assets from the previous crisis and low exposures to areas of concern. Overall, the Bank’s loan loss ratio is expected to stay relatively stable in 2012, unless global economies weaken significantly and affect the Bank’s more insulated markets. The provision for credit losses is expected to increase in line with portfolio growth.
Fourth quarter review
Q4 2011 vs Q4 2010
Net income
Net income was $1,240 million in the fourth quarter, an increase of $125 million or 11% from the same quarter last year. The increase mainly reflected the contributions of acquisitions, growth in earning assets, and stronger securitization revenues. These were offset in part by the negative impact of foreign currency translation and decreased trading revenues due to weaker market conditions.
Total revenue
Total revenue (on a taxable equivalent basis) was $4,420 million, an increase of $408 million or 10% from the same period last year, or $465 million or 12% excluding the negative impact of foreign currency translation. The year-over-year growth reflected higher net interest income from growth in earning assets, and increased other income from the contribution of recent acquisitions, higher securitization revenues and growth in brokerage commissions, despite lower trading revenues.
Net interest income
Net interest income (on a taxable equivalent basis) was a record $2,472 million, an increase of $159 million or 7% from the same quarter last year. This increase was entirely from growth in earning assets of $57 billion as the margin narrowed. Residential mortgages were up and business and government lending grew significantly. There was also growth in deposits with banks and securities.
The Bank’s net interest margin was 1.63% in the fourth quarter, a reduction of 12 basis points compared to the same quarter last year. The main drivers of this decrease were higher volumes of low-spread deposits with banks, growth in non-earning assets and slightly lower gains from changes in the fair value of instruments used for asset/liability management purposes.
Other income
Other income was $1,948 million in the fourth quarter, an increase of $249 million or 15% from the same quarter last year from the contribution of acquisitions and growth in client-driven transactions. Excluding acquisitions, there were increases in securitization revenues from higher volumes, negative goodwill related to a recent acquisition, growth in brokerage commissions, mutual fund fees and credit and acceptance fees. In addition, card revenues and deposit and payment service fees were higher, primarily in Canadian Banking. Trading revenues were significantly lower in both fixed income and institutional equity but were partly offset by stronger precious metals revenues.
Provision for credit losses
The provision for credit losses was $272 million in the fourth quarter, comprised of $302 million in specific provisions and a $30 million reduction in the general allowance. The total provision increased by $18 million from the same period last year, reflecting higher provisions in International Banking and Scotia Capital, partially offset by a decline in provisions in Canadian Banking.
The specific provision for credit losses was $135 million in Canadian Banking, down from $172 million in the same quarter last year. The decrease was due mainly to lower retail provisions in the consumer automotive portfolio and personal lines of credit and improvements in commercial portfolios.
38 2011 Scotiabank Annual Report
MANAGEMENT’S DISCUSSION AND ANALYSIS | GROUP FINANCIAL PERFORMANCE
The provision for credit losses in International Banking was $152 million this quarter, compared to $128 million in the same period last year. The increase was due mainly to higher commercial provisions in the Caribbean and in Chile, which benefited from recoveries last year. Retail provisions were in line with the same period last year.
The provision for credit losses in Global Wealth Management was $1 million this quarter due to new provisions in Canada, compared to $2 million in the same period last year.
Scotia Capital had specific provisions of $14 million this quarter, compared to net recoveries of $8 million in the fourth quarter of last year. The specific provisions in the current quarter were primarily related to higher provisions in Canada, the United States, and one corporate account in Europe.
Total net impaired loans, after deducting the allowance for specific credit losses, were $2,623 million as at October 31, 2011, a decrease of $421 million from a year ago.
The general allowance for credit losses was $1,352 million as at October 31, 2011, a decrease of $58 million from last year, reflecting a $60 million reduction in the general allowance and an increase of $2 million due to acquisitions.
Non-interest expenses and productivity
Non-interest expenses were $2,519 million in the fourth quarter, an increase of $336 million or 15% over the same quarter last year, notwithstanding a favourable impact of $28 million from foreign currency translation. Acquisitions accounted for $201 million of the growth in non-interest expenses. The increase was due mainly to higher salaries and benefits from annual pay increases, additional staff for business expansion, an increase in pension costs, and higher performance-based compensation. As well, premises and technology expenses rose, reflecting ongoing growth initiatives. Partially offsetting this were declines in stock-based compensation and capital taxes.
The productivity ratio was 57.0% in the fourth quarter, up from 54.4% in the same quarter last year.
Provision for income taxes
The Bank’s effective tax rate was 20.3%, compared to 25.9% reported in the same period last year. The decrease was due primarily to a reduction in the statutory tax rate in Canada, higher tax-exempt income and lower taxes in foreign subsidiaries. These items were partially offset by a valuation allowance recorded against a future tax asset related to a loss on disposal of subsidiary operations in a prior year.
Q4 2011 vs Q3 2011
Net income
Net income was $1,240 million this quarter, down 4% compared to $1,285 million in the previous quarter. This quarter included a seasonal increase in operating expenses and an increase in the provision for credit losses. These were offset in part by higher interest income as a result of growth in earning assets and strong securitization revenues.
Total revenue
Total revenue (on a taxable equivalent basis) was $4,420 million, an increase of $47 million or 1% from the previous quarter. There was a positive impact of $10 million from foreign currency translation. Net interest income was higher as a result of growth in earning assets. Other income was up slightly from the previous quarter as stronger securitization revenues and the contribution from acquisitions was partly offset by a decline in net gains on securities and lower trading revenues.
Net interest income
Net interest income (on a taxable equivalent basis) was $2,472 million, an increase of $41 million or 2%. This increase was entirely from growth in earning assets of $12 billion as the margin narrowed from the previous quarter. Business and government lending grew in both International Banking and Scotia Capital, and residential mortgages were the main area of growth in Canadian Banking.
The Bank’s net interest margin narrowed by 4 basis points to 1.63%. The decrease was driven by higher volumes of non-earning assets and low-spread deposits with banks, as well as narrower spreads in Chile and Mexico. These items were partly offset by higher gains from changes in the fair value of instruments used for asset/liability management purposes, and lower wholesale long-term funding costs.
Other income
Other income of $1,948 million in the fourth quarter was up $6 million from the prior quarter. The increase was mainly from stronger securitization revenues due to higher volumes and wider spreads, the recognition of negative goodwill related to a recent acquisition, the contribution from an acquisition in Uruguay and higher card revenues. These were partly offset by lower net gains on securities, reduced underwriting and advisory fees, and a decline in investment management and trust fees and mutual fund fees. While trading revenues declined in institutional equity, they were partly offset by an improvement in fixed income.
Provision for credit losses
The provision for credit losses of $272 million for the fourth quarter was up $29 million from last quarter. Quarter-over-quarter changes in provisions were mixed, with increases in International Banking and Scotia Capital, partially offset by lower provisions in Canadian Banking.
The specific provision for credit losses of $135 million in Canadian Banking was down from $145 million in the previous quarter, due primarily to lower provisions in the commercial portfolio, partially offset by higher provisions in retail lending.
The provision for credit losses in International Banking was $152 million this quarter, compared to $120 million last quarter. The increase was due primarily to higher commercial provisions and retail provisions in the Caribbean and Peru, somewhat offset by lower retail provisions in Mexico.
The provision for credit losses in Global Wealth Management increased by $1 million due to new provisions in Canada. There were no provisions in the prior quarter.
Scotia Capital had specific provisions of $14 million this quarter, compared to $8 million in the previous quarter, with higher provisions in the United States and Europe, the latter due to one corporate account, partially offset by lower provisions in Canada.
Total net impaired loans, after deducting the allowance for specific credit losses, were $2,623 million as at October 31, 2011, a decrease of $148 million from last quarter.
The general allowance for credit losses was $1,352 million as at October 31, 2011, down $30 million from last quarter, due primarily to lower estimates of inherent losses.
Non-interest expenses and productivity
Quarter over quarter, non-interest expenses were up $138 million or 6%, due mainly to the acquisition in Uruguay and higher levels of investment in customer-focused initiatives, reflected in increased advertising, business development, technology and professional expenses.
Scotiabank Annual Report 2011 39
MANAGEMENT’S DISCUSSION AND ANALYSIS
The productivity ratio was 57.0% in the fourth quarter, a 250 basis point increase from the prior quarter.
Provision for income taxes
The Bank’s effective tax rate was 20.3%, compared to 23.3% last quarter. This decrease was due primarily to lower taxes in foreign subsidiaries and higher tax-exempt income, partially offset by a valuation allowance recorded against the future tax asset related to a loss on disposal of subsidiary operations in a prior year.
Summary of Quarterly Results
The Bank reported four quarters of solid performance during a time of challenging markets and slow global economic growth. The Canadian dollar reached par and remained strong throughout the year. This had an overall negative impact on whole year results.
Net interest income rose progressively throughout the year, falling slightly in the second quarter mainly from fewer days in the quarter. Average loan volumes rose in each quarter of the year, with larger increases in the third and fourth quarter.
The Bank’s net interest margin declined during 2011. The first quarter was consistent with the high rate achieved in the fourth quarter of 2010, but it subsequently decreased in the following quarters. Canadian Banking’s margin decreased throughout the year as customers moved to lower-yielding variable rate products. The margin in International Banking was impacted by changes in the fair value of financial instruments during the year, declining in the first quarter, widening in the second quarter and then falling for the remainder of the year. Spreads in Scotia Capital’s corporate lending portfolios peaked in the first quarter, and then declined modestly over the balance of the year.
Other income reached record levels in 2011 from the impact of acquisitions and a strong second quarter. Credit fees rose strongly in the last half of the year as did card revenues. Volatile financial markets and economic uncertainty led to a declining trend in trading revenues and lower returns from fixed income and equity trading. The level of net gains on securities was affected by the timing of write-downs on available-for-sale securities and changes in the fair value of financial instruments. Securitization revenues varied due to the volume of securitizations.
Loan losses trended lower during the first three quarters of the year before moving higher in the fourth quarter. This year’s performance was an improvement from the prior year, reflecting signs of recovery in the first half of the year, followed by challenges in some markets in the latter half.
Non-interest expenses steadily increased over 2011 in large part reflecting the effect of acquisitions this year. The remaining increases were mainly from growth initiatives, and project spending.
The effective tax rate ranged between 24% and 18% reflecting different levels of income earned in lower tax jurisdictions and changes in the valuation of future tax assets.
An eight quarter trend in net income and other selected information is provided on page 99.
40 2011 Scotiabank Annual Report
MANAGEMENT’S DISCUSSION AND ANALYSIS | GROUP FINANCIAL CONDITION
GROUP FINANCIAL CONDITION
C18 Loan portfolio
loans & acceptances, $ billions, as at October 31

C19Deposits
$ billions, as at October 31
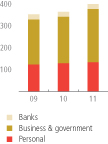
Balance sheet
Assets
The Bank’s total assets at October 31, 2011 were $575 billion, up $49 billion from last year. Excluding the negative impact of foreign currency translation total assets rose $54 billion or 10%.
Cash resources grew by $8 billion, due to increases in interest bearing deposits with banks and precious metals.
Securities purchased under resale agreements increased by $7 billion in line with expansion of the fixed income business in Scotia Capital.
Securities
Total securities were up $3 billion from October 31, 2010. Excluding the negative impact of foreign currency translation total securities increased by $4 billion.
Available-for-sale securities increased by $5 billion due mainly to increased holdings of NHA mortgage-backed securities related to the mortgages securitized and retained by the Bank, and foreign government debt. This growth was partially offset by a decrease in other debt.
Trading securities decreased $1 billion due to reductions in holdings of Canadian government debt, partially offset by increased holdings of equities.
Equity accounted investments decreased $160 million due primarily to the acquisition of the remaining shares of DundeeWealth.
As at October 31, 2011, the unrealized gain on available-for-sale securities, after the impact of qualifying hedges is taken into account, was $1,028 million, a decrease of $161 million from October 31, 2010. The change was due mainly to decreases in the values of foreign government debt, corporate bonds and equities as a result of weaker capital markets.
Loans
The Bank’s loan portfolio increased $14 billion from last year, or $17 billion or 6% excluding the negative impact of foreign currency translation.
Business and government loans increased $12 billion due mainly to growth in Latin America, including new acquisitions in Uruguay and Brazil, and growth in Asia and ScotiaMocatta from increased volumes and gold prices.
In retail lending, residential mortgages increased $3 billion.
Liabilities
Total liabilities were $542 billion as at October 31, 2011, up $43 billion from last year. Excluding the negative impact of foreign currency translation, total liabilities rose $49 billion or 10%.
T14 Condensed balance sheet
| | | | | | | | | | | | | | | | | | | | |
| | | | | |
| As at October 31 ($ billions) | | 2011 | | | 2010 | | | 2009 | | | 2008 | | | 2007 | |
Assets | | | | | | | | | | | | | | | | | | | | |
Cash resources | | $ | 54.5 | | | $ | 46.0 | | | $ | 43.3 | | | $ | 37.3 | | | $ | 29.2 | |
Securities | | | 119.9 | | | | 116.6 | | | | 117.3 | | | | 88.0 | | | | 88.8 | |
Securities purchased under resale agreements | | | 34.6 | | | | 27.9 | | | | 17.8 | | | | 19.5 | | | | 22.5 | |
Loans | | | 298.7 | | | | 284.2 | | | | 266.3 | | | | 288.7 | | | | 227.2 | |
Other | | | 67.6 | | | | 52.0 | | | | 51.8 | | | | 74.1 | | | | 43.8 | |
Total assets | | $ | 575.3 | | | $ | 526.7 | | | $ | 496.5 | | | $ | 507.6 | | | $ | 411.5 | |
| | | | | |
Liabilities and shareholders’ equity | | | | | | | | | | | | | | | | | | | | |
Deposits | | $ | 396.4 | | | $ | 361.7 | | | $ | 350.4 | | | $ | 346.6 | | | $ | 288.5 | |
Obligations related to securities sold under repurchase agreements | | | 46.1 | | | | 40.3 | | | | 36.6 | | | | 36.5 | | | | 28.1 | |
Other liabilities | | | 93.5 | | | | 90.1 | | | | 77.8 | | | | 97.5 | | | | 73.4 | |
Subordinated debentures | | | 5.9 | | | | 5.9 | | | | 5.9 | | | | 4.4 | | | | 1.7 | |
Capital instrument liabilities | | | – | | | | 0.5 | | | | 0.5 | | | | 0.5 | | | | 0.5 | |
Total liabilities | | | 541.9 | | | | 498.5 | | | | 471.2 | | | | 485.5 | | | | 392.2 | |
Shareholders’ equity(1) | | | 33.4 | | | | 28.2 | | | | 25.3 | | | | 22.1 | | | | 19.3 | |
Total liabilities and shareholders’ equity | | $ | 575.3 | | | $ | 526.7 | | | $ | 496.5 | | | $ | 507.6 | | | $ | 411.5 | |
| (1) | Includes non-controlling interests of $0.6 billion in 2010 and 2011, and $0.5 billion in 2007, 2008 and 2009. Refer to Note 1 of the Consolidated Financial Statements for the impact of the new accounting standards adopted effective November 1, 2010. |
Scotiabank Annual Report 2011 41
MANAGEMENT’S DISCUSSION AND ANALYSIS
Deposits
Total deposits increased by $35 billion, net of foreign currency translation of $4 billion. Business and government deposits grew by $31 billion, mainly in the United States. Personal deposits increased by $4 billion, primarily from growth in high interest savings accounts in Canada and the new acquisition in Uruguay. Deposits by banks decreased $1 billion.
Other Liabilities
Obligations related to securities sold under repurchase agreements grew by $6 billion. Derivative instrument liabilities increased by $9 billion, which was similar to the increase in derivative instrument assets. Partially offsetting this growth was a $6 billion decrease in obligations related to securities sold short.
Shareholders’ equity
Total shareholders’ equity increased $5,190 million from last year. The increase was driven by internal capital generation of $2,759 million, the issuance of common shares of $1.8 billion and preferred shares of $409 million for the purchase of DundeeWealth, as well as $783 million common shares issued through the Dividend Reinvestment Plan and the exercise of options. Partially offsetting this growth was an increase of $667 million in accumulated other comprehensive loss. This arose from a $654 million increase in unrealized foreign exchanges losses from the strengthening of the Canadian dollar and a reduction of the unrealized gains on available-for-sale securities, partially offset by an improvement in the unrealized losses on cash flow hedges.
Outlook
Moderate asset and deposits growth is expected in the business lines in 2012 as the Bank benefits from its diversified footprint. This reflects uneven economic growth globally, particularly in the developed economies.
Capital management
Overview
Scotiabank is committed to maintaining a solid capital base to support the risks associated with its diversified businesses. Strong capital levels contribute to safety for the Bank’s customers, foster investor confidence and support strong credit ratings. It also allows the Bank to take advantage of growth opportunities as they arise and enhance shareholder returns through increased dividends or share repurchases.
The Bank’s capital management framework includes a comprehensive internal capital adequacy assessment process (ICAAP), aimed at ensuring that the Bank’s capital is adequate to meet current and future risks and achieve its strategic objectives. Key components of the Bank’s ICAAP include sound corporate governance; creating a comprehensive risk appetite of the Bank; managing and monitoring capital, both currently and prospectively; and utilizing appropriate financial metrics which relate risk to capital, including economic and regulatory capital measures.
Governance and oversight
The Bank has a sound capital management framework to measure, deploy and monitor its available capital and assess its adequacy. Capital is managed in accordance with the Board-approved Capital Management Policy. In addition, the Board reviews and approves the Bank’s annual capital plan. The Liability Committee and senior executive management provide governance over the capital management process. The Bank’s Finance, Treasury and Global Risk Management groups take a coordinated approach to implementing the Bank’s capital plan.
Risk appetite
The risk appetite framework that establishes enterprise wide risk tolerances in addition to capital targets is detailed in the Risk Management section “Risk appetite framework” on page 65. The framework encompasses medium to long-term targets with respect to regulatory capital thresholds, earnings, economic capital and other risk-based parameters. These targets ensure the Bank achieves the following overall objectives: exceed regulatory and internal capital targets, manage capital levels commensurate with the risk profile of the Bank, maintain strong credit ratings and provide the Bank’s shareholders with acceptable returns.
C20 Tier 1 capital
%, as at October 31
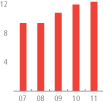
C21 Tangible common equity
%, as at October 31
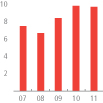
C22Dividend growth
dollars per share
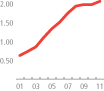
C23 Internally generated capital
$ billions, for years ended October 31
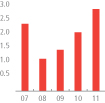
C24Total economic capital by business line
as at October 31, 2011
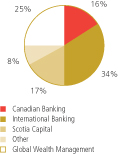
42 2011 Scotiabank Annual Report
MANAGEMENT’S DISCUSSION AND ANALYSIS | GROUP FINANCIAL CONDITION
Managing and monitoring capital
Capital is managed and monitored based on planned changes in the Bank’s strategy, identified changes in its operating environment or changes in its risk profile.
As part of the Bank’s comprehensive ICAAP, sources and uses of capital are continuously measured and monitored through financial metrics, including regulatory thresholds, economic capital and tangible common equity. In addition, the Bank assesses its capital adequacy in the context of its current position and in relation to its expected future risk profile and position. The capital adequacy assessment considers the impact of various stress scenarios on the Bank’s current and future capital position. Specific scenarios are selected based on the current economic conditions and business events facing the Bank. In addition, the Bank’s forward looking capital adequacy assessment includes consideration of the results of enterprise-wide stress testing. This testing is used to determine the extent to which severe, but plausible events, impact the Bank’s capital. These results are used in capital planning and strategic decision-making.
The Bank has a comprehensive risk management framework to ensure that the risks taken while conducting its business activities are consistent with its risk appetite, and that there is an appropriate balance between risk and return. Refer to the Risk Management section on page 63 for further discussions on the Bank’s risk management framework.
In managing the Bank’s capital base, close attention is paid to the cost and availability of the various types of capital, desired leverage, changes in the balance sheet and risk-weighted assets, and the opportunities to profitably deploy capital. The amount of capital required for the business risks being assumed, and to meet regulatory requirements, is always balanced against the goal of generating an appropriate return for the Bank’s shareholders.
Capital generation
Capital is generated through net earnings after dividend payments, refer to Chart 23 for an illustration. This is augmented by the issuance of common shares, preferred shares, Tier 1 innovative instruments and Tier 2 subordinated debentures.
Capital utilization
The Bank deploys capital to support sustainable, long-term revenue and net income growth. The growth can be through existing businesses by attracting new customers, increasing cross-selling activities to existing customers, adding new products and enhancing sales productivity, or through acquisitions. All major initiatives to deploy capital are subject to rigorous analysis, validation of business case assumptions and evaluation of expected benefits. Key criteria include impact on earnings per share, capital ratios, return on invested capital, expected payback period and internal rate of return based on discounted cash flows. Any potential acquisitions, investments or strategic initiatives are reviewed and approved by the Bank’s Strategic Transaction Investment Committee, to ensure effective deployment of capital.
Regulatory capital
Capital adequacy for Canadian banks is regulated by the Canadian regulator, the Office of the Superintendent of Financial Institutions Canada (OSFI). These standards are consistent with international standards set by the Bank for International Settlements (BIS).
Bank regulatory capital consists primarily of two components – Tier 1 capital and Tier 2 capital. Both components of capital provide support for banking operations and protect depositors. Tier 1 capital, which is more permanent, is of particular importance to regulators, financial markets and investors. Tier 1 capital consists primarily of common shareholders’ equity (excluding unrealized gains and losses on available-for-sale debt securities and cash flow hedges), non-cumulative preferred shares, innovative Tier 1 instruments and non-controlling interests less various capital deductions. Tier 2 capital consists mainly of subordinated debentures and the eligible allowances for credit losses less prescribed capital deductions.
Capital ratios are a means to monitor the capital adequacy and the financial strength of banks. The two primary regulatory capital ratios, Tier 1 and Total, are determined by dividing capital components by risk-weighted assets.
Regulatory capital and risk-weighted assets are determined in accordance with the capital framework based on the International Convergence of Capital Measurement and Capital Standards, commonly known as Basel II. Under this framework, the computation of risk-weighted assets aligns risk weight parameters with the individual risk profile of banks. Risk-weighted assets are calculated for credit, market and operational risks.
| • | | Credit Risk: There are two main methods for computing credit risk: a standardized approach, which uses prescribed risk weights; and internal ratings-based approaches, which allow the use of a bank’s internal models to calculate some, or all, of the key inputs into the regulatory capital calculation. Users of the Advanced Internal Ratings Based Approach (AIRB) are required to demonstrate that they have sophisticated risk management systems for the calculation of credit risk regulatory capital and obtain OSFI approval for the use of this approach. The Bank applies the AIRB approach for material Canadian, U.S. and European portfolios and since November 1, 2010 for a significant portion of international corporate and commercial portfolios. The bank applies the standardized approach for all other portfolios. The Bank is assessing the remaining portfolios for application of AIRB in the future. |
| • | | Market Risk: The Bank uses both internal models and standardized approaches to calculate market risk capital. |
| • | | Operational Risk: the Bank uses the Standardized Approach to calculate operational risk capital requirements. |
The Basel II capital framework took effect on November 1, 2007. Capital floors are in place for those applying the AIRB approach and these minimum capital floors are based on a percentage of capital required under the previous capital framework, Basel I.
Tier 1 capital
Tier 1 capital rose to $28.5 billion, an increase of $3.2 billion over last year primarily due to:
| • | | growth in retained earnings of $2.7 billion; |
| • | | common share and preferred share issuances of $1.8 and $0.4 billion as partial consideration for the purchase of DundeeWealth; |
| • | | capital issuance of $0.8 billion through the Dividend Reinvestment Plan and employee option plans |
Scotiabank Annual Report 2011 43
MANAGEMENT’S DISCUSSION AND ANALYSIS
T15 Regulatory capital(1)
| | | | | | | | | | | | | | | | | | | | | | |
As at October 31 ($ millions) | | Basel II | | | | | Basel I | |
| | 2011 | | | 2010 | | | 2009 | | | 2008 | | | | | 2007 | |
Tier 1 capital | | | | | | | | | | | | | | | | | | | | | | |
Common shareholders’ equity(2) | | $ | 27,932 | | | $ | 23,199 | | | $ | 20,945 | | | $ | 20,197 | | | | | $ | 16,477 | |
Innovative capital instruments | | | 2,900 | | | | 3,400 | | | | 3,400 | | | | 2,750 | | | | | | 2,750 | |
Non-cumulative preferred shares | | | 4,384 | | | | 3,975 | | | | 3,710 | | | | 2,860 | | | | | | 1,635 | |
Non-controlling interest in subsidiaries | | | 640 | | | | 579 | | | | 554 | | | | 502 | | | | | | 497 | |
Less: Goodwill | | | (4,377 | ) | | | (3,050 | ) | | | (2,908 | ) | | | (2,273 | ) | | | | | (1,134 | ) |
Other capital items(3) | | | (2,990 | ) | | | (2,769 | ) | | | (2,051 | ) | | | (773 | ) | | | | | – | |
| | | 28,489 | | | | 25,334 | | | | 23,650 | | | | 23,263 | | | | | | 20,225 | |
Tier 2 capital | | | | | | | | | | | | | | | | | | | | | | |
Subordinated debentures(4) | | | 5,723 | | | | 5,790 | | | | 5,833 | | | | 4,227 | | | | | | 1,452 | |
Trust subordinated notes | | | 1,000 | | | | 1,000 | | | | 1,000 | | | | 1,000 | | | | | | 1,000 | |
Eligible amounts of general allowance(5) | | | 353 | | | | 574 | | | | 570 | | | | 534 | | | | | | 1,298 | |
Net unrealized equity gains(6) | | | 152 | | | | 176 | | | | 6 | | | | – | | | | | | 298 | |
| | | 7,228 | | | | 7,540 | | | | 7,409 | | | | 5,761 | | | | | | 4,048 | |
Less: other capital deductions(7) | | | (3,184 | ) | | | (3,275 | ) | | | (2,471 | ) | | | (1,177 | ) | | | | | (1,292 | ) |
Total capital | | $ | 32,533 | | | $ | 29,599 | | | $ | 28,588 | | | $ | 27,847 | | | | | $ | 22,981 | |
| | | | | | |
Risk-weighted assets(1)($ billions) | | | | | | | | | | | | | | | | | | | | | | |
Credit risk | | | 200.8 | | | | 180.5 | | | | 187.8 | | | | 214.5 | | | | | | 208.3 | |
Market risk | | | 5.9 | | | | 10.5 | | | | 11.4 | | | | 15.5 | | | | | | 10.0 | |
Operational risk | | | 27.3 | | | | 24.0 | | | | 22.4 | | | | 20.6 | | | | | | – | |
Total risk-weighted assets | | $ | 234.0 | | | $ | 215.0 | | | $ | 221.6 | | | $ | 250.6 | | | | | $ | 218.3 | |
| | | | | | |
Capital ratios(1) | | | | | | | | | | | | | | | | | | | | | | |
Tier 1 capital ratio | | | 12.2 | % | | | 11.8 | % | | | 10.7 | % | | | 9.3 | % | | | | | 9.3 | % |
Total capital ratio | | | 13.9 | % | | | 13.8 | % | | | 12.9 | % | | | 11.1 | % | | | | | 10.5 | % |
Assets-to-capital multiple | | | 16.6 | | | | 17.0 | | | | 16.6 | | | | 18.0 | | | | | | 18.2 | |
| (1) | Effective November 1, 2007, regulatory capital, risk weighted assets and capital ratios are determined in accordance with Basel II rules. Comparative amounts for prior periods are determined in accordance with Basel I rules. |
| (2) | Effective November 1, 2007, balance excludes unrealized gains and losses on available-for-sale securities and cash flow hedges. |
| (3) | Comprised of net after-tax losses on available-for-sale equity securities, 50/50 deduction of certain investments in associated corporations, non-qualifying intangibles and other items. |
| (5) | Under Basel I, the general allowance is included in Tier 2 capital up to a maximum of 0.875% of risk-weighted assets as per OSFI guidelines. Under Basel II, eligible general allowances in excess of expected losses for advanced internal ratings based exposures and the allocated portion for standardized exposures can be included in capital, subject to certain limitations. |
| (6) | Net unrealized gains (after-tax) on available-for-sale equity securities. |
| (7) | Comprised of investments in insurance entities, 50/50 deduction of certain investments in associated corporations and other items. |
T16 Changes in regulatory capital(1)
| | | | | | | | | | | | | | | | | | | | | | |
For the fiscal years ($ millions) | | Basel II | | | | | Basel I | |
| | 2011 | | | 2010 | | | 2009 | | | 2008 | | | | | 2007 | |
Total capital, beginning of year | | $ | 29,599 | | | $ | 28,588 | | | $ | 27,847 | | | $ | 22,981 | | | | | $ | 22,986 | |
Internally generated capital | | | | | | | | | | | | | | | | | | | | | | |
Net income attributable to equity holders of the Bank | | | 5,175 | | | | 4,239 | | | | 3,547 | | | | 3,140 | | | | | | 4,045 | |
Preferred and common share dividends | | | (2,416 | ) | | | (2,224 | ) | | | (2,176 | ) | | | (2,003 | ) | | | | | (1,771 | ) |
| | | 2,759 | | | | 2,015 | | | | 1,371 | | | | 1,137 | | | | | | 2,274 | |
External financing | | | | | | | | | | | | | | | | | | | | | | |
Subordinated debentures(2) | | | (67 | ) | | | (43 | ) | | | 1,606 | | | | 2,775 | | | | | | (594 | ) |
Trust subordinated notes | | | – | | | | – | | | | – | | | | – | | | | | | 1,000 | |
Preferred shares | | | 409 | | | | 265 | | | | 850 | | | | 1,225 | | | | | | 1,035 | |
Innovative capital instruments | | | (500 | ) | | | – | | | | 650 | | | | – | | | | | | (250 | ) |
Common shares and contributed surplus | | | 2,657 | | | | 829 | | | | 1,117 | | | | 263 | | | | | | 141 | |
Purchase of shares – premium on redemption | | | – | | | | – | | | | – | | | | (37 | ) | | | | | (586 | ) |
| | | 2,499 | | | | 1,051 | | | | 4,223 | | | | 4,226 | | | | | | 746 | |
Other | | | | | | | | | | | | | | | | | | | | | | |
Net after-tax unrealized gains/losses on available-for-sale equity securities | | | (24 | ) | | | 170 | | | | 201 | | | | (493 | ) | | | | | 298 | |
Net unrealized foreign exchange translation gains (losses) | | | (654 | ) | | | (590 | ) | | | (1,736 | ) | | | 2,368 | | | | | | (2,228 | ) |
Non-controlling interest in subsidiaries | | | 61 | | | | 24 | | | | 52 | | | | 5 | | | | | | 62 | |
Other(3) | | | (1,707 | ) | | | (1,659 | ) | | | (3,370 | ) | | | (2,377 | ) | | | | | (1,157 | ) |
| | | (2,324 | ) | | | (2,055 | ) | | | (4,853 | ) | | | (497 | ) | | | | | (3,025 | ) |
Total capital generated (used) | | | 2,934 | | | | 1,011 | | | | 741 | | | | 4,866 | | | | | | (5 | ) |
Total capital, end of year | | $ | 32,533 | | | $ | 29,599 | | | $ | 28,588 | | | $ | 27,847 | | | | | $ | 22,981 | |
| (1) | Effective November 1, 2007, regulatory capital determined in accordance with Basel II rules. Comparative amounts for prior periods are determined in accordance with Basel I rules. |
| (3) | Represents changes to eligible general allowance, regulatory capital deductions for goodwill, non-qualifying intangibles, investments in insurance entities and associated corporations, securitization-related amounts, and other charges (credits) to retained earnings. |
44 2011 Scotiabank Annual Report
MANAGEMENT’S DISCUSSION AND ANALYSIS | GROUP FINANCIAL CONDITION
These were partially offset by:
| • | | capital deductions of $1.6 billion, largely relating to goodwill and intangibles from the Bank’s increased investment in DundeeWealth; |
| • | | an increase in cumulative unrealized foreign currency translation losses of $0.7 billion, net of hedges and related taxes, due to the strengthening of the Canadian dollar; and |
| • | | redemptions of innovative capital instruments of $0.5 billion. |
Over the past five years, the Bank’s level of internal capital generation has been consistently strong. The Bank has generated $9.6 billion of internal capital, notwithstanding an increase in dividends of 48% during this period.
Tier 2 capital
Tier 2 capital decreased by $0.2 billion to $4.0 billion in 2011,due mainly to reductions in the eligible general allowance resulting from the implementation of the AIRB approach in certain international non-retail portfolios.
Risk-weighted assets
Risk-weighted assets increased by $19 billion over the prior year to $234 billion. This increase was due primarilyto underlying volume growth in business and retail loans and off balance sheet commitments.
Regulatory capital ratios
In 2011, both of the Bank’s regulatory capital ratios remained strong as a result of prudent capital management and consistently solid earnings. Tier 1 and Total capital ratios as at year end were 12.2% and 13.9%. These ratios continued to be well in excess of OSFI’s minimum capital ratios of 7% and 10% and were strong by international standards.
In addition to the regulatory capital ratios, banks are also subject to a maximum leverage test, the assets to capital multiple (ACM) as established by OSFI. The ACM is calculated by dividing a bank’s total assets, including specified off-balance sheet items, such as direct credit substitutes and performance letters of credit, by its total capital. As at October 31, 2011 the Bank’s ACM of 16.6:1 was within the regulatory maximum thresholds.
T17 Selected capital management activity
| | | | | | | | | | | | |
| | | |
| For the fiscal years ($ millions) | | 2011 | | | 2010 | | | 2009 | |
Dividends | | | | | | | | | | | | |
Common | | $ | 2,200 | | | $ | 2,023 | | | $ | 1,990 | |
Preferred | | | 216 | | | | 201 | | | | 186 | |
Common shares issued(1)(2) | | | 2,586 | | | | 804 | | | | 1,117 | |
Preferred shares issued(3) | | | 409 | | | | 265 | | | | 850 | |
Subordinated debentures issued(4) | | | – | | | | – | | | | 2,000 | |
Repurchase and redemption of subordinated debentures(4) | | | – | | | | (11 | ) | | | (359 | ) |
Issuance/(redemption) of trust subordinated notes and trust securities(5) | | | (500 | ) | | | – | | | | 650 | |
| (1) | Represents primarily cash received for stock options exercised during the year, common shares issued pursuant to the Dividend and Share Purchase Plan and shares issued for acquisitions. |
| (2) | For further details, refer to Note 15 of the Consolidated Financial Statements. |
| (3) | For further details, refer to Note 14 of the Consolidated Financial Statements. |
| (4) | For further details, refer to Note 12 of the Consolidated Financial Statements. |
| (5) | For further details, refer to Note 13 of the Consolidated Financial Statements. |
Tangible common equity ratio
Tangible common equity (TCE) is generally considered to be an important measure of a bank’s capital strength, and is often used by rating agencies and investors in their assessment of the quality of a bank’s capital position. At year end, the Bank’s TCE ratio continued to be strong at 9.6%.
Economic capital
Economic capital is a measure of the unexpected losses inherent in the Bank’s business activities. Economic capital is also a key metric in the Bank’s ICAAP. The calculation of Economic Capital relies on models that are subject to objective vetting and validation as required by the Bank’s Model Risk Management Policy. Management assesses its risk profile to determine those risks for which the Bank should attribute economic capital. The major risk categories included in economic capital are:
| • | | Credit risk which measures the risk that a borrower or counterparty will fail to honour its financial or contractual obligations to the Bank. Measurement is based on the Bank’s internal credit risk ratings for derivatives, corporate or commercial loans, and credit scoring for retail loans. It is also based on the Bank’s actual experience with recoveries and takes into account differences in term to maturity, probabilities of default, expected severity of loss in the event of default, and the diversification benefits of certain portfolios. |
| • | | Market risk which is the risk of loss from changes in market prices including interest rates, credit spreads, equity prices, foreign exchange rates, and commodity prices, the correlations among them, and their levels of volatility. Exposure is measured based on the internal VaR models used in the trading book; the VaR on the Bank’s structural interest rate risk, structural foreign exchange risk, and equity market risk; and embedded options risk. |
| • | | Operational risk which is the risk of loss, whether direct or indirect, to which the Bank is exposed due to external events, human error, or the inadequacy or failure of processes, procedures, systems or controls. Measurement is based on the distribution of the Bank’s actual losses, supplemented with external loss data where needed. |
| • | | Other risk includes additional risks for which Economic Capital is attributed, such as business risk, goodwill, significant investments, insurance risk and real estate risk. |
The Bank uses its Economic Capital framework to attribute capital to the business lines, refer to non-GAAP measures, page 29. Chart 24 shows the attribution of economic capital by business line which allows the Bank to appropriately compare and measure the returns from the business lines, based upon their inherent risk. For further discussion on risk management and details on credit, market and operational risks, refer to the Risk Management section.
Scotiabank Annual Report 2011 45
MANAGEMENT’S DISCUSSION AND ANALYSIS
Share data and other capital instruments
The Bank’s common and preferred share data, as well as other capital instruments, are shown in Table 18. Further details, including exchangeability features, are discussed in Notes 12, 13, 14 and 15 of the Consolidated Financial Statements.
| | | | | | | | | | | | | | | | |
T18 Shares and other capital instruments As at October 31, 2011 Share data | | Amount
($ millions) | | | Dividend | | | Coupon (%) | | | Number
outstanding
(000s) | |
Common shares(1) | | $ | 8,336 | | | $ | 0.52 | | | | – | | | | 1,088,972 | |
Preferred shares | | | | | | | | | | | | | | | | |
Preferred shares Series 12(2) | | $ | 300 | | | $ | 0.328125 | | | | 5.25 | % | | | 12,000 | |
Preferred shares Series 13(2) | | | 300 | | | | 0.300000 | | | | 4.80 | | | | 12,000 | |
Preferred shares Series 14(2) | | | 345 | | | | 0.281250 | | | | 4.50 | | | | 13,800 | |
Preferred shares Series 15(2) | | | 345 | | | | 0.281250 | | | | 4.50 | | | | 13,800 | |
Preferred shares Series 16(2) | | | 345 | | | | 0.328125 | | | | 5.25 | | | | 13,800 | |
Preferred shares Series 17(2) | | | 230 | | | | 0.350000 | | | | 5.60 | | | | 9,200 | |
Preferred shares Series 18(2)(3)(4) | | | 345 | | | | 0.312500 | | | | 5.00 | | | | 13,800 | |
Preferred shares Series 20(2)(3)(5) | | | 350 | | | | 0.312500 | | | | 5.00 | | | | 14,000 | |
Preferred shares Series 22(2)(3)(6) | | | 300 | | | | 0.312500 | | | | 5.00 | | | | 12,000 | |
Preferred shares Series 24(2)(3)(7) | | | 250 | | | | 0.390600 | | | | 6.25 | | | | 10,000 | |
Preferred shares Series 26(2)(3)(8) | | | 325 | | | | 0.390625 | | | | 6.25 | | | | 13,000 | |
Preferred shares Series 28(2)(3)(9) | | | 275 | | | | 0.390625 | | | | 6.25 | | | | 11,000 | |
Preferred shares Series 30(2)(3)(10) | | | 265 | | | | 0.240625 | | | | 3.85 | | | | 10,600 | |
Preferred shares Series 32(2)(11) | | | 409 | | | | 0.231250 | | | | 3.70 | | | | 16,346 | |
| | | | |
| Trust securities | | Amount
($ millions) | | | Distribution | | | Yield (%) | | | Number
outstanding
(000s) | |
Scotiabank Trust Securities – Series 2002-1 issued by Scotiabank Capital Trust(12)(13) | | $ | 750 | | | $ | 33.13 | | | | 6.626 | % | | | 750 | |
Scotiabank Trust Securities – Series 2003-1 issued by Scotiabank Capital Trust(12)(13) | | | 750 | | | | 31.41 | | | | 6.282 | | | | 750 | |
Scotiabank Trust Securities – Series 2006-1 issued by Scotiabank Capital Trust(12)(13) | | | 750 | | | | 28.25 | | | | 5.650 | | | | 750 | |
Scotiabank Tier 1 Securities – Series 2009-1 issued by Scotiabank Tier 1 Trust(12)(13) | | | 650 | | | | 39.01 | | | | 7.802 | | | | 650 | |
| | | | |
| Trust subordinated notes | | | | | Amount
($ millions) | | | Interest
rate (%) | | | Number
outstanding
(000s) | |
Scotiabank Trust Subordinated Notes – Series A
issued by Scotiabank Subordinated Notes Trust(13)(14) | | | | | | $ | 1,000 | | | | 5.25 | % | | | 1,000 | |
| | | | |
| Options | | | | | | | | | | | Number
outstanding
(000s) | |
Outstanding options granted under the Stock Option Plans to purchase common shares(1)(15) | | | | | | | | | | | | 22,446 | |
| (1) | Dividends on common shares are paid quarterly. As at November 18, 2011, the number of outstanding common shares and options was 1,089,037 thousand and 22,367 thousand, respectively. This includes 31 million common shares issued on February 1, 2011 as consideration for the acquisition of DundeeWealth Inc. and 1,293 thousand options in respect of DundeeWealth Inc.’s stock option plans. |
| (2) | These shares are entitled to non-cumulative preferential cash dividends payable quarterly. |
| (3) | These preferred shares have conversion features (refer to Note 14 of the Consolidated Financial Statements for further details). |
| (4) | Dividends, if and when declared, are for the initial five-year period ending on April 25, 2013. Subsequent to the initial five-year fixed rate period, and resetting every five years thereafter, the dividends will be determined by the sum of the five-year Government of Canada Yield plus 2.05%, multiplied by $25.00. |
| (5) | Dividends, if and when declared, are for the initial five-year period ending on October 25, 2013. Subsequent to the initial five-year fixed rate period, and resetting every five years thereafter, the dividends will be determined by the sum of the five-year Government of Canada Yield plus 1.70%, multiplied by $25.00. |
| (6) | Dividends, if and when declared, are for the initial five-year period ending on January 25, 2014. Subsequent to the initial five-year fixed rate period, and resetting every five years thereafter, the dividends will be determined by the sum of the five-year Government of Canada Yield plus 1.88%, multiplied by $25.00. |
| (7) | Dividends, if and when declared, are for the initial five-year period ending on January 25, 2014. Subsequent to the initial five-year fixed rate period, and resetting every five years thereafter, the dividends will be determined by the sum of the five-year Government of Canada Yield plus 3.84%, multiplied by $25.00. |
| (8) | Dividends, if and when declared, are for the initial five-year period ending on April 25, 2014. Subsequent to the initial five-year fixed rate period, and resetting every five years thereafter, the dividends will be determined by the sum of the five-year Government of Canada Yield plus 4.14%, multiplied by $25.00. |
| (9) | Dividends, if and when declared, are for the initial five-year period ending on April 25, 2014. Subsequent to the initial five-year fixed rate period, and resetting every five years thereafter, the dividends will be determined by the sum of the five-year Government of Canada Yield plus 4.46%, multiplied by $25.00. |
| (10) | Dividends, if and when declared, are for the initial five-year period ending on April 25, 2015. Subsequent to the initial five-year fixed rate period, and resetting every five years thereafter, the dividends will be determined by the sum of the five-year Government of Canada Yield plus 1.00%, multiplied by $25.00. |
| (11) | Dividends, if and when declared, are for the initial five-year period ending on February 1, 2016. Subsequent to the initial five-year fixed rate period, and resetting every five years thereafter, the dividends will be determined by the sum of the five-year Government of Canada Yield plus 1.34%, multiplied by $25.00. |
| (12) | Each security is entitled to receive non-cumulative fixed cash distributions payable semi-annually (refer to Note 13 of the Consolidated Financial Statements for further details). |
| (13) | Reported in deposits on the Consolidated Balance Sheet. |
| (14) | Holders are entitled to receive interest semi-annually until October 31, 2012 (refer to Note 13 of the Consolidated Financial Statements for further details). |
| (15) | Included are 14,163 thousand stock options with tandem stock appreciation right (SAR) features. |
46 2011 Scotiabank Annual Report
MANAGEMENT’S DISCUSSION AND ANALYSIS | GROUP FINANCIAL CONDITION
Changing Regulatory Landscape
Basel II – Market Risk Amendment
In July 2009, the Basel Committee revised the market risk framework, in response to concerns arising from significant losses in trading books in the industry during 2007-2009. One of the key changes is the introduction of a Stressed Value at Risk (VaR) measure that will lead to an increase in market risk capital. BIS has also introduced an Incremental Risk Charge, to capture default and migration risk in debt portfolios over a one year period, at a 99.9% confidence level. In addition, securitized products in the trading book will receive the same capital charge as in the banking book, unless they are in a correlation trading portfolio that meets a number of conditions. The Bank has assessed the impact of these changes which are discussed on page 70.
Basel III
In December 2010, the Basel Committee on Banking Supervision (BCBS)put forth changes to the regulatory requirements that affect financial institutions. The reforms include a number of changes to the existing capital rules and the introduction of a global liquidity standard. These new global standards, referred to as ‘Basel III’ aim to strengthen the financial system by improving the quality, consistency and transparency of the capital base to better absorb losses and promote a more resilient banking sector.
Basel III requires increased capital requirements, including higher minimum common equity, introduces additional capital buffers and requires all existing and new capital deductions to be taken from common equity. The focus of the new rules is on high quality capital placing greater emphasis on common equity and a more restrictive definition of other qualifying capital instruments.
The BCBS have published the final revised Basel III capital adequacy rules. The key changes in Basel III are:
| • | | Increased capital requirements: |
| | – | | The predominant form of Tier 1 capital must be common shareholders’ equity; |
| | – | | Deductions will be applied at the level of common equity; and |
| | – | | Higher minimum capital requirements. |
| • | | Increased counterparty credit risk capital requirements; |
| • | | Introduction of an internationally harmonized leverage ratio that is an expansion of OSFI’s existing assets-to-capital multiple; and |
| • | | Capital conservation and countercyclical buffers above the regulatory minimum. |
To enable banks to meet the new standards, Basel III contains transitional arrangements commencing January 1, 2013 through January 1, 2019. Transitional requirements result in a phase-in of new deductions to common equity over 5 years, phase-out of nonqualifying capital instruments over 10 years and a phase-in of a capital conservation buffer over 5 years. As of January 2019, the banks will be required to meet new minimum requirements related to risk-weighted assets of: Common Equity Tier 1 ratio of 4.5% plus a capital conservation buffer of 2.5%, collectively 7%. Including the capital conservation buffer, the minimum Tier 1 ratio will be 8.5%, and the Total capital ratio will be 10.5%. The minimum leverage ratio (capital as a ratio of adjusted total assets) will be 3%.
Overall, the Basel III rules will increase regulatory deductions from common equity and result in higher risk-weighted assets for the Bank. Management has performed various analyses and projections and continues to believe that, with the Bank’s proven record of strong internal capital generation and its lower-risk business model, the Bank is well positioned to meet the 2019 Basel III capital requirements early in the implementation period.
However, OSFI expects Canadian Banks to meet the 2019 Basel III capital requirements, including all deductions, by the first quarter of 2013.
Furthermore, on January 13, 2011, additional guidance was issued by the BCBS, with respect to requirements for loss absorbency of capital at the point of non-viability. An Advisory from the Office of Superintendent of Financial Institutions in Canada was issued on August 16, 2011 confirming these requirements as effective on January 1, 2013. These rules affect the eligibility of instruments for inclusion in regulatory capital and provide for a transition and phase-out of these instruments.
All of the Bank’s current non-equity capital instruments do not meet these additional criteria and will be subject to phase-out commencing January 2013. Certain innovative Tier 1 capital instruments issued by the Bank contain regulatory event redemption rights. The Bank has no present intention of invoking any regulatory event redemption features in these capital instruments. However, the Bank reserves the right to redeem, call or repurchase any capital instruments within the terms of each offering at any time in the future.
Dividends
The strong earnings and capital position of the Bank allowed the quarterly dividend to be increased by 3 cents to 52 cents in 2011. Dividends have risen at a compound annual rate of 13% over the past 10 years.
Credit ratings
Credit ratings affect the Bank’s access to capital markets and borrowing costs, as well as the terms on which the Bank can conduct derivatives and hedging transactions and obtain related borrowings. The Bank continues to have strong credit ratings. The current ratings are AA by DBRS, Aa1 by Moody’s and AA- by Standard and Poor’s and Fitch.
Outlook
The Bank will maintain its strong capital position. Capital will continue to be prudently managed to support organic growth initiatives, selective acquisitions and evolving regulatory changes. The Bank remains committed to achieving aBasel III common equity Tier 1 ratio in the range of 7 – 7.5% by the first quarter of 2013.
Off-balance sheet arrangements
In the normal course of business, the Bank enters into contractual arrangements with entities that are not required to be consolidated in its financial statements, but could have a current or future impact on the Bank’s results of operations or financial condition. These arrangements can be classified into the following categories: variable interest entities (VIEs), securitizations, and guarantees and other commitments.
Scotiabank Annual Report 2011 47
MANAGEMENT’S DISCUSSION AND ANALYSIS
Variable interest entities (VIEs)
Off-balance sheet arrangements with VIEs include:
| • | | VIEs that are used to provide a wide range of services to customers, these include: VIEs established to allow clients to securitize their financial assets while facilitating cost-efficient financing, and to provide certain investment opportunities. The Bank creates, administers and manages personal and corporate trusts on behalf of its customers. The Bank also sponsors and actively manages mutual funds. |
| • | | VIEs that are used to provide alternative sources of funding for the Bank and to manage its capital position. The Bank may utilize these VIEs to securitize its own assets, primarily residential mortgages. The Bank may also establish VIEs in order to issue capital instruments that qualify as regulatory capital, such as Scotiabank Trust Securities and Scotiabank Subordinated Trust Notes. |
All VIEs are subject to a rigorous review and approval process to ensure that all relevant risks are properly identified and addressed. For many of the VIEs that are used to provide services to customers, the Bank does not guarantee the performance of the VIE’s underlying assets, and does not absorb any related losses. For other VIEs, such as securitization and investment vehicles, the Bank may be exposed to credit, market, liquidity or operational risks. The Bank earns fees based on the nature of its association with a VIE.
As at October 31, 2011, total consolidated assets related to VIEs were $12.1 billion, compared to $9.2 billion at the end of 2010. The increase is due primarily to additional assets held by the Scotia Covered Bond Trust in support of new issuances of Scotia Covered Bonds.
The Bank earned fees of $46 million and $42 million in 2011 and 2010, respectively, from certain VIEs in which it had a significant variable interest at the end of the year but did not consolidate. More information with respect to the Bank’s involvement with VIEs, including details of liquidity facilities and maximum loss exposure by VIE category is provided below and in Note 6 to the Consolidated Financial Statements on page 130.
There are three primary types of association the Bank has with VIEs:
| • | | Multi-seller conduits sponsored by the Bank, |
| • | | Collateralized debt obligation entities. |
Multi-seller conduits sponsored by the Bank
The Bank sponsors three multi-seller conduits, two of which are Canadian and one is based in the United States. The Bank earned commercial paper issuance fees, program management fees, liquidity
fees and other fees from these multi-seller conduits, which totaled $43 million in 2011, compared to $40 million in 2010.
The multi-seller conduits purchase high-quality financial assets and finance these assets through the issuance of highly rated commercial paper. For assets purchased, there are supporting backstop liquidity facilities that are generally equal to 102% of the assets purchased or committed to be purchased. The primary purpose of the backstop liquidity facility is to provide an alternative source of financing in the event the conduit is unable to access the commercial paper market. The Bank is obliged to purchase an interest in the assets owned by these conduits. The administration agent can require the liquidity provider to perform under its asset purchase agreement in the event the conduit is unable to access the commercial paper market. The Bank is not obliged to purchase assets from the conduits in the event the conduit meets the requirements of an insolvency event.
As further described below, the Bank’s exposure to these off-balance sheet conduits primarily consists of liquidity support, program-wide credit enhancement and temporary holdings of commercial paper. The Bank has a process to monitor these exposures and significant events impacting the conduits to ensure there is no change in the primary beneficiary, which could require the Bank to consolidate the assets and liabilities of the conduits at fair value.
Canada
The Bank’s primary exposure to the Canadian-based conduits is the liquidity support provided, with total liquidity facilities of $2.4 billion as at October 31, 2011 (October 31, 2010 – $1.4 billion). The year-over-year increase was due to growth in client business. As at October 31, 2011, total commercial paper outstanding for the Canadian-based conduits was $1.7 billion (October 31, 2010 – $0.9 billion) and the Bank held less than 0.1% of the total commercial paper issued by these conduits. Table 19 presents a summary of assets purchased and held by the Bank’s two Canadian multi-seller conduits as at October 31, 2011 and 2010, by underlying exposure.
Substantially all of the conduits’ assets have been structured to receive credit enhancements from the sellers, including overcollateralization protection and cash reserve accounts. Approximately 11% of the funded assets were externally rated AAA as at October 31, 2011, with the balance having an equivalent rating of AA- or higher based on the Bank’s internal rating program. There were no non-investment grade assets held in these conduits as at October 31, 2011. All of the funded assets have final maturities falling within three years, and the weighted average repayment period, based on cash flows, approximates one year. There is no exposure to the United States subprime mortgage risk within these two conduits.
T19 Assets held by Scotiabank-sponsored Canadian-based multi-seller conduits
| | | | | | | | | | | | | | | | | | | | | | | | |
| | |
| | | 2011 | | | 2010 | |
| | | | | | |
| As at October 31 ($ millions) | | Funded
assets(1) | | | Unfunded
commitments | | | Total
exposure(2) | | | Funded
assets(1) | | | Unfunded
commitments | | | Total
exposure(2) | |
Auto loans/leases | | $ | 1,318 | | | $ | 539 | | | $ | 1,857 | | | $ | 331 | | | $ | 305 | | | $ | 636 | |
Equipment loans | | | – | | | | – | | | | – | | | | 339 | | | | 7 | | | | 346 | |
Trade receivables | | | 184 | | | | 142 | | | | 326 | | | | 206 | | | | 122 | | | | 328 | |
Canadian residential mortgages | | | 174 | | | | 30 | | | | 204 | | | | 19 | | | | – | | | | 19 | |
Retirement savings plan loans | | | 21 | | | | – | | | | 21 | | | | 49 | | | | 2 | | | | 51 | |
Total(3) | | $ | 1,697 | | | $ | 711 | | | $ | 2,408 | | | $ | 944 | | | $ | 436 | | | $ | 1,380 | |
| (1) | Funded assets are reflected at original cost, which approximates estimated fair value. |
| (2) | Exposure to the Bank is through global-style liquidity facilities and letters of guarantee. |
| (3) | These assets are substantially sourced from Canada. |
48 2011 Scotiabank Annual Report
MANAGEMENT’S DISCUSSION AND ANALYSIS | GROUP FINANCIAL CONDITION
United States
The Bank’s primary exposure to the United States-based conduit is the liquidity support and program-wide credit enhancement provided, with total liquidity facilities of $7.0 billion as at October 31, 2011 (October 31, 2010 – $6.5 billion). The year-over-year increase is due to growth in client business. As at October 31, 2011, total commercial paper outstanding for the United States-based conduit was $3.5 billion (October 31, 2010 – $3.1 billion) of which none was held by the Bank.
A significant portion of the conduit’s assets have been structured to receive credit enhancements from the sellers, including overcollateralization protection and cash reserve accounts. Each asset purchased by the conduit has a deal-specific liquidity facility provided by the Bank in the form of a liquidity asset purchase agreement. This is available to absorb the losses on defaulted assets, if any, in excess of losses absorbed by deal-specific seller credit enhancement, and the subordinated note issued by the conduit. The Bank’s liquidity agreements with the conduit generally call for the Bank to fund full par value of all assets, including defaulted assets, if any, of the conduit.
Table 20 presents a summary of assets purchased and held by the Bank’s United States multi-seller conduit as at October 31, 2011 and 2010, by underlying exposure.
The conduit has investments in two pools of diversified asset-backed securities. The assets underlying these securities are primarily retail loans, including the United States home equity, student loans and residential mortgage-backed securities. A significant portion of these pools are guaranteed by monoline insurers which are rated non-investment grade by the external rating agencies.
As at October 31, 2011, approximately 81% of the conduit’s funded assets were rated A or higher, comprised of external ratings of 19%, and internal ratings based upon the Bank’s rating program of 62%. Substantially all of the assets held in this conduit were rated investment grade as at October 31, 2011. While 78% of the total funded assets have final maturities falling within five years, the weighted average repayment period, based on expected cash flows, approximates 1.1 years.
During fiscal 2011, there were no events that required a reassessment of the primary beneficiary of this conduit.
Funding Vehicles
The Bank uses special purpose entities (SPEs) to facilitate the cost-efficient financing of its operations. The Bank has three such SPEs that
facilitate the issuance of certain regulatory capital instruments of the Bank. These are Scotiabank Capital Trust, Scotiabank Subordinated Notes Trust and Scotiabank Tier 1 Trust. These SPEs are not consolidated on the Bank’s balance sheet, as the Bank is not the primary beneficiary. Scotiabank Trust Securities, Scotiabank Tier 1 Securities and Scotiabank Trust Subordinated Notes issued by the trusts are not reported on the Consolidated Balance Sheet, but qualify as regulatory capital. The deposit notes issued by the Bank to Scotiabank Capital Trust, Scotiabank Subordinated Notes Trust and Scotiabank Tier 1 Trust are reported in deposits. Total deposits recorded by the Bank as at October 31, 2011 from these trusts were $4 billion (October 31, 2010 – $4 billion). The Bank recorded interest expense of $242 million on these deposits in 2011 (2010 – $243 million).
Collateralized debt obligation entities
The Bank holds an interest in VIEs structured to match specific investor requirements. Loans or credit derivatives are held by the VIE to create security offerings for investors that match their investment needs and preferences. The Bank’s maximum exposure to loss from VIEs in which the Bank has a significant variable interest was $53 million as at October 31, 2011 (October 31, 2010 – $23 million) including the credit risk amounts relating to derivative contracts with these VIEs.
Securitizations
The Bank securitizes a portion of its residential mortgages and personal loans by transferring the assets on a serviced basis to trusts. Residential mortgage securitizations are principally conducted through the Bank’s participation in the Canadian Government’s Canada Mortgage Bond (CMB) program. If certain requirements are met, these transfers are treated as sales, and the transferred assets are removed from the Consolidated Balance Sheet which are discussed in Note 1 to the Consolidated Financial Statements on page 120. These securitizations enable the Bank to access alternative and more efficient funding sources, and manage liquidity and other risks. The Bank does not provide liquidity facilities to the CMB program, as such, the Bank is not exposed to significant liquidity risks in connection with these off-balance sheet arrangements.
The outstanding amount of off-balance sheet securitized mortgages was $19.1 billion as at October 31, 2011, compared to $16 billion last year. The increase in activity in 2011 stemmed from ongoing sales through the CMB program similar to last year.
T20 Assets held by Scotiabank-sponsored United States-based multi-seller conduit
| | | | | | | | | | | | | | | | | | | | | | | | |
| | | 2011 | | | 2010 | |
| As at October 31 ($ millions) | | Funded
assets(1) | | | Unfunded
commitments | | | Total
exposure(2) | | | Funded
assets(1) | | | Unfunded
commitments | | | Total
exposure(2) | |
Credit card/consumer receivables | | $ | 22 | | | $ | 29 | | | $ | 51 | | | $ | 22 | | | $ | 45 | | | $ | 67 | |
Auto loans/leases | | | 1,046 | | | | 1,009 | | | | 2,055 | | | | 1,198 | | | | 902 | | | | 2,100 | |
Trade receivables | | | 1,425 | | | | 2,403 | | | | 3,828 | | | | 798 | | | | 2,476 | | | | 3,274 | |
Loans to closed-end mutual funds | | | 359 | | | | 7 | | | | 366 | | | | 367 | | | | 7 | | | | 374 | |
Diversified asset-backed securities | | | 549 | | | | 11 | | | | 560 | | | | 622 | | | | 12 | | | | 634 | |
Corporate loans(3) | | | 85 | | | | 11 | | | | 96 | | | | 69 | | | | 23 | | | | 92 | |
Total(4) | | $ | 3,486 | | | $ | 3,470 | | | $ | 6,956 | | | $ | 3,076 | | | $ | 3,465 | | | $ | 6,541 | |
| (1) | Funded assets are reflected at original cost. The fair value of these assets as at October 31, 2011 was estimated to be $3.3 billion (October 31, 2010 – $2.7 billion). |
| (2) | Exposure to the Bank is through global-style liquidity facilities in the form of liquidity asset purchase agreements. |
| (3) | These assets represent secured loans that are externally rated investment grade. |
| (4) | These assets are sourced from the United States. |
Scotiabank Annual Report 2011 49
MANAGEMENT’S DISCUSSION AND ANALYSIS
The amount of off-balance sheet securitized personal loans was $2 million as at October 31, 2011, compared to $10 million last year.
Subsequent to the transfer of assets, the Bank may retain interests in securities issued by the trusts, may make payments to the trusts under certain limited circumstances, maintains relationships with the underlying customers, and provides administrative services to the trusts. Additional information on the commitments to the trusts is disclosed in Note 24 to the Consolidated Financial Statements on page 150.
The Bank recorded securitization revenues of $236 million in 2011, compared to $124 million in 2010. This increase was due mostly to increased volumes of securitized mortgages this year.
Additional information on the amount of securitizations and associated cash flows, servicing fees and retained interests is provided in Note 4(c) to the Consolidated Financial Statements on pages 127 to 128.
Guarantees and other commitments
Guarantees and other commitments are fee-based products that the Bank provides to its customers. These products can be categorized as follows:
| • | | Standby letters of credit and letters of guarantee. As at October 31, 2011, these amounted to $21.2 billion, compared to $20.5 billion last year. These instruments are issued at the request of a Bank customer to secure the customer’s payment or performance obligations to a third party. The year-over-year increase reflects a general increase in customer activity; |
| • | | Liquidity facilities. These generally provide an alternate source of funding to asset-backed commercial paper conduits in the event a general market disruption prevents the conduits from issuing commercial paper or, in some cases, when certain specified conditions or performance measures are not met. Within liquidity facilities are credit enhancements that the Bank provides, in the form of financial standby letters of credit, to commercial paper conduits sponsored by the Bank. As at October 31, 2011, these credit enhancements amounted to $685 million, compared to $669 million last year. Refer to the discussions under VIEs beginning on page 48; |
| • | | Indemnification contracts. In the ordinary course of business, the Bank enters into many contracts where it may indemnify contract counterparties for certain aspects of its operations that are dependent on other parties’ performance, or if certain events occur. The Bank cannot estimate, in all cases, the maximum potential future amount that may be payable, nor the amount of collateral or assets available under recourse provisions that would mitigate any such payments. Historically, the Bank has not made any significant payments under these indemnities; |
| • | | Loan commitments. The Bank has commitments to extend credit, subject to specific conditions, which represent undertakings to make credit available in the form of loans or other financings for specific amounts and maturities. As at October 31, 2011, these commitments amounted to $108 billion, compared to $104 billion last year. Approximately half of these commitments are short-term in nature, with remaining terms to maturity of less than one year. |
These guarantees and loan commitments may expose the Bank to credit or liquidity risks, and are subject to the Bank’s standard review and approval processes. For the guaranteed products, the dollar amounts represent the maximum risk of loss in the event of a total default by the guaranteed parties, and are stated before any reduction
for recoveries under recourse provisions, insurance policies or collateral held or pledged.
Fees from the Bank’s guarantees and loan commitment arrangements, recorded as credit fees in other income in the Consolidated Statement of Income, were $436 million in 2011, compared to $426 million in the prior year. Detailed information on guarantees and loan commitments is disclosed in Note 24 to the Consolidated Financial Statements on pages 150 to 151.
Financial instruments
Given the nature of the Bank’s main business activities, financial instruments make up a substantial portion of the balance sheet and are integral to the Bank’s business. Assets that are financial instruments include cash resources, securities, securities purchased under resale agreements, loans and customers’ liability under acceptances. Financial instrument liabilities include deposits, acceptances, obligations related to securities sold under repurchase agreements, obligations related to securities sold short, subordinated debentures and capital instrument liabilities. In addition, the Bank uses derivative financial instruments for both trading and non-trading purposes, such as asset/liability management.
During fiscal 2009, the Bank reclassified certain debt securities from available-for-sale securities to loans pursuant to changes in accounting standards for financial instruments. Refer to changes in accounting policies on page 82.
Financial instruments are generally carried at fair value, except for loans and receivables, certain securities and most financial liabilities, which are carried at amortized cost unless designated as held for trading at inception.
Unrealized gains and losses on available-for-sale securities, net of related hedges, as well as gains and losses on derivatives designated as cash flow hedges, are recorded in other comprehensive income. Gains and losses on available-for-sale securities are recorded in the Consolidated Statement of Income when realized and cash flow hedges are recorded when the hedged item affects income.
All changes in the fair value of derivatives are recorded in the Consolidated Statement of Income, other than those designated as cash flow and net investment hedges which flow through other comprehensive income. The Bank’s accounting policies for derivatives and hedging activities are further described in Note 1 to the Consolidated Financial Statements (see page 121).
Interest income and expense on interest-bearing financial instruments are recorded in the Consolidated Statement of Income as part of net interest income. Credit losses resulting from loans are recorded in the provision for credit losses. Net gains and losses on trading securities are recorded in other income – trading revenues. Realized gains and losses and writedowns for other-than-temporary impairment on available-for-sale securities and equity accounted investments are recorded in other income – net gains (losses) on securities, other than trading.
Several risks arise from transacting financial instruments, including credit risk, liquidity risk, operational risk and market risk. Market risk arises from changes in market prices and rates including interest rates, credit spreads, foreign exchange rates, equity prices and commodity prices. The Bank manages these risks using extensive risk management policies and practices, including various Board-approved risk management limits.
A discussion of the Bank’s risk management policies and practices can be found in the Risk Management section on pages 63 to 77. In addition, Note 25 to the Consolidated Financial Statements on
50 2011 Scotiabank Annual Report
MANAGEMENT’S DISCUSSION AND ANALYSIS | GROUP FINANCIAL CONDITION
pages 152 to 159 presents the Bank’s exposure to credit risk, liquidity risk and market risks arising from financial instruments as well as the Bank’s corresponding risk management policies and procedures.
There are various measures that reflect the level of risk associated with the Bank’s portfolio of financial instruments. For example, the interest rate risk arising from the Bank’s financial instruments can be estimated by calculating the impact of a 100 or 200 basis point increase in interest rates on annual income and the economic value of shareholders’ equity, as described on page 72. For trading activities, the table on page 72 discloses the average one-day Value at Risk by risk factor. For derivatives, based on the Bank’s maturity profile of derivative instruments, only 3% (2010 – 10%) had a term to maturity greater than five years.
Note 28 to the Consolidated Financial Statements (see pages 162 to 166) provides details about derivatives used in trading and non-trading activities, including notional amounts, remaining term to maturity, credit risk and fair values.
The fair value of the Bank’s financial instruments is provided in Note 26 to the Consolidated Financial Statements (see pages 160 to 161) along with a description of how these amounts were determined.
The fair value of the Bank’s financial instruments was favorable when compared to their carrying value by $2,317 million as at October 31, 2011 (October 31, 2010 – unfavorable $420 million). This difference relates to loan assets, deposit liabilities, subordinated debentures and capital instrument liabilities. The year-over-year change in the fair value over book value arose mainly from changes in interest rates. Fair value estimates are based on market conditions as at October 31, 2011, and may not be reflective of future fair values. Further information on how fair values are estimated is contained in the section on critical accounting estimates on pages 78 to 82.
Disclosures specific to certain financial instruments designated as held for trading under the fair value option can be found in Note 27 to the Consolidated Financial Statements (see pages 161 to 162). These designations were made primarily to avoid an accounting mismatch between two instruments, or to better reflect how the performance of a specific portfolio is evaluated by the Bank.
Selected credit instruments
Mortgage-backed securities
Non-trading portfolio
Total mortgage-backed securities held as available-for-sale securities represent approximately 4% of the Bank’s total assets as at October 31, 2011 and are shown below in Table 21. Exposure to subprime mortgage risk in the United States is nominal.
Trading portfolio
Total mortgage-backed securities held as trading securities represent less than 0.1% of the Bank’s total assets as at October 31, 2011 and are shown in Table 21.
T21 Mortgage-backed securities
| | | | | | | | | | | | | | | | |
| | |
As at October 31 Carrying value
($ millions) | | 2011 | | | 2010 | |
| | Non-trading
portfolio | | | Trading
portfolio | | | Non-trading
portfolio | | | Trading
portfolio | |
Canadian NHA mortgage-backed securities(1) | | $ | 21,941 | | | $ | 396 | | | $ | 18,370 | | | $ | 416 | |
Commercial mortgage-backed securities | | | 3 | (2) | | | 18 | (3) | | | 10 | (2) | | | 28 | (3) |
Other residential mortgage-backed securities | | | 138 | | | | – | | | | 201 | | | | – | |
Total | | $ | 22,082 | | | $ | 414 | | | $ | 18,581 | | | $ | 444 | |
| (1) | Canada Mortgage and Housing Corporation provides a guarantee of timely payment to NHA mortgage-backed security investors. |
| (2) | The assets underlying the commercial mortgage-backed securities in the non-trading portfolio relate primarily to non-Canadian properties. |
| (3) | The assets underlying the commercial mortgage-backed securities in the trading portfolio relate to Canadian properties. |
Montreal Accord Asset-Backed Commercial Paper (ABCP)
As a result of the Montreal Accord ABCP restructuring in the first quarter of 2009, the Bank received longer-dated securities which were classified as available-for-sale. Approximately 45% of the new notes are A-rated Class A-1 notes and 36% are BBB (low)-rated A-2 notes. The Bank’s carrying value of $167 million represents approximately 74% of par value.
As part of the restructuring, the Bank participated in a margin funding facility, which was recorded as an unfunded loan commitment. The Bank’s portion of the facility is $198 million, it is currently undrawn.
Collateralized debt obligations and collateralized loan obligations
Non-trading portfolio
The Bank has collateralized debt obligation (CDO) and collateralized loan obligation (CLO) investments in its non-trading portfolio. CDOs and CLOs generally achieve their structured credit exposure either synthetically through the use of credit derivatives, or by investing and holding corporate loans or bonds.
Since 2009, cash-based CDOs and CLOs are classified as loans and are carried at amortized cost. These are assessed for impairment like all other loans. Synthetic CDOs and CLOs continue to be classified as available-for-sale securities, with changes in the fair value reflected in net income.
As at October 31, 2011, the carrying value of cash-based CDOs and CLOs reported as loans on the Consolidated Balance Sheet was $867 million (October 31, 2010 – $943 million). The fair value was $637 million (October 31, 2010 – $623 million). None of these cash-based CDOs and CLOs are classified as impaired. Substantially all of the referenced assets of the Bank’s CDOs and CLOs are corporate exposures, without any United States mortgage-backed securities.
The Bank’s remaining exposure to synthetic CDOs and CLOs was $99 million as at October 31, 2011 (October 31, 2010 – $185 million). During the year, the Bank recorded a pre-tax gain of $5 million in net income for changes in fair value of synthetic CDOs and CLOs (2010 – pre-tax gain of $85 million). The change in fair value of the synthetic CDOs and CLOs was mainly driven by the tightening of credit spreads in the prior year and the maturity of certain CDOs in 2011.
Scotiabank Annual Report 2011 51
MANAGEMENT’S DISCUSSION AND ANALYSIS
The aggregate CDO and CLO portfolios are well diversified, with an average individual CDO and CLO holding of $8 million, and no single industry exceeding 12% of the referenced portfolio on a weighted average basis. Based on their carrying values, these CDOs and CLOs have a weighted average rating of A. More than 89% of their investments are senior tranches with subordination of 10% or more, and 5% of the investments are in equity tranches.
Based on positions held at October 31, 2011, a 50 basis point widening of relevant credit spreads would result in a pre-tax decrease of approximately $3 million in net income.
Trading portfolio
The Bank also holds synthetic CDOs in its trading portfolio as a result of structuring and managing transactions with clients and other financial institutions. To hedge its trading exposure, the Bank purchases or sells CDOs to other financial institutions, along with purchasing and/or selling index tranches or single name credit default swaps (CDSs). The main driver of the value of CDOs and CDSs is changes in credit spreads. Total CDOs purchased and sold in the trading portfolio are shown in Table 22 below.
T22 Collateralized debt obligations (CDOs)
Trading portfolio
| | | | | | | | | | | | | | | | |
| | |
| | | 2011 | | | 2010 | |
| | | | |
As at October 31 Outstanding ($ millions) | | Notional
Amount | | | Positive/
(negative)
fair value | | | Notional
Amount | | | Positive/ (negative)
fair value | |
CDOs – sold protection | | $ | 2,460 | | | $ | (564 | ) | | $ | 2,890 | | | $ | (498 | ) |
CDOs – purchased protection | | $ | 2,047 | | | $ | 393 | | | $ | 2,719 | | | $ | 491 | |
The decrease in the notional amounts of the CDO portfolio is mainly due to trades that were unwound with counterparties during the year.The increase in the negative fair value of sold protection CDO’s is due to widening in credit spreads that occurred late in the year. The reduction in the positive fair value of purchased protection is due to the significant decline in the notional amounts. Based on positions held at October 31, 2011, a 50 basis point widening of relevant credit spreads in this portfolio would result in a pre-tax decrease of approximately $9 million in net income.
Over 61% of the Bank’s credit exposure to CDO swap counterparties is to entities which are externally or internally rated investment grade equivalent. The referenced assets underlying the trading book CDOs are substantially all corporate exposures, with no mortgage-backed securities.
Exposure to monoline insurers
The Bank has insignificant direct exposure to monoline insurers. The Bank has indirect exposures of $0.5 billion (October 31, 2010 – $0.9 billion) in the form of monoline guarantees, which provide enhancement to public finance and other transactions, where the Bank has provided credit facilities to either the issuers of securities or facilities which hold such securities. These exposures were primarily composed of $0.4 billion (October 31, 2010 – $0.6 billion) of guarantees by two monolines on a significant portion of the diversified asset-backed securities held by the Bank’s United States multi-seller conduit (as discussed on page 49 in the section on Multi-seller conduits sponsored by the Bank). As at October 31, 2011, the two monoline insurers were rated non-investment grade by the external rating agencies.
Other
As at October 31, 2011, the Bank has insignificant exposure to highly leveraged loans awaiting syndication, auction-rate securities, Alt-A type loans and investments in structured investment vehicles.
52 2011 Scotiabank Annual Report
MANAGEMENT’S DISCUSSION AND ANALYSIS | BUSINESS LINES
BUSINESS LINE OVERVIEW
| | | | | | |
| | | | |
CANADIAN BANKING Canadian Banking had record net income in 2011, earning $1,862 million, an increase of $92 million or 5% over last year. Higher revenues were mainly from solid asset and deposit growth in all businesses, initiative-driven growth in card revenues, and higher Commercial Banking fee income. Partly offsetting was margin pressure due to the low interest rate environment. A significant improvement in the provisions for credit losses was partly offset by a 3% increase in non-interest expenses. | | INTERNATIONAL BANKING International Banking recorded strong earnings in 2011 with net income of $1,485 million, up $328 million or 28% year over year, notwithstanding the strengthening Canadian dollar. Acquisitions in Latin America and Asia along with organic growth and prudent risk management across all regions contributed to positive earnings. Loan volumes increased by 9% year-over-year, and there was a 21% improvement in provisions for credit losses. | | GLOBAL WEALTH MANAGEMENT Global Wealth Management reported net income of $1,218 million, an increase of $402 million or 49% from last year’s earnings due mainly to the acquisition of DundeeWealth. Underlying organic growth in both Insurance and Wealth Management businesses in 2011 was driven by strong sales and growth initiatives. | | SCOTIA CAPITAL Scotia Capital reported net income of $1,184 million in 2011, 12% below last year’s earnings as a result of challenging market conditions, especially in the latter half of the year. Corporate lending spreads increased across all geographies. Loan volumes leveled off toward the end of 2011 after declining in 2010. Partly offsetting were higher provisions for credit losses and an increase in non-interest expenses this year. |
C25 Canadian Banking net income$ millions 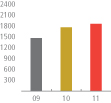
| | C26International Banking net income$ millions 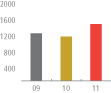
| | C27 Global Wealth Management net income$ millions 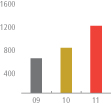
| | C28Scotia Capital net income$ millions 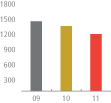
|
T23 2011 financial performance
| | | | | | | | | | | | | | | | | | | | | | | | |
| | | | | | |
| ($ millions) | | Canadian
Banking | | | International
Banking | | | Global Wealth
Management | | | Scotia
Capital | | | Other(1) | | | Total | |
Net interest income(2) | | $ | 4,889 | | | $ | 3,988 | | | $ | 345 | | | $ | 1,066 | | | $ | (1,018 | ) | | $ | 9,270 | |
Other income | | | 1,351 | | | | 1,420 | | | | 2,973 | | | | 1,894 | | | | 380 | | | | 8,018 | |
Provision for credit losses | | | 590 | | | | 485 | | | | 2 | | | | 29 | | | | (60 | ) | | | 1,046 | |
Non-interest expenses | | | 3,069 | | | | 3,056 | | | | 1,890 | | | | 1,409 | | | | 140 | | | | 9,564 | |
Income taxes(2) | | | 719 | | | | 382 | | | | 208 | | | | 338 | | | | (237 | ) | | | 1,410 | |
Net income | | $ | 1,862 | | | $ | 1,485 | | | $ | 1,218 | | | $ | 1,184 | | | $ | (481 | ) | | $ | 5,268 | |
Return on equity(3) (%) | | | 37.9 | % | | | 14.4 | % | | | 18.2 | % | | | 21.2 | % | | | N/A | | | | 18.8 | % |
Average earning assets ($ billions)(3) | | $ | 210 | | | $ | 92 | | | $ | 9 | | | $ | 188 | | | $ | 70 | | | $ | 569 | |
| (1) | The Other category represents smaller operating segments, including Group Treasury, and other corporate adjustments that are not allocated to an operating segment. Corporate adjustments include the elimination of the tax-exempt income gross-up reported in net interest income and provision for income taxes, changes in the general allowance, differences in the actual amount of costs incurred and charged to the operating segments, and the impact of securitizations. |
| (2) | Taxable equivalent basis. See non-GAAP measures on page 29. |
| (3) | Non-GAAP measure. Return on equity for the business segments is based on economic equity attributed. See non-GAAP measures on page 29. |
N/A Not applicable
Scotiabank Annual Report 2011 53
MANAGEMENT’S DISCUSSION AND ANALYSIS
Canadian Banking
| | | | |
| | | | |
| | 2011 Achievements • Mobile Banking – Recognizing early that customers want multiple banking options and a seamless customer experience, Canadian Banking launched the Scotiabank Mobile Banking channel to meet these evolving needs. – Key facts: +500,000 customers using mobile banking, +100,000 logins per day, +10 million transactions to-date. It is one of the most rapid adoptions of any new technology in banking. • ScotiaOnline Banking Refresh – The new ScotiaOnline, introduced in November 2011, enables the Bank to deliver a significantly improved customer experience by providing more robust self service capabilities, and ensures that the Bank continues to meet the evolving needs of its customers. There are over 1.5 million power users. • Payment & Product Innovation – The Bank has made significant progress in payment and product innovation, including launching the VISA payWave feature on select VISA credit cards, and becoming the first bank in Canada to launch Interac Flash contactless debit on our ScotiaCards. These enhancements allow customers to make quick and easy every-day purchases. – The newly launchedScotia Momentum VISA Infinite andScotia Moneyback cards provide a strong competitive advantage for Canadian Banking by offering clients money back for everyday use. • Recognized for excellence: – Canadian Customer Contact Centres were recognized asCall Centre of the Year, Call Center World Class Call CertificationandHighest Employee Satisfaction for the Call Centre & Banking Industries, by SQM’s Service Quality Excellence Awards. – The Toronto Customer Contact Centre achieved the prestigiousPlatinumlevelContact Center Employer of Choice® (CCEOC) Certification for 2011. For the third consecutive year, the Centre attained the highest score of any financial institution. – In March 2011, the recently launched Mobile Banking channel was awarded theCelent Model Bank Award. Scotiabank was recognized for its innovative and effective use of technology in banking. | | |
T24 Canadian Banking financial performance
| | | | | | | | | | | | |
| | | |
| ($ millions) | | 2011 | | | 2010(1) | | | 2009(1) | |
Net interest income(2) | | $ | 4,889 | | | $ | 4,919 | | | $ | 4,537 | |
Other income | | | 1,351 | | | | 1,302 | | | | 1,203 | |
Provision for credit losses | | | 590 | | | | 705 | | | | 700 | |
Non-interest expenses | | | 3,069 | | | | 2,974 | | | | 2,892 | |
Income taxes(2) | | | 719 | | | | 772 | | | | 679 | |
Net income | | $ | 1,862 | | | $ | 1,770 | | | $ | 1,469 | |
| | | |
Key ratios | | | | | | | | | | | | |
Return on economic equity | | | 37.9 | % | | | 38.4 | % | | | 31.3 | % |
Productivity(1) | | | 49.2 | % | | | 47.8 | % | | | 50.4 | % |
Net interest margin(1) | | | 2.33 | % | | | 2.49 | % | | | 2.44 | % |
PCL as a percentage of loans and acceptances | | | 0.28 | % | | | 0.36 | % | | | 0.37 | % |
| | | |
Selected balance sheet data (average balances) | | | | | | | | | | | | |
Earning assets | | | 209,637 | | | | 197,549 | | | | 186,068 | |
Deposits | | | 141,265 | | | | 135,849 | | | | 121,322 | |
Economic equity | | | 5,007 | | | | 4,740 | | | | 4,826 | |
| (1) | 2009 and 2010 amounts have been restated for the business line re-organization effective 2011. |
| (2) | Taxable equivalent basis. |
|
Business Profile |
Canadian Banking provides a range of banking and investing services to more than 7.6 million customers across Canada, through a network of 1,030 branches, 3,027 ABMs, as well as internet, mobile and telephone banking, and third party channels. Canadian Banking is comprised of two main businesses: Retail and Small Business Banking, and Commercial Banking. • Retail and Small Business Banking provides financial advice and solutions that include day-to-day banking products, including debit cards, deposit accounts, credit cards, investments, mortgages, loans, and related creditor insurance products to individuals and small businesses. • Commercial Banking delivers advisory services and a full product suite to medium and large businesses, including banking, cash management, and a broad array of lending and deposit services. Strategy Canadian Banking has refined its customer value proposition to become a truly customer-centric organization by delivering advice and solutions, supported by an excellent customer experience. Canadian Banking will significantly improve its competitive position by achieving superior growth across payments and deposits businesses, while sustaining the growth of its other core businesses. Canadian Banking will continue to support Global Wealth Management partners by distributing Global Transaction Banking, Insurance and Wealth Management products. This will be achieved by offering practical advice and solutions tailored to its customers’ financial priorities, supported by an excellent customer experience. 2012 Priorities • Continue to invest in deposits and payments businesses. • Partner with Global Wealth Management to drive revenue growth in mutual funds and ensure that clients’ wealth management needs are being met. • Investments will be made in the following enablers to support the business line’s strategy and customer value proposition: - Optimizing distribution channels to ensure a fully integrated customer experience. - Achieving operational efficiencies through organizational streamlining, process re-engineering, and product/service rationalization. - Building a strong leadership team for the future. - Strengthening MIS infrastructure to better support and manage capital, pricing, risk and customer profitability. |
54 2011 Scotiabank Annual Report
MANAGEMENT’S DISCUSSION AND ANALYSIS | BUSINESS LINES
Financial Performance
Canadian Banking’s net income was $1,862 million in 2011, $92 million or 5% higher than last year. Return on economic equity of 38.0% was in line with 2010.
Assets and liabilities
Average assets before securitization rose $12 billion or 6% year over year. This included substantial growth in residential mortgages (before securitization) of $10 billion or 8% and consumer auto loans of $1 billion or 11%. Average deposits grew $5 billion or 4%, including $3 billion or 18% in high-interest savings deposits and $1 billion or 8% in retail chequing. This growth reflected the ongoing success of the “Let the Saving Begin” campaign as well as innovative deposit and payments solutions launched this year such as the newScotia Moneyback Account (Canada’s first account that pays customers money back with every debit purchase). There was also strong deposit growth in Small Business and Commercial Banking in both current accounts and term deposits.
Revenues
Total revenues were $6,240 million, up $19 million from last year.
Net interest income decreased 1% to $4,889 million. The impact of solid retail volume growth was offset by a decline of 16 basis points in the interest profit margin to 2.33%. The margin decrease was due to higher wholesale funding rates used for transfer pricing, general competitive pressure on spreads and consumer preferences for lower-spread variable-rate mortgages in the current low interest rate environment.
Other income was $1,351 million in 2011, up $49 million or 4%, mainly from higher transaction-based fees, reflecting in part the success of the newScotia Momentum VISA Infinite card, launched this summer, which allows customers to earn more money back than ever before. There were also higher revenues in Small Business Banking and Commercial Banking as a result of programs focused on advisory and referral services, and targeted customer segments.
Retail & Small Business Banking
Total revenues were $4,730 million, up $119 million or 3% from last year. Net interest income rose by $79 million or 2% due mainly to growth in mortgages and deposits. Other income rose $46 million or 5% mainly from solid growth in card revenues of $24 million or 13% and transaction-based deposit fees of $27 million or 5%.
Commercial Banking
Total revenues declined $99 million or 6% to $1,510 million in 2011. The impact of asset growth of $2 billion or 6% was offset by a lower margin, particularly in automotive lending, due to higher wholesale funding costs, consumer preference for variable rate loans and targeted higher credit quality. Year over year, other income was up $9 million or 2% to $416 million mainly in credit fees and card revenues.
Non-interest expenses
Non-Interest Expenses continued to be subject to tight management control, increasing by $95 million or 3% in 2011. This growth was due mainly to the impact of annual merit increases on salaries, higher pension costs and the full year impact of the Harmonized Sales Tax introduced in certain provinces effective July 2010. Higher pension costs arose from changes in actuarial assumptions and plan asset volumes and were partly offset by a gain on the wind up of a subsidiary pension plan this year. Canadian Banking continued to invest in future growth in 2011 with costs related to new card products such asScotia Momentum VISA Infinite andScotia Moneyback, upgrades to our Scotia Online internet service and Scotiabank.com website, substantial increases in mobile banking transactions and new sponsorship relationships with a number of NHL teams, as the Bank’s reach expands as “Canada’s hockey bank”.
Credit quality
The 2011 provision for credit losses was $590 million, down from $705 or 16% from last year, with significant decreases in Retail Banking in consumer auto and lines of credit, and in Commercial Banking. Last year included a reversal of the sectoral allowance of $7 million.
Provision for income taxes
The effective tax rate of 28% declined from 30% last year, due primarily to the reduction in the statutory tax rate in Canada.
Outlook
In 2012, it is expected that asset growth will moderate in Retail Banking but remain relatively strong in Small Business and Commercial Banking. Deposit growth will likely be tempered by continued low interest rates and increasing competition.
Growth in other income will be moderate in 2012. Provisions for credit losses will remain relatively stable in 2012.
C29Canadian Banking total revenue
As at October 31, 2011

C30Total revenue by sub-segment
$ millions
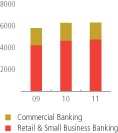
C31 Average loans and acceptances
$ billions
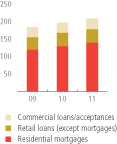
Scotiabank Annual Report 2011 55
MANAGEMENT’S DISCUSSION AND ANALYSIS
International Banking
| | | | |
| | 2011 Achievements | | |
| | • Commercial Banking: – Made significant progress on process re-engineering to improve efficiency and customer satisfaction. – Created a Central America Hub to drive commercial business in the region. • Retail Banking: – Improved distribution productivity and capacity with upgrades to Sales & Service disciplines. – Expanded non-branch channels, especially in award-winning Contact Centres. – Launched an exciting new brand strategy, along with the new tagline “Discover what’s possible”. • Opened 33 new branches, 19 of which were in Peru. • Integrated Siam City Bank with Thanachart Bank in Thailand, in which the Bank has a 49% ownership interest. • Added to the Bank’s presence in China through a 19.99% stake in Bank of Guangzhou, the 29th largest bank in Mainland China (expected to close in the first quarter of 2012). • Expanded the Bank’s presence in Colombia through a 51% interest in Banco Colpatria, Colombia’s 5th largest financial group (closing expected in the first quarter of 2012). • Completed several acquisitions: Pronto! (Uruguay’s 3rd largest consumer finance company); Nuevo Banco Comercial (Uruguay’s 4th largest private bank); Royal Bank of Scotland’s wholesale operations in Chile; and Dresdner Bank Brazil. • Recognized for excellence: – For the second year in a row Scotiabank was named the Best Consumer Internet Bank in 20 Caribbean countries by Global Finance.The Bank was also recognized as the Best Corporate/Institutional Internet Bank in 11 countries by the International Finance magazine. – Scotiabank assisted international agencies in distributing aid to 100,000 Haitians following a devastating earthquake in 2011. These efforts were recognized by three international awards: ¡ 2011 Global Telecoms Business Innovation Award for Consumer Services ¡ Beyond Banking Award by the Inter-American Development Bank ¡ “First to Market Award” from the Bill and Melinda Gates Foundation – Two Contact Centres were recognized this year: Dominican Republic, for the second year in a row, was certified as “World Class Centre” by SQM, and, Jamaica was awarded a Silver Medal for Best Contact Centre in The Americas from Contact Centre World. – Multiple countries were recognized by Global Finance Magazine for Best Consumer Internet Bank. – Scotiabank’s Guangzhou branch was recognized for Best Performance in Foreign Exchange business in China. | | |
T25 International Banking financial performance
| | | | | | | | | | | | |
| | | |
| ($ millions) | | 2011 | | | 2010(1) | | | 2009(1) | |
Net interest income(2) | | $ | 3,988 | | | $ | 3,616 | | | $ | 3,585 | |
Other income | | | 1,420 | | | | 1,323 | | | | 1,182 | |
Provision for credit losses | | | 485 | | | | 616 | | | | 576 | |
Non-interest expenses | | | 3,056 | | | | 2,662 | | | | 2,695 | |
Income taxes(2) | | | 382 | | | | 504 | | | | 256 | |
Net income | | $ | 1,485 | | | $ | 1,157 | | | $ | 1,240 | |
| | | |
Key ratios | | | | | | | | | | | | |
Return on economic equity | | | 14.4 | % | | | 12.5% | | | | 13.5% | |
Productivity(1) | | | 56.5 | % | | | 53.9% | | | | 56.5% | |
Net interest margin(1) | | | 4.33 | % | | | 4.27% | | | | 4.12% | |
PCL as a percentage of loans and acceptances | | | 0.72 | % | | | 1.00% | | | | 0.90% | |
| | | |
Selected balance sheet data (average balances) | | | | | | | | | | | | |
Earning assets | | | 92,196 | | | | 84,648 | | | | 87,013 | |
Deposits | | | 45,320 | | | | 43,464 | | | | 46,999 | |
Economic equity | | | 10,482 | | | | 9,557 | | | | 9,209 | |
| (1) | 2009 and 2010 amounts have been restated for the business line re-organization effective 2011. |
| (2) | Taxable equivalent basis. |
Business Profile
International Banking encompasses Scotiabank’s retail and commercial banking operations in more than 50 countries outside Canada – an international presence unmatched by other Canadian banks. With operations in the Caribbean and Central America, Latin America and Asia, Scotiabank has more than 62,000 employees (including subsidiaries and affiliates) who provide a full range of Personal and Commercial financial services to more than 11.5 million customers through a network of over 2,500 branches and offices, 5,670 ABMs, telephone and Internet banking, in-store banking kiosks, and specialized sales forces.
Strategy
International Banking has a clear strategy, the foundation for which is a focus on driving sustainable and profitable revenue growth. This strategy has three key elements:
| • | | A committment to the Personal & Commercial footprint that is being built in the Americas and Asia, which features stronger economic growth than developed countries, attractive demographics and increasing demand for financial services. |
| • | | Growth will be balanced appropriately between organic initiatives and selective acquisitions. |
| • | | A committment to strong partnerships internally to fully leverage the Bank’s international network and to maximize customer satisfaction between the Retail & Commercial Banking, Wealth Management, Insurance and Wholesale Banking groups. |
2012 Priorities
| • | | Focus on sustainable and profitable revenue growth, through a combination of organic initiatives and selective acquisitions. |
| • | | Commercial Banking: Expand coverage of the mid-market commercial segment; expand and enhance product offerings to achieve deeper penetration; and continue to refine and improve process efficiencies to drive customer satisfaction. |
| • | | Retail Banking: Enhance the distribution model to increase efficiency; expand payment offerings, leverage core capabilities, especially in auto and mortgages; expand the small business, emerging markets and micro-finance segments; and continue to support growth initiatives through enhanced risk management. |
| • | | Emphasize balance sheet strength through deposit growth, capital management and funding/liquidity strategies. |
56 2011 Scotiabank Annual Report
MANAGEMENT’S DISCUSSION AND ANALYSIS | BUSINESS LINES
Financial Performance
International Banking’s net income was a record $1,485 million, up $328 million or 28% from last year. The business benefited from the favourable contribution from recent acquisitions, strong underlying revenue growth, and lower loan losses, offset in part by the $54 million adverse impact of a stronger Canadian dollar. Return on economic equity was 14.4% compared to 12.5% last year.
Assets and liabilities
Average assets increased $8 billion or 9%. Growth through acquisitions, mainly R-G Premier Bank of Puerto Rico, combined with strong organic loan growth, more than offset the negative impact of foreign currency translation. Underlying commercial loans increased $5 billion or 13%, with growth across all regions, particularly Asia and Peru. Retail loans increased $1 billion or 7% (excluding acquisitions), mainly from residential mortgages in the Caribbean and Latin America. Underlying growth in low-cost deposits was strong at 11% and broad-based.
Revenues
Total revenues were $5,408 million in 2011, an increase of $469 million or 9% from last year, despite a $128 million negative impact of foreign currency translation. Net interest income was $3,988 million, up $372 million from the prior year, driven mainly by the acquisition of R-G Premier Bank of Puerto Rico, higher contributions from associated corporations in Asia, and broad-based organic loan growth. The net interest margin was relatively stable at 4.33%. Other income increased $97 million or 7% year-over-year to $1,420 million, reflecting the positive contributions from acquisitions and $79 million of negative goodwill related to recent acquisitions. There was solid growth in transaction-based fees and investment banking revenues, partly offset by lower net gains on securities.
Caribbean and Central America
Total revenues were $1,835 million in 2011, an increase of $90 million or 5%, largely because of the acquisition of R-G Premier Bank, offset partly by the negative impact of foreign exchange translation.
Net interest income was up $76 million from 2010. The full year impact of R-G Premier Bank, was partly offset by lower earnings from associated corporations and foreign currency translation. Underlying commercial and retail loan growth was up 6% and 2% respectively. Other income increased $14 million, mainly from higher transaction-based fees, and increased trading revenue, partly offset by the negative impact of foreign currency translation.
Mexico
Total revenues were $1,173 million in 2011, an increase of $73 million or 7% from last year. Net interest income was up $67 million, driven by growth in retail and commercial volumes, and higher retail and funding spreads. Other income was up $7 million due mainly to growth in credit card revenues and cash management fees.
Latin America, Asia & Other
Total revenues were $2,400 million in 2011, an increase of $306 million or 15% compared to last year, with strong contributions from recent acquisitions, solid growth in retail and commercial volumes, and the negative goodwill related to acquisitions. Net interest income was up $229 million from last year, partly due to the contribution from recent acquisition in Uruguay, and higher earnings from associated corporations in Asia. Underlying retail loan growth was 18%, primarily in Peru and Chile, accompanied by commercial loan growth of 16%, largely in Asia and Peru. Other income increased $77 million compared to last year as higher contributions from acquisitions, and the negative goodwill were in part offset by lower net gains on securities and foreign currency translation.
Non-interest expenses
Non-interest expenses were $3,056 million in 2011, up 15% or $394 million from 2010, with one third of the increase due to new acquisitions, particularly in Puerto Rico, Uruguay and Colombia. The remaining growth reflected higher compensation, premises, technology, professional expenses and advertising costs, to support revenue growth and expansion initiatives.
Credit quality
The provision for credit losses was $485 million in 2011, a decrease of $131 million from 2010. The decline in provisions was primarily attributable to commercial portfolios in the Caribbean and Peru, and lower retail provisions in Mexico and Chile, partially offset by higher retail provisions in the Caribbean.
Provision for income taxes
The effective tax rate dropped to 20% from 30% in 2010, largely from non-deductible losses in 2010 and adjustments to future tax assets in 2011.
Outlook
Despite the current global uncertainty, the outlook remains positive. It is expected that International Banking will benefit from its diversified global footprint, particularly in Latin America. Asset and deposit volumes will continue to grow at a favourable rate and margins are expected to remain relatively stable. Expenses will be carefully managed and initiatives will be advanced to improve customer satisfaction and drive efficiencies.
C32Total revenue
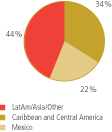
C33Total revenue by region
$ millions
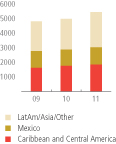
C34 Average loans and acceptances
$ billions
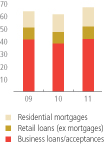
C35Average earning assets by region
$ billions
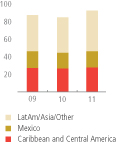
Scotiabank Annual Report 2011 57
Global Wealth Management
| | | | |
| | 2011 Achievements | | |
| | • Completed the acquisition of DundeeWealth, making Scotiabank the second largest bank mutual fund provider in Canada. • Crossed a major milestone surpassing $100 billion in assets under management. • As of September 30, 2011, ScotiaFunds and Dynamic Funds rank #1 in total year-to-date net mutual fund sales. • Growth in ScotiaMcLeod resulted in market share gains, accompanied by improvements in efficiency. • Launched new proprietary mutual funds in Canada (Dynamic and ScotiaFunds), Peru, Chile, Jamaica and Costa Rica. • Launched market leading customer initiatives in Online Brokerage including: ‘Buck-a-Bond’ fixed income initiative, the U.S.-Friendly RRSP, the Active Trader platform FlightDesk, and the first Commission-Free ETF trading offer in Canada. • Expanded life and health product offerings in Canada with the launch of three new term insurance products. • Launched commercial insurance in Barbados and in the Dominican Republic, small business insurance in Barbados and Puerto Rico and micro finance insurance in Peru. • Global Transaction Banking launched Euro and Sterling accounts, a Commercial Deposit ScotiaCard with ABM access, the Scotia Power Savings account and a U.S. Scotia VISA for business customers. • Recognized for excellence: – Dynamic Funds earned sixteen Lipper Awards, Canadian industry awards recognizing excellence – the most of any firm for the second year in a row. – ScotiaTrust ranked #1 in total estate assets based on Investor Economic’s Summer 2011 Fee Based Report. – Thanachart Bank won the Morningstar Fund Award Thailand for best short-term bond fund. | | |
| | | | |
| | Global Transaction Banking – offers comprehensive business solutions – cash management and payment services, business deposits, and trade services, on a global basis to the small business, commercial and corporate customers of the Bank. It also provides correspondent banking products and services to other financial institutions globally. The results of this unit are included in Canadian Banking, International Banking and Scotia Capital. • Recognized for excellence: – Global Finance magazine recognized Scotiabank as the World’s Best Trade Finance Bank in Canada in 2011 for the fourth year in a row. – Trade Finance Magazine awarded Scotiabank Best Overall Trade Bank In Central America and The Caribbean in 2011 and Best International Trade Bank In Peru in 2011. | | |
T26 Global Wealth Management financial performance
| | | | | | | | | | | | |
| | | |
| ($ millions) | | 2011 | | | 2010(2) | | | 2009(2) | |
Net interest income(1) | | $ | 345 | | | $ | 339 | | | $ | 367 | |
Other income | | | 2,973 | | | | 1,864 | | | | 1,522 | |
Provision for credit losses | | | 2 | | | | 1 | | | | 3 | |
Non-interest expenses | | | 1,890 | | | | 1,221 | | | | 1,130 | |
Income taxes(1) | | | 208 | | | | 165 | | | | 131 | |
Net income | | $ | 1,218 | | | $ | 816 | | | $ | 625 | |
| | | |
Key ratios | | | | | | | | | | | | |
Return on economic equity | | | 18.2 | % | | | 19.1 | % | | | 15.7 | % |
Productivity(1) | | | 57.0 | % | | | 55.4 | % | | | 59.8 | % |
| | | |
Selected balance sheet data (average balances) | | | | | | | | | | | | |
Earning assets | | | 9,344 | | | | 8,612 | | | | 8,516 | |
Deposits | | | 11,826 | | | | 11,343 | | | | 10,969 | |
Economic equity | | | 6,852 | | | | 4,354 | | | | 3,993 | |
| | | |
Other ($ billions) | | | | | | | | | | | | |
Assets under administration | | | 271 | | | | 195 | | | | 161 | |
Assets under management | | | 103 | | | | 54 | | | | 46 | |
| (1) | Taxable equivalent basis. |
| (2) | 2009 and 2010 amounts have been restated for the business line re-organization effective 2011. |
Business Profile
Scotiabank’s Global Wealth Management (GWM) division combines the wealth management and insurance operations in Canada and internationally. GWM is diversified across multiple geographies, product lines and strong businesses.
Wealth Management – The business is comprised of two segments: Global Asset Management and Global Wealth Distribution.
Global Asset Management represents the investment manufacturing business including product development and oversight, sales and marketing. It is focused on developing innovative investment solutions for both retail and institutional investors.
Global Wealth Distribution represents the global client-facing wealth businesses including private client, online and full service brokerage and the independent advisor channel. Its focus is on providing investment advice and solutions for affluent and high net worth clients in Canada and internationally.
Insurance – is provided to retail customers in Canada and internationally. Insurance Canada has four main business lines which include; creditor insurance, life and health insurance, home and auto insurance and travel insurance. International Insurance offers a full range of insurance products (creditor, non-creditor, life and health, and property) to bank customers. Products are provided through a number of different Scotiabank channels.
Strategy
GWM is focused on driving strong organic growth. This will be achieved by delivering investment solutions and advice and an excellent customer experience by leveraging its employees, international reach, global platform and expertise. GWM will continue to improve its competitive position by building on existing strengths as well as exploring new strategic opportunities.
2012 Priorities
| • | | Leverage new GWM organizational structure to accelerate growth and increase effectiveness in asset management and distribution. |
| • | | Further capitalize on the acquisition of DundeeWealth. |
| • | | Increase collaboration with partners in Canadian Banking, International Banking and Scotia Capital to drive additional referrals and cross-sell. |
| • | | Complete relaunch of Scotia iTRADE. |
| • | | Increase market penetration of insurance in Canada and internationally. |
58 2011 Scotiabank Annual Report
MANAGEMENT’S DISCUSSION AND ANALYSIS | BUSINESS LINES
Financial Performance
Global Wealth Management reported net income of $1,218 million this year, up $402 million or 49% from $816 million last year. These results reflected a strong performance from the wealth management and insurance businesses. This increase also included a one-time acquisition-related gain of $260 million on the Bank’s initial investment in and subsequent increased ownership interest in DundeeWealth. Return on economic equity was 18.2% compared to 19.1% last year, due to the acquisition of DundeeWealth.
Assets and liabilities
Assets under management (AUM) of $103 billion, increased $49 billion or 90% from the same quarter last year, due mainly to the acquisition of DundeeWealth. Excluding DundeeWealth, AUM was up 6% due to strong sales from Scotia Asset Management and the other Canadian and International wealth management businesses. Assets under administration (AUA) of $271 billion increased $76 billion or 39% also due largely to DundeeWealth. Excluding DundeeWealth, AUA for the other wealth management businesses grew by 4%. AUM and AUA for investments in CI Financial are not included in these results.
Revenues
Total revenues for the year were $3,318 million, an increase of $1,114 million or 51% over last year. Excluding the acquisition-related gain, total revenue was up 39%.
Net interest income of $345 million grew by $5 million or 2% year over year, as growth in average assets and deposits were partly offset by some minor margin compression.
Other income of $2,973 million grew by $1,109 million or 60% due primarily to the revaluation gain on the original investment in DundeeWealth, strong contributions from DundeeWealth, growth in fee-based revenues from higher levels of AUM and AUA and growth in insurance revenue from stronger sales globally.
Wealth Management
Total revenue of $2,825 million, increased $1,060 million or 60% compared to last year, reflecting the revaluation gain on the original investment in DundeeWealth, increased ownership interest in DundeeWealth and strong performances from DundeeWealth and Scotia Asset Management. There was also growth across all other Canadian and International wealth management businesses, particularly in full service brokerage, private client group and online brokerage driven by higher trading volumes and new sales.
Insurance
Total revenue of $491 million, increased $53 million or 12% over last year, mainly reflecting higher sales globally. Insurance revenues represent approximately 15% of Global Wealth Management compared to 20% in 2010.
Non-interest expenses
Non-interest expenses for the year were $1,890 million, an increase of $669 million or 55% from last year due mainly to the acquisition of DundeeWealth, higher volume related expenses and increases in expenses to support business growth.
Provision for income taxes
The lower effective tax rate in 2011 mainly reflects the one-time acquisition-related gain as well as the business mix in Global Wealth Management.
Outlook
The outlook for Global Wealth Management remains positive but subject to market volatility. In global asset management we expect continued strong growth in sales in both Canada and internationally, particularly given the acquisition of DundeeWealth. In global wealth distribution, organic growth will be driven by new client acquisition, as well as deeper penetration of the Bank’s customer base. The outlook for insurance is positive, driven by steady progress in cross-selling, the launch of new products and leveraging the Bank’s extensive distribution network.
C36Total revenue
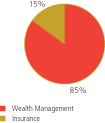
C37Wealth management asset growth
$ billions, as at October 31
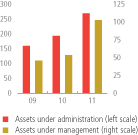
C38Wealth management mutual fund sales
$ millions
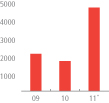
| * | 2011 includes Dynamic Fund net sales from Feb-Oct 2011 |
Scotiabank Annual Report 2011 59
MANAGEMENT’S DISCUSSION AND ANALYSIS
Scotia Capital
| | | | |
| | 2011 Achievements | | |
| | • Scotia Capital was named by Global Finance magazine as: – Best Investment Bank in Canada for the third consecutive year – Best Bank in Infrastructure Globally for the third consecutive year – Best Foreign Exchange Bank in Canada for the seventh consecutive year • Scotia Capital was ranked #1 in Canadian Corporate Debt Underwriting (Bonus), by Bloomberg (2010) for the third year in a row. • Scotia Capital’s Risk Solutions Group was ranked #1 in Canada for the ninth year in a row by an independent third-party in its prestigious 2011 Survey of Derivatives Users in Canada. • Scotia Capital was recognized by The Banker magazine in its 2011 Deal of the Year awards: – Highly commended in the M&A category: Sinopec/Repsol merger (2010). Scotia Waterous acted as Exclusive Financial Advisor to Sinopec. – Highly commended in the Infrastructure and Project Finance category: McGill University Health Centre (2010). Scotia Capital acted as Sole Bookrunner and Lead Underwriter. • Scotia Capital was recognized with two Canadian Dealmaker Awards from The Globe and Mail: – Canadian Dealmaker award – IPO of the Year (2010): MEG Energy Corp. IPO. Scotia Capital acted as a Financial Advisor to MEG Energy Corp. – Canadian Dealmaker award – Mining industry (2010): Acquisition of Red Back Mining Inc. by Kinross Gold Corp. Scotia Capital acted as a Financial Advisor to Red Back Mining Inc. Notable transactions during the year included: • Scotia Waterous acted as Financial Advisor to BHP Billiton on its acquisition of Petrohawk Energy Corporation, for US$15.1 billion. This transaction was the largest oil and gas M&A deal since 2009, and the largest non-Canadian deal ever advised by a member of a Canadian bank group. Scotia Waterous also acted as Financial Advisor to BHP Billiton on its acquisition of Fayetteville Shale Assets from Chesapeake Energy Corporation for $4.75 billion. • Scotia Capital participated in the US$5.45 billion IPO of Hutchison Port Holdings Trust on the Singapore Stock Exchange. The offering represented the largest ever IPO in Singapore and South East Asia. Scotiabank acted as Co-Manager and also provided loan underwriting services in association with this transaction, acting as Underwriter and Mandated Lead Arranger in an accompanying US$3 billion loan. | | |
T27 Scotia Capital financial performance
| | | | | | | | | | | | |
| | | |
| ($ millions) | | 2011 | | | 2010 | | | 2009 | |
Net interest income(1) | | $ | 1,066 | | | $ | 1,093 | | | $ | 1,427 | |
Other income | | | 1,894 | | | | 2,086 | | | | 2,138 | |
Provision for (recovery of) credit losses | | | 29 | | | | (43 | ) | | | 338 | |
Non-interest expenses | | | 1,409 | | | | 1,195 | | | | 1,072 | |
Income taxes(1) | | | 338 | | | | 677 | | | | 704 | |
Net income | | $ | 1,184 | | | $ | 1,350 | | | $ | 1,451 | |
| | | |
Key ratios | | | | | | | | | | | | |
Return on economic equity(2) | | | 21.2 | % | | | 20.4 | % | | | 21.6 | % |
Productivity(1) | | | 47.6 | % | | | 37.6 | % | | | 30.1 | % |
Net interest margin(1) | | | 0.57 | % | | | 0.67 | % | | | 0.78 | % |
PCL as a percentage of loans and acceptances(3) | | | 0.10 | % | | | (0.02 | )% | | | 0.60 | % |
| | | |
Selected balance sheet data (average balances) | | | | | | | | | | | | |
Total assets | | | 187,946 | | | | 164,193 | | | | 183,272 | |
Earning assets | | | 160,064 | | | | 139,442 | | | | 147,159 | |
Loans and acceptances | | | 43,469 | | | | 45,838 | | | | 67,451 | |
Securities purchased under resale agreements | | | 28,768 | | | | 19,888 | | | | 14,123 | |
Securities | | | 71,532 | | | | 60,372 | | | | 54,973 | |
Deposits | | | 42,432 | | | | 38,807 | | | | 34,403 | |
Economic equity | | | 5,807 | | | | 6,980 | | | | 7,013 | |
| (1) | Taxable equivalent basis. |
| (2) | 2009 and 2010 ratios have been restated to conform with current methodology. |
| (3) | Corporate Banking only. |
Business Profile
Scotia Capital is the wholesale banking arm of the Bank. It offers a wide variety of products to corporate, government and institutional investor clients. Scotia Capital is a full-service lender and investment dealer in Canada and Mexico and offers a wide range of products in the United States and other parts of Latin America.It also provides select products and services to niche markets in Europe and Asia. Scotia Capital provides corporate lending, equity and debt underwriting, and mergers and acquisitions advisory services, as well as capital markets products and services, such as fixed income, derivatives, prime brokerage, securitization, foreign exchange, equity sales, trading and research and, through ScotiaMocatta, precious and base metals.
Strategy
Scotia Capital’s strategy remains focused on achieving sustainable revenue and net incomegrowth and earning strong returns on capital while prudently managing risk. Scotia Capital’s strategic vision is to achieve superior growth by being a leading financial partner for clients and a recognized global leader in key sectors. The business line leverages its people, international reach, market intelligence and technical expertise.
2012 Priorities
| • | | Cross-sell capital markets products and services to lending relationships through the Bank’s global wholesale banking initiative. Scotia Capital will expand capital markets sales and trading businesses, beginning in Mexico, Chile and Peru and continue to integrate recent acquisitions and build client relationships in Brazil and Colombia. |
| • | | Grow sustainable revenue and net income in core sectors – Oil and Gas, Mining, Power, Infrastructure, and in specific businesses including Corporate and Investment Banking, Global Fixed Income, Global Equity, Energy, Precious andBase Metals and Foreign Exchange. |
| • | | Prudently manage risks and expenses with global oversight and governance. |
| • | | Build leadership capability and foster a culture of collaboration. |
60 2011 Scotiabank Annual Report
MANAGEMENT’S DISCUSSION AND ANALYSIS | BUSINESS LINES
Financial Performance
Scotia Capital reported net income of $1,184 million in 2011, a decline of $166 million or 12% from last year. This year’s results were adversely impacted by challenging market conditions, particularly in the second half of the year, which reduced revenues. Expenses increased due to implementation of growth initiatives and there were also higher provisions for loan losses. Provisions for taxes were lower year over year mainly reflecting a higher level of tax-exempt income and recoveries this year. Return on economic equity was 21.2% compared to 20.4% last year.
Assets and liabilities
Average assets increased by $24 billion or 15% to $188 billion this year. There were increases of $11 billion in securities and $9 billion in securities purchased under resale agreements, mainly driven by the expansion of the fixed income business. Derivative instrument assets also increased by $3 billion year over year with a corresponding increase in derivative instrument liabilities. Corporate loans and acceptances fell by over $3 billion but this was largely offset by higher deposits with banks.
Revenues
Total revenues during 2011 were $2,960 million compared to $3,179 million last year, a decline of 7% due primarily to challenging market conditions faced by Global Capital Markets especially in the latter half of 2011. There was a significant decline in revenues in the global fixed income business which was partly offset by higher contributions from the precious metals and foreign exchange businesses. Global Corporate and Investment Banking reported marginally higher revenues this year from growth in investment banking and lending revenues in Canada. This was offset by a decline in the United States.
Net interest income declined by 2% to $1,066 million, due primarily to a year-over-year decline in corporate loan volumes which was partly offset by higher spreads. Interest from trading operations also dropped slightly. Other income fell 9% to $1,894 million due mainly to lower trading revenues which were only partly offset by higher investment banking revenues and credit fees.
Global Corporate and Investment Banking
Revenues in Global Corporate and Investment Banking were up marginally to $1,405 million in 2011. Interest income declined 3% despite higher portfolio spreads due to lower asset volumes. Loan origination fees also declined marginally. Other income rose 3% due mainly to higher new issue revenue and advisory fees earned by Scotia Waterous this year. Credit fees also increased. This was partly offset by lower fair value changes in non-trading financial instruments.
Global Capital Markets
Total revenues in Global Capital Markets fell 12% to $1,554 million compared to record revenues achieved last year. Interest income from trading operations declined marginally. Other income dropped 16% due to challenging market conditions, especially in the global fixed income business. This was partly offset by stronger revenues in the precious metals and foreign exchange businesses.
Non-interest expenses
Non-interest expenses increased by 18% to $1,409 million in 2011. This increase was due primarily to higher salaries, benefits and stock-based compensation. Technology and other support costs also increased to assist business expansion.
Credit quality
The specific provision for credit losses for Scotia Capital was $29 million in 2011, versus a net recovery of $6 million in 2010. The specific provisions this year were primarily in Canada and Europe, somewhat offset by net recoveries in the United States. The prior year included a $37 million reversal of the sectoral allowance specific to the automotive sector.
Provision for income taxes
The lower effective tax rate in 2011 mainly reflects a higher level of tax-exempt income and recoveries in the current year.
Outlook
Short-term market conditions will likely continue to be challenging but Scotia Capital expects the diversification of its products and geographies will mitigate the impact. Also, Scotia Capital expects to benefit from modest growth in the core businesses and products in which it has invested. Moderate pressure on corporate loan margins is anticipated given the low interest rate environment as well as competitive pressures, but pricing discipline will be maintained. Scotia Capital will continue to manage operating costs closely. We are seeing signs of better pricing for credit risk. The credit quality of the loan portfolio remains strong and loan loss provisions are expected to remain modest.
C39Total revenue
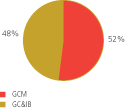
C40Global corporate and investment banking revenue
$ millions
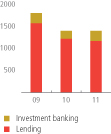
C41Global capital markets revenue by business line
$ millions
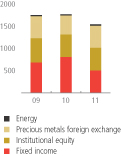
C42Composition of average earning assets
$ billions
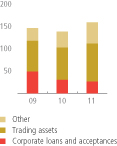
Scotiabank Annual Report 2011 61
MANAGEMENT’S DISCUSSION AND ANALYSIS
Other
The Other category includes Group Treasury and other corporate items, which are not allocated to a business line.
Financial performance
The Other segment had a net loss of $481 million in 2011, compared to a net loss of $754 million in 2010.
Net interest income and the provision for income taxes include the elimination of tax-exempt income gross-up. This amount is included in the operating segments, which are reported on a taxable equivalent basis. The elimination was $287 million in 2011, compared to $286 million in 2010.
Revenues
Net interest income was negative $1,018 million this year, compared to negative $1,346 million in 2010. The improvement was due to the increase in short-term wholesale rates used for transfer pricing with the business segments, lower long-term funding costs, and a favourable change in the fair value of financial instruments used for asset/liability management purposes.
Other Income was $380 million in 2011, compared to $309 million last year. The increase was mainly attributable to higher securitization revenues.
Non-interest expenses
Non-interest expenses were $140 million in 2011, $10 million above last year mainly from higher issuance costs associated with asset securitization.
Credit quality
The provision for credit losses in 2011 included a $60 million reduction in the general allowance, compared to a $40 million reduction in 2010.
Provision for income taxes
The provision for income taxes was a credit of $237 million in 2011, an improvement of $136 million from the prior year. The reduction in the provision for income taxes was mainly driven by stronger pre-tax earnings.
T28 Other financial performance
| | | | | | | | | | | | |
| | | |
| ($ millions) | | 2011 | | | 2010(1) | | | 2009(1) | |
Net interest income(2) | | $ | (1,018 | ) | | $ | (1,346 | ) | | $ | (1,588 | ) |
Other income | | | 380 | | | | 309 | | | | 84 | |
Provision for (recovery of) credit losses | | | (60 | ) | | | (40 | ) | | | 127 | |
Non-interest expenses | | | 140 | | | | 130 | | | | 130 | |
Income taxes(2) | | | (237 | ) | | | (373 | ) | | | (637 | ) |
Net income | | $ | (481 | ) | | $ | (754 | ) | | $ | (1,124 | ) |
| (1) | 2009 and 2010 amounts have been restated to conform with current presentation. |
| (2) | Includes the elimination of the tax-exempt income gross-up reported in net interest income and provision for income taxes in Canadian Banking, International Banking and Scotia Capital to arrive at the amount reported in the Consolidated Statement of Income ($2011 – $287; 2010 – $286; 2009 – $288). |
| | | | |
| | KEY PERFORMANCE INDICATORS FOR ALL BUSINESS LINES Management uses a number of key metrics to monitor business line performance: • Net income • Return on economic equity • Productivity ratio • Loan loss ratio • Value at risk • Employee engagement | | |
| | | | |
62 2011 Scotiabank Annual Report
MANAGEMENT’S DISCUSSION AND ANALYSIS | RISK MANAGEMENT
RISK MANAGEMENT
Effective risk management is fundamental to the success of the Bank, and is recognized as one of the Bank’s five strategic priorities. Scotiabank has a strong, disciplined risk management culture where risk management is a responsibility shared by all of the Bank’s employees. A key aspect of this culture is to be well-diversified across business lines, geographies, products, and industries.
Risk management framework
The primary goals of risk management are to ensure that the outcomes of risk-taking activities are consistent with the Bank’s strategies and risk appetite, and that there is an appropriate balance between risk and reward in order to maximize shareholder returns. The Bank’s enterprise-wide risk management framework provides the foundation for achieving these goals.
This framework is subject to constant evaluation to ensure that it meets the challenges and requirements of the global markets in which the Bank operates, including regulatory standards and industry best practices. For example, the Bank is currently assessing the potential impact of Basel III as well as the United States’ Dodd-Frank Act. The risk management programs of the Bank’s subsidiaries conform in all material respects to the Bank’s risk management framework, although the actual execution of their programs may be different. For new acquisitions, or situations where control of a subsidiary has been recently established, the Bank assesses existing risk management programs and, if necessary, develops an action plan to make improvements in a timely fashion.
The Bank’s risk management framework is applied on an enterprise-wide basis and consists of three key elements:
| • | | Risk Management Techniques. |
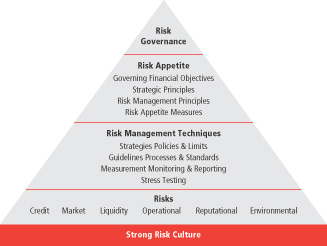
Risk governance
Effective risk management begins with effective risk governance.
The Bank has a well-established risk governance structure, with an active and engaged Board of Directors supported by an experienced senior management team and a centralized risk management group that is independent of the business lines. Decision-making is highly centralized through a number of senior and executive risk management committees.
The Board of Directors
The Bank’s risk management governance structure begins with oversight by the Board of Directors, either directly or through its committees to ensure that decision-making is aligned with the Bank’s strategies and risk appetite. The Board receives regular updates on the key risks of the Bank – including a semi-annual comprehensive summary of the Bank’s risk profile and performance of the portfolio against defined goals, which is also presented quarterly to the Executive and Risk Committee of the Board – and approves key risk policies, limits, strategies, and risk appetite. The Bank’s Internal Audit department reports independently to the Board (through the Audit and Conduct Review Committee) on the effectiveness of the risk governance structure and risk management framework.
Management
Executive management, and in particular the Chief Executive Officer (CEO) and the Chief Risk Officer (CRO), are responsible for risk management under the direct oversight of the Board. The CRO, who oversees the Global Risk Management (GRM) division of the Bank, reports to the CEO but also has direct access to the Executive and Risk Committee of the Board.
The CEO, CRO, and other senior executives chair the Bank’s senior and executive risk management committees. Committee structures and key accountabilities are outlined on page 64.
Global Risk Management (GRM)
GRM is responsible for the design and application of the Bank’s risk management framework, and is independent of the Bank’s business units. It provides oversight of credit, market, liquidity, structural foreign exchange, structural interest rate, models and operational risks.
Scotiabank Annual Report 2011 63
MANAGEMENT’S DISCUSSION AND ANALYSIS
SCOTIABANK’S RISK GOVERNANCE STRUCTURE
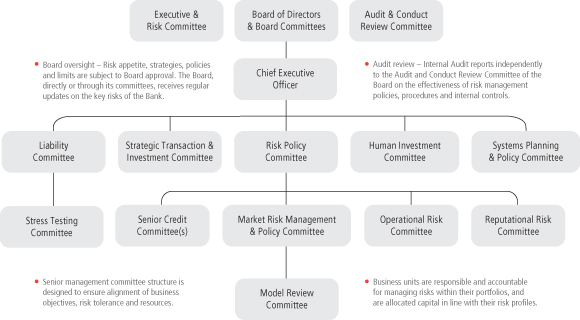
Executive Committees:
Risk Policy Committee: reviews key risk exposures and risk policies, and adjudicates risk issues referred by the Senior Credit, Market, Operational and Reputational Risk committees.
Liability Committee: provides strategic direction in the management of global interest rate risk, foreign exchange risk, liquidity and funding risk, trading and investment portfolio decisions, and capital management.
Strategic Transaction and Investment Committee: reviews and approves all potential acquisitions, investments and strategic initiatives that require a major allocation of the Bank’s capital.
Systems Planning and Policy Committee: reviews and approves significant business initiatives involving system and computing facilities in excess of designated executive approval limits.
Human Investment Committee: reviews and approves all major new and changing Bank-wide Human Resources objectives, strategies, policies and programs including all compensation matters. As well it reviews and approves all senior management appointments and the staffing of key positions.
Senior Management Committees:
Senior Credit Committees: adjudicate credits within prescribed limits and establish the operating rules and guidelines for the implementation of credit policies. Separate committees cover commercial, international and corporate counterparties, and Canadian and international retail, small business, and wealth management.
Market Risk Management and Policy Committee: oversees and establishes standards for market and liquidity risk management processes within the Bank, including the review and approval of new products, limits, practices and policies for the Bank’s principal trading and treasury activities.
Operational Risk Committee: promotes an enterprise-wide operational risk framework to ensure risks are understood, communicated, and appropriate actions are taken to mitigate related losses.
Stress Testing Committee: sets overall direction and makes key decisions relating to stress testing activities across the Bank, and guides the design, execution, and results assessment of the Enterprise Stress Testing program.
Reputational Risk Committee: upon referral from business lines or risk committees, reviews business activities, initiatives, products, services, transactions or processes and recommends either proceeding or not proceeding, based on an assessment of reputational risk, to ensure that the Bank is, and is seen to be, acting with high ethical standards.
The Model Review Committee: oversees model submissions, vetting, approval, and ongoing review processes primarily for market and liquidity risk models.
64 2011 Scotiabank Annual Report
MANAGEMENT’S DISCUSSION AND ANALYSIS | RISK MANAGEMENT
Risk Management Culture
Effective risk management requires a strong, robust, and pervasive risk management culture.
The Business Lines are responsible for the development and execution of business plans that are aligned with the Bank’s risk management framework, and are accountable for the risks they incur. Understanding and managing these risks is a fundamental element of each business plan. Business units work in partnership with Global Risk Management to ensure that risks arising from their business are thoroughly evaluated and appropriately addressed.
Risk education programs, and documented policies and procedures are jointly available to staff in the Business Lines and Global Risk Management.
Decision-making on risk issues is highly centralized. The membership of senior and executive management committees responsible for the review, approval and monitoring of transactions and the related risk exposures, includes Business Line Heads and senior risk officers from Global Risk Management. The flow of information and transactions to these committees keeps senior and executive management well informed of the risks the Bank faces, and ensures that transactions and risks are aligned with the Bank’s risk appetite framework.
Risk appetite
Effective risk management requires clear articulation of the Bank’s risk appetite and how the Bank’s risk profile will be managed in relation to that appetite.
The Bank’s risk appetite framework governs risk taking activities on an enterprise-wide basis.
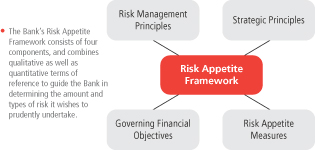
Risk management principles
Provide the qualitative foundation of the risk appetite framework. These principles include:
| • | | Promotion of a robust risk culture, |
| • | | Accountability for risk by the business lines, |
| • | | Independent oversight exercised by Global Risk Management (GRM), |
| • | | Avoidance of excessive risk concentrations, and |
| • | | Ensuring risks are clearly understood, measurable, and manageable. |
Strategic principles
Provide qualitative benchmarks to guide the Bank in its pursuit of the Governing Financial Objectives, and to gauge broad alignment between new initiatives and the Bank’s risk appetite. Strategic principles include:
| • | | Placing emphasis on the diversity, quality and stability of earnings, |
| • | | Focusing on core businesses by leveraging competitive advantages, and |
| • | | Making disciplined and selective strategic investments |
Governing financial objectives
Focus on long-term shareholder value. These objectives include sustainable earnings growth, maintenance of adequate capital in relation to the Bank’s risk profile, and availability of financial resources to meet financial obligations on a timely basis at reasonable prices.
Risk appetite measures
Provide objective metrics that gauge risk and articulate the Bank’s risk appetite. They provide a link between actual risk taking activities and the risk management principles, strategic principles and governing financial objectives described above. These measures include capital and earnings ratios, market and liquidity risk limits, and credit and operational risk targets.
Risk management techniques
Effective risk management includes techniques that are guided by the Bank’s Risk Appetite Framework and integrated with the Bank’s strategies and business planning processes.

Strategies, Policies & Limits
Strategies
Provide quantitative and qualitative guidance. This guidance is, in turn, used to set limits and guidelines on the types of risk taking activities the Bank is prepared to assume in pursuit of its strategic and financial objectives.
Policies
Apply to specific types of risk or to the activities that are used to measure and control risk exposure. They are based on recommendations from risk management, audit, business lines, and senior executive management. They also reflect industry best practices and any regulatory requirements. Policies are guided by the Bank’s risk appetite, and set the limits and controls within which the Bank and its subsidiaries can operate.
| • | | Key risk policies are approved by the Board of Directors, either directly or through the Board’s Executive and Risk Committee (the Board). |
| • | | Management level risk policies associated with processes such as model development and stress testing are approved by executive management and/or key risk committees. |
Limits
Control risk-taking activities within the tolerances established by the Board and senior executive management. Limits also establish accountability for key tasks in the risk-taking process and establish the level or conditions under which transactions may be approved or executed.
Scotiabank Annual Report 2011 65
MANAGEMENT’S DISCUSSION AND ANALYSIS
Guidelines, Processes and Standards
Guidelines
Are the directives provided to implement policies as set out above. Generally, they describe the facility types, aggregate facility exposures and conditions under which the Bank is prepared to do business. Guidelines ensure the Bank has the appropriate knowledge of clients, products, and markets, and that it fully understands the risks associated with the business it underwrites. Guidelines may change from time to time, due to market or other circumstances. Risk taking outside of guidelines usually requires approval of the Bank’s Senior Credit Committees, Market Risk Management and Policy Committee, or Risk Policy Committee.
Processes
Are the activities associated with identifying, evaluating, documenting, reporting and controlling risk.
Standards
Define the breadth and quality of information required to make a decision, and the expectations in terms of quality of analysis and presentation. Processes and standards are developed on an enterprise-wide basis, and documented in a series of policies, manuals and handbooks under the purview of GRM. Key processes cover the review and approval of new products, model validation and stress testing.
Measurement, Monitoring, and Reporting
Measurement
GRM is responsible for developing and maintaining an appropriate suite of risk management techniques to support the operations of the various business lines, and for supporting the measurement of economic capital on an enterprise-wide basis. The risk sections explain the application of these techniques.
Risk measurement techniques include the use of models and stress testing. The Bank uses models for a range of purposes including to estimate the value of transactions, risk exposures, credit risk ratings and parameters, and economic and regulatory capital. The use of quantitative risk methodologies and models is balanced by a strong governance framework and includes the application of sound and experienced judgement. The development, independent review, and approval of models are subject to formalized policies where applicable, including the oversight of senior management committees such as the Model Review Committee for market risk (including counterparty credit risk) and liquidity risk models.
Monitoring
The Bank regularly monitors its risk exposures to ensure business activities are operating within approved limits or guidelines, and the Bank’s strategies and risk appetite. Breaches, if any, of these limits or guidelines are reported to senior management, policy committees, and/or the Board depending on the limit or guideline.
Reporting
Risk reports aggregate measures of risk across products and businesses, and are used to ensure compliance with policies, limits, and guidelines. They also provide a clear statement of the amounts, types, and sensitivities of the various risks in the Bank’s portfolios. Senior management and the Board use this information to understand the Bank’s risk profile and the performance of the portfolios.
Control and audit functions are also established that are independent of the organizations whose activities they review, and whose role includes ensuring that all of the components of the risk management framework are effective and being implemented on a day to day basis.
Stress testing
The Bank uses stress testing programs at both enterprise-wide level and risk level to estimate the potential impact on the Bank’s income and capital as a result of significant changes in market conditions, credit environment, liquidity demands, or other risk factors. Each program is developed with input from a broad base of stakeholders, and results are integrated into management decision-making processes for capital, funding, market risk limits, and credit risk strategy. Enterprise-wide stress testing is also integrated with both the strategic and financial planning processes. The development, approval and on-going review of the Bank’s stress testing programs are subject to formalized policy, and are under the oversight of the Stress Testing Committee, which reports to the Liability Committee.
Basel II
The Basel II regulatory capital framework governs minimum regulatory capital requirements to cover three broad categories of risk – credit risk, market risk and operational risk. This framework is organized under three broad categories or pillars:
| • | | Pillar 1 stipulates the methodologies and parameters that must be applied to calculate minimum capital requirements. |
| • | | Pillar 2 introduces the requirement for formal internal assessment of capital adequacy in relation to strategies, risk appetite, and actual risk profile. Regulators are required to review this internal capital adequacy assessment process (ICAAP – for further discussion, refer to the Capital Management section on page 42). |
| • | | Pillar 3 enhances public disclosure (both quantitative and qualitative) of specific details of risks being assumed, and how capital and risk are being managed under the Basel II framework. |
The following sections on Credit Risk, Market Risk, and Operational Risk include descriptions of the Pillar 1 methodologies and risk parameters, as well as some of the enhanced disclosure requirements associated with Pillar 3.
Credit risk
Credit risk is the risk of loss resulting from the failure of a borrower or counterparty to honour its financial or contractual obligations to the Bank. Credit risk arises in the Bank’s direct lending operations, and in its funding, investment and trading activities where counterparties have repayment or other obligations to the Bank.
The effective management of credit risk requires the establishment of an appropriate credit risk culture. Key credit risk policies and credit risk management strategies are important elements used to create this culture.
The Board of Directors, either directly or through the Executive and Risk Committee (the Board), reviews and approves the Bank’s credit risk strategy and credit risk policy on an annual basis:
| • | | The objectives of the credit risk strategy are to ensure that: |
| | – | | target markets and product offerings are well defined at both the enterprise-wide and business line levels; |
66 2011 Scotiabank Annual Report
MANAGEMENT’S DISCUSSION AND ANALYSIS | RISK MANAGEMENT
| | – | | the risk parameters for new underwritings and for the portfolios as a whole are clearly specified; and |
| | – | | transactions, including origination, syndication, loan sales and hedging, are managed in a manner that is consistent with the Bank’s risk appetite. |
| • | | The credit risk policy articulates the credit risk management framework, including: |
| | – | | aggregate limits, beyond which credit applications must be escalated to the Board for approval; and |
| | – | | single name/aggregation exposures, beyond which exposures must be reported to the Board. |
Global Risk Management develops the credit risk management framework and policies that detail, among other things, the credit risk rating systems and associated parameter estimates; the delegation of authority for granting credit; the calculation of the allowance for credit losses; and the authorization of write-offs.
Corporate and commercial credit exposures are segmented by country and by major industry group. Aggregate credit risk limits for each of these segments are also reviewed and approved annually by the Board. Portfolio management objectives and risk diversification are key factors in setting these limits.
Consistent with the Board-approved limits, borrower limits are set within the context of established lending criteria and guidelines for individual borrowers, particular industries, countries and certain types of lending, to ensure the Bank does not have excessive concentration in any single borrower, or related group of borrowers, particular industry sector or geographic region. Through the portfolio management process, loans may be syndicated to reduce overall exposure to a single name. For certain segments of the portfolio, credit derivative contracts are also used to mitigate the risk of loss due to borrower default. Risk is also mitigated through the selective sale of loans.
Banking units and Global Risk Management regularly review the various segments of the credit portfolio on an enterprise-wide basis to assess the impact of economic trends or specific events on the performance of the portfolio, and to determine whether corrective action is required. These reviews include the examination of the risk factors for particular products, industries and countries. The results of these reviews are reported to the Risk Policy Committee and, when significant, to the Board.
Risk measures
The credit risk rating systems support the determination of key credit risk parameter estimates which measure credit and transaction risk. These risk parameters – probability of default, loss given default and exposure at default are transparent and may be replicated in order to provide consistency of credit adjudication, as well as minimum lending standards for each of the risk rating categories. The parameters are an integral part of enterprise-wide policies and procedures encompassing governance, risk management, and control structure, and are used in various internal and regulatory credit risk quantification calculations.
The Bank’s credit risk rating system is subject to a rigorous validation, governance and oversight framework. The objectives of this framework are to ensure that:
| • | | Credit risk rating methodologies and parameters are appropriately designed and developed, independently validated, and regularly reviewed; and |
| • | | The review and validation processes represent an effective challenge to the design and development process. |
Credit risk rating methodologies and parameters are reviewed and validated at least annually. Units within Global Risk Management are responsible for design and development, validation and review, and are functionally independent from the business units responsible for originating transactions. Within Global Risk Management, they are also independent from the units involved in risk rating approval and credit adjudication.
Internal credit risk ratings and associated risk parameters affect loan pricing, computation of the general allowance for credit losses, and return on economic capital.
Corporate and commercial
Corporate and commercial credit exposure arises in Canadian Banking, International Banking, Global Wealth Management and Scotia Capital business lines.
Adjudication
Credit adjudication units within Global Risk Management analyze and evaluate all significant credit requests for corporate and commercial credit exposures, to ensure that risks are adequately assessed, properly approved, continually monitored and actively managed. The decision-making process begins with an assessment of the credit risk of the individual borrower or counterparty. Key factors considered in the assessment include:
| • | | The borrower’s management; |
| • | | The borrower’s current and projected financial results and credit statistics; |
| • | | The industry in which the borrower operates; |
Based on this assessment, a risk rating is assigned to the individual borrower or counterparty, using the Bank’s risk rating systems.
A separate risk rating is also assigned at the facility level, taking into consideration additional factors, such as security, seniority of claim, structure, term and any other forms of credit risk mitigation that affect the amount of potential loss in the event of a default of the facility. Security typically takes the form of charges over inventory, receivables, real estate, and operating assets when lending to corporate and commercial borrowers; and cash or treasuries for trading lines such as securities lending, repurchase transactions, and derivatives. The types of acceptable collateral, and related valuation processes are documented in risk management policies and manuals. Other forms of credit risk mitigation include third party guarantees and, in the case of derivatives facilities, master netting agreements.
Internal borrower and facility risk ratings are assigned when a facility is first authorized, and are promptly re-evaluated and adjusted, if necessary, as a result of changes to the customer’s financial condition or business prospects. Re-evaluation is an ongoing process, and is done in the context of general economic changes, specific industry prospects, and event risks, such as revised financial projections, interim financial results and extraordinary announcements. Global Risk Management is the final arbiter of internal risk ratings.
The internal credit risk ratings are also considered as part of the Bank’s single borrower limits, as guidelines for hold levels are tied to different risk ratings. Single borrower limits are much lower for higher risk borrowers than low risk borrowers.
The credit adjudication process also uses a risk-adjusted return on equity profitability model to ensure that the client and transaction structure offers an appropriate return for a given level of risk. For the
Scotiabank Annual Report 2011 67
MANAGEMENT’S DISCUSSION AND ANALYSIS
corporate portfolio, and the large borrowers in International, the Loan Portfolio Management Group reviews the profitability model results, together with external benchmarks, and provides an opinion on the relative return and pricing of each transaction above a minimum threshold.
Individual credit exposures are regularly monitored by both the business line units and Global Risk Management for any signs of deterioration. In addition, a review and risk analysis of each borrower is conducted annually, or more frequently for higher-risk borrowers. If, in the judgement of management, an account requires the expertise of specialists in workouts and restructurings, it will be transferred to a special accounts group for monitoring and resolution.
Traded Products
Traded products are transactions such as derivatives, foreign exchange, commodities, repurchase/reverse repurchase agreements, and securities lending/borrowing. Credit risks arising from traded products cannot be determined with certainty at the outset, because during the tenure of a transaction the dollar value of the counterparty’s obligation to the Bank will be affected by changes in the capital markets (such as changes in stock prices, interest rates, exchange rates). The Bank adjudicates credit exposures arising from transacting in traded products by considering their current fair value plus an additional component to reflect potential future changes in their mark-to-market value. The credit adjudication process also includes an evaluation of potential wrong way risk, which arises when the exposure to a counterparty is positively correlated to the probability of default of that counterparty.
Credit risk associated with traded products is managed within the same credit adjudication process as the lending business. The Bank considers the credit risk arising from lending activities, as well as the potential credit risk arising from transacting in traded products with that counterparty.
Most traded products transactions benefit from credit mitigation techniques, such as netting and collateralization, which are taken into consideration in the calculation of counterparty credit risk exposure. A master netting agreement allows for a single net settlement of all transactions covered by that agreement in the event of a default or early termination of the transactions. Collateral agreements with a counterparty allow for variation margin to be called if total uncollateralized mark-to-market exposure exceeds an agreed upon threshold.
Investment grade counterparties account for approximately 90% of the credit risk amount arising from the Bank’s derivative transactions. Approximately 56% of the Bank’s derivative counterparty exposures are to bank counterparties. After taking into consideration, where applicable, netting and collateral arrangements, no net credit risk amount arising from traded products transactions with any single counterparty was considered material to the financial position of the Bank as at October 31, 2011. No individual exposure to either a non-investment grade counterparty or a corporate counterparty exceeded $173 million.
Risk ratings
The Bank’s risk rating system utilizes internal grade (IG) codes – an 18 point scale used to differentiate the risk of default of borrowers, and the risk of loss on facilities. The general relationship between the Bank’s internal borrower IG codes and external agency ratings is shown in Table 29.
T29 Internal rating scale(1) and mapping to external rating agencies
| | | | | | | | |
| | |
Internal
Grade | | Description | | Equivalent Rating |
| | | Moody’s | | S&P | | DBRS |
99 - 98 | | Investment | | Aaa to Aa1 | | AAA to AA+ | | AAA to AA (high) |
95 - 90 | | grade | | Aa2 to A3 | | AA to A- | | AA to A (low) |
87 - 83 | | | | Baa1 to Baa3 | | BBB+ to BBB- | | BBB (high) to BBB (low) |
80 - 75 | | Non-investment | | Ba1 to Ba3 | | BB+ to BB- | | BB (high) to BB (low) |
73 - 70 | | grade | | B1 to B3 | | B+ to B- | | B (high) to B (low) |
65 - 30 | | Watch list | | | | | | |
27 - 21 | | Default | | | | | | |
| (1) | Applies to non-retail portfolio. |
IG codes are also used to define credit adjudication authority levels appropriate to the size and risk of each credit application. Lower-rated credits require increasingly more senior management involvement depending upon the aggregate exposure. Where the decision is beyond their authority levels, credit units will refer the request – with its recommendation – to a senior credit committee for adjudication. Senior credit committees also have defined authority levels and, accordingly, forward certain requests to the Risk Policy Committee. In certain cases, these must be referred to the Executive and Risk Committee of the Board of Directors.
Credit risk and capital
The Bank uses the Advanced Internal Ratings Based (AIRB) approach under Basel II to determine minimum regulatory capital requirements for its domestic, U.S. and European credit portfolios. In 2011, certain international non-retail portfolios implemented the AIRB approach. The remaining credit portfolios are subject to the Standardized approach, which relies on the credit ratings of borrowers, if available, to compute regulatory capital for credit risk. For AIRB portfolios, the key risk measures used in the quantification of regulatory capital for credit risk include probability of default (PD), loss given default (LGD) and exposure at default (EAD).
| • | | Probability of default (PD) measures the likelihood that a borrower, with an assigned IG code, will default within a one-year time horizon. Each of the Bank’s internal borrower IG codes is mapped to a PD estimate. |
| • | | Loss given default (LGD) measures the severity of loss on a facility in the event of a borrower’s default. The Bank’s internal LGD grades are mapped to ranges of LGD estimates. LGD grades are assigned based on facility characteristics such as seniority, collateral type, collateral coverage and other structural elements. |
| • | | Exposure at default (EAD) measures the expected exposure on a facility in the event of a borrower’s default. |
All three risk measures are estimated using the Bank’s historical data, as well as available external benchmarks, and are updated on a regular basis. Further analytical adjustments, as required under the Basel II Framework and OSFI’s requirements set out in their Domestic Implementation Notes, are applied to estimates obtained from historical data. These analytical adjustments incorporate the regulatory requirements pertaining to:
| • | | Long-run estimation of PD, which requires that PD estimates capture average default experience over a reasonable mix of high-default and low-default years of the economic cycle; |
| • | | Downturn estimation for LGD and EAD, which requires that these estimates appropriately reflect conditions observed during periods of economic stress; and |
68 2011 Scotiabank Annual Report
MANAGEMENT’S DISCUSSION AND ANALYSIS | RISK MANAGEMENT
| • | | The addition of an adequate level of conservatism, which should reflect the various sources of uncertainty inherent in historical estimates. |
These risk measures are used in the calculation of regulatory capital requirements based on formulas specified by the Basel framework. The credit quality distribution of the Bank’s AIRB non-retail portfolio is shown in Table 30.
Retail
Retail credit exposure arises in the Canadian Banking, International and Wealth Management business lines.
Adjudication
The decision-making process for retail loans ensures that credit risks are adequately assessed, properly approved, continually monitored and actively managed. Generally, decisions on consumer loans are based on risk ratings, which are generated using predictive credit scoring models. Individual credit requests are processed by proprietary adjudication software.
The Bank’s credit adjudication and portfolio management methodologies are designed to ensure consistent underwriting and early identification of problem loans. The Bank’s rigorous credit underwriting methodology and risk modeling in Canada is more customer focused than product focused. The Bank’s view is that a customer-centric approach provides better risk assessment than product-based approaches, and should result in lower loan losses over time. The adjudication system calculates the maximum debt for which a customer qualifies, allowing customers to choose the products that satisfy all of their credit needs. International Banking uses a similar approach to risk modeling, adjudication and portfolio management.
T30 Credit risk assessment of exposures
Non-retail AIRB portfolio(1)
| | | | | | | | | | | | | | | | |
| As at Oct. 31, 2011 | | Exposure at default(3) ($ millions) | | | Exposure Weighted Average PD (%)(4) | | | Exposure Weighted Average LGD (%)(5) | | | Exposure Weighted Average RW (%)(6) | |
Investment grade(2) | | | 231,063 | | | | 0.12 | | | | 25 | | | | 18 | |
Non-investment grade | | | 57,936 | | | | 0.97 | | | | 42 | | | | 72 | |
Watch list | | | 3,019 | | | | 30.16 | | | | 42 | | | | 204 | |
Default(7) | | | 1,799 | | | | 100.00 | | | | 41 | | | | 248 | |
Total | | | 293,817 | | | | 1.21 | | | | 29 | | | | 32 | |
Total as at
Oct. 31, 2010 | | | 222,255 | | | | 0.92 | | | | 29 | | | | 28 | |
| (1) | Excludes securitization exposures. |
| (2) | Includes government guaranteed residential mortgages. |
| (3) | After credit risk mitigation. |
| (4) | PD – Probability of Default. |
| (5) | LGD – downturn Loss Given Default including a certain conservative factor as per Basel accord. |
| (7) | Gross defaulted exposures, before any related allowances. Defaulted exposures under Basel II definition may be higher than those under accounting definition. |
Credit scoring and policy changes are proposed by risk departments in the business lines with governance, oversight and key approvals made by Global Risk Management. Risk models and parameters are also subject to Global Risk Management’s validation and ongoing review. The review process includes referral to the appropriate Senior Credit Committee for approval, where required. Consumer credit portfolios are reviewed monthly to identify emerging trends in loan quality and to assess whether corrective action is required.
Risk ratings
The Bank’s consumer risk rating systems are oriented to borrower or transaction risk. Each retail exposure is assigned a risk grade based on the customer’s credit history and/or internal credit score. The Bank’s automated risk rating systems assess the ongoing credit-worthiness of individual customers on a monthly basis. This process provides for meaningful differentiation of risk, which allows for accurate, timely and consistent estimation of probability of default and loss, as well as early identification and management of problem loans.
The overall risk ratings system is reviewed annually with specific components evaluated frequently and more thoroughly if significant deterioration is detected in a portfolio or in the performance of a credit scorecard. Risk model validations are conducted independently from the areas responsible for rating system development and implementation, to ensure effective independence.
The Bank’s Canadian retail portfolio uses the AIRB approach under Basel II, while the International portfolios are subject to the Standardized approach at this time.
Credit Risk and Capital – Canadian retail
The AIRB approach is used to determine minimum regulatory capital requirements for the retail credit portfolio. AIRB risk parameters – estimates of probability of default (PD), exposure at default (EAD), and loss given default (LGD) – are fundamental tools in credit review and risk management. They are used as part of the ongoing review and monitoring of policies and procedures. As well, these parameters, along with the estimation of expected loss, are used to determine the Bank’s economic capital requirements. The expected loss calculation is also compared to the provisions in Canadian Banking to assess the reasonability of the risk parameters.
PD is estimated using a statistical model that is applied to all performing (non-defaulted) loans. The model predicts the probability that the facility will default within the next 12 months. The model uses all relevant information, including internal performance, credit bureau score, and certain macroeconomic factors. All retail portfolios use the Basel definition of default in calculating PD. The retail portfolio is comprised of the following Basel-based pools:
| • | | Residential real estate secured exposures: consists of conventional and high ratio residential mortgages and all other products opened under the Scotia Total Equity Plan (STEP), such as loans, credit cards and secured lines of credit; |
| • | | Qualifying revolving retail exposures: consists of all unsecured credit cards and lines of credit; |
| • | | Other retail consists of term loans (secured and unsecured), as well as credit cards and lines of credit which are secured by assets other than real estate. |
Fifteen PD bands are calculated for each retail portfolio, which are then summarized into fewer bands as shown in Table 31.
Retail facilities can generally be cancelled unconditionally at time of default, meaning no additional drawdown of a facility is possible after default. EAD measures the increases in the balance of revolving facilities from the time they are initially observed until the point of default. This historic experience is used to estimate the value of defaulted exposures in the portfolio over the next 12 months.
LGD is calculated by dividing the losses (less the present value of recoveries and collection costs) by EAD. The historic LGD is used to estimate the LGD that will be experienced in the portfolio in the following 12 months.
Scotiabank Annual Report 2011 69
MANAGEMENT’S DISCUSSION AND ANALYSIS
These risk measures are then converted into regulatory capital requirements by means of formulas specified by the Basel Committee. The credit quality distribution of the Bank’s AIRB retail portfolio is shown below in Table 32.
International retail
International retail credit portfolios follow the Standardized approach and consist of the following components:
| • | | Residential real estate secured lending; |
| • | | Qualifying revolving retail exposures consisting of all credit cards and lines of credit; |
| • | | Other retail consisting of term loans. |
Market Risk
Market risk is the risk of loss from changes in market prices and rates (including interest rates, credit spreads, equity prices, foreign exchange rates and commodity prices), the correlations among them, and their levels of volatility. A description of each market risk category is provided below:
Interest rate risk
The risk of loss due to changes in the level, slope and curvature of the yield curve; the volatility of interest rates; and mortgage prepayment rates.
Credit spread risk
The risk of loss due to changes in the market price of credit, or the creditworthiness of a particular issuer.
Foreign currency risk
The risk of loss due to changes in spot and forward prices, and the volatility of currency exchange rates.
Equity risk
The risk of loss due to changes in the prices, and the volatility, of individual equity instruments and equity indices.
Commodity risk
The risk of loss due primarily to changes in, and volatility of, spot and forward prices of precious and base metals, and energy products.
| | | | |
FUNDING Interest rate risk Foreign currency risk | | INVESTMENTS Interest rate risk Credit spread risk Foreign currency risk Equities risk | | TRADING Interest rate risk Credit spread risk Foreign currency risk Equities risk Commodities risk |
The Board of Directors reviews and approves market risk policies and limits annually. The Bank’s Liability Committee (LCO) and Market Risk Management and Policy Committee (MRMPC) oversee the application of the framework set by the Board, and monitor the Bank’s market risk exposures and the activities that give rise to these exposures. The MRMPC establishes specific operating policies, and sets limits at the product, portfolio, business unit and business line levels, and for the Bank in total. Limits are reviewed at least annually.
Global Risk Management provides independent oversight of all significant market risks, supporting the MRMPC and LCO with analysis, risk measurement, monitoring, reporting, proposals for standards and support for new product development. To ensure compliance with policies and limits, market risk exposures are independently monitored on a continuing basis, either by Global Risk Management or by the back offices. They provide senior management, business units, the LCO, and the MRMPC with a series of daily, weekly and monthly reports of market risk exposures by business line and risk type.
The Bank uses a variety of metrics and models to measure and control market risk exposures. These measurements are selected based on an assessment of the nature of risks in a particular activity. The principal measurement techniques are Value at Risk (VaR), stress testing, sensitivity analysis and simulation modeling, and gap analysis. The use and attributes of each of these techniques are noted in the Risk Measurement Summary. Models are independently validated prior to implementation and are subject to formal periodic review.
T31 Retail loan probability of default scale
| | |
| |
| Category of PD Grades | | PD Range |
Very low | | 0.0000% – 0.2099% |
Low | | 0.2100% – 0.4599% |
Medium | | 0.4600% – 3.1999% |
High | | 3.2000% – 17.2899% |
Very high | | 17.2900% – 99.9999% |
Default | | 100% |
T32 Credit risk assessment of exposures – Retail AIRB portfolio
| | | | | | | | | | | | | | | | |
| | | | |
| As at October 31, 2011 | | Exposure at default (EAD)(1) ($ millions) | | | Exposure Weighted Average PD (%)(2)(5) | | | Exposure Weighted Average LGD (%)(3)(5) | | | Exposure Weighted Average RW (%)(4)(5) | |
Very low | | | 92,167 | | | | 0.10 | | | | 24 | | | | 4 | |
Low | | | 16,370 | | | | 0.37 | | | | 44 | | | | 18 | |
Medium | | | 27,682 | | | | 1.33 | | | | 43 | | | | 36 | |
High | | | 6,253 | | | | 6.60 | | | | 44 | | | | 83 | |
Very high | | | 1,104 | | | | 38.10 | | | | 41 | | | | 129 | |
Default(6) | | | 542 | | | | 100.00 | | | | 66 | | | | – | |
Total | | | 144,118 | | | | 1.31 | | | | 31 | | | | 16 | |
Total as at October 31, 2010 | | | 130,951 | | | | 1.08 | | | | 33 | | | | 16 | |
| (1) | After credit risk mitigation. |
| (2) | PD – Probability of Default. |
| (3) | LGD – Loss Given Default. |
| (5) | Exposure at default used as basis for estimated weightings. |
| (6) | Gross defaulted exposures, before any related allowances. |
70 2011 Scotiabank Annual Report
MANAGEMENT’S DISCUSSION AND ANALYSIS | RISK MANAGEMENT
| | | | |
| | Risk Measurement Summary Value at risk Value at Risk (VaR) is a method of measuring market risk based upon a common confidence interval and time horizon. It is a statistical estimate of expected potential loss that is derived by translating the riskiness of any financial instrument into a common standard. The Bank calculates VaR daily using a 99% confidence level, and a one-day holding period for its trading portfolios. This means that about once in every 100 days, the trading positions are expected to lose more than the VaR estimate. The Bank calculates general market risk and equity specific risk VaR using historical simulation based on 300 days of market data. For debt specific risk VaR, the Bank uses a combination of Monte Carlo and historical simulation. Changes in VaR between reporting periods are generally due to changes in levels of exposure, volatilities and/or correlations among asset classes. VaR is also used to evaluate risks arising in certain funding and investment portfolios. Back testing is also an important and necessary part of the VaR process, by validating the quality and accuracy of the Bank’s VaR model. The Board reviews VaR results quarterly. Stress testing VaR measures potential losses in normally active markets. An inherent limitation of VaR is that it gives no information about how much losses could exceed their expected levels. Accordingly, stress testing examines the impact that abnormally large swings in market factors and periods of prolonged inactivity might have on trading portfolios. The stress testing program is designed to identify key risks and ensure that the Bank’s capital can easily absorb potential losses from abnormal events. The Bank subjects its trading portfolios to more than 75 stress tests on a daily basis, and more than 250 stress tests on a monthly basis. The Bank also evaluates risk in its investment portfolios on a monthly basis, using stress tests based on risk factor sensitivities and specific market events. The stress testing program is an essential component of the Bank’s comprehensive risk management framework which complements the current VaR methodology and other risk measures and controls employed by the Bank. The Board reviews stress testing results quarterly. Sensitivity analysis and simulation modeling Sensitivity analysis assesses the effect of changes in interest rates on current earnings and on the economic value of shareholders’ equity related to non-trading portfolios. It is applied globally to each of the major currencies within the Bank’s operations. Simulation models enable the Bank to assess interest rate risk under a variety of scenarios over time. The models incorporate assumptions about changes in interest rates, shape of the yield curve, embedded product options, maturities and other factors. Simulation modeling under various scenarios is particularly important for managing risk in the deposit, lending and investment products the Bank offers to its retail customers. Gap analysis Gap analysis is used to assess the interest rate sensitivity of the Bank’s Canadian and international operations. Under gap analysis, interest rate sensitive assets, liabilities and off-balance sheet instruments are assigned to defined time periods on the basis of expected re-pricing dates. | | |
Funding and investment activities
Market risk arising from the Bank’s funding and investment activities is identified, managed and controlled through the Bank’s asset-liability management processes. The LCO meets weekly to review risks and opportunities, and evaluate performance including the effectiveness of hedging strategies.
Interest Rate Risk
The Bank actively manages its interest rate exposures with the objective of enhancing net interest income within established risk tolerances. Interest rate risk arising from the Bank’s lending, funding and investment activities is managed in accordance with Board-approved policies and global limits, which are designed to control the risk to income and economic value of shareholders’ equity. The income limit measures the effect of a specified change in interest rates on the Bank’s annual net interest income, while the economic value limit measures the impact of a specified change in interest rates on the present value of the Bank’s net assets. Interest rate exposures in individual currencies are also controlled by gap limits. Gap analysis, simulation modeling, sensitivity analysis and VaR are used to assess exposures and for planning purposes.
Table 34 shows the after-tax impact of a 100 and 200 basis point shift on annual income and economic value of shareholder’s equity. Based on the Bank’s interest rate positions at year-end 2011, an immediate and sustained 100 basis point rise in interest rates across all currencies and maturities would increase net income after-tax by approximately $178 million over the next 12-months. During fiscal 2011, this measure ranged between $143 million and $211 million. This same increase in interest rates would result in an after-tax decrease in the present value of the Bank’s net assets of approximately $144 million. During fiscal 2011, this measure ranged between $121 million and $249 million.
Interest rate risk exposure calculations are generally based on the earlier of contractual re-pricing or maturity of on-balance sheet and off-balance sheet assets and liabilities, although certain assets and liabilities such as credit cards and deposits without a fixed maturity are assigned a maturity profile based on the longevity of the exposure. Expected prepayments from loans and cashable investment products are also incorporated into the exposure calculations. Common shareholders’ equity is assumed to be non-interest rate sensitive.
T33 Interest rate gap
| | | | | | | | | | | | | | | | | | | | |
Interest rate sensitivity position(1) As at October 31, 2011
($ billions) | | Within 3 months | | | 3 to 12 months | | | Over 1 year | | | Non- interest
rate sensitive | | | Total | |
Canadian dollars | | | | | | | | | | | | | | | | | | | | |
Assets | | $ | 196.0 | | | $ | 22.1 | | | $ | 77.2 | | | $ | 7.2 | | | $ | 302.5 | |
Liabilities | | | 171.1 | | | | 34.0 | | | | 83.9 | | | | 13.5 | | | | 302.5 | |
Gap | | | 24.9 | | | | (11.9 | ) | | | (6.7 | ) | | | (6.3 | ) | | | – | |
Cumulative gap | | | 24.9 | | | | 13.0 | | | | 6.3 | | | | – | | | | | |
| | | | | |
Foreign currencies | | | | | | | | | | | | | | | | | | | | |
Assets | | $ | 202.0 | | | $ | 17.9 | | | $ | 24.9 | | | $ | 28.0 | | | $ | 272.8 | |
Liabilities | | | 198.6 | | | | 14.0 | | | | 16.3 | | | | 43.9 | | | | 272.8 | |
Gap | | | 3.4 | | | | 3.9 | | | | 8.6 | | | | (15.9 | ) | | | – | |
Cumulative gap | | | 3.4 | | | | 7.3 | | | | 15.9 | | | | – | | | | | |
| | | | | |
Total | | | | | | | | | | | | | | | | | | | | |
Gap | | $ | 28.3 | | | $ | (8.0 | ) | | $ | 1.9 | | | $ | (22.2 | ) | | | | |
Cumulative gap | | | 28.3 | | | | 20.3 | | | | 22.2 | | | | – | | | | | |
| | | | | |
As at October 31, 2010: | | | | | | | | | | | | | | | | | | | | |
Gap | | $ | 24.7 | | | $ | (9.5 | ) | | $ | 6.4 | | | $ | (21.6 | ) | | | | |
Cumulative gap | | | 24.7 | | | | 15.2 | | | | 21.6 | | | | – | | | | | |
| (1) | The above figures reflect the inclusion of off-balance sheet instruments, as well as an estimate of prepayments on consumer and mortgage loans and cashable GICs. The off-balance sheet gap is included in liabilities. |
Scotiabank Annual Report 2011 71
MANAGEMENT’S DISCUSSION AND ANALYSIS
C43Interest rate gap
$ billions, one-year interest rate gap
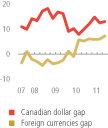
T34 Structural interest sensitivity
| | | | | | | | | | | | | | | | |
As at October 31 ($ millions) | | 2011 | | | 2010 | |
| | Economic
Value of Shareholders’
Equity | | | Annual Income | | | Economic
Value of Shareholders’
Equity | | | Annual Income | |
After-Tax Impact of | | | | | | | | | | | | | | | | |
100bp increase in rates | | | (144 | ) | | | 178 | | | | (415 | ) | | | 50 | |
100bp decrease in rates | | | 86 | | | | (185 | ) | | | 411 | | | | (35 | ) |
After-Tax Impact of | | | | | | | | | | | | | | | | |
200bp increase in rates | | | (300 | ) | | | 368 | | | | (829 | ) | | | 102 | |
200bp decrease in rates | | | 124 | | | | (366 | ) | | | 858 | | | | (80 | ) |
Foreign currency risk
Foreign currency risk in the Bank’s unhedged funding and investment activities arises primarily from the Bank’s net investments in self-sustaining foreign operations as well as foreign currency earnings in its domestic and remitting foreign branch operations.
The Bank’s foreign currency exposure to its net investments in self-sustaining foreign operations is controlled by a Board-approved limit. This limit considers factors such as potential volatility to shareholders’ equity as well as the potential impact on capital ratios from foreign exchange fluctuations. On a quarterly basis, the LCO reviews the Bank’s foreign currency net investment exposures and determines the appropriate hedging strategies. These may include funding the investments in the same currency or using other financial instruments, including derivatives.
In accordance with GAAP, foreign currency translation gains and losses from net investments in self-sustaining foreign operations, net of related hedging activities and tax effects, are recorded in accumulated other comprehensive income within shareholders’ equity. However, the Bank’s regulatory capital ratios are not materially affected by these foreign exchange fluctuations because the risk-weighted assets of the foreign operations tend to move in a similar direction.
The Bank is also subject to foreign currency translation risk on the earnings of its foreign operations which are not self-sustaining. The Bank forecasts foreign currency revenues and expenses, which are primarily denominated in U.S. dollars, over a number of future fiscal quarters. The LCO also assesses economic data trends and forecasts to determine if some or all of the estimated future foreign currency revenues and expenses should be hedged. Hedging instruments normally include foreign currency spot and forward contracts, as well as foreign currency options and swaps. Certain of these economic hedges may not qualify for hedge accounting resulting in a potential for a mismatch in the timing of the recognition of economic hedge gains/losses and the underlying foreign earnings translation gains/losses. In accordance with GAAP, foreign currency translation gains and losses from positions in operations that are not self-sustaining are recorded directly in earnings.
As at October 31, 2011, a one per cent increase in the Canadian dollar against all currencies in which the Bank operates, decreases the Bank’s before-tax annual earnings by approximately $33 million in the absence of hedging activity, primarily from exposure to U.S. dollars. A similar change in the Canadian dollar would increase the unrealized foreign currency translation losses in the accumulated other comprehensive income section of shareholders’ equity by approximately $216 million as at October 31, 2011, net of hedging.
Investment portfolio risks
The Bank holds investment portfolios to meet liquidity and statutory reserve requirements and for investment purposes. These portfolios expose the Bank to interest rate, foreign currency, credit spread and
equity risks. Debt investments primarily consist of government, agency, and corporate bonds. Equity investments include common and preferred shares, as well as a diversified portfolio of third-party managed funds. The majority of these securities are valued using prices obtained from external sources. These portfolios are controlled by a Board-approved policy and limits.
Trading activities
Scotiabank’s policies, processes and controls for trading activities are designed to achieve a balance between pursuing profitable trading opportunities and managing earnings volatility within a framework of sound and prudent practices. Trading activities are primarily customer focused, but also include a proprietary component.
Market risk arising from the Bank’s trading activities is managed in accordance with Board-approved policies, and aggregate VaR and stress testing limits. The quality of the Bank’s VaR is validated by regular backtesting analysis, in which the VaR is compared to theoretical and actual profit and loss results. A VaR at the 99% confidence interval is an indication of the probability that losses will exceed the VaR if positions remain unchanged during the next business day. Trading positions are however managed dynamically and as a result actual profit/loss backtesting exceptions are uncommon. During fiscal 2011 there were five theoretical profit/loss exceptions and one actual profit/loss exception.
In fiscal 2011, the one-day VaR for trading activities averaged $11.3 million, compared to $12.5 million in 2010. The decrease was primarily due to lower interest rate risk.
Chart 44 shows the distribution of daily trading revenue for fiscal 2011. Trading revenue averaged $4.3 million per day, compared to $5.6 million for 2010. Revenue was positive on more than 88% of trading days during the year, unchanged from 2010. During the year the largest single day trading loss was $14.4 million which occurred on August 8, 2011 and was higher than the general market risk VaR of $10.8 million on the same day.
T35 One-day VaR by risk factor
| | | | | | | | | | | | | | | | | | | | | | | | | | | | | | | | | | |
| | | |
| | | 2011 | | | | | 2010 | |
| | | | | | | | | |
| ($ millions) | | Year
end | | | Avg | | | High | | | Low | | | | | Year
end | | | Avg | | | High | | | Low | |
Interest rate | | | 8.3 | | | | 10.3 | | | | 20.9 | | | | 6.2 | | | | | | 9.0 | | | | 11.7 | | | | 19.0 | | | | 7.3 | |
Equities | | | 1.7 | | | | 4.8 | | | | 10.9 | | | | 1.1 | | | | | | 3.4 | | | | 5.1 | | | | 14.1 | | | | 2.3 | |
Foreign exchange | | | 1.3 | | | | 1.2 | | | | 2.4 | | | | 0.4 | | | | | | 0.9 | | | | 1.7 | | | | 4.6 | | | | 0.6 | |
Commodities | | | 2.6 | | | | 2.2 | | | | 4.5 | | | | 1.2 | | | | | | 1.5 | | | | 2.1 | | | | 5.6 | | | | 0.6 | |
Diversification | | | (5.4 | ) | | | (7.2 | ) | | | N/A | | | | N/A | | | | | | (6.3 | ) | | | (8.1 | ) | | | N/A | | | | N/A | |
All-Bank VaR | | | 8.5 | | | | 11.3 | | | | 19.6 | | | | 7.8 | | | | | | 8.5 | | | | 12.5 | | | | 19.5 | | | | 7.4 | |
72 2011 Scotiabank Annual Report
MANAGEMENT’S DISCUSSION AND ANALYSIS | RISK MANAGEMENT
C44Trading revenue distribution(1)
Year ended October 31, 2011
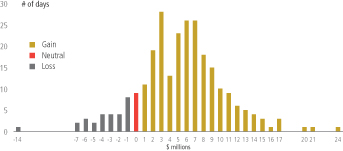
| (1) | Taxable equivalent basis; refer to non-GAAP measures on page 29. |
C45Daily trading revenue vs. VaR(1)
$ millions, November 1, 2010 to October 31, 2011
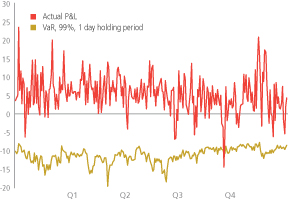
| (1) | Taxable equivalent basis; refer to non-GAAP measures on page 29. |
Calculation of market risk capital for trading
The assessment of market risk for trading activities includes both general market risk and specific risk. General market risk is defined as the risk of loss arising from adverse changes in market prices. Specific risk is defined as the risk of loss caused by an adverse price movement of a debt or equity instrument due principally to factors related to the issuer. Under the Basel II capital adequacy guidelines, the specific risk capital and general market risk capital requirements apply to interest rate risk and equity risk. The general market risk capital requirement also applies to commodities risk and foreign exchange risk.
For all material trading portfolios, the Bank applies its internal Value at Risk (VaR) model to calculate the capital charge for general market risk and specific risk. The attributes/parameters of this model are described in the Risk Measurement Summary on page 71. The Office of the Superintendent of Financial Institutions (OSFI) has approved the Bank’s internal VaR model for the determination of its General Market Risk Capital and Equity and Debt Specific Risk Capital requirements.
For non-material trading portfolios, the Bank applies the Standardized Approach for calculating general market risk and debt specific risk capital. The standardized method uses a “building block” approach with the capital charge for each risk category calculated separately.
The Bank has assessed the quantitative impact on market risk capital of the new trading book rules under the Basel II market risk framework and estimates the increase will be up to $12 billion in risk weighted assets despite the fact that trading risk appetite remains unchanged. This number is based on balances at October 31, 2011 and may change as a result of changes in the portfolio and other management action that has or may be taken.
Derivative instruments and structured transactions
Derivatives
The Bank uses derivatives to meet customer needs, generate revenues from trading activities, manage market and credit risks arising from its lending, funding and investment activities, and lowers its cost of capital. The Bank uses several types of derivative products, including interest rate swaps, futures and options, to hedge interest rate risk exposure. Forward contracts, swaps and options are used to manage foreign currency risk exposures. Credit exposures in its lending and investment books are managed using credit default swaps. As a dealer, the Bank markets a range of derivatives to its customers, including interest rate, foreign exchange, equity, commodity and credit derivatives.
Market risk arising from derivatives transactions is subject to the control, reporting and analytical techniques noted above in the Trading activities section. Additional controls and analytical techniques are applied to address certain market-related risks that are unique to derivative products.
Structured Transactions
Structured transactions are specialized transactions that may involve combinations of cash, other financial assets and derivatives designed to meet the specific risk management or financial requirements of customers. These transactions are carefully evaluated by the Bank to identify and address the credit, market, legal, tax, reputational and other risks, and are subject to a cross-functional review and sign-off by trading management, Global Risk Management, Taxation, Finance and Legal departments. Large structured transactions are also subject to review by senior risk management committees and evaluated in accordance with the procedures described below in Reputational Risk.
The market risk in these transactions is usually minimal, and returns are earned by providing structuring expertise and by taking credit risk. Once executed, structured transactions are subject to the same ongoing credit reviews and market risk analysis as other types of derivatives transactions. This review and analysis includes careful monitoring of the quality of the reference assets, and ongoing valuation of the derivatives and reference assets.
Liquidity Risk
Liquidity risk is the risk that the Bank is unable to meet its financial obligations in a timely manner at reasonable prices. Financial obligations include liabilities to depositors, payments due under derivative contracts, settlement of securities borrowing and repurchase transactions, and lending and investment commitments.
Effective liquidity risk management is essential in order to maintain the confidence of depositors and counterparties, and to enable the core businesses to continue to generate revenue, even under adverse circumstances.
Liquidity risk is managed within the framework of policies and limits that are approved by the Board of Directors. The Board receives reports on risk exposures and performance against approved limits. The Liability Committee (LCO) provides senior management oversight of liquidity risk and meets weekly to review the Bank’s liquidity profile.
The key elements of the liquidity risk framework are:
| • | | Measurement and modeling – the Bank’s liquidity model measures and forecasts cash inflows and outflows, including off-balance sheet cash flows on a daily basis. Risk is managed by a set of key limits over the maximum net cash outflow by currency over specified short-term horizons (cash gaps) and a minimum level of core liquidity. |
Scotiabank Annual Report 2011 73
MANAGEMENT’S DISCUSSION AND ANALYSIS
| • | | Reporting – Global Risk Management provides independent oversight of all significant liquidity risks, supporting the LCO with analysis, risk measurement, stress testing, monitoring and reporting. |
| • | | Stress testing – the Bank performs liquidity stress testing on a regular basis, to evaluate the effect of both industry and Bank-specific disruptions on the Bank’s liquidity position. Liquidity stress testing has many purposes including: |
| | – | | Helping the Bank to understand the potential behavior of various positions on its balance sheet in circumstances of stress; and |
| | – | | Based on this knowledge, facilitating the development of risk mitigation and contingency plans. |
| • | | The Bank’s liquidity stress tests consider the effect of changes in funding assumptions, depositor behavior and the market value of liquid assets. The Bank also performs industry standard stress tests required by regulators and rating agencies. The stress test results are reviewed at senior levels of the organization and are considered in making liquidity management decisions. |
| • | | Contingency planning – the Bank maintains a liquidity contingency plan that specifies an approach for analyzing and responding to actual and potential liquidity events. The plan outlines an appropriate governance structure for the management and monitoring of liquidity events, processes for effective internal and external communication, and identifies potential counter measures to be considered at various stages of an event. A contingency plan is maintained both at the parent level as well as for major subsidiaries. |
| • | | Funding diversification – the Bank actively manages the diversification of its deposit liabilities by source, type of depositor, instrument, term and geographic market. |
| • | | Core liquidity – the Bank maintains a pool of highly liquid, unencumbered assets that can be readily sold, or pledged to secure borrowings, under stressed market conditions or due to company specific events. The Bank also maintains liquid assets to support its intra-day settlement obligations in payment, depository and clearing systems. |
Liquidity Profile
The Bank maintains large holdings of liquid assets to support its operations. These assets generally can be sold or pledged to meet the Banks’ obligations. As at October 31, 2011 liquid assets were $162 billion or 28% of total assets, compared to $148 billion or 28% of total assets as at October 31, 2010. The mix of these assets between securities and other liquid assets, including cash and deposits with banks, was 65% and 35%, respectively (October 31, 2010 – 68% and 32%, respectively).
In the course of the Bank’s day-to-day activities, securities and other assets are pledged to secure an obligation, participate in clearing or settlement systems, or operate in a foreign jurisdiction. Securities may also be sold under repurchase agreements. As at October 31, 2011, total assets pledged or sold under repurchase agreements were $107 billion, compared to $96 billion as at October 31, 2010. The year over year change was largely due to an increase in assets sold under repurchase agreements, pledging activity to support the Bank’s covered bond program and collateral related to other funding activities. In some over-the-counter derivative contracts, the Bank would be required to post additional collateral in the event its credit rating was downgraded. The Bank maintains access to sufficient collateral to meet its obligations in the event of a downgrade of its ratings by one or more of the rating agencies.
Funding
The Bank ensures that its funding sources are well diversified. Funding source concentrations are regularly monitored and analyzed by type and by industry. The principal sources of funding are capital, core deposits from retail and commercial clients through the Canadian and international branch network, and wholesale funding. The Bank also securitizes mortgages through the Canada Mortgage Bonds program as an alternative source of funding, and for liquidity and asset/liability management purposes. To ensure that the Bank does not place undue reliance on a single entity as a funding source, the Bank maintains a limit on the amount of deposits it will accept from any one entity.
T36 Liquidity
| | | | | | | | | | | | | | | | | | | | |
| | | | | |
| As at October 31 ($ millions) | | 2011 | | | 2010 | | | 2009 | | | 2008 | | | 2007 | |
Canadian dollar liquid assets | | | | | | | | | | | | | | | | | | | | |
Cash and deposits with Bank of Canada | | $ | 509 | | | $ | 484 | | | $ | 1,223 | | | $ | 498 | | | $ | 502 | |
Deposits with other banks | | | 2,345 | | | | 2,558 | | | | 1,371 | | | | 1,654 | | | | 4,152 | |
Securities | | | 79,429 | | | | 79,086 | | | | 81,613 | | | | 46,558 | | | | 53,429 | |
| | | 82,283 | | | | 82,128 | | | | 84,207 | | | | 48,710 | | | | 58,083 | |
Foreign currency liquid assets | | | | | | | | | | | | | | | | | | | | |
Cash and deposits with Bank of Canada | | | 10,053 | | | | 7,150 | | | | 6,170 | | | | 3,064 | | | | 4,503 | |
Deposits with other banks | | | 41,563 | | | | 35,835 | | | | 34,513 | | | | 32,102 | | | | 20,039 | |
Securities | | | 26,025 | | | | 21,654 | | | | 19,649 | | | | 21,298 | | | | 19,809 | |
Call and short loans | | | 1,708 | | | | 1,498 | | | | 1,538 | | | | 1,087 | | | | 874 | |
| | | 79,349 | | | | 66,137 | | | | 61,870 | | | | 57,551 | | | | 45,225 | |
Total liquid assets | | | | | | | | | | | | | | | | | | | | |
Cash and deposits with Bank of Canada | | | 10,562 | | | | 7,634 | | | | 7,393 | | | | 3,562 | | | | 5,005 | |
Deposits with other banks | | | 43,908 | | | | 38,393 | | | | 35,884 | | | | 33,756 | | | | 24,191 | |
Securities | | | 105,454 | | | | 100,740 | | | | 101,262 | | | | 67,856 | | | | 73,238 | |
Call and short loans | | | 1,708 | | | | 1,498 | | | | 1,538 | | | | 1,087 | | | | 874 | |
| | $ | 161,632 | | | $ | 148,265 | | | $ | 146,077 | | | $ | 106,261 | | | $ | 103,308 | |
Liquid assets as a % of total assets | | | 28.1 | % | | | 28.2 | % | | | 29.4 | % | | | 20.9 | % | | | 25.1 | % |
C46Core funds
$ billions, as at October 31
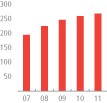
74 2011 Scotiabank Annual Report
MANAGEMENT’S DISCUSSION AND ANALYSIS | RISK MANAGEMENT
Core funds, represented by capital and core deposits of the Bank’s retail and commercial clients, were $265 billion as at October 31, 2011, versus $256 billion last year (see Chart 46). This increase was attributable primarily to an increase in capital and higher balances of demand and notice deposits. As at October 31, 2011, the Bank’s core funds represented 46% of total funding, versus 49% last year.
Contractual Obligations
The Bank’s contractual obligations include contracts and purchase obligations, including agreements to purchase goods and services, that are enforceable and legally binding on the Bank.
Table 37 provides aggregated information about the Bank’s contractual obligations as at October 31, 2011, which affect the Bank’s liquidity and capital resource needs.
The table excludes deposit liabilities (except term funding), pension and other retirement benefit obligations, lending commitments and other short-term financing arrangements which are discussed in Notes 10, 20 and 24, respectively, of the 2011 Consolidated Financial Statements.
The Bank prudently diversifies its wholesale funding activities by using a number of different funding programs to access the global financial markets and extend its maturity profile, as appropriate. In 2011, the Bank issued approximately $21 billion of senior term funding in the domestic, United States and other markets.
The Bank leases a large number of its branches, offices and other locations. The vast majority of these leases are for a term of five years, with an option to renew. The total cost of these leases, net of rental income from subleases, was $276 million in 2011 (2010 – $243 million). The increase of $33 million relates primarily to the acquisition of DundeeWealth and growth in Canadian and International service delivery platforms. Refer to Note 24 of the 2011 Consolidated Financial Statements.
Two major outsourcing contracts have been entered into by the Bank. The largest is a contract with IBM Canada entered into in 2001 to manage the Bank’s domestic computer operations, including data centres, branches, Automated Banking Machines, and desktop computing environment. The contract was expanded in 2005 to also include the computer operations for the Caribbean, Central America, and Mexico. The contract for Canadian operations was renewed in 2007 and is now extended until 2013, co-terminus with Mexico, the Caribbean and Central America contracts.
The second is a three-year contract, with two optional five-year renewals, entered into in 2003 with Symcor Inc. to manage the Bank’s cheque and bill payment processing, including associated statement
and report printing activities across Canada. The final 5-year option has been exercised.
These outsourcing contracts are cancellable with notice.
Capital Expenditures
Scotiabank has an ongoing program of capital investment to provide the necessary level of technology and real estate resources to service our customers and meet new product requirements. All major capital expenditures go through a rigorous review and approval process.
Total capital expenditures in 2011 are estimated to be $262 million, an increase of 25% from 2010. The increase is primarily in Technology, $43 million or 57%, due largely to the ongoing ABM Replacement initiative in Canada and equipment upgrades in our International Branch network.
Operational risk
Operational risk is the risk of loss, whether direct or indirect, to which the Bank is exposed due to inadequate or failed internal processes or systems, human error, or external events. Operational risk includes legal and regulatory risk, business process and change risk, fiduciary or disclosure breaches, technology failure, financial crime and environmental risk. It exists in some form in every Bank business and function. Operational risk can not only result in financial loss, but also regulatory sanctions and damage to the Bank’s reputation. The Bank is very successful at managing operational risk with a view to safeguarding client assets and preserving shareholder value.
The Bank has developed policies, processes and assessment methodologies to ensure that operational risk is appropriately identified and managed with effective controls. The governing principles of the Bank’s operational risk management program include:
| • | | The individual business lines being accountable for management and control of the significant operational risks to which they are exposed. |
| • | | An organization structure through which there is effective oversight and in which operational risk is managed to an established risk appetite, including: |
| | – | | The Board of Directors are responsible for sound corporate governance and approves the Bank’s Operational Risk Management Policy; |
| | – | | A senior level Operational Risk Committee comprised of Heads of Business Lines and key control functions, and chaired by the Group Head and Chief Risk Officer. This Committee provides consistent, Bank-wide oversight of operational risk management. |
T37 Contractual obligations
| | | | | | | | | | | | | | | | | | | | |
| | | | | |
| ($ millions) | | Under 1 year | | | 1-3 years | | | 4-5 years | | | Over 5 years | | | Total | |
Term funding | | | | | | | | | | | | | | | | | | | | |
Wholesale deposit notes | | | 12,321 | | | | 16,465 | | | | 8,609 | | | | 2,039 | | | | 39,434 | |
Euro medium term notes | | | 1,904 | | | | 1,133 | | | | 30 | | | | 52 | | | | 3,119 | |
Covered bonds | | | – | | | | 3,482 | | | | 4,374 | | | | – | | | | 7,856 | |
Subordinated debentures | | | – | | | | 251 | | | | – | | | | 5,672 | | | | 5,923 | |
Other long-term liabilities | | | 806 | | | | 3,122 | | | | 445 | | | | 3,175 | | | | 7,548 | |
Subtotal | | | 15,031 | | | | 24,453 | | | | 13,458 | | | | 10,938 | | | | 63,880 | |
Operating leases | | | 234 | | | | 383 | | | | 256 | | | | 325 | | | | 1,198 | |
Outsourcing obligations | | | 181 | | | | 243 | | | | 74 | | | | – | | | | 498 | |
Total | | | 15,446 | | | | 25,079 | | | | 13,788 | | | | 11,263 | | | | 65,576 | |
Scotiabank Annual Report 2011 75
MANAGEMENT’S DISCUSSION AND ANALYSIS
| | – | | Executive management with clearly defined areas of responsibility; |
| | – | | A central unit in Global Risk Management responsible for: developing and applying methods to identify, assess, and monitor operational risks; and reporting on risks as well as actual loss events; |
| | – | | Independent specialist units responsible for developing methods to mitigate specific components of operational risk, including codifying policies and processes required to control those specific risks; |
| �� | – | | Separation of duties between key functions; and, |
| | – | | An independent internal audit department responsible for verifying that significant risks are identified and assessed, and for testing controls to ensure that overall risk is at an acceptable level. |
The following are key components of the Bank’s operational risk management framework:
| • | | The Bank’s risk and control self-assessment program, which is managed by Global Risk Management’s central operational risk unit, includes formal reviews of significant operations and processes to identify and assess operational risks. Scenario analysis has been successfully introduced to risk assessments as a tool that provides a more forward looking view of key risks. Overall, this program provides a basis for management to ensure that controls are functioning effectively. Business line management attests to the accuracy of each assessment and develops action plans to mitigate risks if controls are not identified as effective. Results of these reviews are summarized and reported to executive management and the Board of Directors. |
| • | | The Bank’s centralized operational loss event database, which is managed and maintained by the central operational risk unit, captures key information on operational losses. This data is analyzed, benchmarked against industry loss data and significant metrics, then reported to executive management and the Board of Directors to provide insight into operational risk exposures and trends. |
| • | | The Bank’s Fraud Management Office, which identifies threats of financial crime, implements systems and processes to mitigate loss and reports on fraud loss activity to senior management. |
| • | | The Bank’s monitoring of industry events, identifies significant losses incurred at other financial institutions and provides a reference for reviewing and assessing the Bank’s own risk exposure. |
| • | | The compliance risk management program led by Group Compliance through an established network and associated processes that include: monitoring regulatory changes; conducting compliance risk assessments; implementing policies and procedures; training; monitoring and resolving issues; and reporting on the status of compliance and compliance controls to executive management, the Board of Directors, and regulators as required. |
| • | | Processes in each business line for evaluation of risk in new businesses and products. |
| • | | The Bank’s business continuity management policy, which requires that all business units develop business continuity capabilities for their respective functions. The Bank’s Business Continuity Management Department is responsible for governance and oversight of the Bank’s business continuity, and monitors units to ensure compliance with these policies. |
| • | | The Bank’s model risk policy, which provides the framework for model review and approval under the oversight of the Operational Risk Committee. |
| • | | The Bank’s training programs, such as the mandatory Anti-Money Laundering and Information Security examinations which ensure employees are aware and equipped to safeguard our customers’ and the Bank’s assets. |
| • | | Risk mitigation programs, which use insurance policies to transfer the risk of high severity losses, where feasible and appropriate. |
The Bank applies the Standardized Approach for calculating operational risk capital under the Basel II capital framework. Total capital is determined as the sum of capital for each of eight Basel defined business activities. The capital for each activity is the product of the relevant risk factor, as defined by Basel, applied to the gross income of each respective business activity. Progress is underway to prepare for the more sophisticated Advanced Measurement Approach (AMA), which is expected to be fully implemented in fiscal 2014. Under AMA, regulatory capital measurement will more directly reflect the Bank’s operational risk environment.
Reputational risk
Reputational risk is the risk that negative publicity regarding Scotiabank’s conduct, business practices or associations, whether true or not, will adversely affect its revenues, operations or customer base, or require costly litigation or other defensive measures.
Negative publicity about an institution’s business practices may involve any aspect of its operations, but usually relates to questions of business ethics and integrity, or quality of products and services. Negative publicity and attendant reputational risk frequently arise as a by-product of some other kind of risk management control failure.
Reputational risk is managed and controlled throughout the Bank by codes of conduct, governance practices and risk management programs, policies, procedures and training. Many relevant checks and balances are outlined in greater detail under other risk management sections, particularly Operational risk, where reference is made to the Bank’s well-established compliance program. All directors, officers and employees have a responsibility to conduct their activities in accordance with the Scotiabank Guidelines for Business Conduct, and in a manner that minimizes reputational risk. The activities of the Legal, Corporate Secretary, Public, Corporate and Government Affairs and Compliance departments, and the Reputational Risk Committee, are particularly oriented to the management of reputational risk.
In providing credit, advice, or products to customers, or entering into associations, the Bank considers whether the transaction, relationship or association might give rise to reputational risk. The Bank has an established, Board-approved reputational risk policy, as well as policy and procedures for managing reputational and legal risk related to structured finance transactions. Global Risk Management plays a significant role in the identification and management of reputational risk related to credit underwriting. In addition, the Reputational Risk Committee is available to support Global Risk Management, as well as other risk management committees and business units, with their assessment of reputational risk associated with transactions, business initiatives, and products and services.
The Reputational Risk Committee considers a broad array of factors when assessing transactions, so that the Bank meets, and will be seen to meet, high ethical standards. These factors include the extent, and outcome, of legal and regulatory due diligence pertinent to the transaction; the economic intent of the transaction; the effect of the transaction on the transparency of a customer’s financial reporting; the need for customer or public disclosure; conflicts of interest; fairness issues; and public perception.
76 2011 Scotiabank Annual Report
MANAGEMENT’S DISCUSSION AND ANALYSIS | RISK MANAGEMENT
The Committee may impose conditions on customer transactions, including customer disclosure requirements to promote transparency in financial reporting, so that transactions meet Bank standards. In the event the Committee recommends not proceeding with a transaction and the sponsor of the transaction wishes to proceed, the transaction is referred to the Risk Policy Committee.
Environmental risk
Environmental risk refers to the possibility that environmental concerns involving the Scotiabank Group or its customers could affect the Bank’s financial performance.
To safeguard the Bank and the interests of its stakeholders, Scotiabank has an environmental policy, which is approved by the Bank’s Board of Directors. The policy guides day-to-day operations, lending practices, supplier agreements, the management of real estate holdings and external reporting practices. It is supplemented by specific policies and practices relating to individual business lines.
Environmental risks associated with the business operations of each borrower and any real property offered as security are considered in the Bank’s credit evaluation procedures. This includes an environmental assessment where applicable, and commentary on climate change where it could have a material impact (including regulatory, physical or reputational impacts) on the borrower. Global Risk Management has primary responsibility for establishing the related policies, processes and standards associated with mitigating environmental risk in the Bank’s lending activities. Decisions are taken in the context of the risk management framework discussed on page 63.
In the area of project finance, the revised Equator Principles have been integrated into the Bank’s internal processes and procedures since 2006. These are environmental and social guidelines for project finance transactions with a capital cost of U.S. $10 million or higher, based on the policies of the International Finance Corporation, the private sector arm of the World Bank. The Equator Principles provide safeguards for sensitive projects to ensure protection of natural habitats and the rights of indigenous peoples, as well as safeguards against child and forced labour.
Environmental concerns also play a prominent role in shaping the Bank’s real estate practices and purchasing decisions. The Real Estate Department adheres to an Environmental Compliance Policy to ensure responsible management of the Bank’s real estate holdings. In addition, considerable recycling and resource management programs are in place in the Bank’s corporate offices and branch networks. Internal tracking systems are in place with respect to energy use, greenhouse gas emissions (GHG) and paper consumption. A variety of reduction measures are in place for energy, paper and waste. In order to further reduce the Bank’s environmental footprint, it has developed an internal Environmental Paper Policy and is in the process of developing and implementing more definitive management processes on energy.
To ensure it continues to operate in an environmentally responsible manner, the Bank monitors policy and legislative requirements through ongoing dialogue with government, industry and stakeholders in countries where it operates. Scotiabank has been meeting with environmental organizations, industry associations and socially responsible investment organizations with respect to the role that banks play to help address issues such as climate change, protection of biodiversity, promotion of sustainable forestry practices, and other environmental issues important to its customers and communities where it operates. The Bank has an ongoing process of reviewing its policies in these areas.
Scotiabank has a number of environmentally related products and services to meet demand and promote the “green” economy, including the Scotiabank Global Climate Change Fund, an EcoEnergy Financing program designed to support personal and small business customers who wish to install small-scale renewable energy projects, an Environmental Markets group, which assists corporate clients originate and trade carbon credits, and an eco-home renovation program, EcoLiving.
Scotiabank is also a signatory, participant and sponsor of the Carbon Disclosure Project in Canada, which provides corporate disclosure to the investment community on greenhouse gas emissions and climate change management. In 2010 Scotiabank was included on the Dow Jones Sustainability Index (DJSI)-(North America), an annual review that recognizes the world’s financial, social and environmental corporate leaders. The Bank was also recognized as one of Canada’s Green 30 by Maclean’s and Canadian Business Magazine. For more information on Scotiabank’s environmental policies and practices, please refer to:
| • | | the Bank’s annual Public Accountability Statement/Corporate Social Responsibility Report, which is also available online at www.scotiabank.com; |
| • | | the Environment section of Scotiabank’s website at www.scotiabank.com/environment; |
| • | | the Bank’s EcoLiving website at www.scotiabank.com/ecoliving; and |
| • | | Scotiabank’s response to the Carbon Disclosure Project at www.cdproject.net. |
Scotiabank Annual Report 2011 77
MANAGEMENT’S DISCUSSION AND ANALYSIS
CONTROLS AND ACCOUNTING POLICIES
Controls and procedures
Management’s responsibility for financial information contained in this annual report is described on page 110.
Disclosure controls and procedures
The Bank’s disclosure controls and procedures are designed to provide reasonable assurance that information is accumulated and communicated to the Bank’s management, including the Chief Executive Officer (CEO) and Chief Financial Officer (CFO), as appropriate, to allow timely decisions regarding required disclosure.
As of October 31, 2011, the Bank’s management, with the participation of the CEO and CFO, evaluated the effectiveness of its disclosure controls and procedures, as defined under the rules adopted by the United States Securities and Exchange Commission (SEC) and the Canadian securities regulatory authorities, and have concluded that the Bank’s disclosure controls and procedures are effective.
Internal control over financial reporting
Management of the Bank is responsible for establishing and maintaining adequate internal control over financial reporting. These controls include policies and procedures that:
| • | | pertain to the maintenance of records that, in reasonable detail, accurately and fairly reflect the transactions and dispositions of the assets of the Bank; |
| • | | provide reasonable assurance that transactions are recorded as necessary to permit preparation of financial statements in accordance with GAAP, and that receipts and expenditures are being made only in accordance with authorizations of management and directors of the Bank; and |
| • | | provide reasonable assurance regarding prevention or timely detection of unauthorized acquisition, use or disposition of the Bank’s assets that could have a material effect on the financial statements. |
All control systems contain inherent limitations, no matter how well designed. As a result, the Bank’s management acknowledges that its internal control over financial reporting will not prevent or detect all misstatements due to error or fraud. In addition, management’s evaluation of controls can provide only reasonable, not absolute, assurance that all control issues that may result in material misstatements, if any, have been detected.
Management assessed the effectiveness of internal control over financial reporting, using the Committee of Sponsoring Organizations of the Treadway Commission (COSO) framework, and based on that assessment concluded that internal control over financial reporting was effective, as at October 31, 2011.
Changes in internal control over financial reporting
There have been no changes in the Bank’s internal control over financial reporting that have materially affected, or are reasonably likely to materially affect, the Bank’s internal control over financial reporting during the year ended October 31, 2011.
Critical accounting estimates
The Bank’s accounting policies are integral to understanding and interpreting the financial results reported in this annual report. Note 1 on pages 117 to 124 summarizes the significant accounting policies used in preparing the Bank’s Consolidated Financial Statements. Certain of these policies require management to make estimates and subjective judgements that are difficult, complex, and often relate to
matters that are inherently uncertain. The policies discussed below are considered to be particularly important to the presentation of the Bank’s financial position and results of operations, because changes in the judgements and estimates could have a material impact on the Bank’s Consolidated Financial Statements. These estimates are adjusted in the normal course of business to reflect changing underlying circumstances.
Allowance for credit losses
The allowance for credit losses represents management’s best estimate of the probable credit losses in the portfolio of deposits with other institutions, loans to borrowers, acceptances and other indirect credit commitments, such as letters of credit and guarantees. Management undertakes regular reviews of credit quality to assess the adequacy of the allowance for credit losses. This process requires the use of estimates and subjective judgements at many levels. These subjective judgements include identifying credits that are impaired, and considering factors specific to individual credits, as well as portfolio characteristics and risks. Changes to these estimates or use of other reasonable judgements and estimates could directly affect the provision for credit losses.
The allowance for credit losses is composed of specific and general, allowances.
Specific allowances are an estimate of probable incurred losses related to existing impaired loans. In establishing specific allowances applicable to individual credit exposures, management first forms a judgement as to whether a loan is impaired. Loan impairment is recognized when, in management’s opinion, there is no longer reasonable assurance that interest and principal payments will be made on a timely basis. Once a loan is determined to be impaired, management estimates its net realizable value by making judgements relating to the timing of future cash flow amounts, the fair value of any underlying security pledged as collateral, costs of realization, observable market prices, and expectations about the future prospects of the borrower and any guarantors.
Management estimates specific allowances for certain homogenous portfolios, including residential mortgages, credit card loans and most personal loans on a group basis. This involves estimating the probable losses inherent in the portfolio by using a formulaic method that considers recent loss experience.
Specific provisions were lower in 2011 than in 2010, driven primarily by net recoveries in Scotia Capital, which more than offset moderate increases in Canadian Banking and International Banking.
The general allowance is an estimate of probable incurred losses that are inherent in the portfolio of loans and loan commitments, but have not yet been specifically identified on an individual basis. Management establishes the general allowance through an assessment of quantitative and qualitative factors. Using an internally developed model, management arrives at an initial quantitative estimate of the general allowance based on numerous factors, including historical average default probabilities, loss given default rates and exposure at default factors. Material changes in any of these parameters or assumptions would affect the range of expected credit losses and, consequently, could affect the general allowance level. For example, if either the probability of default or the loss given default rates for the non-retail portfolio were independently increased or decreased by 10%, the model would indicate an increase or decrease to the quantitative estimate of approximately $62 million (2010 – $69 million). Senior management determines whether it is necessary to adjust the quantitative estimate for the general allowance to account for portfolio conditions not reflected in the historically based credit parameters used in the model.
78 2011 Scotiabank Annual Report
MANAGEMENT’S DISCUSSION AND ANALYSIS | CONTROLS AND ACCOUNTING POLICIES
A qualitative assessment of the general allowance is made based on observable data, such as: economic trends and business conditions, portfolio concentrations, risk migrations and recent trends in volumes and severity of delinquencies and a component for the imprecision inherent in the model and model parameters. Management reviews the general allowance quarterly to assess whether the allowance is at the appropriate level in relation to the size of the portfolio, inherent credit risks and trends in portfolio quality. From time to time, the Bank may establish a sectoral allowance for specific adverse events and changes in economic conditions. These allowances are for losses which have not been specifically identified, and where the losses are not adequately covered by the general allowance. The level of the sectoral allowance considers the probability of default, loss given default and expected exposure at default.
The general allowance for credit losses as at October 31, 2011, was $1,352 million, a decrease of $58 million from a year earlier. The decrease was primarily attributable to improved credit quality. The general allowance amount is primarily attributable to business and government loans ($1,109 million), with the remainder allocated to personal and credit cards ($187 million) and residential mortgages ($56 million). As noted above, the specific allowance for credit losses for personal loans, credit cards and mortgages is formula-based and also reflects incurred but not yet identified losses.
Fair value of financial instruments
All financial instruments are measured at fair value on initial recognition except certain related party transactions. Subsequent measurement of a financial instrument depends on its classification. Loans and receivables, certain securities and most financial liabilities are carried at amortized cost unless classified or designated as held for trading or available-for-sale at inception. All other financial instruments, including those designated as held-for-trading at inception, are carried at fair value.
Financial instruments in the Bank’s trading portfolios are composed primarily of securities and derivatives. These trading instruments are carried at fair value on the Consolidated Balance Sheet, with changes in the fair values of trading instruments included in the Consolidated Statement of Income.
Securities designated as available-for-sale are recorded at fair value on the Consolidated Balance Sheet. Equity securities which do not have a quoted market price in an active market are measured at cost. The unrealized gains and losses as a result of changes in the fair values of available-for-sale securities are included in the Consolidated Statement of Comprehensive Income.
Derivatives used for asset/liability management are recorded at fair value on the Consolidated Balance Sheet. All changes in these derivative fair values other than those designated as cash flow hedges or net investment hedges are recorded in the Consolidated Statement of Income, while the latter flows through other comprehensive income.
Fair value is defined as the amount of consideration that would be agreed upon in an arms-length transaction, other than a forced sale or liquidation, between knowledgeable, willing parties who are under no compulsion to act. The best evidence of fair value is a quoted bid or ask price, as appropriate, in an active market. Where bid or ask prices are not available, such as in an illiquid or inactive market, the closing price of the most recent transaction of that instrument is used subject to appropriate adjustments, supplemented as required with internal valuation models. Where quoted market prices are not available, the
quoted price of similar financial instruments (i.e. with similar characteristics and risk profile) or internal models with observable market-based inputs are used to estimate the fair value.
Fair values are calculated using quoted market prices or observable market inputs for models and require minimal judgement by management. Greater subjectivity is required when making valuation adjustments for financial instruments in inactive markets or when using models where observable parameters do not exist.
Trading securities, available-for-sale securities, and obligations related to securities sold short are normally valued using quoted market prices, including prices obtained from external fund managers and dealers.
To determine the fair value of financial instruments in a less active or inactive market where market prices are not readily observable due to low trading volumes or lack of recent trades, appropriate adjustments are made to available indicative prices to reflect the lack of liquidity in the market for the instruments. Where quoted prices or observable market data is not readily available, for example due to less liquid markets, management’s judgement on valuation inputs is necessary to determine fair value.
Most derivatives are not exchange traded and are therefore normally valued using models which incorporate significant observable market parameters. Securities that are fair valued using models include certain types of asset-backed securities. Market inputs used for the fair value determination include observable interest rates, foreign exchange rates, credit spreads, equity prices, commodity prices and option volatilities.
Certain derivative and other financial instruments are valued using significant unobservable market inputs such as default correlations, among others. These inputs are subject to significantly more quantitative analysis and management judgement. Where significant unobservable market data is used as a key input into the valuation of certain derivatives, the inception profit on those derivatives is deferred over the life of the derivative contract, or until the valuation inputs become observable. This amount was not material in fiscal 2011 and 2010.
Management also applies judgement in the selection of internal valuation models for financial assets and financial liabilities carried at fair value in trading and non-trading portfolios. This includes consideration of credit risk, liquidity and ongoing direct costs in the determination of the fair value of derivatives. Management therefore exercises judgement when establishing market valuation adjustments that would be required in order to arrive at the fair value. Valuation adjustments recorded against the fair value of financial assets and financial liabilities totaled $568 million as at October 31, 2011 (2010 – $441 million), net of any write-offs. These valuation adjustments are mainly due to counterparty credit risk considerations for derivative transactions.
Uncertainty in the estimates used in the models can affect the fair value and financial results recorded. Historically, the impact of any change in these estimates was not expected to be significant; however, in the recent volatile market conditions where significant and rapid changes in observable model inputs can occur, greater volatility in fair values derived from these models is possible.
The Financial Instruments Disclosure Standard requires expanded disclosures of financial instruments and in particular with classification of all financial instruments carried at fair value into a hierarchy based on the determination of fair value. The valuation hierarchy is as follows:
| • | | Level 1 – fair value is based on unadjusted quoted prices in active markets for identical instruments, |
Scotiabank Annual Report 2011 79
MANAGEMENT’S DISCUSSION AND ANALYSIS
| • | | Level 2 – fair value is based on models using inputs other than quoted prices for the instruments, or |
| • | | Level 3 – fair value is based on models using inputs that are not based on observable market data. |
The Bank’s assets and liabilities which are carried at fair value as classified by the valuation hierarchy are reflected in Note 26 on pages 159 to 161. The percentage of each asset and liability category by fair value hierarchy level are outlined as follows:
| | | | | | | | | | | | | | | | | | | | |
| Fair value hierarchy of financial instruments | |
| | |
| | | Assets | | | Liabilities | |
| | | | | |
Fair value hierarchy | | Trading
securities | | | Available-
for-sale
securities | | | Derivatives | | | Obligations
related to
securities
sold short | | | Derivatives | |
Level 1 | | | 66% | | | | 28% | | | | 3% | | | | 66% | | | | 4% | |
Level 2 | | | 31% | | | | 69% | | | | 96% | | | | 34% | | | | 92% | |
Level 3 | | | 3% | | | | 3% | | | | 1% | | | | – | | | | 4% | |
| | | 100% | | | | 100% | | | | 100% | | | | 100% | | | | 100% | |
Other-than-temporary impairment
Available-for-sale securities, except for equity securities which do not have a quoted market price in an active market, are recorded at fair value on the balance sheet. Any unrealized gains and losses on these available-for-sale securities are recorded in other comprehensive income until realized, at which time they are recorded in the Consolidated Statement of Income.
Management reviews the fair value of available-for-sale securities each quarter to determine whether a decline in fair value compared to cost or amortized cost is other-than-temporary. To assess whether an other than temporary impairment has occurred, management must make certain judgements and estimates, and consider factors such as the length of time and extent to which the fair value of a security has been below its cost or amortized cost, prospects for recovery in fair value, the issuer’s financial condition and future prospects, and the Bank’s ability and intent to hold the investment for a period of time sufficient to allow for any anticipated recovery. Once management has determined that the security has experienced an other-than-temporary decline in value, the carrying value of the security is written down to its estimated fair value. To estimate fair value, management considers all of the data gathered during the impairment evaluation process, as well as the market liquidity and the Bank’s plans for the security. Other-than-temporary impairment charges are recorded in net gains on securities, other than trading in the Consolidated Statement of Income.
As at October 31, 2011, the gross unrealized gains on available-for-sale securities recorded in accumulated other comprehensive income were $1,681 million (2010 – $1,687 million), and the gross unrealized losses were $426 million (2010 – $270 million). Net unrealized gains were therefore $1,255 million (2010 – $1,417 million) before related derivative and other hedge amounts. The net unrealized gains after related derivative and other hedge amounts were $1,028 million (2010 – $1,189 million).
At October 31, 2011, the unrealized loss recorded in accumulated other comprehensive income relating to securities in an unrealized loss position for more than 12 months was $174 million (2010 – $211 million). This unrealized loss was comprised of $124 million (2010 – $157 million) in debt securities, $43 million (2010 – $37 million) related to preferred shares and $7 million (2010 – $17 million) related to equity securities. The unrealized losses on the debt securities arose primarily from changes in interest rates and credit spreads. Based on a number of considerations, including underlying credit of the issuers,
the Bank expects that future interest and principal payments will continue to be received on a timely basis in accordance with the contractual terms of the security.
The Bank also holds a diversified portfolio of available-for-sale equities. Since the Bank has the ability and intent to hold these securities until there is a recovery of fair value, which may be at maturity for debt securities, these unrealized losses are considered temporary in nature. The total fair value of the securities with continuous unrealized losses of more than 12 months was $1,921 million as at October 31, 2011, (2010 – $3,064 million).
Pensions and other employee future benefits
The Bank sponsors various pension and other future benefit plans for eligible employees in Canada, the United States, Mexico and other international operations. The pension benefits are generally based on years of service and average earnings at retirement. Other future benefits generally include post-retirement health care, dental care and life insurance, along with post-employment benefits such as long-term disability.
Employee future benefit expense and the related benefit obligation are calculated using actuarial methods and certain actuarial assumptions. Most of these assumptions are based on management’s best estimate and are reviewed and approved annually. The key assumptions include the long-term rate of investment return on plan assets, future compensation, health care costs, employee turnover, retirement age and mortality. When making these estimates, management considers expectations of future economic trends and business conditions, including inflation rates, as well as other factors. Management also reviews historical investment returns, salary increases and health care costs. Another important assumption is the discount rate used for measuring the benefit obligation which is generally prescribed to be equal to the current yield on long term, high-quality corporate bonds with durations similar to the benefit obligation. The management assumptions with the greatest potential impact are the assumed long-term rate of return on assets and the discount rate used for measuring the benefit obligation. If the assumed long-term rate of return on assets was 1% lower (higher), the benefit expense for 2011 would have been $53 million higher (lower). If the assumed discount rate was 1% lower (higher), the benefit expense for 2011 would have been $110 million higher (lower).
The Bank uses a measurement date of July 31 or August 31, depending on the employee future benefit plan. Based on these measurement dates, the Bank reported a deficit of $57 million in its principal pension plans as disclosed in Note 20 to the Consolidated Financial Statements on pages 144 to 146. There has been a decline in the funded status of the plans since 2010 due to a sharp reduction in prescribed discount rates in most countries resulting in higher benefit obligations. In addition, plan asset values are still below their pre-2008 levels.
The decline in the funded status of the plans will impact the benefit expense for fiscal year 2011 and possibly future years.
Actual experience that differs from assumptions made by management will result in a net actuarial gain or loss, consequently increasing or decreasing the benefit expense for future years. In accordance with GAAP, this difference is not recognized immediately as income or expense, but rather is amortized into income over future periods.
Management determines whether the unrecognized net actuarial gain or loss is more than 10% of the greater of the plan assets or benefit obligation at the beginning of each year. Any unrecognized net actuarial gain or loss above this 10% threshold is generally amortized into income over the estimated average remaining service period of
80 2011 Scotiabank Annual Report
MANAGEMENT’S DISCUSSION AND ANALYSIS | CONTROLS AND ACCOUNTING POLICIES
active employees ranging from 10 to 20 years for the Bank’s principal pension plans, and 8 to 27 years for the Bank’s principal other benefit plans.
Note 20 on pages 144 to 146 of the 2011 Consolidated Financial Statements contains details of the Bank’s employee future benefit plans, such as the disclosure of pension and other future benefit amounts, management’s key assumptions, and a sensitivity analysis of changes in these assumptions on the employee future benefit obligation and expense.
Corporate income taxes
Management exercises judgement in determining the provision for income taxes and future income tax assets and liabilities. The provision is based on management’s expectations regarding the income tax consequences of transactions and events during the period. Management interprets the tax legislation for each jurisdiction in which the Bank operates and makes assumptions about the expected timing of the reversal of future assets and liabilities. If management’s interpretations of the legislation differ from those of the tax authorities or if the actual timing of the reversals of the future assets and liabilities is not as anticipated, the provision for income taxes could increase or decrease in future periods. The Bank records a valuation allowance if management assesses it is likely that the future income tax assets will not be realized prior to expiration.
Total gross future tax assets related to subsidiaries’ unused income tax losses from operations arising in prior years were $287 million as at October 31, 2011 (2010 – $347 million). These future tax assets have been reduced by a valuation allowance of $19 million (2010 – $1 million) due to uncertainty about the utilization of these losses. In addition, a future tax asset of $70 million (2010 - $70 million) related to a capital loss on disposal of subsidiary operations in a prior year has been reduced by a valuation allowance of $70 million (2010 – nil). Furthermore, one of the Bank’s foreign subsidiaries has a valuation allowance of $316 million (2010 – $316 million) related to certain loan loss allowances available to be applied against future taxable earnings. If and when there is greater certainty of realizing these future tax assets, the Bank will adjust the valuation allowances. The Bank’s total net future income tax asset was $992 million as at October 31, 2011 (2010 – $1,775 million). Note 19 on pages 142 to 143 of the 2011 Consolidated Financial Statements contains further details with respect to the Bank’s provisions for income taxes.
Variable interest entities
In the normal course of business, the Bank enters into arrangements with variable interest entities (VIEs) on behalf of its customers and for its own purposes. These VIEs can be generally categorized as multi-seller commercial paper conduits, funding vehicles, structured finance entities and collateralized debt obligation entities. Further details are provided on pages 47 to 50 in the off-balance sheet arrangements section.
Management is required to exercise judgement to determine whether a VIE should be consolidated. This evaluation involves understanding the arrangements, determining whether the entity is considered a VIE under the accounting rules, and determining the Bank’s variable interests in the VIE. These interests are then compared to those of the unrelated outside parties to identify the holder that is exposed to the majority of the variability in the VIE’s expected losses, expected residual returns, or both, to determine whether the Bank should consolidate the VIE. The comparison uses both qualitative and quantitative analytical techniques and use of models and involves the use of a number of assumptions about the business environment in which the VIE operates and the amount and timing of future cash flows.
Management is required to exercise judgement to determine if a primary beneficiary reconsideration event has occurred. In applying the guidance under Canadian GAAP, the Bank considers the following to be reconsideration events for VIEs where the Bank has a variable interest: changes to the VIE’s governing documents or contractual arrangements; the primary beneficiary disposing some or all of its variable interest to unrelated parties; or new variable interests issued to parties other than the primary beneficiary.
During 2011, there were no reconsideration events that would have required the Bank to re-assess the primary beneficiary of its multi-seller conduit VIEs.
As described in Note 6 to the Consolidated Financial Statements (on page 130) and in the discussion on off-balance sheet arrangements (starting on pages 47 to 50), the Bank is not the primary beneficiary of the three multi-seller asset-backed commercial paper (ABCP) conduits that it sponsors and is not required to consolidate them on the Bank’s balance sheet.
In the future, if the Bank were to become the primary beneficiary of these three Bank-sponsored multi-seller ABCP conduits and consolidate them on the Bank’s balance sheet, based on the values as at October 31, 2011, it would result in an increase in the Bank’s reported assets of approximately $5 billion, and a reduction in capital ratios of approximately 10 to 15 basis points.
Goodwill
Under GAAP, goodwill is not amortized but assessed for impairment on an annual basis at the reporting unit level, or more frequently if an event or change in circumstances indicates the asset might be impaired. Goodwill is assessed for impairment by comparing the fair value of the reporting unit to its carrying amount. If the fair value of the reporting unit exceeds its carrying amount, no further testing is required. If the fair value is less than the carrying amount of the reporting unit, the amount of impairment loss is quantified by comparing the carrying value of goodwill to its fair value, calculated as the fair value of the reporting unit less the fair value of its assets and liabilities.
The Bank determines its reporting units’ fair values from internally developed valuation models that consider factors such as normalized earnings, projected earnings, and price earnings multiples. Management judgement is required in estimating the fair value of reporting units and imprecision in any assumptions and estimates used in the fair value calculations could influence the determination of goodwill impairment. Management believes the assumptions and estimates used are reasonable and supportable in the current environment.
Based on the assessment approach described above, the Bank did not record any goodwill impairment losses for any of its seven reporting units in 2011.
Contingent liabilities
In the ordinary course of business, the Bank and its subsidiaries are routinely defendants in, or parties to a number of pending and threatened legal actions and proceedings, including actions brought on behalf of claimants. According to GAAP, the Bank should accrue for a loss if, in management’s opinion, it is likely that a future event will confirm a liability existed at the balance sheet date and the amount of loss can be reasonably estimated.
In some cases, it may not be possible to determine whether a liability has been incurred or to reasonably estimate the amount of loss until the case is closer to resolution. In these instances, no accrual can be
Scotiabank Annual Report 2011 81
MANAGEMENT’S DISCUSSION AND ANALYSIS
made until that time. If it can be determined that a liability existed as at the balance sheet date, but a reasonable estimate involves a range within which a particular amount appears to be a better estimate, that amount would be accrued. If no such better estimate within a range exists, the Bank is required to accrue the minimum amount in the range. On a regular basis, management and internal and external experts are involved in assessing the adequacy of the Bank’s contingent loss accrual. Changes in these assessments may lead to changes in litigation accruals.
While there is inherent difficulty in predicting the outcome of such matters, based on current knowledge, management does not believe that liabilities, if any, arising from pending litigation will have a material adverse effect on the Bank’s consolidated financial position, or results of operations.
Changes in accounting policies
Current year
Business combinations, Consolidated Financial Statements and non-controlling interests
In January 2009, the CICA issued new accounting standards on Business Combinations, Consolidated Financial Statements and Non-controlling Interests. These standards are aligned with International Financial Reporting Standards (IFRS) and are effective for periods beginning on or after January 1, 2011, with earlier adoption permitted. If an entity elects to early adopt, all three standards are required to be adopted concurrently.
The business combination standard addresses the valuation of the identified assets and liabilities acquired in a business combination and the date at which the valuations should be determined. The other two standards are revised to ensure that the requirements embedded in the business combination standards are applied appropriately to the preparation of Consolidated Financial Statements and the accounting for non-controlling interests after the acquisition date.
The Bank to early adopted all three standards effective November 1, 2010, and all business acquisitions that occurred from November 1, 2010 have been accounted for under the revised standards.
The key principle underlying the business combinations standard is that all acquisitions be measured at fair value on the acquisition date. The key changes in the standards are:
| • | | The acquisition accounting is at fair value (under prior GAAP only the Bank’s proportionate share of fair value adjustments were accounted for); |
| • | | Non-controlling interests are measured at fair value (may exclude the proportionate share of goodwill) and treated as equity; |
| • | | Acquisition-related costs and restructuring costs are expensed as incurred while prior GAAP permitted some costs to be set up at acquisition date; |
| • | | Contingent consideration and other contingent liabilities, if any, are recorded at fair value on acquisition and subsequent changes in fair value are recorded in income; |
| • | | When the purchase consideration is in the form of equity shares of the acquirer, they are measured at fair value at the acquisition date, rather than the prior GAAP requirement which is the announcement date; and |
| • | | Step-acquisitions are accounted for at fair value allowing for a gain/ loss to be recognized in income on the date of the transaction due to the revaluation of the original investment. |
Application of the non-controlling interests standard in 2011 resulted in a reclassification of non-controlling interests. The reclassifications relating to non-controlling interests were as follows:
| • | | Non-controlling interests have been reclassified from liabilities to equity in the Consolidated Balance Sheet. |
| • | | Non-controlling interests’ portion of income is no longer a deduction when calculating the net income in the Consolidated Statement of Income. Instead, net income is apportioned between the Bank’s equity holders and the non-controlling interests. |
| • | | Prior period information has been reclassified to conform with current period presentation. |
With respect to 2011 Consolidated Financial Statements, the adoption of these new Canadian accounting standards resulted in a net gain of $286 million being recorded in the Consolidated Statement of Income. The gain arose substantially from accounting for the Bank’s investment in DundeeWealth. The additional investment was considered a step-acquisition and accounted for on a fair value basis resulting in a gain of $260 million from the revaluation of the Bank’s original 19% investment in DundeeWealth.
The remaining $26 million gain related to the acquisition accounting for a recent acquisition which was purchased at a price lower than fair value. The new standards require negative goodwill to be recognized in income without first reducing non-monetary assets, resulting in a higher gain in income under the new standards.
Under prior Canadian GAAP, $26 million would have been recorded as negative goodwill. With the change, the total negative goodwill recognized for the acquisition was $52 million.
The adoption of these new accounting standards resulted in additional purchase consideration of approximately $350 million on the acquisition of DundeeWealth. The increase was due primarily to the following:
| • | | The gain from the revaluation of the Bank’s original investment is considered part of the purchase consideration; and |
| • | | The common shares issued by the Bank as consideration for the acquisition were valued at closing date price versus announcement date price as per prior GAAP (incremental $110 million). |
Prior year
There were no changes in accounting standards in 2010 that affected financial statement reporting.
Prior to November 1, 2009
Classification and impairment of financial assets
In August 2009, the CICA amended Section 3855, Financial Instruments – Recognition and Measurement, to harmonize classification and related impairment accounting requirements of Canadian GAAP with International Financial Reporting Standards (IFRS). The amendments allow certain debt securities not quoted in an active market to be classified as loans and measured at amortized cost. The Bank still has the ability to classify these instruments as available-for-sale, in which case they are measured at fair value with unrealized gains and losses recorded through other comprehensive income. The amendments also allow the reversal of impairment charges for debt securities classified as available-for-sale on the
82 2011 Scotiabank Annual Report
MANAGEMENT’S DISCUSSION AND ANALYSIS | CONTROLS AND ACCOUNTING POLICIES
occurrence of specific events. Impairment charges for debt securities classified as loans are recorded as provisions for credit losses. As a result of this change, the Bank reclassified certain securities not quoted in an active market with carrying value of $9,447 million to loans. This reclassification resulted in reduction of after-tax accumulated other comprehensive loss of $595 million. Details of this change in accounting policy are included in Note 1 to the Consolidated Financial Statements on page 117.
Future Accounting Changes
Transition to International Financial Reporting Standards (IFRS)
Canadian publicly accountable enterprises are required to adopt IFRS for fiscal years beginning on or after January 1, 2011. For the Bank, IFRS is effective for interim and annual periods commencing November 1, 2011 (adoption date), and includes the preparation and reporting of one year of comparative figures, including an opening balance sheet as at November 1, 2010 (transition date).
In order to prepare for the transition to IFRS, the Bank set up a significant project, implemented a project governance structure and developed an implementation plan which consisted of three phases: (i) planning and governance; (ii) review and detailed assessment; and (iii) design, development and implementation. The Bank has substantially completed all stages in all critical areas.
Key elements of the Bank’s IFRS changeover plan
The Bank’s IFRS transition project is substantially completed and the current focus is on the finalization of the 2011 quarterly comparative results under IFRS. The following summarizes the Bank’s status on key activities and milestones achieved.
Financial statement presentation
| • | | Detailed assessments of accounting differences between Canadian GAAP and IFRS accounting policies applicable to the Bank are complete. |
| • | | The Bank’s IFRS 1 transition elections and accounting policy choices have been assessed, selected and approved. |
| • | | The quantification and preparation of the IFRS opening balance sheet is complete. Refer to the reconciliation of Canadian GAAP to IFRS on page 86 for details. |
| • | | The quantification and preparation of the IFRS comparative year quarterly results and note disclosures are close to finalization. |
| • | | The format of the annual and interim IFRS financial statements including note disclosures is substantially complete. The statements and notes may evolve as the Bank continues to assess best practices and industry views. |
Training and communication
| • | | A global training strategy for IFRS was developed, approved and implemented. |
| • | | Training programs for Finance employees and other key stakeholders, including the Board of Directors and senior management, were provided. |
| • | | Training provided to credit/loan officers across the organization was conducted through various channels, and has been increasingly focused on specialized subjects. |
| • | | External communication was provided through the quarterly reports. |
| • | | An industry-wide education session on the impact of IFRS for equity analysts and rating agencies was held in Q1 2011 through the Canadian Bankers Association. |
Information technology systems
| • | | A solution for the capture of 2011 comparative year financial information (including IFRS opening balance sheet) was developed and implemented. |
| • | | The Bank did not identify the need for any other significant modifications to its systems as a result of IFRS changes. |
Business and process activities
| • | | Process changes have been substantially implemented as required to address the impact on financial reporting, and on other areas such as the Bank’s performance measurement processes, including planning and budgeting, and capital management. None of these changes have been assessed to be material as they are not pervasive or systematic and have followed the Bank’s existing change identification and management processes. |
Control environment
| • | | The Bank did not identify any material changes in internal controls over financial reporting (ICFR) and disclosure controls and procedures (DC&P) as a result of IFRS. No changes have been identified that may have a pervasive or systematic impact to polices, processes and systems. Any enhancements to policies, processes and systems were assessed and documented prior to implementation. |
Scotiabank Annual Report 2011 83
MANAGEMENT’S DISCUSSION AND ANALYSIS
Key differences between Canadian GAAP and IFRS
The key areas of differences between Canadian GAAP and IFRS that impacted the Bank were identified as follows:
Consolidation
Under IFRS, an entity (including a special purpose entity (SPE)) is consolidated based solely on control, which is evidenced by the power to govern the financial and operating policies of an entity to obtain benefit. When assessing control under IFRS, all relevant factors are considered, including qualitative and quantitative aspects.
Canadian GAAP determines consolidation of an entity using two different frameworks: the variable interest entity (VIE) and voting control models. The consolidation of a VIE under Canadian GAAP is based on whether the Bank is exposed to the majority of the VIE’s expected losses or residual returns, or both and considered to be the primary beneficiary.
The differences in the criteria for consolidation between IFRS and Canadian GAAP have resulted in certain SPEs being consolidated under IFRS that were not previously consolidated under Canadian GAAP.
Derecognition
Canadian GAAP uses a control-based model to assess derecognition, while IFRS primarily focuses on whether risks and rewards have been substantially transferred. As a result of the differences in the derecognition criteria between IFRS and Canadian GAAP, the Bank’s insured residential mortgage securitizations through the Canadian Government’s Canada Mortgage Bond (CMB) Programs do not meet the derecognition criteria under IFRS. Additionally, mortgages securitized and retained as mortgage-backed securities (MBS), currently classified as available-for-sale (AFS) on the Bank’s balance sheet under Canadian GAAP, would be reclassified to residential mortgages under IFRS.
Employee benefits
IFRS requires an entity to make an accounting policy choice regarding the treatment of actuarial gains and losses, subsequent to the transition date. Under IFRS, actuarial gains and losses may either be:
| • | | Deferred and amortized, subject to certain provisions (corridor approach); |
| • | | Immediately recognized in profit or loss; or |
| • | | Immediately recognized in other comprehensive income without subsequent recycling to income. |
Under current Canadian GAAP, the Bank follows the corridor approach in recognizing actuarial gains and losses under its defined benefit plans. The Bank has finalized its decision under IFRS to adopt the corridor approach.
Furthermore, under IFRS, the defined benefit obligation and plan assets are measured at the balance sheet date while under Canadian GAAP, the Bank applied a measurement date of two or three months prior to the financial reporting date. IFRS also requires the use of fair value for determining the expected return on plan assets. The Bank used a market-related value under Canadian GAAP.
IFRS will result in different values for plan assets and benefit obligations due to changes in actuarial assumptions applicable for the different measurement dates. In addition the use of fair value versus market-related value will also result in different plan asset values. Plan asset values and benefit obligations impact future employee benefit expenses.
The effects of changes in foreign exchange rates
IFRS requires that the functional currency for each foreign operation be determined based on the primary economic environment in which the entity operates. IFRS distinguishes primary factors to be considered in determining the functional currency of foreign operations while Canadian GAAP does not place any priority on any factors for consideration. This has resulted in a change in functional currency of certain subsidiaries on transition to IFRS.
Share-based payments
IFRS requires cash-settled (i.e., liability-classified) awards to be remeasured at each reporting date based on changes in fair value of the liability as compared to intrinsic value under Canadian GAAP. This results in measurement differences between IFRS and Canadian GAAP. Furthermore, under IFRS, forfeitures are required to be estimated on the grant date and included in the measurement of the liability. However, under Canadian GAAP, forfeitures may be recognized either as they occur, or estimated on initial recognition. The Bank currently recognizes forfeitures as they occur.
Impairment of goodwill
IFRS uses a one-step approach for impairment testing of non-financial assets by comparing the asset’s carrying value to its recoverable amount. The recoverable amount is the higher of fair value less costs to sell, and value in use. Canadian GAAP however, uses a two-step approach for impairment testing: first comparing an asset’s carrying value with undiscounted future cash flows to determine whether impairment exists; and then measuring any impairment by comparing the asset’s carrying value with its fair value.
IFRS requires that goodwill be allocated and tested for impairment at the level of cash generating unit (CGU) or group of CGUs. Under IFRS, each CGU or group of CGUs to which goodwill is allocated should represent the lowest level within the entity at which goodwill is monitored for internal management purposes. The Bank, based on its analysis, has concluded that under IFRS the level at which goodwill is tested is the same as under Canadian GAAP. Goodwill has been tested for impairment upon transition to IFRS on November 1, 2010 and no impairment was determined.
The impact of these changes on the Bank’s financial position at November 1, 2010 is reflected in the opening equity and balance sheet reconciliation on pages 85 to 89.
84 2011 Scotiabank Annual Report
MANAGEMENT’S DISCUSSION AND ANALYSIS | CONTROLS AND ACCOUNTING POLICIES
Future changes in IFRS standards
The Bank actively monitors developments and changes in standards from the IASB and the Canadian Accounting Standards Board (AcSB), as well as regulatory requirements from the Canadian Securities Administrators and OSFI. The IASB recently issued the following revised standards and amendments to existing standards which will impact the Bank beginning November 1, 2013:
| – | IFRS 10, Consolidated FinancialStatements, |
| – | IFRS 11,Joint Arrangements, |
| – | IFRS 12, Disclosure ofInterests in Other Entities, |
| – | IFRS 13, Fair Value Measurement, |
| – | IAS 19, Employee Benefits, |
| – | IAS 27,Separate Financial Statements, and |
| – | IAS 28,Investments in Associates and Joint Ventures. |
The Bank is not permitted to early adopt any of the above standards or amendments per the OSFI Advisory issued in October 2011. The impact of these future changes in IFRS standards has not been determined. The IASB issued amendments to IAS 1,Presentation of Financial
Statements which would impact the Bank beginning November 1, 2012; however, amendments to IAS 1 affect presentation only with no financial impact.
In a recent exposure draft issued, the IASB is proposing to postpone the mandatory application of IFRS 9, Financial Instruments from fiscal years beginning after January 1, 2013 to fiscal years beginning after January 1, 2015. The proposed change will therefore impact the Bank beginning fiscal 2016. Additionally, the IASB has published an exposure draft on Investment Entities whereby entities that meet the definition of an Investment Entity would be required to apply fair value accounting for their investments. This exemption is not available to the parent company unless it also meets the definition of an Investment Entity.
The IASB also expects to finalize changes to standards on hedge accounting (excluding portfolio hedging) and offsetting of financial assets as well as issue a revised exposure draft on impairment of financial assets by the end of 2011. The proposed implementation dates are currently not known.
Impact of key differences at November 1, 2010
The impact of the adoption of IFRS on the Bank’s equity as at November 1, 2010 is reflected below:
| | | | | | | | | | | | | | | | | | | | | | | | | | | | | | | | |
| | | | |
| | | Total equity attributable to equity holders of the Bank | | | | | | | | | | |
| | | | | | | | |
| As at November 1, 2010 ($ millions) | | Common
shares | | | Retained
earnings | | | AOCI | | | Other
reserves | | | Preferred
shares | | | Capital
instruments | | | NCI | | | Total
equity | |
| | | | | | | | |
Total shareholders’ equity - Canadian
GAAP | | $5,750 | | | $21,932 | | | $(4,051) | | | $25 | | | $3,975 | | | $ – | | | $579 | | | $28,210 | |
Adjustments under IFRS | | | | | | | | | | | | | | | | | | | | | | | | | | | | | | | | |
IFRS 1 | | | – | | | | (5,798 | ) | | | 4,164 | | | | – | | | | – | | | | – | | | | (6 | ) | | | (1,640 | ) |
Consolidation | | | – | | | | (270 | ) | | | 35 | | | | – | | | | – | | | | 956 | | | | – | | | | 721 | |
Financial instruments | | | – | | | | 6 | | | | 180 | | | | – | | | | – | | | | – | | | | – | | | | 186 | |
Employee benefits | | | – | | | | (178 | ) | | | – | | | | – | | | | – | | | | – | | | | (12 | ) | | | (190 | ) |
Business combinations | | | – | | | | (43 | ) | | | – | | | | – | | | | – | | | | – | | | | (1 | ) | | | (44 | ) |
Other | | | – | | | | 35 | | | | (59 | ) | | | – | | | | – | | | | – | | | | (1 | ) | | | (25 | ) |
Subtotal – Adjustments under IFRS | | | $ – | | | $ | (6,248 | ) | | $ | 4,320 | | | | $ – | | | | $ – | | | $ | 956 | | | $ | (20 | ) | | $ | (992 | ) |
Total shareholders’ equity– IFRS | | | $5,750 | | | $ | 15,684 | | | $ | 269 | | | | $25 | | | | $3,975 | | | $ | 956 | | | $ | 559 | | | $ | 27,218 | |
| Refer | to pages 87 to 89 for explanatory notes. |
| AOCI | = Accumulated other comprehensive income |
| NCI | = Non-controlling interests |
Reconciliation of Canadian GAAP Balance Sheet to IFRS as at November 1, 2010
The Consolidated Statement of Financial Position presented on page 86 has been prepared in accordance with IFRS as issued by the International Accounting Standards Board (IASB). Previously, the Consolidated Financial Statements were prepared in accordance with Canadian GAAP. The following notes and tables present reconciliations and provide explanations of how the transition to IFRS has impacted the Bank’s financial position as at November 1, 2010.
The reconciliation is presented in two steps on the following table.
Step 1 changes the presentation from Canadian GAAP to IFRS using the Canadian GAAP amounts.
The change in presentation for the Consolidated Statement of Financial Position is to reflect the assets and liabilities in order of liquidity, versus the product-based categorization used for Canadian GAAP. There are no changes in values.
Step 2 reflects the reclassification and remeasurement adjustments to the Canadian GAAP amounts by IFRS standard to arrive at the IFRS financial statements.
Scotiabank Annual Report 2011 85
MANAGEMENT’S DISCUSSION AND ANALYSIS
Reconciliation of Canadian GAAP Balance Sheet to IFRS as at November 1, 2010
| | | | | | | | | | | | | | | | | | | | | | | | | | | | | | | | | | | | | | | | | | | | | | | | |
| ($ millions) | | Step 1 | | | | | | | Step 2 | |
| Changes in presentation | | | | | IFRS presentation | | IFRS 1 -
first-time
adoption
of IFRS (1) | | | Consolidation (2) | | | Financial
instruments (3) | | | Employee
benefits (4) | | | Business
combinations (5) | | | Other (6) | | | IFRS
| |
| Canadian GAAP presentation | | Canadian GAAP balance | | | From | | | To | | | Canadian GAAP
balance under IFRS presentation | | | | | | | | | | | |
Assets | | | | | | | | | | | | | | | | | | | | Assets | | | | | | | | | | | | | | | | | | | | | | | | | | | | |
Cash resources | | $ | 39,530 | | | $ | – | | | $ | – | | | $ | 39,530 | | | | | Cash and deposits with banks | | $ | 701 | | | $ | – | | | $ | – | | | $ | – | | | $ | – | | | $ | – | | | $ | 40,231 | |
Precious metals | | | 6,497 | | | | – | | | | – | | | | 6,497 | | | | | Precious metals | | | – | | | | – | | | | – | | | | – | | | | – | | | | – | | | | 6,497 | |
Securities | | | | | | | | | | | | | | | | | | | | Trading assets | | | | | | | | | | | | | | | | | | | | | | | | | | | | |
Trading | | | 64,684 | | | | (2,764 | )(a) | | | – | | | | 61,920 | | | | | Securities | | | – | | | | 67 | | | | – | | | | – | | | | – | | | | – | | | | 61,987 | |
Available-for-sale | | | 47,228 | | | | (47,228 | )(b) | | | – | | | | – | | | | | | | | | | | | | | | | | | | | | | | | | | | | | | | | | |
Equity accounted investments | | | 4,651 | | | | (4,651 | )(c) | | | – | | | | – | | | | | | | | | | | | | | | | | | | | | | | | | | | | | | | | | |
| | | | | | | | | | | 9,329 | (d) | | | 9,329 | | | | | Loans | | | 2,098 | | | | – | | | | – | | | | – | | | | – | | | | – | | | | 11,427 | |
| | | | | | | | | | | | | |
| | | | | | | | | | | 2,764 | (a) | | | | | | | | | | | | | | | | | | | | | | | | | | | | | | | | | | | | |
| | | | | | | | | | | 2,098 | (d) | | | | | | | | | | | | | | | | | | | | | | | | | | | | | | | | | | | | |
| | | | | | | | | | | 4,862 | | | | 4,862 | | | | | Financial assets designated at fair value through profit or loss | | | (4,039 | ) | | | – | | | | – | | | | – | | | | – | | | | – | | | | 823 | |
Securities purchased under resale agreements | | | 27,920 | | | | – | | | | – | | | | 27,920 | | | | | Securities purchased under resale agreements | | | – | | | | – | | | | – | | | | – | | | | – | | | | – | | | | 27,920 | |
| | | | | | | | | | | 26,852 | (e) | | | 26,852 | | | | | Derivative financial instruments | | | 9 | | | | 47 | | | | – | | | | – | | | | – | | | | – | | | | 26,908 | |
| | | | | | | | | | | 47,228 | (b) | | | 47,228 | | | | | Financial investments | | | (16,395 | ) | | | 304 | | | | 244 | | | | – | | | | – | | | | – | | | | 31,381 | |
| | | | | | | | | | | | | | | | | | | | | | | | | | | | | | | | | | | | | | | | | | | | | | | | |
Loans | | | | | | | | | | | | | | | | | �� | | | Loans to customers | | | | | | | | | | | | | | | | | | | | | | | | | | | | |
Residential mortgages | | | 120,482 | | | | – | | | | – | | | | 120,482 | | | | | Residential mortgages | | | 31,844 | | | | – | | | | – | | | | – | | | | (2 | ) | | | – | | | | 152,324 | |
Personal and credit cards | | | 62,548 | | | | – | | | | – | | | | 62,548 | | | | | Personal and credit cards | | | – | | | | 983 | | | | – | | | | – | | | | – | | | | – | | | | 63,531 | |
Business and government loans | | | 103,981 | | | | (11,427 | )(d) | | | – | | | | 92,554 | | | | | Business and government loans | | | 813 | | | | 1,444 | | | | – | | | | – | | | | – | | | | – | | | | 94,811 | |
Allowance for credit losses | | | 2,787 | | | | – | | | | – | | | | 2,787 | | | | | Allowance for credit losses | | | – | | | | – | | | | (157 | ) | | | – | | | | – | | | | – | | | | 2,630 | |
| | | | | | | | | | | | | | | | | | | | | | | | | | | | | | | | | | | | | | | | | | | | | | | | |
Derivative instruments | | | 26,852 | | | | (26,852 | )(e) | | | – | | | | – | | | | | | | | | | | | | | | | | | | | | | | | | | | | | | | | | |
| | | | | | | | | | | 4,651 | (c) | | | 4,651 | | | | | Investments in associates and joint ventures | | | – | | | | (37 | ) | | | – | | | | – | | | | – | | | | 21 | | | | 4,635 | |
| | | | | | | | | | | 2,219 | (f) | | | 2,219 | | | | | Deferred tax assets | | | 567 | | | | 176 | | | | (61 | ) | | | 58 | | | | 4 | | | | 13 | | | | 2,976 | |
Other assets | | | 25,071 | | | | (2,219 | )(f) | | | – | | | | 22,852 | | | | | Other assets | | | (1,380 | ) | | | (279 | ) | | | 8 | | | | (3 | ) | | | (4 | ) | | | (45 | ) | | | 21,149 | |
Total assets | | $ | 526,657 | | | $ | (95,141 | ) | | $ | 95,141 | | | $ | 526,657 | | | | | Total assets | | $ | 14,218 | | | $ | 2,705 | | | $ | 348 | | | $ | 55 | | | $ | (2 | ) | | $ | (11 | ) | | $ | 543,970 | |
| | | | | | | | | | | | | | | | | | | | | | | | | | | | | | | | | | | | | | | | | | | | | | | | |
Liabilities and shareholders’ equity | | | | | | | | | | | | | | | | | | | | Liabilities and equity | | | | | | | | | | | | | | | | | | | | | | | | | | | | |
Deposits | | | | | | | | | | | | | | | | | | | | Deposits | | | | | | | | | | | | | | | | | | | | | | | | | | | | |
Personal, Business and government | | $ | 339,537 | | | $ | (2 | )(g) | | $ | – | | | $ | 339,535 | | | | | Deposits from customers | | $ | 23,661 | | | $ | (997 | ) | | $ | – | | | $ | – | | | $ | – | | | $ | – | | | $ | 362,199 | |
Banks | | | 22,113 | | | | – | | | | – | | | | 22,113 | | | | | Deposits from banks | | | – | | | | – | | | | – | | | | – | | | | – | | | | – | | | | 22,113 | |
| | | | | | | | | | | | | | | | | | | | | | | | | | | | | | | | | | | | | | | | | | | | | | | | |
Derivative instruments | | | 31,990 | | | | – | | | | – | | | | 31,990 | | | | | Derivative financial instruments | | | (552 | ) | | | – | | | | – | | | | – | | | | – | | | | – | | | | 31,438 | |
Obligations related to securities sold under repurchase agreements | | | 40,286 | | | | – | | | | – | | | | 40,286 | | | | | Obligations related to securities sold under repurchase agreements | | | (7,498 | ) | | | – | | | | – | | | | – | | | | – | | | | – | | | | 32,788 | |
| | | | | | | | | | | | | | | | | | | | | | | | | | | | | | | | | | | | | | | | | | | | | | | | |
| | | | | | | | | | | 445 | (h) | | | 445 | | | | | Deferred tax liabilities | | | (6 | ) | | | – | | | | 5 | | | | 1 | | | | (1 | ) | | | – | | | | 444 | |
Other liabilities | | | 64,521 | | | | (445 | )(h) | | | 2 | (g) | | | 64,078 | | | | | Other liabilities | | | 253 | | | | 2,981 | | | | 157 | | | | 244 | | | | 43 | | | | 14 | | | | 67,770 | |
| | | | | | | | | | | | | | | | | | | | | | | | | | | | | | | | | | | | | | | | | | | | | | | | |
| | | | | | | | | | | | | | | | | | | | | | | | | | | | | | | | | | | | | | | | | | | | | | | | |
Shareholders’ equity | | | | | | | | | | | | | | | | | | | | Equity | | | | | | | | | | | | | | | | | | | | | | | | | | | | |
Retained earnings | | | 21,932 | | | | – | | | | – | | | | 21,932 | | | | | Retained earnings | | | (5,798 | ) | | | (270 | ) | | | 6 | | | | (178 | ) | | | (43 | ) | | | 35 | | | | 15,684 | |
Accumulated other comprehensive income (loss) | | | (4,051 | ) | | | – | | | | – | | | | (4,051 | ) | | | | Accumulated other comprehensive income (loss) | | | 4,164 | | | | 35 | | | | 180 | | | | – | | | | – | | | | (59 | ) | | | 269 | |
Other equity | | | 9,750 | | | | – | | | | – | | | | 9,750 | | | | | Other equity | | | – | | | | 956 | | | | – | | | | – | | | | – | | | | – | | | | 10,706 | |
Non-controlling interests in subsidiaries | | | 579 | | | | – | | | | – | | | | 579 | | | | | Non-controlling interests | | | (6 | ) | | | – | | | | – | | | | (12 | ) | | | (1 | ) | | | (1 | ) | | | 559 | |
Total liabilities and shareholders’ equity | | $ | 526,657 | | | $ | (447 | ) | | $ | 447 | | | $ | 526,657 | | | | | Total liabilities and equity | | $ | 14,218 | | | $ | 2,705 | | | $ | 348 | | | $ | 55 | | | $ | (2 | ) | | $ | (11 | ) | | $ | 543,970 | |
Explanation for changes in presentation
| (a) | Securities classified under the Trading option ($2,764) now presented under a separate line Financial assets designated at fair value through profit or loss (FVTPL). |
| (b), | (c) and (e) – moved to a different order or line item. |
| (d) | Split out from Business and government loans ($11,427) to FVTPL ($2,098) and Trading assets – loans ($9,329). |
| (f) | Split out from Other assets ($2,219) to Deferred tax assets. |
| (g) | Split out from Deposits - Personal, Business and government ($2) to Other liabilities. |
| (h) | Split out from Other liabilities ($445) to Deferred tax liabilities. |
86 2011 Scotiabank Annual Report
MANAGEMENT’S DISCUSSION AND ANALYSIS | CONTROLS AND ACCOUNTING POLICIES
Explanation of significant adjustments from Canadian GAAP to IFRS
1. IFRS 1, First-time Adoption of International Financial Reporting Standards (IFRS 1) – Optional exemptions and mandatory exceptions
IFRS 1 requires retrospective application of all IFRS standards with certain optional exemptions and mandatory exceptions.
a) Optional exemptions
The Bank elected to take the following optional exemptions available under IFRS 1 at November 1, 2010. The impact of the Bank’s elections with respect to the optional exemptions under IFRS is discussed below.
Employee benefits
The Bank elected to recognize all cumulative unamortized actuarial losses for employee defined benefit plans at the transition date against opening retained earnings, instead of retrospective restatement. The impact of this election on transition was a decrease of $1,037 million in other assets, an increase of $395 million in other liabilities and a decrease of $1,432 million in equity.
Cumulative translation differences
The Bank elected to reset cumulative translation differences for all foreign operations to zero at the date of transition to IFRS, instead of retrospectively recalculating the impact under IFRS. As a result, cumulative translation losses of $4,507 million were reclassified from accumulated other comprehensive income (AOCI) to opening retained earnings within equity on November 1, 2010.
Designation of previously recognized financial instruments
The Bank reclassified and redesignated certain financial assets at the date of transition as follows:
| • | | Corporate loans of $2,098 million currently designated under the fair value option under Canadian GAAP were reclassified to the held-for-trading loans category under IFRS. Canadian GAAP did not permit these loans to be classified as held-for-trading. |
| • | | Certain debt securities ($555 million) traded in an inactive market were reclassified from AFS securities to business and government loans. |
The following exemptions were also elected that did not have an impact on the Bank’s opening balance sheet.
Business combinations
The Bank has elected to not restate any business combinations prior to November 1, 2010.
Deemed cost
The Bank has elected not to remeasure items of property, plant and equipment or investment property at fair value on the transition date.
Leases
The Bank has elected not to reassess its determinations made under Canadian GAAP regarding whether an agreement contains a lease.
Fair value measurement of financial assets or financial liabilities at initial recognition
The Bank will prospectively apply the guidance in IAS 39,Financial Instruments: Recognition and Measurement as this guidance is
substantially aligned with Canadian GAAP. This guidance relates specifically to financial assets or financial liabilities initially recognized at fair value, where the fair value is established through valuation techniques.
Share-based payments
The Bank is not required to apply IFRS 2,Share-based Payment (IFRS 2) to equity instruments that were granted prior to November 7, 2002. The Bank is also not required to apply IFRS 2 to liabilities arising from share-based payment transactions that were settled before the transition date. The Bank has elected to apply both of these exemptions.
Insurance contracts
The Bank applied IFRS 4,Insurance Contracts, prospectively for reporting periods beginning on or after January 1, 2005. In addition, the Bank continued with its existing insurance accounting policies under IFRS.
Borrowing costs
The Bank will prospectively capitalize borrowing costs directly attributable to the acquisition, construction or production of qualifying assets as prescribed by IFRS. Under Canadian GAAP, the Bank’s accounting policy was to expense these costs as incurred.
b) Mandatory exceptions
The impact of the mandatory exceptions under IFRS are noted below.
Derecognition
The Bank has applied the IFRS derecognition requirements retrospectively to January 1, 2004.
Application of the derecognition criteria has resulted in:
| • | | Recognition of cash equivalents, mortgages, AFS securities, other assets, funding liability and derecognition of swaps and other liabilities. Cash and cash equivalents increased by $0.7 billion, residential mortgages increased by $14 billion, AFS securities increased by $0.8 billion and deferred taxes and other assets increased by $0.1 billion. In addition, customer deposits increased by $23.7 billion, obligations related to securities sold under repurchase agreements decreased by $7.5 billion, and derivatives and other liabilities decreased by $0.7 billion. |
| • | | Reclassification of MBS securities retained from AFS securities to residential mortgages. Residential mortgages increased by $17.8 billion, AFS securities decreased by $18.3 billion and deferred tax assets increased by $0.1 billion and AOCI reduced by $0.4 billion. |
| • | | Securities designated as trading using fair value option requirements no longer meeting the criteria for fair value option resulting in a reclassification. AFS securities increased by $1.9 billion with a corresponding decrease in fair value option securities. |
In aggregate, opening retained earnings increased by $140 million and AOCI decreased by $336 million in relation to the AFS securities resulting in a decrease in total equity of $196 million.
Hedge accounting
There is no significant impact as the Bank’s current hedging strategies qualify for hedge accounting under IFRS.
Scotiabank Annual Report 2011 87
MANAGEMENT’S DISCUSSION AND ANALYSIS
Assets and liabilities of subsidiaries
Since the Bank has adopted IFRS subsequent to certain of its international subsidiaries, the classification and carrying value of assets and liabilities of these subsidiaries for the Consolidated Financial Statements must be the same as the standalone financial statements of these subsidiaries. The impact of this mandatory exception was a decrease in AFS securities of $543 million with a corresponding increase in held-to-maturity securities of $270 million, an increase to business and government loans of $258 million, an increase in deferred taxes of $3 million and a decrease in equity of $12 million.
Estimates
Estimates made in accordance with IFRS at the date of transition are consistent with those determined under Canadian GAAP with adjustments made only to reflect any differences in accounting policies. Any additional estimates that are required under IFRS, that were not required under Canadian GAAP, are based on the information and conditions that existed at the date of transition.
2. Consolidation
As a result of the differences in criteria, certain Special Purpose Entities (SPEs) are consolidated under IFRS that were not consolidated under Canadian GAAP. The resulting overall impact on the Bank’s financial position is reflected below.
| | | | | | | | | | | | | | | | | | | | |
| | | | |
| ($ millions) Increase/(Decrease) | | | | | | | | | | | As at November 1, 2010 | |
| | | | | |
| Entity | | Assets | | | Liabilities | | | Retained
earnings | | | AOCI | | | Capital
instruments
equity | |
Bank funding vehicles | | | | | | | | | | | | | | | | | | | | |
Consolidation of trusts | | $ | (121 | ) | | $ | (127 | ) | | $ | 6 | | | $ | – | | | $ | – | |
Liabilities & equity | | | – | | | | (956 | ) | | | – | | | | – | | | | 956 | |
| | | (121 | ) | | | (1,083 | ) | | | 6 | | | | – | | | | 956 | |
Multi-seller conduit | | | 2,951 | | | | 3,084 | | | | (168 | ) | | | 35 | | | | – | |
Other | | | (125 | ) | | | (17 | ) | | | (108 | ) | | | – | | | | – | |
Total | | $ | 2,705 | | | $ | 1,984 | | | $ | (270 | ) | | $ | 35 | | | $ | 956 | |
| AOCI | = Accumulated other comprehensive income |
Bank funding vehicles
The Bank issues certain of its regulatory capital instruments through trusts that were not consolidated under Canadian GAAP. The trusts’ deposits with the Bank were included under deposits on the Bank’s Consolidated Balance Sheet under Canadian GAAP. Under IFRS, these trusts are consolidated. The impact of consolidation is a reduction of deposits from customers ($1.1 billion), an increase to subordinated debentures ($1.0 billion), a reduction in assets of $121 million mainly from the elimination of intercompany balances between the Bank and the trusts, and an increase to retained earnings of $6 million.
In addition, certain capital instruments issued by these trusts have been assessed under IFRS as being equity instruments or compound instruments comprising both liability and equity components. The equity classification, in whole or for part of the instruments, is due to certain payment features in these instruments that do not create an unavoidable obligation to pay cash. The trusts’ instruments with these equity-based features are classified, in whole or in part as applicable, as capital instruments equity. The combined impact of consolidation and the reclassification of these instruments was a reduction of deposits from customers ($2.9 billion), an increase to capital instrument liabilities ($1.9 billion), an increase of $29 million to other liabilities and an increase of $956 million to capital instruments equity.
Multi-seller conduit
The Bank-sponsored U.S. multi-seller conduit was consolidated on transition to IFRS as the Bank meets the control criteria under IFRS. The consolidation of this conduit increased assets by approximately $3.0 billion, comprised primarily of loans and AFS securities, and liabilities by approximately $3.1 billion, comprised primarily of deposits from customers. A net decrease in opening retained earnings of $168 million and an increase of $35 million to AOCI were also recorded.
Other
Due to the consolidation of certain other SPEs, the underlying variable of a financial guarantee changed causing it to be classified as a derivative instrument. The financial guarantee was recorded at amortized cost under Canadian GAAP and is recorded at fair value under IFRS. The resulting impact was a decrease in assets of $125 million, a decrease in liabilities of $17 million, and a corresponding decrease to opening retained earnings of $108 million.
3. Financial instruments
Loan loss provisions
IFRS requires that provisions on undrawn commitments be presented in other liabilities on the Bank’s balance sheet, whereas under Canadian GAAP, these provisions were presented in the allowance for credit losses. As a result, under IFRS, $157 million was reclassified from allowance for credit losses to other liabilities.
Canadian GAAP requires the cessation of the accrual of interest income on any loans identified as being impaired. Under Canadian GAAP, the
Bank classified certain non-performing loans as impaired but no allowance was recorded against the loans due to the adequacy of collateral or security. Under IFRS, a loan is considered not to be impaired if there is no allowance recorded against it, and interest income continues to be accrued and recognized using the original effective interest rate. A net increase of $6 million was recorded in opening retained earnings, offset by an increase in other assets of $8 million and a reduction to deferred tax assets of $2 million as a result of this remeasurement.
88 2011 Scotiabank Annual Report
MANAGEMENT’S DISCUSSION AND ANALYSIS | CONTROLS AND ACCOUNTING POLICIES
Securities carried at cost
IFRS requires that all AFS securities be measured at fair value, whereas Canadian GAAP permits equity securities not quoted in an active market to be measured at cost. On transition, an increase to the fair value adjustment of financial investments of $244 million has resulted in a corresponding increase in AOCI of $180 million, a decrease in deferred tax assets of $59 million and an increase in deferred tax liabilities of $5 million.
4. Employee benefits
The impact on the Bank’s opening balance sheet for measurement differences between IFRS and Canadian GAAP is an increase in assets of $55 million, an increase in other liabilities of $245 million and a decrease in retaining earnings of $178 million and non-controlling interests of $12 million.
5. Business combinations
The business combinations model under IFRS represents a fair value model of accounting which is substantially converged with Canadian GAAP that the Bank early adopted on November 1, 2010. Although the Bank elected to not restate any business combinations that occurred prior to November 1, 2010, certain adjustments are still required upon transition to IFRS which are not grandfathered under the IFRS 1 election.
The impact of these adjustments to the Bank’s opening balance sheet was a net reduction to equity of $44 million, a decrease in assets of $2 million and an increase in liabilities of $42 million, primarily as a result of recognizing contingent consideration at fair value.
6. Other
There are a number of other implications of adopting IFRS that individually were not significant and are summarized below.
Investment property
IFRS requires that property held to earn rental income or for capital appreciation purposes should be classified separately as investment property under IFRS. Under Canadian GAAP, this property was classified as land, buildings and equipment. As a result, $255 million was reclassified from land, buildings and equipment to investment property on the Bank’s opening balance sheet under IFRS.
Property, plant and equipment
IFRS requires a more granular level of assessment of components of property, plant and equipment with each major component depreciated separately over its estimated useful life. The impact of this remeasurement for certain components of buildings on transition was a reduction in the land, buildings and equipment balance of $46 million, an increase to deferred tax assets of $12 million and a reduction to opening retained earnings of $34 million.
The effects of changes in foreign exchange rates
Due to changes in functional currencies of certain subsidiaries on transition to IFRS, a transition adjustment was required to record the cumulative foreign exchange impact on certain AFS equity securities and the related funding liability, resulting in a decrease of $51 million in AOCI and an increase of $51 million in retained earnings.
Financial reporting in hyperinflationary economies
Under IFRS, if the functional currency of a foreign operation is hyperinflationary, then purchasing power adjustments are made to the financial statements of the foreign operation prior to translation. The impact from this remeasurement was an increase of $32 million to equity accounted investments with an offsetting increase to opening retained earnings and AOCI.
Share-based payments
As a result of the difference in measurement bases between IFRS (fair value) and Canadian GAAP (intrinsic value), the resulting adjustment for awards that have not settled on transition date was a decrease to opening retained earnings of $21 million, a decrease to deferred tax assets of $1 million and an increase in other liabilities of $20 million.
Income taxes
Under IFRS, income tax relating to items charged or credited directly to other comprehensive income or equity, is charged or credited directly to those same balance sheet accounts regardless of the period in which the income tax is recognized. On transition, this resulted in an increase of $18 million in retained earnings and a related decrease in accumulated other comprehensive income.
Interests in joint ventures
IFRS provides two acceptable methods to account for interests in joint ventures: proportionate consolidation or the equity method instead of only proportionate consolidation under Canadian GAAP. The Bank has elected to apply the equity method of accounting to all of its joint ventures. The impact is a decrease of $13 million in other liabilities with offsetting decreases in investments in associates and joint ventures of $11 million and other assets of $2 million.
Insurance contracts
IFRS requires the presentation of reinsurance transactions on a gross basis. This resulted in an increase of $5 million to other assets and other liabilities on the balance sheet.
Customer loyalty programs
IFRS applies a revenue approach to accounting for customer loyalty programs, which requires a portion of the revenue earned at the time of the transaction to be deferred, as compared to a liability approach under Canadian GAAP. As a result, on transition, other liabilities increased by $1 million with an offsetting decrease to opening retained earnings.
Impact on regulatory capital
The impact of the IFRS adjustments to the Bank’s regulatory capital ratios is a decline of approximately 77 basis points on the Bank’s Tier 1 capital ratio and an increase of 0.9 to the assets-to-capital multiple. The Office of the Superintendent of Financial Institutions (OSFI) has allowed financial institutions to elect to take the impact over five quarters. The Bank has elected to phase in the impact over five quarters.
Scotiabank Annual Report 2011 89
MANAGEMENT’S DISCUSSION AND ANALYSIS
Related party transactions
The Bank provides regular banking services to its associated and other related corporations in the ordinary course of business. These services are on terms similar to those offered to non-related parties.
Loans granted to Directors and Officers in Canada are at market terms and conditions. Prior to March 1, 2001, the Bank granted loans to officers and employees at reduced rates in Canada. The loans granted prior to March 1, 2001, are grandfathered until maturity. In some of the Bank’s foreign subsidiaries and branches, in accordance with local practices and laws, loans may be made available to officers of those units at reduced rates or on preferred terms. Loans to executive officers of the Bank totaled $11.0 million as at October 31, 2011 (2010 – $7.3 million), and loans to directors $0.3 million (2010 – $0.3 million).
Directors can use some or all of their fees to buy common shares at market rates through the Directors’ Share Purchase Plan. Non-Officer Directors may elect to receive all or a portion of their fees in the form of deferred stock units which vest immediately. Commencing in 2004, the Bank no longer grants stock options to non-officer directors (refer to Note 18 of the Consolidated Financial Statements on page 139).
The Bank may also provide banking services to companies affiliated with the Bank’s Directors. These commercial arrangements are conducted at the same market terms and conditions provided to all customers and follow the normal credit review processes within the Bank. The Bank’s committed credit exposure to companies controlled by Directors totaled $4.4 million as at October 31, 2011 (2010 – $4.6 million), while actual utilized amounts were $2.0 million (2010 – $2.8 million).
The oversight responsibilities of the Audit and Conduct Review Committee (ACRC) with respect to related party transactions include reviewing policies and practices for identifying transactions with related parties that may materially affect the Bank, and reviewing the procedures for ensuring compliance with the Bank Act for related party transactions. The Bank Act requirements encompass a broader definition of related party transactions than is set out in GAAP. In addition, the ACRC approves the terms and conditions of all transactions between the Bank and Bank-sponsored asset securitization special purpose vehicles to ensure that such transactions are at market terms and conditions. The Bank has various procedures in place to ensure that related party information is identified and reported to the ACRC on a semi-annual basis. The ACRC is provided with detailed reports that reflect the Bank’s compliance with its established procedures.
The Bank’s Internal Audit department carries out audit procedures as necessary to provide the ACRC with reasonable assurance that the Bank’s policies and procedures to identify, authorize and report related party transactions are appropriately designed and operating effectively.
90 2011 Scotiabank Annual Report
MANAGEMENT’S DISCUSSION AND ANALYSIS | SUPPLEMENTARY DATA
SUPPLEMENTARY DATA*
Geographic information
T38Net income by geographic segment
| | | | | | | | | | | | | | | | | | | | | | | | | | | | | | | | | | | | | | | | | | | | | | | | | | | | | | | | | | | | | | |
| | | | |
| | | 2011 | | | | | 2010(1) | | | 2009(1) | |
| | | | | | | | | | | | | | | | |
For the fiscal years
($ millions) | | Canada | | | United States | | | Mexico | | | Other Inter- national | | | Total | | | | | Canada | | | United States | | | Mexico | | | Other Inter- national | | | Total | | | Canada | | | United States | | | Mexico | | | Other Inter- national | | | Total | |
Net interest income | | $ | 5,313 | | | $ | 421 | | | $ | 867 | | | $ | 3,385 | | | $ | 9,986 | | | | | $ | 4,960 | | | $ | 458 | | | $ | 801 | | | $ | 3,144 | | | $ | 9,363 | | | $ | 4,482 | | | $ | 641 | | | $ | 821 | | | $ | 3,332 | | | $ | 9,276 | |
Provision for credit losses | | | 619 | | | | (13 | ) | | | 137 | | | | 363 | | | | 1,106 | | | | | | 709 | | | | (54 | ) | | | 168 | | | | 456 | | | | 1,279 | | | | 744 | | | | 296 | | | | 185 | | | | 392 | | | | 1,617 | |
Other income | | | 4,762 | | | | 495 | | | | 452 | | | | 2,079 | | | | 7,788 | | | | | | 3,770 | | | | 609 | | | | 438 | | | | 1,912 | | | | 6,729 | | | | 3,211 | | | | 452 | | | | 424 | | | | 1,673 | | | | 5,760 | |
Non-interest expenses | | | 5,428 | | | | 408 | | | | 858 | | | | 2,810 | | | | 9,504 | | | | | | 4,653 | | | | 327 | | | | 778 | | | | 2,379 | | | | 8,137 | | | | 4,529 | | | | 255 | | | | 791 | | | | 2,317 | | | | 7,892 | |
Provision for income taxes | | | 713 | | | | 210 | | | | 73 | | | | 380 | | | | 1,376 | | | | | | 767 | | | | 330 | | | | 76 | | | | 558 | | | | 1,731 | | | | 538 | | | | 222 | | | | 69 | | | | 380 | | | | 1,209 | |
Net income(1) | | $ | 3,315 | | | $ | 311 | | | $ | 251 | | | $ | 1,911 | | | $ | 5,788 | | | | | $ | 2,601 | | | $ | 464 | | | $ | 217 | | | $ | 1,663 | | | $ | 4,945 | | | $ | 1,882 | | | $ | 320 | | | $ | 200 | | | $ | 1,916 | | | $ | 4,318 | |
Corporate adjustments(2) | | | | | | | | | | | | | | | | | | | (520 | ) | | | | | | | | | | | | | | | | | | | | | (606 | ) | | | | | | | | | | | | | | | | | | | (657 | ) |
| | | | | | | | | | | | | | | | | | $ | 5,268 | | | | | | | | | | | | | | | | | | | | | $ | 4,339 | | | | | | | | | | | | | | | | | | | $ | 3,661 | |
Net income attributable to: | | | | | | | | | | | | | | | | | | | | | | | | | | | | | | | | | | | | | | | | | | | | | | | | | | | | | | | | | | | | | | |
Non-controlling interests | | | | | | | | | | | | | | | | | | | 93 | | | | | | | | | | | | | | | | | | | | | | 100 | | | | | | | | | | | | | | | | | | | | 114 | |
Preferred shareholders | | | | | | | | | | | | | | | | | | | 216 | | | | | | | | | | | | | | | | | | | | | | 201 | | | | | | | | | | | | | | | | | | | | 186 | |
Common shareholders | | | | | | | | | | | | | | | | | | $ | 4,959 | | | | | | | | | | | | | | | | | | | | | $ | 4,038 | | | | | | | | | | | | | | | | | | | $ | 3,361 | |
| (1) | Refer to Note 1 of the Consolidated Financial Statements for the impact of the new accounting standards adopted effective November 1, 2010. Prior period information has been reclassified to conform with current presentation. |
| (2) | Revenues and expenses which have not been allocated to specific operating business lines are reflected in corporate adjustments. |
T39 Loans and acceptances by geography
| | | | | | | | | | | | | | | | | | | | | | | | | | | | |
| | | | | | |
| Excludes reverse repos | | | | | | | | | | | | | | | | | Percentage mix | |
| | | | | | | |
| As at September 30 ($ billions) | | 2011 | | | 2010 | | | 2009 | | | 2008 | | | 2007 | | | 2011 | | | 2007 | |
Canada | | | | | | | | | | | | | | | | | | | | | | | | | | | | |
Atlantic provinces | | $ | 17.9 | | | $ | 17.0 | | | $ | 15.7 | | | $ | 16.2 | | | $ | 14.2 | | | | 5.9 | % | | | 6.2 | % |
Quebec | | | 18.8 | | | | 17.7 | | | | 16.0 | | | | 16.7 | | | | 14.2 | | | | 6.2 | | | | 6.2 | |
Ontario | | | 105.3 | | | | 101.7 | | | | 96.0 | | | | 103.5 | | | | 91.1 | | | | 34.8 | | | | 39.5 | |
Manitoba and Saskatchewan | | | 7.0 | | | | 6.6 | | | | 6.2 | | | | 6.4 | | | | 6.0 | | | | 2.3 | | | | 2.6 | |
Alberta | | | 23.0 | | | | 21.7 | | | | 20.3 | | | | 22.4 | | | | 19.9 | | | | 7.6 | | | | 8.6 | |
British Columbia | | | 22.4 | | | | 21.1 | | | | 18.8 | | | | 21.2 | | | | 18.8 | | | | 7.4 | | | | 8.1 | |
| | | 194.4 | | | | 185.8 | | | | 173.0 | | | | 186.4 | | | | 164.2 | | | | 64.2 | | | | 71.2 | |
United States | | | 22.6 | | | | 21.1 | | | | 22.0 | | | | 20.6 | | | | 14.9 | | | | 7.5 | | | | 6.5 | |
Mexico | | | 10.6 | | | | 10.1 | | | | 9.7 | | | | 10.9 | | | | 8.9 | | | | 3.5 | | | | 3.9 | |
Other International | | | | | | | | | | | | | | | | | | | | | | | | | | | | |
Latin America | | | 27.5 | | | | 23.4 | | | | 21.5 | | | | 22.6 | | | | 11.6 | | | | 9.1 | | | | 5.0 | |
Europe | | | 8.7 | | | | 6.5 | | | | 12.9 | | | | 18.4 | | | | 10.2 | | | | 2.9 | | | | 4.4 | |
Caribbean | | | 19.1 | | | | 18.8 | | | | 15.6 | | | | 14.8 | | | | 12.2 | | | | 6.3 | | | | 5.3 | |
Other | | | 21.1 | | | | 17.0 | | | | 15.1 | | | | 16.1 | | | | 9.9 | | | | 6.9 | | | | 4.3 | |
| | | 76.4 | | | | 65.7 | | | | 65.1 | | | | 71.9 | | | | 43.9 | | | | 25.2 | | | | 19.0 | |
General allowance(1) | | | (1.3 | ) | | | (1.4 | ) | | | (1.4 | ) | | | (1.3 | ) | | | (1.3 | ) | | | (0.4 | ) | | | (0.6 | ) |
Total loans and acceptances | | $ | 302.7 | | | $ | 281.3 | | | $ | 268.4 | | | $ | 288.5 | | | $ | 230.6 | | | | 100.0 | % | | | 100.0 | % |
T40 Gross impaired loans by geographic segment
| | | | | | | | | | | | | | | | | | | | |
| | | | | |
| As at October 31 ($ millions) | | 2011 | | | 2010 | | | 2009 | | | 2008 | | | 2007 | |
Canada | | $ | 1,195 | | | $ | 1,276 | | | $ | 1,258 | | | $ | 761 | | | $ | 606 | |
United States | | | 125 | | | | 179 | | | | 408 | | | | 107 | | | | 11 | |
Mexico | | | 159 | | | | 250 | | | | 238 | | | | 216 | | | | 188 | |
Other International | | | 2,609 | | | | 2,716 | | | | 2,035 | | | | 1,410 | | | | 739 | |
Total | | $ | 4,088 | | | $ | 4,421 | | | $ | 3,939 | | | $ | 2,494 | | | $ | 1,544 | |
| * | Certain comparative amounts in the Supplementary Data section have been reclassified to conform with current year presentation. |
Scotiabank Annual Report 2011 91
MANAGEMENT’S DISCUSSION AND ANALYSIS
T41 Specific provision for credit losses by geographic segment
| | | | | | | | | | | | | | | | | | | | |
| | | | | |
| For the fiscal years ($ millions) | | 2011 | | | 2010 | | | 2009 | | | 2008 | | | 2007 | |
Canada | | $ | 618 | | | $ | 712 | | | $ | 804 | | | $ | 388 | | | $ | 295 | |
United States | | | (13 | ) | | | (13 | ) | | | 192 | | | | 16 | | | | (91 | ) |
Mexico | | | 137 | | | | 168 | | | | 185 | | | | 141 | | | | 68 | |
Other International | | | 364 | | | | 456 | | | | 392 | | | | 85 | | | | 23 | |
Total | | $ | 1,106 | | | $ | 1,323 | | | $ | 1,573 | | | $ | 630 | | | $ | 295 | |
T42Cross-border exposure to select countries(1)
| | | | | | | | | | | | | | | | | | | | | | | | | | | | | | | | |
| | | | | | | | |
As at
October 31
($ millions) | | | | | | | | | | | Government and other securities | | | Investment in
subsidiaries
and affiliates | | | | | | | | | | |
| | Loans | | | Trade | | | Interbank
deposits | | | | | Other | | | 2011 Total | | | 2010 Total | |
Mexico | | $ | 1,793 | | | $ | 300 | | | $ | – | | | $ | 201 | | | $ | 2,225 | | | $ | 59 | | | $ | 4,578 | | | $ | 4,945 | |
Asia | | | | | | | | | | | | | | | | | | | | | | | | | | | | | | | | |
China | | $ | 1,998 | | | $ | 2,695 | | | $ | 353 | | | $ | 475 | | | $ | 95 | | | $ | 63 | | | $ | 5,679 | | | $ | 4,304 | |
India | | | 2,085 | | | | 1,411 | | | | 46 | | | | 207 | | | | – | | | | 50 | | | | 3,799 | | | | 2,943 | |
South Korea | | | 1,306 | | | | 888 | | | | – | | | | 428 | | | | – | | | | 133 | | | | 2,755 | | | | 2,863 | |
Thailand | | | 20 | | | | 28 | | | | – | | | | 22 | | | | 1,430 | | | | 1 | | | | 1,501 | | | | 1,633 | |
Hong Kong | | | 685 | | | | 358 | | | | 120 | | | | 283 | | | | – | | | | 3 | | | | 1,449 | | | | 1,343 | |
Malaysia | | | 522 | | | | 129 | | | | – | | | | 373 | | | | 240 | | | | 10 | | | | 1,274 | | | | 994 | |
Japan | | | 249 | | | | 43 | | | | 30 | | | | 242 | | | | – | | | | 158 | | | | 722 | | | | 516 | |
Other(2) | | | 654 | | | | 391 | | | | 78 | | | | 97 | | | | – | | | | 15 | | | | 1,235 | | | | 979 | |
| | $ | 7,519 | | | $ | 5,943 | | | $ | 627 | | | $ | 2,127 | | | $ | 1,765 | | | $ | 433 | | | $ | 18,414 | | | $ | 15,575 | |
Latin America | | | | | | | | | | | | | | | | | | | | | | | | | | | | | | | | |
Chile | | $ | 1,684 | | | $ | 290 | | | $ | – | | | $ | 24 | | | $ | 2,355 | | | $ | 4 | | | $ | 4,357 | | | $ | 3,769 | |
Peru | | | 790 | | | | 93 | | | | – | | | | 2 | | | | 2,016 | | | | 4 | | | | 2,905 | | | | 2,590 | |
Brazil | | | 727 | | | | 1,787 | | | | – | | | | 231 | | | | 155 | | | | 3 | | | | 2,903 | | | | 2,167 | |
Costa Rica | | | 1,017 | | | | 146 | | | | – | | | | 1 | | | | 566 | | | | – | | | | 1,730 | | | | 1,422 | |
Panama | | | 1,778 | | | | 63 | | | | 21 | | | | – | | | | – | | | | 17 | | | | 1,879 | | | | 1,460 | |
El Salvador | | | 179 | | | | 5 | | | | – | | | | – | | | | 406 | | | | – | | | | 590 | | | | 584 | |
Uruguay | | | 141 | | | | 41 | | | | – | | | | 18 | | | | 279 | | | | – | | | | 479 | | | | 21 | |
Colombia | | | 333 | | | | 73 | | | | – | | | | 2 | | | | 59 | | | | – | | | | 467 | | | | 330 | |
Venezuela | | | 6 | | | | – | | | | – | | | | 5 | | | | 131 | | | | – | | | | 142 | | | | 110 | |
| | $ | 6,655 | | | $ | 2,498 | | | $ | 21 | | | $ | 283 | | | $ | 5,967 | | | $ | 28 | | | $ | 15,452 | | | $ | 12,453 | |
| (1) | Cross-border exposure represents a claim, denominated in a currency other than the local one, against a borrower in a foreign country on the basis of ultimate risk. |
| (2) | Includes Indonesia, the Philippines, Singapore and Taiwan. |
92 2011 Scotiabank Annual Report
MANAGEMENT’S DISCUSSION AND ANALYSIS | SUPPLEMENTARY DATA
Credit Risk
T43Loans and acceptances by type of borrower
| | | | | | | | | | | | | | | | |
| | | |
| | | 2011 | | | | | | | |
| | | | |
| As at October 31 ($ billions) | | Balance | | | % of total | | | 2010 | | | 2009 | |
Loans to households | | | | | | | | | | | | | | | | |
Residential mortgages | | $ | 122.8 | | | | 39.9 | % | | $ | 120.2 | | | $ | 101.3 | |
Credit cards | | | 10.9 | | | | 3.5 | | | | 10.8 | | | | 11.1 | |
Personal loans | | | 51.2 | | | | 16.6 | | | | 51.1 | | | | 49.3 | |
| | | 184.9 | | | | 60.0 | | | | 182.1 | | | | 161.7 | |
| | | | |
Loans to businesses and governments | | | | | | | | | | | | | | | | |
Financial services | | | 22.1 | | | | 7.2 | | | | 19.3 | | | | 18.8 | |
Wholesale and retail | | | 11.5 | | | | 3.7 | | | | 10.4 | | | | 10.9 | |
Real estate | | | 10.9 | | | | 3.5 | | | | 10.7 | | | | 11.7 | |
Oil and gas | | | 10.2 | | | | 3.3 | | | | 9.3 | | | | 9.8 | |
Transportation | | | 7.9 | | | | 2.6 | | | | 7.0 | | | | 7.8 | |
Automotive | | | 5.7 | | | | 1.8 | | | | 5.2 | | | | 5.1 | |
Agriculture | | | 5.5 | | | | 1.8 | | | | 4.5 | | | | 4.3 | |
Government | | | 4.5 | | | | 1.4 | | | | 4.2 | | | | 3.3 | |
Hotels and leisure | | | 3.9 | | | | 1.3 | | | | 4.1 | | | | 4.8 | |
Mining and primary metals | | | 6.7 | | | | 2.2 | | | | 5.3 | | | | 5.7 | |
Utilities | | | 5.3 | | | | 1.7 | | | | 5.0 | | �� | | 6.1 | |
Health care | | | 4.4 | | | | 1.4 | | | | 4.0 | | | | 4.0 | |
Telecommunications and cable | | | 4.4 | | | | 1.4 | | | | 3.7 | | | | 4.6 | |
Media | | | 1.8 | | | | 0.6 | | | | 1.9 | | | | 2.7 | |
Chemical | | | 1.7 | | | | 0.6 | | | | 1.2 | | | | 1.3 | |
Food and beverage | | | 3.0 | | | | 1.0 | | | | 2.8 | | | | 3.8 | |
Forest products | | | 1.1 | | | | 0.4 | | | | 1.1 | | | | 1.5 | |
Other | | | 12.7 | | | | 4.1 | | | | 11.4 | | | | 9.5 | |
| | | 123.3 | | | | 40.0 | | | | 111.1 | | | | 115.7 | |
| | | 308.2 | | | | 100.0 | % | | | 293.2 | | | | 277.4 | |
General and sectoral allowances | | | (1.3 | ) | | | | | | | (1.4 | ) | | | (1.5 | ) |
Total loans and acceptances | | $ | 306.9 | | | | | | | $ | 291.8 | | | $ | 275.9 | |
T44 Off balance-sheet credit instruments
| | | | | | | | | | | | | | | | | | | | |
| | | | | |
| As at October 31 ($ billions) | | 2011 | | | 2010 | | | 2009 | | | 2008 | | | 2007 | |
Commitments to extend credit(1) | | $ | 107.5 | | | $ | 103.6 | | | $ | 104.5 | | | $ | 130.2 | | | $ | 114.3 | |
Standby letters of credit and letters of guarantee | | | 21.1 | | | | 20.4 | | | | 21.9 | | | | 27.8 | | | | 18.4 | |
Securities lending, securities purchase commitments and other | | | 14.2 | | | | 14.0 | | | | 12.7 | | | | 12.8 | | | | 13.8 | |
Total | | $ | 142.8 | | | $ | 138.0 | | | $ | 139.1 | | | $ | 170.8 | | | $ | 146.5 | |
| (1) | Excludes commitments which are unconditionally cancellable at the Bank’s discretion at any time. |
Scotiabank Annual Report 2011 93
MANAGEMENT’S DISCUSSION AND ANALYSIS
T45 Changes in net impaired loans
| | | | | | | | | | | | | | | | | | | | |
| | | | | |
| For the fiscal years ($ millions) | | 2011 | | | 2010 | | | 2009 | | | 2008 | | | 2007 | |
Gross impaired loans | | | | | | | | | | | | | | | | | | | | |
Balance at beginning of year | | $ | 4,421 | | | $ | 3,939 | | | $ | 2,494 | | | $ | 1,544 | | | $ | 1,870 | |
Net additions | | | | | | | | | | | | | | | | | | | | |
New additions | | | 3,007 | | | | 3,298 | | | | 4,461 | | | | 2,158 | | | | 1,338 | |
Declassifications, payments and loan sales | | | (1,948 | ) | | | (1,772 | ) | | | (1,149 | ) | | | (846 | ) | | | (891 | ) |
| | | 1,059 | | | | 1,526 | | | | 3,312 | | | | 1,312 | | | | 447 | |
Acquisition of subsidiaries(1) | | | – | | | | 571 | | | | – | | | | 341 | | | | 33 | |
Writeoffs | | | | | | | | | | | | | | | | | | | | |
Residential mortgages | | | (130 | ) | | | (82 | ) | | | (64 | ) | | | (59 | ) | | | (5 | ) |
Personal loans | | | (374 | ) | | | (804 | ) | | | (669 | ) | | | (424 | ) | | | (301 | ) |
Credit cards | | | (628 | ) | | | (352 | ) | | | (470 | ) | | | (268 | ) | | | (183 | ) |
Business and government | | | (192 | ) | | | (347 | ) | | | (457 | ) | | | (129 | ) | | | (209 | ) |
| | | (1,324 | ) | | | (1,585 | ) | | | (1,660 | ) | | | (880 | ) | | | (698 | ) |
Foreign exchange and other | | | (68 | ) | | | (30 | ) | | | (207 | ) | | | 177 | | | | (108 | ) |
Balance at end of year | | | 4,088 | | | | 4,421 | | | | 3,939 | | | | 2,494 | | | | 1,544 | |
Specific allowance for credit losses | | | | | | | | | | | | | | | | | | | | |
Balance at beginning of year | | | 1,377 | | | | 1,376 | | | | 1,303 | | | | 943 | | | | 1,300 | |
Acquisition of subsidiaries | | | – | | | | 14 | | | | 9 | | | | 232 | | | | 38 | |
Specific provision for credit losses | | | 1,106 | | | | 1,323 | | | | 1,573 | | | | 630 | | | | 295 | |
Writeoffs | | | (1,324 | ) | | | (1,585 | ) | | | (1,660 | ) | | | (880 | ) | | | (698 | ) |
Recoveries by portfolio | | | | | | | | | | | | | | | | | | | | |
Residential mortgages | | | 55 | | | | 18 | | | | 27 | | | | 34 | | | | 4 | |
Personal loans | | | 71 | | | | 122 | | | | 94 | | | | 73 | | | | 73 | |
Credit cards | | | 152 | | | | 56 | | | | 47 | | | | 45 | | | | 35 | |
Business and government | | | 71 | | | | 68 | | | | 55 | | | | 79 | | | | 74 | |
| | | 349 | | | | 264 | | | | 223 | | | | 231 | | | | 186 | |
Foreign exchange and other(2) | | | (43 | ) | | | (15 | ) | | | (72 | ) | | | 147 | | | | (178 | ) |
Balance at end of year | | | 1,465 | | | | 1,377 | | | | 1,376 | | | | 1,303 | | | | 943 | |
Net impaired loans | | | | | | | | | | | | | | | | | | | | |
Balance at beginning of year | | | 3,044 | | | | 2,563 | | | | 1,191 | | | | 601 | | | | 570 | |
Net change in gross impaired loans | | | (333 | ) | | | 482 | | | | 1,445 | | | | 950 | | | | (326 | ) |
Net change in specific allowance for credit losses | | | (88 | ) | | | (1 | ) | | | (73 | ) | | | (360 | ) | | | 357 | |
Balance at end of year | | | 2,623 | | | | 3,044 | | | | 2,563 | | | | 1,191 | | | | 601 | |
General allowance for credit losses | | | 1,352 | | | | 1,410 | | | | 1,450 | | | | 1,323 | | | | 1,298 | |
Sectoral allowance | | | – | | | | – | | | | 44 | | | | – | | | | – | |
Balance after deducting general and sectoral allowance | | $ | 1,271 | | | $ | 1,634 | | | $ | 1,069 | | | $ | (132 | ) | | $ | (697 | ) |
| (1) | Represents primarily $553 of impaired loans purchased as part of the acquisitions of R-G Premier Bank of Puerto Rico. These impaired loans are carried at fair value on date of acquisition and no allowance for credit losses is recorded at the acquisition date as credit losses are included in the determination of the fair value. |
| (2) | Includes $1 transferred to/from other liabilities in 2011, $4 transferred to other liabilities in 2010, $3 transferred from other liabilities in 2009, and $3 transferred from other liabilities in 2008. |
94 2011 Scotiabank Annual Report
MANAGEMENT’S DISCUSSION AND ANALYSIS | SUPPLEMENTARY DATA
T46Provisions for credit losses
| | | | | | | | | | | | | | | | | | | | |
| | | | | |
| For the fiscal years ($ millions) | | 2011 | | | 2010 | | | 2009 | | | 2008 | | | 2007 | |
Specific provisions for credit losses | | | | | | | | | | | | | | | | | | | | |
Gross specific provisions | | $ | 1,623 | | | $ | 1,708 | | | $ | 1,969 | | | $ | 1,084 | | | $ | 720 | |
Reversals | | | (168 | ) | | | (121 | ) | | | (173 | ) | | | (223 | ) | | | (239 | ) |
Recoveries | | | (349 | ) | | | (264 | ) | | | (223 | ) | | | (231 | ) | | | (186 | ) |
Net specific provisions for credit losses | | | 1,106 | | | | 1,323 | | | | 1,573 | | | | 630 | | | | 295 | |
General provision | | | (60 | ) | | | (40 | ) | | | 127 | | | | – | | | | (25 | ) |
Sectoral provision | | | – | | | | (44 | ) | | | 44 | | | | – | | | | – | |
Total net provisions for credit losses | | $ | 1,046 | | | $ | 1,239 | | | $ | 1,744 | | | $ | 630 | | | $ | 270 | |
T47 Specific provisions for credit losses by type of borrower
| | | | | | | | | | | | | | | | | | | | |
| | | | | |
| For the fiscal years ($ millions) | | 2011 | | | 2010 | | | 2009 | | | 2008 | | | 2007 | |
Personal | | | | | | | | | | | | | | | | | | | | |
Residential mortgages | | $ | 176 | | | $ | 104 | | | $ | 25 | | | $ | – | | | $ | (9 | ) |
Other personal loans | | | 763 | | | | 972 | | | | 1,042 | | | | 636 | | | | 449 | |
| | | 939 | | | | 1,076 | | | | 1,067 | | | | 636 | | | | 440 | |
Businesses and governments | | | | | | | | | | | | | | | | | | | | |
Financial services | | | (7 | ) | | | 6 | | | | 199 | | | | 7 | | | | (10 | ) |
Wholesale and retail | | | 23 | | | | 51 | | | | 101 | | | | – | | | | (39 | ) |
Real estate | | | 14 | | | | 16 | | | | 59 | | | | (69 | ) | | | (11 | ) |
Oil and gas | | | 48 | | | | 2 | | | | 34 | | | | 43 | | | | (1 | ) |
Transportation | | | 41 | | | | 44 | | | | (9 | ) | | | (15 | ) | | | (9 | ) |
Automotive | | | (2 | ) | | | (4 | ) | | | 19 | | | | 5 | | | | 1 | |
Agriculture | | | (1 | ) | | | (4 | ) | | | 19 | | | | 5 | | | | (4 | ) |
Government | | | – | | | | 1 | | | | (35 | ) | | | (18 | ) | | | 2 | |
Hotels and leisure | | | 1 | | | | 81 | | | | 10 | | | | (4 | ) | | | (5 | ) |
Mining and primary metals | | | 1 | | | | (2 | ) | | | 3 | | | | (16 | ) | | | (4 | ) |
Utilities | | | 3 | | | | – | | | | – | | | | (2 | ) | | | (18 | ) |
Health care | | | 4 | | | | 8 | | | | 4 | | | | 2 | | | | (1 | ) |
Telecommunications and cable | | | 1 | | | | (4 | ) | | | 6 | | | | (3 | ) | | | (5 | ) |
Media | | | 15 | | | | (15 | ) | | | 52 | | | | 11 | | | | (13 | ) |
Chemical | | | – | | | | (3 | ) | | | 1 | | | | 7 | | | | (22 | ) |
Food and beverage | | | 2 | | | | 2 | | | | 8 | | | | (17 | ) | | | (6 | ) |
Forest products | | | 4 | | | | 2 | | | | 5 | | | | 3 | | | | – | |
Other | | | 20 | | | | 66 | | | | 30 | | | | 55 | | | | – | |
| | | 167 | | | | 247 | | | | 506 | | | | (6 | ) | | | (145 | ) |
Total specific provisions | | $ | 1,106 | | | $ | 1,323 | | | $ | 1,573 | | | $ | 630 | | | $ | 295 | |
Scotiabank Annual Report 2011 95
MANAGEMENT’S DISCUSSION AND ANALYSIS
T48Impaired loans by type of borrower
| | | | | | | | | | | | | | | | | | | | | | | | | | |
| | | |
| | | 2011 | | | | | 2010 | |
| | | | | | | |
| As at October 31 ($ millions) | | Gross | | | Specific allowance for credit losses | | | Net | | | | | Gross | | | Specific allowance for credit losses | | | Net | |
Personal | | | | | | | | | | | | | | | | | | | | | | | | | | |
Residential mortgages | | $ | 1,568 | | | $ | (268 | ) | | $ | 1,300 | | | | | $ | 1,694 | | | $ | (222 | ) | | $ | 1,472 | |
Other personal loans | | | 853 | | | | (683 | ) | | | 170 | | | | | | 756 | | | | (666 | ) | | | 90 | |
| | | 2,421 | | | | (951 | ) | | | 1,470 | | | | | | 2,450 | | | | (888 | ) | | | 1,562 | |
Businesses and governments | | | | | | | | | | | | | | | | | | | | | | | | | | |
Financial services | | | 57 | | | | (24 | ) | | | 33 | | | | | | 91 | | | | (38 | ) | | | 53 | |
Wholesale and retail | | | 187 | | | | (85 | ) | | | 102 | | | | | | 225 | | | | (88 | ) | | | 137 | |
Real estate | | | 471 | | | | (86 | ) | | | 385 | | | | | | 705 | | | | (88 | ) | | | 617 | |
Oil and gas | | | 55 | | | | (61 | ) | | | (6 | ) | | | | | 8 | | | | (3 | ) | | | 5 | |
Transportation | | | 118 | | | | (51 | ) | | | 67 | | | | | | 188 | | | | (51 | ) | | | 137 | |
Automotive | | | 15 | | | | (1 | ) | | | 14 | | | | | | 15 | | | | (11 | ) | | | 4 | |
Agriculture | | | 63 | | | | (23 | ) | | | 40 | | | | | | 78 | | | | (31 | ) | | | 47 | |
Government | | | 32 | | | | (6 | ) | | | 26 | | | | | | 48 | | | | (10 | ) | | | 38 | |
Hotels and leisure | | | 221 | | | | (31 | ) | | | 190 | | | | | | 331 | | | | (49 | ) | | | 282 | |
Mining and primary metals | | | 21 | | | | (10 | ) | | | 11 | | | | | | 18 | | | | (11 | ) | | | 7 | |
Utilities | | | 13 | | | | (4 | ) | | | 9 | | | | | | 2 | | | | – | | | | 2 | |
Health care | | | 44 | | | | (9 | ) | | | 35 | | | | | | 23 | | | | (10 | ) | | | 13 | |
Telecommunications and cable | | | 27 | | | | (10 | ) | | | 17 | | | | | | 18 | | | | (5 | ) | | | 13 | |
Media | | | 42 | | | | (16 | ) | | | 26 | | | | | | 4 | | | | (3 | ) | | | 1 | |
Chemical | | | 1 | | | | – | | | | 1 | | | | | | 1 | | | | (1 | ) | | | – | |
Food and beverage | | | 35 | | | | (14 | ) | | | 21 | | | | | | 35 | | | | (16 | ) | | | 19 | |
Forest products | | | 22 | | | | (8 | ) | | | 14 | | | | | | 14 | | | | (5 | ) | | | 9 | |
Other | | | 243 | | | | (75 | ) | | | 168 | | | | | | 167 | | | | (69 | ) | | | 98 | |
| | | 1,667 | | | | (514 | ) | | | 1,153 | | | | | | 1,971 | | | | (489 | ) | | | 1,482 | |
Total | | $ | 4,088 | | | $ | (1,465 | ) | | $ | 2,623 | | | | | $ | 4,421 | | | $ | (1,377 | ) | | $ | 3,044 | |
T49Total credit risk exposures by geography(1,2)
| | | | | | | | | | | | | | | | | | | | | | | | |
| | |
| | | 2011 | | | 2010 | |
| | | | |
| | | Non-Retail | | | | | | | | | | |
| | | | | | |
| As at October 31 ($ millions) | | Drawn | | | Undrawn | | | Other exposures(3) | | | Retail | | | Total | | | Total | |
Canada | | $ | 53,446 | | | $ | 25,240 | | | $ | 25,092 | | | $ | 201,866 | | | $ | 305,644 | | | $ | 280,984 | |
United States | | | 39,500 | | | | 18,564 | | | | 22,067 | | | | 472 | | | | 80,603 | | | | 73,316 | |
Mexico | | | 6,906 | | | | 161 | | | | 760 | | | | 4,674 | | | | 12,501 | | | | 12,658 | |
Other International | | | | | | | | | | | | | | | | | | | | | | | | |
Europe | | | 14,630 | | | | 4,784 | | | | 7,865 | | | | – | | | | 27,279 | | | | 27,153 | |
Caribbean | | | 15,139 | | | | 2,242 | | | | 2,088 | | | | 12,366 | | | | 31,835 | | | | 30,490 | |
Latin America | | | 18,541 | | | | 820 | | | | 1,684 | | | | 8,431 | | | | 29,476 | | | | 25,267 | |
Other | | | 27,670 | | | | 3,167 | | | | 2,333 | | | �� | 122 | | | | 33,292 | | | | 26,869 | |
Total | | $ | 175,832 | | | $ | 54,978 | | | $ | 61,889 | | | $ | 227,931 | | | $ | 520,630 | | | $ | 476,737 | |
| (1) | Geographic segmentation is based upon the location of the ultimate risk of the credit exposure. Includes all credit risk portfolios and excludes available-for-sale equities and other assets. |
| (3) | Includes off-balance sheet lending instruments such as letters of credit, letters of guarantee, derivatives, securitization and repo-style transactions after collateral. |
T50AIRB credit risk exposures by maturity(1,2)
| | | | | | | | | | | | | | | | | | | | |
| | |
| As at October 31 ($ millions) | | 2011 | | | 2010 | |
| | | | | |
| Residual maturity | | Drawn | | | Undrawn | | | Other exposures(3) | | | Total | | | Total | |
Non-retail | | | | | | | | | | | | | | | | | | | | |
Less than 1 year | | $ | 83,771 | | | $ | 19,136 | | | $ | 27,782 | | | $ | 130,689 | | | $ | 88,543 | |
One to 5 years | | | 49,513 | | | | 32,514 | | | | 30,390 | | | | 112,417 | | | | 90,427 | |
Over 5 years | | | 8,063 | | | | 1,302 | | | | 2,260 | | | | 11,625 | | | | 10,055 | |
Total non-retail | | $ | 141,347 | | | | 52,952 | | | | 60,432 | | | | 254,731 | | | $ | 189,025 | |
Retail | | | | | | | | | | | | | | | | | | | | |
Less than 1 year | | $ | 15,515 | | | $ | 12,410 | | | $ | – | | | $ | 27,925 | | | $ | 22,382 | |
One to 5 years | | | 120,296 | | | | – | | | | – | | | | 120,296 | | | | 115,298 | |
Over 5 years | | | 3,989 | | | | – | | | | – | | | | 3,989 | | | | 2,866 | |
Revolving credits(4) | | | 33,264 | | | | 12,195 | | | | – | | | | 45,459 | | | | 39,138 | |
Total retail | | $ | 173,064 | | | $ | 24,605 | | | $ | – | | | $ | 197,669 | | | $ | 179,684 | |
Total | | $ | 314,411 | | | $ | 77,557 | | | $ | 60,432 | | | $ | 452,400 | | | $ | 368,709 | |
| (1) | Remaining term to maturity of the credit exposure. Includes all credit risk portfolios and excludes available-for-sale equities and other assets. |
| (2) | Exposure at default, before credit risk mitigation. |
| (3) | Off-balance sheet lending instruments, such as letters of credit, letters of guarantee, securitization, derivatives and repo-style transactions after collateral. |
| (4) | Credit cards and lines of credit with unspecified maturity. |
96 2011 Scotiabank Annual Report
MANAGEMENT’S DISCUSSION AND ANALYSIS | SUPPLEMENTARY DATA
T51 Total credit risk exposures and risk-weighted assets
| | | | | | | | | | | | | | | | | | | | | | | | | | |
| | | |
| | | 2011 | | | | | 2010 | |
| | | | | |
| | | Exposure at Default(1) | | | Total Risk-
weighted
assets | | | | | Exposure at
Default
Total(1) | | | Total Risk-
weighted
assets | |
| As at October 31 ($ millions) | | AIRB | | | Standardized(2) | | | Total | | | | | |
Non-retail | | | | | | | | | | | | | | | | | | | | | | | | | | |
Corporate | | | | | | | | | | | | | | | | | | | | | | | | | | |
Drawn | | $ | 72,341 | | | $ | 27,455 | | | $ | 99,796 | | | $ | 75,405 | | | | | $ | 90,678 | | | $ | 71,290 | |
Undrawn | | | 40,712 | | | | 1,797 | | | | 42,509 | | | | 20,783 | | | | | | 39,285 | | | | 19,553 | |
Other(3) | | | 13,821 | | | | 1,401 | | | | 15,222 | | | | 7,307 | | | | | | 12,711 | | | | 6,754 | |
| | | 126,874 | | | | 30,653 | | | | 157,527 | | | | 103,495 | | | | | | 142,674 | | | | 97,597 | |
Bank | | | | | | | | | | | | | | | | | | | | | | | | | | |
Drawn | | | 22,373 | | | | 3,651 | | | | 26,024 | | | | 8,473 | | | | | | 25,835 | | | | 6,107 | |
Undrawn | | | 11,153 | | | | 188 | | | | 11,341 | | | | 2,851 | | | | | | 11,744 | | | | 3,162 | |
Other(3) | | | 10,369 | | | | 56 | | | | 10,425 | | | | 1,536 | | | | | | 10,496 | | | | 1,800 | |
| | | 43,895 | | | | 3,895 | | | | 47,790 | | | | 12,860 | | | | | | 48,075 | | | | 11,069 | |
Sovereign | | | | | | | | | | | | | | | | | | | | | | | | | | |
Drawn | | | 46,633 | | | | 3,379 | | | | 50,012 | | | | 4,392 | | | | | | 43,301 | | | | 2,080 | |
Undrawn | | | 1,087 | | | | 41 | | | | 1,128 | | | | 225 | | | | | | 635 | | | | 71 | |
Other(3) | | | 236 | | | | – | | | | 236 | | | | 17 | | | | | | 151 | | | | 6 | |
| | | 47,956 | | | | 3,420 | | | | 51,376 | | | | 4,634 | | | | | | 44,087 | | | | 2,157 | |
Total Non-retail | | | | | | | | | | | | | | | | | | | | | | | | | | |
Drawn | | | 141,347 | | | | 34,485 | | | | 175,832 | | | | 88,270 | | | | | | 159,814 | | | | 79,477 | |
Undrawn | | | 52,952 | | | | 2,026 | | | | 54,978 | | | | 23,859 | | | | | | 51,664 | | | | 22,786 | |
Other(3) | | | 24,426 | | | | 1,457 | | | | 25,883 | | | | 8,860 | | | | | | 23,358 | | | | 8,560 | |
| | $ | 218,725 | | | $ | 37,968 | | | $ | 256,693 | | | $ | 120,989 | | | | | $ | 234,836 | | | $ | 110,823 | |
Retail | | | | | | | | | | | | | | | | | | | | | | | | | | |
Retail residential mortgages | | | | | | | | | | | | | | | | | | | | | | | | | | |
Drawn | | $ | 127,349 | | | $ | 16,592 | | | $ | 143,941 | | | $ | 10,446 | | | | | $ | 137,931 | | | $ | 12,107 | |
Undrawn | | | – | | | | – | | | | – | | | | – | | | | | | 8,068 | | | | 132 | |
| | | 127,349 | | | | 16,592 | | | | 143,941 | | | | 10,446 | | | | | | 145,999 | | | | 12,239 | |
Secured lines of credit | | | | | | | | | | | | | | | | | | | | | | | | | | |
Drawn | | | 17,937 | | | | – | | | | 17,937 | | | | 4,651 | | | | | | 18,066 | | | | 967 | |
Undrawn | | | 11,780 | | | | – | | | | 11,780 | | | | 1,393 | | | | | | 78 | | | | 1 | |
| | | 29,717 | | | | – | | | | 29,717 | | | | 6,044 | | | | | | 18,144 | | | | 968 | |
Qualifying retail revolving exposures (QRRE) | | | | | | | | | | | | | | | | | | | | | | | | | | |
Drawn | | | 14,239 | | | | – | | | | 14,239 | | | | 5,867 | | | | | | 13,835 | | | | 6,967 | |
Undrawn | | | 12,195 | | | | – | | | | 12,195 | | | | 1,418 | | | | | | 5,948 | | | | 926 | |
| | | 26,434 | | | | – | | | | 26,434 | | | | 7,285 | | | | | | 19,783 | | | | 7,893 | |
Other retail | | | | | | | | | | | | | | | | | | | | | | | | | | |
Drawn | | | 13,539 | | | | 13,670 | | | | 27,209 | | | | 15,911 | | | | | | 24,780 | | | | 14,990 | |
Undrawn | | | 630 | | | | – | | | | 630 | | | | 67 | | | | | | 211 | | | | 131 | |
| | | 14,169 | | | | 13,670 | | | | 27,839 | | | | 15,978 | | | | | | 24,991 | | | | 15,121 | |
Total retail | | | | | | | | | | | | | | | | | | | | | | | | | | |
Drawn | | | 173,064 | | | | 30,262 | | | | 203,326 | | | | 36,875 | | | | | | 194,612 | | | | 35,031 | |
Undrawn | | | 24,605 | | | | – | | | | 24,605 | | | | 2,878 | | | | | | 14,305 | | | | 1,190 | |
| | $ | 197,669 | | | $ | 30,262 | | | $ | 227,931 | | | $ | 39,753 | | | | | $ | 208,917 | | | $ | 36,221 | |
Securitization exposures | | | 14,466 | | | | – | | | | 14,466 | | | | 4,423 | | | | | | 15,503 | | | | 4,606 | |
Trading derivatives | | | 21,540 | | | | – | | | | 21,540 | | | | 5,612 | | | | | | 17,481 | | | | 5,425 | |
Subtotal | | $ | 452,400 | | | $ | 68,230 | | | $ | 520,630 | | | $ | 170,777 | | | | | $ | 476,737 | | | $ | 157,075 | |
Equities | | | 3,184 | | | | – | | | | 3,184 | | | | 6,606 | | | | | | 2,984 | | | | 5,664 | |
Other assets | | | – | | | | 35,968 | | | | 35,968 | | | | 15,622 | | | | | | 28,404 | | | | 12,127 | |
Total credit risk, before scaling factor | | $ | 455,584 | | | $ | 104,198 | | | $ | 559,782 | | | $ | 193,005 | | | | | $ | 508,125 | | | $ | 174,866 | |
Add-on for 6% scaling factor(4) | | | | | | | | | | | | | | | 7,743 | | | | | | | | | | 5,649 | |
Total credit risk | | $ | 455,584 | | | $ | 104,198 | | | $ | 559,782 | | | $ | 200,748 | | | | | $ | 508,125 | | | $ | 180,515 | |
| (1) | Outstanding amount for on-balance sheet exposures and loan equivalent amount for off-balance sheet exposures, before credit risk mitigation. |
| (2) | Net of specific allowances for credit losses. |
| (3) | Other exposures include off-balance sheet lending instruments, such as letters of credit, letters of guarantee, non-trading derivatives and repo-style exposures, after collateral. |
| (4) | Basel Committee imposed scaling factor (6%) on risk-weighted assets for Internal ratings-based credit risk portfolios. |
Scotiabank Annual Report 2011 97
MANAGEMENT’S DISCUSSION AND ANALYSIS
Revenues and Expenses
T52 Volume/rate analysis of changes in net interest income
| | | | | | | | | | | | | | | | | | | | | | | | |
| |
| | | Increase (decrease) due to change in: | |
| | |
| | | 2011 versus 2010 | | | 2010 versus 2009 | |
Taxable equivalent basis(1) | | | Average | | | | Average | | | | Net | | | | Average | | | | Average | | | | Net | |
For the fiscal years ($ millions) | | | volume | | | | rate | | | | change | | | | volume | | | | rate | | | | change | |
Net interest income | | | | | | | | | | | | | | | | | | | | | | | | |
Total earning assets | | $ | 1,624 | | | $ | 198 | | | $ | 1,822 | | | $ | 652 | | | $ | (2,698 | ) | | $ | (2,046 | ) |
Total interest-bearing liabilities | | | (819 | ) | | | (353 | ) | | | (1,172 | ) | | | (299 | ) | | | 2,636 | | | | 2,337 | |
Change in net interest income | | $ | 805 | | | $ | (155 | ) | | $ | 650 | | | $ | 353 | | | $ | (62 | ) | | $ | 291 | |
| (1) | Refer to the non-GAAP measures on page 29. |
T53 Provision for income taxes
| | | | | | | | | | | | | | | | | | | | | | | | |
| | | | | | |
| For the fiscal years ($ millions) | | 2011 | | | 2010 | | | 2009 | | | 2008 | | | 2007 | | | 2011
versus
2010 | |
Income taxes | | | | | | | | | | | | | | | | | | | | | | | | |
Provision for income taxes | | $ | 1,410 | | | $ | 1,745 | | | $ | 1,133 | | | $ | 691 | | | $ | 1,063 | | | | (19 | )% |
Taxable equivalent adjustment(1) | | | 287 | | | | 286 | | | | 288 | | | | 416 | | | | 531 | | | | – | |
Provision for income taxes (TEB)(1) | | | 1,697 | | | | 2,031 | | | | 1,421 | | | | 1,107 | | | | 1,594 | | | | (16 | ) |
| | | | | | |
Other taxes | | | | | | | | | | | | | | | | | | | | | | | | |
Payroll taxes | | | 222 | | | | 197 | | | | 184 | | | | 177 | | | | 164 | | | | 13 | |
Business and capital taxes | | | 183 | | | | 171 | | | | 177 | | | | 116 | | | | 143 | | | | 7 | |
Harmonized sales tax and other(2) | | | 263 | | | | 133 | | | | 136 | | | | 129 | | | | 143 | | | | 98 | |
Total other taxes | | | 668 | | | | 501 | | | | 497 | | | | 422 | | | | 450 | | | | 33 | |
Total income and other taxes (TEB)(3) | | $ | 2,365 | | | $ | 2,532 | | | $ | 1,918 | | | $ | 1,529 | | | $ | 2,044 | | | | (7 | )% |
Net income before income taxes | | | 6,678 | | | $ | 6,084 | | | $ | 4,794 | | | $ | 3,950 | | | $ | 5,226 | | | | 10 | % |
Effective income tax rate (%) | | | 21.1 | | | | 28.7 | | | | 23.6 | | | | 17.5 | | | | 20.3 | | | | (7.6 | ) |
Effective income tax rate (TEB) (%)(4) | | | 24.4 | | | | 31.9 | | | | 28.0 | | | | 25.4 | | | | 27.7 | | | | (7.5 | ) |
Total tax rate (%)(5) | | | 28.3 | | | | 34.1 | | | | 30.8 | | | | 25.5 | | | | 26.7 | | | | (5.8 | ) |
| (1) | Taxable equivalent basis. Refer to the non-GAAP measures on page 29. |
| (2) | Harmonized sales tax was implemented effective July 2010. Prior to this, amounts include goods and services tax. |
| (3) | Comprising $1,398 of Canadian taxes (2010 – $1,365; 2009 – $675; 2008 – $569; 2007 – $1,175) and $967 of foreign taxes (2010 – $1,167; 2009 – $1,243; 2008 – $960; 2007 – $869). |
| (4) | Provision for income tax, expressed on a taxable equivalent basis, as a percentage of net income before income taxes. |
| (5) | Total income and other taxes as a percentage of net income before income and other taxes. |
Other Information
T54Assets under administration and management(1)
| | | | | | | | | | | | | | | | | | | | |
| | | | | |
| ($ billions) | | 2011 | | | 2010 | | | 2009 | | | 2008 | | | 2007 | |
Assets under administration | | | | | | | | | | | | | | | | | | | | |
Personal | | | | | | | | | | | | | | | | | | | | |
Retail brokerage | | $ | 115.2 | | | $ | 87.7 | | | $ | 76.4 | | | $ | 74.3 | | | $ | 77.4 | |
Investment management and trust | | | 72.0 | | | | 68.8 | | | | 60.1 | | | | 55.8 | | | | 53.1 | |
| | | 187.2 | | | | 156.5 | | | | 136.5 | | | | 130.1 | | | | 130.5 | |
Mutual funds | | | 76.0 | | | | 38.8 | | | | 31.6 | | | | 27.9 | | | | 24.8 | |
Institutional | | | 62.1 | | | | 48.5 | | | | 47.0 | | | | 45.1 | | | | 39.8 | |
Total | | $ | 325.3 | | | $ | 243.8 | | | $ | 215.1 | | | $ | 203.1 | | | $ | 195.1 | |
Assets under management(2) | | | | | | | | | | | | | | | | | | | | |
Personal | | $ | 17.2 | | | $ | 14.3 | | | $ | 13.6 | | | $ | 12.5 | | | $ | 11.2 | |
Mutual funds | | | 67.0 | | | | 33.2 | | | | 27.5 | | | | 23.4 | | | | 20.6 | |
Institutional | | | 18.8 | | | | 6.0 | | | | 5.2 | | | | 4.6 | | | | 4.3 | |
Total | | $ | 103.0 | | | $ | 53.5 | | | $ | 46.3 | | | $ | 40.5 | | | $ | 36.1 | |
| (1) | 2009 to 2011 data as at October 31; 2007 and 2008 data as at September 30. |
| (2) | Prior period amounts have been restated to reflect the updated definition of assets under management. Refer to page 29 for a discussion on non-GAAP measures. |
T55Fees paid to the shareholders’ auditors
| | | | | | | | |
| | |
| For the fiscal years ($ millions) | | 2011 | | | 2010 | |
Audit services | | $ | 18.9 | | | $ | 18.0 | |
Audit-related services | | | 1.4 | | | | 0.6 | |
Tax services outside of the audit scope | | | 0.1 | | | | 0.1 | |
Other non-audit services | | | 0.5 | | | | 0.2 | |
Total | | $ | 20.9 | | | $ | 18.9 | |
98 2011 Scotiabank Annual Report
MANAGEMENT’S DISCUSSION AND ANALYSIS | SUPPLEMENTARY DATA
T56Selected quarterly information
| | | | | | | | | | | | | | | | | | | | | | | | | | | | | | | | |
| | |
| | | 2011 | | | 2010 | |
| | | | | | | | |
| As at and for the quarter ended | | Q4 | | | Q3 | | | Q2 | | | Q1 | | | Q4 | | | Q3 | | | Q2 | | | Q1 | |
Operating results ($ millions) | | | | | | | | | | | | | | | | | | | | | | | | | | | | | | | | |
Net interest income | | | 2,398 | | | | 2,358 | | | | 2,214 | | | | 2,300 | | | | 2,243 | | | | 2,173 | | | | 2,058 | | | | 2,147 | |
Net interest income (TEB(1)) | | | 2,472 | | | | 2,431 | | | | 2,283 | | | | 2,371 | | | | 2,313 | | | | 2,243 | | | | 2,129 | | | | 2,222 | |
Total revenue | | | 4,346 | | | | 4,300 | | | | 4,517 | | | | 4,125 | | | | 3,942 | | | | 3,784 | | | | 3,873 | | | | 3,906 | |
Total revenue (TEB(1)) | | | 4,420 | | | | 4,373 | | | | 4,586 | | | | 4,196 | | | | 4,012 | | | | 3,854 | | | | 3,944 | | | | 3,981 | |
Provision for credit losses | | | 272 | | | | 243 | | | | 262 | | | | 269 | | | | 254 | | | | 276 | | | | 338 | | | | 371 | |
Non-interest expenses | | | 2,519 | | | | 2,381 | | | | 2,378 | | | | 2,286 | | | | 2,183 | | | | 2,023 | | | | 1,967 | | | | 2,009 | |
Provision for income taxes | | | 315 | | | | 391 | | | | 334 | | | | 370 | | | | 390 | | | | 399 | | | | 444 | | | | 512 | |
Provision for income taxes (TEB(1)) | | | 389 | | | | 464 | | | | 403 | | | | 441 | | | | 460 | | | | 469 | | | | 515 | | | | 587 | |
Net income(2) | | | 1,240 | | | | 1,285 | | | | 1,543 | | | | 1,200 | | | | 1,115 | | | | 1,086 | | | | 1,124 | | | | 1,014 | |
Net income attributable to common shareholders | | | 1,168 | | | | 1,204 | | | | 1,464 | | | | 1,123 | | | | 1,040 | | | | 1,011 | | | | 1,048 | | | | 939 | |
Operating performance | | | | | | | | | | | | | | | | | | | | | | | | | | | | | | | | |
Basic earnings per share ($) | | | 1.08 | | | | 1.11 | | | | 1.36 | | | | 1.08 | | | | 1.00 | | | | 0.98 | | | | 1.02 | | | | 0.92 | |
Diluted earnings per share ($) | | | 1.07 | | | | 1.11 | | | | 1.36 | | | | 1.07 | | | | 1.00 | | | | 0.98 | | | | 1.02 | | | | 0.91 | |
Diluted cash earnings per share ($)(1) | | | 1.10 | | | | 1.14 | | | | 1.38 | | | | 1.09 | | | | 1.02 | | | | 0.99 | | | | 1.04 | | | | 0.93 | |
Return on equity (%)(1) | | | 16.6 | | | | 17.8 | | | | 22.9 | | | | 18.7 | | | | 17.9 | | | | 18.2 | | | | 19.9 | | | | 17.4 | |
Productivity ratio (%)(TEB)(1) | | | 57.0 | | | | 54.5 | | | | 51.8 | | | | 54.5 | | | | 54.4 | | | | 52.5 | | | | 49.9 | | | | 50.5 | |
Net interest margin on total average assets (%)(TEB)(1) | | | 1.63 | | | | 1.67 | | | | 1.68 | | | | 1.75 | | | | 1.75 | | | | 1.68 | | | | 1.73 | | | | 1.76 | |
Balance sheet information ($ billions) | | | | | | | | | | | | | | | | | | | | | | | | | | | | | | | | |
Cash resources and securities | | | 174.3 | | | | 184.4 | | | | 200.3 | | | | 175.5 | | | | 162.6 | | | | 167.4 | | | | 181.4 | | | | 173.5 | |
Loans and acceptances | | | 306.9 | | | | 301.1 | | | | 294.4 | | | | 292.2 | | | | 291.8 | | | | 286.5 | | | | 281.3 | | | | 275.8 | |
Total assets | | | 575.3 | | | | 567.7 | | | | 571.5 | | | | 541.3 | | | | 526.7 | | | | 523.4 | | | | 526.1 | | | | 507.6 | |
Deposits | | | 396.4 | | | | 390.2 | | | | 396.1 | | | | 374.9 | | | | 361.7 | | | | 365.2 | | | | 371.2 | | | | 364.9 | |
Preferred shares | | | 4.4 | | | | 4.4 | | | | 4.4 | | | | 4.0 | | | | 4.0 | | | | 4.0 | | | | 4.0 | | | | 3.7 | |
Common shareholders’ equity | | | 28.4 | | | | 27.4 | | | | 26.4 | | | | 24.1 | | | | 23.7 | | | | 22.5 | | | | 21.6 | | | | 21.6 | |
Assets under administration(1) | | | 325.3 | | | | 329.8 | | | | 333.0 | | | | 252.9 | | | | 243.8 | | | | 229.3 | | | | 231.0 | | | | 226.3 | |
Assets under management(1)(3) | | | 103.0 | | | | 104.9 | | | | 106.8 | | | | 55.8 | | | | 53.5 | | | | 49.9 | | | | 50.5 | | | | 48.9 | |
Capital measures | | | | | | | | | | | | | | | | | | | | | | | | | | | | | | | | |
Tier 1 capital ratio (%) | | | 12.2 | | | | 12.3 | | | | 12.0 | | | | 11.8 | | | | 11.8 | | | | 11.7 | | | | 11.2 | | | | 11.2 | |
Total capital ratio (%) | | | 13.9 | | | | 14.1 | | | | 13.9 | | | | 13.7 | | | | 13.8 | | | | 13.8 | | | | 13.3 | | | | 13.5 | |
Tangible common equity to risk-weighted assets (%)(1)(4) | | | 9.6 | | | | 9.6 | | | | 9.3 | | | | 9.9 | | | | 9.7 | | | | 9.4 | | | | 8.8 | | | | 8.8 | |
Asset-to-capital multiple | | | 16.6 | | | | 17.0 | | | | 17.6 | | | | 17.6 | | | | 17.0 | | | | 17.1 | | | | 17.7 | | | | 16.8 | |
Risk-weighted assets ($ billions) | | | 234.0 | | | | 224.8 | | | | 222.3 | | | | 215.3 | | | | 215.0 | | | | 213.0 | | | | 215.1 | | | | 215.9 | |
Credit quality | | | | | | | | | | | | | | | | | | | | | | | | | | | | | | | | |
Net impaired loans(5) ($ millions) | | | 2,623 | | | | 2,771 | | | | 2,881 | | | | 2,944 | | | | 3,044 | | | | 2,598 | | | | 2,475 | | | | 2,677 | |
General allowance for credit losses ($ millions) | | | 1,352 | | | | 1,382 | | | | 1,412 | | | | 1,410 | | | | 1,410 | | | | 1,450 | | | | 1,450 | | | | 1,450 | |
Sectoral allowance ($ millions) | | | – | | | | – | | | | – | | | | – | | | | – | | | | – | | | | 24 | | | | 43 | |
Net impaired loans as a % of loans and acceptances(5) | | | 0.85 | | | | 0.92 | | | | 0.98 | | | | 1.01 | | | | 1.04 | | | | 0.91 | | | | 0.88 | | | | 0.97 | |
Specific provision for credit losses as a % of average loans and acceptances (annualized) | | | 0.40 | | | | 0.38 | | | | 0.38 | | | | 0.38 | | | | 0.41 | | | | 0.43 | | | | 0.55 | | | | 0.55 | |
Common share information | | | | | | | | | | | | | | | | | | | | | | | | | | | | | | | | |
Share price ($) | | | | | | | | | | | | | | | | | | | | | | | | | | | | | | | | |
High | | | 54.96 | | | | 59.73 | | | | 61.28 | | | | 57.72 | | | | 55.76 | | | | 52.89 | | | | 55.33 | | | | 49.93 | |
Low | | | 49.00 | | | | 53.77 | | | | 56.25 | | | | 52.11 | | | | 49.00 | | | | 47.71 | | | | 44.39 | | | | 44.12 | |
Close | | | 52.53 | | | | 54.18 | | | | 57.69 | | | | 56.46 | | | | 54.67 | | | | 51.59 | | | | 51.78 | | | | 44.83 | |
Shares outstanding (millions) | | | | | | | | | | | | | | | | | | | | | | | | | | | | | | | | |
Average – Basic | | | 1,086 | | | | 1,082 | | | | 1,079 | | | | 1,044 | | | | 1,039 | | | | 1,034 | | | | 1,030 | | | | 1,025 | |
Average – Diluted | | | 1,087 | | | | 1,084 | | | | 1,080 | | | | 1,044 | | | | 1,040 | | | | 1,036 | | | | 1,031 | | | | 1,028 | |
End of period | | | 1,089 | | | | 1,085 | | | | 1,082 | | | | 1,047 | | | | 1,043 | | | | 1,038 | | | | 1,034 | | | | 1,029 | |
Dividends per share ($) | | | 0.52 | | | | 0.52 | | | | 0.52 | | | | 0.49 | | | | 0.49 | | | | 0.49 | | | | 0.49 | | | | 0.49 | |
Dividend yield (%)(6) | | | 4.0 | | | | 3.7 | | | | 3.5 | | | | 3.6 | | | | 3.7 | | | | 3.9 | | | | 3.9 | | | | 4.2 | |
Market capitalization ($ billions) | | | 57.2 | | | | 58.8 | | | | 62.4 | | | | 59.1 | | | | 57.0 | | | | 53.6 | | | | 53.5 | | | | 46.1 | |
Book value per common share ($) | | | 26.06 | | | | 25.21 | | | | 24.39 | | | | 23.03 | | | | 22.68 | | | | 21.67 | | | | 20.87 | | | | 21.04 | |
Market value to book value multiple | | | 2.0 | | | | 2.1 | | | | 2.4 | | | | 2.5 | | | | 2.4 | | | | 2.4 | | | | 2.5 | | | | 2.1 | |
Price to earnings multiple (trailing 4 quarters) | | | 11.3 | | | | 11.9 | | | | 13.1 | | | | 13.9 | | | | 14.0 | | | | 13.8 | | | | 14.2 | | | | 13.0 | |
| (1) | Non-GAAP measure. Refer to the Non-GAAP Measures on page 29. |
| (2) | Refer to Note 1 of the Consolidated Financial Statements for the impact of the new accounting standards adopted effective November 1, 2010. Prior period information has been reclassified to conform with current period presentation. |
| (3) | Comparative amounts have been restated to reflect the updated definition of assets under management. Refer to page 29 for discussion on non-GAAP measures. |
| (4) | Comparative amounts have been restated to reflect the revised definition of tangible common equity to risk-weighted assets. Refer to page 29 for discussion of non-GAAP measures. |
| (5) | Net impaired loans are impaired loans less the specific allowance for credit losses. |
| (6) | Based on the average of the high and low common share price for the year. |
Scotiabank Annual Report 2011 99
MANAGEMENT’S DISCUSSION AND ANALYSIS
Eleven-year Statistical Review
T57 Consolidated Balance Sheet
| | | | | | | | | | | | | | | | |
| | | | |
| As at October 31 ($ millions) | | 2011 | | | 2010 | | | 2009 | | | 2008 | |
Assets | | | | | | | | | | | | | | | | |
Cash resources | | $ | 54,471 | | | $ | 46,027 | | | $ | 43,278 | | | $ | 37,318 | |
Securities | | | | | | | | | | | | | | | | |
Trading | | | 63,327 | | | | 64,684 | | | | 58,067 | | | | 48,292 | |
Available-for-sale | | | 52,055 | | | | 47,228 | | | | 55,699 | | | | 38,823 | |
Investment | | | – | | | | – | | | | – | | | | – | |
Equity accounted investments | | | 4,491 | | | | 4,651 | | | | 3,528 | | | | 920 | |
| | | 119,873 | | | | 116,563 | | | | 117,294 | | | | 88,035 | |
Securities purchased under resale agreements | | | 34,582 | | | | 27,920 | | | | 17,773 | | | | 19,451 | |
Loans | | | | | | | | | | | | | | | | |
Residential mortgages | | | 123,082 | | | | 120,482 | | | | 101,604 | | | | 115,084 | |
Personal and credit cards | | | 62,764 | | | | 62,548 | | | | 61,048 | | | | 50,719 | |
Business and government | | | 115,673 | | | | 103,981 | | | | 106,520 | | | | 125,503 | |
| | | 301,519 | | | | 287,011 | | | | 269,172 | | | | 291,306 | |
Allowance for credit losses | | | 2,817 | | | | 2,787 | | | | 2,870 | | | | 2,626 | |
| | | 298,702 | | | | 284,224 | | | | 266,302 | | | | 288,680 | |
Other | | | | | | | | | | | | | | | | |
Customers’ liability under acceptances | | | 8,172 | | | | 7,616 | | | | 9,583 | | | | 11,969 | |
Derivative instruments(1) | | | 37,208 | | | | 26,852 | | | | 25,992 | | | | 44,810 | |
Land, buildings and equipment | | | 2,552 | | | | 2,450 | | | | 2,372 | | | | 2,449 | |
Other assets(1) | | | 19,696 | | | | 15,005 | | | | 13,922 | | | | 14,913 | |
| | | 67,628 | | | | 51,923 | | | | 51,869 | | | | 74,141 | |
| | $ | 575,256 | | | $ | 526,657 | | | $ | 496,516 | | | $ | 507,625 | |
Liabilities and shareholders’ equity | | | | | | | | | | | | | | | | |
Deposits | | | | | | | | | | | | | | | | |
Personal | | $ | 133,025 | | | $ | 128,850 | | | $ | 123,762 | | | $ | 118,919 | |
Business and government | | | 242,006 | | | | 210,687 | | | | 203,594 | | | | 200,566 | |
Banks | | | 21,345 | | | | 22,113 | | | | 23,063 | | | | 27,095 | |
| | | 396,376 | | | | 361,650 | | | | 350,419 | | | | 346,580 | |
Other | | | | | | | | | | | | | | | | |
Acceptances | | | 8,172 | | | | 7,616 | | | | 9,583 | | | | 11,969 | |
Obligations related to securities sold under repurchase agreements | | | 46,062 | | | | 40,286 | | | | 36,568 | | | | 36,506 | |
Obligations related to securities sold short | | | 15,450 | | | | 21,519 | | | | 14,688 | | | | 11,700 | |
Derivative instruments(1) | | | 40,889 | | | | 31,990 | | | | 28,806 | | | | 42,811 | |
Other liabilities(1) | | | 28,984 | | | | 28,947 | | | | 24,682 | | | | 31,063 | |
| | | 139,557 | | | | 130,358 | | | | 114,327 | | | | 134,049 | |
| | | | |
Subordinated debentures | | | 5,923 | | | | 5,939 | | | | 5,944 | | | | 4,352 | |
Capital instrument liabilities | | | – | | | | 500 | | | | 500 | | | | 500 | |
Shareholders’ equity | | | | | | | | | | | | | | | | |
Preferred shares | | | 4,384 | | | | 3,975 | | | | 3,710 | | | | 2,860 | |
Common shareholders’ equity | | | | | | | | | | | | | | | | |
Common shares and contributed surplus | | | 8,432 | | | | 5,775 | | | | 4,946 | | | | 3,829 | |
Retained earnings | | | 24,662 | | | | 21,932 | | | | 19,916 | | | | 18,549 | |
Accumulated other comprehensive income (loss) | | | (4,718 | ) | | | (4,051 | ) | | | (3,800 | ) | | | (3,596 | ) |
Total common shareholders’ equity | | | 28,376 | | | | 23,656 | | | | 21,062 | | | | 18,782 | |
Total equity attributable to equity holders of the Bank | | | 32,760 | | | | 27,631 | | | | 24,772 | | | | 21,642 | |
Non-controlling interest(2) | | | 640 | | | | 579 | | | | 554 | | | | 502 | |
Total shareholders’ equity | | | 33,400 | | | | 28,210 | | | | 25,326 | | | | 22,144 | |
| | $ | 575,256 | | | $ | 526,657 | | | $ | 496,516 | | | $ | 507,625 | |
| (1) | Amounts for years prior to 2004 have not been reclassified to conform with current period presentation for derivative accounting as the information is not readily available. |
| (2) | Refer to Note 1 of the Consolidated Financial Statements for the impact of the new accounting standards adopted effective November 1, 2010. Prior period information has been reclassified to conform with current period presentation. |
100 2011 Scotiabank Annual Report
MANAGEMENT’S DISCUSSION AND ANALYSIS | SUPPLEMENTARY DATA
| | | | | | | | | | | | | | | | | | | | | | | | | | |
| | | | | | |
| 2007 | | | 2006 | | | 2005 | | | 2004 | | | 2003 | | | 2002 | | | 2001 | |
| | | | | | | | | | | | | | | | | | | | | | | | | | |
| $ | 29,195 | | | $ | 23,376 | | | $ | 20,505 | | | $ | 17,155 | | | $ | 20,581 | | | $ | 20,273 | | | $ | 20,160 | |
| | | | | | | | | | | | | | | | | | | | | | | | | | |
| | 59,685 | | | | 62,490 | | | | 50,007 | | | | 43,056 | | | | 42,899 | | | | 34,592 | | | | 27,834 | |
| | 28,426 | | | | – | | | | – | | | | – | | | | – | | | | – | | | | – | |
| | – | | | | 32,870 | | | | 23,285 | | | | 15,576 | | | | 20,141 | | | | 21,439 | | | | 25,256 | |
| | 724 | | | | 142 | | | | 167 | | | | 141 | | | | 152 | | | | 163 | | | | 194 | |
| | 88,835 | | | | 95,502 | | | | 73,459 | | | | 58,773 | | | | 63,192 | | | | 56,194 | | | | 53,284 | |
| | 22,542 | | | | 25,705 | | | | 20,578 | | | | 17,880 | | | | 22,648 | | | | 32,262 | | | | 27,500 | |
| | | | | | | | | | | | | | | | | | | | | | | | | | |
| | 102,154 | | | | 89,590 | | | | 75,520 | | | | 69,018 | | | | 61,646 | | | | 56,295 | | | | 52,592 | |
| | 41,734 | | | | 39,058 | | | | 34,695 | | | | 30,182 | | | | 26,277 | | | | 23,363 | | | | 20,116 | |
| | 85,500 | | | | 76,733 | | | | 62,681 | | | | 57,384 | | | | 64,313 | | | | 77,181 | | | | 79,460 | |
| | 229,388 | | | | 205,381 | | | | 172,896 | | | | 156,584 | | | | 152,236 | | | | 156,839 | | | | 152,168 | |
| | 2,241 | | | | 2,607 | | | | 2,469 | | | | 2,696 | | | | 3,217 | | | | 3,430 | | | | 4,236 | |
| | 227,147 | | | | 202,774 | | | | 170,427 | | | | 153,888 | | | | 149,019 | | | | 153,409 | | | | 147,932 | |
| | | | | | | | | | | | | | | | | | | | | | | | | | |
| | 11,538 | | | | 9,555 | | | | 7,576 | | | | 7,086 | | | | 6,811 | | | | 8,399 | | | | 9,301 | |
| | 21,960 | | | | 12,098 | | | | 12,867 | | | | 15,488 | | | | 15,308 | | | | 15,821 | | | | 15,886 | |
| | 2,061 | | | | 2,103 | | | | 1,836 | | | | 1,823 | | | | 1,944 | | | | 2,101 | | | | 2,325 | |
| | 8,232 | | | | 7,893 | | | | 6,777 | | | | 7,119 | | | | 6,389 | | | | 7,921 | | | | 8,037 | |
| | 43,791 | | | | 31,649 | | | | 29,056 | | | | 31,516 | | | | 30,452 | | | | 34,242 | | | | 35,549 | |
| $ | 411,510 | | | $ | 379,006 | | | $ | 314,025 | | | $ | 279,212 | | | $ | 285,892 | | | $ | 296,380 | | | $ | 284,425 | |
| | | | | | | | | | | | | | | | | | | | | | | | | | |
| | | | | | | | | | | | | | | | | | | | | | | | | | |
| $ | 100,823 | | | $ | 93,450 | | | $ | 83,953 | | | $ | 79,020 | | | $ | 76,431 | | | $ | 75,558 | | | $ | 75,573 | |
| | 161,229 | | | | 141,072 | | | | 109,389 | | | | 94,125 | | | | 93,541 | | | | 93,830 | | | | 80,810 | |
| | 26,406 | | | | 29,392 | | | | 24,103 | | | | 22,051 | | | | 22,700 | | | | 26,230 | | | | 29,812 | |
| | 288,458 | | | | 263,914 | | | | 217,445 | | | | 195,196 | | | | 192,672 | | | | 195,618 | | | | 186,195 | |
| | | | | | | | | | | | | | | | | | | | | | | | | | |
| | 11,538 | | | | 9,555 | | | | 7,576 | | | | 7,086 | | | | 6,811 | | | | 8,399 | | | | 9,301 | |
| | 28,137 | | | | 33,470 | | | | 26,032 | | | | 19,428 | | | | 28,686 | | | | 31,881 | | | | 30,627 | |
| | 16,039 | | | | 13,396 | | | | 11,250 | | | | 7,585 | | | | 9,219 | | | | 8,737 | | | | 6,442 | |
| | 24,689 | | | | 12,869 | | | | 13,004 | | | | 16,002 | | | | 14,758 | | | | 15,500 | | | | 15,453 | |
| | 21,138 | | | | 24,799 | | | | 18,983 | | | | 13,785 | | | | 14,145 | | | | 15,678 | | | | 15,369 | |
| | 101,541 | | | | 94,089 | | | | 76,845 | | | | 63,886 | | | | 73,619 | | | | 80,195 | | | | 77,192 | |
| | | | | | |
| | 1,710 | | | | 2,271 | | | | 2,597 | | | | 2,615 | | | | 2,661 | | | | 3,878 | | | | 5,344 | |
| | 500 | | | | 750 | | | | 750 | | | | 2,250 | | | | 2,500 | | | | 2,225 | | | | 1,975 | |
| | | | | | | | | | | | | | | | | | | | | | | | | | |
| | 1,635 | | | | 600 | | | | 600 | | | | 300 | | | | 300 | | | | 300 | | | | 300 | |
| | | | | | | | | | | | | | | | | | | | | | | | | | |
| | 3,566 | | | | 3,425 | | | | 3,317 | | | | 3,229 | | | | 3,141 | | | | 3,002 | | | | 2,920 | |
| | 17,460 | | | | 15,843 | | | | 14,126 | | | | 13,239 | | | | 11,747 | | | | 10,398 | | | | 9,674 | |
| | (3,857 | ) | | | (2,321 | ) | | | (1,961 | ) | | | (1,783 | ) | | | (1,074 | ) | | | 102 | | | | 239 | |
| | 17,169 | | | | 16,947 | | | | 15,482 | | | | 14,685 | | | | 13,814 | | | | 13,502
| | | | 12,833 | |
| | 18,804 | | | | 17,547 | | | | 16,082 | | | | 14,985 | | | | 14,114 | | | | 13,802 | | | | 13,133 | |
| | 497 | | | | 435 | | | | 306 | | | | 280 | | | | 326 | | | | 662 | | | | 586 | |
| | 19,301 | | | | 17,982 | | | | 16,388 | | | | 15,265 | | | | 14,440 | | | | 14,464 | | | | 13,719 | |
| $ | 411,510 | | | $ | 379,006 | | | $ | 314,025 | | | $ | 279,212 | | | $ | 285,892 | | | $ | 296,380 | | | $ | 284,425 | |
Scotiabank Annual Report 2011 101
MANAGEMENT’S DISCUSSION AND ANALYSIS
T58Consolidated Statement of Income
| | | | | | | | | | | | | | | | |
| | | | |
| For the year ended October 31 ($ millions) | | 2011 | | | 2010 | | | 2009 | | | 2008 | |
Interest income | | | | | | | | | | | | | | | | |
Loans | | $ | 13,102 | | | $ | 12,171 | | | $ | 13,973 | | | $ | 15,832 | |
Securities | | | 4,887 | | | | 4,227 | | | | 4,090 | | | | 4,615 | |
Securities purchased under resale agreements | | | 377 | | | | 201 | | | | 390 | | | | 786 | |
Deposits with banks | | | 346 | | | | 292 | | | | 482 | | | | 1,083 | |
| | | 18,712 | | | | 16,891 | | | | 18,935 | | | | 22,316 | |
Interest expenses | | | | | | | | | | | | | | | | |
Deposits | | | 7,598 | | | | 6,768 | | | | 8,339 | | | | 12,131 | |
Subordinated debentures | | | 315 | | | | 289 | | | | 285 | | | | 166 | |
Capital instrument liabilities | | | 6 | | | | 37 | | | | 37 | | | | 37 | |
Other | | | 1,523 | | | | 1,176 | | | | 1,946 | | | | 2,408 | |
| | | 9,442 | | �� | | 8,270 | | | | 10,607 | | | | 14,742 | |
Net interest income | | | 9,270 | | | | 8,621 | | | | 8,328 | | | | 7,574 | |
Provision for credit losses | | | 1,046 | | | | 1,239 | | | | 1,744 | | | | 630 | |
Net interest income after provision for credit losses | | | 8,224 | | | | 7,382 | | | | 6,584 | | | | 6,944 | |
Other income | | | 8,018 | | | | 6,884 | | | | 6,129 | | | | 4,302 | |
Net interest and other income | | | 16,242 | | | | 14,266 | | | | 12,713 | | | | 11,246 | |
Non-interest expenses | | | | | | | | | | | | | | | | |
Salaries and employee benefits | | | 5,399 | | | | 4,647 | | | | 4,344 | | | | 4,109 | |
Other(1) | | | 4,165 | | | | 3,535 | | | | 3,575 | | | | 3,187 | |
| | | 9,564 | | | | 8,182 | | | | 7,919 | | | | 7,296 | |
Income before income taxes | | | 6,678 | | | | 6,084 | | | | 4,794 | | | | 3,950 | |
Provision for income taxes | | | 1,410 | | | | 1,745 | | | | 1,133 | | | | 691 | |
Net income(2) | | $ | 5,268 | | | $ | 4,339 | | | $ | 3,661 | | | $ | 3,259 | |
Net income attributable to non-controlling interests(2) | | | 93 | | | | 100 | | | | 114 | | | | 119 | |
Net income attributable to equity holders of the Bank(2) | | | 5,175 | | | | 4,239 | | | | 3,547 | | | | 3,140 | |
Preferred shareholders | | | 216 | | | | 201 | | | | 186 | | | | 107 | |
Common shareholders | | $ | 4,959 | | | $ | 4,038 | | | $ | 3,361 | | | $ | 3,033 | |
Average number of common shares outstanding (millions): | | | | | | | | | | | | | | | | |
Basic | | | 1,072 | | | | 1,032 | | | | 1,013 | | | | 987 | |
Diluted | | | 1,074 | | | | 1,034 | | | | 1,016 | | | | 993 | |
Earnings per common share (in dollars): | | | | | | | | | | | | | | | | |
Basic | | $ | 4.62 | | | $ | 3.91 | | | $ | 3.32 | | | $ | 3.07 | |
Diluted | | $ | 4.62 | | | $ | 3.91 | | | $ | 3.31 | | | $ | 3.05 | |
Dividends per common share (in dollars) | | $ | 2.05 | | | $ | 1.96 | | | $ | 1.96 | | | $ | 1.92 | |
| (1) | Other non-interest expenses include a loss on disposal of subsidiary operations in 2003 and 2002 of $31 and $237, respectively. |
| (2) | Refer to Note 1 of the Consolidated Financial Statements for the impact of the new accounting standards adopted effective November 1, 2010. Prior period information has been reclassified to conform with current period presentation. |
102 2011 Scotiabank Annual Report
MANAGEMENT’S DISCUSSION AND ANALYSIS | SUPPLEMENTARY DATA
| | | | | | | | | | | | | | | | | | | | | | | | | | |
| | | | | | |
| 2007 | | | 2006 | | | 2005 | | | 2004 | | | 2003 | | | 2002 | | | 2001 | |
| | | | | | | | | | | | | | | | | | | | | | | | | | |
| $ | 13,985 | | | $ | 11,575 | | | $ | 9,236 | | | $ | 8,480 | | | $ | 9,073 | | | $ | 9,635 | | | $ | 11,530 | |
| | 4,680 | | | | 4,124 | | | | 3,104 | | | | 2,662 | | | | 2,859 | | | | 3,087 | | | | 3,062 | |
| | 1,258 | | | | 1,102 | | | | 817 | | | | 594 | | | | 872 | | | | 1,073 | | | | 1,519 | |
| | 1,112 | | | | 881 | | | | 646 | | | | 441 | | | | 442 | | | | 573 | | | | 872 | |
| | 21,035 | | | | 17,682 | | | | 13,803 | | | | 12,177 | | | | 13,246 | | | | 14,368 | | | | 16,983 | |
| | | | | | | | | | | | | | | | | | | | | | | | | | |
| | 10,850 | | | | 8,589 | | | | 5,755 | | | | 4,790 | | | | 5,222 | | | | 5,519 | | | | 8,233 | |
| | 116 | | | | 130 | | | | 134 | | | | 112 | | | | 139 | | | | 203 | | | | 303 | |
| | 53 | | | | 53 | | | | 53 | | | | 164 | | | | 182 | | | | 158 | | | | 136 | |
| | 2,918 | | | | 2,502 | | | | 1,990 | | | | 1,410 | | | | 1,735 | | | | 1,971 | | | | 2,247 | |
| | 13,937 | | | | 11,274 | | | | 7,932 | | | | 6,476 | | | | 7,278 | | | | 7,851 | | | | 10,919 | |
| | 7,098 | | | | 6,408 | | | | 5,871 | | | | 5,701 | | | | 5,968 | | | | 6,517 | | | | 6,064 | |
| | 270 | | | | 216 | | | | 230 | | | | 390 | | | | 893 | | | | 2,029 | | | | 1,425 | |
| | 6,828 | | | | 6,192 | | | | 5,641 | | | | 5,311 | | | | 5,075 | | | | 4,488 | | | | 4,639 | |
| | 5,392 | | | | 4,800 | | | | 4,529 | | | | 4,320 | | | | 4,015 | | | | 3,942 | | | | 4,071 | |
| | 12,220 | | | | 10,992 | | | | 10,170 | | | | 9,631 | | | | 9,090 | | | | 8,430 | | | | 8,710 | |
| | | | | | | | | | | | | | | | | | | | | | | | | | |
| | 3,983 | | | | 3,768 | | | | 3,488 | | | | 3,452 | | | | 3,361 | | | | 3,344 | | | | 3,220 | |
| | 3,011 | | | | 2,675 | | | | 2,555 | | | | 2,410 | | | | 2,370 | | | | 2,630 | | | | 2,442 | |
| | 6,994 | | | | 6,443 | | | | 6,043 | | | | 5,862 | | | | 5,731 | | | | 5,974 | | | | 5,662 | |
| | 5,226 | | | | 4,549 | | | | 4,127 | | | | 3,769 | | | | 3,359 | | | | 2,456 | | | | 3,048 | |
| | 1,063 | | | | 872 | | | | 847 | | | | 786 | | | | 777 | | | | 594 | | | | 869 | |
| $ | 4,163 | | | $ | 3,677 | | | $ | 3,280 | | | $ | 2,983 | | | $ | 2,582 | | | $ | 1,862 | | | $ | 2,179 | |
| | 118 | | | | 98 | | | | 71 | | | | 75 | | | | 160 | | | | 154 | | | | 102 | |
| | 4,045 | | | | 3,579 | | | | 3,209 | | | | 2,908 | | | | 2,422 | | | | 1,708 | | | | 2,077 | |
| | 51 | | | | 30 | | | | 25 | | | | 16 | | | | 16 | | | | 16 | | | | 16 | |
| $ | 3,994 | | | $ | 3,549 | | | $ | 3,184 | | | $ | 2,892 | | | $ | 2,406 | | | $ | 1,692 | | | $ | 2,061 | |
| | | | | | | | | | | | | | | | | | | | | | | | | | |
| | 989 | | | | 988 | | | | 998 | | | | 1,010 | | | | 1,010 | | | | 1,009 | | | | 1,001 | |
| | 997 | | | | 1,001 | | | | 1,012 | | | | 1,026 | | | | 1,026 | | | | 1,026 | | | | 1,018 | |
| | | | | | | | | | | | | | | | | | | | | | | | | | |
| $ | 4.04 | | | $ | 3.59 | | | $ | 3.19 | | | $ | 2.87 | | | $ | 2.38 | | | $ | 1.68 | | | $ | 2.06 | |
| $ | 4.01 | | | $ | 3.55 | | | $ | 3.15 | | | $ | 2.82 | | | $ | 2.34 | | | $ | 1.65 | | | $ | 2.02 | |
| $ | 1.74 | | | $ | 1.50 | | | $ | 1.32 | | | $ | 1.10 | | | $ | 0.84 | | | $ | 0.73 | | | $ | 0.62 | |
Scotiabank Annual Report 2011 103
MANAGEMENT’S DISCUSSION AND ANALYSIS
T59Consolidated Statement of Changes in Shareholders’ Equity
| | | | | | | | | | | | | | | | |
| | | | |
| For the year ended October 31 ($ millions) | | 2011 | | | 2010 | | | 2009 | | | 2008 | |
Preferred shares | | | | | | | | | | | | | | | | |
Balance at beginning of year | | $ | 3,975 | | | $ | 3,710 | | | $ | 2,860 | | | $ | 1,635 | |
Issued | | | 409 | | | | 265 | | | | 850 | | | | 1,225 | |
Balance at end of year | | | 4,384 | | | | 3,975 | | | | 3,710 | | | | 2,860 | |
Common shares and contributed surplus | | | | | | | | | | | | | | | | |
Common shares: | | | | | | | | | | | | | | | | |
Balance at beginning of year | | | 5,750 | | | | 4,946 | | | | 3,829 | | | | 3,566 | |
Issued | | | 2,586 | | | | 804 | | | | 1,117 | | | | 266 | |
Purchased for cancellation | | | – | | | | – | | | | – | | | | (3 | ) |
Balance at end of year | | | 8,336 | | | | 5,750 | | | | 4,946 | | | | 3,829 | |
Contributed surplus: | | | | | | | | | | | | | | | | |
Balance at beginning of year | | | 25 | | | | – | | | | – | | | | – | |
Stock-based compensation | | | 71 | | | | 25 | | | | – | | | | – | |
Balance at end of year | | | 96 | | | | 25 | | | | – | | | | – | |
Total | | | 8,432 | | | | 5,775 | | | | 4,946 | | | | 3,829 | |
Retained earnings | | | | | | | | | | | | | | | | |
Balance at beginning of year | | | 21,932 | | | | 19,916 | | | | 18,549 | | | | 17,460 | |
Adjustments | | | – | | | | – | | | | – | | | | – | |
Net income attributable to equity holders of the Bank | | | 5,175 | | | | 4,239 | | | | 3,547 | | | | 3,140 | |
Dividends: Preferred | | | (216 | ) | | | (201 | ) | | | (186 | ) | | | (107 | ) |
Common | | | (2,200 | ) | | | (2,023 | ) | | | (1,990 | ) | | | (1,896 | ) |
Purchase of shares and premium on redemption | | | – | | | | – | | | | – | | | | (37 | ) |
Other | | | (29 | ) | | | 1 | | | | (4 | ) | | | (11 | ) |
Balance at end of year | | | 24,662 | | | | 21,932 | | | | 19,916 | | | | 18,549 | |
Accumulated other comprehensive income (loss) | | | | | | | | | | | | | | | | |
Balance at beginning of year | | | (4,051 | ) | | | (3,800 | ) | | | (3,596 | ) | | | (3,857 | ) |
Cumulative effect of adopting new accounting policies | | | – | | | | – | | | | 595 | (5) | | | – | |
Other comprehensive income (loss) | | | (667 | ) | | | (251 | ) | | | (799 | ) | | | 261 | |
Balance at end of year | | | (4,718 | ) | | | (4,051 | ) | | | (3,800 | ) | | | (3,596 | ) |
Non-controlling interests(6) | | | | | | | | | | | | | | | | |
Balance at beginning of year | | | 579 | | | | 554 | | | | 502 | | | | N/A | |
Interest in net income of subsidiaries | | | 93 | | | | 100 | | | | 114 | | | | N/A | |
Effect of foreign exchange and others | | | 10 | | | | (40 | ) | | | (26 | ) | | | N/A | |
Dividends | | | (42 | ) | | | (35 | ) | | | (36 | ) | | | N/A | |
Balance at end of year | | | 640 | | | | 579 | | | | 554 | | | | 502 | |
Total shareholders’ equity at end of year | | $ | 33,400 | | | $ | 28,210 | | | $ | 25,326 | | | $ | 22,144 | |
| (1) | Relates to the adoption of new financial instruments accounting standards. |
| (2) | Relates to the adoption of new stock-based compensation accounting standard. |
| (3) | Relates to the adoption of new goodwill accounting standard. |
| (4) | Relates to the adoption of new corporate income taxes accounting standard. |
| (5) | Relates to the adoption of the new accounting standard for impairment and classification of financial instruments. Refer to Note 1 of the Consolidated Financial Statements for details. |
| (6) | Refer to Note 1 of the Consolidated Financial Statements for the impact of the new accounting standards adopted effective November 1, 2010. Prior period information has been reclassified to conform with current period presentation. |
T60 Consolidated Statement of Comprehensive Income
| | | | | | | | | | | | | | | | |
| | | | |
| As at October 31 ($ millions) | | 2011 | | | 2010 | | | 2009 | | | 2008 | |
Net income(1) | | $ | 5,268 | | | $ | 4,339 | | | $ | 3,661 | | | $ | 3,259 | |
Other comprehensive income (loss), net of income taxes: | | | | | | | | | | | | | | | | |
Net change in unrealized foreign currency translation gains (losses) | | | (654 | ) | | | (591 | ) | | | (1,736 | ) | | | 2,368 | |
Net change in unrealized gains (losses) on available-for-sale securities | | | (119 | ) | | | 278 | | | | 894 | | | | (1,588 | ) |
Net change in gains (losses) on derivative instruments designated as cash flow hedges | | | 106 | | | | 62 | | | | 43 | | | | (519 | ) |
Other comprehensive income (loss) | | | (667 | ) | | | (251 | ) | | | (799 | ) | | | 261 | |
Comprehensive income | | $ | 4,601 | | | $ | 4,088 | | | $ | 2,862 | | | $ | 3,520 | |
| (1) | Refer to Note 1 of the Consolidated Financial Statements for the impact of the new accounting standards adopted effective November 1, 2010. Prior period information has been reclassified to conform with current period presentation. |
104 2011 Scotiabank Annual Report
MANAGEMENT’S DISCUSSION AND ANALYSIS | SUPPLEMENTARY DATA
| | | | | | | | | | | | | | | | | | | | | | | | | | |
| | | | | | |
| 2007 | | | 2006 | | | 2005 | | | 2004 | | | 2003 | | | 2002 | | | 2001 | |
| | | | | | | | | | | | | | | | | | | | | | | | | | |
| $ | 600 | | | $ | 600 | | | $ | 300 | | | $ | 300 | | | $ | 300 | | | $ | 300 | | | $ | 300 | |
| | 1,035 | | | | – | | | | 300 | | | | – | | | | – | | | | – | | | | – | |
| | 1,635 | | | | 600 | | | | 600 | | | | 300 | | | | 300 | | | | 300 | | | | 300 | |
| | | | | | | | | | | | | | | | | | | | | | | | | | |
| | | | | | | | | | | | | | | | | | | | | | | | | | |
| | 3,425 | | | | 3,316 | | | | 3,228 | | | | 3,140 | | | | 3,002 | | | | 2,920 | | | | 2,765 | |
| | 184 | | | | 135 | | | | 172 | | | | 117 | | | | 163 | | | | 101 | | | | 155 | |
| | (43 | ) | | | (26 | ) | | | (84 | ) | | | (29 | ) | | | (25 | ) | | | (19 | ) | | | – | |
| | 3,566 | | | | 3,425 | | | | 3,316 | | | | 3,228 | | | | 3,140 | | | | 3,002 | | | | 2,920 | |
| | | | | | | | | | | | | | | | | | | | | | | | | | |
| | – | | | | 1 | | | | 1 | | | | 1 | | | | – | | | | – | | | | – | |
| | – | | | | (1 | ) | | | – | | | | – | | | | 1 | | | | – | | | | – | |
| | – | | | | – | | | | 1 | | | | 1 | | | | 1 | | | | – | | | | – | |
| | 3,566 | | | | 3,425 | | | | 3,317 | | | | 3,229 | | | | 3,141 | | | | 3,002 | | | | 2,920 | |
| | | | | | | | | | | | | | | | | | | | | | | | | | |
| | 15,843 | | | | 14,126 | | | | 13,239 | | | | 11,747 | | | | 10,398 | | | | 9,674 | | | | 8,275 | |
| | (61 | )(1) | | | (25 | )(2) | | | – | | | | – | | | | – | | | | (76 | )(3) | | | (39 | )(4) |
| | 4,045 | | | | 3,579 | | | | 3,209 | | | | 2,908 | | | | 2,422 | | | | 1,708 | | | | 2,077 | |
| | (51 | ) | | | (30 | ) | | | (25 | ) | | | (16 | ) | | | (16 | ) | | | (16 | ) | | | (16 | ) |
| | (1,720 | ) | | | (1,483 | ) | | | (1,317 | ) | | | (1,110 | ) | | | (849 | ) | | | (732 | ) | | | (621 | ) |
| | (586 | ) | | | (324 | ) | | | (973 | ) | | | (290 | ) | | | (201 | ) | | | (154 | ) | | | – | |
| | (10 | ) | | | – | | | | (7 | ) | | | – | | | | (7 | ) | | | (6 | ) | | | (2 | ) |
| | 17,460 | | | | 15,843 | | | | 14,126 | | | | 13,239 | | | | 11,747 | | | | 10,398 | | | | 9,674 | |
| | | | | | | | | | | | | | | | | | | | | | | | | | |
| | (2,321 | ) | | | (1,961 | ) | | | (1,783 | ) | | | (1,074 | ) | | | 102 | | | | 239 | | | | 160 | |
| | 683 | | | | – | | | | – | | | | – | | | | – | | | | – | | | | – | |
| | (2,219 | ) | | | (360 | ) | | | (178 | ) | | | (709 | ) | | | (1,176 | ) | | | (137 | ) | | | 79 | |
| | (3,857 | ) | | | (2,321 | ) | | | (1,961 | ) | | | (1,783 | ) | | | (1,074 | ) | | | 102 | | | | 239 | |
| | | | | | | | | | | | | | | | | | | | | | | | | | |
| | N/A | | | | N/A | | | | N/A | | | | N/A | | | | N/A | | | | N/A | | | | N/A | |
| | N/A | | | | N/A | | | | N/A | | | | N/A | | | | N/A | | | | N/A | | | | N/A | |
| | N/A | | | | N/A | | | | N/A | | | | N/A | | | | N/A | | | | N/A | | | | N/A | |
| | N/A | | | | N/A | | | | N/A | | | | N/A | | | | N/A | | | | N/A | | | | N/A | |
| | 497 | | | | 435 | | | | 306 | | | | 280 | | | | 326 | | | | 662 | | | | 586 | |
| | $ 19,301 | | | $ | 17,982 | | | $ | 16,388 | | | $ | 15,265 | | | $ | 14,440 | | | $ | 14,464 | | | $ | 13,719 | |
| | | | | | | | | | | | | | | | | | | | | | | | | | |
| | | | | | |
| 2007 | | | 2006 | | | 2005 | | | 2004 | | | 2003 | | | 2002 | | | 2001 | |
| $ | 4,163 | | | $ | 3,677 | | | $ | 3,280 | | | $ | 2,983 | | | $ | 2,582 | | | $ | 1,862 | | | $ | 2,179 | |
| | | | | | | | | | | | | | | | | | | | | | | | | | |
| | (2,228 | ) | | | (360 | ) | | | (178 | ) | | | (709 | ) | | | (1,176 | ) | | | (137 | ) | | | 79 | |
| | (67 | ) | | | – | | | | – | | | | – | | | | – | | | | – | | | | – | |
| 76 | | | | – | | | | – | | | | – | | | | – | | | | – | | | | – | |
| | (2,219 | ) | | | (360 | ) | | | (178 | ) | | | (709 | ) | | | (1,176 | ) | | | (137 | ) | | | 79 | |
| | $ 1,944 | | | $ | 3,317 | | | $ | 3,102 | | | $ | 2,274 | | | $ | 1,406 | | | $ | 1,725 | | | $ | 2,258 | |
Scotiabank Annual Report 2011 105
MANAGEMENT’S DISCUSSION AND ANALYSIS
T61Other statistics
| | | | | | | | | | | | | | | | |
| | | | |
| For the year ended October 31 | | 2011 | | | 2010 | | | 2009 | | | 2008 | |
Operating performance | | | | | | | | | | | | | | | | |
Basic earnings per share ($) | | | 4.62 | | | | 3.91 | | | | 3.32 | | | | 3.07 | |
Diluted earnings per share ($) | | | 4.62 | | | | 3.91 | | | | 3.31 | | | | 3.05 | |
Return on equity (%)(1) | | | 18.8 | | | | 18.3 | | | | 16.7 | | | | 16.7 | |
Productivity ratio (%)(TEB(1)) | | | 54.4 | | | | 51.8 | | | | 53.7 | | | | 59.4 | |
Return on assets(2)(%) | | | 0.93 | | | | 0.84 | | | | 0.71 | | | | 0.72 | |
Net interest margin on total average assets (%)(TEB(1)) | | | 1.68 | | | | 1.73 | | | | 1.68 | | | | 1.75 | |
Capital measures(3) | | | | | | | | | | | | | | | | |
Tier 1 capital ratio (%) | | | 12.2 | | | | 11.8 | | | | 10.7 | | | | 9.3 | |
Total capital ratio (%) | | | 13.9 | | | | 13.8 | | | | 12.9 | | | | 11.1 | |
Tangible common equity to risk-weighted assets(1), (4) (%) | | | 9.6 | | | | 9.7 | | | | 8.3 | | | | 6.6 | |
Assets-to-capital multiple | | | 16.6 | | | | 17.0 | | | | 16.6 | | | | 18.0 | |
Common share information | | | | | | | | | | | | | | | | |
Share price ($): | | | | | | | | | | | | | | | | |
High | | | 61.28 | | | | 55.76 | | | | 49.19 | | | | 54.00 | |
Low | | | 49.00 | | | | 44.12 | | | | 23.99 | | | | 35.25 | |
Close | | | 52.53 | | | | 54.67 | | | | 45.25 | | | | 40.19 | |
Number of shares outstanding (millions) | | | 1,089 | | | | 1,043 | | | | 1,025 | | | | 992 | |
Dividends per share ($) | | | 2.05 | | | | 1.96 | | | | 1.96 | | | | 1.92 | |
Dividend yield (%)(5) | | | 3.7 | | | | 3.9 | | | | 5.4 | | | | 4.3 | |
Price to earnings multiple(6) | | | 11.3 | | | | 14.0 | | | | 13.6 | | | | 13.1 | |
Book value per common share ($) | | | 26.06 | | | | 22.68 | | | | 20.55 | | | | 18.94 | |
Other information | | | | | | | | | | | | | | | | |
Average total assets ($ millions) | | | 568,859 | | | | 515,991 | | | | 513,149 | | | | 455,539 | |
Number of branches and offices | | | 2,926 | | | | 2,784 | | | | 2,686 | | | | 2,672 | |
Number of employees | | | 75,362 | | | | 70,772 | | | | 67,802 | | | | 69.049 | |
Number of automated banking machines | | | 6,260 | | | | 5,978 | | | | 5,778 | | | | 5,609 | |
| (1) | Non-GAAP measure. Refer to non-GAAP measures on page 29. |
| (2) | Net income, used in the calculation of return on assets, no longer includes non-controlling interest. Refer to Note 1 of the Consolidated Financial Statements for the impact of the new accounting standards adopted effective November 1, 2010. Prior period information has been restated to conform with current period presentation. |
| (3) | Effective November 1, 2007, regulatory capital ratios are determined in accordance with Basel II rules. Comparative amounts for prior periods are determined in accordance with Basel I rules. |
| (4) | Amounts have been restated to reflect the revised definition of tangible common equity to risk-weighted assets. Refer to page 29 for discussion of non-GAAP measures. |
| (5) | Based on the average of the high and low common share price for the year. |
| (6) | Based on the closing common share price. |
106 2011 Scotiabank Annual Report
MANAGEMENT’S DISCUSSION AND ANALYSIS | SUPPLEMENTARY DATA
| | | | | | | | | | | | | | | | | | | | | | | | | | |
| | | | | | |
| 2007 | | | 2006 | | | 2005 | | | 2004 | | | 2003 | | | 2002 | | | 2001 | |
| | | | | | | | | | | | | | | | | | | | | | | | | | |
| | 4.04 | | | | 3.59 | | | | 3.19 | | | | 2.87 | | | | 2.38 | | | | 1.68 | | | | 2.06 | |
| | 4.01 | | | | 3.55 | | | | 3.15 | | | | 2.82 | | | | 2.34 | | | | 1.65 | | | | 2.02 | |
| | 22.0 | | | | 22.1 | | | | 20.9 | | | | 19.9 | | | | 17.6 | | | | 13.0 | | | | 17.3 | |
| | 53.7 | | | | 55.3 | | | | 56.3 | | | | 56.9 | | | | 55.9 | | | | 55.7 | | | | 54.6 | |
| | 1.03 | | | | 1.05 | | | | 1.06 | | | | 1.05 | | | | 0.89 | | | | 0.63 | | | | 0.80 | |
| | 1.89 | | | | 1.95 | | | | 2.00 | | | | 2.10 | | | | 2.16 | | | | 2.29 | | | | 2.32 | |
| | | | | | | | | | | | | | | | | | | | | | | | | | |
| | 9.3 | | | | 10.2 | | | | 11.1 | | | | 11.5 | | | | 10.8 | | | | 9.9 | | | | 9.3 | |
| | 10.5 | | | | 11.7 | | | | 13.2 | | | | 13.9 | | | | 13.2 | | | | 12.7 | | | | 13.0 | |
| | 7.4 | | | | 8.3 | | | | 9.3 | | | | 9.7 | | | | 8.8 | | | | 8.3 | | | | 7.8 | |
| | 18.2 | | | | 17.1 | | | | 15.1 | | | | 13.8 | | | | 14.4 | | | | 14.5 | | | | 13.5 | |
| | | | | | | | | | | | | | | | | | | | | | | | | | |
| | | | | | | | | | | | | | | | | | | | | | | | | | |
| | 54.73 | | | | 49.80 | | | | 44.22 | | | | 40.00 | | | | 33.70 | | | | 28.10 | | | | 25.25 | |
| | 46.70 | | | | 41.55 | | | | 36.41 | | | | 31.08 | | | | 22.28 | | | | 21.01 | | | | 18.65 | |
| | 53.48 | | | | 49.30 | | | | 42.99 | | | | 39.60 | | | | 32.74 | | | | 22.94 | | | | 21.93 | |
| | 984 | | | | 990 | | | | 990 | | | | 1,009 | | | | 1,011 | | | | 1,008 | | | | 1,008 | |
| | 1.74 | | | | 1.50 | | | | 1.32 | | | | 1.10 | | | | 0.84 | | | | 0.73 | | | | 0.62 | |
| | 3.4 | | | | 3.3 | | | | 3.3 | | | | 3.1 | | | | 3.0 | | | | 3.0 | | | | 2.8 | |
| | 13.2 | | | | 13.7 | | | | 13.5 | | | | 13.8 | | | | 13.8 | | | | 13.7 | | | | 10.6 | |
| | 17.45 | | | | 17.13 | | | | 15.64 | | | | 14.56 | | | | 13.67 | | | | 13.39 | | | | 12.74 | |
| | | | | | | | | | | | | | | | | | | | | | | | | | |
| | 403,475 | | | | 350,709 | | | | 309,374 | | | | 283,986 | | | | 288,513 | | | | 296,852 | | | | 271,843 | |
| | 2,331 | | | | 2,191 | | | | 1,959 | | | | 1,871 | | | | 1,850 | | | | 1,847 | | | | 2,005 | |
| | 58,113 | | | | 54,199 | | | | 46,631 | | | | 43,928 | | | | 43,986 | | | | 44,633 | | | | 46,804 | |
| | 5,283 | | | | 4,937 | | | | 4,449 | | | | 4,219 | | | | 3,918 | | | | 3,693 | | | | 3,761 | |
Scotiabank Annual Report 2011 107