Table of Contents
Exhibit 99.1
 |
|
Scotiabank reports second quarter results
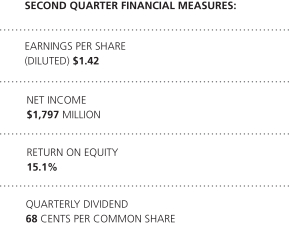
Toronto, May 29, 2015 – Scotiabank today reported second quarter net income of $1,797 million, in line with the same period last year. Diluted earnings per share were $1.42 compared to $1.39 in the same period a year ago. Return on equity was 15.1% compared to 16.3% last year.
“We delivered solid second quarter results, with earnings per share growth of 2% compared to the same quarter last year,” said Brian Porter, President and CEO. “Our strong capital position, including a Common Equity Tier 1 capital ratio of 10.6%, allows us to make further investments to better serve our customers and grow our well-diversified businesses.
“Canadian Banking had a strong quarter driven by a 12 basis point increase in the net interest margin, as well as good growth in retail and commercial loans and deposits. The expanded margin mostly results from our strategy to grow higher return businesses within our risk appetite. Wealth Management continued to perform very well with 13% growth in assets under management.
“Our focus on customers remains our number one priority and it is resonating widely across the Bank. We’re working to make it easier for our customers to do business with us, whether in a branch, online, or on their smartphone with new investments in technology. We recognize that investing in technology is fundamental to the Bank’s ability to better serve our existing customers, and to build relationships with new ones.
“We are continuing to grow in our priority markets such as our 51% acquisition of Cencosud’s financial services business in Chile. This will provide us access to more than two million new customers.
“This quarter’s results reflect the strength of our strategy, our priorities and our ability to grow during more moderate economic times.”
 | Live audio Web broadcast of the Bank’s analysts’ conference call. See page 81 for details. |  |
Table of Contents
Financial Highlights
| As at and for the three months ended | For the six months ended | |||||||||||||||||||
| (Unaudited) | | April 30 2015 | | | January 31 2015 | | | April 30 2014 | |
| April 30 2015 |
|
| April 30 2014 |
| |||||
Operating results($ millions) | ||||||||||||||||||||
Net interest income | 3,198 | 3,169 | 3,051 | 6,367 | 6,056 | |||||||||||||||
Net interest income (TEB(1)) | 3,202 | 3,174 | 3,054 | 6,376 | 6,062 | |||||||||||||||
Non-interest income | 2,739 | 2,694 | 2,674 | 5,433 | 5,314 | |||||||||||||||
Non-interest income (TEB(1)) | 2,852 | 2,781 | 2,755 | 5,633 | 5,472 | |||||||||||||||
Total revenue | 5,937 | 5,863 | 5,725 | 11,800 | 11,370 | |||||||||||||||
Total revenue (TEB(1)) | 6,054 | 5,955 | 5,809 | 12,009 | 11,534 | |||||||||||||||
Provision for credit losses | 448 | 463 | 375 | 911 | 731 | |||||||||||||||
Non-interest expenses | 3,224 | 3,197 | 2,995 | 6,421 | 6,100 | |||||||||||||||
Provision for income taxes | 468 | 477 | 555 | 945 | 1,030 | |||||||||||||||
Provision for income taxes (TEB(1)) | 585 | 569 | 639 | 1,154 | 1,194 | |||||||||||||||
Net income | 1,797 | 1,726 | 1,800 | 3,523 | 3,509 | |||||||||||||||
Net income attributable to common shareholders | 1,727 | 1,649 | 1,699 | 3,376 | 3,306 | |||||||||||||||
Operating performance | ||||||||||||||||||||
Basic earnings per share($) | 1.43 | 1.36 | 1.40 | 2.78 | 2.73 | |||||||||||||||
Diluted earnings per share ($) | 1.42 | 1.35 | 1.39 | 2.77 | 2.71 | |||||||||||||||
Adjusted diluted earnings per share(1) ($) | 1.43 | 1.36 | 1.40 | 2.79 | 2.74 | |||||||||||||||
Return on equity(1) (%) | 15.1 | 14.2 | 16.3 | 14.7 | 15.9 | |||||||||||||||
Productivity ratio(%) (TEB(1)) | 53.3 | 53.7 | 51.6 | 53.5 | 52.9 | |||||||||||||||
Core banking margin(%) (TEB(1)) | 2.41 | 2.41 | 2.42 | 2.41 | 2.38 | |||||||||||||||
Financial position information($ millions) | ||||||||||||||||||||
Cash and deposits with financial institutions | 60,664 | 65,894 | 59,758 | |||||||||||||||||
Trading assets | 113,120 | 109,619 | 117,728 | |||||||||||||||||
Loans | 435,958 | 439,916 | 418,864 | |||||||||||||||||
Total assets | 837,161 | 851,873 | 791,772 | |||||||||||||||||
Deposits | 575,281 | 584,598 | 551,543 | |||||||||||||||||
Common equity | 46,712 | 46,893 | 42,986 | |||||||||||||||||
Preferred shares | 2,934 | 2,934 | 3,234 | |||||||||||||||||
Assets under administration(1) | 445,773 | 440,785 | 418,971 | |||||||||||||||||
Assets under management(1) | 176,795 | 173,779 | 158,820 | |||||||||||||||||
Capital and liquidity measures | ||||||||||||||||||||
Common Equity Tier 1 (CET1) capital ratio(%) | 10.6 | 10.3 | 9.8 | |||||||||||||||||
Tier 1 capital ratio(%) | 11.9 | 11.5 | 11.3 | |||||||||||||||||
Total capital ratio(%) | 13.9 | 13.2 | 13.3 | |||||||||||||||||
Leverage ratio(2) | 4.1 | 4.1 | N/A | |||||||||||||||||
CET1 risk-weighted assets($ millions)(3) | 328,688 | 335,200 | 300,155 | |||||||||||||||||
Liquidity coverage ratio (LCR)(%)(4) | 123 | N/A | N/A | |||||||||||||||||
Credit quality | ||||||||||||||||||||
Net impaired loans($ millions)(5) | 2,172 | 2,266 | 1,941 | |||||||||||||||||
Allowance for credit losses($ millions) | 3,694 | 3,788 | 3,364 | |||||||||||||||||
Net impaired loans as a % of loans and acceptances(5) | 0.48 | 0.50 | 0.45 | |||||||||||||||||
Provision for credit losses as a % of average loans and acceptances (annualized) | 0.41 | 0.42 | 0.36 | 0.41 | 0.35 | |||||||||||||||
Common share information | ||||||||||||||||||||
Share price($) (TSX) | ||||||||||||||||||||
High | 67.73 | 71.18 | 66.72 | 71.18 | 66.75 | |||||||||||||||
Low | 61.30 | 60.75 | 59.92 | 60.75 | 59.92 | |||||||||||||||
Close | 66.53 | 61.06 | 66.60 | |||||||||||||||||
Shares outstanding(millions) | ||||||||||||||||||||
Average – Basic | 1,210 | 1,215 | 1,215 | 1,213 | 1,212 | |||||||||||||||
Average – Diluted | 1,231 | 1,220 | 1,222 | 1,233 | 1,219 | |||||||||||||||
End of period | 1,210 | 1,210 | 1,217 | |||||||||||||||||
Dividends per share($) | 0.68 | 0.66 | 0.64 | 1.34 | 1.26 | |||||||||||||||
Dividend yield (%)(6) | 4.2 | 4.0 | 4.0 | 4.1 | 4.0 | |||||||||||||||
Market capitalization($ millions) (TSX) | 80,499 | 73,887 | 81,027 | |||||||||||||||||
Book value per common share($) | 38.61 | 38.75 | 35.33 | |||||||||||||||||
Market value to book value multiple | 1.7 | 1.6 | 1.9 | |||||||||||||||||
Price to earnings multiple (trailing 4 quarters) | 11.6 | 10.7 | 12.3 | |||||||||||||||||
Other information | ||||||||||||||||||||
Employees | 87,324 | 87,090 | 86,479 | |||||||||||||||||
Branches and offices | 3,244 | 3,266 | 3,321 | |||||||||||||||||
| (1) | Refer to page 4 for a discussion of non-GAAP measures. |
| (2) | Effective November 1, 2014, the Bank is subject to OSFI’s Leverage Requirements Guideline (refer to Note 12). |
| (3) | Credit valuation adjustment (CVA) risk-weighted assets were calculated using scalars of 0.64, 0.71 and 0.77 to compute CET1, Tier 1 and Total capital ratios, respectively in 2015. |
| (4) | LCR is based on OSFI’s guideline, Liquidity Adequacy Requirement (LAR), effective commencing Q2/15. |
| (5) | Excludes Federal Deposit Insurance Corporation (FDIC) guaranteed loans related to the acquisition of R-G Premier Bank of Puerto Rico. |
| (6) | Based on the average of the high and low common share prices for the period. |
2 Scotiabank Second Quarter Report 2015
Table of Contents
Forward-looking statements Our public communications often include oral or written forward-looking statements. Statements of this type are included in this document, and may be included in other filings with Canadian securities regulators or the United States Securities and Exchange Commission, or in other communications. All such statements are made pursuant to the “safe harbour” provisions of the United States Private Securities Litigation Reform Act of 1995 and any applicable Canadian securities legislation. Forward-looking statements include, but are not limited to, statements made in this document, the Management’s Discussion and Analysis in the Bank’s 2014 Annual Report under the headings “Overview – Outlook”, for Group Financial Performance “Outlook”, for each business segment “Outlook” and in other statements regarding the Bank’s objectives, strategies to achieve those objectives, expected financial results (including those in the area of risk management), and the outlook for the Bank’s businesses and for the Canadian, United States and global economies. Such statements are typically identified by words or phrases such as “believe”, “expect”, “anticipate”, “intent”, “estimate”, “plan”, “may increase”, “may fluctuate”, and similar expressions of future or conditional verbs, such as “will”, “should”, “would” and “could”.
By their very nature, forward-looking statements involve numerous assumptions, inherent risks and uncertainties, both general and specific, and the risk that predictions and other forward-looking statements will not prove to be accurate. Do not unduly rely on forward-looking statements, as a number of important factors, many of which are beyond our control, could cause actual results to differ materially from the estimates and intentions expressed in such forward-looking statements. These factors include, but are not limited to: the economic and financial conditions in Canada and globally; fluctuations in interest rates and currency values; liquidity; significant market volatility and interruptions; the failure of third parties to comply with their obligations to us and our affiliates; the effect of changes in monetary policy; legislative and regulatory developments in Canada and elsewhere, including changes in tax laws; the effect of changes to our credit ratings; amendments to, and interpretations of, risk-based capital guidelines and reporting instructions and liquidity regulatory guidance; operational and reputational risks; the risk that the Bank’s risk management models may not take into account all relevant factors; the accuracy and completeness of information the Bank receives on customers and counterparties; the timely development and introduction of new products and services in receptive markets; the Bank’s ability to expand existing distribution channels and to develop and realize revenues from new distribution channels; the Bank’s ability to complete and integrate acquisitions and its other growth strategies; changes in accounting policies and methods the Bank uses to report its financial condition and financial performance, including uncertainties associated with critical accounting assumptions and estimates (see “Controls and Accounting Policies – Critical accounting estimates” in the Bank’s 2014 Annual Report, as updated in this document); the effect of applying future accounting changes (see “Controls and Accounting Policies – Future accounting developments” in the Bank’s 2014 Annual Report, as updated in this document); global capital markets activity; the Bank’s ability to attract and retain key executives; reliance on third parties to provide components of the Bank’s business infrastructure; unexpected changes in consumer spending and saving habits; technological developments; fraud by internal or external parties, including the use of new technologies in unprecedented ways to defraud the Bank or its customers; increasing cyber security risks which may include theft of assets, unauthorized access to sensitive information or operational disruption; consolidation in the Canadian financial services sector; competition, both from new entrants and established competitors; judicial and regulatory proceedings; acts of God, such as earthquakes and hurricanes; the possible impact of international conflicts and other developments, including terrorist acts and war on terrorism; the effects of disease or illness on local, national or international economies; disruptions to public infrastructure, including transportation, communication, power and water; and the Bank’s anticipation of and success in managing the risks implied by the foregoing. A substantial amount of the Bank’s business involves making loans or otherwise committing resources to specific companies, industries or countries. Unforeseen events affecting such borrowers, industries or countries could have a material adverse effect on the Bank’s financial results, businesses, financial condition or liquidity. These and other factors may cause the Bank’s actual performance to differ materially from that contemplated by forward-looking statements. For more information, see the “Risk Management” section starting on page 65 of the Bank’s 2014 Annual Report.
Material economic assumptions underlying the forward-looking statements contained in this document are set out in the Bank’s 2014 Annual Report under the headings “Overview – Outlook”, as updated in this document; and for each business segment “Outlook”. The “Outlook” sections are based on the Bank’s views and the actual outcome is uncertain. Readers should consider the above-noted factors when reviewing these sections.
The preceding list of important factors is not exhaustive. When relying on forward-looking statements to make decisions with respect to the Bank and its securities, investors and others should carefully consider the preceding factors, other uncertainties and potential events. The Bank does not undertake to update any forward-looking statements, whether written or oral, that may be made from time to time by or on its behalf.
Additional information relating to the Bank, including the Bank’s Annual Information Form, can be located on the SEDAR website at www.sedar.com and on the EDGAR section of the SEC’s website at www.sec.gov.
Scotiabank Second Quarter Report 2015 3
Table of Contents
MANAGEMENT’S DISCUSSION & ANALYSIS
MANAGEMENT’S DISCUSSION & ANALYSIS
The Management’s Discussion and Analysis (MD&A) is provided to enable readers to assess the Bank’s financial condition and results of operations as at and for the periods ended April 30, 2015, compared to corresponding periods. The MD&A should be read in conjunction with the Bank’s unaudited Condensed Interim Consolidated Financial Statements included in this Report to Shareholders and the Bank’s 2014 Annual Report. This MD&A is dated May 29, 2015.
Additional information relating to the Bank, including the Bank’s 2014 Annual Report, are available on the Bank’s website at www.scotiabank.com, as well as on SEDAR at www.sedar.com and on the EDGAR section of the SEC’s website at www.sec.gov.
Non-GAAP Measures
The Bank uses a number of financial measures to assess its performance. Some of these measures are not calculated in accordance with Generally Accepted Accounting Principles (GAAP), which are based on International Financial Reporting Standards (IFRS), are not defined by GAAP and do not have standardized meanings that would ensure consistency and comparability between companies using these measures. These non-GAAP measures are used throughout this report and defined below.
Assets under administration (AUA)
AUA are assets administered by the Bank which are beneficially owned by clients and therefore not reported on the Bank’s Consolidated Statement of Financial Position. Services provided for AUA are of an administrative nature, such as trusteeship, custodial, safekeeping, income collection and distribution, securities trade settlements, customer reporting, and other similar services.
Assets under management (AUM)
AUM are assets managed by the Bank on a discretionary basis and in respect of which the Bank earns investment management fees. AUM are beneficially owned by clients and are therefore not reported on the Bank’s Consolidated Statement of Financial Position. Some AUM are also administered assets and are therefore included in assets under administration.
Adjusted diluted earnings per share
The adjusted diluted earnings per share is calculated by adjusting the diluted earnings per share to add back the non-cash, after-tax amortization of intangible assets related to acquisitions (excluding software).
Core banking assets
Core banking assets are average earning assets excluding bankers’ acceptances and average trading assets within Global Banking & Markets.
Core banking margin (TEB)
This ratio represents net interest income (on a taxable equivalent basis) divided by average core banking assets. This is consistent with the Bank’s Consolidated Statement of Income presentation where net interest income from trading operations is recorded in trading revenues included in non-interest income.
Economic equity and return on economic equity
For internal reporting purposes, the Bank attributes capital to its business segments based on their risk profile and uses a methodology that considers credit, market, operational and other risks inherent in each business segment. The amount of risk capital attributed is commonly referred to as economic equity. The economic equity methodology, models and assumptions are updated annually and applied prospectively. Return on economic equity for the business segments is calculated as a ratio of net income attributable to common shareholders of the business segment and the economic equity attributed.
Operating leverage (TEB)
The Bank defines operating leverage as the rate of growth in total revenue (on a taxable equivalent basis), less the rate of growth in non-interest expenses.
Productivity ratio (TEB)
Management uses the productivity ratio as a measure of the Bank’s efficiency. This ratio represents non-interest expenses as a percentage of total revenue (on a taxable equivalent basis).
4 Scotiabank Second Quarter Report 2015
Table of Contents
MANAGEMENT’S DISCUSSION & ANALYSIS
Return on equity
Return on equity is a profitability measure that presents the net income attributable to common shareholders as a percentage of common shareholders’ equity. The Bank calculates its return on equity using average common shareholders’ equity.
Regulatory capital and liquidity ratios
Regulatory capital ratios, such as Common Equity Tier 1, Tier 1, Total Capital, Leverage and Liquidity coverage ratios, have standardized meanings as defined by the Office of the Superintendent of Financial Institutions, Canada.
Taxable equivalent basis
The Bank analyzes net interest income, non-interest income, and total revenue on a taxable equivalent basis (TEB). This methodology grosses up tax-exempt income earned on certain securities reported in either net interest income or non-interest income to an equivalent before tax basis. A corresponding increase is made to the provision for income taxes; hence, there is no impact on net income. Management believes that this basis for measurement provides a uniform comparability of net interest income and non-interest income arising from both taxable and non-taxable sources and facilitates a consistent basis of measurement. While other banks also use TEB, their methodology may not be comparable to the Bank’s methodology. For purposes of segmented reporting, a segment’s revenue and provision for income taxes are grossed up by the taxable equivalent amount. The elimination of the TEB gross up is recorded in the Other segment. The TEB gross up to net interest income, non-interest income, total revenue, and provision for income taxes is presented below:
| For the three months ended | For the six months ended | |||||||||||||||||||
TEB Gross up ($ millions) | April 30 2015 | January 31 2015 | April 30 2014 | April 30 2015 | April 30 2014 | |||||||||||||||
Net interest income | $ | 4 | $ | 5 | $ | 3 | $ | 9 | $ | 6 | ||||||||||
Non-interest income | 113 | 87 | 81 | 200 | 158 | |||||||||||||||
Total revenue and provision for taxes | $ | 117 | $ | 92 | $ | 84 | $ | 209 | $ | 164 | ||||||||||
Tax normalization adjustment of net income from associated corporations
For business line performance assessment and reporting, net income from associated corporations, which is an after-tax number, is adjusted to normalize for income taxes.
The tax normalization adjustment grosses up the amount of net income from associated corporations and normalizes the effective tax rate in the business lines to better present the contribution of the associated corporations to the business line results.
Scotiabank Second Quarter Report 2015 5
Table of Contents
MANAGEMENT’S DISCUSSION & ANALYSIS
| Group Financial Performance and Financial Condition |
The Bank’s net income for the second quarter was $1,797 million compared to $1,800 million in the same period last year and $1,726 million last quarter. Diluted earnings per share were $1.42, compared to $1.39 in the same period a year ago and $1.35 last quarter. Return on equity was at 15.1%, compared to 16.3% last year and 14.2% last quarter.
Impact of foreign currency translation
The table below reflects the impact of foreign currency translation on key income statement items.
| ($ millions) | For the three months ended | For the six months ended | ||||||||||
April 30, 2015 vs. April 30, 2014 | April 30, 2015 vs. January 31, 2015 | April 30, 2015 vs. April 30, 2014 | ||||||||||
U.S./Canadian dollar exchange rate (average) | ||||||||||||
April 30, 2015 | $ | 0.801 | $ | 0.801 | $ | 0.830 | ||||||
January 31, 2015 | $ | 0.859 | ||||||||||
April 30, 2014 | $ | 0.905 | $ | 0.921 | ||||||||
% change | (11.5 | )% | (6.7 | )% | (9.8 | )% | ||||||
Impact on income:(1) | ||||||||||||
Net interest income | $ | 66 | $ | 64 | $ | 104 | ||||||
Non-interest income(2) | 58 | 47 | 95 | |||||||||
Non-interest expenses | (45 | ) | (49 | ) | (64 | ) | ||||||
Other items (net of tax) | (15 | ) | (21 | ) | (24 | ) | ||||||
Net income | $ | 64 | $ | 41 | $ | 111 | ||||||
Earnings per share (diluted) | $ | 0.05 | $ | 0.03 | $ | 0.09 | ||||||
Impact by business line: | ||||||||||||
Canadian Banking | $ | 4 | $ | 3 | $ | 6 | ||||||
International Banking(2) | 34 | 49 | 31 | |||||||||
Global Banking & Markets | 33 | 21 | 60 | |||||||||
Other(1)(2) | $ | (7 | ) | $ | (32 | ) | $ | 14 | ||||
| (1) | Includes the impact of all currencies. |
| (2) | Includes the impact of foreign currency hedges. |
Financial results commentary
Net income
Q2 2015 vs Q2 2014
The Bank’s net income was $1,797 million in the second quarter, in line with $1,800 million in the same period a year ago. Higher net interest income, stronger banking and wealth management revenues, combined with a lower effective income tax rate and the positive impact of foreign currency translation, were offset by higher provision for credit losses, higher non-interest expenses and lower net gains on investment securities. Net income attributable to common shareholders was up 2%.
Q2 2015 vs Q1 2015
Net income was up $71 million or 4% from the prior quarter. This increase was due primarily to higher underwriting, trading and wealth management revenues, lower provision for credit losses, and the positive impact of foreign currency translation. This was partly offset by lower net gains on investment securities. Net income attributable to common shareholders was up 5%.
Year-to-date Q2 2015 vs Year-to-date Q2 2014
Net income was $3,523 million, up $14 million from $3,509 million in the same period last year. The year-over-year increase resulted from higher net interest margins, stronger wealth management and banking revenues, a lower effective income tax rate and the favourable impact of foreign currency translation. Partly offsetting were higher provision for credit losses and non-interest expenses, lower net gains on investment securities and a lower contribution from investments in associates. Net income attributable to common shareholders was up 2%.
6 Scotiabank Second Quarter Report 2015
Table of Contents
MANAGEMENT’S DISCUSSION & ANALYSIS
Net interest income
Q2 2015 vs Q2 2014
Net interest income (on a taxable equivalent basis) was $3,202 million, up $148 million or 5% higher than the same quarter last year. The increase was attributable to asset growth primarily in retail lending in Canadian and International Banking, and the positive impact of foreign currency translation partly offset by lower volumes in Global Banking & Markets, primarily in Asia. The core banking margin was 2.41%, a slight decrease from 2.42% last year. Substantial margin increases in Canadian Banking were offset by margin compression in Latin America and the impact of higher volumes of lower yielding deposits with financial institutions.
Q2 2015 vs Q1 2015
Net interest income (on a taxable equivalent basis) was up $28 million or 1% from the previous quarter. The increase was due to asset growth in International Banking and Global Banking & Markets, and the positive impact of foreign currency translation. The core banking margin was flat compared to last quarter. An increase in the Canadian Banking margin was offset by margin compression in Latin America and Global Banking & Markets and lower asset/liability management income.
Year-to-date Q2 2015 vs Year-to-date Q2 2014
Net interest income (on a taxable equivalent basis) was $6,376 million for the six month period, up $314 million or 5% from the previous period. This increase was attributable to strong loan growth in International Banking, higher retail and consumer auto loans in Canadian Banking, and the positive impact of foreign currency translation.
The core banking margin was 2.41%, up from 2.38% for the same period last year. Canadian Banking margin drove much of the increase.
Non-interest income
Q2 2015 vs Q2 2014
Non-interest income (on a taxable equivalent basis) was $2,852 million, up $97 million or 4% from the same period last year. The growth was mainly from higher banking, wealth management and underwriting revenues, higher trading revenues, and the positive impact of foreign currency translation. These increases were mostly offset by lower contributions from investments in associates, lower net gains on investment securities and losses on financial instrument hedges.
Q2 2015 vs Q1 2015
Compared to the previous quarter, non-interest income (on a taxable equivalent basis) was up $71 million or 3%. The increase was mostly due to higher trading revenues, wealth management revenues and underwriting fees, and the positive impact of foreign currency translation. These were mostly offset by lower net gains on investment securities.
Year-to-date Q2 2015 vs Year-to-date Q2 2014
Compared to the same period last year, non-interest income was $5,633 million, up $161 million or 3%. The growth was primarily in banking and wealth management revenues, as well as higher non-trading foreign exchange fees, higher insurance income, and the positive impact of foreign currency translation. Mostly offsetting were lower net gains on investment securities, lower contributions from associated corporations and losses on financial instrument hedges, including foreign exchange hedges.
Provision for credit losses
Q2 2015 vs Q2 2014
The provision for credit losses was $448 million this quarter, up $73 million or 20% from the same period last year. The year-over-year increase was due to higher retail lending provisions in Canadian Banking driven by growth in relatively higher spread products. International Banking retail provisions increased due primarily to the reduced benefit of the credit mark in Banco Colpatria.
Q2 2015 vs Q1 2015
The provision for credit losses was down $15 million or 3% from the prior quarter. The decrease was due primarily to lower provisions in Mexico and Peru, partly offset by the reduced benefit of the credit mark in Banco Colpatria.
Scotiabank Second Quarter Report 2015 7
Table of Contents
MANAGEMENT’S DISCUSSION & ANALYSIS
Year-to-date Q2 2015 vs Year-to-date Q2 2014
For the six month period, total provisions for credit losses were $911 million, up $180 million or 25% from the same period last year. The increase was due primarily to higher retail provisions in Canadian Banking due mostly to growth in relatively higher spread products, and International Banking from the reduced benefit of the credit mark in Banco Colpatria. Further discussion on credit risk is provided in the following Risk Management section.
Non-interest expenses
Q2 2015 vs Q2 2014
Non-interest expenses were $3,224 million this quarter, up from $2,995 million or 8% from the same quarter last year. After adjusting for the negative impact of foreign currency translation, about half of the increase arose from higher remuneration, mostly from year-over-year salary and staffing increases and higher pension costs from the lower rate environment. The balance of the growth was generally split between higher volume-related expenses, increased business taxes, and growth in technology and project spend reflecting investments in improving customer experiences and efficiency initiatives. The productivity ratio was 53.3% this quarter, compared to 51.6% for the same period last year.
Q2 2015 vs Q1 2015
Non-interest expenses increased modestly by $27 million or 1% quarter over quarter. Adjusting for the negative impact of foreign currency translation, expenses declined as seasonally lower share-based compensation was partly offset by higher business taxes, professional expenses, and performance-based compensation. The productivity ratio was 53.3%, compared to 53.7% in the previous quarter.
Year-to-date Q2 2015 vs Year-to-date Q2 2014
Non-interest expenses were $6,421 million, up $321 million or 5% higher from the same period last year. Expenses increased across most categories reflecting the support for ongoing growth initiatives and the negative impact of foreign currency translation. The productivity ratio was 53.5% for the six-month period, compared to 52.9% for the same period last year. On a year-to-date basis, operating leverage was negative 1.1%.
Taxes
The effective tax rate this quarter was 20.7%, down from 23.6% in the same quarter last year and 21.7% in the prior quarter, due primarily to lower taxes in foreign jurisdictions and higher tax-exempt income during the current quarter.
The effective tax rate for the six-month period was 21.2%, down from 22.7% in the same period last year, due primarily to higher tax-exempt income in the current period.
The Bank’s risk management policies and practices are unchanged from those outlined in pages 65 to 89 of the Bank’s 2014 Annual Report.
Credit risk
Provision for credit losses
Q2 2015 vs Q2 2014
The provision for credit losses was $448 million this quarter, compared to $375 million in the same period last year.
The provision for credit losses was $169 million in Canadian Banking, up from $140 million in the same quarter last year, due to higher provisions in retail portfolios driven by growth in relatively higher spread products. The provision for credit losses ratio was 0.24%, up 4 basis points from 0.20% in the same period last year.
The provision for credit losses was $266 million in International Banking, compared to $229 million in the same period last year due to higher retail provisions, partly offset by lower commercial provisions. Higher retail provisions in Colombia and the Caribbean were in part offset by lower provisions in Peru. Adjusting for the reduced benefit of the credit mark in Banco Colpatria, the growth in retail provisions was in line with retail asset growth. Commercial provisions declined with improvements across most geographies. The provision for credit losses ratio was 1.19%, up 3 basis points from 1.16% in the same period last year, or down 8 basis points to 1.21% excluding the credit mark in Banco Colpatria.
Global Banking & Markets’ provision for credit losses was $13 million this quarter, compared to $6 million in the same quarter last year, due to increases in Canada and Europe. The provision for credit losses ratio was 8 basis points, compared to 4 basis points in the same period last year.
8 Scotiabank Second Quarter Report 2015
Table of Contents
MANAGEMENT’S DISCUSSION & ANALYSIS
Q2 2015 vs Q1 2015
The provision for credit losses was down $15 million from the prior quarter.
The provision for credit losses of $169 million this quarter in Canadian Banking was up $4 million from the previous quarter, due to slight increases of provisions in retail and commercial portfolios. The provision for credit losses ratio increased by 1 basis point.
The provision for credit losses was $266 million in International Banking this quarter, down from $285 million in the previous quarter. The decrease in provisions was primarily driven by lower commercial provisions in Peru and the Caribbean. Lower retail provisions in Mexico and Peru were largely offset by higher provisions in the Caribbean related to mortgages, and Colombia due to volume growth and the reduced benefit of the credit mark in Banco Colpatria. The provision for credit losses ratio improved by 14 basis points relative to the previous quarter. Adjusting for the credit mark benefit related to Banco Colpatria, the ratio improved by 19 basis points.
Global Banking & Markets’ provision for credit losses was $13 million this quarter, unchanged from the previous quarter.
Year-to-date Q2 2015 vs Year-to-date Q2 2014
For the six month period, total provision for credit losses was $911 million, up $180 million from $731 million during the same period last year.
The provision for credit losses was $334 million in Canadian Banking, up $59 million from the same period last year, with higher provisions in retail portfolios driven by growth in relatively higher spread products, slightly offset by lower provisions in commercial portfolios. The provision for credit losses ratio was 0.23%, up 3 basis points compared to the same period last year.
The provision for credit losses was $551 million in International Banking, compared to $446 million in the same period last year. The increase was entirely due to higher provisions in the retail portfolio in Latin America, primarily as a result of the reduced benefit of the credit mark in Banco Colpatria, and the Caribbean. The provision for credit losses ratio was 1.26%, up 13 basis points compared to the same period last year. Adjusting for the reduced benefit of the credit mark in Banco Colpatria, the ratio improved by 3 basis points to 1.30%.
Global Banking & Markets’ provision for credit losses was $26 million, compared to $10 million in the same period last year, due primarily to higher provisions in Canada and Europe, partially offset by lower provisions in the United States. The provision for credit losses ratio was 8 basis points, compared to 3 basis points in the same period last year.
Allowance for credit losses
Total allowance for credit losses was $3,497 million as at April 30, 2015 (excluding $197 million of allowance covered by FDIC guarantees related to R-G Premier Bank of Puerto Rico) compared to $3,595 million as at January 31, 2015 (excluding $193 million related to R-G Premier Bank). The decrease was almost entirely due to foreign exchange translation. In addition, the allowance for off-balance-sheet credit risks classified as other liabilities remained at $184 million.
The allowance for credit losses related to impaired loans was $2,225 million compared to $2,323 million as at January 31, 2015. The total allowance for credit losses includes allowances of $1,272 million related to performing loans as at April 30, 2015, unchanged from January 31, 2015.
In Canadian Banking, the allowance decreased to $726 million from $741 million as at January 31, 2015, due to decreases in the retail portfolios.
In International Banking, the allowance for credit losses decreased $94 million to $1,442 million, primarily due to the impact of foreign currency translation, partially offset by a decrease in write-offs in International commercial.
Global Banking & Markets had an allowance of $57 million, up $11 million from January 31, 2015, due to increases across all regions.
Impaired loans
Total gross impaired loans as at April 30, 2015, were $4,397 million, down $192 million from January 31, 2015, of which $165 million relates to foreign currency translation. The remainder of the decrease was in Canadian retail and Global Banking & Markets portfolios.
Total net impaired loans as at April 30, 2015 were $2,172 million, a decline of $94 million from $2,266 million as at January 31, 2015.
Net impaired loans in Canadian Banking were $369 million, a decrease of $64 million from January 31, 2015, due to decreases in the retail portfolios.
Scotiabank Second Quarter Report 2015 9
Table of Contents
MANAGEMENT’S DISCUSSION & ANALYSIS
International Banking’s net impaired loans decreased to $1,693 million from $1,705 million as at January 31, 2015, due to decreases in the retail portfolios, partially offset by increases in the commercial portfolios.
In Global Banking & Markets, net impaired loans decreased to $110 million from $128 million last quarter, due to decreases in Canada, Asia and the United States, partially offset by an increase in Europe.
Acquisition-related purchased loans
All purchased loans are initially measured at fair value on the date of acquisition, with no allowance for credit losses recorded in the Consolidated Statement of Financial Position on the date of acquisition. Consequently, none of the purchased loans are considered to be impaired on the date of acquisition. In arriving at the fair value, the Bank considers interest rate mark and credit rate mark adjustments.
The interest rate mark on the date of acquisition is principally set up for fixed interest rate loans and captures the impact of the interest rate differential between the contractual rate of interest on the loan and the prevailing interest rate on the loan on the date of acquisition for the remaining term. The interest rate mark is fully amortized into interest income in the Consolidated Statement of Income over the expected life of the loan using the effective interest method.
In 2012, a credit mark of $549 million for combined expected and incurred losses was recognized during the acquisition of Banco Colpatria in Colombia. As at April 30, 2015, the remaining balance of the credit mark was $21 million (January 31, 2015 – $25 million; October 31, 2014 – $41 million). The credit mark was utilized in the past three years as follows: $141 million in 2012; $204 million in 2013; and $163 million in 2014. For the first six months of 2015, $20 million of the credit mark was utilized.
Overview of loan portfolio – Top and emerging risks
The Bank has a well diversified portfolio by product, business and geography. Details of certain portfolios of current focus are highlighted below.
Oil and gas
The Bank’s outstanding corporate loan exposure to oil and gas was relatively flat at $15.5 billion as at April 30, 2015 (January 31, 2015 – $15.4 billion; October 31, 2014 – $12.8 billion), reflecting approximately 3.4% (January 31, 2015 – 3.4%; October 31, 2014 – 2.9%) of the Bank’s total loan book. In addition, the Bank has related undrawn corporate oil and gas loan commitments amounting to $12.0 billion as at April 30, 2015 (January 31, 2015 – $12.7 billion; October 31, 2014 – $10.8 billion).
The Bank believes that its oil and gas exposures are manageable and the Bank continues to evaluate exposures through various stress tests.
Residential mortgages
A large portion of the Bank’s lending portfolio is comprised of residential mortgages and consumer loans, which are well diversified by borrower. As at April 30, 2015, these loans amounted to $300 billion or 66% of the Bank’s total loans and acceptances outstanding (January 31, 2015 – $301 billion or 66%; October 31, 2014 – $297 billion or 68%). Of these, $232 billion or 77% are real estate secured loans (January 31, 2015 – $234 billion or 78%; October 31, 2014 – $232 billion or 78%). The tables below provide more details by portfolios.
10 Scotiabank Second Quarter Report 2015
Table of Contents
MANAGEMENT’S DISCUSSION & ANALYSIS
Insured and uninsured mortgages and home equity lines of credit
The following table presents amounts of insured and uninsured residential mortgages and home equity lines of credit (HELOCs) by geographic areas.
| As at April 30, 2015 | ||||||||||||||||||||||||||||||||||||||||||||||||
| Residential mortgages | Home equity lines of credit | |||||||||||||||||||||||||||||||||||||||||||||||
| Insured(1) | Uninsured | Total | Insured(1) | Uninsured | Total | |||||||||||||||||||||||||||||||||||||||||||
| ($ millions) | Amount | % | Amount | % | Amount | % | Amount | % | Amount | % | Amount | % | ||||||||||||||||||||||||||||||||||||
Canada:(2) | ||||||||||||||||||||||||||||||||||||||||||||||||
Atlantic provinces | $ | 6,742 | 3.6 | % | $ | 5,338 | 2.8 | % | $ | 12,080 | 6.4 | % | $ | 2 | – | $ | 1,283 | 6.8 | % | $ | 1,285 | 6.8 | % | |||||||||||||||||||||||||
Quebec | 7,174 | 3.8 | 8,176 | 4.4 | 15,350 | 8.2 | 1 | – | 1,045 | 5.5 | 1,046 | 5.5 | ||||||||||||||||||||||||||||||||||||
Ontario | 44,582 | 23.7 | 48,045 | 25.5 | 92,627 | 49.2 | 3 | – | 9,449 | 50.1 | 9,452 | 50.1 | ||||||||||||||||||||||||||||||||||||
Manitoba & Saskatchewan | 4,679 | 2.5 | 3,783 | 2.0 | 8,462 | 4.5 | 2 | – | 869 | 4.6 | 871 | 4.6 | ||||||||||||||||||||||||||||||||||||
Alberta | 17,465 | 9.2 | 11,985 | 6.4 | 29,450 | 15.6 | 3 | 0.1 | 3,047 | 16.1 | 3,050 | 16.2 | ||||||||||||||||||||||||||||||||||||
British Columbia & Territories | 14,037 | 7.5 | 16,281 | 8.6 | 30,318 | 16.1 | – | – | 3,178 | 16.8 | 3,178 | 16.8 | ||||||||||||||||||||||||||||||||||||
Canada(3) | $ | 94,679 | 50.3 | % | $ | 93,608 | 49.7 | % | $ | 188,287 | 100 | % | $ | 11 | 0.1 | % | $ | 18,871 | 99.9 | % | $ | 18,882 | 100 | % | ||||||||||||||||||||||||
International | – | – | 25,235 | 100 | 25,235 | 100 | – | – | – | – | – | – | ||||||||||||||||||||||||||||||||||||
Total | $ | 94,679 | 44.3 | % | $ | 118,843 | 55.7 | % | $ | 213,522 | 100 | % | $ | 11 | 0.1 | % | $ | 18,871 | 99.9 | % | $ | 18,882 | 100 | % | ||||||||||||||||||||||||
| As at January 31, 2015 | ||||||||||||||||||||||||||||||||||||||||||||||||
Canada(3) | $ | 97,322 | 51.6 | % | $ | 91,355 | 48.4 | % | $ | 188,677 | 100 | % | $ | 11 | 0.1 | % | $ | 18,782 | 99.9 | % | $ | 18,793 | 100 | % | ||||||||||||||||||||||||
International | – | – | 26,114 | 100 | 26,114 | 100 | – | – | – | – | – | – | ||||||||||||||||||||||||||||||||||||
Total | $ | 97,322 | 45.3 | % | $ | 117,469 | 54.7 | % | $ | 214,791 | 100 | % | $ | 11 | 0.1 | % | $ | 18,782 | 99.9 | % | $ | 18,793 | 100 | % | ||||||||||||||||||||||||
| As at October 31, 2014 | ||||||||||||||||||||||||||||||||||||||||||||||||
Canada | $ | 97,943 | 51.9 | % | $ | 90,899 | 48.1 | % | $ | 188,842 | 100 | % | $ | 12 | 0.1 | % | $ | 18,946 | 99.9 | % | $ | 18,958 | 100 | % | ||||||||||||||||||||||||
International | – | – | 23,806 | 100 | 23,806 | 100 | – | – | – | – | – | – | ||||||||||||||||||||||||||||||||||||
Total | $ | 97,943 | 46.1 | % | $ | 114,705 | 53.9 | % | $ | 212,648 | 100 | % | $ | 12 | 0.1 | % | $ | 18,946 | 99.9 | % | $ | 18,958 | 100 | % | ||||||||||||||||||||||||
| (1) | Default insurance is contractual coverage for the life of eligible facilities whereby the Bank’s exposure to real estate secured lending is protected against potential shortfalls caused by borrower default. This insurance is provided by either government-backed entities or private mortgage insurers. |
| (2) | The province represents the location of the property in Canada. |
| (3) | Includes multi-residential dwellings (4 + units) of $1,917 (January 31, 2015 – $1,816; October 31, 2014 – $1,518) of which $852 are insured (January 31, 2015 – $770; October 31, 2014 – $632). |
Amortization period ranges for residential mortgages
The following table presents the distribution of residential mortgages by remaining amortization periods, and by geographic areas.
| As at April 30, 2015 | ||||||||||||||||||||||||
| Residential mortgages by amortization period | ||||||||||||||||||||||||
| Less than 20 years | 20-24 years | 25-29 years | 30-34 Years | 35 years and greater | Total residential mortgages | |||||||||||||||||||
Canada | 35.3 | % | 35.3 | % | 24.5 | % | 4.8 | % | 0.1 | % | 100 | % | ||||||||||||
International | 67.4 | % | 20.2 | % | 11.1 | % | 1.1 | % | 0.2 | % | 100 | % | ||||||||||||
| As at January 31, 2015 | ||||||||||||||||||||||||
Canada | 35.3 | % | 35.1 | % | 24.2 | % | 5.3 | % | 0.1 | % | 100 | % | ||||||||||||
International | 66.2 | % | 20.6 | % | 11.6 | % | 1.4 | % | 0.2 | % | 100 | % | ||||||||||||
| As at October 31, 2014 | ||||||||||||||||||||||||
Canada | 34.6 | % | 34.0 | % | 25.1 | % | 6.2 | % | 0.1 | % | 100 | % | ||||||||||||
International | 66.6 | % | 20.5 | % | 11.5 | % | 1.2 | % | 0.2 | % | 100 | % | ||||||||||||
Loan to value ratios
The Canadian residential mortgage portfolio is 50% uninsured (January 31, 2015 – 48%; October 31, 2014 – 48%). The average loan-to-value (LTV) ratio of the uninsured portfolio is 53% (January 31, 2015 – 55%; October 31, 2014 – 54%).
Scotiabank Second Quarter Report 2015 11
Table of Contents
MANAGEMENT’S DISCUSSION & ANALYSIS
The following table presents the weighted average LTV ratio for total newly originated uninsured residential mortgages and home equity lines of credit under the Scotia Total Equity Plan, which include mortgages for purchases, refinances with a request for additional funds and transfer from other financial institutions, by geographic areas in the current quarter.
| Uninsured LTV ratios(1) | ||||||||
For the three months ended April 30, 2015 | ||||||||
Residential mortgages | Home equity lines of credit(2) | |||||||
| LTV% | LTV% | |||||||
Canada: | ||||||||
Atlantic provinces | 68.0 | 64.7 | ||||||
Quebec | 62.4 | 69.0 | ||||||
Ontario | 61.8 | 63.8 | ||||||
Manitoba & Saskatchewan | 65.8 | 66.7 | ||||||
Alberta | 65.2 | 68.4 | ||||||
British Columbia & Territories | 59.4 | 61.5 | ||||||
Canada | 62.3 | % | 64.5 | % | ||||
International | 68.6 | % | N/A | |||||
| For the three months ended January 31, 2015 | ||||||||
Canada | 62.0 | % | 65.3 | % | ||||
International | 68.2 | % | N/A | |||||
| For the three months ended October 31, 2014 | ||||||||
Canada | 62.0 | % | 65.0 | % | ||||
International | 68.8 | % | N/A | |||||
| (1) | The province represents the location of the property in Canada. |
| (2) | Includes only home equity lines of credit (HELOC) under Scotia Total Equity Plan. LTV is calculated based on the sum of residential mortgages and the authorized limit for related HELOCs, divided by the value of the related residential property, and presented on a weighted average basis for newly originated mortgages and HELOCs. |
Potential impact on residential mortgages and real estate home equity lines of credit in the event of an economic downturn
The Bank stress tests its retail lending portfolio to assess the potential impact of worsening economic conditions such as increases in unemployment and declines in residential real estate prices. It has an ongoing program to apply topical scenarios such as assessing the impact of a decrease in oil prices on retail loan losses in relevant regions. Potential losses in the mortgage portfolio under such scenarios are manageable due to the diversified composition of the portfolio, the high percentage of insured exposures, and the low LTV in the portfolio. This is further supported by sound risk management oversight and risk mitigation strategies.
Loans to Canadian condominium developers
With respect to loans to Canadian condominium developers, the Bank had loans outstanding of $1,076 million as at April 30, 2015 (January 31, 2015 – $958 million; October 31, 2014 – $978 million). This is a high quality portfolio with well-known developers who have long-term relationships with the Bank.
European exposures
As a result of the Bank’s broad international operations, the Bank has sovereign credit risk exposure to a number of countries. The Bank actively manages this sovereign risk, including the use of risk limits calibrated to the credit worthiness of the sovereign exposure.
12 Scotiabank Second Quarter Report 2015
Table of Contents
MANAGEMENT’S DISCUSSION & ANALYSIS
The current European exposure is provided below:
| As at | ||||||||||||||||||||||||||||||||
| April 30, 2015 | January 31 2015 | October 31 2014 | ||||||||||||||||||||||||||||||
| Loans and loan equivalents | ||||||||||||||||||||||||||||||||
| ($ millions) | Loans and acceptances(1) | Letters of credit and guarantees(2) | Undrawn commitments(3) | Securities and deposits with financial institutions(4) | Securities Financing Transactions (SFT) and derivatives(5) | Total European exposure | Total European exposure | Total European exposure | ||||||||||||||||||||||||
Gross exposures | $ | 10,327 | $ | 2,122 | $ | 11,671 | $ | 8,972 | $ | 2,824 | $ | 35,916 | $ | 37,499 | $ | 31,073 | ||||||||||||||||
Less: Undrawn commitments | – | – | 11,671 | – | – | 11,671 | 13,388 | 11,187 | ||||||||||||||||||||||||
Net funded exposure | $ | 10,327 | $ | 2,122 | $ | – | $ | 8,972 | $ | 2,824 | $ | 24,245 | $ | 24,111 | $ | 19,886 | ||||||||||||||||
| (1) | Individual allowance for credit losses are $4. Gross and net values are equal as collateral is not posted against these exposures. |
| (2) | Letters of credit and guarantees are included as funded exposure as they have been issued. |
| (3) | Undrawn commitments represent an estimate of the contractual amount that may be drawn upon by the obligor. |
| (4) | Exposures for securities are calculated taking into account derivative positions where the security is the underlying reference asset and short trading positions. Gross and net values are equal as collateral is not posted against these exposures. |
| (5) | SFT comprise of securities purchased under resale agreements, obligations related to securities sold under repurchase agreements and securities lending and borrowing transactions. Net funded exposure represents all net positive positions after taking into account collateral. Collateral held against derivatives was $1,990 and collateral held against SFT was $7,998. |
The Bank believes that its European exposures are manageable, are sized appropriately relative to the credit worthiness of the counterparties (80% of the exposures are to investment grade counterparties based on a combination of internal and external ratings), and are modest relative to the capital levels of the Bank. The Bank’s European exposures are carried at amortized cost or fair value using observable inputs, with negligible amounts valued using models with unobservable inputs (Level 3). There were no significant events in the quarter that have materially impacted the Bank’s exposures.
Below are the funded exposures related to all European countries:
| As at | ||||||||||||||||||||||||
| April 30, 2015 | January 31 2015 | October 31 2014 | ||||||||||||||||||||||
| ($ millions) | Sovereign(1) | Bank | Corporate(2) | Total | Total | Total | ||||||||||||||||||
Greece | $ | – | $ | – | $ | 332 | $ | 332 | $ | 396 | $ | 384 | ||||||||||||
Ireland | 19 | – | 313 | 332 | 697 | 295 | ||||||||||||||||||
Italy | 150 | 253 | 15 | 418 | 540 | 271 | ||||||||||||||||||
Portugal | 1 | 3 | – | 4 | 6 | 6 | ||||||||||||||||||
Spain | 10 | 54 | 317 | 381 | 310 | 330 | ||||||||||||||||||
Total GIIPS | $ | 180 | $ | 310 | $ | 977 | $ | 1,467 | $ | 1,949 | $ | 1,286 | ||||||||||||
U.K. | $ | 1,438 | $ | 2,302 | $ | 6,072 | $ | 9,812 | $ | 10,216 | $ | 8,072 | ||||||||||||
Germany | 1,680 | 603 | 1,010 | 3,293 | 2,680 | 2,535 | ||||||||||||||||||
France | 1,999 | 786 | 336 | 3,121 | 2,602 | 3,077 | ||||||||||||||||||
Netherlands | (21 | ) | 462 | 657 | 1,098 | 896 | 588 | |||||||||||||||||
Switzerland | 6 | 346 | 746 | 1,098 | 1,476 | 969 | ||||||||||||||||||
Other | 1,264 | 119 | 2,973 | 4,356 | 4,292 | 3,359 | ||||||||||||||||||
Total Non-GIIPS | $ | 6,366 | $ | 4,618 | $ | 11,794 | $ | 22,778 | $ | 22,162 | $ | 18,600 | ||||||||||||
Total Europe | $ | 6,546 | $ | 4,928 | $ | 12,771 | $ | 24,245 | $ | 24,111 | $ | 19,886 | ||||||||||||
Total Europe as at January 31, 2015 | $ | 5,528 | $ | 5,157 | $ | 13,426 | $ | 24,111 | ||||||||||||||||
Total Europe as at October 31, 2014 | $ | 5,159 | $ | 4,208 | $ | 10,519 | $ | 19,886 | ||||||||||||||||
| (1) | Includes $686 (January 31, 2015 – $614; October 31, 2014 – $397) in exposures to supra-national agencies. |
| (2) | Corporate includes financial institutions that are not banks. |
The Bank’s exposure to certain European countries of focus – Greece, Ireland, Italy, Portugal and Spain (GIIPS) – is not significant. As of April 30, 2015, the Bank’s current funded exposure to the GIIPS sovereign entities, as well as banks and non-bank financial institutions and corporations domiciled in these countries, totaled approximately $1.5 billion, down from $1.9 billion last quarter. Of the $1.5 billion, $1.1 billion related to loans, loan equivalents and deposits with financial institutions which dropped $172 million over last quarter.
Scotiabank Second Quarter Report 2015 13
Table of Contents
MANAGEMENT’S DISCUSSION & ANALYSIS
Specific to sovereign exposures to GIIPS, the Bank’s exposure to Ireland included central bank deposits of $18 million and $1 million in trading book securities. The Bank was net long securities in sovereign exposures to Italy ($150 million) and Spain ($10 million). The Bank had no sovereign securities holdings of Greece and Portugal.
The Bank had exposures to Italian banks of $253 million, as at April 30, 2015 (January 31, 2015 – $281 million; October 31, 2014 – $268 million), primarily related to short-term precious metals trading and lending activities. Greek exposure of $332 million (January 31, 2015 – $396 million; October 31, 2014 – $384 million) related primarily to secured loans to shipping companies.
The Bank’s exposures are distributed as follows:
| As at | ||||||||||||||||||||||||||||
| April 30, 2015 | January 31 2015 | October 31 2014 | ||||||||||||||||||||||||||
| ($ millions) | Loans and loan equivalents | Deposits with financial institutions | Securities | SFT and derivatives | Total | Total | Total | |||||||||||||||||||||
Greece | $ | 328 | $ | – | $ | 3 | $ | 1 | $ | 332 | $ | 396 | $ | 384 | ||||||||||||||
Ireland | 103 | 18 | 211 | – | 332 | 697 | 295 | |||||||||||||||||||||
Italy | 302 | 2 | 111 | 3 | 418 | 540 | 271 | |||||||||||||||||||||
Portugal | – | – | 3 | 1 | 4 | 6 | 6 | |||||||||||||||||||||
Spain | 362 | – | 15 | 4 | 381 | 310 | 330 | |||||||||||||||||||||
Total GIIPS | $ | 1,095 | $ | 20 | $ | 343 | $ | 9 | $ | 1,467 | $ | 1,949 | $ | 1,286 | ||||||||||||||
U.K. | $ | 5,351 | $ | 1,148 | $ | 1,863 | $ | 1,450 | $ | 9,812 | $ | 10,216 | $ | 8,072 | ||||||||||||||
Germany | 1,076 | 306 | 1,767 | 144 | 3,293 | 2,680 | 2,535 | |||||||||||||||||||||
France | 631 | 29 | 2,224 | 237 | 3,121 | 2,602 | 3,077 | |||||||||||||||||||||
Netherlands | 546 | 110 | 228 | 214 | 1,098 | 896 | 588 | |||||||||||||||||||||
Switzerland | 748 | 32 | 256 | 62 | 1,098 | 1,476 | 969 | |||||||||||||||||||||
Other | 3,002 | 41 | 605 | 708 | 4,356 | 4,292 | 3,359 | |||||||||||||||||||||
Total Non-GIIPS | $ | 11,354 | $ | 1,666 | $ | 6,943 | $ | 2,815 | $ | 22,778 | $ | 22,162 | $ | 18,600 | ||||||||||||||
Total Europe | $ | 12,449 | $ | 1,686 | $ | 7,286 | $ | 2,824 | $ | 24,245 | $ | 24,111 | $ | 19,886 | ||||||||||||||
Securities exposures to European sovereigns and banks (excluding GIIPS) were $5.9 billion as at April 30, 2015 (January 31, 2015 – $4.6 billion; October 31, 2014 – $4.9 billion), predominately related to issuers in France, Germany, United Kingdom and Luxembourg. Securities are carried at fair value and substantially all holdings have strong market liquidity.
The majority of the current funded credit exposure is in the form of funded loans which are recorded on an accrual basis. As well, credit exposure to clients arises from client-driven derivative transactions and securities financing transactions (reverse repurchase agreements, repurchase agreements, and securities lending and borrowing). OTC derivative counterparty exposures are recorded on a fair value basis and security financing transactions are recorded on an accrual basis. As at April 30, 2015, credit exposure to banks in the form of issued letters of credit amounted to $1.3 billion (January 31, 2015 – $1.2 billion; October 31, 2014 – $3.6 billion).
Undrawn commitments of $11.7 billion (January 31, 2015 – $13.4 billion; October 31, 2014 – $11.0 billion) are comprised of unfunded loan commitments and commitments to issue letters of credit on behalf of other banks in a syndicated bank lending arrangement. Total unfunded loan commitments to corporations in Europe (excluding GIIPS) were $8.1 billion as at April 30, 2015 (January 31, 2015 – $9.4 billion; October 31, 2014 – $7.5 billion). Unfunded commitments are detailed further by country in the table on page 15.
The Bank’s indirect exposure is also detailed in the table below and is defined as:
| • | Securities where the exposures are to non-European entities whose parent company is domiciled in Europe, and |
| • | Letters of credit or guarantees (included as loan equivalents in the above table) from entities in European countries to entities in countries outside of Europe. |
14 Scotiabank Second Quarter Report 2015
Table of Contents
MANAGEMENT’S DISCUSSION & ANALYSIS
Included in the indirect securities exposure was $463 million related to GIIPS, $95 million to the United Kingdom and $75 million to Switzerland. Indirect exposure by way of letters of credit totaled $2,122 million at April 30, 2015 (January 31, 2015 – $2,246 million; October 31, 2014 – $1,839 million), of which $62 million (January 31, 2015 – $76 million; October 31, 2014 – $43 million) was indirect exposure to GIIPS. Indirect exposure is managed through the Bank’s credit risk management framework, with a robust assessment of the counterparty. In addition to the total indirect exposures detailed further below, the Bank had Euro-denominated collateral held for non-European counterparties of $1,927 million (January 31, 2015 –$1,490 million; October 31, 2014 – $1,371 million).
| Undrawn commitments | Indirect exposure(1) | |||||||||||||||||||||||
| ($ millions) | April 30 2015 | January 31 2015 | October 31 2014 | April 30 2015 | January 31 2015 | October 31 2014 | ||||||||||||||||||
Greece | $ | – | $ | – | $ | – | $ | – | $ | – | $ | – | ||||||||||||
Ireland | 71 | 89 | 87 | – | (1 | ) | (1 | ) | ||||||||||||||||
Italy | 82 | 66 | 45 | 9 | 25 | 7 | ||||||||||||||||||
Portugal | – | – | – | – | – | – | ||||||||||||||||||
Spain | 98 | 271 | 57 | 516 | 429 | 490 | ||||||||||||||||||
Total GIIPS | $ | 251 | $ | 426 | $ | 189 | $ | 525 | $ | 453 | $ | 496 | ||||||||||||
U.K. | $ | 5,632 | $ | 5,645 | $ | 5,662 | $ | 879 | $ | 870 | $ | 693 | ||||||||||||
Germany | 829 | 1,161 | 791 | 181 | 255 | 313 | ||||||||||||||||||
France | 1,393 | 1,535 | 1,269 | 399 | 423 | 346 | ||||||||||||||||||
Netherlands | 1,200 | 1,109 | 1,056 | 205 | 206 | 175 | ||||||||||||||||||
Switzerland | 678 | 703 | 806 | 155 | 163 | 172 | ||||||||||||||||||
Other | 1,688 | 2,809 | 1,414 | 413 | 425 | 365 | ||||||||||||||||||
Total Non-GIIPS | $ | 11,420 | $ | 12,962 | $ | 10,998 | $ | 2,232 | $ | 2,342 | $ | 2,064 | ||||||||||||
Total Europe | $ | 11,671 | $ | 13,388 | $ | 11,187 | $ | 2,757 | $ | 2,795 | $ | 2,560 | ||||||||||||
| (1) | Amounts in brackets represent net short positions arising from trading transactions. |
The Bank does not use credit default swaps (CDS) as a risk mitigation technique to reduce its non-trading sovereign debt exposures. With respect to banks and non-bank financial institutions and corporations, the Bank may on occasion use CDS to partially offset its funded loan exposures. Specific to GIIPS as at April 30, 2015, the Bank had no CDS protection on funded loan exposures. As part of the trading portfolio, the Bank may purchase or sell CDS. All exposures, including CDS, are subject to risk limits and ongoing monitoring by the Bank’s independent risk management department.
Like other banks, the Bank also provides settlement and clearing facilities for a variety of clients in these countries and actively monitors and manages these intra-day exposures. However, the Bank has no funded exposure in these countries to retail customers or small businesses.
Market risk
Value at Risk (VaR) is a key measure of market risk in the Bank’s trading activities. VaR includes both general market risk and debt specific risk components. The Bank also calculates a Stressed VaR measure.
| Average for the three months ended | ||||||||||||
| Risk factor($ millions) | April 30 2015 | January 31 2015 | April 30 2014 | |||||||||
Credit spread plus interest rate | $ | 8.0 | $ | 7.9 | $ | 13.2 | ||||||
Credit spread | 8.2 | 6.9 | 9.5 | |||||||||
Interest rate | 4.3 | 4.1 | 10.4 | |||||||||
Equities | 2.5 | 2.1 | 2.5 | |||||||||
Foreign exchange | 1.1 | 1.3 | 0.8 | |||||||||
Commodities | 4.1 | 4.2 | 2.7 | |||||||||
Debt specific | 5.1 | 5.8 | 12.4 | |||||||||
Diversification effect | (10.2 | ) | (10.0 | ) | (13.5 | ) | ||||||
All Bank VaR | $ | 10.5 | $ | 11.2 | $ | 18.1 | ||||||
All Bank Stressed VaR | $ | 23.3 | $ | 27.0 | $ | 30.7 | ||||||
In the second quarter of 2015, the average one-day total VaR was $10.5 million, a decrease from $11.2 million in the previous quarter largely due to a reduction in Debt Specific Risk. The average one-day VaR declined year-over-year by $7.6 million due substantially to a model enhancement to the treatment of credit spreads in VaR, in 2015.
Scotiabank Second Quarter Report 2015 15
Table of Contents
MANAGEMENT’S DISCUSSION & ANALYSIS
The average one-day total Stressed VaR during the quarter was $23.3 million, down from $27.0 million in the previous quarter due to both reduced Stressed General Market Risk and Stressed Debt Specific Risk. Stressed VaR is calculated using market volatility from a one-year period identified as stressful given the risk profile of the trading portfolio. The current period is the 2008/2009 credit crisis.
There were four trading loss days in the second quarter, compared to two in the previous quarter. The losses were well within the range predicted by VaR. The quality and accuracy of the VaR models is validated by backtesting, which compares daily actual and theoretical profit and loss with the daily output of the VaR model.
Incremental Risk Charge and Comprehensive Risk Measure
Basel market risk capital requirements include the Incremental Risk Charge (IRC) and Comprehensive Risk Measure (CRM) which capture the following:
| • | Default risk: This is the potential for direct losses due to an obligor’s (equity/bond issuer or counterparty) default, as well as the potential for indirect losses that may arise from a default event; and |
| • | Credit migration risk: This is the potential for direct losses due to a credit rating downgrade or upgrade, as well as the potential for indirect losses that may arise from a credit migration event. |
A Monte Carlo model is used to perform default and migration simulations for the obligors underlying credit derivative and bond portfolios. In addition, for CRM in correlation trading there is a market simulation model to capture historical price movements. Both IRC and CRM are calculated at the 99.9th percentile with a one year liquidity horizon.
Validation of new models
Prior to the implementation of new market risk models, substantial validation and testing is conducted. Validation is conducted when a model is initially developed and when any significant changes are made to a model. Models are also subject to ongoing validation, the frequency of which is determined by model risk ratings. Models may also be triggered for earlier re-validation due to significant structural changes in the market or changes to the composition of the portfolio. Model validation includes backtesting and additional analysis such as:
| • | Theoretical review or tests to demonstrate whether assumptions made within the internal model are appropriate; |
| • | Impact tests including stress testing that would occur under historical and hypothetical market conditions; |
| • | The use of hypothetical portfolios to ensure that models are able to capture concentration risk that may arise in an undiversified portfolio. |
16 Scotiabank Second Quarter Report 2015
Table of Contents
MANAGEMENT’S DISCUSSION & ANALYSIS
Market risk linkage to Consolidated Statement of Financial Position
Trading assets and liabilities are marked to market daily and included in trading risk measures such as VaR. Derivatives risk related to Global Banking & Markets’ activities is captured under trading risk measures while derivatives used in asset/liability management are in the non-trading risk category. A comparison of balance sheet items which are covered under the trading and non-trading risk measures is provided in the table below.
Market risk linkage to Consolidated Statement of Financial Position of the Bank
| As at April 30, 2015 | Market Risk Measure | |||||||||||||||||||
| ($ millions) | Consolidated Statement of Financial Position | Trading risk | Non-trading risk | Not subject to market-risk | Primary risk sensitivity of non-trading risk | |||||||||||||||
Precious metals | $ | 8,438 | $ | 8,438 | $ | – | $ | – | n/a | |||||||||||
Trading assets | 113,120 | 113,120 | – | – | n/a | |||||||||||||||
Financial assets designated at fair value through profit or loss | 129 | – | 129 | – | Interest rate | |||||||||||||||
Derivative financial instruments | 37,669 | 34,952 | 2,717 | – | Interest rate, FX, equity | |||||||||||||||
Investment securities | 39,828 | – | 39,828 | – | Interest rate, equity | |||||||||||||||
Loans | 435,958 | – | 435,958 | – | Interest rate, FX | |||||||||||||||
Assets not subject to market risk(1) | 202,019 | – | – | 202,019 | n/a | |||||||||||||||
Total assets | $ | 837,161 | $ | 156,510 | $ | 478,632 | $ | 202,019 | ||||||||||||
Deposits | $ | 575,281 | $ | – | $ | 547,868 | $ | 27,413 | Interest rate, FX, equity | |||||||||||
Financial instruments designated at fair value through profit or loss | 1,102 | – | 1,102 | – | Interest rate, equity | |||||||||||||||
Obligations related to securities sold short | 22,843 | 22,843 | – | – | n/a | |||||||||||||||
Derivative financial instruments | 43,613 | 41,135 | 2,478 | – | Interest rate, FX, equity | |||||||||||||||
Trading liabilities(2) | 4,325 | 4,325 | – | – | n/a | |||||||||||||||
Pension and other benefit liabilities | 2,623 | – | 2,623 | – | Interest rate, credit spread | |||||||||||||||
Liabilities not subject to market risk(3) | 136,431 | – | – | 136,431 | n/a | |||||||||||||||
Total liabilities | $ | 786,218 | $ | 68,303 | $ | 554,071 | $ | 163,844 | ||||||||||||
| (1) | Includes goodwill, intangibles, other assets and securities purchased under resale agreements and securities borrowed. |
| (2) | Gold and silver certificates and bullion included in other liabilities. |
| (3) | Includes obligations related to securities sold under repurchase agreements and securities lent and other liabilities. |
| As at October 31, 2014 | Market Risk Measure | |||||||||||||||||||
| ($ millions) | Consolidated Statement of Financial Position | Trading risk | Non-trading risk | Not subject to market-risk | Primary risk sensitivity of non-trading risk | |||||||||||||||
Precious metals | $ | 7,286 | $ | 7,286 | $ | – | $ | – | n/a | |||||||||||
Trading assets | 113,248 | 113,248 | – | – | n/a | |||||||||||||||
Financial instruments designated at fair value through profit or loss | 111 | – | 111 | – | Interest rate | |||||||||||||||
Derivative financial instruments | 33,439 | 31,401 | 2,038 | – | Interest rate, FX, equity | |||||||||||||||
Investment securities | 38,662 | – | 38,662 | – | Interest rate, equity | |||||||||||||||
Loans | 424,309 | – | 424,309 | – | Interest rate, FX | |||||||||||||||
Assets not subject to market risk(1) | 188,611 | – | – | 188,611 | n/a | |||||||||||||||
Total assets | $ | 805,666 | $ | 151,935 | $ | 465,120 | $ | 188,611 | ||||||||||||
Deposits | $ | 554,017 | $ | – | $ | 526,929 | $ | 27,088 | Interest rate, FX, equity | |||||||||||
Financial instruments designated at fair value through profit or loss | 465 | – | 465 | – | Interest rate, equity | |||||||||||||||
Obligations related to securities sold short | 27,050 | 27,050 | – | – | n/a | |||||||||||||||
Derivative financial instruments | 36,438 | 34,992 | 1,446 | – | Interest rate, FX, equity | |||||||||||||||
Trading liabilities(2) | 4,571 | 4,571 | – | – | n/a | |||||||||||||||
Pension and other benefit liabilities | 2,095 | – | 2,095 | – | Interest rate, credit spread | |||||||||||||||
Liabilities not subject to market risk(3) | 131,819 | – | – | 131,819 | n/a | |||||||||||||||
Total liabilities | $ | 756,455 | $ | 66,613 | $ | 530,935 | $ | 158,907 | ||||||||||||
| (1) | Includes goodwill, intangibles, other assets and securities purchased under resale agreements and securities borrowed. |
| (2) | Gold and silver certificates and bullion included in other liabilities. |
| (3) | Includes obligations related to securities sold under repurchase agreements and securities lent and other liabilities. |
Scotiabank Second Quarter Report 2015 17
Table of Contents
MANAGEMENT’S DISCUSSION & ANALYSIS
Liquidity risk
Effective liquidity risk management is essential to maintain the confidence of depositors and counterparties, manage the Bank’s cost of funds and to support core business activities, even under adverse circumstances.
Liquidity risk is managed within a framework of policies and limits that are approved by the Board of Directors, as outlined in Note 18 to the condensed interim consolidated financial statements and in Note 39 of the audited consolidated financial statements in the Bank’s 2014 Annual Report. Liquid assets are a key component of this framework.
The determination of the appropriate levels for liquid asset portfolios is based on the amount of liquidity the Bank might need to fund expected cash flows in the normal course of business, as well as what might be required in periods of stress to meet cash outflows. Stress events include periods when there are disruptions in the capital markets or events which may impair the Bank’s access to funding markets or liquidity. The Bank uses stress testing to assess the impact of stress events and to assess the amount of liquid assets that would be required in various stress scenarios.
Liquid assets
Liquid assets are a key component of liquidity management and the Bank holds these types of assets in sufficient quantity to meet potential needs for liquidity management.
Liquid assets can be used to generate cash either through sale, repurchase transactions or other transactions where these assets can be used as collateral to generate cash, or by allowing the asset to mature. Liquid assets include deposits with central banks, deposits with financial institutions, call and other short-term loans, marketable securities, precious metals and securities received as collateral from securities financing and derivative transactions. Liquid assets do not include liquidity which may be obtained from central bank facilities.
Marketable securities are securities traded in active markets, which can be converted to cash within a timeframe that is in accordance with the Bank’s liquidity management framework. Assets are assessed considering a number of factors, including the time it would take to convert them to cash.
Marketable securities included in liquid assets are comprised of securities specifically held as a liquidity buffer or for asset liability management purposes, trading securities, which are primarily held by Global Banking & Markets; and collateral received for securities financing and derivative transactions.
The Bank maintains large holdings of unencumbered liquid assets to support its operations. These assets generally can be sold or pledged to meet the Bank’s obligations. As at April 30, 2015, unencumbered liquid assets were $182 billion (October 31, 2014 – $183 billion). The mix of these liquid assets, comprising securities and NHA mortgage-backed securities, was 66% (October 31, 2014 – 68%). Other unencumbered liquid assets, comprising cash, deposits with financial institutions, precious metals and call and short loans, was 34% (October 31, 2014 – 32%).
The carrying values outlined in the liquid asset table are consistent with the carrying values in the Bank’s Statement of Financial Position as at April 30, 2015. The liquidity value of the portfolio will vary under different stress events as different assumptions are used for the stress scenarios.
The Bank’s liquid asset pool is summarized in the following table:
| As at April 30, 2015 | ||||||||||||||||||||||||||||
| ($ millions) | Bank- owned liquid assets | Securities received as collateral from securities financing and derivative transactions | Total liquid assets | Encumbered liquid assets | Total unencumbered liquid assets | |||||||||||||||||||||||
| Pledged as collateral | Other(1) | Available as collateral | Other | |||||||||||||||||||||||||
Cash and deposits with central banks | $ | 52,562 | $ | – | $ | 52,562 | $ | – | $ | 6,175 | $ | 46,387 | $ | – | ||||||||||||||
Deposits with financial institutions | 8,102 | – | 8,102 | – | 2,383 | 5,719 | – | |||||||||||||||||||||
Precious metals | 8,438 | – | 8,438 | – | 44 | 8,394 | – | |||||||||||||||||||||
Securities | ||||||||||||||||||||||||||||
Canadian government obligations | 27,505 | 20,800 | 48,305 | 32,592 | – | 15,713 | – | |||||||||||||||||||||
Foreign government obligations | 35,302 | 34,794 | 70,096 | 51,161 | – | 18,935 | – | |||||||||||||||||||||
Other securities | 60,841 | 56,487 | 117,328 | 66,584 | – | 50,744 | – | |||||||||||||||||||||
Loans | ||||||||||||||||||||||||||||
NHA mortgage-backed securities(2) | 37,665 | – | 37,665 | 2,979 | – | 34,686 | – | |||||||||||||||||||||
Call and short loans | 1,007 | – | 1,007 | – | – | 1,007 | – | |||||||||||||||||||||
Total | $ | 231,422 | $ | 112,081 | $ | 343,503 | $ | 153,316 | $ | 8,602 | $ | 181,585 | $ | – | ||||||||||||||
18 Scotiabank Second Quarter Report 2015
Table of Contents
MANAGEMENT’S DISCUSSION & ANALYSIS
| As at October 31, 2014 | ||||||||||||||||||||||||||||
| ($ millions) | Bank- liquid assets | Securities received as collateral from securities financing and derivative transactions | Total liquid assets | Encumbered liquid assets | Total unencumbered liquid assets | |||||||||||||||||||||||
| Pledged as collateral | Other(1) | Available as collateral | Other | |||||||||||||||||||||||||
Cash and deposits with central banks | $ | 49,507 | $ | – | $ | 49,507 | $ | – | $ | 5,262 | $ | 44,245 | $ | – | ||||||||||||||
Deposits with financial institutions | 7,223 | – | 7,223 | – | 1,441 | 5,782 | – | |||||||||||||||||||||
Precious metals | 7,286 | – | 7,286 | – | 43 | 7,243 | – | |||||||||||||||||||||
Securities | ||||||||||||||||||||||||||||
Canadian government obligations | 31,551 | 17,595 | 49,146 | 27,059 | – | 22,087 | – | |||||||||||||||||||||
Foreign government obligations | 36,959 | 41,405 | 78,364 | 61,380 | – | 16,984 | – | |||||||||||||||||||||
Other securities | 55,868 | 44,195 | 100,063 | 52,586 | – | 47,477 | – | |||||||||||||||||||||
Loans | ||||||||||||||||||||||||||||
NHA mortgage-backed securities(2) | 42,286 | – | 42,286 | 3,686 | – | 38,600 | – | |||||||||||||||||||||
Call and short loans | 976 | – | 976 | – | – | 976 | – | |||||||||||||||||||||
Total | $ | 231,656 | $ | 103,195 | $ | 334,851 | $ | 144,711 | $ | 6,746 | $ | 183,394 | $ | – | ||||||||||||||
| (1) | Assets which are restricted from being used to secure funding for legal or other reasons. |
| (2) | These mortgage-backed securities, which are available-for-sale, are reported as residential mortgage loans on the balance sheet. |
A summary of total unencumbered liquid assets held by the parent bank and its branches, and domestic and foreign subsidiaries, is presented below:
| As at | ||||||||
| ($ millions) | April 30 2015 | October 31 2014 | ||||||
Bank of Nova Scotia (Parent) | $ | 145,622 | $ | 141,999 | ||||
Bank domestic subsidiaries | 15,095 | 23,583 | ||||||
Bank foreign subsidiaries | 20,868 | 17,812 | ||||||
Total | $ | 181,585 | $ | 183,394 | ||||
The Bank’s liquidity pool is held across major currencies, mostly comprised of Canadian and U.S. dollar holdings. As shown above, the vast majority (89%) of liquid assets are held by the Bank’s corporate office, branches of the Bank, and Canadian subsidiaries of the Bank. To the extent a liquidity reserve held in a foreign subsidiary of the Bank is required for regulatory purposes, it is assumed to be unavailable to the rest of the Group. Other liquid assets held by a foreign subsidiary are assumed to be available only in limited circumstances. The Bank monitors and ensures compliance in relation to minimum levels of liquidity required and assets held within each entity, and/or jurisdiction.
Scotiabank Second Quarter Report 2015 19
Table of Contents
MANAGEMENT’S DISCUSSION & ANALYSIS
Encumbered assets
In the course of the Bank’s day-to-day activities, securities and other assets are pledged to secure an obligation, participate in clearing or settlement systems, or operate in a foreign jurisdiction. Securities may also be pledged under repurchase agreements. A summary of encumbered and unencumbered assets is presented below:
Asset encumbrance
| As at April 30, 2015 | Encumbered assets | Unencumbered assets | ||||||||||||||||||||||||||
| ($ millions) | Bank-owned assets | Securities received as collateral from securities financing and derivative transactions | Total assets | Pledged as collateral | Other(1) | Available as collateral(2) | Other(3) | |||||||||||||||||||||
Cash and deposits with central banks | $ | 52,562 | $ | – | $ | 52,562 | $ | – | $ | 6,175 | $ | 46,387 | $ | – | ||||||||||||||
Deposits with financial institutions | 8,102 | – | 8,102 | – | 2,383 | 5,719 | – | |||||||||||||||||||||
Precious metals | 8,438 | – | 8,438 | – | 44 | 8,394 | – | |||||||||||||||||||||
Liquid securities: | ||||||||||||||||||||||||||||
Canadian government obligations | 27,505 | 20,800 | 48,305 | 32,592 | – | 15,713 | – | |||||||||||||||||||||
Foreign government obligations | 35,302 | 34,794 | 70,096 | 51,161 | – | 18,935 | – | |||||||||||||||||||||
Other liquid securities | 60,841 | 56,487 | 117,328 | 66,584 | – | 50,744 | – | |||||||||||||||||||||
Other securities | 8,404 | 4,232 | 12,636 | 4,672 | – | – | 7,964 | |||||||||||||||||||||
Loans classified as liquid assets: | ||||||||||||||||||||||||||||
NHA mortgage-backed securities | 37,665 | – | 37,665 | 2,979 | – | 34,686 | – | |||||||||||||||||||||
Call and short loans | 1,007 | – | 1,007 | – | – | 1,007 | – | |||||||||||||||||||||
Other loans | 414,565 | – | 414,565 | 10,331 | 39,671 | 8,945 | 355,618 | |||||||||||||||||||||
Other financial assets(4) | 157,014 | (87,756 | ) | 69,258 | 2,801 | – | – | 66,457 | ||||||||||||||||||||
Non-financial assets | 25,756 | – | 25,756 | – | – | – | 25,756 | |||||||||||||||||||||
Total | $ | 837,161 | $ | 28,557 | $ | 865,718 | $ | 171,120 | $ | 48,273 | $ | 190,530 | $ | 455,795 | ||||||||||||||
| As at October 31, 2014 | Encumbered assets | Unencumbered assets | ||||||||||||||||||||||||||
| ($ millions) | Bank-owned assets | Securities received securities financing and derivative transactions | Total assets | Pledged as collateral | Other(1) | Available as collateral(2) | Other(3) | |||||||||||||||||||||
Cash and deposits with central banks | $ | 49,507 | $ | – | $ | 49,507 | $ | – | $ | 5,262 | $ | 44,245 | $ | – | ||||||||||||||
Deposits with financial institutions | 7,223 | – | 7,223 | – | 1,441 | 5,782 | – | |||||||||||||||||||||
Precious metals | 7,286 | – | 7,286 | – | 43 | 7,243 | – | |||||||||||||||||||||
Liquid securities: | ||||||||||||||||||||||||||||
Canadian government obligations | 31,551 | 17,595 | 49,146 | 27,059 | – | 22,087 | – | |||||||||||||||||||||
Foreign government obligations | 36,959 | 41,405 | 78,364 | 61,380 | – | 16,984 | – | |||||||||||||||||||||
Other liquid securities | 55,868 | 44,195 | 100,063 | 52,586 | – | 47,477 | – | |||||||||||||||||||||
Other securities | 9,759 | 4,840 | 14,599 | 3,291 | – | – | 11,308 | |||||||||||||||||||||
Loans classified as liquid assets: | ||||||||||||||||||||||||||||
NHA mortgage-backed securities | 42,286 | – | 42,286 | 3,686 | – | 38,600 | – | |||||||||||||||||||||
Call and short loans | 976 | – | 976 | – | – | 976 | – | |||||||||||||||||||||
Other loans | 395,554 | – | 395,554 | 11,625 | 38,435 | 10,358 | 335,136 | |||||||||||||||||||||
Other financial assets(4) | 144,019 | (86,166 | ) | 57,853 | 2,748 | – | – | 55,105 | ||||||||||||||||||||
Non-financial assets | 24,678 | – | 24,678 | – | – | – | 24,678 | |||||||||||||||||||||
Total | $ | 805,666 | $ | 21,869 | $ | 827,535 | $ | 162,375 | $ | 45,181 | $ | 193,752 | $ | 426,227 | ||||||||||||||
| (1) | Assets which are restricted from being used to secure funding for legal or other reasons. |
| (2) | Assets that are readily available in the normal course of business to secure funding or meet collateral needs including central bank borrowing immediately available. |
| (3) | Other unencumbered assets are not subject to any restrictions on their use to secure funding or as collateral but the Bank would not consider them to be readily available. These include loans, a portion of which may be used to access central bank facilities outside of the normal course or to raise secured funding through the Bank’s secured funding programs. |
| (4) | Securities received as collateral against other financial assets are included within liquid securities and other securities. |
As of April 30, 2015 total encumbered assets of the Bank were $219 billion (October 31, 2014 – $208 billion). Of the remaining $646 billion (October 31, 2014 – $620 billion) of unencumbered assets, $191 billion (October 31, 2014 – $194 billion) are considered readily available in the normal course of business to secure funding or meet collateral needs as detailed above.
20 Scotiabank Second Quarter Report 2015
Table of Contents
MANAGEMENT’S DISCUSSION & ANALYSIS
In some over-the-counter derivative contracts, the Bank would be required to post additional collateral in the event its credit rating was downgraded. The Bank maintains access to sufficient collateral to meet these obligations in the event of a downgrade of its ratings by one or more of the rating agencies. In the event of a one-notch or two-notch downgrade of the Bank’s rating by rating agencies, the Bank has to provide an additional $527 million or $751 million of collateral, respectively, to meet contractual derivative funding or margin requirements.
Encumbered liquid assets are not considered to be available for liquidity management purposes. Liquid assets which are being employed to hedge derivative positions in trading books or for hedging purposes, are considered to be available for liquidity management provided they meet the criteria discussed in liquid assets above.
Regulatory developments relating to liquidity
In January 2013 the Basel Committee on Banking Supervision (BCBS) finalized its international framework on Liquidity Coverage Ratio (LCR) requirements. Subsequently, in May 2014, OSFI released its Liquidity Adequacy Requirements (LAR) which contains the rules for Canadian Banks including LCR and the Net Cumulative Cash Flow (NCCF). The LCR and NCCF were implemented in January 2015.
In October 2014, BCBS released its final document on the Net Stable Funding Ratio (NSFR). NSFR will become a minimum standard by January 1, 2018. The Bank continues to monitor developments related to liquidity requirements.
Liquidity coverage ratio
The Liquidity Coverage Ratio measure (LCR) is based on a 30 day liquidity stress scenario, with assumptions defined in the OSFI Liquidity Adequacy Requirements (LAR) Guideline. The LCR is calculated as the ratio of high quality liquid assets (HQLA) to net cash outflows. The Bank is subject to a regulatory minimum LCR of 100%.
HQLA are defined in the LAR Guideline, and are grouped into three main categories, with varying haircuts applied to arrive at the amount included in the total weighted value in the table that follows.
The total weighted values for net cash outflows for the next 30 days are derived by applying the assumptions specified in the LAR Guideline to specific items, including loans, deposits, maturing debt, derivative transactions and commitments to extend credit.
Scotiabank Second Quarter Report 2015 21
Table of Contents
MANAGEMENT’S DISCUSSION & ANALYSIS
The following table presents the Bank’s average LCR for the quarter ended April 30, 2015, based on month-end LCR calculations for February, March and April.
| For the quarter ended April 30, 2015($ millions) | Total unweighted value (Average) | Total weighted value (Average) | ||||||
High-quality liquid assets | ||||||||
Total high-quality liquid assets (HQLA) | * | 138,542 | ||||||
Cash outflows | ||||||||
Retail deposits and deposits from small business customers, of which: | 147,825 | 9,992 | ||||||
Stable deposits | 70,575 | 2,267 | ||||||
Less stable deposits | 77,250 | 7,725 | ||||||
Unsecured wholesale funding, of which: | 142,153 | 80,483 | ||||||
Operational deposits (all counterparties) and deposits in networks of cooperative banks | 28,548 | 7,242 | ||||||
Non-operational deposits (all counterparties) | 92,345 | 51,981 | ||||||
Unsecured debt | 21,260 | 21,260 | ||||||
Secured wholesale funding | * | 18,913 | ||||||
Additional requirements, of which: | 190,806 | 72,589 | ||||||
Outflows related to derivative exposures and other collateral requirements | 59,061 | 49,970 | ||||||
Outflows related to loss of funding on debt products | 4,374 | 4,374 | ||||||
Credit and liquidity facilities | 127,371 | 18,245 | ||||||
Other contractual funding obligations | 23,860 | 1,329 | ||||||
Other contingent funding obligations | 196,917 | 7,180 | ||||||
Total | * | 190,486 | ||||||
Cash inflows | ||||||||
Secured lending (e.g. reverse repos) | 82,667 | 14,835 | ||||||
Inflows from fully performing exposures | 25,415 | 18,235 | ||||||
Other cash inflows | 44,826 | 44,826 | ||||||
Total | 152,908 | 77,896 | ||||||
| Total adjusted value | ||||||||
Total HQLA | 138,542 | |||||||
Total net cash outflows | 112,590 | |||||||
Liquidity coverage ratio (%) | 123 | % | ||||||
| * | Not disclosed as required by the LAR guideline. |
HQLA is substantially comprised of Level 1 assets (as defined in the LAR guideline), such as cash, deposits with central banks, central bank reserves available to the Bank in times of stress and securities with a 0% risk weight, as defined under OSFI Capital Adequacy guidelines.
Over time the Bank expects some variability in its reported LCR; much of this variability will result from normal business activities and will not necessarily be indicative of any trend or change in risk appetite. Potential sources of variability in the reported LCR include the Bank’s capital markets businesses and wholesale funding activities.
The Bank’s significant operating currencies are Canadian and U.S. dollars. The Bank monitors its significant currency exposures in accordance with its liquidity risk management framework and risk appetite.
Funding
The Bank ensures that its funding sources are well diversified. Funding concentrations are regularly monitored and analyzed by type. The sources of funding are capital, deposits from retail and commercial clients sourced through the Canadian and international branch network, deposits from financial institutions as well as wholesale debt issuances.
Capital and personal deposits are key components of the Bank’s core funding and these amounted to $239 billion as at April 30, 2015 (October 31, 2014 – $231 billion). The increase since October 31, 2014, was due primarily to personal deposits, internal capital
22 Scotiabank Second Quarter Report 2015
Table of Contents
MANAGEMENT’S DISCUSSION & ANALYSIS
generation and the issuance of NVCC subordinated debentures. A portion of commercial deposits, particularly those of an operating or relationship nature, would be considered part of the Bank’s core funding. Furthermore, core funding is augmented by longer term wholesale debt issuances (original maturity over 1 year) of $127 billion (October 31, 2014 – $123 billion). Longer term wholesale debt issuances includes medium-term notes, deposit notes, mortgage securitizations, asset-backed securities and covered bonds.
The Bank operates in many different currencies and countries. From a funding perspective, the most significant currencies are Canadian and U.S. dollars. With respect to the Bank’s operations outside Canada, there are different funding strategies depending on the nature of the activities in a country. For those countries where the Bank operates a branch banking subsidiary, the strategy is for the subsidiary to be substantially self-funding in its local market. For other subsidiaries or branches outside Canada where local deposit gathering capability is not sufficient, funding is provided through the wholesale funding activities of the Bank.
From an overall funding perspective the Bank’s objective is to achieve an appropriate balance between the cost and the stability of funding. Diversification of funding sources is a key element of the funding strategy.
The Bank’s wholesale debt diversification strategy is primarily executed via the Bank’s main wholesale funding centres, located in Toronto, New York, London and Singapore. The majority of these funds are sourced in Canadian and U.S. dollars. Where required, these funds are swapped to fund assets in different currencies. The funding strategy deployed by wholesale funding centres and the management of associated risks, such as geographic and currency risk, are managed centrally within the framework of policies and limits that are approved by the Board of Directors.
In the normal course, the Bank uses a mix of unsecured and secured wholesale funding instruments across a variety of markets. The choice of instruments and market is based on a number of factors, including relative cost and market capacity as well as an objective of maintaining a diversified mix of sources of funding. Market conditions can change over time, impacting cost and capacity in particular markets or instruments. Changing market conditions can include periods of stress where the availability of funding in particular markets or instruments is constrained. In these circumstances the Bank would increase its focus on sources of funding in functioning markets and secured funding instruments. Should a period of extreme stress exist such that all wholesale funding sources are constrained, the Bank maintains a pool of liquid assets to mitigate its liquidity risk. This pool includes cash, deposits with central banks and securities.
In Canada, the Bank raises short- and longer-term wholesale debt through the issuance of senior unsecured deposit notes. Additional longer-term wholesale debt is generated through the Bank’s Canadian Debt and Equity Shelf and the securitization of Canadian insured residential mortgages through CMHC securitization programs (such as Canada Mortgage Bonds), and of unsecured personal lines of credits through the Hollis Receivables Term Trust II Shelf. While the Bank includes CMHC securitization programs in its view of wholesale debt issuance, this source of funding does not entail the run-off risk that can be experienced in funding raised from capital markets.
Outside of Canada, short-term wholesale debt is raised through the issuance of negotiable certificates of deposit in the United States, Hong Kong and Australia and the issuance of commercial paper in the United States. The Bank operates longer-term wholesale debt issuance registered programs in the United States, such as its SEC Registered Debt and Equity Shelf and SEC Registered Covered Bond Shelf. As well, the Bank’s Covered Bond Program is listed with the U.K. Listing Authority and the Bank may issue under the program in Australia. The Bank also raises longer-term funding across a variety of currencies through its Australian Medium Term Note Programme, European Medium Term Note Programme and Singapore Medium Term Note Programme.
The table below provides the remaining contractual maturities of funding raised through wholesale funding. The products are aligned to Enhanced Disclosure Task Force (EDTF) recommended categories for comparability with other banks. In the Consolidated Statement of Financial Position, unless separately disclosed, most sources are included in Business and Government Deposits.
Scotiabank Second Quarter Report 2015 23
Table of Contents
MANAGEMENT’S DISCUSSION & ANALYSIS
Wholesale funding sources(1)
| As at April 30, 2015 | ||||||||||||||||||||||||||||||||||||||||
| ($ millions) | Less than 1 month | 1-3 months | 3-6 months | 6-9 months | 9-12 months | Sub-Total < 1 Year | 1-2 years | 2-5 years | >5 years | Total | ||||||||||||||||||||||||||||||
Deposits from banks(2) | $ | 4,326 | $ | 1,225 | $ | 197 | $ | 132 | $ | 76 | $ | 5,956 | $ | 188 | $ | 48 | $ | 12 | $ | 6,204 | ||||||||||||||||||||
Bearer deposit notes, commercial paper and certificate of deposits | 9,582 | 25,846 | 31,677 | 16,737 | 11,482 | 95,324 | 6,861 | 996 | 40 | 103,221 | ||||||||||||||||||||||||||||||
Asset-backed commercial paper(3) | 3,478 | 3,028 | 334 | – | – | 6,840 | – | – | – | 6,840 | ||||||||||||||||||||||||||||||
Medium term notes and deposit notes | 2,193 | 364 | 5,740 | 2,394 | 6,967 | 17,658 | 18,833 | 26,007 | 8,042 | 70,540 | ||||||||||||||||||||||||||||||
Asset-backed securities | 2 | – | – | 2 | 1 | 5 | 599 | 1,184 | 482 | 2,270 | ||||||||||||||||||||||||||||||
Covered bonds | – | – | 3,017 | – | – | 3,017 | 7,843 | 7,776 | 2,032 | 20,668 | ||||||||||||||||||||||||||||||
Mortgage securitization(4) | – | 696 | 392 | 1,236 | 795 | 3,119 | 4,233 | 7,228 | 5,408 | 19,988 | ||||||||||||||||||||||||||||||
Subordinated debentures(5) | 55 | 23 | 95 | 6 | 22 | 201 | – | – | 6,643 | 6,844 | ||||||||||||||||||||||||||||||
Total wholesale funding sources | $ | 19,636 | $ | 31,182 | $ | 41,452 | $ | 20,507 | $ | 19,343 | $ | 132,120 | $ | 38,557 | $ | 43,239 | $ | 22,659 | $ | 236,575 | ||||||||||||||||||||
Of Which: | ||||||||||||||||||||||||||||||||||||||||
Unsecured funding | $ | 16,156 | $ | 27,458 | $ | 37,709 | $ | 19,269 | $ | 18,547 | $ | 119,139 | $ | 25,882 | $ | 27,051 | $ | 14,737 | $ | 186,809 | ||||||||||||||||||||
Secured funding | 3,480 | 3,724 | 3,743 | 1,238 | 796 | 12,981 | 12,675 | 16,188 | 7,922 | 49,766 | ||||||||||||||||||||||||||||||
| As at October 31, 2014 | ||||||||||||||||||||||||||||||||||||||||
| ($ millions) | Less than | 1-3 months | 3-6 months | 6-9 months | 9-12 months | Sub-Total < 1 Year | 1-2 years | 2-5 years | >5 years | Total | ||||||||||||||||||||||||||||||
Deposits from banks(2) | $ | 5,417 | $ | 755 | $ | 514 | $ | 104 | $ | 153 | $ | 6,943 | $ | 96 | $ | 117 | $ | – | $ | 7,156 | ||||||||||||||||||||
Bearer deposit notes, commercial paper and certificate of deposits | 9,111 | 24,400 | 33,152 | 15,192 | 3,913 | 85,768 | 8,567 | 1,103 | 121 | 95,559 | ||||||||||||||||||||||||||||||
Asset-backed commercial paper(3) | 3,691 | 2,609 | 32 | – | – | 6,332 | – | – | – | 6,332 | ||||||||||||||||||||||||||||||
Medium term notes and deposit notes | 3,127 | 6,266 | 2,953 | 2,294 | 5,499 | 20,139 | 12,026 | 30,448 | 7,317 | 69,930 | ||||||||||||||||||||||||||||||
Asset-backed securities | – | 1 | 279 | – | 1 | 281 | 507 | 794 | 523 | 2,105 | ||||||||||||||||||||||||||||||
Covered bonds | 2,254 | – | 1,408 | – | 2,817 | 6,479 | 2,254 | 8,205 | 2,158 | 19,096 | ||||||||||||||||||||||||||||||
Mortgage securitization(4) | – | 616 | 779 | 696 | 392 | 2,483 | 3,869 | 8,526 | 5,356 | 20,234 | ||||||||||||||||||||||||||||||
Subordinated debentures(5) | 16 | 16 | 53 | 45 | 29 | 159 | – | – | 5,288 | 5,447 | ||||||||||||||||||||||||||||||
Total wholesale funding sources | $ | 23,616 | $ | 34,663 | $ | 39,170 | $ | 18,331 | $ | 12,804 | $ | 128,584 | $ | 27,319 | $ | 49,193 | $ | 20,763 | $ | 225,859 | ||||||||||||||||||||
Of Which: | ||||||||||||||||||||||||||||||||||||||||
Unsecured funding | $ | 17,671 | $ | 31,437 | $ | 36,672 | $ | 17,635 | $ | 9,594 | $ | 113,009 | $ | 20,689 | $ | 31,668 | $ | 12,726 | $ | 178,092 | ||||||||||||||||||||
Secured funding | 5,945 | 3,226 | 2,498 | 696 | 3,210 | 15,575 | 6,630 | 17,525 | 8,037 | 47,767 | ||||||||||||||||||||||||||||||
| (1) | Wholesale funding sources exclude repo transactions and bankers acceptances, which are disclosed in the contractual maturities table in Note 19 of the Condensed Interim Consolidated Financial Statements. Amounts are based on remaining term to maturity. |
| (2) | Only includes commercial bank deposits raised by Group Treasury. |
| (3) | Wholesale funding sources also exclude asset-backed commercial paper (ABCP) issued by certain ABCP conduits that are not consolidated for financial reporting purposes. |
| (4) | Represents residential mortgages funded through Canadian Federal Government agency sponsored programs. Funding accessed through such programs does not impact the funding capacity of the Bank in its own name. |
| (5) | Although subordinated debentures are a component of regulatory capital, they are included in this table in accordance with EDTF recommended disclosures. |
Wholesale funding generally bears a higher risk of run-off in a stressed environment than other sources of funding. The Bank mitigates this risk through funding diversification, ongoing engagement with investors and by maintaining a large holding of unencumbered liquid assets. Unencumbered liquid assets of $182 billion as at April 30, 2015 (October 31, 2014 – $183 billion) were well in excess of wholesale funding sources which mature in the next 12 months.
Credit ratings
Credit ratings affect the Bank’s access to capital markets and borrowing costs, as well as the terms on which the Bank can conduct derivatives and hedging transactions and obtain related borrowings. The Bank continues to have strong credit ratings. The current ratings are AA by DBRS, Aa2 by Moody’s, AA- by Fitch and A+ by Standard and Poor’s (S&P).
In May 2015, DBRS changed its trend on six Canadian banks to “negative” from “stable.” Before that, Moody’s affirmed the long-term ratings and “negative outlook” of the six largest Canadian banks and two other deposit-taking issuers in April 2015. Moody’s had originally changed the outlook to “negative” from “stable” for these Canadian banks in June 2014. In August 2014, S&P had similarly changed the outlook for several Canadian banks to “negative” from “stable”. These actions are not downgrades, nor do they
24 Scotiabank Second Quarter Report 2015
Table of Contents
MANAGEMENT’S DISCUSSION & ANALYSIS
suggest that downgrades are highly likely to follow. Rather, these changes suggest that, over the following 12-18 months, these rating agencies feel that a downgrade is more likely than an upgrade for the Canadian banks. All three rating agencies cited the uncertainty around the federal government’s proposed new “bail-in” regime for senior unsecured debt as the principal reason for these system-wide changes in outlook in order to reflect the greater likelihood that such debt may incur losses in the unlikely event of a distress scenario.
In June 2014, Moody’s placed the Bank’s standalone rating – which assumes no government support – on “negative outlook”. This was also not a downgrade. This change was done primarily because Moody’s believes that the Bank’s international business is more risky than its Canadian business and is likely to grow more rapidly in the coming years. Moody’s also cited the Bank’s plans to grow its unsecured consumer lending businesses – both in Canada and internationally – as a reason for the change.
The Bank remains confident that it will retain strong credit ratings.
The Bank’s total assets at April 30, 2015 were $837 billion, up $31 billion or 4% from October 31, 2014. Adjusting for the impact of foreign currency translation, total assets were up $15 billion or 2%.
Cash and deposits with financial institutions increased $4 billion or $1 billion after adjusting for the impact of foreign currency translation, due mainly to higher interest bearing deposits with banks. Securities purchased under resale agreements and securities borrowed increased $4 billion or $2 billion after adjusting for the impact of foreign currency translation.
Adjusting for the impact of foreign currency translation, trading assets decreased $2 billion from October 31, 2014 due primarily to a decrease in trading securities of $4 billion from lower holdings of Canadian and U.S. government debt.
Investment securities grew by $1 billion. As at April 30, 2015, the unrealized gain on available-for-sale securities, after the impact of qualifying hedges, was $716 million, a decrease of $131 million from October 31, 2014. The decrease was due mainly to realized gains on sales and an overall decrease in the market value of equities.
Loans increased $12 billion or 3% from October 31, 2014. Adjusting for the impact of foreign currency translation, loans increased $7 billion or 2%. Residential mortgages increased $1 billion, mainly in Latin America as underlying growth in Canadian residential mortgages was largely offset by the planned run-off of Tangerine’s mortgage portfolio. Personal and credit card loans rose $2 billion, due mainly to growth in Canada. Business and government loans were up $4 billion mainly in the U.S. and Canada.
Total liabilities were $786 billion as at April 30, 2015, up $30 billion or 4% from October 31, 2014. Adjusting for the impact of foreign currency translation, total liabilities increased $13 billion or 2%.
Total deposits increased $21 billion or $8 billion after adjusting for the impact of foreign currency translation. Personal deposits grew by $4 billion due primarily to growth in Canada.
After adjusting for the impact of foreign currency translation, obligations related to securities sold under repurchase agreements and securities lent decreased by $2 billion and obligations related to securities sold short decreased by $4 billion. Derivative instrument liabilities increased $7 billion, $5 billion after adjusting for the impact of foreign currency translation, due primarily to the impact of significant changes in interest rate and foreign currency translation on derivative instrument values.
Total shareholders’ equity increased $1,732 million from October 31, 2014. This increase was driven by current year earnings less dividends paid of $1,838 million and a $413 million increase in accumulated other comprehensive income due primarily to unrealized foreign exchange gains on the Bank’s investments in its foreign operations. This was partly offset by the repurchase and cancellation of approximately 7.5 million common shares or $474 million under the normal course issuer bid program.
Scotiabank is committed to maintaining a solid capital base to support the risks associated with its diversified businesses. The Bank’s capital management framework includes a comprehensive internal capital adequacy assessment process (ICAAP), aimed at ensuring that the Bank’s capital is more than adequate to meet current and future risks and achieve its strategic objectives. Key components of the Bank’s ICAAP include sound corporate governance; creating a comprehensive risk appetite for the Bank; managing and monitoring capital, both currently and prospectively; and utilizing appropriate financial metrics which relate risk to capital, including economic and regulatory capital measures. The Bank’s capital management practices are unchanged from those outlined on pages 41 to 50 of the Bank’s 2014 Annual Report.
Implementation of the Basel III framework
Effective November 1, 2012, Canadian banks are subject to the revised capital adequacy requirements as published by the Basel Committee on Banking Supervision (BCBS) and commonly referred to as Basel III. Basel III builds on the “International Convergence of Capital Measurement and Capital Standards: A Revised Framework” (Basel II). Under Basel III, there are three primary risk-based regulatory capital ratios used to assess capital adequacy, CET1, Tier 1 and Total capital ratios, which are determined by dividing those
Scotiabank Second Quarter Report 2015 25
Table of Contents
MANAGEMENT’S DISCUSSION & ANALYSIS
capital components by risk-weighted assets. Basel III also provides guidance on non-viability contingent capital (NVCC). The guidance stipulates that in order to qualify as regulatory capital, non-common share capital instruments must be convertible into common equity upon a trigger event as defined within the guidance. All non-common instruments issued after December 31, 2012, were required to meet these NVCC requirements to qualify as regulatory capital. To enable banks to meet the new standards, the BCBS Basel III rules contain transitional arrangements commencing January 1, 2013, through January 1, 2019. Transitional requirements result in a 5 year phase-in of new deductions and additional components to common equity. Non-qualifying non-common capital instruments will be phased out over 10 years and the capital conservation buffer will be phased in over 4 years. As of January 2019, banks will be required to meet new minimum requirements related to risk-weighted assets of: Common Equity Tier 1 ratio of 4.5% plus a capital conservation buffer of 2.5%, collectively 7%, minimum Tier 1 ratio of 8.5%, and Total capital ratio of 10.5%.
The Office of the Superintendent of Financial Institutions (OSFI) has issued guidelines, reporting requirements and disclosure guidance which are consistent with the Basel III reforms, except for its deferral of the Basel III credit valuation adjustment (CVA) related capital charges, requiring they be phased-in over a five-year period, beginning January 2014. Effective the third quarter of 2014, the CVA scalars for the CET1 capital ratio, Tier 1 capital ratio and Total capital ratio are 0.57, 0.65 and 0.77, respectively. As at April 30, 2015, these scalars are 0.64, 0.71 and 0.77, respectively.
Commencing the first quarter of 2013, OSFI required Canadian deposit-taking institutions to fully implement the 2019 Basel III reforms, without the transitional phase-in provisions for capital deductions (referred to as ‘all-in’) and achieve a minimum 7% Common Equity Tier 1 (CET1) target.
In a March 2013 advisory letter, OSFI designated the 6 largest banks in Canada as domestic systemically important banks(D-SIBs), increasing its minimum capital ratio requirements by 1% for the identified D-SIBs. This 1% surcharge is applicable to all minimum capital ratio requirements for CET1, Tier 1 and Total capital, by no later than January 1, 2016, in line with the requirements for global systemically important banks.
In addition to risk-based capital requirements, the Basel III reforms introduced a simpler, non risk-based Leverage ratio requirement to act as a supplementary measure to its risk-based capital requirements. The Leverage ratio is defined as a ratio of Basel III Tier 1 capital to a leverage exposure measure which includes on-balance sheet assets and off-balance sheet commitments, derivatives and securities financing transactions, as defined within the requirements. The final calibration will be completed by 2017, with a view to migrating to a Pillar 1 (minimum capital requirement) treatment by January 2018.
In October 2014, OSFI released its Leverage Requirements Guideline which outlines the application of the Basel III Leverage ratio in Canada and the replacement of the former Assets-to-Capital Multiple (ACM), effective Q1 2015. Institutions are expected to maintain a material operating buffer above the 3% minimum. Commencing Q1 2015, disclosure in accordance with OSFI’s September 2014 Public Disclosure Requirements related to Basel III Leverage ratio has been made in the Supplementary Regulatory Capital Disclosures.
Capital ratios
The Bank’s various regulatory capital measures consist of the following:
| As at | ||||||||||||
| April 30 2015 | January 31 2015 | October 31 2014 | ||||||||||
| ($ millions) | All-in | All-in | All-in | |||||||||
Common Equity Tier 1 capital | $ | 34,750 | $ | 34,389 | $ | 33,742 | ||||||
Tier 1 capital | 39,077 | 38,717 | 38,073 | |||||||||
Total regulatory capital | 45,863 | 44,354 | 43,592 | |||||||||
CET1 risk-weighted assets(1) | 328,688 | 335,200 | 312,473 | |||||||||
Tier 1 risk-weighted assets(1) | 329,424 | 336,092 | 313,263 | |||||||||
Total risk-weighted assets(1) | 330,055 | 336,857 | 314,449 | |||||||||
Capital ratios: | ||||||||||||
Common Equity Tier 1 capital | 10.6 | % | 10.3 | % | 10.8 | % | ||||||
Tier 1 capital ratio % | 11.9 | % | 11.5 | % | 12.2 | % | ||||||
Total capital ratio % | 13.9 | % | 13.2 | % | 13.9 | % | ||||||
Leverage: | ||||||||||||
Leverage exposures(2) | 947,169 | 953,626 | N/A | |||||||||
Leverage ratio(2) | 4.1 | % | 4.1 | % | N/A | |||||||
Assets-to-capital multiple(2) | N/A | N/A | 17.1 x | |||||||||
| (1) | CVA risk-weighted assets were calculated using scalars of 0.64, 0.71 and 0.77 to compute CET1, Tier1 and Total capital ratios, respectively in 2015 (October 31, 2014 – scalars of 0.57, 0.65 and 0.77). |
| (2) | Effective November 1, 2014, the leverage ratio replaced the assets-to-capital multiple. |
26 Scotiabank Second Quarter Report 2015
Table of Contents
MANAGEMENT’S DISCUSSION & ANALYSIS
The Bank’s Common Equity Tier 1 ratio increased by approximately 30 basis points this quarter primarily due to internal capital generation (24 basis points) and a decrease in liabilities relating to employee benefits (12 basis points) from a partial recovery in long term interest rates.
The Bank continues to maintain a strong capital position. As at April 30, 2015, the CET1, Tier 1, Total capital and Leverage ratios are well above Basel III all-in minimum requirements.
Changes in regulatory capital
The Bank’s Common Equity Tier 1 capital was $34.8 billion, as at April 30, 2015 (January 31, 2015 – $34.4 billion; October 31, 2014 – $33.7 billion), an increase of approximately $0.4 billion during the quarter, mainly due to:
| • | internal capital generation of $0.9 billion; |
| • | reduced threshold-related deductions of $0.4 billion; and |
| • | lower goodwill of $0.2 billion due to foreign currency translation. |
Partly offset by:
| • | decreases in accumulated other comprehensive income of $1.1 billion, primarily from foreign currency translation losses of $1.5 billion, partly offset by gains of $0.3 billion from decreased liabilities relating to employee benefits and other of $0.1 billion. |
In addition, the above changes impacted Tier 1 and Total capital. Total capital also increased due to the issuance of $1.25 billion of NVCC subordinated debentures.
Risk-weighted assets (RWA)
CET1 RWA decreased by $6.5 billion or 1.9% during the quarter to $328.7 billion, primarily due to:
| • | the impact of $8.9 billion from a stronger Canadian dollar on foreign currency denominated assets; and, |
| • | lower counterparty credit risk on derivatives and credit valuation adjustment RWA of $2.2 billion. |
Partly offset by:
| • | growth in personal and business lending of $3.9 billion; and, |
| • | increased operational risk RWA of $0.5 billion. |
Normal Course Issuer Bid
On May 27, 2014, the Bank announced that OSFI and the Toronto Stock Exchange (TSX) approved its normal course issuer bid pursuant to which it may repurchase for cancellation up to 12 million of the Bank’s common shares. The bid ends on May 29, 2015. On March 3, 2015, the Bank announced that OSFI and the TSX approved an increase in the bid up to 16 million shares. During the six months ended April 30, 2015, the Bank repurchased and cancelled approximately 7.5 million common shares under this bid at an average price of $63.18 per share for a total amount of approximately $474 million. Under this bid, the Bank has repurchased and cancelled approximately 12 million common shares at an average price of $66.12.
On May 29, 2015, the Bank announced that OSFI and the TSX approved its normal course issuer bid pursuant to which it may repurchase for cancellation up to 24 million of the Bank’s common shares, which represents approximately 2% of the Bank’s common shares issued and outstanding as of May 25, 2015. Purchases under the new bid may commence on June 2, 2015, and will end on the earlier of June 1, 2016, or the date on which the Bank completes its purchases. On a quarterly basis, the Bank will consult with OSFI prior to making purchases.
The Board of Directors, at its meeting on May 28, 2015, approved a dividend of 68 cents per share. This quarterly dividend is payable to shareholders of record as of July 7, 2015 on July 29, 2015.
Given the nature of the Bank’s main business activities, financial instruments make up a substantial portion of the balance sheet and are integral to the Bank’s business. There are various measures that reflect the level of risk associated with the Bank’s portfolio of financial instruments. Further discussion of some of these risk measures is included in the Risk Management section on page 8. The methods of determining the fair value of financial instruments are detailed on page 52 of the Bank’s 2014 Annual Report.
Scotiabank Second Quarter Report 2015 27
Table of Contents
MANAGEMENT’S DISCUSSION & ANALYSIS
Management’s judgment on valuation inputs is necessary when observable market data is not available, and in the selection of appropriate valuation models. Uncertainty in these estimates and judgments can affect fair value and financial results recorded. During the quarter, changes in the fair value of financial instruments generally arose from normal economic, industry and market conditions.
Many financial instruments are traded products such as derivatives, and are generally transacted under industry standard International Swaps and Derivatives Association (ISDA) master netting agreements with counterparties, which allow for a single net settlement of all transactions covered by that agreement in the event of a default or early termination of the transactions. ISDA agreements are frequently accompanied by an ISDA Credit Support Annex (CSA), the terms of which may vary according to each party’s view of the other party’s creditworthiness. CSAs can require one party to post initial margin at the onset of each transaction. CSAs also allow for variation margin to be called if total uncollateralized mark-to-market exposure exceeds an agreed upon threshold. Such variation margin provisions can be one-way (only one party will ever post collateral) or bi-lateral (either party may post depending upon which party is in-the-money). The CSA will also detail the types of collateral that are acceptable to each party, and the haircuts that will be applied against each collateral type. The terms of the ISDA master netting agreements and CSAs are taken into consideration in the calculation of counterparty credit risk exposure (see also page 74 of the Bank’s 2014 Annual Report).
Total derivative notional amounts were $5,674 billion as at April 30, 2015, compared to $5,772 billion as at January 31, 2015 and $4,970 billion as at October 31, 2014. The quarterly change was due largely to an increase in the volume of interest rate and foreign exchange contracts, fully offset by a decrease due to the impact of foreign currency translation. The total notional amount of over-the-counter derivatives was $5,076 billion (January 31, 2015 – $5,088 billion; October 31, 2014 – $4,597 billion), of which $3,511 billion are settled through central counterparties as at April 30, 2015 (January 31, 2015 – $3,359 billion; October 31, 2014 – $3,012 billion). The credit equivalent amount, after taking master netting arrangements into account, was $47.9 billion, compared to $52.8 billion at January 31, 2015. The change from January 31, 2015 was due largely to lower market value of derivative contracts and the impact of foreign currency translation.
A complete discussion of selected credit instruments which markets regarded as higher risk during the financial crisis was provided on page 52 of the Bank’s 2014 Annual Report. This disclosure provides a detailed discussion on the nature and extent of the Bank’s exposures which have substantially remained unchanged from year end.
Collateralized debt obligations and collateralized loan obligations
Non-trading portfolio
As at April 30, 2015, the carrying value of cash-based CLOs reported as loans on the Consolidated Statement of Financial Position was $77 million (January 31, 2015 – $90 million; October 31, 2014 – $87 million). The fair value was $74 million (January 31, 2015 – $86 million; October 31, 2014 – $84 million). The decrease was due to paydowns and the impact of foreign exchange rate changes in the quarter. None of these cash-based CLOs are classified as impaired loans. The overall risk profile of cash-based CLOs held has not changed significantly since October 31, 2014.
Trading portfolio
The Bank holds synthetic CDOs in its trading portfolio as a result of legacy transactions with clients and other financial institutions. These trading exposures have been hedged and are subject to risk limits and ongoing monitoring by the Bank’s independent risk management department.
The risk profile of the Bank’s CDOs outstanding has not changed significantly from October 31, 2014.
Other
As at April 30, 2015, the Bank has insignificant exposure to highly leveraged loans awaiting syndication, auction-rate securities,Alt-A type loans, monoline insurers and investments in structured investment vehicles.
Off-balance sheet arrangements
In the normal course of business, the Bank enters into contractual arrangements that are not required to be consolidated in its financial statements, but could have a current or future impact on the Bank’s financial performance or financial condition. These arrangements can be classified into the following categories: structured entities and guarantees and other commitments.
28 Scotiabank Second Quarter Report 2015
Table of Contents
MANAGEMENT’S DISCUSSION & ANALYSIS
No material contractual obligations were entered into this quarter by the Bank with the structured entities that are not in the ordinary course of business. Processes for review and approval of these contractual arrangements are unchanged from last year.
For a complete discussion of these types of arrangements, please refer to pages 50 to 51 of the Bank’s 2014 Annual Report.
Structured entities
The Bank sponsors two Canadian multi-seller conduits that are not consolidated. These multi-seller conduits purchase high-quality financial assets and finance these assets through the issuance of highly rated commercial paper.
Although the Bank has power over the relevant activities of the conduits, it has limited exposure to variability in returns, which results in the Bank not consolidating the two Canadian conduits.
A significant portion of the conduits’ assets have been structured to receive credit enhancements from the sellers, including overcollateralization protection and cash reserve accounts. Each asset purchased by the conduits is supported by a backstop liquidity facility provided by the Bank in the form of a liquidity asset purchase agreement (LAPA). The primary purpose of the backstop liquidity facility is to provide an alternative source of financing in the event the conduits are unable to access the commercial paper market. Under the terms of the LAPA, the Bank is not obliged to purchase defaulted assets.
The Bank’s primary exposure to the Canadian-based conduits is the liquidity support provided, with total liquidity facilities of $3.9 billion as at April 30, 2015 (October 31, 2014 – $4.1 billion). As at April 30, 2015, total commercial paper outstanding for these conduits was $2.7 billion (October 31, 2014 – $2.7 billion). Funded assets purchased and held by these conduits as at April 30, 2015, as reflected at original cost, were $2.7 billion (October 31, 2014 – $2.7 billion). The fair value of these assets approximates original cost. There has been no significant change in the composition or risk profile of these conduits since October 31, 2014.
Other off-balance sheet arrangements
Guarantees and other indirect commitments increased 11% from October 31, 2014, due to the impact of foreign exchange rate changes on undrawn loan commitments and increased commitments in relation to securities lending activities. Fees from guarantees and loan commitment arrangements recorded in non-interest income – banking were $119 million for the three months ended April 30, 2015, compared to $111 million in the previous quarter.
The Bank continues to respond to global regulatory developments, such as capital and liquidity requirements under the Basel Committee on Banking Supervision global standards (Basel III), over-the-counter derivatives reform, consumer protection measures and specific financial reforms, such as theDodd-Frank Wall Street Reform and Consumer Protection Act. The Bank monitors these and other developments and is working to ensure business impacts, if any, are minimized.
On December 10, 2013, the Federal Reserve approved a final rule implementing Section 619 of Dodd Frank, commonly known as the Volcker Rule. The Volcker Rule impacts our global activities as its reach extends to the Bank and each of its subsidiaries and affiliates (subject to certain exceptions and exclusions). The Volcker Rule imposes prohibitions and restrictions on banking entities and their affiliates in connection with proprietary trading and investing in or sponsoring of hedge funds or private equity funds. In the final rule, the Federal Reserve extended the conformance period to July 2015. The Bank has developed an enterprise-wide plan to be in compliance by July 21, 2015 with the requirements of the Volcker Rule applicable to the Bank as of that date.
On February 18, 2014 the Board of Governors of the Federal Reserve System (“Federal Reserve”) in the U.S. approved the final rule to implement the enhanced prudential standards and early remediation requirements of sections 165 and 166 of the Dodd-Frank Act (the FBO Rule) for bank holding companies and foreign banking organizations. With respect to foreign banking organizations, the overall intent of the final rule is to strengthen the regulation of the U.S. operations of foreign banking organizations by requiring home country capital certification consistent with the Basel capital framework, home country capital stress tests comparable to U.S. standards, maintenance of a liquidity buffer for U.S. branches and agencies and establishment of a U.S. risk committee with the appointment of a U.S. Chief Risk Officer. The Bank has appointed a Chief Risk Officer for the U.S. and will work to help ensure compliance with the final rule by the effective date of July 2016. The Bank is not currently required to form a U.S. intermediate holding company under the final rule.
In August 2014, the Federal Government proposed a “bail-in” regime (called the Taxpayer Protection and Bank Recapitalization Regime) for the six largest Canadian banks designated as domestic systematically important banks (D-SIBs). The proposed regime is aimed at ensuring that financial stability is preserved and taxpayers and depositors are protected from having to bail out a D-SIB in the highly unlikely event of the institution’s failure, and would grant the Federal Government the power to permanently cancel an institution’s existing common shares and/or convert an institution’s long term senior unsecured debt into common shares. Either power would only be exercisable once the institution was no longer viable and full conversion of the institution’s non-viability
Scotiabank Second Quarter Report 2015 29
Table of Contents
MANAGEMENT’S DISCUSSION & ANALYSIS
contingent capital (NVCC) instruments into common shares had already occurred. Deposits (including those insured by the CDIC), shorter term unsecured wholesale debt, and derivatives would not be subject to conversion or cancellation. On April 21, 2015, the Federal Government confirmed its intention to implement a “bail-in” regime for D-SIBs. The Government intends to introduce legislative amendments to enhance the resolution toolkit for D-SIBs, including implementation of the framework for the Taxpayer Protection and Bank Recapitalization regime, with associated regulations and guidelines to follow. The Bank will continue to monitor developments and will have a period of time to transition to the new regime.
The Foreign Account Tax Compliance Act (FATCA) is U.S. legislation designed to prevent U.S. taxpayers from using accounts held outside of the U.S. to evade taxes. FATCA, and in some countries, related local regulations, will require financial institutions to report annually on specified accounts held outside of the U.S. by U.S. taxpayers. This reporting will be made available to the U.S. Internal Revenue Service either directly or through local regulatory agencies. In October 2014, over 100 OECD member countries committed to standardize the automatic exchange of information relating to accounts held by tax residents of signatory countries (known as Global FATCA). A Common Reporting Standard (CRS) was agreed to and implementation is scheduled to commence January 2016. 38 countries where Scotiabank has a presence have signed on to the CRS. 17 countries where Scotiabank operates have signed on to be early adopters. Under the guidance of an enterprise program office, dedicated project teams in each of the business lines are working to meet all FATCA-related obligations worldwide while minimizing negative impact on the client experience.
The 2015 Canadian Federal Budget proposed tax rules for synthetic equity arrangements which if enacted, would impact the tax deductibility of Canadian dividends paid or payable after October 31, 2015, in certain circumstances. The Bank is currently assessing the impact of this proposal.
Accounting Policies and Controls
Accounting policies and estimates
The condensed interim consolidated financial statements have been prepared in accordance with IAS 34,Interim Financial Reporting, using International Financial Reporting Standards (IFRS) as issued by the International Accounting Standards Board (IASB). Except for the changes in accounting policies described below, the significant accounting policies used in the preparation of the condensed interim consolidated financial statements are consistent with those used in the Bank’s audited consolidated financial statements for the year ended October 31, 2014. Note 3 of the Bank’s consolidated financial statements in the 2014 Annual Report describes the Bank’s significant accounting policies.
Changes in accounting policies
The Bank has adopted the following new accounting standards issued by the IASB effective November 1, 2014.
Own credit risk of liabilities designated at fair value through profit or loss (IFRS - 9)
The own credit risk provisions of IFRS 9,Financial Instruments, changes the accounting for liabilities designated at fair value through profit or loss such that changes in fair value arising from changes in the Bank’s own credit risk are recognized in other comprehensive income unless doing so creates or increases an accounting mismatch. Cumulative fair value changes related to own credit risk recognized in other comprehensive income cannot be subsequently reclassified to net income. This replaces the previous requirement in IAS 39,Financial Instruments: Recognition and Measurement, to recognize such changes in net income.
In July 2014, the IASB issued the final IFRS 9 standard which permitted entities to early adopt this requirement prior to the IFRS 9 mandatory effective date of January 1, 2018. The Bank early adopted this requirement as it relates to deposit note liabilities designated at fair value, effective November 1, 2014. This change was applied retrospectively. However, in accordance with the IFRS 9 transition provisions, prior period comparatives have not been restated. The impact of this change on opening retained earnings was an increase of $5 million and on accumulated other comprehensive income was a decrease of $5 million.
Levies
IFRIC 21,Levies, provides guidance on when to recognize a liability to pay a levy imposed by government that is accounted for in accordance with IAS 37,Provisions, Contingent Liabilities and Contingent Assets,and also for a liability to pay a levy whose timing and amount is certain. The interpretation clarifies that an obligating event, as identified by the legislation would trigger the recognition of a liability to pay a levy. While the interpretation discusses the timing of the recognition, it does not change the measurement of the amount to be recognized. The adoption of IFRIC 21 did not have a significant impact on the Bank.
30 Scotiabank Second Quarter Report 2015
Table of Contents
MANAGEMENT’S DISCUSSION & ANALYSIS
Presentation
The amendments to IAS 32,Financial Instruments: Presentation, clarifies the requirements relating to offsetting financial assets and financial liabilities. The adoption of these amendments did not have a significant impact on the Bank.
Future accounting developments
The Bank actively monitors developments and changes in accounting standards from the IASB as well as regulatory requirements from the Canadian Securities Administrators and OSFI.
The Bank is currently assessing the impact the adoption of new and revised standards issued by the IASB will have on its consolidated financial statements.
The IASB issued IFRS 9,Financial Instruments, which will replace IAS 39,Financial Instruments: Recognition and Measurement, effective for annual periods beginning on or after January 1, 2018. On January 9, 2015, OSFI issued an advisory on the early adoption of IFRS 9 for Domestic Systematically Important Banks (D-SIBs) for annual reporting periods beginning on November 1, 2017. The Bank has been identified as a D-SIB and is required to adopt IFRS 9 effective November 1, 2017.
There are no other significant updates to the future accounting developments effective after November 1, 2014, as reflected in Note 5 of the Bank’s consolidated financial statements in the 2014 Annual Report.
Changes in internal control over financial reporting
There have been no changes in the Bank’s internal control over financial reporting during the six months ended April 30, 2015, that have materially affected, or are reasonably likely to materially affect, the Bank’s internal control over financial reporting. Commencing first quarter 2015, the Bank used the Internal Control – Integrated Framework 2013 issued by the Committee of Sponsoring Organizations of the Treadway Commission to evaluate the effectiveness of internal control over financial reporting.
There were no changes to the Bank’s procedures and policies for related party transactions from those outlined on pages 97 and 186 of the Bank’s 2014 Annual Report. All transactions with related parties continued to be at market terms and conditions.
The global economy continues to post moderate growth. While the U.S. and U.K. are pacing activity among the advanced economies, stronger performances have been slow to develop. The euro zone is showing signs of reviving on the back of aggressive central bank easing and low oil prices, though the output gain remains quite modest, as is growth in Japan. The economic performance in Canada, Mexico and Australia has been restrained by the reduced investment attributable to the low price of crude oil and other commodities, though most non-energy sectors retain some positive momentum.
At the same time, output growth in many of the larger emerging market economies is slowing alongside the continuing deceleration in China, and lingering recession in Brazil. Outside of India which is recording the strongest growth around the world, most developing nations, including those in Latin America and Asia-Pacific, are posting moderate economic gains despite the lacklustre performance of international trade.
Nevertheless, global growth is expected to regain some traction, with most nations benefiting from the support provided by low borrowing costs and gasoline prices, currency revaluations which should help underpin export competitiveness, and in some countries, increased infrastructure-related spending. While the U.S. is widely expected to begin the cautious process of normalizing interest rates in the second-half of 2015, monetary officials will likely maintain very accommodative policies in most countries and, in the case of some underperforming nations such as China, potentially ease further.
Scotiabank Second Quarter Report 2015 31
Table of Contents
MANAGEMENT’S DISCUSSION & ANALYSIS
Changes to operating segments effective November 1, 2014
Effective November 1, 2014, the Canadian and International businesses previously reported in Global Wealth & Insurance are included in Canadian Banking’s and International Banking’s results, respectively. As well, certain Asia business activity previously reported in International Banking is now included in Global Banking & Markets. Prior period comparative results have been restated.
The 2015 business results are presented below:
| Canadian Banking | For the three months ended | For the six months ended | ||||||||||||||||||
(Unaudited) ($ millions) (Taxable equivalent basis)(1) | | April 30 2015 | |
| January 31 2015 |
| | April 30 2014 | | | April 30 2015 | | | April 30 2014 | | |||||
Business segment income | ||||||||||||||||||||
Net interest income | $ | 1,574 | $ | 1,551 | $ | 1,454 | $ | 3,125 | $ | 2,934 | ||||||||||
Non-interest income(2) | 1,210 | 1,181 | 1,183 | 2,391 | 2,347 | |||||||||||||||
Total revenue | 2,784 | 2,732 | 2,637 | 5,516 | 5,281 | |||||||||||||||
Provision for credit losses | 169 | 165 | 140 | 334 | 275 | |||||||||||||||
Non-interest expenses | 1,487 | 1,464 | 1,400 | 2,951 | 2,806 | |||||||||||||||
Income tax expense | 299 | 288 | 273 | 587 | 547 | |||||||||||||||
Net income | $ | 829 | $ | 815 | $ | 824 | $ | 1,644 | $ | 1,653 | ||||||||||
Net income attributable to non-controlling interests in subsidiaries | $ | – | $ | – | $ | 1 | $ | – | $ | 1 | ||||||||||
Net income attributable to equity holders of the Bank | $ | 829 | $ | 815 | $ | 823 | $ | 1,644 | $ | 1,652 | ||||||||||
Other measures | ||||||||||||||||||||
Return on economic equity(1) | 30.7 | % | 29.0 | % | 25.5 | % | 29.8 | % | 25.2 | % | ||||||||||
Assets under administration($ billions) | $ | 312 | $ | 305 | $ | 286 | $ | 312 | $ | 286 | ||||||||||
Assets under management($ billions) | $ | 134 | $ | 130 | $ | 118 | $ | 134 | $ | 118 | ||||||||||
Average assets($ billions) | $ | 298 | $ | 297 | $ | 290 | $ | 297 | $ | 290 | ||||||||||
Average liabilities($ billions) | $ | 216 | $ | 213 | $ | 206 | $ | 215 | $ | 206 | ||||||||||
| (1) | Refer to page 4 for a discussion of non-GAAP measures. |
| (2) | Includes net income from investments in associated corporations for the three months ended April 30, 2015 $19 (January 31, 2015 – $15 and April 30, 2014 – $68) and for the six months ended April 30, 2015 $34 (April 30, 2014 – $130). |
Net income
Q2 2015 vs Q2 2014
Canadian Banking reported net income attributable to equity holders of $829 million, an increase of $6 million or 1% compared to the same quarter last year. Adjusting for the prior contribution from CI Financial Corp. (CI) and a change in this year’s effective tax rate, net income attributable to equity holders increased $70 million or 9% compared to the same period last year. Good growth in assets and deposits, an increase in the net interest margin and higher non-interest income were partially offset by increased provision for credit losses and non-interest expenses.
Q2 2015 vs Q1 2015
Net income attributable to equity holders increased $14 million or 2% from last quarter, mainly due to an increase in the net interest margin and growth in non-interest income, partly offset by higher non-interest expenses.
Year-to-date Q2 2015 vs Year-to-date Q2 2014
Canadian Banking reported net income attributable to equity holders of $1,644 million, a decrease of $8 million from the same period last year. Adjusting for the prior contribution from CI and a change in this year’s effective tax rate, net income attributable to equity holders increased $116 million or 8% from the same period last year driven by growth in assets and deposits, an increase in the net interest margin and an increase in non-interest income. Partly offsetting were higher non-interest expenses and provision for credit losses.
Average assets
Q2 2015 vs Q2 2014
Average assets grew $8 billion or 2% from the same quarter last year. Adjusting for the impact of the Tangerine broker originated and white label mortgage run off portfolios, assets increased $12 billion or 5%. The growth included $5 billion or 3% in residential
32 Scotiabank Second Quarter Report 2015
Table of Contents
MANAGEMENT’S DISCUSSION & ANALYSIS
mortgages, $6 billion or 10% in personal loans primarily in consumer auto lending and credit cards, as well as $4 billion or 13% in business loans and acceptances. This was partially offset by a decline in securities of $2 billion, mostly related to the sale of the investment in CI.
Q2 2015 vs Q1 2015
Average assets rose $1 billion from last quarter. Adjusting for the impact of the Tangerine broker originated and white label mortgage run off portfolios, assets increased $2 billion or 1%, mainly reflecting growth in business loans and acceptances.
Year-to-date Q2 2015 vs Year-to-date Q2 2014
Average assets grew $7 billion or 3% from the same period last year. Adjusting for the impact of the Tangerine broker originated and white label mortgage run off portfolios, assets increased $13 billion or 5%. The growth reflected $6 billion or 11% in personal loans primarily in consumer auto lending and credit cards, $5 billion or 3% in residential mortgages, and $ 4 billion or 12% in business loans and acceptances. This was partially offset by a decline in securities of $2 billion, mostly related to the sale of the investment in CI.
Average liabilities
Q2 2015 vs Q2 2014
Average liabilities increased $10 billion or 5% from the same quarter last year, including strong growth of $1 billion or 9% in retail banking chequing accounts and $4 billion or 6% in savings deposits. Canadian Banking also recorded growth of $5 billion or 10% in small business and commercial banking business operating accounts. This was partially offset by a decline in lower margin GICs of $1 billion or 1%.
Q2 2015 vs Q1 2015
Average liabilities increased $3 billion or 1% from last quarter primarily due to growth in chequing and savings deposits.
Year-to-date Q2 2015 vs Year-to-date Q2 2014
Average liabilities increased $9 billion or 4% from the same period last year, reflecting strong growth in retail banking chequing accounts of $1 billion or 8% and in savings deposits of $3 billion or 5%. There was also growth of $4 billion or 9% in small business and commercial banking business operating accounts. This was partially offset by a decline in GICs of $1 billion or 1%.
Assets under management (AUM) and assets under administration (AUA)
AUM of $134 billion increased $16 billion or 13% from same quarter last year and grew $4 billion or 3% from the previous quarter, driven by strong net sales and market appreciation. AUA of $312 billion increased $26 billion or 9% from the same quarter last year and increased $7 billion or 2% from the previous quarter.
Net interest income
Q2 2015 vs Q2 2014
Net interest income of $1,574 million was up $120 million or 8% from the same period last year. This was driven by a 12 basis point increase in the margin to 2.26% and asset growth. The margin increase was primarily driven by higher spreads in personal lending, including mortgages, as well as growth in higher margin credit card and auto loans.
Q2 2015 vs Q1 2015
Net interest income increased $23 million or 2% from the previous quarter, notwithstanding a shorter quarter. This was due to a 10 basis point increase in the margin driven by higher asset spreads across all segments and deposit growth.
Year-to-date Q2 2015 vs Year-to-date Q2 2014
Net interest income of $3,125 million was up $191 million or 7% from the same period last year. This was driven by solid asset growth and an 8 basis point improvement in the interest margin to 2.21%.
Scotiabank Second Quarter Report 2015 33
Table of Contents
MANAGEMENT’S DISCUSSION & ANALYSIS
Non-interest income
Q2 2015 vs Q2 2014
Non-interest income increased $27 million or 2% from the same quarter last year. Adjusting for the prior contribution from CI, non-interest income increased $96 million or 9%, primarily due to growth in mutual fund and brokerage revenues driven by higher net sales and market appreciation, and an increase in card revenues.
Q2 2015 vs Q1 2015
Non-interest income grew $29 million or 2% from the previous quarter primarily driven by higher wealth management revenues.
Year-to-date Q2 2015 vs Year-to-date Q2 2014
Non-interest income of $2,391 million was up $44 million or 2% from the same period last year. Adjusting for the prior contribution from CI, non-interest income increased $176 million or 8% primarily driven by growth in mutual fund and brokerage revenues, and an increase in card revenues.
Provision for credit losses
Q2 2015 vs Q2 2014
The provision for credit losses was $169 million this quarter, up from $140 million in the same quarter last year, due to higher provisions in retail portfolios driven by growth in relatively higher spread products. The provision for credit losses ratio was 0.24%, up 4 basis points from 0.20% in the same period last year.
Q2 2015 vs Q1 2015
The provision for credit losses was up $4 million from the previous quarter due to slight increases of provisions in retail and commercial portfolios. The provision for credit losses ratio increased by 1 basis point.
Year-to-date Q2 2015 vs Year-to-date Q2 2014
The provision for credit losses was $334 million, up $59 million from the same period last year, with higher provisions in retail portfolios driven by growth in relatively higher spread products, slightly offset by lower provisions in commercial portfolios. The provision for credit losses ratio was 0.23%, up 3 basis points compared to the same period last year.
Non-interest expenses
Q2 2015 vs Q2 2014
Non-interest expenses were up $87 million or 6% from the same quarter last year, primarily due to increased investment to support business growth and higher wealth management volume-related expenses, partially offset by a decrease in advertising expenses as last year included costs for Tangerine brand transition.
Q2 2015 vs Q1 2015
Non-interest expenses were up $23 million or 2% quarter over quarter, primarily related to investment to support business growth.
Year-to-date Q2 2015 vs Year-to-date Q2 2014
Non-interest expenses were up $145 million or 5% from the same period last year, primarily reflecting salary increases, volume and revenue driven expenses, and higher technology spending.
Taxes
The effective tax rate increased to 26.5% compared to 24.9% in the same quarter last year. On a year-to-date basis, the effective tax rate increased to 26.3% compared to 24.9% in the same period last year. The increases were primarily due to changes in the Canadian tax legislation. The effective tax rate increased slightly to 26.5% from 26.1% in the previous quarter.
34 Scotiabank Second Quarter Report 2015
Table of Contents
MANAGEMENT’S DISCUSSION & ANALYSIS
| International Banking | For the three months ended | For the six months ended | ||||||||||||||||||
(Unaudited) ($ millions) (Taxable equivalent basis)(1) | | April 30 2015 | | | January 31 2015 | | | April 30 2014 | | | April 30 2015 | | | April 30 2014 | | |||||
Business segment income | ||||||||||||||||||||
Net interest income | $ | 1,380 | $ | 1,349 | $ | 1,289 | $ | 2,729 | $ | 2,545 | ||||||||||
Non-interest income(2) | 751 | 726 | 739 | 1,477 | 1,468 | |||||||||||||||
Total revenue | 2,131 | 2,075 | 2,028 | 4,206 | 4,013 | |||||||||||||||
Provision for credit losses | 266 | 285 | 229 | 551 | 446 | |||||||||||||||
Non-interest expenses | 1,224 | 1,204 | 1,117 | 2,428 | 2,286 | |||||||||||||||
Income tax expense | 154 | 122 | 174 | 276 | 294 | |||||||||||||||
Net income | $ | 487 | $ | 464 | $ | 508 | $ | 951 | $ | 987 | ||||||||||
Net income attributable to non-controlling interests in subsidiaries | $ | 40 | $ | 47 | $ | 57 | $ | 87 | $ | 111 | ||||||||||
Net income attributable to equity holders of the Bank | $ | 447 | $ | 417 | $ | 451 | $ | 864 | $ | 876 | ||||||||||
Other measures | ||||||||||||||||||||
Return on economic equity(1) | 12.7 | % | 12.0 | % | 14.6 | % | 12.4 | % | 14.1 | % | ||||||||||
Average assets($ billions) | $ | 128 | $ | 120 | $ | 117 | $ | 124 | $ | 115 | ||||||||||
Average liabilities($ billions) | $ | 94 | $ | 89 | $ | 86 | $ | 91 | $ | 85 | ||||||||||
| (1) | Refer to page 4 for a discussion of non-GAAP measures. |
| (2) | Includes net income from investments in associated corporation for the three months ended April 30, 2015 $112 (January 31, 2015 – $108 and April 30, 2014 – $99) and for the six months ended April 30, 2015 $220 (April 30, 2014 – $216) |
Net income
Q2 2015 vs Q2 2014
Net income attributable to equity holders was $447 million, a decrease of $4 million or 1% from the same period last year.
The quarter’s results reflected strong loan growth across most geographies partly offset by margin compression, particularly in our Latin American markets compared to a year ago. The positive impact of foreign currency translation largely offset higher business taxes, reduced benefit from the credit mark in Banco Colpatria, and a lower contribution from Banco del Caribe in Venezuela.
Q2 2015 vs Q1 2015
Quarter over quarter, net income attributable to equity holders increased $30 million or 7% due to strong loan growth, and lower provision for credit losses and expenses. The positive impact of foreign currency translation was partly offset by the impact of a shorter quarter and lower tax benefits.
Year-to-date Q2 2015 vs Year-to-date Q2 2014
Net income attributable to equity holders decreased by $12 million or 1% to $864 million. Results reflected strong loan growth, particularly in Latin America, and the positive impact of foreign currency translation; offsetting were lower net interest margins in our Latin American markets, reduced benefit from the credit mark in Banco Colpatria, and higher business taxes.
Average assets
Q2 2015 vs Q2 2014
Average assets rose $11 billion or 10% to $128 billion from the same quarter last year. This was due primarily to strong retail and commercial loan growth of 12% and 13%, respectively, or 8% and 5% adjusting for positive foreign exchange translation. Growth in retail loans was driven by a 12% increase in Latin America. Commercial loan growth was driven by a 10% increase in Latin America offset by a 5% reduction in Caribbean and Central America.
Q2 2015 vs Q1 2015
Average assets rose $8 billion or 7% from last quarter with strong retail and commercial loan growth of 6% and 8%, respectively, or 2% and 3% adjusting for positive foreign currency translation, driven by 4% growth in both retail and commercial loans in Latin America.
Year-to-date Q2 2015 vs Year-to-date Q2 2014
Average assets were $124 billion, up $10 billion or 9% compared to the same period last year. This was due to strong retail and commercial loan growth of 12% and 11% respectively, or 9% and 5% adjusting for foreign currency translation. Growth in retail was driven primarily by a 13% increase in Latin America, while underlying commercial loan growth of 10% in Latin America was offset by contraction of 7% in the Caribbean.
Scotiabank Second Quarter Report 2015 35
Table of Contents
MANAGEMENT’S DISCUSSION & ANALYSIS
Average liabilities
Q2 2015 vs Q2 2014
Average liabilities increased $7 billion or 8% to $94 billion from the same period last year largely due to 11% growth in deposits, or 6% adjusting for positive foreign currency translation. Growth was primarily in retail and commercial deposits in Latin America. Core retail deposits in Latin America rose 11%, or 7% adjusting for the impact of foreign currency translation.
Q2 2015 vs Q1 2015
Average liabilities rose $5 billion or 5% from last quarter primarily driven by 8% growth in deposits, or 3% excluding foreign currency translation, primarily in Latin America.
Year-to-date Q2 2015 vs Year-to-date Q2 2014
Average liabilities rose $7 billion or 8% to $91 billion from the same period last year largely due to 9% growth in deposits, or 5% adjusting for positive foreign currency translation. Growth was primarily in retail and commercial deposits in Latin America.
Net interest income
Q2 2015 vs Q2 2014
Net interest income of $1,380 million was up $91 million or 7% from the same period last year. Growth primarily reflected strong asset growth in Latin America, and positive foreign currency translation. Partly offsetting was a lower margin due to Central Bank rate cuts in Latin America.
Q2 2015 vs Q1 2015
Compared to last quarter, net interest income increased $31 million or 2% due to good asset growth in Latin America and positive foreign currency translation. This was partly offset by the impact of less days in the quarter.
Year-to-date Q2 2015 vs Year-to-date Q2 2014
Net interest income of $2,729 million increased $184 million or 7% driven by the strong loan and deposit growth in Latin America, and the positive impact of foreign currency translation, partly offset by a slight decline in the net interest margin.
Non-interest income
Q2 2015 vs Q2 2014
Non-interest income of $751 million increased $12 million or 2% from the same quarter last year. Solid growth in fee income, particularly in Colombia and Caribbean, and the positive impact of foreign currency translation, were partly offset by lower securities gains and trading revenues, and a lower contribution from Banco del Caribe in Venezuela.
Q2 2015 vs Q1 2015
Non-interest income increased $25 million or 3% due largely to the positive impact of foreign currency translation and last quarter’s negative changes in the fair value of financial instruments used for foreign currency hedging.
Year-to-date Q2 2015 vs Year-to-date Q2 2014
Non-interest income increased $9 million or 1% to $1,477 million with higher fees and commissions, partly offset by the negative valuation of financial instruments used for foreign currency hedging purposes and lower trading revenues. Net income from investments in associated corporations at $220 million was up $4 million as higher contributions from Thanachart Bank in Thailand and Bank of Xi’an in China were mostly offset by a lower contribution from Banco del Caribe in Venezuela.
Provision for credit losses
Q2 2015 vs Q2 2014
The provision for credit losses was $266 million, compared to $229 million in the same period last year due to higher retail provisions, partly offset by lower commercial provisions. Higher retail provisions in Colombia and the Caribbean were in part offset
36 Scotiabank Second Quarter Report 2015
Table of Contents
MANAGEMENT’S DISCUSSION & ANALYSIS
by lower provisions in Peru. Adjusting for the reduced benefit of the credit mark in Banco Colpatria, the growth in retail provisions was in line with retail asset growth. Commercial provisions declined with improvements across most geographies. The provision for credit losses ratio was 1.19%, up 3 basis points from 1.16% in the same period last year, or down 8 basis points to 1.21% excluding the credit mark in Banco Colpatria.
Q2 2015 vs Q1 2015
The provision for credit losses was $266 million this quarter, down from $285 million in the previous quarter. The decrease in provisions was primarily driven by lower commercial provisions in Peru and the Caribbean. Retail provisions were slightly lower with lower provisions in Mexico and Peru largely offset by higher provisions in the Caribbean related to mortgages, and Colombia due to asset growth and the reduced benefit of the credit mark in Banco Colpatria. The provision for credit losses ratio improved by 14 basis points relative to the previous quarter. Excluding the credit mark benefits related to Colombia, the ratio improved by 19 basis points.
Year-to-date Q2 2015 vs Year-to-date Q2 2014
The provision for credit losses was $551 million, compared to $446 million in the same period last year. The increase was entirely due to higher provisions in the retail portfolio in Latin America, primarily as a result of reduced benefit of the credit mark in Banco Colpatria, and the Caribbean. The provision for credit losses ratio was 1.26%, up 13 basis points compared to the same period last year. Adjusting for the reduced benefit of the credit mark in Banco Colpatria, the ratio improved by 3 basis points to 1.30%.
Non-interest expenses
Q2 2015 vs Q2 2014
Non-interest expenses were $1,224 million, up $107 million or 10%. Foreign currency translation accounted for one quarter of the increase with the balance largely from increased volume-related expenses, inflation-related increases and higher business taxes.
Q2 2015 vs Q1 2015
Non-interest expenses were up $20 million or 2% compared to last quarter; however, $14 million lower when excluding foreign currency translation. Last quarter’s expenses reflected seasonally higher share-based compensation.
Year-to-date Q2 2015 vs Year-to-date Q2 2014
Non-interest expenses of $2,428 million were up $142 million or 6% versus the same period last year. Underlying expenses, excluding foreign currency translation, were up 5% reflective of increased volume-related expenses, inflation related increases, and higher business taxes. Expense management remains a key priority.
Taxes
The effective tax rate decreased to 24.1% compared to 25.6% in the same quarter last year due to higher tax benefits in certain jurisdictions.
Compared to the previous quarter the effective tax rate increased from 20.8% due to higher tax benefits in certain jurisdictions in the preceding quarter.
The year-to-date effective tax rate decreased to 22.5% compared to 23.0% last year as a result of higher tax benefits.
Scotiabank Second Quarter Report 2015 37
Table of Contents
MANAGEMENT’S DISCUSSION & ANALYSIS
| Global Banking & Markets | For the three months ended | For the six months ended | ||||||||||||||||||
(Unaudited) ($ millions) (Taxable equivalent basis)(1) | | April 30 2015 | | | January 31 2015 | | | April 30 2014 | | | April 30 2015 | | | April 30 2014 | | |||||
Business segment income | ||||||||||||||||||||
Net interest income | $ | 259 | $ | 267 | $ | 270 | $ | 526 | $ | 530 | ||||||||||
Non-interest income | 839 | 765 | 805 | 1,604 | 1,569 | |||||||||||||||
Total revenue | 1,098 | 1,032 | 1,075 | 2,130 | 2,099 | |||||||||||||||
Provision for credit losses | 13 | 13 | 6 | 26 | 10 | |||||||||||||||
Non-interest expenses | 467 | 465 | 437 | 932 | 926 | |||||||||||||||
Income tax expense | 169 | 150 | 196 | 319 | 339 | |||||||||||||||
Net income | $ | 449 | $ | 404 | $ | 436 | $ | 853 | $ | 824 | ||||||||||
Net income attributable to non-controlling interests in subsidiaries | $ | – | $ | – | $ | – | $ | – | $ | – | ||||||||||
Net income attributable to equity holders of the Bank | $ | 449 | $ | 404 | $ | 436 | $ | 853 | $ | 824 | ||||||||||
Other measures | ||||||||||||||||||||
Return on economic equity(1) | 29.9 | % | 29.3 | % | 29.0 | % | 29.7 | % | 27.0 | % | ||||||||||
Average assets($ billions) | $ | 355 | $ | 339 | $ | 313 | $ | 347 | $ | 306 | ||||||||||
Average liabilities($ billions) | $ | 247 | $ | 238 | $ | 218 | $ | 242 | $ | 215 | ||||||||||
| (1) | Refer to page 4 for a discussion of non-GAAP measures. |
Net income
Q2 2015 vs Q2 2014
Net income attributable to equity holders was $449 million, an increase of $13 million or 3% from the same period last year. This was driven by the positive impact of foreign currency translation and by strong results in capital markets and Canadian lending. This was partly offset by a lower contribution from investment banking, slightly higher provisions for credit losses and higher expenses. The prior year also included a securities gain in U.S. lending.
Q2 2015 vs Q1 2015
Quarter-over-quarter net income attributable to equity holders increased $45 million or 11%. Stronger results in fixed income, commodities, Canadian lending and investment banking were partly offset by declines in foreign exchange and Asia lending.
Year-to-date Q2 2015 vs Year-to-date Q2 2014
Year-to-date net income attributable to equity holders increased $29 million or 4%. This was driven by the positive impact of foreign currency translation, and by stronger results in the equities and commodities businesses. This was partly offset by a lower contribution from investment banking, higher provisions for credit losses and lower securities gains in U.S. lending.
Average assets
Q2 2015 vs Q2 2014
Average assets were $355 billion, an increase of $42 billion or 13% from the same quarter last year. Adjusting for the positive impact of foreign currency translation, assets increased by $20 billion or 6%. This was mainly due to growth of $14 billion in derivative-related assets, $9 billion in securities purchased under resale agreements, and $3 billion in deposits with banks, partly offset by reductions in trading assets of $3 billion, and $3 billion in corporate loans and acceptances. The latter was mostly due to reductions in Asia Trade Finance balances.
Q2 2015 vs Q1 2015
Average assets increased by $16 billion or 5% compared to last quarter, mainly due to the positive impact of foreign currency translation. Growth of $2 billion of derivative-related assets, $2 billion in corporate loans and acceptances, and $1 billion in securities purchased under resale agreements was mostly offset by a reduction of $4 billion in trading assets.
Year-to-date Q2 2015 vs Year-to-date Q2 2014
Average assets increased by $41 billion or 13% compared to the same period last year. This was partly due to the positive impact of foreign currency translation. On an underlying basis, the increase was $23 billion or 8%, which was driven by growth of $10 billion of derivative-related assets, $8 billion in securities purchased under resale agreements, $3 billion in deposits with banks and $1 billion in trading assets. This was partly offset by reductions in corporate loans and acceptances of $3 billion, entirely due to reductions in Asia Trade Finance balances.
38 Scotiabank Second Quarter Report 2015
Table of Contents
MANAGEMENT’S DISCUSSION & ANALYSIS
Average liabilities
Q2 2015 vs Q2 2014
Average liabilities were $247 billion, an increase of $29 billion or 13% from the same quarter last year. Adjusting for the positive impact of foreign currency translation, the increase was $19 billion or 9%. This was mainly due to growth of $14 billion in derivative-related liabilities and $4 billion in other capital markets liabilities, partly offset by a reduction of $2 billion in corporate deposits.
Q2 2015 vs Q1 2015
Average liabilities increased by $9 billion or 4% compared to last quarter. Adjusting for the positive impact of foreign currency translation, liabilities were $1 billion higher, driven by growth in derivative-related liabilities.
Year-to-date Q2 2015 vs Year-to-date Q2 2014
Average liabilities increased by $27 billion or 13% compared to the same period last year. Excluding the positive impact of foreign currency translation, liabilities were $16 billion or 7% higher. This was mainly due to growth of $12 billion in derivative-related liabilities and $4 billion in other capital markets liabilities.
Net interest income
Q2 2015 vs Q2 2014
Net interest income of $259 million was down $11 million or 4% from the same period last year. This was due mainly to lower lending volumes in Asia and lower spreads in Europe, the U.S. and Asia, which were partly offset by higher lending volumes in Canada and Europe and the positive impact of foreign currency translation.
Q2 2015 vs Q1 2015
Net interest income was $8 million or 3% lower than the previous quarter due to a shorter quarter, as well as lower interest income from capital markets operations and lower loan volumes in Asia. This was partly offset by increased volumes in the U.S., Europe and Canadian lending businesses, higher loan origination fees and the positive impact of foreign currency translation.
Year-to-date Q2 2015 vs Year-to-date Q2 2014
Net interest income was $4 million or 1% lower than the first half of last year. This was due mainly to lower interest income from capital markets operations and lower loan volumes and spreads in Asia, which was only partly offset by increased volumes in Canada, the U.S., and Europe and the positive impact of foreign currency translation.
Non-interest income
Q2 2015 vs Q2 2014
Non-interest income was $839 million, which was an increase of $34 million or 4% from the same period last year. This was mainly due to higher debt and equity underwriting fees, increased trading revenues in equities, commodities, precious metals and foreign exchange, higher banking fees, and the positive impact of foreign currency translation, partly offset by lower advisory fees. The prior year also included a securities gain in U.S. lending.
Q2 2015 vs Q1 2015
Non-interest income increased $74 million or 10% from last quarter. Increased trading revenues in precious metals, fixed income and commodities, higher debt and equity underwriting fees, higher banking fees and the positive impact of foreign currency translation was partly offset by lower advisory fees.
Year-to-date Q2 2015 vs Year-to-date Q2 2014
Non-interest income increased $35 million or 2% from the same period last year. This was driven by increased trading revenues in equities, foreign exchange and commodities, higher debt and equity underwriting fees and the positive impact of foreign currency translation. This was partly offset by lower advisory fees and reduced securities gains in U.S. lending.
Provision for credit losses
Q2 2015 vs Q2 2014
The provision for credit losses was $13 million this quarter, compared to $6 million in the same quarter last year, due to increases in Canada and Europe. The provision for credit losses ratio was 8 basis points, compared to 4 basis points in the same period last year.
Scotiabank Second Quarter Report 2015 39
Table of Contents
MANAGEMENT’S DISCUSSION & ANALYSIS
Q2 2015 vs Q1 2015
The provision for credit losses was $13 million this quarter, unchanged from the previous quarter.
Year-to-date Q2 2015 vs Year-to-date Q2 2014
The provision for credit losses was $26 million compared to $10 million in the same period last year, due primarily to higher provisions in Canada and Europe, partially offset by lower provisions in the United States. The provision for credit losses ratio was 8 basis points, compared to 3 basis points in the same period last year.
Non-interest expenses
Q2 2015 vs Q2 2014
Non-interest expenses of $467 million were higher by $30 million or 7% compared to the same quarter last year. Most of the increase related to the negative impact of foreign currency translation and the remaining increase was largely driven by higher professional fees, technology expenses and salaries and benefits.
Q2 2015 vs Q1 2015
Non-interest expenses increased $2 million compared to last quarter. Adjusting for the negative impact of foreign currency translation, expenses were down slightly, mainly due to lower share-based compensation costs.
Year-to-date Q2 2015 vs Year-to-date Q2 2014
Non-interest expenses increased $6 million or 1% compared the same period last year. Adjusting for the negative impact of foreign currency translation, expenses were down slightly, mainly due to lower share-based compensation costs.
Taxes
The effective tax rate decreased to 27.3% compared to 31.0% in the same period last year, mainly due to a lower level of income in higher tax jurisdictions. The current quarter’s rate was in line with the previous quarter.
Year-to-date Q2 2015 vs Year-to-date Q2 2014
The effective tax rate was 27.2% compared to 29.1% in the same period last year, mainly due to a lower level of income in higher tax jurisdictions.
| Other(1) | For the three months ended | For the six months ended | ||||||||||||||||||
(Unaudited) ($ millions) (Taxable equivalent basis)(2) | | April 30 2015 | | | January 31 2015 | |
| April 30 2014 |
| | April 30 2015 | | | April 30 2014 | | |||||
Business segment income | ||||||||||||||||||||
Net interest income(3) | $ | (15 | ) | $ | 2 | $ | 38 | $ | (13 | ) | $ | 47 | ||||||||
Non-interest income(3)(4) | (61 | ) | 22 | (53 | ) | (39 | ) | (70 | ) | |||||||||||
Total revenue | (76 | ) | 24 | (15 | ) | (52 | ) | (23 | ) | |||||||||||
Provision for credit losses | – | – | – | – | – | |||||||||||||||
Non-interest expenses | 46 | 64 | 41 | 110 | 82 | |||||||||||||||
Income tax expense(3) | (154 | ) | (83 | ) | (88 | ) | (237 | ) | (150 | ) | ||||||||||
Net income | $ | 32 | $ | 43 | $ | 32 | $ | 75 | $ | 45 | ||||||||||
Net income attributable to non-controlling interests in subsidiaries | $ | – | $ | – | $ | – | $ | – | $ | – | ||||||||||
Net income attributable to equity holders of the Bank | $ | 32 | $ | 43 | $ | 32 | $ | 75 | $ | 45 | ||||||||||
Other measures | ||||||||||||||||||||
Average assets($ billions) | $ | 89 | $ | 79 | $ | 78 | $ | 82 | $ | 76 | ||||||||||
Average liabilities($ billions) | $ | 262 | $ | 245 | $ | 240 | $ | 252 | $ | 234 | ||||||||||
| (1) | Includes all other smaller operating segments and corporate adjustments, such as the elimination of the tax-exempt income gross-up reported in net interest income, non-interest income and provision for income taxes and differences in the actual amount of costs incurred and charged to the operating segments. |
| (2) | Refer to page 4 for a discussion of non-GAAP measures. |
| (3) | Includes the elimination of the tax-exempt income gross-up reported in net interest income, non-interest income and provision for income taxes for the three months ended April 30, 2015 $(117), (January 31, 2015 $(92), and April 30, 2014 $(84)) and for the six months ended April 30, 2015 $(209) and April 30, 2014 $(164) to arrive at the amounts reported in the Consolidated Statement of Income. |
| (4) | Net income from investments in associated corporations and the provision for income taxes in each period include the tax normalization adjustments related to the gross-up of income from associated companies of $(32), (January 31, 2015 – $(33) and April 30, 2014 – $(40)) and for the six months ended April 30, 2015 $(65) and April 30, 2014 $(84). |
40 Scotiabank Second Quarter Report 2015
Table of Contents
MANAGEMENT’S DISCUSSION & ANALYSIS
Other
The Other segment includes Group Treasury, smaller operating segments and other corporate items which are not allocated to a business line.
Net interest income, other operating income, and the provision for income taxes in each period include the elimination of tax-exempt income gross-up. This amount is included in the operating segments, which are reported on a taxable equivalent basis. The elimination was $117 million in the second quarter, compared to $84 million in the same period last year and $92 million last quarter.
Net income from investments in associated corporations and the provision for income taxes in each period include the tax normalization adjustments related to the gross-up of income from associated companies. This adjustment normalizes the effective tax rate in the divisions to better present the contribution of the associated companies to the divisional results.
Q2 2015 vs Q2 2014
The Other segment had a net income attributable to equity holders of $32 million in the quarter, unchanged with the net income last year. Higher net gains on investment securities and lower taxes, were partly offset by lower contributions from asset/liability management activities.
Q2 2015 vs Q1 2015
The Other segment had a net income attributable to equity holders of $32 million in the quarter, compared to $43 million last quarter. The decrease was mainly due to lower contributions from asset/liability management activities and the impact of foreign currency translation (including hedges). Partly offsetting were lower expenses and taxes this quarter.
Year-to-date Q2 2015 vs Year-to-date Q2 2014
The Other segment had a net income attributable to equity holders of $75 million, compared to $45 million last year. The increase was mainly due to higher net gains on investment securities and lower taxes. Partly offsetting were lower contributions from asset/liability management activities, the impact of foreign currency translation (including hedges), and higher expenses.
| Geographic highlights | For the three months ended | For the six months ended | ||||||||||||||||||
| (Unaudited) ($ millions) | April 30 2015 | January 31 2015 | April 30 2014 | April 30 2015 | April 30 2014 | |||||||||||||||
Geographic segment income | ||||||||||||||||||||
Canada | $ | 1,046 | $ | 969 | $ | 1,013 | $ | 2,015 | $ | 2,036 | ||||||||||
United States | 139 | 172 | 164 | 311 | 256 | |||||||||||||||
Mexico | 105 | 101 | 104 | 206 | 186 | |||||||||||||||
Peru | 114 | 100 | 88 | 214 | 175 | |||||||||||||||
Other international | 421 | 413 | 475 | 834 | 949 | |||||||||||||||
Corporate adjustments | (28 | ) | (29 | ) | (44 | ) | (57 | ) | (93 | ) | ||||||||||
Net income | $ | 1,797 | $ | 1,726 | $ | 1,800 | $ | 3,523 | $ | 3,509 | ||||||||||
Average assets($ billions) | ||||||||||||||||||||
Canada | $ | 510 | $ | 493 | $ | 470 | $ | 500 | $ | 464 | ||||||||||
United States | 124 | 117 | 119 | 121 | 118 | |||||||||||||||
Mexico | 25 | 25 | 24 | 25 | 23 | |||||||||||||||
Peru | 20 | 18 | 17 | 19 | 17 | |||||||||||||||
Other international | 179 | 170 | 154 | 174 | 153 | |||||||||||||||
Corporate adjustments | 12 | 12 | 14 | 11 | 12 | |||||||||||||||
| $ | 870 | $ | 835 | $ | 798 | $ | 850 | $ | 787 | |||||||||||
Scotiabank Second Quarter Report 2015 41
Table of Contents
MANAGEMENT’S DISCUSSION & ANALYSIS
Quarterly Financial Highlights
| For the three months ended | ||||||||||||||||||||||||||||||||
(Unaudited) |
| April 30 2015 |
|
| January 31 2015 |
| | October 31 2014 | |
| July 31 2014 |
| | April 30 2014 | |
| January 31 2014 |
|
| October 31 2013 | (1) |
| July 31 2013 | (1) | ||||||||
Total revenue($ millions) | $ | 5,937 | $ | 5,863 | $ | 5,747 | $ | 6,487 | $ | 5,725 | $ | 5,645 | $ | 5,400 | $ | 5,515 | ||||||||||||||||
Total revenue (TEB(2))($ millions) | 6,054 | 5,955 | 5,848 | 6,576 | 5,809 | 5,725 | 5,477 | 5,594 | ||||||||||||||||||||||||
Net income($ millions) | 1,797 | 1,726 | 1,438 | 2,351 | 1,800 | 1,709 | 1,676 | 1,747 | ||||||||||||||||||||||||
Basic earnings per share($) | 1.43 | 1.36 | 1.10 | 1.86 | 1.40 | 1.33 | 1.30 | 1.37 | ||||||||||||||||||||||||
Diluted earnings per share($) | 1.42 | 1.35 | 1.10 | 1.85 | 1.39 | 1.32 | 1.29 | 1.36 | ||||||||||||||||||||||||
| (1) | Prior period amounts are retrospectively adjusted to reflect the adoption of new and amended IFRS standards (IFRS 10 and IAS 19) in 2014. |
| (2) | Refer to page 4 for a discussion of non-GAAP measures. |
42 Scotiabank Second Quarter Report 2015
Table of Contents
MANAGEMENT’S DISCUSSION & ANALYSIS
| As at April 30, 2015 | Amount ($ millions) | Dividend | Dividend (%) | Number outstanding (000s) | ||||||||||||
Common shares (1) | $ | 15,186 | $ | 0.68 | – | 1,209,962 | ||||||||||
Preferred shares | ||||||||||||||||
Preferred shares Series 14(2) | 345 | 0.281250 | 4.50 | 13,800 | ||||||||||||
Preferred shares Series 15(2) | 345 | 0.281250 | 4.50 | 13,800 | ||||||||||||
Preferred shares Series 16(2) | 345 | 0.328125 | 5.25 | 13,800 | ||||||||||||
Preferred shares Series 17(2) | 230 | 0.350000 | 5.60 | 9,200 | ||||||||||||
Preferred shares Series 18(2)(3)(4) | 187 | 0.209375 | 3.35 | 7,498 | ||||||||||||
Preferred shares Series 19(2)(3)(5) | 158 | 0.161125 | 2.58 | 6,302 | ||||||||||||
Preferred shares Series 20(2)(3)(6) | 201 | 0.225625 | 3.61 | 8,039 | ||||||||||||
Preferred shares Series 21(2)(3)(7) | 149 | 0.139250 | 2.23 | 5,961 | ||||||||||||
Preferred shares Series 22(2)(3)(8) | 234 | 0.239375 | 3.83 | 9,377 | ||||||||||||
Preferred shares Series 23(2)(3)(9) | 66 | 0.150500 | 2.41 | 2,623 | ||||||||||||
Preferred shares Series 30(2)(3)(10) | 154 | 0.113750 | 1.82 | 6,143 | ||||||||||||
Preferred shares Series 31(2)(3)(11) | 111 | 0.095500 | 1.53 | 4,457 | ||||||||||||
Preferred shares Series 32(2)(3)(12) | 409 | 0.231250 | 3.70 | 16,346 | ||||||||||||
| Trust securities | Amount ($ millions) | Distri- bution | Yield (%) | Number outstanding (000s) | ||||||||||||
Scotiabank Trust Securities –Series 2006-1 issued by Scotiabank Capital Trust(13a,c,d) | 750 | 28.25 | 5.650 | 750 | ||||||||||||
Scotiabank Tier 1 Securities –Series 2009-1 issued by Scotiabank Tier 1 Trust(13b,c,d) | 650 | 39.01 | 7.802 | 650 | ||||||||||||
| NVCC Subordinated debentures | Amount ($ millions) | Interest Rate (%) | ||||||||||||||
Subordinated debentures due March 2027(14) | 1,250 | 2.58 | ||||||||||||||
| Options | Number outstanding (000s) | |||||||||||||||
Outstanding options granted under the Stock Option Plans to purchase common shares(1)(15) | 23,983 | |||||||||||||||
| (1) | Dividends on common shares are paid quarterly. As at May 20, 2015, the number of outstanding common shares and options was 1,209,983 thousand and 23,966 thousand, respectively. |
| (2) | These shares are entitled to non-cumulative preferential cash dividends payable quarterly. |
| (3) | These preferred shares have conversion features (refer to Note 27 of the consolidated financial statements in the Bank’s 2014 Annual Report for further details). |
| (4) | Subsequent to the initial five-year fixed rate period which ended on April 25, 2013, and resetting every five years thereafter, the dividends, if and when declared, will be determined by the sum of the five-year Government of Canada Yield plus 2.05%, multiplied by $25.00. |
| (5) | Dividends, if and when declared, are determined by the sum of the three-month Government of Canada Treasury Bill Yield plus 2.05%, multiplied by $25.00, which will be reset quarterly until April 25, 2018. |
| (6) | Subsequent to the initial five-year fixed rate period which ended on October 25, 2013, and resetting every five years thereafter, the dividends, if and when declared, will be determined by the sum of the five-year Government of Canada Yield plus 1.70%, multiplied by $25.00. |
| (7) | Dividends, if and when declared, are determined by the sum of the three-month Government of Canada Treasury Bill Yield plus 1.70%, multiplied by $25.00, which will be reset quarterly until October 25, 2018. |
| (8) | Subsequent to the initial five-year fixed rate period which ended on January 25, 2014, and resetting every five years thereafter, the dividends, if and when declared, will be determined by the sum of the five-year Government of Canada Yield plus 1.88%, multiplied by $25.00. |
| (9) | Dividends, if and when declared, are determined by the sum of the three-month Government of Canada Treasury Bill Yield plus 1.88%, multiplied by $25.00, which will be reset quarterly until January 25, 2019. |
| (10) | Subsequent to the initial five-year fixed rate period which ended on April 25, 2015, and resetting every five years thereafter, the dividends, if and when declared, will be determined by the sum of the five-year Government of Canada Yield plus 1.00%, multiplied by $25.00. On April 27, 2015, 4,457 thousand of the 10,600 thousand non-cumulative preferred shares Series 30 were converted into non-cumulative preferred shares Series 31. |
| (11) | Dividends, if and when declared, are determined by the sum of the three-month Government of Canada Treasury Bill Yield plus 1.00%, multiplied by $25.00, which will be reset quarterly until April 25, 2020. |
| (12) | Dividends, if and when declared, are for the initial five-year period ending on February 1, 2016. Subsequent to the initial five-year fixed rate period, and resetting every five years thereafter, the dividends will be determined by the sum of the five-year Government of Canada Yield plus 1.34%, multiplied by $25.00. |
| (13)(a) | On September 28, 2006, Scotiabank Capital Trust issued 750,000 Scotiabank Trust Securities – Series 2006-1 (Scotia BaTS II Series 2006-1). The holders of Scotia BaTS II Series 2006-1 are entitled to receive non-cumulative fixed cash distributions payable semi-annually in an amount of $28.25 per security. With regulatory approval, these securities may be redeemed in whole upon the occurrence of certain tax or regulatory capital changes, or in whole or in part on December 30, 2011 and on any distribution date thereafter at the option of Scotiabank Capital Trust. The holder has the right at any time to exchange their security into Non-cumulative Preferred Shares Series S of the Bank. The Series S shares will be entitled to cash dividends payable semi-annually in an amount of $0.4875 per $25.00 share [refer to Notes 26 and 27 – Restrictions on dividend payments in the Bank’s 2014 Annual Report]. Under the circumstances outlined in 12(c) below, the Scotia BaTS II Series 2006-1 would be automatically exchanged without the consent of the holder, into Non-cumulative Preferred Shares Series T of the Bank. The Series T shares will be entitled to non-cumulative cash dividends payable semi-annually in an amount of $0.625 per $25.00 share. If there is an automatic exchange of the Scotia BaTS II Series 2006-1 into Preferred Shares Series T of the Bank, then the Bank would become the sole beneficiary of the Trust. |
| (13)(b) | On May 7, 2009, Scotiabank Tier 1 Trust issued 650,000 Scotiabank Tier 1 Securities Series 2009-1 (Scotia BaTS III Series 2009-1). Interest is payable semi-annually in an amount of $39.01 per Scotia BaTS III Series 2009-1 on the last day of June and December until June 30, 2019. After June 30, 2019 and on every fifth anniversary thereafter until June 30, 2104, the interest rate on the Scotia BaTS III Series 2009-1 will be reset at an interest rate per annum equal to the then prevailing 5-year Government of Canada Yield plus 7.05%. On or after June 30, 2014, the Trust may, at its option redeem the Scotia BaTS III Series 2009-1, in whole or in part, subject to regulatory approval. Under the circumstances outlined in 12(c) below, the Scotia BaTS III Series 2009-1, including accrued and unpaid interest thereon, would be exchanged automatically without the consent of the holder, into newly issued Non-cumulative Preferred Shares Series R of the Bank. In addition, in certain circumstances, holders of Scotia BaTS III Series 2009-1 may be required to invest interest paid on the Scotia BaTS III Series 2009-1 in a series of newly-issued preferred shares of the Bank with non-cumulative dividends (each such series is referred to as Bank Deferral Preferred Shares). If there is an automatic exchange of the Scotia BaTS Preferred Shares, then the Bank would become the sole beneficiary of the Trust. |
| (13)(c) | The Scotia BaTS II Series 2006-1 and Scotia BaTS III Series 2009-1 may be automatically exchanged, without the consent of the holder, into Non-cumulative Preferred Shares of the Bank in the following circumstances: (i) proceedings are commenced for the winding-up of the Bank; (ii) the Superintendent takes control of the Bank or its assets; (iii) the Bank has a Tier 1 Capital ratio of less than 5% or a Total Capital ratio of less than 8%; or (iv) the Superintendent has directed the Bank to increase its capital or provide additional liquidity and the Bank elects such automatic exchange or the Bank fails to comply with such direction. |
Scotiabank Second Quarter Report 2015 43
Table of Contents
MANAGEMENT’S DISCUSSION & ANALYSIS
| (13)(d) | No cash distributions will be payable on the Scotia BaTS II Series 2006-1 and Scotia BaTS III Series 2009-1 in the event that the regular dividend is not declared on the Bank’s preferred shares and, if no preferred shares are outstanding, the Bank’s common shares. In such a circumstance the net distributable funds of the Trust will be payable to the Bank as the holder of the residual interest in the Trust. Should the Trust fail to pay the semi-annual distributions on the Scotia BaTS II Series 2006-1 and Scotia BaTS III Series 2009-1 in full, the Bank will not declare dividends of any kind on any of its preferred or common shares for a specified period of time [refer to Notes 26 and 27 – Restrictions on dividend payments in the Bank’s 2014 Annual Report]. |
| (14) | On March 30, 2015, the Bank issued $1.25 billion subordinated debentures due March 30, 2027. The debentures contain non-viability contingent capital (NVCC) provisions. Under such NVCC provisions, the debentures are convertible into a variable number of common shares if OSFI announces that the Bank has ceased, or is about to cease, to be viable, or if a federal or provincial government in Canada publicly announces that the Bank has accepted or agreed to accept a capital injection, or equivalent support, from the federal government or any provincial government or political subdivision or agent thereof without which the Bank would have been determined by OSFI to be non-viable. If such a conversion were to occur, the debentures would be converted into common shares pursuant to an automatic conversion formula defined as 150% of the par value plus accrued and unpaid interested divided by the conversion price. The conversion price is based on the greater of: (i) a floor price of $5.00 (subject to adjustments in certain events as set out in the prospectus supplement March 23, 2015), and (ii) the current market price of the Bank’s common shares at the time of the trigger event (10-day weighted average). Based on the floor price of $5.00 and excluding the impact of accrued and unpaid interest (if any) and declared but unpaid dividends (if any), the maximum number of common shares issuable on conversion of the debentures would be 375 million shares, which would represent a dilution impact of 31% based on the common shares outstanding as at April 30, 2015. |
| (15) | Included are 224,144 stock options with tandem stock appreciation rights (Tandem SAR) features. |
Further details, including convertibility features, are available in Notes 23, 26, 27 and 29 of the Bank’s consolidated financial statements in the 2014 Annual Report.
44 Scotiabank Second Quarter Report 2015
Table of Contents
CONDENSED INTERIM CONSOLIDATED FINANCIAL STATEMENTS
Consolidated Statement of Financial Position
| As at | ||||||||||||||
| (Unaudited) ($ millions) | Note | | April 30 2015 | | | January 31 2015 | | | October 31 2014 | | ||||
Assets | ||||||||||||||
Cash and deposits with financial institutions | 5 | $ | 60,664 | $ | 65,894 | $ | 56,730 | |||||||
Precious metals | 8,438 | 9,698 | 7,286 | |||||||||||
Trading assets | ||||||||||||||
Securities | 92,095 | 86,695 | 95,363 | |||||||||||
Loans | 17,279 | 18,990 | 14,508 | |||||||||||
Other | 3,746 | 3,934 | 3,377 | |||||||||||
| 113,120 | 109,619 | 113,248 | ||||||||||||
Financial instruments designated at fair value through profit or loss | 129 | 119 | 111 | |||||||||||
Securities purchased under resale agreements and securities borrowed | 98,205 | 87,217 | 93,866 | |||||||||||
Derivative financial instruments | 37,669 | 55,435 | 33,439 | |||||||||||
Investment securities | 6 | 39,828 | 40,905 | 38,662 | ||||||||||
Loans | ||||||||||||||
Residential mortgages | 213,522 | 214,791 | 212,648 | |||||||||||
Personal and credit cards | 86,186 | 85,929 | 84,204 | |||||||||||
Business and government | 139,944 | 142,984 | 131,098 | |||||||||||
| 439,652 | 443,704 | 427,950 | ||||||||||||
Allowance for credit losses | 8(b) | 3,694 | 3,788 | 3,641 | ||||||||||
| 435,958 | 439,916 | 424,309 | ||||||||||||
Other | ||||||||||||||
Customers’ liability under acceptances | 13,549 | 11,898 | 9,876 | |||||||||||
Property and equipment | 2,182 | 2,334 | 2,272 | |||||||||||
Investments in associates | 9 | 3,845 | 3,907 | 3,461 | ||||||||||
Goodwill and other intangible assets | 10,923 | 11,068 | 10,884 | |||||||||||
Deferred tax assets | 2,031 | 2,354 | 1,763 | |||||||||||
Other assets | 10,620 | 11,509 | 9,759 | |||||||||||
| 43,150 | 43,070 | 38,015 | ||||||||||||
Total assets | $ | 837,161 | $ | 851,873 | $ | 805,666 | ||||||||
Liabilities | ||||||||||||||
Deposits | ||||||||||||||
Personal | 10 | $ | 180,312 | $ | 180,973 | $ | 175,163 | |||||||
Business and government | 10 | 358,400 | 364,260 | 342,367 | ||||||||||
Financial institutions | 10 | 36,569 | 39,365 | 36,487 | ||||||||||
| 575,281 | 584,598 | 554,017 | ||||||||||||
Financial instruments designated at fair value through profit or loss | 1,102 | 736 | 465 | |||||||||||
Other | ||||||||||||||
Acceptances | 13,549 | 11,898 | 9,876 | |||||||||||
Obligations related to securities sold short | 22,843 | 22,784 | 27,050 | |||||||||||
Derivative financial instruments | 43,613 | 57,725 | 36,438 | |||||||||||
Obligations related to securities sold under repurchase agreements and securities lent | 89,676 | 79,322 | 88,953 | |||||||||||
Subordinated debentures | 11 | 6,134 | 4,973 | 4,871 | ||||||||||
Other liabilities | 34,020 | 38,656 | 34,785 | |||||||||||
| 209,835 | 215,358 | 201,973 | ||||||||||||
Total liabilities | 786,218 | 800,692 | 756,455 | |||||||||||
Equity | ||||||||||||||
Common equity | ||||||||||||||
Common shares | 11 | 15,186 | 15,173 | 15,231 | ||||||||||
Retained earnings | 29,984 | 29,103 | 28,609 | |||||||||||
Accumulated other comprehensive income (loss) | 1,362 | 2,436 | 949 | |||||||||||
Other reserves | 180 | 181 | 176 | |||||||||||
Total common equity | 46,712 | 46,893 | 44,965 | |||||||||||
Preferred shares | 11 | 2,934 | 2,934 | 2,934 | ||||||||||
Total equity attributable to equity holders of the Bank | 49,646 | 49,827 | 47,899 | |||||||||||
Non-controlling interests in subsidiaries | 1,297 | 1,354 | 1,312 | |||||||||||
Total equity | 50,943 | 51,181 | 49,211 | |||||||||||
Total liabilities and equity | $ | 837,161 | $ | 851,873 | $ | 805,666 | ||||||||
The accompanying notes are an integral part of these condensed interim consolidated financial statements.
Scotiabank Second Quarter Report 2015 45
Table of Contents
CONDENSED INTERIM CONSOLIDATED FINANCIAL STATEMENTS
Consolidated Statement of Income
| For the three months ended | For the six months ended | |||||||||||||||||||||||
| (Unaudited) ($ millions) | Note | | April 30 2015 | | | January 31 2015 | | | April 30 2014 | | | April 30 2015 | | | April 30 2014 | | ||||||||
Revenue Interest income | ||||||||||||||||||||||||
Loans | $ | 4,561 | $ | 4,707 | $ | 4,478 | $ | 9,268 | $ | 8,960 | ||||||||||||||
Securities | 235 | 233 | 240 | 468 | 474 | |||||||||||||||||||
Securities purchased under resale agreements and securities borrowed | 38 | 40 | 48 | 78 | 91 | |||||||||||||||||||
Deposits with financial institutions | 74 | 69 | 66 | 143 | 136 | |||||||||||||||||||
| 4,908 | 5,049 | 4,832 | 9,957 | 9,661 | ||||||||||||||||||||
Interest expense | ||||||||||||||||||||||||
Deposits | 1,496 | 1,575 | 1,498 | 3,071 | 3,064 | |||||||||||||||||||
Subordinated debentures | 43 | 45 | 55 | 88 | 113 | |||||||||||||||||||
Other | 171 | 260 | 228 | 431 | 428 | |||||||||||||||||||
| 1,710 | 1,880 | 1,781 | 3,590 | 3,605 | ||||||||||||||||||||
Net interest income | 3,198 | 3,169 | 3,051 | 6,367 | 6,056 | |||||||||||||||||||
Non-interest income | ||||||||||||||||||||||||
Banking | 16 | 818 | 810 | 745 | 1,628 | 1,548 | ||||||||||||||||||
Wealth management | 16 | 824 | 799 | 747 | 1,623 | 1,478 | ||||||||||||||||||
Underwriting and other advisory | 173 | 130 | 146 | 303 | 299 | |||||||||||||||||||
Non-trading foreign exchange | 116 | 124 | 98 | 240 | 207 | |||||||||||||||||||
Trading revenues | 340 | 320 | 344 | 660 | 669 | |||||||||||||||||||
Net gain on sale of investment securities | 139 | 182 | 219 | 321 | 361 | |||||||||||||||||||
Net income from investments in associated corporations | 99 | 90 | 127 | 189 | 262 | |||||||||||||||||||
Insurance underwriting income, net of claims | 137 | 130 | 112 | 267 | 227 | |||||||||||||||||||
Other | 93 | 109 | 136 | 202 | 263 | |||||||||||||||||||
| 2,739 | 2,694 | 2,674 | 5,433 | 5,314 | ||||||||||||||||||||
Total revenue | 5,937 | 5,863 | 5,725 | 11,800 | 11,370 | |||||||||||||||||||
Provision for credit losses | 448 | 463 | 375 | 911 | 731 | |||||||||||||||||||
| 5,489 | 5,400 | 5,350 | 10,889 | 10,639 | ||||||||||||||||||||
Non-interest expenses | ||||||||||||||||||||||||
Salaries and employee benefits | 1,690 | 1,714 | 1,580 | 3,404 | 3,285 | |||||||||||||||||||
Premises and technology | 502 | 490 | 476 | 992 | 945 | |||||||||||||||||||
Depreciation and amortization | 144 | 139 | 129 | 283 | 258 | |||||||||||||||||||
Communications | 110 | 106 | 105 | 216 | 207 | |||||||||||||||||||
Advertising and business development | 132 | 128 | 147 | 260 | 272 | |||||||||||||||||||
Professional | 129 | 114 | 106 | 243 | 214 | |||||||||||||||||||
Business and capital taxes | 98 | 87 | 74 | 185 | 149 | |||||||||||||||||||
Other | 419 | 419 | 378 | 838 | 770 | |||||||||||||||||||
| 3,224 | 3,197 | 2,995 | 6,421 | 6,100 | ||||||||||||||||||||
Income before taxes | 2,265 | 2,203 | 2,355 | 4,468 | 4,539 | |||||||||||||||||||
Income tax expense | 468 | 477 | 555 | 945 | 1,030 | |||||||||||||||||||
Net income | $ | 1,797 | $ | 1,726 | $ | 1,800 | $ | 3,523 | $ | 3,509 | ||||||||||||||
Net income attributable to non-controlling interests in subsidiaries | 40 | 47 | 58 | 87 | 112 | |||||||||||||||||||
Net income attributable to equity holders of the Bank | 1,757 | 1,679 | 1,742 | 3,436 | 3,397 | |||||||||||||||||||
Preferred shareholders | 30 | 30 | 43 | 60 | 91 | |||||||||||||||||||
Common shareholders | $ | 1,727 | $ | 1,649 | $ | 1,699 | $ | 3,376 | $ | 3,306 | ||||||||||||||
Earnings per common share(in dollars) | ||||||||||||||||||||||||
Basic | 17 | $ | 1.43 | $ | 1.36 | $ | 1.40 | $ | 2.78 | $ | 2.73 | |||||||||||||
Diluted | 17 | $ | 1.42 | $ | 1.35 | $ | 1.39 | $ | 2.77 | $ | 2.71 | |||||||||||||
Certain prior period amounts for April 30, 2014 have been restated to conform to the current period presentation.
The accompanying notes are an integral part of these condensed interim consolidated financial statements.
46 Scotiabank Second Quarter Report 2015
Table of Contents
CONDENSED INTERIM CONSOLIDATED FINANCIAL STATEMENTS
Consolidated Statement of Comprehensive Income
| For the three months ended | For the six months ended | |||||||||||||||||||
| (Unaudited) ($ millions) | | April 30 2015 | | | January 31 2015 | | | April 30 2014 | | | April 30 2015 | | | April 30 2014 | | |||||
Net income | $ | 1,797 | $ | 1,726 | $ | 1,800 | $ | 3,523 | $ | 3,509 | ||||||||||
Other comprehensive income (loss) | ||||||||||||||||||||
Items that will be reclassified subsequently to net income | ||||||||||||||||||||
Net change in unrealized foreign currency translation gains (losses): | ||||||||||||||||||||
Net unrealized foreign currency translation gains (losses) | (2,143 | ) | 3,421 | (467 | ) | 1,278 | 1,189 | |||||||||||||
Net gains (losses) on hedges of net investments in foreign operations | 828 | (1,489 | ) | 159 | (661 | ) | (644 | ) | ||||||||||||
Income tax expense (benefit): | ||||||||||||||||||||
Net unrealized foreign currency translation gains (losses) | (19 | ) | 35 | (3 | ) | 16 | 19 | |||||||||||||
Net gains (losses) on hedges of net investments in foreign operations | 218 | (381 | ) | 43 | (163 | ) | (169 | ) | ||||||||||||
| (1,514 | ) | 2,278 | (348 | ) | 764 | 695 | ||||||||||||||
Net change in unrealized gains (losses) on available-for-sale securities: | ||||||||||||||||||||
Net unrealized gains (losses) on available-for-sale securities | (165 | ) | 560 | 181 | 395 | 460 | ||||||||||||||
Reclassification of net (gains) losses to net income(1) | 134 | (660 | ) | (178 | ) | (526 | ) | (433 | ) | |||||||||||
Income tax expense (benefit): | ||||||||||||||||||||
Net unrealized gains (losses) on available-for-sale securities | (29 | ) | 125 | 53 | 96 | 129 | ||||||||||||||
Reclassification of net (gains) losses to net income | 28 | (179 | ) | (57 | ) | (151 | ) | (133 | ) | |||||||||||
| (30 | ) | (46 | ) | 7 | (76 | ) | 31 | |||||||||||||
Net change in gains (losses) on derivative instruments designated as cash flow hedges: | ||||||||||||||||||||
Net gains (losses) on derivative instruments designated as cash flow hedges | (732 | ) | 679 | (31 | ) | (53 | ) | 708 | ||||||||||||
Reclassification of net (gains) losses to net income | 877 | (814 | ) | 75 | 63 | (769 | ) | |||||||||||||
Income tax expense (benefit): | ||||||||||||||||||||
Net gains (losses) on derivative instruments designated as cash flow hedges | (232 | ) | 212 | (9 | ) | (20 | ) | 218 | ||||||||||||
Reclassification of net (gains) losses to net income | 270 | (248 | ) | 21 | 22 | (232 | ) | |||||||||||||
| 107 | (99 | ) | 32 | 8 | (47 | ) | ||||||||||||||
Other comprehensive income from investments in associates | 2 | 15 | (3 | ) | 17 | 18 | ||||||||||||||
Items that will not be reclassified subsequently to net income | ||||||||||||||||||||
Net change in remeasurement of employee benefit plan asset and liability: | ||||||||||||||||||||
Actuarial gains (losses) on employee benefit plans | 405 | (865 | ) | (63 | ) | (460 | ) | (141 | ) | |||||||||||
Income tax expense (benefit) | 102 | (224 | ) | (14 | ) | (122 | ) | (33 | ) | |||||||||||
| 303 | (641 | ) | (49 | ) | (338 | ) | (108 | ) | ||||||||||||
Net change in fair value due to change in own credit risk on financial liabilities designated under the fair value option(2): | ||||||||||||||||||||
Change in fair value due to change in own credit risk on financial liabilities designated under the fair value option | (4 | ) | 4 | – | – | – | ||||||||||||||
Income tax expense (benefit) | (1 | ) | 1 | – | – | – | ||||||||||||||
| (3 | ) | 3 | – | – | – | |||||||||||||||
Other comprehensive income from investments in associates | 1 | – | (2 | ) | 1 | (2 | ) | |||||||||||||
Other comprehensive income (loss) | (1,134 | ) | 1,510 | (363 | ) | 376 | 587 | |||||||||||||
Comprehensive income | $ | 663 | $ | 3,236 | $ | 1,437 | $ | 3,899 | $ | 4,096 | ||||||||||
Comprehensive income (loss) attributable to non-controlling interests | (20 | ) | 65 | 97 | 45 | 144 | ||||||||||||||
Comprehensive income attributable to equity holders of the Bank | 683 | 3,171 | 1,340 | 3,854 | 3,952 | |||||||||||||||
Preferred shareholders | 30 | 30 | 43 | 60 | 91 | |||||||||||||||
Common shareholders | $ | 653 | $ | 3,141 | $ | 1,297 | $ | 3,794 | $ | 3,861 | ||||||||||
| (1) | Includes amounts related to qualifying hedges. |
| (2) | In accordance with the transition requirements for the own credit risk provisions of IFRS 9, prior year comparatives have not been restated for the adoption of this standard in 2015 (refer to Note 3). |
The accompanying notes are an integral part of these condensed interim consolidated financial statements.
Scotiabank Second Quarter Report 2015 47
Table of Contents
CONDENSED INTERIM CONSOLIDATED FINANCIAL STATEMENTS
Consolidated Statement of Changes in Equity
| Accumulated other comprehensive income (loss) | Non-controlling interests | |||||||||||||||||||||||||||||||||||||||||||||||||||||||||||
| (Unaudited) ($ millions) |
| Common shares |
|
| Retained earnings | (1) |
| Foreign currency translation |
|
| Available- for-sale securities |
|
| Cash flow hedges |
|
| Share from associates |
(2) | | Employee benefits | (2) | | Own credit risk | (2) |
| Other reserves | (3) |
| Total common equity |
|
| Preferred shares |
|
| Total common and preferred equity |
|
| Non-controlling interests in subsidiaries |
|
| Capital instrument equity holders |
| Total | |||||||||||||||||
Balance as at November 1, 2014 | $ | 15,231 | $ | 28,609 | $ | 700 | $ | 664 | $ | (48 | ) | $ | 113 | $ | (480 | ) | $ | – | $ | 176 | $ | 44,965 | $ | 2,934 | $ | 47,899 | $ | 1,312 | $ | – | $ | 49,211 | ||||||||||||||||||||||||||||
Opening adjustment(4) | – | 5 | – | – | – | – | – | (5 | ) | – | – | – | – | – | – | – | ||||||||||||||||||||||||||||||||||||||||||||
Restated balances | 15,231 | 28,614 | 700 | 664 | (48 | ) | 113 | (480 | ) | (5 | ) | 176 | 44,965 | 2,934 | 47,899 | 1,312 | – | 49,211 | ||||||||||||||||||||||||||||||||||||||||||
Net income | – | 3,376 | – | – | – | – | – | – | – | 3,376 | 60 | 3,436 | 87 | – | 3,523 | |||||||||||||||||||||||||||||||||||||||||||||
Other comprehensive income (loss) | – | – | 809 | (77 | ) | 8 | 18 | (340 | ) | – | – | 418 | – | 418 | (42 | ) | – | 376 | ||||||||||||||||||||||||||||||||||||||||||
Total comprehensive income | $ | – | $ | 3,376 | $ | 809 | $ | (77 | ) | $ | 8 | $ | 18 | $ | (340 | ) | $ | – | $ | – | $ | 3,794 | $ | 60 | $ | 3,854 | $ | 45 | $ | – | $ | 3,899 | ||||||||||||||||||||||||||||
Shares issued | 49 | – | – | – | – | – | – | – | (7 | ) | 42 | – | 42 | – | – | 42 | ||||||||||||||||||||||||||||||||||||||||||||
Shares repurchased/redeemed | (94 | ) | (380 | ) | – | – | – | – | – | – | – | (474 | ) | – | (474 | ) | – | – | (474 | ) | ||||||||||||||||||||||||||||||||||||||||
Common dividends paid | – | (1,625 | ) | – | – | – | – | – | – | – | (1,625 | ) | – | (1,625 | ) | – | – | (1,625 | ) | |||||||||||||||||||||||||||||||||||||||||
Preferred dividends paid | – | – | – | – | – | – | – | – | – | – | (60 | ) | (60 | ) | – | – | (60 | ) | ||||||||||||||||||||||||||||||||||||||||||
Distributions to non-controlling interests | – | – | – | – | – | – | – | – | – | – | – | – | (58 | ) | – | (58 | ) | |||||||||||||||||||||||||||||||||||||||||||
Share-based payments | – | – | – | – | – | – | – | – | 11 | 11 | – | 11 | – | – | 11 | |||||||||||||||||||||||||||||||||||||||||||||
Other | – | (1 | ) | – | – | – | – | – | – | – | (1 | ) | – | (1 | ) | (2 | ) | – | (3 | ) | ||||||||||||||||||||||||||||||||||||||||
Balance as at April 30, 2015 | $ | 15,186 | $ | 29,984 | $ | 1,509 | $ | 587 | $ | (40 | ) | $ | 131 | $ | (820 | ) | $ | (5 | ) | $ | 180 | $ | 46,712 | $ | 2,934 | $ | 49,646 | $ | 1,297 | $ | – | $ | 50,943 | |||||||||||||||||||||||||||
Balance as at November 1, 2013 | $ | 14,516 | $ | 25,315 | $ | (173 | ) | $ | 705 | $ | (42 | ) | $ | 55 | $ | – | $ | – | $ | 193 | $ | 40,569 | $ | 4,084 | $ | 44,653 | $ | 1,155 | $ | 743 | $ | 46,551 | ||||||||||||||||||||||||||||
Opening adjustment(5) | – | (247 | ) | – | – | – | – | (157 | ) | – | – | (404 | ) | – | (404 | ) | (17 | ) | (743 | ) | (1,164 | ) | ||||||||||||||||||||||||||||||||||||||
Restated balances | 14,516 | 25,068 | (173 | ) | 705 | (42 | ) | 55 | (157 | ) | – | 193 | 40,165 | 4,084 | 44,249 | 1,138 | – | 45,387 | ||||||||||||||||||||||||||||||||||||||||||
Net income | – | 3,306 | – | – | – | – | – | – | – | 3,306 | 91 | 3,397 | 112 | – | 3,509 | |||||||||||||||||||||||||||||||||||||||||||||
Other comprehensive income (loss) | – | – | 665 | 30 | (47 | ) | 16 | (109 | ) | – | – | 555 | – | 555 | 32 | – | 587 | |||||||||||||||||||||||||||||||||||||||||||
Total comprehensive income | $ | – | $ | 3,306 | $ | 665 | $ | 30 | $ | (47 | ) | $ | 16 | $ | (109 | ) | $ | – | $ | – | $ | 3,861 | $ | 91 | $ | 3,952 | $ | 144 | $ | – | $ | 4,096 | ||||||||||||||||||||||||||||
Shares issued | 483 | 3 | – | – | – | – | – | – | (22 | ) | 464 | – | 464 | – | – | 464 | ||||||||||||||||||||||||||||||||||||||||||||
Shares redeemed | – | – | – | – | – | – | – | – | – | – | (850 | ) | (850 | ) | – | – | (850 | ) | ||||||||||||||||||||||||||||||||||||||||||
Common dividends paid | – | (1,528 | ) | – | – | – | – | – | – | – | (1,528 | ) | – | (1,528 | ) | – | – | (1,528 | ) | |||||||||||||||||||||||||||||||||||||||||
Preferred dividends paid | – | – | – | – | – | – | – | – | – | – | (91 | ) | (91 | ) | – | – | (91 | ) | ||||||||||||||||||||||||||||||||||||||||||
Distributions to non-controlling interests | – | – | – | – | – | – | – | – | – | – | – | – | (51 | ) | – | (51 | ) | |||||||||||||||||||||||||||||||||||||||||||
Share-based payments | – | – | – | – | – | – | – | – | 24 | 24 | – | 24 | – | – | 24 | |||||||||||||||||||||||||||||||||||||||||||||
Other | – | – | – | – | – | – | – | – | – | – | – | – | 6 | (6) | – | 6 | ||||||||||||||||||||||||||||||||||||||||||||
Balance as at April 30, 2014 | $ | 14,999 | $ | 26,849 | $ | 492 | $ | 735 | $ | (89 | ) | $ | 71 | $ | (266 | ) | $ | – | $ | 195 | $ | 42,986 | $ | 3,234 | $ | 46,220 | $ | 1,237 | $ | – | $ | 47,457 | ||||||||||||||||||||||||||||
| (1) | Includes undistributed retained earnings of $57 (April 30, 2014 – $46) related to a foreign associated corporation, which is subject to local regulatory restriction. |
| (2) | Represents amounts that will not be reclassified subsequently to net income. Share from associates $1 (April 30, 2014 – $(2)) will not be reclassified subsequently to net income. |
| (3) | Represents amounts on account of share-based payments (refer to Note 13). |
| (4) | Adjusted to reflect the adoption of the own credit risk provisions of IFRS 9 pertaining to financial liabilities designated at fair value through profit or loss (refer to Note 3). |
| (5) | Certain prior period amounts are retrospectively adjusted to reflect the adoption of new and amended IFRS standards (IFRS 10 and IAS 19) in 2014 (refer to Note 4 of the Bank’s consolidated financial statements in the 2014 Annual Report). |
| (6) | Includes changes to non-controlling interests arising from business combinations. |
The accompanying notes are an integral part of these condensed interim consolidated financial statements.
48 Scotiabank Second Quarter Report 2015
Table of Contents
CONDENSED INTERIM CONSOLIDATED FINANCIAL STATEMENTS
Consolidated Statement of Cash Flows
(Unaudited) ($ millions) | For the three months ended | For the six months ended | ||||||||||||||
| Sources (uses) of cash flows | | April 30 2015 | | | April 30 2014 | | | April 30 2015 | | | April 30 2014 | | ||||
Cash flows from operating activities | ||||||||||||||||
Net income | $ | 1,797 | $ | 1,800 | $ | 3,523 | $ | 3,509 | ||||||||
Adjustment for: | ||||||||||||||||
Net interest income | (3,198 | ) | (3,051 | ) | (6,367 | ) | (6,056 | ) | ||||||||
Depreciation and amortization | 144 | 129 | 283 | 258 | ||||||||||||
Provision for credit losses | 448 | 375 | 911 | 731 | ||||||||||||
Equity-settled share-based payment expense | 2 | 4 | 11 | 24 | ||||||||||||
Net gain on sale of investment securities | (139 | ) | (219 | ) | (321 | ) | (361 | ) | ||||||||
Net income from investments in associated corporations | (99 | ) | (127 | ) | (189 | ) | (262 | ) | ||||||||
Provision for income taxes | 468 | 555 | 945 | 1,030 | ||||||||||||
Changes in operating assets and liabilities: | ||||||||||||||||
Trading assets | (6,804 | ) | (5,118 | ) | 2,322 | (18,547 | ) | |||||||||
Securities purchased under resale agreements and securities borrowed | (14,221 | ) | (1,419 | ) | (1,723 | ) | 2,447 | |||||||||
Loans | (3,933 | ) | (5,914 | ) | (7,826 | ) | (12,169 | ) | ||||||||
Deposits | 6,387 | 15,487 | 8,249 | 22,142 | ||||||||||||
Obligations related to securities sold short | 736 | 762 | (4,361 | ) | 1,882 | |||||||||||
Obligations related to assets sold under repurchase agreements and securities lent | 13,578 | 976 | (1,981 | ) | 7,552 | |||||||||||
Net derivative financial instruments | 3,152 | 1,915 | 3,128 | (351 | ) | |||||||||||
Other, net | (2,821 | ) | (1,407 | ) | 2,160 | 2,223 | ||||||||||
Dividends received | 341 | 255 | 611 | 495 | ||||||||||||
Interest received | 4,410 | 4,486 | 9,340 | 9,089 | ||||||||||||
Interest paid | (1,643 | ) | (1,839 | ) | (3,750 | ) | (3,973 | ) | ||||||||
Income tax paid | (682 | ) | (465 | ) | (1,192 | ) | (964 | ) | ||||||||
Net cash from/(used in) operating activities | (2,077 | ) | 7,185 | 3,773 | 8,699 | |||||||||||
Cash flows from investing activities | ||||||||||||||||
Interest-bearing deposits with financial institutions | 1,794 | (4,929 | ) | (632 | ) | (3,697 | ) | |||||||||
Purchase of investment securities | (10,959 | ) | (12,171 | ) | (24,236 | ) | (26,379 | ) | ||||||||
Proceeds from sale and maturity of investment securities | 10,308 | 12,779 | 23,481 | 24,728 | ||||||||||||
Acquisition/sale of subsidiaries, associated corporations or business units, net of cash acquired | – | – | – | 15 | ||||||||||||
Property and equipment, net of disposals | (1 | ) | (51 | ) | (59 | ) | (112 | ) | ||||||||
Other, net | 88 | 45 | (364 | ) | (71 | ) | ||||||||||
Net cash from/(used in) investing activities | 1,230 | (4,327 | ) | (1,810 | ) | (5,516 | ) | |||||||||
Cash flows from financing activities | ||||||||||||||||
Proceeds from subordinated debentures | 1,236 | – | 1,236 | – | ||||||||||||
Redemption/repayment of subordinated debentures | – | (1,000 | ) | – | (1,000 | ) | ||||||||||
Redemption of preferred shares | – | (600 | ) | – | (850 | ) | ||||||||||
Proceeds from common shares issued | 19 | 109 | 47 | 478 | ||||||||||||
Common shares purchased for cancellation | (29 | ) | – | (474 | ) | – | ||||||||||
Cash dividends paid | (853 | ) | (821 | ) | (1,685 | ) | (1,619 | ) | ||||||||
Distributions to non-controlling interests | (37 | ) | (33 | ) | (58 | ) | (51 | ) | ||||||||
Other, net | (2 | ) | (247 | ) | (849 | ) | 176 | |||||||||
Net cash from/(used in) financing activities | 334 | (2,592 | ) | (1,783 | ) | (2,866 | ) | |||||||||
Effect of exchange rate changes on cash and cash equivalents | (253 | ) | (30 | ) | 108 | 184 | ||||||||||
Net change in cash and cash equivalents | (766 | ) | 236 | 288 | 501 | |||||||||||
Cash and cash equivalents at beginning of period(1) | 6,882 | 5,714 | 5,828 | 5,449 | ||||||||||||
Cash and cash equivalents at end of period(1) | $ | 6,116 | $ | 5,950 | $ | 6,116 | $ | 5,950 | ||||||||
| (1) | Represents cash and non-interest-bearing deposits with financial institutions (refer to Note 5). |
The accompanying notes are an integral part of these condensed interim consolidated financial statements.
Scotiabank Second Quarter Report 2015 49
Table of Contents
CONDENSED INTERIM CONSOLIDATED FINANCIAL STATEMENTS
NOTES TO THE Q2 2015
Condensed Interim Consolidated Financial Statements (unaudited)
TABLE OF CONTENTS
| Page | Note | |||||
| 51 | 1. | Reporting entity | ||||
| 51 | 2. | Basis of preparation | ||||
| 51 | 3. | Significant accounting policies | ||||
| 52 | 4. | Future accounting developments | ||||
| 53 | 5. | Cash and deposits with financial institutions | ||||
| 53 | 6. | Investment securities | ||||
| 54 | 7. | Derecognition of financial assets | ||||
| 55 | 8. | Impaired loans and allowance for credit losses | ||||
| 57 | 9. | Investments in associates | ||||
| 58 | 10. | Deposits | ||||
| 58 | 11. | Capital and financing transactions | ||||
| 59 | 12. | Capital management | ||||
| 61 | 13. | Share-based payments | ||||
| 62 | 14. | Employee benefits | ||||
| 62 | 15. | Operating segments | ||||
| 65 | 16. | Non-interest income | ||||
| 66 | 17. | Earnings per share | ||||
| 66 | 18. | Financial instruments | ||||
| 77 | 19. | Contractual maturities | ||||
| 79 | 20. | Events after the Consolidated Statement of Financial Position date | ||||
50 Scotiabank Second Quarter Report 2015
Table of Contents
CONDENSED INTERIM CONSOLIDATED FINANCIAL STATEMENTS
Notes to the Condensed Interim Consolidated Financial Statements (Unaudited)
| 1. | Reporting entity |
The Bank of Nova Scotia (the Bank) is a chartered bank under the Bank Act (Canada) (the Bank Act). The Bank is a Schedule I Bank under the Bank Act and is regulated by the Office of the Superintendent of Financial Institutions (OSFI). The Bank is a global financial services provider offering a diverse range of products and services, including personal, commercial, corporate and investment banking. The head office of the Bank is located at 1709 Hollis Street, Halifax, Nova Scotia, Canada and its executive offices are at Scotia Plaza, 44 King Street West, Toronto, Canada. The common shares of the Bank are listed on the Toronto Stock Exchange and the New York Stock Exchange.
| 2. | Basis of preparation |
Statement of compliance
These condensed interim consolidated financial statements of the Bank have been prepared in accordance with International Financial Reporting Standards (IFRS) as issued by the International Accounting Standards Board (IASB), which is in line with the requirements of Section 308 of the Bank Act. These condensed interim consolidated financial statements were prepared in accordance with International Accounting Standard 34,Interim Financial Reporting (IAS 34) and do not include all of the information required for full annual financial statements. These condensed interim consolidated financial statements should be read in conjunction with the Bank’s annual consolidated financial statements for the year ended October 31, 2014.
The condensed interim consolidated financial statements for the quarter ended April 30, 2015 have been approved by the Board of Directors for issue on May 29, 2015.
Basis of measurement
The condensed interim consolidated financial statements have been prepared on the historical cost basis except for the following material items that are measured at fair value in the Consolidated Statement of Financial Position:
| • | Financial assets and liabilities held-for-trading |
| • | Financial assets and liabilities designated at fair value through profit or loss |
| • | Derivative financial instruments |
| • | Available-for-sale investment securities |
Functional and presentation currency
These condensed interim consolidated financial statements are presented in Canadian dollars, which is the Bank’s functional currency. All financial information presented in Canadian dollars has been rounded to the nearest million unless otherwise stated.
Use of estimates and judgments
The preparation of financial statements, in conformity with IFRS, requires management to make estimates, apply judgments and make assumptions that affect the reported amount of assets and liabilities at the date of the financial statements, and income and expenses during the reporting period. Key areas where management has made difficult, complex or subjective judgments, often as a result of matters that are inherently uncertain, include those relating to the allowance for credit losses, the fair value of financial instruments (including derivatives), corporate income taxes, employee benefits, the fair value of all identifiable assets and liabilities as a result of business combinations, impairment of investment securities, impairment of non-financial assets, determination of the control of structured entities, de facto control of other entities, and provisions. Actual results could differ from these estimates.
| 3. | Significant accounting policies |
These condensed interim consolidated financial statements should be read in conjunction with the Bank’s audited consolidated financial statements for the year ended October 31, 2014. Except for the changes in accounting policies described below, the significant accounting policies used in the preparation of these condensed interim consolidated financial statements are consistent with those used in the Bank’s audited consolidated financial statements for the year ended October 31, 2014. Note 3 of the Bank’s consolidated financial statements in the 2014 Annual Report describes the Bank’s significant accounting policies.
Scotiabank Second Quarter Report 2015 51
Table of Contents
CONDENSED INTERIM CONSOLIDATED FINANCIAL STATEMENTS
Changes in accounting policies
The Bank has adopted the following new accounting standards issued by the IASB effective November 1, 2014.
Own credit risk of liabilities designated at fair value through profit or loss (IFRS - 9)
The own credit risk provisions of IFRS 9,Financial Instruments, changes the accounting for liabilities designated at fair value through profit or loss such that changes in fair value arising from changes in the Bank’s own credit risk are recognized in other comprehensive income unless doing so creates or increases an accounting mismatch. Cumulative fair value changes related to own credit risk recognized in other comprehensive income cannot be subsequently reclassified to net income. This replaces the previous requirement in IAS 39,Financial Instruments: Recognition and Measurement, to recognize such changes in net income.
In July 2014, the IASB issued the final IFRS 9 standard which permitted entities to early adopt this requirement prior to the IFRS 9 mandatory effective date of January 1, 2018. The Bank early adopted this requirement as it relates to deposit note liabilities designated at fair value through profit or loss, effective November 1, 2014. This change was applied retrospectively. However, in accordance with the IFRS 9 transition provisions, prior year comparatives have not been restated. The impact of this change on opening retained earnings was an increase of $5 million and on accumulated other comprehensive income was a decrease of $5 million.
Levies
IFRIC 21,Levies, provides guidance on when to recognize a liability to pay a levy imposed by government that is accounted for in accordance with IAS 37,Provisions, Contingent Liabilities and Contingent Assets,and also for a liability to pay a levy whose timing and amount is certain. The interpretation clarifies that an obligating event, as identified by the legislation would trigger the recognition of a liability to pay a levy. While the interpretation discusses the timing of the recognition, it does not change the measurement of the amount to be recognized. The adoption of IFRIC 21 did not have a significant impact on the Bank.
Presentation
The amendments to IAS 32,Financial Instruments: Presentation, clarifies the requirements relating to offsetting financial assets and financial liabilities. The adoption of these amendments did not have a significant impact on the Bank.
| 4. | Future accounting developments |
The Bank actively monitors developments and changes in accounting standards from the IASB as well as regulatory requirements from the Canadian Securities Administrators and OSFI.
The Bank is currently assessing the impact the adoption of new and revised standards issued by the IASB will have on its consolidated financial statements.
The IASB issued IFRS 9,Financial Instruments, which will replace IAS 39,Financial Instruments: Recognition and Measurement, effective for annual periods beginning on or after January 1, 2018. On January 9, 2015, OSFI issued an advisory on the early adoption of IFRS 9 for Domestic Systematically Important Banks (D-SIBs) for annual reporting periods beginning on November 1, 2017. The Bank has been identified as a D-SIB and is required to adopt IFRS 9 effective November 1, 2017.
There are no other significant updates to the future accounting developments effective after November 1, 2014, as reflected in Note 5 of the Bank’s consolidated financial statements in the 2014 Annual Report.
52 Scotiabank Second Quarter Report 2015
Table of Contents
CONDENSED INTERIM CONSOLIDATED FINANCIAL STATEMENTS
| 5. | Cash and deposits with financial institutions |
| As at | ||||||||||||
| ($ millions) | April 30 2015 | January 31 2015 | October 31 2014 | |||||||||
Cash and non-interest-bearing deposits with financial institutions | $ | 6,116 | $ | 6,882 | $ | 5,828 | ||||||
Interest-bearing deposits with financial institutions | 54,548 | 59,012 | 50,902 | |||||||||
Total | $ | 60,664 | $ | 65,894 | $ | 56,730 | ||||||
The Bank is required to maintain balances with central banks, other regulatory authorities and certain counterparties and these amount to $5,000 million (January 31, 2015 – $4,851 million; October 31, 2014 – $4,628 million).
| 6. | Investment securities |
Investment securities includes held-to-maturity securities of $174 million (January 31, 2015 – $183 million; October 31, 2014 – $166 million) and available-for-sale securities of $39,654 million (January 31, 2015 – $40,722 million; October 31, 2014 – $38,496 million).
An analysis of unrealized gains and losses on available-for-sale securities is as follows:
| As at April 30, 2015 | ||||||||||||||||
| ($ millions) | Cost | Gross unrealized gains | Gross unrealized losses | Fair value | ||||||||||||
Canadian federal government issued or guaranteed debt | $ | 7,342 | $ | 252 | $ | 2 | $ | 7,592 | ||||||||
Canadian provincial and municipal debt | 3,642 | 34 | 1 | 3,675 | ||||||||||||
U.S. treasury and other U.S. agencies’ debt | 5,476 | 22 | 5 | 5,493 | ||||||||||||
Other foreign governments’ debt | 12,683 | 34 | 21 | 12,696 | ||||||||||||
Bonds of designated emerging markets | 39 | 7 | 1 | 45 | ||||||||||||
Other debt | 6,409 | 81 | 7 | 6,483 | ||||||||||||
Preferred shares | 407 | 13 | 121 | 299 | ||||||||||||
Common shares | 2,479 | 919 | 27 | 3,371 | ||||||||||||
Total available-for-sale securities | $ | 38,477 | $ | 1,362 | $ | 185 | $ | 39,654 | ||||||||
| As at January 31, 2015 | ||||||||||||||||
| ($ millions) | Cost | Gross unrealized gains | Gross unrealized losses | Fair value | ||||||||||||
Canadian federal government issued or guaranteed debt | $ | 7,370 | $ | 374 | $ | – | $ | 7,744 | ||||||||
Canadian provincial and municipal debt | 3,587 | 50 | – | 3,637 | ||||||||||||
U.S. treasury and other U.S. agencies’ debt | 5,798 | 47 | 3 | 5,842 | ||||||||||||
Other foreign governments’ debt | 12,541 | 63 | 22 | 12,582 | ||||||||||||
Bonds of designated emerging markets | 42 | 8 | 1 | 49 | ||||||||||||
Other debt | 6,615 | 93 | 6 | 6,702 | ||||||||||||
Preferred shares | 409 | 14 | 100 | 323 | ||||||||||||
Common shares | 2,875 | 1,024 | 56 | 3,843 | ||||||||||||
Total available-for-sale securities | $ | 39,237 | $ | 1,673 | $ | 188 | $ | 40,722 | ||||||||
| As at October 31, 2014 | ||||||||||||||||
| ($ millions) | Cost | Gross unrealized gains | Gross unrealized losses | Fair value | ||||||||||||
Canadian federal government issued or guaranteed debt | $ | 6,704 | $ | 147 | $ | – | $ | 6,851 | ||||||||
Canadian provincial and municipal debt | 3,284 | 20 | 1 | 3,303 | ||||||||||||
U.S. treasury and other U.S. agencies’ debt | 6,218 | 11 | 3 | 6,226 | ||||||||||||
Other foreign governments’ debt | 10,940 | 60 | 17 | 10,983 | ||||||||||||
Bonds of designated emerging markets | 39 | 7 | 1 | 45 | ||||||||||||
Other debt | 6,666 | 128 | 7 | 6,787 | ||||||||||||
Preferred shares | 412 | 15 | 59 | 368 | ||||||||||||
Common shares | 3,097 | 871 | 35 | 3,933 | ||||||||||||
Total available-for-sale securities | $ | 37,360 | $ | 1,259 | $ | 123 | $ | 38,496 | ||||||||
Scotiabank Second Quarter Report 2015 53
Table of Contents
CONDENSED INTERIM CONSOLIDATED FINANCIAL STATEMENTS
The net unrealized gain on available-for-sale securities of $1,177 million (January 31, 2015 – $1,485 million; October 31, 2014 – $1,136 million) decreases to a net unrealized gain of $716 million (January 31, 2015 – $747 million; October 31, 2014 – $847 million) after the impact of qualifying hedges is taken into account. The net unrealized gain on available-for-sale securities is recorded in accumulated other comprehensive income.
| 7. | Derecognition of financial assets |
Securitization of residential mortgage loans
The Bank securitizes fully insured residential mortgage loans, Bank originated and others, through the creation of mortgage backed securities (MBS) under the National Housing Act (NHA) MBS program, sponsored by Canada Mortgage Housing Corporation (CMHC). MBS created under the program are sold to Canada Housing Trust (the Trust), a government sponsored entity under the Canada Mortgage Bond (CMB) program, and/or to third-party investors. The Trust issues securities to third-party investors.
The sale of mortgages under the above programs does not meet the derecognition requirements, as the Bank retains the pre-payment and interest rate risks associated with the mortgages, which represents substantially all the risk and rewards associated with the transferred assets.
The transferred mortgages continue to be recognized on the Consolidated Statement of Financial Position as residential mortgage loans. Cash proceeds from the transfer are treated as secured borrowings and included in Deposits – Business and government on the Consolidated Statement of Financial Position.
The following table provides the carrying amount of transferred assets that do not qualify for derecognition and the associated liabilities:
| As at | ||||||||||||
| ($ millions) | April 30 2015(1) | January 31 2015(1) | October 31 2014(1) | |||||||||
Assets | ||||||||||||
Carrying value of residential mortgage loans | $ | 18,629 | $ | 18,384 | $ | 17,969 | ||||||
Other related assets(2) | 1,849 | 2,130 | 2,425 | |||||||||
Liabilities | ||||||||||||
Carrying value of associated liabilities | 20,466 | 20,527 | 20,414 | |||||||||
| (1) | The fair value of the transferred assets is $20,589 (January 31, 2015 – $20,549; October 31, 2014 – $20,430) and the fair value of the associated liabilities is $21,097 (January 31, 2015 – $21,412; October 31, 2014 – $20,791) for a net position of $(508) (January 31, 2015 – $(863); October 31, 2014 – $(361)). |
| (2) | These include cash held in trust and trust permitted investment assets acquired as part of principal reinvestment account that the Bank is required to maintain in order to participate in the programs. |
Securitization of personal loans
The Bank securitizes a portion of its unsecured personal line of credit receivables on a revolving basis through a consolidated structured entity. The receivables continue to be recognized on the Consolidated Statement of Financial Position as personal loans.
Securities sold under repurchase agreements and securities lent
The Bank enters into transactions, such as repurchase agreements and securities lending agreements, where the Bank transfers assets under agreements to repurchase them on a future date and retains all the substantial risks and rewards associated with the assets. The transferred securities remain on the Consolidated Statement of Financial Position along with the cash collateral received from the counterparty that is classified as deposit liabilities.
54 Scotiabank Second Quarter Report 2015
Table of Contents
CONDENSED INTERIM CONSOLIDATED FINANCIAL STATEMENTS
The following table provides the carrying amount of the transferred assets and the associated liabilities:
| As at | ||||||||||||
| ($ millions) | April 30 2015(1) | January 31 2015(1) | October 31 2014(1) | |||||||||
Carrying value of securities associated with: | ||||||||||||
Repurchase agreements(2) | $ | 79,971 | $ | 69,285 | $ | 80,335 | ||||||
Securities lending agreements | 45,409 | 40,086 | 37,110 | |||||||||
Total | 125,380 | 109,371 | 117,445 | |||||||||
Carrying value of associated liabilities(3) | $ | 89,676 | $ | 79,322 | $ | 88,953 | ||||||
| (1) | The fair value of transferred assets is $125,380 (January 31, 2015 – $109,371; October 31, 2014 – $117,445) and the fair value of the associated liabilities is $89,676 (January 31, 2015 – $79,322; October 31, 2014 – $88,953), for a net position of $35,704 (January 31, 2015 – $30,049; October 31, 2014 – $28,492). |
| (2) | Does not include over-collateralization of assets pledged. |
| (3) | Liabilities for securities lending arrangements only include amounts related to cash collateral received. In most cases, securities are received as collateral. |
| 8. | Impaired loans and allowance for credit losses |
| (a) | Impaired loans(1)(2)(3) |
| April 30, 2015 | ||||||||||||
| ($ millions) | Gross impaired loans | Allowance for credit losses | Net | |||||||||
Business and government | $ | 1,503 | $ | 573 | (4) | $ | 930 | |||||
Residential mortgages | 1,598 | 381 | (5) | 1,217 | ||||||||
Personal and credit cards | 1,296 | 1,271 | (5) | 25 | ||||||||
Total | $ | 4,397 | $ | 2,225 | $ | 2,172 | ||||||
By geography: | ||||||||||||
Canada | $ | 430 | ||||||||||
United States | 19 | |||||||||||
Other international | 1,723 | |||||||||||
Total | $ | 2,172 | ||||||||||
| As at | ||||||||||||||||||||||||
| January 31, 2015 | October 31, 2014 | |||||||||||||||||||||||
| ($ millions) | Gross impaired loans(6) | Allowance for credit losses | Net | Gross impaired loans | Allowance for credit losses | Net | ||||||||||||||||||
Business and government | $ | 1,526 | $ | 600 | (4) | $ | 926 | $ | 1,455 | $ | 614 | (4) | $ | 841 | ||||||||||
Residential mortgages | 1,714 | 408 | (5) | 1,306 | 1,491 | 359 | (5) | 1,132 | ||||||||||||||||
Personal and credit cards | 1,349 | 1,315 | (5) | 34 | 1,254 | 1,225 | (5) | 29 | ||||||||||||||||
Total | $ | 4,589 | $ | 2,323 | $ | 2,266 | $ | 4,200 | $ | 2,198 | $ | 2,002 | ||||||||||||
By geography: | ||||||||||||||||||||||||
Canada | $ | 511 | $ | 378 | ||||||||||||||||||||
United States | 26 | 11 | ||||||||||||||||||||||
Other international | 1,729 | 1,613 | ||||||||||||||||||||||
Total | $ | 2,266 | $ | 2,002 | ||||||||||||||||||||
| (1) | Interest income recognized on impaired loans during the three months ended April 30, 2015 was $3 (January 31, 2015 – $7; October 31, 2014 – $6). |
| (2) | Additional interest income of approximately $78 would have been recorded if the above loans had not been classified as impaired (January 31, 2015 – $85; October 31, 2014 – $73). |
| (3) | Excludes Federal Deposit Insurance Corporation (FDIC) guaranteed loans related to the acquisition of R-G Premier Bank of Puerto Rico. |
| (4) | Allowance for credit losses for business and government loans is individually assessed. |
| (5) | Allowance for credit losses for residential mortgages and personal and credit card loans is assessed on a collective basis. |
| (6) | Includes acceptances. |
Scotiabank Second Quarter Report 2015 55
Table of Contents
CONDENSED INTERIM CONSOLIDATED FINANCIAL STATEMENTS
| (b) | Allowance for credit losses |
| As at and for the six months ended April 30, 2015 | ||||||||||||||||||||||||
| ($ millions) | Balance at beginning of year | Write-offs | Recoveries | Provision for credit losses | Other, including foreign currency adjustment | Balance at end of period | ||||||||||||||||||
Individual | $ | 614 | $ | (203 | ) | $ | 29 | $ | 109 | $ | 24 | $ | 573 | |||||||||||
Collective | 2,856 | (940 | ) | 179 | 806 | 23 | 2,924 | |||||||||||||||||
Total before FDIC guaranteed loans | 3,470 | (1,143 | ) | 208 | 915 | 47 | 3,497 | |||||||||||||||||
FDIC guaranteed loans(1) | 171 | – | 18 | (4 | ) | 12 | 197 | |||||||||||||||||
Total allowances | $ | 3,641 | $ | (1,143 | ) | $ | 226 | $ | 911 | $ | 59 | $ | 3,694 | |||||||||||
| As at and for the three months ended January 31, 2015 | ||||||||||||||||||||||||
| ($ millions) | Balance at beginning of year | Write-offs | Recoveries | Provision for credit losses | Other, including foreign currency adjustment | Balance at end of period | ||||||||||||||||||
Individual | $ | 614 | $ | (170 | ) | $ | 15 | $ | 63 | $ | 78 | $ | 600 | |||||||||||
Collective | 2,856 | (438 | ) | 89 | 406 | 82 | 2,995 | |||||||||||||||||
Total before FDIC guaranteed loans | 3,470 | (608 | ) | 104 | 469 | 160 | 3,595 | |||||||||||||||||
FDIC guaranteed loans(1) | 171 | – | 6 | (6 | ) | 22 | 193 | |||||||||||||||||
Total allowances | $ | 3,641 | $ | (608 | ) | $ | 110 | $ | 463 | $ | 182 | $ | 3,788 | |||||||||||
| As at and for the twelve months ended October 31, 2014 | ||||||||||||||||||||||||
| ($ millions) | Balance at beginning of year | Write-offs | Recoveries | Provision for credit losses | Other, including foreign currency adjustment | Balance at end of year | ||||||||||||||||||
Individual | $ | 561 | $ | (338 | ) | $ | 93 | $ | 265 | $ | 33 | $ | 614 | |||||||||||
Collective | 2,604 | (1,559 | ) | 399 | 1,403 | 9 | 2,856 | |||||||||||||||||
Total before FDIC guaranteed loans | 3,165 | (1,897 | ) | 492 | 1,668 | 42 | 3,470 | |||||||||||||||||
FDIC guaranteed loans(1) | 108 | – | 18 | 35 | 10 | 171 | ||||||||||||||||||
| $ | 3,273 | $ | (1,897 | ) | $ | 510 | $ | 1,703 | $ | 52 | $ | 3,641 | ||||||||||||
Represented by:
| As at | ||||||||||||
| ($ millions) | April 30 2015 | January 31 2015 | October 31 2014 | |||||||||
Allowance against impaired loans | $ | 2,225 | $ | 2,323 | $ | 2,198 | ||||||
Allowance against performing loans(2) | 1,272 | 1,272 | 1,272 | |||||||||
Total before FDIC guaranteed loans | 3,497 | 3,595 | 3,470 | |||||||||
FDIC guaranteed loans(1) | 197 | 193 | 171 | |||||||||
| $ | 3,694 | $ | 3,788 | $ | 3,641 | |||||||
| (1) | This represents the gross amount of allowance for credit losses as the receivable from FDIC is separately recorded in other assets. |
| (2) | The allowance for performing loans is attributable to business and government loans $527 (January 31, 2015 – $551; October 31, 2014 – $584) with the remainder allocated to personal and credit card loans $588 (January 31, 2015 – $561; October 31, 2014 – $527) and residential mortgages $157 (January 31, 2015 – $160; October 31, 2014 – $161). |
| (c) | Total FDIC guaranteed loans |
| As at | ||||||||||||
| ($ millions) | April 30 2015 | January 31 2015 | October 31 2014 | |||||||||
R-G Premier Bank | ||||||||||||
Unpaid principal balance | $ | 2,622 | $ | 2,909 | $ | 2,688 | ||||||
Fair value adjustments | (251 | ) | (344 | ) | (357 | ) | ||||||
Net carrying value | 2,371 | 2,565 | 2,331 | |||||||||
Allowance for credit losses | (197 | ) | (193 | ) | (171 | ) | ||||||
| $ | 2,174 | $ | 2,372 | $ | 2,160 | |||||||
Loans purchased as part of the acquisition of R-G Premier Bank of Puerto Rico are subject to loss share agreements with the FDIC. Under these agreements, the FDIC guarantees 80% of loan losses. Claims for losses under these guarantees expire in June 2015 and April 2020 for non-single family loans and loans for single family homes, respectively. The provision for credit losses in the Consolidated Statement of Income related to these loans is reflected net of the amount expected to be reimbursed by the FDIC.
56 Scotiabank Second Quarter Report 2015
Table of Contents
CONDENSED INTERIM CONSOLIDATED FINANCIAL STATEMENTS
Allowance for credit losses in the Consolidated Statement of Financial Position is reflected on a gross basis. As at April 30, 2015 the carrying value of loans guaranteed by FDIC was $2.2 billion (January 31, 2015 – $2.4 billion; October 31, 2014 –$2.2 billion) with a net receivable of $220 million (January 31, 2015 – $265 million; October 31, 2014 – $275 million) from the FDIC included in Other assets in the Consolidated Statement of Financial Position.
| (d) | Loans past due but not impaired(1) |
A loan is considered past due when a counterparty has not made a payment by the contractual due date. The following table presents the carrying value of loans that are past due but not classified as impaired because they are either less than 90 days past due, or fully secured and collection efforts are reasonably expected to result in repayment, or restoring it to a current status in accordance with the Bank’s policy.
| As at April 30, 2015(2)(3) | ||||||||||||||||
| ($ millions) | 31-60 days | 61-90 days | 91 days and greater | Total | ||||||||||||
Residential mortgages | $ | 1,225 | $ | 435 | $ | 133 | $ | 1,793 | ||||||||
Personal and credit cards | 651 | 320 | 52 | 1,023 | ||||||||||||
Business and government | 196 | 59 | 211 | 466 | ||||||||||||
Total | $ | 2,072 | $ | 814 | $ | 396 | $ | 3,282 | ||||||||
| As at January 31, 2015(2)(3) | ||||||||||||||||
| ($ millions) | 31-60 days | 61-90 days | 91 days and greater | Total | ||||||||||||
Residential mortgages | $ | 1,365 | $ | 458 | $ | 140 | $ | 1,963 | ||||||||
Personal and credit cards | 637 | 337 | 53 | 1,027 | ||||||||||||
Business and government | 153 | 59 | 165 | 377 | ||||||||||||
Total | $ | 2,155 | $ | 854 | $ | 358 | $ | 3,367 | ||||||||
| As at October 31, 2014(2)(3) | ||||||||||||||||
| ($ millions) | 31-60 days | 61-90 days | 91 days and greater | Total | ||||||||||||
Residential mortgages | $ | 1,253 | $ | 483 | $ | 153 | $ | 1,889 | ||||||||
Personal and credit cards | 591 | 298 | 48 | 937 | ||||||||||||
Business and government | 140 | 57 | 233 | 430 | ||||||||||||
Total | $ | 1,984 | $ | 838 | $ | 434 | $ | 3,256 | ||||||||
| (1) | Loans past due 30 days or less are not presented in this analysis as they are not administratively considered past due. |
| (2) | Excludes Federal Deposit Insurance Corporation (FDIC) guaranteed loan related to the acquisition of R-G Premier Bank of Puerto Rico. |
| (3) | These loans would be considered in the determination of an appropriate level of collective allowances despite not being individually classified as impaired. |
| 9. | Investments in associates |
The Bank had significant investments in the following associates:
| As at | ||||||||||||||||||||||||||||
April 30 2015 | January 31 2015 | October 31 2014 | ||||||||||||||||||||||||||
| ($ millions) | Country of incorporation | Nature of business | Ownership percentage | Date of financial | Carrying value | Carrying value | Carrying value | |||||||||||||||||||||
Thanachart Bank Public Company Limited | Thailand | Banking | 49.0% | March 31, 2015 | $ | 2,323 | $ | 2,460 | $ | 2,134 | ||||||||||||||||||
Canadian Tire’s Financial Services business (CTFS)(2)(3) | Canada | | Financial Services | | 20.0% | March 31, 2015 | 517 | 520 | 509 | |||||||||||||||||||
Bank of Xi’an Co. Ltd. | China | Banking | 19.9% | March 31, 2015 | 554 | 421 | 359 | |||||||||||||||||||||
Maduro & Curiel’s Bank N.V.(4) | Curacao | Banking | 48.1% | March 31, 2015 | 233 | 244 | 221 | |||||||||||||||||||||
Banco del Caribe(5) | Venezuela | Banking | 26.6% | March 31, 2015 | 19 | 61 | 54 | |||||||||||||||||||||
| (1) | Represents the date of the most recent published financial statements. Where available, financial statements prepared by the associates’ management or other published information is used to estimate the change in the Bank’s interest since the most recent published financial statements. |
| (2) | On October 1, 2014, the Bank acquired a 20% equity interest in Canadian Tire’s Financial Services business (CTFS). |
| (3) | Under the agreement Canadian Tire has an option to sell to the Bank up to an additional 29% equity interest within the next 10 years at the then fair value, that can be settled, at the Bank’s discretion, by issuance of common shares or cash. After 10 years, for a period of six months, the Bank has the option to sell its equity interest back to Canadian Tire at the then fair value. |
Scotiabank Second Quarter Report 2015 57
Table of Contents
CONDENSED INTERIM CONSOLIDATED FINANCIAL STATEMENTS
| (4) | The local regulator requires financial institutions to set aside reserves for general banking risks. These reserves are not required under IFRS, and represent undistributed retained earnings related to a foreign associated corporation, which are subject to local regulatory restrictions. As of January 31, 2015 these reserves amounted to $57 (January 31, 2015 – $59; October 31, 2014 – $52). |
| (5) | Revalued using SIMADI rate of 1 USD to 199 VEF replacing the SICAD II rate (January 31, 2015 – SICAD II rate of 1 USD to 52 VEF; October 31, 2014 – 1 USD to 50 VEF). The Bank recorded a reduction in the carrying value of the investment in associates of $42 million through other comprehensive income and foreign exchange losses of $5 million in the Consolidated Statement of Income in relation to the monetary assets. |
| 10. | Deposits |
| As at | ||||||||||||||||||||||||||||
| April 30, 2015 |
| | January 31 2015 | | | October 31 2014 | | ||||||||||||||||||||
| Payable on demand | Payable after notice | Payable on a fixed date | Total | Total | Total | |||||||||||||||||||||||
| ($ millions) | Interest- bearing | Non-interest- bearing | ||||||||||||||||||||||||||
Personal | $ | 9,066 | $ | 5,000 | $ | 92,551 | $ | 73,695 | $ | 180,312 | $ | 180,973 | $ | 175,163 | ||||||||||||||
Business and government | 56,300 | 19,331 | 26,796 | 255,973 | 358,400 | 364,260 | 342,367 | |||||||||||||||||||||
Financial institutions | 3,479 | 2,976 | 1,419 | 28,695 | 36,569 | 39,365 | 36,487 | |||||||||||||||||||||
Total | $ | 68,845 | $ | 27,307 | $ | 120,766 | (1) | $ | 358,363 | $ | 575,281 | $ | 584,598 | $ | 554,017 | |||||||||||||
Recorded in: | ||||||||||||||||||||||||||||
Canada | $ | 382,514 | $ | 378,906 | $ | 373,491 | ||||||||||||||||||||||
United States | 87,146 | 96,387 | 84,710 | |||||||||||||||||||||||||
U.K. | 14,821 | 15,947 | 13,296 | |||||||||||||||||||||||||
Mexico | 13,960 | 14,646 | 13,668 | |||||||||||||||||||||||||
Peru | 12,620 | 12,527 | 11,701 | |||||||||||||||||||||||||
Chile | 7,297 | 7,056 | 5,785 | |||||||||||||||||||||||||
Colombia | 7,624 | 7,376 | 7,450 | |||||||||||||||||||||||||
Other International | 49,299 | 51,753 | 43,916 | |||||||||||||||||||||||||
Total(2) | $ | 575,281 | $ | 584,598 | $ | 554,017 | ||||||||||||||||||||||
| (1) | Includes $106 of non-interest bearing deposits. |
| (2) | Deposits denominated in U.S. dollars amount to $219,222 (January 31, 2015 – $229,066; October 31, 2014 – $201,891) deposits denominated in Mexican pesos amount to $12,269 (January 31, 2015 – $12,862; October 31, 2014 – $12,444) and deposits denominated in other foreign currencies amount to $59,316 (January 31, 2015 – $59,255; October 31, 2014 – $49,836). |
Refer to Note 19 for contractual maturities for deposits, which provides maturities less than one month, one to three months, three to six months, six to nine months, nine to twelve months, one to two years, two to five years, over five years, and with no specific maturity.
The following table presents the maturity schedule for term deposits in Canada greater than $100,000(1).
| ($ millions) | Within three months | Three to six months | Six to twelve months | One to five years | Over five years | Total | ||||||||||||||||||
As at April 30, 2015 | $ | 24,616 | $ | 21,194 | $ | 22,361 | $ | 84,325 | $ | 14,759 | $ | 167,255 | ||||||||||||
As at January 31, 2015 | $ | 30,879 | $ | 12,608 | $ | 26,788 | $ | 87,001 | $ | 14,849 | $ | 172,125 | ||||||||||||
As at October 31, 2014 | $ | 42,801 | $ | 13,907 | $ | 23,338 | $ | 75,987 | $ | 14,110 | $ | 170,143 | ||||||||||||
| (1) | The majority of foreign term deposits are in excess of $100,000. |
| 11. | Capital and financing transactions |
Covered bonds
During the six month period ending April 30, 2015, two series of covered bonds totalling US$3.25 billion matured under the Bank’s Global Public Sector Covered Bond Programme.
During the six month period ended April 30, 2015, the Bank issued four series of covered bonds under the Bank’s Global Registered Covered Bond Program as follows:
| • | EUR 1.250 billion due November 2, 2017; |
| • | GBP 550 million due November 2, 2017; |
| • | AUD 600 million due January 21, 2020; and |
| • | US$1.1 billion due April 14, 2020. |
58 Scotiabank Second Quarter Report 2015
Table of Contents
CONDENSED INTERIM CONSOLIDATED FINANCIAL STATEMENTS
Subordinated debentures
On March 30, 2015, the Bank issued $1.25 billion subordinated debentures due March 30, 2027. The debentures are redeemable on or after March 30, 2022. Interest is payable at a rate of 2.58% per annum until March 30, 2022 and thereafter until March 30, 2027 at the 90 day Bankers’ Acceptance rate plus 1.19%. The debentures contain non-viability contingent capital (NVCC) provisions necessary for the debentures to qualify as Tier 2 regulatory capital. Under the NVCC provisions, the debentures are convertible into a variable number of common shares upon either of two events: (i) the public announcement by OSFI that the Bank has ceased, or is about to cease, to be viable; or (ii) a federal or provincial government of Canada publicly announces that the Bank has accepted or agreed to accept a capital injection, or equivalent support, from the federal government or any provincial government or political subdivision or agent thereof without which the Bank would have been determined by OSFI to be non-viable.
Common shares
Normal Course Issuer Bid
On May 27, 2014, the Bank announced that OSFI and the TSX approved its normal course issuer bid pursuant to which it may repurchase for cancellation up to 12 million of the Bank’s common shares. The bid will end on the earlier of May 29, 2015, or the date on which the Bank completes its purchases. On March 3, 2015, the Bank announced that OSFI and the TSX approved an increase in the bid up to 16 million shares. During the six months ended April 30, 2015, the Bank repurchased and cancelled approximately 7.5 million common shares under this bid at an average price of $63.18 per share for a total amount of approximately $474 million. Under this bid the Bank has repurchased and cancelled approximately 12 million common shares at an average price of $66.12.
Preferred shares
Certain holders of Series 30 Non-cumulative 5-Year Rate Reset Preferred Shares elected to exchange 4,457,262 shares into an equal number of Series 31 Non-cumulative Floating Rate Preferred Shares effective April 27, 2015. Dividends, if and when declared, on the Series 31 Preferred Shares are determined by the sum of the three-month Government of Canada Treasury Bill Yield plus 1.00%, multiplied by $25.00, which will be reset quarterly until April 25, 2020.
| 12. | Capital management |
The Bank has a capital management process in place to measure, deploy and monitor its available capital and assess its adequacy. This capital management process aims to achieve four major objectives: exceed regulatory thresholds and meet longer-term internal capital targets, maintain strong credit ratings, manage capital levels commensurate with the risk profile of the Bank and provide the Bank’s shareholders with acceptable returns.
Capital is managed in accordance with the Board-approved Capital Management Policy. Senior executive management develop the capital strategy and oversee the capital management processes of the Bank. The Bank’s Finance, Group Treasury and Global Risk Management (GRM) groups are key in implementing the Bank’s capital strategy and managing capital. Capital is managed using both regulatory capital measures and internal metrics.
Although the Bank is subject to several capital regulations in the different business lines and countries in which the Bank operates, capital adequacy is managed on a consolidated Bank basis. The Bank also takes measures to ensure its subsidiaries meet or exceed local regulatory capital requirements. The primary regulator of its consolidated capital adequacy is the Office of the Superintendent of Financial Institutions Canada (OSFI). The capital adequacy regulations in Canada are largely consistent with international standards set by the Basel Committee on Banking Supervision (BCBS).
Effective November 1, 2012, Canadian banks are subject to the revised capital adequacy requirements as published by BCBS and commonly referred to as Basel III. Basel III builds on the “International Convergence of Capital Measurement and Capital Standards: A Revised Framework” (Basel II). The Office of the Superintendent of Financial Institutions (OSFI) has issued guidelines, reporting requirements and disclosure guidance which are consistent with the Basel III reforms, except for its deferral of the Basel III credit valuation adjustment (CVA) related capital charges, requiring they be phased-in over a five-year period, beginning January 2014. In accordance with OSFI’s requirements as at April 30, 2015, the scalar for CVA risk-weighted assets (RWA) of 0.64, 0.71 and 0.77 for Common Equity Tier 1 (CET1) capital ratio, Tier 1 capital ratio and Total capital ratio, respectively (January 31, 2015 – scalars of 0.64, 0.71 and 0.77; October 31, 2014 – scalars of 0.57, 0.65 and 0.77, respectively).
Under Basel III, there are three primary risk-based regulatory capital ratios used to assess capital adequacy, CET1, Tier 1 and Total capital ratios, which are determined by dividing those capital components by risk-weighted assets. Basel III also
Scotiabank Second Quarter Report 2015 59
Table of Contents
CONDENSED INTERIM CONSOLIDATED FINANCIAL STATEMENTS
provides guidance on non-viability contingent capital (NVCC). The guidance stipulates that in order to qualify as regulatory capital, non-common share capital instruments must be convertible into common equity upon a trigger event as defined within the guidance. All non-common instruments issued after December 31, 2012, were required to meet these NVCC requirements to qualify as regulatory capital.
To enable banks to meet the new standards, Basel III contains transitional arrangements commencing January 1, 2013, through January 1, 2019. Transitional requirements result in a 5 year phase-in of new deductions and additional capital components to common equity. Non-qualifying non-common capital instruments will be phased out over 10 years and the capital conservation buffer will be phased in over 4 years.
OSFI requires Canadian deposit-taking institutions to fully implement the 2019 Basel III reforms, without the transitional phase-in provisions for capital deductions (referred to as ‘all-in’), and achieve a minimum 7% common equity target. OSFI has also designated the bank as a domestic systemically important banks (D-SIB), increasing its minimum capital ratio requirements by 1% effective January 1, 2016, in line with the requirements for global systemically important banks.
Risk-weighted assets represent the Bank’s exposure to credit, market and operational risk and are computed by applying a combination of the Bank’s internal credit risk parameters and OSFI prescribed risk weights to on-and off-balance sheet exposures. Under the Basel framework there are two main methods for computing credit risk: the standardized approach, which uses prescribed risk weights; and internal ratings-based approaches, which allow the use of a Bank’s internal models to calculate some, or all, of the key inputs into the regulatory capital calculation. Users of the Advanced Internal Ratings Based Approach (AIRB) are required to have sophisticated risk management systems for the calculations of credit risk regulatory capital. Once banks demonstrate full compliance with the AIRB requirements, and OSFI has approved its use, they may proceed to apply the AIRB approach in computing capital requirements. The Bank uses the AIRB to compute credit risk for material Canadian, U.S. and European portfolios, and for a significant portion of the international corporate and commercial portfolio. The Bank continues to assess the remaining portfolios for the application of AIRB in the future. In 2012, the Bank implemented the Basel Committee’s revised market risk framework. The Bank uses the Standardized Approach to calculate the operational risk capital requirements.
In addition to risk-based capital requirements, the Basel III reforms introduced a simpler, non risk-based Leverage ratio requirement to act as a supplementary measure to its risk-based capital requirements. The Leverage ratio is defined as a ratio of Basel III Tier 1 capital to a leverage exposure measure as defined within the requirements which includes on balance sheet assets, derivatives, securities financing transaction and off-balance sheet items including commitments. Minimum public disclosure requirements are effective January 2015. The final calibration will be completed by 2017, with a view to migrating to a Pillar 1 (minimum capital requirement) treatment by January 2018.
In October 2014, OSFI released its Leverage Requirements Guideline which outlines the application of the Basel III Leverage ratio in Canada and the replacement of the existing Assets-to-Capital Multiple (ACM), effective November 1, 2014. Institutions will be expected to maintain a material operating buffer above the 3% minimum. The Bank meets OSFI’s authorized leverage ratio.
60 Scotiabank Second Quarter Report 2015
Table of Contents
CONDENSED INTERIM CONSOLIDATED FINANCIAL STATEMENTS
The Bank’s Common Equity Tier 1, Tier 1 and Total capital are composed of the following:
| As at | ||||||||||||||||||||||||
| April 30, 2015 | January 31, 2015 | October 31, 2014 | ||||||||||||||||||||||
| ($ millions) | All-in | Transitional | All-in | Transitional | All-in | Transitional | ||||||||||||||||||
Total Common Equity | $ | 46,712 | $ | 46,712 | $ | 46,893 | $ | 46,893 | $ | 44,965 | $ | 44,965 | ||||||||||||
Qualifying non-controlling interests in common equity of subsidiaries | 521 | – | 486 | – | 514 | – | ||||||||||||||||||
Goodwill and non-qualifying intangibles, net of deferred tax liabilities(1) | (10,530 | ) | – | (10,686 | ) | – | (10,482 | ) | – | |||||||||||||||
Threshold related deductions | (928 | ) | – | (1,350 | ) | – | (305 | ) | – | |||||||||||||||
Net deferred tax assets (excluding those arising from temporary differences) | (602 | ) | – | (615 | ) | – | (620 | ) | – | |||||||||||||||
Other Common Equity Tier 1 adjustments(2) | (423 | ) | (4,093 | ) | (339 | ) | (4,247 | ) | (330 | ) | (3,253 | ) | ||||||||||||
Common Equity Tier 1 Capital | $ | 34,750 | $ | 42,619 | $ | 34,389 | $ | 42,646 | $ | 33,742 | $ | 41,712 | ||||||||||||
Preferred Shares(3) | 2,934 | 2,934 | 2,934 | 2,934 | 2,934 | 2,934 | ||||||||||||||||||
Capital instrument liabilities – trust securities(3) | 1,400 | 1,400 | 1,400 | 1,400 | 1,400 | 1,400 | ||||||||||||||||||
Other Tier 1 capital adjustments(4) | (7 | ) | (4,334 | ) | (6 | ) | (4,334 | ) | (3 | ) | (4,334 | ) | ||||||||||||
Net Tier 1 Capital | $ | 39,077 | $ | 42,619 | $ | 38,717 | $ | 42,646 | $ | 38,073 | $ | 41,712 | ||||||||||||
Subordinated debentures, net of amortization(3) | 6,134 | 6,134 | 4,973 | 4,973 | 4,871 | 4,871 | ||||||||||||||||||
Other Tier 2 capital adjustments(4) | 652 | 409 | 664 | 340 | 648 | 517 | ||||||||||||||||||
Total regulatory capital | $ | 45,863 | $ | 49,162 | $ | 44,354 | $ | 47,959 | $ | 43,592 | $ | 47,100 | ||||||||||||
CET1 risk-weighted assets(5) | $ | 328,688 | $ | 335,233 | $ | 335,200 | $ | 342,740 | $ | 312,473 | $ | 319,936 | ||||||||||||
Tier 1 risk-weighted assets(5) | 329,424 | 335,233 | 336,092 | 342,740 | 313,263 | 319,936 | ||||||||||||||||||
Total risk-weighted assets(5) | $ | 330,055 | $ | 335,233 | $ | 336,857 | $ | 342,740 | $ | 314,449 | $ | 319,936 | ||||||||||||
Capital ratios | ||||||||||||||||||||||||
Common Equity Tier 1 Capital ratio | 10.6 | % | 12.7 | % | 10.3 | % | 12.4 | % | 10.8 | % | 13.0 | % | ||||||||||||
Tier 1 capital ratio | 11.9 | % | 12.7 | % | 11.5 | % | 12.4 | % | 12.2 | % | 13.0 | % | ||||||||||||
Total capital ratio | 13.9 | % | 14.7 | % | 13.2 | % | 14.0 | % | 13.9 | % | 14.7 | % | ||||||||||||
Leverage: | ||||||||||||||||||||||||
Leverage exposures(6) | $ | 947,169 | $ | 950,456 | $ | 953,626 | $ | 957,249 | N/A | N/A | ||||||||||||||
Leverage ratio(6) | 4.1 | % | 4.5 | % | 4.1 | % | 4.5 | % | N/A | N/A | ||||||||||||||
Assets-to-capital multiple(6)(7) | N/A | N/A | N/A | N/A | 17.1 | x | 17.1 | x | ||||||||||||||||
| (1) | Reported amounts are based on OSFI’s requirements that goodwill relating to investments in associates be classified as goodwill for regulatory reporting purposes beginning Q3 2014. |
| (2) | Other Common Equity Tier 1 capital adjustments under the all-in approach include defined pension plan assets and other items. For the transitional approach, deductions include: Common Equity Tier 1 all-in deductions multiplied by an annual transitional factor (40% in 2015; 20% in 2014) and an adjustment for Additional Tier 1 deductions for which there is insufficient Additional Tier 1 capital. |
| (3) | Qualifying Tier 1 and Tier 2 Capital instruments are compliant with Basel III requirement for NVCC. Non-qualifying Tier 1 and Tier 2 capital instruments are subject to a phase-out period of 10 years. Amounts reported for regulatory capital may be less than as reported on the Consolidated Statement of Financial Position. |
| (4) | Other Tier 1/Tier 2 capital adjustments under the all-in approach include eligible non-controlling interests in subsidiaries; in addition, Tier 2 includes eligible collective allowance and excess allowance. For the transitional approach, other Tier 1/Tier 2 capital adjustments include the amount of the Common Equity Tier 1 regulatory adjustment not deducted that were Tier 1/Tier 2 deductions under Basel II (such as 50% of significant investments in financial institutions). |
| (5) | As at April 30, 2015, the CVA risk-weighted assets were calculated using scalars of 0.64, 0.71 and 0.77 to compute CET1 capital ratio, Tier 1 capital ratio and Total capital ratio, respectively (January 31, 2015 – scalars of 0.64, 0.71 and 0.77; October 31, 2014 – scalars of 0.57, 0.65 and 0.77, respectively). |
| (6) | Effective January 31, 2015, the leverage ratio replaced the Assets-to-capital multiple. |
| (7) | As prescribed by OSFI, asset-to-capital multiple is calculated by dividing the Bank’s total assets, including specific off-balance sheet items, by total regulatory capital on a transitional basis. |
The Bank substantially exceeded the OSFI minimum capital requirement as at April 30, 2015. OSFI has also prescribed an authorized leverage ratio and the Bank was above the regulatory minimum as at April 30, 2015.
| 13. | Share-based payments |
During the first quarter, the Bank granted 1,514,158 options with an exercise price of $68.32 per option and a weighted average fair value of $7.63 to selected employees, under the terms of the Employee Stock Option Plan. These stock options vest 50% at the end of the third year and 50% at the end of the fourth year. This change is prospective and does not impact prior period grants. Options granted prior to December 2014 vest evenly over a four-year period.
Scotiabank Second Quarter Report 2015 61
Table of Contents
CONDENSED INTERIM CONSOLIDATED FINANCIAL STATEMENTS
The Bank recorded an increase to equity – other reserves of $2 million and $11 million for the three months and six months ended April 30, 2015, respectively (April 30, 2014 – $4 million and $24 million) as a result of equity-classified share-based payment expense.
| 14. | Employee benefits |
Employee benefits include pensions, other post-retirement benefits, and post-employment benefits. The following table summarizes the expenses for the Bank’s principal plans(1).
| For the three months ended | ||||||||||||||||||||||||||
| Pension plans | Other benefit plans | |||||||||||||||||||||||||
| ($ millions) | April 30 2015 | January 31 2015 | April 30 2014 | April 30 2015 | January 31 2015 | April 30 2014 | ||||||||||||||||||||
Defined benefit service cost | $ | 77 | $ | 75 | $ | 67 | $ | 11 | $ | 12 | $ | 10 | ||||||||||||||
Interest on net defined benefit (asset) liability | 5 | 5 | 3 | 15 | 15 | 15 | ||||||||||||||||||||
Other | 2 | 2 | 2 | (3 | ) | 3 | 1 | |||||||||||||||||||
Defined benefit expense | $ | 84 | $ | 82 | $ | 72 | $ | 23 | $ | 30 | $ | 26 | ||||||||||||||
Defined contribution expense | $ | 7 | $ | 7 | $ | 5 | n/a | n/a | n/a | |||||||||||||||||
Increase (decrease) in other comprehensive income related to employee benefits(2) | $ | 328 | $ | (725 | ) | $ | – | $ | 77 | $ | (140 | ) | $ | (63 | ) | |||||||||||
| For the six months ended | ||||||||||||||||||
| Pension plans | Other benefit plans | |||||||||||||||||
| ($ millions) | April 30 2015 | April 30 2014 | April 30 2015 | April 30 2014 | ||||||||||||||
Defined benefit service cost | $ | 152 | $ | 131 | $ | 23 | $ | 19 | ||||||||||
Interest on net defined benefit (asset) liability | 10 | 4 | 30 | 29 | ||||||||||||||
Other | 4 | 4 | – | 2 | ||||||||||||||
Defined benefit expense | $ | 166 | $ | 139 | $ | 53 | $ | 50 | ||||||||||
Defined contribution expense | $ | 14 | $ | 10 | n/a | n/a | ||||||||||||
Increase (decrease) in other comprehensive income related to employee benefits(2) | $ | (397 | ) | $ | (84 | ) | $ | (63 | ) | $ | (57 | ) | ||||||
| (1) | Other plans operated by certain subsidiaries of the Bank are not considered material and are not included in this note. |
| (2) | Changes in discount rates and return on plan assets are reviewed and updated on a quarterly basis. All other assumptions are updated annually. |
| 15. | Operating segments |
Scotiabank is a diversified financial services institution that provides a wide range of financial products and services to retail, commercial and corporate customers around the world. The Bank’s businesses are grouped into three business lines: Canadian Banking, International Banking and Global Banking & Markets. The results of these business segments are based upon the internal financial reporting systems of the Bank. The accounting policies used in these segments are generally consistent with those followed in the preparation of the consolidated financial statements as disclosed in Note 3 of the Bank’s consolidated financial statements in the 2014 Annual Report. Notable accounting measurement differences are:
| – | tax normalization adjustments related to the gross-up of income from associated corporations. This adjustment normalizes the effective tax rate in the divisions to better present the contribution of the associated companies to the divisional results. |
| – | the grossing up of tax-exempt net interest income and non-interest income to an equivalent before-tax basis for those affected segments. This change in measurement enables comparison of net interest income and non-interest income arising from taxable and tax-exempt sources. |
Changes to operating segments effective November 1, 2014
Effective November 1, 2014, the Canadian and International businesses previously reported in Global Wealth & Insurance are included in Canadian Banking and International Banking’s results, respectively. As well, certain Asia business activity previously reported in International Banking is now included in Global Banking & Markets. Prior period comparative results have been restated.
62 Scotiabank Second Quarter Report 2015
Table of Contents
CONDENSED INTERIM CONSOLIDATED FINANCIAL STATEMENTS
Scotiabank’s results, and average assets and liabilities, allocated by these operating segments, are as follows:
| For the three months ended April 30, 2015 | ||||||||||||||||||||
| Taxable equivalent basis(1) ($ millions) | Canadian Banking | International Banking | Global Banking | Other(2) | Total | |||||||||||||||
Net interest income | $ | 1,574 | $ | 1,380 | $ | 259 | $ | (15 | ) | $ | 3,198 | |||||||||
Non-interest income(3) | 1,210 | 751 | 839 | (61 | ) | 2,739 | ||||||||||||||
Total revenues | 2,784 | 2,131 | 1,098 | (76 | ) | 5,937 | ||||||||||||||
Provision for credit losses | 169 | 266 | 13 | – | 448 | |||||||||||||||
Non-interest expenses | 1,487 | 1,224 | 467 | 46 | 3,224 | |||||||||||||||
Provision for income taxes | 299 | 154 | 169 | (154 | ) | 468 | ||||||||||||||
Net income | $ | 829 | $ | 487 | $ | 449 | $ | 32 | $ | 1,797 | ||||||||||
Net income attributable to non-controlling interests in subsidiaries | $ | – | $ | 40 | $ | – | $ | – | $ | 40 | ||||||||||
Net income attributable to equity holders of the Bank | $ | 829 | $ | 447 | $ | 449 | $ | 32 | $ | 1,757 | ||||||||||
Average assets($ billions) | $ | 298 | $ | 128 | $ | 355 | $ | 89 | $ | 870 | ||||||||||
Average liabilities($ billions) | $ | 216 | $ | 94 | $ | 247 | $ | 262 | $ | 819 | ||||||||||
| (1) | Refer to page 4 for a discussion of non-GAAP measures. |
| (2) | Includes all other smaller operating segments and corporate adjustments, such as the elimination of the tax-exempt income gross-up reported in net interest income and non-interest income and provision for income taxes of ($117) to arrive at the amounts reported in the Consolidated Statement of Income, differences in the actual amount of costs incurred and charged to the operating segments. |
| (3) | Includes net income from investments in associated corporations for Canadian Banking – $19; International Banking – $112 and Other– $(32). |
| For the three months ended January 31, 2015 | ||||||||||||||||||||
| Taxable equivalent basis(1) ($ millions) | Canadian Banking | International Banking | Global Banking | Other(2) | Total | |||||||||||||||
Net interest income | $ | 1,551 | $ | 1,349 | $ | 267 | $ | 2 | $ | 3,169 | ||||||||||
Non-interest income(3) | 1,181 | 726 | 765 | 22 | 2,694 | |||||||||||||||
Total revenues | 2,732 | 2,075 | 1,032 | 24 | 5,863 | |||||||||||||||
Provision for credit losses | 165 | 285 | 13 | – | 463 | |||||||||||||||
Non-interest expenses | 1,464 | 1,204 | 465 | 64 | 3,197 | |||||||||||||||
Provision for income taxes | 288 | 122 | 150 | (83 | ) | 477 | ||||||||||||||
Net income | $ | 815 | $ | 464 | $ | 404 | $ | 43 | $ | 1,726 | ||||||||||
Net income attributable to non-controlling interests in subsidiaries | $ | – | $ | 47 | $ | – | $ | – | $ | 47 | ||||||||||
Net income attributable to equity holders of the Bank | $ | 815 | $ | 417 | $ | 404 | $ | 43 | $ | 1,679 | ||||||||||
Average assets($ billions) | $ | 297 | $ | 120 | $ | 339 | $ | 79 | $ | 835 | ||||||||||
Average liabilities($ billions) | $ | 213 | $ | 89 | $ | 238 | $ | 245 | $ | 785 | ||||||||||
| (1) | Refer to page 4 for a discussion of non-GAAP measures. |
| (2) | Includes all other smaller operating segments and corporate adjustments, such as the elimination of the tax-exempt income gross-up reported in net interest income and non-interest income and provision for income taxes of $(92) to arrive at the amounts reported in the Consolidated Statement of Income, differences in the actual amount of costs incurred and charged to the operating segments. |
| (3) | Includes net income from investments in associated corporations for Canadian Banking – $15; International Banking – $108 and Other – $(33). |
Scotiabank Second Quarter Report 2015 63
Table of Contents
CONDENSED INTERIM CONSOLIDATED FINANCIAL STATEMENTS
| For the three months ended April 30, 2014 | ||||||||||||||||||||
| Taxable equivalent basis(1) ($ millions) | Canadian Banking | International Banking | Global Banking & Markets | Other(2) | Total | |||||||||||||||
Net interest income | $ | 1,454 | $ | 1,289 | $ | 270 | $ | 38 | $ | 3,051 | ||||||||||
Non-interest income(3) | 1,183 | 739 | 805 | (53 | ) | 2,674 | ||||||||||||||
Total revenues | 2,637 | 2,028 | 1,075 | (15 | ) | 5,725 | ||||||||||||||
Provision for credit losses | 140 | 229 | 6 | – | 375 | |||||||||||||||
Non-interest expenses | 1,400 | 1,117 | 437 | 41 | 2,995 | |||||||||||||||
Provision for income taxes | 273 | 174 | 196 | (88 | ) | 555 | ||||||||||||||
Net income | $ | 824 | $ | 508 | $ | 436 | $ | 32 | $ | 1,800 | ||||||||||
Net income attributable to non-controlling interests in subsidiaries | 1 | 57 | – | – | 58 | |||||||||||||||
Net income attributable to equity holders of the Bank | $ | 823 | $ | 451 | $ | 436 | $ | 32 | $ | 1,742 | ||||||||||
Average assets($ billions) | $ | 290 | $ | 117 | $ | 313 | $ | 78 | $ | 798 | ||||||||||
Average liabilities($ billions) | $ | 206 | $ | 86 | $ | 218 | $ | 240 | $ | 750 | ||||||||||
| (1) | Refer to page 4 for a discussion of non-GAAP measures. |
| (2) | Includes all other smaller operating segments and corporate adjustments, such as the elimination of the tax-exempt income gross-up reported in net interest income and non-interest income and provision for income taxes of $(84) to arrive at the amounts reported in the Consolidated Statement of Income, differences in the actual amount of costs incurred and charged to the operating segments. |
| (3) | Includes net income from investments in associated corporations for Canadian Banking – $68; International Banking – $99 and Other – $(40). |
| For the six months ended April 30, 2015 | ||||||||||||||||||||
| Taxable equivalent basis(1) ($ millions) | Canadian Banking | International Banking | Global Banking | Other(2) | Total | |||||||||||||||
Net interest income | $ | 3,125 | $ | 2,729 | $ | 526 | $ | (13 | ) | $ | 6,367 | |||||||||
Non-interest income(3) | 2,391 | 1,477 | 1,604 | (39 | ) | 5,433 | ||||||||||||||
Total revenues | 5,516 | 4,206 | 2,130 | (52 | ) | 11,800 | ||||||||||||||
Provision for credit losses | 334 | 551 | 26 | – | 911 | |||||||||||||||
Non-interest expenses | 2,951 | 2,428 | 932 | 110 | 6,421 | |||||||||||||||
Provision for income taxes | 587 | 276 | 319 | (237 | ) | 945 | ||||||||||||||
Net income | $ | 1,644 | $ | 951 | $ | 853 | $ | 75 | $ | 3,523 | ||||||||||
Net income attributable to non-controlling interests in subsidiaries | $ | – | $ | 87 | $ | – | $ | – | $ | 87 | ||||||||||
Net income attributable to equity holders of the Bank | $ | 1,644 | $ | 864 | $ | 853 | $ | 75 | $ | 3,436 | ||||||||||
Average assets($ billions) | $ | 297 | $ | 124 | $ | 347 | $ | 82 | $ | 850 | ||||||||||
Average liabilities($ billions) | $ | 215 | $ | 91 | $ | 242 | $ | 252 | $ | 800 | ||||||||||
| (1) | Refer to page 4 for a discussion of non-GAAP measures. |
| (2) | Includes all other smaller operating segments and corporate adjustments, such as the elimination of the tax-exempt income gross-up reported in net interest income and non-interest income and provision for income taxes of $(209) to arrive at the amounts reported in the Consolidated Statement of Income, differences in the actual amount of costs incurred and charged to the operating segments. |
| (3) | Includes net income from investments in associated corporations for Canadian Banking – $34; International Banking – $220 and Other – $(65). |
64 Scotiabank Second Quarter Report 2015
Table of Contents
CONDENSED INTERIM CONSOLIDATED FINANCIAL STATEMENTS
| For the six months ended April 30, 2014 | ||||||||||||||||||||
| Taxable equivalent basis(1) ($ millions) | Canadian Banking | International Banking | Global Banking & Markets | Other(2) | Total | |||||||||||||||
Net interest income | $ | 2,934 | $ | 2,545 | $ | 530 | $ | 47 | $ | 6,056 | ||||||||||
Non-interest income(3) | 2,347 | 1,468 | 1,569 | (70 | ) | 5,314 | ||||||||||||||
Total revenues | 5,281 | 4,013 | 2,099 | (23 | ) | 11,370 | ||||||||||||||
Provision for credit losses | 275 | 446 | 10 | – | 731 | |||||||||||||||
Non-interest expenses | 2,806 | 2,286 | 926 | 82 | 6,100 | |||||||||||||||
Provision for income taxes | 547 | 294 | 339 | (150 | ) | 1,030 | ||||||||||||||
Net income | $ | 1,653 | $ | 987 | $ | 824 | $ | 45 | $ | 3,509 | ||||||||||
Net income attributable to non-controlling interests in subsidiaries | 1 | 111 | – | – | 112 | |||||||||||||||
Net income attributable to equity holders of the Bank | $ | 1,652 | $ | 876 | $ | 824 | $ | 45 | $ | 3,397 | ||||||||||
Average assets($ billions) | $ | 290 | $ | 115 | $ | 306 | $ | 76 | $ | 787 | ||||||||||
Average liabilities($ billions) | $ | 206 | $ | 85 | $ | 215 | $ | 234 | $ | 740 | ||||||||||
| (1) | Refer to page 4 for a discussion of non-GAAP measures. |
| (2) | Includes all other smaller operating segments and corporate adjustments, such as the elimination of the tax-exempt income gross-up reported in net interest income and non-interest income and provision for income taxes of $(164) to arrive at the amounts reported in the Consolidated Statement of Income, differences in the actual amount of costs incurred and charged to the operating segments. |
| (3) | Includes net income from investments in associated corporations for Canadian Banking – $130; International Banking – $216 and Other – $(84). |
| 16. | Non-interest income |
The following table presents details of banking revenues and wealth management revenues in non-interest income.
| For the three months ended | For the six months ended | |||||||||||||||||||
| ($ millions) | April 30 2015 | January 31 2015 | April 30 2014 | April 30 2015 | April 30 2014 | |||||||||||||||
Banking | ||||||||||||||||||||
Card revenues | $ | 263 | $ | 259 | $ | 224 | $ | 522 | $ | 456 | ||||||||||
Deposit and payment services | 306 | 302 | 291 | 608 | 580 | |||||||||||||||
Credit fees | 261 | 252 | 235 | 513 | 506 | |||||||||||||||
Other | 90 | 90 | 80 | 180 | 172 | |||||||||||||||
| 920 | 903 | 830 | 1,823 | 1,714 | ||||||||||||||||
Banking fee related expenses | 102 | 93 | 85 | 195 | 166 | |||||||||||||||
Total banking revenues | $ | 818 | $ | 810 | $ | 745 | $ | 1,628 | $ | 1,548 | ||||||||||
Wealth management | ||||||||||||||||||||
Mutual funds | $ | 405 | $ | 393 | $ | 359 | $ | 798 | $ | 714 | ||||||||||
Brokerage fees | 254 | 247 | 234 | 501 | 465 | |||||||||||||||
Investment management and trust | 165 | 159 | 154 | 324 | 299 | |||||||||||||||
Total wealth management revenues | $ | 824 | $ | 799 | $ | 747 | $ | 1,623 | $ | 1,478 | ||||||||||
Prior period amounts for April 30, 2014 have been restated to conform with current period presentation.
Scotiabank Second Quarter Report 2015 65
Table of Contents
CONDENSED INTERIM CONSOLIDATED FINANCIAL STATEMENTS
| 17. | Earnings per share |
| For the three months ended | For the six months ended | |||||||||||||||||||
| ($ millions) |
| April 30 2015 |
|
| January 31 2015 |
|
| April 30 2014 |
| | April 30 2015 | |
| April 30 2014 |
| |||||
Basic earnings per common share | ||||||||||||||||||||
Net income attributable to common shareholders | $ | 1,727 | $ | 1,649 | $ | 1,699 | $ | 3,376 | $ | 3,306 | ||||||||||
Average number of common shares outstanding(millions) | 1,210 | 1,215 | 1,215 | 1,213 | 1,212 | |||||||||||||||
Basic earnings per common share(1) (in dollars) | $ | 1.43 | $ | 1.36 | $ | 1.40 | $ | 2.78 | $ | 2.73 | ||||||||||
Diluted earnings per common share | ||||||||||||||||||||
Net income attributable to common shareholders | $ | 1,727 | $ | 1,649 | $ | 1,699 | $ | 3,376 | $ | 3,306 | ||||||||||
Adjustments to net income due to share-based payment options and others(2) | 16 | – | 1 | 34 | 4 | |||||||||||||||
Adjusted income attributable to common shareholders | $ | 1,743 | $ | 1,649 | $ | 1,700 | $ | 3,410 | $ | 3,310 | ||||||||||
Average number of common shares outstanding(millions) | 1,210 | 1,215 | 1,215 | 1,213 | 1,212 | |||||||||||||||
Adjustments to average shares due toshare-based payment options and others(2)(millions) | 21 | 5 | 7 | 20 | 7 | |||||||||||||||
Average number of diluted common shares outstanding(millions) | 1,231 | 1,220 | 1,222 | 1,233 | 1,219 | |||||||||||||||
Diluted earnings per common share(1) (in dollars) | $ | 1.42 | $ | 1.35 | $ | 1.39 | $ | 2.77 | $ | 2.71 | ||||||||||
| (1) | Earnings per share calculations are based on full dollar and share amounts. |
| (2) | Certain grants of tandem stock appreciation rights or options that the Bank may settle at its own discretion by issuing common shares in relation to non-controlling interests and additional interest in an associated company were not included in the calculation of diluted earnings per share as they were anti-dilutive. |
| 18. | Financial instruments |
(a) Risk management
The Bank’s principal business activities result in a balance sheet that consists primarily of financial instruments. In addition, the Bank uses derivative financial instruments for both trading and hedging purposes. The principal financial risks that arise from transacting financial instruments include credit risk, liquidity risk and market risk. The Bank’s framework to monitor, evaluate and manage these risks is consistent with that in place as at October 31, 2014.
(i) Credit risk
Credit risk is the risk of loss resulting from the failure of a borrower or counterparty to honour its financial or contractual obligations to the Bank.
Credit risk exposures disclosed below are presented based on Basel framework utilized by the Bank. The Bank uses the Advanced Internal Ratings Based approach (AIRB) for all material Canadian, U.S. and European portfolios, and for a significant portion of the international corporate and commercial portfolios. The remaining portfolios, including other international portfolios, are treated under the standardized approach. Under the AIRB approach, the Bank uses internal risk parameter estimates, based on historical experience.
66 Scotiabank Second Quarter Report 2015
Table of Contents
CONDENSED INTERIM CONSOLIDATED FINANCIAL STATEMENTS
Under the standardized approach, credit risk is estimated using the risk weights as prescribed by the Basel framework, either based on credit assessments by external rating agencies or based on the counterparty type for non-retail exposures and product type for retail exposures.
| Exposure at default(1) | As at | |||||||||||||||||||
| April 30, 2015 | January 31 2015 | October 31 2014 | ||||||||||||||||||
| ($ millions) | AIRB | Standardized | Total | Total | Total | |||||||||||||||
By exposure sub-type | ||||||||||||||||||||
Non-retail(2) | ||||||||||||||||||||
Drawn(3) | $ | 290,125 | $ | 51,149 | $ | 341,274 | $ | 351,289 | $ | 316,057 | ||||||||||
Undrawn commitments | 59,718 | 4,592 | 64,310 | 67,661 | 59,388 | |||||||||||||||
Other exposures(4) | 93,930 | 3,384 | 97,314 | 103,579 | 85,909 | |||||||||||||||
Total non-retail | $ | 443,773 | $ | 59,125 | $ | 502,898 | $ | 522,529 | $ | 461,354 | ||||||||||
Retail | ||||||||||||||||||||
Drawn(5) | $ | 157,985 | $ | 48,434 | $ | 206,419 | $ | 205,166 | $ | 210,101 | ||||||||||
Undrawn commitments | 29,748 | – | 29,748 | 29,695 | 29,064 | |||||||||||||||
Total retail | $ | 187,733 | $ | 48,434 | $ | 236,167 | $ | 234,861 | $ | 239,165 | ||||||||||
Total | $ | 631,506 | $ | 107,559 | $ | 739,065 | $ | 757,390 | $ | 700,519 | ||||||||||
| (1) | After credit risk mitigation and excludes available-for-sale equity securities and other assets. |
| (2) | Non-retail AIRB drawn exposures include government guaranteed mortgages. |
| (3) | Non-retail drawn includes loans, bankers’ acceptances, deposits with financial institutions and available-for-sale debt securities. |
| (4) | Includes off-balance sheet lending instruments such as letters of credit, letters of guarantee, securitization, over-the-counter derivatives and repo-style transactions net of related collateral. |
| (5) | Retail drawn includes residential mortgages, credit cards, lines of credit and other personal loans. |
Credit quality of non-retail exposures
The Bank’s non-retail portfolio is well diversified by industry. As at April 30, 2015, January 31, 2015 and October 31, 2014, a significant portion of the authorized corporate and commercial lending portfolio was internally assessed at a grade that would generally equate to an investment grade rating by external rating agencies. There has not been a significant change in concentrations of credit risk since October 31, 2014.
Credit quality of retail exposures
The Bank’s retail portfolios consist of a number of relatively small loans to a large number of borrowers. The portfolios are distributed across Canada and a wide range of countries. As such, the portfolios inherently have a high degree of diversification. In addition, as of April 30, 2015, 50% (January 31, 2015 – 52%; October 31, 2014 – 52%) of the Canadian residential mortgage portfolio is insured. The average loan-to-value ratio of the uninsured portion of the Canadian residential mortgage portfolio is 53% (January 31, 2015 – 55%; October 31, 2014 – 54%).
Retail standardized portfolio
The retail standardized portfolio of $48 billion as at April 30, 2015 (January 31, 2015 – $50 billion; October 31, 2014 – $47 billion), was comprised of residential mortgages, personal loans, credit cards and lines of credit to individuals, mainly in the Caribbean and Latin American region. Of the total standardized retail exposures, $25 billion (January 31, 2015 – $26 billion; October 31, 2014 – $24 billion) was represented by mortgages and loans secured by residential real estate, mostly with a loan-to-value ratio of below 80%.
(ii) Liquidity risk
Liquidity risk is the risk that the Bank is unable to meet its financial obligations in a timely manner at reasonable prices. The Bank’s liquidity risk is subject to extensive risk management controls and is managed within the framework of policies and limits approved by the Board. The Board receives reports on risk exposures and performance against approved limits. The Asset/Liability Committee (ALCO) provides senior management oversight of liquidity risk.
The key elements of the Bank’s liquidity risk management framework include:
| – | liquidity risk measurement and management limits, including limits on maximum net cash outflow by currency over specified short-term horizons; |
Scotiabank Second Quarter Report 2015 67
Table of Contents
CONDENSED INTERIM CONSOLIDATED FINANCIAL STATEMENTS
| – | prudent diversification of its wholesale funding activities by using a number of different funding programs to access the global financial markets and manage its maturity profile, as appropriate; |
| – | large holdings of liquid assets to support its operations, which can generally be sold or pledged to meet the Bank’s obligations; |
| – | liquidity stress testing, including Bank-specific, global-systemic, and combination systemic/specific scenarios; and |
| – | liquidity contingency planning. |
The Bank’s foreign operations have liquidity management frameworks that are similar to the Bank’s framework. Local deposits are managed from a liquidity risk perspective based on the local management frameworks and regulatory requirements.
(iii) Market risk
Market risk arises from changes in market prices and rates (including interest rates, credit spreads, equity prices, foreign exchange rates and commodity prices), the correlations among them, and their levels of volatility.
Interest rate risk
Interest rate risk, inclusive of credit spread risk, is the risk of loss due to the following: changes in the level, slope and curvature of the yield curve; the volatility of interest rates; mortgage prepayment rates; changes in the market price of credit; and the creditworthiness of a particular issuer.
Non-trading interest rate sensitivity
Based on the Bank’s interest rate positions, the following table shows the pro-forma after-tax impact on the Bank’s net income over the next twelve months and economic value of shareholders’ equity of an immediate and sustained 100 and 200 basis point (bp) increase and decrease in interest rates across major currencies as defined by the Bank.
| As at | ||||||||||||||||||||||||||||||||||||||||
| April 30, 2015 | January 31, 2015 | April 30, 2014 | ||||||||||||||||||||||||||||||||||||||
| Net income | Economic value | |||||||||||||||||||||||||||||||||||||||
| ($ millions) | Canadian dollar | Other currencies | Total | Canadian dollar | Other currencies | Total | Net income | Economic value | Net income | Economic value | ||||||||||||||||||||||||||||||
+ 100 bps | $ | 13 | $ | 111 | $ | 124 | $ | (357 | ) | $ | (86 | ) | $ | (444 | ) | $ | 193 | $ | (278 | ) | $ | 182 | $ | (489 | ) | |||||||||||||||
– 100 bps(1) | (13 | ) | (33 | ) | (46 | ) | 238 | 150 | 389 | (96 | ) | 235 | (102 | ) | 387 | |||||||||||||||||||||||||
+ 200 bps | $ | 25 | $ | 222 | $ | 247 | $ | (787 | ) | $ | (173 | ) | $ | (959 | ) | $ | 385 | $ | (625 | ) | $ | 367 | $ | (1,111 | ) | |||||||||||||||
– 200 bps(1) | (25 | ) | (40 | ) | (65 | ) | 15 | 407 | 421 | (160 | ) | 68 | (171 | ) | 728 | |||||||||||||||||||||||||
| (1) | Corresponding with the current low interest rate environment; the annual income sensitivity for US, EUR, and GBP exposures are measured using a 25 bp decline. April 30, 2014 amounts have been restated to reflect this change. |
Non-trading foreign currency risk
Foreign currency risk is the risk of loss due to changes in spot and forward rates.
As at April 30, 2015, a one per cent increase (decrease) in the Canadian dollar against all currencies in which the Bank operates decreases (increases) the Bank’s before-tax annual earnings by approximately $59 million (January 31, 2015 – $54 million; April 30, 2014 – $52 million) in the absence of hedging activity, primarily from exposure to U.S. dollars. The Bank hedges a portion of this foreign currency risk.
A similar change in the Canadian dollar as at April 30, 2015, would decrease (increase) the unrealized foreign currency translation gains in the accumulated other comprehensive income section of shareholders’ equity by approximately $281 million (January 31, 2015 – $276 million; April 30, 2014 – $233 million), net of hedging.
Non-trading equity risk
Equity risk is the risk of loss due to adverse movements in equity prices. The Bank is exposed to equity risk through its available-for-sale equity portfolios. The fair value of available-for-sale equity securities is shown in Note 6.
68 Scotiabank Second Quarter Report 2015
Table of Contents
CONDENSED INTERIM CONSOLIDATED FINANCIAL STATEMENTS
Trading portfolio risk management
The table below shows the Bank’s VaR by risk factor along with Stressed VaR:
| One-day VaR by risk factor | ||||||||||||||||||||||||
| For the three months ended | As at | As at | ||||||||||||||||||||||
| April 30, 2015 | April 30 2015 | January 31 2015 | April 30 2014 | |||||||||||||||||||||
| ($ millions) | Average | High | Low | |||||||||||||||||||||
Credit spread plus interest rate | $ | 8.0 | $ | 9.8 | $ | 6.3 | $ | 7.3 | $ | 8.4 | $ | 16.6 | ||||||||||||
Credit spread | 8.2 | 9.8 | 7.2 | 7.2 | 7.6 | 8.6 | ||||||||||||||||||
Interest rate | 4.3 | 6.8 | 2.8 | 3.1 | 4.1 | 12.9 | ||||||||||||||||||
Equities | 2.5 | 10.7 | 1.2 | 2.1 | 2.5 | 3.0 | ||||||||||||||||||
Foreign exchange | 1.1 | 2.3 | 0.6 | 0.8 | 1.8 | 0.7 | ||||||||||||||||||
Commodities | 4.1 | 5.4 | 3.0 | 4.7 | 4.1 | 2.6 | ||||||||||||||||||
Debt specific | 5.1 | 5.7 | 4.3 | 4.4 | 5.4 | 11.4 | ||||||||||||||||||
Diversification effect | (10.2 | ) | N/A | N/A | (9.8 | ) | (10.9 | ) | (14.3 | ) | ||||||||||||||
All-Bank VaR | $ | 10.5 | $ | 13.6 | $ | 8.4 | $ | 9.4 | $ | 11.3 | $ | 20.0 | ||||||||||||
All-Bank Stressed VaR | $ | 23.3 | $ | 35.1 | $ | 19.7 | $ | 19.7 | $ | 23.8 | $ | 28.4 | ||||||||||||
(iv) Operational risk
Operational risk is the risk of loss, whether direct or indirect, to which the Bank is exposed due to inadequate or failed internal processes or systems, human error, or external events. Operational risk includes legal and regulatory risk, business process and change risk, fiduciary or disclosure breaches, technology failure, financial crime and environmental risk. It exists in some form in every Bank business and function.
Operational risk can not only result in financial loss, but also regulatory sanctions and damage to the Bank’s reputation. The Bank is very successful at managing operational risk with a view to safeguarding client assets and preserving shareholder value. The Bank has developed policies, processes and assessment methodologies to ensure that operational risk is appropriately identified and managed with effective controls.
(b) Financial instruments designated at fair value through profit or loss
In accordance with its risk management strategy, the Bank has elected to designate certain financial instruments at fair value through profit or loss. These include:
| • | certain investments, in order to significantly reduce an accounting mismatch between fair value changes in these assets and fair value changes in related derivatives; and |
| • | certain deposit note liabilities containing extension and equity linked features that are economically hedged with derivatives and managed on a fair value basis. |
For assets designated at fair value through profit or loss, changes in fair value are recognized in net income. For liabilities designated at fair value through profit or loss, changes in fair value arising from changes in the Bank’s own credit risk are recognized in other comprehensive income, without subsequent reclassification to net income, unless doing so would create or increase an accounting mismatch. All other changes in fair value are recognized in net income.
For deposit note liabilities designated at fair value through profit or loss, presenting changes in fair value due to changes in the Bank’s own credit risk in other comprehensive income would not create or increase an accounting mismatch in net income since the Bank does not currently hedge its own credit risk.
The cumulative fair value adjustment due to own credit risk is determined at a point in time by comparing the present value of expected future cash flows over the term of these liabilities discounted at the Bank’s effective funding rate, and the present value of expected future cash flows discounted under a benchmark rate. The change in fair value attributable to change in credit risk is determined by the change in the cumulative fair value adjustment due to own credit risk.
Scotiabank Second Quarter Report 2015 69
Table of Contents
CONDENSED INTERIM CONSOLIDATED FINANCIAL STATEMENTS
The following table presents the fair value of assets and liabilities designated at fair value through profit or loss and their changes in fair value.
| Fair value | Change in fair value | Cumulative change in fair value(3) | ||||||||||||||||||||||||||||||||||
| As at | For the three months ended | As at | ||||||||||||||||||||||||||||||||||
| ($ millions) | April 30 2015 | January 31 | October 31 2014 | April 30 2015 | January 31 2015 | April 30 2014 | April 30 2015 | January 31 | April 30 2014 | |||||||||||||||||||||||||||
Investment securities(1) | $ | 129 | $ | 119 | $ | 111 | $ | – | $ | (1 | ) | $ 1 | $ 12 | $ | 12 | $ 15 | ||||||||||||||||||||
Deposit note liabilities(2) | 1,102 | 736 | 465 | (10 | ) | 2 | (1 | ) | 10 | 20 | 2 | |||||||||||||||||||||||||
| (1) | Changes in fair value are recorded in non-interest income – other. |
| (2) | Changes in fair value attributable to changes in the Bank’s own credit risk are recorded in other comprehensive income. Other changes in fair value are recorded in non-interest income – other. |
| (3) | The cumulative change in fair value is measured from the instruments’ date of initial recognition. |
The following tables present the changes in fair value attributable to changes in the Bank’s own credit risk for financial liabilities designated at fair value through profit or loss as well as their contractual maturity and carrying amounts.
| Term deposits | ||||||||||||||||||||
| ($ millions) | Contractual maturity amount(1) | Carrying value | Difference value and | Changes in fair value for the three month period attributable to changes in own credit risk recorded in other comprehensive income | Cumulative changes in fair value attributable to changes in own credit risk(2)(3) | |||||||||||||||
As at April 30, 2015 | $ 1,112 | $ | 1,102 | $ 10 | $ (4 | ) | $ (5 | ) | ||||||||||||
As at January 31, 2015 | $ | 756 | $ | 736 | $ | 20 | $ | 4 | $ | (1 | ) | |||||||||
| (1) | As at October 31, 2014, the contractual maturity amount of term deposits designated at fair value through profit or loss was $483. |
| (2) | The cumulative change in fair value is measured from the instruments’ date of initial recognition. |
| (3) | For the quarter ended April 30, 2015, the Bank did not realize any changes in fair value previously recorded in other comprehensive income on liabilities which were derecognized during the period. |
(c) Financial instruments – fair value
Fair value of financial instruments
The calculation of fair value is based on market conditions at a specific point in time and therefore may not be reflective of future fair values. The Bank has controls and processes in place to ensure that the valuation of financial instruments is appropriately determined.
Refer to Note 7 of the Bank’s consolidated financial statements in the 2014 Annual Report for the valuation techniques used to fair value our significant financial assets and liabilities.
70 Scotiabank Second Quarter Report 2015
Table of Contents
CONDENSED INTERIM CONSOLIDATED FINANCIAL STATEMENTS
The following table sets out the fair values of financial instruments of the Bank. The fair values disclosed do not include non-financial assets, such as property and equipment, investments in associates, precious metals, goodwill and other intangible assets.
| April 30, 2015 | January 31, 2015 | October 31, 2014 | ||||||||||||||||||||||||||||||||||
| ($ millions) | Total fair value | Total carrying value | Favourable/ (Unfavourable) | Total fair value | Total carrying value | Favourable/ (Unfavourable) | Total fair value | Total carrying value | Favourable/ (Unfavourable) | |||||||||||||||||||||||||||
Assets: | ||||||||||||||||||||||||||||||||||||
Cash and deposits with financial institutions | $ | 60,664 | $ | 60,664 | $ | – | $ | 65,894 | 65,894 | $ | – | $ | 56,730 | $ | 56,730 | $ | – | |||||||||||||||||||
Trading assets | 113,120 | 113,120 | – | 109,619 | 109,619 | – | 113,248 | 113,248 | – | |||||||||||||||||||||||||||
Financial instruments designated at fair value through profit or loss | 129 | 129 | – | 119 | 119 | – | 111 | 111 | – | |||||||||||||||||||||||||||
Securities purchased under resale agreements and securities borrowed | 98,205 | 98,205 | – | 87,217 | 87,217 | – | 93,866 | 93,866 | – | |||||||||||||||||||||||||||
Derivative financial instruments | 37,669 | 37,669 | – | 55,435 | 55,435 | – | 33,439 | 33,439 | – | |||||||||||||||||||||||||||
Investment securities | 39,828 | 39,828 | – | 40,905 | 40,905 | – | 38,662 | 38,662 | – | |||||||||||||||||||||||||||
Loans | 440,948 | 435,958 | 4,990 | 444,897 | 439,916 | 4,981 | 428,616 | 424,309 | 4,307 | |||||||||||||||||||||||||||
Customers’ liability under acceptances | 13,549 | 13,549 | – | 11,898 | 11,898 | – | 9,876 | 9,876 | – | |||||||||||||||||||||||||||
Other assets | 7,344 | 7,344 | – | 8,315 | 8,315 | – | 7,029 | 7,029 | – | |||||||||||||||||||||||||||
Liabilities: | ||||||||||||||||||||||||||||||||||||
Deposits | 577,938 | 575,281 | (2,657 | ) | 587,555 | 584,598 | (2,957 | ) | 555,754 | 554,017 | (1,737 | ) | ||||||||||||||||||||||||
Financial instruments designated at fair value through profit or loss | 1,102 | 1,102 | – | 736 | 736 | – | 465 | 465 | – | |||||||||||||||||||||||||||
Acceptances | 13,549 | 13,549 | – | 11,898 | 11,898 | – | 9,876 | 9,876 | – | |||||||||||||||||||||||||||
Obligations related to securities sold short | 22,843 | 22,843 | – | 22,784 | 22,784 | – | 27,050 | 27,050 | – | |||||||||||||||||||||||||||
Derivative financial instruments | 43,613 | 43,613 | – | 57,725 | 57,725 | – | 36,438 | 36,438 | – | |||||||||||||||||||||||||||
Obligations related to securities sold under repurchase agreements and securities lent | 89,676 | 89,676 | – | 79,322 | 79,322 | – | 88,953 | 88,953 | – | |||||||||||||||||||||||||||
Subordinated debentures | 6,323 | 6,134 | (189 | ) | 5,189 | 4,973 | (216 | ) | 5,073 | 4,871 | (202 | ) | ||||||||||||||||||||||||
Other liabilities | 21,645 | 21,209 | (436 | ) | 24,532 | 24,266 | (266 | ) | 21,668 | 21,218 | (450 | ) | ||||||||||||||||||||||||
(d) Fair value hierarchy
The best evidence of fair value for a financial instrument is the quoted price in an active market. Quoted market prices represent a Level 1 valuation. Where possible, valuations are based on quoted prices or observable inputs obtained from active markets.
Quoted prices are not always available for over-the-counter transactions, as well as transactions in inactive or illiquid markets. In these instances, internal models that maximize the use of observable inputs are used to estimate fair value. The chosen valuation technique incorporates all the factors that market participants would take into account in pricing a transaction. When all significant inputs to models are observable, the valuation is classified as Level 2. Financial instruments traded in a less active market are valued using indicative market prices, present value of cash flows or other valuation techniques. Fair value estimates normally do not consider forced or liquidation sales.
Where financial instruments trade in inactive markets or when using models where observable parameters do not exist, greater management judgment is required for valuation purposes. Valuations that require the significant use of unobservable inputs are considered Level 3.
Scotiabank Second Quarter Report 2015 71
Table of Contents
CONDENSED INTERIM CONSOLIDATED FINANCIAL STATEMENTS
The following table outlines the fair value hierarchy of instruments carried at fair value on a recurring basis.
| As at April 30, 2015 | As at January 31, 2015 | |||||||||||||||||||||||||||||||
| ($ millions) | Level 1 | Level 2 | Level 3 | Total | Level 1 | Level 2 | Level 3 | Total | ||||||||||||||||||||||||
Instruments carried at fair value on a recurring basis: | ||||||||||||||||||||||||||||||||
Assets: | ||||||||||||||||||||||||||||||||
Precious metals(1) | $ | – | $ | 8,438 | $ | – | $ | 8,438 | $ | – | $ | 9,698 | $ | – | $ | 9,698 | ||||||||||||||||
Trading assets | ||||||||||||||||||||||||||||||||
Loans | – | 17,279 | – | 17,279 | – | 18,990 | – | 18,990 | ||||||||||||||||||||||||
Canadian federal government and government guaranteed debt | 9,366 | – | – | 9,366 | 8,009 | – | – | 8,009 | ||||||||||||||||||||||||
Canadian provincial and municipal debt | – | 6,795 | – | 6,795 | – | 6,263 | – | 6,263 | ||||||||||||||||||||||||
US treasury and other US agencies’ debt | 5,131 | 729 | – | 5,860 | 5,362 | 900 | – | 6,262 | ||||||||||||||||||||||||
Other foreign governments’ debt | 8,690 | 3,133 | – | 11,823 | 8,060 | 1,904 | – | 9,964 | ||||||||||||||||||||||||
Corporate and other debt | 134 | 13,487 | 32 | 13,653 | 167 | 13,676 | 32 | 13,875 | ||||||||||||||||||||||||
Income funds and hedge funds | 156 | 1,969 | 1,393 | 3,518 | 123 | 2,065 | 1,427 | 3,615 | ||||||||||||||||||||||||
Equity securities | 40,869 | 155 | 56 | 41,080 | 38,539 | 112 | 56 | 38,707 | ||||||||||||||||||||||||
Other(2) | 3,746 | – | – | 3,746 | 3,934 | – | – | 3,934 | ||||||||||||||||||||||||
| $ | 68,092 | $ | 51,985 | $ | 1,481 | $ | 121,558 | $ | 64,194 | $ | 53,608 | $ | 1,515 | $ | 119,317 | |||||||||||||||||
Financial assets designated at fair value through profit or loss | $ | 15 | $ | 93 | $ | 21 | $ | 129 | $ | – | $ | 98 | $ | 21 | $ | 119 | ||||||||||||||||
Investment securities(3) | ||||||||||||||||||||||||||||||||
Canadian federal government and government guaranteed debt | $ | 5,850 | $ | 1,742 | $ | – | $ | 7,592 | $ | 6,047 | $ | 1,697 | $ | – | $ | 7,744 | ||||||||||||||||
Canadian provincial and municipal debt | 853 | 2,822 | – | 3,675 | 784 | 2,853 | – | 3,637 | ||||||||||||||||||||||||
US treasury and other US agencies’ debt | 5,395 | 98 | – | 5,493 | 5,809 | 33 | – | 5,842 | ||||||||||||||||||||||||
Other foreign governments’ debt | 6,006 | 6,271 | 419 | 12,696 | 5,696 | 6,442 | 444 | 12,582 | ||||||||||||||||||||||||
Bonds of designated emerging markets | – | 45 | – | 45 | – | 49 | – | 49 | ||||||||||||||||||||||||
Corporate and other debt | 883 | 5,297 | 154 | 6,334 | 875 | 5,531 | 152 | 6,558 | ||||||||||||||||||||||||
Mortgage-backed securities | 6 | 106 | 37 | 149 | – | 106 | 38 | 144 | ||||||||||||||||||||||||
Equity securities | 2,399 | 212 | 1,059 | 3,670 | 2,838 | 227 | 1,101 | 4,166 | ||||||||||||||||||||||||
| $ | 21,392 | $ | 16,593 | $ | 1,669 | $ | 39,654 | $ | 22,049 | $ | 16,938 | $ | 1,735 | $ | 40,722 | |||||||||||||||||
Derivative financial instruments | ||||||||||||||||||||||||||||||||
Interest rate contracts | $ | – | $ | 14,211 | $ | 156 | $ | 14,367 | $ | – | $ | 17,729 | $ | 138 | $ | 17,867 | ||||||||||||||||
Foreign exchange and gold contracts | 1 | 17,774 | – | 17,775 | – | 29,603 | – | 29,603 | ||||||||||||||||||||||||
Equity contracts | 165 | 1,733 | 325 | 2,223 | 144 | 2,798 | 380 | 3,322 | ||||||||||||||||||||||||
Credit contracts | – | 475 | 2 | 477 | – | 742 | 3 | 745 | ||||||||||||||||||||||||
Commodity contracts | 1,254 | 1,561 | 12 | 2,827 | 1,875 | 2,013 | 10 | 3,898 | ||||||||||||||||||||||||
| $ | 1,420 | $ | 35,754 | $ | 495 | $ | 37,669 | $ | 2,019 | $ | 52,885 | $ | 531 | $ | 55,435 | |||||||||||||||||
Liabilities: | ||||||||||||||||||||||||||||||||
Deposits(4) | $ | – | $ | 179 | $ | 1,110 | $ | 1,289 | $ | – | $ | 162 | $ | 1,149 | $ | 1,311 | ||||||||||||||||
Financial liabilities designated at fair value through profit or loss | $ | – | $ | 1,102 | $ | – | $ | 1,102 | $ | – | $ | 736 | $ | – | $ | 736 | ||||||||||||||||
Obligations related to securities sold short | $ | 18,676 | $ | 4,167 | $ | – | $ | 22,843 | $ | 18,706 | $ | 4,078 | $ | – | $ | 22,784 | ||||||||||||||||
Derivative financial instruments | ||||||||||||||||||||||||||||||||
Interest rate contracts | $ | – | $ | 13,381 | $ | 50 | $ | 13,431 | $ | – | $ | 16,412 | $ | 50 | $ | 16,462 | ||||||||||||||||
Foreign exchange and gold contracts | 2 | 19,692 | – | 19,694 | – | 28,186 | – | 28,186 | ||||||||||||||||||||||||
Equity contracts | 210 | 1,860 | 441 | 2,511 | 228 | 1,582 | 517 | 2,327 | ||||||||||||||||||||||||
Credit contracts | – | 3,452 | 8 | 3,460 | – | 3,959 | 4 | 3,963 | ||||||||||||||||||||||||
Commodity and other contracts | 1,074 | 3,185 | 258 | 4,517 | 1,309 | 5,220 | 258 | 6,787 | ||||||||||||||||||||||||
| $ | 1,286 | $ | 41,570 | $ | 757 | $ | 43,613 | $ | 1,537 | $ | 55,359 | $ | 829 | $ | 57,725 | |||||||||||||||||
| (1) | The fair value of precious metals is determined based on quoted market prices and forward spot prices. |
| (2) | Consists primarily of base metal positions. The fair value of these positions is determined based on quoted prices in active markets. |
| (3) | Excludes investments which are held-to-maturity of $174 (January 31, 2015 – $183). |
| (4) | These amounts represent embedded derivatives bifurcated from structured deposit notes. |
72 Scotiabank Second Quarter Report 2015
Table of Contents
CONDENSED INTERIM CONSOLIDATED FINANCIAL STATEMENTS
| As at October 31, 2014 | ||||||||||||||||
| ($ millions) | Level 1 | Level 2 | Level 3 | Total | ||||||||||||
Instruments carried at fair value on a recurring basis: | ||||||||||||||||
Assets: | ||||||||||||||||
Precious metals(1) | $ | – | $ | 7,286 | $ | – | $ | 7,286 | ||||||||
Trading assets | ||||||||||||||||
Loans | – | 14,508 | – | 14,508 | ||||||||||||
Canadian federal government and government guaranteed debt | 13,848 | – | – | 13,848 | ||||||||||||
Canadian provincial and municipal debt | – | 7,531 | – | 7,531 | ||||||||||||
US treasury and other US agencies’ debt | 9,212 | 1,764 | – | 10,976 | ||||||||||||
Other foreign governments’ debt | 8,004 | 2,230 | – | 10,234 | ||||||||||||
Corporate and other debt | 85 | 12,453 | 32 | 12,570 | ||||||||||||
Income funds and hedge funds | 144 | 2,946 | 1,282 | 4,372 | ||||||||||||
Equity securities | 35,564 | 217 | 51 | 35,832 | ||||||||||||
Other(2) | 3,377 | – | – | 3,377 | ||||||||||||
| $ | 70,234 | �� | $ | 48,935 | $ | 1,365 | $ | 120,534 | ||||||||
Financial assets designated at fair value through profit or loss | $ | – | $ | 90 | $ | 21 | $ | 111 | ||||||||
Investment securities (3) | ||||||||||||||||
Canadian federal government and government guaranteed debt | $ | 5,520 | $ | 1,331 | $ | – | $ | 6,851 | ||||||||
Canadian provincial and municipal debt | 803 | 2,500 | – | 3,303 | ||||||||||||
US treasury and other US agencies’ debt | 6,096 | 130 | – | 6,226 | ||||||||||||
Other foreign governments’ debt | 5,793 | 4,779 | 411 | 10,983 | ||||||||||||
Bonds of designated emerging markets | – | 45 | – | 45 | ||||||||||||
Corporate and other debt | 889 | 5,260 | 500 | 6,649 | ||||||||||||
Mortgage-backed securities | – | 99 | 39 | 138 | ||||||||||||
Equity securities | 3,087 | 208 | 1,006 | 4,301 | ||||||||||||
| $ | 22,188 | $ | 14,352 | $ | 1,956 | $ | 38,496 | |||||||||
Derivative financial instruments | ||||||||||||||||
Interest rate contracts | $ | – | $ | 12,668 | $ | 146 | $ | 12,814 | ||||||||
Foreign exchange and gold contracts | 2 | 14,996 | – | 14,998 | ||||||||||||
Equity contracts | 237 | 1,547 | 573 | 2,357 | ||||||||||||
Credit contracts | – | 970 | 4 | 974 | ||||||||||||
Commodity contracts | 875 | 1,380 | 41 | 2,296 | ||||||||||||
| $ | 1,114 | $ | 31,561 | $ | 764 | $ | 33,439 | |||||||||
Liabilities: | ||||||||||||||||
Deposits(4) | $ | – | $ | 136 | $ | 1,011 | $ | 1,147 | ||||||||
Financial liabilities designated at fair value through profit or loss | $ | – | $ | 465 | $ | – | $ | 465 | ||||||||
Obligations related to securities sold short | $ | 24,025 | $ | 3,025 | $ | – | $ | 27,050 | ||||||||
Derivative financial instruments | ||||||||||||||||
Interest rate contracts | $ | – | $ | 13,003 | $ | 52 | $ | 13,055 | ||||||||
Foreign exchange and gold contracts | 3 | 13,927 | – | 13,930 | ||||||||||||
Equity contracts | 463 | 1,711 | 456 | 2,630 | ||||||||||||
Credit contracts | – | 3,947 | 2 | 3,949 | ||||||||||||
Commodity and other contracts | 579 | 2,295 | – | 2,874 | ||||||||||||
| $ | 1,045 | $ | 34,883 | $ | 510 | $ | 36,438 | |||||||||
| (1) | The fair value of precious metals is determined based on quoted market prices and forward spot prices. |
| (2) | Consists primarily of base metal positions. The fair value of these positions is determined based on quoted prices in active markets. |
| (3) | Excludes investments which are held-to-maturity of $166. |
| (4) | These amounts represent embedded derivatives bifurcated from structured deposit notes. |
Non-recurring fair value measurements
There were no non-recurring fair value measurements at April 30, 2015, January 31, 2015 and October 31, 2014.
Level 3 instrument fair value changes
Financial instruments categorized as Level 3 in the fair value hierarchy comprise certain illiquid government bonds, highly-structured corporate bonds, mortgage-backed securities, illiquid investments in funds, private equity securities, income funds, hedge funds, complex derivatives, and embedded derivatives in structured deposit notes.
The following table summarizes the changes in Level 3 instruments carried at fair value for the three months ended April 30, 2015.
Scotiabank Second Quarter Report 2015 73
Table of Contents
CONDENSED INTERIM CONSOLIDATED FINANCIAL STATEMENTS
All positive balances represent assets and negative balances represent liabilities. Consequently, positive amounts indicate purchases of assets or settlements of liabilities and negative amounts indicate sales of assets or issuances of liabilities.
| As at April 30, 2015 | ||||||||||||||||||||||||||||||||
| ($ millions) | | Fair value, beginning of period | | | Gains/ (losses) recorded in income | (1) |
| Gains/ (losses) in OCI | (2) |
| Purchases/ Issuances |
|
| Sales/ Settlements |
|
| Transfers into / out of Level 3 |
| | Fair value, end of period | | | Change in unrealized | | ||||||||
Trading assets(4) | ||||||||||||||||||||||||||||||||
Corporate and other debt | $ | 32 | $ | – | $ | – | $ | – | $ | – | $ | – | $ | 32 | $ | – | ||||||||||||||||
Income funds and hedge funds | 1,448 | (40 | ) | – | 11 | (5 | ) | – | 1,414 | (40 | )(5) | |||||||||||||||||||||
Equity securities | 56 | – | – | – | – | – | 56 | – | ||||||||||||||||||||||||
| 1,536 | (40 | ) | – | 11 | (5 | ) | – | 1,502 | (40 | ) | ||||||||||||||||||||||
Investment securities | ||||||||||||||||||||||||||||||||
Other foreign governments’ debt | 444 | – | (25 | ) | 229 | (229 | ) | – | 419 | – | ||||||||||||||||||||||
Corporate and other debt | 152 | – | 4 | – | (2 | ) | – | 154 | – | |||||||||||||||||||||||
Mortgage-backed securities | 38 | – | – | – | (1 | ) | – | 37 | – | |||||||||||||||||||||||
Equity securities | 1,101 | 20 | (37 | ) | 22 | (47 | ) | – | 1,059 | – | ||||||||||||||||||||||
| 1,735 | 20 | (58 | ) | 251 | (279 | ) | – | 1,669 | – | |||||||||||||||||||||||
Derivative financial instruments – assets | ||||||||||||||||||||||||||||||||
Interest rate contracts | 138 | 15 | – | 3 | – | – | 156 | 15 | ||||||||||||||||||||||||
Equity contracts | 380 | 5 | – | 2 | (48 | ) | (14 | ) | 325 | (3 | ) | |||||||||||||||||||||
Credit contracts | 3 | (1 | ) | – | – | – | – | 2 | (1 | ) | ||||||||||||||||||||||
Commodity contracts | 10 | 2 | – | – | – | – | 12 | 2 | ||||||||||||||||||||||||
Derivative financial instruments – liabilities | ||||||||||||||||||||||||||||||||
Interest rate contracts | (50 | ) | 4 | – | (4 | ) | – | – | (50 | ) | 4 | |||||||||||||||||||||
Equity contracts | (517 | ) | 23 | – | (1 | ) | 35 | 19 | (441 | ) | 23 | (6) | ||||||||||||||||||||
Credit contracts | (4 | ) | 2 | – | (6 | ) | – | – | (8 | ) | 2 | |||||||||||||||||||||
Other contracts | (258 | ) | – | – | – | – | – | (258 | ) | – | ||||||||||||||||||||||
| (298 | ) | 50 | – | (6 | ) | (13 | ) | 5 | (262 | ) | 42 | |||||||||||||||||||||
Deposits(7) | (1,149 | ) | 39 | – | – | – | – | (1,110 | ) | 39 | (5) | |||||||||||||||||||||
Total | $ | 1,824 | $ | 69 | $ | (58 | ) | $ | 256 | $ | (297 | ) | $ | 5 | $ | 1,799 | $ | 41 | ||||||||||||||
| (1) | Gains and losses on trading assets and all derivative financial instruments are included in trading revenues in the Consolidated Statement of Income. Gains and losses on disposal of investment securities are included in net gain on sale of investment securities in the Consolidated Statement of Income. |
| (2) | Gains and losses from fair value changes of investment securities are presented in the net change in unrealized gains (losses) on available-for-sale securities in the Consolidated Statement of Shareholder’s Equity – Accumulated Other Comprehensive Income. |
| (3) | These amounts represent the gains and losses from fair value changes of Level 3 instruments still held at the end of the period that are recorded in the Consolidated Statement of Income. |
| (4) | Trading assets include an insignificant amount of financial assets designated at fair value through profit or loss. |
| (5) | The unrealized losses on income fund and hedge fund units are offset by the mark-to-market changes in an equity-linked deposit note and certain other derivative instruments in structured transactions. Both losses and offsetting gains are included in trading revenues in the Consolidated Statement of Income. |
| (6) | Certain unrealized gains and losses on derivative assets and liabilities are largely offset by mark-to-market changes on other instruments included in trading revenues in the Consolidated Statement of Income, since these instruments act as an economic hedge to certain derivative assets and liabilities. |
| (7) | These amounts represent embedded derivatives bifurcated from structured deposit notes. |
The following table summarizes the changes in Level 3 instruments carried at fair value for the three months ended January 31, 2015 and October 31, 2014(1):
| As at January 31, 2015 | ||||||||||||||||||||||||||||
| ($ millions) | Fair value, beginning of period | Gains/ (losses) recorded in income(1) | Gains/ (losses) recorded in OCI | Purchases/ Issuances | Sales/ Settlements | Transfers into/ out of Level 3 | Fair value, end of period | |||||||||||||||||||||
Trading assets(2) | $ | 1,386 | $ | 148 | $ | – | $ | 4 | $ | (2 | ) | $ | – | $ | 1,536 | |||||||||||||
Investment securities | 1,956 | 83 | 83 | 173 | (560 | ) | – | 1,735 | ||||||||||||||||||||
Derivative financial instruments | 254 | 20 | – | (1 | ) | 7 | (578 | ) | (298 | ) | ||||||||||||||||||
Deposits(3) | (1,011 | ) | (138 | ) | – | – | – | – | (1,149 | ) | ||||||||||||||||||
| (1) | Gains or losses for items in Level 3 may be offset with losses or gains on related hedges in Level 1 or Level 2. |
| (2) | Trading assets include an insignificant amount of financial assets designated at fair value through profit or loss. |
| (3) | These amounts represent embedded derivatives bifurcated from structured deposit notes. |
74 Scotiabank Second Quarter Report 2015
Table of Contents
CONDENSED INTERIM CONSOLIDATED FINANCIAL STATEMENTS
| As at October 31, 2014 | ||||||||||||||||||||||||||||
| ($ millions) | Fair value, beginning of period | Gains/ (losses) recorded in income(1) | Gains/ (losses) recorded in OCI | Purchases/ Issuances | Sales/ Settlements | Transfers into/ out of Level 3 | Fair value, end of period | |||||||||||||||||||||
Trading assets(2) | $ | 1,345 | $ | 25 | $ | – | $ | 51 | $ | (35 | ) | $ | – | $ | 1,386 | |||||||||||||
Investment securities | 2,023 | 105 | (46 | ) | 222 | (348 | ) | – | 1,956 | |||||||||||||||||||
Derivative financial instruments | 225 | 2 | – | (3 | ) | 10 | 20 | 254 | ||||||||||||||||||||
Deposits(3) | (986 | ) | (25 | ) | – | – | – | – | (1,011 | ) | ||||||||||||||||||
| (1) | Gains or losses for items in Level 3 may be offset with losses or gains on related hedges in Level 1 or Level 2. |
| (2) | Trading assets include an insignificant amount of financial assets designated at fair value through profit or loss. |
| (3) | These amounts represent embedded derivatives bifurcated from structured deposit notes. |
Level 3 sensitivity analysis
The table below sets out information about significant unobservable inputs used in measuring financial instruments categorized as Level 3 in the fair value hierarchy.
| | Valuation technique | | | Significant unobservable inputs | |
| Range of estimates for unobservable inputs | (1) |
| Changes in fair value from reasonably possible alternatives ($ millions) |
| |||||
Trading assets(2) | ||||||||||||||||
Corporate and other debt | Model based | Default correlation | 60% – 86% | – | ||||||||||||
Investment securities | ||||||||||||||||
Other foreign governments’ debt | Price based | Price | 100% | (2)/– | ||||||||||||
Corporate and other debt |
| Price based Discounted cash flow Model based |
|
| Price
Discount rate Default correlation |
|
| 95%
1% – 2% 60% – 86% |
| (1)/1 | ||||||
Mortgage-backed securities | Price based | Price | 95% | – | ||||||||||||
Private equity securities | Market | General Partner | ||||||||||||||
| comparable | | valuations per statements | | 100% | ||||||||||||
| Capitalization rate | 7% | (36)/36 | ||||||||||||||
Derivative financial instruments | ||||||||||||||||
Interest rate contracts |
| Option pricing model |
| Interest rate volatility | 15% – 193% | (5)/5 | ||||||||||
Equity contracts |
| Option pricing model |
|
| Equity volatility Single stock correlation |
|
| 4% – 98% (77)% – 98% |
| (7)/7 | ||||||
Credit contracts | Model based | Default correlation | 51% – 86% | (1)/1 |
| (1) | The range of estimates represents the actual lowest and highest level inputs used to fair value financial instruments within each financial statement category. |
| (2) | The valuation of private equity, hedge fund investments and embedded derivatives, bifurcated from structured deposit notes, utilize net asset values as reported by fund managers. Net asset values are not considered observable as the Bank cannot redeem these instruments at such values. The range for net asset values per unit or price per share has not been disclosed for these instruments since the valuations are not model based. |
The Bank applies judgment in determining unobservable inputs used to calculate the fair value of Level 3 instruments.
Refer to Note 7 of the Bank’s consolidated financial statements in the 2014 Annual Report for a description of the significant unobservable inputs for Level 3 instruments and the potential effect that a change in each unobservable input may have on the fair value measurement.
Changes in fair value from reasonably possible alternatives
The fair value of Level 3 instruments is determined using management’s judgements about the appropriate value of unobservable inputs. Due to the unobservable nature of the inputs used, there may be uncertainty about the valuation of Level 3 instruments. Management has used reasonably possible alternative assumptions to determine the sensitivity of these inputs and the resulting potential impact on fair value of these Level 3 instruments.
Scotiabank Second Quarter Report 2015 75
Table of Contents
CONDENSED INTERIM CONSOLIDATED FINANCIAL STATEMENTS
For the Bank’s investment securities, the impact of applying these other reasonably possible inputs is a potential gain of $37 million and a potential loss of $39 million (January 31, 2015 – potential gain of $44 milion and a potential loss of $45 million; October 31, 2014 – potential gain of $48 million and a potential loss of $57 million) recorded through other comprehensive income until the security is sold or becomes impaired.
For the Bank’s trading securities, derivative instruments and obligations related to securities sold short, the impact of applying these other reasonably possible assumptions is a potential net gain of $13 million and a potential net loss of $13 million (January 31, 2015 – potential net gain of $10 million and a potential net loss of $10 million; October 31, 2014 – potential net gain of $10 million and a potential net loss of $10 million).
A sensitivity analysis has not been performed on certain equity investments not quoted in an active market that are hedged with total return swaps.
Significant transfers
Significant transfers can occur between the fair value hierarchy levels when additional or new information regarding valuation inputs and their refinement and observability become available. The Bank recognizes transfers between levels of the fair value hierarchy as of the end of the reporting period during which the change has occurred.
During the three months ended April 30, 2015, a net amount of derivative assets of $14 million was transferred out of Level 3. $15 million was transferred into Level 2 and $1 million was transferred out of Level 1. A net amount of derivative liabilities of $19 million was transferred out of Level 3. $20 million was transferred into Level 2 and $1 million was transferred out of Level 1. During the three months ended January 31, 2015, a net amount of derivative assets of $242 million was transferred out of Level 3 to Level 2, and a net amount of derivative liabilities of $336 million was transferred into Level 3 from Level 2. During the three months ended October 31, 2014, a net amount of $20 million was transferred into Level 3 from Level 2 for derivative instruments.
All transfers were as a result of new information being obtained regarding the observability of inputs used in the valuation.
76 Scotiabank Second Quarter Report 2015
Table of Contents
CONDENSED INTERIM CONSOLIDATED FINANCIAL STATEMENTS
| 19. | Contractual maturities |
The table below provides the maturity of assets and liabilities as well as the off-balance sheet commitments based on the contractual maturity date. From a liquidity risk perspective the Bank considers factors other than contractual maturity in the assessment of liquid assets or in determining expected future cash flows. In particular, for securities with a fixed maturity date, the ability and time horizon to raise cash from these securities is more relevant to liquidity management than contractual maturity. For other assets and deposits the Bank uses assumptions about rollover rates to assess liquidity risk for normal course and stress scenarios. Similarly, the Bank uses assumptions to assess the potential drawdown of credit commitments in various scenarios.
| As at April 30, 2015 | ||||||||||||||||||||||||||||||||||||||||
| ($ millions) | Less than one month | One to three months | Three to six months | Six to nine | Nine to twelve months | One to years | Two to five years | Over five years | No specific maturity | Total | ||||||||||||||||||||||||||||||
Assets | ||||||||||||||||||||||||||||||||||||||||
Cash and deposits with financial institutions and precious metals | $ | 53,180 | $ | 1,193 | $ | 443 | $ | 443 | $ | 811 | $ | 472 | $ | 483 | $ | 35 | $ | 12,042 | $ | 69,102 | ||||||||||||||||||||
Trading assets | 4,991 | 5,607 | 3,902 | 2,043 | 2,467 | 6,914 | 16,564 | 22,258 | 48,374 | 113,120 | ||||||||||||||||||||||||||||||
Financial instruments designated at fair value through profit or loss | 12 | – | – | – | 63 | – | 14 | – | 40 | 129 | ||||||||||||||||||||||||||||||
Securities purchased under resale agreements and securities borrowed | 76,171 | 11,694 | 5,908 | 1,541 | 1,662 | 1,229 | – | – | – | 98,205 | ||||||||||||||||||||||||||||||
Derivative financial instruments | 2,636 | 1,684 | 1,434 | 1,347 | 964 | 3,380 | 7,847 | 18,377 | – | 37,669 | ||||||||||||||||||||||||||||||
Investment securities | 1,921 | 1,879 | 3,816 | 1,714 | 1,451 | 6,571 | 14,081 | 4,708 | 3,687 | 39,828 | ||||||||||||||||||||||||||||||
Loans | 23,160 | 28,378 | 26,481 | 23,222 | 26,192 | 68,461 | 165,476 | 29,051 | 45,537 | 435,958 | ||||||||||||||||||||||||||||||
Residential mortgages | 4,137 | 7,549 | 10,986 | 11,595 | 13,618 | 42,570 | 102,004 | 19,289 | 1,774 | (1) | 213,522 | |||||||||||||||||||||||||||||
Personal and credit cards | 3,169 | 2,775 | 2,418 | 2,346 | 2,263 | 8,431 | 17,415 | 4,603 | 42,766 | 86,186 | ||||||||||||||||||||||||||||||
Business and government | 15,854 | 18,054 | 13,077 | 9,281 | 10,311 | 17,460 | 46,057 | 5,159 | 4,691 | (2) | 139,944 | |||||||||||||||||||||||||||||
Allowance for credit losses | – | – | – | – | – | – | – | – | (3,694 | ) | (3,694 | ) | ||||||||||||||||||||||||||||
Customers’ liabilities under acceptances | 10,551 | 2,868 | 130 | – | – | – | – | – | – | 13,549 | ||||||||||||||||||||||||||||||
Other assets | – | – | – | – | – | – | – | – | 29,601 | 29,601 | ||||||||||||||||||||||||||||||
Total assets | $ | 172,622 | $ | 53,303 | $ | 42,114 | $ | 30,310 | $ | 33,610 | $ | 87,027 | $ | 204,465 | $ | 74,429 | $ | 139,281 | $ | 837,161 | ||||||||||||||||||||
Liabilities and equity | ||||||||||||||||||||||||||||||||||||||||
Deposits | $ | 54,171 | $ | 53,222 | $ | 56,434 | $ | 32,948 | $ | 30,299 | $ | 57,645 | $ | 58,680 | $ | 14,964 | $ | 216,918 | $ | 575,281 | ||||||||||||||||||||
Personal | 6,812 | 7,246 | 8,507 | 8,763 | 8,132 | 16,900 | 16,978 | 357 | 106,617 | 180,312 | ||||||||||||||||||||||||||||||
Non-personal | 47,359 | 45,976 | 47,927 | 24,185 | 22,167 | 40,745 | 41,702 | 14,607 | 110,301 | 394,969 | ||||||||||||||||||||||||||||||
Financial instruments designated at fair value through profit or loss | 6 | 24 | 12 | – | – | 7 | 528 | 525 | – | 1,102 | ||||||||||||||||||||||||||||||
Acceptances | 10,551 | 2,868 | 130 | – | – | – | – | – | – | 13,549 | ||||||||||||||||||||||||||||||
Obligations related to securities sold short | 203 | 88 | 239 | 122 | 220 | 2,994 | 6,008 | 9,107 | 3,862 | 22,843 | ||||||||||||||||||||||||||||||
Derivative financial instruments | 3,722 | 1,956 | 1,871 | 1,338 | 1,342 | 3,390 | 9,818 | 20,176 | – | 43,613 | ||||||||||||||||||||||||||||||
Obligations related to securities sold under repurchase agreements and securities lent | 76,196 | 3,802 | 4,120 | 3,556 | 2,002 | – | – | – | – | 89,676 | ||||||||||||||||||||||||||||||
Subordinated debentures | – | – | – | – | – | – | – | 6,134 | – | 6,134 | ||||||||||||||||||||||||||||||
Other liabilities | 434 | 1,011 | 311 | 622 | 137 | 1,023 | 2,587 | 3,478 | 24,417 | 34,020 | ||||||||||||||||||||||||||||||
Total equity | – | – | – | – | – | – | – | – | 50,943 | 50,943 | ||||||||||||||||||||||||||||||
Total liabilities and equity | $ | 145,283 | $ | 62,971 | $ | 63,117 | $ | 38,586 | $ | 34,000 | $ | 65,059 | $ | 77,621 | $ | 54,384 | $ | 296,140 | $ | 837,161 | ||||||||||||||||||||
Off-Balance sheet commitments | ||||||||||||||||||||||||||||||||||||||||
Operating leases | $ | 26 | $ | 55 | $ | 81 | $ | 80 | $ | 77 | $ | 284 | $ | 581 | $ | 563 | $ | – | $ | 1,747 | ||||||||||||||||||||
Credit commitments(3) | 1,872 | 7,557 | 11,942 | 10,716 | 11,605 | 19,900 | 75,246 | 9,201 | 5 | 148,044 | ||||||||||||||||||||||||||||||
Financial guarantees(4) | – | – | – | – | – | – | – | – | 29,790 | 29,790 | ||||||||||||||||||||||||||||||
Outsourcing obligations | 19 | 38 | 57 | 56 | 52 | 196 | 296 | 18 | 1 | 733 | ||||||||||||||||||||||||||||||
| (1) | Includes primarily impaired mortgages. |
| (2) | Includes primarily overdrafts and impaired loans. |
| (3) | Includes the undrawn component of committed credit and liquidity facilities. |
| (4) | Includes outstanding balances of guarantees, standby letters of credit and commercial letters of credit which may expire undrawn. |
Scotiabank Second Quarter Report 2015 77
Table of Contents
CONDENSED INTERIM CONSOLIDATED FINANCIAL STATEMENTS
| As at January 31, 2015 | ||||||||||||||||||||||||||||||||||||||||
| ($ millions) | Less than one month | One to three months | Three to six months | Six to nine | Nine to twelve months | One to years | Two to five years | Over five years | No specific maturity | Total | ||||||||||||||||||||||||||||||
Assets | ||||||||||||||||||||||||||||||||||||||||
Cash and deposits with financial institutions and precious metals | $ | 57,940 | $ | 1,692 | $ | 299 | $ | 171 | $ | 1,062 | $ | 284 | $ | 502 | $ | 44 | $ | 13,598 | $ | 75,592 | ||||||||||||||||||||
Trading assets | 6,326 | 5,285 | 4,268 | 1,702 | 2,184 | 6,491 | 13,854 | 23,270 | 46,239 | 109,619 | ||||||||||||||||||||||||||||||
Financial instruments designated at fair value through profit or loss | – | – | 13 | – | – | 67 | – | – | 39 | 119 | ||||||||||||||||||||||||||||||
Securities purchased under resale agreements and securities borrowed | 62,752 | 14,507 | 6,141 | 1,307 | 1,249 | 1,261 | – | – | – | 87,217 | ||||||||||||||||||||||||||||||
Derivative financial instruments | 3,879 | 3,641 | 2,253 | 1,706 | 1,852 | 4,968 | 11,642 | 25,494 | – | 55,435 | ||||||||||||||||||||||||||||||
Investment securities | 1,543 | 2,338 | 3,861 | 1,348 | 1,664 | 7,244 | 13,736 | 4,987 | 4,184 | 40,905 | ||||||||||||||||||||||||||||||
Loans | 23,205 | 26,950 | 31,643 | 22,815 | 24,900 | 73,556 | 161,658 | 29,714 | 45,475 | 439,916 | ||||||||||||||||||||||||||||||
Residential mortgages | 2,914 | 7,841 | 14,062 | 12,152 | 11,833 | 46,901 | 97,493 | 19,648 | 1,947 | (1) | 214,791 | |||||||||||||||||||||||||||||
Personal and credit cards | 3,395 | 1,612 | 3,011 | 2,303 | 2,175 | 8,182 | 17,670 | 4,943 | 42,638 | 85,929 | ||||||||||||||||||||||||||||||
Business and government | 16,896 | 17,497 | 14,570 | 8,360 | 10,892 | 18,473 | 46,495 | 5,123 | 4,678 | (2) | 142,984 | |||||||||||||||||||||||||||||
Allowance for credit losses | – | – | – | – | – | – | – | – | (3,788 | ) | (3,788 | ) | ||||||||||||||||||||||||||||
Customers’ liabilities under acceptances | 9,001 | 2,777 | 120 | – | – | – | – | – | – | 11,898 | ||||||||||||||||||||||||||||||
Other assets | – | – | – | – | – | – | – | – | 31,172 | 31,172 | ||||||||||||||||||||||||||||||
Total assets | $ | 164,646 | $ | 57,190 | $ | 48,598 | $ | 29,049 | $ | 32,911 | $ | 93,871 | $ | 201,392 | $ | 83,509 | $ | 140,707 | $ | 851,873 | ||||||||||||||||||||
Liabilities and equity | ||||||||||||||||||||||||||||||||||||||||
Deposits | $ | 60,277 | $ | 54,288 | $ | 51,019 | $ | 39,003 | $ | 20,871 | $ | 59,858 | $ | 62,238 | $ | 15,240 | $ | 221,804 | $ | 584,598 | ||||||||||||||||||||
Personal | 6,937 | 6,872 | 9,229 | 7,712 | 8,884 | 17,416 | 17,751 | 308 | 105,864 | 180,973 | ||||||||||||||||||||||||||||||
Non-personal | 53,340 | 47,416 | 41,790 | 31,291 | 11,987 | 42,442 | 44,487 | 14,932 | 115,940 | 403,625 | ||||||||||||||||||||||||||||||
Financial instruments designated at fair value through profit or loss | – | 18 | 23 | – | – | – | 303 | 392 | – | 736 | ||||||||||||||||||||||||||||||
Acceptances | 9,001 | 2,777 | 120 | – | – | – | – | – | – | 11,898 | ||||||||||||||||||||||||||||||
Obligations related to securities sold short | 155 | 78 | 302 | 143 | 301 | 1,774 | 7,149 | 10,228 | 2,654 | 22,784 | ||||||||||||||||||||||||||||||
Derivative financial instruments | 5,054 | 3,183 | 2,148 | 1,819 | 1,740 | 5,032 | 12,401 | 26,348 | – | 57,725 | ||||||||||||||||||||||||||||||
Obligations related to securities sold under repurchase agreements and securities lent | 64,112 | 4,847 | 2,807 | 4,129 | 3,427 | – | – | – | – | 79,322 | ||||||||||||||||||||||||||||||
Subordinated debentures | – | – | – | – | – | – | – | 4,973 | – | 4,973 | ||||||||||||||||||||||||||||||
Other liabilities | 497 | 1,139 | 290 | 117 | 636 | 983 | 2,828 | 3,645 | 28,521 | 38,656 | ||||||||||||||||||||||||||||||
Total equity | – | – | – | – | – | – | – | – | 51,181 | 51,181 | ||||||||||||||||||||||||||||||
Total liabilities and equity | $ | 139,096 | $ | 66,330 | $ | 56,709 | $ | 45,211 | $ | 26,975 | $ | 67,647 | $ | 84,919 | $ | 60,826 | $ | 304,160 | $ | 851,873 | ||||||||||||||||||||
Off-Balance sheet commitments | ||||||||||||||||||||||||||||||||||||||||
Operating leases | $ | 26 | $ | 57 | $ | 83 | $ | 81 | $ | 78 | $ | 272 | $ | 562 | $ | 575 | $ | – | $ | 1,734 | ||||||||||||||||||||
Credit commitments(3) | 3,422 | 6,034 | 13,213 | 12,536 | 14,168 | 17,126 | 74,016 | 13,467 | 5 | 153,987 | ||||||||||||||||||||||||||||||
Financial guarantees(4) | – | – | – | – | – | – | – | – | 30,131 | 30,131 | ||||||||||||||||||||||||||||||
Outsourcing obligations | 19 | 38 | 57 | 57 | 50 | 147 | 250 | 1 | 1 | 620 | ||||||||||||||||||||||||||||||
| (1) | Includes primarily impaired mortgages. |
| (2) | Includes primarily overdrafts and impaired loans. |
| (3) | Includes the undrawn component of committed credit and liquidity facilities. |
| (4) | Includes outstanding balances of guarantees, standby letters of credit and commercial letters of credit which may expire undrawn. |
78 Scotiabank Second Quarter Report 2015
Table of Contents
CONDENSED INTERIM CONSOLIDATED FINANCIAL STATEMENTS
| As at October 31, 2014 | ||||||||||||||||||||||||||||||||||||||||
| ($ millions) | Less than one month | One to three months | Three to six months | Six to nine months | Nine to twelve months | One to two years | Two to five years | Over five years | No specific maturity | Total | ||||||||||||||||||||||||||||||
Assets | ||||||||||||||||||||||||||||||||||||||||
Cash and deposits with financial institutions and precious metals | $ | 49,912 | $ | 1,312 | $ | 398 | $ | 125 | $ | 715 | $ | 125 | $ | 394 | $ | 2 | $ | 11,033 | $ | 64,016 | ||||||||||||||||||||
Trading assets | 5,038 | 6,068 | 2,921 | 2,628 | 3,051 | 8,707 | 16,124 | 25,143 | 43,568 | 113,248 | ||||||||||||||||||||||||||||||
Financial instruments designated at fair value through profit or loss | – | – | – | 12 | – | 60 | – | – | 39 | 111 | ||||||||||||||||||||||||||||||
Securities purchased under resale agreements and securities borrowed | 71,611 | 14,251 | 3,604 | 2,134 | 1,148 | 1,118 | – | – | – | 93,866 | ||||||||||||||||||||||||||||||
Derivative financial instruments | 2,216 | 2,582 | 1,430 | 1,059 | 1,011 | 3,559 | 6,922 | 14,660 | – | 33,439 | ||||||||||||||||||||||||||||||
Investment securities | 1,846 | 1,674 | 2,951 | 1,740 | 1,577 | 10,071 | 9,805 | 4,697 | 4,301 | 38,662 | ||||||||||||||||||||||||||||||
Loans | 25,495 | 21,343 | 25,828 | 27,558 | 23,305 | 71,750 | 155,459 | 28,112 | 45,459 | �� | 424,309 | |||||||||||||||||||||||||||||
Residential mortgages | 2,589 | 3,983 | 12,441 | 15,686 | 12,309 | 47,999 | 97,540 | 18,395 | 1,706 | (1) | 212,648 | |||||||||||||||||||||||||||||
Personal and credit cards | 2,719 | 1,530 | 2,239 | 2,797 | 2,450 | 7,735 | 17,448 | 5,003 | 42,283 | 84,204 | ||||||||||||||||||||||||||||||
Business and government | 20,187 | 15,830 | 11,148 | 9,075 | 8,546 | 16,016 | 40,471 | 4,714 | 5,111 | (2) | 131,098 | |||||||||||||||||||||||||||||
Allowance for credit losses | – | – | – | – | – | – | – | – | (3,641 | ) | (3,641 | ) | ||||||||||||||||||||||||||||
Customers’ liabilities under acceptances | 7,778 | 2,032 | 65 | 1 | – | – | – | – | – | 9,876 | ||||||||||||||||||||||||||||||
Other assets | – | – | – | – | – | – | – | – | 28,139 | 28,139 | ||||||||||||||||||||||||||||||
Total assets | $ | 163,896 | $ | 49,262 | $ | 37,197 | $ | 35,257 | $ | 30,807 | $ | 95,390 | $ | 188,704 | $ | 72,614 | $ | 132,539 | $ | 805,666 | ||||||||||||||||||||
Liabilities and equity | ||||||||||||||||||||||||||||||||||||||||
Deposits | $ | 53,612 | $ | 58,296 | $ | 52,802 | $ | 29,330 | $ | 22,930 | $ | 45,523 | $ | 65,793 | $ | 14,755 | $ | 210,976 | $ | 554,017 | ||||||||||||||||||||
Personal | 7,261 | 7,401 | 8,334 | 8,319 | 7,850 | 16,763 | 17,292 | 257 | 101,686 | 175,163 | ||||||||||||||||||||||||||||||
Non-personal | 46,351 | 50,895 | 44,468 | 21,011 | 15,080 | 28,760 | 48,501 | 14,498 | 109,290 | 378,854 | ||||||||||||||||||||||||||||||
Financial instruments designated at fair value through profit or loss | 3 | 23 | 17 | – | – | – | 187 | 235 | – | 465 | ||||||||||||||||||||||||||||||
Acceptances | 7,778 | 2,032 | 65 | 1 | – | – | – | – | – | 9,876 | ||||||||||||||||||||||||||||||
Obligations related to securities sold short | 34 | 159 | 990 | 269 | 183 | 3,912 | 7,645 | 10,924 | 2,934 | 27,050 | ||||||||||||||||||||||||||||||
Derivative financial instruments | 2,156 | 2,629 | 1,266 | 1,386 | 945 | 4,232 | �� | 8,656 | 15,168 | – | 36,438 | |||||||||||||||||||||||||||||
Obligations related to securities sold under repurchase agreements and securities lent | 73,074 | 8,929 | 2,280 | 1,586 | 3,084 | – | – | – | – | 88,953 | ||||||||||||||||||||||||||||||
Subordinated debentures | – | – | – | – | – | – | – | 4,871 | – | 4,871 | ||||||||||||||||||||||||||||||
Other liabilities | 372 | 489 | 398 | 184 | 92 | 1,948 | 2,999 | 3,387 | 24,916 | 34,785 | ||||||||||||||||||||||||||||||
Total equity | – | – | – | – | – | – | – | – | 49,211 | 49,211 | ||||||||||||||||||||||||||||||
Total liabilities and equity | $ | 137,029 | $ | 72,557 | $ | 57,818 | $ | 32,756 | $ | 27,234 | $ | 55,615 | $ | 85,280 | $ | 49,340 | $ | 288,037 | $ | 805,666 | ||||||||||||||||||||
Off-Balance sheet commitments | ||||||||||||||||||||||||||||||||||||||||
Operating leases | $ | 25 | $ | 53 | $ | 78 | $ | 78 | $ | 76 | $ | 261 | $ | 550 | $ | 577 | $ | – | $ | 1,698 | ||||||||||||||||||||
Credit commitments(3) | 5,062 | 4,165 | 9,950 | 13,315 | 14,475 | 13,821 | 73,224 | 3,424 | 5 | 137,441 | ||||||||||||||||||||||||||||||
Financial guarantees(4) | – | – | – | – | – | – | – | – | 27,137 | 27,137 | ||||||||||||||||||||||||||||||
Outsourcing obligations | 19 | 38 | 57 | 57 | 57 | 161 | 286 | 1 | 1 | 677 | ||||||||||||||||||||||||||||||
| (1) | Includes primarily impaired mortgages. |
| (2) | Includes primarily overdrafts and impaired loans. |
| (3) | Includes the undrawn component of committed credit and liquidity facilities. |
| (4) | Includes outstanding balances of guarantees, standby letters of credit and commercial letters of credit which may expire undrawn. |
| 20. | Events after the Consolidated Statement of Financial Position date |
Cencosud Administradora de Tarjetas S.A.
On May 1, 2015, the Bank acquired a 51% controlling interest in Cencosud Administradora de Tarjetas S.A., and certain other smaller entities (collectively, CAT), from Cencosud S.A. (Cencosud), for cash consideration of US$280 million. CAT is the financial services business of Cencosud and distributes credit cards and consumer loans in Chile. The acquisition will allow the Bank to provide its customers with more credit card options, attract new customers and build scale in Chile. The Bank and Cencosud have entered into a 15 year partnership agreement to manage the credit card business and provide additional products and services to customers of both organizations. The Bank has also committed to fund 100% of CAT’s loan portfolio. The acquisition will be accounted for as a business combination and will result in assets and liabilities comprising mainly of personal and credit card loans and related funding.
Citibank Peru operations
On May 1, 2015, the Bank announced that its subsidiary in Peru acquired the retail and commercial banking operations of Citibank in Peru. The transaction will result in the recognition of credit card, personal loan and commercial loan related assets of an approximate Canadian equivalent of $475 million. This acquisition will be accounted for as a business combination.
Scotiabank Second Quarter Report 2015 79
Table of Contents
CONDENSED INTERIM CONSOLIDATED FINANCIAL STATEMENTS
Normal Course Issuer Bid
On May 29, 2015, the Bank announced that OSFI and the TSX approved its normal course issuer bid pursuant to which it may repurchase for cancellation up to 24 million of the Bank’s common shares, which represents approximately 2% of the Bank’s common shares issued and outstanding as of May 25, 2015. Purchases under the bid may commence on June 2, 2015, and will end on the earlier of June 1, 2016, or the date on which the Bank completes its purchases. On a quarterly basis, the Bank will consult with OSFI prior to making purchases.
80 Scotiabank Second Quarter Report 2015
Table of Contents
Direct deposit service
Shareholders may have dividends deposited directly into accounts held at financial institutions which are members of the Canadian Payments Association. To arrange direct deposit service, please write to the transfer agent.
Dividend and Share Purchase Plan
Scotiabank’s dividend reinvestment and share purchase plan allows common and preferred shareholders to purchase additional common shares by reinvesting their cash dividend without incurring brokerage or administrative fees.
As well, eligible shareholders may invest up to $20,000 each fiscal year to purchase additional common shares of the Bank. All administrative costs of the plan are paid by the Bank.
For more information on participation in the plan, please contact the transfer agent.
Dividend dates for 2015
Record and payment dates for common and preferred shares, subject to approval by the Board of Directors.
| Record Date | Payment Date | |
| January 6 | January 28 | |
| April 7 | April 28 | |
| July 7 | July 29 | |
| October 6 | October 28 |
Duplicated communication
If your shareholdings are registered under more than one name or address, multiple mailings will result. To eliminate this duplication, please write to the transfer agent to combine the accounts.
Normal Course Issuer Bid
A copy of the Notice of Intention to commence the Normal Course Issuer Bid is available without charge by contacting the Secretary’s Department at (416)-866-3672.
Website
For information relating to Scotiabank and its services, visit us at our website: www.scotiabank.com.
Conference call and Web broadcast
The quarterly results conference call will take place on May 29, 2015, at 8:00 am EDT and is expected to last approximately one hour. Interested parties are invited to access the call live, in listen-only mode, by telephone, toll-free, at (416) 849-1847 or 1-866-530-1554 (please call five to 15 minutes in advance). In addition, an audio webcast, with accompanying slide presentation, may be accessed via the Investor Relations page of www.scotiabank.com. Following discussion of the results by Scotiabank executives, there will be a question and answer session.
A telephone replay of the conference call will be available from May 29, 2015, to June 13, 2015, by calling (647) 436-0148 or 1-888-203-1112 (North America toll-free) and entering the identification code 1232313#. The archived audio webcast will be available on the Bank’s website for three months.
Contact information
Investors:
Financial analysts, portfolio managers and other investors requiring financial information, please contact Investor Relations, Finance Department:
Scotiabank
Scotia Plaza, 44 King Street West
Toronto, Ontario, Canada M5H 1H1
Telephone: (416) 933-8774
Fax: (416) 866-7867
E-mail: investor.relations@scotiabank.com
Media:
For media enquiries, please contact the Public and Corporate Affairs Department at the above address.
Telephone: (416) 866-6806
Fax: (416) 866-4988
E-mail: corporate.communications@scotiabank.com
Scotiabank Second Quarter Report 2015 81
Table of Contents
SHAREHOLDER INFORMATION
Shareholders:
For enquiries related to changes in share registration or address, dividend information, lost share certificates, estate transfers, or to advise of duplicate mailings, please contact the Bank’s transfer agent:
Computershare Trust Company of Canada
100 University Avenue, 8th Floor
Toronto, Ontario, Canada M5J 2Y1
Telephone: 1-877-982-8767
Fax: 1-888-453-0330
E-mail: service@computershare.com
Co-Transfer Agent (U.S.A.)
Computershare Trust Company N.A.
250 Royall Street
Canton, MA 02021 U.S.A.
Telephone: 1-800-962-4284
For other shareholder enquiries, please contact the Finance Department:
Scotiabank
Scotia Plaza, 44 King Street West
Toronto, Ontario, Canada M5H 1H1
Telephone: (416) 866-4790
Fax: (416) 866-4048
E-mail: corporate.secretary@scotiabank.com
Rapport trimestriel disponible en français
Le Rapport annuel et les états financiers de la Banque sont publiés en français et en anglais et distribués aux actionnaires dans la version de leur choix. Si vous préférez que la documentation vous concernant vous soit adressée en français, veuillez en informer Relations publiques, Affaires de la société et Affaires gouvernementales, La Banque de Nouvelle-Écosse, Scotia Plaza, 44, rue King Ouest, Toronto (Ontario), Canada M5H 1H1, en joignant, si possible, l’étiquette d’adresse, afin que nous puissions prendre note du changement.
82 Scotiabank Second Quarter Report 2015
Table of Contents
| The Bank of Nova Scotia is incorporated in Canada with limited liability. |  |