|
MANAGEMENT’S DISCUSSION AND ANALYSIS |
TABLE OF CONTENTS
| | |
| 12 | | Forward-looking statements |
| 13 | | Non-GAAP measures |
| 14 | | Financial highlights |
| | |
| ¢ Overview |
| |
| 15 | | Financial results |
| 15 | | Economic outlook |
| 16 | | Shareholder returns |
| 17 | | Impact of foreign currency translation |
| | |
| ¢ Group Financial Performance |
| |
| 18 | | Net income |
| 18 | | Net interest income |
| 20 | | Non-interest income |
| 21 | | Provision for credit losses |
| 24 | | Non-interest expenses |
| 24 | | Income taxes |
| 25 | | Financial results review: 2015 vs 2014 |
| 27 | | Fourth quarter review |
| 29 | | Trending analysis |
| | |
| ¢ Group Financial Condition |
| |
| 30 | | Statement of financial position |
| 31 | | Capital management |
| 42 | | Off-balance sheet arrangements |
| 45 | | Financial instruments |
| 46 | | Selected credit instruments – publically known risk items |
| | |
| | |
| | |
| ¢ Business Lines |
| |
| 47 | | Overview |
| 49 | | Canadian Banking |
| 52 | | International Banking |
| 55 | | Global Banking and Markets |
| 58 | | Other |
| | |
| ¢ Risk Management |
| |
| 70 | | Credit risk |
| 80 | | Market Risk |
| 87 | | Liquidity risk |
| 96 | | Other risks |
| 96 | | Operational risk |
| 97 | | Reputational risk |
| 97 | | Environmental risk |
| 98 | | Insurance risk |
| 98 | | Strategic risk |
| | |
| ¢ Controls and Accounting Policies |
| |
| 99 | | Controls and procedures |
| 99 | | Critical accounting estimates |
| 103 | | Future accounting developments |
| 106 | | Regulatory developments |
| 107 | | Related party transactions |
| | |
| ¢ Supplementary Data |
| |
| 109 | | Geographic information |
| 112 | | Credit risk |
| 117 | | Revenues and expenses |
| 119 | | Selected quarterly information |
| 120 | | Eleven-year statistical review |
2 0 1 6 S C O T I A B A N K A N N U A L R E P O R T | 11
MANAGEMENT’S DISCUSSION AND ANALYSIS
FORWARD LOOKING STATEMENTS
Our public communications often include oral or written forward-looking statements. Statements of this type are included in this document, and may be included in other filings with Canadian securities regulators or the U.S. Securities and Exchange Commission, or in other communications. All such statements are made pursuant to the “safe harbor” provisions of the U.S. Private Securities Litigation Reform Act of 1995 and any applicable Canadian securities legislation. Forward-looking statements may include, but are not limited to, statements made in this document, the Management’s Discussion and Analysis in the Bank’s 2016 Annual Report under the headings “Overview-Outlook,” for Group Financial Performance “Outlook,” for each business segment “Outlook” and in other statements regarding the Bank’s objectives, strategies to achieve those objectives, the regulatory environment in which the Bank operates, anticipated financial results (including those in the area of risk management), and the outlook for the Bank’s businesses and for the Canadian, U.S. and global economies. Such statements are typically identified by words or phrases such as “believe,” “expect,” “anticipate,” “intent,” “estimate,” “plan,” “may increase,” “may fluctuate,” and similar expressions of future or conditional verbs, such as “will,” “may,” “should,” “would” and “could.”
By their very nature, forward-looking statements involve numerous assumptions, inherent risks and uncertainties, both general and specific, and the risk that predictions and other forward-looking statements will not prove to be accurate. Do not unduly rely on forward-looking statements, as a number of important factors, many of which are beyond the Bank’s control and the effects of which can be difficult to predict, could cause actual results to differ materially from the estimates and intentions expressed in such forward-looking statements. These factors include, but are not limited to: the economic and financial conditions in Canada and globally; fluctuations in interest rates and currency values; liquidity and funding; significant market volatility and interruptions; the failure of third parties to comply with their obligations to the Bank and its affiliates; changes in monetary policy; legislative and regulatory developments in Canada and elsewhere, including changes to, and interpretations of tax laws and risk-based capital guidelines and reporting instructions and liquidity regulatory guidance; changes to the Bank’s credit ratings; operational (including technology) and infrastructure risks; reputational risks; the risk that the Bank’s risk management models may not take into account all relevant factors; the accuracy and completeness of information the Bank receives on customers and counterparties; the timely development and introduction of new products and services in receptive markets; the Bank’s ability to expand existing distribution channels and to develop and realize revenues from new distribution channels; the Bank’s ability to complete and integrate acquisitions and its other growth strategies; critical accounting estimates and the effects of changes in accounting policies and methods used by the Bank as described in the Bank’s annual financial statements (See “Controls and Accounting Policies – Critical accounting estimates” in the Bank’s 2016 Annual Report) and updated by this document; global capital markets activity; the Bank’s ability to attract and retain key executives; reliance on third parties to provide components of the Bank’s business infrastructure; unexpected changes in consumer spending and saving habits; technological developments; fraud or other criminal behavior by internal or external parties, including the use of new technologies in unprecedented ways to defraud the Bank or its customers; increasing cyber security risks which may include theft of assets, unauthorized access to sensitive information or operational disruption; anti-money laundering; consolidation in the financial services sector in Canada and globally; competition, both from new entrants and established competitors including through internet and mobile banking; judicial and regulatory proceedings; natural disasters, including, but not limited to, earthquakes and hurricanes, and disruptions to public infrastructure, such as transportation, communication, power or water supply; the possible impact of international conflicts and other developments, including terrorist activities and war; the effects of disease or illness on local, national or international economies; and the Bank’s anticipation of and success in managing the risks implied by the foregoing. A substantial amount of the Bank’s business involves making loans or otherwise committing resources to specific companies, industries or countries. Unforeseen events affecting such borrowers, industries or countries could have a material adverse effect on the Bank’s financial results, businesses, financial condition or liquidity. These and other factors may cause the Bank’s actual performance to differ materially from that contemplated by forward-looking statements. For more information, see the “Risk Management” section Bank’s 2016 Annual Report.
Material economic assumptions underlying the forward-looking statements contained in this document are set out in the 2016 Annual Report under the heading “Overview-Outlook,” as updated by this document; and for each business segment “Outlook”. The “Outlook” sections are based on the Bank’s views and the actual outcome is uncertain. Readers should consider the above-noted factors when reviewing these sections. The preceding list of factors is not exhaustive of all possible risk factors and other factors could also adversely affect the Bank’s results. When relying on forward-looking statements to make decisions with respect to the Bank and its securities, investors and others should carefully consider the preceding factors, other uncertainties and potential events. The Bank does not undertake to update any forward-looking statements, whether written or oral, that may be made from time to time by or on its behalf.
Additional information relating to the Bank, including the Bank’s Annual Information Form, can be located on the SEDAR website at www.sedar.com and on the EDGAR section of the SEC’s website at www.sec.gov.
November 29, 2016
12 | 2 0 1 6 S C O T I A B A N K A N N U A L R E P O R T
MANAGEMENT’S DISCUSSION AND ANALYSIS | OVERVIEW
MANAGEMENT’S DISCUSSION & ANALYSIS
The Management’s Discussion and Analysis (MD&A) is provided to enable readers to assess the Bank’s financial condition and results of operations as at and for the year ended October 31, 2016. The MD&A should be read in conjunction with the Bank’s 2016 Consolidated Financial Statements and Notes. This MD&A is dated November 29, 2016.
Additional information relating to the Bank, including the Bank’s 2016 Annual Report, are available on the Bank’s website at www.scotiabank.com. As well, the Bank’s 2016 Annual Report and Annual Information Form are available on SEDAR at www.sedar.com and on the EDGAR section of the SEC’s website at www.sec.gov.
Non-GAAP Measures
The Bank uses a number of financial measures to assess its performance. Some of these measures are not calculated in accordance with Generally Accepted Accounting Principles (GAAP), which are based on International Financial Reporting Standards (IFRS), are not defined by GAAP and do not have standardized meanings that would ensure consistency and comparability among companies using these measures. The Bank believes that certain non-GAAP measures are useful in assessing underlying ongoing business performance and provide readers with a better understanding of how management assesses performance. These non-GAAP measures are used throughout this report and defined below.
T1 Impact of the 2016 restructuring charge
The table below reflects the impact of the 2016 restructuring charge of $378 million pre-tax ($278 million after tax)(1).
| | | | | | | | | | | | |
| | | |
For the year ended October 31, 2016 ($ millions) | | Reported | | | Impact of the
restructuring charge | | | Adjusting for the
restructuring charge | |
Net income ($ millions) | | $ | 7,368 | | | $ | 278 | | | $ | 7,646 | |
Diluted earnings per share | | $ | 5.77 | | | $ | 0.23 | | | $ | 6.00 | |
Return on equity | | | 13.8 | % | | | 0.5 | % | | | 14.3 | % |
Productivity ratio | | | 55.2 | % | | | (1.5 | )% | | | 53.7 | % |
Operating leverage | | | (1.9 | )% | | | 2.9 | % | | | 1.0 | % |
| | | | | | | | | | | | | |
| (1) | Calculated using the statutory tax rates of the various jurisdictions. |
T2 Adjusted diluted earnings per share
The adjusted diluted earnings per share (EPS) is calculated as follows:
| | | | | | | | | | | | | | | | | | | | | | | | |
| | | |
| | | 2016 | | | 2015 | | | 2014 | |
| For the year ended October 31 ($ millions) | | Diluted EPS(1) | | | Diluted EPS(1) | | | Diluted EPS(1) | |
Net income attributable to common shareholders (diluted) (refer to Note 33) | | $ | 7,070 | | | $ | 5.77 | | | $ | 6,983 | | | $ | 5.67 | | | $ | 6,924 | | | $ | 5.66 | |
Restructuring charge | | | 278 | | | | 0.23 | | | | – | | | | – | | | | 110 | | | | 0.09 | |
Net income attributable to common shareholders (diluted) adjusting for restructuring charge | | | 7,348 | | | | 6.00 | | | | 6,983 | | | | 5.67 | | | | 7,034 | | | | 5.75 | |
Other 2014 notable items(2) | | | – | | | | – | | | | – | | | | – | | | | (400 | ) | | | (0.32 | ) |
Net income attributable to common shareholders (diluted) adjusting for restructuring charge and other notable items | | | 7,348 | | | | 6.00 | | | | 6,983 | | | | 5.67 | | | | 6,634 | | | | 5.43 | |
Amortization of intangible assets, excluding software | | | 76 | | | | 0.05 | | | | 65 | | | | 0.05 | | | | 62 | | | | 0.06 | |
Adjusted net income attributable to common shareholders (diluted) | | $ | 7,424 | | | $ | 6.05 | | | $ | 7,048 | | | $ | 5.72 | | | $ | 6,696 | | | $ | 5.49 | |
Weighted average number of diluted common shares outstanding (millions) | | | 1,226 | | | | | | | | 1,232 | | | | | | | | 1,222 | | | | | |
| (1) | Adjusted diluted earnings per share calculations are based on full dollar and share amounts. |
| (2) | Refer to T15 Notable items. |
Core banking assets
Core banking assets are average earning assets excluding bankers’ acceptances and average trading assets within Global Banking and Markets.
Core banking margin
This ratio represents net interest income divided by average core banking assets.
2 0 1 6 S C O T I A B A N K A N N U A L R E P O R T | 13
MANAGEMENT’S DISCUSSION AND ANALYSIS
T3 Financial highlights
| | | | | | | | | | | | |
| | | |
| As at and for the years ended October 31 | | 2016 | | | 2015 | | | 2014 | |
Operating results($ millions) | | | | | | | | | | | | |
Net interest income | | | 14,292 | | | | 13,092 | | | | 12,305 | |
Non-interest income | | | 12,058 | | | | 10,957 | | | | 11,299 | |
Total revenue | | | 26,350 | | | | 24,049 | | | | 23,604 | |
Provision for credit losses | | | 2,412 | | | | 1,942 | | | | 1,703 | |
Non-interest expenses | | | 14,540 | | | | 13,041 | | | | 12,601 | |
Income tax expense | | | 2,030 | | | | 1,853 | | | | 2,002 | |
Net income | | | 7,368 | | | | 7,213 | | | | 7,298 | |
Net income attributable to common shareholders | | | 6,987 | | | | 6,897 | | | | 6,916 | |
Operating performance | | | | | | | | | | | | |
Basic earnings per share ($) | | | 5.80 | | | | 5.70 | | | | 5.69 | |
Diluted earnings per share ($) | | | 5.77 | | | | 5.67 | | | | 5.66 | |
Adjusted diluted earnings per share ($)(1)(2) | | | 6.05 | | | | 5.72 | | | | 5.49 | |
Return on equity (%) | | | 13.8 | | | | 14.6 | | | | 16.1 | |
Productivity ratio (%)(3) | | | 55.2 | | | | 54.2 | | | | 53.4 | |
Operating leverage (%)(3) | | | (1.9 | ) | | | (1.6 | ) | | | 2.8 | |
Core banking margin (%)(1)(3) | | | 2.38 | | | | 2.39 | | | | 2.39 | |
Financial position information($ millions) | | | | | | | | | | | | |
Cash and deposits with financial institutions | | | 46,344 | | | | 73,927 | | | | 56,730 | |
Trading assets | | | 108,561 | | | | 99,140 | | | | 113,248 | |
Loans | | | 480,164 | | | | 458,628 | | | | 424,309 | |
Total assets | | | 896,266 | | | | 856,497 | | | | 805,666 | |
Deposits | | | 611,877 | | | | 600,919 | | | | 554,017 | |
Common equity | | | 52,657 | | | | 49,085 | | | | 44,965 | |
Preferred shares | | | 3,594 | | | | 2,934 | | | | 2,934 | |
Assets under administration | | | 472,817 | | | | 453,926 | | | | 427,547 | |
Assets under management | | | 192,702 | | | | 179,007 | | | | 164,820 | |
Capital and liquidity measures | | | | | | | | | | | | |
Common Equity Tier 1 (CET1) capital ratio (%) | | | 11.0 | | | | 10.3 | | | | 10.8 | |
Tier 1 capital ratio (%) | | | 12.4 | | | | 11.5 | | | | 12.2 | |
Total capital ratio (%) | | | 14.6 | | | | 13.4 | | | | 13.9 | |
Leverage ratio (%) | | | 4.5 | | | | 4.2 | | | | N/A | |
CET1 risk-weighted assets ($ millions)(4) | | | 364,048 | | | | 357,995 | | | | 312,473 | |
Liquidity coverage ratio (LCR) (%) | | | 127 | | | | 124 | | | | N/A | |
Credit quality | | | | | | | | | | | | |
Net impaired loans ($ millions)(5) | | | 2,446 | | | | 2,085 | | | | 2,002 | |
Allowance for credit losses ($ millions) | | | 4,626 | | | | 4,197 | | | | 3,641 | |
Net impaired loans as a % of loans and acceptances(5) | | | 0.49 | | | | 0.44 | | | | 0.46 | |
Provision for credit losses as a % of average net loans and acceptances | | | 0.50 | | | | 0.43 | | | | 0.40 | |
Common share information | | | | | | | | | | | | |
Closing share price ($)(TSX) | | | 72.08 | | | | 61.49 | | | | 69.02 | |
Shares outstanding (millions) | | | | | | | | | | | | |
Average – Basic | | | 1,204 | | | | 1,210 | | | | 1,214 | |
Average – Diluted | | | 1,226 | | | | 1,232 | | | | 1,222 | |
End of period | | | 1,208 | | | | 1,203 | | | | 1,217 | |
Dividends per share ($) | | | 2.88 | | | | 2.72 | | | | 2.56 | |
Dividend yield (%)(6) | | | 4.7 | | | | 4.4 | | | | 3.8 | |
Market capitalization ($ millions)(TSX) | | | 87,065 | | | | 73,969 | | | | 83,969 | |
Book value per common share ($) | | | 43.59 | | | | 40.80 | | | | 36.96 | |
Market value to book value multiple | | | 1.7 | | | | 1.5 | | | | 1.9 | |
Price to earnings multiple (trailing 4 quarters) | | | 12.4 | | | | 10.8 | | | | 12.1 | |
Other information | | | | | | | | | | | | |
Employees | | | 88,901 | | | | 89,214 | | | | 86,932 | |
Branches and offices | | | 3,113 | | | | 3,177 | | | | 3,288 | |
| | | | | | | | | | | | | |
| (1) | Refer to page 13 for a discussion of Non-GAAP measures. |
| (2) | Refer to T2 Adjusted diluted earnings per share. |
| (3) | Effective 2016, the taxable equivalent adjustment is no longer included in the calculation. Prior period amounts have been restated. |
| (4) | As at October 31, 2016, credit valuation adjustment (CVA) risk-weighted assets were calculated using scalars of 0.64, 0.71 and 0.77 to compute CET1, Tier 1 and Total Capital ratios, respectively. |
| (5) | Excludes loans acquired under the Federal Deposit Insurance Corporation (FDIC) guarantee related to the acquisition of R-G Premier Bank of Puerto Rico. |
| (6) | Based on the average of the high and low common share price for the year. |
14 | 2 0 1 6 S C O T I A B A N K A N N U A L R E P O R T
MANAGEMENT’S DISCUSSION AND ANALYSIS | OVERVIEW
Overview
Financial Results
The Bank’s net income for the year was $7,368 million, up 2% from $7,213 million last year and diluted earnings per share (EPS) were $5.77 compared to $5.67 last year. Return on equity was 13.8% in 2016 compared to 14.6% last year.
The Bank recorded a restructuring charge of $378 million pre-tax, or $278 million after tax, in 2016 (refer T1). Adjusting for the restructuring charge, net income was $7,646 million, up 6% and diluted earnings per share rose 6% to $6.00 compared to last year. Return on equity was 14.3% compared to 14.6% last year.
Current year net income was positively impacted by increases in net interest income and non-interest income, as well as acquisitions and the favourable impact of foreign currency translation. Partially offsetting were higher provision for credit losses, non-interest expenses and income taxes.
Net interest income increased $1,200 million or 9% to $14,292 million, driven by growth in core banking assets across all business lines and acquisitions. The core banking margin was 2.38%, down one basis point from last year.
Non-interest income increased $1,101 million or 10% to $12,058 million from the prior year. Strong growth in banking and trading revenues, acquisitions and the favourable impact of foreign currency translation contributed to the increase. Also contributing to the increase was a gain on sale of a non-core lease financing business in Canada, while gains on sale of real estate this year were largely offset by lower net gains on investment securities.
The total provision for credit losses was $2,412 million, up $470 million from last year. Contributing to this increase were higher provisions related to energy exposures in Global Banking and Markets, higher commercial provisions in International Banking, and higher retail provisions in Canadian Banking, primarily in credit cards and automotive loans, generally in line with volume growth. Partially offsetting were higher acquisition-related benefits this year.
Non-interest expenses were $14,540 million this year, an increase of $1,499 million or 11% over last year. Adjusting for the restructuring charge (refer T1), expenses increased 9%. The increase reflects the impact of acquisitions, higher performance-based compensation, as well as higher business initiative and volume-driven costs including technology and professional fees, software amortization, and deposit insurance. As well, last year benefited from lower pension benefit costs of $204 million related to modifications made to the Bank’s main pension plan partly offset by the costs relating to the reorganization of Canadian shared services of $61 million. Operating leverage was negative 1.9% on a reported basis, or positive 1.0% adjusting for the restructuring charge (refer T1).
The provision for income taxes was $2,030 million, an increase of $177 million from last year. The Bank’s overall effective tax rate for the year was 21.6% compared to 20.4% in 2015. The increase in the effective tax rate was due primarily to lower tax-exempt income and higher taxes in foreign jurisdictions this year.
The all-in Basel III Common Equity Tier 1 ratio was 11.0% as at October 31, 2016, compared to 10.3% last year, and remained well above the regulatory minimum.
Economic Outlook
The United States will be the reference point for economic developments in the year ahead owing to the potentially large shifts brought about by the results of the November 2016 elections. After an initial period of uncertainty as the priorities of the new American administration are clarified, we expect U.S. economic activity to continue picking up as additional fiscal stimulus, delivered through tax cuts and infrastructure spending, accelerates the recovery in U.S. domestic demand that has already been buoyed by reasonably strong gains in employment, consumer spending, and residential construction.
Canadian output growth is rebounding owing to the rebuilding of Fort McMurray after the devastating wildfires in early May, a resumption of crude oil shipments from Alberta post-fire, and a modest pick-up in non-energy exports. Although uncertainty about the new U.S. government’s approach to trade policy may temporarily dampen investment growth in early 2017, capital spending should pick up again as Canada’s federal stimulus package and U.S. demand growth both take hold later in the year. Consumer demand should be reasonably well supported in the year ahead by recent employment gains and the anticipated impact of the Canada Child Benefit. A number of downside risks to Canada’s economy remain, including stretched valuations in the Vancouver and Toronto housing markets and high household indebtedness, but these appear well-managed.
The outlook for the Pacific Alliance countries remains closely tied to the U.S. economy. Some country-specific risks will remain salient in the year ahead, but the medium-term outlook for the region remains strong. We are positive about Mexico’s underlying strengths, and we also anticipate further economic rebound in Brazil.
Across the Atlantic, most economic indicators in the U.K. point to much stronger than expected growth in the aftermath of the ‘Brexit’ vote as currency movements provide a cushion for real activity. Despite this unanticipated resilience, we continue to expect the U.K. economy to slow as the British government moves towards negotiations on withdrawal from the E.U. The knock-on effects in Europe, alongside financial sector challenges and local political uncertainty, are likely to provide a drag on growth across the Continent. Japan’s recovery will probably remain muted as the authorities strive to make new monetary and fiscal measures effective. The pace of growth throughout the rest of the Pacific Rim will be favourable, with indicators pointing to a pick-up in China’s industrial activity.
2 0 1 6 S C O T I A B A N K A N N U A L R E P O R T | 15
MANAGEMENT’S DISCUSSION AND ANALYSIS
Shareholder Returns
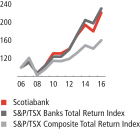
In fiscal 2016, the total shareholder return on the Bank’s shares was 22.5%, which outperformed the 12.6% total return of the S&P/TSX Composite Index.
The total compound annual shareholder return on the Bank’s shares over the past five years was 11.1%, and 8.2% over the past 10 years. This exceeded the total return of the S&P/TSX Composite Index, which was 7.0% over the past five years and 4.8% over the last ten years, as shown in chart C2.
Quarterly dividends were raised twice during the year – a two cent increase effective the second quarter and a further two cent increase effective in the fourth quarter. As a result, dividends per share totaled $2.88 for the year, up 6% from 2015. The Bank was within its target payout range of40-50%, with a payout ratio of 49.6% for the year.
T4 Shareholder returns
| | | | | | | | | | | | |
| | | |
| For the years ended October 31 | | 2016 | | | 2015 | | | 2014 | |
Closing market price per common share ($) | | | 72.08 | | | | 61.49 | | | | 69.02 | |
Dividends paid ($ per share) | | | 2.88 | | | | 2.72 | | | | 2.56 | |
Dividend yield (%)(1) | | | 4.7 | | | | 4.4 | | | | 3.8 | |
Increase (decrease) in share price (%) | | | 17.2 | | | | (10.9 | ) | | | 8.9 | |
Total annual shareholder return (%)(2) | | | 22.5 | | | | (7.0 | ) | | | 13.2 | |
| (1) | Dividend yield is calculated as the dividend paid divided by the average of the high and low common share price for the year. |
| (2) | Total annual shareholder return assumes reinvestment of quarterly dividends, and therefore may not equal the sum of dividend and share price returns in the table. |
16 | 2 0 1 6 S C O T I A B A N K A N N U A L R E P O R T
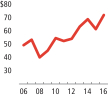
| C1 | Closing common share price |
as at October 31
| C2 | Return to common shareholders |
Share price appreciation plus dividends reinvested, 2006=100
MANAGEMENT’S DISCUSSION AND ANALYSIS | OVERVIEW
Impact of Foreign Currency Translation
The impact of foreign currency translation on net income is shown in T5.
T5 Impact of foreign currency translation
| | | | | | | | | | | | | | | | | | | | | | | | |
| | | |
| | | 2016 | | | 2015 | | | 2014 | |
| For the fiscal years | | Average
exchange rate | | | % Change | | | Average
exchange rate | | | % Change | | | Average
exchange rate | | | % Change | |
U.S. dollar/Canadian dollar | | | 0.754 | | | | (6.4 | )% | | | 0.806 | | | | (12.2 | )% | | | 0.918 | | | | (6.5 | )% |
Mexican Peso/Canadian dollar | | | 13.666 | | | | 10.3 | % | | | 12.386 | | | | 2.8 | % | | | 12.049 | | | | (3.7 | )% |
Peruvian Sol/Canadian dollar | | | 2.539 | | | | 1.3 | % | | | 2.505 | | | | (3.0 | )% | | | 2.582 | | | | (1.3 | )% |
Colombian Peso/Canadian dollar | | | 2,307 | | | | 10.8 | % | | | 2,082 | | | | 16.4 | % | | | 1,789 | | | | (1.4 | )% |
Chilean Peso/Canadian dollar | | | 514.549 | | | | 0.5 | % | | | 512.203 | | | | 0.2 | % | | | 511.261 | | | | 6.8 | % |
| | | | | | | | | | | | |
| | | |
| Impact on net income(1) ($ millions except EPS) | | 2016 vs. 2015 | | | 2015 vs. 2014 | | | 2014 vs. 2013 | |
Net interest income | | $ | (51 | ) | | $ | 232 | | | $ | 191 | |
Non-interest income(2) | | | 182 | | | | 243 | | | | 195 | |
Non-interest expenses | | | 86 | | | | (151 | ) | | | (134 | ) |
Other items (net of tax) | | | (34 | ) | | | (62 | ) | | | (70 | ) |
Net income | | $ | 183 | | | $ | 262 | | | $ | 182 | |
Earnings per share (diluted) | | $ | 0.15 | | | $ | 0.21 | | | $ | 0.15 | |
Impact by business line ($ millions) | | | | | | | | | | | | |
Canadian Banking | | $ | 14 | | | $ | 20 | | | $ | 8 | |
International Banking(2) | | | 44 | | | | 84 | | | | 80 | |
Global Banking and Markets | | | 65 | | | | 110 | | | | 85 | |
Other(2) | | | 60 | | | | 48 | | | | 9 | |
| | | $ | 183 | | | $ | 262 | | | $ | 182 | |
| (1) | Includes impact of all currencies |
| (2) | Includes the impact of foreign currency hedges. |
2 0 1 6 S C O T I A B A N K A N N U A L R E P O R T | 17
MANAGEMENT’S DISCUSSION AND ANALYSIS
GROUP FINANCIAL PERFORMANCE
Net Income
Net income was $7,368, up 2% compared to $7,213 last year. Included in this year’s results is a restructuring charge of $378 million pre-tax, or $278 million after tax (refer T1). Adjusting for the restructuring charge, net income increased $433 million or 6%.
Net Interest Income
Net interest income was $14,292 million, an increase of $1,200 million or 9% from the prior year. This increase was driven by a 9% growth in core earning assets, including acquisitions, as the core banking margin was in line with last year.
Canadian Banking’s net interest income was up $608 million or 9% driven by strong asset and deposit growth, expansion in margin, and the impact of an acquisition. Net interest income increased $652 million or 11% in International Banking primarily due to strong asset growth and the impact of acquisitions. Global Banking and Markets net interest income increased $222 million or 21% driven by an increase in both average earning assets and margin. Partially offsetting these increases were lower contribution from asset/liability management activities reflected in the Other segment.
Core banking assets increased $50 billion to $598 billion. The increase was driven by strong growth in both retail and commercial loans in International Banking, corporate loans in Global Banking and Markets, automotive and credit card loans in Canadian Banking and higher volume of assets held for liquidity purposes in the Other segment. Also contributing to the asset increase was the positive impact of foreign currency translation.
The core banking margin of 2.38% was in line with the previous year. The margin increase in Canadian Banking was offset by lower contribution from asset/liability management activities reflected in the Other segment.
Outlook
Net interest income is expected to increase in 2017 mainly due to growth in core banking assets across all business lines. The total margin is expected to be in line with 2016, as improvements from business mix, both on the asset and deposit side, are generally offset by continued deposit margin compression in an expected low interest rate environment.
T6 Net interest income and core banking margin(1)
| | | | | | | | | | | | | | | | | | | | | | | | | | | | | | | | | | | | |
| | | |
| | | 2016 | | | 2015 | | | 2014 | |
($ billions, except percentage amounts) | | Average balance | | | Interest | | | Average rate | | | Average balance | | | Interest | | | Average rate | | | Average balance | | | Interest | | | Average rate | |
Total average assets and net interest income | | $ | 913.8 | | | $ | 14.3 | | | | | | | $ | 860.6 | | | $ | 13.1 | | | | | | | $ | 795.6 | | | $ | 12.3 | | | | | |
Less: total assets in Capital Markets(1) | | | 259.4 | | | | – | | | | | | | | 258.1 | | | | – | | | | | | | | 232.5 | | | | – | | | | | |
Banking margin on average total assets | | $ | 654.4 | | | $ | 14.3 | | | | 2.18 | % | | $ | 602.5 | | | $ | 13.1 | | | | 2.18 | % | | $ | 563.1 | | | $ | 12.3 | | | | 2.19 | % |
Less: non-earning assets and customers’ liability under acceptances | | | 56.6 | | | | | | | | | | | | 54.4 | | | | | | | | | | | | 48.0 | | | | | | | | | |
Core banking assets and margin | | $ | 597.8 | | | $ | 14.3 | | | | 2.38 | % | | $ | 548.1 | | | $ | 13.1 | | | | 2.39 | % | | $ | 515.1 | | | $ | 12.3 | | | | 2.39 | % |
| (1) | Net interest income from Capital Markets trading assets is recorded in trading revenues in non-interest income. |
18 | 2 0 1 6 S C O T I A B A N K A N N U A L R E P O R T
MANAGEMENT’S DISCUSSION AND ANALYSIS | GROUP FINANCIAL PERFORMANCE
T7 Average balance sheet(1) and net interest income
| | | | | | | | | | | | | | | | | | | | | | | | | | | | | | | | | | | | |
| | | |
| | | 2016 | | | 2015 | | | 2014 | |
| | | | | | | | | |
| For the fiscal years ($ billions) | | Average
balance | | | Interest | | | Average
rate | | | Average
balance | | | Interest | | | Average
rate | | | Average
balance | | | Interest | | | Average
rate | |
Assets | | | | | | | | | | | | | | | | | | | | | | | | | | | | | | | | | | | | |
Deposits with financial institutions | | $ | 67.8 | | | $ | 0.4 | | | | 0.58 | % | | $ | 71.1 | | | $ | 0.3 | | | | 0.41 | % | | $ | 60.1 | | | $ | 0.3 | | | | 0.44 | % |
Trading assets | | | 107.2 | | | | 0.2 | | | | 0.16 | % | | | 111.2 | | | | 0.2 | | | | 0.17 | % | | | 113.3 | | | | 0.1 | | | | 0.12 | % |
Securities purchased under resale agreements and securities borrowed | | | 99.8 | | | | 0.1 | | | | 0.16 | % | | | 99.9 | | | | 0.2 | | | | 0.16 | % | | | 91.1 | | | | 0.2 | | | | 0.20 | % |
Investment securities | | | 67.8 | | | | 1.1 | | | | 1.57 | % | | | 43.7 | | | | 0.7 | | | | 1.69 | % | | | 41.2 | | | | 0.8 | | | | 1.91 | % |
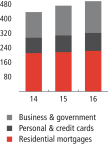
Loans: | | | | | | | | | | | | | | | | | | | | | | | | | | | | | | | | | | | | |
Residential mortgages | | | 218.6 | | | | 7.4 | | | | 3.37 | % | | | 214.4 | | | | 7.5 | | | | 3.51 | % | | | 210.9 | | | | 7.6 | | | | 3.60 | % |
Personal and credit cards | | | 96.8 | | | | 7.3 | | | | 7.57 | % | | | 87.5 | | | | 6.6 | | | | 7.52 | % | | | 79.6 | | | | 6.1 | | | | 7.61 | % |
Business and government | | | 161.4 | | | | 5.5 | | | | 3.41 | % | | | 142.2 | | | | 4.6 | | | | 3.25 | % | | | 128.5 | | | | 4.3 | | | | 3.39 | % |
Allowance for credit losses | | | (4.6 | ) | | | | | | | | | | | (4.0 | ) | | | | | | | | | | | (3.6 | ) | | | | | | | | |
Total loans | | $ | 472.2 | | | $ | 20.2 | | | | 4.28 | % | | $ | 440.1 | | | $ | 18.7 | | | | 4.26 | % | | $ | 415.4 | | | $ | 18.0 | | | | 4.34 | % |
Total earning assets | | $ | 814.8 | | | $ | 22.0 | | | | 2.70 | % | | $ | 766.0 | | | $ | 20.1 | | | | 2.63 | % | | $ | 721.1 | | | $ | 19.4 | | | | 2.69 | % |
Customers’ liability under acceptances | | | 11.4 | | | | | | | | | | | | 11.4 | | | | | | | | | | | | 10.4 | | | | | | | | | |
Other assets | | | 87.6 | | | | | | | | | | | | 83.2 | | | | | | | | | | | | 64.1 | | | | | | | | | |
Total assets | | $ | 913.8 | | | $ | 22.0 | | | | 2.41 | % | | $ | 860.6 | | | $ | 20.1 | | | | 2.34 | % | | $ | 795.6 | | | $ | 19.4 | | | | 2.43 | % |
Liabilities and equity | | | | | | | | | | | | | | | | | | | | | | | | | | | | | | | | | | | | |
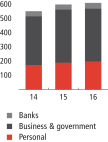
Deposits: | | | | | | | | | | | | | | | | | | | | | | | | | | | | | | | | | | | | |
Personal | | $ | 195.1 | | | $ | 2.4 | | | | 1.22 | % | | $ | 181.4 | | | $ | 2.3 | | | | 1.27 | % | | $ | 172.6 | | | $ | 2.4 | | | | 1.42 | % |
Business and government | | | 384.7 | | | | 3.9 | | | | 1.01 | % | | | 368.1 | | | | 3.4 | | | | 0.91 | % | | | 339.7 | | | | 3.5 | | | | 1.02 | % |
Financial institutions | | | 42.8 | | | | 0.4 | | | | 1.03 | % | | | 37.3 | | | | 0.3 | | | | 0.85 | % | | | 38.4 | | | | 0.3 | | | | 0.77 | % |
Total deposits | | $ | 622.6 | | | $ | 6.7 | | | | 1.08 | % | | $ | 586.8 | | | $ | 6.0 | | | | 1.02 | % | | $ | 550.7 | | | $ | 6.2 | | | | 1.13 | % |
Obligations related to securities sold under repurchase agreements and securities lent | | | 99.1 | | | | 0.2 | | | | 0.19 | % | | | 90.7 | | | | 0.2 | | | | 0.26 | % | | | 87.3 | | | | 0.3 | | | | 0.32 | % |
Subordinated debentures | | | 7.5 | | | | 0.2 | | | | 3.10 | % | | | 5.6 | | | | 0.2 | | | | 3.33 | % | | | 5.3 | | | | 0.2 | | | | 3.84 | % |
Other interest-bearing liabilities | | | 54.9 | | | | 0.6 | | | | 1.04 | % | | | 50.1 | | | | 0.6 | | | | 1.20 | % | | | 50.2 | | | | 0.4 | | | | 0.72 | % |
Total interest-bearing liabilities | | $ | 784.1 | | | $ | 7.7 | | | | 0.98 | % | | $ | 733.2 | | | $ | 7.0 | | | | 0.96 | % | | $ | 693.5 | | | $ | 7.1 | | | | 1.02 | % |
Other liabilities including acceptances | | | 74.4 | | | | | | | | | | | | 75.9 | | | | | | | | | | | | 54.4 | | | | | | | | | |
Equity(2) | | | 55.3 | | | | | | | | | | | | 51.5 | | | | | | | | | | | | 47.7 | | | | | | | | | |
Total liabilities and equity | | $ | 913.8 | | | $ | 7.7 | | | | 0.84 | % | | $ | 860.6 | | | $ | 7.0 | | | | 0.81 | % | | $ | 795.6 | | | $ | 7.1 | | | | 0.89 | % |
Net interest income | | | | | | $ | 14.3 | | | | | | | | | | | $ | 13.1 | | | | | | | | | | | $ | 12.3 | | | | | |
| (1) | Average of daily balances. |
| (2) | Includes non-controlling interests of $1.5 in 2016, $1.3 in 2015 and $1.2 in 2014. |
2 0 1 6 S C O T I A B A N K A N N U A L R E P O R T | 19
MANAGEMENT’S DISCUSSION AND ANALYSIS
T8 Non-interest income
| | | | | | | | | | | | | | | | |
| | | | |
For the fiscal years ($ millions) | | 2016 | | | 2015 | | | 2014 | | | 2016 versus 2015 | |
Banking | | | | | | | | | | | | | | | | |
Card revenues | | $ | 1,359 | | | $ | 1,089 | | | $ | 933 | | | | 25 | % |
Deposit and payment services | | | | | | | | | | | | | | | | |
Deposit services | | | 949 | | | | 928 | | | | 901 | | | | 2 | |
Other payment services | | | 330 | | | | 307 | | | | 282 | | | | 7 | |
| | $ | 1,279 | | | $ | 1,235 | | | $ | 1,183 | | | | 4 | % |
Credit fees | | | | | | | | | | | | | | | | |
Commitment and other credit fees | | | 870 | | | | 787 | | | | 778 | | | | 11 | |
Acceptance fees | | | 284 | | | | 266 | | | | 236 | | | | 7 | |
| | $ | 1,154 | | | $ | 1,053 | | | $ | 1,014 | | | | 10 | % |
Other | | | 436 | | | | 406 | | | | 379 | | | | 7 | |
Banking fee related expenses | | | 559 | | | | 423 | | | | 339 | | | | 32 | |
Total banking revenues | | $ | 3,669 | | | $ | 3,360 | | | $ | 3,170 | | | | 9 | % |
Wealth management | | | | | | | | | | | | | | | | |
Mutual funds | | $ | 1,624 | | | $ | 1,619 | | | $ | 1,468 | | | | – | % |
Brokerage fees | | | 1,010 | | | | 1,006 | | | | 942 | | | | – | |
Investment management and trust | | | | | | | | | | | | | | | | |
Investment management and custody | | | 443 | | | | 440 | | | | 419 | | | | 1 | |
Personal and corporate trust | | | 205 | | | | 204 | | | | 194 | | | | – | |
| | | 648 | | | | 644 | | | | 613 | | | | 1 | |
Total wealth management revenues | | $ | 3,282 | | | $ | 3,269 | | | $ | 3,023 | | | | – | % |
Underwriting and other advisory | | $ | 594 | | | $ | 525 | | | $ | 712 | | | | 13 | % |
Non-trading foreign exchange | | | 540 | | | | 492 | | | | 420 | | | | 10 | |
Trading revenues | | | 1,403 | | | | 1,185 | | | | 1,114 | | | | 18 | |
Net gain on investment securities | | | 534 | | | | 639 | | | | 741 | | | | (16 | ) |
Net income from investments in associated corporations | | | 414 | | | | 405 | | | | 428 | | | | 2 | |
Insurance underwriting income, net of claims | | | 603 | | | | 556 | | | | 474 | | | | 8 | |
Other | | | 1,019 | | | | 526 | | | | 1,217 | | | | 94 | |
Total non-interest income | | $ | 12,058 | | | $ | 10,957 | | | $ | 11,299 | | | | 10 | % |
| C3 | Sources of non-interest income |
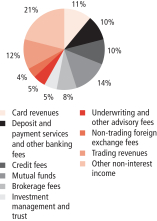
Non-Interest Income
Non-interest income was $12,058 million, up $1,101 million or 10%, primarily from growth in banking and trading revenues and higher underwriting and advisory fees. The positive impact of acquisitions, foreign currency translation and hedging activities, and gain from the sale of a non-core lease finance business also contributed to the increase. Gains on sales of real estate were generally offset by lower net gains on investment securities.
Banking revenues, excluding related expenses, grew $445 million or 12% to $4,228 million reflecting strong growth in card revenues of 25% due to higher fee income and the impact from acquisitions in Canadian Banking and International Banking. Credit fees were up $101 million or 10% mainly from growth in Global Banking and Markets, as well as contributions from Canadian Banking and International Banking. Banking fee related expenses rose $136 million or 32%, primarily due to card expenses in Canadian Banking and International Banking, reflecting higher transaction volumes as well as acquisitions.
Underwriting and other advisory fees were up $69 million or 13%, mainly due to higher new issue activity and investment advisory fees in Global Banking and Markets.
Non-trading foreign exchange revenues rose $48 million or 10% to $540 million, primarily in Latin America and the Caribbean.
Trading revenues of $1,403 million were higher by $218 million or 18% (refer to T9) from the prior year mainly related to fixed income. Higher commodities and foreign exchange trading revenues were offset by lower equity trading revenues.
Insurance underwriting income was up $47 million or 8%, mostly from strong premium growth in Canada and the Caribbean.
Other income increased significantly by $493 million to $1,019 million primarily due to the gain on sale of a non-core lease financing business, the impact of acquisitions, and gains on sale of real estate.
Outlook
Non-interest income is expected to reflect continued growth in 2017 benefiting from higher card revenues, mutual fund management fees and brokerage revenues. Gains on investment securities, primarily recorded in the Other segment, are expected to be lower than 2016.
20 | 2 0 1 6 S C O T I A B A N K A N N U A L R E P O R T
MANAGEMENT’S DISCUSSION AND ANALYSIS | GROUP FINANCIAL PERFORMANCE
T9 Trading revenues
| | | | | | | | | | | | |
| | | |
| For the fiscal years ($ millions) | | 2016 | | | 2015 | | | 2014 | |
By trading products: | | | | | | | | | | | | |
Interest rate and credit | | $ | 613 | | | $ | 400 | | | $ | 415 | |
Equities | | | 101 | | | | 177 | | | | 92 | |
Commodities | | | 376 | | | | 345 | | | | 359 | |
Foreign exchange | | | 262 | | | | 201 | | | | 208 | |
Other | | | 51 | | | | 62 | | | | 40 | |
Total trading revenues | | | 1,403 | | | | 1,185 | | | | 1,114 | |
% of total revenues | | | 5.3 | % | | | 4.9 | % | | | 4.7 | % |
Provision for Credit Losses
The total provision for credit losses was $2,412 million, up $470 million from last year net of acquisition-related benefits of $152 million. The provision for credit losses ratio was 50 basis points compared to 43 basis points in the prior year.
In Canadian Banking, the provision for credit losses was $832 million, an increase of $145 million. The provision for credit losses was higher due to growth in retail portfolios, primarily in credit cards and auto loans, with additional increases from commercial provisions. The provision for credit losses ratio was 28 basis points, up five basis points from the prior year.
The provision for credit losses in International Banking increased $153 million to $1,281 million. Retail provisions were flat compared to 2015. Increases from acquisitions and higher provisions for credit losses in Latin America from strong retail loan growth were offset by favourable foreign currency translation. In the commercial portfolio, provisions were higher in Colombia, primarily the energy sector, and in Puerto Rico. Overall, the provision for credit losses ratio was 126 basis points, up two basis points from last year.
The provision for credit losses in Global Banking and Markets was $249 million, an increase of $182 million from last year due to higher provisions in the United States and Europe, primarily in the energy sector, and also in Asia. The provision for credit losses ratio was up 20 basis points to 30 basis points.
Outlook
The quality of the Bank’s credit portfolio is expected to remain strong given its broad global diversification. The total provision for credit losses ratio is expected to reduce in 2017. In Canadian Banking, the retail provision for credit losses ratio is expected to increase from changes in the business mix while the commercial ratio is expected to normalize in relation to historical experience. In International Banking, the retail provision for credit losses ratio is expected to be in line with last year after accounting for the integration of prior acquisitions while the commercial ratio should improve. In Global Banking and Markets, the provision for credit losses ratio is expected to decline driven by lower energy related issues. Overall, provision levels in 2017 will be within the Bank’s risk appetite and aligned with strategy.
T10 Provisions against impaired loans by business line
| | | | | | | | | | | | |
| | | |
| For the fiscal years ($ millions) | | 2016 | | | 2015 | | | 2014 | |
Canadian Banking | | | | | | | | | | | | |
Retail | | $ | 770 | | | $ | 642 | | | $ | 607 | |
Commercial | | | 62 | | | | 45 | | | | 56 | |
| | $ | 832 | | | $ | 687 | | | $ | 663 | |
International Banking | | | | | | | | | | | | |
Caribbean and Central America | | $ | 250 | | | $ | 184 | | | $ | 248 | |
Latin America | | | | | | | | | | | | |
Mexico | | | 224 | | | | 260 | | | | 240 | |
Peru | | | 317 | | | | 265 | | | | 267 | |
Chile | | | 112 | | | | 108 | | | | 74 | |
Colombia | | | 320 | | | | 247 | | | | 146 | |
Other Latin America | | | 58 | | | | 64 | | | | 49 | |
Total Latin America | | | 1,031 | | | | 944 | | | | 776 | |
| | $ | 1,281 | | | $ | 1,128 | | | $ | 1,024 | |
Global Banking and Markets | | | | | | | | | | | | |
Canada | | $ | 43 | | | $ | 42 | | | $ | 3 | |
U.S. | | | 113 | | | | 4 | | | | 2 | |
Asia and Europe | | | 93 | | | | 21 | | | | 11 | |
| | $ | 249 | | | $ | 67 | | | $ | 16 | |
Total | | $ | 2,362 | | | $ | 1,882 | | | $ | 1,703 | |
2 0 1 6 S C O T I A B A N K A N N U A L R E P O R T | 21
MANAGEMENT’S DISCUSSION AND ANALYSIS
T11 Provision for credit losses as a percentage of average net loans and acceptances
| | | | | | | | | | | | |
| | | |
| For the fiscal years (%) | | 2016 | | | 2015 | | | 2014 | |
Canadian Banking | | | | | | | | | | | | |
Retail | | | 0.29 | % | | | 0.25 | % | | | 0.24 | % |
Commercial | | | 0.15 | | | | 0.12 | | | | 0.17 | |
| | | 0.28 | | | | 0.23 | | | | 0.23 | |
International Banking | | | | | | | | | | | | |
Retail | | | 2.08 | | | | 2.33 | | | | 2.13 | |
Commercial | | | 0.52 | | | | 0.26 | | | | 0.51 | |
| | | 1.26 | | | | 1.24 | | | | 1.27 | |
Global Banking and Markets | | | 0.30 | | | | 0.10 | | | | 0.03 | |
Provisions against impaired loans | | | 0.49 | | | | 0.42 | | | | 0.40 | |
Provisions against performing loans | | | 0.01 | | | | 0.01 | | | | 0.00 | |
Total | | | 0.50 | % | | | 0.43 | % | | | 0.40 | % |
T12 Net charge-offs(1) as a percentage of average loans and acceptances
| | | | | | | | | | | | |
| | | |
| For the fiscal years (%) | | 2016 | | | 2015 | | | 2014 | |
Canadian Banking | | | | | | | | | | | | |
Retail | | | 0.26 | % | | | 0.26 | % | | | 0.21 | % |
Commercial | | | 0.16 | | | | 0.20 | | | | 0.24 | |
| | | 0.24 | | | | 0.25 | | | | 0.21 | |
International Banking | | | | | | | | | | | | |
Retail | | | 1.90 | | | | 1.99 | | | | 1.66 | |
Commercial | | | 0.31 | | | | 0.30 | | | | 0.14 | |
| | | 1.06 | | | | 1.10 | | | | 0.70 | |
Global Banking and Markets | | | 0.21 | | | | 0.01 | | | | 0.11 | |
Total | | | 0.41 | % | | | 0.39 | % | | | 0.33 | % |
| (1) | Write-offs net of recoveries. |
22 | 2 0 1 6 S C O T I A B A N K A N N U A L R E P O R T
MANAGEMENT’S DISCUSSION AND ANALYSIS | GROUP FINANCIAL PERFORMANCE
T13 Non-interest expenses and productivity
| | | | | | | | | | | | | | | | |
| | | | |
For the fiscal years ($ millions) | | 2016 | | | 2015 | | | 2014 | | | 2016 versus 2015 | |
Salaries and employee benefits | | | | | | | | | | | | | | | | |
Salaries | | $ | 4,071 | | | $ | 4,019 | | | $ | 3,680 | | | | 1 | % |
Performance-based compensation | | | 1,538 | | | | 1,438 | | | | 1,473 | | | | 7 | |
Share-based payments | | | 243 | | | | 220 | | | | 270 | | | | 10 | |
Other employee benefits | | | 1,173 | | | | 1,004 | | | | 1,124 | | | | 17 | |
| | $ | 7,025 | | | $ | 6,681 | | | $ | 6,547 | | | | 5 | % |
Premises and technology | | | | | | | | | | | | | | | | |
Premises | | | | | | | | | | | | | | | | |
Net rent | | | 428 | | | | 433 | | | | 392 | | | | (1 | ) |
Property taxes | | | 89 | | | | 89 | | | | 82 | | | | – | |
Other premises costs | | | 431 | | | | 421 | | | | 415 | | | | 2 | |
| | $ | 948 | | | $ | 943 | | | $ | 889 | | | | 1 | % |
| | | | | | | | | | | | | | | | |
Technology | | $ | 1,290 | | | $ | 1,143 | | | $ | 1,047 | | | | 13 | % |
| | $ | 2,238 | | | $ | 2,086 | | | $ | 1,936 | | | | 7 | % |
| | | | |
Depreciation and amortization | | | | | | | | | | | | | | | | |
Depreciation | | | 325 | | | | 303 | | | | 297 | | | | 7 | |
Amortization of intangible assets | | | 359 | | | | 281 | | | | 229 | | | | 28 | |
| | $ | 684 | | | $ | 584 | | | $ | 526 | | | | 17 | % |
| | | | | | | | | | | | | | | | |
Communications | | $ | 442 | | | $ | 434 | | | $ | 417 | | | | 2 | % |
| | | | | | | | | | | | | | | | |
Advertising and business development | | $ | 617 | | | $ | 592 | | | $ | 571 | | | | 4 | % |
| | | | | | | | | | | | | | | | |
Professional | | $ | 693 | | | $ | 548 | | | $ | 471 | | | | 27 | % |
| | | | | | | | | | | | | | | | |
Business and capital taxes | | | | | | | | | | | | | | | | |
Business taxes | | | 356 | | | | 319 | | | | 276 | | | | 12 | |
Capital taxes | | | 47 | | | | 42 | | | | 38 | | | | 12 | |
| | $ | 403 | | | $ | 361 | | | $ | 314 | | | | 12 | % |
| | | | | | | | | | | | | | | | |
Other | | $ | 2,438 | | | $ | 1,755 | | | $ | 1,819 | | | | 39 | % |
| | | | | | | | | | | | | | | | |
Total non-interest expenses | | $ | 14,540 | | | $ | 13,041 | | | $ | 12,601 | | | | 11 | % |
Productivity ratio | | | 55.2 | % | | | 54.2 | % | | | 53.4 | % | | | | |
$ millions
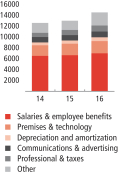
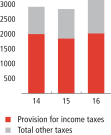
| C5 | Direct and indirect taxes |
$ millions
2 0 1 6 S C O T I A B A N K A N N U A L R E P O R T | 23
MANAGEMENT’S DISCUSSION AND ANALYSIS
Non-Interest Expenses
Non-interest expenses were $14,540 million, an increase of $1,499 million or 11% from the prior year.
The Bank took a restructuring charge this year of $378 million (refer T1). The restructuring will enable the Bank to enhance its customer experience, drive a digital transformation and improve its productivity. The restructuring charge, recorded in the Other segment, arises from a structural cost reduction program that relates primarily to changes in Canadian Banking and organization-wide structural changes. These strategic efforts will better position the Bank for long-term growth.
Adjusting for the restructuring charge, the increase was $1,121 million or 9%. The increase was driven by acquisitions, higher performance-based compensation, as well as initiative and volume-driven growth in technology, software amortization, professional fees, and deposit insurance. There were also higher employee pension and benefit expenses as last year benefited from lower pension benefit costs related to modifications made to the Bank’s main pension plan. These were partly offset by net savings of $55 million realized from structural cost reduction initiatives related to this year’s restructuring charge, as well as the reorganization cost incurred in 2015.
The productivity ratio was 55.2%, or 53.7% on an adjusted basis (refer T1), compared to 54.2% in 2015.
Operating leverage was negative 1.9%. Adjusting for the restructuring charge, it was positive 1.0% (refer T1).
Outlook
Non-interest expenses are expected to rise in 2017, after adjusting for the 2016 restructuring charge. This is driven by business growth, ongoing strategic and technology investments as well as higher pension and benefit expenses. The growth will be partly offset by savings from structural cost reduction initiatives.
Income Taxes
The provision for income taxes was $2,030 million, an increase from $1,853 million last year. The Bank’s overall effective tax rate for the year was 21.6% compared to 20.4% for 2015. The increase in the effective tax rate was due primarily to lower tax-exempt income and higher taxes in foreign jurisdictions this year.
Outlook
The Bank’s consolidated effective tax rate is expected to be in the range of 22% to 25% in 2017.
24 | 2 0 1 6 S C O T I A B A N K A N N U A L R E P O R T
MANAGEMENT’S DISCUSSION AND ANALYSIS | GROUP FINANCIAL PERFORMANCE
Financial Results Review: 2015 vs. 2014
In order to identify key business trends between 2015 and 2014, commentary and the related financial results are below.
Net income
The Bank had net income of $7,213 million in 2015, compared to $7,298 million in 2014 and diluted earnings per share (EPS) of $5.67 compared to $5.66 in 2014. Return on equity was 14.6% compared to 16.1% in 2014.
The 2015 net income was positively impacted by an increase in net interest income, the favourable impact of foreign currency translation and lower income taxes. Mostly offsetting these positive impacts were higher provision for credit losses and higher non-interest expenses. The 2015 net income included the following, largely offsetting items, comprised of a reduction in the pension benefit accrual related to modifications made to the Bank’s main pension plan of $204 million pre-tax ($151 million after tax; approximately 3% of the pension liability), an increase to the collective allowance against performing loans of $60 million pre-tax ($44 million after tax) to support the growing loan portfolio, and reorganization costs related to the consolidation of Canadian shared services operations of $61 million pre-tax ($45 million after tax). These items were recorded in the Other segment. The 2014 net income was impacted by several notable items (refer T15) totaling a net benefit of $301 million pre-tax or $290 million after tax, or approximately 23 cents per share.
Net interest income
Net interest income increased $787 million or 6% to $13,092 million in 2015, primarily from growth in core banking assets and the favourable impact of foreign currency translation. The core banking margin was stable at 2.39%.
Non-interest income
Non-interest income was $10,957 million, a decrease of $342 million from $11,299 million. The 2014 non-interest income was positively impacted by notable items of $566 million (refer T15). In 2015, increases in wealth management and banking revenues and the positive impact of foreign currency translation were partly offset by lower underwriting and advisory fees and lower net gains on investment securities.
Provision for credit losses
The total provision for credit losses was $1,942 million in 2015, up $239 million from 2014. This was primarily from increased provisions in the Canadian and International retail portfolios, as well as higher Global Banking and Markets corporate loan provisions in Canada and Europe. These higher provisions were partially offset by lower commercial provisions in Canadian Banking. The 2015 provision also included a $60 million increase in the collective allowance against performing loans. The 2014 provision included a notable item of $62 million related to a change in write-off policy on unsecured bankrupt retail accounts in Canada.
Non-interest expenses
Non-interest expenses were $13,041 million in 2015, an increase of $440 million or 3% over 2014. The increase reflects higher technology, business development and reorganization costs and the negative impact of foreign currency translation. These were partly offset by lower pension benefit costs. The 2014 non-interest expenses included notable items of $203 million (refer T15). Operating leverage was negative 1.5% on a reported basis, or negative 0.7% after adjusting for the 2014 notable items.
Provision for income taxes
The provision for income taxes was $1,853 million, a decrease of $149 million from 2014. The Bank’s overall effective tax rate for 2015 was 20.4% compared to 21.5% in 2014. The decrease in the effective tax rate was due primarily to higher tax-exempt income and lower earnings in higher tax jurisdictions, partially offset by a lower tax rate on the notable gain in the prior year.
T14 Financial Results Review
| | | | | | | | | | | | | | | | | | | | |
| | | | | |
| For the year ended October 31, 2015 ($ millions)(1) | | Canadian
Banking | | | International
Banking | | | Global Banking
and Markets | | | Other(2) | | | Total | |
Net interest income | | $ | 6,415 | | | $ | 5,706 | | | $ | 1,071 | | | $ | (100 | ) | | $ | 13,092 | |
Non-interest income | | | 4,832 | | | | 3,137 | | | | 2,953 | | | | 35 | | | | 10,957 | |
Total revenue | | $ | 11,247 | | | $ | 8,843 | | | $ | 4,024 | | | $ | (65 | ) | | $ | 24,049 | |
Provision for credit losses | | | 687 | | | | 1,128 | | | | 67 | | | | 60 | | | | 1,942 | |
Non-interest expenses | | | 6,014 | | | | 5,095 | | | | 1,846 | | | | 86 | | | | 13,041 | |
Income tax expense | | | 1,202 | | | | 568 | | | | 558 | | | | (475 | ) | | | 1,853 | |
Net income | | $ | 3,344 | | | $ | 2,052 | | | $ | 1,553 | | | $ | 264 | | | $ | 7,213 | |
Net income attributable to non-controlling interests | | | – | | | | 199 | | | | – | | | | – | | | | 199 | |
Net income attributable to equity holders of the Bank | | $ | 3,344 | | | $ | 1,853 | | | $ | 1,553 | | | $ | 264 | | | $ | 7,014 | |
| | (1) | Taxable equivalent basis. Refer to Glossary. |
| | (2) | Includes all other smaller operating segments, including Group Treasury, and corporate adjustments, such as the elimination of the tax-exempt income gross-up reported in net interest income, non-interest income and provision for income taxes for the year ended October 31, 2015 – $390 to arrive at the amounts reported in Consolidated Statement of income, and differences in the actual amount of costs incurred and charged to the operating segments. |
2 0 1 6 S C O T I A B A N K A N N U A L R E P O R T | 25
MANAGEMENT’S DISCUSSION AND ANALYSIS
| | | | | | | | | | | | | | | | | | | | |
| | | | | |
| For the year ended October 31, 2014 ($ millions)(1) | | Canadian
Banking | | | International
Banking | | | Global Banking
and Markets | | | Other(2) | | | Total | |
Net interest income | | $ | 5,996 | | | $ | 5,155 | | | $ | 1,064 | | | $ | 90 | | | $ | 12,305 | |
Non-interest income | | | 5,263 | | | | 2,945 | | | | 3,167 | | | | (76 | ) | | | 11,299 | |
Total revenue | | $ | 11,259 | | | $ | 8,100 | | | $ | 4,231 | | | $ | 14 | | | $ | 23,604 | |
Provision for credit losses | | | 663 | | | | 1,024 | | | | 16 | | | | – | | | | 1,703 | |
Non-interest expenses | | | 5,799 | | | | 4,690 | | | | 1,880 | | | | 232 | | | | 12,601 | |
Income tax expense | | | 1,113 | | | | 544 | | | | 665 | | | | (320 | ) | | | 2,002 | |
Net income | | $ | 3,684 | | | $ | 1,842 | | | $ | 1,670 | | | $ | 102 | | | $ | 7,298 | |
Net income attributable to non-controlling interests | | | 1 | | | | 226 | | | | – | | | | – | | | | 227 | |
Net income attributable to equity holders of the Bank | | $ | 3,683 | | | $ | 1,616 | | | $ | 1,670 | | | $ | 102 | | | $ | 7,071 | |
| | (1) | Taxable equivalent basis. Refer to Glossary. | |
| | (2) | Includes all other smaller operating segments, including Group Treasury and corporate adjustments, such as the elimination of the tax-exempt income gross-up reported in net interest income, non-interest income and provision for income taxes for the year ended October 31, 2014 – $354 million to arrive at the amounts reported in Consolidated Statement of Income, and differences in the actual amount of costs incurred and charged to the operating segments. |
2014 Notable Items
There were several notable items in 2014 totaling a net benefit of $290 million ($301 million pre-tax), or approximately 23 cents per share as outlined in the table below.
T15 2014 Notable items
| | | | | | | | | | | | | | | | |
| | |
| | | | | | 2014 | |
| | | | |
For the year ended October 31 ($ millions, except EPS) | | Notes | | | Pre-tax | | | After-tax | | | EPS
Impact | |
Gain on sale | | | | | | | | | | | | | | | | |
Sale of holdings in CI Financial Corp. | | | 1 | | | $ | 643 | | | $ | 555 | | | $ | 0.45 | |
Provision for credit losses | | | | | | | | | | | | | | | | |
Unsecured bankrupt retail accounts in Canada | | | 2 | | | | (62 | ) | | | (46 | ) | | | (0.04 | ) |
Valuation adjustments | | | | | | | | | | | | | | | | |
Funding valuation adjustment | | | 3 | | | | (30 | ) | | | (22 | ) | | | (0.02 | ) |
Revaluation of monetary assets in Venezuela | | | 4 | | | | (47 | ) | | | (47 | ) | | | (0.04 | ) |
Legal provisions | | | 5 | | | | (55 | ) | | | (40 | ) | | | (0.03 | ) |
Sub-total | | | | | | | 449 | | | | 400 | | | | 0.32 | |
Restructuring charges | | | 6 | | | | (148 | ) | | | (110 | ) | | | (0.09 | ) |
Total | | | | | | $ | 301 | | | $ | 290 | | | $ | 0.23 | |
By Business line | | | | | | | | | | | | | | | | |
Canadian Banking | | | | | | $ | 506 | | | $ | 453 | | | | | |
International Banking | | | | | | | (81 | ) | | | (74 | ) | | | | |
Global Banking and Markets | | | | | | | (38 | ) | | | (27 | ) | | | | |
Other | | | | | | | (86 | ) | | | (62 | ) | | | | |
Total | | | | | | $ | 301 | | | $ | 290 | | | $ | 0.23 | |
By Consolidated Statement of Income line | | | | | | | | | | | | | | | | |
Trading revenues | | | | | | $ | (30 | ) | | $ | (22 | ) | | | | |
Other income | | | | | | | 596 | | | | 508 | | | | | |
Non-interest income | | | | | | | 566 | | | | 486 | | | | | |
Provision for credit losses | | | | | | | (62 | ) | | | (46 | ) | | | | |
Non-interest expenses | | | | | | | (203 | ) | | | (150 | ) | | | | |
Total | | | | | | $ | 301 | | | $ | 290 | | | $ | 0.23 | |
Notes
Q3 2014 items
(1) Sale of majority of Bank’s holding in CI Financial Corp.
The Bank sold a majority of its holding in CI Financial Corp. resulting in a $643 million pre-tax gain ($555 million after tax), or 45 cents per share. This included an unrealized gain of $174 million pre-tax, or $152 million after tax, on the reclassification of the Bank’s remaining investment to available-for-sale securities.
Q4 2014 items
(2) Provision for credit losses
The Bank changed its write-off policy on unsecured bankrupt retail accounts in Canada in order to accelerate write-offs upon notification of a bankruptcy filing. As a result, a charge of $62 million ($46 million after tax) was recorded.
(3) Funding valuation adjustment
The Bank enhanced the fair value methodology and recognized a funding valuation adjustment (FVA) charge of $30 million ($22 million after tax), to reflect the implied funding cost on uncollateralized derivative instruments.
(4) Venezuela
Venezuela was designated as hyper-inflationary and measures of exchange controls have been imposed by the Venezuelan government. These restrictions have limited the Bank’s ability to repatriate cash and dividends out of Venezuela.
The Bank’s Venezuelan Bolivar (VEF) exposures include its investment in Banco del Caribe, and unremitted dividends and other cash amounts (“monetary assets”) in Venezuela. As at October 31, 2014, the Bank remeasured its net investment and monetary assets at the SICAD II rate (1 USD to 50 VEF). As a result, the Bank recorded a charge of $47 million in the Consolidated Statement of Income representing the revaluation impact on the monetary assets and a reduction in carrying value of the net investment of $129 million has been charged to Other Comprehensive Income.
(5) Legal provision
The Bank recorded a legal provision of approximately $55 million ($40 million after tax) related to certain ongoing legal claims.
(6) Restructuring charges
The Bank recorded a restructuring charge of $148 million ($110 million after tax), the majority relating to employee severance charges. These charges will drive greater operational efficiencies. In Canada, the charges relate to recent initiatives to centralize and automate several mid-office branch functions, as well as reductions in required wealth management operational support. In International Banking, the charges are primarily for closing or downsizing approximately 120 branches, which will allow us to focus on high-growth markets, minimize branch overlap, and realize synergies resulting from recent acquisitions. The Bank also made a series of changes to simplify its leadership structure and operating model, recorded in the Other segment.
26 | 2 0 1 6 S C O T I A B A N K A N N U A L R E P O R T
MANAGEMENT’S DISCUSSION AND ANALYSIS | GROUP FINANCIAL PERFORMANCE
Fourth Quarter Review
T16 Fourth Quarter Financial Results
| | | | | | | | | | | | |
| |
| | | For the three months ended | |
| | | |
| ($ millions) | | October 31
2016 | | | July 31 2016 | | | October 31
2015 | |
Net Interest income | | $ | 3,653 | | | $ | 3,602 | | | $ | 3,371 | |
Non-interest income | | | 3,098 | | | | 3,038 | | | | 2,754 | |
Total revenue | | | 6,751 | | | | 6,640 | | | | 6,125 | |
Provision for credit losses | | | 550 | | | | 571 | | | | 551 | |
Non-interest expenses | | | 3,650 | | | | 3,505 | | | | 3,286 | |
Income tax expense | | | 540 | | | | 605 | | | | 445 | |
Net income | | $ | 2,011 | | | $ | 1,959 | | | $ | 1,843 | |
Net income attributable to non-controlling interests in subsidiaries | | $ | 72 | | | $ | 62 | | | $ | 60 | |
Net income attributable to equity holders of the Bank | | $ | 1,939 | | | $ | 1,897 | | | $ | 1,783 | |
Preferred shareholders | | | 31 | | | | 37 | | | | 29 | |
Common shareholders | | $ | 1,908 | | | $ | 1,860 | | | $ | 1,754 | |
Q4 2016 vs. Q4 2015
Net income
Net income was $2,011 million, an increase of $168 million or 9%. Strong asset growth and higher capital markets revenues were partly offset by higher non-interest expenses and income taxes.
Net interest income
Net interest income was $3,653 million, an increase of $282 million or 8%. The increase was attributable primarily to growth in retail and commercial loans in International Banking, credit cards, automotive loans and residential mortgages in Canadian Banking, and corporate loans in Global Banking and Markets.
The core banking margin was 2.40%, up five basis points driven by higher margins across all business lines, partially offset by lower contribution from asset/liability management activities in the Other segment.
Non-interest income
Non-interest income of $3,098 million was up $344 million or 12%. This was driven by higher banking fees, wealth management and trading revenues, underwriting and other advisory fees and net income from investments in associated corporations. Gains on sale of real estate were largely offset by lower net gains on investment securities.
Provision for credit losses
The provision for credit losses was $550 million, down $1 million. Last year’s increase in collective allowance against performing loans of $60 million was mostly offset by higher provisions in Canadian Banking and International Banking.
Non-interest expenses
Non-interest expenses increased by $364 million or 11% to $3,650 million. Last year benefited from lower pension benefit costs, partly offset by the reorganization costs relating to Canadian shared services. The increase was primarily due to higher performance and stock-based compensation, acquisitions and continued investments in the business, including technology and professional expenses. This was partly offset by the favourable impact of foreign currency translation and savings from structural cost reduction initiatives.
The productivity ratio was 54.1%, compared to 53.6%.
Income taxes
The tax rate was 21.2% compared to 19.4%, due primarily to lower tax-exempt income.
2 0 1 6 S C O T I A B A N K A N N U A L R E P O R T | 27
MANAGEMENT’S DISCUSSION AND ANALYSIS
Q4 2016 vs. Q3 2016
Net income
Net income was $2,011 million, an increase of $52 million or 3% over the prior quarter. Higher revenues, lower provision for credit losses and lower income taxes, were partly offset by higher non-interest expenses.
Net interest income
Net interest income was $3,653 million, an increase of $51 million or 1%. The increase was attributable to asset growth primarily in residential mortgages and automotive loans in Canadian Banking, and retail loans in International Banking.
The core-banking margin was 2.40%, up two basis points, mostly from higher margins in Canadian Banking and Global Banking and Markets.
Non-interest income
Non-interest income was $3,098 million, up $60 million or 2%. Higher banking and wealth management revenues and contributions from associated corporations were partly offset by lower underwriting and advisory fees. Gains on sale of real estate were offset by lower net gains on investment securities.
Provision for credit losses
The provision for credit losses was $550 million, a decline from $571 million, due primarily to lower provisions in International Banking.
Non-interest expenses and productivity
Non-interest expenses were up $145 million or 4%. This was mainly due to continued investments in the business, including technology and professional fees, and higher seasonal marketing expenses.
The productivity ratio was 54.1% compared to 52.8%.
Income taxes
The effective tax rate was 21.2% compared to 23.6%, due primarily to higher taxes in certain foreign jurisdictions in the previous quarter.
28 | 2 0 1 6 S C O T I A B A N K A N N U A L R E P O R T
MANAGEMENT’S DISCUSSION AND ANALYSIS | GROUP FINANCIAL PERFORMANCE
Trending Analysis
T17Quarterly financial highlights
| | | | | | | | | | | | | | | | | | | | | | | | | | | | | | | | |
| |
| | | For the three months ended | |
| | | | | | | | |
| ($ millions) | | October 31
2016 | | | July 31
2016 | | | April 30
2016 | | | January 31
2016 | | | October 31
2015 | | | July 31
2015 | | | April 30
2015 | | | January 31
2015 | |
Net interest income | | $ | 3,653 | | | $ | 3,602 | | | $ | 3,518 | | | $ | 3,519 | | | $ | 3,371 | | | $ | 3,354 | | | $ | 3,198 | | | $ | 3,169 | |
Non-interest income | | | 3,098 | | | | 3,038 | | | | 3,076 | | | | 2,846 | | | | 2,754 | | | | 2,770 | | | | 2,739 | | | | 2,694 | |
Total revenue | | $ | 6,751 | | | $ | 6,640 | | | $ | 6,594 | | | $ | 6,365 | | | $ | 6,125 | | | $ | 6,124 | | | $ | 5,937 | | | $ | 5,863 | |
Provision for credit losses | | | 550 | | | | 571 | | | | 752 | | | | 539 | | | | 551 | | | | 480 | | | | 448 | | | | 463 | |
Non-interest expenses | | | 3,650 | | | | 3,505 | | | | 3,817 | | | | 3,568 | | | | 3,286 | | | | 3,334 | | | | 3,224 | | | | 3,197 | |
Income tax expense | | | 540 | | | | 605 | | | | 441 | | | | 444 | | | | 445 | | | | 463 | | | | 468 | | | | 477 | |
Net income | | $ | 2,011 | | | $ | 1,959 | | | $ | 1,584 | | | $ | 1,814 | | | $ | 1,843 | | | $ | 1,847 | | | $ | 1,797 | | | $ | 1,726 | |
Basic earnings per share ($) | | | 1.58 | | | | 1.55 | | | | 1.24 | | | | 1.44 | | | | 1.46 | | | | 1.46 | | | | 1.43 | | | | 1.36 | |
Diluted earnings per share ($) | | | 1.57 | | | | 1.54 | | | | 1.23 | | | | 1.43 | | | | 1.45 | | | | 1.45 | | | | 1.42 | | | | 1.35 | |
Net income
The Bank recorded strong net income over the past eight quarters. The second quarter of 2016 was impacted by a restructuring charge of $378 million pre-tax, or $278 million after tax.
Net interest income
Net interest income rose throughout the year. Core banking assets increased steadily during 2016 from continuing growth in Latin America, and retail loan growth in Canadian Banking, corporate loan growth in Global Banking and Markets, as well as the benefit from the impact of foreign currency translation. The average balance of low-spread deposits with banks has declined since the fourth quarter of last year.
The core banking margin for the year was 2.38%, a one basis point decrease from last year. The margin was stable for the first three quarters, and increased by five basis points in the fourth quarter.
Canadian Banking’s margin improved during the year mainly from growth in higher spread products, including credit cards and consumer automotive. International Banking’s margin increased in each of the first three quarters, but declined slightly in the fourth quarter due to lower spreads in Chile, Peru and the Caribbean. The banking margin in Global Banking and Markets increased each quarter during the year mainly due to higher deposit interest and loan amortization fees, partly offset by lower spreads in the U.S. and Asia corporate loan portfolios. Lower contributions from asset/liability management activities and higher funding costs in the Other segment had a dampening effect on the margin.
Non-interest income
Non-interest revenues grew during the first two quarters, declined in the third and rebounded in the fourth quarter. Banking revenues trended upward during the year with strong growth in card fees in Canadian and International Banking. Mutual fund fees and retail brokerage fees were strong in the first quarter, but dropped back in the second before climbing steadily through the second half of the year. Trading revenues recovered in the last three quarters of the year, from the low levels experienced at the end of last year and the first quarter of the current year. The level of net gains on investment securities reflected market opportunities.
Provision for credit losses
Provision for credit losses peaked in the second quarter, primarily in the energy sector, with declines in the third and fourth quarters. Loan loss ratios in Canadian Banking increased slightly in the first three quarters, and declined by one basis point in the last quarter of the year. Overall provisions were up slightly from last year due mainly to an increased mix of consumer loan and credit card volumes. International Banking provisions peaked in the second quarter, and then declined in both the third and fourth quarters. The provision for credit losses in Global Banking and Markets was impacted by softness in the energy sector, with increases in both the first and second quarters, before returning to more normalized levels in the second half of the year.
Non-interest expenses
Non-interest expenses increased during the year. This was in part due to the impact of acquisitions, continued investment in growth initiatives, and volume-related technology expenses. The restructuring charge taken in the second quarter and timing-related expenses, such as share and performance-based compensation as well as advertising and business development costs, contributed to the quarterly fluctuations.
Income taxes
The effective tax rate ranged between 19.4% and 23.6% reflecting different levels of income earned in lower tax jurisdictions, as well as the fluctuation of tax-exempt dividend income.
2 0 1 6 S C O T I A B A N K A N N U A L R E P O R T | 29
MANAGEMENT’S DISCUSSION AND ANALYSIS
GROUP FINANCIAL CONDITION
T18Condensed statement of financial position
| | | | | | | | | | | | |
| | | |
| As at October 31 ($ billions) | | 2016 | | | 2015 | | | 2014 | |
Assets | | | | | | | | | | | | |
Cash, deposits with financial institutions and precious metals | | $ | 54.8 | | | $ | 84.5 | | | $ | 64.0 | |
Trading assets | | | 108.6 | | | | 99.1 | | | | 113.2 | |
Securities purchased under resale agreements and securities borrowed | | | 92.1 | | | | 87.3 | | | | 93.9 | |
Investment securities | | | 72.9 | | | | 43.2 | | | | 38.7 | |
Loans | | | 480.2 | | | | 458.6 | | | | 424.3 | |
Other | | | 87.7 | | | | 83.8 | | | | 71.6 | |
Total assets | | $ | 896.3 | | | $ | 856.5 | | | $ | 805.7 | |
| | | |
Liabilities | | | | | | | | | | | | |
Deposits | | $ | 611.9 | | | $ | 600.9 | | | $ | 554.0 | |
Obligations related to securities sold under repurchase agreements and securities lent | | | 97.1 | | | | 77.0 | | | | 89.0 | |
Other liabilities | | | 121.8 | | | | 118.9 | | | | 108.6 | |
Subordinated debentures | | | 7.6 | | | | 6.2 | | | | 4.9 | |
Total liabilities | | $ | 838.4 | | | $ | 803.0 | | | $ | 756.5 | |
| | | |
Equity | | | | | | | | | | | | |
Common equity | | | 52.7 | | | | 49.1 | | | | 45.0 | |
Preferred shares | | | 3.6 | | | | 2.9 | | | | 2.9 | |
Non-controlling interests in subsidiaries | | | 1.6 | | | | 1.5 | | | | 1.3 | |
Total equity | | $ | 57.9 | | | $ | 53.5 | | | $ | 49.2 | |
Total liabilities and shareholders’ equity | | $ | 896.3 | | | $ | 856.5 | | | $ | 805.7 | |
loans & acceptances, $ billions, as at October 31
$ billions, as at October 31
Statement of Financial Position
Assets
The Bank’s total assets as at October 31, 2016 were $896 billion, up $40 billion or 5% from October 31, 2015. This growth was primarily in loans and trading assets, while higher investment securities were offset by lower deposits with financial institutions.
Cash and deposits with financial institutions decreased $28 billion due primarily to lower balances with the U.S. Federal Reserve. Securities purchased under resale agreements and securities borrowed increased $5 billion.
Trading assets increased $9 billion or 10% from October 31, 2015, due primarily to an increase in trading securities from higher holdings of Canadian and U.S. government debt and common equities.
Investment securities increased $30 billion or 69% from October 31, 2015, due primarily to an increase in held-to-maturity securities. As of October 31, 2016, the unrealized gain on available-for-sale securities, after the impact of qualifying hedges, decreased $241 million to $26 million due mainly to realized gains on disposals.
Loans increased $22 billion or 5% from October 31, 2015. Residential mortgages increased $5 billion, mainly in Canada and Latin America. Personal and credit card loans rose $8 billion, due mainly to organic growth in Canada and Latin America and the acquisition of the Canadian credit card portfolio from JPMorgan Chase Bank. Business and government loans were up $9 billion across all business lines.
30 | 2 0 1 6 S C O T I A B A N K A N N U A L R E P O R T
MANAGEMENT’S DISCUSSION AND ANALYSIS | GROUP FINANCIAL CONDITION
Liabilities
Total liabilities were $838 billion as at October 31, 2016, up $35 billion or 4% from October 31, 2015.
Total deposits increased $11 billion. Personal deposits grew by $9 billion mainly in Canada and Latin America.
Obligations related to securities sold under repurchase agreements and securities lent increased by $20 billion, mostly in line with higher trading securities and securities purchased under resale agreements.
Equity
Total shareholders’ equity increased $4,342 million from October 31, 2015. This increase was driven by current year earnings of $7,368 million, the issuance of common shares of $391 million mainly through the Dividend Reinvestment Plan and the exercise of options, and a net increase in preferred shares of $660 million. This was partially offset by dividends paid of $3,598 million, distributions to non-controlling interests of $116 million, other comprehensive loss of $229 million due primarily to an increase in the net pension obligation from a lower rate environment, as well as, the repurchase and cancellation of approximately 1.5 million common shares for $80 million under the Normal Course Issuer Bid program.
Outlook
Assets and deposits are expected to continue to grow in 2017 across all business lines. In Canada, while growth in residential mortgages is expected to remain moderate, other retail and commercial lending should continue to have good growth. Internationally, lending assets and personal deposits are expected to grow with stronger growth in the Pacific Alliance countries.
Capital Management
Overview
Scotiabank is committed to maintaining a strong capital base to support the risks associated with its diversified businesses. Strong capital levels contribute to safety for the Bank’s customers, foster investor confidence and support strong credit ratings. It also allows the Bank to take advantage of growth opportunities as they arise and enhance shareholder returns through increased dividends. The Bank’s capital management framework includes a comprehensive internal capital adequacy assessment process (ICAAP), aimed at ensuring that the Bank’s capital is adequate to meet current and future risks and achieve its strategic objectives. Key components of the Bank’s ICAAP include sound corporate governance; creating a comprehensive risk appetite for the Bank; managing and monitoring capital, both currently and prospectively; and utilizing appropriate financial metrics which relate risk to capital, including internal capital and regulatory capital measures.
Governance and oversight
The Bank has a sound capital management framework to measure, deploy and monitor its available capital and assess its adequacy. Capital is managed in accordance with the Board-approved Capital Management Policy. In addition, the Board reviews and approves the Bank’s annual capital plan. The Asset-Liability Committee and senior executive management provide governance over the capital management process. The Bank’s Finance, Treasury and Global Risk Management groups take a coordinated approach to implementing the Bank’s capital plan.
Risk appetite
The risk appetite framework that establishes enterprise wide risk tolerances in addition to capital targets are detailed in the Risk Management section “Risk appetite framework”. The framework encompasses medium term targets with respect to regulatory capital thresholds, earnings and other risk-based parameters. These targets ensure the Bank achieves the following overall objectives: exceed regulatory and internal capital targets, manage capital levels commensurate with the risk profile of the Bank, maintain strong credit ratings and provide the Bank’s shareholders with acceptable returns.
Regulatory capital
Effective November 1, 2012, Canadian banks are subject to the revised capital adequacy requirements as published by the Basel Committee on Banking Supervision (BCBS) and commonly referred to as Basel III. Basel III builds on the “International Convergence of Capital Measurement and Capital Standards: A Revised Framework” (Basel II). Under Basel III, there are three primary risk-based regulatory capital ratios used to assess capital adequacy; Common Equity Tier 1 (CET1), Tier 1 and Total capital ratios, which are determined by dividing those capital components by risk-weighted assets. Basel III also provides guidance on non-viability contingent capital (NVCC). The guidance stipulates that in order to qualify as regulatory capital, non-common share capital instruments must be convertible into common equity upon a trigger event as defined within the guidance. All non-common share capital instruments issued after December 31, 2012, are required to meet these NVCC requirements to qualify as regulatory capital.
To enable banks to meet the new standards, the BCBS Basel III rules contain transitional arrangements commencing January 1, 2013, through January 1, 2019. Transitional requirements result in a five year phase-in of new deductions and additional components to common equity. Non-qualifying non-common capital instruments are being phased-out over 10 years and the capital conservation buffer is being phased-in over four years. As of January 2019, banks will be required to meet new minimum requirements related to risk-weighted assets of: CET1 ratio of 4.5% plus a capital conservation buffer of 2.5%, collectively 7%, minimum Tier 1 ratio of 8.5%, and Total capital ratio of 10.5%.
The Office of the Superintendent of Financial Institutions, Canada (OSFI) has issued guidelines, reporting requirements and disclosure guidance which are consistent with the Basel III reforms, except for its deferral of the Basel III credit valuation adjustment (CVA) related capital charges, requiring they be phased-in over a five year period, beginning January 2014. In accordance with OSFI’s requirements, during 2016, the scalars for CVA risk-weighted assets of 0.64, 0.71 and 0.77 were used to compute the CET1, Tier 1 and Total capital ratios, respectively (October 31, 2015 – scalars of 0.64, 0.71 and 0.77, respectively). The scalars will increase to 0.72, 0.77 and 0.81, respectively, effective in the first quarter of 2017.
2 0 1 6 S C O T I A B A N K A N N U A L R E P O R T | 31
MANAGEMENT’S DISCUSSION AND ANALYSIS
Commencing the first quarter of 2013, OSFI required Canadian deposit-taking institutions to fully implement the 2019 Basel III reforms, without the transitional phase-in provisions for capital deductions (referred to as ‘all-in’) and achieve minimums of 7%, 8.5% and 10.5% for CET1, Tier 1 and Total Capital ratios, respectively. OSFI has also designated the Bank a domestic systemically important bank (D-SIB), increasing its minimum capital ratio requirements by 1% across all tiers of capital effective January 1, 2016, in line with the requirements for global systemically important banks.
Regulatory developments related to capital
In addition to risk-based capital requirements, the Basel III reforms introduced a simpler, non risk-based Leverage ratio requirement to act as a supplementary measure to its risk-based capital requirements. The Leverage ratio is defined as a ratio of Basel III Tier 1 capital to a leverage exposure measure which includes on-balance sheet assets and off-balance sheet commitments, derivatives and securities financing transactions, as defined within the requirements. In January 2014, the BCBS issued revisions to the Basel III Leverage ratio framework noting that the final calibration of the Leverage ratio will be completed by 2017.
In 2014, OSFI released its Basel III Leverage Ratio Requirements Guideline and Public Disclosure Requirements which outlines the application and disclosure of the Basel III Leverage ratio in Canada and the replacement of the former Assets-to-Capital Multiple (ACM), effective the first quarter of 2015. Institutions are expected to maintain a material operating buffer above the 3% minimum.
In April 2016, OSFI published a consultative paper proposing updates to the capital requirements for residential mortgage loans in response to evolving risks, such as risks associated with elevated house prices in certain markets, and increasing levels of household debt. The proposed changes include a risk sensitive floor for loss given default (LGD) that will be tied to increases in local property prices and/or to house prices that are high relative to borrower income. This will apply to banks using the advanced internal ratings-based approach to determining risk-weighted assets for residential real estate secured lending. The proposed changes are published as draft requirements and are expected to be implemented in the first quarter of 2017. New mortgage originations, refinances and mortgage renewals will be subject to the new rules on a go-forward basis.
Planning, managing and monitoring capital
Capital is managed and monitored based on planned changes in the Bank’s strategy, identified changes in its operating environment or changes in its risk profile. As part of the Bank’s comprehensive ICAAP, sources and uses of capital are continuously measured and monitored through financial metrics, including regulatory thresholds, and internal capital. These results are used in capital planning and strategic decision-making.
The Bank’s assessment of capital adequacy is in the context of its current position and its expected future risk profile and position relative to its internal targets while considering the potential impact of various stress scenarios. Specific scenarios are selected based on the current economic conditions and business events facing the Bank. In addition, the Bank’s forward looking capital adequacy assessment includes a consideration of the results of more severe multi-risk scenarios within its enterprise-wide stress testing. This testing is used to determine the extent to which severe, but plausible events, impact the Bank’s capital.
The Bank sets internal regulatory capital targets to ensure the Bank’s available capital is sufficient within the context of its risk appetite.
The Bank’s internal target includes an adequate buffer over the regulatory minimum ensuring sufficient flexibility for future capital deployment and in consideration of the Bank’s risk appetite, the volatility of planning assumptions, the results from stress testing and contingency planning.
The Bank has a comprehensive risk management framework to ensure that the risks taken while conducting its business activities are consistent with its risk appetite, its impact on capital relative to internal targets, and that there is an appropriate balance between risk and return. Refer to the Risk Management section on page 60 for further discussion on the Bank’s risk management framework. In managing the Bank’s capital base, close attention is paid to the cost and availability of the various types of capital, desired leverage, changes in the assets and risk-weighted assets, and the opportunities to profitably deploy capital. The amount of capital required for the business risks being assumed, and to meet regulatory requirements, is balanced against the goal of generating an appropriate return for the Bank’s shareholders.
Capital generation
Capital is generated internally through net earnings after dividend payments. As well, capital is generated by the issuance of common shares, preferred shares, and subordinated debentures, net of redemptions.
Capital utilization
The Bank deploys capital to support sustainable, long-term revenue and net income growth. The growth can be through existing businesses by attracting new customers, increasing cross-selling activities to existing customers, adding new products and enhancing sales productivity, or through acquisitions. All major initiatives to deploy capital are subject to rigorous analysis, validation of business case assumptions and evaluation of expected benefits. Key financial criteria include impact on earnings per share, capital ratios, return on invested capital, expected payback period and internal rate of return based on discounted cash flows. Any potential business acquisitions, investments or strategic initiatives are reviewed and approved by the Bank’s Strategic Transaction Executive Committee, to ensure effective deployment of capital.
Regulatory capital ratios
The Bank continues to maintain strong, high quality capital levels which positions it well for future business growth. The Basel III all-in Common Equity Tier 1 (CET1) ratio as at October 31, 2016 was 11.0%. Increases in the CET1 ratio from 2015 were primarily from strong internal capital generation and the prudent management of asset growth during the year.
The Bank’s Basel III all-in Tier 1 and Total Capital ratios were 12.4% and 14.6%, respectively, as at October 31, 2016. Tier 1 and Total Capital also benefited from capital issuances during the year.
The Bank’s capital ratios continue to be well in excess of OSFI’s minimum capital ratio requirements for 2016 (including the 1% D-SIB surcharge) of 8%, 9.5% and 11.5% for CET1, Tier 1 and Total Capital, respectively.
Outlook
The Bank will continue to have a strong capital position in 2017. Capital will be prudently managed to support: organic growth initiatives; selective acquisitions that enhance shareholder returns; and higher capital requirements from evolving accounting and regulatory changes.
32 | 2 0 1 6 S C O T I A B A N K A N N U A L R E P O R T
MANAGEMENT’S DISCUSSION AND ANALYSIS | GROUP FINANCIAL CONDITION
T19 Regulatory capital(1)
| | | | | | | | | | | | |
| | | Basel III All-in | |
| | | | | | | | | | |
| | | |
| As at October 31 ($ millions) | | 2016 | | | 2015 | | | 2014 | |
Common Equity Tier 1 capital | | | | | | | | | | | | |
Total Common Equity | | $ | 52,657 | | | $ | 49,085 | | | $ | 44,965 | |
Qualifying non-controlling interest in common equity of subsidiaries | | | 597 | | | | 557 | | | | 514 | |
Goodwill and non-qualifying intangibles, net of deferred tax liabilities(2) | | | (11,589 | ) | | | (11,018 | ) | | | (10,482 | ) |
Threshold related deductions | | | (435 | ) | | | (664 | ) | | | (305 | ) |
Net deferred tax assets (excluding those arising from temporary differences) | | | (484 | ) | | | (539 | ) | | | (620 | ) |
Other Common Equity Tier 1 capital deductions(3) | | | (757 | ) | | | (456 | ) | | | (330 | ) |
Common Equity Tier 1 | | | 39,989 | | | | 36,965 | | | | 33,742 | |
Preferred shares(4) | | | 3,594 | | | | 2,934 | | | | 2,934 | |
Capital instrument liabilities – trust securities(4) | | | 1,400 | | | | 1,400 | | | | 1,400 | |
Other Tier 1 capital adjustments(5) | | | 83 | | | | 67 | | | | (3 | ) |
Net Tier 1 capital | | | 45,066 | | | | 41,366 | | | | 38,073 | |
Tier 2 capital | | | | | | | | | | | | |
Subordinated debentures, net of amortization(4) | | | 7,633 | | | | 6,182 | | | | 4,871 | |
Eligible collective allowance for inclusion in Tier 2 and excess allowance (re: IRB approach) | | | 528 | | | | 486 | | | | 468 | |
Qualifying non-controlling interest in Tier 2 capital of subsidiaries | | | 103 | | | | 196 | | | | 180 | |
Other Tier 2 capital adjustments | | | – | | | | – | | | | – | |
Tier 2 capital | | | 8,264 | | | | 6,864 | | | | 5,519 | |
Total regulatory capital | | | 53,330 | | | | 48,230 | | | | 43,592 | |
Risk-weighted assets ($ billions) | | | | | | | | | | | | |
Credit risk | | | 314.8 | | | | 308.0 | | | | 261.9 | |
Market risk | | | 10.6 | | | | 14.4 | | | | 17.3 | |
Operational risk | | | 38.6 | | | | 35.6 | | | | 33.3 | |
CET1 risk-weighted assets(6) | | $ | 364.0 | | | $ | 358.0 | | | $ | 312.5 | |
Capital ratios(7) | | | | | | | | | | | | |
Common Equity Tier 1 | | | 11.0 | % | | | 10.3 | % | | | 10.8 | % |
Tier 1 | | | 12.4 | % | | | 11.5 | % | | | 12.2 | % |
Total | | | 14.6 | % | | | 13.4 | % | | | 13.9 | % |
Leverage: | | | | | | | | | | | | |
Leverage exposures(8) | | $ | 1,010,987 | | | $ | 980,212 | | | | N/A | |
Leverage ratio(8) | | | 4.5 | % | | | 4.2 | % | | | N/A | |
| (1) | Effective November 1, 2012, regulatory capital ratios are determined in accordance with Basel III rules on an all-in basis (refer to page 31). Prior period amounts have not been restated for new and amended IFRS standards as they represent the actual amounts reported in that period for regulatory purposes. |
| (2) | Reported amounts are based on OSFI’s requirements that goodwill relating to investments in associates be classified as goodwill for regulatory reporting purposes beginning Q3 2014. |
| (3) | Other CET1 capital deductions under Basel III all-in include gains/losses due to changes in own credit risk on fair valued liabilities, pension plan assets and other items. |
| (4) | Non-qualifying Tier 1 and Tier 2 capital instruments are subject to a phase-out period of 10 years. |
| (5) | Other Tier 1 capital adjustments under the all-in approach include eligible non-controlling interests in subsidiaries. |
| (6) | As at October 31, 2016, CVA risk-weighted assets were calculated using scalars of 0.64, 0.71, and 0.77 to compute CET1 , Tier 1 and Total capital ratios, respectively, (scalars of 0.64, 0.71, and 0.77 in 2015). |
| (7) | OSFI designated the Bank as a domestic systemically important bank (D-SIB), increasing its minimum capital ratio requirements by 1% for the identified D-SIBs. This 1% surcharge was applicable to all minimum capital ratio requirements for CET1, Tier 1 and Total Capital, by January 1, 2016, in line with the requirements for global systemically important banks. |
| (8) | Effective November 1, 2014, the leverage ratio replaced the assets-to-capital multiple. |
2 0 1 6 S C O T I A B A N K A N N U A L R E P O R T | 33
MANAGEMENT’S DISCUSSION AND ANALYSIS
T20 Changes in regulatory capital(1)
| | | | | | | | | | | | |
| | | Basel III All-in | |
| | | | | | | | | | |
| For the fiscal years ($ millions) | | 2016 | | | 2015 | | | 2014 | |
Total capital, beginning of year | | $ | 48,230 | | | $ | 43,592 | | | $ | 38,841 | |
Changes in Common Equity Tier 1 | | | | | | | | | | | | |
Net income attributable to common equity holders of the Bank | | | 6,987 | | | | 6,897 | | | | 6,916 | |
Dividends paid to equity holders of the Bank | | | (3,468 | ) | | | (3,289 | ) | | | (3,110 | ) |
Shares issued | | | 391 | | | | 104 | | | | 771 | |
Shares repurchased/redeemed | | | (80 | ) | | | (955 | ) | | | (320 | ) |
Gains/losses due to changes in own credit risk on fair valued liabilities | | | (2 | ) | | | (158 | ) | | | | |
Movements in accumulated other comprehensive income, excluding cash flow hedges | | | (472 | ) | | | 1,451 | | | | 410 | |
Change in non-controlling interest in common equity of subsidiaries | | | 40 | | | | 43 | | | | 35 | |
Change in goodwill and other intangible assets (net of related tax liability)(2) | | | (571 | ) | | | (535 | ) | | | (710 | ) |
Other changes including regulatory adjustments below: | | | 199 | | | | (335 | ) | | | 3,391 | |
– Deferred tax assets that rely on future profitability (excluding those arising from temporary differences) | | | 55 | | | | 81 | | | | 132 | |
– Significant investments in the common equity of other financial institutions (amount above 10% threshold) | | | 61 | | | | (317 | ) | | | 2,583 | |
– Other capital deductions | | | 126 | | | | 44 | | | | 941 | |
– Other | | | (43 | ) | | | (143 | ) | | | (265 | ) |
Changes in Common Equity Tier 1 | | $ | 3,024 | | | $ | 3,223 | | | $ | 7,383 | |
Changes in Additional Tier 1 Capital | | | | | | | | | | | | |
Issued | | | 1,350 | | | | – | | | | – | |
Redeemed | | | (690 | ) | | | – | | | | (1,150 | ) |
Other changes including regulatory adjustments and phase-out of non-qualifying instruments | | | 16 | | | | 70 | | | | (74 | ) |
Changes in Additional Tier 1 Capital | | $ | 676 | | | $ | 70 | | | $ | (1,224 | ) |
Changes in Tier 2 Capital | | | | | | | | | | | | |
Issued | | | 2,502 | | | | 1,250 | | | | – | |
Redeemed | | | (1,035 | ) | | | – | | | | (970 | ) |
Collective allowances eligible for inclusion in Tier 2 and Excess Allowance under AIRB | | | 42 | | | | 17 | | | | (502 | ) |
Other changes including regulatory adjustments and phase-out of non-qualifying instruments | | | (109 | ) | | | 78 | | | | 64 | |
Changes in Tier 2 Capital | | $ | 1,400 | | | $ | 1,345 | | | $ | (1,408 | ) |
Total capital generated (used) | | $ | 5,100 | | | $ | 4,638 | | | $ | 4,751 | |
Total capital, end of year | | $ | 53,330 | | | $ | 48,230 | | | $ | 43,592 | |
| (1) | Effective November 1, 2012, regulatory capital ratios are determined in accordance with Basel III rules on an all-in basis (refer to page 31). Prior period amounts have not been restated for new and amended IFRS standards as they represent the actual amounts reported in that period for regulatory capital. |
| (2) | Reported amounts are based on OSFI’s requirements that goodwill relating to investments in associates be classified as goodwill for regulatory reporting purposes beginning Q3 2014. |
34 | 2 0 1 6 S C O T I A B A N K A N N U A L R E P O R T
MANAGEMENT’S DISCUSSION AND ANALYSIS | GROUP FINANCIAL CONDITION
Regulatory capital components
The Bank’s regulatory capital is divided into three components – Common Equity Tier 1 (CET1), Tier 1 capital and Tier 2 capital, depending on their degree of permanency and loss absorbency. All components of capital provide support for banking operations and protect depositors.
CET1 consists primarily of common shareholders’ equity, a proration of non-controlling interests, and regulatory deductions. These regulatory deductions include goodwill, intangible assets (net of deferred tax liabilities), deferred tax assets that rely on future profitability, defined-benefit pension fund net assets, shortfall of allowance for credit losses to expected losses and significant investments in the common equity of other financial institutions.
Additional Tier 1 capital consists primarily of qualifying non-cumulative preferred shares or non-qualifying preferred shares and innovative Tier 1 instruments subject to phase-out. Tier 2 capital consists mainly of qualifying or non-qualifying subordinated debentures subject to phase-out and the eligible allowances for credit losses.
The Bank’s Common Equity Tier 1 capital was $40.0 billion as at October 31, 2016, an increase of $3.0 billion from the prior year primarily from:
| • | | $3.5 billion growth from internal capital generation; |
| • | | $0.3 billion from net common share issuances under the Bank’s dividend reinvestment, employee share purchase, and stock option plans; and, |
| • | | $0.2 billion from decreases in other regulatory capital adjustments, including capital deductions. |
Partly offset by:
| • | | $0.6 billion increases in goodwill and intangibles (net of related tax liability) including the impacts from the acquisition of JP Morgan Canadian Credit Card Business, Citibank Costa Rica and Panama Retail Banking Operations. |
| • | | $0.5 billion decrease from movements in Accumulated Other Comprehensive Income, excluding cash flow hedges, primarily from employee benefits and available-for-sale securities partly offset by impacts from foreign currency translation. |
The Bank’s Tier 1 and Total capital ratios were also impacted by the above changes and the issuances of $1.35 billion of NVCC preferred shares, partly offset by the redemption of $690 million of non-NVCC preferred shares during the year. In addition, Total capital increased mainly due to the issuance of approximately $2.5 billion of NVCC subordinated debentures, partly offset by the $1.0 billion redemption of non-NVCC subordinated debentures during the year.
Dividends
The strong earnings and capital position allowed the Bank to increase its dividends twice in 2016. The annual dividend in 2016 was $2.88, compared to $2.72 in 2015, an increase of 6%. The dividend payout ratio was 49.6% in line with the Bank’s Board approved target dividend payout ratio of 40-50%.
T21 Selected capital management activity
| | | | | | | | | | | | |
| | | |
| For the fiscal years ($ millions) | | 2016 | | | 2015 | | | 2014 | |
Dividends | | | | | | | | | | | | |
Common | | $ | 3,468 | | | $ | 3,289 | | | $ | 3,110 | |
Preferred | | | 130 | | | | 117 | | | | 155 | |
Common shares issued(1)(2) | | | 391 | | | | 104 | | | | 771 | |
Common shares repurchased for cancellation under the Normal Course Issuer Bid(2) | | | 80 | | | | 955 | | | | 320 | |
Preferred shares issued | | | 1,350 | | | | – | | | | – | |
Preferred shares redeemed | | | 690 | | | | – | | | | 1,150 | |
Subordinated debentures issued | | | 2,502 | | | | 1,250 | | | | – | |
Maturity, redemption and repurchase of subordinated debentures | | | 1,035 | | | | 20 | | | | 1,000 | |
| (1) | Represents primarily cash received for stock options exercised during the year, common shares issued pursuant to the Dividend and Share Purchase Plan and shares issued for acquisitions. |
| (2)�� | Represents reduction to Common shares and Retained earnings (refer to the Consolidated Statement of Changes in Equity). Prior period amounts have been restated to conform with current period presentation. |
|
C8 CET1 capital %, as at October 31 |
|
dollars per share

| C10 | Internally generated capital |
$ billions, for years ended October 31
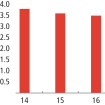
Normal Course Issuer Bid
During the year ended October 31, 2016, under normal course issuer bids, the Bank repurchased and cancelled approximately 1.5 million common shares (2015 –15.5 million) at an average price of $52.34 per share (2015 – $61.64) for a total amount of approximately $80 million (2015 – $955 million).
On May 31, 2016, the Bank announced that OSFI and the Toronto Stock Exchange (TSX) approved a normal course issuer bid pursuant to which it may repurchase for cancellation up to 12 million of the Bank’s common shares, which represented approximately 1% of the Bank’s common shares issued and outstanding as of May 26, 2016. Purchases under the new bid commenced on June 2, 2016, and will end on the earlier of June 1, 2017, or the date on which the Bank completes its purchases. On a quarterly basis, the Bank will consult with OSFI prior to making purchases. Under this bid, the Bank has not repurchased any common shares.
On May 29, 2015, the Bank announced that OSFI and the TSX approved its normal course issuer bid pursuant to which it may repurchase for cancellation up to 24 million of the Bank’s common shares, which represented approximately 2% of the Bank’s common shares issued and outstanding as of May 25, 2015. The bid ended on June 1, 2016. Under this bid, the Bank repurchased and cancelled approximately 9.5 million common shares at an average price of $58.94 per share.
2 0 1 6 S C O T I A B A N K A N N U A L R E P O R T | 35
MANAGEMENT’S DISCUSSION AND ANALYSIS
Share data and other capital instruments
The Bank’s common and preferred share data, as well as other capital instruments, are shown in T22. Further details, including exchangeability features, are discussed in Note 20 and Note 23 of the Consolidated Financial Statements.
T22 Shares and other instruments
| | | | | | | | | | | | | | | | |
As at October 31, 2016 Share data | | | | | |
| Amount
($ millions) |
| |
| Dividends
declared
per share |
| |
| Number
outstanding
(000s) |
|
Common shares(1) | | | | | | $ | 15,513 | | | $ | 2.88 | | | | 1,207,894 | |
Preferred shares | | | | | | | | | | | | | | | | |
Preferred shares Series 16(2) | | | | | | | 345 | | | | 1.312500 | | | | 13,800 | |
Preferred shares Series 17(2) | | | | | | | 230 | | | | 1.400000 | | | | 9,200 | |
Preferred shares Series 18(2)(3)(4) | | | | | | | 187 | | | | 0.837500 | | | | 7,498 | |
Preferred shares Series 19(2)(3)(5) | | | | | | | 158 | | | | 0.628938 | | | | 6,302 | |
Preferred shares Series 20(2)(3)(6) | | | | | | | 201 | | | | 0.902500 | | | | 8,039 | |
Preferred shares Series 21(2)(3)(7) | | | | | | | 149 | | | | 0.541438 | | | | 5,961 | |
Preferred shares Series 22(2)(3)(8) | | | | | | | 234 | | | | 0.957500 | | | | 9,377 | |
Preferred shares Series 23(2)(3)(9) | | | | | | | 66 | | | | 0.586438 | | | | 2,623 | |
Preferred shares Series 30(2)(3)(10) | | | | | | | 154 | | | | 0.455000 | | | | 6,143 | |
Preferred shares Series 31(2)(3)(11) | | | | | | | 111 | | | | 0.366438 | | | | 4,457 | |
Preferred shares Series 32(2)(3)(12) | | | | | | | 279 | | | | 0.638235 | | | | 11,162 | |
Preferred shares Series 33(2)(3)(13) | | | | | | | 130 | | | | 0.334959 | | | | 5,184 | |
Preferred shares Series 34(2)(3)(14)(15) | | | | | | | 350 | | | | 1.184800 | | | | 14,000 | |
Preferred shares Series 36(2)(3)(14)(16) | | | | | | | 500 | | | | 0.852350 | | | | 20,000 | |
Preferred shares Series 38(2)(3)(14)(17) | | | | | | | 500 | | | | – | | | | 20,000 | |
| | | | |
| Trust securities | | Amount
($ millions) | | | Distribution | | | Yield (%) | | | Number
outstanding
(000s) | |
Scotiabank Trust Securities – Series 2006-1 issued by Scotiabank Capital Trust(18a,c,d) | | $ | 750 | | | | 28.25 | | | | 5.650 | | | | 750 | |
Scotiabank Tier 1 Securities – Series 2009-1 issued by Scotiabank Tier 1 Trust(18b,c,d) | | | 650 | | | | 39.01 | | | | 7.802 | | | | 650 | |
| | | | |
| NVCC subordinated debentures | | | | | | | | Amount
($ millions) | | | Interest
Rate (%) | |
Subordinated debentures due March 2027 | | | | | | | | | | $ | 1,250 | | | | 2.58 | |
Subordinated debentures due December 2025(19) | | | | | | | | | | | 750 | | | | 3.37 | |
Subordinated debentures due December 2025(20) | | | | | | | | | | US$ | 1,250 | | | | 4.50 | |
| | | | |
| Options | | | | | | | | | | | Number
outstanding
(000s) | |
Outstanding options granted under the Stock Option Plans to purchase common shares(1)(21) | | | | | | | | | | | | 19,852 | |
| | |
| (1) | | Dividends on common shares are paid quarterly, if and when declared. As at November 18, 2016, the number of outstanding common shares and options was 1,208,151 thousand and 19,594 thousand, respectively. |
| (2) | | These preferred shares are entitled to non-cumulative preferential cash dividends payable quarterly. |
| (3) | | These preferred shares have conversion features (refer to Note 23 of the Consolidated Financial Statements for further details). |
| (4) | | Subsequent to the initial five-year fixed rate period which ended on April 25, 2013, and resetting every five years thereafter, the dividends, if and when declared, will be determined by the sum of the five-year Government of Canada Yield plus 2.05%, multiplied by $25.00. |
| (5) | | Dividends, if and when declared, are determined by the sum of the three-month Government of Canada Treasury Bill Yield plus 2.05%, multiplied by $25.00, which will be reset quarterly. |
| (6) | | Subsequent to the initial five-year fixed rate period which ended on October 25, 2013, and resetting every five years thereafter, the dividends, if and when declared, will be determined by the sum of the five-year Government of Canada Yield plus 1.70%, multiplied by $25.00. |
| (7) | | Dividends, if and when declared, are determined by the sum of the three-month Government of Canada Treasury Bill Yield plus 1.70%, multiplied by $25.00, which will be reset quarterly. |
| (8) | | Subsequent to the initial five-year fixed rate period which ended on January 25, 2014, and resetting every five years thereafter, the dividends, if and when declared, will be determined by the sum of the five-year Government of Canada Yield plus 1.88%, multiplied by $25.00. |
| (9) | | Dividends, if and when declared, are determined by the sum of the three-month Government of Canada Treasury Bill Yield plus 1.88%, multiplied by $25.00, which will be reset quarterly. |
| (10) | | Subsequent to the initial five-year fixed rate period which ended on April 25, 2015, and resetting every five years thereafter, the dividends, if and when declared, will be determined by the sum of the five-year Government of Canada Yield plus 1.00%, multiplied by $25.00. |
| (11) | | Dividends, if and when declared, are determined by the sum of the three-month Government of Canada Treasury Bill Yield plus 1.00%, multiplied by $25.00, which will be reset quarterly. |
| (12) | | Subsequent to the initial five-year fixed rate period which ended on February 1, 2016, and resetting every five years thereafter, the dividends, if and when declared, will be determined by the sum of the five-year Government of Canada Yield plus 1.34%, multiplied by $25.00. |
| (13) | | Dividends, if and when declared, are determined by the sum of the three-month Government of Canada Treasury Bill Yield plus 1.34%, multiplied by $25.00, which will be reset quarterly. |
| (14) | | These preferred shares contain Non-Viability Contingent Capital (NVCC) provisions necessary for the shares to qualify as Tier 1 regulatory capital under Basel III. Refer to Note 23 of the Consolidated Financial Statements. |
| (15) | | On December 17, 2015, the Bank issued 14,000 thousand Non-cumulative 5-Year Rate Reset Preferred Shares Series 34 (NVCC) for $350 million. Dividends, if and when declared, are for the initial five-year period ending on April 25, 2021. Subsequent to the initial five-year fixed rate period, and resetting every five years thereafter, the dividends will be determined by the sum of the five-year Government of Canada Yield plus 4.51%, multiplied by $25.00. |
| (16) | | On March 14, 2016, the Bank issued 20,000 thousand Non-cumulative 5-Year Rate Reset Preferred Shares Series 36 (NVCC) for $500 million. Dividends, if and when declared, are for the initial five-year period ending on July 25, 2021. Subsequent to the initial five-year fixed rate period, and resetting every five years thereafter, the dividends will be determined by the sum of the five-year Government of Canada Yield plus 4.72%, multiplied by $25.00. |
| (17) | | On September 16, 2016, the Bank issued 20,000 thousand Non-cumulative 5-Year Rate Reset Preferred Shares Series 38 (NVCC) for $500 million. The initial dividend, if and when declared, will be payable on January 27, 2017. Dividends, if and when declared are for the initial five-year period ending on January 26, 2022. Subsequent to the initial five-year fixed rate period, and resetting every five years thereafter, the dividends will be determined by the sum of the five-year Government of Canada Yield plus 4.19%, multiplied by $25.00. |
| (18)(a) | | On September 28, 2006, Scotiabank Capital Trust issued 750,000 Scotiabank Trust Securities – Series 2006-1 (Scotia BaTS II Series 2006-1). The holders of Scotia BaTS II Series 2006-1 are entitled to receive non-cumulative fixed cash distributions payable semi-annually in an amount of $28.25 per security. With regulatory approval, these securities may be redeemed in whole upon the occurrence of certain tax or regulatory capital changes, or in whole or in part on December 30, 2011 and on any distribution date thereafter at the option of Scotiabank Capital Trust. The holder has the right at any time to exchange their security into Non-cumulative Preferred Shares Series S of the Bank. The Series S shares will be entitled to cash dividends payable semi-annually in an amount of $0.4875 per $25.00 share [refer to Note 23 – Restrictions on dividend payments]. Under the circumstances outlined in 18(c) below, the Scotia BaTS II Series 2006-1 would be automatically exchanged without the consent of the holder, into Non-cumulative Preferred Shares Series T of the Bank. The Series T shares will be entitled to non-cumulative cash dividends payable semi-annually in an amount of $0.625 per $25.00 share. If there is an automatic exchange of the Scotia BaTS II Series 2006-1 into Preferred Shares Series T of the Bank, then the Bank would become the sole beneficiary of the Trust. |
| (18)(b) | | On May 7, 2009, Scotiabank Tier 1 Trust issued 650,000 Scotiabank Tier 1 Securities Series 2009-1 (Scotia BaTS III Series 2009-1). Interest is payable semi-annually in an amount of $39.01 per Scotia BaTS III Series 2009-1 on the last day of June and December until June 30, 2019. After June 30, 2019 and on every fifth anniversary thereafter until June 30, 2104, the interest rate on the Scotia BaTS III Series 2009-1 will be reset at an interest rate per annum equal to the then prevailing 5-year Government of Canada Yield plus 7.05%. On or after June 30, 2014, the Trust may, at its option redeem the Scotia BaTS III Series 2009-1, in whole or in part, subject to regulatory approval. Under the circumstances outlined in 18(c) below, the Scotia BaTS III Series 2009-1, including accrued and unpaid interest thereon, would be exchanged automatically without the consent of the holder, into newly issued Non-cumulative Preferred Shares Series R of the Bank. In addition, in certain circumstances, holders of Scotia BaTS III Series 2009-1 may be required to invest interest paid on the Scotia BaTS III Series 2009-1 in a series of newly-issued preferred shares of the Bank with non-cumulative dividends (each such series is referred to as Bank Deferral Preferred Shares). If there is an automatic exchange of the Scotia BaTS Preferred Shares, then the Bank would become the sole beneficiary of the Trust. |
36 | 2 0 1 6 S C O T I A B A N K A N N U A L R E P O R T
MANAGEMENT’S DISCUSSION AND ANALYSIS | GROUP FINANCIAL CONDITION
| | |
| (18)(c) | | The Scotia BaTS II Series 2006-1 and Scotia BaTS III Series 2009-1 may be automatically exchanged, without the consent of the holder, into Non-cumulative Preferred Shares of the Bank in the following circumstances: (i) proceedings are commenced for the winding-up of the Bank; (ii) the Superintendent takes control of the Bank or its assets; (iii) the Bank has a Tier 1 Capital ratio of less than 5% or a Total Capital ratio of less than 8%; or (iv) the Superintendent has directed the Bank to increase its capital or provide additional liquidity and the Bank elects such automatic exchange or the Bank fails to comply with such direction. |
| (18)(d) | | No cash distributions will be payable on the Scotia BaTS II Series 2006-1 and Scotia BaTS III Series 2009-1 in the event that the regular dividend is not declared on the Bank’s preferred shares and, if no preferred shares are outstanding, the Bank’s common shares. In such a circumstance the net distributable funds of the Trust will be payable to the Bank as the holder of the residual interest in the Trust. Should the Trust fail to pay the semi-annual distributions on the Scotia BaTS II Series 2006-1 and Scotia BaTS III Series 2009-1 in full, the Bank will not declare dividends of any kind on any of its preferred or common shares for a specified period of time [refer to Note 23 – Restrictions on dividend payments]. |
| (19) | | On December 8, 2015, the Bank issued $750 million subordinated debentures (NVCC) due December 8, 2025. |
| (20) | | On December 16, 2015, the Bank issued US$1.25 billion subordinated debentures (NVCC) due December 16, 2025. |
| (21) | | Included are 57,800 stock options with tandem stock appreciation rights (Tandem SAR) features. |
2 0 1 6 S C O T I A B A N K A N N U A L R E P O R T | 37
MANAGEMENT’S DISCUSSION AND ANALYSIS
Credit ratings
Credit ratings are one of the factors that affect the Bank’s access to capital markets and borrowing costs, as well as the terms on which the Bank can conduct derivatives and hedging transactions and obtain related borrowings. The credit ratings and outlook that the rating agencies assign to the Bank are based on their own views and methodologies.
The Bank continues to have strong credit ratings and is rated AA by DBRS, Aa3 by Moody’s, AA- by Fitch and A+ by Standard and Poor’s (S&P).
On December 11, 2015, S&P affirmed the Bank’s A+ rating for deposits and senior debt, as well as the A-1 rating for short-term instruments. The Bank’s outlook was changed to stable from negative. The outlook change was predicated on S&P’s belief that the potential negative ratings impact from the proposed bail-in regime has subsided, with a view that the implementation timetable could be two years or more to 2018 or later.
On January 25, 2016, Moody’s downgraded the Bank’s long-term ratings by one notch to Aa3 from Aa2, while affirming the Bank’s short-term deposit rating of P-1.
On August 22, 2016, DBRS confirmed the Bank’s long and short-term rating of AA and R-1 (high), respectively.
On October 27, 2016, Fitch affirmed the Bank’s long and short-term rating of AA- and F1+, respectively.
Fitch and S&P have a stable outlook on the Bank. Meanwhile, DBRS and Moody’s continue to maintain their negative outlook for all Canadian banks citing the uncertainty around the federal government’s proposed new bail-in regime for senior unsecured debt, to reflect the greater likelihood that such debt may incur losses in the unlikely event of a distress scenario.
Risk-weighted assets
Regulatory capital requirements are based on OSFI’s target minimum percentage of risk-weighted assets (RWA). RWA represent the Bank’s exposure to credit, market and operational risk and are computed by applying a combination of the OSFI approved Bank’s internal risk models and OSFI prescribed risk-weights to on- and off-balance sheet exposures. Common Equity Tier 1 (CET1), Tier 1 and Total Capital RWA were $364.0, $364.5 and $364.9 billion, respectively at year end, representing increases from 2015 of approximately $6.0 billion. The increases are due to higher credit risk RWA of approximately $6.8 billion (including the impact of foreign currency translation of $2.7 billion) and operational risk RWA of $3.0 billion, partly offset by lower market risk RWA of $3.8 billion.
CET1 Credit risk-weighted assets
As shown in T23, CET1 credit risk-weighted assets increased by $6.8 billion to $314.8 billion primarily due to the following components:
| • | | Book quality changes increased RWA by $10.5 billion. |
| • | | The implementation of the Internal Modeling Method for the determination of counterparty credit risk and credit valuation adjustment RWA decreased RWA by $3.2 billion. |
| • | | Implementation of methodology and policy changes during the year decreased RWA by $2.8 billion. |
| • | | Higher RWA from acquisitions, net of divestitures, of $1.7 billion were mainly due to the acquisitions of JP Morgan Canadian Credit Card Business, Citibank Costa Rica and Panama Retail Banking Operations. |
| • | | The impact of foreign exchange translation increased RWA by $2.7 billion. |
T23 Flow statement for Basel III All-in credit risk-weighted assets ($ millions)
| | | | | | | | | | | | | | | | |
| | |
| | | 2016 | | | 2015 | |
| | | | |
Credit risk-weighted assets movement by key driver(1)
($ millions) | | Credit risk | | | Of which
counterparty
credit risk | | | Credit risk | | | Of which
counterparty
credit risk | |
CET1 Credit risk-weighted assets as at beginning of year | | $ | 308,035 | | | $ | 22,940 | | | $ | 261,887 | | | $ | 17,935 | |
Book size(2) | | | 1,781 | | | | (4,082 | ) | | | 24,339 | | | | 1,988 | |
Book quality(3) | | | 10,542 | | | | 740 | | | | 3,575 | | | | 181 | |
Model updates(4) | | | (3,214 | ) | | | (3,214 | ) | | | 843 | | | | – | |
Methodology and policy(5) | | | (2,849 | ) | | | – | | | | 892 | | | | 892 | |
Acquisitions and disposals | | | 1,672 | | | | – | | | | 1,340 | | | | – | |
Foreign exchange movements | | | 2,731 | | | | 48 | | | | 15,159 | | | | 1,944 | |
Other | | | (3,876 | ) | | | – | | | | – | | | | – | |
CET1 Credit risk-weighted assets as at end of year(6) | | $ | 314,822 | | | $ | 16,432 | | | $ | 308,035 | | | $ | 22,940 | |
Tier 1 CVA scalar | | | 456 | | | | 456 | | | | 785 | | | | 785 | |
Tier 1 Credit risk-weighted assets as at end of year(6) | | | 315,278 | | | | 16,888 | | | | 308,820 | | | | 23,725 | |
Total CVA scalar | | | 390 | | | | 390 | | | | 673 | | | | 673 | |
Total Credit risk-weighted assets as at end of year(6) | | $ | 315,668 | | | $ | 17,278 | | | $ | 309,493 | | | $ | 24,398 | |
| (1) | Includes counterparty credit risk. |
| (2) | Book size is defined as organic changes in book size and composition (including new business and maturing loans). |
| (3) | Book quality is defined as quality of book changes caused by experience such as underlying customer behaviour or demographics, including changes through model calibrations/realignments. |
| (4) | Model updates are defined as model implementation, change in model scope or any change to address model enhancement. |
| (5) | Methodology and policy is defined as methodology changes to the calculations driven by regulatory policy changes, such as new regulation (e.g. Basel III). |
| (6) | As at October 31, 2016, risk-weighted assets were calculated using scalars of 0.64, 0.71, and 0.77 to compute CET1, Tier 1, and Total capital ratios, respectively, (scalars of 0.64, 0.71, and 0.77 in 2015). |
38 | 2 0 1 6 S C O T I A B A N K A N N U A L R E P O R T
MANAGEMENT���S DISCUSSION AND ANALYSIS | GROUP FINANCIAL CONDITION
T24 Internal rating scale(1)and mapping to external rating agencies
| | | | | | | | | | |
| Equivalent Rating | | | | | | | | | | |
| External Rating – S&P | | External Rating – Moody’s | | External Rating – DBRS | | Grade | | IG Code | | PD Range(2) |
AAA to AA+ | | Aaa to Aa1 | | AAA to AA (high) | | Investment
grade | | 99-98 | | 0.0000% – 0.0510% |
AA to A+ | | Aa2 to A1 | | AA to A (high) | | | 95 | | 0.0510% – 0.1321% |
A to A- | | A2 to A3 | | A to A (low) | | | 90 | | 0.0618% – 0.1517% |
BBB+ | | Baa1 | | BBB (high) | | | 87 | | 0.0969% – 0.2429% |
BBB | | Baa2 | | BBB | | | | 85 | | 0.1381% – 0.3383% |
BBB- | | Baa3 | | BBB (low) | | | | 83 | | 0.1969% – 0.4714% |
BB+ | | Ba1 | | BB (high) | | Non-Investment
grade | | 80 | | 0.3059% – 0.5239% |
BB | | Ba2 | | BB | | | 77 | | 0.4751% – 0.5822% |
BB- | | Ba3 | | BB (low) | | | 75 | | 0.5822% – 0.7380% |
B+ | | B1 | | B (high) | | | 73 | | 0.7380% – 1.4180% |
B to B- | | B2 to B3 | | B to B (low) | | | 70 | | 1.4180% – 2.7248% |
CCC+ | | Caa1 | | – | | Watch list | | 65 | | 2.7248% – 9.9903% |
CCC | | Caa2 | | – | | | 60 | | 9.9903% – 19.0626% |
CCC- to CC | | Caa3 to Ca | | – | | | 40 | | 19.0626% – 35.9847% |
– | | – | | – | | | 30 | | 35.9847% – 59.9872% |
Default | | | | | | Default | | 27-21 | | 100% |
| (1) | Applies to non-retail portfolio. |
| (2) | PD ranges overlap across IG codes as the Bank utilizes two risk rating systems for its AIRB portfolios, and each risk rating system has its own separate IG to PD mapping. |
T25 Non-retail AIRB portfolio exposure by internal rating grade(1)(2)
| | | | | | | | | | | | | | | | | | | | | | | | | | | | | | | | | | | | | | | | | | |
| | |
| As at October 31 ($ millions) | | 2016 | | | 2015 | |
| | | | | | | | | | | |
| Grade | | IG Code | | Exposure
at default
($)(4) | | | RWA
($) | | | PD
(%)(5)(8) | | | LGD (%)(6)(8) | | | RW (%)(7)(8) | | | Exposure
at default
($)(4) | | | RWA ($) | | | PD
(%)(5)(8) | | | LGD (%)(6)(8) | | | RW (%)(7)(8) | |
Investment grade(3) | | 99-98 | | | 66,127 | | | | 878 | | | | 0.01 | | | | 18 | | | | 1 | | | | 80,227 | | | | 423 | | | | 0.00 | | | | 16 | | | | 1 | |
| | 95 | | | 45,031 | | | | 6,458 | | | | 0.06 | | | | 30 | | | | 14 | | | | 40,068 | | | | 7,673 | | | | 0.07 | | | | 37 | | | | 19 | |
| | 90 | | | 52,357 | | | | 8,540 | | | | 0.07 | | | | 37 | | | | 16 | | | | 48,131 | | | | 9,144 | | | | 0.08 | | | | 37 | | | | 19 | |
| | 87 | | | 42,398 | | | | 10,326 | | | | 0.13 | | | | 37 | | | | 24 | | | | 43,056 | | | | 10,137 | | | | 0.14 | | | | 36 | | | | 24 | |
| | 85 | | | 40,162 | | | | 14,189 | | | | 0.18 | | | | 41 | | | | 35 | | | | 33,413 | | | | 12,819 | | | | 0.19 | | | | 42 | | | | 38 | |
| | 83 | | | 37,926 | | | | 16,704 | | | | 0.25 | | | | 44 | | | | 44 | | | | 38,499 | | | | 20,036 | | | | 0.31 | | | | 46 | | | | 52 | |
Non-Investment grade | | 80 | | | 36,135 | | | | 20,502 | | | | 0.36 | | | | 46 | | | | 57 | | | | 33,036 | | | | 18,735 | | | | 0.41 | | | | 44 | | | | 57 | |
| | 77 | | | 23,941 | | | | 14,955 | | | | 0.51 | | | | 43 | | | | 62 | | | | 20,340 | | | | 14,158 | | | | 0.55 | | | | 45 | | | | 70 | |
| | 75 | | | 15,941 | | | | 11,830 | | | | 0.74 | | | | 46 | | | | 74 | | | | 19,589 | | | | 14,102 | | | | 0.80 | | | | 41 | | | | 72 | |
| | 73 | | | 7,307 | | | | 6,063 | | | | 1.42 | | | | 40 | | | | 83 | | | | 8,737 | | | | 7,414 | | | | 1.54 | | | | 40 | | | | 85 | |
| | 70 | | | 4,692 | | | | 4,682 | | | | 2.73 | | | | 43 | | | | 100 | | | | 4,804 | | | | 3,855 | | | | 2.97 | | | | 34 | | | | 80 | |
Watch list | | 65 | | | 1,297 | | | | 2,078 | | | | 9.99 | | | | 41 | | | | 160 | | | | 991 | | | | 1,679 | | | | 10.55 | | | | 44 | | | | 169 | |
| | 60 | | | 1,221 | | | | 2,447 | | | | 19.05 | | | | 40 | | | | 200 | | | | 1,101 | | | | 2,287 | | | | 19.42 | | | | 40 | | | | 208 | |
| | 40 | | | 2,465 | | | | 4,901 | | | | 28.77 | | | | 37 | | | | 199 | | | | 1,454 | | | | 3,267 | | | | 30.14 | | | | 43 | | | | 225 | |
| | | 30 | | | 100 | | | | 178 | | | | 59.28 | | | | 43 | | | | 178 | | | | 3 | | | | 5 | | | | 69.10 | | | | 45 | | | | 167 | |
Default(9) | | 27-21 | | | 2,520 | | | | 8,106 | | | | 100 | | | | 42 | | | | 322 | | | | 1,093 | | | | 3,786 | | | | 100 | | | | 52 | | | | 346 | |
Total, excluding residential mortgages | | | 379,620 | | | | 132,837 | | | | 1.20 | | | | 36 | | | | 35 | | | | 374,542 | | | | 129,520 | | | | 0.76 | | | | 35 | | | | 35 | |
Government guaranteed residential mortgages | | | 100,869 | | | | – | | | | – | | | | 25 | | | | – | | | | 86,832 | | | | – | | | | – | | | | 15 | | | | – | |
Total | | | | | 480,489 | | | | 132,837 | | | | 0.95 | | | | 34 | | | | 28 | | | | 461,374 | | | | 129,520 | | | | 0.62 | | | | 31 | | | | 28 | |
| (1) | Refer to the Bank’s Supplementary Regulatory Capital Disclosures for a more detailed breakdown by asset class, exposure at default, probability at default, loss given default and risk weighting. |
| (2) | Excludes securitization exposures. |
| (3) | Excludes government guaranteed residential mortgages of $100.9 billion ($86.8 billion in 2015). |
| (4) | After credit risk mitigation. |
| (5) | PD – Probability of Default. |
| (6) | LGD – Loss Given Default. |
| (8) | Exposure at default used as basis for estimated weightings. |
| (9) | Gross defaulted exposures, before any related allowances. |
Credit risk-weighted assets – non-retail
Credit risk measures the risk that a borrower or counterparty will fail to honour its financial or contractual obligations to the Bank. The Bank uses the Advanced Internal Ratings Based (AIRB) approach under Basel III to determine minimum regulatory capital requirements for its domestic, U.S. and European credit portfolios, and certain international non-retail portfolios. The remaining credit portfolios are subject to the Standardized approach, which relies on the external credit ratings of borrowers, if available, to compute regulatory capital for credit risk. For AIRB portfolios, the key risk measures used in the quantification of regulatory capital for credit risk include probability of default (PD), loss given default (LGD) and exposure at default (EAD).
| • | | Probability of default (PD) measures the likelihood that a borrower, with an assigned Internal Grade (IG) code, will default within a one-year time horizon. IG codes are a component of the Bank’s risk rating system. Each of the Bank’s internal borrower IG codes is mapped to a PD estimate. |
2 0 1 6 S C O T I A B A N K A N N U A L R E P O R T | 39
MANAGEMENT’S DISCUSSION AND ANALYSIS
| • | | Loss given default (LGD) measures the severity of loss on a facility in the event of a borrower’s default. The Bank’s internal LGD grades are mapped to ranges of LGD estimates. LGD grades are assigned based on facility characteristics such as seniority, collateral type, collateral coverage and other structural elements. LGD for a defaulted exposure is based on the concept of economic loss and is calculated using the present value of repayments, recoveries and related direct and indirect expenses. |
| • | | Exposure at default (EAD) measures the expected exposure on a facility at the time of default. |
All three risk measures are estimated using the Bank’s historical data, as well as available external benchmarks, and are updated on a regular basis. The historical data used for estimating these risk measures exceeds the minimum five-year AIRB requirement for PD estimates and the minimum seven-year AIRB requirement for LGD and EAD estimates. Further analytical adjustments, as required under the Basel III Framework and OSFI’s requirements set out in its Domestic Implementation Notes, are applied to average estimates obtained from historical data. These analytical adjustments incorporate the regulatory requirements pertaining to:
| • | | Long-run estimation of PD, which requires that PD estimates capture average default experience over a reasonable mix of high-default and low-default years of the economic cycle; |
| • | | Downturn estimation for LGD, which requires that LGD estimates appropriately reflect conditions observed during periods where credit losses are substantially higher than average; and |
| • | | Downturn estimation for EAD, which requires that EAD estimates appropriately reflect conditions observed during periods of economic downturn; and |
| • | | The addition of a margin of conservatism, which is related to the likely range of errors based on the identification and quantification of the various sources of uncertainty inherent in historical estimates. |
These risk measures are used in the calculation of regulatory capital requirements based on formulas specified by the Basel framework. The credit quality distribution of the Bank’s AIRB non-retail portfolio is shown in T25.
The risk measures are subject to a rigorous back-testing framework which uses the Bank’s historical data to ensure that they are appropriately calibrated. Based on results obtained from the back-testing process, risk measures are reviewed, re-calibrated and independently validated on at least an annual basis to ensure that they reflect the implications of new data, technical advances and other relevant information.
| • | | As PD estimates represent long-run parameters, back-testing is performed using historical data spanning at least one full economic cycle. Realized PDs are back-tested using pre-defined confidence intervals, and the results are then aggregated to provide an overall assessment of the appropriateness of each PD estimate; |
| • | | The back-testing for LGD and EAD estimates is conducted from both long-run and downturn perspectives, in order to ensure that these estimates are adequately conservative to reflect both long-run and downturn conditions. |
Portfolio-level back-testing results, based on a comparison of estimated and realized parameters for the four-quarter period ended at July 31, 2016, are shown in T26.
T26 Portfolio-level comparison of estimated and actual non-retail percentages
| | | | | | | | |
| | | Estimated(1) | | | Actual | |
Average PD | | | 0.85 | | | | 0.69 | |
Average LGD | | | 41.26 | | | | 24.63 | |
Average CCF(2) | | | 49.94 | | | | 16.08 | |
| (1) | Estimated parameters are based on portfolio averages at Q3/15, whereas actual parameters are based on averages of realized parameters during the subsequent four quarters. |
| (2) | EAD back-testing is performed through Credit Conversion Factor (CCF) back-testing, as EAD is computed using the sum of the drawn exposure and the committed undrawn exposure multiplied by the estimated CCF. |
Credit risk-weighted assets – Canadian retail
The AIRB approach is used to determine minimum regulatory capital requirements for the retail credit portfolio. The retail portfolio is comprised of the following Basel-based pools:
| • | | Residential real estate secured exposures consists of conventional and high ratio residential mortgages and all other products opened under the Scotia Total Equity Plan (STEP), such as loans, credit cards and secured lines of credit; |
| • | | Qualifying revolving retail exposures consists of all unsecured credit cards and lines of credit; |
| • | | Other retail consists of term loans (secured and unsecured), as well as credit cards and lines of credit which are secured by assets other than real estate. |
For the AIRB portfolios, the following models and parameters are estimated:
| • | | Probability of default (PD) is the likelihood that the facility will default within the next 12 months. |
| • | | Loss Given Default (LGD) measures the economic loss as a proportion of the defaulted balance. |
| • | | Exposure at Default (EAD) is the portion of expected exposures at time of default. |
The data observation period used for PD/EAD/LGD estimates meets the five year minimum. Various statistical techniques including predictive modeling and decision trees were used to develop models. The models assign accounts into homogenous segments using internal and external borrower/facility-level credit experience. Every month, exposures are automatically re-rated based on risk and loss characteristics. PD, LGD and EAD estimates are then assigned to each of these segments incorporating the following regulatory requirements:
| • | | PD incorporates the average long run default experience over an economic cycle. This long run average includes a mix of high and low default years. |
| • | | LGD is adjusted to appropriately reflect economic downturn conditions. |
| • | | EAD may also be adjusted to reflect downturn conditions when PD and EAD are highly correlated. |
| • | | Sources of uncertainty are reviewed regularly to ensure uncertainties are identified, quantified and included in calculations so that all parameter estimates reflect appropriate levels of conservatism. |
40 | 2 0 1 6 S C O T I A B A N K A N N U A L R E P O R T
MANAGEMENT’S DISCUSSION AND ANALYSIS | GROUP FINANCIAL CONDITION
The table below summarizes the credit quality distribution of the Bank’s AIRB retail portfolio as at October 31, 2016.
T27 Retail AIRB portfolio exposure by PD range(1)(2)
| | | | | | | | | | | | | | | | | | | | | | | | | | | | | | | | | | | | | | | | | | |
| As at October 31 ($ millions) | | 2016 | | | 2015 | |
| Category | | PD Range | | Exposure
at default ($)(2) | | | RWA ($) | | | PD (%)(3)(6) | | | LGD (%)(4)(6) | | | RW (%)(5)(6) | | | Exposure
at default ($)(2) | | | RWA ($) | | | PD (%)(3)(6) | | | LGD (%)(4)(6) | | | RW (%)(5)(6) | |
Exceptionally low | | 0.0000% – 0.0499% | | | 44,356 | | | | 964 | | | | 0.04 | | | | 30 | | | | 2 | | | | 49,414 | | | | 1,154 | | | | 0.04 | | | | 28 | | | | 2 | |
Very low | | 0.0500% – 0.1999% | | | 59,509 | | | | 4,417 | | | | 0.15 | | | | 31 | | | | 7 | | | | 59,484 | | | | 4,064 | | | | 0.14 | | | | 28 | | | | 7 | |
Low | | 0.2000% – 0.9999% | | | 52,261 | | | | 12,483 | | | | 0.54 | | | | 42 | | | | 24 | | | | 53,094 | | | | 12,507 | | | | 0.54 | | | | 41 | | | | 24 | |
Medium low | | 1.0000% – 2.9999% | | | 20,851 | | | | 10,961 | | | | 1.75 | | | | 53 | | | | 53 | | | | 21,545 | | | | 11,558 | | | | 1.80 | | | | 53 | | | | 54 | |
Medium | | 3.0000% – 9.9999% | | | 6,265 | | | | 6,028 | | | | 5.34 | | | | 61 | | | | 96 | | | | 5,551 | | | | 5,533 | | | | 5.69 | | | | 65 | | | | 100 | |
High | | 10.0000% – 19.9999% | | | 1,997 | | | | 2,926 | | | | 10.77 | | | | 67 | | | | 147 | | | | 2,213 | | | | 3,261 | | | | 11.36 | | | | 63 | | | | 147 | |
Extremely high | | 20.0000% – 99.9999% | | | 2,312 | | | | 3,682 | | | | 35.12 | | | | 56 | | | | 159 | | | | 2,521 | | | | 3,914 | | | | 35.28 | | | | 52 | | | | 155 | |
Default(7) | | 100% | | | 677 | | | | – | | | | 100.00 | | | | 74 | | | | – | | | | 611 | | | | – | | | | 100.00 | | | | 72 | | | | – | |
Total | | | | | 188,228 | | | | 41,461 | | | | 1.48 | | | | 38 | | | | 22 | | | | 194,433 | | | | 41,991 | | | | 1.46 | | | | 36 | | | | 22 | |
| (1) | Refer to the Bank’s Supplementary Regulatory Capital Disclosures for a more detailed breakdown by asset class, exposure at default, probability at default, loss given default and risk-weighting. |
| (2) | After credit risk mitigation. |
| (3) | PD – Probability of Default. |
| (4) | LGD – Loss Given Default. |
| (6) | Exposure at default used as basis for estimated weightings. |
| (7) | Gross defaulted exposures, before any related allowances. |
All AIRB models and parameters are monitored on a quarterly basis and independently validated annually by the Global Risk Management group. These models are tested to ensure rank ordering and back testing of parameters is appropriate. Comparison of estimated and actual loss parameters for the period ended July 31, 2016 are shown in Table T28. During this period the actual experience was significantly better than the estimated risk parameters.
T28 Estimated and actual loss parameters(1)
| | | | | | | | | | | | | | | | | | | | | | | | |
| | | | | | |
| ($ millions) | | Average
estimated
PD (%)(2)(7) | | | Actual
default
rate (%)(2)(5) | | | Average
estimated
LGD (%)(3)(7) | | | Actual
LGD (%)(3)(6) | | | Estimated
EAD ($)(4)(7) | | | Actual
EAD ($)(4)(5) | |
Residential real estate secured | | | | | | | | | | | | | | | | | | | | | | | | |
Residential mortgages | | | | | | | | | | | | | | | | | | | | | | | | |
Insured mortgages(8) | | | 1.01 | | | | 0.46 | | | | – | | | | – | | | | – | | | | – | |
Uninsured mortgages | | | 0.54 | | | | 0.25 | | | | 19.37 | | | | 11.54 | | | | – | | | | – | |
Secured lines of credit | | | 0.77 | | | | 0.25 | | | | 29.53 | | | | 20.47 | | | | 89 | | | | 79 | |
Qualifying revolving retail exposures | | | 2.02 | | | | 1.78 | | | | 77.74 | | | | 65.66 | | | | 656 | | | | 573 | |
Other retail | | | 1.95 | | | | 1.32 | | | | 58.88 | | | | 49.85 | | | | 6 | | | | 5 | |
| (1) | Estimates and Actual Values are restated to align with new models implemented during the period. |
| (2) | Account weighted aggregation. |
| (3) | Default weighted aggregation. |
| (4) | EAD is estimated for revolving products only. |
| (5) | Actual based on accounts not at default as at four quarters prior to reporting date. |
| (6) | Actual LGD calculated based on 24 month recovery period after default and therefore excludes any recoveries received after the 24 month period. |
| (7) | Estimates are based on the four quarters prior to the reporting date. |
| (8) | Actual and Estimated LGD for insured mortgages are not shown. Actual LGD includes the insurance benefit, whereas estimated LGD may not. |
Credit risk-weighted assets – International retail
International retail credit portfolios follow the Standardized approach and consist of the following components:
| • | | Residential real estate secured lending; |
| • | | Qualifying revolving retail exposures consisting of all credit cards and lines of credit; |
| • | | Other retail consisting of term loans. |
Under the standardized approach, in general, residential real estate secured lending products are risk-weighted 35% and other retail products receive a 75% risk-weight.
Market risk
Market risk is the risk of loss from changes in market prices including interest rates, credit spreads, equity prices, foreign exchange rates, and commodity prices, the correlations between them, and their levels of volatility.
For all material trading portfolios, the Bank applies its internal models to calculate the market risk capital charge. OSFI has approved the Bank’s internal VaR, Stressed VaR, Incremental Risk Charge and Comprehensive Risk Measure models for the determination of market risk capital. The attributes and parameters of these models are described in the Risk Measurement Summary.
For some non-material trading portfolios, the Bank applies the Standardized Approach for calculating market risk capital. The standardized method uses a “building block” approach, with the capital charge for each risk category calculated separately.
2 0 1 6 S C O T I A B A N K A N N U A L R E P O R T | 41
MANAGEMENT’S DISCUSSION AND ANALYSIS
Below are the market risk requirements as at October 31, 2016 and 2015:
T29 Total market risk capital
| | | | | | | | |
| | |
| ($ millions) | | 2016 | | | 2015 | |
All-Bank VaR | | $ | 105 | | | $ | 141 | |
All-Bank stressed VaR | | | 209 | | | | 246 | |
Incremental risk charge | | | 407 | | | | 488 | |
Comprehensive risk measure | | | 77 | | | | 201 | |
Standardized approach | | | 48 | | | | 72 | |
Total market risk capital(1) | | $ | 846 | | | $ | 1,148 | |
| (1) | Equates to $10,571 of market risk-weighted assets (2015 – $14,350). |
T30 Risk-weighted assets movement by key drivers
| | | | | | | | |
| |
| | | Market risk | |
| | |
| ($ millions) | | 2016 | | | 2015 | |
RWA as at beginning of the year | | $ | 14,350 | | | $ | 17,251 | |
Movement in risk levels(1) | | | (5,018 | ) | | | 2,004 | |
Model updates(2) | | | 1,239 | | | | (2,723 | ) |
Methodology and policy(3) | | | – | | | | (2,182 | ) |
RWA as at end of the year | | $ | 10,571 | | | $ | 14,350 | |
| (1) | Movement in risk levels are defined as changes in risk due to position changes and market movements. Foreign exchange movements are imbedded within Movement in risk levels. |
| (2) | Model updates are defined as updates to the model to reflect recent experience, change in model scope. |
| (3) | Methodology and policy is defined as methodology changes to the calculations driven by regulatory policy changes (eg. Basel III). |
Market risk-weighted assets decreased by $3.8 billion to $10.6 billion as shown in T30 primarily due to movements in risk levels.
Operational risk
Operational risk is the risk of loss, whether direct or indirect, to which the Bank is exposed due to external events, human error, or the inadequacy or failure of processes, procedures, systems or controls. The Bank currently applies the Standardized Approach for calculating operational risk capital as per applicable Basel Standards. Total capital is determined as the sum of capital for each of eight Basel defined business activities. The capital for each activity is the product of the relevant risk factor, as defined by Basel, applied to the gross income of each respective business activity.
The Bank has received approval from OSFI to use the Advanced Measurement Approach (AMA) commencing the first quarter of 2017. Under AMA, regulatory capital measurement will more directly reflect the Bank’s operational risk environment through the use of a loss distribution approach model which will use internal loss events, external loss events, scenario analysis and other adjustments to arrive at a final operational risk regulatory capital calculation. No significant capital increase is expected under AMA.
Operational risk-weighted assets increased by $3.0 billion during the year to $38.6 billion primarily due to organic growth in gross income and acquisitions which closed during the year.
Internal capital
The Bank utilizes economic capital methodologies and measures to calculate internal capital. Internal capital is a measure of the unexpected losses inherent in the Bank’s business activities. The calculation of internal capital relies on models that are subject to independent vetting and validation as required by the Bank’s Model Risk Management Policy.
Management assesses its risk profile to determine those risks for which the Bank should attribute internal capital. The major risk categories included in internal capital are:
| • | | Credit risk measurement is based on the Bank’s internal credit risk ratings for derivatives, corporate and commercial loans, and credit scoring for retail loans. It is also based on the Bank’s actual experience with recoveries and takes into account differences in term to maturity, probabilities of default, expected severity of loss in the event of default, and the diversification benefits of certain portfolios. |
| • | | Market risk for internal capital incorporates models consistent with the regulatory basis, with some exclusions, and calibrated to a higher 99.95% confidence interval, and models of other market risks, mainly structural interest rate and foreign exchange risks. |
| • | | Operational risk for internal capital is based on a model incorporating actual losses, adjusted for an add-on for regulatory capital. |
| • | | Other risks include additional risks for which internal capital is attributed, such as business risk, significant investments, insurance risk and real estate risk. |
In addition, the Bank’s measure of internal capital includes a diversification benefit which recognizes that all of the above risks will not occur simultaneously. The Bank also includes the full amount of goodwill and intangible assets in the internal capital amount.
For further discussion on risk management and details on credit, market and operational risks, refer to the Risk Management section.
Off-Balance Sheet Arrangements
In the normal course of business, the Bank enters into contractual arrangements with entities that are either consolidated or not required to be consolidated in its financial statements, but could have a current or future impact on the Bank’s financial performance or financial condition. These arrangements can be classified into the following categories: structured entities, securitizations, guarantees and other commitments.
Structured entities
Arrangements with structured entities include structured entities that are used to provide a wide range of services to customers, such as structured entities established to allow clients to securitize their financial assets while facilitating cost-efficient financing, and to provide certain investment opportunities. The Bank creates, administers and manages personal and corporate trusts on behalf of its customers. The Bank also sponsors and actively manages certain structured entities (see discussion on other unconsolidated structured entities on page 44).
42 | 2 0 1 6 S C O T I A B A N K A N N U A L R E P O R T
MANAGEMENT’S DISCUSSION AND ANALYSIS | GROUP FINANCIAL CONDITION
All structured entities are subject to a rigorous review and approval process to ensure that all significant risks are properly identified and addressed. For many of the structured entities that are used to provide services to customers, the Bank does not guarantee the performance of the structured entities’ underlying assets, and does not absorb any related losses. For other structured entities, such as securitization and investment vehicles, the Bank may be exposed to credit, market, liquidity or operational risks. The Bank earns fees based on the nature of its association with a structured entity.
Consolidated structured entities
The Bank controls its U.S.-based multi-seller conduit and certain funding and other vehicles, and consolidates these structured entities in the Bank’s consolidated financial statements.
As at October 31, 2016, total assets of consolidated structured entities were $59 billion, compared to $47 billion at the end of 2015. The change was primarily due to asset purchases by Scotiabank Covered Bond Guarantor Limited Partnership. More details of the Bank’s consolidated structured entities are provided in Note 14(a) to the consolidated financial statements.
Unconsolidated structured entities
There are two primary types of association the Bank has with unconsolidated structured entities:
| • | | Canadian multi-seller conduits administered by the Bank, and |
| • | | Structured finance entities. |
The Bank earned total fees of $23 million in 2016 (October 31, 2015 – $18 million) from certain structured entities in which it had a significant interest at the end of the year but did not consolidate. More information with respect to the Bank’s involvement with these unconsolidated structured entities, including details of liquidity facilities and maximum loss exposure by category is provided below and in Note 14(b) to the consolidated financial statements.
Canadian multi-seller conduits administered by the Bank
The Bank sponsors two Canadian-based multi-seller conduits that are not consolidated. The Bank earned commercial paper issuance fees, program management fees, liquidity fees and other fees from these multi-seller conduits, which totaled $22 million in 2016, compared to $17 million in 2015. These multi-seller conduits purchase high-quality financial assets and finance these assets through the issuance of highly-rated commercial paper.
As further described below, the Bank’s exposure to these off-balance sheet conduits primarily consists of liquidity support and temporary holdings of commercial paper. Although the Bank has power over the relevant activities of the conduits, it has limited exposure to variability in returns, which results in the Bank not consolidating the two Canadian conduits. The Bank has a process to monitor these exposures and significant events impacting the conduits to ensure there is no change in control, which could require the Bank to consolidate the assets and liabilities of the conduits at fair value.
A significant portion of the conduits’ assets have been structured to receive credit enhancements from the sellers, including overcollateralization protection and cash reserve accounts. Each asset purchased by the conduits is supported by a backstop liquidity facility provided by the Bank in the form of a liquidity asset purchase agreement (LAPA). The primary purpose of the backstop liquidity facility is to provide an alternative source of financing in the event the conduits are unable to access the commercial paper market. Under the terms of the LAPA, in most cases, the Bank is not obliged to purchase defaulted assets.
The Bank’s primary exposure to the Canadian-based conduits is the liquidity support provided, with total liquidity facilities of $5.8 billion as at October 31, 2016 (October 31, 2015 – $3.9 billion). The year-over-year increase was due to normal business operations. As at October 31, 2016, total commercial paper outstanding for the Canadian-based conduits was $4.4 billion (October 31, 2015 – $2.5 billion) and the Bank held less than 0.1% of the total commercial paper issued by these conduits. Table T31 presents a summary of assets purchased and held by the Bank’s two Canadian multi-seller conduits as at October 31, 2016 and 2015, by underlying exposure.
All of the funded assets have at least an equivalent rating of AA– or higher based on the Bank’s internal rating program. Assets held in these conduits were investment grade as at October 31, 2016. Approximately 75% of the funded assets have final maturities falling within four years, and the weighted-average repayment period, based on cash flows, approximates 1.8 years.
T31 Assets held by Scotiabank-sponsored Canadian-based multi-seller conduits
| | | | | | | | | | | | | | | | | | | | | | | | |
| | |
| As at October 31 ($ millions) | | 2016 | | | 2015 | |
| | Funded
assets(1) | | | Unfunded
commitments | | | Total
exposure(2) | | | Funded
assets(1) | | | Unfunded
commitments | | | Total
exposure(2) | |
Auto loans/leases | | $ | 3,168 | | | $ | 601 | | | $ | 3,769 | | | $ | 1,200 | | | $ | 573 | | | $ | 1,773 | |
Trade receivables | | | 131 | | | | 618 | | | | 749 | | | | 131 | | | | 614 | | | | 745 | |
Canadian residential mortgages | | | 1,081 | | | | 194 | | | | 1,275 | | | | 1,082 | | | | 193 | | | | 1,275 | |
Equipment loans/leases | | | 21 | | | | – | | | | 21 | | | | 78 | | | | 2 | | | | 80 | |
| | | | | | |
Total(3) | | $ | 4,401 | | | $ | 1,413 | | | $ | 5,814 | | | $ | 2,491 | | | $ | 1,382 | | | $ | 3,873 | |
| (1) | Funded assets are reflected at original cost, which approximates estimated fair value. |
| (2) | Exposure to the Bank is through global-style liquidity facilities. |
| (3) | These assets are substantially sourced from Canada. |
2 0 1 6 S C O T I A B A N K A N N U A L R E P O R T | 43
MANAGEMENT’S DISCUSSION AND ANALYSIS
Structured finance entities
The Bank has interests in structured finance entities used to assist corporate clients in accessing cost-efficient financing through their securitization structures. The Bank’s maximum exposure to loss from structured finance entities was $2,326 million as at October 31, 2016, (October 31, 2015 – $2,330 million).
Other unconsolidated structured entities
The Bank sponsors unconsolidated structured entities in which it has insignificant or no interest at the reporting date. The Bank is a sponsor when it is significantly involved in the design and formation at inception of the structured entity, and the Bank’s name is used by the structured entity to create an awareness of the instruments being backed by the Bank’s reputation and obligation. The Bank also considers other factors, such as its continuing involvement and obligations to determine if, in substance, the Bank is a sponsor. The Bank earned $1,968 million income from its involvement with the unconsolidated Bank-sponsored structured entities for the year ended October 31, 2016 (for the year ended October 31, 2015 – $1,977 million).
Securitizations
The Bank securitizes fully insured residential mortgage loans, Bank originated and others, through the creation of mortgage backed securities (MBS) that are sold to Canada Housing Trust (CHT) and/or third party investors. The sale of such mortgages does not qualify for derecognition with the exception of social housing mortgage pools. The outstanding amount of off-balance sheet securitized social housing pools was $1,237 million as at October 31, 2016, compared to $1,366 million last year. The transferred mortgages sold to CHT and/or third party investors continue to be recognized on balance sheet along with the proceeds from sale treated as secured borrowings. More details have been provided in Note 13 to the consolidated financial statements on page 173.
The Bank securitizes a portion of its Canadian lines of credit and credit card receivables (receivables) through two Bank-sponsored structured entities. The receivables are comprised of unsecured personal lines of credit, securitized through Hollis Receivables Term Trust II (Hollis), and personal and small business credit card receivables, securitized through Trillium Credit Card Trust II (Trillium). Hollis and Trillium issue Class A notes to third-party investors and subordinated notes to the Bank, and the proceeds of such issuances are used to purchase co-ownership interests in the respective receivables originated by the Bank. The sale of such co-ownership interests does not qualify for derecognition and therefore the receivables continue to be recognized on the Consolidated Statement of Financial Position. Recourse of the note holders is limited to the purchased co-ownership interests. During the year, no receivables were securitized through Hollis (2015 – $1,145 million) and $1,242 million were securitized through Trillium. The subordinated notes issued by Hollis of $297 million (2015 – $399 million) and Trillium of $99 million, both held by the Bank, are eliminated on consolidation.
The Bank securitizes a portion of its Canadian auto loan receivables (receivables) through Securitized Term Auto Receivables Trust 2016-1 (START), a Bank-sponsored structured entity. START issues multiple series of Class A notes to third-party investors and subordinated notes to the Bank, and the proceeds of such issuances are used to purchase a discrete pool of retail indirect auto loan receivables from the Bank on a fully serviced basis. The sale of such pool does not qualify for derecognition and therefore the receivables continue to be recognized on the Consolidated Statement of Financial Position. Recourse of the note holders is limited to the receivables. During the year, $740 million of assets were securitized through START. The subordinated notes issued by START of $45 million, held by the Bank, are eliminated on consolidation.
Guarantees and other commitments
Guarantees and other commitments are fee-based products that the Bank provides to its customers. These products can be categorized as follows:
| • | | Standby letters of credit and letters of guarantee. As at October 31, 2016, these amounted to $35 billion, compared to $31 billion last year. These instruments are issued at the request of a Bank customer to secure the customer’s payment or performance obligations to a third party. The year-over-year increase reflects a general increase in customer activity and the impact of foreign currency translation; |
| • | | Liquidity facilities. These generally provide an alternate source of funding to asset-backed commercial paper conduits in the event a general market disruption prevents the conduits from issuing commercial paper or, in some cases, when certain specified conditions or performance measures are not met; |
| • | | Indemnification contracts. In the ordinary course of business, the Bank enters into many contracts where it may indemnify contract counterparties for certain aspects of its operations that are dependent on other parties’ performance, or if certain events occur. The Bank cannot estimate, in all cases, the maximum potential future amount that may be payable, nor the amount of collateral or assets available under recourse provisions that would mitigate any such payments. Historically, the Bank has not made any significant payments under these indemnities; |
| • | | Loan commitments. The Bank has commitments to extend credit, subject to specific conditions, which represent undertakings to make credit available in the form of loans or other financings for specific amounts and maturities. As at October 31, 2016, these commitments amounted to $174 billion, compared to $166 billion last year. The year-over-year increase primarily reflects an increase in foreign currency denominated business activity. |
These guarantees and loan commitments may expose the Bank to credit or liquidity risks, and are subject to the Bank’s standard review and approval processes. For the guaranteed products, the dollar amounts represent the maximum risk of loss in the event of a total default by the guaranteed parties, and are stated before any reduction for recoveries under recourse provisions, insurance policies or collateral held or pledged.
Fees from the Bank’s guarantees and loan commitment arrangements, recorded as credit fees in other income in the Consolidated Statement of Income, were $574 million in 2016, compared to $489 million in the prior year. Detailed information on guarantees and loan commitments is disclosed in Note 35 to the consolidated financial statements.
44 | 2 0 1 6 S C O T I A B A N K A N N U A L R E P O R T
MANAGEMENT’S DISCUSSION AND ANALYSIS | GROUP FINANCIAL CONDITION
Financial Instruments
Given the nature of the Bank’s main business activities, financial instruments make up a substantial portion of the Bank’s financial position and are integral to the Bank’s business. Assets that are financial instruments include cash resources, securities, securities purchased under resale agreements, loans and customers’ liability under acceptances. Financial instrument liabilities include deposits, acceptances, obligations related to securities sold under repurchase agreements, obligations related to securities sold short, subordinated debentures and capital instrument liabilities. In addition, the Bank uses derivative financial instruments for both trading and hedging purposes.
Financial instruments are generally carried at fair value, except for non-trading loans and receivables, certain securities and most financial liabilities, which are carried at amortized cost unless designated as fair value through profit or loss at inception.
Unrealized gains and losses on the following items are recorded in other comprehensive income:
| • | | available-for-sale securities, net of related hedges, |
| • | | derivatives designated as cash flow hedges, and |
Gains and losses on available-for-sale securities are recorded in the Consolidated Statement of Income when realized. Gains and losses on cash flow hedges and net investment hedges are recorded in the Consolidated Statement of Income when the hedged item affects income.
All changes in the fair value of derivatives, including embedded derivatives that must be separately accounted for, are recorded in the Consolidated Statement of Income, other than those designated as cash flow and net investment hedges which flow through other comprehensive income. The Bank’s accounting policies for derivatives and hedging activities are further described in Note 3 to the consolidated financial statements.
Interest income and expense on non-trading interest-bearing financial instruments are recorded in the Consolidated Statement of Income as part of net interest income. Credit losses resulting from loans are recorded in the provision for credit losses. Interest income and expense, as well as gains and losses, on trading securities and trading loans are recorded in other operating income – trading revenues. Realized gains and losses and write-downs for impairment on available-for-sale debt or equity instruments are recorded in net gain on investment securities within other operating income.
Several risks arise from transacting financial instruments, including credit risk, liquidity risk, operational risk and market risk. The Bank manages these risks using extensive risk management policies and practices, including various Board-approved risk management limits.
A discussion of the Bank’s risk management policies and practices can be found in the Risk Management section on pages 60 to 98. In addition, Note 35 to the consolidated financial statements presents the Bank’s exposure to credit risk, liquidity risk and market risks arising from financial instruments as well as the Bank’s corresponding risk management policies and procedures.
There are various measures that reflect the level of risk associated with the Bank’s portfolio of financial instruments. For example, the interest rate risk arising from the Bank’s financial instruments can be estimated by calculating the impact of a 100 basis point increase or decrease in interest rates on annual income, and the economic value of shareholders’ equity, as described on page 83. For trading activities, T50 discloses the average one-day Value at Risk by risk factor. For derivatives, based on the Bank’s maturity profile of derivative instruments, only 16% (2015 – 14%) had a term to maturity greater than five years.
Note 9 to the consolidated financial statements provides details about derivatives used in trading and hedging activities, including notional amounts, remaining term to maturity, credit risk and fair values.
The fair value of the Bank’s financial instruments is provided in Note 6 to the consolidated financial statements along with a description of how these amounts were determined.
The fair value of the Bank’s financial instruments was favourable when compared to their carrying value by $2,148 million as at October 31, 2016 (October 31, 2015 – favourable $2,410 million). This difference relates mainly to loan assets, deposit liabilities, subordinated debentures and other liabilities. The year-over-year change in the fair value over carrying value arose mainly from changes in interest rates since origination. Fair value estimates are based on market conditions as at October 31, 2016, and may not be reflective of future fair values. Further information on how fair values are estimated is contained in the section on critical accounting estimates on page 99.
Disclosures specific to certain financial instruments designated at fair value through profit or loss can be found in Note 8 to the consolidated financial statements. These designations were made primarily to significantly reduce accounting mismatches.
2 0 1 6 S C O T I A B A N K A N N U A L R E P O R T | 45
MANAGEMENT’S DISCUSSION AND ANALYSIS
Selected Credit Instruments – Publically Known Risk Items
Mortgage-backed securities
Total mortgage-backed securities held in the non-trading and trading portfolios are shown in T32.
T32Mortgage-backed securities
| | | | | | | | | | | | | | | | |
| | |
As at October 31 Carrying value ($ millions) | | 2016 | | | 2015 | |
| | Non-trading
portfolio | | | Trading
portfolio | | | Non-trading
portfolio | | | Trading
portfolio | |
Canadian NHA mortgage-backed securities(1) | | $ | 1,591 | | | $ | 1,546 | | | $ | 137 | | | $ | 1,335 | |
Commercial mortgage-backed securities | | | – | | | | 57 | | | | 2 | | | | 113 | |
Other residential mortgage-backed securities | | �� | 521 | | | | – | | | | 206 | | | | 3 | |
Total | | $ | 2,112 | | | $ | 1,603 | | | $ | 345 | | | $ | 1,451 | |
| (1) | Canada Mortgage and Housing Corporation provides a guarantee of timely payment to NHA mortgage-backed security investors. |
Collateralized debt obligations and collateralized loan obligations
Non-trading portfolio
The Bank has collateralized loan obligation (CLO) investments in its non-trading portfolio. CLOs generally achieve their structured credit exposure by investing and holding corporate loans or bonds. Cash-based CLOs are classified as loans and are carried at amortized cost. These are assessed for impairment like all other loans.
As at October 31, 2016, the carrying value of cash-based CLOs reported as loans on the Consolidated Statement of Financial Position was $14 million (October 31, 2015 – $34 million). The fair value was $7 million (October 31, 2015 – $28 million). The year-over-year decline was due to paydowns. None of these cash-based CLOs are classified as impaired loans. Substantially all of the referenced assets of the Bank’s CLOs are corporate exposures, without any U.S. mortgage-backed securities.
Trading portfolio
The Bank also holds synthetic CDOs in its trading portfolio as a result of structuring and managing transactions with clients and other financial institutions. To hedge its trading exposure, the Bank purchases or sells CDOs to other financial institutions, along with purchasing and/or selling index tranches or single name credit default swaps (CDSs). The main driver of the value of CDOs and CDSs is changes in credit spreads. Total CDOs purchased and sold in the trading portfolio are shown in T33 below.
T33 Collateralized debt obligations (CDOs)
| | | | | | | | | | | | | | | | |
| | |
| | | 2016 | | | 2015 | |
| | | | |
As at October 31 Outstanding ($ millions) | | Notional
Amount | | | Positive/
(negative)
fair value | | | Notional
Amount | | | Positive/
(negative)
fair value | |
CDOs – sold protection | | $ | 142 | | | $ | 4 | | | $ | 1,977 | | | $ | 24 | |
CDOs – purchased protection | | $ | – | | | $ | – | | | $ | 1,776 | | | $ | (8 | ) |
The change in the notional amount and fair value of CDOs were due mainly to trades that matured or were unwound during the year. The change in fair value of CDOs was due to the reduction of probability of deals experiencing defaults as they approach maturity. Based on positions held at October 31, 2016, a 50 basis point widening of relevant credit spreads in this portfolio would result in a pre-tax decrease of approximately $2.0 million in net income.
The referenced assets underlying the trading book CDOs are substantially all corporate exposures, with no mortgage-backed securities.
Other
As at October 31, 2016, the Bank has insignificant exposure to highly leveraged loans awaiting syndication, auction-rate securities,Alt-A type loans, monoline insurance and investments in structured investment vehicles.
46 | 2 0 1 6 S C O T I A B A N K A N N U A L R E P O R T
MANAGEMENT’S DISCUSSION AND ANALYSIS | BUSINESS LINES
BUSINESS LINE OVERVIEW
Business line results are presented on a taxable equivalent basis, adjusting for the following:
| • | | The Bank analyzes revenue on a taxable equivalent basis (TEB) for business lines. This methodology grosses up tax-exempt income earned on certain securities reported in either net interest income or non-interest income to an equivalent before tax basis. A corresponding increase is made to the provision for income taxes; hence, there is no impact on net income. Management believes that this basis for measurement provides a uniform comparability of net interest income and non-interest income arising from both taxable and non-taxable sources and facilitates a consistent basis of measurement. While other banks also use TEB, their methodology may not be comparable to the Bank’s methodology. A segment’s revenue and provision for income taxes are grossed up by the taxable equivalent amount. The elimination of the TEB gross up is recorded in the Other segment. |
| • | | For business line performance assessment and reporting, net income from associated corporations, which is an after-tax number, is adjusted to normalize for income taxes. The tax normalization adjustment grosses up the amount of net income from associated corporations and normalizes the effective tax rate in the business lines to better present the contribution of the associated corporations to the business line results. |
Below are the results of the Bank’s three business operating segments for 2016:
CANADIAN BANKING
Canadian Banking reported net income to equity holders of $3,736 million, up 12% from last year. Solid asset and deposit growth, along with increasing margin driven by credit cards and deposits, gain on sale of a non-core lease financing business and higher non-interest income contributed to this increase. This was partially offset by higher provision for credit losses and non-interest expenses. Return on equity was 22.0% compared to 21.0% last year.
INTERNATIONAL BANKING
International Banking had net income attributable to equity holders of $2,079 million, up $226 million or 12% from last year. Results benefited from strong asset and fee growth and the positive impact of foreign currency translation. This was partly offset by higher provision for credit losses. Return on equity was 12.8%, compared to 13.0% last year.
GLOBAL BANKING AND MARKETS
Global Banking and Markets reported net income attributable to equity holders of $1,571 million, an increase of $18 million from last year. Strong revenue performances in the fixed income, corporate lending and commodities businesses, were mainly offset by higher provision for credit losses and lower results in equities. Return on equity was 12.6% compared to 13.0% last year.
2 0 1 6 S C O T I A B A N K A N N U A L R E P O R T | 47
MANAGEMENT’S DISCUSSION AND ANALYSIS
| | | | | | | | | | | | |
| | KEY PERFORMANCE INDICATORS FOR ALL BUSINESS LINES | | |
| | | | | | | | | | |
| | Management uses a number of key metrics to monitor business line performance: |
| | • Net income | | • Return on equity | | • Productivity ratio | | • Provision for credit losses ratio | | • Employee engagement |
T34 2016 Financial performance
| | | | | | | | | | | | | | | | | | | | |
| ($ millions) | | Canadian
Banking | | | International
Banking | | | Global Banking
and Markets | | | Other(1) | | | Total | |
Net interest income(2) | | $ | 7,024 | | | $ | 6,359 | | | $ | 1,293 | | | $ | (384 | ) | | $ | 14,292 | |
Non-interest income(2) | | | 5,164 | | | | 3,482 | | | | 3,139 | | | | 273 | | | | 12,058 | |
Total revenue(2) | | | 12,188 | | | | 9,841 | | | | 4,432 | | | | (111 | ) | | | 26,350 | |
Provision for credit losses | | | 832 | | | | 1,281 | | | | 249 | | | | 50 | | | | 2,412 | |
Non-interest expenses | | | 6,324 | | | | 5,523 | | | | 2,040 | | | | 653 | | | | 14,540 | |
Income tax expense(2) | | | 1,296 | | | | 707 | | | | 572 | | | | (545 | ) | | | 2,030 | |
Net income | | $ | 3,736 | | | $ | 2,330 | | | $ | 1,571 | | | $ | (269 | ) | | $ | 7,368 | |
Net income attributable to non-controlling interests in subsidiaries | | | – | | | | 251 | | | | – | | | | – | | | | 251 | |
Net income attributable to equity holders of the Bank | | $ | 3,736 | | | $ | 2,079 | | | $ | 1,571 | | | $ | (269 | ) | | $ | 7,117 | |
Return on equity (%)(3) | | | 22.0 | % | | | 12.8 | % | | | 12.6 | % | | | – | % | | | 13.8 | % |
Average assets ($ billions) | | $ | 309 | | | $ | 143 | | | $ | 351 | | | $ | 111 | | | $ | 914 | |
Average liabilities ($ billions) | | $ | 232 | | | $ | 109 | | | $ | 270 | | | $ | 247 | | | $ | 858 | |
| (1) | The Other category represents smaller operating segments, including Group Treasury, and other corporate adjustments that are not allocated to an operating segment. Corporate adjustments include the net residual in matched maturity transfer pricing, the elimination of the tax-exempt income gross-up reported in net interest income, non-interest income and provision for income taxes, changes in the collective allowance on performing loans, and differences in the actual amount of costs incurred and charged to the operating segments. |
| (2) | Taxable equivalent basis. |
48 | 2 0 1 6 S C O T I A B A N K A N N U A L R E P O R T
MANAGEMENT’S DISCUSSION AND ANALYSIS | CANADIAN BANKING
Canadian Banking
Canadian Banking provides a full suite of financial advice and banking solutions, supported by an excellent customer experience, to retail, small business, commercial and wealth management customers in Canada.
| | | | | | |
| | 2016 Achievements | | | | |
| | • Delivered an industry-leading customer experience across our businesses and channels. • Launched two new customer-focused branch formats –Scotiabank Express in Guelph and Montreal andScotiabank Solutionsin Guelph and Kitchener. Also, launched theNetwork Transformation Wave Pilot to improve the customer and employee experience. • Scotiabank received a record nine awards in the2016 Ipsos Best Banking Awards, placing 2nd among the Big Five Banks for Overall Service Quality. • Tangerine earned the highest ranking in customer satisfaction among mid-sized banks for the fifth straight year in the2016 J.D. Power Canadian Retail Banking Customer Satisfaction Study. • For the eleventh year in a row, Tangerine was recognized as a customer service leader in theIpsos Best Banking Awards. • Contact centres for Scotiabank (Halifax) and ScotiaLife Financial both receivedContact Centre World Class First Call Resolution (FCR) Certificationfrom the Service Quality Management (SQM) Group. • Delivered industry-leading solutions to enhance the customer experience, including best-in-class processes for mortgage, credit card, small business loan applications and branch onboarding. • Launched new Scotia Wealth Management brand – “Enriched Thinking” – one unified voice, one strong brand, and one integrated approach to serving client needs. • HollisWealth ranking moved up from fourth place in 2015 to secure third place in theJ.D. Power 2016 Canadian Full Service Investor Satisfaction Study. • Further optimized our business mix by growing our higher margin assets, building sticky core deposits, and earning higher fee income. • Two popular co-brand credit cards from Scotiabank – the Scotiabank GM Visa Infinite card and the Scotiabank SCENE Visa card – were recognized with highest honours in the2015 MoneySense Annual Credit Cards Ranking. • Launched theScotiabank More Rewards Visa in partnership with Western Canada based grocer Overwaitea Food Group. • Successfully completed the acquisition of theJPMorgan Chase MasterCard portfolio. • Completed the sale of Roynat’s non-core lease financing business. • Tangerine won the2016 Product of the Year award for the Tangerine Money-Back Credit Card. • Scotiabank iTRADE selected by MoneySense Magazine as aTop 3 pick in best online brokerages in Canada. • Record year for life insurance revenue driven by Private Banking, Private Investment Counsel, and stronger partnership with Financial Planning specialists. • Dynamic Funds won fiveFundata FundGrade A+ Awards. • Made significant investments to become a digital banking leader. • Named the2016 World’s Best Consumer Digital Bank in Canada by Global Finance Magazine. • Tied for highest overall score in the2016 Canadian Mobile Banking Functionality Benchmark by Forrester Research. • Tied for third place overall in the2016 Global Mobile Banking Functionality Benchmark by Forrester Research. • Tangerine named the industry leader in Canadian Mobile Banking Services according to Surviscor’s 2015 Mobile Banking scorecard Review. Scotiabank came in at #2. • LaunchedApple Pay. All Scotiabank customers can now use mobile payments through Apple Pay (for iPhone) and My Mobile Wallet (for Android and Blackberry). | | | | |
Business Profile
Canadian Banking provides a full suite of financial advice and banking solutions, supported by an excellent customer experience, to over 10 million Retail, Small Business, Commercial Banking, and Wealth Management customers. It serves these customers through its network of 980 branches and more than 3,500 automated banking machines (ABMs), as well as internet, mobile and telephone banking and specialized sales teams. Canadian Banking also provides an alternative self-directed banking solution to over two million Tangerine Bank customers. Canadian Banking is comprised of the following areas:
| • | | Retail and Small Business Banking provides financial advice and solutions and day-to-day banking products, including debit cards, chequing accounts, credit cards, investments, mortgages, loans and related creditor insurance products, to individuals and small businesses. Tangerine Bank provides day-to-day banking products, including chequing and saving accounts, credit cards, and investments to self-directed customers. |
| • | | Commercial Banking delivers advice and a full suite of lending, deposit, cash management and trade finance solutions to medium and large businesses, including automotive dealers and their customers to whom we provide retail automotive financing solutions. |
| • | | Wealth Management provides a suite of investment and wealth management advice, services, products and solutions to customers, as well as advisors. The asset management business is focused on developing investment solutions for both retail and institutional investors. The customer-facing wealth businesses, including private customer, online brokerage, full-service brokerage, pensions, institutional customer services and an independent advisor channel, are focused on providing a full suite of wealth management solutions to our customers. |
Strategy
Canadian Banking continues to execute on a long term strategy to deliver a best-in-class customer experience, grow its primary banking relationships, and outperform competitors in earnings growth through customer experience, business mix, operational improvements and digital transformation.
2017 Priorities
| • | | Customer experience:Deliver an excellent customer experience across our businesses and channels. |
| • | | Business mix: Optimize our business mix by growing higher margin assets, building core deposits, and earning higher fee income. |
| • | | Operational improvement:Reduce structural costs to build the capacity to invest in our businesses and technology. |
| • | | Digital transformation:Enhance our digital offering and e-commerce capabilities to drive digital sales and engagement. |
2 0 1 6 S C O T I A B A N K A N N U A L R E P O R T | 49
MANAGEMENT’S DISCUSSION AND ANALYSIS
T35 Canadian Banking financial performance
| | | | | | | | | | | | |
| | | |
| ($ millions) | | 2016 | | | 2015 | | | 2014 | |
Net interest income(1) | | $ | 7,024 | | | $ | 6,415 | | | $ | 5,996 | |
Non-interest income(1)(2) | | | 5,164 | | | | 4,832 | | | | 5,263 | |
Total revenue(1) | | | 12,188 | | | | 11,247 | | | | 11,259 | |
Provision for credit losses | | | 832 | | | | 687 | | | | 663 | |
Non-interest expenses | | | 6,324 | | | | 6,014 | | | | 5,799 | |
Income tax expense(1) | | | 1,296 | | | | 1,202 | | | | 1,113 | |
Net income | | $ | 3,736 | | | $ | 3,344 | | | $ | 3,684 | |
Net income attributable to non-controlling interests | | | – | | | | – | | | | 1 | |
Net income attributable to equity holders of the Bank | | $ | 3,736 | | | $ | 3,344 | | | $ | 3,683 | |
| | | |
Key ratios | | | | | | | | | | | | |
Return on equity(3) | | | 22.0 | % | | | 21.0 | % | | | 22.8 | % |
Productivity(1) | | | 51.9 | % | | | 53.5 | % | | | 51.5 | % |
Net interest margin(4) | | | 2.38 | % | | | 2.23 | % | | | 2.14 | % |
Provision for credit losses as a percentage of loans and acceptances | | | 0.28 | % | | | 0.23 | % | | | 0.23 | % |
| | | |
Selected Consolidated Statement of Financial Position data (average balances) | | | | | | | | | | | | |
Earning assets | | $ | 302,648 | | | $ | 293,460 | | | $ | 284,966 | |
Total assets | | | 309,232 | | | | 299,929 | | | | 291,549 | |
Deposits | | | 224,006 | | | | 210,241 | | | | 202,088 | |
Total liabilities | | | 232,498 | | | | 217,753 | | | | 208,354 | |
| | | |
Other ($ billions) as at October 31 | | | | | | | | | | | | |
Assets under administration | | $ | 318 | | | $ | 310 | | | $ | 296 | |
Assets under management | | $ | 145 | | | $ | 135 | | | $ | 124 | |
| (1) | Taxable equivalent basis. |
| (2) | Includes net income from investments in associated corporations of $78 (2015 – $66; 2014 – $157). |
| (4) | Net interest income (TEB) as % of average earning assets excluding bankers acceptances. |
50 | 2 0 1 6 S C O T I A B A N K A N N U A L R E P O R T
MANAGEMENT’S DISCUSSION AND ANALYSIS | CANADIAN BANKING
Financial Performance
Canadian Banking’s net income attributable to equity holders was $3,736 million in 2016, an increase of $392 million or 12%. The gain on the sale of a non-core lease financing business (“the gain on sale”) of $116 million pre-tax or $100 million after tax contributed 3% growth to net income. Strong performance from retail and small business banking, commercial banking and wealth management, as well as the impact of the credit card portfolio acquired from JPMorgan Chase Bank (“the acquisition”) contributed to the growth.
Assets and liabilities
Average assets rose $9 billion or 3% to $309 billion. Adjusting for the impact of the Tangerine broker-originated and white-label mortgage run-off portfolios, assets increased $14 billion or 5%. The growth reflected $6 billion or 8% in personal loans primarily in consumer automotive lending and credit cards, $5 billion or 3% in residential mortgages, as well as $3 billion or 9% in business loans and acceptances.
Average liabilities rose $14 billion or 7% to $232 billion. Retail banking experienced solid growth in chequing accounts of $2 billion or 9% and savings deposits of $8 billion or 14%. There was also growth of $2 billion or 4% in small business and commercial banking business operating accounts and $4 billion or 25% in wealth management deposits. Partially offsetting was a decline in lower spread GICs of $2 billion or 2%.
Assets under management (AUM) and assets under administration (AUA)
AUM of $145 billion increased $10 billion or 7% driven by market appreciation and net sales. AUA increased $8 billion or 3% to $318 billion driven by market appreciation.
Revenues
Canadian Banking reported total revenues of $12,188 million in 2016, up $941 million from last year, including the gain on sale.
Net interest income increased $609 million or 9% to $7,024 million. The increase was driven by a 15 basis point increase in the margin to 2.38%, strong growth in assets and deposits, and the impact of the acquisition. The increase in margin was primarily driven by growth in higher margin credit cards, margin expansion in deposits, the run-off of lower spread Tangerine mortgages, and the acquisition.
Non-interest income increased $332 million or 7% to $5,164 million. The increase was driven by strong growth in credit cards, retail and commercial banking, insurance and wealth management businesses and includes gains on sale of real estate and the non-core lease financing business.
Retail & Small Business Banking
Total retail and small business banking revenues were $6,843 million, up $607 million or 10%. Net interest income grew $428 million or 9%, primarily driven by a 16 basis point improvement in the margin and solid growth in credit card products and deposits. Non-interest income increased $179 million or 11%, primarily due to growth in credit card revenues, deposit payment service fees and insurance revenues.
Commercial Banking
Total commercial banking revenues increased $274 million or 15% to $2,133 million, including the gain on sale. Net interest income rose $135 million or 9% due mainly to growth in loans and business operating accounts and a margin expansion of six basis points. Non-interest income increased $139 million or 33% mainly driven by the gain on sale and higher acceptance fees.
Wealth Management
Total wealth management revenues were $3,212 million, an increase of $60 million or 2%. Net interest income rose $46 million or 15% mainly due to growth in deposits and loans. Non-interest revenues increased $13 million from higher investment management fees and growth in mutual funds revenues as a result of net sales and market appreciation. Partly offsetting these increases was lower transaction based brokerage fees.
Non-interest expenses
Non-interest expenses were $6,324 million, an increase of $310 million or 5%, primarily reflecting the impact of the acquisition, technology and project spending, partially offset by benefits realized from cost reduction initiatives. Operating leverage was positive 3.2%, or 2.2% adjusting for the gain on sale.
Provision for credit losses
The provision for credit losses in Canadian Banking was $832 million, an increase of $145 million. The provision for credit losses was higher due to growth in retail portfolios, primarily in credit cards and auto loans, with additional increases from commercial provisions, partly offset by acquisition-related benefits. The provision for credit losses ratio was 28 basis points, compared to 23 basis points in the prior year due to growth in higher margin products.
Provision for income taxes
The effective tax rate decreased to 25.8%, compared to 26.4% in the previous year.
Outlook
Canadian Banking’s growth in 2017 will be driven in part by an improving economic outlook for Canada. Assets are projected to grow across retail mortgages, automotive, commercial loans and credit cards. Deposits are also expected to grow across retail chequing and savings, small business and commercial deposits. Margins are expected to be stable to slightly increasing during 2017. Provisions for credit losses will rise reflecting primarily a changing asset mix. Wealth management is expected to see continued growth in 2017. Expense management continues to be a focus that will lead to further improvements in productivity.
|
C11 Total revenue $ millions 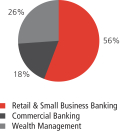
C12 Total revenue by sub-segment $ millions 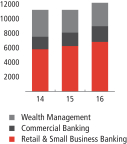
C13 Average loans and acceptances $ billions 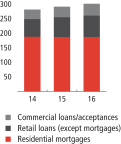
C14 Canadian wealth management assets $ billions, as at October 31 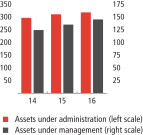
|
2 0 1 6 S C O T I A B A N K A N N U A L R E P O R T | 51
MANAGEMENT’S DISCUSSION AND ANALYSIS
International Banking
International Banking provides a full range of financial products, solutions and advice to retail and commercial customers in select regions outside of Canada.
| | | | |
| | 2016 Achievements | | |
| | • Improved customer experience across our businesses and channels. • Developed 4 new retail branch prototypes in Mexico City to focus on improving customer experience. • Launched the Net Promoter System (NPS) to build customer advocacy across the Pacific Alliance and Canada. • Named Scotiabank “World’s Best Emerging Market Bank 2016” in the Bahamas, Barbados, Costa Rica, Trinidad & Tobago, Turks & Caicos and The U.S. Virgin Islands by Global Finance Magazine. • Achieved Service Quality Measurement World Class Certification and recognition at the 2015 SQM Conference Awards for our contact centres in Mexico, Jamaica and the Dominican Republic. • Further optimized our business mix by growing high-yielding assets, building sticky core deposits, and earning higher fee income. • Introduced new Premium Banking Model in eight branches in Peru. • Achieved leading bookrunner by volume in Latin America (Thomson Reuters). • Renewed partnership with Cencosud in Colombia to target new credit card customers. • Extended ATM alliance to Mifel and Actiniver (regional financial services providers) in Mexico to provide customers with access to a broader self-service network. • Made significant investments to become a digital banking leader. • Launched the Global Digital Banking Organization including stand-alone Digital Banking Units in Mexico, Peru, Chile and Colombia. • Launched significant enhancements to Online and Mobile Banking platforms in Mexico. • Redeployed new Online and Mobile Banking platforms in the Caribbean. • Recognized as the #1 Global Bank with the Best Digital Strategy for 2016 by Retail Banker International. • Named the “World’s Best Consumer Digital Bank 2016” in Latin America, the Caribbean and Canada for 2016 by Global Finance magazine. • Launched fintech partnership with Kabbage in Mexico and Canada to provide customers with real-time credit adjudication. | | |
Business Profile
International Banking (IB) has a well-established, diversified franchise that serves more than 14 million Retail, Corporate, and Commercial customers across our footprint. These customers are supported by over 50,000 employees, 1,800+ branches, and a network of contact and business support centres. IB is focused on Latin America, including the Pacific Alliance countries of Mexico, Peru, Chile and Colombia, and the Caribbean and Central America.
We believe the Pacific Alliance countries offer excellent opportunities for growth with young demographics, low banking penetration, growing economies, low consumer indebtedness and stable banking systems. The Caribbean and Central American markets are more mature and have lower growth, but are still very profitable.
Strategy
International Banking continues to pursue: (i) a growth strategy in the Pacific Alliance countries and (ii) an optimization strategy in the Caribbean and Central American countries.
Our strategy is organized around five key areas:
| • | | Customer focus – Increase the number of primary customers in target segments by creating a simpler and more compelling digital customer experience, and a systematic approach to gathering and acting upon customer feedback. |
| • | | Digital transformation – Drive digital adoption and sales for customers through digital customer-facing and internal processes and increase our operational efficiency. |
| • | | Business mix alignment – Optimize the business mix by growing core deposits, targeting more profitable products, balancing portfolio growth, and closely managing our usage of wholesale funding. |
| • | | Structural costs transformation – Optimize the operating model and footprint to lower structural costs, reduce complexity, digitize processes, leverage scale and ultimately improve productivity. |
| • | | Leadership – Make leadership a competitive advantage by actively acquiring, developing and engaging a diverse pool of leaders to deepen bench strength and reflect our growth markets. |
2017 Priorities
Aligned to our strategy and in addition to the growth in our core business, our primary focus is on the following key growth initiatives over the next3-5 years:
| 1. | Customer focus:Launch Net Promoter System (NPS) across Peru, Chile, Colombia and Mexico to provide our employees and leadership with timely and specific customer feedback. |
| 2. | Digital transformation:Establish digital banking organizations within our Pacific Alliance operations to drive greater digital adoption and sales. |
| 3. | Business mix:Enhance business mix by growing core deposits to reduce funding costs along with growing in targeted profitable segments/products. |
| 4. | Structural costs transformation:Continue cost reduction programs to lower expenses and use the savings to fund strategic initiatives, make investments in technology, and improve productivity. |
52 | 2 0 1 6 S C O T I A B A N K A N N U A L R E P O R T
MANAGEMENT’S DISCUSSION AND ANALYSIS | INTERNATIONAL BANKING
T36 International Banking financial performance
| | | | | | | | | | | | |
| | | |
| ($ millions) | | 2016 | | | 2015 | | | 2014 | |
Net interest income(1) | | $ | 6,359 | | | $ | 5,706 | | | $ | 5,155 | |
Non-interest income(1)(2) | | | 3,482 | | | | 3,137 | | | | 2,945 | |
Total revenue(1) | | | 9,841 | | | | 8,843 | | | | 8,100 | |
Provision for credit losses | | | 1,281 | | | | 1,128 | | | | 1,024 | |
Non-interest expenses | | | 5,523 | | | | 5,095 | | | | 4,690 | |
Income tax expense(1) | | | 707 | | | | 568 | | | | 544 | |
Net income | | $ | 2,330 | | | $ | 2,052 | | | $ | 1,842 | |
Net income attributable to non-controlling interests | | | 251 | | | | 199 | | | | 226 | |
Net income attributable to equity holders of the Bank | | $ | 2,079 | | | $ | 1,853 | | | $ | 1,616 | |
| | | |
Key ratios | | | | | | | | | | | | |
Return on equity(3) | | | 12.8 | % | | | 13.0 | % | | | 11.7 | % |
Productivity(1) | | | 56.1 | % | | | 57.6 | % | | | 57.9 | % |
Net interest margin(4) | | | 4.71 | % | | | 4.71 | % | | | 4.75 | % |
Provision for credit losses as a percentage of loans and acceptances | | | 1.26 | % | | | 1.24 | % | | | 1.27 | % |
| | | |
Selected Consolidated Statement of Financial Position data (average balances) | | | | | | | | | | | | |
Earning assets | | $ | 135,167 | | | $ | 121,130 | | | $ | 108,717 | |
Total assets | | | 142,582 | | | | 128,248 | | | | 114,996 | |
Deposits | | | 87,508 | | | | 73,946 | | | | 65,025 | |
Total liabilities | | | 109,302 | | | | 94,340 | | | | 84,969 | |
| | | |
Other ($ millions as at October 31) | | | | | | | | | | | | |
Assets under administration | | $ | 85,888 | | | $ | 80,606 | | | $ | 71,587 | |
Assets under management | | $ | 47,287 | | | $ | 43,560 | | | $ | 41,125 | |
| (1) | Taxable equivalent basis. |
| (2) | Includes net income from investments in associated corporations of $473 (2015 – $476; 2014 – $411). |
| (4) | Net interest income (TEB) as % of average earning assets excluding bankers acceptances. |
2 0 1 6 S C O T I A B A N K A N N U A L R E P O R T | 53
MANAGEMENT’S DISCUSSION AND ANALYSIS
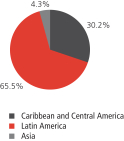
| C16 | Total revenue by region |
$ millions
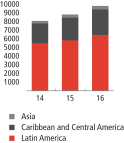
| C17 | Average loans and acceptances |
$ billions
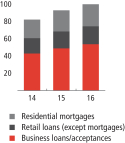
| C18 | Average earning assets(1) by region |
$ billions
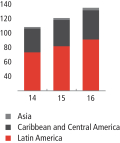
| (1) | Average earning assets excluding bankers acceptances |
Financial Performance
Net income attributable to equity holders was $2,079 million, an increase of $226 million or 12%. Earnings from strong asset and fee growth, including the positive impact of foreign currency translation, were partly offset by higher provision for credit losses. Strong underlying asset and fee growth in Latin America and a solid contribution from Caribbean & Central America, were complemented by earnings in Asia.
Assets and Liabilities
Average assets of $143 billion increased $14 billion or 11%, driven by strong retail and commercial loan growth of 11% and 12% respectively. Latin America primarily drove the growth in lending assets with retail and commercial assets increasing 11% and 14%, respectively. Caribbean and Central America saw retail assets increase by 12% with commercial assets up 6%. Average liabilities increased $15 billion or 16% to $109 billion largely due to 18% growth in deposits, including demand and savings deposits up 16%, partly offset by lower securities sold under repurchase agreements down 20%.
Revenues
Total revenues of $9,841 million increased $998 million or 11%. Net interest income increased 11% driven by strong loan growth and recent acquisitions. The net interest margin was stable at 4.71%. Non-interest income increased $345 million or 11%. This increase was largely driven by higher net fee and commission revenues which increased 10% to $2,579 million with higher banking and wealth management fees across Latin America and the Caribbean. Other operating income rose by $104 million or 14% due mainly to foreign exchange hedge related gains, higher acquisition benefits, and insurance revenues, partly offset by lower net gains on investment securities.
Latin America
Total revenues of $6,455 million increased 10% from last year, or 16% adjusting for the negative impact of foreign currency translation. Non-interest income was up $191 million or 10%. Net interest income increased $418 million or 11%, reflecting the impact of strong asset growth and a stable net interest margin. Net fee and commission revenues increased by $174 million or 10% largely driven by higher transaction, credit card fees, wealth management fees, and foreign exchange fees. Other non-interest income increased by $17 million, due mainly to foreign exchange hedge related gains, higher acquisition-related benefits, and trading revenues, partly offset lower net gains on investment securities.
Caribbean and Central America
Total revenues were $2,967 million, up 14% versus last year or 7% adjusting for the positive impact of foreign currency translation. Net interest income increased $234 million or 13%, driven by positive foreign currency translation and acquisitions of Citi Central America. Non-interest income including net fees and commissions was up 16%, or 7% adjusting for foreign currency translation, as a result of strong growth in banking, credit card and foreign exchange fees, and higher insurance revenues, and hedge gains vs losses last year.
Asia
Total revenues were $419 million, up 6% versus last year, or down 3% adjusting for the positive impact of foreign currency translation. This was primarily driven by a lower contribution from Thanachart Bank, partly offset by a higher contribution from Bank of Xi’an.
Non-interest expenses
Non-interest expenses of $5,523 million increased $428 million or 8% from last year. The increase reflected the impact of acquisitions, business volume growth and inflationary increases, partly offset by the positive impact of foreign currency translation. Operating leverage was a positive 2.9%.
Provision for credit losses
The provision for credit losses increased $153 million or 14% to $1,281 million. Retail provisions were flat compared to 2015. Increases from acquisitions and higher provisions for credit losses in Latin America from strong retail growth were offset by favourable foreign currency translation. Commercial provisions for credit losses increased mainly in Colombia, primarily the energy sector, and Puerto Rico. Overall, the provision for credit losses ratio was stable, up two basis points to 1.26% relative to last year.
Provision for income taxes
The effective tax rate was 23.3% compared to 21.7% last year due primarily to lower tax benefits in Mexico and the Caribbean.
Outlook
International Banking’s growth in 2017 will be achieved through leveraging its diversified footprint, with particular focus on the Pacific Alliance countries. Despite moderation of economic growth in the Pacific Alliance countries, we expect to continue to deliver low double digit loan growth in this region. Margins and credit quality are expected to remain stable. Expense management and delivering positive operating leverage remains a key business priority, with strategic investments in optimizing the business structure and delivering a stronger customer experience being funded through internal structural cost reduction programs. While the primary business focus is on organic growth, acquisition opportunities will continue to be considered that are strategically aligned and complement current operations within the existing footprint.
54 | 2 0 1 6 S C O T I A B A N K A N N U A L R E P O R T
MANAGEMENT’S DISCUSSION AND ANALYSIS | GLOBAL BANKING AND MARKETS
Global Banking and Markets
Global Banking and Markets (GBM) provides clients with corporate banking, investment banking, capital markets and transaction banking solutions. GBM’s products and services are offered to corporate, government and institutional clients in Canada, the U.S., Latin America, Europe, Asia and Australia.
| | | | |
| | |
| | 2016 Achievements • Enhanced customer focus and leveraged our global footprint and our core sector expertise to deliver value-added solutions and superior service to clients. Examples include: • US$11.8 billion acquisition by Fortis Inc. of ITC Holdings Corp. Scotiabank acted as financial advisor and provided financing to Fortis. This transaction made Fortis one of the top 15 North American public utilities by enterprise value. Scotiabank was also exclusive financial advisor to Fortis on its US$1.2 billion sale of a 19.9% equity interest in ITC to GIC Private Limited, Singapore’s sovereign wealth fund. • $3.2 billion sale of RONA Inc. to Lowe’s Companies Inc. Scotiabank acted as exclusive financial advisor to RONA. Together, RONA and Lowe’s Canada stores created Canada’s leading home improvement retailer. • Mandated lead arranger, underwriter, book-runner and swaps provider on the three largest debt transactions in Australia over the past year: A$12.8 billion debt facility for the acquisition of the Ausgrid electricity network; A$5.9 billion debt facility for the acquisition of the TransGrid electricity network; and A$4.2 billion debt facility for the acquisition of the Port of Melbourne. The Ausgrid financing was the largest ever AUD corporate loan transaction. • US$900 million sale by Glencore plc of silver production from the Antamina mine in Peru to Silver Wheaton Corp., and US$500 million sale of gold and silver production from its Antapaccay mine in Peru to Franco-Nevada Corp. Scotiabank was sole financial advisor to Glencore, one of the world’s largest diversified natural resource companies. Joint book-runner on a US$920 million bought deal by Franco-Nevada, largely aimed for the acquisition from Glencore. Franco-Nevada is the leading precious metals royalty and streaming company by both gold revenue and number of precious metal assets. • US$525 million acquisition by Gran Tierra Energy Inc. of PetroLatina Energy Ltd. Scotiabank acted as lead financial advisor, sole lead arranger for a US$130 million bridge credit facility and top left book-runner in two equity offerings for a total of US$303 million. Gran Tierra is an oil and gas exploration and production company based in Canada with operations in South America, mainly Colombia. • $1.9 billion inaugural Scotiabank lead bond underwriting for the Province of Alberta on its September 2021 offering, the largest Canadian bond underwriting for a province in history. • JPY 6 billion 30-year bond deal for the Province of Manitoba, Scotiabank’s inaugural JPY transaction for a Canadian province. Scotiabank was joint lead underwriter and sole hedge provider on this deal, named as the 2016 Deal of the Year for Asia-Pacific from mtn-i awards. • Scotiabank’s Equity Research team earned eleven #1 industry rankings and 17 top-tier sector rankings in the 2016 Canadian Equity Investors Study by Greenwich Associates. Additionally, the team ranked joint second overall in the 2016 Thomson Reuters Analyst Awards for Canada, recognizing analysts’ performance based on their stock picking ability and accuracy of their earnings estimates. • Implemented a new client segmentation and coverage model to improve customer experience and better align our resources and capabilities to meet our clients’ needs. • First Canadian bank to offer Bulk Interac e-Transfer, making it easier for businesses to send refunds or payments to customers online. • Further optimized our business mix, including growing our Latin America business and repositioning our business in Asia and Australia. • Obtained all licenses required to operate as a branch of The Bank of Nova Scotia in Australia. This allows Scotiabank to extend our offerings to Australian-based customers and better serve Canadian and international customers with business interests in Australia. • Named Best Foreign Exchange Provider in Canada, Peru and Costa Rica, Global Finance (2016). • Hired new staff to support our Investment Banking coverage in the Pacific Alliance. • Strengthened our customer data and analytics capabilities by enhancing our customer relationship management system and data quality and by introducing new client planning tools. • Following the creation of the GBM Diversity & Inclusion (D&I) Office in late 2015, we have made good progress towards making GBM a more diverse and inclusive workplace, including creating steering committees in each region in which we operate to advance our D&I initiatives globally. | | |
Business Profile
Global Banking and Markets (GBM) conducts the Bank’s wholesale banking and capital markets business with corporate, government and institutional investor clients. GBM is a full-service wholesale bank and investment dealer in Canada and Mexico, and offers a range of products and services in the U.S., Latin America (excluding Mexico), and in select markets in Europe, Asia and Australia.
More specifically, GBM provides clients with: corporate lending; transaction banking (including trade finance and cash management); investment banking (including corporate finance and mergers & acquisitions); fixed income and equity underwriting, sales, trading and research; prime services (prime brokerage and stock lending); foreign exchange sales and trading; commodity derivatives; precious and base metals sales, trading, financing and physical services; and collateral management.
Scotiabank took steps to refocus its Asia business this year. This included the establishment of a fully-licensed branch in Australia, the closing of our representative offices in Vietnam and Thailand, and the closing of our branches in Taiwan and Dubai.
Strategy
GBM aims to be a leading wholesale bank in Canada and the Pacific Alliance and maintain a focused presence in other regions to support multi-regional customers and leverage GBM’s strengths in its core markets and sectors.
We will achieve this objective by:
| • | | Enhancing our customer focus to strengthen customer relationships; |
| • | | Making the required investments in our platform and technology; |
2 0 1 6 S C O T I A B A N K A N N U A L R E P O R T | 55
MANAGEMENT’S DISCUSSION AND ANALYSIS
| • | | Executing on cost control strategies; and |
| • | | Directing capital and resources to businesses which optimize profitability and align with our customer-focused strategies. |
2017 Priorities
| • | | Improve customer focus – Improve our customer coverage and deepen relationships with our most important customers. Increase our emphasis on investment banking and other fee-based activities that strengthen customer relationships. Leverage our global platforms to serve the strategic and financial objectives of our customers. |
| • | | Align business mix – Shift our business mix to more closely align with our customer-focused strategy and other priorities by: (i) increasing fee-based revenue as a percentage of total revenue; (ii) improving sector diversification; and (iii) shifting more focus and resources to our Pacific Alliance operations. |
| • | | Improve resource productivity – Improve productivity and achieve cost efficiencies through: (i) structural cost management and the re-purposing of our cost base; (ii) further reduction in costs and risks through enhanced client on-boarding processes; and (iii) re-alignment of global wholesale operations. |
| • | | Further digital transformation– Improve automation and embrace disruptive technologies to improve the customer experience and reduce costs. Invest in advanced analytics to drive revenues and optimize the use of capital and funding. |
T37 Global Banking and Markets financial performance
| | | | | | | | | | | | |
| | | |
| ($ millions) | | 2016 | | | 2015 | | | 2014 | |
Net interest income(1) | | $ | 1,293 | | | $ | 1,071 | | | $ | 1,064 | |
Non-interest income(1) | | | 3,139 | | | | 2,953 | | | | 3,167 | |
Total revenue(1) | | | 4,432 | | | | 4,024 | | | | 4,231 | |
Provision for credit losses | | | 249 | | | | 67 | | | | 16 | |
Non-interest expenses | | | 2,040 | | | | 1,846 | | | | 1,880 | |
Income tax expense(1) | | | 572 | | | | 558 | | | | 665 | |
Net income | | $ | 1,571 | | | $ | 1,553 | | | $ | 1,670 | |
Net income attributable to non-controlling interests in subsidiaries | | | – | | | | – | | | | – | |
Net income attributable to equity holders of the Bank | | $ | 1,571 | | | $ | 1,553 | | | $ | 1,670 | |
| | | |
Key ratios | | | | | | | | | | | | |
Return on equity(2) | | | 12.6 | % | | | 13.0 | % | | | 15.2 | % |
Productivity(1) | | | 46.0 | % | | | 45.9 | % | | | 44.4 | % |
Net interest margin(3) | | | 1.67 | % | | | 1.65 | % | | | 1.69 | % |
Provision for credit losses as a percentage of loans and acceptances | | | 0.30 | % | | | 0.10 | % | | | 0.03 | % |
| | | |
Selected Consolidated Statement of Financial Position data (average balances) | | | | | | | | | | | | |
Trading assets | | $ | 103,316 | | | $ | 108,137 | | | $ | 110,869 | |
Loans and acceptances | | | 81,662 | | | | 70,103 | | | | 63,818 | |
Earning assets | | | 298,664 | | | | 290,482 | | | | 274,386 | |
Total assets | | | 350,627 | | | | 342,389 | | | | 311,021 | |
Deposits | | | 77,261 | | | | 63,308 | | | | 59,273 | |
Total liabilities | | | 269,755 | | | | 239,628 | | | | 217,408 | |
| (1) | Taxable equivalent basis. |
| (3) | Net interest income (TEB) as % of average earning assets excluding bankers’ acceptances. |
56 | 2 0 1 6 S C O T I A B A N K A N N U A L R E P O R T
MANAGEMENT’S DISCUSSION AND ANALYSIS | GLOBAL BANKING AND MARKETS
Financial Performance
Global Banking and Markets reported net income attributable to equity holders of $1,571 million in 2016, an increase of $18 million or 1% from last year. Stronger results in the fixed income, corporate lending and commodities businesses, as well as the positive impact of foreign currency translation, were mainly offset by higher provision for credit losses and lower results in equities.
Average assets
Average assets increased by $9 billion or 3% to $351 billion this year. Adjusting for the positive impact of foreign currency translation, average assets decreased by $4 billion or 1%, due primarily to a decrease of $7 billion in trading assets and $3 billion in securities purchased under resale agreements. This was partly offset by growth of $6 billion in corporate loans and acceptances.
Average liabilities
Average liabilities increased by $30 billion or 13% to $270 billion this year. Adjusting for the impact of foreign currency translation, the increase was $19 billion or 8%, mainly due to growth of $12 billion in deposits and $6 billion in securities sold under repurchase agreements.
Net interest income
Net interest income increased by 21% to $1,293 million, mainly due to higher lending volumes and loan origination fees in Canada, U.S. and Europe, and the positive impact of foreign currency translation. The net interest margin was 1.67%, which was two basis points higher than 2015.
Non-interest income
Non-interest income of $3,139 million increased by $186 million or 6%. Stronger fixed income and commodities trading revenues, higher underwriting and advisory fees and higher banking fees all contributed to the growth. This was partly offset by lower revenues in equities.
Non-interest expenses
Non-interest expenses increased by $194 million or 11% to $2,040 million in 2016. This was due to higher performance-related and share-based compensation, higher technology, compliance and regulatory costs, volume-driven securities expenses, and the negative impact of foreign currency translation. Operating leverage was negative 0.4%.
Provision for credit losses
The provision for credit losses was $249 million, up $182 million from last year, due to higher provisions in the U.S., Europe and Asia, primarily in the energy sector. The provision for credit losses ratio was up 20 basis points to 30 basis points.
Provision for income taxes
The effective tax rate of 26.7% was 0.3% higher than the prior year.
Outlook
Global Banking and Markets expects business conditions and financial results to continue to moderately improve in 2017, as volatility driven by political (US election, Brexit) and monetary (Fed policy) events influence investor and business confidence. Improved focus client revenues, growth in deposits, improved Corporate Banking results and strong performance from Investment Banking will be partly offset by lower other capital markets’ activities. Expense management is expected to provide benefits in 2017 with expenses down from 2016 from benefits from the recent structural cost initiatives, partly offset by higher technology costs. Provisions for credit losses are expected to moderate to longer term average levels. The U.S. and Canada are expected to drive the bulk of growth in 2017 as Europe suffers from Brexit uncertainty and high regulatory costs, and Asia begins to grow from a lower asset base after recent repositioning.
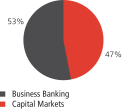
| C20 | Business banking revenue |
$ millions
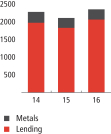
| C21 | Capital markets revenue by business line |
$ millions
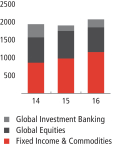
| C22 | Composition of average earning assets |
$ billions
2 0 1 6 S C O T I A B A N K A N N U A L R E P O R T | 57
MANAGEMENT’S DISCUSSION AND ANALYSIS
Other
The Other segment includes Group Treasury, smaller operating segments, business line elimination items and other corporate items which are not allocated to a business line.
Financial Performance
Net interest income, non-interest income, and income taxes in each period include the elimination of tax-exempt incomegross-up. This amount is included in the operating segments, which are reported on a taxable equivalent basis. The elimination was $299 million in 2016, compared to $390 million in 2015.
Net income from investments in associated corporations and the provision for income taxes in each period include the tax normalization adjustments related to the gross-up of income from associated corporations. This adjustment normalizes the effective tax rate in the divisions to better present the contribution of the associated corporations to the divisional results.
The Other segment had a net loss attributable to equity holders of $269 million in 2016. Adjusting for the restructuring charge of $378 million ($278 million after tax; refer T1), net income was $9 million this year.
The prior year included a number of largely offsetting items, comprised of a reduction in pension benefit accrual related to modifications made to the Bank’s main pension plan of $204 million pre-tax ($151 million after tax), an increase to the collective allowance for credit losses against performing loans due to the increase in the loan portfolio of $60 million pre-tax ($44 million after tax), and reorganization costs related to Canadian Banking’s shared services operations of $61 million pre-tax ($45 million after tax).
Revenues
Revenues declined by $46 million mainly due to lower contributions from asset/liability management activities. Partly offsetting were lower taxable equivalent basis offsets and the positive impact of foreign currency translation. Gains on sale of real estate were largely offset by lower net gains on investment securities.
Provision for credit losses
The increase in collective allowance for credit losses on performing loans was $50 million this year compared to $60 million last year.
Non-interest expenses
Non-interest expenses increased by $567 million to $653 million. The increase was largely due to the restructuring charge of $378 million and increased costs relating to strategic and technology initiatives. There were also higher employee pension and benefit expenses in 2016 as last year included lower pension expenses from a reduction in pension benefit accrual, partially offset by reorganization costs related to Canadian Banking’s shared service operations in the prior year.
T38 Other financial performance
| | | | | | | | | | | | |
| | | |
| ($ millions) | | 2016 | | | 2015 | | | 2014 | |
Net interest income(1) | | $ | (384 | ) | | $ | (100 | ) | | $ | 90 | |
Non-interest income(1)(2) | | | 273 | | | | 35 | | | | (76 | ) |
Total revenue(1) | | | (111 | ) | | | (65 | ) | | | 14 | |
Provision for credit losses | | | 50 | | | | 60 | | | | – | |
Non-interest expenses | | | 653 | | | | 86 | | | | 232 | |
Income tax expense(1) | | | (545 | ) | | | (475 | ) | | | (320 | ) |
Net income | | $ | (269 | ) | | $ | 264 | | | $ | 102 | |
Net income attributable to equity holders of the bank | | $ | (269 | ) | | $ | 264 | | | $ | 102 | |
| (1) | Includes the net residual in matched maturity transfer pricing and the elimination of the tax-exempt income gross-up reported in net interest income, non-interest income and provision for income taxes in the business segments. |
| (2) | Includes net income from investments in associated corporations of $(137) in 2016; (2015 – $(137); 2014 – $(140)). |
58 | 2 0 1 6 S C O T I A B A N K A N N U A L R E P O R T
MANAGEMENT’S DISCUSSION AND ANALYSIS | OTHER
Financial Performance of Business Lines: 2015 vs. 2014
Canadian Banking
Canadian Banking’s net income attributable to equity holders was $3,344 million in 2015, a decrease of $339 million or 9% primarily from changes in the Canadian tax legislation and the gain on sale of the Bank’s investment in CI Financial Corp. in 2014 (refer T15). Retail and small business banking and wealth management generated strong performances. This year’s results were positively impacted by good asset and deposit growth and an eight basis point increase in the margin to 2.23%. Also contributing was the full year impact of the Bank’s investment in Canadian Tire Financial Services. Return on equity was 21.0% versus 22.8% in 2014.
International Banking
Net income attributable to equity holders was $1,853 million in 2015, an increase of $237 million or 15% resulting from the favourable impact of foreign currency translation, strong asset and fee growth, and acquisitions partly offset by lower securities gains and higher provisions for credit losses. The 2014 results were negatively impacted by the revaluation of monetary assets in Venezuela and the restructuring charge, totaling $74 million (refer T15), which also contributed to the year-over-year increase. Return on equity was 13.0%, up from 11.7% in 2014.
Global Banking and Markets
Global Banking and Markets reported net income attributable to equity holders of $1,553 million in 2015, a decrease of $117 million from 2014. Lower results in investment banking, Asia lending and precious metals, as well as lower securities gains in U.S. were only partly offset by growth in other businesses. The 2014 results were also impacted primarily by the restructuring charge (refer T15).
Return on equity decreased to 13.0% from 15.2% in 2014.
Other
The Other segment had net income attributable to equity holders of $264 million in 2015, up $162 million from last year. The 2015 net income included the following largely offsetting items, comprised of a reduction in the pension benefit accrual related to modifications made to the Bank’s main pension plan of $204 million pre-tax ($151 million after tax), an increase to the collective allowance against performing loans due to the relative increase in the loan portfolio of $60 million pre-tax ($44 million after tax), and reorganization costs related to the consolidation of Canadian shared services of $61 million pre-tax ($45 million after tax). Included in the 2014 results were additional legal provisions and a restructuring charge (refer T15), totaling $62 million.
2 0 1 6 S C O T I A B A N K A N N U A L R E P O R T | 59
MANAGEMENT’S DISCUSSION AND ANALYSIS
RISK MANAGEMENT
Effective risk management is fundamental to the success of the Bank, and is recognized as a core deliverable in the Bank’s overall approach to strategy management. Scotiabank has a strong, disciplined risk management culture where risk management is a responsibility shared by all of the Bank’s employees.
Risk Management Framework
The primary goals of risk management are to ensure that the outcomes of risk-taking activities are consistent with the Bank’s strategies and risk appetite, and that there is an appropriate balance between risk and reward in order to maximize shareholder value. Scotiabank’s Enterprise-Wide Risk Management Framework (the Framework) articulates the foundation for achieving these goals.
This Framework is subject to constant evaluation to ensure that it meets the challenges and requirements of the global markets in which the Bank operates, including regulatory standards and industry best practices. The risk management programs of the Bank’s subsidiaries conform in all material respects to the Bank’s risk management framework, although the actual execution of their programs may be different.
The Bank’s risk management framework is applied on an enterprise-wide basis and consists of five key elements:
1. Risk Governance,
2. Risk Appetite,
3. Risk Management Tools,
4. Risk Identification and Assessment, and
5. Risk Culture.
The Types of Risk
The Bank ensures that risk-taking activities are consistent with the Bank’s strategies and risk appetite by favouring businesses that generate sustainable, consistent and predictable earnings over the business cycle. In order to mitigate risk, the Bank seeks to avoid excessive risk concentrations through a diversified mix of businesses, products, geographies, currencies and customers. The Framework provides an overview of each principal risk type that can materially impact the Bank and how each principal risk type is managed. Scotiabank’s principal risk types include: Credit, Market, Liquidity, Operational, Reputational, Strategic, Insurance and Environmental.
Risk Management Principles
Risk-taking and risk management activities across the enterprise are guided by the following principles:
Risk and reward – business decisions are consistent with strategies and risk appetite, and there is an appropriate balance between risk and reward in order to maximize shareholder value.
Understand the risks – the Bank limits its risk taking activities to those that are well understood, and where there is sufficient expertise, resources and infrastructure to effectively measure and manage the risks – all material risks are identified, measured and managed.
Forward thinking – forward thinking and the use of stress testing are utilized to proactively identify emerging risks and potential vulnerabilities.
Everyone is a risk manager – within the Bank’s risk governance structure, it is the shared responsibility of every employee to manage risk.
Protect our brand –all risk taking activities must be in line with the Bank’s risk appetite, Scotiabank’s Code of Conduct, Values and policy principles which are established to guide risk taking behaviors and protect the Bank’s brand.
Compensation – compensation plan design and decisions are aligned with the Bank’s strategy and risk culture and support appropriate risk behaviors.
Risk Governance
Effective risk management begins with effective risk governance.
The Bank has a well-established risk governance structure, with an active and engaged Board of Directors supported by an experienced executive management team. Decision-making is highly centralized through a number of senior and executive risk management committees.
The Bank’s risk management framework is predicated on the three-lines-of-defence model. Within this model, the First Line of Defence (typically comprised of the business lines and most corporate functions) incur and own the risks, while the Second Line of Defence (typically comprised of control functions such as Global Risk Management, Compliance, and Finance) provide independent oversight and objective challenge to the First Line of Defence, as well as monitoring and control of risk. Internal Audit Department (the Third Line of Defence) provides enterprise-wide independent assurance over the design and operation of the Bank’s internal control, risk management and governance processes throughout the first and second lines of defence. In this risk governance structure, employees in every area of the organization are responsible for risk management.
60 | 2 0 1 6 S C O T I A B A N K A N N U A L R E P O R T
MANAGEMENT’S DISCUSSION AND ANALYSIS | RISK MANAGEMENT
The Board of Directors: as the top of the Bank’s risk management governance structure, provides oversight, either directly or through its committees, to satisfy itself that decision making is aligned with the Bank’s strategies and risk appetite. The Board receives regular updates on the key risks of the Bank – including a quarterly comprehensive summary of the Bank’s risk profile and performance of the portfolio against defined limits – and approves key risk policies, limits, the Risk Appetite Framework and the Credit Risk Appetite.
The Risk Committee of the Board: assists the Board by providing oversight to the risk management function at the Bank. This includes periodically reviewing and approving the Bank’s key risk management policies, frameworks and limits and satisfying itself that management is operating within the Bank’s Risk Appetite Framework. The Committee also oversees the risk management function’s independence from the Business Lines and oversees the effectiveness of the Chief Risk Officer and risk management function.
The Audit and Conduct Review Committee of the Board: assists the Board by providing oversight on the effectiveness of the Bank’s system of internal controls. The Committee oversees the integrity of the Bank’s consolidated financial statements and related quarterly results. The Committee oversees the Bank’s compliance with legal and regulatory requirements and oversees the Compliance, Finance, Audit, and Anti-Money Laundering/Anti-Terrorist Financing functions at the Bank.
Human Resources Committee of the Board: in conjunction with the Risk Committee of the Board, satisfies itself that adequate procedures are in place to identify, assess and manage the risks associated with the Bank’s material compensation programs and that such procedures are consistent with the Bank’s risk management programs. The Committee has further responsibilities relating to leadership, succession planning and total rewards.
Corporate Governance Committee of the Board: acts in an advisory capacity to the Board to enhance the Bank’s corporate governance through a continuing assessment of the Bank’s approach to corporate governance and makes policy recommendations.
President and Chief Executive Officer (CEO): reports directly to the Board and is responsible for defining, communicating and implementing the strategic direction, goals and core values for Scotiabank that maximize long term shareholder value. The CEO oversees the establishment of the Bank’s risk appetite, in collaboration with the CRO and CFO, which is consistent with the Bank’s short and long term strategy, business and capital plans, as well as compensation programs.
Chief Risk Officer (CRO): is responsible for the overall management of Global Risk Management. The CRO has unfettered access to the Risk Committee of the Board to ensure independence of GRM. As a senior member of the Bank’s executive management team, the CRO participates in strategic decisions related to where and how the Bank will deploy its various resources sources of capital to meet the performance targets of the business lines and the Bank’s Balanced Scorecard. The CRO reports directly to the CEO and the Risk Committee of the Board.
Executive Committees:
Operating Committee: serves as a forum for the President and Chief Executive Officer (the “CEO”) to discuss key strategic issues and the long-term direction of the Bank with senior executives. Through the Operating Committee, the CEO may solicit views and advice and counsel from senior
2 0 1 6 S C O T I A B A N K A N N U A L R E P O R T | 61
MANAGEMENT’S DISCUSSION AND ANALYSIS
executives on issues pertinent to the CEO and the direction of the Bank. Meetings of the Operating Committee also consider “tone from the top” matters, enabling its members to shape, reinforce and role-model the Bank’s desired operating style and organizational culture. The Operating Committee may discuss topics including: setting the Bank’s key strategies and, upon approval by the Board, directing the execution of those strategies and the execution of the Bank’s overall risk strategy; and monitoring and evaluating how risks are managed across the Bank.
Asset-Liability Committee (ALCO): is chaired by the CEO and consists of the executive and senior management of the Bank, including members from Group Treasury, Finance, Global Banking & Markets, Canadian Banking, International Banking and GRM. The purpose of the committee is to provide high level oversight and strategic direction for the management of funding, foreign exchange risk, hedging stock based compensation, and economic forecasts. This committee also reviews monthly economic updates and the performance of the key topics discussed.
Additionally, the Committee reviews balance sheet management topics, such as: deposits, liquidity, net interest margin, and capital management topics. The committee’s focus is on business line activity (i.e. mortgages and deposits) as well as funding aspects. The committee reviews high level strategies, monitors progress and discusses various trends and key issues. As well, the committee reviews quarterly capital plans, capital allocation and capital risk indicators.
Strategic Transaction Investment Committee (STIC): is chaired by the CEO and provides advice, counsel and decisions on effective allocation and prioritization of resources with respect to the Bank’s portfolio of businesses, strategic investments including mergers and acquisitions (M&A), and divestitures. The committee’s objectives include review and approval of the Bank’s business mix guidelines, review of the Bank’s portfolio of businesses and post-acquisition assessments at 12 and 24-36 month benchmarks.
Risk Policy Committee (RPC): is chaired by the CEO and includes the CRO and the heads of the business lines, Group Treasury and GRM. It is responsible for policies, limits, proposals, and other issues covering credit, market, reputational, legal and operational risk, as well as adjudicating on issues referred by the senior management committees. The committee’s accountabilities include reviewing and adjudicating on the mandates of its subcommittees.
Human Capital Committee (HCC): is chaired by the Group Head & Chief Human Resources Officer and includes the President and CEO, the CRO, and the heads of the business lines, among others. The committee reviews and approves all major new and changing Bank-wide Human Resources objectives, strategies, policies and programs including all compensation matters. As well, the committee reviews and approves all senior management appointments and the staffing of key positions.
Systems Planning and Policy Committee (SPPC): is chaired by the CEO and consists of the executive and senior management of the Bank, including Canadian Banking, Global Banking & Markets, International Banking, and GRM. This committee reviews and approves major business initiatives involving human and computing facilities, and reviews and adjudicates on submissions in excess of designated executive approval limits.
Senior Management Committees:
Stress Testing Committee (STC): is chaired by the Senior Vice President & Chief Market Risk Officer. It consists of senior management from GRM, Executive Offices (E.O.) Audit, E.O. Finance, Group Treasury, Economics, Enterprise Strategy, and the Group Head and Chief Financial Officers (CFO) of the business lines. The purpose of the committee is to provide high level oversight of stress testing; serve as the most senior point of management that establishes and enhances policies to develop, review, challenge and communicate stress testing results; and promote consistent, collaborative application of the stress testing program Bank-wide.
Senior Credit Committees (SCCs): consist of three non-retail Senior Credit Committees (Corporate, Commercial, and International) which are chaired by the Executive Vice President & Chief Credit Officer (with the Chief Risk Officer as alternate chair), and two Senior Credit Committees (Canadian Banking and International) for Retail, Small Business and Wealth Management which is chaired by the Chief Risk Officer (with the Executive Vice President & Chief Credit Officer as the alternate chair). The Senior Vice President & Chief Market Risk Officer is also an alternate for Corporate SCC. Other voting members of each committee include the Senior Vice Presidents of the relevant credit units, and the Managing Director and Heads of the relevant business lines. A quorum must include the chair or alternate chair, and a member from the relevant business line.
Market Risk Management and Policy Committee (MRMPC): is chaired by the Senior Vice President & Chief Market Risk Officer. It consists of executive and senior management of the Bank including representatives from GRM (Chief Risk Officer and Executive Vice President & Chief Credit Officer), Group Treasury, International Banking and Global Banking & Markets. The MRMPC is responsible for overseeing and establishing standards for market, liquidity and insurance risk management processes within the Bank. For subsidiaries, the MRMPC provides advice and counsel to ensure that their limits are consistent with the overall objectives and strategic direction of the Bank. The MRMPC may delegate in writing the authority to approve specified types of transactions and changes to approved limits to staff in GRM and other departments (Delegated Authorities).
Reputational Risk Committee (RRC): is chaired by the Executive Vice President, General Counsel. It consists of senior management from Audit, Finance, GRM, Group Treasury, Global Compliance, Legal and Public Corporate & Government Affairs as well as senior management from Canadian Banking, International Banking and Global Banking & Markets. The mandate of the RRC is to promote conduct consistent with high ethical standards and protect the reputation of the Bank, by recommending reputational risk policies and procedures as may be necessary to the Board; overseeing the implementation of Board-approved reputational risk policies and procedures; approving additions or exceptions to policies and procedures as may be reserved to the RRC; and upon referral to the RRC from the various business line divisions, risk committees or sub-committees, reviewing business activities, initiatives, products, services, transactions or processes which the sponsor believes may embody a degree of reputational risk, and recommending either for or against proceeding or proceeding subject to conditions, based on an assessment of the reputational risk involved.
Operational Risk Committee (ORC): is chaired by the Chief Risk Officer. It consists of executive and senior management, including the CFO, and the heads of the business lines and key functional areas. The committee provides high level oversight of operational risk, and promotes an enterprise-wide operational risk framework to ensure risks are understood, communicated, and appropriate actions are taken to mitigate related losses. In particular, the committee reviews the Bank’s top operational risks, including those arising in new products and initiatives and in existing products and programs where the risk profile may be changing due to internal or external factors.
Risk Rating Governance Committee (RRGC): provides oversight of the Bank’s Non-retail credit risk rating system, including policies governing the development, validation, approval and ongoing maintenance of the Bank’s Non-retail credit risk rating models and parameter estimates. RRGC also acts as a forum that provides an opportunity for executive/senior management discussion on various aspects of the Non-retail credit risk rating system,
62 | 2 0 1 6 S C O T I A B A N K A N N U A L R E P O R T
MANAGEMENT’S DISCUSSION AND ANALYSIS | RISK MANAGEMENT
including potential refinements and enhancements. As part of its mandate, RRGC is responsible for reviewing, updating and approving the Bank’s Non-retail credit risk rating system. RRGC membership includes the Bank’s Chief Risk Officer, the Executive Vice-President and Chief Credit Officer, the Senior Vice-President and Chief Market Risk Officer, as well as other executive/senior management representatives from risk management, banking and internal audit.
Business Line and Corporate Functions: as the first line of defence in the Three Lines of Defence model, are accountable for effective management of the risks within their business lines and functions through identifying, assessing, mitigating and monitoring the risks. Business lines and corporate functions actively implement effective internal controls to manage risk and maintain activities within risk appetite and policies. Further, business lines have processes to be able to effectively identify, monitor and report against allocated risk appetite limits.
Global Risk Management (GRM): supports the Bank’s objectives and is mandated to maintain an ongoing and effective enterprise-wide risk management framework that resonates through all levels of the Bank. GRM is responsible for providing reasonable assurance to executive management, the Board of Directors and shareholders that risks are actively identified, managed and communicated to all key stakeholders – this is achieved through timely and relevant reporting. GRM’s mission is to ensure that the outcomes of risk taking activities are consistent with the Bank’s strategies and risk appetite, and that there is an appropriate balance between risk and reward in order to maximize shareholder value.
Global Compliance: on an enterprise-wide basis, promotes ethical conduct and compliance generally throughout Scotiabank; and supports directors, officers and employees of the Bank and its subsidiaries in managing compliance risk. Compliance is ultimately the responsibility of line management, supported by compliance officers. Together, they comprise the compliance network by which compliance activities are managed throughout Scotiabank. Global Compliance acts as a consultant and educator on regulatory and internal policies and procedures and in this role may establish, or assist with the establishment of, various compliance risk management related programs, sources of written policy, procedures or guidance, training programs or systems as may be necessary or appropriate.
Global Finance: leads enterprise-wide financial strategies which support the Bank’s ability to maximize sustainable shareholder value, and actively manages the reliable and timely reporting of financial information to management, the Board of Directors and shareholders, as well as other stakeholders. This reporting includes the Bank’s consolidated financial statements and related quarterly and annual results. Global Finance executes the Bank’s financial and capital management strategies with appropriate governance and control, while ensuring its processes are efficient and effective.
Internal Audit: reports independently to the Board through the Audit and Conduct Review Committee on the design and operating effectiveness of the Bank’s risk governance and risk management framework. The mission of the audit department is to provide enterprise-wide independent, objective assurance over the design and operation of the Bank’s controls and operational processes and to provide advisory services designed to improve the Bank’s operations.
Risk Appetite
Effective risk management requires clear articulation of the Bank’s risk appetite and how the Bank’s risk profile will be managed in relation to that appetite.
The Bank’s Risk Appetite Framework consists of the identification of 1) risk capacity, the maximum level of risk the Bank can assume before breaching key constraints, 2) risk appetite, the level and types of risk the Bank is willing to assume within its risk capacity to achieve its strategic objectives, and 3) key risk appetite measures, quantitative metrics that capture the Bank’s risk appetite. Together, the application of these components helps to ensure the Bank stays within appropriate risk boundaries. Scotiabank’s risk appetite is integrated into the strategic and capital planning process and is reviewed annually by senior management who recommend it to the Board for approval. Business lines and control functions develop their own Risk Appetite Frameworks, which are in alignment with the risk appetite and strategies articulated in the Bank’s Risk Appetite Framework. Scotiabank actively communicates the Bank’s risk appetite, and how it relates to Scotiabankers, to further promote a sound risk culture.
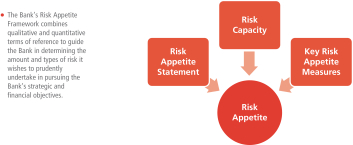
The Bank’s risk appetite is aligned with its enterprise strategy, where the most notable strategic choice is to have highly diversified, well-balanced and sustainable operations within a clearly defined, global footprint.
Key risk appetite measures provide clear risk limits, which are critical in implementing effective risk management. For major risks (credit, market, liquidity, and operational), the key risk appetite measures are supported by management level limit structures and controls. Management’s dedicated attention to these risks creates a focus on forward-looking activities that keeps the Bank within its risk appetite on an on-going basis. Other components of Scotiabank’s key risk appetite measures include measures that:
| • | | Set risk capacity and appetite in relation to regulatory constraints |
| • | | Use stress testing to provide forward-looking metrics |
| • | | Ensure Scotiabank’s credit rating remains strong |
| • | | Minimize earnings volatility |
| • | | Limit exposure to operational events that can have an impact on earnings, including regulatory fines |
| • | | Ensure reputational risk is top of mind and strategy is being executed within operating parameters |
2 0 1 6 S C O T I A B A N K A N N U A L R E P O R T | 63
MANAGEMENT’S DISCUSSION AND ANALYSIS
Risk Management Tools
Effective risk management includes tools that are guided by the Bank’s Risk Appetite Framework and integrated with the Bank’s strategies and business planning processes.
Scotiabank’s risk management framework is supported by a variety of risk management tools that are used together to manage bank-wide risks. Risk management tools are regularly reviewed and updated to ensure consistency with risk-taking activities, and relevance to the business and financial strategies of the Bank.
Policies & limits
The Bank develops and implements its key risk policies in consultation with the Board. Such policies (which include appetites and frameworks) are also subject to the requirements and guidelines of the Office of the Superintendent of Financial Institutions (OSFI), the Bank Act, and the Canada Deposit Insurance Corporation (CDIC). Policy development and implementation reflect best governance practices which the Bank strives to adhere to at all times. The Bank also provides advice and counsel to its subsidiaries in respect of their risk policies to ensure alignment with the Bank’s policies, subject to the local regulatory requirements of each subsidiary.
Policies apply to specific types of risk or to the activities that are used to measure and control risk exposure. They are based on recommendations from risk management, internal audit, business lines, and senior executive management. Industry best practices and regulatory requirements are also factored into the policies. Policies are guided by the Bank’s Risk Appetite, and set the limits and controls within which the Bank and its subsidiaries can operate.
Limits control risk-taking activities within the appetite and tolerances established by the Board and executive management. Limits also establish accountability for key tasks in the risk-taking process and establish the level or conditions under which transactions may be approved or executed.
Guidelines, processes and standards
Guidelines are the directives provided to implement policies as set out above. Generally, they describe the facility types, aggregate facility exposures and conditions under which the Bank is prepared to do business. Guidelines ensure the Bank has the appropriate knowledge of clients, products and markets, and that it fully understands the risks associated with the business it underwrites. Guidelines may change from time to time, due to market or other circumstances.
Processes are the activities associated with identifying, evaluating, documenting, reporting and controlling risk.
Standards define the breadth and quality of information required to make a decision, and the expectations in terms of quality of analysis and presentation. Processes and standards are documented in a series of policies, manuals and handbooks.
Measurement, monitoring, and reporting
Risk measurement tools include the use of models. The Bank uses models for a range of purposes including:
| • | | measuring risk exposures, |
| • | | determining credit risk ratings and parameters, and |
| • | | calculating economic and regulatory capital. |
The use of quantitative risk methodologies and models is balanced by a strong governance framework and includes the application of sound and experienced judgment. The development, independent review, and approval of models is subject to formalized policies such as the Model Risk Management Policy and oversight of senior management committees such as the Model Review Committee (for market risk, counterparty credit risk, and liquidity risk models). Key models used in the calculation of credit and market risk regulatory capital on an enterprise basis are OSFI approved. These models are incorporated into the Bank’s framework for governance and control of model risk to ensure that they continue to perform in line with regulatory requirements.
The Bank continuously monitors its risk exposures to ensure business activities are operating within approved limits or guidelines, and the Bank’s strategies and risk appetite. Breaches, if any, of these limits or guidelines are reported to senior management and/or the Board depending on the limit or guideline.
Risk Reports aggregate measures of risk across products and businesses, and are used to ensure compliance with risk policies, limits, and guidelines. They also provide a clear statement of the amounts, types, and sensitivities of the various risks in the portfolio. Senior management and the Board use this information to understand the Bank’s risk profile and the performance of the portfolios. A comprehensive summary of the Bank’s risk profile and performance of the portfolio is presented quarterly to the Risk Committee of the Board.
Stress testing
Stress testing programs at both the enterprise-wide level and individual risk level allow the Bank to estimate the potential impact on the Bank’s income and capital as a result of significant changes in market conditions, credit environment, liquidity demands, or other risk factors. Enterprise-wide stress testing is also integrated with both the strategic and financial planning processes, as well as crisis management planning. The development, approval and on-going review of the Bank’s stress testing programs are subject to policy, and the oversight of the Stress Testing Committee. Where appropriate, the Board of Directors or the Risk Committee of the Board approves stress testing limits for certain risk factors, and receives reports on performance regularly. Each stress testing program is developed with input from a broad base of stakeholders, and results are integrated into management decision-making processes for capital, funding, market risk limits, and credit risk appetite. The stress testing programs are designed to capture a number of enterprise-wide stress scenarios with differing severities and time horizons.
64 | 2 0 1 6 S C O T I A B A N K A N N U A L R E P O R T
MANAGEMENT’S DISCUSSION AND ANALYSIS | RISK MANAGEMENT
Risk Culture
Effective risk management requires a strong, robust, and pervasive risk management culture where every Bank employee is a risk manager and is responsible for managing risks.
The Bank’s risk governance structure, risk appetite, and risk management tools influence – and are in turn influenced by – the Bank’s risk culture. This symbiotic inter-relationship ensures a strong alignment exists between strategy, risk culture, and the key components of the Bank’s risk management framework.
The following are the foundational support on which the Bank’s risk culture is built upon:
| • | | Tone from the top – Clear and consistent communication from leaders on risk behavior expectations and the importance of Scotiabank’s values. |
| • | | Accountability – All Scotiabankers in every business function are held accountable for risk ownership and their actions in accordance with the Three Lines of Defence model. |
| • | | Incentives – Motivate and reward key risk takers for identifying, managing and promoting a sound risk culture within their environment. |
| • | | Effective challenge – Effective challenge, alternative views and open dialogue are promoted when identifying risks – Scotiabankers are encouraged and expected to “Raise a hand”. |
Other elements of Scotiabank’s strong risk culture:
| • | | Compensation: programs are structured to discourage behaviours that are not aligned with the Bank’s values or Scotiabank’s Code of Conduct, and ensure that such behaviors will not be rewarded. Higher risk behaviors are also discouraged and there are reduced opportunities for significant one-time rewards. The Bank’s material compensation programs are structured to reflect the Bank’s risk appetite, with a substantial portion deferred for material risk takers in order to achieve stronger alignment with the results of risk-taking activities. |
| • | | Risk appetite: the Bank uses a variety of communication channels to build and sustain employee awareness of the qualitative and quantitative constraints (i.e. the “boundaries”) that apply to each and every employee’s activities. |
| • | | Reporting: reputational & operational risk dashboards and other key metrics are monitored and reported. The Bank also seeks out employee feedback through a variety of surveys. |
| • | | Training: risk education programs are available to employees in the business lines and control functions. Scotiabank continually reinforces risk culture by providing effective and informative mandatory and non-mandatory training modules for all employees, as well as presentations, videos, and other training media on a variety of risk management topics. |
| • | | Decision-making on risk issues is highly centralized: The membership of senior and executive management committees responsible for the review, approval and monitoring of transactions and the related risk exposures (whether global or local) includes business line heads and senior risk officers from GRM. The flow of information and transactions to these committees keeps senior and executive management well informed of the risks the Bank faces, and ensures that transactions and risks are aligned with the Bank’s risk appetite. |
Risk culture is a component of the Bank’s organizational culture. Key elements that support the Bank’s organizational culture are as follows:
| • | | Scotiabank’s Code of Conduct: stringent guidelines to which all staff must attest on an annual basis |
| • | | Values: Integrity – Act With Honour; Respect – Value Every Voice; Accountability – Make It Happen; Passion – Be Your Best |
| • | | Organizational fit: cultural behaviours are considered in hiring and promotional processes. Assessment of organizational fit is increasingly considered when evaluating new business opportunities and hiring practices |
2 0 1 6 S C O T I A B A N K A N N U A L R E P O R T | 65
MANAGEMENT’S DISCUSSION AND ANALYSIS
Principal Risk Types
| | | | |
Risk Type | | Governing Documentation | | Application to Risk Appetite |
| Credit Risk | | Credit Risk Policy Credit Risk Appetite Industry Concentration Framework Collective Allowance Policy for Performing Loans Residential Mortgage Underwriting Policy | | Quantitative limits: • Exposure to a single counterparty or group of related parties (limits differentiated by counterparty type, customer risk rating and security cover); • Country risk (exposure limits to control transfer/cross-border and sovereign default risks); and • Industry concentrations (exposure and risk adjusted concentration limits). |
| Market Risk | | Market and Structural Risk Management Policy | | Quantitative limits, such as various value at risk (VaR), stress test results, equity and debt investment exposures, and structural interest rate and foreign exchange exposures. |
| Liquidity Risk | | Liquidity Risk and Collateral Management Policy | | Quantitative limits: • Minimum Liquidity Coverage Ratio (LCR); • Appropriate levels of unencumbered high quality liquid assets that can be readily sold or pledged; • Limits to control the maximum net cash outflow over specified short-term horizon; and • Diversification of funding by source, type of depositor, instrument, term and geographic market. |
| Operational Risk | | Operational Risk Management Policy and Framework Internal Control Policy Fiduciary Risk Management Policy Model Risk Management Policy New Products and Services Risk Management Policy Global Fraud Policy Third Party Risk Management Policy | | • Systematic identification, measurement, mitigation and monitoring of operational risk, regardless of whether the risk is internal to the Bank or outsourced to a third party; • Minimization of residual operational risk; and • Expressed quantitatively by an aggregate loss event limit, a single event loss limit, and a variety of limits for individual categories of operational risk. |
| Reputational Risk | | Reputational Risk Policy Scotiabank’s Code of Conduct Compliance Policy KYC Policy | | Low appetite for reputational, legal, or taxation risk arising in business activities, initiatives, products, services, transactions or processes, or from a lack of suitability of products for clients. |
| Environmental Risk | | Environmental Policy | | Consistent with the Equator Principles, to which the Bank is a signatory, the Bank provides project finance loans and project-related corporate loans only to those projects whose borrowers can demonstrate their ability and willingness to comply with comprehensive processes aimed at ensuring that the projects are developed in a socially responsible manner and according to sound environmental management practices. |
| Strategic Risk | | Annual Strategy Report to the Board of Directors | | Strategy report considers linkages between the Bank’s Risk Appetite Framework with the enterprise strategy, business line strategies and corporate function strategies; also incorporates linkages to measuring progress against strategic priorities and implementation. |
| Insurance Risk | | Insurance Risk Policy Insurance Risk Management Framework | | The Bank will limit its insurance risk-taking activities to those that are well understood and where there is sufficient expertise, resources and infrastructure to effectively measure and manage the risks and to earn commensurate returns. Where insurance risks are taken, it is on a selective basis to achieve stable and sustainable earnings; and the risk assumed is diversified geographically and by product. |
66 | 2 0 1 6 S C O T I A B A N K A N N U A L R E P O R T
MANAGEMENT’S DISCUSSION AND ANALYSIS | RISK MANAGEMENT
T39 Exposure to risks arising from the activities of the Bank’s businesses
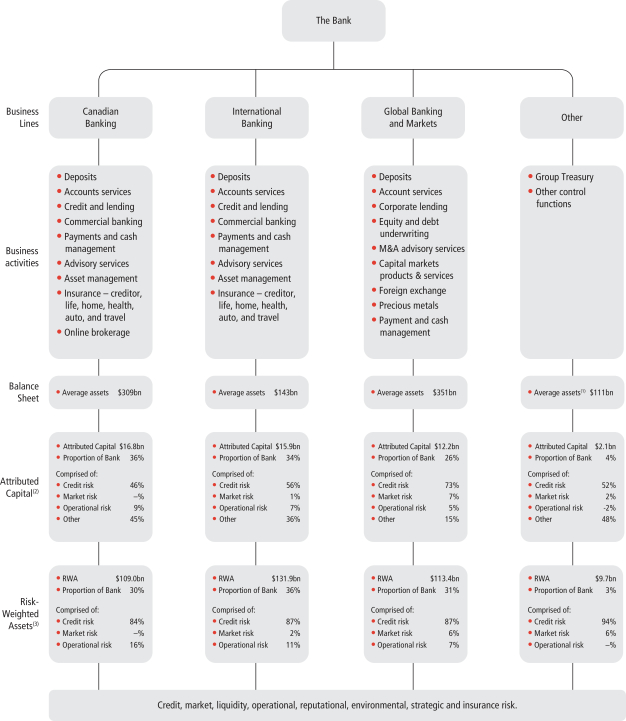
| (1) | Average assets for the Other segment include certain non-earning assets related to the business lines. |
| (2) | Attributed Capital is a combination of regulatory: (i) Risk-based capital and (ii) Leverage capital. Attributed Capital is reported on an average basis. |
| (3) | Risk-weighted assets (RWA) are as at October 31, 2016 as measured for regulatory purposes in accordance with the Basel III all-in approach. |
2 0 1 6 S C O T I A B A N K A N N U A L R E P O R T | 67
MANAGEMENT’S DISCUSSION AND ANALYSIS
Top and emerging risks
The Bank is exposed to a variety of top and emerging risks. These risks can potentially adversely affect the Bank’s business, financial performance, reputation and business strategies. As part of our risk management approach, we proactively identify, assess, review, monitor and manage a broad range of top and emerging risks so that appropriate risk mitigation strategies can be taken. Every quarter, a listing and a brief discussion of selected top and emerging risks is presented to Senior Management and the Board of Directors.
The Bank’s top and emerging risks are as follows:
Geopolitical risk
Geopolitical risks could affect volatility in foreign exchange and capital markets globally. This affects all participants in these markets. In the short run, a market shock could potentially impact the Bank’s trading and non-trading market activities and revenues. Over a longer period of time, the more broadly based macroeconomic effects could potentially impact the Bank’s exposures to customers and market segments impacted by those shocks. Although it is difficult to predict where new geopolitical disruption will occur, the Bank’s stress testing program assists in evaluating the potential impact of severe conditions, whether caused by geopolitical or other circumstances. Management’s strong understanding of the local political landscapes and macroeconomic environments in which the Bank operates, combined with the Bank’s business model and diversified geographic footprint, serve as ongoing mitigants to this risk.
Legal and regulatory compliance risk
The Bank is subject to extensive regulation in the jurisdictions in which it operates. Although the Bank continually monitors and evaluates the potential impact of regulatory developments to assess the impact on our businesses and to implement any necessary changes, regulators and private parties may challenge our compliance. Failure to comply with legal and regulatory requirements may result in fines, penalties, litigation, regulatory sanctions, enforcement actions and limitations or prohibitions from engaging in business activities, all of which may negatively impact the Bank’s financial performance and its reputation. In addition, day-to-day compliance with existing laws and regulations, has involved and will continue to involve significant resources, including requiring the Bank to take actions or incur greater costs than anticipated, which may negatively impact the Bank’s financial performance. Such changes could also adversely impact the Bank’s business strategies or limit its product or service offerings, or enhance the ability of the Bank’s competitors to offer their own products and services that rival the Bank’s.
Anti-money laundering
Money laundering and terrorist financing are receiving significant attention as nations attempt to deal with the harmful legal, economic, and social consequences of illegal activities. Governments, law enforcement agencies, and regulators around the world employ a variety of means, including establishing regulatory requirements on financial institutions, to curtail the ability of criminal and terrorist elements to profit from, or finance, their activities. It is widely recognized that financial institutions are uniquely positioned and possess the necessary infrastructure to assist in the fight against money laundering, terrorist financing, and criminal activity through prevention, detection, and the exchange of information.
Money laundering, terrorist financing and economic sanctions violations represent regulatory, legal, financial and reputational risk to the Bank. Scotiabank is subject to a number of expanding and constantly evolving anti-money laundering/anti-terrorist financing (AML/ATF) and economic sanctions laws and regulations internationally given the Bank’s global footprint.
The Bank is committed to sustaining secure financial systems in the countries around the world in which it maintains operations by taking the necessary action, using a risk-based approach. The Bank’s AML program includes policies and internal controls with respect to client identification and due diligence, transaction monitoring, investigating and reporting of suspicious activity, and evaluation of new products and services to prevent and/or detect activities that may pose AML risk to the Bank. The AML program also facilitates an annual enterprise-wide AML/ATF risk assessment process and ensures that all employees, including the Board of Directors, undergo initial and ongoing AML/ATF training.
Technology and Information Security Risk
Technology and information security risks have become increasingly prevalent in business in general and for financial institutions in particular. Globally these risks have increased as a result of the sophistication and constant evolution of new technologies and attack methodologies. The Bank’s technologies, systems and networks, and those of our customers and the third parties providing services to us, may be subject to attacks, breaches or other compromises. With any such attack, breach, compromise, or weakness of technology or information systems, hardware or related processes, the Bank may experience, among other things: financial loss; a loss of customers or business opportunities; disruption to operations; misappropriation or unauthorized release of confidential, financial or personal information; damage to computers or systems of the Bank and those of its customers and counterparties; violations of applicable privacy and other laws; litigation; regulatory penalties or intervention, remediation, investigation or restoration cost; increased costs to maintain and update our operational and security systems and infrastructure; and reputational damage. The Bank actively monitors and manages these technology and information security risks. Through enterprise-wide programs, industry best practices, and robust threat and vulnerability assessments and responses, the Bank dynamically adapts its information technology operations, protocols, and governance standards against these proliferating risks and their potential impacts.
Technology disruption
Technology continues to impact the banking industry and its customers. Non-traditional new participants are entering certain segments of the financial industry which, in some cases, reduced regulatory requirements or other oversight. New entrants may use new technologies, advanced data and analytical tools, lower cost to market and/or faster processes to challenge traditional financial institutions. The scope and breadth of technology disruption is difficult to anticipate and has the potential to impact revenues and costs in certain of the Bank’s businesses. To mitigate this risk, the Bank continues to adapt and employs a number of strategies to ensure its continuing competitiveness against disruptive technologies, including using data and analytical tools to understand and respond swiftly to customer needs, and investing in technology and innovation. The Bank also considers the use of partnerships to appropriately meet the pace of innovation in financial services products and delivery channels. Failure to properly implement and deploy key technological innovations could adversely affect the Bank’s operating results or financial position.
68 | 2 0 1 6 S C O T I A B A N K A N N U A L R E P O R T
MANAGEMENT’S DISCUSSION AND ANALYSIS | RISK MANAGEMENT
Low commodity prices / energy exposure
Oil prices have continued their weakness well into 2016. The protracted low oil price has challenged many businesses, and with forecasts calling for modest price increases into 2017, continued stress can be expected on vulnerable companies in this sector. Weak performance in the energy sector is also having a negative impact on Canadian tax revenues and has contributed to softness in Alberta’s housing market. The Bank has taken a number of actions to prudently manage loan exposures in this sector and in related consumer loan segments, and according to the Bank’s stress test scenarios, losses are expected to be manageable.
Canadian consumer indebtedness
Canadian household indebtedness continues to outpace growth in disposable income fueled by persistently low interest rates and stable national employment levels. In such an environment, higher consumer indebtedness contributed to an upward trend in mortgage credit growth and strong home sales. In light of these trends, multiple levels of government implemented new legislation to introduce additional safeguards to the housing market. These include the foreign buyer tax in British Columbia and changes on a national basis to tighten origination criteria for insured mortgages. While interest rates are expected to remain at relatively low in the mid to long term, the risks of an external shock, such as higher unemployment rates, could impact Canadians’ ability to repay their loans and consequently drive a correction in the housing market.
We actively manage our lending portfolios and stress test them against various scenarios. For further discussion relating to our retail portfolio, refer to the Credit Risk Summary section.
2 0 1 6 S C O T I A B A N K A N N U A L R E P O R T | 69
MANAGEMENT’S DISCUSSION AND ANALYSIS
Credit Risk
Credit risk is the risk of loss resulting from the failure of a borrower or counterparty to honour its financial or contractual obligations to the Bank. Credit risk arises in the Bank’s direct lending operations, and in its funding, investment and trading activities where counterparties have repayment or other obligations to the Bank. Credit risk includes settlement risk, suitability risk and wrong way risk.
| | |
| | Index of all credit risk disclosures |
| | | | | | | | | | |
| | | |
| | | Page | | | Tables and charts | | Page | |
Credit risk summary | | | 71 | | | | | | | |
Credit Risk Management Framework | | | | | | | | | | |
Risk measures | | | 71 | | | | | | | |
Corporate and commercial | | | 71 | | | | | | | |
Risk ratings | | | 71 | | | | | | | |
Adjudication | | | 72 | | | | | | | |
Credit Risk Mitigation-Collateral/Security | | | 72 | | | | | | | |
Traditional Non-Retail Products | | | 72 | | | | | | | |
Commercial/Corporate Real Estate | | | 72 | | | | | | | |
Traded products | | | 73 | | | | | | | |
Credit Risk Mitigation-Collateral/Security | | | 73 | | | | | | | |
Retail | | | 73 | | | | | | | |
Adjudication | | | 73 | | | | | | | |
Risk ratings | | | 73 | | | | | | | |
Credit Risk Mitigation-Collateral/Security | | | 73 | | | | | | | |
Credit Quality | | | 74 | | | T3 Financial highlights | | | 14 | |
Allowance for credit losses | | | 74 | | | T11 Provision for credit losses as a percentage of average loans and acceptances | | | 22 | |
Impaired loans | | | 74 | | | T12 Net charge-offs as a percentage of average loans and acceptances | | | 22 | |
| | | | | | T65 Gross impaired loans by geographic segment | | | 110 | |
| | | | | | T66 Provision against impaired loans by geographic segment | | | 110 | |
| | | | | | T67 Cross-border exposure to select countries | | | 111 | |
| | | | | | T68 Loans and acceptances by type of borrower | | | 112 | |
| | | | | | T69 Off balance-sheet credit instruments | | | 112 | |
| | | | | | T70 Changes in net impaired loans | | | 113 | |
| | | | | | T71 Provision for credit losses | | | 113 | |
| | | | | | T72 Provision for credit losses against impaired loans by type of borrower | | | 114 | |
| | | | | | T73 Impaired loans by type of borrower | | | 114 | |
| | | | | | T74 Total credit risk exposures by geography | | | 115 | |
| | | | | | T75 AIRB credit risk exposures by maturity | | | 115 | |
| | | | | | T76 Total credit risk exposures and risk-weighted assets | | | 116 | |
| | | |
| | | | | | | Analysis of the aggregate credit risk exposure including market risk exposure, assets of the Bank’s insurance subsidiaries and other assets that fully reconciles to the balance sheet (refer Note 35 – Financial instruments – risk management in the consolidated financial statements) | | | 202 | |
Acquisition-related purchased loans | | | 75 | | | | | | | |
Portfolio review | | | 75 | | | | | | | |
Risk diversification | | | 75 | | | C24 Well diversified in Canada and internationally – loans and acceptances | | | 76 | |
| | | | | | C25 and in household and business lending – loans and acceptances | | | 76 | |
| | | | | | | T64 Loans and acceptances by geography | | | 110 | |
Risk mitigation | | | 75 | | | | | | | |
Overview of loan portfolio | | | 75 | | | T44 European exposure | | | 77 | |
Energy | | | 75 | | | T45 Funded exposures | | | 78 | |
Real estate secured lending | | | 76 | | | T46 Bank’s exposure distribution by country | | | 78 | |
| Loans to Canadian condominium developers | | | 77 | | | T47 Indirect exposures | | | 79 | |
European exposures | | | 77 | | | | | | | |
Financial instruments | | | 45 | | | T32 Mortgage-backed securities | | | 46 | |
| | | | | | | T33 Collateralized debt obligations (CDOs) | | | 46 | |
70 | 2 0 1 6 S C O T I A B A N K A N N U A L R E P O R T
MANAGEMENT’S DISCUSSION AND ANALYSIS | RISK MANAGEMENT
Credit risk summary
| • | | Loans and acceptances (Retail and Non-Retail) remained diversified by region, industry and customer. Regional exposure is spread across our key markets (Canada 66.1%, United States 7.7%, Mexico 4.2% and Other 22%). Financial Services, constitutes 3.9% of overall gross exposures (before consideration of collateral) and was $20 billion, a decrease of $1 billion from October 31, 2015. These exposures are predominately to highly rated counterparties and are generally collateralized. |
| • | | The Bank’s overall loan book as of October 31, 2016 increased to $497 billion versus $473 billion as of October 31, 2015, with growth reflected in Personal, and Business and Government lending. Residential mortgages were $223 billion as of October 31, 2016, with 87% in Canada. The corporate loan book, which accounts for 35% of the total loan book, is composed of 53% of loans with an investment grade rating as of October 31, 2016, down from 55% as of October 31, 2015. |
The effective management of credit risk requires the establishment of an appropriate credit risk culture. Key credit risk policies and appetite statements are important elements used to create this culture.
The Board of Directors, either directly or through the Risk Committee (the Board), reviews and approves the Bank’s Credit Risk Appetite annually and Credit Risk Policy biennially.
| • | | The objectives of the Credit Risk Appetite are to ensure that: |
| | – | | target markets and product offerings are well defined at both the enterprise-wide and business line levels; |
| | – | | the risk parameters for new underwritings and for the portfolios as a whole are clearly specified; and |
| | – | | transactions, including origination, syndication, loan sales and hedging, are managed in a manner that is consistent with the Bank’s risk appetite. |
| • | | The Credit Risk Policy articulates the credit risk management framework, including: |
| | – | | key credit risk management principles; |
| | – | | delegation of authority; |
| | – | | the credit risk management program; |
| | – | | counterparty credit risk management for trading and investment activities; and |
| | – | | aggregate limits, beyond which credit applications must be escalated to the Board for approval. |
Global Risk Management develops the credit risk management framework and policies that detail, among other things, the credit risk rating systems and associated parameter estimates; the delegation of authority for granting credit; the calculation of the allowance for credit losses; and the authorization of write-offs.
Corporate and commercial credit exposures are segmented by country and by major industry group. Aggregate credit risk limits for each of these segments are also reviewed and approved annually by the Board. Portfolio management objectives and risk diversification are key factors in setting these limits.
Consistent with the Board-approved limits, borrower limits are set within the context of established lending criteria and guidelines for individual borrowers, particular industries, countries and certain types of lending, to ensure the Bank does not have excessive concentration in any single borrower, or related group of borrowers, particular industry sector or geographic region. Through the portfolio management process, loans may be syndicated to reduce overall exposure to a single name. For certain segments of the portfolio, credit derivative contracts are also used to mitigate the risk of loss due to borrower default. Risk is also mitigated through the selective sale of loans.
Banking units and Global Risk Management regularly review the various segments of the credit portfolio on an enterprise-wide basis to assess the impact of economic trends or specific events on the performance of the portfolio, and to determine whether corrective action is required. These reviews include the examination of the risk factors for particular products, industries and countries. The results of these reviews are reported to the Risk Policy Committee and, when significant, to the Board.
Risk measures
The credit risk rating systems support the determination of key credit risk parameter estimates which measure credit and transaction risk. These risk parameters – probability of default, loss given default and exposure at default are transparent and may be replicated in order to provide consistency of credit adjudication, as well as minimum lending standards for each of the risk rating categories. The parameters are an integral part of enterprise-wide policies and procedures encompassing governance, risk management, and control structure, and are used in various internal and regulatory credit risk quantification calculations.
The Bank’s credit risk rating system is subject to a rigorous validation, governance and oversight framework. The objectives of this framework are to ensure that:
| • | | Credit risk rating methodologies and parameters are appropriately designed and developed, independently validated, and regularly reviewed; and |
| • | | The review and validation processes represent an effective challenge to the design and development process. |
Non-retail credit risk rating methodologies and parameters are reviewed and validated at least annually. Units within Global Risk Management are responsible for design and development, validation and review, and are functionally independent from the business units responsible for originating transactions. Within Global Risk Management, they are also independent from the units involved in risk rating approval and credit adjudication.
Internal credit risk ratings and associated risk parameters affect loan pricing, computation of the collective allowance for credit losses, and return on equity.
Corporate and commercial
Corporate and commercial credit exposure arises in Canadian Banking, International Banking and Global Banking and Markets business lines.
Risk ratings
The Bank’s risk rating system utilizes internal grade (IG) codes – an 18 point scale used to differentiate the risk of default of borrowers and the risk of loss on facilities. The general relationship between the Bank’s internal borrower IG codes and external agency ratings is shown in T24.
IG codes are also used to define credit adjudication authority levels appropriate to the size and risk of each credit application. Lower-rated credits require increasingly more senior management involvement depending upon the aggregate exposure. Where the decision is beyond their authority
2 0 1 6 S C O T I A B A N K A N N U A L R E P O R T | 71
MANAGEMENT’S DISCUSSION AND ANALYSIS
levels, credit units will refer the request – with its recommendation – to a senior credit committee for adjudication. Senior credit committees also have defined authority levels and, accordingly, forward certain requests to the Risk Policy Committee. In certain cases, these must be referred to the Risk Committee of the Board of Directors.
Adjudication
Credit adjudication units within Global Risk Management analyze and evaluate all significant credit requests for corporate and commercial credit exposures, to ensure that risks are adequately assessed, properly approved, continually monitored and actively managed. The decision-making process begins with an assessment of the credit risk of the individual borrower or counterparty. Key factors considered in the assessment include:
| • | | The borrower’s management; |
| • | | The borrower’s current and projected financial results and credit statistics; |
| • | | The industry in which the borrower operates; |
Based on this assessment, a risk rating is assigned to the individual borrower or counterparty, using the Bank’s risk rating systems. A separate risk rating is also assigned at the facility level, taking into consideration additional factors, such as security, seniority of claim, structure, term and any other forms of credit risk mitigation that affect the amount of potential loss in the event of a default of the facility. Security typically takes the form of charges over inventory, receivables, real estate, and operating assets when lending to corporate and commercial borrowers; and cash or treasuries for trading lines such as securities lending, repurchase transactions, and derivatives. The types of acceptable collateral, and related valuation processes are documented in risk management policies and manuals.
Other forms of credit risk mitigation include third party guarantees and, in the case of derivatives facilities, master netting agreements.
Internal borrower and facility risk ratings are assigned when a facility is first authorized, and are promptly re-evaluated and adjusted, if necessary, as a result of changes to the customer’s financial condition or business prospects. Re-evaluation is an ongoing process, and is done in the context of general economic changes, specific industry prospects, and event risks, such as revised financial projections, interim financial results and extraordinary announcements.
The internal credit risk ratings are also considered as part of the Bank’s adjudication limits, as guidelines for hold levels are tied to different risk ratings. Single borrower limits are much lower for higher risk borrowers than low risk borrowers.
The credit adjudication process also uses a risk-adjusted return on equity profitability model to ensure that the client and transaction structure offers an appropriate return for a given level of risk. For the corporate portfolio, and the large borrowers in International, the Loan Portfolio Management Group reviews the profitability model results, together with external benchmarks, and provides an opinion on the relative return and pricing of each transaction above a minimum threshold.
Individual credit exposures are regularly monitored by both the business line units and Global Risk Management for any signs of deterioration. In addition, a review and risk analysis of each borrower is conducted annually, or more frequently for higher-risk borrowers. If, in the judgement of management, an account requires the expertise of specialists in workouts and restructurings, it will be transferred to a special accounts group for monitoring and resolution.
Credit Risk Mitigation – Collateral/Security
Traditional Non-Retail Products (e.g. Operating lines of Credit, Term Loans)
Collateral values are accurately identified at the outset and throughout the tenure of a transaction by using standard evaluation methodologies. Collateral valuation estimates are conducted at a frequency that is appropriate to the frequency by which the market value fluctuates, using the collateral type and the Borrower risk profile.
In addition, when it is not cost effective to monitor highly volatile collateral (e.g. accounts receivable, inventory), appropriate lending margins are applied to compensate (e.g. accounts receivable are capped at 80% of value, inventory at 50%). The frequency of collateral valuations is also increased when early warning signals of a Borrower’s deteriorating financial condition are identified.
Borrowers are required to confirm adherence to covenants including confirmation of collateral values on a periodic basis, which are used by the Bank to provide early warning signals of collateral value deterioration. Periodic inspections of physical collateral are performed where appropriate and where reasonable means of doing so are available.
Bank procedures require verification including certification by Banking officers during initial, annual, and periodic reviews, that collateral values/margins/etc. have been assessed and, where necessary, steps have been taken to mitigate any decreased collateral values.
The Bank does not use automated valuation models (AVMs) for valuation purposes. Global Risk Management (GRM) performs its own valuations of companies based on various factors such as book value, discounted book value, enterprise value etc.
Commercial/Corporate Real Estate
New or updated appraisals are generally obtained at inception of a new facility, as well as during Loan Modifications, Loan Workouts and Troubled Debt Restructure. The primary reason for requiring a new appraisal is if, in the reasonable opinion of the Banking Execution Unit, or GRM Real Estate, there has been a material change in value. Additionally, none of the appraisal guidelines contained within the policies should dissuade the Bank from requesting an appraisal more frequently if an adverse change in market conditions, sponsorship, credit worthiness, of other underwriting assumptions is realized or expected.
Appraisals must be in writing and must contain sufficient information and analysis to support the Bank’s decision to make the loan. Moreover, in rendering an opinion of the property’s market value, third party appraisers are responsible for establishing the scope of work necessary to develop credible assignment results. The appraisal must meet the regulatory and industry requirements which, depending on the type of property being appraised, contain any or all of the following three approaches to value:
| | i. | comparable sales approach |
| | ii. | replacement cost approach |
The appraiser should disclose the rationale for the omission of any valuation approach. Furthermore, the appraiser must disclose whether the subject property was physically inspected and whether anyone provided significant assistance to the person signing the appraisal report. The report should contain a presentation and explanation of the assumptions used in determining value under each of the above mentioned approaches.
72 | 2 0 1 6 S C O T I A B A N K A N N U A L R E P O R T
MANAGEMENT’S DISCUSSION AND ANALYSIS | RISK MANAGEMENT
Review of every appraisal is conducted by the banking units and GRM Real Estate to confirm that the appraisal identifies all of the relevant issues for the specific asset class, location and economic environment and incorporates all appropriate valuation methodologies and assumptions. In most cases, the banking units also include comparable properties in addition to what is included in the appraisal to further justify value.
When third party assessors are used, they must be accredited and satisfactory to the Bank. In addition, GRM validates any third party valuations via internal desktop estimates either based on comparables or discounted income valuations.
Traded products
Traded products are transactions such as derivatives, foreign exchange, commodities, repurchase/reverse repurchase agreements, and securities lending/borrowing. Credit risks arising from traded products cannot be determined with certainty at the outset, because during the tenure of a transaction the dollar value of the counterparty’s obligation to the Bank will be affected by changes in the capital markets (such as changes in stock prices, interest rates, and exchange rates). The Bank adjudicates credit exposures arising from transacting in traded products by considering their current fair value plus an additional component to reflect potential future changes in their mark-to-market value. The credit adjudication process also includes an evaluation of potential wrong way risk, which arises when the exposure to a counterparty is positively correlated to the probability of default of that counterparty.
Credit risk associated with traded products is managed within the same credit adjudication process as the lending business. The Bank considers the credit risk arising from lending activities, as well as the potential credit risk arising from transacting in traded products with that counterparty.
Credit risk mitigation – collateral/security
Derivatives are generally transacted under industry standard International Swaps and Derivatives Association (ISDA) master netting agreements, which allow for a single net settlement of all transactions covered by that agreement in the event of a default or early termination of the transactions. ISDA agreements are frequently accompanied by an ISDA Credit Support Annex (CSA), the terms of which may vary according to each party’s view of the other party��s creditworthiness. CSAs can require one party to post initial margin at the onset of each transaction. CSAs also allow for variation margin to be called if total uncollateralized mark-to-market exposure exceeds an agreed upon threshold. Such variation margin provisions can be one-way (only one party will ever post collateral) or bilateral (either party may post depending upon which party is in-the-money). The CSA will also detail the types of collateral that are acceptable to each party, and the haircuts that will be applied against each collateral type. The terms of the ISDA master netting agreements and CSAs are taken into consideration in the calculation of counterparty credit risk exposure.
For derivative transactions, investment grade counterparties account for approximately 86% of the credit risk. Approximately 30% of the Bank’s derivative counterparty exposures are to bank counterparties. After taking into consideration, where applicable, netting and collateral arrangements, no net credit risk amount arising from traded products transactions with any single counterparty was considered material to the financial position of the Bank as at October 31, 2016. No individual exposure to an investment grade bilateral counterparty exceeded $1,002 million and no individual exposure to a corporate counterparty exceeded $293 million.
Retail
Retail credit exposures arise in the Canadian Banking and International Banking business lines.
Adjudication
The decision-making process for retail loans ensures that credit risks are adequately assessed, properly approved, continually monitored and actively managed. Generally, credit decisions on consumer loans are processed by proprietary adjudication software and are based on risk ratings, which are generated using predictive credit scoring models.
The Bank’s credit adjudication and portfolio management methodologies are designed to ensure consistent underwriting and early identification of problem loans. The Bank’s rigorous credit underwriting methodology and retail risk modeling is more customer focused than product focused. The Bank’s view is that a customer-centric approach provides better risk assessment than product-based approaches, and should result in lower loan losses over time.
All credit scoring and policy changes are initiated by units within Global Risk Management that are functionally independent from the business units responsible for retail portfolios. Risk models and parameters are also subject to independent validation and review from the units involved in the design and development of models. The review process includes referral to the appropriate Senior Credit Committee for approval, where required. Consumer credit portfolios are reviewed monthly to identify emerging trends in loan quality and to assess whether corrective action is required.
Risk ratings
The Bank’s consumer risk rating systems are oriented to borrower or transaction risk. Each retail exposure is assigned a risk grade based on the customer’s credit history and/or internal credit score. The Bank’s automated risk rating systems assess the ongoing credit-worthiness of individual customers on a monthly basis. This process provides for meaningful and timely identification and management of problem loans.
The overall risk ratings system under AIRB approach is subject to regular review with ongoing performance monitoring of key components. Risk model validations are conducted independently from the areas responsible for rating system development and implementation, to ensure effective independence.
Customer behavior characteristics which are used as inputs within the Bank’s Basel III AIRB models are consistent with those used by the Bank’s Canadian consumer risk rating systems. The International portfolios are subject to the Standardized approach at this time.
Credit risk mitigation – collateral/security
The property values for residential real estate secured exposures are confirmed at origination through a variety of validation methodologies, including AVM and full appraisal’s (in-person inspection). The appraisal is completed by a third party, Bank approved appraiser. For monitoring of material portfolios, property values are indexed quarterly to house prices. For loan impairment within the material portfolios, residential property values are re-confirmed using third party AVM’s.
Where AVM values are used, these AVM values are subject to routine validation through a continuous random sampling process that back-tests AVM values against available property appraisals (primarily third party AVMs). Where third party appraisals are obtained, the Bank relies on the professional industry accreditation of the appraiser. Samples of approved appraisal reports are reviewed by the Bank’s senior appraisers to ensure consistent appraisal quality and satisfactory appraisal values. The third party appraisers are selected from a pre-approved list of Bank-vetted appraisers.
2 0 1 6 S C O T I A B A N K A N N U A L R E P O R T | 73
MANAGEMENT’S DISCUSSION AND ANALYSIS
Credit quality
T40 Impaired loans by business line(1)
| | | | | | | | | | | | | | | | | | | | | | | | |
| | |
| | | 2016 | | | 2015 | |
| | | | | | |
| As at October 31 ($ millions) | | Gross impaired loans | | | Allowance for credit
losses | | | Net impaired loans | | | Gross impaired loans | | | Allowance for credit losses | | | Net impaired loans | |
Canadian Banking | | | | | | | | | | | | | | | | | | | | | | | | |
Retail | | $ | 1,003 | | | $ | (656 | ) | | $ | 347 | | | $ | 843 | | | $ | (543 | ) | | $ | 300 | |
Commercial | | | 228 | | | | (160 | ) | | | 68 | | | | 208 | | | | (157 | ) | | | 51 | |
| | $ | 1,231 | | | $ | (816 | ) | | $ | 415 | | | $ | 1,051 | | | $ | (700 | ) | | $ | 351 | |
International Banking | | | | | | | | | | | | | | | | | | | | | | | | |
Caribbean and Central America | | $ | 1,540 | | | $ | (648 | ) | | $ | 892 | | | $ | 1,588 | | | $ | (647 | ) | | $ | 941 | |
Latin America | | | | | | | | | | | | | | | | | | | | | | | | |
Mexico | | | 301 | | | | (215 | ) | | | 86 | | | | 271 | | | | (186 | ) | | | 85 | |
Peru | | | 764 | | | | (501 | ) | | | 263 | | | | 603 | | | | (422 | ) | | | 181 | |
Chile | | | 499 | | | | (237 | ) | | | 262 | | | | 405 | | | | (175 | ) | | | 230 | |
Colombia | | | 381 | | | | (239 | ) | | | 142 | | | | 356 | | | | (235 | ) | | | 121 | |
Other Latin America | | | 143 | | | | (136 | ) | | | 7 | | | | 117 | | | | (117 | ) | | | – | |
Total Latin America | | | 2,088 | | | | (1,328 | ) | | | 760 | | | | 1,752 | | | | (1,135 | ) | | | 617 | |
| | $ | 3,628 | | | $ | (1,976 | ) | | $ | 1,652 | | | $ | 3,340 | | | $ | (1,782 | ) | | $ | 1,558 | |
Global Banking and Markets | | | | | | | | | | | | | | | | | | | | | | | | |
Canada | | $ | 27 | | | $ | (7 | ) | | $ | 20 | | | $ | 138 | | | $ | (39 | ) | | $ | 99 | |
U.S. | | | 210 | | | | (47 | ) | | | 163 | | | | 11 | | | | (6 | ) | | | 5 | |
Asia and Europe | | | 298 | | | | (102 | ) | | | 196 | | | | 118 | | | | (46 | ) | | | 72 | |
| | $ | 535 | | | $ | (156 | ) | | $ | 379 | | | $ | 267 | | | $ | (91 | ) | | $ | 176 | |
Totals | | $ | 5,394 | | | $ | (2,948 | ) | | $ | 2,446 | | | $ | 4,658 | | | $ | (2,573 | ) | | $ | 2,085 | |
| | | | | | |
Allowance for credit losses against performing loans | | | | | | $ | (1,444 | ) | | | | | | | | | | $ | (1,404 | ) | | | | |
Impaired loan metrics
| | | | | | | | |
| | | Net impaired loans | |
| | |
| As at October 31 ($ millions) | | 2016(1) | | | 2015(1) | |
Net impaired loans as a % of loans and acceptances | | | 0.49 | % | | | 0.44 | % |
Allowance against impaired loans as a % of gross impaired loans | | | 55 | % | | | 55 | % |
| (1) | Excludes loans acquired under the Federal Deposit Insurance Corporation (FDIC) guarantee related to the acquisition of R-G Premier Bank of Puerto Rico. |
Allowance for credit losses
The total allowance for credit losses was up $415 million to $4,392 million as at October 31, 2016 (excluding $234 million related to loans acquired under FDIC guarantee related to the acquisition of R-G Premier Bank of Puerto Rico), from $3,977 million (excluding $220 million related to R-G Premier Bank) last year.
Allowances in Canadian Banking increased by $116 million to $816 million, in line with the increases in gross impaired loans.
In International Banking, allowances increased by $194 million to $1,976 million mainly in Peru, Chile, and Mexico.
Global Banking and Markets allowances increased by $65 million to $156 million, reflecting the increase in gross impaired loans.
The collective allowance against performing loans increased by $40 million to $1,444 million due to a $50 million increase in the collective allowance against performing loans and partially offset by a $10 million re-allocation to the reserves against unfunded commitments and other off-balance sheet items.
Impaired loans
Gross impaired loans increased to $5,394 million as at October 31, 2016 (excluding $100 million related to loans purchased under FDIC guarantee related to the acquisition of R-G Premier Bank of Puerto Rico), from $4,658 million (excluding $157 million related to R-G Premier Bank of Puerto Rico) last year.
Impaired loans in Canadian Banking increased by $180 million, primarily in the retail portfolio.
In International Banking, impaired loans increased by $288 million due to increases in Latin America region, primarily in Peru and Chile.
Impaired loans in Global Banking and Markets increased by $268 million, primarily in the United States and Asia.
Net impaired loans, after deducting the allowance for credit losses, were $2,446 million as at October 31, 2016, an increase of $361 million from a year ago. Net impaired loans as a percentage of loans and acceptances were 0.49% as at October 31, 2016, an increase of five basis points from a year ago.
74 | 2 0 1 6 S C O T I A B A N K A N N U A L R E P O R T
MANAGEMENT’S DISCUSSION AND ANALYSIS | RISK MANAGEMENT
Acquisition-related purchased loans
All purchased loans are initially measured at fair value on the date of acquisition, with no allowance for credit losses recorded in the Consolidated Statement of Financial Position on the date of acquisition. Consequently, none of the purchased loans are considered to be impaired on the date of acquisition. In arriving at the fair value, the Bank considers interest rate mark and credit rate mark adjustments.
The interest rate mark on the date of acquisition is principally set up for fixed interest rate loans and captures the impact of the interest rate differential between the contractual rate of interest on the loan and the prevailing interest rate on the loan on the date of acquisition for the remaining term. The interest rate mark is fully amortized into interest income in the Consolidated Statement of Income over the expected life of the loan using the effective interest method.
The credit mark captures management’s best estimate of cash flow shortfalls on the loans over their lifetime as determined at the date of acquisition. Changes to the expected cash flows of these loans are recorded as a charge/recovery in the provision for credit losses in the Consolidated Statement of Income.
The total credit mark remaining on all acquired loans in Canadian Banking and International Banking as at October 31, 2016 was $259 million (October 31, 2015 – $148 million).
Adjusting for the impact of foreign currency translation, the utilization of incurred and expected losses in the credit mark during the year was $244 million (for the year ended October 31, 2015 – $68 million). The net benefit to net income attributable to common shareholders from the credit mark on acquired loans this year was $123 million (for the year ended October 31, 2015 – $23 million).
Portfolio review
Canadian Banking
Gross impaired loans in the retail portfolio increased by $160 million to $1,003 million. Provision for credit losses in the retail portfolio were $770 million, up $128 million from last year driven by growth in relatively higher spread loans. In the commercial loan portfolio, gross impaired loans increased by $20 million to $228 million and the provision for credit losses was $62 million, up $17 million from last year.
International Banking
In retail, gross impaired loans increased by $70 million to $2,227 million during the year, with an increase attributable mainly to Peru. Retail provisions were flat compared to 2015. Increases from acquisitions and higher provisions for credit losses in Latin America from strong retail loan growth were offset by favourable foreign currency translation. In commercial banking, gross impaired loans were $1,401 million, an increase of $218 million over the prior year. The provision for credit losses in the commercial portfolio was $274 million in 2016, versus $126 million in 2015. The increase was attributable to higher provisions in the energy sector, primarily in Colombia, and in Puerto Rico.
Global Banking and Markets
Gross impaired loans in Global Banking and Markets increased by $268 million in 2016 to $535 million primarily in the energy sector. The provision for credit losses was $249 million in 2016, versus $67 million in 2015. The provisions this year were primarily in the energy sector.
Risk diversification
The Bank’s exposures to various countries and types of borrowers are well diversified (see T64 on page 110 and T68 on page 112). Chart C24 shows loans and acceptances by geography. Ontario represents the largest Canadian exposure at 31.5% of the total. Latin America was 10.7% of the total exposure and the U.S. was 7.7%.
C25 shows loans and acceptances by type of borrower (see T68 on page 112). Excluding loans to households, the largest industry exposures were wholesale and retail (4.5%), real estate and construction (4.5%), financial services (3.9% including banks and non-banks), and energy (3.1%).
Risk mitigation
To mitigate exposures in its performing corporate portfolios, the Bank uses diversification by company, industry, and country, with loan sales and credit derivatives used sparingly. In 2016, loan sales totaled $42 million, compared to $143 million in 2015. The largest volume of loan sales in 2016 related to loans in the energy industry. As at October 31, 2016, credit derivatives used to mitigate exposures in the portfolios totaled $24 million (notional amount), compared to $39 million as at October 31, 2015.
The Bank actively monitors industry and country concentrations. As is the case with all industry exposures, the Bank continues to closely follow developing trends and takes additional steps to mitigate risk as warranted. Energy, mining, and shipping portfolios are being closely managed.
Overview of loan portfolio
The Bank has a well-diversified portfolio by product, business and geography. Details of certain portfolios of current focus are highlighted below.
Energy
The Bank’s outstanding loan exposure to commercial and corporate companies in the energy sector was $15.6 billion as at October 31, 2016 (October 31, 2015 – $16.5 billion), reflecting approximately 3.1% (October 31, 2015 – 3.5%) of the Bank’s total loan portfolio. In addition, the Bank has related undrawn energy loan commitments amounting to $11.1 billion as at October 31, 2016 (October 31, 2015 – $14.3 billion). The decline in undrawn loan commitments is primarily driven by the upstream and midstream sub-sectors. Exposure in the upstream sub-sector declined by $2.2 billion since October 31, 2015. Approximately 59% of the Bank’s outstanding energy loan exposure and associated undrawn commitments are investment grade, after taking into account the benefit of collateral and guarantees.
2 0 1 6 S C O T I A B A N K A N N U A L R E P O R T | 75
MANAGEMENT’S DISCUSSION AND ANALYSIS
| C24 | Well diversified in Canada and internationally… |
loans and acceptances, October 2016
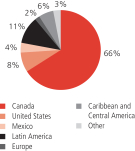
| C25 | … and in household and business lending |
loans & acceptances, October 2016

As expected, retail delinquencies are tracking higher in Alberta. The outstanding loan exposures are primarily secured. The Bank continues to consider the impact of lower energy prices in its ongoing stress testing program. Results continue to be within our risk tolerance.
Real estate secured lending
A large portion of the Bank’s lending portfolio is comprised of residential mortgages and consumer loans, which are well diversified by borrower. As at October 31, 2016, these loans accounted for $322 billion or 65% of the Bank’s total loans and acceptances outstanding (October 31, 2015 – $309 billion or 65%). Of these, $242 billion or 75% are real estate secured loans (October 31, 2015 – $236 billion or 76%). The tables below provide more details by portfolios.
Insured and uninsured residential mortgages and home equity lines of credit
The following table presents amounts of insured and uninsured residential mortgages and home equity lines of credit (HELOCs), by geographic area.
T41 Insured and uninsured residential mortgages and home equity lines of credit (HELOCs), by geographic areas
| | | | | | | | | | | | | | | | | | | | | | | | | | | | | | | | | | | | | | | | | | | | | | | | |
| | | 2016 | |
| | | Residential mortgages | | | Home equity lines of credit | |
| As at October 31 | | Insured(1) | | | Uninsured | | | Total | | | Insured(1) | | | Uninsured | | | Total | |
| ($ millions) | | Amount | | | % | | | Amount | | | % | | | Amount | | | % | | | Amount | | | % | | | Amount | | | % | | | Amount | | | % | |
Canada:(2) | | | | | | | | | | | | | | | | | | | | | | | | | | | | | | | | | | | | | | | | | | | | | | | | |
Atlantic provinces | | $ | 7,034 | | | | 3.7 | | | $ | 4,901 | | | | 2.5 | | | $ | 11,935 | | | | 6.2 | | | $ | 1 | | | | – | | | $ | 1,259 | | | | 6.6 | | | $ | 1,260 | | | | 6.6 | |
Quebec | | | 8,346 | | | | 4.3 | | | | 7,150 | | | | 3.7 | | | | 15,496 | | | | 8.0 | | | | – | | | | – | | | | 999 | | | | 5.2 | | | | 999 | | | | 5.2 | |
Ontario | | | 52,230 | | | | 27.0 | | | | 41,935 | | | | 21.7 | | | | 94,165 | | | | 48.7 | | | | 2 | | | | – | | | | 9,646 | | | | 50.6 | | | | 9,648 | | | | 50.6 | |
Manitoba & Saskatchewan | | | 5,857 | | | | 3.0 | | | | 3,236 | | | | 1.7 | | | | 9,093 | | | | 4.7 | | | | 2 | | | | – | | | | 840 | | | | 4.4 | | | | 842 | | | | 4.4 | |
Alberta | | | 19,551 | | | | 10.1 | | | | 10,828 | | | | 5.6 | | | | 30,379 | | | | 15.7 | | | | 3 | | | | 0.1 | | | | 3,027 | | | | 15.8 | | | | 3,030 | | | | 15.9 | |
British Columbia & Territories | | | 16,929 | | | | 8.8 | | | | 15,306 | | | | 7.9 | | | | 32,235 | | | | 16.7 | | | | – | | | | – | | | | 3,294 | | | | 17.3 | | | | 3,294 | | | | 17.3 | |
Canada(3) | | $ | 109,947 | | | | 56.9 | % | | $ | 83,356 | | | | 43.1 | % | | $ | 193,303 | | | | 100 | % | | $ | 8 | | | | 0.1 | % | | $ | 19,065 | | | | 99.9 | % | | $ | 19,073 | | | | 100 | % |
International | | | – | | | | – | | | | 29,585 | | | | 100 | | | | 29,585 | | | | 100 | | | | – | | | | – | | | | – | | | | – | | | | – | | | | – | |
Total | | $ | 109,947 | | | | 49.3 | % | | $ | 112,941 | | | | 50.7 | % | | $ | 222,888 | | | | 100 | % | | $ | 8 | | | | 0.1 | % | | $ | 19,065 | | | | 99.9 | % | | $ | 19,073 | | | | 100 | % |
| | | | 2015 | |
Canada(3) | | $ | 92,802 | | | | 48.8 | % | | $ | 97,321 | | | | 51.2 | % | | $ | 190,123 | | | | 100 | % | | $ | 9 | | | | 0.1 | % | | $ | 18,627 | | | | 99.9 | % | | $ | 18,636 | | | | 100 | % |
International | | | – | | | | – | | | | 27,375 | | | | 100 | | | | 27,375 | | | | 100 | | | | – | | | | – | | | | – | | | | – | | | | – | | | | – | |
Total | | $ | 92,802 | | | | 42.7 | % | | $ | 124,696 | | | | 57.3 | % | | $ | 217,498 | | | | 100 | % | | $ | 9 | | | | 0.1 | % | | $ | 18,627 | | | | 99.9 | % | | $ | 18,636 | | | | 100 | % |
| (1) | Default insurance is contractual coverage for the life of eligible facilities whereby the Bank’s exposure to real estate secured lending is protected against potential shortfalls caused by borrower default. This insurance is provided by either government-backed entities or private mortgage insurers. |
| (2) | The province represents the location of the property in Canada. |
| (3) | Includes multi-residential dwellings (4+ units) of $2,376 (October 31, 2015 – $2,104) of which $1,392 are insured (October 31, 2015 – $1,005). |
Amortization period ranges for residential mortgages
The following table presents the distribution of residential mortgages by amortization periods, and by geographic areas.
T42 Distribution of residential mortgages by amortization periods, and by geographic areas
| | | | | | | | | | | | | | | | | | | | | | | | |
| | | 2016 | |
| | | Residential mortgages by amortization | |
| As at October 31 | | Less than 20 years | | | 20-24 years | | | 25-29 years | | | 30-34 years | | | 35 years and greater | | | Total residential mortgages | |
Canada | | | 35.2 | % | | | 36.3 | % | | | 26.7 | % | | | 1.7 | % | | | 0.1 | % | | | 100 | % |
International | | | 67.7 | % | | | 19.0 | % | | | 11.5 | % | | | 1.7 | % | | | 0.1 | % | | | 100 | % |
| | | | 2015 | |
Canada | | | 35.6 | % | | | 35.6 | % | | | 25.7 | % | | | 3.0 | % | | | 0.1 | % | | | 100 | % |
International | | | 66.4 | % | | | 20.4 | % | | | 11.4 | % | | | 1.6 | % | | | 0.2 | % | | | 100 | % |
Loan to value ratios
The Canadian residential mortgage portfolio is 43% uninsured (October 31, 2015 – 51%). The average loan-to-value (LTV) ratio of the uninsured portfolio is 50% (October 31, 2015 – 53%).
The following table presents the weighted average LTV ratio for total newly originated uninsured residential mortgages and home equity lines of credit during the year, which include mortgages for purchases, refinances with a request for additional funds and transfer from other financial institutions, by geographic areas.
76 | 2 0 1 6 S C O T I A B A N K A N N U A L R E P O R T
MANAGEMENT’S DISCUSSION AND ANALYSIS | RISK MANAGEMENT
T43 Loan to value ratios
| | | | | | | | | | |
| | | | | Uninsured LTV ratios(1) | |
| | | | | For the year ended October 31, 2016 | |
| | | | | Residential mortgages LTV% | | | Home equity lines of credit(2) LTV% | |
Canada: | | | | | | | | | | |
Atlantic provinces | | | | | 68.1 | % | | | 59.4 | % |
Quebec | | | | | 63.0 | | | | 68.8 | |
Ontario | | | | | 62.4 | | | | 64.6 | |
Manitoba & Saskatchewan | | | | | 67.6 | | | | 64.4 | |
Alberta | | | | | 66.7 | | | | 69.3 | |
British Columbia & Territories | | | | | 60.7 | | | | 61.7 | |
Canada | | | | | 62.9 | % | | | 64.5 | % |
International | | | | | 69.1 | % | | | N/A | |
| | | | | | For the year end October 31, 2015 | |
Canada | | | | | 62.5 | % | | | 65.7 | % |
International | | | | | 68.3 | % | | | N/A | |
| (1) | The province represents the location of the property in Canada. |
| (2) | Includes only home equity lines of credit (HELOC) under Scotia Total Equity Plan. LTV is calculated based on the sum of residential mortgages and the authorized limit for related HELOCs, divided by the value of the related residential property, and presented on a weighted average basis for newly originated mortgages and HELOCs. |
Potential impact on residential mortgages and real estate home equity lines of credit in the event of an economic downturn
The Bank performs stress testing on its portfolio to assess the impact of increased levels of unemployment, rising interest rates, reduction in property values and changes in other relevant macro-economic variables. Potential losses in the mortgage portfolio under such economic downturn scenarios are considered manageable given the diversified composition of the portfolio, the high percentage of insured exposures, and the low LTV in the portfolio. This is further supported by sound risk management oversight and pro-active risk mitigation strategies.
Loans to Canadian condominium developers
With respect to loans to Canadian condominium developers, the Bank had loans outstanding of $956 million as at October 31, 2016 (October 31, 2015 – $927 million). This is a high quality portfolio with well-known developers who have long-term relationships with the Bank.
European exposures
As a result of the Bank’s broad international operations, the Bank has sovereign credit risk exposure to a number of countries. The Bank actively manages this sovereign risk, including the use of risk limits calibrated to the credit worthiness of the sovereign exposure.
The Bank believes that its European exposures are manageable, are sized appropriately relative to the credit worthiness of the counterparties (83% of the exposures are to investment grade counterparties based on a combination of internal and external ratings), and are modest relative to the capital levels of the Bank. The Bank’s European exposures are carried at amortized cost or fair value using observable inputs, with negligible amounts valued using models with unobservable inputs (Level 3). There were no significant events in the quarter that have materially impacted the Bank’s exposures.
The current European exposure is provided in T44 below.
T44 European exposure
| | | | | | | | | | | | | | | | | | | | | | | | | | | | |
| As at October 31 | | 2016 | | | 2015 | |
| | | Loans and loan equivalents | | | Other | | | | | | | |
| ($ millions) | | Loans and
acceptances(1) | | | Letters of credit and guarantees(2) | | | Undrawn commitments(3) | | | Securities and deposits with financial institutions(4) | | | Securities Financing Transactions (SFT) and derivatives(5) | | | Total European exposure | | | Total European exposure | |
Gross exposures | | $ | 11,858 | | | $ | 2,890 | | | $ | 12,472 | | | $ | 10,823 | | | $ | 3,554 | | | $ | 41,597 | | | $ | 39,231 | |
Less: Undrawn commitments | | | – | | | | – | | | | 12,472 | | | | – | | | | – | | | | 12,472 | | | | 12,409 | |
Net funded exposure | | $ | 11,858 | | | $ | 2,890 | | | $ | – | | | $ | 10,823 | | | $ | 3,554 | | | $ | 29,125 | | | $ | 26,822 | |
| (1) | Individual allowances for credit loss are $37.7. |
| (2) | Letters of credit and guarantees are included as funded exposure as they have been issued. |
| (3) | Undrawn commitments represent an estimate of the contractual amount that may be drawn upon by the obligor. |
| (4) | Exposures for securities are calculated taking into account derivative positions where the security is the underlying reference asset and short trading positions. |
| (5) | SFT comprise of securities purchased under resale agreements, obligations related to securities sold under repurchase agreements and securities lending and borrowing transactions. Gross and net funded exposures represent all net positive positions after taking into account collateral. Collateral held against derivatives was $2,547 and collateral held against SFT was $7,714. |
2 0 1 6 S C O T I A B A N K A N N U A L R E P O R T | 77
MANAGEMENT’S DISCUSSION AND ANALYSIS
Below are the funded exposures related to all European countries:
T45 Funded exposures
| | | | | | | | | | | | | | | | | | | | |
| As at October 31 | | 2016 | | | 2015 | |
| ($ millions) | | Sovereign(1) | | | Bank | | | Corporate(2) | | | Total | | | Total | |
Greece | | $ | – | | | $ | – | | | $ | 311 | | | $ | 311 | | | $ | 339 | |
Ireland | | | 27 | | | | 37 | | | | 286 | | | | 350 | | | | 428 | |
Italy | | | (1 | ) | | | 181 | | | | 11 | | | | 191 | | | | 509 | |
Portugal | | | – | | | | – | | | | – | | | | – | | | | (2 | ) |
Spain | | | 111 | | | | 181 | | | | 307 | | | | 599 | | | | 505 | |
Total GIIPS | | $ | 137 | | | $ | 399 | | | $ | 915 | | | $ | 1,451 | | | $ | 1,779 | |
| | | | | |
U.K. | | $ | 1,163 | | | $ | 2,304 | | | $ | 7,561 | | | $ | 11,028 | | | $ | 12,895 | |
Germany | | | 1,799 | | | | 306 | | | | 1,975 | | | | 4,080 | | | | 2,847 | |
France | | | 1,947 | | | | 1,196 | | | | 599 | | | | 3,742 | | | | 2,569 | |
Netherlands | | | 452 | | | | 398 | | | | 1,255 | | | | 2,105 | | | | 974 | |
Switzerland | | | 239 | | | | 309 | | | | 1,051 | | | | 1,599 | | | | 1,042 | |
Other | | | 1,599 | | | | 246 | | | | 3,275 | | | | 5,120 | | | | 4,716 | |
Total Non-GIIPS | | $ | 7,199 | | | $ | 4,759 | | | $ | 15,716 | | | $ | 27,674 | | | $ | 25,043 | |
Total Europe | | $ | 7,336 | | | $ | 5,158 | | | $ | 16,631 | | | $ | 29,125 | | | $ | 26,822 | |
Total Europe as at October 31, 2015 | | $ | 6,214 | | | $ | 5,480 | | | $ | 15,128 | | | $ | 26,822 | | | | | |
| (1) | Includes $1,959 (October 31, 2015 – $667) in exposures to supra-national agencies. |
| (2) | Corporate includes financial institutions that are not banks. |
The Bank’s exposure are distributed as follows:
T46 Bank’s exposure distribution by country
| | | | | | | | | | | | | | | | | | | | | | | | |
| As at October 31 | | 2016 | | | 2015 | |
| ($ millions) | | Loans and
loan
equivalents | | | Deposits
with
financial
institutions | | | Securities | | | SFT and
derivatives | | | Total | | | Total | |
Greece | | $ | 311 | | | $ | – | | | $ | – | | | $ | – | | | $ | 311 | | | $ | 339 | |
Ireland | | | 99 | | | | 27 | | | | 55 | | | | 169 | | | | 350 | | | | 428 | |
Italy | | | 213 | | | | – | | | | (22 | ) | | | – | | | | 191 | | | | 509 | |
Portugal | | | – | | | | – | | | | – | | | | – | | | | – | | | | (2 | ) |
Spain | | | 486 | | | | – | | | | 103 | | | | 10 | | | | 599 | | | | 505 | |
Total GIIPS | | $ | 1,109 | | | $ | 27 | | | $ | 136 | | | $ | 179 | | | $ | 1,451 | | | $ | 1,779 | |
| | | | | | |
U.K. | | $ | 6,090 | | | $ | 1,620 | | | $ | 1,279 | | | $ | 2,039 | | | $ | 11,028 | | | $ | 12,895 | |
Germany | | | 1,371 | | | | 204 | | | | 2,389 | | | | 116 | | | | 4,080 | | | | 2,847 | |
France | | | 754 | | | | 517 | | | | 2,251 | | | | 220 | | | | 3,742 | | | | 2,569 | |
Netherlands | | | 1,090 | | | | 85 | | | | 600 | | | | 330 | | | | 2,105 | | | | 974 | |
Switzerland | | | 1,102 | | | | 23 | | | | 158 | | | | 316 | | | | 1,599 | | | | 1,042 | |
Other | | | 3,232 | | | | 43 | | | | 1,491 | | | | 354 | | | | 5,120 | | | | 4,716 | |
Total Non-GIIPS | | $ | 13,639 | | | $ | 2,492 | | | $ | 8,168 | | | $ | 3,375 | | | $ | 27,674 | | | $ | 25,043 | |
Total Europe | | $ | 14,748 | | | $ | 2,519 | | | $ | 8,304 | | | $ | 3,554 | | | $ | 29,125 | | | $ | 26,822 | |
As at October 31, 2015 | | $ | 14,547 | | | $ | 2,709 | | | $ | 6,669 | | | $ | 2,897 | | | $ | 26,822 | | | | | |
The Bank’s exposure to certain European countries of focus – Greece, Ireland, Italy, Portugal and Spain (GIIPS) – is not significant. As of October 31, 2016, the Bank’s current funded exposure to the GIIPS sovereign entities, as well as banks and non-bank financial institutions and corporations domiciled in these countries, totaled approximately $1.5 billion, down from $1.8 billion last year. Of the $1.5 billion, $1.1 billion was related to loans and loan equivalents.
Specific to sovereign exposures to GIIPS, the Bank’s exposure to Ireland included central bank deposits of $26 million and $1 million in trading book securities. The Bank was net long securities in sovereign exposures to Spain ($111 million) and net short to Italy (-$1 million). The Bank had no sovereign securities holdings of Greece and Portugal.
The Bank had exposures to Italian banks of $181 million, as at October 31, 2016 (October 31, 2015 – $187 million), primarily related to short-term precious metals trading. Greek exposure of $311 million (October 31, 2015 – $339 million) related primarily to secured loans to shipping companies.
Securities exposures to European sovereigns and banks (excluding GIIPS) were $6.0 billion as at October 31, 2016 (October 31, 2015 – $5.3 billion), predominantly related to issuers in France, Germany, Luxembourg, the Netherlands and the United Kingdom. Securities are carried at fair value and substantially all holdings have strong market liquidity.
The majority of funded credit exposure is in the form of funded loans which are recorded on an accrual basis. As well, credit exposure to clients arises from client-driven derivative transactions and securities financing transactions (reverse repurchase agreements, repurchase agreements, and securities lending and borrowing). OTC derivative counterparty exposures are recorded on a fair value basis and security financing transactions are recorded on an accrual basis. As at October 31, 2016, credit exposure to banks in the form of issued letters of credit amounted to $1.4 billion (October 31, 2015 – $1.2 billion).
78 | 2 0 1 6 S C O T I A B A N K A N N U A L R E P O R T
MANAGEMENT’S DISCUSSION AND ANALYSIS | RISK MANAGEMENT
Undrawn commitments of $12.5 billion (October 31, 2015 – $12.4 billion) are comprised of unfunded loan commitments and commitments to issue letters of credit on behalf of other banks in a syndicated bank lending arrangement. Total unfunded loan commitments to corporations in Europe (excluding GIIPS) were $9.1 billion as at October 31, 2016 (October 31, 2015 – $8.6 billion). As at October 31, 2016, commitments related to letters of credit with banks amounted to $2.7 billion (October 31, 2015 – $3.3 billion). Unfunded commitments are detailed further by country in T47.
The Bank’s indirect exposure is also detailed in the table below and is defined as:
| • | | Securities where the exposures are to non-European entities whose parent company is domiciled in Europe, and; |
| • | | Letters of credit or guarantees (included as loan equivalents in the above table). |
Included in the indirect exposure was securities exposure of $485 million related to GIIPS, $75 million to Germany and $25 million to the United Kingdom. Indirect exposure by way of letters of credit totaled $2,890 million at October 31, 2016 (October 31, 2015 – $2,593 million), of which $184 million (October 31, 2015 – $62 million) was indirect exposure to GIIPS. Indirect exposure is managed through the Bank’s credit risk management framework, with a robust assessment of the counterparty.
In addition to the total indirect exposures detailed further below, the Bank had Euro-denominated collateral held for non-European counterparties of $295 million (October 31, 2015 – $555 million).
The Bank may on occasion use credit default swaps (CDS) to partially offset its banking book exposure. As part of the trading portfolio, the Bank may purchase or sell CDS. Specific to GIIPS as at October 31, 2016, the Bank had no CDS protection on funded loan exposures. All exposures, including CDS, are subject to risk limits and ongoing monitoring by the Bank’s independent risk management department.
Like other banks, the Bank also provides settlement and clearing facilities for a variety of clients in these countries and actively monitors and manages these intra-day exposures. However, the Bank has no funded exposure in these countries to retail customers or small businesses.
T47 Undrawn commitments and indirect exposure
| | | | | | | | | | | | | | | | |
| As at October 31 | | Undrawn Commitments | | | Indirect Exposure(1) | |
| ($ millions) | | 2016 | | | 2015 | | | 2016 | | | 2015 | |
Greece | | $ | – | | | $ | – | | | $ | – | | | $ | – | |
Ireland | | | 421 | | | | 256 | | | | 35 | | | | (1 | ) |
Italy | | | 49 | | | | 53 | | | | 73 | | | | 6 | |
Portugal | | | – | | | | – | | | | – | | | | – | |
Spain | | | 172 | | | | 180 | | | | 561 | | | | 420 | |
Total GIIPS | | $ | 642 | | | $ | 489 | | | $ | 669 | | | $ | 425 | |
| | | | |
U.K. | | $ | 4,958 | | | $ | 5,526 | | | $ | 1,270 | | | $ | 1,365 | |
Germany | | | 798 | | | | 607 | | | | 154 | | | | 161 | |
France | | | 1,583 | | | | 1,599 | | | | 459 | | | | 338 | |
Netherlands | | | 1,364 | | | | 1,188 | | | | 291 | | | | 210 | |
Switzerland | | | 701 | | | | 740 | | | | 146 | | | | 144 | |
Other | | | 2,426 | | | | 2,260 | | | | 463 | | | | 554 | |
Total Non-GIIPS | | $ | 11,830 | | | $ | 11,920 | | | $ | 2,783 | | | $ | 2,772 | |
Total Europe | | $ | 12,472 | | | $ | 12,409 | | | $ | 3,452 | | | $ | 3,197 | |
| (1) | Amounts in brackets represent net short positions arising from trading transactions. |
2 0 1 6 S C O T I A B A N K A N N U A L R E P O R T | 79
MANAGEMENT’S DISCUSSION AND ANALYSIS
80 | 2 0 1 6 S C O T I A B A N K A N N U A L R E P O R T
Market Risk
Market risk is the risk of loss from changes in market prices and rates (including interest rates, credit spreads, equity prices, foreign exchange rates and commodity prices), the correlations between them, and their levels of volatility. Below is an index of market risk disclosures:
| | |
| | Index of all market risk disclosures |
| | | | | | | | | | |
| | | |
| Index | | Page | | | Tables and charts | | Page | |
| Market risk factors | | | 81 | | | | | | | |
Interest rate risk | | | 81 | | | | | | | |
Credit spread risk | | | 81 | | | | | | | |
Foreign currency risk | | | 81 | | | | | | | |
Equity risk | | | 81 | | | | | | | |
Commodity risk | | | 81 | | | | | | | |
| Market risk governance | | | 81 | | | | | | | |
| Risk measurement summary | | | 81-82 | | | | | | | |
Value at risk | | | 81 | | | | | | | |
Incremental risk charge and comprehensive risk measure | | | 82 | | | | | | | |
Stress testing | | | 82 | | | | | | | |
Sensitivity analysis | | | 82 | | | | | | | |
Gap analysis | | | 82 | | | | | | | |
| Validation of market risk models | | | 82 | | | | | | | |
| Non-trading market risk | | | | | | | | | | |
Interest rate risk | | | 82-84 | | | C26 Interest rate gap | | | 83 | |
| | | | | | T48 Interest rate gap | | | 83 | |
| | | | | | T49 Structural interest rate sensitivity | | | 83 | |
Foreign currency risk | | | 84 | | | | | | | |
Investment portfolio risks | | | 84 | | | | | | | |
| Trading market risk | | | 84 | | | T50 Total one-day VaR by risk factor | | | 84 | |
| | | | | | C27 Trading revenue distribution | | | 85 | |
| | | | | | | C28 Daily trading revenue vs. VaR | | | 85 | |
| Market risk linkage to balance sheet | | | 86 | | | T51 Market risk linkage to balance sheet of the Bank | | | 86 | |
| Derivative instruments and structured transactions | | | 86 | | | | | | | |
Derivatives | | | 86 | | | | | | | |
Structured transactions | | | 86-87 | | | | | | | |
European exposures | | | 77-79 | | | T44 European exposure | | | 77 | |
| | | | | | T45 Funded exposures | | | 78 | |
| | | | | | | T46 Bank’s exposure distribution by country | | | 78 | |
| Market risk | | | 41-42 | | | T29 Total market risk capital | | | 42 | |
Financial instruments | | | 45-46 | | | T32 Mortgage-backed securities | | | 46 | |
| | | | | | | T33 Collateralized debt obligations (CDOs) | | | 46 | |
MANAGEMENT’S DISCUSSION AND ANALYSIS | RISK MANAGEMENT
Market risk factors
Interest rate risk
The risk of loss due to changes in the level and/or the volatility of interest rates. This risk affects instruments such as, but not limited to, debt securities, loans, mortgages, deposits and derivatives.
Interest rate risks are managed through sensitivity, gap, stress testing, annual income and VaR limits and mitigated through portfolio diversification and hedges using interest rate derivatives and debt securities.
Credit spread risk
The risk of loss due to changes in the market price and volatility of credit, or the creditworthiness of issuers. This risk is mainly concentrated in loan and debt securities portfolios. Risk is managed through sensitivity, jump-to-default, stress testing and VaR limits and mitigated through hedges using credit derivatives.
Foreign currency risk
The risk of loss resulting from changes in currency exchange rates and exchange rate volatility. Foreign currency denominated debt and other securities as well as future cash flows in foreign currencies are exposed to this type of risk. Risk is managed through maximum net trading position, sensitivity, stress testing and VaR limits and mitigated through hedges using foreign exchange positions or derivatives.
Equity risk
The risk of loss due to changes in prices, volatility or any other equity related risk factor of individual equity or equity linked securities. This risk affects instruments such as, but not limited to, equities, exchange traded funds, mutual funds, derivatives and other equity linked products. Risk is managed through sensitivity, stress testing and VaR limits and mitigated through hedges using physical equity and derivative instruments.
Commodity risk
The risk of loss due to changes in prices or volatility of precious metal, base metal, energy and agriculture products. Both physical commodity and derivative positions are exposed to this risk. Risk is managed through aggregate and net trading position, sensitivity, stress testing and VaR limits and mitigated through hedges using physical commodity and derivative positions.
The following maps risk factors to trading and non-trading activities:
| | | | |
| Non-trading Funding | | Investments | | Trading |
Interest rate risk Foreign currency risk | | Interest rate risk Credit spread risk Foreign currency risk Equity risk | | Interest rate risk
Credit spread risk Foreign currency risk Equity risk Commodity risk |
Market risk governance
Overview
The Board of Directors reviews and approves market risk policies and limits annually. The Bank’s Asset-Liability Committee (ALCO) and Market Risk Management and Policy Committee (MRMPC) oversee the application of the framework set by the Board, and monitor the Bank’s market risk exposures and the activities that give rise to these exposures. The MRMPC establishes specific operating policies and sets limits at the product, portfolio, business unit and business line levels, and for the Bank in total. Limits are reviewed at least annually.
Global Risk Management provides independent oversight of all significant market risks, supporting the MRMPC and ALCO with analysis, risk measurement, monitoring, reporting, proposals for standards and support for new product development. To ensure compliance with policies and limits, market risk exposures are independently monitored on a continuing basis, either by Global Risk Management, the back offices, or Finance. They provide senior management, business units, the ALCO, and the MRMPC with a series of daily, weekly and monthly reports of market risk exposures by business line and risk type.
The Bank uses a variety of metrics and models to measure and control market risk exposures. These measurements are selected based on an assessment of the nature of risks in a particular activity. The principal measurement techniques are Value at Risk (VaR), Incremental Risk Charge, Comprehensive Risk Measure, stress testing, sensitivity analysis and gap analysis. The use and attributes of each of these techniques are noted in the Risk Measurement Summary.
Risk measurement summary
Value at risk (VaR)
VaR is a statistical method of measuring potential loss due to market risk based upon a common confidence interval and time horizon. The Bank calculates VaR daily using a 99% confidence level, and a one-day holding period for its trading portfolios. This means that once in every 100 days, the trading positions are expected to lose more than the VaR estimate. VaR has two components: general market risk and debt specific risk. The Bank calculates general market risk VaR using historical simulation based on 300 days of market data. Obligor specific risk on debt instruments and credit derivatives not captured in general market risk VaR is calculated through the debt specific risk VaR, which uses historical resampling. In addition, the Bank calculates a Stressed VaR measure which follows the same basic methodology as VaR but is calibrated to a one year stressed period. The stressed period is determined based on analysis of the trading book’s risk profile against historical market data. Stressed VaR complements VaR in that it evaluates the impact of market volatility that is outside the VaR’s historical set.
All material risk factors are captured in VaR. Where historical data is not available, proxies are used to establish the relevant volatility for VaR and Stressed VaR until sufficient data is available. Changes in VaR between reporting periods are generally due to changes in positions, volatilities and/or correlations between asset classes. VaR is also used to evaluate risks arising in certain funding and investment portfolios. Backtesting is also an important and necessary part of the VaR process. The Bank backtests the actual trading profit or loss against the VaR result to validate the quality and accuracy of the Bank’s VaR model. The Board reviews VaR and backtesting results quarterly.
2 0 1 6 S C O T I A B A N K A N N U A L R E P O R T | 81
MANAGEMENT’S DISCUSSION AND ANALYSIS
Incremental Risk Charge (IRC) and Comprehensive Risk Measure (CRM)
Basel market risk capital requirements include IRC and CRM which capture the following:
Default risk: This is the potential for direct losses due to an obligor’s (equity/bond issuer or counterparty) default.
Credit migration risk: This is the potential for direct losses due to a credit rating downgrade or upgrade.
A Monte Carlo model is used to perform default and migration simulations for the obligors underlying credit derivative and bond portfolios. In addition, for CRM in correlation trading there is a market simulation model to capture historical price movements. Both IRC and CRM are calculated at the 99.9th percentile with a one year liquidity horizon. The Board reviews IRC and CRM results quarterly.
Stress testing
A limitation of VaR and Stressed VaR is that they only reflect the recent history of market volatility and a specific one year stressed period, respectively. To complement these measures, stress testing examines the impact that abnormally large changes in market factors and periods of prolonged inactivity might have on trading portfolios. Stress testing scenarios are designed to include large shifts in risk factors as well as historical and theoretical multi risk market events. Historical scenarios capture severe movements over periods that are significantly longer than the one-day holding period captured in VaR, such as the 2008 Credit Crisis or the 1998 Russian Financial Crisis. Similar to Stressed VaR, stress testing provides management with information on potential losses due to tail events. In addition, the results from the stress testing program are used to verify that the Bank’s market risk capital is sufficient to absorb these potential losses.
The Bank subjects its trading portfolios to a series of daily, weekly and monthly stress tests. The Bank also evaluates risk in its investment portfolios monthly, using stress tests based on risk factor sensitivities and specific market events. The stress testing program is an essential component of the Bank’s comprehensive risk management framework which complements the VaR methodology and other risk measures and controls employed by the Bank. The Board reviews stress testing results quarterly.
Sensitivity analysis
In trading portfolios, sensitivity analysis is used to measure the effect of changes in risk factors, including prices and volatility, on financial products and portfolios. These measures apply across product types and geographies and are used for limit monitoring and management reporting.
In non-trading portfolios, sensitivity analysis assesses the effect of changes in interest rates on current earnings and on the economic value of shareholders’ equity. It is applied globally to each of the major currencies within the Bank’s operations. The Bank’s sensitivity analysis for limit and disclosure purposes is measured through positive and negative parallel shifts in the underlying interest rate curves. The Bank also performs sensitivity analysis using various non-parallel interest rate curve shifts, for example: curve steepeners, curve flatteners and curve twists. The Board reviews sensitivity results quarterly.
Gap analysis
Gap analysis is used to assess the interest rate sensitivity of re-pricing mismatches in the Bank’s non-trading operations. Under gap analysis, interest rate sensitive assets, liabilities and off-balance sheet instruments are assigned to defined time periods based on expected re-pricing dates. Products with a contractual maturity are assigned an interest rate gap term based on the shorter of the contractual maturity date and the next re-pricing date. Products with no contractual maturity are assigned an interest rate gap based on observed historical consumer behaviour.
Validation of market risk models
Prior to the implementation of new market risk models, rigorous validation and testing is conducted. Validation is conducted when the model is initially developed and when any significant changes are made to the model. The models are also subject to ongoing validation, the frequency of which is determined by model risk ratings. Models may also be triggered for earlier revalidation when there have been significant structural changes in the market or changes to the composition of the portfolio. Model validation includes backtesting, and additional analysis such as:
| • | | Theoretical review or tests to demonstrate whether assumptions made within the internal model are appropriate; |
| • | | Impact tests including stress testing that would occur under historical and hypothetical market conditions; |
| • | | The use of hypothetical portfolios to ensure that the model is able to capture concentration risk that may arise in an undiversified portfolio. |
The validation process is governed by the Bank’s Model Risk Management Policy.
Non-trading market risk
Funding and investment activities
Market risk arising from the Bank’s funding and investment activities is identified, managed and controlled through the Bank’s asset-liability management processes. The Asset-Liability Committee meets biweekly to review risks and opportunities, and evaluate performance including the effectiveness of hedging strategies.
Interest rate risk
Interest rate risks in the non-trading portfolios are predominately driven by the interest rate mismatch (i.e. repricing frequency) in the asset and liability exposures. The largest exposures in the non-trading book arise from retail banking operations in Canada. The largest component of this risk is from positions related to the retail mortgage book. T48 shows a summary of the interest rate gaps for the Bank’s non-trading positions.
Interest rate risk arising from the Bank’s lending, funding and investment activities is managed in accordance with Board-approved policies and global limits, which are designed to control the risk to net interest income and economic value of shareholders’ equity. The annual income limit measures the effect of a specified change in interest rates on the Bank’s annual net interest income over the next twelve months, while the economic value limit measures the impact of a specified change in interest rates on the present value of the Bank’s net assets. These limits are set according to the documented risk appetite of the Bank. Board-level limit utilization is reported to both the Asset-Liability Committee and the Board on a regular basis. Any limit exceptions are reported according to the Limit Monitoring and Compliance Policy of the Bank.
82 | 2 0 1 6 S C O T I A B A N K A N N U A L R E P O R T
MANAGEMENT’S DISCUSSION AND ANALYSIS | RISK MANAGEMENT
Net interest income and the economic value of equity result from the differences between yields earned on the Bank’s non-trading assets and interest rate paid on its liabilities. The difference in yields partly reflects mismatch between the maturity and re-pricing characteristics of the assets and liabilities. This mismatch is inherent in the non-trading operations of the Bank and exposes it to adverse changes in the level of interest rates. The Asset-Liability Committee provides strategic direction for the management of structural interest rate risk within the risk appetite framework authorized by the Board of Directors. The asset/liability management strategy is executed by Group Treasury with the objective of enhancing net interest income within established risk tolerances.
Gap analysis, simulation modeling, sensitivity analysis and VaR are used to assess exposures and for limit monitoring and planning purposes. The Bank’s interest rate risk exposure calculations are generally based on the earlier of contractual re-pricing or maturity of on-balance sheet and off-balance sheet assets and liabilities, although certain assets and liabilities such as credit cards and deposits without a fixed maturity are assigned a maturity profile based on the longevity of the exposure. Expected prepayments from loans and cashable investment products are also incorporated into the exposure calculations.
T49 shows the after-tax impact of an immediate and sustained 100 basis point shock over a one year period on annual income and economic value of shareholders’ equity. The interest rate sensitivities tabulated are based on a static balance sheet. There are no assumptions made for management actions that may mitigate risk. Based on the Bank’s interest rate positions at year-end 2016, an immediate and sustained 100 basis point rise in interest rates across all currencies and maturities would decrease after-tax net income by approximately $32 million over the next 12 months. The Bank is relatively balanced from an earnings perspective, with positive near-term earnings sensitivity to rising rates in the US and most other Foreign currencies, and positive medium-term earnings sensitivity to rising rates in Canada. During fiscal 2016, this measure ranged between $(55) million and $160 million.
This same increase in interest rates would result in an after-tax decrease in the present value of the Bank’s net assets of approximately $785 million. During fiscal 2016, this measure ranged between $(263) million and $(805) million. The directional sensitivity of these two key metrics is largely determined by the difference in time horizons (annual income captures the impact over the next twelve months only, whereas economic value considers the potential impact of interest rate changes on the present value of all future cash flows). The annual income and economic value results are compared to the authorized Board limits. There were no limit breaches in the reporting period.
$ billions, one-year interest rate gap
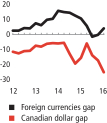
T48 Interest rate gap
| | | | | | | | | | | | | | | | | | | | |
Interest rate sensitivity position(1) As at October 31, 2016 ($ billions) | | Within
3 months | | | 3 to 12
months | | | Over
1 year | | | Non-interest
rate
sensitive | | | Total | |
Canadian dollars | | | | | | | | | | | | | | | | | | | | |
Assets | | $ | 208.7 | | | $ | 46.8 | | | $ | 146.0 | | | $ | 6.8 | | | $ | 408.3 | |
Liabilities | | $ | 231.5 | | | $ | 49.0 | | | $ | 113.0 | | | $ | 14.8 | | | $ | 408.3 | |
Gap | | $ | (22.8 | ) | | $ | (2.2 | ) | | $ | 33.0 | | | $ | (8.0 | ) | | $ | – | |
| | | | | |
Foreign currencies | | | | | | | | | | | | | | | | | | | | |
Assets | | $ | 311.7 | | | $ | 28.0 | | | $ | 68.4 | | | $ | 79.9 | | | $ | 488.0 | |
Liabilities | | $ | 296.8 | | | $ | 38.8 | | | $ | 43.3 | | | $ | 109.1 | | | $ | 488.0 | |
Gap | | $ | 14.9 | | | $ | (10.8 | ) | | $ | 25.1 | | | $ | (29.2 | ) | | $ | – | |
| | | | | |
Total | | | | | | | | | | | | | | | | | | | | |
Gap | | $ | (7.9 | ) | | $ | (13.0 | ) | | $ | 58.1 | | | $ | (37.2 | ) | | $ | – | |
As at October 31, 2015 | | | | | | | | | | | | | | | | | | | | |
Gap | | $ | 24.4 | | | $ | (29.1 | ) | | $ | 37.7 | | | $ | (33.0 | ) | | $ | – | |
| (1) | The above figures reflect the inclusion of off-balance sheet instruments, as well as an estimate of prepayments on consumer and mortgage loans and cashable GICs. The off-balance sheet gap is included in liabilities. |
T49 Structural interest sensitivity
| | | | | | | | | | | | | | | | |
| | | 2016 | | | 2015 | |
| | | | |
| As at October 31 ($ millions) | | Economic
Value of
Shareholders’
Equity | | | Annual
Income | | | Economic
Value of
Shareholders’
Equity | | | Annual
Income | |
After-Tax Impact of | | | | | | | | | | | | | | | | |
100bp increase in rates | | | | | | | | | | | | | | | | |
Non-trading risk | | $ | (785 | ) | | $ | (32 | ) | | $ | (488 | ) | | $ | 242 | |
100bp decrease in rates(1) | | | | | | | | | | | | | | | | |
Non-trading risk | | $ | 650 | | | $ | 32 | | | $ | 418 | | | $ | (240 | ) |
| (1) | The annual income sensitivity for CAD, USD, EUR, and GBP exposures is now measured using a 100 basis point decline. Prior period items have been restated to reflect this change. |
2 0 1 6 S C O T I A B A N K A N N U A L R E P O R T | 83
MANAGEMENT’S DISCUSSION AND ANALYSIS
Foreign currency risk
Foreign currency risk in the Bank’s unhedged funding and investment activities arises primarily from the Bank’s net investments in foreign operations as well as foreign currency earnings in its domestic and remitting foreign branch operations.
The Bank’s foreign currency exposure to its net investments in foreign operations is controlled by a Board-approved limit. This limit considers factors such as potential volatility to shareholders’ equity as well as the potential impact on capital ratios from foreign exchange fluctuations. On a quarterly basis, the Asset-Liability Committee reviews the Bank’s foreign currency net investment exposures and determines the appropriate hedging strategies. These may include funding the investments in the same currency or using other financial instruments, including derivatives.
Foreign currency translation gains and losses from net investments in foreign operations, net of related hedging activities and tax effects, are recorded in accumulated other comprehensive income within shareholders’ equity. However, the Bank’s regulatory capital ratios are not materially affected by these foreign exchange fluctuations because the risk-weighted assets of the foreign operations tend to move in a similar direction.
The Bank is also subject to foreign currency translation risk on the earnings of its domestic and remitting foreign branch operations. The Bank forecasts foreign currency revenues and expenses, which are primarily denominated in U.S. dollars, over a number of future fiscal quarters. The Asset-Liability Committee also assesses economic data trends and forecasts to determine if some or all of the estimated future foreign currency revenues and expenses should be hedged. Hedging instruments normally include foreign currency spot and forward contracts, as well as foreign currency options and swaps. Certain of these economic hedges may not qualify for hedge accounting resulting in a potential for a mismatch in the timing of the recognition of economic hedge gains/losses and the underlying foreign earnings translation gains/losses. In accordance with IFRS, foreign currency translation gains and losses relating to monetary and non-monetary items are recorded directly in earnings.
As at October 31, 2016, a one per cent increase (decrease) in the Canadian dollar against all currencies in which the Bank operates decreases (increases) the Bank’s before-tax annual earnings by approximately $60 million (October 31, 2015 – $60 million) in the absence of hedging activity, primarily from the exposure to U.S. dollars.
Investment portfolio risks
The Bank holds investment portfolios to meet liquidity and statutory reserve requirements and for investment purposes. These portfolios expose the Bank to interest rate, foreign currency, credit spread and equity risks. Debt investments primarily consist of government, agency, and corporate bonds. Equity investments include common and preferred shares, as well as a diversified portfolio of third-party managed funds. The majority of these securities are valued using prices obtained from external sources. These portfolios are controlled by a Board-approved policy and limits.
Trading market risk
The Bank’s policies, processes and controls for trading activities are designed to achieve a balance between pursuing profitable trading opportunities and managing earnings volatility within a framework of sound and prudent practices. Trading activities are primarily customer focused.
Market risk arising from the Bank’s trading activities is managed in accordance with Board-approved policies, and aggregate VaR and stress testing limits. The quality of the Bank’s VaR is validated by regular backtesting analysis, in which the VaR is compared to both theoretical profit or loss results based on fixed end of day positions and actual reported profit or loss. A VaR at the 99% confidence interval is an indication of a 1% probability that losses will exceed the VaR if positions remain unchanged during the next business day. Trading positions are however managed dynamically and, as a result, actual profit/loss backtesting exceptions are uncommon.
In fiscal 2016, the total one-day VaR for trading activities averaged $12.6 million, compared to $11.3 million in 2015.
T50Total one-day VaR by risk factor
| | | | | | | | | | | | | | | | | | | | | | | | | | | | | | | | | | | | |
| | | |
| | | 2016 | | | | | | 2015 | |
| | | | | | | | | |
| ($ millions) | | Year end | | | Avg | | | High | | | Low | | | | | | Year end | | | Avg | | | High | | | Low | |
Credit Spread plus Interest Rate | | $ | 10.6 | | | $ | 10.6 | | | $ | 16.4 | | | $ | 7.5 | | | | | | | $ | 10.6 | | | $ | 9.0 | | | $ | 15.2 | | | $ | 6.3 | |
Credit Spread | | | 8.0 | | | | 8.3 | | | | 13.6 | | | | 4.5 | | | | | | | | 8.1 | | | | 7.8 | | | | 10.1 | | | | 5.8 | |
Interest Rate | | | 8.5 | | | | 6.4 | | | | 10.0 | | | | 3.0 | | | | | | | | 4.3 | | | | 4.4 | | | | 7.9 | | | | 2.7 | |
Equities | | | 2.0 | | | | 2.7 | | | | 6.4 | | | | 0.8 | | | | | | | | 4.1 | | | | 2.5 | | | | 10.7 | | | | 1.1 | |
Foreign Exchange | | | 2.1 | | | | 1.3 | | | | 2.9 | | | | 0.6 | | | | | | | | 0.8 | | | | 1.1 | | | | 3.2 | | | | 0.4 | |
Commodities | | | 2.0 | | | | 2.4 | | | | 3.9 | | | | 1.3 | | | | | | | | 2.0 | | | | 4.0 | | | | 5.6 | | | | 1.9 | |
Debt Specific | | | 4.2 | | | | 6.3 | | | | 12.6 | | | | 3.7 | | | | | | | | 7.4 | | | | 5.5 | | | | 20.7 | | | | 3.9 | |
Diversification Effect | | | (7.6 | ) | | | (10.7 | ) | | | N/A | | | | N/A | | | | | | | | (12.9) | | | | (10.8) | | | | N/A | | | | N/A | |
All-Bank VaR | | $ | 13.2 | | | $ | 12.6 | | | $ | 20.3 | | | $ | 8.7 | | | | | | | $ | 11.9 | | | $ | 11.3 | | | $ | 23.0 | | | $ | 8.2 | |
All-Bank Stressed VaR | | $ | 21.2 | | | $ | 27.6 | | | $ | 37.4 | | | $ | 18.0 | | | | | | | $ | 22.3 | | | $ | 24.4 | | | $ | 36.9 | | | $ | 17.4 | |
The Bank also calculates a Stressed VaR which uses the same basic methodology as the VaR. However, Stressed VaR is calculated using market volatility from a one-year time period identified as stressful, given the risk profile of the trading portfolio. The current period is the 2008/2009 credit crisis surrounding the collapse of Lehman Brothers. In fiscal 2016, the total one-day Stressed VaR for trading activities averaged $27.6 million compared to $24.4 million in 2015.
Basel market risk capital requirements include IRC and CRM which capture obligor default and migration risk. On October 31, 2016 the market risk capital requirements for IRC and CRM were $407 million and $77 million, respectively.
84 | 2 0 1 6 S C O T I A B A N K A N N U A L R E P O R T
MANAGEMENT’S DISCUSSION AND ANALYSIS | RISK MANAGEMENT
Description of trading revenue components and graphical comparison of VaR to daily P&L
Chart C27 shows the distribution of daily trading revenue for fiscal 2016 and Chart C28 compares that distribution to daily VaR results. Trading revenue includes changes in portfolio value as well as the impact of new trades, commissions, fees and reserves. Some components of revenue which are calculated less frequently are pro-rated. Trading revenue averaged $6.5 million per day, compared to $6.1 million for 2015. Revenue was positive on 98% of trading days during the year, an increase from 95% in 2015. During the year, the largest single day trading loss was $8.0 million which occurred on May 2, 2016, and was smaller than the total VaR of $9.7 million on the same day.
| C27 | Trading revenue distribution |
Year ended October 31, 2016
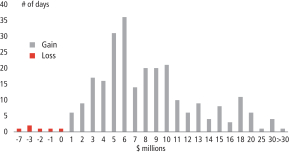
| C28 | Daily trading revenue vs. VaR |
$ millions, November 1, 2015 to October 31, 2016
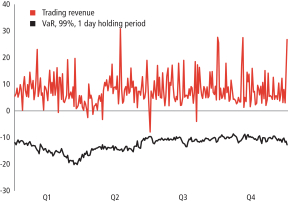
2 0 1 6 S C O T I A B A N K A N N U A L R E P O R T | 85
MANAGEMENT’S DISCUSSION AND ANALYSIS
Market risk linkage to Consolidated Statement of Financial Position
Trading assets and liabilities are marked to market daily and included in trading risk measures such as VaR. Derivatives risk related to Global Banking and Markets’ activities is captured under trading risk measures while derivatives used in asset/liability management are in the non-trading risk category. A comparison of Consolidated Statement of Financial Position items which are covered under the trading and non-trading risk measures is provided in the table below.
T51 Market risk linkage to Consolidated Statement of Financial Position of the Bank
| | | | | | | | | | | | | | | | | | | | |
| | | Market Risk Measure | |
| | | | | |
As at October 31, 2016 ($ millions) | | Consolidated Statement of Financial Position | | | Trading Risk | | | Non-trading
risk | | | Not subject to market risk | | | Primary risk sensitivity of non-trading risk | |
Precious metals | | | $ 8,442 | | | $ | 8,442 | | | $ | – | | | $ | – | | | | n/a | |
Trading assets | | | 108,561 | | | | 108,561 | | | | – | | | | – | | | | n/a | |
Financial instruments designated at fair value through profit or loss | | | 221 | | | | – | | | | 221 | | | | – | | | | Interest rate | |
Derivative financial instruments | | | 41,657 | | | | 36,401 | | | | 5,256 | | | | – | | | | Interest rate, FX, equity | |
Investment securities | | | 72,919 | | | | – | | | | 72,919 | | | | – | | | | Interest rate, equity | |
Loans | | | 480,164 | | | | – | | | | 480,164 | | | | – | | | | Interest rate, FX | |
Assets not subject to market risk (1) | | | 184,302 | | | | – | | | | – | | | | 184,302 | | | | n/a | |
Total assets | | | $ 896,266 | | | $ | 153,404 | | | $ | 558,560 | | | $ | 184,302 | | | | | |
| | | | | | | | | | | | | | | | | | | | |
Deposits | | | $ 611,877 | | | $ | – | | | $ | 580,814 | | | $ | 31,063 | | | | Interest rate, FX, equity | |
Financial instruments designated at fair value through profit or loss | | | 1,459 | | | | – | | | | 1,459 | | | | – | | | | Interest rate, equity | |
Obligations related to securities sold short | | | 23,312 | | | | 23,312 | | | | – | | | | – | | | | n/a | |
Derivative financial instruments | | | 42,387 | | | | 38,213 | | | | 4,174 | | | | – | | | | Interest rate, FX, equity | |
Trading liabilities(2) | | | 8,430 | | | | 8,430 | | | | – | | | | – | | | | n/a | |
Retirement and other benefit liabilities | | | 3,011 | | | | – | | | | 3,011 | | | | – | | | | Interest rate, credit spread | |
Liabilities not subject to market risk (3) | | | 147,969 | | | | – | | | | – | | | | 147,969 | | | | n/a | |
Total liabilities | | | $ 838,445 | | | $ | 69,955 | | | $ | 589,458 | | | $ | 179,032 | | | | | |
| (1) | Includes goodwill, intangibles, other assets and securities purchased under resale agreements and securities borrowed. |
| (2) | Gold and silver certificates and bullion included in other liabilities. |
| (3) | Includes obligations related to securities sold under repurchase agreements and securities lent and other liabilities. |
| | | | | | | | | | | | | | | | | | | | |
| | | Market Risk Measure | |
| | | | | |
As at October 31, 2015 ($ millions) | | Consolidated
Statement of
Financial
Position | | | Trading Risk | | | Non-trading
risk | | | Not subject to market risk | | | Primary risk sensitivity of non-trading risk | |
Precious metals | | $ | 10,550 | | | $ | 10,550 | | | $ | – | | | $ | – | | | | n/a | |
Trading assets | | | 99,140 | | | | 99,140 | | | | – | | | | – | | | | n/a | |
Financial instruments designated at fair value through profit or loss | | | 320 | | | | – | | | | 320 | | | | – | | | | Interest rate | |
Derivative financial instruments | | | 41,003 | | | | 36,131 | | | | 4,872 | | | | – | | | | Interest rate, FX, equity | |
Investment securities | | | 43,216 | | | | – | | | | 43,216 | | | | – | | | | Interest rate, equity | |
Loans | | | 458,628 | | | | – | | | | 458,628 | | | | – | | | | Interest rate, FX | |
Assets not subject to market risk (1) | | | 203,640 | | | | – | | | | – | | | | 203,640 | | | | n/a | |
Total assets | | $ | 856,497 | | | $ | 145,821 | | | $ | 507,036 | | | $ | 203,640 | | | | | |
| | | | | | | | | | | | | | | | | | | | |
Deposits | | $ | 600,919 | | | $ | – | | | $ | 572,766 | | | $ | 28,153 | | | | Interest rate, FX, equity | |
Financial instruments designated at fair value through profit or loss | | | 1,486 | | | | – | | | | 1,486 | | | | – | | | | Interest rate, equity | |
Obligations related to securities sold short | | | 20,212 | | | | 20,212 | | | | – | | | | – | | | | n/a | |
Derivative financial instruments | | | 45,270 | | | | 41,988 | | | | 3,282 | | | | – | | | | Interest rate, FX, equity | |
Trading liabilities(2) | | | 7,812 | | | | 7,812 | | | | – | | | | – | | | | n/a | |
Retirement and other benefit liabilities | | | 2,054 | | | | – | | | | 2,054 | | | | – | | | | Interest rate, credit spread | |
Liabilities not subject to market risk (3) | | | 125,265 | | | | – | | | | – | | | | 125,265 | | | | n/a | |
Total liabilities | | $ | 803,018 | | | $ | 70,012 | | | $ | 579,588 | | | $ | 153,418 | | | | | |
| (1) | Includes goodwill, intangibles, other assets and securities purchased under resale agreements and securities borrowed. |
| (2) | Gold and silver certificates and bullion included in other liabilities. |
| (3) | Includes obligations related to securities sold under repurchase agreements and securities lent and other liabilities. |
Derivative instruments and structured transactions
Derivatives
The Bank uses derivatives to meet customer needs, generate revenues from trading activities, manage market and credit risks arising from its lending, funding and investment activities, and to lower its cost of capital. The Bank uses several types of derivative products, including interest rate swaps, futures and options, to hedge interest rate risk exposure. Forward contracts, swaps and options are used to manage foreign currency risk exposures. Credit exposures in its lending and investment books are managed using credit default swaps. As a dealer, the Bank markets a range of derivatives to its customers, including interest rate, foreign exchange, equity, commodity and credit derivatives.
Market risk arising from derivatives transactions is subject to the control, reporting and analytical techniques noted above. Additional controls and analytical techniques are applied to address certain market-related risks that are unique to derivative products.
Structured transactions
Structured transactions are specialized transactions that may involve combinations of cash, other financial assets and derivatives designed to meet the specific risk management or financial requirements of customers. These transactions are carefully evaluated by the Bank to identify and address the
86 | 2 0 1 6 S C O T I A B A N K A N N U A L R E P O R T
MANAGEMENT’S DISCUSSION AND ANALYSIS | RISK MANAGEMENT
credit, market, legal, tax, reputational and other risks, and are subject to a cross-functional review and sign-off by Trading Management, Global Risk Management, Taxation, Finance and Legal departments. Large structured transactions are also subject to review by senior risk management committees and evaluated in accordance with the procedures described below in Reputational Risk.
The market risk in these transactions is usually minimal, and returns are earned by providing structuring expertise and by taking credit risk. Once executed, structured transactions are subject to the same ongoing credit reviews and market risk analysis as other types of derivatives transactions. This review and analysis includes careful monitoring of the quality of the reference assets, and ongoing valuation of the derivatives and reference assets.
Liquidity Risk
Liquidity risk is the risk that the Bank is unable to meet its financial obligations in a timely manner at reasonable prices. Financial obligations include liabilities to depositors, payments due under derivative contracts, settlement of securities borrowing and repurchase transactions, and lending and investment commitments.
Effective liquidity risk management is essential to maintain the confidence of depositors and counterparties, manage the Bank’s cost of funds and to support core business activities, even under adverse circumstances.
Liquidity risk is managed within the framework of policies and limits that are approved by the Board of Directors. The Board receives reports on risk exposures and performance against approved limits. The Asset-Liability Committee (ALCO) provides senior management oversight of liquidity risk.
The key elements of the liquidity risk framework are:
| • | | Measurement and modeling – the Bank’s liquidity model measures and forecasts cash inflows and outflows, including off-balance sheet cash flows on a daily basis. Risk is managed by a set of key limits over the maximum net cash outflow by currency over specified short-term horizons (cash gaps), a minimum level of core liquidity, and liquidity stress tests. |
| • | | Reporting – Global Risk Management provides independent oversight of all significant liquidity risks, supporting the ALCO with analysis, risk measurement, stress testing, monitoring and reporting. |
| • | | Stress testing – the Bank performs liquidity stress testing on a regular basis, to evaluate the effect of both industry-wide and Bank-specific disruptions on the Bank’s liquidity position. Liquidity stress testing has many purposes including: |
| | – | | Helping the Bank to understand the potential behavior of various on-balance sheet and off-balance sheet positions in circumstances of stress; and |
| | – | | Based on this knowledge, facilitating the development of risk mitigation and contingency plans. |
The Bank’s liquidity stress tests consider the effect of changes in funding assumptions, depositor behavior and the market value of liquid assets. The Bank performs industry standard stress tests, the results of which are reviewed at senior levels of the organization and are considered in making liquidity management decisions.
| • | | Contingency planning – the Bank maintains a liquidity contingency plan that specifies an approach for analyzing and responding to actual and potential liquidity events. The plan outlines an appropriate governance structure for the management and monitoring of liquidity events, processes for effective internal and external communication, and identifies potential counter measures to be considered at various stages of an event. A contingency plan is maintained both at the parent-level as well as for major subsidiaries. |
| • | | Funding diversification – the Bank actively manages the diversification of its deposit liabilities by source, type of depositor, instrument, term and geography. |
| • | | Core liquidity – the Bank maintains a pool of highly liquid, unencumbered assets that can be readily sold or pledged to secure borrowings under stressed market conditions or due to Bank-specific events. The Bank also maintains liquid assets to support its intra-day settlement obligations in payment, depository and clearing systems. |
Liquid assets
Liquid assets are a key component of liquidity management and the Bank holds these types of assets in sufficient quantity to meet potential needs for liquidity management.
Liquid assets can be used to generate cash either through sale, repurchase transactions or other transactions where these assets can be used as collateral to generate cash, or by allowing the asset to mature. Liquid assets include deposits at central banks, deposits with financial institutions, call and other short-term loans, marketable securities, precious metals and securities received as collateral from securities financing and derivative transactions. Liquid assets do not include borrowing capacity from central bank facilities.
Marketable securities are securities traded in active markets, which can be converted to cash within a timeframe that is in accordance with the Bank’s liquidity management framework. Assets are assessed considering a number of factors, including the expected time it would take to convert them to cash.
Marketable securities included in liquid assets are comprised of securities specifically held as a liquidity buffer or for asset liability management purposes; trading securities, which are primarily held by Global Banking and Markets; and collateral received for securities financing and derivative transactions.
The Bank maintains large holdings of unencumbered liquid assets to support its operations. These assets generally can be sold or pledged to meet the Bank’s obligations. As at October 31, 2016, unencumbered liquid assets were $183 billion (October 31, 2015 – $201 billion). Securities including NHA mortgage-backed securities, comprised 74% of liquid assets (October 31, 2015 – 62%). Other unencumbered liquid assets, comprising cash and deposits with central banks, deposits with financial institutions, precious metals and call and short loans, was 26% (October 31, 2015 – 38%). The decrease in liquid assets was mainly attributable to a decrease in cash and deposits with central banks, partly offset by an increase in unencumbered government securities.
The carrying values outlined in the liquid asset table are consistent with the carrying values in the Bank’s Statement of Financial Position as at October 31, 2016. The liquidity value of the portfolio will vary under different stress events as different assumptions are used for the stress scenarios.
2 0 1 6 S C O T I A B A N K A N N U A L R E P O R T | 87
MANAGEMENT’S DISCUSSION AND ANALYSIS
The Bank’s liquid asset pool is summarized in the following table:
T52Liquid asset pool
| | | | | | | | | | | | | | | | | | | | | | | | | | | | | | | | |
| | | | | | | | | | | | Encumbered liquid assets | | | | | | Unencumbered liquid assets | |
| | | | | | | | |
As at October 31, 2016 ($ millions) | | Bank-owned
liquid assets | | | Securities received as
collateral from securities
financing and derivative
transactions | | | Total liquid
assets | | | Pledged as
collateral | | | Other(1) | | | | | | Available as
collateral | | | Other | |
Cash and deposits with central banks | | $ | 35,396 | | | $ | – | | | $ | 35,396 | | | $ | – | | | $ | 7,917 | | | | | | | $ | 27,479 | | | $ | – | |
Deposits with financial institutions | | | 10,948 | | | | – | | | | 10,948 | | | | – | | | | 196 | | | | | | | | 10,752 | | | | – | |
Precious metals | | | 8,442 | | | | – | | | | 8,442 | | | | – | | | | 115 | | | | | | | | 8,327 | | | | – | |
Securities | | | | | | | | | | | | | | | | | | | | | | | | | | | | | | | | |
Canadian government obligations | | | 45,825 | | | | 12,482 | | | | 58,307 | | | | 27,187 | | | | – | | | | | | | | 31,120 | | | | – | |
Foreign government obligations | | | 50,761 | | | | 36,822 | | | | 87,583 | | | | 58,680 | | | | – | | | | | | | | 28,903 | | | | – | |
Other securities | | | 58,833 | | | | 60,745 | | | | 119,578 | | | | 76,394 | | | | – | | | | | | | | 43,184 | | | | – | |
Loans | | | | | | | | | | | | | | | | | | | | | | | | | | | | | | | | |
NHA mortgage-backed securities(2) | | | 33,072 | | | | – | | | | 33,072 | | | | 1,993 | | | | – | | | | | | | | 31,079 | | | | – | |
Call and short loans | | | 1,673 | | | | – | | | | 1,673 | | | | – | | | | – | | | | | | | | 1,673 | | | | – | |
Total | | $ | 244,950 | | | $ | 110,049 | | | $ | 354,999 | | | $ | 164,254 | | | $ | 8,228 | | | | | | | $ | 182,517 | | | $ | – | |
| | | | | | |
| | | | | | | | | | | | Encumbered liquid assets | | | | | | Unencumbered liquid assets | |
| | | | | | | | |
As at October 31, 2015 ($ millions) | | Bank-owned
liquid assets | | | Securities received as
collateral from securities
financing and derivative
transactions | | | Total liquid
assets | | | Pledged as
collateral | | | Other(1) | | | | | | Available as
collateral | | | Other | |
Cash and deposits with central banks | | $ | 63,228 | | | $ | – | | | $ | 63,228 | | | $ | – | | | $ | 8,700 | | | | | | | $ | 54,528 | | | $ | – | |
Deposits with financial institutions | | | 10,699 | | | | – | | | | 10,699 | | | | – | | | | 293 | | | | | | | | 10,406 | | | | – | |
Precious metals | | | 10,550 | | | | – | | | | 10,550 | | | | – | | | | 117 | | | | | | | | 10,433 | | | | – | |
Securities | | | | | | | | | | | | | | | | | | | | | | | | | | | | | | | | |
Canadian government obligations | | | 24,198 | | | | 21,206 | | | | 45,404 | | | | 22,242 | | | | – | | | | | | | | 23,162 | | | | – | |
Foreign government obligations | | | 39,525 | | | | 29,989 | | | | 69,514 | | | | 44,547 | | | | – | | | | | | | | 24,967 | | | | – | |
Other securities | | | 52,396 | | | | 55,752 | | | | 108,148 | | | | 65,405 | | | | – | | | | | | | | 42,743 | | | | – | |
Loans | | | | | | | | | | | | | | | | | | | | | | | | | | | | | | | | |
NHA mortgage-backed securities(2) | | | 36,409 | | | | – | | | | 36,409 | | | | 2,847 | | | | – | | | | | | | | 33,562 | | | | – | |
Call and short loans | | | 1,352 | | | | – | | | | 1,352 | | | | – | | | | – | | | | | | | | 1,352 | | | | – | |
Total | | $ | 238,357 | | | $ | 106,947 | | | $ | 345,304 | | | $ | 135,041 | | | $ | 9,110 | | | | | | | $ | 201,153 | | | $ | – | |
| (1) | Assets which are restricted from being used to secure funding for legal or other reasons. |
| (2) | These mortgage-backed securities, which are available for sale, are reported as residential mortgage loans on the balance sheet. |
A summary of total unencumbered liquid assets held by the parent bank and its branches, and domestic and foreign subsidiaries, is presented below:
T53Total unencumbered liquid assets held by the parent bank and its branches, and domestic and foreign subsidiaries
| | | | | | | | |
As at October 31 ($ millions) | | 2016 | | | 2015 | |
Bank of Nova Scotia (Parent) | | $ | 135,335 | | | $ | 154,830 | |
Bank domestic subsidiaries | | | 13,871 | | | | 20,374 | |
Bank foreign subsidiaries | | | 33,311 | | | | 25,949 | |
Total | | $ | 182,517 | | | $ | 201,153 | |
The Bank’s liquidity pool is held across major currencies, mostly comprised of Canadian and U.S. dollar holdings. As shown above, the vast majority (82%) of liquid assets are held by the Bank’s corporate office, branches of the Bank, and Canadian subsidiaries of the Bank. To the extent a liquidity reserve held in a foreign subsidiary of the Bank is required for regulatory purposes, it is assumed to be unavailable to the rest of the Group. Other liquid assets held by a foreign subsidiary are assumed to be available only in limited circumstances. The Bank monitors and ensures compliance in relation to minimum levels of liquidity required and assets held within each entity, and/or jurisdiction.
88 | 2 0 1 6 S C O T I A B A N K A N N U A L R E P O R T
MANAGEMENT’S DISCUSSION AND ANALYSIS | RISK MANAGEMENT
Encumbered assets
In the course of the Bank’s day-to-day activities, securities and other assets are pledged to secure an obligation, participate in clearing or settlement systems, or operate in a foreign jurisdiction. Securities may also be pledged under repurchase agreements. A summary of encumbered and unencumbered assets is presented below:
T54Asset Encumbrance
| | | | | | | | | | | | | | | | | | | | | | | | | | | | | | | | |
| | | | | | | | | | | | Encumbered assets | | | | | | Unencumbered assets | |
| | | | | | | | |
As at October 31, 2016 ($ millions) | | Bank-owned
assets | | | Securities received as collateral from securities financing and derivative
transactions | | | Total assets | | | Pledged as
collateral | | | Other(1) | | | | | | Available as
collateral(2) | | | Other(3) | |
Cash and deposits with central banks | | $ | 35,396 | | | $ | – | | | $ | 35,396 | | | $ | – | | | $ | 7,917 | | | | | | | $ | 27,479 | | | $ | – | |
Deposits with financial institutions | | | 10,948 | | | | – | | | | 10,948 | | | | – | | | | 196 | | | | | | | | 10,752 | | | | – | |
Precious metals | | | 8,442 | | | | – | | | | 8,442 | | | | – | | | | 115 | | | | | | | | 8,327 | | | | – | |
Liquid securities: | | | | | | | | | | | | | | | | | | | | | | | | | | | | | | | | |
Canadian government obligations | | | 45,825 | | | | 12,482 | | | | 58,307 | | | | 27,187 | | | | – | | | | | | | | 31,120 | | | | – | |
Foreign government obligations | | | 50,761 | | | | 36,822 | | | | 87,583 | | | | 58,680 | | | | – | | | | | | | | 28,903 | | | | – | |
Other liquid securities | | | 58,833 | | | | 60,745 | | | | 119,578 | | | | 76,394 | | | | – | | | | | | | | 43,184 | | | | – | |
Other securities | | | 5,007 | | | | 4,149 | | | | 9,156 | | | | 3,615 | | | | – | | | | | | | | – | | | | 5,541 | |
Loans classified as liquid assets: | | | | | | | | | | | | | | | | | | | | | | | | | | | | | | | | |
NHA mortgage-backed securities | | | 33,072 | | | | – | | | | 33,072 | | | | 1,993 | | | | – | | | | | | | | 31,079 | | | | – | |
Call and short loans | | | 1,673 | | | | – | | | | 1,673 | | | | – | | | | – | | | | | | | | 1,673 | | | | – | |
Other loans | | | 464,840 | | | | – | | | | 464,840 | | | | 5,934 | | | | 60,311 | | | | | | | | 11,596 | | | | 386,999 | |
Other financial assets(4) | | | 151,916 | | | | (84,399 | ) | | | 67,517 | | | | 5,316 | | | | – | | | | | | | | – | | | | 62,201 | |
Non-financial assets | | | 29,553 | | | | – | | | | 29,553 | | | | – | | | | – | | | | | | | | – | | | | 29,553 | |
Total | | $ | 896,266 | | | $ | 29,799 | | | $ | 926,065 | | | $ | 179,119 | | | $ | 68,539 | | | | | | | $ | 194,113 | | | $ | 484,294 | |
| | | | | | |
| | | | | | | | | | | | Encumbered assets | | | | | | Unencumbered assets | |
| | | | | | | | |
As at October 31, 2015 ($ millions) | | Bank-owned
assets | | | Securities received as collateral from securities financing and derivative
transactions | | | Total assets | | | Pledged as
collateral | | | Other(1) | | | | | | Available as
collateral(2) | | | Other(3) | |
Cash and deposits with central banks | | $ | 63,228 | | | $ | – | | | $ | 63,228 | | | $ | – | | | $ | 8,700 | | | | | | | $ | 54,528 | | | $ | – | |
Deposits with financial institutions | | | 10,699 | | | | – | | | | 10,699 | | | | – | | | | 293 | | | | | | | | 10,406 | | | | – | |
Precious metals | | | 10,550 | | | | – | | | | 10,550 | | | | – | | | | 117 | | | | | | | | 10,433 | | | | – | |
Liquid securities: | | | | | | | | | | | | | | | | | | | | | | | | | | | | | | | | |
Canadian government obligations | | | 24,198 | | | | 21,206 | | | | 45,404 | | | | 22,242 | | | | – | | | | | | | | 23,162 | | | | – | |
Foreign government obligations | | | 39,525 | | | | 29,989 | | | | 69,514 | | | | 44,547 | | | | – | | | | | | | | 24,967 | | | | – | |
Other liquid securities | | | 52,396 | | | | 55,752 | | | | 108,148 | | | | 65,405 | | | | – | | | | | | | | 42,743 | | | | – | |
Other securities | | | 5,797 | | | | 3,313 | | | | 9,110 | | | | 2,806 | | | | – | | | | | | | | – | | | | 6,304 | |
Loans classified as liquid assets: | | | | | | | | | | | | | | | | | | | | | | | | | | | | | | | | |
NHA mortgage-backed securities | | | 36,409 | | | | – | | | | 36,409 | | | | 2,847 | | | | – | | | | | | | | 33,562 | | | | – | |
Call and short loans | | | 1,352 | | | | – | | | | 1,352 | | | | – | | | | – | | | | | | | | 1,352 | | | | – | |
Other loans | | | 439,207 | | | | – | | | | 439,207 | | | | 2,915 | | | | 49,481 | | | | | | | | 9,134 | | | | 377,677 | |
Other financial assets(4) | | | 145,063 | | | | (80,907 | ) | | | 64,156 | | | | 5,299 | | | | – | | | | | | | | – | | | | 58,857 | |
Non-financial assets | | | 28,073 | | | | – | | | | 28,073 | | | | – | | | | – | | | | | | | | – | | | | 28,073 | |
Total | | $ | 856,497 | | | $ | 29,353 | | | $ | 885,850 | | | $ | 146,061 | | | $ | 58,591 | | | | | | | $ | 210,287 | | | $ | 470,911 | |
| (1) | Assets which are restricted from being used to secure funding for legal or other reasons. |
| (2) | Assets that are readily available in the normal course of business to secure funding or meet collateral needs including central bank borrowing immediately available. |
| (3) | Other unencumbered assets are not subject to any restrictions on their use to secure funding or as collateral but the Bank would not consider them to be readily available. These include loans, a portion of which may be used to access central bank facilities outside of the normal course or to raise secured funding through the Bank’s secured funding programs. |
| (4) | Securities received as collateral against other financial assets are included within liquid securities and other securities. |
As of October 31, 2016 total encumbered assets of the Bank were $248 billion (October 31, 2015 – $205 billion). Of the remaining $678 billion (October 31, 2015 – $681 billion) of unencumbered assets, $194 billion (October 31, 2015 – $210 billion) are considered readily available in the normal course of business to secure funding or meet collateral needs as detailed above.
In some over-the-counter derivative contracts, the Bank would be required to post additional collateral in the event its credit rating was downgraded. The Bank maintains access to sufficient collateral to meet these obligations in the event of a downgrade of its ratings by one or more of the rating agencies. In the event of a one-notch or two-notch downgrade of the Bank’s rating below its lowest current rating, the Bank has to provide an additional $98 million or $218 million of collateral, respectively, to meet contractual derivative funding or margin requirements.
Encumbered liquid assets are not considered to be available for liquidity management purposes. Liquid assets which are used to hedge derivative positions in trading books or for hedging purposes are considered to be available for liquidity management provided they meet the criteria discussed in liquid assets above.
Regulatory developments relating to liquidity
The Net Stable Funding Ratio (NSFR) is expected to become a minimum standard in OSFI’s liquidity framework by November 1, 2017, following a consultation process with banks and the public. The NSFR is aimed at reducing structural funding risk by requiring banks to fund their activities with sufficiently stable sources of funding.
2 0 1 6 S C O T I A B A N K A N N U A L R E P O R T | 89
MANAGEMENT’S DISCUSSION AND ANALYSIS
Liquidity coverage ratio
The Liquidity Coverage Ratio (LCR) measure is based on a 30 day liquidity stress scenario, with assumptions defined in the OSFI Liquidity Adequacy Requirements (LAR) Guideline. The LCR is calculated as the ratio of high quality liquid assets (HQLA) to net cash outflows. The Bank is subject to a regulatory minimum LCR of 100%.
OSFI’s LAR stipulates that banks must maintain an adequate level of unencumbered HQLA that can be converted into cash to meet liquidity needs over a 30 calendar day horizon under a pre-defined significantly severe liquidity stress scenario. The LCR-prescribed liquidity stress scenario includes assumptions for asset haircuts, deposit run-off, wholesale rollover rates, and outflow rates for commitments.
The HQLA are grouped into three categories: Level 1, Level 2A and Level 2B, based on guidelines from the LAR. Level 1 HQLA receive no haircuts, and includes cash, deposits with central banks, central bank reserves available to the Bank in times of stress, and securities with a 0% risk weight. Level 2A and 2B include HQLA of lesser quality and attracts haircuts ranging from 15%-50%.
The total weighted values for net cash outflows for the next 30 days are derived by applying the assumptions specified in the LAR Guideline to specific items, including loans, deposits, maturing debt, derivative transactions and commitments to extend credit.
The following table presents the Bank’s average LCR for the quarter ended October 31, 2016, based on month-end LCR calculations for August, September and October.
T55Bank’s average LCR
| | | | | | | | |
| For the quarter ended October 31, 2016 ($ millions) | | Total unweighted value (Average)(1) | | | Total weighted value (Average)(2) | |
High-quality liquid assets | | | | | | | | |
Total high-quality liquid assets (HQLA) | | | * | | | $ | 136,401 | |
Cash outflows | | | | | | | | |
Retail deposits and deposits from small business customers, of which: | | | 160,438 | | | | 11,070 | |
Stable deposits | | | 73,193 | | | | 2,346 | |
Less stable deposits | | | 87,245 | | | | 8,724 | |
Unsecured wholesale funding, of which: | | | 155,616 | | | | 82,996 | |
Operational deposits (all counterparties) and deposits in networks of cooperative banks | | | 37,039 | | | | 8,957 | |
Non-operational deposits (all counterparties) | | | 96,196 | | | | 51,658 | |
Unsecured debt | | | 22,381 | | | | 22,381 | |
Secured wholesale funding | | | | * | | | 37,940 | |
Additional requirements, of which: | | | 169,782 | | | | 42,806 | |
Outflows related to derivative exposures and other collateral requirements | | | 17,134 | | | | 17,097 | |
Outflows related to loss of funding on debt products | | | 5,681 | | | | 5,681 | |
Credit and liquidity facilities | | | 146,967 | | | | 20,028 | |
Other contractual funding obligations | | | 3,002 | | | | 1,292 | |
Other contingent funding obligations(3) | | | 426,203 | | | | 7,182 | |
Total cash outflows | | | | * | | $ | 183,286 | |
Cash inflows | | | | | | | | |
Secured lending (e.g. reverse repos) | | $ | 105,477 | | | $ | 34,145 | |
Inflows from fully performing exposures | | | 21,534 | | | | 13,291 | |
Other cash inflows | | | 28,028 | | | | 28,028 | |
Total cash inflows | | $ | 155,039 | | | $ | 75,464 | |
| | |
| | | | | | Total
adjusted
value(4) | |
Total HQLA | | | | * | | $ | 136,401 | |
Total net cash outflows | | | | * | | $ | 107,822 | |
Liquidity coverage ratio (%) | | | | * | | | 127 | % |
| | |
| For the quarter ended October 31, 2015 ($ millions) | | | | | Total
adjusted
value(4) | |
Total HQLA | | | * | | | $ | 145,859 | |
Total net cash outflows | | | * | | | $ | 117,474 | |
Liquidity coverage ratio (%) | | | * | | | | 124 | % |
| * | Disclosure is not required under regulatory guideline. |
| (1) | Unweighted values represent outstanding balances maturing or callable within the next 30 days. |
| (2) | Weighted values represent balances calculated after the application of HQLA haircuts or inflow and outflow rates, as prescribed by the OSFI LAR guidelines. |
| (3) | Total unweighted value includes uncommitted credit and liquidity facilities, guarantees and letters of credit, outstanding debt securities with remaining maturity greater than 30 days, and other contractual cash outflows. |
| (4) | Total adjusted value represents balances calculated after the application of both haircuts and inflow and outflow rates and any applicable caps. |
HQLA continues to be substantially comprised of Level 1 assets (as defined in the LAR guideline). The increase in the Bank’s average LCR for the quarter ended October 31, 2016 versus the average for the quarter ended October 31, 2015 was attributable to normal business activity.
90 | 2 0 1 6 S C O T I A B A N K A N N U A L R E P O R T
MANAGEMENT’S DISCUSSION AND ANALYSIS | RISK MANAGEMENT
The Bank’s significant operating currencies are Canadian and U.S. dollars. The Bank monitors its significant currency exposures in accordance with its liquidity risk management framework and risk appetite.
Funding
The Bank ensures that its funding sources are well diversified. Funding concentrations are regularly monitored and analyzed by type. The sources of funding are capital, deposits from retail and commercial clients sourced through the Canadian and international branch network, deposits from financial institutions as well as wholesale debt issuance.
Capital and personal deposits are key components of the Bank’s core funding and these amounted to $266 billion as at October 31, 2016 (October 31, 2015 – $251 billion). The increase since October 31, 2015, was due primarily to personal deposits, internal capital generation and the issuance of NVCC subordinated debentures and preferred shares, net of redemptions. A portion of commercial deposits, particularly those of an operating or relationship nature, would be considered part of the Bank’s core funding. Furthermore, core funding is augmented by longer term wholesale debt issuances (original maturity over 1 year) of $141 billion (October 31, 2015 – $137 billion). Longer term wholesale debt issuances include medium-term notes, deposit notes, mortgage securitization, asset-backed securities and covered bonds. The increase since October 31, 2015, was primarily due to foreign exchange movement.
The Bank operates in many different currencies and countries. From a funding perspective, the most significant currencies are Canadian and U.S. dollars. With respect to the Bank’s operations outside Canada, there are different funding strategies depending on the nature of the activities in a country. For those countries where the Bank operates a branch banking subsidiary, the strategy is for the subsidiary to be substantially self-funding in its local market. For other subsidiaries or branches outside Canada where local deposit gathering capability is not sufficient, funding is provided through the wholesale funding activities of the Bank.
From an overall funding perspective the Bank’s objective is to achieve an appropriate balance between the cost and the stability of funding. Diversification of funding sources is a key element of the funding strategy.
The Bank’s wholesale debt diversification strategy is primarily executed via the Bank’s main wholesale funding centres, located in Toronto, New York, London and Singapore. The majority of these funds are sourced in Canadian and U.S. dollars. Where required, these funds are swapped to fund assets in different currencies. The funding strategy deployed by wholesale funding centres and the management of associated risks, such as geographic and currency risk, are managed centrally within the framework of policies and limits that are approved by the Board of Directors.
In the normal course, the Bank uses a mix of unsecured and secured wholesale funding instruments across a variety of markets. The choice of instruments and markets is based on a number of factors, including relative cost and market capacity as well as an objective of maintaining a diversified mix of sources of funding. Market conditions can change over time, impacting cost and capacity in particular markets or instruments. Changing market conditions can include periods of stress where the availability of funding in particular markets or instruments is constrained. In these circumstances the Bank would increase its focus on sources of funding in functioning markets and secured funding instruments. Should a period of extreme stress exist such that all wholesale funding sources are constrained, the Bank maintains a pool of liquid assets to mitigate its liquidity risk. This pool includes cash, deposits with central banks and securities.
In Canada, the Bank raises short- and longer-term wholesale debt through the issuance of senior unsecured deposit notes. Additional longer-term wholesale debt is generated through the Bank’s Canadian Debt and Equity Shelf and the securitization of Canadian insured residential mortgages through CMHC securitization programs (such as Canada Mortgage Bonds), uninsured residential mortgages through the Bank’s Covered Bond Program, unsecured personal lines of credit through the Hollis Receivables Term Trust II Shelf and retail credit card receivables through the Trillium Credit Card Trust II Shelf. While the Bank includes CMHC securitization programs in its view of wholesale debt issuance, this source of funding does not entail the same type of run-off risk that can be experienced in funding raised from capital markets.
Outside of Canada, short-term wholesale debt is raised through the issuance of negotiable certificates of deposit in the United States, Hong Kong and Australia and the issuance of commercial paper in the United States. The Bank operates longer-term wholesale debt issuance registered programs in the United States, such as its SEC Registered Debt and Equity Shelf and non-registered programs, such as the securitization of retail indirect auto loan receivables through Securitized Term Auto Receivables Trust 2016-1. The Bank’s Covered Bond Program is listed with the U.K. Listing Authority, and the Bank may issue under the program in Europe, the United States, Australia and Switzerland. The Bank also raises longer-term funding across a variety of currencies through its Australian Medium Term Note Programme, European Medium Term Note Programme and Singapore Medium Term Note Programme. The Bank’s European Medium Term Note Programme is listed with the U.K. Listing Authority, Swiss Stock Exchange and the Tokyo Pro-Bond Market. The Bank’s Singapore Medium Term Note Programme is listed with the Singapore Exchange and the Taiwan Exchange.
2 0 1 6 S C O T I A B A N K A N N U A L R E P O R T | 91
MANAGEMENT’S DISCUSSION AND ANALYSIS
The table below provides the remaining contractual maturities of funding raised through wholesale funding. In the Statement of Financial Position, these liabilities are primarily included in Business & Government Deposits.
T56 Wholesale funding(1)
| | | | | | | | | | | | | | | | | | | | | | | | | | | | | | | | | | | | | | | | |
| | | | | | | | | | |
As at October 31, 2016 ($ millions) | | Less
than 1
month | | | 1-3 months | | | 3-6 months | | | 6-9 months | | | 9-12 months | | | Sub-Total < 1 Year | | | 1-2 years | | | 2-5 years | | | >5 years | | | Total | |
Deposits from banks(2) | | $ | 2,958 | | | $ | 571 | | | $ | 187 | | | $ | 148 | | | $ | 31 | | | $ | 3,895 | | | $ | 103 | | | $ | 149 | | | $ | – | | | $ | 4,147 | |
Bearer deposit notes, commercial paper and certificate of deposits | | | 11,434 | | | | 16,838 | | | | 25,324 | | | | 8,181 | | | | 7,357 | | | | 69,134 | | | | 3,151 | | | | 333 | | | | – | | | | 72,618 | |
Asset-backed commercial paper(3) | | | 2,625 | | | | 3,978 | | | | 1,906 | | | | – | | | | – | | | | 8,509 | | | | – | | | | – | | | | – | | | | 8,509 | |
Medium term notes and deposit notes | | | 1,573 | | | | 5,700 | | | | 4,576 | | | | 3,681 | | | | 3,962 | | | | 19,492 | | | | 21,935 | | | | 31,195 | | | | 7,576 | | | | 80,198 | |
Asset-backed securities | | | – | | | | 451 | | | | 25 | | | | 26 | | | | 189 | | | | 691 | | | | 1,218 | | | | 1,555 | | | | 417 | | | | 3,881 | |
Covered bonds | | | – | | | | 3,353 | | | | 2,707 | | | | – | | | | – | | | | 6,060 | | | | 3,413 | | | | 19,160 | | | | 1,381 | | | | 30,014 | |
Mortgage securitization(4) | | | – | | | | 1,376 | | | | 663 | | | | 950 | | | | 1,063 | | | | 4,052 | | | | 2,102 | | | | 7,834 | | | | 3,782 | | | | 17,770 | |
Subordinated debentures(5) | | | 22 | | | | 30 | | | | 62 | | | | 1 | | | | 3 | | | | 118 | | | | – | | | | 109 | | | | 8,767 | | | | 8,994 | |
Total wholesale funding sources | | $ | 18,612 | | | $ | 32,297 | | | $ | 35,450 | | | $ | 12,987 | | | $ | 12,605 | | | $ | 111,951 | | | $ | 31,922 | | | $ | 60,335 | | | $ | 21,923 | | | $ | 226,131 | |
| | | | | | | | | | |
Of Which: | | | | | | | | | | | | | | | | | | | | | | | | | | | | | | | | | | | | | | | | |
| | | | | | | | | | |
Unsecured funding | | $ | 15,987 | | | $ | 23,139 | | | $ | 30,149 | | | $ | 12,011 | | | $ | 11,353 | | | $ | 92,639 | | | $ | 25,189 | | | $ | 31,786 | | | $ | 16,343 | | | $ | 165,957 | |
Secured funding | | | 2,625 | | | | 9,158 | | | | 5,301 | | | | 976 | | | | 1,252 | | | | 19,312 | | | | 6,733 | | | | 28,549 | | | | 5,580 | | | | 60,174 | |
| | | | | | | | | | | | | | | | | | | | | | | | | | | | | | | | | | | | | | | | |
| | | | | | | | | | |
As at October 31, 2015 ($ millions) | | Less
than 1
month | | | 1-3 months | | | 3-6 months | | | 6-9 months | | | 9-12 months | | | Sub-Total < 1 Year | | | 1-2 years | | | 2-5 years | | | >5 years | | | Total | |
Deposits from banks(2) | | $ | 3,553 | | | $ | 904 | | | $ | 343 | | | $ | 211 | | | $ | 122 | | | $ | 5,133 | | | $ | 88 | | | $ | 80 | | | $ | – | | | $ | 5,301 | |
Bearer deposit notes, commercial paper and certificate of deposits | | | 15,006 | | | | 20,128 | | | | 42,633 | | | | 13,417 | | | | 3,671 | | | | 94,855 | | | | 4,195 | | | | 964 | | | | 36 | | | | 100,050 | |
Asset-backed commercial paper(3) | | | 1,720 | | | | 3,920 | | | | 1,648 | | | | – | | | | – | | | | 7,288 | | | | – | | | | – | | | | – | | | | 7,288 | |
Medium term notes and deposit notes | | | 390 | | | | 2,365 | | | | 7,565 | | | | 6,149 | | | | 1,837 | | | | 18,306 | | | | 16,926 | | | | 33,674 | | | | 9,929 | | | | 78,835 | |
Asset-backed securities | | | – | | | | 1 | | | | – | | | | – | | | | 500 | | | | 501 | | | | 661 | | | | 1,042 | | | | 440 | | | | 2,644 | |
Covered bonds | | | – | | | | – | | | | – | | | | – | | | | 2,615 | | | | 2,615 | | | | 5,909 | | | | 11,359 | | | | 2,473 | | | | 22,356 | |
Mortgage securitization(4) | | | – | | | | 1,208 | | | | 794 | | | | 997 | | | | 829 | | | | 3,828 | | | | 4,100 | | | | 6,214 | | | | 5,632 | | | | 19,774 | |
Subordinated debentures(5) | | | 19 | | | | 59 | | | | 64 | | | | 3 | | | | 6 | | | | 151 | | | | – | | | | 20 | | | | 6,626 | | | | 6,797 | |
Total wholesale funding sources | | $ | 20,688 | | | $ | 28,585 | | | $ | 53,047 | | | $ | 20,777 | | | $ | 9,580 | | | $ | 132,677 | | | $ | 31,879 | | | $ | 53,353 | | | $ | 25,136 | | | $ | 243,045 | |
| | | | | | | | | | |
Of Which: | | | | | | | | | | | | | | | | | | | | | | | | | | | | | | | | | | | | | | | | |
| | | | | | | | | | |
Unsecured funding | | $ | 18,968 | | | $ | 23,456 | | | $ | 50,605 | | | $ | 19,780 | | | $ | 5,636 | | | $ | 118,445 | | | $ | 21,209 | | | $ | 34,738 | | | $ | 16,591 | | | $ | 190,983 | |
Secured funding | | | 1,720 | | | | 5,129 | | | | 2,442 | | | | 997 | | | | 3,944 | | | | 14,232 | | | | 10,670 | | | | 18,615 | | | | 8,545 | | | | 52,062 | |
| (1) | Wholesale funding sources exclude repo transactions and bankers acceptances, which are disclosed in T57 Contractual maturities. Amounts are based on remaining term to maturity. |
| (2) | Only includes commercial bank deposits raised by Group Treasury. |
| (3) | Wholesale funding sources also exclude asset-backed commercial paper issued by certain ABCP conduits that are not consolidated for financial reporting purposes. |
| (4) | Represents residential mortgages funded through Canadian Federal Government agency sponsored programs. Funding accessed through such programs does not impact the funding capacity of the Bank in its own name. |
| (5) | Although subordinated debentures are a component of regulatory capital, they are included in this table in accordance with EDTF recommended disclosures. |
92 | 2 0 1 6 S C O T I A B A N K A N N U A L R E P O R T
MANAGEMENT’S DISCUSSION AND ANALYSIS | RISK MANAGEMENT
Wholesale funding generally bears a higher risk of run-off in a stressed environment than other sources of funding. The Bank mitigates this risk through funding diversification, ongoing engagement with investors and by maintaining a large holding of unencumbered liquid assets. Unencumbered liquid assets of $183 billion as at October 31, 2016 (October 31, 2015 – $201 billion) were well in excess of wholesale funding sources that mature in the next twelve months.
Contractual maturities and obligations
The table below provides the maturity of assets and liabilities as well as the off-balance sheet commitments as at October 31, 2016, based on the contractual maturity date.
From a liquidity risk perspective the Bank considers factors other than contractual maturity in the assessment of liquid assets or in determining expected future cash flows. In particular, for securities with a fixed maturity date, the ability and time horizon to raise cash from these securities is more relevant to liquidity management than contractual maturity. For other assets and deposits the Bank uses assumptions about rollover rates to assess liquidity risk for normal course and stress scenarios. Similarly, the Bank uses assumptions to assess the potential drawdown of credit commitments in various scenarios.
The Bank’s contractual obligations include contracts and purchase obligations, including agreements to purchase goods and services that are enforceable, legally binding on the Bank and affect the Bank’s liquidity and capital resource needs. The Bank leases a large number of its branches, offices and other locations. The majority of these leases are for a term of five years, with options to renew. The total cost of these leases, net of rental income from subleases, was $428 million in 2016 (2015 – $433 million). The decrease reflects cost reductions resulting from structural cost transformation initiatives, partially offset by unfavourable forex impact.
Two major outsourcing contracts have been entered into by the Bank. Both are cancellable with notice.
The largest is a contract with IBM Canada entered into in 2001 to manage the Bank’s domestic computer operations, including data centres, branches, Automated Banking Machines, and desktop computing environment. The contract was expanded in 2005 to also include the computer operations for the Caribbean & Central America, and Mexico. The contract for the Canadian operations, Mexico and Caribbean & Central America was renewed earlier in 2013, for a further five year period.
The second is with Symcor Inc. consisting of two contracts (a 2 year term and a 5 year term with a renewal option) to manage the Bank’s cheque and bill payment processing, including associated statement and report printing activities and cheque services across Canada.
2 0 1 6 S C O T I A B A N K A N N U A L R E P O R T | 93
MANAGEMENT’S DISCUSSION AND ANALYSIS
T57 Contractual maturities
| | | | | | | | | | | | | | | | | | | | | | | | | | | | | | | | | | | | | | | | |
| | | As at October 31, 2016 | |
| | | | | | | | | | |
| ($ millions) | | Less
than one
month | | | One to
three
months | | | Three
to six
months | | | Six to
nine
months | | | Nine to
twelve
months | | | One to
two years | | | Two
to five
years | | | Over five
years | | | No specific
maturity | | | Total | |
Assets | | | | | | | | | | | | | | | | | | | | | | | | | | | | | | | | | | | | | | | | |
Cash and deposits with financial institutions and precious metals | | $ | 37,703 | | | $ | 1,071 | | | $ | 320 | | | $ | 237 | | | $ | 1,198 | | | $ | 932 | | | $ | 537 | | | $ | 38 | | | $ | 12,750 | | | $ | 54,786 | |
Trading assets | | | 8,579 | | | | 7,984 | | | | 2,485 | | | | 2,754 | | | | 2,762 | | | | 4,683 | | | | 17,149 | | | | 20,109 | | | | 42,056 | | | | 108,561 | |
Financial instruments designated at fair value through profit or loss | | | – | | | | – | | | | – | | | | – | | | | 205 | | | | – | | | | 16 | | | | – | | | | – | | | | 221 | |
Securities purchased under resale agreement and securities borrowed | | | 70,343 | | | | 13,250 | | | | 6,156 | | | | 1,541 | | | | 839 | | | | – | | | | – | | | | – | | | | – | | | | 92,129 | |
Derivative financial instruments | | | 2,311 | | | | 3,041 | | | | 1,210 | | | | 1,218 | | | | 900 | | | | 3,694 | | | | 9,986 | | | | 19,297 | | | | – | | | | 41,657 | |
Investment securities – available-for-sale | | | 1,933 | | | | 4,088 | | | | 3,265 | | | | 2,641 | | | | 1,301 | | | | 5,666 | | | | 23,587 | | | | 5,945 | | | | 2,083 | | | | 50,509 | |
Investment securities – held-to-maturity | | | 207 | | | | 439 | | | | 1,162 | | | | 522 | | | | 1,003 | | | | 4,347 | | | | 14,434 | | | | 296 | | | | – | | | | 22,410 | |
Loans | | | 23,431 | | | | 24,057 | | | | 26,091 | | | | 25,375 | | | | 26,331 | | | | 81,473 | | | | 190,391 | | | | 31,851 | | | | 51,164 | | | | 480,164 | |
Residential mortgages | | | 3,382 | | | | 5,485 | | | | 8,771 | | | | 12,693 | | | | 10,796 | | | | 48,038 | | | | 112,675 | | | | 19,265 | | | | 1,783 | (1) | | | 222,888 | |
Personal and credit cards | | | 2,790 | | | | 2,484 | | | | 2,902 | | | | 3,154 | | | | 2,777 | | | | 10,277 | | | | 20,914 | | | | 5,813 | | | | 48,391 | | | | 99,502 | |
Business and government | | | 17,259 | | | | 16,088 | | | | 14,418 | | | | 9,528 | | | | 12,758 | | | | 23,158 | | | | 56,802 | | | | 6,773 | | | | 5,616 | (2) | | | 162,400 | |
Allowance for credit losses | | | – | | | | – | | | | – | | | | – | | | | – | | | | – | | | | – | | | | – | | | | (4,626 | ) | | | (4,626 | ) |
Customers’ liabilities under acceptances | | | 9,899 | | | | 1,816 | | | | 248 | | | | 9 | | | | 6 | | | | – | | | | – | | | | – | | | | – | | | | 11,978 | |
Other assets | | | – | | | | – | | | | – | | | | – | | | | – | | | | – | | | | – | | | | – | | | | 33,851 | | | | 33,851 | |
Liabilities and equity | | | | | | | | | | | | | | | | | | | | | | | | | | | | | | | | | | | | | | | | |
Deposits | | $ | 55,066 | | | $ | 59,091 | | | $ | 55,977 | | | $ | 24,792 | | | $ | 22,794 | | | $ | 50,504 | | | $ | 75,096 | | | $ | 13,125 | | | $ | 255,432 | | | $ | 611,877 | |
Personal | | | 6,944 | | | | 8,892 | | | | 9,131 | | | | 7,392 | | | | 6,501 | | | | 15,206 | | | | 16,317 | | | | 549 | | | | 128,370 | | | | 199,302 | |
Non-personal | | | 48,122 | | | | 50,199 | | | | 46,846 | | | | 17,400 | | | | 16,293 | | | | 35,298 | | | | 58,779 | | | | 12,576 | | | | 127,062 | | | | 412,575 | |
Financial instruments designated at fair value through profit or loss | | | – | | | | 4 | | | | – | | | | – | | | | 3 | | | | 110 | | | | 1,038 | | | | 304 | | | | – | | | | 1,459 | |
Acceptances | | | 9,899 | | | | 1,816 | | | | 248 | | | | 9 | | | | 6 | | | | – | | | | – | | | | – | | | | – | | | | 11,978 | |
Obligations related to securities sold short | | | 80 | | | | 200 | | | | 388 | | | | 897 | | | | 22 | | | | 2,755 | | | | 4,544 | | | | 9,039 | | | | 5,387 | | | | 23,312 | |
Derivative financial instruments | | | 1,711 | | | | 2,237 | | | | 1,399 | | | | 1,399 | | | | 1,035 | | | | 4,267 | | | | 10,473 | | | | 19,866 | | | | – | | | | 42,387 | |
Obligations related to securities sold under repurchase agreements and securities lent | | | 87,130 | | | | 7,050 | | | | 215 | | | | 335 | | | | 2,352 | | | | 1 | | | | – | | | | – | | | | – | | | | 97,083 | |
Subordinated debentures | | | – | | | | – | | | | – | | | | – | | | | – | | | | – | | | | – | | | | 7,633 | | | | – | | | | 7,633 | |
Other liabilities | | | 568 | | | | 819 | | | | 591 | | | | 316 | | | | 550 | | | | 1,434 | | | | 2,432 | | | | 4,094 | | | | 31,912 | | | | 42,716 | |
Total equity | | | – | | | | – | | | | – | | | | – | | | | – | | | | – | | | | – | | | | – | | | | 57,821 | | | | 57,821 | |
Off-Balance sheet commitments | | | | | | | | | | | | | | | | | | | | | | | | | | | | | | | | | | | | | | | | |
Operating leases | | $ | 28 | | | $ | 60 | | | $ | 88 | | | $ | 85 | | | $ | 83 | | | $ | 291 | | | $ | 631 | | | $ | 536 | | | $ | – | | | $ | 1,802 | |
Credit commitments(3) | | | 5,081 | | | | 5,170 | | | | 12,498 | | | | 15,381 | | | | 20,870 | | | | 15,723 | | | | 93,842 | | | | 5,680 | | | | – | | | | 174,245 | |
Financial guarantees(4) | | | – | | | | – | | | | – | | | | – | | | | – | | | | – | | | | – | | | | – | | | | 35,297 | | | | 35,297 | |
Outsourcing obligations | | | 17 | | | | 35 | | | | 50 | | | | 49 | | | | 49 | | | | 197 | | | | 114 | | | | – | | | | 1 | | | | 512 | |
| (1) | Includes primarily impaired mortgages. |
| (2) | Includes primarily overdrafts and impaired loans. |
| (3) | Includes the undrawn component of committed credit and liquidity facilities. |
| (4) | Includes outstanding balances of guarantees, standby letters of credit and commercial letters of credit which may expire undrawn. |
94 | 2 0 1 6 S C O T I A B A N K A N N U A L R E P O R T
MANAGEMENT’S DISCUSSION AND ANALYSIS | RISK MANAGEMENT
| | | | | | | | | | | | | | | | | | | | | | | | | | | | | | | | | | | | | | | | |
| | | As at October 31, 2015 | |
| | | | | | | | | | |
| ($ millions) | | Less
than one
month | | | One to
three
months | | | Three
to six
months | | | Six to
nine
months | | | Nine to
twelve
months | | | One to
two years | | | Two
to five
years | | | Over five years | | | No specific
maturity | | | Total | |
Assets | | | | | | | | | | | | | | | | | | | | | | | | | | | | | | | | | | | | | | | | |
Cash and deposits with financial institutions and precious metals | | $ | 65,315 | | | $ | 1,367 | | | $ | 477 | | | $ | 593 | | | $ | 567 | | | $ | 593 | | | $ | 892 | | | $ | 7 | | | $ | 14,666 | | | $ | 84,477 | |
Trading assets | | | 6,595 | | | | 6,148 | | | | 4,580 | | | | 3,467 | | | | 1,177 | | | | 6,599 | | | | 12,665 | | | | 19,759 | | | | 38,150 | | | | 99,140 | |
Financial instruments designated at fair value through profit or loss | | | – | | | | – | | | | 66 | | | | – | | | | – | | | | – | | | | 16 | | | | – | | | | 238 | | | | 320 | |
Securities purchased under resale agreement and securities borrowed | | | 65,182 | | | | 11,121 | | | | 5,738 | | | | 2,003 | | | | 3,268 | | | | – | | | | – | | | | – | | | | – | | | | 87,312 | |
Derivative financial instruments | | | 2,789 | | | | 2,412 | | | | 1,580 | | | | 1,168 | | | | 1,479 | | | | 3,761 | | | | 9,541 | | | | 18,273 | | | | – | | | | 41,003 | |
Investment securities – available-for-sale | | | 1,292 | | | | 2,215 | | | | 3,941 | | | | 2,059 | | | | 2,136 | | | | 7,423 | | | | 16,185 | | | | 4,291 | | | | 3,023 | | | | 42,565 | |
Investment securities – held-to-maturity | | | – | | | | – | | | | 65 | | | | – | | | | 4 | | | | 111 | | | | 463 | | | | 8 | | | | – | | | | 651 | |
Loans | | | 25,763 | | | | 24,120 | | | | 27,190 | | | | 23,976 | | | | 24,561 | | | | 71,989 | | | | 181,600 | | | | 32,772 | | | | 46,657 | | | | 458,628 | |
Residential mortgages | | | 3,120 | | | | 5,695 | | | | 11,584 | | | | 11,690 | | | | 11,570 | | | | 43,088 | | | | 108,597 | | | | 20,366 | | | | 1,788 | (1) | | | 217,498 | |
Personal and credit cards | | | 2,456 | | | | 1,732 | | | | 2,577 | | | | 2,607 | | | | 2,500 | | | | 10,146 | | | | 19,563 | | | | 5,719 | | | | 44,177 | | | | 91,477 | |
Business and government | | | 20,187 | | | | 16,693 | | | | 13,029 | | | | 9,679 | | | | 10,491 | | | | 18,755 | | | | 53,440 | | | | 6,687 | | | | 4,889 | (2) | | | 153,850 | |
Allowance for credit losses | | | – | | | | – | | | | – | | | | – | | | | – | | | | – | | | | – | | | | – | | | | (4,197 | ) | | | (4,197 | ) |
Customers’ liabilities under acceptances | | | 7,987 | | | | 2,120 | | | | 146 | | | | 37 | | | | 6 | | | | – | | | | – | | | | – | | | | – | | | | 10,296 | |
Other assets | | | – | | | | – | | | | – | | | | – | | | | – | | | | – | | | | – | | | | – | | | | 32,105 | | | | 32,105 | |
Liabilities and equity | | | | | | | | | | | | | | | | | | | | | | | | | | | | | | | | | | | | | | | | |
Deposits | | $ | 54,015 | | | $ | 50,230 | | | $ | 67,936 | | | $ | 33,177 | | | $ | 19,993 | | | $ | 50,181 | | | $ | 68,116 | | | $ | 17,118 | | | $ | 240,153 | | | $ | 600,919 | |
Personal | | | 6,506 | | | | 7,960 | | | | 8,938 | | | | 8,303 | | | | 7,186 | | | | 15,762 | | | | 16,646 | | | | 326 | | | | 118,417 | | | | 190,044 | |
Non-personal | | | 47,509 | | | | 42,270 | | | | 58,998 | | | | 24,874 | | | | 12,807 | | | | 34,419 | | | | 51,470 | | | | 16,792 | | | | 121,736 | | | | 410,875 | |
Financial instruments designated at fair value through profit or loss | | | – | | | | 18 | | | | – | | | | – | | | | 7 | | | | 9 | | | | 648 | | | | 804 | | | | – | | | | 1,486 | |
Acceptances | | | 7,987 | | | | 2,120 | | | | 146 | | | | 37 | | | | 6 | | | | – | | | | – | | | | – | | | | – | | | | 10,296 | |
Obligations related to securities sold short | | | 52 | | | | 50 | | | | 208 | | | | 162 | | | | 223 | | | | 2,530 | | | | 5,425 | | | | 7,851 | | | | 3,711 | | | | 20,212 | |
Derivative financial instruments | | | 3,767 | | | | 2,196 | | | | 1,912 | | | | 1,182 | | | | 1,241 | | | | 3,786 | | | | 11,109 | | | | 20,077 | | | | – | | | | 45,270 | |
Obligations related to securities sold under repurchase agreements and securities
lent | | | 60,814 | | | | 8,232 | | | | 4,483 | | | | 332 | | | | 3,154 | | | | – | | | | – | | | | – | | | | – | | | | 77,015 | |
Subordinated debentures | | | – | | | | – | | | | – | | | | – | | | | – | | | | – | | | | – | | | | 6,182 | | | | – | | | | 6,182 | |
Other liabilities | | | 867 | | | | 1,535 | | | | 358 | | | | 533 | | | | 307 | | | | 878 | | | | 2,444 | | | | 3,803 | | | | 30,913 | | | | 41,638 | |
Total equity | | | – | | | | – | | | | – | | | | – | | | | – | | | | – | | | | – | | | | – | | | | 53,479 | | | | 53,479 | |
Off-Balance sheet commitments | | | | | | | | | | | | | | | | | | | | | | | | | | | | | | | | | | | | | | | | |
Operating leases | | $ | 27 | | | $ | 57 | | | $ | 83 | | | $ | 81 | | | $ | 80 | | | $ | 285 | | | $ | 595 | | | $ | 546 | | | $ | – | | | $ | 1,754 | |
Credit commitments(3) | | | 6,633 | | | | 6,588 | | | | 16,985 | | | | 16,264 | | | | 18,052 | | | | 20,335 | | | | 76,660 | | | | 4,878 | | | | 5 | | | | 166,400 | |
Financial guarantees(4) | | | – | | | | – | | | | – | | | | – | | | | – | | | | – | | | | – | | | | – | | | | 31,865 | | | | 31,865 | |
Outsourcing obligations | | | 19 | | | | 36 | | | | 51 | | | | 50 | | | | 50 | | | | 183 | | | | 225 | | | | 4 | | | | 1 | | | | 619 | |
| (1) | Includes primarily impaired mortgages. |
| (2) | Includes primarily overdrafts and impaired loans. |
| (3) | Includes the undrawn component of committed credit and liquidity facilities. |
| (4) | Includes outstanding balances of guarantees, standby letters of credit and commercial letters of credit which may expire undrawn. |
2 0 1 6 S C O T I A B A N K A N N U A L R E P O R T | 95
MANAGEMENT’S DISCUSSION AND ANALYSIS
Other Risks
Operational Risk
Operational risk is the risk of loss, whether direct or indirect, to which the Bank is exposed due to inadequate or failed internal processes or systems, human error, or external events. Operational risk includes legal and regulatory risk, business process and change risk, fiduciary or disclosure breaches, technology failure, financial crime and environmental risk. It exists in some form in every Bank business and function. Operational risk can not only result in financial loss, but also regulatory sanctions and damage to the Bank’s reputation. The Bank is very successful at managing operational risk with a view to safeguarding client assets and preserving shareholder value.
In fiscal 2016, operational risk losses continue to be within the Bank’s risk appetite.
Governance and organization
The Bank has developed policies, processes and assessment methodologies to ensure that operational risk is appropriately identified and managed with effective controls. The governing principles of the Bank’s Operational Risk Management Framework include:
| • | | The three lines of defence model helps to ensure proper accountability and clearly defines the roles and responsibilities for operational risk management. The first line of defence is the business units, who own the risks in their businesses and operations. The second line of defence is led by a central risk management unit within Global Risk Management, with support from control and stewardship functions across the Bank. The third line of defence is Internal Audit. |
| • | | The individual business lines are accountable for the identification, management and control of the significant operational risks to which they are exposed. |
The Bank has a governance and organizational structure through which there is effective oversight and in which operational risk is managed to an established risk appetite, including:
| • | | The Board of Directors is responsible for sound corporate governance and approves biennially the Bank’s Operational Risk Management Policy; |
| • | | A senior level Operational & Compliance Risk Committee comprised of Heads of business lines and key control functions, and chaired by the Chief Risk Officer. This Committee provides consistent, Bank-wide oversight of operational and compliance risk management; |
| • | | Business-line level committees are in place to ensure operational risk issues are known, discussed, managed and escalated, as needed and in a timely manner; |
| • | | Executive management with clearly defined areas of responsibility; |
| • | | A central unit in Global Risk Management responsible for: developing methods to identify, assess, manage and monitor operational risks; and reporting on risks as well as actual loss events and to play a challenge role to the business units in their assessment and management of operational risk; |
| • | | Independent specialist units responsible for developing methods to mitigate specific components of operational risk, including codifying policies and processes required to control those specific risks; |
| • | | Separation of duties between key functions; and |
| • | | An independent internal audit department responsible for verifying that significant risks are identified and assessed, and for testing controls to ensure that overall risk is at an acceptable level. The Internal Audit department is also responsible for auditing and assessing the Bank’s Operational Risk Management Framework, including its design and effectiveness. |
Operational Risk Management Framework
The Bank’s Operational Risk Management Framework sets out an integrated approach to identify, assess, control, mitigate and report operational risks across the Bank. The following are key components of the Bank’s Operational Risk Management Framework:
| • | | The Bank’s risk and control assessment program, which includes formal reviews of significant units, operations and processes to identify and assess operational risks. This program provides a basis for management to ensure that key risks have been identified and that controls are functioning effectively. Business line management attests to the accuracy of each assessment and develops action plans to mitigate residual risk exposure, as appropriate. Results of these reviews are summarized and reported to executive management and the Board of Directors. |
| • | | The Bank has a standard inventory of operational risks which are discussed and considered in each risk assessment. |
| • | | The Bank’s scenario analysis program provides a forward looking view of key risks and provides management with insights into how plausible but highly unlikely operational risk events might occur. Scenario analysis will also assist in the selection of severity distributions in the Bank’s Advanced Measurement Approach (AMA) capital model (discussed below). |
| • | | The Bank’s Key Risk Indicator (KRI) program provides information on the level of exposure to a given operational risk to a particular point in time and can help to monitor potential shifts in risk conditions or new emerging risk and/or measure residual risk exposure and effectiveness of controls. KRIs exist within the business lines and at the enterprise level. |
| • | | The Business Environment and Internal Control Factors (BEICF) program incorporates the impact of key business environment and internal control factors into the regulatory capital allocated to divisions by utilizing a BEICF scorecard. The scorecard will be used to potentially adjust capital calculations produced using the Bank’s AMA capital model and due to its forward-looking nature, it also assists with identifying new trends and emerging risks. |
| • | | The Bank’s centralized operational loss event database, which is managed and maintained by the central operational risk unit within Global Risk Management, captures key information on operational losses. This data is analyzed, benchmarked against industry loss data and significant metrics, then reported to executive management and the Board of Directors to provide insight into operational risk exposures, appetites and trends. |
| • | | Operational risk is difficult to quantify in a fulsome and accurate manner, due to the nature of operational risk itself. Operational risk is often included with or is a by-product of another form of risk and is not taken on intentionally. Tools for operational risk management and measurement continue to evolve across the global financial services industry. There are two methods for the calculation of operational risk regulatory capital available to the Bank under Basel framework – The Standardized Approach and the Advanced Measurement Approach (AMA). The Bank was approved by OSFI in August 2016 to use AMA; implementation is planned for FY2017. |
| • | | Operational risk reporting is provided to the Bank’s senior executive management and the Board of Directors, and includes information relating to key events, results, trends and themes across the operational risk tools. The combination of these information sources provides both a backward and forward-looking view of operational risk at the Bank. |
96 | 2 0 1 6 S C O T I A B A N K A N N U A L R E P O R T
MANAGEMENT’S DISCUSSION AND ANALYSIS | RISK MANAGEMENT
| • | | The Bank is a member of the Operational Riskdata Exchange Association (ORX), an international consortium of banks that share anonymized loss data. This industry data is used to support risk identification, assessment and will be used as an input to the Bank’s AMA capital model. Discussion forums within ORX also help to ensure that the Bank is current of all industry best practices and developments. |
| • | | The Bank’s Fraud Management Office, which identifies threats of financial crime, implements systems and processes to mitigate loss and reports on fraud loss activity to senior management. |
| • | | The Bank’s monitoring of industry events, identifies significant losses incurred at other financial institutions and provides a reference for reviewing and assessing the Bank’s own risk exposure. |
| • | | The compliance risk management program led by Global Compliance through an established network and associated processes that include: monitoring regulatory changes; conducting compliance risk assessments; implementing policies and procedures; training; monitoring and resolving issues; and reporting on the status of compliance and compliance controls to executive management, the Board of Directors, and regulators as required. |
| • | | The Bank’s New Products and Services Risk Management Policy which describes the general principles applicable to the review, approval and implementation of new products and services within Scotiabank and is intended to provide overarching guidance. Processes are in place at the all-Bank level and in each business line for evaluation of risk in new businesses, services and products. |
| • | | The Bank’s Business Continuity Management Department is responsible for governance and oversight of the Bank’s business continuity, and monitors units to ensure compliance with these policies. The Bank’s business continuity management policy requires that all business units develop business continuity capabilities for their respective functions. |
| • | | The Bank is exposed to ever increasing cyber risks, which may include theft of assets, unauthorized access to sensitive information, or operational disruption such as breaches or denials of service attacks, and has implemented a robust and continuously evolving cyber security program in response. While the Bank’s computer systems continue to be subject to cyber-attack attempts, the countermeasures in place remain effective. Scotiabank has not experienced material breaches of cyber security. The Bank continues to actively monitor this risk, leveraging external threat intelligence, internal monitoring, reviewing best practices and implementing additional controls as required, to mitigate these risks. |
| • | | The Bank’s Model Risk Management Policy, which provides the framework for model review and approval under the oversight of the Operational Risk Committee. |
| • | | The Bank’s training programs, including the mandatory Anti-Money Laundering, Operational Risk and Information Security courses and examinations which ensure employees are aware and equipped to safeguard our customers’ and the Bank’s assets. |
| • | | Risk mitigation programs, which use insurance policies to transfer the risk of high severity losses, where feasible and appropriate. |
Reputational Risk
Reputational risk is the risk that negative publicity regarding Scotiabank’s conduct, business practices or associations, whether true or not, will adversely affect its revenues, operations or customer base, or require costly litigation or other defensive measures.
Negative publicity about an institution’s business practices may involve any aspect of its operations, but usually relates to questions of business ethics and integrity, or quality of products and services. Negative publicity and attendant reputational risk frequently arise as a by-product of some other kind of risk management control failure.
Reputational risk is managed and controlled throughout the Bank by codes of conduct, governance practices and risk management programs, policies, procedures and training. Many relevant checks and balances are outlined in greater detail under other risk management sections, particularly Operational Risk, where reference is made to the Bank’s well-established compliance program. All directors, officers and employees have a responsibility to conduct their activities in accordance with Scotiabank’s Code of Conduct, and in a manner that minimizes reputational risk. While all employees, officers and directors are expected to protect the reputation of Scotiabank by complying with Scotiabank’s Code of Conduct, the activities of the Legal, Corporate Secretary, Public, Corporate and Government Affairs and Compliance departments, and the Reputational Risk Committee, are particularly oriented to the management of reputational risk.
In providing credit, advice, or products to customers, or entering into associations, the Bank considers whether the transaction, relationship or association might give rise to reputational risk. The Bank has an established, Board-approved Reputational Risk Policy, as well as policy and procedures for managing reputational and legal risk related to structured finance transactions. Global Risk Management plays a significant role in the identification and management of reputational risk related to credit underwriting. In addition, the Reputational Risk Committee is available to support Global Risk Management, as well as other risk management committees and business units, with their assessment of reputational risk associated with transactions, business initiatives, and new products and services.
The Reputational Risk Committee considers a broad array of factors when assessing transactions, so that the Bank meets, and will be seen to meet, high ethical standards. These factors include the extent, and outcome, of legal and regulatory due diligence pertinent to the transaction; the economic intent of the transaction; the effect of the transaction on the transparency of a customer’s financial reporting; the need for customer or public disclosure; conflicts of interest; fairness issues; and public perception.
The Committee may impose conditions on customer transactions, including customer disclosure requirements to promote transparency in financial reporting, so that transactions meet Bank standards. In the event the Committee recommends not proceeding with a transaction and the sponsor of the transaction wishes to proceed, the transaction is referred to the Risk Policy Committee.
Environmental Risk
Environmental risk refers to the possibility that environmental concerns involving Scotiabank or its customers could affect the Bank’s performance.
To safeguard the Bank and the interests of its stakeholders, Scotiabank has an environmental policy, which is approved by the Bank’s Board of Directors. The policy guides day-to-day operations, lending practices, supplier agreements, the management of real estate holdings and external reporting practices. It is supplemented by specific policies and practices relating to individual business lines.
2 0 1 6 S C O T I A B A N K A N N U A L R E P O R T | 97
MANAGEMENT’S DISCUSSION AND ANALYSIS
Environmental risks associated with the business operations of each borrower and any real property offered as security are considered in the Bank’s credit evaluation procedures. This includes an environmental assessment where applicable, and commentary on the impact of climate (including regulatory, physical or reputational impacts) on the borrower. Global Risk Management has primary responsibility for establishing the related policies, processes and standards associated with mitigating environmental risk in the Bank’s lending activities. Decisions are taken in the context of the risk management framework.
In the area of project finance, the Equator Principles have been integrated into the Bank’s internal processes and procedures since 2006. The Equator Principles help financial institutions determine, assess, manage and report environmental and social risk. The principles apply to project finance loans and advisory assignments where total capital costs exceed US$10 million, and to certain project-related corporate loans. The Equator Principles provide safeguards for sensitive projects to ensure protection of natural habitats and the rights of indigenous peoples, as well as safeguards against the use of child and forced labour.
Environmental concerns also play a prominent role in shaping the Bank’s real estate practices and purchasing decisions. The Real Estate Department adheres to an Environmental Compliance Policy to ensure responsible management of the Bank’s real estate holdings from an environmental perspective. In addition, recycling and resource management programs are in place in the Bank’s corporate offices and branch networks. Internal tracking systems are in place with respect to energy use, greenhouse gas emissions (GHG) and paper consumption. Since 2012, GHG emissions data for the branch network and corporate offices has been externally verified. A variety of reduction measures are in place for energy, paper and waste. In order to further reduce the Bank’s environmental footprint, it is guided by an Environmental Paper Policy.
To ensure it continues to operate in an environmentally responsible manner, the Bank monitors policy and legislative requirements through ongoing dialogue with government, industry and stakeholders in countries where it operates. Scotiabank has been meeting with environmental organizations, industry associations and socially responsible investment organizations with respect to the role that banks can play to help address issues such as climate change, protection of biodiversity, promotion of sustainable forestry practices, and other environmental issues important to its customers and communities where it operates. The Bank has an ongoing process of reviewing its practices in these areas.
Scotiabank has a number of environmentally related products and services to meet demand and promote the “green” economy. These include: an EcoEnergy Financing program designed to support personal and small business customers who wish to install small-scale renewable energy projects; an auto loan product for hybrid, electric and clean diesel vehicles; an Energy and Agriculture Commodities group, which assists corporate clients by providing liquidity and hedge solutions in the carbon market; and an eco-home renovation program.
Environmental Reporting
Scotiabank is also a signatory to, and participant in the Carbon Disclosure Project, which provides corporate disclosure to the investment community on greenhouse gas emissions and climate change management. Further information is available in the Bank’s annual Corporate Social Responsibility Report.
Insurance Risk
The Bank is both a distributor of third party insurance products and underwriter of insurance risk. As a distributor of third party insurance products, the Bank earns fees but bears no insurance risk. The Bank bears insurance risk in its role as an underwriter, either through direct underwriting or via reinsurance.
Insurance risk is the risk of potential financial loss due to actual experience being different from that assumed in the pricing process of the insurance products.
Insurance by nature involves the distribution of products that transfer individual risks to the issuer with the expectation of a return built into the insurance premiums earned. The Bank is exposed to insurance risk primarily through its creditor, life and select property and casualty insurance and reinsurance products.
The insurance governance and risk management frameworks are calibrated within each insurance subsidiary commensurate with the nature and materiality of risk assumed. Senior management within the insurance business subsidiaries has primary responsibility for managing insurance risk, with oversight by Global Risk Management through the Insurance Risk Committee. The insurance subsidiaries have their own boards of directors, as well as independent appointed actuaries who provide additional risk management oversight.
The insurance subsidiaries maintain a number of policies and practices to manage insurance risk. Sound product design is an essential element. The vast majority of risks insured are short-term in nature, that is, they do not involve long-term pricing guarantees. Geographic diversification and product-line diversification are important elements as well. Reinsurance is commonly used as an effective tool to manage the insurance risk exposures. Insurance risk is also managed through effective underwriting and claim adjudication practices, ongoing monitoring of experience, and stress-testing scenario analysis.
Strategic Risk
Strategic risk is the risk that the Bank’s business strategies are ineffective, being poorly executed, or insufficiently resilient to changes in the business environment.
The Board of Directors is ultimately responsible for oversight of strategic risk, by adopting a strategic planning process and approving, on an annual basis, a strategic plan for the Bank.
The Bank manages its strategic planning process through a series of coordinated efforts between the Executive Management Team, the Business Lines and the Corporate Functions. These efforts address a wide range of relevant considerations including capital and resource allocation, business initiatives, strategic transactions and investments, stress testing and alignment with the Bank’s Risk Appetite Framework. These considerations are reviewed in a consistent and disciplined manner. The process involves input from the entire Executive Management Team and from the Board of Directors.
On an annual basis, a comprehensive Strategy Report is prepared that summarizes the Bank’s key strategic considerations, and is presented by the President and Chief Executive Officer to the Board of Directors for their review and approval.
The execution and evaluation of strategic plans within the Bank is critically important to the Bank’s enterprise-wide risk management framework. The Bank makes continuous efforts to ensure that all employees are aware of the Bank’s overall strategic direction, and that employees are also aware of the strategies and objectives for their respective business line or corporate function. On an ongoing basis, the business lines and corporate functions identify, manage and assess the internal and external considerations – including risk factors – that could affect the achievement of their strategic objectives. These matters are considered on an enterprise-wide basis by the Bank’s Executive Management Team, which makes adjustments, as required.
98 | 2 0 1 6 S C O T I A B A N K A N N U A L R E P O R T
MANAGEMENT’S DISCUSSION AND ANALYSIS | CONTROLS AND ACCOUNTING POLICIES
CONTROLS AND ACCOUNTING POLICIES
Controls and Procedures
Management’s responsibility for financial information contained in this annual report is described on page 130.
Disclosure controls and procedures
The Bank’s disclosure controls and procedures are designed to provide reasonable assurance that information is accumulated and communicated to the Bank’s management, including the President and Chief Executive Officer and the Group Head and Chief Financial Officer, as appropriate, to allow timely decisions regarding required disclosure.
As of October 31, 2016, the Bank’s management, with the participation of the President and Chief Executive Officer and Group Head and Chief Financial Officer, evaluated the effectiveness of its disclosure controls and procedures, as defined under the rules adopted by the U.S. Securities and Exchange Commission (SEC) and the Canadian securities regulatory authorities, and have concluded that the Bank’s disclosure controls and procedures are effective.
Internal control over financial reporting
Management of the Bank is responsible for establishing and maintaining adequate internal control over financial reporting. These controls include policies and procedures that:
| • | | pertain to the maintenance of records that, in reasonable detail, accurately and fairly reflect the transactions and dispositions of the assets of the Bank; |
| • | | provide reasonable assurance that transactions are recorded as necessary to permit preparation of financial statements in accordance with International Financial Reporting Standards (IFRS) as issued by the International Accounting Standards Board (IASB), and that receipts and expenditures are being made only in accordance with authorizations of management and directors of the Bank; and |
| • | | provide reasonable assurance regarding prevention or timely detection of unauthorized acquisition, use or disposition of the Bank’s assets that could have a material effect on the financial statements. |
All control systems contain inherent limitations, no matter how well designed. As a result, the Bank’s management acknowledges that its internal control over financial reporting will not prevent or detect all misstatements due to error or fraud. In addition, management’s evaluation of controls can provide only reasonable, not absolute, assurance that all control issues that may result in material misstatements, if any, have been detected.
Management assessed the effectiveness of internal control over financial reporting, using the Internal Control-Integrated Framework 2013 issued by the Committee of Sponsoring Organizations of the Treadway Commission (COSO), and based on that assessment concluded that internal control over financial reporting was effective as at October 31, 2016.
Changes in internal control over financial reporting
There have been no changes in the Bank’s internal control over financial reporting that have materially affected, or are reasonably likely to materially affect, the Bank’s internal control over financial reporting during the year ended October 31, 2016.
Critical Accounting Estimates
The Bank’s accounting policies are integral to understanding and interpreting the financial results reported in this annual report. Note 3 summarizes the significant accounting policies used in preparing the Bank’s consolidated financial statements. Certain of these policies require management to make estimates, assumptions and subjective judgements that are difficult, complex, and often relate to matters that are inherently uncertain. The policies discussed below are considered to be particularly important to the presentation of the Bank’s financial position and results of operations, because changes in the estimates, assumptions and judgements could have a material impact on the Bank’s consolidated financial statements. These estimates, assumptions and judgements are adjusted in the normal course of business to reflect changing underlying circumstances.
Allowance for credit losses
The allowance for credit losses represents management’s best estimate of the probable credit losses in the portfolio of deposits with other institutions, loans to borrowers and acceptances. Management undertakes regular reviews of credit quality to assess the adequacy of the allowance for credit losses. This process requires the use of estimates, assumptions and subjective judgements at many levels. These subjective judgements include identifying credits that are impaired, and considering factors specific to individual credits, as well as portfolio characteristics and risks. Changes to these estimates or use of other reasonable judgements and estimates could directly affect the provision for credit losses.
The allowance for credit losses is comprised of collective and individually assessed allowances.
Allowances in respect of individually significant credit exposures are an estimate of probable incurred losses related to existing impaired loans. In establishing these allowances applicable to individual credit exposures, management individually assesses each loan for objective indicators of impairment and forms a judgement as to whether the loan is impaired. Loan impairment is recognized when, in management’s opinion, there is no longer reasonable assurance that interest and principal payments will be collected based on original contractual terms. Once a loan is determined to be impaired, management estimates its net realizable value by making judgements relating to the timing of future cash flow amounts, the fair value of any underlying security pledged as collateral, costs of realization, observable market prices, and expectations about the future prospects of the borrower and any guarantors.
Individual provisions were higher in 2016 than in 2015 across all business lines.
Management estimates allowances on a collective basis for exposures in certain homogenous portfolios, including residential mortgages, credit card loans and most personal loans. This collective assessment for these positions involves estimating the probable losses inherent in the portfolio by using a formulaic method that considers recent loss experience.
An allowance is also determined in respect of probable incurred losses that are inherent in the portfolio, of performing loans, but have not yet been specifically identified on an individual basis. Management establishes this allowance on a collective basis through an assessment of quantitative and qualitative factors. Using an internally developed methodology, management arrives at an initial quantitative estimate of the collective allowance for the performing portfolio based on numerous factors, including historical average default probabilities, loss given default rates and exposure at default
2 0 1 6 S C O T I A B A N K A N N U A L R E P O R T | 99
MANAGEMENT’S DISCUSSION AND ANALYSIS
factors. Material changes in any of these parameters or assumptions would affect the range of expected credit losses and, consequently, could affect the collective allowance level. For example, if either the probability of default or the loss given default rates for the non-retail portfolio were independently increased or decreased by 10%, the methodology would indicate an increase or decrease to the quantitative estimate of approximately $71 million (2015 – $73 million).
A qualitative assessment of the collective allowance is made based on observable data, such as: economic trends and business conditions, portfolio concentrations, risk migrations and recent trends in volumes and severity of delinquencies, and a component for the imprecision inherent in the methodology and parameters. Management reviews the collective allowance quarterly to assess whether the allowance is at the appropriate level in relation to the size of the portfolio, inherent credit risks and trends in portfolio quality.
The total collective allowance for credit losses as at October 31, 2016, was $3,498 million, an increase of $238 million from a year earlier. This year included an increase in collective allowance against performing loans of $50 million primarily related to the energy sector. Of the collective allowance amount, $662 million is attributable to business and government performing loans (2015 - $644 million), with the remainder allocated to personal lending and credit cards of $2,258 million (2015 - $1,941 million) and residential mortgages of $578 million (2015 - $675 million). These amounts for personal lending and credit cards, and for residential mortgages include allowances for both performing and impaired loans.
As noted above, the individual allowance for credit losses for personal loans, credit cards and mortgages is formula-based and also reflects incurred but not yet identified losses.
Fair value of financial instruments
All financial instruments are measured at fair value on initial recognition. Subsequent measurement of a financial instrument depends on its classification. Non-trading loans and receivables, certain securities and most financial liabilities are carried at amortized cost unless classified or designated as fair value through profit or loss or available-for-sale at inception. All other financial instruments, including those designated as fair value through profit or loss at inception, are carried at fair value.
Fair value of a financial asset or liability is the price that would be received to sell an asset or paid to transfer a liability in an orderly transaction between market participants in the principal, or in its absence, the most advantageous market to which the Bank has access at the measurement date.
The best evidence of fair value for a financial instrument is the quoted price in an active market. Quoted market prices represent a Level 1 valuation. Quoted prices are not always available for over-the-counter transactions, as well as transactions in inactive or illiquid markets. In these instances, internal models that maximize the use of observable inputs are used to estimate fair value. The chosen valuation technique incorporates all the factors that market participants would take into account in pricing a transaction. When all significant inputs are observable, the valuation is classified as Level 2. Financial instruments traded in a less active market have been valued using indicative market prices, present value of cash-flows or other valuation techniques. Fair value estimates normally do not consider forced or liquidation sales. Where financial instruments trade in inactive markets or when using models where observable parameters do not exist, greater management judgement is required for valuation purposes. Valuations that require the significant use of unobservable inputs are considered Level 3. The calculation of estimated fair value is based on market conditions at a specific point in time and therefore may not be reflective of future fair values.
The Bank has controls and processes in place to ensure that the valuation of financial instruments is appropriately determined. Global Risk Management (GRM) is responsible for the design and application of the Bank’s risk management framework. GRM is independent from the Bank’s business units and is overseen by Executive Management and the Board of Directors. Senior management committees within GRM oversee and establish standards for risk management processes that are critical in ensuring that appropriate valuation methodologies and policies are in place for determining fair value.
Where possible, valuations are based on quoted prices or observable inputs obtained from active markets. GRM oversees a monthly Independent Price Verification (IPV) process in order to assess the reliability and accuracy of prices and inputs used in the determination of fair value. The IPV process is performed by price verification groups that are independent from the business. The Bank maintains an approved list of pricing sources that are used in the IPV process. These sources include, but are not limited to, brokers, dealers and consensus pricing services. The valuation policies relating to the IPV process require that all pricing or rate sources used be external to the Bank. On a periodic basis, an independent assessment of pricing or rate sources is also performed by GRM to determine market presence or market representative levels.
Where quoted prices are not readily available, such as for transactions in inactive or illiquid markets, internal models that maximize the use of observable inputs are used to estimate fair value. An independent senior management committee within GRM oversees the vetting, approval and ongoing validation of valuation models used in determining fair value. Risk policies associated with model development are approved by Executive Management and/or key risk committees.
In determining fair value for certain instruments or portfolios of instruments, valuation adjustments or reserves may be required to arrive at a more accurate representation of fair value. The Bank’s policy of applying valuation reserves to a portfolio of instruments is approved by a senior management committee. These reserves include adjustments for credit risk, bid-offer spreads, unobservable parameters, constraints on prices in inactive or illiquid markets and when applicable funding costs. The methodology for the calculation of valuation reserves are reviewed at least annually by senior management.
Valuation adjustments recorded against the fair value of financial assets and financial liabilities totaled $119 million as at October 31, 2016, (2015 – $27 million), net of any write-offs. These valuation adjustments are due mainly to credit risk considerations and bid-offer spreads on derivative transactions.
As at October 31, 2016, a funding valuation adjustment (FVA) of $92 million pre-tax (2015 – $42 million) was recorded relating to uncollateralized derivative instruments.
The Bank discloses the classification of all financial instruments carried at fair value in a hierarchy based on the determination of fair value. The valuation hierarchy is as follows:
| • | | Level 1 – fair value is based on unadjusted quoted prices in active markets for identical instruments, |
| • | | Level 2 – fair value is based on models using significant market-observable inputs other than quoted prices for the instruments, or |
| • | | Level 3 – fair value is based on models using significant inputs that are not based on observable market data. |
100 | 2 0 1 6 S C O T I A B A N K A N N U A L R E P O R T
MANAGEMENT’S DISCUSSION AND ANALYSIS | CONTROLS AND ACCOUNTING POLICIES
The Bank’s assets and liabilities which are carried at fair value as classified by the valuation hierarchy are reflected in Note 6. The percentage of each asset and liability category by fair value hierarchy level are outlined as follows:
T58Fair value hierarchy of financial instruments carried at fair value
| | | | | | | | | | | | | | | | | | | | |
| | | Assets | | | Liabilities | |
Fair value hierarchy As at October 31, 2016 | | Trading
assets
(incl. precious
metals) | | | Available-
for-sale
securities | | | Derivatives | | | Obligations
related to
securities
sold short | | | Derivatives | |
Level 1 | | | 56% | | | | 62% | | | | 2% | | | | 85% | | | | 1% | |
Level 2 | | | 43% | | | | 36% | | | | 98% | | | | 15% | | | | 98% | |
Level 3 | | | 1% | | | | 2% | | | | –% | | | | –% | | | | 1% | |
| | | | 100% | | | | 100% | | | | 100% | | | | 100% | | | | 100% | |
Impairment of investment securities
Investment securities are evaluated for impairment at the end of each reporting date, or more frequently, if events or changes in circumstances indicate the existence of objective evidence of impairment.
In the case of equity instruments classified as available-for-sale, a significant or prolonged decline in the fair value of the security below its original cost is considered in determining whether impairment exists. In the case of debt instruments classified as available-for-sale and held-to-maturity investment securities, the criteria for assessment of impairment is consistent with the criteria for impairment of loans.
When a decline in value of available-for-sale debt or equity instrument is due to impairment, the value of the security is written down to fair value. The losses arising from impairment are reclassified from accumulated other comprehensive income and included in net gain on investment securities within other operating income in the Consolidated Statement of Income.
The losses arising from impairment of held-to-maturity investment securities are recognized in net gain on investment securities within other operating income in the Consolidated Statement of Income.
Reversals of impairment losses on available-for-sale debt instruments resulting from increases in fair value related to events occurring after the date of impairment are included in net gain on investment securities within other operating income in the Consolidated Statement of Income, to a maximum of the original impairment charge. Reversals of impairment on available-for-sale equity instruments are not recognized in the Consolidated Statement of Income; increases in fair value of such instruments after impairment are recognized in equity.
Reversals of impairment losses on held-to-maturity investment securities are included in net gain on investment securities within other operating income in the Consolidated Statement of Income, to a maximum of the amortized cost of the investment before the original impairment charge.
As at October 31, 2016, the gross unrealized gains on available-for-sale securities recorded in accumulated other comprehensive income were $740 million (2015 – $1,058 million), and the gross unrealized losses were $285 million (2015 – $291 million). Net unrealized gains were therefore $455 million (2015 – $767 million) before hedge amounts. The net unrealized gains after hedge amounts were $26 million (2015 – $267 million).
At October 31, 2016, the unrealized loss recorded in accumulated other comprehensive income relating to securities in an unrealized loss position for more than 12 months was $206 million (2015 – $191 million). This unrealized loss was comprised of $11 million (2015 – $24 million) in debt securities, $160 million (2015 – $164 million) related to preferred shares and $35 million (2015 – $3 million) related to common shares. The unrealized losses on the debt securities arose primarily from changes in interest rates and credit spreads. For debt securities, based on a number of considerations, including underlying credit of the issuers, the Bank expects that future interest and principal payments will continue to be received on a timely basis in accordance with the contractual terms of the security.
Employee benefits
The Bank sponsors various pension and other benefit plans for eligible employees in Canada, the U.S., and other international operations. The pension benefits are generally based on years of service and average earnings at retirement. Other benefits generally include post-retirement health care, dental care and life insurance, along with other long-term employee benefits such as long-term disability.
Employee benefit expense and the related benefit obligation are calculated using actuarial methods and certain actuarial assumptions. These assumptions are based on management’s best estimate and are reviewed and approved annually. The management assumptions with the greatest potential impact are the discount rates. These rates are used for measuring the benefit obligation, service cost and interest cost. The discount rate used to determine the defined benefit obligation is based on the yield at the reporting date on high quality corporate bonds that have durations that match the terms of the Bank’s obligations. Prior to 2016, the discount rate used to determine the annual benefit expense was the same as the rate used to determine the defined benefit obligation. Beginning in 2016, separate discount rates were used to determine the annual benefit expense in Canada and the U.S. These rates were determined with reference to the yields on high quality corporate bonds with durations that match the various components of the annual defined benefit expense. The discount rate used to determine the annual benefit expense for all other plans continues to be same as the rate used to determine the defined benefit obligation. If the assumed discount rates were 1% lower, the benefit expense for 2016 would have been $116 million higher. Other key assumptions include future compensation, health care costs, employee turnover, retirement age and mortality. When making these estimates, management considers expectations of future economic trends and business conditions, including inflation rates as well as other factors, such as plan specific experience and best practices.
The Bank uses a measurement date of October 31, and based on this measurement date, the Bank reported a deficit of $1,369 million in its principal pension plans as at October 31, 2016, as disclosed in Note 27 to the consolidated financial statements.
Actual experience that differs from assumptions made by management will result in a net actuarial gain or loss recognized immediately in other comprehensive income.
Note 27 contains details of the Bank’s employee benefit plans, such as the disclosure of pension and other benefit amounts, management’s key assumptions, and a sensitivity analysis of changes in these assumptions on the employee benefit obligation and expense.
Corporate income taxes
Management exercises judgment in determining the provision for income taxes and deferred income tax assets and liabilities. The provision is based on management’s expectations regarding the income tax consequences of transactions and events during the period. Management interprets the tax
2 0 1 6 S C O T I A B A N K A N N U A L R E P O R T | 101
MANAGEMENT’S DISCUSSION AND ANALYSIS
legislation for each jurisdiction in which the Bank operates and makes assumptions about the expected timing of the reversal of deferred income tax assets and liabilities. If management’s interpretations of the legislation differ from those of the tax authorities or if the actual timing of the reversals of the deferred income tax assets and liabilities is not as anticipated, the provision for income taxes could increase or decrease in future periods.
Total deferred tax assets related to the Bank’s unused income tax losses from operations arising in prior years were $484 million as at October 31, 2016 (2015 – $539 million). The tax related to temporary differences, unused tax losses and unused tax credits for which no deferred tax asset is recognized in the Consolidated Statement of Financial Position amounted to $55 million (2015 – $166 million). The amount related to unrecognized tax losses was $14 million, which will expire as follows: $13 million in 2018 and beyond and $1 million have no fixed expiry date.
The Bank maintains provisions for uncertain tax positions that it believes appropriately reflect the risk of tax positions under discussion, audit, dispute, or appeal with tax authorities, or which are otherwise considered to involve uncertainty. These provisions are made using the Bank’s best estimate of the amount expected to be paid based on an assessment of all relevant factors, which are reviewed at the end of each reporting period.
In November 2016 the Bank received a federal reassessment of $179 million for tax and interest as a result of the Canada Revenue Agency denying the tax deductibility of certain Canadian dividends received during the 2011 taxation year. The circumstances of the dividends subject to the reassessment are similar to those prospectively addressed by recently enacted rules which had been introduced in the 2015 Canadian federal budget. The Bank is confident that its tax filing position was appropriate and in accordance with the relevant provisions of the Income Tax Act (Canada), and intends to vigorously defend its position.
Note 26 of the 2016 consolidated financial statements contains further details with respect to the Bank’s provisions for income taxes.
Structured entities
In the normal course of business, the Bank enters into arrangements with structured entities on behalf of its customers and for its own purposes. These structured entities can be generally categorized as multi-seller commercial paper conduits, Bank funding vehicles and structured finance entities. Further details are provided in the off-balance sheet arrangements section.
Management is required to exercise judgement to determine whether a structured entity should be consolidated. This evaluation involves understanding the arrangements, determining whether decisions about the relevant activities are made by means of voting rights or other contractual arrangements and determining whether the Bank controls the structured entity.
The Bank controls an investee when it is exposed, or has rights, to variable returns from its involvement with the investee and has the ability to affect those returns through its power over the investee. The three elements of control are:
| • | | power over the investee; |
| • | | exposure, or rights, to variable returns from involvement with the investee; and |
| • | | the ability to use power over the investee to affect the amount of the investor’s returns. |
This definition of control applies to circumstances:
| • | | when voting rights or similar rights give the Bank power, including situations where the Bank holds less than a majority of voting rights or involving potential voting rights; |
| • | | when an investee is designed so that voting rights are not the dominant factor in deciding who controls the investee (i.e., relevant activities are directed by contractual arrangements); |
| • | | involving agency relationships; and |
| • | | when the Bank has control over specified assets of an investee. |
The Bank does not control an investee when it is acting in an agent’s capacity. The Bank assesses whether it is an agent by determining whether it is primarily engaged to act on behalf and for the benefit of another party or parties. Factors that the Bank considers in this assessment include the scope of its decision-making authority over the investee, the rights held by other parties, the remuneration to which it is entitled, and the Bank’s exposure to variability of returns from other interests that it holds in the investee.
The analysis uses both qualitative and quantitative analytical techniques and involves the use of a number of assumptions about the business environment in which the structured entity operates and the amount and timing of future cash flows.
The Bank reassesses whether it controls an investee if facts and circumstances indicate that one or more of the three elements of control change.
Management is required to exercise judgement to determine if a change in control event has occurred.
During 2016, there were no change in control events that caused the Bank to change its control conclusion of its multi-seller conduits or other structured entities.
As described in Note 14 to the consolidated financial statements and in the discussion of off-balance sheet arrangements, the Bank does not control the two Canadian-based multi-seller conduits that it sponsors and they are not required to be consolidated on the Bank’s Consolidated Statement of Financial Position. The Bank controls its U.S.-based multi-seller conduit and consolidates it on the Bank’s Consolidated Statement of Financial Position.
Goodwill
For the purpose of impairment testing, goodwill acquired in a business combination is, on the acquisition date, allocated to each of the Bank’s group of cash-generating units (CGU) that are expected to benefit from the particular acquisition.
Goodwill is not amortized but tested for impairment annually and when circumstances indicate that the carrying value may be impaired.
Goodwill is reviewed at each reporting date to determine whether there is any indication of impairment. Each CGU to which goodwill is allocated for impairment testing purposes reflects the lowest level at which goodwill is monitored for internal management purposes.
The Bank determines the carrying value of the CGU using a regulatory capital approach based on credit, market, and operational risks, and leverage, consistent with the Bank’s capital attribution for business line performance measurement. An impairment loss is recognized if the carrying amount of a CGU exceeds its recoverable amount. The recoverable amount is the greater of fair value less costs of disposal and value in use. If either fair value less costs of disposal or value in use exceeds the carrying amount, there is no need to determine the other. The recoverable amount for the CGU has been determined using the fair value less costs of disposal method. In arriving at such value an appropriate valuation model is used which considers various factors including normalized net income, price earnings multiples and control premium. These calculations are corroborated by valuation multiples, quoted share prices for publicly traded subsidiaries or other available fair value indicators. An impairment loss, in respect of goodwill, is not reversed.
102 | 2 0 1 6 S C O T I A B A N K A N N U A L R E P O R T
MANAGEMENT’S DISCUSSION AND ANALYSIS | CONTROLS AND ACCOUNTING POLICIES
Significant judgement is applied in determining the recoverable amounts of the CGU and assessing whether certain events or circumstances constitute objective evidence of impairment.
Goodwill was assessed for annual impairment based on the methodology as at July 31, 2016, and no impairment was determined to exist.
Indefinite life intangible assets
Intangible assets with indefinite useful lives are not amortized but tested for impairment annually and when circumstances indicate that the carrying value may be impaired. Intangible assets are reviewed at each reporting date to determine whether there is any indication of impairment.
The recoverable amount is the greater of fair value less costs of disposal and value in use. If either fair value less costs of disposal or value in use exceeds the carrying amount, there is no need to determine the other. Value in use method is used by the Bank to determine the recoverable amount of the intangible asset. In determining value in use, an appropriate valuation model is used which considers factors such as management-approved cash flow projections, discount rate and terminal growth rate. An impairment loss is recognized if the carrying amount of the intangible asset exceeds its recoverable amount. Impairment losses recognized in prior periods are reassessed at each reporting period for any indication that the loss has decreased or no longer exists. An impairment loss is reversed if there has been a change in the estimates used to determine the recoverable amount. An impairment loss is reversed only to the extent that the intangible asset’s carrying amount does not exceed the carrying amount that would have been determined if no impairment loss had been recognized.
The recoverable amount is significantly impacted by the discount rate and the terminal value. Significant judgement is applied in determining the intangible asset’s recoverable amount and assessing whether certain events or circumstances constitute objective evidence of impairment.
Intangible assets were assessed for annual impairment based on the methodology as at July 31, 2016, and no impairment was determined to exist.
Provisions
According to IFRS, the Bank should recognize a provision if, as a result of a past event, the Bank has a present legal or constructive obligation that can be estimated reliably, and it is probable that an outflow of economic benefits will be required to settle the obligation. Probable in this context means more likely than not.
Off-balance sheet credit risks
The provisions for off-balance sheet credit risks relates primarily to off-balance sheet credit risks such as undrawn lending commitments, letters of credit and letters of guarantee. These are collectively assessed in a manner consistent with the collective allowance for performing on-balance sheet credit risks.
Restructuring
Certain of the Banks provisions relate to restructuring as part of the Bank’s efforts to enhance the customer experience, drive digital transformation and improve productivity. Restructuring provisions are primarily related to employee severance and require managements best estimate of the amount required to settle the obligation. Uncertainty exists with respect to when the obligation will be settled and the amounts ultimately paid, as this will largely depend upon individual facts and circumstances. The restructuring provision is expected to be utilized in line with the approved plans; the actual utilization will be assessed quarterly and may lead to changes in the provision amount recorded.
Litigation and other
In the ordinary course of business, the Bank and its subsidiaries are routinely defendants in, or parties to a number of pending and threatened legal actions and regulatory proceedings, including actions brought on behalf of various classes of claimants. In view of the inherent difficulty of predicting the outcome of such matters, the Bank cannot state what the eventual outcome of such matters will be. However, based on current knowledge, management does not believe that liabilities, if any, arising from pending litigation or regulatory proceedings will have a material adverse effect on the Consolidated Statement of Financial Position or results of operations of the Bank.
Legal provisions are established when it becomes probable that the Bank will incur an expense related to a legal action and the amount can be reliably estimated. Such provisions are recorded at the best estimate of the amount required to settle any obligation related to these legal actions as at the balance sheet date, taking into account the risks and uncertainties surrounding the obligation. Management and internal and external experts are involved in estimating any amounts that may be required. The actual costs of resolving these claims may vary significantly from the amount of the legal provisions. The Bank’s estimate involves significant judgement, given the varying stages of the proceedings, the fact that the Bank’s liability, if any, has yet to be determined and the fact that the underlying matters will change from time to time. As such, there is a possibility that the ultimate resolution of those legal actions may be material to the Bank’s consolidated results of operations for any particular reporting period.
Future Accounting Developments
The Bank actively monitors developments and changes in accounting standards from the IASB as well as regulatory requirements from the Canadian Securities Administrators and OSFI.
Effective November 1, 2017
IFRS 9Financial instruments
On July 24, 2014, the IASB issued IFRS 9Financial Instruments(“the Standard”), which will replace IAS 39. The Standard covers three broad topics: Classification and Measurement, Impairment and Hedging. In line with OSFI’s advisory, all Canadian D-SIBs, including the Bank are required to early adopt IFRS 9 effective November 1, 2017.
In June 2016, OSFI issued “IFRS 9 Financial Instruments and Disclosures” which provides guidance on the application of IFRS 9 that is consistent with the BCBS guidance issued in 2015.
In light of IASB and FASB’s new standards on expected credit loss (“ECL”) accounting, the Basel Committee appointed the Task Force on Provisioning (TFP) to consider the implications of this change in accounting for regulatory capital. The TFP published in October 2016:
| | • | | A Consultative Document outlining the Committee’s proposal in the interim along with possible transitional arrangements – this document proposes to retain in the interim the current regulatory treatment of provisions in each jurisdiction. There are three approaches that all propose to transition the impact over a number of years. |
| | • | | The TFP also issued for discussion a document that assesses regulatory capital policy options for the longer-term. |
Governance and project management
The adoption of IFRS 9 is a significant initiative for the Bank that commenced in 2014, involving substantial finance, risk management and technology resources. The project is managed through a governance structure that includes an Executive Steering Committee (EC) comprised of senior levels of management from risk management, finance, technology, and the business units. Periodic reporting on the progress against plan is provided to the Executive Steering committee and Bank senior management.
2 0 1 6 S C O T I A B A N K A N N U A L R E P O R T | 103
MANAGEMENT’S DISCUSSION AND ANALYSIS
To date, as per the plan, the Bank’s efforts have largely been focused on updating accounting policies to address key aspects of the Standard, developing risk models and associated methodologies, and conducting training sessions to impacted internal stakeholders. The Bank will complete the development and validation of the impairment models for the calculation of expected credit losses in 2017 to support a parallel run during 2017. The Bank will update accounting policy manuals, internal control documents, implement changes to business and financial reporting processes and systems, and enhance the Bank’s existing governance process to support the high quality implementation of the Standard by November 1, 2017.
The following is a summary of some of the more significant items that are likely to be important in understanding the impact of the implementation of IFRS 9:
Classification and measurement, and hedging
The Standard introduces new requirements to determine the measurement basis of financial assets, involving the cash flow characteristics of assets and the business models under which they are managed. Accordingly, the basis of measurement for the Bank’s financial assets may change. The Bank is currently completing detailed reviews of its business models and the cash flow characteristics of its portfolio holdings. This Standard affects the accounting for available-for-sale equity securities, requiring a designation, by portfolio, between recording both unrealized and realized gains either through (i) OCI or (ii) Income Statement. As a result, the amount of equity securities gains recorded through income is expected to be lower than current levels and levels recorded in recent years. For other financial instruments, based on assessments completed to date, the Bank does not expect the implementation will result in a significant change in the classification and measurement of the Bank’s financial assets, between Amortized cost, Fair Value through OCI and Fair Value through Income Statement.
The Standard expands the scope of eligible hedged items and aims to better align the accounting with risk management activities. The Bank is permitted to adopt the hedge accounting requirements of IFRS 9 concurrently or to defer the adoption of the hedge accounting requirements of the standard to a future period. The Bank is currently considering deferring the adoption of these requirements, although it will implement the revised hedge accounting disclosures.
Impairment
The adoption of IFRS 9 will have a significant impact on the Bank’s impairment methodology. The IFRS 9 expected credit loss (ECL) model is forward looking compared to the current incurred loss approach. Expected credit losses under IFRS 9 are the present value of all cash shortfalls related to default events either (i) over the following twelve months or (ii) over the expected life of a financial instrument depending on credit deterioration from inception. ECL should reflect an unbiased, probability-weighted outcome as opposed to the single best estimate allowed under the current approach. The probability-weighted outcome considers multiple scenarios based on reasonable and supportable forecasts.
The Bank’s approach leverages the existing regulatory capital models and processes to the extent possible. New models and systems are being developed to meet the requirements of IFRS 9. While most of the Bank’s loan portfolios use the existing Advanced Internal Ratings Based (AIRB) credit models for Basel purposes and can be leveraged for developing IFRS 9 models, for other Standardized portfolios the Bank will develop new methodologies and models taking into account the relative size, quality and complexity of the portfolios.
IFRS 9 considers the calculation of ECL by multiplying the Probability of default (PD), Loss Given Default (LGD) and Exposure at Default (EAD).
IFRS 9 Impairment model uses a three stage approach based on the extent of credit deterioration since origination:
Stage 1 – 12-month ECL applies to all financial assets that have not experienced a significant increase in credit risk (SIR) since origination and are not credit impaired. The ECL will be computed using a 12-month PD that represents the probability of default occurring over the next 12 months or less in line with the maturity profile of the asset. This is different than the current approach which estimates a collective allowance to recognize losses that have been incurred but not reported on performing loans.
Stage 2 – When a financial asset experiences a SIR since origination but is not credit impaired, it is considered to be in Stage 2. This requires the computation of ECL based on lifetime PD that represents the probability of default occurring over the remaining lifetime of the financial asset. Provisions are higher in this stage because of an increase in risk and the impact of a longer time horizon being considered compared to 12 months in Stage 1.
Stage 3 – Financial assets that have an objective evidence of impairment will be included in this stage. Similar to stage 2, the allowance for credit losses will continue to capture the lifetime expected credit losses for such loans. As the Bank’s definition of default is not likely to change materially and will align with the regulatory definition, the treatment of loans in stage 3 remains substantially the same as the current treatment of impaired loans under IAS 39.
Some of the key concepts in IFRS 9 that have the most significant impact and require a high level of judgement are:
Assessment of Significant Increase in Credit Risk
The assessment of a significant increase in credit risk is done on a relative basis. To assess whether the credit risk on a financial asset has increased significantly since origination, the Bank will compare the risk of default at the reporting date to the risk of default at origination, using key risk indicators that are used in the Bank’s existing risk management processes. At each reporting date, the assessment of a change in credit risk will be individually assessed for those considered individually significant and at the segment level for retail exposures. This assessment is symmetrical in nature, allowing credit risk of financial assets to move back to Stage 1 if the increase in credit risk since origination has reduced and is no longer deemed to be significant.
Macroeconomic Factors, Forward Looking Information (FLI) and Multiple Scenarios
IFRS 9 requires an unbiased and probability weighted estimate of credit losses by evaluating a range of possible outcomes that incorporates forecasts of future economic conditions.
Macroeconomic factors and FLI are required to be incorporated into the measurement of ECL as well as the determination of whether there has been a significant increase in credit risk since origination. Measurement of ECLs at each reporting period should reflect reasonable and supportable information at the reporting date about past events, current conditions and forecasts of future economic conditions. The assessment of whether there has been a SIR is to be performed at each reporting date.
The Bank will use multiple scenarios that will be probability weighted to determine ECL, leveraging its existing Enterprise Wide Stress Testing modeling framework.
Expected Life
When measuring ECL, the Bank must consider the maximum contractual period over which the Bank is exposed to credit risk. All contractual terms should be considered when determining the expected life, including prepayment options and extension and rollover options.
104 | 2 0 1 6 S C O T I A B A N K A N N U A L R E P O R T
MANAGEMENT’S DISCUSSION AND ANALYSIS | CONTROLS AND ACCOUNTING POLICIES
For certain revolving credit facilities, such as credit cards which qualify for a narrow exception under IFRS 9, the expected life is extended beyond the contractual period and is estimated based on the period over which the Bank is exposed to credit risk and where the credit losses would not be mitigated by management actions.
Definition of Default and Write-off
The Bank’s definition of default described in Note 3 is not expected to be materially different and will align with the regulatory definition of default upon implementation of IFRS 9. The Bank does not expect to rebut the presumption in IFRS 9 that loans which are 90 days past due are in default for retail loans. The policy on the write-off of loans is expected to remain unchanged.
The main adjustments to the regulatory capital risk components are summarized in the following chart:
| | | | |
| | | Regulatory capital | | IFRS 9 |
PD | | Through the cycle (represents long-run average PD throughout a full economic cycle) 12 month PD is used. | | Point in time (based on current conditions, adjusted to take into account estimates of future conditions that will impact PD). 12 month PD for Stage 1 ECL and Lifetime PD for Stage 2 and Stage 3 ECL. |
LGD | | Downturn LGD based on losses that would be expected in an economic downturn and subject to certain regulatory floors. Both direct and indirect collection costs are considered. | | Expected LGD based on historical charge-off events and recovery payments, current information about attributes specific to borrower, and direct costs. Forward-looking macroeconomic variables and expected cash flows from credit enhancements will be incorporated as appropriate and excludes floors and undue conservatism. |
EAD | | Based on the drawn balance plus expected utilization of any undrawn portion prior to default, and cannot be lower than the drawn balance. | | EAD represents the expected balance at default over the lifetime and is conditional on forward looking expectations. |
Discounting factors | | Not applicable | | Expected credit losses are discounted from default date to the reporting date |
Transition and impact
The new requirements will be applied retrospectively by adjusting the opening balance sheet for the transition impact at November 1, 2017 with no requirement to restate comparative periods. The impact of IFRS 9 on the Bank’s consolidated financial results at the time of adoption is dependent upon prevailing market factors and economic conditions at that time, as well as future forecasts of macro-economic factors and forward looking information. The Bank will disclose the impact on transition to the balance sheet and regulatory capital, when reliable estimates are available and this will be no later than in the annual report of 2017.
At transition, we expect the existing Collective Allowances against performing loans to contribute a significant component of allowance levels required for Stage 1 and Stage 2 assets under IFRS 9 at transition. The existing Specific Allowances and Collective Allowances against impaired loans should not change significantly for Stage 3 assets under IFRS 9 at transition. Under the existing accounting practice by the Bank, the change to Collective Allowance against performing loans is recorded in the Other business segment on a periodic basis as risk changes and/or if volumes change over a period of time. Under IFRS 9, the change in allowances on performing loans (Stage 1 and Stage 2) will now be recorded in the Bank’s three main business lines on a regular quarterly basis.
For a description of the changes in requirements please refer to Note 4 of the 2016 consolidated financial statements.
Effective November 1, 2018
Revenue from contracts with customers
On May 28, 2014, the IASB issued IFRS 15Revenue from Contracts with Customers, which provides a single principle based framework to be applied to all contracts with customers. IFRS 15 replaces the previous revenue standard IAS 18Revenue, and the related Interpretations on revenue recognition. The standard scopes out contracts that are considered to be lease contracts, insurance contracts and financial instruments, and as such will impact the businesses that earn fee and commission revenues. The new standard is a control based model as compared to the existing revenue standard which is primarily focused on risks and rewards. Under the new standard revenue is recognized when a customer obtains control of a good or service. Transfer of control occurs when the customer has the ability to direct the use of and obtain the benefits of the good or service. The standard is effective for the Bank on November 1, 2018, with early adoption permitted, using either a full retrospective approach or a modified retrospective approach. A majority of the Bank’s revenue generating instruments meet the definition of financial instruments and remain out of scope. The areas of focus for the Bank’s assessment will be fees and commission revenues from wealth management and other banking services.
On April 12, 2016, the IASB issued amendments to the revenue standard, IFRS 15Revenue From Contracts with Customers. The amendments provide additional clarification on the identification of a performance obligation in a contract, determining the principal and agent in an agreement, and determining whether the licensing revenues should be recognized at a point in time or over a specific period. The amendments also provide additional practical expedients upon transition to IFRS 15. The amendments are effective for the Bank on November 1, 2018, consistent with the effective date of the standard.
2 0 1 6 S C O T I A B A N K A N N U A L R E P O R T | 105
MANAGEMENT’S DISCUSSION AND ANALYSIS
Effective November 1, 2019
Leases
On January 13, 2016, the IASB issued IFRS 16Leases, which requires a lessee to recognize an asset for the right to use the leased item and a liability for the present value of its future lease payments. IFRS 16 will result in leases being recorded on the Bank’s balance sheet, including those currently classified as operating leases except for short-term leases and leases with low value of the underlying asset. IFRS 16 substantially carries forward the lessor accounting requirements in IAS 17.
IFRS 16 is effective for the Bank on November 1, 2019, with early adoption permitted from the date the Bank applies IFRS 15 Revenue from Contracts with Customers on or before the date of initial application of IFRS 16. On transition there are practical expedients available whereby the Bank will not need to reassess whether a contract is, or contains a lease, or reassess the accounting of sale leaseback transactions recognized prior to the date of initial application.
A lessee will apply IFRS 16 to its leases either retrospectively to each prior reporting period presented; or retrospectively with the cumulative effect of initially applying IFRS 16 being recognized at the date of initial application.
Regulatory Developments
The Bank continues to respond to global regulatory developments, such as capital and liquidity requirements under the Basel Committee on Banking Supervision global standards (Basel III), over-the-counter derivatives reform, consumer protection measures and specific financial reforms, such as theDodd-Frank Wall Street Reform and Consumer Protection Act (“Dodd-Frank Act”). The Bank continues to monitor these and other developments and is working to ensure business impacts, if any, are minimized.
Bank recapitalization regime
On June 22, 2016, the Federal Government passed legislation to implement a “bail-in” regime, in accordance with regulations to the Canada Deposit Insurance Corporation Act that have not yet been prescribed (the “CDIC Act Regulations”), for the largest six Canadian banks, including The Bank of Nova Scotia, designated as domestic systemically important banks (D-SIBs). The legislation aims to enhance the resolution toolkit for D-SIBs, including the framework for the conversion of certain eligible shares and liabilities of the D-SIB into common equity of the bank (or any of its affiliates) in the event the D-SIB becomes non-viable. This bail-in regime is aimed at ensuring that in the unlikely event of a failure of a D-SIB, it is the D-SIB’s shareholders and creditors that are responsible for the institution’s risks and not the taxpayers. The types of eligible shares and liabilities subject to the statutory conversion power will be set out in the CDIC Act Regulations, and while these regulations have not yet been prescribed, in its previous consultation paper, the Federal Government had proposed that certain unsecured debt would be subject to the conversion power and customer deposits would be excluded. D-SIBs would also be subject to minimum loss absorbency requirements to ensure they can withstand significant losses and emerge from a conversion well capitalized, as well as comprehensive disclosure and reporting requirements. The regime would apply only to eligible shares and liabilities issued after the implementation of the proposed regime with no retroactive application to existing debt. The proposed “bail-in” regime has not yet been finalized, much of the detail will be set out in the CDIC Act Regulations, and timing for implementation has yet to be determined, but these proposed changes could adversely impact the Bank’s cost of funding.
Synthetic Equity Arrangement Rules
Proposed tax rules for synthetic equity arrangements, which impact the tax deductibility of Canadian dividends in certain circumstances, have been enacted. These rules are not expected to materially affect the Bank’s overall financial results.
Dodd-Frank Act
The Dodd-Frank Wall Street Reform and Consumer Protection Act (the “Dodd-Frank Act”) was enacted in the U.S. in July 2010. The Dodd-Frank Act contains many broad reforms impacting the financial services industry. These reforms impact every financial institution in the U.S. and many financial institutions that operate outside the U.S. Certain portions of the Dodd-Frank Act became effective immediately, and many are now effective following transition periods or final rulemakings, while the effectiveness of some other portions is still subject to final rulemakings by U.S. government agencies, or the expiration of transition periods.
The Bank is subject to a number of specific requirements, including, among other things, mandatory clearing, trade reporting and registration of OTC derivative trading activities, heightened capital liquidity and prudential standards, such as the enhanced prudential standards and early remediation requirements under Sections 165 and 166 of the Dodd-Frank Act, and restrictions on proprietary trading, private equity and hedge fund activities, commonly known as the Volcker Rule. The Bank continues to devote resources necessary to ensure that it implements the requirements in compliance with all applicable regulations under the Dodd-Frank Act. The Bank continually monitors developments to prepare for rulemakings that have the potential to impact its operations in the U.S. and elsewhere.
More recently, on April 14, 2016, the SEC adopted final rules requiring securities-based swap dealers (SBSDs) to establish a supervisory regime for their securities-based swaps activities, including designating a Chief Compliance Officer. The final rule also requires SBSDs to disclose risks, conflicts, and other material information about a swap to a counterparty, and ensure any recommendations made to a counterparty are suitable. Most recently, on August 12, 2016, the SEC adopted amendments and guidance related to rules regarding the regulatory reporting and public dissemination of security-based swap transactions, known as Regulation SBSR.
On May 31, 2016, the U.S. Commodity Futures Trading Commission (CFTC) issued a final rule establishing margin requirements for uncleared cross-border swaps (to the extent not already covered by its previously adopted uncleared swaps rules), and is expected to issue final rules on algorithmic trading by the end of 2016. The CFTC is also considering the adoption of final rules that would impose limits on the size of positions that may be entered into in certain derivatives contracts.
The Bank does not expect costs and restrictions associated with the new regulations to have a material impact on our financial results.
106 | 2 0 1 6 S C O T I A B A N K A N N U A L R E P O R T
MANAGEMENT’S DISCUSSION AND ANALYSIS | CONTROLS AND ACCOUNTING POLICIES
Over-the-counter derivatives reform
In March 2015, the Basel Committee on Banking Supervision and the International Organization of Securities Commissions published a framework establishing minimum standards for margin requirements for non-centrally cleared derivatives for financial firms and systemically important non-financial entities (“BCBS Framework”). On February 29, 2016, the Office of the Superintendent of Financial Institutions (“OSFI”) issued the final version of Guideline E-22 to implement the BCBS Framework for federally regulated financial institutions. The Guideline is effective September 1, 2016 with compliance to be phased in over the next four years in accordance with the BCBS Framework. The regulatory dates for the Bank are March 1, 2017 for variation margin and September 1, 2019 for initial margin. Margin requirements are designed to be coordinated with the rules established in the U.S., the European Union and other relevant jurisdictions with respect to cross-border activities. The Bank expects to meet all obligations imposed by the Guideline as the relevant requirements come into effect.
The Foreign Account Tax Compliance Act (FATCA) and Common Reporting Standard (CRS)
FATCA is U.S. legislation designed to prevent U.S. taxpayers from using accounts held outside of the U.S. to evade taxes. FATCA and in some countries, related local regulations now require financial institutions to report annually on specified accounts held outside of the U.S. by U.S. taxpayers. This reporting is made available to the U.S. Internal Revenue Service either directly or through local regulatory agencies. Under an initiative known as Global FATCA, more than 100 OECD member countries have committed to automatic exchange of information relating to accounts held by tax residents of signatory countries, using a CRS. Implementation of the CRS commenced in January 2016 in countries that signed on as “early adopters.” Draft legislation to implement the CRS in Canada was released by the Department of Finance on October 14, 2016. More than 40 countries where the Bank has a presence have now signed on to the CRS, and 17 of these signed on as early adopters. Under the guidance of an enterprise program office, dedicated project teams in each of the Bank’s business lines are working to meet all FATCA and CRS related obligations worldwide while minimizing negative impact on the client experience.
The Bank will meet all obligations imposed under FATCA, CRS, and other tax information exchange regimes, in accordance with local law.
United Kingdom’s Membership in the European Union (Brexit)
On June 23, 2016, the United Kingdom (UK) held a referendum to decide on its membership in the European Union. The resulting vote was to leave the European Union. There are a number of uncertainties in connection with the future of the UK and its relationship with the European Union, including the terms of the agreement it reaches in relation to its withdrawal from the European Union. The negotiation of the UK’s exit terms is likely to take a number of years. Until the terms and timing of the UK’s exit from the European Union are clearer, it is not possible to determine the longer term impact that the referendum, the UK’s departure from the European Union and/or any related matters may have on the Bank or its business. UK’s exit from the European Union may result in significant changes in law, which may include changes in statutory, tax and regulatory regimes in the UK and in Europe. Such changes may impact the Bank’s business, financial condition and results of operations and could adversely impact the Bank’s cost of funding in Europe. The Bank continually monitors developments to prepare for changes that have the potential to impact its operations in the UK and elsewhere in Europe.
Related Party Transactions
Compensation of key management personnel
Key management personnel are those persons having authority and responsibility for planning, directing and controlling the activities of the Bank, directly or indirectly, and comprise the directors of the Bank, the President and Chief Executive Officer, certain direct reports of the President and Chief Executive Officer and Group Heads.
T59Compensation of the Bank key management personnel
| | | | | | | | |
| | |
| For the year ended October 31 ($ millions) | | 2016 | | | 2015 | |
Salaries and cash incentives(1) | | $ | 20 | | | $ | 13 | |
Equity-based payment(2) | | | 24 | | | | 20 | |
Pension and other benefits(1) | | | 3 | | | | 3 | |
Total | | $ | 47 | | | $ | 36 | |
| (1) | Expensed during the year. |
| (2) | Awarded during the year. |
Directors can use some or all of their director fees earned to buy common shares of the Bank at market rates through the Directors’ Share Purchase Plan. Non-officer directors may elect to receive all or a portion of their fees in the form of deferred stock units which vest immediately. Refer to Note 25 – Share-based payments for further details of these plans.
T60Loans and deposits of key management personnel
Loans are currently granted to key management personnel at market terms and conditions.
| | | | | | | | |
| | |
| As at October 31 ($ millions) | | 2016 | | | 2015 | |
Loans | | $ | 6 | | | $ | 5 | |
Deposits | | $ | 11 | | | $ | 5 | |
2 0 1 6 S C O T I A B A N K A N N U A L R E P O R T | 107
MANAGEMENT’S DISCUSSION AND ANALYSIS
The Bank’s committed credit exposure to companies controlled by directors totaled $99.5 million as at October 31, 2016 (October 31, 2015 – $182.9 million) while actual utilized accounts were $3.9 million (October 31, 2015 – $6.7 million).
Transactions with associates and joint ventures
In the ordinary course of business, the Bank provides normal banking services and enters into transactions with its associated and other related corporations on terms similar to those offered to non-related parties. If these transactions are eliminated on consolidation, they are not disclosed as related party transactions. Transactions between the Bank and its associated companies and joint ventures also qualify as related party transactions and are as follows:
T62Transactions with associates and joint ventures
| | | | | | | | |
| | |
| As at and for the year ended October 31 ($ millions) | | 2016 | | | 2015 | |
Net income / (loss) | | $ | (45 | ) | | $ | (27 | ) |
Loans | | | 788 | | | | 747 | |
Deposits | | | 338 | | | | 187 | |
Guarantees and commitments | | $ | 99 | | | $ | 84 | |
Scotiabank principal pension plan
The Bank manages assets of $1.9 billion (October 31, 2015 – $2.0 billion) which is a portion of the Scotiabank principal pension plan assets and earned $4 million (October 31, 2015 – $4 million) in fees.
Oversight and governance
The oversight responsibilities of the Audit and Conduct Review Committee (ACRC) with respect to related party transactions include reviewing policies and practices for identifying transactions with related parties that may materially affect the Bank, and reviewing the procedures for ensuring compliance with the Bank Act for related party transactions. The Bank Act requirements encompass a broader definition of related party transactions than is set out in IFRS. The Bank has various procedures in place to ensure that related party information is identified and reported to the ACRC on a semi-annual basis. The ACRC is provided with detailed reports that reflect the Bank’s compliance with its established procedures.
The Bank’s Internal Audit department carries out audit procedures as necessary to provide the ACRC with reasonable assurance that the Bank’s policies and procedures to identify, authorize and report related party transactions are appropriately designed and operating effectively.
108 | 2 0 1 6 S C O T I A B A N K A N N U A L R E P O R T
MANAGEMENT’S DISCUSSION AND ANALYSIS | SUPPLEMENTARY DATA
SUPPLEMENTARY DATA
Geographic information
T63 Net income by geographic segment
| | | | | | | | | | | | | | | | | | | | | | | | | | | | | | | | | | | | | | | | | | | | | | | | | | | | | | | | | | | | | | | | | | | | | | | | | | | | | | | | | | | | | | | | | | | | | | | | | | | | | | | | |
| | | |
| | | 2016 | | | 2015 | | | 2014 | |
| | | | | | | | | | | | | | | | | | | | | | | | | | |
For the fiscal years
($ millions) | | Canada | | | U.S. | | | Mexico | | | Peru | | | Chile | | | Colombia | | | Other
Inter-
national | | | Total | | | | | | Canada | | | U.S. | | | Mexico | | | Peru | | | Chile | | | Colombia | | | Other
Inter-
national | | | Total | | | | | | Canada | | | U.S. | | | Mexico | | | Peru | | | Chile | | | Colombia | | | Other
Inter-
national | | | Total | |
Net interest income | | $ | 7,022 | | | $ | 479 | | | $ | 1,224 | | | $ | 1,231 | | | $ | 763 | | | $ | 674 | | | $ | 2,950 | | | $ | 14,343 | | | | | | | $ | 6,458 | | | $ | 472 | | | $ | 1,246 | | | $ | 1,077 | | | $ | 554 | | | $ | 677 | | | $ | 2,631 | | | $ | 13,115 | | | | | | | $ | 6,219 | | | $ | 440 | | | $ | 1,180 | | | $ | 935 | | | $ | 407 | | | $ | 726 | | | $ | 2,443 | | | $ | 12,350 | |
Non-interest income | | | 6,893 | | | | 871 | | | | 554 | | | | 600 | | | | 325 | | | | 419 | | | | 2,409 | | | | 12,071 | | | | | | | | 6,272 | | | | 882 | | | | 561 | | | | 601 | | | | 231 | | | | 372 | | | | 2,163 | | | | 11,082 | | | | | | | | 7,071 | | | | 810 | | | | 599 | | | | 534 | | | | 226 | | | | 391 | | | | 2,049 | | | | 11,680 | |
Provision for credit losses | | | 876 | | | | 112 | | | | 225 | | | | 315 | | | | 113 | | | | 320 | | | | 401 | | | | 2,362 | | | | | | | | 728 | | | | 6 | | | | 260 | | | | 266 | | | | 108 | | | | 246 | | | | 268 | | | | 1,882 | | | | | | | | 662 | | | | 6 | | | | 240 | | | | 267 | | | | 74 | | | | 145 | | | | 309 | | | | 1,703 | |
Non-interest expenses | | | 7,339 | | | | 633 | | | | 1,121 | | | | 740 | | | | 605 | | | | 550 | | | | 3,036 | | | | 14,024 | | | | | | | | 6,936 | | | | 507 | | | | 1,160 | | | | 744 | | | | 431 | | | | 541 | | | | 2,745 | | | | 13,064 | | | | | | | | 6,986 | | | | 513 | | | | 1,154 | | | | 645 | | | | 348 | | | | 556 | | | | 2,495 | | | | 12,697 | |
Income tax expense | | | 1,235 | | | | 155 | | | | 69 | | | | 201 | | | | 45 | | | | 89 | | | | 497 | | | | 2,291 | | | | | | | | 1,038 | | | | 267 | | | | 27 | | | | 195 | | | | 24 | | | | 84 | | | | 401 | | | | 2,036 | | | | | | | | 1,156 | | | | 237 | | | | 35 | | | | 175 | | | | 16 | | | | 141 | | | | 340 | | | | 2,100 | |
Total | | $ | 4,465 | | | $ | 450 | | | $ | 363 | | | $ | 575 | | | $ | 325 | | | $ | 134 | | | $ | 1,425 | | | $ | 7,737 | | | | | | | $ | 4,028 | | | $ | 574 | | | $ | 360 | | | $ | 473 | | | $ | 222 | | | $ | 178 | | | $ | 1,380 | | | $ | 7,215 | | | | | | | $ | 4,486 | | | $ | 494 | | | $ | 350 | | | $ | 382 | | | $ | 195 | | | $ | 275 | | | $ | 1,348 | | | $ | 7,530 | |
Corporate adjustments | | | | | | | | | | | | | | | | | | | | | | | | | | | | | | | (369 | ) | | | | | | | | | | | | | | | | | | | | | | | | | | | | | | | | | | | (2 | ) | | | | | | | | | | | | | | | | | | | | | | | | | | | | | | | | | | | (232 | ) |
Net Income | | | | | | | | | | | | | | | | | | | | | | | | | | | | | | $ | 7,368 | | | | | | | | | | | | | | | | | | | | | | | | | | | | | | | | | | | $ | 7,213 | | | | | | | | | | | | | | | | | | | | | | | | | | | | | | | | | | | $ | 7,298 | |
2 0 1 6 S C O T I A B A N K A N N U A L R E P O R T | 109
MANAGEMENT’S DISCUSSION AND ANALYSIS
T64 Loans and acceptances by geography (1)
| | | | | | | | | | | | | | | | | | | | | | | | |
| | | | | |
| | | | | | | | | | | | | | | Percentage mix | |
| | | | | | | | | | | | | | | | |
| | | | | | |
| As at October 31 ($ billions) | | 2016 | | | 2015 | | | 2014 | | | | | | 2016 | | | 2014 | |
Canada | | | | | | | | | | | | | | | | | | | | | | | | |
Atlantic provinces | | $ | 26.7 | | | $ | 25.6 | | | $ | 25.5 | | | | | | | | 5.4 | % | | | 5.8 | % |
Quebec | | | 29.7 | | | | 28.5 | | | | 27.7 | | | | | | | | 6.0 | | | | 6.3 | |
Ontario | | | 156.7 | | | | 150.7 | | | | 145.1 | | | | | | | | 31.5 | | | | 33.1 | |
Manitoba and Saskatchewan | | | 17.0 | | | | 16.5 | | | | 15.1 | | | | | | | | 3.4 | | | | 3.4 | |
Alberta | | | 50.8 | | | | 49.6 | | | | 46.3 | | | | | | | | 10.2 | | | | 10.6 | |
British Columbia | | | 47.6 | | | | 44.5 | | | | 43.0 | | | | | | | | 9.6 | | | | 9.8 | |
| | | 328.5 | | | | 315.4 | | | | 302.7 | | | | | | | | 66.1 | | | | 69.0 | |
U.S. | | | 38.5 | | | | 30.2 | | | | 23.5 | | | | | | | | 7.7 | | | | 5.4 | |
Mexico | | | 20.8 | | | | 18.6 | | | | 16.0 | | | | | | | | 4.2 | | | | 3.7 | |
Peru | | | 17.8 | | | | 17.0 | | | | 13.3 | | | | | | | | 3.6 | | | | 3.0 | |
Chile | | | 19.4 | | | | 16.4 | | | | 13.9 | | | | | | | | 3.9 | | | | 3.2 | |
Colombia | | | 9.3 | | | | 8.7 | | | | 9.1 | | | | | | | | 1.9 | | | | 2.1 | |
Other International | | | | | | | | | | | | | | | | | | | | | | | | |
Latin America | | | 6.4 | | | | 6.7 | | | | 5.3 | | | | | | | | 1.3 | % | | | 1.2 | % |
Europe | | | 8.4 | | | | 9.3 | | | | 6.3 | | | | | | | | 1.7 | | | | 1.5 | |
Caribbean and Central America | | | 32.6 | | | | 31.8 | | | | 27.7 | | | | | | | | 6.6 | | | | 6.3 | |
Asia and Other | | | 15.0 | | | | 19.0 | | | | 20.0 | | | | | | | | 3.0 | | | | 4.6 | |
| | | 62.4 | | | | 66.8 | | | | 59.3 | | | | | | | | 12.6 | | | | 13.6 | |
| | $ | 496.7 | | | $ | 473.1 | | | $ | 437.8 | | | | | | | | 100.0 | % | | | 100.0 | % |
Total allowance for loan losses(2) | | | (4.6 | ) | | | (4.2 | ) | | | (3.6 | ) | | | | | | | | | | | | |
Total loans and acceptances net of allowance for loan losses | | $ | 492.1 | | | $ | 468.9 | | | $ | 434.2 | | | | | | | | | | | | | |
| (1) | Prior periods have been restated to reflect the current period presentation. |
| (2) | Total allowance includes a collective allowance on performing loans of $1,444 million in 2016 and $1,404 million in 2015. The increase reflects an overall increase in the collective allowance of $50 million and a $10 million reallocation to reserves against unfunded commitments and other off-balance-sheet items. |
T65 Gross impaired loans by geographic segment
| | | | | | | | | | | | | | | | |
| | | | |
| As at October 31 ($ millions) | | 2016(1) | | | 2015(1) | | | | | | 2014(1) | |
Canada | | $ | 1,258 | | | $ | 1,189 | | | | | | | $ | 1,116 | |
U.S. | | | 210 | | | | 11 | | | | | | | | 11 | |
Mexico | | | 301 | | | | 271 | | | | | | | | 314 | |
Peru | | | 764 | | | | 603 | | | | | | | | 423 | |
Chile | | | 499 | | | | 405 | | | | | | | | 381 | |
Colombia | | | 381 | | | | 356 | | | | | | | | 332 | |
Other International | | | 1,981 | | | | 1,823 | | | | | | | | 1,623 | |
Total | | $ | 5,394 | | | $ | 4,658 | | | | | | | $ | 4,200 | |
| (1) | Excludes loans acquired under the Federal Deposit Insurance Corporation (FDIC) guarantee related to the acquisition of R-G Premier Bank of Puerto Rico. |
T66 Provision against impaired loans by geographic segment
| | | | | | | | | | | | | | | | |
| | | | |
| For the fiscal years ($ millions) | | 2016 | | | 2015 | | | | | | 2014 | |
Canada | | $ | 876 | | | $ | 727 | | | | | | | $ | 662 | |
U.S. | | | 112 | | | | 6 | | | | | | | | 6 | |
Mexico | | | 224 | | | | 260 | | | | | | | | 240 | |
Peru | | | 317 | | | | 265 | | | | | | | | 267 | |
Chile | | | 112 | | | | 108 | | | | | | | | 74 | |
Colombia | | | 320 | | | | 247 | | | | | | | | 146 | |
Other International | | | 401 | | | | 269 | | | | | | | | 308 | |
Total | | $ | 2,362 | | | $ | 1,882 | | | | | | | $ | 1,703 | |
110 | 2 0 1 6 S C O T I A B A N K A N N U A L R E P O R T
MANAGEMENT’S DISCUSSION AND ANALYSIS | SUPPLEMENTARY DATA
T67 Cross-border exposure to select countries(1)
| | | | | | | | | | | | | | | | | | | | | | | | | | | | | | | | |
| | | | | | | | |
As at October 31 ($ millions) | | Loans | | | Trade | | | Interbank
deposits | | | Government
and other
securities | | | Investment in
subsidiaries
and affiliates | | | Other | | | | | | 2015
Total | |
| | | | | | | | 2016 Total | | |
Asia | | | | | | | | | | | | | | | | | | | | | | | | | | | | | | | | |
China | | $ | 2,893 | | | $ | 938 | | | $ | 414 | | | $ | 206 | | | $ | 685 | | | $ | 69 | | | $ | 5,205 | | | $ | 8,248 | |
India | | | 1,641 | | | | 231 | | | | – | | | | – | | | | – | | | | 21 | | | | 1,893 | | | | 3,144 | |
Thailand | | | 143 | | | | 4 | | | | 476 | | | | – | | | | 2,612 | | | | 14 | | | | 3,249 | | | | 3,074 | |
South Korea | | | 1,213 | | | | 70 | | | | – | | | | – | | | | – | | | | 281 | | | | 1,564 | | | | 2,626 | |
Hong Kong | | | 1,468 | | | | 178 | | | | 38 | | | | – | | | | – | | | | 52 | | | | 1,736 | | | | 1,827 | |
Malaysia | | | 793 | | | | – | | | | 1 | | | | – | | | | 311 | | | | 3 | | | | 1,108 | | | | 1,423 | |
Japan | | | 324 | | | | 11 | | | | 114 | | | | 1,273 | | | | – | | | | 34 | | | | 1,756 | | | | 730 | |
Taiwan | | | 112 | | | | 16 | | | | 72 | | | | 37 | | | | – | | | | 32 | | | | 269 | | | | 1,173 | |
Others(2) | | | 1,101 | | | | 247 | | | | 51 | | | | – | | | | – | | | | 5 | | | | 1,404 | | | | 1,460 | |
Total | | $ | 9,688 | | | $ | 1,695 | | | $ | 1,166 | | | $ | 1,516 | | | $ | 3,608 | | | $ | 511 | | | $ | 18,184 | | | $ | 23,705 | |
Latin America | | | | | | | | | | | | | | | | | | | | | | | | | | | | | | | | |
Chile | | $ | 2,479 | | | $ | 276 | | | $ | – | | | $ | 200 | | | $ | 3,312 | | | $ | 47 | | | $ | 6,314 | | | $ | 6,387 | |
Mexico | | | 2,772 | | | | 367 | | | | – | | | | 144 | | | | 3,141 | | | | 40 | | | | 6,464 | | | | 6,374 | |
Brazil | | | 3,132 | | | | 1,024 | | | | – | | | | 99 | | | | 225 | | | | 718 | | | | 5,198 | | | | 6,050 | |
Peru | | | 2,310 | | | | 139 | | | | – | | | | 205 | | | | 4,046 | | | | 60 | | | | 6,760 | | | | 6,112 | |
Colombia | | | 1,122 | | | | 216 | | | | – | | | | 6 | | | | 1,592 | | | | 4 | | | | 2,940 | | | | 2,476 | |
Others(3) | | | 80 | | | | 7 | | | | – | | | | – | | | | 545 | | | | – | | | | 632 | | | | 667 | |
Total | | $ | 11,895 | | | $ | 2,029 | | | $ | – | | | $ | 654 | | | $ | 12,861 | | | $ | 869 | | | $ | 28,308 | | | $ | 28,066 | |
Caribbean and Central America | | | | | | | | | | | | | | | | | | | | | | | | | | | | | | | | |
Panama | | $ | 4,025 | | | $ | 126 | | | $ | 45 | | | $ | – | | | $ | 297 | | | $ | 2 | | | $ | 4,495 | | | $ | 3,646 | |
Costa Rica | | | 1,543 | | | | 131 | | | | – | | | | – | | | | 1,090 | | | | 3 | | | | 2,767 | | | | 2,213 | |
El Salvador | | | 788 | | | | 26 | | | | – | | | | – | | | | 646 | | | | – | | | | 1,460 | | | | 1,209 | |
Dominican Republic | | | 961 | | | | 69 | | | | 81 | | | | – | | | | – | | | | 2 | | | | 1,113 | | | | 892 | |
Jamaica | | | 51 | | | | 2 | | | | – | | | | – | | | | 690 | | | | – | | | | 743 | | | | 747 | |
Others(4) | | | 1,638 | | | | 72 | | | | 1 | | | | 9 | | | | 463 | | | | – | | | | 2,183 | | | | 2,267 | |
Total | | $ | 9,006 | | | $ | 426 | | | $ | 127 | | | $ | 9 | | | $ | 3,186 | | | $ | 7 | | | $ | 12,761 | | | $ | 10,974 | |
As at October 31, 2016 | | $ | 30,589 | | | $ | 4,150 | | | $ | 1,293 | | | $ | 2,179 | | | $ | 19,655 | | | $ | 1,387 | | | $ | 59,253 | | | | | |
As at October 31, 2015 | | $ | 33,509 | | | $ | 7,602 | | | $ | 1,292 | | | $ | 1,723 | | | $ | 17,304 | | | $ | 1,316 | | | $ | 62,745 | | | | | |
| (1) | Cross-border exposure represents a claim, denominated in a currency other than the local one, against a borrower in a foreign country on the basis of ultimate risk. |
| (2) | Includes Indonesia, Macau, Singapore, Vietnam and Turkey. |
| (3) | Includes Venezuela and Uruguay |
| (4) | Includes other English and Spanish Caribbean countries, such as Bahamas, Barbados, British Virgin Islands, Trinidad & Tobago, Turks & Caicos. |
2 0 1 6 S C O T I A B A N K A N N U A L R E P O R T | 111
MANAGEMENT’S DISCUSSION AND ANALYSIS
Credit Risk
T68 Loans and acceptances by type of borrower
| | | | | | | | | | | | | | | | |
| | | |
| | | 2016 | | | | | | | |
| | | | |
| As at October 31 ($ billions) | | Balance | | | % of total | | | 2015(4) | | | 2014(4) | |
Residential mortgages | | $ | 222.9 | | | | 44.9 | % | | $ | 217.5 | | | $ | 212.6 | |
Personal loans and credit cards | | | 99.5 | | | | 20.0 | | | | 91.5 | | | | 84.2 | |
Personal | | $ | 322.4 | | | | 64.9 | % | | $ | 309.0 | | | $ | 296.8 | |
Financial services | | | | | | | | | | | | | | | | |
Non-bank | | $ | 16.1 | | | | 3.2 | % | | $ | 14.3 | | | $ | 13.4 | |
Bank(1) | | | 3.7 | | | | 0.7 | | | | 6.7 | | | | 8.9 | |
Wholesale and retail | | | 22.1 | | | | 4.5 | | | | 21.5 | | | | 16.6 | |
Real estate and construction | | | 22.6 | | | | 4.5 | | | | 19.5 | | | | 15.5 | |
Energy | | | 15.6 | | | | 3.1 | | | | 16.5 | | | | 12.8 | |
Transportation | | | 9.0 | | | | 1.8 | | | | 9.1 | | | | 8.1 | |
Automotive | | | 11.5 | | | | 2.3 | | | | 10.4 | | | | 8.1 | |
Agriculture | | | 8.8 | | | | 1.8 | | | | 8.1 | | | | 7.1 | |
Hospitality and leisure | | | 3.5 | | | | 0.7 | | | | 3.6 | | | | 3.6 | |
Mining | | | 5.4 | | | | 1.1 | | | | 4.5 | | | | 3.2 | |
Metals refinery and processing | | | 2.5 | | | | 0.5 | | | | 2.8 | | | | 2.8 | |
Utilities | | | 7.8 | | | | 1.6 | | | | 5.8 | | | | 5.9 | |
Health care | | | 5.2 | | | | 1.1 | | | | 5.0 | | | | 3.5 | |
Technology and media | | | 11.8 | | | | 2.4 | | | | 9.1 | | | | 5.4 | |
Chemical | | | 1.6 | | | | 0.3 | | | | 2.0 | | | | 1.4 | |
Food and beverage | | | 4.9 | | | | 1.0 | | | | 4.9 | | | | 3.9 | |
Forest products | | | 2.5 | | | | 0.5 | | | | 1.7 | | | | 1.3 | |
Other(2) | | | 14.7 | | | | 3.0 | | | | 13.6 | | | | 15.3 | |
Sovereign(3) | | | 5.0 | | | | 1.0 | | | | 5.0 | | | | 4.2 | |
Business and government | | $ | 174.3 | | | | 35.1 | % | | $ | 164.1 | | | $ | 141.0 | |
| | $ | 496.7 | | | | 100.0 | % | | $ | 473.1 | | | $ | 437.8 | |
Total allowance for loan losses | | | (4.6 | ) | | | | | | | (4.2 | ) | | | (3.6 | ) |
Total loans and acceptances net of allowance for loan losses | | $ | 492.1 | | | | | | | $ | 468.9 | | | $ | 434.2 | |
| (1) | Deposit taking institutions and securities firms. |
| (2) | Other related to $3.2 in financing products, $2.4 in services and $2.0 in wealth management (2015 – $2.3, $1.5, and $1.5 respectively). |
| (3) | Includes central banks, regional and local governments, and supra-national agencies. |
| (4) | 2015 and 2014 numbers have been restated to reflect the separate Mining and Metals Refinery and Processing. |
T69 Off-balance sheet credit instruments
| | | | | | | | | | | | |
| | | |
| As at October 31 ($ billions) | | 2016 | | | 2015 | | | 2014 | |
Commitments to extend credit(1) | | $ | 174.2 | | | $ | 166.4 | | | $ | 137.3 | |
Standby letters of credit and letters of guarantee | | | 34.5 | | | | 30.9 | | | | 26.0 | |
Securities lending, securities purchase commitments and other | | | 40.0 | | | | 42.8 | | | | 38.9 | |
Total | | $ | 248.7 | | | $ | 240.1 | | | $ | 202.2 | |
| (1) | Excludes commitments which are unconditionally cancellable at the Bank’s discretion at any time. |
112 | 2 0 1 6 S C O T I A B A N K A N N U A L R E P O R T
MANAGEMENT’S DISCUSSION AND ANALYSIS | SUPPLEMENTARY DATA
T70 Changes in net impaired loans(1)
| | | | | | | | | | | | |
| | | |
| For the fiscal years ($ millions) | | 2016 | | | 2015 | | | 2014 | |
Gross impaired loans | | | | | | | | | | | | |
Balance at beginning of year | | $ | 4,658 | | | $ | 4,200 | | | $ | 3,701 | |
Net additions | | | | | | | | | | | | |
New additions | | | 4,684 | | | | 3,763 | | | | 3,767 | |
Declassifications | | | (24 | ) | | | (13 | ) | | | (32 | ) |
Payments | | | (1,344 | ) | | | (1,254 | ) | | | (1,295 | ) |
Sales | | | (95 | ) | | | (11 | ) | | | (141 | ) |
| | | 3,221 | | | | 2,485 | | | | 2,299 | |
Write-offs | | | | | | | | | | | | |
Residential mortgages | | | (201 | ) | | | (109 | ) | | | (69 | ) |
Personal loans | | | (1,279 | ) | | | (1,310 | ) | | | (1,027 | ) |
Credit cards | | | (671 | ) | | | (490 | ) | | | (463 | ) |
Business and government | | | (428 | ) | | | (319 | ) | | | (338 | ) |
| | | (2,579 | ) | | | (2,228 | ) | | | (1,897 | ) |
Foreign exchange and other | | | 94 | | | | 201 | | | | 97 | |
Balance at end of year | | $ | 5,394 | | | $ | 4,658 | | | $ | 4,200 | |
| | | | | | | | | | | | |
Allowance for credit losses on impaired loans | | | | | | | | | | | | |
Balance at beginning of year | | $ | 2,573 | | | $ | 2,198 | | | $ | 1,893 | |
Provision for credit losses | | | 2,362 | | | | 1,916 | | | | 1,668 | |
Write-offs | | | (2,579 | ) | | | (2,228 | ) | | | (1,897 | ) |
Recoveries | | | | | | | | | | | | |
Residential mortgages | | | 20 | | | | 35 | | | | 68 | |
Personal loans | | | 305 | | | | 260 | | | | 224 | |
Credit cards | | | 217 | | | | 82 | | | | 107 | |
Business and government | | | 40 | | | | 52 | | | | 93 | |
| | | 582 | | | | 429 | | | | 492 | |
Foreign exchange and other | | | 10 | | | | 258 | | | | 42 | |
Balance at end of year | | $ | 2,948 | | | $ | 2,573 | | | $ | 2,198 | |
| | | | | | | | | | | | |
Net impaired loans | | | | | | | | | | | | |
Balance at beginning of year | | $ | 2,085 | | | $ | 2,002 | | | $ | 1,808 | |
Net change in gross impaired loans | | | 736 | | | | 458 | | | | 499 | |
Net change in allowance for credit losses on impaired loans | | | (375 | ) | | | (375 | ) | | | (305 | ) |
Balance at end of year | | $ | 2,446 | | | $ | 2,085 | | | $ | 2,002 | |
| (1) | Excludes loans acquired under the Federal Deposit Insurance Corporation (FDIC) guarantee related to the acquisition of R-G Premier Bank of Puerto Rico. |
T71 Provision for credit losses
| | | | | | | | | | | | |
| | | |
| For the fiscal years ($ millions) | | 2016 | | | 2015 | | | 2014 | |
Gross provisions | | $ | 3,072 | | | $ | 2,435 | | | $ | 2,312 | |
Reversals | | | (110 | ) | | | (68 | ) | | | (99 | ) |
Recoveries | | | (600 | ) | | | (485 | ) | | | (510 | ) |
Net provisions for credit losses on impaired loans | | | 2,362 | | | | 1,882 | | | | 1,703 | |
Collective provision (reversals) on performing loans | | | 50 | | | | 60 | | | | – | |
Total net provisions for credit losses | | $ | 2,412 | | | $ | 1,942 | | | $ | 1,703 | |
2 0 1 6 S C O T I A B A N K A N N U A L R E P O R T | 113
MANAGEMENT’S DISCUSSION AND ANALYSIS
T72 Provision for credit losses against impaired loans by type of borrower
| | | | | | | | | | | | |
| | | |
| For the fiscal years ($ millions) | | 2016 | | | 2015 | | | 2014 | |
Residential mortgages | | $ | 100 | | | $ | 118 | | | $ | – | |
Personal loans and credit cards | | | 1,677 | | | | 1,526 | | | | 1,414 | |
Personal | | $ | 1,777 | | | $ | 1,644 | | | $ | 1,414 | |
Financial services | | | | | | | | | | | | |
Non-bank | | | (1 | ) | | | (1 | ) | | | 5 | |
Bank | | | 2 | | | | (1 | ) | | | – | |
Wholesale and retail | | | 61 | | | | 62 | | | | 58 | |
Real estate and construction | | | 34 | | | | 30 | | | | 61 | |
Energy | | | 290 | | | | 48 | | | | 3 | |
Transportation | | | 45 | | | | 23 | | | | 12 | |
Automotive | | | 28 | | | | 9 | | | | 1 | |
Agriculture | | | 14 | | | | 12 | | | | 7 | |
Hospitality and leisure | | | 25 | | | | 1 | | | | 44 | |
Mining | | | 6 | | | | 7 | | | | 13 | |
Metals refinery and processing | | | 11 | | | | 4 | | | | (1 | ) |
Utilities | | | 20 | | | | – | | | | 24 | |
Health care | | | 9 | | | | 9 | | | | 15 | |
Technology and media | | | 14 | | | | 4 | | | | 32 | |
Chemical | | | (7 | ) | | | 4 | | | | – | |
Food and beverage | | | 6 | | | | 16 | | | | 9 | |
Forest products | | | 1 | | | | 4 | | | | – | |
Other | | | 23 | | | | 6 | | | | 6 | |
Sovereign | | | 4 | | | | 1 | | | | – | |
Business and government | | $ | 585 | | | $ | 238 | | | $ | 289 | |
Total provisions against impaired loans | | $ | 2,362 | | | $ | 1,882 | | | $ | 1,703 | |
T73 Impaired loans by type of borrower
| | | | | | | | | | | | | | | | | | | | | | | | | | | | |
| | | 2016(1) | | | | | | 2015(1) | |
| | | | | | | |
| As at October 31 ($ millions) | | Gross | | | Allowance
for credit
losses | | | Net | | | | | | Gross | | | Allowance
for credit
losses | | | Net | |
Residential mortgages | | $ | 1,608 | | | $ | 458 | | | $ | 1,150 | | | | | | | $ | 1,668 | | | $ | 529 | | | $ | 1,139 | |
Personal loans and credit cards | | | 1,622 | | | | 1,596 | | | | 26 | | | | | | | | 1,332 | | | | 1,327 | | | | 5 | |
Personal | | $ | 3,230 | | | $ | 2,054 | | | $ | 1,176 | | | | | | | $ | 3,000 | | | $ | 1,856 | | | $ | 1,144 | |
Financial services | | | | | | | | | | | | | | | | | | | | | | | | | | | | |
Non-bank | | | 23 | | | | 8 | | | | 15 | | | | | | | | 21 | | | | 9 | | | | 12 | |
Bank | | | 2 | | | | 2 | | | | – | | | | | | | | – | | | | – | | | | – | |
Wholesale and retail | | | 290 | | | | 193 | | | | 97 | | | | | | | | 260 | | | | 174 | | | | 86 | |
Real estate and construction | | | 234 | | | | 105 | | | | 129 | | | | | | | | 266 | | | | 120 | | | | 146 | |
Energy | | | 324 | | | | 89 | | | | 235 | | | | | | | | 165 | | | | 61 | | | | 104 | |
Transportation | | | 214 | | | | 84 | | | | 130 | | | | | | | | 152 | | | | 43 | | | | 109 | |
Automotive | | | 70 | | | | 38 | | | | 32 | | | | | | | | 35 | | | | 12 | | | | 23 | |
Agriculture | | | 75 | | | | 37 | | | | 38 | | | | | | | | 95 | | | | 39 | | | | 56 | |
Hospitality and leisure | | | 83 | | | | 27 | | | | 56 | | | | | | | | 60 | | | | 8 | | | | 52 | |
Mining | | | 14 | | | | 6 | | | | 8 | | | | | | | | 7 | | | | 4 | | | | 3 | |
Metals refinery and processing | | | 159 | | | | 25 | | | | 134 | | | | | | | | 20 | | | | 13 | | | | 7 | |
Utilities | | | 252 | | | | 53 | | | | 199 | | | | | | | | 274 | | | | 30 | | | | 244 | |
Health care | | | 49 | | | | 29 | | | | 20 | | | | | | | | 46 | | | | 30 | | | | 16 | |
Technology and media | | | 32 | | | | 28 | | | | 4 | | | | | | | | 18 | | | | 14 | | | | 4 | |
Chemical | | | 15 | | | | 6 | | | | 9 | | | | | | | | 23 | | | | 23 | | | | – | |
Food and beverage | | | 110 | | | | 44 | | | | 66 | | | | | | | | 64 | | | | 37 | | | | 27 | |
Forest products | | | 23 | | | | 6 | | | | 17 | | | | | | | | 19 | | | | 5 | | | | 14 | |
Other | | | 150 | | | | 108 | | | | 42 | | | | | | | | 123 | | | | 91 | | | | 32 | |
Sovereign | | | 45 | | | | 6 | | | | 39 | | | | | | | | 10 | | | | 4 | | | | 6 | |
Business and government | | $ | 2,164 | | | $ | 894 | | | $ | 1,270 | | | | | | | $ | 1,658 | | | $ | 717 | | | $ | 941 | |
Total | | $ | 5,394 | | | $ | 2,948 | | | $ | 2,446 | | | | | | | $ | 4,658 | | | $ | 2,573 | | | $ | 2,085 | |
| (1) | Excludes loans acquired under the Federal Deposit Insurance Corporation (FDIC) guarantee related to the acquisition of R-G Premier Bank of Puerto Rico. |
114 | 2 0 1 6 S C O T I A B A N K A N N U A L R E P O R T
MANAGEMENT’S DISCUSSION AND ANALYSIS | SUPPLEMENTARY DATA
T74 Total credit risk exposures by geography(1)(2)
| | | | | | | | | | | | | | | | | | | | | | | | | | | | |
| | | 2016 | | | | | | 2015 | |
| | | | | |
| | | Non-Retail | | | | | | | | | | | | | |
| | | | | | | |
| As at October 31 ($ millions) | | Drawn | | | Undrawn | | | Other
exposures(3) | | | Retail | | | Total | | | | | | Total | |
Canada | | $ | 89,894 | | | $ | 32,953 | | | $ | 42,208 | | | $ | 303,868 | | | $ | 468,923 | | | | | | | $ | 435,953 | |
U.S. | | | 79,932 | | | | 27,951 | | | | 35,925 | | | | – | | | | 143,808 | | | | | | | | 153,285 | |
Mexico | | | 15,331 | | | | 1,183 | | | | 1,725 | | | | 8,634 | | | | 26,873 | | | | | | | | 23,808 | |
Peru | | | 16,693 | | | | 1,413 | | | | 2,984 | | | | 7,238 | | | | 28,328 | | | | | | | | 27,007 | |
Chile | | | 10,384 | | | | 782 | | | | 1,374 | | | | 10,970 | | | | 23,510 | | | | | | | | 19,777 | |
Colombia | | | 4,891 | | | | 186 | | | | 518 | | | | 5,348 | | | | 10,943 | | | | | | | | 9,899 | |
Other International | | | | | | | | | | | | | | | | | | | | | | | | | | | | |
Europe | | | 23,164 | | | | 5,936 | | | | 12,425 | | | | – | | | | 41,525 | | | | | | | | 40,048 | |
Caribbean and Central America | | | 19,048 | | | | 1,704 | | | | 1,564 | | | | 18,852 | | | | 41,168 | | | | | | | | 39,831 | |
Latin America (other) | | | 7,258 | | | | 522 | | | | 495 | | | | 633 | | | | 8,908 | | | | | | | | 8,962 | |
Other | | | 23,971 | | | | 4,115 | | | | 2,843 | | | | – | | | | 30,929 | | | | | | | | 36,052 | |
Total | | $ | 290,566 | | | $ | 76,745 | | | $ | 102,061 | | | $ | 355,543 | | | $ | 824,915 | | | | | | | $ | 794,622 | |
As at October 31, 2015 | | $ | 280,942 | | | $ | 72,434 | | | $ | 105,581 | | | $ | 335,665 | | | $ | 794,622 | | | | | | | | | |
| (1) | Geographic segmentation is based upon the location of the ultimate risk of the credit exposure. Includes all credit risk portfolios and excludes available-for-sale equities and other assets. |
| (2) | Amounts represent exposure at default. |
| (3) | Includes off-balance sheet lending instruments such as letters of credit, letters of guarantee, derivatives, securitization and repo-style transactions after collateral. |
T75 AIRB credit risk exposures by maturity(1)(2)
| | | | | | | | | | | | | | | | | | | | | | | | |
| | | 2016 | | | | | | 2015 | |
| | | | | | |
| Residual maturity as at October 31 ($ millions) | | Drawn | | | Undrawn | | | Other
exposures(3) | | | Total | | | | | | Total | |
Non-retail | | | | | | | | | | | | | | | | | | | | | | | | |
Less than 1 year | | $ | 109,752 | | | $ | 22,766 | | | $ | 62,851 | | | $ | 195,369 | | | | | | | $ | 213,600 | |
One to 5 years | | | 112,975 | | | | 46,971 | | | | 28,805 | | | | 188,751 | | | | | | | | 163,961 | |
Over 5 years | | | 10,351 | | | | 1,239 | | | | 7,290 | | | | 18,880 | | | | | | | | 17,937 | |
Total non-retail | | $ | 233,078 | | | $ | 70,976 | | | $ | 98,946 | | | $ | 403,000 | | | | | | | $ | 395,498 | |
Retail | | | | | | | | | | | | | | | | | | | | | | | | |
Less than 1 year | | $ | 28,829 | | | $ | 15,386 | | | $ | – | | | $ | 44,215 | | | | | | | $ | 45,368 | |
One to 5 years | | | 167,999 | | | | – | | | | – | | | | 167,999 | | | | | | | | 160,660 | |
Over 5 years | | | 20,243 | | | | – | | | | – | | | | 20,243 | | | | | | | | 20,682 | |
Revolving credits(4) | | | 37,177 | | | | 21,108 | | | | – | | | | 58,285 | | | | | | | | 54,555 | |
Total retail | | $ | 254,248 | | | $ | 36,494 | | | $ | – | | | $ | 290,742 | | | | | | | $ | 281,265 | |
Total | | $ | 487,326 | | | $ | 107,470 | | | $ | 98,946 | | | $ | 693,742 | | | | | | | $ | 676,763 | |
As at October 31, 2015 | | $ | 475,832 | | | $ | 98,446 | | | $ | 102,485 | | | $ | 676,763 | | | | | | | | | |
| (1) | Remaining term to maturity of the credit exposure. Includes all credit risk portfolios and excludes available-for-sale equities and other assets. |
| (2) | Exposure at default, before credit risk mitigation. |
| (3) | Off-balance sheet lending instruments, such as letters of credit, letters of guarantee, securitization, derivatives and repo-style transactions after collateral. |
| (4) | Credit cards and lines of credit with unspecified maturity. |
2 0 1 6 S C O T I A B A N K A N N U A L R E P O R T | 115
MANAGEMENT’S DISCUSSION AND ANALYSIS
T76 Total credit risk exposures and risk-weighted assets
| | | | | | | | | | | | | | | | | | | | | | | | | | | | | | | | | | | | |
| | | |
| | | 2016 | | | | | | 2015 | |
| | | | | |
| | | AIRB | | | Standardized(1) | | | Total | | | | | | Total | |
| | | | | | | | | |
| As at October 31 ($ millions) | | Exposure at
Default(2) | | | CET1 risk-
weighted
assets(3) | | | Exposure at
Default(2) | | | CET1 risk-
weighted
assets(3) | | | Exposure at
Default(2) | | | CET1 risk-
weighted
assets(3) | | | | | | Exposure at
Default(2) | | | CET1 risk-
weighted
assets(3) | |
Non-retail | | | | | | | | | | | | | | | | | | | | | | | | | | | | | | | | | | | | |
Corporate | | | | | | | | | | | | | | | | | | | | | | | | | | | | | | | | | | | | |
Drawn | | $ | 128,742 | | | $ | 71,771 | | | $ | 47,042 | | | $ | 45,407 | | | $ | 175,784 | | | $ | 117,178 | | | | | | | $ | 157,514 | | | $ | 112,836 | |
Undrawn | | | 67,990 | | | | 28,839 | | | | 5,721 | | | | 5,660 | | | | 73,711 | | | | 34,499 | | | | | | | | 58,915 | | | | 29,035 | |
Other(4) | | | 37,024 | | | | 13,455 | | | | 2,919 | | | | 2,901 | | | | 39,943 | | | | 16,356 | | | | | | | | 40,425 | | | | 15,476 | |
| | | 233,756 | | | | 114,065 | | | | 55,682 | | | | 53,968 | | | | 289,438 | | | | 168,033 | | | | | | | | 256,854 | | | | 157,347 | |
Bank | | | | | | | | | | | | | | | | | | | | | | | | | | | | | | | | | | | | |
Drawn | | | 23,978 | | | | 5,211 | | | | 2,044 | | | | 1,356 | | | | 26,022 | | | | 6,567 | | | | | | | | 27,165 | | | | 8,344 | |
Undrawn | | | 1,944 | | | | 334 | | | | 38 | | | | 34 | | | | 1,982 | | | | 368 | | | | | | | | 11,386 | | | | 3,726 | |
Other(4) | | | 12,979 | | | | 2,371 | | | | 196 | | | | 196 | | | | 13,175 | | | | 2,567 | | | | | | | | 14,906 | | | | 3,253 | |
| | | 38,901 | | | | 7,916 | | | | 2,278 | | | | 1,586 | | | | 41,179 | | | | 9,502 | | | | | | | | 53,457 | | | | 15,323 | |
Sovereign | | | | | | | | | | | | | | | | | | | | | | | | | | | | | | | | | | | | |
Drawn | | | 80,358 | | | | 3,861 | | | | 8,402 | | | | 1,300 | | | | 88,760 | | | | 5,161 | | | | | | | | 96,263 | | | | 4,203 | |
Undrawn | | | 1,042 | | | | 112 | | | | 10 | | | | 7 | | | | 1,052 | | | | 119 | | | | | | | | 2,133 | | | | 355 | |
Other(4) | | | 497 | | | | 12 | | | | – | | | | – | | | | 497 | | | | 12 | | | | | | | | 1,016 | | | | 36 | |
| | | 81,897 | | | | 3,985 | | | | 8,412 | | | | 1,307 | | | | 90,309 | | | | 5,292 | | | | | | | | 99,412 | | | | 4,594 | |
Total Non-retail | | | | | | | | | | | | | | | | | | | | | | | | | | | | | | | | | | | | |
Drawn | | | 233,078 | | | | 80,843 | | | | 57,488 | | | | 48,063 | | | | 290,566 | | | | 128,906 | | | | | | | | 280,942 | | | | 125,383 | |
Undrawn | | | 70,976 | | | | 29,285 | | | | 5,769 | | | | 5,701 | | | | 76,745 | | | | 34,986 | | | | | | | | 72,434 | | | | 33,116 | |
Other(4) | | | 50,500 | | | | 15,838 | | | | 3,115 | | | | 3,097 | | | | 53,615 | | | | 18,935 | | | | | | | | 56,347 | | | | 18,765 | |
| | $ | 354,554 | | | $ | 125,966 | | | $ | 66,372 | | | $ | 56,861 | | | $ | 420,926 | | | $ | 182,827 | | | | | | | $ | 409,723 | | | $ | 177,264 | |
Retail(5) | | | | | | | | | | | | | | | | | | | | | | | | | | | | | | | | | | | | |
Retail residential mortgages | | | | | | | | | | | | | | | | | | | | | | | | | | | | | | | | | | | | |
Drawn | | $ | 190,052 | | | $ | 10,228 | | | $ | 30,865 | | | $ | 14,800 | | | $ | 220,917 | | | $ | 25,028 | | | | | | | $ | 215,590 | | | $ | 24,967 | |
| | | 190,052 | | | | 10,228 | | | | 30,865 | | | | 14,800 | | | | 220,917 | | | | 25,028 | | | | | | | | 215,590 | | | | 24,967 | |
Secured lines of credit | | | | | | | | | | | | | | | | | | | | | | | | | | | | | | | | | | | | |
Drawn | | | 19,233 | | | | 4,497 | | | | – | | | | – | | | | 19,233 | | | | 4,497 | | | | | | | | 18,804 | | | | 4,197 | |
Undrawn | | | 14,587 | | | | 1,359 | | | | – | | | | – | | | | 14,587 | | | | 1,359 | | | | | | | | 12,631 | | | | 1,133 | |
| | | 33,820 | | | | 5,856 | | | | – | | | | – | | | | 33,820 | | | | 5,856 | | | | | | | | 31,435 | | | | 5,330 | |
Qualifying retail revolving exposures | | | | | | | | | | | | | | | | | | | | | | | | | | | | | | | | | | | | |
Drawn | | | 16,717 | | | | 9,463 | | | | – | | | | – | | | | 16,717 | | | | 9,463 | | | | | | | | 16,910 | | | | 10,031 | |
Undrawn | | | 21,108 | | | | 2,656 | | | | – | | | | – | | | | 21,108 | | | | 2,656 | | | | | | | | 17,705 | | | | 2,241 | |
| | | 37,825 | | | | 12,119 | | | | – | | | | – | | | | 37,825 | | | | 12,119 | | | | | | | | 34,615 | | | | 12,272 | |
Other retail | | | | | | | | | | | | | | | | | | | | | | | | | | | | | | | | | | | | |
Drawn | | | 28,246 | | | | 13,055 | | | | 33,936 | | | | 24,951 | | | | 62,182 | | | | 38,006 | | | | | | | | 53,313 | | | | 32,002 | |
Undrawn | | | 799 | | | | 203 | | | | – | | | | – | | | | 799 | | | | 203 | | | | | | | | 712 | | | | 178 | |
| | | 29,045 | | | | 13,258 | | | | 33,936 | | | | 24,951 | | | | 62,981 | | | | 38,209 | �� | | | | | | | 54,025 | | | | 32,180 | |
Total retail | | | | | | | | | | | | | | | | | | | | | | | | | | | | | | | | | | | | |
Drawn | | | 254,248 | | | | 37,243 | | | | 64,801 | | | | 39,751 | | | | 319,049 | | | | 76,994 | | | | | | | | 304,617 | | | | 71,197 | |
Undrawn | | | 36,494 | | | | 4,218 | | | | – | | | | – | | | | 36,494 | | | | 4,218 | | | | | | | | 31,048 | | | | 3,552 | |
| | $ | 290,742 | | | $ | 41,461 | | | $ | 64,801 | | | $ | 39,751 | | | $ | 355,543 | | | $ | 81,212 | | | | | | | $ | 335,665 | | | $ | 74,749 | |
Securitization exposures | | | 25,025 | | | | 2,613 | | | | – | | | | – | | | | 25,025 | | | | 2,613 | | | | | | | | 21,000 | | | | 2,759 | |
Trading derivatives | | | 23,421 | | | | 6,599 | | | | – | | | | – | | | | 23,421 | | | | 6,599 | | | | | | | | 28,234 | | | | 8,232 | |
CVA derivatives | | | – | | | | – | | | | – | | | | 4,165 | | | | – | | | | 4,165 | | | | | | | | – | | | | 7,183 | |
Subtotal | | $ | 693,742 | | | $ | 176,639 | | | $ | 131,173 | | | $ | 100,777 | | | $ | 824,915 | | | $ | 277,416 | | | | | | | $ | 794,622 | | | $ | 270,187 | |
Equities | | | 2,042 | | | | 2,042 | | | | – | | | | – | | | | 2,042 | | | | 2,042 | | | | | | | | 2,985 | | | | 2,985 | |
Other assets | | | – | | | | – | | | | 49,829 | | | | 24,659 | | | | 49,829 | | | | 24,659 | | | | | | | | 50,873 | | | | 24,265 | |
Total credit risk, before scaling factor | | $ | 695,784 | | | $ | 178,681 | | | $ | 181,002 | | | $ | 125,436 | | | $ | 876,786 | | | $ | 304,117 | | | | | | | $ | 848,480 | | | $ | 297,437 | |
Add-on for 6% scaling factor(6) | | | – | | | | 10,705 | | | | – | | | | – | | | | – | | | | 10,705 | | | | | | | | – | | | | 10,597 | |
Total credit risk | | $ | 695,784 | | | $ | 189,386 | | | $ | 181,002 | | | $ | 125,436 | | | $ | 876,786 | | | $ | 314,822 | | | | | | | $ | 848,480 | | | $ | 308,034 | |
| (1) | Net of specific allowances for credit losses. |
| (2) | Outstanding amount for on-balance sheet exposures and loan equivalent amount for off-balance sheet exposures, before credit risk mitigation. |
| (3) | As at October 31, 2016, CVA risk-weighted assets were calculated using scalars of 0.64, 0.71 and 0.77 for the CET1, Tier 1 and Total capital ratios, respectively (scalars of 0.64, 0.71 and 0.77 in 2015). |
| (4) | Other exposures include off-balance sheet lending instruments, such as letters of credit, letters of guarantee, non-trading derivatives and repo-style exposures, after collateral. |
| (5) | During the year ended October 31, 2015, the Bank implemented new retail probability of default and loss given default models for mortgages and term loans. |
| (6) | Basel Committee imposed a scaling factor (6%) on risk-weighted assets for Internal Ratings-Based credit risk portfolios. |
116 | 2 0 1 6 S C O T I A B A N K A N N U A L R E P O R T
MANAGEMENT’S DISCUSSION AND ANALYSIS | SUPPLEMENTARY DATA
Revenues and Expenses
T77Volume/rate analysis of change in net interest income
| | | | | | | | | | | | | | | | | | | | | | | | |
| | |
| | | Increase (decrease) due to change in:
2016 versus 2015 | | | Increase (decrease) due to change in:
2015 versus 2014 | |
| | | Average | | | | Average | | | | Net | | | | Average | | | | Average | | | | Net | |
| ($ millions) | | | volume | | | | rate | | | | change | | | | volume | | | | rate | | | | change | |
Net interest income | | | | | | | | | | | | | | | | | | | | | | | | |
Total earning assets | | $ | 1,859 | | | $ | 13 | | | $ | 1,872 | | | $ | 1,304 | | | $ | (558 | ) | | $ | 746 | |
Total interest-bearing liabilities | | | 515 | | | | 157 | | | | 672 | | | | 428 | | | | (466 | ) | | | (38 | ) |
Change in net interest income | | $ | 1,344 | | | $ | (144 | ) | | $ | 1,200 | | | $ | 876 | | | $ | (92 | ) | | $ | 784 | |
Assets | | | | | | | | | | | | | | | | | | | | | | | | |
| | | | | | |
Deposits with banks | | $ | (14 | ) | | $ | 116 | | | $ | 102 | | | $ | 48 | | | $ | (19 | ) | | $ | 29 | |
Trading assets | | | (7 | ) | | | (6 | ) | | | (13 | ) | | | (2 | ) | | | 52 | | | | 50 | |
Securities purchased under resale agreements | | | – | | | | (4 | ) | | | (4 | ) | | | 17 | | | | (34 | ) | | | (17 | ) |
Investment securities | | | 407 | | | | (79 | ) | | | 328 | | | | 46 | | | | (95 | ) | | | (49 | ) |
Loans: | | | | | | | | | | | | | | | | | | | | | | | | |
Residential mortgages | | | 147 | | | | (311 | ) | | | (164 | ) | | | 127 | | | | (195 | ) | | | (68 | ) |
Personal loans and credit cards | | | 701 | | | | 44 | | | | 745 | | | | 597 | | | | (77 | ) | | | 520 | |
Business and government | | | 625 | | | | 253 | | | | 878 | | | | 471 | | | | (190 | ) | | | 281 | |
Total loans | | | 1,473 | | | | (14 | ) | | | 1,459 | | | | 1,195 | | | | (462 | ) | | | 733 | |
Total earning assets | | $ | 1,859 | | | $ | 13 | | | $ | 1,872 | | | $ | 1,304 | | | $ | (558 | ) | | $ | 746 | |
| | | | | | |
Liabilities | | | | | | | | | | | | | | | | | | | | | | | | |
| | | | | | |
Deposits: | | | | | | | | | | | | | | | | | | | | | | | | |
Personal | | $ | 174 | | | $ | (95 | ) | | $ | 79 | | | $ | 125 | | | $ | (261 | ) | | $ | (136 | ) |
Business and government | | | 151 | | | | 359 | | | | 510 | | | | 290 | | | | (393 | ) | | | (103 | ) |
Banks | | | 47 | | | | 79 | | | | 126 | | | | (8 | ) | | | 28 | | | | 20 | |
Total deposits | | | 372 | | | | 343 | | | | 715 | | | | 407 | | | | (626 | ) | | | (219 | ) |
Obligations related to securities sold under repurchase agreements | | | 22 | | | | (64 | ) | | | (42 | ) | | | 11 | | | | (53 | ) | | | (42 | ) |
Subordinated debentures | | | 62 | | | | (17 | ) | | | 45 | | | | 11 | | | | (28 | ) | | | (17 | ) |
Other interest-bearing liabilities | | | 59 | | | | (105 | ) | | | (46 | ) | | | (1 | ) | | | 241 | | | | 240 | |
Total interest-bearing liabilities | | $ | 515 | | | $ | 157 | | | $ | 672 | | | $ | 428 | | | $ | (466 | ) | | $ | (38 | ) |
T78 Provision for income taxes
| | | | | | | | | | | | | | | | |
| | | | |
| For the fiscal years ($ millions) | | 2016 | | | 2015 | | | 2014 | | | 2016
versus
2015 | |
Income taxes | | | | | | | | | | | | | | | | |
Income tax expense | | $ | 2,030 | | | $ | 1,853 | | | $ | 2,002 | | | | 10 | % |
| | | | |
Other taxes | | | | | | | | | | | | | | | | |
Payroll taxes | | | 347 | | | | 329 | | | | 312 | | | | 6 | |
Business and capital taxes | | | 403 | | | | 361 | | | | 314 | | | | 12 | |
Harmonized sales tax and other | | | 363 | | | | 310 | | | | 295 | | | | 17 | |
Total other taxes | | | 1,113 | | | | 1,000 | | | | 921 | | | | 11 | |
Total income and other taxes(1) | | $ | 3,143 | | | $ | 2,853 | | | $ | 2,923 | | | | 10 | % |
Net income before income taxes | | $ | 9,398 | | | $ | 9,066 | | | $ | 9,300 | | | | 4 | % |
Effective income tax rate (%) | | | 21.6 | | | | 20.4 | | | | 21.5 | | | | 1.2 | |
Total tax rate (%)(2) | | | 29.9 | | | | 28.3 | | | | 28.6 | | | | 1.6 | |
| (1) | Comprising $1,742 of Canadian taxes (2015 – $1,849; 2014 – $1,679) and $1,401 of foreign taxes (2015 – $1,004; 2014 – $1,244). |
| (2) | Total income and other taxes as a percentage of net income before income and other taxes. |
2 0 1 6 S C O T I A B A N K A N N U A L R E P O R T | 117
MANAGEMENT’S DISCUSSION AND ANALYSIS
T79 Assets under administration and management
| | | | | | | | | | | | |
| | | |
| ($ billions) | | 2016 | | | 2015 | | | 2014 | |
Assets under administration | | | | | | | | | | | | |
Personal | | | | | | | | | | | | |
Retail brokerage | | $ | 163.5 | | | $ | 155.9 | | | $ | 148.8 | |
Investment management and trust | | | 106.4 | | | | 100.2 | | | | 95.1 | |
| | | 269.9 | | | | 256.1 | | | | 243.9 | |
Mutual funds | | | 139.2 | | | | 130.7 | | | | 122.5 | |
Institutional | | | 63.7 | | | | 67.1 | | | | 61.1 | |
Total | | $ | 472.8 | | | $ | 453.9 | | | $ | 427.5 | |
| | | |
Assets under management | | | | | | | | | | | | |
Personal | | $ | 47.9 | | | $ | 43.0 | | | $ | 35.7 | |
Mutual funds | | | 125.1 | | | | 117.7 | | | | 110.6 | |
Institutional | | | 19.7 | | | | 18.3 | | | | 18.5 | |
Total | | $ | 192.7 | | | $ | 179.0 | | | $ | 164.8 | |
T80 Assets under administration and management
| | | | | | | | | | | | |
| | | |
| As at October 31 ($ billions) | | 2016 | | | 2015 | | | 2014 | |
Assets under administration | | | | | | | | | | | | |
Balance at beginning of year | | $ | 453.9 | | | $ | 427.5 | | | $ | 377.8 | |
Net inflows (outflows)(1) | | | 4.3 | | | | 14.3 | | | | 22.0 | |
Impact of market changes, including foreign currency translation | | | 14.6 | | | | 12.1 | | | | 27.7 | |
Balance at end of year | | $ | 472.8 | | | $ | 453.9 | | | $ | 427.5 | |
| (1) | Includes impact of business acquisitions/dispositions of nil (2015 – nil; 2014 – $(0.9)). |
| | | | | | | | | | | | |
| | | |
| As at October 31 ($ billions) | | 2016 | | | 2015 | | | 2014 | |
Assets under management | | | | | | | | | | | | |
Balance at beginning of year | | $ | 179.0 | | | $ | 164.8 | | | $ | 145.5 | |
Net inflows (outflows)(1) | | | 6.6 | | | | 8.2 | | | | 6.5 | |
Impact of market changes, including foreign currency translation | | | 7.1 | | | | 6.0 | | | | 12.8 | |
Balance at end of year | | $ | 192.7 | | | $ | 179.0 | | | $ | 164.8 | |
| (1) | Includes impact of business acquisitions/dispositions of nil (2015 – nil; 2014 – $(0.9)). |
T81 Fees paid to the shareholders’ auditors
| | | | | | | | | | | | |
| | | |
| For the fiscal years ($ millions) | | 2016 | | | 2015 | | | 2014 | |
Audit services | | $ | 26.1 | | | $ | 25.5 | | | $ | 24.6 | |
Audit-related services | | | 0.7 | | | | 0.9 | | | | 0.6 | |
Tax services outside of the audit scope | | | – | | | | – | | | | – | |
Other non-audit services | | | 0.4 | | | | 0.4 | | | | 0.7 | |
Total | | $ | 27.2 | | | $ | 26.8 | | | $ | 25.9 | |
118 | 2 0 1 6 S C O T I A B A N K A N N U A L R E P O R T
MANAGEMENT’S DISCUSSION AND ANALYSIS | SUPPLEMENTARY DATA
Selected Quarterly Information
T82 Selected quarterly information
| | | | | | | | | | | | | | | | | | | | | | | | | | | | | | | | |
| | |
| | | 2016 | | | 2015 | |
| | | | | | | | |
| As at and for the quarter ended | | Q4 | | | Q3 | | | Q2 | | | Q1 | | | Q4 | | | Q3 | | | Q2 | | | Q1 | |
Operating results ($ millions) | | | | | | | | | | | | | | | | | | | | | | | | | | | | | | | | |
Net interest income | | | 3,653 | | | | 3,602 | | | | 3,518 | | | | 3,519 | | | | 3,371 | | | | 3,354 | | | | 3,198 | | | | 3,169 | |
Non-interest income | | | 3,098 | | | | 3,038 | | | | 3,076 | | | | 2,846 | | | | 2,754 | | | | 2,770 | | | | 2,739 | | | | 2,694 | |
Total revenue | | | 6,751 | | | | 6,640 | | | | 6,594 | | | | 6,365 | | | | 6,125 | | | | 6,124 | | | | 5,937 | | | | 5,863 | |
Provision for credit losses | | | 550 | | | | 571 | | | | 752 | | | | 539 | | | | 551 | | | | 480 | | | | 448 | | | | 463 | |
Non-interest expenses | | | 3,650 | | | | 3,505 | | | | 3,817 | | | | 3,568 | | | | 3,286 | | | | 3,334 | | | | 3,224 | | | | 3,197 | |
Income tax expense | | | 540 | | | | 605 | | | | 441 | | | | 444 | | | | 445 | | | | 463 | | | | 468 | | | | 477 | |
Net income | | | 2,011 | | | | 1,959 | | | | 1,584 | | | | 1,814 | | | | 1,843 | | | | 1,847 | | | | 1,797 | | | | 1,726 | |
Net income attributable to common shareholders | | | 1,908 | | | | 1,860 | | | | 1,489 | | | | 1,730 | | | | 1,754 | | | | 1,767 | | | | 1,727 | | | | 1,649 | |
Operating performance | | | | | | | | | | | | | | | | | | | | | | | | | | | | | | | | |
Basic earnings per share ($) | | | 1.58 | | | | 1.55 | | | | 1.24 | | | | 1.44 | | | | 1.46 | | | | 1.46 | | | | 1.43 | | | | 1.36 | |
Diluted earnings per share ($) | | | 1.57 | | | | 1.54 | | | | 1.23 | | | | 1.43 | | | | 1.45 | | | | 1.45 | | | | 1.42 | | | | 1.35 | |
Adjusted diluted earnings per share ($)(1) | | | 1.58 | | | | 1.55 | | | | 1.48 | | | | 1.44 | | | | 1.46 | | | | 1.47 | | | | 1.43 | | | | 1.36 | |
Return on equity (%) | | | 14.7 | | | | 14.8 | | | | 12.1 | | | | 13.8 | | | | 14.2 | | | | 14.7 | | | | 15.1 | | | | 14.2 | |
Productivity ratio (%)(2) | | | 54.1 | | | | 52.8 | | | | 57.9 | | | | 56.1 | | | | 53.6 | | | | 54.4 | | | | 54.3 | | | | 54.5 | |
Core banking margin (%)(1)(2) | | | 2.40 | | | | 2.38 | | | | 2.38 | | | | 2.38 | | | | 2.35 | | | | 2.40 | | | | 2.41 | | | | 2.41 | |
Financial position information($ billions) | | | | | | | | | | | | | | | | | | | | | | | | | | | | | | | | |
Cash and deposits with financial institutions | | | 46.3 | | | | 69.8 | | | | 61.2 | | | | 75.3 | | | | 73.9 | | | | 82.8 | | | | 60.7 | | | | 65.9 | |
Trading assets | | | 108.6 | | | | 103.9 | | | | 101.4 | | | | 104.3 | | | | 99.1 | | | | 103.7 | | | | 113.1 | | | | 109.6 | |
Loans | | | 480.2 | | | | 472.8 | | | | 466.8 | | | | 476.6 | | | | 458.6 | | | | 451.0 | | | | 436.0 | | | | 439.9 | |
Total assets | | | 896.3 | | | | 906.8 | | | | 895.0 | | | | 919.6 | | | | 856.5 | | | | 863.1 | | | | 837.2 | | | | 851.9 | |
Deposits | | | 611.9 | | | | 631.3 | | | | 609.3 | | | | 630.9 | | | | 600.9 | | | | 602.8 | | | | 575.3 | | | | 584.6 | |
Common equity | | | 52.7 | | | | 50.8 | | | | 48.9 | | | | 50.9 | | | | 49.1 | | | | 48.7 | | | | 46.7 | | | | 46.9 | |
Preferred shares | | | 3.6 | | | | 3.1 | | | | 3.4 | | | | 3.3 | | | | 2.9 | | | | 2.9 | | | | 2.9 | | | | 2.9 | |
Assets under administration | | | 472.8 | | | | 464.9 | | | | 453.5 | | | | 452.6 | | | | 453.9 | | | | 459.8 | | | | 445.8 | | | | 440.8 | |
Assets under management | | | 192.7 | | | | 187.9 | | | | 179.4 | | | | 179.0 | | | | 179.0 | | | | 182.9 | | | | 176.8 | | | | 173.8 | |
Capital and liquidity measures | | | | | | | | | | | | | | | | | | | | | | | | | | | | | | | | |
Common Equity Tier 1 (CET1) capital ratio (%) | | | 11.0 | | | | 10.5 | | | | 10.1 | | | | 10.1 | | | | 10.3 | | | | 10.4 | | | | 10.6 | | | | 10.3 | |
Tier 1 capital ratio (%) | | | 12.4 | | | | 11.8 | | | | 11.4 | | | | 11.2 | | | | 11.5 | | | | 11.6 | | | | 11.9 | | | | 11.5 | |
Total capital ratio (%) | | | 14.6 | | | | 14.1 | | | | 13.6 | | | | 13.4 | | | | 13.4 | | | | 13.5 | | | | 13.9 | | | | 13.2 | |
Leverage ratio (%) | | | 4.5 | | | | 4.2 | | | | 4.1 | | | | 4.0 | | | | 4.2 | | | | 4.1 | | | | 4.1 | | | | 4.1 | |
CET1 risk-weighted assets ($ billions)(3) | | | 364.0 | | | | 357.7 | | | | 356.9 | | | | 374.5 | | | | 358.0 | | | | 348.0 | | | | 328.7 | | | | 335.2 | |
Liquidity coverage ratio (LCR)(%) | | | 127 | | | | 125 | | | | 121 | | | | 124 | | | | 124 | | | | 127 | | | | 123 | | | | N/A | |
Credit quality | | | | | | | | | | | | | | | | | | | | | | | | | | | | | | | | |
Net impaired loans ($ millions)(4) | | | 2,446 | | | | 2,491 | | | | 2,347 | | | | 2,335 | | | | 2,085 | | | | 2,096 | | | | 2,172 | | | | 2,266 | |
Allowance for credit losses ($ millions) | | | 4,626 | | | | 4,542 | | | | 4,402 | | | | 4,354 | | | | 4,197 | | | | 4,125 | | | | 3,694 | | | | 3,788 | |
Net impaired loans as a % of loans and acceptances(4) | | | 0.49 | | | | 0.51 | | | | 0.49 | | | | 0.48 | | | | 0.44 | | | | 0.45 | | | | 0.48 | | | | 0.50 | |
Provision for credit losses as a % of average net loans and acceptances (annualized) | | | 0.45 | | | | 0.47 | | | | 0.64 | | | | 0.45 | | | | 0.47 | | | | 0.42 | | | | 0.41 | | | | 0.42 | |
Common share information | | | | | | | | | | | | | | | | | | | | | | | | | | | | | | | | |
Closing share price ($) (TSX) | | | 72.08 | | | | 66.33 | | | | 65.80 | | | | 57.39 | | | | 61.49 | | | | 64.19 | | | | 66.53 | | | | 61.06 | |
Shares outstanding (millions) | | | | | | | | | | | | | | | | | | | | | | | | | | | | | | | | |
Average – Basic | | | 1,206 | | | | 1,203 | | | | 1,203 | | | | 1,203 | | | | 1,205 | | | | 1,210 | | | | 1,210 | | | | 1,215 | |
Average – Diluted | | | 1,226 | | | | 1,222 | | | | 1,228 | | | | 1,225 | | | | 1,227 | | | | 1,231 | | | | 1,231 | | | | 1,220 | |
End of period | | | 1,208 | | | | 1,205 | | | | 1,203 | | | | 1,203 | | | | 1,203 | | | | 1,208 | | | | 1,210 | | | | 1,210 | |
Dividends per share ($) | | | 0.74 | | | | 0.72 | | | | 0.72 | | | | 0.70 | | | | 0.70 | | | | 0.68 | | | | 0.68 | | | | 0.66 | |
Dividend yield (%)(5) | | | 4.3 | | | | 4.5 | | | | 4.9 | | | | 4.9 | | | | 4.8 | | | | 4.3 | | | | 4.2 | | | | 4.0 | |
Market capitalization ($ billions) (TSX) | | | 87.1 | | | | 79.9 | | | | 79.1 | | | | 69.0 | | | | 74.0 | | | | 77.5 | | | | 80.5 | | | | 73.9 | |
Book value per common share ($) | | | 43.59 | | | | 42.14 | | | | 40.70 | | | | 42.32 | | | | 40.80 | | | | 40.30 | | | | 38.61 | | | | 38.75 | |
Market value to book value multiple | | | 1.7 | | | | 1.6 | | | | 1.6 | | | | 1.4 | | | | 1.5 | | | | 1.6 | | | | 1.7 | | | | 1.6 | |
Price to earnings multiple (trailing 4 quarters) | | | 12.4 | | | | 11.7 | | | | 11.8 | | | | 9.9 | | | | 10.8 | | | | 12.0 | | | | 11.6 | | | | 10.7 | |
| (1) | Refer to page 13 for a discussion of non-GAAP measures. |
| (2) | Effective Q3, 2016 the tax equivalent adjustment was no longer included in the calculation. Prior period amounts have been restated. |
| (3) | Credit valuation adjustment (CVA) risk-weighted assets were calculated using scalars of 0.64, 0.71 and 0.77 to compute CET1, Tier 1 and Total capital ratios, respectively in 2016. |
| (4) | Excludes loans acquired under the Federal Deposit Insurance Corporation (FDIC) guarantee related to the acquisition of R-G Premier Bank of Puerto Rico. |
| (5) | Based on the average of the high and low common share price for the period. |
2 0 1 6 S C O T I A B A N K A N N U A L R E P O R T | 119
MANAGEMENT’S DISCUSSION AND ANALYSIS
Eleven-Year Statistical Review
T83 Consolidated Statement of Financial Position
| | | | | | | | | | | | | | | | | | | | | | | | |
| | | IFRS | |
| | | | | | | | | | | | | | | | | | | | | | | | |
| | | | | | |
| As at October 31 ($ millions) | | 2016 | | | 2015 | | | 2014 | | | 2013(1) | | | 2012(1) | | | 2011 | |
Assets | | | | | | | | | | | | | | | | | | | | | | | | |
Cash and deposits with financial institutions | | $ | 46,344 | | | $ | 73,927 | | | $ | 56,730 | | | $ | 53,338 | | | $ | 47,337 | | | $ | 38,723 | |
Precious metals | | | 8,442 | | | | 10,550 | | | | 7,286 | | | | 8,880 | | | | 12,387 | | | | 9,249 | |
Trading assets | | | | | | | | | | | | | | | | | | | | | | | | |
Securities | | | 87,287 | | | | 78,380 | | | | 95,363 | | | | 84,196 | | | | 74,639 | | | | 62,192 | |
Loans | | | 19,421 | | | | 18,341 | | | | 14,508 | | | | 11,225 | | | | 12,857 | | | | 13,607 | |
Other | | | 1,853 | | | | 2,419 | | | | 3,377 | | | | 1,068 | | | | 100 | | | | – | |
| | | 108,561 | | | | 99,140 | | | | 113,248 | | | | 96,489 | | | | 87,596 | | | | 75,799 | |
Financial instruments designated at fair value through profit or loss | | | 221 | | | | 320 | | | | 111 | | | | 106 | | | | 197 | | | | 375 | |
Securities purchased under resale agreements and securities borrowed | | | 92,129 | | | | 87,312 | | | | 93,866 | | | | 82,533 | | | | 66,189 | | | | 47,181 | |
Derivative financial instruments | | | 41,657 | | | | 41,003 | | | | 33,439 | | | | 24,503 | | | | 30,338 | | | | 37,322 | |
Investment securities | | | 72,919 | | | | 43,216 | | | | 38,662 | | | | 34,319 | | | | 33,376 | | | | 30,176 | |
Loans | | | | | | | | | | | | | | | | | | | | | | | | |
Residential mortgages | | | 222,888 | | | | 217,498 | | | | 212,648 | | | | 209,865 | | | | 175,630 | | | | 161,685 | |
Personal and credit cards | | | 99,502 | | | | 91,477 | | | | 84,204 | | | | 76,008 | | | | 68,277 | | | | 63,317 | |
Business and government | | | 162,400 | | | | 153,850 | | | | 131,098 | | | | 119,615 | | | | 111,648 | | | | 96,743 | |
| | | 484,790 | | | | 462,825 | | | | 427,950 | | | | 405,488 | | | | 355,555 | | | | 321,745 | |
Allowance for credit losses | | | 4,626 | | | | 4,197 | | | | 3,641 | | | | 3,273 | | | | 2,977 | | | | 2,689 | |
| | | 480,164 | | | | 458,628 | | | | 424,309 | | | | 402,215 | | | | 352,578 | | | | 319,056 | |
Other | | | | | | | | | | | | | | | | | | | | | | | | |
Customers’ liability under acceptances | | | 11,978 | | | | 10,296 | | | | 9,876 | | | | 10,556 | | | | 8,932 | | | | 8,172 | |
Property and equipment | | | 2,520 | | | | 2,286 | | | | 2,272 | | | | 2,214 | | | | 2,218 | | | | 2,504 | |
Investments in associates | | | 4,299 | | | | 4,033 | | | | 3,461 | | | | 5,326 | | | | 4,791 | | | | 4,434 | |
Goodwill and other intangible assets | | | 12,141 | | | | 11,449 | | | | 10,884 | | | | 10,704 | | | | 8,692 | | | | 7,639 | |
Deferred tax assets | | | 2,021 | | | | 2,034 | | | | 1,763 | | | | 1,938 | | | | 2,273 | | | | 2,214 | |
Other assets | | | 12,870 | | | | 12,303 | | | | 9,759 | | | | 10,523 | | | | 11,321 | | | | 11,579 | |
| | | 45,829 | | | | 42,401 | | | | 38,015 | | | | 41,261 | | | | 38,227 | | | | 36,542 | |
| | $ | 896,266 | | | $ | 856,497 | | | $ | 805,666 | | | $ | 743,644 | | | $ | 668,225 | | | $ | 594,423 | |
Liabilities | | | | | | | | | | | | | | | | | | | | | | | | |
Deposits | | | | | | | | | | | | | | | | | | | | | | | | |
Personal | | $ | 199,302 | | | $ | 190,044 | | | $ | 175,163 | | | $ | 171,048 | | | $ | 138,051 | | | $ | 133,025 | |
Business and government | | | 372,303 | | | | 375,144 | | | | 342,367 | | | | 313,820 | | | | 293,460 | | | | 262,833 | |
Financial institutions | | | 40,272 | | | | 35,731 | | | | 36,487 | | | | 33,019 | | | | 34,178 | | | | 25,376 | |
| | | 611,877 | | | | 600,919 | | | | 554,017 | | | | 517,887 | | | | 465,689 | | | | 421,234 | |
Financial instruments designated at fair value through profit or loss | | | 1,459 | | | | 1,486 | | | | 465 | | | | 174 | | | | 157 | | | | 101 | |
Other | | | | | | | | | | | | | | | | | | | | | | | | |
Acceptances | | | 11,978 | | | | 10,296 | | | | 9,876 | | | | 10,556 | | | | 8,932 | | | | 8,172 | |
Obligations related to securities sold short | | | 23,312 | | | | 20,212 | | | | 27,050 | | | | 24,977 | | | | 18,622 | | | | 15,450 | |
Derivative financial instruments | | | 42,387 | | | | 45,270 | | | | 36,438 | | | | 29,267 | | | | 35,323 | | | | 40,236 | |
Obligations related to securities sold under repurchase agreements and securities lent | | | 97,083 | | | | 77,015 | | | | 88,953 | | | | 77,508 | | | | 56,968 | | | | 38,216 | |
Subordinated debentures | | | 7,633 | | | | 6,182 | | | | 4,871 | | | | 5,841 | | | | 10,143 | | | | 6,923 | |
Capital instruments | | | – | | | | – | | | | – | | | | – | | | | – | | | | 2,003 | |
Other liabilities | | | 42,716 | | | | 41,638 | | | | 34,785 | | | | 32,047 | | | | 32,726 | | | | 29,848 | |
| | | 225,109 | | | | 200,613 | | | | 201,973 | | | | 180,196 | | | | 162,714 | | | | 140,848 | |
| | | 838,445 | | | | 803,018 | | | | 756,455 | | | | 698,257 | | | | 628,560 | | | | 562,183 | |
Equity | | | | | | | | | | | | | | | | | | | | | | | | |
Common equity | | | | | | | | | | | | | | | | | | | | | | | | |
Common shares | | | 15,513 | | | | 15,141 | | | | 15,231 | | | | 14,516 | | | | 13,139 | | | | 8,336 | |
Retained earnings | | | 34,752 | | | | 31,316 | | | | 28,609 | | | | 25,068 | | | | 21,775 | | | | 18,421 | |
Accumulated other comprehensive income (loss) | | | 2,240 | | | | 2,455 | | | | 949 | | | | 388 | | | | (745 | ) | | | (497 | ) |
Other reserves | | | 152 | | | | 173 | | | | 176 | | | | 193 | | | | 166 | | | | 96 | |
Total common equity | | | 52,657 | | | | 49,085 | | | | 44,965 | | | | 40,165 | | | | 34,335 | | | | 26,356 | |
Preferred shares | | | 3,594 | | | | 2,934 | | | | 2,934 | | | | 4,084 | | | | 4,384 | | | | 4,384 | |
Total equity attributable to equity holders of the Bank | | | 56,251 | | | | 52,019 | | | | 47,899 | | | | 44,249 | | | | 38,719 | | | | 30,740 | |
Non-controlling interests | | | | | | | | | | | | | | | | | | | | | | | | |
Non-controlling interests in subsidiaries | | | 1,570 | | | | 1,460 | | | | 1,312 | | | | 1,138 | | | | 946 | | | | 626 | |
Capital instrument equity holders | | | – | | | | – | | | | – | | | | – | | | | – | | | | 874 | |
Total equity | | | 57,821 | | | | 53,479 | | | | 49,211 | | | | 45,387 | | | | 39,665 | | | | 32,240 | |
| | | $ | 896,266 | | | $ | 856,497 | | | $ | 805,666 | | | $ | 743,644 | | | $ | 668,225 | | | $ | 594,423 | |
| (1) | Certain prior period amounts are retrospectively adjusted to reflect the adoption of new and amended IFRS standards (IFRS 10 and IAS 19) in 2014. |
120 | 2 0 1 6 S C O T I A B A N K A N N U A L R E P O R T
MANAGEMENT’S DISCUSSION AND ANALYSIS | SUPPLEMENTARY DATA
T84 Consolidated Statement of Income
| | | | | | | | | | | | | | | | | | | | | | | | |
| | | IFRS | |
| | | | | | | | | | | | | | | | | | | | | | | | |
| | | | | | |
| For the year ended October 31 ($ millions) | | 2016 | | | 2015 | | | 2014 | | | 2013(1) | | | 2012(1) | | | 2011 | |
Revenue | | | | | | | | | | | | | | | | | | | | | | | | |
Interest income | | | | | | | | | | | | | | | | | | | | | | | | |
Loans | | $ | 20,419 | | | $ | 18,912 | | | $ | 18,176 | | | $ | 17,359 | | | $ | 15,606 | | | $ | 14,373 | |
Securities | | | 1,237 | | | | 922 | | | | 921 | | | | 1,000 | | | | 1,045 | | | | 986 | |
Securities purchased under resale agreements and securities borrowed | | | 158 | | | | 161 | | | | 180 | | | | 190 | | | | 221 | | | | 221 | |
Deposits with financial institutions | | | 394 | | | | 292 | | | | 263 | | | | 279 | | | | 287 | | | | 275 | |
| | | 22,208 | | | | 20,287 | | | | 19,540 | | | | 18,828 | | | | 17,159 | | | | 15,855 | |
Interest expense | | | | | | | | | | | | | | | | | | | | | | | | |
Deposits | | | 6,793 | | | | 6,070 | | | | 6,173 | | | | 6,397 | | | | 6,117 | | | | 5,589 | |
Subordinated debentures | | | 232 | | | | 187 | | | | 204 | | | | 339 | | | | 381 | | | | 369 | |
Capital instruments | | | – | | | | – | | | | – | | | | – | | | | – | | | | 138 | |
Other | | | 891 | | | | 938 | | | | 858 | | | | 742 | | | | 691 | | | | 745 | |
| | | 7,916 | | | | 7,195 | | | | 7,235 | | | | 7,478 | | | | 7,189 | | | | 6,841 | |
Net interest income | | | 14,292 | | | | 13,092 | | | | 12,305 | | | | 11,350 | | | | 9,970 | | | | 9,014 | |
Non-interest income | | | 12,058 | | | | 10,957 | | | | 11,299 | | | | 9,949 | | | | 9,676 | | | | 8,296 | |
Total revenue | | | 26,350 | | | | 24,049 | | | | 23,604 | | | | 21,299 | | | | 19,646 | | | | 17,310 | |
Provision for credit losses | | | 2,412 | | | | 1,942 | | | | 1,703 | | | | 1,288 | | | | 1,252 | | | | 1,076 | |
Non-interest expenses | | | 14,540 | | | | 13,041 | | | | 12,601 | | | | 11,664 | | | | 10,436 | | | | 9,481 | |
Income before taxes | | | 9,398 | | | | 9,066 | | | | 9,300 | | | | 8,347 | | | | 7,958 | | | | 6,753 | |
Income tax expense | | | 2,030 | | | | 1,853 | | | | 2,002 | | | | 1,737 | | | | 1,568 | | | | 1,423 | |
Net income | | $ | 7,368 | | | $ | 7,213 | | | $ | 7,298 | | | $ | 6,610 | | | $ | 6,390 | | | $ | 5,330 | |
Net income attributable to non-controlling interests | | $ | 251 | | | $ | 199 | | | $ | 227 | | | $ | 231 | | | $ | 196 | | | $ | 149 | |
Non-controlling interests in subsidiaries | | | 251 | | | | 199 | | | | 227 | | | | 231 | | | | 196 | | | | 91 | |
Capital instrument equity holders | | | – | | | | – | | | | – | | | | – | | | | – | | | | 58 | |
Net income attributable to equity holders of the Bank | | $ | 7,117 | | | $ | 7,014 | | | $ | 7,071 | | | $ | 6,379 | | | $ | 6,194 | | | $ | 5,181 | |
Preferred shareholders | | | 130 | | | | 117 | | | | 155 | | | | 217 | | | | 220 | | | | 216 | |
Common shareholders | | $ | 6,987 | | | $ | 6,897 | | | $ | 6,916 | | | $ | 6,162 | | | $ | 5,974 | | | $ | 4,965 | |
Earnings per common share (in dollars) | | | | | | | | | | | | | | | | | | | | | | | | |
Basic | | $ | 5.80 | | | $ | 5.70 | | | $ | 5.69 | | | $ | 5.15 | | | $ | 5.27 | | | $ | 4.63 | |
Diluted | | $ | 5.77 | | | $ | 5.67 | | | $ | 5.66 | | | $ | 5.11 | | | $ | 5.18 | | | $ | 4.53 | |
Dividends per common share (in dollars) | | $ | 2.88 | | | $ | 2.72 | | | $ | 2.56 | | | $ | 2.39 | | | $ | 2.19 | | | $ | 2.05 | |
| (1) | Certain amounts are retrospectively adjusted to reflect the adoption of new and amended IFRS standards (IFRS 10 and IAS 19) in 2014. |
2 0 1 6 S C O T I A B A N K A N N U A L R E P O R T | 121
MANAGEMENT’S DISCUSSION AND ANALYSIS
T83AConsolidated Balance Sheet – CGAAP
| | | | | | | | | | | | | | | | | | | | |
| | | CGAAP | |
| | | | | |
| As at October 31 ($ millions) | | 2010 | | | 2009 | | | 2008 | | | 2007 | | | 2006 | |
Assets | | | | | | | | | | | | | | | | | | | | |
Cash resources | | $ | 46,027 | | | $ | 43,278 | | | $ | 37,318 | | | $ | 29,195 | | | $ | 23,376 | |
Securities | | | | | | | | | | | | | | | | | | | | |
Trading | | | 64,684 | | | | 58,067 | | | | 48,292 | | | | 59,685 | | | | 62,490 | |
Available-for-sale | | | 47,228 | | | | 55,699 | | | | 38,823 | | | | 28,426 | | | | – | |
Investment | | | – | | | | – | | | | – | | | | – | | | | 32,870 | |
Equity accounted investments | | | 4,651 | | | | 3,528 | | | | 920 | | | | 724 | | | | 142 | |
| | | 116,563 | | | | 117,294 | | | | 88,035 | | | | 88,835 | | | | 95,502 | |
Securities purchased under resale agreements | | | 27,920 | | | | 17,773 | | | | 19,451 | | | | 22,542 | | | | 25,705 | |
Loans | | | | | | | | | | | | | | | | | | | | |
Residential mortgages | | | 120,482 | | | | 101,604 | | | | 115,084 | | | | 102,154 | | | | 89,590 | |
Personal and credit cards | | | 62,548 | | | | 61,048 | | | | 50,719 | | | | 41,734 | | | | 39,058 | |
Business and government | | | 103,981 | | | | 106,520 | | | | 125,503 | | | | 85,500 | | | | 76,733 | |
| | | 287,011 | | | | 269,172 | | | | 291,306 | | | | 229,388 | | | | 205,381 | |
Allowance for credit losses | | | 2,787 | | | | 2,870 | | | | 2,626 | | | | 2,241 | | | | 2,607 | |
| | | 284,224 | | | | 266,302 | | | | 288,680 | | | | 227,147 | | | | 202,774 | |
Other | | | | | | | | | | | | | | | | | | | | |
Customers’ liability under acceptances | | | 7,616 | | | | 9,583 | | | | 11,969 | | | | 11,538 | | | | 9,555 | |
Derivative instruments | | | 26,852 | | | | 25,992 | | | | 44,810 | | | | 21,960 | | | | 12,098 | |
Land, buildings and equipment | | | 2,450 | | | | 2,372 | | | | 2,449 | | | | 2,061 | | | | 2,103 | |
Other assets | | | 15,005 | | | | 13,922 | | | | 14,913 | | | | 8,232 | | | | 7,893 | |
| | | 51,923 | | | | 51,869 | | | | 74,141 | | | | 43,791 | | | | 31,649 | |
| | $ | 526,657 | | | $ | 496,516 | | | $ | 507,625 | | | $ | 411,510 | | | $ | 379,006 | |
Liabilities and shareholders’ equity | | | | | | | | | | | | | | | | | | | | |
Deposits | | | | | | | | | | | | | | | | | | | | |
Personal | | $ | 128,850 | | | $ | 123,762 | | | $ | 118,919 | | | $ | 100,823 | | | $ | 93,450 | |
Business and government | | | 210,687 | | | | 203,594 | | | | 200,566 | | | | 161,229 | | | | 141,072 | |
Banks | | | 22,113 | | | | 23,063 | | | | 27,095 | | | | 26,406 | | | | 29,392 | |
| | | 361,650 | | | | 350,419 | | | | 346,580 | | | | 288,458 | | | | 263,914 | |
Other | | | | | | | | | | | | | | | | | | | | |
Acceptances | | | 7,616 | | | | 9,583 | | | | 11,969 | | | | 11,538 | | | | 9,555 | |
Obligations related to securities sold under repurchase agreements | | | 40,286 | | | | 36,568 | | | | 36,506 | | | | 28,137 | | | | 33,470 | |
Obligations related to securities sold short | | | 21,519 | | | | 14,688 | | | | 11,700 | | | | 16,039 | | | | 13,396 | |
Derivative instruments | | | 31,990 | | | | 28,806 | | | | 42,811 | | | | 24,689 | | | | 12,869 | |
Other liabilities | | | 28,947 | | | | 24,682 | | | | 31,063 | | | | 21,138 | | | | 24,799 | |
| | | 130,358 | | | | 114,327 | | | | 134,049 | | | | 101,541 | | | | 94,089 | |
| | | | | |
Subordinated debentures | | | 5,939 | | | | 5,944 | | | | 4,352 | | | | 1,710 | | | | 2,271 | |
Capital instrument liabilities | | | 500 | | | | 500 | | | | 500 | | | | 500 | | | | 750 | |
Shareholders’ equity | | | | | | | | | | | | | | | | | | | | |
Preferred shares | | | 3,975 | | | | 3,710 | | | | 2,860 | | | | 1,635 | | | | 600 | |
Common shareholders’ equity | | | | | | | | | | | | | | | | | | | | |
Common shares and contributed surplus | | | 5,775 | | | | 4,946 | | | | 3,829 | | | | 3,566 | | | | 3,425 | |
Retained earnings | | | 21,932 | | | | 19,916 | | | | 18,549 | | | | 17,460 | | | | 15,843 | |
Accumulated other comprehensive income (loss) | | | (4,051 | ) | | | (3,800 | ) | | | (3,596 | ) | | | (3,857 | ) | | | (2,321 | ) |
Total common shareholders’ equity | | | 23,656 | | | | 21,062 | | | | 18,782 | | | | 17,169 | | | | 16,947 | |
Total equity attributable to equity holders of the Bank | | | 27,631 | | | | 24,772 | | | | 21,642 | | | | 18,804 | | | | 17,547 | |
Non-controlling interests | | | 579 | | | | 554 | | | | 502 | | | | 497 | | | | 435 | |
Total shareholders’ equity | | | 28,210 | | | | 25,326 | | | | 22,144 | | | | 19,301 | | | | 17,982 | |
| | | $ | 526,657 | | | $ | 496,516 | | | $ | 507,625 | | | $ | 411,510 | | | $ | 379,006 | |
122 | 2 0 1 6 S C O T I A B A N K A N N U A L R E P O R T
MANAGEMENT’S DISCUSSION AND ANALYSIS | SUPPLEMENTARY DATA
T84A Consolidated Statement of Income – CGAAP
| | | | | | | | | | | | | | | | | | | | |
| | | CGAAP | |
| | | | | |
| For the year ended October 31 ($ millions) | | 2010 | | | 2009 | | | 2008 | | | 2007 | | | 2006 | |
Interest income | | | | | | | | | | | | | | | | | | | | |
Loans | | $ | 12,171 | | | $ | 13,973 | | | $ | 15,832 | | | $ | 13,985 | | | $ | 11,575 | |
Securities | | | 4,227 | | | | 4,090 | | | | 4,615 | | | | 4,680 | | | | 4,124 | |
Securities purchased under resale agreements | | | 201 | | | | 390 | | | | 786 | | | | 1,258 | | | | 1,102 | |
Deposits with banks | | | 292 | | | | 482 | | | | 1,083 | | | | 1,112 | | | | 881 | |
| | | 16,891 | | | | 18,935 | | | | 22,316 | | | | 21,035 | | | | 17,682 | |
Interest expense | | | | | | | | | | | | | | | | | | | | |
Deposits | | | 6,768 | | | | 8,339 | | | | 12,131 | | | | 10,850 | | | | 8,589 | |
Subordinated debentures | | | 289 | | | | 285 | | | | 166 | | | | 116 | | | | 130 | |
Capital instrument liabilities | | | 37 | | | | 37 | | | | 37 | | | | 53 | | | | 53 | |
Other | | | 1,176 | | | | 1,946 | | | | 2,408 | | | | 2,918 | | | | 2,502 | |
| | | 8,270 | | | | 10,607 | | | | 14,742 | | | | 13,937 | | | | 11,274 | |
Net interest income | | | 8,621 | | | | 8,328 | | | | 7,574 | | | | 7,098 | | | | 6,408 | |
Provision for credit losses | | | 1,239 | | | | 1,744 | | | | 630 | | | | 270 | | | | 216 | |
Net interest income after provision for credit losses | | | 7,382 | | | | 6,584 | | | | 6,944 | | | | 6,828 | | | | 6,192 | |
Other income | | | 6,884 | | | | 6,129 | | | | 4,302 | | | | 5,392 | | | | 4,800 | |
Net interest and other income | | | 14,266 | | | | 12,713 | | | | 11,246 | | | | 12,220 | | | | 10,992 | |
Non-interest expenses | | | | | | | | | | | | | | | | | | | | |
Salaries and employee benefits | | | 4,647 | | | | 4,344 | | | | 4,109 | | | | 3,983 | | | | 3,768 | |
Other | | | 3,535 | | | | 3,575 | | | | 3,187 | | | | 3,011 | | | | 2,675 | |
| | | 8,182 | | | | 7,919 | | | | 7,296 | | | | 6,994 | | | | 6,443 | |
Income before income taxes | | | 6,084 | | | | 4,794 | | | | 3,950 | | | | 5,226 | | | | 4,549 | |
Provision for income taxes | | | 1,745 | | | | 1,133 | | | | 691 | | | | 1,063 | | | | 872 | |
Net income | | $ | 4,339 | | | $ | 3,661 | | | $ | 3,259 | | | $ | 4,163 | | | $ | 3,677 | |
Net income attributable to non-controlling interests | | $ | 100 | | | $ | 114 | | | $ | 119 | | | $ | 118 | | | $ | 98 | |
Net income attributable to equity holders of the Bank | | | 4,239 | | | | 3,547 | | | | 3,140 | | | | 4,045 | | | | 3,579 | |
Preferred shareholders | | | 201 | | | | 186 | | | | 107 | | | | 51 | | | | 30 | |
Common shareholders | | $ | 4,038 | | | $ | 3,361 | | | $ | 3,033 | | | $ | 3,994 | | | $ | 3,549 | |
| Average number of common shares outstanding (millions) | | | | | | | | | | | | | | | | | | | | |
Basic | | | 1,032 | | | | 1,013 | | | | 987 | | | | 989 | | | | 988 | |
Diluted | | | 1,034 | | | | 1,016 | | | | 993 | | | | 997 | | | | 1,001 | |
Earnings per common share (in dollars)(1) | | | | | | | | | | | | | | | | | | | | |
Basic | | $ | 3.91 | | | $ | 3.32 | | | $ | 3.07 | | | $ | 4.04 | | | $ | 3.59 | |
Diluted | | $ | 3.91 | | | $ | 3.31 | | | $ | 3.05 | | | $ | 4.01 | | | $ | 3.55 | |
Dividends per common share (in dollars) | | $ | 1.96 | | | $ | 1.96 | | | $ | 1.92 | | | $ | 1.74 | | | $ | 1.50 | |
| (1) | The calculation of earnings per share is based on full dollar and share amounts. |
2 0 1 6 S C O T I A B A N K A N N U A L R E P O R T | 123
MANAGEMENT’S DISCUSSION AND ANALYSIS
T85 Consolidated Statement of Changes in Equity
| | | | | | | | | | | | | | | | | | | | | | | | |
| | | IFRS | |
| | | | | | | | | | | | | | | | | | | | | | | | |
| | | | | | |
| For the year ended October 31 ($ millions) | | 2016 | | | 2015 | | | 2014 | | | 2013(1) | | | 2012(1) | | | 2011 | |
Common shares | | | | | | | | | | | | | | | | | | | | | | | | |
Balance at beginning of year | | $ | 15,141 | | | $ | 15,231 | | | $ | 14,516 | | | $ | 13,139 | | | $ | 8,336 | | | $ | 5,750 | |
Issued | | | 391 | | | | 104 | | | | 771 | | | | 1,377 | | | | 4,803 | | | | 2,586 | |
Purchased for cancellation | | | (19 | ) | | | (194 | ) | | | (56 | ) | | | – | | | | – | | | | – | |
Balance at end of year | | $ | 15,513 | | | $ | 15,141 | | | $ | 15,231 | | | $ | 14,516 | | | $ | 13,139 | | | $ | 8,336 | |
Retained earnings | | | | | | | | | | | | | | | | | | | | | | | | |
Balance at beginning of year | | | 31,316 | | | | 28,609 | | | | 25,315 | | | | 21,978 | | | | 18,421 | | | | 21,932 | |
IFRS adjustment | | | – | | | | – | | | | (247 | ) | | | (203 | ) | | | (144 | ) | | | (6,248 | ) |
Restated balances | | | 31,316 | | | | 28,609 | | | | 25,068 | | | | 21,775 | | | | 18,277 | | | | 15,684 | |
Adjustments | | | – | | | | – | | | | – | | | | – | | | | – | | | | – | |
Net income attributable to common shareholders of the Bank(4) | | | 6,987 | | | | 6,897 | | | | 6,916 | | | | 6,162 | | | | 5,974 | | | | 4,965 | |
Dividends: Preferred(5) | | | – | | | | – | | | | – | | | | – | | | | – | | | | – | |
Common | | | (3,468 | ) | | | (3,289 | ) | | | (3,110 | ) | | | (2,858 | ) | | | (2,493 | ) | | | (2,200 | ) |
Purchase of shares for cancellation and premium on redemption | | | (61 | ) | | | (761 | ) | | | (264 | ) | | | – | | | | – | | | | – | |
Other | | | (22 | ) | | | (140 | )(6) | | | (1 | ) | | | (11 | ) | | | 17 | | | | (28 | ) |
Balance at end of year | | $ | 34,752 | | | $ | 31,316 | | | $ | 28,609 | | | $ | 25,068 | | | $ | 21,775 | | | $ | 18,421 | |
Accumulated other comprehensive income (loss) | | | | | | | | | | | | | | | | | | | | | | | | |
Balance at beginning of year | | | 2,455 | | | | 949 | | | | 545 | | | | (31 | ) | | | (497 | ) | | | (4,051 | ) |
IFRS adjustment | | | – | | | | – | | | | (157 | ) | | | (714 | ) | | | 32 | | | | 4,320 | |
Restated balances | | | 2,455 | | | | 949 | | | | 388 | | | | (745 | ) | | | (465 | ) | | | 269 | |
Cumulative effect of adopting new accounting policies | | | – | | | | (5 | )(7) | | | – | | | | – | | | | – | | | | – | |
Other comprehensive income (loss) | | | (215 | ) | | | 1,511 | | | | 561 | | | | 1,133 | | | | (280 | ) | | | (766 | ) |
Balance at end of year | | $ | 2,240 | | | $ | 2,455 | | | $ | 949 | | | $ | 388 | | | $ | (745 | ) | | $ | (497 | ) |
Other reserves(9) | | | | | | | | | | | | | | | | | | | | | | | | |
Balance at beginning of year | | | 173 | | | | 176 | | | | 193 | | | | 166 | | | | 96 | | | | 25 | |
Share-based payments | | | 7 | | | | 14 | | | | 30 | | | | 36 | | | | 38 | | | | 46 | |
Other | | | (28 | ) | | | (17 | ) | | | (47 | ) | | | (9 | ) | | | 32 | | | | 25 | |
Balance at end of year | | $ | 152 | | | $ | 173 | | | $ | 176 | | | $ | 193 | | | $ | 166 | | | $ | 96 | |
Total common equity | | $ | 52,657 | | | $ | 49,085 | | | $ | 44,965 | | | $ | 40,165 | | | $ | 34,335 | | | $ | 26,356 | |
Preferred shares | | | | | | | | | | | | | | | | | | | | | | | | |
Balance at beginning of year | | | 2,934 | | | | 2,934 | | | | 4,084 | | | | 4,384 | | | | 4,384 | | | | 3,975 | |
Net income attributable to preferred shareholders of the Bank(4) | | | 130 | | | | 117 | | | | 155 | | | | 217 | | | | 220 | | | | 216 | |
Preferred dividends(5) | | | (130 | ) | | | (117 | ) | | | (155 | ) | | | (217 | ) | | | (220 | ) | | | (216 | ) |
Issued | | | 1,350 | | | | – | | | | – | | | | – | | | | – | | | | 409 | |
Redeemed | | | (690 | ) | | | – | | | | (1,150 | ) | | | (300 | ) | | | – | | | | – | |
Balance at end of year | | $ | 3,594 | | | $ | 2,934 | | | $ | 2,934 | | | $ | 4,084 | | | $ | 4,384 | | | $ | 4,384 | |
Non-controlling interests | | | | | | | | | | | | | | | | | | | | | | | | |
Balance at beginning of year | | | 1,460 | | | | 1,312 | | | | 1,155 | | | | 1,743 | | | | 1,500 | | | | 579 | |
IFRS adjustment | | | – | | | | – | | | | (17 | ) | | | (797 | ) | | | (891 | ) | | | 936 | |
Restated balances | | | 1,460 | | | | 1,312 | | | | 1,138 | | | | 946 | | | | 609 | | | | 1,515 | |
Net income attributable to non-controlling interests | | | 251 | | | | 199 | | | | 227 | | | | 231 | | | | 196 | | | | 149 | |
Distributions to non-controlling interests | | | (116 | ) | | | (86 | ) | | | (76 | ) | | | (80 | ) | | | (44 | ) | | | (181 | ) |
Effect of foreign exchange and others | | | (25 | ) | | | 35 | | | | 23 | | | | 41 | | | | 185 | | | | 17 | |
Balance at end of year | | $ | 1,570 | | | $ | 1,460 | | | $ | 1,312 | | | $ | 1,138 | | | $ | 946 | | | $ | 1,500 | |
Total equity at end of year | | $ | 57,821 | | | $ | 53,479 | | | $ | 49,211 | | | $ | 45,387 | | | $ | 39,665 | | | $ | 32,240 | |
| (1) | Certain prior period amounts are retrospectively adjusted to reflect the adoption of new and amended IFRS standards (IFRS 10 and IAS 19) in 2014. |
| (2) | Relates to the adoption of new financial instruments accounting standards under CGAAP. |
| (3) | Relates to the adoption of new stock-based compensation accounting standard under CGAAP. |
| (4) | Under CGAAP, net income attributable to preferred shareholders was included in retained earnings. |
| (5) | Under IFRS, preferred dividends are recorded as a reduction to preferred shareholders’ equity. Under CGAAP, dividends are a reduction to retained earnings. |
| (6) | Includes retrospective adjustments primarily related to foreign currency translation on Allowance for Credit Losses with respect to periods prior to 2013 ($152). |
| (7) | To reflect the adoption of the own credit risk provisions of IFRS 9 pertaining to financial liabilities designated at fair value through profit or loss. |
| (8) | Relates to the adoption of the new accounting standard for impairment and classification of financial instruments under CGAAP. |
| (9) | Under CGAAP, amounts represent Contributed Surplus. |
T86 Consolidated Statement of Comprehensive Income
| | | | | | | | | | | | | | | | | | | | | | | | |
| | | IFRS | |
| | | | | | | | | | | | | | | | | | | | | | | | |
| For the year ended October 31 ($ millions) | | 2016 | | | 2015 | | | 2014 | | | 2013(1) | | | 2012(1) | | | 2011 | |
Net income | | $ | 7,368 | | | $ | 7,213 | | | $ | 7,298 | | | $ | 6,610 | | | $ | 6,390 | | | $ | 5,330 | |
Other comprehensive income (loss), net of income taxes: | | | | | | | | | | | | | | | | | | | | | | | | |
Items that will be reclassified subsequently to net income | | | | | | | | | | | | | | | | | | | | | | | | |
Net change in unrealized foreign currency translation gains (losses) | | | 396 | | | | 1,855 | | | | 889 | | | | 346 | | | | 149 | | | | (697 | ) |
Net change in unrealized gains (losses) on available-for-sale securities | | | (172 | ) | | | (480 | ) | | | (38 | ) | | | 110 | | | | 151 | | | | (169 | ) |
Net change in gains (losses) on derivative instruments designated as cash flow hedges | | | 258 | | | | 55 | | | | (6 | ) | | | 93 | | | | 116 | | | | 105 | |
Other comprehensive income from investments in associates | | | 31 | | | | (9 | ) | | | 60 | | | | 20 | | | | 25 | | | | – | |
Items that will not be reclassified subsequently to net income | | | | | | | | | | | | | | | | | | | | | | | | |
Net change in remeasurement of employee benefit plan asset and liability | | | (716 | ) | | | (1 | ) | | | (320 | ) | | | 563 | | | | (747 | ) | | | – | |
Net change in fair value due to change in own credit risk on financial liabilities designated under the fair value option(2) | | | (16 | ) | | | 15 | | | | N/A | | | | N/A | | | | N/A | | | | N/A | |
Other comprehensive income from investments in associates | | | (10 | ) | | | 1 | | | | (2 | ) | | | – | | | | – | | | | – | |
Other comprehensive income (loss) | | | (229 | ) | | | 1,436 | | | | 583 | | | | 1,132 | | | | (306 | ) | | | (761 | ) |
Comprehensive income | | $ | 7,139 | | | $ | 8,649 | | | $ | 7,881 | | | $ | 7,742 | | | $ | 6,084 | | | $ | 4,569 | |
Comprehensive income attributable to: | | | | | | | | | | | | | | | | | | | | | | | | |
Common shareholders of the Bank | | $ | 6,772 | | | $ | 8,408 | | | $ | 7,477 | | | $ | 7,298 | | | $ | 5,694 | | | $ | 4,199 | |
Preferred shareholders of the Bank | | | 130 | | | | 117 | | | | 155 | | | | 217 | | | | 220 | | | | 216 | |
Non-controlling interests in subsidiaries | | | 237 | | | | 124 | | | | 249 | | | | 227 | | | | 170 | | | | 96 | |
Capital instrument equity holders | | | – | | | | – | | | | – | | | | – | | | | – | | | | 58 | |
| | | $ | 7,139 | | | $ | 8,649 | | | $ | 7,881 | | | $ | 7,742 | | | $ | 6,084 | | | $ | 4,569 | |
| (1) | Certain prior period amounts are retrospectively adjusted to reflect the adoption of new and amended IFRS standards (IFRS 10 and IAS 19) in 2014. |
| (2) | In accordance with the transition requirements for the own credit risk provisions of IFRS 9, prior year comparatives have not been restated for the adoption of this standard in 2015. |
124 | 2 0 1 6 S C O T I A B A N K A N N U A L R E P O R T
MANAGEMENT’S DISCUSSION AND ANALYSIS | SUPPLEMENTARY DATA
| | | | | | | | | | | | | | | | | | |
| CGAAP | |
| | | | | | | | | | | | | | | | | | |
| | | | |
| 2010 | | | 2009 | | | 2008 | | | 2007 | | | 2006 | |
| | | | | | | | | | | | | | | | | | |
| $ | 4,946 | | | $ | 3,829 | | | $ | 3,566 | | | $ | 3,425 | | | $ | 3,316 | |
| | 804 | | | | 1,117 | | | | 266 | | | | 184 | | | | 135 | |
| | – | | | | – | | | | (3 | ) | | | (43 | ) | | | (26 | ) |
| $ | 5,750 | | | $ | 4,946 | | | $ | 3,829 | | | $ | 3,566 | | | $ | 3,425 | |
| | | | | | | | | | | | | | | | | | |
| | 19,916 | | | | 18,549 | | | | 17,460 | | | | 15,843 | | | | 14,126 | |
| | – | | | | – | | | | – | | | | – | | | | – | |
| | 19,916 | | | | 18,549 | | | | 17,460 | | | | 15,843 | | | | 14,126 | |
| | – | | | | – | | | | – | | | | (61 | )(2) | | | (25 | )(3) |
| | 4,239 | | | | 3,547 | | | | 3,140 | | | | 4,045 | | | | 3,579 | |
| | (201 | ) | | | (186 | ) | | | (107 | ) | | | (51 | ) | | | (30 | ) |
| | (2,023 | ) | | | (1,990 | ) | | | (1,896 | ) | | | (1,720 | ) | | | (1,483 | ) |
| | – | | | | – | | | | (37 | ) | | | (586 | ) | | | (324 | ) |
| | 1 | | | | (4 | ) | | | (11 | ) | | | (10 | ) | | | – | |
| $ | 21,932 | | | $ | 19,916 | | | $ | 18,549 | | | $ | 17,460 | | | $ | 15,843 | |
| | | | | | | | | | | | | | | | | | |
| | (3,800 | ) | | | (3,596 | ) | | | (3,857 | ) | | | (2,321 | ) | | | (1,961 | ) |
| | – | | | | – | | | | – | | | | – | | | | – | |
| | (3,800 | ) | | | (3,596 | ) | | | (3,857 | ) | | | (2,321 | ) | | | (1,961 | ) |
| | – | | | | 595 | (8) | | | – | | | | 683 | | | | – | |
| | (251 | ) | | | (799 | ) | | | 261 | | | | (2,219 | ) | | | (360 | ) |
| $ | (4,051 | ) | | $ | (3,800 | ) | | $ | (3,596 | ) | | $ | (3,857 | ) | | $ | (2,321 | ) |
| | | | | | | | | | | | | | | | | | |
| | – | | | | – | | | | – | | | | – | | | | 1 | |
| | 25 | | | | – | | | | – | | | | – | | | | (1 | ) |
| | – | | | | – | | | | – | | | | – | | | | – | |
| $ | 25 | | | $ | – | | | $ | – | | | $ | – | | | $ | – | |
| $ | 23,656 | | | $ | 21,062 | | | $ | 18,782 | | | $ | 17,169 | | | $ | 16,947 | |
| | | | | | | | | | | | | | | | | | |
| | 3,710 | | | | 2,860 | | | | 1,635 | | | | 600 | | | | 600 | |
| | – | | | | – | | | | – | | | | – | | | | – | |
| | – | | | | – | | | | – | | | | – | | | | – | |
| | 265 | | | | 850 | | | | 1,225 | | | | 1,035 | | | | – | |
| | – | | | | – | | | | – | | | | – | | | | – | |
| $ | 3,975 | | | $ | 3,710 | | | $ | 2,860 | | | $ | 1,635 | | | $ | 600 | |
| | | | | | | | | | | | | | | | | | |
| | 554 | | | | 502 | | | | N/A | | | | N/A | | | | N/A | |
| | – | | | | – | | | | – | | | | – | | | | – | |
| | 554 | | | | 502 | | | | N/A | | | | N/A | | | | N/A | |
| | 100 | | | | 114 | | | | N/A | | | | N/A | | | | N/A | |
| | (35 | ) | | | (36 | ) | | | N/A | | | | N/A | | | | N/A | |
| | (40 | ) | | | (26 | ) | | | N/A | | | | N/A | | | | N/A | |
| $ | 579 | | | $ | 554 | | | $ | 502 | | | $ | 497 | | | $ | 435 | |
| $ | 28,210 | | | $ | 25,326 | | | $ | 22,144 | | | $ | 19,301 | | | $ | 17,982 | |
| | | | | | | | | | | | | | | | | | |
| CGAAP | |
| | | | | | | | | | | | | | | | | | |
| 2010 | | | 2009 | | | 2008 | | | 2007 | | | 2006 | |
| $ | 4,339 | | | $ | 3,661 | | | $ | 3,259 | | | $ | 4,163 | | | $ | 3,677 | |
| | | | | | | | | | | | | | | | | | |
| | | | | | | | | | | | | | | | | | |
| | (591 | ) | | | (1,736 | ) | | | 2,368 | | | | (2,228 | ) | | | (360 | ) |
| | 278 | | | | 894 | | | | (1,588 | ) | | | (67 | ) | | | – | |
| | | | | | | | | | | | | | | | | | |
| | 62 | | | | 43 | | | | (519 | ) | | | 76 | | | | – | |
| | – | | | | – | | | | – | | | | – | | | | – | |
| | | | | | | | | | | | | | | | | | |
| | – | | | | – | | | | – | | | | – | | | | – | |
|
N/A |
| | | N/A | | | | N/A | | | | N/A | | | | N/A | |
| | – | | | | – | | | | – | | | | – | | | | – | |
| | (251 | ) | | | (799 | ) | | | 261 | | | | (2,219 | ) | | | (360 | ) |
| $ | 4,088 | | | $ | 2,862 | | | $ | 3,520 | | | $ | 1,944 | | | $ | 3,317 | |
| | | | | | | | | | | | | | | | | | |
| $ | 3,787 | | | $ | 2,562 | | | $ | 3,294 | | | $ | 1,775 | | | $ | 3,189 | |
| | 201 | | | | 186 | | | | 107 | | | | 51 | | | | 30 | |
| | 100 | | | | 114 | | | | 119 | | | | 118 | | | | 98 | |
| | – | | | | – | | | | – | | | | – | | | | – | |
| $ | 4,088 | | | $ | 2,862 | | | $ | 3,520 | | | $ | 1,944 | | | $ | 3,317 | |
2 0 1 6 S C O T I A B A N K A N N U A L R E P O R T | 125
MANAGEMENT’S DISCUSSION AND ANALYSIS
T87 Other statistics
| | | | | | | | | | | | | | | | | | | | | | | | |
| | | IFRS | |
| | | | | | | | | | | | | | | | | | | | | | | | |
| | | | | | |
| For the year ended October 31 | | 2016 | | | 2015 | | | 2014 | | | 2013(1) | | | 2012(1) | | | 2011 | |
Operating performance | | | | | | | | | | | | | | | | | | | | | | | | |
Basic earnings per share ($) | | | 5.80 | | | | 5.70 | | | | 5.69 | | | | 5.15 | | | | 5.27 | | | | 4.63 | |
Diluted earnings per share ($) | | | 5.77 | | | | 5.67 | | | | 5.66 | | | | 5.11 | | | | 5.18 | | | | 4.53 | |
Return on equity (%) | | | 13.8 | | | | 14.6 | | | | 16.1 | | | | 16.6 | | | | 19.9 | | | | 20.3 | |
Productivity ratio (%)(2) | | | 55.2 | | | | 54.2 | | | | 53.4 | | | | 54.8 | | | | 53.1 | | | | 54.8 | |
Return on assets (%) | | | 0.81 | | | | 0.84 | | | | 0.92 | | | | 0.88 | | | | 0.97 | | | | 0.91 | |
Core banking margin (%)(2)(3) | | | 2.38 | | | | 2.39 | | | | 2.39 | | | | 2.31 | | | | 2.31 | | | | 2.32 | |
Net interest margin on total average assets (%) | | | N/A | | | | N/A | | | | N/A | | | | N/A | | | | N/A | | | | N/A | |
Capital measures(4) | | | | | | | | | | | | | | | | | | | | | | | | |
Common Equity Tier 1 (CET1) capital ratio (%) | | | 11.0 | | | | 10.3 | | | | 10.8 | | | | 9.1 | | | | N/A | | | | N/A | |
Tier 1 capital ratio (%) | | | 12.4 | | | | 11.5 | | | | 12.2 | | | | 11.1 | | | | 13.6 | | | | 12.2 | |
Total capital ratio (%) | | | 14.6 | | | | 13.4 | | | | 13.9 | | | | 13.5 | | | | 16.7 | | | | 13.9 | |
Leverage ratio (%) | | | 4.5 | | | | 4.2 | | | | N/A | | | | N/A | | | | N/A | | | | N/A | |
Common share information | | | | | | | | | | | | | | | | | | | | | | | | |
Closing share price ($)(TSX) | | | 72.08 | | | | 61.49 | | | | 69.02 | | | | 63.39 | | | | 54.25 | | | | 52.53 | |
Number of shares outstanding (millions) | | | 1,208 | | | | 1,203 | | | | 1,217 | | | | 1,209 | | | | 1,184 | | | | 1,089 | |
Dividends per share ($) | | | 2.88 | | | | 2.72 | | | | 2.56 | | | | 2.39 | | | | 2.19 | | | | 2.05 | |
Dividend yield (%)(5) | | | 4.7 | | | | 4.4 | | | | 3.8 | | | | 4.1 | | | | 4.2 | | | | 3.7 | |
Price to earnings multiple (trailing 4 quarters) | | | 12.4 | | | | 10.8 | | | | 12.1 | | | | 12.3 | | | | 10.3 | | | | 11.3 | |
Book value per common share ($) | | | 43.59 | | | | 40.80 | | | | 36.96 | | | | 33.23 | | | | 28.99 | | | | 24.20 | |
Other information | | | | | | | | | | | | | | | | | | | | | | | | |
Average total assets ($ millions) | | | 913,844 | | | | 860,607 | | | | 795,641 | | | | 748,901 | | | | 659,538 | | | | 586,101 | |
Number of branches and offices | | | 3,113 | | | | 3,177 | | | | 3,288 | | | | 3,330 | | | | 3,123 | | | | 2,926 | |
Number of employees | | | 88,901 | | | | 89,214 | | | | 86,932 | | | | 86,690 | | | | 81,497 | | | | 75,362 | |
Number of automated banking machines | | | 8,144 | | | | 8,191 | | | | 8,732 | | | | 8,471 | | | | 7,341 | | | | 6,260 | |
| (1) | Certain prior period amounts are retrospectively adjusted to reflect the adoption of new and amended IFRS standards (IFRS 10 and IAS 19) in 2014. Capital measures have not been restated for the new IFRS standards as they represent the actual amounts in the period for regulatory purposes. |
| (2) | Effective 2016, the taxable equivalent adjustment was no longer included in the calculation. Prior period amounts have been restated. |
| (3) | Refer to page 13 for a discussion of non-GAAP measures. |
| (4) | Effective November 1, 2012, regulatory capital ratios are determined in accordance with Basel III rules as an all-in basis. Comparative amounts for periods 2012-2007 were determined in accordance with Basel II rules. Amounts prior to 2007 were determined in accordance with Basel I rules and have not been restated. |
| (5) | Based on the average of the high and low common share price for the year. |
126 | 2 0 1 6 S C O T I A B A N K A N N U A L R E P O R T
MANAGEMENT’S DISCUSSION AND ANALYSIS | SUPPLEMENTARY DATA
| | | | | | | | | | | | | | | | | | |
| CGAAP | |
| | | | | | | | | | | | | | | | | | |
| | | | |
| 2010 | | | 2009 | | | 2008 | | | 2007 | | | 2006 | |
| | | | | | | | | | | | | | | | | | |
| | 3.91 | | | | 3.32 | | | | 3.07 | | | | 4.04 | | | | 3.59 | |
| | 3.91 | | | | 3.31 | | | | 3.05 | | | | 4.01 | | | | 3.55 | |
| | 18.3 | | | | 16.7 | | | | 16.7 | | | | 22.0 | | | | 22.1 | |
| | 52.8 | | | | 54.8 | | | | 61.4 | | | | 56.0 | | | | 57.5 | |
| | 0.84 | | | | 0.71 | | | | 0.72 | | | | 1.03 | | | | 1.05 | |
| | N/A | | | | N/A | | | | N/A | | | | N/A | | | | N/A | |
| | 1.67 | | | | 1.62 | | | | 1.66 | | | | 1.76 | | | | 1.83 | |
| | | | | | | | | | | | | | | | | | |
| | N/A | | | | N/A | | | | N/A | | | | N/A | | | | N/A | |
| | 11.8 | | | | 10.7 | | | | 9.3 | | | | 9.3 | | | | 10.2 | |
| | 13.8 | | | | 12.9 | | | | 11.1 | | | | 10.5 | | | | 11.7 | |
| | N/A | | | | N/A | | | | N/A | | | | N/A | | | | N/A | |
| | | | | | | | | | | | | | | | | | |
| | | | | | | | | | | | | | | | | | |
| | 54.67 | | | | 45.25 | | | | 40.19 | | | | 53.48 | | | | 49.30 | |
| | 1,043 | | | | 1,025 | | | | 992 | | | | 984 | | | | 990 | |
| | 1.96 | | | | 1.96 | | | | 1.92 | | | | 1.74 | | | | 1.50 | |
| | 3.9 | | | | 5.4 | | | | 4.3 | | | | 3.4 | | | | 3.3 | |
| | 14.0 | | | | 13.6 | | | | 13.1 | | �� | | 13.2 | | | | 13.7 | |
| | 22.68 | | | | 20.55 | | | | 18.94 | | | | 17.45 | | | | 17.13 | |
| | | | | | | | | | | | | | | | | | |
| | 515,991 | | | | 513,149 | | | | 455,539 | | | | 403,475 | | | | 350,709 | |
| | 2,784 | | | | 2,686 | | | | 2,672 | | | | 2,331 | | | | 2,191 | |
| | 70,772 | | | | 67,802 | | | | 69,049 | | | | 58,113 | | | | 54,199 | |
| | 5,978 | | | | 5,778 | | | | 5,609 | | | | 5,283 | | | | 4,937 | |
2 0 1 6 S C O T I A B A N K A N N U A L R E P O R T | 127