Exhibit (c)(3)

Confidential CORPORATE FINANCE FINANCIAL ADVISORY SERVICES FINANCIAL RESTRUCTURING STRATEGIC CONSULTING HL.com Project Horizon Presentation to the Board of Directors of Pulse Electronics Corporation February 27, 2015 Confidential
Confidential Table of Contents Page Situation Overview 2 Transaction Overview 10 Financial Analysis 15 Appendix 25 Additional Financial Information 26 Disclaimer 34 Project Horizon 1

Confidential Situation Overview
Confidential Scope of Opinion Situation Overview 3 We understand that OCM PE Holdings, L . P . (“Parent”) and other affiliated investment funds managed by Oaktree Capital Management L . P . (“ Oaktree ”) currently own 11 , 999 , 585 shares of the common stock, par value $ 0 . 125 per share (“Company Common Stock”), of Pulse Electronics Corporation (the “Company”), which represents approximately 68 . 7 % of the outstanding shares of Company Common Stock . The Company intends to enter into an Agreement pursuant to which, among other things : Parent will invest, or cause to be invested, $ 17 , 000 , 000 in the Company in consideration for the issuance of additional shares of Company Common Stock (collectively, the “Investment”) as follows : Parent will cause one or more of its affiliates to make loans (the “Loans”) to the Company or one or more subsidiaries of the Company in an aggregate principal amount equal to $ 8 , 500 , 000 on economic and other terms no less favorable to the Company than the terms of the Term B Loans made under the Company’s existing credit agreement ; and At consummation of the Transactions (as defined below), Parent will contribute to the Company, or cause to be contributed, $ 17 , 000 , 000 in cash, less the principal amount of any Loans, in exchange for shares of Company Common Stock, and the Loans will convert into shares of Company Common Stock, in each case at a per share price equal to the Merger Consideration (as defined below), subject to adjustment, such that Parent and affiliates of investment funds managed by Oaktree will own in excess of 80 % of the outstanding shares of Company Common Stock . Immediately following the consummation of the Investment, OCM PE Merger Sub, Inc . , a wholly owned subsidiary of Parent (“Merger Sub”), will merge with and into the Company (the “Merger” and, together with the Investment, the “Transactions”) ; and Each issued and outstanding share of Company Common Stock, other than dissenting shares and shares owned by Parent, Merger Sub and any of their affiliates, will be converted into the right to receive $ 1 . 50 in cash without interest (the “Merger Consideration”) .
Confidential Scope of Opinion (cont.) Situation Overview 4 The Board of Directors of the Company (the “Board”) has formed a special committee of independent directors (the “Committee”) to provide certain financial advisory services in connection with the Transactions . The Committee has requested that Houlihan Lokey provide an opinion (the “Opinion”) to the Committee and the Board as to whether the Merger Consideration to be received by the holders of Company Common Stock, other than holders of dissenting shares and Parent, Merger Sub and any of their affiliates in the Merger is fair, from a financial point of view, to such holders .
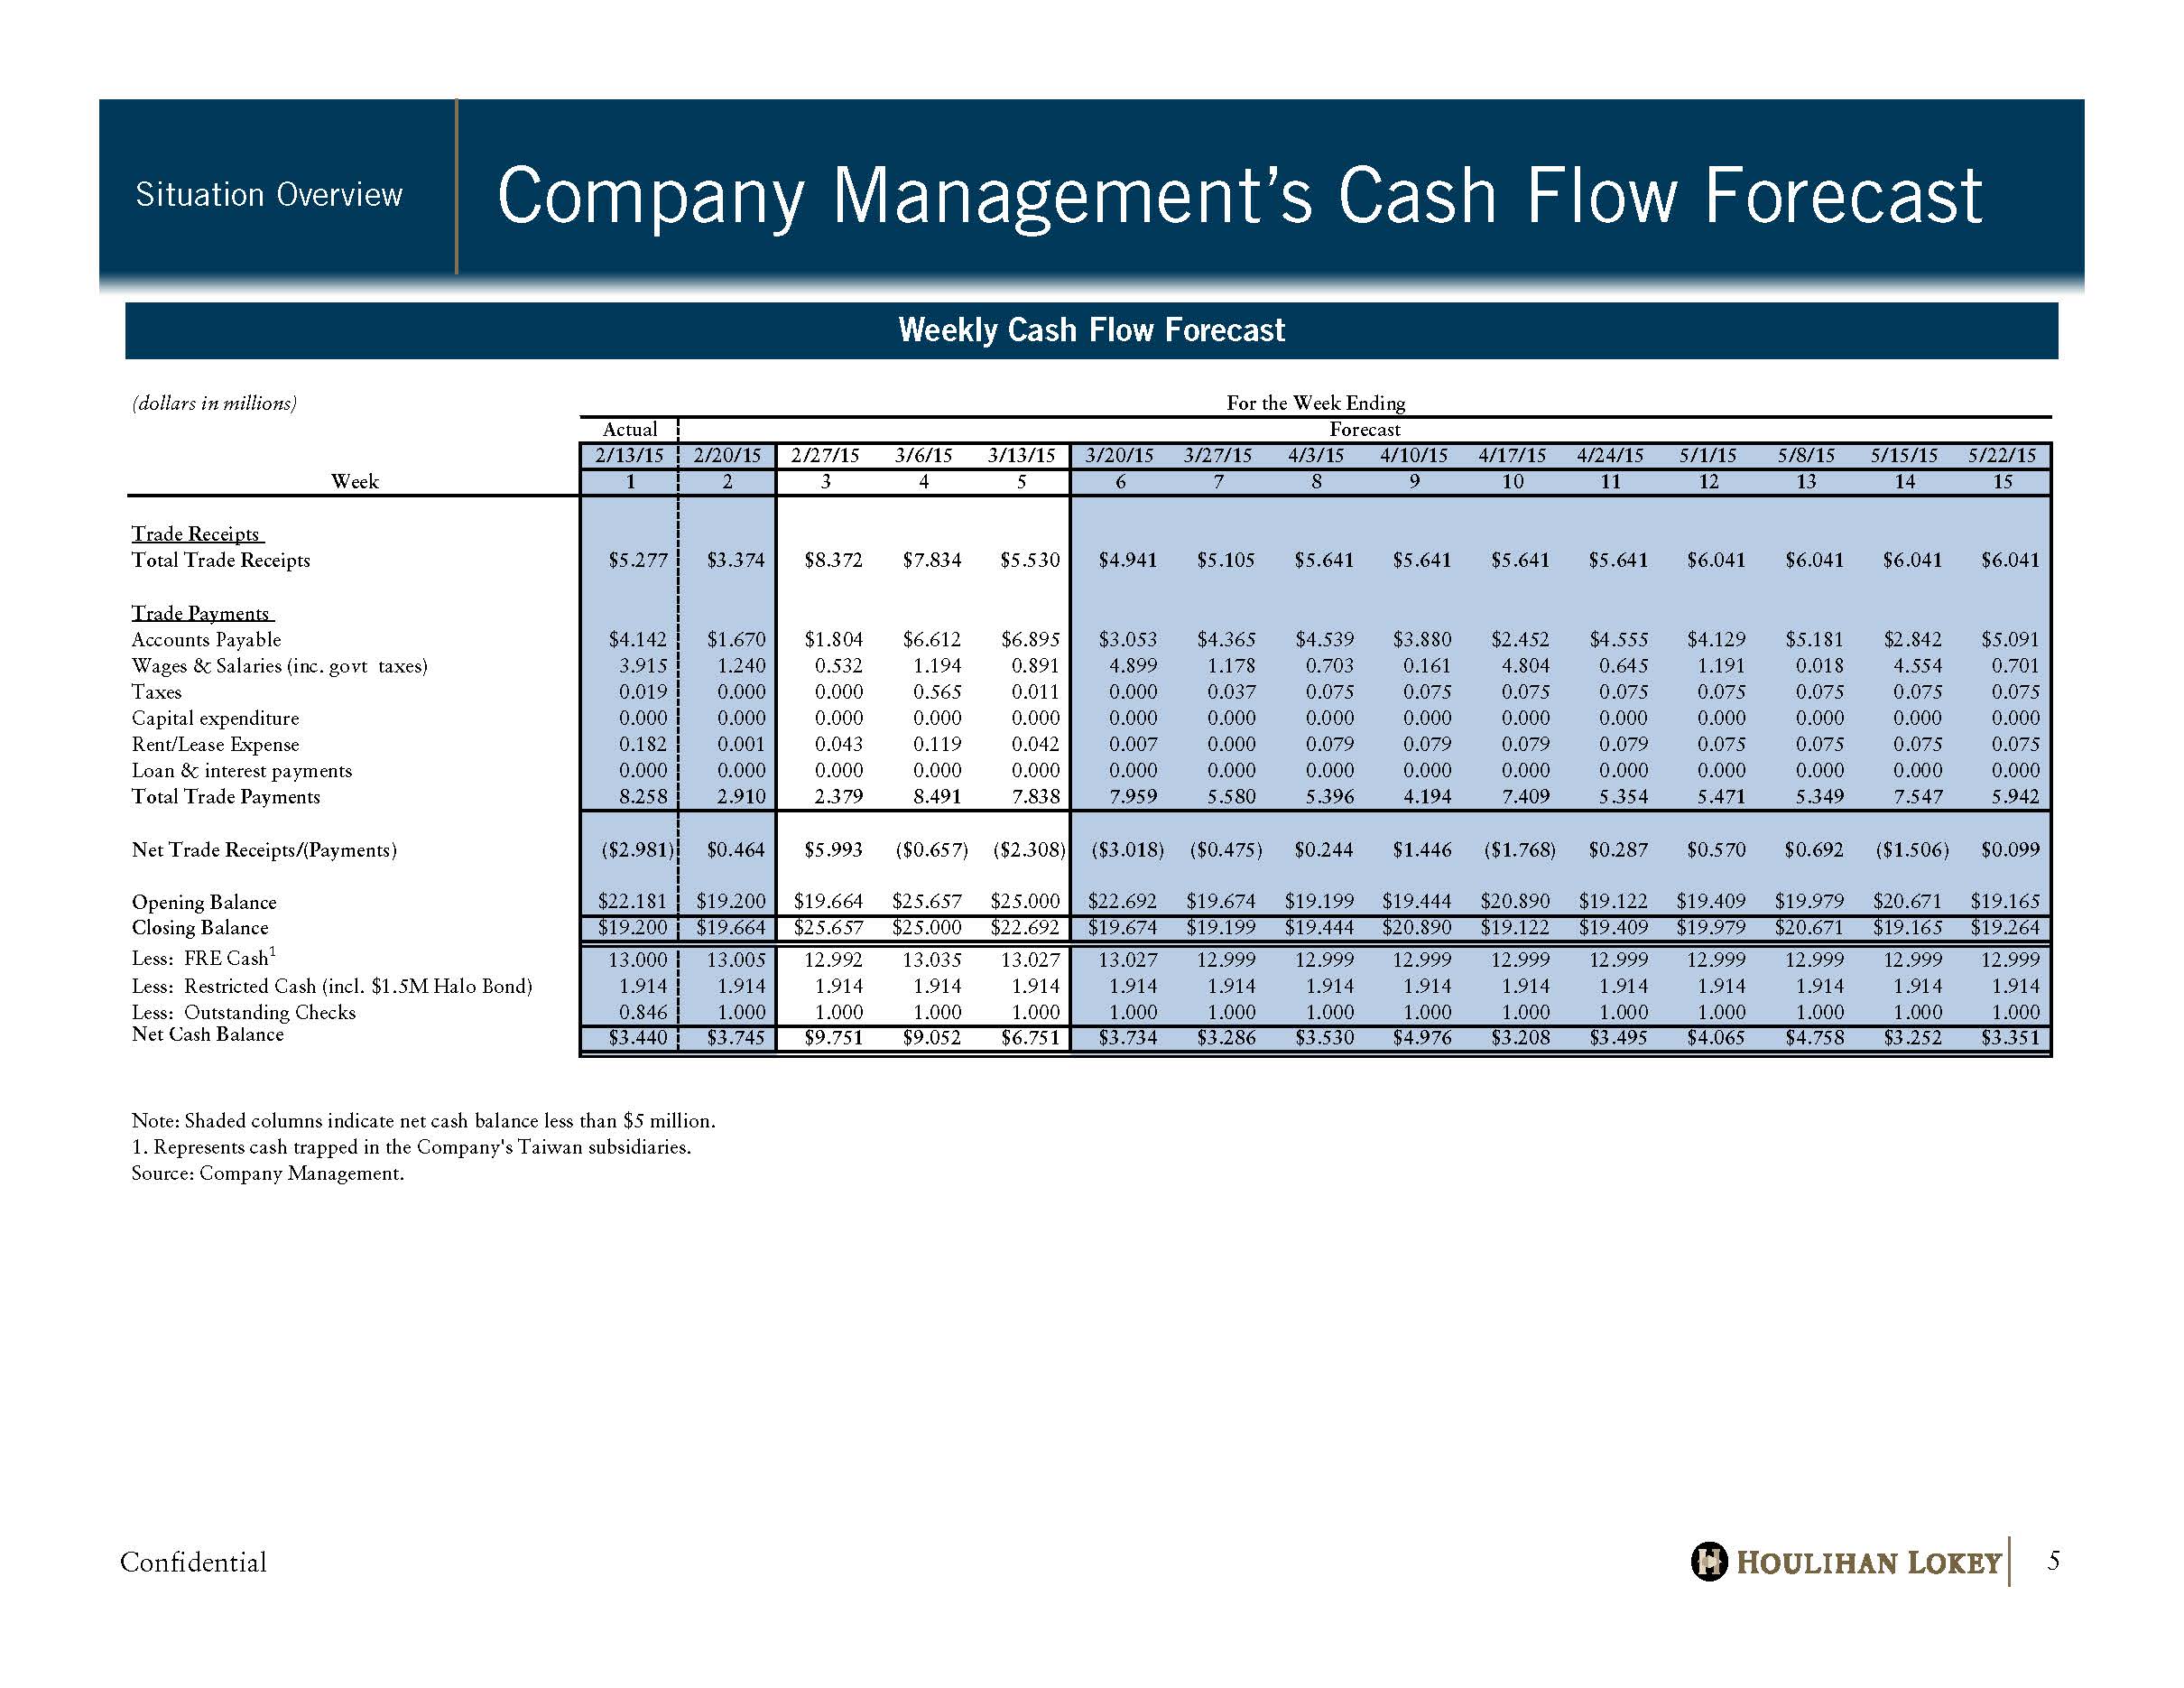
Confidential Company Management’s Cash Flow Forecast Situation Overview 5 Weekly Cash Flow Forecast (dollars in millions) For the Week Ending Actual Forecast 2/13/15 2/20/15 2/27/15 3/6/15 3/13/15 3/20/15 3/27/15 4/3/15 4/10/15 4/17/15 4/24/15 5/1/15 5/8/15 5/15/15 5/22/15 Week 1 2 3 4 5 6 7 8 9 10 11 12 13 14 15 Trade Receipts Total Trade Receipts $5.277 $3.374 $8.372 $7.834 $5.530 $4.941 $5.105 $5.641 $5.641 $5.641 $5.641 $6.041 $6.041 $6.041 $6.041 Trade Payments Accounts Payable $4.142 $1.670 $1.804 $6.612 $6.895 $3.053 $4.365 $4.539 $3.880 $2.452 $4.555 $4.129 $5.181 $2.842 $5.091 Wages & Salaries (inc. govt taxes) 3.915 1.240 0.532 1.194 0.891 4.899 1.178 0.703 0.161 4.804 0.645 1.191 0.018 4.554 0.701 Taxes 0.019 0.000 0.000 0.565 0.011 0.000 0.037 0.075 0.075 0.075 0.075 0.075 0.075 0.075 0.075 Capital expenditure 0.000 0.000 0.000 0.000 0.000 0.000 0.000 0.000 0.000 0.000 0.000 0.000 0.000 0.000 0.000 Rent/Lease Expense 0.182 0.001 0.043 0.119 0.042 0.007 0.000 0.079 0.079 0.079 0.079 0.075 0.075 0.075 0.075 Loan & interest payments 0.000 0.000 0.000 0.000 0.000 0.000 0.000 0.000 0.000 0.000 0.000 0.000 0.000 0.000 0.000 Total Trade Payments 8.258 2.910 2.379 8.491 7.838 7.959 5.580 5.396 4.194 7.409 5.354 5.471 5.349 7.547 5.942 Net Trade Receipts/(Payments) ($2.981) $0.464 $5.993 ($0.657) ($2.308) ($3.018) ($0.475) $0.244 $1.446 ($1.768) $0.287 $0.570 $0.692 ($1.506) $0.099 Opening Balance $22.181 $19.200 $19.664 $25.657 $25.000 $22.692 $19.674 $19.199 $19.444 $20.890 $19.122 $19.409 $19.979 $20.671 $19.165 Closing Balance $19.200 $19.664 $25.657 $25.000 $22.692 $19.674 $19.199 $19.444 $20.890 $19.122 $19.409 $19.979 $20.671 $19.165 $19.264 Less: FRE Cash 1 13.000 13.005 12.992 13.035 13.027 13.027 12.999 12.999 12.999 12.999 12.999 12.999 12.999 12.999 12.999 Less: Restricted Cash (incl. $1.5M Halo Bond) 1.914 1.914 1.914 1.914 1.914 1.914 1.914 1.914 1.914 1.914 1.914 1.914 1.914 1.914 1.914 Less: Outstanding Checks 0.846 1.000 1.000 1.000 1.000 1.000 1.000 1.000 1.000 1.000 1.000 1.000 1.000 1.000 1.000 Net Cash Balance $3.440 $3.745 $9.751 $9.052 $6.751 $3.734 $3.286 $3.530 $4.976 $3.208 $3.495 $4.065 $4.758 $3.252 $3.351 Note: Shaded columns indicate net cash balance less than $5 million. 1. Represents cash trapped in the Company's Taiwan subsidiaries. Source: Company Management.
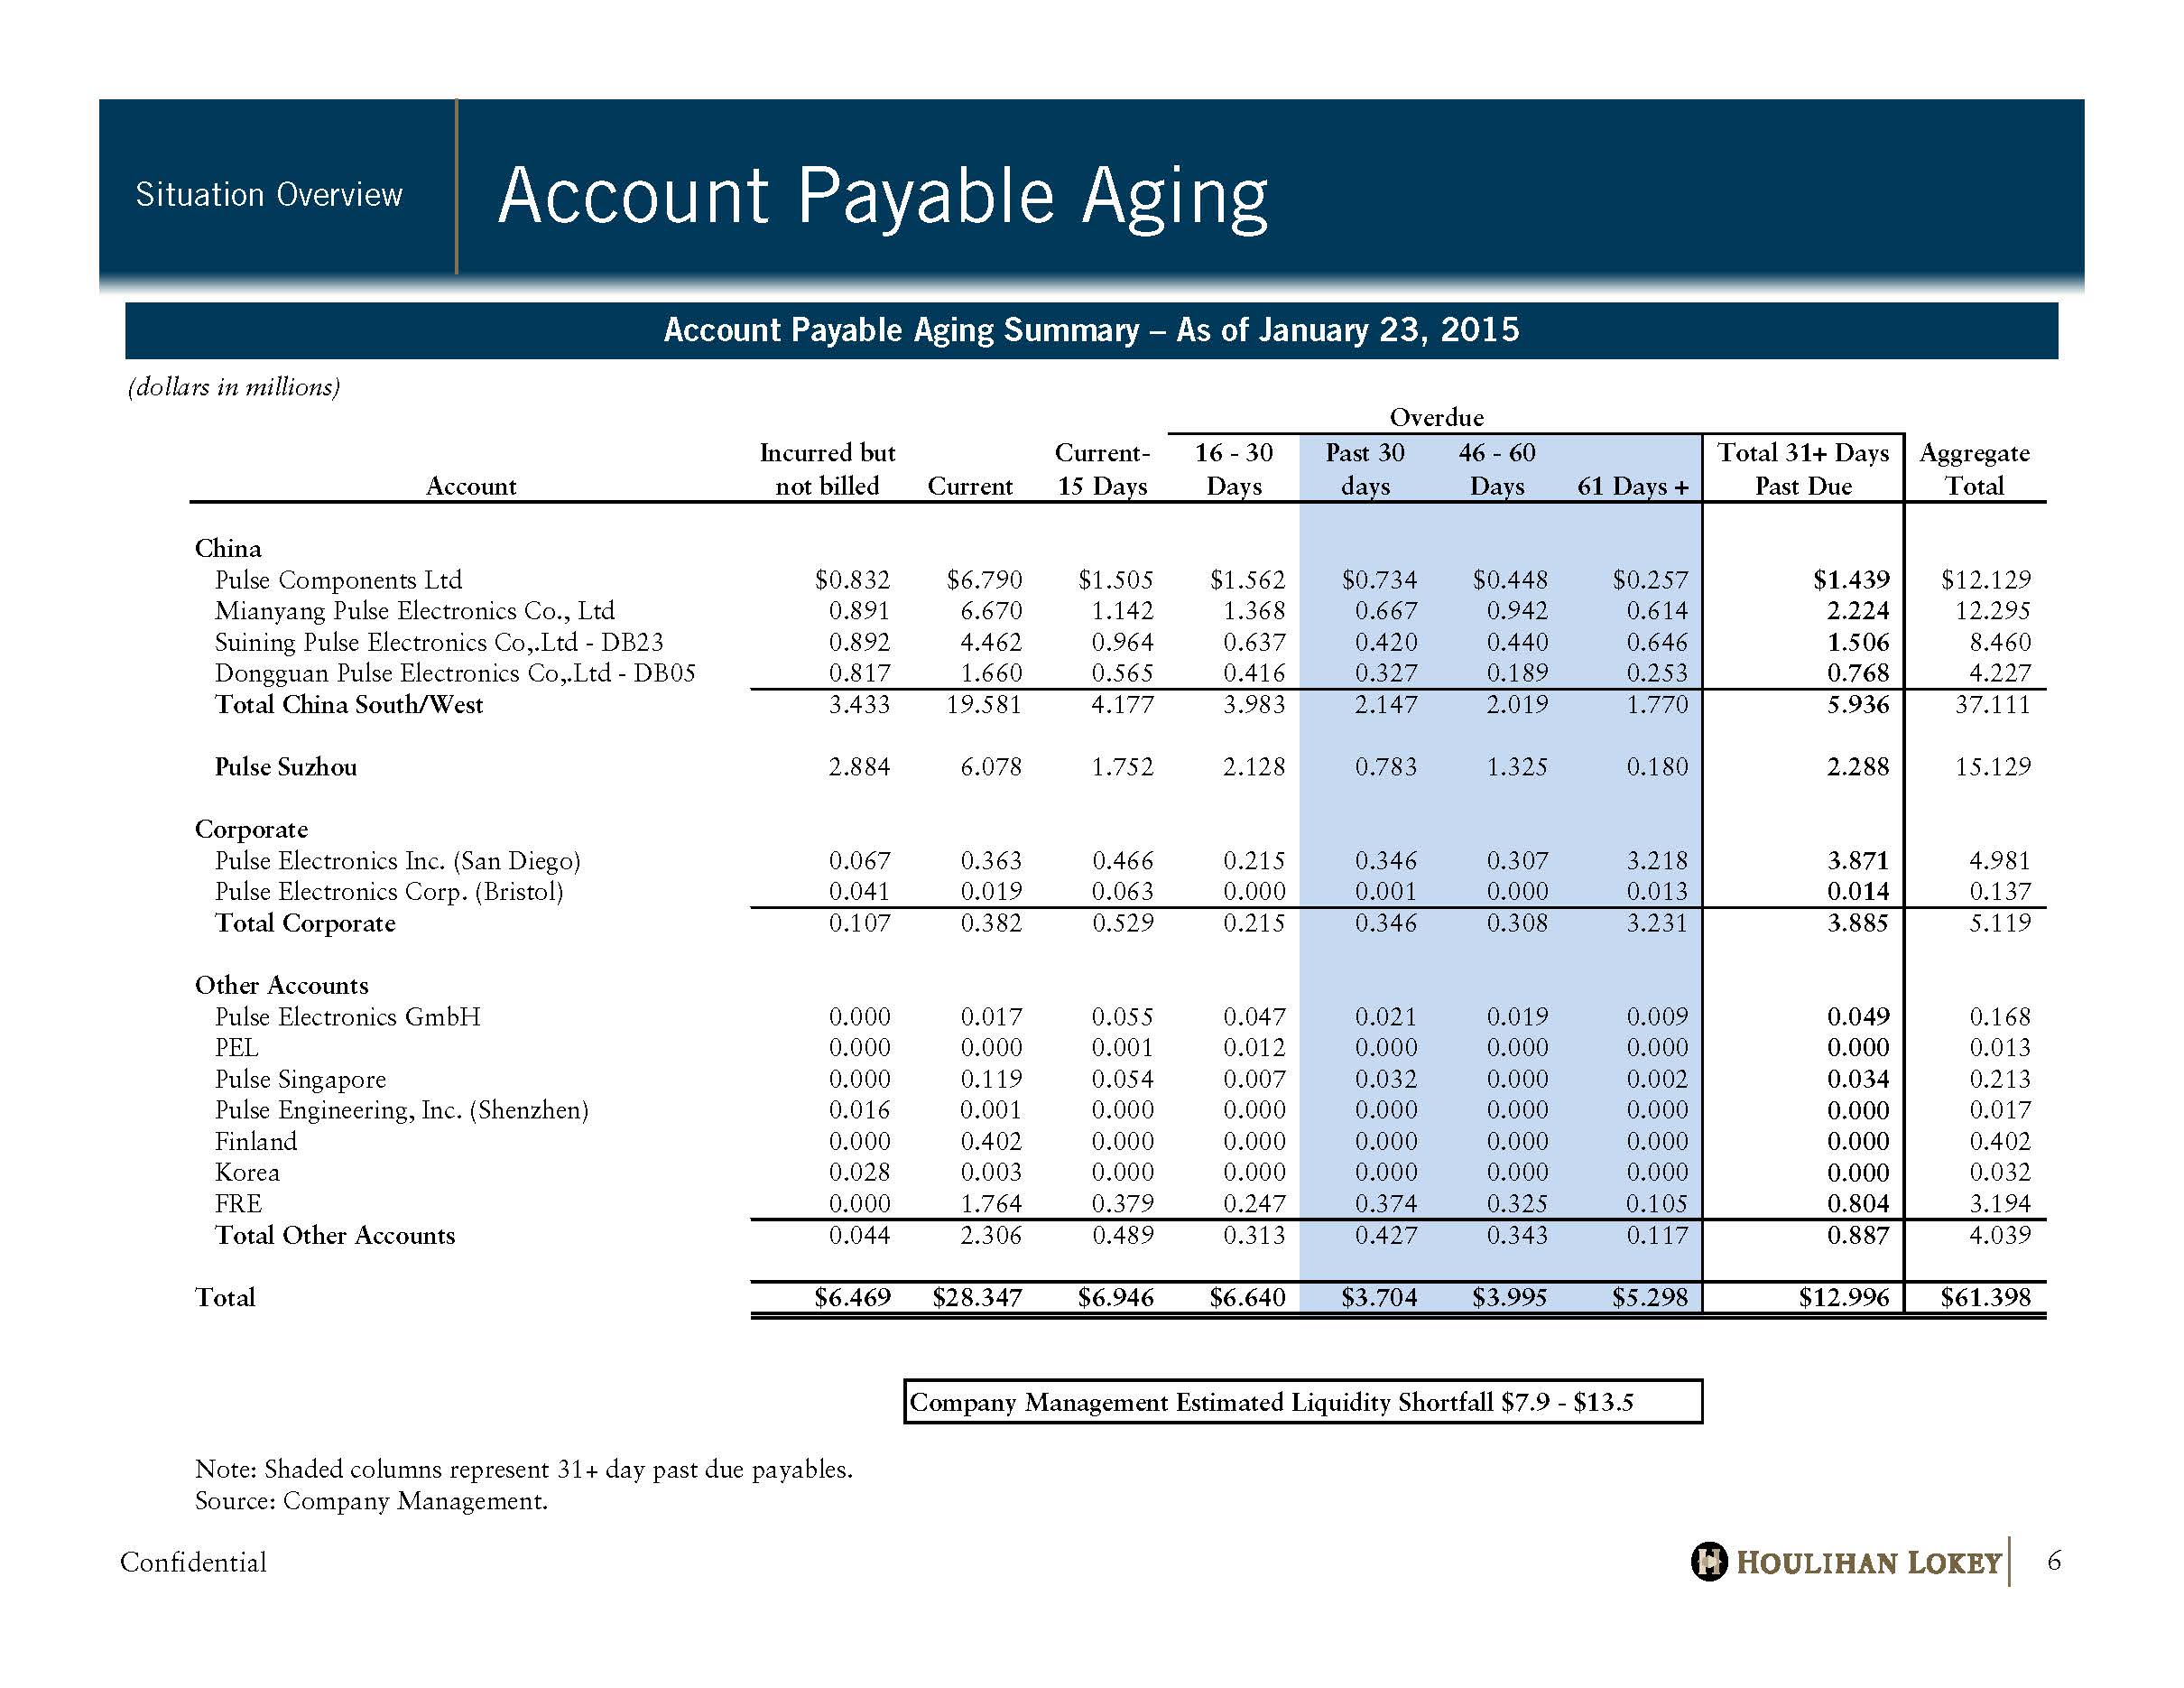
Confidential Account Payable Aging Situation Overview 6 Account Payable Aging Summary – As of January 23, 2015 (dollars in millions) Overdue Account Incurred but not billed Current Current- 15 Days 16 - 30 Days Past 30 days 46 - 60 Days 61 Days + Total 31+ Days Past Due Aggregate Total China Pulse Components Ltd $0.832 $6.790 $1.505 $1.562 $0.734 $0.448 $0.257 $1.439 $12.129 Mianyang Pulse Electronics Co., Ltd 0.891 6.670 1.142 1.368 0.667 0.942 0.614 2.224 12.295 Suining Pulse Electronics Co,.Ltd - DB23 0.892 4.462 0.964 0.637 0.420 0.440 0.646 1.506 8.460 Dongguan Pulse Electronics Co,.Ltd - DB05 0.817 1.660 0.565 0.416 0.327 0.189 0.253 0.768 4.227 Total China South/West 3.433 19.581 4.177 3.983 2.147 2.019 1.770 5.936 37.111 Pulse Suzhou 2.884 6.078 1.752 2.128 0.783 1.325 0.180 2.288 15.129 Corporate Pulse Electronics Inc. (San Diego) 0.067 0.363 0.466 0.215 0.346 0.307 3.218 3.871 4.981 Pulse Electronics Corp. (Bristol) 0.041 0.019 0.063 0.000 0.001 0.000 0.013 0.014 0.137 Total Corporate 0.107 0.382 0.529 0.215 0.346 0.308 3.231 3.885 5.119 Other Accounts Pulse Electronics GmbH 0.000 0.017 0.055 0.047 0.021 0.019 0.009 0.049 0.168 PEL 0.000 0.000 0.001 0.012 0.000 0.000 0.000 0.000 0.013 Pulse Singapore 0.000 0.119 0.054 0.007 0.032 0.000 0.002 0.034 0.213 Pulse Engineering, Inc. (Shenzhen) 0.016 0.001 0.000 0.000 0.000 0.000 0.000 0.000 0.017 Finland 0.000 0.402 0.000 0.000 0.000 0.000 0.000 0.000 0.402 Korea 0.028 0.003 0.000 0.000 0.000 0.000 0.000 0.000 0.032 FRE 0.000 1.764 0.379 0.247 0.374 0.325 0.105 0.804 3.194 Total Other Accounts 0.044 2.306 0.489 0.313 0.427 0.343 0.117 0.887 4.039 Total $6.469 $28.347 $6.946 $6.640 $3.704 $3.995 $5.298 $12.996 $61.398 Company Management Estimated Liquidity Shortfall $7.9 - $13.5 Note: Shaded columns represent 31+ day past due payables. Source: Company Management.
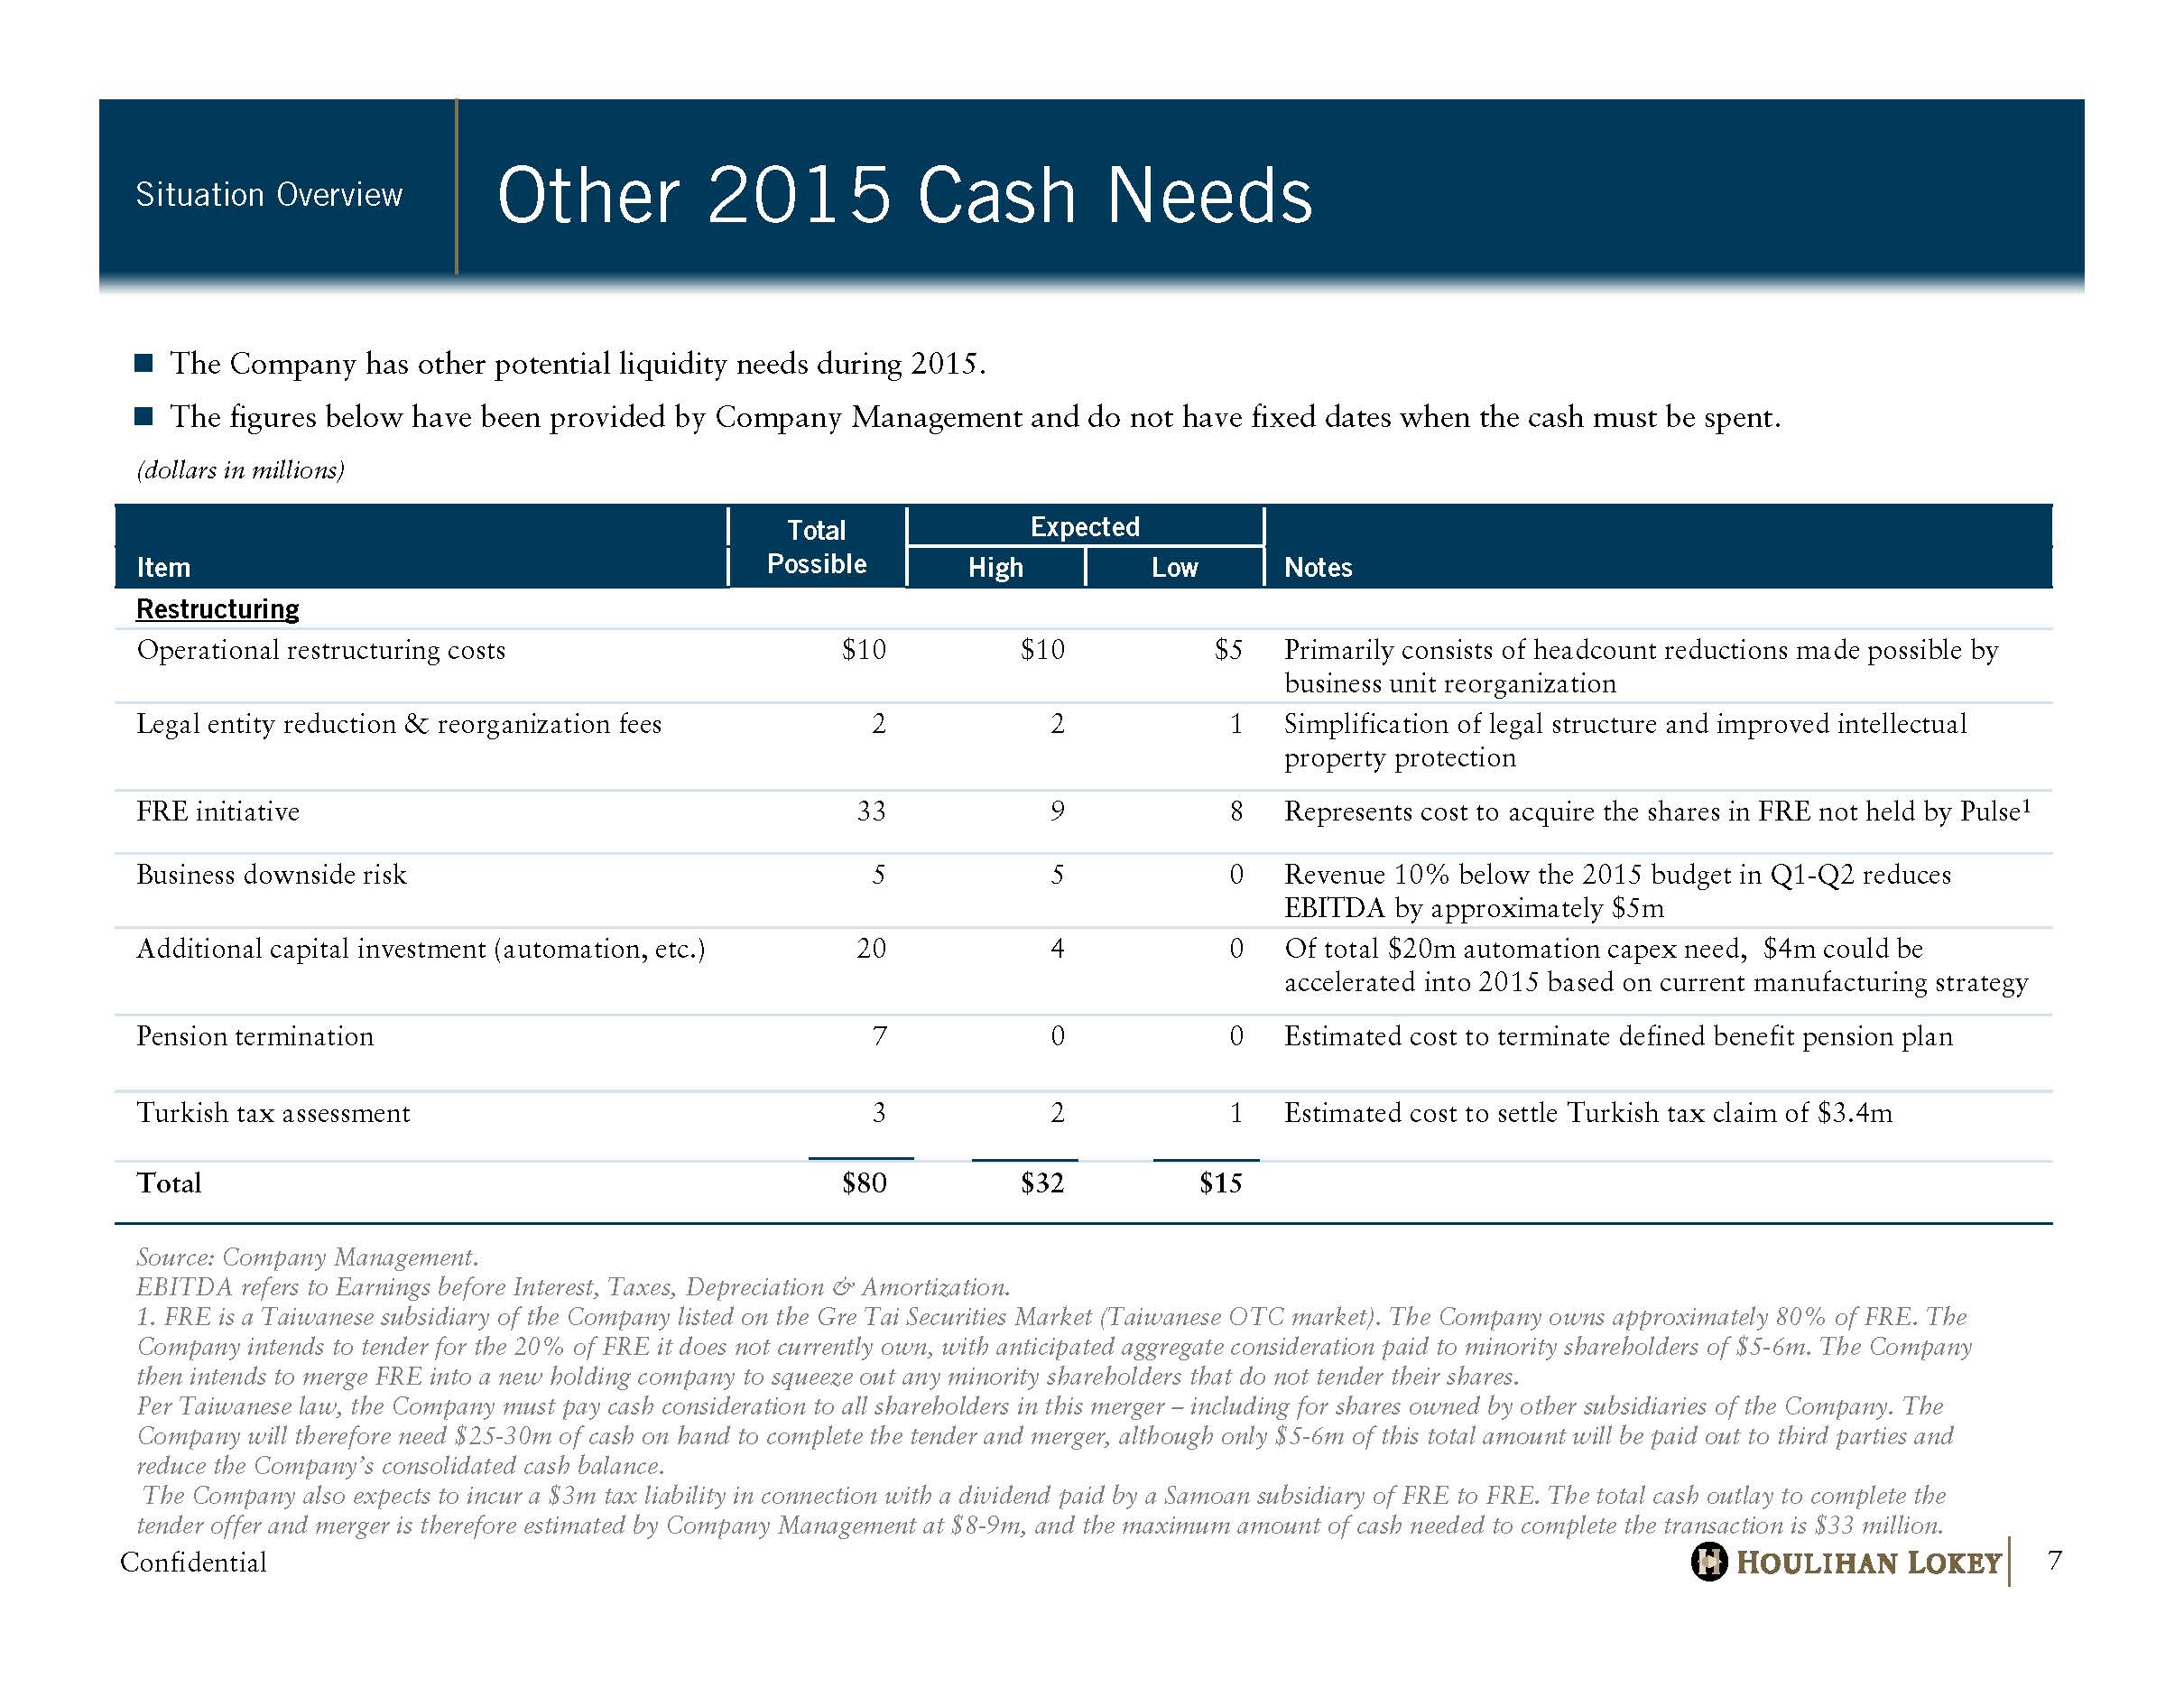
Confidential Other 2015 Cash Needs Situation Overview 7 The Company has other potential liquidity needs during 2015 . The figures below have been provided by Company Management and do not have fixed dates when the cash must be spent . Source: Company Management. EBITDA refers to Earnings before Interest, Taxes, Depreciation & Amortization. 1. FRE is a Taiwanese subsidiary of the Company listed on the Gre Tai Securities Market (Taiwanese OTC market). The Company owns approximately 80% of FRE. The Company intends to tender for the 20% of FRE it does not currently own, with anticipated aggregate consideration paid to minority sha reh olders of $5 - 6m. The Company then intends to merge FRE into a new holding company to squeeze out any minority shareholders that do not tender their shares. Per Taiwanese law, the Company must pay cash consideration to all shareholders in this merger – including for shares owned by other subsidiaries of the Company. The Company will therefore need $25 - 30m of cash on hand to complete the tender and merger, although only $5 - 6m of this total amount will be paid out to third parties and reduce the Company’s consolidated cash balance. The Company also expects to incur a $3m tax liability in connection with a dividend paid by a Samoan subsidiary of FRE to FRE . The total cash outlay to complete the tender offer and merger is therefore estimated by Company Management at $ 8 - 9m, and the maximum amount of cash needed to complete the transaction is $33 million. (dollars in millions) Total Possible Expected Item High Low Notes Restructuring Operational restructuring costs $10 $10 $5 Primarily consists of headcount reductions made possible by business unit reorganization Legal entity reduction & reorganization fees 2 2 1 Simplification of legal structure and improved intellectual property protection FRE initiative 33 9 8 Represents cost to acquire the shares in FRE not held by Pulse 1 Business downside risk 5 5 0 Revenue 10% below the 2015 budget in Q1 - Q2 reduces EBITDA by approximately $5m Additional capital investment (automation, etc.) 20 4 0 Of total $20m automation capex need, $4m could be accelerated into 2015 based on current manufacturing strategy Pension termination 7 0 0 Estimated cost to terminate defined benefit pension plan Turkish tax assessment 3 2 1 Estimated cost to settle Turkish tax claim of $3.4m Total $80 $32 $15
Confidential Summary of Terms of Transactions Situation Overview 8 Parties to the Merger Transactions: Pulse Electronics Corporation OCM PE Holdings, L.P. OCM/Pulse Merger Sub, Inc. Form of Merger Transactions: Merger of Merger Sub with and into the Company, with the Company as the surviving entity . Form of Consideration: Cash : The holders of the issued and outstanding shares of Company Common Stock (other than dissenting shares and shares owned by Parent, Merger Sub and any of their affiliates) will be converted into the right to receive $ 1 . 50 in cash per share without interest .
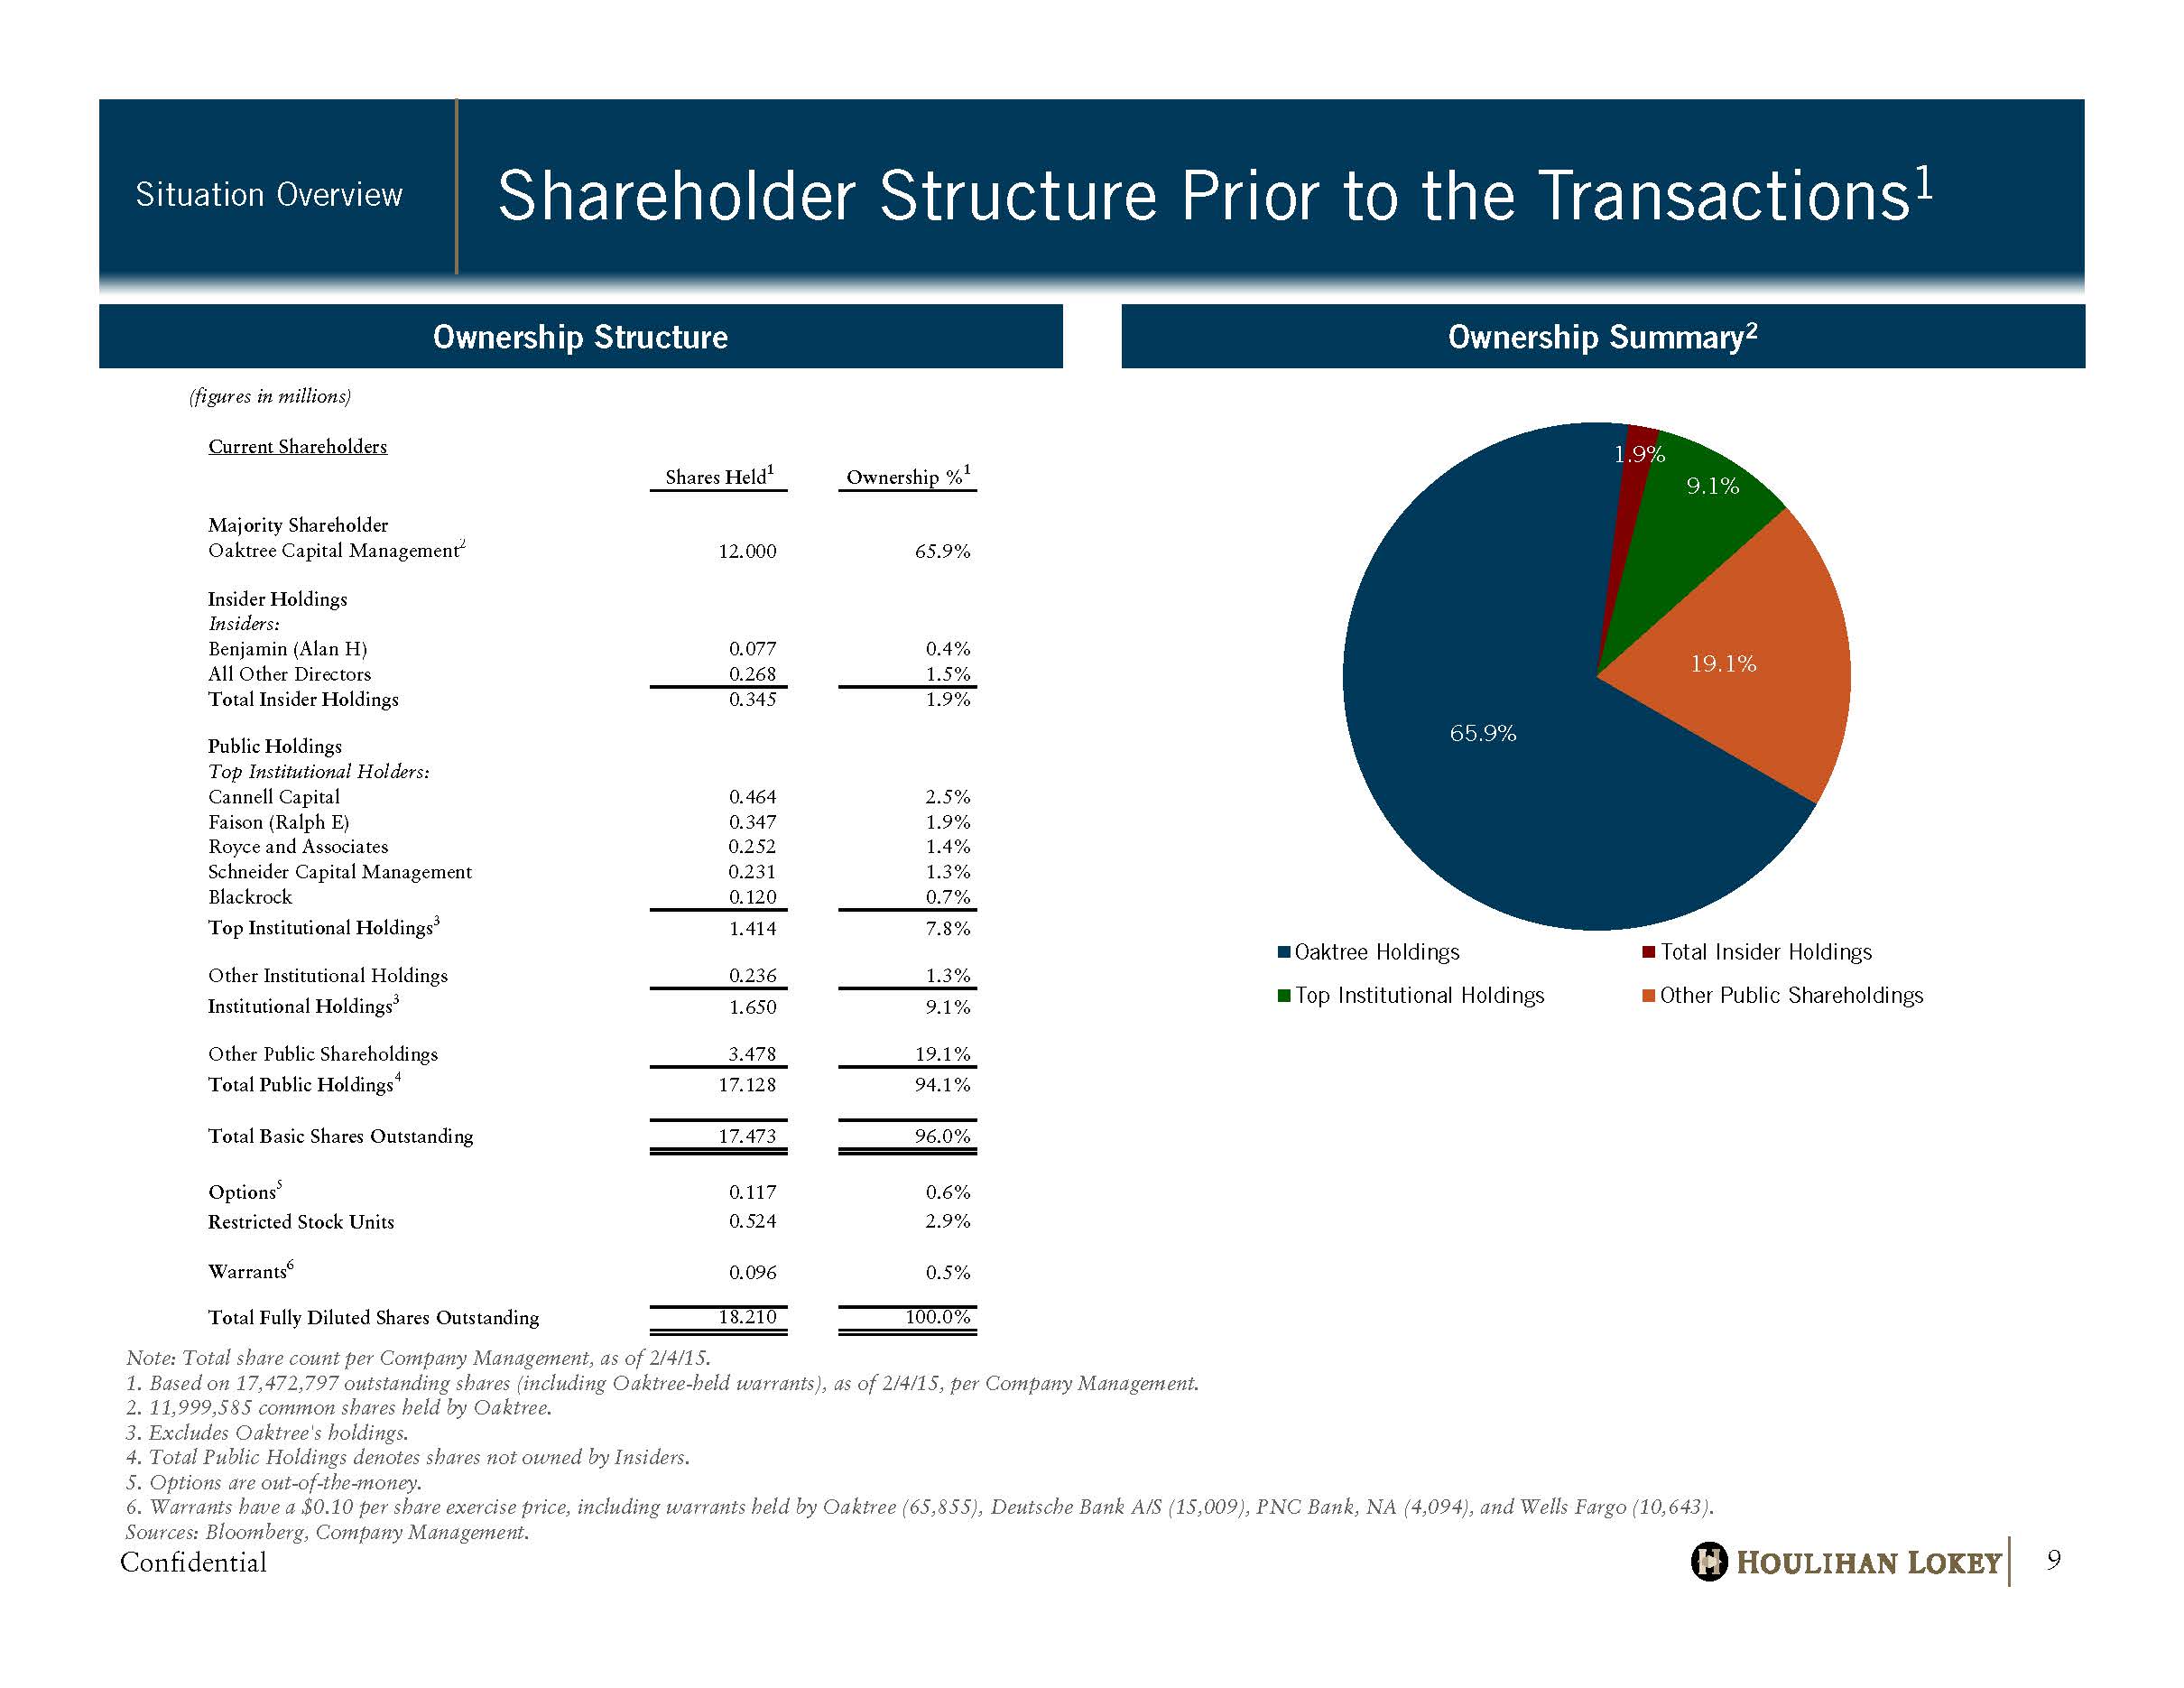
Confidential Shareholder Structure Prior to the Transactions 1 Situation Overview 9 Ownership Summary 2 Ownership Structure Note: Total share count per Company Management, as of 2/4/15. 1. Based on 17,472,797 outstanding shares (including Oaktree - held warrants), as of 2/4/15, per Company Management. 2. 11,999,585 common shares held by Oaktree . 3. Excludes Oaktree's holdings. 4. Total Public Holdings denotes shares not owned by Insiders. 5. Options are out - of - the - money. 6. Warrants have a $0.10 per share exercise price, including warrants held by Oaktree (65,855), Deutsche Bank A/S (15,009), PNC Bank, NA (4,094), and Wells Fargo (10,643). Sources: Bloomberg, Company Management. 65.9% 1.9% 9.1% 19.1% Oaktree Holdings Total Insider Holdings Top Institutional Holdings Other Public Shareholdings (figures in millions) Current Shareholders Shares Held 1 Ownership % 1 Majority Shareholder Oaktree Capital Management 2 12.000 65.9% Insider Holdings Insiders: Benjamin (Alan H) 0.077 0.4% All Other Directors 0.268 1.5% Total Insider Holdings 0.345 1.9% Public Holdings Top Institutional Holders: Cannell Capital 0.464 2.5% Faison (Ralph E) 0.347 1.9% Royce and Associates 0.252 1.4% Schneider Capital Management 0.231 1.3% Blackrock 0.120 0.7% Top Institutional Holdings 3 1.414 7.8% Other Institutional Holdings 0.236 1.3% Institutional Holdings 3 1.650 9.1% Other Public Shareholdings 3.478 19.1% Total Public Holdings 4 17.128 94.1% Total Basic Shares Outstanding 17.473 96.0% Options 5 0.117 0.6% Restricted Stock Units 0.524 2.9% Warrants 6 0.096 0.5% Total Fully Diluted Shares Outstanding 18.210 100.0%

Confidential Transaction Overview
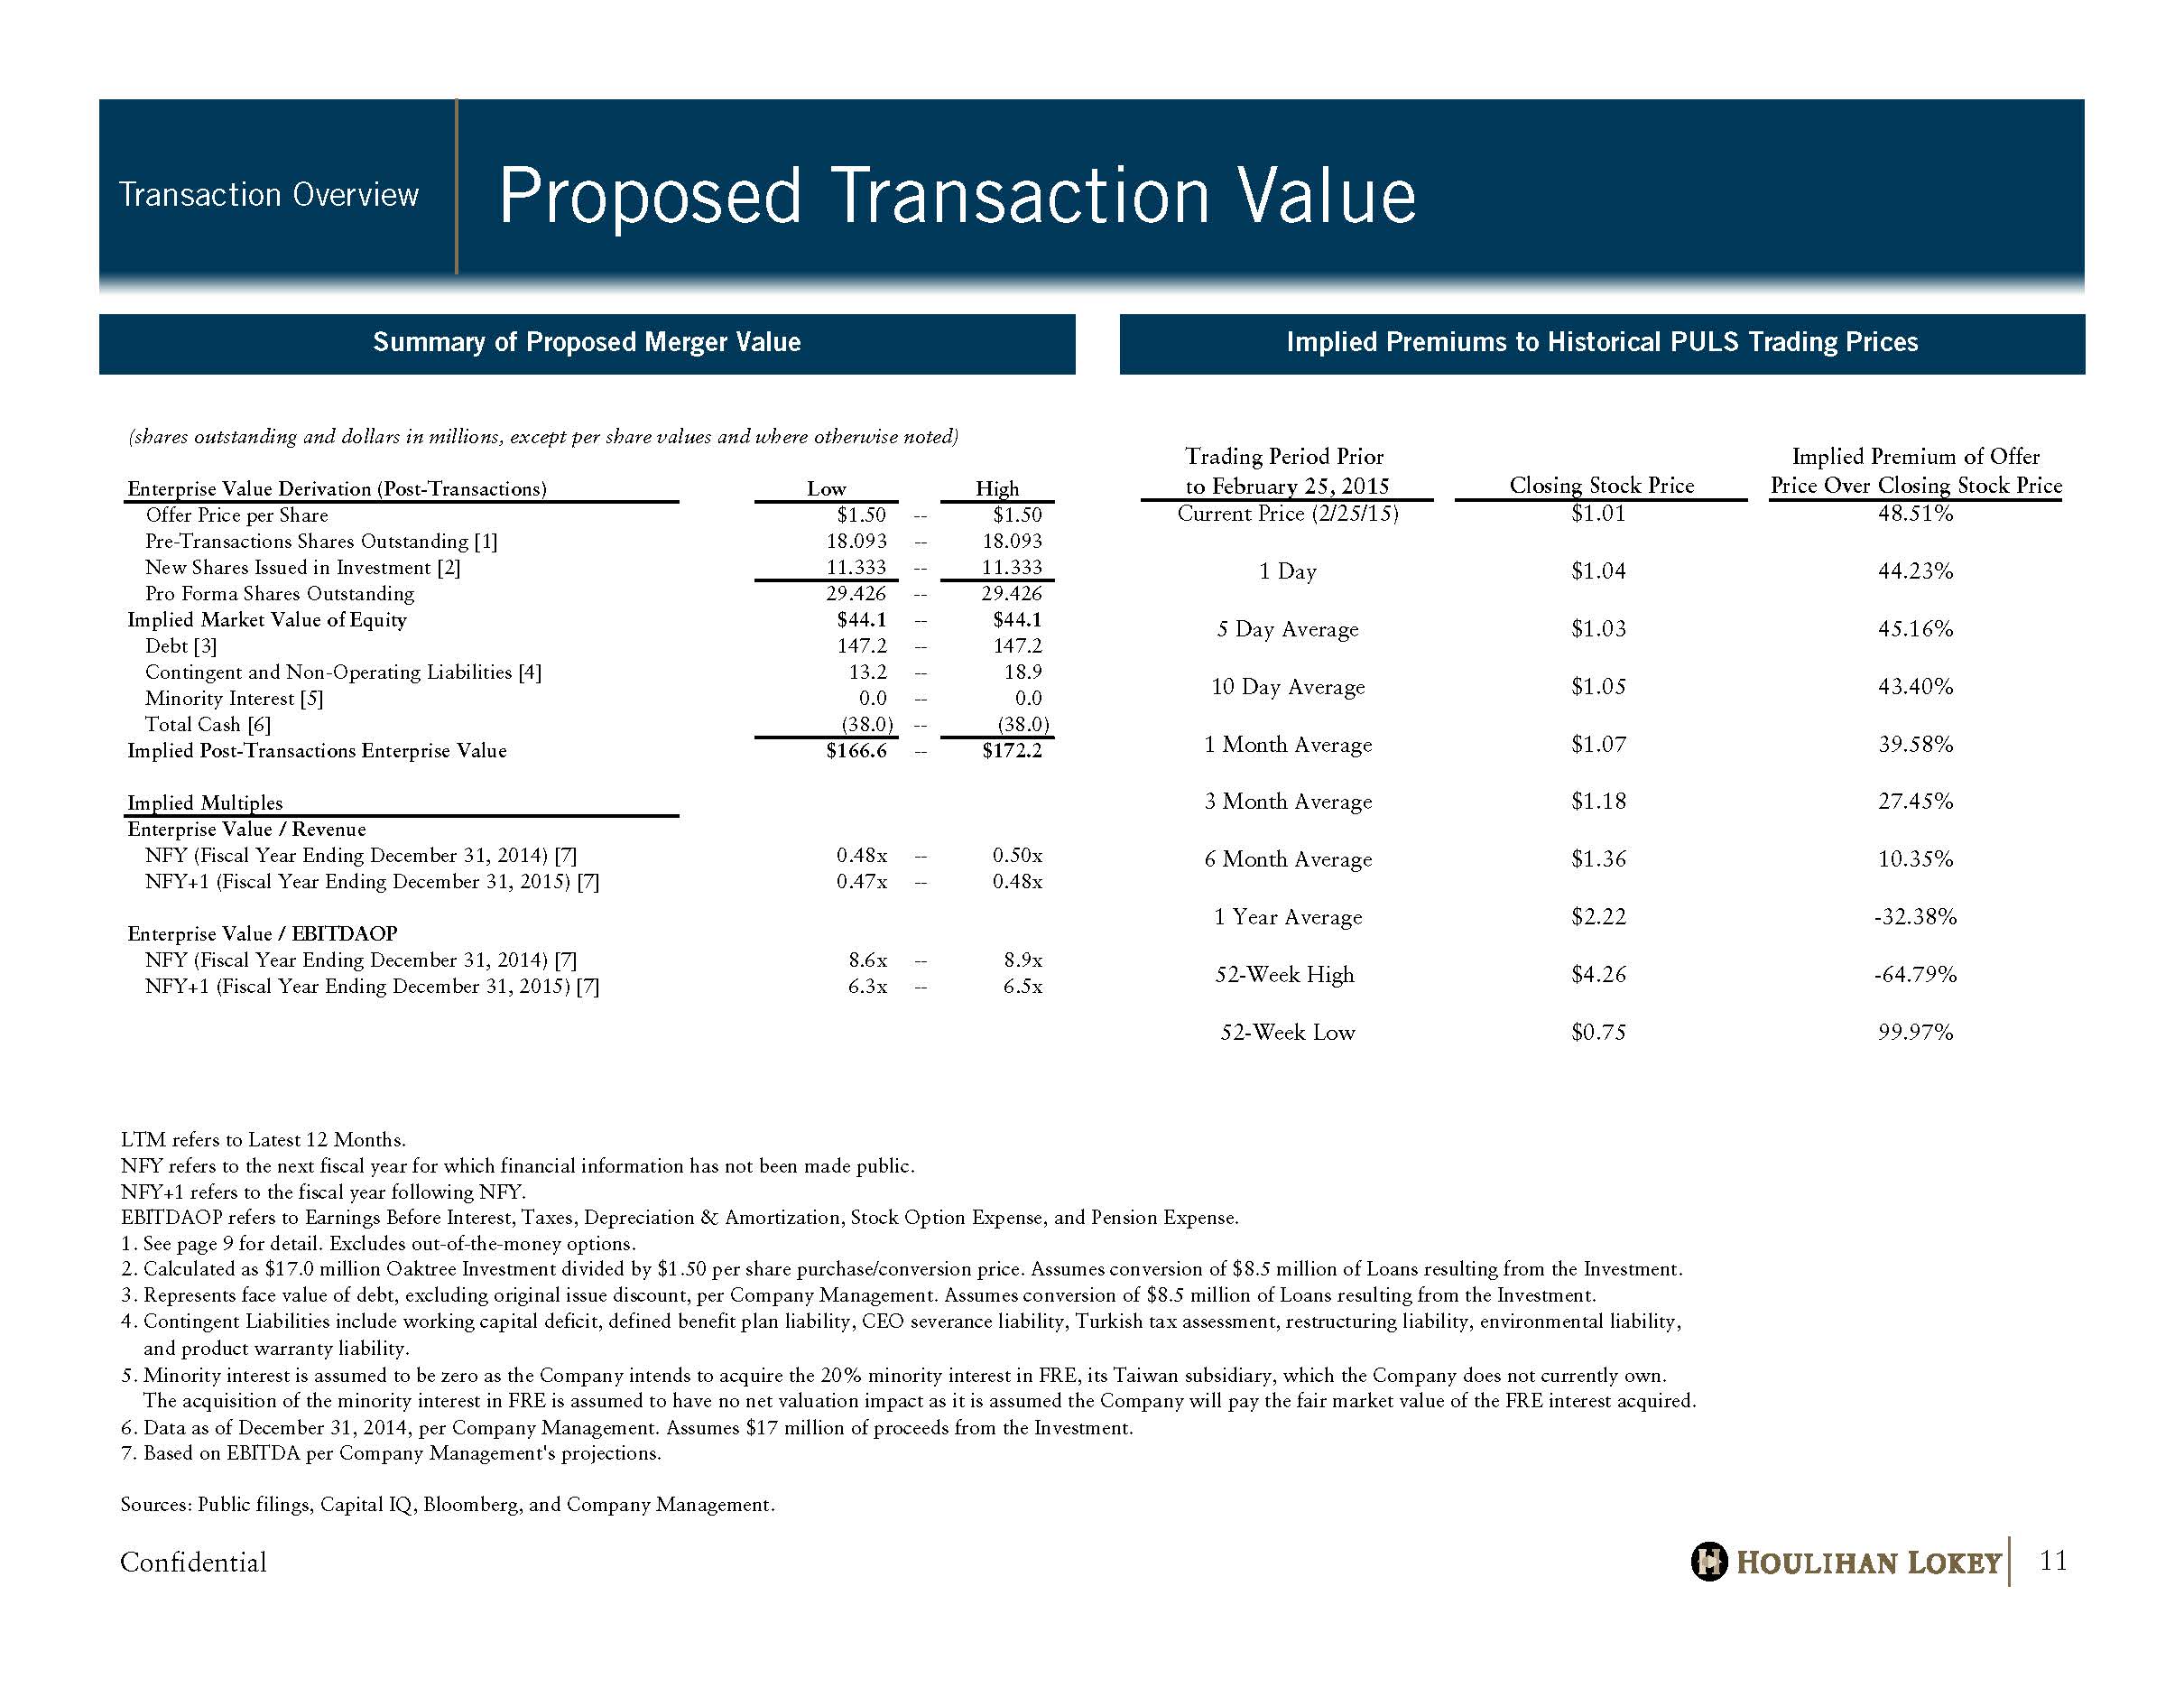
Confidential Proposed Transaction Value Transaction Overview 11 Summary of Proposed Merger Value Implied Premiums to Historical PULS Trading Prices Trading Period Prior Implied Premium of Offer to February 25, 2015 Closing Stock Price Price Over Closing Stock Price Current Price (2/25/15) $1.01 48.51% 1 Day $1.04 44.23% 5 Day Average $1.03 45.16% 10 Day Average $1.05 43.40% 1 Month Average $1.07 39.58% Number of estimates per Bloomberg EEO 3 Month Average $1.18 27.45% 6 Month Average $1.36 10.35% 1 Year Average $2.22 -32.38% 52-Week High $4.26 -64.79% 52-Week Low $0.75 99.97% LTM refers to Latest 12 Months. NFY refers to the next fiscal year for which financial information has not been made public. NFY+1 refers to the fiscal year following NFY. EBITDAOP refers to Earnings Before Interest, Taxes, Depreciation & Amortization, Stock Option Expense, and Pension Expense. 1. See page 9 for detail. Excludes out-of-the-money options. 2. Calculated as $17.0 million Oaktree Investment divided by $1.50 per share purchase/conversion price. Assumes conversion of $8.5 million of Loans resulting from the Investment. 3. Represents face value of debt, excluding original issue discount, per Company Management. Assumes conversion of $8.5 million of Loans resulting from the Investment. 4. Contingent Liabilities include working capital deficit, defined benefit plan liability, CEO severance liability, Turkish tax assessment, restructuring liability, environmental liability, and product warranty liability. 5. Minority interest is assumed to be zero as the Company intends to acquire the 20% minority interest in FRE, its Taiwan subsidiary, which the Company does not currently own. The acquisition of the minority interest in FRE is assumed to have no net valuation impact as it is assumed the Company will pay the fair market value of the FRE interest acquired. 6. Data as of December 31, 2014, per Company Management. Assumes $17 million of proceeds from the Investment. 7. Based on EBITDA per Company Management's projections. Sources: Public filings, Capital IQ, Bloomberg, and Company Management. (shares outstanding and dollars in millions, except per share values and where otherwise noted) Enterprise Value Derivation (Post-Transactions) Low High Offer Price per Share $1.50 -- $1.50 Pre-Transactions Shares Outstanding [1] 18.093 -- 18.093 New Shares Issued in Investment [2] 11.333 -- 11.333 Pro Forma Shares Outstanding 29.426 -- 29.426 Implied Market Value of Equity $44.1 -- $44.1 Debt [3] 147.2 -- 147.2 Contingent and Non-Operating Liabilities [4] 13.2 -- 18.9 Minority Interest [5] 0.0 -- 0.0 Total Cash [6] (38.0) -- (38.0) Implied Post-Transactions Enterprise Value $166.6 -- $172.2 Implied Multiples Enterprise Value / Revenue NFY (Fiscal Year Ending December 31, 2014) [7] 0.48x -- 0.50x NFY+1 (Fiscal Year Ending December 31, 2015) [7] 0.47x -- 0.48x Enterprise Value / EBITDAOP NFY (Fiscal Year Ending December 31, 2014) [7] 8.6x -- 8.9x NFY+1 (Fiscal Year Ending December 31, 2015) [7] 6.3x -- 6.5x
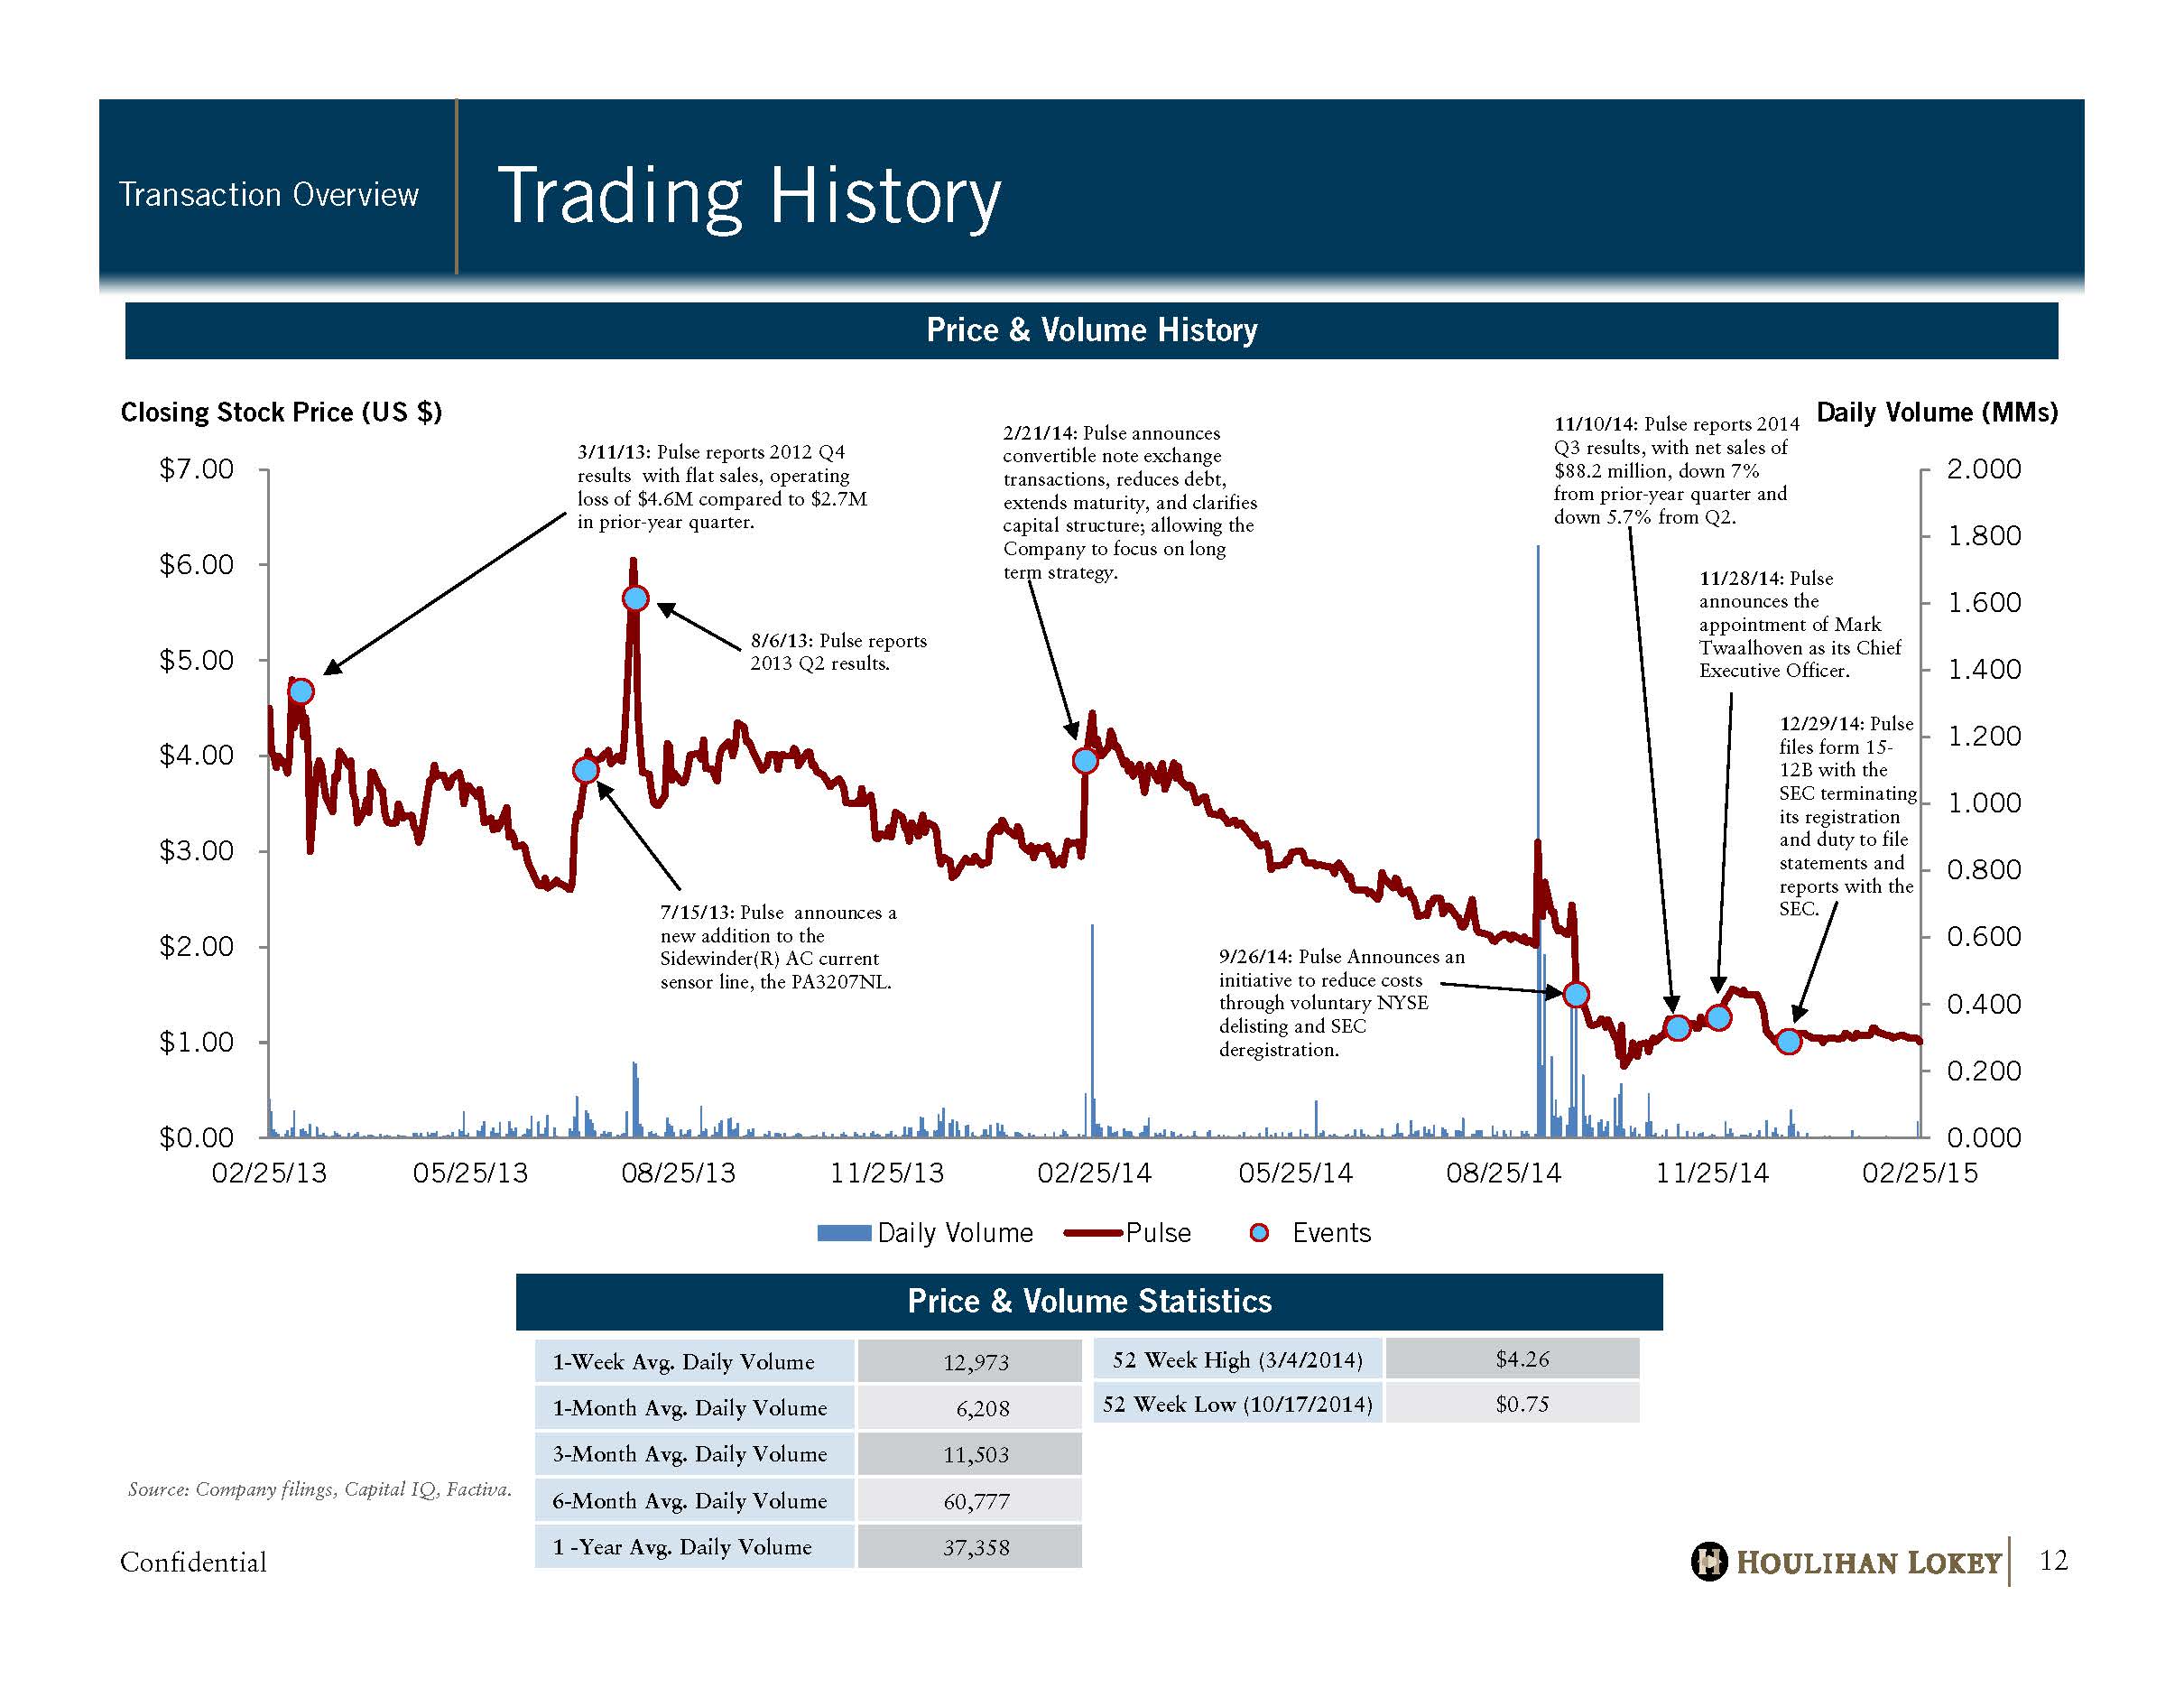
Confidential 0.000 0.200 0.400 0.600 0.800 1.000 1.200 1.400 1.600 1.800 2.000 $0.00 $1.00 $2.00 $3.00 $4.00 $5.00 $6.00 $7.00 02/25/13 05/25/13 08/25/13 11/25/13 02/25/14 05/25/14 08/25/14 11/25/14 02/25/15 Daily Volume (MMs) Closing Stock Price (US $) Daily Volume Pulse Events Trading History Transaction Overview 12 Price & Volume History Price & Volume Statistics 1 - Week Avg. Daily Volume 12,973 1 - Month Avg. Daily Volume 6,208 3 - Month Avg. Daily Volume 11,503 6 - Month Avg. Daily Volume 60,777 1 - Year Avg. Daily Volume 37,358 52 Week High (3/4/2014) $4.26 52 Week Low (10/17/2014) $0.75 Source: Company filings, Capital IQ, Factiva. 3 /11/13: Pulse r eports 2012 Q4 results with flat sales, operating loss of $4.6M compared to $2.7M in prior - year quarter. 7/15/13: Pulse announces a new addition to the Sidewinder(R) AC current sensor line, the PA3207NL. 8/6/13: Pulse r eports 2013 Q2 results. 2/21/14: Pulse announces convertible n ote exchange transactions, r educes d ebt , extends m aturity , and clarifies capital structure ; allowing the Company to focus on long term s trategy. 9/26/14: Pulse Announces an initiative to reduce c osts through v oluntary NYSE delisting and SEC deregistration. 11/10/14: Pulse reports 2014 Q3 results , with net sales of $88.2 million, down 7% from prior - year quarter and down 5.7% from Q2. 11/28/14 : Pulse announces the appointment of Mark Twaalhoven as its Chief Executive Officer. 12/29/14 : Pulse files f orm 15 - 12B with the SEC terminating its registration and duty to file statements and reports with the SEC.
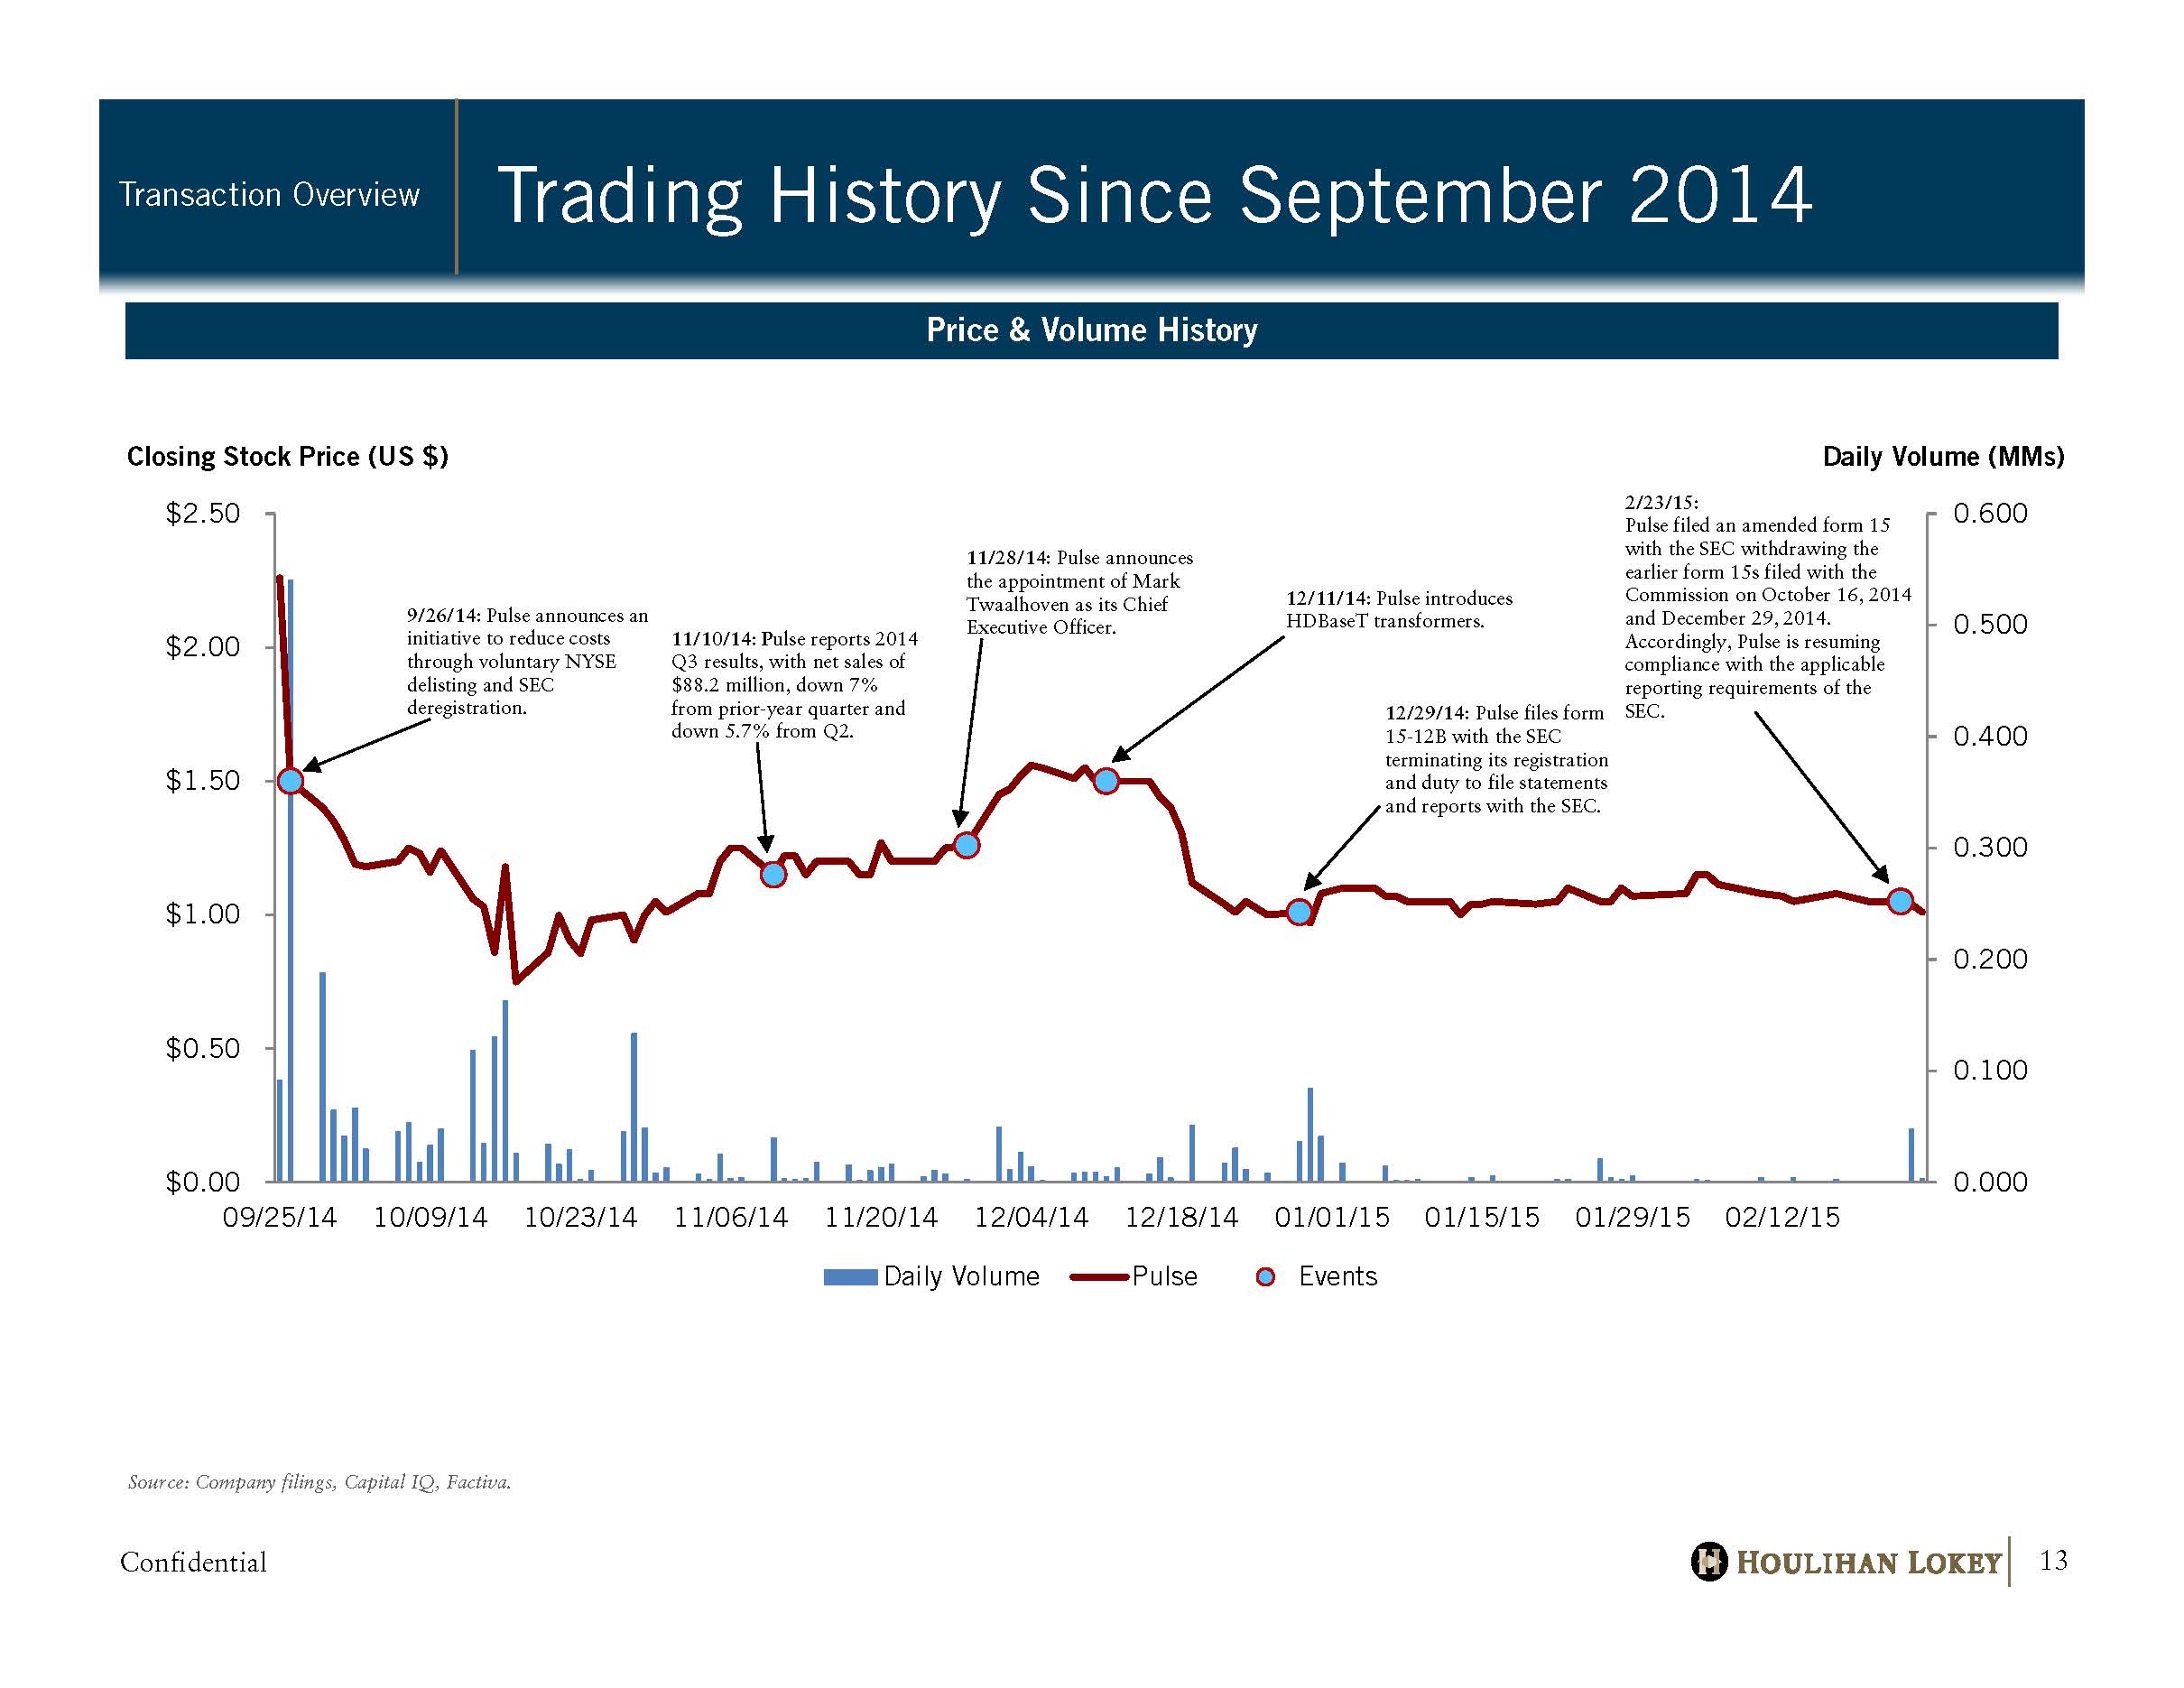
Confidential 0.000 0.100 0.200 0.300 0.400 0.500 0.600 $0.00 $0.50 $1.00 $1.50 $2.00 $2.50 09/25/14 10/09/14 10/23/14 11/06/14 11/20/14 12/04/14 12/18/14 01/01/15 01/15/15 01/29/15 02/12/15 Daily Volume (MMs) Closing Stock Price (US $) Daily Volume Pulse Events Trading History Since September 2014 Transaction Overview 13 Price & Volume History Source: Company filings, Capital IQ, Factiva. 11/10/14: P ulse reports 2014 Q3 results, with net sales of $88.2 million, down 7% from prior - year quarter and down 5.7% from Q2. 9/26/14: Pulse announces an initiative to reduce c osts through v oluntary NYSE delisting and SEC deregistration. 11/28/14: Pulse announces the appointment of Mark Twaalhoven as its Chief Executive Officer. 12/11/14: Pulse i ntroduces HDBaseT transformers. 12/29/14: Pulse files form 15 - 12B with the SEC terminating its registration and duty to file statements and reports with the SEC. 2/23/15 : Pulse filed an amended form 15 with the SEC withdrawing the earlier form 15s filed with the Commission on October 16, 2014 and December 29, 2014. Accordingly, Pulse is resuming compliance with the applicable reporting requirements of the SEC.
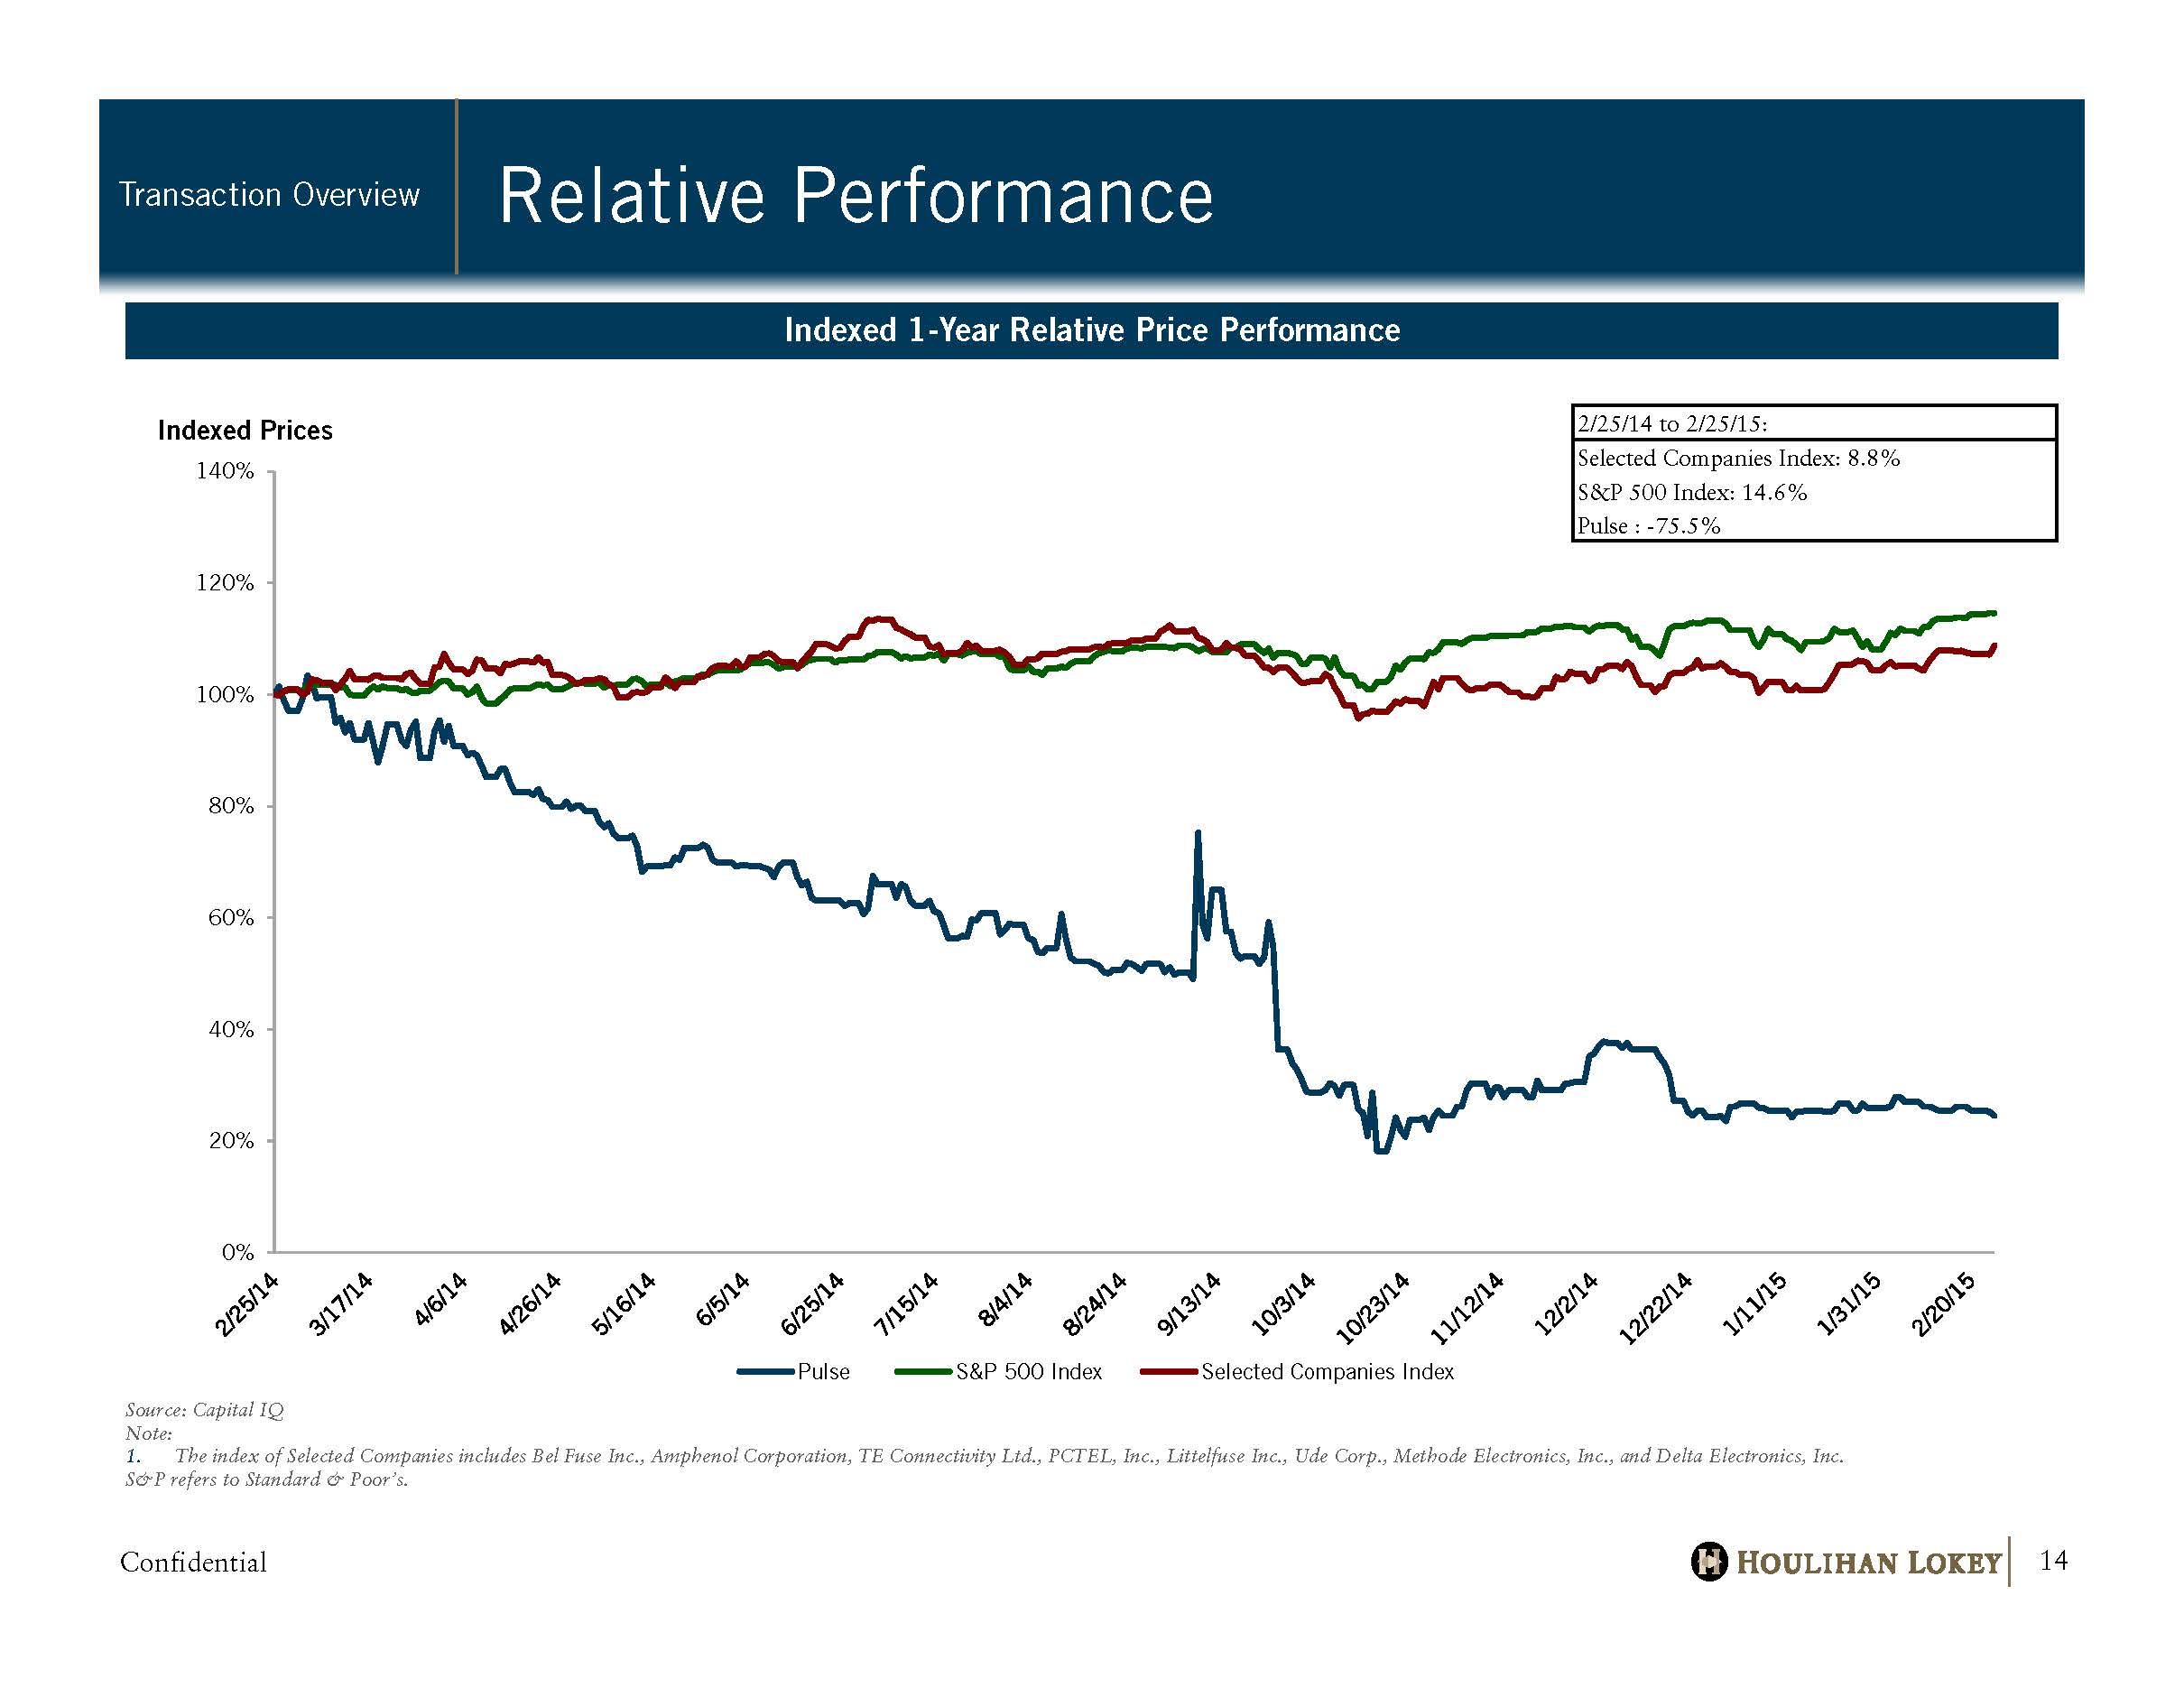
Confidential Relative Performance Transaction Overview 14 Indexed 1 - Year Relative Price Performance Source: Capital IQ Note: 1. The index of Selected Companies includes Bel Fuse Inc., Amphenol Corporation, TE Connectivity Ltd., PCTEL, Inc., Littelfuse Inc., Ude Corp., Methode Electronics, Inc., and Delta Electronics, Inc. S&P refers to Standard & Poor’s. 0% 20% 40% 60% 80% 100% 120% 140% Indexed Prices Pulse S&P 500 Index Selected Companies Index 2/25/14 to 2/25/15: Selected Companies Index: 8.8% S&P 500 Index: 14.6% Pulse : -75.5%

Confidential Financial Analysis
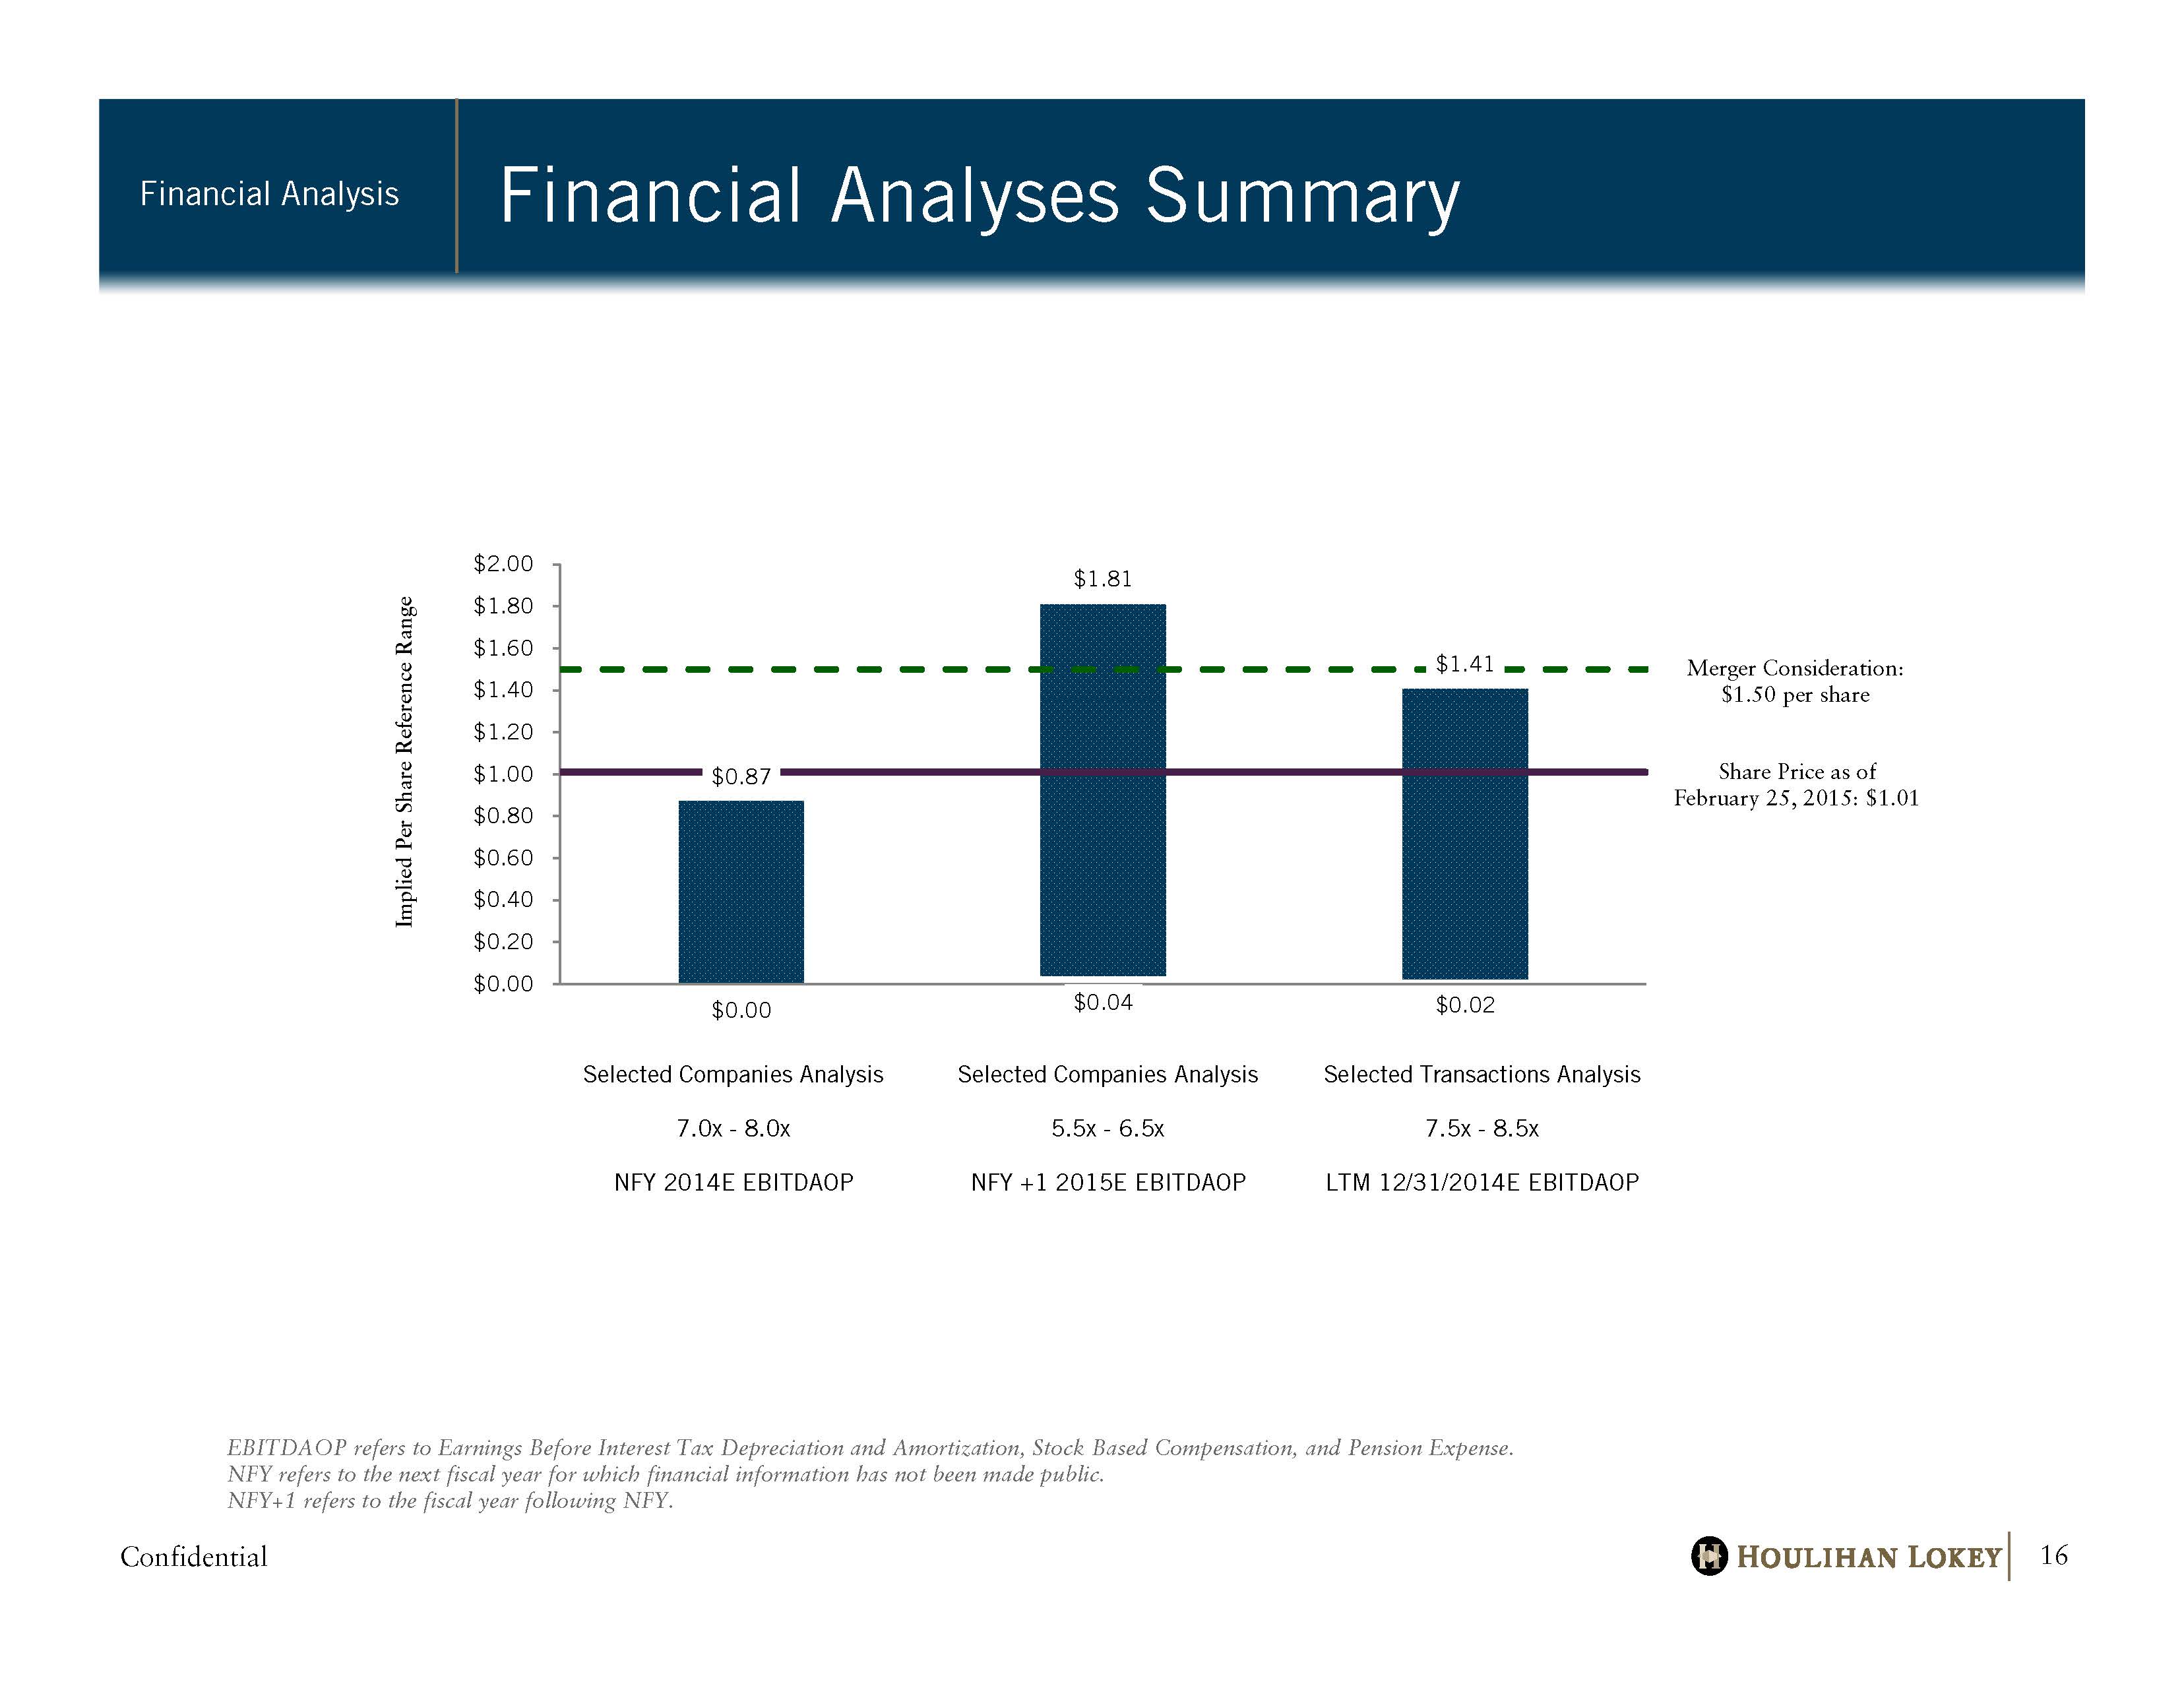
Confidential $0.00 $0.04 $0.02 $0.87 $1.81 $1.41 $0.00 $0.20 $0.40 $0.60 $0.80 $1.00 $1.20 $1.40 $1.60 $1.80 $2.00 $0.00 $0.20 $0.40 $0.60 $0.80 $1.00 $1.20 $1.40 $1.60 $1.80 $2.00 Implied Per Share Reference Range Financial Analyses Summary Financial Analysis 16 EBITDAOP refers to Earnings Before Interest Tax Depreciation and Amortization, Stock Based Compensation, and Pension Expense. NFY refers to the next fiscal year for which financial information has not been made public. NFY+1 refers to the fiscal year following NFY. Share Price as of February 25 , 2015: $1.01 Merger Consideration: $ 1.50 per share Selected Companies Analysis Selected Companies Analysis Selected Transactions Analysis 7.0x - 8.0x 5.5x - 6.5x 7.5x - 8.5x NFY 2014E EBITDAOP NFY +1 2015E EBITDAOP LTM 12/31/2014E EBITDAOP
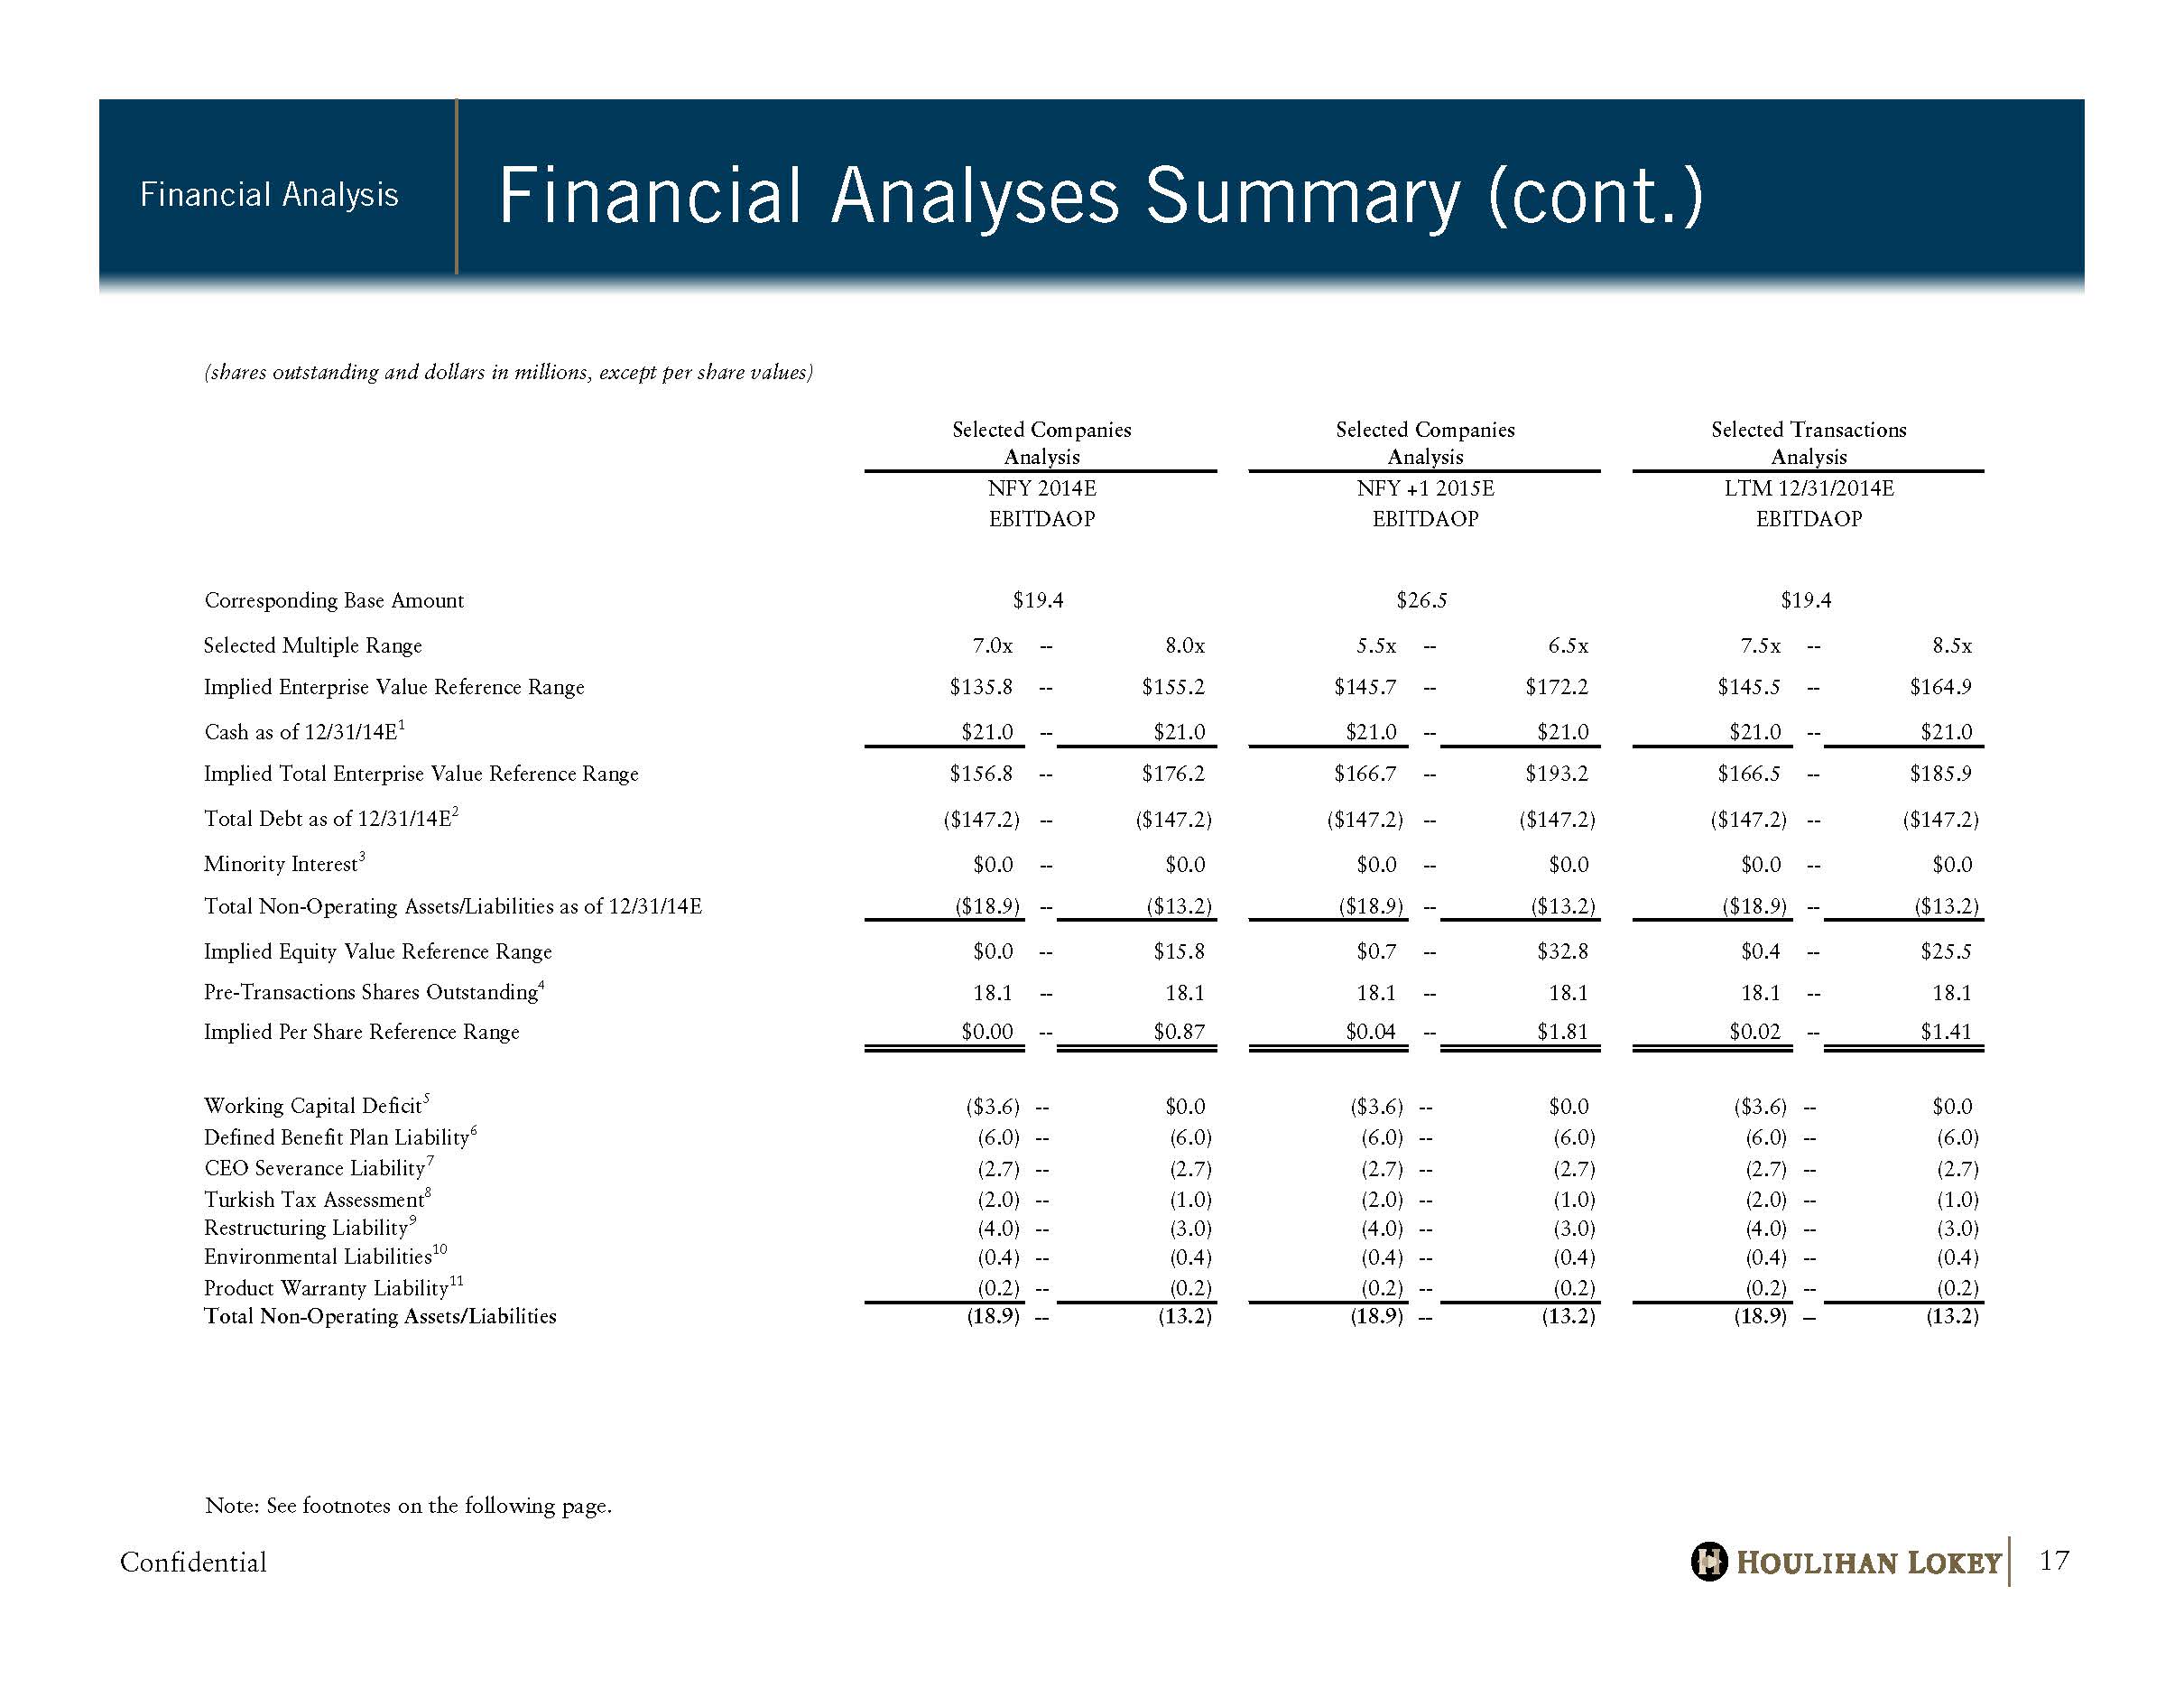
Confidential Financial Analyses Summary (cont .) Financial Analysis 17 Note: See footnotes on the following page. (shares outstanding and dollars in millions, except per share values) Selected Companies Selected Companies Selected Transactions Analysis Analysis Analysis NFY 2014E NFY +1 2015E LTM 12/31/2014E EBITDAOP EBITDAOP EBITDAOP Corresponding Base Amount $19.4 $26.5 $19.4 Selected Multiple Range 7.0x -- 8.0x 5.5x -- 6.5x 7.5x -- 8.5x Implied Enterprise Value Reference Range $135.8 -- $155.2 $145.7 -- $172.2 $145.5 -- $164.9 Cash as of 12/31/14E 1 $21.0 -- $21.0 $21.0 -- $21.0 $21.0 -- $21.0 Implied Total Enterprise Value Reference Range $156.8 -- $176.2 $166.7 -- $193.2 $166.5 -- $185.9 Total Debt as of 12/31/14E 2 ($147.2) -- ($147.2) ($147.2) -- ($147.2) ($147.2) -- ($147.2) Minority Interest 3 $0.0 -- $0.0 $0.0 -- $0.0 $0.0 -- $0.0 Total Non-Operating Assets/Liabilities as of 12/31/14E ($18.9) -- ($13.2) ($18.9) -- ($13.2) ($18.9) -- ($13.2) Implied Equity Value Reference Range $0.0 -- $15.8 $0.7 -- $32.8 $0.4 -- $25.5 Pre-Transactions Shares Outstanding 4 18.1 -- 18.1 18.1 -- 18.1 18.1 -- 18.1 Implied Per Share Reference Range $0.00 -- $0.87 $0.04 -- $1.81 $0.02 -- $1.41 Working Capital Deficit 5 ($3.6) -- $0.0 ($3.6) -- $0.0 ($3.6) -- $0.0 Defined Benefit Plan Liability 6 (6.0) -- (6.0) (6.0) -- (6.0) (6.0) -- (6.0) CEO Severance Liability 7 (2.7) -- (2.7) (2.7) -- (2.7) (2.7) -- (2.7) Turkish Tax Assessment 8 (2.0) -- (1.0) (2.0) -- (1.0) (2.0) -- (1.0) Restructuring Liability 9 (4.0) -- (3.0) (4.0) -- (3.0) (4.0) -- (3.0) Environmental Liabilities 10 (0.4) -- (0.4) (0.4) -- (0.4) (0.4) -- (0.4) Product Warranty Liability 11 (0.2) -- (0.2) (0.2) -- (0.2) (0.2) -- (0.2) Total Non-Operating Assets/Liabilities (18.9) -- (13.2) (18.9) -- (13.2) (18.9) -- (13.2)
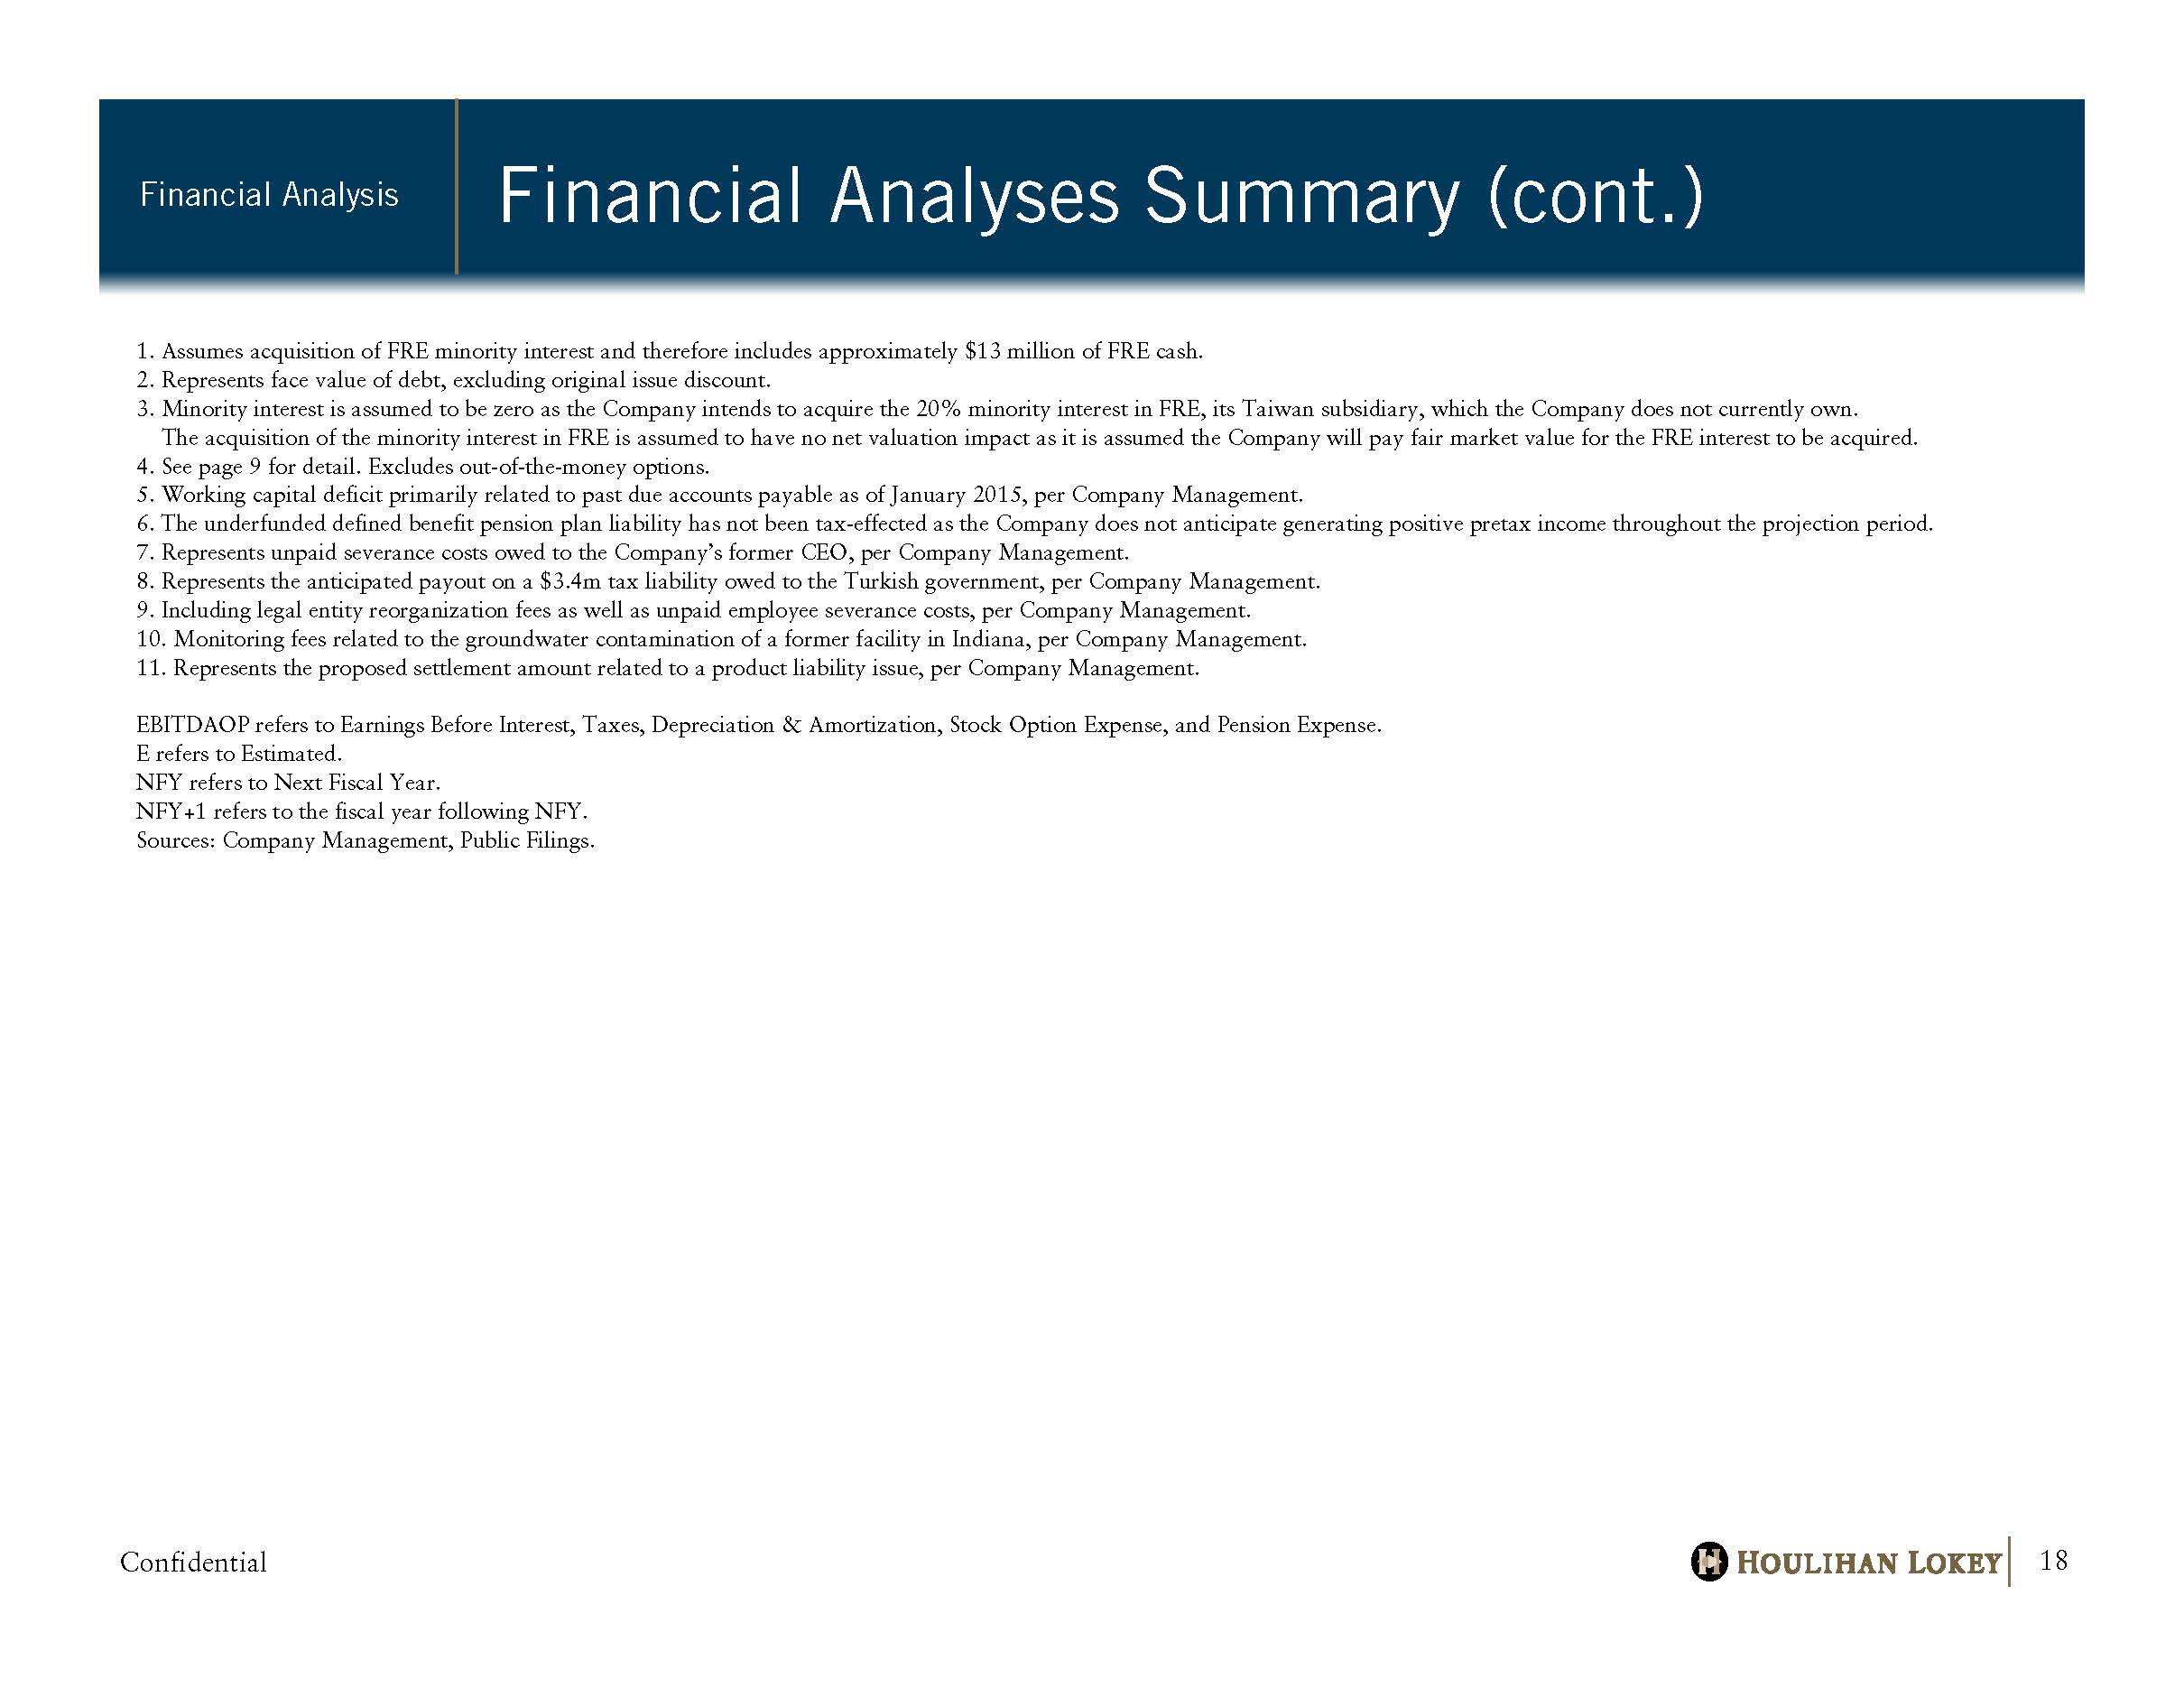
Confidential Financial Analyses Summary (cont .) Financial Analysis 18 1. Assumes acquisition of FRE minority interest and therefore includes approximately $13 million of FRE cash. 2. Represents face value of debt, excluding original issue discount. 3. Minority interest is assumed to be zero as the Company intends to acquire the 20% minority interest in FRE, its Taiwan subsidiary, which the Company does not currently own. The acquisition of the minority interest in FRE is assumed to have no net valuation impact as it is assumed the Company will pay fair market value for the FRE interest to be acquired. 4. See page 9 for detail. Excludes out-of-the-money options. 5. Working capital deficit primarily related to past due accounts payable as of January 2015, per Company Management. 6. The underfunded defined benefit pension plan liability has not been tax-effected as the Company does not anticipate generating positive pretax income throughout the projection period. 7. Represents unpaid severance costs owed to the Company’s former CEO, per Company Management. 8. Represents the anticipated payout on a $3.4m tax liability owed to the Turkish government, per Company Management. 9. Including legal entity reorganization fees as well as unpaid employee severance costs, per Company Management. 10. Monitoring fees related to the groundwater contamination of a former facility in Indiana, per Company Management. 11. Represents the proposed settlement amount related to a product liability issue, per Company Management. EBITDAOP refers to Earnings Before Interest, Taxes, Depreciation & Amortization, Stock Option Expense, and Pension Expense. E refers to Estimated. NFY refers to Next Fiscal Year. NFY+1 refers to the fiscal year following NFY. Sources: Company Management, Public Filings.

Confidential Selected Historical and Projected Financial Data Financial Analysis 19 EBITDAOP refers to Earnings Before Interest Tax Depreciation and Amortization, Stock Based Compensation, and Pension Expense. CAGR refers to Compound Annual Growth Rate. E refers to Estimated. Sources: Company Management. (dollars in millions) Fiscal Year Ended December 31, Fiscal Year Ending December 31, CAGR 2012 2013 2014E 2015E 2013 to 2015E Revenues, Net $373.2 $355.7 $343.5 $357.5 0.3% Growth % 1.1% -4.7% -3.4% 4.1% Cost of Sales (Goods Sold) ($298.9) ($274.0) ($266.6) ($270.1) Gross Profit $74.3 $81.7 $76.9 $87.4 Margin % 19.9% 23.0% 22.4% 24.4% Total SG&A ($74.8) ($73.9) ($67.5) ($69.8) Depreciation & Amortization 7.8 7.4 7.3 7.1 Non-Cash Stock Based Compensation 1.8 1.8 2.5 1.5 Pension Expense 0.1 (0.1) 0.2 0.3 EBITDAOP $9.2 $16.9 $19.4 $26.5 25.1% Margin % 2.5% 4.8% 5.6% 7.4% Growth % -14.3% 84.3% 14.5% 36.6% Cost Savings Program [1] [FRC Only] $0.0 $0.0 $10.0 $10.0 Run-Rate EBITDAOP (with cost savings) [FRC Only] $9.2 $16.9 $29.4 $36.5 46.8% Margin % 2.5% 4.8% 8.6% 10.2% Growth % -14.3% 84.3% 73.5% 24.2%

Confidential Representative Levels - Segments Financial Analysis 20 CAGR refers to Compound Annual Growth Rate. E refers to Estimated. Sources: Company Management. (dollars in millions) Fiscal Year Ended December 31, Fiscal Year Ending December 31, CAGR 2012 2013 2014E 2015E 2013 to 2015E Network Revenues, Net $158.1 $150.6 $152.6 $167.3 5.4% Growth % NA -4.8% 1.3% 9.6% Cost of Sales (Goods Sold) ($124.4) ($116.5) ($117.8) ($127.4) Gross Profit $33.7 $34.1 $34.8 $39.9 Margin % 21.3% 22.6% 22.8% 23.8% Power Revenues, Net $120.1 $111.5 $105.9 $111.4 -0.1% Growth % NA -7.2% -5.0% 5.2% Cost of Sales (Goods Sold) ($91.7) ($80.9) ($75.7) ($79.9) Gross Profit $28.5 $30.7 $30.2 $31.5 Margin % 23.7% 27.5% 28.5% 28.3% Wireless Revenues, Net $94.9 $93.6 $85.0 $78.8 -8.2% Growth % NA -1.4% -9.2% -7.3% Cost of Sales (Goods Sold) ($82.9) ($76.6) ($73.1) ($62.8) Gross Profit $12.1 $16.9 $11.9 $16.0 Margin % 12.7% 18.1% 14.0% 20.3%
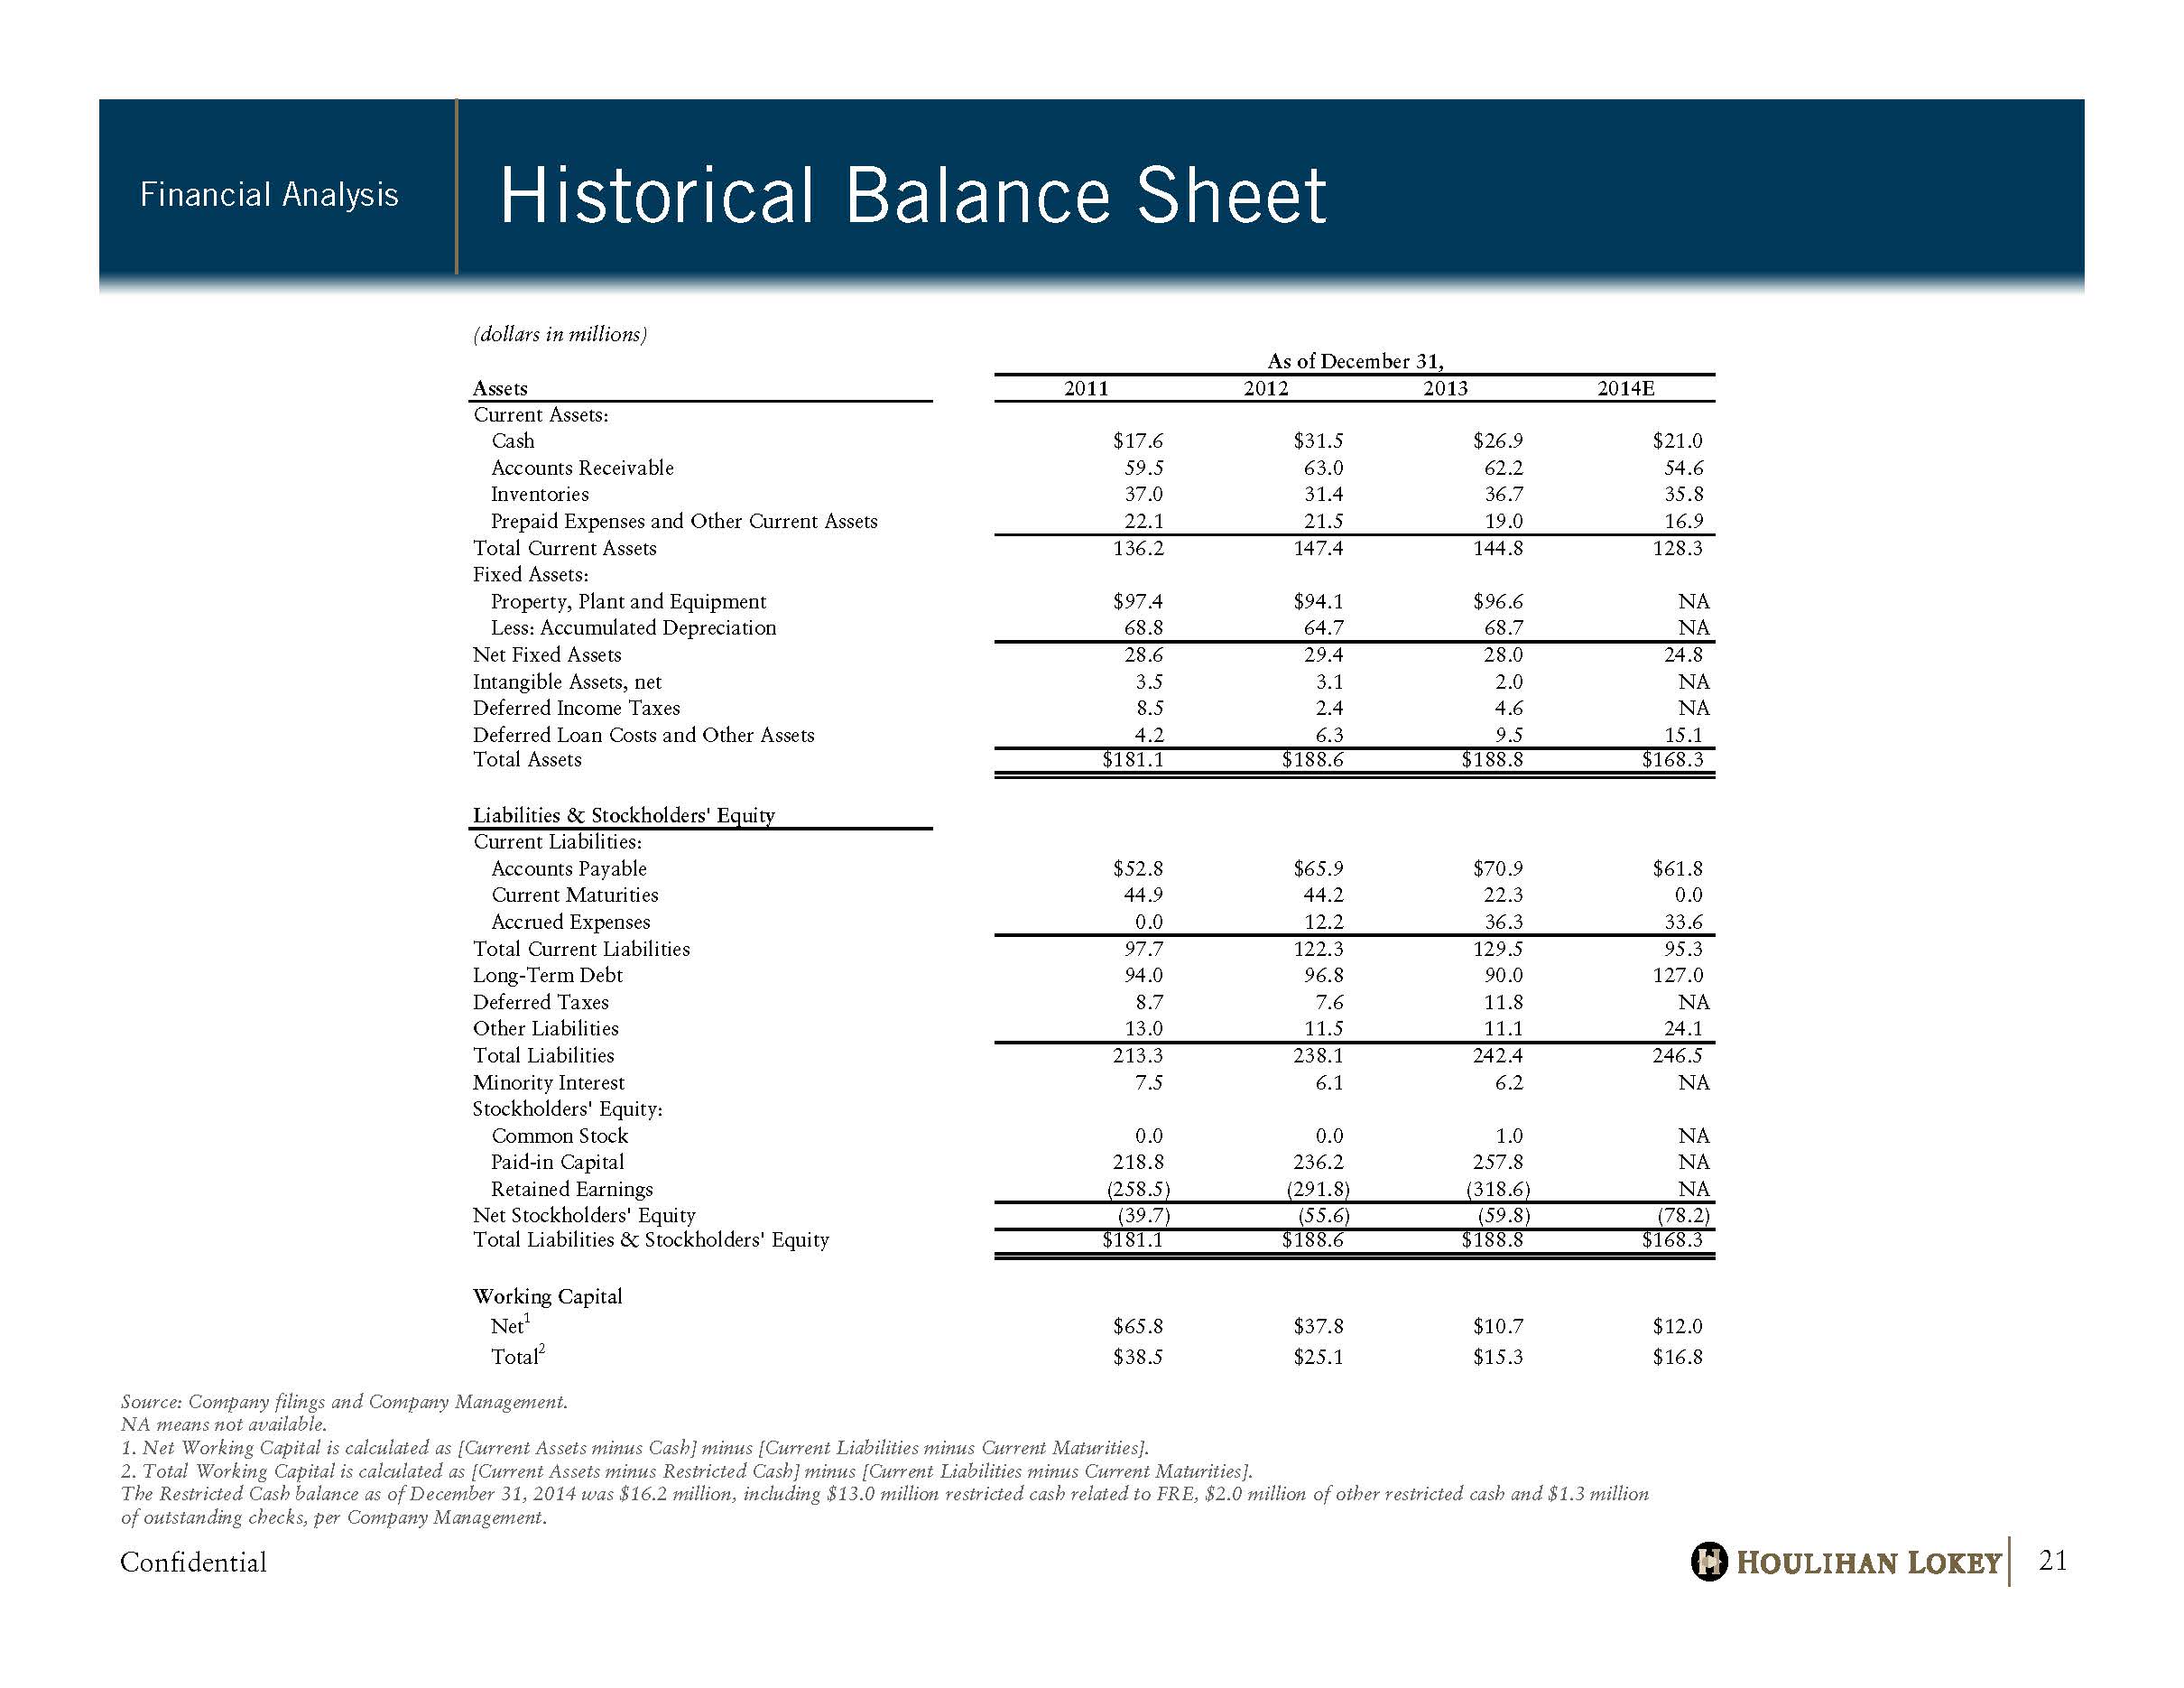
Confidential Historical Balance Sheet Financial Analysis 21 Source: Company filings and Company Management. NA means not available. 1. Net Working Capital is calculated as [Current Assets minus Cash ] minus [Current Liabilities minus Current Maturities]. 2. Total Working Capital is calculated as [Current Assets minus Restricted Cash] minus [Current Liabilities minus Current Mat uri ties ]. The Restricted Cash balance as of December 31, 2014 was $16.2 million, including $13.0 million restricted cash related to FRE , $ 2.0 million of other restricted cash and $1.3 million of outstanding checks, per Company Management. (dollars in millions) As of December 31, Assets 2011 2012 2013 2014E Current Assets: Cash $17.6 $31.5 $26.9 $21.0 Accounts Receivable 59.5 63.0 62.2 54.6 Inventories 37.0 31.4 36.7 35.8 Prepaid Expenses and Other Current Assets 22.1 21.5 19.0 16.9 Total Current Assets 136.2 147.4 144.8 128.3 Fixed Assets: Property, Plant and Equipment $97.4 $94.1 $96.6 NA Less: Accumulated Depreciation 68.8 64.7 68.7 NA Net Fixed Assets 28.6 29.4 28.0 24.8 Intangible Assets, net 3.5 3.1 2.0 NA Deferred Income Taxes 8.5 2.4 4.6 NA Deferred Loan Costs and Other Assets 4.2 6.3 9.5 15.1 Total Assets $181.1 $188.6 $188.8 $168.3 Liabilities & Stockholders' Equity Current Liabilities: Accounts Payable $52.8 $65.9 $70.9 $61.8 Current Maturities 44.9 44.2 22.3 0.0 Accrued Expenses 0.0 12.2 36.3 33.6 Total Current Liabilities 97.7 122.3 129.5 95.3 Long-Term Debt 94.0 96.8 90.0 127.0 Deferred Taxes 8.7 7.6 11.8 NA Other Liabilities 13.0 11.5 11.1 24.1 Total Liabilities 213.3 238.1 242.4 246.5 Minority Interest 7.5 6.1 6.2 NA Stockholders' Equity: Common Stock 0.0 0.0 1.0 NA Paid-in Capital 218.8 236.2 257.8 NA Retained Earnings (258.5) (291.8) (318.6) NA Net Stockholders' Equity (39.7) (55.6) (59.8) (78.2) Total Liabilities & Stockholders' Equity $181.1 $188.6 $188.8 $168.3 Working Capital Net 1 $65.8 $37.8 $10.7 $12.0 Total 2 $38.5 $25.1 $15.3 $16.8
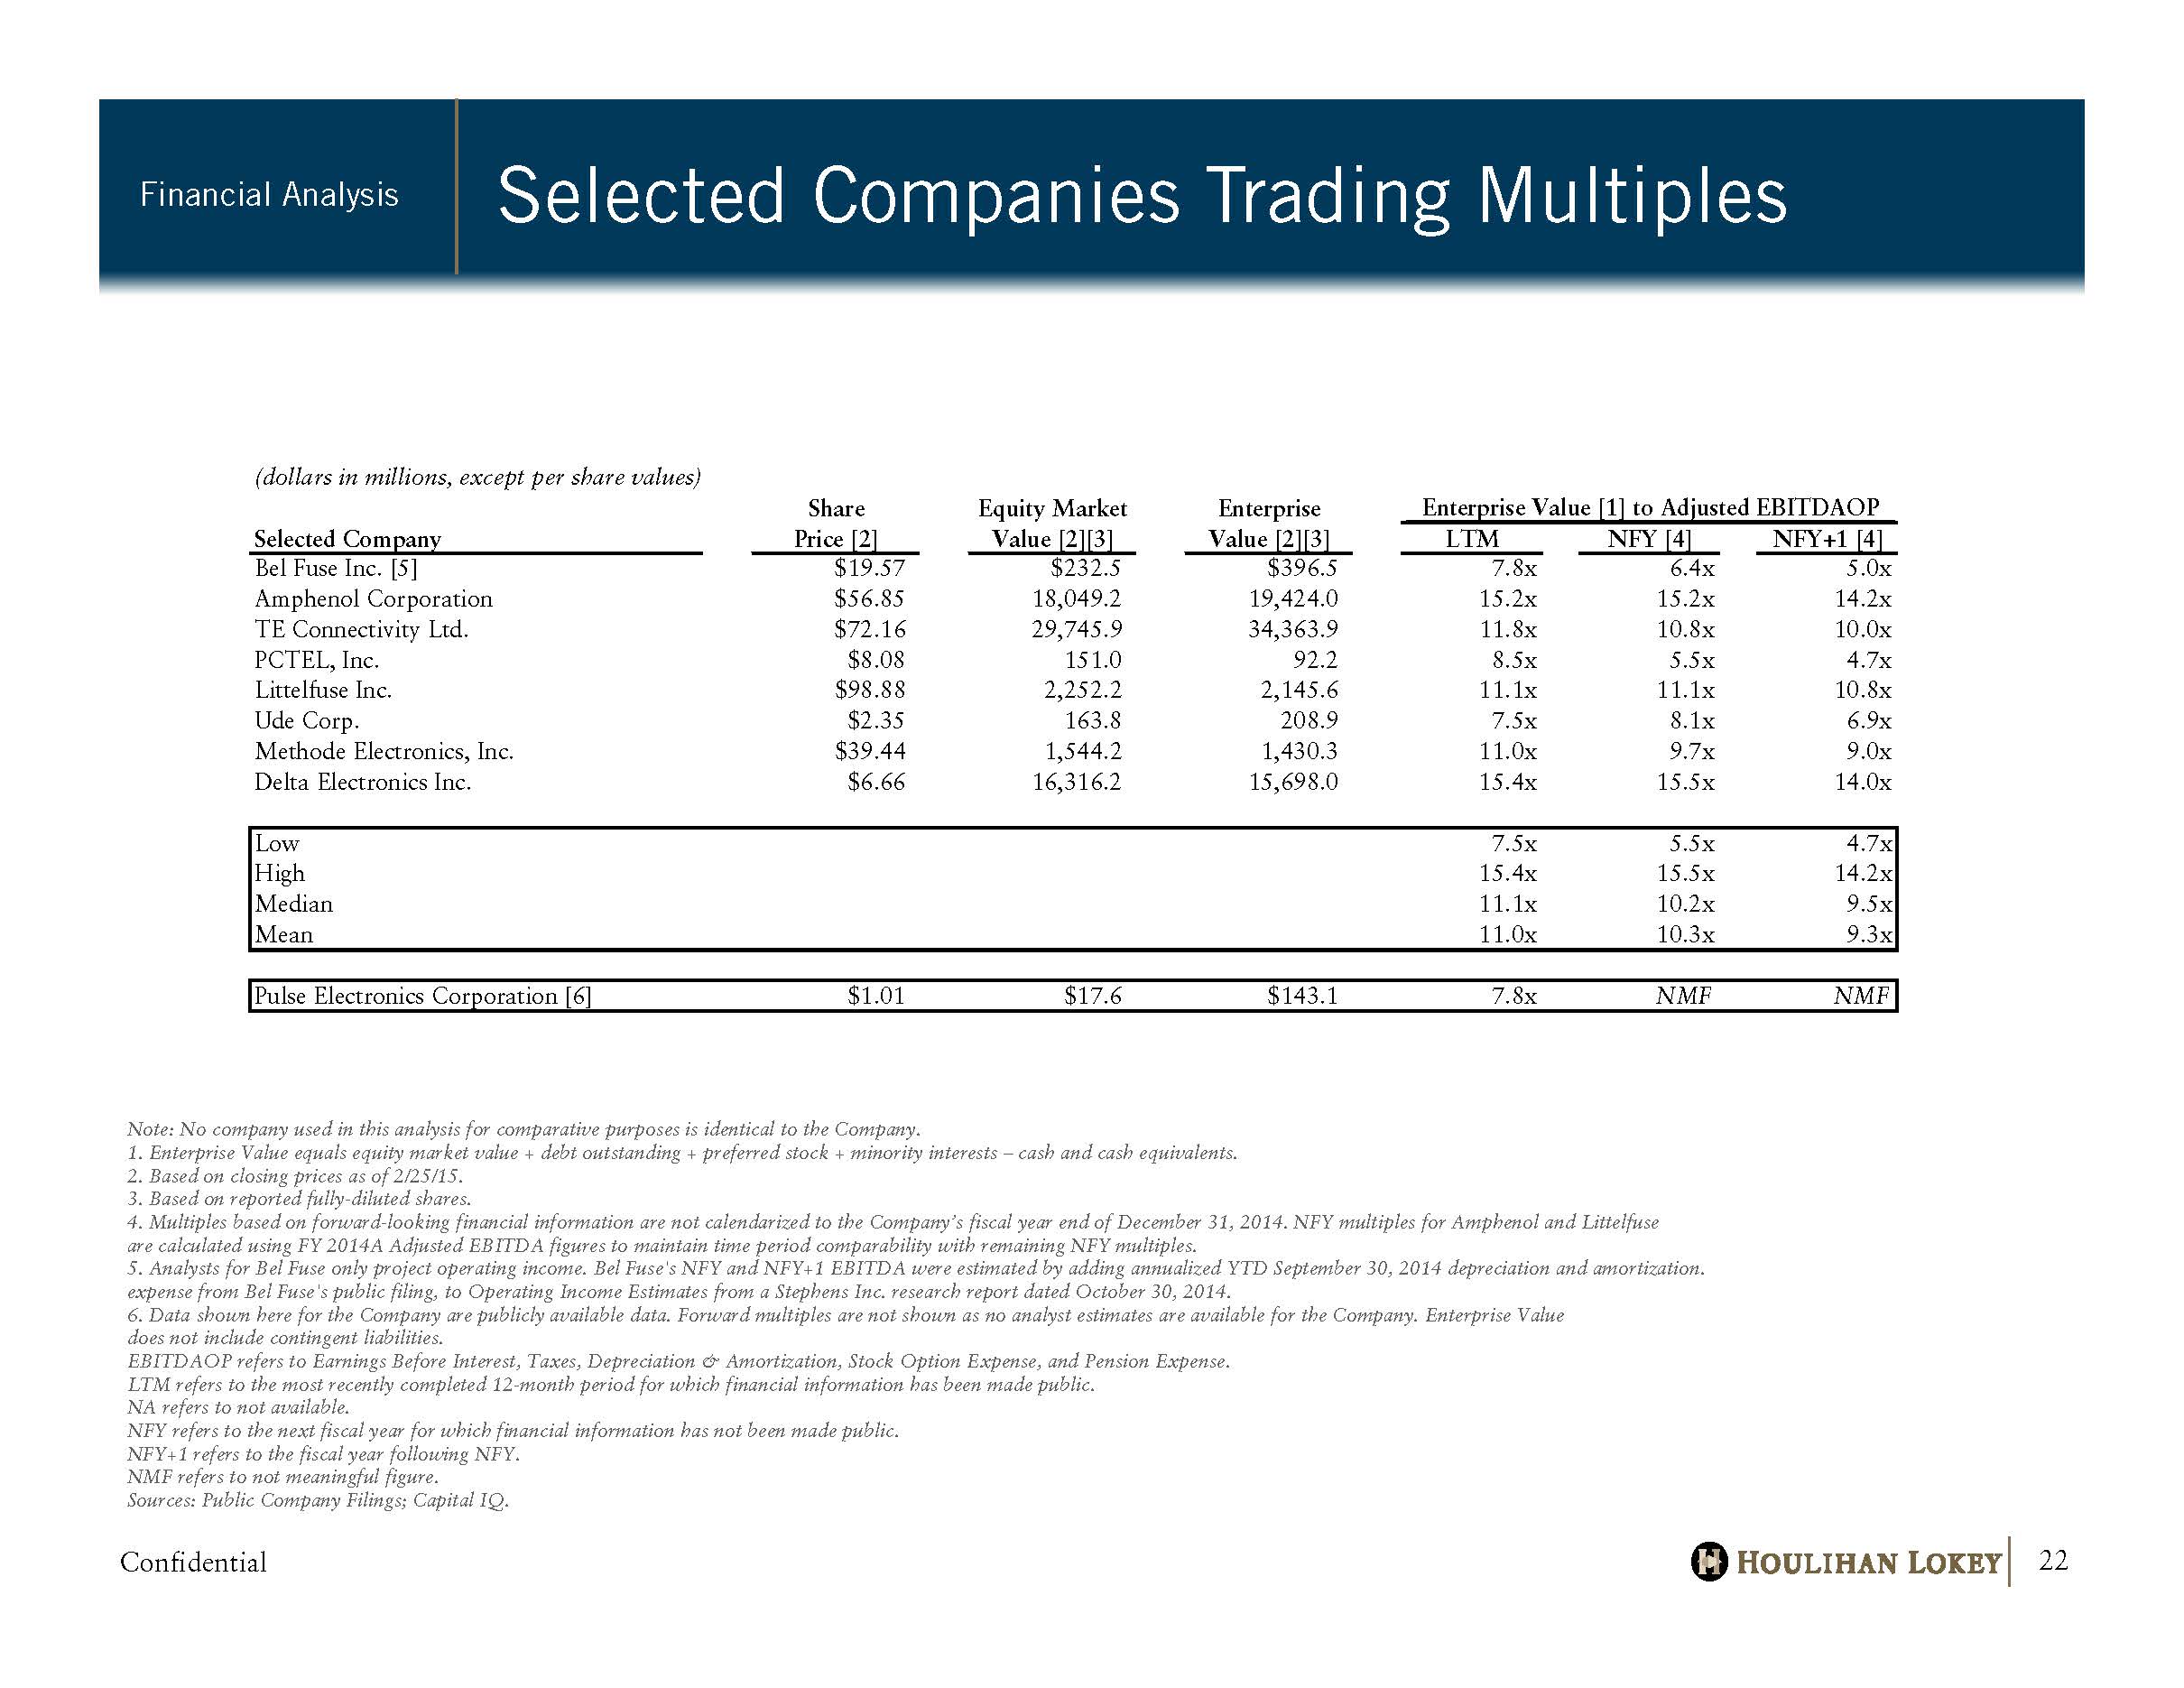
Confidential Selected Companies Trading Multiples Financial Analysis 22 Note: No company used in this analysis for comparative purposes is identical to the Company. 1. Enterprise Value equals equity market value + debt outstanding + preferred stock + minority interests – cash and cash equival ents. 2. Based on closing prices as of 2/25/15. 3. Based on reported fully - diluted shares. 4. Multiples based on forward - looking financial information are not calendarized to the Company’s fiscal year end of December 31, 2014. NFY multiples for Amphenol and Littelfuse are calculated using FY 2014A Adjusted EBITDA figures to maintain time period comparability with remaining NFY multiples. 5. Analysts for Bel Fuse only project operating income. Bel Fuse's NFY and NFY+1 EBITDA were estimated by adding annualized Y TD September 30, 2014 depreciation and amortization. expense from Bel Fuse's public filing, to Operating Income Estimates from a Stephens Inc. research report dated October 30, 2 014 . 6. Data shown here for the Company are publicly available data. Forward multiples are not shown as no analyst estimates are a vai lable for the Company. Enterprise Value does not include contingent liabilities. EBITDAOP refers to Earnings Before Interest, Taxes, Depreciation & Amortization, Stock Option Expense, and Pension Expense. LTM refers to the most recently completed 12 - month period for which financial information has been made public. NA refers to not available. NFY refers to the next fiscal year for which financial information has not been made public. NFY+1 refers to the fiscal year following NFY. NMF refers to not meaningful figure. Sources: Public Company Filings; Capital IQ. (dollars in millions, except per share values) Share Equity Market Enterprise Enterprise Value [1] to Adjusted EBITDAOP Selected Company Price [2] Value [2][3] Value [2][3] LTM NFY [4] NFY+1 [4] Bel Fuse Inc. [5] $19.57 $232.5 $396.5 7.8x ## 6.4x ## 5.0x 5 Amphenol Corporation $56.85 18,049.2 19,424.0 15.2x ## 15.2x ## 14.2x 14 TE Connectivity Ltd. $72.16 29,745.9 34,363.9 11.8x ## 10.8x ## 10.0x 10 PCTEL, Inc. $8.08 151.0 92.2 8.5x ## 5.5x ## 4.7x 5 Littelfuse Inc. $98.88 2,252.2 2,145.6 11.1x ## 11.1x ## 10.8x 11 Ude Corp. $2.35 163.8 208.9 7.5x ## 8.1x ## 6.9x 7 Methode Electronics, Inc. $39.44 1,544.2 1,430.3 11.0x ## 9.7x ## 9.0x 9 Delta Electronics Inc. $6.66 16,316.2 15,698.0 15.4x ## 15.5x ## 14.0x 14 Low 7.5x 5.5x 4.7x High 15.4x 15.5x 14.2x Median 11.1x 10.2x 9.5x Mean 11.0x 10.3x 9.3x Pulse Electronics Corporation [6] $1.01 $17.6 $143.1 7.8x ## NMF NMF NMF NMF
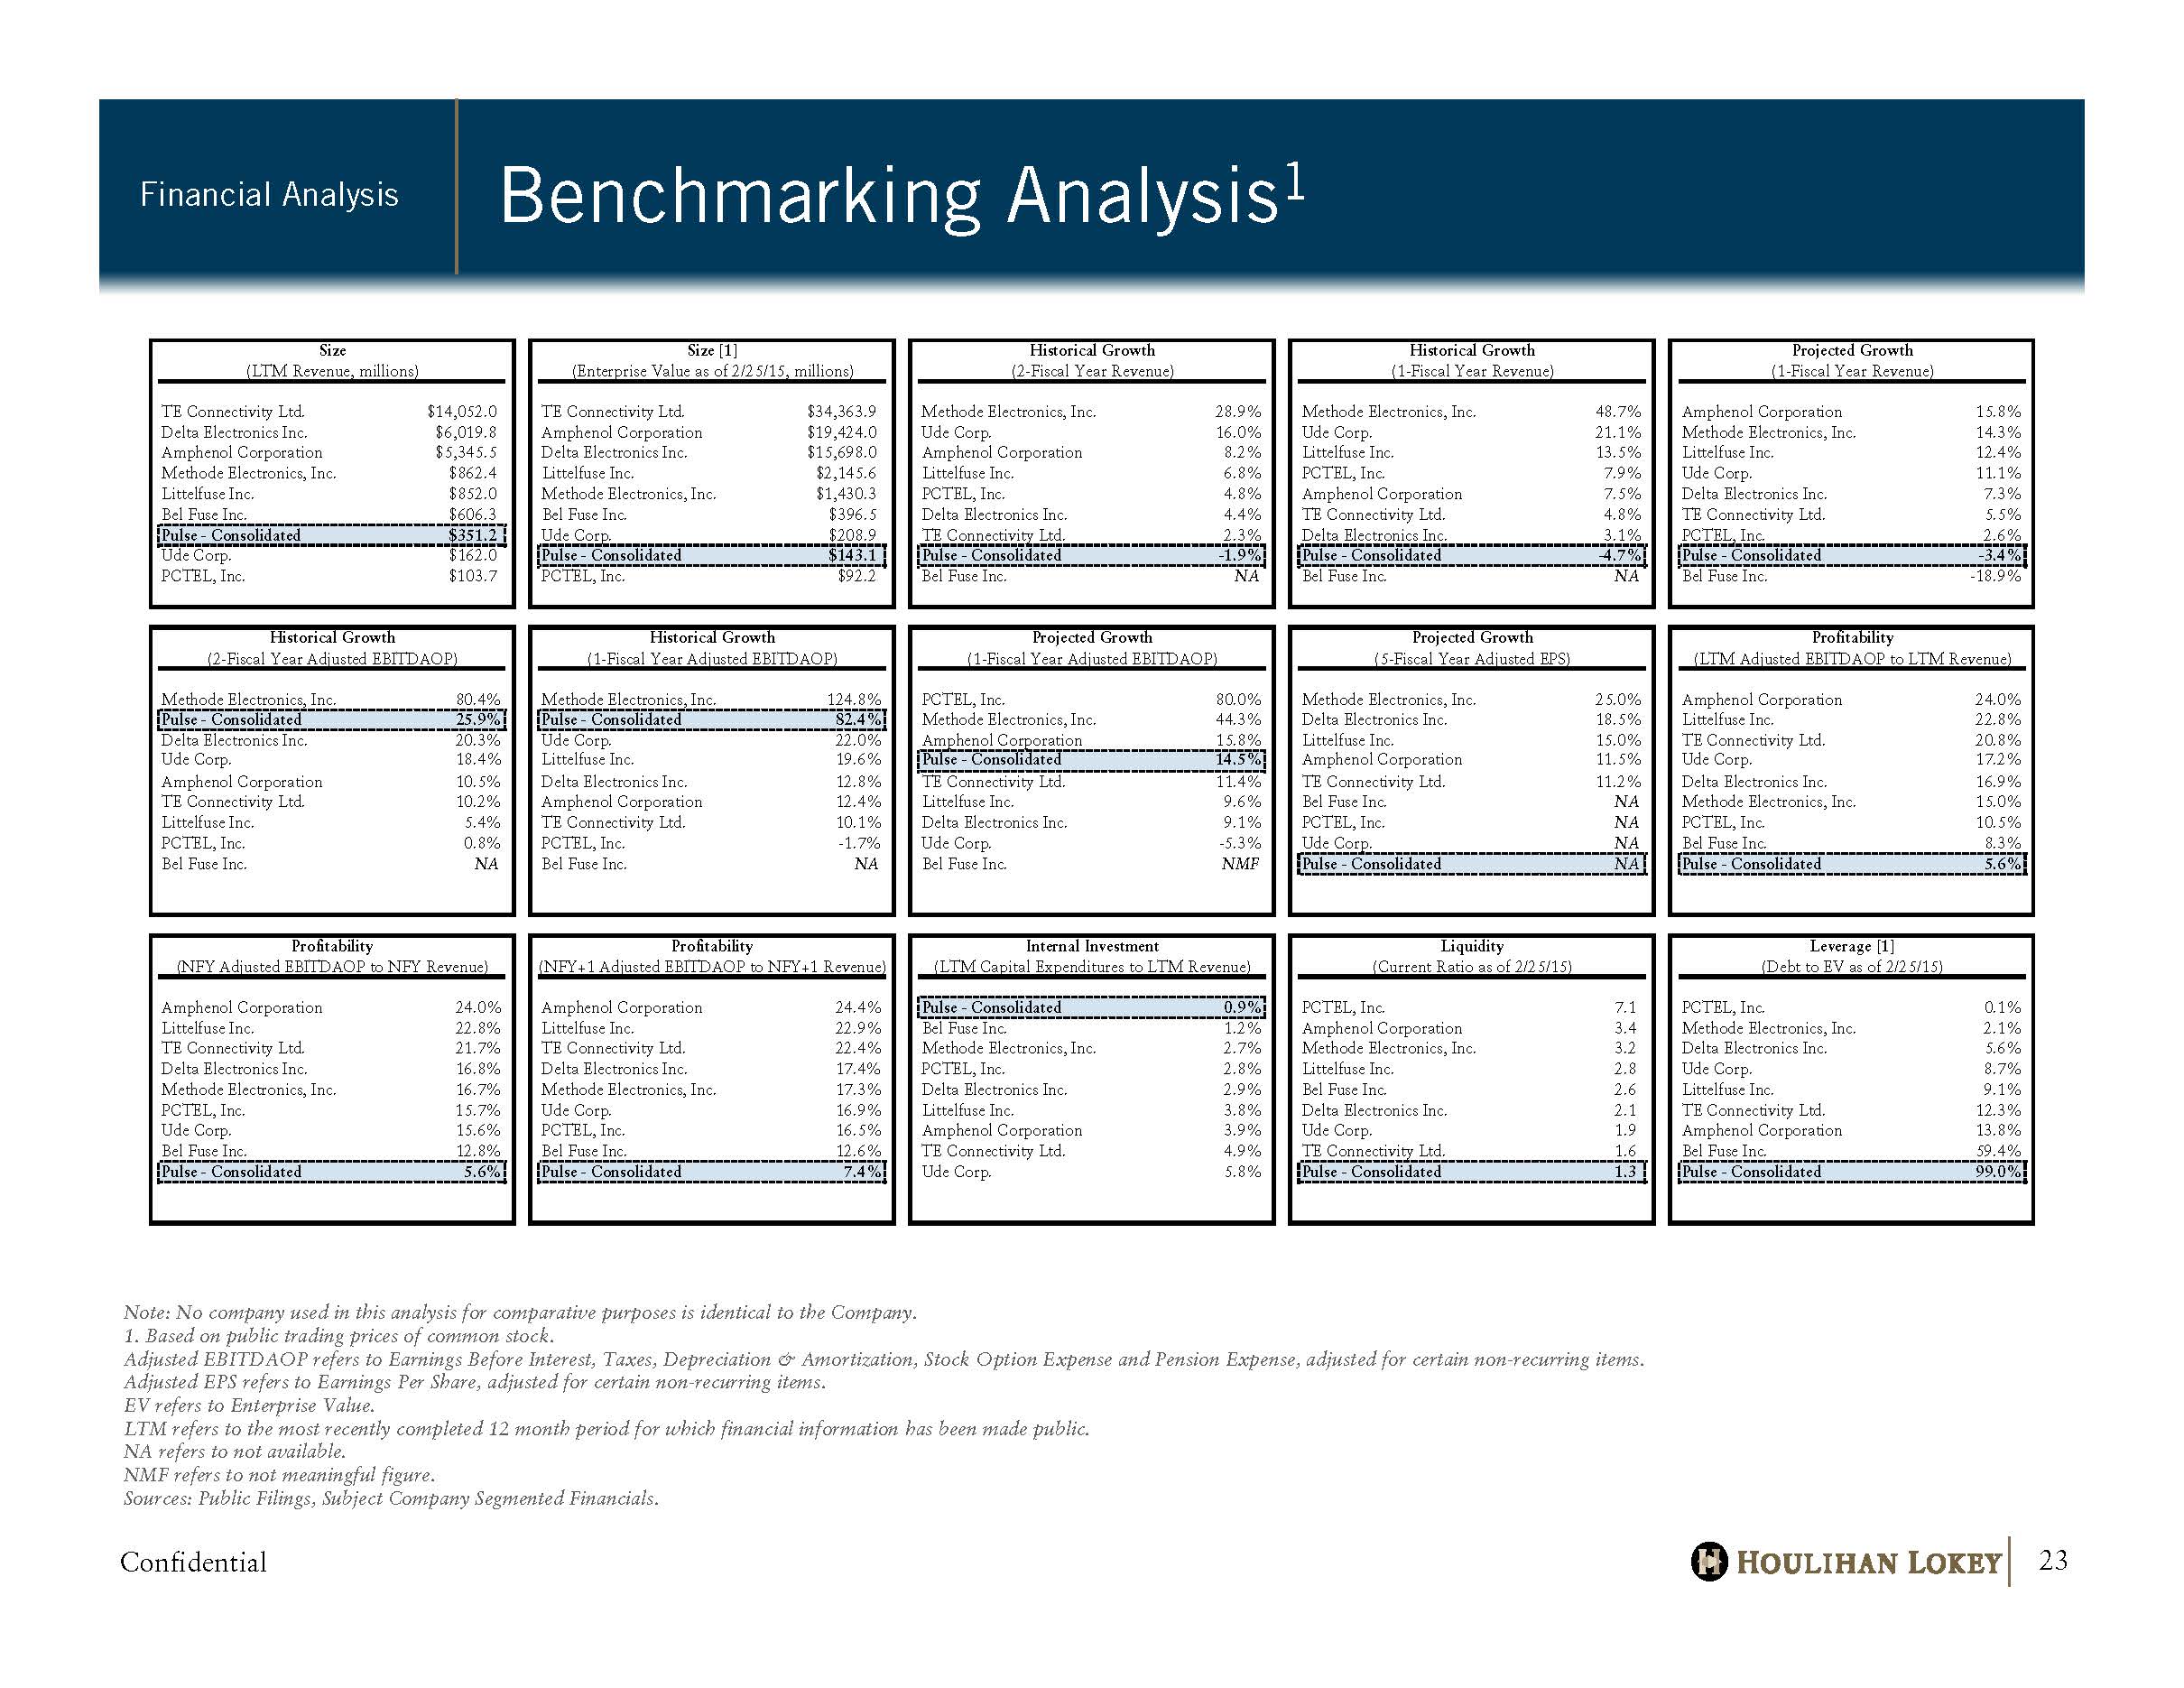
Confidential Benchmarking Analysis 1 Financial Analysis 23 Note: No company used in this analysis for comparative purposes is identical to the Company. 1. Based on public trading prices of common stock. Adjusted EBITDAOP refers to Earnings Before Interest, Taxes, Depreciation & Amortization, Stock Option Expense and Pension Expense, adjusted for certain non - recurring items. Adjusted EPS refers to Earnings Per Share, adjusted for certain non - recurring items. EV refers to Enterprise Value. LTM refers to the most recently completed 12 month period for which financial information has been made public. NA refers to not available. NMF refers to not meaningful figure. Sources: Public Filings, Subject Company Segmented Financials. Size Size [1] Historical Growth Historical Growth Projected Growth (LTM Revenue, millions) (Enterprise Value as of 2/25/15, millions) (2-Fiscal Year Revenue) (1-Fiscal Year Revenue) (1-Fiscal Year Revenue) Name Value Name Value Name Value Name Value Name Value TE Connectivity Ltd. $14,052.0 TE Connectivity Ltd. $34,363.9 Methode Electronics, Inc. 28.9% Methode Electronics, Inc. 48.7% Amphenol Corporation 15.8% Delta Electronics Inc. $6,019.8 Amphenol Corporation $19,424.0 Ude Corp. 16.0% Ude Corp. 21.1% Methode Electronics, Inc. 14.3% Amphenol Corporation $5,345.5 Delta Electronics Inc. $15,698.0 Amphenol Corporation 8.2% Littelfuse Inc. 13.5% Littelfuse Inc. 12.4% Methode Electronics, Inc. $862.4 Littelfuse Inc. $2,145.6 Littelfuse Inc. 6.8% PCTEL, Inc. 7.9% Ude Corp. 11.1% Littelfuse Inc. $852.0 Methode Electronics, Inc. $1,430.3 PCTEL, Inc. 4.8% Amphenol Corporation 7.5% Delta Electronics Inc. 7.3% Bel Fuse Inc. $606.3 Bel Fuse Inc. $396.5 Delta Electronics Inc. 4.4% TE Connectivity Ltd. 4.8% TE Connectivity Ltd. 5.5% Pulse - Consolidated $351.2 Ude Corp. $208.9 TE Connectivity Ltd. 2.3% Delta Electronics Inc. 3.1% PCTEL, Inc. 2.6% Ude Corp. $162.0 Pulse - Consolidated $143.1 Pulse - Consolidated -1.9% Pulse - Consolidated -4.7% Pulse - Consolidated -3.4% PCTEL, Inc. $103.7 PCTEL, Inc. $92.2 Bel Fuse Inc. NA Bel Fuse Inc. NA Bel Fuse Inc. -18.9% Historical Growth Historical Growth Projected Growth Projected Growth Profitability (2-Fiscal Year Adjusted EBITDAOP) (1-Fiscal Year Adjusted EBITDAOP) (1-Fiscal Year Adjusted EBITDAOP) (5-Fiscal Year Adjusted EPS) (LTM Adjusted EBITDAOP to LTM Revenue) Name Value Name Value Name Value Name Value Name Value Methode Electronics, Inc. 80.4% Methode Electronics, Inc. 124.8% PCTEL, Inc. 80.0% Methode Electronics, Inc. 25.0% Amphenol Corporation 24.0% Pulse - Consolidated 25.9% Pulse - Consolidated 82.4% Methode Electronics, Inc. 44.3% Delta Electronics Inc. 18.5% Littelfuse Inc. 22.8% Delta Electronics Inc. 20.3% Ude Corp. 22.0% Amphenol Corporation 15.8% Littelfuse Inc. 15.0% TE Connectivity Ltd. 20.8% Ude Corp. 18.4% Littelfuse Inc. 19.6% Pulse - Consolidated 14.5% Amphenol Corporation 11.5% Ude Corp. 17.2% Amphenol Corporation 10.5% Delta Electronics Inc. 12.8% TE Connectivity Ltd. 11.4% TE Connectivity Ltd. 11.2% Delta Electronics Inc. 16.9% TE Connectivity Ltd. 10.2% Amphenol Corporation 12.4% Littelfuse Inc. 9.6% Bel Fuse Inc. NA Methode Electronics, Inc. 15.0% Littelfuse Inc. 5.4% TE Connectivity Ltd. 10.1% Delta Electronics Inc. 9.1% PCTEL, Inc. NA PCTEL, Inc. 10.5% PCTEL, Inc. 0.8% PCTEL, Inc. -1.7% Ude Corp. -5.3% Ude Corp. NA Bel Fuse Inc. 8.3% Bel Fuse Inc. NA Bel Fuse Inc. NA Bel Fuse Inc. NMF Pulse - Consolidated NA Pulse - Consolidated 5.6% Profitability Profitability Internal Investment Liquidity Leverage [1] (NFY Adjusted EBITDAOP to NFY Revenue) (NFY+1 Adjusted EBITDAOP to NFY+1 Revenue) (LTM Capital Expenditures to LTM Revenue) (Current Ratio as of 2/25/15) (Debt to EV as of 2/25/15) Name Value Name Value Name Value Name Value Name Value Amphenol Corporation 24.0% Amphenol Corporation 24.4% Pulse - Consolidated 0.9% PCTEL, Inc. 7.1 PCTEL, Inc. 0.1% Littelfuse Inc. 22.8% Littelfuse Inc. 22.9% Bel Fuse Inc. 1.2% Amphenol Corporation 3.4 Methode Electronics, Inc. 2.1% TE Connectivity Ltd. 21.7% TE Connectivity Ltd. 22.4% Methode Electronics, Inc. 2.7% Methode Electronics, Inc. 3.2 Delta Electronics Inc. 5.6% Delta Electronics Inc. 16.8% Delta Electronics Inc. 17.4% PCTEL, Inc. 2.8% Littelfuse Inc. 2.8 Ude Corp. 8.7% Methode Electronics, Inc. 16.7% Methode Electronics, Inc. 17.3% Delta Electronics Inc. 2.9% Bel Fuse Inc. 2.6 Littelfuse Inc. 9.1% PCTEL, Inc. 15.7% Ude Corp. 16.9% Littelfuse Inc. 3.8% Delta Electronics Inc. 2.1 TE Connectivity Ltd. 12.3% Ude Corp. 15.6% PCTEL, Inc. 16.5% Amphenol Corporation 3.9% Ude Corp. 1.9 Amphenol Corporation 13.8% Bel Fuse Inc. 12.8% Bel Fuse Inc. 12.6% TE Connectivity Ltd. 4.9% TE Connectivity Ltd. 1.6 Bel Fuse Inc. 59.4% Pulse - Consolidated 5.6% Pulse - Consolidated 7.4% Ude Corp. 5.8% Pulse - Consolidated 1.3 Pulse - Consolidated 99.0% (Invalid Identifier) #VALUE!
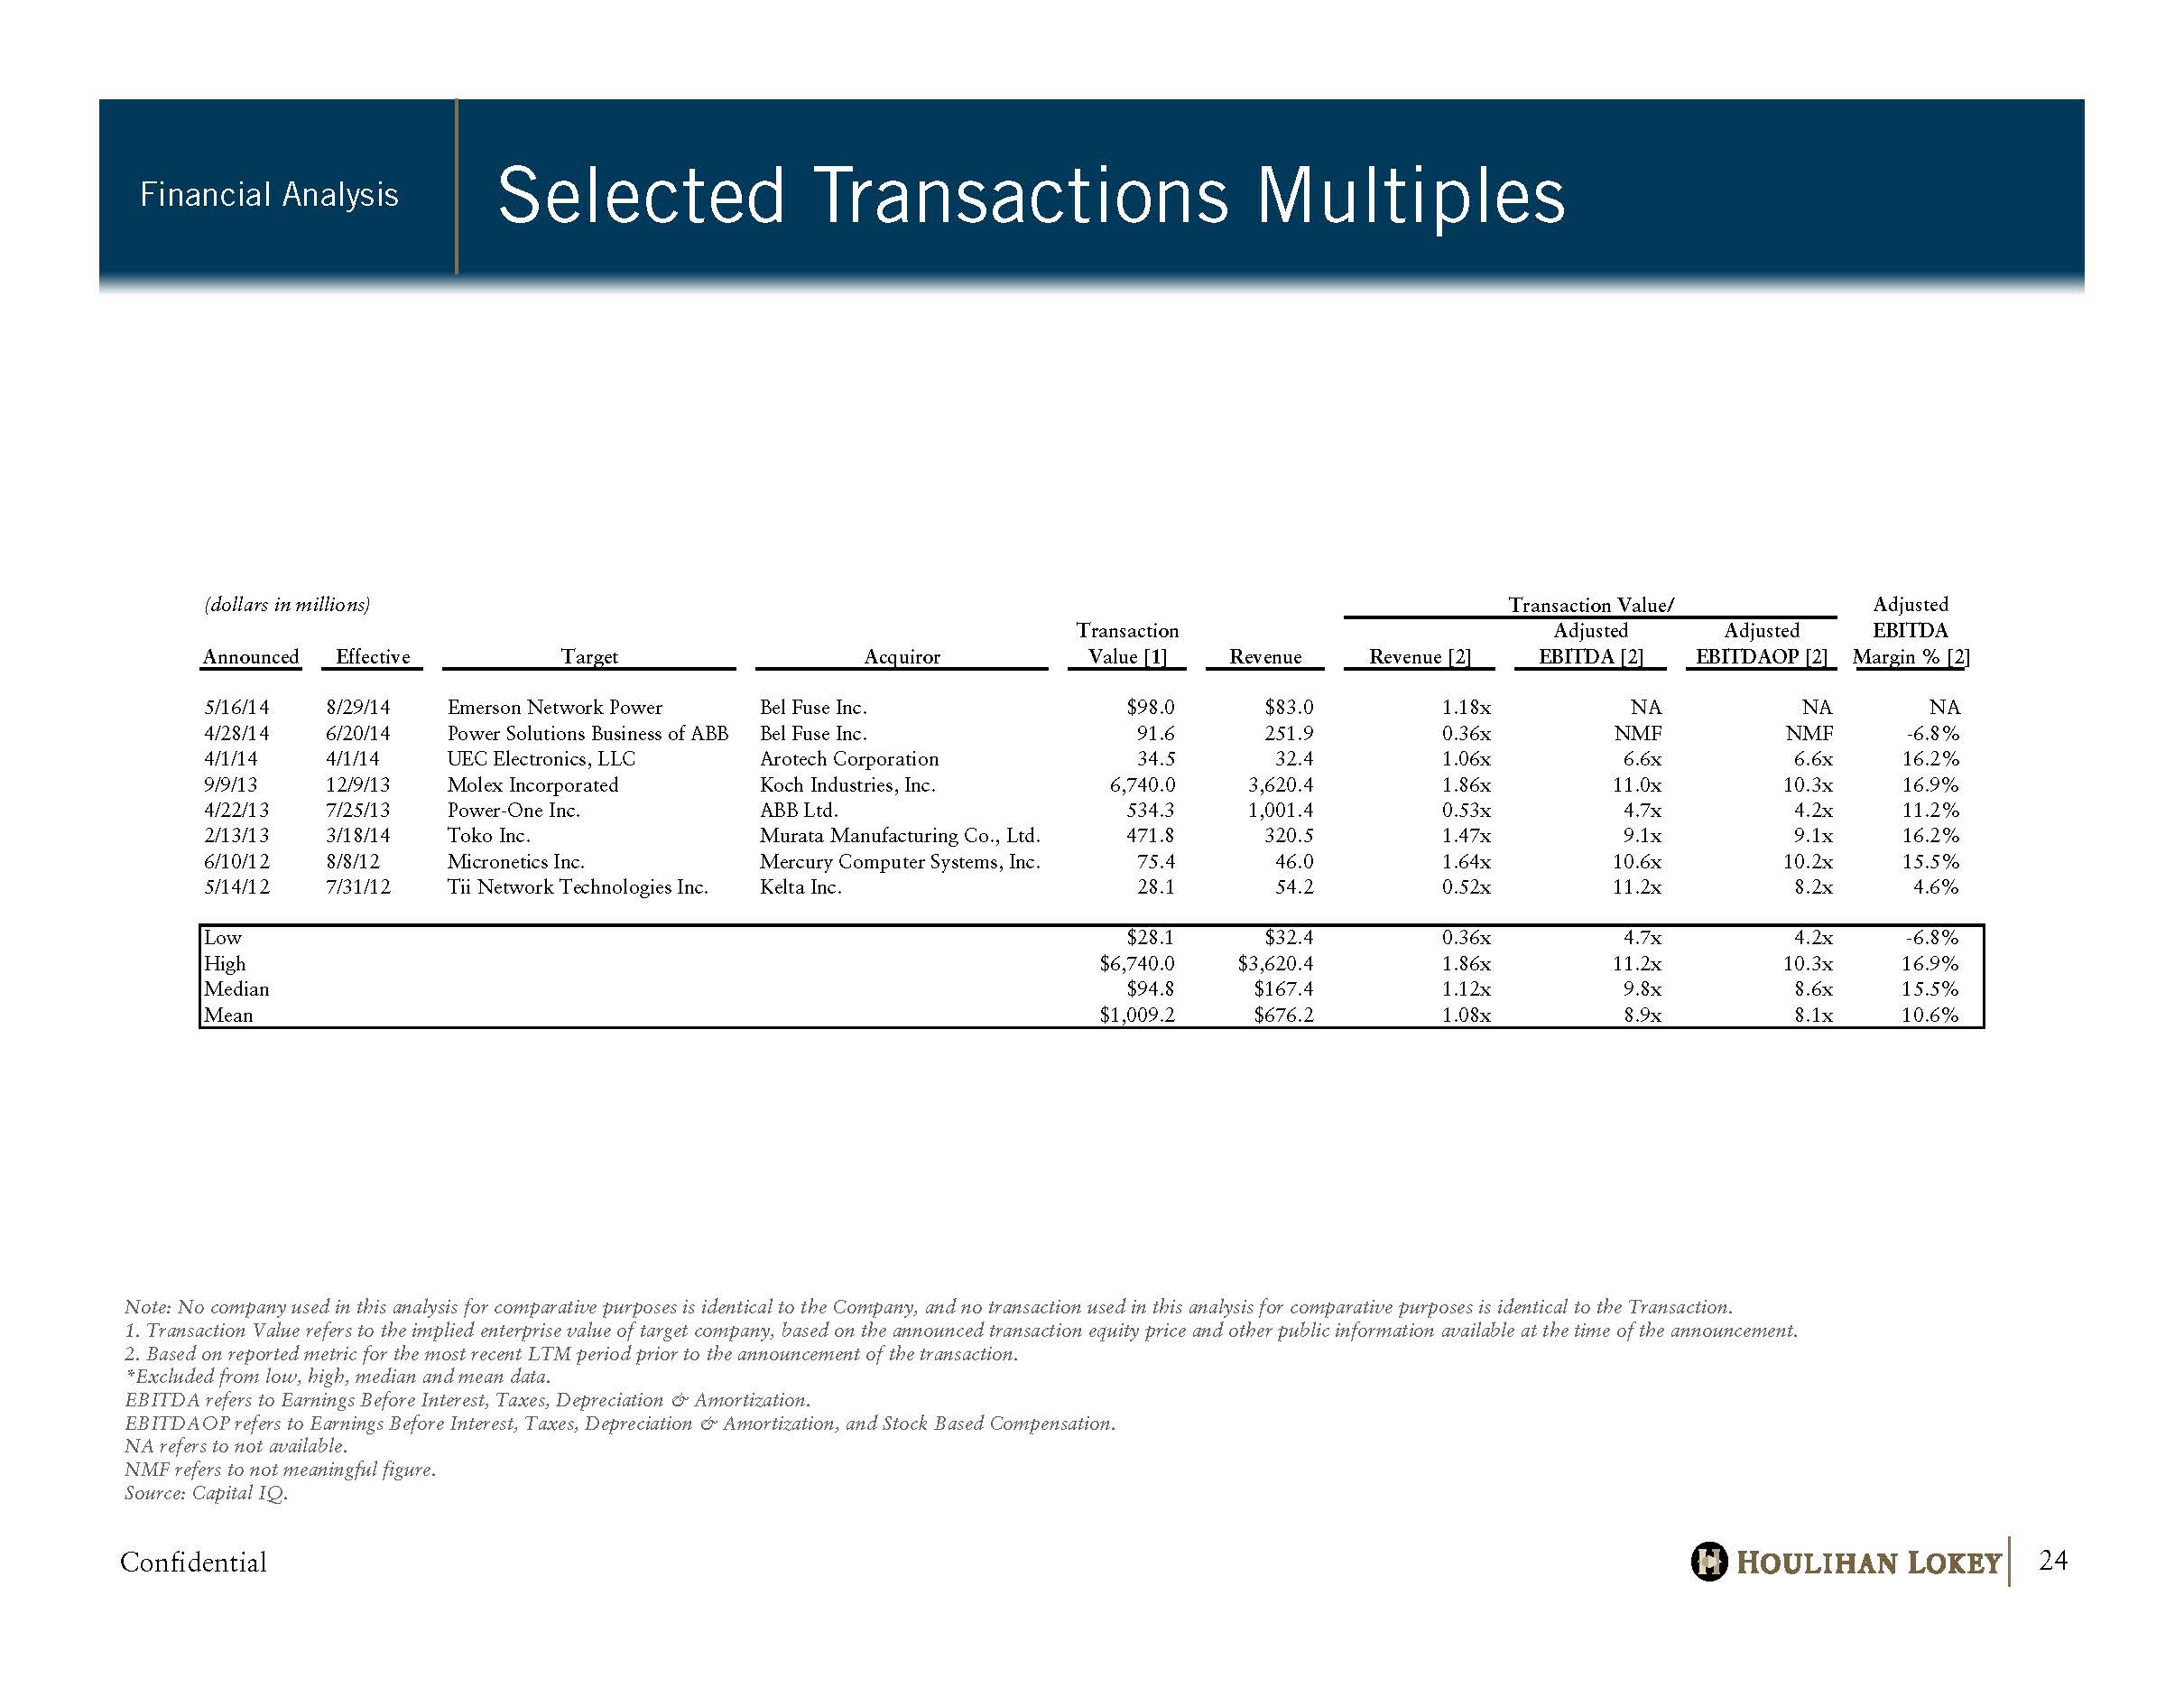
Confidential Selected Transactions Multiples Financial Analysis 24 Note: No company used in this analysis for comparative purposes is identical to the Company, and no transaction used in this ana lysis for comparative purposes is identical to the Transaction. 1. Transaction Value refers to the implied enterprise value of target company, based on the announced transaction equity pric e a nd other public information available at the time of the announcement. 2. Based on reported metric for the most recent LTM period prior to the announcement of the transaction. *Excluded from low, high, median and mean data. EBITDA refers to Earnings Before Interest, Taxes, Depreciation & Amortization . EBITDAOP refers to Earnings Before Interest, Taxes, Depreciation & Amortization, and Stock Based Compensation. NA refers to not available. NMF refers to not meaningful figure. Source: Capital IQ. (dollars in millions) Transaction Value/ Adjusted Transaction Adjusted Adjusted EBITDA Announced Effective Target Acquiror Value [1] Revenue Revenue [2] EBITDA [2] EBITDAOP [2] Margin % [2] 5/16/14 8/29/14 Emerson Network Power Bel Fuse Inc. $98.0 # $83.0 # 1.18x # NA NA NA NA NA NA 4/28/14 6/20/14 Power Solutions Business of ABB Bel Fuse Inc. 91.6 # 251.9 # 0.36x # NMF NMF NMF NMF -6.8% # 4/1/14 4/1/14 UEC Electronics, LLC Arotech Corporation 34.5 # 32.4 # 1.06x # 6.6x # 6.6x # 16.2% 0 9/9/13 12/9/13 Molex Incorporated Koch Industries, Inc. 6,740.0 # 3,620.4 # 1.86x # 11.0x # 10.3x # 16.9% 0 4/22/13 7/25/13 Power-One Inc. ABB Ltd. 534.3 # 1,001.4 # 0.53x # 4.7x # 4.2x # 11.2% 0 2/13/13 3/18/14 Toko Inc. Murata Manufacturing Co., Ltd. 471.8 # 320.5 # 1.47x # 9.1x # 9.1x # 16.2% 0 6/10/12 8/8/12 Micronetics Inc. Mercury Computer Systems, Inc. 75.4 # 46.0 # 1.64x # 10.6x # 10.2x # 15.5% 0 5/14/12 7/31/12 Tii Network Technologies Inc. Kelta Inc. 28.1 # 54.2 # 0.52x # 11.2x # 8.2x # 4.6% 0 Low $28.1 $32.4 0.36x 4.7x 4.2x -6.8% High $6,740.0 $3,620.4 1.86x 11.2x 10.3x 16.9% Median $94.8 $167.4 1.12x 9.8x 8.6x 15.5% Mean $1,009.2 $676.2 1.08x 8.9x 8.1x 10.6%

Confidential Appendix

Confidential Appendix Additional Financial Information
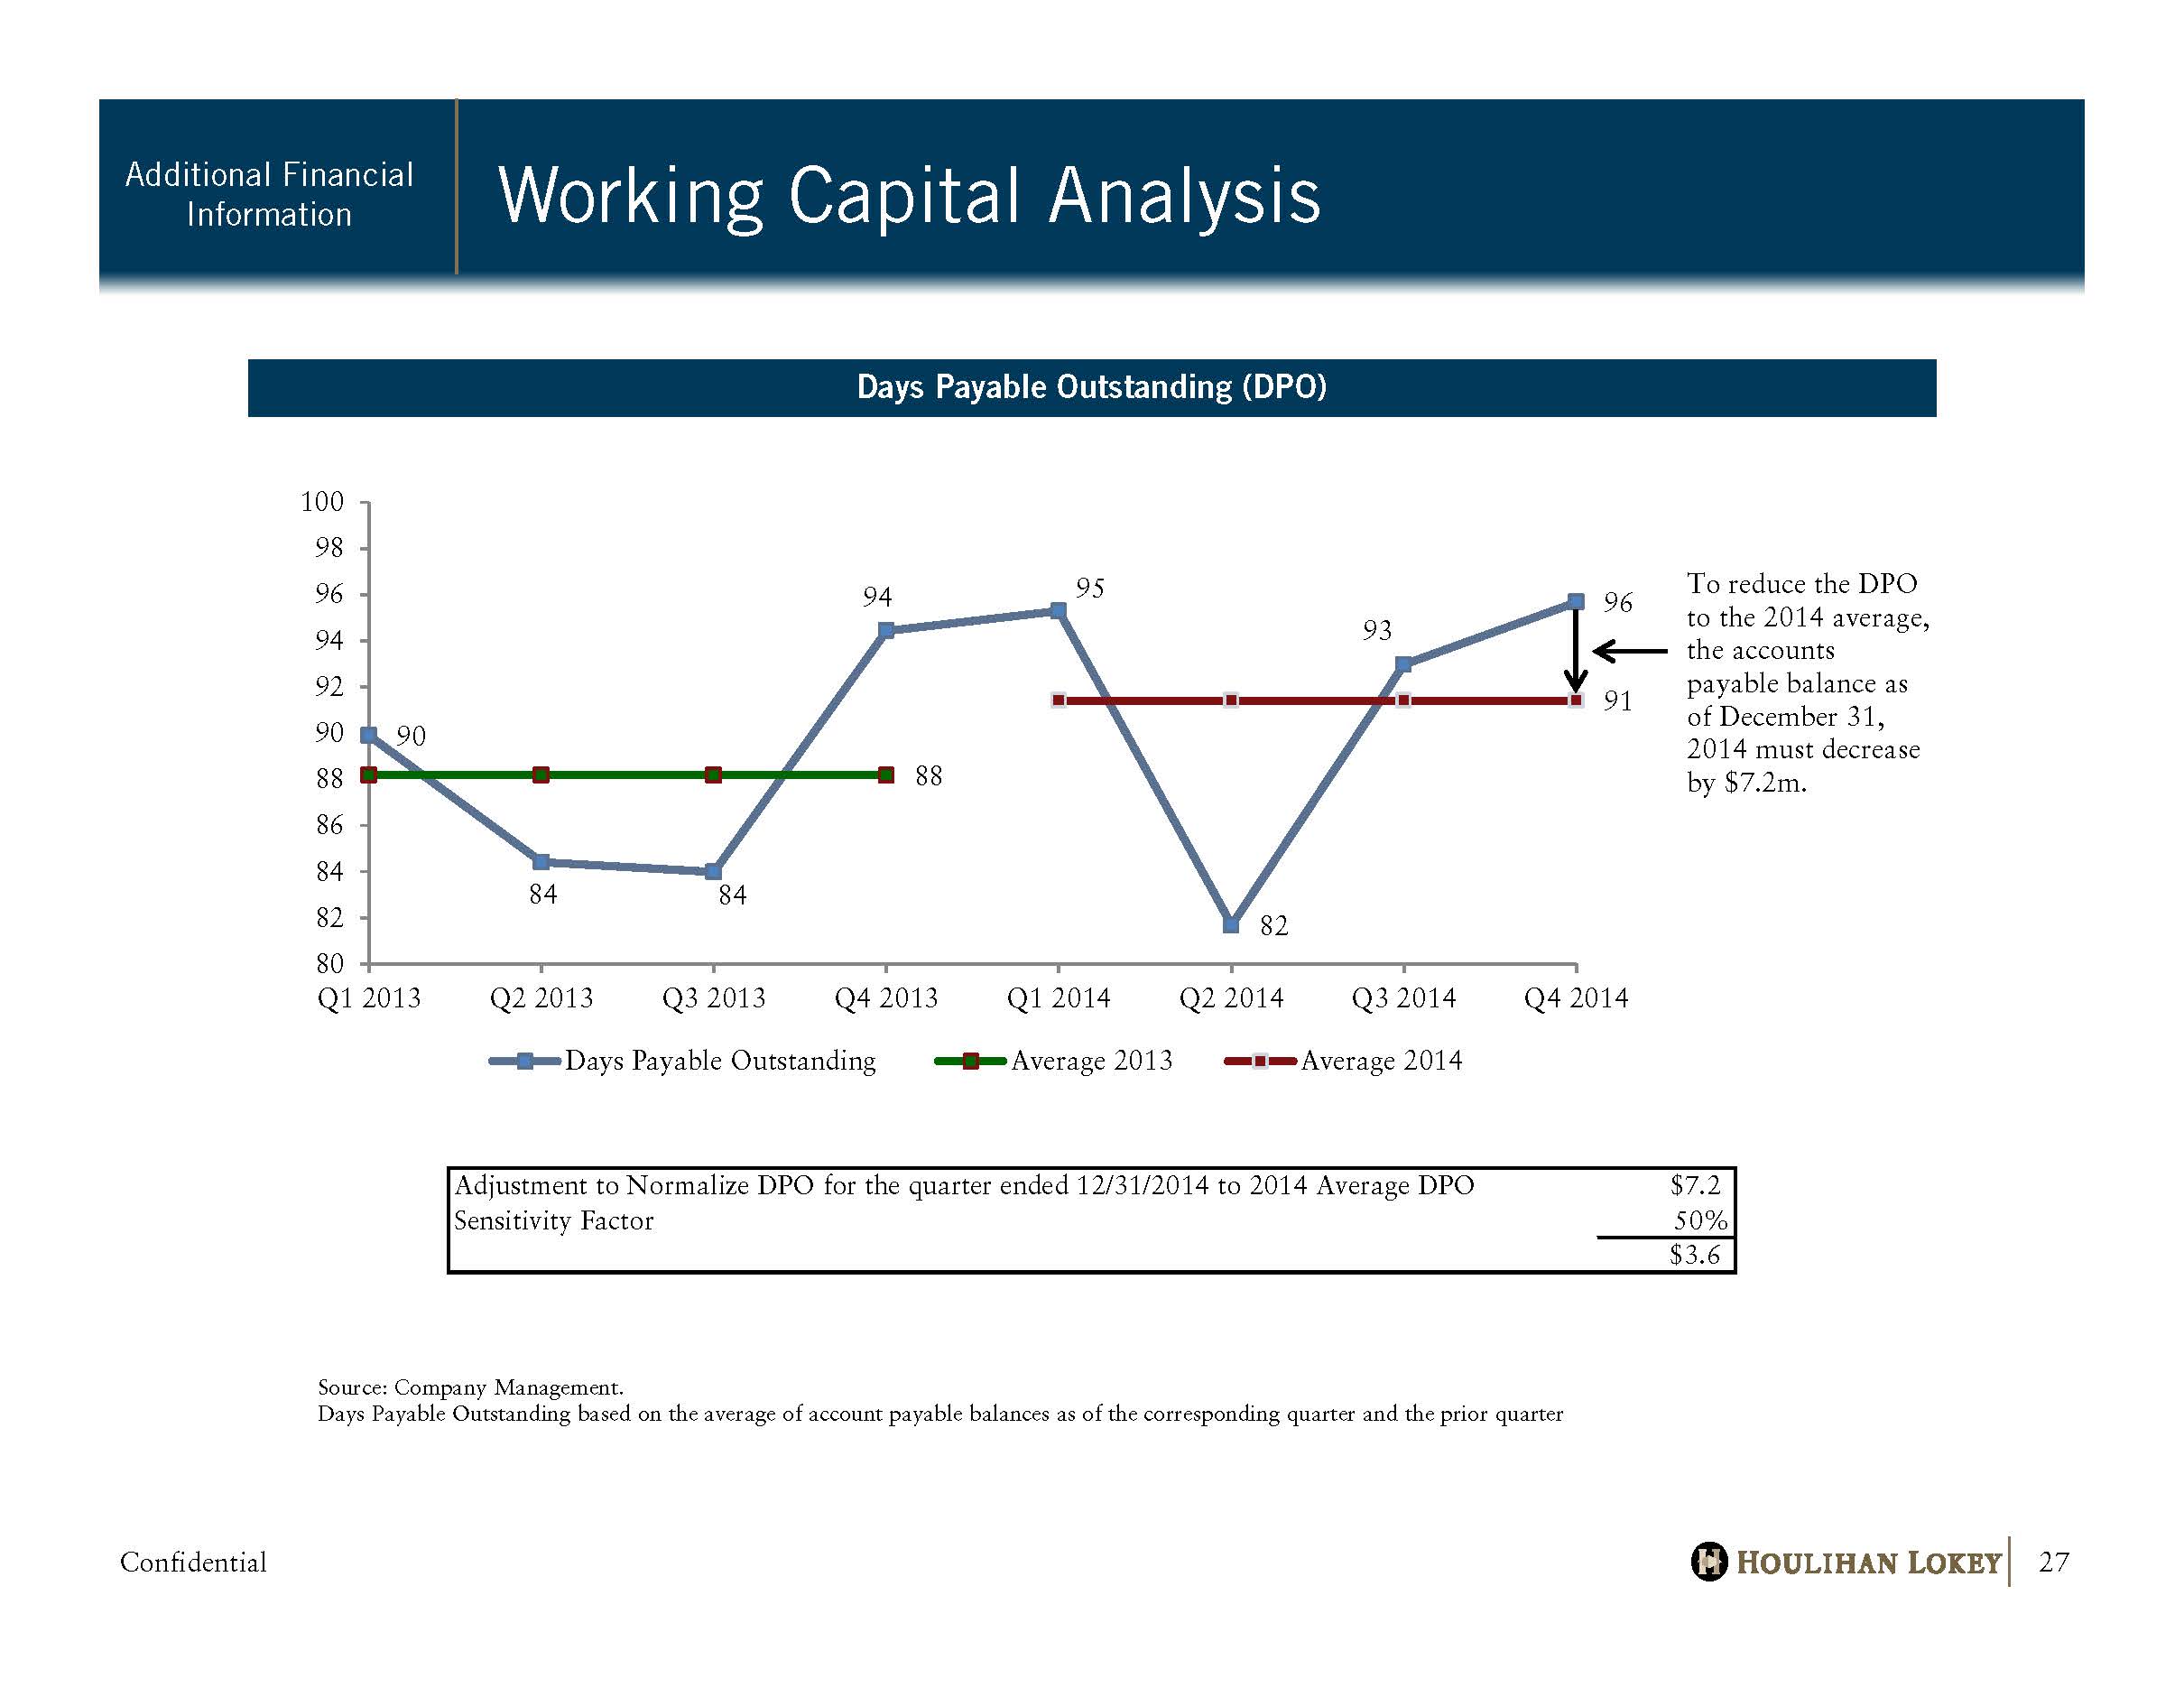
Confidential Working Capital Analysis Additional Financial Information 27 Source: Company Management. Days Payable Outstanding based on the average of account payable balances as of the corresponding quarter and the prior quart er Days Payable Outstanding (DPO) 90 84 84 94 95 82 93 96 88 91 80 82 84 86 88 90 92 94 96 98 100 Q1 2013 Q2 2013 Q3 2013 Q4 2013 Q1 2014 Q2 2014 Q3 2014 Q4 2014 Days Payable Outstanding Average 2013 Average 2014 To reduce the DPO to the 2014 average, the accounts payable balance as of December 31, 2014 must decrease by $7.2m. Adjustment to Normalize DPO for the quarter ended 12/31/2014 to 2014 Average DPO $7.2 Sensitivity Factor 50% $3.6
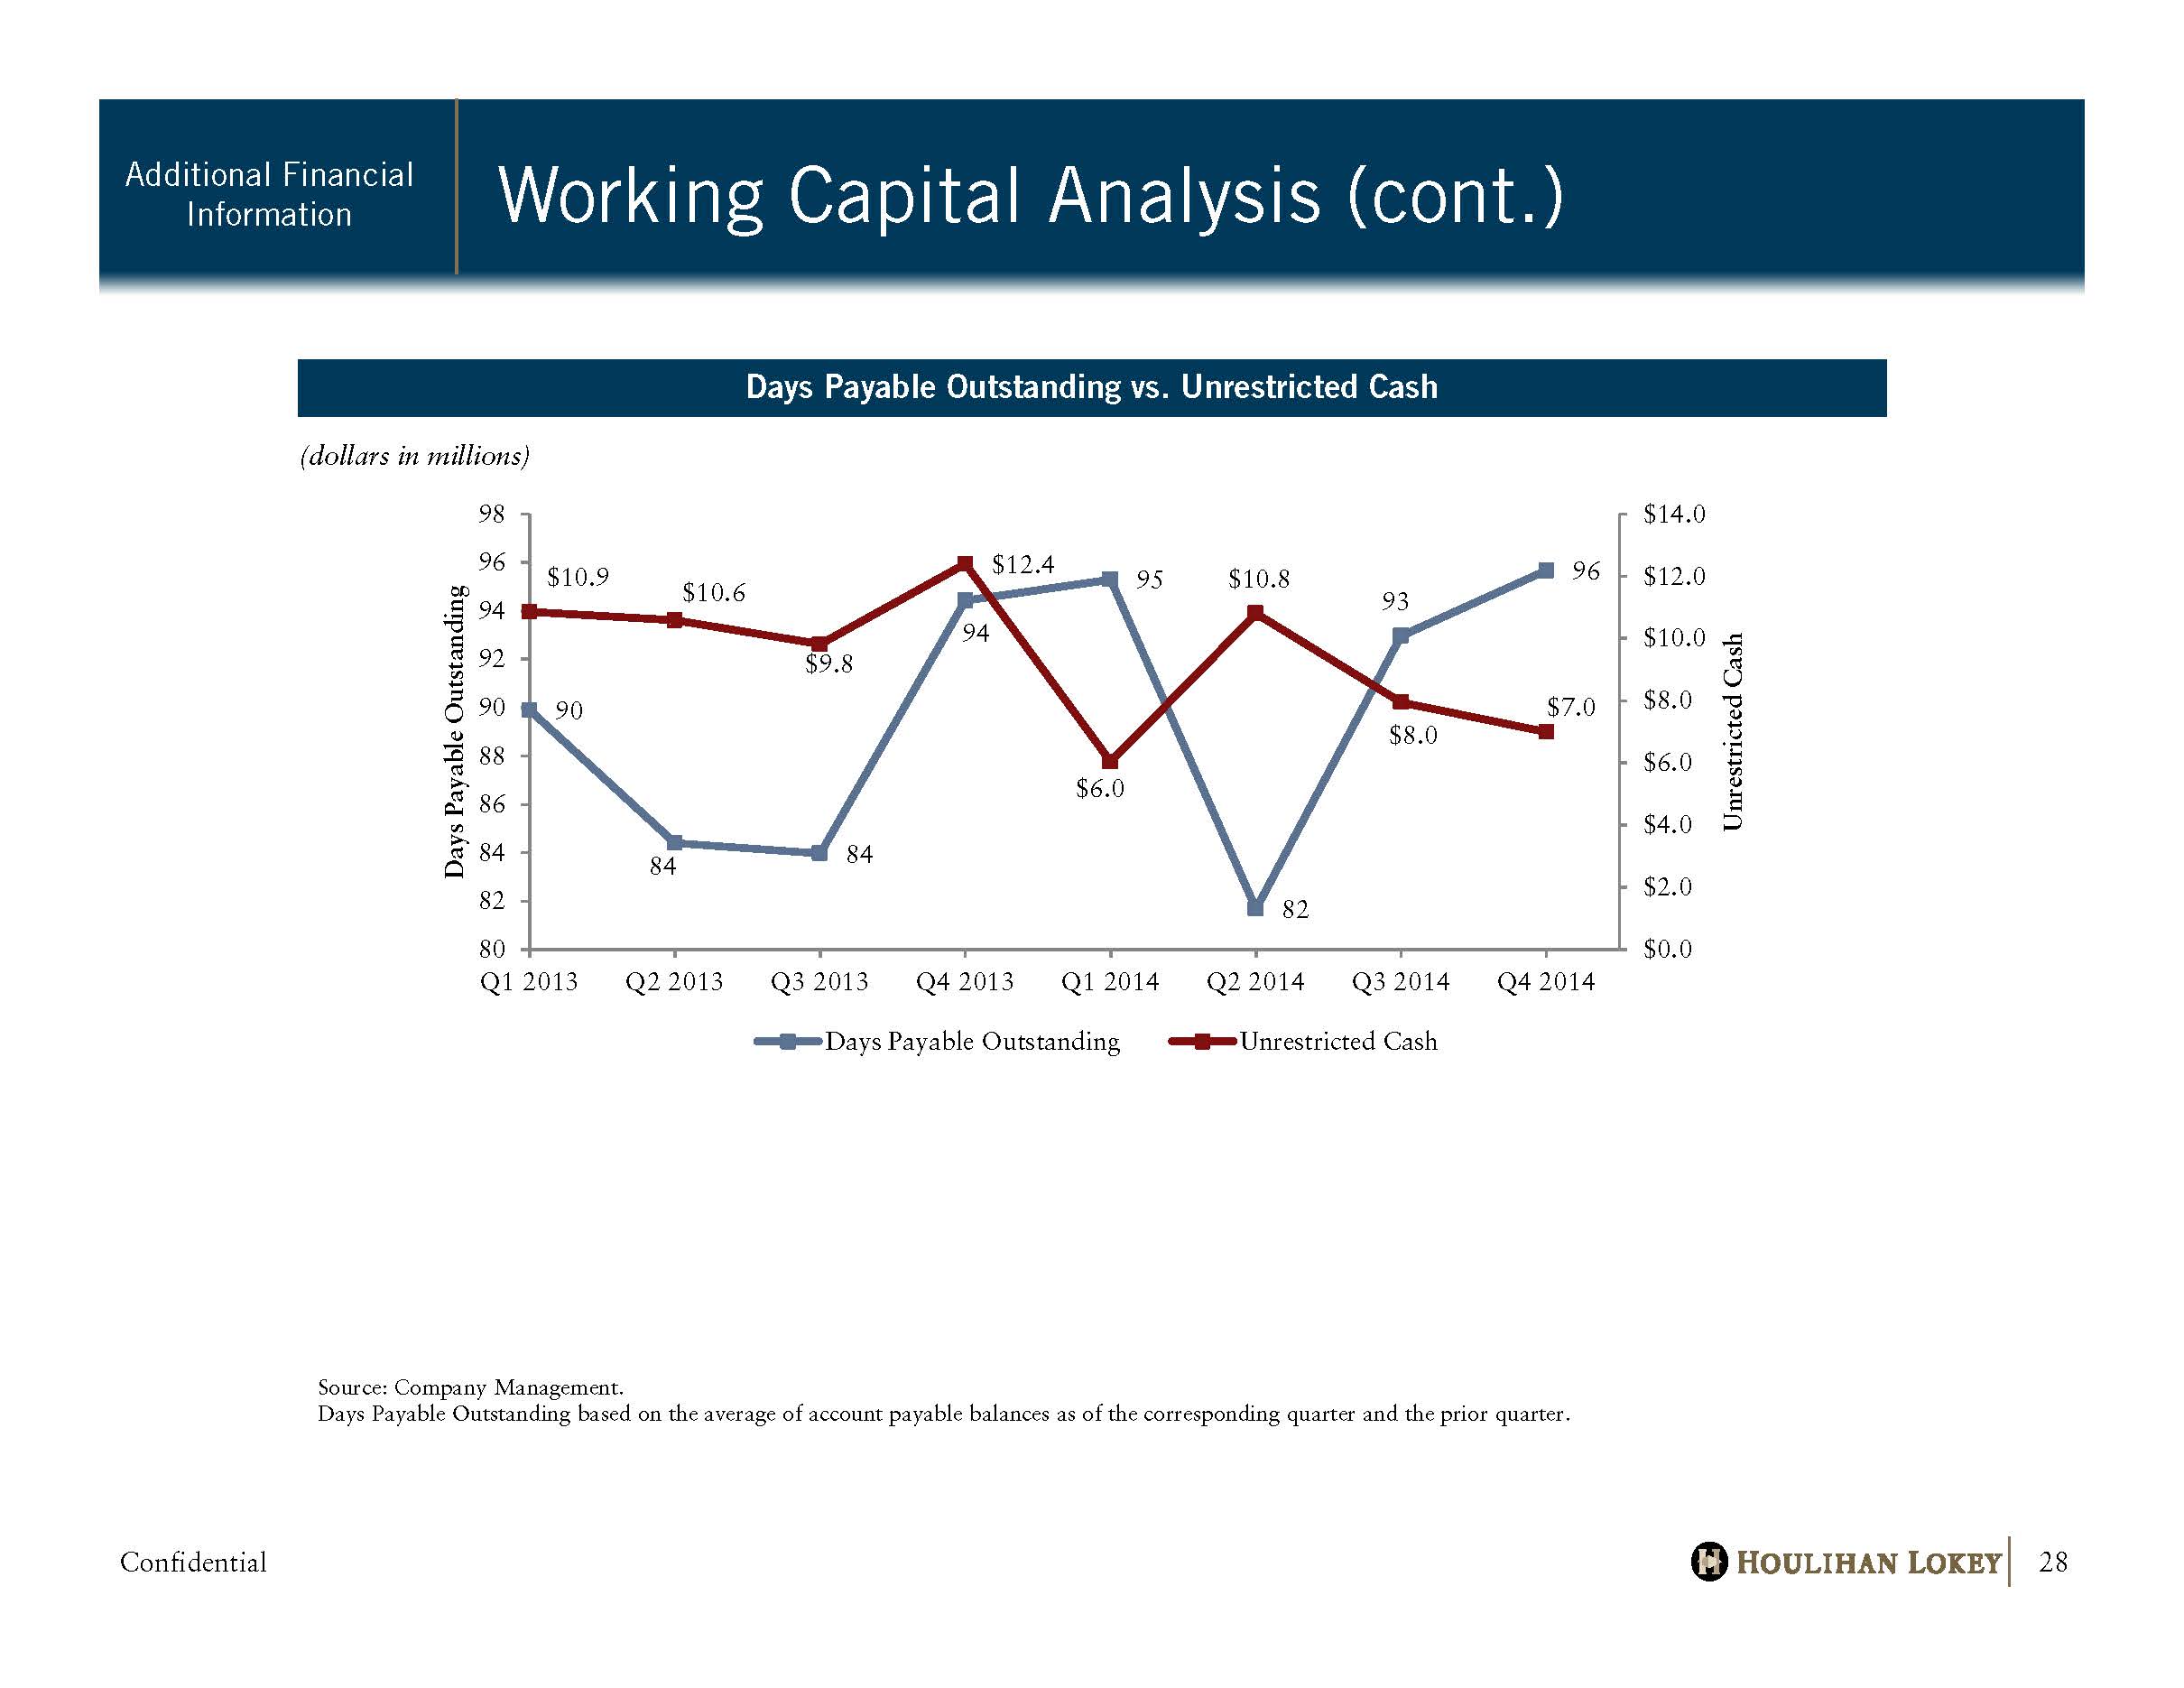
Confidential Working Capital Analysis (cont.) Additional Financial Information 28 Source: Company Management. Days Payable Outstanding based on the average of account payable balances as of the corresponding quarter and the prior quart er. Days Payable Outstanding vs. Unrestricted Cash 90 84 84 94 95 82 93 96 $10.9 $10.6 $9.8 $12.4 $6.0 $10.8 $8.0 $7.0 $0.0 $2.0 $4.0 $6.0 $8.0 $10.0 $12.0 $14.0 80 82 84 86 88 90 92 94 96 98 Q1 2013 Q2 2013 Q3 2013 Q4 2013 Q1 2014 Q2 2014 Q3 2014 Q4 2014 Unrestricted Cash Days Payable Outstanding Days Payable Outstanding Unrestricted Cash (dollars in millions)
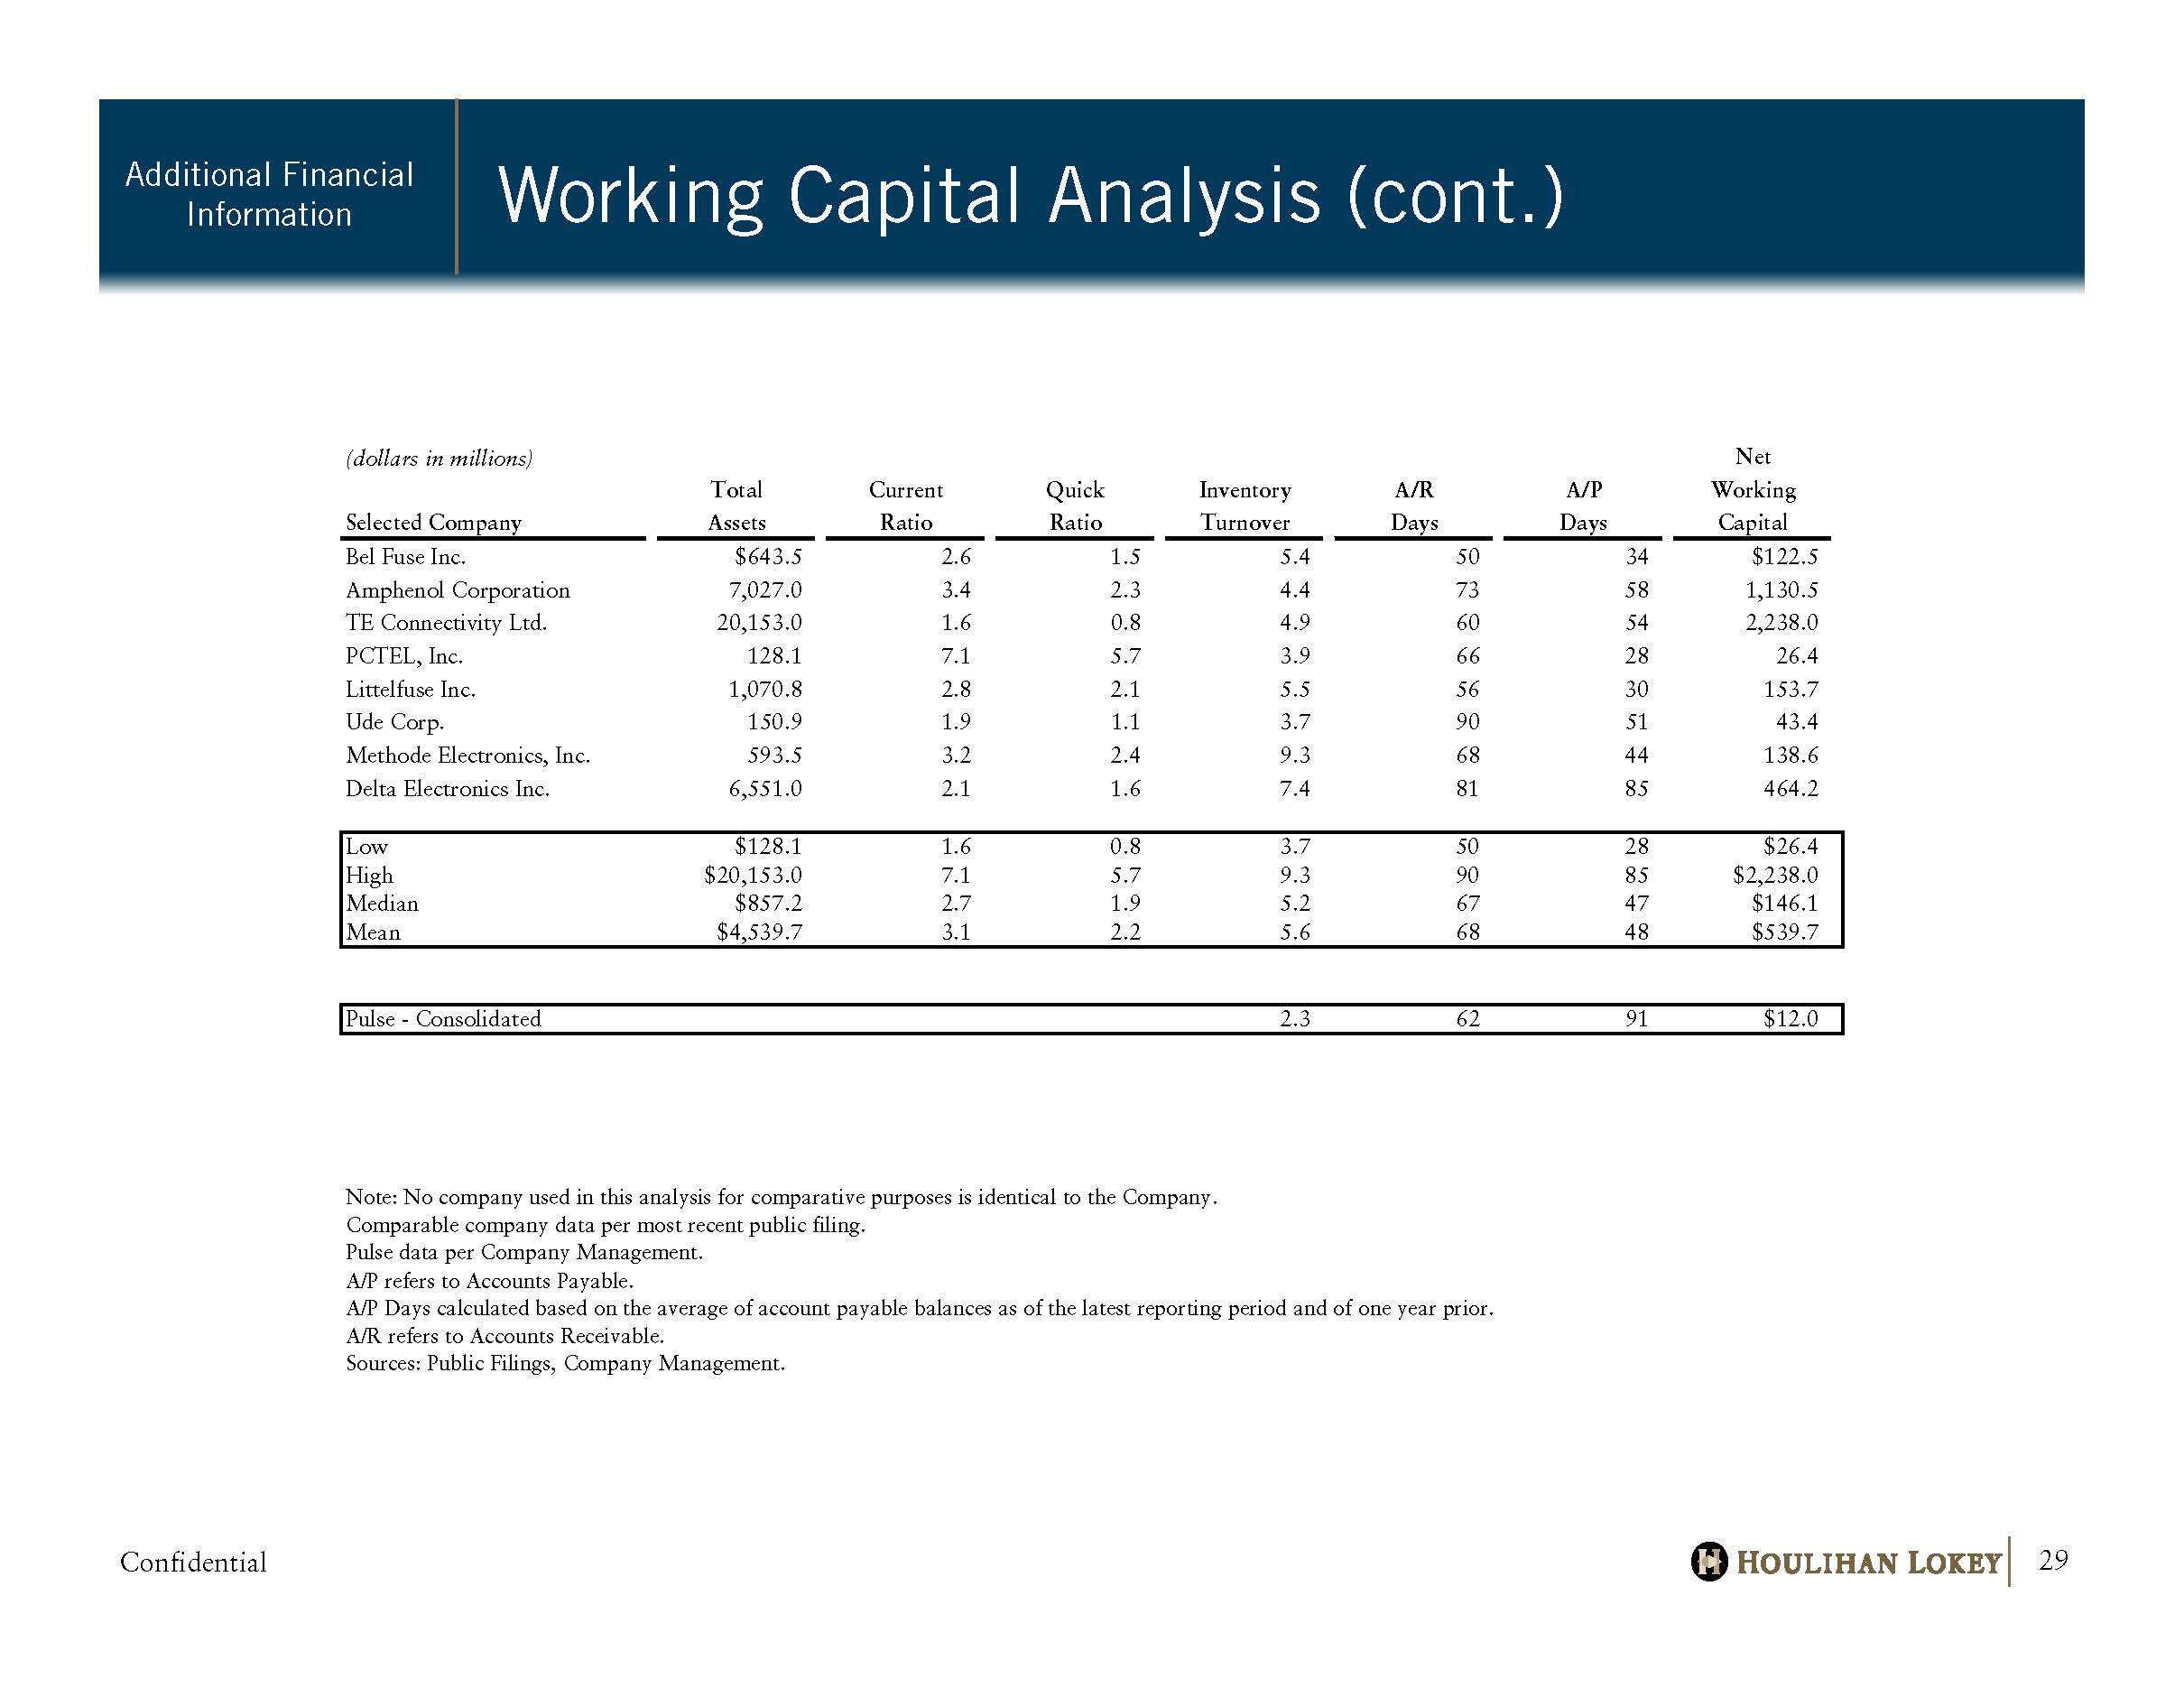
Confidential Working Capital Analysis (cont.) Additional Financial Information 29 (dollars in millions) Net Total Current Quick Inventory A/R A/P Working Selected Company Assets Ratio Ratio Turnover Days Days Capital Bel Fuse Inc. $643.5 2.6 1.5 5.4 50 34 $122.5 Amphenol Corporation 7,027.0 3.4 2.3 4.4 73 58 1,130.5 TE Connectivity Ltd. 20,153.0 1.6 0.8 4.9 60 54 2,238.0 PCTEL, Inc. 128.1 7.1 5.7 3.9 66 28 26.4 Littelfuse Inc. 1,070.8 2.8 2.1 5.5 56 30 153.7 Ude Corp. 150.9 1.9 1.1 3.7 90 51 43.4 Methode Electronics, Inc. 593.5 3.2 2.4 9.3 68 44 138.6 Delta Electronics Inc. 6,551.0 2.1 1.6 7.4 81 85 464.2 Low $128.1 1.6 0.8 3.7 50 28 $26.4 High $20,153.0 7.1 5.7 9.3 90 85 $2,238.0 Median $857.2 2.7 1.9 5.2 67 47 $146.1 Mean $4,539.7 3.1 2.2 5.6 68 48 $539.7 Pulse - Consolidated $168.3 1.3 0.8 2.3 62 91 $12.0 Note: No company used in this analysis for comparative purposes is identical to the Company. Comparable company data per most recent public filing. Pulse data per Company Management. A/P refers to Accounts Payable. A/P Days calculated based on the average of account payable balances as of the latest reporting period and of one year prior. A/R refers to Accounts Receivable. Sources: Public Filings, Company Management.
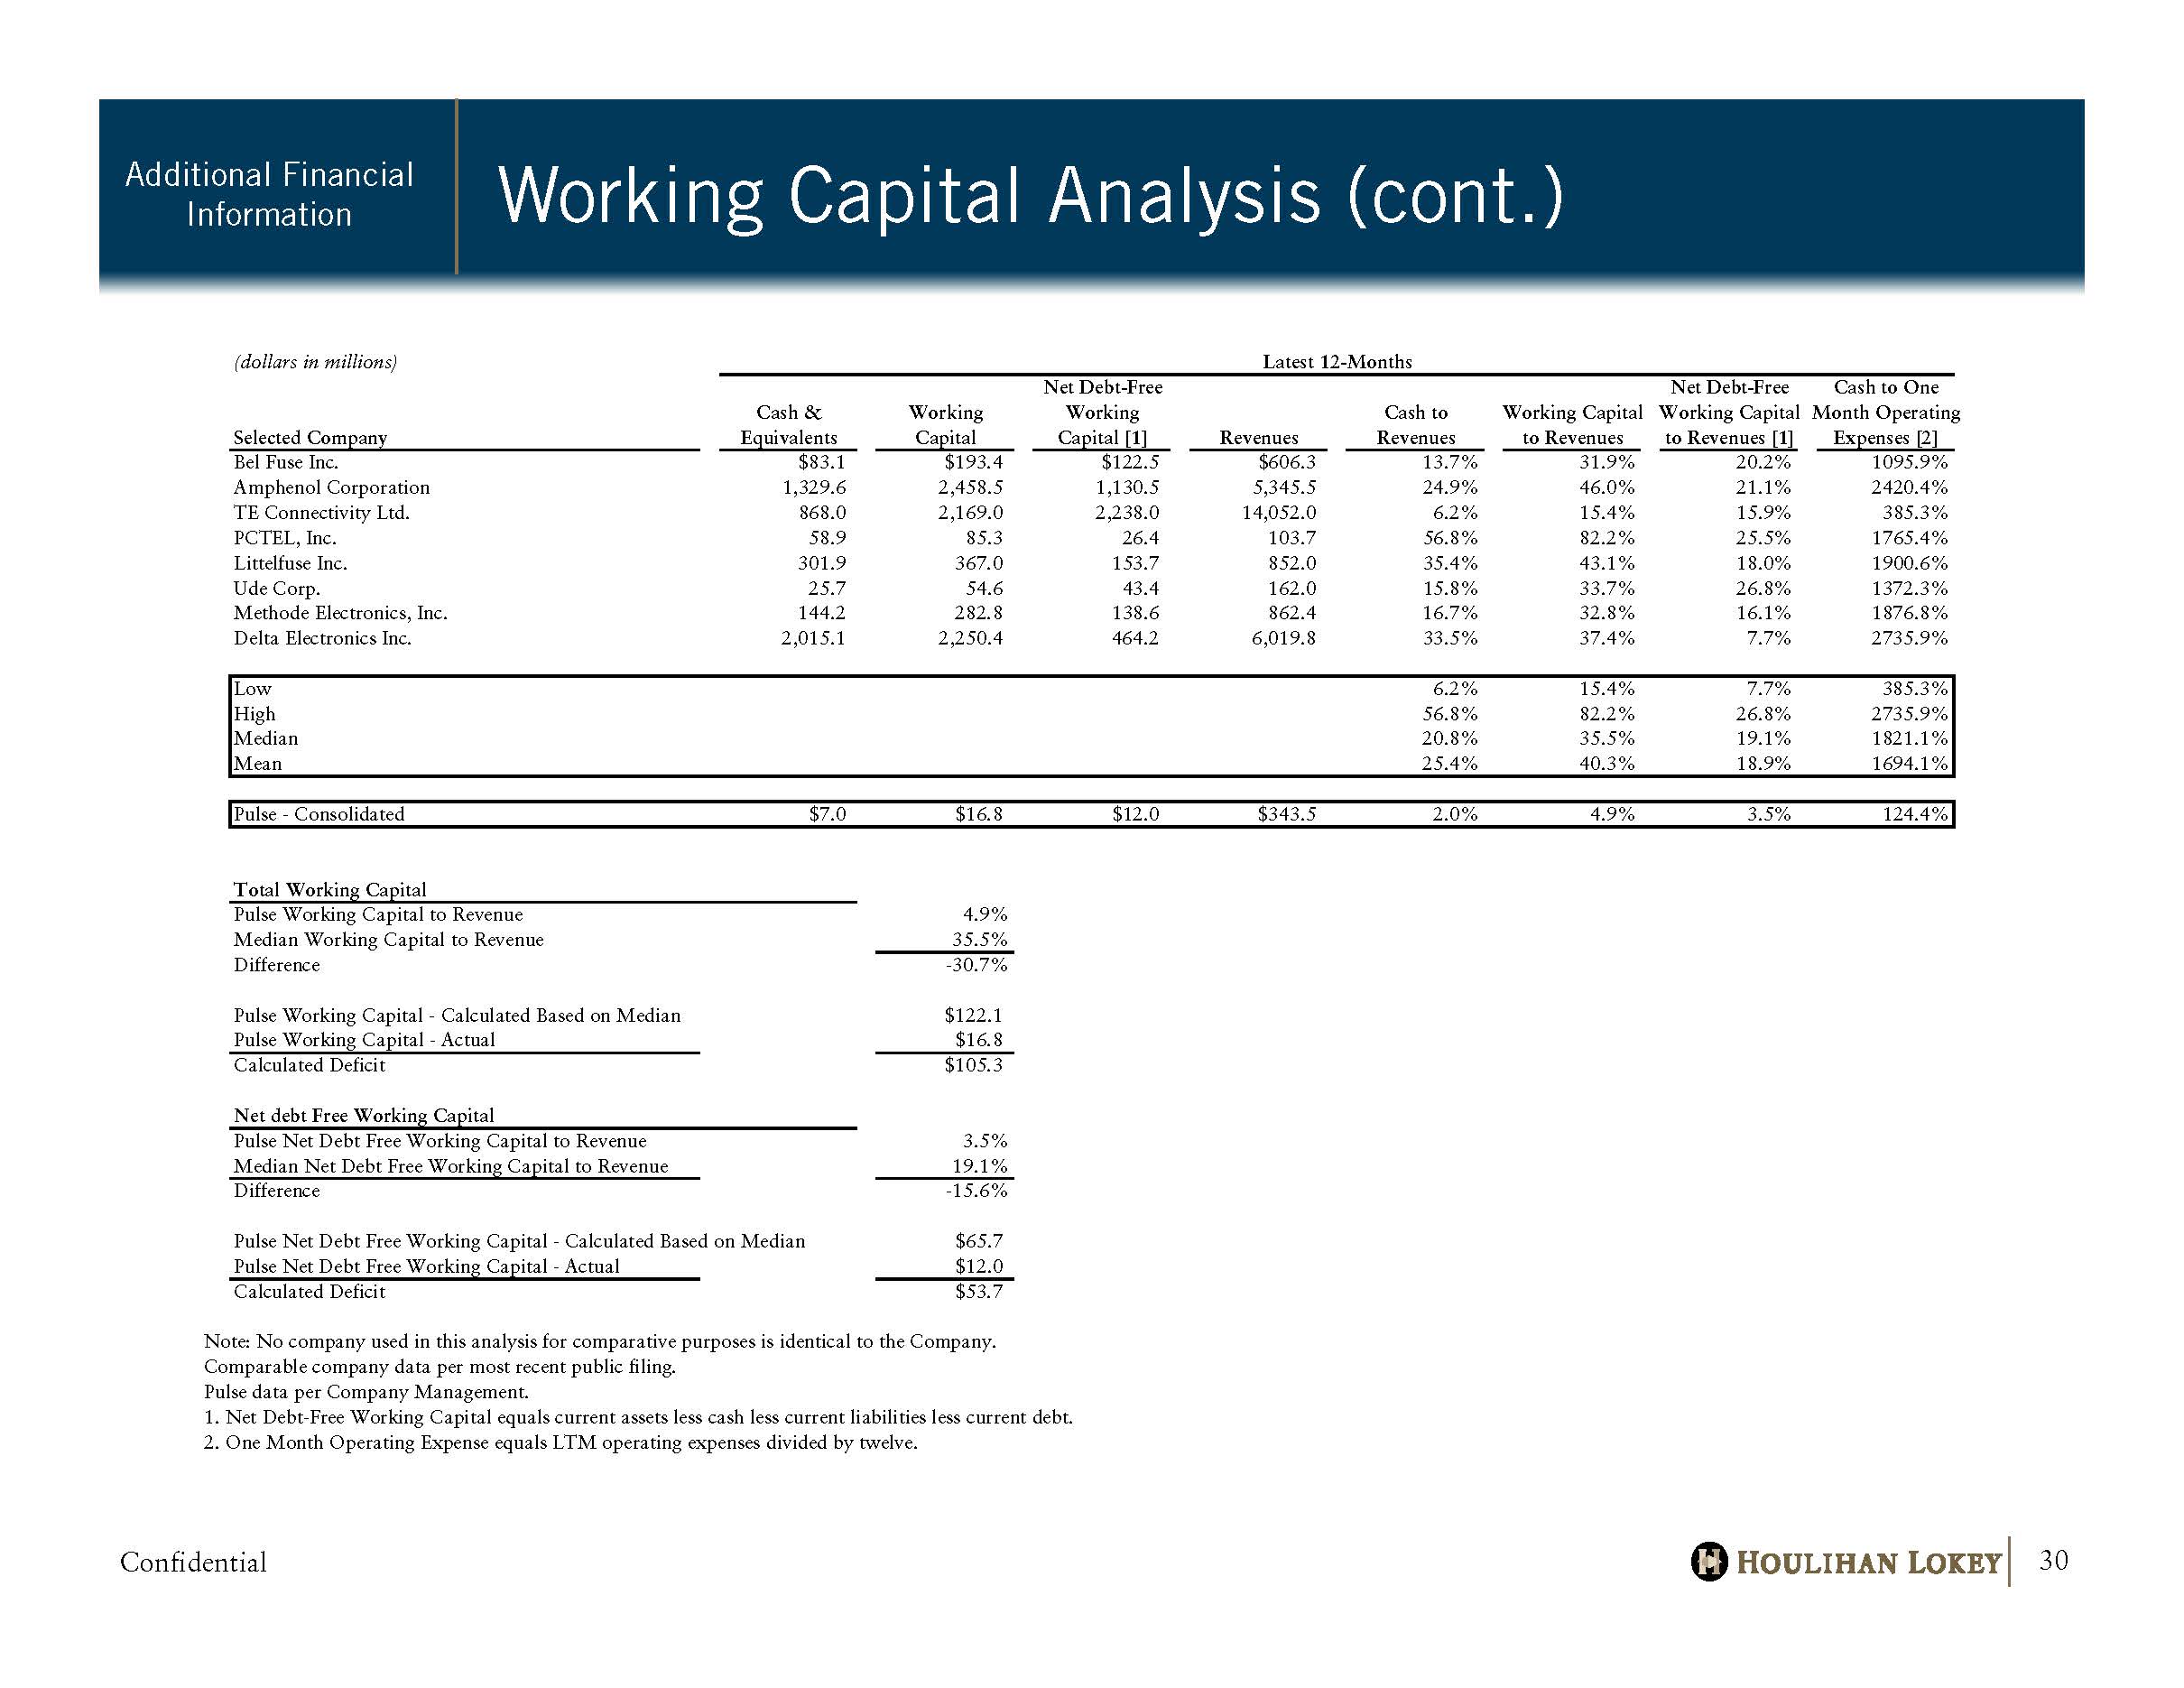
Confidential Working Capital Analysis (cont.) Additional Financial Information 30 (dollars in millions) Latest 12-Months Net Debt-Free Net Debt-Free Cash to One Cash & Working Working Cash to Working Capital Working Capital Month Operating Selected Company Equivalents Capital Capital [1] Revenues Revenues to Revenues to Revenues [1] Expenses [2] Bel Fuse Inc. $83.1 $193.4 $122.5 $606.3 13.7% # 31.9% # 20.2% # 1095.9% 11 Amphenol Corporation 1,329.6 2,458.5 1,130.5 5,345.5 24.9% # 46.0% # 21.1% # 2420.4% 24 TE Connectivity Ltd. 868.0 2,169.0 2,238.0 14,052.0 6.2% # 15.4% # 15.9% # 385.3% 4 PCTEL, Inc. 58.9 85.3 26.4 103.7 56.8% # 82.2% # 25.5% # 1765.4% 18 Littelfuse Inc. 301.9 367.0 153.7 852.0 35.4% # 43.1% # 18.0% # 1900.6% 19 Ude Corp. 25.7 54.6 43.4 162.0 15.8% # 33.7% # 26.8% # 1372.3% 14 Methode Electronics, Inc. 144.2 282.8 138.6 862.4 16.7% # 32.8% # 16.1% # 1876.8% 19 Delta Electronics Inc. 2,015.1 2,250.4 464.2 6,019.8 33.5% # 37.4% # 7.7% # 2735.9% 27 Low 6.2% 15.4% 7.7% 385.3% High 56.8% 82.2% 26.8% 2735.9% Median 20.8% 35.5% 19.1% 1821.1% Mean 25.4% 40.3% 18.9% 1694.1% Pulse - Consolidated $7.0 $16.8 $12.0 $343.5 2.0% 4.9% 3.5% 124.4% Total Working Capital Pulse Working Capital to Revenue 4.9% Median Working Capital to Revenue 35.5% Difference -30.7% Pulse Working Capital - Calculated Based on Median $122.1 Pulse Working Capital - Actual $16.8 Calculated Deficit $105.3 Net debt Free Working Capital Pulse Net Debt Free Working Capital to Revenue 3.5% Median Net Debt Free Working Capital to Revenue 19.1% Difference -15.6% Pulse Net Debt Free Working Capital - Calculated Based on Median $65.7 Pulse Net Debt Free Working Capital - Actual $12.0 Calculated Deficit $53.7 Note: No company used in this analysis for comparative purposes is identical to the Company. Comparable company data per most recent public filing. Pulse data per Company Management. 1. Net Debt-Free Working Capital equals current assets less cash less current liabilities less current debt. 2. One Month Operating Expense equals LTM operating expenses divided by twelve.
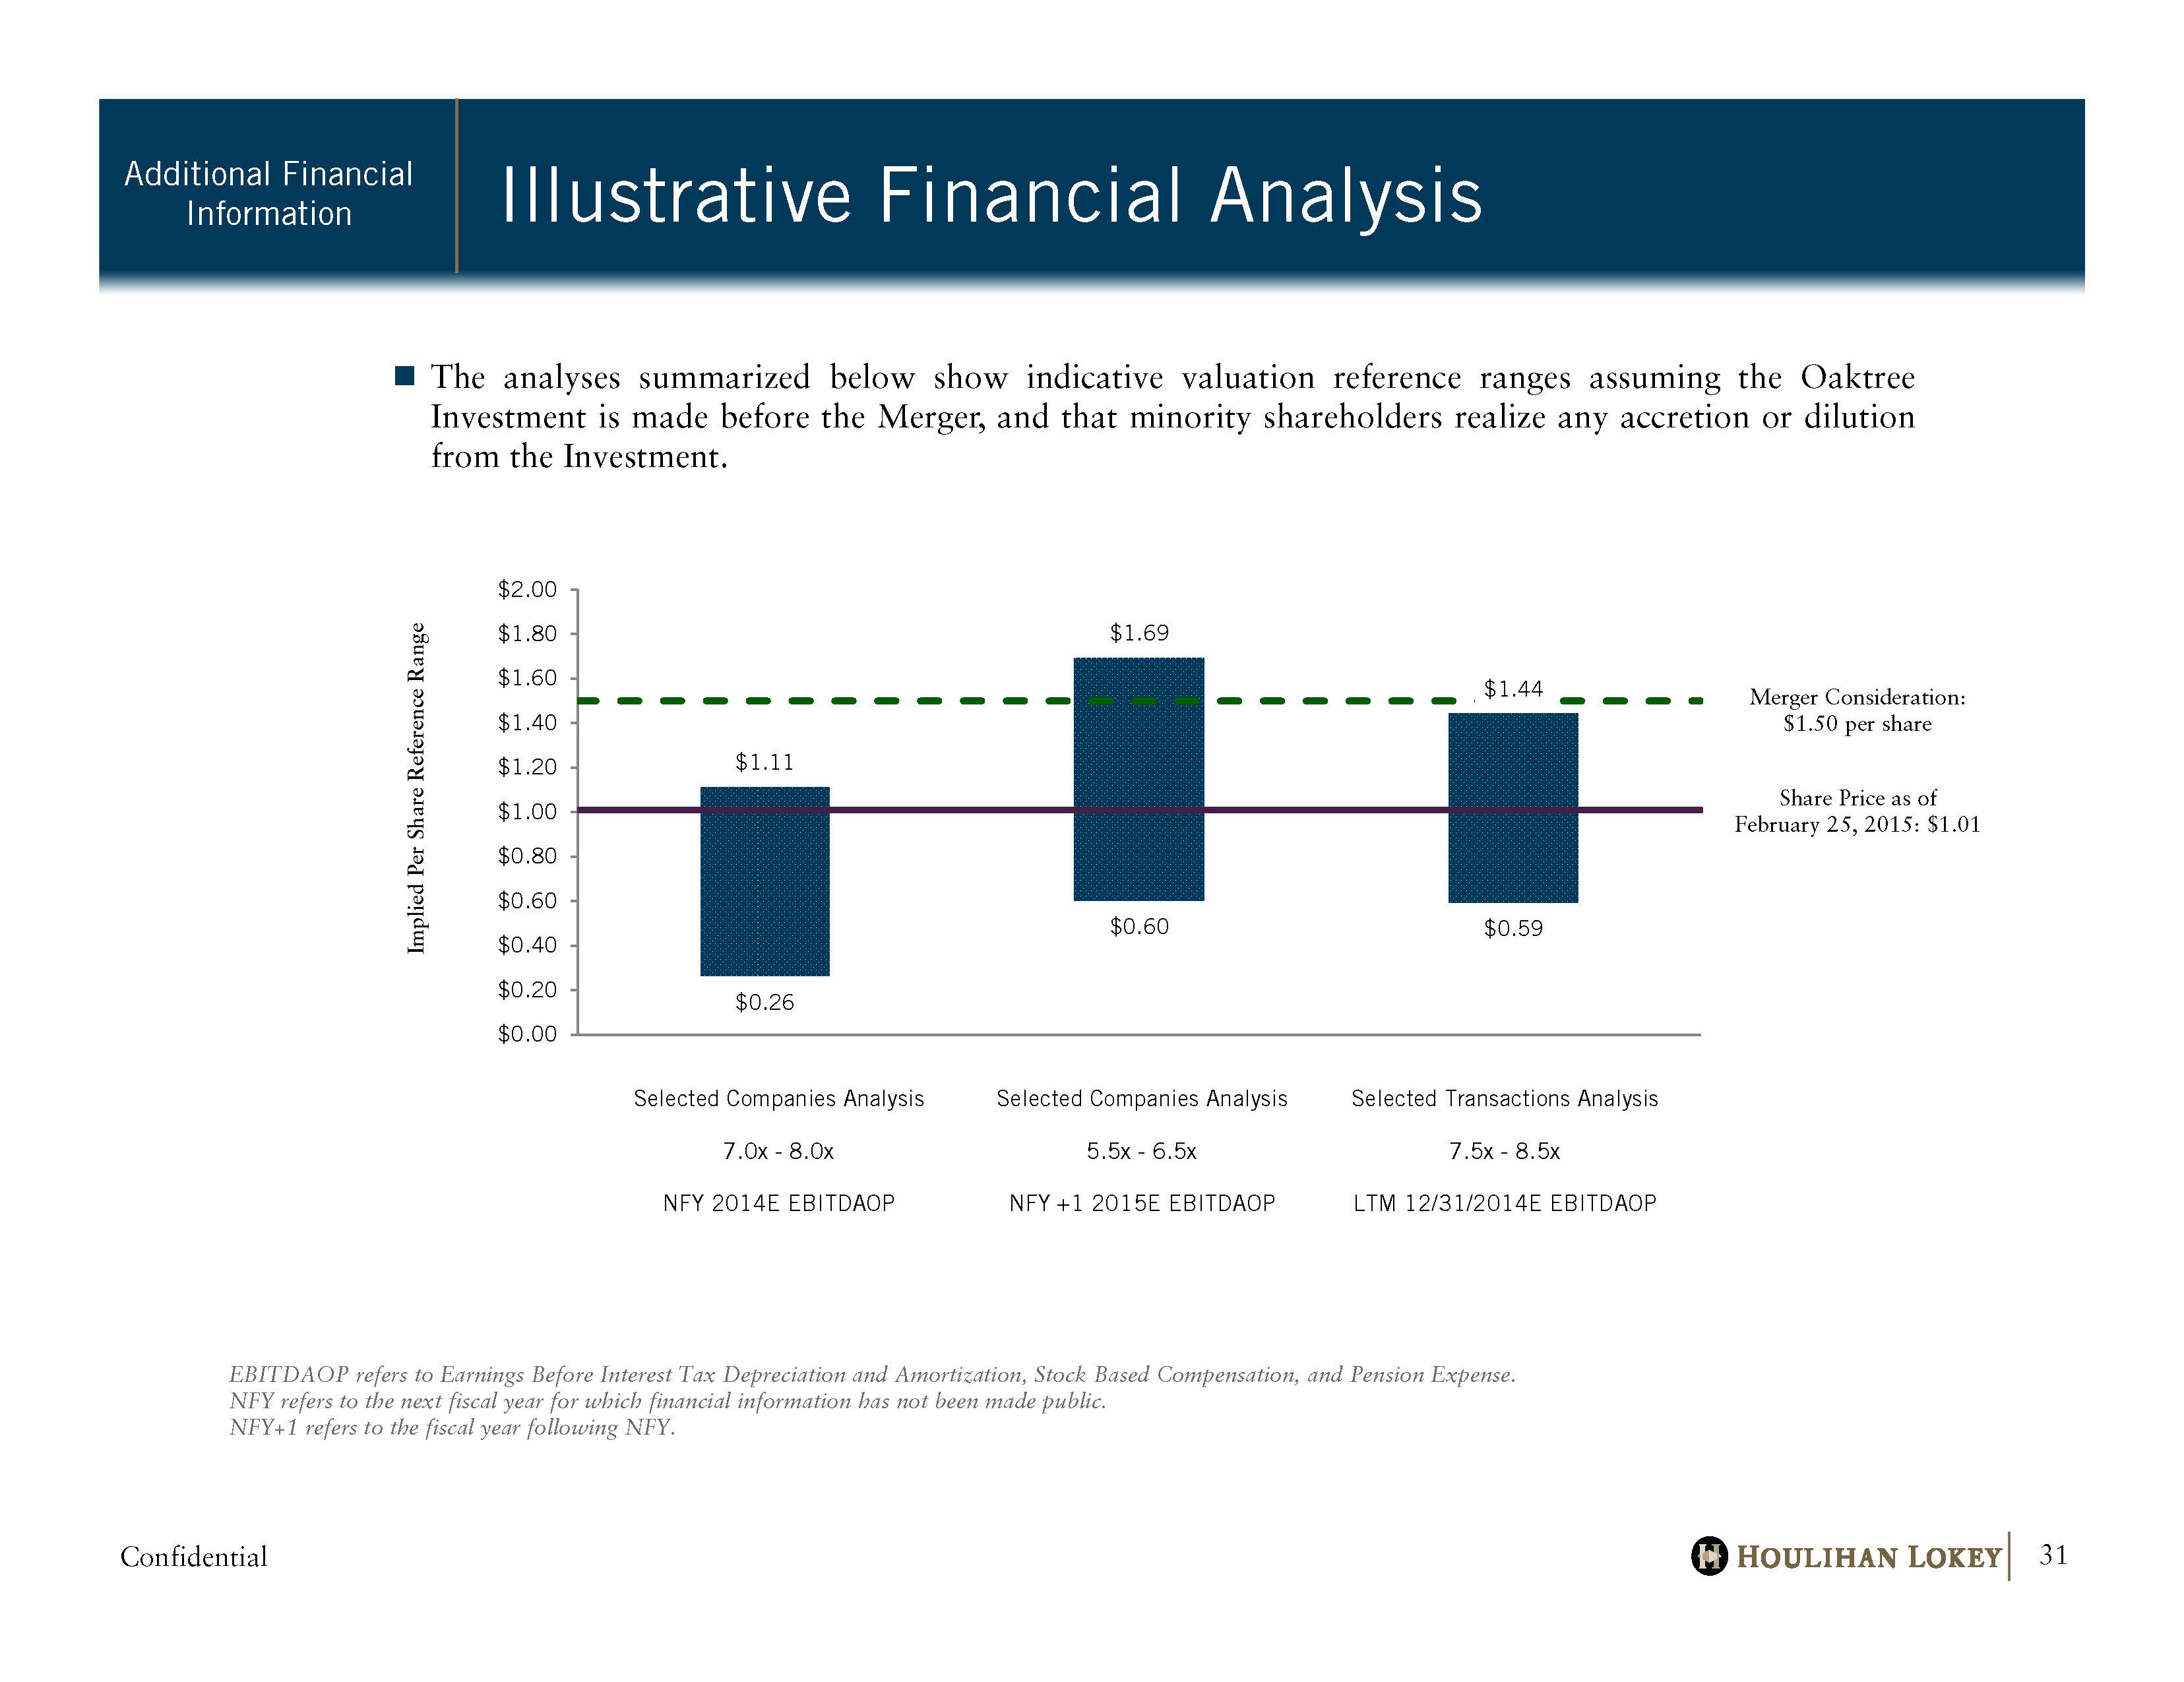
Confidential $0.26 $0.60 $0.59 $1.11 $1.69 $1.44 $0.00 $0.20 $0.40 $0.60 $0.80 $1.00 $1.20 $1.40 $1.60 $1.80 $2.00 $0.00 $0.20 $0.40 $0.60 $0.80 $1.00 $1.20 $1.40 $1.60 $1.80 $2.00 Implied Per Share Reference Range Illustrative Financial Analysis Additional Financial Information 31 The analyses summarized below show indicative valuation reference ranges assuming the Oaktree Investment is made before the Merger, and that minority shareholders realize any accretion or dilution from the Investment . EBITDAOP refers to Earnings Before Interest Tax Depreciation and Amortization, Stock Based Compensation, and Pension Expense. NFY refers to the next fiscal year for which financial information has not been made public. NFY+1 refers to the fiscal year following NFY. Merger Consideration: $ 1.50 per share Share Price as of February 25, 2015: $1.01 Selected Companies Analysis Selected Companies Analysis Selected Transactions Analysis 7.0x - 8.0x 5.5x - 6.5x 7.5x - 8.5x NFY 2014E EBITDAOP NFY +1 2015E EBITDAOP LTM 12/31/2014E EBITDAOP
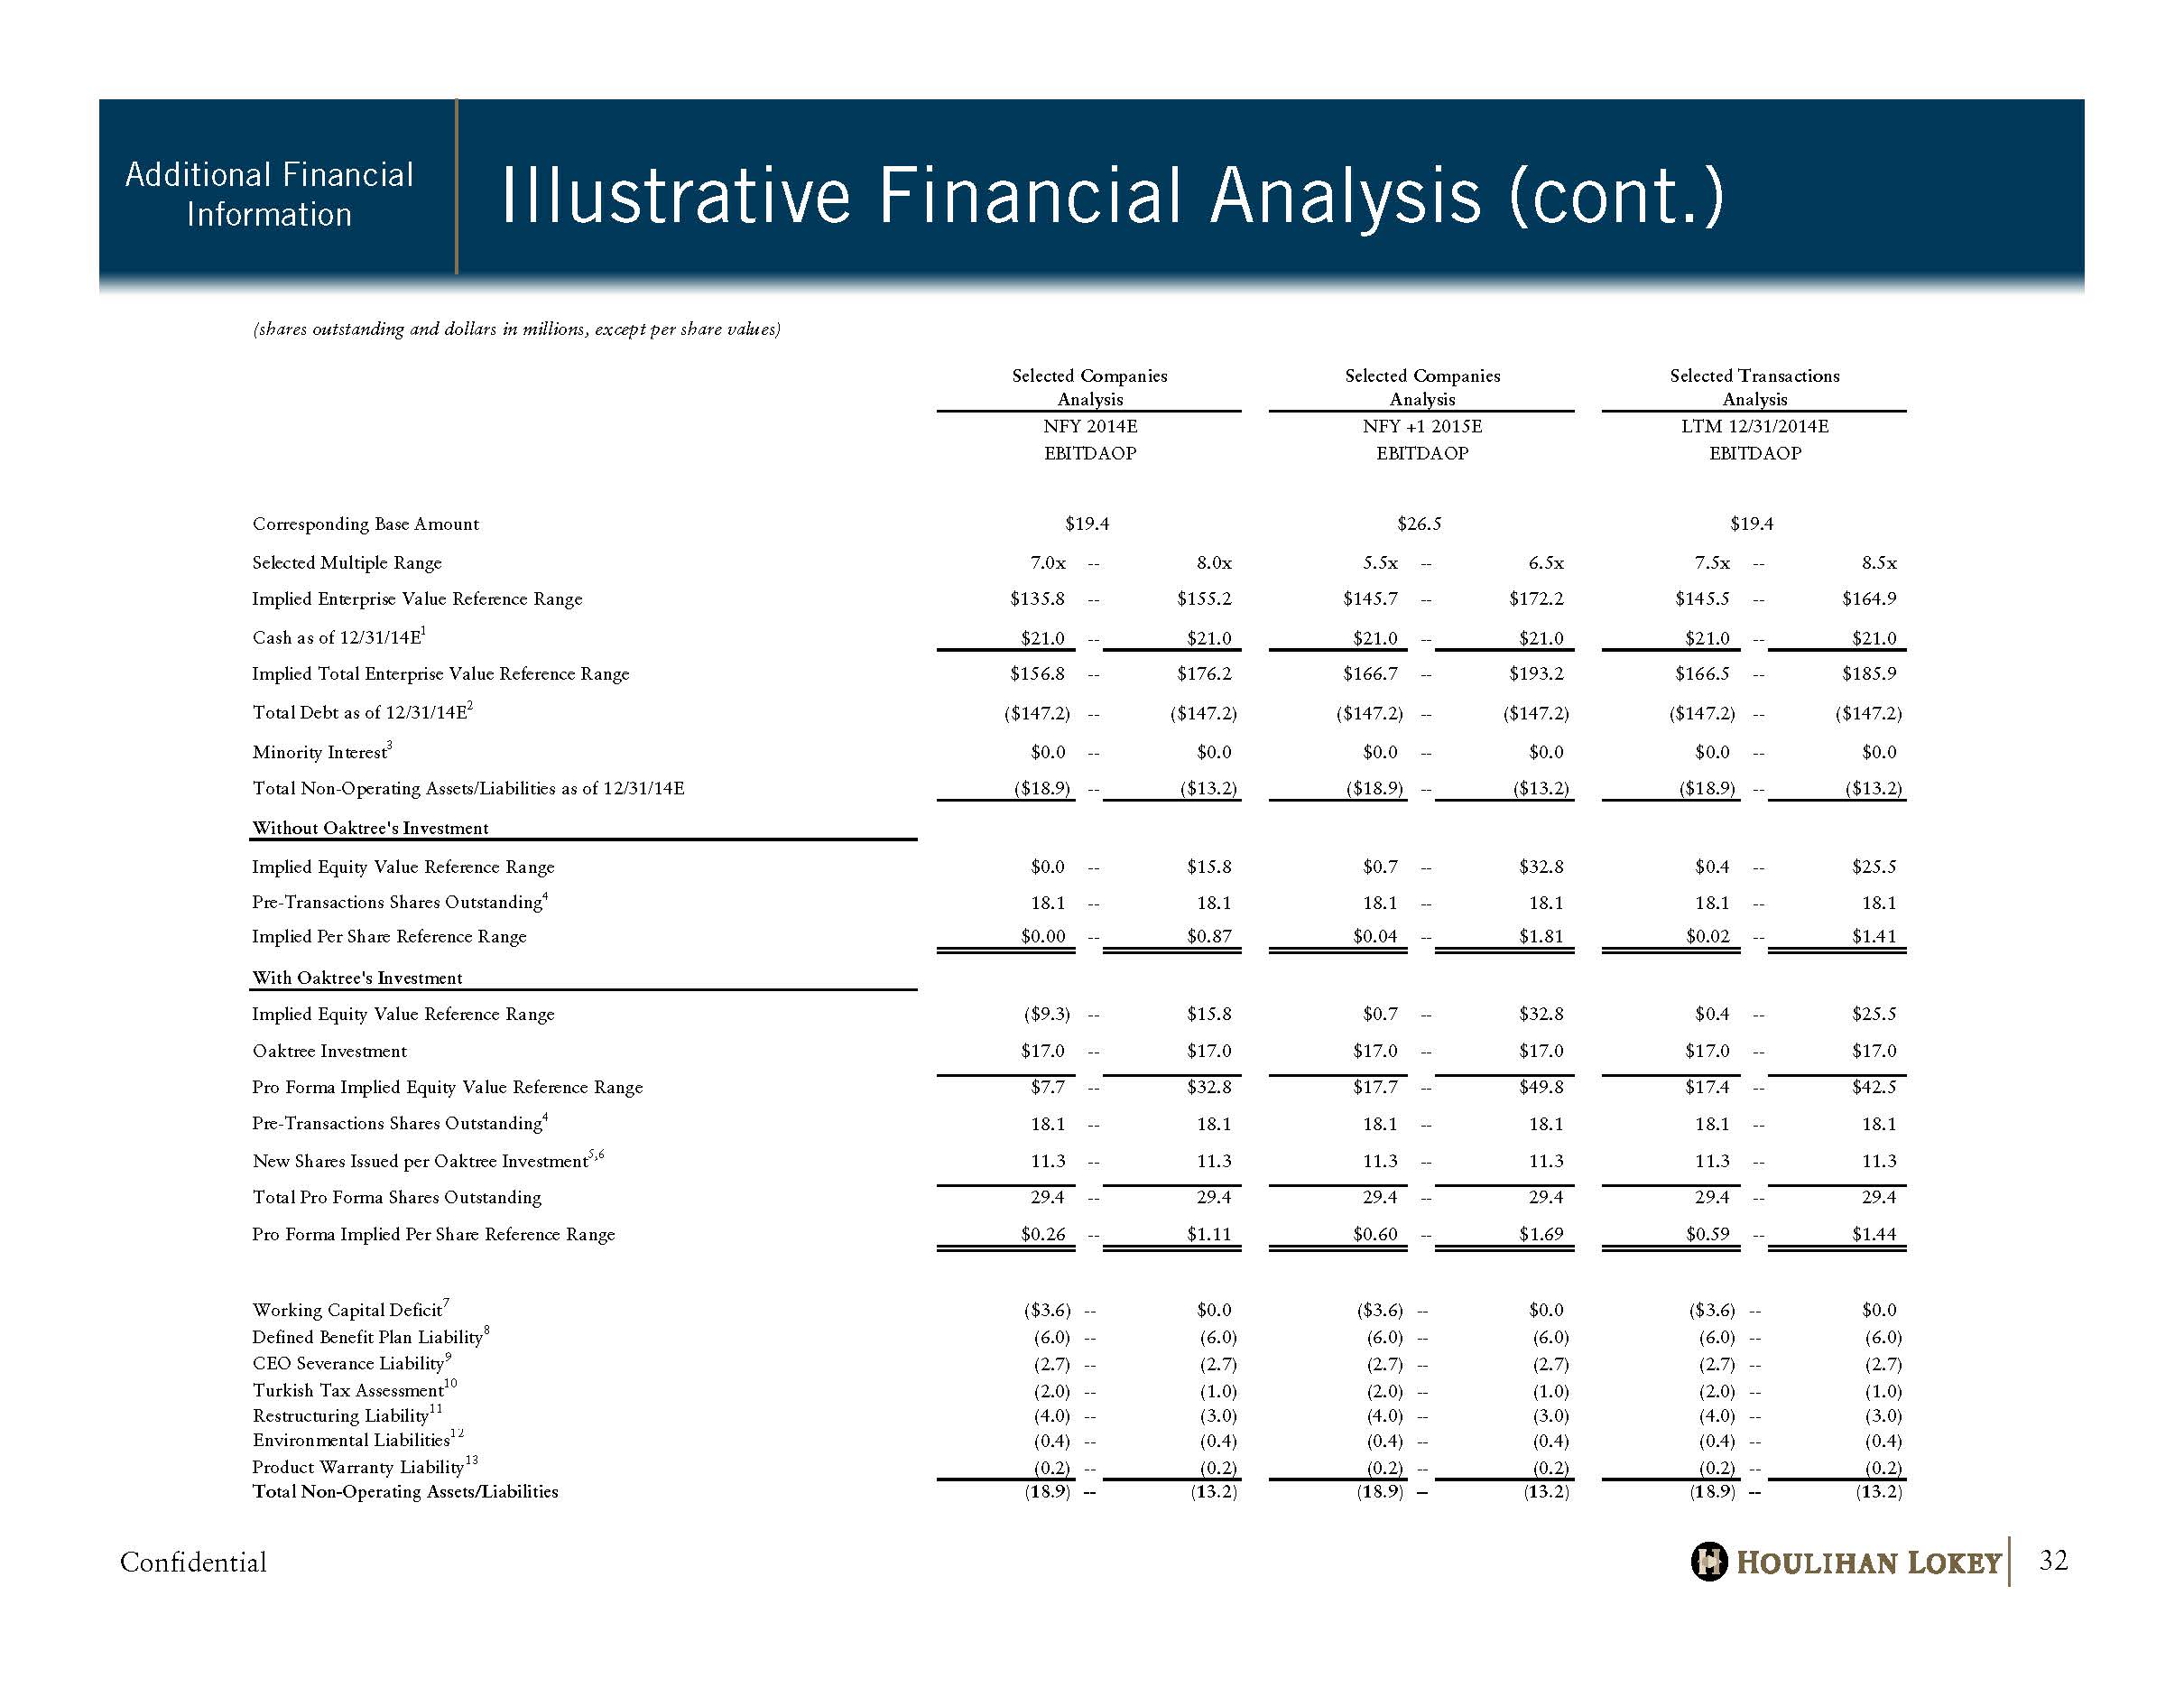
Confidential Illustrative Financial Analysis (cont.) Additional Financial Information 32 (shares outstanding and dollars in millions, except per share values) Selected Companies Selected Companies Selected Transactions Analysis Analysis Analysis NFY 2014E NFY +1 2015E LTM 12/31/2014E EBITDAOP EBITDAOP EBITDAOP Corresponding Base Amount $19.4 $26.5 $19.4 Selected Multiple Range 7.0x -- 8.0x 5.5x -- 6.5x 7.5x -- 8.5x Implied Enterprise Value Reference Range $135.8 -- $155.2 $145.7 -- $172.2 $145.5 -- $164.9 Cash as of 12/31/14E 1 $21.0 -- $21.0 $21.0 -- $21.0 $21.0 -- $21.0 Implied Total Enterprise Value Reference Range $156.8 -- $176.2 $166.7 -- $193.2 $166.5 -- $185.9 Total Debt as of 12/31/14E 2 ($147.2) -- ($147.2) ($147.2) -- ($147.2) ($147.2) -- ($147.2) Minority Interest 3 $0.0 -- $0.0 $0.0 -- $0.0 $0.0 -- $0.0 Total Non-Operating Assets/Liabilities as of 12/31/14E ($18.9) -- ($13.2) ($18.9) -- ($13.2) ($18.9) -- ($13.2) Without Oaktree's Investment Implied Equity Value Reference Range $0.0 -- $15.8 $0.7 -- $32.8 $0.4 -- $25.5 Pre-Transactions Shares Outstanding 4 18.1 -- 18.1 18.1 -- 18.1 18.1 -- 18.1 Implied Per Share Reference Range $0.00 -- $0.87 $0.04 -- $1.81 $0.02 -- $1.41 With Oaktree's Investment Implied Equity Value Reference Range ($9.3) -- $15.8 $0.7 -- $32.8 $0.4 -- $25.5 Oaktree Investment $17.0 -- $17.0 $17.0 -- $17.0 $17.0 -- $17.0 Pro Forma Implied Equity Value Reference Range $7.7 -- $32.8 $17.7 -- $49.8 $17.4 -- $42.5 Pre-Transactions Shares Outstanding 4 18.1 -- 18.1 18.1 -- 18.1 18.1 -- 18.1 New Shares Issued per Oaktree Investment 5,6 11.3 -- 11.3 11.3 -- 11.3 11.3 -- 11.3 Total Pro Forma Shares Outstanding 29.4 -- 29.4 29.4 -- 29.4 29.4 -- 29.4 Pro Forma Implied Per Share Reference Range $0.26 -- $1.11 $0.60 -- $1.69 $0.59 -- $1.44 Working Capital Deficit 7 ($3.6) -- $0.0 ($3.6) -- $0.0 ($3.6) -- $0.0 Defined Benefit Plan Liability 8 (6.0) -- (6.0) (6.0) -- (6.0) (6.0) -- (6.0) CEO Severance Liability 9 (2.7) -- (2.7) (2.7) -- (2.7) (2.7) -- (2.7) Turkish Tax Assessment 10 (2.0) -- (1.0) (2.0) -- (1.0) (2.0) -- (1.0) Restructuring Liability 11 (4.0) -- (3.0) (4.0) -- (3.0) (4.0) -- (3.0) Environmental Liabilities 12 (0.4) -- (0.4) (0.4) -- (0.4) (0.4) -- (0.4) Product Warranty Liability 13 (0.2) -- (0.2) (0.2) -- (0.2) (0.2) -- (0.2) Total Non-Operating Assets/Liabilities (18.9) -- (13.2) (18.9) -- (13.2) (18.9) -- (13.2)
Confidential Illustrative Financial Analysis (cont.) Additional Financial Information 33 1. Assumes acquisition of FRE minority interest and therefore includes approximately $13 million of FRE cash. 2. Represents face value of debt, excluding original issue discount. 3. Minority interest is assumed to be zero as the Company intends to acquire the 20% minority interest in FRE, its Taiwan subsidiary, which the Company does not currently own. The acquisition of the minority interest in FRE is assumed to have no net valuation impact as it is assumed the Company will pay fair market value for the FRE interest to be acquired. 4. See page 9 for detail. Excludes out-of-the-money options. 5. Assumes conversion of $8.5 million of Loans to equity at $1.50 per share. 6. Calculated as $17 million Oaktree Investment divided by the $1.50 per share purchase/conversion price. 7. Working capital deficit primarily related to past due accounts payable as of January 2015, per Company Management. 8. The underfunded defined benefit pension plan liability has not been tax-effected as the Company does not anticipate generating positive pretax income throughout the projection period. 9. Represents unpaid severance costs owed to the Company’s former CEO , per Company Management . 10. Represents the anticipated payout on a $3.4m tax liability owed to the Turkish government, per Company Management. 11. Including legal entity reorganization fees as well as unpaid employee severance costs, per Company Management. 12. Monitoring fees related to the groundwater contamination of a former facility in Indiana, per Company Management. 13. Represents the proposed settlement amount related to a product liability issue, per Company Management. EBITDAOP refers to Earnings Before Interest, Taxes, Depreciation & Amortization, Stock Option Expense, and Pension Expense. E refers to Estimated. NFY refers to Next Fiscal Year. NFY+1 refers to the fiscal year following NFY. Sources: Company Management, Public Filings.

Confidential Disclaimer

Confidential Disclaimer Disclaimer 35 This presentation, and any supplemental information (written or oral) or other documents provided in connection therewith (collectively, the “materials”), are provided solely for the information of the Special Committee (the “Committee”) of the Board of Directors (the “Board”) of Pulse Electronics Corporation (the “Company”) by Houlihan Lokey in connection with the Committee’s consideration of potential transactions (the “ Transactions”) involving the Company . This presentation is incomplete without reference to, and should be considered in conjunction with, any supplemental information provided by and discussions with Houlihan Lokey in connection therewith . Any defined terms used herein shall have the meanings set forth herein, even if such defined terms have been given different meanings elsewhere in the materials . The materials are for discussion purposes only and may not be relied upon by any person or entity for any purpose except as expressly permitted by Houlihan Lokey’s engagement letter . The materials were prepared for specific persons familiar with the business and affairs of the Company for use in a specific context and were not prepared with a view to public disclosure or to conform with any disclosure standards under any state, federal or international securities laws or other laws, rules or regulations, and none of the Committee, the Company or Houlihan Lokey takes any responsibility for the use of the materials by persons other than the Committee . The materials are provided on a confidential basis solely for the information of the Committee and may not be disclosed, summarized, reproduced, disseminated or quoted or otherwise referred to, in whole or in part, without Houlihan Lokey’s express prior written consent . Notwithstanding any other provision herein, the Company (and each employee, representative or other agent of the Company) may disclose to any and all persons without limitation of any kind, the tax treatment and tax structure of any transaction and all materials of any kind (including opinions or other tax analyses, if any) that are provided to the Company relating to such tax treatment and structure . However, any information relating to the tax treatment and tax structure shall remain confidential (and the foregoing sentence shall not apply) to the extent necessary to enable any person to comply with securities laws . For this purpose, the tax treatment of a transaction is the purported or claimed U . S . income or franchise tax treatment of the transaction and the tax structure of a transaction is any fact that may be relevant to understanding the purported or claimed U . S . income or franchise tax treatment of the transaction . If the Company plans to disclose information pursuant to the first sentence of this paragraph, the Company shall inform those to whom it discloses any such information that they may not rely upon such information for any purpose without Houlihan Lokey’s prior written consent . Houlihan Lokey is not an expert on, and nothing contained in the materials should be construed as advice with regard to, legal, accounting, regulatory, insurance, tax or other specialist matters . Houlihan Lokey’s role in reviewing any information is limited solely to performing such a review as it shall deem necessary to support its own advice and analysis and shall not be on behalf of the Committee . The materials necessarily are based on financial, economic, market and other conditions as in effect on, and the information available to Houlihan Lokey as of, the date of the materials . Although subsequent developments may affect the contents of the materials, Houlihan Lokey has not undertaken, and is under no obligation, to update, revise or reaffirm the materials : The materials are not intended to provide the sole basis for evaluation of the Transactions and do not purport to contain all information that may be required . The materials do not address the underlying business decision of the Company or any other party to proceed with or effect the Transactions, or the relative merits of the Transactions as compared to any alternative business strategies or transactions that might be available for the Company or any other party . The materials do not constitute any opinion, nor do the materials constitute a recommendation to the Committee, the Board, the Company, any security holder of the Company or any other party as to how to vote or act with respect to any matter relating to the Transactions or otherwise or whether to buy or sell any assets or securities of any company . Houlihan Lokey’s only opinion is the opinion, if any, that is actually delivered to the Committee . The materials may not reflect information known to other professionals in other business areas of Houlihan Lokey and its affiliates . The analyses contained in the materials must be considered as a whole . Selecting portions of the analyses, analytic methods and factors without considering all analyses and factors could create a misleading or incomplete view . The materials reflect judgments and assumptions with regard to industry performance, general business, economic, regulatory, market and financial conditions and other matters, many of which are beyond the control of the participants in the Transactions . Any estimates of value contained in the materials are not necessarily indicative of actual value or predictive of future results or values, which may be significantly more or less favorable . Any analyses relating to the value of assets, businesses or securities do not purport to be appraisals or to reflect the prices at which any assets, businesses or securities may actually be sold . The materials do not constitute a valuation opinion or credit rating . In preparing the materials, Houlihan Lokey has not conducted any physical inspection or independent appraisal or evaluation of any of the assets, properties or liabilities (contingent or otherwise) of the Company or any other party and has no obligation to evaluate the solvency of the Company or any other party under any law . All budgets, projections, estimates, financial analyses, reports and other information with respect to operations (including estimates of potential cost savings and expenses) reflected in the materials have been prepared by management of the relevant party or are derived from such budgets, projections, estimates, financial analyses, reports and other information or from other sources, which involve numerous and significant subjective determinations made by management of the relevant party and/or which such management has reviewed and found reasonable . The budgets, projections and estimates contained in the materials may or may not be achieved and differences between projected results and those actually achieved may be material . Houlihan Lokey has relied upon representations made by management of the Company and other participants in the Transactions that such budgets, projections and estimates have been reasonably prepared in good faith on bases reflecting the best currently available estimates and judgments of such management (or, with respect to information obtained from public sources, represent reasonable estimates), and Houlihan Lokey expresses no opinion with respect to such budgets, projections or estimates or the assumptions on which they are based . The scope of the financial analysis contained herein is based on discussions with the Company (including, without limitation, regarding the methodologies to be utilized), and Houlihan Lokey does not make any representation, express or implied, as to the sufficiency or adequacy of such financial analysis or the scope thereof for any particular purpose . Houlihan Lokey has assumed and relied upon the accuracy and completeness of the financial and other information provided to, discussed with or reviewed by it without (and without assuming responsibility for) independent verification of such information, makes no representation or warranty (express or implied) in respect of the accuracy or completeness of such information and has further relied upon the assurances of the Company that it is not aware of any facts or circumstances that would make such information inaccurate or misleading . In addition, Houlihan Lokey has relied upon and assumed, without independent verification, that there has been no change in the business, assets, liabilities, financial condition, results of operations, cash flows or prospects of the Company or any other participant in the Transactions since the respective dates of the most recent financial statements and other information, financial or otherwise, provided to Houlihan Lokey that would be material to its analyses, and that the final forms of any draft documents reviewed by Houlihan Lokey will not differ in any material respect from such draft documents . The materials are not an offer to sell or a solicitation of an indication of interest to purchase any security, option, commodity, future, loan or currency . The materials do not constitute a commitment by Houlihan Lokey or any of its affiliates to underwrite, subscribe for or place any securities, to extend or arrange credit, or to provide any other services . In the ordinary course of business, certain of Houlihan Lokey’s affiliates and employees, as well as investment funds in which they may have financial interests or with which they may co - invest, may acquire, hold or sell, long or short positions, or trade or otherwise effect transactions, in debt, equity, and other securities and financial instruments (including loans and other obligations) of, or investments in, one or more parties that may be involved in the Transactions and their respective affiliates or any currency or commodity that may be involved in the Transactions . Houlihan Lokey provides mergers and acquisitions, restructuring and other advisory services to clients . Houlihan Lokey’s personnel may make statements or provide advice that is contrary to information contained in the materials . Houlihan Lokey’s or its affiliates’ proprietary interests may conflict with the Company’s interests . Houlihan Lokey may have advised, may seek to advise and may in the future advise companies mentioned in the materials .