
1 Teleflex Incorporated Third Quarter 2016 Earnings Conference Call
2 Conference Call Logistics The release, accompanying slides, and replay webcast are available online at www.teleflex.com (click on “Investors”) Telephone replay available by dialing 855-859-2056 or for international calls, 404- 537-3406, pass code number 97714633
3 Introductions Benson Smith Chairman and CEO Liam Kelly President and COO Thomas Powell Executive Vice President and CFO Jake Elguicze Treasurer and Vice President of Investor Relations
4 Forward Looking Statements This presentation and our discussion contain forward-looking information and statements including, but not limited to, forecasted 2016 GAAP and constant currency revenue growth; forecasted 2016 GAAP and adjusted gross and operating margins; forecasted 2016 GAAP and adjusted earnings per share results; forecasted pre-tax charges, cash outlays and capital expenditures associated with our 2014 manufacturing footprint realignment plan, annualized savings we expect to achieve through implementation of the plan and estimated timing for completion of the plan; and other matters which inherently involve risks and uncertainties which could cause actual results to differ from those projected or implied in the forward–looking statements. These risks and uncertainties are addressed in the Company’s SEC filings, including its most recent Form 10-K. Non-GAAP Financial Measures This presentation refers to certain non-GAAP financial measures, including, but not limited to, constant currency revenue growth, adjusted diluted earnings per share, adjusted gross and operating margins and adjusted tax rate. These non-GAAP financial measures should not be considered replacements for, and should be read together with, the most comparable GAAP financial measures. Additional notes and tables reconciling these non-GAAP financial measures to the most comparable GAAP financial measures are contained within the appendices to this presentation. Additional Notes Unless otherwise noted, the following slides reflect continuing operations. As used in this presentation, "new products" are products we have sold for 36 months or less, and “existing products” are products we have sold for more than 36 months. Discussion of the effects of acquired businesses (except as noted below with respect to acquired distributors) generally reflects the impact of the acquisitions within the first 12 months after the acquisition date. In addition to increases and decreases in the per unit selling prices of our products to our customers, our discussion of the impact of product price increases and decreases also reflects, for the first 12 months following the acquisition or termination of a distributor, the impact on the pricing of our products resulting from the elimination of the distributor from the sales channel. To the extent an acquired distributor had pre-acquisition sales of products other than ours, the impact of the post-acquisition sales of those products on our results of operations is included within our discussion of the impact of acquired businesses.
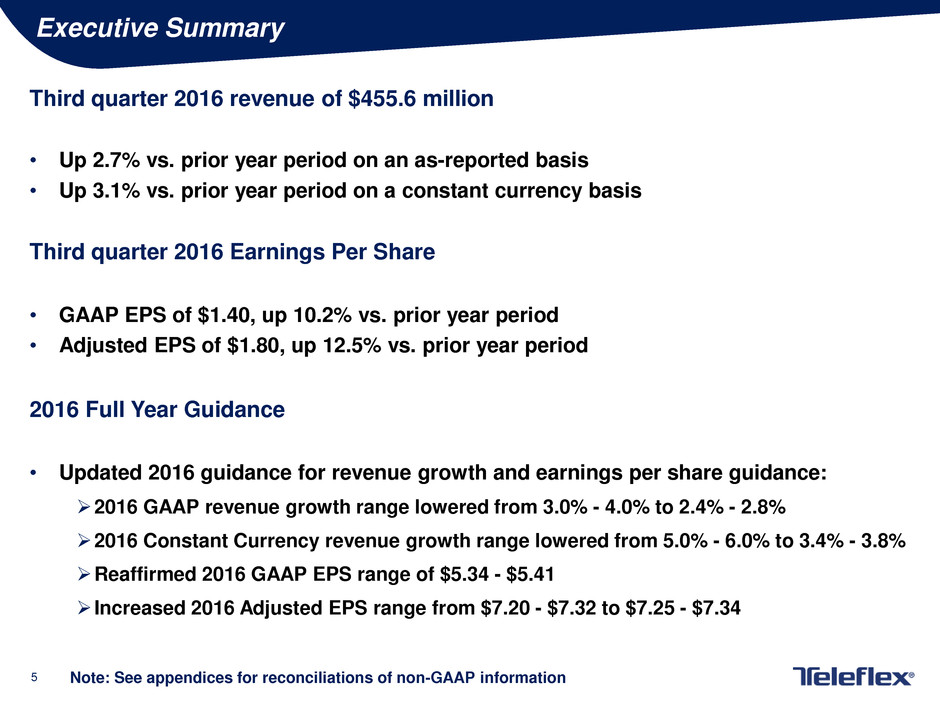
5 Executive Summary Third quarter 2016 revenue of $455.6 million • Up 2.7% vs. prior year period on an as-reported basis • Up 3.1% vs. prior year period on a constant currency basis Third quarter 2016 Earnings Per Share • GAAP EPS of $1.40, up 10.2% vs. prior year period • Adjusted EPS of $1.80, up 12.5% vs. prior year period 2016 Full Year Guidance • Updated 2016 guidance for revenue growth and earnings per share guidance: 2016 GAAP revenue growth range lowered from 3.0% - 4.0% to 2.4% - 2.8% 2016 Constant Currency revenue growth range lowered from 5.0% - 6.0% to 3.4% - 3.8% Reaffirmed 2016 GAAP EPS range of $5.34 - $5.41 Increased 2016 Adjusted EPS range from $7.20 - $7.32 to $7.25 - $7.34 Note: See appendices for reconciliations of non-GAAP information
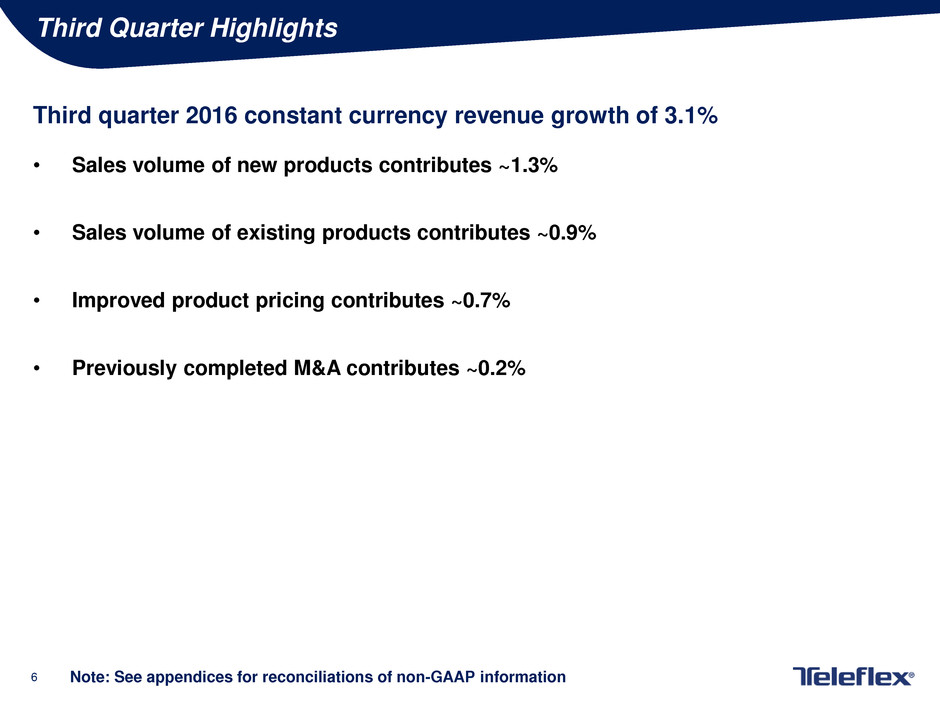
6 Third Quarter Highlights Third quarter 2016 constant currency revenue growth of 3.1% • Sales volume of new products contributes ~1.3% • Sales volume of existing products contributes ~0.9% • Improved product pricing contributes ~0.7% • Previously completed M&A contributes ~0.2% Note: See appendices for reconciliations of non-GAAP information

7 Segment Revenue Review Q3’16 Q3’15 Constant Currency Revenue Commentary Vascular N.A.: $85.1 million, up 3.0% Anesthesia N.A.: $48.7 million, up 2.2% Surgical N.A.: $41.9 million, up 5.7% EMEA: $121.4 million, up 2.2% Asia: $64.0 million, up 2.1% OEM: $41.4 million, up 6.3% All Other: $53.1 million, up 2.8% Note: Increases and decreases in revenue referred to above are as compared to results for the third quarter of 2015. See appendices for reconciliations of non-GAAP information. 19% 9% 11% 26% 14% 9% 12% Vascular North America Surgical North America Anesthesia North America EMEA Asia OEM All Other 18% 9% 11% 27% 14% 9% 12% Vascular North America Surgical North America Anesthesia North America EMEA Asia OEM All Other

8 Group Purchasing Organization and IDN Review Track record of expansion of contractual agreements continues in Q3’16 Group Purchasing Organization Update • 5 new agreements • 5 renewed agreements IDN Update • 10 new agreements • 5 renewed agreements • 1 existing agreement not renewed
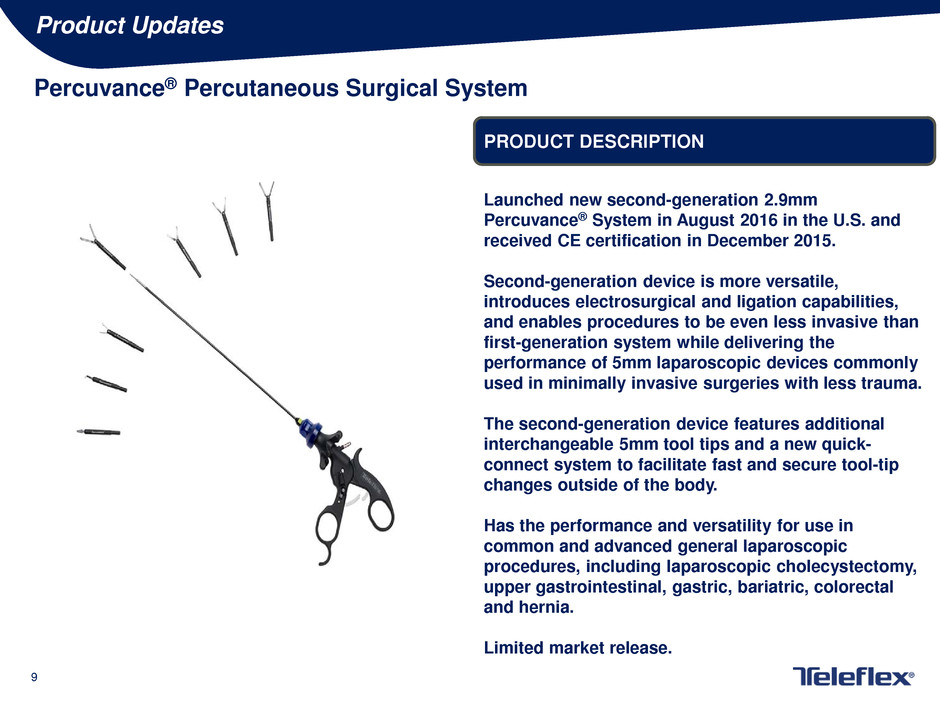
9 Product Updates PRODUCT DESCRIPTION Percuvance® Percutaneous Surgical System Launched new second-generation 2.9mm Percuvance® System in August 2016 in the U.S. and received CE certification in December 2015. Second-generation device is more versatile, introduces electrosurgical and ligation capabilities, and enables procedures to be even less invasive than first-generation system while delivering the performance of 5mm laparoscopic devices commonly used in minimally invasive surgeries with less trauma. The second-generation device features additional interchangeable 5mm tool tips and a new quick- connect system to facilitate fast and secure tool-tip changes outside of the body. Has the performance and versatility for use in common and advanced general laparoscopic procedures, including laparoscopic cholecystectomy, upper gastrointestinal, gastric, bariatric, colorectal and hernia. Limited market release.
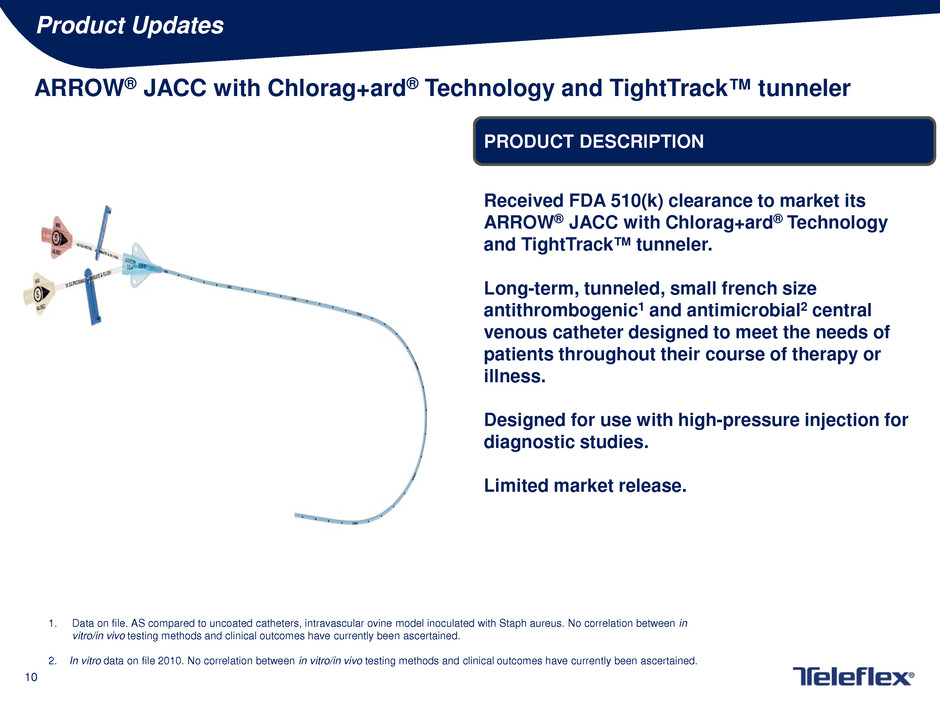
10 Product Updates PRODUCT DESCRIPTION ARROW® JACC with Chlorag+ard® Technology and TightTrack™ tunneler Received FDA 510(k) clearance to market its ARROW® JACC with Chlorag+ard® Technology and TightTrack™ tunneler. Long-term, tunneled, small french size antithrombogenic1 and antimicrobial2 central venous catheter designed to meet the needs of patients throughout their course of therapy or illness. Designed for use with high-pressure injection for diagnostic studies. Limited market release. 1. Data on file. AS compared to uncoated catheters, intravascular ovine model inoculated with Staph aureus. No correlation between in vitro/in vivo testing methods and clinical outcomes have currently been ascertained. 2. In vitro data on file 2010. No correlation between in vitro/in vivo testing methods and clinical outcomes have currently been ascertained.
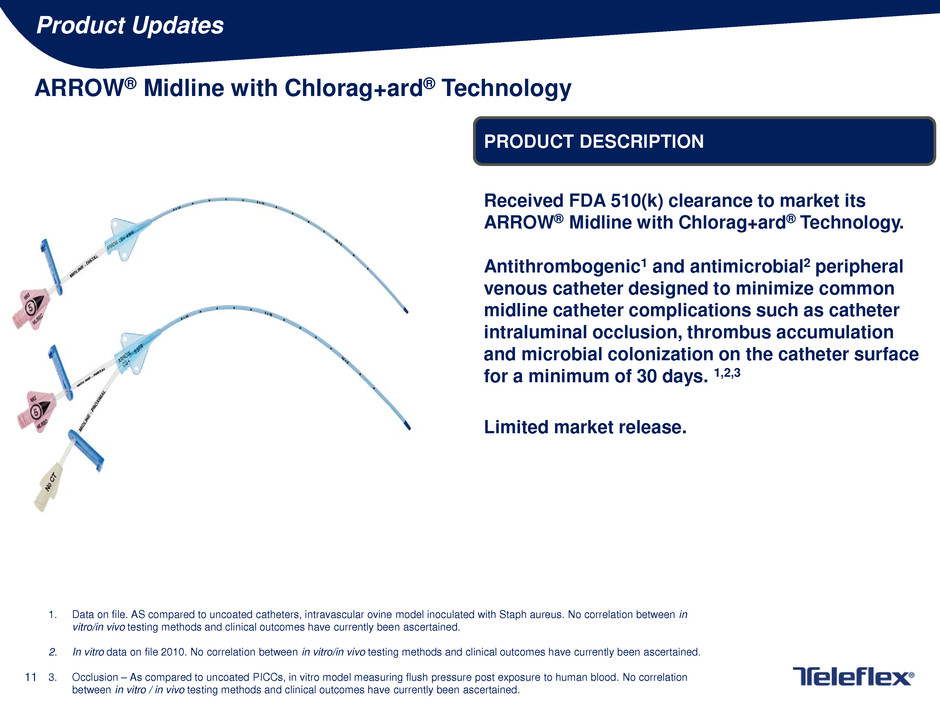
11 Product Updates PRODUCT DESCRIPTION ARROW® Midline with Chlorag+ard® Technology Received FDA 510(k) clearance to market its ARROW® Midline with Chlorag+ard® Technology. Antithrombogenic1 and antimicrobial2 peripheral venous catheter designed to minimize common midline catheter complications such as catheter intraluminal occlusion, thrombus accumulation and microbial colonization on the catheter surface for a minimum of 30 days. 1,2,3 Limited market release. 1. Data on file. AS compared to uncoated catheters, intravascular ovine model inoculated with Staph aureus. No correlation between in vitro/in vivo testing methods and clinical outcomes have currently been ascertained. 2. In vitro data on file 2010. No correlation between in vitro/in vivo testing methods and clinical outcomes have currently been ascertained. 3. Occlusion – As compared to uncoated PICCs, in vitro model measuring flush pressure post exposure to human blood. No correlation between in vitro / in vivo testing methods and clinical outcomes have currently been ascertained.
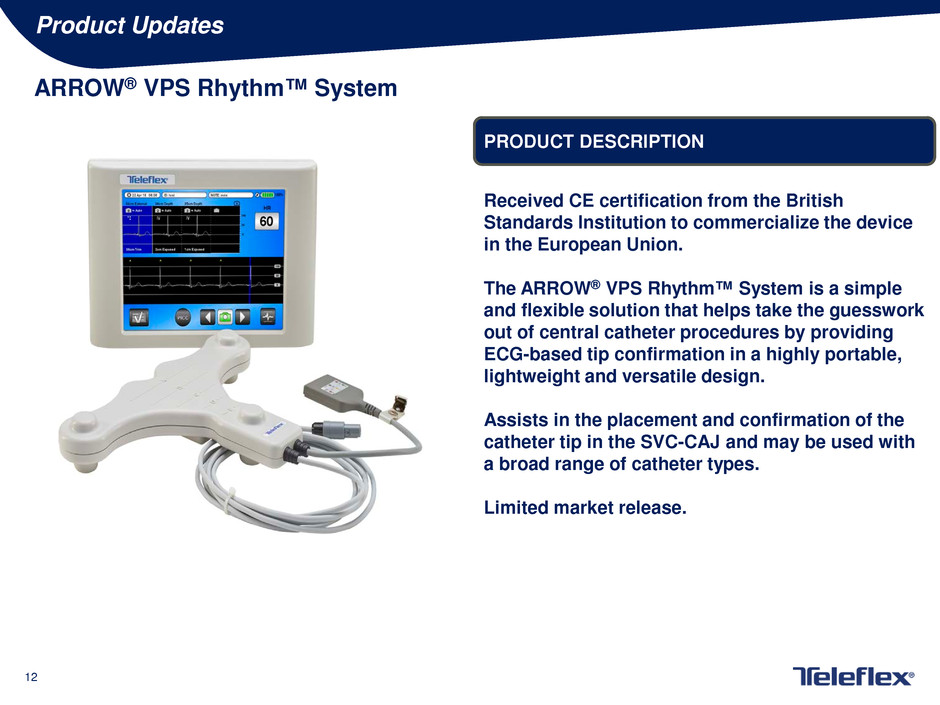
12 Product Updates PRODUCT DESCRIPTION ARROW® VPS Rhythm™ System Received CE certification from the British Standards Institution to commercialize the device in the European Union. The ARROW® VPS Rhythm™ System is a simple and flexible solution that helps take the guesswork out of central catheter procedures by providing ECG-based tip confirmation in a highly portable, lightweight and versatile design. Assists in the placement and confirmation of the catheter tip in the SVC-CAJ and may be used with a broad range of catheter types. Limited market release.
13 Restructuring Update 2014 Manufacturing Footprint Realignment Plan In April 2014, our Board of Directors approved a restructuring plan involving the consolidation of operations and a related reduction in workforce at certain facilities, and the relocation of manufacturing operations from certain higher-cost locations to existing lower-cost locations. These actions commenced in the second quarter 2014 and were initially expected to be substantially completed by the end of 2017. To date, we have completed the consolidation and relocation of a significant portion of the operations, and estimate that we will achieve annualized savings of approximately $17 million by the end of 2016 directly related to these actions. With respect to the remaining actions to be taken under the plan, we revised our savings, expense and timing estimates during the third quarter of 2016 to reflect the impact of changes we have implemented with respect to medication delivery devices included in certain kits primarily sold by our Vascular North America operating segment and, to a lesser extent, certain kits primarily sold by our Anesthesia North America operating segment. As a result of these changes, we have reduced our estimate with respect to the overall annualized savings we expect to realize under the plan from our prior estimate of $28 million to $35 million to a range of $23 million to $27 million. We anticipate that this decrease in projected savings will be offset, in large part, by an expected increase in annual revenues resulting from improved pricing on the affected Vascular kits directly related to the changes described above. We anticipate that this projected increase in annual revenues, taken together with the projected annualized savings we expect to realize under the plan, should enable us to improve our pre-tax income on an annualized basis by approximately $28 million to $33 million once the plan has been completed. As a result of the changes described above, we also revised our estimates with respect to the charges we expect to incur in connection with the plan. Specifically, we now estimate that we will incur $43 million to $48 million in aggregate pre-tax charges associated with the plan, compared to our prior estimate of approximately $37 million to $44 million. In addition, we expect cash outlays associated with the plan to be in the range of $33 million to $38 million, compared to our prior estimate of approximately $26 million to $31 million. We continue to expect to incur $24 million to $30 million in aggregate capital expenditures under the plan. We currently expect that the plan will be substantially complete by the end of the first half of 2020 rather than the end of 2017, which we previously anticipated. We currently are evaluating the feasibility of alternative measures designed to mitigate the loss of expected savings and accelerate the currently estimated timetable for completion of the plan.
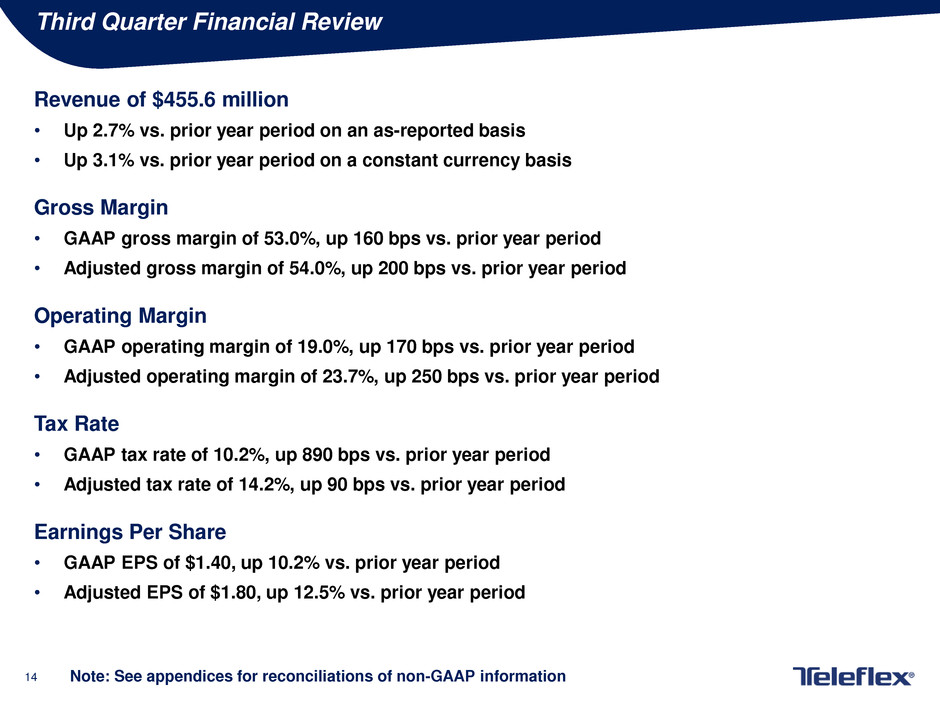
14 Third Quarter Financial Review Revenue of $455.6 million • Up 2.7% vs. prior year period on an as-reported basis • Up 3.1% vs. prior year period on a constant currency basis Gross Margin • GAAP gross margin of 53.0%, up 160 bps vs. prior year period • Adjusted gross margin of 54.0%, up 200 bps vs. prior year period Operating Margin • GAAP operating margin of 19.0%, up 170 bps vs. prior year period • Adjusted operating margin of 23.7%, up 250 bps vs. prior year period Tax Rate • GAAP tax rate of 10.2%, up 890 bps vs. prior year period • Adjusted tax rate of 14.2%, up 90 bps vs. prior year period Earnings Per Share • GAAP EPS of $1.40, up 10.2% vs. prior year period • Adjusted EPS of $1.80, up 12.5% vs. prior year period Note: See appendices for reconciliations of non-GAAP information
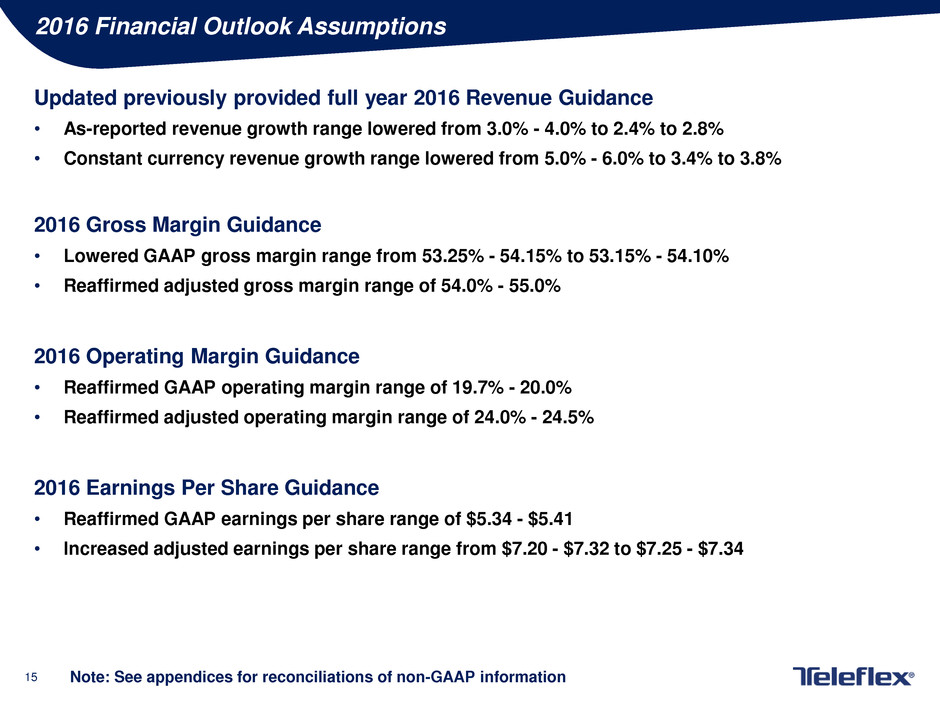
15 2016 Financial Outlook Assumptions Updated previously provided full year 2016 Revenue Guidance • As-reported revenue growth range lowered from 3.0% - 4.0% to 2.4% to 2.8% • Constant currency revenue growth range lowered from 5.0% - 6.0% to 3.4% to 3.8% 2016 Gross Margin Guidance • Lowered GAAP gross margin range from 53.25% - 54.15% to 53.15% - 54.10% • Reaffirmed adjusted gross margin range of 54.0% - 55.0% 2016 Operating Margin Guidance • Reaffirmed GAAP operating margin range of 19.7% - 20.0% • Reaffirmed adjusted operating margin range of 24.0% - 24.5% 2016 Earnings Per Share Guidance • Reaffirmed GAAP earnings per share range of $5.34 - $5.41 • Increased adjusted earnings per share range from $7.20 - $7.32 to $7.25 - $7.34 Note: See appendices for reconciliations of non-GAAP information

16 Any Questions?

17 Thank You

18 Appendices

19 Non-GAAP Financial Measures The following appendices include, among other things, tables reconciling the following non-GAAP financial measures to the most comparable GAAP financial measure: • Constant currency revenue growth. This measure excludes the impact of translating the results of international subsidiaries at different currency exchange rates from period to period. • Adjusted diluted earnings per share. This measure excludes, depending on the period presented (i) restructuring and other impairment charges; (ii) certain losses and other charges, including, for 2016, charges related to facility consolidations and contingent consideration liabilities, net of the gain on sale of assets and, for 2015, charges related to acquisition and integration costs, and charges related to facility consolidations, net of the gain on sale of assets and reversal of charges related to contingent consideration and a litigation verdict against the Company with respect to a non-operating joint venture; (iii) amortization of the debt discount on the Company’s convertible notes; (iv) intangible amortization expense; (v) loss on extinguishment of debt; and (vi) tax benefits resulting primarily from the resolution of audits of prior year returns and tax law changes affecting the Company's deferred tax liability. In addition, the calculation of diluted shares within adjusted earnings per share gives effect to the anti-dilutive impact of the Company’s convertible note hedge agreements, which reduce the potential economic dilution that otherwise would occur upon conversion of the Company’s senior subordinated convertible notes (under GAAP, the anti-dilutive impact of the convertible note hedge agreements is not reflected in diluted shares). • Adjusted gross margin. This measure excludes, depending on the period presented, certain losses, other charges and charge reversals, primarily related to facility consolidations. • Adjusted operating margin. This measure excludes, depending on the period presented, (i) the impact of restructuring and other impairment charges; (ii) losses and other charges, including charges related to facility consolidations and acquisition and integration costs, net of the gain on sale of an asset and reversal of charges related to contingent consideration; and (iii) intangible amortization expense. • Adjusted tax rate. This measure is the percentage of the Company’s adjusted taxes on income from continuing operations to its adjusted income from continuing operations before taxes. Adjusted taxes on income from continuing operations excludes, depending on the period presented, the impact of tax benefits or costs associated with (i) restructuring and impairment charges; (ii) amortization of the debt discount on the Company’s convertible notes; (iii) intangible amortization expense; (iv) tax adjustments relating to the resolution of, or expiration of statutes of limitations with respect to, various prior year returns and tax law changes; and (v) losses and other charges, including charges related to facility consolidations, net of the gain on sale of an asset and reversal of charges related to contingent consideration.
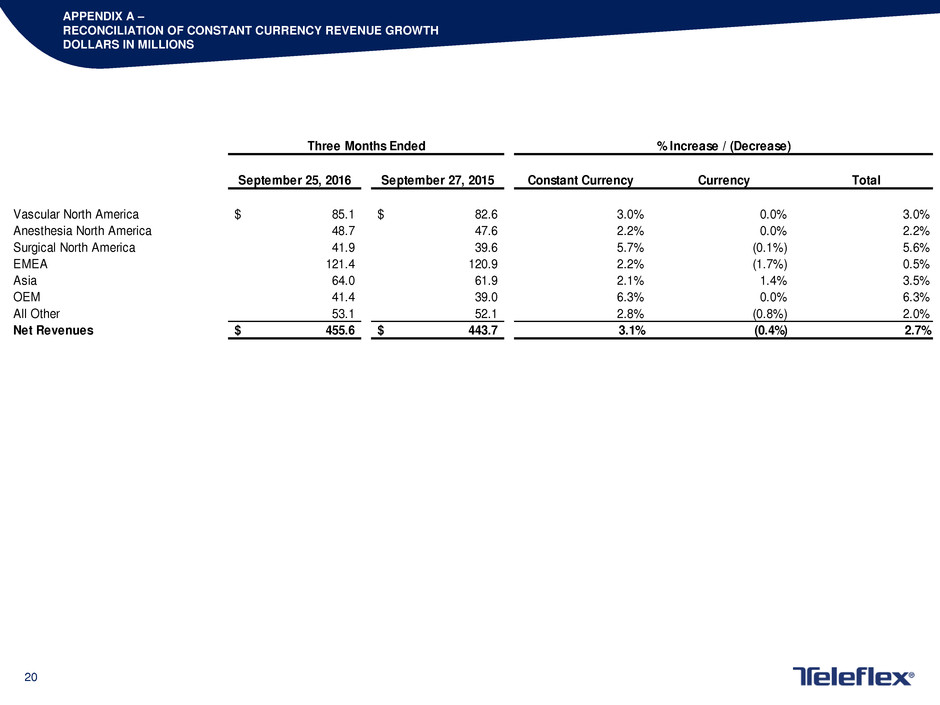
20 APPENDIX A – RECONCILIATION OF CONSTANT CURRENCY REVENUE GROWTH DOLLARS IN MILLIONS September 25, 2016 September 27, 2015 Constant Currency Currency Total Vascular North America 85.1$ 82.6$ 3.0% 0.0% 3.0% Anesthesia North America 48.7 47.6 2.2% 0.0% 2.2% Surgical North America 41.9 39.6 5.7% (0.1%) 5.6% EMEA 121.4 120.9 2.2% (1.7%) 0.5% Asia 64.0 61.9 2.1% 1.4% 3.5% OEM 41.4 39.0 6.3% 0.0% 6.3% All Other 53.1 52.1 2.8% (0.8%) 2.0% Net Revenues 455.6$ 443.7$ 3.1% (0.4%) 2.7% Three Months Ended % Increase / (Decrease)
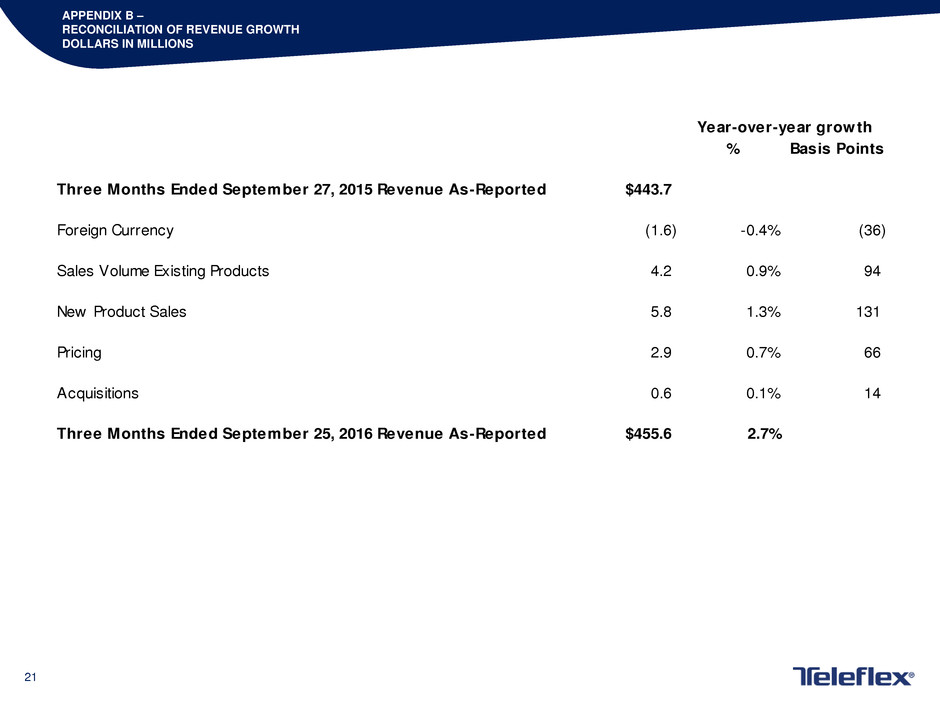
21 APPENDIX B – RECONCILIATION OF REVENUE GROWTH DOLLARS IN MILLIONS % Basis Points Three Months Ended September 27, 2015 Revenue As-Reported $443.7 Foreign Currency (1.6) -0.4% (36) Sales Volume Existing Products 4.2 0.9% 94 New Product Sales 5.8 1.3% 131 Pricing 2.9 0.7% 66 Acquisitions 0.6 0.1% 14 Three Months Ended September 25, 2016 Revenue As-Reported $455.6 2.7% Year-over-year growth
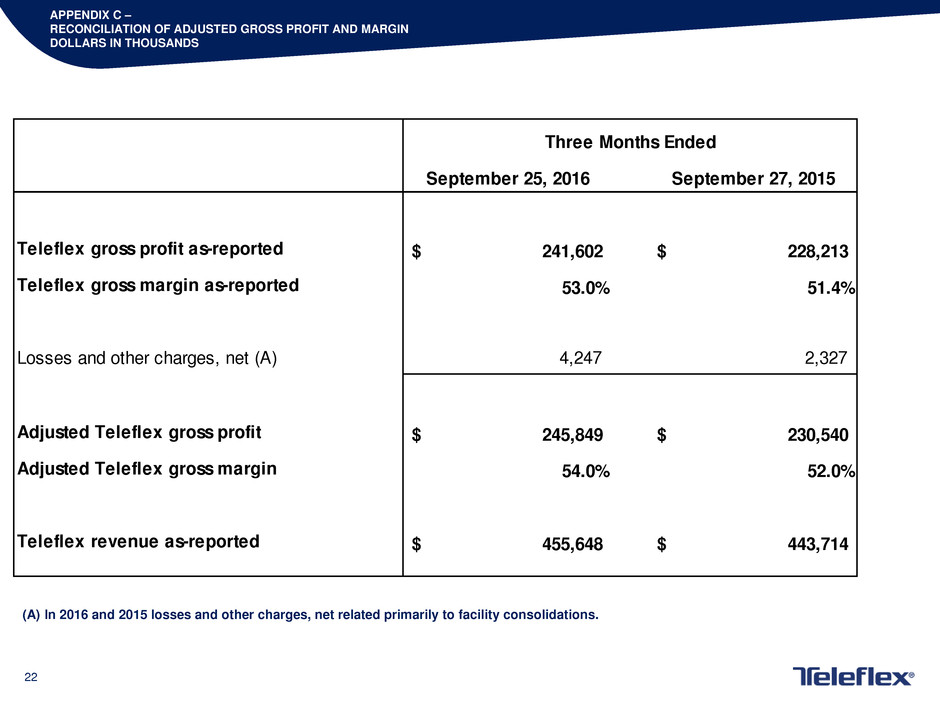
22 APPENDIX C – RECONCILIATION OF ADJUSTED GROSS PROFIT AND MARGIN DOLLARS IN THOUSANDS September 25, 2016 September 27, 2015 Teleflex gross profit as-reported 241,602$ 228,213$ Teleflex gross margin as-reported 53.0% 51.4% Losses and other charges, net (A) 4,247 2,327 Adjusted Teleflex gross profit 245,849$ 230,540$ Adjusted Teleflex gross margin 54.0% 52.0% Teleflex revenue as-reported 455,648$ 443,714$ Three Months Ended (A) In 2016 and 2015 losses and other charges, net related primarily to facility consolidations.
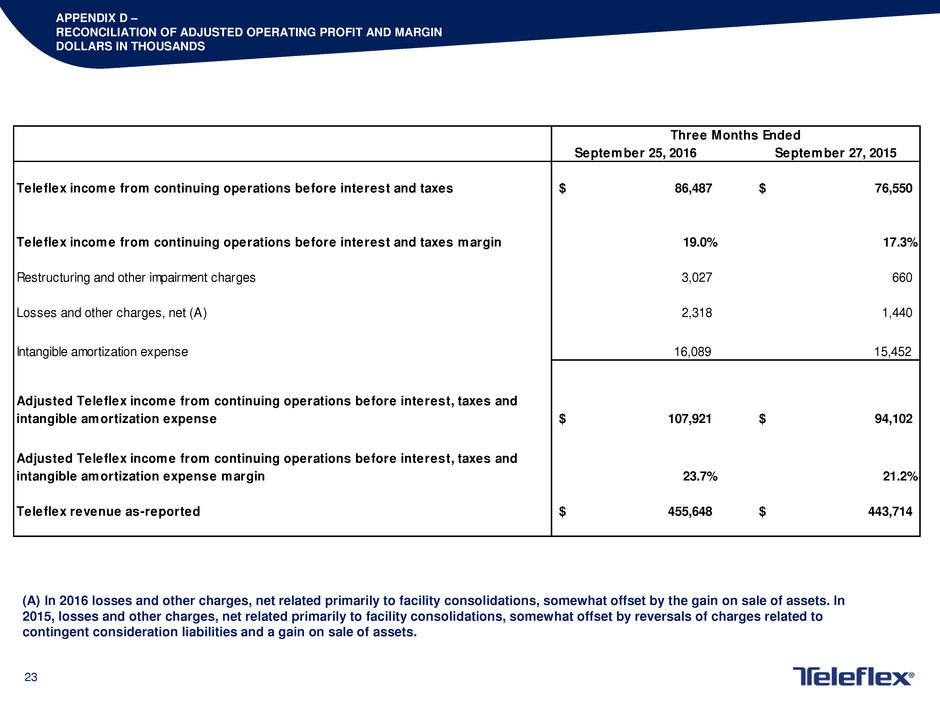
23 APPENDIX D – RECONCILIATION OF ADJUSTED OPERATING PROFIT AND MARGIN DOLLARS IN THOUSANDS (A) In 2016 losses and other charges, net related primarily to facility consolidations, somewhat offset by the gain on sale of assets. In 2015, losses and other charges, net related primarily to facility consolidations, somewhat offset by reversals of charges related to contingent consideration liabilities and a gain on sale of assets. September 25, 2016 September 27, 2015 Teleflex income from continuing operations before interest and taxes 86,487$ 76,550$ Teleflex income from continuing operations before interest and taxes margin 19.0% 17.3% Restructuring and other impairment charges 3,027 660 Losses and other charges, net (A) 2,318 1,440 Intangible amortization expense 16,089 15,452 Adjusted Teleflex income from continuing operations before interest, taxes and intangible amortization expense 107,921$ 94,102$ Adjusted Teleflex income from continuing operations before interest, taxes and intangible amortization expense margin 23.7% 21.2% Teleflex revenue as-reported 455,648$ 443,714$ Three Months Ended
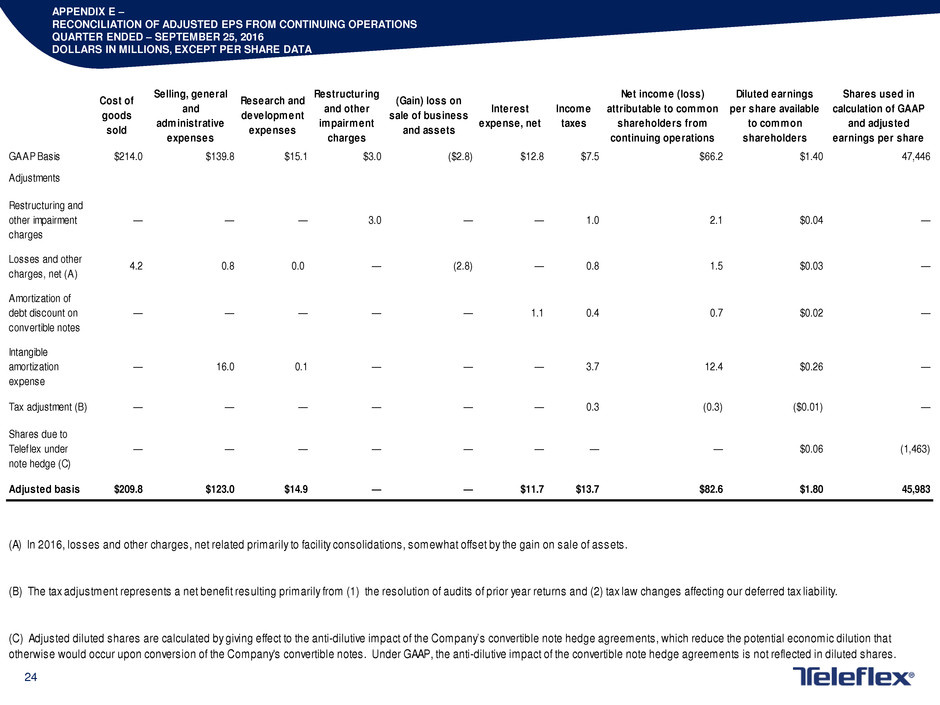
24 APPENDIX E – RECONCILIATION OF ADJUSTED EPS FROM CONTINUING OPERATIONS QUARTER ENDED – SEPTEMBER 25, 2016 DOLLARS IN MILLIONS, EXCEPT PER SHARE DATA Cost of goods sold Selling, general and administrative expenses Research and development expenses Restructuring and other impairment charges (Gain) loss on sale of business and assets Interest expense, net Income taxes Net income (loss) attributable to common shareholders from continuing operations Diluted earnings per share available to common shareholders Shares used in calculation of GAAP and adjusted earnings per share GAAP Basis $214.0 $139.8 $15.1 $3.0 ($2.8) $12.8 $7.5 $66.2 $1.40 47,446 Adjustments Restructuring and other impairment charges — — — 3.0 — — 1.0 2.1 $0.04 — Losses and other charges, net (A) 4.2 0.8 0.0 — (2.8) — 0.8 1.5 $0.03 — Amortization of debt discount on convertible notes — — — — — 1.1 0.4 0.7 $0.02 — Intangible amortization expense — 16.0 0.1 — — — 3.7 12.4 $0.26 — Tax adjustment (B) — — — — — — 0.3 (0.3) ($0.01) — Shares due to Teleflex under note hedge (C) — — — — — — — — $0.06 (1,463) Adjusted basis $209.8 $123.0 $14.9 — — $11.7 $13.7 $82.6 $1.80 45,983 (A) In 2016, losses and other charges, net related primarily to facility consolidations, somewhat offset by the gain on sale of assets. (B) The tax adjustment represents a net benefit resulting primarily from (1) the resolution of audits of prior year returns and (2) tax law changes affecting our deferred tax liability. (C) Adjusted diluted shares are calculated by giving effect to the anti-dilutive impact of the Company’s convertible note hedge agreements, which reduce the potential economic dilution that otherwise would occur upon conversion of the Company's convertible notes. Under GAAP, the anti-dilutive impact of the convertible note hedge agreements is not reflected in diluted shares.
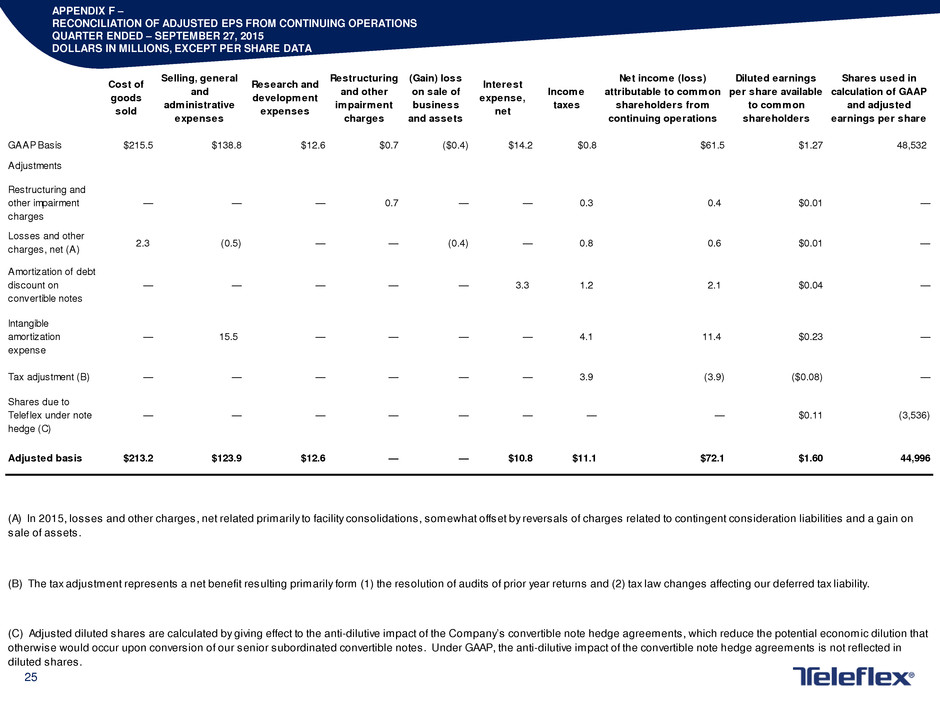
25 APPENDIX F – RECONCILIATION OF ADJUSTED EPS FROM CONTINUING OPERATIONS QUARTER ENDED – SEPTEMBER 27, 2015 DOLLARS IN MILLIONS, EXCEPT PER SHARE DATA Cost of goods sold Selling, general and administrative expenses Research and development expenses Restructuring and other impairment charges (Gain) loss on sale of business and assets Interest expense, net Income taxes Net income (loss) attributable to common shareholders from continuing operations Diluted earnings per share available to common shareholders Shares used in calculation of GAAP and adjusted earnings per share GAAP Basis $215.5 $138.8 $12.6 $0.7 ($0.4) $14.2 $0.8 $61.5 $1.27 48,532 Adjustments Restructuring and other impairment charges — — — 0.7 — — 0.3 0.4 $0.01 — Losses and other charges, net (A) 2.3 (0.5) — — (0.4) — 0.8 0.6 $0.01 — Amortization of debt discount on convertible notes — — — — — 3.3 1.2 2.1 $0.04 — Intangible amortization expense — 15.5 — — — — 4.1 11.4 $0.23 — Tax adjustment (B) — — — — — — 3.9 (3.9) ($0.08) — Shares due to Teleflex under note hedge (C) — — — — — — — — $0.11 (3,536) Adjusted basis $213.2 $123.9 $12.6 — — $10.8 $11.1 $72.1 $1.60 44,996 (A) In 2015, losses and other charges, net related primarily to facility consolidations, somewhat offset by reversals of charges related to contingent consideration liabilities and a gain on sale of assets. (B) The tax adjustment represents a net benefit resulting primarily form (1) the resolution of audits of prior year returns and (2) tax law changes affecting our deferred tax liability. (C) Adjusted diluted shares are calculated by giving effect to the anti-dilutive impact of the Company’s convertible note hedge agreements, which reduce the potential economic dilution that otherwise would occur upon conversion of our senior subordinated convertible notes. Under GAAP, the anti-dilutive impact of the convertible note hedge agreements is not reflected in diluted shares.
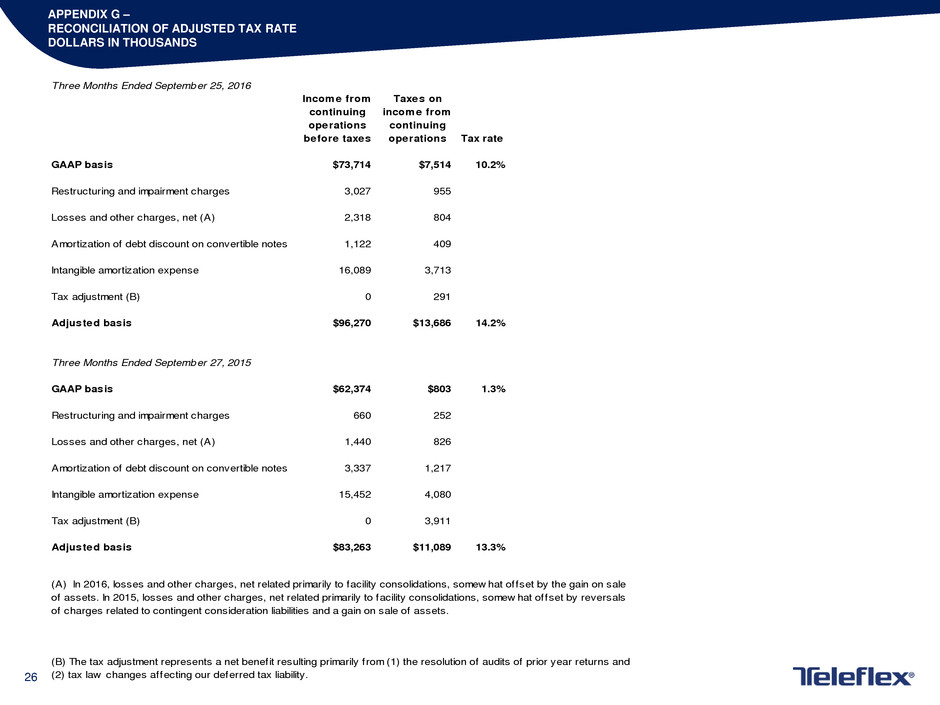
26 APPENDIX G – RECONCILIATION OF ADJUSTED TAX RATE DOLLARS IN THOUSANDS Three Months Ended September 25, 2016 Income from continuing operations before taxes Taxes on income from continuing operations Tax rate GAAP basis $73,714 $7,514 10.2% Restructuring and impairment charges 3,027 955 Losses and other charges, net (A) 2,318 804 Amortization of debt discount on convertible notes 1,122 409 Intangible amortization expense 16,089 3,713 Tax adjustment (B) 0 291 Adjusted basis $96,270 $13,686 14.2% Three Months Ended September 27, 2015 GAAP basis $62,374 $803 1.3% Restructuring and impairment charges 660 252 Losses and other charges, net (A) 1,440 826 Amortization of debt discount on convertible notes 3,337 1,217 Intangible amortization expense 15,452 4,080 Tax adjustment (B) 0 3,911 Adjusted basis $83,263 $11,089 13.3% (A) In 2016, losses and other charges, net related primarily to facility consolidations, somew hat offset by the gain on sale of assets. In 2015, losses and other charges, net related primarily to facility consolidations, somew hat offset by reversals of charges related to contingent consideration liabilities and a gain on sale of assets. (B) The tax adjustment represents a net benefit resulting primarily from (1) the resolution of audits of prior year returns and (2) tax law changes affecting our deferred tax liability.
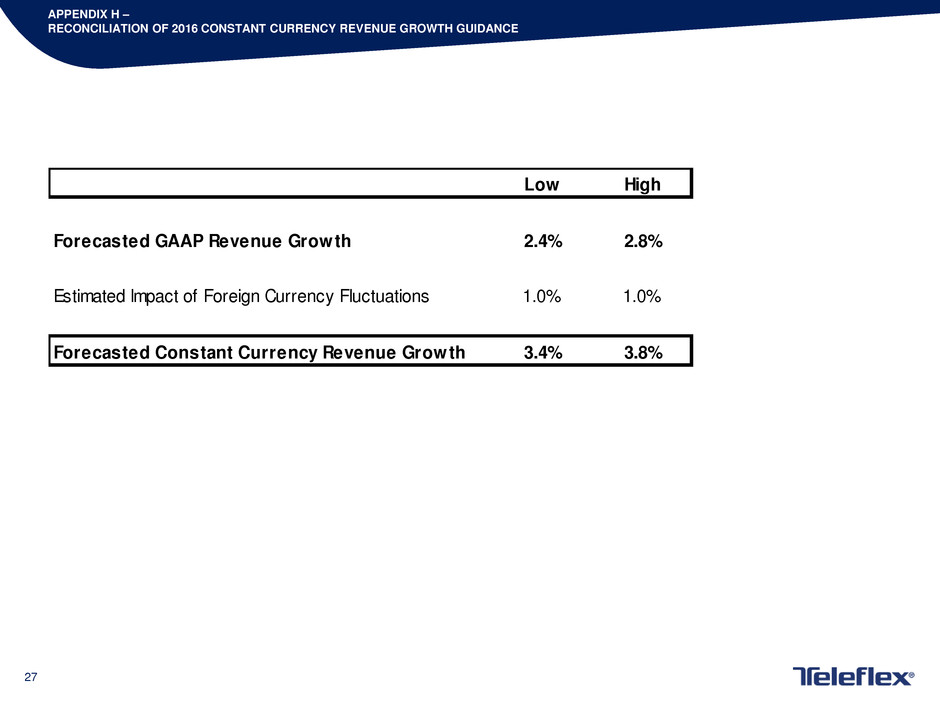
27 APPENDIX H – RECONCILIATION OF 2016 CONSTANT CURRENCY REVENUE GROWTH GUIDANCE Low High Forecasted GAAP Revenue Growth 2.4% 2.8% Estimated Impact of Foreign Currency Fluctuations 1.0% 1.0% Forecasted Constant Currency Revenue Growth 3.4% 3.8%
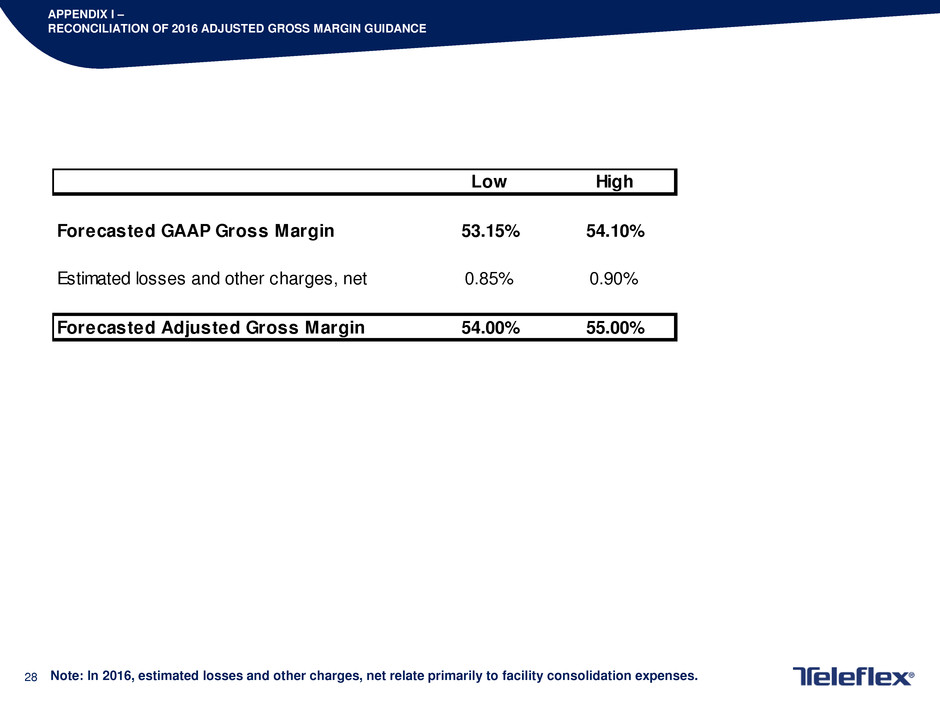
28 APPENDIX I – RECONCILIATION OF 2016 ADJUSTED GROSS MARGIN GUIDANCE Note: In 2016, estimated losses and other charges, net relate primarily to facility consolidation expenses. Low High Forecasted GAAP Gross Margin 53.15% 54.10% Estimated losses and other charges, net 0.85% 0.90% Forecasted Adjusted Gross Margin 54.00% 55.00%
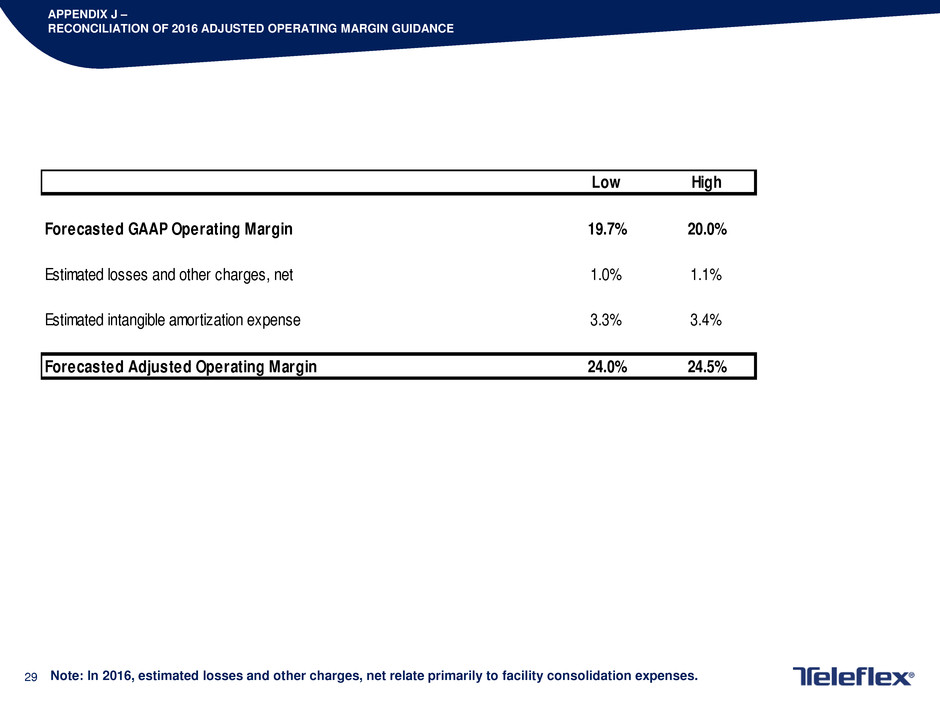
29 APPENDIX J – RECONCILIATION OF 2016 ADJUSTED OPERATING MARGIN GUIDANCE Note: In 2016, estimated losses and other charges, net relate primarily to facility consolidation expenses. Low High Forecasted GAAP Operating Margin 19.7% 20.0% Estimated losses and other charges, net 1.0% 1.1% Estimated intangible amortization expense 3.3% 3.4% Forecasted Adjusted Operating Margin 24.0% 24.5%
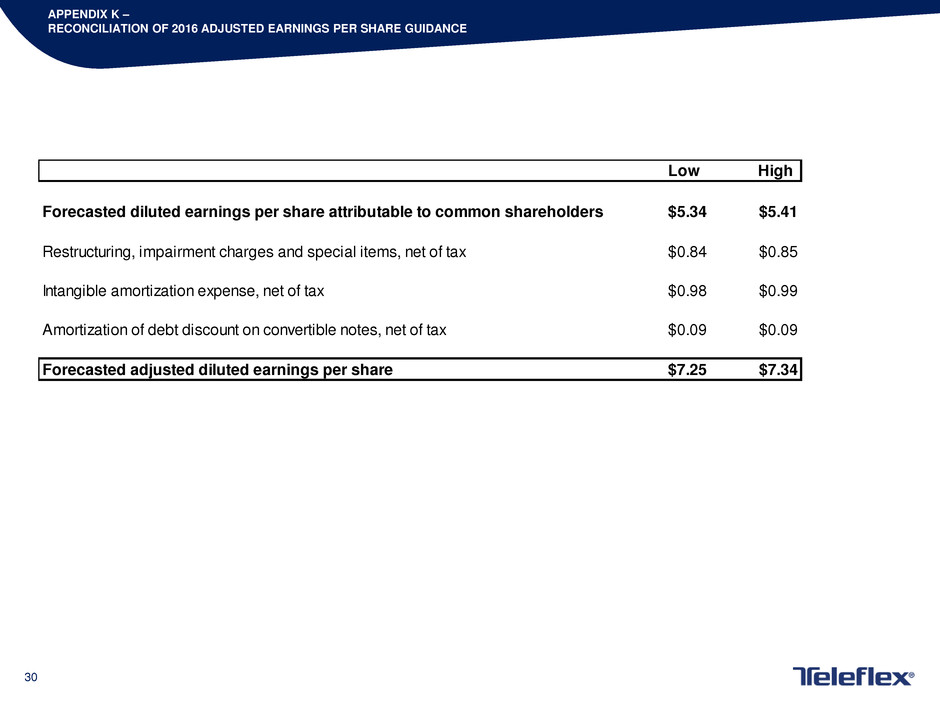
30 APPENDIX K – RECONCILIATION OF 2016 ADJUSTED EARNINGS PER SHARE GUIDANCE Low High Forecasted diluted earnings per share attributable to common shareholders $5.34 $5.41 Restructuring, impairment charges and special items, net of tax $0.84 $0.85 Intangible amortization expense, net of tax $0.98 $0.99 Amortization of debt discount on convertible notes, net of tax $0.09 $0.09 Forecasted adjusted diluted earnings per share $7.25 $7.34