
Teleflex Incorporated Fourth Quarter 2018 Earnings Conference Call 1
Conference Call Logistics The release, accompanying slides, and replay webcast are available online at www.teleflex.com (click on “Investors”) Telephone replay available by dialing (855) 859-2056 or for international calls, (404) 537-3406, pass code number 3059948 2
Today’s Speakers Liam Kelly President and CEO Thomas Powell Executive Vice President and CFO Jake Elguicze Treasurer and Vice President, Investor Relations 3
Note on Forward-Looking Statements This presentation and our discussion contain forward-looking information and statements including, but not limited to, our expected commercial efforts in 2019 related to our MANTA Vascular Closure Device; statements regarding our 2019 strategic initiatives; forecasted 2019 GAAP, constant currency and organic constant currency revenue growth, GAAP and adjusted gross and operating margins, GAAP and adjusted earnings per share and the items that are expected to impact each of those forecasted results; our assumptions with respect to the euro to U.S. dollar exchange rate for 2019 and our adjusted weighted average shares for 2019; estimated pre-tax charges we expect to incur in connection with our ongoing restructuring programs; estimated annualized pre-tax savings we expect to realize in connection with our ongoing restructuring programs and a similar initiative within our OEM segment (the “OEM initiative”); our expectations with respect to when we will begin to realize savings from our ongoing restructuring programs and the OEM initiative and when those programs will be substantially completed; and other matters which inherently involve risks and uncertainties which could cause actual results to differ from those projected or implied in the forward–looking statements. These risks and uncertainties are addressed in our SEC filings, including our most recent Form 10-K. We expressly disclaim any obligation to update forward-looking statements, except as otherwise specifically stated by us or as required by law or regulation. Note on Non-GAAP Financial Measures This presentation refers to certain non-GAAP financial measures, including, but not limited to, constant currency revenue growth, organic constant currency revenue growth, adjusted diluted earnings per share, adjusted gross and operating margins and adjusted tax rate. These non-GAAP financial measures should not be considered replacements for, and should be read together with, the most comparable GAAP financial measures. Tables reconciling these non-GAAP financial measures to the most comparable GAAP financial measures are contained within this presentation and the appendices at the end of this presentation. Additional Notes This document contains certain highlights with respect to our fourth quarter and full year 2018 performance and developments and does not purport to be a complete summary thereof. Accordingly, we encourage you to read our Earnings Release for the quarter ended December 31, 2018 located in the investor section of our website at www.teleflex.com and our Annual Report on Form 10-k for the year ended December 31, 2018 to be filed with the Securities and Exchange Commission. Unless otherwise noted, the following slides reflect continuing operations. 4
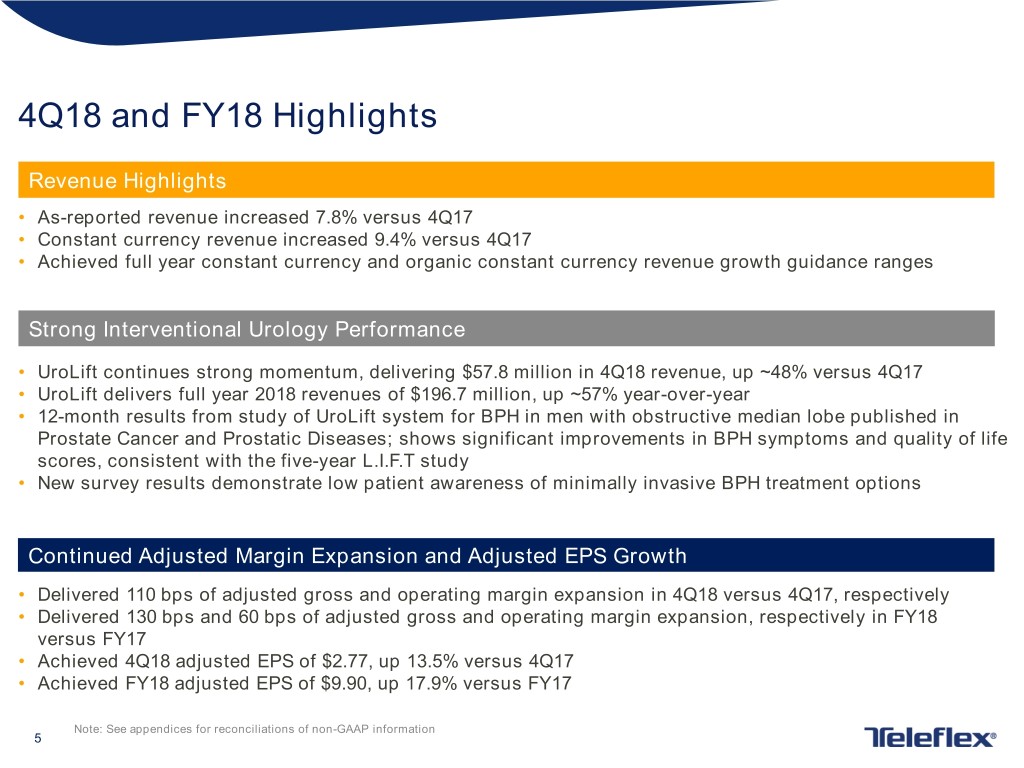
4Q18 and FY18 Highlights Revenue Highlights • As-reported revenue increased 7.8% versus 4Q17 • Constant currency revenue increased 9.4% versus 4Q17 • Achieved full year constant currency and organic constant currency revenue growth guidance ranges Strong Interventional Urology Performance • UroLift continues strong momentum, delivering $57.8 million in 4Q18 revenue, up ~48% versus 4Q17 • UroLift delivers full year 2018 revenues of $196.7 million, up ~57% year-over-year • 12-month results from study of UroLift system for BPH in men with obstructive median lobe published in Prostate Cancer and Prostatic Diseases; shows significant improvements in BPH symptoms and quality of life scores, consistent with the five-year L.I.F.T study • New survey results demonstrate low patient awareness of minimally invasive BPH treatment options Continued Adjusted Margin Expansion and Adjusted EPS Growth • Delivered 110 bps of adjusted gross and operating margin expansion in 4Q18 versus 4Q17, respectively • Delivered 130 bps and 60 bps of adjusted gross and operating margin expansion, respectively in FY18 versus FY17 • Achieved 4Q18 adjusted EPS of $2.77, up 13.5% versus 4Q17 • Achieved FY18 adjusted EPS of $9.90, up 17.9% versus FY17 Note: See appendices for reconciliations of non-GAAP information 5
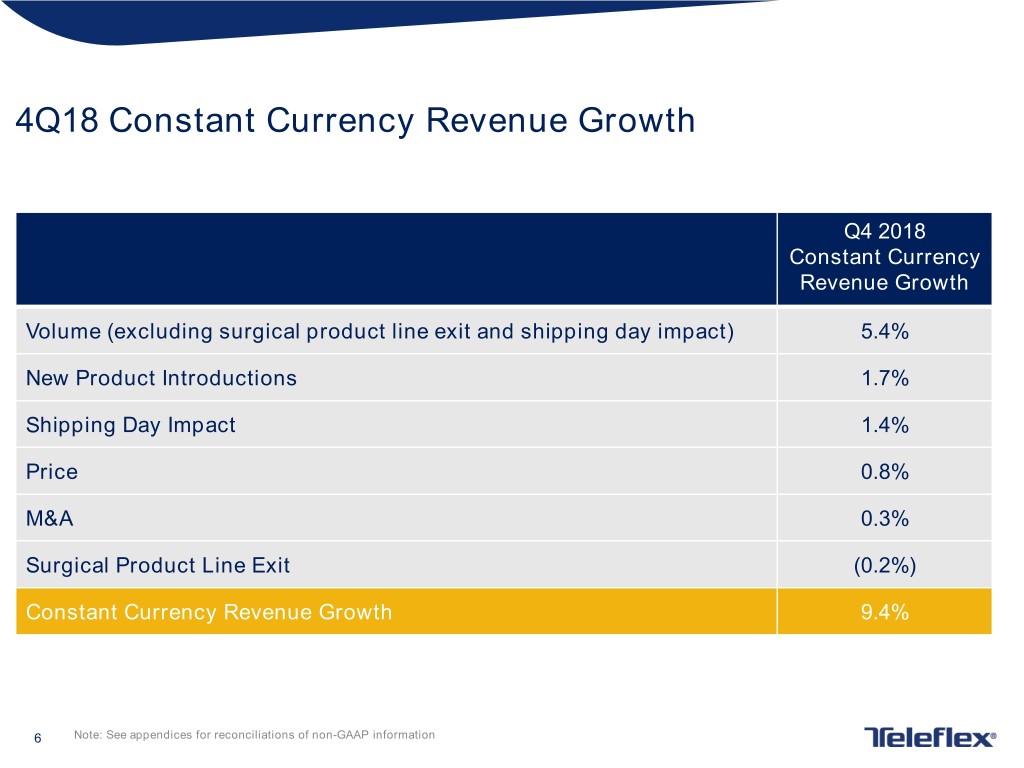
4Q18 Constant Currency Revenue Growth Q4 2018 Constant Currency Revenue Growth Volume (excluding surgical product line exit and shipping day impact) 5.4% New Product Introductions 1.7% Shipping Day Impact 1.4% Price 0.8% M&A 0.3% Surgical Product Line Exit (0.2%) Constant Currency Revenue Growth 9.4% 6 Note: See appendices for reconciliations of non-GAAP information
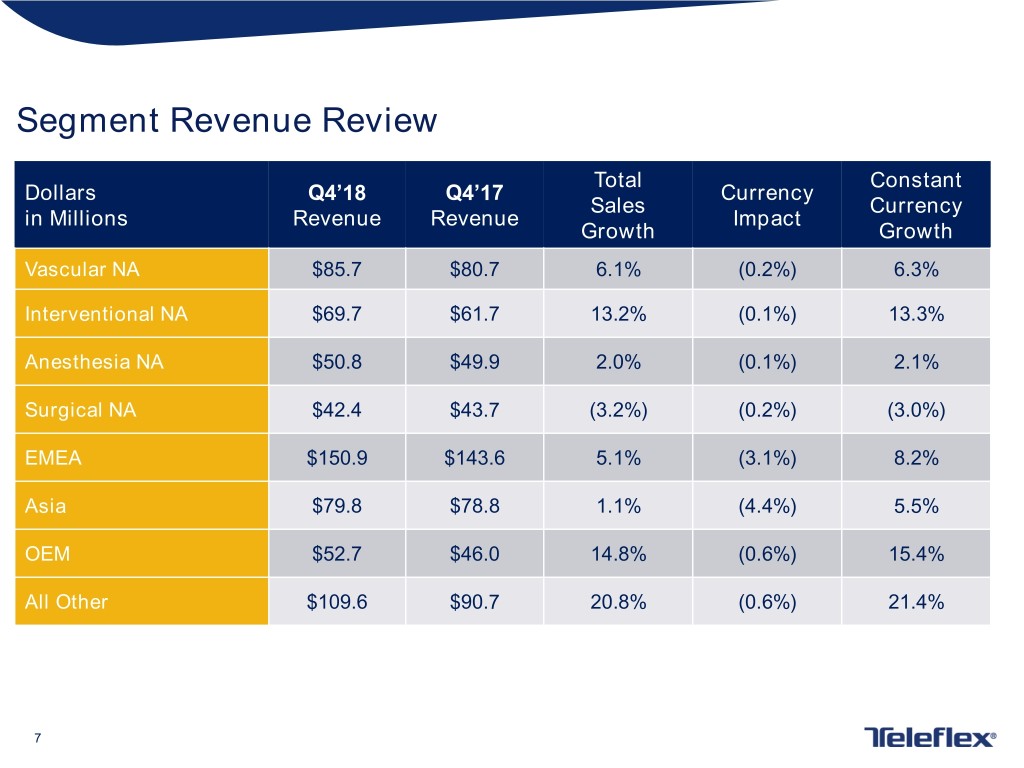
Segment Revenue Review Total Constant Dollars Q4’18 Q4’17 Currency Sales Currency in Millions Revenue Revenue Impact Growth Growth Vascular NA $85.7 $80.7 6.1% (0.2%) 6.3% Interventional NA $69.7 $61.7 13.2% (0.1%) 13.3% Anesthesia NA $50.8 $49.9 2.0% (0.1%) 2.1% Surgical NA $42.4 $43.7 (3.2%) (0.2%) (3.0%) EMEA $150.9 $143.6 5.1% (3.1%) 8.2% Asia $79.8 $78.8 1.1% (4.4%) 5.5% OEM $52.7 $46.0 14.8% (0.6%) 15.4% All Other $109.6 $90.7 20.8% (0.6%) 21.4% 7
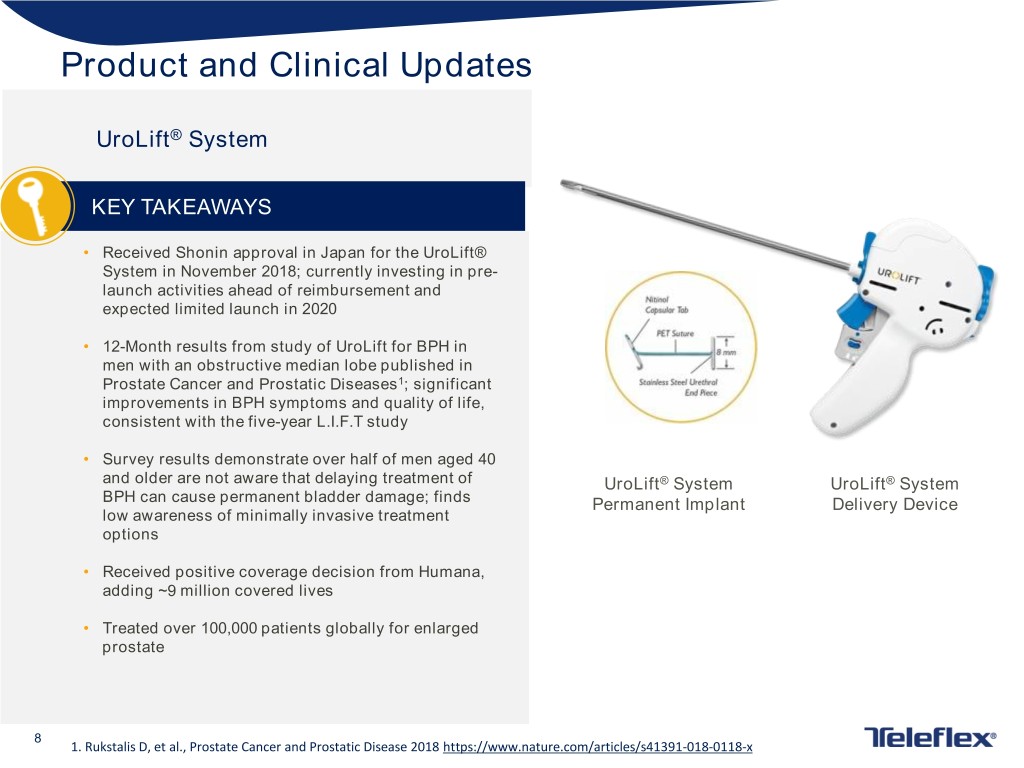
Product and Clinical Updates UroLift® System KEY TAKEAWAYS • Received Shonin approval in Japan for the UroLift® System in November 2018; currently investing in pre- launch activities ahead of reimbursement and expected limited launch in 2020 • 12-Month results from study of UroLift for BPH in men with an obstructive median lobe published in Prostate Cancer and Prostatic Diseases1; significant improvements in BPH symptoms and quality of life, consistent with the five-year L.I.F.T study • Survey results demonstrate over half of men aged 40 and older are not aware that delaying treatment of UroLift® System UroLift® System BPH can cause permanent bladder damage; finds Permanent Implant Delivery Device low awareness of minimally invasive treatment options • Received positive coverage decision from Humana, adding ~9 million covered lives • Treated over 100,000 patients globally for enlarged prostate 8 1. Rukstalis D, et al., Prostate Cancer and Prostatic Disease 2018 https://www.nature.com/articles/s41391-018-0118-x
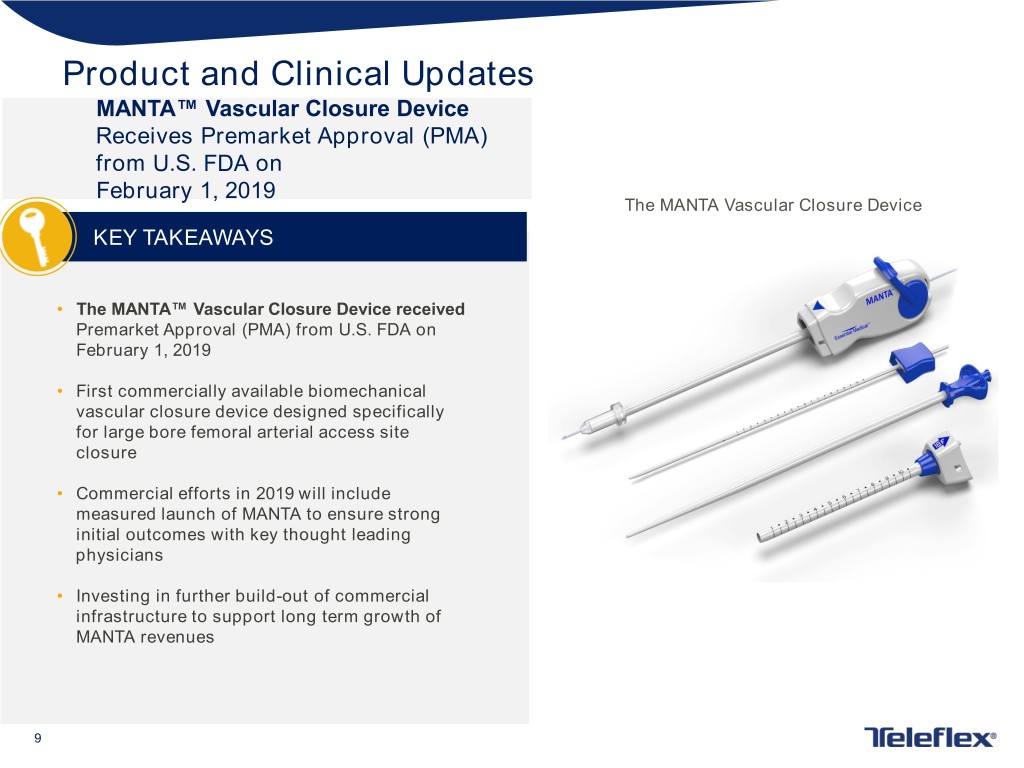
Product and Clinical Updates MANTA™ Vascular Closure Device Receives Premarket Approval (PMA) from U.S. FDA on February 1, 2019 The MANTA Vascular Closure Device KEY TAKEAWAYS • The MANTA™ Vascular Closure Device received Premarket Approval (PMA) from U.S. FDA on February 1, 2019 • First commercially available biomechanical vascular closure device designed specifically for large bore femoral arterial access site closure • Commercial efforts in 2019 will include measured launch of MANTA to ensure strong initial outcomes with key thought leading physicians • Investing in further build-out of commercial infrastructure to support long term growth of MANTA revenues 9

2019 Strategic Initiatives Delivering 6% - 7% Constant Currency Revenue Growth and Robust Adjusted Earnings Growth While Investing in the Future • Execute go-deep commercial strategy Drive Penetration • Methodically expand sales force (reps and clinical associates) of UroLift • Leverage strong reimbursement and >270 million covered lives • Interventional Urology: Expand direct-to-consumer campaign; Build pre- commercial infrastructure in Japan Invest in Growth • Interventional Access: Build MANTA commercial infrastructure; Drive Businesses ON-CONTROL utilization • Vascular: Invest behind EZ-IO commercial team • Asia: Add sales and clinical support resources • Complete RePlas BLA submission in 3Q19 Advance Pipeline • Begin UroLift 2 Roll-out in 2H19 Products • Methodically introduce Percuvance to leading KOLs Execute • Deliver anticipated synergies from previously announced programs Restructuring • Initiate 2019 restructuring program Initiatives 10
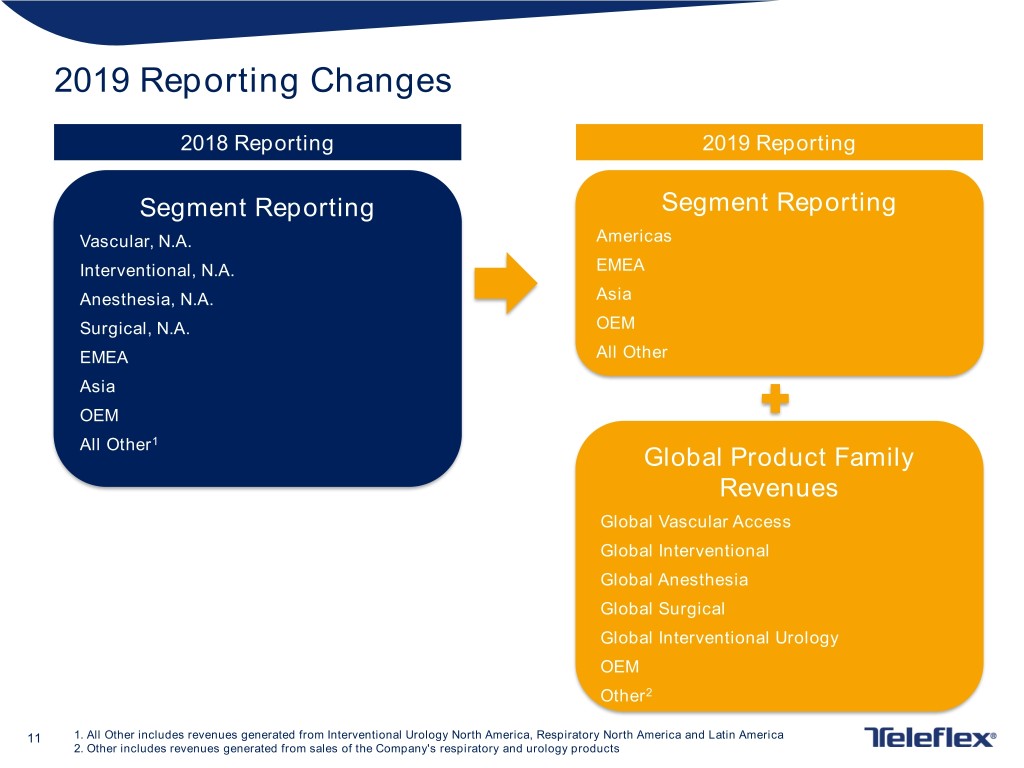
2019 Reporting Changes 2018 Reporting 2019 Reporting Segment Reporting Segment Reporting Vascular, N.A. Americas Interventional, N.A. EMEA Anesthesia, N.A. Asia Surgical, N.A. OEM EMEA All Other Asia OEM All Other1 Global Product Family Revenues Global Vascular Access Global Interventional Global Anesthesia Global Surgical Global Interventional Urology OEM Other2 11 1. All Other includes revenues generated from Interventional Urology North America, Respiratory North America and Latin America 2. Other includes revenues generated from sales of the Company's respiratory and urology products
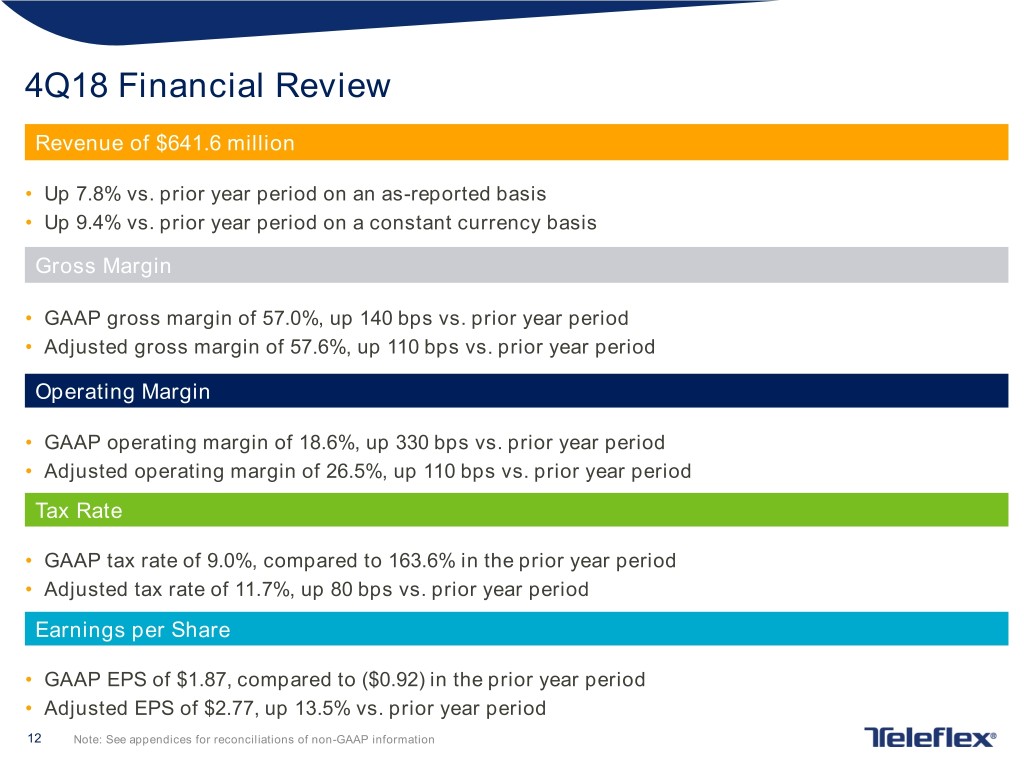
4Q18 Financial Review Revenue of $641.6 million • Up 7.8% vs. prior year period on an as-reported basis • Up 9.4% vs. prior year period on a constant currency basis Gross Margin • GAAP gross margin of 57.0%, up 140 bps vs. prior year period • Adjusted gross margin of 57.6%, up 110 bps vs. prior year period Operating Margin • GAAP operating margin of 18.6%, up 330 bps vs. prior year period • Adjusted operating margin of 26.5%, up 110 bps vs. prior year period Tax Rate • GAAP tax rate of 9.0%, compared to 163.6% in the prior year period • Adjusted tax rate of 11.7%, up 80 bps vs. prior year period Earnings per Share • GAAP EPS of $1.87, compared to ($0.92) in the prior year period • Adjusted EPS of $2.77, up 13.5% vs. prior year period 12 Note: See appendices for reconciliations of non-GAAP information
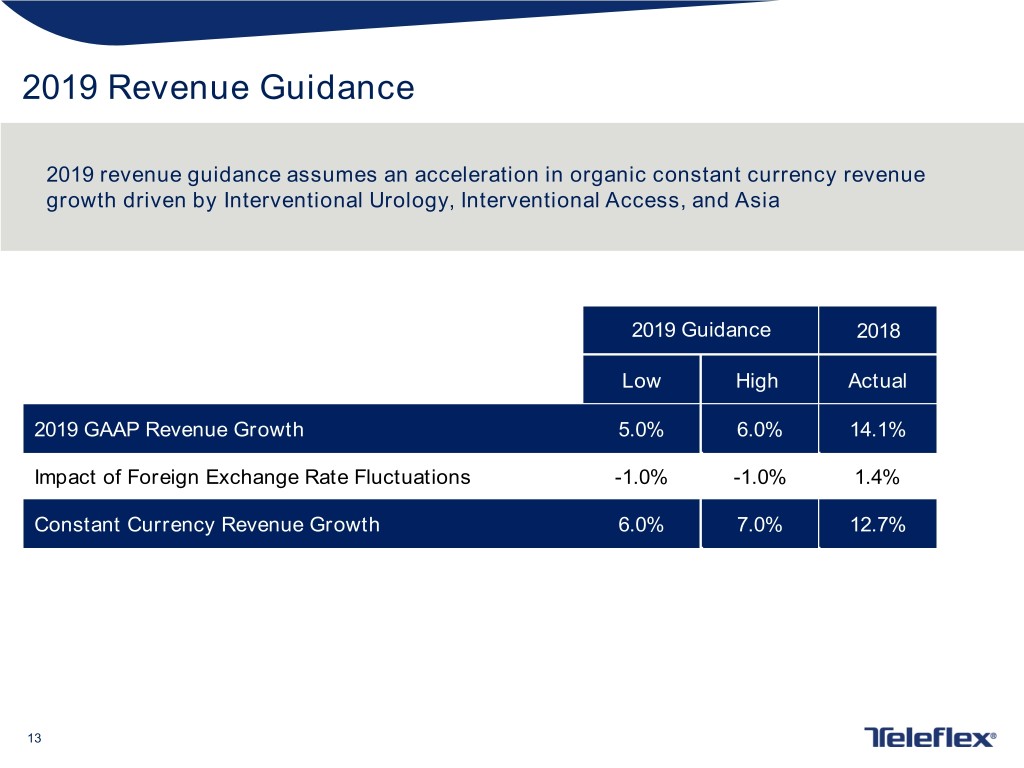
2019 Revenue Guidance 2019 revenue guidance assumes an acceleration in organic constant currency revenue growth driven by Interventional Urology, Interventional Access, and Asia 2019 Guidance 2018 Low High Actual 2019 GAAP Revenue Growth 5.0% 6.0% 14.1% Impact of Foreign Exchange Rate Fluctuations -1.0% -1.0% 1.4% Constant Currency Revenue Growth 6.0% 7.0% 12.7% 13
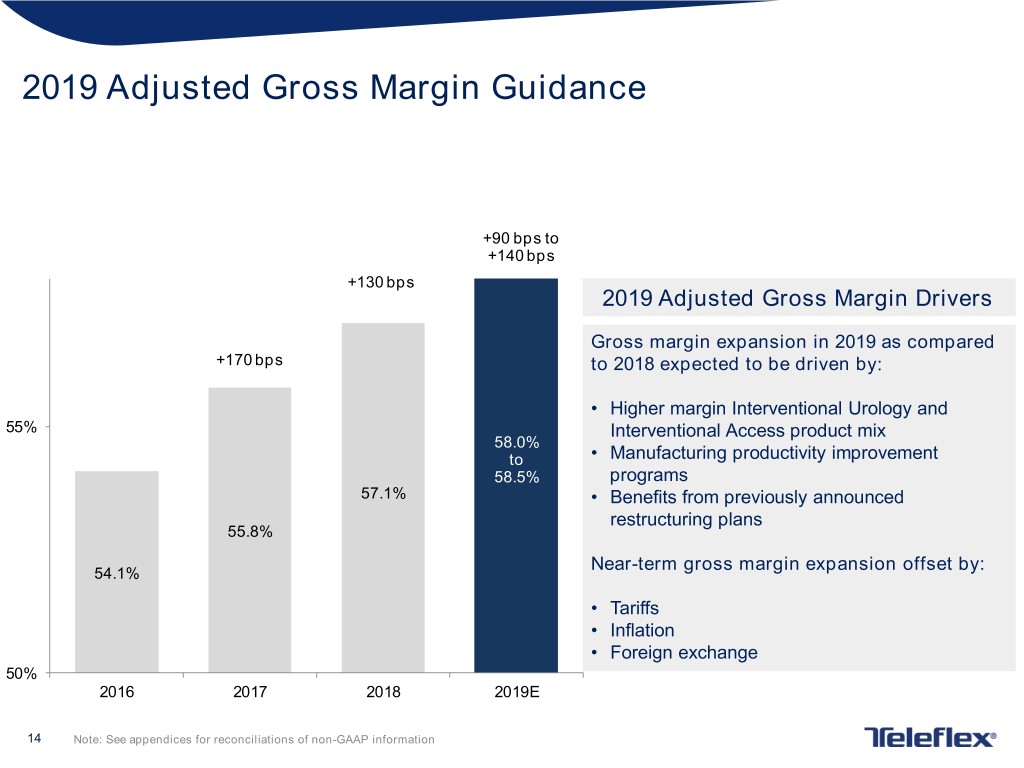
2019 Adjusted Gross Margin Guidance +90 bps to +140 bps +130 bps 2019 Adjusted Gross Margin Drivers Gross margin expansion in 2019 as compared +170 bps to 2018 expected to be driven by: • Higher margin Interventional Urology and 55% Interventional Access product mix 58.0% to • Manufacturing productivity improvement 58.5% programs 57.1% • Benefits from previously announced restructuring plans 55.8% Near-term gross margin expansion offset by: 54.1% • Tariffs • Inflation • Foreign exchange 50% 2016 2017 2018 2019E 14 Note: See appendices for reconciliations of non-GAAP information
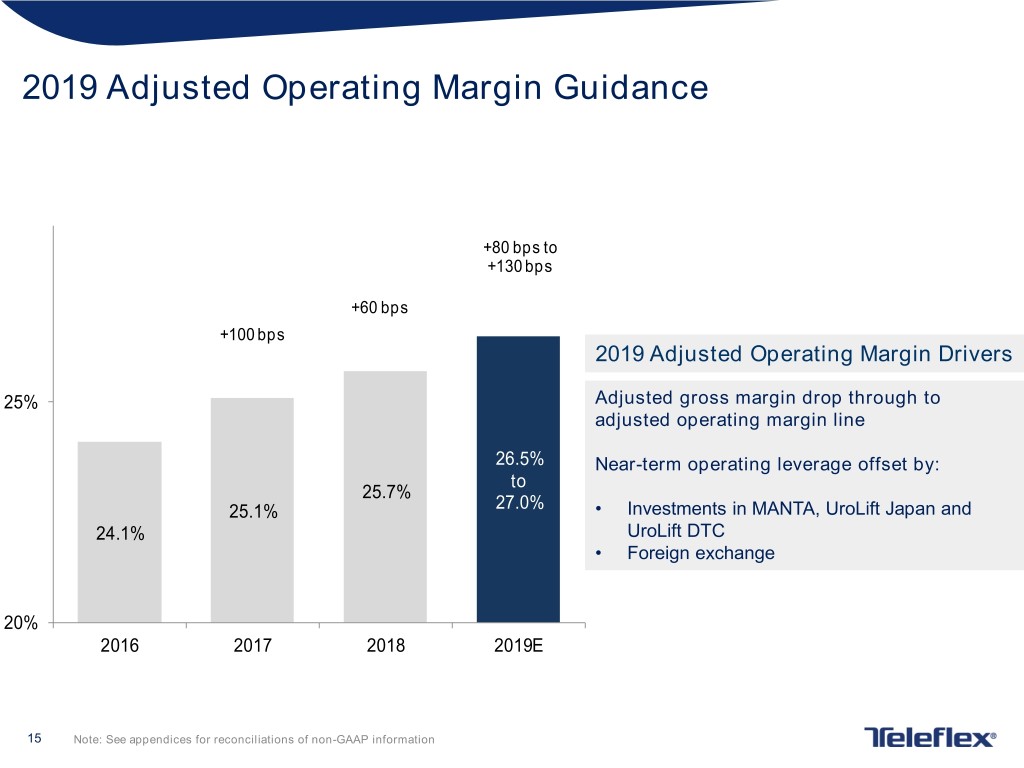
2019 Adjusted Operating Margin Guidance +80 bps to +130 bps +60 bps +100 bps 2019 Adjusted Operating Margin Drivers 25% Adjusted gross margin drop through to adjusted operating margin line 26.5% Near-term operating leverage offset by: to 25.7% 25.1% 27.0% • Investments in MANTA, UroLift Japan and 24.1% UroLift DTC • Foreign exchange 20% 2016 2017 2018 2019E 15 Note: See appendices for reconciliations of non-GAAP information
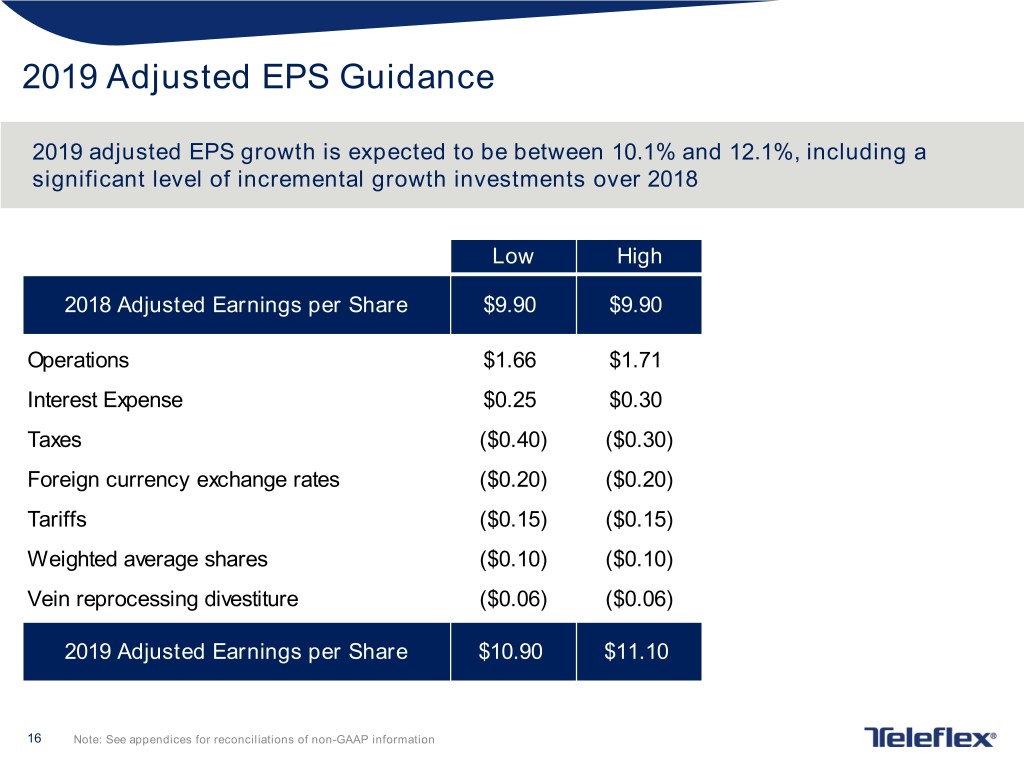
2019 Adjusted EPS Guidance 2019 adjusted EPS growth is expected to be between 10.1% and 12.1%, including a significant level of incremental growth investments over 2018 Low High 2018 Adjusted Earnings per Share $9.90 $9.90 Operations $1.66 $1.71 Interest Expense $0.25 $0.30 Taxes ($0.40) ($0.30) Foreign currency exchange rates ($0.20) ($0.20) Tariffs ($0.15) ($0.15) Weighted average shares ($0.10) ($0.10) Vein reprocessing divestiture ($0.06) ($0.06) 2019 Adjusted Earnings per Share $10.90 $11.10 16 Note: See appendices for reconciliations of non-GAAP information

Question and Answer Section 17

THANK YOU 18
Appendices 19
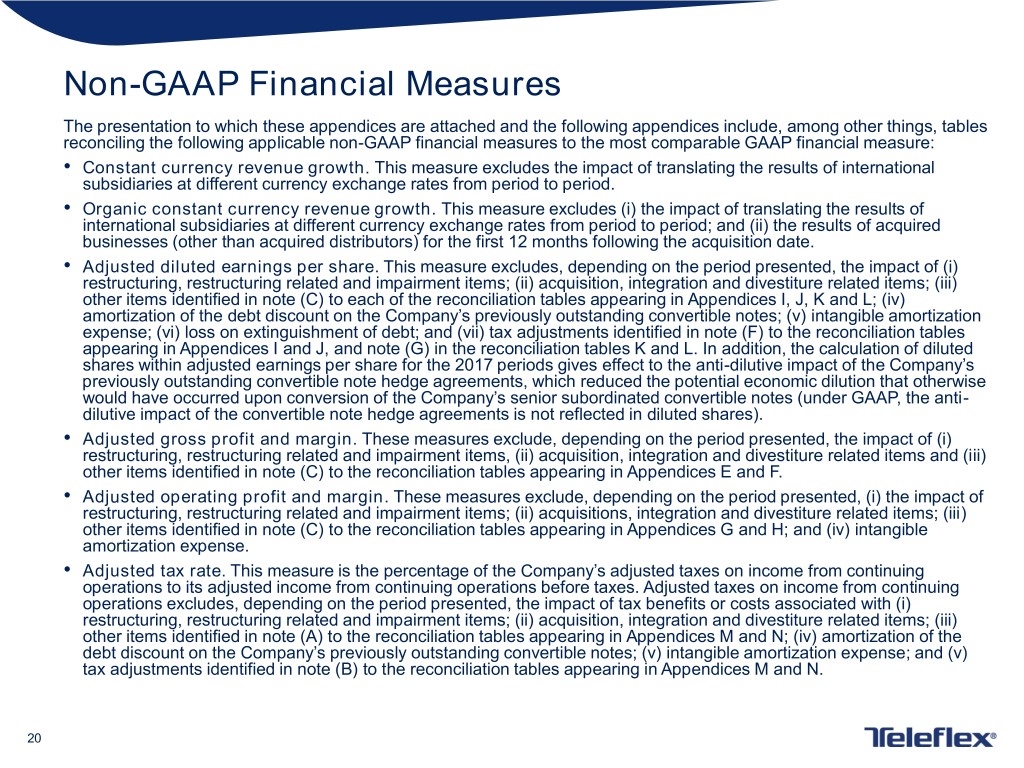
Non-GAAP Financial Measures The presentation to which these appendices are attached and the following appendices include, among other things, tables reconciling the following applicable non-GAAP financial measures to the most comparable GAAP financial measure: • Constant currency revenue growth. This measure excludes the impact of translating the results of international subsidiaries at different currency exchange rates from period to period. • Organic constant currency revenue growth. This measure excludes (i) the impact of translating the results of international subsidiaries at different currency exchange rates from period to period; and (ii) the results of acquired businesses (other than acquired distributors) for the first 12 months following the acquisition date. • Adjusted diluted earnings per share. This measure excludes, depending on the period presented, the impact of (i) restructuring, restructuring related and impairment items; (ii) acquisition, integration and divestiture related items; (iii) other items identified in note (C) to each of the reconciliation tables appearing in Appendices I, J, K and L; (iv) amortization of the debt discount on the Company’s previously outstanding convertible notes; (v) intangible amortization expense; (vi) loss on extinguishment of debt; and (vii) tax adjustments identified in note (F) to the reconciliation tables appearing in Appendices I and J, and note (G) in the reconciliation tables K and L. In addition, the calculation of diluted shares within adjusted earnings per share for the 2017 periods gives effect to the anti-dilutive impact of the Company’s previously outstanding convertible note hedge agreements, which reduced the potential economic dilution that otherwise would have occurred upon conversion of the Company’s senior subordinated convertible notes (under GAAP, the anti- dilutive impact of the convertible note hedge agreements is not reflected in diluted shares). • Adjusted gross profit and margin. These measures exclude, depending on the period presented, the impact of (i) restructuring, restructuring related and impairment items, (ii) acquisition, integration and divestiture related items and (iii) other items identified in note (C) to the reconciliation tables appearing in Appendices E and F. • Adjusted operating profit and margin. These measures exclude, depending on the period presented, (i) the impact of restructuring, restructuring related and impairment items; (ii) acquisitions, integration and divestiture related items; (iii) other items identified in note (C) to the reconciliation tables appearing in Appendices G and H; and (iv) intangible amortization expense. • Adjusted tax rate. This measure is the percentage of the Company’s adjusted taxes on income from continuing operations to its adjusted income from continuing operations before taxes. Adjusted taxes on income from continuing operations excludes, depending on the period presented, the impact of tax benefits or costs associated with (i) restructuring, restructuring related and impairment items; (ii) acquisition, integration and divestiture related items; (iii) other items identified in note (A) to the reconciliation tables appearing in Appendices M and N; (iv) amortization of the debt discount on the Company’s previously outstanding convertible notes; (v) intangible amortization expense; and (v) tax adjustments identified in note (B) to the reconciliation tables appearing in Appendices M and N. 20
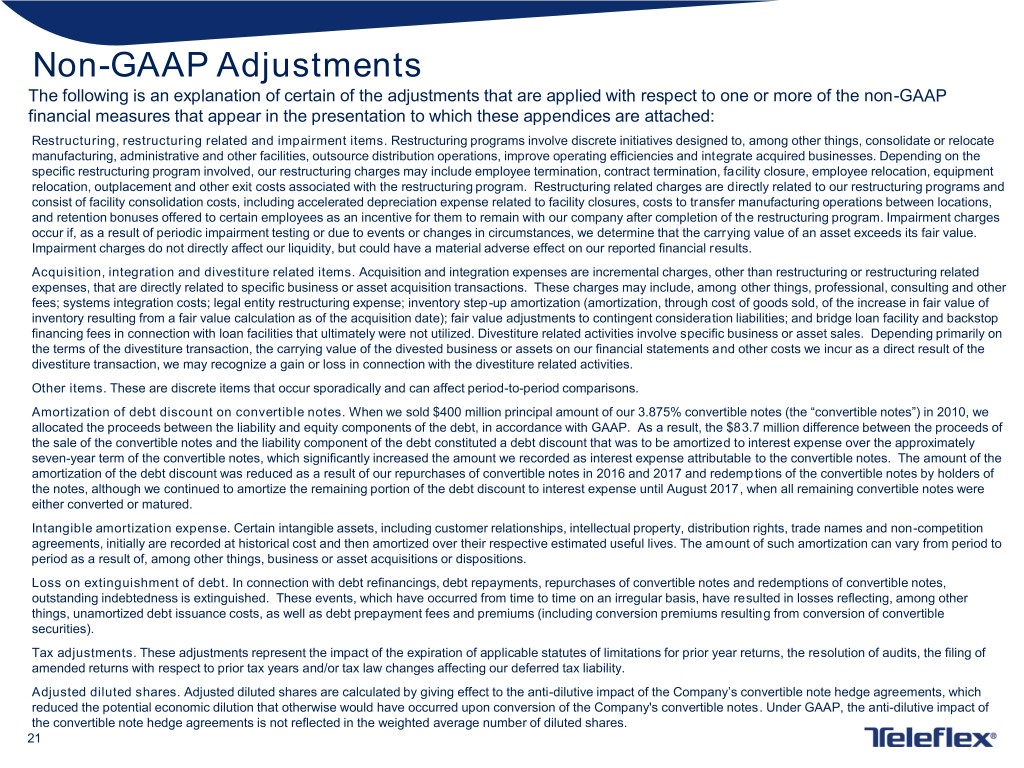
Non-GAAP Adjustments The following is an explanation of certain of the adjustments that are applied with respect to one or more of the non-GAAP financial measures that appear in the presentation to which these appendices are attached: Restructuring, restructuring related and impairment items. Restructuring programs involve discrete initiatives designed to, among other things, consolidate or relocate manufacturing, administrative and other facilities, outsource distribution operations, improve operating efficiencies and integrate acquired businesses. Depending on the specific restructuring program involved, our restructuring charges may include employee termination, contract termination, facility closure, employee relocation, equipment relocation, outplacement and other exit costs associated with the restructuring program. Restructuring related charges are directly related to our restructuring programs and consist of facility consolidation costs, including accelerated depreciation expense related to facility closures, costs to transfer manufacturing operations between locations, and retention bonuses offered to certain employees as an incentive for them to remain with our company after completion of the restructuring program. Impairment charges occur if, as a result of periodic impairment testing or due to events or changes in circumstances, we determine that the carrying value of an asset exceeds its fair value. Impairment charges do not directly affect our liquidity, but could have a material adverse effect on our reported financial results. Acquisition, integration and divestiture related items. Acquisition and integration expenses are incremental charges, other than restructuring or restructuring related expenses, that are directly related to specific business or asset acquisition transactions. These charges may include, among other things, professional, consulting and other fees; systems integration costs; legal entity restructuring expense; inventory step-up amortization (amortization, through cost of goods sold, of the increase in fair value of inventory resulting from a fair value calculation as of the acquisition date); fair value adjustments to contingent consideration liabilities; and bridge loan facility and backstop financing fees in connection with loan facilities that ultimately were not utilized. Divestiture related activities involve specific business or asset sales. Depending primarily on the terms of the divestiture transaction, the carrying value of the divested business or assets on our financial statements and other costs we incur as a direct result of the divestiture transaction, we may recognize a gain or loss in connection with the divestiture related activities. Other items. These are discrete items that occur sporadically and can affect period-to-period comparisons. Amortization of debt discount on convertible notes. When we sold $400 million principal amount of our 3.875% convertible notes (the “convertible notes”) in 2010, we allocated the proceeds between the liability and equity components of the debt, in accordance with GAAP. As a result, the $83.7 million difference between the proceeds of the sale of the convertible notes and the liability component of the debt constituted a debt discount that was to be amortized to interest expense over the approximately seven-year term of the convertible notes, which significantly increased the amount we recorded as interest expense attributable to the convertible notes. The amount of the amortization of the debt discount was reduced as a result of our repurchases of convertible notes in 2016 and 2017 and redemptions of the convertible notes by holders of the notes, although we continued to amortize the remaining portion of the debt discount to interest expense until August 2017, when all remaining convertible notes were either converted or matured. Intangible amortization expense. Certain intangible assets, including customer relationships, intellectual property, distribution rights, trade names and non-competition agreements, initially are recorded at historical cost and then amortized over their respective estimated useful lives. The amount of such amortization can vary from period to period as a result of, among other things, business or asset acquisitions or dispositions. Loss on extinguishment of debt. In connection with debt refinancings, debt repayments, repurchases of convertible notes and redemptions of convertible notes, outstanding indebtedness is extinguished. These events, which have occurred from time to time on an irregular basis, have resulted in losses reflecting, among other things, unamortized debt issuance costs, as well as debt prepayment fees and premiums (including conversion premiums resulting from conversion of convertible securities). Tax adjustments. These adjustments represent the impact of the expiration of applicable statutes of limitations for prior year returns, the resolution of audits, the filing of amended returns with respect to prior tax years and/or tax law changes affecting our deferred tax liability. Adjusted diluted shares. Adjusted diluted shares are calculated by giving effect to the anti-dilutive impact of the Company’s convertible note hedge agreements, which reduced the potential economic dilution that otherwise would have occurred upon conversion of the Company's convertible notes. Under GAAP, the anti-dilutive impact of the convertible note hedge agreements is not reflected in the weighted average number of diluted shares. 21
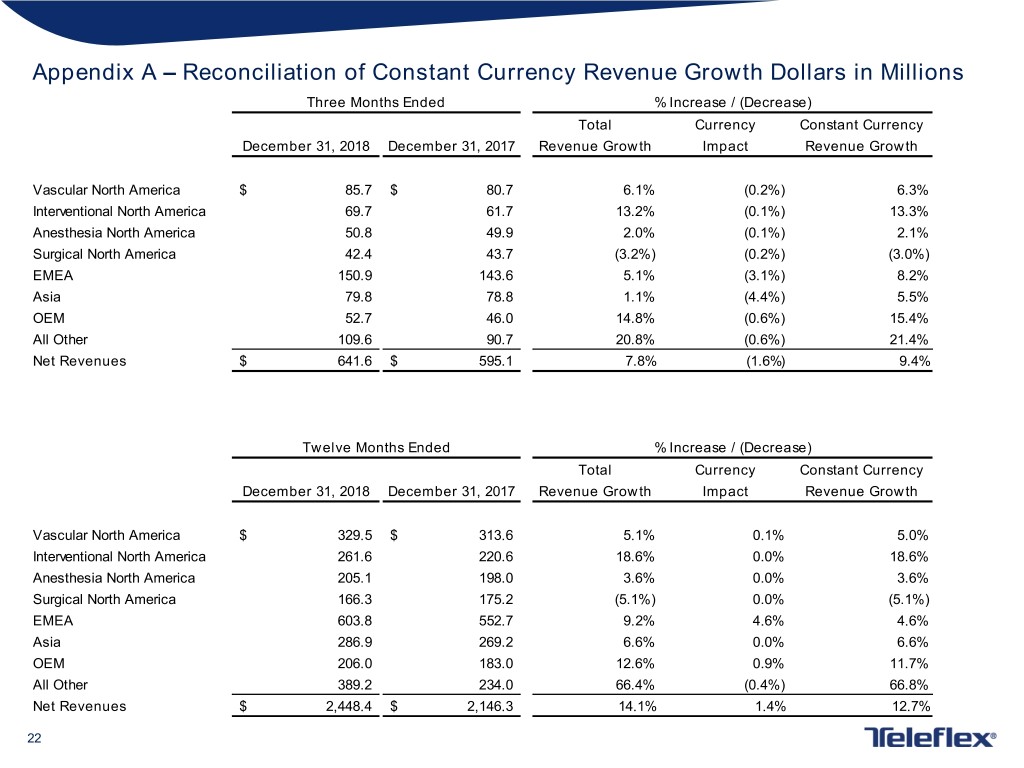
Appendix A – Reconciliation of Constant Currency Revenue Growth Dollars in Millions Three Months Ended % Increase / (Decrease) Total Currency Constant Currency December 31, 2018 December 31, 2017 Revenue Growth Impact Revenue Growth Vascular North America $ 85.7 $ 80.7 6.1% (0.2%) 6.3% Interventional North America 69.7 61.7 13.2% (0.1%) 13.3% Anesthesia North America 50.8 49.9 2.0% (0.1%) 2.1% Surgical North America 42.4 43.7 (3.2%) (0.2%) (3.0%) EMEA 150.9 143.6 5.1% (3.1%) 8.2% Asia 79.8 78.8 1.1% (4.4%) 5.5% OEM 52.7 46.0 14.8% (0.6%) 15.4% All Other 109.6 90.7 20.8% (0.6%) 21.4% Net Revenues $ 641.6 $ 595.1 7.8% (1.6%) 9.4% Twelve Months Ended % Increase / (Decrease) Total Currency Constant Currency December 31, 2018 December 31, 2017 Revenue Growth Impact Revenue Growth Vascular North America $ 329.5 $ 313.6 5.1% 0.1% 5.0% Interventional North America 261.6 220.6 18.6% 0.0% 18.6% Anesthesia North America 205.1 198.0 3.6% 0.0% 3.6% Surgical North America 166.3 175.2 (5.1%) 0.0% (5.1%) EMEA 603.8 552.7 9.2% 4.6% 4.6% Asia 286.9 269.2 6.6% 0.0% 6.6% OEM 206.0 183.0 12.6% 0.9% 11.7% All Other 389.2 234.0 66.4% (0.4%) 66.8% Net Revenues $ 2,448.4 $ 2,146.3 14.1% 1.4% 12.7% 22
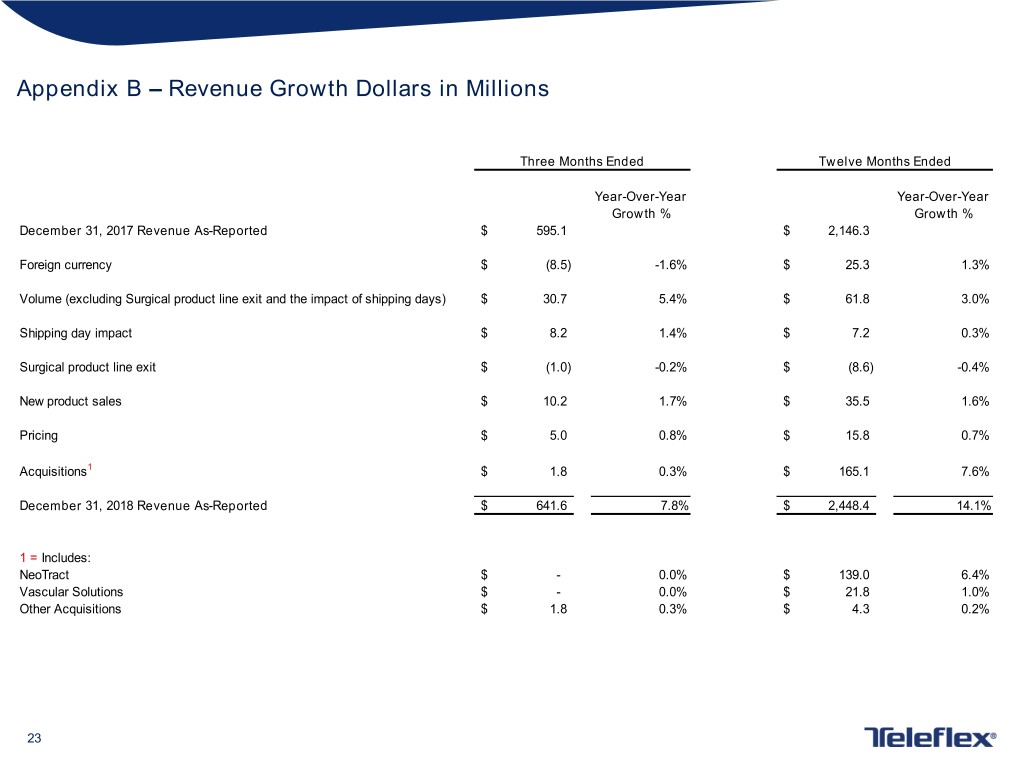
Appendix B – Revenue Growth Dollars in Millions Three Months Ended Twelve Months Ended Year-Over-Year Year-Over-Year Growth % Growth % December 31, 2017 Revenue As-Reported $ 595.1 $ 2,146.3 Foreign currency $ (8.5) -1.6% $ 25.3 1.3% Volume (excluding Surgical product line exit and the impact of shipping days) $ 30.7 5.4% $ 61.8 3.0% Shipping day impact $ 8.2 1.4% $ 7.2 0.3% Surgical product line exit $ (1.0) -0.2% $ (8.6) -0.4% New product sales $ 10.2 1.7% $ 35.5 1.6% Pricing $ 5.0 0.8% $ 15.8 0.7% Acquisitions1 $ 1.8 0.3% $ 165.1 7.6% December 31, 2018 Revenue As-Reported $ 641.6 7.8% $ 2,448.4 14.1% 1 = Includes: NeoTract $ - 0.0% $ 139.0 6.4% Vascular Solutions $ - 0.0% $ 21.8 1.0% Other Acquisitions $ 1.8 0.3% $ 4.3 0.2% 23
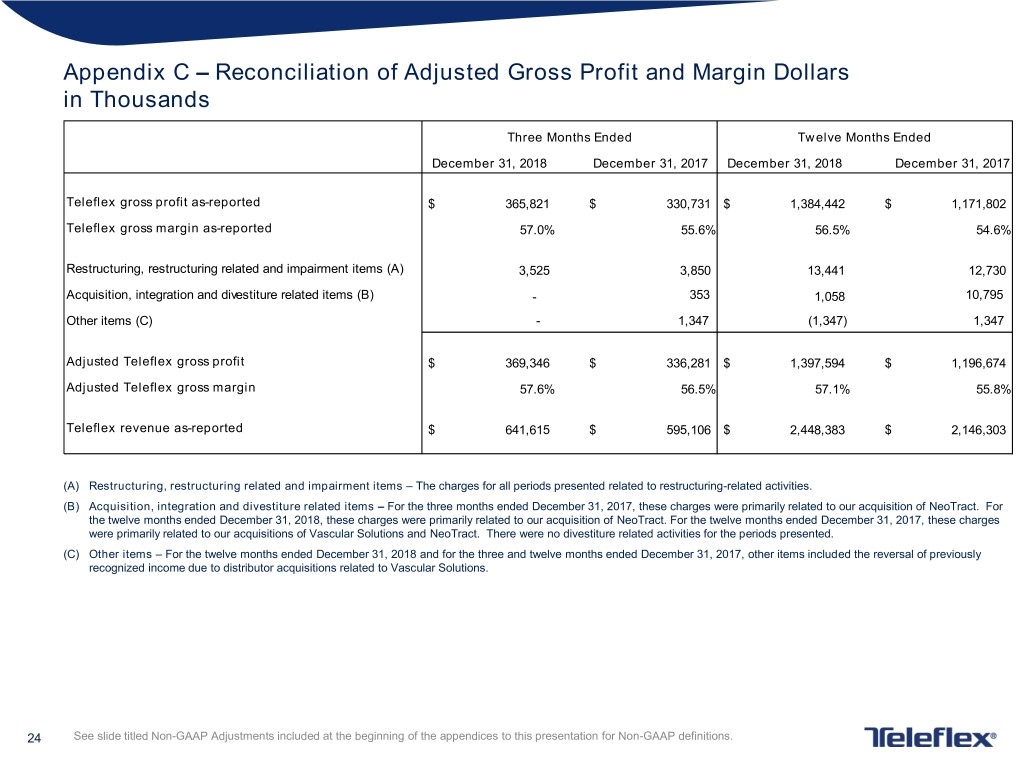
Appendix C – Reconciliation of Adjusted Gross Profit and Margin Dollars in Thousands Three Months Ended Twelve Months Ended December 31, 2018 December 31, 2017 December 31, 2018 December 31, 2017 Teleflex gross profit as-reported $ 365,821 $ 330,731 $ 1,384,442 $ 1,171,802 Teleflex gross margin as-reported 57.0% 55.6% 56.5% 54.6% Restructuring, restructuring related and impairment items (A) 3,525 3,850 13,441 12,730 Acquisition, integration and divestiture related items (B) - 353 1,058 10,795 Other items (C) - 1,347 (1,347) 1,347 Adjusted Teleflex gross profit $ 369,346 $ 336,281 $ 1,397,594 $ 1,196,674 Adjusted Teleflex gross margin 57.6% 56.5% 57.1% 55.8% Teleflex revenue as-reported $ 641,615 $ 595,106 $ 2,448,383 $ 2,146,303 (A) Restructuring, restructuring related and impairment items – The charges for all periods presented related to restructuring-related activities. (B) Acquisition, integration and divestiture related items – For the three months ended December 31, 2017, these charges were primarily related to our acquisition of NeoTract. For the twelve months ended December 31, 2018, these charges were primarily related to our acquisition of NeoTract. For the twelve months ended December 31, 2017, these charges were primarily related to our acquisitions of Vascular Solutions and NeoTract. There were no divestiture related activities for the periods presented. (C) Other items – For the twelve months ended December 31, 2018 and for the three and twelve months ended December 31, 2017, other items included the reversal of previously recognized income due to distributor acquisitions related to Vascular Solutions. 24 See slide titled Non-GAAP Adjustments included at the beginning of the appendices to this presentation for Non-GAAP definitions.
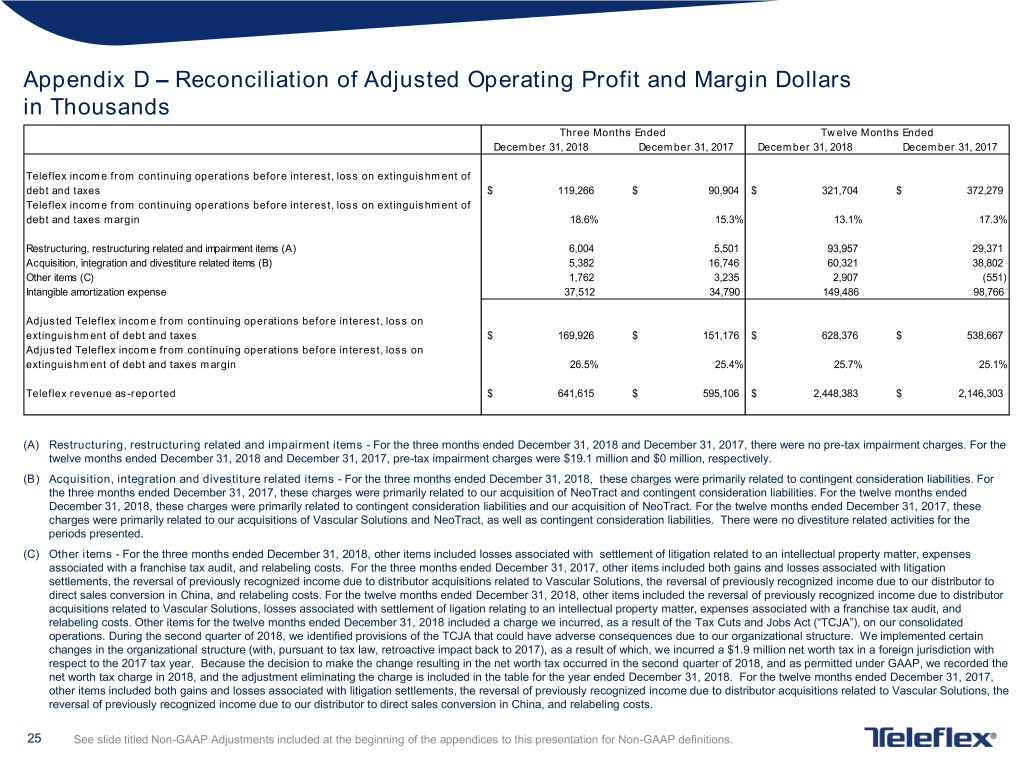
Appendix D – Reconciliation of Adjusted Operating Profit and Margin Dollars in Thousands Three Months Ended Twelve Months Ended December 31, 2018 December 31, 2017 December 31, 2018 December 31, 2017 Teleflex income from continuing operations before interest, loss on extinguishment of debt and taxes $ 119,266 $ 90,904 $ 321,704 $ 372,279 Teleflex income from continuing operations before interest, loss on extinguishment of debt and taxes margin 18.6% 15.3% 13.1% 17.3% Restructuring, restructuring related and impairment items (A) 6,004 5,501 93,957 29,371 Acquisition, integration and divestiture related items (B) 5,382 16,746 60,321 38,802 Other items (C) 1,762 3,235 2,907 (551) Intangible amortization expense 37,512 34,790 149,486 98,766 Adjusted Teleflex income from continuing operations before interest, loss on extinguishment of debt and taxes $ 169,926 $ 151,176 $ 628,376 $ 538,667 Adjusted Teleflex income from continuing operations before interest, loss on extinguishment of debt and taxes margin 26.5% 25.4% 25.7% 25.1% Teleflex revenue as-reported $ 641,615 $ 595,106 $ 2,448,383 $ 2,146,303 (A) Restructuring, restructuring related and impairment items - For the three months ended December 31, 2018 and December 31, 2017, there were no pre-tax impairment charges. For the twelve months ended December 31, 2018 and December 31, 2017, pre-tax impairment charges were $19.1 million and $0 million, respectively. (B) Acquisition, integration and divestiture related items - For the three months ended December 31, 2018, these charges were primarily related to contingent consideration liabilities. For the three months ended December 31, 2017, these charges were primarily related to our acquisition of NeoTract and contingent consideration liabilities. For the twelve months ended December 31, 2018, these charges were primarily related to contingent consideration liabilities and our acquisition of NeoTract. For the twelve months ended December 31, 2017, these charges were primarily related to our acquisitions of Vascular Solutions and NeoTract, as well as contingent consideration liabilities. There were no divestiture related activities for the periods presented. (C) Other items - For the three months ended December 31, 2018, other items included losses associated with settlement of litigation related to an intellectual property matter, expenses associated with a franchise tax audit, and relabeling costs. For the three months ended December 31, 2017, other items included both gains and losses associated with litigation settlements, the reversal of previously recognized income due to distributor acquisitions related to Vascular Solutions, the reversal of previously recognized income due to our distributor to direct sales conversion in China, and relabeling costs. For the twelve months ended December 31, 2018, other items included the reversal of previously recognized income due to distributor acquisitions related to Vascular Solutions, losses associated with settlement of ligation relating to an intellectual property matter, expenses associated with a franchise tax audit, and relabeling costs. Other items for the twelve months ended December 31, 2018 included a charge we incurred, as a result of the Tax Cuts and Jobs Act (“TCJA”), on our consolidated operations. During the second quarter of 2018, we identified provisions of the TCJA that could have adverse consequences due to our organizational structure. We implemented certain changes in the organizational structure (with, pursuant to tax law, retroactive impact back to 2017), as a result of which, we incurred a $1.9 million net worth tax in a foreign jurisdiction with respect to the 2017 tax year. Because the decision to make the change resulting in the net worth tax occurred in the second quarter of 2018, and as permitted under GAAP, we recorded the net worth tax charge in 2018, and the adjustment eliminating the charge is included in the table for the year ended December 31, 2018. For the twelve months ended December 31, 2017, other items included both gains and losses associated with litigation settlements, the reversal of previously recognized income due to distributor acquisitions related to Vascular Solutions, the reversal of previously recognized income due to our distributor to direct sales conversion in China, and relabeling costs. 25 See slide titled Non-GAAP Adjustments included at the beginning of the appendices to this presentation for Non-GAAP definitions.

Appendix E – Reconciliation of 2016 Adjusted Gross and Operating Profit and Margin Dollars in Thousands Twelve Months Ended Twelve Months Ended December 31, 2016 December 31, 2016 Income from continuing operations before interest, loss on Gross profit as-reported $ 996,200 extinguishment of debt and taxes $ 319,453 Income from continuing operations before interest, loss on Gross margin as-reported 53.3% extinguishment of debt and taxes margin 17.1% Restructuring, restructuring related and impairment items (A) 14,559 Restructuring, restructuring related and impairment items (A) 74,559 Acquisition, integration and divestiture related items (B) - Acquisition, integration and divestiture related items (B) (7,399) Other items (C) - Other items (C) 572 Intangible amortization expense 63,491 Adjusted income from continuing operations before interest, loss Adjusted gross profit $ 1,010,759 on extinguishment of debt and taxes $ 450,676 Adjusted income from continuing operations before interest, loss Adjusted gross margin 54.1% on extinguishment of debt and taxes margin 24.1% Revenue as-reported $ 1,868,027 Revenue as-reported $ 1,868,027 Adjusted Gross Margin: (A) Restructuring, restructuring related and impairment items – In 2016, these charges were related to restructuring related activity. Adjusted Operating Margin: (A) Restructuring, restructuring related and impairment items – In 2016, these charges include; (i) charges related to facility consolidations, (ii) a pre-tax, non-cash $41.0 million impairment charge in connection with discontinuation of an in-process research and development project; (iii) $2.4 million in pre-tax, non-cash impairment charges related to two properties, one of which was classified as an asset held for sale. (B) Acquisition, integration and divestiture related items – In 2016, the majority of these charges included reversals related to contingent consideration liabilities, including $8.3 million related to the discontinuation of an in-process research and development project, and the gain on a sale of assets, somewhat offset by acquisition costs. (C) Other items – In 2016, the majority of these charges were related to relabeling costs and costs associated with a facility that was exited. 26 See slide titled Non-GAAP Adjustments included at the beginning of the appendices to this presentation for Non-GAAP definitions.
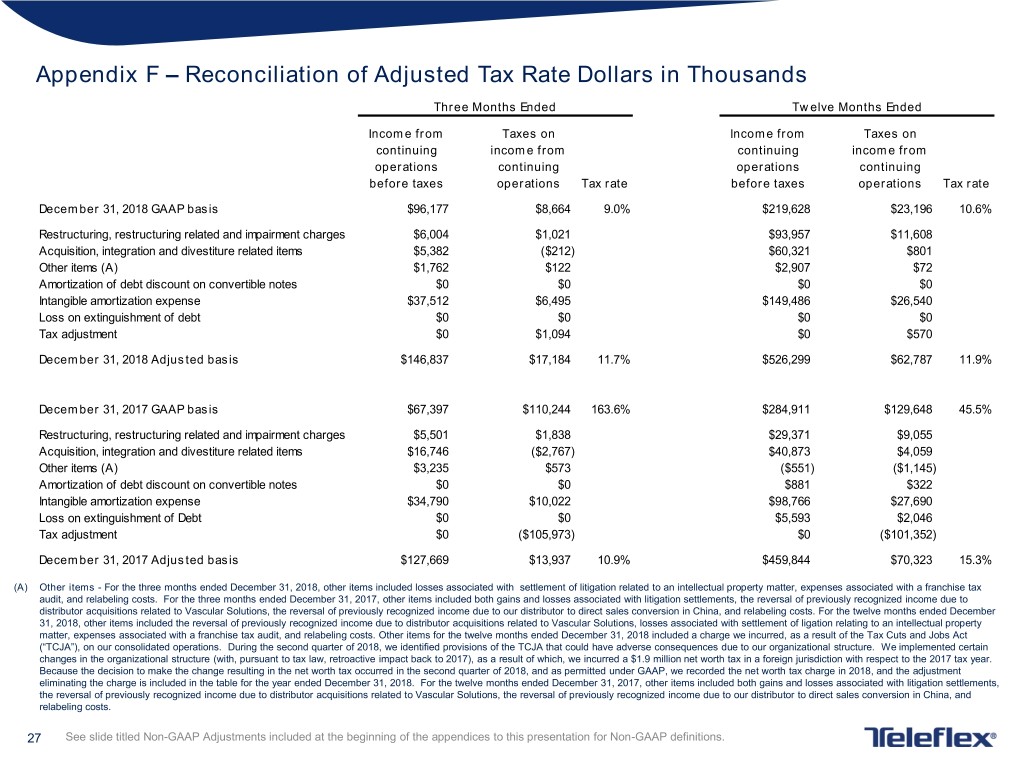
Appendix F – Reconciliation of Adjusted Tax Rate Dollars in Thousands Three Months Ended Twelve Months Ended Income from Taxes on Income from Taxes on continuing income from continuing income from operations continuing operations continuing before taxes operations Tax rate before taxes operations Tax rate December 31, 2018 GAAP basis $96,177 $8,664 9.0% $219,628 $23,196 10.6% Restructuring, restructuring related and impairment charges $6,004 $1,021 $93,957 $11,608 Acquisition, integration and divestiture related items $5,382 ($212) $60,321 $801 Other items (A) $1,762 $122 $2,907 $72 Amortization of debt discount on convertible notes $0 $0 $0 $0 Intangible amortization expense $37,512 $6,495 $149,486 $26,540 Loss on extinguishment of debt $0 $0 $0 $0 Tax adjustment $0 $1,094 $0 $570 December 31, 2018 Adjusted basis $146,837 $17,184 11.7% $526,299 $62,787 11.9% December 31, 2017 GAAP basis $67,397 $110,244 163.6% $284,911 $129,648 45.5% Restructuring, restructuring related and impairment charges $5,501 $1,838 $29,371 $9,055 Acquisition, integration and divestiture related items $16,746 ($2,767) $40,873 $4,059 Other items (A) $3,235 $573 ($551) ($1,145) Amortization of debt discount on convertible notes $0 $0 $881 $322 Intangible amortization expense $34,790 $10,022 $98,766 $27,690 Loss on extinguishment of Debt $0 $0 $5,593 $2,046 Tax adjustment $0 ($105,973) $0 ($101,352) December 31, 2017 Adjusted basis $127,669 $13,937 10.9% $459,844 $70,323 15.3% (A) Other items - For the three months ended December 31, 2018, other items included losses associated with settlement of litigation related to an intellectual property matter, expenses associated with a franchise tax audit, and relabeling costs. For the three months ended December 31, 2017, other items included both gains and losses associated with litigation settlements, the reversal of previously recognized income due to distributor acquisitions related to Vascular Solutions, the reversal of previously recognized income due to our distributor to direct sales conversion in China, and relabeling costs. For the twelve months ended December 31, 2018, other items included the reversal of previously recognized income due to distributor acquisitions related to Vascular Solutions, losses associated with settlement of ligation relating to an intellectual property matter, expenses associated with a franchise tax audit, and relabeling costs. Other items for the twelve months ended December 31, 2018 included a charge we incurred, as a result of the Tax Cuts and Jobs Act (“TCJA”), on our consolidated operations. During the second quarter of 2018, we identified provisions of the TCJA that could have adverse consequences due to our organizational structure. We implemented certain changes in the organizational structure (with, pursuant to tax law, retroactive impact back to 2017), as a result of which, we incurred a $1.9 million net worth tax in a foreign jurisdiction with respect to the 2017 tax year. Because the decision to make the change resulting in the net worth tax occurred in the second quarter of 2018, and as permitted under GAAP, we recorded the net worth tax charge in 2018, and the adjustment eliminating the charge is included in the table for the year ended December 31, 2018. For the twelve months ended December 31, 2017, other items included both gains and losses associated with litigation settlements, the reversal of previously recognized income due to distributor acquisitions related to Vascular Solutions, the reversal of previously recognized income due to our distributor to direct sales conversion in China, and relabeling costs. 27 See slide titled Non-GAAP Adjustments included at the beginning of the appendices to this presentation for Non-GAAP definitions.
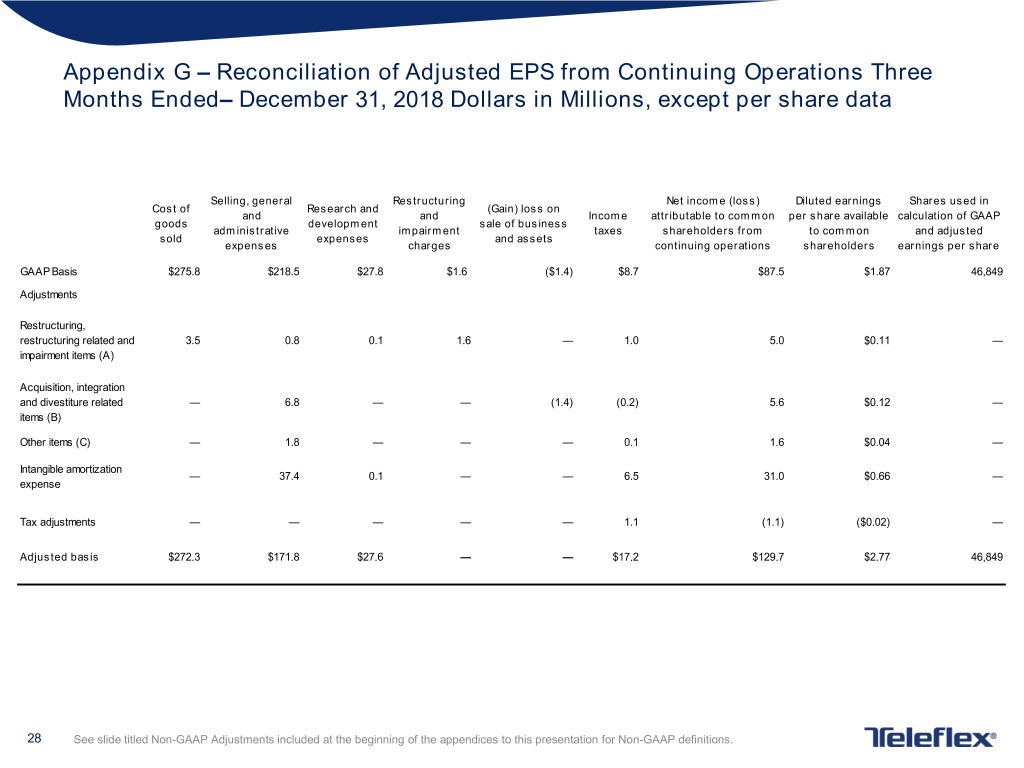
Appendix G – Reconciliation of Adjusted EPS from Continuing Operations Three Months Ended– December 31, 2018 Dollars in Millions, except per share data Selling, general Restructuring Net income (loss) Diluted earnings Shares used in Cost of Research and (Gain) loss on and and Income attributable to common per share available calculation of GAAP goods development sale of business administrative impairment taxes shareholders from to common and adjusted sold expenses and assets expenses charges continuing operations shareholders earnings per share GAAP Basis $275.8 $218.5 $27.8 $1.6 ($1.4) $8.7 $87.5 $1.87 46,849 Adjustments Restructuring, restructuring related and 3.5 0.8 0.1 1.6 — 1.0 5.0 $0.11 — impairment items (A) Acquisition, integration and divestiture related — 6.8 — — (1.4) (0.2) 5.6 $0.12 — items (B) Other items (C) — 1.8 — — — 0.1 1.6 $0.04 — Intangible amortization — 37.4 0.1 — — 6.5 31.0 $0.66 — expense Tax adjustments — — — — — 1.1 (1.1) ($0.02) — Adjusted basis $272.3 $171.8 $27.6 — — $17.2 $129.7 $2.77 46,849 28 See slide titled Non-GAAP Adjustments included at the beginning of the appendices to this presentation for Non-GAAP definitions.
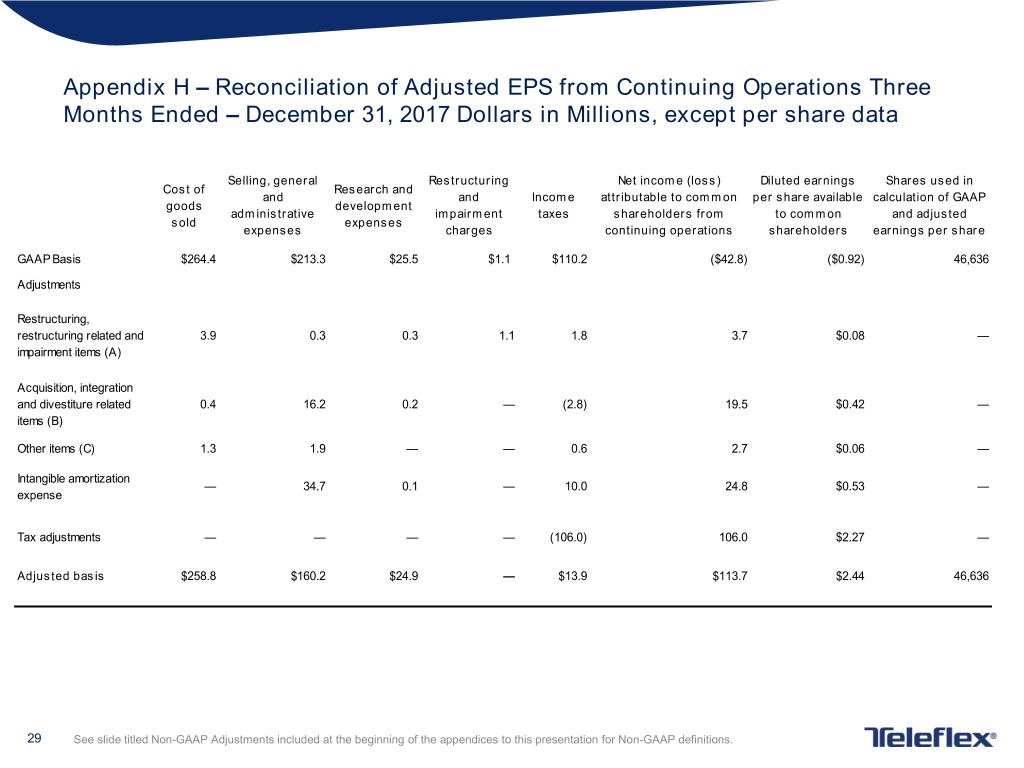
Appendix H – Reconciliation of Adjusted EPS from Continuing Operations Three Months Ended – December 31, 2017 Dollars in Millions, except per share data Selling, general Restructuring Net income (loss) Diluted earnings Shares used in Cost of Research and and and Income attributable to common per share available calculation of GAAP goods development administrative impairment taxes shareholders from to common and adjusted sold expenses expenses charges continuing operations shareholders earnings per share GAAP Basis $264.4 $213.3 $25.5 $1.1 $110.2 ($42.8) ($0.92) 46,636 Adjustments Restructuring, restructuring related and 3.9 0.3 0.3 1.1 1.8 3.7 $0.08 — impairment items (A) Acquisition, integration and divestiture related 0.4 16.2 0.2 — (2.8) 19.5 $0.42 — items (B) Other items (C) 1.3 1.9 — — 0.6 2.7 $0.06 — Intangible amortization — 34.7 0.1 — 10.0 24.8 $0.53 — expense Tax adjustments — — — — (106.0) 106.0 $2.27 — Adjusted basis $258.8 $160.2 $24.9 — $13.9 $113.7 $2.44 46,636 29 See slide titled Non-GAAP Adjustments included at the beginning of the appendices to this presentation for Non-GAAP definitions.
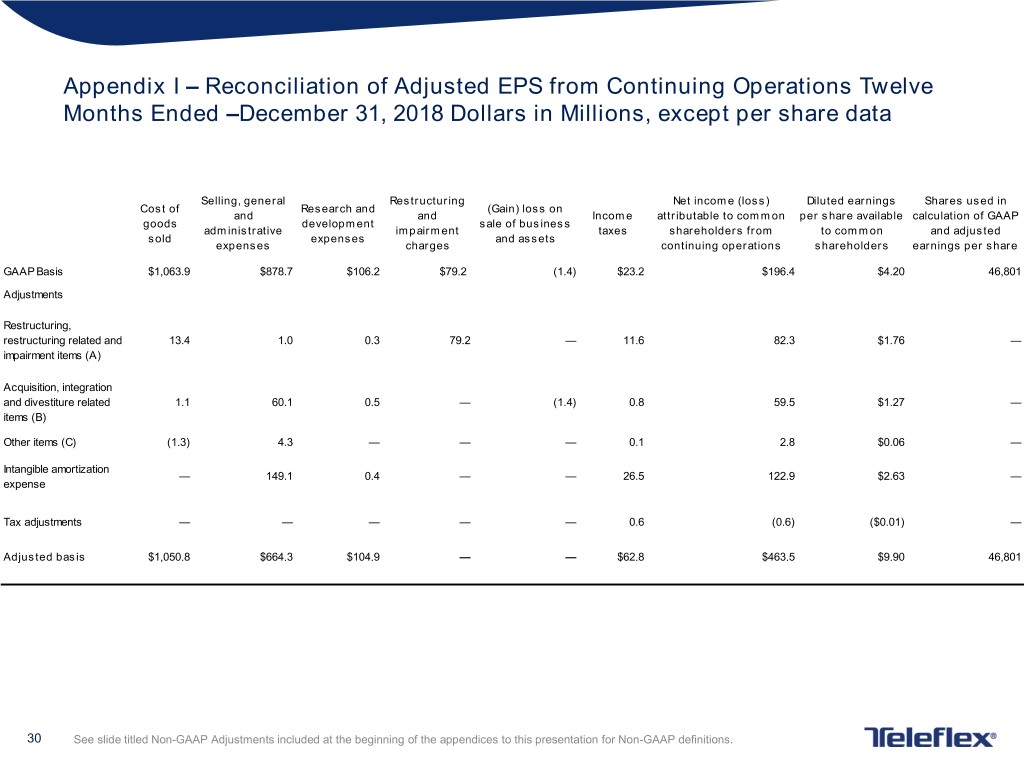
Appendix I – Reconciliation of Adjusted EPS from Continuing Operations Twelve Months Ended –December 31, 2018 Dollars in Millions, except per share data Selling, general Restructuring Net income (loss) Diluted earnings Shares used in Cost of Research and (Gain) loss on and and Income attributable to common per share available calculation of GAAP goods development sale of business administrative impairment taxes shareholders from to common and adjusted sold expenses and assets expenses charges continuing operations shareholders earnings per share GAAP Basis $1,063.9 $878.7 $106.2 $79.2 (1.4) $23.2 $196.4 $4.20 46,801 Adjustments Restructuring, restructuring related and 13.4 1.0 0.3 79.2 — 11.6 82.3 $1.76 — impairment items (A) Acquisition, integration and divestiture related 1.1 60.1 0.5 — (1.4) 0.8 59.5 $1.27 — items (B) Other items (C) (1.3) 4.3 — — — 0.1 2.8 $0.06 — Intangible amortization — 149.1 0.4 — — 26.5 122.9 $2.63 — expense Tax adjustments — — — — — 0.6 (0.6) ($0.01) — Adjusted basis $1,050.8 $664.3 $104.9 — — $62.8 $463.5 $9.90 46,801 30 See slide titled Non-GAAP Adjustments included at the beginning of the appendices to this presentation for Non-GAAP definitions.
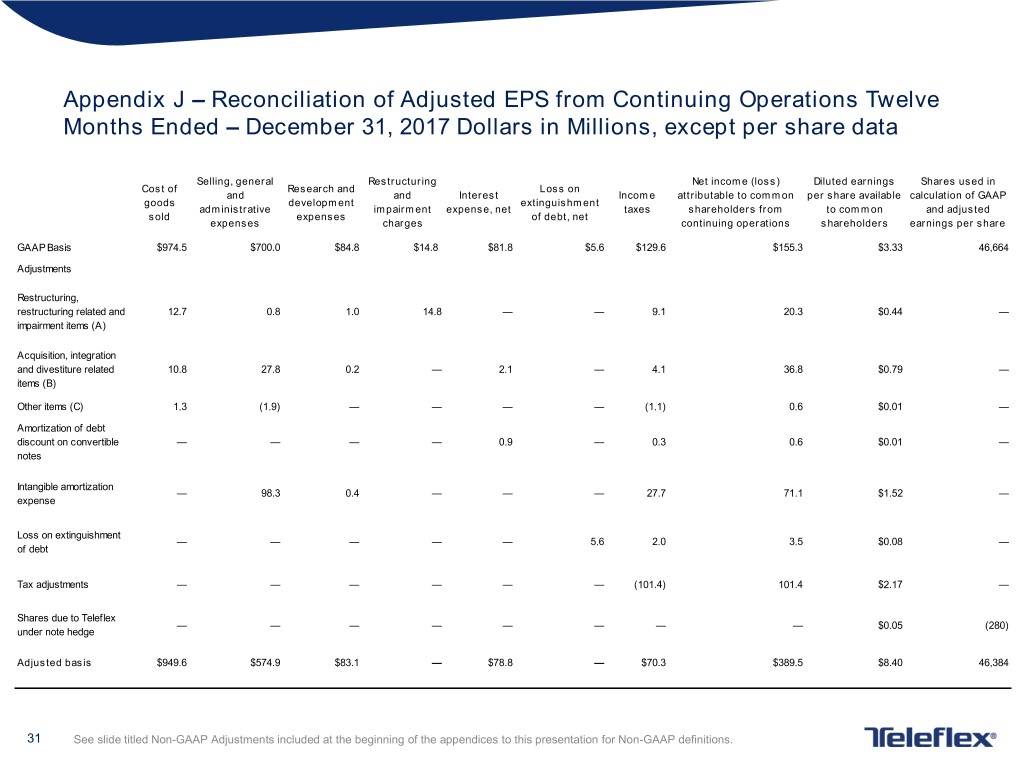
Appendix J – Reconciliation of Adjusted EPS from Continuing Operations Twelve Months Ended – December 31, 2017 Dollars in Millions, except per share data Selling, general Restructuring Net income (loss) Diluted earnings Shares used in Cost of Research and Loss on and and Interest Income attributable to common per share available calculation of GAAP goods development extinguishment administrative impairment expense, net taxes shareholders from to common and adjusted sold expenses of debt, net expenses charges continuing operations shareholders earnings per share GAAP Basis $974.5 $700.0 $84.8 $14.8 $81.8 $5.6 $129.6 $155.3 $3.33 46,664 Adjustments Restructuring, restructuring related and 12.7 0.8 1.0 14.8 — — 9.1 20.3 $0.44 — impairment items (A) Acquisition, integration and divestiture related 10.8 27.8 0.2 — 2.1 — 4.1 36.8 $0.79 — items (B) Other items (C) 1.3 (1.9) — — — — (1.1) 0.6 $0.01 — Amortization of debt discount on convertible — — — — 0.9 — 0.3 0.6 $0.01 — notes Intangible amortization — 98.3 0.4 — — — 27.7 71.1 $1.52 — expense Loss on extinguishment — — — — — 5.6 2.0 3.5 $0.08 — of debt Tax adjustments — — — — — — (101.4) 101.4 $2.17 — Shares due to Teleflex — — — — — — — — $0.05 (280) under note hedge Adjusted basis $949.6 $574.9 $83.1 — $78.8 — $70.3 $389.5 $8.40 46,384 31 See slide titled Non-GAAP Adjustments included at the beginning of the appendices to this presentation for Non-GAAP definitions.

Appendices G, H, I and J – tickmarks (A) Restructuring, restructuring related and impairment items - For the three months ended December 31, 2018 and December 31, 2017, pre- tax restructuring related charges were $4.4 million and $4.4 million, respectively. For the twelve months ended December 31, 2018 and December 31, 2017, pre-tax restructuring related charges were $14.7 million and $14.6 million, respectively. For the twelve months ended December 31, 2018 and December 31, 2017, pre-tax impairment charges were $19.1 million and $0.0 million, respectively. (B) Acquisition, integration and divestiture related items - For the three months ended December 31, 2018, these charges were primarily related to contingent consideration liabilities. For the three months ended December 31, 2017, these charges were primarily related to our acquisition of NeoTract and contingent consideration liabilities. For the twelve months ended December 31, 2018, these charges were primarily related to contingent consideration liabilities and our acquisition of NeoTract. For the twelve months ended December 31, 2017, these charges were primarily related to our acquisitions of Vascular Solutions and NeoTract, as well as contingent consideration liabilities. There were no divestiture related activities for the periods presented. (C) Other items - For the three months ended December 31, 2018, other items included losses associated with settlement of litigation related to an intellectual property matter, expenses associated with a franchise tax audit, and relabeling costs. For the three months ended December 31, 2017, other items included both gains and losses associated with litigation settlements, the reversal of previously recognized income due to distributor acquisitions related to Vascular Solutions, the reversal of previously recognized income due to our distributor to direct sales conversion in China, and relabeling costs. For the twelve months ended December 31, 2018, other items included the reversal of previously recognized income due to distributor acquisitions related to Vascular Solutions, losses associated with settlement of ligation relating to an intellectual property matter, expenses associated with a franchise tax audit, and relabeling costs. Other items for the twelve months ended December 31, 2018 included a charge we incurred, as a result of the Tax Cuts and Jobs Act (“TCJA”), on our consolidated operations. During the second quarter of 2018, we identified provisions of the TCJA that could have adverse consequences due to our organizational structure. We implemented certain changes in the organizational structure (with, pursuant to tax law, retroactive impact back to 2017), as a result of which, we incurred a $1.9 million net worth tax in a foreign jurisdiction with respect to the 2017 tax year. Because the decision to make the change resulting in the net worth tax occurred in the second quarter of 2018, and as permitted under GAAP, we recorded the net worth tax charge in 2018, and the adjustment eliminating the charge is included in the table for the year ended December 31, 2018. For the twelve months ended December 31, 2017, other items included both gains and losses associated with litigation settlements, the reversal of previously recognized income due to distributor acquisitions related to Vascular Solutions, the reversal of previously recognized income due to our distributor to direct sales conversion in China, and relabeling costs. 32 See slide titled Non-GAAP Adjustments included at the beginning of the appendices to this presentation for Non-GAAP definitions.

Appendix K – Reconciliation of 2019 Adjusted Gross and Operating Margin Guidance 2019 Guidance Low High Forecasted GAAP Gross Margin 57.20% 57.75% Estimated restructuring, restructuring related and impairment items 0.80% 0.75% Estimated acquisition, integration and divestiture related items 0.00% 0.00% Estimated other items 0.00% 0.00% Forecasted Adjusted Gross Margin 58.00% 58.50% 2019 Guidance Low High Forecasted GAAP Operating Margin 17.40% 18.10% Estimated restructuring, restructuring related and impairment items 1.65% 1.60% Estimated acquisition, integration and divestiture related items 1.40% 1.35% Estimated other items 0.20% 0.15% Estimated intangible amortization expense 5.85% 5.80% Forecasted Adjusted Operaitng Margin 26.50% 27.00% 33
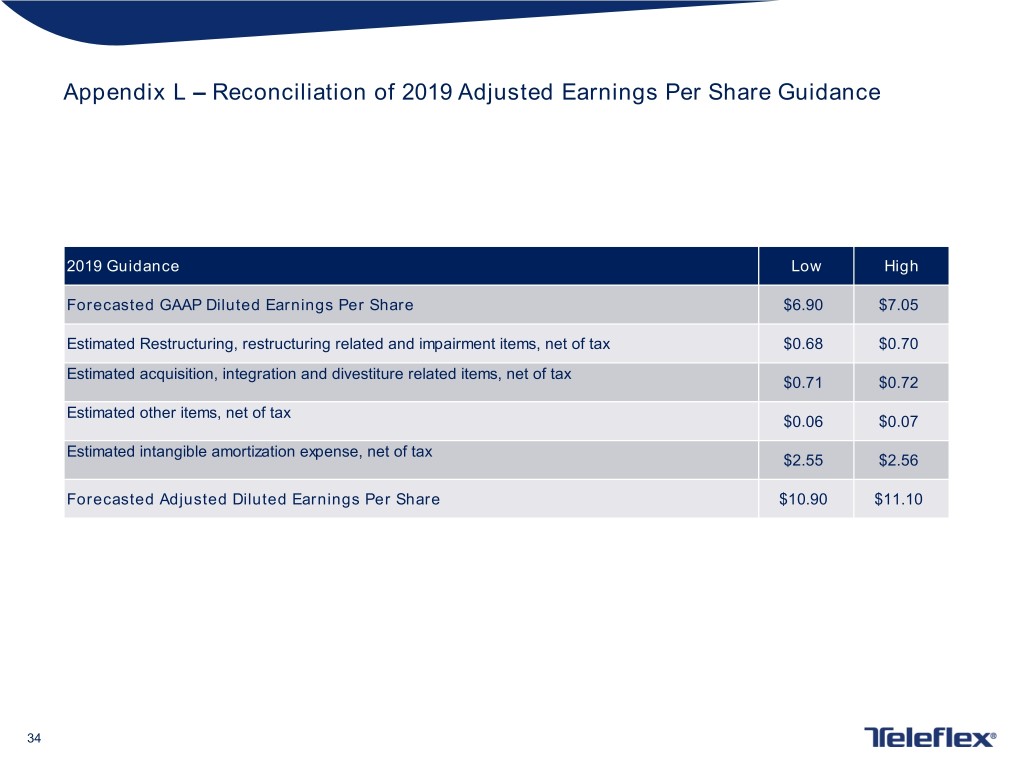
Appendix L – Reconciliation of 2019 Adjusted Earnings Per Share Guidance 2019 Guidance Low High Forecasted GAAP Diluted Earnings Per Share $6.90 $7.05 Estimated Restructuring, restructuring related and impairment items, net of tax $0.68 $0.70 Estimated acquisition, integration and divestiture related items, net of tax $0.71 $0.72 Estimated other items, net of tax $0.06 $0.07 Estimated intangible amortization expense, net of tax $2.55 $2.56 Forecasted Adjusted Diluted Earnings Per Share $10.90 $11.10 34
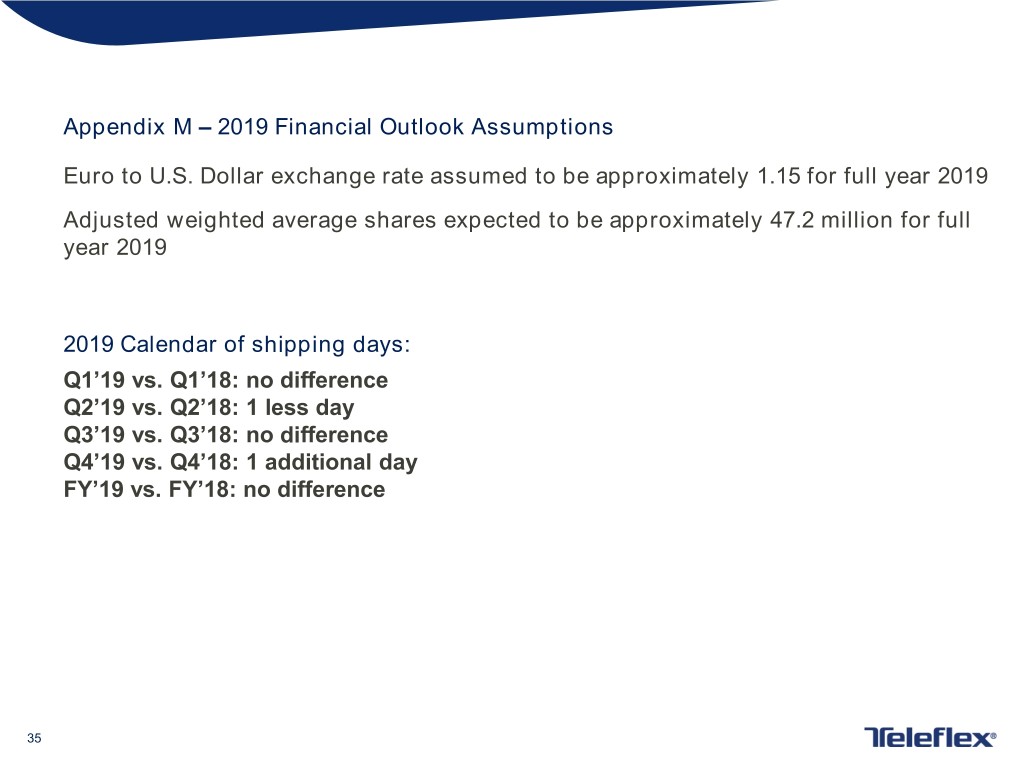
Appendix M – 2019 Financial Outlook Assumptions Euro to U.S. Dollar exchange rate assumed to be approximately 1.15 for full year 2019 Adjusted weighted average shares expected to be approximately 47.2 million for full year 2019 2019 Calendar of shipping days: Q1’19 vs. Q1’18: no difference Q2’19 vs. Q2’18: 1 less day Q3’19 vs. Q3’18: no difference Q4’19 vs. Q4’18: 1 additional day FY’19 vs. FY’18: no difference 35
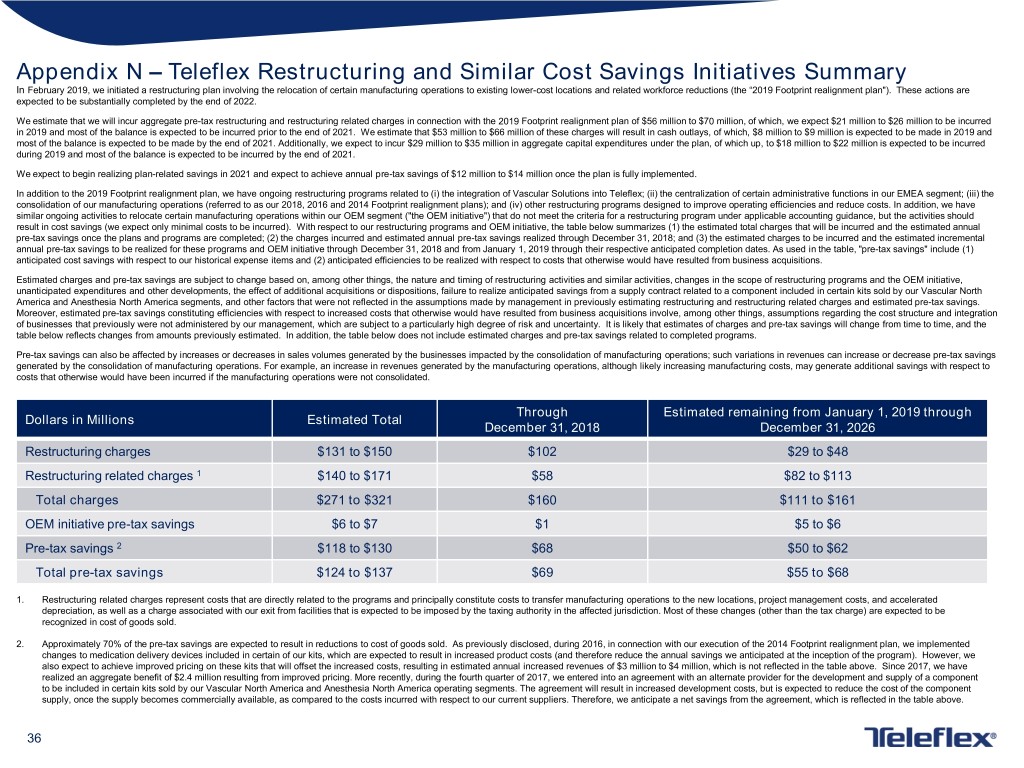
Appendix N – Teleflex Restructuring and Similar Cost Savings Initiatives Summary In February 2019, we initiated a restructuring plan involving the relocation of certain manufacturing operations to existing lower-cost locations and related workforce reductions (the “2019 Footprint realignment plan"). These actions are expected to be substantially completed by the end of 2022. We estimate that we will incur aggregate pre-tax restructuring and restructuring related charges in connection with the 2019 Footprint realignment plan of $56 million to $70 million, of which, we expect $21 million to $26 million to be incurred in 2019 and most of the balance is expected to be incurred prior to the end of 2021. We estimate that $53 million to $66 million of these charges will result in cash outlays, of which, $8 million to $9 million is expected to be made in 2019 and most of the balance is expected to be made by the end of 2021. Additionally, we expect to incur $29 million to $35 million in aggregate capital expenditures under the plan, of which up, to $18 million to $22 million is expected to be incurred during 2019 and most of the balance is expected to be incurred by the end of 2021. We expect to begin realizing plan-related savings in 2021 and expect to achieve annual pre-tax savings of $12 million to $14 million once the plan is fully implemented. In addition to the 2019 Footprint realignment plan, we have ongoing restructuring programs related to (i) the integration of Vascular Solutions into Teleflex; (ii) the centralization of certain administrative functions in our EMEA segment; (iii) the consolidation of our manufacturing operations (referred to as our 2018, 2016 and 2014 Footprint realignment plans); and (iv) other restructuring programs designed to improve operating efficiencies and reduce costs. In addition, we have similar ongoing activities to relocate certain manufacturing operations within our OEM segment ("the OEM initiative") that do not meet the criteria for a restructuring program under applicable accounting guidance, but the activities should result in cost savings (we expect only minimal costs to be incurred). With respect to our restructuring programs and OEM initiative, the table below summarizes (1) the estimated total charges that will be incurred and the estimated annual pre-tax savings once the plans and programs are completed; (2) the charges incurred and estimated annual pre-tax savings realized through December 31, 2018; and (3) the estimated charges to be incurred and the estimated incremental annual pre-tax savings to be realized for these programs and OEM initiative through December 31, 2018 and from January 1, 2019 through their respective anticipated completion dates. As used in the table, "pre-tax savings" include (1) anticipated cost savings with respect to our historical expense items and (2) anticipated efficiencies to be realized with respect to costs that otherwise would have resulted from business acquisitions. Estimated charges and pre-tax savings are subject to change based on, among other things, the nature and timing of restructuring activities and similar activities, changes in the scope of restructuring programs and the OEM initiative, unanticipated expenditures and other developments, the effect of additional acquisitions or dispositions, failure to realize anticipated savings from a supply contract related to a component included in certain kits sold by our Vascular North America and Anesthesia North America segments, and other factors that were not reflected in the assumptions made by management in previously estimating restructuring and restructuring related charges and estimated pre-tax savings. Moreover, estimated pre-tax savings constituting efficiencies with respect to increased costs that otherwise would have resulted from business acquisitions involve, among other things, assumptions regarding the cost structure and integration of businesses that previously were not administered by our management, which are subject to a particularly high degree of risk and uncertainty. It is likely that estimates of charges and pre-tax savings will change from time to time, and the table below reflects changes from amounts previously estimated. In addition, the table below does not include estimated charges and pre-tax savings related to completed programs. Pre-tax savings can also be affected by increases or decreases in sales volumes generated by the businesses impacted by the consolidation of manufacturing operations; such variations in revenues can increase or decrease pre-tax savings generated by the consolidation of manufacturing operations. For example, an increase in revenues generated by the manufacturing operations, although likely increasing manufacturing costs, may generate additional savings with respect to costs that otherwise would have been incurred if the manufacturing operations were not consolidated. Through Estimated remaining from January 1, 2019 through Dollars in Millions Estimated Total December 31, 2018 December 31, 2026 Restructuring charges $131 to $150 $102 $29 to $48 Restructuring related charges 1 $140 to $171 $58 $82 to $113 Total charges $271 to $321 $160 $111 to $161 OEM initiative pre-tax savings $6 to $7 $1 $5 to $6 Pre-tax savings 2 $118 to $130 $68 $50 to $62 Total pre-tax savings $124 to $137 $69 $55 to $68 1. Restructuring related charges represent costs that are directly related to the programs and principally constitute costs to transfer manufacturing operations to the new locations, project management costs, and accelerated depreciation, as well as a charge associated with our exit from facilities that is expected to be imposed by the taxing authority in the affected jurisdiction. Most of these changes (other than the tax charge) are expected to be recognized in cost of goods sold. 2. Approximately 70% of the pre-tax savings are expected to result in reductions to cost of goods sold. As previously disclosed, during 2016, in connection with our execution of the 2014 Footprint realignment plan, we implemented changes to medication delivery devices included in certain of our kits, which are expected to result in increased product costs (and therefore reduce the annual savings we anticipated at the inception of the program). However, we also expect to achieve improved pricing on these kits that will offset the increased costs, resulting in estimated annual increased revenues of $3 million to $4 million, which is not reflected in the table above. Since 2017, we have realized an aggregate benefit of $2.4 million resulting from improved pricing. More recently, during the fourth quarter of 2017, we entered into an agreement with an alternate provider for the development and supply of a component to be included in certain kits sold by our Vascular North America and Anesthesia North America operating segments. The agreement will result in increased development costs, but is expected to reduce the cost of the component supply, once the supply becomes commercially available, as compared to the costs incurred with respect to our current suppliers. Therefore, we anticipate a net savings from the agreement, which is reflected in the table above. 36
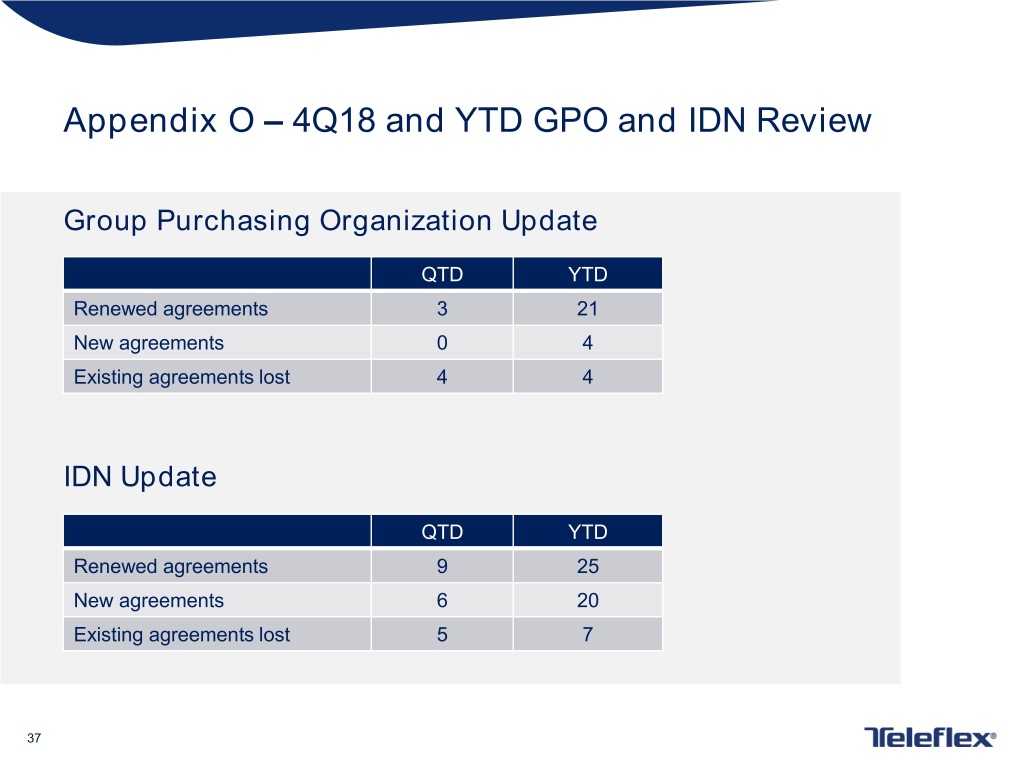
Appendix O – 4Q18 and YTD GPO and IDN Review Group Purchasing Organization Update QTD YTD Renewed agreements 3 21 New agreements 0 4 Existing agreements lost 4 4 IDN Update QTD YTD Renewed agreements 9 25 New agreements 6 20 Existing agreements lost 5 7 37


