
| Teleflex Incorporated Q4 and Year-End 2007 Financial Results February 29, 2008 Exhibit 99.1 |

| Forward-Looking Statements/Additional Notes This presentation and our discussion contain forward-looking information and statements including, but not limited to, such matters as business strategies, market trends, future financial performance, forecast of diluted earnings per share, forecast of cash flow from operations, cost of restructuring actions, gain or loss from divestitures, and other matters which inherently involve risks and uncertainties which could cause actual results to differ from those projected or implied in the forward-looking statements. These risks and uncertainties are addressed in the Company's SEC filings including its most recent Form 10-K. This presentation includes certain non-GAAP financial measures, which include adjusted operating income, adjusted operating margins, operating margins before special charges, adjusted net income and adjusted earnings per share. These non-GAAP measures exclude the impact of restructuring and impairment costs, gain or loss on the sale of assets, transaction-related charges for in process research and development costs, fair market value adjustments for inventory, and a one-time tax adjustment. Reconciliation of those measures to the most comparable GAAP measures is contained within this presentation. Segment operating profit is defined as a segment's revenues reduced by its materials, labor, and other product costs along with the segment's selling, engineering, and administrative expenses and minority interest. Unallocated corporate expenses, restructuring costs, gain or loss on the sale of assets, transaction-related charges for in process research and development costs and fair market adjustments for inventory, interest income and expense and taxes on income are excluded from the measure. The following slides reflect continuing operations. |
| Conference Call Logistics The release, accompanying slides, and replay webcast available online at www.teleflex.com (click on "Investors") Telephone replay available by dialing 888-286-8010 or for international calls, 617-801-6888, pass code number 30859245 |

| Jeff Black Chairman and Chief Executive Officer |
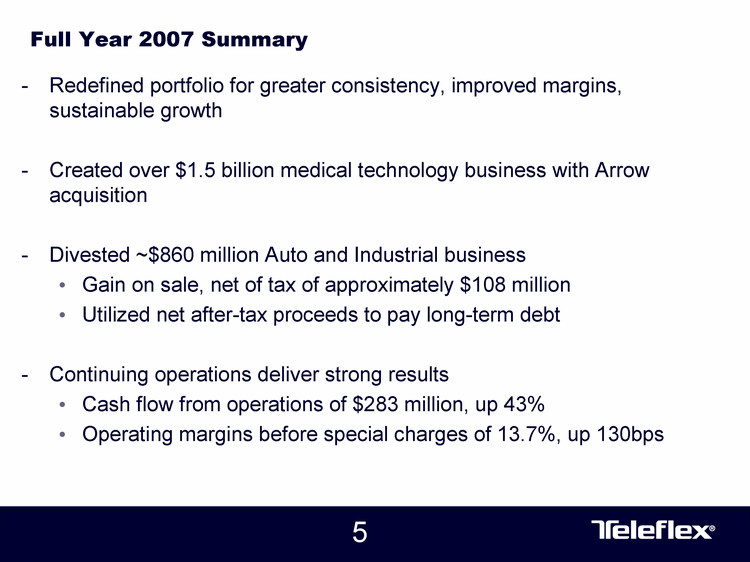
| Full Year 2007 Summary Redefined portfolio for greater consistency, improved margins, sustainable growth Created over $1.5 billion medical technology business with Arrow acquisition Divested ~$860 million Auto and Industrial business Gain on sale, net of tax of approximately $108 million Utilized net after-tax proceeds to pay long-term debt Continuing operations deliver strong results Cash flow from operations of $283 million, up 43% Operating margins before special charges of 13.7%, up 130bps |
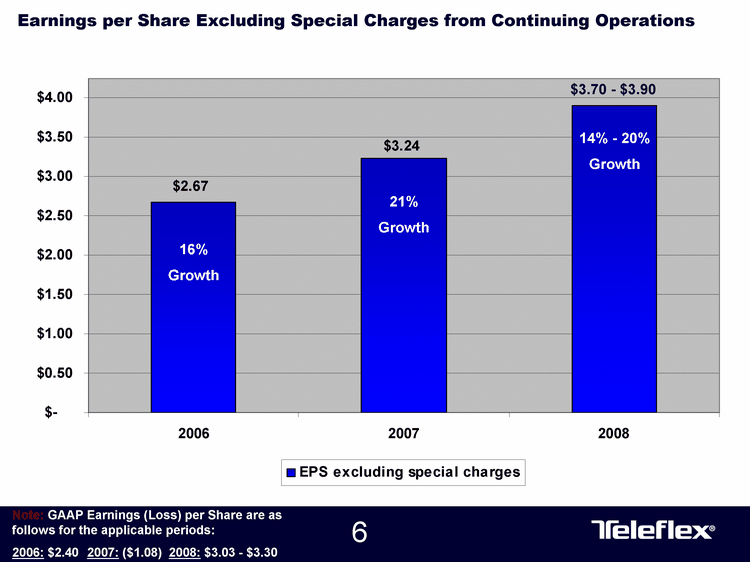
| Earnings per Share Excluding Special Charges from Continuing Operations $3.70 - $3.90 21% Growth 14% - 20% Growth 16% Growth Note: GAAP Earnings (Loss) per Share are as follows for the applicable periods: 2006: $2.40 2007: ($1.08) 2008: $3.03 - $3.30 |

| Teleflex Fourth Quarter Objectives Complete automotive and industrial business divestiture Utilize net proceeds from acquisition to pay-down debt Execute on Arrow International integration activities Accelerate regulatory compliance program to respond to Arrow FDA corporate warning letter Realize benefit of restructuring and productivity initiatives in Aerospace Segment Complete acquisition of Nordisk Aviation Products SAP Go-Live |

| Fourth Quarter Summary Continuing operations deliver solid results Gross Margins improve 450 bps over prior year Operating margins before special charges of 14.4%, up 100 bps Medical adjusted segment operating margins exceed 19% Aerospace segment operating margins return to 12% range Commercial segment: Marine operating profit improvement, offset by Power Systems loss Transaction related charges impact Q4'07 In-process R&D, Inventory step-up Restructuring and financing costs Intangible asset impairment charge in Power Systems |

| Fourth Quarter Business Dynamics Teleflex Medical Teleflex Commercial Teleflex Aerospace Medical Sales up on acquisitions; Arrow growth of 6% International markets lead sales growth Strong surgical device sales in North America, decline in alternate site sales Asia, Canada, Latin America - sales up 14% Weaker sales to medical device manufacturers Aerospace Cargo systems sales up double digits SFE selections on new Boeing, Airbus platforms Engine repair revenues decline on phased out product lines Commercial Marine aftermarket/international sales up Downturn in NA truck market negatively impacts APU product lines |

| Kevin Gordon Executive Vice President and Chief Financial Officer |
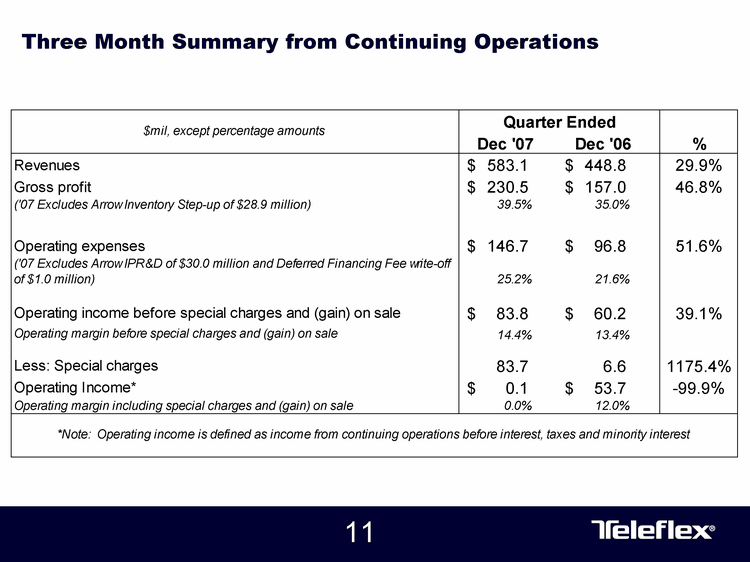
| Three Month Summary from Continuing Operations |

| Three Month Summary from Continuing Operations Note: Q4'07 (Gains)/Losses and other charges includes write-off of $3.4m financing costs, net of tax |
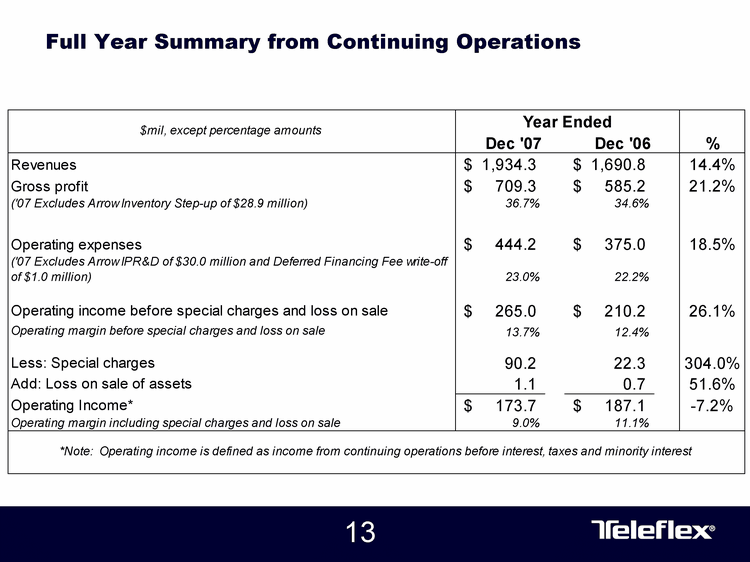
| Full Year Summary from Continuing Operations |

| Full Year Summary from Continuing Operations Note: FY'07 (Gains)/Losses and other charges includes write-off of $3.4m financing costs, net of tax |

| Cash Flow From Continuing Operations ($ Millions) Note: Free Cash Flow defined as Cash Flow from Operations less Capital Expenditures and Dividends 43% Growth 67% Growth Capital Expenditures - $40.8 million; Dividends - $44.1 million Capital Expenditures - $44.7 million; Dividends - $48.9 million |

| Net Debt Trend ($ Millions) Pre-Arrow Acquisition Post-Arrow Acquisition Post- Auto/Industrial Divestiture |

| Medical Segment FY'07 vs. FY'06 Commentary European Markets Anesthesia & urology sales lead growth Favorable currency impact North American Markets Acquisitions drive growth Q4 core growth impacted by negative comparison with 2006 which had one additional week Decline in alternate site product lines and OEM sales Strong Q4 surgical sales Increase in gross & operating margins Fourth quarter SAP launch Asia, Canada, Latin America Double digit sales growth Improved margins Arrow 6% growth over prior comparable period revenue Synergies ahead of schedule $30 million IPR&D & $29 million inventory step-up charges Note: Operating Profit above excludes $30M IPR&D and $29M inventory step-up charges |
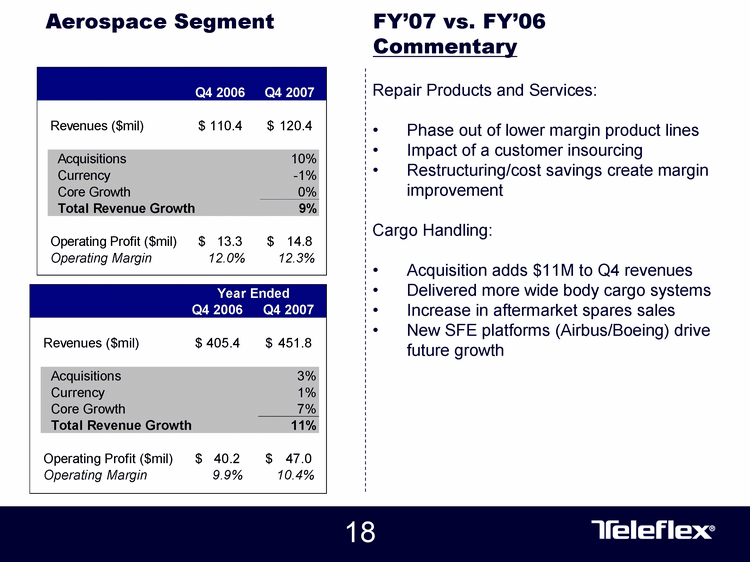
| Aerospace Segment FY'07 vs. FY'06 Commentary Repair Products and Services: Phase out of lower margin product lines Impact of a customer insourcing Restructuring/cost savings create margin improvement Cargo Handling: Acquisition adds $11M to Q4 revenues Delivered more wide body cargo systems Increase in aftermarket spares sales New SFE platforms (Airbus/Boeing) drive future growth |

| Commercial Segment FY'07 vs. FY'06 Commentary Continuing Commercial Businesses: Marine aftermarket and international sales strength Marine cost controls, pricing, and currency improve profitability Marine profit improvement in Q4 Loss in power systems Rigging services growth due to acquisition Margin pressure due to commodity prices & increased overhead costs Q4'06 record quarter for Power Systems Down cycle in NA truck market Power Systems intangible asset impairment in Q4'07 |
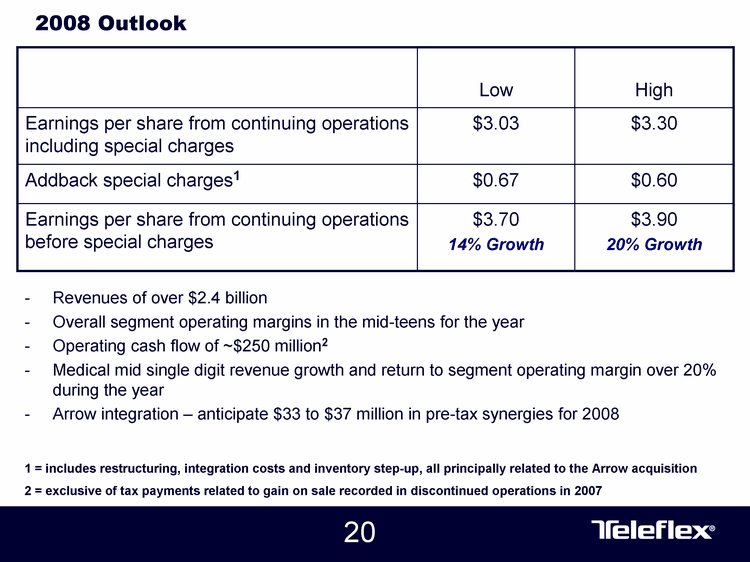
| Low High Earnings per share from continuing operations including special charges $3.03 $3.30 Addback special charges1 $0.67 $0.60 Earnings per share from continuing operations before special charges $3.70 14% Growth $3.90 20% Growth 2008 Outlook Revenues of over $2.4 billion Overall segment operating margins in the mid-teens for the year Operating cash flow of ~$250 million2 Medical mid single digit revenue growth and return to segment operating margin over 20% during the year Arrow integration - anticipate $33 to $37 million in pre-tax synergies for 2008 1 = includes restructuring, integration costs and inventory step-up, all principally related to the Arrow acquisition 2 = exclusive of tax payments related to gain on sale recorded in discontinued operations in 2007 |
| Jeff Black Chairman and Chief Executive Officer |

| 2008 Objectives Teleflex Medical Teleflex Commercial Teleflex Aerospace Execute Arrow integration plans and achieve synergies Invest for core growth Medical R&D initiatives Engineering for new aircraft platforms New technologies Acquire to enhance product offerings Deliver strong cash flow and continue to improve capital structure |

| Question and Answer Session |

| Appendices |
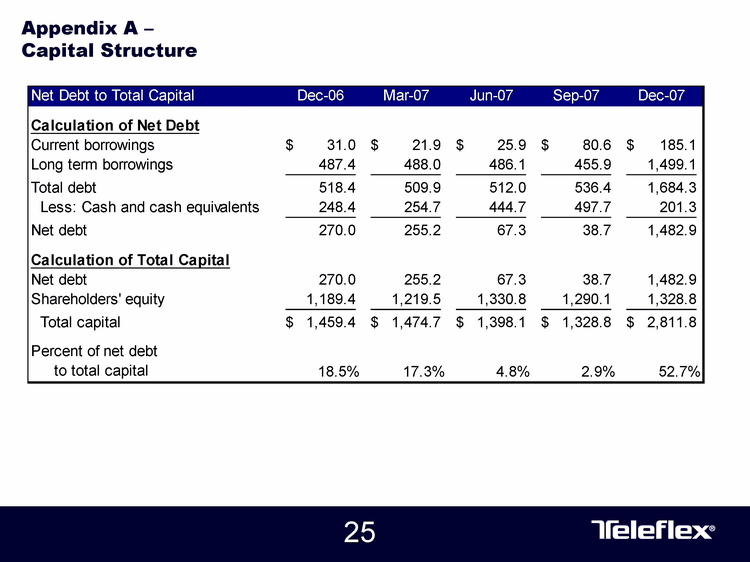
| Appendix A - Capital Structure |
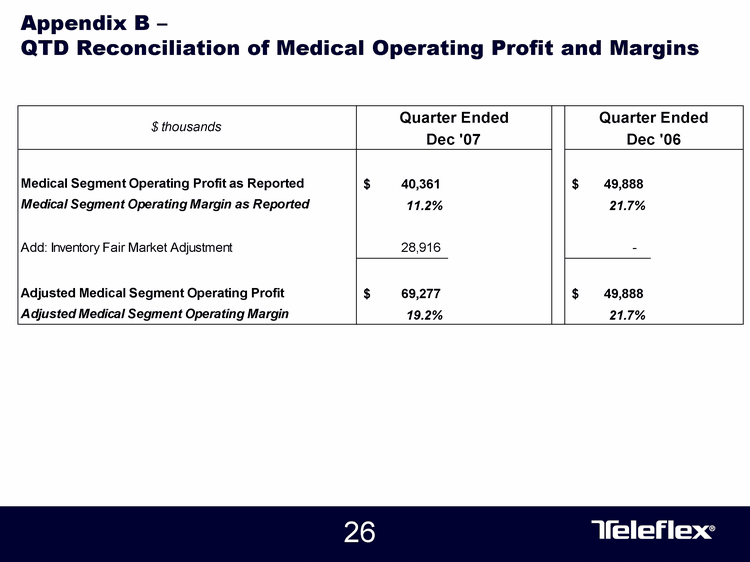
| Appendix B - QTD Reconciliation of Medical Operating Profit and Margins |
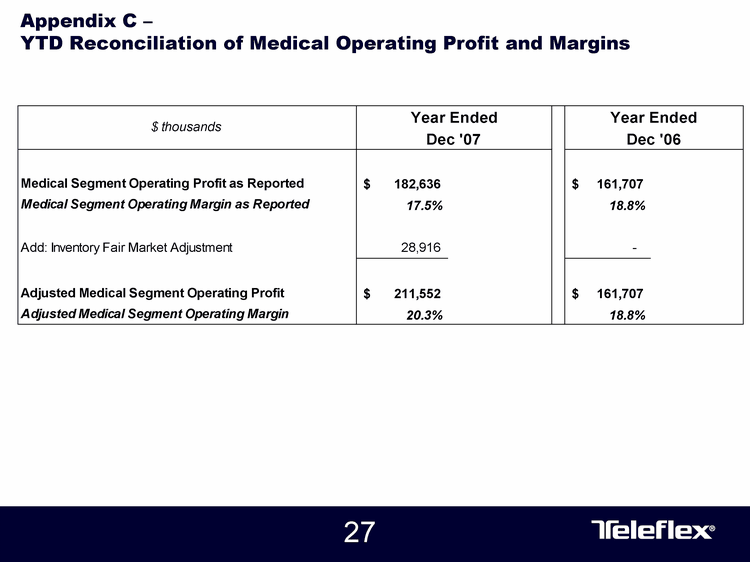
| Appendix C - YTD Reconciliation of Medical Operating Profit and Margins |

| Appendix D - 2007 vs. 2006 Special Charge Income Statement Classification Summary |