Exhibit 99.1
Teleflex Incorporated Q3 2008 Financial Results October 28, 2008 Exhibit 99.1 |
Forward-Looking Statements/Additional Notes This presentation and our discussion contain forward-looking information and statements including, but not limited to, such matters as expected core revenue growth, synergies from acquisitions, operating margins and product deliveries; expectations with respect to currency; forecasts of earnings per share including special charges, special charges, earnings per share excluding special charges and adjusted operating cash flow; market trends, future business and financial performance; and other matters which inherently involve risks and uncertainties which could cause actual results to differ from those projected or implied in the forward-looking statements. These risks and uncertainties are addressed in the Company's SEC filings including its most recent Form 10-K. This presentation includes certain non-GAAP financial measures, which include operating margins before special charges; earnings per share excluding special charges; segment operating margins before special charges; adjusted segment operating margins; adjusted gross profit; adjusted operating expenses; operating income before special charges and (gain)/loss on sale; and income and diluted earnings per share, excluding restructuring & impairment charges, (gains)/losses and other charges and tax adjustment. These non-GAAP measures exclude the impact of restructuring and impairment costs, gain or loss on the sale of assets, a tax payment related to gain on sale of Automotive & Industrial businesses, fair market value adjustments for inventory and acquisition integration costs. In addition, this presentation includes information regarding free cash flow, which reflects cash from operations minus capital expenditures and dividend payments. Reconciliation of these non-GAAP measures to the most comparable GAAP measures is contained within this presentation. Segment operating profit is defined as a segment's revenues reduced by its materials, labor, and other product costs along with the segment's selling, engineering, and administrative expenses and minority interest. Unallocated corporate expenses, restructuring costs, gain or loss on the sale of assets, acquisition integration costs, fair market adjustments for inventory, interest income and expense and taxes on income are excluded from the measure. The following slides reflect continuing operations. |
Conference Call Logistics The release, accompanying slides, and replay webcast available online at www.teleflex.com (click on "Investors") Telephone replay available by dialing 888-286-8010 or for international calls, 617-801-6888, pass code number 25612541 |
Jeff Black Chairman and Chief Executive Officer |
First Nine Months Highlights Solid progress on 2008 goals as outlined in January: Benefiting from portfolio changes in 2007 Segment operating margins before special charges in the mid-teens Medical adjusted operating margins in the 20% range Improvement in Commercial and Aerospace margins Low to mid-single digit core growth in Medical Achieving higher growth in international markets & OEM Strong cash flow from operations Strengthened balance sheet |
Third Quarter Financial Highlights Strong performance from continuing operations: Sales increase 30% driven by acquisition EPS excluding special charges of $1.11 - up 41% Segment operating margins before special charges of 16.2%, up 350 bps Adjusted Segment Operating Margins Medical margins: 20.0% Aerospace margins: 13.2% Commercial margins: 7.0% Cash flow from operations up 65% to $76 million |
Strategic Highlights Medical FDA compliance program continues Arrow integration initiatives on track to deliver up to $40 million in pre-tax synergies in 2008 Aerospace Benefiting from investments in new technologies for engine repairs Continue to invest in engineering capacity for new cargo system platforms Commercial Increasing backlog of APU's for Q4'08 and Q1'09 deliveries Controlling costs & managing thru difficult market conditions General Solid capital structure & liquidity Vigilant regarding customers & credit risk |
Kevin Gordon Executive Vice President and Chief Financial Officer |
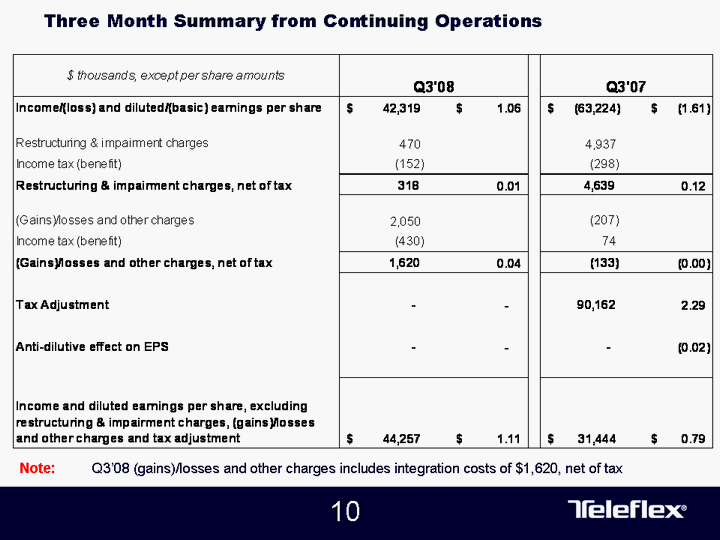
Three Month Summary from Continuing Operations |
Three Month Summary from Continuing Operations Note: Q3'08 (gains)/losses and other charges includes integration costs of $1,620, net of tax |
Year-to-Date Summary from Continuing Operations |
Year-to-Date Summary from Continuing Operations Note: Year-to-date Q3'08 (gains)/losses and other charges includes integration costs of $4,184, net of tax |
Medical Segment Note: Year-to-date Operating Profit excludes $6.9M inventory step-up and $5.9M integration charges Strongest sales growth in Europe, Asia and Latin America Sales in North America decline SAP pull-forward in Q3'07 impacts sales by approximately $5 million FDA remediation spending of approximately $15 million year-to-date Arrow integration initiatives on track to deliver up to $40 million in pre-tax synergies in 2008 |
Medical Segment Critical Care Arrow adds revenues of $114 million Vascular access sales growth in North America, Asia & Latin America - driven by PICC, specialty catheters Anesthesia & Urology sales growth in EMEA, Asia & Latin America Respiratory sales growth in Asia & Latin America Surgical Sales up 5% on strength in European, Asian & Latin American markets Closure ligation lines drive growth Cardiac Care Arrow adds revenues of $16 million Production issues being addressed OEM Sales up 3% Sutures / Specialty sales strength continue |
Cargo Handling Aftermarket spare & repair sales near record levels Narrow-body unit volume up > 50% Nordisk acquisition adds $14M and $41M to Q3 and year-to-date revenues, respectively Airbus 330/340 system deliveries accelerated in 2008 enhance core revenue growth First 747-8 to ship end of 2008 Repair Products and Services Core growth tempered by phase out of lower margin products and mix of repairs Mix of increased repair vs. part sales continues to drive margin improvement PTI joint venture continues to contribute positively to earnings Aerospace Segment |
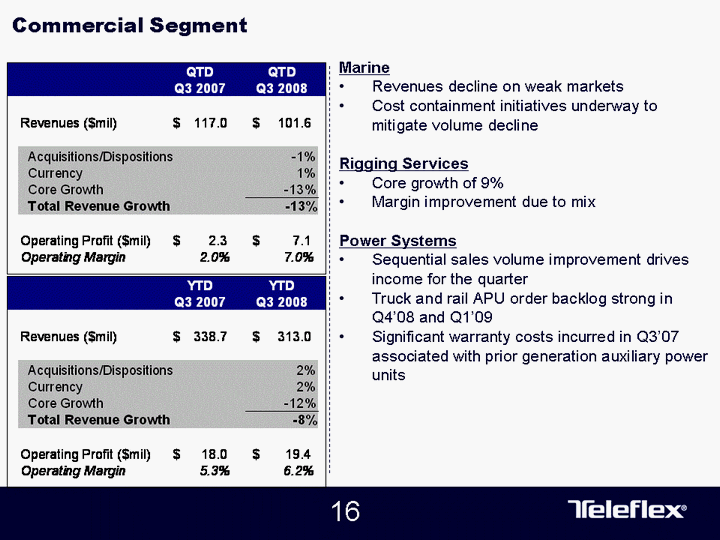
Marine Revenues decline on weak markets Cost containment initiatives underway to mitigate volume decline Rigging Services Core growth of 9% Margin improvement due to mix Power Systems Sequential sales volume improvement drives income for the quarter Truck and rail APU order backlog strong in Q4'08 and Q1'09 Significant warranty costs incurred in Q3'07 associated with prior generation auxiliary power units Commercial Segment |
Year-to-Date Cash Flow From Continuing Operations ($ Millions) Capital Expenditures - $30.2 million; Dividends - $36.3 million Capital Expenditures - $28.3 million; Dividends - $39.6 million Note: Q3'08 Year-to-Date Cash Flow from Operations excludes tax payments of $90M related to gain on sale of Automotive & Industrial businesses in Q4'07 |
Capital Structure ($ Millions) Q4'07 Q1'08 Q2'08 Q3'08 Total Debt 1684.3 1681.8 1646 1578.3 % of Net Debt to Total Capital 0.527 0.53 0.525 0.517 |
Remaining 2008 2009 2010 2011 2012 2013 and thereafter 38.8 103.5 102.2 247.2 860.1 226 Debt Maturity Schedule ($ Millions) |
Current Estimate Low Current Estimate High Earnings per share from continuing operations including special charges $3.38 $3.51 Addback special charges1 $0.52 $0.49 Earnings per share from continuing operations before special charges $3.90 $4.00 2008 Outlook Adjusted operating cash flow of approximately $260 million2 1 = includes restructuring, integration costs and inventory step-up, all principally related to the Arrow acquisition 2 = exclusive of tax payments related to gain on sale recorded in discontinued operations in 2007 |
Jeff Black Chairman and Chief Executive Officer |
Outlook Medical core revenue growth of low-to-mid single digits for the year Arrow integration on track to achieve 2008 synergies up to $40 million Medical operating margins over 20% for the year Cargo systems wide-body delivery schedule ramps in 4Q; tempered by impact of Boeing strike Cautious on Commercial Marine outlook Power Systems APU backlog for 4Q and 2009 delivery Expectation that USD continues to strengthen Adjusted Cash Flow from Operations of approximately $260 million Continued focus on reducing outstanding debt |
Question and Answer Session |
Appendices |
Appendix A - QTD & YTD Reconciliation of Medical Operating Profit and Margins |
Appendix B - QTD & YTD Reconciliation of Teleflex Gross Profit and Margins |
Appendix C - QTD & YTD Reconciliation of Teleflex Operating Expenses |
Appendix D - Special Charge Income Statement Classification Summary |
Appendix E - QTD & YTD Reconciliation of Teleflex Cash Flow from Operations |
Appendix F - Net Debt to Total Capital Reconciliation ($ Millions) |
Appendix G - Q3 Medical Revenue by Region & Product Summary Note: Q3'07 excludes Arrow acquisition which occurred in Q4'07 |