1 TELEFLEX INCORPORATED FOURTH QUARTER AND FULL YEAR 2013 EARNINGS CONFERENCE CALL Exhibit 99.1 |
Conference Call Logistics The release, accompanying slides, and replay webcast are available online at www.teleflex.com (click on “Investors”) Telephone replay available by dialing 888-286-8010 or for international calls, 617- 801-6888, pass code number 68453301 2 |
Introductions Benson Smith Chairman, President and CEO Thomas Powell Executive Vice President and CFO Jake Elguicze Treasurer and Vice President of Investor Relations 3 |
Forward-Looking Statements/Additional Notes 4 This presentation and our discussion contain forward-looking information and statements including, but not limited to, the expected accretive impact of our acquisition of Mayo Healthcare Pty Ltd.; forecasted 2014 constant currency revenue growth; the expected contributions of our acquisition of Vidacare and distributor-to-direct conversions, both completed and planned, to our 2014 constant currency revenue growth; our expectation that 2014 constant currency revenue growth from new product introductions will be at levels comparable to 2012 and 2013; our expectation that 2014 base volume growth will be modest; our expectation that the majority of pricing improvements in 2014 will result from our distributor-to-direct strategy and that we will be selective with respect to product pricing opportunities; forecasted 2014 adjusted gross and operating margins; our expectation that 2014 gross margins for the Vidacare business will remain at approximately 85%; our expectation that distributor-to-direct conversions and manufacturing cost improvements will contribute to improvements in our 2014 adjusted gross and operating margins; forecasted 2013 adjusted earnings per share; and other matters which inherently involve risks and uncertainties which could cause actual results to differ from those projected or implied in the forward–looking statements. These risks and uncertainties are addressed in our SEC filings, including our most recent Form 10-K. This presentation includes certain non-GAAP financial measures, which include revenue growth on a constant currency basis; adjusted gross profit and margin; adjusted operating income and margins; and adjusted earnings per share. Adjusted diluted earnings per share excludes, depending on the period presented, (i) the effect of charges associated with our restructuring programs, as well as goodwill and other asset impairment charges; (ii) loss on extinguishment of debt; (iii) the gain or loss on sales of businesses and assets; (iv) losses and other charges related to acquisition and integration costs, the reversal of liabilities related to certain contingent consideration arrangements and a previously announced stock keeping unit rationalization program, a litigation verdict against the Company with respect to a non-operating joint venture, the establishment of a litigation reserve and facility relocation costs; (v) amortization of the debt discount on the Company’s convertible notes; (vi) charges associated with the amortization of additional interest expense related to an interest rate swap terminated in 2011; (vii) intangible amortization expense; and (viii) tax benefits resulting from the resolution of prior years’ tax matters and the filing of prior years’ amended tax returns. In addition, the calculation of diluted shares within adjusted earnings per share gives effect to the anti-dilutive impact of the Company’s convertible note hedge agreements, which reduce the potential economic dilution that otherwise would occur upon conversion of the Company’s senior subordinated convertible notes (under GAAP, the anti-dilutive impact of the convertible note hedge agreements is not reflected in diluted shares). Constant currency revenue growth excludes the impact of translating the results of international subsidiaries at different currency exchange rates from period to period. Adjusted gross profit and margin exclude the impact of certain losses and other charges, primarily related to acquisition and severance costs. Adjusted operating income and margins exclude the impact of a goodwill impairment, restructuring and other impairment charges, (gain) loss on sale of businesses and assets and certain losses and other charges. In addition, adjusted operating margins exclude the impact of intangible amortization expense. Reconciliation of these non-GAAP measures to the most comparable GAAP measures is contained within this presentation. Unless otherwise noted, the following slides reflect continuing operations. |
5 FOURTH QUARTER AND FULL YEAR 2013 HIGHLIGHTS |
Fourth Quarter Highlights Strong final two weeks of December and contribution from Vidacare lead to revenue of $450.5 million, up 6.9% constant currency vs. prior year Adjusted gross margin of 50.0%, up 240 bps vs. prior year Adjusted operating margins of 16.0%, up 50 bps vs. prior year • Adjusted operating margin excluding intangible amortization expense of 19.0%, up 70 bps vs. prior year Adjusted EPS of $1.36, up 18.3% vs. prior year 6 |
Fourth Quarter Highlights Improvement in the average selling prices of products contribute 86 bps of top-line growth in Q4’13 compared to Q4’12 • EMEA up 129 bps • Asia Pacific up 89 bps • Americas up 86 bps • OEM down 81 bps Continue to expand GPO & IDN relationships • 4 new agreements (2 IDN; 2 GPO) • 7 renewed agreements (4 IDN; 3 GPO) New product introductions contribute 102 bps of top-line growth in Q4’13 compared to Q4’12 7 |
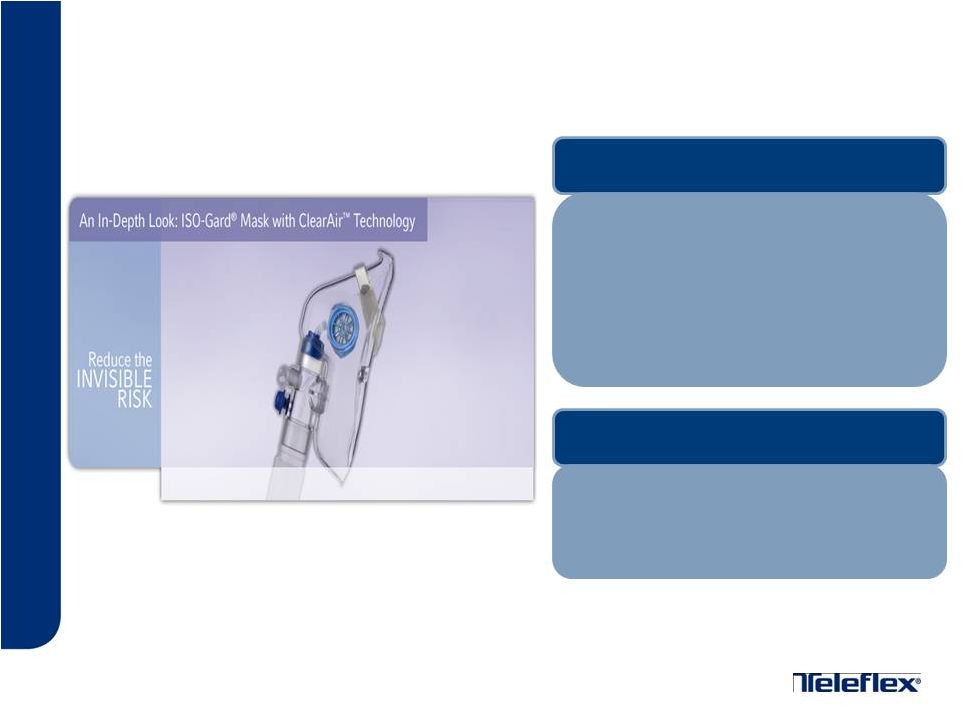
ISO-Gard® Mask with ClearAir™ Technology Designed to help reduce hazardous waste anesthetic gas (WAG) within a nurse’s breathing zone Developed in partnership with clinicians and is the only solution available for “source control” of WAG in the recovery room PRODUCT DESCRIPTION Fourth Quarter Highlights PRODUCT UPDATE 8 Community Surgery Center North, part of Community Health Network in Indianapolis, Indiana, becomes the first center to incorporate the device into daily protocols |
LMA International N.V. and affiliates • Contributed revenue of approximately $34.2 million in Q4’13 • Contributed revenue and gross margin of approximately $134.2 million and 59%, respectively for full year 2013 • Integration of acquisition and financial performance during 2013 ahead of expectations Fourth Quarter Highlights 9 |
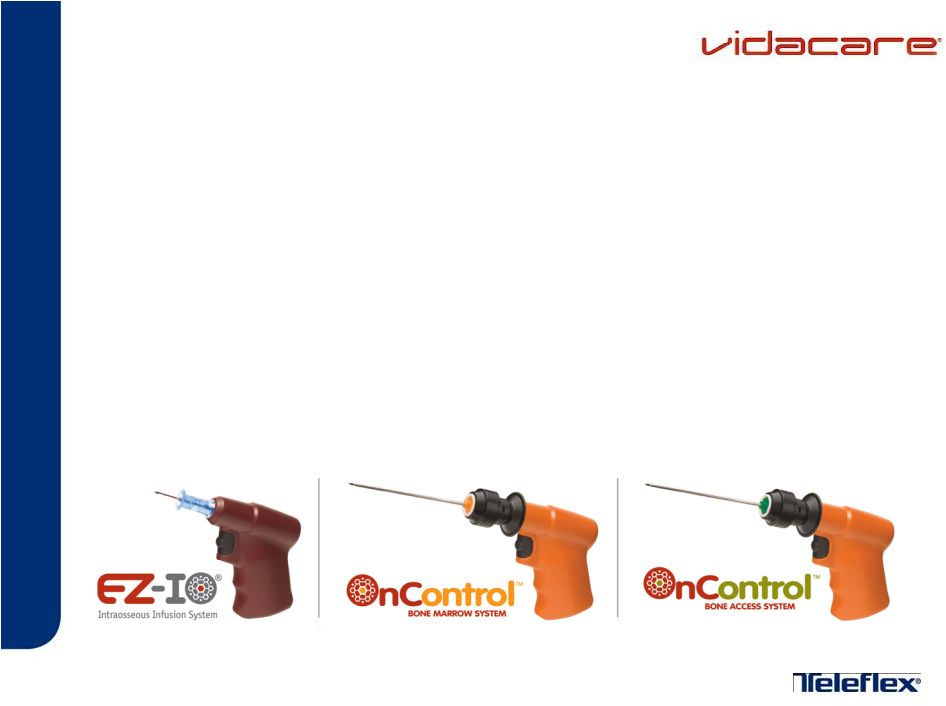
Fourth Quarter Highlights Completed acquisition of Vidacare Corporation • Transaction closed on December 2, 2013 • Q4’13 revenue contribution ahead of initial expectations • Integration activities on schedule 10 |
Mayo Healthcare Pty Ltd. • Definitive agreement signed in December 2013 to acquire one of Australia’s largest medical device distributors • Provides high quality products, education services, technical services and customer support to healthcare institutions throughout Australia • Accretive, all-cash transaction was completed in February 2014 • Represents the major distributor-to-direct conversion assumed in previously provided 2014 financial guidance Fourth Quarter Highlights 11 |
Full Year Highlights Revenue of $1.696 billion, up 9.0% constant currency vs. prior year Adjusted gross margin of 49.6%, up 130 bps vs. prior year Adjusted operating margins of 16.3%, flat vs. prior year primarily due to medical device excise tax • Adjusted operating margin excluding intangible amortization expense of 19.3%, up 20 bps vs. prior year Adjusted EPS of $5.03, up 13.5% vs. prior year 12 |
Full Year Highlights 13 New product introductions contribute 124 bps of top-line growth in 2013 compared to 2012 Improvement in the average selling prices of products contribute 98 bps of top-line growth in 2013 compared to 2012 • Americas up 122 bps • EMEA up 111 bps • Asia Pacific up 66 bps • OEM down 30 bps Solidified foundation for future growth through expansion of GPO & IDN relationships • 25 new agreements (18 IDN; 7 GPO) • 12 renewed agreements (4 IDN; 8 GPO) |
Full Year Highlights 14 Combination of market-share enhancing and technology acquisitions across multiple product areas positions Company for sustainable revenue growth and margin expansion • Vidacare Corporation • Ultimate Medical Pty. Ltd. • Eon Surgical, Ltd. |
FOURTH QUARTER 2013 FINANCIAL REVIEW 15 |
Financial Results Revenue of $450.5 million • Up 7.5% vs. prior year period on an as-reported basis • Up 6.9% vs. prior year period on a constant currency basis Adjusted gross margin of 50.0% • Up 240 bps vs. prior year period Research & development spending up 9.9% from prior year period Adjusted operating margin of 16.0%, up 50 bps vs. prior year period • Adjusted operating margin excluding intangible amortization expense of 19.0%, up 70 bps vs. prior year period Adjusted EPS of $1.36, up 18.3% vs. prior year period 16 |
17 FOURTH QUARTER 2013 PRODUCT & SEGMENT REVENUE REVIEW |
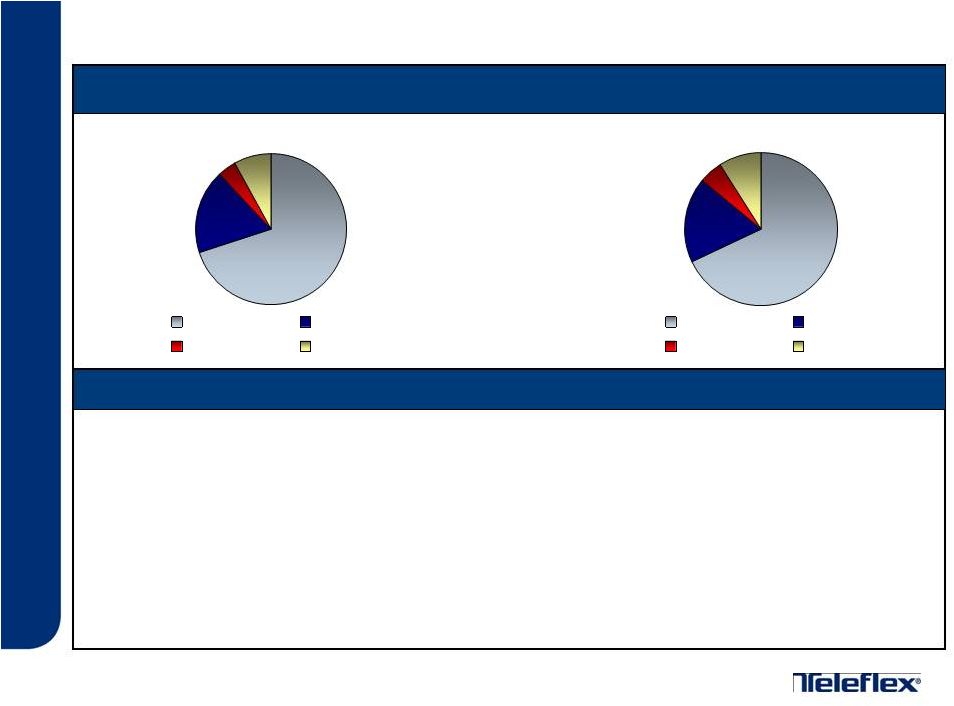
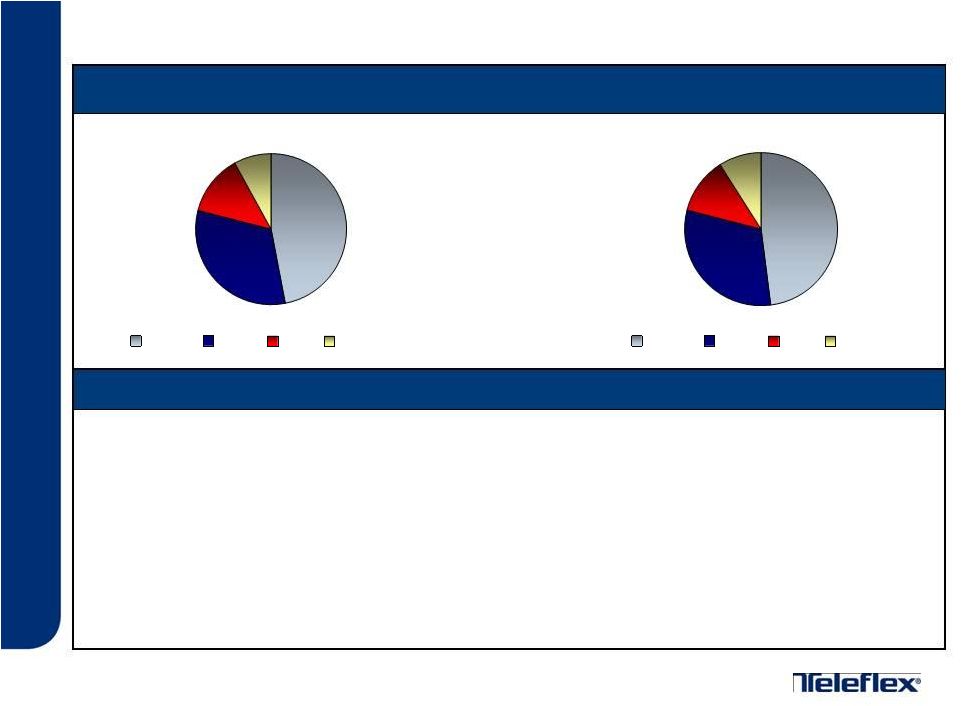
Product Revenue Review Q4’13 Q4’12 Constant Currency Revenue Commentary Critical Care: $316.7 million, up 10.2% Surgical Care: $80.5 million, up 4.0% Anesthesia – up 16.9% Vascular and interventional access – up 11.3% Urology – up 6.3% Respiratory – down 0.9% Cardiac Care: $19.2 million, down 6.0% OEM: $34.1 million, down 5.7% Note: Increases and decreases in revenue referred to above are as compared to results for the fourth quarter of 2012. 18 4% 8% 70% 18% 5% 9% 68% 18% Critical Care Cardiac Care Surgical Care OEM Critical Care Cardiac Care Surgical Care OEM |
Segment Revenue Review Q4’13 Q4’12 Constant Currency Revenue Commentary Americas: $212.4 million, up 6.6% EMEA: $144.9 million, up 5.2% Asia: $59.1 million, up 21.6% OEM: $34.1 million, down 5.7% Note: Increases and decreases in revenue referred to above are as compared to results for the fourth quarter of 2012. 19 13% 8% 47% 32% 31% 12% 9% 48% Americas Asia EMEA OEM Americas Asia EMEA OEM |
20 2014 FINANCIAL OUTLOOK |
2014 Financial Outlook 21 Constant currency revenue growth expected to be between 7% and 9% • Full year impact of Vidacare and distributor-to-direct conversions, both completed and planned to be completed in 2014 • Growth from new product pipeline comparable to 2012-2013 levels • Assumption of modest base volume growth • Distributor-to-direct strategy yields majority of pricing gains; product pricing opportunities will be selective Adjusted gross margin anticipated to improve by approximately 240bps to 290bps and reach 52.0% to 52.5% • Vidacare gross margin expected to remain at current level of ~ 85% • Pricing and margin gains from distributor to direct strategy • Manufacturing cost improvement programs |
2014 Financial Outlook 22 Adjusted operating margin excluding intangible amortization expense expected to be between 20% and 21% • Previously provided adjusted operating margin range of 17% to 18% included approximately 325 bps of intangible amortization expense • Year-over-year gross margin gains tempered by investment in distributor-to- direct strategy and Vidacare’s higher relative SG&A Adjusted earnings per share anticipated to be between $5.35 and $5.55 per share • Represents growth of between 6% and 10% as compared to 2013 adjusted EPS |
23 QUESTION & ANSWER |
24 APPENDICES |
Appendix A – Reconciliation of Product Constant Currency Revenue Growth Dollars in Millions 25 December 31, 2013 December 31, 2012 Constant Currency Currency Total Critical Care 316.7 $ 286.5 $ 10.2% 0.4% 10.6% Surgical Care 80.5 76.5 4.0% 1.2% 5.2% Cardiac Care 19.2 20.4 (6.0%) 0.0% (6.0%) OEM 34.1 35.7 (5.7%) 0.9% (4.8%) Net Revenues 450.5 $ 419.1 $ 6.9% 0.6% 7.5% Three Months Ended % Increase / (Decrease) |
Appendix B – Reconciliation of Segment Constant Currency Revenue Growth Dollars in Millions 26 December 31, 2013 December 31, 2012 Constant Currency Currency Total Americas 212.4 $ 200.1 $ 6.6% (0.4%) 6.2% EMEA 144.9 132.8 5.2% 4.0% 9.2% Asia 59.1 50.5 21.6% (4.5%) 17.1% OEM 34.1 35.7 (5.7%) 0.9% (4.8%) Net Revenues 450.5 $ 419.1 $ 6.9% 0.6% 7.5% Three Months Ended % Increase / (Decrease) |
Appendix C – Reconciliation of Critical Care Product Constant Currency Revenue Growth Dollars in Millions 27 December 31, 2013 December 31, 2012 Constant Currency Currency Total Vascular & Interventional Access 129.5 $ 117.1 $ 11.3% (0.7%) 10.6% Anesthesia 95.4 81.3 16.9% 0.5% 17.3% Respiratory 47.1 47.0 (0.9%) 1.0% 0.2% Urology 44.9 41.2 6.3% 2.6% 8.9% Critical Care Net Sales 316.7 $ 286.5 $ 10.2% 0.4% 10.6% Three Months Ended % Increase / (Decrease) |
28 Cost of goods sold Selling, general and administrative expenses Income taxes Net income (loss) attributable to common shareholders from continuing operations GAAP Basis $225.6 $143.8 $17.9 $9.2 $14.2 $4.6 $35.1 $0.78 45,033 Adjustments Restructuring and other impairment charges Losses and other charges (A) Amortization of debt discount on convertible notes Intangible amortization expense — 13.5 — — — 4.5 9.0 $0.20 — Tax Adjustment (B) — — — — — 1.5 (1.5) ($0.03) — Shares due to Teleflex under note (C) Adjusted basis $225.3 $122.0 $17.3 — $11.3 $15.8 $58.5 $1.36 42,868 Research and development expenses Restructuring and other impairment charges Interest expense, net Diluted earnings per share available to common shareholders Shares used in calculation of GAAP and adjusted earnings per share — — — 9.2 — 1.7 7.6 — 2.5 6.5 $0.14 0.3 8.2 0.5 — $0.04 — $0.17 — — — — — — — — 2.9 1.1 1.8 (2,165) (A) In 2013, losses and other charges include approximately $4.0 million, net of tax, or $0.09 per share, primarily related to acquisition and integration costs; $1.9 million, net of tax, or $0.04 per share related to the establishment of a litigation reserve; and $0.6 million, net of tax, or $0.01 per share related to costs incurred to relocate facilities. (B) The tax adjustment represents a net benefit resulting from the resolution of, or the expiration of statute of limitations with respect to, various prior years’ U.S. federal, state and foreign tax matters. (C) Adjusted diluted shares are calculated by giving effect to the anti-dilutive impact of the Company’s convertible note hedge agreements, which reduce the potential economic dilution that otherwise would occur upon conversion of our senior subordinated convertible notes. Under GAAP, the anti-dilutive impact of the convertible note hedge agreements is not reflected in diluted shares. — — — $0.06 — — Appendix D – EPS Reconciliation from Continuing Operations Quarter Ended – December 31, 2013 Dollars in millions, except per share data |
29 Cost of goods sold Selling, general and administrative expenses Income taxes Net income (loss) attributable to common shareholders from continuing operations GAAP Basis $219.9 $121.5 $16.3 $3.0 $14.4 $13.5 $30.4 $0.72 42,007 Adjustments Restructuring and other impairment charges Losses and other charges (A) 0.5 3.0 — — — (1.9) 5.4 $0.13 — Amortization of debt discount on convertible notes Intangible amortization expense — 12.0 — — — 4.2 7.8 $0.19 — Tax adjustment (B) Shares due to Teleflex under note hedge (C) Adjusted basis $219.4 $106.5 $16.3 — $11.7 $17.3 $47.6 $1.15 41,274 Research and development expenses Restructuring and other impairment charges Interest expense, net Diluted earnings per share available to common shareholders Shares used in calculation of GAAP and adjusted earnings per share — — — 3.0 — 0.6 2.3 2.7 1.0 1.7 $0.04 — — — — — — $0.06 — — — — — — — — — — — (733) (A) In 2012, losses and other charges include approximately $5.4 million, net of tax, or $0.13 per share, related to acquisition costs. (B) The tax adjustment represents a net benefit resulting from the resolution of, or the expiration of statute of limitations with respect to various prior years’ U.S. federal, state and foreign tax matters. (C) Adjusted diluted shares are calculated by giving effect to the anti-dilutive impact of the Company’s convertible note hedge agreements, which reduce the potential economic dilution that otherwise would occur upon conversion of our senior subordinated convertible notes. Under GAAP, the anti-dilutive impact of the convertible note hedge agreements is not reflected in diluted shares. — — — $0.02 — — Appendix E – EPS Reconciliation from Continuing Operations Quarter Ended – December 31, 2012 Dollars in millions, except per share data |
30 Appendix F – Reconciliation of Teleflex Gross Profit and Margin December 31, 2013 December 31, 2012 Teleflex gross profit as-reported 224,943 $ 199,180 $ Teleflex gross margin as-reported 49.9% 47.5% Losses and other charges (A) 253 459 Adjusted Teleflex gross profit 225,196 $ 199,639 $ Adjusted Teleflex gross margin 50.0% 47.6% Teleflex revenue as-reported 450,539 $ 419,056 $ $ thousands Three Months Ended A: In 2013, losses and other charges primarily relate to acquisition and integration costs. In 2012, losses and other charges relate to acquisition costs. |
31 Appendix G – Reconciliation of Teleflex Operating Profit and Margin A: In 2013, losses and other charges primarily relate to acquisition and integration costs; the establishment of a litigation reserve; and costs incurred to relocate facilities. In 2012, losses and other charges related to acquisition costs. December 31, 2013 December 31, 2012 Teleflex income from continuing operations before interest, loss on extinguishment of debt and taxes 54,064 $ 58,440 $ Teleflex income from continuing operations before interest, loss on extinguishment of debt and taxes margin 12.0% 13.9% Restructuring and other impairment charges 9,247 2,953 Losses and other charges (A) 8,959 3,493 Adjusted Teleflex income from continuing operations before interest, loss on extinguishment of debt and taxes 72,270 $ 64,886 $ Adjusted Teleflex income from continuing operations before interest, loss on extinguishment of debt and taxes margin 16.0% 15.5% Intangible amortization expense 13,536 12,001 Adjusted Teleflex income from continuing operations before interest, loss on extinguishment of debt, taxes and intangible amortization expense 85,806 $ 76,887 $ Adjusted Teleflex income from continuing operations before interest, loss on extinguishment of debt, taxes and intangible amortization expense margin 19.0% 18.3% Teleflex revenue as-reported 450,539 $ 419,056 $ $ thousands Three Months Ended |
Appendix H – Reconciliation of Product Constant Currency Revenue Growth Dollars in Millions 32 December 31, 2013 December 31, 2012 Constant Currency Currency Total Critical Care 1,182.7 $ 1,040.3 $ 13.4% 0.3% 13.7% Surgical Care 306.5 291.1 4.5% 0.8% 5.3% Cardiac Care 75.9 79.4 (4.1%) (0.4%) (4.5%) OEM 131.2 140.2 (7.0%) 0.5% (6.5%) Net Revenues 1,696.3 $ 1,551.0 $ 9.0% 0.4% 9.4% Twelve Months Ended % Increase / (Decrease) |
33 Appendix I – Reconciliation of Teleflex Gross Profit and Margin December 31, 2013 December 31, 2012 Teleflex gross profit as-reported 838,945 $ 748,225 $ Teleflex gross margin as-reported 49.5% 48.2% Losses and other charges (A) 2,275 459 Adjusted Teleflex gross profit 841,220 $ 748,684 $ Adjusted Teleflex gross margin 49.6% 48.3% Teleflex revenue as-reported 1,696,271 $ 1,551,009 $ $ thousands Twelve Months Ended A: In 2013, losses and other charges primarily relate to acquisition and integration costs, and a reserve reversal associated with a previously announced stock keeping unit (“SKU”) rationalization charge. In 2012, losses and other charges relate to acquisition costs. |
34 Appendix J – Reconciliation of Teleflex Operating Profit and Margin A: In 2013, losses and other charges primarily relate to the reversal of contingent consideration liabilities, acquisition and integration costs, the reserve reversal associated with a previously announced stock keeping unit (“SKU”) rationalization charge, a litigation verdict against the Company with respect to a non-operating joint venture; the establishment of a litigation reserve; and costs incurred to relocate facilities. In 2012, losses and other charges relate to the reversal of contingent consideration liabilities and acquisition costs. December 31, 2013 December 31, 2012 Teleflex income (loss) from continuing operations before interest, loss on extinguishment of debt and taxes 233,261 $ (97,375) $ Teleflex income (loss) from continuing operations before interest, loss on extinguishment of debt and taxes margin 13.8% -6.3% Goodwill impairment - 332,128 Restructuring and other impairment charges 38,452 3,037 Net (gain) loss on sales of businesses and assets - (332) Losses and other charges (A) 4,327 14,640 Adjusted Teleflex income from continuing operations before interest, loss on extinguishment of debt and taxes 276,040 $ 252,098 $ Adjusted Teleflex income from continuing operations before interest, loss on extinguishment of debt and taxes margin 16.3% 16.3% Intangible amortization expense 50,608 44,264 Adjusted Teleflex income from continuing operations before interest, loss on extinguishment of debt, taxes and intangible amortization expense 326,648 $ 296,362 $ Adjusted Teleflex income from continuing operations before interest, loss on extinguishment of debt, taxes and intangible amortization expense margin 19.3% 19.1% Teleflex revenue as-reported 1,696,271 $ 1,551,009 $ $ thousands Twelve Months Ended |
35 Cost of goods sold Selling, general and administrative expenses Income taxes GAAP Basis $857.3 $502.2 $65.0 — $38.5 $23.5 Adjustments Restructuring and other impairment charges Gain/(loss) on sales of businesses and assets — — — — — — Loss on extinguishment of debt — — — — — 0.5 Losses and other charges (A) Amortization of debt discount on convertible notes Intangible amortization expense — 50.6 — — — 17.3 Tax Adjustment (B) — — — — — 11.1 Shares due to Teleflex under note hedge (C) Adjusted basis $855.1 $450.1 $64.5 — — $69.2 Gain/(loss) on sales of businesses and assets Loss on extinguishment of debt Interest expense, net Research and development expenses Goodwill impairment Restructuring and other impairment charges Diluted earnings per share available to common shareholders Shares used in calculation of GAAP and adjusted earnings per share $56.3 $151.3 Net income (loss) attributable to common shareholders from continuing operations $3.46 43,693 — $1.3 — — — — $0.71 — 38.5 — — — — — 7.8 30.7 — — — 1.3 — 0.8 $0.02 — — — 2.3 1.5 0.5 — — — — — 4.9 (0.6) ($0.02) — — — — — $0.16 — — — — 11.3 — 33.4 4.1 7.2 $0.76 — — — — (11.1) ($0.25) — — — — — — — — — — — — — $0.19 (1,620) (C) Adjusted diluted shares are calculated by including the anti-dilutive impact of the Company’s convertible note hedge agreements, which reduce the potential economic dilution that otherwise would occur upon conversion of our senior subordinated convertible notes. Under GAAP, the anti-dilutive impact of the convertible note hedge agreements is not reflected in diluted shares. (B) The tax adjustment represents a net benefit resulting from the resolution of, or the expiration of statutes of limitations with respect to various prior years’ U.S. federal, state and foreign tax matters. $5.03 42,073 (A) In 2013, losses and other charges include approximately ($12.4) million, net of tax, or ($0.28) per share, related to the reversal of contingent consideration liabilities; $7.8 million, net of tax, or $0.18 per share, primarily related to acquisition and integration costs; ($0.3) million, net of tax, or ($0.01) per share, related to a reserve reversal associated with a previously announced stock keeping unit (“SKU”) rationalization charge; $0.8 million, net of tax, or $0.02 per share, related to a litigation verdict against the Company with respect to a non-operating joint venture; $1.9 million, net of tax, or $0.04 per share related to the establishment of a litigation reserve; and $1.6 million, net of tax, or $0.04 per share related to costs incurred to relocate facilities. — — $45.0 $211.6 Appendix K – EPS Reconciliation from Continuing Operations Year Ended – December 31, 2013 Dollars in millions, except per share data |
36 Cost of goods sold Selling, general and administrative expenses Income taxes GAAP Basis $802.8 $454.5 $56.3 $332.1 $3.0 $16.4 Adjustments Goodwill impairment — — — 332.1 — 17.0 Restructuring and other impairment charges Gain/(loss) on sales of businesses and assets — — — — — — Loss on extinguishment of debt Losses and other charges (A) 0.5 14.2 — — — — Early termination of interest rate swap (B) — — — — — 4.0 Amortization of debt discount on convertible notes Intangible amortization expense — 44.3 — — — 16.0 Anti-dilutive effect on EPS (C) — — — — — — Tax adjustment (D) Shares due to Teleflex under note hedge (E) Adjusted basis $802.3 $396.0 $56.3 — — $66.7 Gain/(loss) on sales of businesses and assets Loss on extinguishment of debt Interest expense, net Research and development expenses Goodwill impairment Restructuring and other impairment charges Diluted earnings per share available to common shareholders Shares used in calculation of GAAP and adjusted earnings per share $68.0 ($182.7) Net income (loss) attributable to common shareholders from continuing operations ($4.47) 40,859 $0.3 — — — — 315.1 $7.71 — — — — — 3.0 — — — 0.6 2.5 $0.06 — (0.3) — — (0.3) — — — — — — — — — — ($0.01) — — 14.6 — — $0.36 — — — 11.1 7.0 $0.17 — — — — — — — $0.16 — — — — 10.5 — 28.3 3.8 6.7 $0.69 — — — — — ($0.06) 542 — — — — — — — — — — 9.0 (9.0) ($0.22) — — — — — (275) — — — — $182.2 — — $0.03 (C) The Company presents per share results using basic weighted average shares, and separately presents diluted per share results, which reflect with the impact of dilution on income. Under applicable accounting guidance, if a company has a net loss from continuing operations, as was the case for the Company in 2012, no common shares that potentially may be issued are included in the computation of diluted per-share amounts because such inclusion would result in an anti-dilutive per share amount. However, the Company had net income on an adjusted basis in 2012. Therefore, common shares that would have a dilutive effect on adjusted net income are deemed to be outstanding for purposes of the calculation of 2012 adjusted diluted earnings per share. (D) The tax adjustment represents a net benefit resulting from the resolution of, or the expiration of statutes of limitations with respect to various prior years’ U.S. federal, state and foreign tax matters. (E) Adjusted diluted shares are calculated by including the anti-dilutive impact of the Company’s convertible note hedge agreements, which reduce the potential economic dilution that otherwise would occur upon conversion of our senior subordinated convertible notes. Under GAAP, the anti-dilutive impact of the convertible note hedge agreements is not reflected in diluted shares. $4.43 41,126 (A) In 2012, losses and other charges include approximately $0.2 million, net of tax related to contingent consideration liabilities; and $14.4 million, net of tax, or $0.36 per share, related to acquisition costs. (B) In 2011, the Company terminated an interest rate swap that, at the date of termination, had a notional amount of $350 million. The interest rate swap was designated as a cash flow hedge against the term loan under our senior credit facility. At the date of termination, the interest rate swap was in a liability position resulting in a cash payment by the Company to the counterparty of approximately $14.8 million, which included $3.1 million of accrued interest. In accordance with GAAP, the Company amortized this amount as additional interest expense over the remainder of the original term of the interest rate swap, which expired in September 2012. In the first nine months of 2012, the impact of the amortization, net of tax, was approximately $7.0 million, or $0.17 per share. — — $46.5 Appendix L – EPS Reconciliation from Continuing Operations Year Ended – December 31, 2012 Dollars in millions, except per share data |
Appendix M – Reconciliation of 2014 Constant Currency Revenue Growth Guidance 37 Low High Full Year 2014 Forecasted GAAP Revenue Growth 6.0% 8.0% Foreign Exchange 1.0% 1.0% Full Year 2014 Forecasted Constant Currency Revenue Growth 7.0% 9.0% |
Appendix N – Reconciliation of 2014 Gross Margin Guidance 38 2014 Forecast GAAP Gross Margin 52.0% 52.5% Losses and other charges - - Adjusted Gross Margin 52.0% 52.5% |
Appendix O – Reconciliation of 2014 Operating Margin 39 2014 Forecast GAAP Operating Margin 16.1% 17.0% Losses and other charges 0.4% 0.5% Adjusted Operating Margin 16.5% 17.5% Intangible amortization expense 3.5% 3.5% Adjusted Operating Margin Excluding Intangible Amortization Expense 20.0% 21.0% |
Appendix P – Reconciliation of 2014 Adjusted Earnings per Share Guidance 40 Low High Diluted earnings per share attributable to common shareholders $3.60 $3.75 Restructuring, impairment charges, and special items, net of tax $0.65 $0.70 Intangible amortization expense, net of tax $0.93 $0.93 Amortization of debt discount on convertible notes, net of tax $0.17 $0.17 Adjusted diluted earnings per share $5.35 $5.55 |