Exhibit 13.1
clean, lean and green
Creating a cleaner, safer world™

TENNANT COMPANY
2002 ANNUAL REPORT
At Tennant, we provide customers around the world with innovative
solutions that provide superior cleaning performance, high productivity
and a cleaner environment.
clean, lean and green
Tennant Company is a world leader in designing, manufacturing and marketing products that help create a cleaner, safer world. Our floor maintenance equipment, outdoor cleaning equipment, coatings and related products are used to clean factories, office buildings, airports, hospitals, schools, warehouses, shopping centers, parking lots, streets and more.
Our customers include the building services contractors to whom many organizations now outsource facilities maintenance, as well as users in corporations, health care facilities, schools and federal, state and local governments who handle facilities and outdoor maintenance themselves. We reach these customers through the industry’s largest direct sales and service organization and through a strong and well-supported network of authorized distributors worldwide.
In the $5 billion market we serve, we offer customers solutions that are distinguished by being CLEAN, LEAN and GREEN. With respect to our solutions, we define these attributes to mean:
• Better cleaning results than alternatives,
• Improved labor productivity that lowers customers’ cleaning costs, and
• Environmental benefits, such as lower emissions of noise and dust, lower water consumption and less wastewater generation, resulting in healthier and safer environments.
At Tennant, we focus on economic profit (operating profit after taxes less a capital charge for net assets employed) as the most important measure of our financial performance. Economic profit has a high correlation to the creation of value for shareholders. Accordingly, incentive compensation for the majority of our employees worldwide is linked to economic profit targets.
Tennant is headquartered in Minneapolis, Minnesota and also has manufacturing operations in Holland, Michigan and Uden, The Netherlands. We sell our products directly in 10 countries and through distributors in more than 50 others. Our shares are traded on the New York Stock Exchange under the symbol TNC.
FINANCIAL HIGHLIGHTS
(In thousands, except shares and per share data)
| | 2002 | | 2001 | | % Change | |
| | | | | | | |
For the year as reported | | | | | | | |
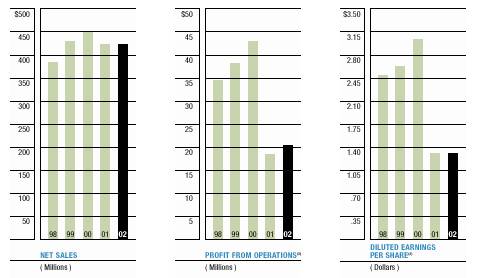
Net sales | | $ | 424,183 | | $ | 422,425 | | 0.4 | |
Profit from operations | | $ | 15,576 | | $ | 13,451 | | 15.8 | |
% of net sales | | 3.7 | % | 3.2 | % | — | |
Net earnings | | $ | 8,265 | | $ | 4,608 | | 79.4 | |
% of net sales | | 1.9 | % | 1.1 | % | — | |
Basic earnings per share | | $ | 0.92 | | $ | 0.51 | | 80.4 | |
Diluted earnings per share | | $ | 0.91 | | $ | 0.50 | | 82.0 | |
Dividends per share | | $ | 0.82 | | $ | 0.80 | | 2.5 | |
Economic profit (loss)(1) | | $ | (9,600 | ) | $ | (9,000 | ) | (6.7 | ) |
Return on invested capital | | 6.2 | % | 6.4 | % | — | |
Average shares outstanding – diluted | | 9,048 | | 9,203 | | (1.7 | ) |
| | | | | | | |
For the year excluding unusual items (2) | | | | | | | |
Profit from operations | | $ | 20,578 | | $ | 18,492 | | 11.3 | |
% of net sales | | 4.9 | % | 4.4 | % | — | |
Net earnings | | $ | 11,884 | | $ | 12,017 | | (1.1 | ) |
% of net sales | | 2.8 | % | 2.8 | % | — | |
Basic earnings per share | | $ | 1.32 | | $ | 1.32 | | — | |
Diluted earnings per share | | $ | 1.31 | | $ | 1.31 | | — | |
| | | | | | | |
At year-end | | | | | | | |
Total assets | | $ | 256,237 | | $ | 252,559 | | 1.5 | |
Total debt | | $ | 19,948 | | $ | 25,914 | | (23.0 | ) |
Shareholders’ equity | | $ | 154,145 | | $ | 151,971 | | 1.4 | |
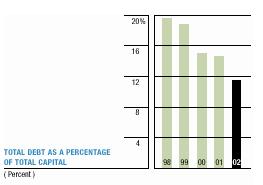
Ratio of total debt to total capital | | 11.5 | % | 14.6 | % | — | |
Shareholders’ equity per share (ending) | | $ | 17.16 | | $ | 16.82 | | 2.0 | |
(1) Economic Profit is operating profit after tax less a capital charge for net assets employed in the operations of the Company. The capital charge is intended to represent the return expected by the providers of our capital. Economic profit is not intended to be prepared in accordance with generally accepted accounting principles.
(2) Excludes unusual items in 2002 of $5,002 pre-tax ($4,002 of restructuring charges, $500 of inventory write-downs and $500 in certain severance payments), 2001 unusual items of $5,041 pre-tax ($9,962 of restructuring charges, $1,007 of inventory write-downs and a $5,928 pension settlement gain) and a $4,267 after-tax charge in 2001 to establish an initial deferred tax valuation allowance.
(3) Excludes unusual items.
1
Tennant At-A—Glance
| PRODUCTS AND APPLICATIONS |
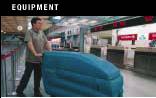
EQUIPMENT | |
| |
| Tennant designs, manufactures and markets equipment used for cleaning and maintenance in industrial, commercial and outdoor environments. Products range from full-sized street sweepers to vacuums, polishers and other specialized equipment. Representative products include: |
| |
| • Rider and walk-behind sweepers and scrubbers for use in industrial environments such as factories, warehouses, stadiums, airports and parking garages as well as in commercial environments such as schools, hospitals, office buildings, supermarkets, retail outlets and airport terminals. |
| |
| • Carpet extractors, burnishers, vacuums, polishers and other specialized equipment used to clean hard surfaces and carpets in commercial environments. |
| |
| • Rider broom and vacuum sweepers for outdoor cleaning of parking lots, streets, sidewalks, alleys and parks. |
| |
AFTERMARKET PARTS & SERVICE | |

| |
| Tennant’s customer and field service organizations help customers achieve maximum uptime for their cleaning equipment. |
| |
| Aftermarket parts include squeegees, hydraulic and electrical components, engine parts and detergents. |
| |
| Tennant also designs and manufactures most of the brushes used on its equipment to ensure quality and proper brush-machine combinations for optimal cleaning performance. |
| |
COATINGS | |

| |
| Tennant develops specialty coatings used to protect, repair and upgrade concrete floors. |
| |
| Products, which are sold primarily in North America, include resinous polymer and epoxy coatings that provide protection, enhanced cleanability and superior wear. |
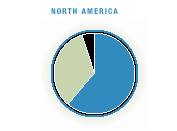
TENNANT COMPANY | | GLOBAL SALES |
2002 GEOGRAPHIC SALES | | |
BY PRODUCT CATEGORY
EQUIPMENT
AFTERMARKET & SERVICE
COATINGS
 | | 
|
2
In this year’s annual report, we present “Tennant At-A-Glance”in a manner more consistent with the way our customers view us — as a provider of equipment, aftermarket parts and service, and coatings that together offer customers solutions for their cleaning and maintenance requirements.
TENNANT SALES | | COMPETITIVE ADVANTAGES | |
| | | |
2002 net sales:
$265 million | | • Reputation for quality. | |
| | • Superior cleaning results. | |
| | | |
| | • Broad product line. | |
| | | |
| | • Innovative technologies. | |
| | | |
| | • Strong direct sales organization complemented by a well-supported distributor network. | |
| | | |
2002 net sales:
$141 million | | • Tennant’s global field service network is the most extensive in the industry. | |
| | | |
| | • Service representatives serve customers on site to assure minimum downtime for equipment. | |
| | | |
| | • Our customer service representatives are highly regarded by customers for their product knowledge and responsiveness. | |
| | | |
| | • Our field and customer service organizations drive sales of aftermarket parts. | |
| | | |
2002 net sales:
$18 million | | • In-house chemistry lab develops proprietary products for specific applications. | |
| | | |
| | • Broad line of coatings, sealers and resurfacers. | |
| | | |
| | • Extensive network of skilled contractors coupled with direct sales force. | |
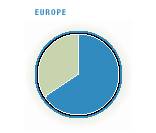
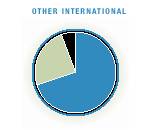
NORTH AMERICA | EUROPE | OTHER INTERNATIONAL |
| 
| 
|
3
TO OUR SHAREHOLDERS:
The extraordinarily difficult conditions we encountered in the worldwide industrial economy in 2001 persisted throughout 2002, once again dampening our financial performance. While some signs of an imminent turnaround appeared in North America early in the year, they faded as the year progressed. By the end of 2002, no significant recovery in capital spending had yet materialized. As a result, we once again saw a decline in our sales of equipment for industrial applications and our profitability suffered accordingly.
We deeply appreciate the support our shareholders have shown us through this challenging period. We also recognize that to merit your continued loyalty we must succeed in strengthening our company even in the face of unfavorable business conditions. | | 
JANET M. DOLAN
President and Chief Executive Officer
|
At Tennant, we are not content to wait on a positive turn in the business cycle to drive an upturn in our results. We are committed to achieving sustainable improvements in our operating effectiveness and competitive position despite the recessionary conditions in which we have been operating. In 2002, we focused particularly on reducing our costs to serve our customers, strengthening our North American sales management team, reinvigorating our new product development process and positioning our operations in Europe for improved performance. We believe our achievements in these areas have us well positioned to continue winning in our markets and improve our financial performance.
2002 FINANCIAL PERFORMANCE Our net sales for 2002 totaled $424.2 million, a slight increase from 2001. The increase is primarily attributable to contributions from Centurion™, our first full-sized street sweeper, and growth in sales of cleaning equipment for commercial applications and aftermarket parts and service revenues, partially offset by the lower sales of equipment for industrial applications. Sales of Centurion™, a newly introduced product, particularly benefited the second half of 2002. In addition, 2002 net sales benefited from the redirection of our

4
marketing and sales efforts toward segments of our market where demand has been less severely depressed. As a result, we were able to achieve modest revenue growth in a very difficult environment, but with a less profitable mix of business.
To keep capacity in line with the weaker equipment demand we experienced in 2002, we twice shut down North American manufacturing operations for industrial applications equipment for week-long periods during the year. In addition, in part through productivity improvements, we further reduced direct labor in North American industrial equipment manufacturing by 5 percent. It is important to note, however, that in our flexible manufacturing environment, we have preserved our ability to increase production quickly once an increase in demand materializes. In fact, we expect to enjoy favorable operating leverage once global industrial economies recover from the current downturn.
Our profitability in 2002, before unusual items, was adversely affected by several factors. They included slightly lower sales of our cleaning equipment and the related sales mix and manufacturing absorption effects, unfavorable foreign currency exchange effects and a higher tax rate resulting from the mix of taxable results we generated by country. In addition, we chose to maintain our research and development spending at nearly 4 percent of net sales to ensure that we continue to bring to market innovative products that separate us from our competitors.
Our net earnings for 2002, before unusual charges, totaled $11.9 million, or $1.31 per diluted share. The year’s unusual charges totaled $3.6 million after tax, or $0.40 per diluted share, and were primarily for restructuring actions. These restructuring actions included centralizing our customer service operations in Europe and transferring our North American distribution operations to a third-party logistics services provider.
CLEAN TENNANT’S CENTURION™ IS CURRENTLY THE ONLY FULL-SIZED BROOM STREET SWEEPER WITH DRY DUST CONTROL. THIS UNIQUE TECHNOLOGY VIRTUALLY ELIMINATES THE DUST CLOUD THAT TYPICALLY SURROUNDS STREET SWEEPERS WHILE THE SUPERIOR SWEEPING SYSTEM REDUCES THE LEVEL OF SAND, DUST AND DEBRIS DEPOSITED INTO STORM SEWERS. WATERLESS DUST CONTROL ALSO MEANS CENTURION™ CAN BE USED YEAR ROUND, EVEN IN COLD CLIMATES, THEREBY EXTENDING THE SWEEPING SEASON.
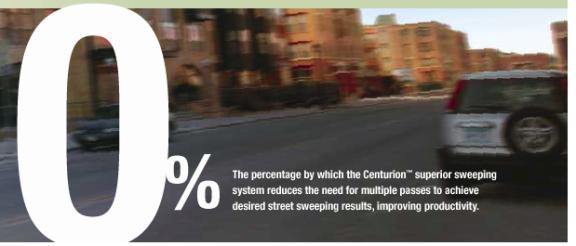
0% The percentage by which the Centurion™ superior sweeping system reduces the need for multiple passes to achieve desired street sweeping results, improving productivity.
5
| | For further information on our 2002 financial performance, please refer to the Management’s Discussion and Analysis section of this annual report, beginning on page 10.
IMPROVING OPERATING EFFECTIVENESS During 2002, we began to see initial benefits from prior restructuring actions, such as our decision to close a plant in Germany and transfer the related production to a contract manufacturer. Throughout the year, we continued to work on initiatives intended to improve our overall operating effectiveness and reduce our costs to serve our customers.
Also, during 2002, we completed the transfer of our distribution operations in North America to a third-party logistics services provider. With this transition, we were able to close seven Tennant-owned or -leased centers and consolidate our distribution operations into two facilities leased and operated by the service provider. As a result, beginning in 2004, we expect to realize reductions in our operating costs. At the same time, the service provider’s operating scale and efficiency should enable us to further improve the level of service our customers experience by expediting delivery of complete equipment and parts orders.
|
LEAN TENNANT’S FOAM-SCRUBBING TECHNOLOGY — FaST™ — IMPROVES LABOR PRODUCTIVITY IN FLOOR CLEANING BY UP TO 30% BY REDUCING THE NUMBER OF TIMES THE SCRUBBER MUST BE EMPTIED AND REFILLED. THE FaST™ SYSTEM MIXES WATER, AIR AND A SPECIALLY FORMULATED DETERGENT TO CREATE A SCRUBBING FOAM THAT USES LESS WATER THAN CONVENTIONAL SCRUBBERS, REDUCING WATER CONSUMPTION AND WASTEWATER GENERATION, WHILE LEAVING SCRUBBED FLOORS DRY.

6
In Europe, we have completed the transition to a more efficient pan-European operating model. We previously transitioned all of our European operations to our common Enterprise Resource Planning system, implemented common pricing practices across Europe and made other changes to align the way we manage our business in Europe with the unified marketplace Europe has become. In the 2002 fourth quarter, our new centralized pan-European customer service call center in Antwerp, Belgium, began operation. This move to a centralized call center serving all of Europe is helping to improve our level of customer service in Europe while actually reducing our number of customer support personnel by more than 25 percent. While economic conditions remain very difficult in Europe, we plan to capitalize on the downturn to further improve our position there. In 2003, for example, we plan to invest in further expanding our sales and service coverage in Europe.
FOCUSED ON CLEAN, LEAN AND GREEN During 2002, we altered somewhat the composition of our research and development team to achieve sharper focus on innovative new products that represent true breakthroughs in their categories rather than incremental improvements on existing technology. Our aim in new product development is to deliver compelling and superior solutions that offer at least two – and ideally all three – of the following attributes:
• Better cleaning results than alternatives,
• Improved labor productivity that lowers our customers’ cleaning costs, and
• Environmental benefits, such as lower emissions of noise and dust, lower water consumption and less wastewater generation, resulting in healthier and safer environments.
Our Centurion™ street sweeper is an example of a product that combines these attributes in a unique solution. The system leaves streets demonstrably cleaner than alternative sweepers, emits considerably less dust in operation and can be used without water, thereby conserving water as well as saving operators the time and expense of filling and dumping water tanks. The market reception for Centurion™ has been even stronger than our expectations, particularly among customers concerned with preserving clean air in their communities, conserving water and maintaining clean streets year-round in climates where street sweeping with water is impractical. During the year, we raised our target for Centurion™ deliveries and, thanks to an extraordinary team effort, exceeded our stretch goal.
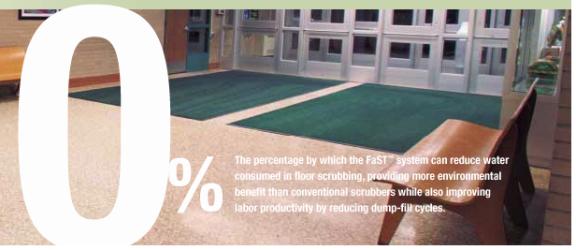
0% The percentage by which the FaST™ system can reduce water consumed in floor scrubbing, providing more environmental benefit than conventional scrubbers while also improving labor productivity by reducing dump-fill cycles.
7
This enthusiastic market response validates our conviction that solutions offering a combination of “clean, lean and green” benefits will command preference in the marketplace. We followed the introduction of Centurion™ with a second technology that combines performance, productivity and environmental benefits in a single package. That technology is our FaST™ foam-scrubbing technology.
The FaST™ system consists of a Tennant or Nobles brand scrubber equipped with integral foam-generating components, an onboard detergent dispenser and specially formulated detergent. The system substantially improves labor productivity in the cleaning of hard-surface floors, primarily by reducing the amount of water used and therefore the number of times operators must dump and refill the scrubber’s tanks. This translates to more cleaning time, as well as less wastewater generated, a further environmental benefit. The FaST™ system clearly differentiates our cleaning equipment from competitive offerings by enabling customers to improve labor productivity and reduce cleaning costs with a system that benefits the environment and that leaves floors drier than conventional cleaning methods. We currently have five patents pending on the technology, which we can incorporate on many different scrubber models. The first FaST™-equipped systems began shipping in the summer of 2002. We have recently introduced FaST™-equipped systems in Europe and our other international markets.
Another new product representative of our “clean, lean and green” approach is our Model 3090 Backpack Vacuum. This product, which we are introducing in 2003, incorporates noise dampers and an intricate exhaust baffle system to achieve very quiet operation compared to other products. This means the vacuum can be used during the day without disturbing tenants, customers or patients in commercial and professional settings. The quieter operation also reduces operator fatigue. The Model 3090’s powerful motor provides superior cleaning performance while three levels of exhaust air filtration help maintain very clean indoor air, enabling its use in environments where dust suppression is critical.
POSITIONED FOR RECOVERY The past two years have been trying ones for all of us at Tennant, as well as our customers and our shareholders. Together we have endured the most severe downturn in the worldwide industrial economy in decades.

8
Tough times have some benefits, however. They serve to expose problems and weaknesses that easy growth masks. At Tennant, the past two years have provided the opportunity to examine and assess our business, better understand where our opportunities lie and rally around what we must do to transform Tennant from a good company into a truly great one.
Accordingly, we have taken advantage of the recent industrial sector downturn to strengthen our company and extend our lead over our competitors. We have taken actions to permanently reduce our costs and improve our overall operating effectiveness. We have maintained aggressive investment in the development of new products that fulfill our “clean, lean and green” strategy. Building on our long-term commitment to quality, we are delivering breakthrough new products that are good for our customers and good for the environment. We have also maintained a solid balance sheet through the difficulties of the past two years and continued to offer our shareholders a dividend, increased in 2002 for the 31st consecutive year.
Historically, we have seen strong rebounds in our business as industrial economies emerge from downturns. This happened following the recession of the 1980s and again in the early 1990s. If history is any guide, it should happen again. And this time, thanks to the hard work of our employees over the past two years, we are better positioned than ever to prosper as business conditions improve.
We thank them, and our customers, distributors, suppliers and shareholders for their loyalty and support. We look forward to reporting to you on improving performance in 2003.

Janet M. Dolan, President & Chief Executive Officer
GREEN TENNANT’S MODEL 3090 BACKPACK VACUUM FEATURES A TRIPLE FILTRATION SYSTEM THAT REMOVES 99.999% OF PARTICLES 0.3 MICRONS OR LARGER, FAR EXCEEDING HEPA REQUIREMENTS. THIS BEST-IN-CLASS FILTRATION MAKES IT IDEAL FOR USE IN ENVIRONMENTALLY SENSITIVE AREAS. IN ADDITION, THE MODEL 3090 HAS A TWO-SPEED MOTOR AND SOUND-BAFFLING DESIGN THAT RESULT IN EXTREMELY QUIET OPERATION, ALLOWING DAYTIME USE IN AREAS WHERE AMBIENT NOISE MUST BE MINIMIZED.
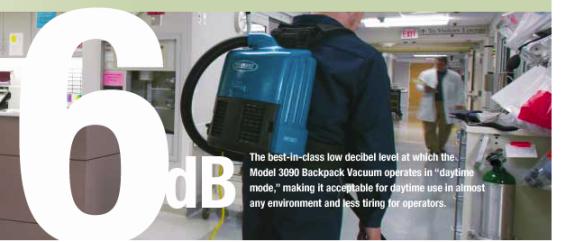
6dB The best-in-class low decibel level at which the Model 3090 Backpack Vacuum operates in “daytime mode,” making it acceptable for daytime use in almost any environment and less tiring for operators.
9
MANAGEMENT‘S DISCUSSION AND ANALYSIS
Overview
Tennant Company is a world leader in designing, manufacturing and marketing products that help create a cleaner, safer world. Our floor maintenance equipment, outdoor cleaning equipment, coatings and related products are used to clean factories, office buildings, airports, hospitals, schools, warehouses, shopping centers, parking lots, streets and more. Customers include contract cleaners, corporations, health care facilities, schools and local, state and federal governments.
Operating results for 2002 continued to be adversely affected by the prolonged global manufacturing sector recession, especially for industrial equipment products. A downturn in the global industrial economy began late in 2000 and deepened into a recession during 2001 and 2002.
In response to the economic conditions, management took several actions in 2001 to reduce headcount, salaries, direct labor hours and discretionary spending. In addition, we launched major initiatives in 2001 and 2002 to improve overall operating efficiency. Unusual charges totaling $5.0 million and $11.0 million pre-tax were recorded during 2002 and 2001, respectively, as a result of these actions and initiatives.
Consolidated net sales of $424.2 million in 2002 increased from $422.4 million in 2001. Foreign currency exchange fluctuations, resulting primarily from the weakness of the U.S.dollar compared to the Euro, had a favorable impact of approximately $3.9 million on revenues in 2002 compared to the prior year. Net sales for 2001 included an additional month of sales from our European operations. This resulted from our decision to adjust the fiscal year of our European operations from November to the calendar year. The extra month increased net sales for 2001 by $5.6 million, but reduced 2001 net earnings by approximately $0.06 per diluted share because, historically, we operate at a loss in Europe during the shortened holiday month of December.
In 2001, consolidated net sales of $422.4 million decreased 6.6% from 2000. The negative impact of foreign currency exchange fluctuations on net sales was approximately $5.5 million in 2001 compared to 2000.
Net earnings for 2002 were $8.3 million or $0.91 per diluted share, compared to $4.6 million or $0.50 per diluted share in 2001. Unfavorable foreign currency exchange fluctuations reduced earnings per diluted share by approximately $0.05 in 2002 and $0.23 in 2001, compared with the respective prior year. Net earnings for 2002 included unusual charges of $5.0 million pre-tax. The unusual pre-tax charges included net restructuring charges of $4.0 million, an inventory write-down of $0.5 million that was recorded in cost of sales and $0.5 million in certain severance payments that were recorded in selling and administrative expenses. The restructuring charges primarily related to a workforce reduction and consolidation of our North American distribution operations from a network of seven distribution centers into two new facilities that are leased and managed by a third-party logistics services provider, as well as the consolidation and centralization of our European customer service operations. These initiatives should enable us to reduce our operating costs over time while further improving the level of customer service. Excluding the effects of these unusual charges, net earnings for 2002 were $11.9 million or $1.31 per diluted share.
Net earnings of $4.6 million in 2001 or $0.50 per diluted share decreased 83% compared to $27.7 million or $3.04 per diluted share in 2000. Net earnings for 2001 included unusual charges of $11.0 million pre-tax, as well as an unusual pension gain of $5.9 million pre-tax. The unusual pre-tax charges included restructuring charges of $10.0 million and an inventory write-down of $1.0 million that was recorded in cost of sales. We also recognized a non-cash income tax charge of $4.3 million, to establish a valuation allowance against our future benefits from European tax-loss carryforwards. The 2001 European tax losses resulted largely from restructuring actions taken in 2001. Excluding the effects of these unusual items, net earnings for 2001 were $12.0 million or $1.31 per diluted share.
Net Sales
Sales in North America increased 3.4% in 2002 to $311.9 million compared with $301.5 million in 2001. Sales growth in equipment of 4.6% was driven by contributions from Centurion™, our new street sweeper product which began shipping in 2002, and an increase in sales of equipment for commercial cleaning applications, partially offset by a decline in sales of equipment for industrial cleaning applications. An increase of 3% in aftermarket and service revenues was partially offset by a 7.1% decrease in the sales of coating products.
In 2001, North American sales of $301.5 million decreased 7.5% compared to 2000. Declines occurred primarily in sales of equipment for industrial cleaning applications and coating products, with equipment sales decreasing 12.8% and coating products decreasing 8.9%. These decreases were offset by 4.1% growth in aftermarket and service revenues. Equipment and coating declines were due primarily to the North American manufacturing sector recession.
European sales of $73.7 million in 2002 decreased 8.6% compared to 2001 sales. During 2001, our European operation changed its fiscal year-end from November to December because of the conversion of the European information system to the U.S. platform. This resulted in an additional month of sales in 2001 totalling $5.6 million. Positive foreign currency exchange fluctuations increased European revenues approximately $3.9 million in 2002. Excluding the effects of positive foreign currency exchange and the additional month of sales in 2001, European sales in 2002 decreased 7% as a result of continued weakness in economic conditions.
European sales in 2001 were $80.6 million, essentially flat compared to 2000 sales of $80.7 million. Adjusted for the negative impact of foreign currency exchange and the additional month of sales in 2001, sales decreased 3% primarily due to weakening economic conditions in 2001.
Other international sales in 2002 were $38.6 million, a decrease of 4.2% compared to 2001 sales of $40.3 million. Adjusted to exclude the positive impact of foreign currency exchange, other international sales decreased 5%, primarily reflecting the continued deterioration in global economic conditions, particularly in Japan and Latin America.
Other international sales in 2001 were $40.3 million, a decrease of 11.2% over 2000 sales of $45.4 million. Adjusted to exclude the negative impact from foreign currency exchange, other international sales decreased 7% compared with 2000 primarily due to weakening economic conditions in several geographies.
Consolidated order backlog at December 31, 2002, totaled $8.0 million compared with $5.0 million at the end of 2001 and $7.0 million at the end of 2000.
10
Costs and Expenses
The following is a summary of major operating costs and expenses as a percentage of net sales:
| | 2002 | | 2001 | | 2000 | |
| | | | | | | |
Cost of sales | | 60.0 | % | 59.6 | % | 56.2 | % |
Research and development expenses | | 3.9 | % | 3.9 | % | 3.4 | % |
Selling and administrative expenses | | 31.6 | % | 32.3 | % | 30.9 | % |
Restructuring charges | | 0.9 | % | 2.4 | % | — | |
Beginning in 2002, we have classified research and development expenses as a separate line item within the earnings statement. Research and development expenses had previously been reported as a component of cost of sales. This reclassification of 2001 and 2000 amounts had no impact on previously reported operating profit, net earnings or shareholders’ equity for all periods presented.
Cost of sales as a percentage of sales increased by 0.4 percentage points in 2002 compared with 2001. The primary factor contributing to the increase in the cost of sales percentage was an unfavorable sales mix resulting from the shift in sales toward lower margin equipment for commercial cleaning applications, as well as lower margins on Centurion™. Centurion™ generates lower margins because there is no mark-up of the value of the chassis manufactured by our supplier. Other factors contributing to the percentage increase in cost of sales was a $0.5 million inventory write-down related to the consolidation of distribution operations, as well as unfavorable foreign exchange fluctuations.
Cost of sales as a percentage of sales increased by 3.4 percentage points in 2001 compared with 2000. The primary factors contributing to the increase in the cost of sales percentage were the 6.6% decline in consolidated net sales, an unfavorable sales mix, unfavorable foreign currency fluctuations, and the $1.0 million inventory write-down related to the closure of the plant in Germany.
Future gross margins could continue to be impacted by competitive market conditions, the mix of products both within and among product lines and geographies, and the effects of foreign currency exchange fluctuations.
Research and development expenses as a percentage of sales were flat in 2002 compared with 2001.
In 2001, research and development expenses as a percentage of sales increased 0.5 percentage points compared with 2000. This increase was due primarily to substantial spending for development of the Centurion™.
Selling and administrative expenses as a percentage of sales decreased 0.7 percentage points in 2002 compared with 2001. This decrease was attributable to the favorable impact of cost-reduction measures taken as well as general cost-containment initiatives throughout the entire organization, partially offset by the effect of a settlement of a royalty obligation.
In 2001, selling and administrative expenses as a percentage of sales increased 1.4 percentage points compared with 2000. The increase was primarily attributable to the decline in sales volume from 2000 to 2001. This increase was partially offset by cost-reduction measures taken during 2001 and lower profit-related expenses.
On January 1, 2002, the Company adopted SFAS No. 142, “Goodwill and Other Intangible Assets.” Under this standard, purchased goodwill is no longer amortized over its useful life. Rather, goodwill is subject to a periodic impairment test based on its fair value. Therefore, we did not recognize any goodwill amortization expense in 2002, compared to $0.8 million and $1.2 million in 2001 and 2000, respectively.
Restructuring Charges
As discussed in Note 2 to the consolidated financial statements, we recorded $4.0 million of net pre-tax restructuring charges during 2002 related to a work-force reduction and consolidation of our North American distribution operations from a network of seven distribution centers into two new facilities that will be leased and managed by a third-party logistics services provider. This initiative should enable us to reduce over time our operating costs while further improving the level of customer service. In addition, we took actions to consolidate and centralize customer service operations in Europe, as well as streamline other operations in North America. The majority of these actions were completed during 2002 with the remainder expected to be completed during 2003. The 2002 restructuring actions are expected to provide annualized pre-tax benefits of up to approximately $2.0 million by 2004.
During 2001, we recorded pre-tax restructuring charges of $10.0 million. The charges pertained to a workforce reduction and the closure of our Germany facility and the transfer of its production to a contract manufacturer in the Czech Republic. These initiatives were completed in 2001 and 2002. The actions improved the efficiency and productivity of our European organization and reduced global infrastructure.
Management regularly reviews our business operations with the objective of improving financial performance and maximizing its return on investment. As a result of this ongoing process to improve financial performance, we may incur additional restructuring charges in the future which, if taken, could be material to our financial results.
Pension Settlement Gain
As described in Note 9 to the consolidated financial statements, we approved enhancements to our defined benefit retirement program during 2000. Plan participants were given the choice of remaining in a modified defined benefit plan or receiving a lump-sum distribution that could be rolled over into our 401(k) plan. As a result of these actions, the former plan was terminated during 2001 and the plan assets were distributed to the participants, resulting in a non-recurring, pre-tax pension settlement gain of $5.9 million.
Other Income (Expense)
In 2002, other expense was $0.7 million compared to none in 2001. The decrease is primarily attributable to losses on the sale or disposal of fixed assets and net foreign currency transaction losses offset by a reduction in interest expense.
In 2001, other income was zero compared to $0.4 million in 2000. The major factors causing the change were a reduction in interest income, along with an increase in miscellaneous expense year over year, offset by an increase in net foreign currency transaction gains.
11
MANAGEMENT‘S DISCUSSION AND ANALYSIS
Income Taxes
Our effective income tax rate was 44.5%, 65.7% and 35.8% for the years 2002, 2001 and 2000, respectively. The decrease in the effective rate in 2002 is the result of a decrease in a non-cash income tax charge to establish a valuation allowance against our future benefits from European tax-loss carryforwards of $2.9 million in 2002 compared to $4.3 million in 2001. The European tax losses resulted largely from restructuring actions taken in 2001 and 2002 for which no loss carryback is available. In the future, we may experience changes in our effective tax rate based on our ability to utilize the net operating loss carryforwards.
Liquidity and Capital Resources
Despite continued difficult economic conditions, we maintained a favorable financial position in 2002. At December 31, 2002, cash and cash equivalents totaled $16.4 million, down 31.1% from $23.8 million as of December 31, 2001. Our current ratio was 2.3 at December 31, 2002, and 2.5 at December 31, 2001, based on working capital of $92.6 million and $92.1 million, respectively. At December 31, 2002, our capital structure was comprised of $14.9 million of current debt, $5.0 million of long-term debt and $154.1 million of shareholders’ equity. Debt-to-total-capital ratio was 11.5% at December 31, 2002, compared with 14.6% at December 31, 2001.
Our contractual cash obligations at December 31, 2002, are summarized in the following table (in thousands):
| | Total | | 2003 | | 2004-2005 | | 2006-2007 | | After 2007 | |
| | | | | | | | | | | |
Contractual cash obligations: | | | | | | | | | | | |
Debt | | $ | 19,948 | | $ | 14,948 | | $ | 5,000 | | $ | — | | $ | — | |
Operating leases | | 8,350 | | 3,817 | | 3,211 | | 1,112 | | 210 | |
Unconditional purchase obligations | | 3,540 | | 3,540 | | — | | — | | — | |
Total contractual cash obligations | | $ | 31,838 | | $ | 22,305 | | $ | 8,211 | | $ | 1,112 | | $ | 210 | |
For 2003, we have available committed and uncommitted lines of credit totaling $42.0 million, with terms generally one year or less. At December 31, 2002, $3.2 million of related debt was outstanding. If the global economy remains weak during 2003, it could have an unfavorable impact on the demand for our products and, as a result, operating cash flow. We believe that the combination of internally generated funds, present capital resources and available financing sources are more than sufficient to meet cash requirements for 2003.
We have a cancellation clause with our third-party logistics provider which would require payment of a cancellation fee in the event we elect to cancel the agreement prior to the contract expiration date. This fee, which approximated $2.5 million at December 31, 2002, declines on a straight-line basis over the five-year life of the contract.
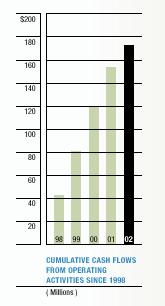
Cash Flows
Cash provided by operating activities was $19.2 million in 2002, $34.1 million in 2001 and $38.9 million in 2000. The $14.9 million decrease in operating cash flows from 2001 to 2002 is primarily attributable to a $7.5 million increase in accounts receivable and $7.8 million increase in inventories. The increase in accounts receivable is due to increased sales in the fourth quarter of 2002 compared to the same period in 2001. The increase in inventory levels is primarily due to our decision to maintain duplicate parts inventories during the transition of our distribution function to a third-party logistics provider and to carry higher inventories in Europe to respond more quickly to shorter lead time demands from customers, along with higher inventories associated with new products such as Centurion. During 2001, the $4.7 million decrease in operating cash flows compared to 2000 was due to the $23.1 million decrease in net earnings compared to 2000, including cash used for restructuring activities, and an $8.7 million decrease in accounts payable, accrued expenses and deferred revenues. These decreases were substantially offset by the $14.1 million decrease in accounts receivable and $5.6 million decrease in inventories.
Capital expenditures for property, plant and equipment totaled $13.1 million in 2002, $23.4 million in 2001 and $20.5 million in 2000. Capital expenditures in 2002 were significantly decreased compared to the prior year as 2001 capital spending projects included significant investments in design systems software, new product tooling and the purchase of a previously leased production facility. Capital spending in 2003 is expected to be approximately $12 to $17 million. Expenditures for capital in 2003 are expected to be financed primarily with funds from operations. Other significant uses of cash in 2002 included $6.7 million for repayment of debt.
Dividends and Share Repurchases
We paid $7.4 million in dividends to shareholders and $3.1 million for net purchases of Tennant common stock during 2002. Cash dividends increased for the 31st consecutive year to $0.82 per share in 2002, an increase of $0.02 per share over 2001. Shares repurchased during 2002, 2001 and 2000 approximated
12
124,000, 130,000 and 90,000, respectively. The average repurchase price was $37.38 during 2002, $38.69 during 2001 and $35.50 during 2000. During May 2001, our Board of Directors authorized a share repurchase program to repurchase up to 400,000 shares of common stock. At December 31, 2002, approximately 185,000 shares were available for repurchase under this program.
Critical Accounting Policies
Our consolidated financial statements are based on the selection and application of accounting principles generally accepted in the United States of America, which require us to make estimates and assumptions about future events that affect the amounts reported in our financial statements and the accompanying notes. Future events and their effects cannot be determined with absolute certainty. Therefore, the determination of estimates requires the exercise of judgment. Actual results could differ from those estimates, and any such differences may be material to the financial statements. We believe that the following policies may involve a higher degree of judgment and complexity in their application and represent the critical accounting policies used in the preparation of our financial statements. If different assumptions or conditions were to prevail, the results could be materially different from our reported results.
ALLOWANCE FOR DOUBTFUL ACCOUNTS — We record a reserve for accounts receivable which are potentially uncollectible. A considerable amount of judgment is required in assessing the realization of these receivables including the current creditworthiness of each customer and related aging of the past-due balances. In order to assess the collectibility of these receivables, we perform ongoing credit evaluations of our customers’ financial condition. Through these evaluations, we may become aware of a situation where a customer may not be able to meet its financial obligations due to deterioration of its financial viability, credit ratings or bankruptcy. The reserve requirements are based on the best facts available to us and are reevaluated and adjusted as additional information is received. Our reserves are also based on amounts determined by using percentages applied to certain aged receivable categories. These percentages are determined by a variety of factors including, but are not limited to, current economic trends, historical payment and bad debt write-off experience. We are not able to predict changes in the financial condition of our customers and if circumstances related to these customers deteriorate, our estimates of the recoverability of accounts receivable could be materially affected and we may be required to record additional allowances. Alternatively, if more allowances are provided than are ultimately required, we may reverse a portion of such provisions in future periods based on the actual collection experience. As of December 31, 2002, we had $5.1 million reserved against our accounts receivable.
INVENTORY SHRINKAGE AND OBSOLESCENCE RESERVES — We record reserves for inventory shrinkage and for potentially excess, obsolete and slow-moving inventory. The amounts of these reserves are based upon historical loss trends, inventory levels, historical physical inventory and cycle count adjustments, expected product lives and forecasted sales demand. In assessing the ultimate realization of inventories, we are required to make judgments as to future demand requirements compared with current or committed inventory levels. Reserve requirements generally increase as our projected demand requirements decrease due to market conditions, technological and product life cycle changes, as well as longer than previously expected usage periods. It is possible that increases in inventory reserves may be required in the future if there is a significant decline in demand for our products. Alternatively, if market conditions improve, we may find it necessary to reverse a portion ofthese reserves. As of December 31, 2002, we had $3.3 million reserved against inventories.
WARRANTY RESERVES — We record a liability for warranty claims at the time of sale. The amount of the liability is based on the trend in the historical ratio of claims to sales, the historical length of time between the sale and resulting warranty claim, anticipated releases of new products and other factors. Claims experience could be materially different from actual results because of the introduction of new, more complex products, a change in our warranty policy in response to industry trends, competition or other external forces, or manufacturing changes that could impact product quality. As of December 31, 2002, we had $4.5 million reserved related to future estimated warranty costs.
DEFERRED TAX ASSETS — We recognize deferred tax assets for the expected future tax impact of temporary differences between book and taxable income. Deferred tax assets are measured using enacted tax rates expected to apply to taxable income in the years in which those temporary differences are expected to be recovered or settled. A valuation allowance and income tax charge are recorded when, in management’s judgment, realization of a specific deferred tax asset is uncertain. The deferred tax asset valuation allowance could be materially different from actual results because of changes in management’s expectations regarding our future taxable income, the relationship between book and taxable income and our tax planning strategies. The valuation allowance at December 31, 2002, was $7.2 million.
New Accounting Standards
SFAS No. 146, “Accounting for Costs Associated with Exit or Disposal Activities” (“SFAS 146”), was issued in June 2002. SFAS 146 requires that a liability for a cost associated with an exit or disposal activity, including restructuring, be recognized and measured at fair value when the liability is incurred, instead of the commitment date. This pronouncement is effective for us in 2003 and, accordingly, we will apply its provisions to all exit or disposal activities after December 31, 2002.
In November 2002, the Financial Accounting Standards Board (“FASB”) issued Interpretation No. 45, “Guarantor’s Accounting and Disclosure Requirements for Guarantees, Including Indirect Guarantees of Indebtedness of Others” (“Interpretation”). This Interpretation elaborates on the existing disclosure requirements for most guarantees, including loan guarantees, standby letters of credit and product warranties. It also clarifies that at the time a company issues a guarantee, the company must recognize an initial liability for the fair market value of the obligations it assumes under that guarantee and must disclose that information in its interim and annual financial statements. The initial recognition and measurement provisions of the Interpretation apply on a prospective basis to guarantees issued or modified after December 15, 2002. As of December 31, 2002, we have adopted the disclosure-only requirements of this Interpretation.
13
MANAGEMENT‘S DISCUSSION AND ANALYSIS
Market Risk
We expect the unfavorable economic conditions in the manufacturing sector of the global economy to continue in 2003 and believe the timing of any economic recovery is uncertain.
Due to the global nature of our operations, we are subject to exposures resulting from foreign currency exchange fluctuations in the normal course of business. Because our products are manufactured or sourced primarily from the United States, a stronger dollar generally has a negative impact on results from operations outside the United States while a weaker dollar generally has a positive effect. Our primary exchange rate exposure is with the Euro, the Canadian dollar, the Australian dollar, the British pound and the Japanese yen against the U.S. dollar. Our objective in managing the exposure to foreign currency fluctuations is to minimize the earnings effects associated with foreign exchange rate changes on certain of our foreign currency-denominated assets and liabilities. We periodically enter into various contracts, principally forward exchange contracts, to protect the value of certain of our foreign currency-denominated assets and liabilities. The gains and losses on these contracts generally approximate changes in the value of the related assets and liabilities. We had forward exchange contracts outstanding in the notional amounts of approximately $35.0 million and $22.0 million at the end of 2002 and 2001, respectively. The potential loss in fair value of foreign currency contracts outstanding and the related underlying exposures as of December 31, 2002, from a 10% adverse change are not material. We maintain the policy of entering into foreign currency contracts only to the extent that actual exposures exist and do not enter into transactions for speculative purposes.
It is not possible to estimate the full impact of foreign currency exchange rate changes; however, the direct impact on net sales and net earnings can be estimated. For 2002, the foreign currency exchange effect on sales compared with 2001 was an increase of approximately $3.9 million. The total unfavorable effect on net earnings, which includes net foreign currency transaction losses in 2002, approximated $0.5 million or $0.05 per diluted share. We expect that our sales and net earnings will continue to be impacted by the effects of foreign currency exchange rates in 2003. If exchange rates generally continue to strengthen relative to the U.S. dollar, the related effect of foreign currency exchange rates would be favorable in 2003.
Subsequent Events
On February 4, 2003, we amended our agreement with our U.S. third-party lessor such that future equipment sales to the third-party lessor which are considered operating leases will result in immediate revenue recognition. The amendment to the agreement is retroactive to the beginning of the agreement; therefore, it will also result in the recognition of previously deferred revenue in the first quarter of 2003. This will increase net earnings by approximately $1.8 million or $0.20 per diluted share.
In March 2000, we entered into a joint venture with an unrelated third party to develop and market a revolutionary new product. In February 2003, we and our joint-venture partner agreed in principle to begin dissolving the joint venture. In March 2003, we made a decision to permanently discontinue manufacturing the product. At December 31, 2002, our book value of inventory, accounts receivable and intangible assets related to joint-venture activities totaled approximately $2.1 million. As a result of the joint-venture dissolution, we expect to record an after-tax charge in 2003 of approximately $1.1 to $1.5 million, or $0.12 to $0.17 per diluted share, the majority of which will occur in the first quarter. The charge will include the write-off of assets and accrual of certain contractual obligations.
Cautionary Factors Relevant to Forward-Looking Information
Certain statements contained in this document as well as other written and oral statements made by us from time to time are considered “forward-looking statements” within the meaning of the Private Securities Litigation Reform Act. These statements do not relate to strictly historical or current facts and provide current expectations or forecasts of future events. Any such expectations or forecasts of future events are subject to a variety of factors. These include factors that affect all businesses operating in a global market as well as matters specific to us and the markets we serve. Particular risks and uncertainties presently facing us include: the ability to implement our plans to increase worldwide operational efficiencies; the success of new products; geo-political and economic uncertainty throughout the world; changes in tax laws and regulations; inflationary pressures; the potential for increased competition in our business from competitors that have substantial financial resources; the potential for soft markets in certain regions including North America, Asia, Latin America and Europe; the relative strength of the U.S. dollar, which affects the cost of our products sold internationally; and our plan for growth. We caution that forward-looking statements must be considered carefully and that actual results may differ in material ways due to risks and uncertainties both known and unknown. Shareholders, potential investors and other readers are urged to consider these factors in evaluating forward-looking statements and are cautioned not to place undue reliance on such forward-looking statements.
We do not undertake to update any forward-looking statement, and investors are advised to consult any further disclosures by us on this matter in our filings with the Securities and Exchange Commission and in other written statements we make from time to time. It is not possible to anticipate or foresee all risk factors, and investors should not consider that any list of such factors to be an exhaustive or complete list of all risks or uncertainties.
14
CONSOLIDATED STATEMENTS OF EARNINGS
TENNANT COMPANY AND SUBSIDIARIES
(In thousands, except shares and per share data)
Years ended December 31 | | 2002 | | 2001 | | 2000 | |
Net sales | | $ | 424,183 | | $ | 422,425 | | $ | 452,176 | |
Cost of sales | | 254,360 | | 251,922 | | 254,192 | |
Gross profit | | 169,823 | | 170,503 | | 197,984 | |
Operating expense (income): | | | | | | | |
Research and development expenses | | 16,331 | | 16,578 | | 15,466 | |
Selling and administrative expenses | | 133,914 | | 136,440 | | 139,665 | |
Restructuring charges | | 4,002 | | 9,962 | | — | |
Pension settlement gain | | — | | (5,928 | ) | — | |
Total operating expenses | | 154,247 | | 157,052 | | 155,131 | |
Profit from operations | | 15,576 | | 13,451 | | 42,853 | |
Other income (expense): | | | | | | | |
Interest income | | 1,891 | | 2,133 | | 2,532 | |
Interest expense | | (1,381 | ) | (2,131 | ) | (1,886 | ) |
Net foreign currency transaction gains (losses) | | (752 | ) | 241 | | (517 | ) |
Miscellaneous income (expense), net | | (436 | ) | (248 | ) | 230 | |
Total other income (expense) | | (678 | ) | (5 | ) | 359 | |
Profit before income taxes | | 14,898 | | 13,446 | | 43,212 | |
Income tax expense | | 6,633 | | 8,838 | | 15,470 | |
Net earnings | | $ | 8,265 | | $ | 4,608 | | $ | 27,742 | |
Basic earnings per share | | $ | 0.92 | | $ | 0.51 | | $ | 3.05 | |
Diluted earnings per share | | $ | 0.91 | | $ | 0.50 | | $ | 3.04 | |
See accompanying notes to consolidated financial statements.
15
CONSOLIDATED BALANCE SHEETS
TENNANT COMPANY AND SUBSIDIARIES
(In thousands, except shares and per share data)
December 31 | | 2002 | | 2001 | |
A s s e t s | | | | | |
CURRENT ASSETS | | | | | |
| | | | | |
Cash and cash equivalents | | $ | 16,356 | | $ | 23,783 | |
Receivables: | | | | | |
Trade, less allowance for doubtful accounts ($5,137 in 2002 and $4,701 in 2001) | | 77,002 | | 70,855 | |
Other, net | | 769 | | 1,396 | |
Net receivables | | 77,771 | | 72,251 | |
Inventories | | 58,941 | | 48,288 | |
Prepaid expenses | | 2,416 | | 2,394 | |
Deferred income taxes, current portion | | 7,417 | | 6,879 | |
Total current assets | | 162,901 | | 153,595 | |
Property, plant and equipment,net | | 69,153 | | 73,096 | |
Deferred income taxes, long-term portion | | 3,688 | | 5,496 | |
Goodwill and intangible assets, net | | 17,720 | | 17,198 | |
Other assets | | 2,775 | | 3,174 | |
Total assets | | $ | 256,237 | | $ | 252,559 | |
| | | | | |
Liabilities and Shareholders’ Equity | | | | | |
CURRENT LIABILITIES | | | | | |
Current debt and collateralized borrowings | | $ | 14,948 | | $ | 13,418 | |
Accounts payable, accrued expenses and deferred revenues | | 55,401 | | 48,031 | |
Total current liabilities | | 70,349 | | 61,449 | |
LONG-TERM DEBT | | 5,000 | | 12,496 | |
LONG-TERM EMPLOYEE-RELATED BENEFITS | | 26,743 | | 26,643 | |
Total liabilities | | 102,092 | | 100,588 | |
SHAREHOLDERS’ EQUITY | | | | | |
| | | | | |
Preferred stock of $0.02 par value per share, authorized 1,000,000; none issued | | — | | — | |
Common stock of $0.375 par value per share, authorized 30,000,000; 8,981,417 and 9,036,095 issued and outstanding, respectively | | 3,380 | | 3,389 | |
Additional paid-in capital | | — | | 383 | |
Unearned restricted shares | | (612 | ) | (278 | ) |
Retained earnings | | 161,281 | | 161,945 | |
Accumulated other comprehensive income (loss) | | (3,586 | ) | (6,247 | ) |
Receivable from ESOP | | (6,318 | ) | (7,221 | ) |
Total shareholders’ equity | | 154,145 | | 151,971 | |
Total liabilities and shareholders’ equity | | $ | 256,237 | | $ | 252,559 | |
See accompanying notes to consolidated financial statements.
16
CONSOLIDATED STATEMENTS OF CASH FLOWS
TENNANT COMPANY AND SUBSIDIARIES
(In thousands, except shares and per share data)
Years ended December 31 | | 2002 | | 2001 | | 2000 | |
CASH FLOWS RELATED TO OPERATING ACTIVITIES | | | | | | | |
| | | | | | | |
Net earnings | | $ | 8,265 | | $ | 4,608 | | $ | 27,742 | |
Adjustments to net earnings to arrive at operating cash flow: | | | | | | | |
Depreciation and amortization | | 16,947 | | 19,282 | | 18,766 | |
Deferred tax expense | | 1,626 | | 1,715 | | 4,662 | |
Tax benefit on ESOP | | (356 | ) | (468 | ) | (375 | ) |
Provision for bad debts | | 2,116 | | 2,016 | | 1,270 | |
Changes in operating assets and liabilities: | | | | | | | |
Accounts receivable | | (7,482 | ) | 14,103 | | (1,944 | ) |
Inventories | | (7,776 | ) | 5,622 | | (6,427 | ) |
Accounts payable, accrued expenses and deferred revenues | | 6,378 | | (8,746 | ) | (4,391 | ) |
Other current/noncurrent assets and liabilities | | 31 | | (4,931 | ) | (1,667 | ) |
Other, net | | (530 | ) | 940 | | 1,230 | |
Net cash flows related to operating activities | | 19,219 | | 34,141 | | 38,866 | |
CASH FLOWS RELATED TO INVESTING ACTIVITIES | | | | | | | |
| | | | | | | |
Acquisition of property, plant and equipment | | (13,072 | ) | (23,364 | ) | (20,531 | ) |
Proceeds from disposals of property, plant and equipment | | 2,649 | | 2,820 | | 2,280 | |
Other, net | | — | | — | | (1,000 | ) |
Net cash flows related to investing activities | | (10,423 | ) | (20,544 | ) | (19,251 | ) |
CASH FLOWS RELATED TO FINANCING ACTIVITIES | | | | | | | |
| | | | | | | |
Net changes in short-term borrowings | | (6,690 | ) | 2,094 | | (447 | ) |
Payments of long-term debt | | — | | (5,000 | ) | (5,000 | ) |
Proceeds from issuance of common stock | | 1,509 | | 1,874 | | 2,289 | |
Purchase of common stock | | (4,628 | ) | (5,035 | ) | (3,203 | ) |
Dividends paid | | (7,373 | ) | (7,244 | ) | (7,045 | ) |
Principal payment from ESOP | | 968 | | 1,678 | | 726 | |
Net cash flows related to financing activities | | (16,214 | ) | (11,633 | ) | (12,680 | ) |
Effect of exchange rate changes on cash and cash equivalents | | (9 | ) | 307 | | (351 | ) |
NET (DECREASE) INCREASE IN CASH AND CASH EQUIVALENTS | | (7,427 | ) | 2,271 | | 6,584 | |
Cash and cash equivalents at beginning of year | | 23,783 | | 21,512 | | 14,928 | |
CASH AND CASH EQUIVALENTS AT END OF YEAR | | $ | 16,356 | | $ | 23,783 | | $ | 21,512 | |
| | | | | | | |
SUPPLEMENTAL SCHEDULE OF NONCASH INVESTING AND FINANCING ACTIVITIES | | | | | | | |
| | | | | | | |
Collateralized borrowings incurred for operating lease equipment | | $ | 1,761 | | $ | 1,979 | | $ | 1,679 | |
See accompanying notes to consolidated financial statements.
17
CONSOLIDATED STATEMENTS OF SHAREHOLDERS‘ EQUITY AND COMPREHENSIVE INCOME
TENNANT COMPANY AND SUBSIDIARIES
(In thousands, except shares and per share data)
Years ended December 31 | | 2002 | | 2001 | | 2000 | |
| | Shares | | Amount | | Shares | | Amount | | Shares | | Amount | |
COMMON STOCK | | | | | | | | | | | | | |
| | | | | | | | | | | | | |
Beginning balance | | 9,036,095 | | $ | 3,389 | | 9,052,789 | | $ | 3,395 | | 8,989,480 | | $ | 3,371 | |
Issue stock for employee benefit plans and directors | | 69,116 | | 37 | | 113,449 | | 43 | | 153,537 | | 58 | |
Purchase of common stock | | (123,794 | ) | (46 | ) | (130,143 | ) | (49 | ) | (90,228 | ) | (34 | ) |
Ending balance | | 8,981,417 | | $ | 3,380 | | 9,036,095 | | $ | 3,389 | | 9,052,789 | | $ | 3,395 | |
ADDITIONAL PAID-IN CAPITAL | | | | | | | | | | | | | |
| | | | | | | | | | | | | |
Beginning balance | | | | $ | 383 | | | | $ | 1,544 | | | | $ | — | |
Issue stock for employee benefit plans and directors | | | | 2,287 | | | | 3,825 | | | | 4,713 | |
Purchase of common stock | | | | (2,670 | ) | | | (4,986 | ) | | | (3,169 | ) |
Ending balance | | | | $ | — | | | | $ | 383 | | | | $ | 1,544 | |
COMMON STOCK SUBSCRIBED | | | | | | | | | | | | | |
| | | | | | | | | | | | | |
Beginning balance | | — | | $ | — | | 9,575 | | $ | 459 | | 27,607 | | $ | 904 | |
Issue stock for employee benefit plans | | — | | — | | (9,575 | ) | (459 | ) | (27,607 | ) | (904 | ) |
Subscribed stock for employee benefit plans | | — | | — | | — | | — | | 9,575 | | 459 | |
Ending balance | | — | | $ | — | | — | | $ | — | | 9,575 | | $ | 459 | |
UNEARNED RESTRICTED SHARES | | | | | | | | | | | | | |
| | | | | | | | | | | | | |
Beginning balance | | | | $ | (278 | ) | | | $ | (905 | ) | | | $ | (843 | ) |
Restricted share activity, net | | | | (334 | ) | | | 627 | | | | (62 | ) |
Ending balance | | | | $ | (612 | ) | | | $ | (278 | ) | | | $ | (905 | ) |
RETAINED EARNINGS | | | | | | | | | | | | | |
| | | | | | | | | | | | | |
Beginning balance | | | | $ | 161,945 | | | | $ | 164,113 | | | | $ | 143,041 | |
Net earnings | | | | 8,265 | | | | 4,608 | | | | 27,742 | |
Dividends paid, $0.82, $0.80 and $0.78, respectively, per common share | | | | (7,373 | ) | | | (7,244 | ) | | | (7,045 | ) |
Purchase of common stock | | | | (1,912 | ) | | | — | | | | — | |
Tax benefit on ESOP | | | | 356 | | | | 468 | | | | 375 | |
Ending balance | | | | $ | 161,281 | | | | $ | 161,945 | | | | $ | 164,113 | |
ACCUMULATED OTHER COMPREHENSIVE INCOME (LOSS) (1) | | | | | | | | | | | | | |
| | | | | | | | | | | | | |
Beginning balance | | | | $ | (6,247 | ) | | | $ | (6,886 | ) | | | $ | (2,454 | ) |
Foreign currency translation adjustments | | | | 2,661 | | | | 639 | | | | (4,432 | ) |
Ending balance | | | | $ | (3,586 | ) | | | $ | (6,247 | ) | | | $ | (6,886 | ) |
RECEIVABLE FROM ESOP | | | | | | | | | | | | | |
| | | | | | | | | | | | | |
Beginning balance | | | | $ | (7,221 | ) | | | $ | (8,933 | ) | | | $ | (9,758 | ) |
Principal payments | | | | 968 | | | | 1,678 | | | | 726 | |
Shares allocated | | | | (65 | ) | | | 34 | | | | 99 | |
Ending balance | | | | $ | (6,318 | ) | | | $ | (7,221 | ) | | | $ | (8,933 | ) |
Total shareholders’ equity | | | | $ | 154,145 | | | | $ | 151,971 | | | | $ | 152,787 | |
(1) Reconciliations of net earnings to comprehensive income are as follows:
Net earnings | | | | $ | 8,265 | | | | $ | 4,608 | | | | $ | 27,742 | |
Foreign currency translation adjustments | | | | 2,661 | | | | 639 | | | | (4,432 | ) |
Comprehensive income | | | | $ | 10,926 | | | | $ | 5,247 | | | | $ | 23,910 | |
The company had 30,000,000 authorized shares of common stock as of December 31, 2002, 2001 and 2000.
See accompanying notes to consolidated financial statements.
18
NOTES TO THE CONSOLIDATED FINANCIAL STATEMENTS
(In thousands, except shares and per share data)

1 Summary of Significant Accounting Policies and Other Related Data
C O N S O L I D A T I O N — The consolidated financial statements include the accounts of Tennant Company and its subsidiaries. All material intercompany transactions and balances have been eliminated. In these Notes to the Consolidated Financial Statements, Tennant Company is referred to as “Tennant,” “we,”“us,” or “our.”
FISCAL YEAR-END — During 2001, we changed the fiscal year-end of our European subsidiaries from November to December because of the conversion of the European information system to the U.S. platform. This resulted in the inclusion of an additional month of sales and net earnings, increasing 2001 sales by $5,618 but decreasing net earnings by $503, or $0.06 per share. Our European subsidiaries typically operate at a loss during the holiday-shortened month of December.
TRANSLATION OF NON-U.S. CURRENCY — Foreign currency-denominated assets and liabilities have been translated to U.S. dollars at year-end exchange rates, while income and expense items are translated at exchange rates prevailing during the year. Gains or losses resulting from translation are included as a separate component of shareholders’ equity. Transaction gains or losses are included in other income (expense).
USE OF ESTIMATES — The preparation of financial statements in conformity with generally accepted accounting principles in the United States requires management to make estimates and assumptions that affect the amounts reported in the financial statements and accompanying notes. Actual results could differ from those estimates.
RECLASSIFICATIONS — Certain prior years’ amounts have been reclassified to conform with the current year presentation. Beginning in 2002, we reclassified research and development expenses from cost of sales to a separate line item within operating expenses. This reclassification has no impact on previously reported operating profit, net earnings or shareholders’ equity for all current and prior periods.
CASH EQUIVALENTS — We consider all highly liquid investments with maturities of three months or less from the date of purchase to be cash equivalents.
INVENTORIES — Inventories are valued at the lower of cost (principally on a last-in, first-out basis) or market.
PROPERTY, PLANT AND EQUIPMENT — Property, plant and equipment is carried at cost. We generally depreciate buildings and improvements by the straight-line method over a 30-year life. Other property, plant and equipment is generally depreciated using the straight-line method based on lives of three to ten years.
GOODWILL AND INTANGIBLE ASSETS — Goodwill represents the excess of cost over the fair value of net assets of businesses acquired. Intangible assets also includes purchased technology and patents. In June 2001, the Financial Accounting Standards Board issued SFAS No. 141, “Business Combinations” and SFAS No. 142, “Goodwill and Other Intangible Assets.” We adopted these standards on January 1, 2002. Under these standards, goodwill is no longer amortized but is reviewed annually for impairment. Our other intangible assets (consisting primarily of purchased technology and patents) will continue to be amortized over their useful lives, typically 10 years. Refer to Note 5 for details about the adoption of this standard and the results of our initial impairment tests.
PENSION AND PROFIT SHARING PLANS — We have pension and/or profit sharing plans covering substantially all of our employees. Pension plan costs are accrued based on actuarial estimates with the pension cost funded annually.
POSTRETIREMENT BENEFITS — We recognize the cost of retiree health benefits over the employees’ period of service.
WARRANTY — We record a liability for warranty claims at the time of sale. The amount of the liability is based on the trend in the historical ratio of claims to sales, the historical length of time between the sale and resulting warranty claim, anticipated releases of new products and other factors. Warranty terms on machines range from one to four years.
The changes in warranty reserves for the three years ended December 31, 2002, were as follows:
| | 2002 | | 2001 | | 2000 | |
Beginning balance | | $ | 4,062 | | $ | 3,818 | | $ | 3,222 | |
Additions charged to expense | | 6,978 | | 6,909 | | 6,185 | |
Claims paid | | (6,521 | ) | (6,665 | ) | (5,589 | ) |
Ending balance | | $ | 4,519 | | $ | 4,062 | | $ | 3,818 | |
RESEARCH AND DEVELOPMENT — Research and development costs are expensed as incurred.
INCOME TAXES — Deferred tax assets and liabilities are recognized for the expected future tax consequences of temporary differences between the book and tax bases of existing assets and liabilities. A valuation allowance is provided when, in management’s judgment, realization of a specific deferred tax asset is uncertain.
STOCK-BASED COMPENSATION — We account for stock-based compensation for employees under Accounting Principles Board (“APB”) Opinion No. 25, “Accounting for Stock Issued to Employees”. APB No. 25 requires compensation cost to be recorded on the date of the grant only if the current market price of the underlying stock exceeds the exercise price. Accordingly, no compensation cost has been recognized for stock option plans. At December 31, 2002, we have six stock-based employee compensation plans, which are described more fully in Note 13.
We have adopted the disclosure-only provisions of SFAS 148, “Accounting for Stock-Based Compensation — Transition and Disclosure” (“SFAS 148”). SFAS 148 amends the disclosure requirements of SFAS 123, “Accounting for Stock-Based Compensation” (“SFAS 123”). In accordance with SFAS 123, the fair value of options at the date of grant is estimated using the Black-Scholes option pricing model. The following weighted-average assumptions were used for the 2002, 2001 and 2000 grants, respectively: dividend yield of 2.3%, 1.8% and 2.3%;
19
expected volatility of 21%, 21% and 20%; risk-free interest rates of 3.8%, 4.9% and 6.4%; and expected life of option of five years. The weighted-average fair value of each option granted was $6.56, $8.10 and $5.94 in 2002, 2001 and 2000, respectively.
Had stock-based compensation cost been determined consistent with the provisions of SFAS 123, net earnings would have been reduced to the pro forma amounts indicated below:
| | 2002 | | 2001 | | 2000 | |
Net earnings — as reported | | $ | 8,265 | | $ | 4,608 | | $ | 27,742 | |
Deduct: Total stock-based employee compensation expense determined under fair value–based method for all awards, net of related tax effects | | 831 | | 731 | | 829 | |
Net earnings — pro forma | | $ | 7,434 | | $ | 3,877 | | $ | 26,913 | |
Earnings per share: | | | | | | | |
Basic — as reported | | $ | 0.92 | | $ | 0.51 | | $ | 3.05 | |
Basic — pro forma | | $ | 0.83 | | $ | 0.43 | | $ | 2.96 | |
Diluted — as reported | | $ | 0.91 | | $ | 0.50 | | $ | 3.04 | |
Diluted — pro forma | | $ | 0.82 | | $ | 0.42 | | $ | 2.95 | |
REVENUE RECOGNITION — We recognize revenue when title passes, which is generally upon shipment. Service revenue is recognized in the period the service is performed, or ratably over the period of the related service contract. Customers may obtain financing through a third-party leasing company to assist in their acquisition of our equipment products. Under the terms of our agreement with a U.S. third-party leasing company, transactions classified as operating leases result in recognition of revenue over the lease term and, for short-term rental transactions, at the time customers convert the short-term rental to an outright purchase or long-term capital lease of the equipment. As a result, we defer the sale on these transactions and record the sales proceeds as collateralized borrowings or deferred revenue. The underlying equipment relating to operating leases is depreciated on a straight-line basis over the lease term, which does not exceed the equipment’s estimated useful life.
DERIVATIVE FINANCIAL INSTRUMENTS — We enter into forward foreign exchange contracts principally to hedge certain foreign currency-denominated net assets and liabilities (principally the Euro, British pound, Australian dollar, Canadian dollar and Japanese yen). Gains or losses on forward foreign exchange contracts to hedge foreign currency-denominated net assets and liabilities are recognized in net earnings on a current basis over the term of the contracts.
EARNINGS PER SHARE — Basic earnings per share is computed by dividing net earnings by the weighted average number of common shares outstanding during the period. Diluted earnings per share assumes conversion of potentially dilutive stock options and performance-related shares.
LONG-LIVED ASSETS — We periodically review our long-lived assets for impairment and assess whether events or circumstances indicate that the carrying amount of the asset may not be recoverable. We generally deem an asset to be impaired if an estimate of undiscounted future operating cash flows is less than its carrying amount.
NEW ACCOUNTING STANDARDS — SFAS No. 146, “Accounting for Costs Associated with Exit or Disposal Activities” (“SFAS 146”), was issued by the FASB in June 2002. SFAS 146 requires that a liability for a cost associated with an exit or disposal activity, including restructuring, be recognized and measured at fair value when the liability is incurred, instead of the commitment date. This pronouncement is effective January 1, 2003, and, accordingly, we will apply its provisions to all exit or disposal activities after December 31, 2002.
In November 2002, FASB issued Interpretation No. 45, “Guarantor’s Accounting and Disclosure Requirements for Guarantees, Including Indirect Guarantees of Indebtedness of Others” (“Interpretation”). This Interpretation elaborates on the existing disclosure requirements for most guarantees, including loan guarantees and standby letters of credit. It also clarifies that at the time a company issues a guarantee, the company must recognize an initial liability for the fair market value of the obligations it assumes under that guarantee and must disclose that information in its interim and annual financial statements. The initial recognition and measurement provisions of the Interpretation apply on a prospective basis to guarantees issued or modified after December 15, 2002. As of December 31, 2002, we have adopted the disclosure-only requirements of this interpretation.

2 Restructuring and Other Unusual Charges
During 2002, we recorded pre-tax charges of $4,396 for restructuring, $500 in certain severance payments and $500 for a write-down of inventory. In addition, we recorded a change in estimate of $(394) related to our 2001 and 1999 restructuring activities. The restructuring charges related to a workforce reduction, consolidation of our North American distribution operations from a network of seven distribution centers into two new facilities that will be leased and managed by a third-party logistics services provider, and actions to consolidate and centralize customer service operations in Europe, as well as streamline other operations in North America. These initiatives should enable us to reduce our operating costs while further improving the level of customer service. Approximately 140 employees were terminated as a result of these actions. The restructuring charges primarily consisted of severance payments, building lease costs and write-downs of certain fixed assets. The inventory write-down related to the consolidation of distribution operations and has been classified in cost of sales. The $500 in certain severance payments has been classified as selling and administrative expense. The majority of these actions were completed during 2002 with the remainder expected to be completed during 2003.
The components of the 2002 restructuring charges and cash and non-cash applications against these charges were as follows:
| | Severance,
Early Retirement
and Related Costs | | Noncancelable
Contractual
Obligations
and Other | | Total | |
2002 Initial charges | | $ | 4,005 | | $ | 391 | | $ | 4,396 | |
2002 Utilization: | | | | | | | |
Cash | | (2,568 | ) | (57 | ) | (2,625 | ) |
Non-cash | | 219 | | (54 | ) | 165 | |
2002 Year-end liability balance | | $ | 1,656 | | $ | 280 | | $ | 1,936 | |
20
During 2001, we recorded pre-tax charges of $9,962 for restructuring and $1,007 for a write-down of inventory. The restructuring charges related to a work-force reduction and the closure of a leased plant in Germany and the transfer of its production to a contract manufacturer in the Czech Republic. Approximately 150 employees were terminated as a result of these actions. The charges primarily consisted of severance payments, building lease costs and write-downs of certain fixed assets and are classified as restructuring charges. The inventory write-down related to the closing of the leased plant in Germany and has been classified in cost of sales. The majority of these actions were completed during 2001 and 2002 with the remainder expected to be completed during 2003.
The components of the 2001 restructuring charges and cash and non-cash applications against these charges were as follows:
| | Severance,
Early Retirement
and Related Costs | | Noncancelable
Contractual
Obligations
and Other | | Total | |
2001 Initial charges | | $ | 6,159 | | $ | 3,803 | | $ | 9,962 | |
2001 Utilization: | | | | | | | |
Cash | | (4,801 | ) | (708 | ) | (5,509 | ) |
Non-cash | | (397 | ) | (2,276 | ) | (2,673 | ) |
2001 Year-end liability balance | | 961 | | 819 | | 1,780 | |
2002 Utilization: | | | | | | | |
Cash | | (911 | ) | (389 | ) | (1,300 | ) |
Non-cash | | 19 | | 67 | | 86 | |
Change in estimate | | (69 | ) | (124 | ) | (193 | ) |
2002 Year-end liability balance | | $ | — | | $ | 373 | | $ | 373 | |
In addition, we completed restructuring initiatives, originally accrued in 1999, during 2002. This resulted in cash usage of ($312), non-cash usage of $48 and a change in estimate of ($201) in 2002.

3 Inventories
The composition of inventories at December 31 was as follows:
| | 2002 | | 2001 | |
FIFO inventories: | | | | | |
Finished goods | | $ | 43,364 | | $ | 34,271 | |
Raw materials, parts and work-in-process | | 35,974 | | 34,487 | |
Total FIFO inventories | | 79,338 | | 68,758 | |
LIFO reserve | | (20,397 | ) | (20,470 | ) |
LIFO inventories | | $ | 58,941 | | $ | 48,288 | |
The LIFO reserve approximates the difference between LIFO carrying cost and replacement cost.

4 Property, Plant and Equipment
Property, plant and equipment and related accumulated depreciation at December 31 consisted of the following:
| | 2002 | | 2001 | |
Land | | $ | 4,079 | | $ | 3,756 | |
Buildings and improvements | | 32,942 | | 31,596 | |
Machinery and equipment | | 168,527 | | 162,988 | |
Construction in progress | | 1,547 | | 2,485 | |
Total property, plant and equipment | | 207,095 | | 200,825 | |
Less accumulated depreciation | | (137,942 | ) | (127,729 | ) |
Net property, plant and equipment | | $ | 69,153 | | $ | 73,096 | |

5 Goodwill and Intangible Assets
The gross and net amounts of goodwill and intangible assets at December 31 consisted of the following:
| | 2002 | | 2001 | |
Goodwill — gross | | $ | 23,506 | | $ | 22,849 | |
Less accumulated amortization | | (6,511 | ) | (6,476 | ) |
| | $ | 16,995 | | $ | 16,373 | |
Other intangibles — gross | | $ | 1,000 | | $ | 1,075 | |
Less accumulated amortization | | (275 | ) | (250 | ) |
| | $ | 725 | | $ | 825 | |
Total intangible assets — gross | | $ | 24,506 | | $ | 23,924 | |
Less accumulated amortization | | (6,786 | ) | (6,726 | ) |
Goodwill and intangible assets, net | | $ | 17,720 | | $ | 17,198 | |
On January 1, 2002, we adopted SFAS No. 142, “Goodwill and Intangible Assets” (“SFAS 142”). SFAS 142 eliminates the amortization of goodwill and instead requires goodwill be tested for impairment at least annually. Events or circumstances which may trigger impairment write-downs include, but are not limited to, a prolonged industry downturn, a significant decline in our market value, or significant reductions in projected future cash flows. In assessing the recoverability of goodwill, we compare the carrying value of our goodwill to our market value. We completed our initial and annual impairment tests of goodwill and concluded there was no impairment.
Intangible assets with finite lives are amortized over their useful lives. Amortization expense relating to these types of intangible assets will approximate $100 per year for each of the five succeeding years.
21
As required by SFAS 142, the results for periods prior to 2002 were not restated. A reconciliation between net earnings and earnings per share reported by us and net earnings and earnings per share as adjusted to reflect the impact of SFAS 142 is provided below:
| | 2002 | | 2001 | | 2000 | |
Net earnings: | | | | | | | |
As reported | | $ | 8,265 | | $ | 4,608 | | $ | 27,742 | |
Goodwill amortization, net of tax | | — | | 510 | | 772 | |
Adjusted net earnings | | $ | 8,265 | | $ | 5,118 | | $ | 28,514 | |
Basic earnings per share | | | | | | | |
As reported | | $ | 0.92 | | $ | 0.51 | | $ | 3.05 | |
Goodwill amortization, net of tax | | — | | 0.05 | | 0.08 | |
Adjusted basic earnings per share | | $ | 0.92 | | $ | 0.56 | | $ | 3.13 | |
Diluted earnings per share | | | | | | | |
As reported | | $ | 0.91 | | $ | 0.50 | | $ | 3.04 | |
Goodwill amortization, net of tax | | — | | 0.05 | | 0.08 | |
Adjusted diluted earnings per share | | $ | 0.91 | | $ | 0.55 | | $ | 3.12 | |

6 Short and Long-Term Debt
Debt at December 31 consisted of the following:
| | 2002 | | 2001 | |
Short-term borrowings: | | | | | |
Short-term bank borrowings | | $ | 3,172 | | $ | 9,206 | |
Current portion of long-term debt | | 5,000 | | — | |
Collateralized borrowings | | 6,776 | | 4,212 | |
Total short-term borrowings | | $ | 14,948 | | $ | 13,418 | |
Long-term debt: | | | | | |
Note at 7.21%, due in 2003 | | $ | — | | $ | 5,000 | |
Note at 7.84%, due in 2005 | | 5,000 | | 5,000 | |
Collateralized borrowings | | — | | 2,496 | |
Total long-term debt | | $ | 5,000 | | $ | 12,496 | |
The weighted-average interest rates on the short-term bank borrowings at December 31, 2002 and 2001, were 5.6% and 6.4%, respectively. This interest rate represents the weighted-average rate for the respective period and is calculated using the actual interest costs, exclusive of commitment fees, and month-end average outstanding debt.
Collateralized borrowings primarily represent deferred sales proceeds on certain leasing transactions with our U.S. third-party leasing company.
At December 31, 2002, we had available uncommitted lines of credit with banks of approximately $17,000 and available committed lines of credit of approximately $25,000.
Minimum principal payments are due as follows: $5,000 in 2003 and $5,000 in 2005.
Interest paid during 2002, 2001 and 2000, was $1,086, $1,788 and $1,766, respectively.

7 Accounts Payable, Accrued Expenses and Deferred Revenue
Accounts payable, accrued expenses and deferred revenue at December 31 consisted of the following:
| | 2002 | | 2001 | |
Trade accounts payable | | $ | 18,095 | | $ | 19,294 | |
Wages, bonuses and commissions | | 13,941 | | 11,786 | |
Taxes, other than income taxes | | 1,971 | | 3,368 | |
Restructuring reserves | | 2,309 | | 2,245 | |
Warranty | | 4,519 | | 4,062 | |
Deferred revenue | | 3,110 | | 2,161 | |
Other | | 11,456 | | 5,115 | |
Total | | $ | 55,401 | | $ | 48,031 | |

8 Fair Value of Financial Instruments
Our short-term financial instruments are valued at their carrying amounts in the consolidated balance sheets, which are reasonable estimates of their fair value due to their short maturities. Our foreign currency forward exchange contracts are valued at fair market value, which is the amount we would receive or pay to terminate the contracts at the reporting date. The fair market value of our long-term debt approximates cost, based on the borrowing rates currently available to us for bank loans with similar terms and remaining maturities.
We use derivative instruments to manage exposures to foreign currency only in an attempt to limit underlying exposures from currency fluctuations and not for trading purposes. We periodically enter into various contracts, principally forward exchange contracts, to protect the value of certain of our foreign currency-denominated assets and liabilities. These contracts are designated as fair value hedges with the hedge asset or liability recorded in prepaid or accrued expenses, as applicable, and changes to the fair value of these contracts recorded in the earnings statement. The gains and losses on these contracts generally approximate changes in the value of the related assets and liabilities. As of December 31, 2002, the fair value of such contracts outstanding was $45.
At December 31, 2002 and 2001, the notional amounts of foreign currency forward exchange contracts outstanding were $34,807 and $21,744, respectively.
22

9 Retirement Benefit Plans
Substantially all U.S. employees are covered by various retirement benefit plans maintained by us. Retirement benefits for eligible employees in foreign locations are funded principally through annuity or government programs. The total cost of these benefits was $5,217, $4,962 and $5,257 in 2002, 2001 and 2000, respectively.
We have a 401(k) plan that covers substantially all U.S. employees. Under this plan, we match employee contributions to the plan up to 4% of the employee’s compensation in the form of Tennant stock. We also make a profit sharing contribution to the plan to employees with more than one year of service in accordance with our Profit Sharing Plan. This contribution can be in the form of Tennant stock or cash and is based upon our financial performance, subject to a 2% minimum contribution. Both the matching and profit sharing contributions are funded primarily by our ESOP Plan. Expenses under these plans were $3,409, $3,051 and $4,341 during 2002, 2001 and 2000, respectively.
During 2000, we approved enhancements to our defined benefit retirement plan (“the Former Plan”) that also offered each plan member the choice of remaining in a modified defined benefit plan (the Tennant Company Pension Plan), or leaving the Former Plan and receiving a lump-sum distribution that could be rolled over into the 401(k) plan.
During 2001, assets and liabilities attributable to approximately 300 employees and all inactive participants were spun off into the Tennant Company Pension Plan. This plan received benefit enhancements increasing the projected benefit obligation approximately $5,900 effective January 1, 2001. Plan benefits are based on the employee’s years of service and compensation during the highest five consecutive years of service of the final ten years of employment.
The enhancements to the Former Plan increased the projected benefit obligation approximately $10,600 for the remaining 900 participants that elected to leave and receive a lump-sum distribution. The Former Plan was terminated during 2001, and the Plan assets were distributed to the participants resulting in a non-recurring pension settlement gain of $5,928 before tax.
We also provide certain health-care benefits for substantially all of our U.S. retired employees. Eligibility for those benefits is based upon a combination of years of service with Tennant and age upon retirement.
Summaries related to changes in benefit obligations and plan assets and to the funded status of the defined benefit and postretirement medical benefit plans were as follows:
| | Pension Benefits | | Postretirement
Medical Benefits | |
| | 2002 | | 2001 | | 2002 | | 2001 | |
Change in benefit obligation: | | | | | | | | | |
Benefit obligation at beginning of year | | $ | 22,191 | | $ | 25,258 | | $ | 13,555 | | $ | 12,817 | |
Service cost | | 846 | | 850 | | 391 | | 347 | |
Interest cost | | 1,472 | | 1,410 | | 1,051 | | 878 | |
Amendments | | — | | 16,515 | | — | | — | |
Actuarial loss/(gain) | | 787 | | 2,087 | | 2,624 | | 150 | |
Benefits paid | | (774 | ) | (23,929 | ) | (848 | ) | (637 | ) |
Benefit obligation at end of year | | $ | 24,522 | | $ | 22,191 | | $ | 16,773 | | $ | 13,555 | |
Change in plan assets: | | | | | | | | | |
Fair value of plan assets at beginning of year | | $ | 27,813 | | $ | 50,712 | | $ | — | | $ | — | |
Actual return on plan assets | | (4,164 | ) | 922 | | — | | — | |
Employer contributions | | 203 | | 108 | | 848 | | 637 | |
Benefits paid | | (774 | ) | (23,929 | ) | (848 | ) | (637 | ) |
Fair value of plan assets at end of year | | $ | 23,078 | | $ | 27,813 | | $ | — | | $ | — | |
Funded status | | $ | (1,444 | ) | $ | 5,622 | | $ | (16,773 | ) | $ | (13,555 | ) |
Unrecognized actuarial loss/(gain) | | (4,912 | ) | (13,310 | ) | 2,610 | | 6 | |
Unrecognized transition obligation/(asset) | | (154 | ) | (177 | ) | — | | — | |
Unrecognized prior service cost | | 5,426 | | 5,996 | | — | | — | |
Net accrued liability | | $ | (1,084 | ) | $ | (1,869 | ) | $ | (14,163 | ) | $ | (13,549 | ) |
Amounts recognized in the consolidated balance sheets consisted of: | | | | | | | | | | | | | |
Prepaid benefit cost | | $ | 385 | | $ | — | | $ | — | | $ | — | |
Accrued benefit liability | | (1,608 | ) | (2,037 | ) | (14,163 | ) | (13,549 | ) |
Intangible asset | | 139 | | 168 | | — | | — | |
Net accrued liability | | $ | (1,084 | ) | $ | (1,869 | ) | $ | (14,163 | ) | $ | (13,549 | ) |
Weighted-average assumptions as of December 31: | | | | | | | | | |
Discount rate | | 6.50 | % | 7.00 | % | 6.50 | % | 7.00 | % |
Expected return on plan assets | | 8.75 | % | 9.50 | % | — | | — | |
Rate of compensation increase | | 4.00 | % | 4.00 | % | — | | — | |
23
The projected benefit obligation, accumulated benefit obligation and fair value of plan assets for the pension plan with accumulated benefit obligations in excess of plan assets were $1,983, $1,608 and $0, respectively, as of December 31, 2002, and $1,956, $1,619 and $0, respectively, as of December 31, 2001.
For purposes of determining the December 31, 2002, accumulated post-retirement medical benefit obligations, the weighted-average assumed annual rate of future increases in the per-capita cost of covered health-care benefits was 9.5% for 2003, declining gradually to 5.0% in 2023 and after.
The health-care trend rate assumption does not have a large impact on the postretirement medical benefit obligations since our obligations are largely fixed dollar amounts in future years. To illustrate, a one-percentage-point change in assumed health-care cost trends would have the following effects:
| | 1-Percentage–
Point Increase | | 1-Percentage–
Point Decrease | |
Effect on total of service and interest cost components | | $ | 38 | | $ | (38 | ) |
Effect on postretirement benefit obligation | | $ | 369 | | $ | 385 | |
Components of net periodic benefit cost for the three years ended December 31, 2002, were as follows:
| | Pension Benefits | |
| | 2002 | | 2001 | | 2000 | |
Service cost | | $ | 846 | | $ | 850 | | $ | 1,660 | |
Interest cost | | 1,472 | | 1,410 | | 1,577 | |
Expected return on plan | | | | | | | |
assets | | (2,495 | ) | (2,141 | ) | (3,195 | ) |
Recognized actuarial gain | | (953 | ) | (827 | ) | (1,307 | ) |
Amortization of transition | | | | | | | |
obligation/(asset) | | (22 | ) | (22 | ) | (46 | ) |
Amortization of prior | | | | | | | |
service cost | | 570 | | 570 | | 89 | |
Net periodic cost (benefit) | | (582 | ) | (160 | ) | (1,222 | ) |
Settlement gain | | — | | (5,928 | ) | — | |
Total cost (benefit) | | $ | (582 | ) | $ | (6,088 | ) | $ | (1,222 | ) |
| | | | | | | |
| | Postretirement Medical Benefits | |
| | 2002 | | 2001 | | 2000 | |
Service cost | | $ | 391 | | $ | 347 | | $ | 317 | |
Interest cost | | 1,051 | | 878 | | 855 | |
Recognized actuarial loss | | 19 | | — | | — | |
Net periodic cost | | $ | 1,461 | | $ | 1,225 | | $ | 1,172 | |
For purposes of determining the 2002 postretirement medical net periodic benefit cost, the weighted-average assumed annual rate of future increase in the per-capita cost of covered health-care benefits was 10% for 2002, declining gradually to 5.75% in 2022 and after.

10 Common and Preferred Stock and Additional Paid-in Capital
We are authorized to issue an aggregate of 31,000,000 shares; 30,000,000 were designated as Common Stock, having a par value of $0.375 per share, and 1,000,000 were designated as Preferred Stock, having a par value of $0.02 per share. The Board of Directors is authorized to establish one or more series of Preferred Stock, setting forth the designation of each such series, and fixing the relative rights and preferences of each such series.
On November 19, 1996, the Board of Directors approved a Shareholder Rights Plan allowing a dividend of one preferred share purchase Right for each outstanding Common Share of the par value of $0.375 per share of the Company. Each Right entitles the registered holder to purchase from us one one-hundredth of a Series A Junior Participating Preferred Share of the par value of $0.02 per share of the Company at a price of $100 per one one-hundredth of a Preferred Share, subject to adjustment. The Rights are not exercisable or transferable apart from the common stock until the earlier of:(i) the close of business on the fifteenth day following a public announcement that a person or group of affiliated or associated persons has become an “Acquiring Person” (i.e., has become, subject to certain exceptions, the beneficial owner of 20% or more of the outstanding Common Shares), or (ii) the close of business on the fifteenth day following the commencement or public announcement of a tender offer or exchange offer the consummation of which would result in a person or group of affiliated or associated persons becoming, subject to certain exceptions, the beneficial owner of 20% or more of the outstanding Common Shares (or such later date as may be determined by the Board of Directors of the Company prior to a person or group of affiliated or associated persons becoming an Acquiring Person). At no time do the Rights have any voting power. The Rights may be redeemed by us for $0.01 per right at any time prior to (and, in certain circumstances, within twenty days after) a person or group acquiring 20% or more of the common stock. The 20% thresholds do not apply to stock ownership by or on behalf of employee benefit plans. Under certain circumstances, the Board of Directors may exchange the Rights for our common stock or reduce the 20% thresholds to not less than 10%. The Rights will expire on December 23, 2006, unless extended or earlier redeemed or exchanged by us.

11 Commitments and Contingent Liabilities
We lease office and warehouse facilities, vehicles and office equipment under operating lease agreements which include both monthly and longer-term arrangements. Leases with initial terms of one year or more expire at various dates through 2007 and generally provide for extension options. Rent expense under the leasing agreements (exclusive of real estate taxes, insurance and other expenses payable under the leases) amounted to $4,560, $4,645 and $5,110, in 2002, 2001 and 2000, respectively.
24
The aggregate lease commitments with an initial term of one year or more at December 31, 2002, were $8,350 with minimum rentals for the years as follows:
2003 | | $ | 3,817 | |
2004 | | 2,164 | |
2005 | | 1,047 | |
2006 | | 663 | |
2007 and beyond | | 659 | |
Total | | $ | 8,350 | |
In the ordinary course of business, we may become liable with respect to pending and threatened litigation, tax, environmental and other matters. While the ultimate results of current claims, investigations and lawsuits involving us are unknown at this time, we do not expect that these matters will have a material adverse effect on our consolidated financial position.

12 Income Taxes
In 2002, 2001 and 2000, we recognized tax benefits directly to shareholders’ equity of $356, $468 and $375, respectively, relating to our ESOP and stock plans.
Income tax expense for the three years ended December31, 2002, was as follows:
| | Current | | Deferred | | Total | |
2002 | | | | | | | |
Federal | | $ | 4,000 | | $ | 1,179 | | $ | 5,179 | |
Foreign | | 812 | | — | | 812 | |
State | | 551 | | 91 | | 642 | |
| | $ | 5,363 | | $ | 1,270 | | $ | 6,633 | |
2001 | | | | | | | |
Federal | | $ | 6,894 | | $ | 1,436 | | $ | 8,330 | |
Foreign | | 25 | | (524 | ) | (499 | ) |
State | | 606 | | 401 | | 1,007 | |
| | $ | 7,525 | | $ | 1,313 | | $ | 8,838 | |
2000 | | | | | | | |
Federal | | $ | 9,056 | | $ | 3,601 | | $ | 12,657 | |
Foreign | | 416 | | 564 | | 980 | |
State | | 1,782 | | 51 | | 1,833 | |
| | $ | 11,254 | | $ | 4,216 | | $ | 15,470 | |
Our effective income tax rate varied from the U.S. federal statutory tax rate for the three years ended December 31, 2002, as follows:
| | 2002 | | 2001 | | 2000 | |
Tax at statutory rate | | 35.0 | % | 35.0 | % | 35.0 | % |
Increases (decreases) in the tax rate from: | | | | | | | |
State and local taxes, net of federal benefit | | 2.8 | | 4.9 | | 2.8 | |
Effect of foreign operations | | (6.3 | ) | (1.2 | ) | 1.0 | |
Valuation allowance | | 19.9 | | 31.7 | | — | |
Effect of export transactions | | (5.0 | ) | (4.6 | ) | (2.5 | ) |
Other, net | | (1.9 | ) | (0.1 | ) | (0.5 | ) |
Effective income tax rate | | 44.5 | % | 65.7 | % | 35.8 | % |
Deferred tax assets and liabilities were comprised of the following as of December 31, 2002 and 2001:
| | 2002 | | 2001 | |
Deferred tax assets: | | | | | |
Inventories, principally due to additional costs inventoried for tax purposes pursuant to the Tax Reform Act of 1986 and changes in inventory reserves | | $ | 1,582 | | $ | 1,234 | |
Employee wages and benefits, principally due to accruals for financial reporting purposes | | 11,358 | | 11,459 | |
Warranty reserves accrued for financial reporting purposes | | 1,312 | | 1,323 | |
Accounts receivable, principally due to allowance for doubtful accounts and tax accounting method for equipment rentals | | 2,727 | | 2,566 | |
Tax loss carryforwards | | 7,231 | | 4,267 | |
Valuation allowance | | (7,231 | ) | (4,267 | ) |
Other | | 1,196 | | 890 | |
Total deferred tax assets | | $ | 18,175 | | $ | 17,472 | |
Deferred tax liabilities:
Property, plant and equipment, principally due to differences in depreciation and related gains | | $ | 5,137 | | $ | 3,595 | |
Goodwill | | 1,933 | | 1,502 | |
Total deferred tax liabilities | | $ | 7,070 | | $ | 5,097 | |
Net deferred tax assets | | $ | 11,105 | | $ | 12,375 | |
A tax loss carryforward of $23,900 is primarily attributable to losses from European restructuring initiatives. Because of the uncertainty regarding realizability of this asset, a valuation allowance was established against this loss carryforward. A valuation allowance for the remaining deferred tax assets is not required since it is likely that they will be realized through carryback to taxable income in prior years, future reversals of existing taxable temporary differences and future taxable income.
Income taxes paid were $3,465, $10,390 and $15,420, in 2002, 2001 and 2000, respectively.
25

13 Stock Award Plans
We have six plans under which stock-based compensation grants are provided annually. The 1992 Stock Incentive Plan (“1992 Plan”), 1995 Stock Incentive Plan (“1995 Plan”), 1998 Management Incentive Plan (“1998 Plan”) and 1999 Stock Incentive Plan (“1999 Plan”) provide for stock-based compensation grants to our executives and key employees. The 1993 Directors’ Restricted Plan (“1993 Plan”) provides for the annual retainer in the form of restricted shares to our non-employee Directors. The 1997 Directors’ Option Plan (“1997 Plan”) provides for stock option grants to our non-employee Directors. A maximum of 1,875,000 shares can be awarded under these plans; 772,000 shares were available for award as of December 31, 2002. The grant size under all plans is determined by the Compensation Committee of the Board of Directors.
Restricted shares are granted annually and typically have a two- or three-year restriction period from the effective date of the grant. During the restricted period, the restricted shares may not be sold or transferred, but the shares entitle the participants to dividends and voting rights. In 2002, 2001 and 2000, respectively, 21,300, 9,100 and 39,000 restricted shares were granted. The weighted-average fair values of stock on the grant date were $41.53, $43.64 and $34.43 per share in 2002, 2001 and 2000, respectively.
Under the 1998 Plan, performance-related compensation grants were made and are payable in cash or shares. The awards earned are based on achievement of certain financial performance goals and payout is over a three-year period following the award year. In 2002, 2001 and 2000, respectively, $764, $662 and $649 in grants were made.
In 2002, 2001 and 2000, respectively, expenses of $528, $1,021 and $2,585 were charged to operations for the above-described restricted and performance-related award programs.
Under the 1995 Plan, the 1997 Plan and the 1999 Plan, 10-year fixed stock options are granted annually at a price equal to the stock’s fair market value on the date of the grant. Options generally become exercisable on a cumulative basis at a rate of 25% per year prior to 2002 and 33% per year thereafter.
A summary of the status of our stock option transactions during 2002, 2001 and 2000 is shown below:
| | Shares | | Weighted-
Average
Exercise Price | |
2000 | | | | | |
Outstanding at beginning of year | | 589,800 | | $ | 33.79 | |
Granted | | 271,800 | | 33.94 | |
Exercised | | (59,800 | ) | 32.22 | |
Forfeited | | — | | — | |
Outstanding at end of year | | 801,800 | | $ | 33.96 | |
Exercisable at end of year | | 460,400 | | $ | 33.96 | |
| | | | | |
2001 | | | | | |
Outstanding at beginning of year | | 801,800 | | $ | 33.96 | |
Granted | | 210,200 | | 43.66 | |
Exercised | | (80,300 | ) | 32.38 | |
Forfeited | | (43,800 | ) | 36.53 | |
Outstanding at end of year | | 887,900 | | $ | 36.25 | |
Exercisable at end of year | | 523,500 | | $ | 34.64 | |
| | | | | |
2002 | | | | | |
Outstanding at beginning of year | | 887,900 | | $ | 36.25 | |
Granted | | 295,300 | | 35.63 | |
Exercised | | (53,600 | ) | 32.03 | |
Forfeited | | (133,500 | ) | 36.92 | |
Outstanding at end of year | | 996,100 | | $ | 36.21 | |
Exercisable at end of year | | 574,200 | | $ | 35.55 | |
The following table contains details of our outstanding stock options as of December 31, 2002:
Range of Exercise
Prices Between | | Number
Outstanding | | Weighted-
Average
Remaining
Contractual Life | | Weighted-
Average
Exercise Price | | Number
Exercisable | | Weighted-
Average
Exercise Price | |
$ | 22.00 | | $ | 29.00 | | 99,600 | | 4.0 | | $ | 27.22 | | 93,800 | | $ | 27.18 | |
$ | 29.01 | | $ | 36.00 | | 535,900 | | 7.4 | | $ | 34.18 | | 253,600 | | $ | 33.99 | |
$ | 36.01 | | $ | 43.00 | | 179,200 | | 5.7 | | $ | 38.32 | | 140,400 | | $ | 37.83 | |
$ | 43.01 | | $ | 49.63 | | 181,400 | | 7.9 | | $ | 45.17 | | 86,400 | | $ | 45.53 | |
| | | | 996,100 | | 6.8 | | $ | 36.21 | | 574,200 | | $ | 35.55 | |
26

14 Employee Stock Ownership Plan
We established a leveraged Employee Stock Ownership Plan (“ESOP”) in 1990. The ESOP covers substantially all domestic employees. The shares required for our 401(k) matching contribution program, as well as our Profit Sharing Plan, are provided principally by our ESOP, supplemented as needed by newly issued shares. We make annual contributions to the ESOP equal to the ESOP’s debt service less dividends and Company match contributions received by the ESOP. All dividends received by the ESOP are used to pay debt service. The ESOP shares initially were pledged as collateral for its debt. As the debt is repaid, shares are released from collateral and allocated to employees who made 401(k) contributions that year, as well as to profit sharing participants, based on the proportion of debt service paid in the year. We account for the ESOP in accordance with EITF Issue 89-8, “Expense Recognition for Employee Stock Ownership Plans.” Accordingly, the shares pledged as collateral are reported as unearned ESOP shares in the consolidated balance sheets. As shares are released from collateral, we report compensation expense equal to the cost of the shares to the ESOP. All ESOP shares are considered outstanding in EPS computations, and dividends on allocated and unallocated shares are recorded as a reduction of retained earnings.
Our cash contributions to the ESOP during 2002, 2001 and 2000 were $1,513, $1,239 and $1,203, respectively.
Expenses in excess of (less than) benefits provided to employees through the ESOP, which were recorded in miscellaneous expense (income), were $153, $110 and $(402) in 2002, 2001 and 2000, respectively. Interest earned and received on our loan to the ESOP was $1,114, $1,222 and $1,301, in 2002, 2001 and 2000, respectively. Dividends on our shares held by the ESOP used for debt service were $627, $813 and $818, in 2002, 2001 and 2000, respectively. At December 31, 2002, the ESOP indebtedness to us, which bears an interest rate of 10.05% and is due December 31, 2009, was $10,120.
The ESOP shares as of December 31 were as follows:
| | 2002 | | 2001 | | 2000 | |
Allocated shares | | 619,202 | | 569,221 | | 479,660 | |
Shares released for allocation | | — | | — | | 38,987 | |
Unreleased shares | | 349,864 | | 399,845 | | 450,419 | |
Total ESOP shares | | 969,066 | | 969,066 | | 969,066 | |

15 Earnings Per Share Computations
The computations of basic and diluted earnings per share for the years ended December 31 were as follows:
| | Net Earnings
(Numerator) | | Shares
(Denominator) | | Per-Share
Amount | |
2002 | | | | | | | |
Basic earnings per share | | $ | 8,265 | | 9,001,000 | | $ | 0.92 | |
Dilutive share equivalents | | | | 47,000 | | | |
Diluted earnings per share | | $ | 8,265 | | 9,048,000 | | $ | 0.91 | |
| | | | | | | |
2001 | | | | | | | |
Basic earnings per share | | $ | 4,608 | | 9,070,000 | | $ | 0.51 | |
Dilutive share equivalents | | | | 133,000 | | | |
Diluted earnings per share | | $ | 4,608 | | 9,203,000 | | $ | 0.50 | |
| | | | | | | |
2000 | | | | | | | |
Basic earnings per share | | $ | 27,742 | | 9,082,000 | | $ | 3.05 | |
Dilutive share equivalents | | | | 53,000 | | | |
Diluted earnings per share | | $ | 27,742 | | 9,135,000 | | $ | 3.04 | |

16 Segment Reporting
We operate in one industry segment which consists of the design, manufacture and sale of products used primarily in the maintenance of nonresidential floors.
The following sets forth net sales and long-lived assets by geographic area:
| | 2002 | | 2001 | | 2000 | |
Net sales: | | | | | | | |
North America | | $ | 311,862 | | $ | 301,529 | | $ | 326,083 | |
Europe | | 73,703 | | 80,605 | | 80,668 | |
Other international | | 38,618 | | 40,291 | | 45,425 | |
Total | | $ | 424,183 | | $ | 422,425 | | $ | 452,176 | |
| | | | | | | |
| | | | 2002 | | 2001 | |
Long-lived assets: | | | | | | | |
North America | | | | $ | 76,125 | | $ | 81,178 | |
Europe | | | | 12,302 | | 11,026 | |
Other international | | | | 1,221 | | 1,264 | |
Total | | | | $ | 89,648 | | $ | 93,468 | |
Net sales by geographic area are net of intercompany sales. North America sales include sales in the United States and Canada. Sales in Canada comprise less than 10% of consolidated sales and are interrelated with our U.S. operations. No single customer represents more than 10% of our consolidated sales.
27

17 Consolidated Quarterly Data (Unaudited)
| | Net Sales | | Gross Profit | |
Quarter | | 2002 | | 2001 | | 2002 | | 2001 | |
First | | $ | 96,419 | | $ | 104,628 | | $ | 38,746 | | $ | 44,532 | |
Second | | 106,099 | | 109,667 | | 42,977 | | 43,999 | |
Third | | 107,838 | | 105,129 | | 42,995 | | 42,078 | |
Fourth | | 113,827 | | 103,001 | | 45,105 | | 39,894 | |
Year | | $ | 424,183 | | $ | 422,425 | | $ | 169,823 | | $ | 170,503 | |
| | | | | | | | | |
| | Net Earnings (Loss) | | Diluted Earnings
(Loss per Share) | |
Quarter | | 2002 | | 2001 | | 2002 | | 2001 | |
First | | $ | (1,443 | )(1) | $ | 439 | (2) | $ | (0.16 | )(1) | $ | 0.05 | (2) |
Second | | 2,954 | (1) | 1,023 | (2) | 0.32 | (1) | 0.11 | (2) |
Third | | 2,794 | | 2,936 | | 0.31 | | 0.32 | |
Fourth | | 3,960 | | 210 | (2) | 0.44 | | 0.02 | (2) |
Year | | $ | 8,265 | (1) | $ | 4,608 | (2) | $ | 0.91 | (1) | $ | 0.50 | (2) |
(1) Includes after-tax restructuring and unusual charges of $3,319 ($0.37 per diluted share) in the first quarter and $300 ($0.03 per diluted share) in the second quarter.
(2) Includes after-tax restructuring charges of $3,354 ($0.36 per diluted share) and $3,522 ($0.39 per diluted share) in the first and second quarters, respectively, as well as the after-tax pension settlement gain of $3,735 ($0.41 per diluted share) and the deferred tax asset valuation allowance of $4,267 ($0.47 per diluted share) in the fourth quarter.
Regular quarterly dividends aggregated $0.82 per share in 2002, or $0.20 per share for the first and second quarters and $0.21 for the third and fourth quarters, and $0.80 per share in 2001, or $0.20 per share for all quarters.
18 Subsequent Events
On February 4, 2003, we amended our agreement with our U.S. third-party lessor such that future equipment sales to the third-party lessor which are considered operating leases will result in immediate revenue recognition. The amendment to the agreement is retroactive to the beginning of the agreement; therefore, it will also result in the recognition of previously deferred revenue in the first quarter of 2003 and increase net earnings by approximately $1,800 or $0.20 per diluted share.
In March 2000, we entered into a joint venture with an unrelated third party to develop and market a revolutionary new product. In February 2003, we and our joint-venture partner agreed in principle to begin dissolving the joint venture. In March 2003, we made a decision to permanently discontinue manufacturing the product. At December 31, 2002, our book value of inventory, accounts receivable and intangible assets related to joint-venture activities totaled approximately $2,100. As a result of the joint-venture dissolution, we expect to record an after-tax charge in 2003 of approximately $1,100 to $1,500, or $0.12 to $0.17 per diluted share, the majority of which will occur in the first quarter. The charge will include the write-off of assets and accrual of certain contractual obligations.
28
MANAGEMENT‘S REPORT
Our management is responsible for the preparation, integrity and objectivity of the financial statements. Management believes that the financial statements for the three years ended December 31, 2002, have been prepared in conformity with accounting principles generally accepted in the United States of America appropriate in the circumstances. In preparing the financial statements, man-agement makes informed judgments and estimates where necessary to reflect the expected effects of events and transactions that have not been completed.
In meeting its responsibility for the reliability of the financial statements, management relies on a system of internal accounting controls. This system is designed to provide reasonable assurance that assets are safeguarded and transactions are executed in accordance with management’s authorization and recorded properly to permit the preparation of financial statements in accordance with accounting principles generally accepted in the United States of America. The design of this system recognizes that errors or irregularities may occur and that estimates and judgments are required to assess the relative cost and expected benefits of the controls. Management believes that our accounting controls provide reasonable, but not absolute, assurance that errors or irregularities that could be material to the financial statements are prevented or would be detected within a timely period.
Our consolidated financial statements have been audited by KPMG LLP, independent accountants. The independent accountants conduct a review of internal accounting controls to the extent required by generally accepted auditing standards and perform such tests and related procedures as they deem necessary to arrive at an opinion on the fairness of the financial statements in accordance with generally accepted accounting principles in the United States of America. The opinion of the independent auditors is contained in this Annual Report.
The Audit Committee of the Board of Directors, which is comprised solely of Directors who are not employees of Tennant Company, is responsible for monitoring our accounting and reporting practices. The Audit Committee meets periodically with management and the independent auditors to discuss internal accounting controls, auditing and financial reporting matters. In addition, the independent auditors have access to the Audit Committee with or without the presence of management.

Janet M. Dolan
President and Chief Executive Officer

Anthony T. Brausen
Vice President, Chief Financial Officer and Treasurer
INDEPENDENT AUDITORS’ REPORT
The Board of Directors and Shareholders
Tennant Company:
We have audited the accompanying consolidated balance sheets of Tennant Company and subsidiaries as of December 31, 2002 and 2001, and the related consolidated statements of earnings, cash flows, and shareholders’ equity and comprehensive income for each of the years in the three-year period ended December 31, 2002. These consolidated financial statements are the responsibility of the Company’s management. Our responsibility is to express an opinion on these consolidated financial statements based on our audits.
We conducted our audits in accordance with auditing standards generally accepted in the United States of America. Those standards require that we plan and perform the audit to obtain reasonable assurance about whether the financial statements are free of material misstatement. An audit includes examining, on a test basis, evidence supporting the amounts and disclosures in the financial statements. An audit also includes assessing the accounting principles used and significant estimates made by management, as well as evaluating the overall financial statement presentation. We believe that our audits provide a reasonable basis for our opinion.
In our opinion, the consolidated financial statements referred to above present fairly, in all material respects, the financial position of Tennant Company and subsidiaries as of December 31, 2002 and 2001, and the results of their operations and their cash flows for each of the years in the three-year period ended December 31, 2002, in conformity with accounting principles generally accepted in the United States of America.
As discussed in Note 1 to the consolidated financial statements, the Company adopted the provisions of Financial Accounting Standard No. 142, Goodwill and Other Intangible Assets, on January 1, 2002.

Minneapolis, Minnesota
February 4, 2003
29
HISTORICAL FINANCIAL REVIEW
TENNANT COMPANY AND SUBSIDIARIES
(In thousands, except shares and per share data)
Years Ended December 31 | | 2002 | | 2001 | | 2000 | | 1999 | | 1998 | | 1997 | | 1996 | | 1995 | | 1994 | | 1993 | |
Net sales | | $424,183 | | 422,425 | | 452,176 | | 429,739 | | 383,765 | | 372,428 | | 344,433 | | 325,368 | | 281,685 | | 221,002 | |
Cost of sales | | $254,360 | | 251,922 | | 254,191 | | 240,667 | | 209,145 | | 204,100 | | 191,392 | | 174,701 | | 152,315 | | 116,404 | |
Gross margin –% | | 40.0 | | 40.4 | | 43.8 | | 44.0 | | 45.5 | | 45.2 | | 44.4 | | 46.3 | | 45.9 | | 47.3 | |
Research and development expenses | | $16,331 | | 16,578 | | 15,466 | | 14,861 | | 14,224 | | 13,470 | | 12,773 | | 12,695 | | 11,674 | | 11,445 | |
% of net sales | | 3.9 | | 3.9 | | 3.4 | | 3.5 | | 3.7 | | 3.6 | | 3.7 | | 3.9 | | 4.1 | | 5.2 | |
Selling and administrative expenses | | $133,914 | | 136,440 | | 139,665 | | 136,076 | | 125,806 | | 118,770 | | 108,637 | | 107,790 | | 93,572 | | 77,730 | |
% of net sales | | 31.6 | | 32.3 | | 30.9 | | 31.7 | | 32.8 | | 31.9 | | 31.5 | | 33.1 | | 33.2 | | 35.2 | |
Profit from operations | | $15,576 | (1) | 13,451 | (2) | 42,853 | | 31,464 | (4) | 34,590 | | 36,088 | | 31,631 | | 30,182 | | 24,124 | | 11,333 | (5) |
% of net sales | | 3.7 | | 3.2 | | 9.5 | | 7.3 | | 9.0 | | 9.7 | | 9.2 | | 9.3 | | 8.6 | | 5.1 | |
Other income (expense) | | $(678 | ) | (5 | ) | 359 | | (770 | ) | 1,732 | | 1,542 | | 698 | | (747 | ) | (43 | ) | 1,595 | |
Income tax expense | | $6,633 | | 8,838 | | 15,470 | | 10,939 | | 12,713 | | 13,425 | | 11,302 | | 9,773 | | 8,346 | | 3,802 | |
% of earnings before income taxes | | 44.5 | | 65.7 | | 35.8 | | 35.6 | | 35.0 | | 35.7 | | 35.0 | | 33.2 | | 34.7 | | 29.4 | |
Net earnings | | $8,265 | (1) | 4,608 | (2(3) | 27,742 | | 19,755 | (4) | 23,609 | | 24,205 | | 21,027 | | 19,662 | | 15,735 | | 9,126 | (5) |
% of net sales | | 1.9 | | 1.1 | | 6.1 | | 4.6 | | 6.2 | | 6.5 | | 6.1 | | 6.0 | | 5.6 | | 4.1 | |
Return on beginning shareholders’ equity –% | | 5.4 | | 3.0 | | 20.7 | | 15.2 | | 16.7 | | 18.8 | | 18.4 | | 20.4 | | 18.7 | | 10.8 | |
PER SHARE DATA (6) | | | | | | | | | | | | | | | | | | | | | |
Basic net earnings | | $0.92 | (1) | 0.51 | (2(3) | 3.05 | | 2.17 | (4) | 2.49 | | 2.43 | | 2.09 | | 1.98 | | 1.60 | | 0.93 | (5) |
Diluted net earnings | | $0.91 | (1) | 0.50 | (2(3) | 3.04 | | 2.16 | (4) | 2.49 | | 2.41 | | 2.09 | | 1.98 | | 1.60 | | 0.93 | (5) |
Cash dividends | | $0.82 | | 0.80 | | 0.78 | | 0.76 | | 0.74 | | 0.72 | | 0.69 | | 0.68 | | 0.65 | | 0.64 | |
Shareholders’ equity (ending) | | $17.16 | | 16.82 | | 16.88 | | 14.94 | | 14.20 | | 13.82 | | 12.93 | | 11.47 | | 9.78 | | 8.56 | |
YEAR-END FINANCIAL POSITION | | | | | | | | | | | | | | | | | | | | | |
Cash and cash equivalents | | $16,356 | | 23,783 | | 21,512 | | 14,928 | | 17,693 | | 16,279 | | 9,881 | | 4,247 | | 1,851 | | 2,675 | |
Total current assets | | $162,901 | | 153,595 | | 173,220 | | 166,745 | | 153,069 | | 143,105 | | 126,481 | | 123,508 | | 98,454 | | 73,752 | |
Property, plant and equipment, net | | $69,153 | | 73,096 | | 69,054 | | 67,388 | | 67,302 | | 65,111 | | 65,384 | | 63,724 | | 56,552 | | 46,622 | |
Total assets | | $256,237 | | 252,559 | | 268,472 | | 261,269 | | 243,000 | | 233,870 | | 219,180 | | 215,750 | | 182,834 | | 128,634 | |
Current liabilities excluding current debt | | $55,401 | | 48,031 | | 57,594 | | 65,362 | | 54,044 | | 53,738 | | 45,724 | | 44,374 | | 41,959 | | 29,657 | |
Current ratio excluding current debt | | 2.9 | | 3.2 | | 3.0 | | 2.6 | | 2.8 | | 2.7 | | 2.8 | | 2.8 | | 2.3 | | 2.5 | |
Long-term liabilities excluding long-term debt | | $26,743 | | 26,643 | | 31,081 | | 30,616 | | 27,802 | | 22,801 | | 18,908 | | 16,747 | | 15,318 | | 12,591 | |
Debt: | | | | | | | | | | | | | | | | | | | | | |
Current | | $14,948 | | 13,418 | | 15,274 | | 14,191 | | 7,969 | | 2,377 | | 3,864 | | 17,349 | | 23,008 | | 1,190 | |
Long-term | | $5,000 | | 12,496 | | 11,736 | | 16,839 | | 23,635 | | 20,678 | | 21,824 | | 23,149 | | 6,300 | | 1,103 | |
Total debt as % of total capital | | 11.5 | | 14.6 | | 15.0 | | 18.8 | | 19.6 | | 14.7 | | 16.6 | | 26.2 | | 23.3 | | 2.7 | |
Shareholders’ equity | | $154,145 | | 151,971 | | 152,787 | | 134,261 | | 129,550 | | 134,086 | | 128,860 | | 114,131 | | 96,249 | | 84,093 | |
CASH FLOW INCREASE (DECREASE) | | | | | | | | | | | | | | | | | | | | | |
Related to operating activities | | $19,219 | | 34,141 | | 38,866 | | 37,603 | | 42,890 | | 41,892 | | 44,566 | | 17,834 | | 26,754 | | 21,922 | |
Related to investing activities | | $(10,423 | ) | (20,544 | ) | (19,251 | ) | (25,343 | ) | (17,221 | ) | (15,490 | ) | (17,240 | ) | (22,107 | ) | (47,931 | ) | (13,569 | ) |
Related to financing activities | | $(16,214 | ) | (11,633 | ) | (12,680 | ) | (14,665 | ) | (24,290 | ) | (20,434 | ) | (22,024 | ) | 6,721 | | 20,351 | | (9,244 | ) |
OTHER DATA | | | | | | | | | | | | | | | | | | | | | |
Interest income | | $1,891 | | 2,133 | | 2,532 | | 2,847 | | 3,771 | | 4,699 | | 4,259 | | 4,132 | | 3,807 | | 3,583 | |
Interest expense | | $1,381 | | 2,131 | | 1,886 | | 2,665 | | 2,303 | | 2,021 | | 2,491 | | 2,640 | | 1,677 | | 509 | |
Depreciation and amortization expense | | $16,947 | | 19,282 | | 18,766 | | 19,028 | | 17,590 | | 17,468 | | 16,387 | | 14,090 | | 13,121 | | 10,987 | |
Net expenditures for property, plant and equipment | | $10,423 | | 20,544 | | 18,251 | | 16,362 | | 17,221 | | 16,424 | | 17,581 | | 19,117 | | 18,870 | | 12,877 | |
Number of employees at year-end | | 2,380 | | 2,416 | | 2,471 | | 2,266 | | 2,127 | | 2,019 | | 1,950 | | 1,997 | | 1,916 | | 1,707 | |
Diluted average shares outstanding(6) | | 9,048 | | 9,203 | | 9,135 | | 9,140 | | 9,500 | | 10,032 | | 10,076 | | 9,916 | | 9,826 | | 9,836 | |
Closing share price at year-end(6) | | $32.60 | | 37.10 | | 48.00 | | 32.75 | | 40.13 | | 36.38 | | 27.50 | | 23.88 | | 24.13 | | 23.50 | |
Common stock price range during year(6) | | $26.35
44.00 | - | 32.80
49.56 | - | 28.25
53.38 | - | 31.44
45.00 | - | 33.00
44.81 | - | 26.13
39.63 | - | 21.25
27.50 | - | 22.25
29.00 | - | 20.47
24.25 | - | 19.75
24.25 | - |
Closing price/earnings ratio | | 35.8 | | 74.2 | | 15.8 | | 15.2 | | 16.1 | | 15.1 | | 13.2 | | 12.1 | | 15.1 | | 25.3 | |
(1) 2002 includes unusual charges of $5,002 pre-tax ($3,619 net of taxes or $0.40 per diluted share)
(2) 2001 includes net unusual charges of $5,041 pre-tax ($3,141 net of taxes or $0.34 per diluted share)
(3) Includes a charge of $4,267 after-tax (or $0.47 per diluted share) to record a deferred tax asset valuation allowance
(4) 1999 includes pre-tax restructuring charges of $6,671 ($4,308 net of taxes or $0.47 per diluted share)
(5) 1993 includes pre-tax restructuring charges of $4,090 ($2,536 net of taxes or $0.26 per share)
(6) Adjusted retroactively for two-for-one stock split effective April 26, 1995
30
INVESTOR INFORMATION
ANNUAL MEETING — The annual meeting of Tennant Company will be held at 10:30 a.m. on Thursday, May 1, at the Radisson Hotel & Conference Center, 3131 Campus Drive, Plymouth, Minnesota.
STOCK MARKET INFORMATION — Tennant common stock is traded on the New York Stock Exchange, under the ticker symbol TNC. As of December 31, 2002, there were approximately 2,700 shareholders.
QUARTERLY PRICE RANGE — The accompanying chart shows the quarterly price range of the Company’s shares over the past five years:
| | First | | Second | | Third | | Fourth | |
1998 | | $ | 34.75-41.13 | | $ | 40.75-44.81 | | $ | 37.00-44.50 | | $ | 33.00-41.25 | |
| | | | | | | | | |
1999 | | $ | 31.44-45.00 | | $ | 32.00-38.50 | | $ | 32.63-37.25 | | $ | 32.00-35.63 | |
| | | | | | | | | |
2000 | | $ | 28.25-34.50 | | $ | 30.50-38.00 | | $ | 33.75-44.25 | | $ | 39.00-53.38 | |
| | | | | | | | | |
2001 | | $ | 39.95-49.56 | | $ | 39.85-45.60 | | $ | 33.32-40.25 | | $ | 32.80-38.40 | |
| | | | | | | | | |
2002 | | $ | 34.60-41.99 | | $ | 38.54-44.00 | | $ | 31.23-39.67 | | $ | 26.35-36.10 | |
DIVIDEND INFORMATION — Cash dividends on Tennant’s common stock have been paid for 59 consecutive years, and the Company has increased the dividend payout in each of the last 31 years. Dividends generally are declared each quarter. Following are the remaining record dates anticipated for 2003:
May 30, 2003 August 29, 2003 November 28, 2003
DIVIDEND REINVESTMENT OR DIRECT DEPOSIT OPTIONS — Shareholders have the option of reinvesting quarterly dividends in additional shares of Company stock or having dividends deposited directly to a bank account. The Transfer Agent should be contacted for additional information.
TRANSFER AGENT AND REGISTRAR — Shareholders with a change of address or questions about their account may contact:
Wells Fargo Bank Minnesota, N.A.
161 North Concord Exchange
P.O. Box 738
St. Paul, MN 55075-0738
651-450-4064 • 1-800-468-9716
TENNANT INFORMATION ON THE COMPANY’S WEB SITE — Investor, product, news releases and other company information can be found on Tennant’s web site: www.tennantco.com. A portion of the web site is devoted to investors and contains several convenient investor-oriented features. In addition to general company information and extensive information about our common stock, the investor portion of the site enables investors to view a calendar of upcoming events and register to receive e-mailed notification of Company news releases and Securities and Exchange Commission filings. The site allows users to interactively chart our share price performance over multiple time intervals and against multiple indices, request Company information and obtain information on our dividend reinvestment plan. The site also provides links to our filings with the Securities and Exchange Commission.
10-K AND OTHER INVESTOR INFORMATION — To be included in a list to receive mailed or e-mailed copies of Tennant’s quarterly earnings news releases or to receive a copy of Tennant’s 2002 Form 10-K filed with the Securities and Exchange Commission and other financial information, please write to Tennant Company, Attn: Investor Relations, P.O. Box 1452, Minneapolis, MN 55440, or call (763) 540-1553.
31
TENNANT COMPANY
701 NORTH LILAC DRIVE
P.O. BOX 1452
MINNEAPOLIS, MN 55440
www.tennantco.com