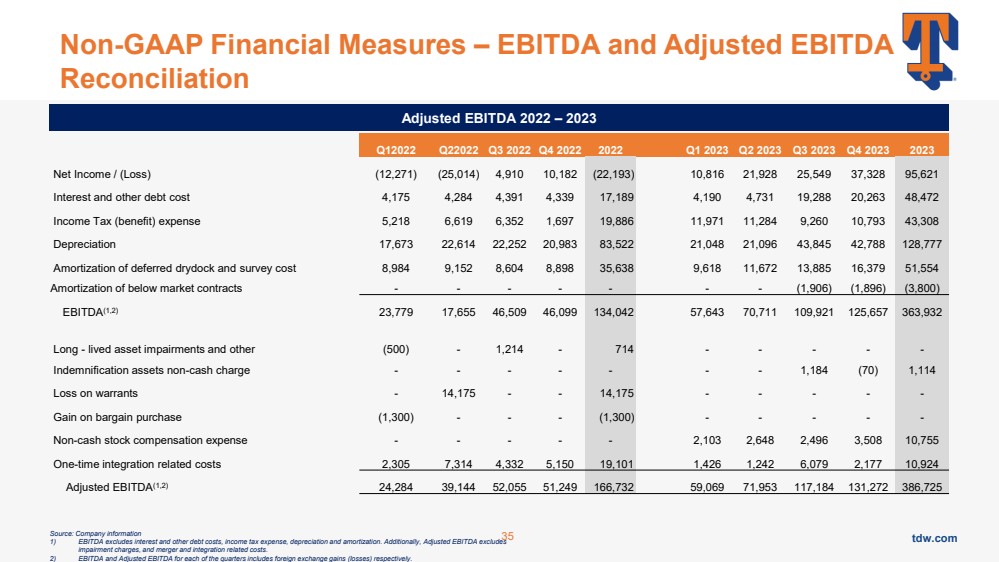
| tdw.com Non-GAAP Financial Measures – EBITDA and Adjusted EBITDA Reconciliation Source: Company information 1) EBITDA excludes interest and other debt costs, income tax expense, depreciation and amortization. Additionally, Adjusted EBITDA excludes impairment charges, and merger and integration related costs. 2) EBITDA and Adjusted EBITDA for each of the quarters includes foreign exchange gains (losses) respectively. Q12022 Q22022 Q3 2022 Q4 2022 2022 Q1 2023 Q2 2023 Q3 2023 Q4 2023 2023 Net Income / (Loss) (12,271) (25,014) 4,910 10,182 (22,193) 10,816 21,928 25,549 37,328 95,621 Interest and other debt cost 4,175 4,284 4,391 4,339 17,189 4,190 4,731 19,288 20,263 48,472 Income Tax (benefit) expense 5,218 6,619 6,352 1,697 19,886 11,971 11,284 9,260 10,793 43,308 Depreciation 17,673 22,614 22,252 20,983 83,522 21,048 21,096 43,845 42,788 128,777 Amortization of deferred drydock and survey cost 8,984 9,152 8,604 8,898 35,638 9,618 11,672 13,885 16,379 51,554 Amortization of below market contracts - - - - - - - (1,906) (1,896) (3,800) EBITDA(1,2) 23,779 17,655 46,509 46,099 134,042 57,643 70,711 109,921 125,657 363,932 Long - lived asset impairments and other (500) - 1,214 - 714 - - - - - Indemnification assets non-cash charge - - - - - - - 1,184 (70) 1,114 Loss on warrants - 14,175 - - 14,175 - - - - - Gain on bargain purchase (1,300) - - - (1,300) - - - - - Non-cash stock compensation expense - - - - - 2,103 2,648 2,496 3,508 10,755 One-time integration related costs 2,305 7,314 4,332 5,150 19,101 1,426 1,242 6,079 2,177 10,924 Adjusted EBITDA(1,2) 24,284 39,144 52,055 51,249 166,732 59,069 71,953 117,184 131,272 386,725 Adjusted EBITDA 2022 – 2023 35 |