July 20, 2006 2006 Annual Stockholders Meeting Exhibit 99.2 |
TIDEWATER 601 Poydras Street, Suite 1900 New Orleans, LA 70130 Phone: 504.568.1010 Fax: 504.566.4580 Web site address: www.tdw.com Email: connect@tdw.com FORWARD-LOOKING-STATEMENTS In accordance with the safe harbor provisions of the Private Securities Litigation Reform Act of 1995, the Company notes that certain statements set forth in this presentation provide other than historical information and are forward looking. The actual achievement of any forecasted results, or the unfolding of future economic or business developments in any way anticipated or projected by the Company, involve many risks and uncertainties. Among those risks and uncertainties, many of which are beyond the control of the Company, are: fluctuations in oil and gas prices; the level of fleet additions by competitors and vessel overcapacity; changes in levels of capital spending in domestic and international markets by customers in the energy industry for exploration, development and production; unsettled political conditions, civil unrest and governmental actions, especially in higher risk countries of operations; changing customer demands for different vessel specifications; acts of terrorism; unsettled political conditions, war, civil unrest and governmental actions, especially in higher risk countries of operations; foreign currency fluctuations; and environmental and labor laws. Participants should consider all of these risk factors as well as other information contained in the Company’s form 10-K’s and 10-Q’s. |
Fiscal 2006 Highlights Celebration of 50 th Anniversary Continued strong safety record – only one offshore LTA in over 30 million man hours during FY 2006 Withstood nation’s worst natural disaster – Exceptional personnel performance during/post Hurricanes Katrina and Rita Continued re-generation of Tidewater by disposing of old vessels and adding new vessels Continued improved worldwide operating environment resulted in second best financial performance in company history |
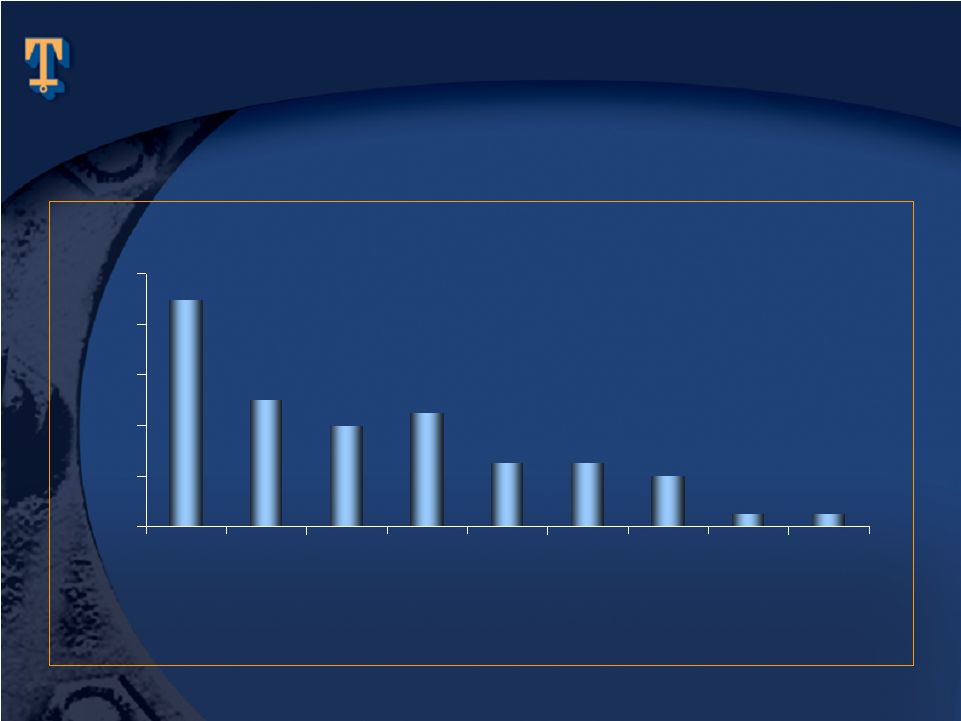
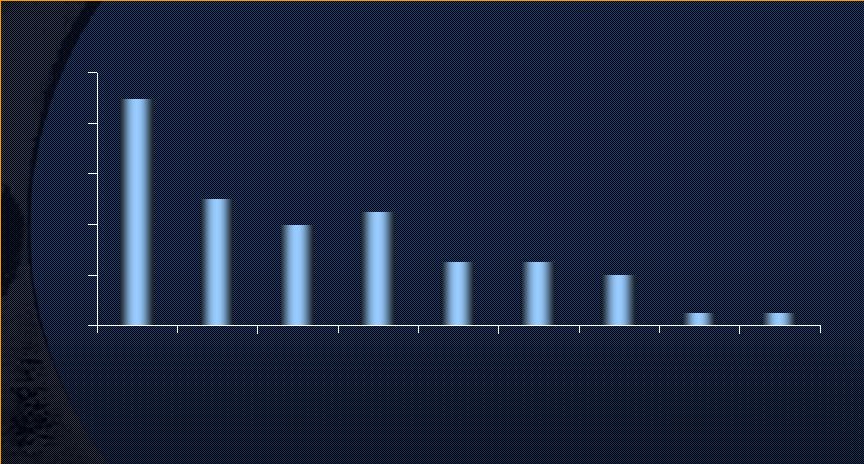
18 10 8 9 5 5 4 1 1 0 4 8 12 16 20 1998 1999 2000 2001 2002 2003 2004 2005 2006 Lost Time Accidents |
Total Recordable Incident Rates Calendar Years 1.5 0 0.5 1 2001 2002 2003 2004 2005 TIDEWATER DOW CHEMICAL DUPONT EXXON/MOBIL BP “Safest Company In The Industry” |
Why A Positive Outlook Favorable commodity prices E&P spending up Rig count up New rig construction Strong demand in virtually all areas of operation Growing financial effect of our “new” fleet Favorable tax changes |
Active Vessel Count By Region (excludes stacked vessels) A Strong Global Presence North America 64 (17%) Central/ South America 96 (26%) West Africa 121 (33%) Europe/M.E. 39 (11%) Far East 48 (13%) Vessel count above includes only active vessels |
82% of fiscal 2005 and 79% of fiscal 2006 revenue generated in international markets Areas of Opportunity Grow International Market Share |
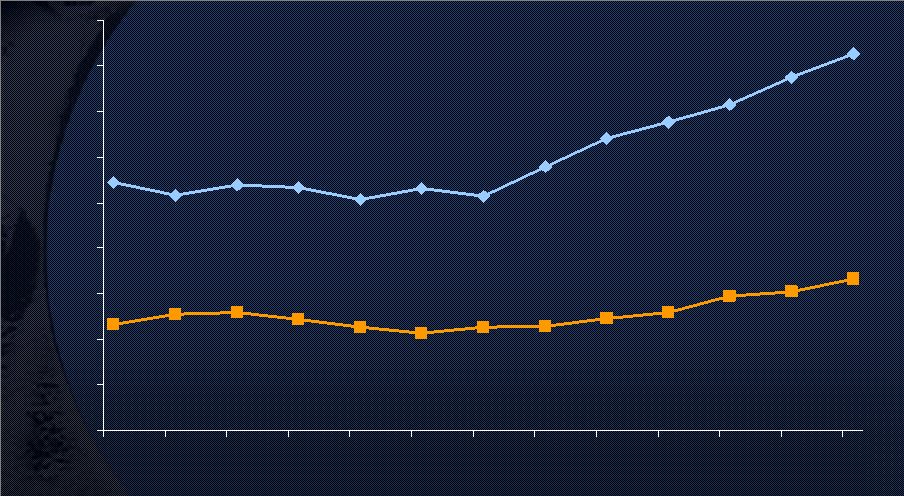
International Vessel Dayrates and Utilization $100 change in dayrate = $9.6M in revenue 1% change in utilization = $9.3M in revenue 40% 50% 60% 70% 80% 3/03 6/03 9/03 12/03 3/04 6/04 9/04 12/04 3/05 6/05 9/05 12/05 3/06 $5,000 $5,500 $6,000 $6,500 $7,000 $7,500 $8,000 |
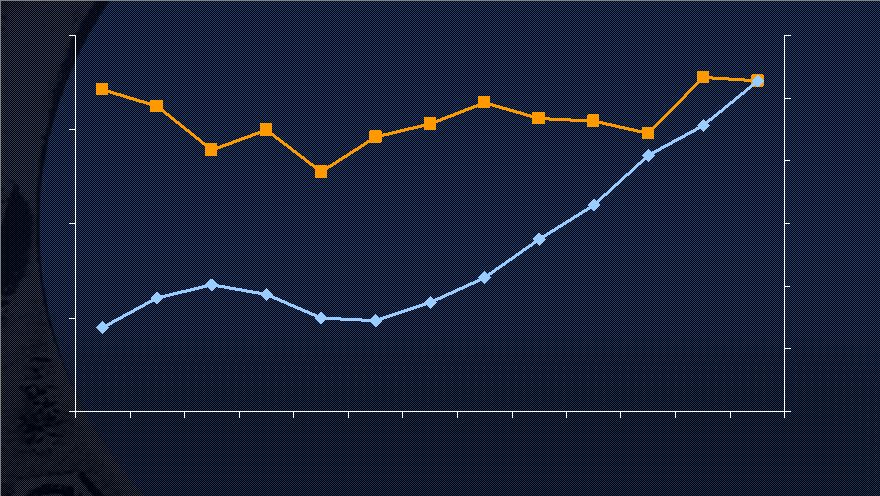
International Dayrates New Vessels Remaining Vessels $3,000 $4,000 $5,000 $6,000 $7,000 $8,000 $9,000 $10,000 $11,000 $12,000 3/03 6/03 9/03 12/03 3/04 6/04 9/04 12/04 3/05 6/05 9/05 12/05 3/06 |
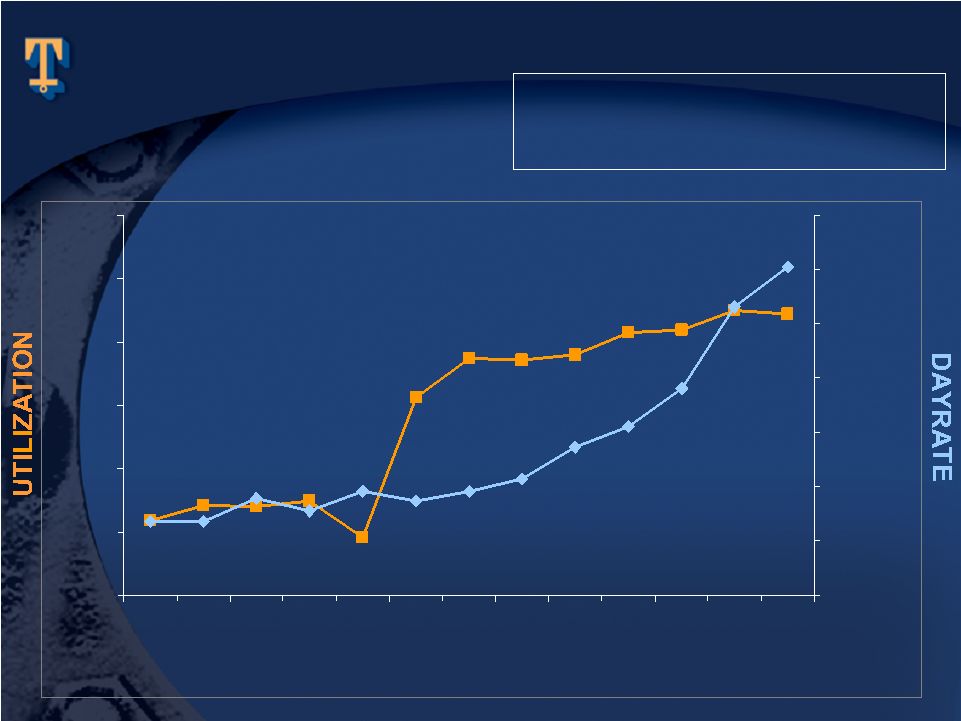
Domestic Vessel Dayrates and Utilization $100 change in dayrate = $2.2M in revenue 1% change in utilization = $2.0M in revenue 20% 30% 40% 50% 60% 70% 80% 3/03 6/03 9/03 12/03 3/04 6/04 9/04 12/04 3/05 6/05 9/05 12/05 3/06 $4,000 $5,000 $6,000 $7,000 $8,000 $9,000 $10,000 $11,000 |
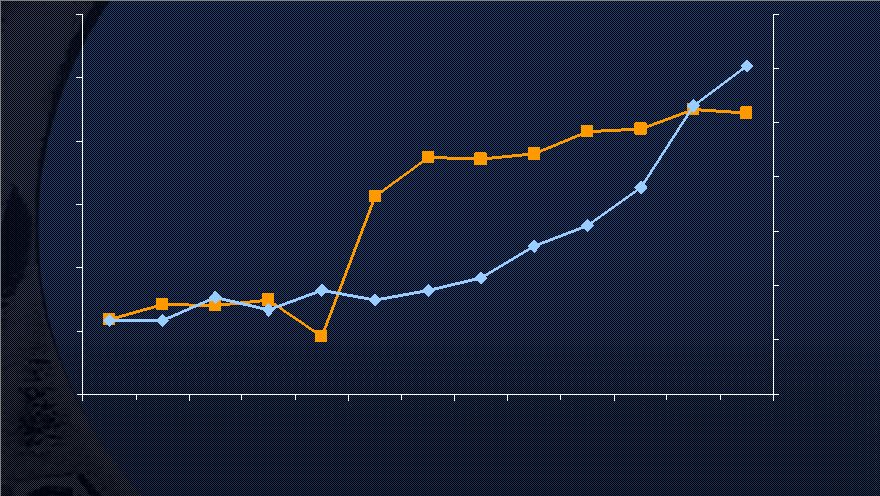
Domestic Dayrates New Vessels Remaining Vessels $3,000 $4,000 $5,000 $6,000 $7,000 $8,000 $9,000 $10,000 $11,000 $12,000 3/03 6/03 9/03 12/03 3/04 6/04 9/04 12/04 3/05 6/05 9/05 12/05 3/06 |
20 435 TOTAL 21 8 Other 26 52 Offshore Tugs 13 83 Crew/Utility 22 257 Towing Supply/Supply 9 35 Deepwater Vessels Average Age In years Vessel Count * Why Renew Our Worldwide Fleet * Vessel count is inclusive of stacked vessels |
“$1,395 funded to date” Vessel Commitments Post January 2000 Through 6/30/06 * Excludes ENSCO fleet acquisition effected April 1, 2003 143 $1,771m 53 $200m 44 $699m 46 $872m TOTALS: Vessels $ Committed 52 18 1 33 Int.l Built Replacements 52 35 17 U.S. Built Replacements 39 26 13 Deepwater Vessels TOTAL CREW/ OTHER PSV AHTS |
Fiscal 2006 Profit Contribution Average Age Vessel Count Profit Contribution Average Age Vessel Count 47% 5 130 0% 0 Vessels built or acquired since January 2000 53% 24 257 100% 19 509 Vessels built prior to January 2000 Fiscal 2000 Fleet Age And Profit Contribution * New vessel contribution for Fiscal 2005 was 30% |
* New vessels added to the fleet since January 2000, including 29 vessels under construction * Since 4/01/05, 19 vessels have been scrapped and 51 have been sold Out With the Old In With the New (last 7 years) 0 100 200 300 400 258 Sold 62 Scrapped 320 Mindful Of Industry Fleet Totals Active Fleet Disposition 406 143 New Vessels |
FISCAL 2006 FINANCIAL REPORT CARD |
Balance Financial Strength |
FISCAL 2006 FINANCIAL HIGHLIGHTS $55.09 Stock Price at Year End $1,659,121 Stockholders’ Equity $172,408 Capital Expenditures $283,578 Net Cash from Operations $4.07 Earnings Per Share $235,756 Net Earnings $877,617 Revenues (000’s omitted, except per share data) |
Balance Sheet $ 325 $ 300 Total Debt 300 300 Senior Notes Debt 25 0 Revolver Debt $ 2,213 $ 2,365 Total Liabilities & Equity 1,443 1,659 Stockholders’ Equity 676 590 Other Liabilities 94 116 Current Liabilities $ 2,213 $ 2,365 Total Assets 533 463 Other Assets 1,452 1,373 PP&E 213 283 Other Current Assets $ 15 $ 246 Cash March 2005 March 2006 (millions of dollars) |
FISCAL 2006 vs FISCAL 2005 (000's omitted, except per share data) 2005 2006 Stock Price at Year End Stockholders’ Equity Capital Expenditures Net Cash from Operations Earnings Per Share Net Earnings Revenues $55.09 $1,659,121 $172,408 $283,578 $4.07 $235,756 $877,617 $38.86 $1,442,702 $207,391 $160,062 $1.78 $101,339 $692,150 |
1.11 236 116 Earnings Growth Over The Last Year (1) Exclusive of $31.8 million income tax benefit ($.55 per share) resulting from the American Jobs Creation Act of 2004 (2) Exclusive of $42.8 million after tax gain ($.74 per share) resulting from the sale of six KMAR 404 vessels in July 2005 .68 39 198 106 41 157 9/30/05 Qtr .36 21 175 103 31 144 3/31/05 Qtr .50 29 185 106 35 150 6/30/05 Qtr Diluted EPS Net Earnings Vessel Revenue: Domestic International (IN MILLIONS) 228 103 1.04 60 12/31/05 Qtr 51 177 65 03/31/06 Qtr 54 182 Vessel Oper. Costs (2) (2) (1) (1) |
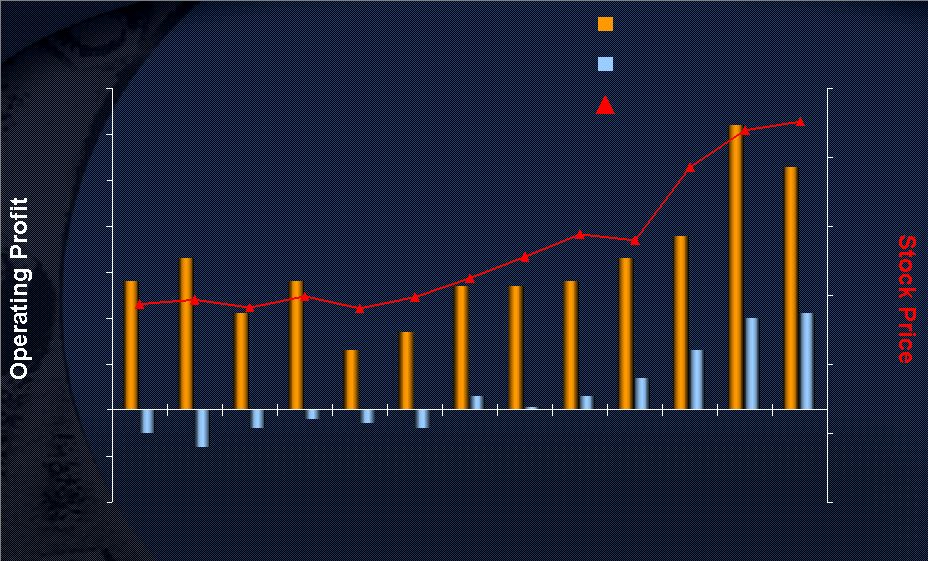
Operating Profits vs Stock Price International Domestic Stock Price Millions ($20) ($10) $0 $10 $20 $30 $40 $50 $60 $70 3/03 6/03 9/03 12/03 3/04 6/04 9/04 12/04 3/05 6/05 9/05 12/05 3/06 $0 $10 $20 $30 $40 $50 $60 |
Current OSX Dividend Yields 1.1% 0.7% 0.8% 0.6% 1.5% 0.5% 0.7% 0 0.5 1 1.5 2 Tidewater Schlumberger Halliburton Baker Hughes Global Santa Fe BJ Services Smith International 0.2% Noble Corp 0.2% Rowan |
Future Outlook * 7/9/06 First Call consensus of analysts reporting on Tidewater *$5.38 Fiscal 2008 *$4.80 Fiscal 2007 $4.07 Fiscal 2006 Actual $1.78 Fiscal 2005 Actual EPS |
OVERALL X On to Year 51 FISCAL 2006 FINANCIAL REPORT CARD Excellent Performance: Increased Revenues X + 27% Cost Control X + 7% Increased Earnings X +133% Increased Cash Flow X + 77% Growth: Increasing “New Fleet” X 35 vessels Stock Price Growth X + 42% Prospects for Future X + 12% Earnings Exceeding Expectations X + 84% for FY 2007 Financial Strength: Low Debt to Equity X 15% Increasing Equity X Added $216,000,000 Strong Cash Flow X Plus $123,000,000 Personnel: Effort X Cooperation X Attitude X Katrina/Rita Reaction Good Criteria Very Good Comment |
Our Strategy Grow international market share Continue to improve domestic profitability Renew the fleet & assess opportunities for stacked fleet Be ready for the right acquisition Continue to push dayrates to grow profits and cash flow Maintain financial strength |
Celebrating our 50 th Anniversary at NYSE |
July 20, 2006 2006 Annual Stockholders Meeting |