Exhibit 99.1

FISCAL 2009 ANNUAL
SHAREHOLDERS MEETING
July 9, 2009
TIDEWATER
601 Poydras Street, Suite 1900
New Orleans, LA 70130
FORWARD-LOOKING STATEMENTS
In accordance with the safe harbor provisions of the Private Securities Litigation Reform Act of 1995, the Company notes that certain statements set forth in this presentation provide other than historical information and are forward looking. The actual achievement of any forecasted results, or the unfolding of future economic or business developments in a way anticipated or projected by the Company, involve numerous risks and uncertainties that may cause the Company’s actual performance to be materially different from that stated or implied in the forward-looking statement. Among those risks and uncertainties, many of which are beyond the control of the Company, include, without limitation, fluctuations in worldwide energy demand and oil and gas prices; fleet additions by competitors and industry overcapacity; changes in capital spending by customers in the energy industry for offshore exploration, development and production; changing customer demands for different vessel specifications, which may make some of our older vessels technologically obsolete for certain customer projects or in certain markets; instability of global financial markets and difficulty accessing credit or capital; acts of terrorism and piracy; significant weather conditions; unsettled political conditions, war, civil unrest and governmental actions, especially in higher risk countries of operations; foreign currency fluctuations; and enforcement of laws related to the environment, labor and foreign corrupt practices. Participants should consider all of these risk factors as well as other information contained in the Company’s form 10-K’s and 10-Q’s.
Phone: 504.568.1010 | Fax: 504.566.4580 | Web: www.tdw.com | Email: connect@tdw.com
2
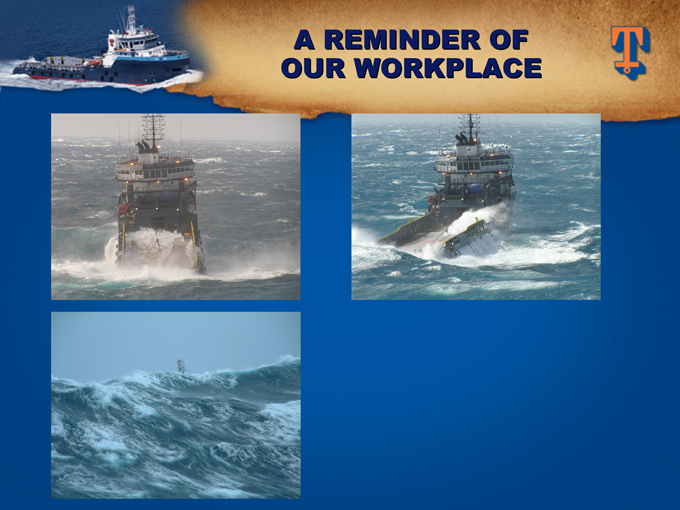
A REMINDER OF
OUR WORKPLACE
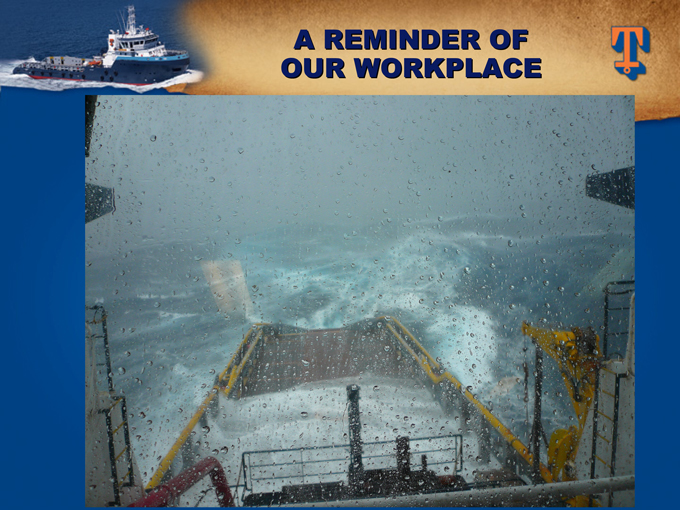
A REMINDER OF
OUR WORKPLACE
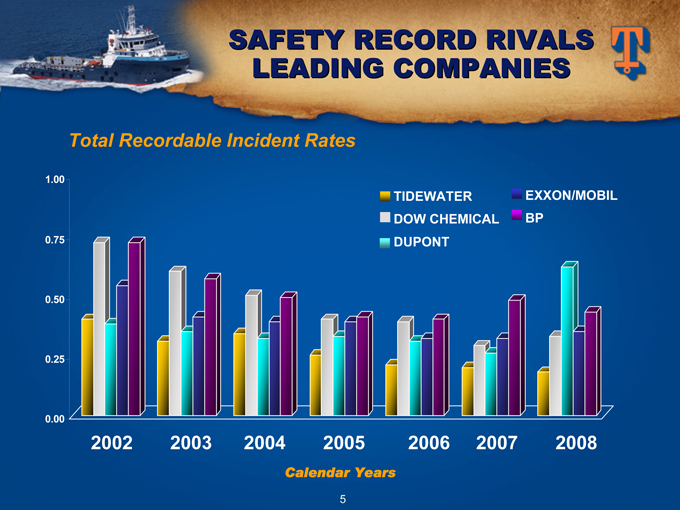
SAFETY RECORD RIVALS LEADING COMPANIES
TOTAL RECORDABLE INCIDENT RATES
1.00 0.75 0.50 0.25 0.00
2002 2003 2004 2005 2006 2007 2008
TIDEWATER DOW CHEMICAL DUPONT EXXON/MOBIL BP
CALENDAR YEARS
5
TIDEWATER
TODAY
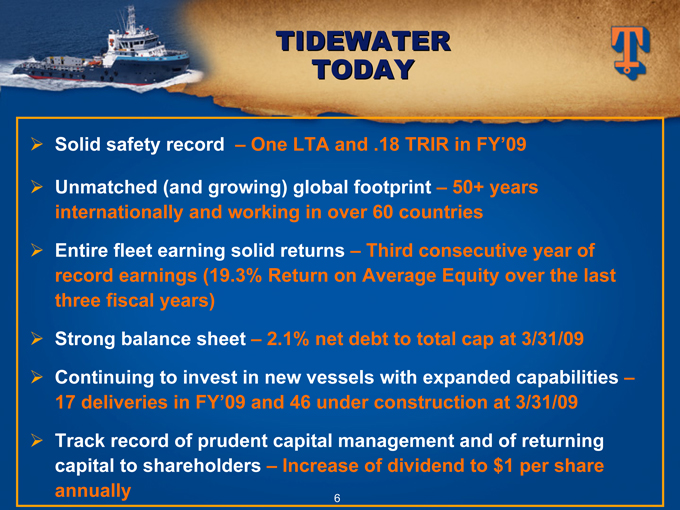
Solid safety record – One LTA and .18 TRIR in FY’09
Unmatched (and growing) global footprint – 50+ years internationally and working in over 60 countries
Entire fleet earning solid returns – Third consecutive year of record earnings (19.3% Return on Average Equity over the last three fiscal years)
Strong balance sheet – 2.1% net debt to total cap at 3/31/09
Continuing to invest in new vessels with expanded capabilities – 17 deliveries in FY’09 and 46 under construction at 3/31/09
Track record of prudent capital management and of returning capital to shareholders – Increase of dividend to $1 per share
annually
6
MANY UNANSWERED QUESTIONS AT THIS TIME
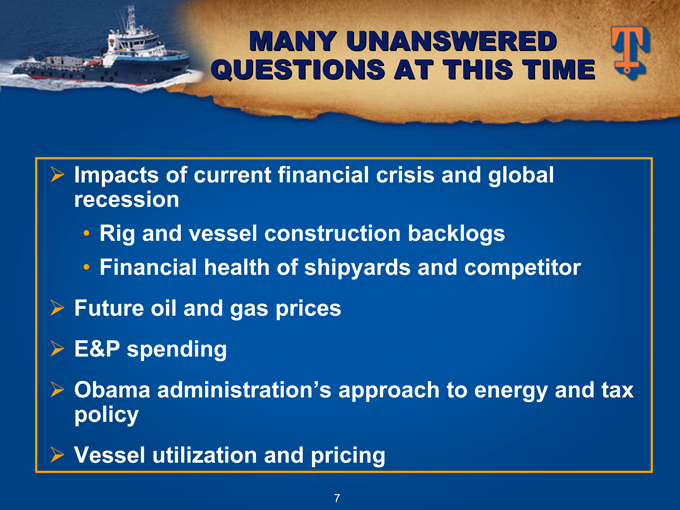
Impacts of current financial crisis and global recession
Rig and vessel construction backlogs
Financial health of shipyards and competitor
Future oil and gas prices
E&P spending
Obama administration’s approach to energy and tax policy
Vessel utilization and pricing
7 |
|
OUR STRATEGY
(Not much has changed!)
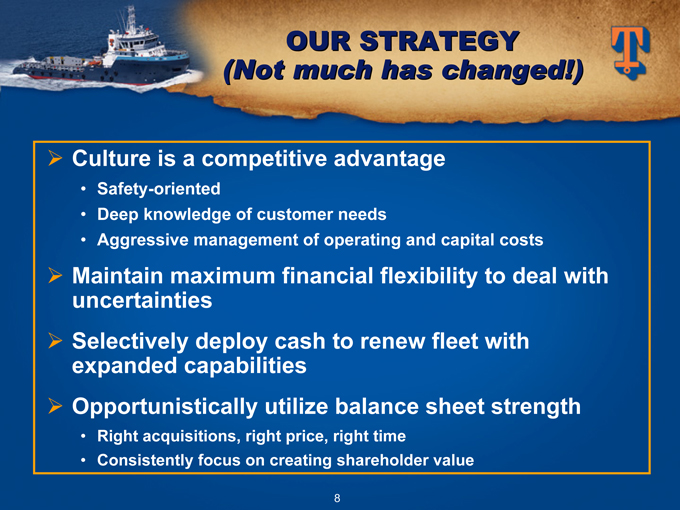
Culture is a competitive advantage
Safety-oriented
Deep knowledge of customer needs
Aggressive management of operating and capital costs
Maintain maximum financial flexibility to deal with uncertainties
Selectively deploy cash to renew fleet with expanded capabilities
Opportunistically utilize balance sheet strength
Right acquisitions, right price, right time
Consistently focus on creating shareholder value
8 |
|
TIDEWATER TODAY
INTERNATIONAL STRENGTH
(as of 3/31/09)
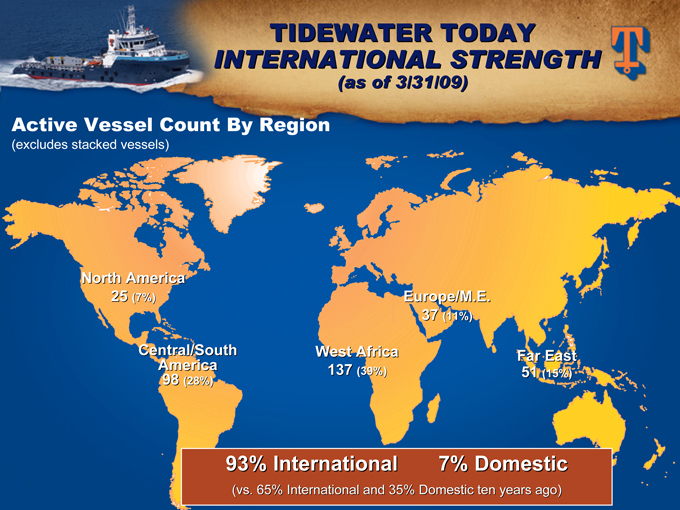
Active Vessel Count By Region
(excludes stacked vessels)
North America
25 (7%)
Central/South
America
98 (28%)
Europe/M.E.
37 (11%)
Far East
51 (15%)
West Africa
137(39%)
93% International 7% Domestic
(vs. 65% International and 35% Domestic ten years ago)
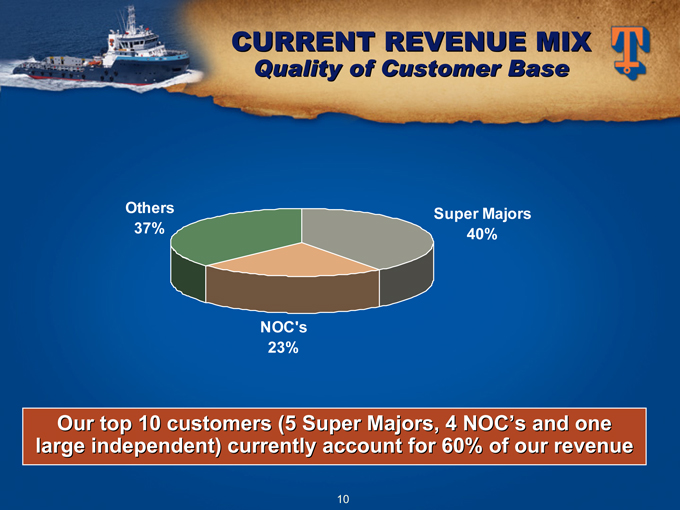
CURRENT REVENUE MIX
Quality of Customer Base
Others Super Majors
37% 40%
NOC's
23%
Our top 10 customers (5 Super Majors, 4 NOC’s and one large independent) currently account for 60% of our revenue
10
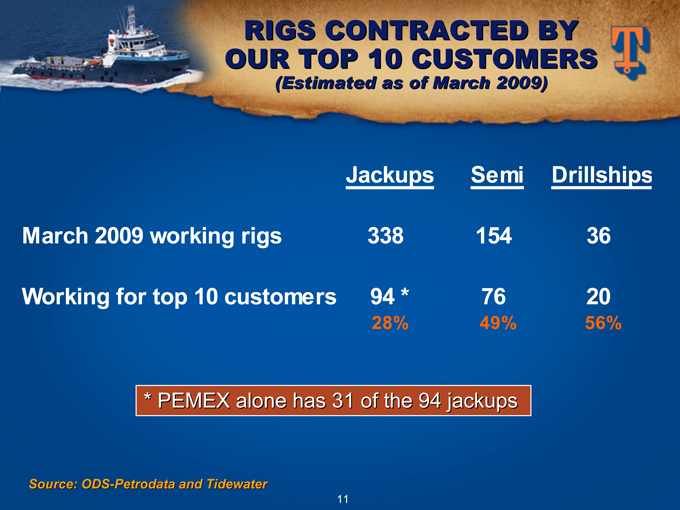
RIGS CONTRACTED BY OUR TOP 10
CUSTOMERS
(Estimated as of March 2009)
Jackups Semi Drillships
March 2009 working rigs 338 154 36
Working for top 10 customers 94 * 76 20
28% 49% 56%
* PEMEX alone has 31 of the 94 jackups
Source: ODS-Petrodata and Tidewater
11
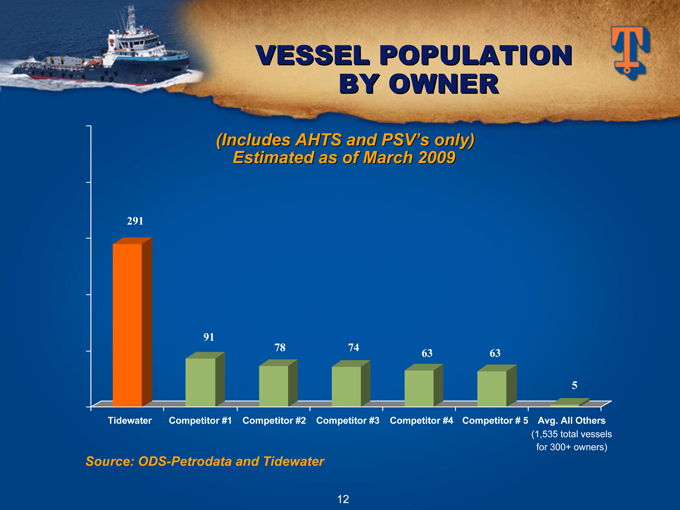
VESSEL POPULATION
BY OWNER
(Includes AHTS and PSV’s only)
Estimated as of March 2009
291
91
78
74
63
63
5
Tidewater
Competitor #1
Competitor #2
Competitor #3
Competitor #4
Competitor # 5
Avg. All Others
(1,535 total vessels
for 300+ owners)
Source: ODS-Petrodata and Tidewater
12
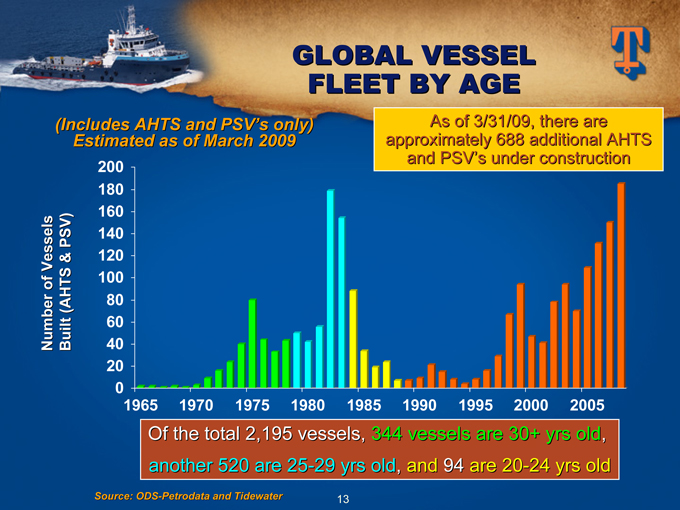
GLOBAL VESSEL
FLEET BY AGE
(Includes AHTS and PSV’s only) Estimated as of March 2009
As of 3/31/09, there are approximately 688 additional AHTS and PSV’s under construction
Number of Vessels
Built (AHTS & PSV)
Of the total 2,195 vessels, 344 vessels are 30+ yrs old, another 520 are 25-29 yrs old, and 94 are 20-24 yrs old
200
180
160
140
120
100
80
60
40
20
0
1965
1970
1975
1980
1985
1990
1995
2000
2005
Source: ODS-Petrodata and Tidewater
13
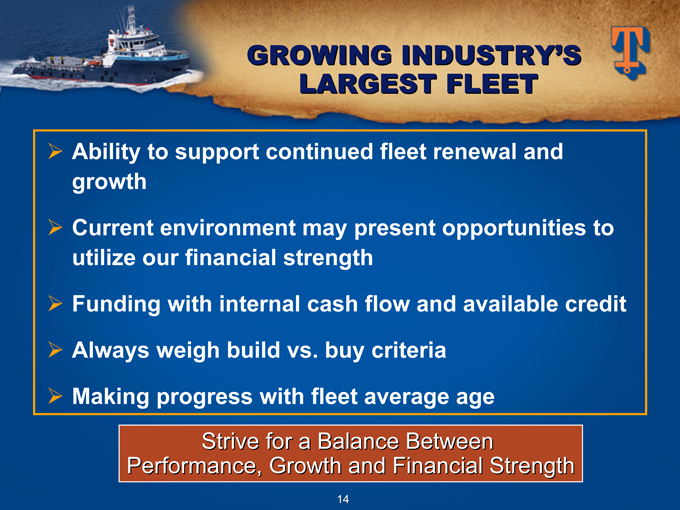
GROWING
INDUSTRY’S LARGEST FLEET
Ability to support continued fleet renewal and growth
Current environment may present opportunities to utilize our financial strength
Funding with internal cash flow and available credit
Always weigh build vs. buy criteria
Making progress with fleet average age
Strive for a Balance Between Performance, Growth and Financial Strength
14
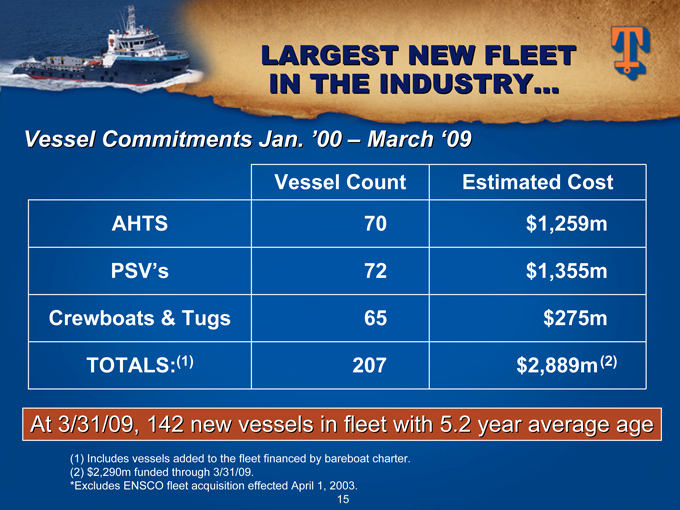
LARGEST NEW FLEET
IN THE INDUSTRY…
Vessel Commitments Jan. ‘00 – March ‘09
Vessel Count Estimated Cost
AHTS 70 $1,259m
PSV’s 72 $1,355m
Crewboats & Tugs 65 $275m
TOTALS:(1) 207 $2,889m (2)
At 3/31/09, 142 new vessels in fleet with 5.2 year average age
(1) Includes vessels added to the fleet financed by bareboat charter.
(2) $2,290m funded through 3/31/09.
*Excludes ENSCO fleet acquisition effected April 1, 2003.
15
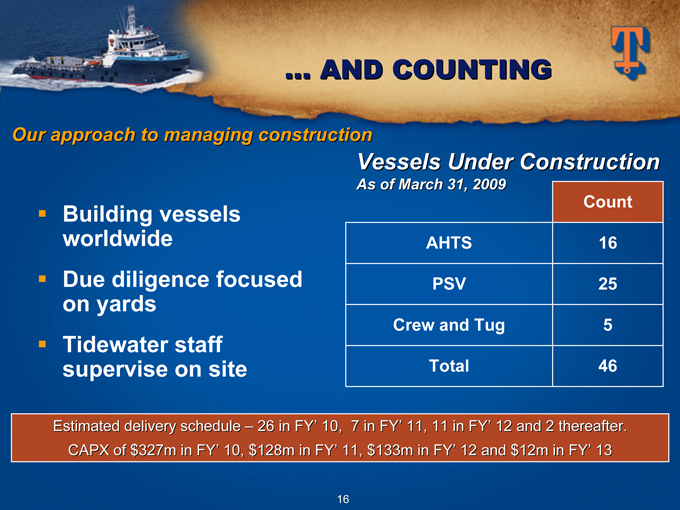
…AND COUNTING
Our approach to managing construction
Vessels Under Construction
As of March 31, 2009
Building vessels Count
worldwide AHTS 16
Due diligence focused PSV 25
on yards
Crew and Tug 5
Tidewater staff
supervise on site Total 46
Estimated delivery schedule – 26 in FY’ 10, 7 in FY’ 11, 11 in FY’ 12 and 2 thereafter. CAPX of $327m in FY’ 10, $128m in FY’ 11, $133m in FY’ 12 and $12m in FY’ 13
16
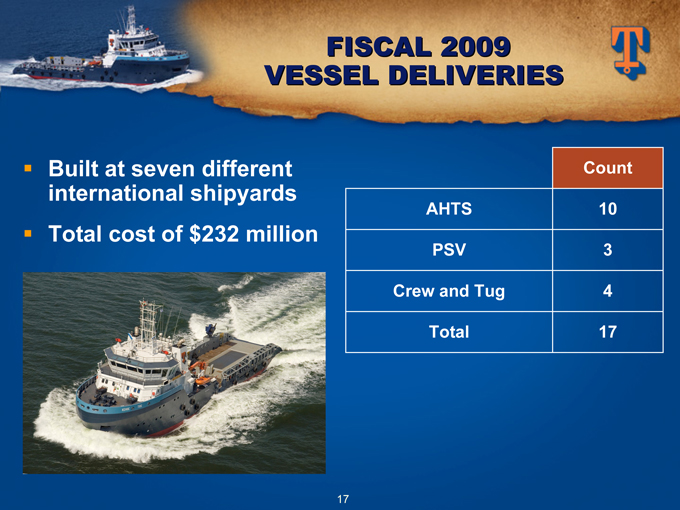
FISCAL 2009
VESSEL DELIVERIES
Built at seven different international shipyards
Total cost of $232 million
Count
AHTS 10
PSV 3
Crew and Tug 4
Total 17
17
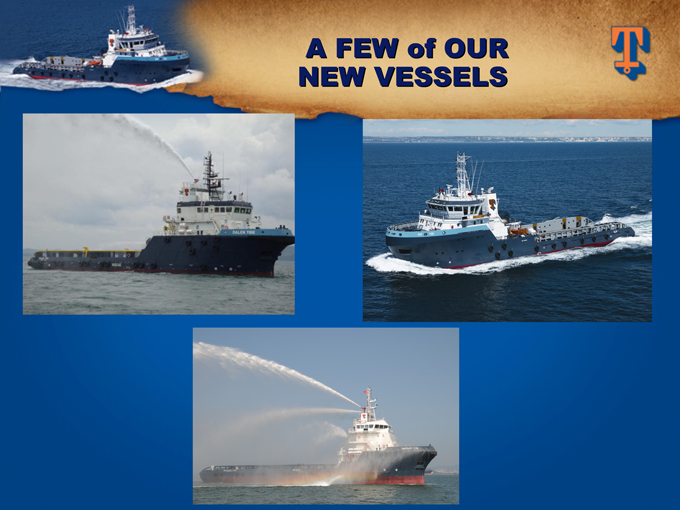
A FEW of OUR NEW VESSELS
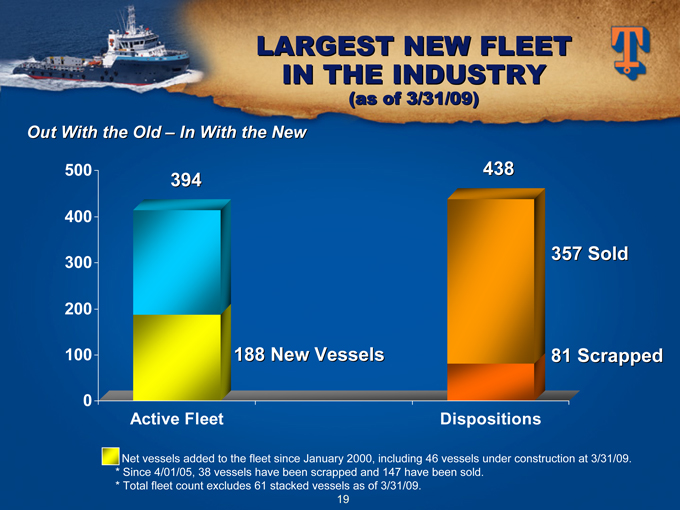
LARGEST NEW FLEET
IN THE INDUSTRY
(as of 3/31/09)
Out with the Old - In with the New
500
400
300
200
100
0
394
188 New Vessels
438
357 Sold
81 Scrapped
Active Fleet
Dispositions
Net vessels added to the fleet since January 2000, including 46 vessels under construction at 3/31/09.
* Since 4/01/05, 38 vessels have been scrapped and 147 have been sold.
* Total fleet count excludes 61 stacked vessels as of 3/31/09.
19
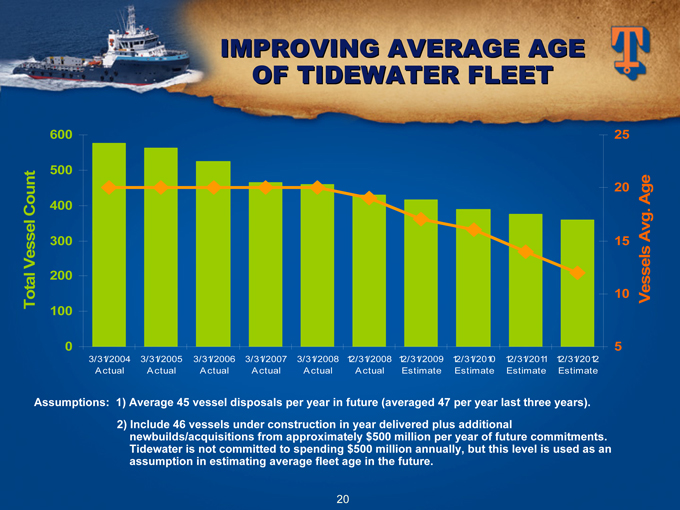
IMPROVING AVERAGE AGE
OF TIDEWATER FLEET
600
500
400
300
200
100
0
3/31/2004 Actual
3/31/2005 Actual
3/31/2006 Actual
3/31/2007 Actual
3/31/2008 Actual
12/31/2008 Actual
12/31/2009 Estimate
12/31/2010 Estimate
12/31/2011 Estimate
12/31/2012 Estimate
Total Vessel Count
25
20
15
10
5
Vessels Avg.Age
Assumptions: 1) Average 45 vessel disposals per year in future (averaged 47 per year last three years).
2) Include 46 vessels under construction in year delivered plus additional newbuilds/acquisitions from approximately $500 million per year of future commitments. Tidewater is not committed to spending $500 million annually, but this level is used as an assumption in estimating average fleet age in the future.
20
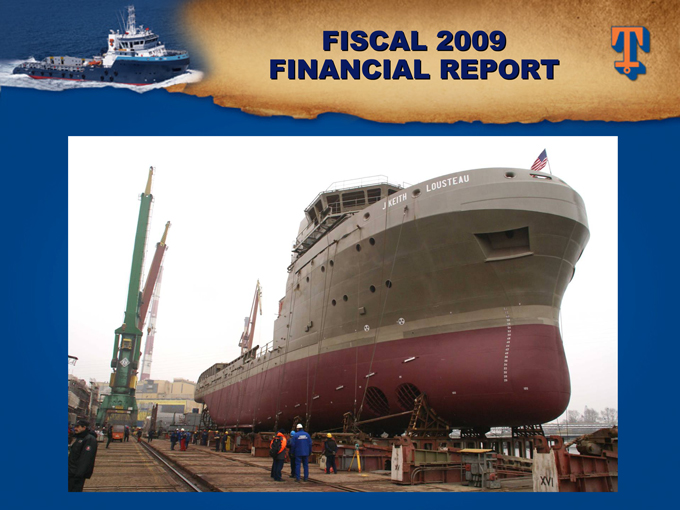
FISCAL 2009
FINANCIAL REPORT
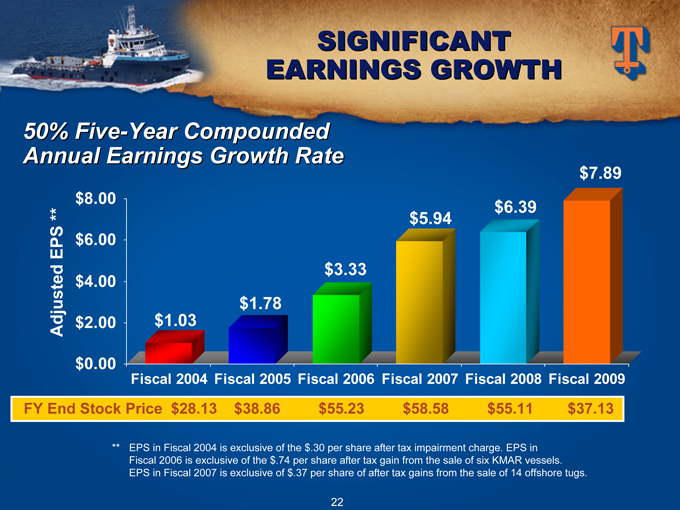
SIGNIFICANT EARNINGS GROWTH
50% Five-Year Compounded Annual Earnings Growth Rate
Adjusted EPS**
$8.00 $6.00 $4.00 $2.00 $0.00
$1.03 $1.78 $3.33 $5.94 $6.39 $7.89
Fiscal 2004 Fiscal 2005 Fiscal 2006 Fiscal 2007 Fiscal 2008 Fiscal 2009
FY End Stock Price $28.13 $38.86 $55.23 $58.58 $55.11 $37.13
** EPS in Fiscal 2004 is exclusive of the $.30 per share after tax impairment charge. EPS in Fiscal 2006 is exclusive of the $.74 per share after tax gain from the sale of six KMAR vessels.
EPS in Fiscal 2007 is exclusive of $.37 per share of after tax gains from the sale of 14 offshore tugs.
22
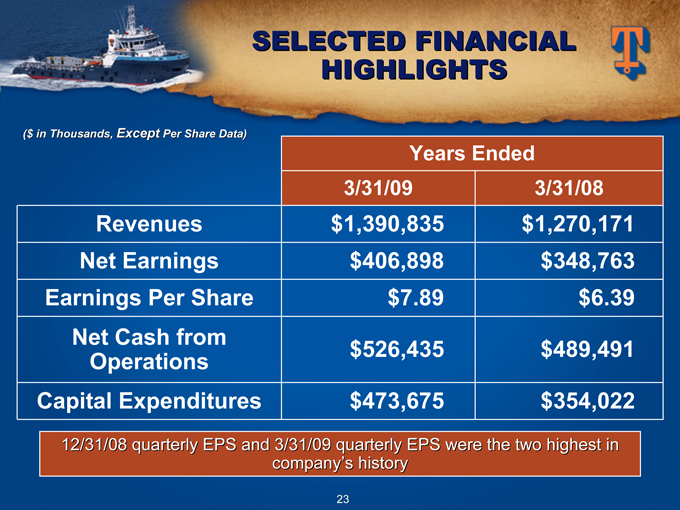
SELECTED FINANCIAL HIGHLIGHTS
($ in Thousands, Except Per Share Data)
Years Ended
3/31/09 3/31/08
Revenues $1,390,835 $1,270,171
Net Earnings $406,898 $348,763
Earnings Per Share $7.89 $6.39
Net Cash from $526,435 $489,491
Operations
Capital Expenditures $473,675 $354,022
12/31/08 quarterly EPS and 3/31/09 quarterly EPS were the two highest in company’s history
23
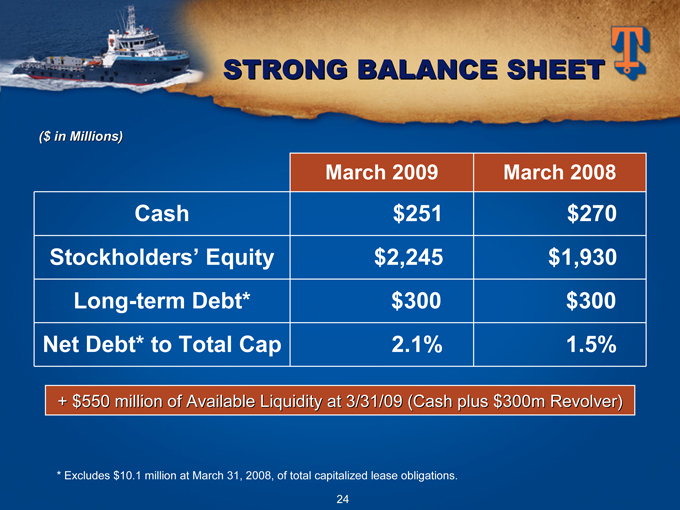
STRONG BALANCE SHEET
($ in Millions)
March 2009 March 2008
Cash $251 $270
Stockholders’ Equity $2,245 $1,930
Long-term Debt* $300 $300
Net Debt* to Total Cap 2.1% 1.5%
+ $550 million of Available Liquidity at 3/31/09 (Cash plus $300m Revolver)
* Excludes $10.1 million at March 31, 2008, of total capitalized lease obligations.
24
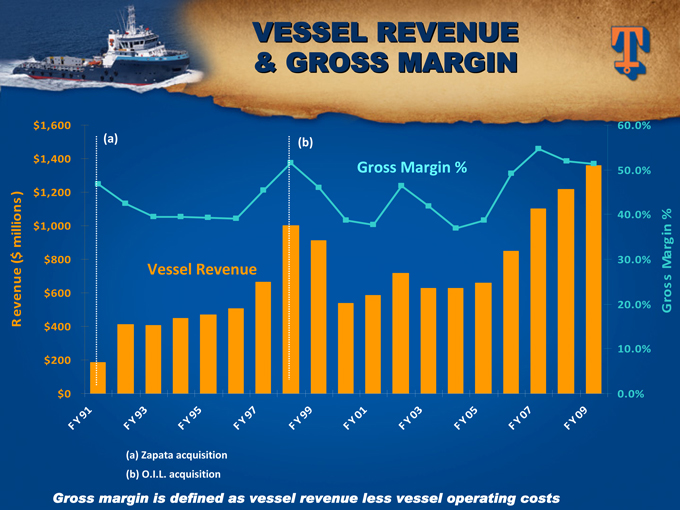
VESSEL REVENUE
& GROSS MARGIN
Gross Margin %
Vessel Revenue
(a) Zapata acquisition
(b) O.I.L. acquisition
Gross margin is defined as vessel revenue less vessel
operating costs
Revenue ($ millions)
(a)
(b)
Gross Margin %
$1,600
$1,400
$1,200
$1,000
$800
$600
$400
$200
$0
FY91
FY93
FY95
FY97
FY99
FY01
FY03
FY05
FY07
FY09
60.0%
50.0%
40.0%
30.0%
20.0%
10.0%
0.0%
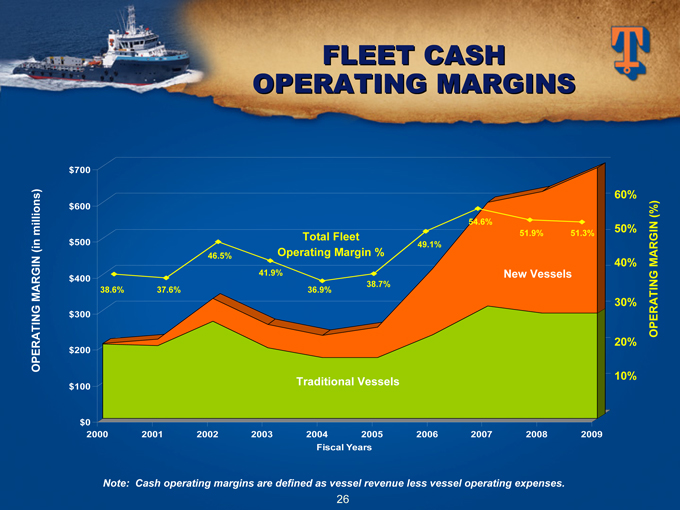
FLEET CASH
OPERATING MARGINS
OPERATING MARGIN (in millions)
$700 $600 $500 $400 $300 $200 $100 $0
2000 2001 2002 2003 2004 2005 2006 2007 2008 2009
38.6% 37.6% 46.5% 41.9% 36.9% 38.7% 49.1% 54.6% 51.9% 51.3%
Fiscal Years
OPERATING MARGIN (%)
New Vessels
Traditional Vessels
Total Fleet
Operating Margin %
Note: Cash operating margins are defined as vessel revenue less vessel operating expenses.
26
RETURNING VALUE TO SHAREHOLDERS
SHARE REPURCHASE PROGRAM
Current repurchase authority of $200 MM
Since 8/05, have repurchased 9.5 MM shares for $516.2 MM
SHARE REPURCHASE PROGRAM
Recent dividend declaration
increased from $.15/share/quarter to $.25/share/quarter
One of eight OSX companies paying dividends
Current 2.3% yield (highest among OSX companies)
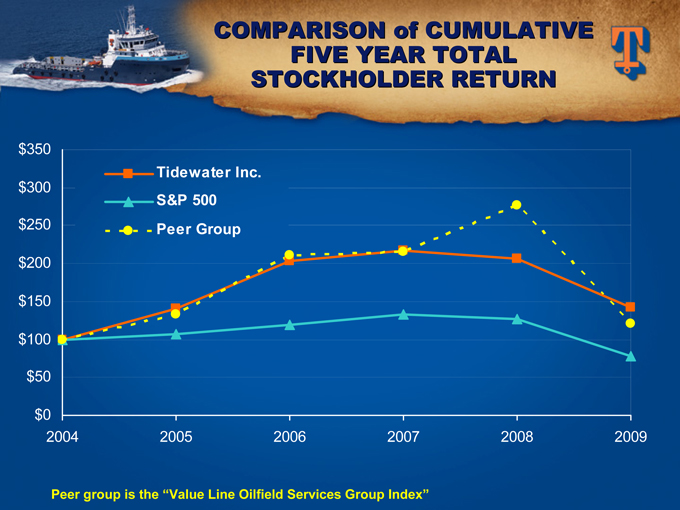
COMPARISON of CUMULATIVE FIVE YEAR TOTAL STOCKHOLDER RETURN
$350 $300 $250 $200 $150 $100 $50 $0
2004 2005 2006 2007 2008 2009
Tidewater Inc.
S&P 500
Peer Group
Peer group is the “Value Line Oilfield Services Group Index”
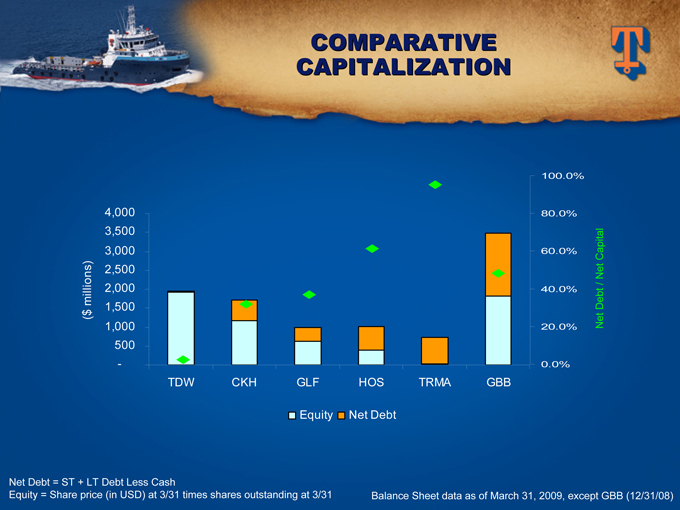
COMPARATIVE CAPITALIZATION
Net Debt = ST + LT Debt Less Cash
Equity = Share price (in USD) at 3/31 times shares outstanding at 3/31
Balance Sheet data as of March 31, 2009, except GBB (12/31/08)
($ millions)
4,000
3,500
3,000
2,500
2,000
1,500
1,000
500
TDW
CKH
GLF
HOS
TRMA
GBB
100.0%
80.0%
60.0%
40.0%
20.0%
0.0%
Net Debt/New Capital
Equity
Net Debt
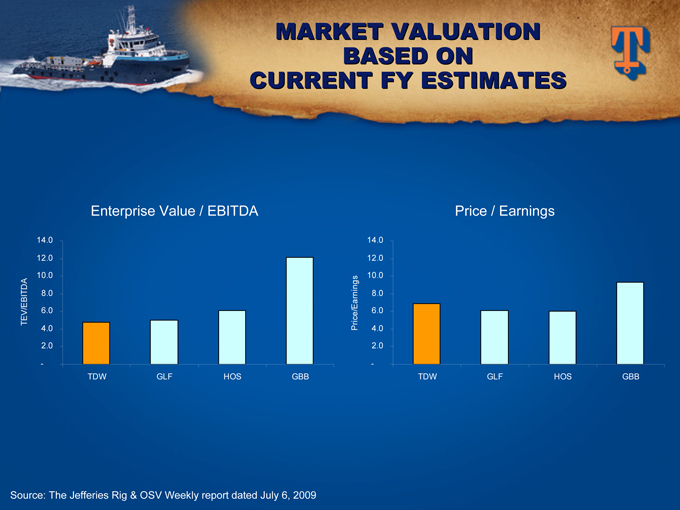
MARKET VALUATION
BASED ON
CURRENT FY ESTIMATES
Enterprise Value / EBITDA
Price / Earnings
Source: The Jefferies Rig & OSV Weekly report dated July 6, 2009
14.0
12.0
10.0
8.0
6.0
4.0
2.0
TEV/EBITDA
Price/Earnings
TDW
GLF
HOS
GBB
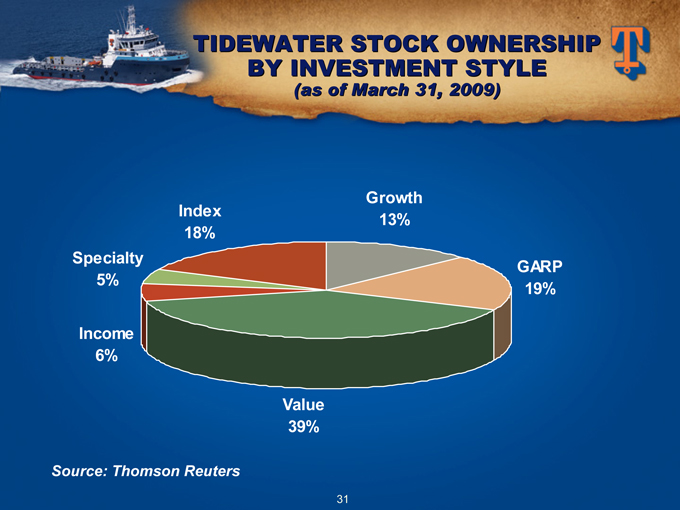
TIDEWATER STOCK OWNERSHIP BY INVESTMENT STYLE
(as of March 31, 2009)
Source: Thomson Reuters
Index 18%
Growth 13%
GARP 19%
Specialty 5%
Income 6%
Value 39%
31
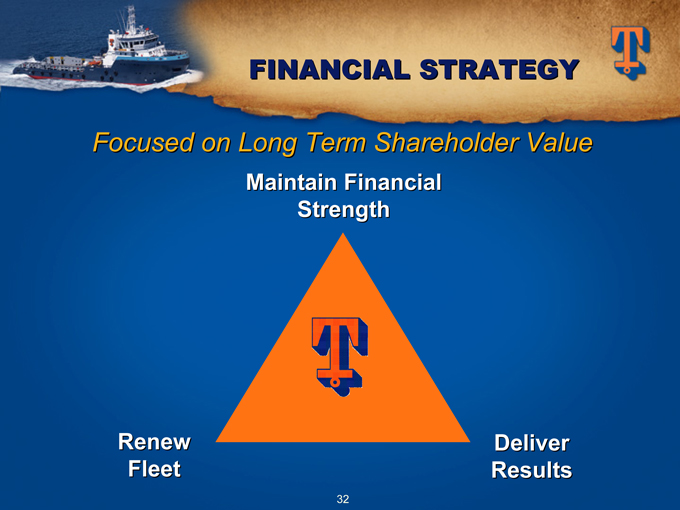
FINANCIAL STRATEGY
Focused on Long Term Shareholder Value
Maintain Financial
Strength
Renew
Fleet
Deliver
Results
32
FISCAL 2009 ANNUAL
SHAREHOLDERS MEETING
July 9, 2009
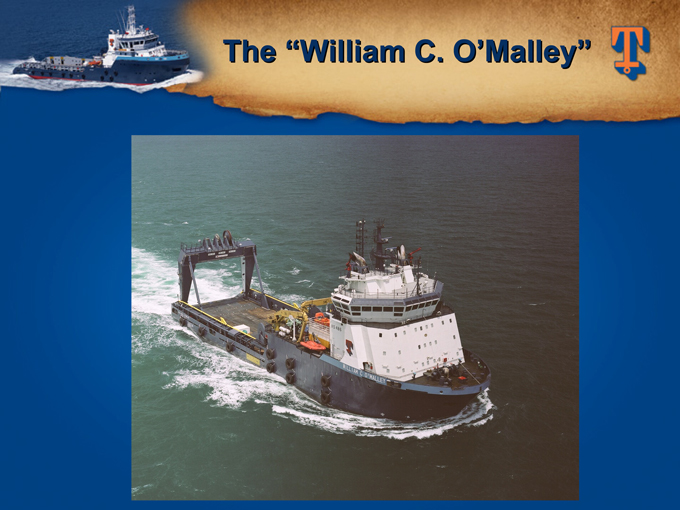
The “William C. O’Malley”
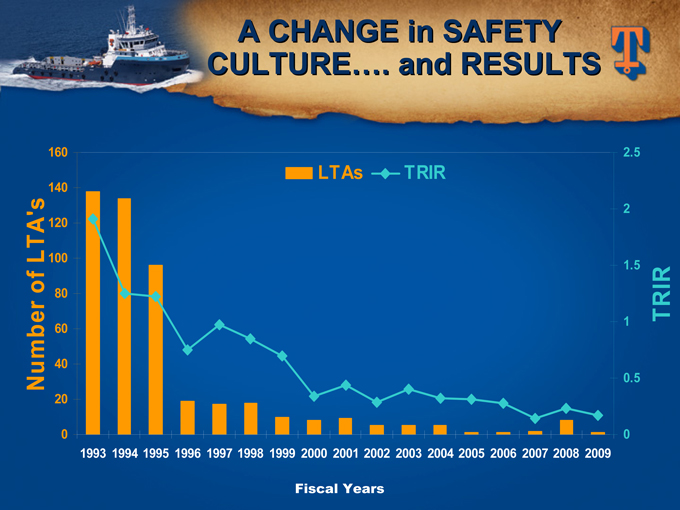
A CHANGE in SAFETY CULTURE…. and RESULTS
LTAs TRIR
Number of LTA’s
TRIR
160 140 120 100 80 60 40 20 0
1993 1994 1995 1996 1997 1998 1999 2000 2001 2002 2003 2004 2005 2006 2007 2008 2009
2.5 2 1.5 1 0.5 0
Fiscal Years
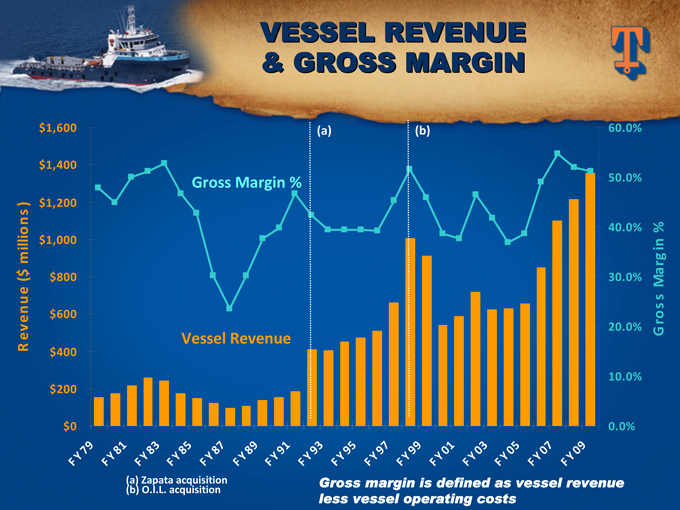
VESSEL REVENUE
& GROSS MARGIN
Gross Margin %
Vessel Revenue
Revenue ($ millions)
(a) (b)
Gross Margin %
$1,600 $1,400 $1,200 $1,000 $800 $600 $400 $200 $0
FY79 FY81 FY83 FY85 FY87 FY89 FY91 FY93 FY95 FY97 FY99 FY01 FY03 FY05 FY07 FY09
60.0% 50.0% 40.0% 30.0% 20.0% 10.0% 0.0%
(a) Zapata acquisition
(b) O.I.L. acquisition
Gross margin is defined as vessel revenue
less vessel operating costs
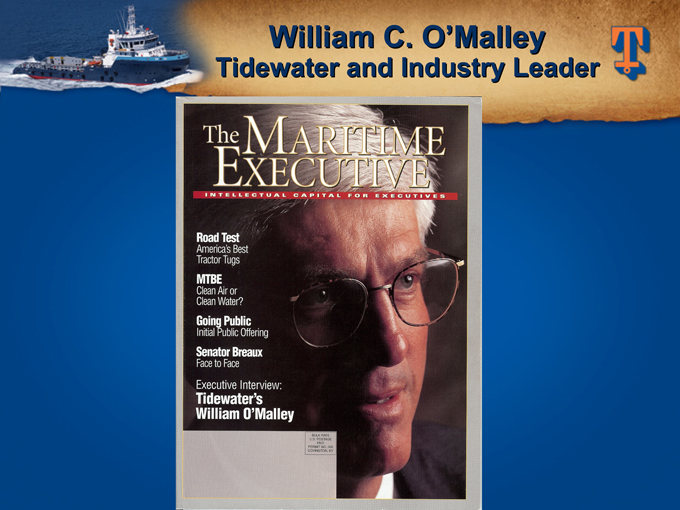
William C. O’Malley Tidewater and Industry Leader