 TIDEWATER TIDEWATER JEFFERIES JEFFERIES 6 6 ANNUAL ANNUAL SHIPPING SHIPPING & & OFFSHORE SERVICES CONFERENCE OFFSHORE SERVICES CONFERENCE September 9, 2009 Dean E. Taylor Dean E. Taylor Chairman, President & CEO Chairman, President & CEO Joseph M. Bennett Joseph M. Bennett Executive Vice President and Executive Vice President and Chief Investor Relations Chief Investor Relations Officer Officer Exhibit 99.1 TH TH |
 2 TIDEWATER TIDEWATER 601 Poydras Street, Suite 1900 New Orleans, LA 70130 FORWARD-LOOKING STATEMENTS In accordance with the safe harbor provisions of the Private Securities Litigation Reform Act of 1995, the Company notes that certain statements set forth in this presentation provide other than historical information and are forward looking. The actual achievement of any forecasted results, or the unfolding of future economic or business developments in a way anticipated or projected by the Company, involve numerous risks and uncertainties that may cause the Company’s actual performance to be materially different from that stated or implied in the forward-looking statement. Among those risks and uncertainties, many of which are beyond the control of the Company, include, without limitation, fluctuations in worldwide energy demand and oil and gas prices; fleet additions by competitors and industry overcapacity; changes in capital spending by customers in the energy industry for offshore exploration, development and production; changing customer demands for different vessel specifications, which may make some of our older vessels technologically obsolete for certain customer projects or in certain markets; instability of global financial markets and difficulty accessing credit or capital; acts of terrorism and piracy; significant weather conditions; unsettled political conditions, war, civil unrest and governmental actions, especially in higher risk countries of operations; foreign currency fluctuations; and enforcement of laws related to the environment, labor and foreign corrupt practices. Participants should consider all of these risk factors as well as other information contained in the Company’s form 10-K’s and 10-Q’s. Phone: 504.568.1010 | Fax: 504.566.4580 | Web: www.tdw.com | Email: connect@tdw.com |
 3 SAFETY RECORD RIVALS SAFETY RECORD RIVALS LEADING COMPANIES LEADING COMPANIES Total Recordable Incident Rates 2002 2003 2004 2005 2006 2007 Calendar Years 2008 TIDEWATER DOW CHEMICAL DUPONT EXXON/MOBIL BP 0.00 0.25 0.50 0.75 1.00 |
 A REMINDER OF A REMINDER OF OUR WORKPLACE OUR WORKPLACE |
 5 TIDEWATER TIDEWATER TODAY TODAY Solid safety record – One LTA and .18 TRIR in FY’09 Unmatched (and growing) global footprint – 50+ years internationally and working in over 60 countries Entire fleet earning solid returns – Third consecutive year of record earnings (19.3% Return on Average Equity over the last three fiscal years) Strong balance sheet – no net debt to total cap at 6/30/09 Continuing to invest in new vessels with expanded capabilities – 22 deliveries in last year and a quarter and 45 under construction at 6/30/09 Track record of prudent capital management and of returning capital to shareholders – Increase of dividend to $1 per share annually |
 6 Culture is a competitive advantage • Safety-oriented • Deep knowledge of customer needs • Aggressive management of operating and capital costs Maintain maximum financial flexibility to deal with uncertainties Selectively deploy cash to renew fleet with expanded capabilities Opportunistically utilize balance sheet strength • Right acquisitions, right price, right time • Consistently focus on creating shareholder value OUR STRATEGY OUR STRATEGY (Not much has changed!) (Not much has changed!) |
 7 Cash on the balance sheet Low debt, and no net debt at 6/30/09 Undrawn, new, expanded credit facility Manageable new construction backlog Solid customer base (large exposure to NOC’s and IOC’s) Good contract coverage TDW’s FINANCIAL STABILITY TDW’s FINANCIAL STABILITY DURING TRYING TIMES DURING TRYING TIMES |
 STRONG BALANCE SHEET STRONG BALANCE SHEET + $750 million of Available Liquidity at 7/31/09 (Cash plus $450m Revolver) + $750 million of Available Liquidity at 7/31/09 (Cash plus $450m Revolver) $300 $300 Long-term Debt* $2,245 $2,280 Stockholders’ Equity 2.1% 0% Net Debt* to Total Cap $251 $315 Cash March 2009 June 2009 ($ in Millions) ($ in Millions) 8 |
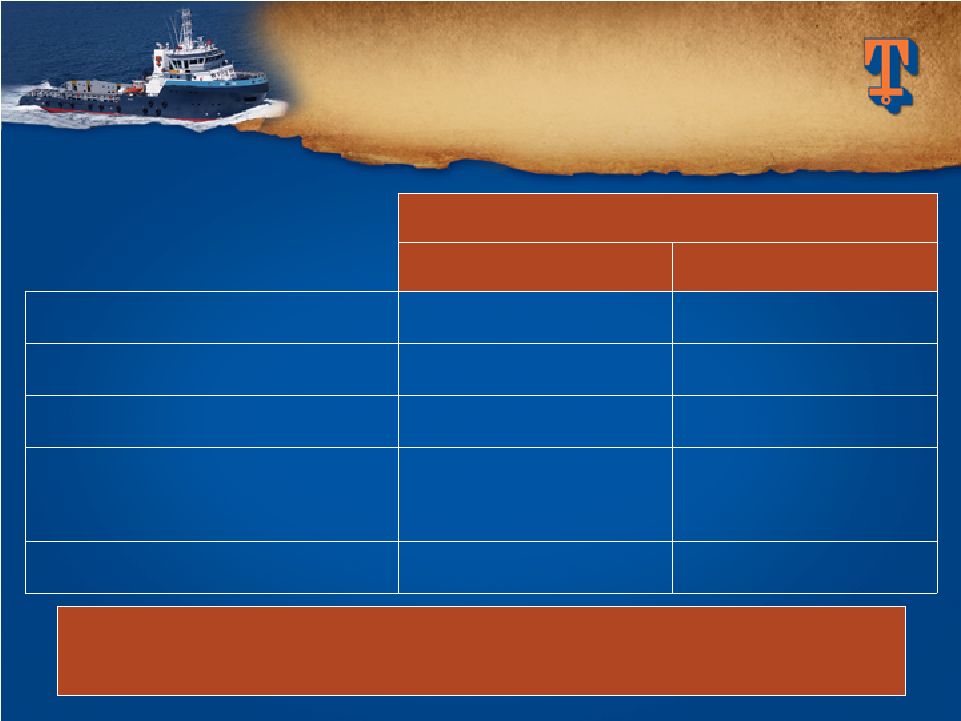 SELECTED FINANCIAL SELECTED FINANCIAL HIGHLIGHTS HIGHLIGHTS * Adjusted Net Earnings and Adjusted EPS for the quarter ended 6/30/09 * Adjusted Net Earnings and Adjusted EPS for the quarter ended 6/30/09 excludes $47.7 million, or $0.93 per share, related to provision excludes $47.7 million, or $0.93 per share, related to provision for for Venezuelan operations Venezuelan operations ($ in Thousands, Except ($ in Thousands, Except Except Per Share Data) Per Share Data) Quarters Ended $1.64 $1.79 Adjusted EPS* $84,776 $92,222 Adjusted Net Earnings* $90,997 $70,350 Net Cash from Operations $129,657 $92,172 Capital Expenditures $340,054 $326,609 Revenues 6/30/08 6/30/09 9 |
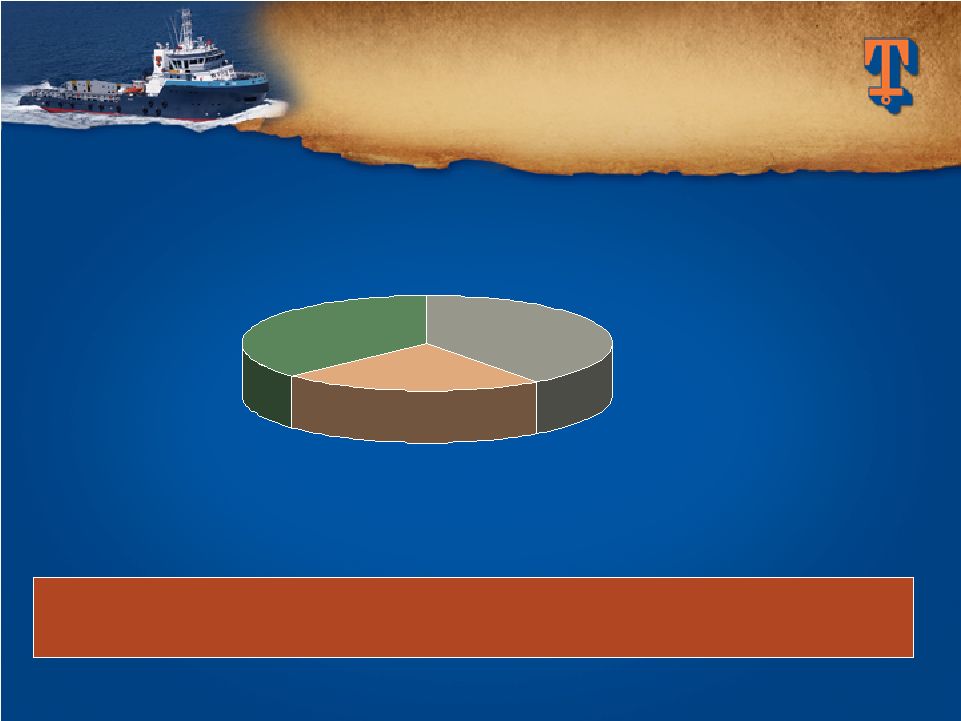
 (Includes AHTS and PSV’s only) (Includes AHTS and PSV’s only) 10 VESSEL POPULATION VESSEL POPULATION BY OWNER BY OWNER Estimated as of June 2009 Estimated as of June 2009 Source: ODS-Petrodata and Tidewater Tidewater Competitor #2 Competitor #3 Competitor #4 Competitor # 5 Competitor #1 Avg. All Others (1,589 total vessels for 300+ owners) 277 92 83 72 64 61 5 |
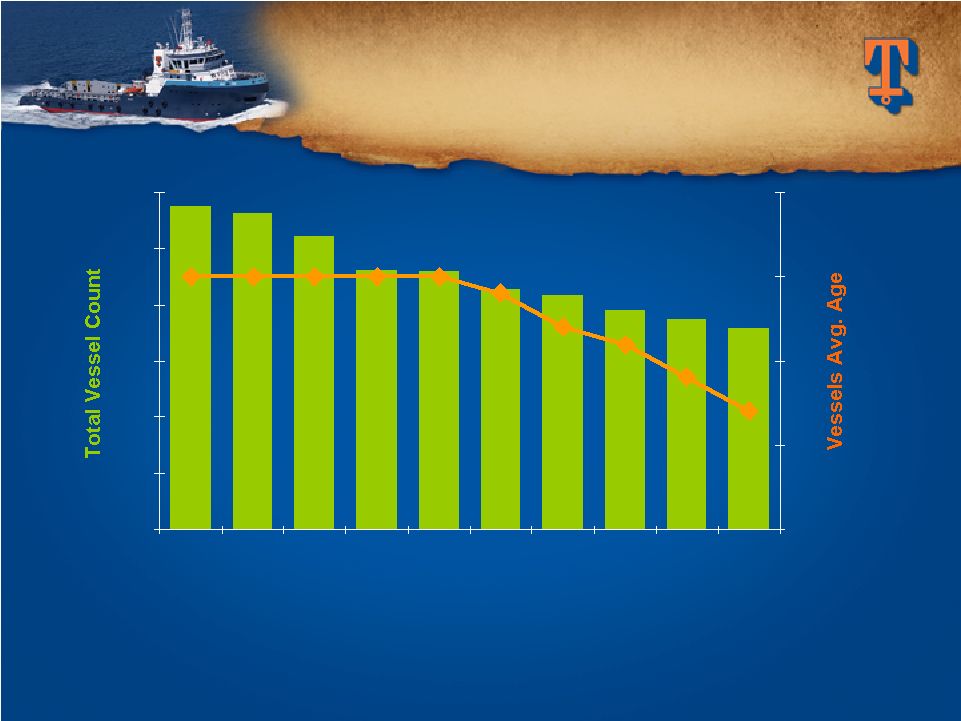
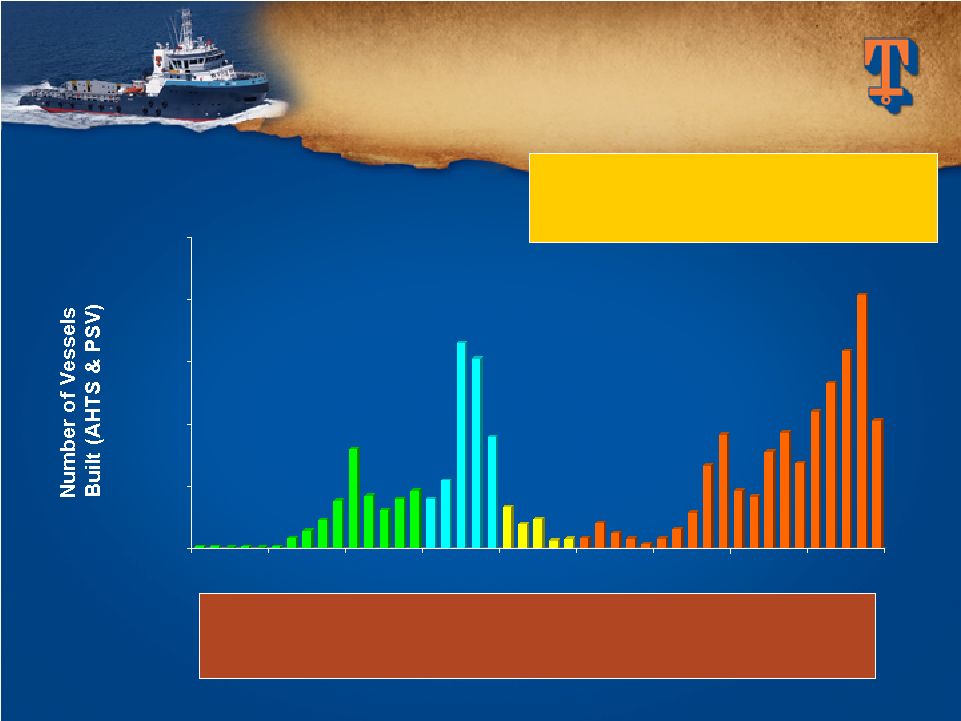 0 50 100 150 200 250 1965 1970 1975 1980 1985 1990 1995 2000 2005 11 GLOBAL VESSEL GLOBAL VESSEL FLEET BY AGE FLEET BY AGE (Includes AHTS and PSV’s only) (Includes AHTS and PSV’s only) Estimated as of June 2009 Estimated as of June 2009 As of 6/30/09, there are As of 6/30/09, there are approximately 631 additional AHTS approximately 631 additional AHTS and PSV’s under construction and PSV’s under construction Of the total 2,238 vessels, 337 vessels are 30+ yrs old, Of the total 2,238 vessels, 337 vessels are 30+ yrs old, another another 503 503 are are 25-29 25-29 yrs yrs old, old, and and 93 93 are are 20-24 20-24 yrs yrs old old Source: ODS-Petrodata and Tidewater |
 12 Unique global footprint; 50+ years of Int’l experience 1Q FY ‘10, Int’l was 92.1% of revenues & 97.4% of profits, (excluding provision for Venezuelan ops) 43 of 45 of current newbuilds in Int’l yards Longer contracts, better utilization, higher dayrates for new & traditional vessels operating in Int’l markets Solid customer base of NOC’s and IOC’s INTERNATIONAL INTERNATIONAL STRENGTH STRENGTH |
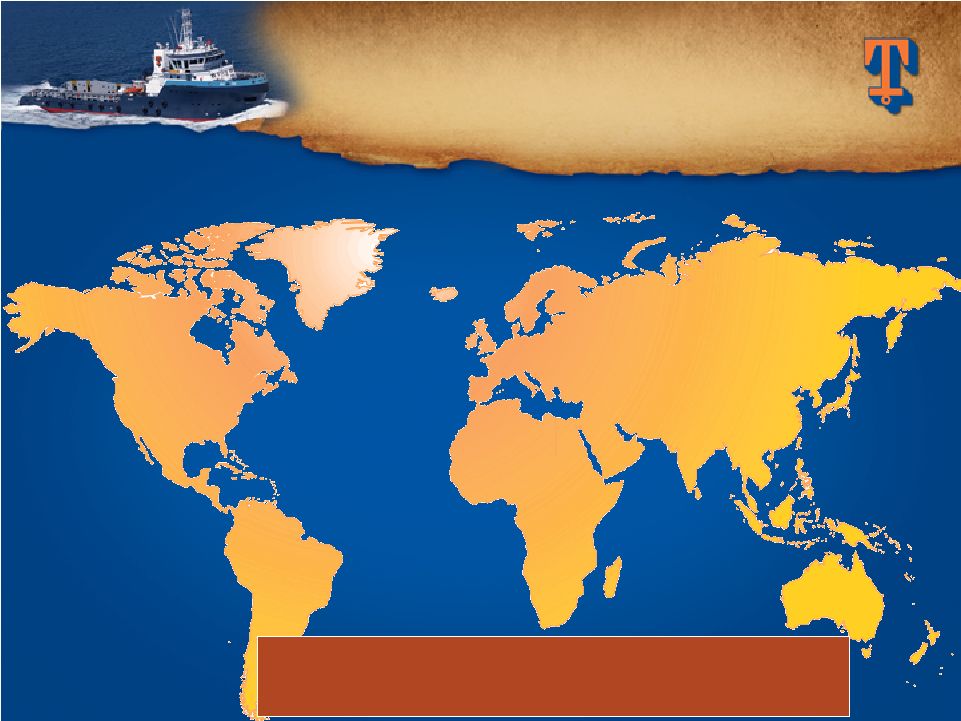 Active Vessel Count By Region (excludes stacked vessels) 94% International 6% Domestic 94% International 6% Domestic (vs. 65% International and 35% Domestic ten years ago) (vs. 65% International and 35% Domestic ten years ago) TIDEWATER TODAY TIDEWATER TODAY INTERNATIONAL STRENGTH INTERNATIONAL STRENGTH (as of 6/30/09) (as of 6/30/09) North America North America 19 (6%) 19 (6%) (6%) Central/South Central/South America America 81 (25%) 81 (25%) (25%) West Africa West Africa 136 (43%) 136 (43%) (43%) Europe/M.E. Europe/M.E. 37 (12%) 37 (12%) (12%) Far East Far East 45 (14%) 45 (14%) (14%) |
 14 Strive for a Balance Between Strive for a Balance Between Performance, Growth and Financial Strength Performance, Growth and Financial Strength Ability to support continued fleet renewal and growth Current environment will present opportunities to utilize our financial strength Funding with internal cash flow and available credit Always weigh build vs. buy criteria Making progress with fleet average age GROWING INDUSTRY’S GROWING INDUSTRY’S LARGEST FLEET LARGEST FLEET |
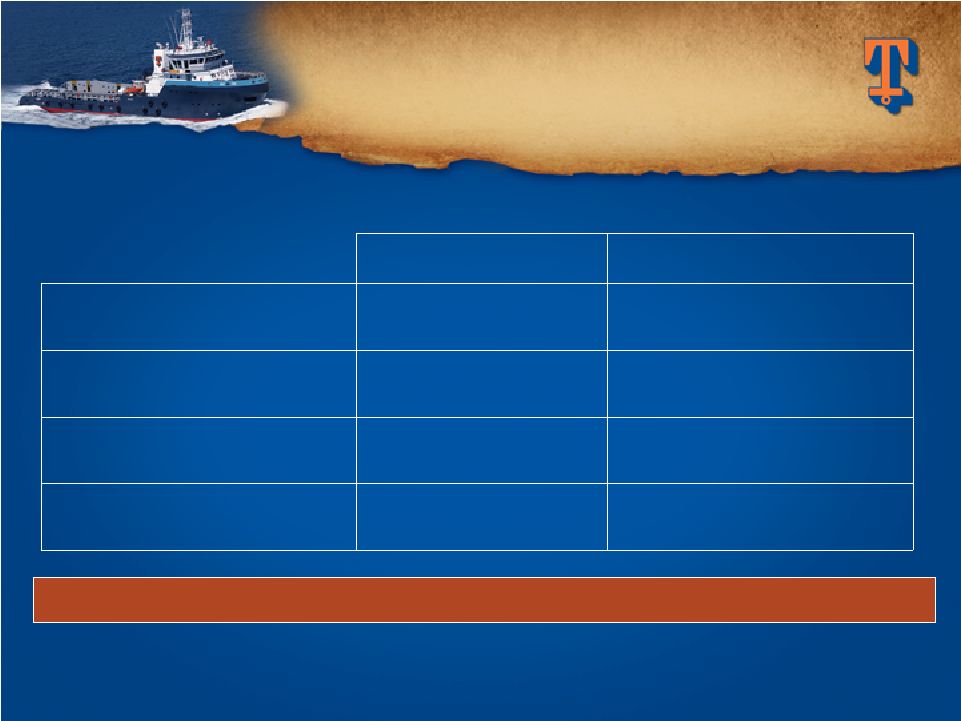 15 LARGEST NEW FLEET LARGEST NEW FLEET IN THE INDUSTRY… IN THE INDUSTRY… Vessel Commitments Jan. ’00 – Vessel Commitments Jan. ’00 – June ‘09 June ‘09 (1) Includes vessels added to the fleet financed by bareboat charter. (2) $2,372m funded through 6/30/09. *Excludes ENSCO fleet acquisition effected April 1, 2003. At 6/30/09, 147 new vessels in fleet with 5.0 year average age At 6/30/09, 147 new vessels in fleet with 5.0 year average age $1,360m 72 PSV’s $2,944m (2) 207 TOTALS: (1) $275m 65 Crewboats & Tugs $1,309m 70 AHTS Estimated Cost Vessel Count |
 … … AND COUNTING AND COUNTING 16 Estimated delivery schedule – 22 remaining in FY’ 10, 9 in FY’ 11, 11 in FY’ 12 and 2 thereafter. CAPX of $272m remaining in FY’ 10, $153m in FY’ 11, $135m in FY’ 12 and $12m in FY’ 13 Our approach to managing construction Our approach to managing construction Building vessels worldwide Due diligence focused on yards Tidewater staff supervise on site Vessels Under Construction Vessels Under Construction As As of of June June 30, 30, 2009 2009 9 45 Total 23 PSV 4 Crew and Tug 18 AHTS Count |
 17 FINANCIAL STRATEGY FINANCIAL STRATEGY Renew Renew Fleet Fleet Deliver Deliver Results Results Maintain Financial Maintain Financial Strength Strength Focused on Long Term Shareholder Value Focused on Long Term Shareholder Value |
 TIDEWATER TIDEWATER JEFFERIES 6 JEFFERIES 6 ANNUAL SHIPPING & ANNUAL SHIPPING & OFFSHORE SERVICES CONFERENCE OFFSHORE SERVICES CONFERENCE September 9, 2009 Dean E. Taylor Dean E. Taylor Chairman, President & CEO Chairman, President & CEO Joseph M. Bennett Joseph M. Bennett Executive Vice President and Executive Vice President and Chief Investor Relations Chief Investor Relations Officer Officer TH TH |
 TIDEWATER TIDEWATER APPENDIX APPENDIX |
 20 Impacts of current financial crisis and global recession • Rig and vessel construction backlogs • Financial health of shipyards and competitor Future oil and gas prices E&P spending Obama administration’s approach to energy and tax policy Vessel utilization and pricing MANY UNANSWERED MANY UNANSWERED QUESTIONS AT THIS TIME QUESTIONS AT THIS TIME |
 SHARE REPURCHASE PROGRAM Current repurchase authority of $200 MM Since 8/05, have repurchased 9.5 MM shares for $516.2 MM SHARE REPURCHASE PROGRAM Recent dividend declaration increased from $.15/share/quarter to $.25/share/quarter One of eight OSX companies paying dividends Current 2.3% yield (highest among OSX companies) RETURNING VALUE TO RETURNING VALUE TO SHAREHOLDERS SHAREHOLDERS 21 |
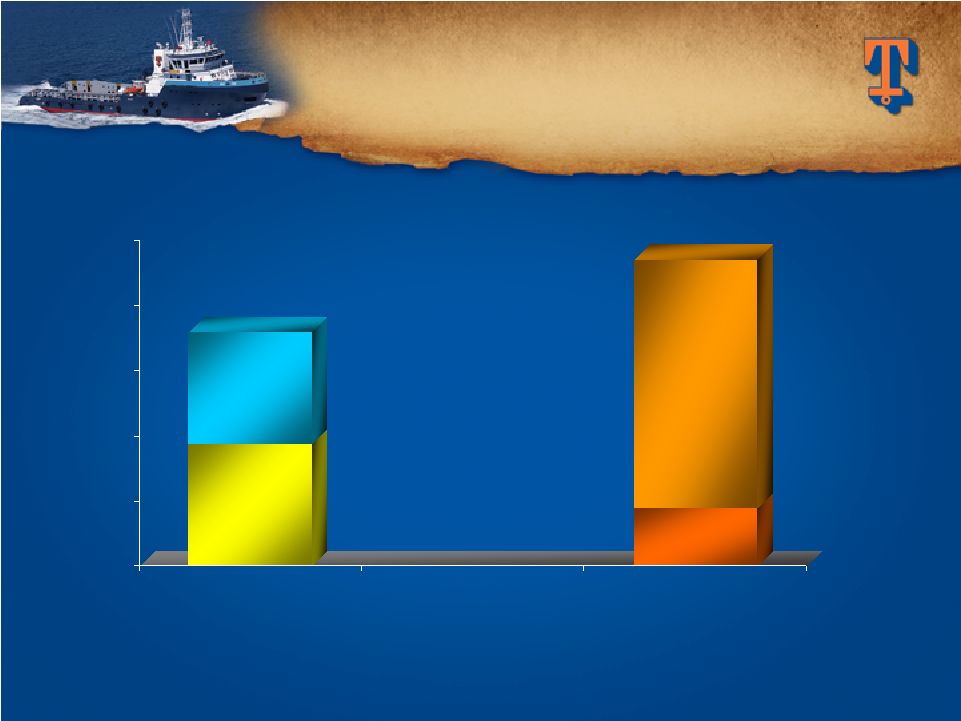
 22 Current Vessel Demand Dynamics: 2,238 Global Vessel Count (AHTS & PSV only) 550 Global Working Rigs 4.1 Vessel to Rig Ratio Possible Incremental Vessel Demand: 158 New rigs under construction (???Cancellations???) VESSEL / RIG RATIO VESSEL / RIG RATIO Source: ODS-Petrodata and Tidewater Estimated as of June 2009 |
 Jackups Semi Drillships June 2008 379 145 30 June 2009 317 151 38 Variance (62) 6 8 23 GOM accounts for 40 of the 62 working jackup count variance GOM accounts for 40 of the 62 working jackup count variance Source: ODS-Petrodata and Tidewater WORKING RIG COUNTS WORKING RIG COUNTS |
 NOC's 23% Others 37% Super Majors 40% Our top 10 customers (5 Super Majors, 4 NOC’s and one Our top 10 customers (5 Super Majors, 4 NOC’s and one large independent) currently account for 60% of our revenue large independent) currently account for 60% of our revenue CURRENT REVENUE MIX CURRENT REVENUE MIX Quality of Customer Base Quality of Customer Base 24 |
 RIGS CONTRACTED BY RIGS CONTRACTED BY OUR TOP 10 CUSTOMERS OUR TOP 10 CUSTOMERS (Estimated as of June 2009) (Estimated as of June 2009) * PEMEX alone has 31 of the 84 jackups * PEMEX alone has 31 of the 84 jackups Source: ODS-Petrodata and Tidewater 25 Jackups Semi Drillships June 2009 working rigs 317 151 38 Working for top 10 customers 84 76 24 26% 50% 63% |
 26 IMPROVING AVERAGE AGE IMPROVING AVERAGE AGE OF TIDEWATER FLEET OF TIDEWATER FLEET Assumptions: 1) Average 45 vessel disposals per year in future (averaged 47 per year last three years). 2) Include 46 vessels under construction in year delivered plus additional newbuilds/acquisitions from approximately $500 million per year of future commitments. Tidewater is not committed to spending $500 million annually, but this level is used as an assumption in estimating average fleet age in the future. 600 25 0 100 200 300 400 500 3/31/04 Actual 3/31/05 Actual 3/31/06 Actual 3/31/07 Actual 3/31/08 Actual 12/31/08 Actual 12/31/09 Estimate 12/31/10 Estimate 12/31/11 Estimate 12/31/12 Estimate 5 10 15 20 |
 27 LARGEST NEW FLEET LARGEST NEW FLEET IN THE INDUSTRY IN THE INDUSTRY (as of 6/30/09) (as of 6/30/09) (A) Net new vessels added to the fleet since January 2000, including 45 vessels under construction at 6/30/09. Out With the Old – Out With the Old – In With the New In With the New 0 100 200 300 400 500 Active Fleet Dispositions 363 363 (B) (B) 470 470 (C) (C) 192 New Vessels 192 New Vessels (A) (A) 381 Sold 381 Sold 89 Scrapped 89 Scrapped (C) 470 vessel dispositions generated $615 million of proceeds and $254 million of gains. (B) Total fleet count excludes 66 stacked vessels as of 6/30/09. |
 $0 $100 $200 $300 $400 $500 $600 $700 2000 2001 2002 2003 2004 2005 2006 2007 2008 2009 Fiscal Years FLEET CASH FLEET CASH OPERATING MARGINS OPERATING MARGINS 28 Note: Cash operating margins are defined as vessel revenue less vessel operating expenses. 50% 40% 30% 20% 10% 60% Total Fleet Operating Margin % Traditional Vessels New Vessels 38.6% 37.6% 46.5% 41.9% 36.9% 38.7% 49.1% 54.6% 51.9% 51.3% |
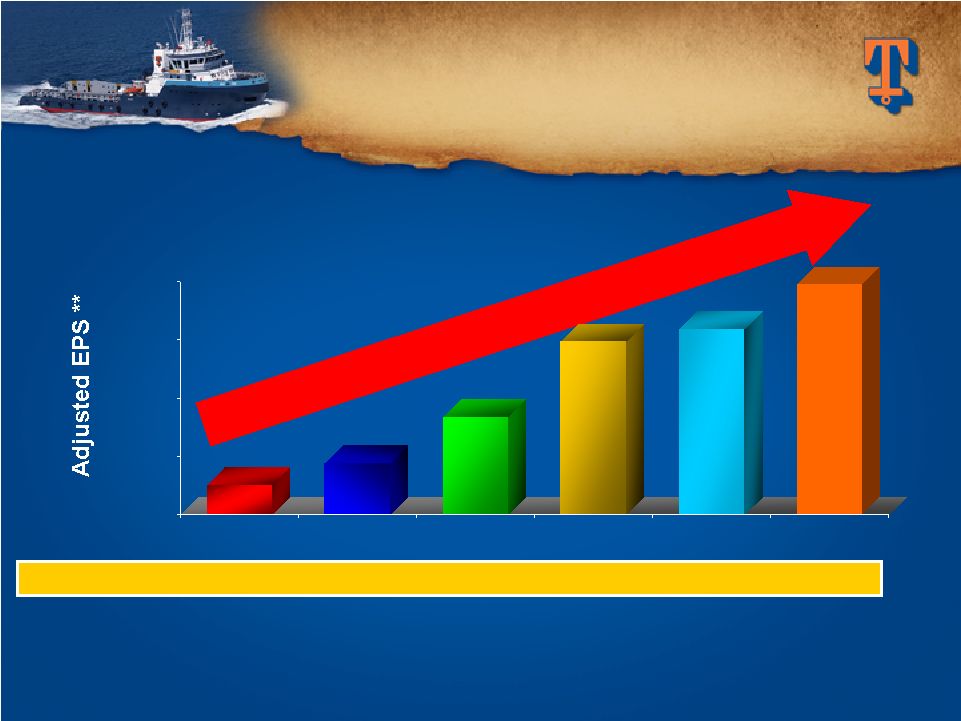 $0.00 $2.00 $4.00 $6.00 $8.00 Fiscal 2004 Fiscal 2005 Fiscal 2006 Fiscal 2007 Fiscal 2008 Fiscal 2009 SIGNIFICANT SIGNIFICANT EARNINGS GROWTH EARNINGS GROWTH 29 50% 50% Five-Year Five-Year Compounded Compounded Annual Earnings Growth Rate Annual Earnings Growth Rate FY End Stock Price $28.13 $38.86 $55.23 $58.58 $55.11 $37.13 ** EPS in Fiscal 2004 is exclusive of the $.30 per share after tax impairment charge. EPS in Fiscal 2006 is exclusive of the $.74 per share after tax gain from the sale of six KMAR vessels. EPS in Fiscal 2007 is exclusive of $.37 per share of after tax gains from the sale of 14 offshore tugs. $1.03 $1.78 $3.33 $5.94 $6.39 $7.89 |
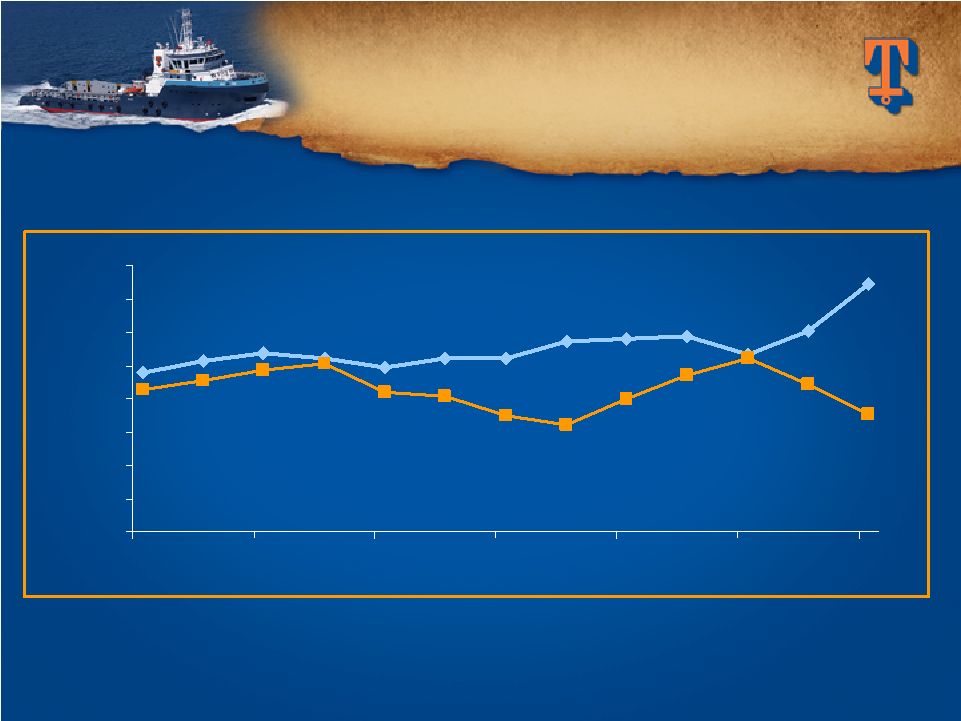
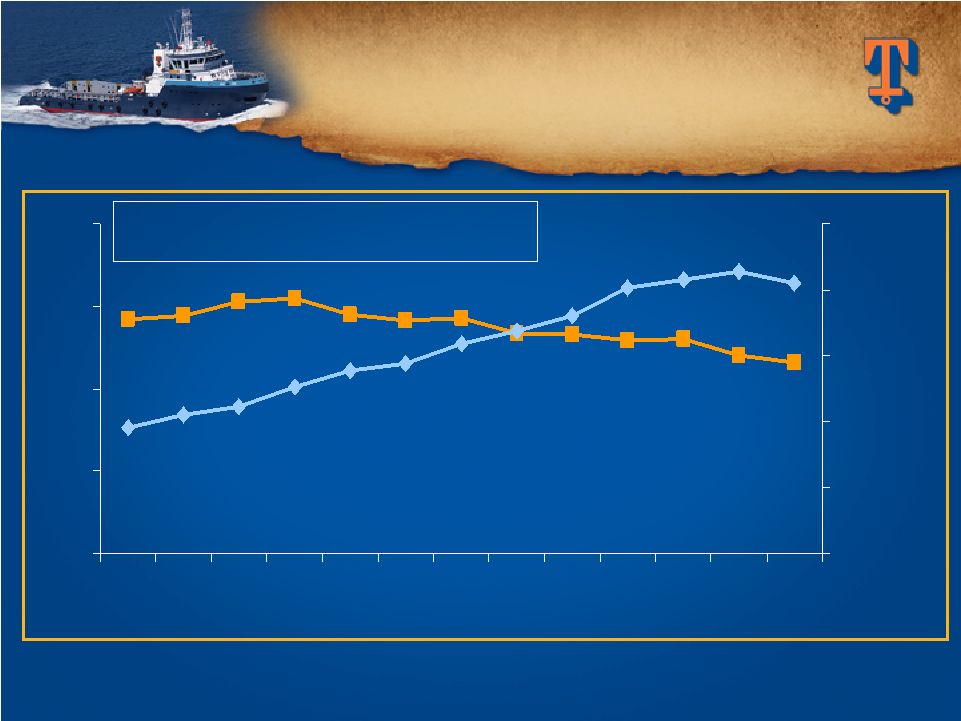 50% 60% 70% 80% 90% 6/06 12/06 6/07 12/07 6/08 12/08 6/09 $4,000 $6,000 $8,000 $10,000 $12,000 $14,000 30 INTERNATIONAL VESSELS INTERNATIONAL VESSELS Dayrates and Utilization Dayrates and Utilization $100 change in dayrate = $9.4M in revenue 1% change in utilization = $15.7M in revenue * Dayrate and utilization information is for all classes of vessels operating international. Utilization Dayrate |
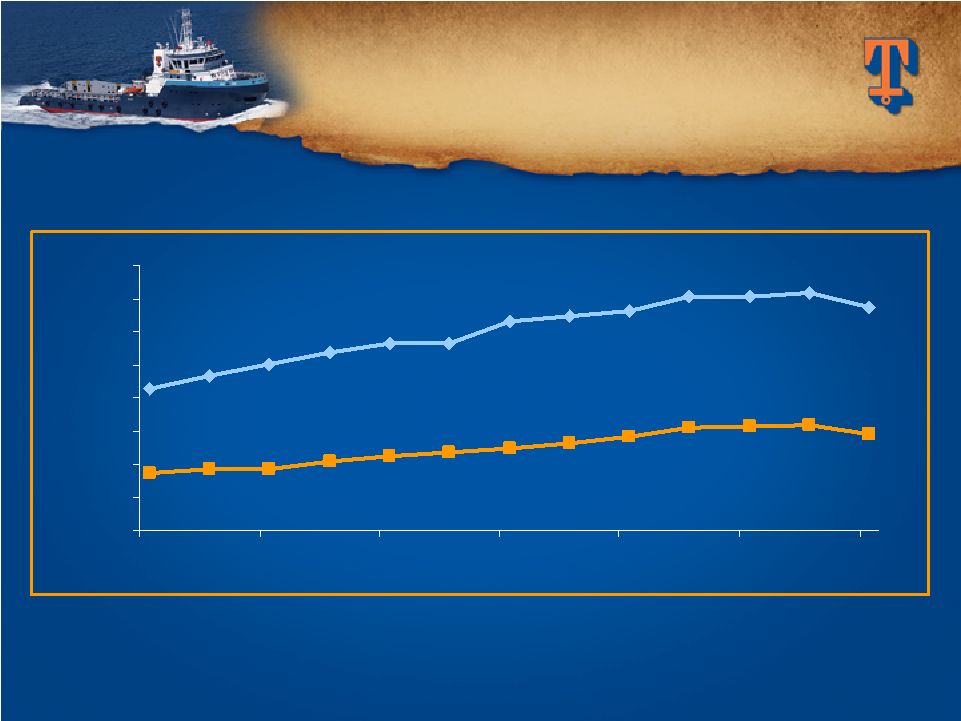 $3,000 $5,000 $7,000 $9,000 $11,000 $13,000 $15,000 $17,000 $19,000 Jun-06 Dec-06 Jun-07 Dec-07 Jun-08 Dec-08 Jun-09 New Vessels Traditional Vessels INTERNATIONAL INTERNATIONAL VESSEL VESSEL DAYRATES DAYRATES * Dayrate information is for all classes of vessels operating internationally. 31 |
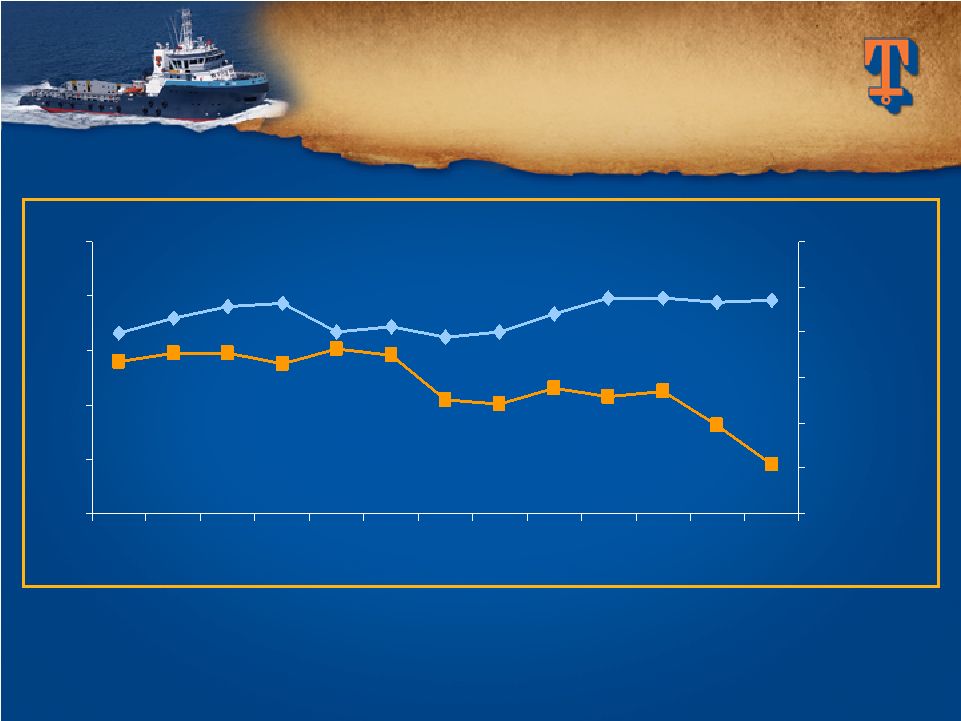 40% 50% 60% 70% 80% 90% 6/06 12/06 6/07 12/07 6/08 12/08 6/09 $4,000 $6,000 $8,000 $10,000 $12,000 $14,000 $16,000 32 DOMESTIC VESSELS DOMESTIC VESSELS Dayrates and Utilization Dayrates and Utilization * Dayrate and utilization information is for all classes of vessels operating in the U.S. Utilization Dayrate |
 $3,000 $5,000 $7,000 $9,000 $11,000 $13,000 $15,000 $17,000 $19,000 Jun-06 Dec-06 Jun-07 Dec-07 Jun-08 Dec-08 Jun-09 New Vessels Traditional Vessels DOMESTIC VESSEL DOMESTIC VESSEL DAYRATES DAYRATES * Dayrate information is for all classes of vessels operating in the U.S. 33 |
 34 SUPERIOR OPERATING SUPERIOR OPERATING CAPABILITIES DRIVE OUR CAPABILITIES DRIVE OUR COMPETITIVE ADVANTAGE COMPETITIVE ADVANTAGE Superior operating performance Superior operating performance – Safety-oriented culture – Deep knowledge of customer needs International scope and relationships International scope and relationships – Worldwide market presence (over 60 countries) – Long-term relationships with major operators (Over 200 customers) Attractive fleet Attractive fleet – Most new vessels in industry – Wide range of equipment types Cost efficient management Cost efficient management – “Lean” operations and overhead – Aggressive construction cost management |
 35 VESSEL ACQUISITION VESSEL ACQUISITION ALTERNATIVES ALTERNATIVES Buy Existing Buy Existing Construct New Construct New Buy Fleet Buy Fleet (e.g., Buy Company) (e.g., Buy Company) Considerations: Considerations: Usually one-off purchases, often to match specific client needs Immediate delivery Entry price at “full” market rate Considerations: Considerations: Built to Tidewater quality standards 18 + months to delivery Potential shipyard backlog Contract terms (e.g., fixed price, LDs, etc.) Resource requirements to oversee construction Considerations: Considerations: : Quality of equipment Existing contracts Potential synergies Potential divestiture of non core assets Potential premium Execution risk Value creation potential vs. alternatives |
 36 CONSIDERATIONS IN CONSIDERATIONS IN DESIGNING OUR “OPTIMAL” DESIGNING OUR “OPTIMAL” VESSEL MIX VESSEL MIX Custom/ Specialized Standardized Small Ultra big Renew existing Expand to niche markets Drilling, production Subsea, maintenance, LNG etc. Cycle timers Invest across cycle *Arrows are illustrative of Tidewater’s current views; they should not be interpreted as excluding other points on the continuums in the future. Vessel Type Vessel Type Specifications Specifications Operating Capabilities Operating Capabilities End Users End Users Supply/Demand Supply/Demand TDW* TDW* |