 Joseph M. Bennett Joseph M. Bennett Executive Vice President and Executive Vice President and Chief Investor Relations Officer Chief Investor Relations Officer June 26, 2012 June 26, 2012 2012 Global Hunter Securities 2012 Global Hunter Securities 100 Energy Conference 100 Energy Conference Exhibit 99.1 |
 2 FORWARD-LOOKING STATEMENTS FORWARD-LOOKING STATEMENTS FORWARD-LOOKING STATEMENTS 2 Phone: 504.568.1010 • Fax: 504.566.4580 • Email:connect@tdw.com Web:www.tdw.com In accordance with the safe harbor provisions of the Private Securities Litigation Reform Act of 1995, the Company notes that certain statements set forth in this presentation provide other than historical information and are forward looking. The actual achievement of any forecasted results, or the unfolding of future economic or business developments in any way anticipated or projected by the Company, involve many risks and uncertainties. Among those risks and uncertainties, many of which are beyond the control of the Company, are: fluctuations in oil and gas prices; the level of fleet additions by competitors and vessel overcapacity; changes in levels of capital spending in domestic and international markets by customers in the energy industry for exploration, development and production; unsettled political conditions, civil unrest and governmental actions, especially in higher risk countries of operations; changing customer demands for different vessel specifications; acts of terrorism; unsettled political conditions, war, civil unrest and governmental actions, especially in higher risk countries of operations; foreign currency fluctuations; and environmental and labor laws. Participants should consider all of these risk factors as well as other information contained in the Company’s form 10-K’s and 10-Q’s. |
 3 KEY TAKEAWAYS KEY TAKEAWAYS KEY TAKEAWAYS • Culture of safety & operating excellence • Macro picture improving – stable oil prices, increased E&P spending, improving rig count • History of earnings growth and solid returns • Unmatched scale and scope of operations • World’s largest and newest fleet provides basis for continued earnings growth • Strong balance sheet allows us to act upon available opportunities |
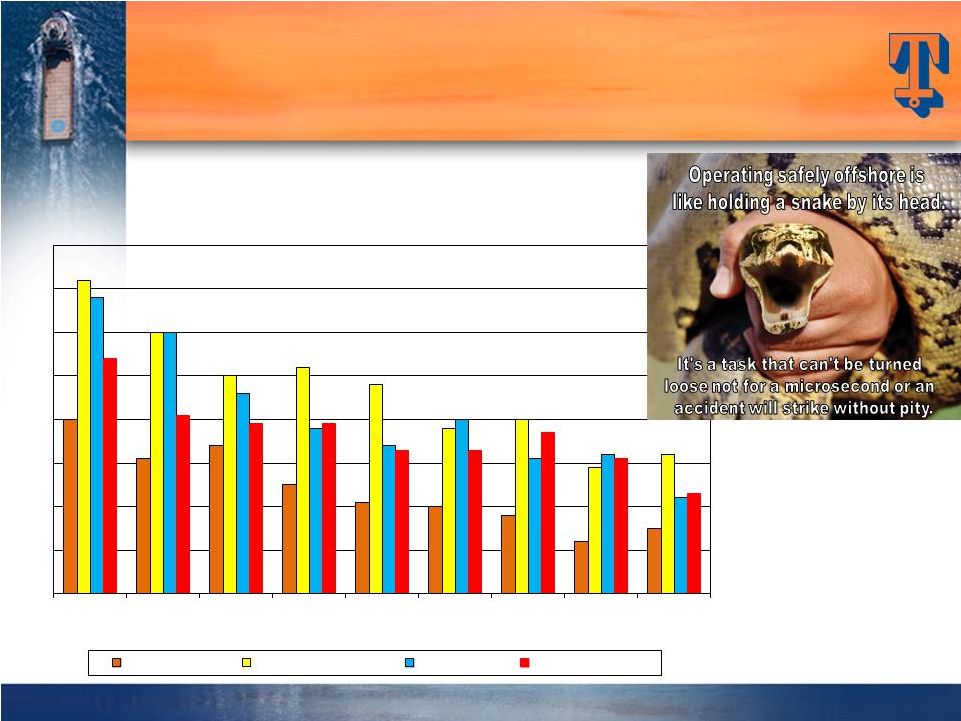 4 SAFETY RECORD RIVALS LEADING COMPANIES SAFETY RECORD RIVALS SAFETY RECORD RIVALS LEADING COMPANIES LEADING COMPANIES 0.00 0.10 0.20 0.30 0.40 0.50 0.60 0.70 0.80 2002 2003 2004 2005 2006 2007 2008 2009 2010 CALENDAR YEARS TOTAL RECORDABLE INCIDENT RATES TIDEWATER DOW CHEMICAL CHEVRON EXXON/MOBIL |
 5 Source: ODS-Petrodata and Tidewater June 2008 (Peak) Jan. 2011 May 2012 Working Rigs 603 538 611 Rigs Under Construction 186 118 188 OSV Global Population 2,033 2,599 2,756 OSV’s Under Construction 736 367 404 OSV/Rig Ratio 3.37 4.83 4.51 DRIVERS OF OUR BUSINESS “Peak to Present” DRIVERS OF OUR BUSINESS DRIVERS OF OUR BUSINESS “Peak to Present” “Peak to Present” |
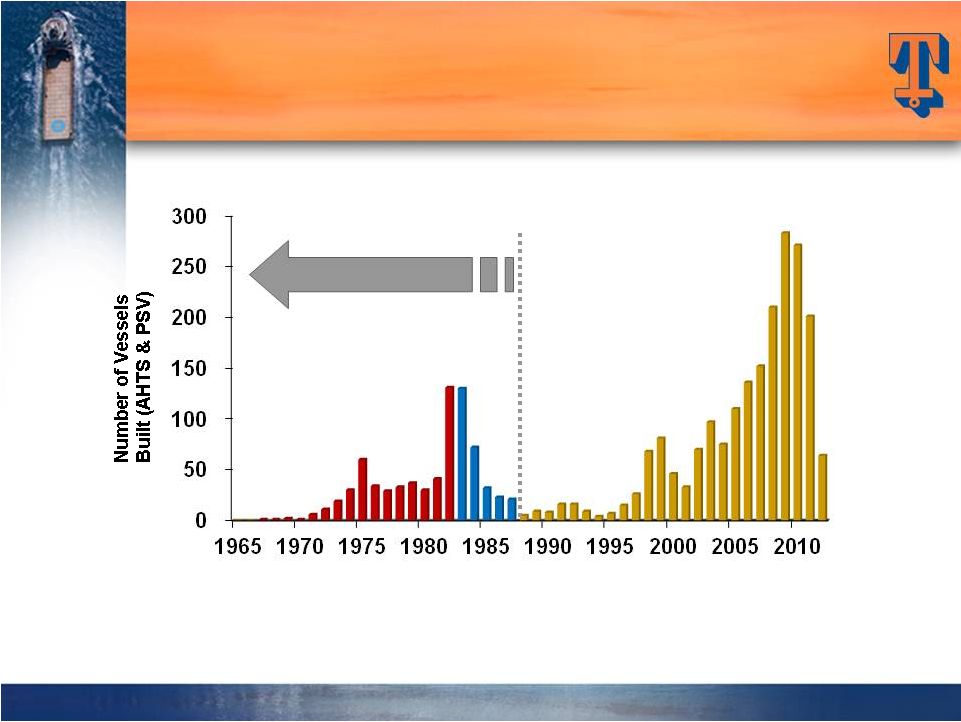 6 Source: ODS-Petrodata and Tidewater As of May 2012, there are approximately 404 additional AHTS and PSV’s (~15% of the global fleet) under construction. Global fleet estimated at 2,756 vessels, including 466 vessels that are 30+ yrs old (17%), and another 278 vessels that are 25-29 yrs old (10%) Vessels > 25 years old today THE WORLDWIDE OSV FLEET – RETIREMENTS EXPECTED TO EXCEED NEW DELIVERIES (Includes AHTS and PSV’s only) Estimated as of May 2012 THE WORLDWIDE OSV FLEET – RETIREMENTS EXPECTED TO EXCEED NEW DELIVERIES (Includes AHTS and PSV’s only) Estimated as of May 2012 |
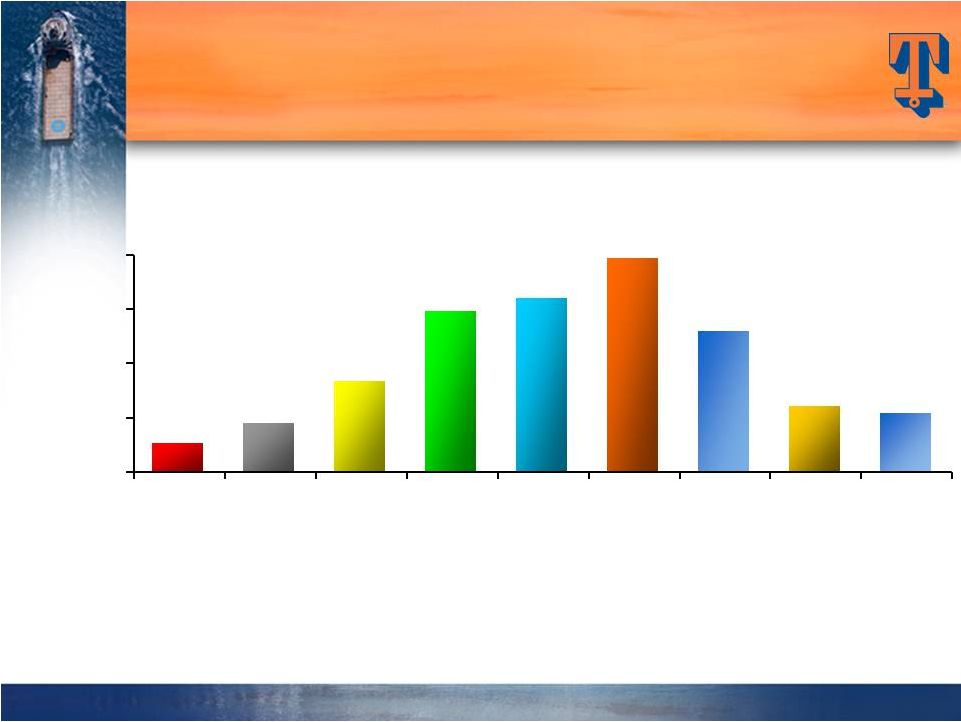
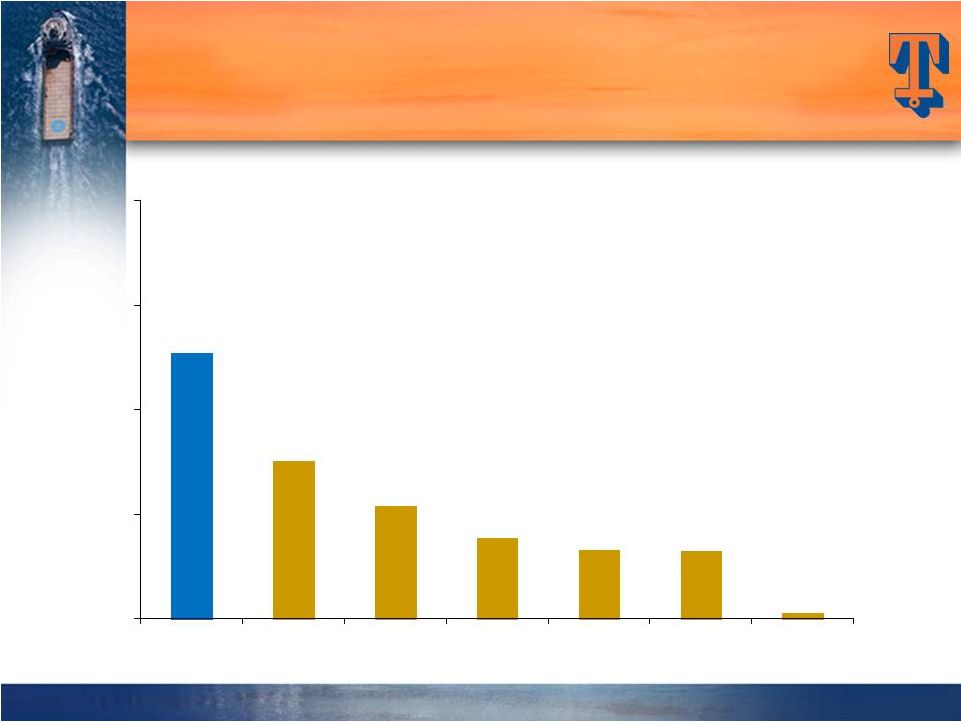 7 VESSEL POPULATION BY OWNER (AHTS and PSV’s only) – Estimated as of May 2012 VESSEL POPULATION BY OWNER (AHTS and PSV’s only) – Estimated as of May 2012 Source: ODS-Petrodata and Tidewater Tidewater Competitor #2 Competitor #3 Competitor #4 Competitor # 5 Competitor #1 Avg. All Others (1,993 total vessels for 350+ owners) Tidewater AHTS and PSV fleet includes 165 vessel additions since 2000 254 151 108 77 66 65 5 0 100 200 300 400 |
 ** EPS in Fiscal 2004 is exclusive of the $.30 per share after tax impairment charge. EPS in Fiscal 2006 is exclusive of the $.74 per share after tax gain from the sale of six KMAR vessels. EPS in Fiscal 2007 is exclusive of $.37 per share of after tax gains from the sale of 14 offshore tugs. EPS in Fiscal 2010 is exclusive of $.66 per share Venezuelan provision, a $.70 per share tax benefit related to favorable resolution of tax litigation and a $0.22 per share charge for the proposed settlement with the SEC of the company’s FCPA matter. EPS in Fiscal 2011 is exclusive of total $0.21 per share charges for settlements with DOJ and Government of Nigeria for FCPA matters, a $0.08 per share charge related to participation in a multi-company U.K.-based pension plan and a $0.06 per share impairment charge related to certain vessels. EPS in Fiscal 2012 is exclusive of $0.43 per share goodwill impairment charge. Adjusted Return On Avg. Equity 4.3% 7.2% 12.4% 18.9% 18.3% 19.5% 11.4% 5.0% 4.3% Adjusted EPS** Adjusted EPS** HISTORY OF EARNINGS GROWTH AND SOLID THROUGH-CYCLE RETURNS HISTORY OF EARNINGS GROWTH HISTORY OF EARNINGS GROWTH AND SOLID THROUGH-CYCLE RETURNS AND SOLID THROUGH-CYCLE RETURNS $1.03 $1.78 $3.33 $5.94 $6.39 $7.89 $5.20 $2.40 $2.13 $0.00 $2.00 $4.00 $6.00 $8.00 Fiscal 2004 Fiscal 2005 Fiscal 2006 Fiscal 2007 Fiscal 2008 Fiscal 2009 Fiscal 2010 Fiscal 2011 Fiscal 2012 8 |
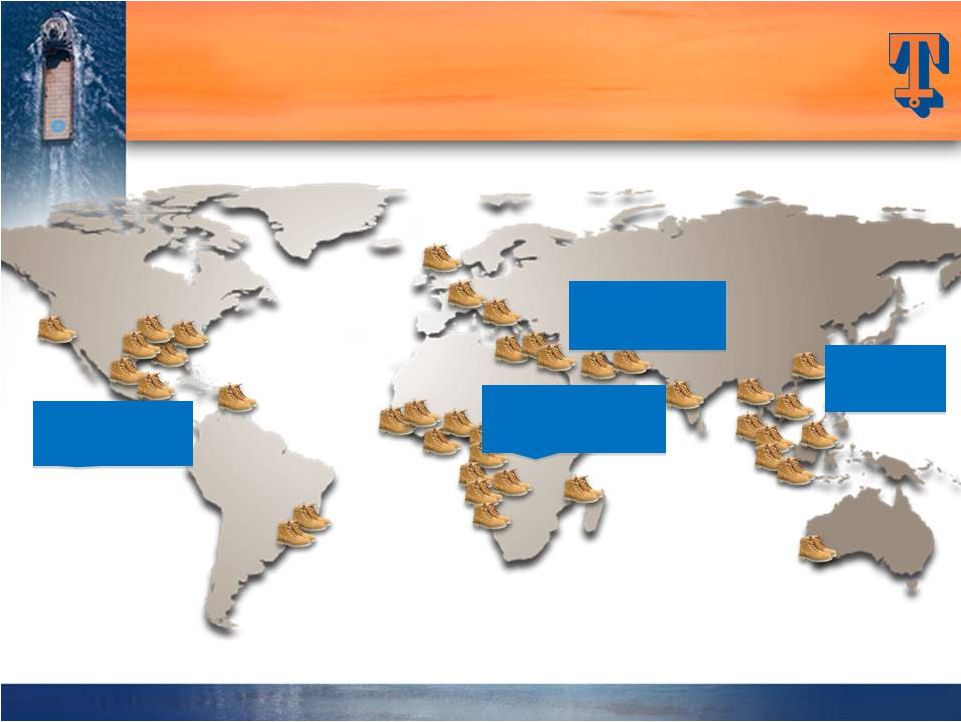 OUR GLOBAL FOOTPRINT Vessel Distribution by Region (excludes stacked vessels – as of 3/31/12) OUR GLOBAL FOOTPRINT OUR GLOBAL FOOTPRINT Vessel Distribution by Region Vessel Distribution by Region (excludes stacked vessels – (excludes stacked vessels – as of 3/31/12) as of 3/31/12) In 4Q FY 2012, ~6% of vessels/revenue was generated in U.S. GOM; however, 38 total active U.S.-flagged vessels provide good optionality to a recovery in the U.S. GOM. Americas 63(24%) SS Africa/Europe 132(50%) MENA 35(13%) Asia/Pac 33(13%) 9 |
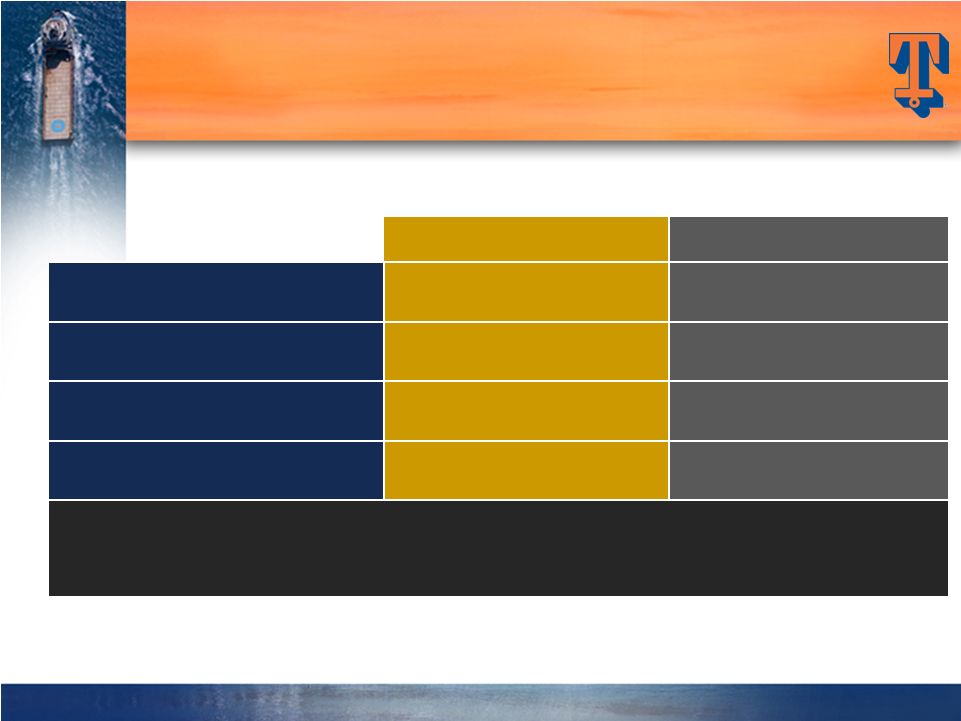 10 Vessel Count Estimated Cost AHTS 101 $1,765m PSV’s 91 $1,934m Crewboats & Tugs 71 $301m TOTALS: 263 $4,000m (1) . At 3/31/12, 215 new vessels were in our fleet with ~5.7 year average age Vessel Commitments Jan. ’00 – March ‘12 (1) $3,640m (91%) funded through 3/31/12 THE LARGEST MODERN OSV FLEET IN THE INDUSTRY…. THE LARGEST MODERN OSV FLEET IN THE INDUSTRY…. |
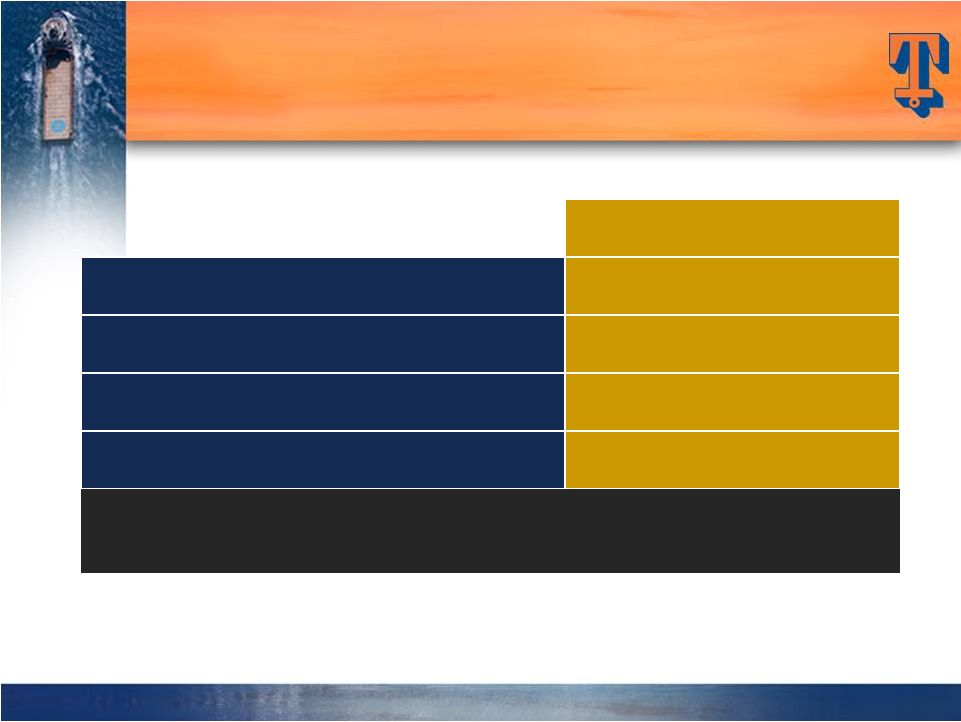 11 Count AHTS 2 PSV 18 Crew and Tug 5 Total 25 Vessels Under Construction* As of March 31, 2012 * Includes 3 new vessel purchase commitments at 3/31/12 Estimated delivery schedule – 13 in FY ‘13, 10 in FY ‘14 and 2 thereafter. CAPX of $220m in FY ‘13, $95m in FY ‘14 and $44m in FY ’15. …. AND MORE TO COME …. AND MORE TO COME …. AND MORE TO COME |
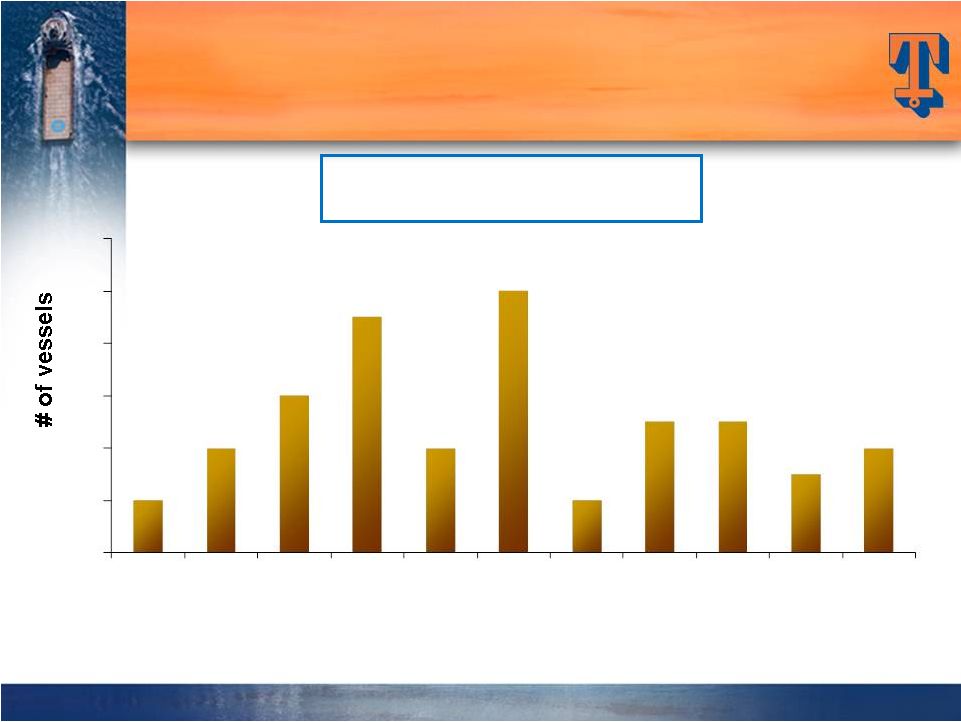
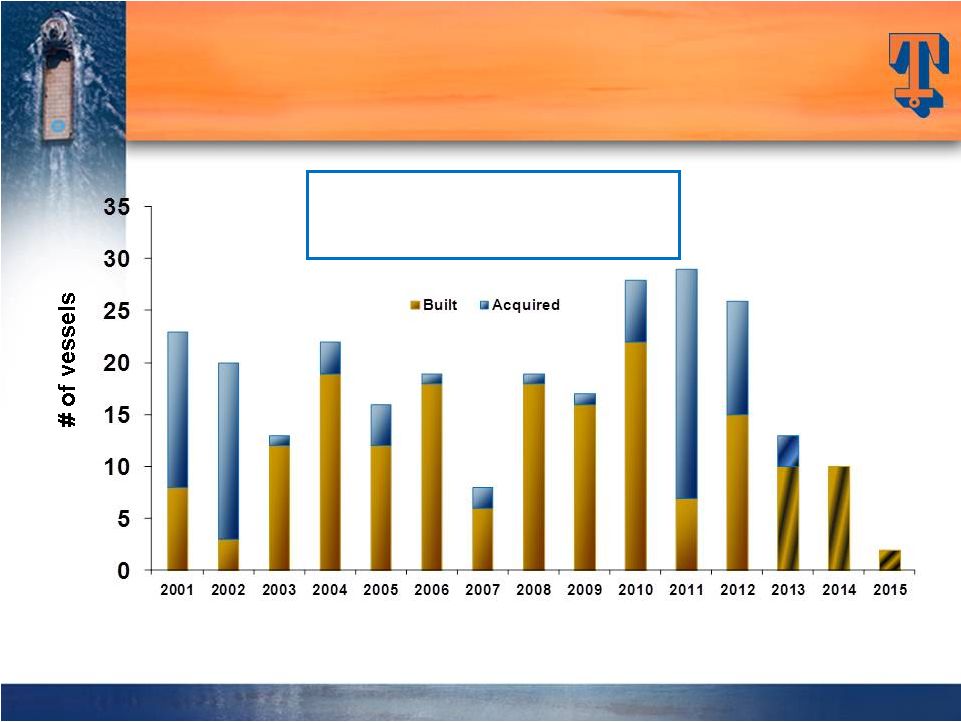 Fiscal Year Actual vessel deliveries through 3/31/12; estimated vessel deliveries based on commitments to build or acquire as of 3/31/12 Through 3/31/12, vessel commitments include 263 vessels with a capital cost of $4.0 billion THROUGH-CYCLE, EVA-BASED INVESTMENT; BALANCE BETWEEN “BUY” and “BUILD” THROUGH-CYCLE, EVA-BASED INVESTMENT; THROUGH-CYCLE, EVA-BASED INVESTMENT; BALANCE BETWEEN “BUY” BALANCE BETWEEN “BUY” and “BUILD” and “BUILD” 12 |
 13 RECENT VESSEL COMMITMENTS RECENT VESSEL COMMITMENTS RECENT VESSEL COMMITMENTS Amounts depict vessel count and total cost in quarter commitment was made to acquire (not when delivery or payments were made) $96M $55M $72M $179M 1 MPSV 1 PSV 4 AHTS 6 AHTS 6 AHTS 3 PSV’s 54 vessels over last 2+ years with a total capital cost of ~$1 billion $66M 4 AHTS 1 PSV 9 AHTS $139M $101M 2 PSV’s 4 PSV 1 AHTS $100M $24M 1 AHTS 4 CREW $83M 3 PSV $116M 4 PSV 0 2 4 6 8 10 12 9/30/09 Qtr 12/31/09 Qtr 3/31/10 Qtr 6/30/10 Qtr 9/30/10 Qtr 12/31/10 Qtr 3/31/11 Qtr 6/30/11 Qtr 9/30/11 Qtr 12/31/11 Qtr 3/31/12 Qtr |
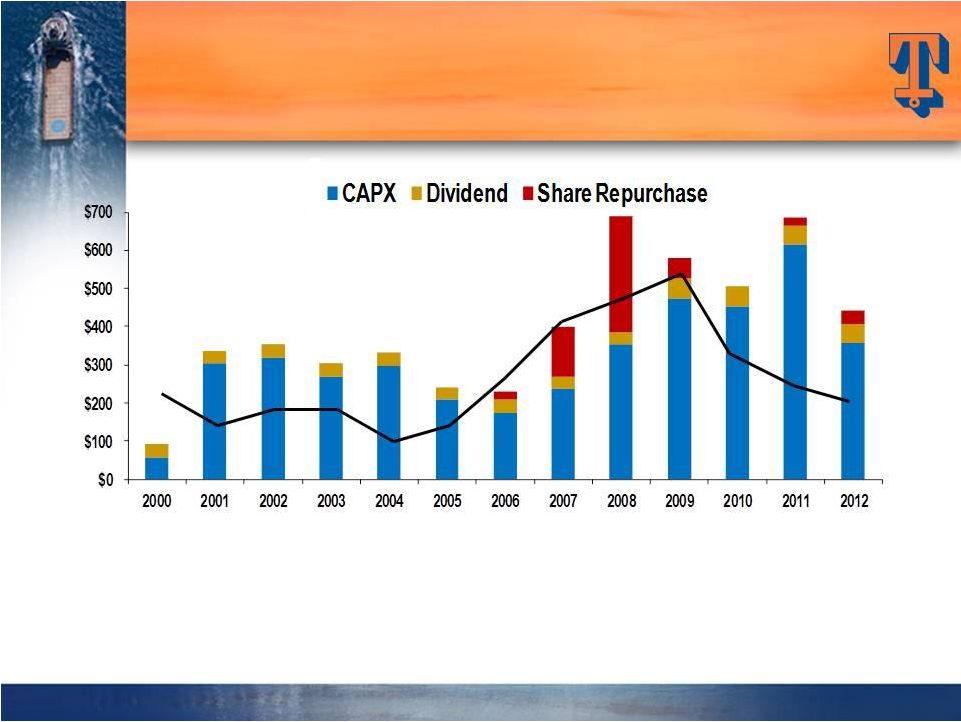 14 Over a 13-year period, Tidewater has invested $4.1 billion in CapEx($3.6 billion in the “new” fleet), and paid out ~$1 billion through dividends and share repurchases. Over the same period, CFFO and proceeds from dispositions were $3.6 billion and $732 million, respectively FLEET RENEWAL & EXPANSION FUNDED BY CFFO THROUGH FISCAL 2012 FLEET RENEWAL & EXPANSION FLEET RENEWAL & EXPANSION FUNDED BY CFFO THROUGH FISCAL 2012 FUNDED BY CFFO THROUGH FISCAL 2012 $ in millions CFFO Fiscal Year |
 15 Senior Unsecured Notes $590 million Average Life to Maturity (as of 3/31/12) ~ 7.9 years Weighted Average Coupon 4.30% Term Loan $125 million* Revolving Line of Credit $450 million Remaining Term ~ 3.8 years Interest Rate LIBOR plus 1.5% to 2.25%, based on leverage *Term Loan drawn in January 2012 RECENT FINANCINGS WILL FUND GROWTH AT AN ATTRACTIVE RELATIVE COST RECENT FINANCINGS WILL FUND GROWTH AT AN ATTRACTIVE RELATIVE COST Private Placement Financings: Private Placement Financings: Credit Facilities: Credit Facilities: |
 16 As of March 31, 2012 Cash & Cash Equivalents $321 million Total Debt $950 million Shareholders Equity $2,526 million Net Debt / Net Capitalization 20% Total Debt / Capitalization 27% ~$770 million of pro forma liquidity as of 3/31/12, including $450 million of availability under bank credit facilities. STRONG FINANCIAL POSITION PROVIDES ADDITIONAL STRATEGIC OPTIONALITY STRONG FINANCIAL POSITION PROVIDES ADDITIONAL STRATEGIC OPTIONALITY |
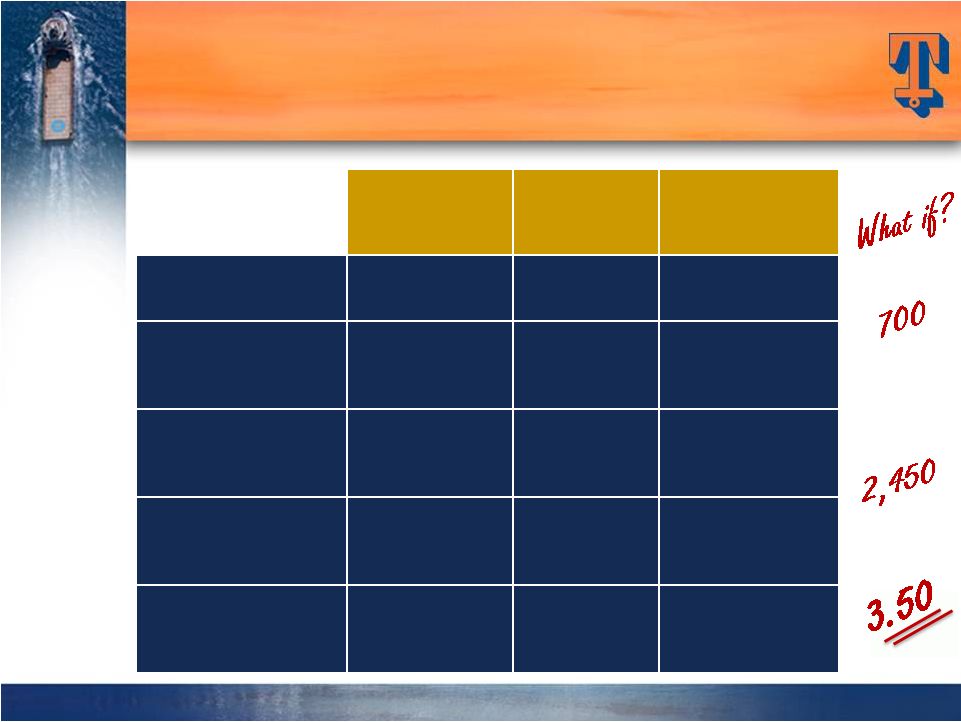
 17 WHERE COULD FISCAL 2014 FIND US? Potential for Earnings Acceleration WHERE COULD FISCAL 2014 FIND US? WHERE COULD FISCAL 2014 FIND US? Potential for Earnings Acceleration Potential for Earnings Acceleration Avg. Dayrates $15,658* $17,224 (+ 10%) $18,946 (+ 10%) 83.2%* 85.0% 90.0% 260 vessel assumption (215 current new vessels + 25 under construction + 20 additional new vessels next year). * 3/31/12 quarterly actual stats This info is not meant to be a prediction of future earnings performance, but simply an indication of earning sensitivities resulting from future fleet additions and reductions and varying operating assumptions ~$400M+ EBITDA ~$535M EBITDA ~$760M EBITDA Actual QtrlyDayrates 6/30/11 $14,091 9/30/11 $14,291 12/31/11 $14,835 3/31/12 $15,658 ~$9.50 EPS ~$5.50 EPS ~$3.40 EPS 17 |
 18 FINANCIAL STRATEGY FOCUSED ON CREATING LONG-TERM SHAREHOLDER VALUE FINANCIAL STRATEGY FOCUSED ON CREATING LONG-TERM SHAREHOLDER VALUE Maintain Maintain Financial Strength Financial Strength EVA-Based Investments EVA-Based Investments On Through-cycle Basis On Through-cycle Basis Deliver Results Deliver Results |
 Joseph M. Bennett Joseph M. Bennett Executive Vice President and Executive Vice President and Chief Investor Relations Officer Chief Investor Relations Officer June 26, 2012 June 26, 2012 2012 Global Hunter Securities 2012 Global Hunter Securities 100 Energy Conference 100 Energy Conference |
 20 APPENDIX APPENDIX APPENDIX |
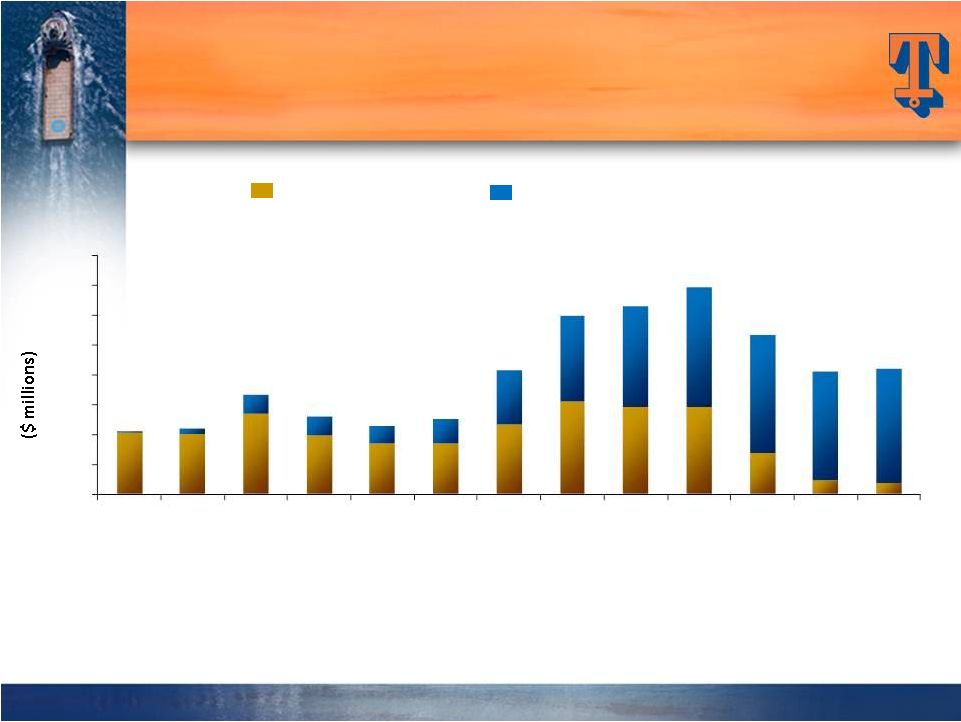
 21 NEW FLEET DRIVING RESULTS NEW FLEET DRIVING RESULTS NEW FLEET DRIVING RESULTS Vessel Revenue ($) Average Fleet Count 213 Average New Vessels in Q4 2012 $288 million Vessel Revenue in Q4 2012 (88% from New Vessels) 0 50 100 150 200 250 300 350 400 450 Q1 Q2 Q3 Q4 Q1 Q2 Q3 Q4 Q1 Q2 Q3 Q4 Q1 Q2 Q3 Q4 FY 2009 FY 2010 FY 2011 FY 2012 New Traditional 0 50 100 150 200 250 300 350 400 450 Q1 Q2 Q3 Q4 Q1 Q2 Q3 Q4 Q1 Q2 Q3 Q4 Q1 Q2 Q3 Q4 FY 2009 FY 2010 FY 2011 FY 2012 New Traditional Stacked |
 22 Vessel Cash Operating Margin ($) Vessel Cash Operating Margin (%) $120 million Vessel Margin in Q4 2012 (91% from New Vessels) Q4 2012 Vessel Margin: 41% CYCLICAL UPTURN SHOULD DRIVE MARGIN EXPANSION CYCLICAL UPTURN SHOULD DRIVE MARGIN EXPANSION 0 25 50 75 100 125 150 175 200 Q1 Q2 Q3 Q4 Q1 Q2 Q3 Q4 Q1 Q2 Q3 Q4 Q1 Q2 Q3 Q4 FY 2009 FY 2010 FY 2011 FY 2012 New Traditional 0% 10% 20% 30% 40% 50% 60% 70% Q1 Q2 Q3 Q4 Q1 Q2 Q3 Q4 Q1 Q2 Q3 Q4 Q1 Q2 Q3 Q4 FY 2009 FY 2010 FY 2011 FY 2012 Total New Traditional |
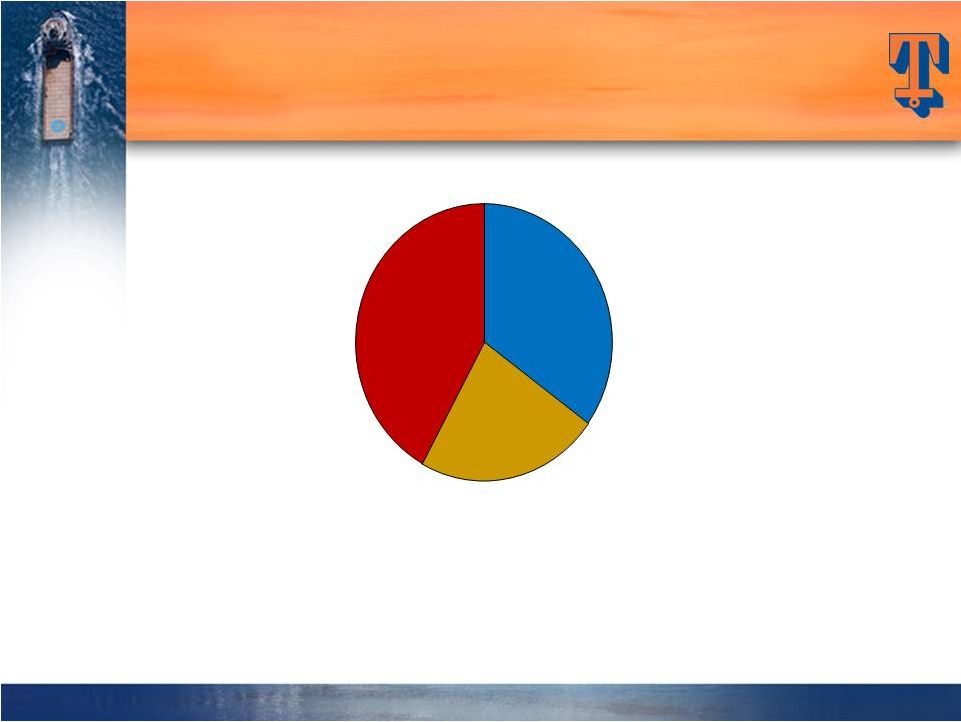 CURRENT REVENUE MIX Quality of Customer Base CURRENT REVENUE MIX CURRENT REVENUE MIX Quality of Customer Base Quality of Customer Base Our top 10 customers in Fiscal 2012 (4 Super Majors, 3 NOC’s and 3 IOC’s) accounted for 59% of our revenue Super Majors 35% NOC's 23% Others 42% 23 |
 24 Other Operators Top 10 Customers Tidewater’s top 10 customers contract ~19% of the working worldwide jackup fleet and ~50% of the working worldwide floater fleet Jackups (334 Working Rigs) Floater Rigs (232 Working Rigs) 62 272 116 Source: ODS-Petrodata and Tidewater Other Operators Top 10 customers 116 RIGS CONTRACTED BY OUR TOP 10 CUSTOMERS RIGS CONTRACTED BY OUR RIGS CONTRACTED BY OUR TOP 10 CUSTOMERS TOP 10 CUSTOMERS (Estimated as of May 2012) (Estimated as of May 2012) |
 25 FLEET CASH OPERATING MARGINS FLEET CASH OPERATING MARGINS FLEET CASH OPERATING MARGINS Traditional Vessels New Vessels Cash Oper Margin 38.6% 37.6% 46.5% 41.9% 36.9% 38.7% 49.1% 54.6% 51.9% 51.3% 46.8% 39.3% 39.8% Note: Cash operating margins are defined as vessel revenue less vessel operating expenses Fiscal Years $0 $100 $200 $300 $400 $500 $600 $700 $800 2000 2001 2002 2003 2004 2005 2006 2007 2008 2009 2010 2011 2012 |
 26 Twelve Months Ended 3/31/12 3/31/11 Revenues $1,067 $1,055 Net Earnings* $110 $123 EPS* $2.13 $2.40 Net Cash from Operations $222 $264 Capital Expenditures $357 $615 *Fiscal 2012 excludes $22.1 million, or $0.43 per share, goodwill impairment charge in September 2011. Fiscal 2011 excludes an after-tax $4.35 million, or $0.09 per share, charge related to settlement with DOJ and an after-tax $6.3 million, or $0.12 per share, charge related to settlement with the Government of Nigeria for FCPA matters, an after-tax $3.9 million, or $0.08 per share, charge related to participation in a multi-company U.K.-based pension plan, and an after-tax $3.0 million, or $0.06 per share, impairment charge related to certain vessels. $ in Millions, Except Per Share Data RECENT FINANCIAL RESULTS REFLECT CYCLICAL DOWNTURN RECENT FINANCIAL RESULTS RECENT FINANCIAL RESULTS REFLECT CYCLICAL DOWNTURN REFLECT CYCLICAL DOWNTURN |
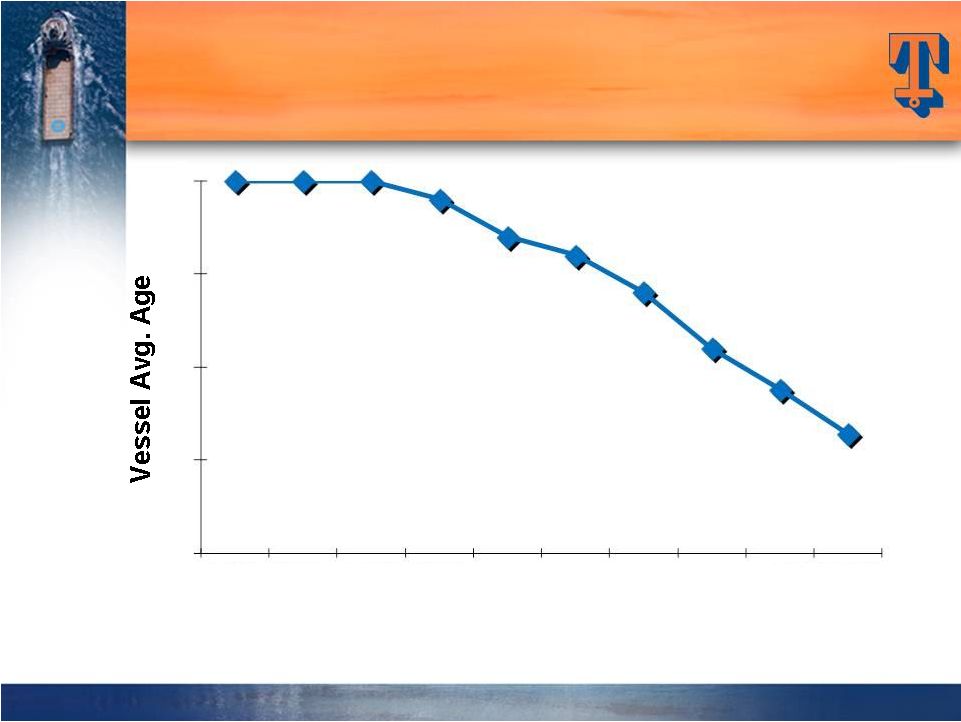 27 SIGNIFICANT AVERAGE AGE IMPROVEMENT SIGNIFICANT AVERAGE SIGNIFICANT AVERAGE AGE IMPROVEMENT AGE IMPROVEMENT 20 14 6 0 5 10 15 20 12/31/11 12/31/12 12/31/13 12/31/14 3/31/06 3/31/07 3/31/08 12/31/08 12/31/09 12/31/10 1) Average 45 vessel disposals per year in future (versus an average of 50+ vessel dispositions per year over last 3 years). 2) Includes 25 vessels under construction, including 3 vessel purchase commitments (based on current estimated delivery schedule), plus additional newbuilds/acquisitions of ~20 vessels per year (approximately $500 million in new capital commitments per year). Tidewater is not committed to spending $500 million annually, but we use this assumption in estimating average fleet age in the future. Assumptions: |
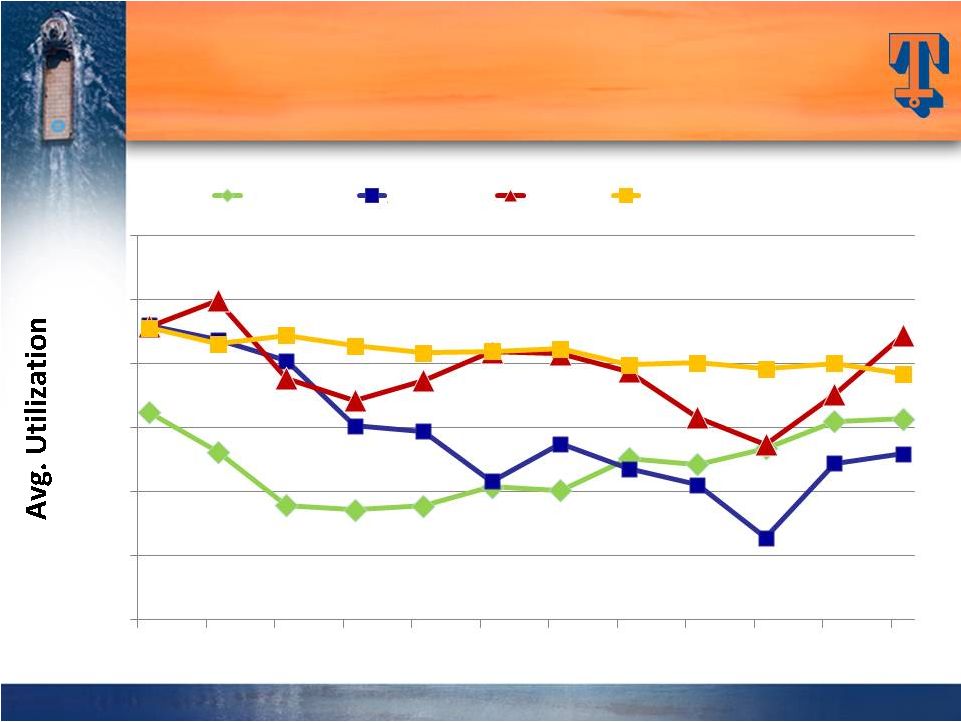 28 VESSEL UTILIZATION BY SEGMENT VESSEL UTILIZATION BY SEGMENT VESSEL UTILIZATION BY SEGMENT 30% 40% 50% 60% 70% 80% 90% 6/09 9/09 12/09 3/10 6/10 9/10 12/10 3/11 6/11 9/11 12/11 3/12 Americas Asia/Pac MENA Sub Sah Africa |
 VESSEL DAYRATES BY SEGMENT VESSEL DAYRATES BY SEGMENT VESSEL DAYRATES BY SEGMENT 29 |