 Exhibit 99.1 Exhibit 99.1 |
 2 In accordance with the safe harbor provisions of the Private Securities Litigation Reform Act of 1995, the Company notes that certain statements set forth in this presentation provide other than historical information and are forward looking. The actual achievement of any forecasted results, or the unfolding of future economic or business developments in any way anticipated or projected by the Company, involve many risks and uncertainties. Among those risks and uncertainties, many of which are beyond the control of the Company, are: fluctuations in oil and gas prices; the level of fleet additions by competitors and vessel overcapacity; changes in levels of capital spending in domestic and international markets by customers in the energy industry for exploration, development and production; unsettled political conditions, civil unrest and governmental actions, especially in higher risk countries of operations; changing customer demands for different vessel specifications; acts of terrorism; unsettled political conditions, war, civil unrest and governmental actions, especially in higher risk countries of operations; foreign currency fluctuations; and environmental and labor laws. Participants should consider all of these risk factors as well as other information contained in the Company’s form 10-K’s and 10-Q’s. |
 3 |
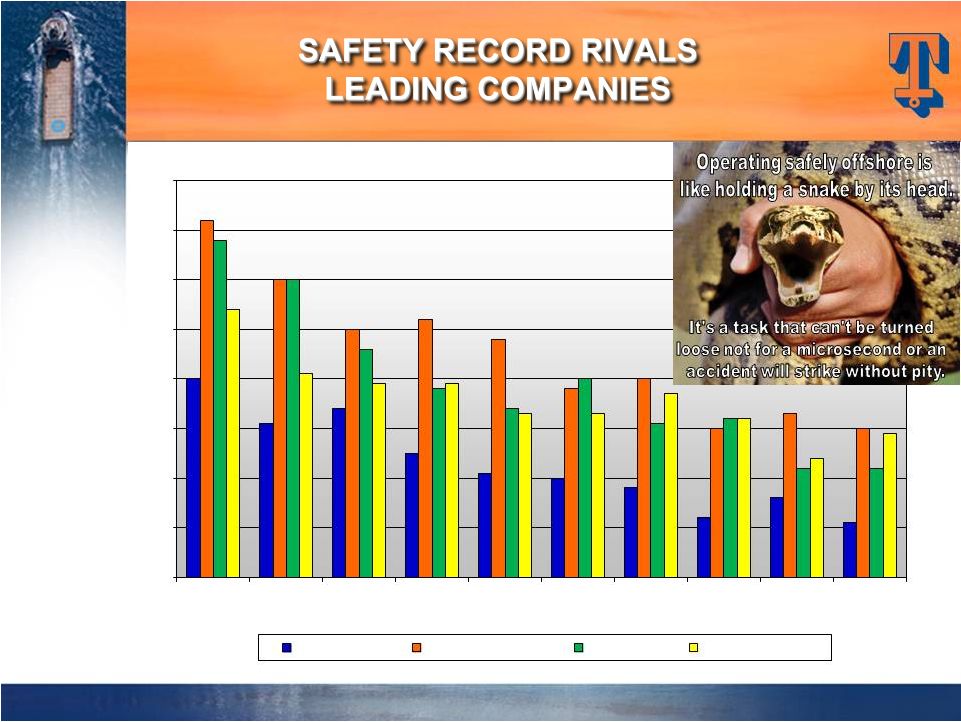 4 TOTAL RECORDABLE INCIDENT RATES 0.80 0.00 0.10 0.70 0.60 0.50 0.40 0.30 0.20 2002 2003 2004 2005 2006 2007 2008 2009 2011 2010 CALENDAR YEARS TIDEWATER DOW CHEMICAL CHEVRON EXXON/MOBIL |
 5 Unique global footprint; 50+ years of Int’l experience Unmatched scale and scope of operations Strength of International business compliments U.S. activity Secular growth Longer contracts Better utilization Higher day rates Solid customer base of NOC’s and IOC’s |
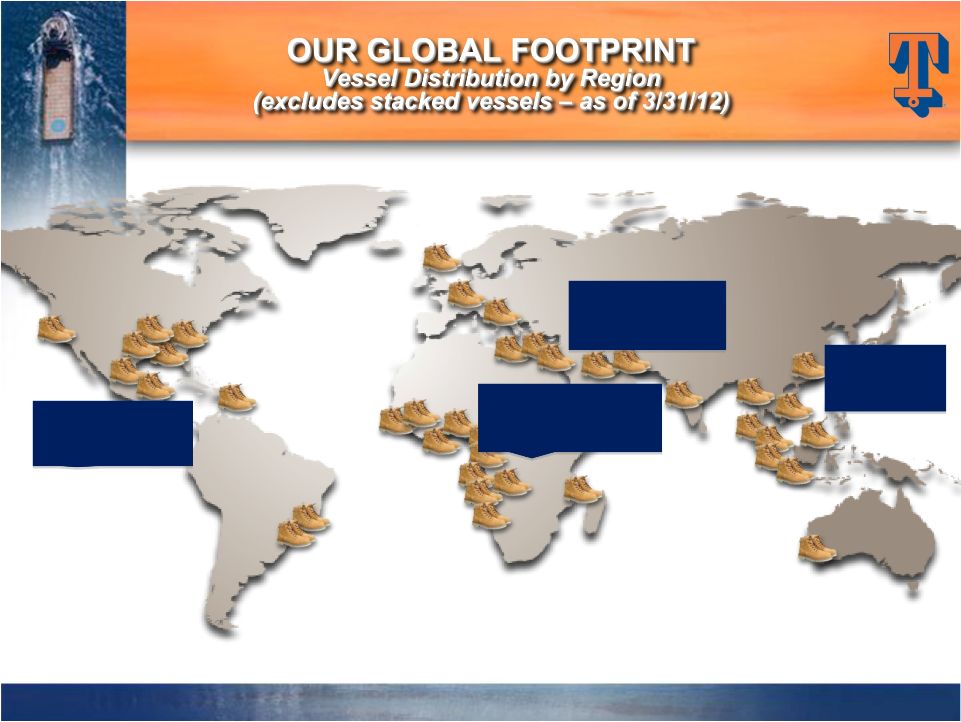 In 4Q FY 2012, ~6% of vessels/revenue was generated in U.S. GOM; however, 38 total active U.S.-flagged vessels provide good optionality to a recovery in the U.S. GOM. 6 Asia/Pac 33(13%) MENA 35(13%) SS Africa/Europe 132(50%) Americas 63(24%) |
 Vessel Count Estimated Cost AHTS 101 $1,765m PSV’s 91 $1,934m Crew boats & Tugs 71 $301m TOTALS: 263 $4,000m (1) . At 3/31/12, 215 new vessels were in our fleet with ~5.7 year average age Vessel Commitments Jan. ’00 – March ‘12 (1) $3,640m (91%) funded through 3/31/12 7 |
 8 Count AHTS 2 PSV 18 Crew and Tug 5 Total 25 Vessels Under Construction* As of March 31, 2012 Estimated delivery schedule – 13 in FY ‘13, 10 in FY ‘14 and 2 thereafter. CAPX of $220m in FY ‘13, $95m in FY ‘14 and $44m in FY ’15. * Includes 3 new vessel purchase commitments at 3/31/12 8 |
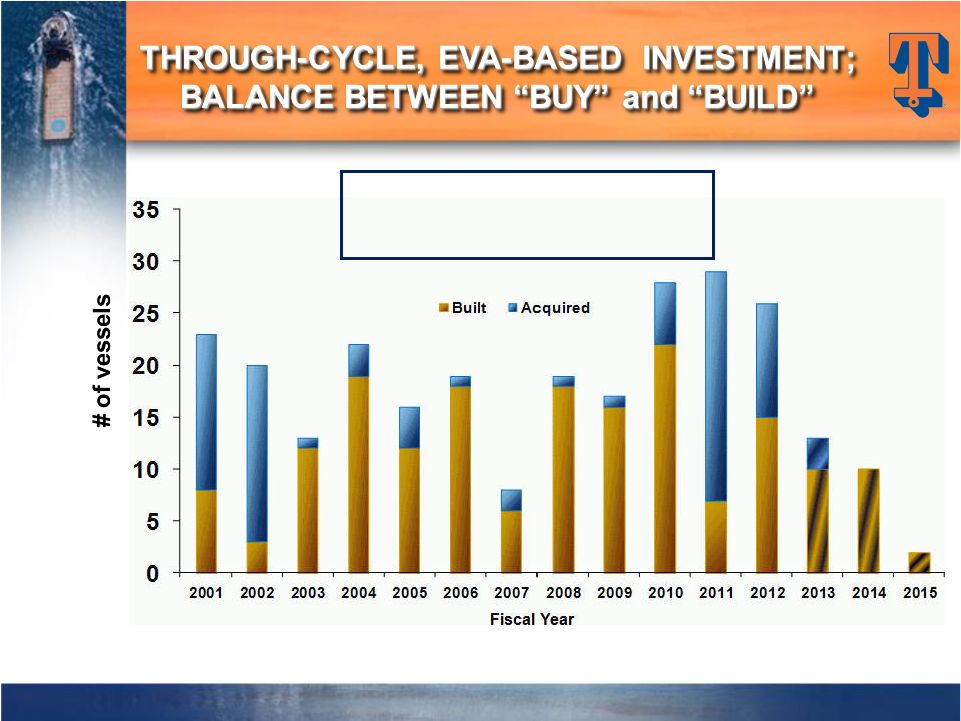 Actual vessel deliveries through 3/31/12; estimated vessel deliveries based on commitments to build or acquire as of 3/31/12 Through 3/31/12, vessel commitments include 263 vessels with a capital cost of $4.0 billion 9 |
 10 |
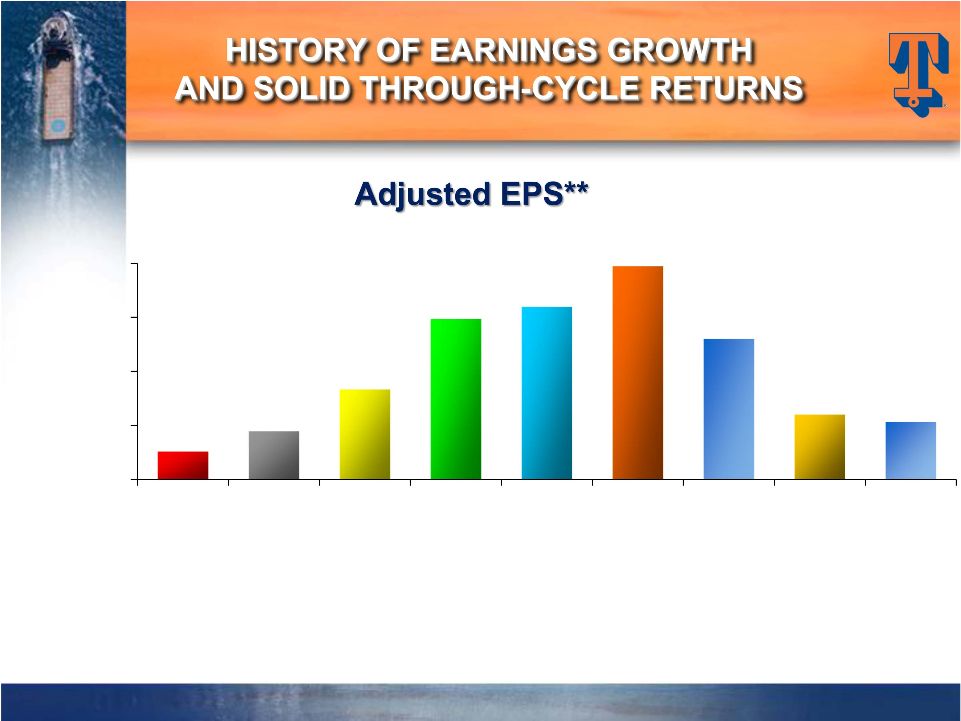 11 ** EPS in Fiscal 2004 is exclusive of the $.30 per share after tax impairment charge. EPS in Fiscal 2006 is exclusive of the $.74 per share after tax gain from the sale of six KMAR vessels. EPS in Fiscal 2007 is exclusive of $.37 per share of after tax gains from the sale of 14 offshore tugs. EPS in Fiscal 2010 is exclusive of $.66 per share Venezuelan provision, a $.70 per share tax benefit related to favorable resolution of tax litigation and a $0.22 per share charge for the proposed settlement with the SEC of the company’s FCPA matter. EPS in Fiscal 2011 is exclusive of total $0.21 per share charges for settlements with DOJ and Government of Nigeria for FCPA matters, a $0.08 per share charge related to participation in a multi-company U.K.-based pension plan and a $0.06 per share impairment charge related to certain vessels. EPS in Fiscal 2012 is exclusive of $0.43 per share goodwill impairment charge. Adjusted Return On Avg. Equity $8.00 $6.00 $4.00 $2.00 $0.00 Fiscal 2004 Fiscal 2005 Fiscal 2006 Fiscal 2007 Fiscal 2008 Fiscal 2009 Fiscal 2010 Fiscal 2011 Fiscal 2012 $1.03 $1.78 $3.33 $5.94 $6.39 $7.89 $5.20 $2.40 $2.13 4.3% 7.2% 12.4% 18.9% 18.3% 19.5% 11.4% 5.0% 4.3% |
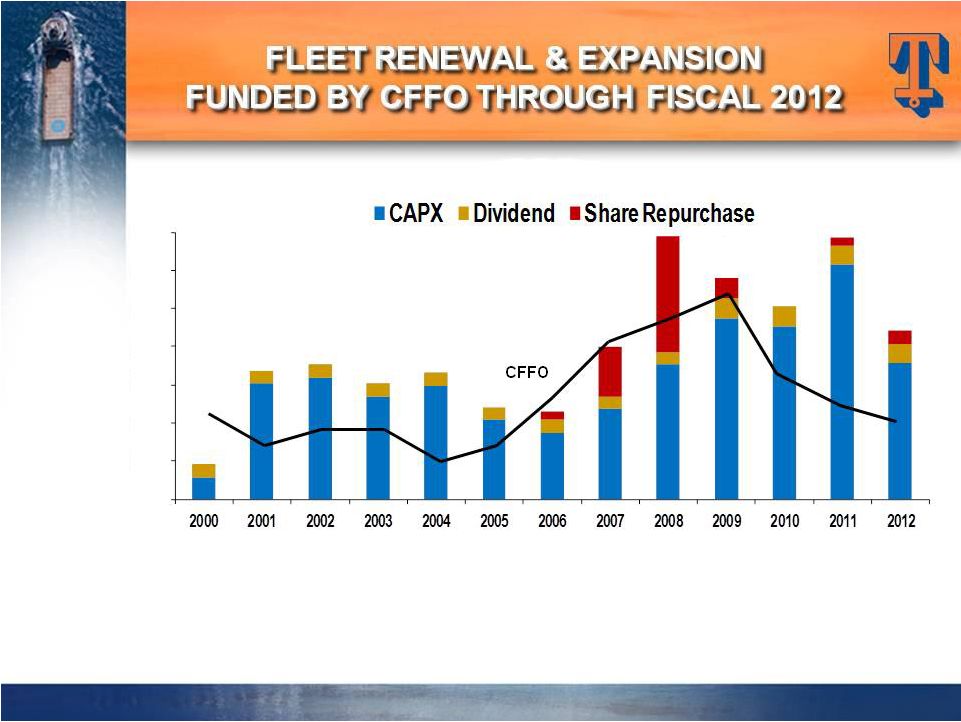 12 Over a 13-year period, Tidewater has invested $4.1 billion in CapEx($3.6 billion in the “new” fleet), and paid out ~$1 billion through dividends and share repurchases. Over the same period, CFFO and proceeds from dispositions were $3.6 billion and $732 million, respectively 12 Fiscal Year $0 $700 $600 $500 $400 $300 $200 $100 $ in millions |
 13 ~$770 million of available liquidity as of 3/31/12, including $450 million of unused capacity under committed bank credit facilities. Cash & Cash Equivalents Total Debt Shareholders Equity Net Debt / Net Capitalization Total Debt / Capitalization $321 million $950 million $2,526 million 20% 27% As of March 31, 2012 13 |
 14 $ in Millions, Except Per Share Data Six Months Ended Revenues Net Earnings* EPS* Net Cash from Operations Capital Expenditures 9/30/11 $506 $42 $0.81 $87 $155 3/31/12 $562 $68 $1.33 $135 $202 *9/30/11 Six Month amounts exclude $22.1 million, or $0.43 per share, goodwill impairment charge in September 2011. |
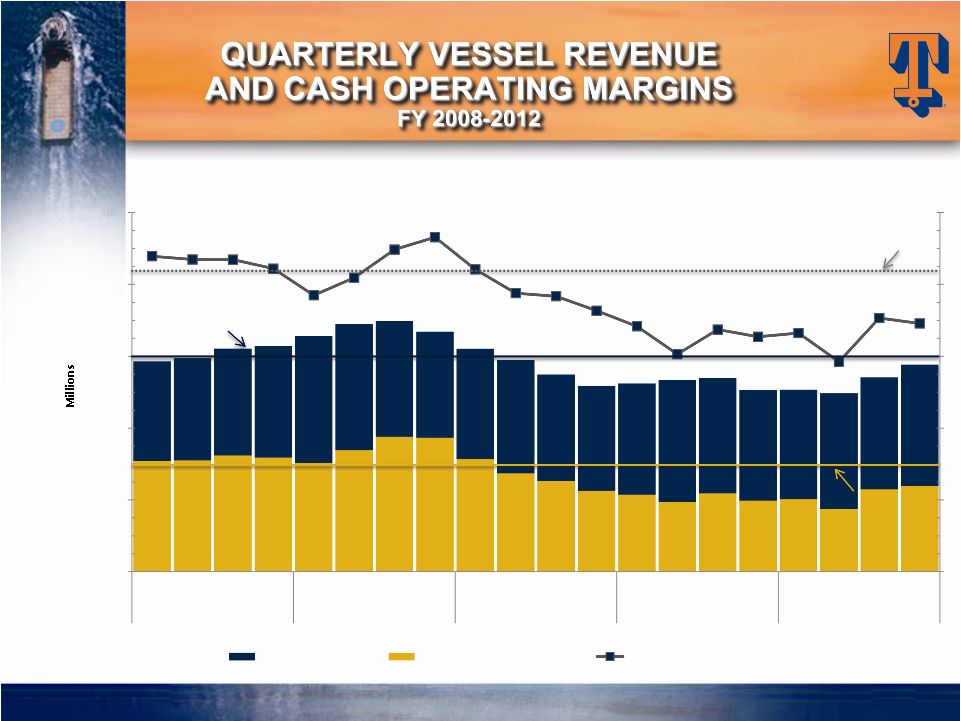 Prior peak period (FY2009) averaged quarterly revenue of $339M, and operating margin of $174M, or 51% $500 $400 $300 $200 $100 $- $300 million 52.7% 52.1% 46.2% 53.8% 55.9% 50.5% 43.6% 36.3% 39.3% 35.1% 42.4% 41.5% $150 million 50% Qtr 1 Qtr 2 Qtr 3 Qtr 4 Qtr 1 Qtr 2 Qtr 3 Qtr 4 Qtr 1 Qtr 2 Qtr 3 Qtr 4 Qtr 1 Qtr 2 Qtr 3 Qtr 4 Qtr 1 Qtr 2 Qtr 3 Qtr 4 Fiscal 08 Fiscal 09 Fiscal 10 Fiscal 11 Fiscal 12 Vessel Revenue ($) Vessel Operating Margin ($) Vessel Operating Margin (%) Vessel Cash Operating Margin is defined as Vessel Revenues less Vessel Operating Costs. 15 |
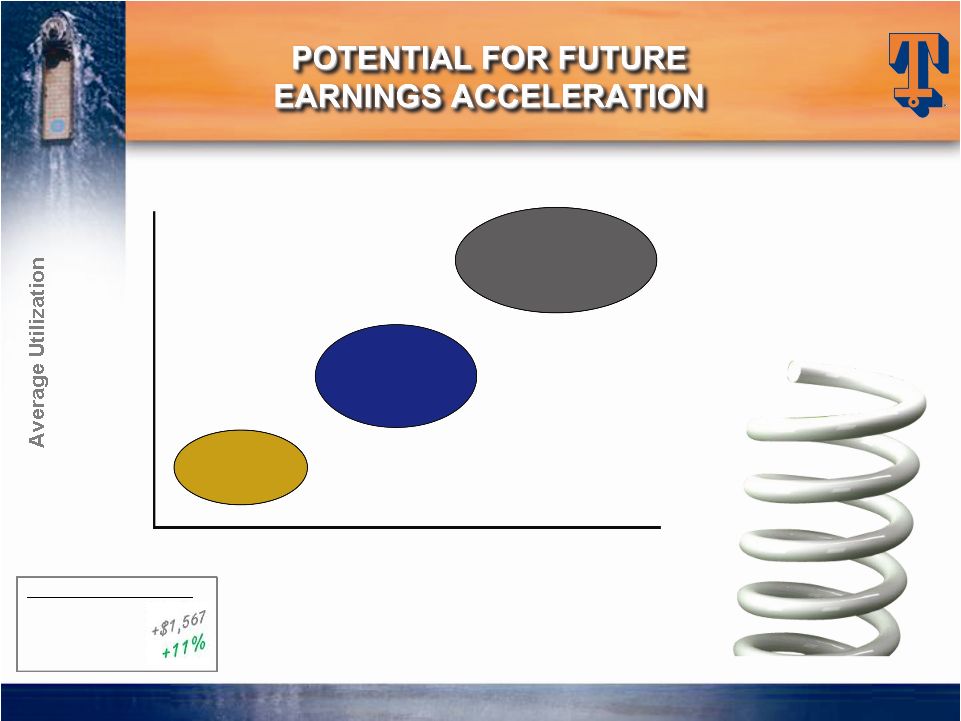 Average Day rates $15,658* $17,224 (+ 10%) $18,946 (+ 10%) 83.2%* 85.0% 90.0% ~$3.40 EPS ~$5.50 EPS ~$9.50 EPS 260 vessel assumption (215 current new vessels + 25 under construction + 20 additional new vessels next year). * 3/31/12 quarterly actual stats This info is not meant to be a prediction of future earnings performance, but simply an indication of earning sensitivities resulting from future fleet additions and reductions and varying operating assumptions ~$400M+ EBITDA +$500M EBITDA +$700M EBITDA Actual Avg Qtrly Day rates 6/30/11 $14,091 9/30/11 $14,291 12/31/11 $14,835 3/31/12 $15,658 16 |
 17 |
 To recognize an individual or team that has: Performed heroic acts in time of crisis Significantly impacted the TDW business Significantly contributed to our customer success or relationships Had a breakthrough idea or contribution resulting in significant improvements for TDW Went above and beyond on normal duties and responsibilities to achieve greatness 18 |
 19 |
 |
 21 |
 |