UBS Global Oil and Gas Conference John Rynd Quinn Fanning Chief Executive Officer Chief Financial Officer May 23, 2018 Exhibit 99.1
FORWARD-LOOKING STATEMENTS In accordance with the safe harbor provisions of the Private Securities Litigation Reform Act of 1995, the Company notes that certain statements set forth in this presentation provide other than historical information and are forward looking. The unfolding of future economic or business developments may happen in a way not as anticipated or projected by the Company and may involve numerous risks and uncertainties that may cause the Company’s actual achievement of any forecasted results to be materially different from that stated or implied in the forward-looking statement. Among those risks and uncertainties, many of which are beyond the control of the Company, include, without limitation, fluctuations in worldwide energy demand and oil and gas prices; fleet additions by competitors and industry overcapacity; customer actions including changes in capital spending for offshore exploration, development and production and changes in demands for different vessel specifications; acts of terrorism and piracy; the impact of potential information technology, cybersecurity or data security breaches; significant weather conditions; unsettled political conditions, war, civil unrest and governmental actions, especially in higher political risk countries where we operate; labor changes proposed by international conventions; increased regulatory burdens and oversight; changes in law, economic and global financial market conditions, including the effect of enactment of U.S. tax reform or other tax law changes, trade policy and tariffs, interest and foreign currency exchange rate volatility, commodity and equity prices and the value of financial assets; and enforcement of laws related to the environment, labor and foreign corrupt practices. Readers should consider all of these risks factors, other factors that are described in “Forward-Looking Statements,” as well as other information contained in the Company’s form 10-K’s and 10-Q’s. UBS Global Oil and Gas Conference 2018 | Tidewater Inc.
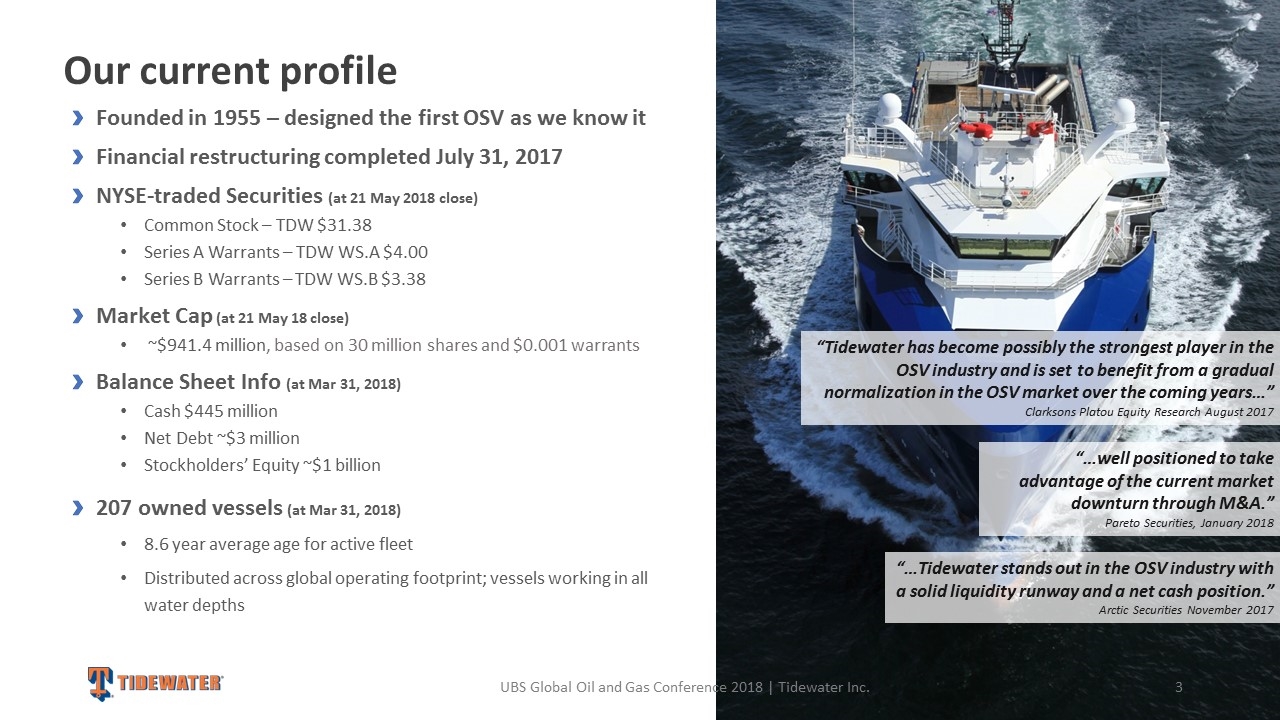
Founded in 1955 – designed the first OSV as we know it Financial restructuring completed July 31, 2017 NYSE-traded Securities (at 21 May 2018 close) Common Stock – TDW $31.38 Series A Warrants – TDW WS.A $4.00 Series B Warrants – TDW WS.B $3.38 Market Cap (at 21 May 18 close) ~$941.4 million, based on 30 million shares and $0.001 warrants Balance Sheet Info (at Mar 31, 2018) Cash $445 million Net Debt ~$3 million Stockholders’ Equity ~$1 billion 207 owned vessels (at Mar 31, 2018) 8.6 year average age for active fleet Distributed across global operating footprint; vessels working in all water depths Our current profile “Tidewater has become possibly the strongest player in the OSV industry and is set to benefit from a gradual normalization in the OSV market over the coming years…” Clarksons Platou Equity Research August 2017 “…well positioned to take advantage of the current market downturn through M&A.” Pareto Securities, January 2018 “…Tidewater stands out in the OSV industry with a solid liquidity runway and a net cash position.” Arctic Securities November 2017 UBS Global Oil and Gas Conference 2018 | Tidewater Inc.
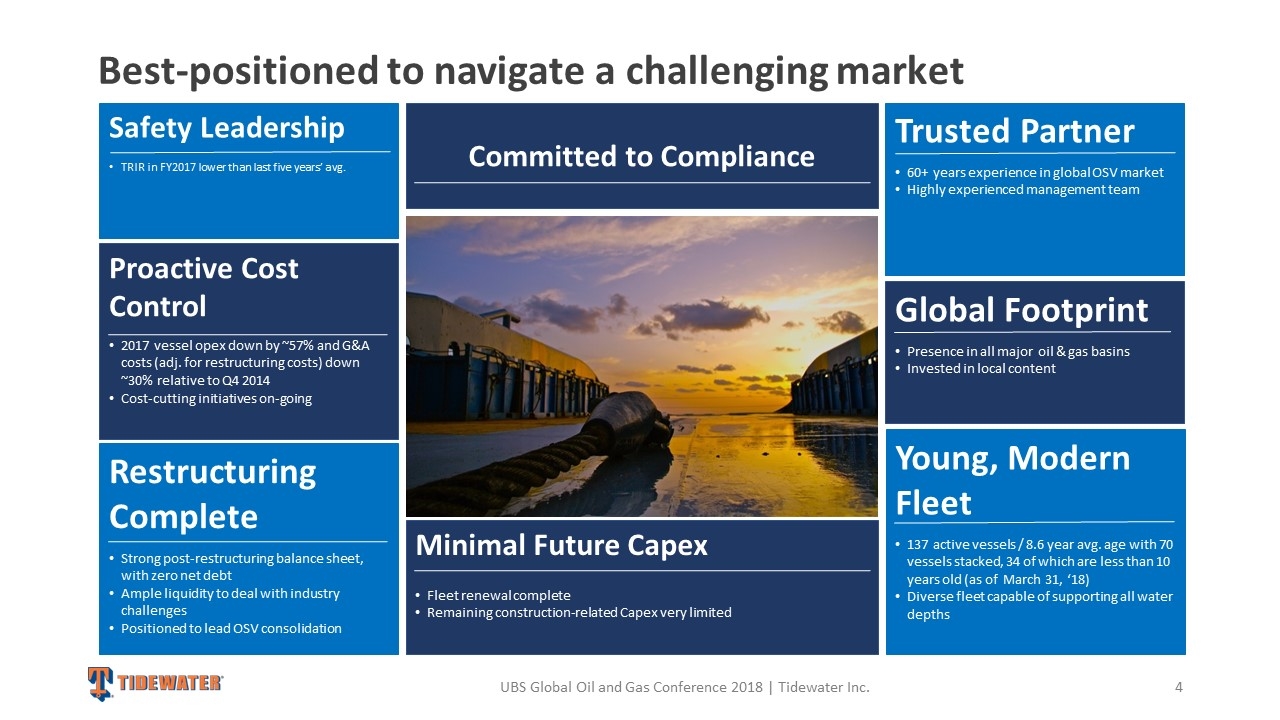
Best-positioned to navigate a challenging market Safety Leadership TRIR in FY2017 lower than last five years’ avg. Trusted Partner 60+ years experience in global OSV market Highly experienced management team Committed to Compliance Global Footprint Presence in all major oil & gas basins Invested in local content Minimal Future Capex Fleet renewal complete Remaining construction-related Capex very limited Young, Modern Fleet 137 active vessels / 8.6 year avg. age with 70 vessels stacked, 34 of which are less than 10 years old (as of March 31, ‘18) Diverse fleet capable of supporting all water depths Restructuring Complete Strong post-restructuring balance sheet, with zero net debt Ample liquidity to deal with industry challenges Positioned to lead OSV consolidation Proactive Cost Control 2017 vessel opex down by ~57% and G&A costs (adj. for restructuring costs) down ~30% relative to Q4 2014 Cost-cutting initiatives on-going UBS Global Oil and Gas Conference 2018 | Tidewater Inc.
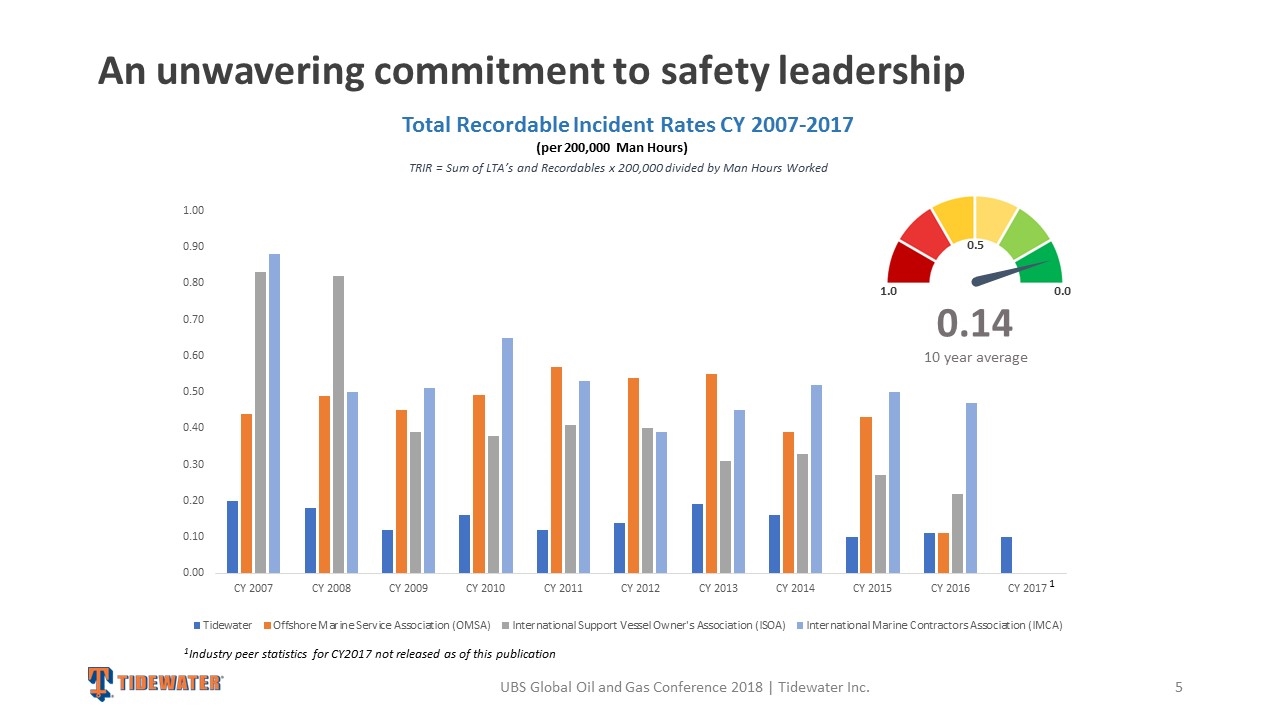
An unwavering commitment to safety leadership Total Recordable Incident Rates CY 2007-2017 (per 200,000 Man Hours) TRIR = Sum of LTA’s and Recordables x 200,000 divided by Man Hours Worked 0.0 1.0 0.5 0.14 10 year average 1 1Industry peer statistics for CY2017 not released as of this publication UBS Global Oil and Gas Conference 2018 | Tidewater Inc.
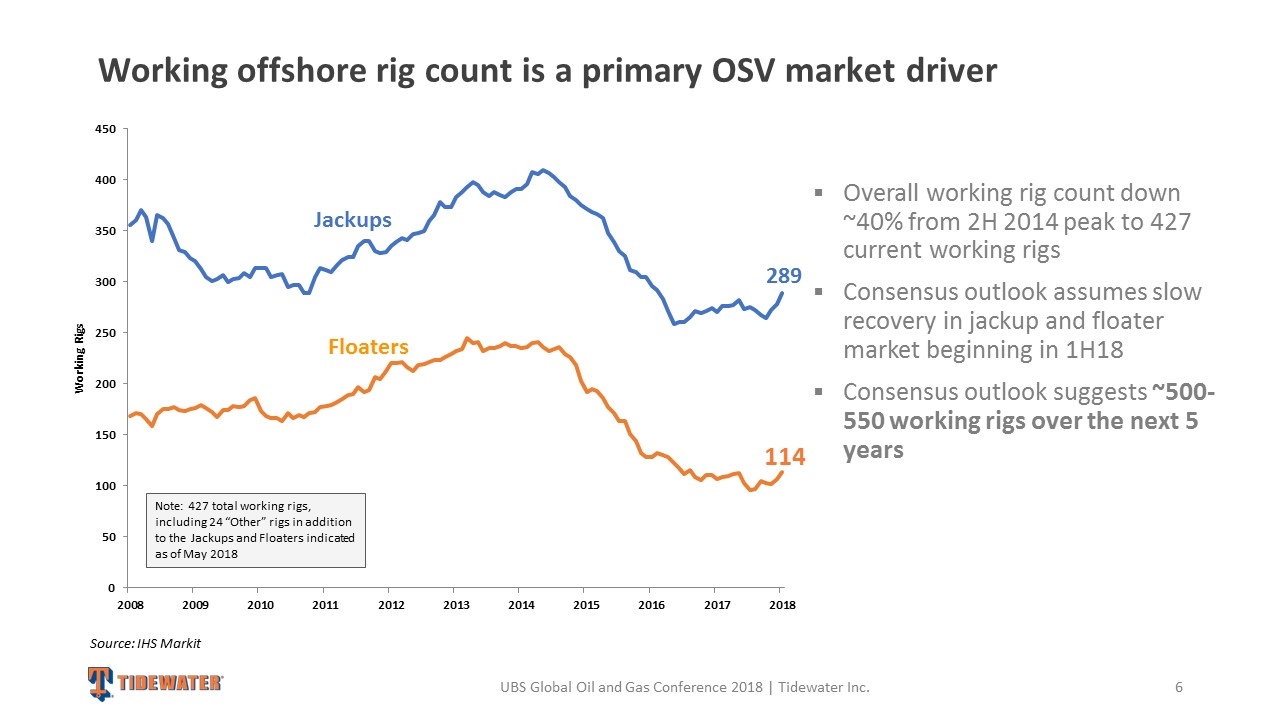
Overall working rig count down ~40% from 2H 2014 peak to 427 current working rigs Consensus outlook assumes slow recovery in jackup and floater market beginning in 1H18 Consensus outlook suggests ~500-550 working rigs over the next 5 years Working offshore rig count is a primary OSV market driver Source: IHS Markit UBS Global Oil and Gas Conference 2018 | Tidewater Inc. Note: 427 total working rigs, including 24 “Other” rigs in addition to the Jackups and Floaters indicated as of May 2018 114 289 Jackups Floaters
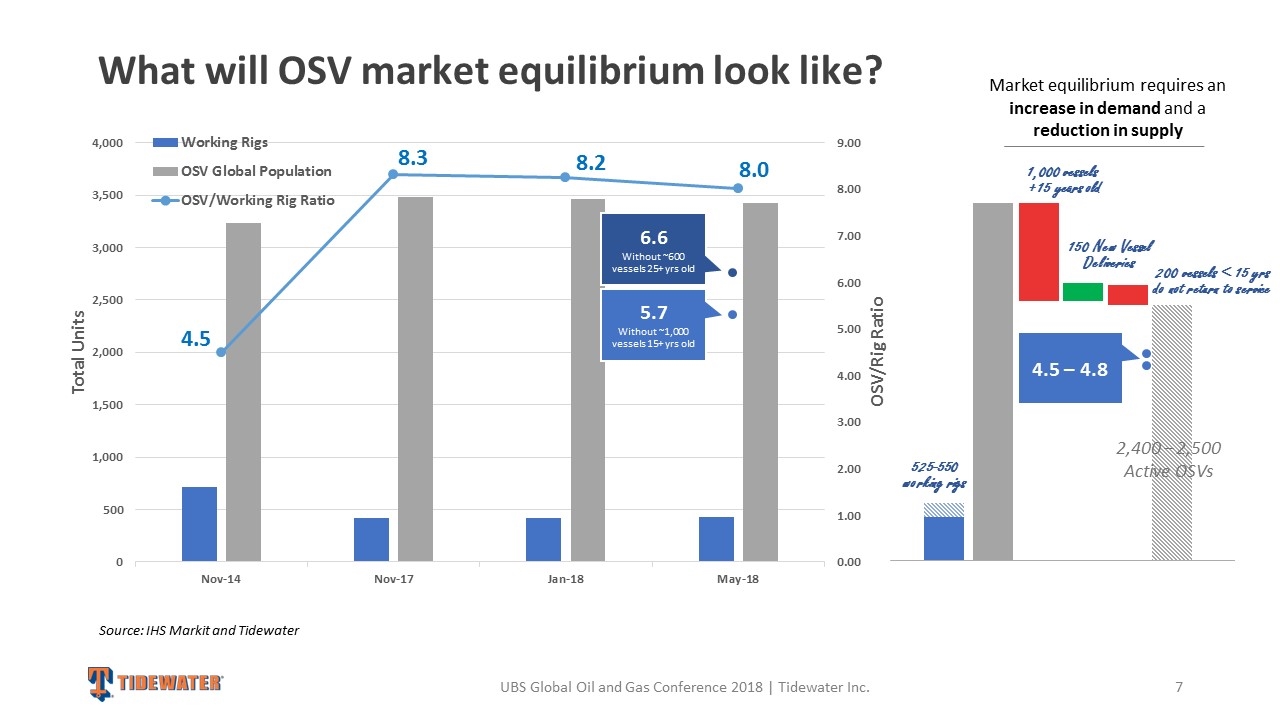
What will OSV market equilibrium look like? Source: IHS Markit and Tidewater 1,000 vessels +15 years old 200 vessels < 15 yrs do not return to service 525-550 working rigs 150 New Vessel Deliveries 4.5 – 4.8 2,400 – 2,500 Active OSVs Market equilibrium requires an increase in demand and a reduction in supply UBS Global Oil and Gas Conference 2018 | Tidewater Inc. 6.6 Without ~600 vessels 25+ yrs old 5.7 Without ~1,000 vessels 15+ yrs old
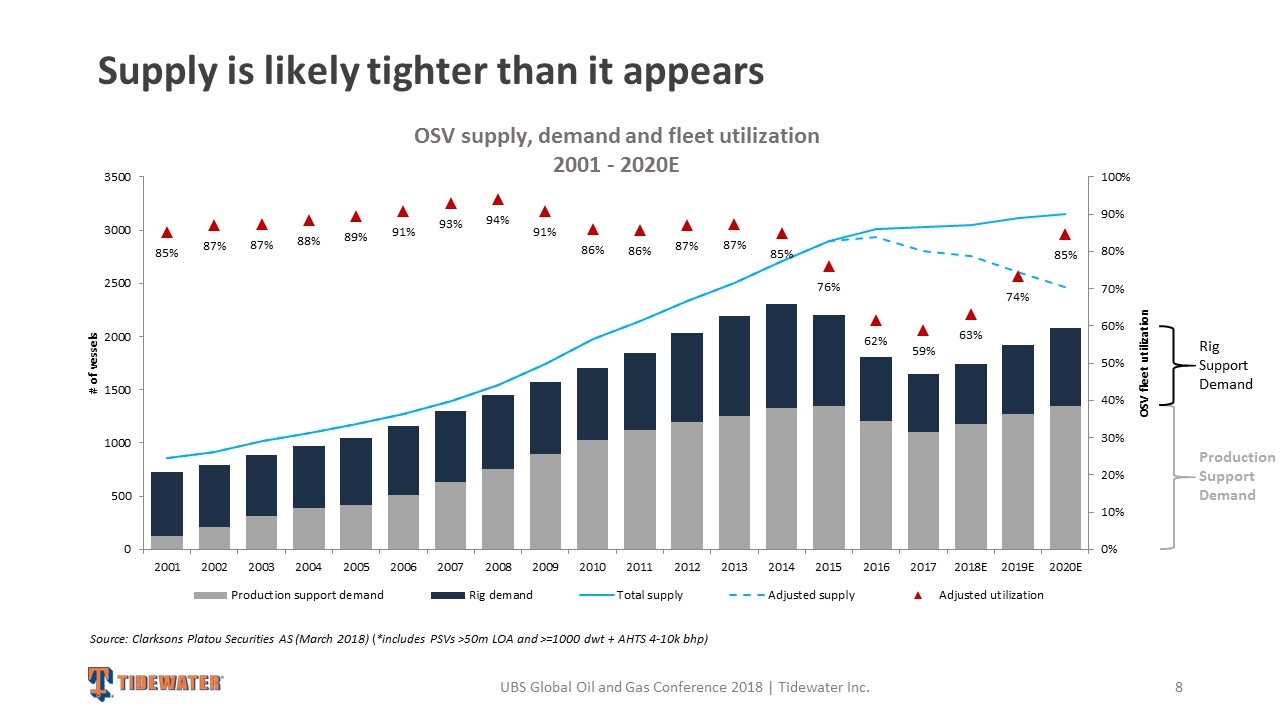
Supply is likely tighter than it appears Source: Clarksons Platou Securities AS (March 2018) (*includes PSVs >50m LOA and >=1000 dwt + AHTS 4-10k bhp) OSV supply, demand and fleet utilization 2001 - 2020E Production Support Demand Rig Support Demand UBS Global Oil and Gas Conference 2018 | Tidewater Inc.
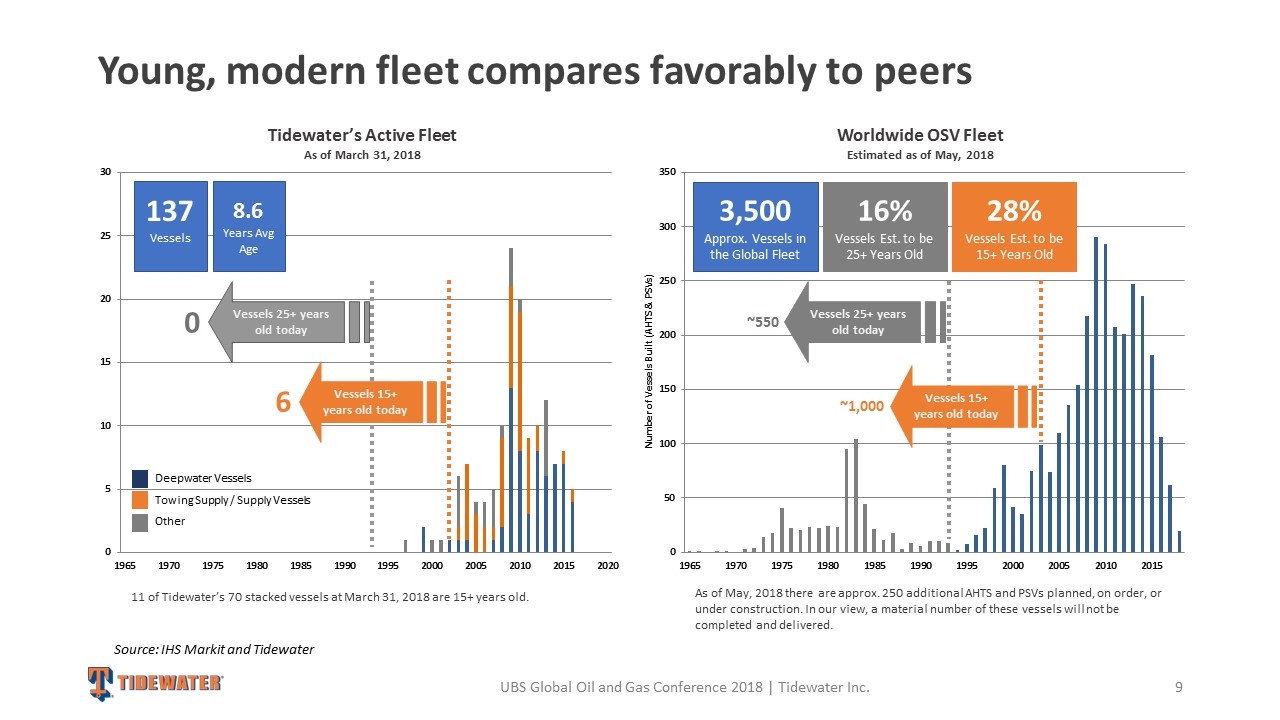
Young, modern fleet compares favorably to peers Source: IHS Markit and Tidewater As of May, 2018 there are approx. 250 additional AHTS and PSVs planned, on order, or under construction. In our view, a material number of these vessels will not be completed and delivered. Worldwide OSV Fleet Estimated as of May, 2018 Tidewater’s Active Fleet As of March 31, 2018 11 of Tidewater’s 70 stacked vessels at March 31, 2018 are 15+ years old. UBS Global Oil and Gas Conference 2018 | Tidewater Inc. Deepwater Vessels Towing Supply / Supply Vessels Other 137 Vessels 8.6 Years Avg Age Vessels 25+ years old today Vessels 15+ years old today 6 0 3,500 Approx. Vessels in the Global Fleet 16% Vessels Est. to be 25+ Years Old Vessels 25+ years old today Vessels 15+ years old today ~1,000 ~550 28% Vessels Est. to be 15+ Years Old
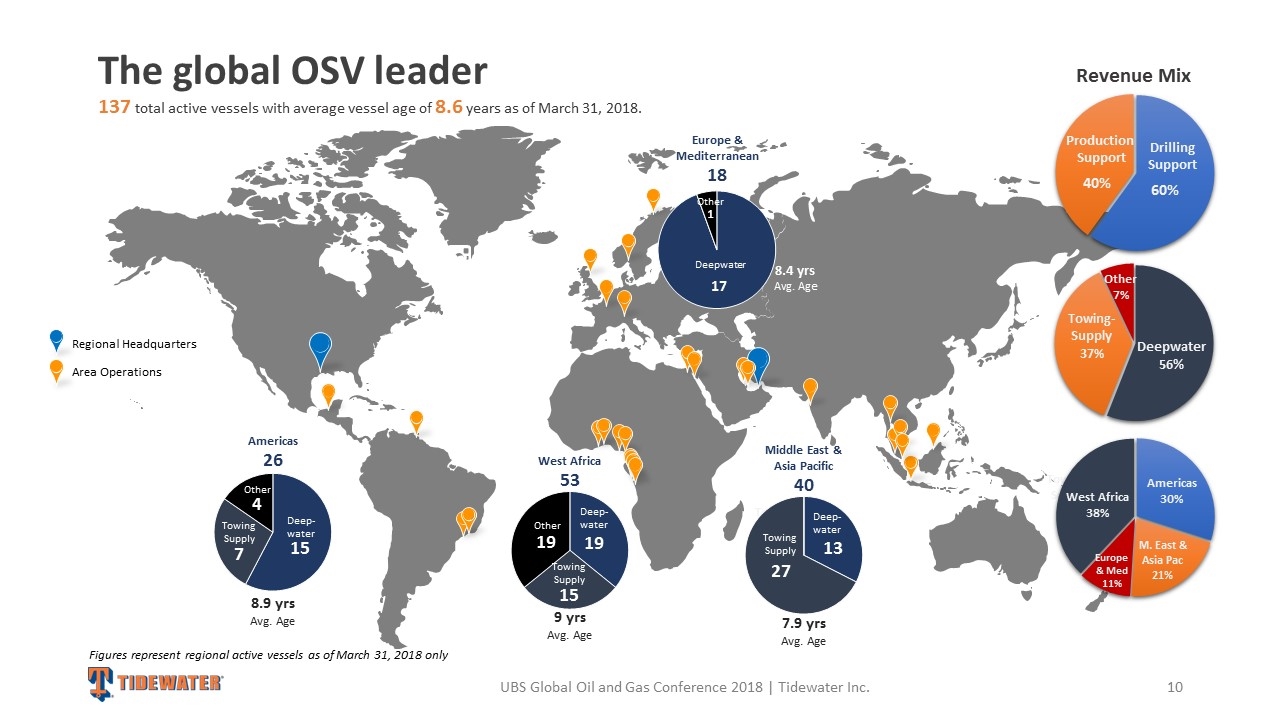
The global OSV leader Regional Headquarters Area Operations Americas 26 Towing Supply Towing Supply Revenue Mix Production Support Drilling Support 137 total active vessels with average vessel age of 8.6 years as of March 31, 2018. Other Deepwater Towing Supply Deepwater Towing Supply 8.9 yrs Avg. Age 8.4 yrs Avg. Age Europe & Mediterranean 18 Deepwater Other Deep- water Towing Supply 7.9 yrs Avg. Age Middle East & Asia Pacific 40 Deep- water Other Towing Supply UBS Global Oil and Gas Conference 2018 | Tidewater Inc. West Africa 53 9 yrs Avg. Age Deep- water Other Towing Supply Figures represent regional active vessels as of March 31, 2018 only
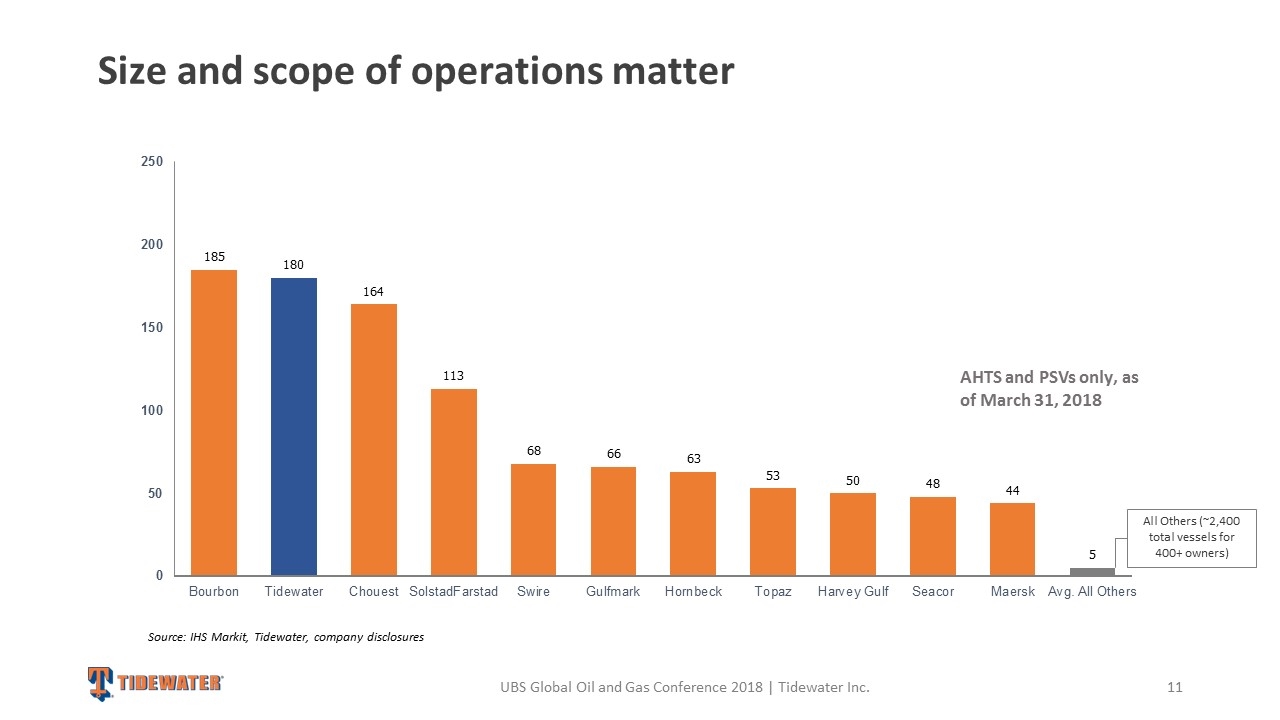
Size and scope of operations matter AHTS and PSVs only, as of March 31, 2018 All Others (~2,400 total vessels for 400+ owners) Source: IHS Markit, Tidewater, company disclosures UBS Global Oil and Gas Conference 2018 | Tidewater Inc.
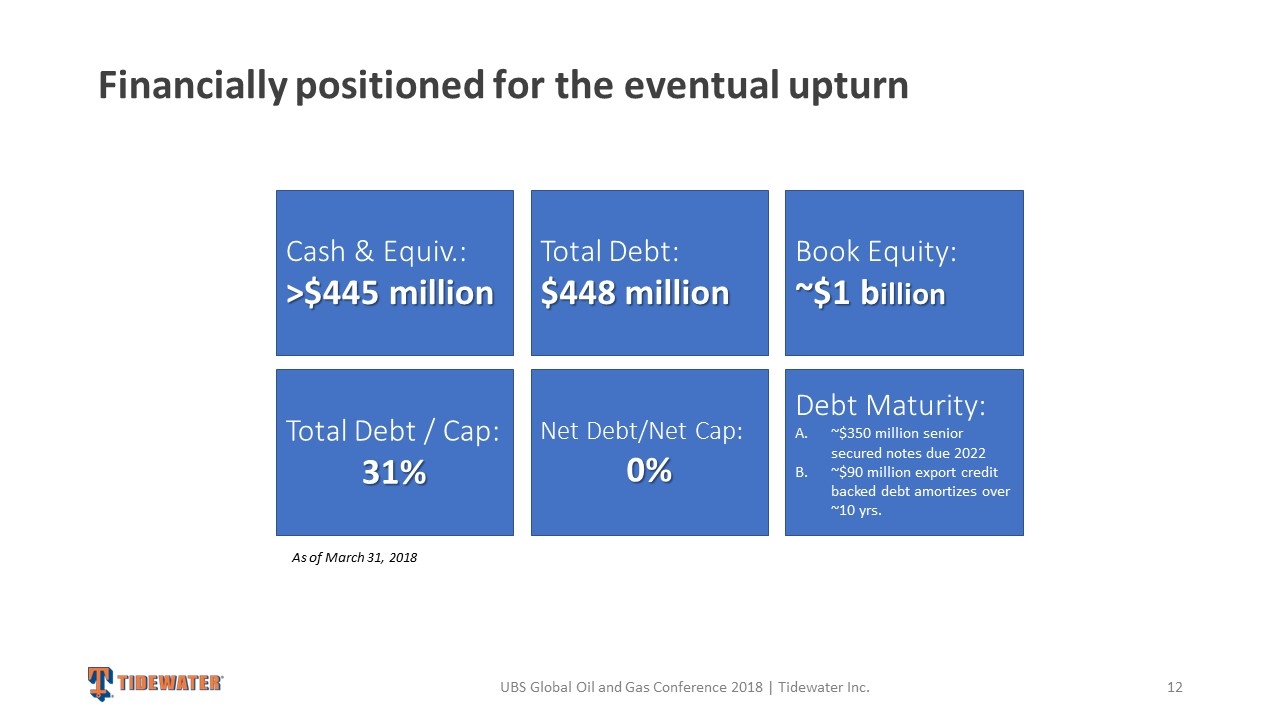
Financially positioned for the eventual upturn Cash & Equiv.: >$445 million Total Debt: $448 million Book Equity: ~$1 billion Net Debt/Net Cap: 0% Total Debt / Cap: 31% Debt Maturity: ~$350 million senior secured notes due 2022 ~$90 million export credit backed debt amortizes over ~10 yrs. As of March 31, 2018 UBS Global Oil and Gas Conference 2018 | Tidewater Inc.
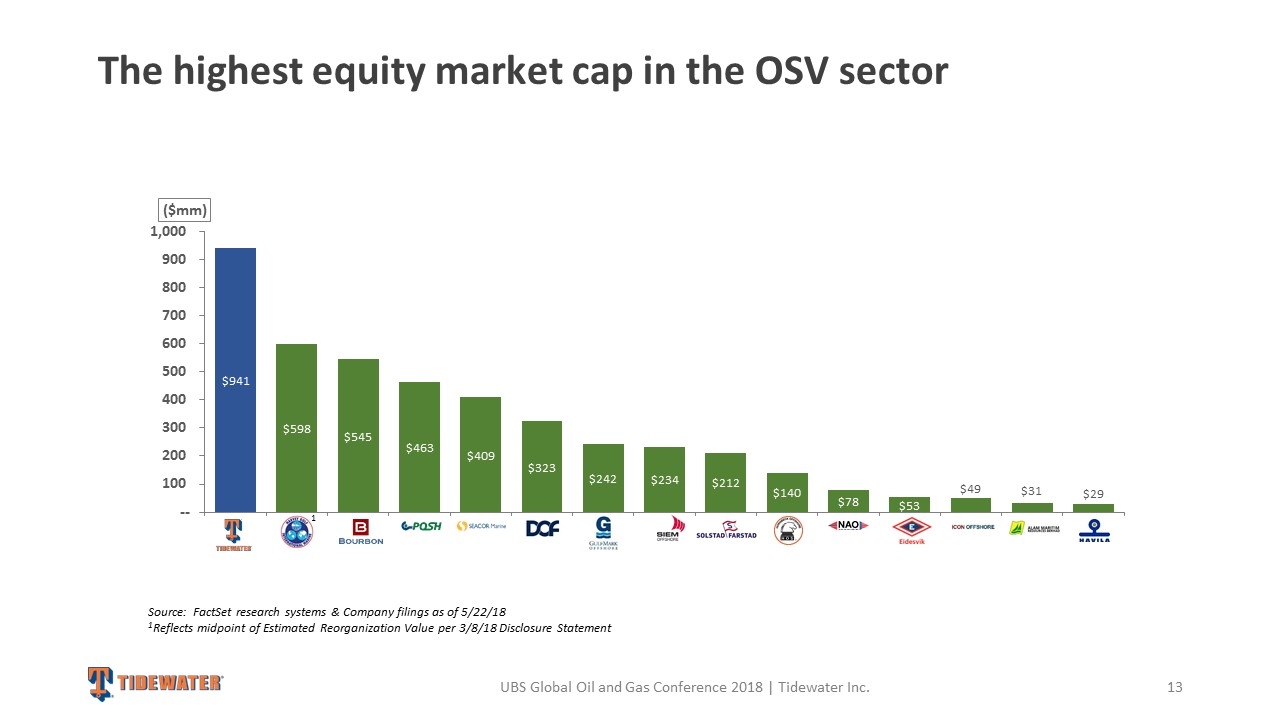
Source: FactSet research systems & Company filings as of 5/22/18 1Reflects midpoint of Estimated Reorganization Value per 3/8/18 Disclosure Statement 1 The highest equity market cap in the OSV sector UBS Global Oil and Gas Conference 2018 | Tidewater Inc.
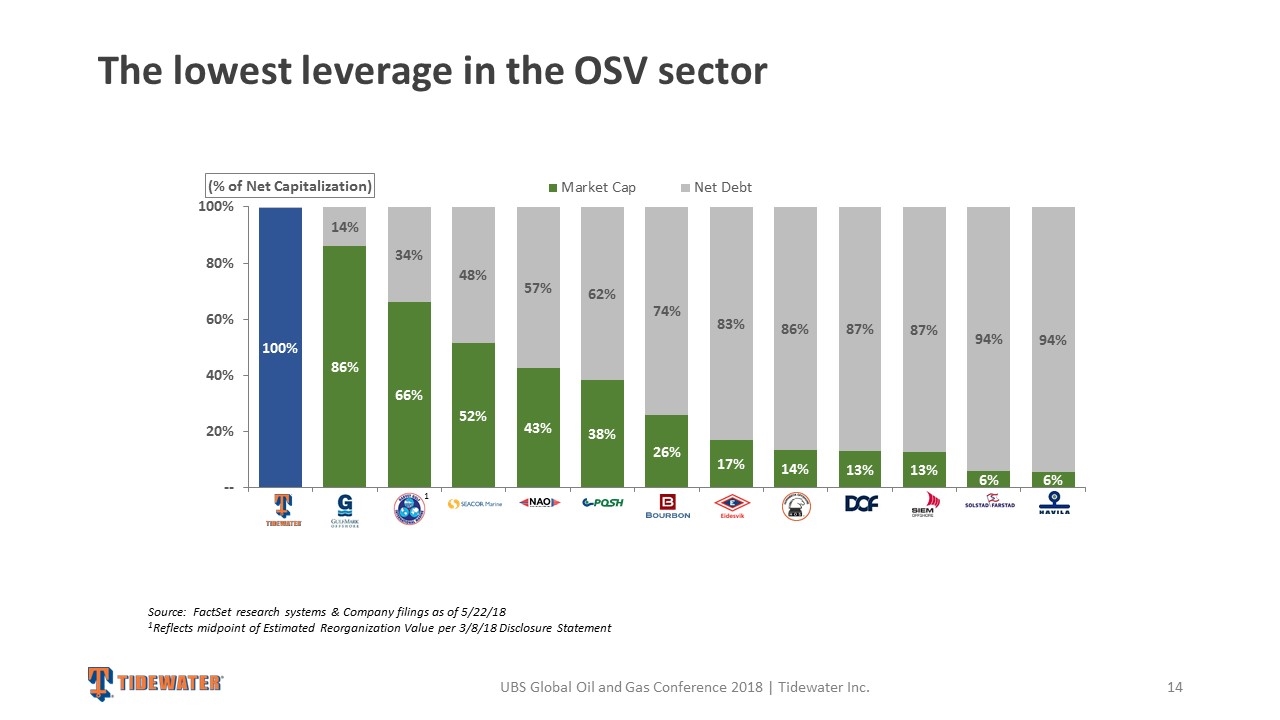
The lowest leverage in the OSV sector 1 UBS Global Oil and Gas Conference 2018 | Tidewater Inc. Source: FactSet research systems & Company filings as of 5/22/18 1Reflects midpoint of Estimated Reorganization Value per 3/8/18 Disclosure Statement
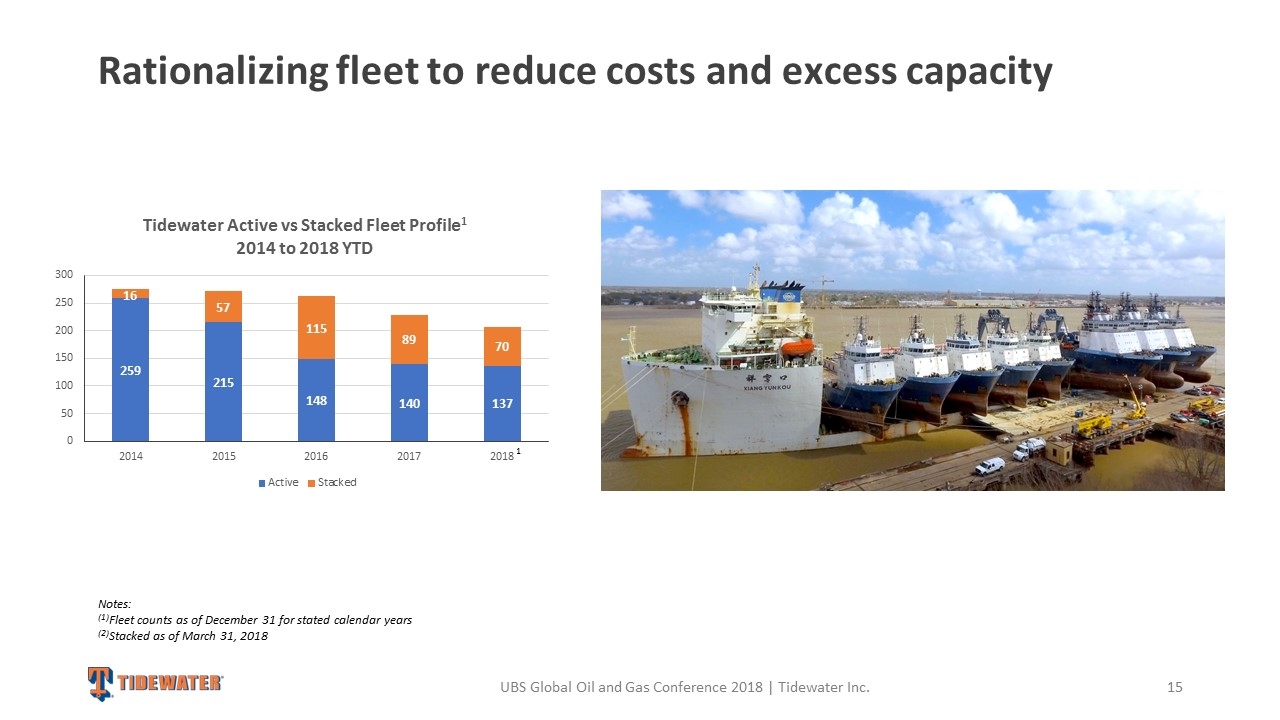
Rationalizing fleet to reduce costs and excess capacity 1 Notes: (1)Fleet counts as of December 31 for stated calendar years (2)Stacked as of March 31, 2018 UBS Global Oil and Gas Conference 2018 | Tidewater Inc.
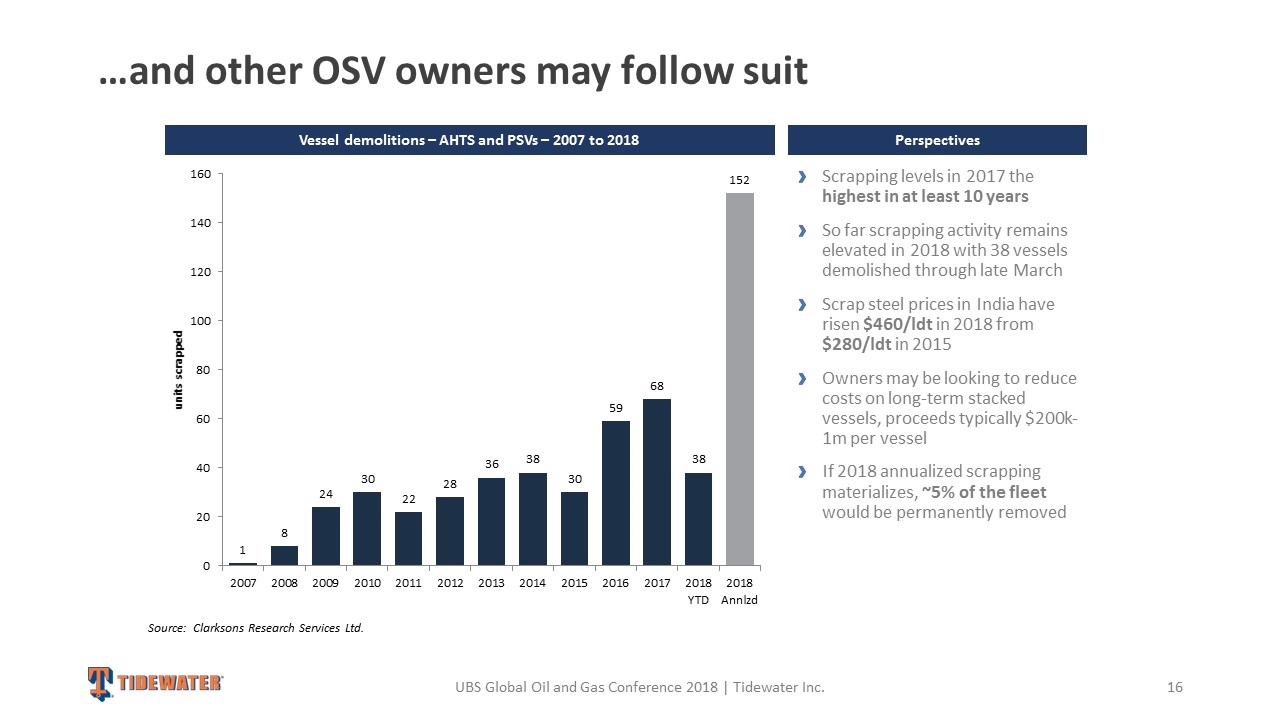
…and other OSV owners may follow suit UBS Global Oil and Gas Conference 2018 | Tidewater Inc. Vessel demolitions – AHTS and PSVs – 2007 to 2018 Scrapping levels in 2017 the highest in at least 10 years So far scrapping activity remains elevated in 2018 with 38 vessels demolished through late March Scrap steel prices in India have risen $460/ldt in 2018 from $280/ldt in 2015 Owners may be looking to reduce costs on long-term stacked vessels, proceeds typically $200k-1m per vessel If 2018 annualized scrapping materializes, ~5% of the fleet would be permanently removed Perspectives Source: Clarksons Research Services Ltd.
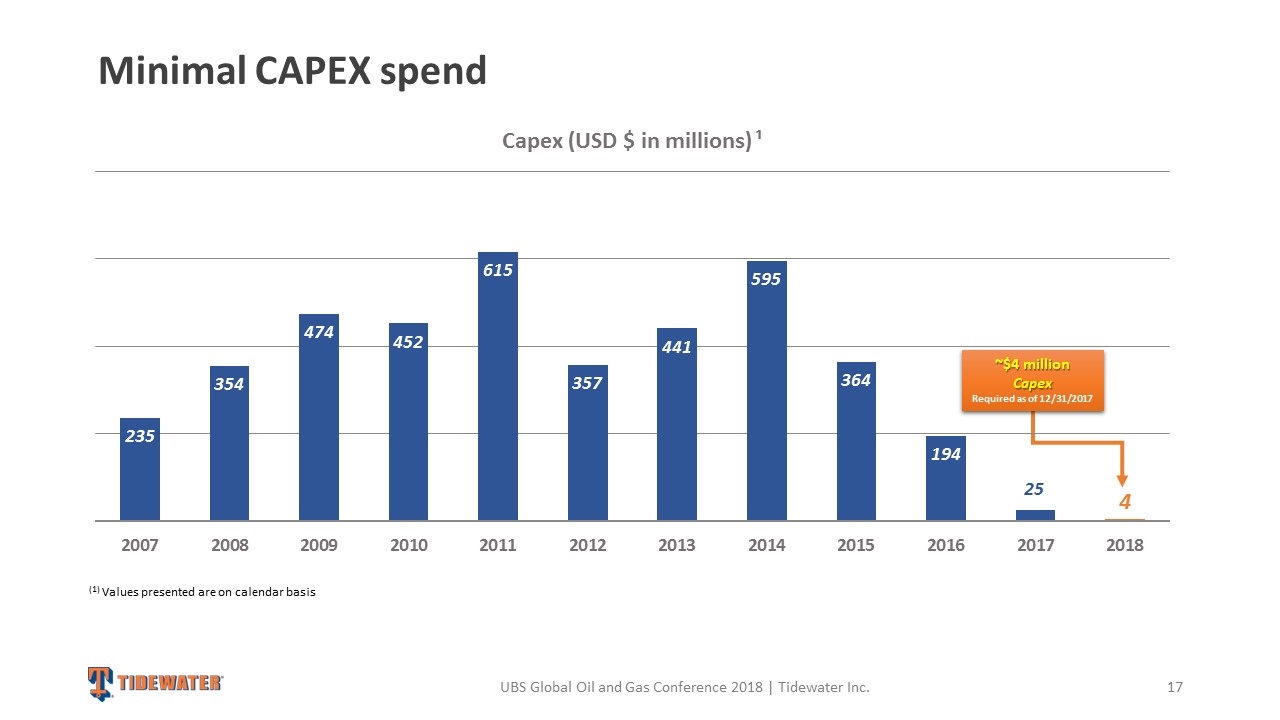
Minimal CAPEX spend (1) Values presented are on calendar basis ~$4 million Capex Required as of 12/31/2017 UBS Global Oil and Gas Conference 2018 | Tidewater Inc.
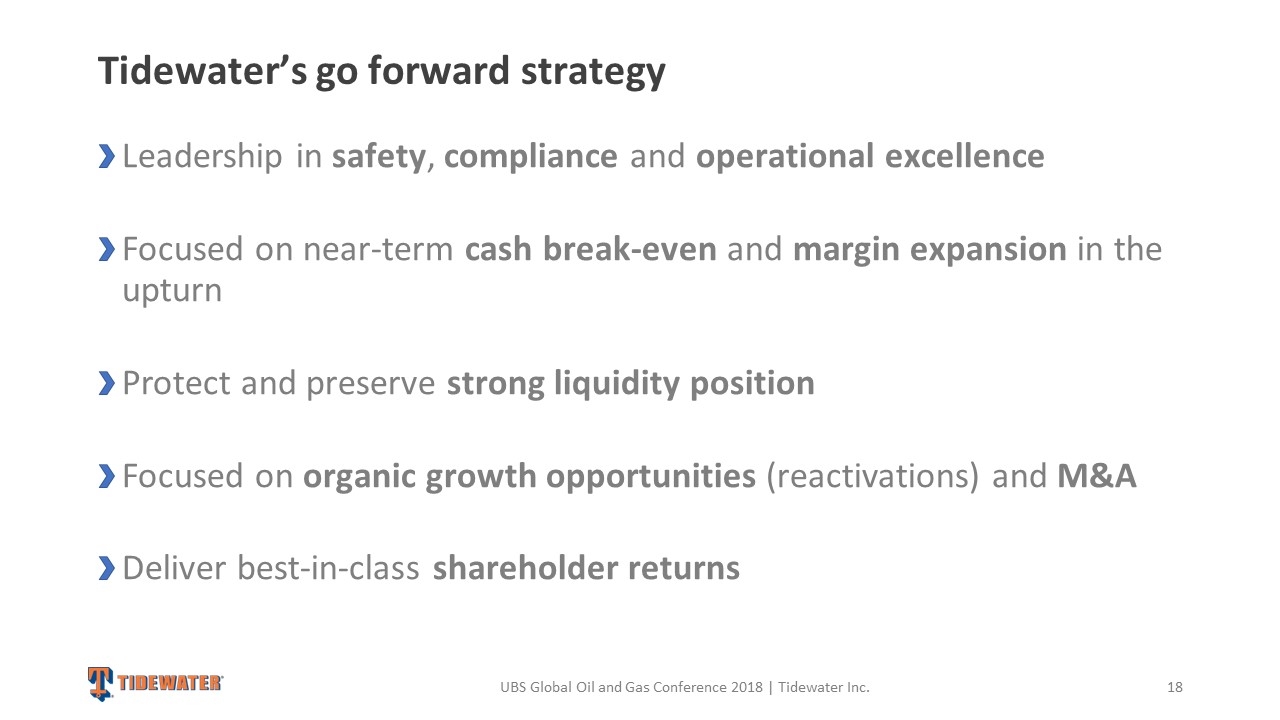
Tidewater’s go forward strategy Leadership in safety, compliance and operational excellence Focused on near-term cash break-even and margin expansion in the upturn Protect and preserve strong liquidity position Focused on organic growth opportunities (reactivations) and M&A Deliver best-in-class shareholder returns UBS Global Oil and Gas Conference 2018 | Tidewater Inc.

Appendix
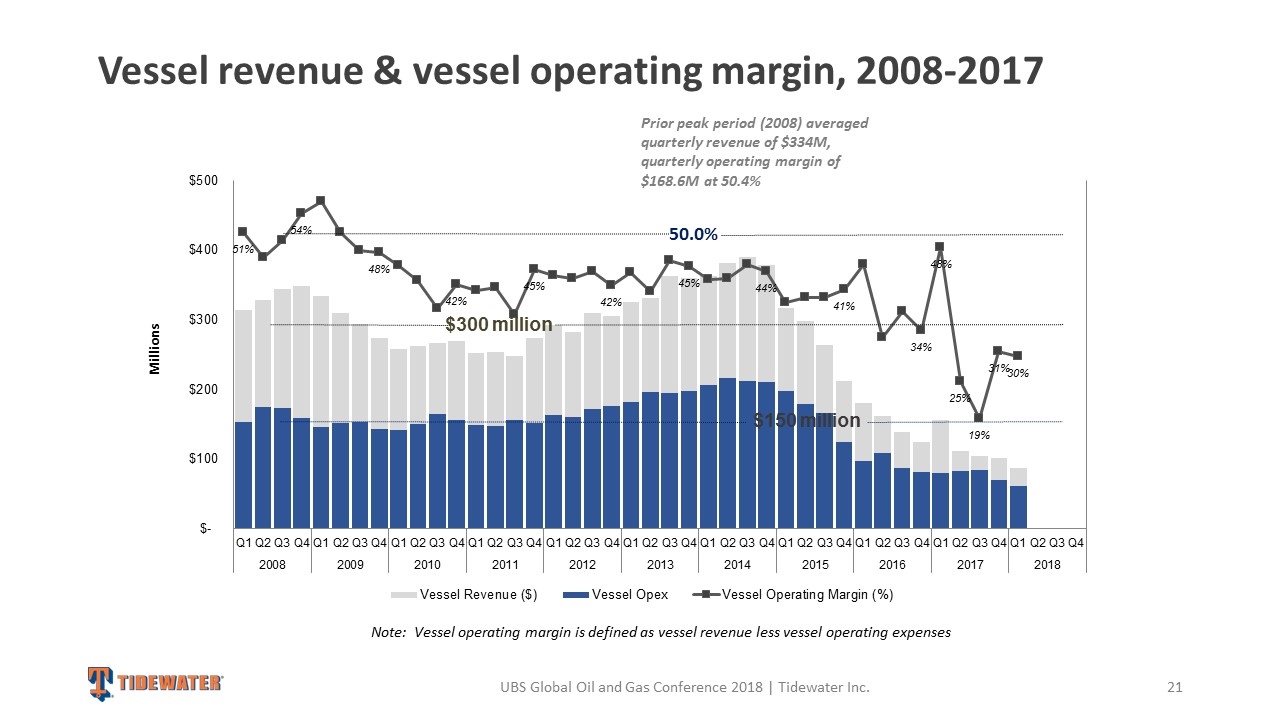
Vessel revenue & vessel operating margin, 2008-2017 Prior peak period (2008) averaged quarterly revenue of $334M, quarterly operating margin of $168.6M at 50.4% Note: Vessel operating margin is defined as vessel revenue less vessel operating expenses $150 million 50.0% Millions UBS Global Oil and Gas Conference 2018 | Tidewater Inc.
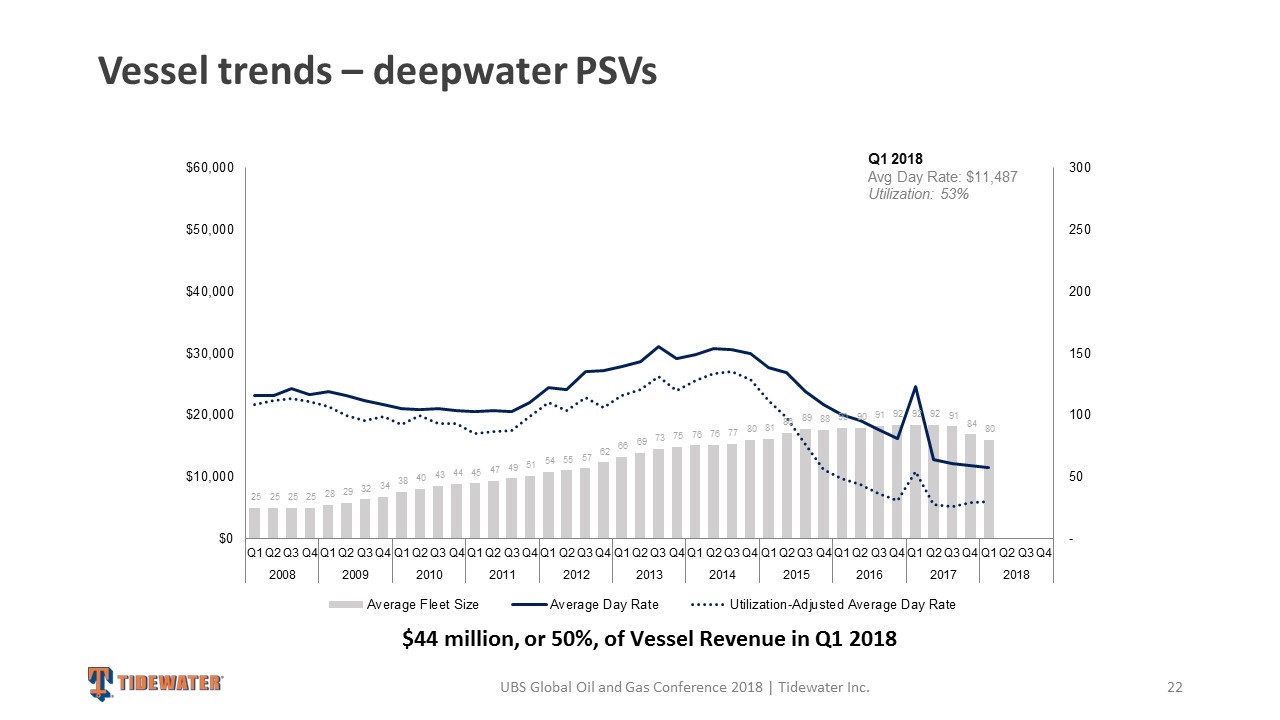
Vessel trends – deepwater PSVs $44 million, or 50%, of Vessel Revenue in Q1 2018 Q1 2018 Avg Day Rate: $11,487 Utilization: 53% UBS Global Oil and Gas Conference 2018 | Tidewater Inc.
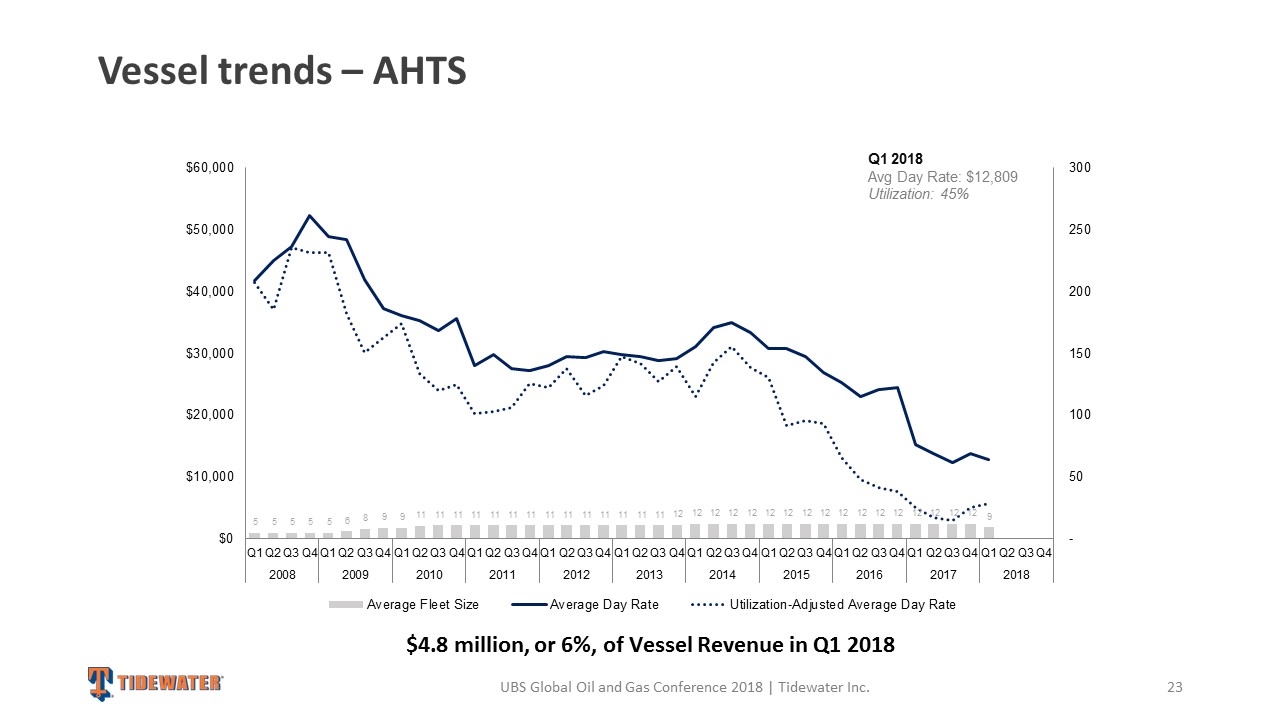
Vessel trends – AHTS $4.8 million, or 6%, of Vessel Revenue in Q1 2018 UBS Global Oil and Gas Conference 2018 | Tidewater Inc. Q1 2018 Avg Day Rate: $12,809 Utilization: 45%
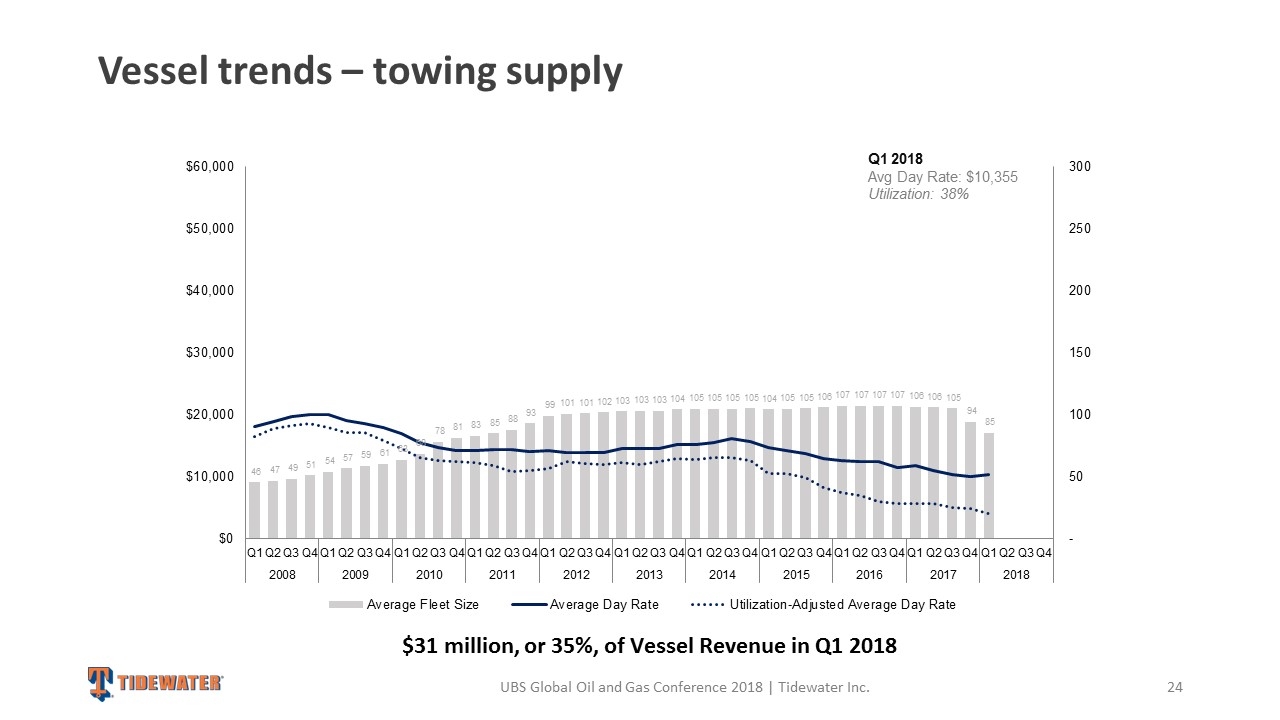
Vessel trends – towing supply $31 million, or 35%, of Vessel Revenue in Q1 2018 UBS Global Oil and Gas Conference 2018 | Tidewater Inc. Q1 2018 Avg Day Rate: $10,355 Utilization: 38%
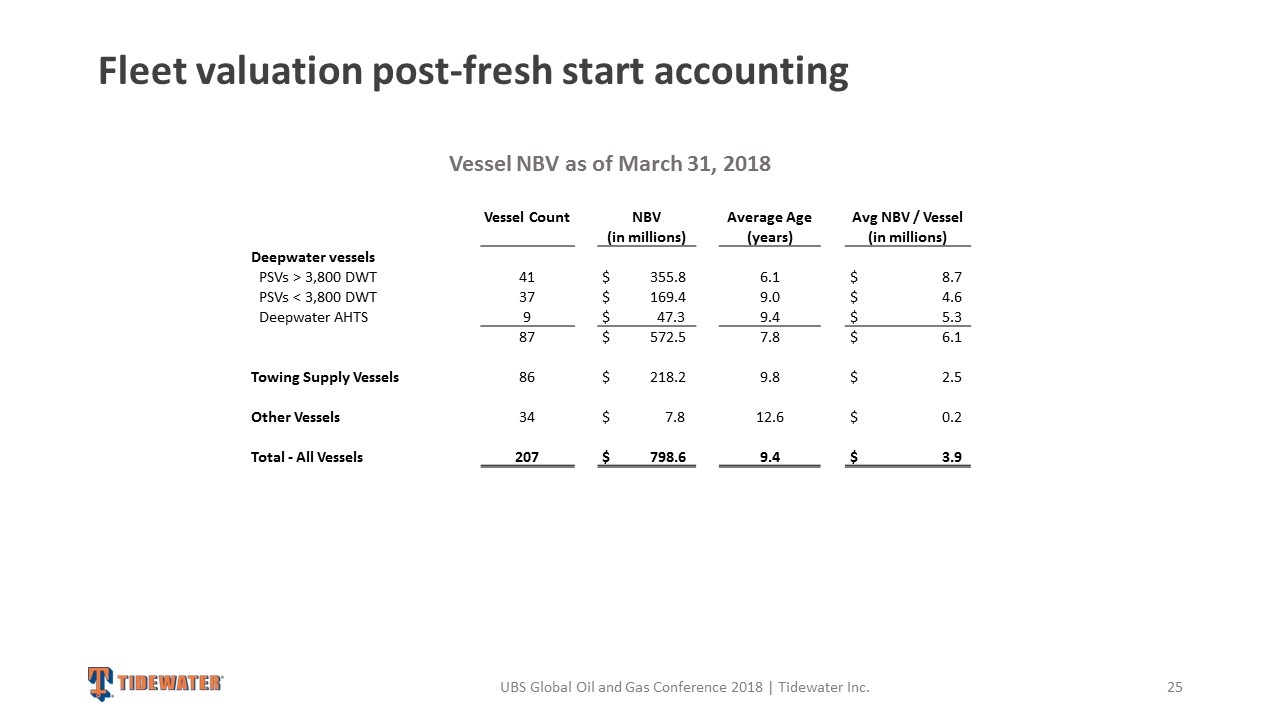
Fleet valuation post-fresh start accounting Vessel Count NBV Average Age Avg NBV / Vessel (in millions) (years) (in millions) Deepwater vessels PSVs > 3,800 DWT 41 $ 355.8 6.1 $ 8.7 PSVs < 3,800 DWT 37 $ 169.4 9.0 $ 4.6 Deepwater AHTS 9 $ 47.3 9.4 $ 5.3 87 $ 572.5 7.8 $ 6.1 Towing Supply Vessels 86 $ 218.2 9.8 $ 2.5 Other Vessels 34 $ 7.8 12.6 $ 0.2 Total - All Vessels 207 $ 798.6 9.4 $ 3.9 Vessel NBV as of March 31, 2018 UBS Global Oil and Gas Conference 2018 | Tidewater Inc.


