2017 Investor Day MAY 19, 2017 Delivering Next-Level Performance
2017 Investor Day Shelly Chadwick Vice President, Finance and Chief Accounting Officer 2

Today’s Agenda 3 Noon Welcome Shelly Chadwick Company Overview and Direction Rich Kyle Our Outgrowth Strategy Chris Coughlin Strengthening Our Bearings Core Amanda Montgomery Keeping the World in Motion Andreas Roellgen 1:20 Q&A 1:40 Break 2:00 Reconvene Jason Hershiser Our M&A Strategy Rich Kyle Beyond Bearings: MPT Products Hans Landin Operational Excellence Rick Boyer Financial Review Phil Fracassa 2:50 Q&A 3:15 Networking Reception/Departure

Forward-Looking Statements Safe Harbor and Non-GAAP Financial Information Certain statements in this presentation (including statements regarding the company's forecasts, beliefs, estimates and expectations) that are not historical in nature are "forward-looking" statements within the meaning of the Private Securities Litigation Reform Act of 1995. In particular, the statements related to Timken’s plans, outlook, future financial performance, targets, projected sales, cash flows, liquidity and expectations regarding the future financial performance of the company are forward-looking. The Company cautions that actual results may differ materially from those projected or implied in forward-looking statements due to a variety of important factors, including: the company's ability to respond to the changes in its end markets that could affect demand for the company's products; unanticipated changes in business relationships with customers or their purchases from the company; changes in the financial health of the company's customers, which may have an impact on the company's revenues, earnings and impairment charges; fluctuations in material and energy costs; the impact of changes to the company’s accounting methods; weakness in global or regional economic conditions and capital markets; fluctuations in currency valuations; changes in the expected costs associated with product warranty claims; the ability to achieve satisfactory operating results in the integration of acquired companies, including realizing any accretion within expected timeframes or at all; the impact on operations of general economic conditions; fluctuations in customer demand; the impact on the company’s pension obligations due to changes in interest rates, investment performance and other tactics designed to reduce risk; the company’s ability to complete and achieve the benefits of announced plans, programs, initiatives, and capital investments; and retention of U.S. Continued Dumping and Subsidy Offset Act (CDSOA) distributions. Additional factors are discussed in the company's filings with the Securities and Exchange Commission, including the company's Annual Report on Form 10-K for the year ended Dec. 31, 2016, quarterly reports on Form 10-Q and current reports on Form 8-K. Except as required by the federal securities laws, the company undertakes no obligation to publicly update or revise any forward-looking statement, whether as a result of new information, future events or otherwise. This presentation includes certain non-GAAP financial measures as defined by the rules and regulations of the Securities and Exchange Commission. Reconciliation of those measures to the most directly comparable GAAP equivalents are provided in the Appendix to this presentation. 4
Next-Level Performance 5 Rich Kyle President and Chief Executive Officer
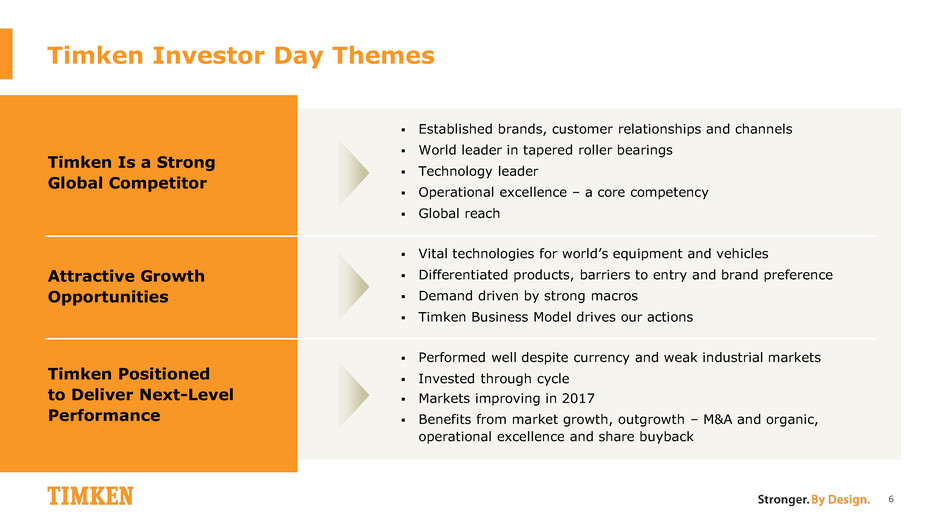
Timken Investor Day Themes Attractive Growth Opportunities Timken Is a Strong Global Competitor Timken Positioned to Deliver Next-Level Performance Vital technologies for world’s equipment and vehicles Differentiated products, barriers to entry and brand preference Demand driven by strong macros Timken Business Model drives our actions Established brands, customer relationships and channels World leader in tapered roller bearings Technology leader Operational excellence – a core competency Global reach Performed well despite currency and weak industrial markets Invested through cycle Markets improving in 2017 Benefits from market growth, outgrowth – M&A and organic, operational excellence and share buyback 6
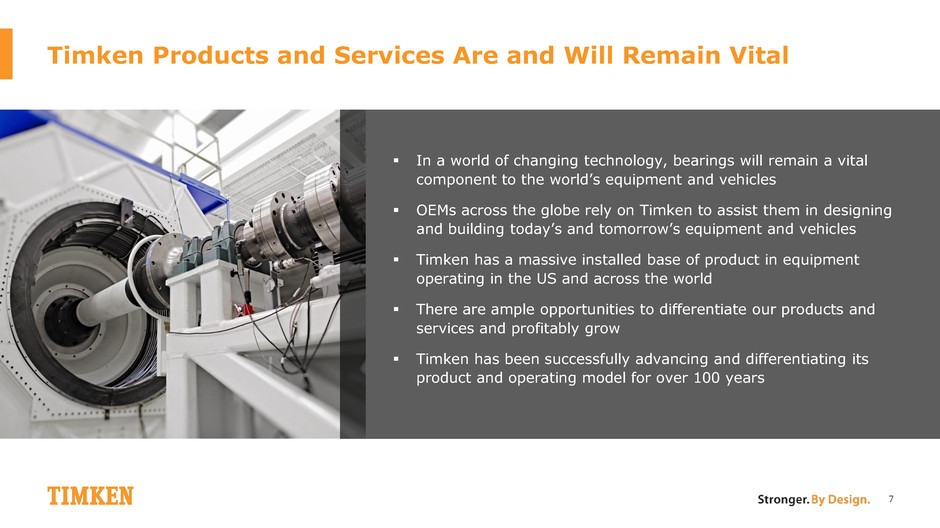
Timken Products and Services Are and Will Remain Vital In a world of changing technology, bearings will remain a vital component to the world’s equipment and vehicles OEMs across the globe rely on Timken to assist them in designing and building today’s and tomorrow’s equipment and vehicles Timken has a massive installed base of product in equipment operating in the US and across the world There are ample opportunities to differentiate our products and services and profitably grow Timken has been successfully advancing and differentiating its product and operating model for over 100 years 7
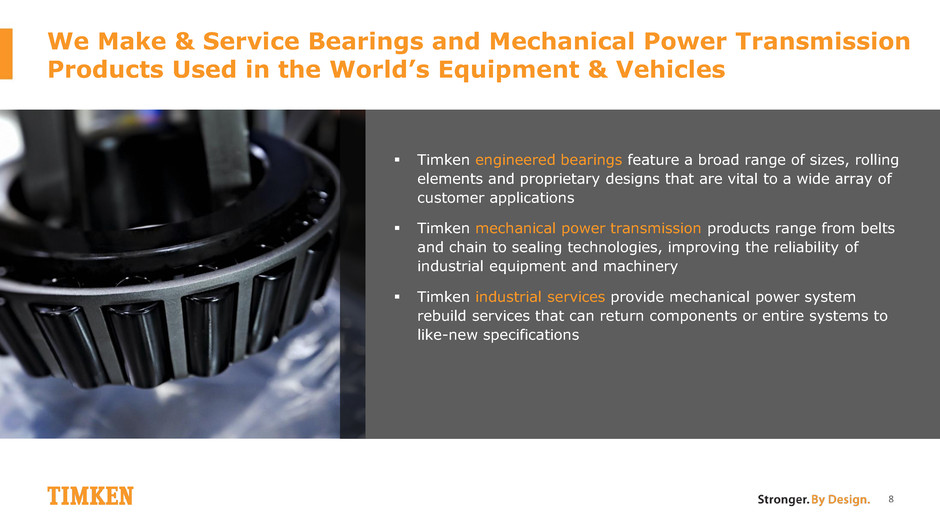
We Make & Service Bearings and Mechanical Power Transmission Products Used in the World’s Equipment & Vehicles Timken engineered bearings feature a broad range of sizes, rolling elements and proprietary designs that are vital to a wide array of customer applications Timken mechanical power transmission products range from belts and chain to sealing technologies, improving the reliability of industrial equipment and machinery Timken industrial services provide mechanical power system rebuild services that can return components or entire systems to like-new specifications 8
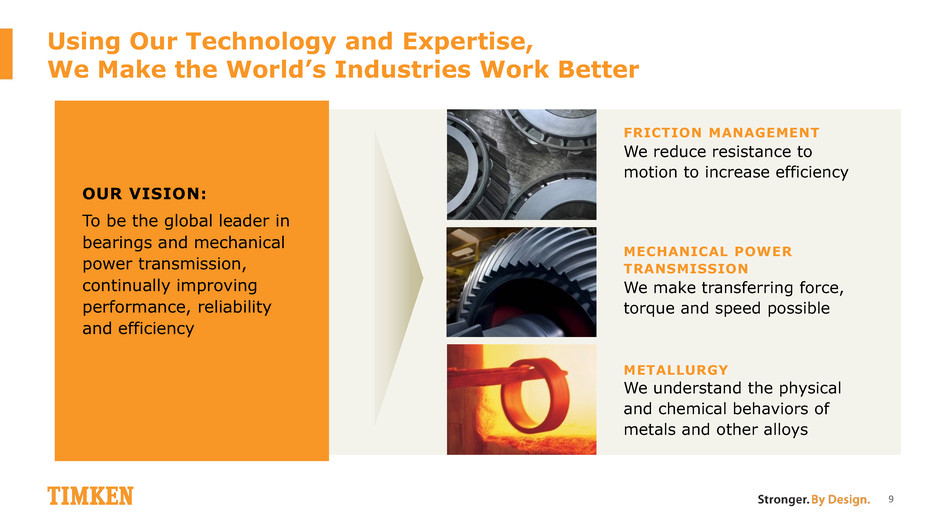
Using Our Technology and Expertise, We Make the World’s Industries Work Better FRICTION MANAGEMENT We reduce resistance to motion to increase efficiency MECHANICAL POWER TRANSMISSION We make transferring force, torque and speed possible METALLURGY We understand the physical and chemical behaviors of metals and other alloys 9 OUR VISION: To be the global leader in bearings and mechanical power transmission, continually improving performance, reliability and efficiency
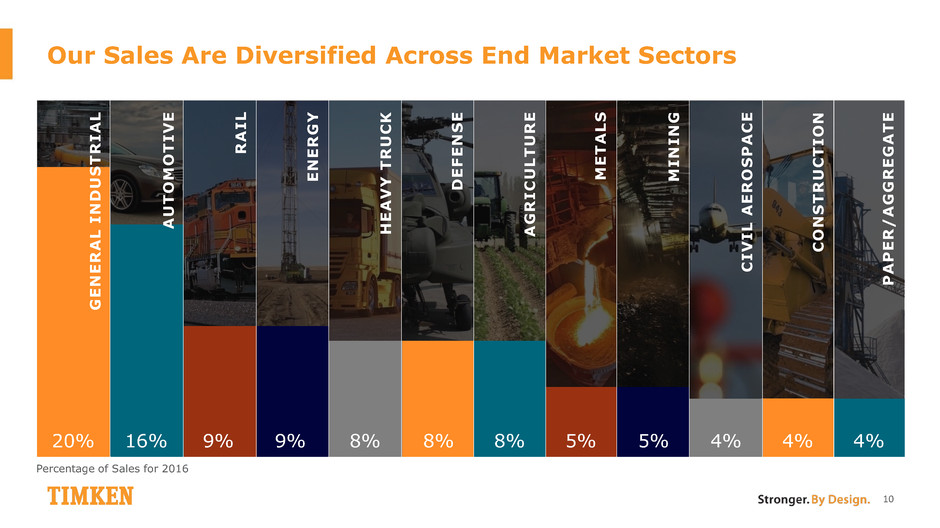
Our Sales Are Diversified Across End Market Sectors 10 Percentage of Sales for 2016 20% 16% 9% 9% 8% 8% 8% 5% 5% 4% 4% 4% G E N E R A L I N D U S T R I A L P A P E R / A G G R E G A T E C O N S T R U C T I O N C I V I L A E R O S P A C E M I N I N G M E T A L S A G R I C U L T U R E D E F E N S E H E A V Y T R U C K E N E R G Y R A I L A U T O M O T I V E

Mobile Industries Features a Balanced & Attractive Market Mix 11 29% 25% 18% 14% 14% Automotive Off-Highway Rail Aerospace Heavy Truck MARKET SECTOR MIX (SALES) SALES $1.45 billion EBIT MARGIN* 6.0% ADJUSTED EBIT MARGIN* 9.6% PRODUCT PORTFOLIO Engineered bearings, mechanical power transmission products and related services FISCAL YEAR 2016 KEY METRICS MOBILE INDUSTRIES *2016 has been recast for change to mark-to-market accounting for pensions. See appendix for reconciliation of adjusted EBIT margin to its most directly comparable GAAP equivalent.
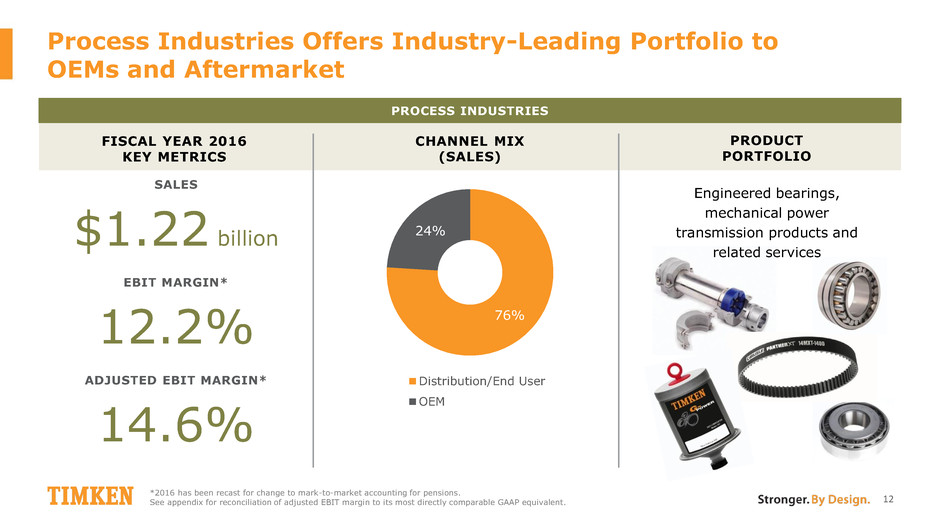
Process Industries Offers Industry-Leading Portfolio to OEMs and Aftermarket 12 76% 24% Distribution/End User OEM CHANNEL MIX (SALES) PRODUCT PORTFOLIO Engineered bearings, mechanical power transmission products and related services SALES $1.22 billion EBIT MARGIN* 12.2% ADJUSTED EBIT MARGIN* 14.6% FISCAL YEAR 2016 KEY METRICS PROCESS INDUSTRIES *2016 has been recast for change to mark-to-market accounting for pensions. See appendix for reconciliation of adjusted EBIT margin to its most directly comparable GAAP equivalent.
We Feature an Increasingly Broad Portfolio of Quality Brands 13
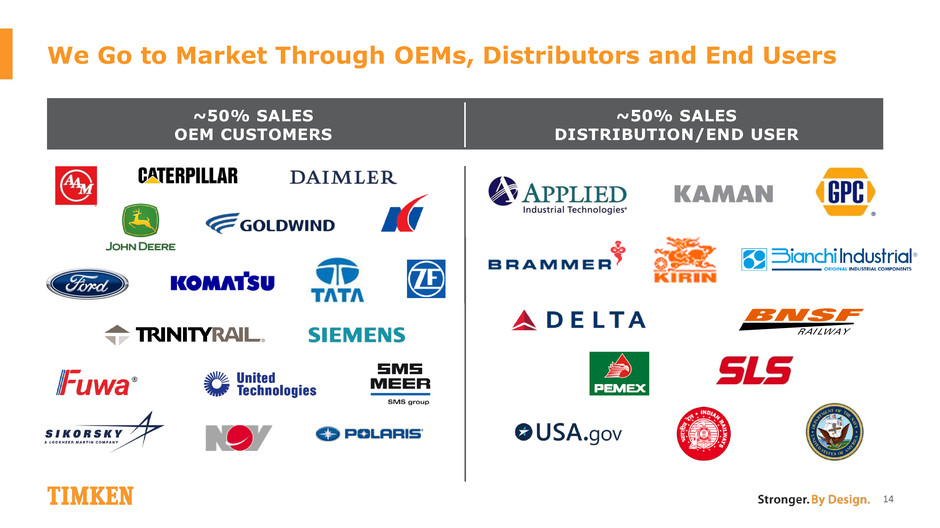
We Go to Market Through OEMs, Distributors and End Users 14 ~50% SALES OEM CUSTOMERS ~50% SALES DISTRIBUTION/END USER

2016 SALES BY GEOGRAPHY We Have Built Global Capabilities 28 countries 73 plants and service centers 58 sales offices 14K associates 25 logistics centers 15 60% North America 17% Europe, Middle East, Africa 16% Asia Pacific 7% Latin America Percentage of Sales for 2016

Driven by a Team of Strong, Respected Executive Leaders 16 Rich Kyle President and Chief Executive Officer 11 years with Timken William Burkhart Executive Vice President, General Counsel and Secretary 23 years with Timken Michael Connors Vice President, Marketing 34 years with Timken Ajay Das Vice President, Strategy and Business Development 25 years with Timken Michael Discenza Vice President and Group Controller 17 years with Timken Ronald Myers Vice President, Human Resources 35 years with Timken Douglas Nelson Vice President, Compensation and Benefits 21 years with Timken Carl Rapp Group Vice President, Power Systems 16 years with Timken Sandra Rapp Vice President, Information Technology 6 years with Timken Brian Ruel Vice President, Sales, Americas 33 years with Timken Douglas Smith Vice President & Product Line Executive 25 years with Timken Peter Sproson Vice President, Sales and Managing Director of Europe 39 years with Timken Chris Coughlin Executive Vice President, Group President 33 years with Timken Phil Fracassa Executive Vice President and Chief Financial Officer 12 years with Timken Amanda Montgomery Vice President & Product Line Executive 19 years with Timken Shelly Chadwick Vice President, Finance and Chief Accounting Officer 6 years with Timken Rick Boyer Vice President, Operations 33 years with Timken Hans Landin Group Vice President, Mechanical Power Transmission Products 20 years with Timken Jason Hershiser Manager, Investor Relations 6 years with Timken Andreas Roellgen Vice President, Sales, Europe, Asia and Africa 20 years with Timken

OPERATE WITH EXCELLENCE Drive enterprise-wide Lean and continuous improvement efforts Build a more cost-effective global manufacturing footprint Deliver efficiencies across our supply chains Optimize processes and SG&A efficiency DEPLOY CAPITAL TO DRIVE SHAREHOLDER VALUE Invest in organic growth and productivity initiatives Pay an attractive dividend that grows over time with earnings Broaden portfolio and reach through value-accretive M&A Return capital through share repurchases OUTGROW OUR MARKETS Be the technical leader in solving customers’ friction and power transmission challenges Expand both our product portfolio and geographic presence Deliver best-in-class customer service experience using a differentiated technical sales model NEXT-LEVEL PERFORMANCE Our Proven Strategy Drives Next-Level Performance 17
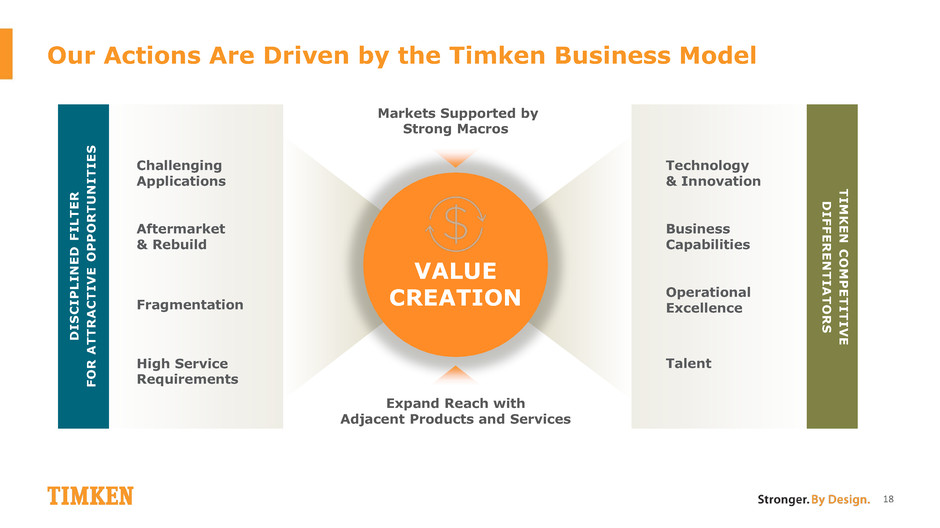
Our Actions Are Driven by the Timken Business Model 18 Challenging Applications Aftermarket & Rebuild Fragmentation High Service Requirements Markets Supported by Strong Macros Technology & Innovation Business Capabilities Operational Excellence Talent T I M K E N C O M P E T I T I V E D I F F E R E N T I A T O R S D I S C I P L I N E D F I L T E R F O R A T T R A C T I V E O P P O R T U N I T I E S Expand Reach with Adjacent Products and Services VALUE CREATION

19 Strategic Actions Delivered Results and Strengthened Company Spun off Steel business and restructured Aerospace division Invested heavily in product development and outgrowth initiatives Drove operational excellence initiatives and invested in footprint Structurally reduced fixed cost Improved cash generation and restructured pensions Created value through balanced and disciplined capital allocation Acquired $230M in incremental revenue Delivered solid performance in challenging industrial cycle Positioned company for next-level performance 10.3% 2016 adjusted EBIT margin* in tough industrial market $680M of free cash flow* generated in 2014-2016 $230M in revenue added through M&A** *2016 results include impact of change to mark-to-market accounting (both GAAP and adjusted) for pensions. **Trailing twelve months (TTM) as of acquisition date. See appendix for reconciliations of adjusted EBIT margin and free cash flow to their most directly comparable GAAP equivalents.
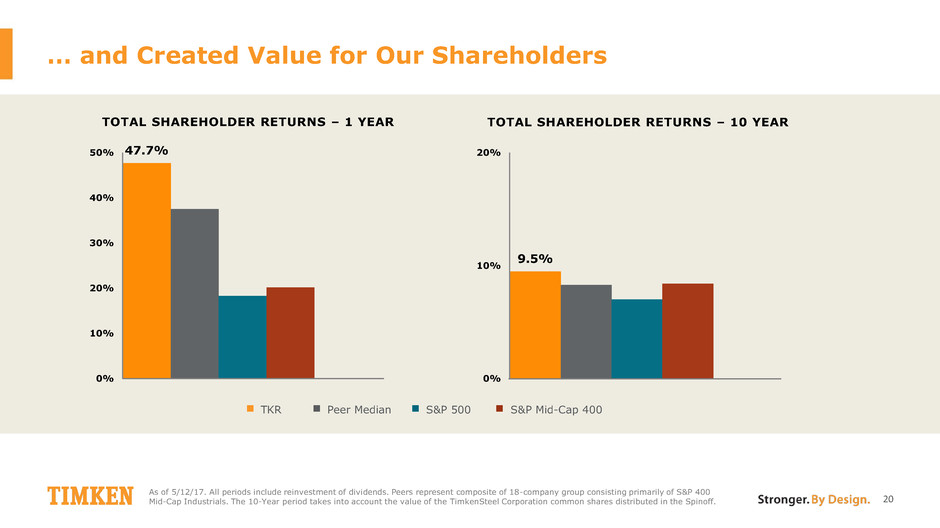
… and Created Value for Our Shareholders As of 5/12/17. All periods include reinvestment of dividends. Peers represent composite of 18-company group consisting primarily of S&P 400 Mid-Cap Industrials. The 10-Year period takes into account the value of the TimkenSteel Corporation common shares distributed in the Spinoff. 20 47.7% 0% 10% 20% 30% 40% 50% TKR Peer Median S&P Mid-Cap 400 S&P 500 9.5% 0% 10% 20% TOTAL SHAREHOLDER RETURNS – 1 YEAR TOTAL SHAREHOLDER RETURNS – 10 YEAR

We will: Win with customers – innovate, differentiate, deliver value Outgrow improving end markets through the differentiators of the Timken Business Model Invest in the business to drive competitive advantage Generate strong cash flow and create value through capital allocation – core business, dividend, M&A and buyback Deliver next-level financial performance – revenue, margins, EPS and ROIC 21 Timken Is Positioned to Deliver Next-Level Performance

What You Will Hear Today 22 Focused, talented and committed management team Strong market, brand and technical position Sound strategy to: - Grow and improve market position - Deliver next-level financial results Timken is a compelling investment

Leveraging Investments, Achieving Outgrowth 23 Chris Coughlin Executive Vice President and Group President

Key Messages Well-Positioned to Drive Long-Term Growth Strategic Initiatives Support Growth Confident in Our Ability to Outgrow Markets Attractive end markets supported by strong macros Robust business model drives long-term organic growth Operational excellence in engineering, manufacturing and distribution enhances growth potential Proven strategy to continually increase addressable markets via expansion of products and services Current and past investments in global infrastructure position Timken for success Demonstrated track record of international growth Ample opportunity for global expansion and increased market penetration Timken has the talent, capabilities and strategies to win 24

Our Differentiated Business Model Is Creating Value 25 Challenging Applications Aftermarket & Rebuild Fragmentation High Service Requirements Markets Supported by Strong Macros Technology & Innovation Business Capabilities Operational Excellence Talent T I M K E N C O M P E T I T I V E D I F F E R E N T I A T O R S D I S C I P L I N E D F I L T E R F O R A T T R A C T I V E O P P O R T U N I T I E S Expand Reach with Adjacent Products and Services VALUE CREATION
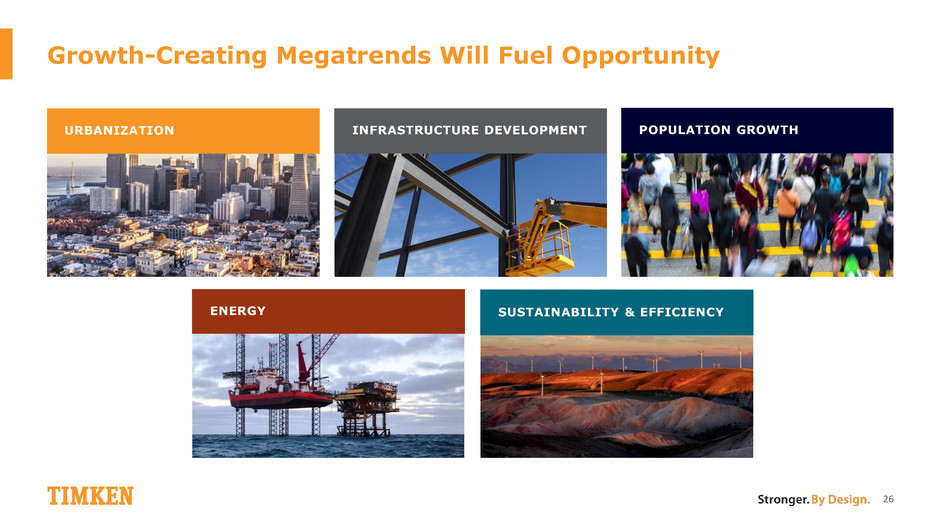
Growth-Creating Megatrends Will Fuel Opportunity 26 URBANIZATION INFRASTRUCTURE DEVELOPMENT SUSTAINABILITY & EFFICIENCY ENERGY POPULATION GROWTH
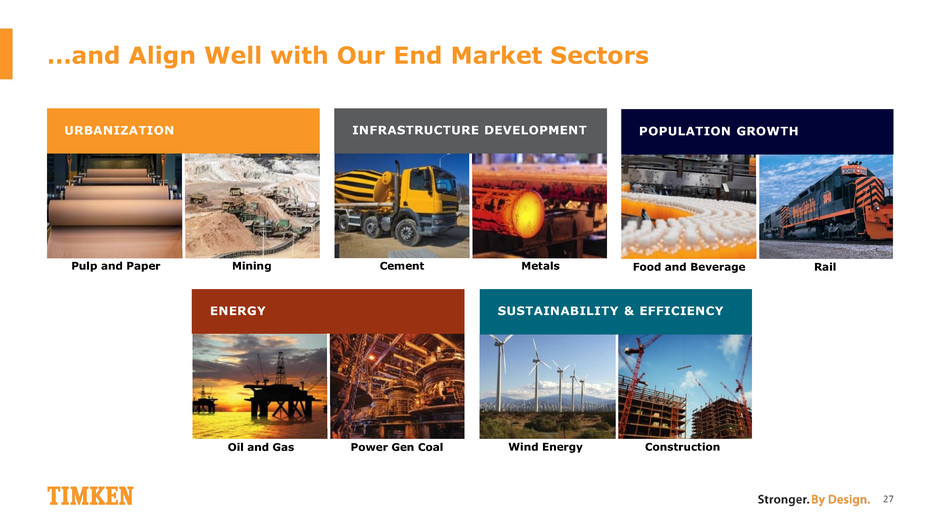
…and Align Well with Our End Market Sectors 27 URBANIZATION INFRASTRUCTURE DEVELOPMENT ENERGY Mining Pulp and Paper Cement Metals Power Gen Coal Oil and Gas SUSTAINABILITY & EFFICIENCY POPULATION GROWTH Rail Food and Beverage Construction Wind Energy
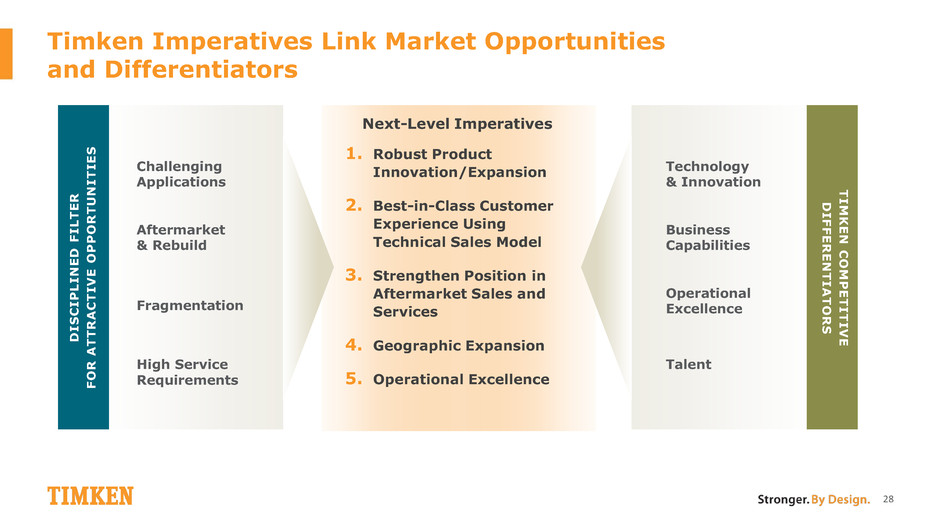
Timken Imperatives Link Market Opportunities and Differentiators 28 28 1. Robust Product Innovation/Expansion 2. Best-in-Class Customer Experience Using Technical Sales Model 3. Strengthen Position in Aftermarket Sales and Services 4. Geographic Expansion 5. Operational Excellence Challenging Applications Aftermarket & Rebuild Fragmentation High Service Requirements Technology & Innovation Business Capabilities Operational Excellence Talent T I M K E N C O M P E T I T I V E D I F F E R E N T I A T O R S D I S C I P L I N E D F I L T E R F O R A T T R A C T I V E O P P O R T U N I T I E S Next-Level Imperatives

1. Robust Product and Process Development Utilizes Disciplined Approach from Concept to Commercialization 29 Specify and validate product, manufacturing and supply chain requirements Evaluate macro trends and customer needs to identify opportunities and meet requirements Move product into the marketplace through OEM collaboration and end user service DEFINE DEVELOP DELIVER
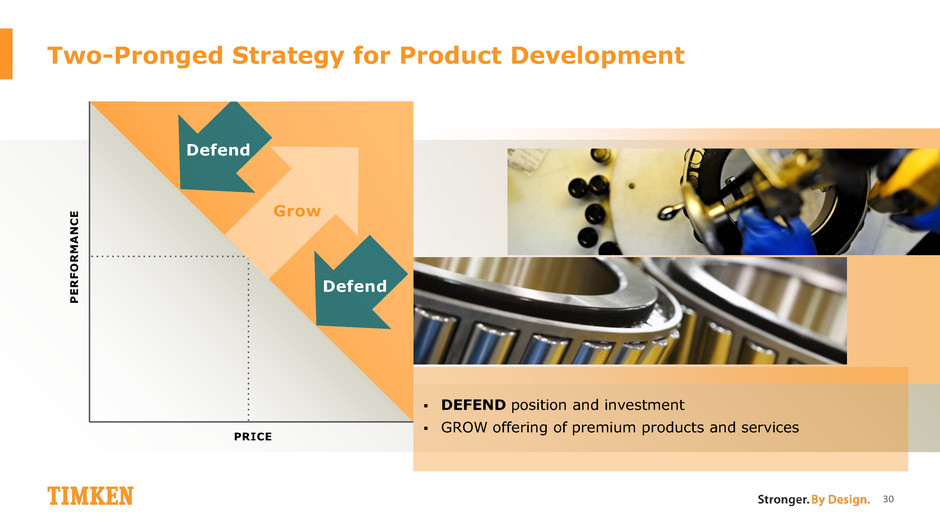
Two-Pronged Strategy for Product Development 30 DEFEND position and investment GROW offering of premium products and services PRICE P E R F O R M A N C E Grow Defend Defend
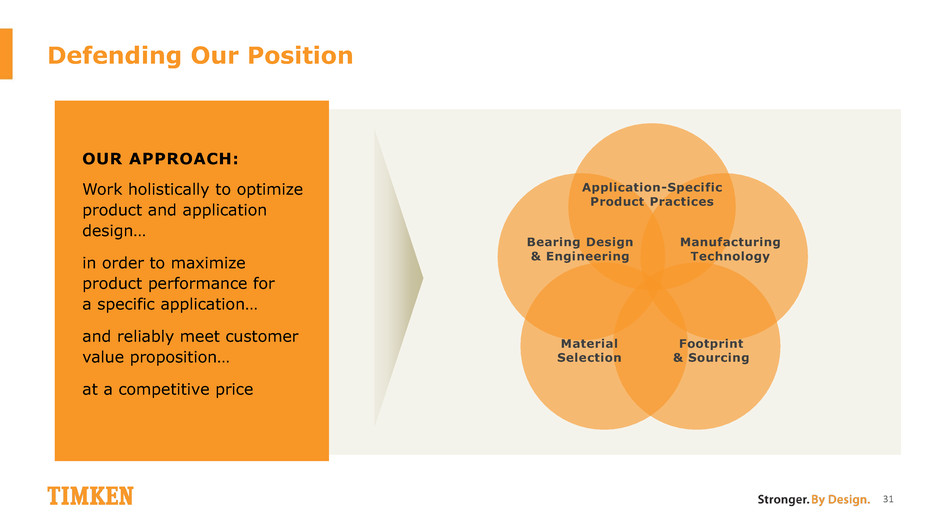
Application-Specific Product Practices Manufacturing Technology Bearing Design & Engineering Footprint & Sourcing Material Selection Defending Our Position 31 OUR APPROACH: Work holistically to optimize product and application design… in order to maximize product performance for a specific application… and reliably meet customer value proposition… at a competitive price
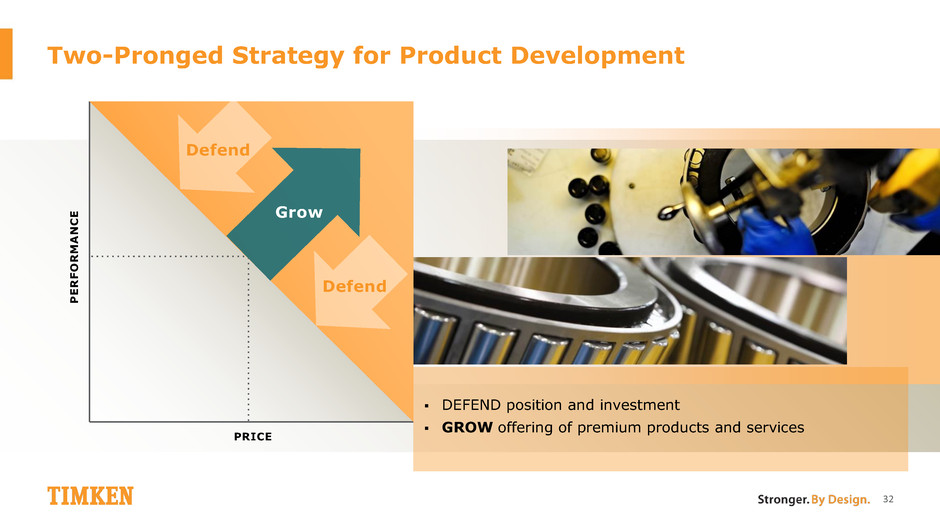
Two-Pronged Strategy for Product Development 32 DEFEND position and investment GROW offering of premium products and services PRICE P E R F O R M A N C E Defend Defend Grow

Annualized Value of Prototype Orders Shipped Actual/Expected Net Revenue Impact PROTOTYPE SHIPMENTS AND ACTUAL/EXPECTED SALES Momentum in Prototypes Expected to Generate New Revenue 33 2014 2015 2016 2017 2018 2019 2020
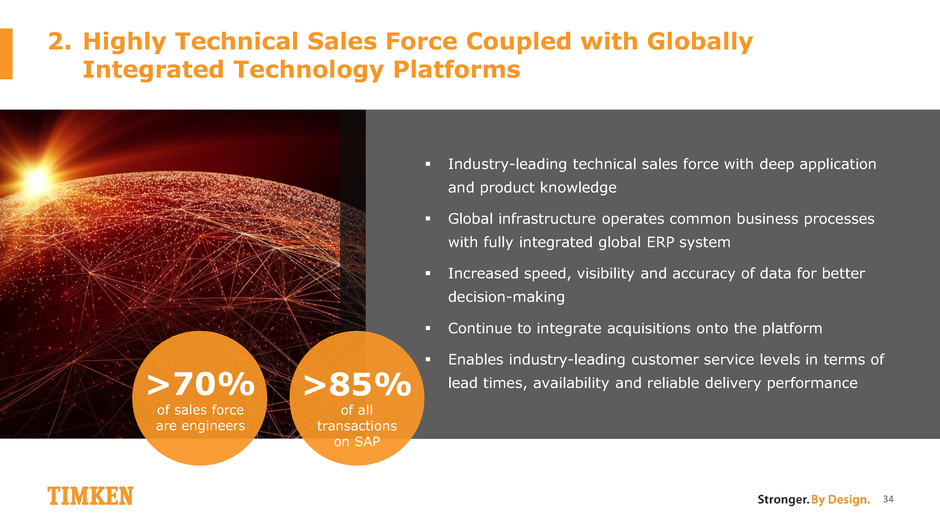
Industry-leading technical sales force with deep application and product knowledge Global infrastructure operates common business processes with fully integrated global ERP system Increased speed, visibility and accuracy of data for better decision-making Continue to integrate acquisitions onto the platform Enables industry-leading customer service levels in terms of lead times, availability and reliable delivery performance 2. Highly Technical Sales Force Coupled with Globally Integrated Technology Platforms 34 >85% of all transactions on SAP >70% of sales force are engineers

DATA ANALYSIS Convert analysis into insights to engender customer loyalty and drive growth WEB & SOCIAL Reach individual customers, end-users and distributors and aid in product selection/problem-solving OUR VISION: Deliver our long-standing and proven customer value proposition both physically and digitally. For every customer “touch point” with Timken, provide a digitized option that both enhances the customer experience with Timken and also provides customer insight and market intelligence. E-COMMERCE Enhance capabilities with distributors and their end-user customers Customer-Facing Digitization 35 35

Investments in Sales Tools Increase Our Market Responsiveness, Efficiency and Productivity 36 36 Customer Relationship Management (CRM): centralized sales data repository enhances connectivity New Sales Support Infrastructure to increase productivity of global sales team, with priority on face-to-face customer time Implemented New Global Pricing System
Our Newest Investment Streamlines Our Product Data and Engineering Processes 37 37 Consolidate Engineering Product Data into one global data management system connected to SAP Connect and Automate 50+ Internal Systems to significantly increase engineering efficiency Dramatically Improve Speed to market for new products
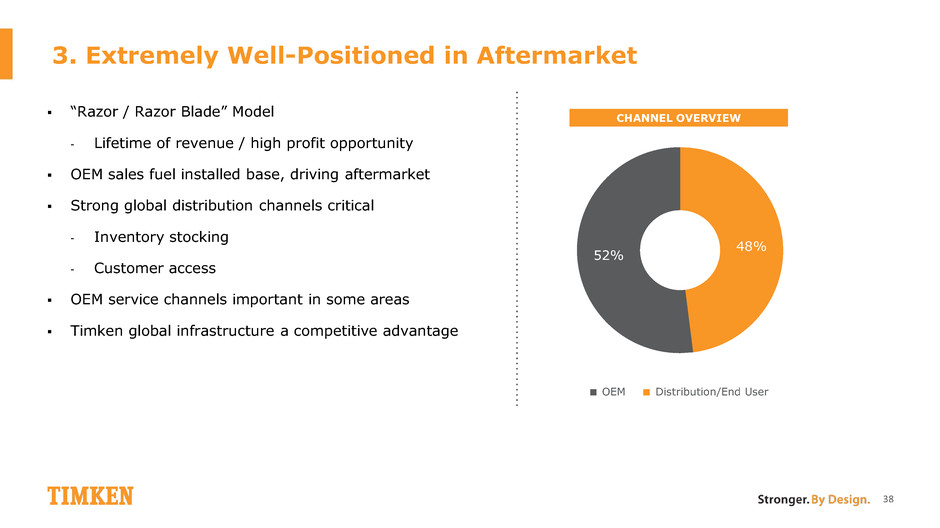
3. Extremely Well-Positioned in Aftermarket “Razor / Razor Blade” Model - Lifetime of revenue / high profit opportunity OEM sales fuel installed base, driving aftermarket Strong global distribution channels critical - Inventory stocking - Customer access OEM service channels important in some areas Timken global infrastructure a competitive advantage 38 48% 52% CHANNEL OVERVIEW OEM Distribution/End User

Timken Has Been Aggressively Expanding Its Product and Service Portfolio to Drive Aftermarket Penetration 39 COUPLING BEARINGS BEARINGS ELECTRIC MOTOR SERVICES SPLIT HOUSED UNIT BEARING CLUTCH GEARBOX COUPLING BRAKE DRIVEN EQUIPMENT PUMPS/COMPRESSORS FANS CONVEYORS GENERATORS MILLS BEARINGS HOUSED UNIT BEARING CHAIN BELTS LUBRICATION SYSTEMS BEARINGS
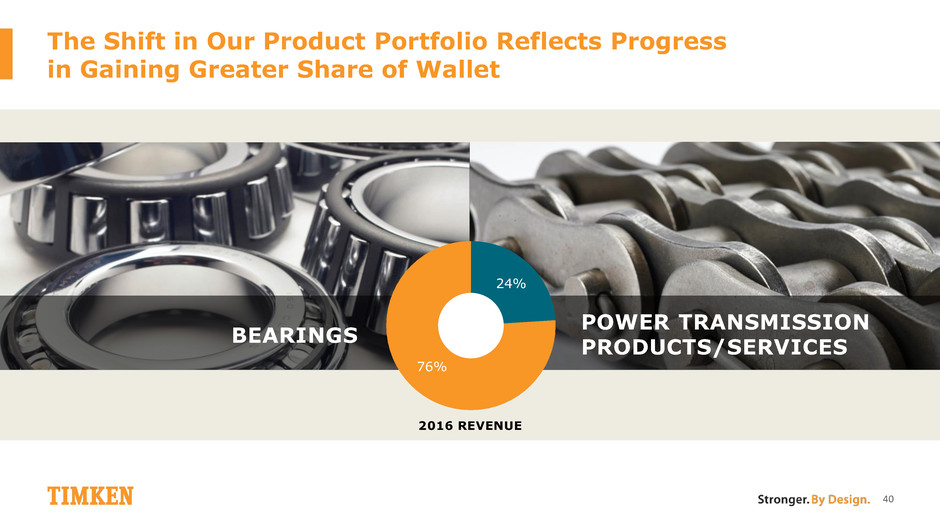
The Shift in Our Product Portfolio Reflects Progress in Gaining Greater Share of Wallet 40 BEARINGS POWER TRANSMISSION PRODUCTS/SERVICES 24% 76% 2016 REVENUE
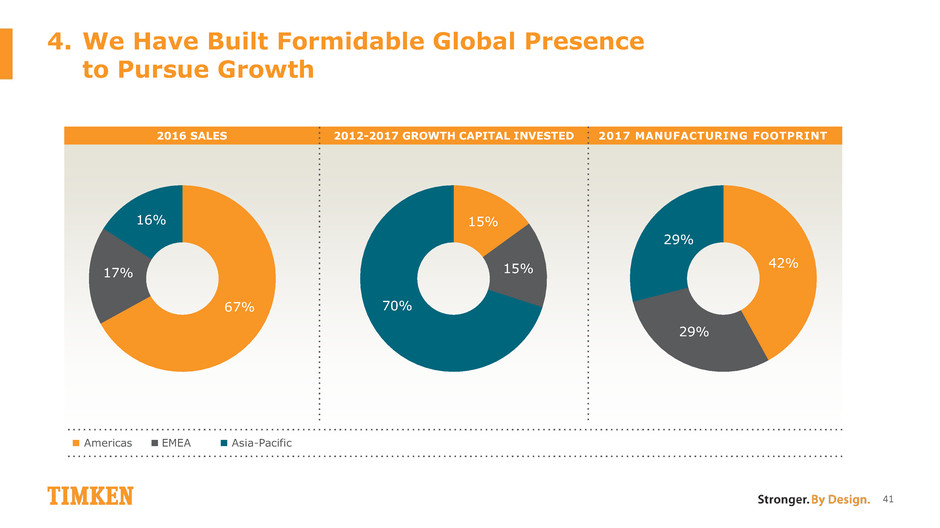
42% 29% 29% 67% 17% 16% 15% 15% 70% 41 4. We Have Built Formidable Global Presence to Pursue Growth 2016 SALES 2012-2017 GROWTH CAPITAL INVESTED 2017 MANUFACTURING FOOTPRINT Americas EMEA Asia-Pacific

5. Operational Excellence Is Critical to Our Success 42 OUR APPROACH: Work holistically to optimize product and application design… in order to maximize product performance for a specific application… and reliably meet customer value proposition… at a competitive price Application-Specific Product Practices Manufacturing Technology Bearing Design & Engineering Footprint & Sourcing Material Selection

Summary 43 NEXT-LEVEL PERFORMANCE Strategic Initiatives Support Growth Confident in Our Ability to Outgrow Markets Well-Positioned to Drive Long-term Growth
Strengthening Our Bearings Core 44 Amanda Montgomery Vice President and Product Line Executive

Key Messages 45 Timken’s Disciplined Product Development Process Drives Success Delivered Through Product Vitality and Lifecycle Management Multi-Dimensional Approach Fuels Robust Pipeline of Solutions Key to outgrowth strategy Primary focus of global engineering resources Defends base business and accelerates growth Purposely reposition to align with customer needs for performance and value Expand product range, optimize performance and continue to improve competitive position Increases markets and customer base served Evolving from catalog offerings to market specific solutions Penetration at original equipment and end user customers
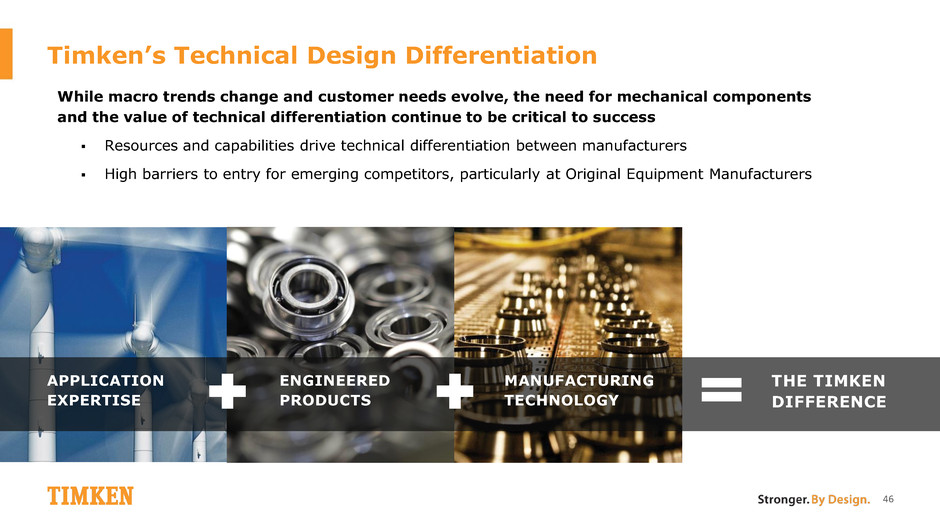
Timken’s Technical Design Differentiation 46 While macro trends change and customer needs evolve, the need for mechanical components and the value of technical differentiation continue to be critical to success Resources and capabilities drive technical differentiation between manufacturers High barriers to entry for emerging competitors, particularly at Original Equipment Manufacturers APPLICATION EXPERTISE ENGINEERED PRODUCTS MANUFACTURING TECHNOLOGY THE TIMKEN DIFFERENCE
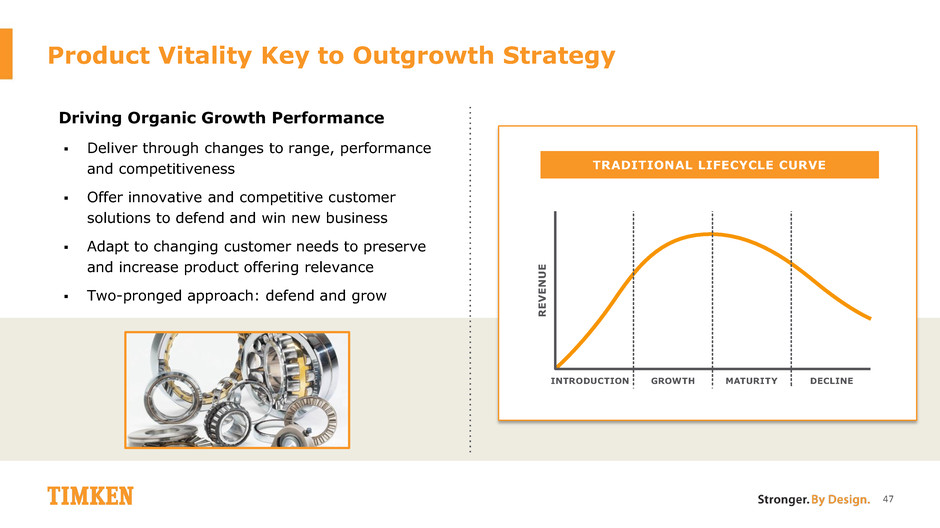
INTRODUCTION RE VE NU E GROWTH MATURITY DECLINE Product Vitality Key to Outgrowth Strategy Driving Organic Growth Performance Deliver through changes to range, performance and competitiveness Offer innovative and competitive customer solutions to defend and win new business Adapt to changing customer needs to preserve and increase product offering relevance Two-pronged approach: defend and grow TRADITIONAL LIFECYCLE CURVE 47

Innovative Product and Process Development Rigorous Business Process Accelerates Product Development Opportunity evaluation begins with understanding customer needs Product definition and process specifications balance differentiation and manufacturability Performance validation ensures success Innovation scaled across customers, market sectors and product categories OPPORTUNITY EVALUATION PRODUCT DEFINITION PROCESS SPECIFICATIONS PERFORMANCE VALIDATION LAUNCH AND EXPAND 48 TIMKEN DEVELOPMENT CYCLE

Delivering Next-Level Performance Expand and enhance offering under product line structure Delivering diversification and globalization Applied across all product categories and types Bundled into global growth platforms 49 Over 10,000 New Products Record Number of Prototype Bearing Shipments New Products Delivered Double the Industry CAGR Decade of Results
Two-Pronged Strategy Fuels Success 50 Application-driven Market-driven Significant product diversification achieved through multi-dimensional approach NEW PRODUCTS EXISTING PRODUCTS Portfolio expansion Industry innovation

Continue to Defend Core Markets Purposefully design to align with customer need for performance and value Innovate where valued within customer’s total system performance Globalize offering and expand reach Create installed base for future aftermarket replacement INTRODUCTION RE VE NU E GROWTH MATURITY AND PRODUCT REPOSITIONING INNOVATE & TRANSFORM PRODUCT EXTENSION Transforming Existing Products 51

SUCCESS STORY: APPLICATION-DRIVEN SOLUTION Timken SheavePac™ Bearing First to offer industry a totally maintenance-free design Replaces standard bearings – upgraded performance interchangeable with legacy bearings and seal assemblies Significantly reduces assembly time and risk for OEMs and rebuilders Improves operator safety and profitability Advanced technology recognized across industry, including 2016 Bearing Specialists Association Bearing Manufacturer Excellence of Innovation in Product Design Award 52
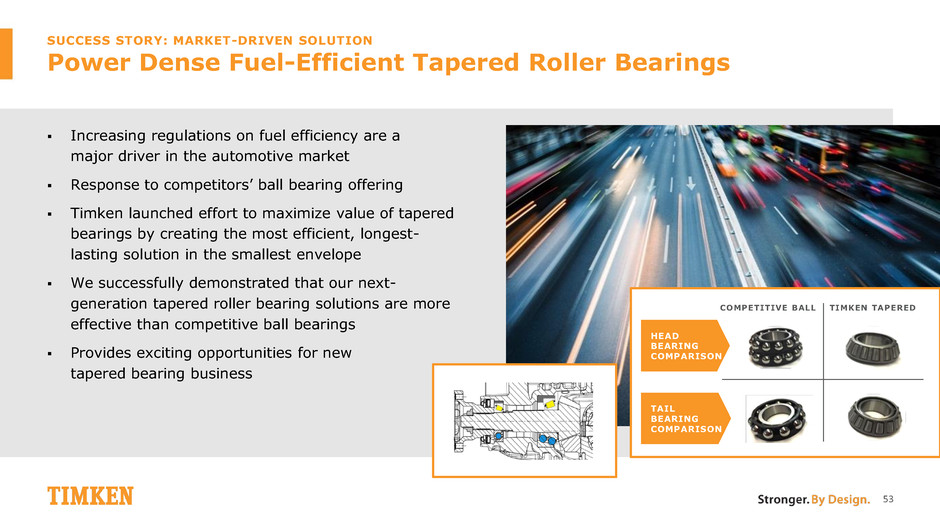
Increasing regulations on fuel efficiency are a major driver in the automotive market Response to competitors’ ball bearing offering Timken launched effort to maximize value of tapered bearings by creating the most efficient, longest- lasting solution in the smallest envelope We successfully demonstrated that our next- generation tapered roller bearing solutions are more effective than competitive ball bearings Provides exciting opportunities for new tapered bearing business 53 TIMKEN TAPERED HEAD BEARING COMPARISON COMPETITIVE BALL TAIL BEARING COMPARISON SUCCESS STORY: MARKET-DRIVEN SOLUTION Power Dense Fuel-Efficient Tapered Roller Bearings
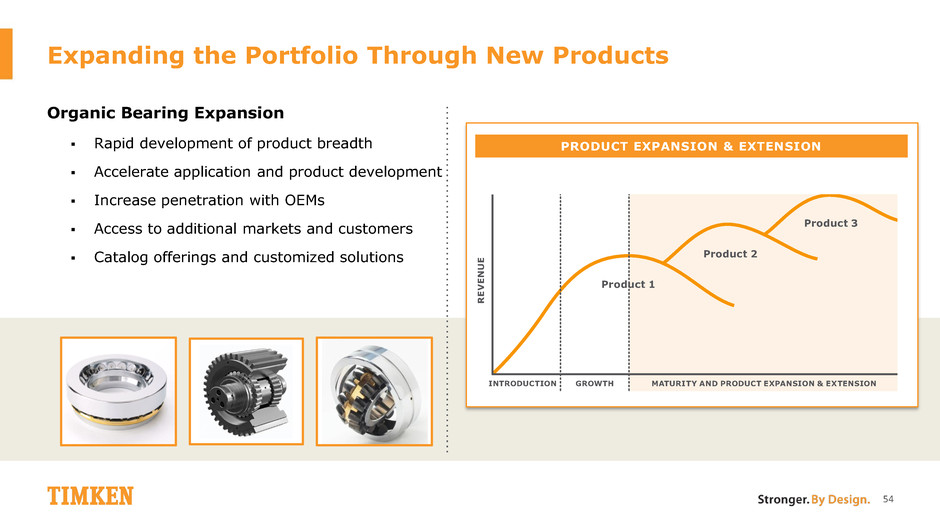
Expanding the Portfolio Through New Products Organic Bearing Expansion Rapid development of product breadth Accelerate application and product development Increase penetration with OEMs Access to additional markets and customers Catalog offerings and customized solutions 54 INTRODUCTION RE VE NU E GROWTH MATURITY AND PRODUCT EXPANSION & EXTENSION Product 1 Product 2 Product 3 PRODUCT EXPANSION & EXTENSION

SUCCESS STORY: INDUSTRY INNOVATION ADAPT Bearing New-to-industry bearing addressing installation and performance shortcomings from existing solutions Originally designed for the metals industry Recipient of PEC Engineers’ Choice Award for mechanical equipment and parts category Scaling innovative approach across the range of Timken industries 55
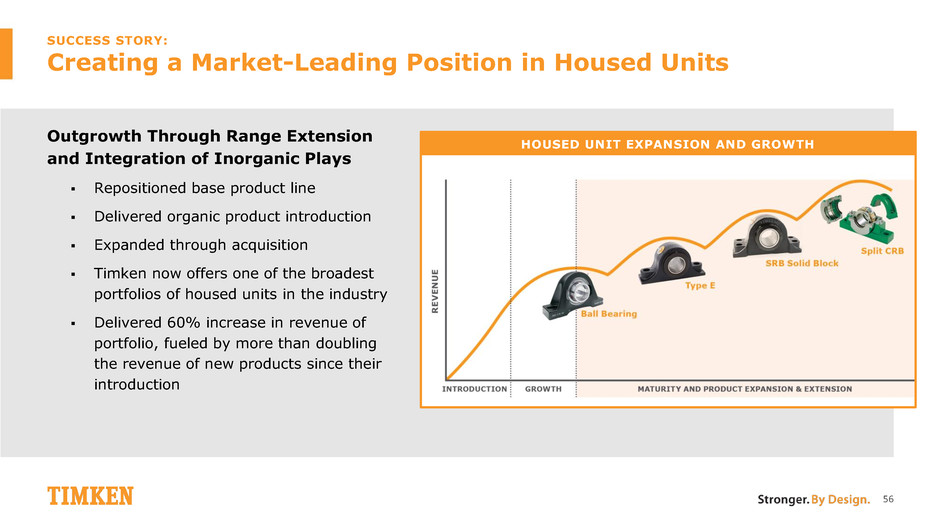
HOUSED UNIT EXPANSION AND GROWTH SUCCESS STORY: Creating a Market-Leading Position in Housed Units Outgrowth Through Range Extension and Integration of Inorganic Plays Repositioned base product line Delivered organic product introduction Expanded through acquisition Timken now offers one of the broadest portfolios of housed units in the industry Delivered 60% increase in revenue of portfolio, fueled by more than doubling the revenue of new products since their introduction 56
Product Vitality Contributes to Next-Level Performance 57 Timken’s Disciplined Product Development Process Drives Success Delivered Through Product Vitality and Lifecycle Management Multi-dimensional Approach Fuels Robust Pipeline of Solutions NEXT-LEVEL PERFORMANCE

Keeping the World in Motion 58 Andreas Roellgen Vice President, Europe, Asia & Africa

Key Messages 59 Strong Macro Trends in Asia Strong Investments & Leverage Focus on Execution, Innovation & Customer Intimacy to Outgrow Markets Population growth Trending to higher quality and performance India’s economic transformation Investing in manufacturing, engineering, sales, management Leveraging global assets Leveraging global accounts Wind – challenging applications, high service needs Heavy truck – road safety, fuel efficiency, global accounts India – government & infrastructure
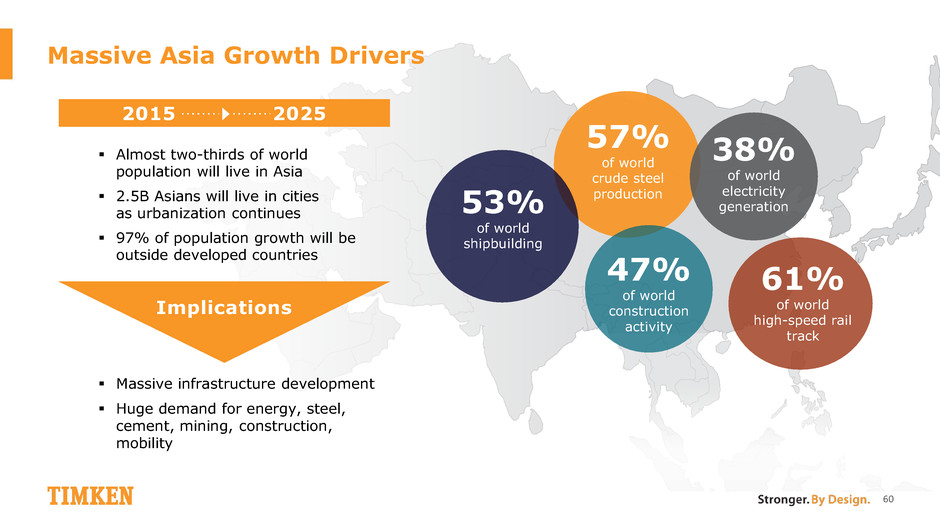
Massive Asia Growth Drivers 60 57% of world crude steel production 47% of world construction activity 38% of world electricity generation 61% of world high-speed rail track 53% of world shipbuilding 2015 2025 Implications Almost two-thirds of world population will live in Asia 2.5B Asians will live in cities as urbanization continues 97% of population growth will be outside developed countries Massive infrastructure development Huge demand for energy, steel, cement, mining, construction, mobility
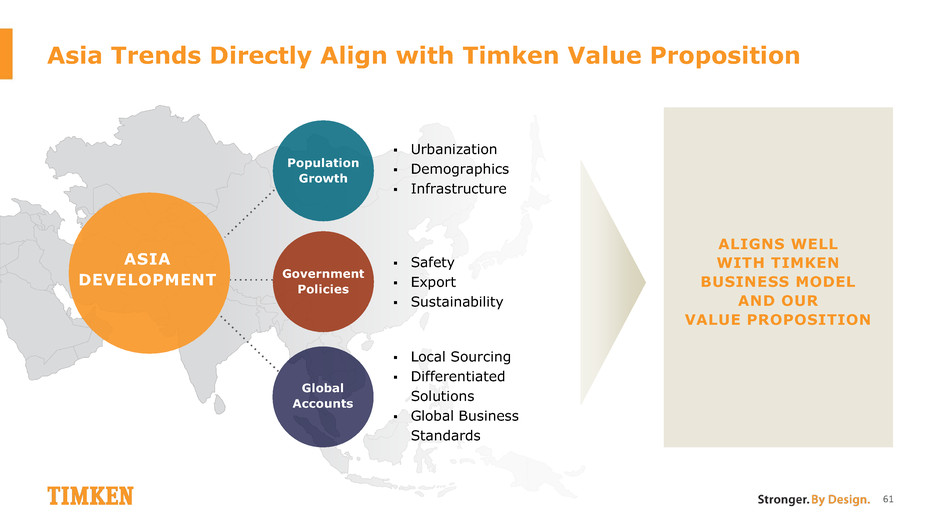
Asia Trends Directly Align with Timken Value Proposition ALIGNS WELL WITH TIMKEN BUSINESS MODEL AND OUR VALUE PROPOSITION ASIA DEVELOPMENT Urbanization Demographics Infrastructure Safety Export Sustainability Local Sourcing Differentiated Solutions Global Business Standards 61 Population Growth Government Policies Global Accounts

Timken in Asia Today 28 countries 8 manufacturing plants 26 sales offices 3 innovation centers 8 distribution centers 62 4,500 associates MYSORE BANGALORE RAIPUR KOLKATA AHMEDABAD GURGAON NEW DELHI JAMSHEDPUR CHENNAI KUALA LUMPUR BANGKOK JAKARTA SINGAPORE HANOI TAIPEI SHANGHAI NAGOYA YOKOHAMA SEOUL SHENYANG TIANJIN BEIJING ZHENGZHOU XI’AN YANTAI QINGDAO WUXI GUANGZHOU CHENGDU XIANGTAN PUNE
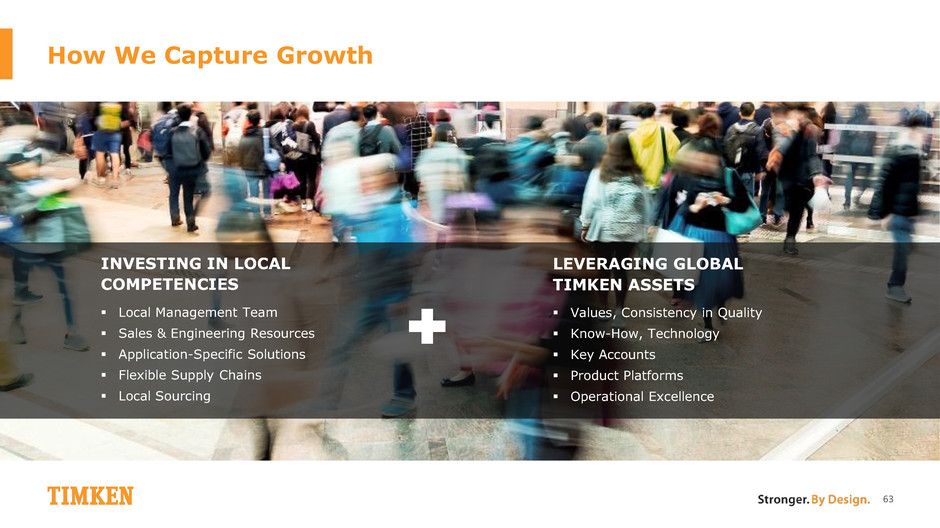
How We Capture Growth LEVERAGING GLOBAL TIMKEN ASSETS Values, Consistency in Quality Know-How, Technology Key Accounts Product Platforms Operational Excellence INVESTING IN LOCAL COMPETENCIES Local Management Team Sales & Engineering Resources Application-Specific Solutions Flexible Supply Chains Local Sourcing 63

Outgrowth in Wind DRIVERS Energy Mix Change Larger Turbines Aging Installed Base End-User Service Turbine Upgrades HOW WE CAPTURE GROWTH 64 Heavy application of our know-how, advancing technology with customers Establish local relationships Leverage global accounts Heavy investment in innovative products and local manufacturing Operational excellence
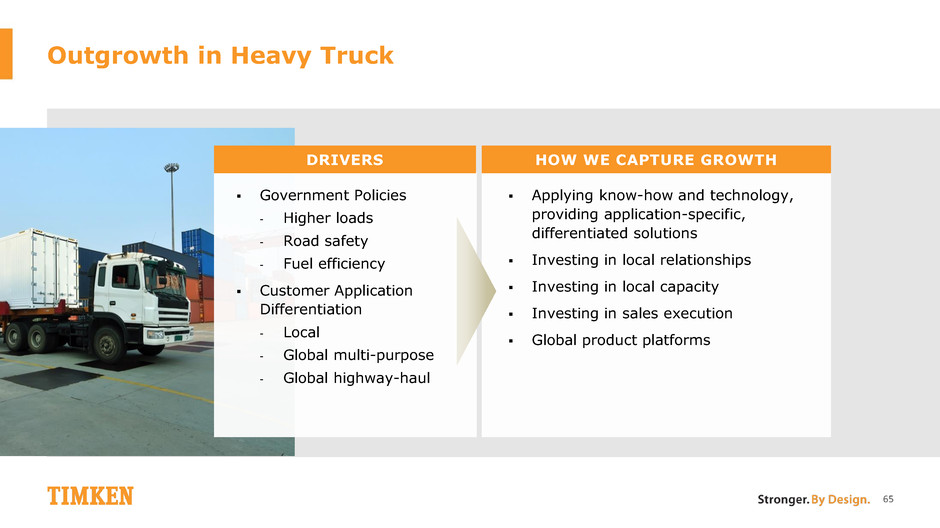
Outgrowth in Heavy Truck DRIVERS Government Policies - Higher loads - Road safety - Fuel efficiency Customer Application Differentiation - Local - Global multi-purpose - Global highway-haul HOW WE CAPTURE GROWTH 65 Applying know-how and technology, providing application-specific, differentiated solutions Investing in local relationships Investing in local capacity Investing in sales execution Global product platforms
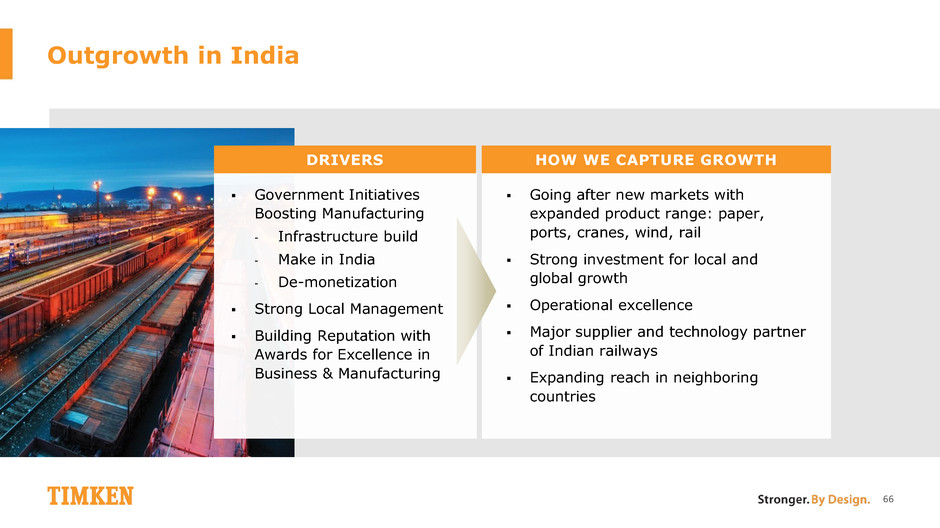
Outgrowth in India Government Initiatives Boosting Manufacturing - Infrastructure build - Make in India - De-monetization Strong Local Management Building Reputation with Awards for Excellence in Business & Manufacturing Going after new markets with expanded product range: paper, ports, cranes, wind, rail Strong investment for local and global growth Operational excellence Major supplier and technology partner of Indian railways Expanding reach in neighboring countries DRIVERS HOW WE CAPTURE GROWTH 66

2017: ~10% GROWTH Asia Contributes to Next-Level Performance 67 Strong Macro Trends in Asia Strong Investments & Leverage Focus on Execution, Innovation & Customer Intimacy to Outgrow Markets
Enhancing Value Through M&A 68 Rich Kyle President and Chief Executive Officer

69 What We Achieve Through M&A Stronger. Together. DELIVER FINANCIAL VALUE Discipline & Returns Maintain financial discipline & deliver returns ROIC – earn the cost of capital by Year 3 EPS – accretive in Year 1 Improve mix – margins & growth STRENGTHEN THE COMPANY’S STRATEGIC POSITION Customer Reach Customers, channels, markets & geography Mix Growth, technology, margins, diversity & cyclicality Cost Scale, operational excellence & business capabilities Talent Leverage existing & add new

How We Create Value Through M&A 70 Five Pillars of Integration Acquire Good, Adjacent Businesses Fit Timken Business Model filters Deploy Timken Business Model Differentiators Talent Technology & Product Vitality Operational Excellence Business Capabilities Allocate Capital Across Portfolio Leverage Timken Scale Increase Sales Reach Integration customized to deliver value Growth Margin Expansion Mix Cost Reduction Global Reach IT Sourcing Talent Logistics Resources Channels Geographies Customers End Users Markets

1. Acquire Good, Adjacent Businesses Identify and cultivate opportunities Focused on industrial bearings and adjacent products Adjacent product characteristics - Engineered mechanical components - Used in applications and systems where bearings are used - Timken Business Model filters - Ability to create value through Timken capabilities and differentiators 71 Existing Timken Portfolio Industrial Bearings Adjacent Products Stronger. Together.
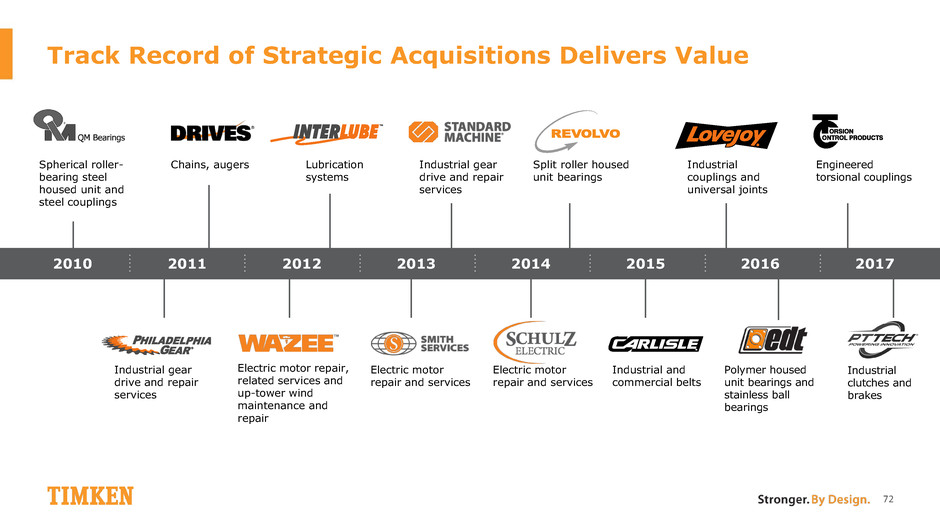
PURSUE STRATEGIC BOLT-ON ACQUISITIONS PORTFOLIO TRANSFORMATION - BUILDING FOR GROWTH Track ecord of Strategic Acquisitions Delivers Value 72 2012 2011 2013 2014 2015 2010 2016 2017 Lubrication systems Chains, augers Industrial gear drive and repair services Split roller housed unit bearings Spherical roller- bearing steel housed unit and steel couplings Electric motor repair and services Industrial gear drive and repair services Electric motor repair and services Industrial and commercial belts Industrial couplings and universal joints Polymer housed unit bearings and stainless ball bearings Engineered torsional couplings Industrial clutches and brakes Electric motor repair, related services and up-tower wind maintenance and repair

Growing Beyond Bearings: Mechanical Power Transmission Products 73 Hans Landin Vice President, Mechanical Power Transmission

Key Messages Mechanical Power Transmission Products and Services – A Great Fit Provide Value for Customers, Opportunity for Company A Key Element of Our Outgrowth Strategy Leverages our market space and knowledge, which are significantly broader than bearings Common customers, channel partners and challenging applications Significant growth and value creation opportunity with both OEM and Aftermarket customers Provides customers and distributors one-stop shop for critical mechanical components and related services Leverages business capabilities, corporate resources Further diversifies customer base/industries served Growing markets, partly underserved No other bearing company offers a similar breadth of mechanical power transmission products 74

Timken Mechanical Power Transmission Products & Services Have Natural Adjacency to Bearings Our target products are the critical mechanical components located between a drive element/motor and the driven equipment Close proximity to bearing positions Require same engineering expertise – friction, motion and materials Often served through same aftermarket channels 75 COUPLING BEARINGS BEARINGS ELECTRIC MOTOR SERVICES SPLIT HOUSED UNIT BEARING CLUTCH GEARBOX COUPLING BRAKE DRIVEN EQUIPMENT PUMPS/COMPRESSORS FANS CONVEYORS GENERATORS MILLS BEARINGS HOUSED UNIT BEARING CHAIN BELTS LUBRICATION SYSTEMS BEARINGS

Our Focus on Mechanical Power Transmission Opens Up Significant Additional Market Space 76 $10B TRB* $3B Mechanical Power Transmission Products and Services Space $70B Bearings *TRB = Tapered roller bearings
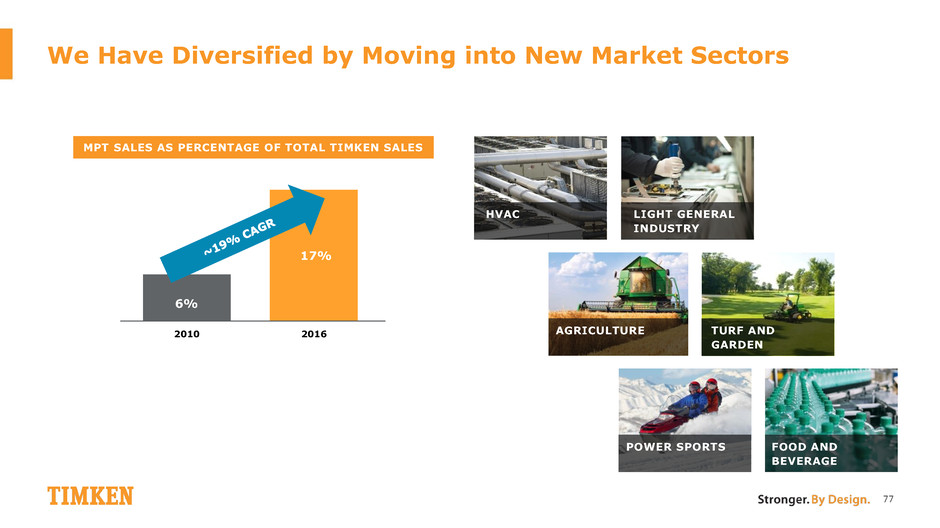
6% 17% 0% 2% 4% 6% 8% 10% 12% 14% 16% 18% We Have Diversified by Moving into New Market Sectors 2010 MPT SALES AS PERCENTAGE OF TOTAL TIMKEN SALES 77 2016 LIGHT GENERAL INDUSTRY AGRICULTURE HVAC TURF AND GARDEN POWER SPORTS FOOD AND BEVERAGE

To Achieve Growth and Margin Improvement, We Focus on Five Pillars 78 Five Pillars of Integration Acquire Good, Adjacent Businesses Deploy Timken Business Model Differentiators Allocate Capital Across Portfolio Leverage Timken Scale Increase Sales Reach
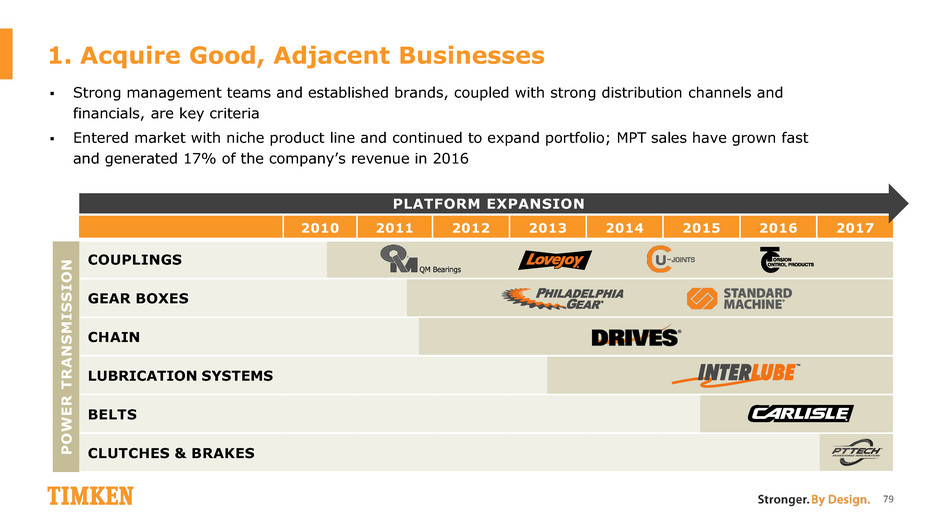
2010 2011 2012 2013 2014 2015 2016 2017 COUPLINGS GEAR BOXES CHAIN LUBRICATION SYSTEMS BELTS CLUTCHES & BRAKES 1. Acquire Good, Adjacent Businesses 79 Strong management teams and established brands, coupled with strong distribution channels and financials, are key criteria Entered market with niche product line and continued to expand portfolio; MPT sales have grown fast and generated 17% of the company’s revenue in 2016 PLATFORM EXPANSION P O W E R T R A N S M I S S I O N
2. Deploy Timken Business Model Differentiators Timken best practices applied to new acquisition: - Product development rigor - Operational excellence - Cost control discipline - Talent management Further accelerates Interlube™ profitability and brings added innovation to benefit customers 80 Launching record number of new products in 2017, driving accelerated and profitable organic growth
3. Allocate Capital Across Portfolio Immediate availability of increased resources: - Talent - Expertise and experience - Capital - Engineering Quick deployment of additional resources supports growing customer demand and accelerating product development 81 Quickly increase engineering capacity to support growing customer demand
4. Leverage Timken Scale Applying established infrastructure initiatives: - Technology - Logistics and warehousing optimization - IT – moving to common platforms, lowering ongoing costs and increasing effectiveness - Ease of doing business for customers - Corporate cost structure Streamlined process for distributors, improved product availability and increased sales 82 Growing sales through Distribution Channel due to online ordering, shipping consolidation with bearings and improved product availability
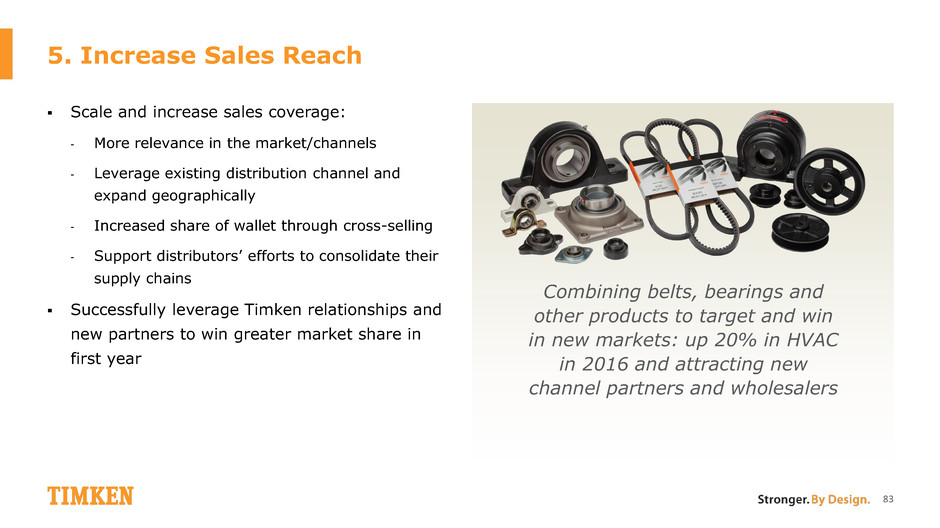
5. Increase Sales Reach 83 Scale and increase sales coverage: - More relevance in the market/channels - Leverage existing distribution channel and expand geographically - Increased share of wallet through cross-selling - Support distributors’ efforts to consolidate their supply chains Successfully leverage Timken relationships and new partners to win greater market share in first year Combining belts, bearings and other products to target and win in new markets: up 20% in HVAC in 2016 and attracting new channel partners and wholesalers

Establish Strong Connectivity to the Timken Brand 84
Growing Both Organically and Inorganically to Create Strategic Value for Customers and Shareholders Move into Mechanical Power Transmission products and services has been well-received by customers and distributors MPT is a major focus of our M&A activity Offers significant opportunity to grow A key thrust of our outgrowth strategy Employs our five fundamentals to deliver financial returns 85

MPT Contributes to Next-Level Performance 86 NEXT-LEVEL PERFORMANCE Mechanical Power Transmission Products and Services – A Great Fit Provide Value for Customers, Opportunity for Company A Key Element of Our Outgrowth Strategy
Operating with Excellence 87 Rick Boyer Vice President, Operations

Key Messages 88 Constructing ‘Footprint for the Future’ Driving Manufacturing Excellence Expanded capacity in high-growth, low-cost geographies Regional manufacturing hubs in Americas, Asia and Europe Continually implementing state-of-the-art processes and technologies Rigorous Lean implementation Enterprise-wide improvement initiatives Proprietary technologies and increased automation IT platforms optimizing business functions Leveraging best-cost locations Driving Lean principles through support functions Streamlining Business Processes Supporting Product Vitality Design for manufacturability Leverage global footprint Service and speed to market
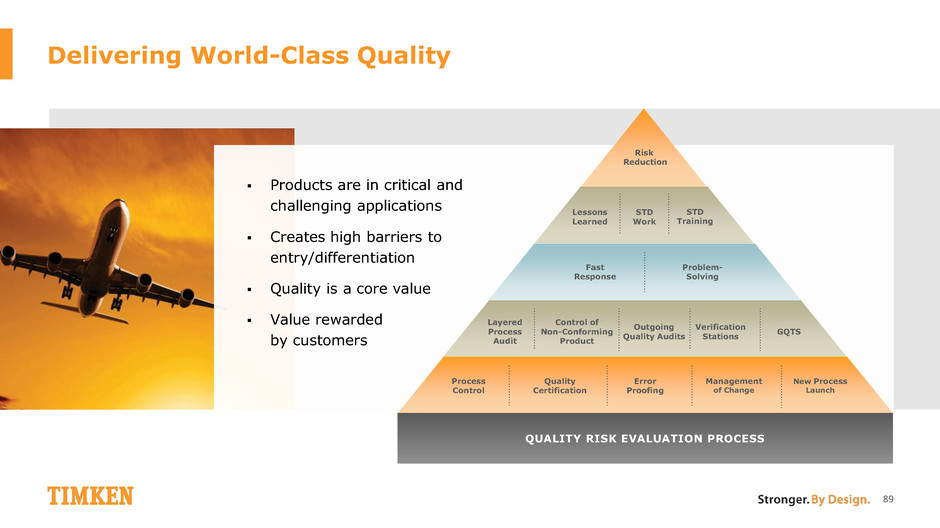
Delivering World-Class Quality 89 Products are in critical and challenging applications Creates high barriers to entry/differentiation Quality is a core value Value rewarded by customers Risk Reduction Lessons Learned STD Work STD Training Fast Response Problem- Solving Layered Process Audit QUALITY RISK EVALUATION PROCESS Control of Non-Conforming Product Outgoing Quality Audits Verification Stations GQTS Process Control Quality Certification Error Proofing Management of Change New Process Launch
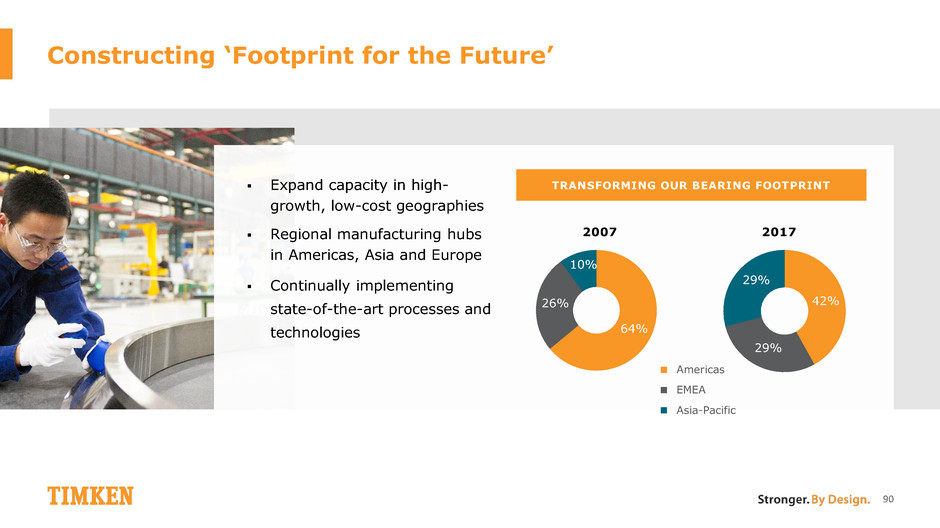
64% 26% 10% Constructing ‘Footprint for the Future’ 90 Expand capacity in high- growth, low-cost geographies Regional manufacturing hubs in Americas, Asia and Europe Continually implementing state-of-the-art processes and technologies 2007 Americas EMEA Asia-Pacific TRANSFORMING OUR BEARING FOOTPRINT 2017 42% 29% 29%

Rigorous Lean implementation Enterprise-wide improvement initiatives Proprietary technologies and automation Driving Manufacturing Excellence 91 THE TIMKEN MANUFACTURING OPERATING SYSTEM Future State Vision – Hoshin Plan Leader Values, Principles, Thinking Structures, Behaviors & Routines Management System & Organizational Structure Processes Tools & Techniques STEP 5 STEP 4 STEP 3 STEP 2 STEP 1 Lean Transformation Pyramid 2011 2012 2013 2014 2015 2016 Sample Plant – Labor Productivity

Supporting Product Vitality 92 Design for manufacturability Leverage global footprint Service and speed to market Application-Specific Product Practices Manufacturing Technology Bearing Design & Engineering Footprint & Sourcing Material Selection
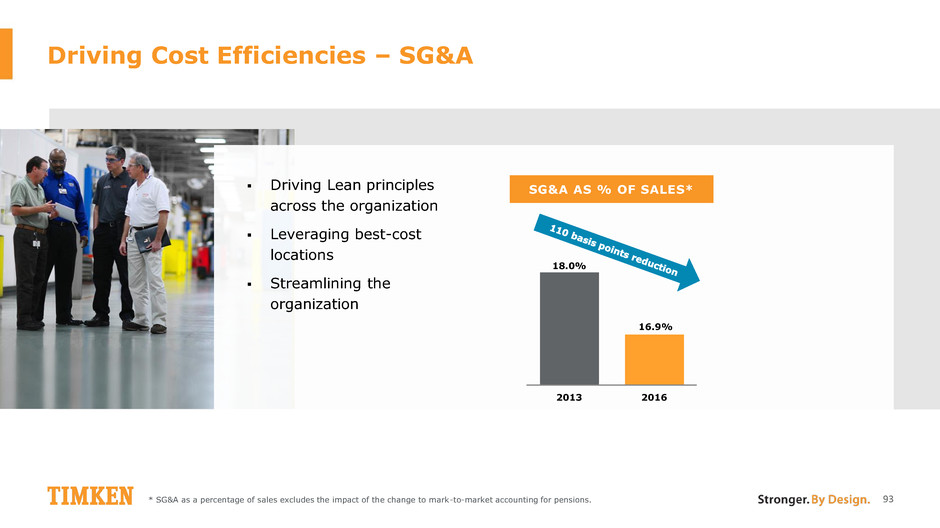
Driving Cost Efficiencies – SG&A 93 * SG&A as a percentage of sales excludes the impact of the change to mark-to-market accounting for pensions. Driving Lean principles across the organization Leveraging best-cost locations Streamlining the organization 18.0% 16.9% 2013 2016 SG&A AS % OF SALES*
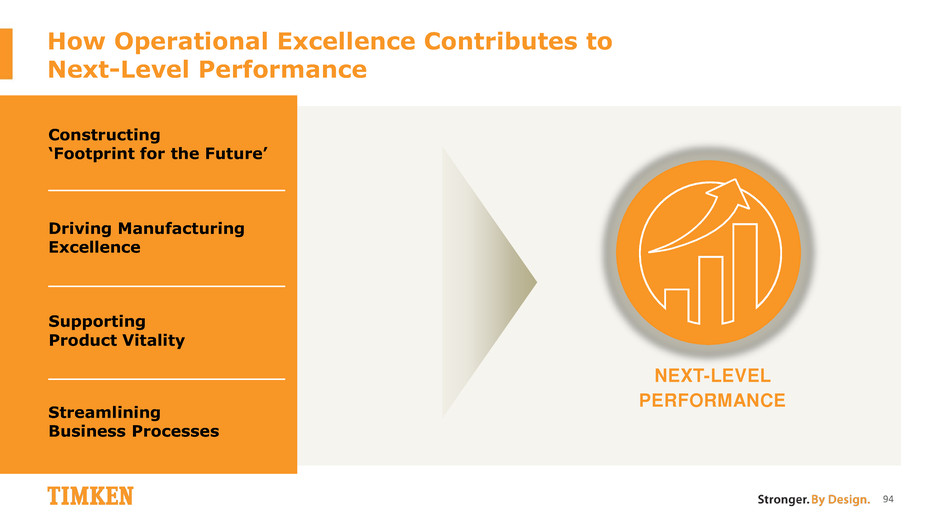
How Operational Excellence Contributes to Next-Level Performance 94 NEXT-LEVEL PERFORMANCE Constructing ‘Footprint for the Future’ Driving Manufacturing Excellence Streamlining Business Processes Supporting Product Vitality

Next-Level Financial Performance Phil Fracassa Executive Vice President and Chief Financial Officer 95

Key Messages 96 2017 YTD – Off to Good Start Recent Performance Sets New Standard Well-Positioned to Deliver Next-Level Performance Strong first-quarter results Market momentum is holding Maintaining 2017 guidance Reacted quickly to 2015-2016 industrial down-cycle Protected margins and generated strong cash flow Advanced our strategic initiatives Expect to capitalize on improving markets, drive organic growth and expand margins New long-range financial framework Balance sheet and cash flow continue to provide opportunities
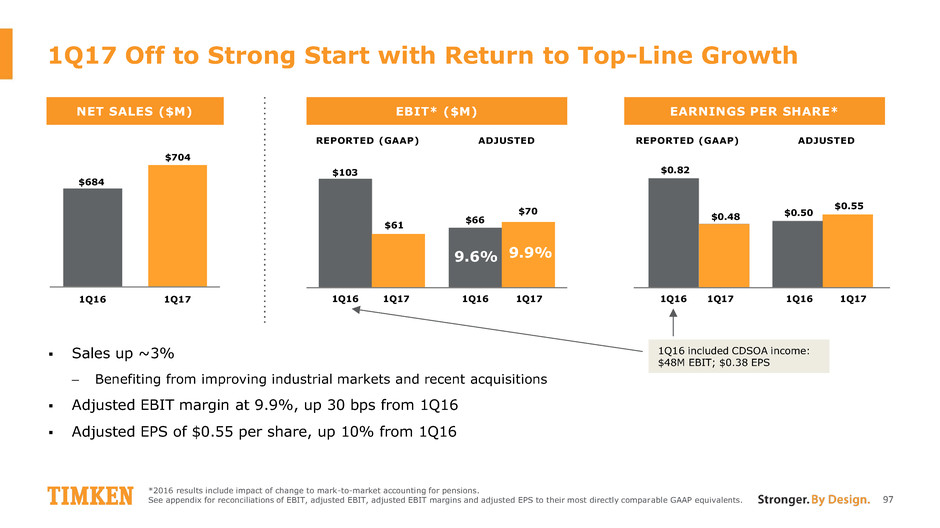
1Q17 Off to Strong Start with Return to Top-Line Growth Sales up ~3% – Benefiting from improving industrial markets and recent acquisitions Adjusted EBIT margin at 9.9%, up 30 bps from 1Q16 Adjusted EPS of $0.55 per share, up 10% from 1Q16 $684 $704 1Q16 1Q17 $103 $66 $61 $70 $0.82 $0.50 $0.48 $0.55 NET SALES ($M) EBIT* ($M) 9.6% 9.9% EARNINGS PER SHARE* 97 REPORTED (GAAP) ADJUSTED 1Q16 1Q17 1Q16 1Q17 1Q16 1Q17 1Q16 1Q17 REPORTED (GAAP) ADJUSTED *2016 results include impact of change to mark-to-market accounting for pensions. See appendix for reconciliations of EBIT, adjusted EBIT, adjusted EBIT margins and adjusted EPS to their most directly comparable GAAP equivalents. 1Q16 included CDSOA income: $48M EBIT; $0.38 EPS

MOBILE INDUSTRIES 1Q17: Improving End Markets Drive Increased Demand Sales roughly flat - Improved off-highway demand (mining and agriculture) - Rail still weak; lower aerospace shipments Adjusted EBIT margin at 9.6%, down 20 bps from 1Q16; driven by price/mix 9.8% 9.6% 1Q16 1Q17 NET SALES ($M) AND ADJ. EBIT MARGIN* Sales up ~7% - Increased distribution demand and higher marine revenue, plus benefit of acquisitions - Lower wind and services revenue Adjusted EBIT margin at 13.8%, up 140 bps from 1Q16; driven by volume, lower operating costs and acquisitions, offset partially by price/mix 12.4% 13.8% 1Q16 1Q17 NET SALES ($M) AND ADJ. EBIT MARGIN* PROCESS INDUSTRIES $383.2 $383.0 $300.8 $320.8 98 *See appendix for reconciliations of adjusted EBIT margins to their most directly comparable GAAP equivalents.

2017 Full-Year Outlook – Guidance Maintained Net sales up 5-6%; components (at the mid-point): CURRENT OUTLOOK VS. 2016 Adjusted EPS up 13% at the mid-point Free Cash Flow >1x adjusted net income +4% Organic +2% Acquisitions -0.5% Currency 99 See appendix for reconciliations of adjusted EPS and free cash flow to their most directly comparable GAAP equivalents. Free cash flow is defined as net cash provided by operating activities minus capital expenditures. APRIL OUTLOOK CURRENT OUTLOOK Net Sales $2.80B to $2.83B $2.80B to $2.83B GAAP EPS $2.15 to $2.25 $2.15 to $2.25 Adjusted EPS $2.35 to $2.45 $2.35 to $2.45 Free Cash Flow ~$210M ~$210M
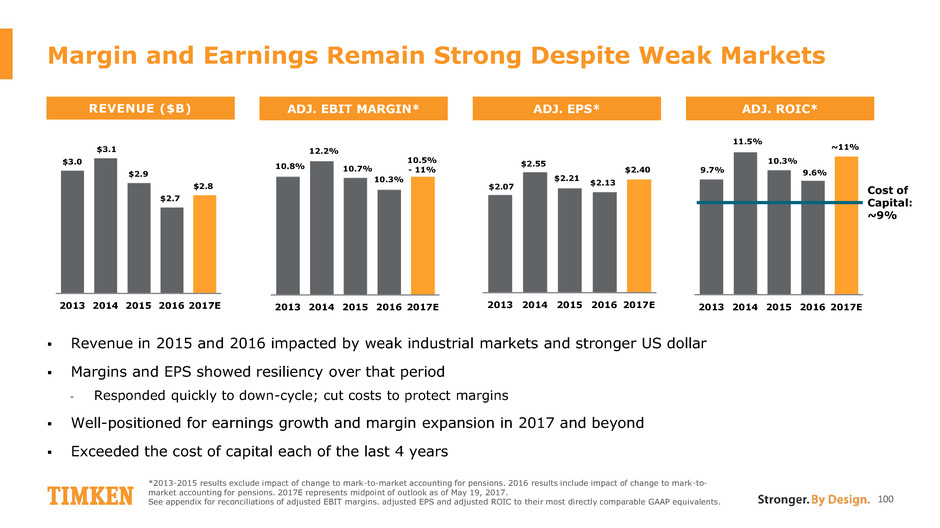
ADJ. EBIT MARGIN* Margin and Earnings Remain Strong Despite Weak Markets Revenue in 2015 and 2016 impacted by weak industrial markets and stronger US dollar Margins and EPS showed resiliency over that period - Responded quickly to down-cycle; cut costs to protect margins Well-positioned for earnings growth and margin expansion in 2017 and beyond Exceeded the cost of capital each of the last 4 years $3.0 $3.1 $2.9 $2.7 $2.8 2013 2014 2015 2016 2017E 10.8% 12.2% 10.7% 10.3% 10.5% - 11% 2013 2014 2015 2016 2017E $2.07 $2.55 $2.21 $2.13 $2.40 2013 2014 2015 2016 2017E REVENUE ($B) ADJ. EPS* 100 *2013-2015 results exclude impact of change to mark-to-market accounting for pensions. 2016 results include impact of change to mark-to- market accounting for pensions. 2017E represents midpoint of outlook as of May 19, 2017. See appendix for reconciliations of adjusted EBIT margins. adjusted EPS and adjusted ROIC to their most directly comparable GAAP equivalents. ADJ. ROIC* 9.7% 11.5% 10.3% 9.6% ~11% 2013 2014 2015 2016 2017E Cost of Capital: ~9%

$159 $155 $269 $265 $210 2013 2014 2015 2016 2017E FREE CASH FLOW ($M)*, FCF CONVERSION* Strong Free Cash Flow Expected to Continue Biggest “step-change” in performance has been cash flow – Provides fuel for growth and other capital allocation initiatives Expect strong cash flow going forward – Manage working capital during the up-cycle Net debt/capital target of 30-45%; debt/EBITDA of ~1.5-2.5x – Maintain investment grade rating (target 2.0-3.0x debt/EBITDA (Moody’s)) Capital Structure ($M) Cash $132 Debt 637 Net Debt 505 Equity 1,355 Net Capital $1,860 Leverage Total Debt/Capital 32% Net Debt/Capital 27% Debt/EBITDA 1.5x BALANCE SHEET (AS OF: 3/31/17) 0.8x 0.7x 1.4x 1.6x >1x 101 *2013-2015 FCF and FCF Conversion exclude impact of change to mark-to-market accounting for pensions. 2016 FCF and FCF Conversion include impact of change to mark-to-market accounting for pensions. 2016 includes $39 million in after-tax income received under CDSOA. See appendix for reconciliations of net debt, net debt/capital and free cash flow to their most directly comparable GAAP equivalents. Free cash flow is defined as net cash provided by operating activities minus capital expenditures. FCF conversion is defined as free cash flow divided by adjusted net income.
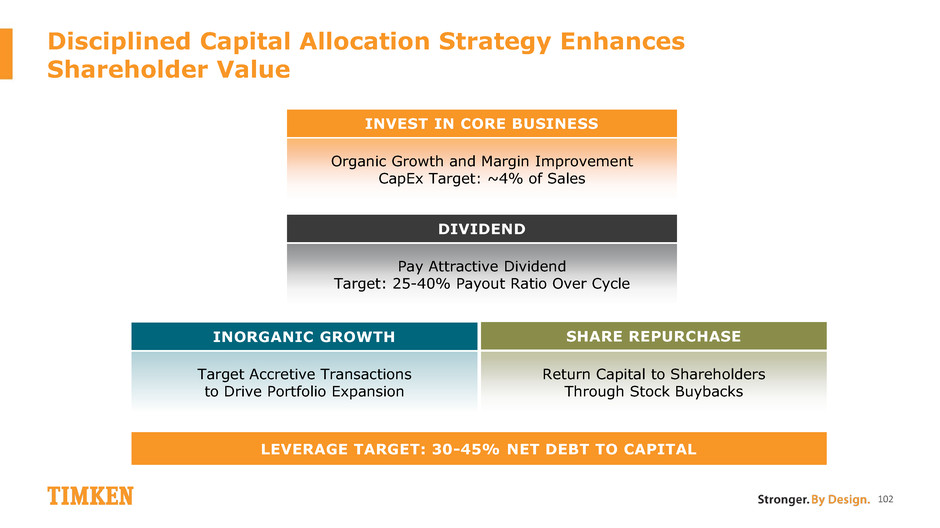
Disciplined Capital Allocation Strategy Enhances Shareholder Value 102 INVEST IN CORE BUSINESS Organic Growth and Margin Improvement CapEx Target: ~4% of Sales Pay Attractive Dividend Target: 25-40% Payout Ratio Over Cycle DIVIDEND Return Capital to Shareholders Through Stock Buybacks SHARE REPURCHASE Target Accretive Transactions to Drive Portfolio Expansion INORGANIC GROWTH LEVERAGE TARGET: 30-45% NET DEBT TO CAPITAL
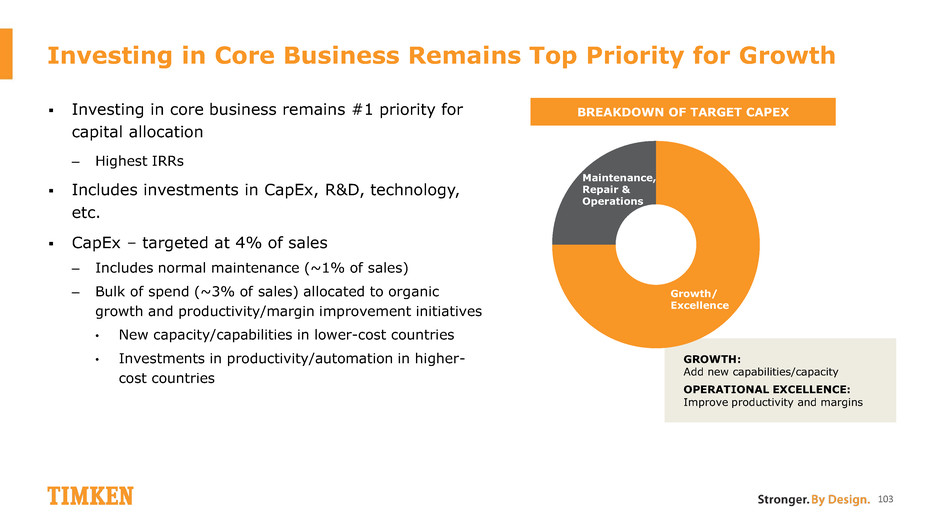
Investing in Core Business Remains Top Priority for Growth Investing in core business remains #1 priority for capital allocation – Highest IRRs Includes investments in CapEx, R&D, technology, etc. CapEx – targeted at 4% of sales – Includes normal maintenance (~1% of sales) – Bulk of spend (~3% of sales) allocated to organic growth and productivity/margin improvement initiatives • New capacity/capabilities in lower-cost countries • Investments in productivity/automation in higher- cost countries 103 BREAKDOWN OF TARGET CAPEX GROWTH: Add new capabilities/capacity OPERATIONAL EXCELLENCE: Improve productivity and margins Growth/ Excellence Maintenance, Repair & Operations
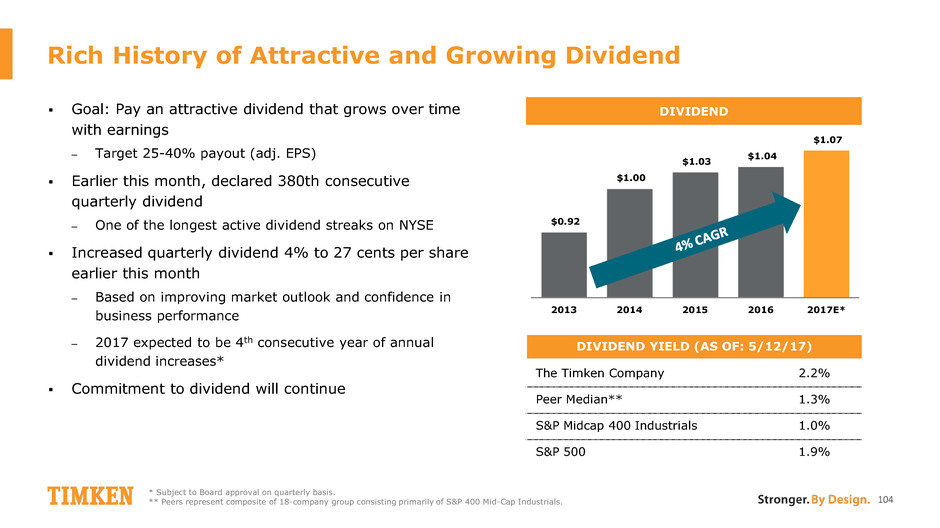
Rich History of Attractive and Growing Dividend Goal: Pay an attractive dividend that grows over time with earnings – Target 25-40% payout (adj. EPS) Earlier this month, declared 380th consecutive quarterly dividend – One of the longest active dividend streaks on NYSE Increased quarterly dividend 4% to 27 cents per share earlier this month – Based on improving market outlook and confidence in business performance – 2017 expected to be 4th consecutive year of annual dividend increases* Commitment to dividend will continue $0.92 $1.00 $1.03 $1.04 $1.07 2013 2014 2015 2016 2017E* DIVIDEND YIELD (AS OF: 5/12/17) The Timken Company 2.2% Peer Median** 1.3% S&P Midcap 400 Industrials 1.0% S&P 500 1.9% * Subject to Board approval on quarterly basis. ** Peers represent composite of 18-company group consisting primarily of S&P 400 Mid-Cap Industrials. DIVIDEND 104

2012 2011 2013 2014 2015 2010 2016 2017 Lubrication systems Chains, augers Industrial gear drive and repair services Split roller housed unit bearings Spherical roller- bearing steel housed unit and steel couplings Electric motor repair and services Electric motor repair, related services and up-tower wind maintenance and repair Industrial gear drive and repair services Electric motor repair and services Industrial and commercial belts Industrial couplings and universal joints Polymer housed unit bearings and stainless ball bearings Engineered torsional couplings Proven Track Record of Driving Inorganic Growth 105 Industrial clutches and brakes Since 2010: Spent ~$770M on 14 acquisitions (avg. < 9x EBITDA), adding TTM revenue of ~$575M over that period

Share Repurchases Play an Important Role Share repurchase an important component of capital allocation strategy Since June 30, 2014: – Repurchased 14.5M shares for $538M (avg. ~$37/share); ~16% of outstanding shares as of 6/30/14 – Includes 185K shares repurchased in 1Q17 Current share repurchase authorization (approved in January 2017): – 10 million shares over 4 years – ~9.8 million shares remaining as of 3/31/17 Plan for 2017: more modest buyback than past years; bias toward growth/M&A 90.7 78.0 6/30/14 3/31/17 BASIC SHARES OUTSTANDING (MILLIONS) 106
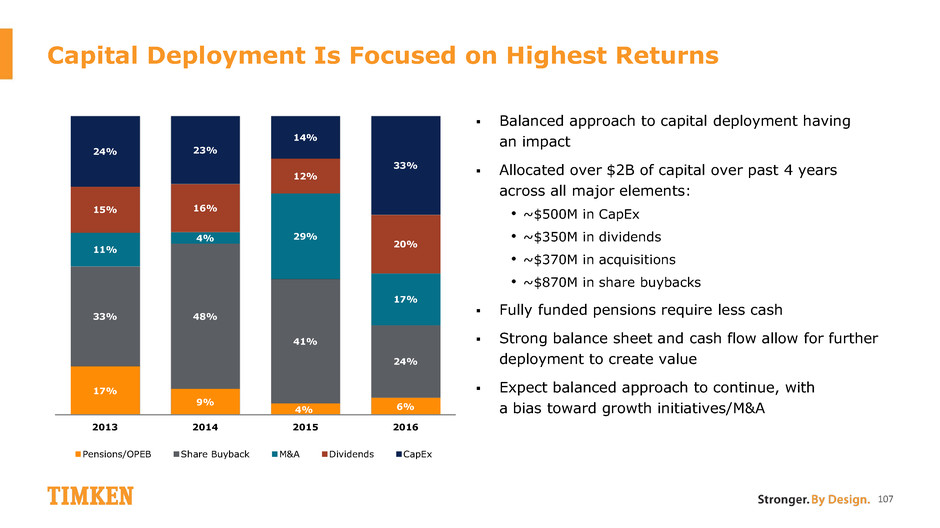
Capital Deployment Is Focused on Highest Returns Balanced approach to capital deployment having an impact Allocated over $2B of capital over past 4 years across all major elements: • ~$500M in CapEx • ~$350M in dividends • ~$370M in acquisitions • ~$870M in share buybacks Fully funded pensions require less cash Strong balance sheet and cash flow allow for further deployment to create value Expect balanced approach to continue, with a bias toward growth initiatives/M&A 17% 9% 4% 6% 33% 48% 41% 24% 11% 4% 29% 17% 15% 16% 12% 20% 24% 23% 14% 33% 2013 2014 2015 2016 Pensions/OPEB Share Buyback M&A Dividends CapEx 107
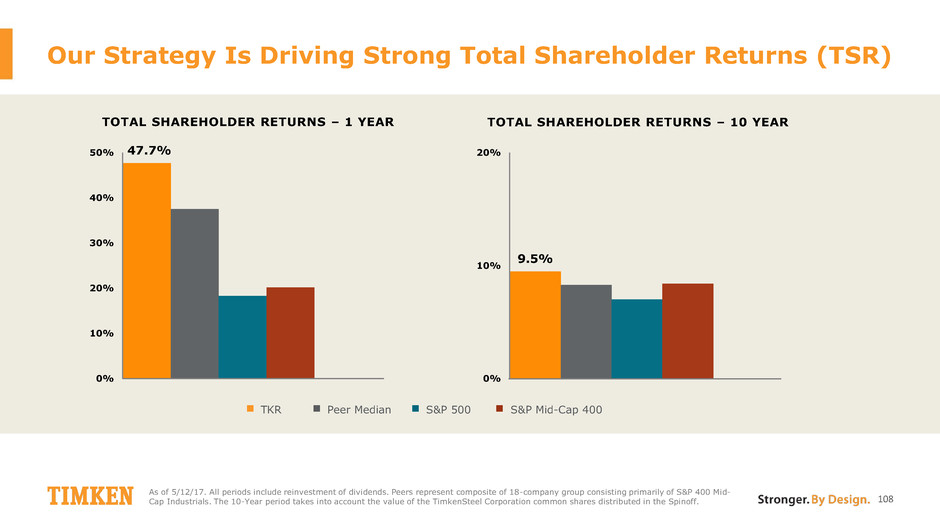
Our Strategy Is Driving Strong Total Shareholder Returns (TSR) As of 5/12/17. All periods include reinvestment of dividends. Peers represent composite of 18-company group consisting primarily of S&P 400 Mid- Cap Industrials. The 10-Year period takes into account the value of the TimkenSteel Corporation common shares distributed in the Spinoff. 108 47.7% 0% 10% 20% 30% 40% 50% TKR Peer Median S&P Mid-Cap 400 S&P 500 9.5% 0% 10% 20% TOTAL SHAREHOLDER RETURNS – 1 YEAR TOTAL SHAREHOLDER RETURNS – 10 YEAR

Next-Level Financial Framework 109 Drive Above-Market Top-Line Growth; Improved Mix Robust Earnings and Cash Generation Value-Driven Capital Deployment Grow top line organically – target 1% above market growth rates Add >2% top-line growth annually through M&A Expand operating margins with growth, improved mix and operational excellence initiatives Target EBIT margins – Process Industries 16-19%; Mobile Industries 10-12%; Consolidated 11-13% ROIC >12% (average over the cycle) Free cash flow conversion >100% (over the cycle) Invest in the core business; CapEx spending at 4% of sales Attractive dividend that grows over time with earnings Disciplined, value-accretive M&A Share buyback with residual capacity Investment-grade; target 30-45% net debt to capital Use strong balance sheet and cash flow to generate highest returns, with a bias for growth Top-tier shareholder returns Balance Sheet as Differentiator
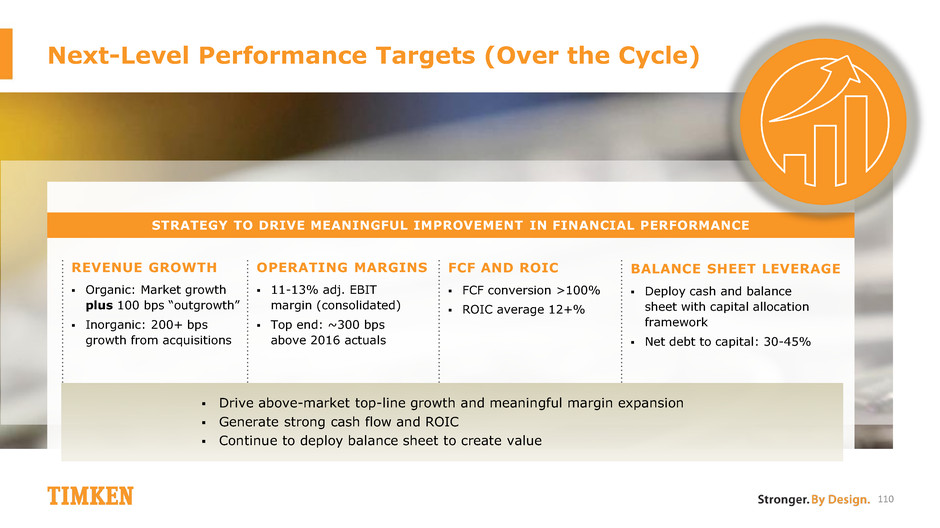
110 Next-Level Performance Targets (Over the Cycle) REVENUE GROWTH Organic: Market growth plus 100 bps “outgrowth” Inorganic: 200+ bps growth from acquisitions 11-13% adj. EBIT margin (consolidated) Top end: ~300 bps above 2016 actuals OPERATING MARGINS FCF conversion >100% ROIC average 12+% FCF AND ROIC Deploy cash and balance sheet with capital allocation framework Net debt to capital: 30-45% BALANCE SHEET LEVERAGE STRATEGY TO DRIVE MEANINGFUL IMPROVEMENT IN FINANCIAL PERFORMANCE Drive above-market top-line growth and meaningful margin expansion Generate strong cash flow and ROIC Continue to deploy balance sheet to create value

111 NEXT-LEVEL PERFORMANCE Well-Positioned to Deliver Higher Levels of Performance Over the Cycle Disciplined and Balanced Capital Allocation Framework Focus on Generating Top-Tier Shareholder Returns Financial Strength Contributes to Next-Level Performance

We will: Win with customers – innovate, differentiate, deliver value Outgrow improving end markets through the differentiators of the Timken Business Model Invest in the business to drive competitive advantage Generate strong cash flow and create value through capital allocation – core business, dividend, M&A and buyback Deliver next-level financial performance – revenue, margins, EPS and ROIC 112 Timken Is Positioned to Deliver Next-Level Performance

Appendix: Additional Slides 113
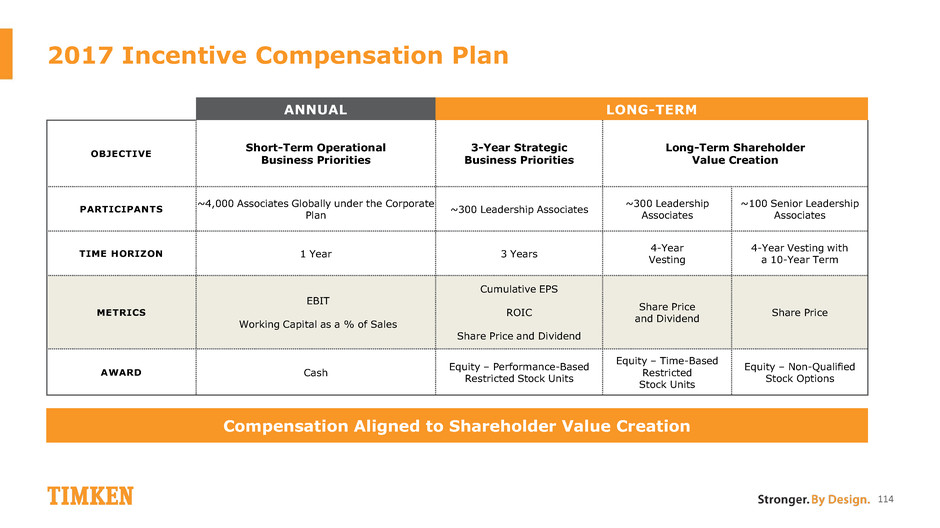
2017 INCENTIVE COMPENSATION PLAN Compensation Aligned to Shareholder Value Creation ANNUAL LONG-TERM OBJECTIVE Short-Term Operational Business Priorities 3-Year Strategic Business Priorities Long-Term Shareholder Value Creation PARTICIPANTS ~4,000 Associates Globally under the Corporate Plan ~300 Leadership Associates ~300 Leadership Associates ~100 Senior Leadership Associates TIME HORIZON 1 Year 3 Years 4-Year Vesting 4-Year Vesting with a 10-Year Term METRICS EBIT Working Capital as a % of Sales Cumulative EPS ROIC Share Price and Dividend Share Price and Dividend Share Price AWARD Cash Equity – Performance-Based Restricted Stock Units Equity – Time-Based Restricted Stock Units Equity – Non-Qualified Stock Options 2017 Incentive Compensation Plan 114

Strong Corporate Governance Strongly independent Board (9 of 11 directors are independent) Independent Chairman of the Board (non-executive) and Independent Lead Director Declassified Board – all Directors elected annually Annual Board, Committee and Director evaluations Board refreshment – 4 new independent Directors since ‘14; Director retirement policy at age 72 Proactively adopted shareholder proxy access in ‘16 with 3/3/20/20; received 99% shareholder approval Say-on-pay received 97% favorable vote in ‘17 Majority Voting Policy requires resignation of Directors who fail to receive a majority of votes cast Over-boarding policy limits number of public company boards a Director can serve on Special Meetings may be called by shareholders holding 25% of the Company’s shares “Clawback” policy permits clawback of executive compensation for detrimental conduct No excise tax gross-ups in executive severance agreements Stock ownership requirements for Directors (5x annual retainer) and executive officers (multiple of base salary) 115
Appendix: Executive Bios 116

Richard G. Kyle is president, chief executive officer and a board member of The Timken Company. Prior to being elected president and CEO in 2014, Kyle served as chief operating officer of the Bearings and Power Transmission Group. In 2012, he was named group president responsible for the company’s Aerospace and Steel segments as well as the engineering and technology organizations. Kyle started his Timken career in 2006 as vice president of manufacturing, responsible for the company’s global bearings operations. He was named president of the Aerospace and Mobile Industries segments in 2008. During his tenure, he led Mobile Industries through significant changes, reshaping its product portfolio, market mix and operating capabilities, which yielded dramatic improvements in the company’s financial performance. Before joining Timken, Kyle held management positions with Cooper Industries and Hubbell, Inc. In 2015, he was elected to the board of directors of Sonoco (NYSE: SON), a global provider of consumer packaging, industrial products, protective solutions and display and packaging services. A native of Mishawaka, Ind., Kyle received a bachelor’s degree in mechanical engineering from Purdue University and earned a Master of Business Administration degree in management from Northwestern University’s Kellogg Graduate School of Management. Kyle was elected to the Timken board in 2013. 117 Richard G. Kyle PRESIDENT AND CHIEF EXECUTIVE OFFICER
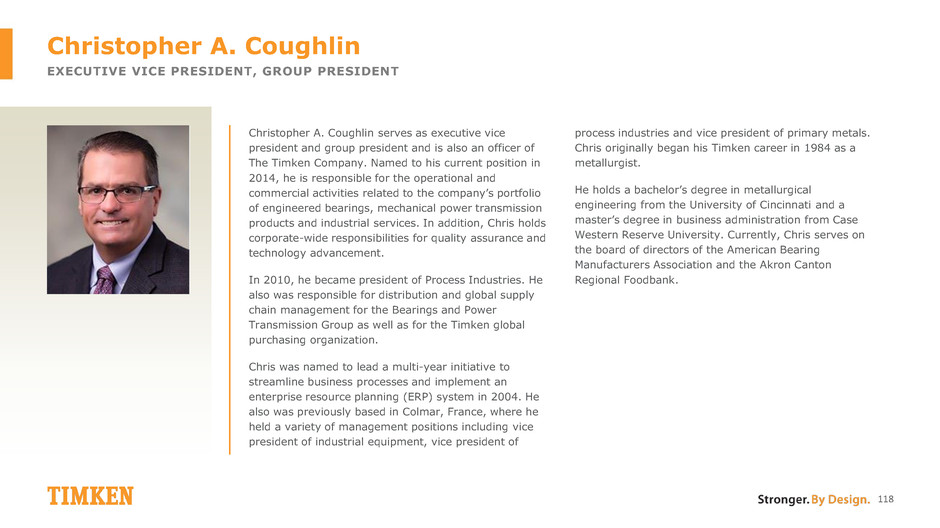
Christopher A. Coughlin serves as executive vice president and group president and is also an officer of The Timken Company. Named to his current position in 2014, he is responsible for the operational and commercial activities related to the company’s portfolio of engineered bearings, mechanical power transmission products and industrial services. In addition, Chris holds corporate-wide responsibilities for quality assurance and technology advancement. In 2010, he became president of Process Industries. He also was responsible for distribution and global supply chain management for the Bearings and Power Transmission Group as well as for the Timken global purchasing organization. Chris was named to lead a multi-year initiative to streamline business processes and implement an enterprise resource planning (ERP) system in 2004. He also was previously based in Colmar, France, where he held a variety of management positions including vice president of industrial equipment, vice president of process industries and vice president of primary metals. Chris originally began his Timken career in 1984 as a metallurgist. He holds a bachelor’s degree in metallurgical engineering from the University of Cincinnati and a master’s degree in business administration from Case Western Reserve University. Currently, Chris serves on the board of directors of the American Bearing Manufacturers Association and the Akron Canton Regional Foodbank. 118 Christopher A. Coughlin EXECUTIVE VICE PRESIDENT, GROUP PRESIDENT
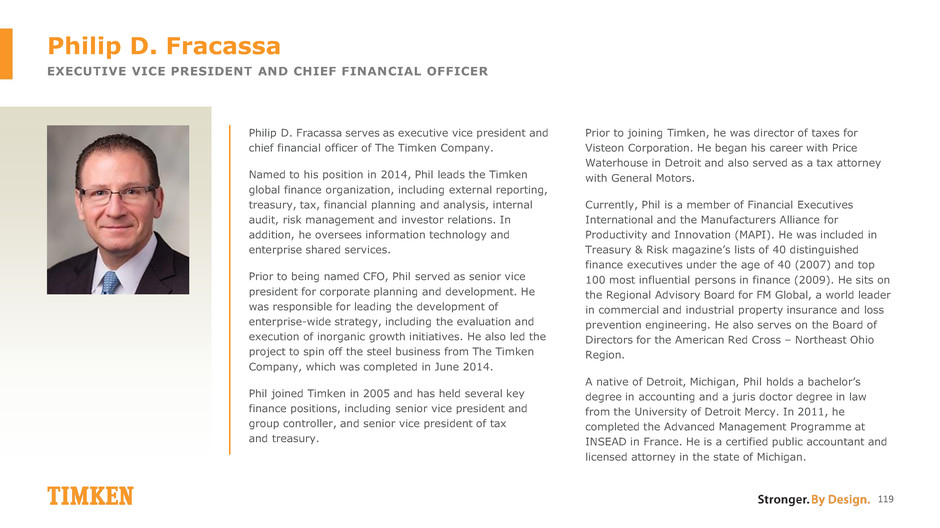
Philip D. Fracassa serves as executive vice president and chief financial officer of The Timken Company. Named to his position in 2014, Phil leads the Timken global finance organization, including external reporting, treasury, tax, financial planning and analysis, internal audit, risk management and investor relations. In addition, he oversees information technology and enterprise shared services. Prior to being named CFO, Phil served as senior vice president for corporate planning and development. He was responsible for leading the development of enterprise-wide strategy, including the evaluation and execution of inorganic growth initiatives. He also led the project to spin off the steel business from The Timken Company, which was completed in June 2014. Phil joined Timken in 2005 and has held several key finance positions, including senior vice president and group controller, and senior vice president of tax and treasury. Prior to joining Timken, he was director of taxes for Visteon Corporation. He began his career with Price Waterhouse in Detroit and also served as a tax attorney with General Motors. Currently, Phil is a member of Financial Executives International and the Manufacturers Alliance for Productivity and Innovation (MAPI). He was included in Treasury & Risk magazine’s lists of 40 distinguished finance executives under the age of 40 (2007) and top 100 most influential persons in finance (2009). He sits on the Regional Advisory Board for FM Global, a world leader in commercial and industrial property insurance and loss prevention engineering. He also serves on the Board of Directors for the American Red Cross – Northeast Ohio Region. A native of Detroit, Michigan, Phil holds a bachelor’s degree in accounting and a juris doctor degree in law from the University of Detroit Mercy. In 2011, he completed the Advanced Management Programme at INSEAD in France. He is a certified public accountant and licensed attorney in the state of Michigan. 119 Philip D. Fracassa EXECUTIVE VICE PRESIDENT AND CHIEF FINANCIAL OFFICER
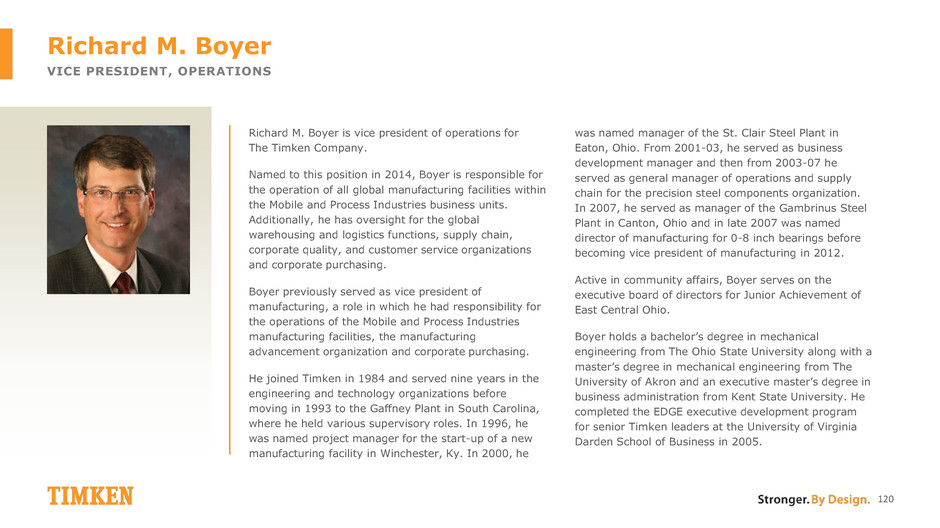
Richard M. Boyer is vice president of operations for The Timken Company. Named to this position in 2014, Boyer is responsible for the operation of all global manufacturing facilities within the Mobile and Process Industries business units. Additionally, he has oversight for the global warehousing and logistics functions, supply chain, corporate quality, and customer service organizations and corporate purchasing. Boyer previously served as vice president of manufacturing, a role in which he had responsibility for the operations of the Mobile and Process Industries manufacturing facilities, the manufacturing advancement organization and corporate purchasing. He joined Timken in 1984 and served nine years in the engineering and technology organizations before moving in 1993 to the Gaffney Plant in South Carolina, where he held various supervisory roles. In 1996, he was named project manager for the start-up of a new manufacturing facility in Winchester, Ky. In 2000, he was named manager of the St. Clair Steel Plant in Eaton, Ohio. From 2001-03, he served as business development manager and then from 2003-07 he served as general manager of operations and supply chain for the precision steel components organization. In 2007, he served as manager of the Gambrinus Steel Plant in Canton, Ohio and in late 2007 was named director of manufacturing for 0-8 inch bearings before becoming vice president of manufacturing in 2012. Active in community affairs, Boyer serves on the executive board of directors for Junior Achievement of East Central Ohio. Boyer holds a bachelor’s degree in mechanical engineering from The Ohio State University along with a master’s degree in mechanical engineering from The University of Akron and an executive master’s degree in business administration from Kent State University. He completed the EDGE executive development program for senior Timken leaders at the University of Virginia Darden School of Business in 2005. 120 Richard M. Boyer VICE PRESIDENT, OPERATIONS
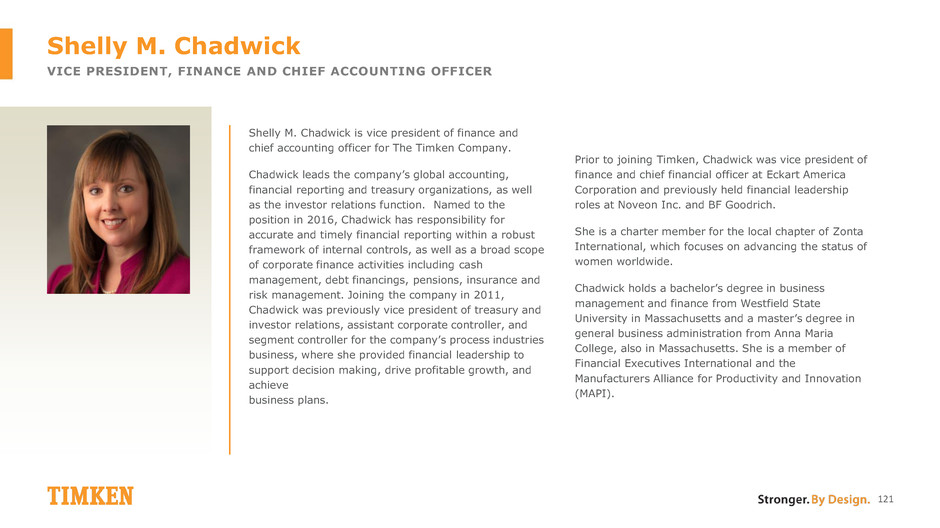
Shelly M. Chadwick is vice president of finance and chief accounting officer for The Timken Company. Chadwick leads the company’s global accounting, financial reporting and treasury organizations, as well as the investor relations function. Named to the position in 2016, Chadwick has responsibility for accurate and timely financial reporting within a robust framework of internal controls, as well as a broad scope of corporate finance activities including cash management, debt financings, pensions, insurance and risk management. Joining the company in 2011, Chadwick was previously vice president of treasury and investor relations, assistant corporate controller, and segment controller for the company’s process industries business, where she provided financial leadership to support decision making, drive profitable growth, and achieve business plans. Prior to joining Timken, Chadwick was vice president of finance and chief financial officer at Eckart America Corporation and previously held financial leadership roles at Noveon Inc. and BF Goodrich. She is a charter member for the local chapter of Zonta International, which focuses on advancing the status of women worldwide. Chadwick holds a bachelor’s degree in business management and finance from Westfield State University in Massachusetts and a master’s degree in general business administration from Anna Maria College, also in Massachusetts. She is a member of Financial Executives International and the Manufacturers Alliance for Productivity and Innovation (MAPI). 121 Shelly M. Chadwick VICE PRESIDENT, FINANCE AND CHIEF ACCOUNTING OFFICER
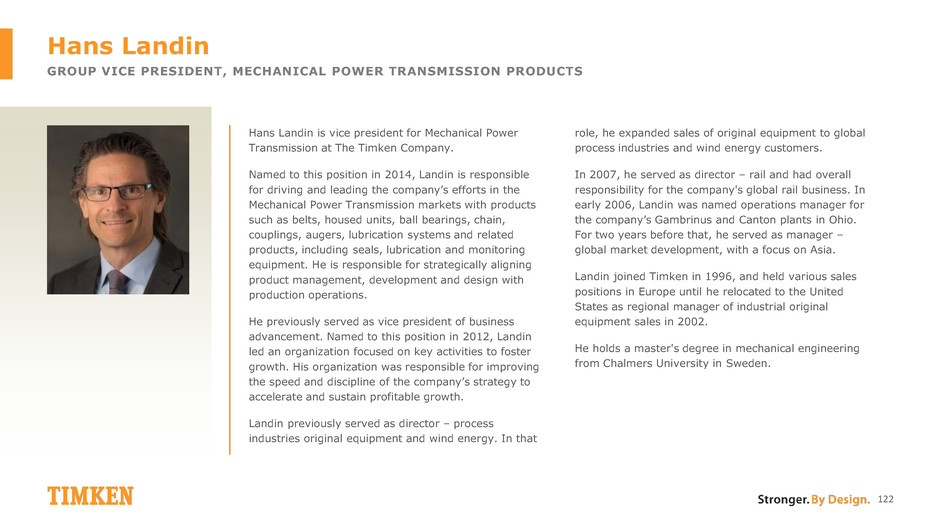
Hans Landin is vice president for Mechanical Power Transmission at The Timken Company. Named to this position in 2014, Landin is responsible for driving and leading the company’s efforts in the Mechanical Power Transmission markets with products such as belts, housed units, ball bearings, chain, couplings, augers, lubrication systems and related products, including seals, lubrication and monitoring equipment. He is responsible for strategically aligning product management, development and design with production operations. He previously served as vice president of business advancement. Named to this position in 2012, Landin led an organization focused on key activities to foster growth. His organization was responsible for improving the speed and discipline of the company’s strategy to accelerate and sustain profitable growth. Landin previously served as director – process industries original equipment and wind energy. In that role, he expanded sales of original equipment to global process industries and wind energy customers. In 2007, he served as director – rail and had overall responsibility for the company's global rail business. In early 2006, Landin was named operations manager for the company’s Gambrinus and Canton plants in Ohio. For two years before that, he served as manager – global market development, with a focus on Asia. Landin joined Timken in 1996, and held various sales positions in Europe until he relocated to the United States as regional manager of industrial original equipment sales in 2002. He holds a master's degree in mechanical engineering from Chalmers University in Sweden. 122 Hans Landin GROUP VICE PRESIDENT, MECHANICAL POWER TRANSMISSION PRODUCTS

Amanda J. Montgomery is vice president of industrial bearings at The Timken Company. Named to this position in 2014, Montgomery is responsible for driving strategy development to deliver profitable growth in spherical, cylindrical, and large bore tapered roller bearings, as well as Timken’s precision and Aerospace product lines. She leads product management, product development, and manufacturing engineering teams responsible for advancing the company’s position as a full-line bearing leader. She previously served as director of marketing and product management for the company’s bearing and power transmission business. She was named to the position in 2012 and led a team that managed global market growth and product diversification for both original equipment manufacturers and distribution customers. Prior to that role, Ms. Montgomery served as manager of global product management for Process Industries following assignments as a product manager for various product lines. Since joining Timken in 1998, she has held a number of engineering roles and served as an expert in the company's former Lean6Sigma program. She holds a bachelor's degree in mechanical engineering from Ohio Northern University and a master's degree in business administration from Ashland University. In addition to her role at Timken, Amanda serves on the Board of Directors for the Akron Canton Regional Foodbank, as a committee member for the Power Transmission Distributors Association, and is a member of Women’s Impact, an organization of providing networking, mentorship and leadership for professional women in Stark County, Ohio. 123 Amanda J. Montgomery VICE PRESIDENT, INDUSTRIAL BEARINGS
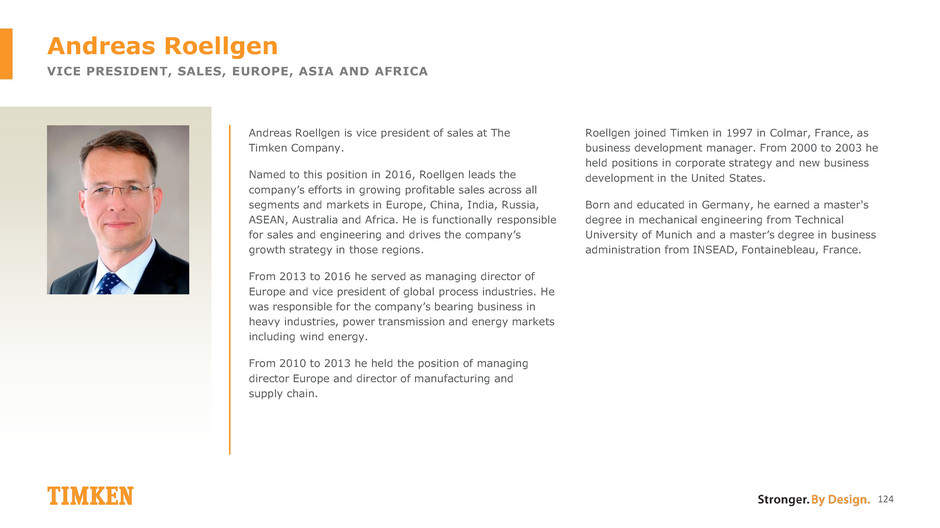
Andreas Roellgen is vice president of sales at The Timken Company. Named to this position in 2016, Roellgen leads the company’s efforts in growing profitable sales across all segments and markets in Europe, China, India, Russia, ASEAN, Australia and Africa. He is functionally responsible for sales and engineering and drives the company’s growth strategy in those regions. From 2013 to 2016 he served as managing director of Europe and vice president of global process industries. He was responsible for the company’s bearing business in heavy industries, power transmission and energy markets including wind energy. From 2010 to 2013 he held the position of managing director Europe and director of manufacturing and supply chain. Roellgen joined Timken in 1997 in Colmar, France, as business development manager. From 2000 to 2003 he held positions in corporate strategy and new business development in the United States. Born and educated in Germany, he earned a master's degree in mechanical engineering from Technical University of Munich and a master’s degree in business administration from INSEAD, Fontainebleau, France. 124 Andreas Roellgen VICE PRESIDENT, SALES, EUROPE, ASIA AND AFRICA

Jason Hershiser is manager of investor relations for The Timken Company. Named to this position in 2016, Jason is responsible for communicating the company’s financial results, performance and strategies to the financial community. Since joining Timken in 2011, Jason has held several roles with various finance and accounting responsibilities, most recently in the financial, planning and analysis group. Prior to joining Timken, Jason held positions in the finance area at Robert Half International and Charles Schwab. Jason holds a bachelor’s degree in finance from the University of Akron, a master’s degree in finance from the University of Michigan – Dearborn, and a master’s degree in business administration from the University of Michigan – Dearborn. He is a certified financial planning and analysis professional. Jason is a member of the National Investor Relations Institute (NIRI). 125 Jason Hershiser MANAGER, INVESTOR RELATIONS

Appendix: GAAP Reconciliations 126
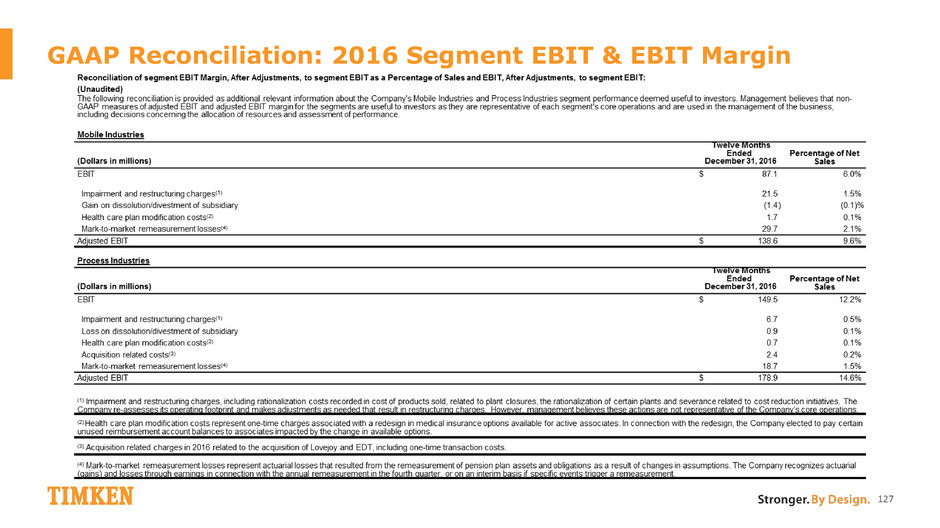
GAAP Reconciliation: 2016 Segment EBIT & EBIT Margin 127
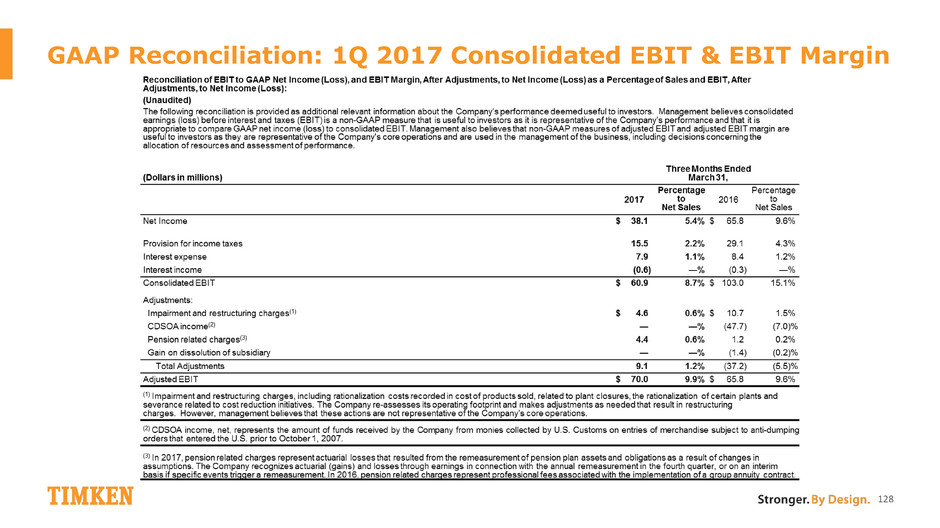
GAAP Reconciliation: 1Q 2017 Consolidated EBIT & EBIT Margin 128

GAAP Reconciliation: 1Q 2017 Net Income & EPS 129

GAAP Reconciliation: 1Q 2017 Segment EBIT & EBIT Margin 130
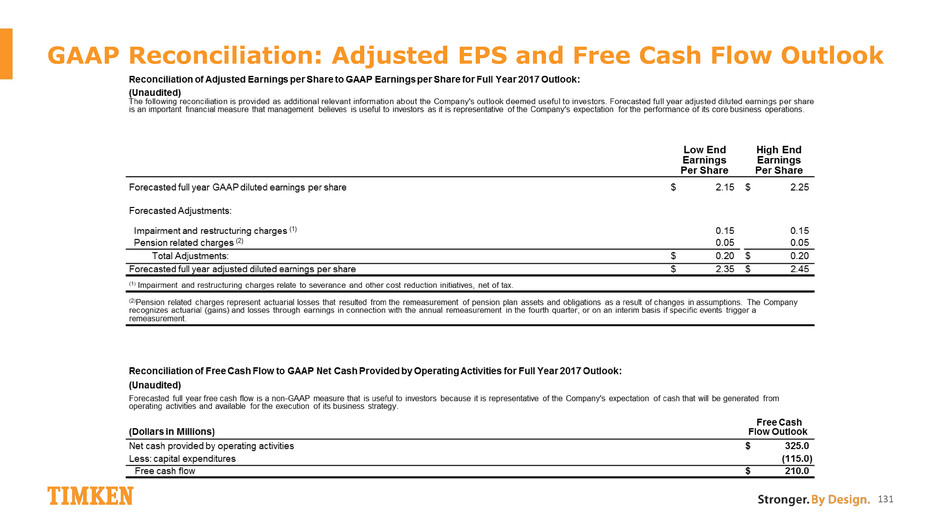
GAAP Reconciliation: Adjusted EPS and Free Cash Flow Outlook 131
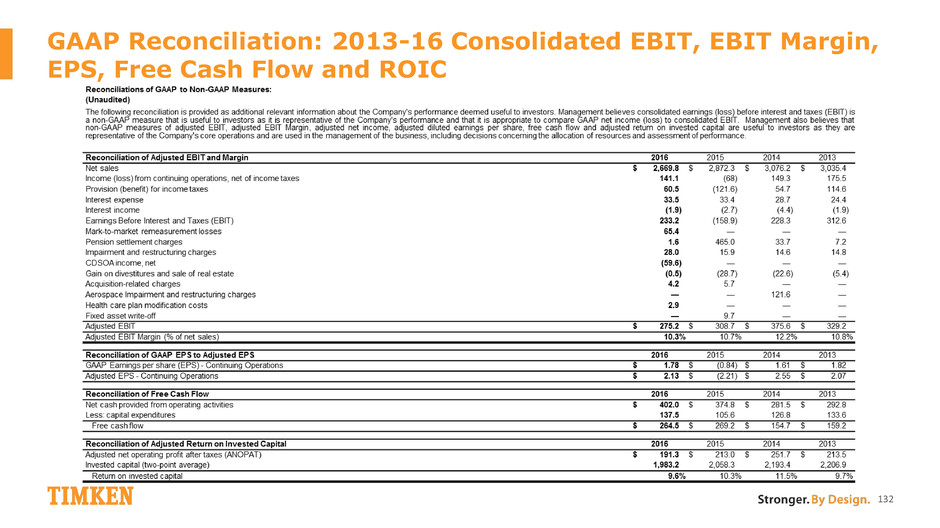
GAAP Reconciliation: 2013-16 Consolidated EBIT, EBIT Margin, EPS, Free Cash Flow and ROIC 132

GAAP Reconciliation: Net Debt and Net Debt to Capital 133


