UNITED STATES
SECURITIES AND EXCHANGE COMMISSION
WASHINGTON, D.C. 20549
FORM 10-K
| | | | | |
| ☒ | ANNUAL REPORT PURSUANT TO SECTION 13 OR 15(d) OF THE SECURITIES EXCHANGE ACT OF 1934 |
For the fiscal year ended December 31, 2024
OR
| | | | | |
| ☐ | TRANSITION REPORT PURSUANT TO SECTION 13 OR 15(d) OF THE SECURITIES EXCHANGE ACT OF 1934 |
For the transition period from______to_______
Commission file number: 1-1169
THE TIMKEN COMPANY
(Exact name of registrant as specified in its charter)
| | | | | | | | | | | |
| Ohio | | 34-0577130 |
(State or other jurisdiction of
incorporation or organization) | | (I.R.S. Employer
Identification No.) |
| | | |
| 4500 Mount Pleasant Street NW | | |
| North Canton | Ohio | | 44720-5450 |
| (Address of principal executive offices) | | (Zip Code) |
234.262.3000
(Registrant’s telephone number, including area code)
Securities registered pursuant to Section 12(b) of the Act:
| | | | | | | | | | | | | | |
| Title of each class | | Trading Symbol | | Name of each exchange on which registered |
| Common Shares, without par value | | TKR | | New York Stock Exchange |
Securities registered pursuant to Section 12(g) of the Act: None
Indicate by check mark if the registrant is a well-known seasoned issuer, as defined in Rule 405 of the Securities Act. Yes ☒ No ☐
Indicate by check mark if the registrant is not required to file reports pursuant to Section 13 or Section 15(d) of the Exchange Act. Yes ☐ No ☒
Indicate by check mark whether the registrant (1) has filed all reports required to be filed by Section 13 or 15(d) of the Securities Exchange Act of 1934 during the preceding 12 months (or for such shorter period that the registrant was required to file such reports), and (2) has been subject to such filing requirements for the past 90 days. Yes ☒ No ☐
Indicate by check mark whether the registrant has submitted electronically every Interactive Data File required to be submitted pursuant to Rule 405 of Regulation S-T during the preceding 12 months (or for such shorter period that the registrant was required to submit such files).
Yes ☒ No ☐
Indicate by check mark whether the registrant is a large accelerated filer, an accelerated filer, a non-accelerated filer, a smaller reporting company or an emerging growth company. See the definitions of “large accelerated filer,” “accelerated filer,” “smaller reporting company” and "emerging growth company" in Rule 12b-2 of the Exchange Act.
| | | | | | | | | | | | | | | | | | | | | | | | | | | | | |
| Large accelerated filer | ☒ | Accelerated filer | ☐ | Non-accelerated filer | ☐ | Smaller reporting company | ☐ | Emerging growth company | ☐ |
If an emerging growth company, indicate by check mark if the registrant has elected not to use the extended transition period for complying with any new or revised financial accounting standards provided pursuant to Section 13(a) of the Exchange Act. ☐
Indicate by check mark whether the Registrant has filed a report on and attestation to its management's assessment of the effectiveness of its internal control over financial reporting under Section 404(b) of the Sarbanes-Oxley Act (15 U.S.C. 762(b)) by the registered public accounting firm that prepared or issued its audit report ☒
If securities are registered pursuant to Section 12(b) of the Act, indicate by check mark whether the financial statements of the registrant included in the filing reflect the correction of an error to previously issued financial statements. ☐
Indicate by check mark whether the registrant is a shell company (as defined in Rule 12b-2 of the Exchange Act). Yes ☐ No ☒
If securities are registered pursuant to Section 12(b) of the Act, indicate by check mark whether the financial statements of the registrant included in the filing reflect the correction of an error to previously issued financial statements. ☐
Indicate by check mark whether any of those error corrections are restatements that required a recovery analysis of incentive-based compensation received by an of the registrant's executive officers during the period pursuant to §240.10D-1(b). ☐
As of June 28, 2024, the aggregate market value of the registrant’s common shares held by non-affiliates of the registrant was $4,985,749,739 based on the closing sale price as reported on the New York Stock Exchange.
Indicate the number of shares outstanding of each of the issuer’s classes of common stock, as of the latest practicable date.
| | | | | | | | |
| Class | | Outstanding at January 31, 2025 |
| Common Shares, without par value | | 70,001,123 shares |
DOCUMENTS INCORPORATED BY REFERENCE
| | | | | | | | |
| Document | | Parts Into Which Incorporated |
| Proxy Statement for the Annual Meeting of Shareholders to be held on or about May 2, 2025 (Proxy Statement) | | Part III |
THE TIMKEN COMPANY
INDEX TO FORM 10-K REPORT
| | | | | | | | | | | |
| | | | PAGE |
| I. | PART I. | | |
| Item 1. | | |
| Item 1A. | | |
| Item 1B. | | |
| Item 1C. | | |
| Item 2. | | |
| Item 3. | | |
| Item 4. | | |
| Item 4A. | | |
| II. | | | |
| Item 5. | | |
| Item 6. | | |
| Item 7. | | |
| Item 7A. | | |
| Item 8. | | |
| Item 9. | | |
| Item 9A. | | |
| Item 9B. | | |
| Item 9C. | | |
| III. | PART III. | | |
| Item 10. | | |
| Item 11. | | |
| Item 12. | | |
| Item 13. | | |
| Item 14. | | |
| IV. | | | |
| Item 15. | | |
| Item 16. | | |
PART I.
Item 1. Business
General:
As used herein, the term “Timken” or the “Company” refers to The Timken Company and its subsidiaries unless the context otherwise dictates. Timken designs and manages a portfolio of engineered bearings and industrial motion products, and provides related services. The Company’s growing portfolio features many strong brands, including Timken®, GGB®, Philadelphia Gear®, Cone Drive®, Rollon®, Nadella®, Diamond®, Drives®, Groeneveld®, BEKA®, Des-Case®, Lovejoy®, Lagersmit® and CGI.
The Company was founded in 1899 by Henry Timken, who received two patents on the design of a tapered roller bearing. Timken remains the world's leading authority on tapered roller bearings and has leveraged that expertise to develop a full portfolio of industry-leading engineered bearings and industrial motion products. Timken built its reputation as a global leader by applying its knowledge of metallurgy, friction management and industrial motion to increase the reliability and efficiency of its customers' equipment across a diverse range of industries. Today, the Company's global footprint consists of 124 manufacturing facilities and service centers, 28 technology and engineering centers, and 77 distribution centers and warehouses, supported by a team comprised of approximately 19,000 employees. Timken operates in 45 countries around the globe.
Major Customers:
The Company sells products and services to a diverse customer base globally, including customers in the following market sectors: industrial distribution, renewable energy, automation, automotive original equipment ("OE"), agriculture/turf, rail, aerospace, auto/truck aftermarket, construction, services, metals and mining, heavy truck OE, and marine. No single customer accounts for more than 6% of total net sales.
Products:
Timken manufactures and manages global supply chains for multiple product lines including engineered bearings and industrial motion products designed to operate in demanding environments. The Company leverages its technical knowledge, research expertise, and production and engineering capabilities across all of its products and end markets to deliver high-performance products and services to its customers. Differentiation within these product lines is generally based on application engineering, product performance, product quality or customer service.
Engineered Bearings:
The Timken® bearing portfolio features a broad range of engineered bearing products, including tapered, spherical and cylindrical roller bearings; plain bearings and rod end bearings; thrust and specialty ball bearings; and housed bearings. Timken is a leading authority on tapered roller bearings and leverages its position by applying engineering know-how and technology across its entire bearing portfolio.
A bearing is a mechanical device that reduces friction between moving parts. The purpose of a bearing is to carry a load while allowing a machine shaft to rotate freely. The basic elements of the bearing generally include two rings, called races; a set of rolling elements that rotate around the bearing raceway; and a cage to separate and guide the rolling elements. Bearings come in a number of designs, featuring tapered, spherical, cylindrical or ball rolling elements. The various bearing designs accommodate radial and/or thrust loads differently, making certain bearing types better suited for specific applications.
Selection and development of bearings for customer applications and demand for high reliability require sophisticated engineering and analytical techniques. High precision tolerances, proprietary internal geometries and quality materials provide Timken bearings with high load-carrying capacity, excellent friction-reducing qualities and long service lives. The uses for bearings are diverse and can be found in transportation applications that include premium passenger cars and trucks, heavy trucks, helicopters, airplanes and trains. Ranging in size from precision bearings the size of a pencil eraser to more than roughly three meters in diameter, Timken components are also used in a wide variety of industrial applications, including: paper and steel mills, mining, oil and gas extraction and production, agriculture, construction, machine tools, gear drives, health and positioning control, wind turbines and food and beverage processing.
Tapered Roller Bearings. Timken tapered roller bearings can increase power density and can include customized geometries, engineered surfaces and specialized sealing solutions. The Company’s tapered roller bearing line comes in thousands of combinations in single-, double- and four-row configurations. Tapered roller designs permit ready absorption of both radial and axial load combinations, which makes them particularly well-adapted to reducing friction where shafts, gears or wheels are used.
Spherical and Cylindrical Roller Bearings. Timken also produces spherical and cylindrical roller bearings that are used in gear drives, rolling mills and other industrial and infrastructure development applications. These products are sold worldwide to OE manufacturers ("OEMs") and industrial distributors serving major end-market sectors, including construction and mining, natural resources, wind energy, defense, pulp and paper production, rolling mills and general industrial goods.
Ball Bearings. Timken radial, angular and precision ball bearings are used by customers in a variety of market sectors, including aerospace, agriculture, construction, health, machine tool, the automotive aftermarket and general industries. Radial ball bearings are designed to tolerate relatively high-speed operation under a range of load conditions. These bearing types consist of an inner and outer ring with a cage containing a complement of precision balls. Angular contact ball bearings are designed for a combination of radial and axial loading. Precision ball bearings are manufactured to tight tolerances and come in miniature and instrument, thin section and ball screw support designs.
Housed Bearings. Timken markets among the broadest range of housed or mounted bearings in the industry. These products include durable, heavy-duty components designed to protect spherical, tapered and ball bearings in debris-filled, contaminated or high-moisture environments. Common housed unit applications include material handling and processing equipment.
Plain Bearings. Timken produces a range of plain bearings including rod ends, spherical plain bearings, metal-polymer bearings and journal bearings. These bearings are used to support misalignment and oscillating movements in a variety of applications and end-markets including aircraft controls, packaging equipment, off-highway equipment, heavy truck, performance auto racing, robotics and many more. Various combinations of material pairs and engineered coatings improve friction management for application specific conditions.
Industrial Motion Products:
Linear Motion Solutions. The Company designs and manufactures a global portfolio of Rollon® and Nadella® engineered linear motion products, including linear guides, telescopic rails, linear actuators, seventh-axis robotic transfer units and gantry systems. These engineered products are highly customized to control movements with different variability and complexity based on the application. Rollon and Nadella products serve a wide range of industries, including passenger rail, aerospace, packaging and logistics, medical and automation.
Industrial Drives. The Company’s Philadelphia Gear® line of low- and high-speed gear drive designs are used in large-scale industrial applications such as crushing and pulverizing equipment, conveyors and pumps, power generation and military marine. These gear drive designs are custom made to meet user specifications, offering a wide array of size, footprint and gear arrangements. Timken has one of the broadest and most differentiated precision drives product portfolios in the global automation industry. These products include Cone Drive® high-torque worm gears, harmonic solutions and precision slew drives. Cone Drive products can be found in a variety of industrial end-market sectors, including solar, oil and gas, aerial platforms, automation and food and beverage. The Company's Spinea® line features highly engineered cycloidal reduction gears and actuators. Spinea's solutions primarily serve high precision automation and robotics applications in the factory automation sector. The portfolio also features CGI precision drive systems, which serve a broad range of automation markets with a concentration in medical robotics.
Automatic Lubrication Systems. The Company's Groeneveld® and BEKA® lubrication systems include a wide variety of automatic lubrication delivery devices, oil management systems and safety support systems designed to reduce operational costs for customers while increasing equipment uptime, productivity and safety. These systems support many industries, including renewable energy, transportation, construction, mining, port, forestry and agriculture. Timken also offers over two dozen different formulations of grease, leveraging its knowledge of tribology and anti-friction bearings to enable smooth equipment operation.
Belts. The Company makes and markets a full line of Timken® belts used in industrial, commercial and consumer applications. The portfolio features more than 20,000 parts designed for demanding applications, which are sold to original equipment and aftermarket customers. These belts are engineered for maximum performance and durability, with products available in wrap molded, raw edge, v-ribbed and synchronous belt designs. Common applications include agriculture, construction, industrial machinery, outdoor power equipment and powersports.
Chain. Timken manufactures precision Diamond® and Drives® roller chain, pintle chain, agricultural conveyor chain, engineering class chain and oil field roller chain. These engineered products are used in a wide range of mobile and industrial machinery applications, including agriculture, oil and gas, aggregate and mining, primary metals, forest products and other heavy industries. They are also used in the food and beverage and packaged goods sectors, which often require high-end, specialty products, including stainless-steel and corrosion-resistant roller chain.
Couplings. The Company offers a full range of industrial couplings within its industrial motion products portfolio. The Lovejoy brand is widely known for its flexible coupling design and as the creator of the jaw-style coupling. Lovejoy® couplings are available in curved jaw, jaw in-shear, s-flex, gear-torsional and disc style configurations. These components are used in a wide range of industries such as steel, pulp and paper, power generation, food processing, mining and construction. The Company also offers an extensive line of torsional couplings offered under the Torsion Control Products brand.
Industrial Clutches and Brakes. Timken offers a selection of engineered clutches, brakes, hydraulic power take-off units and other torque management devices marketed under the PT Tech® brand. These products are custom engineered for OEMs and used in marine, mining, aggregate, wood recycling and metals industries.
Seals. The Company's Lagersmit® engineered sealing solutions serve demanding marine, dredging, water, tidal energy and other industrial applications. The business serves leading propulsion manufacturers, ship owners, pump makers and other global industrial customers that require advanced sealing systems. Timken offers other industrial sealing solutions that come in a variety of types and material options and are used in manufacturing, food processing, mining, power generation, chemical processing, primary metals, pulp and paper and oil and gas industry applications.
Other Products. The Company also offers specialty filtration products, augers and other specialized industrial motion products. Des-Case is a technical leader in branded filtration solutions that sit adjacent to Timken's automatic lubrication systems. Des-Case features a comprehensive product offering including breathers, filter elements, condition monitoring, lubrication storage and filter systems used throughout the entire lubricant lifecycle. These solutions are critical for enhancing reliability, reducing downtime and extending the useful life of customers' systems. The Company also designs and manufactures Drives® helicoid and sectional augers for agricultural applications, like conveying, digging and combines. The Company's specialized industrial motion components include Shuton and Ipiranga ball screws among other key products.
Services:
Power Systems. Timken services components in the industrial customer's drive train, including switch gears, electric motors and generators, gearboxes, bearings, couplings and control panels. The Company’s Philadelphia Gear services for gear drive applications include onsite technical services; inspection, repair and upgrade capabilities; and manufacturing of parts to specifications. In addition, the Company’s Wazee, Smith Services, Schulz, Standard Machine and H&N service centers provide customers with services that include motor and generator rewind and repair and uptower wind turbine maintenance and repair. Timken Power Systems commonly serves customers in the power, wind energy, hydro and fossil fuel, water management, paper, mining and general manufacturing sectors.
Bearing Repair. Timken bearing repair services return worn bearings to like-new specifications, which increases bearing service life and often can restore bearings in less time than required to manufacture new. Bearing remanufacturing is available for any bearing type or brand - including competitor products - and is well-suited to heavy industrial applications such as paper, metals, mining, power generation and cement; railroad locomotives, passenger cars and freight cars; and aerospace engines and gearboxes.
Sales and Distribution:
Timken products are sold principally by its internal sales organizations. A portion of each segment's sales are made through authorized distributors or sales agents.
Customer collaboration is central to the Company's sales strategy. Therefore, Timken goes where its customers need us, with sales engineers primarily working in close proximity to customers rather than at production sites. The Company's sales force continuously updates the team's training and knowledge regarding engineered bearings and industrial motion products and related market sector trends, and they assist customers during product development and implementation phases and provide ongoing service and support.
The Company has a joint venture in North America focused on joint logistics and e-business services. This joint venture, CoLinx, LLC, includes five equity members: Timken, SKF Group, Schaeffler Group, RBC Bearings and Gates Industrial Corp. The e-business service focuses on information and business services for authorized distributors in the Engineered Bearings segment.
Timken has entered into individually negotiated contracts with some of its customers. These contracts may extend for one or more years and, if a price is fixed for any period extending beyond current shipments, customarily include a commitment by the customer to purchase a designated percentage of its requirements from Timken. Timken does not believe that there is any significant loss of earnings risk associated with any given contract.
Competition:
The bearing and industrial motion industries are highly competitive. Timken primarily competes based on its total value proposition, including product design and performance, application engineering, quality, price, timeliness of delivery, and the ability to provide technical sales and service support on a global basis. The Company competes with a variety of domestic and foreign manufacturers of anti-friction bearings, including SKF Group and Schaeffler Group, and with a diverse group of domestic and foreign manufacturers of industrial motion products.
Joint Ventures:
Investments in affiliated companies accounted for under the equity method were $0.9 million and $1.7 million, respectively, at December 31, 2024 and 2023. The investment balance at December 31, 2024 was reported in other non-current assets on the Consolidated Balance Sheets.
Backlog:
The following table provides the backlog of orders for the Company's domestic and overseas operations at December 31, 2024 and 2023:
| | | | | | | | |
| |
| (Dollars in millions) | 2024 | 2023 |
| Segment: | | |
| Engineered Bearings | $ | 1,341.8 | | $ | 1,502.0 | |
| Industrial Motion | 679.7 | | 775.2 | |
| Total Company | $ | 2,021.5 | | $ | 2,277.2 | |
Approximately 92% of the Company’s backlog at December 31, 2024 is scheduled for delivery in the succeeding 12 months. Actual shipments depend upon customers' ever-changing production schedules. Accordingly, Timken does not believe that its backlog data and comparisons thereof, as of different dates, reliably indicate future sales or shipments.
Sources and Availability of Raw Materials:
The principal raw materials used by the Company to make engineered bearings are special bar quality ("SBQ") steel and steel components. SBQ steel and steel components are produced around the world by various suppliers. SBQ steel is purchased in bar, tube and wire forms, while steel components are commonly purchased as forgings, semi-finished or finished components. The availability and price of SBQ steel are subject to changes in supply and demand, commodity prices for ferrous scrap, ore, alloy, electricity, natural gas, transportation fuel, and labor costs. The Company manages price variability of commodities by using surcharge mechanisms on some of its contracts with its customers that provides for partial recovery of these cost increases in the price of bearing products.
The availability of bearing-quality tubing is relatively limited, and the Company has taken steps to limit its exposure to this particular form of SBQ steel. Overall, the Company believes that the number of suppliers of SBQ steel is adequate to support the needs of global bearing production, and, in general, the Company is not dependent on any single source of supply.
The Company also purchases a variety of materials and components to produce industrial motion products, such as non-SBQ steel, synthetic rubber, fabrics, castings and plastics. The Company sources these components from various suppliers in the world market. The Company believes its supply base is adequate to support its manufacturing requirements.
Research:
Timken operates a network of technology and engineering centers to support its global customers with sites in North America, Europe and Asia. This network develops and delivers innovative engineered bearings and industrial motion solutions and technical services. Timken's largest technical center is located at the Company's world headquarters in North Canton, Ohio. Other smaller sites in the United States ("U.S.") include Los Alamitos, California; Downer's Grove, Fulton and Montgomery, Illinois; Norton Shores and Traverse City, Michigan; Springfield, Missouri; Keene and Lebanon, New Hampshire; Thorofare, New Jersey; Morganton, North Carolina; Carson City, Nevada; and King of Prussia, Pennsylvania. Within Europe, the Company has technology facilities in Plymouth, England; Annecy and Colmar, France; Heilbronn, Pegnitz and Werdohl, Germany; Valmadrera, Italy; Gorinchem, Netherlands; Porto, Portugal; and Ploiesti, Romania. In Asia, Timken operates technology and engineering facilities in Bangalore, India and Shanghai, China.
Compliance with Governmental Regulations:
Environmental Matters
The Company continues its efforts to protect the environment and comply with environmental protection laws. Additionally, it has invested in pollution control equipment and updated plant operational practices. The Company's manufacturing plants are expected to have an effective environmental management system which follows the ISO 14001 principles and internal audits are performed against this standard. Where appropriate to meet or exceed customer requirements, we are certified under the formal ISO 14001 certification process. As of the end of 2024, 28 of the Company’s plants, which includes a majority of the Company's bearing manufacturing plants, had obtained ISO 14001 certification.
The Company establishes appropriate levels of reserves to cover its environmental expenses and has a well-established environmental compliance audit program for its domestic and international units. This program measures performance against applicable laws, as well as against internal standards that have been established for all units worldwide. It is difficult to assess the possible effect of compliance with future requirements that differ from existing requirements.
The Company and certain of its subsidiaries have previously been and could in the future be identified as potentially responsible parties for investigation and remediation at off-site disposal or recycling facilities under the Comprehensive Environmental Response, Compensation and Liability Act (“CERCLA”), known as the Superfund, or state, foreign, or international laws similar to CERCLA. In general, such claims for investigation and remediation also have been asserted against numerous other entities.
Management believes any ultimate liability with respect to pending actions will not materially affect the Company’s annual results of operations, cash flows or consolidated financial position. The Company also is conducting environmental investigation and/or remediation activities at certain current or former operating sites. The costs of such investigation and remediation activities, in the aggregate, are not expected to be material to the operations or financial position of the Company.
New laws and regulations, stricter enforcement of existing laws and regulations, the discovery of previously unknown contamination or the imposition of new clean-up requirements may require Timken to incur costs, change production methods or materials, or become the basis for new or increased liabilities that could have a materially adverse effect on the Company's business, financial condition or results of operations.
Other Regulations
Because of its global operations, the Company is subject to a wide variety of domestic and foreign laws and regulations, including securities laws, tax laws, data privacy, employment and pension-related laws, competition laws, U.S. and foreign export and trade laws, the Foreign Corrupt Practices Act ("FCPA") and similar worldwide anti-bribery laws, government procurement regulations and laws governing improper business practices. The Company has policies and procedures in place to promote compliance with these laws and regulations and management believes any ultimate liability with respect to pending actions will not materially affect the Company’s annual results of operations, cash flows or consolidated financial position. In the future, the Company may be subject to both new laws and regulations, and changes to existing laws and regulations which may continue to evolve through interpretations by courts and regulators. Accordingly, it is difficult to assess the possible effect of compliance with future requirements that differ from existing requirements. Such changes may require the Company to incur costs and such changes could form the basis for new or increased liabilities that could have a materially adverse effect on the Company’s business, financial condition or results of operations. Refer to Item 1.A Risk Factors – Risks Related to Legal, Compliance and Regulatory Matters for further discussion.
Patents, Trademarks and Licenses:
Timken owns numerous U.S. and foreign patents, trademarks and licenses relating to certain products. While Timken regards these as important, it does not deem its business as a whole, or any industry segment, to be materially dependent upon any one item of intellectual property or group of items.
Employment:
At December 31, 2024, Timken had approximately 19,000 employees worldwide. Approximately 9% of Timken’s U.S. employees are covered under collective bargaining agreements.
Human Capital:
The Company believes that its employees and their collective knowledge and experience are among its most valuable resources. The Company is committed to providing a safe work environment and growth opportunities for its employees to learn and advance their career with the Company to promote and safeguard these key resources.
Employee Health and Safety
Employee health and safety remains a top priority for the Company and the Company's Environmental Health and Safety Steering Committee, which was created in 2009, continues to drive accountability and responsibility for safety throughout the organization.
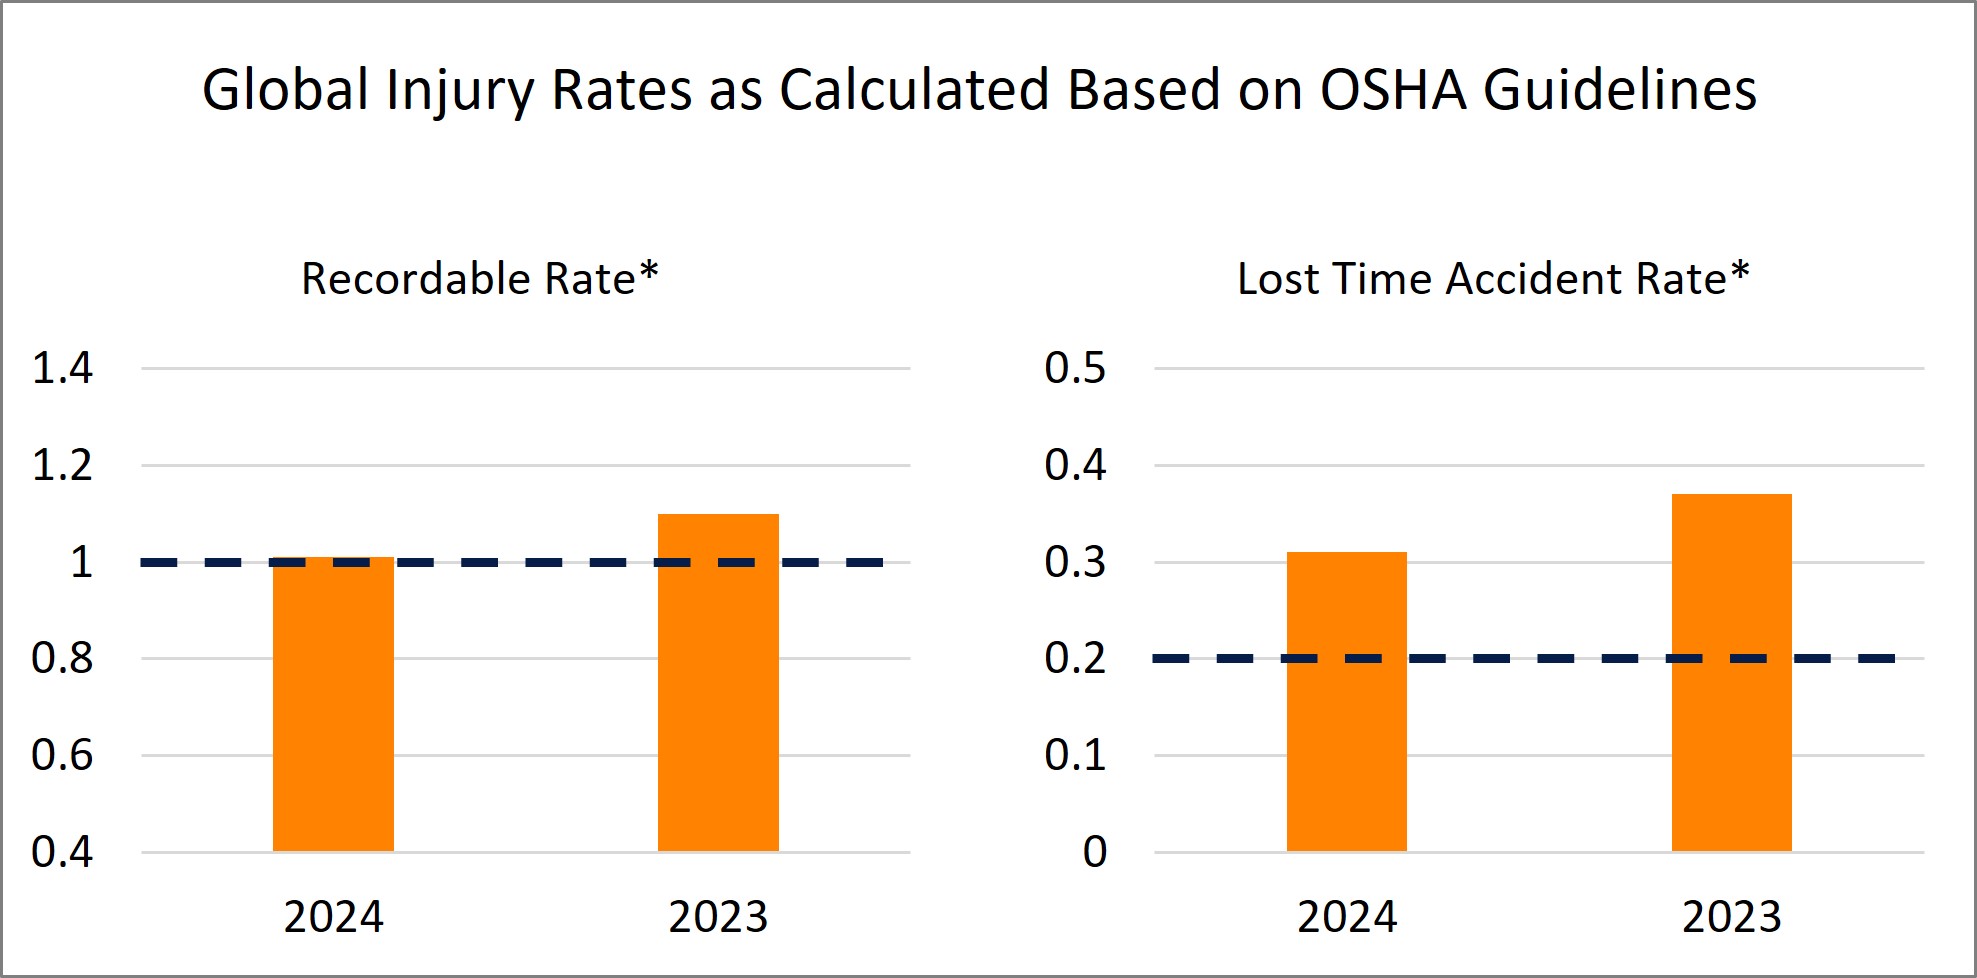
The Company's commitment to the health and safety of its employees is evidenced by its strong safety results in 2024 and 2023 shown in the charts below:
*Rates calculated as (number of injuries and illnesses x 200,000) / employee hours worked per 100 full-time workers. 2024 rates represent the Company's best estimate as of the date of this report
- - - represents the 2023 top quartile cutoff for U.S. metal manufacturers (North American Industry Classification System ("NAICS") code 332) that employ at least 1,000 employees, based on information provided by the U.S. Bureau of Labor Statistics at https://www.bls.gov/iif/.
The Company aims to maintain a recordable rate within the top quartile of U.S. metal manufacturers (NAICS code 332) based on information provided by the U.S. Bureau of Labor Statistics. In 2024, the Company improved on 2023 performance with both its lost time accident rate of 0.31 (0.37 in 2023) and its recordable rate of 1.01 (1.10 in 2023).
Attracting, Retaining, and Motivating Highly Qualified Employees
Successful execution of the Company's strategy depends on attracting, retaining, and motivating highly qualified talent. The Company provides professional growth and learning opportunities and individualized career development to support these objectives. The Company also believes it is important to recognize and reward its employees with pay and comprehensive benefits that are competitive and equitable based on the local markets in which it operates.
The Company believes that having open, honest dialogue with its employees is key to maintaining its strong culture and ethical work practices. In line with that approach, the Company conducts comprehensive surveys on a periodic basis and individual stay interviews to measure employee engagement. Exit interviews are also conducted with employees who voluntarily terminate their employment, which helps improve management processes. The Company deploys pulse surveys to gain insights from employees’ recent experiences and to better understand how effectively it is engaging, energizing and enabling its workforce.
The Company also provides several professional development and training opportunities to advance our employees’ skills and expertise. Some of these opportunities include online-learning platforms, job-specific training, our operations development program (a training program designed to increase the internal pool of employees who are ready to take on leadership positions) and our educational reimbursement programs. The Company has recruited and trained many of its employees through its engineering co-op program, where engineering students have the opportunity to work up to five semesters alongside the Company’s experienced engineers while they complete their bachelor’s degrees. Comprehensive leadership, skill and competency assessments are offered to company employees to best identify and address individual and team development needs and activities. To better inform its hiring and employee development efforts, the Company has also partnered with third-party vendors to provide required training for its managers focused on leadership, diversity and inclusion.
To further our Company’s diverse and inclusive culture, Timken employee resource groups (“ERGs”) around the world help us understand and address the challenges and opportunities faced by our diverse workforce and the benefits inclusion offers in advancing our collective knowledge. Our employees continue to drive new programming and culture acumen development across our six primary ERGs: Women’s International Network (WIN), Multicultural Association of Professionals (MAP), Young Professionals Network (YPN), Veteran Engagement at Timken (VET), Timken PRIDE Network (TPN), and Celebrating Abilities Network (CAN). Additionally, we partner with an online platform, Aperian®, to help our employees further their global competency.
Available Information:
The Company uses its Investor Relations website at http://investors.timken.com, as a channel for routine distribution of important information, including news releases, analyst presentations and financial information. The Company posts filings as soon as reasonably practicable after they are electronically filed with, or furnished to, the Securities and Exchange Commission (the "SEC"), including its annual, quarterly and current reports on Forms 10-K, 10-Q and 8-K; its proxy statements; and any amendments to those reports or statements. All such postings and filings are available on the Company’s website free of charge. In addition, this website allows investors and other interested persons to sign up to automatically receive e-mail alerts when the Company posts news releases and financial information on the Company’s website. The content on any website referred to in this Annual Report on Form 10-K is not incorporated by reference into this Annual Report unless expressly noted.
Item 1A. Risk Factors
The following are certain risk factors that could affect our business, financial condition and results of operations. The risks that are described below are not the only ones that we face. These risk factors should be considered in connection with evaluating forward-looking statements contained in this Annual Report on Form 10-K because these factors could cause our actual results and financial condition to differ materially from those projected in forward-looking statements. Although the risks are organized by headings, and each risk is discussed separately, many are interrelated. If any of the following risks actually occur, our business, financial condition or results of operations could be negatively affected.
Risk Relating to our Business
The bearing and industrial motion industries are highly competitive, and this competition results in significant pricing pressure for our products that could affect our revenues and profitability.
The global bearing industry is highly competitive and consolidated. We compete with many domestic and foreign manufacturers of anti-friction bearings. In addition, the industries into which we sell our industrial motion products are also highly competitive and consolidating. Due to competitiveness within these industries, we may not be able to continue to increase prices for our products to cover increases in our costs or to achieve desired profitability. In addition, we face pressure from our customers to reduce prices, which coupled with the contractual nature of business with OEM customers, could adversely affect our revenues and profitability. In addition, our customers may choose to purchase products from one of our competitors rather than pay the prices we seek for our products, which could adversely affect our revenues and profitability.
Our business is capital intensive, and if there are downturns in the industries that we serve, we may be forced to significantly curtail or suspend operations with respect to those industries, which could result in our recording asset impairment charges, restructuring charges or taking other measures that may adversely affect our results of operations and profitability.
Our business operations are capital intensive, and we devote a significant amount of capital to certain industries. Our profitability is dependent on factors such as labor compensation and productivity and inventory and supply chain management, which are subject to risks that we may not be able to control. If there are downturns in the industries that we serve, including as a result of high inflation or a recession, we may be forced to significantly curtail or suspend our operations with respect to those industries, including laying-off employees, reducing production, recording asset impairment charges and other measures, which may adversely affect our results of operations and profitability. We have taken approximately $133 million in impairment and restructuring charges in the aggregate during the last five years. Changes in business or economic conditions, or our business strategy, may result in additional restructuring actions and may require us to take additional charges in the future, which could have a material adverse effect on our earnings.
Changes in customer preferences and inventory reductions by customers or distributors could adversely affect the Company's business.
The Company has previously experienced distributor inventory corrections reflecting de-stocking of the supply chain associated with softer demand in certain markets. The Company's results in a period may be adversely impacted by similar customer inventory adjustments in the future, as well as changes in customer buying preferences.
Any change in raw material prices, the availability or cost of raw materials or logistics expenses could adversely affect our results of operations and profit margins.
We require substantial amounts of raw materials, including steel, to operate our business. Our supply of raw materials could be and has in the past been interrupted for a variety of reasons, including availability and pricing. Prices for raw materials necessary for production have fluctuated significantly in the past, have risen substantially at times in the past, and could continue to do so in the future. We generally attempt to manage these fluctuations by passing along increased raw material prices to our customers in the form of price increases or surcharges; however, we may be unable to continue to increase the price of our products, or may experience a lag in doing so, due to pricing pressure, contract terms or other factors, which could adversely impact our revenue and profit margins.
Moreover, future disruptions in the supply of our raw materials could impair our ability to manufacture our products for our customers, impact our ability to manufacture and deliver our products on a timely basis, require us to pay higher prices in order to obtain these raw materials from other sources or necessitate the use of expedited or more costly freight options. Any significant increase in the prices for such raw materials or logistics expenses could adversely affect our results of operations and profit margins.
We may not realize the improved operating results that we anticipate from past and future acquisitions, may experience challenges in integrating acquired businesses, and may incur unanticipated liabilities and costs associated with such acquired businesses.
We seek to grow, in part, through strategic acquisitions, joint ventures and other alliances, which are intended to complement or expand our businesses, and expect to continue to do so in the future. These acquisitions involve challenges and risks. In the event that we do not successfully integrate these acquisitions into our existing operations so as to realize the expected return on our investment, issues identified in our due diligence review are not adequately addressed or the costs associated with such issues are higher than expected, or we uncover material issues (including historical environmental, trade, sanctions, tax or compliance violations) that were not identified during our due diligence review, our results of operations, cash flow or financial condition could be adversely affected.
Our operating results depend in part on continued successful research, development and marketing of new and/or improved products and services, and there can be no assurance that we will continue to successfully introduce new products and services.
The success of new and improved products and services depends on their initial and continued acceptance by our customers. Our businesses are affected, to varying degrees, by technological change and corresponding shifts in customer demand, which could result in unpredictable product transitions or shortened life cycles, especially as it relates to market and technological changes driven by electrification, environmental requirements, automation, the continued rising importance of e-commerce, artificial intelligence and increased digitization. We may experience difficulties or delays in the research, development, production, or marketing of new products and services that may prevent us from recouping or realizing a return on the investments required to bring new products and services to market. The end result could have a negative impact on our operating results.
Loss of our rights to exclusive use of our intellectual property whether through patent infringement, counterfeiting, theft of trade secrets, or otherwise could have a material adverse effect on the Company. Third-party claims alleging our infringement of intellectual property rights could also have a material adverse effect on the Company.
We rely on a combination of patents, trademarks, trade secret laws, invention assignment agreements, confidentiality agreements, and other arrangements to protect our intellectual property rights. These rights are important to our business, and their loss, whether through patent infringement, counterfeiting, theft of trade secrets, data breach, or otherwise, could have a material adverse effect on the Company.
Additionally, third parties may bring claims and have brought claims in the past to challenge the validity of our patents or other intellectual property rights or allege that we infringe their patents or other intellectual property rights. We may incur substantial costs if our competitors or other third parties validate such claims. If the outcomes of any such disputes are unfavorable to us, we could be subject to damages and reputational harm and our business could be otherwise adversely affected.
Risks Related to our Capital Structure, the Global Financial Markets, and Currency Exchange Rates
An increase in our levels of debt and the corresponding impact to our financial covenants or a failure to maintain our credit ratings could limit our ability to invest in our business.
An increase in our levels of debt might lead us to have less cash flow available for our business operations, capital expenditures, and strategic transactions and our ability to service our debt obligations or to obtain future financing could be negatively impacted by general adverse economic and industry conditions and rising interest rate trends. In addition, a failure to maintain our credit ratings could adversely affect our cost of borrowing, liquidity and access to capital markets.
Some of our debt has variable interest rates, which could increase the cost of servicing such debt, and fixed rate debt may have increased cost to refinance at maturity.
We have seen interest rates rise significantly in recent years, and while rates fell in 2024, they may rise again in the future due to inflation or other causes. As a result, the costs of servicing our variable interest rate debt could increase even if the amount borrowed under such facilities remains the same. Increased servicing costs could in turn negatively impact our profitability and cash flow. In addition, fixed rate debt currently outstanding that matures in the future may be refinanced with higher interest rates leading to additional servicing costs.
The global nature of our business exposes us to foreign currency fluctuations that may affect our asset values, results of operations and competitiveness.
We are exposed to the risks of currency exchange rate fluctuations because a significant portion of our net sales, costs, assets and liabilities, are denominated in currencies other than the U.S. dollar. These risks include a reduction in our net asset values, net sales, operating income and competitiveness.
For those countries outside the U.S. where we have significant sales, a strengthening in the U.S. dollar as we have seen over the past few years or devaluation in the local currency would reduce revenue, operating profit and shareholders' equity due to the impact of foreign exchange translation on our Consolidated Financial Statements. Fluctuations in foreign currency exchange rates may make our products more expensive for others to purchase or increase our operating costs, affecting our competitiveness and our profitability.
Changes in exchange rates between the U.S. dollar and other currencies and volatile economic, political and market conditions throughout the world have in the past adversely affected our financial performance and may in the future adversely affect the value of our assets located outside the U.S., our gross profit and our results of operations.
Our results of operations may be materially affected by conditions in global financial markets or in any of the geographic regions in which we, our customers or our suppliers operate. If an end user cannot obtain financing to purchase our products, either directly or indirectly contained in machinery or equipment, demand for our products will be reduced, which could have a material adverse effect on our financial condition and earnings.
Global financial markets have experienced volatility in the past, including volatility in securities prices and diminished liquidity and credit availability. Our access to the financial markets cannot be assured and is dependent on, among other things, market conditions and company performance. Accordingly, we may be forced to delay raising capital, issue shorter tenors than we prefer or pay unattractive interest rates, which could increase our interest expense, decrease our profitability and significantly reduce our financial flexibility.
If a customer becomes insolvent or files for bankruptcy (events which we have occasionally experienced in the past and continue to experience from time to time), our ability to recover accounts receivable from that customer would be adversely affected and any payment we received during the preference period prior to a bankruptcy filing potentially may be recoverable by the bankruptcy estate. Furthermore, if certain of our customers liquidate in bankruptcy, we may incur impairment charges relating to obsolete inventory and machinery and equipment.
In addition, financial instability of certain companies in the supply chain could disrupt production in any particular industry. A disruption of production in any of the industries where we participate could have a material adverse effect on our financial condition and earnings. If any of our suppliers are unable or unwilling to provide the products or services that we require or materially increase their costs, our ability to offer and deliver our products on a timely and profitable basis could be impaired. Furthermore, if any of our suppliers were to become subject to bankruptcy, receivership or similar proceedings, we may be unable to arrange for alternate or replacement relationships on favorable terms, which could harm our sales and operating results.
Risks Related to the Global Nature of our Operations
Global political instability and other risks of international operations may adversely affect our operating costs, revenues and the price of our products.
Our international operations expose us to risks not present in a purely domestic business, including primarily:
•changes in international treaties or trade unions, which may make our products or our customers' products more costly to export or import;
•changes in tariff regulations, which may make our products more costly to export or import;
•threatened or actual state seizure of foreign-owned manufacturing assets;
•hostilities between countries in which we operate which could limit our ability to manufacture in, sell into, export out of, or access assets located in such jurisdictions;
•the imposition of sanctions on countries in which we operate, from which we receive critical supplies or into which we sell our products;
•strained geopolitical relations between countries in which we have significant operations including the U.S., China and Mexico, among others;
•political protests or unrest which could negatively impact our operations;
•difficulties establishing and maintaining relationships with local OEMs, distributors and dealers;
•import and export licensing requirements;
•compliance with a variety of foreign laws and regulations, including unexpected changes in taxation, environmental, sustainability or other regulatory requirements, which could increase our operating and other expenses and limit our operations;
•additional costs, taxes and restrictions related to repatriation of cash in international jurisdictions;
•disadvantages of competing against companies from countries that are not subject to U.S. laws and regulations, including the FCPA;
•difficulty in staffing and managing geographically diverse operations;
•disruptions to our global supply chain and logistical issues associated with port closures or strikes, delays or increased costs;
•tax exposures related to cross-border intercompany transfer pricing and other tax risks unique to international operations; and
•compliance with data protection regulations.
These and other risks also may increase the relative price of our products compared to those manufactured in other countries, reducing the demand for our products in the markets in which we operate, which could have a material adverse effect on our revenues and earnings.
We have global operations, and changes to government trade policies including the imposition of tariffs and other trade barriers, as well as the resulting consequences, could adversely impact our revenue and profit margins.
The U.S. government has imposed tariffs on certain foreign goods, including steel and other raw materials as well as certain products made from such materials. Changes in U.S. trade policy have resulted in, and could further result in, U.S. trading partners adopting responsive trade policies that make it more difficult or costly for us to export our products to those countries. In addition, the governments of other countries in which we have substantial operations could impose tariffs on, or restrict trade in, the materials and components necessary for the production of our products. These measures could result in an increase in our production costs. If we are unable to increase the price of our products or otherwise mitigate these increased costs, it could adversely impact our revenue and profit margins.
Risks Related to Human Capital Management and Employee Benefits
If we are unable to attract, retain and develop key personnel and develop and successfully execute succession plans, our business could be materially adversely affected.
Our business substantially depends on the continued service of key members of our management and other key employees. The loss of the services of a significant number of members of our management or other key employees could have a material adverse effect on our business. Our future success also will depend on our ability to attract, retain and develop highly skilled personnel at all levels of the organization, such as engineering, finance, marketing and senior management professionals, as well as skilled labor. Competition for these types of employees is intense, and has increased recently, and we could experience difficulty from time to time in hiring, developing and retaining the personnel necessary to support our business. If we do not succeed in retaining and developing our current employees, attracting new high-quality employees, and developing and successfully executing succession plans, our business could be materially adversely affected.
Work stoppages or similar difficulties could significantly disrupt our operations, reduce our revenues and materially affect our earnings.
A work stoppage at one or more of our facilities, whether caused by fire, flooding, epidemics, pandemics, public health concerns, military hostilities, government-imposed shutdowns, severe weather, including that caused by climate change, other natural disaster or otherwise, could have a material adverse effect on our business, financial condition and results of operations. In addition, some of our employees are represented by labor unions or works councils under collective bargaining agreements with varying durations and terms. We have experienced work stoppages at certain of our facilities historically at times, and while these stoppages have been short-term in nature, no assurances can be made that we will not experience additional work stoppages due to government directives, employee health concerns, and other types of conflicts with labor unions, works councils, and other similar groups in the future.
A work stoppage at one of our suppliers could also materially and adversely affect our operations if an alternative source of supply were not readily available. In addition, if one or more of our customers were to experience a work stoppage, that customer could halt or limit purchases of our products, which could have a material adverse effect on our business, financial condition and results of operations. In addition, the credit and default risk or bankruptcy of customers or suppliers as a result of work stoppages could also materially and adversely affect our operations and results.
Expenses and contributions related to our defined benefit plans are affected by factors outside our control, including the performance of plan assets, interest rates, actuarial data and experience, and changes in laws and regulations, all of which could impact our funded status.
Our future expense and funding obligations for defined benefit pension plans depend upon a number of factors, including the level of benefits provided for by the plans, the future performance of assets with specific country economic performance risks set aside in trust for these plans, the level of interest rates used to determine the discount rate to calculate the amount of liabilities, actuarial data and experience, and any changes in government laws and regulations. In addition, if the various investments held by our pension trusts do not perform as expected or the liabilities increase as a result of discount rate changes and other actuarial changes, our pension expense and required contributions would increase and, as a result, could materially adversely affect our business or require us to record charges that could be significant and would cause a reduction in our shareholders' equity. We may be required legally to make contributions to the pension plans in the future in excess of our current expectations, and those contributions could be material.
Future actions involving our defined benefit and other postretirement plans, such as annuity purchases, lump-sum payouts, and/or plan terminations could cause us to incur significant pension and postretirement settlement and curtailment charges, and require cash contributions.
We have purchased annuities and offered lump-sum payouts to defined benefit plan and other postretirement plan participants and retirees in the past. If we were to take similar actions in the future, we could incur significant pension settlement and curtailment charges related to the reduction in pension and postretirement obligations from annuity purchases, lump-sum payouts of benefits to plan participants, and/or plan terminations. Pursuing these types of actions could require us to make additional contributions to the defined benefit plans to maintain a legally required funded status.
Risks Related to Legal, Compliance and Regulatory Matters
Current and future environmental health and safety laws, regulations, and customer requirements impose substantial costs and limitations on our operations and compliance may be more costly than we expect.
We are subject to the risk of potentially substantial environmental liability and limitations on our operations due to current environmental laws and regulations and future environmental laws and regulations could impose additional potential risks and limitations. We are or may become subject to extensive federal, state, local and foreign environmental, health and safety laws and regulations concerning matters such as air emissions, wastewater discharges, the use of per- and polyfluoroalkyl substances ("PFAS"), such as polytetrafluoroethylene ("PTFE"), or other chemicals of concern, waste management (e.g. storage, disposal) and the investigation and remediation of contamination. The risks of substantial costs and liabilities related to compliance with these laws and regulations are an inherent part of our business, and conditions may develop, arise or be discovered that create substantial environmental compliance or remediation liabilities and costs or which may require that we change certain production methods or materials used in our manufacturing processes or products.
Compliance with environmental, health and safety legislation and regulatory requirements may prove to be more limiting and costly than we anticipate. To date, we have committed significant expenditures in our efforts to manage remediation activities and maintain compliance with these requirements at our facilities, and we expect that we will continue to make significant expenditures related to such compliance in the future. From time to time, we may be subject to legal proceedings brought by private parties or governmental authorities with respect to environmental matters, including matters involving alleged noncompliance with or liability arising from environmental, health and safety laws, property damage or personal injury. Actual or alleged violations of environmental, health and safety laws or environmental permit requirements could result in restrictions or prohibitions on operations and substantial civil or criminal fines, as well as, under some environmental, health, and safety laws, the assessment of strict liability and/or joint and several liability. New laws and regulations, including those that may relate to emissions of greenhouse gases or the use, discharge or disposal of chemicals of concern utilized in our manufacturing processes, stricter enforcement of existing laws and regulations, new and more stringent customer requirements, the discovery of previously unknown contamination or the imposition of new clean-up requirements or standards could require us to incur costs, change production methods or materials or become the basis for new or increased liabilities that could have a material adverse effect on our business, financial condition or results of operations.
PTFE and other fluoropolymer materials, which are known to be included in certain of our products, are subject to increasing regulatory scrutiny.
Certain of our products, including but not limited to certain seals and plain bearings, are known to contain PTFE or other fluoropolymer materials, which are included in certain broad definitions of PFAS. These products represent a relatively small portion of our total product portfolio. PFAS have been increasingly scrutinized due to their potential environmental and health risks and are now the subject of increasing regulatory attention from the Environmental Protection Agency, state governments, the European Union and other regulators. These evolving regulations may restrict the use, manufacture, sale and/or distribution of our products or our ability to obtain components of our products, or may require us to report data on our use of certain PFAS. Such regulations could lead to significant costs. In addition, certain PFAS, including PFAS previously or currently within PTFE or other fluoropolymer materials, have increasingly become subject to new or more stringent investigation and remediation requirements where such PFAS is believed to have caused an impact to the environment. Certain of the Company’s operations and facilities have already been, or may in the future become, the subject of formal or informal investigations, enforcement actions or proceedings relating to these regulations or of private or public rights of action for the investigation and remediation of PFAS released into the environment. Such investigations, remediations, other response actions, and any related proceedings could lead to significant costs or limitations on future production in the absence of viable alternatives.
We are subject to a wide variety of domestic and foreign laws and regulations that could adversely affect our results of operations, cash flow or financial condition.
We are subject to a wide variety of domestic and foreign laws and regulations, and legal compliance risks, including securities laws, tax laws, data privacy laws, employment and pension-related laws, competition laws, U.S. and foreign export and trade laws, government procurement regulations, and laws governing improper business practices. We are affected by both new laws and regulations, and changes to existing laws and regulations which may continue to evolve through interpretations by courts and regulators. Furthermore, the laws and regulations to which we are subject may differ from jurisdiction to jurisdiction, further increasing the cost of compliance and the risk of noncompliance.
In addition, we could be adversely affected by violations of the FCPA and similar worldwide anti-bribery laws as well as export controls and economic sanction laws. The FCPA and similar anti-bribery laws in other jurisdictions generally prohibit companies and their intermediaries from making improper payments to non-U.S. government officials for the purpose of obtaining or retaining business. In the past, there has been a substantial increase in the global enforcement of anti-corruption laws. We operate in many parts of the world that have experienced governmental corruption to some degree and, in certain circumstances, strict compliance with anti-bribery laws may conflict with local customs and practices. Our policies mandate compliance with these laws, but we cannot assure you that our internal controls and procedures will always protect us from the improper acts committed by our employees, agents or third-party intermediaries. If we are found to be liable for FCPA, export control or sanction violations, we could suffer from criminal or civil penalties or other sanctions, including loss of export privileges or authorization needed to conduct aspects of our international business, which could have a material adverse effect on our business.
Also, our sales to public-sector customers are subject to complex regulations. Noncompliance with government procurement regulations, information security requirements such as the National Institute of Standards and Technology standards and guidelines, or other applicable laws or regulations could result in civil, criminal and administrative liability, termination of government contracts or other public-sector customer contracts, and suspension, debarment or ineligibility from doing business with governmental entities or other customers in the public sector.
Compliance with the laws and regulations described above or with other applicable foreign, federal, state, and local laws and regulations currently in effect or that may be adopted in the future could materially adversely affect our competitive position, operating results, financial condition and liquidity.
The global regulatory landscape is rapidly evolving and new and potentially conflicting requirements or preferences, including with respect to climate change, environmental sustainability and other matters, could lead to added operational complexity and compliance risks while adversely impacting our costs and financial results. In addition, severe weather associated with a changing climate could negatively impact our operations and those of our customers and suppliers.
The pace at which regulators in many jurisdictions are implementing regulatory change is currently heightened across a wide variety of topics including climate change, environmental sustainability, employment and labor, ethics, data privacy, governance, and others. Rapid changes in the regulatory environment may lead to additional costs of compliance and risks associated with non-compliance. Furthermore, regulations governing our global operations may at times conflict across jurisdictions leading to additional complexity and operating costs.
In addition, environmental activism, government regulations and reporting standards, and other initiatives aimed at limiting climate change and reducing global greenhouse gas emissions could interfere with our business strategy and operations as well as require material investment in energy efficiency projects, renewable energy sourcing, emission controls, data collection and verification resources. Severe weather associated with a changing climate could also negatively impact the operation of our facilities, as well as those of our customers and suppliers and impact our ability to insure our assets on commercially desirable terms and conditions.
Actions required to comply with regulations or stakeholder expectations associated with corporate social responsibility (“CSR”) topics, including those related to climate change, could adversely affect our business and performance.
Investors, customers, suppliers, employees, regulators and other stakeholders are increasingly focused on CSR practices and disclosures, and expectations in this area are rapidly evolving and growing and sometimes conflicting. We have announced goals covering certain CSR topics, such as those related to reductions in greenhouse gas emissions and maintaining employee health and safety. Over time, stakeholder expectations for, and regulatory requirements (such as the European Union, Corporate Sustainability Reporting Directive) related to, our CSR program and initiatives may change, and our investors, customers, suppliers, employees or regulators may advocate that we implement additional, or stricter, goals and initiatives related to CSR topics. Greater expectations or legal requirements may cause us to undertake costly initiatives to satisfy such new criteria. If we do not meet, or are perceived to have not met, announced CSR goals or do not accurately disclose our progress on such goals, our reputation, competitive position, financial condition and operating results could be adversely impacted.
Risks Related to Data Privacy and Information Security
The Company may be subject to risks relating to its information technology systems, including the risk of cybersecurity incidents.
The Company relies on information technology systems and those of third parties who provide products or services to us to manage and operate its business and to process, transmit and store data, including its intellectual property, personal data and other proprietary business information and that of its employees, customers and suppliers. Despite security measures taken by the Company, the Company’s information technology systems (both on-premises and third-party managed) may be vulnerable to attacks by hackers or subject to unauthorized access due to employee error, technology vulnerabilities or misconfigurations, supplier error, malfeasance or other causes. Cybersecurity incidents and similar attacks vary in their form and can include the deployment of harmful malware or ransomware, denial-of-services attacks, and other attacks, which may affect business continuity and threaten the availability, confidentiality and integrity of our systems and information. While we have utilized and continue to utilize various controls and systems to mitigate such risks, we cannot assure that the actions we have implemented and are implementing, or that we have required or will require third-party service providers and other business partners to implement, will be sufficient to protect our systems or data. We have been and may in the future be subject to attempts to gain unauthorized access to our information technology systems. To date, the impacts of prior incidents have not had a material adverse effect on us. A cybersecurity incident or failure or disruption relating to our information systems or technology infrastructure or that of our third-party service providers, could expose the Company and its employees, customers and suppliers to risks of misuse of confidential information, manipulation and destruction of data, production downtimes and operational disruptions, which in turn could result in litigation, business disputes and government investigations, and related monetary damages, injunctive requirements and fines, and could adversely affect the Company's reputation, competitive position, business or results of operations.
Data privacy and security concerns, as well as evolving regulation and enforcement, could adversely affect our results of operations and profitability.
We and certain authorized third parties of ours, collect, transmit, store, access and otherwise process certain confidential or sensitive data, including proprietary business information, personal data or other information that is subject to privacy, data protection and security laws, regulations and/or government or customer-imposed controls. We operate in a global environment in which the data privacy regulatory and legal framework and corresponding enforcement and litigation landscape are evolving quickly. Moreover, the data privacy laws and regulations of the specific jurisdictions in which we operate may vary and potentially conflict. These laws and regulations can also impose significant fines and penalties for noncompliance and afford private rights of action to individuals under certain circumstances. As such, we incur and expect to continue to incur significant ongoing costs as part of our efforts to comply with applicable law. Any failure, or perceived failure, to comply with our data protection or privacy-related legal obligations may result in reputational damage, loss of business, regulatory investigations and fines, and litigation, and related monetary damages and injunctive requirements, any of which may adversely affect our results of operations and profitability.
General Risk Factors
Weakness in global economic conditions or in any of the industries or geographic regions in which we or our customers operate, as well as the cyclical nature of our customers' businesses generally or sustained uncertainty in financial markets, could adversely impact our revenues and profitability by reducing demand and margins.
There has been significant volatility in the capital markets and in the end markets and geographic regions in which we and our customers operate, which has negatively affected our revenues. Our revenues also may be negatively affected by changes in customer demand, changes in the product mix and negative pricing pressure in the industries in which we operate. Margins in those industries are highly sensitive to demand cycles, and our customers in those industries historically have tended to delay large capital projects, including expensive maintenance and upgrades during economic downturns. As a result, our revenues and earnings are impacted by overall levels of industrial production.
Rising inflationary pressure has resulted in and could further result in increased employee expenses, shipping costs, raw material costs, energy and fuel costs and other costs of production. If we cannot continue to absorb or pass these increases in our costs of production to our customers, our results of operations, profit margins and cash flows could be adversely affected.
Increases in compensation, wage pressure, and other expenses for our employees have adversely affected our profitability and could continue to do so. These cost increases may continue to be impacted by inflationary pressures that could further reduce our sales or profitability. Inflation has led to and could continue to lead to further increases in other operating costs, such as shipping costs, costs of raw materials, and energy and fuel prices. If we are unable to continue to increase the price of our products to offset further cost increases, or experience a lag in doing so, due to pricing pressure, contract terms or other factors, our financial condition, results of operations and cash flows may be adversely affected.
Warranty, recall, quality or product liability claims could materially adversely affect our earnings.
Warranty, recall, quality or product liability claims could materially adversely affect our earnings and brand reputation. In our business, we are exposed to warranty and product liability claims, including in certain industry segments with potential high value claims, such as rail, aerospace and wind energy, and through our automotive customer contracts which often contain negotiated warranty provisions. In addition, we may be required to participate in the recall of a product. If we fail to meet customer specifications for their products, we may be subject to product quality costs and claims, as well as adverse brand reputational impacts. A successful warranty or product liability claim against us, or a requirement that we participate in a product recall, could have a material adverse effect on our earnings and brand reputation.
If our internal controls are found to be ineffective, our financial results or our stock price may be adversely affected.
Our most recent evaluation resulted in our conclusion that, as of December 31, 2024, our internal control over financial reporting was effective. We believe that we currently have adequate internal control procedures in place for future periods, including processes related to newly acquired businesses; however, increased risk of internal control breakdowns generally exists in a business environment that is decentralized. In addition, if our internal control over financial reporting is found to be ineffective, investors may lose confidence in the reliability of our financial statements, which may adversely affect our stock price.
Changes in accounting standards could have an adverse effect on our results of operations, as reported in our financial statements.
Our consolidated financial statements are prepared in accordance with U.S. Generally Accepted Accounting Principles ("U.S. GAAP"), which is periodically revised and/or expanded. Accordingly, from time to time we are required to adopt new or revised accounting standards and related interpretations issued by recognized authoritative bodies, including the Financial Accounting Standards Board ("FASB") and the SEC. The impact of accounting pronouncements that have been issued but not yet implemented is disclosed in this Annual Report on Form 10-K and our Quarterly Reports on Form 10-Q. It is possible that future accounting guidance we are required to adopt, or future changes in accounting principles, could change the current accounting treatment that we apply to our consolidated financial statements and that such changes could have an adverse effect on our results of operations, as reported in our consolidated financial statements.
Item 1B. Unresolved Staff Comments
None.
Item 1C. Cybersecurity
Cybersecurity Risk Management and Governance
Information security is an integral part of the Company’s overall enterprise risk management program. The Company maintains cybersecurity processes designed to detect and assess the severity of cybersecurity threats and incidents and, where applicable and possible, to identify the source of a threat or incident, including, whether it is associated with the use of third-party service providers. The Company's processes also include cybersecurity testing, detection, response, prevention and mitigation strategies, conducting contract and vendor due diligence review, and informing management and the Company's Board of Directors of material cybersecurity threats and incidents. The Company's information security team also engages third-party security consultants for penetration testing, training and system enhancements. The Company provides training and education for employees on cybersecurity awareness, including confidential information protection and simulated phishing attacks where appropriate for the employee’s role.
The Board of Directors has overall oversight responsibility for the Company's risk management function, and primarily relies on the Audit Committee to administer this oversight. With respect to cybersecurity, the Board and Audit Committee are responsible for confirming that the Company's management maintains appropriate cybersecurity policies and has processes in place designed to identify and evaluate cybersecurity risks to which the Company is exposed, to manage cybersecurity risks and to mitigate any cybersecurity incidents. The Vice President of Information Technology is responsible for identifying, considering and assessing material cybersecurity risks on an ongoing basis, establishing processes for monitoring and mitigating potential cybersecurity risks, exposures, implementing appropriate mitigation measures and maintaining our cybersecurity program. The Company's dedicated personnel, who report to the Vice President of Information Technology, are certified and experienced information systems security professionals and information security managers with many years of experience. The Vice President of Information Technology has managed this team for over five years after having progressed through various roles of increasing responsibility in both operations and technology at the Company. The Vice President of Information Technology and other members of management report to either the Board of Directors or the Audit Committee at least annually on, among other topics, updates to the Company’s cybersecurity program and mitigation strategies, developments in cybersecurity practices generally, and third-party assessments of the Company’s cybersecurity program. Management also provides general program updates and industry trends to the Board and Audit Committee on a more ad hoc basis.
In 2024, the Company did not identify any cybersecurity threats that have materially affected or are reasonably likely to materially affect us, including our business strategy, results of operations, or financial condition. However, despite our efforts, the Company cannot eliminate all risks from cybersecurity threats, or provide assurances that it has not experienced an undetected cybersecurity incident. For more information about these risks, please refer to Item 1A. Risk Factors – Risks Related to Data Privacy and Information Security in this Annual Report on Form 10-K.
Item 2. Properties
The Company’s corporate headquarters is located in North Canton, Ohio, and, as of December 31, 2024, the Company maintained 93 plants that perform manufacturing, assembly or repair services. The Company also maintains various sales and administrative offices and distribution centers throughout the world. None of these plants, administrative offices or distribution centers are individually material to the Company’s operations. The facilities are situated in the United States, as well as 44 other countries, including China, India, and Romania. The Company owns the vast majority of its plants, while most of its sales and administrative offices and distribution centers are leased.
The buildings occupied by Timken are principally made of brick, steel, reinforced concrete and concrete block construction. The Company believes all buildings are in satisfactory operating condition to conduct business. The extent to which the Company utilizes its properties varies by property and from time to time. The Company believes that its capacity levels are adequate for its present and anticipated future needs. Most of the Company’s manufacturing facilities remain capable of handling additional volume increases.
Item 3. Legal Proceedings
The Company is involved in various claims and legal actions arising in the ordinary course of business. SEC regulations require us to disclose certain information about legal proceedings when a governmental authority is a party to the proceedings if we reasonably believe that such proceedings may result in monetary sanctions above a stated threshold. Pursuant to such regulations, the Company uses a threshold of $1 million or more for purposes of determining whether disclosure of any such proceedings is required. We believe matters under this threshold are not material to the Company. In the opinion of management, the ultimate disposition of open proceedings as of December 31, 2024 will not have a material adverse effect on the Company’s consolidated financial position or annual results of operations.
Item 4. Mine Safety Disclosures
Not applicable.
Item 4A. Information about our Executive Officers
The executive officers are elected by the Board of Directors normally for a term of one year and until the election of their successors. All executive officers, except Tarak B. Mehta, have been employed by Timken for the past five years. Mr. Mehta joined the Company on September 5, 2024. The executive officers of the Company as of February 20, 2025 are as follows:
| | | | | | | | | | | | | | |
| Name | | Age | | Current Position and Previous Positions During Last Five Years |
| Christopher A. Coughlin | | 64 | | 2022 Executive Vice President and President of Industrial Motion |
| | | | 2014 Executive Vice President and Group President |
| Philip D. Fracassa | | 56 | | 2014 Executive Vice President and Chief Financial Officer |
| Tarak B. Mehta | | 58 | | 2024 President and Chief Executive Officer |
| | | | 2022 President Motion Business – ABB Ltd |
| | | | 2016 President Electrification – ABB Ltd |
| | | | |
| Hansal N. Patel | | 44 | | 2024 Executive Vice President, General Counsel and Secretary |
| | | | 2019 Vice President, General Counsel and Secretary |
| Natasha Pollock | | 50 | | 2024 Vice President, Chief Human Resources Officer |
| | | | 2021 Vice President, Human Resources |
| | | | 2020 Director - Human Resources |
| Andreas Roellgen | | 57 | | 2022 Executive Vice President and President of Engineered Bearings |
| | | | 2016 Vice President - Europe, Asia and Africa |
PART II.
Item 5. Market for Registrant’s Common Equity, Related Stockholder Matters and Issuer Purchases of Equity Securities
The Company’s common shares are traded on the New York Stock Exchange under the symbol “TKR". The number of record holders of the Company’s common shares at December 31, 2024 was 2,729. The estimated number of beneficial shareholders at December 31, 2024 exceeds 90,000.
During the quarter ended December 31, 2024, no director or officer (as defined in Exchange Act Rule 16a-1(f)) of the Company adopted or terminated a “Rule 10b5-1 trading arrangement” or “non-Rule 10b5-1 trading arrangement” (as each term is defined in Regulation 408(a) of Regulation S-K).
Issuer Purchases of Common Shares:
The following table provides information about purchases of its common shares by the Company during the quarter ended December 31, 2024.
| | | | | | | | | | | | | | |
| Period | Total number
of shares purchased | Average
price paid per share | Total number of
shares purchased as
part of publicly
announced
plans or programs | Maximum number of shares that may yet be purchased under the plans or programs (1) |
| 10/1/2024 - 10/31/2024 | — | | $ | — | | — | | 2,258,990 | |
| 11/1/2024 - 11/30/2024 | 120,000 | | 75.45 | | 120,000 | | 2,138,990 | |
| 12/1/2024 - 12/31/2024 | — | | — | | — | | 2,138,990 | |
| Total | 120,000 | | $ | 75.45 | | 120,000 | | — | |
(1)On February 12, 2021, the Company's Board of Directors approved a share repurchase plan, effective March 1, 2021, pursuant to which the Company may purchase up to ten million of its common shares, in the aggregate. This share purchase plan expires on February 28, 2026. Under this plan, the Company may purchase shares from time to time in open market purchases or privately negotiated transaction, and it may make all or part of the purchases pursuant to accelerated share repurchases or Rule 10b5-1 plans.
Item 5. Market for Registrant’s Common Equity, Related Stockholder Matters and Issuer Purchases of Equity Securities (continued)
| | |
| *Total return assumes reinvestment of dividends. Fiscal years ending December 31. |
| | | | | | | | | | | | | | | | | |
| 2020 | 2021 | 2022 | 2023 | 2024 |
| Timken | $ | 140 | | $ | 128 | | $ | 133 | | $ | 153 | | $ | 139 | |
| S&P 500 | 118 | | 152 | | 125 | | 158 | | 197 | |
| S&P 400 Industrials | 116 | | 150 | | 132 | | 174 | | 198 | |
The line graph compares the cumulative total shareholder returns over five years for The Timken Company, the S&P 500 Stock Index and the S&P 400 Industrials Index. The graph assumes, in each case, an initial investment of $100 on January 1, 2020, in Timken common shares, S&P 500 Index and S&P 400 Industrials Index, based on market prices at the end of each fiscal year through and including December 31, 2024, and reinvestment of dividends.
Item 6. Reserved
Item 7. Management’s Discussion and Analysis of Financial Condition and Results of Operations
(Dollars in millions, except per share data)
OVERVIEW
Introduction:
The Timken Company designs and manufactures a growing portfolio of engineered bearings and industrial motion products, and related services. With more than a century of knowledge and innovation, the Company continuously improves the reliability and efficiency of global machinery and equipment to move the world forward. The Company’s growing product and services portfolio features many strong industrial brands, such as Timken®, GGB®, Philadelphia Gear®, Cone Drive®, Rollon®, Nadella®, Diamond®, Drives®, Groeneveld®, BEKA®, Des-Case®, Lovejoy® and Lagersmit®. Timken posted $4.6 billion in sales in 2024 and employs approximately 19,000 people globally, operating in 45 countries. The Company operates under two reportable segments: (1) Engineered Bearings and (2) Industrial Motion. The following further describes these business segments:
•Timken’s Engineered Bearings segment features a broad range of product designs serving original equipment manufacturers (OEMs) and end-users worldwide. Timken is a leading authority on tapered roller bearings and leverages its position by applying engineering know-how and technology across its entire bearing portfolio, which includes tapered, spherical and cylindrical roller bearings; plain bearings, metal-polymer bearings and rod end bearings; thrust and specialty ball bearings; and housed or mounted bearings. The Engineered Bearings portfolio features the Timken®, GGB® and Fafnir® brands and serves customers across global industries, including wind energy, agriculture, construction, food and beverage, metals and mining, automotive and truck, aerospace, rail and more.
•Timken’s Industrial Motion segment includes a diverse and growing portfolio of engineered products, including industrial drives, automatic lubrication systems, linear motion products and systems, chains, belts, couplings, filtration systems, seals, and industrial clutches and brakes that keep systems running efficiently. Industrial Motion also includes industrial drivetrain services, which return equipment to like-new condition. The Industrial Motion portfolio features many strong brands, including Philadelphia Gear®, Cone Drive®, Spinea®, Rollon®, Nadella®, Groeneveld®, BEKA®, Des-Case®, Diamond®, Drives®, Timken® Belts, Lovejoy®, PT Tech®, Lagersmit® and CGI. Industrial Motion products are used across a broad range of industries, including solar energy, automation, construction, agriculture and turf, passenger rail, marine, aerospace, packaging and logistics, medical and more.
Timken creates value by understanding customer needs and applying its know-how to serve a broad range of customers in attractive markets and industries across the globe. The Company’s business strengths include its product technology, end-market diversity, geographic reach and aftermarket mix. Timken collaborates with OEMs to improve equipment efficiency with its engineered products and captures subsequent equipment replacement cycles by selling largely through independent channels in the aftermarket. Timken focuses its international efforts and footprint in regions of the world where strong macroeconomic factors such as urbanization, infrastructure development, industrialization and sustainability create demand for its products and services.
The Company's strategy has three primary elements:
Profitable Growth. The Company intends to expand into new and existing markets by leveraging its collective knowledge of materials science, friction management and power transmission to create value for Timken customers. Using a highly collaborative technical selling approach, the Company places particular emphasis on creating unique solutions for challenging and/or demanding applications. The Company intends to grow in attractive market sectors around the world, emphasizing those spaces that are highly fragmented, demand high service and value the reliability and efficiency offered by Timken products. The Company also targets applications that offer significant aftermarket demand, thereby providing product and services revenue throughout the equipment’s lifetime.
Operational Excellence. Timken operates with a relentless drive for exceptional results and a passion for superior execution. The Company embraces a continuous improvement culture that is charged with increasing efficiency, lowering costs, eliminating waste, increasing cash flow, driving organizational advancement and agility, and building greater brand equity to fuel growth. This requires the Company’s ongoing commitment to attract, retain and develop the best talent across the world.
Capital Deployment to Drive Shareholder Value. The Company is focused on providing the highest returns for shareholders through its capital allocation framework, which includes: (1) investing in the core business through capital expenditures, research and development and initiatives to drive profitable organic growth; (2) pursuing strategic acquisitions to broaden its portfolio and capabilities across diverse markets, with a focus on engineered bearings, industrial motion products and related services; (3) returning capital to shareholders through dividends and share repurchases; and (4) maintaining a strong balance sheet and sufficient liquidity. As part of this framework, the Company may also restructure, reposition or divest underperforming product lines or assets.
The following items highlight some of the Company's accomplishments in 2024:
•In August, Timken issued its annual CSR report, highlighting the Company's progress towards its target to reduce aggregate Scope 1 and Scope 2 greenhouse gas (GHG) emissions intensity by 50 percent by 2030, as well as providing an update on the company's actions to improve the lives of individuals and communities, benefit the planet and strengthen its business.
•On September 9, 2024, the Company acquired CGI, Inc. ("CGI"), a Nevada-based manufacturer of precision drive systems serving a broad range of automation markets with a concentration in medical robotics. CGI employs approximately 130 people and has its headquarters and manufacturing facilities in Carson City, Nevada. CGI will further Timken's strategy to expand and scale its leading industrial motion product portfolio.
•Timken increased its quarterly dividend by 3% in the second quarter and paid its 410th consecutive quarterly dividend in the fourth quarter. The Company achieved eleven straight years of higher annual dividends in 2024. Timken also repurchased half a million common shares during the year.
•Executed a CEO succession plan and welcomed Tarak Mehta to Timken as its new president and CEO in September.
•Throughout 2024, Timken received third-party recognition for the role it plays as a global industrial leader, responsible corporate citizen, innovator and employer of choice. The Company was named one of the World's Most Ethical Companies® for the 13th time by Ethisphere, one of America's Most Responsible Companies for the 5th year in a row by Newsweek and Statista, one of the Best Companies to Work For by U.S. News & World Report, and one of the World's Most Innovative Companies by Fast Company.
RESULTS OF OPERATIONS
2024 vs. 2023
Overview:
| | | | | | | | | | | | | | |
| 2024 | 2023 | $ Change | % Change |
| Net sales | $ | 4,573.0 | | $ | 4,769.0 | | $ | (196.0) | | (4.1 | %) |
| | | | |
| | | | |
| Net income | 375.3 | | 408.0 | | (32.7) | | (8.0 | %) |
| Net income attributable to noncontrolling interest | 22.6 | | 13.9 | | 8.7 | | 62.6 | % |
| Net income attributable to The Timken Company | $ | 352.7 | | $ | 394.1 | | $ | (41.4) | | (10.5 | %) |
| | | | |
| | | | |
| | | | |
| Diluted earnings per share | $ | 4.99 | | $ | 5.47 | | $ | (0.48) | | (8.8 | %) |
| Average number of diluted shares | 70,750,482 | | 72,081,884 | | — | | (1.8 | %) |
The decrease in net sales was primarily driven by lower demand in China and Europe, and the unfavorable impact of foreign currency exchange rate changes, partially offset by the benefit of acquisitions (net of divestitures) and favorable pricing. The decrease in net income was primarily due to the impact of lower volume, higher manufacturing costs, the unfavorable impact of foreign currency exchange rate changes, and an increase in net interest expense, partially offset by favorable price/mix, lower impairment and pension remeasurement charges and a gain on the sale of certain real estate.
Outlook:
The Company expects 2025 full-year revenue to range from down 4% to 1% in total compared to 2024, primarily driven by the unfavorable impact of foreign currency exchange rates and lower demand in Europe, partially offset by the benefit of acquisitions completed during 2024 and slightly favorable pricing. The Company's earnings are expected to be down in 2025 compared with 2024, primarily due to the impact of foreign currency exchange rate changes and lower organic sales volume, offset partially by lower operating costs and the favorable impact of acquisitions.
The Company expects to generate a higher amount of cash from operating activities in 2025 compared to 2024, driven by improved working capital performance, a lower level of capital expenditures, and lower cash taxes. The Company expects capital expenditures in 2025 to be in the range of 3.5% of sales.
THE STATEMENTS OF INCOME
Operating Income:
| | | | | | | | | | | | | | |
| Twelve Months Ended
December 31, | | |
| 2024 | 2023 | $ Change | Change |
| Net sales | $ | 4,573.0 | | $ | 4,769.0 | | $ | (196.0) | | (4.1%) |
| Cost of products sold | 3,132.3 | | 3,259.9 | | (127.6) | | (3.9%) |
| Selling, general and administrative expenses | 752.0 | | 740.8 | | 11.2 | | 1.5% |
| Amortization of intangible assets | 78.0 | | 65.7 | | 12.3 | | 18.7% |
| Impairment and restructuring charges | 13.4 | | 45.5 | | (32.1) | | (70.5%) |
| Gain on sale of real estate | (13.8) | | — | | (13.8) | | NM |
| Operating income | $ | 611.1 | | $ | 657.1 | | (46.0) | | (7.0%) |
| Operating income % to net sales | 13.4 | % | 13.8 | % | | (40) | bps |
Net sales decreased in 2024 compared to 2023 primarily due to lower organic sales of $276 million (lower demand, favorable pricing) as well as the unfavorable impact of foreign currency exchange of $34 million, partially offset by the favorable impact of acquisitions (net of divestitures) of $114 million.
Operating income decreased in 2024 compared to 2023 due to the impact of lower sales net of cost of products sold, higher selling, general and administrative ("SG&A") expenses, and increased amortization expense, partially offset by lower impairment and restructuring charges.
•Cost of products sold decreased in 2024 compared to 2023 due to the impact of lower volume of $173 million and the impact of foreign currency exchange rate changes of $22 million, partially offset by the incremental cost of goods sold from acquisitions (net of divestitures) of $37 million, higher manufacturing costs of $28 million and unfavorable net material and logistics costs (net) of $5 million.
•SG&A expenses increased in 2024 compared to 2023 primarily due to the incremental SG&A expense associated with recent acquisitions. Excluding acquisitions, SG&A expenses were lower in 2024 compared to 2023 primarily due to reduced discretionary spending to align with lower demand levels and the favorable impact of foreign currency, partially offset by increased accruals for potential uncollectible accounts
•Amortization of intangible assets increased in 2024 compared to 2023 due to the addition of intangible assets from the acquisitions, which were completed in 2024 and 2023. Refer to Note 2 - Acquisitions and Divestitures in the Notes to the Consolidated Financial Statements for additional information.
•Impairment and restructuring charges decreased significantly in 2024 compared to 2023 primarily due to lower impairment charges. During 2023, the Company recorded a pretax goodwill impairment loss for one of its reporting units in the Industrial Motion segment in the amount of $28.3 million.
•Gain on sale of real estate for 2024 was due to a gain of $13.8 million on the sale of a former bearing manufacturing plant in Gaffney, South Carolina during the quarter ended September 30, 2024. Refer to Note 8 - Property, Plant and Equipment in the Notes to the Consolidated Financial Statements for additional information.
Interest Expense and Income:
| | | | | | | | | | | | | | |
| 2024 | 2023 | $ Change | % Change |
| Interest expense | $ | (125.1) | | $ | (110.7) | | $ | (14.4) | | 13.0 | % |
| Interest income | 14.9 | | 9.3 | | 5.6 | | 60.2 | % |
| Interest expense, net | $ | (110.2) | | $ | (101.4) | | $ | (8.8) | | 8.7 | % |
Interest expense increased in 2024 compared to 2023, primarily due to higher average debt levels during the year and higher average interest rates. Interest income increased in 2024 compared to 2023, primarily due to higher average cash levels during the year and improved returns on invested cash.
Other Income (Expense):
| | | | | | | | | | | | | | |
| 2024 | 2023 | $ Change | % Change |
Non-service pension and other postretirement
expense | $ | (2.6) | | $ | (24.0) | | $ | 21.4 | | (89.2 | %) |
| | | | |
| Other expense, net | (4.1) | | (1.2) | | (2.9) | | 241.7 | % |
| Total other expense, net | $ | (6.7) | | $ | (25.2) | | $ | 18.5 | | (73.4) | % |
The change in non-service pension and other postretirement expense and income was primarily due to net actuarial ("mark-to-market") gains recorded in 2024 compared to net actuarial losses in 2023. In 2024, the Company recognized $1.3 million of net mark-to-market gains, compared to $20.6 million of net mark-to-market charges in 2023. Refer to Note 17 - Retirement Benefit Plans and Note 18 - Other Postretirement Benefit Plans in the Notes to the Consolidated Financial Statements for more information.
The change in other expense, net was primarily due to higher foreign currency exchange losses recognized in 2024 compared to 2023. In addition, 2023 includes a gain on the divestiture of S.E. Setco Service Company, LLC ("SE Setco"), a formerly 50%-owned joint venture, partially offset by the non-cash impact of deconsolidating the Company's 51%-owned joint venture in Russia ("Russian JV").
Income Tax Expense:
| | | | | | | | | | | | | | |
| 2024 | 2023 | $ Change | Change |
| Income tax expense | $ | 118.9 | | $ | 122.5 | | $ | (3.6) | | (2.9 | %) |
| Effective tax rate | 24.1 | % | 23.1 | % | — | | 100 | bps |
The effective tax rate for 2024 was 24.1%, which was unfavorable compared to the U.S. federal statutory rate of 21%, primarily due to the unfavorable impact of earnings in foreign jurisdictions where the effective tax rate was higher than 21% and U.S. state and local income taxes. This was partially offset by the release of accruals for uncertain tax positions.
The effective tax rate for 2023 was 23.1%, which was unfavorable compared to the U.S. federal statutory rate of 21%, primarily due to the unfavorable impact of earnings in foreign jurisdictions where the effective tax rate was higher than 21% and withholding taxes accrued on planned dividend distributions in 2024. This was partially offset by the favorable impact of U.S. foreign tax credit utilization from acquisition integration structuring.
The change in the effective rate for 2024 compared with 2023 was an increase of 1.0%. The increase was partially due to the unfavorable impact of earnings in foreign jurisdictions where the effective tax rate was higher than 21%. The increase was also the result of the 2023 net discrete impact of the accrual of withholding taxes on dividend distributions and favorable U.S. foreign tax credit utilization that did not reoccur in 2024.
Refer to Note 5 - Income Taxes in the Notes to the Consolidated Financial Statements for more information on the computation of the income tax expense in interim periods.
For a discussion of changes in consolidated results from 2023 to 2022, refer to Management's Discussion and Analysis of Financial Condition and Results of Operations in Part II, Item 7 of our Annual Report on Form 10-K for the year ended December 31, 2023.
BUSINESS SEGMENTS
The Company's reportable segments are product-based business groups that serve customers in diverse industrial markets. The primary measurement used by management to measure the financial performance of each segment is adjusted EBITDA. Refer to Note 4 - Segment Information in the Notes to the Consolidated Financial Statements for the reconciliation of adjusted EBITDA by segment to consolidated income before income taxes.
The presentation of segment results below includes a reconciliation of the changes in net sales for each segment reported in accordance with U.S. GAAP to net sales adjusted to remove the effects of acquisitions and divestitures completed in 2024 and 2023 and foreign currency exchange rate changes. The effects of acquisitions, divestitures and foreign currency exchange rate changes on net sales are removed to allow investors and the Company to meaningfully evaluate the percentage change in net sales on a comparable basis from period to period.
The following items highlight the Company's acquisitions and divestitures completed in 2024 and 2023:
•The Company acquired CGI during the third quarter of 2024. Results for CGI are reported in the Industrial Motion segment.
•The Company acquired Lagersmit Holding B.V. ("Lagersmit") during the fourth quarter of 2023. Results for Lagersmit are reported in the Industrial Motion segment.
•The Company acquired Engineered Solutions Group ("iMECH") during the fourth quarter of 2023. Results for iMECH are reported in the Engineered Bearings segment.
•The Company completed the sale of Jiangsu TWB Bearings Co., Ltd. ("TWB") during the fourth quarter of 2023. Results for TWB were reported in the Engineered Bearings segment.
•The Company acquired Rosa Sistemi S.p.A.("Rosa") and D-C Filtrations Holding Corp. ("Des-Case") during the third quarter of 2023. Results for Rosa and Des-Case are reported in the Industrial Motion segment.
•The Company acquired Leonardo Top S.a.r.l. ("Nadella") during the second quarter of 2023. Results for Nadella are reported in the Industrial Motion segment.
•The Company acquired American Roller Bearing Company ("ARB") during the first quarter of 2023. Results for ARB are reported in the Engineered Bearings segment.
Engineered Bearings Segment:
| | | | | | | | | | | | | | |
| 2024 | 2023 | $ Change | Change |
| Net sales | $ | 3,034.3 | | $ | 3,257.7 | | $ | (223.4) | | (6.9 | %) |
| Cost of products sold | (2,106.9) | | (2,246.0) | | 139.1 | | (6.2 | %) |
| Selling, general and administrative expenses | (419.3) | | (425.4) | | 6.1 | | (1.4 | %) |
| Other segment items | 4.5 | | 4.2 | | 0.3 | | 7.1 | % |
| Depreciation and amortization | 95.6 | | 92.1 | | 3.5 | | 3.8 | % |
| Adjusted EBITDA | $ | 608.2 | | $ | 682.6 | | $ | (74.4) | | (10.9 | %) |
| Adjusted EBITDA margin | 20.0 | % | 21.0 | % | — | | (100) | bps |
| | | | |
| 2024 | 2023 | $ Change | % Change |
| Net sales | $ | 3,034.3 | | $ | 3,257.7 | | $ | (223.4) | | (6.9 | %) |
| Less: Acquisitions | 19.0 | | — | | 19.0 | | NM |
| Divestitures | (22.7) | | — | | (22.7) | | NM |
| Currency | (30.7) | | — | | (30.7) | | NM |
| Net sales, excluding the impact of acquisitions, divestitures and currency | $ | 3,068.7 | | $ | 3,257.7 | | $ | (189.0) | | (5.8 | %) |
The Engineered Bearings segment's net sales, excluding the effects of acquisitions, divestitures and foreign currency exchange rate changes, decreased $189.0 million or 5.8% in 2024 compared with 2023, primarily driven by lower demand in China and Europe, partially offset by higher demand in Latin America and India, and higher pricing. Among market sectors, the segment experienced a significant decline in the renewable energy sector and lower demand in the off-highway and general & heavy industrial market sectors, partially offset by higher demand in the industrial distribution, rail, and aerospace sectors.
Adjusted EBITDA for the Engineered Bearings segment decreased in 2024 by $74.4 million or 10.9% compared with 2023, primarily due to the impact of lower sales net of cost of products sold, partially offset by lower SG&A expenses.
•Cost of products sold decreased in 2024 compared to 2023 due to the impact of lower volume of $116 million, the impact of foreign currency exchange rate changes of $21 million, and lower incremental cost of goods sold from acquisitions (net of divestitures) of $9 million, partially offset by unfavorable net material and logistics costs of $4 million and higher manufacturing costs of $2 million.
•SG&A expenses decreased in 2024 compared to 2023 driven primarily by lower compensation expense, reduced discretionary spending and the favorable impact of foreign currency.
•Depreciation and amortization increased slightly in 2024 compared to 2023 primarily due to the addition of property, plant and equipment assets from capital projects in China and the Americas.
Industrial Motion Segment:
| | | | | | | | | | | | | | |
| 2024 | 2023 | $ Change | Change |
| Net sales | $ | 1,538.7 | | $ | 1,511.3 | | $ | 27.4 | | 1.8 | % |
| Cost of products sold | (1,008.5) | | (979.7) | | (28.8) | | 2.9 | % |
| Selling, general and administrative expenses | (269.1) | | (253.0) | | (16.1) | | 6.4 | % |
| Other segment items | (0.1) | | (0.1) | | — | | — | % |
| Depreciation and amortization | 45.5 | | 41.3 | | 4.2 | | 10.2 | % |
| Adjusted EBITDA | $ | 306.5 | | $ | 319.8 | | $ | (13.3) | | (4.2 | %) |
| Adjusted EBITDA margin | 19.9 | % | 21.2 | % | — | | (130) | bps |
| | | | |
| 2024 | 2023 | $ Change | % Change |
| Net sales | $ | 1,538.7 | | $ | 1,511.3 | | $ | 27.4 | | 1.8 | % |
| Less: Acquisitions | 117.4 | | — | | 117.4 | | NM |
| | | | |
| Currency | (2.8) | | — | | (2.8) | | NM |
| Net sales, excluding the impact of acquisitions and currency | $ | 1,424.1 | | $ | 1,511.3 | | $ | (87.2) | | (5.8 | %) |
The Industrial Motion segment's net sales, excluding the effects of acquisitions and foreign currency exchange rate changes, decreased $87.2 million or 5.8% in 2024 compared with 2023, driven primarily by lower end-market demand in Europe and North America, partially offset by higher pricing. Excluding acquisitions, sales were down across most segment platforms with the largest decreases in automatic lubrication systems, linear motion solutions, and belts and chain.
Adjusted EBITDA decreased $13.3 million or 4.2% in 2024 compared with 2023 primarily due to the impact of lower sales net of cost of products sold and higher SG&A expenses.
•Cost of products sold increased in 2024 compared to 2023 due to the impact of the incremental cost of goods sold from acquisitions of $63 million and higher manufacturing costs of $26 million, partially offset by the impact of lower volume of $58 million.
•SG&A expenses increased in 2024 compared to 2023 due to the incremental SG&A expense associated with recent acquisitions. Excluding acquisitions, SG&A expenses were lower versus 2023 driven primarily by lower discretionary spending.
•Depreciation and amortization increased in 2024 compared to 2023 primarily due to the addition of property, plant and equipment assets from acquisitions completed during 2024 and 2023. Refer to Note 2 - Acquisitions and Divestitures in the Notes to the Consolidated Financial Statements for additional information.
Unallocated Corporate:
| | | | | | | | | | | | | | |
| 2024 | 2023 | $ Change | Change |
| Unallocated corporate expense | $ | (69.9) | | $ | (62.7) | | $ | (7.2) | | 11.5 | % |
| Unallocated corporate expense % to net sales | (1.5 | %) | (1.3 | %) | — | | (20) | bps |
Unallocated corporate expense increased in 2024 compared with 2023 primarily due to the unfavorable impact of foreign currency losses of $8.2 million in 2024 compared to $3.7 million in 2023.
CASH FLOWS
| | | | | | | | | | | |
| 2024 | 2023 | $ Change |
| Net cash provided by operating activities | $ | 475.7 | | $ | 545.2 | | $ | (69.5) | |
| Net cash used in investing activities | (304.6) | | (806.5) | | 501.9 | |
| Net cash (used in) provided by financing activities | (194.8) | | 347.1 | | (541.9) | |
| Effect of exchange rate changes on cash | (22.0) | | (7.2) | | (14.8) | |
| (Decrease) increase in cash, cash equivalents and restricted cash | $ | (45.7) | | $ | 78.6 | | $ | (124.3) | |
Operating Activities:
The decrease in net cash provided by operating activities in 2024 compared with 2023 was primarily due to the unfavorable impact of working capital items of $43.7 million, a decrease in net income of $32.7 million, a decrease in impairment charges of $29.7 million, partially offset by the favorable impact of income taxes on cash of $56.5 million due to lower tax payments. Refer to the table below for additional detail of the impact of each line on net cash provided by operating activities.
The following chart displays the impact of working capital items on cash during 2024 and 2023:
| | | | | | | | | | | |
| | 2024 | 2023 | $ Change |
| Cash (used in) provided by: | | | |
| Accounts receivable | $ | (14.2) | | $ | 71.6 | | $ | (85.8) | |
| Unbilled receivables | 3.3 | | (40.4) | | 43.7 | |
| Inventories | 9.6 | | 72.0 | | (62.4) | |
| Trade accounts payable | (37.1) | | (57.4) | | 20.3 | |
| Other accrued expenses | (7.1) | | (47.6) | | 40.5 | |
| Cash used in working capital items | $ | (45.5) | | $ | (1.8) | | $ | (43.7) | |
The following table displays the impact of income taxes on cash during 2024 and 2023:
| | | | | | | | | | | |
| | 2024 | 2023 | $ Change |
| Accrued income tax expense | $ | 118.9 | | $ | 122.5 | | $ | (3.6) | |
| Income tax payments | (183.5) | | (240.3) | | 56.8 | |
| Other miscellaneous | 1.1 | | (2.2) | | 3.3 | |
| Change in income taxes | $ | (63.5) | | $ | (120.0) | | $ | 56.5 | |
Investing Activities:
The decrease in net cash used in investing activities in 2024 compared with 2023 was primarily due to a decrease in cash used for acquisitions of $471.4 million, a decrease in capital expenditures of $17.8 million and an increase in cash from the net liquidation of short-term marketable securities of $9.5 million.
Financing Activities:
The change in net cash used in/provided by financing activities in 2024 compared with 2023 was primarily due to a decrease in net borrowings of $686.2 million and lower proceeds from the 2024 sale of shares of Timken India Limited ("TIL") as compared to the 2023 sale in the amount of $52.5 million, partially offset by a decrease in the purchase of treasury shares of $210.4 million.
LIQUIDITY AND CAPITAL RESOURCES
Reconciliation of total debt to net debt and the ratio of net debt to capital:
Net Debt:
| | | | | | | | |
| December 31, |
| 2024 | 2023 |
| Short-term debt, including current portion of long-term debt | $ | 13.0 | | $ | 605.6 | |
| | |
| Long-term debt | 2,049.7 | | 1,790.3 | |
| Total debt | $ | 2,062.7 | | $ | 2,395.9 | |
| Less: Cash and cash equivalents | 373.2 | | 418.9 | |
| Net debt | $ | 1,689.5 | | $ | 1,977.0 | |
Ratio of Net Debt to Capital:
| | | | | | | | |
| December 31, |
| 2024 | 2023 |
| Net debt | $ | 1,689.5 | | $ | 1,977.0 | |
| Total equity | 2,984.1 | | 2,702.4 | |
| Net debt plus total equity (capital) | $ | 4,673.6 | | $ | 4,679.4 | |
| Ratio of net debt to capital | 36.1 | % | 42.2 | % |
The Company presents net debt because it believes net debt is more representative of the Company's financial position than total debt due to the amount of cash and cash equivalents held by the Company and the ability to utilize such cash and cash equivalents to reduce debt if needed.
At December 31, 2024, the Company had strong liquidity with $373.2 million of cash and cash equivalents on the Consolidated Balance Sheet, as well as $843.9 million available under committed credit lines. Of the $373.2 million of cash and cash equivalents, $338.6 million resided in jurisdictions outside the United States. Repatriation of non-U.S. cash could be subject to taxes and some portion may be subject to governmental restrictions. Part of the Company's strategy is to grow in attractive market sectors, many of which are outside the United States. This strategy includes making investments in facilities, equipment and potential new acquisitions. The Company plans to fund these investments, as well as meet working capital requirements, with cash and cash equivalents and unused lines of credit within the geographic location of these investments where feasible.
On December 5, 2022 the Company entered into the Fifth Amended and Restated Credit Agreement ("Credit Agreement"), which is comprised of a $750.0 million unsecured revolving credit facility ("Senior Credit Facility") and a $400.0 million unsecured term loan facility ("2027 Term Loan") that each mature on December 5, 2027. Interest rates under the Credit Agreement are based on the Secured Overnight Financing Rate ("SOFR"). At December 31, 2024, the Senior Credit Facility had no outstanding borrowings. The Credit Agreement has two financial covenants: a consolidated net leverage ratio and a consolidated interest coverage ratio. The maximum consolidated net leverage ratio permitted under the Senior Credit Facility is 3.5 to 1.0. As of December 31, 2024, the Company's consolidated net leverage ratio was 2.01 to 1.0. The minimum consolidated interest coverage ratio permitted under the Senior Credit Facility is 3.0 to 1.0. As of December 31, 2024, the Company's consolidated interest coverage ratio was 7.69 to 1.0.
The interest rate under the Senior Credit Facility is variable with a spread based on the Company's debt rating. In addition, the Company pays a facility fee based on the applicable rate, which is variable with a spread based on the Company's debt rating, multiplied by the aggregate commitments of all of the lenders under the Senior Credit Facility. As of December 31, 2024, the Company carried investment-grade credit ratings with both Moody's (Baa2) and S&P Global (BBB-).
The Company renewed the Amended and Restated Asset Securitization Agreement (the "Accounts Receivable Facility") on December 6, 2023. The $100.0 million Accounts Receivable Facility matures on November 30, 2026. The Accounts Receivable Facility is subject to certain borrowing base limitations and is secured by certain domestic trade accounts receivable of the Company. These limitations reduced the availability of the Accounts Receivable Facility to $93.9 million at December 31, 2024. As of December 31, 2024, there were no outstanding borrowings under the Accounts Receivable Facility.
Other sources of liquidity include uncommitted short-term lines of credit for certain of the Company's foreign subsidiaries, which currently allows for borrowings of up to $226.9 million. At December 31, 2024, the Company had borrowings outstanding of $8.7 million and bank guarantees of $1.6 million, which reduced the aggregate availability under these facilities to $216.6 million.
On May 23, 2024, the Company issued fixed-rate unsecured senior notes ("2034 Notes") in the aggregate principal amount of €600 million with an interest rate of 4.125%, maturing on May 23, 2034. Proceeds from the 2034 Notes were used for the redemption of the Company's outstanding fixed-rate unsecured senior notes ("2024 Notes") in the aggregate principal amount of $350 million that were due to mature on September 1, 2024, as well as the repayment of other debt outstanding at the time of the issuance.
At December 31, 2024, the Company was in full compliance with all applicable covenants on its outstanding debt.
The Company expects to generate a higher amount of cash from operating activities in 2025 compared to 2024, driven by improved working capital performance, a lower level of capital expenditures, and lower cash taxes. The Company expects capital expenditures in 2025 to be in the range of 3.5% of sales.
FUTURE CONTRACTUAL AND OTHER PAYMENTS
The Company’s material cash requirements for contractual debt obligations and other contractual commitments outstanding as of December 31, 2024 were as follows:
Payments due by period:
| | | | | | | | | | | | | | |
| Future Contractual and Other Payments | Total | Less than
1 Year | 1-5 Years | More than
5 Years |
| Interest payments | $ | 600.1 | | $ | 93.0 | | $ | 315.5 | | $ | 191.6 | |
| Long-term debt, including current portion of long-term debt | 2,072.9 | | 4.3 | | 1,091.4 | | 977.2 | |
| Short-term debt | 8.7 | | 8.7 | | — | | — | |
| Purchase commitments | 114.7 | | 81.1 | | 33.6 | | — | |
| Operating leases | 129.5 | | 36.2 | | 81.2 | | 12.1 | |
| Retirement benefit plans | 274.3 | | 27.4 | | 117.4 | | 129.5 | |
| Total | $ | 3,200.2 | | $ | 250.7 | | $ | 1,639.1 | | $ | 1,310.4 | |
The interest payments beyond five years primarily relate to long-term fixed-rate notes. Refer to Note 12 - Financing Arrangements in the Notes to the Consolidated Financial Statements for additional information.
In order to maintain minimum funding requirements, the Company is required to make contributions to the trusts established for its defined benefit pension plans and other postretirement benefit plans. The table above shows the expected future minimum cash contributions to the trusts for the funded plans as well as estimated future benefit payments to participants for the unfunded plans. Those minimum funding requirements and estimated benefit payments can vary significantly. The amounts in the table above are based on actuarial estimates using current assumptions for, among other things, discount rates, expected return on assets and health care cost trend rates. During 2024, the Company made cash contributions and payments of $24.6 million to its global defined benefit pension plans and $1.6 million to its other postretirement benefit plans. Refer to Note 17 - Retirement Benefit Plans and Note 18 - Other Postretirement Benefit Plans in the Notes to the Consolidated Financial Statements for additional information.
Refer to Note 5 - Income Taxes and Note 14 - Contingencies in the Notes to the Consolidated Financial Statements for additional information regarding the Company's exposure for certain tax and legal matters.
In the ordinary course of business, the Company utilizes standby letters of credit issued by financial institutions to guarantee certain obligations, most of which relate to insurance contracts. At December 31, 2024, outstanding letters of credit totaled $55.7 million, primarily having expiration dates within 12 months.
NEW ACCOUNTING GUIDANCE ISSUED AND NOT YET ADOPTED
Information required for this Item is incorporated by reference to Note 1 - Significant Accounting Policies in the Notes to the Consolidated Financial Statements.
CRITICAL ACCOUNTING POLICIES AND ESTIMATES
The Company’s financial statements are prepared in accordance with accounting principles generally accepted in the United States. The preparation of these financial statements requires management to make estimates and assumptions that affect the reported amounts of assets and liabilities at the date of the financial statements and the reported amounts of revenues and expenses during the periods presented. The following paragraphs include a discussion of some critical areas that require a higher degree of judgment, estimates and complexity.
Goodwill and Indefinite-lived Intangible Assets:
The Company tests goodwill and indefinite-lived intangible assets for impairment at least annually, performing its annual impairment test as of October 1st. Furthermore, goodwill and indefinite-lived intangible assets are reviewed for impairment whenever events or changes in circumstances indicate that the carrying value may not be recoverable. Each interim period, the Company assesses whether or not an indicator of impairment is present that would necessitate a goodwill and indefinite-lived intangible assets impairment analysis be performed in an interim period other than during the fourth quarter.
As of December 31, 2024, the Company had $1,383.3 million of goodwill on its Consolidated Balance Sheet, of which $692.0 million was attributable to the Engineered Bearings segment and $691.3 million was attributable to the Industrial Motion segment. See Note 9 - Goodwill and Other Intangible Assets in the Notes to the Consolidated Financial Statements for movements in the carrying amount of goodwill by segment.
The Company reviews goodwill for impairment at the reporting unit level. The Engineered Bearings segment has one reporting unit and the Industrial Motion segment has six reporting units.
Accounting guidance permits an entity to first assess qualitative factors to determine whether additional indefinite-lived intangible asset impairment testing, including goodwill, is required. The Company chose to utilize this qualitative assessment in the annual goodwill impairment testing for all reporting units, except its Belts and Chain reporting unit, in the fourth quarter of 2024. Based on the qualitative assessment, the Company concluded that it was more likely than not that the fair value of these reporting units exceeded their respective carrying values. The Company chose to perform a quantitative impairment analysis in the fourth quarter of 2024 for its Belts and Chain reporting unit. The result of this impairment analysis was to recognize an impairment loss of $1.5 million, reducing goodwill for this reporting unit to zero.
As of December 31, 2024, the Company had $96.0 million of indefinite-lived intangible assets on its Consolidated Balance Sheet. The Company’s indefinite-lived intangible assets primarily consist of acquired trade names. As mentioned above, accounting guidance permits an entity to first assess qualitative factors to determine whether additional indefinite-lived intangible asset impairment testing is required. The Company chose to utilize this qualitative assessment in the annual impairment testing for all of its indefinite-lived intangible assets in the fourth quarter of 2024. Based on the qualitative assessment, the Company concluded that it was more likely than not that the fair value of these indefinite-lived intangible assets would exceed their respective carrying values.
Income Taxes:
Management judgment is required in determining the provision for income taxes, deferred tax assets and liabilities, valuation allowances against deferred tax assets, and accruals for uncertain tax positions.
The Company, which is subject to income taxes in the U.S. and numerous non-U.S. jurisdictions, accounts for income taxes in accordance with Accounting Standards Codification ("ASC") Topic 740, “Income Taxes.” Deferred tax assets and liabilities are recorded for the future tax consequences attributable to differences between financial statement carrying amounts of existing assets and liabilities and their respective tax bases, as well as net operating losses and tax credit carryforwards. Deferred tax assets and liabilities are measured using enacted tax rates expected to apply to taxable income in the years in which temporary differences are expected to be recovered or settled. Deferred tax assets relate primarily to tax loss carryforwards in foreign jurisdictions, as well as pension and postretirement benefit obligations in the U.S., which the Company believes are more likely than not to result in future tax benefits. In determining the need for a valuation allowance, the historical and projected financial performance of the entity recording the net deferred tax asset is considered along with any other pertinent information. The Company recorded $0.9 million in 2024 and $2.1 million in 2023 of tax benefits related to the reversal of valuation allowances. Refer to Note 5 - Income Taxes in the Notes to the Consolidated Financial Statements for further discussion on the valuation allowance reversals.
In the ordinary course of the Company’s business, there are many transactions and calculations where the ultimate income tax determination is uncertain. The Company is regularly under audit by tax authorities. Accruals for uncertain tax positions are provided for in accordance with the requirements of ASC Topic 740. The Company records interest and penalties related to uncertain tax positions as a component of income tax expense. In 2024, the Company recorded $2.4 million of net tax benefit for uncertain tax positions, which consisted primarily of $8.8 million related to increases to current and prior year uncertain tax positions and interest. This expense was partially offset by $11.2 million of the net reversal of accruals for prior year uncertain tax positions and settlements with tax authorities. During 2024, the Company recorded a $2.0 million decrease of uncertain tax positions related to foreign currency translation adjustments and deferred tax liabilities. The Company also recorded $5.9 million of uncertain tax positions related to prior years for acquisitions made during 2024.
Purchase Accounting and Business Combinations:
Assets acquired and liabilities assumed as part of a business combination are recognized at their acquisition date fair values. In determining these fair values, the Company utilized various forms of the income, cost and market approaches depending on the asset or liability being valued. For certain acquisitions, the Company used a benchmarking model to measure the trade names, customer relationship, and technology and know-how-related intangible assets. The estimation of fair value required judgment related to future net cash flows based on assumptions related to revenue and EBITDA growth rates, customer attrition rates and discount rates. Inputs were generally determined by taking into account competitive trends, market comparisons, independent appraisals, and historical data, among other factors, and were supplemented by current and anticipated market conditions.
Refer to Note 1 - Significant Accounting Policies for further discussion regarding the fair value process.
Revenue Recognition:
A contract exists when it has approval and commitment from both parties, the rights of the parties are identified, payment terms are identified, the contract has commercial substance and collectability of consideration is probable.
Revenue is generally recognized as performance obligations under the terms of a contract with a customer of the Company are satisfied. Refer to Note 1 - Significant Accounting Policies in the Notes to the Consolidated Financial Statements for further discussion around the Company's revenue policy.
Benefit Plans:
The Company sponsors a number of defined benefit pension plans that cover eligible employees. The Company also sponsors several funded and unfunded postretirement plans that provide health care and life insurance benefits for eligible retirees and their dependents. These plans are accounted for in accordance with ASC Topic 715-30, "Defined Benefit Plans – Pension," and ASC Topic 715-60, "Defined Benefit Plans – Other Postretirement."
The measurement of liabilities related to these plans is based on management's assumptions related to future events, including discount rates and health care cost trend rates. Management regularly evaluates these assumptions and adjusts them as required and appropriate. Other plan assumptions also are reviewed on a regular basis to reflect recent experience and the Company's future expectations. Actual experience that differs from these assumptions may affect future liquidity, expense and the overall financial position of the Company. While the Company believes that current assumptions are appropriate, significant differences in actual experience or significant changes in these assumptions may affect materially the Company's pension and other postretirement employee benefit obligations and its future expense and cash flow.
The discount rate is used to calculate the present value of expected future pension and postretirement cash flows as of the measurement date. The Company establishes the discount rate by constructing a notional portfolio of high-quality corporate bonds and matching the coupon payments and bond maturities to projected benefit payments under the Company's pension and postretirement welfare plans. The bonds included in the portfolio generally are non-callable. A lower discount rate will result in a higher benefit obligation; conversely, a higher discount rate will result in a lower benefit obligation. The discount rate also is used to calculate the annual interest cost, which is a component of net periodic benefit cost.
The expected rate of return on plan assets is determined by analyzing the historical long-term performance of the Company's pension plan assets, as well as the mix of plan assets between equities, fixed-income securities and other investments, the expected long-term rate of return expected for those asset classes and long-term inflation rates. Short-term asset performance can differ significantly from the expected rate of return, especially in volatile markets. A lower-than-expected rate of return on pension plan assets will increase pension expense and future contributions.
The Company recognizes actuarial gains and losses immediately through net periodic benefit cost upon the annual remeasurement in the fourth quarter, or on an interim basis if specific events trigger a remeasurement.
Defined Benefit Pension Plans:
The Company recognized net periodic benefit cost of $12.2 million during 2024 for defined benefit pension plans, compared to net periodic benefit cost of $33.8 million during 2023. The Company recognized net mark-to-market gains of $0.7 million during 2024 compared to net mark-to-market charges of $21.6 million during 2023. Mark-to-market gains during 2024 were primarily due to the impact of a net increase in the discount rate used to measure the Company's defined benefit pension obligations of $28.7 million, partially offset by lower than expected returns on plans assets of $26.8 million and experience losses of $1.2 million. The impact of the net increase in the discount rate used to measure the Company's defined benefit pension obligations was primarily driven by a 95 basis point increase in the discount rate used to measure its plan obligations in the United Kingdom ("U.K."), which increased from 4.48% in 2023 to 5.43% in 2024, and a 43 basis point increase in the weighted-average discount rate used to measure its U.S. plan obligations, which increased from 5.40% in 2023 to 5.83% in 2024. Excluding mark-to-market gains and losses recognized in 2024 and 2023, including a curtailment gain, net period benefit cost was $13.0 million and $12.2 million, respectively. The increase in 2024 was due to a lower expected return on pension assets.
In 2025, the Company expects net periodic benefit cost to be approximately $14 million for defined benefit pension plans, compared with net periodic benefit cost of $12.2 million in 2024. Net periodic benefit cost for 2025 does not include mark-to-market charges that will be recognized immediately through earnings in the fourth quarter of 2025, or on an interim basis if specific events trigger a remeasurement. Excluding the mark-to-market gains of $0.7 million and the curtailment gain of $0.1 million, recognized in 2024, net periodic benefit cost was $13.0 million in 2024. The expected increase in net periodic benefit cost for 2025, excluding mark-to-market gains, primarily reflects higher expected interest cost.
The Company expects to contribute to its defined benefit pension plans or pay directly to participants of defined benefit plans approximately $38 million in 2025 compared with $24.6 million of contributions and payments in 2024. The increase is primarily due to expected contributions of $8 million to the U.K. pension plan in 2025.
For expense purposes in 2024, the Company applied a weighted-average discount rate of 5.40% to its U.S. defined benefit pension plans. For expense purposes in 2025, the Company will apply a weighted-average discount rate of 5.83% to its U.S. defined benefit pension plans.
For expense purposes in 2024, the Company applied an expected weighted-average rate of return of 3.94% for the Company’s U.S. pension plan assets. For expense purposes in 2025, the Company will apply an expected weighted-average rate of return on plan assets of 4.30%.
The following table presents the sensitivity of the Company's global projected pension benefit obligation ("PBO") to the indicated increase/decrease in key assumptions:
| | | | | | | | | | | | | | | | |
| | | | + / - Change at December 31, 2024 | | |
| | Change | | PBO | | |
| Assumption: | | | | | | |
| Discount rate | | .25% | | $ | 13.0 | | | |
| | | | | | |
| | | | | | |
In the table above, a 25 basis point decrease in the discount rate will increase the PBO by $13.0 million and decrease income before income taxes through the recognition of actuarial losses of $13.0 million. A 25 basis point increase in the discount rate will decrease the PBO by $13.0 million and increase income before income taxes through the recognition of actuarial gains of $13.0 million. In addition, a 25 basis point decrease in returns on pension assets will decrease income before income taxes by $0.9 million, and a 25 basis point increase in return on pension assets will increase income before income taxes by $0.9 million.
Other Postretirement Benefit Plans:
The Company recognized net periodic benefit credit of $6.9 million during 2024 for other postretirement benefit plans, compared to net periodic benefit credit of $7.3 million during 2023. The Company recognized actuarial gains of $0.5 million during 2024 compared to $1.0 million in 2023. Actuarial gains of $0.5 million during 2024 were primarily due to lower than expected benefit payments of $2.0 million, the impact of experience gains of $1.2 million and $0.6 million due to the impact of a 28 basis point increase in the discount rate used to measure the Company's defined benefit postretirement obligations. The discount rate increased from 5.55% in 2023 to 5.83% in 2024. These actuarial gains were partially offset by actuarial losses of $3.1 million due to the impact of an increase in the rate of Medicare Advantage plans and $0.2 million due to changes in other actuarial assumptions.
In 2025, the Company expects net periodic benefit credit of approximately $6 million for other postretirement benefit plans, compared to net periodic benefit credit of $6.9 million in 2024. Net periodic benefit credit for 2025 does not include actuarial gains or losses that will be recognized immediately through earnings in the fourth quarter of 2025, or on an interim basis if specific events trigger a remeasurement. Excluding the mark-to-market gains of $0.5 million recognized in 2024, the net periodic benefit credit was $6.3 million in 2024.
For expense purposes in 2024, the Company applied a discount rate of 5.55% to its other postretirement benefit plans. For expense purposes in 2025, the Company will apply a discount rate of 5.83% to its other postretirement benefit plans.
The following table presents the sensitivity of the Company's accumulated other postretirement benefit obligation ("APBO") to the indicated increase/decrease in key assumptions:
| | | | | | | | | | | | | | | | |
| | | | + / - Change at December 31, 2024 | | |
| | Change | | APBO | | |
| Assumption: | | | | | | |
| Discount rate | | .25% | | $ | 0.6 | | | |
| | | | | | |
| | | | | | |
In the table above, a 25 basis point decrease in the discount rate will increase the APBO by $0.6 million and decrease income before income taxes through the recognition of actuarial losses of $0.6 million. A 25 basis point increase in the discount rate will decrease the APBO by $0.6 million and increase income before income taxes through the recognition of actuarial gains of $0.6 million.
For measurement purposes, the Company assumed a weighted-average annual rate of increase in the per capita cost (health care cost trend rate) for medical benefits of 7.00% for 2025, declining gradually to 5.0% in 2033 and thereafter for medical and prescription drug benefits. For Medicare Advantage benefits, actual contract rates have been set for 2025 through 2026, and are assumed to increase by $10 per year for 2027 through 2029 and then 6.0% for 2029, declining gradually to 5.0% in 2033 and thereafter. The assumed health care cost trend rate may have a significant effect on the amounts reported. A one percentage point increase in the assumed health care cost trend rate would have increased the 2024 total service and interest cost components by $0.1 million and would have increased the postretirement benefit obligation by $0.7 million. A one percentage point decrease would provide corresponding reductions of $0.1 million and $0.7 million, respectively.
NON-GAAP MEASURES
Supplemental Non-GAAP Measures:
In addition to results reported in accordance with U.S. GAAP, the Company provides information on non-GAAP financial measures. These non-GAAP financial measures include adjusted net income, adjusted earnings per share, adjusted EBITDA and adjusted EBITDA margins, ratio of net debt to adjusted EBITDA (for the trailing 12 months), net debt, ratio of net debt to capital, free cash flow and return on invested capital. This information is intended to supplement GAAP financial measures and is not intended to replace GAAP financial measures. Net debt and the ratio of net debt to capital is disclosed in the "Liquidity and Capital Resources" section of Management's Discussion and Analysis of Financial Condition and Results of Operations.
Adjusted Net Income and Adjusted EBITDA:
Adjusted net income and adjusted earnings per share represent net income attributable to The Timken Company and diluted earnings per share, respectively, adjusted for the amortization of intangible assets related to acquisitions, impairment, restructuring and reorganization charges, acquisition costs, including transaction costs and the amortization of the inventory step-up, property losses and recoveries, actuarial gains and losses associated with the remeasurement of the Company's defined benefit pension and other postretirement benefit plans, gains and losses on the sale of real estate, gains and losses on divestitures, the income tax impact of these adjustments, as well as other income tax discrete items, and other items from time to time that are not part of the Company's core operations. Management believes adjusted net income and adjusted earnings per share are useful to investors as they are representative of the Company's core operations and are used in the management of the business.
Adjusted EBITDA represents earnings before interest, taxes, depreciation and amortization, adjusted for items that are not part of the Company's core operations. These items include impairment, restructuring and reorganization charges, acquisition costs, including transaction costs and the amortization of the inventory step-up, property losses and recoveries, actuarial gains and losses associated with the remeasurement of the Company's defined benefit pension and other postretirement benefit plans, gains and losses on the sale of real estate, gains and losses on divestitures, and other items from time to time that are not part of the Company's core operations. Management believes adjusted EBITDA is useful to investors as it is representative of the Company's core operations and is used in the management of the business, including decisions concerning the allocation of resources and assessment of performance.
Reconciliation of net income attributable to The Timken Company to adjusted net income, adjusted EBITDA and adjusted EBITDA Margin:
| | | | | | | | | | | | | | | | | |
| Twelve Months Ended December 31, |
| 2024 | 2023 | 2022 | 2021 | 2020 |
| Net sales | $ | 4,573.0 | $ | 4,769.0 | $ | 4,496.7 | $ | 4,132.9 | $ | 3,513.2 |
| Net Income Attributable to The Timken Company | 352.7 | 394.1 | 407.4 | 369.1 | 284.5 |
| Net Income Attributable to The Timken Company as a Percentage of Sales | 7.7% | 8.3% | 9.1% | 8.9% | 8.1% |
| Adjustments: | | | | | |
| Acquisition intangible amortization | 78.0 | 65.7 | 43.9 | 46.8 | 47.3 |
Impairment, restructuring and reorganization charges (1) | 19.1 | 60.1 | 55.1 | 15.1 | 29.0 |
Corporate pension and other postretirement benefit related (income) expense (2) | (1.3) | 20.6 | 2.9 | 0.3 | 18.5 |
Acquisition-related charges (3) | 13.0 | 31.8 | 14.8 | 3.2 | 3.7 |
Acquisition-related gain (4) | — | — | — | (0.9) | (11.1) |
| | | | | |
Gain on divestitures and sale of certain assets (5) | (14.7) | (5.2) | (2.9) | — | (0.4) |
Property losses (recoveries) and related expenses (6) | 1.2 | — | — | — | (5.5) |
| | | | | |
| Tax indemnification and related items | (1.1) | — | 0.3 | 0.2 | 0.5 |
CEO succession expenses (7) | 3.7 | — | — | — | — |
| Noncontrolling interest of above adjustments | (0.2) | (2.1) | (5.3) | — | (0.1) |
Provision for income taxes (8) | (41.0) | (56.9) | (35.9) | (35.0) | (18.2) |
| Adjusted Net Income | $ | 409.4 | $ | 508.1 | $ | 480.3 | $ | 398.8 | $ | 348.2 |
Net income attributable to noncontrolling
interest | 22.6 | 13.9 | 9.6 | 12.4 | 7.9 |
| Provision for income taxes (as reported) | 118.9 | 122.5 | 133.9 | 95.1 | 103.9 |
| Interest expense | 125.1 | 110.7 | 74.6 | 58.8 | 67.6 |
| Interest income | (14.9) | (9.3) | (3.8) | (2.3) | (3.7) |
Depreciation and amortization expense (9) | 220.5 | 200.5 | 164.0 | 167.0 | 164.0 |
| Less: Acquisition intangible amortization | 78.0 | 65.7 | 43.9 | 46.8 | 47.3 |
| Less: Noncontrolling interest | (0.2) | (2.1) | (5.3) | — | (0.1) |
Less: Provision for income taxes (8) | (41.0) | (56.9) | (35.9) | (35.0) | (18.2) |
| Adjusted EBITDA | $ | 844.8 | $ | 939.7 | $ | 855.9 | $ | 718.0 | $ | 658.9 |
| Adjusted EBITDA Margin (% of net sales) | 18.5 | % | 19.7 | % | 19.0 | % | 17.4 | % | 18.8 | % |
Diluted earnings and adjusted earnings per share in the table below are based on net income attributable to The Timken Company and adjusted net income, respectively, in the table above.
| | | | | | | | | | | | | | | | | |
| Twelve Months Ended December 31, |
| 2024 | 2023 | 2022 | 2021 | 2020 |
| Diluted earnings per share (EPS) | $ | 4.99 | | $ | 5.47 | | $ | 5.48 | | $ | 4.79 | | $ | 3.72 | |
| Adjusted EPS | $ | 5.79 | | $ | 7.05 | | $ | 6.46 | | $ | 5.18 | | $ | 4.56 | |
| Diluted shares | 70,750,482 | | 72,081,884 | | 74,323,839 | | 77,006,589 | | 76,401,366 | |
(1) Impairment, restructuring and reorganization charges (including items recorded in cost of products sold) relate to: (i) plant closures; (ii) the rationalization of certain plants; (iii) severance related to cost reduction initiatives; (iv) impairment of assets; and (v) related depreciation and amortization. Impairment, restructuring and reorganization charges for 2023 included $28.3 million related to the impairment of goodwill. Impairment, restructuring and reorganization charges for 2022 included $29.3 million related to the sale of ADS. The Company re-assesses its operating footprint and cost structure periodically, and makes adjustments as needed that result in restructuring charges. However, management believes these actions are not representative of the Company’s core operations.
(2) Corporate pension and other postretirement benefit related (income) expense represents actuarial (gains) and losses that resulted from the remeasurement of plan assets and obligations as a result of changes in assumptions or experience. The Company recognizes actuarial (gains) and losses in connection with the annual remeasurement in the fourth quarter, or if specific events trigger a remeasurement. Refer to Note 17 - Retirement Benefit Plans and Note 18 - Other Postretirement Benefit Plans for additional discussion.
(3) Acquisition-related charges represent deal-related expenses associated with completed transactions and certain unsuccessful transactions, as well as any resulting inventory step-up impact.
(4) The acquisition-related gain represents a bargain purchase gain on the acquisition of the assets of Aurora Bearing Company ("Aurora") that closed on November 30, 2020.
(5) Represents the net gain resulting from divestitures and sale of certain assets.
(6) Represents property loss and related expenses incurred during the periods presented resulting from a fire that occurred during the second quarter of 2024 at one of the Company's plants in Slovakia, as well as insurance recoveries received in 2020 resulting from property loss that occurred during the first quarter of 2019 at one of the Company's warehouses in Knoxville, Tennessee and during the third quarter of 2019 at one of the Company's warehouses in Yantai, China.
(7) On March 26, 2024, the Company announced that Richard G. Kyle, President and Chief Executive Officer (“CEO”) of the Company would be retiring from his position as CEO and that Tarak Mehta would be appointed CEO on September 5, 2024. CEO succession expenses include the acceleration of certain stock compensation awards for Mr. Kyle and other one-time costs associated with the transition.
(8) Provision for income taxes includes the net tax impact on pre-tax adjustments (listed above), the impact of discrete tax items recorded during the respective periods as well as other adjustments to reflect the use of one overall effective tax rate on adjusted pre-tax income.
(9) Depreciation and amortization shown excludes depreciation recognized in reorganization charges, if any.
Free Cash Flow:
Free cash flow represents net cash provided by operating activities less capital expenditures. Management believes free cash flow is useful to investors because it is a meaningful indicator of cash generated from operating activities available for the execution of its business strategy.
Reconciliation of net cash provided by operating activities to free cash flow:
| | | | | | | | | | | | | | | | | |
| Twelve Months Ended December 31, |
| 2024 | 2023 | 2022 | 2021 | 2020 |
| Net cash provided by operating activities | $ | 475.6 | | $ | 545.2 | | $ | 463.8 | | $ | 387.3 | | $ | 577.6 | |
| Capital expenditures | (170.0) | | (187.8) | | (178.4) | | (148.3) | | (121.6) | |
| Free cash flow | $ | 305.6 | | $ | 357.4 | | $ | 285.4 | | $ | 239.0 | | $ | 456.0 | |
Ratio of Net Debt to Adjusted EBITDA:
The ratio of net debt to adjusted EBITDA for the trailing twelve months represents total debt less cash and cash equivalents divided by adjusted EBITDA for the trailing twelve months. The Company presents net debt to adjusted EBITDA because it believes it is more representative of the Company's financial position as it is reflective of the Company's ability to cover its net debt obligations with results from its core operations. Net income for the trailing twelve months ended December 31, 2024 and December 31, 2023 was $375.3 million and $408.0 million, respectively. Net debt to adjusted EBITDA for the trailing twelve months was 2.0 at December 31, 2024, compared with 2.1 at December 31, 2023.
Reconciliation of Net income to Adjusted EBITDA for the twelve months:
| | | | | | | | |
| Twelve Months Ended December 31, |
| 2024 | 2023 |
| Net income | $ | 375.3 | | $ | 408.0 | |
| Provision for income taxes | 118.9 | | 122.5 | |
| Interest expense | 125.1 | | 110.7 | |
| Interest income | (14.9) | | (9.3) | |
| Depreciation and amortization | 221.8 | | 201.3 | |
| Consolidated EBITDA | 826.2 | | 833.2 | |
| Adjustments: | | |
Impairment, restructuring and reorganization charges (1) | $ | 17.8 | | $ | 59.3 | |
Corporate pension and other postretirement related (income) expense (2) | (1.3) | | 20.6 | |
Acquisition-related charges (3) | 13.0 | | 31.8 | |
| | |
| | |
Property losses and related expenses (4) | 1.2 | | — | |
| | |
| | |
Gain on divestitures and sale of certain assets (5) | (14.7) | | (2.9) | |
CEO succession expenses (6) | 3.7 | | — | |
| Tax indemnification and related items | (1.1) | | — | |
| | |
| Total Adjustments | 18.6 | | 108.8 | |
| Adjusted EBITDA | $ | 844.8 | | $ | 942.0 | |
| Net Debt | $ | 1,689.5 | | $ | 1,977.0 | |
| Ratio of Net Debt to Adjusted EBITDA | 2.0 | | 2.1 | |
(1) Impairment, restructuring and reorganization charges (including items recorded in cost of products sold) relate to: (i) plant closures; (ii) the rationalization of certain plants; (iii) severance related to cost reduction initiatives; and (iv) impairment of assets. Impairment, restructuring and reorganization charges for the twelve months ended December 31, 2023 included $28.3 million related to the impairment of goodwill. The Company re-assesses its operating footprint and cost structure periodically, and makes adjustments as needed that result in restructuring charges. However, management believes these actions are not representative of the Company’s core operations.
(2) Corporate pension and other postretirement benefit related (income) expense represents actuarial (gains) and losses that resulted from the remeasurement of plan assets and obligations as a result of changes in assumptions or experience. The Company recognizes actuarial (gains) and losses in connection with the annual remeasurement in the fourth quarter, or if specific events trigger a remeasurement.
(3) Acquisition-related charges represent deal-related expenses associated with completed transactions and any resulting inventory step-up impact.
(4) Represents property loss and related expenses incurred during the periods presented resulting from property loss that occurred during the second quarter of 2024 at one of the Company's plants in Slovakia.
(5) Represents the net gain resulting from divestitures and sale of certain assets.
(6) On March 26, 2024, the Company announced that Richard G. Kyle, President and CEO of the Company would be retiring from his position as CEO and that Tarak Mehta would be appointed CEO on September 5, 2024. CEO Succession expenses include the acceleration of certain stock compensation awards for Mr. Kyle and other one-time costs associated with the transition.
Return on Invested Capital:
Return on Invested Capital is defined as adjusted net operating profit after taxes divided by average invested capital. The Company uses Average Invested Capital as a type of non-GAAP ratio that indicates return on invested capital, which management believes is useful to investors as a measure of return on their investment.
Reconciliation of adjusted net operating profit after taxes, adjusted invested capital and return on adjusted invested capital:
| | | | | | | | | | | | | | | | | |
| Adjusted Net Operating Profit after Taxes (ANOPAT): |
| Twelve Months Ended December 31, |
| 2024 | 2023 | 2022 | 2021 | 2020 |
Adjusted EBITDA (1) | $ | 844.8 | | $ | 939.7 | | $ | 855.9 | | $ | 718.0 | | $ | 658.9 | |
| Acquisition intangible amortization | 78.0 | | 65.7 | | 43.9 | | 46.8 | | 47.3 | |
Less: depreciation and amortization expense (2) | 220.5 | | 200.5 | | 164.0 | | 167.0 | | 164.0 | |
| Adjusted EBIT | 702.3 | | 804.9 | | 735.8 | | 597.8 | | 542.2 | |
| Adjusted tax rate | 27.0 | % | 25.5 | % | 25.5 | % | 24.0 | % | 25.5 | % |
| Calculated income taxes | 189.6 | | 205.2 | | 187.6 | | 143.5 | | 138.3 | |
| ANOPAT | $ | 512.7 | | $ | 599.7 | | $ | 548.2 | | $ | 454.3 | | $ | 403.9 | |
| | | | | | | | | | | | | | | | | | | | |
| Adjusted Invested Capital: | | | | | | |
| Twelve Months Ended December 31, |
| 2024 | 2023 | 2022 | 2021 | 2020 | 2019 |
| Total debt | $ | 2,062.7 | | $ | 2,395.9 | | $ | 1,963.2 | | $ | 1,464.9 | | $ | 1,564.6 | | $ | 1,730.1 | |
| Less: cash and cash equivalents | 373.2 | | 418.9 | | 331.6 | | 257.1 | | 320.3 | | 209.5 | |
| Net debt | 1,689.5 | | 1,977.0 | | 1,631.6 | | 1,207.8 | | 1,244.3 | | 1,520.6 | |
| Total equity | 2,984.1 | | 2,702.4 | | 2,352.9 | | 2,377.7 | | 2,225.2 | | 1,954.8 | |
Invested capital (total debt + total
equity) | 4,673.6 | | 4,679.4 | | 3,984.5 | | 3,585.5 | | 3,469.5 | | 3,475.4 | |
| Invested capital (two-point average) | $ | 4,676.5 | | $ | 4,332.0 | | $ | 3,785.0 | | $ | 3,527.5 | | $ | 3,472.5 | | |
| | | | | | | | | | | | | | | | | |
| Return on Invested Capital: |
| Twelve Months Ended December 31, |
| 2024 | 2023 | 2022 | 2021 | 2020 |
| ANOPAT | $ | 512.7 | | $ | 599.7 | | $ | 548.2 | | $ | 454.3 | | $ | 403.9 | |
| Invested capital (two-point average) | 4,676.5 | | 4,332.0 | | 3,785.0 | | 3,527.5 | | 3,472.5 | |
| Return on invested capital | 11.0 | % | 13.8 | % | 14.5 | % | 12.9 | % | 11.6 | % |
(1) Refer to page 43 for reconciliations to the most directly comparable GAAP financial measures. (2) Depreciation and amortization shown excludes depreciation recognized in reorganization charges, if any.
OTHER DISCLOSURES:
Foreign Currency:
Assets and liabilities of subsidiaries are translated at the rate of exchange in effect on the balance sheet date; income and expenses are translated at the average rates of exchange prevailing during the reporting period. Related translation adjustments are reflected as a separate component of accumulated other comprehensive loss. Foreign currency gains and losses resulting from transactions are included in the Consolidated Statements of Income.
Net of related derivative activity, the Company recognized a foreign currency exchange loss resulting from transactions of $9.3 million for the year ended December 31, 2024, a loss of $14.8 million and a gain of $15.4 million for the years ended December 31, 2023 and 2022, respectively. For the year ended December 31, 2024, the Company recorded a negative non-cash foreign currency translation adjustment of $156.4 million that decreased shareholders’ equity, compared with a positive non-cash foreign currency translation adjustment of $35.3 million that increased shareholders’ equity for the year ended December 31, 2023. The foreign currency translation adjustments for the year ended December 31, 2024 were negatively impacted by the strengthening of the U.S. dollar relative to other currencies as of December 31, 2024 compared to December 31, 2023.
CEO Succession:
On September 5, 2024, the Board of Directors (the "Board") of the Company appointed Tarak Mehta President and CEO of the Company and appointed Richard G. Kyle Advisor to the CEO. Mr. Mehta is an accomplished industry veteran who most recently served as President of the Motion business and a member of the Group Executive Committee at ABB Ltd. He succeeds Richard G. Kyle, who has served as Timken’s President and CEO since 2014.
Trade Law Enforcement:
The U.S. government has an antidumping duty order in effect covering tapered roller bearings from China. The Company is a producer of these bearings, as well as ball bearings and other bearing types, in the U.S.
Quarterly Dividend:
On February 14, 2025, the Company’s Board of Directors declared a quarterly cash dividend of $0.34 per common share. The quarterly dividend will be paid on March 7, 2025 to shareholders of record as of February 25, 2025. This will be the 411th consecutive quarterly dividend paid on the common shares of the Company.
Forward-Looking Statements
Certain statements set forth in this Annual Report on Form 10-K and in the Company’s 2024 Annual Report to Shareholders that are not historical in nature (including the Company’s forecasts, beliefs and expectations) are “forward-looking” statements within the meaning of the Private Securities Litigation Reform Act of 1995. In particular, Management’s Discussion and Analysis contains numerous forward-looking statements. Forward-looking statements generally will be accompanied by words such as “anticipate,” “believe,” “could,” “estimate,” “expect,” “forecast,” “outlook,” “intend,” “may,” “possible,” “potential,” “predict,” “project” or other similar words, phrases or expressions. You are cautioned not to place undue reliance on forward-looking statements, which speak only as of the date of this Annual Report on Form 10-K. The Company cautions readers that actual results may differ materially from those expressed or implied in forward-looking statements made by or on behalf of the Company due to a variety of factors, such as:
(a)deterioration in world economic conditions, or in economic conditions in any of the geographic regions in which the Company or its customers or suppliers conduct business, including adverse effects from a global economic slowdown or recession, pandemics, epidemics or other public health concerns, terrorism, or hostilities. This includes: political risks associated with the potential instability of governments and legal systems in countries in which the Company or its customers or suppliers conduct business, changes in currency valuations, additional costs, taxes and restrictions related to repatriation of cash in international jurisdictions, strained geopolitical relations between countries in which we have significant operations, and recent world events that have increased the risks posed by international trade disputes, tariffs and sanctions;
(b)negative impacts to the Company's business, results of operations, financial position or liquidity, disruption to the Company's supply chains, and negative impacts to operations;
(c)the effects of fluctuations in customer demand on sales, product mix and prices in the industries in which the Company operates. This includes: the ability of the Company to respond to rapid changes in customer demand, disruptions to the Company's supply chain, the effects of customer or supplier bankruptcies or liquidations, the impact of changes in industrial business cycles, the ability of the Company to effectively adjust the prices for its products in response to changing dynamics, the effects of distributor inventory corrections reflecting de-stocking of the supply chain and whether conditions of fair trade continue in the Company's markets;
(d)competitive factors, including changes in market penetration, increasing price competition by existing or new foreign and domestic competitors, the introduction of new products or services by existing and new competitors, competition for skilled labor and new technology that may impact the way the Company’s products are produced, sold or distributed;
(e)changes in operating costs. This includes: the effect of changes in the Company’s manufacturing processes; changes in costs associated with varying levels of operations and manufacturing capacity; availability and cost of raw materials, energy and fuel; changes in costs associated with the effects of tariffs; disruptions to the Company's supply chain and logistical issues associated with port closures or delays or increased costs; changes in the expected costs associated with product warranty claims especially in industry segments with potential high claim values; changes in the global regulatory landscape (including with respect to climate change or other environmental regulations); changes resulting from inventory management and cost reduction initiatives; the effects of unplanned plant shutdowns; the effects of government-imposed restrictions, commercial requirements and Company goals associated with climate change and emissions or other sustainability initiatives; and changes in the cost of labor and benefits;
(f)the success of the Company’s operating plans, announced programs, initiatives and capital investments; the ability to integrate acquired companies and to address material issues both identified and not uncovered during the Company's due diligence review; and the ability of acquired companies to achieve satisfactory operating results, including results being accretive to earnings, realization of synergies and expected cash flow generation;
(g)the Company’s ability to maintain appropriate relations with unions or works councils that represent Company employees in certain locations in order to avoid disruptions of business;
(h)the continued attraction, retention and development of management, other key employees, and other skilled personnel, the successful development and execution of succession plans and management of other human capital matters;
(i)unanticipated litigation, claims, investigations, remediation or assessments. This includes: claims, investigations or problems related to intellectual property, product liability or warranty, foreign export, sanctions and trade laws, government procurement regulations, competition and anti-bribery laws, climate change, PTFE, PFAS, other environmental or health and safety issues, data privacy and taxes;
(j)the rapidly evolving global regulatory landscape and the corresponding heightened operational complexity and compliance risks;
(k)changes in worldwide financial and capital markets, including fluctuations in interest rates, impacting the availability of financing on satisfactory terms as a result of financial stress affecting the banking system or otherwise, which affect the Company’s cost of funds and/or ability to raise capital, as well as customer demand and the ability of customers to obtain financing to purchase the Company’s products or equipment that contain the Company’s products;
(l)the Company's ability to satisfy its obligations and comply with covenants under its debt agreements, maintain favorable credit ratings and its ability to renew or refinance borrowings on favorable terms;
(m)the impact on the Company's pension obligations and assets due to changes in interest rates, investment performance and other tactics designed to reduce risk; and
(n)those items identified under Item 1A. Risk Factors on pages 9 through 18. Additional risks relating to the Company’s business, the industries in which the Company operates or the Company’s common shares may be described from time to time in the Company’s filings with the SEC. All of these risk factors are difficult to predict, are subject to material uncertainties that may affect actual results and may be beyond the Company’s control.
Readers are cautioned that it is not possible to predict or identify all of the risks, uncertainties and other factors that may affect future results and that the above list should not be considered to be a complete list. Except as required by the federal securities laws, the Company undertakes no obligation to publicly update or revise any forward-looking statement, whether as a result of new information, future events or otherwise.
Item 7A. Quantitative and Qualitative Disclosures About Market Risk
Interest Rate Risk:
Changes in short-term interest rates related to several separate funding sources impact the Company’s earnings. These sources are borrowings under the Accounts Receivable Facility, borrowings under the Senior Credit Facility and short-term bank borrowings by the Company's international subsidiaries. If the market rates for short-term borrowings increased by one-percentage-point around the globe, the impact from the Company's variable rate debt would be an increase in interest expense of $3.8 million annually, with a corresponding decrease in income from continuing operations before income taxes of the same amount. This amount was determined by considering the impact of hypothetical interest rates on the Company’s borrowing cost and year-end debt balances by category.
Foreign Currency Exchange Rate Risk:
Fluctuations in the value of the U.S. dollar compared to foreign currencies, including the Euro, can impact the Company’s earnings. The greatest risk relates to products shipped between the Company’s European operations and the United States, as well as intercompany loans between Timken affiliates. Foreign currency forward contracts are used to hedge a portion of these intercompany transactions. Additionally, hedges are used to cover third-party purchases of products and equipment. As of December 31, 2024, there were $471.6 million of hedges in place. A uniform 10% weakening of the U.S. dollar against all currencies would have resulted in a benefit of $11.9 million related to these hedges, which would have partially offset the impact of the underlying currency fluctuation. In addition to the direct impact of the hedged amounts, changes in exchange rates also affect the volume of sales or foreign currency sales price as competitors’ products become more or less attractive.
Commodity Price Risk:
In the ordinary course of business, the Company is exposed to market and other risk with respect to commodity price fluctuations, primarily related to our purchases of raw materials and energy, principally steel and natural gas. Whenever possible, the Company manages its exposure to commodity risks primarily through the use of supplier pricing agreements that enable the Company to establish the purchase prices for certain inputs that are used in our manufacturing and distribution business.
Item 8. Financial Statements and Supplementary Data
The Timken Company and Subsidiaries
Consolidated Statements of Income
| | | | | | | | | | | |
| | Year Ended December 31, |
| 2024 | 2023 | 2022 |
| (Dollars in millions, except per share data) | | | |
| Net sales | $ | 4,573.0 | | $ | 4,769.0 | | $ | 4,496.7 | |
| Cost of products sold | 3,132.3 | | 3,259.9 | | 3,164.7 | |
| | | |
| Selling, general and administrative expenses | 752.0 | | 740.8 | | 637.1 | |
| Amortization of intangible assets | 78.0 | | 65.7 | | 43.9 | |
| Impairment and restructuring charges | 13.4 | | 45.5 | | 44.1 | |
| Gain on sale of real estate | (13.8) | | — | | — | |
| Operating Income | 611.1 | | 657.1 | | 606.9 | |
| Interest expense | (125.1) | | (110.7) | | (74.6) | |
| Interest income | 14.9 | | 9.3 | | 3.8 | |
| Non-service pension and other postretirement (expense) income | (2.6) | | (24.0) | | 9.3 | |
| Other (expense) income, net | (4.1) | | (1.2) | | 5.5 | |
| | | |
| Income Before Income Taxes | 494.2 | | 530.5 | | 550.9 | |
| Provision for income taxes | 118.9 | | 122.5 | | 133.9 | |
| Net Income | 375.3 | | 408.0 | | 417.0 | |
| Less: Net income attributable to noncontrolling interest | 22.6 | | 13.9 | | 9.6 | |
| Net Income Attributable to The Timken Company | $ | 352.7 | | $ | 394.1 | | $ | 407.4 | |
| | | |
Net Income per Common Share Attributable to The Timken Company
Common Shareholders | | | |
| Basic earnings per share | $ | 5.02 | | $ | 5.52 | | $ | 5.54 | |
| | | |
| Diluted earnings per share | $ | 4.99 | | $ | 5.47 | | $ | 5.48 | |
See accompanying Notes to the Consolidated Financial Statements.
Consolidated Statements of Comprehensive Income
| | | | | | | | | | | |
| Year Ended December 31, |
| 2024 | 2023 | 2022 |
| (Dollars in millions) | | | |
| Net Income | $ | 375.3 | | $ | 408.0 | | $ | 417.0 | |
| Other comprehensive income (loss), net of tax: | | | |
| Foreign currency translation adjustments | (161.2) | | 33.5 | | (162.7) | |
| Pension and postretirement liability adjustments | (6.0) | | (6.1) | | (5.8) | |
| | | |
| Change in fair value of derivative financial instruments | 2.0 | | (0.8) | | 2.3 | |
| Other comprehensive (loss) income, net of tax | (165.2) | | 26.6 | | (166.2) | |
| Comprehensive Income, net of tax | 210.1 | | 434.6 | | 250.8 | |
| Less: comprehensive income attributable to noncontrolling interest | 17.8 | | 12.1 | | 2.3 | |
| Comprehensive Income Attributable to The Timken Company | $ | 192.3 | | $ | 422.5 | | $ | 248.5 | |
See accompanying Notes to the Consolidated Financial Statements.
Consolidated Balance Sheets
| | | | | | | | |
| | December 31, |
| 2024 | 2023 |
| (Dollars in millions) | | |
| ASSETS | | |
| Current Assets | | |
| Cash and cash equivalents | $ | 373.2 | | $ | 418.9 | |
| Restricted cash | 0.4 | | 0.4 | |
| Accounts receivable, less allowances: (2024 - $21.5 million; 2023 - $17.1 million) | 664.6 | | 671.7 | |
| Unbilled receivables | 140.8 | | 144.5 | |
| Inventories, net | 1,195.6 | | 1,229.1 | |
| Deferred charges and prepaid expenses | 39.5 | | 41.5 | |
| Other current assets | 102.8 | | 128.8 | |
| Total Current Assets | 2,516.9 | | 2,634.9 | |
| Property, Plant and Equipment, Net | 1,306.9 | | 1,311.9 | |
| Other Assets | | |
| Goodwill | 1,383.3 | | 1,369.6 | |
| Other intangible assets, net | 1,006.5 | | 1,031.4 | |
| Operating lease assets | 130.6 | | 119.7 | |
| | |
| | |
| Deferred income taxes | 41.0 | | 44.3 | |
| Other non-current assets | 25.8 | | 29.9 | |
| Total Other Assets | 2,587.2 | | 2,594.9 | |
| Total Assets | $ | 6,411.0 | | $ | 6,541.7 | |
| LIABILITIES AND EQUITY | | |
| Current Liabilities | | |
| Accounts payable, trade | $ | 321.7 | | $ | 367.2 | |
| Short-term debt, including current portion of long-term debt | 13.0 | | 605.6 | |
| | |
| | |
| Salaries, wages and benefits | 142.2 | | 161.5 | |
| Income taxes payable | 24.4 | | 19.9 | |
| Other current liabilities | 319.2 | | 317.1 | |
| Total Current Liabilities | 820.5 | | 1,471.3 | |
| Non-Current Liabilities | | |
| Long-term debt | 2,049.7 | | 1,790.3 | |
| Accrued pension benefits | 157.7 | | 172.3 | |
| Accrued postretirement benefits | 29.8 | | 30.2 | |
| Long-term operating lease liabilities | 84.0 | | 78.7 | |
| Deferred income taxes | 175.0 | | 186.5 | |
| Other non-current liabilities | 110.2 | | 110.0 | |
| Total Non-Current Liabilities | 2,606.4 | | 2,368.0 | |
| Shareholders’ Equity | | |
| Class I and II Serial Preferred Stock without par value: | | |
| Authorized - 10,000,000 shares each class, none issued | — | | — | |
| Common stock without par value: | | |
| Authorized - 200,000,000 shares | | |
| Issued (including shares in treasury) (2024 – 79,173,667 shares; 2023 – 78,680,164 shares) | | |
| Stated capital | 40.7 | | 40.7 | |
| Other paid-in capital | 1,269.3 | | 1,076.5 | |
| Retained earnings | 2,488.8 | | 2,232.2 | |
| Accumulated other comprehensive loss | (301.7) | | (146.9) | |
| Treasury shares at cost (2024 – 9,174,863 shares; 2023 – 8,553,272 shares) | (670.6) | | (620.1) | |
| Total Shareholders’ Equity | 2,826.5 | | 2,582.4 | |
| Noncontrolling interest | 157.6 | | 120.0 | |
| Total Equity | 2,984.1 | | 2,702.4 | |
| Total Liabilities and Equity | $ | 6,411.0 | | $ | 6,541.7 | |
See accompanying Notes to the Consolidated Financial Statements.
Consolidated Statements of Cash Flows
| | | | | | | | | | | |
| Year Ended December 31, |
| 2024 | 2023 | 2022 |
| (Dollars in millions) | | | |
| CASH PROVIDED (USED) | | | |
| Operating Activities | | | |
| Net income | $ | 375.3 | | $ | 408.0 | | $ | 417.0 | |
| Adjustments to reconcile net income to net cash provided by operating activities: | | | |
| Depreciation and amortization | 221.8 | | 201.3 | | 164.0 | |
| Impairment charges | 3.5 | | 33.2 | | 38.3 | |
| (Gain) loss on sale of assets | (14.4) | | 1.3 | | (1.9) | |
| | | |
| | | |
| (Gain) loss on acquisitions and divestitures | — | | (2.9) | | 3.5 | |
| Deferred income tax benefit | (35.3) | | (11.6) | | (3.6) | |
| Stock-based compensation expense | 25.9 | | 30.6 | | 30.4 | |
| Pension and other postretirement expense (income) | 5.3 | | 26.5 | | (0.6) | |
| Pension and other postretirement benefit contributions and payments | (26.1) | | (29.8) | | (14.6) | |
| Changes in operating assets and liabilities: | | | |
| | | |
| | | |
| Accounts receivable | (14.2) | | 71.6 | | (73.5) | |
| Unbilled receivables | 3.3 | | (40.4) | | (26.0) | |
| Inventories | 9.6 | | 72.0 | | (145.6) | |
| Accounts payable, trade | (37.1) | | (57.4) | | (10.2) | |
| Other accrued expenses | (7.1) | | (47.6) | | 91.9 | |
| Income taxes | (28.2) | | (108.4) | | 16.3 | |
| Other, net | (6.6) | | (1.2) | | (21.6) | |
| Net Cash Provided by Operating Activities | 475.7 | | 545.2 | | 463.8 | |
| | | |
| Investing Activities | | | |
| Capital expenditures | (170.0) | | (187.8) | | (178.4) | |
Acquisitions, net of cash acquired of $8.9 million in 2024; $30.0 million in 2023; and $19.4 million in 2022 | (167.4) | | (638.8) | | (453.7) | |
| Proceeds from disposals of property, plant and equipment | 17.6 | | 1.8 | | 9.6 | |
Proceeds from divestitures, net of cash divested of $0.7 million in 2023 and $5.3 million in 2022 | 0.3 | | 13.5 | | 33.9 | |
| Investments in short-term marketable securities, net | 15.2 | | 5.7 | | 14.6 | |
| Other | (0.3) | | (0.9) | | 0.7 | |
| Net Cash Used in Investing Activities | (304.6) | | (806.5) | | (573.3) | |
| | | |
| Financing Activities | | | |
| Cash dividends paid to shareholders | (96.1) | | (94.0) | | (91.7) | |
| Purchase of treasury shares | (40.5) | | (250.9) | | (211.6) | |
| Proceeds from exercise of stock options | 5.6 | | 21.8 | | 8.5 | |
| Payments related to tax withholding for stock-based compensation | (10.0) | | (17.0) | | (10.7) | |
| Proceeds from long-term debt | 1,858.3 | | 1,564.9 | | 1,399.5 | |
| Payments on long-term debt | (1,839.3) | | (1,329.0) | | (978.5) | |
| Deferred financing costs | (5.5) | | (0.5) | | (6.6) | |
| Accounts receivable facility financing borrowings | 366.0 | | 104.0 | | 297.0 | |
| Accounts receivable facility financing payments | (433.0) | | (122.0) | | (212.0) | |
| Short-term debt activity, net | (230.3) | | 190.0 | | 6.9 | |
| Noncontrolling interest dividends paid | (1.1) | | (0.6) | | (0.5) | |
| Proceeds from the sale of shares in Timken India Limited | 232.3 | | 284.8 | | — | |
| Other | (1.2) | | (4.4) | | 6.5 | |
| Net Cash (Used in) Provided by Financing Activities | (194.8) | | 347.1 | | 206.8 | |
| Effect of exchange rate changes on cash | (22.0) | | (7.2) | | (14.5) | |
| (Decrease) Increase In Cash, Cash Equivalents and Restricted Cash | (45.7) | | 78.6 | | 82.8 | |
| Cash, cash equivalents and restricted cash at beginning of year | 419.3 | | 340.7 | | 257.9 | |
| Cash, Cash Equivalents and Restricted Cash at End of Year | $ | 373.6 | | $ | 419.3 | | $ | 340.7 | |
See accompanying Notes to the Consolidated Financial Statements.
Consolidated Statements of Shareholders’ Equity
| | | | | | | | | | | | | | | | | | | | | | | |
| | The Timken Company Shareholders | |
| (Dollars in millions, except per share data) | Total | Stated
Capital | Other
Paid-In
Capital | Retained Earnings | Accumulated
Other
Comprehensive
(Loss) | Treasury
Shares | Non-
controlling
Interest |
| Year Ended December 31, 2022 | | | | | | | |
| Balance at January 1, 2022 | $ | 2,377.7 | | $ | 40.7 | | $ | 786.9 | | $ | 1,616.4 | | $ | (23.0) | | $ | (126.1) | | $ | 82.8 | |
| Net income | 417.0 | | | | 407.4 | | | | 9.6 | |
| Foreign currency translation adjustments | (162.7) | | | | | (155.4) | | | (7.3) | |
Pension and other postretirement liability adjustments (net of $1.9 million income tax benefit) | (5.8) | | | | | (5.8) | | | |
Change in fair value of derivative financial
instruments, net of reclassifications | 2.3 | | | | | 2.3 | | | |
| | | | | | | |
| | | | | | | |
| Dividends declared to noncontrolling interest | (0.5) | | | | | | | (0.5) | |
| | | | | | | |
| Dividends – $1.23 per share | (91.7) | | | | (91.7) | | | | |
| Stock-based compensation expense | 30.4 | | | 30.4 | | | | | |
| Purchase of treasury shares | (211.6) | | | | | | (211.6) | | |
| Shares surrendered for stock option activity | — | | | 3.8 | | | | (3.8) | | |
| Stock option exercise activity | 8.5 | | | 8.5 | | | | | |
| | | | | | | |
Payments related to tax withholding for stock-based
compensation | (10.7) | | | | | | (10.7) | | |
| Balance at December 31, 2022 | $ | 2,352.9 | | $ | 40.7 | | $ | 829.6 | | $ | 1,932.1 | | $ | (181.9) | | $ | (352.2) | | $ | 84.6 | |
| Year Ended December 31, 2023 | | | | | | | |
| | | | | | | |
| Net income | 408.0 | | | | 394.1 | | | | 13.9 | |
| Foreign currency translation adjustments | 33.5 | | | | | 35.3 | | | (1.8) | |
Pension and other postretirement liability adjustments (net of $2.0 million income tax benefit) | (6.1) | | | | | (6.1) | | | |
| | | | | | | |
Change in fair value of derivative financial
instruments, net of reclassifications | (0.8) | | | | | (0.8) | | | |
| | | | | | | |
| | | | | | | |
| Dividends declared to noncontrolling interest | (0.6) | | | | | | | (0.6) | |
| | | | | | | |
| Dividends – $1.30 per share | (94.0) | | | | (94.0) | | | | |
| Sale of shares of Timken India Limited | 229.0 | | | 194.5 | | | 8.1 | | | 26.4 | |
| Other ownership changes | (4.0) | | | | | (1.5) | | | (2.5) | |
| Stock-based compensation expense | 30.6 | | | 30.6 | | | | | |
| Purchase of treasury shares | (250.9) | | | | | | (250.9) | | |
| | | | | | | |
| Stock option exercise activity | 21.8 | | | 21.8 | | | | | |
| | | | | | | |
Payments related to tax withholding for stock-based
compensation | (17.0) | | | | | | (17.0) | | |
| Year Ended December 31, 2023 | $ | 2,702.4 | | $ | 40.7 | | $ | 1,076.5 | | $ | 2,232.2 | | $ | (146.9) | | $ | (620.1) | | $ | 120.0 | |
| Year Ended December 31, 2024 | | | | | | | |
| Net income | 375.3 | | | | 352.7 | | | | 22.6 | |
| Foreign currency translation adjustments | (161.2) | | | | | (156.4) | | | (4.8) | |
Pension and other postretirement liability adjustments (net of $2.0 million income tax benefit) | (6.0) | | | | | (6.0) | | | |
Change in fair value of derivative financial
instruments, net of reclassifications | 2.0 | | | | | 2.0 | | | |
| Dividends declared to noncontrolling interest | (1.1) | | | | | | | (1.1) | |
| Dividends – $1.35 per share | (96.1) | | | | (96.1) | | | | |
| Sale of shares of Timken India Limited | 186.8 | | | 161.3 | | | 5.6 | | 19.9 |
| Other ownership changes | 1.0 | | | | | | | 1.0 | |
| Stock-based compensation expense | 25.9 | | | 25.9 | | | | | |
| | | | | | | |
| Purchase of treasury shares | (40.5) | | | | | | (40.5) | | |
| Stock option exercise activity | 5.6 | | | 5.6 | | | | | |
| | | | | | | |
| | | | | | | |
Payments related to tax withholding for stock-based
compensation | (10.0) | | | | | | (10.0) | | |
| Balance at December 31, 2024 | $ | 2,984.1 | | $ | 40.7 | | $ | 1,269.3 | | $ | 2,488.8 | | $ | (301.7) | | $ | (670.6) | | $ | 157.6 | |
See accompanying Notes to the Consolidated Financial Statements.
NOTES TO CONSOLIDATED FINANCIAL STATEMENTS
(Dollars in millions, except per share data)
Note 1 - Significant Accounting Policies
Principles of Consolidation:
The consolidated financial statements include the accounts and operations of the Company in which a controlling interest is maintained. Investments in affiliated companies where the Company exercises significant influence, but does not control, and the activities of which it is not the primary beneficiary, are accounted for using the equity method. All intercompany accounts and transactions are eliminated upon consolidation.
Revenue:
A contract exists when it has approval and commitment from both parties, the rights of the parties are identified, payment terms are identified, the contract has commercial substance and collectability of consideration is probable.
Revenue is generally recognized as performance obligations under the terms of a contract with a customer of the Company are satisfied. Of the Company's revenue, approximately 90% is from fixed-price contracts and continues to be recognized as of a point in time when products are shipped from the Company's manufacturing or distribution facilities or at a later point in time when control of the products transfers to the customer. The Company recognizes approximately 10% of revenue over time primarily for certain sales of customer-specific product as it satisfies the performance obligations because of the continuous transfer of control to the customer, supported as follows:
•For U.S. government contracts, the customer is allowed to unilaterally terminate the contract for convenience, and is required to pay the Company for costs incurred plus a reasonable margin and can take control of any work in process.
•For certain non-U.S. government contracts involving customer-specific products, the customer controls the work in process based on contractual termination clauses or restrictions on the Company's use of the product, and the Company possesses a right to payment for work performed to date plus a reasonable margin.
•For certain service contracts, this continuous transfer of control to the customer occurs as the Company's service enhances assets that the customer owns and controls at all times, and the Company is contractually entitled to payment for work performed to date plus a reasonable margin.
As a result of control transferring over time, revenue is recognized based on progress toward completion of the performance obligation. The selection of the method to measure progress towards completion requires judgment and is based on the nature of the products or services to be provided. The Company has elected to use the cost-to-cost input measure of progress for these contracts because it best depicts the transfer of goods or services to the customer based on incurring costs on the contracts. Under the cost-to-cost measure of progress, the extent of progress towards completion is measured based on the ratio of costs incurred to date to the total estimated costs at completion of the performance obligation. Revenues are recorded proportionally as costs are incurred.
The pricing and payment terms for non-U.S. government contracts are based on the Company's standard terms and conditions or the result of specific negotiations with each customer. The Company's standard terms and conditions require payment 30 to 90 days from the invoice date based on geographic region, but the timing of payment for specific negotiated terms may vary. The Company also has both prime and subcontracts in support of the provision of goods and services to the U.S. government. Certain of these contracts are subject to the Federal Acquisition Regulation ("FAR") and are priced based on competitive market prices. Under the payment terms of certain of these U.S. government fixed-price contracts, the customer pays the Company performance-based payments, which are interim payments of up to 90% of the costs incurred to date based on quantifiable measures of performance or on the achievement of specified events or milestones. Because the customer retains a portion of the contract price until completion of such contracts, certain of these U.S. government fixed-price contracts result in revenue recognized in excess of billings, which is presented within "Unbilled receivables" on the Consolidated Balance Sheets. The portion of the payments retained by the customer until final contract settlement is not considered a significant financing component because the intent is to protect the customer.
Note 1 - Significant Accounting Policies (continued)
Revenue is measured as the amount of consideration the Company expects to receive in exchange for transferring goods or providing services. Sales, value-added, and other taxes the Company collects concurrent with revenue-producing activities are excluded from revenue. As a practical expedient, the Company may exclude an assessment of whether promised goods are performance obligations, if such promised goods are immaterial to the customer contract taken as a whole, and combine these with other performance obligations. The Company has also elected not to adjust the promised amount of consideration for the effects of any significant financing component where the Company expects, at contract inception, that the period between when the Company transfers a promised good to a customer and when the customer pays for that good will be one year or less. Finally, the Company's policy is to exclude performance obligations resulting from contracts with a duration of one year or less from its disclosures related to remaining performance obligations.
The amount of consideration to which the Company expects to be entitled in exchange for the goods and services is not generally subject to significant variations. However, the Company does offer certain customers rebates, prompt payment discounts, end-user discounts, the right to return eligible products, and/or other forms of variable consideration. The Company estimates this variable consideration using the expected value amount, which is based on historical experience. The Company includes estimated amounts in the transaction price to the extent it is probable that a significant reversal of cumulative revenue recognized will not occur when the uncertainty associated with the variable consideration is resolved. The Company adjusts the estimate of revenue at the earlier of when the amount of consideration the Company expects to receive changes or when the consideration becomes fixed. The Company recognizes the cost of freight and shipping when control of the products or services has transferred to the customer as an expense in "Cost of products sold" on the Consolidated Statements of Income, because those are costs incurred to fulfill the promise recognized, not a separate performance obligation. To the extent certain freight and shipping fees are charged to customers, the Company recognizes the amounts charged to customers as revenues and the related costs as an expense in "Cost of products sold" when control of the related products or services has transferred to the customer.
Contracts are occasionally modified to account for changes in contract specifications, requirements, and pricing. The Company considers contract modifications to exist when the modification either creates new enforceable rights and obligations or changes existing ones. Substantially all of the Company's contract modifications are for goods or services that are distinct from the existing contract. Therefore, the effect of a contract modification on the transaction price and the Company's measure of progress for the performance obligation to which it relates is generally recognized on a prospective basis.
Cash Equivalents:
The Company considers all highly liquid investments with a maturity of three months or less when purchased to be cash equivalents.
Restricted Cash:
Cash and cash equivalents of $0.4 million were restricted at December 31, 2024 and 2023.
Accounts Receivable, Less Allowances:
Accounts receivable, less allowances on the Consolidated Balance Sheets include amounts billed and currently due from customers. The amounts due are stated at their net estimated realizable value. The Company maintains an allowance for doubtful accounts, which represents an estimate of the losses expected from the accounts receivable portfolio, to reduce accounts receivable to their net realizable value. The allowance is based upon historical trends in collections and write-offs, management's judgment of the probability of collecting accounts and management's evaluation of business risk. The Company extends credit to customers satisfying predefined credit criteria. The Company believes it has limited concentration of credit risk due to the diversity of its customer base.
Unbilled Receivables:
Unbilled receivables on the Consolidated Balance Sheets primarily include unbilled amounts typically resulting from sales under long-term contracts when the following conditions exist: (i) cost-to-cost method of revenue recognition is utilized; (ii) the revenue recognized exceeds the amount billed to the customer; and (iii) the right to payment is generally subject to the passage of time as milestones are achieved. The amounts recorded for unbilled receivables do not exceed their net realizable value.
Note 1 - Significant Accounting Policies (continued)
Inventories:
Inventories are valued at the lower of cost or net realizable value, with approximately 59% valued by the first-in, first-out ("FIFO") method and the remaining 41% valued by the last-in, first-out ("LIFO") method. The majority of the Company’s domestic inventories are valued by the LIFO method, while substantially all of the Company’s international inventories are valued by the FIFO method.
Investments:
Short-term investments are investments with maturities between four months and one year and are valued at amortized cost, which approximates fair value. The Company held short-term investments as of December 31, 2024 and 2023 with a fair value and cost basis of $15.9 million and $31.6 million, respectively, which were included in "Other current assets" on the Consolidated Balance Sheets.
Property, Plant and Equipment:
Property, plant and equipment, net on the Consolidated Balance Sheets is valued at cost less accumulated depreciation. Maintenance and repairs are charged to expense as incurred. The provision for depreciation is computed by the straight-line method based upon the estimated useful lives of the assets. The useful lives are 10 to 30 years for buildings, three to 10 years for computer software and three to 20 years for machinery and equipment.
The impairment of long-lived assets is evaluated when events or changes in circumstances indicate that the carrying amount of the asset or related group of assets may not be recoverable. If the expected future undiscounted cash flows are less than the carrying amount of the asset, an impairment loss is recognized at that time to reduce the asset to the lower of its fair value or its net book value.
Leases:
The Company determines if any arrangement is a lease at the inception of a contract. For leases where the Company is the lessee, it recognizes lease assets and related lease liabilities at the lease commencement date based on the present value of lease payments over the lease term. Most of the Company’s leases do not provide an implicit interest rate. As a result, the Company uses its incremental borrowing rate based on the information available at the commencement date in determining the present value of lease payments. The lease assets also consist of amounts for favorable or unfavorable lease terms related to acquisitions. Lease expense for operating leases is recognized on a straight-line basis over the lease term as an operating expense while the expense for finance leases is recognized as depreciation expense and interest expense using the accelerated interest method of recognition. A lease asset and lease liability are not recorded for leases with an initial term of 12 months or less, and the lease expense related to these leases is recognized as incurred over the lease term.
Goodwill and Other Intangible Assets:
Intangible assets subject to amortization are amortized on a straight-line method over their legal or estimated useful lives, with useful lives ranging from one to 20 years. Goodwill and indefinite-lived intangible assets not subject to amortization are tested for impairment at least annually. The Company performs its annual impairment test as of October 1st. Furthermore, goodwill and intangible assets are reviewed for impairment whenever events or changes in circumstances indicate that the carrying values may not be recoverable in accordance with accounting rules related to goodwill and other intangible assets.
Purchase accounting and business combinations:
Assets acquired and the liabilities assumed as part of a business combination are recognized at their acquisition date fair values. Goodwill as of the acquisition date is measured as the excess of consideration transferred over the net of the acquisition date fair values of the assets acquired and the liabilities assumed. The Company considers inputs to value the assets and liabilities by taking into account competitive trends, market comparisons, independent appraisals, and historical data, among other factors, as supplemented by current and anticipated market conditions. The valuation inputs in these analyses are based on market participant assumptions. The Company may refine these estimates and record adjustments to an asset or liability with the offset to goodwill during the measurement period, which may be up to one year from the acquisition date. Upon the conclusion of the measurement period or final determination of the values of the assets acquired or liabilities assumed, whichever comes first, any subsequent adjustments are recorded in the Company’s Consolidated Statements of Income.
Note 1 - Significant Accounting Policies (continued)
Product Warranties:
The Company provides limited warranties on certain of its products. The Company accrues liabilities for warranties generally based upon specific claims and in certain instances based on historical warranty claim experience in accordance with accounting rules relating to contingent liabilities. When the Company becomes aware of a specific potential warranty claim for which liability is probable and reasonably estimable, a specific charge is recorded and accounted for accordingly. Adjustments are made quarterly to the accruals as claim data and historical experience change.
Income Taxes:
The Company accounts for income taxes in accordance with ASC 740, “Income Taxes.” Deferred tax assets and liabilities are recorded for the future tax consequences attributable to differences between financial statement carrying amounts of existing assets and liabilities and their respective tax bases, as well as net operating loss and tax credit carryforwards. The Company recognizes valuation allowances against deferred tax assets by tax jurisdiction when it is more likely than not those assets will not be realized. Accruals for uncertain tax positions are provided for in accordance with ASC 740-10. The Company recognizes interest and penalties related to uncertain tax positions as a component of income tax expense. The Company has elected to account for Global Intangible Low Tax Income as a period cost.
Foreign Currency:
Assets and liabilities of subsidiaries are translated at the rate of exchange in effect on the balance sheet date; income and expenses are translated at the average rates of exchange prevailing during the reporting period. Translation adjustments for assets and liabilities are reflected as a separate component of accumulated other comprehensive loss (income). Foreign currency gains and losses resulting from transactions are included in the Consolidated Statements of Income. Net of related derivative activity, the Company recognized a foreign currency exchange loss resulting from transactions of $9.3 million for the year ended December 31, 2024 and recognized a loss of $14.8 million and a gain of $15.4 million for the years ended December 31, 2023 and 2022, respectively.
Pension and Other Postretirement Benefits:
The Company recognizes actuarial gains and losses immediately through net periodic benefit cost upon the annual remeasurement in the fourth quarter, or on an interim basis if specific events trigger a remeasurement. Actuarial gains and losses are excluded from segment results, while all other components of net periodic benefit cost will continue to be included within segment results.
Stock-Based Compensation:
The Company recognizes stock-based compensation expense over the related vesting period of the awards based on the fair value on the grant date. Stock options are issued with an exercise price equal to the opening market price of Timken common shares on the date of grant. The fair value of stock options is determined using a Black-Scholes option pricing model, which incorporates assumptions regarding the expected volatility, the expected option life, the risk-free interest rate and the expected dividend yield. The fair value of stock-based awards that will settle in Timken common shares, other than stock options, is based on the opening market price of Timken common shares on the grant date. The fair value of stock-based awards that will settle in cash are remeasured at each reporting period until settlement of the awards. The Company recognizes forfeitures on stock-based awards as they occur.
Earnings Per Share:
Earnings per share are computed by dividing net income by the weighted-average number of common shares outstanding during the year. Diluted earnings per share are computed by dividing net income by the weighted-average number of common shares outstanding, adjusted for the dilutive impact of potential common shares for share-based compensation awards.
Note 1 - Significant Accounting Policies (continued)
Derivative Instruments:
The Company recognizes all derivatives on the Consolidated Balance Sheets at fair value. Derivatives that are not designated as hedges are adjusted to fair value through earnings. If the derivative is designated and qualifies as a hedge, depending on the nature of the hedge, changes in the fair value of the derivatives are either offset against the change in fair value of the hedged assets, liabilities or firm commitments through earnings or recognized in accumulated other comprehensive loss (income) until the hedged item is recognized in earnings. The Company’s holdings of forward foreign currency exchange contracts qualify as derivatives pursuant to the criteria established in derivative accounting guidance, and the Company has designated certain of those derivatives as hedges.
Use of Estimates:
The preparation of consolidated financial statements in conformity with U.S. GAAP requires management to make estimates and assumptions that affect the amounts reported in the consolidated financial statements and accompanying notes. Because actual results could differ from these estimates, the Company reviews and updates these estimates and assumptions regularly to reflect recent experience.
Recent Accounting Pronouncements:
New Accounting Guidance Adopted:
In November 2023, the FASB issued Accounting Standards Update ("ASU") 2023-07, Segment Reporting (Topic 280). ASU 2023-07 requires that a public entity disclose: (1) on an annual and interim basis, significant segment expenses that are regularly provided to the Chief Operating Decision Maker ("CODM") and included within each reported measure of segment profit or loss; (2) on an annual and interim basis, an amount for other segment items by reportable segment and a description of its composition; and (3) the title and position of the CODM and an explanation of how the CODM uses the reported measures of segment profit or loss in assessing segment performance and deciding how to allocate resources. The other segment items category is the difference between segment revenue less the segment expenses disclosed and each reported measure of segment profit or loss. For public business entities, the new guidance is effective for annual periods beginning after December 15, 2023, and interim periods within fiscal years beginning after December 15, 2024. The Company adopted the new guidance in the fourth quarter of 2024. Refer to Note 4 - Segment Information in the Notes to the Consolidated Financial Statements for additional information.
New Accounting Guidance Issued and Not Yet Adopted:
In November 2024, the FASB issued ASU 2024-03, Income Statement—Reporting Comprehensive Income - Expense Disaggregation Disclosures (Subtopic 220-40). ASU 2024-03 requires that a public entity disclose the detailed information about types of expense. Specifically, a public entity would disclose the amounts of (a) purchases of inventory, (b) employee compensation, (c) depreciation and (d) intangible asset amortization included in each relevant expense caption. A relevant expense caption is an expense caption presented on the face of the income statement within continuing operations that contains any of the expense categories listed in (a)–(d). In addition, a public entity should include certain amounts that are already required to be disclosed under current GAAP in the same disclosure as the other disaggregation requirements. A public entity would also disclose a qualitative description of the amounts remaining in relevant expense captions that are not separately disaggregated quantitatively and disclose the total amount of selling expenses and, in annual reporting periods, an entity’s definition of selling expenses. For public business entities, the new guidance is effective for annual periods beginning after December 15, 2026, and interim reporting periods beginning after December 15, 2027. Early adoption is permitted. The Company is currently evaluating the impact of the new guidance.
In December 2023, the FASB issued ASU 2023-09, Income Taxes (Topic 40). ASU 2023-09 is intended to enhance the transparency and decision to improve the usefulness of income tax disclosures primarily related to the rate reconciliation and income taxes paid information. The amendments in this update require that public business entities on an annual basis (1) disclose specific categories in the rate reconciliation and (2) provide additional information for reconciling items that meet a quantitative threshold. The amendments require that all entities disclose on an annual basis the amount of income taxes paid disaggregated for federal, state, and foreign taxes and further disaggregated for specific jurisdictions to the extent the related amounts exceed a quantitative threshold. For public business entities, the new guidance is effective for annual periods beginning after December 15, 2024. Early adoption is permitted. The Company is preparing to adopt the new guidance in 2025.
Note 2 - Acquisitions and Divestitures
Acquisitions:
On September 9, 2024, the Company acquired 100% of the capital stock of CGI, a Nevada-based manufacturer of precision drive systems serving medical robotics and other automation markets. CGI employs approximately 130 people and has its headquarters and manufacturing facilities in Carson City, Nevada. With its concentration on medical robotics, CGI enhances the Company's product portfolio serving this attractive sector. The total purchase price for this acquisition was $167.1 million, net of cash acquired of $8.9 million. Results for CGI are reported in the Industrial Motion segment. The Company incurred acquisition-related costs of $2.0 million to complete this acquisition. Acquisition costs are recorded in selling, general and administrative expenses on the Consolidated Statements of Income.
During 2023, the Company completed six acquisitions, which enhanced the Company's capabilities and product portfolio. On December 20, 2023, the Company completed the acquisition of 100% of the capital stock of Lagersmit, a Netherlands-based manufacturer of highly engineered sealing solutions for marine, dredging, water, tidal energy and other industrial applications, for $128.2 million, net of cash acquired of $6.5 million. Lagersmit employs approximately 90 people. Results for Lagersmit are reported in the Industrial Motion segment. On September 1, 2023, the Company acquired 100% of the capital stock of Des-Case, a Tennessee-based manufacturer of specialty filtration products for industrial lubricants, for $123.2 million, net of cash acquired of $1.8 million. Des-Case has manufacturing facilities in Tennessee and the Netherlands and employs approximately 120 people. Results for Des-Case are reported in the Industrial Motion segment. On April 4, 2023, the Company acquired 100% of the capital stock of Nadella, a leading European manufacturer of linear guides, telescopic rails, actuators and systems and other specialized industrial motion solutions, for $293.5 million, net of cash acquired of $21.0 million. Based in Italy, Nadella employs approximately 450 people and operates manufacturing facilities in Europe and China. Results for Nadella are reported in the Industrial Motion segment.
On November 1, 2023, the Company acquired iMECH. The Company acquired 100% of the capital stock in the U.S. and substantially all of the assets in Canada. iMECH manufactures thrust bearings, radial bearings, specialty coatings and other components primarily used in the energy industry. iMECH employs approximately 70 people and has facilities in Houston, Texas and Alberta, Canada. Results for iMECH are reported in the Engineered Bearings segment. On September 29, 2023, the Company acquired 100% of the capital stock of Rosa, a European designer and manufacturer of roller guideways, linear bearings, customized linear systems and actuators, commercialized ball guideways and precision ball screws. Rosa employs approximately 65 people and has its headquarters, R&D and high-precision manufacturing facility in Milan, Italy. Results for Rosa are reported in the Industrial Motion segment. On January 31, 2023, the Company acquired substantially all of the assets of ARB, a North Carolina-based manufacturer of industrial bearings. ARB, which boasts a large U.S. installed base and strong aftermarket business, operates manufacturing facilities in Hiddenite and Morganton, North Carolina. ARB employs approximately 190 people. Results for ARB are reported in the Engineered Bearings segment. The total purchase price for these three acquisitions was $95.7 million, net of cash acquired of $1.4 million. The Company incurred transaction costs of $6.7 million to complete the 2023 acquisitions.
Note 2 - Acquisitions and Divestitures (continued)
The purchase price allocations at fair value, net of cash acquired, for 2024 and 2023 acquisitions as of December 31, 2024 and 2023 are presented below:
| | | | | | | | |
| 2024 | 2023 |
| Assets: | | |
| Accounts receivable | $ | 4.2 | | $ | 43.9 | |
| Inventories | 13.7 | | 111.8 | |
| Other current assets | 0.3 | | 5.0 | |
| Property, plant and equipment | 20.6 | | 47.9 | |
| Operating lease assets | 2.6 | | 7.2 | |
| Goodwill | 61.4 | | 292.0 | |
| Other intangible assets | 100.4 | | 299.5 | |
| Other non-current assets | 3.0 | | 5.1 | |
| Total assets acquired | $ | 206.2 | | $ | 812.4 | |
| Liabilities: | | |
| Accounts payable, trade | $ | 0.6 | | $ | 24.2 | |
| Salaries, wages and benefits | 1.5 | | 14.9 | |
| Income taxes payable | 0.2 | | 4.5 | |
| Other current liabilities | 1.3 | | 11.0 | |
| Short-term debt | — | | 4.7 | |
| Long-term debt | — | | 6.0 | |
| Accrued pension cost | — | | 3.6 | |
| Long-term operating lease liabilities | 1.9 | | 6.4 | |
| Deferred income taxes | 28.4 | | 81.9 | |
| Other non-current liabilities | 5.2 | | 7.6 | |
| Total liabilities assumed | $ | 39.1 | | $ | 164.8 | |
| Noncontrolling interest acquired | — | | 6.3 | |
| Net assets acquired | $ | 167.1 | | $ | 641.3 | |
| Cash flow reconciling items: | | |
| Working capital adjustment related to 2023 acquisitions paid in 2024 | 0.3 | | (0.3) | |
| Working capital adjustment related to 2022 acquisition received in 2023 | — | | (2.2) | |
| | |
| Cash paid for acquisitions, net of cash acquired | $ | 167.4 | | $ | 638.8 | |
The 2023 acquisitions presented above include goodwill of $59.1 million and intangible assets of $71.9 million for Lagersmit, goodwill of $78.7 million and intangible assets of $45.1 million for Des-Case, and goodwill of $129.0 million and intangible assets of $158.9 million for Nadella.
In determining the fair value of the amounts above, the Company utilized various forms of the income, cost and market approaches depending on the asset or liability being valued. The estimation of fair value required judgment related to future net cash flows, discount rates, competitive trends, market comparisons and other factors. As a result, the Company utilized third-party valuation specialists to assist in determining the fair value of certain assets. Inputs were generally determined by considering independent appraisals and historical data, supplemented by current and anticipated market conditions.
Note 2 - Acquisitions and Divestitures (continued)
The 2024 amounts in the table above represent the preliminary purchase price allocation for the CGI acquisition. This purchase price allocation, including the residual amount allocated to goodwill, is based on preliminary information and is subject to change as additional information concerning final asset and liability valuations are obtained. The purchase price allocation for CGI is preliminary as a result of the proximity of the acquisition date to December 31, 2024, and as a result, no elements of the purchase price allocation have been finalized. During the applicable measurement period, the Company will adjust assets and liabilities if new information is obtained about facts and circumstances that existed as of the acquisition date that, if known, would have resulted in revised estimated values for those assets or liabilities as of that date. The effect of measurement period adjustments to the estimated fair values will be reflected as if the adjustments had been completed on the acquisition date.
The following table summarizes the preliminary purchase price allocation at fair value for identifiable intangible assets acquired in 2024 and 2023:
| | | | | | | | | | | | | | | | |
| 2024 | 2023 | |
| | Weighted-
Average Life | | Weighted-
Average Life | | |
| | | | | | |
| Trade names (finite life) | 6.1 | | 18 years | 25.6 | | 17 years | | |
| Technology and know-how | 35.3 | | 16 years | 70.5 | | 15 years | | |
| | | | | | |
| Customer relationships | 59.0 | | 17 years | 201.8 | | 14 years | | |
| Non-competes | — | | | 1.0 | | 3 years | | |
| Capitalized software | — | | | 0.6 | | 2 years | | |
| Total intangible assets | $ | 100.4 | | | $ | 299.5 | | | | |
Divestitures:
During the third quarter of 2023, the Company made the decision to sell its TWB business, located in Jiangsu Province, China. The business met the held for sale criteria, and the Company reclassified its assets and liabilities accordingly. As a result of the carrying value of the business exceeding the estimated sales price less costs to sell, the Company recorded an impairment charge of $1.0 million in 2023. On October 16, 2023, the Company completed the divestiture of TWB. TWB had net sales of $22.7 million and $39.3 million in 2023 and 2022, respectively. The results of operations of TWB were reported in the Engineered Bearings segment. The Company recorded proceeds of $9.0 million, net of cash divested of $0.7 million, on the sale of the business and reported an additional loss of $0.6 million in the fourth quarter of 2023.
On February 28, 2023, the Company completed the sale of its 50% membership interests in SE Setco, a joint venture. The Company had accounted for SE Setco as an equity method investment prior to the sale. The Company received $5.7 million in proceeds for SE Setco and recognized a pretax gain of $4.8 million on the sale. The gain was reflected in other (expense) income, net in the Consolidated Statement of Income.
Note 3 - Revenue
The following table presents details deemed most relevant to the users of the financial statements about total revenue for the years ended December 31, 2024, 2023 and 2022:
| | | | | | | | | | | |
| December 31, 2024 |
| Engineered Bearings | Industrial Motion | Total |
| United States | $ | 1,281.6 | | $ | 795.3 | | $ | 2,076.9 | |
| Americas excluding United States | 383.1 | | 102.7 | | 485.8 | |
| Europe / Middle East / Africa | 599.2 | | 520.7 | | 1,119.9 | |
| | | |
| Asia-Pacific | 770.4 | | 120.0 | | 890.4 | |
| Net sales | $ | 3,034.3 | | $ | 1,538.7 | | $ | 4,573.0 | |
| | | |
| December 31, 2023 |
| Engineered Bearings | Industrial Motion | Total |
| United States | $ | 1,266.1 | | $ | 789.8 | | $ | 2,055.9 | |
| Americas excluding United States | 375.6 | | 106.1 | | 481.7 | |
| Europe / Middle East / Africa | 678.6 | | 499.7 | | 1,178.3 | |
| | | |
| Asia-Pacific | 937.4 | | 115.7 | | 1,053.1 | |
| Net sales | $ | 3,257.7 | | $ | 1,511.3 | | $ | 4,769.0 | |
| | | |
| December 31, 2022 |
| Engineered Bearings | Industrial Motion | Total |
| United States | $ | 1,198.1 | | $ | 793.9 | | $ | 1,992.0 | |
| Americas excluding United States | 383.2 | | 93.0 | | 476.2 | |
| Europe / Middle East / Africa | 588.9 | | 406.8 | | 995.7 | |
| | | |
| Asia-Pacific | 922.4 | | 110.4 | | 1,032.8 | |
| Net sales | $ | 3,092.6 | | $ | 1,404.1 | | $ | 4,496.7 | |
Net sales by geographic area are reported by the destination of net sales.
When reviewing revenues by sales channel, the Company separates net sales to OEMs from sales to distributors and end users. The following table presents the percent of revenues by sales channel for the years ended December 31, 2024, 2023 and 2022:
| | | | | | | | | | | |
| Revenue by sales channel | 2024 | 2023 | 2022 |
| Original equipment manufacturers | 55% | 60% | 60% |
| Distribution/end users | 45% | 40% | 40% |
In addition to disaggregating revenue by segment and geography and by sales channel as shown above, the Company believes information about the timing of transfer of goods or services and type of customer is also relevant. During the year ended December 31, 2024, approximately 10% of total net sales were recognized on an over-time basis compared to 9% in 2023 and 2022. These sales were recognized over-time due to the continuous transfer of control to the customer, with the remainder recognized as of a point in time. Finally, business with the U.S. government or its contractors represented approximately 7% of total net sales in 2024, 6% of total net sales in 2023, and 7% of total net sales for 2022.
Note 3 - Revenue (continued)
Remaining Performance Obligations:
Remaining performance obligations represent the transaction price of orders meeting the definition of a contract for which work has not been performed and excludes unexercised contract options. Performance obligations having a duration of more than one year are concentrated in contracts for certain products and services provided to the U.S. government or its contractors. The aggregate amount of the transaction price allocated to remaining performance obligations for such contracts with a duration of more than one year was approximately $153 million at December 31, 2024.
Unbilled Receivables:
The following table contains a rollforward of unbilled receivables for the years ended December 31, 2024 and 2023:
| | | | | | | | |
| 2024 | 2023 |
| Beginning balance, January 1 | $ | 144.5 | | $ | 103.9 | |
| Additional unbilled revenue recognized | 380.5 | | 424.1 | |
| Less: amounts billed to customers | (384.2) | | (383.5) | |
| | |
| | |
| Ending balance | $ | 140.8 | | $ | 144.5 | |
There were no impairment losses recorded on unbilled receivables for the years ended December 31, 2024 and 2023.
Deferred Revenue:
The following table contains a rollforward of deferred revenue for the years ended December 31, 2024 and 2023:
| | | | | | | | |
| 2024 | 2023 |
| Beginning balance, January 1 | $ | 45.4 | | $ | 54.3 | |
| Acquisitions | 0.7 | | 1.4 | |
| Revenue (cash) received in advance | 153.0 | | 165.2 | |
| Less: revenue recognized | (157.7) | | (175.5) | |
| Ending balance | $ | 41.4 | | $ | 45.4 | |
Note 4 - Segment Information
The Company operates under two reportable segments: (1) Engineered Bearings and (2) Industrial Motion.
Description of types of products and services from which each reportable segment derives its revenues:
The Company's reportable segments are product business units that serve customers in diverse industrial markets. Each reportable segment is managed to address specific customer needs in these diverse market segments.
The Engineered Bearings portfolio features bearings with precision tolerances, proprietary internal geometries and quality materials. Products include tapered, spherical, cylindrical, thrust, ball, plain, miniature, precision and housed unit bearings that deliver strong performance, consistency and reliability. The portfolio serves OEMs and end users in the following markets: industrial distribution, renewable energy, automotive, rail, aerospace, metals and mining, heavy truck, agriculture and turf, and construction. Beyond products sold to OEMs, aftermarket sales to individual end users, equipment owners, operators and maintenance shops are handled directly or through the Company's extensive network of authorized automotive and heavy truck distributors.
The Industrial Motion portfolio features products such as drives, breathers, seals, automatic lubrication systems, linear motion products, chain, belts, couplings, industrial clutches and brakes, and gears and gearboxes. The portfolio products and services are sold to OEMs and end users in markets that place heavy demands on operating equipment they make or use. This includes: industrial distribution, automation, agriculture and turf, services, marine, renewable energy, aerospace and construction. This segment also supports aftermarket sales through its global network of authorized industrial distributors and through the provision of services directly to end users. In addition, the Company’s industrial drivetrain services offer end users a broad portfolio of maintenance support and capabilities that include repair and service for bearings and gearboxes as well as electric motor rewind, repair and services.
Measurement of segment profit or loss and segment assets:
The Company's CODM is the President and Chief Executive Officer. The primary measurement used by the CODM to measure the financial performance of each segment is adjusted EBITDA. The Company's CODM evaluates financial performance and allocates resources based on return on capital and profitable growth. The CODM considers actual and budget results provided on a regular basis for both segment's profit measures when making decisions about allocating capital and personnel to the segments.
The Company adopted the new disclosure requirements under ASU 2023-07, which requires that the Company disclose significant segment expenses. The Company concluded that the significant segment expenses provided to the CODM are: (1) cost of products sold and (2) selling, general and administrative expenses. 2023 and 2022 have been revised to align with the new presentation guidance.
The accounting policies of the reportable segments are the same as those described in the summary of significant accounting policies.
Note 4 - Segment Information (continued)
Business Segment Information:
The following tables provide segment financial information and a reconciliation of segment results to consolidated results for the year ended December 31, 2024:
| | | | | | | | | | | |
| Engineered Bearings | Industrial Motion | Total |
| Net sales | $ | 3,034.3 | | $ | 1,538.7 | | $ | 4,573.0 | |
Cost of products sold(1) | (2,106.9) | | (1,008.5) | | |
Selling, general and administrative expenses(2) | (419.3) | | (269.1) | | |
Other segment items(3) | 4.5 | | (0.1) | | |
Depreciation and amortization(4) | 95.6 | | 45.5 | | |
| Adjusted EBITDA for reportable segments | $ | 608.2 | | $ | 306.5 | | $ | 914.7 | |
| | | |
| Unallocated corporate expense | | | (69.9) | |
| Impairment, restructuring and reorganization charges | | | (17.8) | |
| Corporate pension and other postretirement benefit income | | | 1.3 | |
| Acquisition-related charges | | | (13.0) | |
| Tax indemnification and related items | | | 1.1 | |
| Gain on divestitures and sale of certain assets | | | 14.7 | |
| CEO succession expenses | | | (3.7) | |
| Property losses and related expenses | | | (1.2) | |
| Depreciation and amortization | | | (221.8) | |
| Interest expense | | | (125.1) | |
| Interest income | | | 14.9 | |
| Income before income taxes | | | $ | 494.2 | |
Year ended December 31, 2023:
| | | | | | | | | | | |
| Engineered Bearings | Industrial Motion | Total |
| Net sales | $ | 3,257.7 | | $ | 1,511.3 | | $ | 4,769.0 | |
Cost of products sold(1) | (2,246.0) | | (979.7) | | |
Selling, general and administrative expenses(2) | (425.4) | | (253.0) | | |
Other segment items(3) | 4.2 | | (0.1) | | |
Depreciation and amortization(4) | 92.1 | | 41.3 | | |
| Adjusted EBITDA for reportable segments | $ | 682.6 | | $ | 319.8 | | $ | 1,002.4 | |
| | | |
| Unallocated corporate expense | | | (62.7) | |
| Impairment, restructuring and reorganization charges | | | (59.3) | |
| Corporate pension and other postretirement benefit expense | | | (20.6) | |
| Acquisition-related charges | | | (31.8) | |
| | | |
| Gain on divestitures and sale of certain assets | | | 5.2 | |
| | | |
| | | |
| Depreciation and amortization | | | (201.3) | |
| Interest expense | | | (110.7) | |
| Interest income | | | 9.3 | |
| Income before income taxes | | | $ | 530.5 | |
Note 4 - Segment Information (continued)
Year ended December 31, 2022:
| | | | | | | | | | | |
| Engineered Bearings | Industrial Motion | Total |
| Net sales | $ | 3,092.6 | | $ | 1,404.1 | | $ | 4,496.7 | |
Cost of products sold(1) | (2,184.7) | | (962.8) | | |
Selling, general and administrative expenses(2) | (368.1) | | (213.6) | | |
Other segment items(3) | 14.7 | | 1.0 | | |
Depreciation and amortization(4) | 84.0 | | 35.0 | | |
| Adjusted EBITDA for reportable segments | $ | 638.5 | | $ | 263.7 | | $ | 902.2 | |
| | | |
| Unallocated corporate expense | | | (46.3) | |
| Impairment, restructuring and reorganization charges | | | (55.1) | |
| Corporate pension and other postretirement benefit expense | | | (2.9) | |
| Acquisition-related charges | | | (14.8) | |
| Tax indemnification and related items | | | (0.3) | |
| Gain on divestitures and sale of certain assets | | | 2.9 | |
| | | |
| | | |
| Depreciation and amortization | | | (164.0) | |
| Interest expense | | | (74.6) | |
| Interest income | | | 3.8 | |
| Income before income taxes | | | $ | 550.9 | |
(1) Cost of products sold exclude acquisition-related and reorganization charges, and property losses and related expenses.
(2) Selling, general, and administrative expenses exclude acquisition-related charges.
(3) Other segments items is Other (expense) income, net and exclude gain on divestitures and sale of certain assets, and tax indemnification and
related items.
(4) Depreciation and amortization excludes acquisition intangible amortization and depreciation recognized in reorganization charges, if any.
The following tables provide additional segment financial information:
| | | | | | | | |
| 2024 | 2023 |
| Assets employed at year-end: | | |
| Engineered Bearings | $ | 3,126.1 | | $ | 3,296.8 | |
| Industrial Motion | 2,822.6 | | 2,744.5 | |
Corporate (5) | 462.3 | | 500.4 | |
| | $ | 6,411.0 | | $ | 6,541.7 | |
(5) Corporate assets include corporate buildings and cash and cash equivalents.
| | | | | | | | | | | |
| 2024 | 2023 | 2022 |
| Capital expenditures: | | | |
| Engineered Bearings | $ | 120.3 | | $ | 140.7 | | $ | 143.8 | |
| Industrial Motion | 49.1 | | 46.2 | | 33.2 | |
| Corporate | 0.6 | | 0.9 | | 1.4 | |
| | $ | 170.0 | | $ | 187.8 | | $ | 178.4 | |
| Depreciation and amortization: | | | |
| Engineered Bearings | $ | 108.6 | | $ | 107.2 | | $ | 87.6 | |
| Industrial Motion | 111.6 | | 92.7 | | 74.8 | |
| Corporate | 1.6 | | 1.4 | | 1.6 | |
| | $ | 221.8 | | $ | 201.3 | | $ | 164.0 | |
Note 4 - Segment Information (continued)
Geographic Financial Information:
| | | | | | | | |
| 2024 | 2023 |
| Property, Plant and Equipment, net: | | |
| United States | $ | 470.0 | | $ | 446.3 | |
| China | 264.5 | | 278.8 | |
| India | 174.2 | | 146.2 | |
| | |
| Rest of world | 398.2 | | 440.6 | |
| $ | 1,306.9 | | $ | 1,311.9 | |
Long-lived assets by geographic area are reported by the location of the subsidiary. Refer to Note 3 - Revenue for further information pertaining to geographic net sales information.
Note 5 - Income Taxes
Income before income taxes, based on geographic location of the operations to which such earnings are attributable, is provided below. As the Company has elected to treat certain foreign subsidiaries as branches for U.S. income tax purposes, pretax income attributable to the United States shown below may differ from the pretax income reported in the Company’s annual U.S. federal income tax return.
Income before income taxes:
| | | | | | | | | | | |
| 2024 | 2023 | 2022 |
| United States | $ | 175.6 | | $ | 173.8 | | $ | 86.0 | |
| Non-United States | 318.6 | | 356.7 | | 464.9 | |
| Income before income taxes | $ | 494.2 | | $ | 530.5 | | $ | 550.9 | |
The provision for income taxes consisted of the following:
| | | | | | | | | | | |
| 2024 | 2023 | 2022 |
| Current: | | | |
| Federal | $ | 28.6 | | $ | 10.4 | | $ | 11.2 | |
| State and local | 9.1 | | 3.8 | | 6.7 | |
| Foreign | 116.5 | | 119.9 | | 119.6 | |
| $ | 154.2 | | $ | 134.1 | | $ | 137.5 | |
| Deferred: | | | |
| Federal | $ | (6.6) | | $ | (12.1) | | $ | (7.8) | |
| State and local | (2.7) | | (1.5) | | (0.3) | |
| Foreign | (26.0) | | 2.0 | | 4.5 | |
| | $ | (35.3) | | $ | (11.6) | | $ | (3.6) | |
| United States and foreign tax provision on income | $ | 118.9 | | $ | 122.5 | | $ | 133.9 | |
The Company made net income tax payments of $183.5 million, $240.3 million and $120.6 million in 2024, 2023 and 2022, respectively. These income tax payments included $45.2 million and $55.2 million in 2024 and 2023, respectively, that were recorded in other paid-in capital related to sale of shares of Timken India Limited.
The following table is the reconciliation between the provision for income taxes and the amount computed by applying the U.S. federal income tax rate of 21% to income before taxes:
| | | | | | | | | | | |
| 2024 | 2023 | 2022 |
| Income tax at the U.S. federal statutory rate | $ | 103.8 | | $ | 111.4 | | $ | 115.7 | |
| Adjustments: | | | |
| State and local income taxes, net of federal tax benefit | 4.9 | | 5.3 | | 5.3 | |
| Tax on foreign remittances and U.S. tax on foreign income | 16.8 | | 25.6 | | 19.0 | |
| Tax expense related to undistributed earnings of foreign subsidiaries | 1.3 | | 15.0 | | 1.0 | |
| Foreign losses without current tax benefits | 6.1 | | 7.7 | | 3.1 | |
| Foreign earnings taxed at different rates including tax holidays | 16.6 | | 18.1 | | 19.4 | |
| | | |
| U.S. foreign tax credit | (21.1) | | (55.8) | | (15.2) | |
| Effect of cross-border tax laws | (5.2) | | (10.3) | | (3.9) | |
| Accruals and settlements related to tax audits | (6.7) | | (3.2) | | (9.5) | |
| | | |
| | | |
| | | |
| | | |
| | | |
| | | |
| Other items, net | 2.4 | | 8.7 | | (1.0) | |
| Provision for income taxes | $ | 118.9 | | $ | 122.5 | | $ | 133.9 | |
| Effective income tax rate | 24.1 | % | 23.1 | % | 24.3 | % |
Note 5 - Income Taxes (continued)
The Company recognized $55.8 million of tax benefits for U.S. foreign tax credit utilization primarily from acquisition integration structuring for the year ended December 31, 2023.
There has been no change in the Company’s assertion about its permanent reinvestment in undistributed foreign earnings. The Company recorded $1.3 million and $15.0 million of income tax expense related to foreign withholding taxes on planned one-time distributions for the years ended December 31, 2024 and 2023, respectively. No additional deferred taxes have been recorded for any other outside basis differences as these amounts continue to be indefinitely reinvested in foreign operations. The amounts of undistributed foreign earnings were $1,834.6 million and $1,608.8 million at December 31, 2024 and December 31, 2023, respectively. It is not practicable to calculate the additional taxes that might be payable on such unremitted earnings due to the variety of circumstances and tax laws applicable at the time of distribution.
The Organization for Economic Co-operation and Development ("OECD") has a framework to implement a global minimum corporate tax of 15% applied on a country-by-country basis for companies with global revenues and profits above certain thresholds (referred to as "Pillar 2"), with certain aspects of Pillar 2 effective January 1, 2024 and other aspects effective January 1, 2025. While the United States has not enacted legislation to adopt Pillar 2, and it is uncertain if it will do so in the future, certain countries in which the Company operates have enacted such legislation, and other countries are in the process of doing so. The enactment of Pillar 2 was not material to the Company’s results of operations and financial condition.
The effect of temporary differences giving rise to deferred tax assets and liabilities at December 31, 2024 and 2023 was as follows:
| | | | | | | | |
| 2024 | 2023 |
| Deferred tax assets: | | |
| Accrued postretirement benefits cost | $ | 7.9 | | $ | 8.0 | |
| Accrued pension cost | 39.3 | | 44.1 | |
| Other employee benefit accruals | 10.7 | | 14.3 | |
| Tax loss and credit carryforwards | 89.1 | | 84.9 | |
| Other, net | 75.9 | | 58.3 | |
| Valuation allowances | (48.7) | | (39.3) | |
| $ | 174.2 | | $ | 170.3 | |
| Deferred tax liabilities - principally depreciation and amortization | (308.2) | | (312.5) | |
| Net deferred tax liabilities | $ | (134.0) | | $ | (142.2) | |
The Company has U.S. federal and state tax credit and loss carryforwards with tax benefits totaling $23.3 million, portions of which will expire in 2024 and continue until 2043. In addition, the Company has loss carryforwards in various non-U.S. jurisdictions with tax benefits totaling $64.5 million, portions of which will expire in 2025 while others will be carried forward indefinitely. The Company has provided valuation allowances of $47.9 million against certain of these carryforwards and $0.8 million against other deferred tax assets. A majority of the non-U.S. loss carryforwards represent local country net operating losses for branches of the Company or entities treated as branches of the Company under U.S. tax law for which deferred taxes have been recorded.
As of December 31, 2024, the Company had $35.8 million of total gross unrecognized tax benefits, $24.4 million of which would favorably impact the Company’s effective income tax rate in any future period if such benefits were recognized. As of December 31, 2024, the Company believes it is reasonably possible that the amount of unrecognized tax positions could decrease by approximately $9 million during the next 12 months. The potential decrease would primarily be driven by settlements with tax authorities and the expiration of various applicable statutes of limitation. As of December 31, 2024, the Company had accrued $11.8 million of interest and penalties related to uncertain tax positions. The Company records interest and penalties related to uncertain tax positions as a component of income tax expense.
Note 5 - Income Taxes (continued)
As of December 31, 2023, the Company had $34.2 million of total gross unrecognized tax benefits, $24.2 million of which would favorably impact the Company’s effective income tax rate in any future period if such benefits were recognized. As of December 31, 2023, the Company believed it was reasonably possible that the amount of unrecognized tax positions could decrease by approximately $5 million during the next 12 months. The potential decrease would primarily be driven by settlements with tax authorities and the expiration of various applicable statutes of limitation. As of December 31, 2023, the Company had accrued $11.8 million of interest and penalties related to uncertain tax positions. The Company records interest and penalties related to uncertain tax positions as a component of income tax expense.
As of December 31, 2022, the Company had $26.0 million of total gross unrecognized tax benefits, $23.3 million of which would favorably impact the Company’s effective income tax rate in any future period if such benefits were recognized. As of December 31, 2022, the Company had accrued $8.8 million of interest and penalties related to uncertain tax positions. The Company records interest and penalties related to uncertain tax positions as a component of income tax expense.
The following table reconciles the Company’s total gross unrecognized tax benefits for the years ended December 31, 2024, 2023 and 2022:
| | | | | | | | | | | |
| 2024 | 2023 | 2022 |
| Beginning balance, January 1 | $ | 34.2 | | $ | 26.0 | | $ | 36.1 | |
| Tax positions related to the current year: | | | |
| Additions | 4.2 | | 7.0 | | 0.6 | |
| Tax positions related to prior years: | | | |
| Additions | 4.5 | | 9.6 | | 4.0 | |
| Reductions | (1.6) | | (4.7) | | (4.7) | |
| Settlements with tax authorities | (0.1) | | (0.4) | | (1.9) | |
| Lapses in statutes of limitation | (5.4) | | (3.3) | | (8.1) | |
| Ending balance, December 31 | $ | 35.8 | | $ | 34.2 | | $ | 26.0 | |
During 2024, gross unrecognized tax benefits increased primarily for accruals related to prior year tax matters in multiple jurisdictions related to acquisitions and non-deductible expenses. These increases were partially offset by releases of accruals related to closing agreements and lapses in statute of limitations.
During 2023, gross unrecognized tax benefits increased primarily for accruals related to prior year tax matters in multiple jurisdictions related to acquisitions and non-U.S. non-deductible expenses. These increases were partially offset by releases of accruals related to closing agreements and lapses in statute of limitations.
During 2022, gross unrecognized tax benefits decreased primarily for releases of accruals related to lapses in statute of limitations and reductions related to foreign currency for non-U.S. positions. These decreases were partially offset by accruals for uncertain tax positions related to prior year tax matters in multiple jurisdictions related to acquisitions.
As of December 31, 2024, the Company is subject to examination by the IRS for tax years 2019 to the present. The Company also is subject to tax examination in various U.S. state and local tax jurisdictions for tax years 2017 to the present, as well as various foreign tax jurisdictions, including Mexico, China, Poland, France, India, Italy, Romania, Germany, Spain and Slovakia for tax years as early as 2003 to the present. The Company’s unrecognized tax benefits are presented on the Consolidated Balance Sheets as a component of other non-current liabilities, or in certain instances, as a reduction to deferred income taxes.
Note 6 - Earnings Per Share
The following table sets forth the reconciliation of the numerator and the denominator of basic earnings per share and diluted earnings per share for the years ended December 31, 2024, 2023 and 2022:
| | | | | | | | | | | |
| 2024 | 2023 | 2022 |
| Numerator: | | | |
| Net income attributable to The Timken Company | $ | 352.7 | | $ | 394.1 | | $ | 407.4 | |
| | | |
| | | |
| Denominator: | | | |
| Weighted average number of shares outstanding - basic | 70,198,067 | | 71,377,656 | | 73,602,247 | |
| Effect of dilutive securities: | | | |
| Stock options and awards - based on the treasury stock method | 552,415 | | 704,228 | | 721,592 | |
| Weighted average number of shares outstanding, assuming dilution of stock options and awards | 70,750,482 | | 72,081,884 | | 74,323,839 | |
| Basic earnings per share | $ | 5.02 | | $ | 5.52 | | $ | 5.54 | |
| Diluted earnings per share | $ | 4.99 | | $ | 5.47 | | $ | 5.48 | |
The dilutive effect of performance-based restricted stock units is taken into account once they have met minimum performance thresholds. The dilutive effect of stock options includes all outstanding stock options except stock options that are considered antidilutive. Stock options are antidilutive when the exercise price exceeds the average market price of the Company’s common shares during the periods presented. There were no antidilutive stock options outstanding during 2024, 2023 and 2022.
Note 7 - Inventories
The components of inventories at December 31, 2024 and 2023 were as follows:
| | | | | | | | |
| 2024 | 2023 |
| Manufacturing supplies | $ | 42.8 | | $ | 41.9 | |
| Raw materials | 155.2 | | 145.6 | |
| Work in process | 476.0 | | 496.1 | |
| Finished products | 595.0 | | 619.2 | |
| Subtotal | $ | 1,269.0 | | $ | 1,302.8 | |
| Allowance for surplus and obsolete inventory | (73.4) | | (73.7) | |
| Total Inventories, net | $ | 1,195.6 | | $ | 1,229.1 | |
Inventories at December 31, 2024 valued on the FIFO cost method were 59% and the remaining 41% were valued by the LIFO method. If all inventories had been valued at FIFO, inventories would have been $257.2 million and $232.1 million greater at December 31, 2024 and 2023, respectively. The Company recognized an increase in its LIFO reserve of $25.1 million during 2024, compared to a decrease in its LIFO reserve of $3.3 million during 2023.
Note 8 - Property, Plant and Equipment
The components of property, plant and equipment, net at December 31, 2024 and 2023 were as follows:
| | | | | | | | |
| 2024 | 2023 |
| Land and buildings | $ | 673.6 | | $ | 679.9 | |
| Machinery and equipment | 2,439.4 | | 2,483.4 | |
| Subtotal | $ | 3,113.0 | | $ | 3,163.3 | |
| Less: accumulated depreciation | (1,806.1) | | (1,851.4) | |
| Property, Plant and Equipment, net | $ | 1,306.9 | | $ | 1,311.9 | |
Total depreciation expense was $136.3 million, $129.0 million and $113.4 million in 2024, 2023 and 2022, respectively.
At December 31, 2024 and 2023, $21.4 million and $22.9 million of property, plant and equipment was included in accounts payable, trade and were paid subsequent to year-end. The Consolidated Statements of Cash Flows were adjusted accordingly.
On September 30, 2024, the Company completed the sale of its former bearing plant in Gaffney, South Carolina. The Company received $16.0 million in cash proceeds for the Gaffney plant and recognized a pretax gain of $13.8 million on the sale. The gain was reflected in gain on sale of real estate in the Consolidated Statements of Income.
Note 9 - Goodwill and Other Intangible Assets
Goodwill:
The Company tests goodwill and indefinite-lived intangible assets for impairment at least annually, performing its annual impairment test as of October 1st. Furthermore, goodwill and indefinite-lived intangible assets are reviewed for impairment whenever events or changes in circumstances indicate that the carrying value may not be recoverable.
The Engineered Bearings segment has one reporting unit and the Industrial Motion segment has six reporting units.
During the first quarter of 2023, the Company reviewed goodwill for impairment for its reporting units due to the change in segment reporting that went into effect January 1, 2023. The Company utilizes both an income approach and a market approach in testing goodwill for impairment. The Company utilized updated forecasts for the income approach as part of the goodwill impairment review. Based on the earnings and cash flow forecasts for the Belts and Chain reporting unit within the Industrial Motion segment, the Company determined that the reporting unit could not support the carrying value of its goodwill. As a result, the Company recorded a pretax impairment loss of $28.3 million during the first quarter of 2023, which was reported in impairment and restructuring charges on the Consolidated Statement of Income. During the fourth quarter of 2024, the Company recorded an additional goodwill impairment loss of $1.5 million for the Belts and Chain reporting unit, bringing their goodwill balance to zero. This impairment loss is reported in impairment and restructuring charges on the Consolidated Statements of Income.
Changes in the carrying value of goodwill were as follows:
Year ended December 31, 2024: | | | | | | | | | | | |
| Engineered Bearings | Industrial Motion | Total |
| Beginning Balance | $ | 692.3 | | $ | 677.3 | | $ | 1,369.6 | |
| Acquisitions | — | | 61.4 | | 61.4 | |
| Measurement period adjustments related to 2023 acquisitions | 6.0 | | 0.4 | | 6.4 | |
| Impairment loss | — | | (1.5) | | (1.5) | |
| Foreign currency translation adjustments and other changes | (6.3) | | (46.3) | | (52.6) | |
| Ending Balance | $ | 692.0 | | $ | 691.3 | | $ | 1,383.3 | |
Note 9 - Goodwill and Other Intangible Assets (continued)
The acquisition of CGI added goodwill of $61.4 million in 2024. Goodwill arising from this acquisition is attributed to the expected synergies, including future cost savings, and other benefits expected to be generated by combining the companies. The goodwill related to CGI is not deductible for tax purposes.
Year ended December 31, 2023:
| | | | | | | | | | | |
| Engineered Bearings | Industrial Motion | Total |
| Beginning Balance | $ | 679.8 | | $ | 418.5 | | $ | 1,098.3 | |
| Acquisitions | 13.2 | | 272.4 | | 285.6 | |
| Impairment loss | — | | (28.3) | | (28.3) | |
Foreign currency translation adjustments and other changes
| (0.7) | | 14.7 | | 14.0 | |
| Ending Balance | $ | 692.3 | | $ | 677.3 | | $ | 1,369.6 | |
The acquisitions of Lagersmit, iMECH, Rosa, Des-Case, Nadella and ARB added goodwill of $58.5 million, $12.8 million, $6.5 million, $78.9 million, $128.5 million and $0.4 million, respectively, in 2023. Goodwill arising from these acquisitions is attributed to the expected synergies, including future cost savings, and other benefits expected to be generated by combining the companies. The goodwill related to iMECH and ARB is deductible for tax purposes and will be amortized over 15 years. For the other 2023 acquisitions, goodwill is not deductible for tax purposes.
No material goodwill impairment losses were recorded in 2022.
Intangible Assets:
The following table displays intangible assets as of December 31, 2024 and 2023:
| | | | | | | | | | | | | | | | | | | | |
| 2024 | 2023 |
| Gross
Carrying
Amount | Accumulated
Amortization | Net
Carrying
Amount | Gross
Carrying
Amount | Accumulated
Amortization | Net
Carrying
Amount |
Intangible assets subject
to amortization: | | | | | | |
| Customer relationships | $ | 805.7 | | $ | (262.9) | | $ | 542.8 | | $ | 776.5 | | $ | (222.8) | | $ | 553.7 | |
| Technology and know-how | 369.6 | | (120.4) | | 249.2 | | 343.3 | | (100.9) | | 242.4 | |
| Trade names | 107.5 | | (16.9) | | 90.6 | | 71.3 | | (11.2) | | 60.1 | |
| Capitalized Software | 302.8 | | (276.1) | | 26.7 | | 299.5 | | (272.8) | | 26.7 | |
| Other | 11.0 | | (9.8) | | 1.2 | | 10.8 | | (8.7) | | 2.1 | |
| | $ | 1,596.6 | | $ | (686.1) | | $ | 910.5 | | $ | 1,501.4 | | $ | (616.4) | | $ | 885.0 | |
Intangible assets not
subject to amortization: | | | | | | |
| Trade names | $ | 87.3 | | | $ | 87.3 | | $ | 137.7 | | | $ | 137.7 | |
| FAA air agency certificates | 8.7 | | | 8.7 | | 8.7 | | | 8.7 | |
| | $ | 96.0 | | | $ | 96.0 | | $ | 146.4 | | | $ | 146.4 | |
| Total intangible assets | $ | 1,692.6 | | $ | (686.1) | | $ | 1,006.5 | | $ | 1,647.8 | | $ | (616.4) | | $ | 1,031.4 | |
Intangible assets acquired in 2024 totaled $100.4 million. The intangible assets subject to amortization were assigned useful lives of 15 to 18 years and had a weighted-average amortization of 16.8 years.
Amortization expense for intangible assets was $85.5 million, $72.3 million and $50.6 million for the years ended December 31, 2024, 2023 and 2022, respectively. Amortization expense for intangible assets is estimated to be approximately $82 million in 2025, $80 million in 2026, $77 million in 2027, $74 million in 2028 and $71 million in 2029.
Note 10 - Other Current Liabilities
The following table displays other current liabilities as of December 31, 2024 and 2023:
| | | | | | | | |
| (Dollars in millions) | |
| 2024 | 2023 |
| Sales rebates | $ | 69.2 | | $ | 79.0 | |
| Deferred revenue | 41.4 | | 45.4 | |
| Operating lease liabilities | 32.0 | | 25.9 | |
| Product warranty | 18.0 | | 15.2 | |
| Freight and duties | 14.3 | | 13.4 | |
| Current derivative liability | 10.4 | | 11.4 | |
| Taxes other than income and payroll taxes | 25.8 | | 17.8 | |
| Professional fees | 11.5 | | 12.5 | |
| Interest | 25.3 | | 16.4 | |
| Restructuring | 3.7 | | 5.8 | |
| Other | 67.6 | | 74.3 | |
| Total other current liabilities | $ | 319.2 | | $ | 317.1 | |
Note 11 - Leasing
The Company enters into operating and finance leases for manufacturing facilities, warehouses, sales offices, information technology equipment, plant equipment, vehicles and certain other equipment.
Lease expense for the years ended December 31, 2024, 2023 and 2022 was as follows:
| | | | | | | | | | | |
| | | |
| 2024 | 2023 | 2022 |
| Operating lease expense | $ | 32.7 | | $ | 33.5 | | $ | 30.3 | |
| Amortization of right-of-use assets on finance leases | 3.0 | | 2.2 | | 1.7 | |
| Total lease expense | $ | 35.7 | | $ | 35.7 | | $ | 32.0 | |
Cash flows from operating and financing leases for the years ended December 31, 2024, 2023 and 2022 was as follows:
| | | | | | | | | | | |
| | | |
| 2024 | 2023 | 2022 |
| Cash paid for amounts included in the measurement of lease liabilities: | | | |
| Operating cash flows from operating leases | $ | 35.7 | | $ | 33.6 | | $ | 30.1 | |
| Financing cash flows from finance leases | 2.8 | | 2.1 | | 1.2 | |
The following tables present the impact of leasing on the Consolidated Balance Sheets at December 31, 2024 and 2023:
| | | | | | | | |
| Operating Leases | 2024 | 2023 |
| Lease assets: | | |
| Operating lease assets | $ | 130.6 | | $ | 119.7 | |
| Lease liabilities: | | |
| Short-term operating lease liabilities | $ | 32.0 | | $ | 25.9 | |
| Long-term operating lease liabilities | 84.0 | | 78.7 | |
| Total operating lease liabilities | $ | 116.0 | | $ | 104.6 | |
Short-term operating lease liabilities at December 31, 2024 and 2023 are included in other current liabilities on the Consolidated Balance Sheets.
| | | | | | | | |
| Finance Leases | 2024 | 2023 |
| Lease assets: | | |
| Property, plant and equipment, net | $ | 8.4 | | $ | 8.9 | |
| Lease liabilities: | | |
| Current portion of long-term debt | $ | 2.7 | | $ | 2.4 | |
| Long-term debt | 6.1 | | 6.1 | |
| Total finance lease liabilities | $ | 8.8 | | $ | 8.5 | |
Note 11 - Leasing (continued)
Future minimum lease payments under non-cancellable leases at December 31, 2024 were as follows:
| | | | | | | | |
| Operating Leases | Finance Leases |
| Year Ending December 31, | | |
| 2025 | $ | 36.2 | | $ | 2.9 | |
| 2026 | 28.5 | | 2.5 | |
| 2027 | 22.5 | | 1.7 | |
| 2028 | 17.0 | | 0.9 | |
| 2029 | 13.2 | | 0.5 | |
| Thereafter | 12.1 | | 1.0 | |
| Total future minimum lease payments | $ | 129.5 | | $ | 9.5 | |
| Less: imputed interest | (13.5) | | (0.7) | |
| Total | $ | 116.0 | | $ | 8.8 | |
The following tables present lease assets added for the periods ended December 31, 2024 and 2023:
| | | | | | | | |
| | |
| 2024 | 2023 |
| Lease assets added in the period: | | |
| Operating leases | $ | 36.0 | | $ | 23.3 | |
| Finance leases | 3.9 | | 7.9 | |
The following tables present other information related to leases at December 31, 2024 and 2023:
| | | | | | | | |
| 2024 | 2023 |
| Weighted-average remaining lease term: | | |
| Operating leases | 4.6 years | 5.3 years |
| Finance leases | 4.3 years | 5.1 years |
| Weighted-average discount rate: | | |
| Operating leases | 4.65 | % | 4.20 | % |
| Finance leases | 4.87 | % | 4.24 | % |
Note 12 - Financing Arrangements
Short-term debt as of December 31, 2024 and 2023 was as follows:
| | | | | | | | |
| 2024 | 2023 |
Variable-rate Term Loan(1), originally due to mature on August 16, 2024; redeemed on May 29, 2024. | $ | — | | $ | 220.8 | |
| Borrowings under lines of credit for certain of the Company’s foreign subsidiaries with various banks with interest rates ranging from 3.36% to 3.95% at December 31, 2024 and 4.35% to 7.33% at December 31, 2023 | 8.7 | | 25.4 | |
| Short-term debt | $ | 8.7 | | $ | 246.2 | |
On August 16, 2023, the Company entered into a €200 million variable-rate term loan ("2024 Term Loan"), maturing on August 16, 2024. The Company repaid the 2024 Term Loan during the second quarter of 2024.
The lines of credit for certain of the Company’s foreign subsidiaries provide for short-term borrowings, with most of these lines of credit being uncommitted. At December 31, 2024, the Company’s foreign subsidiaries had borrowings outstanding of $8.7 million and bank guarantees of $1.6 million. The weighted-average interest rate on these lines of credit during the year were 4.19%, 4.24% and 1.40% in 2024, 2023 and 2022, respectively. The weighted-average interest rate on lines of credit outstanding at December 31, 2024 and 2023 was 3.58% and 4.81%, respectively.
Long-term debt as of December 31, 2024 and 2023 was as follows:
| | | | | | | | |
| 2024 | 2023 |
| Variable-rate Senior Credit Facility with an average interest rate on U.S. Dollar of 6.48% and Euro of 4.85% at December 31, 2023 | $ | — | | $ | 247.4 | |
| | |
| Variable-rate Accounts Receivable Facility, with an interest rate of 6.42% at December 31, 2023 | — | | 67.0 | |
Fixed-rate Senior Unsecured Notes(1), originally due to mature on September 1, 2024; redeemed on June 24, 2024 | — | | 350.0 | |
Fixed-rate Euro Senior Unsecured Notes(1), maturing on September 7, 2027, with an interest rate of 2.02% | 155.3 | | 165.5 | |
Variable-rate Term Loan(1), maturing on December 5, 2027, with an interest rate of 5.58% at December 31, 2024 and of 6.58% at December 31, 2023 | 369.6 | | 399.3 | |
Fixed-rate Medium-Term Notes, Series A(1), maturing at various dates through May 2028, with interest rates ranging from 6.74% to 7.76% | 154.8 | | 154.8 | |
Fixed-rate Senior Unsecured Notes(1), maturing on December 15, 2028, with an interest rate of 4.50% | 398.1 | | 397.7 | |
Fixed-rate Senior Unsecured Notes(1), maturing on April 1, 2032, with an interest rate of 4.13% | 345.1 | | 343.7 | |
Fixed-rate Euro Senior Unsecured Notes(1), maturing on May 23, 2034, with an interest rate of 4.13% | 609.7 | | — | |
| Fixed-rate Euro Bank Loan, maturing on June 30, 2033, with an interest rate of 2.15% | 10.6 | | 12.7 | |
| | |
| Other | 10.8 | | 11.6 | |
| Total debt | $ | 2,054.0 | | $ | 2,149.7 | |
| Less current maturities | 4.3 | | 359.4 | |
| Long-term debt | $ | 2,049.7 | | $ | 1,790.3 | |
(1) Net of discount and fees
Note 12 - Financing Arrangements (continued)
The Company renewed the Accounts Receivable Facility on December 6, 2023. The $100.0 million Accounts Receivable Facility matures on November 30, 2026. Under the terms of the Accounts Receivable Facility, the Company sells, on an ongoing basis, certain domestic trade receivables to Timken Receivables Corporation, a wholly owned consolidated subsidiary that, in turn, uses the trade receivables to secure borrowings that are funded through a vehicle that issues commercial paper in the short-term market. Borrowings under the Accounts Receivable Facility may be limited to certain borrowing base limitations. These limitations reduced the availability of the Accounts Receivable Facility to $93.9 million at December 31, 2024. As of December 31, 2024, there were no outstanding borrowings under the Accounts Receivable Facility. The cost of this facility, which is the prevailing commercial paper rate plus facility fees, is considered a financing cost and is included in interest expense in the Consolidated Statements of Income. The interest rate was 5.67%, 6.42% and 5.01% at December 31, 2024, 2023 and 2022, respectively.
On December 5, 2022, the Company entered into the Credit Agreement, which is comprised of a $750.0 million Senior Credit Facility and $400.0 million 2027 Term Loan, both of which mature on December 5, 2027. The Credit Agreement amended and restated the Company's previous revolving credit agreement that was set to mature on June 25, 2024, and replaced a $350.0 million term loan that was set to mature on September 11, 2023. The interest rates under the Credit Agreement are based on SOFR. At December 31, 2024, the Senior Credit Facility had no outstanding borrowings. The Credit Agreement has two financial covenants: a consolidated net leverage ratio and a consolidated interest coverage ratio.
On May 23, 2024, the Company issued the 2034 Notes in the aggregate principal amount of €600 million with an interest rate of 4.13%, maturing on May 23, 2034. Proceeds from the 2034 Notes were used for the redemption of the Company's outstanding 2024 Notes in the aggregate principal amount of $350 million, that were due to mature on September 1, 2024, as well as the repayment of other debt outstanding at the time of issuance.
On March 28, 2022, the Company issued the 2032 Notes in the aggregate principal amount of $350.0 million with an interest rate of 4.13%, maturing on April 1, 2032. Proceeds from the 2032 Notes were used for general corporate purposes, which included the repayment of borrowings under the Company's previous senior credit facility and Accounts Receivable Facility at the time of issuance.
At December 31, 2024, the Company was in full compliance with all applicable covenants on its outstanding debt.
In the ordinary course of business, the Company utilizes standby letters of credit issued by financial institutions to guarantee certain obligations, most of which relate to insurance contracts. At December 31, 2024, outstanding letters of credit totaled $55.7 million, primarily having expiration dates within 12 months.
The maturities of long-term debt (including $8.8 million of finance leases) for the years subsequent to December 31, 2024 are as follows:
| | | | | |
| Year | |
| 2025 | $ | 4.3 | |
| 2026 | 54.1 | |
| 2027 | 513.4 | |
| 2028 | 522.3 | |
| 2029 | 1.6 | |
| Thereafter | 977.2 | |
Interest paid was $113.2 million in 2024, $108.8 million in 2023 and $72.5 million in 2022. This differs from interest expense due to the timing of payments, the amortization of deferred financing fees and interest capitalized of $1.0 million in 2024, $0.2 million in 2023 and $1.0 million in 2022.
Note 13 - Supply Chain Financing
The Company has entered into a supplier finance program with two different financial institutions where suppliers may receive early payment from the financial institutions on invoices issued to the Company. The Company and each financial institution entered into arrangements providing for the Company to pay the financial institution per the terms of any supplier invoice paid early under the program and to pay an annual fee for the supplier finance platform subscription and related support. The Company or the financial institutions may terminate participation in the program with 90 days’ written notice. The supplier finance programs are unsecured and are not guaranteed by the Company. The financial institutions enter into separate arrangements with suppliers directly to participate in the program. The Company does not determine the terms or conditions of such arrangements or participate in the transactions between the suppliers and the financial institutions. The supplier invoice terms under the program typically require payment in full within 90 days of the invoice date.
The following table is a rollforward of the outstanding obligations for the Company’s supplier finance program for the twelve months ended December 31, 2024 and December 31, 2023:
| | | | | | | | | | |
| 2024 | 2023 | | |
| Confirmed obligations outstanding, January 1 | $ | 21.3 | | $ | 14.4 | | | |
| Invoices confirmed | 105.0 | | 97.1 | | | |
| Confirmed invoices paid | (109.6) | | (90.2) | | | |
| Confirmed obligations outstanding, ending balance | $ | 16.7 | | $ | 21.3 | | | |
The obligations outstanding at December 31, 2024 and December 31, 2023 were included in accounts payable, trade on the Consolidated Balance Sheet.
Note 14 - Contingencies
The Company is responsible for environmental remediation at various manufacturing facilities presently or formerly operated by the Company. In addition, the Company, through one of its subsidiaries, has currently been identified as a potentially responsible party for investigation and remediation under the Comprehensive Environmental Response, Compensation and Liability Act, known as the Superfund, or similar state laws with respect to one site. Claims for investigation and remediation have been asserted against numerous other unrelated entities, which are believed to be financially solvent and are expected to fulfill their proportionate share of the obligation.
On December 28, 2004, the United States Environmental Protection Agency (“USEPA”) sent Lovejoy, LLC ("Lovejoy") a Special Notice Letter that identified Lovejoy as a potentially responsible party, together with at least 12 unrelated parties, at the Ellsworth Industrial Park Site, Downers Grove, DuPage County, Illinois (the “Site”). The Company acquired Lovejoy in 2016. Lovejoy’s Downers Grove property is situated within the Ellsworth Industrial Complex. The USEPA and the Illinois Environmental Protection Agency (“IEPA”) allege there have been one or more releases or threatened releases of hazardous substances, including, but not limited to, a release or threatened release on or from Lovejoy's property at the Site. The relief sought by the USEPA and IEPA includes further investigation and potential remediation of the Site and reimbursement of response costs. Lovejoy’s allocated share of past and future costs related to the Site, including for investigation and/or remediation, could be significant. All previously pending property damage and personal injury lawsuits against Lovejoy related to the Site were settled or dismissed prior to our acquisition of Lovejoy.
In addition, governmental authorities in the United States and the European Union are increasingly focused on regulating PFAS. PFAS regulations are applicable to portions of the Company's products, and conditions may develop, arise or be discovered that create environmental compliance or remediation liabilities at certain of its facilities.
The Company had total environmental accruals of $4.8 million and $4.7 million for various known environmental matters that are probable and reasonably estimable as of December 31, 2024 and 2023, respectively, which includes the Lovejoy matter discussed above. These accruals were recorded based upon the best estimate of costs to be incurred in light of the progress made in determining the magnitude of remediation costs, the timing and extent of remedial actions required by governmental authorities and the amount of the Company’s liability in proportion to other responsible parties. The ultimate resolution of these matters could result in actual costs that exceed amounts accrued.
Legal Matter:
On June 11, 2024, the Company's subsidiary in India, TIL, received a government order claiming damages (penalties and interest) totaling approximately $12.4 million. The order relates to the closure of TIL’s retirement trust for employees and subsequent transfer of trust assets to the government-administered Employees’ Provident Fund Organization ("EFPO"). The order alleges that the surrender of trust assets did not follow applicable EFPO timing guidelines. TIL believes it fully complied with EFPO requirements and guidelines under the circumstances. TIL is disputing the merits of the order and has filed an appeal with the high court in India having jurisdiction over the matter. Management believes that relief will be provided to TIL once the matter is fully adjudicated; accordingly, no liability has been recorded. While no assurance can be given as to the ultimate outcome of this matter, the Company does not believe that the final resolution will have a material effect on the Company's consolidated financial position or liquidity; however, the effect of any future outcome may be material to the results of operations of any particular period in which costs, if any, are recognized.
Note 14 - Contingencies (continued)
Product Warranties:
In addition to the contingencies above, the Company provides limited warranties on certain of its products. The balances at the end of each respective period represent the best estimates of costs for existing and future claims for products that are still under warranty. The liability primarily relates to accruals for products sold into the automotive and wind energy sectors. Accrual estimates are based on actual claims and expected trends that continue to mature. In addition, the Company continues to evaluate claims raised by certain customers with respect to the performance of bearings sold into the wind energy and automotive sectors. Management believes that the outcome of these claims will not have a material effect on the Company's consolidated financial position; however, the effect of any such change may be material to the results of operations of any particular period in which such change occurs.
The following is a rollforward of the consolidated product warranty accrual at December 31, 2024 and 2023:
| | | | | | | | | |
| 2024 | 2023 | |
| Beginning balance, January 1 | $ | 15.2 | | $ | 23.5 | | |
| Expense | 9.4 | | 5.9 | | |
| Payments | (6.6) | | (14.2) | | |
| Ending balance | $ | 18.0 | | $ | 15.2 | | |
The product warranty accrual at December 31, 2024 and 2023 is included in other current liabilities on the Consolidated Balance Sheets.
Note 15 - Stock Compensation
Under its long-term incentive plan, the Company's common shares have been made available for grant, at the discretion of the Compensation Committee of the Board of Directors or its designees, to officers, directors and other key employees. Grants can take the form of performance- or time-based restricted stock units, deferred shares and stock options. A summary of the awards granted in 2024 is presented below:
| | | | | | | | | | | |
| Expected to be Settled in Equity | Expected to be Settled in Cash | Total Awards Granted |
| Performance-based restricted stock units | 233,895 | | 7,085 | | 240,980 | |
| Time-based restricted stock units | 171,130 | | 4,730 | | 175,860 | |
| Deferred shares | 30,100 | | — | | 30,100 | |
Performance-based restricted stock units are calculated and awarded based on the achievement of specified performance objectives and cliff vest three years from the date of grant. Time-based restricted stock units generally vest in 25% increments annually beginning on the first anniversary of the grant. Deferred shares generally cliff vest in a range of two to five years from the date of grant. For time-based restricted stock units that are expected to settle in cash, the Company had $2.1 million and $2.0 million accrued in salaries, wages and benefits as of December 31, 2024 and 2023, respectively, on the Consolidated Balance Sheets.
Note 15 - Stock Compensation (continued)
A summary of stock award activity, including performance-based restricted stock units, time-based restricted stock units and deferred shares that will settle in common shares for the year ended December 31, 2024 is as follows:
| | | | | | | | |
| Number of Shares | Weighted-average
Grant Date Fair Value |
| Outstanding - beginning of year | 869,386 | | $ | 75.00 | |
| Granted - new awards | 435,125 | | 81.23 | |
Adjusted for performance results achieved (1) | 71,092 | | 74.70 | |
| Vested | (366,427) | | 72.84 | |
| Canceled or expired | (27,166) | | 79.38 | |
| Outstanding - end of year | 982,010 | | $ | 78.43 | |
| | |
(1) Adjustments for the number of shares vested under the 2021 performance-based restricted stock unit awards at the end of the three-year period ended December 31, 2023 being higher than the target number of shares. |
The Company distributed shares totaling 366,427 in 2024, 376,261 in 2023 and 386,594 in 2022 due to the vesting of stock awards. The grant date fair value of these vested shares was $26.7 million, $20.8 million and $18.7 million, respectively. The Company recognized compensation expense of $25.9 million, $30.5 million and $29.3 million for the years ended December 31, 2024, 2023 and 2022, respectively, relating to performance-based restricted stock units, time-based restricted stock units, deferred shares and restricted shares.
As of December 31, 2024, the Company had unrecognized compensation expense of $31.8 million related to unvested stock awards, which is expected to be recognized over a total weighted-average period of two years.
In addition to performance-based restricted stock units, time-based restricted stock units and deferred shares, the Company has granted stock option awards to officers and key employees. Stock options typically have a ten-year term and generally vest in 25% increments beginning annually on the first anniversary date of grant.
During 2024, the Company recognized no stock-based compensation expense for stock options awards. During 2023 and 2022, the Company recognized stock-based compensation expense of $0.1 million and $1.1 million, respectively, for stock option awards.
Beginning in 2020, the Company discontinued the use of nonqualified stock options. As such, there were no stock option awards granted in 2024, 2023 or 2022.
A summary of stock option award activity for the year ended December 31, 2024 is presented below:
| | | | | | | | | | | | | | |
| Number of Shares | Weighted-average Exercise Price | Weighted-average Remaining Contractual Term | Aggregate Intrinsic Value (millions) |
| Outstanding - beginning of year | 386,617 | | $ | 42.69 | | | |
| | | | |
| Exercised | (128,888) | | 43.00 | | | |
| | | | |
| Outstanding - end of year | 257,729 | | $ | 42.53 | | 4 years | $ | 7.4 | |
| | | | |
| | | | |
As of December 31, 2024, there were 257,729 stock options outstanding. All of these options are fully vested and are exercisable at December 31, 2024.
The total intrinsic value of stock option awards exercised during the years ended December 31, 2024, 2023 and 2022 was $5.8 million, $22.2 million and $7.3 million, respectively. Net cash proceeds from the exercise of stock option awards were $5.6 million, $21.8 million and $8.5 million, respectively.
There were 5.8 million shares available for future grants for all plans at December 31, 2024.
Note 16 - Impairment and Restructuring Charges
Impairment and restructuring charges by segment were as follows:
Year ended December 31, 2024:
| | | | | | | | | | | | |
| Engineered Bearings | Industrial Motion | | Total |
| Impairment charges | $ | 2.0 | | $ | 1.5 | | | $ | 3.5 | |
| Severance and related benefit costs | 2.6 | | 5.0 | | | 7.6 | |
| Exit costs | 2.0 | | 0.3 | | | 2.3 | |
| Total | $ | 6.6 | | $ | 6.8 | | | $ | 13.4 | |
Year ended December 31, 2023:
| | | | | | | | | | | | |
| Engineered Bearings | Industrial Motion | | Total |
| Impairment charges | $ | 4.9 | | $ | 28.3 | | | $ | 33.2 | |
| Severance and related benefit costs | 5.5 | | 5.6 | | | 11.1 | |
| Exit costs | 0.9 | | 0.3 | | | 1.2 | |
| Total | $ | 11.3 | | $ | 34.2 | | | $ | 45.5 | |
Year ended December 31, 2022:
| | | | | | | | | | | | |
| Engineered Bearings | Industrial Motion | | Total |
| Impairment charges | $ | 9.0 | | $ | 29.3 | | | $ | 38.3 | |
| Severance and related benefit costs | 2.7 | | 1.5 | | | 4.2 | |
| Exit costs | 1.4 | | 0.2 | | | 1.6 | |
| Total | $ | 13.1 | | $ | 31.0 | | | $ | 44.1 | |
The following discussion explains the major impairment and restructuring charges recorded for the periods presented; however, it is not intended to reflect a comprehensive discussion of all amounts in the tables above.
Engineered Bearings:
On January 16, 2023, the Company announced the closure of its bearing plant in Gaffney, South Carolina. The facility ceased operations at the end of the fourth quarter of 2023 and affected approximately 225 employees. The Company transferred its operations to other bearing manufacturing facilities. During 2024, the Company recorded severance and related benefits of $0.2 million and exit costs of $1.7 million related to this closure. During 2023, the Company recorded severance and related benefits of $3.6 million and exit costs of $0.6 million related to this closure. During 2022, the Company recorded severance and related benefits of $0.9 million related to this closure. The Company incurred cumulative pretax costs related to this closure of $16.8 million as of December 31, 2024, including rationalization costs recorded in cost of products sold.
During 2024, the Company recorded impairment charges of $2.0 million related to certain engineering-related assets used in the business. Management concluded no further investment would be made in these assets and as a result, reduced the value to zero.
As a result of Russia's invasion of Ukraine (and associated sanctions), the Company suspended its operations in Russia in 2022. During the year ended December 31, 2023, the Company recorded impairment charges of $3.9 million related to certain assets of its Russian JV. During the year ended December 31, 2022, the Company recorded impairment charges of $9.0 million related to certain assets of its Russian JV. During the fourth quarter of 2023, after evaluating various plans for the Russian JV and the Company's ability to control and influence the joint venture, the Company concluded it should deconsolidate its Russian JV and wrote-down the remaining investment of $4.7 million to zero.
Note 16 - Impairment and Restructuring Charges (continued)
During the year ended December 31, 2023 the Company classified TWB as assets held for sale and recorded impairment charges of $1.0 million. The Company subsequently completed the sale of TWB on October 16, 2023.
On July 19, 2021, the Company announced the closure of its bearing manufacturing facility in Villa Carcina, Italy. The Company transferred the manufacturing of its single-row tapered roller bearing production to other bearing facilities. The Company completed the closure of the facility on October 31, 2022, and it affected approximately 110 employees. During 2022, the Company recorded severance and related benefits of $1.4 million and exit costs of $1.6 million related to this closure. The exit costs recognized in 2022 primarily related to environmental remediation. The Company incurred cumulative pretax costs related to this closure of $9.9 million as of December 31, 2022, including rationalization costs recorded in cost of products sold. On November 1, 2022, the Company completed the sale of this facility and recognized a pretax gain of $3.6 million.
Industrial Motion:
On December 6, 2024, the Company announced a reduction in force for its belts manufacturing facility in Springfield, Missouri. The reorganization of this facility is expected to affect approximately 100 employees and be completed during the first half of 2026. On November 30, 2023, the Company announced the closure of its belts manufacturing facility in Fort Scott, Kansas. The Company expects to transfer its operations to other belts manufacturing facilities. The closure of this facility is expected to occur by the end of the second quarter of 2025 and is expected to affect approximately 155 employees. The Company expects to incur approximately $12 million to $14 million of pretax costs in total related to the closure of the Fort Scott facility and the reorganization of the Springfield facility. During the twelve months ended December 31, 2024, the Company recorded severance and related benefits of $2.5 million, related to the closure and reorganization. The Company has incurred cumulative pretax costs related to this closure of $6.8 million as of December 31, 2024, including rationalization costs recorded in cost of products sold.
During 2022, the Company announced certain organizational changes, which included the appointment of executive leaders for its Engineered Bearings and Industrial Motion product groups. After evaluating the impact from the organizational changes and related segmentation implications through the balance of 2022, the Company concluded that it would begin operating under two new reportable segments, Engineered Bearings and Industrial Motion, effective January 1, 2023. In conjunction with this change in segmented results, the Company reallocated its goodwill to new reporting units under these two segments. In addition, the Company was required to review goodwill for impairment under these new reporting units. As a result of this goodwill impairment review, the Company recognized a pretax goodwill impairment loss of $28.3 million during the three months ended March 31, 2023 for its Belts and Chain reporting unit. In 2024, the Company recognized a pretax goodwill impairment loss of $1.5 million for its Belts and Chain reporting unit.
In 2022, the Company classified the Timken Aerospace Drives Systems, LLC ("ADS") business as assets held for sale and recorded impairment charges of $29.3 million. The Company subsequently completed the sale of the ADS business on November 1, 2022.
During the year ended December 31, 2023, the Company recorded severance and related benefits of $2.2 million related to one of its automatic lubrication systems facilities in Europe and $1.5 million related to its gear drive manufacturing facility in Europe to align current employment levels with current demand.
Consolidated Restructuring Accrual:
The following is a rollforward of the consolidated restructuring accrual for the years ended December 31, 2024 and 2023:
| | | | | | | | |
| 2024 | 2023 |
| Beginning balance, January 1 | $ | 5.8 | | $ | 3.1 | |
| Expense | 9.9 | | 12.3 | |
| Payments | (12.0) | | (9.6) | |
| Ending balance, December 31 | $ | 3.7 | | $ | 5.8 | |
The restructuring accrual at December 31, 2024 and 2023 is included in other current liabilities on the Consolidated Balance Sheets.
Note 17 - Retirement Benefit Plans
The Company and its subsidiaries sponsor a number of defined benefit pension plans, which cover eligible employees, including certain employees in foreign countries. These plans generally are noncontributory. Pension benefits earned generally are based on years of service and compensation during active employment. The cash contributions and payments for the Company’s defined benefit pension plans were $24.6 million, $27.1 million and $11.2 million in 2024, 2023 and 2022, respectively.
The following tables summarize the net periodic benefit cost information and the related assumptions used to measure the net periodic benefit cost for the years ended December 31:
| | | | | | | | | | | | | | | | | | | | |
| U.S. Plans | International Plans |
| | 2024 | 2023 | 2022 | 2024 | 2023 | 2022 |
Components of net periodic
benefit cost: | | | | | | |
| Service cost | $ | 0.7 | | $ | 0.8 | | $ | 6.9 | | $ | 1.9 | | $ | 1.6 | | $ | 1.6 | |
| Interest cost | 17.1 | | 17.9 | | 17.7 | | 10.2 | | 10.4 | | 5.7 | |
| Expected return on plan assets | (7.6) | | (8.5) | | (18.9) | | (9.6) | | (10.4) | | (9.3) | |
| Amortization of prior service cost | 0.1 | | 0.2 | | 1.2 | | 0.2 | | 0.2 | | 0.1 | |
Recognition of net actuarial
(gains) losses | (1.3) | | 9.2 | | 22.6 | | 0.6 | | 12.4 | | (6.6) | |
| Curtailment gain | — | | — | | — | | (0.1) | | — | | — | |
| Net periodic benefit cost (credit) | $ | 9.0 | | $ | 19.6 | | $ | 29.5 | | $ | 3.2 | | $ | 14.2 | | $ | (8.5) | |
| | | | | | | | | | | |
| Assumptions | 2024 | 2023 | 2022 |
| U.S. Plans: | | | |
| Discount rate | 5.37% to 5.53% | 5.62% to 5.74% | 3.03% to 4.95% |
| Future compensation assumption | 3.25% | 2.50% to 3.50% | 2.50% to 3.50% |
| Expected long-term return on plan assets | 2.09% to 4.67% | 4.31% to 4.91% | 4.35% to 5.65% |
| International Plans: | | | |
| Discount rate | 3.15% to 11.70% | 3.70% to 10.70% | 1.00% to 9.50% |
| Future compensation assumption | 3.00% to 8.00% | 2.80% to 8.00% | 2.10% to 8.00% |
| Expected long-term return on plan assets | 2.50% to 8.90% | 2.50% to 8.90% | 2.00% to 8.90% |
The following table summarizes assumptions used to measure the benefit obligation for the defined benefit pension plans at December 31:
| | | | | | | | |
| Assumptions | 2024 | 2023 |
| U.S. Plans: | | |
| Discount rate | 5.78% to 5.84% | 5.37% to 5.53% |
| Future compensation assumption | 3.00% | 3.25 | % |
| International Plans: | | |
| Discount rate | 3.35% to 11.40% | 3.15% to 11.70% |
| Future compensation assumption | 2.62% to 8.00% | 3.00% to 8.00% |
Note 17 - Retirement Benefit Plans (continued)
The Company recognized actuarial gains of $0.7 million during 2024 primarily due to the impact of a net increase in the discount rate used to measure its defined benefit pension obligations of $28.7 million, partially offset by lower than expected returns on plan assets of $26.8 million and experience losses of $1.2 million. The impact of the net increase in the discount rate used to measure the Company's defined benefit pension obligations was primarily driven by a 95 basis point increase in the discount rate used to measure its U.K. plan obligations, which increased from 4.48% in 2023 to 5.43% in 2024, and a 43 basis point increase in the weighted-average discount rate used to measure its U.S. plan obligations, which increased from 5.40% in 2023 to 5.83% in 2024.
The Company recognized actuarial losses of $21.6 million during 2023 primarily due to the impact of a net reduction in the discount rate used to measure its defined benefit pension obligations of $17.6 million and the impact of experience losses of $10.3 million, partially offset by changes in mortality of $6.0 million primarily related to the U.K. plan obligations and other actuarial gains of $0.3 million. The impact of the net reduction in the discount rate used to measure the Company's defined benefit pension obligations was primarily driven by a 24 basis point reduction in the weighted-average discount rate used to measure its U.S. plan obligations, which decreased from 5.64% in 2022 to 5.40% in 2023, and a 33 basis point decrease in the discount rate used to measure its U.K. plan obligations, which decreased from 4.81% in 2022 to 4.48% in 2023. Returns on plan assets had no impact on actuarial losses for 2023.
The Company recognized actuarial losses of $16.0 million during 2022 primarily due to the impact of lower than expected returns on plan assets of $220.6 million, the impact of experience losses of $33.0 million, the impact of inflation of $5.4 million and other actuarial losses of $0.2 million, partially offset by the favorable impact of a net increase in the discount rate used to measure its defined benefit pension obligations of $243.2 million. The impact of the net increase in the discount rate used to measure the Company's defined benefit pension obligations was primarily driven by a 257 basis point increase in the weighted-average discount rate used to measure its U.S. plan obligations, which increased from 3.07% in 2021 to 5.64% in 2022, and a 301 basis point increase in the discount rate used to measure its U.K. plan obligations, which increased from 1.80% in 2021 to 4.81% in 2022.
For expense purposes in 2024, the Company applied a weighted-average discount rate of 5.40% to its U.S. defined benefit pension plans. For expense purposes in 2025, the Company will apply a weighted-average discount rate of 5.83% to its U.S. defined benefit pension plans.
For expense purposes in 2024, the Company applied a weighted-average expected rate of return of 3.94% for the Company’s U.S. pension plan assets. For expense purposes in 2025, the Company will apply a weighted-average expected rate of return on plan assets of 4.30%.
Note 17 - Retirement Benefit Plans (continued)
The following tables set forth the change in the benefit obligation and plan assets, funded status and amounts recognized on the Consolidated Balance Sheets for defined benefit pension plans as of December 31, 2024 and 2023:
| | | | | | | | | | | | | | |
| U.S. Plans | International Plans |
| | 2024 | 2023 | 2024 | 2023 |
| Change in benefit obligation: | | | | |
| Benefit obligation at beginning of year | $ | 333.2 | | $ | 335.3 | | $ | 242.3 | | $ | 218.1 | |
| Service cost | 0.7 | | 0.8 | | 1.9 | | 1.6 | |
| Interest cost | 17.1 | | 17.9 | | 10.2 | | 10.4 | |
| Plan amendments | — | | — | | 0.3 | | — | |
| Actuarial (gains) losses | (12.6) | | 10.8 | | (14.9) | | 10.8 | |
| International plan exchange rate change | — | | — | | (6.9) | | 10.4 | |
| Curtailments | — | | — | | (0.1) | | — | |
| Benefits paid | (21.0) | | (31.6) | | (15.0) | | (14.7) | |
| Acquisitions | — | | — | | — | | 3.9 | |
| Other | — | | — | | 0.4 | | 1.8 | |
| | | | |
| Benefit obligation at end of year | $ | 317.4 | | $ | 333.2 | | $ | 218.2 | | $ | 242.3 | |
| | | | | | | | | | | | | | |
| | |
| | | | |
| Change in plan assets: | | | | |
| Fair value of plan assets at beginning of year | $ | 199.2 | | $ | 201.6 | | $ | 196.8 | | $ | 185.5 | |
| Actual return on plan assets | (3.7) | | 10.1 | | (5.9) | | 8.8 | |
| Company contributions / payments | 20.5 | | 19.1 | | 4.1 | | 8.0 | |
| International plan exchange rate change | — | | — | | (4.1) | | 9.2 | |
| | | | |
| | | | |
| Benefits paid | (21.0) | | (31.6) | | (15.0) | | (14.7) | |
| Fair value of plan assets at end of year | 195.0 | | 199.2 | | 175.9 | | 196.8 | |
| Funded status at end of year | $ | (122.4) | | $ | (134.0) | | $ | (42.3) | | $ | (45.5) | |
| | | | | | | | | | | | | | |
| Amounts recognized on the Consolidated Balance Sheets: | | | | |
| | | | |
| Current liabilities | $ | (4.9) | | $ | (4.8) | | $ | (2.1) | | $ | (2.4) | |
| Non-current liabilities | (117.5) | | (129.2) | | (40.2) | | (43.1) | |
| $ | (122.4) | | $ | (134.0) | | $ | (42.3) | | $ | (45.5) | |
| | | | | | | | | | | | | | |
| Amounts recognized in accumulated other comprehensive loss: | | | | |
| | | | |
| Net prior service cost | $ | — | | $ | 0.1 | | $ | 3.6 | | $ | 3.6 | |
| Accumulated other comprehensive loss | $ | — | | $ | 0.1 | | $ | 3.6 | | $ | 3.6 | |
| | | | | | | | | | | | | | |
Changes in prior service cost recognized in accumulated other
comprehensive loss: | | | | |
| Accumulated other comprehensive loss at beginning of year | $ | 0.1 | | $ | 0.3 | | $ | 3.6 | | $ | 3.6 | |
| | | | |
| Prior service cost | — | | — | | 0.3 | | — | |
| Recognized prior service cost | (0.1) | | (0.2) | | (0.2) | | (0.2) | |
| | | | |
| | | | |
| Foreign currency impact | — | | — | | (0.1) | | 0.2 | |
Total recognized in accumulated other comprehensive
loss at December 31 | $ | — | | $ | 0.1 | | $ | 3.6 | | $ | 3.6 | |
The presentation in the above tables for amounts recognized in accumulated other comprehensive loss on the Consolidated Balance Sheets is before the effect of income taxes.
Note 17 - Retirement Benefit Plans (continued)
No defined benefit pension plans were overfunded as of December 31, 2024 and 2023. The current portion of accrued pension benefits, which was included in salaries, wages and benefits on the Consolidated Balance Sheets, was $7.0 million and $7.2 million at December 31, 2024 and 2023, respectively. In 2024, the current portion of accrued pension benefits relates to unfunded plans and represents the actuarial present value of expected payments related to the plans to be made over the next 12 months.
The four largest defined benefit pension plans, covering certain employees in the United States and U.K., represent 83% of the Company's projected benefit obligation at December 31, 2024 and 2023. These defined benefit pension plans are closed to new entrants and benefits have been frozen for three of these plans.
The projected benefit obligation at December 31, 2024 exceeded the market value of plan assets for most of the Company's pension plans. For these plans, the projected benefit obligation was $534.9 million, the accumulated benefit obligation was $527.6 million and the fair value of plan assets was $370.3 million at December 31, 2024. The accumulated benefit obligation at December 31, 2024 exceeded the market value of plan assets for most of the Company’s pension plans. For these plans, the projected benefit obligation was $526.3 million, the accumulated benefit obligation was $521.4 million and the fair value of plan assets was $361.9 million at December 31, 2024.
The total accumulated benefit obligation for all plans was $528.0 million and $567.0 million at December 31, 2024 and 2023, respectively.
Investment performance decreased the value of the Company’s pension assets by 1.4% in 2024 largely due to increases in bond rates.
As of December 31, 2024, 2023 and 2022, the Company’s defined benefit pension plans did not directly hold any of the Company’s common shares.
Plan Assets:
The Company’s target allocation for pension plan assets, as well as the actual pension plan asset allocations as of December 31, 2024 and 2023, was as follows:
| | | | | | | | | | | | | | | | | | |
| Current Target
Allocation | Percentage of Pension Plan
Assets at December 31, | |
| Asset Category | | | | 2024 | 2023 | |
| Equity securities | 10% | to | 14% | 13% | 13% | |
| Fixed income securities | 78% | to | 90% | 83% | 84% | |
| Other investments | 2% | to | 6% | 4% | 3% | |
| Total | | | | 100% | 100% | |
The Company recognizes its overall responsibility to ensure that the assets of its various defined benefit pension plans are managed effectively and prudently and in compliance with its policy guidelines and all applicable laws. Preservation of capital is important; however, the Company also recognizes that appropriate levels of risk are necessary to allow its investment managers to achieve satisfactory long-term results consistent with the objectives and the fiduciary character of the pension funds. Asset allocations are established in a manner consistent with projected plan liabilities, benefit payments and expected rates of return for various asset classes, and are reviewed regularly by management. The expected rate of return for the investment portfolio is based on expected rates of return for various asset classes, as well as historical asset class and fund performance.
Note 17 - Retirement Benefit Plans (continued)
Fair value is defined as the price that would be received to sell an asset or paid to transfer a liability in an orderly transaction between market participants at the measurement date (exit price). The FASB provides accounting rules that classify the inputs used to measure fair value into the following hierarchy:
Level 1 -Unadjusted quoted prices in active markets for identical assets or liabilities.
Level 2 -Unadjusted quoted prices in active markets for similar assets or liabilities, or unadjusted quoted prices for identical or similar assets or liabilities in markets that are not active, or inputs other than quoted prices that are observable for the asset or liability.
Level 3 -Unobservable inputs for the asset or liability.
The following table presents the fair value hierarchy for those investments of the Company’s pension assets measured at fair value on a recurring basis:
| | | | | | | | | | | | | | | | | | | | | | | | | | |
| December 31, 2024 | December 31, 2023 |
| Level 1 | Level 2 | Level 3 | Total | Level 1 | Level 2 | Level 3 | Total |
| Assets: | | | | | | | | |
| Cash and cash equivalents | $ | 14.0 | | $ | — | | $ | — | | $ | 14.0 | | $ | 28.0 | | $ | — | | $ | — | | $ | 28.0 | |
| Government and agency securities | 8.0 | | — | | — | | 8.0 | | 9.0 | | — | | — | | 9.0 | |
| | | | | | | | |
| | | | | | | | |
| | | | | | | | |
| | | | | | | | |
| Equity securities - U.S. companies | 0.1 | | — | | — | | 0.1 | | 0.1 | | — | | — | | 0.1 | |
| | | | | | | | |
| | | | | | | | |
| | | | | | | | |
| | | | | | | | |
| | | | | | | | |
| | | | | | | | |
| Common collective funds - fixed income | — | | — | | — | | — | | 31.0 | | — | | — | | 31.0 | |
| | | | | | | | |
| | | | | | | | |
| | | | | | | | |
| | | | | | | | |
| Mutual funds - fixed income | 28.8 | | — | | — | | 28.8 | | 30.5 | | — | | — | | 30.5 | |
| | | | | | | | |
| | | | | | | | |
| | | | | | | | |
| | | | | | | | |
| | | | | | | | |
| $ | 50.9 | | $ | — | | $ | — | | $ | 50.9 | | $ | 98.6 | | $ | — | | $ | — | | $ | 98.6 | |
| Investments measured at net asset value: | | | | | | | | |
| | | | | | | | |
| | | | | | | | |
| | | | | | | | |
| | | | | | | | |
| Common collective funds - international equities | | | | 47.3 | | | | | 45.8 | |
| Common collective funds - fixed income | | | | 132.2 | | | | | 166.1 | |
| | | | | | | | |
| Limited partnerships | | | | 4.2 | | | | | 5.4 | |
| Real estate partnerships | | | | 2.3 | | | | | 3.5 | |
| Other liability-driven investments | | | | 109.1 | | | | | 51.6 | |
| Other assets | | | | 24.9 | | | | | 25.0 | |
| | | | | | | | |
| Total Assets | | | | $ | 370.9 | | | | | $ | 396.0 | |
International investments measured at net asset value totaled $173.5 million and $164.0 million at December 31, 2024 and 2023, respectively.
Cash and cash equivalents are valued at redemption value. Government and agency securities are valued at the closing price reported in the active market in which the individual securities are traded. Certain corporate bonds are valued at the closing price reported in the active market in which the bond is traded. Equity securities (both common and preferred stock) are valued at the closing price reported in the active market in which the individual security is traded. Common collective funds are valued based on a net asset value per share. Mutual funds classified as Level 1 assets include investments in fixed income and international equities. These investments are comprised of securities listed on exchange, market, or automated quotation systems, for which active, quoted prices are available. Mutual funds are valued based on a net asset value per share for shares held at year end, as determined by the closing price reported on the active market on which the individual securities are traded, or a pricing vendor or the fund family if an active market is not available. Asset-backed securities are valued based on quoted prices for similar assets in active markets. When such prices are unavailable, the plan trustee determines a valuation from the market maker dealing in the particular security.
Note 17 - Retirement Benefit Plans (continued)
Limited partnerships include investments in funds that invest primarily in private equity, venture capital and distressed debt. Limited partnerships are valued based on the ownership interest in the net asset value of the investment, which is used as a practical expedient to fair value, per the underlying investment fund, which is based upon the general partner's own assumptions about the assumptions a market participant would use in pricing the assets and liabilities of the partnership. Real estate investments include funds that invest in companies that primarily invest in commercial and residential properties, commercial mortgage-backed securities, debt and equity securities of real estate operating companies, and real estate investment trusts. Other real estate investments are valued based on the ownership interest in the net asset value of the investment, which is used as a practical expedient to fair value per the underlying investment fund, which is based on appraised values and current transaction prices.
Other liability-driven investments mainly include investments in index-linked open-end swap funds. These funds invest in cash held deposits that reflect the index-linked deferred annuity with payment terms of specific years linked to UK inflation measures. The underlying assets in this investment are valued daily.
Cash Flows:
| | | | | |
| Employer Contributions to Defined Benefit Plans | |
| 2023 | $ | 27.1 | |
| 2024 | 24.6 | |
| 2025 (estimated) | 37.6 | |
Estimated future benefit payments, including estimated lump sum distributions, are expected to be as follows:
| | | | | |
| Benefit Payments | |
| 2025 | $ | 56.4 | |
| 2026 | 48.5 | |
| 2027 | 44.2 | |
| 2028 | 42.6 | |
| 2029 | 41.7 | |
| 2030-2034 | 211.3 | |
U.K. Pension Plan
In January 2025, the Company entered into an insurance buy-in contract for its pension obligation for its U.K. defined benefit pension plan which was funded from existing pension plan assets without any adjustment to the benefit obligation. In addition, the Company contributed £6 million towards this insurance buy-in contract. The insurance buy-in contract will be classified as “Annuity Contracts” since the insurance buy-in contract is similar to an annuity contract. The insurance buy-in contract matches cash flows with future benefit payments for participants as of the contract date with the obligation remaining with the plan.
Employee Savings Plans:
The Company sponsors defined contribution retirement and savings plans covering substantially all employees in the United States and employees at certain non-U.S. locations. The Company made contributions to its defined contribution plans of $32.1 million, $35.6 million and $29.4 million in 2024, 2023 and 2022, respectively.
Note 18 - Other Postretirement Benefit Plans
The Company and its subsidiaries sponsor several postretirement plans that provide health care and life insurance benefits for eligible retirees and dependents. Depending on retirement date and employee classification, certain health care plans contain contribution and cost-sharing features such as deductibles, coinsurance and limitations on employer-provided subsidies. The remaining health care and life insurance plans are noncontributory.
The following tables summarize the net periodic benefit cost information and the related assumptions used to measure the net periodic benefit cost for the years ended December 31:
| | | | | | | | | | | |
| | 2024 | 2023 | 2022 |
| Components of net periodic credit: | | | |
| Service cost | $ | 0.1 | | $ | 0.1 | | $ | 0.2 | |
| Interest cost | 1.7 | | 1.9 | | 1.4 | |
| | | |
| Amortization of prior service credit | (8.2) | | (8.3) | | (10.1) | |
| Recognition of net actuarial gains | (0.5) | | (1.0) | | (13.1) | |
| Net periodic credit | $ | (6.9) | | $ | (7.3) | | $ | (21.6) | |
| | | | | | | | | | | |
| Assumptions: | 2024 | 2023 | 2022 |
| Discount rate | 5.55 | % | 5.75 | % | 2.99 | % |
| | | |
The following table summarizes assumptions used to measure the benefit obligation for the other postretirement benefit plans at December 31:
| | | | | | | | |
| Assumptions: | 2024 | 2023 |
| Discount rate | 5.83 | % | 5.55 | % |
The Company recognized actuarial gains of $0.5 million during 2024 primarily due to lower than expected benefit payments of $2.0 million, the impact of experience gains of $1.2 million and $0.6 million due to the impact of a 28 basis point increase in the discount rate used to measure the Company's defined benefit postretirement obligations. The discount rate increased from 5.55% in 2023 to 5.83% in 2024. These actuarial gains were partially offset by actuarial losses of $3.1 million due to the impact of an increase in the rate of Medicare Advantage plans and $0.2 million due to changes in other actuarial assumptions.
The Company recognized actuarial gains of $1.0 million during 2023 primarily due to lower than expected benefit payments of $1.4 million and $0.1 million due to changes in other actuarial assumptions. These actuarial gains were partially offset by a $0.5 million loss due to the impact of a 20 basis point decrease in the discount rate used to measure the Company's defined benefit postretirement obligations, which decreased from 5.75% in 2022 to 5.55% in 2023.
The Company recognized actuarial gains of $13.1 million during 2022 primarily due to the impact of a 276 basis point increase in the discount rate used to measure the Company's defined benefit postretirement obligations, which increased from 2.99% in 2021 to 5.75% in 2022. The increase in the discount rate resulted in a $8.4 million gain. In addition to the gain from the discount rate increases, the Company recognized actuarial gains of $3.0 million due to the impact of a reduction in the rate of Medicare Advantage plans and $1.9 million due to lower than expected benefit payments. These actuarial gains were offset by $0.2 million of changes in other actuarial assumptions.
Note 18 - Other Postretirement Benefit Plans (continued)
The discount rate assumption is based on current rates of high-quality long-term corporate bonds over the same period that benefit payments will be required to be made.
For expense purposes in 2024, the Company applied a discount rate of 5.55% to its other postretirement benefit plans. For expense purposes in 2025, the Company will apply a discount rate of 5.83% to its other postretirement benefit plans.
The following tables set forth the change in the benefit obligation and amounts recognized on the Consolidated Balance Sheets for other postretirement benefit plans as of December 31, 2024 and 2023:
| | | | | | | | |
| 2024 | 2023 |
| Change in benefit obligation: | | |
| Benefit obligation at beginning of year | $ | 33.7 | | $ | 35.5 | |
| Service cost | 0.1 | | 0.1 | |
| Interest cost | 1.7 | | 1.9 | |
| | |
| Actuarial gains | (0.5) | | (1.0) | |
| International plan exchange rate change | — | | (0.1) | |
| Benefits paid | (1.6) | | (2.7) | |
| | |
| Benefit obligation at end of year | $ | 33.4 | | $ | 33.7 | |
| Funded status at end of year | $ | (33.4) | | $ | (33.7) | |
| | | | | | | | |
| Amounts recognized on the Consolidated Balance Sheets: | | |
| | |
| Current liabilities | $ | (3.6) | | $ | (3.5) | |
| Non-current liabilities | (29.8) | | (30.2) | |
| | $ | (33.4) | | $ | (33.7) | |
| | | | | | | | |
| Amounts recognized in accumulated other comprehensive loss: | | |
| | |
| Net prior service credit | $ | (55.4) | | $ | (63.6) | |
| Accumulated other comprehensive loss | $ | (55.4) | | $ | (63.6) | |
| | | | | | | | |
Changes to prior service credit recognized in accumulated other
comprehensive loss: | | |
| Accumulated other comprehensive loss at beginning of year | $ | (63.6) | | $ | (71.9) | |
| | |
| Recognized prior service credit | 8.2 | | 8.3 | |
| | |
| | |
| Total recognized in accumulated other comprehensive loss at December 31 | $ | (55.4) | | $ | (63.6) | |
The presentation in the above tables for amounts recognized in accumulated other comprehensive loss on the Consolidated Balance Sheets is before the effect of income taxes.
The current portion of accrued postretirement benefits, which was included in salaries, wages and benefits on the Consolidated Balance Sheets, was $3.6 million and $3.5 million at December 31, 2024 and 2023, respectively. In 2024, the current portion of accrued postretirement benefits related to unfunded plans and represented the actuarial present value of expected payments related to the plans to be made over the next 12 months.
Note 18 - Other Postretirement Benefit Plans (continued)
For measurement purposes, the Company assumed a weighted-average annual rate of increase in the per capita cost (health care cost trend rate) of 7.00% for 2025, declining gradually to 5.0% in 2033 and thereafter for medical and prescription drug benefits. For Medicare Advantage benefits, actual contract rates have been set for 2025 through 2026, and are assumed to increase by $10 per year for 2027 through 2029 and then 6.0% for 2029, declining gradually to 5.0% in 2033 and thereafter.
Cash Flows:
Estimated future benefit payments to be funded by the Company are expected to be as follows:
| | | | | | | |
| Future Benefit Payments | | |
| 2025 | $ | 3.7 | | | |
| 2026 | 3.7 | | | |
| 2027 | 3.6 | | | |
| 2028 | 3.5 | | | |
| 2029 | 3.4 | | | |
| 2030-2034 | 14.0 | | | |
Note 19 - Sale of Shares of Timken India Limited
On June 20, 2023, the Company completed the sale of 7.6 million shares of TIL, a publicly traded subsidiary of the Company, generating net proceeds of $229.0 million after income taxes of $55.2 million and transaction costs. The sale reduced the Company’s ownership in TIL from 67.80 percent to 57.70 percent.
On May 28, 2024, the Company completed the sale of 5.0 million shares of TIL, generating net proceeds of $186.8 million after income taxes of $45.2 million and transaction costs. The sale reduced the Company’s ownership in TIL from 57.70 percent to 51.05 percent. The India market remains strategically important to Timken, and the Company is not contemplating any further sale transactions at the present time.
Note 20 - Accumulated Other Comprehensive (Loss) Income
The following tables present details about components of accumulated other comprehensive (loss) income for the years ended December 31, 2024 and December 31, 2023:
| | | | | | | | | | | | | | | |
| Foreign currency
translation adjustments | Pension and postretirement
liability adjustments | | Change in fair value of
derivative financial instruments | Total |
| Balance at December 31, 2023 | $ | (193.8) | | $ | 44.7 | | | $ | 2.2 | | $ | (146.9) | |
| Ownership changes | 5.6 | | — | | | — | | 5.6 | |
Other comprehensive income (loss) before reclassifications
and income taxes | (153.5) | | (0.1) | | | 5.5 | | (148.1) | |
Amounts reclassified from accumulated other comprehensive
(loss) income, before income tax | — | | (7.9) | | | (2.5) | | (10.4) | |
| Income tax (expense) benefit | (7.7) | | 2.0 | | | (1.0) | | (6.7) | |
Net current period other comprehensive income (loss),
net of income taxes and ownership changes | (155.6) | | (6.0) | | | 2.0 | | (159.6) | |
| Noncontrolling interest | 4.8 | | — | | | — | | 4.8 | |
Net current period comprehensive income (loss), net
of income taxes, noncontrolling interest and ownership
changes | (150.8) | | (6.0) | | | 2.0 | | (154.8) | |
| Balance at December 31, 2024 | $ | (344.6) | | $ | 38.7 | | | $ | 4.2 | | $ | (301.7) | |
| | | | | | | | | | | | | | | |
| Foreign currency
translation adjustments | Pension and postretirement
liability adjustments | | Change in fair value of
derivative financial instruments | Total |
| Balance at December 31, 2022 | $ | (235.7) | | $ | 50.8 | | | $ | 3.0 | | $ | (181.9) | |
| Ownership changes | 6.6 | | — | | | — | | 6.6 | |
Other comprehensive income (loss) before reclassifications
and income taxes | 33.5 | | (0.2) | | | (2.0) | | 31.3 | |
Amounts reclassified from accumulated other comprehensive
(loss) income, before income tax | — | | (7.9) | | | 0.9 | | (7.0) | |
| Income tax benefit | — | | 2.0 | | | 0.3 | | 2.3 | |
Net current period other comprehensive income (loss),
net of income taxes and ownership changes | 40.1 | | (6.1) | | | (0.8) | | 33.2 | |
| Noncontrolling interest | 1.8 | | — | | | — | | 1.8 | |
Net current period comprehensive (loss) income, net
of income taxes, noncontrolling interest and ownership
changes | 41.9 | | (6.1) | | | (0.8) | | 35.0 | |
| Balance at December 31, 2023 | $ | (193.8) | | $ | 44.7 | | | $ | 2.2 | | $ | (146.9) | |
Foreign currency translation adjustments at December 31, 2024 and 2023 included cumulative gains of $27.1 million and $3.3 million, respectively, net of deferred taxes, related to net investment hedges. Refer to Note 22 - Derivative Instruments for additional information on the net investment hedges.
Other comprehensive (loss) income before reclassifications and income taxes includes the effect of foreign currency.
Note 21 - Fair Value
The following tables present the fair value hierarchy for those assets and liabilities on the Consolidated Balance Sheets measured at fair value on a recurring basis as of December 31, 2024 and 2023:
| | | | | | | | | | | | | | |
| | December 31, 2024 |
| Total | Level 1 | Level 2 | Level 3 |
| Assets: | | | | |
| Cash and cash equivalents | $ | 343.1 | | $ | 341.8 | | $ | 1.3 | | $ | — | |
| Cash and cash equivalents measured at net asset value | 30.1 | | | | |
| Restricted cash | 0.4 | | 0.4 | | — | | — | |
| Short-term investments | 15.9 | | — | | 15.9 | | — | |
| | | | |
| Foreign currency forward contracts | 4.9 | | — | | 4.9 | | — | |
| Total Assets | $ | 394.4 | | $ | 342.2 | | $ | 22.1 | | $ | — | |
| Liabilities: | | | | |
| Foreign currency forward contracts | $ | 10.4 | | $ | — | | $ | 10.4 | | $ | — | |
| Total Liabilities | $ | 10.4 | | $ | — | | $ | 10.4 | | $ | — | |
| | | | | | | | | | | | | | |
| | December 31, 2023 |
| Total | Level 1 | Level 2 | Level 3 |
| Assets: | | | | |
| Cash and cash equivalents | $ | 384.4 | | $ | 381.0 | | $ | 3.4 | | $ | — | |
| Cash and cash equivalents measured at net asset value | 34.5 | | | | |
| Restricted cash | 0.4 | | 0.4 | | — | | — | |
| Short-term investments | 31.6 | | — | | 31.6 | | — | |
| | | | |
| Foreign currency forward contracts | 3.3 | | — | | 3.3 | | — | |
| Total Assets | $ | 454.2 | | $ | 381.4 | | $ | 38.3 | | $ | — | |
| Liabilities: | | | | |
| Foreign currency forward contracts | $ | 11.4 | | $ | — | | $ | 11.4 | | $ | — | |
| Total Liabilities | $ | 11.4 | | $ | — | | $ | 11.4 | | $ | — | |
Cash and cash equivalents are highly liquid investments with maturities of 90 days or less when purchased that are valued at redemption value. Short-term investments are investments with maturities between 91 days and one year, and generally are valued at amortized cost, which approximates fair value. A portion of the cash and cash equivalents and short-term investments are valued based on net asset value. The Company uses publicly available market interest rates to measure the fair value of its interest rate swap contracts. The Company uses publicly available foreign currency forward and spot rates to measure the fair value of its foreign currency forward contracts.
In addition, the Company remeasures certain assets to fair value, using Level 3 measurements, as a result of the occurrence of triggering events such as purchase accounting for acquisitions or goodwill impairment.
No material assets were measured at fair value on a nonrecurring basis during the years ended December 31, 2024 and 2023.
Note 21 - Fair Value (continued)
Financial Instruments:
The Company’s financial instruments consist primarily of cash and cash equivalents, short-term investments, net accounts receivable, trade accounts payable, short-term borrowings and long-term debt. Due to their short-term nature, the carrying value of cash and cash equivalents, short-term investments, accounts receivable, trade accounts payable, and short-term borrowings are a reasonable estimate of their fair value. Due to the nature of fair value calculations for variable-rate debt, the carrying value of the Company's long-term variable-rate debt is a reasonable estimate of its fair value. The fair value of the Company’s long-term fixed-rate debt, based on quoted market prices, was $1,659.2 million and $1,387.7 million at December 31, 2024 and 2023, respectively. The carrying value of this debt was $1,675.6 million and $1,424.3 million at December 31, 2024 and 2023, respectively. The fair value of long-term fixed-rate debt was measured using Level 2 inputs.
The Company does not believe it has significant concentrations of risk associated with the counterparts to its financial instruments.
Note 22 - Derivative Instruments
The Company is exposed to certain risks relating to its ongoing business operations. The primary risks managed by using derivative instruments are foreign currency exchange rate risk and interest rate risk. Forward contracts on various foreign currencies are entered into in order to manage the foreign currency exchange rate risk associated with certain of the Company's commitments denominated in foreign currencies. From time to time, interest rate swaps are used to manage interest rate risk associated with the Company’s fixed, and floating-rate borrowings.
The Company designates certain foreign currency forward contracts as cash flow hedges of forecasted revenues and certain interest rate hedges as cash flow hedges of fixed-rate borrowings.
On May 23, 2024, the Company designated its 2034 Notes, in the aggregate principal amount of €600.0 million, as a hedge against its net investment in one of its European subsidiaries. The objective of the hedge transaction is to protect the net investment in the foreign operations against changes in the exchange rate between the U.S. dollar and the Euro. The net impact for the year ended December 31, 2024 was a gain of $27.7 million recorded to accumulated comprehensive (loss) income.
On September 15, 2020, the Company designated €54.5 million of its €150.0 million fixed-rate senior unsecured notes, maturing on September 7, 2027 (the "2027 Notes") as a hedge against its net investment in one of its European subsidiaries. The objective of the hedge transaction is to protect the net investment in the foreign operations against changes in the exchange rate between the U.S. dollar and the Euro. The net impact for the year ended December 31, 2024 was to record a gain of $3.7 million to accumulated comprehensive loss (income).
The Company does not purchase or hold any derivative financial instruments for trading purposes. As of December 31, 2024 and 2023, the Company had $471.6 million and $591.8 million, respectively, of outstanding foreign currency forward contracts at notional value. Refer to Note 21 - Fair Value for the fair value disclosure of derivative financial instruments. Foreign currency forward contracts classified as assets are included in other current assets, and foreign currency forward contracts classified as liabilities are included in other current liabilities on the Consolidated Balance Sheets.
Cash Flow Hedging Strategy:
For certain derivative instruments that are designated and qualify as cash flow hedges (i.e., hedging the exposure to variability in expected future cash flows that is attributable to a particular risk), the gain or loss on the derivative instrument is reported as a component of other comprehensive income and reclassified into earnings in the same line item associated with the forecasted transaction and in the same period or periods during which the hedged transaction affects earnings.
To protect against a reduction in the value of forecasted foreign currency cash flows resulting from export sales, the Company has instituted a foreign currency cash flow hedging program. The Company hedges portions of its forecasted cash flows denominated in foreign currencies with forward contracts. When the dollar strengthens significantly against foreign currencies, the decline in the present value of future foreign currency revenue is offset by gains in the fair value of the forward contracts designated as hedges. Conversely, when the dollar weakens, the increase in the present value of future foreign currency cash flows is offset by losses in the fair value of the forward contracts. As of December 31, 2024 and 2023, the Company had $63.0 million and $73.8 million, respectively, of outstanding foreign currency forward contracts at notional value that were classified as cash flow hedges.
The maximum length of time over which the Company hedges it exposure to the variability in future cash flows for forecast transactions is generally eighteen months or less.
Note 22 - Derivative Instruments (continued)
Derivative Instruments not designated as Hedging Instruments:
For derivative instruments that are not designated as hedging instruments, the instruments are typically forward contracts. In general, the practice is to reduce volatility by selectively hedging transaction exposures including intercompany loans, accounts payable and accounts receivable. Intercompany loans between entities with different functional currencies typically are hedged with a forward contract at the inception of loan with a maturity date at the maturity of the loan. The revaluation of these contracts, as well as the revaluation of the underlying balance sheet items, is recorded directly to the income statement so the adjustment generally offsets the revaluation of the underlying balance sheet items to protect cash payments and reduce income statement volatility.
As of December 31, 2024 and 2023, the Company had $408.6 million and $518.0 million, respectively, of outstanding foreign currency forward contracts at notional value that were not designated as hedging instruments. The following table presents the impact of derivative instruments not designated as hedging instruments for the years ended December 31, 2024, 2023 and 2022, and the related location within the Consolidated Statements of Income.
| | | | | | | | | | | | | | |
| | Amount of gain or (loss)
recognized in income |
| | Year Ended December 31, |
| Derivatives not designated as hedging instruments | Location of gain or (loss) recognized in income | 2024 | 2023 | 2022 |
| Foreign currency forward contracts | Other income (expense), net | $ | (18.8) | | $ | (15.0) | | $ | (25.2) | |
Note 23 - Research and Development
The Company leverages its technical knowledge, research expertise, and production and engineering capabilities across all of its products and end markets to deliver high-performance products and services to its customers. Costs included in "Research and Development Expense" primarily relate to new product innovation. Costs included in "Engineering Expense" primarily relate to the technological enhancement of existing products and services as we align with our customers evolving needs. Expenditures may fluctuate from year-to-year depending on special projects and needs.
| | | | | | | | | | | |
| Year Ended December 31, |
| Expenditures as a percentage of sales | 2024 | 2023 | 2022 |
| Research and Development Expense | 1.1 | % | 0.8 | % | 0.8 | % |
| Engineering Expense | 2.1 | % | 1.9 | % | 1.5 | % |
| Total | 3.2 | % | 2.7 | % | 2.3 | % |
Note 24 - Government Assistance
From time to time, the Company receives government assistance in the form of grants and other incentives from various governments to support capital projects and other business development. The amounts received are typically based on the amount of qualifying capital expenditures or business development costs in the countries providing the government assistance. The Company typically has to meet certain requirements, such as adding or maintaining a specified number of qualifying positions, to retain the government assistance or the funds can be clawed back by the government. Once the Company determines that it will meet the requirements of the government assistance, the funds are recognized over the life of the related assets or as the costs are incurred. For amounts that are expected to be paid back, the Company recognizes applicable interest expense.
As of December 31, 2024 and December 31, 2023, the Company has recorded $1.5 million and $1.6 million, respectively, of government assistance in other current liabilities and $42.2 million and $36.0 million, respectively, in other non-current liabilities. In addition, as of December 31, 2024, the Company has cumulatively recorded $7.9 million of government assistance as a reduction to cost of products sold and $0.2 million as a reduction to SG&A. The Company has also cumulatively recognized interest expense of $2.1 million related to the expected shortfall of incentive obligations. The following paragraphs discuss the Company's most significant government assistance programs.
In December 2023, the Company reached a definitized technology investment agreement with the United States Government for the purposes of enhancing and expanding the industrial base for high performance, precision ball bearings. Title to assets purchased under this agreement vest with the Government throughout the agreement. The Government may elect to transfer all, or some, of the assets purchased to the Company at the end of the agreement, provided the Company's performance is satisfactory and in compliance with the terms of the agreement. As of December 31, 2024, the company is accounting for $7.2 million of awards received as other non-current liabilities. The awards will be amortized over the useful life of the assets purchased as a reduction to cost of products sold. As of December 31, 2024, amortization is less than $0.1 million.
In 2022, the Company acquired Spinea, s.r.o. ("Spinea"). Prior to the acquisition, Spinea received incentives totaling $18.0 million from the Slovakian government to invest in a new production facility and related machinery and equipment. As a result, Spinea was required to create 450 new jobs. If Spinea is unable to meet these commitments, all or a portion of the incentive could be recaptured with interest by October 2027. The Company is currently accounting for a potential shortfall of $16.6 million, including interest. The remaining amount is being amortized over the period the costs are being incurred. Cumulatively as of December 31, 2024, the Company recorded amortization expense of $3.3 million as a reduction to cost of products sold. In addition, the Company recorded total interest expense of $1.2 million due to the possibility of having to pay a portion of the incentive back.
In 2017 and 2018, the Company received grants from the Romanian Government for the reimbursement of capital investments for its new production facility, totaling $16.5 million. While the original grants were based on capital investments, the Company needs to pay various taxes, including corporate income tax, payroll taxes and building tax, totaling $16.6 million between 2019 and 2024. If the total tax obligation is not met, any shortfall could result in a recapture of the grant with interest as early as December 2024. The Company is currently accounting for a potential shortfall of $8.4 million, including interest. The incentive is being amortized over the useful life of the assets. Cumulatively as of December 31, 2024, the Company recorded amortization expense of $2.0 million as a reduction to cost of products sold. In addition, the Company recorded total interest expense of $0.9 million due to the expectation of having to pay a portion of the grant back.
The Company may have received other government assistance that is not described above; however, the total amount of the government assistance is immaterial to the Company’s Consolidated Financial Statements.
Note 25 - Quarterly Financial Data
(Unaudited) | | | | | | | | | | | | | | | | | |
| 2024 |
| 1st | 2nd | 3rd | 4th | Total |
| Net sales | $ | 1,190.3 | | $ | 1,182.3 | | $ | 1,126.8 | | $ | 1,073.6 | | $ | 4,573.0 | |
| Cost of products sold | 792.7 | | 808.7 | | 782.4 | | 748.5 | | 3,132.3 | |
| Selling, general and administrative expenses | 190.7 | | 184.1 | | 189.7 | | 187.5 | | 752.0 | |
| Amortization of intangible assets | 20.0 | | 19.0 | | 19.7 | | 19.3 | | 78.0 | |
| Impairment and restructuring charges | 2.3 | | 3.3 | | 2.5 | | 5.3 | | 13.4 | |
| | | | | |
| Operating income | 184.6 | | 167.2 | | 146.3 | | 113.0 | | 611.1 | |
Net income (1) | 110.6 | | 102.0 | | 87.6 | | 75.1 | | 375.3 | |
| Net income attributable to noncontrolling interests | 7.1 | | 5.8 | | 5.8 | | 3.9 | | 22.6 | |
| Net income attributable to The Timken Company | 103.5 | | 96.2 | | 81.8 | | 71.2 | | 352.7 | |
| Net income per share - Basic: | $ | 1.47 | | $ | 1.37 | | $ | 1.17 | | $ | 1.02 | | $ | 5.02 | |
| Net income per share - Diluted: | $ | 1.46 | | $ | 1.36 | | $ | 1.16 | | $ | 1.01 | | $ | 4.99 | |
| Dividends per share | $ | 0.33 | | $ | 0.34 | | $ | 0.34 | | $ | 0.34 | | $ | 1.35 | |
| | | | | |
| 2023 |
| 1st | 2nd | 3rd | 4th | Total |
| Net sales | $ | 1,262.8 | | $ | 1,272.3 | | $ | 1,142.7 | | $ | 1,091.2 | | $ | 4,769.0 | |
| Cost of products sold | 846.0 | | 866.9 | | 787.1 | | 759.9 | | 3,259.9 | |
| Selling, general and administrative expenses | 186.8 | | 184.9 | | 179.6 | | 189.5 | | 740.8 | |
| Amortization of intangible assets | 13.5 | | 17.3 | | 17.5 | | 17.4 | | 65.7 | |
| Impairment and restructuring charges | 28.9 | | 2.5 | | 8.9 | | 5.2 | | 45.5 | |
| | | | | |
| Operating income | 187.6 | | 200.7 | | 149.6 | | 119.2 | | 657.1 | |
Net income (2) | 125.7 | | 129.5 | | 90.9 | | 61.9 | | 408.0 | |
| Net income attributable to noncontrolling interests | 3.4 | | 4.3 | | 3.0 | | 3.2 | | 13.9 | |
| Net income attributable to The Timken Company | 122.3 | | 125.2 | | 87.9 | | 58.7 | | 394.1 | |
| Net income per share - Basic: | $ | 1.69 | | $ | 1.74 | | $ | 1.24 | | $ | 0.84 | | $ | 5.52 | |
| Net income per share - Diluted: | $ | 1.67 | | $ | 1.73 | | $ | 1.23 | | $ | 0.83 | | $ | 5.47 | |
| Dividends per share | $ | 0.31 | | $ | 0.33 | | $ | 0.33 | | $ | 0.33 | | $ | 1.30 | |
Earnings per share are computed independently for each of the quarters presented; therefore, the sum of the quarterly earnings per share may not equal the total computed for the year.
(1)Net income for the third quarter of 2024 included the gain on the sale of a former bearing manufacturing plant of $13.8 million. Net income for the fourth quarter of 2024 included net actuarial gains of $1.3 million.
(2)Net income for the first quarter of 2023 included goodwill impairment charges of $28.3 million. Net income for the fourth quarter of 2023 included net actuarial losses of $22.3 million.
Report of Independent Registered Public Accounting Firm
To the Shareholders and the Board of Directors of The Timken Company
Opinion on the Financial Statements
We have audited the accompanying consolidated balance sheets of The Timken Company and subsidiaries (the Company) as of December 31, 2024 and 2023, the related consolidated statements of income, comprehensive income, shareholders’ equity and cash flows for each of the three years in the period ended December 31, 2024, and the related notes and financial statement schedule listed in the Index at Item 15(a)(2) (collectively referred to as the “consolidated financial statements”). In our opinion, the consolidated financial statements present fairly, in all material respects, the financial position of the Company at December 31, 2024 and 2023, and the results of its operations and its cash flows for each of the three years in the period ended December 31, 2024, in conformity with U.S. generally accepted accounting principles.
We also have audited, in accordance with the standards of the Public Company Accounting Oversight Board (United States) (PCAOB), the Company’s internal control over financial reporting as of December 31, 2024, based on criteria established in Internal Control—Integrated Framework issued by the Committee of Sponsoring Organizations of the Treadway Commission (2013 framework), and our report dated February 20, 2025 expressed an unqualified opinion thereon.
Basis for Opinion
These financial statements are the responsibility of the Company’s management. Our responsibility is to express an opinion on the Company’s financial statements based on our audits. We are a public accounting firm registered with the PCAOB and are required to be independent with respect to the Company in accordance with the U.S. federal securities laws and the applicable rules and regulations of the Securities and Exchange Commission and the PCAOB.
We conducted our audits in accordance with the standards of the PCAOB. Those standards require that we plan and perform the audit to obtain reasonable assurance about whether the financial statements are free of material misstatement, whether due to error or fraud. Our audits included performing procedures to assess the risks of material misstatement of the financial statements, whether due to error or fraud, and performing procedures that respond to those risks. Such procedures included examining, on a test basis, evidence regarding the amounts and disclosures in the financial statements. Our audits also included evaluating the accounting principles used and significant estimates made by management, as well as evaluating the overall presentation of the financial statements. We believe that our audits provide a reasonable basis for our opinion.
Critical Audit Matter
The critical audit matter communicated below is a matter arising from the current period audit of the financial statements that was communicated or required to be communicated to the audit committee and that: (1) relates to accounts or disclosures that are material to the financial statements and (2) involved our especially challenging, subjective or complex judgments. The communication of the critical audit matter does not alter in any way our opinion on the consolidated financial statements, taken as a whole, and we are not, by communicating the critical audit matter below, providing a separate opinion on the critical audit matter or on the accounts or disclosures to which it relates.
| | | | | |
| United States and United Kingdom Pension Benefit Obligations |
| Description of the Matter | At December 31, 2024, the Company’s pension benefit obligation was $535.6 million. The four plans with the largest pension benefit obligations, covering certain employees in the United States and the United Kingdom, comprised 83% of the total projected benefit obligation as of December 31, 2024. As explained in Note 1 to the consolidated financial statements, the Company recognizes actuarial gains and losses immediately through net periodic benefit cost upon the annual remeasurement in the fourth quarter, or on an interim basis if specific events trigger a remeasurement. Auditing the pension benefit obligations of these four plans was complex and required the involvement of specialists due to the estimation uncertainty involved in determining the discount rates used in the measurement of these benefit obligations. |
| How We Addressed the Matter in Our Audit | We obtained an understanding, evaluated the design and tested the operating effectiveness of controls over the Company’s accounting for the measurement of the pension benefit obligations. For example, we tested controls over management’s review of the discount rates used in the measurement of these benefit obligations. To test the pension benefit obligation, our audit procedures included, among others, evaluating the methodology used and the significant actuarial assumptions discussed above. We compared the actuarial assumptions used by management to historical trends and, we involved actuarial specialists to assist with our procedures. For example, we evaluated management’s methodology for determining the discount rate that reflects the maturity and duration of the benefit payments and is used to measure the pension benefit obligations. In certain instances, as part of this assessment, we compared the projected cash flows to prior year and compared the current year benefits paid to the prior year projected cash flows. |
/s/ Ernst & Young LLP
We have served as the Company’s auditor since 1910.
Cleveland, Ohio
February 20, 2025
Item 9. Changes in and Disagreements with Accountants on Accounting and Financial Disclosure
Not applicable.
Item 9A. Controls and Procedures
As of the end of the period covered by this Annual Report on Form 10-K, the Company’s management carried out an evaluation, under the supervision and with the participation of the Company’s principal executive officer and principal financial officer, of the effectiveness of the design and operation of the Company’s disclosure controls and procedures as defined in Exchange Act Rule 13a-15(e). Based upon that evaluation, the principal executive officer and principal financial officer concluded that the Company’s disclosure controls and procedures were effective as of the end of the period covered by this Annual Report on Form 10-K.
There have been no changes during the Company’s fourth quarter of 2024 in the Company’s internal control over financial reporting that have materially affected, or are reasonably likely to materially affect, the Company’s internal control over financial reporting.
Report of Management on Internal Control Over Financial Reporting
The management of The Timken Company is responsible for establishing and maintaining adequate internal control over financial reporting for the Company. Timken’s internal control system is designed to provide reasonable assurance regarding the preparation and fair presentation of published financial statements. Because of its inherent limitations, internal control over financial reporting may not prevent or detect misstatements. Also, projections of any evaluation of effectiveness to future periods are subject to the risk that controls may become inadequate because of changes in conditions, or that the degree of compliance with the policies or procedures may deteriorate.
Timken management assessed the effectiveness of the Company’s internal control over financial reporting as of December 31, 2024. In making this assessment, it used the criteria set forth by the Committee of Sponsoring Organizations of the Treadway Commission ("COSO"). Based on this assessment under COSO’s “Internal Control–Integrated Framework,” management believes that, as of December 31, 2024, Timken’s internal control over financial reporting is effective.
During 2024, the Company completed the acquisition of CGI. The results of this acquisition are included in the Company's consolidated financial statements for 2024. The total and net assets of this acquisition represented 3% of the Company's total assets and 5% of the Company's net assets as of December 31, 2024. The net sales of this acquisition in the aggregate represented less than 1% of the Company's consolidated net sales for 2024. The scope of the Company's assessment of the effectiveness of internal control over financial reporting does not include the CGI acquisition noted above. This exclusion is in accordance with the SEC's general guidance that an assessment of a recently acquired business may be omitted from the Company's scope in the year of acquisition.
The effectiveness of the Company’s internal control over financial reporting as of December 31, 2024 has been audited by Ernst & Young LLP, an independent registered public accounting firm, as stated in their report which is presented in this Annual Report on Form 10-K.
Report of Independent Registered Public Accounting Firm
To the Shareholders and the Board of Directors of The Timken Company
Opinion on Internal Control Over Financial Reporting
We have audited The Timken Company and subsidiaries’ internal control over financial reporting as of December 31, 2024, based on criteria established in Internal Control—Integrated Framework issued by the Committee of Sponsoring Organizations of the Treadway Commission (2013 framework) (the COSO criteria). In our opinion, The Timken Company and subsidiaries (the Company) maintained, in all material respects, effective internal control over financial reporting as of December 31, 2024, based on the COSO criteria.
As indicated in the accompanying Report of Management on Internal Control Over Financial Reporting, management’s assessment of and conclusion on the effectiveness of internal control over financial reporting did not include the internal controls of CGI, Inc., which is included in the 2024 consolidated financial statements of the Company and constituted 3% and 5% of total and net assets, respectively, as of December 31, 2024 and less than 1% of revenues for the year then ended. Our audit of internal control over financial reporting of the Company also did not include an evaluation of the internal control over financial reporting of CGI, Inc.
We also have audited, in accordance with the standards of the Public Company Accounting Oversight Board (United States) (PCAOB), the consolidated balance sheets of the Company as of December 31, 2024 and 2023, the related consolidated statements of income, comprehensive income, shareholders' equity and cash flows for each of the three years in the period ended December 31, 2024, and the related notes and financial statement schedule listed in the Index at Item 15(a)(2) and our report dated February 20, 2025 expressed an unqualified opinion thereon.
Basis for Opinion
The Company’s management is responsible for maintaining effective internal control over financial reporting and for its assessment of the effectiveness of internal control over financial reporting included in the accompanying Report of Management on Internal Control Over Financial Reporting. Our responsibility is to express an opinion on the Company’s internal control over financial reporting based on our audit. We are a public accounting firm registered with the PCAOB and are required to be independent with respect to the Company in accordance with the U.S. federal securities laws and the applicable rules and regulations of the Securities and Exchange Commission and the PCAOB.
We conducted our audit in accordance with the standards of the PCAOB. Those standards require that we plan and perform the audit to obtain reasonable assurance about whether effective internal control over financial reporting was maintained in all material respects.
Our audit included obtaining an understanding of internal control over financial reporting, assessing the risk that a material weakness exists, testing and evaluating the design and operating effectiveness of internal control based on the assessed risk, and performing such other procedures as we considered necessary in the circumstances. We believe that our audit provides a reasonable basis for our opinion.
Definition and Limitations of Internal Control Over Financial Reporting
A company’s internal control over financial reporting is a process designed to provide reasonable assurance regarding the reliability of financial reporting and the preparation of financial statements for external purposes in accordance with generally accepted accounting principles. A company’s internal control over financial reporting includes those policies and procedures that (1) pertain to the maintenance of records that, in reasonable detail, accurately and fairly reflect the transactions and dispositions of the assets of the company; (2) provide reasonable assurance that transactions are recorded as necessary to permit preparation of financial statements in accordance with generally accepted accounting principles, and that receipts and expenditures of the company are being made only in accordance with authorizations of management and directors of the company; and (3) provide reasonable assurance regarding prevention or timely detection of unauthorized acquisition, use, or disposition of the company’s assets that could have a material effect on the financial statements.
Because of its inherent limitations, internal control over financial reporting may not prevent or detect misstatements. Also, projections of any evaluation of effectiveness to future periods are subject to the risk that controls may become inadequate because of changes in conditions, or that the degree of compliance with the policies or procedures may deteriorate.
/s/ Ernst & Young LLP
Cleveland, Ohio
February 20, 2025
Item 9B. Other Information
Not applicable.
Item 9C. Disclosure Regarding Foreign Jurisdictions that Prevent Inspections
Not applicable.
PART III.
Item 10. Directors, Executive Officers and Corporate Governance
Required information is set forth under the caption "Nominees" and "Insider Trading Policy" in the proxy statement filed in connection with the annual meeting of shareholders to be held on or about May 2, 2025 (the "Proxy Statement"), and is incorporated herein by reference. Information regarding the executive officers of the registrant is included in Part I hereof. Information regarding the Company’s Audit Committee and its Audit Committee Financial Experts is set forth under the caption “Audit Committee” in the Proxy Statement, and is incorporated herein by reference.
The General Policies and Procedures of the Board of Directors of the Company and the charters of its Audit Committee, Compensation Committee and Nominating and Corporate Governance Committee are also available on the Company’s website at https://investors.timken.com/corporate-governance/documents/default.aspx and are available to any shareholder upon request to the Executive Vice President, General Counsel and Secretary. The information on the Company’s website is not incorporated by reference into this Annual Report on Form 10-K.
The Company has adopted a code of ethics that applies to all of its employees, including its principal executive officer, principal financial officer and principal accounting officer, as well as its directors. The Company’s code of ethics, The Timken Company Standards of Business Ethics Policy, is available on its website at https://investors.timken.com/corporate-governance/documents/default.aspx. The Company intends to disclose any amendment to, or waiver from, its code of ethics by posting such amendment or waiver, as applicable, on its website.
Item 11. Executive Compensation
Required information is set forth under the captions “Compensation Discussion and Analysis,” “2024 Summary Compensation Table,” “2024 Grants of Plan-Based Awards,” “Outstanding Equity Awards at 2024 Fiscal Year-End,” “2024 Option Exercises and Stock Vested,” “2024 Pension Benefits Table,” “2024 Nonqualified Deferred Compensation,” “Potential Payments Upon Termination or Change in Control,” “Director Compensation,” "CEO Pay Ratio," "Equity Compensation Plan Information," “Compensation Committee,” “Compensation Committee Report” and "Insider Trading Policy" in the Proxy Statement, and is incorporated herein by reference.
Item 12. Security Ownership of Certain Beneficial Owners and Management and Related Shareholder Matters
Required information, including with respect to institutional investors owning more than 5% of the Company’s common shares, is set forth under the caption “Beneficial Ownership of Common Shares” in the Proxy Statement, and is incorporated herein by reference.
Required information is set forth under the caption “Equity Compensation Plan Information” in the Proxy Statement, and is incorporated herein by reference.
Item 13. Certain Relationships and Related Transactions, and Director Independence
Required information is set forth under the captions "Nominees," "Independence Determinations" and "Related Party Transactions Approval Policy" in the Proxy Statement, and is incorporated herein by reference.
Item 14. Principal Accountant Fees and Services
Required information regarding fees paid to and services provided by the Company’s independent auditor during the years ended December 31, 2024 and 2023 and the pre-approval policies and procedures of the Audit Committee of the Company’s Board of Directors is set forth under the caption “Auditor” in the Proxy Statement, and is incorporated herein by reference.
PART IV.
Item 15. Exhibits and Financial Statement Schedules
(a)(1) - Financial Statements are included in Part II, Item 8 of the Annual Report on Form 10-K.
(a)(2) - Schedule II - Valuation and Qualifying Accounts is submitted as a separate section of this report. Schedules I, III, IV and V are not applicable to the Company and, therefore, have been omitted.
(a)(3) - Listing of Exhibits
| | | | | | | | |
| Exhibit | | |
| | |
| | Amended Articles of Incorporation of the Registrant (effective May 11, 2023), were filed on August 3, 2023 with Form 10-Q (Commission File No. 1-1169) and are incorporated herein by reference. |
| | |
| | Amended Regulations of the Registrant adopted on May 10, 2016, were filed on July 28, 2016 with Form 10-Q (Commission File No. 1-1169) and are incorporated herein by reference. |
| | |
| | Fifth Amended and Restated Credit Agreement, dated as of December 5, 2022, among The Timken Company, Bank of America, N.A. and KeyBank National Association, as Co-Administrative Agents, and the Lenders party thereto, was filed on December 6, 2022 with Form 8-K (Commission File no. 1-1169) and is incorporated herein by reference.* |
| | |
| | Indenture, dated as of August 20, 2014, by and between The Timken Company and The Bank of New York Mellon Trust Company, N.A., was filed on August 20, 2014 with Form 8-K (Commission File No. 1-1169) and is incorporated herein by reference. |
| | |
| | Indenture, dated as of September 6, 2018, by and between The Timken Company and The Bank of New York Mellon Trust Company, N.A., as Trustee, was filed on September 6, 2018 with Form 8-K (Commission File No. 1-1169) and is incorporated herein by reference. |
| | |
| | First Supplemental Indenture, dated as of September 6, 2018, by and between The Timken Company and The Bank of New York Mellon Trust Company, N.A., as Trustee (including Form of Note), was filed on September 6, 2018 with Form 8-K (Commission File No. 1-1169) and is incorporated herein by reference. |
| | |
| | Indenture, dated as of March 28, 2022, by and between the Company and U.S. Bank Trust Company, National Association, as Trustee, was filed on March 28, 2022 with Form 8-K (Commission File no. 1-1169) and is incorporated herein by reference. |
| | |
| | First Supplemental Indenture, dated as of March 28, 2022, by and between the Company and U.S. Bank Trust Company, National Association, as Trustee (including Form of Note), was filed on March 28, 2022 with Form 8-K (Commission File no. 1-1169) and is incorporated herein by reference. |
| | |
| | Second Supplemental Indenture, dated as of May 23, 2024, by and between the Company and U.S. Bank Trust Company, National Association, as Trustee (including Form of Note), was filed on May 23, 2024 with Form 8-K (Commission File No. 1-1169) and is incorporated herein by reference. |
| | |
| | Description of The Timken Company Common Shares, as attached hereto as Exhibit 4.8. |
| | |
| | The Company is also a party to agreements with respect to other long-term debt in total amount less than 10% of the Registrant's consolidated total assets. The Registrant agrees to furnish a copy of such agreements upon request.* |
Management Contracts and Compensation Plans
| | | | | | | | |
| | The Timken Company 1996 Deferred Compensation Plan for officers and other key employees, amended and restated effective as of January 1, 2023, was filed on February 16, 2023 with Form 10-K (Commission File No. 1-1169) and is incorporated herein by reference. |
| . | | |
| | The Timken Company Director Deferred Compensation Plan, amended and restated effective December 31, 2008, was filed on February 25, 2010 with Form 10-K (Commission File No. 1-1169) and is incorporated herein by reference. |
| | |
| | Form of The Timken Company 1996 Deferred Compensation Plan Election Agreement, amended and restated as of January 1, 2008, was filed on February 25, 2010 with Form 10-K (Commission File No. 1-1169) and is incorporated herein by reference. |
| | |
| | Form of The Timken Company Director Deferred Compensation Plan Election Agreement, amended and restated as of January 1, 2008, was filed on February 25, 2010 with Form 10-K (Commission File No. 1-1169) and is incorporated herein by reference. |
| | |
| | The Timken Company 2011 Long-Term Incentive Plan, as amended and restated as of February 13, 2015 for directors, officers and other key employees as approved by the shareholders on May 7, 2015 was filed on March 27, 2015 with Definitive Proxy Statement on Schedule 14A (Commission File No. 1-1169) and is incorporated herein by reference. |
| | |
| | | | | | | | |
| | The Timken Company 2019 Equity and Incentive Compensation Plan for directors, officers and other key employees as approved by the shareholders on May 10, 2019 was filed on March 22, 2019 as Appendix B to Definitive Proxy Statement on Schedule 14A (Commission File No. 1-1169) and is incorporated herein by reference. |
| | |
| | The Timken Company 2019 Equity and Incentive Compensation Plan (Amended and Restated as of May 3, 2024) for directors, officers and other key employees as approved by the shareholders on May 3, 2024 was filed on March 14, 2024 as Appendix B to Definitive Proxy Statement on Schedule 14A (Commission File No. 1-1169) and is incorporated herein by reference. |
| | |
| | Amended and Restated Supplemental Pension Plan of The Timken Company, amended and restated effective as of January 1, 2011, was filed on February 17, 2012 with Form 10-K (Commission File No. 1-1169) and is incorporated herein by reference. |
| | |
| | Amended and Restated Supplemental Pension Plan of The Timken Company, effective as of June 30, 2014, was filed on October 30, 2018 with Form 10-Q (Commission File No. 1-1169) and is incorporated herein by reference. |
| | |
| | Amendment No. 1 to the Amended and Restated Supplemental Pension Plan of The Timken Company, effective as of June 30, 2014, was filed on October 30, 2018 with Form 10-Q (Commission File No. 1-1169) and is incorporated herein by reference. |
| | |
| | Amended and Restated Supplemental Pension Plan of The Timken Company, effective as of October 1, 2018, was filed on October 30, 2018 with Form 10-Q (Commission File No. 1-1169) and is incorporated herein by reference. |
| | |
| | The Timken Company Short-Term Incentive Plan Global Plan Document for officers and other key employees, amended and restated effective as of January 1, 2021 and pursuant to The Timken Company 2019 Equity and Incentive Compensation Plan, was filed on February 15, 2022 with Form 10-K (Commission File No. 1-1169) and is incorporated herein by reference. |
| | |
| | Form of Severance Agreement (for Executive Officers appointed on or after November 12, 2015), as adopted on November 12, 2015, was filed on February 24, 2016 with Form 10-K (Commission File No. 1-1169) and is incorporated herein by reference. |
| | |
| | Form of Severance Agreement as adopted on December 9, 2010 was filed on February 22, 2011 with Form 10-K (Commission File No. 1-1169) and is incorporated herein by reference. |
| | |
| | Amended and Restated Severance Agreement with Andreas Roellgen, dated as of December 9, 2022, was filed on February 16, 2023 with Form 10-K (Commission File No. 1-1169) and is incorporated herein by reference. |
| | |
| | Form of Indemnification Agreement for Directors was filed on February 14, 2020 with Form 10-K (Commission File No. 1-1169) and is incorporated herein by reference. |
| | |
| | Form of Indemnification Agreement for Executive Officers was filed on February 14, 2020 with Form 10-K (Commission File No. 1-1169) and is incorporated herein by reference. |
| | |
| | Form of Amended and Restated Employee Excess Benefits Agreement entered into with certain Executive Officers and certain key employees of the Company, was filed on February 26, 2009 with Form 10-K (Commission File No. 1-1169) and is incorporated herein by reference |
| | |
| | Form of Amended and Restated Employee Excess Benefits Agreement entered into with the Chief Executive Officer, was filed on February 26, 2009 with Form 10-K (Commission File No. 1-1169) and is incorporated herein by reference. |
| | |
| | Form of Employee Excess Benefits Agreement, entered into with all Executive Officers after January 1, 2011, was filed on August 4, 2011 with Form 10-Q (Commission File No. 1-1169) and is incorporated herein by reference. |
| | |
| | Amendment No. 1 to the Employee Excess Benefits Agreement, dated January 1, 2011, entered into with Richard G. Kyle, approved as of November 8, 2018 was filed on February 15, 2019 with Form 10-K (Commission File No. 1-1169) and is incorporated herein by reference. |
| | |
| | Form of Amendment No. 1 to The Amended and Restated Employee Excess Benefit Agreement, entered into with certain Executive Officers and certain key employees of the Company, was filed on September 2, 2009 with Form 8-K (Commission File No. 1-1169) and is incorporated herein by reference. |
| | |
| | Form of Amendment No. 1 to The Amended and Restated Employee Excess Benefits Agreement with all Executive Officers after January 1, 2011 and Form of Amendment No. 2 to the Amended and Restated Excess Benefits Agreement with certain Executive Officers and certain key employees of the Company, as adopted December 8, 2011, was filed on February 17, 2012 with Form 10-K (Commission File No. 1-1169) and is incorporated herein by reference. |
| | |
| | Amendment No. 2 to the Amended and Restated Employee Excess Benefits Agreement, dated December 17, 2008, entered into with Christopher A. Coughlin, approved as of November 8, 2018 was filed on February 15, 2019 with Form 10-K (Commission File No. 1-1169) and is incorporated herein by reference. |
| | |
| | Amendment No. 3 to the Amended and Restated Employee Excess Benefits Agreement, dated December 18, 2008, entered into with Philip D. Fracassa, approved as of November 8, 2018 was filed on February 15, 2019 with Form 10-K (Commission File No. 1-1169) and is incorporated herein by reference. |
| | | | | | | | |
| | |
| | Form of Amendment No. 1 to The Amended and Restated Employee Excess Benefits Agreement entered into with the Chief Executive Officer, as adopted December 8, 2011, was filed on February 17, 2012 with Form 10-K (Commission File No. 1-1169) and is incorporated herein by reference. |
| | |
| | Form of Amendment No. 2 to The Amended and Restated Employee Excess Benefits Agreement entered into with the Chief Executive Officer, as adopted December 8, 2011, was filed on February 17, 2012 with Form 10-K (Commission File No. 1-1169) and is incorporated herein by reference. |
| | |
| | Form of Nonqualified Stock Option Agreement for non-transferable options for Non-Officer Employees, as adopted on December 8, 2011, was filed on February 17, 2012 with Form 10-K (Commission File No. 1-1169) and is incorporated herein by reference. |
| | |
| | Form of Nonqualified Stock Option Agreement, as adopted on February 8, 2018, was filed on May 1, 2018 with Form 10-Q (Commission File No. 1-1169) and is incorporated herein by reference. |
| | |
| | Form of Nonqualified Stock Option Agreement (U.S), as adopted on September 24, 2018, was filed on October 30, 2018 with Form 10-Q (Commission File No. 1-1169) and is incorporated herein by reference. |
| | |
| | Form of Nonqualified Stock Option Agreement (Non-U.S), as adopted on September 24, 2018, was filed on October 30, 2018 with Form 10-Q (Commission File No. 1-1169) and is incorporated herein by reference. |
| | |
| | Form of Nonqualified Stock Option Agreement (U.S.), as adopted February 7, 2019 and pursuant to the Timken Company 2011 Long-Term Incentive Plan, was filed on May 1, 2019 with Form 10-Q (Commission File No. 1-1169) and is incorporated herein by reference. |
| | |
| | Form of Nonqualified Stock Option Agreement (non-U.S.), as adopted February 7, 2019 and pursuant to the Timken Company 2011 Long-Term Incentive Plan, was filed on May 1, 2019 with Form 10-Q (Commission File No. 1-1169) and is incorporated herein by reference. |
| | |
| | Form of Nonqualified Stock Option Agreement (U.S., retirement age 62), as adopted February 7, 2019 and pursuant to the Timken Company 2011 Long-Term Incentive Plan, was filed on May 1, 2019 with Form 10-Q (Commission File No. 1-1169) and is incorporated herein by reference. |
| | |
| | Form of Nonqualified Stock Option Agreement (non-U.S., retirement age 62), as adopted February 7, 2019 and pursuant to the Timken Company 2011 Long-Term Incentive Plan, was filed on May 1, 2019 with Form 10-Q (Commission File No. 1-1169) and is incorporated herein by reference. |
| | |
| | Form of Nonqualified Stock Option Agreement (U.S.) as adopted February 7, 2019 and to be granted pursuant to the Timken Company 2019 Equity and Incentive Compensation Plan, was filed on May 1, 2019 with Form 10-Q (Commission File No. 1-1169) and is incorporated herein by reference. |
| | |
| | Form of Nonqualified Stock Option Agreement (non-U.S.) as adopted February 7, 2019 and to be granted pursuant to the Timken Company 2019 Equity and Incentive Compensation Plan, was filed on May 1, 2019 with Form 10-Q (Commission File No. 1-1169) and is incorporated herein by reference. |
| | |
| | Form of Nonqualified Stock Option Agreement (U.S., retirement age 62), as adopted February 7, 2019 and to be granted pursuant to the Timken Company 2019 Equity and Incentive Compensation Plan, was filed on May 1, 2019 with Form 10-Q (Commission File No. 1-1169) and is incorporated herein by reference. |
| | |
| | Form of Nonqualified Stock Option Agreement (non-U.S., retirement age 62), as adopted February 7, 2019 and to be granted pursuant to the Timken Company 2019 Equity and Incentive Compensation Plan, was filed on May 1, 2019 with Form 10-Q (Commission File No. 1-1169) and is incorporated herein by reference. |
| | |
| | Form of Deferred Shares Agreement (three year cliff vesting), as adopted February 7, 2019 and to be granted pursuant to the Timken Company 2019 Equity and Incentive Compensation Plan, was filed on May 1, 2019 with Form 10-Q (Commission File No. 1-1169) and is incorporated herein by reference. |
| | |
| | Form of Deferred Shares Agreement (five year cliff vesting), as adopted February 7, 2019 and to be granted pursuant to the Timken Company 2019 Equity and Incentive Compensation Plan, was filed on May 1, 2019 with Form 10-Q (Commission File No. 1-1169) and is incorporated herein by reference. |
| | |
| | Form of Deferred Shares Agreement (three year cliff vesting, retirement age 62), as adopted February 7, 2019 and to be granted pursuant to the Timken Company 2019 Equity and Incentive Compensation Plan, was filed on May 1, 2019 with Form 10-Q (Commission File No. 1-1169) and is incorporated herein by reference. |
| | |
| | Form of Deferred Shares Agreement (five year cliff vesting, retirement age 62), as adopted February 7, 2019 and to be granted pursuant to the Timken Company 2019 Equity and Incentive Compensation Plan, was filed on May 1, 2019 with Form 10-Q (Commission File No. 1-1169) and is incorporated herein by reference. |
| | |
| | Form of Deferred Shares Agreement, as adopted February 8, 2024 and granted pursuant to The Timken Company 2019 Equity and Incentive Compensation Plan was filed on April 30, 2024 with Form 10-Q (Commission File No. 1-1169) and is incorporated herein by reference. |
| | |
| | Deferred Shares Agreement, entered into with Tarak Mehta on September 5, 2024 and granted pursuant to The Timken Company 2019 Equity and Incentive Compensation Plan as amended and restated was filed on November 11, 2024 with Form 10-Q (Commission File No. 1-1169) and is incorporated herein by reference. |
| | |
| | Deferred Shares Agreement, entered into with Christopher A. Coughlin on February 10, 2023 and granted pursuant to The Timken Company 2019 Equity and Incentive Compensation Plan, as attached hereto as Exhibit 10.1. |
| | |
| | | | | | | | |
| | Deferred Shares Agreement, entered into with Philip D. Fracassa on December 7, 2023 and granted pursuant to The Timken Company 2019 Equity and Incentive Compensation Plan, as attached hereto as Exhibit 10.2. |
| | |
| | Form of Deferred Share Equivalents Agreement (three year cliff vesting), as adopted February 7, 2019 and to be granted pursuant to the Timken Company 2019 Equity and Incentive Compensation Plan, was filed on May 1, 2019 with Form 10-Q (Commission File No. 1-1169) and is incorporated herein by reference. |
| | |
| | Form of Deferred Share Equivalents Agreement (five year cliff vesting), as adopted February 7, 2019 and to be granted pursuant to the Timken Company 2019 Equity and Incentive Compensation Plan, was filed on May 1, 2019 with Form 10-Q (Commission File No. 1-1169) and is incorporated herein by reference. |
| | |
| | Form of Deferred Share Equivalents Agreement (three year cliff vesting, retirement age 62), as adopted February 7, 2019 and to be granted pursuant to the Timken Company 2019 Equity and Incentive Compensation Plan, was filed on May 1, 2019 with Form 10-Q (Commission File No. 1-1169) and is incorporated herein by reference. |
| | |
| | Form of Deferred Share Equivalents Agreement (five year cliff vesting, retirement age 62), as adopted February 7, 2019 and to be granted pursuant to the Timken Company 2019 Equity and Incentive Compensation Plan, was filed on May 1, 2019 with Form 10-Q (Commission File No. 1-1169) and is incorporated herein by reference. |
| | |
| | Form of Deferred Share Equivalents Agreement, as adopted February 8, 2024 and granted pursuant to The Timken Company 2019 Equity and Incentive Compensation Plan was filed on April 30, 2024 with Form 10-Q (Commission File No. 1-1169) and is incorporated herein by reference. |
| | |
| | Form of Performance-Based Restricted Stock Unit Agreement, as adopted February 7, 2019 and pursuant to the Timken Company 2011 Long-Term Incentive Plan, was filed on May 1, 2019 with Form 10-Q (Commission File No. 1-1169) and is incorporated herein by reference. |
| | |
| | Form of Performance-Based Restricted Stock Unit Agreement (retirement age 62), as adopted February 7, 2019 and pursuant to the Timken Company 2011 Long-Term Incentive Plan, was filed on May 1, 2019 with Form 10-Q (Commission File No. 1-1169) and is incorporated herein by reference. |
| | |
| | Form of Performance-Based Restricted Stock Unit Agreement, as adopted February 7, 2019 and to be granted pursuant to the Timken Company 2019 Equity and Incentive Compensation Plan, was filed on May 1, 2019 with Form 10-Q (Commission File No. 1-1169) and is incorporated herein by reference. |
| | |
| | Form of Performance-Based Restricted Stock Unit Agreement (retirement age 62), as adopted February 7, 2019 and to be granted pursuant to the Timken Company 2019 Equity and Incentive Compensation Plan, was filed on May 1, 2019 with Form 10-Q (Commission File No. 1-1169) and is incorporated herein by reference. |
| | |
| | Form of Performance-Based Restricted Stock Unit Agreement, as adopted February 8, 2024 and granted pursuant to The Timken Company 2019 Equity and Incentive Compensation Plan was filed on April 30, 2024 with Form 10-Q (Commission File No. 1-1169) and is incorporated herein by reference. |
| | |
| | Form of Time-Based Restricted Stock Unit Agreement, as adopted February 7, 2019 and pursuant to the Timken Company 2011 Long-Term Incentive Plan, was filed on May 1, 2019 with Form 10-Q (Commission File No. 1-1169) and is incorporated herein by reference. |
| | |
| | Form of Time-Based Restricted Stock Unit Agreement (retirement age 62), as adopted February 7, 2019 and pursuant to the Timken Company 2011 Long-Term Incentive Plan, was filed on May 1, 2019 with Form 10-Q (Commission File No. 1-1169) and is incorporated herein by reference. |
| | |
| | Form of Time-Based Restricted Stock Unit Agreement, as adopted February 7, 2019 and to be granted pursuant to the Timken Company 2019 Equity and Incentive Compensation Plan, was filed on May 1, 2019 with Form 10-Q (Commission File No. 1-1169) and is incorporated herein by reference. |
| | |
| | Form of Time-Based Restricted Stock Unit Agreement (retirement age 62), as adopted February 7, 2019 and to be granted pursuant to the Timken Company 2019 Equity and Incentive Compensation Plan, was filed on May 1, 2019 with Form 10-Q (Commission File No. 1-1169) and is incorporated herein by reference. |
| | |
| | Form of Time-Based Restricted Stock Unit Agreement, as adopted February 8, 2024 and granted pursuant to The Timken Company 2019 Equity and Incentive Compensation Plan was filed on April 30, 2024 with Form 10-Q (Commission File No. 1-1169) and is incorporated herein by reference. |
| | |
| | Form of Time-Based Restricted Stock Unit Agreement, as adopted November 8, 2024 and granted pursuant to The Timken Company 2019 Equity and Incentive Compensation Plan as amended and restated, as attached hereto as Exhibit 10.3. |
| | |
| | Form of Time-Based Restricted Stock Unit Agreement for Nonemployee Directors (new member grant), as adopted February 7, 2019, was filed on May 1, 2019 with Form 10-Q (Commission File No. 1-1169) and is incorporated herein by reference. |
| | |
| | Form of Time-Based Restricted Stock Unit Agreement for Nonemployee Directors (annual grant), as adopted February 7, 2019, was filed on May 1, 2019 with Form 10-Q (Commission File No. 1-1169) and is incorporated herein by reference. |
| | |
| | Form of Time-Based Restricted Stock Unit Agreement for Nonemployee Directors, as adopted February 8, 2024 and granted pursuant to The Timken Company 2019 Equity and Incentive Compensation Plan was filed on April 30, 2024 with Form 10-Q (Commission File No. 1-1169) and is incorporated herein by reference. |
| | |
| | | | | | | | |
| | Appendix for special terms and conditions for equity awards granted to Timken participants in France pursuant to The Timken Company 2019 Equity and Incentive Compensation Plan was filed on April 30, 2024 with Form 10-Q (Commission File No. 1-1169) and is incorporated herein by reference. |
| | |
| | Form of Associate Non-Compete Agreement entered into with key employees was filed on December 3, 2012 with Form 10-Q/A (Commission File No. 1-1169) and is incorporated herein by reference. |
| | |
| | *Portions of this exhibit have been omitted, which portions will be furnished to the Securities and Exchange Commission upon request. |
| | | | | | | | |
| Listing of Exhibits (continued) |
| | |
| | Description of The Timken Company Common Shares, as attached hereto as Exhibit 4.8. |
| | |
| | Deferred Shares Agreement, entered into with Christopher A. Coughlin on February 10, 2023 and granted pursuant to The Timken Company 2019 Equity and Incentive Compensation Plan. |
| | |
| | Deferred Shares Agreement, entered into with Philip D. Fracassa on December 7, 2023 and granted pursuant to The Timken Company 2019 Equity and Incentive Compensation Plan. |
| | |
| | Form of Time-Based Restricted Stock Unit Agreement, as adopted November 8, 2024 and granted pursuant to The Timken Company 2019 Equity and Incentive Compensation Plan as amended and restated. |
| | |
| | Statement of Policy Regarding Trading In Stock and Prohibiting the Improper Use or Disclosure of Material, Non-public Information (effective August 2, 2023). |
| | |
| | A list of subsidiaries of the Registrant. |
| | |
| | Consent of Independent Registered Public Accounting Firm. |
| | |
| | Power of Attorney. |
| | |
| | Principal Executive Officer's Certifications pursuant to Section 302 of the Sarbanes-Oxley Act of 2002. |
| | |
| | Principal Financial Officer's Certifications pursuant to Section 302 of the Sarbanes-Oxley Act of 2002. |
| | |
| | Certification pursuant to 18 U.S.C. Section 1350, as adopted pursuant to Section 906 of the Sarbanes-Oxley Act of 2002. |
| | |
| | The Timken Company Clawback Policy (effective October 2, 2023) was filed on February 26, 2024 with Form 10-K (Commission File No. 1-1169) and is incorporated herein by reference. |
| | |
| | Financial statements from the Annual Report on Form 10-K of The Timken Company for the year ended December 31, 2024, formatted in Inline XBRL: (i) the Consolidated Statements of Income, (ii) the Consolidated Statements of Comprehensive Income, (iii) the Consolidated Balance Sheets, (iv) the Consolidated Statements of Cash Flows, (v) the Consolidated Statements of Shareholders' Equity and (vi) the Notes to the Consolidated Financial Statements. |
| | |
| | Cover Page Interactive Data File (formatted as Inline XBRL and contained in Exhibit 101). |
Item 16. Form 10-K Summary
None.
SIGNATURES
Pursuant to the requirements of Section 13 or 15(d) of the Securities Exchange Act of 1934, the Company has duly caused this report to be signed on its behalf by the undersigned, thereunto duly authorized.
THE TIMKEN COMPANY
| | | | | | | | |
| By: /s/ Tarak B. Mehta | | By: /s/ Philip D. Fracassa |
| Tarak B. Mehta | | Philip D. Fracassa |
| President, Chief Executive Officer and Director | | Executive Vice President and Chief Financial Officer |
| (Principal Executive Officer) | | (Principal Financial Officer and Principal
Accounting Officer) |
| Date: February 20, 2025 | | Date: February 20, 2025 |
| | |
Pursuant to the requirements of the Securities Exchange Act of 1934, this report has been signed by the following persons on behalf of the registrant and in the capacities and on the dates indicated.
| | | | | | | | |
| By: /s/ Maria A. Crowe * | | By: /s/ James F. Palmer * |
| Maria A. Crowe, Director | | James F. Palmer, Director |
| Date: February 20, 2025 | | Date: February 20, 2025 |
| | |
| By: /s/ Elizabeth A. Harrell * | | By: /s/ Ajita G. Rajendra * |
| Elizabeth A. Harrell, Director | | Ajita G. Rajendra, Director |
| Date: February 20, 2025 | | Date: February 20, 2025 |
| | |
| By: /s/ Richard G. Kyle * | | By: /s/ Kimberly K. Ryan * |
| Richard G. Kyle, Director | | Kimberly K. Ryan, Director |
| Date: February 20, 2025 | | Date: February 20, 2025 |
| | |
| By: /s/ Sarah C. Lauber * | | By: /s/ Frank C. Sullivan * |
| Sarah C. Lauber, Director | | Frank C. Sullivan, Director |
| Date: February 20, 2025 | | Date: February 20, 2025 |
| | |
| By: /s/ Todd M. Leombruno * | | By: /s/ John M. Timken, Jr. * |
| Todd M. Leombruno, Director | | John M. Timken, Jr., Director |
| Date: February 20, 2025 | | Date: February 20, 2025 |
| | |
| By: /s/ Christopher L. Mapes * | | By: /s/ Ward J. Timken, Jr. * |
| Christopher L. Mapes, Director | | Ward J. Timken, Jr., Director |
| Date: February 20, 2025 | | Date: February 20, 2025 |
| | |
| By: /s/ Tarak B. Mehta * | | By: /s/ Philip D. Fracassa |
| Tarak B. Mehta, Director | | Philip D. Fracassa, attorney-in-fact |
| Date: February 20, 2025 | | * By authority of Power of Attorney |
| | filed as Exhibit 24 hereto |
| | Date: February 20, 2025 |
| | |
| | |
| | |
Schedule II—Valuation and Qualifying Accounts
The Timken Company and Subsidiaries
| | | | | | | | | | | |
| Allowance for uncollectible accounts: | 2024 | 2023 | 2022 |
| Balance at beginning of period | $ | 17.1 | | $ | 17.9 | | $ | 16.9 | |
| Additions: | | | |
Charged to costs and expenses (1) | 7.2 | | (1.0) | | 3.7 | |
| | | |
| Deductions: | | | |
Charged to costs and expenses (3) | (3.6) | | 0.2 | | 0.4 | |
Charged to other accounts (2) | 0.8 | | (0.4) | | 2.3 | |
| Balance at end of period | $ | 21.5 | | $ | 17.1 | | $ | 17.9 | |
| | | |
| Allowance for surplus and obsolete inventory: | 2024 | 2023 | 2022 |
| Balance at beginning of period | $ | 73.7 | | $ | 58.4 | | $ | 63.3 | |
| Additions: | | | |
Charged to costs and expenses (4) | 20.9 | | 25.0 | | 12.9 | |
Charged to other accounts (2) | (6.8) | | 7.9 | | 1.2 | |
Deductions (5) | 14.4 | | 17.6 | | 19.0 | |
| Balance at end of period | $ | 73.4 | | $ | 73.7 | | $ | 58.4 | |
| | | |
| Valuation allowance on deferred tax assets: | 2024 | 2023 | 2022 |
| Balance at beginning of period | $ | 39.3 | | $ | 31.3 | | $ | 31.0 | |
| Additions: | | | |
Charged to costs and expenses (6) | 11.7 | | 10.6 | | 3.1 | |
| | | |
| Deductions | | | |
Charged to costs and expenses (7) | 0.9 | | 2.1 | | 0.9 | |
Charged to other accounts (2) | 1.4 | | 0.5 | | 1.9 | |
| Balance at end of period | $ | 48.7 | | $ | 39.3 | | $ | 31.3 | |
(1)Provision for uncollectible accounts included in expenses.
(2)Currency translation and change in reserves due to acquisitions, net of divestitures.
(3)Actual accounts written off against the allowance, net of recoveries.
(4)Provision for surplus and obsolete inventory included in expenses.
(5)Inventory items written off against the allowance.
(6)Increase in valuation allowance is recorded as a component of the provision for income taxes.
(7)Amount relates to the reversal of valuation allowances and was recorded as a component of the provision for income taxes. The Company released $0.9 million of foreign valuation allowances for the year ended December 31, 2024. Refer to Note 5 - Income Taxes in the Notes to the Consolidated Financial Statements for further discussion on valuation allowance reversals.