 St. Regis - NYC Feb. 14, 2012 Exhibit 99.1 TIMKEN ANALYSTS ’ DAY |
 TIMKEN ANALYSTS’ DAY Steve Tschiegg Director – Capital Markets and Investor Relations Feb. 14, 2012 |
 3 Certain statements in this presentation (including statements regarding the company's forecasts, beliefs, estimates and expectations) that are not historical in nature are "forward-looking" statements within the meaning of the Private Securities Litigation Reform Act of 1995. In particular, the statements related to Timken’s plans, outlook, future financial performance, targets, projected sales, cash flows, and liquidity, including the information under the headings “Looking Forward”, “Key Takeaways”, “2012 Outlook Estimates,” “Sales,” “Earnings Per Share,” “Free Cash Flow,” “Capital Spending,” “Pension,” “Net Debt,” “Liquidity and Debt Maturity”, “Return on Invested Capital” and “2012 Capital Allocation Highlights” are forward-looking. The company cautions that actual results may differ materially from those projected or implied in forward-looking statements due to a variety of important factors, including: the company’s ability to respond to the changes in its end markets that could affect demand for the company’s products; unanticipated changes in business relationships with customers or their purchases from the company; changes in the financial health of the company’s customers, which may have an impact on the company’s revenues, earnings and impairment charges; fluctuations in raw-material and energy costs and their impact on the operation of the company’s surcharge mechanisms; the impact of the company’s last-in, first-out accounting; weakness in global economic conditions and financial markets; changes in the expected costs associated with product warranty claims; the ability to integrate acquired companies to achieve satisfactory operating results; the impact on operations of general economic conditions, higher or lower raw- material and energy costs, fluctuations in customer demand, and the company’s ability to achieve the benefits of its ongoing programs and initiatives. Additional factors are discussed in the company’s filings with the Securities and Exchange Commission, including the company’s Annual Report on Form 10-K for the year ended Dec. 31, 2010, quarterly reports on Form 10-Q and current reports on Form 8-K. The company undertakes no obligation to update or revise any forward-looking statement. This presentation includes certain non-GAAP financial measures as defined by the rules and regulations of the Securities and Exchange Commission. A reconciliation of those measures to the most directly comparable GAAP equivalent is provided in the Appendix to this presentation. FORWARD-LOOKING STATEMENTS SAFE HARBOR AND NON-GAAP FINANCIAL INFORMATION |
 Topic Presenter Time Welcome Steve Tschiegg 1 p.m. Director, Capital Markets & Investor Relations Strategic Update & Review Jim Griffith President and Chief Executive Officer Mobile Industries Rich Kyle President - Mobile Industries and Aerospace & Defense Aerospace & Defense Rich Kyle President - Mobile Industries and Aerospace & Defense Process Industries Chris Coughlin President - Process Industries 4 AGENDA |
 Topic Presenter Time Break Approx. 2:30 p.m. Steel Sal Miraglia President - Steel Financial Review Glenn Eisenberg Executive VP - Finance & Administration Q&A Presenter Panel Program Concludes 4:30 p.m. 5 AGENDA |
 S TRATEGIC U PDATE & R EVIEW TIMKEN ANALYSTS’ DAY James W. Griffith President and Chief Executive Officer Feb. 14, 2012 |
 Leader in friction management & mechanical power transmission reliability for diverse markets, including: Established in 1899 Headquartered in Canton, Ohio 2011 sales: $5.2 billion Global footprint with operations in 30 countries 21,000 associates • Aerospace • Mining • Energy / Wind • Rail • Construction • Truck • Automotive • Aftermarket 7 TIMKEN OVERVIEW |
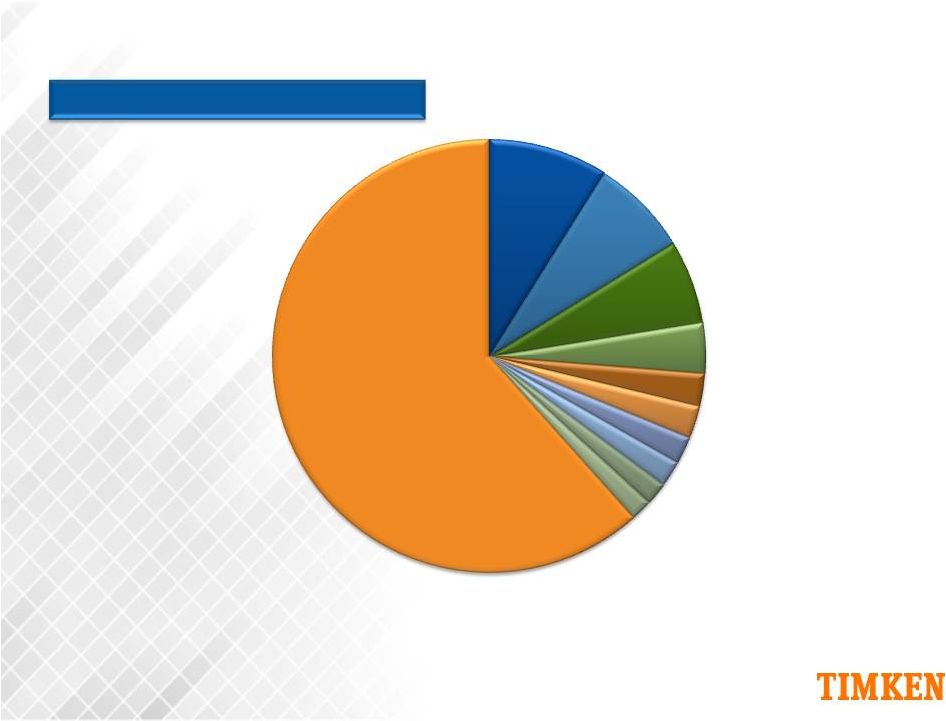
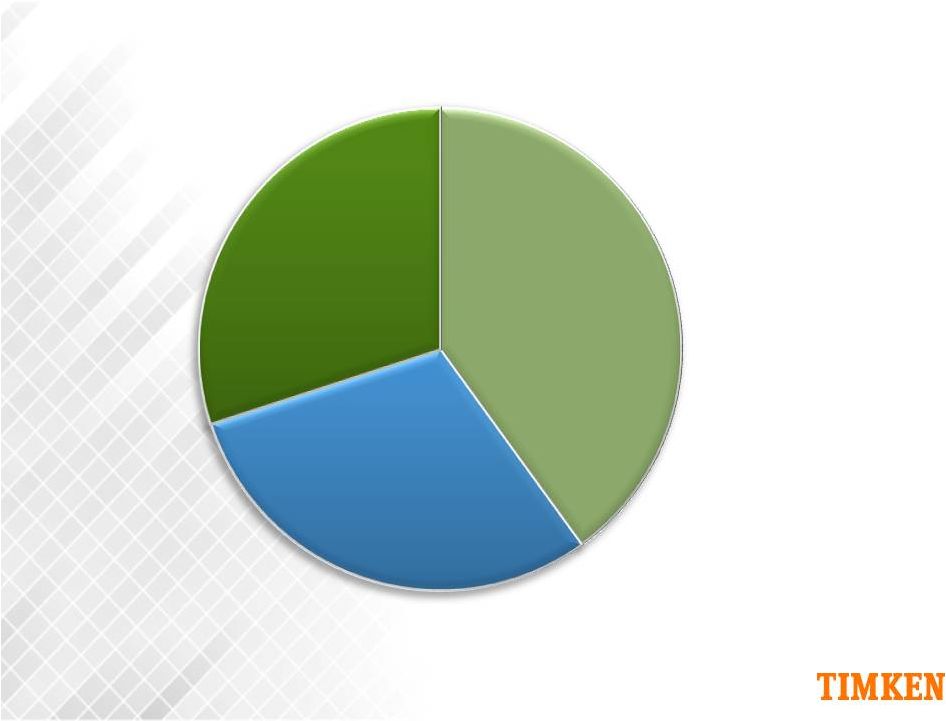
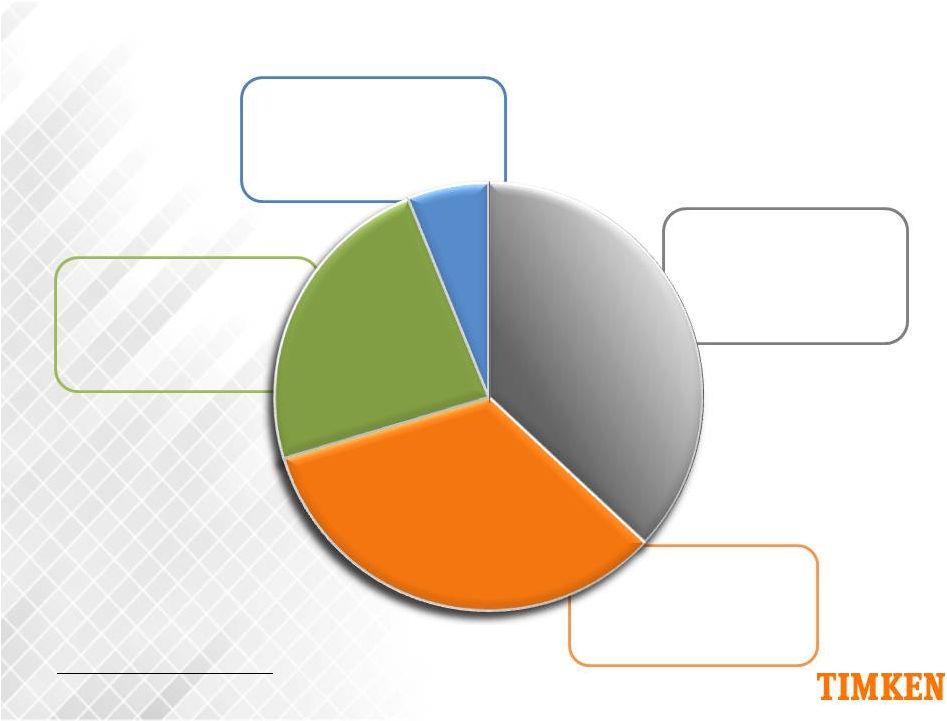 Note: Based on 2011 sales. Steel segment sales includes $120 million inter-segment sales. Process Process Industries Industries Steel Steel Aerospace Aerospace & Defense & Defense Mobile Mobile Industries Industries 8 Aerospace & Defense -- Diversified into transmissions, and aftermarket Sales: $0.3 Billion EBIT Margin: 2.3% Process -- Global growth beyond bearings, diversified, strong aftermarket Sales: $1.2 Billion EBIT Margin: 22.6% Steel -- High-performance, custom steels Sales: $2.0 Billion EBIT Margin: 13.8% Mobile -- Transformed portfolio, more aftermarket Sales: $1.8 Billion EBIT Margin: 13.7% T HE T IMKEN C OMPANY T ODAY |
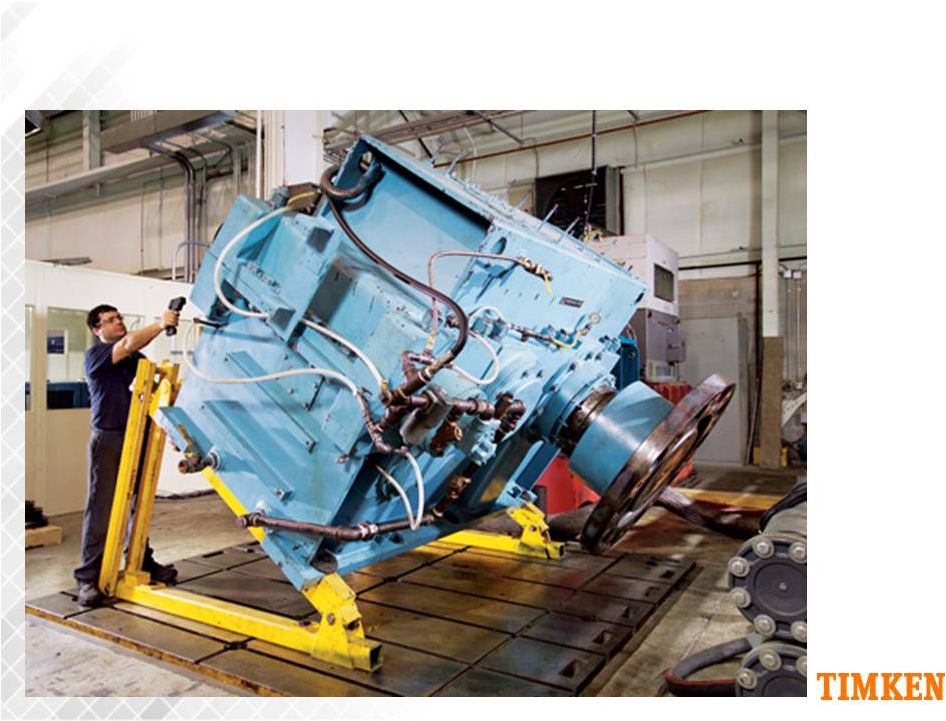
 The more extreme the engineering challenge, the more grueling the conditions, the more value we bring to customers. 9 T HE T IMKEN C OMPANY T ODAY |
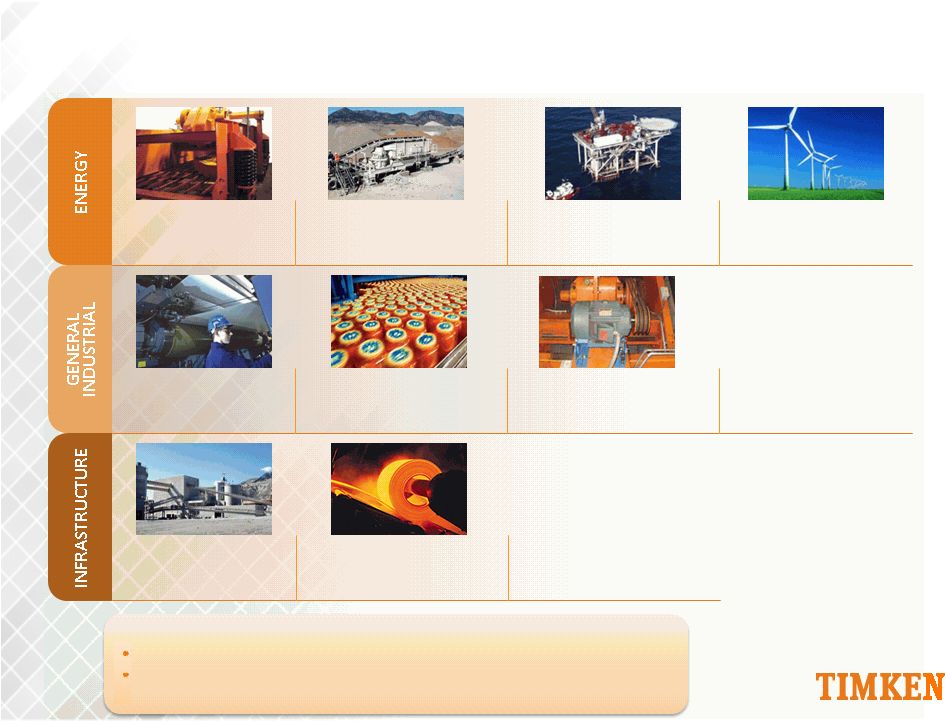
 10 GROWING WHERE END-MARKETS CONNECT |
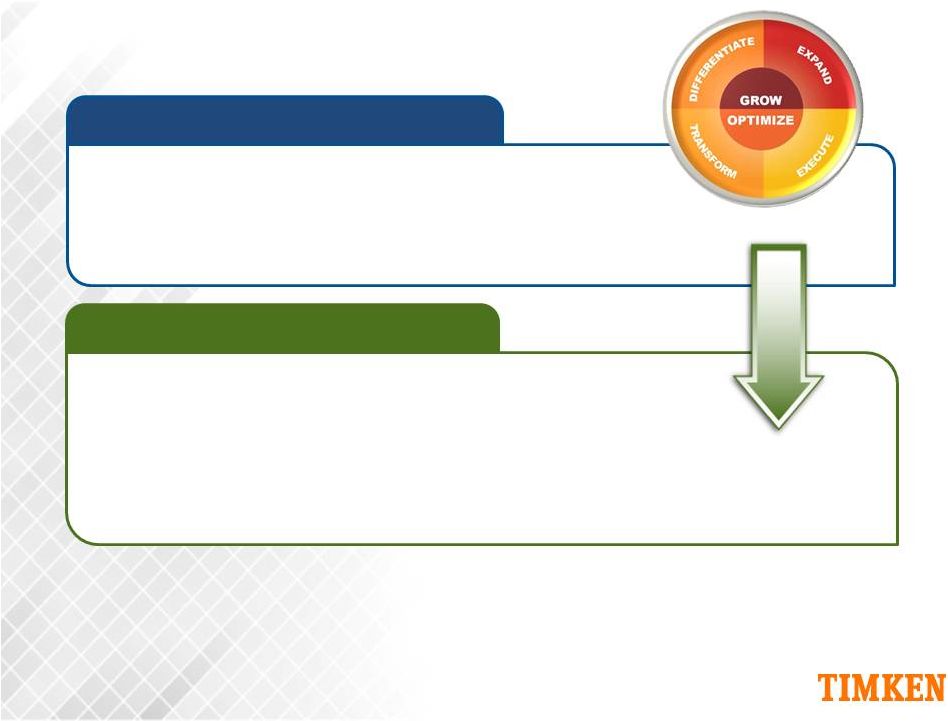
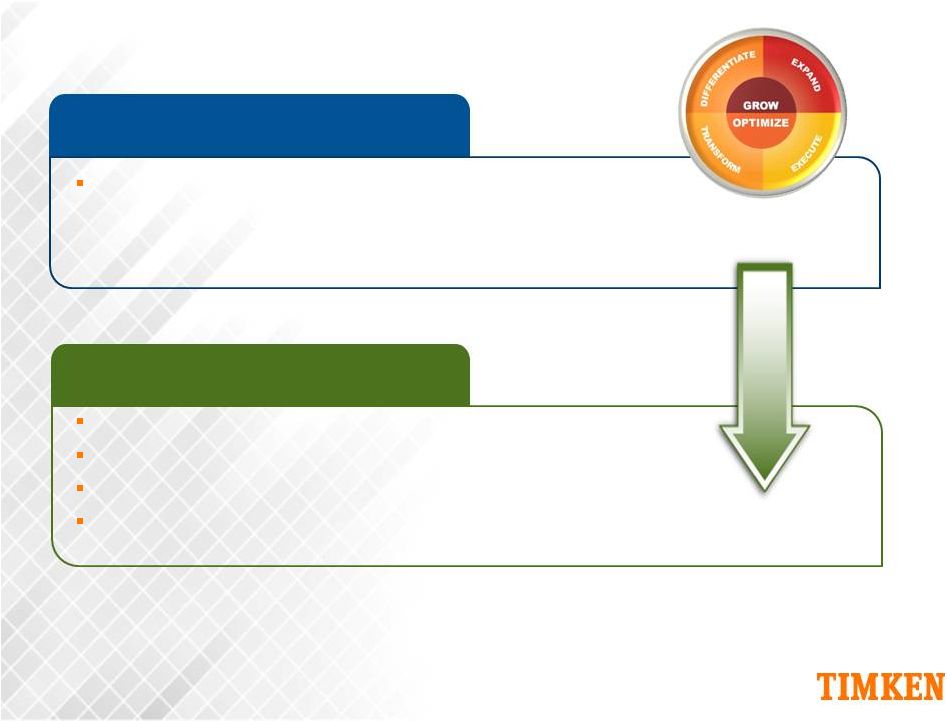
 Enhance existing products and services Leverage technology to create value Capture lifetime of opportunity Structure portfolio for value creation Fix/Exit under-performing areas Refine lean operating model Improve efficiency and reduce cost structure Increase agility Deliver greater profitability Attractive industrial markets Developing geographies Channels, services, distribution/aftermarket 11 THE STRATEGY IS WORKING |
 Record Sales Record Profitability Record New Products Record Customer Service Record Safety More Profitable Portfolio Strategic Acquisitions Increased Industrial Aftermarket Growing End-markets Global Expansion 12 KEY ACCOMPLISHMENTS IN 2011 |
 Markets Products Geographies People Performance 13 A M ULTI -F ACETED T RANSFORMATION |
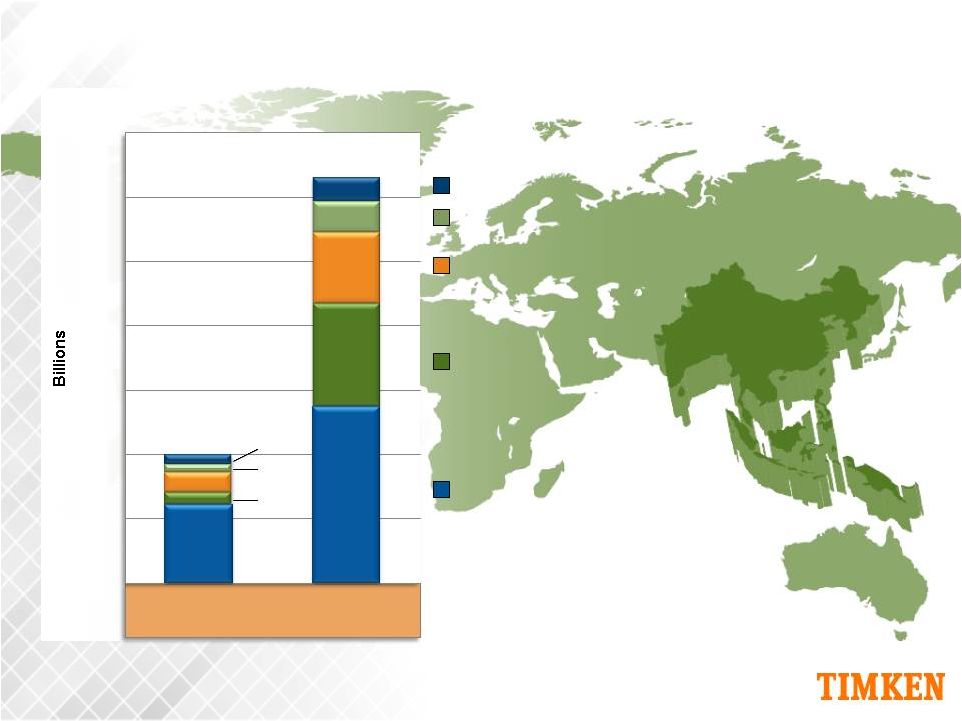
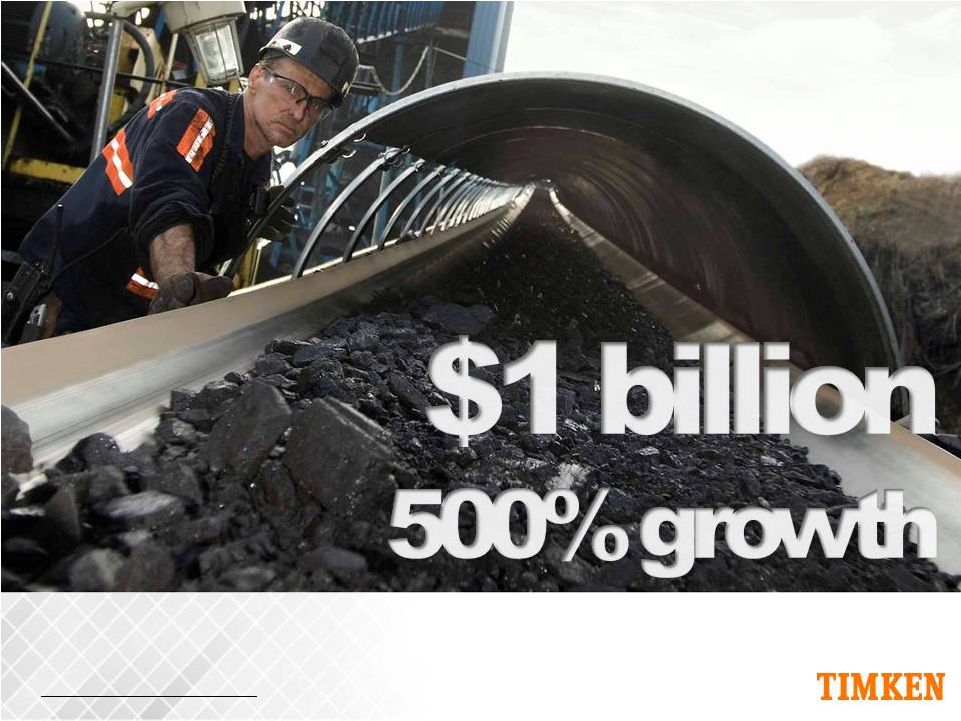 14 Reflects $1 billion in Timken aftermarket sales in 2011, up 500% since the year 2000. MARKETS: INDUSTRIAL AFTERMARKET A DECADE OF GROWTH |
 15 Reflects $500 million in Timken energy end-market sales in 2011, up 270% since the year 2000. MARKETS: ENERGY DECADE OF GROWTH |
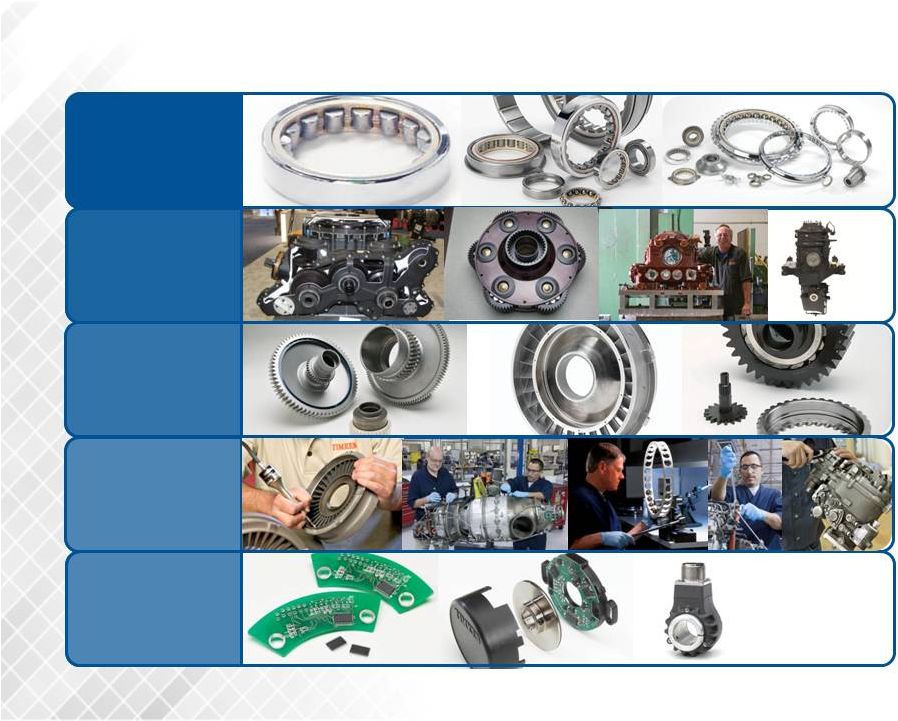
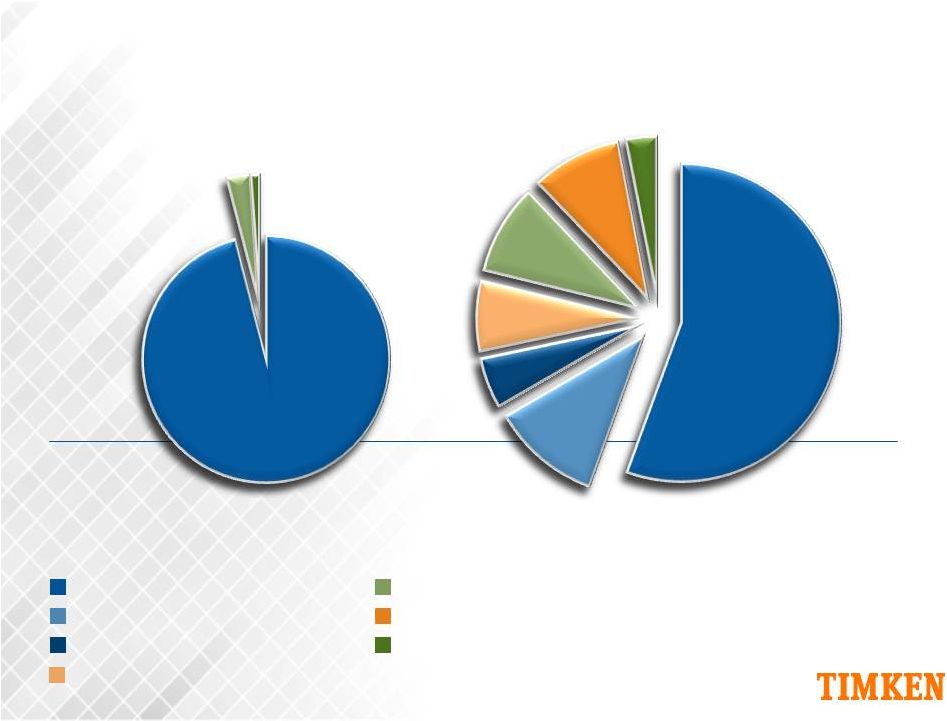
 16 PRODUCTS: DIVERSIFIED PORTFOLIO |
 17 Timken Boring Specialties Timken Boring Specialties Of Timken’s Steel segment, 30% of sales are from new products or new customers introduced within the past 5 years. PRODUCTS: DIVERSIFIED PORTFOLIO |
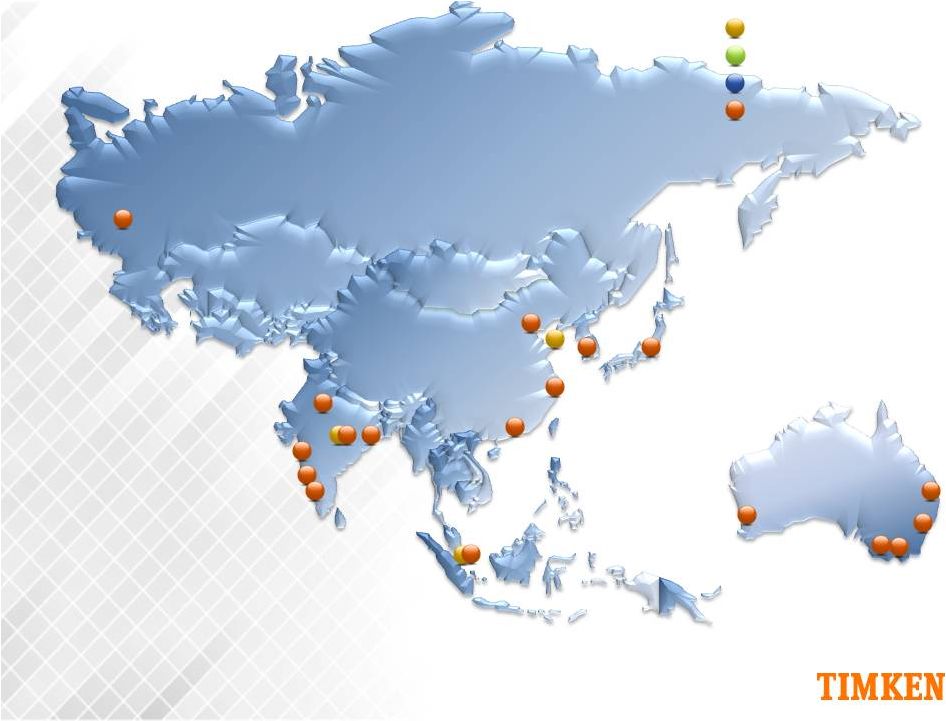 18 GEOGRAPHIES: E ASIA GROWTH Ballarat Brisbane Melbourne Perth Sydney Calcutta Bejing Hong Kong Seoul Yokohama Yantai Moscow Pune Bangalore New Delhi Shanghai Bombay Jamshedpur Manufacturing Plants Innovation Centers Distribution Centers Offices Singapore 2000 XPANDED |
 19 New Delhi Kolkata Gurgaon Nanjing Zhengzhou Xi’an Mysore Chongqing Shenyang Bejing Tianjin Guangzhou Seoul Yokohama Nagoya Chennai Moscow Pune Bangalore Jamshedpur Chengdu Manufacturing Plants Innovation Centers Distribution Centers Offices Bangkok Jakarta Hanoi Ballarat Brisbane Melbourne Perth Sydney Wuhan Taipei Kuala Lumpur Hong Kong Yantai Singapore Shanghai Wuxi Xiangtan Changsha GEOGRAPHIES: E ASIA GROWTH 2012 XPANDED |
 20 PEOPLE: KNOWLEDGE DRIVES VALUE |
 21 PERFORMANCE : D ELIVERING FOR CUSTOMERS |
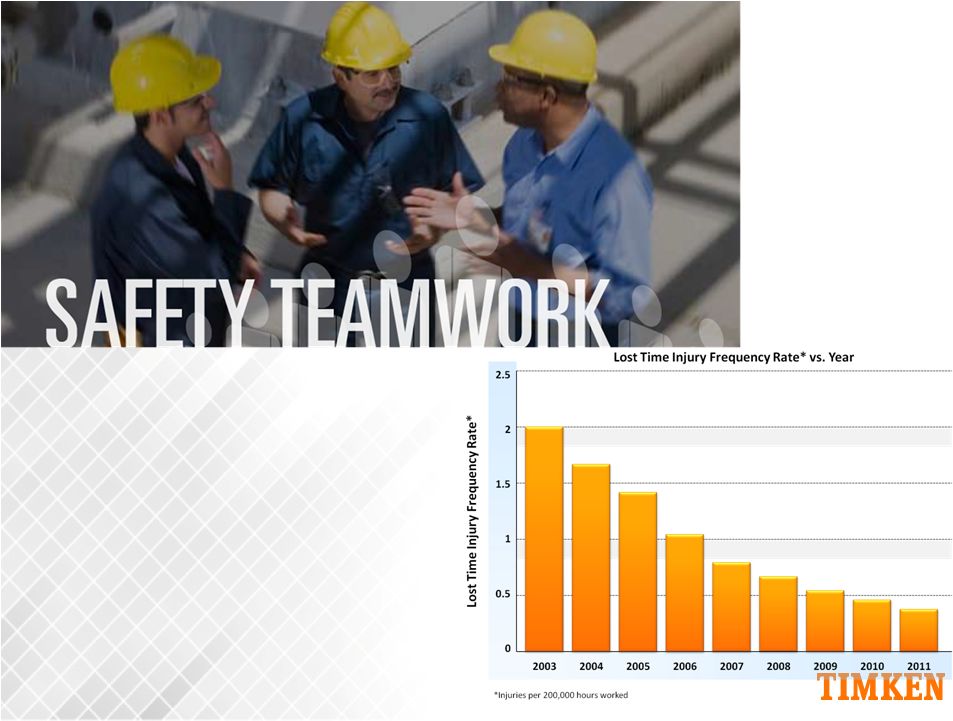 22 PERFORMANCE: DELIVERING ON SAFETY |
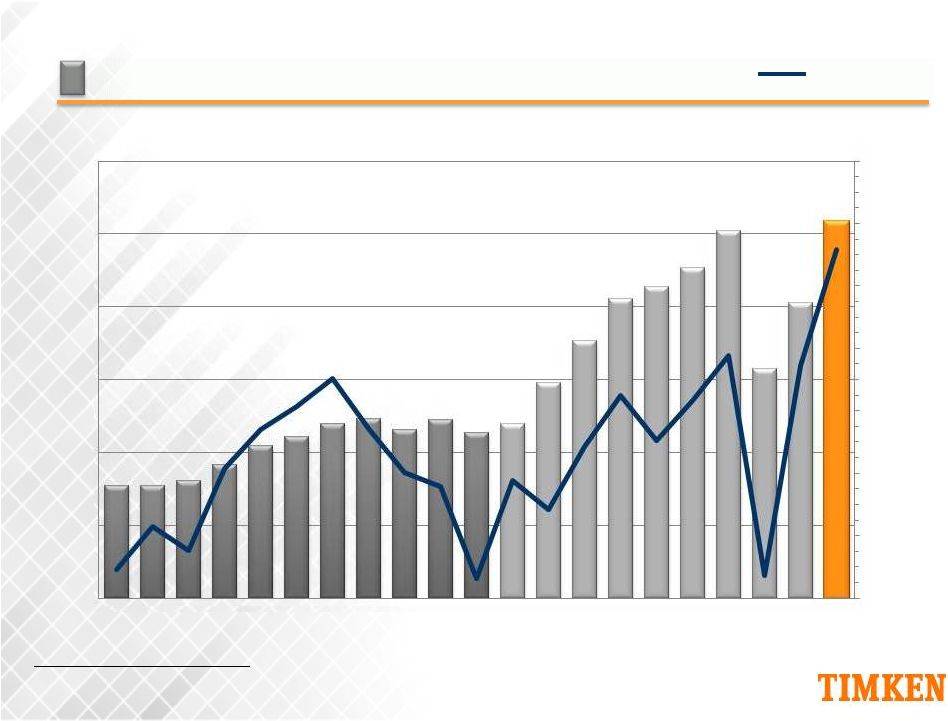 Earnings Per Share Net Sales ($ in Millions) 23 $0 $1,000 $2,000 $3,000 $4,000 $5,000 $6,000 ($1.00) $0.00 $1.00 $2.00 $3.00 $4.00 $5.00 $6.00 1991 1993 1995 1997 1999 2001 2003 2005 2007 2009 2011 RECORD PERFORMANCE: DELIVERING ON SALES & EARNINGS EPS assumes dilution. 2003 includes Torrington acquisition as acquired February 2003. Historical results exclude the discontinued operations of Latrobe Steel (2006 divestment) and the Needle Roller Bearings (NRB) business (2009 divestment). NRB discontinued operations for 2003 and 2004 are based on internal estimates. Note: |
 24 WHAT’S NEXT |
 Philadelphia Gear 25 N EXT : E XPANDING P RODUCTS AND S ERVICES |
 26 NEXT: EXPANDING GEOGRAPHIES |
 27 KEY T AKEAWAYS Delivering on strategy; more diversified and stronger today Performing at a higher level; well-positioned for the future Applying knowledge to create substantial value serving growing, global end-markets |
 Rich Kyle President – Mobile Industries and Aerospace Feb. 14, 2012 M OBILE I NDUSTRIES TIMKEN ANALYSTS’ DAY |
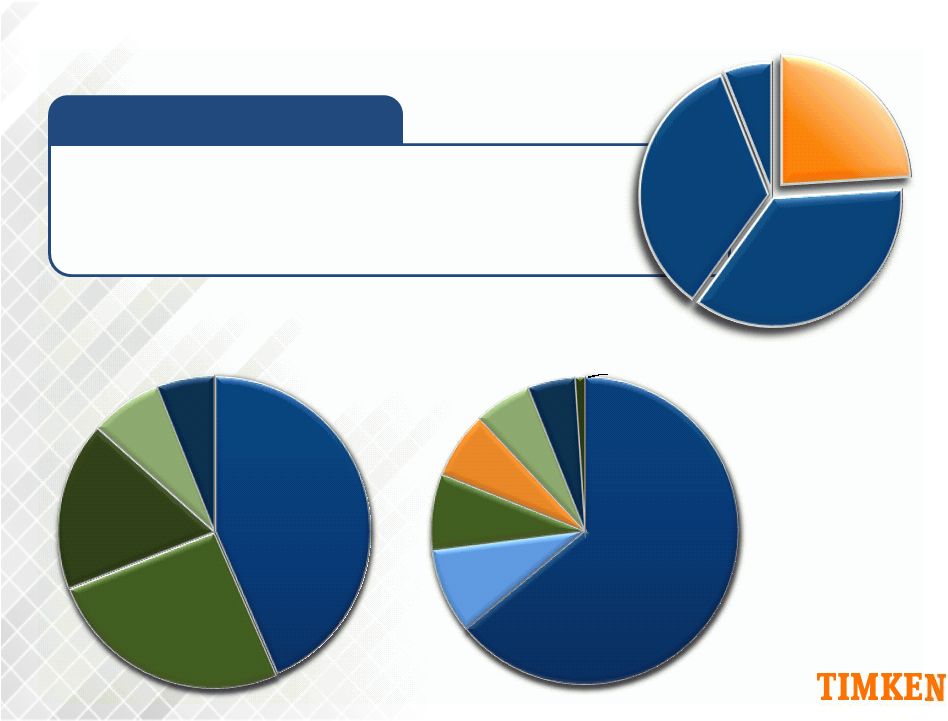
 2011 Sales: $1.8 Billion Premium bearings, lubricants, seals and aftermarket services for mobile equipment and vehicle applications Percent of Total Company Sales Market Sales Geographic Sales Aerospace Aerospace & Defense & Defense 29 U.S. 56% Europe 19% Asia 11% Latin America 6% ROW 9% Process Steel Mobile 34% Off- Highway 26% Light Truck 26% Heavy Truck 13% Rail 13% On-Highway Aftermarket 13% Passenger Car 9% MOBILE INDUSTRIES OVERVIEW |
 Drivetrain, wheel ends Rebuild kits, wheel ends, services, unit bearings Axles, transmissions, wheel ends Gear drives, axles, wheel ends Drivetrain, wheel ends, services 30 GROWING, DIVERSE MARKETS |
 Bearings Engineered Chains & Augers Seals, Lubricants Services 31 D IFFERENTIATED S YSTEMS AND C OMPONENTS |
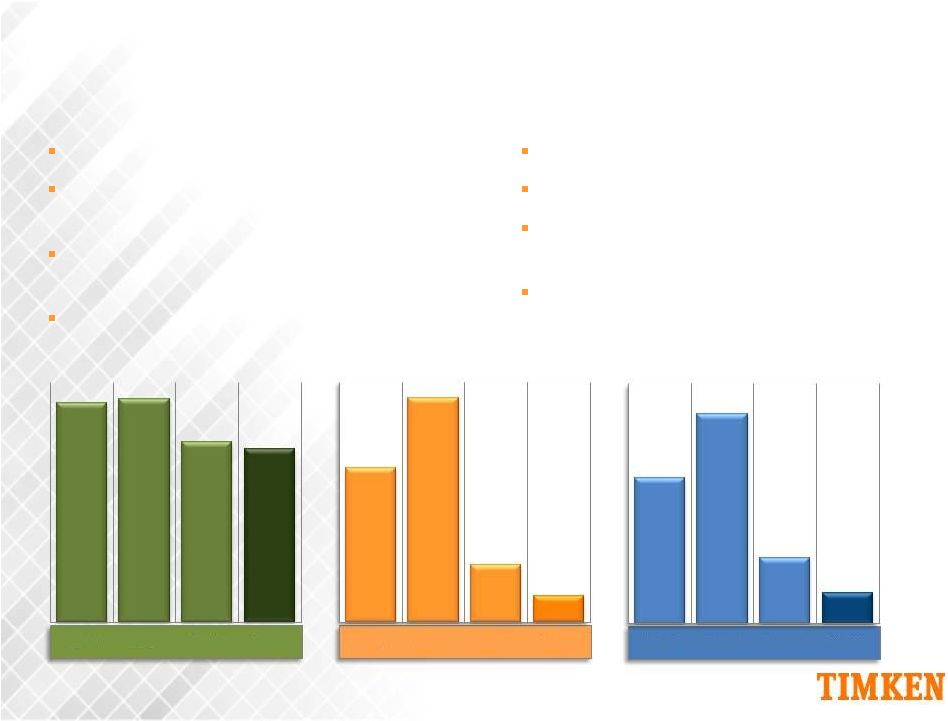
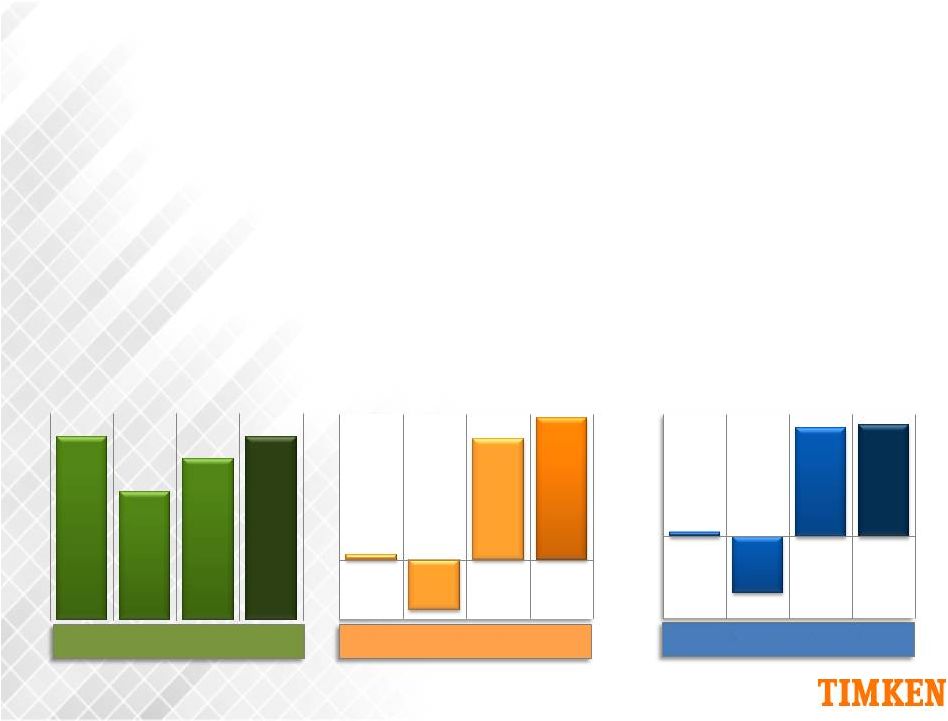 Sales of $1.8 billion, up 13.7% from 2010 Sales increase driven by higher demand and penetration in the off-highway, rail and heavy truck sectors Achieved EBIT of $243 million, up 17% from 2010 Record EBIT margin of 13.7% Industry leading service levels 32 $1,772 $1,245 $1,561 $1,769 2008 2009 2010 2011 $9 -$86 $208 $243 2008 2009 2010 2011 0.5% 6.9% 13.3% 13.7% 2008 2009 2010 2011 - Net Sales ($Millions) EBIT ($Millions) EBIT Margins • • • • • • • • Top line growth, record profitability and strong cash generation Improved customer relationships with excellent customer service and support Continued portfolio shift toward attractive markets, winning new business while managing exited business 2011 Performance Update Key Accomplishments R ECORD F INANCIAL P ERFORMANCE |
 Strategy and Approach • Provide high-value power transmission products and services focused on demanding mobile equipment and vehicle applications to OE and aftermarket channels globally Strategic Imperatives • Capitalize on mining, agricultural and commercial transportation demand • Improve mix in end markets, channels, geography and products • Manage exited business • Industry leading customer service and technical support 33 STRATEGY IS WORKING |
 2005 Sales 2011 Sales 34 Off- Highway 16% Light Vehicle Systems 54% Heavy Truck 13% On- Highway Aftermarket 9% Rail 8% Light Vehicle Systems 35% 25% On Highway Aftermarket 14% Heavy Truck 13% Rail 13% S TRATEGY : I MPROVING THE M IX - Off- Highway |
 • Extensive portfolio of differentiated products for mission critical and demanding applications • Additional capacity for growing markets • Leader in customer service and technical support The Future of Mobile Industries • Leverage strong demand across global mobile markets • Low to mid double digit operating margins • Improve mix in off-highway, rail and mobile aftermarket 35 L OOKING F ORWARD : M ORE G ROWTH |
 Population Growth Infrastructure Growth Mobile Equipment Growth • Mining • Heavy Truck • Rail • Agriculture • Light Vehicle 36 Mobile Equipment Aftermarket Growth MARKETS TARGETED FOR GROWTH |
 • Demand for mining equipment projected to grow at 8% CAGR; sustained through 2020 * • Mining equipment manufacturers investing to support growth • Equipment rebuilds drive large aftermarket 37 * Source: Freedonia Industry study World Mining Equipment Jan. 2012 #2840 FOCUS ON MINING |
 Haul Truck • Equipment Life: 20+ years • Typical Bearings Cycle: 3-5 years • Lifetime Opportunity: ~$500,000 Longwall Shearer Electric Shovel • Equipment Life: 30+ years • Typical Bearings Cycle: 4-8 years • Lifetime Opportunity: ~$2.4 Million • Equipment Life: 20+ years • Typical Bearings Cycle: 0.5-1.5 years • Lifetime Opportunity: ~$450,000 Crushing , Screening and Conveying • Equipment Life: 20+ years • Typical Bearings Cycle: 4-8 years • Lifetime Opportunity: ~$200,000 38 L IFETIME OF R EVENUE O PPORTUNITY |
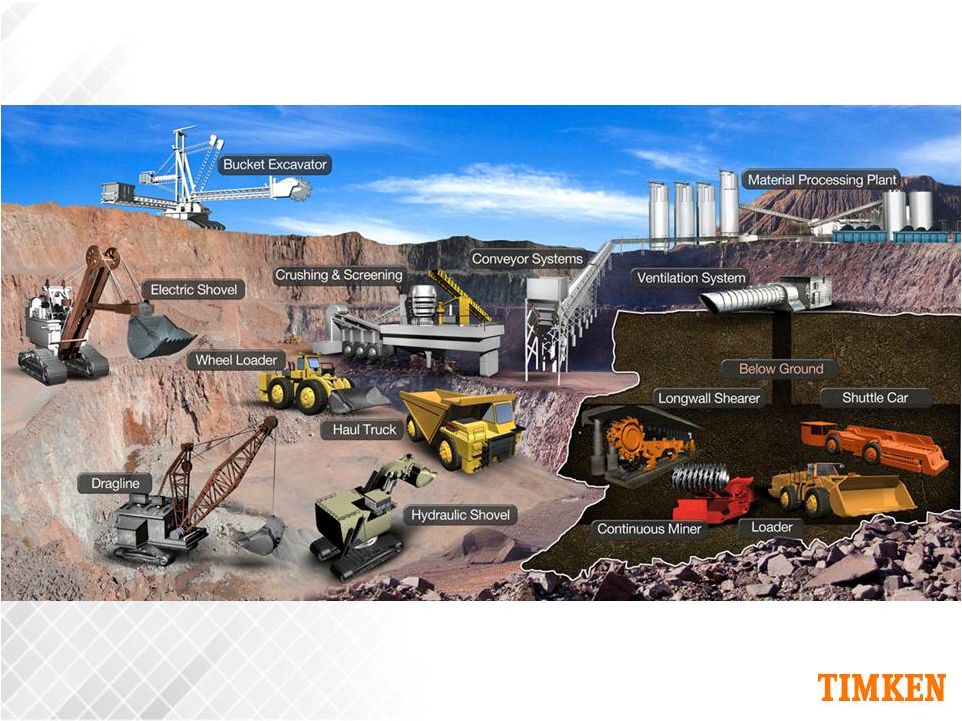 39 P OPULAR M INING E QUIPMENT |
 • Record financial performance; strong cash generation • Robust market demand across all global mobile markets • Focused on products, applications, and markets where customers value our engineering, manufacturing and service capabilities • Strong growth in rail and off-highway markets as well as on-highway vehicle aftermarket What’s Next What’s Different Today • Continued strong financial performance • Sustained leadership position in target markets • Diversified products and markets 40 M OBILE I NDUSTRIES : K EY T AKEAWAYS |
 Rich Kyle President – Mobile Industries and Aerospace Feb. 14, 2012 TIMKEN ANALYSTS’ DAY |
 Percent of Total Company Sales Market Sales Aerospace Aerospace & Defense & Defense 6% 6% • Flight critical components and services for aircraft engines and transmissions • Precision bearings, assemblies, encoders, sensors for the motion control market Geographic Sales 42 2011 Sales: $324 Million U.S. 78% Europe 12% Asia 6% 4% ROW Process Mobile Steel Defense 46% Civil 43% Motion Control 11% AEROSPACE A ND DEFENSE OVERVIEW |
 Commercial Bearings, replacement parts, bearing repair Guidance Bearings, Sensors Machine Tool Precision bearings, OE and aftermarket Motion & Position Control Bearings, replacement parts Rotorcraft Bearings, engine and drive train, overhaul, replacement parts, bearing repair General Aviation Engine overhaul, replacement parts, bearing repair Rotorcraft Transmissions, bearings, drive trains, replacement parts, bearing repair Fixed Wing Bearings, replacement parts, bearing repair Military Ground Equipment Powertrain, transmissions, positioning bearings Submarine Bearings, guidance systems, sensors 43 GROWING, DIVERSE MARKETS |
 44 Bearings Transmissions Encoders and Sensors Complex Parts Services DIFFERENTIATED SYSTEMS A COMPONENTS ND |
 2011 Net Sales: $324M Top 10 represent 38% of net sales 45 -60 Rolls Royce 250 GE CF6 Boeing Chinook Sikorsky CH-53 GE CF34 Boeing Apache H PWC PT6 Sikorsky Sikorsky Other 62% Other 62% Sikorsky S-76 V-22 Bell Boeing A EROSPACE AND D EFENSE P LATFORMS |
 2011 Net Sales: $324M 46 Original Equipment MRO 40% Original Equipment 30% Aftermarket 30% AEROSPACE & DEFENSE SALES BY CHANNEL |
 Key Accomplishments Positioned business for improvement Executed system and process improvements Strengthened customer service and business relationships Targeted growth to drive mix 2011 Performance Update Sales of $324 million slightly lower than 2010 Sales decrease resulting from defense-related weakness EBIT down on lower volumes, unfavorable sales and execution EBIT margin of 2.3% 47 $412 $418 $338 $324 2008 2009 2010 2011 Net Sales $45 $65 $17 $8 2008 2009 2010 2011 10.9% 15.7% 4.9% 2.3% 2008 2009 2010 2011 EBIT Margins EBIT A EROSPACE A ND D EFENSE ($Millions) ($Millions) |
 Strategy and Approach Provide a globally diverse portfolio of high-value parts, integrated assemblies and service capabilities focused on growing platforms through OE and aftermarket channels Leverage strong commercial and improving general aviation markets Navigate uncertainty in defense markets Improve mix and execution Advance leadership in intellectual property, service and execution 48 S TRATEGY I S W ORKING |
 Improved execution and service, strong commercial markets, a bottom in defense demand, and growth opportunities focused on profitable products, markets and channels What’s Next What’s Different Today Flat revenue and weak EBIT performance in 2011, due to execution, mix, and a weak defense market Strong execution combined with improving markets and targeted channels lead to growth and a return to attractive profitability 49 AEROSPACE A ND DEFENSE: KEY T AKEAWAYS |
 Chris Coughlin President – Process Industries Feb. 14, 2012 PROCESS INDUSTRIES TIMKEN ANALYSTS ’ DAY |
 2011 Sales: $1.2 Billion Precision-engineered bearings and mechanical power transmission products for diverse markets. Percent of Total Company Sales Geographic Sales Market Sales Aerospace Aerospace & Defense & Defense 51 Process 24% Mobile Steel U.S. 43% Asia 26% Europe 18% Latin America 7% ROW 6% Aftermarket 64% Service 9% Metals 8% Machinery 7% Energy 6% Gear Drives 5% Other 1 PROCESS INDUSTRIES OVERVIEW |
 Power Gen Coal: Pulverizers, ball mills, pumps Mining: Shovels/draglines, material handling Oil and Gas: Top drives, mud pumps Wind Energy: Main shafts, gear boxes Cement: Vertical rolling mills, crushing, screening Metals: Casters, flat products, long products Gear Drives: Industrial and planetary gear boxes, geared motors Pulp and Paper: Chippers/de-barkers, dryer, calendar Food and Beverage: Peelers/dicers, sorting equipment 52 RAPIDLY GROWING, DIVERSE MARKETS Creating customer value by: Focusing on challenging applications in tough industrial environments Offering differentiated systems and components critical to the reliable operation of complex machinery |
 Bearings Engineered Chains Gears Services 53 DIFFERENTIATED SYSTEMS AND COMPONENTS |
 2011 Performance Update Key Acomplishments 54 $1,166 $809 $903 $1,245 2008 2009 2010 2011 Net Sales ($Millions $215 $73 $134 $282 2008 2009 2010 2011 EBIT ) 18.4% 9.0% 14.8% 22.6% 2008 2009 2010 2011 EBIT Margins Record $1.2B sales, up 38% from 2010 Record 22.6% EBIT margin End-user focus leading to aftermarket growth Asia sales growth and geographic expansion New products and acquisitions Break-through customer service levels Value-based pricing S&A control and inventory management RECORD FINANCIAL PERFORMANCE ($Millions) |
 Strategy and Approach Strategic Imperatives 55 Focus on end-user value chain and needs Continually penetrate end-user value chain with new products and services Utilize strong distribution channels to maximize lifetime profit Achieve a leading market position in Asia Pacific Compete at original-equipment manufacturers level to drive the installed base Drive product and technology diversification beyond tapered bearings PROVEN STRATEGY |
 Prioritized efforts to serve the most attractive markets to Timken Percent of OE Sales in Target Markets Power Gen Coal Power Gen Coal Mining Mining Oil and Gas Oil and Gas Wind Energy Wind Energy Cement Cement Metals Metals Gear Drives Gear Drives Pulp and Paper Pulp and Paper Food and Beverage Food and Beverage 56 53% 79% 0% 10% 20% 30% 40% 50% 60% 70% 80% 90% 2000 2011 FOCUSED GROWTH IN DIVERSE MARKETS |
 Percent of Total Sales by Geography $0.40B $1.24B Asia ROW Latin America Europe U.S. 57 61% 43% 9% 25% 15% 17% 6% 7% 7% 5% $0.0 $0.2 $0.4 $0.6 $0.8 $1.0 $1.2 $1.4 2000 2011 EXPANDING GLOBAL P RESENCE |
 Product Sales 2011: $1.24B 2001: $0.40B TRB: Tapered Roller Bearings SRB: Spherical Roller Bearings CRB: Cylindrical Roller Bearings HU: Housed Units Other Bearings Services Non-Bearing Products Non-Bearing Products Services Other Bearings HU CRB SRB Non-Bearing Products Other Bearings 58 56% 56% TRB TRB 96% 96% TRB TRB NEW PRODUCTS, NEW OPPORTUNITIES |
 Differentiated performance • Industrial focus • Strong aftermarket • Supply chain synergy Sales/Timing Product Offering Growth Synergies Sales: $85M Purchase date: July ‘11 Sales: $100M Purchase date: Oct. ‘11 2011 Sales: $23M Purchase date: Sept. ‘10 Gear drive repair Engineered chains and augers Mounted spherical roller bearings and couplings 59 Capture lifetime of revenue opportunity Leverage distribution channel Opportunities for cross-selling and development of product lines Global expansion NEW ACQUISITIONS, NEW CAPABILITIES NOTE: Sales for Philadelphia Gear and Drives reflect last 12-month sales at time of purchase. Sales for QM Bearings reflect both Mobile Industries and Process Industries sales. |
 Large-bore Bearings On-time Delivery/ Stock-in Rate Right product at the right place, right time= Gains in market share + Premium pricing + Increased inventory turns 60 70% 87% 0% 10% 20% 30% 40% 50% 60% 70% 80% 90% 100% 2006 2011 8- 12 -6 0 1 2 3 4 5 6 7 8 9 10 11 12 2006 2011 4 39% 25% 2006 2011 Working Capital (% of Sales) Large-bore Bearings Lead Time (Months) EXCELLENT CUSTOMER SERVICE WITH WORKING CAPITAL DISCIPLINE NOTE: Large-bore bearings include greater than 8 inch tapered, spherical and cylindrical roller bearings. |
 The Future of Process Industries Extensive portfolio of differentiated mechanical power transmission products and services Expansive OE installed base to seed the aftermarket Additional capacity for growing markets Leader in customer service in mechanical power transmission 61 Aggressive sales growth >20% operating margins Leading position in focused markets with strong aftermarket opportunity L OOKING F ORWARD : M ORE I NDUSTRIAL G ROWTH |
 Mechanical Power Transmission Bearings Tapered Roller Bearings NOTE: Based on Timken’s internal projections and analysis of third party source materials. 62 Chains, belts, gear drives, couplings, brakes, sprockets, clutches, services, condition monitoring, rebuild, repair Spherical, cylindrical, housed unit, ball EXPANDING OUR MARKET SPACE |
 New product sales: 2011 YOY growth of 40-50% Ample opportunity to gain market share in new products Timken Market Share Based on Timken’s internal projections and analysis of third party source materials. 63 Introduce and globalize products and services Invest in ASEAN, Latin America, Africa, Russia Grow in China, India Increase capacity in new products NOTE: New product sales from cylindrical roller bearings, roller housed units and spherical roller bearings. GAINING SHARE: ORGANIC GROWTH |
 Acquisition strategy NOTE: Based on Timken’s internal projections and analysis of third party source materials. 64 Differentiated mechanical power transmission products and services in demanding applications Products with broad aftermarkets Industrial services that penetrate end-user value chains Leverage the Timken brand and global distribution infrastructure Strong financial returns Chains, belts, gear drives, couplings, brakes, sprockets, clutches, services, condition monitoring, rebuild, repair U NLOCKING N EW S PACES : I NORGANIC G ROWTH |
 Record sales and EBIT stemming from a solid strategy and end-user focus in attractive markets. Product line expansion; mechanical power transmission acquisitions; excellent customer service; and greater market and geographic growth/diversification. Aggressive annual sales growth by gaining share in focused markets and unlocking new mechanical power transmission opportunities. What’s Next What’s Different Today 65 PROCESS INDUSTRIES: KEY TAKEAWAYS |
 Sal Miraglia President – Steel Group Feb. 14, 2012 TIMKEN ANALYSTS’ DAY STEEL |
 STEEL GROUP OVERVIEW 2011 Sales: $2 Billion Percent of Total Company Sales Geographic Sales Market Sales 67 Aerospace Aerospace & Defense & Defense High-performance alloy steel Know-how to design custom solutions Broad product line Efficient supply chains Passenger Car 14% Light Truck 11% Heavy / Medium Truck 2% Vehicular Bearing Steels 1% Oil and Gas Drilling 17% Distribution General 13% Aerospace & Defense 2% Agriculture Machinery 1% Mining Machinery 3% Industrial Machinery 10% Rail 3% General Industrial 10% Industrial Bearing Steels 6% US 93% Outside US 7% Process Mobile Steel 36% Oil and Gas Completion 7% |
 Seamless mechanical steel tubing Special bar quality steel Value-added solutions 450 grades of carbon and alloy steels Well suited for power transmission applications 68 DIFFERENTIATED SOLUTIONS |
 Steel Applications Non-Timken Bearings Bearing Races Fuel Injectors Gun Barrels Crankshafts Energy Production CV Joints Transmissions Gears Fasteners Hand Tools Leaf Springs Shopping Carts Table Legs Reinforcing Bar 69 LOW HIGH HIGH THE S TRATEGY IS WORKING |
 We build trust by turning We build trust by turning what we know about high what we know about high performance steels into performance steels into improved customer improved customer performance. performance. What are What are we best at? we best at? What are we What are we passionate passionate about? about? Offering differentiated alloy steels and supply chain solutions in attractive market segments 70 What powers our What powers our economic engine? economic engine? T HE S TRATEGY IS W ORKING |
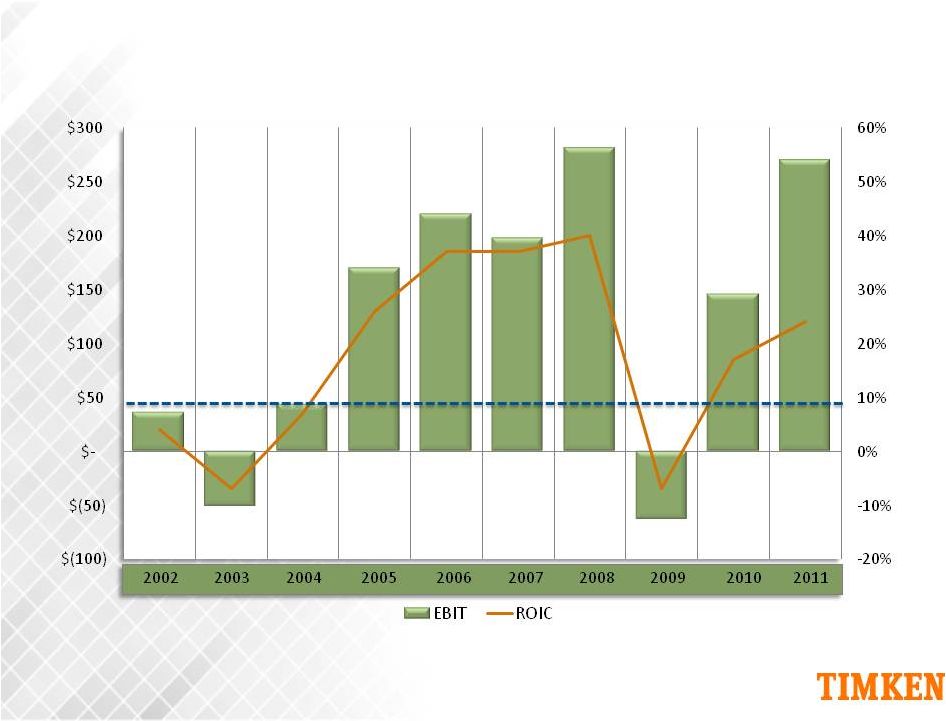 71 Note: EBIT is defined as operating income plus other income (expense), net; ROIC is calculated as NOPAT/invested capital. See Appendix for reconciliation of ROIC to the most directly comparable GAAP equivalent. ($ MILS.) Timken’s Average Cost of Capital ~9% Steel Segment PROFITABILITY TRACK RECORD |
 STRONG PERFORMANCE 2011 Performance Update Sales of $2 billion, up 44% from 2010 Higher volume, surcharges and pricing High demand from energy and industrial EBIT margin of 13.8% Key Accomplishments 25 percent increase in shipped tons Capacity improvements Continued portfolio management Customer service improvements 72 $1,852 $715 $1,360 $1,954 Net Sales $281 -$63 $146 $271 EBIT ($Millions) 14.3% -8.1% 10.8% 13.8% EBIT Margin 2008 2009 2010 2011 2008 2009 2010 2011 2008 2009 2010 2011 ($Millions) |
 73 Note: ROIC is calculated as NOPAT/invested capital; see Appendix for reconciliation of ROIC to the most directly comparable GAAP equivalent. Steel special peers are a representative group of eight steel companies. The Timken Peers are comprised of 36 industrial companies from the S&P 400 index. Capital IQ is the data source for all peer companies. 24% 8% 12% Timken Steel Special Steel Peers Timken Peers ROIC - One Year 11% 6% 11% Timken Steel Special Steel Peers Timken Peers ROIC – Three Year 22% 11% 13% Timken Steel Special Steel Peers Timken Peers ROIC - Five Year 18% 14% 13% Timken Steel Special Steel Peers Timken Peers ROIC - Year Ten TIMKEN STEEL PERFORMS |
 74 Actions/Tactics: Pricing action Cost reductions Tube Finishing Line (IFL) Expected Results: Diversification/flexibility Significantly improved performance in downturn P ERFORMANCE STABILIZATION Forge Press Caster/Refiner Portfolio management Growth in attractive areas Lower break even Product differentiation |
 Mining Rail Passenger Car Light Truck Drilling Equipment Production Equipment Heavy/Medium Truck Wind Energy Completion Farm Equipment Vocational Truck Horizontal Drilling 75 RAPIDLY GROWING, DIVERSE M ARKETS |
 High performance application Drill bits/hydraulic impact hammers Drivetrains Bearings Strength Where It Matters For Mining Transportation Motorized Wheel Drive System Internal cleanliness Consistent chemistry Special steel grades Small quantities and diverse sizes 76 T HE S TRATEGY IS W ORKING – I NDUSTRIAL |
 Planetary Ring Gear Unique rotary forging capability Managed supply chains Conserve capital Unique finishing capability Alloy development capability Improved fuel economy Forged Crankshaft 77 T HE S TRATEGY IS W ORKING – M OBILE O N -H IGHWAY |
 Stator Tubes Used in horizontal drilling Helps rotor movement More reliable, better product Grade: Impact 7 Quench and temper tube 78 T HE S TRATEGY IS W ORKING – O IL AND G AS |
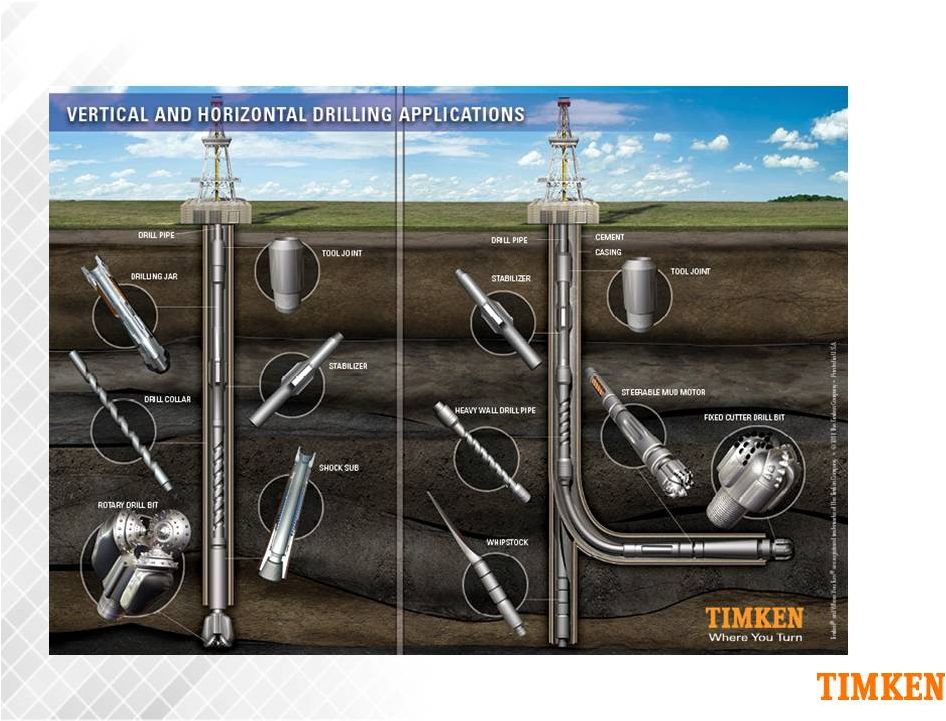 79 T HE S TRATEGY IS W ORKING – O IL AND G AS |
 Positioning to Serve Attractive Market Segments Large bar ultrasonic Custom heat treat Forge press Capacity and productivity enhancements Organic Growth Value-Add Initiatives Value selling & pricing International growth Business portfolio development Inorganic Growth Timken Boring Specialties expansion Asia value-add Asia steelmaking Operational Excellence Tube finishing line (IFL) Lean6Sigma /Cont. imp. Customer service Recycling business 80 L OOKING F ORWARD – S TRATEGY R OAD M AP |
 Defend and Grow Leadership Position in Large Bar Extend differentiation business model Increase capacity for profitable growth Grow international sales Dampen financial impact of economic cycles Deliver cost savings through yield and productivity gains Extending competitive advantage 81 Note: Subject to ratification of a new collective bargaining agreement with the United Steelworkers. LOOKING FORWARD – P ROPOSED FAIRCREST INVESTMENT |
 Investment Overview: Expected productivity improvement and cost savings Increased capacity Extend differentiation Barrier to entry Projected rate of return > 20% 82 Note: Subject to ratification of a new collective bargaining agreement with the United Steelworkers. LOOKING FORWARD – P ROPOSED FAIRCREST INVESTMENT $225 million proposed investment at Canton Faircrest Steel Plant Ladle refiner & new large-bloom continuous caster Expected capacity increase of ~25% Production commencement target in 2014 |
 83 Strong financial performance Capturing value with differentiated offerings Operational excellence Demand for energy (oil, gas, wind) Demand for raw materials New product sales Diversified markets S TEEL : K EY T AKEAWAYS Capital investment program Pricing and continuous improvement Value-added opportunities Performing Improving Growing |
 Glenn Eisenberg Executive Vice President – Finance & Administration Feb. 14, 2012 T IMKEN A NALYSTS D AY ’ |
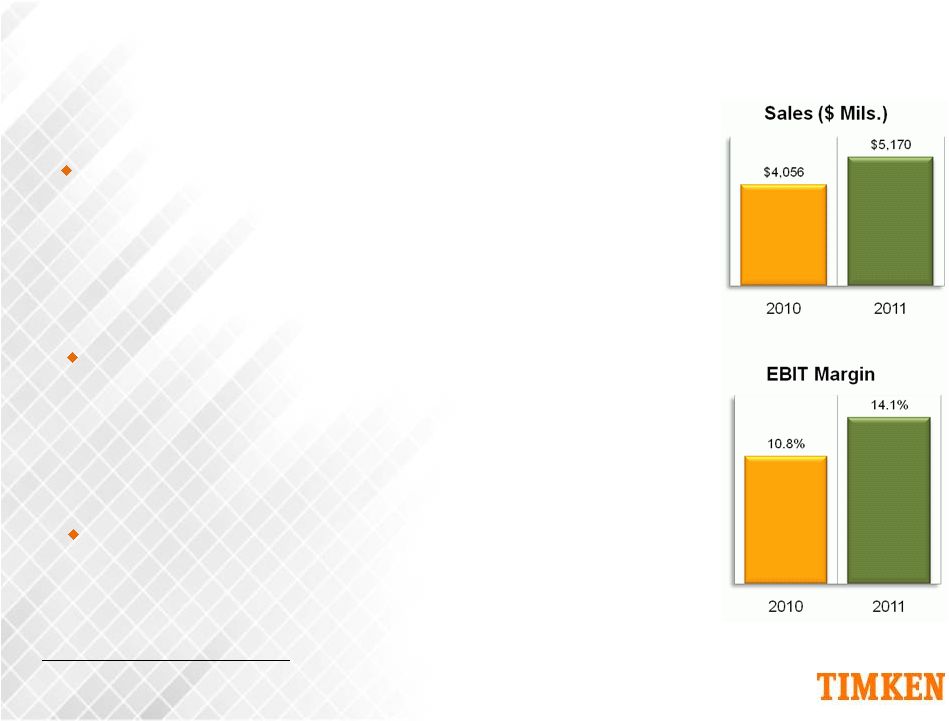 Sales of $5.2B, up 28% from prior year Driven primarily by strong demand across the company's diverse industrial sectors, along with favorable pricing, material surcharges and acquisitions EBIT of $728M, or 14.1% of sales Record EPS: $4.59, up 68% from prior year’s $2.73 Note: See Appendix for reconciliation of EBIT to the most directly comparable GAAP equivalent. 85 Earnings benefited from improved demand, favorable mix, surcharges and pricing, which more than offset higher raw material and SG&A costs Reflecting strong execution and operating leverage 2011 RESULTS |
 2011 RESULTS Free Cash Flow a use of $70M From operating activities after pension contributions, capital expenditures and dividends Includes $256M discretionary pension and VEBA trust contributions, net of tax Strong Balance Sheet Cash position of $468M, or $47M net debt Pension & postretirement benefits unfunded liability of $950M, up slightly from prior year • Discretionary cash contributions were more than offset by negative impact of year-end discount rate and low asset returns Liquidity of $1.3B, with no significant debt maturities until 2014 Note: 86 Free cash flow is defined as net cash provided by operating activities (includes pension contributions) minus capital expenditures and dividends. Net debt is not a GAAP measure. Management believes Net Debt is an important measure of the Company's financial position, due to the amount of cash and cash equivalents. VEBA is in reference to the Company’s Voluntary Employee Benefit Association (VEBA) trust. See Appendix for reconciliation of Free Cash Flow and Net Debt to the most directly comparable GAAP equivalents. |
 2012 OUTLOOK ESTIMATES Sales Growth 5 to 8% Mobile Industries Flat Process Industries 8 to 13% Aerospace & Defense 10 to 15% Steel 5 to 10% EPS (diluted) $4.90 to $5.20 Free Cash Flow $80M CapEx $345M Dividends $90M Pension/VEBA contributions (discretionary) $150M, net of tax Note: Free cash flow is defined as net cash provided by operating activities (includes pension contributions) minus capital expenditures and dividends. See Appendix for reconciliation of Free Cash Flow to the most directly comparable GAAP equivalent. 87 |
 SALES 88 ’91 to ’01 Cycle CAGR: 4% ’02 to ‘09 Cycle CAGR: 4% Net Sales ($ Mils.) Outlook 2012 Sales Estimate: +5 to 8% Y-O-Y - improved demand 2014 Sales Target: 3-Year CAGR of +7 to 12% - global GDP recovery/ - includes inorganic 2012 Sales Estimate 2014 Sales Target growth growth in 2013-2014 of 3.5% to 4% across broad end- markets, partially offset by exited light- vehicle business in Mobile $0 $1,000 $2,000 $3,000 $4,000 $5,000 $6,000 $7,000 $8,000 1991 1993 1995 1997 1999 2001 2003 2005 2007 2009 2011 2013 Note: 2003 includes Torrington acquisition as acquired February 2003. Historical results exclude the discontinued operations of Latrobe Steel (2006 divestment) and the Needle Roller Bearings (NRB) business (2009 divestment). NRB discontinued operations for 2003 and 2004 are based on internal estimates. |
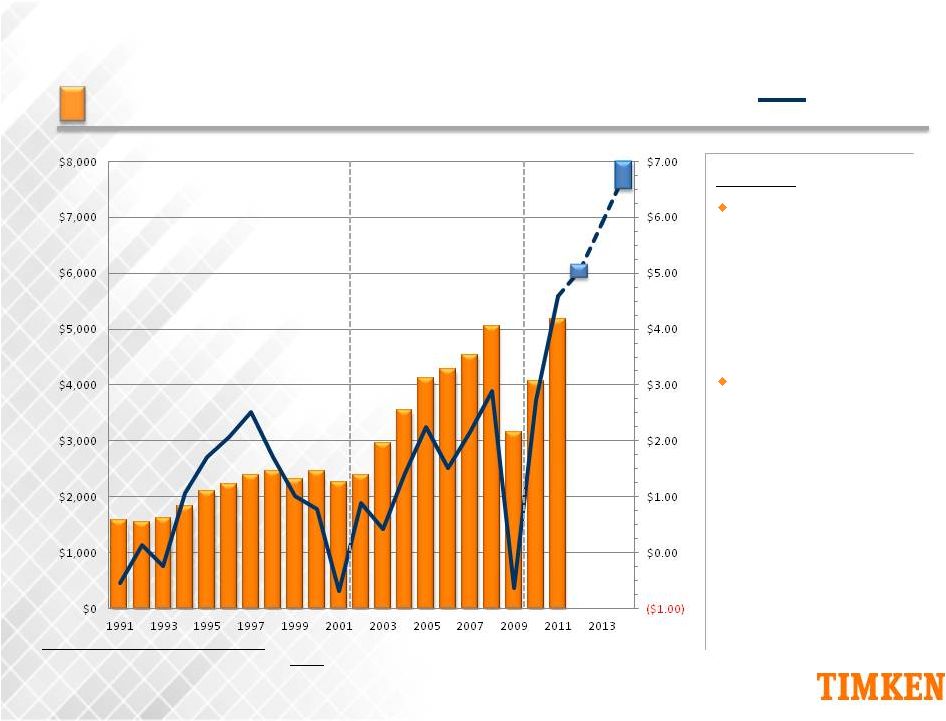 EARNINGS PER SHARE Earnings Per Share Net Sales ($ Mils.) 2014 EPS Target 2012 EPS Estimate 89 Outlook 2012 EPS Estimate: $4.90 to $5.20 per diluted share 2014 EPS Target: $6.50 to $7.00 per diluted share - redeployment of capital including inorganic growth - reflecting improved operating performance Note: Earnings are reported on a GAAP basis and include the impact of special items, such as restructuring and reorganization expenses, CDSOA payments and goodwill amortizatiion. EPS assumes dilution. 2003 includes Torrington acquisition as acquired February 2003. Historical results exclude the discontinued operations of Latrobe Steel (2006 diivestment) and the Needle Roller Bearings (NRB) business (2009 disvestment). NRB discontinued operations for 2003 and 2004 are based on internal estimates. |
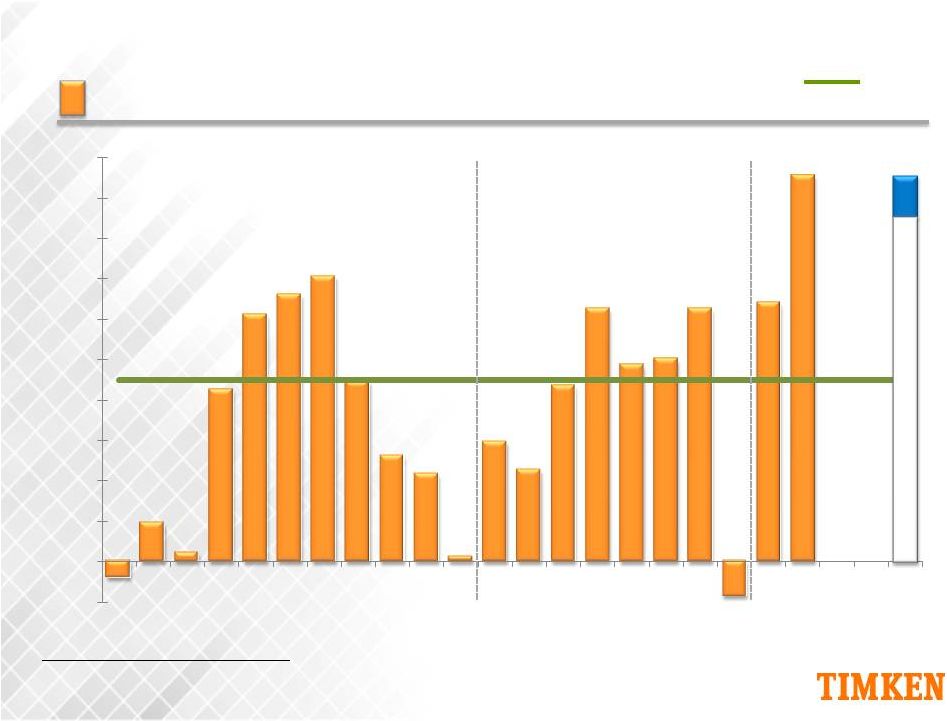
 FREE CASH FLOW Free Cash Flow ($ Mils.) 90 ’91-’01 Cycle Avg: $16M ’02-’09 Cycle Avg: $87M Outlook 2012 FCF Estimate: $80M after, - CapEx of $345M - dividends of $90M - discretionary 2014 FCF Target: $250 to $300M - CapEx above 2012 FCF Estimate 2014 FCF Target targeted range, increased dividends and lower pension / VEBA contributions pension / VEBA trust contributions of $150M (net of tax) -$100 $0 $100 $200 $300 $400 $500 1991 1993 1995 1997 1999 2001 2003 2005 2007 2009 2011 2013 Note: Free cash flow defined as net cash provided by operating activities (includes pension contributions) minus capital expenditures and dividends. Results include discontinued operations until divested. See Appendix for reconciliation of Free Cash Flow to the most directly comparable GAAP equivalent. |
 CAPITAL SPENDING Outlook 2012 CapEx Estimate: $345M - driven by global - targeted +20% IRR - ~$80M maintenance 2013-2014 CapEx above long term target 2012 Estimate 91 Long-term Target: 4% of Sales Capital Spending ($ Mils.) Cap Ex % of Sales 0% 1% 2% 3% 4% 5% 6% 7% $0 $50 $100 $150 $200 $250 $300 $350 $400 2002 2003 2004 2005 2006 2007 2008 2009 2010 2011 2012 spending hurdle rate energy, mining, infrastructure and heavy industries growth Estimated 2012 capital spending as a percent of sales is based on mid-point of company sales estimate. Note: |
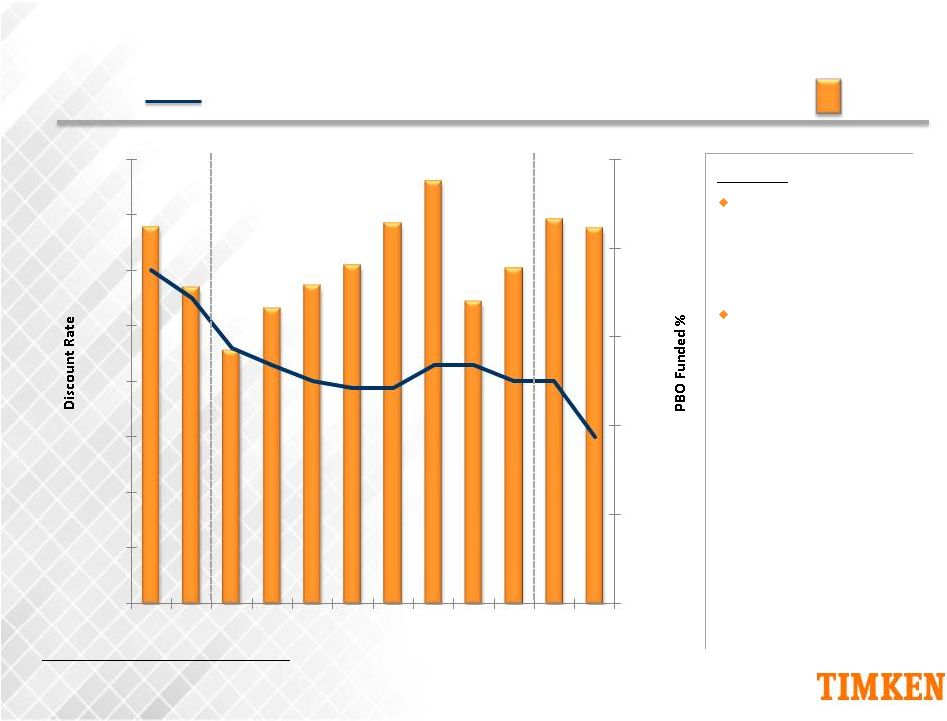 PENSION Note: Discount rate noted is for Timken’s domestic pension fund which represents the majority of the company’s global pension assets. PBO funded percent denotes the Company’s pension benefit obligation (PBO) funded status. Outlook 2012: - discretionary pension 2013 – 2014: - discretionary pension - targeting to reduce 92 contributions of ~$100M/year, net of tax liability through potential lump-sum and annuitization programs contributions of ~$100M, net of tax PBO Funded % Discount Rate 86% 84% 10.0% 9.0% 8.0% 7.0% 6.0% 5.0% 4.0% 3.0% 2.0% 0% 20% 40% 60% 80% 100% 2000 2002 2004 2006 2008 2010 |
 NET DEBT Net Debt /Capital Net Debt ($ Mils.) Note: 93 -30% -20% -10% 0% 10% 20% 30% 40% 50% -$600 -$400 -$200 $0 $200 $400 $600 $800 $1,000 1991 1993 1995 1997 1999 2001 2003 2005 2007 2009 2011 Long-term Leverage Target: 30% - 35% 2003 includes Torrington acquisition as acquired February 2003. Net debt is not a GAAP measure. Management believes Net Debt is an important measure of Company's financial position, due to the amount of cash and cash equivalents. Net Debt / Capital (leverage) defined as Net Debt / (Net Debt + Equity). See Appendix for reconciliation of Net Debt to the most directly comparable GAAP equivalent. |
 LIQUIDITY AND DEBT MATURITY ($ Mils.) Dec. 31, 2011 Cash 468 $ U.S. Senior Credit Facility 483 U.S. Accounts Receivable Securitization 150 Foreign Facilities 212 Sub-total credit availability 845 $ Total (including cash) 1,313 $ Dec. 31 Less than 2015 & 2011 1 Year 2013 2014 After Short-Term Debt + CPLTD $36 $36 $500M Senior Credit Facility (May '16) 0 $150M AR Securitization (Nov. '12) 0 Other Long-Term Debt 479 1 273 205 Total Debt $515 $36 $1 $273 $205 Payments Due by Period 94 |
 RETURN ON INVESTED CAPITAL Note: The company uses NOPAT/Average Invested Capital as a type of ratio that indicates return on capital (ROIC). See Appendix for reconciliation of ROIC to the most directly comparable GAAP equivalent. 95 Cost of Capital Return on Invested Capital ’91–’01 Cycle Avg. : 6.2% ’02–’09 Cycle Avg. : 7.8% Cost of Capital ~ 9% 2014 Target 17-19% 20% 18% 16% 14% 12% 10% 8% 6% 4% 2% 0% -2% 1991 1993 1995 1997 1999 2001 2003 2005 2007 2009 2011 2013 |
 2011 CAPITAL ALLOCATION HIGHLIGHTS • Returning cash to shareholders • 358 consecutive quarterly dividend paid in December 2011 • Discretionary contributions as capital structure and cash flow permit • Industrial & aftermarket focus • International • Accretive to earnings in year 1 • Earn cost of capital in 3 years • Target spend in industrial sectors: oil & gas, infrastructure, heavy industries and aerospace • Asia growth • Philadelphia Gear $200M • Drives $92M • Discretionary contributions of $401M, pre-tax • Pension funded status of 84% • Dividends $76M; raised 11% to $0.20/quarter in May 2011 • Share repurchase $44M 96 Over $1 Billion of Capital Deployed in 2011 Dividends/Share Repurchase Pension OPEB/Funding Capital Spend Acquisitions • $205M spent on growth, continuous improvement and maintenance th |
 • Returning cash to shareholders • 90 years of consecutive quarterly dividends • Industrial & aftermarket focus • International • Accretive to earnings in year 1 • Earn cost of capital in 3 years • Discretionary contributions as capital structure and cash flow permit • Target spend in industrial sectors: oil & gas, infrastructure, heavy industries and aerospace • Asia growth 2012 CAPITAL ALLOCATION HIGHLIGHTS • $345M spent on growth, continuous improvement and maintenance • Dividends ~$90M; raised 15% to $0.23/quarter in February 2012 • New share repurchase program increased to 10M shares • Strong balance sheet to fund future acquisitions • Discretionary contributions of ~$250M, pre-tax • Expected pension funded status of 90%+ 97 Pension OPEB/Funding Dividends/Share Repurchase Acquisitions Capital Spend Strong Capital Redeployment |
 INCENTIVE COMPENSATION Annual Long-Term Objective Short-term operational business priorities 3 year strategic business priorities Long-term shareholder value creation 6,000 Associates globally 160 General Managers & above 265 Senior Managers 160 General Managers & above Participants Time Horizon 1 Year 3 Years 4 Years 10 Years Metrics 40% Corporate EBIT/BIC 50% EPS 50% ROIC Share price 30% Business Unit EBIT/BIC 15% BU working capital % of sales 15% Customer service or New business sales ratio Note: EBIT/BIC is a pre-tax return on invested capital (ROIC) measure. BIC denotes beginning invested capital. The incentive compensation plan depicted above is effective January 2012. Award Cash Cash or Equity 98 Equity Restricted Non Qualified Stock Units Stock Options |
 THE STRATEGY IS WORKING • Enhance existing products and services • Leverage technology to create value • Capture lifetime of opportunity • Structure portfolio for value creation • Fix/Exit under-performing areas • Refine lean operating model • Improve efficiency and reduce cost structure • Increase agility • Deliver greater profitability • Attractive industrial markets • Developing geographies • Channels, services and distribution 99 |
 APPENDIX TIMKEN ANALYSTS’ DAY Feb. 14, 2012 |
 RECONCILIATION TO GAAP 2011 2010 2011 2010 159.5 $ 99.9 $ 696.8 $ 405.5 $ 8.6 9.5 36.8 38.2 (1.2) (1.4) (5.6) (3.7) 166.9 $ 108.0 $ 728.0 $ 440.0 $ 49.6 47.5 192.5 189.7 216.5 $ 155.5 $ 920.5 $ 629.7 $ Interest expense Interest income (Dollars in millions) (Unaudited) Reconciliation of GAAP income from continuing operations before income taxes This reconciliation is provided as additional relevant information about the company's performance. Management believes consolidated earnings before interest and taxes (EBIT) are representative of the company's performance and therefore useful to investors. Consolidated earnings before interest, taxes, depreciation and amortization (EBITDA) are another important measure of financial performance and cash generation of the business and therefore useful to investors. Management also believes that it is appropriate to compare GAAP income from continuing operations before income taxes to consolidated EBIT and EBITDA. Three Months Ended December 31, Twelve Months Ended December 31, Consolidated earnings before interest and taxes (EBIT) Depreciation and Amortization Consolidated earnings before interest, taxes, depreciation and amortization (EBITDA) Income from continuing operations before income taxes Pre-tax reconciling items: ($ Mils.) 101 |
 1991 1992 1993 1994 1995 1996 1997 1998 1999 2000 Total Debt (a) 273 321 277 280 211 303 359 469 450 514 Less: Cash 2 8 5 12 7 5 10 0 8 11 Net Debt 271 313 271 267 204 297 350 469 442 503 Equity 1,019 985 685 733 821 922 1,032 1,056 1,046 1,005 Total Debt to Capital 21.1% 24.5% 28.7% 27.6% 20.5% 24.7% 25.8% 30.8% 30.1% 33.8% Net Debt to Capital 21.0% 24.1% 28.4% 26.7% 19.9% 24.4% 25.3% 30.8% 29.7% 33.4% 2001 2002 2003 2004 2005 2006 2007 2008 2009 2010 2011 Total Debt (a) 497 461 735 779 721 598 723 624 513 514 515 Less: Cash 33 82 29 51 65 101 30 133 756 877 468 Net Debt 464 379 706 728 656 497 693 490 (243) (363) 47 Equity 782 609 1,090 1,270 1,497 1,476 1,961 1,663 1,596 1,942 2,043 Total Debt to Capital 38.9% 43.1% 40.3% 38.0% 32.5% 28.8% 26.9% 27.3% 24.3% 20.9% 20.1% Net Debt to Capital 37.2% 38.4% 39.3% 36.5% 30.5% 25.2% 26.1% 22.8% -18.0% -23.0% 2.2% RECONCILIATION TO GAAP ($ Mils.) 102 (a) Total Debt is the sum of commercial paper, short-term debt, current portion of long-term debt and long-term debt |
 RECONCILIATION TO GAAP ($ Mils.) 103 1990 1991 1992 1993 1994 1995 1996 1997 1998 1999 2000 GAAP Operating Income (1) (9) 42 14 132 203 247 280 225 133 106 GAAP Other Income / (Expenses) (8) (2) (6) 2 (5) (5) 7 (16) (10) (7) Earnings Before Interest and Taxes (EBIT) (2) (17) 41 8 135 198 242 287 209 123 99 Provision for income taxes (6) 15 3 51 73 93 102 80 45 35 Adjusted tax rate 37.6% 37.6% 37.6% 37.6% 36.9% 38.3% 35.7% 38.2% 36.8% 35.0% Net Operating Profit After Taxes (NOPAT) (3) (10) 25 5 84 125 149 184 129 78 64 Invested Capital: Total Debt 266 273 321 277 280 211 303 359 469 450 514 Shareholders' Equity 1,075 1,019 985 685 733 821 922 1,032 1,056 1,046 1,005 Total 1,341 1,292 1,306 962 1,012 1,032 1,225 1,392 1,526 1,496 1,519 Average Invested Capital (4) 1,317 1,299 1,134 987 1,022 1,129 1,308 1,459 1,511 1,507 ROIC: NOPAT / Average Invested Capital (4) -0.8% 1.9% 0.4% 8.5% 12.2% 13.2% 14.1% 8.9% 5.2% 4.3% 2001 2002 2003 2004 2005 2006 2007 2008 2009 2010 2011 GAAP Operating Income (1) (18) 79 98 237 327 219 295 462 (54) 436 729 GAAP Other Income / (Expenses) 22 37 10 12 68 80 5 16 (0) 4 (1) Earnings Before Interest and Taxes (EBIT) (2) 4 115 108 249 395 299 300 478 (54) 440 728 Provision for income taxes 2 46 43 80 129 91 61 171 (16) 148 251 Adjusted tax rate 39.8% 39.8% 40.0% 32.1% 32.6% 30.6% 20.4% 35.7% 29.9% 33.5% 34.5% Net Operating Profit After Taxes (NOPAT) (3) 3 69 65 169 266 208 239 307 (38) 292 477 Invested Capital: Total Debt 497 461 735 779 721 598 723 624 513 514 515 Shareholders' Equity 782 609 1,090 1,270 1,497 1,476 1,961 1,623 1,596 1,942 2,043 Total 1,279 1,070 1,824 2,049 2,218 2,074 2,684 2,246 2,108 2,456 2,558 Average Invested Capital (4) 1,399 1,175 1,447 1,937 2,134 2,146 2,379 2,465 2,177 2,282 2,507 ROIC: NOPAT / Average Invested Capital (4) 0.2% 5.9% 4.5% 8.7% 12.5% 9.7% 10.0% 12.5% -1.7% 12.8% 19.0% (1) GAAP Operating Income excludes discontinued operations for Latrobe Steel (divested Dec. 8, 2006) for years 2004 through 2006 and the Needle Roller Bearings business for years 2007 through 2009 (divested Dec. 31, 2009). (2) EBIT is defined as operating income plus other income (expense) - net. (3) NOPAT is defined as EBIT less an estimated provision for income taxes. This tax provision excludes the tax effect of pre-tax special items on the company's effective tax rate, as well as the the impact of discrete tax items recorded during the year. (4) The company uses NOPAT/Average Invested Capital as a type of ratio that indicates return on capital (ROIC). Average Invested Capital is the sum of Total Debt and Share- holders' Equity taken at the beginning and ending of each year and then averaged. Total Debt is the sum of commercial paper, ST-debt, curr. portion of LT-debt & LT-debt. |
 RECONCILIATION TO GAAP 104 (1) Free cash flow is defined as net cash provided by operating activities (including pension contributions) minus capital expenditures and dividends. Results include discontinued operations until divested. Management believes that free cash flow is useful to investors because it is a meaningful indicator of cash generated from operating activities that is available for the execution of its business strategy. US$ Million 1991 1992 1993 1994 1995 1996 1997 1998 1999 2000 GAAP Net Cash Provided by Operating Activities 140 116 154 147 224 186 312 292 277 157 GAAP Capital expenditures (140) (136) (89) (114) (129) (151) (233) (238) (165) (159) GAAP Cash dividends paid to shareholders (23) (22) (25) (26) (28) (30) (39) (45) (45) (44) Free Cash Flow (1) (23) (43) 39 6 67 5 40 9 68 (46) Estimate 2001 2002 2003 2004 2005 2006 2007 2008 2009 2010 2011 2012 Net Cash Provided by Operating Activities 178 206 204 121 319 337 337 569 588 313 212 515 Capital expenditures (91) (85) (119) (155) (221) (296) (314) (272) (114) (116) (205) (345) Cash dividends paid to shareholders (40) (32) (42) (47) (55) (58) (63) (67) (43) (51) (76) (90) Free Cash Flow (1) 47 89 43 (81) 43 (17) (40) 230 430 146 (69) 80 |
 105 RECONCILIATION TO GAAP - STEEL Steel Segment 2002 2003 2004 2005 2006 2007 2008 2009 2010 2011 Earnings Before Interest and Taxes (EBIT) (1) 36 (51) 44 170 220 198 281 (63) 146 271 Provision for income taxes 14 (21) 14 55 67 40 57 (23) 44 91 Net Operating Profit After Taxes (NOPAT) (2) 22 (31) 30 115 152 158 224 (41) 102 180 Average Beginning Invested Capital 492 432 422 447 411 425 566 550 601 754 ROIC: NOPAT / Average Beginning Invested Capital (3) 4% -7% 7% 26% 37% 37% 40% -7% 17% 24% (1) EBIT is defined as operating income plus other income (expense) - net. (2) NOPAT is defined as EBIT less an estimated provision for income taxes. (3) NOPAT/Average Begining Invested Capital is a type of ratio that indicates return on capital (ROIC). Invested Capital is a five quarter average of current assets, ppe, net of current non interest bearing liabilities, and short term pension obligations. |
 TIMKEN ANALYSTS’ DAY Feb. 14, 2012 CORPORATE BIOS |
 James W. Griffith President and Chief Executive Officer James W. Griffith is president and chief executive officer of The Timken Company and a member of the company’s board of directors. Since being named president in 1999, Griffith has led a transformation of The Timken Company focused on creating ever-increasing levels of value for customers and shareholders. By harnessing its legendary quality and industry-leading innovation, Timken has pushed beyond its historic leadership in the tapered roller bearing market into a vast global market for technologies to manage the friction generated by moving parts and improve the transmission of power in a wide array of machines. Griffith joined The Timken Company in 1984 and has held positions as plant manager, vice president of manufacturing in North America and managing director of the company’s business in Australia. From 1996 to 1999, he led Timken’s automotive business in North America and the company’s bearing business activities in Asia and Latin America. He was elected president, chief operating officer and director in 1999 and was named chief executive officer in 2002. Griffith is president of the World Bearing Association and chairman of the board of the Manufacturing Advocacy and Growth Network (MAGNET). He is vice president of the Management Executives’ Society and serves on the boards of directors of the US-China Business Council and Goodrich Corporation (NYSE: GR). In September 2011, he began a two-year term as a member of the management board of the Stanford Graduate School of Business. He also serves on the board of the University of Mount Union. Griffith holds a bachelor’s degree in industrial engineering and a Master of Business Administration from Stanford University. |
 Glenn A. Eisenberg Executive Vice President – Finance and Administration Glenn A. Eisenberg is executive vice president – finance and administration and chief financial officer of The Timken Company. He also is an officer of the company. Eisenberg is responsible for the executive leadership of the company’s financial organization, including accounting, tax, treasury, audit, risk management, financial analysis and investor relations. He also has responsibility for strategic planning, corporate development, communications, information technology and shared services. He is a member of the company’s executive council. Since joining Timken in 2001, Eisenberg has been instrumental in executing Timken’s global growth and financial strategies, including the billion-dollar acquisition of The Torrington Company. Prior to joining the company, Eisenberg served as president and chief operating officer of United Dominion Industries, a diversified industrial manufacturing company with $2.5 billion in sales, prior to its acquisition by SPX Corporation. At UDI, he also held the positions of president – test instrument segment, executive vice president and chief financial officer and vice president – planning and development. Before joining UDI in 1990, he was a vice president at the Citizens and Southern Corporation. Eisenberg serves on the boards of directors for Family Dollar Stores Inc. (NYSE: FDO) and Alpha Natural Resources Inc. (NYSE: ANR). In addition, he serves on the boards of Aultman Hospital and the Manufacturers Alliance/MAPI. He holds a bachelor’s degree in economics and environmental studies from Tulane University and a master’s degree in business administration from Georgia State University. |
 Salvatore J. Miraglia, Jr. President – Steel Group Salvatore J. Miraglia, Jr. is president – Steel Group at The Timken Company and an officer of the company. Since his appointment in August 2005, the Steel Group has surpassed previous records for production, shipments and profitability. The Group has increased capacity and expanded its line of alloy bar products while continuing to increase sales for alloy tubing and precision steel components. Miraglia has a unique mix of experience in research and development, steelmaking and purchasing, as well as knowledge of the bearing and mechanical power transmission markets. Prior to being named to his current position, Miraglia served as senior vice president of technology, group vice president of industrial and super precision bearings in North America and director of manufacturing in Europe, Africa and West Asia. He also has held the positions of vice president and director of steel manufacturing, and a variety of roles in research and purchasing. Miraglia joined the company in 1972. A member of the American Society of Professional Engineers, the American Institute of Metallurgical Engineers and the American Society for Metals, Miraglia also serves on the president’s council of the Manufacturers Alliance/MAPI. He is a member of the Ohio Aerospace Institute Board of Trustees and was appointed as President/Chairman of the Ohio Steel Council. Miraglia holds a bachelor’s degree in metallurgy and material science from Lehigh University and a master’s degree in metallurgy and material science from Case Western Reserve University. He also has completed the Advanced Management Program at Harvard University. |
 Christopher A. Coughlin President – Process Industries ® Christopher A. Coughlin is president of Process Industries and Supply Chain within the Bearings and Power Transmission Group at The Timken Company. The Process Industries segment provides bearings and related products and services for heavy industry, power transmission and energy market sectors. Named to the position in 2009, Coughlin also is responsible for distribution and global supply chain management for the Bearings and Power Transmission Group. In 2010, he assumed direction for the company's global purchasing organization and cross-business responsibility for the European organization. Coughlin served for five years as senior vice president – Supply Chain and Project O.N.E. Coughlin was responsible for global supply chain management, including strategy, demand planning, inventory management, order fulfillment and purchasing for the Bearings and Power Transmission Group. He also led Project O.N.E., a multiyear initiative to streamline business processes and implement an enterprise resource planning system. Coughlin first took over leadership of Project O.N.E. in 2004. Previously, Coughlin was based in Colmar, France where he held a variety of management positions including vice president - industrial equipment, vice president – process industries and vice president – primary metals. He also has served as business development manager for Timken’s customized Milltec program, which provides mill operation and maintenance services in India. Coughlin began his Timken career in 1984 in the company’s steel operations. Coughlin serves on the board of directors of the Akron Canton Foodbank. He received a bachelor’s degree in metallurgical engineering from the University of Cincinnati and a master’s degree in business administration from Case Western Reserve University. |
 Richard G. Kyle President – Mobile Industries and Aerospace Richard G. Kyle is president of Mobile Industries and Aerospace segments of The Timken Company. In 2010, Kyle expanded his role to include responsibility for the company's high-growth aerospace segment. That segment includes Timken's global commercial and military aviation and aerospace businesses as well as the health and positioning control business. The segment is focused on growing its portfolio of high-technology products and services to provide greater value to its diverse base of global customers and markets. Previously, Kyle was the president of the Mobile Industries segment. He led the business through significant changes in product portfolio, market mix and operating capabilities that yielded dramatic improvements in the financial performance of the segment. The Mobile Industries business is now focused on growing globally by serving the mining, heavy-truck, construction, agriculture, rail and light-vehicle equipment markets with a broad offering of high-performance power transmission products and related services. Kyle previously served as vice president – manufacturing for the Mobile Industries segment. He was a key leader in the transformation of the segment while also being responsible for managing the Bearings and Power Transmission Group’s global manufacturing operations. He was charged with driving operational excellence through lean manufacturing while supporting the company’s strategic growth initiatives. Kyle joined Timken in 2006 as vice president of manufacturing for the company’s former Industrial Group. Kyle previously served as vice president of operations for a division of Hubbell, Inc. Before joining Hubbell, he served in a variety of management positions with Cooper Industries. Kyle serves on the board of directors of the United Way of Greater Stark County. He received a bachelor’s degree in mechanical engineering from Purdue University and a master’s degree in management from Northwestern University’s J.L. Kellogg Graduate School of Management. |
 Philip D. Fracassa Senior Vice President and Controller - Bearings and Power Transmission Philip D. Fracassa is senior vice president and group controller for the Bearings and Power Transmission (B&PT) Group at The Timken Company. Named to this newly created position in 2010, Fracassa leads the finance activities supporting the global B&PT business, which includes Timken’s Mobile Industries, Process Industries and Aerospace & Defense reporting segments. He focuses on integrating the efforts of the group's controllers and leveraging the capabilities of Project O.N.E. to support Timken’s growth in key markets around the world. Fracassa previously served as senior vice president – tax and treasury. Named to that role in 2006, he led the company’s global treasury and tax activities, including liquidity management, pension funding, corporate insurance, and tax compliance, planning and strategy. Fracassa joined the company as vice president – tax in 2005. Prior to joining Timken, he was senior tax counsel and director of taxes for Visteon Corporation. He began his career with Price Waterhouse LLP in Detroit and also served as a tax attorney with General Motors Corporation. Fracassa is a member of Financial Executives International, the Tax Executives Institute and the Manufacturers Alliance/MAPI. He was included in Treasury & Risk magazine's lists of 40 distinguished finance executives under age 40 (2007) and top 100 most influential persons in finance (2009). He is active in community affairs in Northeast Ohio and currently serves on the boards of the Canton Regional Chamber of Commerce and the Cuyahoga Valley Scenic Railroad. Fracassa holds a bachelor's degree in accounting and a juris doctor degree in law from the University of Detroit. In 2011, he completed the Advanced Management Programme at INSEAD. He is a certified public accountant and licensed attorney in the state of Michigan. |
 Christopher J. Holding Senior Vice President – Tax and Treasury Christopher J. Holding is senior vice president of tax and treasury for The Timken Company. Named to this position in 2010, he leads the company’s global tax and treasury activities, including cash and liquidity management, pension funding, corporate insurance, and tax compliance, planning and strategy. Holding previously served three years as controller of the company's Process Industries segment within the Bearings and Power Transmission Group. He joined Timken in 2004 as operations controller for the company's former Industrial Group. Prior to joining Timken, Holding served in various financial management positions with Arthur Andersen & Company, Bishopric Inc., Ashley Ward Inc. and Union Metal Corp. Holding is a member of the American Institute of Certified Public Accountants and is on the Treasury Council of the Manufacturers Alliance/MAPI. He is also a member of Financial Executives International. Holding serves as president of the board of Jackson Local Schools Foundation and as secretary/treasurer of the board of Project REBUILD, which is a nonprofit agency that re-engages at-risk youth to complete their high school education. He holds a bachelor's degree in accounting and a master's degree in taxation, both from the University of Cincinnati. |
 J. Ted Mihaila Senior Vice President – Controller J. Ted Mihaila is senior vice president – controller and an officer of The Timken Company. Mihaila directs the company’s finance and corporate shared services teams. His oversight of the two teams enables leverage of the services the company provides on an enterprise basis. Mihaila has responsibility for the compilation, analysis and reporting of accurate and timely actual and forecasted financial results. Under his guidance, the finance team provides information that enables company leaders to make strategic decisions about growth opportunities, investments and markets. Mihaila previously served as vice president – business development and controller in the Industrial Group. He directed the development of long-term strategies and implementation of tactical plans to accelerate the growth of the company’s former Industrial Group through acquisitions and affiliations. Mihaila has managed finances for various production facilities and business groups during his career at Timken. He was promoted to an accounting role in 1977 after joining the company in 1975. He was named to his current position in 2006. Mihaila is an active member of the Manufacturers Alliance/MAPI. Financial Council. He also serves on the board of Habitat for Humanity of Greater Stark County and the George W. Daverio School of Accountancy Advisory Board at The University of Akron. Mihaila received a bachelor’s degree in accounting from The University of Akron and a master’s degree in business administration from Kent State University. |
 Kari Groh Vice President – Communications and Public Relations Kari Groh is vice president – communications and public relations for The Timken Company. Named to the position in 2009, she is responsible for worldwide communications, directing the development of Timken messaging with customers, media, associates and shareholders. She oversees reputation management, brand strategy, marketing communications, corporate events, creative services and design, the corporate website and the company’s global intranet, including a daily newspaper available in seven languages. She also has responsibility for directing Timken’s global citizenship strategy and programs. Groh began her career at Timken while pursuing a degree in journalism. In 1981, she was named assistant editor of the TIMKEN magazine. Thereafter, she held a number of positions in communications including supervisor. In 1992, she was named manager – public relations and marketing communications. Groh was promoted to general manager in the company’s bearing business in 1998 and then advanced through a series of operating roles, ultimately assuming responsibility for global customer service, warehouse management and logistics for the distribution business. She was instrumental in implementing a number of warehousing and logistics improvements and steered the integration of customer service following the company’s largest acquisition in 2003. Groh also played a role in the company’s “Project O.N.E.” enterprise system and process implementation. Prior to being named to her current position, she was general manager of organizational effectiveness as part of the company’s Information Technology leadership team. She is a member of Team NEO marketing Council, the Arthur W. Page Society, Northeast Ohio Senior Communicators Forum, the Ohio Steel Council’s Communications Committee and OESA’s Communications Council. She serves as a board member of Stark State College in Canton, Ohio, and Pathway Caring for Children. In addition to a bachelor's degree from The University of Akron, Groh holds an MBA degree from Ashland University. |
 Steve D. Tschiegg Director – Capital Markets and Investor Relations Steve D. Tschiegg is director – capital markets and investor relations at The Timken Company. Tschiegg has responsibility for communicating the company's financial results, performance and strategies to the financial community, as well as leading company efforts in capital structure planning, new financings and refinancings, bank relationships and rating agency relations in addition to oversight of the company’s risk management function. Prior to being named to his current position in 2008, Tschiegg was manager of investor relations. He also has held positions including senior financial analyst, principal – corporate finance and manager – global risk management in the company's finance group. Tschiegg joined Timken in 1997. He previously held several positions in the finance area at Ford Motor Company, including financial analysis – Engine Operations, new product business planning – Transmission & Chassis Operations and the most recent being supervisor – operations analysis at one of Ford’s engine manufacturing facilities. Tschiegg received a bachelor’s degree in business administration and mathematics from Heidelberg College and a master's degree in business administration from Case Western Reserve University. He completed the Executive Development for Global Excellence program at the Darden School of Business at the University of Virginia. |
 Jack Gecovich Capital Markets and Investor Relations Specialist Jack Gecovich is capital markets and investor relations specialist within the Treasury Corporate Center for the Timken Company. Gecovich is responsible for analytical work across a broad range of areas to expand the company's overall investor relations program, which communicates the company's financial performance, strategy and special developments to prospective and existing investors and the broader financial community. He also supports various corporate finance special projects within the treasury function. Gecovich joined Timken in 2010. Gecovich previously served as co-portfolio investment manager for LanderNorth Asset Management in Beachwood, Ohio. Prior to that, he was with KeyCorp in Cleveland as a lead financial analyst. Gecovich holds a bachelor's degree in business administration from Yeshiva University in New York and a master's degree in business administration finance from Cleveland State University. |
 Lorrie Paul Crum Manager – Global Media and Strategic Communications Lorrie Paul Crum is manager – global media and strategic communications at The Timken Company. Named to the position in December 2008, Crum is responsible for leading Timken’s global reputation and media relations efforts, while also contributing expertise in financial communications. As part of the company's communications leadership team, she provides executive support to guide effective corporate and marketing communications among the company's internal and external stakeholders. Before joining Timken in 2007 as a consultant on corporate reputation and communication, Crum served as vice president of corporate communications at Parker Hannifin. In the 1990s, she was chief of communications at Rubbermaid, Inc. through the company's merger with Newell Co. She also managed financial communications and public relations at Tampa Electric/TECO Energy. Crum is a member of the National Investor Relations Institute and the Northeast Ohio Marketing Leadership Roundtable. She also is accredited by the Public Relations Society of America (PRSA) and served as a PRSA chapter president. Crum received a bachelor's degree in organizational communication and Spanish from The Ohio State University and a master's in business and public administration from Golden Gate University. |