 New York City March 5, 2013 ISI GROUP INDUSTRIALS INVESTOR CONFERENCE • Exhibit 99.1 |
 FORWARD-LOOKING STATEMENTS SAFE HARBOR AND NON-GAAP FINANCIAL INFORMATION Certain statements in this presentation (including statements regarding the company's forecasts, beliefs, estimates and expectations) that are not historical in nature are "forward-looking" statements within the meaning of the Private Securities Litigation Reform Act of 1995. In particular, the statements related to Timken’s plans, outlook, future financial performance, targets, projected sales, cash flows, and liquidity, including the information under the heading “The Strategy Is Working: Key Takeaways,” “Attractiveness /Strategic Priorities,” “2013 Full Year Outlook,” “Sales,” “Earnings Per Share,” “Free Cash Flow,” “Capital Spending,” “Pension,” and “Return on Invested Capital” are forward-looking. The company cautions that actual results may differ materially from those projected or implied in forward-looking statements due to a variety of important factors, including: the company’s ability to respond to the changes in its end markets that could affect demand for the company’s products; unanticipated changes in business relationships with customers or their purchases from the company; changes in the financial health of the company’s customers, which may have an impact on the company’s revenues, earnings and impairment charges; fluctuations in raw-material and energy costs and their impact on the operation of the company’s surcharge mechanisms; the impact of the company’s last-in, first-out accounting; weakness in global or regional economic conditions and financial markets; changes in the expected costs associated with product warranty claims; the ability to integrate acquired companies to achieve satisfactory operating results; the impact on operations of general economic conditions, higher or lower raw-material and energy costs, fluctuations in customer demand, the company’s ability to achieve the benefits of its ongoing programs, initiatives & capital investments, and retention of CDSOA distributions. Additional factors are discussed in the company’s filings with the Securities and Exchange Commission, including the company’s annual report on Form 10-K for the year ended Dec. 31, 2012, quarterly reports on Form 10-Q and current reports on Form 8-K. The company undertakes no obligation to update or revise any forward-looking statement. This presentation includes certain non-GAAP financial measures as defined by the rules and regulations of the Securities and Exchange Commission. A reconciliation of those measures to the most directly comparable GAAP equivalent is provided in the Appendix to this presentation. 2 |
 Strategic Update & Review |
 TIMKEN OVERVIEW • A global industrial technology leader that applies its deep knowledge of metallurgy, friction management and mechanical power transmission to improve the reliability and efficiency of machinery all around the world • Our high-performance steel and mechanical components support diversified markets worldwide • Established in 1899 and headquartered in Canton, Ohio • 2012 sales: $5.0 billion • Global footprint with operations in 30 countries & 20,000 associates • Bearings • Alloy steel bars & tubes • Transmissions • Gearboxes • Engineered chain • Related products & services 4 |
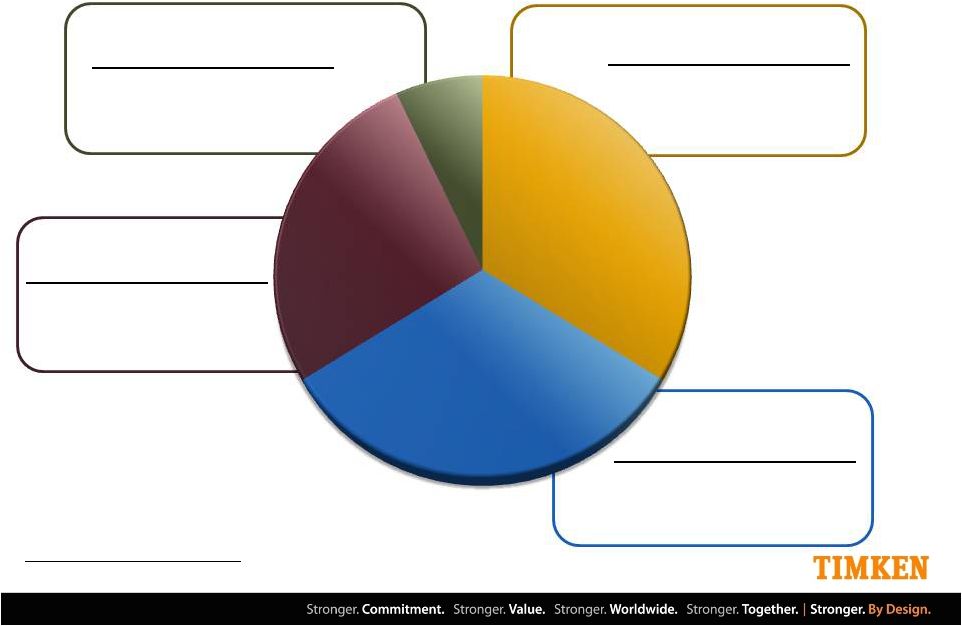 OUR BUSINESS Sales: $1.7 Billion EBIT Margin: 14.6% High-performance, customized alloy steels Note: Based on 2012 financial results. EBIT Margin is defined as EBIT divided by net sales. Steel segment sales include $101.2 million of inter-segment sales. 2012 Total Sales: $5.0 Billion Sales: $1.3 Billion EBIT Margin: 20.5% Global growth beyond bearings, diversified, strong aftermarket Sales: $347 million EBIT Margin: 10.5% Diversified into transmissions and aftermarket Sales: $1.7 Billion EBIT Margin: 12.4% Transformed portfolio, more aftermarket focus 5 Aerospace & Defense 7% Process Industries 27% Mobile Industries 34% Steel 32% |
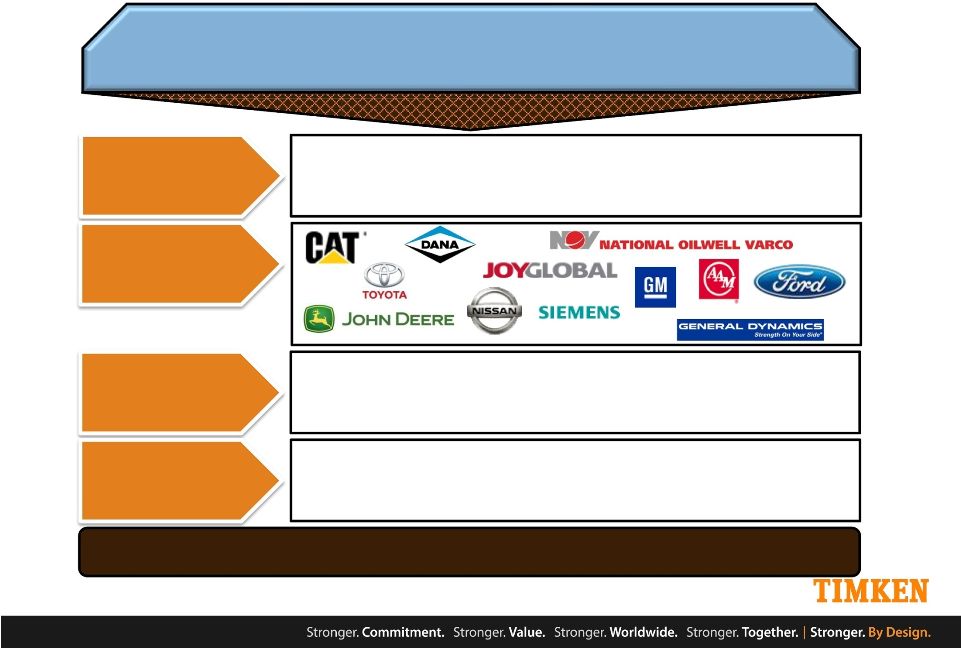 STRONG TIES BETWEEN BUSINESS DRIVE VALUE • Best in class provider of high performance products for demanding conditions • Technical knowledge • Research synergies • Production capabilities • Application engineering • Supply-chain efficiencies • Manufacturing efficiencies • Value-based pricing • Ability to leverage investments across platform • Customer service and delivery Process Industries | Mobile Industries Steel | Aerospace & Defense • Automotive Common End- Market Sectors • Construction • Energy Shared Customers Shared Expertise Operating Efficiencies Combined platform drives performance and value • Aerospace & Defense • Mining • Agriculture • Industrial Machinery • Rail • Heavy Truck 6 |
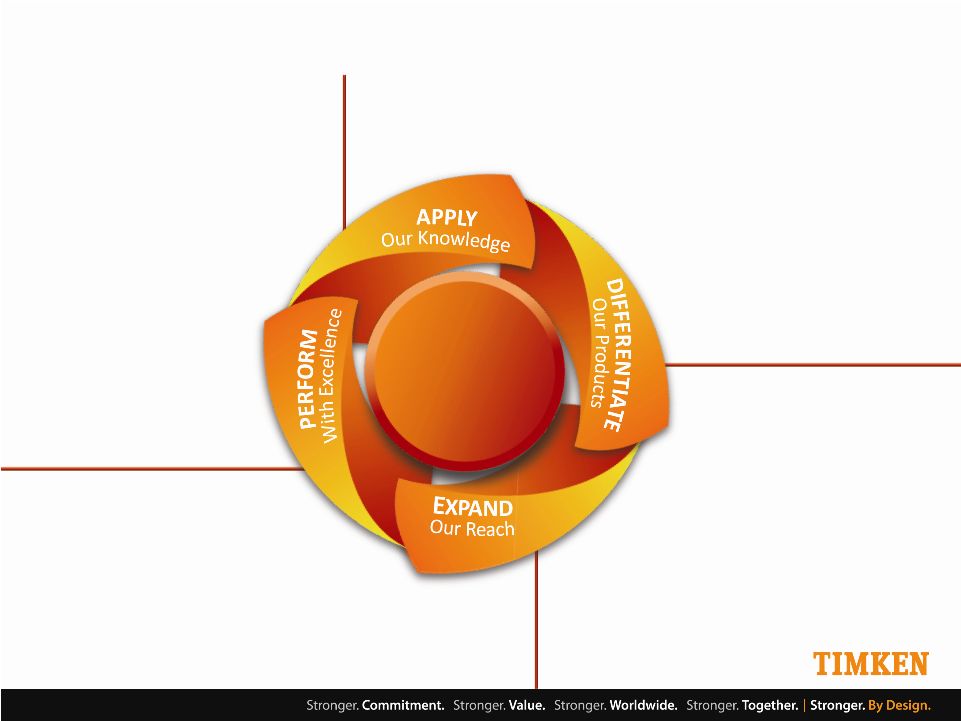 7 CREATE UNPARALLELED VALUE Offering a broad array of mechanical power transmission components, high-performance steel and related solutions and services. Extending our knowledge, products, services and channels to meet customer needs, wherever they are in the world. Delivering exceptional results with a passion for superior execution. Using our knowledge of metallurgy, friction management and mechanical power transmission to create unique solutions used in demanding applications. TIMKEN STRATEGY TO DELIVER SHAREHOLDER VALUE |
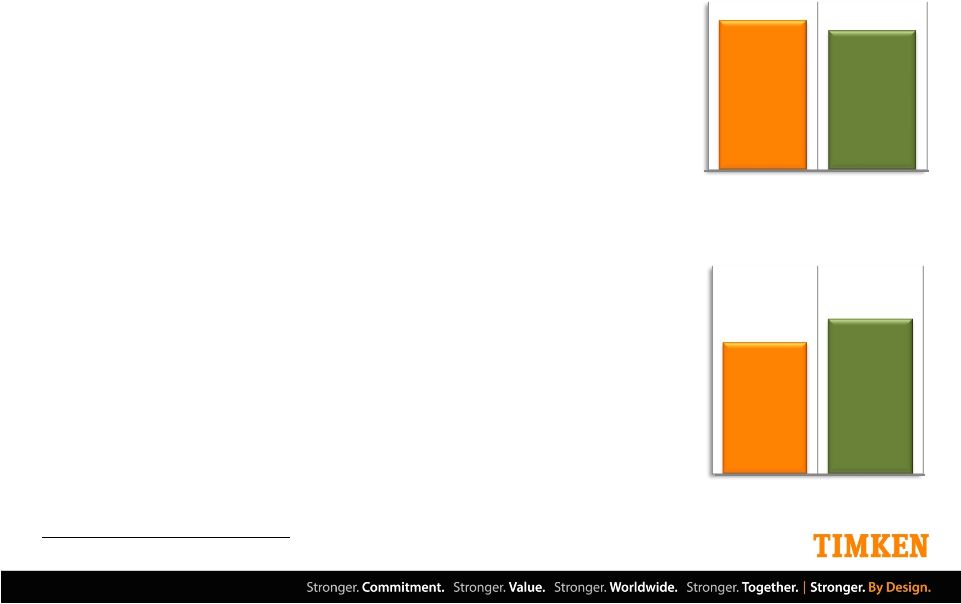
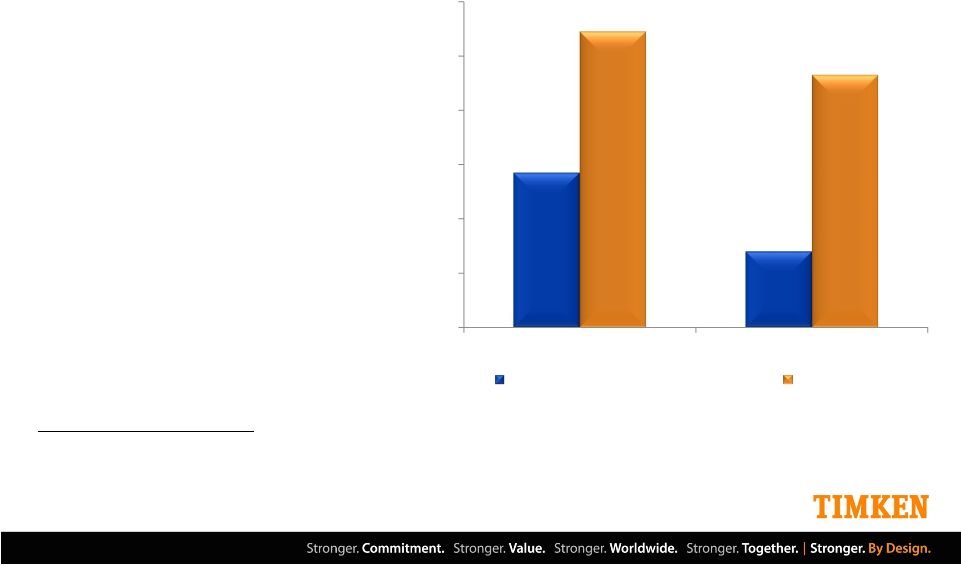 (1) Source: Most recent company filings and FactSet as of February 22, 2013. Represents average of 2008 through 2012. Tax rate assumed at 35% for U.S. companies and 26% for NSK, NTN, and JTEKT. Results exclude U.S. Continued Dumping Subsidy Offset Act (CDSOA) receipts and impairment and restructuring expense. See Appendix for reconciliation of EBITDA and ROIC to the most directly comparable GAAP equivalents. EBITDA and ROIC are not defined under U.S. GAAP and should not be considered in isolation or as a substitute for measures of our performance prepared in accordance with GAAP. Because not all companies use identical calculations, the presentation of EBITDA and ROIC may not be comparable to other similarly titled measures of other companies. (2) Comparable companies include: AK Steel, Allegheny Technologies, Altra, Carpenter Technology, JTEKT, Kennametal, NSK, NTN, Nucor, SKF, Steel Dynamics, and US Steel. THE STRATEGY IS WORKING: TIMKEN HAS DELIVERED TOP QUARTILE PERFORMANCE • Timken has delivered top quartile performance versus comparable companies in: • EBITDA margin • Return on invested capital (ROIC) 5 Year Average (1) (2) 8 16% 14% 12% 10% 8% 6% 4% 9.7% 14.9% 6.8% 13.3% EBITDA Margin ROIC Comparable Company Average Timken |
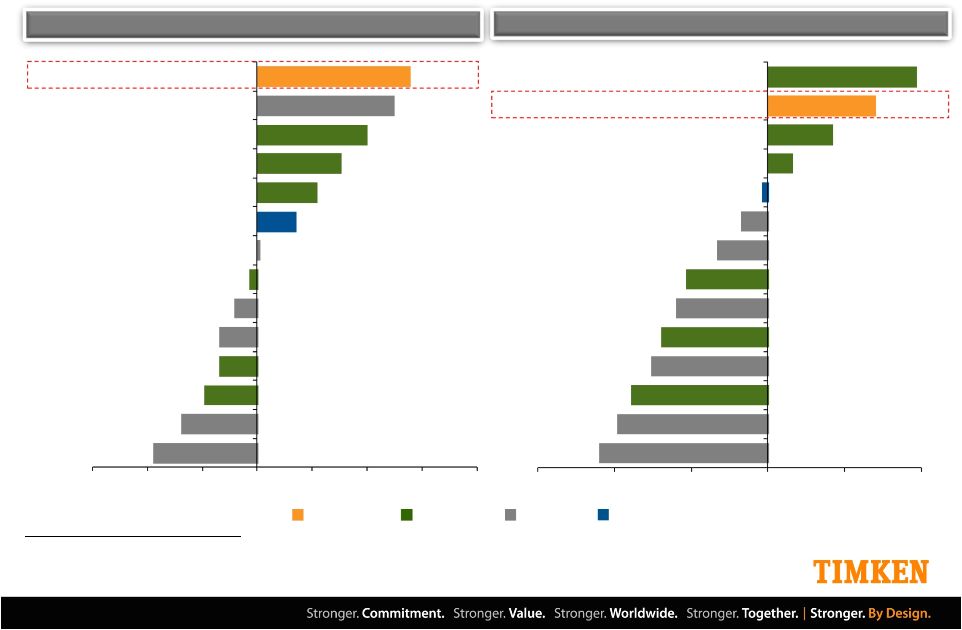 DELIVERING STRONG TOTAL SHAREHOLDER RETURNS S&P 500 Source: Factset as of December 31, 2012. (1) Bearings & Power Transmission (B&PT) comparable companies include: Altra, JTEKT, Kennametal, NSK, NTN, and SKF. (2) Steel comparable companies include: AK Steel, Allegheny Technologies, Carpenter Technology, Nucor, Steel Dynamics, and US Steel. Timken Kennametal Carpenter Altra Nucor SKF Allegheny NSK Steel Dynamics JTEKT NTN US Steel AK Steel S&P 500 SKF Altra Timken Kennametal NSK Carpenter Nucor Steel Dynamics JTEKT Allegheny NTN US Steel AK Steel S&P 500 9 111.1% 99.6% 79.8% 60.4% 43.4% 27.9% 1.9% (5.6%) (16.3%) (27.4%) (27.5%) (38.8%) (55.6%) (76.1%) (120.0%) (40.0%) 0.0% 40.0% 80.0% 120.0% 160.0% (80.0%) 77.2% 55.9% 33.6% 12.4% (2.9%) (14.2%) (26.6%) (42.5%) (47.8%) (55.5%) (60.7%) (71.4%) (78.5%) (88.1%) (120.0%) (40.0%) 0.0% 40.0% 80.0% Steel (2) (80.0%) B&PT (1) Timken Last 3 Years – Total Shareholder Return Last 5 Years – Total Shareholder Return |
 More Diversified Geographic – strategically expanded market presence globally Product – expanded steel & bearing portfolio as well as complementary products & services Improved cost structure Leaner and more variable Ability to tightly control supply chain and react to market variability Focused execution Well-positioned to achieve solid performance through market cycles Leveraging synergies among businesses THE STRATEGY IS WORKING: KEY TAKEAWAYS 10 |
 • Markets • Geographies • Products • Performance A MULTI-FACETED TRANSFORMATION 11 |
 GLOBAL E -MARKET SECTOR DIVERSIFICATION Portfolio Diversification Note: End market sector diversification based on 2002 sales of $2.6 billion and 2012 sales of $5.0 billion. 2012 2002 Industrial Automotive Broad-based end markets and customers Increased sales from demanding applications Expanded channels into the aftermarket; represents approximately 25% of 2012 global sales 12 Aerospace & Defenze Rail Passenger Car Energy Light Truck Industrial Aftermarket Industrial Machinery Other Construction Agriculture Heavy Truck Mining On-Highway Aftermarket ND |
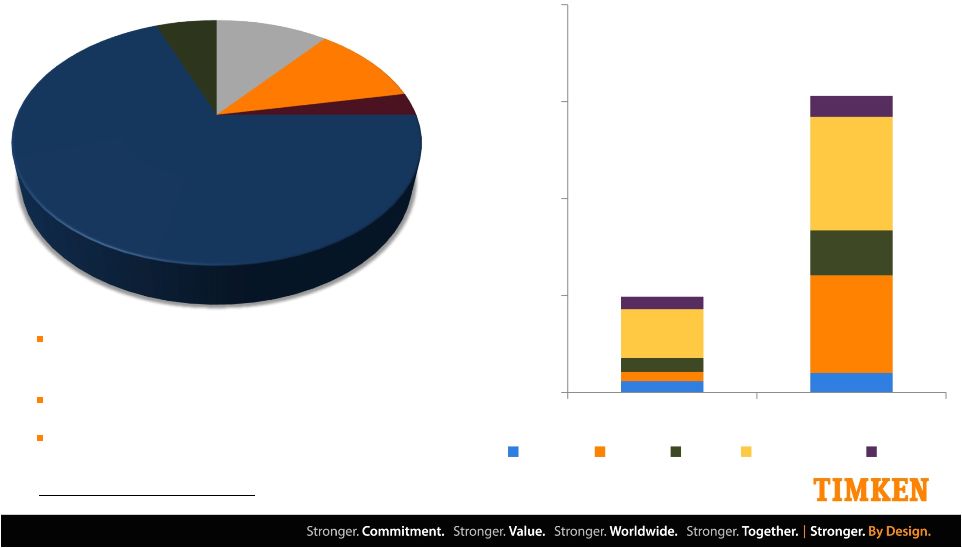 EMERGING MARKETS: A SOURCE OF GROWTH Diversified global scope, growing faster outside the U.S. (1) Note: (1) Geographic diversification based on 2012 sales of $5.0 billion. Over 85 manufacturing facilities and distribution centers across the globe 10 global Technology & Engineering Centers 95 sales offices to serve customers in different regions of the world Emerging market growth 10-Year Sales Revenue -- CAGR 12% ($ in Millions) 13 ROW 6% Asia 11% Europe 11% Latin America 3% United States 69% $1,000 $750 $500 $250 $0 2002 2012 ASEAN China India LA+Mexico Africa |
 PRODUCT LINE EXPANSION & DIVERSIFICATION Bearings Engineered Steels Power Transmission Services Related Products 14 |
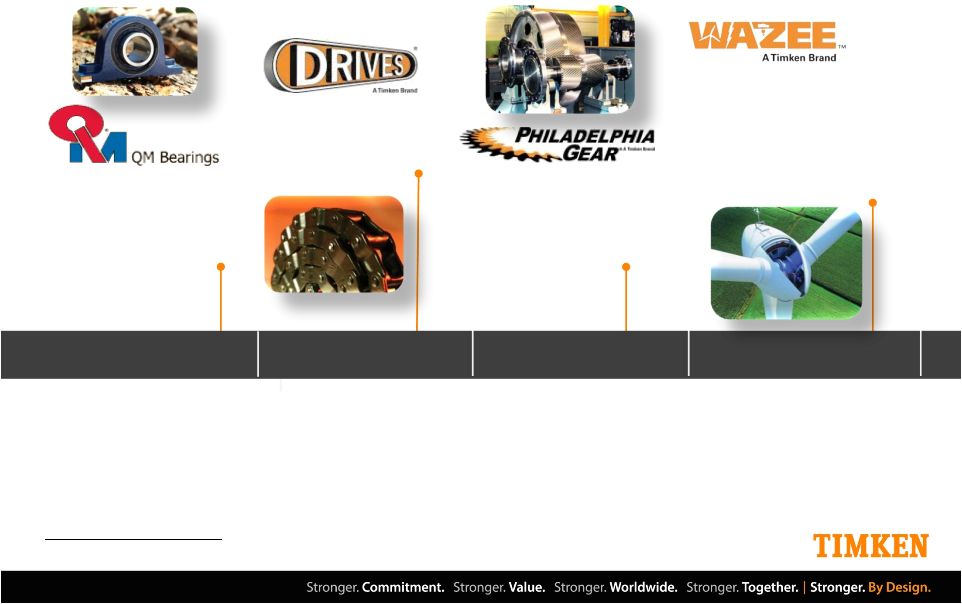 • Capture lifetime of revenue opportunity • Leverage distribution channel • Opportunities for cross-selling and development of product lines • Global expansion Sales: $100M Product Offering Engineered chains and augers Sales: $85M Product Offering Engineered gear drive repair and manufacture Sales: $30M Product Offering Critical motor and generator services, and up-tower wind maintenance and repair Sales: $23M Product Offering Mounted spherical roller bearings and couplings NEW ACQUISITIONS, NEW CAPABILITIES Differentiated performance • Industrial focus • Strong aftermarket • Supply chain synergy October 1, 2011 July 1, 2011 December 31, 2012 September 21, 2010 15 Growth Synergies Note: Sales for Wazee Companies, Philadelphia Gear and Drives reflect last 12-month sales at time of purchase. QM Bearings sales reflect full-year 2011. |
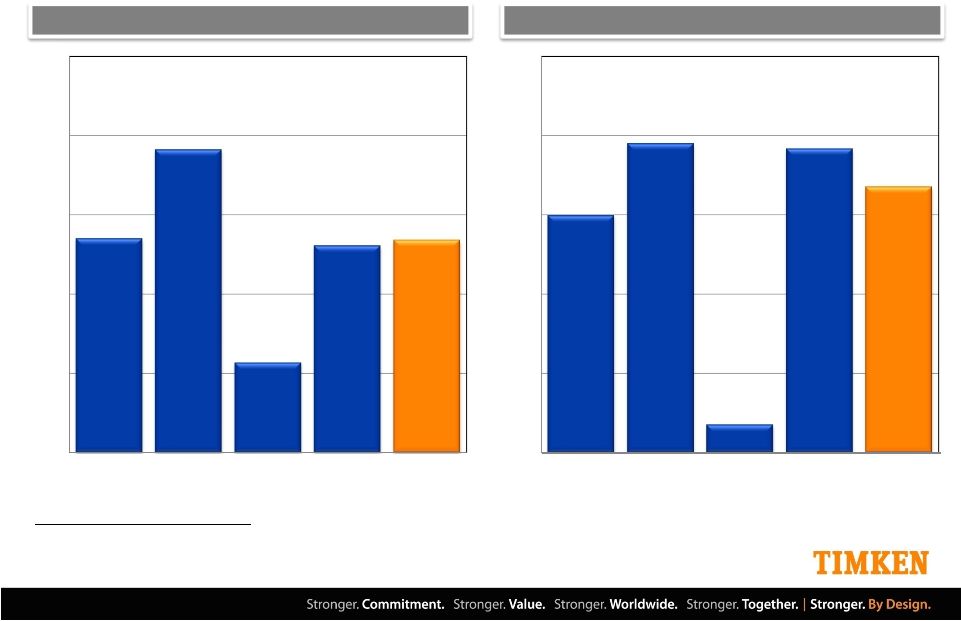 DELIVERING SUPERIOR FINANCIAL PERFORMANCE 3 year average EBIT Margins 3 year average ROIC 16 14% 19% 6% 13% 13% 0% 5% 10% 15% 20% 25% Mobile Process Aerospace Steel Timken 15% 19% 2% 19% 17% 0% 5% 10% 15% 20% 25% Mobile Process Aerospace Steel Timken Note: The above data represents an average of 2010 through 2012. Segment returns have been adjusted to reflect a proportionate amount of unallocated corporate expenses. Tax rate assumed at 35% for ROIC calculations. Results exclude CDSOA receipts and impairment and restructuring charges. See Appendix for reconciliation of ROIC and consolidated EBIT to the most directly comparable GAAP equivalents. |
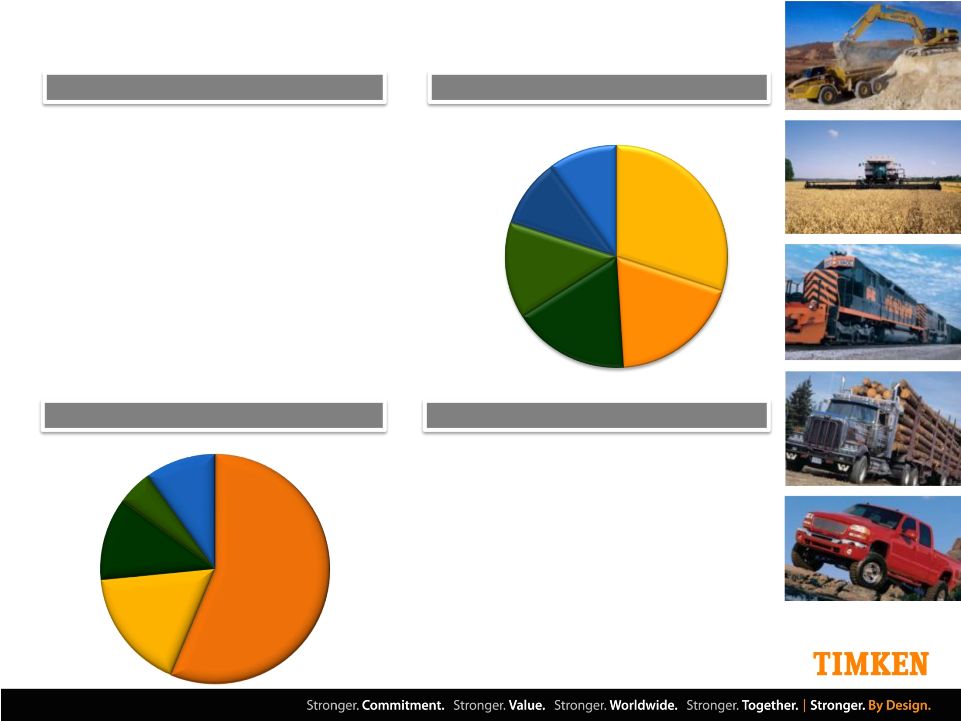 MOBILE INDUSTRIES • Bearings, power transmission components and related products and services • Serves diverse market sectors • Customers: OEM and aftermarket distributors • Portfolio shift toward attractive markets; • In 2005 passenger car and light truck was 54% of the portfolio versus 29% in 2012 2012 sales: $1.7B • Profitability turn-around; achieving returns in excess of cost of capital • Capitalizing on mining, agricultural and commercial transportation demand while managing strategic pricing initiative • Strategy – provide high-value power transmission products and services focused on demanding applications to global OE and aftermarket channels Based on 2012 sales of $1.7 billion. 17 Segment Overview Geographic Sales Attractiveness/Strategic Priorities Sector Profile Rail 17% Off- Highway 30% Light Truck 19% Passenger Car 10% Heavy Truck 10% On- Highway Aft Mkt 14% Latin America 5% Asia Asia ROW ROW Europe Europe U.S. U.S. 10% 10% 12% 12% 17% 17% 56% 56% |
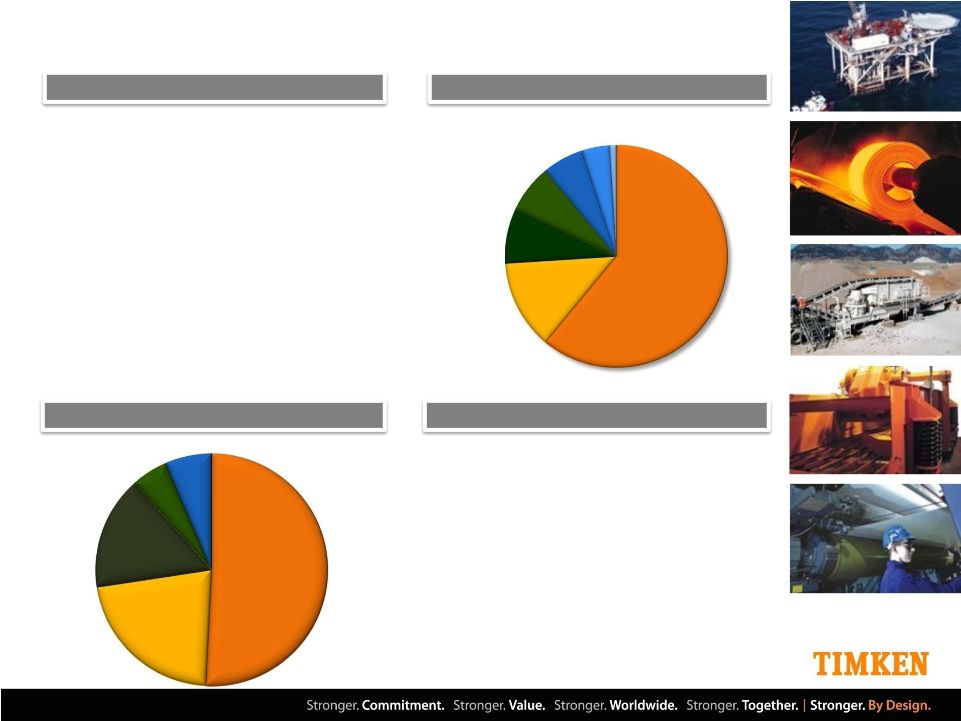 PROCESS INDUSTRIES • Precision-engineered bearings and related mechanical components and services for diverse industrial markets • Diverse and global customer base • ~60% aftermarket in 2012; consistent, profitable business • Diversified product portfolio • 52% tapered roller bearings in 2012 versus 96% in 2000 • Growing market share in spherical & cylindrical roller bearings, housed units, other bearings & services 2012 sales: $1.3B • Extensive global portfolio of differentiated mechanical power transmission products and services • Strong distribution channels to maximize lifetime profit • Aggressive annual sales growth; gaining share and unlocking new mechanical power transmission opportunities • Strategy - focus on end-user value chain and needs Based on 2012 sales of $1.3 billion. 18 Segment Overview Sector Profile Geographic Sales Attractiveness/Strategic Priorities Latin America 5% ROW ROW 6% 6% Europe Europe Asia Asia U.S. U.S. 16% 16% 22% 22% 51% 51% Machinery Energy Gear Drives Infrastructure 7% 6% 4% 1% Metals 8% Service 13% Aftermarket 61% |
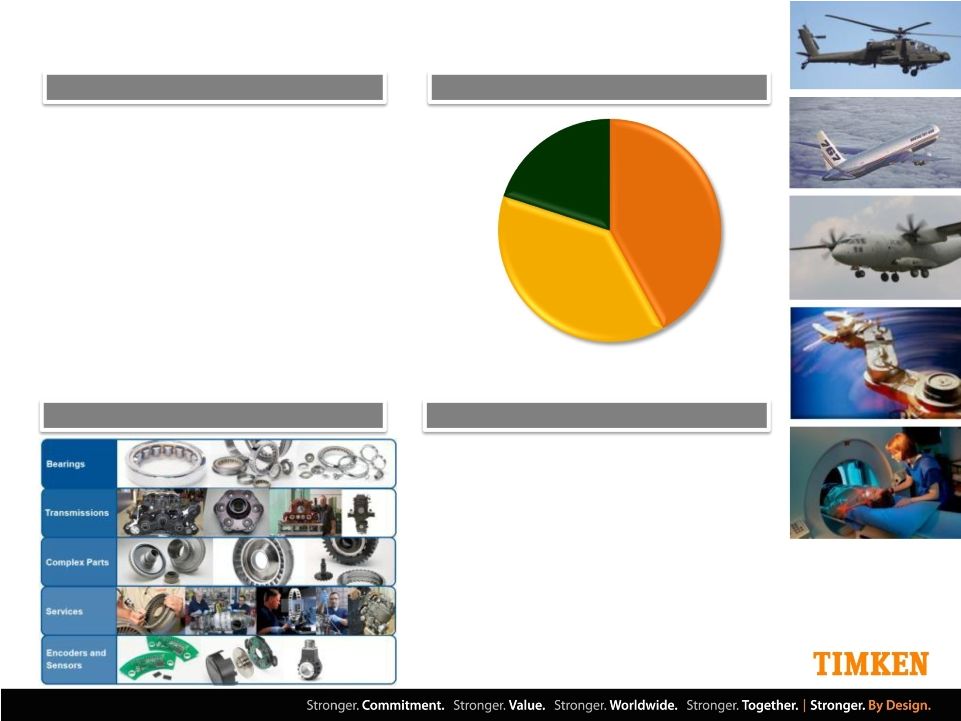 AEROSPACE & DEFENSE • Power transmission systems and flight-critical components for civil and military aircraft • Top 10 aerospace platforms represent ~ 40% of sales in 2012 • Aftermarket engine overhaul, replacement parts, bearing and component repair • Strong aftermarket channel • Health and positioning control applications 2012 sales: $0.3B • Leverage strong commercial and improving general aviation market sectors serving diverse platforms while defense market sectors have bottomed • Strong execution combined with improving markets and targeted channels have led to growth and a return to attractive profitability • Strategy – provide a globally diverse portfolio focused on growing platforms through OE & aftermarket channels 19 Segment Overview Sector Profile Product Offering Beyond Bearings Attractiveness/Strategic Priorities Motion Control Civil 38% Defense 20% 42% |
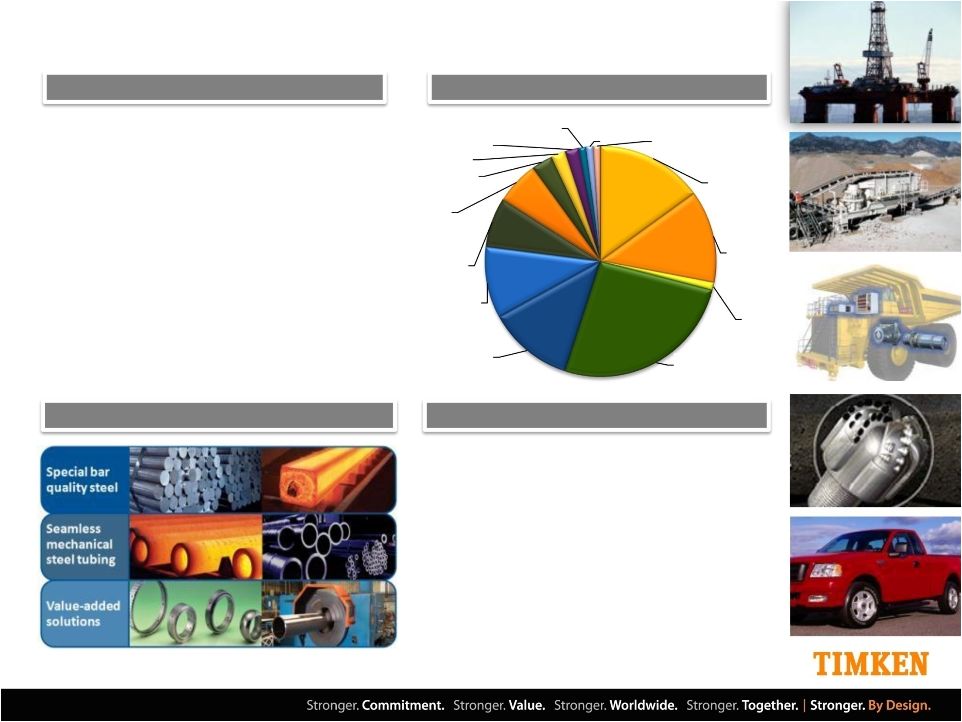 STEEL • Market leadership position in high quality air-melted alloy steel bars, tubes, precision components and value-added services • Bars: 1” to 16” • Serving niche high-end applications where demands on performance are significant • Special machining characteristics • Resistance to heat, stresses or wear • High strength or other traits • Tubes: 2” to 13” 2012 sales: $1.7B Differentiated Solutions • An improved variable cost structure • More than half of our specialized products cannot be competitively replicated in North America today • 450 grades of high-performance steels; for power transmission applications • Know-how to design custom solutions with strength where it matters • Efficient supply chains 20 Segment Overview Attractiveness/Strategic Priorities Sector Profile Passenger Car 15% Light Truck 13% Heavy /Med.Truck 1% Oil & Gas 26% General Industrial 12% Distribution 10% Machinery 7% Industrial Bearings 6% Mining 3% Constr. 2% Rail 2% Military & Def 1% Agriculture 1% Power Generation 1% |
 Financial Review |
 2012 RESULTS Sales of $5.0B, down 4% from prior year • Reduced light vehicle, heavy truck, industrial machinery, and oil & gas market demand in the second half, as well as lower surcharges and currency negatively impacted sales • Top line benefited from pricing, the Philadelphia Gear and Drives acquisitions, and strength in the rail and aerospace & defense markets EBIT of $794M, or 15.9% of sales • Includes CDSOA receipts of $108M & St. Thomas plant closure costs of $29M • Earnings benefited from improved pricing, lower material costs, LIFO income and acquisitions, partially offset by lower volume, mix, surcharges and manufacturing costs EPS of $5.07 per diluted share vs. prior year $4.59 • Includes CDSOA receipts of $0.69 per share & St. Thomas plant closure costs of $0.28 per share Note: See Appendix for reconciliation of EBIT to the most directly comparable GAAP equivalent. CDSOA is a reference to the US Continued Dumping Subsidy and Offset Act. 22 $5,170 $4,987 2011 2012 Sales ($ Mils.) 14.1% 15.9% 2011 2012 EBIT Margin |
 Note: Free cash flow is defined as net cash provided by operating activities (includes pension contributions) minus capital expenditures and dividends. Net debt is not a GAAP measure. See Appendix for reconciliation of Free Cash Flow and Net Debt to the most directly comparable GAAP equivalents. Free Cash Flow of $240M vs. $(70)M use of cash in prior year • From operating activities after pension contributions, capital expenditures and dividends • Includes $245M of discretionary pension and post-retirement benefit contributions and $68M of CDSOA receipts, both net of tax Strong Balance Sheet • Cash position of $586M and debt of $479M, or $107M net cash • Pension & post-retirement benefit liability 89% funded resulting from contributions and favorable asset returns that more than offset an unfavorable decline in discount rate • Repurchased 2.5 million shares for $112 million; 7.5 million shares remaining under authorization • Liquidity of $1.4B 2012 RESULTS 23 |
 Note: Free cash flow is defined as net cash provided by operating activities (includes pension contributions) minus capital expenditures and dividends. The Company has included in its outlook charges totaling ~$20 million, net of tax, related to the previously announced St. Thomas, Ontario, Canada and Sao Paulo, Brazil plant closures. Sales: down approximately 5% 2013 FULL YEAR OUTLOOK 24 * Excluding discretionary pension & VEBA trust (OPEB) contributions, net of tax January Sales (vs. 2012) Down 5% Mobile Industries Down 5-10% Process Industries Flat Aerospace & Defense Up 7-12% Steel Down 7-12% Earnings Per Share (EPS) $3.75 - $4.05 Includes: Restructuring costs ~$(0.20) Free Cash Flow ($ Millions) Cash from operations $330M Less: CapEx $360M Less: Dividends $90M Free Cash Flow $(120)M Add: Pension/VEBA contributions, net of tax $180M Free Cash Flow* $60M • Weakening demand in mobile, oil & gas and industrial end markets • Mobile market strategy expected to result in $150 million of exited business EPS Estimate: $3.75 to $4.05 per diluted share • Includes restructuring costs of roughly $0.20 related to two previously announced plant closures 2013 FCF Estimate: $(120)M • $60M excluding discretionary pension/VEBA trust contributions |
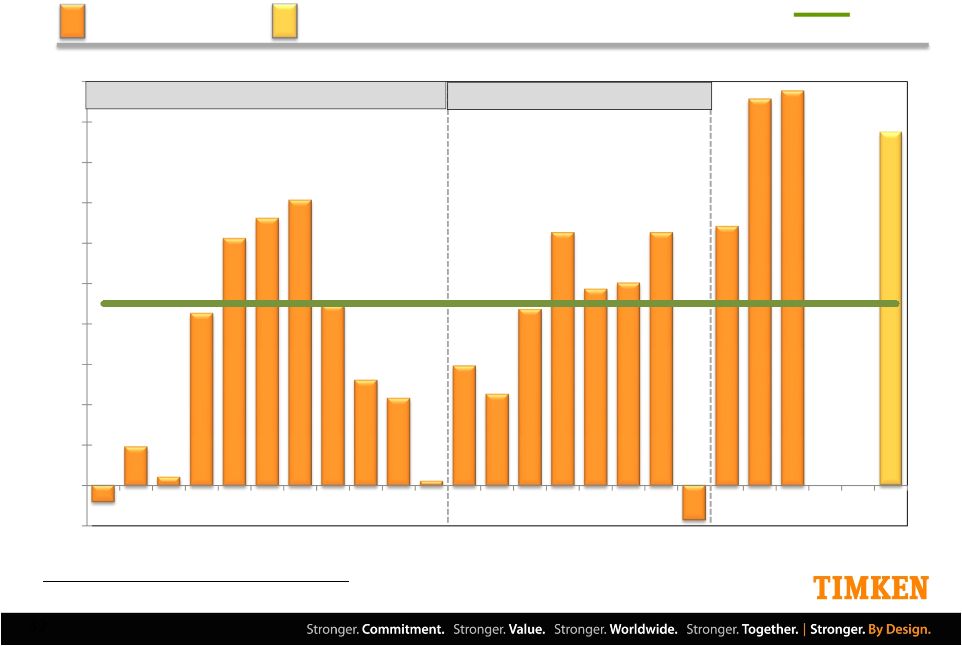
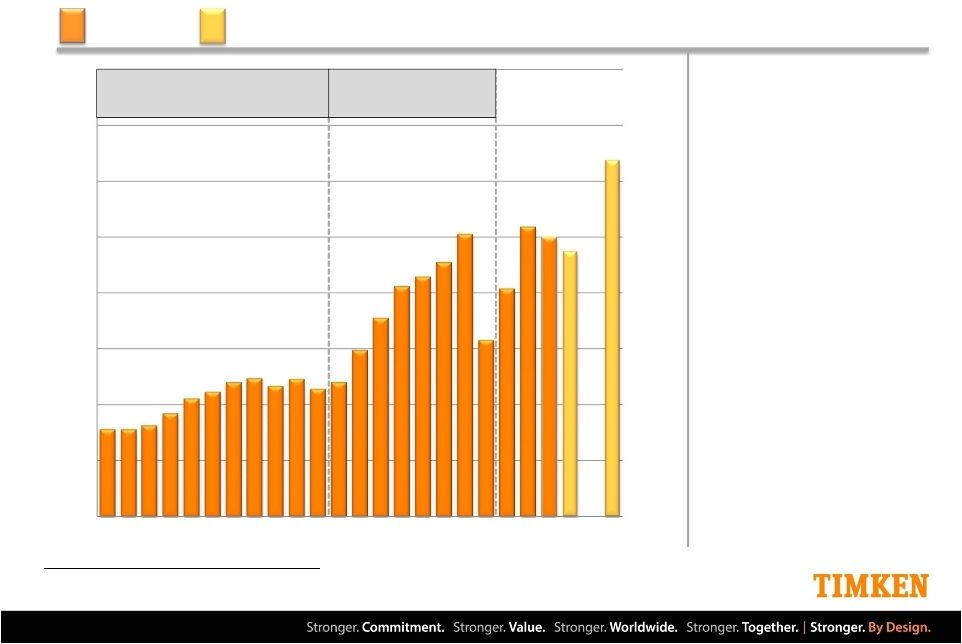 Outlook • 2013 Sales Estimate: down ~5% Y-O-Y • Weakening demand in mobile, oil & gas and industrial end markets • Mobile market strategy expected to result in $150 million of exited business • 2015 Sales Target: 3-year CAGR of +6 to 11% • Global GDP growth of 2.5% in 2013 & growth in 2014-2015 of 3.5% to 4% • Roughly half of growth from inorganic investments SALES Net Sales ($ Mils.) Note: 2003 includes Torrington acquisition as acquired February 2003. Historical results exclude the discontinued operations of Latrobe Steel (2006 divestment) and the Needle Roller Bearings (NRB) business (2009 divestment). NRB discontinued operations for 2003 and 2004 are based on internal estimates. 25 Net Sales Midpoint Estimate / Target 25 ’91 to ’01 Cycle: 4% CAGR ’02 to ‘09 Cycle: 4% CAGR $8,000 $7,000 $6,000 $5,000 $4,000 $3,000 $2,000 $1,000 $0 1991 1993 1995 1997 1999 2001 2003 2005 2007 2009 2011 2013 2015 |
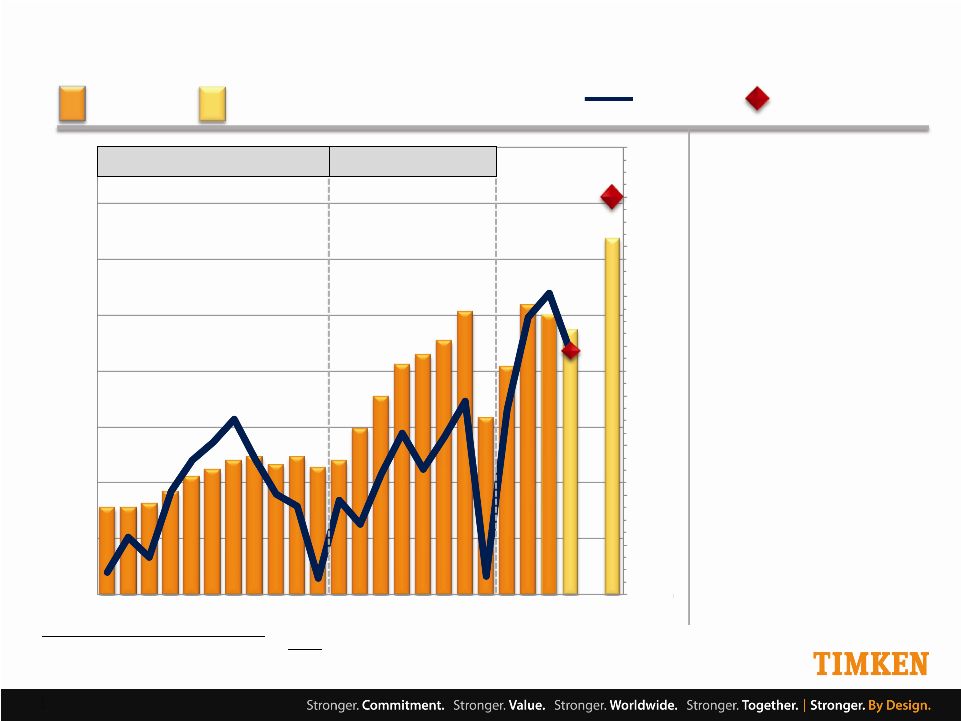 Outlook • 2013 EPS Estimate: $3.75 to $4.05 per diluted share • Includes restructuring costs of roughly $0.20 related to two previously announced plant closures • 2015 EPS Target: $6.75 to $7.25 per diluted share • Assumes redeployment of capital including inorganic growth EARNINGS PER SHARE Net Sales ($ Mils.) Earnings Per Share EPS Midpoint Estimate / Target ’91 to ’01 Cycle ’02 to ‘09 Cycle Net Sales Midpoint Estimate / Target $8,000 $7,000 $6,000 $5,000 $4,000 $3,000 $2,000 $1,000 $0 1991 1993 1995 1997 1999 2007 2001 2003 2005 2009 2011 2013 2015 $8.00 $7.00 $6.00 $5.00 $4.00 $3.00 $2.00 $1.00 $0.00 ($1.00) 26 Note: Earnings are reported on a GAAP basis and include the impact of special items, such as restructuring and reorganization expenses, CDSOA payments and goodwill amortization. EPS assumes dilution. 2003 includes Torrington acquisition as acquired February 2003. Historical results exclude the discontinued operations of Latrobe Steel (2006 divestment) and the Needle Roller Bearings (NRB) business (2009 divestment). NRB discontinued operations for 2003 and 2004 are based on internal estimates. |
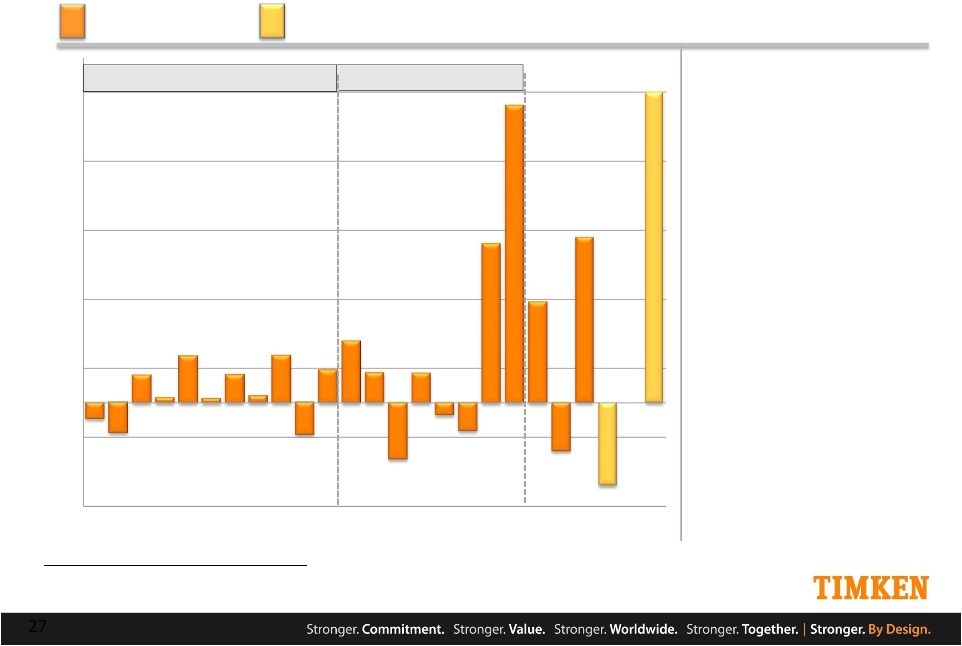 FREE CASH FLOW Free Cash Flow ($ Mils.) ’91-’01 Cycle Avg: $16M ’02-’09 Cycle Avg: $87M Note: Free cash flow is defined as net cash provided by operating activities (includes pension contributions) minus capital expenditures and dividends. Results include discontinued operations until divested. See Appendix for reconciliation of Free Cash Flow to the most directly comparable GAAP equivalent. VEBA is in reference to the company’s voluntary employee benefit association trust. 27 Outlook • 2013 FCF Estimate: $(120)M after, Free Cash Flow Midpoint Estimate / Target 27 • High CapEx declining to targeted range by 2015 • Increased dividends and moderate pension contributions • CapEx of $360M • Dividends of $90M • Discretionary pension / VEBA trust contributions of $180M (net of tax) • 2015 FCF Target: $425-$475M $450 $350 $250 $150 $50 -$50 -$150 1991 1993 1995 1997 1999 2001 2003 2005 2007 2009 2011 2013 2015 |
 CAPITAL SPENDING Note: Estimated 2013 capital spending as a percent of sales is based on mid-point of company sales estimate. Capital Spending ($ Mils.) Cap Ex % of Sales Long-term Target: 4% of Sales 2013 Capital Spending Estimate 28 $400 $350 $300 $250 $200 $150 $100 $50 $0 2002 2003 2004 2005 2006 2007 2008 2009 2010 2011 2012 2013 8% 7% 6% 5% 4% 3% 2% 1% 0% • Driven by global energy, mining, infrastructure and heavy industries growth • Targeted +20% IRR hurdle rate • ~$80M maintenance spending • 2013 CapEx Estimate: $360M Outlook |
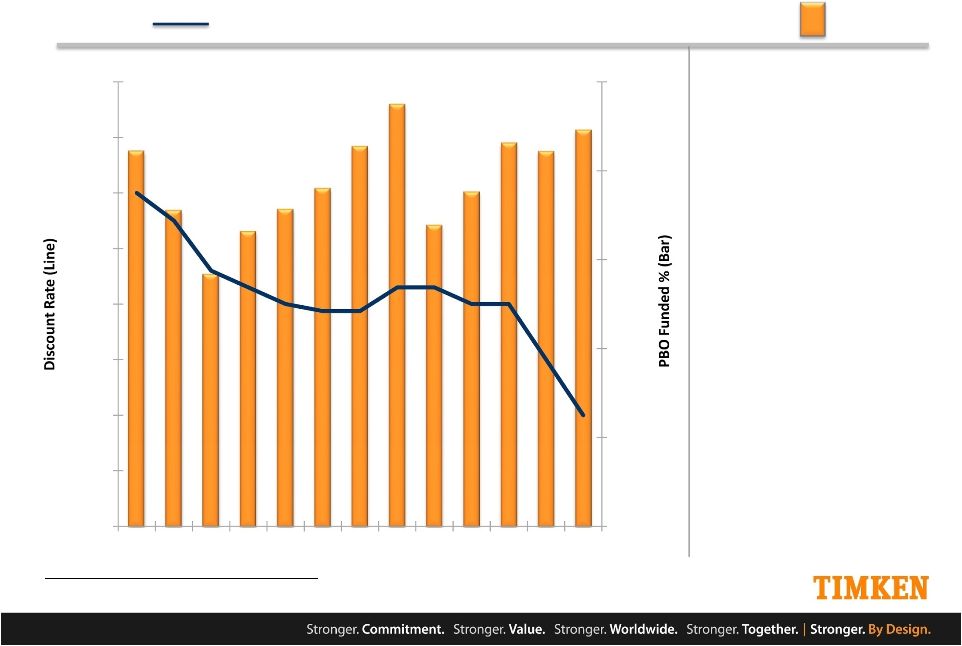 PENSION PBO Funded % Discount Rate Note: Discount rate noted is for Timken’s domestic pension fund which represents the majority of the company’s global pension assets. PBO funded percent denotes the Company’s pension benefit obligation (PBO) funded status. 84% Outlook • 2013 discretionary Pension & VEBA trust (OPEB) contributions totaling ~$280M (or ~$180M, net of tax) 89% 29 • Pension plans expected to be essentially fully funded by year-end • Long-term strategy to reduce liability through lump-sum and potential annuitization programs 10.0% 9.0% 7.0% 8.0% 6.0% 5.0% 4.0% 3.0% 2.0% 2000 2002 2004 2006 2008 2010 2012 100% 80% 60% 40% 20% 0% |
 Note: 2003 includes Torrington acquisition as acquired February 2003. Net debt is not a GAAP measure. Net Debt / Capital (leverage) is defined as Net Debt / (Net Debt + Equity). See Appendix for reconciliation of Net Debt to the most directly comparable GAAP equivalent. NET DEBT Net Debt /Capital Net Debt ($ Mils.) Long-term Leverage Target: 30% - 35% 30 $600 $800 $1,000 $0 $200 $400 -$200 -$600 -$400 0% 10% 20% 30% 40% 50% -30% -20% -10% 1991 1993 1995 1997 1999 2001 2003 2005 2007 2009 2011 |
 - Improved pension • Discretionary contributions of $245M, net of tax • Returning cash to shareholders • 90+ years of consecutive quarterly dividends • Industrial & aftermarket focus • International • Accretive to earnings in year 1 • Earn cost of capital in 3 years • Discretionary contributions as capital structure and cash flow permit • Target spend in industrial sectors: oil & gas, infrastructure, heavy industries and aerospace • Asia growth 2012 CAPITAL ALLOCATION HIGHLIGHTS Capital Spend Dividends / Share Repurchase • $300M spent on growth, continuous improvement and maintenance • $200M returned to shareholders - Dividend raised 15% to $0.23/quarter - 2.5 million shares repurchased Strong Capital Redeployment • Wazee (12/31/12) • Strong balance sheet to Acquisitions Pension / OPEB Funding 31 fund future acquisitions funded status to 89% by year end |
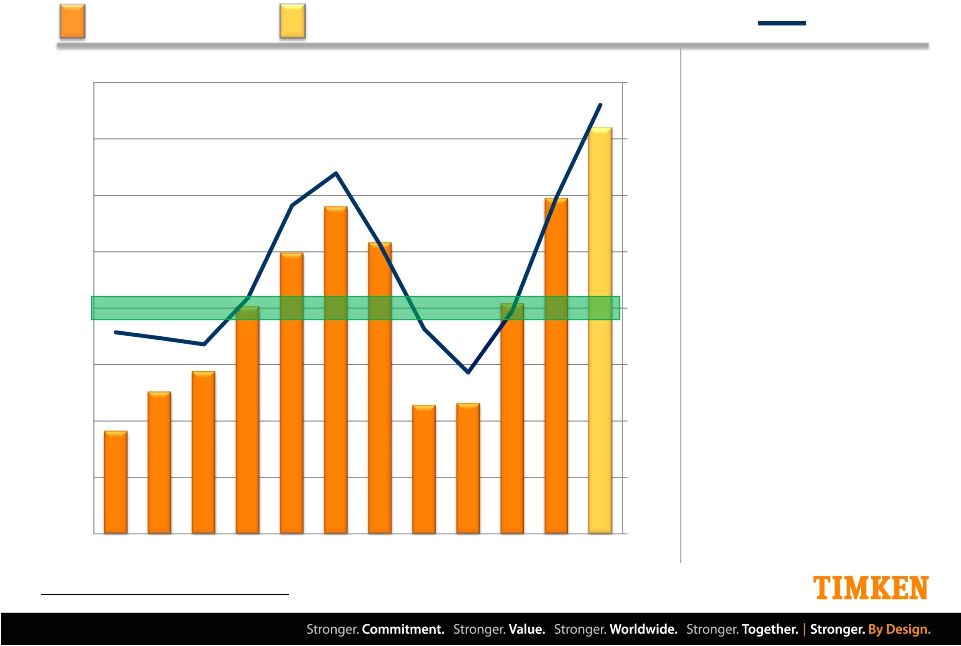
 RETURN ON INVESTED CAPITAL Cost of Capital Return on Invested Capital Note: The company uses NOPAT/Average Invested Capital as a type of ratio that indicates return on invested capital (ROIC). See Appendix for reconciliation of ROIC to the most directly comparable GAAP equivalent. Long-term Cost of Capital ~ 9% ROIC Midpoint Target ’91 to ’01 Cycle Average: 6.2% ’02 to ‘09 Cycle Average: 7.8% 32 -2% 0% 2% 4% 6% 8% 10% 12% 14% 16% 18% 20% 1991 1993 1995 1997 1999 2001 2003 2005 2007 2009 2011 2013 2015 2015 Target 17-19% |
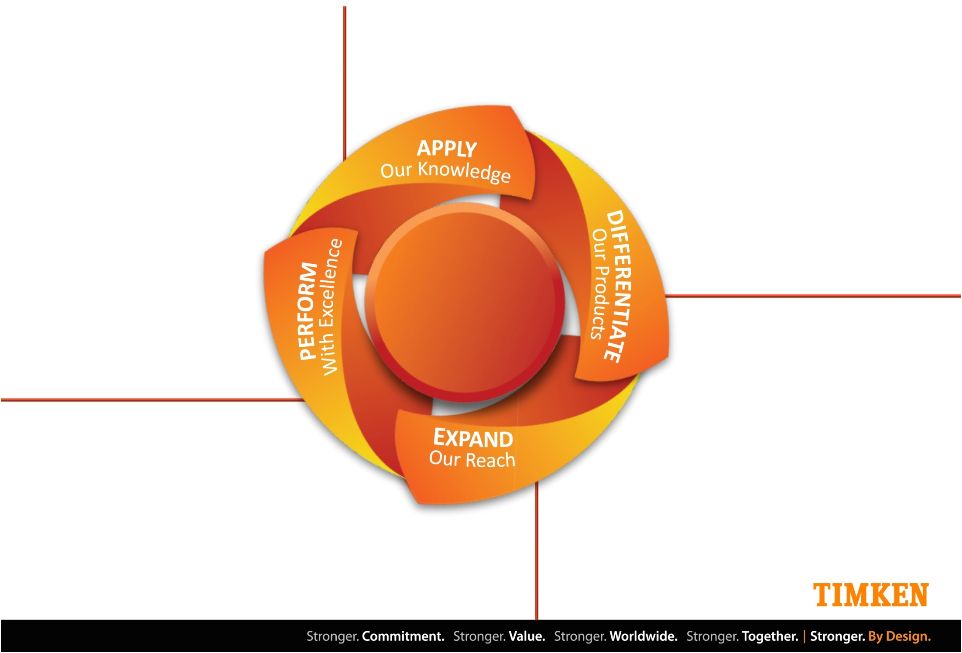 CREATE UNPARALLELED VALUE Offering a broad array of mechanical power transmission components, high-performance steel and related solutions and services. Extending our knowledge, products, services and channels to meet customer needs, wherever they are in the world. Delivering exceptional results with a passion for superior execution. Using our knowledge of metallurgy, friction management and mechanical power transmission to create unique solutions used in demanding applications. TIMKEN STRATEGY TO DELIVER SHAREHOLDER VALUE 33 |
 New York City March 5, 2013 • ISI GROUP INDUSTRIALS INVESTOR CONFERENCE |
 A PPENDIX |
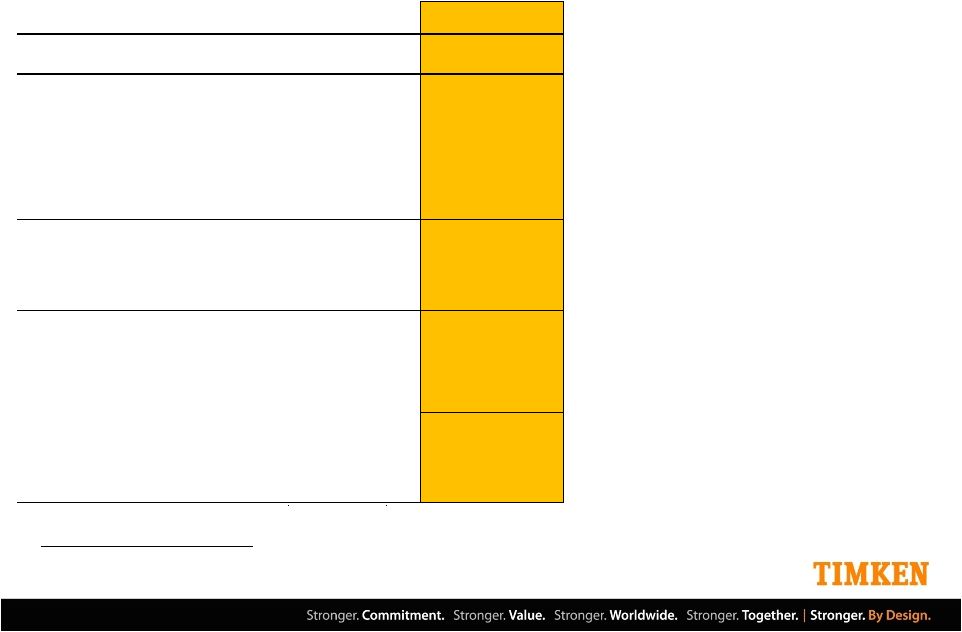
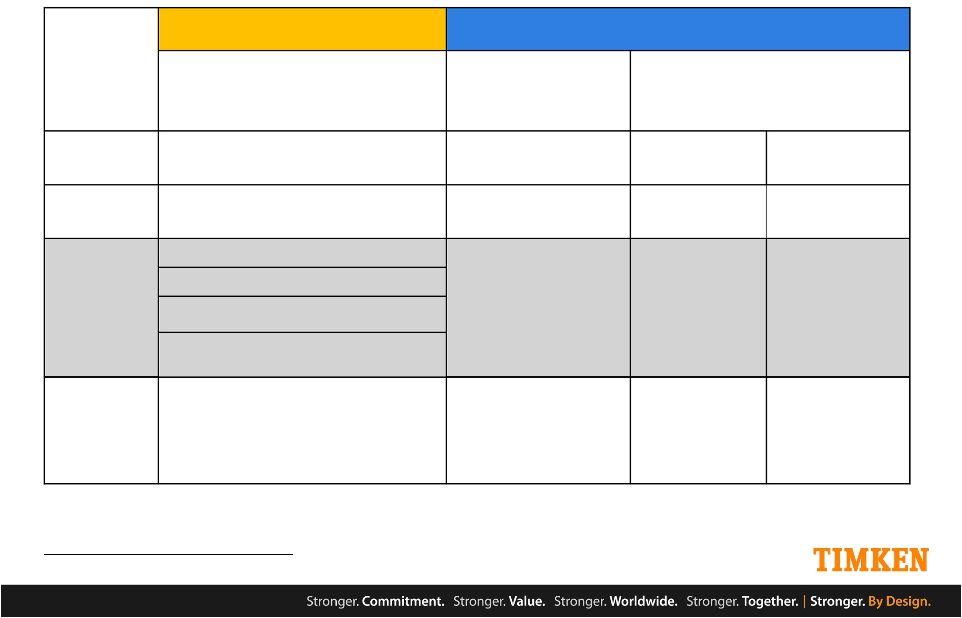 Award Cash Restricted Stock Units (in cash or shares) Equity – Restricted Stock Units Equity – Non Qualified Stock Options Participants 6,000 Associates Globally 160 Senior Leadership Associates 265 Mid-level Managers 160 Senior Leadership Associates Time Horizon 1 Year 3 Years 4 Year Vesting with a 10 Year Term 4 Year Vesting with a 10 Year Term Metrics 40% Corporate EBIT/BIC 50% EPS 50% ROIC Share Price Share Price 30% Business Unit EBIT/BIC 15% BU Working Capital % of Sales 15% Customer Service or New Business Sales Ratio INCENTIVE COMPENSATION Note: EBIT/BIC is a pre-tax return on invested capital (ROIC) measure. BIC denotes beginning invested capital. The incentive compensation plan depicted above is effective January 2012. 36 Annual Long-Term Long-term Shareholder Value Creation 3-Year Strategic Business Priorities Short-term Operational Business Priorities Objective |
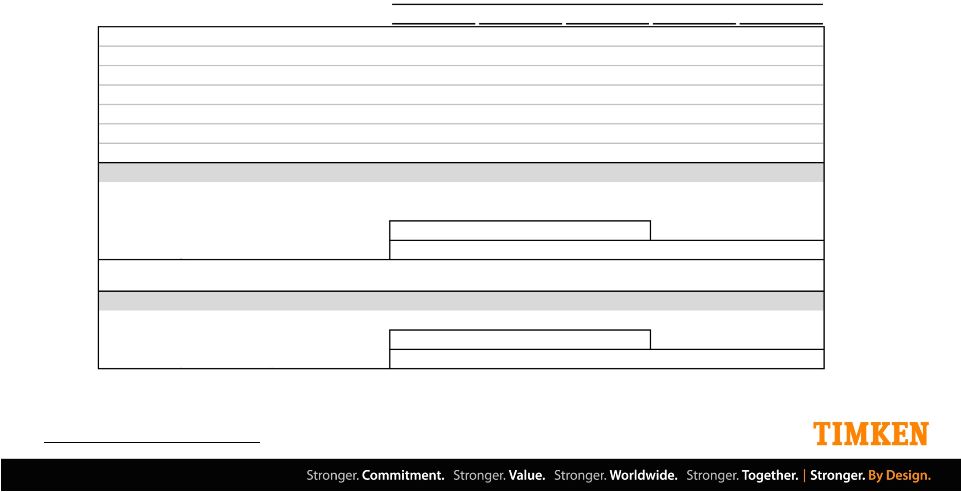 GAAP RECONCILIATION OF EBIT AND EBITDA ($ Mils.) This reconciliation is provided as additional relevant information about the Company’s performance. Management believes consolidated earnings before interest and taxes (EBIT) are representative of the Company’s performance and therefore useful to investors. Consolidated earnings before interest, taxes, depreciation and amortization (EBITDA) are another important measure of financial performance and cash generation of the business and therefore useful to investors. Management also believes that it is appropriate to compare GAAP net income to consolidated EBIT and EBITDA. Source: Company filings and Factset as of January 31, 2013 37 EBIT margin is defined as earnings before interest and tax divided by net sales. EBITDA margin is defined as earnings before interest, tax, depreciation and amortization divided by net sales. 12-Months Ended 12/31/2012 12/31/2011 12/31/2010 12/31/2009 12/31/2008 Net Income $495.9 $456.6 $276.9 ($139) $271 Income from discontinued operations, net of tax 0.0 0.0 (7.4) 72.6 11.3 Provision for income taxes 270.1 240.2 136.0 (28.2) 157.1 Interest Expense 31.1 36.8 38.2 41.9 44.4 Interest Income (2.9) (5.6) (3.7) (1.9) (5.8) Impairment and Restructuring 29.5 14.4 21.7 164.1 32.8 Receipt of CDSOA Distribution (108.0) 1.1 (2.0) (3.6) (9.1) EBIT $715.7 $743.5 $459.7 $106.3 $501.9 Revenue $4,987.0 $5,170.2 $4,055.5 $3,141.6 $5,663.7 % EBIT Margin 14.4% 14.4% 11.3% 3.4% 8.9% 3-Year Average EBIT Margin 13.4% 5-Year Average EBIT Margin 10.5% Depreciation and Amortization 198.0 192.5 189.7 201.5 200.8 EBITDA $913.7 $936.0 $649.4 $307.8 $702.7 % EBITDA Margin 18.3% 18.1% 16.0% 9.8% 12.4% 3-Year Average EBITDA Margin 17.5% 5-Year Average EBITDA Margin 14.9% |
 (1) Return on Invested Capital calculated as Net Operating Profit After Taxes / (Average Total Debt + Average Shareholders’ Equity). Tax rate assumed at 35%. Source: Company filings and Factset as of January 31, 2013 GAAP RECONCILIATION OF ROIC Reconciliation of ROIC to GAAP Operating Income Management believes ROIC is representative of the company’s performance and therefore useful to investors. ($ Mils.) 38 12-Months Ended 12/31/2012 12/31/2011 12/31/2010 12/31/2009 12/31/2008 GAAP Operating Income $692.9 $729.1 $436.2 ($54.1) $462.0 GAAP Other Income / Expenses 101.3 (1.1) 3.8 (0.1) 16.2 Impairment and Restructuring 29.5 14.4 21.7 164.1 32.8 Receipt of CDSOA Distribution (108.0) 1.1 (2.0) (3.6) (9.1) EBIT $715.7 $743.5 $459.7 $106.3 $501.9 Tax Rate 35.0% 35.0% 35.0% 35.0% 35.0% Provision for Income taxes $250.5 $260.2 $160.9 $37.2 $175.7 NOPAT $465.2 $483.3 $298.8 $69.1 $326.2 Total Debt $479.0 $515.1 $513.7 $512.7 $623.9 Shareholder's Equity 2,232.3 2,042.5 1,941.8 1,595.6 1,663.0 Invested Capital 2,711.3 2,557.6 2,455.5 2,108.3 2,286.9 Average Invested Capital 2,634.5 2,506.6 2,281.9 2,197.6 2,485.4 ROIC (1) 17.7% 19.3% 13.1% 3.1% 13.1% 3-Year Average ROIC 16.7% 5-Year Average ROIC 13.3% |
 GAAP RECONCILIATION OF SEGMENT ROIC Reconciliation of ROIC to GAAP Operating Income Management believes ROIC is representative of the company’s performance and therefore useful to investors. ($ Mils.) 2010 2011 2012 2010 2011 2012 2010 2011 2012 2010 2011 2012 2010 2011 2012 GAAP Operating Inc 183 218 183 118 261 250 6 (3) 25 129 251 230 437 728 687 Impairment/Restructuring 13 13 28 3 1 2 5 1 (0) (0) - - 21 14 29 EBIT 197 232 210 122 262 251 11 (3) 25 129 251 230 458 742 716 Tax Rate 35.0% 35.0% 35.0% 35.0% 35.0% 35.0% 35.0% 35.0% 35.0% 35.0% 35.0% 35.0% 35.0% 35.0% 35.0% Provision for Taxes 69 81 74 43 92 88 4 (1) 9 45 88 80 160 260 251 NOPAT 128 151 137 79 170 163 7 (2) 16 84 163 149 298 482 466 Invested Capital 879 840 1,273 553 692 1,277 391 362 581 632 663 1,114 2,456 2,558 2,726 Avg Invested Capital 860 860 1,057 511 623 984 378 377 472 533 647 888 2,282 2,507 2,642 ROIC 14.9% 17.5% 12.9% 15.5% 27.3% 16.6% 1.8% -0.4% 3.4% 15.7% 25.2% 16.8% 13.0% 19.2% 17.6% 3 year average ROIC 15.0% 19.5% 1.7% 19.1% 16.8% Mobile Process Aerospace Steel Timken 39 |
 GAAP RECONCILIATION OF EBIT ($ Mils.) Year Ended Year Ended (Dollars in millions) (Unaudited) December 31, 2012 Percentage to Net Sales December 31, 2011 Percentage to Net Sales Net Income 495.9 $ 9.9 % 456.6 $ 8.8 % Provision for income taxes 270.1 5.4 % 240.2 4.6 % Interest expense 31.1 0.6 % 36.8 0.7 % Interest income (2.9) (0.1)% (5.6) (0.1)% Consolidated earnings before interest and taxes (EBIT) 794.2 $ 15.9 % 728.0 $ 14.1 % Reconciliation of EBIT Margin to Net Income as a Percentage of Sales and EBIT to Net Income: The following reconciliation is provided as additional relevant information about the Company's performance. Management believes that EBIT and EBIT margin are representative of the Company's core operations and therefore useful to investors. 40 |
 GAAP RECONCILIATION OF FREE CASH FLOW ($ Mils.) (Dollars in millions) (Unaudited) December 31, 2012 December 31, 2011 Net cash provided (used) by operating activities 626.1 $ 211.7 $ Less: capital expenditures (297.2) (205.3) Less: cash dividends paid to shareholders (89.0) (76.0) Free cash flow 239.9 (69.6) Plus: discretionary pension and postretirement benefit contributions, net of the tax benefit (1) 245.0 256.0 Less: CDSOA receipts, net of tax expense (2) (68.0) — Free cash flow less discretionary contributions postretirement contributions and CDSOA 416.9 $ 186.4 $ Reconciliation of Free Cash Flow to GAAP Net Cash Provided by Operating Activities: Management believes that free cash flow and free cash flow less discretionary pension and postretirement contributions and CDSOA receipts are useful to investors because they are meaningful indicators of cash generated from operating activities available for the execution of its business strategy. Year Ended 41 |
 ($ Mils.) (Dollars in millions) (Unaudited) December 31, 2012 December 31, 2011 Short-term debt 23.9 $ 36.3 $ Long-term debt 455.1 478.8 Total Debt 479.0 $ 515.1 $ Less: Cash, cash equivalents and restricted cash (586.4) (468.4) Net (Cash) Debt (107.4) $ 46.7 $ Total equity 2,246.6 $ 2,042.5 $ Ratio of Total Debt to Capital 17.6 % 20.1 % Ratio of Net Debt to Capital (5.0)% 2.2 % Reconciliation of Total Debt to Net Debt and the Ratio of Net Debt to Capital: This reconciliation is provided as additional relevant information about The Timken Company's financial position. Capital is defined as total debt plus total shareholders' equity. Management believes Net Debt is an important measure of Timken's financial position, due to the amount of cash and cash equivalents. 42 GAAP RECONCILIATION OF NET DEBT |
 GAAP RECONCILIATION OF FREE CASH FLOW Free cash flow is defined as net cash provided by operating activities (including pension contributions) minus capital expenditures and dividends. Results include discontinued operations until divested. Reconciliation of Free Cash Flow to GAAP Net Cash Provided (Used) by Operating Activities Management believes that free cash flow is useful to investors because it is a meaningful indicator of cash generated from operating activities available for the execution of its business strategy. 43 1991 1992 1993 1994 1995 1996 1997 1998 1999 2000 Net Cash Provided by Operating Activities 140 116 154 147 224 186 312 292 277 157 Capital expenditures (140) (136) (89) (114) (129) (151) (233) (238) (165) (159) Cash dividends paid to shareholders (23) (22) (25) (26) (28) (30) (39) (45) (45) (44) Free Cash Flow (1) (23) (43) 39 6 67 5 40 9 68 (46) 2001 2002 2003 2004 2005 2006 2007 2008 2009 2010 2011 2012 Net Cash Provided by Operating Activities 178 206 204 121 319 337 337 569 588 313 212 626 Capital expenditures (91) (85) (119) (155) (221) (296) (314) (272) (114) (116) (205) (297) Cash dividends paid to shareholders (40) (32) (42) (47) (55) (58) (63) (67) (43) (51) (76) (89) Free Cash Flow (1) 47 89 43 (81) 43 (17) (40) 230 430 146 (69) 240 (1) |
 GAAP RECONCILIATION OF NET DEBT Note: (a) Total Debt is the sum of commercial paper, short-term debt, current portion of long-term debt and long-term debt Reconciliation of Net Debt to Total Debt and the Ratio of Net Debt to Capital Management believes Net Debt is an important measure of Timken's financial position, due to the amount of cash and cash equivalents. ($ Mils.) 1991 1992 1993 1994 1995 1996 1997 1998 1999 2000 Total Debt (a) 273 321 277 280 211 303 359 469 450 514 Less: Cash 2 8 5 12 7 5 10 0 8 11 Net Debt 271 313 271 267 204 297 350 469 442 503 Equity 1,019 985 685 733 821 922 1,032 1,056 1,046 1,005 Total Debt to Capital 21.1% 24.5% 28.7% 27.6% 20.5% 24.7% 25.8% 30.8% 30.1% 33.8% Net Debt to Capital 21.0% 24.1% 28.4% 26.7% 19.9% 24.4% 25.3% 30.8% 29.7% 33.4% 2001 2002 2003 2004 2005 2006 2007 2008 2009 2010 2011 2012 Total Debt (a) 497 461 735 779 721 598 723 624 513 514 515 479 Less: Cash 33 82 29 51 65 101 30 133 756 877 468 586 Net Debt 464 379 706 728 656 497 693 490 (243) (363) 47 (107) Equity 782 609 1,090 1,270 1,497 1,476 1,961 1,663 1,596 1,942 2,043 2,247 Total Debt to Capital 38.9% 43.1% 40.3% 38.0% 32.5% 28.8% 26.9% 27.3% 24.3% 20.9% 20.1% 17.6% Net Debt to Capital 37.2% 38.4% 39.3% 36.5% 30.5% 25.2% 26.1% 22.8% -18.0% -23.0% 2.2% -5.0% 44 |
 GAAP RECONCILIATION OF ROIC Reconciliation of ROIC to GAAP Operating Income Management believes ROIC is representative of the company’s performance and therefore useful to investors. ($ Mils.) 45 1990 1991 1992 1993 1994 1995 1996 1997 1998 1999 2000 GAAP Operating Income (1) (9) 42 14 132 203 247 280 225 133 106 GAAP Other Income / (Expenses) (8) (2) (6) 2 (5) (5) 7 (16) (10) (7) Earnings Before Interest and Taxes (EBIT) (2) (17) 41 8 135 198 242 287 209 123 99 Provision for income taxes (6) 15 3 51 73 93 102 80 45 35 Adjusted tax rate 37.6% 37.6% 37.6% 37.6% 36.9% 38.3% 35.7% 38.2% 36.8% 35.0% Net Operating Profit After Taxes (NOPAT) (3) (10) 25 5 84 125 149 184 129 78 64 Invested Capital: Total Debt 266 273 321 277 280 211 303 359 469 450 514 Shareholders' Equity 1,075 1,019 985 685 733 821 922 1,032 1,056 1,046 1,005 Total 1,341 1,292 1,306 962 1,012 1,032 1,225 1,392 1,526 1,496 1,519 Average Invested Capital (4) 1,317 1,299 1,134 987 1,022 1,129 1,308 1,459 1,511 1,507 ROIC: NOPAT / Average Invested Capital (4) -0.8% 1.9% 0.4% 8.5% 12.2% 13.2% 14.1% 8.9% 5.2% 4.3% 2001 2002 2003 2004 2005 2006 2007 2008 2009 2010 2011 2012 GAAP Operating Income (1) (18) 79 98 237 327 219 295 462 (54) 436 729 693 GAAP Other Income / (Expenses) 22 37 10 12 68 80 5 16 (0) 4 (1) 101 Earnings Before Interest and Taxes (EBIT) (2) 4 115 108 249 395 299 300 478 (54) 440 728 794 Provision for income taxes 2 46 43 80 129 91 61 171 (16) 148 251 280 Adjusted tax rate 39.8% 39.8% 40.0% 32.1% 32.6% 30.6% 20.4% 35.7% 29.9% 33.5% 34.5% 35.3% Net Operating Profit After Taxes (NOPAT) (3) 3 69 65 169 266 208 239 307 (38) 292 477 514 Total Debt 497 461 735 779 721 598 723 624 513 514 515 479 Shareholders' Equity 782 609 1,090 1,270 1,497 1,476 1,961 1,623 1,596 1,942 2,043 2,247 Total 1,279 1,070 1,824 2,049 2,218 2,074 2,684 2,246 2,108 2,456 2,558 2,726 Average Invested Capital (4) 1,399 1,175 1,447 1,937 2,134 2,146 2,379 2,465 2,177 2,282 2,507 2,642 ROIC: NOPAT / Average Invested Capital (4) 0.2% 5.9% 4.5% 8.7% 12.5% 9.7% 10.0% 12.5% -1.7% 12.8% 19.0% 19.5% (1) GAAP Operating Income excludes discontinued operations for Latrobe Steel (divested Dec. 8, 2006) for years 2004 through 2006 and the Needle Roller Bearings business for years 2007 through 2009 (divested Dec. 31, 2009). (2) EBIT is defined as operating income plus other income (expense) - net. (3) NOPAT is defined as EBIT less an estimated provision for income taxes. This tax provision excludes the tax effect of pre-tax special items on the company's effective tax rate, as well as the the impact of discrete tax items recorded during the year. (4) The company uses NOPAT/Average Invested Capital as a type of ratio that indicates return on invested capital (ROIC). Average Invested Capital is the sum of Total Debt and Share- holders' Equity taken at the beginning and ending of each year and then averaged. Total Debt is the sum of commercial paper, ST-debt, curr. portion of LT-debt & LT-debt. Invested Capital: |
 |