Exhibit 99.2
TIMKEN
Stronger. By Design.
Timken Investor Day
June 19, 2014
FORWARD-LOOKING STATEMENTS
Certain statements in this presentation (including statements regarding the company’s forecasts, estimates and expectations) that are not historical in nature are “forward-looking” statements within the meaning of the Private Securities Litigation Reform Act of 1995. In particular, the statements related to expectations regarding each company’s future financial performance, plans for executing the spinoff, the taxable nature of the spinoff, future prospects of the companies as independent companies, revenue and market growth and similar statements are forward-looking. The company cautions that actual results may differ materially from those projected or implied in forward-looking statements due to a variety of important factors, including: each company’s ability to respond to the changes in its end markets that could affect demand for the company’s products; unanticipated changes in business relationships with customers or their purchases from each company; changes in the financial health of each company’s customers, which may have an impact on each company’s revenues, earnings and impairment charges; fluctuations in raw material and energy costs and their impact on the operation of each company’s surcharge mechanisms; the impact of each company’s last-in, first-out accounting; weakness in global or regional economic conditions and financial markets; changes in the expected costs associated with product warranty claims; the ability to achieve satisfactory operating results in the integration of acquired companies; the impact on operations of general economic conditions; higher or lower raw material and energy costs; fluctuations in customer demand; the impact on each company’s pension obligations due to changes in interest rates or investment performance; each company’s ability to achieve the benefits of announced programs, initiatives, and capital investments; each company’s ability to fund its pension plans; the timing and amount of any additional repurchases of the company’s common shares; the timing and amount of dividends on the company’s common shares; uncertainties that may delay or negatively impact the spinoff or cause the spinoff to not occur; changes to the actual amount of one-time spinoff costs compared to the company’s estimate; the inability to establish or maintain certain strategic relationships between both companies; and disruptions to operations as a result of effecting the spinoff. Additional factors are discussed in the company’s filings with the Securities and Exchange Commission, including the company’s Annual Report on Form 10-K for the year ended Dec. 31, 2013, quarterly reports on Form
10-Q and current reports on Form 8-K. Except as required by the federal securities laws, the company undertakes no obligation to publicly update or revise any forward-looking statement, whether as a result of new information, future events or otherwise.
This presentation includes certain non-GAAP financial measures as defined by the rules and regulations of the Securities and Exchange Commission. A reconciliation of those measures to the most directly comparable GAAP equivalent is provided in the Appendix to this presentation.
2
Stronger.By Design. TIMKEN
AGENDA
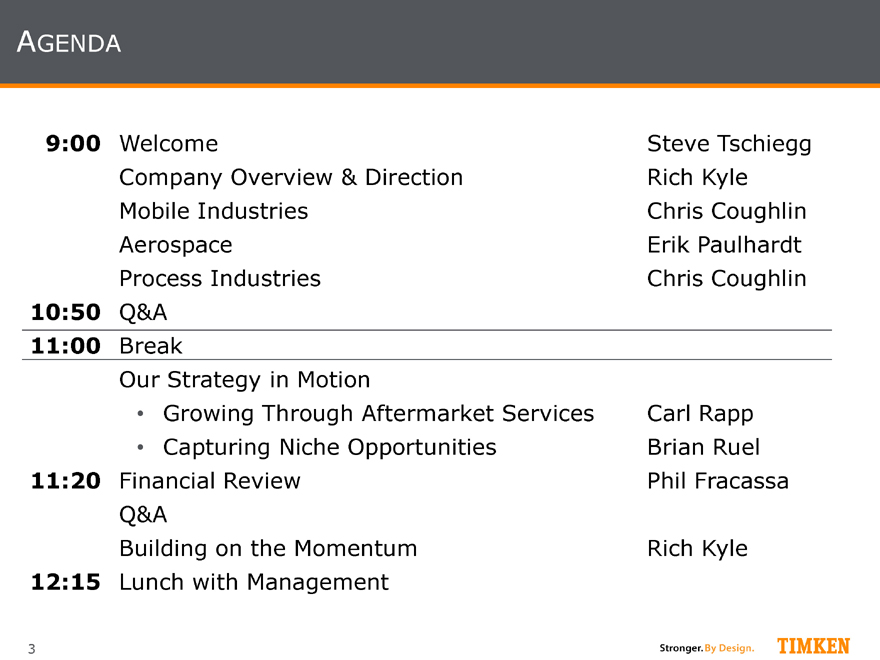
9:00 Welcome Steve Tschiegg
Company Overview & Direction Rich Kyle
Mobile Industries Chris Coughlin
Aerospace Erik Paulhardt
Process Industries Chris Coughlin
10:50 Q&A
11:00 Break
Our Strategy in Motion
Growing Through Aftermarket Services Carl Rapp
Capturing Niche Opportunities Brian Ruel
11:20 Financial Review Phil Fracassa
Q&A
Building on the Momentum Rich Kyle
12:15 Lunch with Management
3
Stronger.By Design. TIMKEN
TIMKEN
Stronger.By Design.
Company Overview and Direction Rich Kyle, President and CEO
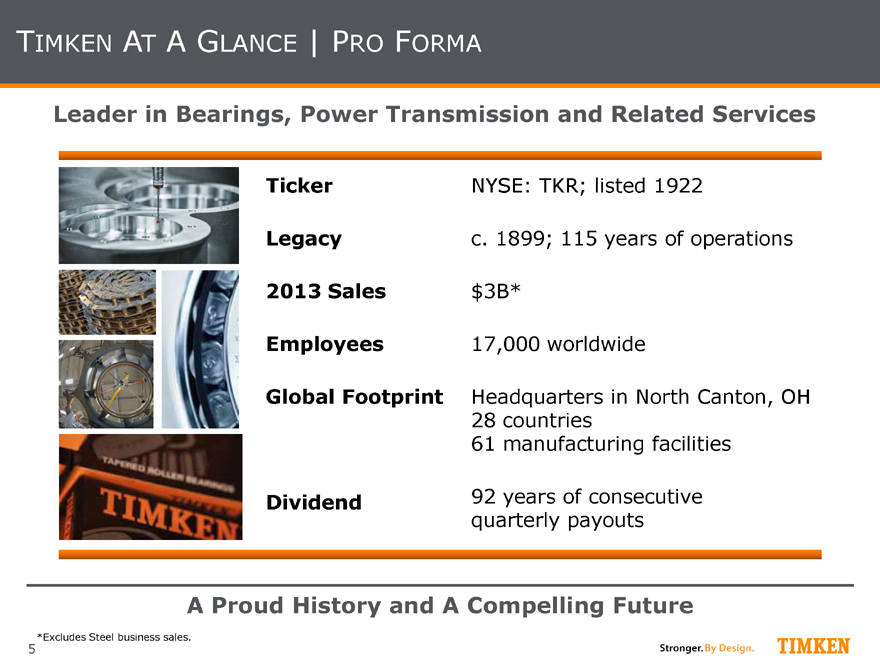
TIMKEN AT A GLANCE | PRO FORMA
Leader in Bearings, Power Transmission and Related Services
Ticker NYSE: TKR; listed 1922
Legacy c. 1899; 115 years of operations
2013 Sales $3B*
Employees 17,000 worldwide
Global Footprint Headquarters in North Canton, OH
28 countries
61 manufacturing facilities
Dividend 92 years of consecutive
quarterly payouts
A Proud History and A Compelling Future
*Excludes Steel business sales.
5
Stronger.By Design. TIMKEN
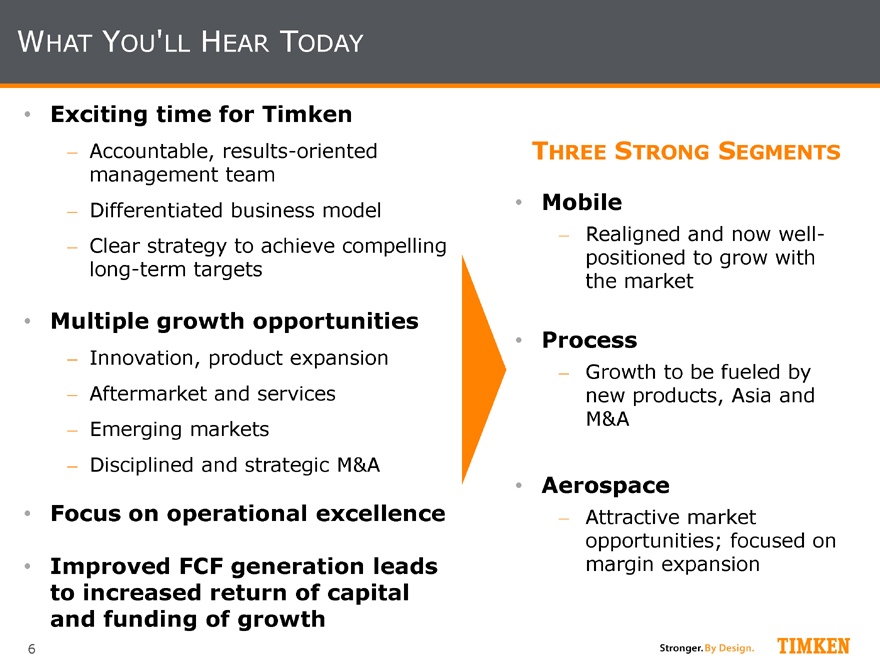
WHAT YOU’LL HEAR TODAY
Exciting time for Timken
Accountable, results-oriented
management team
Differentiated business model
Clear strategy to achieve compelling
long-term targets
Multiple growth opportunities
Innovation, product expansion
Aftermarket and services
Emerging markets
Disciplined and strategic M&A
Focus on operational excellence
Improved FCF generation leads
to increased return of capital
and funding of growth
THREE STRONG SEGMENTS
Mobile
Realigned and now well-
positioned to grow with
the market
Process
Growth to be fueled by
new products, Asia and
M&A
Aerospace
Attractive market
opportunities; focused on
margin expansion
6
Stronger.By Design. TIMKEN
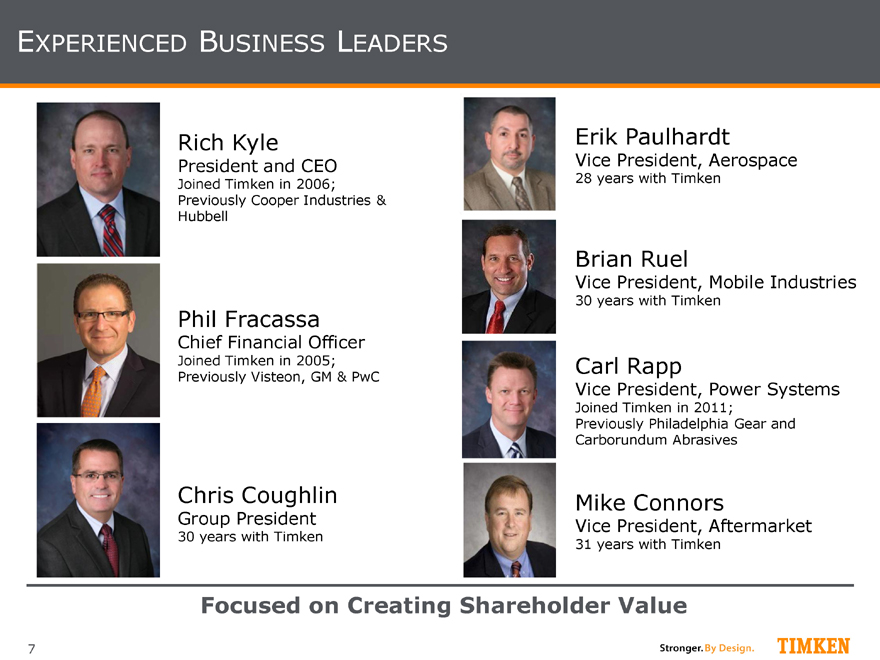
EXPERIENCED BUSINESS LEADERS
Rich Kyle
President and CEO
Joined Timken in 2006;
Previously Cooper Industries &
Hubbell
Phil Fracassa
Chief Financial Officer
Joined Timken in 2005;
Previously Visteon, GM & PwC
Chris Coughlin
Group President
30 years with Timken
Erik Paulhardt
Vice President, Aerospace
28 years with Timken
Brian Ruel
Vice President, Mobile Industries
30 years with Timken
Carl Rapp
Vice President, Power Systems
Joined Timken in 2011;
Previously Philadelphia Gear and Carborundum Abrasives
Mike Connors
Vice President, Aftermarket
31 years with Timken
Focused on Creating Shareholder Value
7
Stronger.By Design. TIMKEN
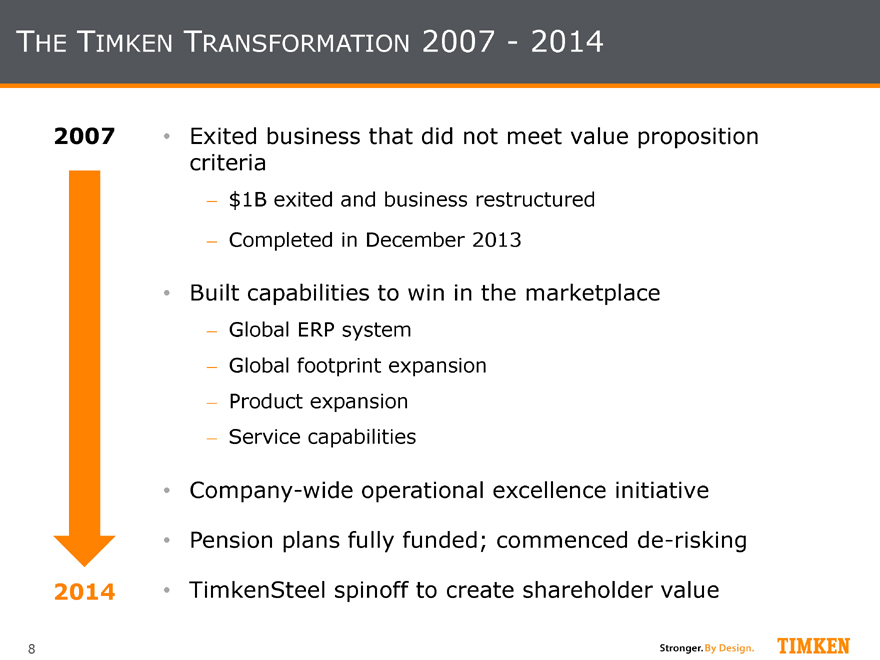
THE TIMKEN TRANSFORMATION 2007 - 2014
2007 • Exited business that did not meet value proposition
criteria
$1B exited and business restructured
Completed in December 2013
Built capabilities to win in the marketplace
Global ERP system
Global footprint expansion
Product expansion
Service capabilities
Company-wide operational excellence initiative
Pension plans fully funded; commenced de-risking
2014 • TimkenSteel spinoff to create shareholder value
8
Stronger.By Design. TIMKEN
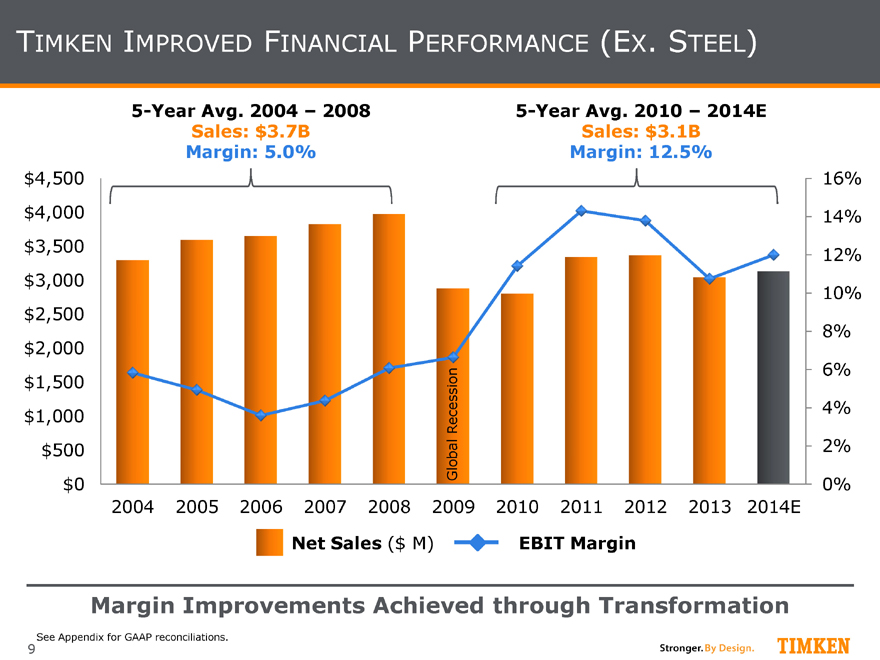
TIMKEN IMPROVED FINANCIAL PERFORMANCE (EX. STEEL)
5-Year Avg. 2004 – 2008 5-Year Avg. 2010 – 2014E
Sales: $3.7B Sales: $3.1B
Margin: 5.0% Margin: 12.5%
$4,500 16%
$4,000 14%
$3,500 12%
$3,000
10%
$2,500 8%
$2,000
6%
$1,500
$1,000 Recession 4%
$500 Global 2%
$0 0%
2004 2005 2006 2007 2008 2009 2010 2011 2012 2013 2014E
Net Sales ($ M) EBIT Margin
Margin Improvements Achieved through Transformation
See Appendix for GAAP reconciliations.
9
Stronger.By Design. TIMKEN
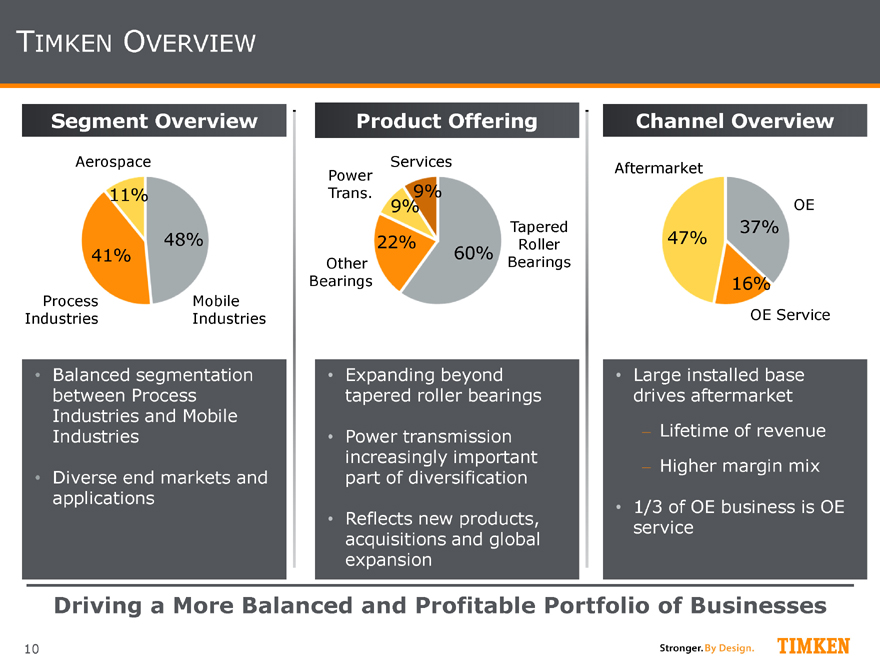
TIMKEN OVERVIEW
Segment Overview Product Offering Channel Overview
Aerospace Services Aftermarket
Power 9%
11% Trans.
9% OE
Tapered 37% 48% 22% Roller 47%
41% 60%
Other Bearings
Bearings 16% Process Mobile
Industries Industries OE Service
Balanced segmentation
between Process
Industries and Mobile
Industries
Diverse end markets and
applications
Expanding beyond
tapered roller bearings
Power transmission
increasingly important
part of diversification
Reflects new products,
acquisitions and global
expansion
Large installed base
drives aftermarket
Lifetime of revenue
Higher margin mix
1/3 of OE business is OE
service
Driving a More Balanced and Profitable Portfolio of Businesses
10
Stronger.By Design. TIMKEN

OPERATING IN 28 COUNTRIES ACROSS THE GLOBE
EMEA
18% Russia
Canada U.K. Germany
Poland Czech Republic
NA 59%
France Japan
ItalyRomania
U.S. Spain China
Turkey South Korea
LatAm 8%
India
Mexico U.A.E. Thailand Taiwan APAC 15%
Vietnam
Singapore
Brazil Indonesia
Australia
Plants/Service Centers | 61
South Africa
Distribution/Shipping | 23 Argentina
Technology Center |5
24% of 2013 Revenue Derived from Developing Markets
Note: Based on 2013 sales of $3.0B, ex. Steel business sales.
11
Stronger.By Design. TIMKEN
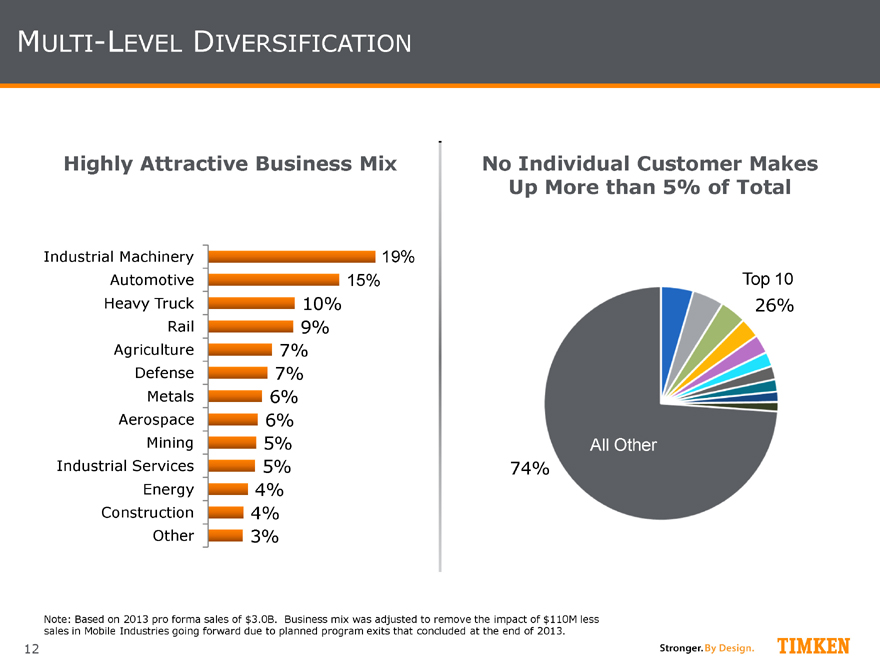
MULTI-LEVEL DIVERSIFICATION
Highly Attractive Business Mix
Industrial Machinery 19%
Automotive 15%
Heavy Truck 10%
Rail 9%
Agriculture 7%
Defense 7%
Metals 6%
Aerospace 6%
Mining 5%
Industrial Services 5%
Energy 4%
Construction 4%
Other 3%
No Individual Customer Makes
Up More than 5% of Total
Top 10
26%
All Other
74%
Note: Based on 2013 pro forma sales of $3.0B. Business mix was adjusted to remove the impact of $110M less
sales in Mobile Industries going forward due to planned program exits that concluded at the end of 2013.
12
Stronger.By Design. TIMKEN
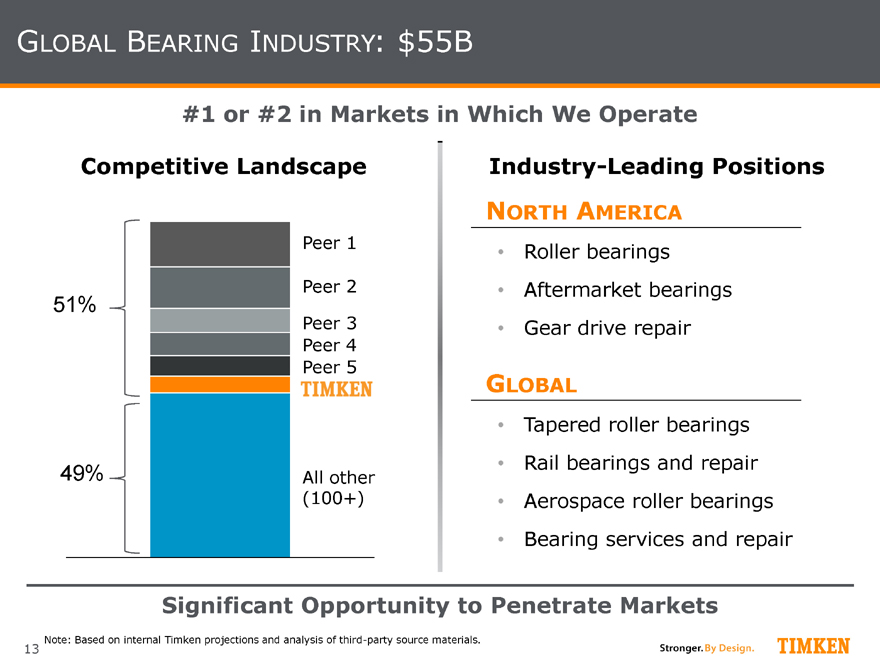
GLOBAL BEARING INDUSTRY: $55B
#1 or #2 in Markets in Which We Operate
Competitive Landscape Industry-Leading Positions
NORTH AMERICA
Peer 1
51% Peer 2
Peer 3
Peer 4
Peer 5 TIMKEN
49% All other
(100+)
Roller bearings
Aftermarket bearings
Gear drive repair
GLOBAL
Tapered roller bearings
Rail bearings and repair
Aerospace roller bearings
Bearing services and repair
Significant Opportunity to Penetrate Markets
Note: Based on internal Timken projections and analysis of third-party source materials.
13
Stronger.By Design. TIMKEN
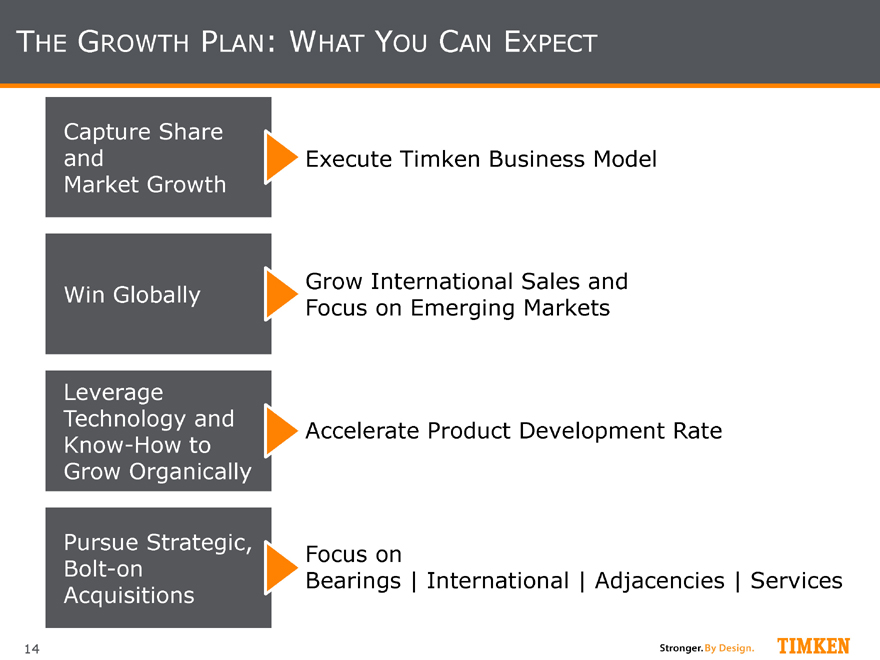
THE GROWTH PLAN: WHAT YOU CAN EXPECT
Capture Share
and
Market Growth
Win Globally
Leverage
Technology and
Know-How to
Grow Organically
Pursue Strategic,
Bolt-on
Acquisitions
Execute Timken Business Model
Grow International Sales and
Focus on Emerging Markets
Accelerate Product Development Rate
Focus on
Bearings | International | Adjacencies | Services
14
Stronger.By Design. TIMKEN
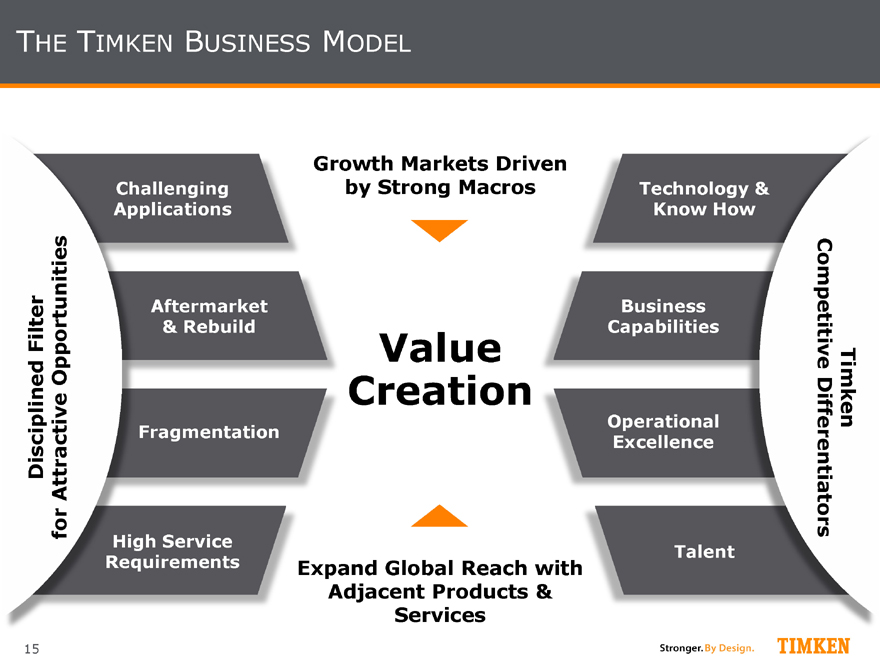
THE TIMKEN BUSINESS MODEL
15 Disciplined Filter for Attractive Opportunities
Challenging
Applications
Aftermarket
& Rebuild
Fragmentation
High Service
Requirements
Growth Markets Driven
by Strong Macros
Value
Creation
Expand Global Reach with
Adjacent Products &
Services
Technology & Know How
Business Capabilities
Operational Excellence
Talent
Timken
Competitive Differentiators
Stronger.By Design. TIMKEN
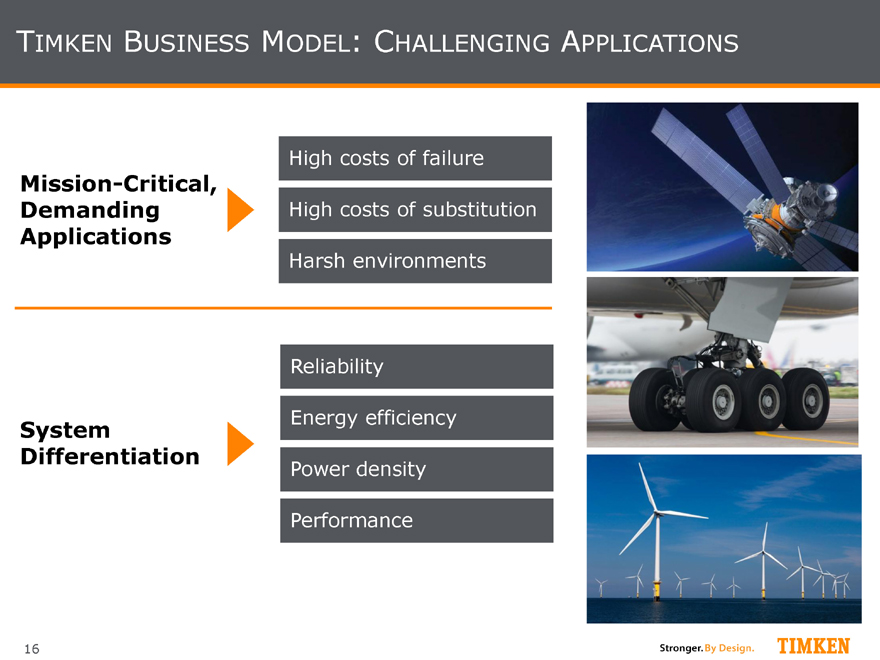
TIMKEN BUSINESS MODEL: CHALLENGING APPLICATIONS
Mission-Critical,
Demanding Applications
System
Differentiation
High costs of failure
High costs of substitution
Harsh environments
Reliability
Energy efficiency
Power density
Performance
16
Stronger.By Design. TIMKEN
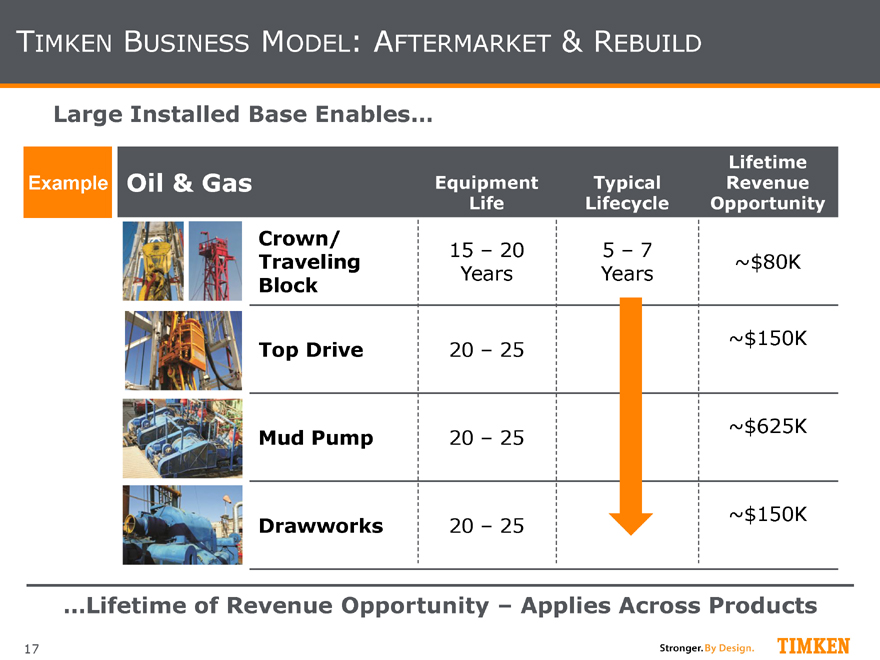
TIMKEN BUSINESS MODEL: AFTERMARKET & REBUILD
Large Installed Base Enables…
Lifetime Example Oil & Gas Equipment Typical Revenue Life Lifecycle Opportunity
Crown/
15 – 20 5 – 7
Traveling ~$80K
Years Years
Block
~$150K
Top Drive 20 – 25
~$625K
Mud Pump 20 – 25
~$150K
Drawworks 20 – 25
…Lifetime of Revenue Opportunity – Applies Across Products
17
Stronger.By Design. TIMKEN
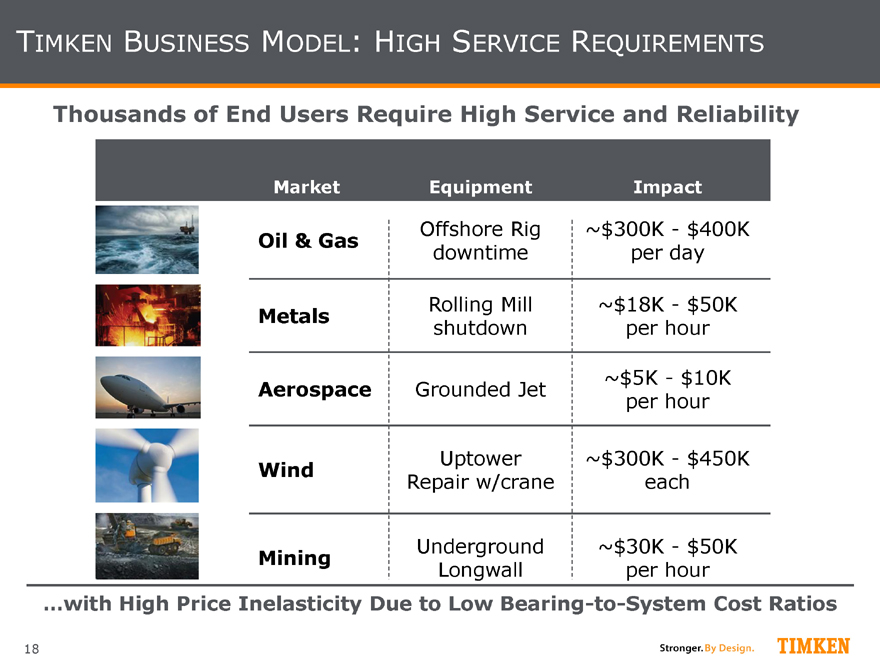
TIMKEN BUSINESS MODEL: HIGH SERVICE REQUIREMENTS
Thousands of End Users Require High Service and Reliability
Market Equipment Impact
Offshore Rig ~$300K - $400K
Oil & Gas downtime per day
Rolling Mill ~$18K - $50K
Metals shutdown per hour
~$5K - $10K
Aerospace Grounded Jet per hour
Uptower ~$300K - $450K
Wind
Repair w/crane each
Underground ~$30K - $50K
Mining
Longwall per hour
…with High Price Inelasticity Due to Low Bearing-to-System Cost Ratios
18
Stronger.By Design. TIMKEN
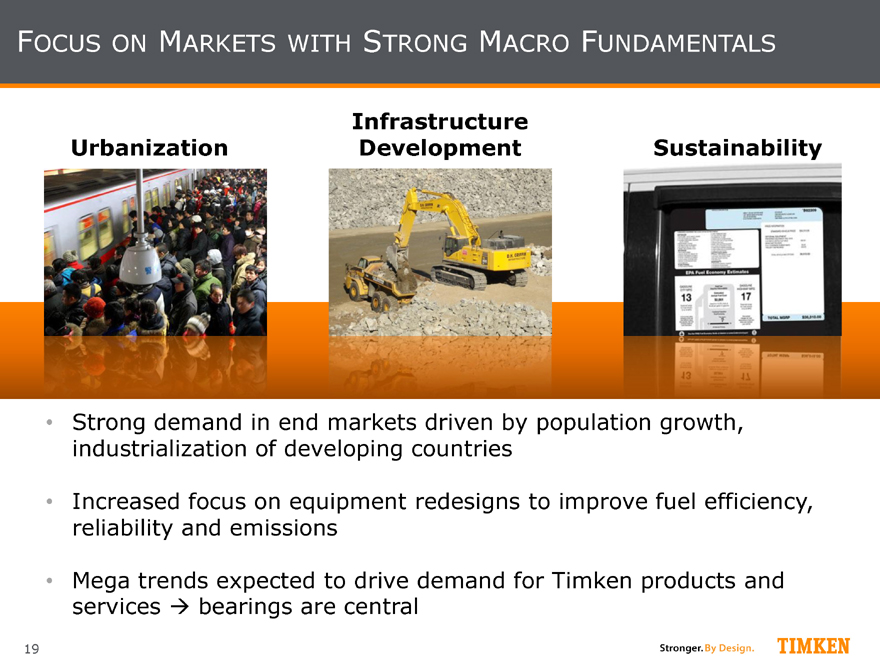
FOCUS ON MARKETS WITH STRONG MACRO FUNDAMENTALS
Infrastructure
Urbanization Development Sustainability
Strong demand in end markets driven by population growth, industrialization of developing countries
Increased focus on equipment redesigns to improve fuel efficiency, reliability and emissions
Mega trends expected to drive demand for Timken products and services bearings are central
19
Stronger.By Design. TIMKEN
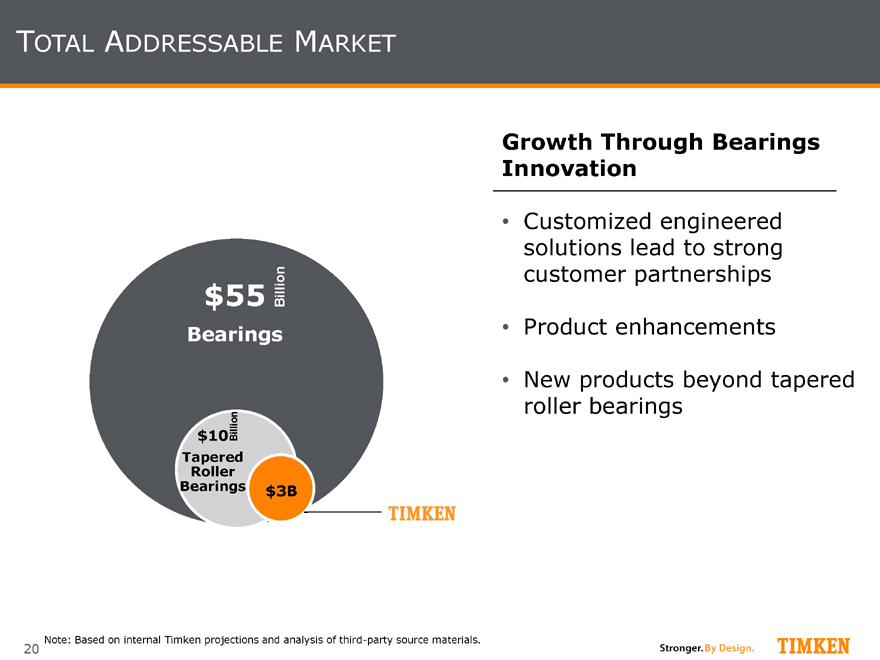
TOTAL ADDRESSABLE MARKET
Growth Through Bearings Innovation
Customized engineered solutions lead to strong customer partnerships
Product enhancements
New products beyond tapered roller bearings
$55 Billion
Bearings
$10 Billion
Tapered
Roller
Bearings $3B TIMKEN
Note: Based on internal Timken projections and analysis of third-party source materials.
20
Stronger.By Design. TIMKEN
|
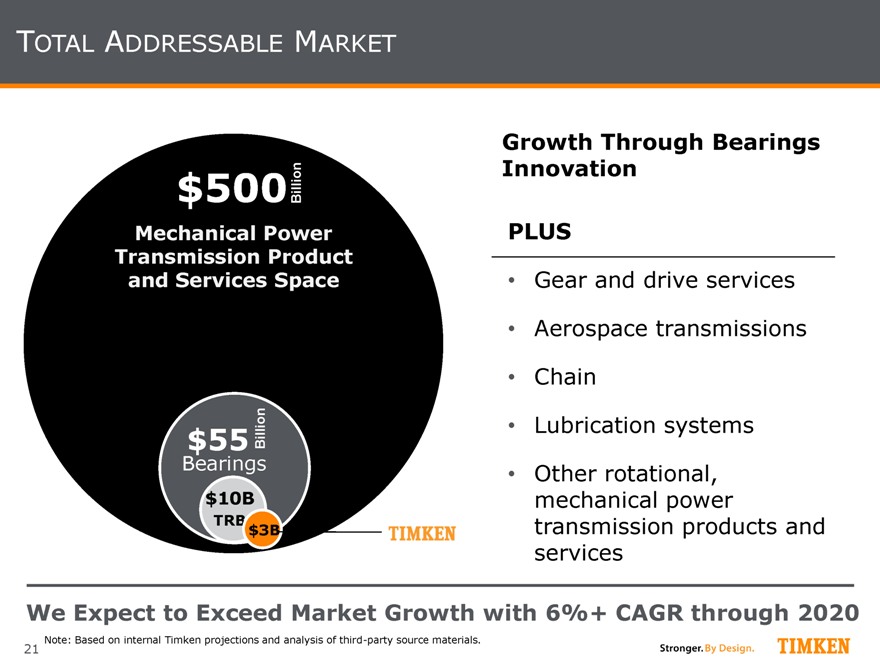
TOTAL ADDRESSABLE MARKET
$500Billion
Mechanical Power Transmission Product and Services Space
Billion
Bearings $55 $10B
TRB $3B
We Expect to Exceed Market Growth with 6%+ CAGR through 2020
Note: Based on internal Timken projections and analysis of third-party source materials.
Growth Through Bearings Innovation
PLUS
Gear and drive services
Aerospace transmissions
Chain
Lubrication systems
Other rotational, mechanical power transmission products and services
21
|
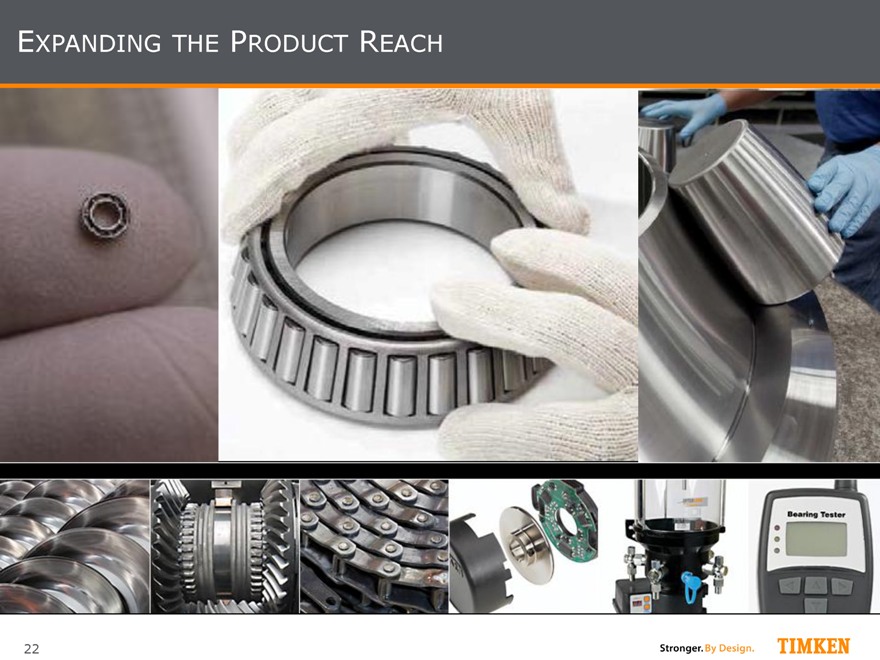
EXPANDING THE PRODUCT REACH
22
|
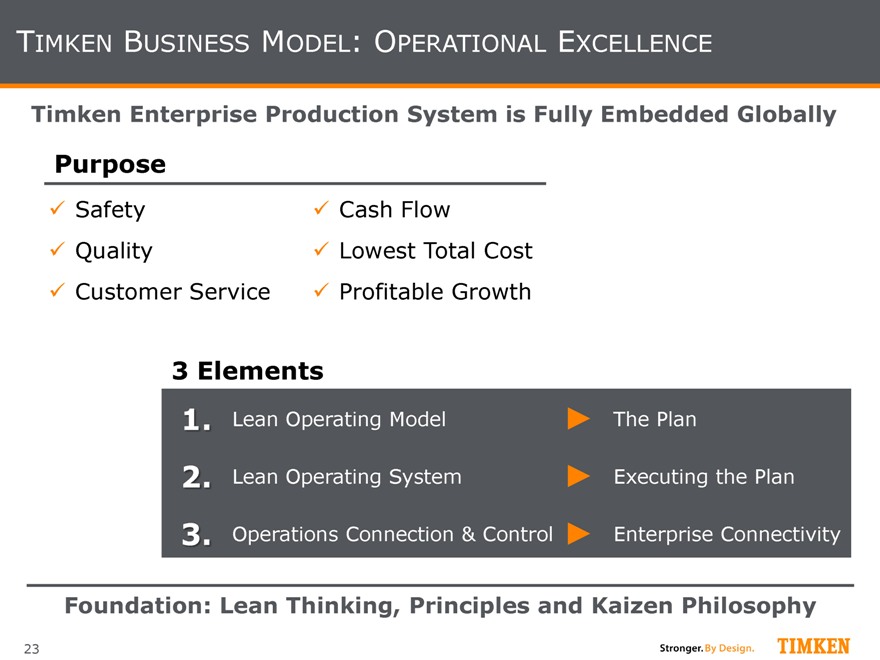
TIMKEN BUSINESS MODEL: OPERATIONAL EXCELLENCE
Timken Enterprise Production System is Fully Embedded Globally
Purpose
Safety Cash Flow
Quality Lowest Total Cost Customer Service Profitable Growth
3 Elements
1. Lean Operating Model The Plan
2. Lean Operating System Executing the Plan
3. Operations Connection & Control Enterprise Connectivity
Foundation: Lean Thinking, Principles and Kaizen Philosophy
23
|
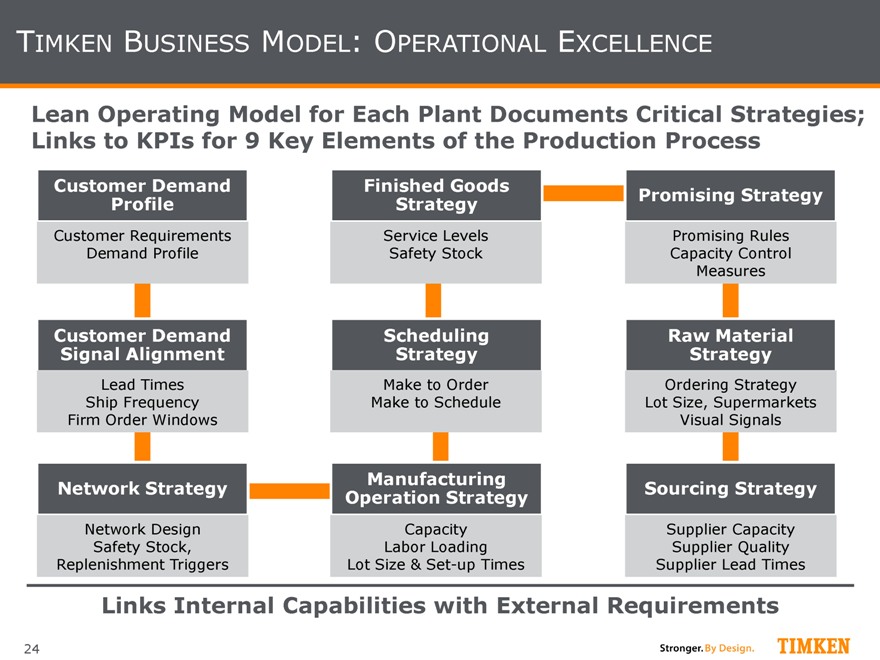
TIMKEN BUSINESS MODEL: OPERATIONAL EXCELLENCE
Lean Operating Model for Each Plant Documents Critical Strategies; Links to KPIs for 9 Key Elements of the Production Process
Customer Demand Profile
Customer Requirements Demand Profile
Customer Demand Signal Alignment
Lead Times Ship Frequency Firm Order Windows
Network Strategy
Network Design Safety Stock, Replenishment Triggers
Finished Goods Strategy
Service Levels Safety Stock
Scheduling Strategy
Make to Order Make to Schedule
Manufacturing Operation Strategy
Capacity Labor Loading Lot Size & Set-up Times
Promising Strategy
Promising Rules Capacity Control Measures
Raw Material Strategy
Ordering Strategy Lot Size, Supermarkets Visual Signals
Sourcing Strategy
Supplier Capacity Supplier Quality Supplier Lead Times
Links Internal Capabilities with External Requirements
24
|
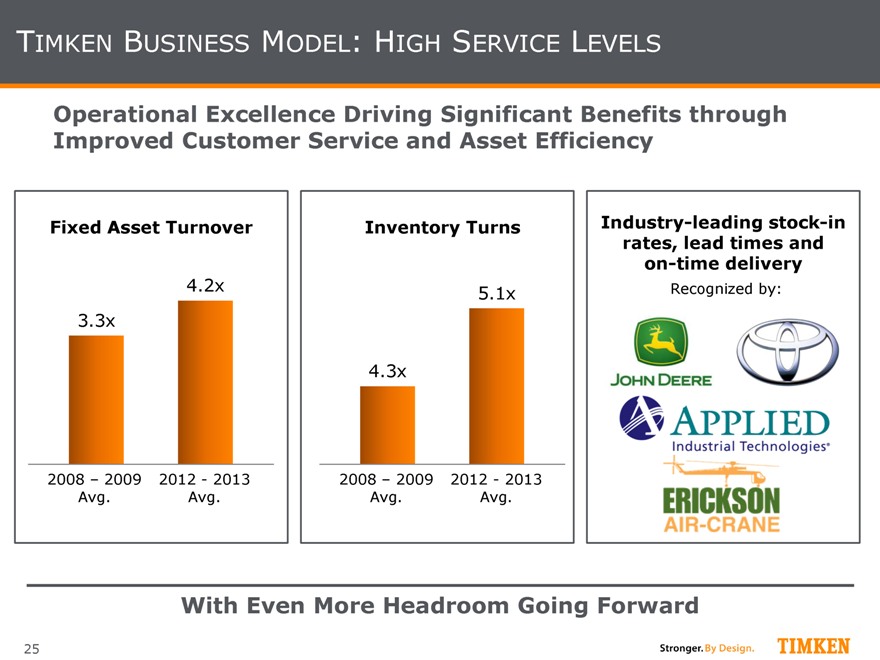
TIMKEN BUSINESS MODEL: HIGH SERVICE LEVELS
Operational Excellence Driving Significant Benefits through Improved Customer Service and Asset Efficiency
Fixed Asset Turnover
4.2x
3.3x
2008 – 2009 2012—2013 Avg. Avg.
Inventory Turns
5.1x
4.3x
2008 – 2009 2012—2013 Avg. Avg.
Industry-leading stock-in rates, lead times and on-time delivery
Recognized by:
With Even More Headroom Going Forward
25
|
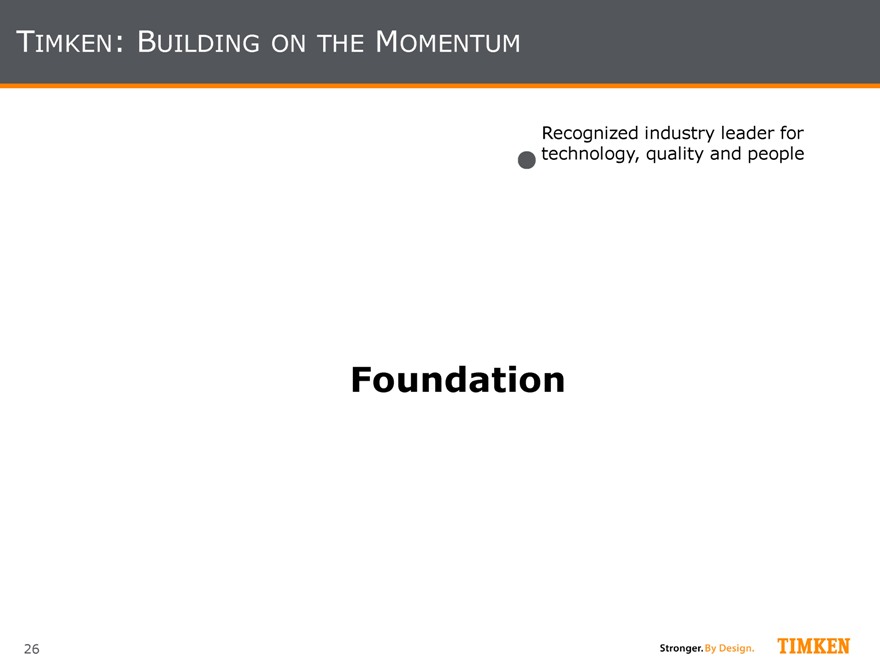
TIMKEN: BUILDING ON THE MOMENTUM
Recognized industry leader for technology, quality and people
Foundation
26
|
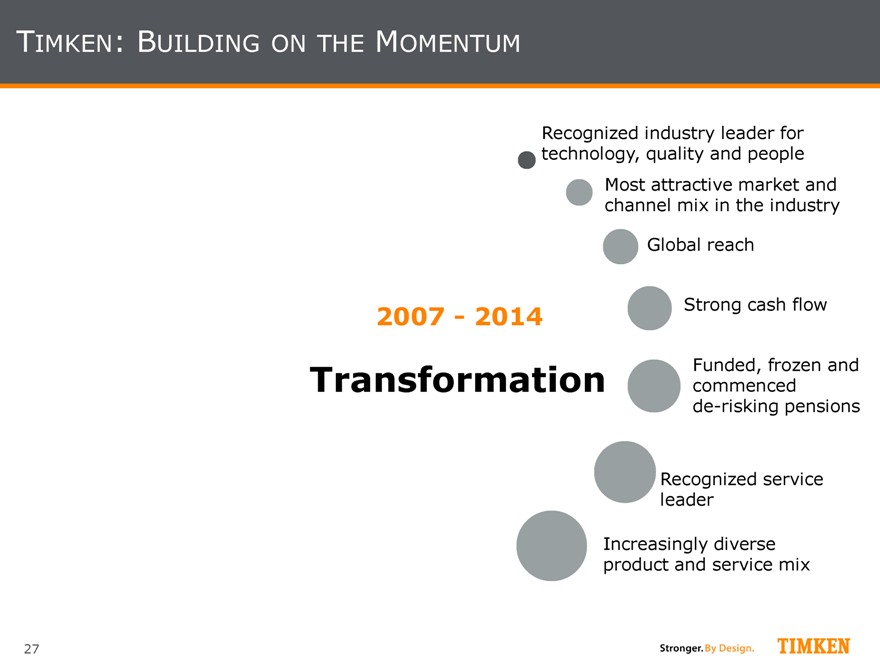
TIMKEN: BUILDING ON THE MOMENTUM
Recognized industry leader for technology, quality and people Most attractive market and channel mix in the industry
Global reach
2007—2014 Strong cash flow Funded, frozen and
Transformation commenced
de-risking pensions
Recognized service leader
Increasingly diverse product and service mix
27
|
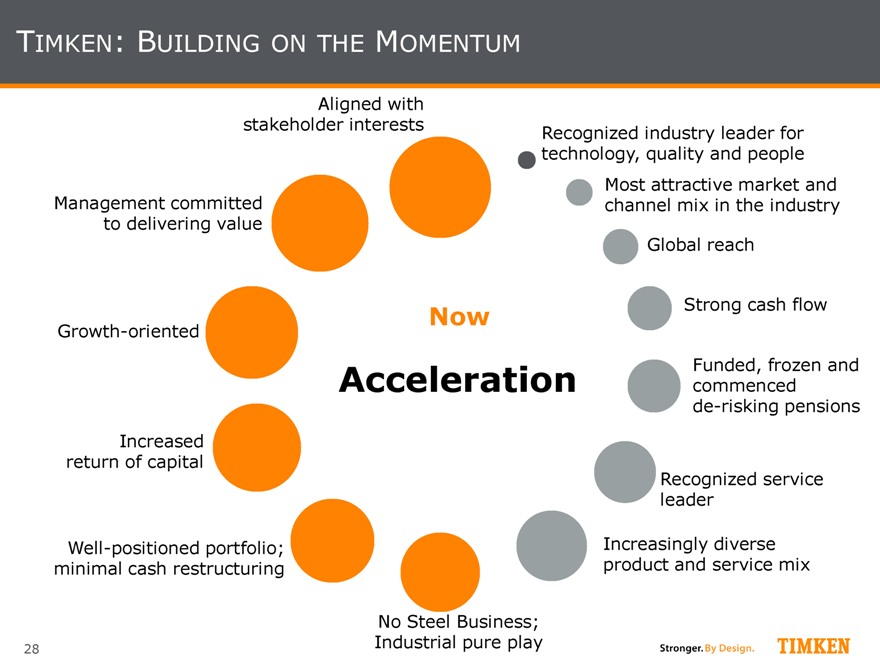
TIMKEN: BUILDING ON THE MOMENTUM
Aligned with
stakeholder interests Recognized industry leader for
technology, quality and people
Most attractive market and
Management committed channel mix in the industry
to delivering value
Global reach
Now Strong cash flow
Growth-oriented
frozen and
Acceleration commenced Funded,
de-risking pensions
Increased
return of capital
Recognized service
leader
Well-positioned portfolio; Increasingly diverse
minimal cash restructuring product and service mix
No Steel Business;
Industrial pure play
28
|
SUMMARY
Timken: What You Can Expect
Leverage the Timken Business Model to Accelerate Attractive Organic Growth Rates
Expand our reach through organic product and geographic expansion
Add complementary products and services through acquisitions that fit the business model and meet financial criteria
Continue to build our business capabilities to further our differentiation in serving diverse industrial markets and customers
Expanding Margins
Top Quartile Shareholder Returns among Industrial Peer Group
29
|
Mobile Industries
Chris Coughlin, Group President
|
KEY MESSAGES
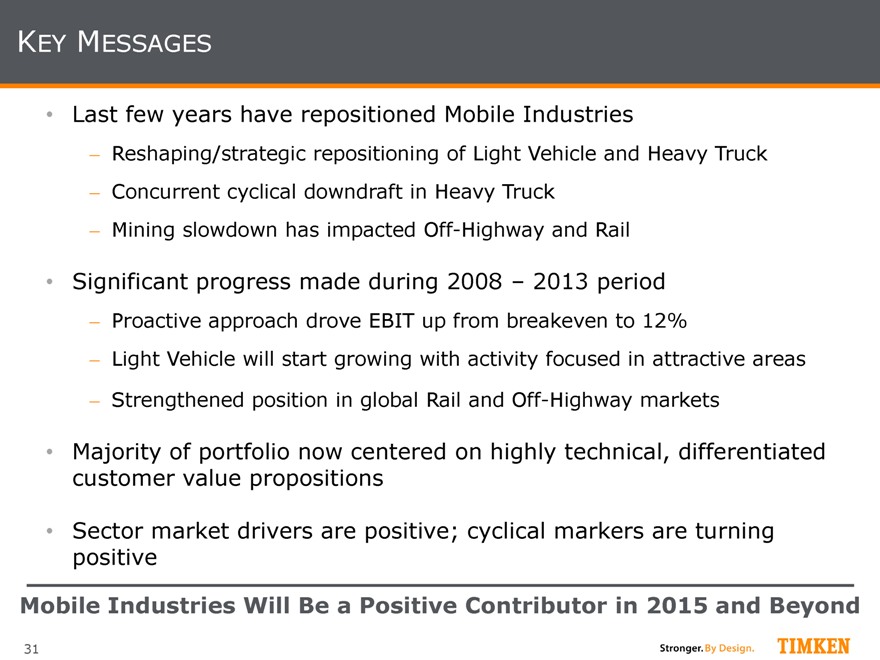
Last few years have repositioned Mobile Industries
Reshaping/strategic repositioning of Light Vehicle and Heavy Truck
Concurrent cyclical downdraft in Heavy Truck
Mining slowdown has impacted Off-Highway and Rail
Significant progress made during 2008 – 2013 period
Proactive approach drove EBIT up from breakeven to 12%
Light Vehicle will start growing with activity focused in attractive areas
Strengthened position in global Rail and Off-Highway markets
Majority of portfolio now centered on highly technical, differentiated customer value propositions
Sector market drivers are positive; cyclical markers are turning positive
Mobile Industries Will Be a Positive Contributor in 2015 and Beyond
31
|
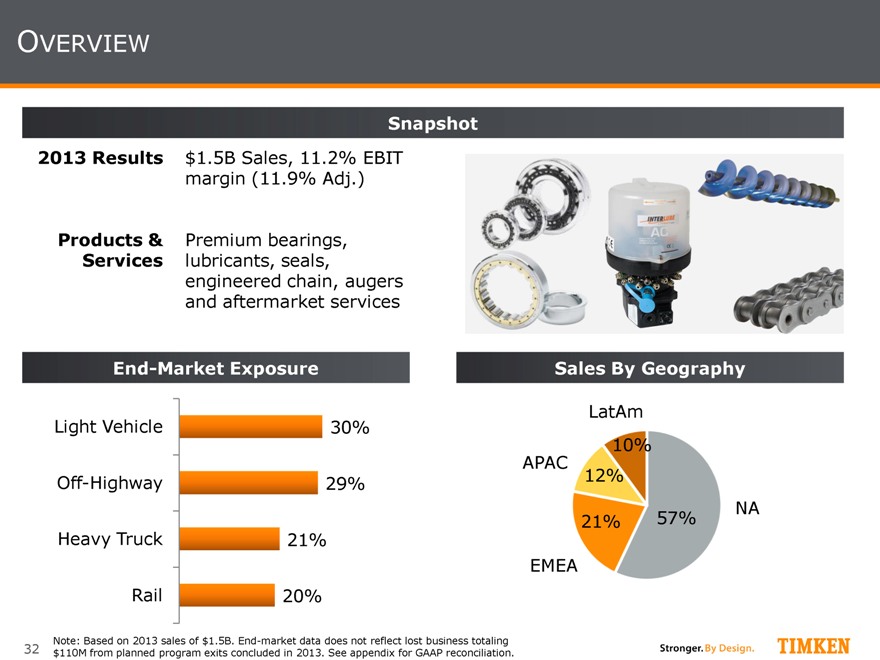
OVERVIEW
Snapshot
2013 Results $1.5B Sales, 11.2% EBIT
margin (11.9% Adj.)
Products & Premium bearings,
Services lubricants, seals,
engineered chain, augers
and aftermarket services
End-Market Exposure
Light Vehicle 30% Off-Highway 29% Heavy Truck 21% Rail 20%
Sales By Geography
LatAm APAC 10% 12%
NA 21% 57%
EMEA
Note: Based on 2013 sales of $1.5B. End-market data does not reflect lost business totaling $110M from planned program exits concluded in 2013. See appendix for GAAP reconciliation.
32
|
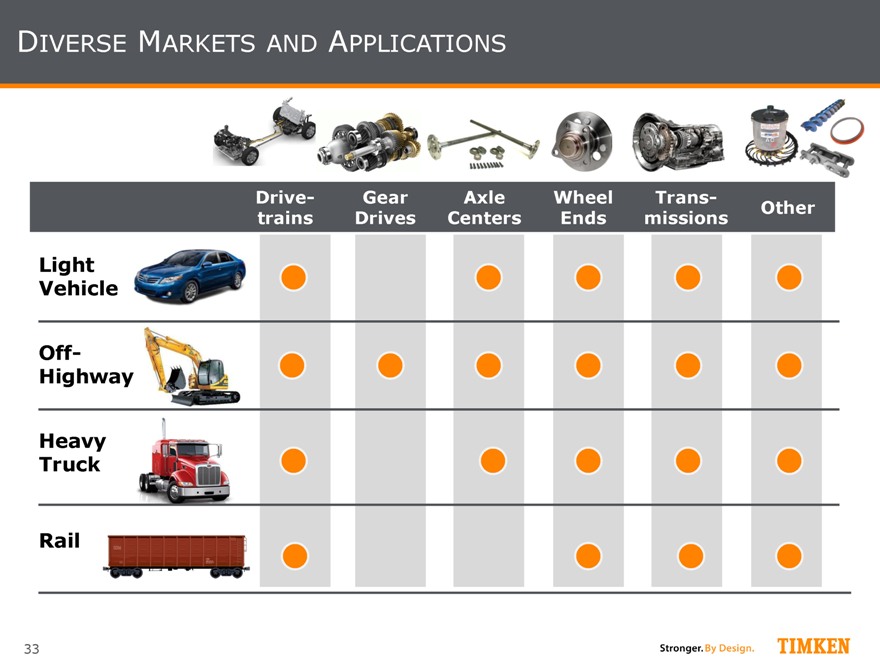
DIVERSE MARKETS AND APPLICATIONS
Drive- Gear Axle Wheel Trans-
Other trains Drives Centers Ends missions
Light Vehicle
Off-Highway
Heavy Truck
Rail
33
|
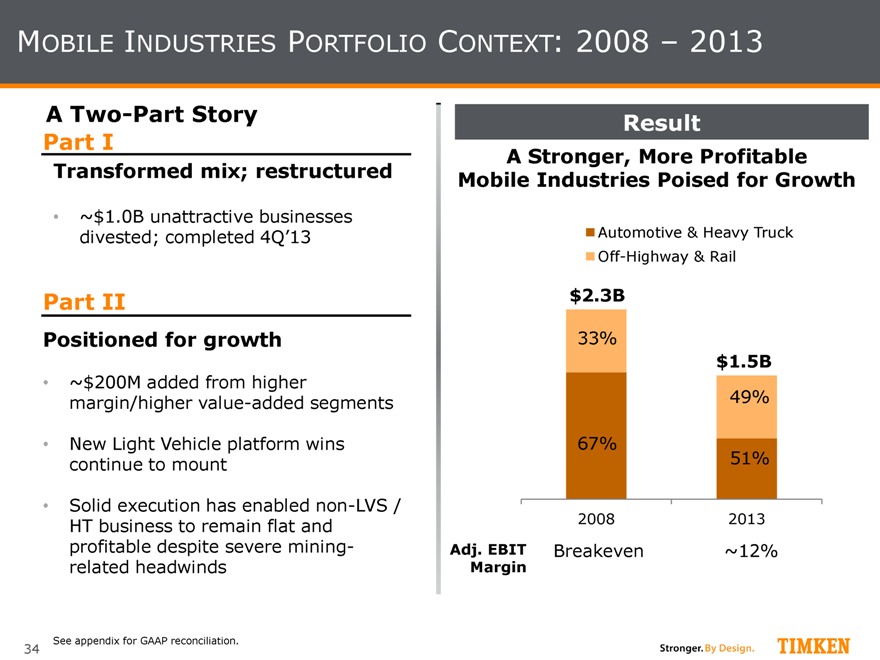
MOBILE INDUSTRIES PORTFOLIO CONTEXT: 2008 – 2013
A Two-Part Story Part I
Transformed mix; restructured
~$1.0B unattractive businesses divested; completed 4Q’13
Part II
Positioned for growth
~$200M added from higher margin/higher value-added segments
New Light Vehicle platform wins continue to mount
Solid execution has enabled non-LVS / HT business to remain flat and profitable despite severe mining-related headwinds
Result
A Stronger, More Profitable Mobile Industries Poised for Growth
Automotive & Heavy Truck Off-Highway & Rail
$2.3B
33% $1.5B
49%
67%
51%
2008 2013
Adj. EBIT Breakeven ~12%
Margin
See appendix for GAAP reconciliation.
34
|
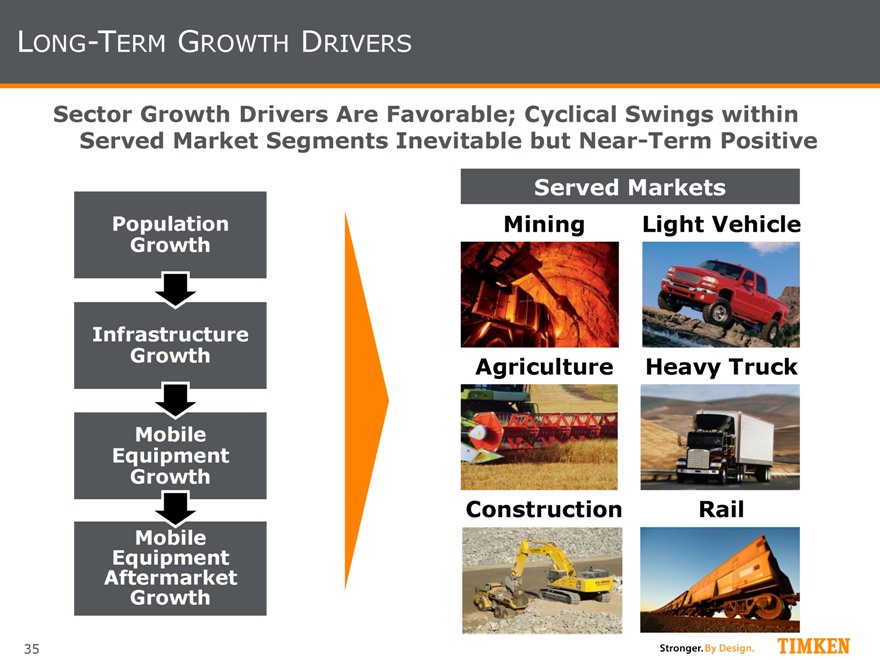
LONG-TERM GROWTH DRIVERS
Sector Growth Drivers Are Favorable; Cyclical Swings within Served Market Segments Inevitable but Near-Term Positive
Population Growth
Infrastructure Growth
Mobile Equipment Growth
Equipment Mobile Aftermarket Growth
Served Markets
Mining Light Vehicle Agriculture Heavy Truck Construction Rail
35
|
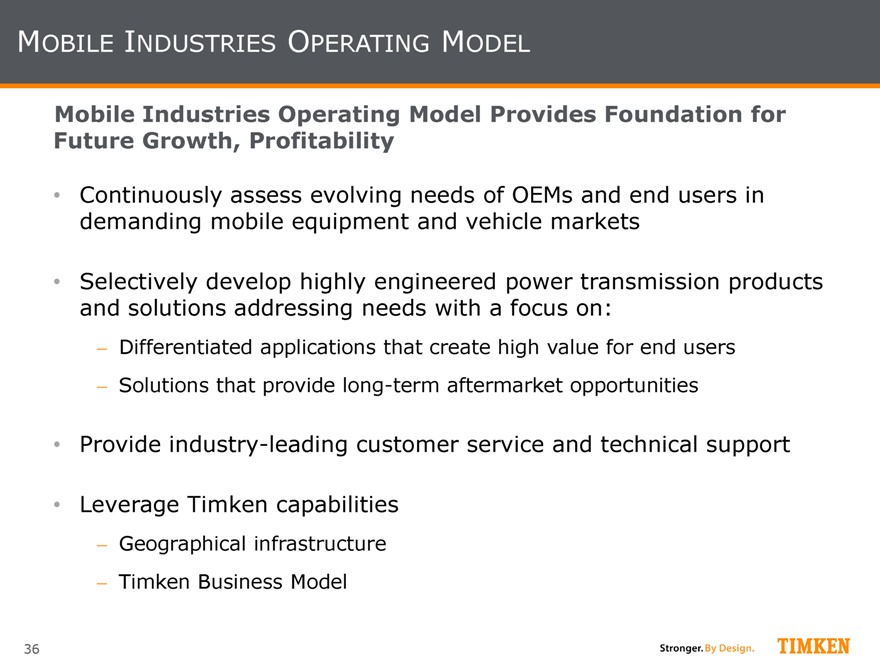
MOBILE INDUSTRIES OPERATING MODEL
Mobile Industries Operating Model Provides Foundation for Future Growth, Profitability
Continuously assess evolving needs of OEMs and end users in demanding mobile equipment and vehicle markets
Selectively develop highly engineered power transmission products and solutions addressing needs with a focus on:
Differentiated applications that create high value for end users
Solutions that provide long-term aftermarket opportunities
Provide industry-leading customer service and technical support
Leverage Timken capabilities
Geographical infrastructure
Timken Business Model
36
|
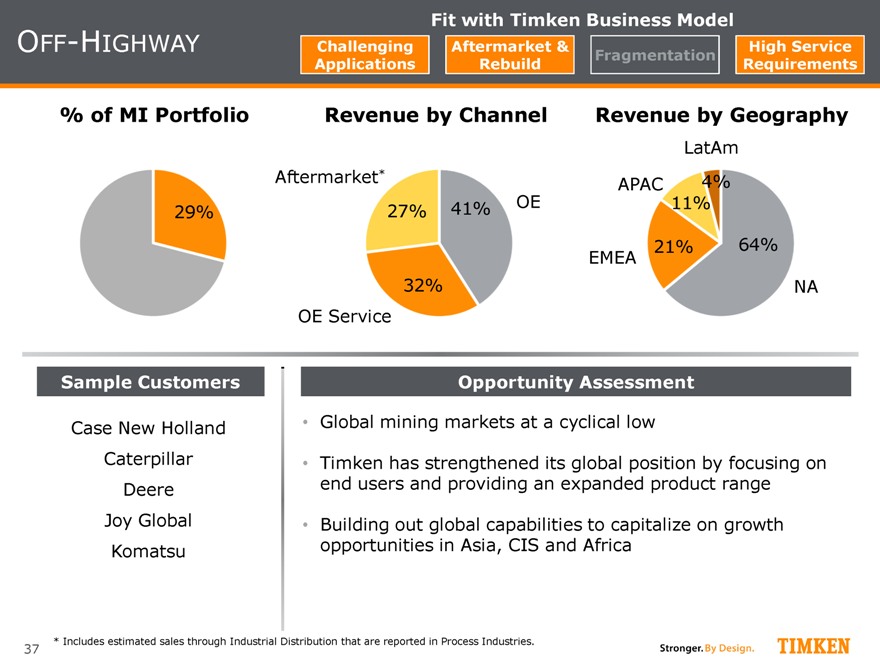
Fit with Timken Business Model
OFF-HIGHWAY Challenging Aftermarket & High Service Fragmentation Applications Rebuild Requirements
% of MI Portfolio Revenue by Channel Revenue by Geography
LatAm Aftermarket* 4% OE APAC
27% 41% 11% 29%
21% 64% EMEA
32% NA OE Service
Sample Customers
Case New Holland Caterpillar Deere Joy Global Komatsu
Opportunity Assessment
Global mining markets at a cyclical low
Timken has strengthened its global position by focusing on end users and providing an expanded product range
Building out global capabilities to capitalize on growth opportunities in Asia, CIS and Africa
* Includes estimated sales through Industrial Distribution that are reported in Process Industries.
37
|
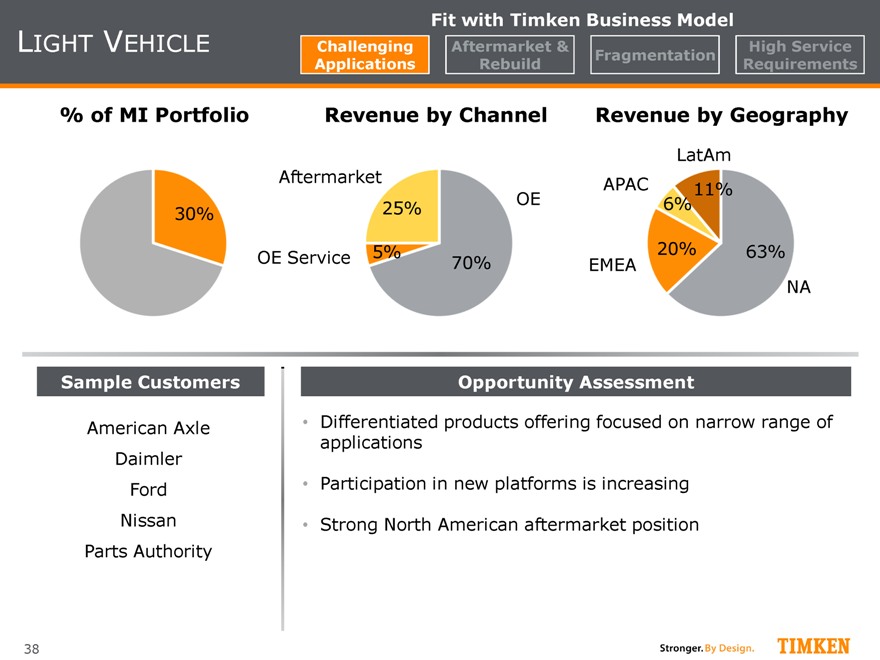
LIGHT VEHICLE
Fit with Timken Business Model
Challenging Aftermarket & High Service Fragmentation Applications Rebuild Requirements
% of MI Portfolio Revenue by Channel Revenue by Geography
LatAm Aftermarket APAC
11% OE 6% 30% 25%
5% 20% 63% OE Service 70% EMEA
NA
Sample Customers
American Axle Daimler Ford Nissan Parts Authority
Opportunity Assessment
Differentiated products offering focused on narrow range of applications
Participation in new platforms is increasing
Strong North American aftermarket position
38
|
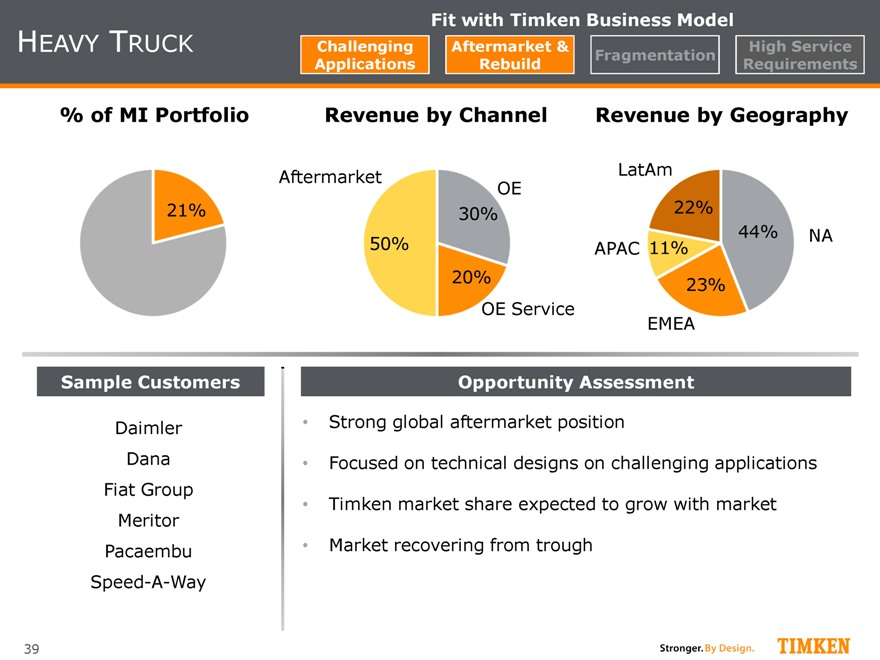
HEAVY TRUCK
Fit with Timken Business Model
Challenging Aftermarket & High Service Fragmentation Applications Rebuild Requirements
% of MI Portfolio
21%
Revenue by Channel
Aftermarket
OE 30% 50% 20% OE Service
Revenue by Geography
LatAm 22%
44% NA APAC 11% 23%
EMEA
Sample Customers
Daimler Dana Fiat Group Meritor Pacaembu Speed-A-Way
Opportunity Assessment
Strong global aftermarket position
Focused on technical designs on challenging applications
Timken market share expected to grow with market
Market recovering from trough
39
|
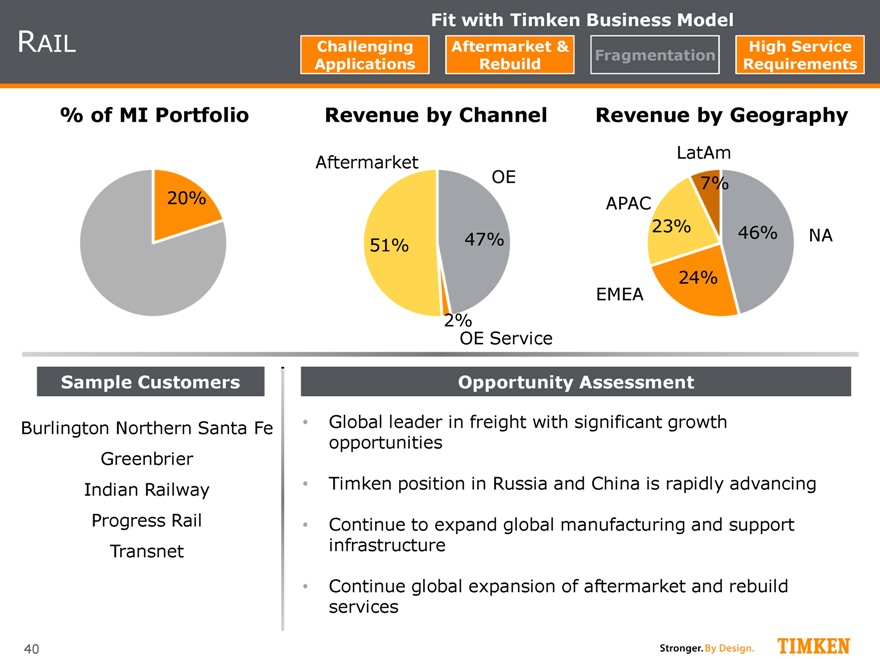
RAIL
Fit with Timken Business Model
Aftermarket & High
% of MI Portfolio
20%
Revenue by Channel
Aftermarket
OE
51% 47%
2%
OE Service
Revenue by Geography
LatAm 7% APAC
23% 46% NA
EMEA 24%
Sample Customers
Burlington Northern Santa Fe Greenbrier Indian Railway Progress Rail Transnet
Opportunity Assessment
Global leader in freight with significant growth opportunities
Timken position in Russia and China is rapidly advancing
Continue to expand global manufacturing and support infrastructure
Continue global expansion of aftermarket and rebuild services
40
|
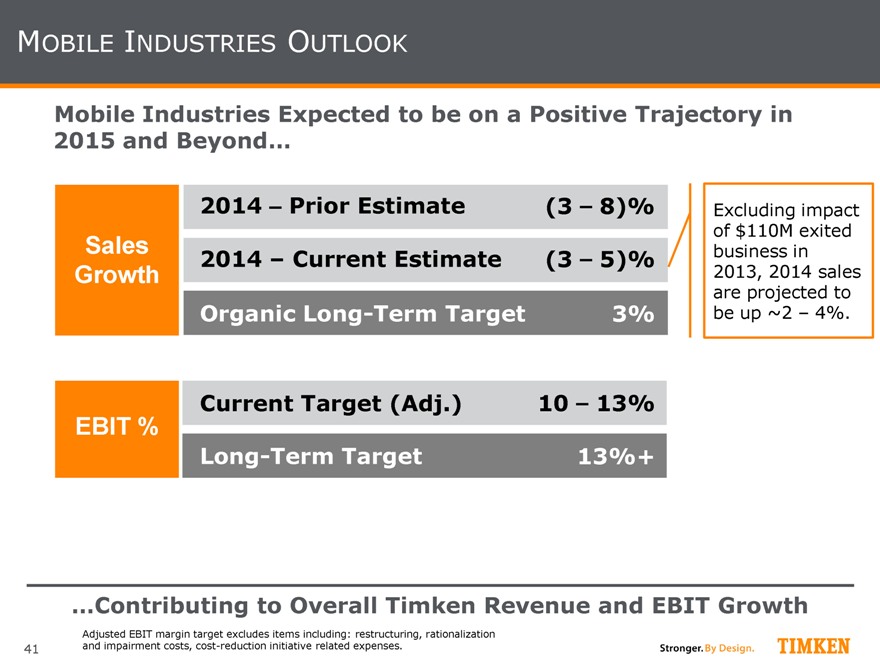
MOBILE INDUSTRIES OUTLOOK
Mobile Industries Expected to be on a Positive Trajectory in
2015 and Beyond…
2014 – Prior Estimate (3 – 8)%
Sales
2014 – Current Estimate (3 – 5)%
Growth
Organic Long-Term Target 3%
Current Target (Adj.) 10 – 13%
EBIT %
Long-Term Target 13%+
Excluding impact of $110M exited business in 2013, 2014 sales are projected to be up ~2 – 4%.
…Contributing to Overall Timken Revenue and EBIT Growth
Adjusted EBIT margin target excludes items including: restructuring, rationalization and impairment costs, cost-reduction initiative related expenses.
41
|
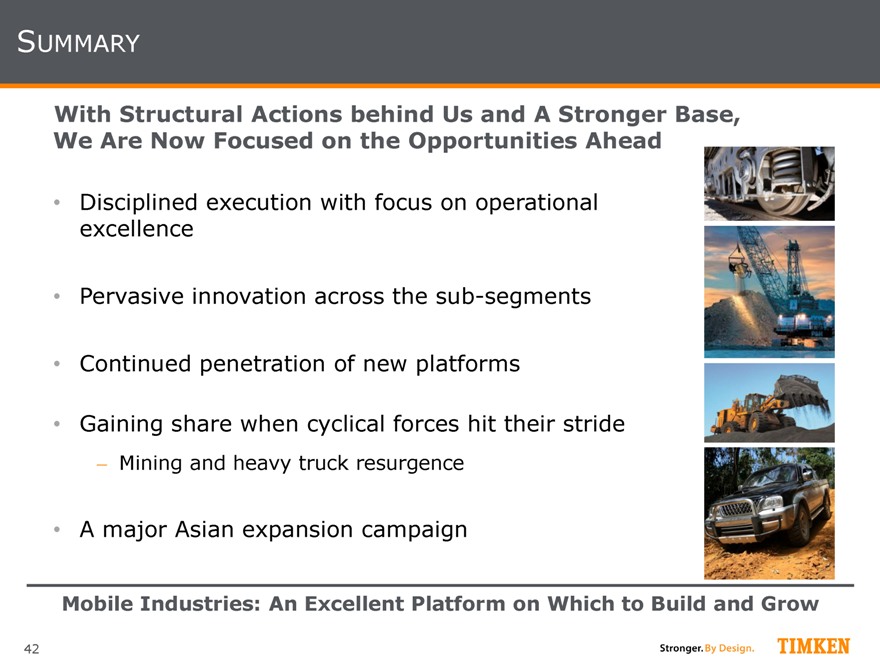
SUMMARY
With Structural Actions behind Us and A Stronger Base, We Are Now Focused on the Opportunities Ahead
Disciplined execution with focus on operational excellence
Pervasive innovation across the sub-segments
Continued penetration of new platforms
Gaining share when cyclical forces hit their stride
Mining and heavy truck resurgence
A major Asian expansion campaign
Mobile Industries: An Excellent Platform on Which to Build and Grow
42
|
Aerospace
Erik Paulhardt, Vice President
|
KEY MESSAGES
Aerospace is an attractive market
Timken has built strong niche positions; can compete effectively
Revenue weighted in defense, which continues to face headwinds
Focusing on margin expansion and establishing moderate growth rate
Cost and mix improvement
Timken to expand in civil fixed-wing applications with emphasis on airframe systems; longer-term opportunity expected
Focused on Margin Improvement, Longer-Term Growth
44
|

TIMKEN BUSINESS MODEL
Challenging
Applications
Aftermarket
& Rebuild
Fragmentation
High Service
Requirements
Broad array of complex flight-critical mechanical applications
Key trends driving innovation
Weight reduction/fuel efficiency and extended life
Long life of aircraft (20+ years) enables lifetime-of-revenue opportunity
Regulatory-mandated repair cycles
Fragmented low-volume components Service levels enable differentiation Countercyclical
45
|
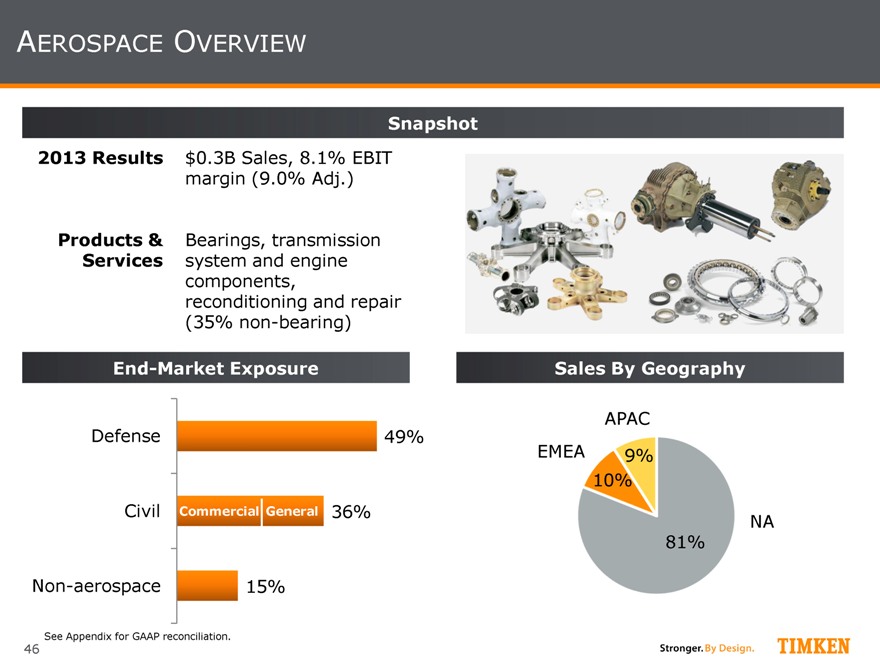
AEROSPACE OVERVIEW
Snapshot
2013 Results $0.3B Sales, 8.1% EBIT
margin (9.0% Adj.)
Products & Bearings, transmission
Services system and engine
components,
reconditioning and repair
(35% non-bearing)
End-Market Exposure
Defense 49%
Civil Commercial General 36%
Non-aerospace 15%
Sales By Geography
APAC EMEA 9% 10%
NA 81%
See Appendix for GAAP reconciliation.
46
|
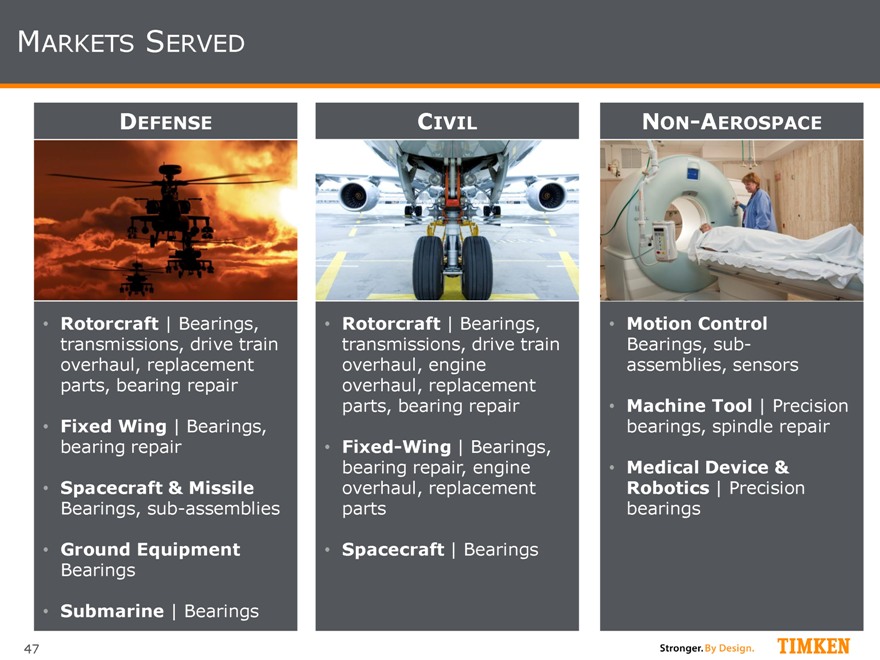
MARKETS SERVED
DEFENSE
CIVIL
NON-AEROSPACE
Rotorcraft | Bearings, transmissions, drive train overhaul, replacement parts, bearing repair
Fixed Wing | Bearings, bearing repair
Spacecraft & Missile
Bearings, sub-assemblies
Ground Equipment
Bearings
Submarine | Bearings
Rotorcraft | Bearings, transmissions, drive train overhaul, engine overhaul, replacement parts, bearing repair
Fixed-Wing | Bearings, bearing repair, engine overhaul, replacement parts
Spacecraft | Bearings
Motion Control
Bearings, sub-assemblies, sensors
Machine Tool | Precision bearings, spindle repair
Medical Device & Robotics | Precision bearings
47
|
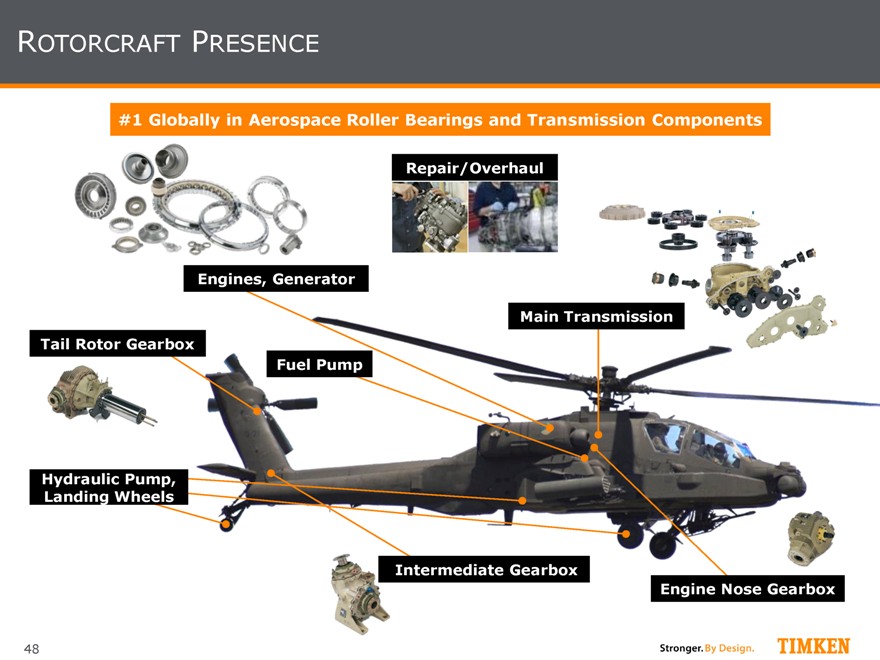
ROTORCRAFT PRESENCE
#1 Globally in Aerospace Roller Bearings and Transmission Components
Intermediate Gearbox
Engine Nose Gearbox
Fuel Pump
Engines, Generator
Tail Rotor Gearbox
Hydraulic Pump, Landing Wheels
Repair/Overhaul
Main Transmission
48
|
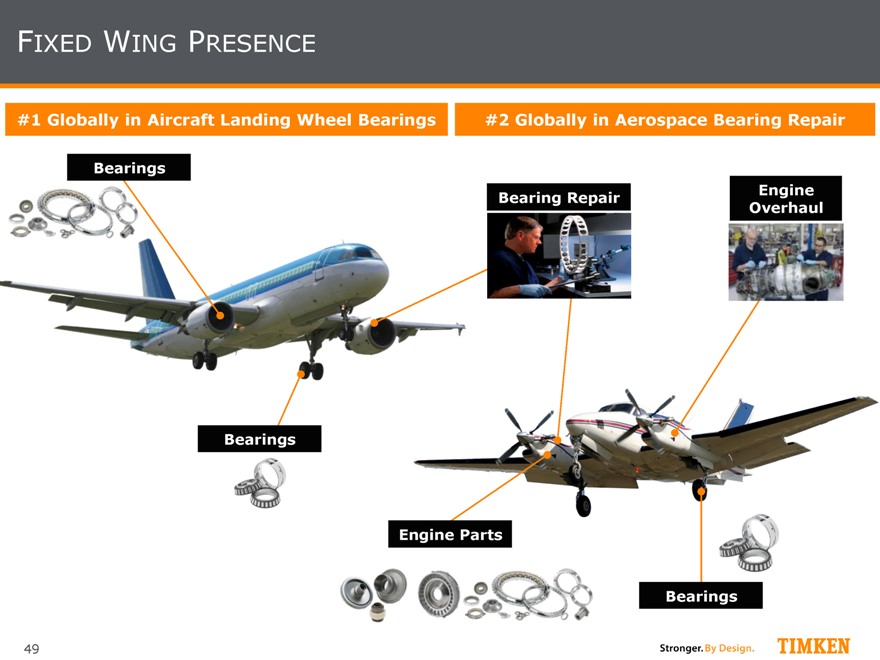
FIXED WING PRESENCE
#1 Globally in Aircraft Landing Wheel Bearings
#2 Globally in Aerospace Bearing Repair
Bearings
Bearing Repair
Engine Overhaul
Bearings
Engine Parts
Bearings
49
|
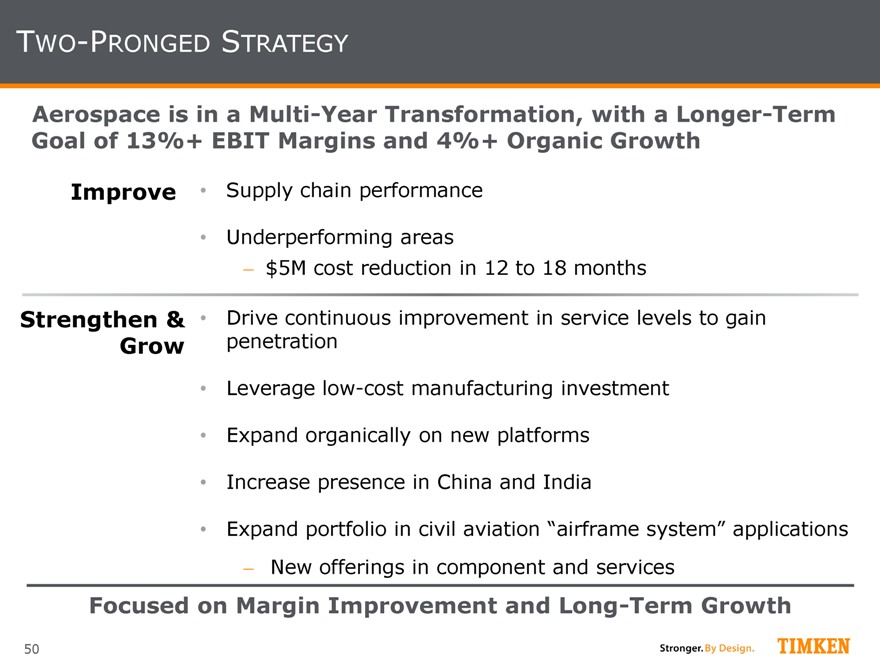
TWO-PRONGED STRATEGY
Aerospace is in a Multi-Year Transformation, with a Longer-Term Goal of 13%+ EBIT Margins and 4%+ Organic Growth
Improve • Supply chain performance
Underperforming areas
$5M cost reduction in 12 to 18 months
Strengthen & • Drive continuous improvement in service levels to gain Grow penetration
Leverage low-cost manufacturing investment
Expand organically on new platforms
Increase presence in China and India
Expand portfolio in civil aviation “airframe system” applications
New offerings in component and services
Focused on Margin Improvement and Long-Term Growth
50
|
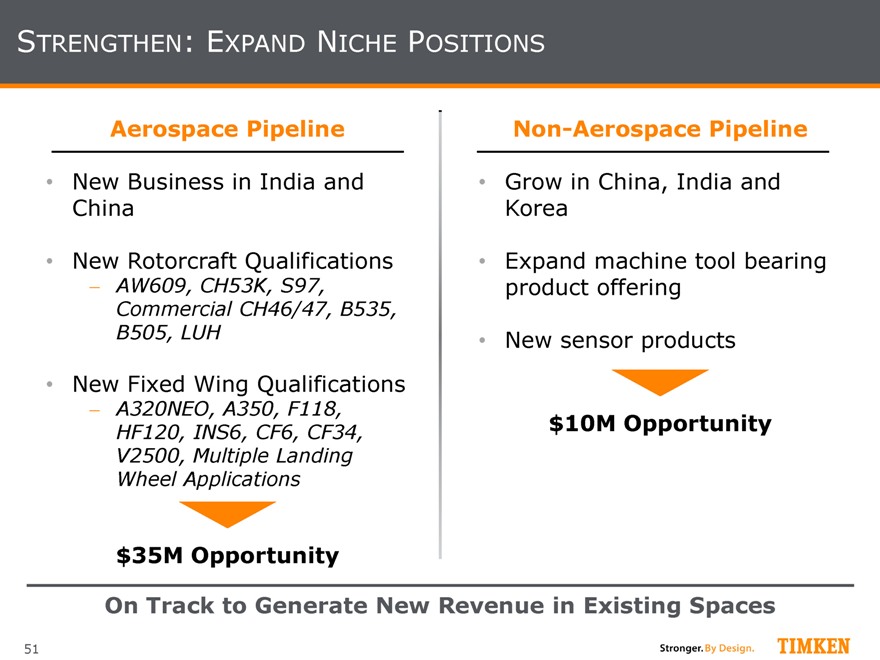
STRENGTHEN: EXPAND NICHE POSITIONS
Aerospace Pipeline
New Business in India and
China
New Rotorcraft Qualifications
AW609, CH53K, S97,
Commercial CH46/47, B535, B505, LUH
New Fixed Wing Qualifications
A320NEO, A350, F118, HF120, INS6, CF6, CF34, V2500, Multiple Landing Wheel Applications
$35M Opportunity
Non-Aerospace Pipeline
Grow in China, India and
Korea
Expand machine tool bearing product offering
New sensor products $10M Opportunity
On Track to Generate New Revenue in Existing Spaces
51
|

AEROSPACE OUTLOOK
Aerospace is Expected to Improve its Bottom Line Near-Term, while Growing the Top-Line over Time…
2014 – Prior Estimate 5 – 10%
Sales 2014 – Current Estimate 0 – 3%
Growth
Organic Long-Term Target 4%+
Current Target (Adj.) 10 – 13% (2014: 7 – 9%)
EBIT %
Long-Term Target 13%+
Focus on Performance Improvement and Margin Expansion
Adjusted EBIT margin target excludes items including: restructuring, rationalization and impairment costs, cost-reduction initiative related expenses.
52
|
SUMMARY
Aerospace is attractive and is expected to become a stronger component of the Timken portfolio
Top-line growth expectations are moderate despite defense market
Margin improvement will be a focus
53
|
Process Industries
Chris Coughlin, Group President
|
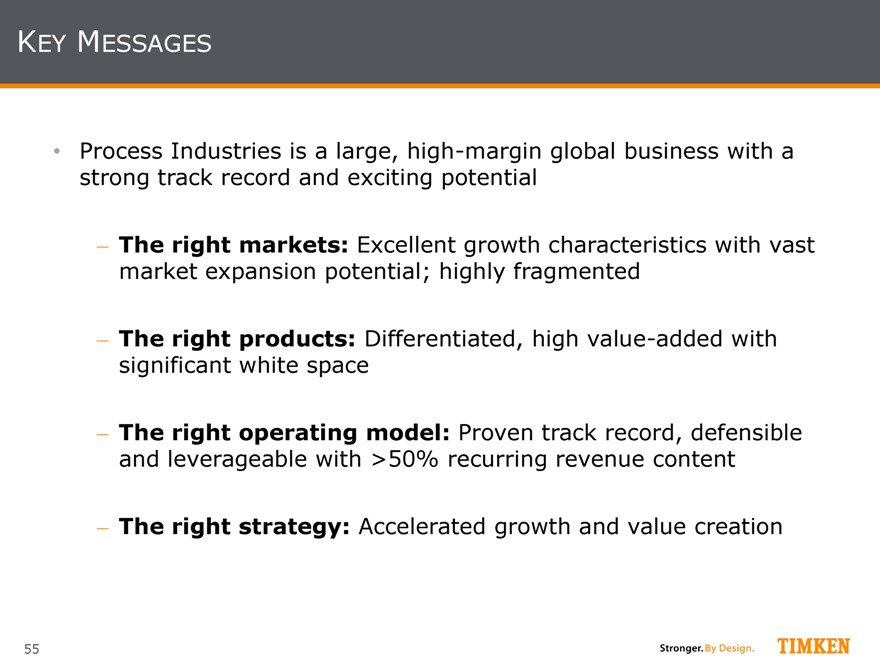
KEY MESSAGES
Process Industries is a large, high-margin global business with a strong track record and exciting potential
The right markets: Excellent growth characteristics with vast market expansion potential; highly fragmented
The right products: Differentiated, high value-added with significant white space
The right operating model: Proven track record, defensible and leverageable with >50% recurring revenue content
The right strategy: Accelerated growth and value creation
55
|
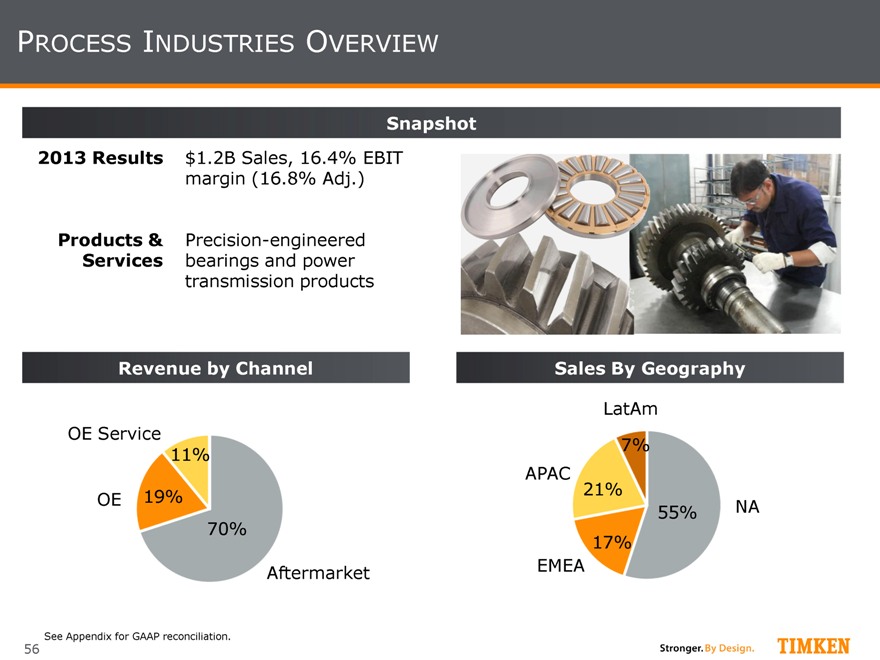
PROCESS INDUSTRIES OVERVIEW
Snapshot
2013 Results $1.2B Sales, 16.4% EBIT margin (16.8% Adj.)
Products & Precision-engineered Services bearings and power transmission products
Revenue by Channel Sales By Geography
LatAm
OE Service
11% 7%
APAC 21%
OE 19% 55% NA
70%
17%
Aftermarket EMEA
See Appendix for GAAP reconciliation.
56
|
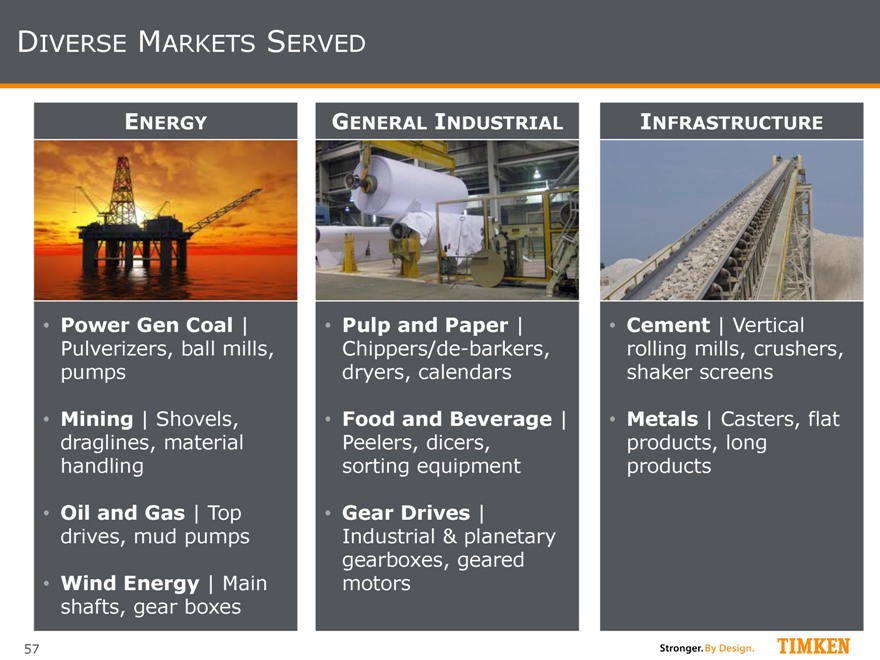
DIVERSE MARKETS SERVED
ENERGY
Power Gen Coal | Pulverizers, ball mills, pumps
Mining | Shovels, draglines, material handling
Oil and Gas | Top drives, mud pumps
Wind Energy | Main shafts, gear boxes
GENERAL INDUSTRIAL
Pulp and Paper | Chippers/de-barkers, dryers, calendars
Food and Beverage | Peelers, dicers, sorting equipment
Gear Drives |
Industrial & planetary gearboxes, geared motors
INFRASTRUCTURE
Cement | Vertical rolling mills, crushers, shaker screens
Metals | Casters, flat products, long products
57
|
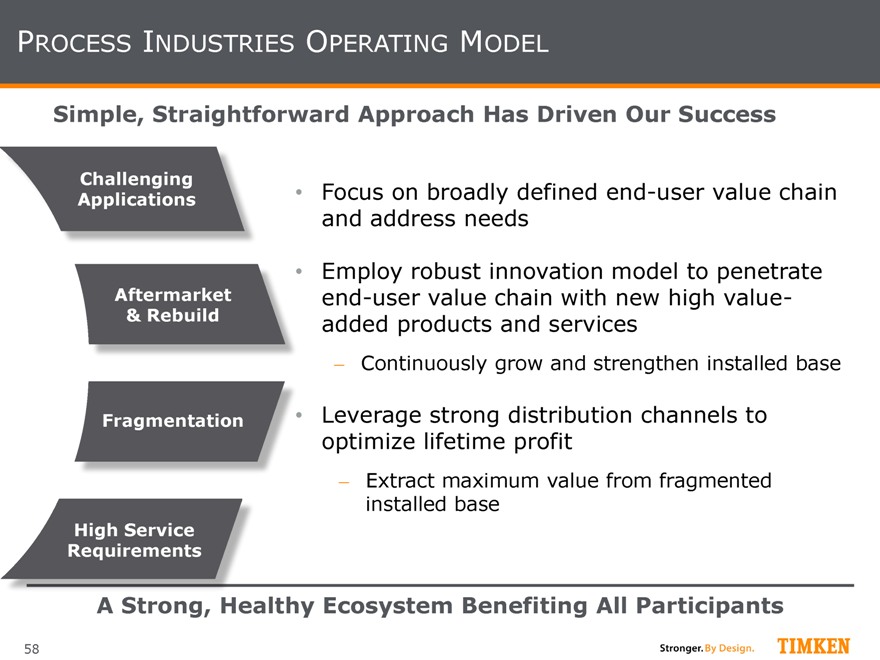
PROCESS INDUSTRIES OPERATING MODEL
Simple, Straightforward Approach Has Driven Our Success
Focus on broadly defined end-user value chain and address needs
Employ robust innovation model to penetrate end-user value chain with new high value-added products and services
Continuously grow and strengthen installed base
Leverage strong distribution channels to optimize lifetime profit
Extract maximum value from fragmented installed base
A Strong, Healthy Ecosystem Benefiting All Participants
Challenging Applications
Aftermarket
& Rebuild Fragmentation
High Service Requirements
58
|
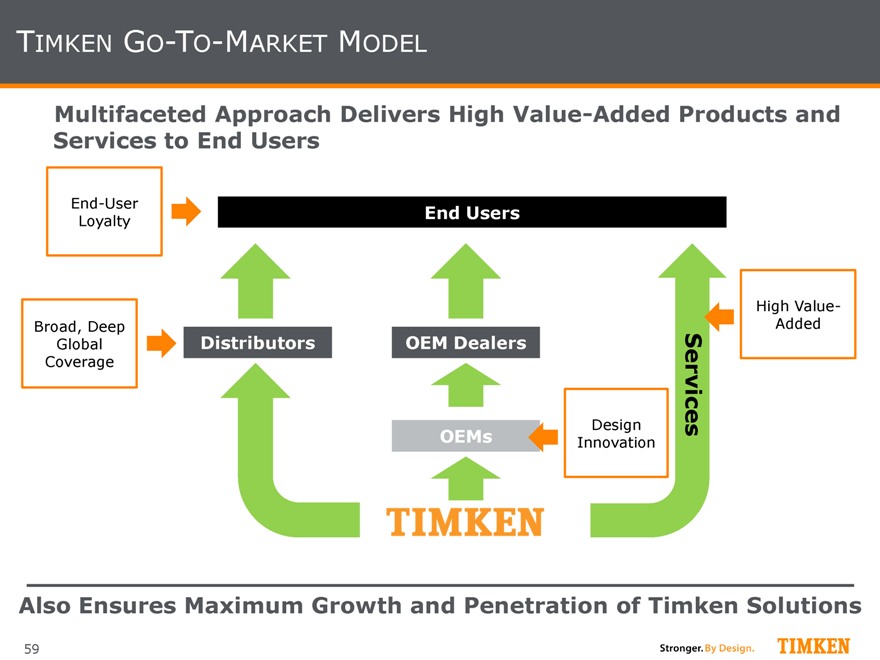
TIMKEN GO-TO-MARKET MODEL
Multifaceted Approach Delivers High Value-Added Products and Services to End Users
End-User
Loyalty End Users
High Value-
Broad, Deep Added
Global Distributors OEM Dealers
Coverage
Design Services
OEMs Innovation
Also Ensures Maximum Growth and Penetration of Timken Solutions
59
|
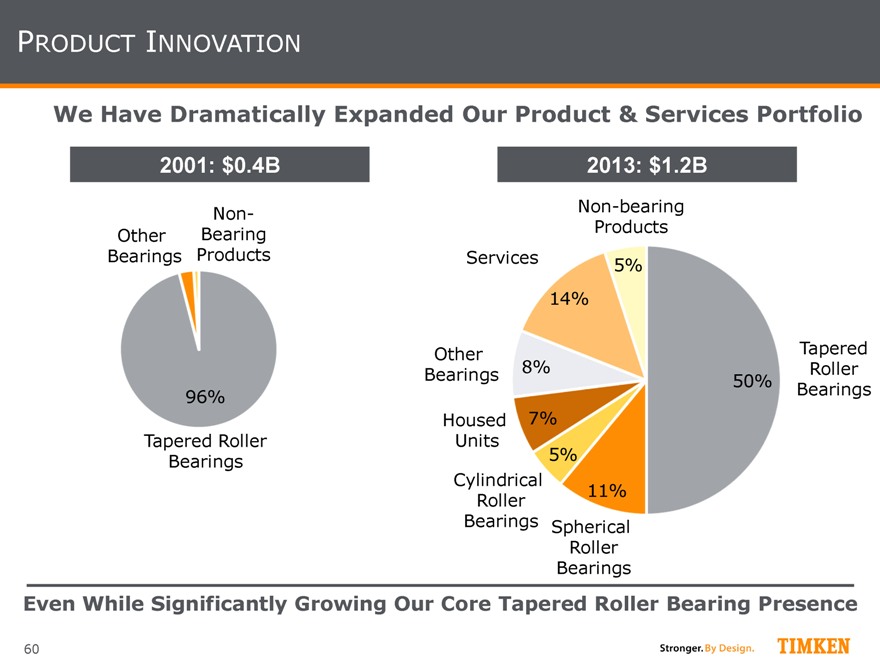
PRODUCT INNOVATION
We Have Dramatically Expanded Our Product & Services Portfolio
2001: $0.4B
Non-Other Bearing Bearings Products
96%
Tapered Roller Bearings
2013: $1.2B
Non-bearing
Products
Services 5%
14%
Other Tapered
Bearings 8% 50% Roller
Bearings
Housed 7%
Units
5%
Cylindrical
Roller 11%
Bearings Spherical
Roller
Bearings
Even While Significantly Growing Our Core Tapered Roller Bearing Presence
60
|
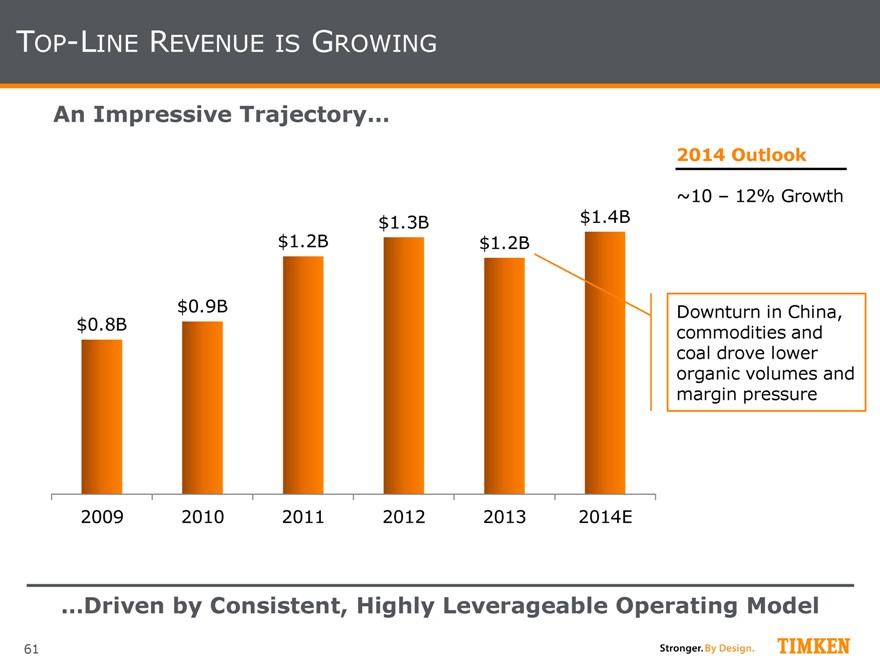
TOP-LINE REVENUE IS GROWING
An Impressive Trajectory…
2014 Outlook
~10 – 12% Growth
$1.3B $1.4B
$1.2B $1.2B
$0.9B Downturn in China,
$0.8B commodities and
coal drove lower
organic volumes and
margin pressure
2009 2010 2011 2012 2013 2014E
…Driven by Consistent, Highly Leverageable Operating Model
61
|
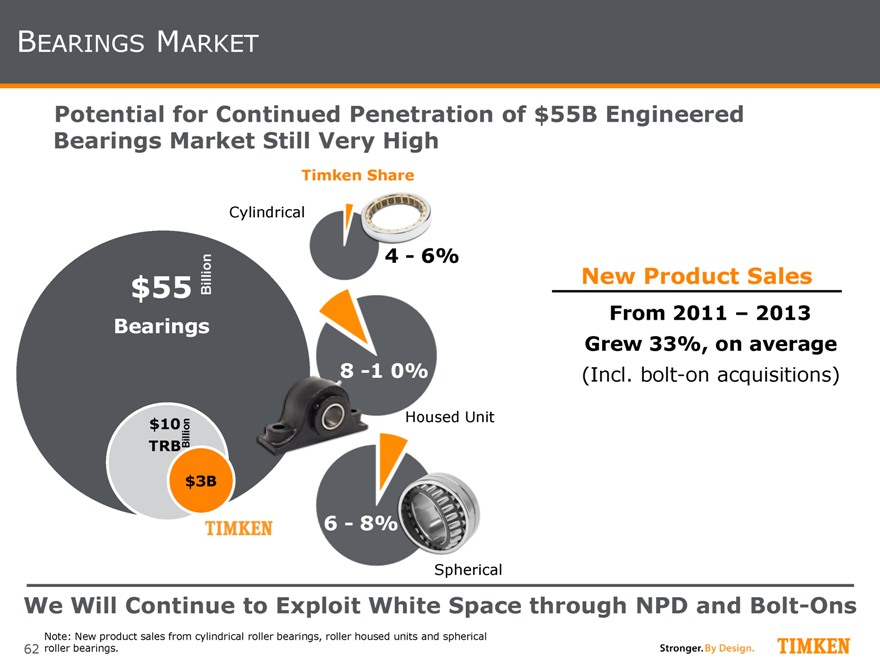
BEARINGS MARKET
Potential for Continued Penetration of $55B Engineered Bearings Market Still Very High
Timken Share
Cylindrical
4—6%
$55 Billion New Product Sales
Bearings From 2011 – 2013
Grew 33%, on average
8-1 0% (Incl. bolt-on acquisitions)
Housed Unit
TRB $10Billion
$3B
6—8%
Spherical
We Will Continue to Exploit White Space through NPD and Bolt-Ons
Note: New product sales from cylindrical roller bearings, roller housed units and spherical roller bearings.
62
|
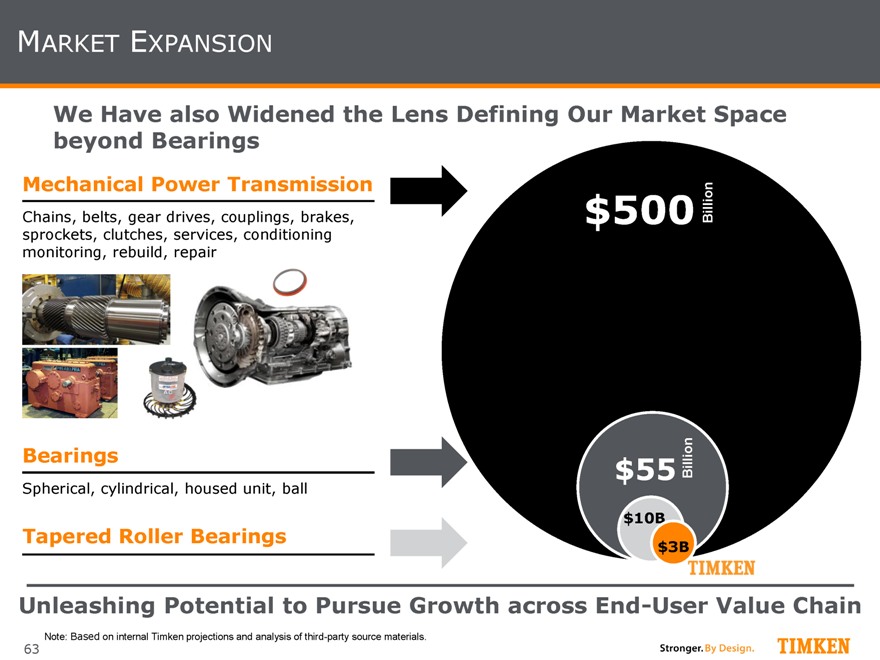
MARKET EXPANSION
We Have also Widened the Lens Defining Our Market Space beyond Bearings
Mechanical Power Transmission
Chains, belts, gear drives, couplings, brakes, sprockets, clutches, services, conditioning monitoring, rebuild, repair
Bearings
Spherical, cylindrical, housed unit, ball
Tapered Roller Bearings
Billion
$500
Billion
$55
$10B $3B
Unleashing Potential to Pursue Growth across End-User Value Chain
Note: Based on internal Timken projections and analysis of third-party source materials.
63
|
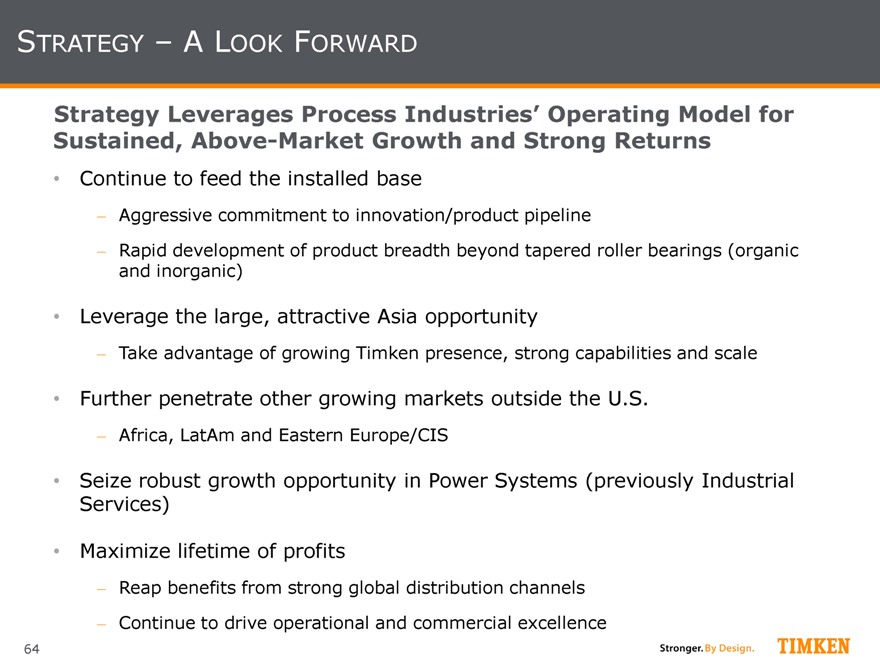
STRATEGY – A LOOK FORWARD
Strategy Leverages Process Industries’ Operating Model for
Sustained, Above-Market Growth and Strong Returns
Continue to feed the installed base
Aggressive commitment to innovation/product pipeline
Rapid development of product breadth beyond tapered roller bearings (organic and inorganic)
Leverage the large, attractive Asia opportunity
Take advantage of growing Timken presence, strong capabilities and scale
Further penetrate other growing markets outside the U.S.
Africa, LatAm and Eastern Europe/CIS
Seize robust growth opportunity in Power Systems (previously Industrial Services)
Maximize lifetime of profits
Reap benefits from strong global distribution channels
Continue to drive operational and commercial excellence
64
|
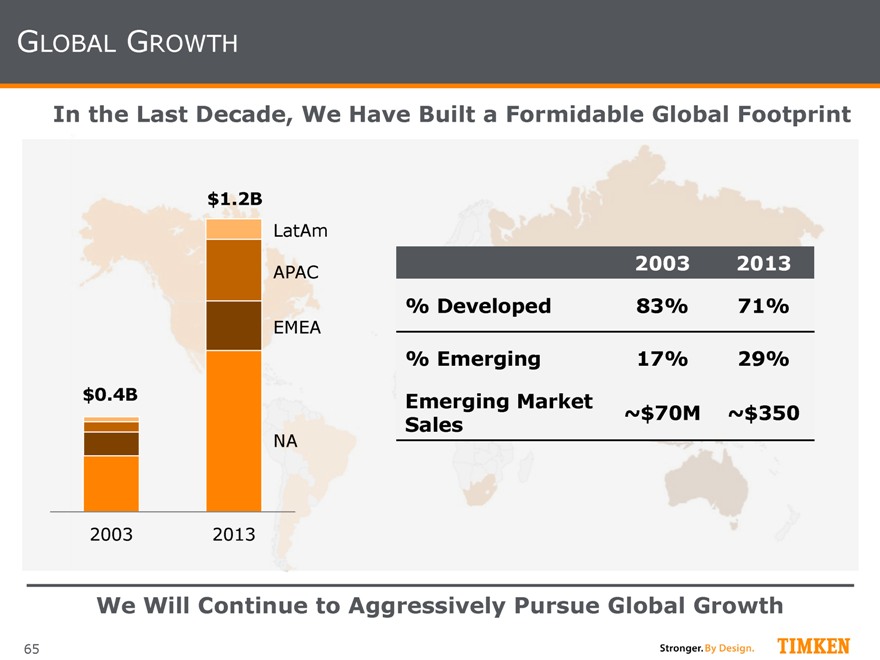
GLOBAL GROWTH
In the Last Decade, We Have Built a Formidable Global Footprint
$1.2B
LatAm
APAC 2003 2013
% Developed 83% 71%
EMEA
% Emerging 17% 29%
$0.4B Emerging Market
Sales ~$70M ~$350
NA
2003 2013
We Will Continue to Aggressively Pursue Global Growth
65
|
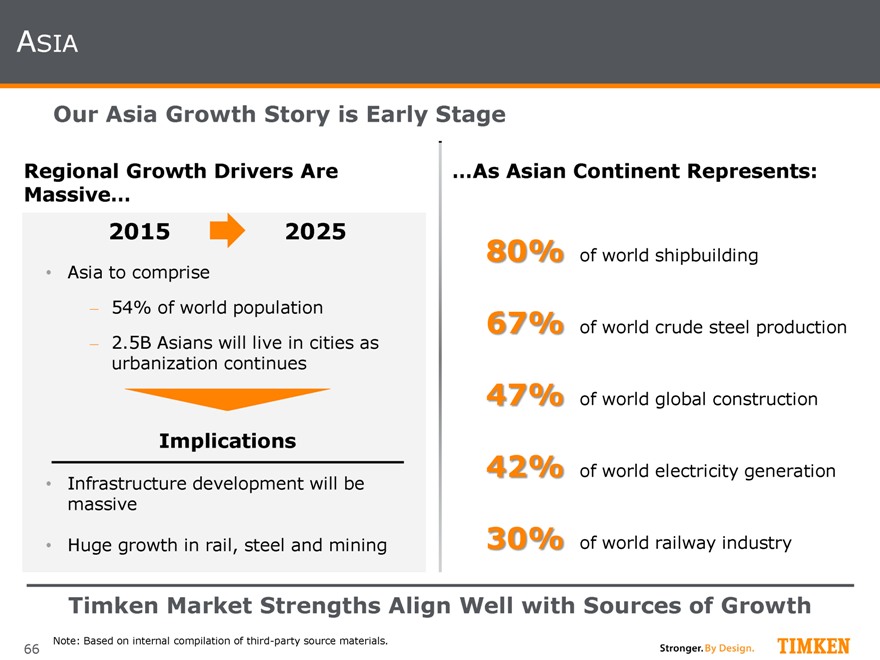
ASIA
Our Asia Growth Story is Early Stage
Regional Growth Drivers Are
Massive…
2015 2025
Asia to comprise
54% of world population
2.5B Asians will live in cities as urbanization continues
Implications
Infrastructure development will be massive
Huge growth in rail, steel and mining
…As Asian Continent Represents:
80% of world shipbuilding
67% of world crude steel production 47% of world global construction 42% of world electricity generation 30% of world railway industry
Timken Market Strengths Align Well with Sources of Growth
Note: Based on internal compilation of third-party source materials.
66
|
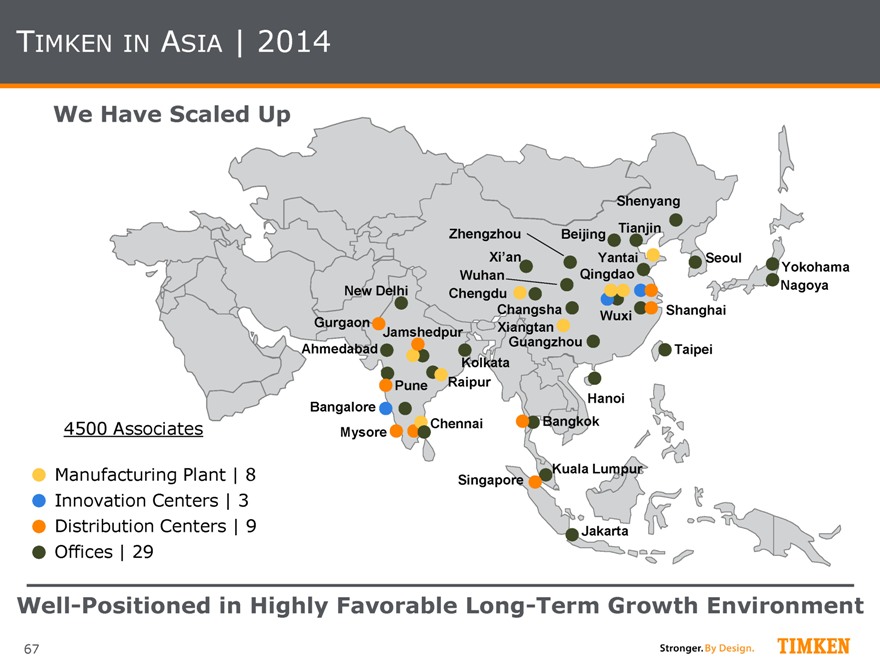
TIMKEN IN ASIA | 2014
We Have Scaled Up
Shenyang
Zhengzhou Beijing Tianjin
Xi’an Yantai Seoul
Wuhan Qingdao Yokohama
New Delhi Chengdu Nagoya
Changsha Wuxi Shanghai
Gurgaon Xiangtan
Jamshedpur
Guangzhou
Ahmedabad Taipei
Kolkata
Pune Raipur
Bangalore Hanoi
4500 Associates Mysore Chennai Bangkok
Manufacturing Plant | 8 Singapore Kuala Lumpur
Innovation Centers | 3
Distribution Centers | 9 Jakarta
Offices | 29
Well-Positioned in Highly Favorable Long-Term Growth Environment
67
|
POWER SYSTEMS
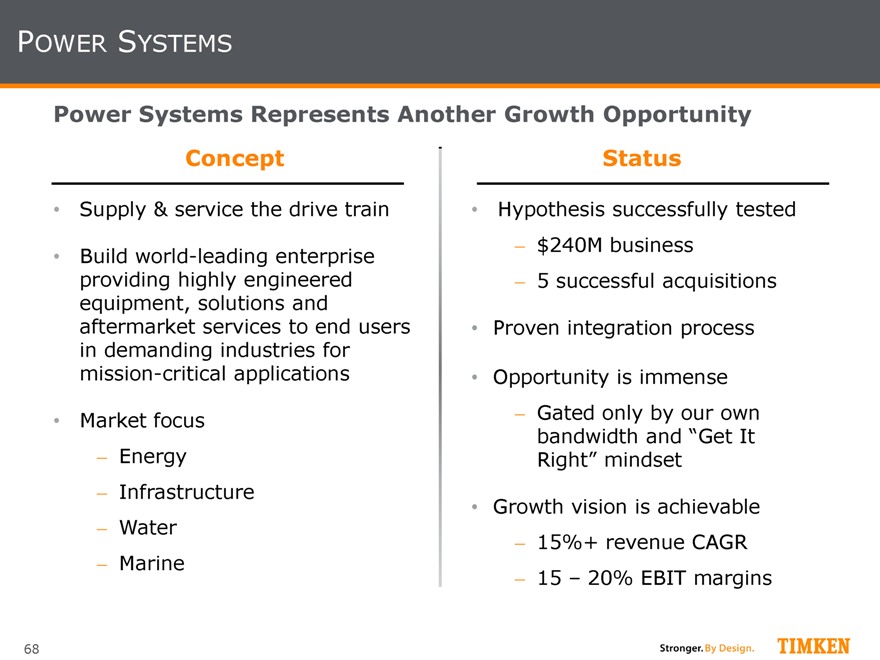
Power Systems Represents Another Growth Opportunity
Concept Status
Supply & service the drive train Hypothesis successfully tested
Build world-leading enterprise $240M business
providing highly engineered 5 successful acquisitions
equipment, solutions and
aftermarket services to end users Proven integration process
in demanding industries for
mission-critical applications Opportunity is immense
Market focus Gated only by our own
bandwidth and “Get It
Energy Right” mindset
Infrastructure Growth vision is achievable
Water 15%+ revenue CAGR
Marine 15 – 20% EBIT margins
68
|
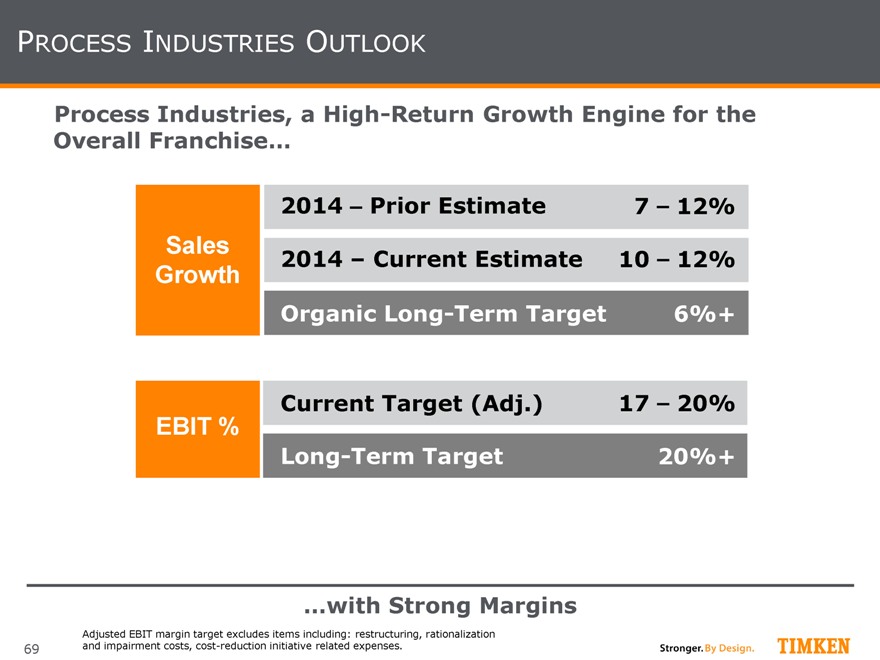
PROCESS INDUSTRIES OUTLOOK
Process Industries, a High-Return Growth Engine for the
Overall Franchise…
2014 – Prior Estimate 7 – 12%
Sales 2014 – Current Estimate 10 – 12%
Growth
Organic Long-Term Target 6%+
Current Target (Adj.) 17 – 20%
EBIT %
Long-Term Target 20%+
…with Strong Margins
Adjusted EBIT margin target excludes items including: restructuring, rationalization and impairment costs, cost-reduction initiative related expenses.
69
|
SUMMARY
Timken Process Industries is a Great Business
Operating model is proven and scalable
Excellent core growth and returns
Significant recurring revenue content
Several large, compelling opportunities ahead
Added product breadth
Asia growth
Power Systems expansion
Commitment to robust growth and profitable expansion backed up by experienced management team
70
|
Growing Through Aftermarket Services Carl Rapp, Vice President | Power Systems
|
POWER SYSTEMS
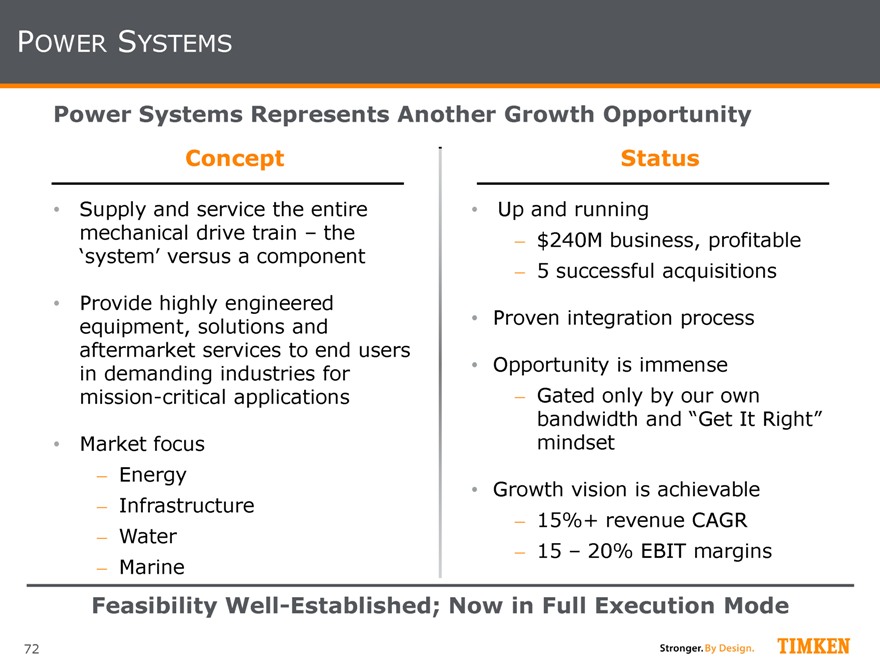
Power Systems Represents Another Growth Opportunity
Concept Status
Supply and service the entire Up and running
mechanical drive train – the $240M business, profitable
‘system’ versus a component 5 successful acquisitions
Provide highly engineered
equipment, solutions and Proven integration process
aftermarket services to end users
in demanding industries for Opportunity is immense
mission-critical applications Gated only by our own
bandwidth and “Get It Right”
Market focus mindset
Energy Growth vision is achievable
Infrastructure 15%+ revenue CAGR
Water 15 – 20% EBIT margins
Marine
Feasibility Well-Established; Now in Full Execution Mode
72
|
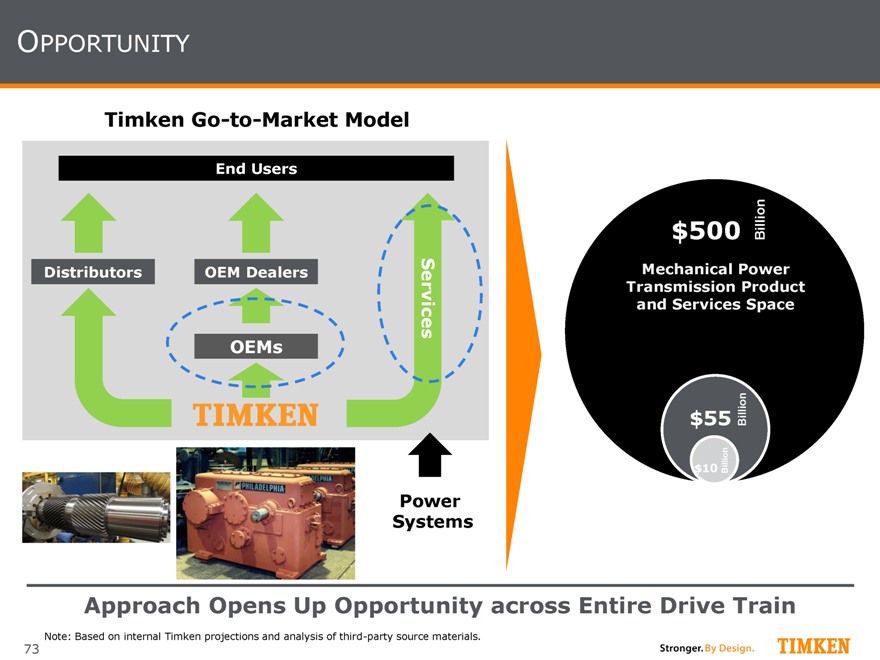
OPPORTUNITY
Timken Go-to-Market Model
End Users
Distributors OEM Dealers
Services
OEMs
Power
Systems
$500 Billion
Mechanical Power Transmission Product and Services Space
$55 Billion
$10 Billion
Approach Opens Up Opportunity across Entire Drive Train
Note: Based on internal Timken projections and analysis of third-party source materials.
73
|
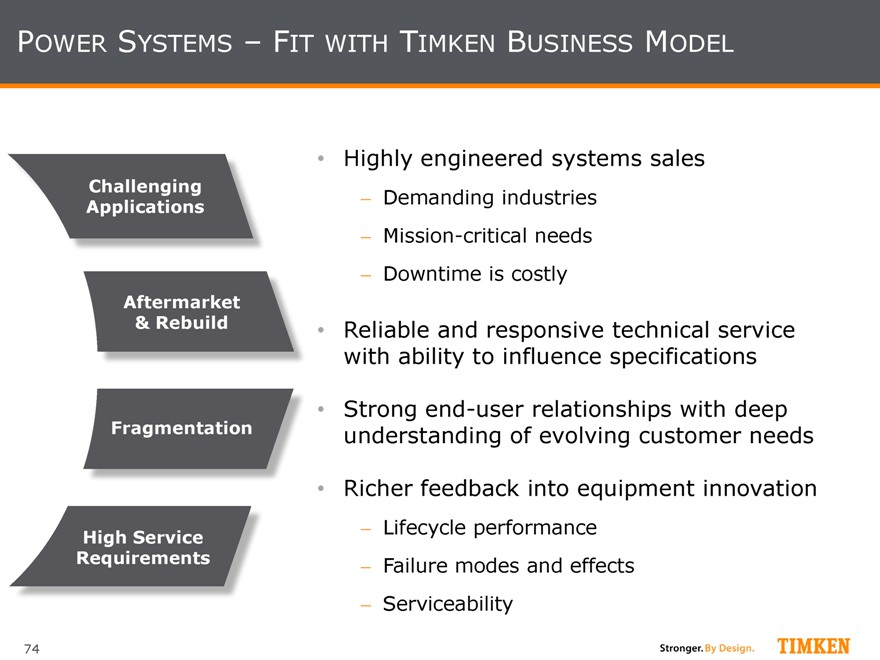
POWER SYSTEMS – FIT WITH TIMKEN BUSINESS MODEL
Challenging Applications
Aftermarket
& Rebuild Fragmentation
High Service Requirements
Highly engineered systems sales
Demanding industries
Mission-critical needs
Downtime is costly
Reliable and responsive technical service with ability to influence specifications
Strong end-user relationships with deep understanding of evolving customer needs
Richer feedback into equipment innovation
Lifecycle performance
Failure modes and effects
Serviceability
74
|
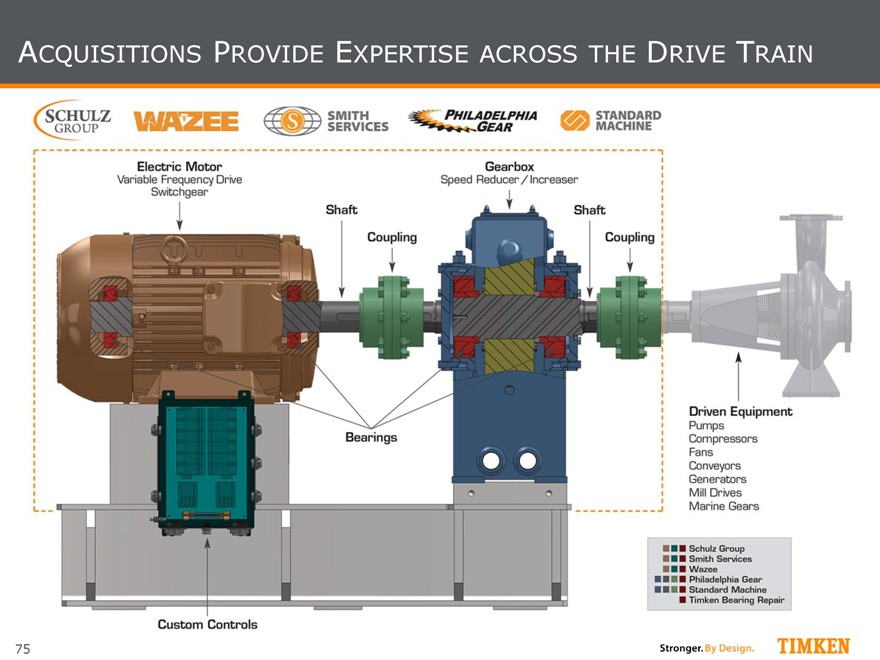
ACQUISITIONS PROVIDE EXPERTISE ACROSS THE DRIVE TRAIN
75
|
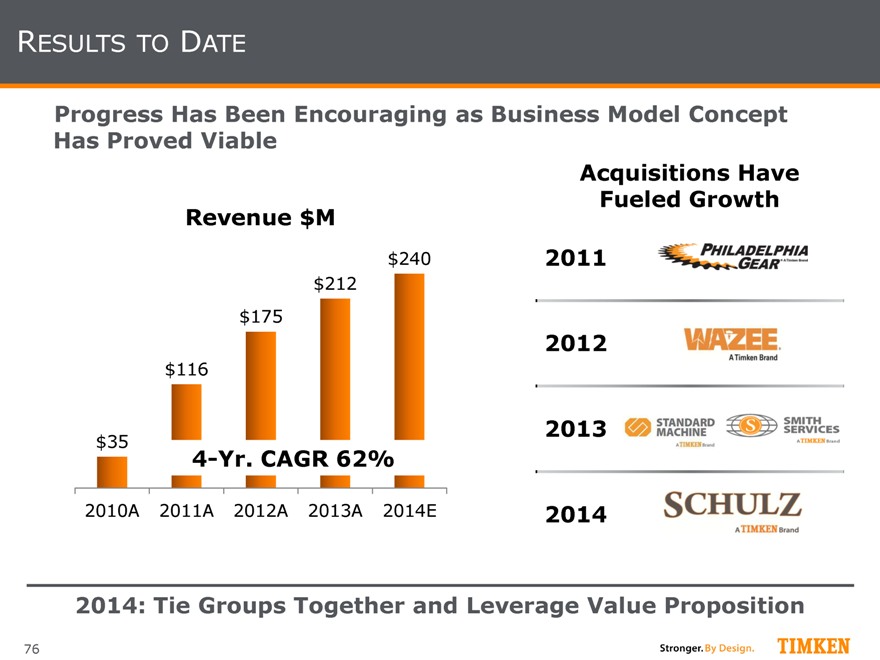
RESULTS TO DATE
Progress Has Been Encouraging as Business Model Concept Has Proved Viable
Revenue $M
$240
$212
$175
$116
$35
4-Yr. CAGR 62%
2010A 2011A 2012A 2013A 2014E
Acquisitions Have Fueled Growth
2011
2012
2013
2014
2014: Tie Groups Together and Leverage Value Proposition
76
|
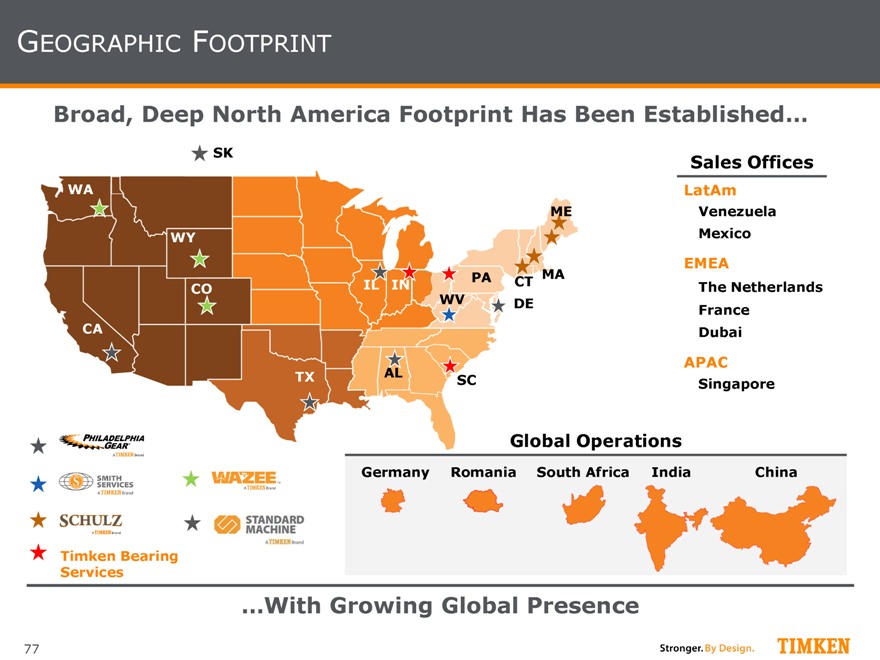
GEOGRAPHIC FOOTPRINT
Broad, Deep North America Footprint Has Been Established…
SK Sales Offices
WA LatAm
ME Venezuela
WY Mexico
EMEA
CO IL IN PA CT MA The Netherlands
WV DE France
CA Dubai
AL APAC
TX SC Singapore
Global Operations
Germany Romania South Africa India China
Timken Bearing
Services
…With Growing Global Presence
77
|
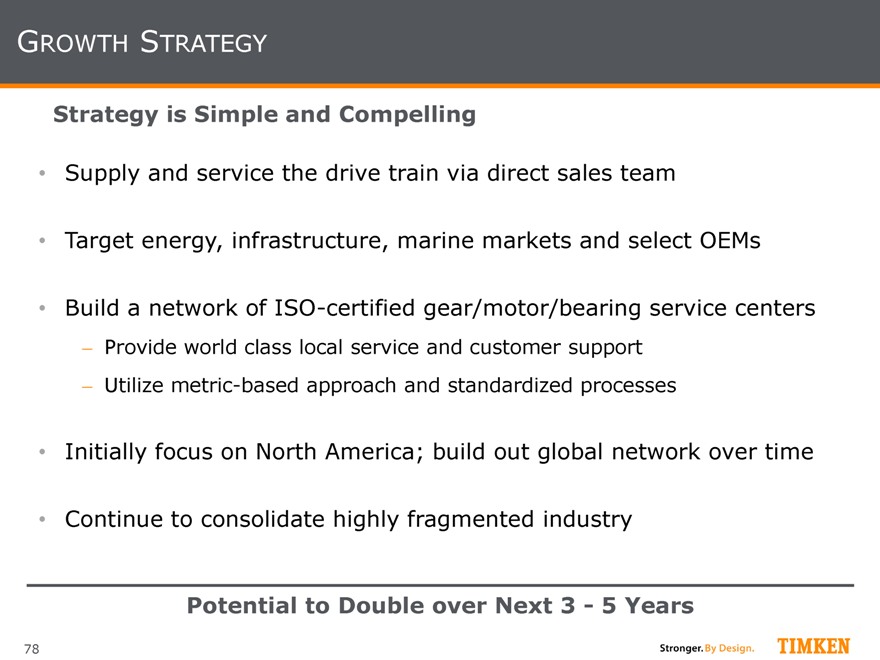
GROWTH STRATEGY
Strategy is Simple and Compelling
Supply and service the drive train via direct sales team
Target energy, infrastructure, marine markets and select OEMs
Build a network of ISO-certified gear/motor/bearing service centers
Provide world class local service and customer support
Utilize metric-based approach and standardized processes
Initially focus on North America; build out global network over time
Continue to consolidate highly fragmented industry
Potential to Double over Next 3—5 Years
78
|
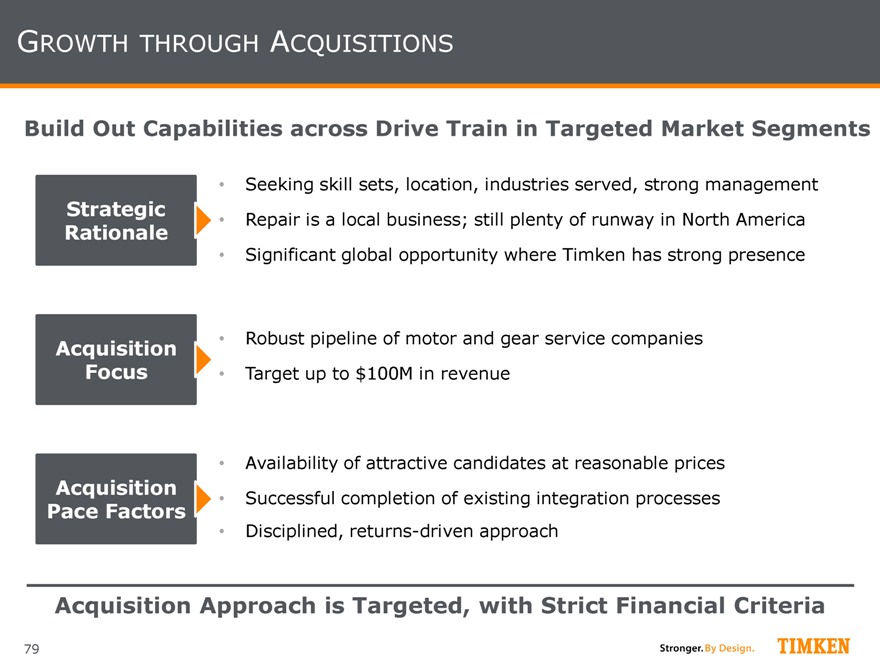
GROWTH THROUGH ACQUISITIONS
Build Out Capabilities across Drive Train in Targeted Market Segments
Seeking skill sets, location, industries served, strong management
Strategic Repair is a local business; still plenty of runway in North America
Rationale
Significant global opportunity where Timken has strong presence
Acquisition Robust pipeline of motor and gear service companies
Focus Target up to $100M in revenue
Availability of attractive candidates at reasonable prices
Acquisition Successful completion of existing integration processes
Pace Factors
Disciplined, returns-driven approach
Acquisition Approach is Targeted, with Strict Financial Criteria
79
|
SUMMARY
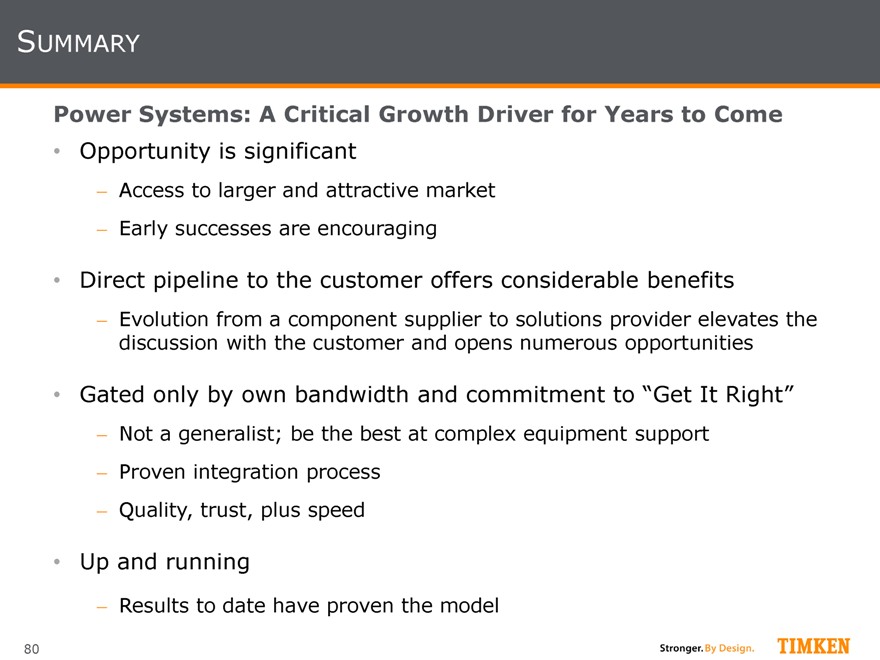
Power Systems: A Critical Growth Driver for Years to Come
Opportunity is significant
Access to larger and attractive market
Early successes are encouraging
Direct pipeline to the customer offers considerable benefits
Evolution from a component supplier to solutions provider elevates the discussion with the customer and opens numerous opportunities
Gated only by own bandwidth and commitment to “Get It Right”
Not a generalist; be the best at complex equipment support
Proven integration process
Quality, trust, plus speed
Up and running
Results to date have proven the model
80
|
Capturing Niche Opportunities
Brian Ruel, Vice President | Mobile Industries
|
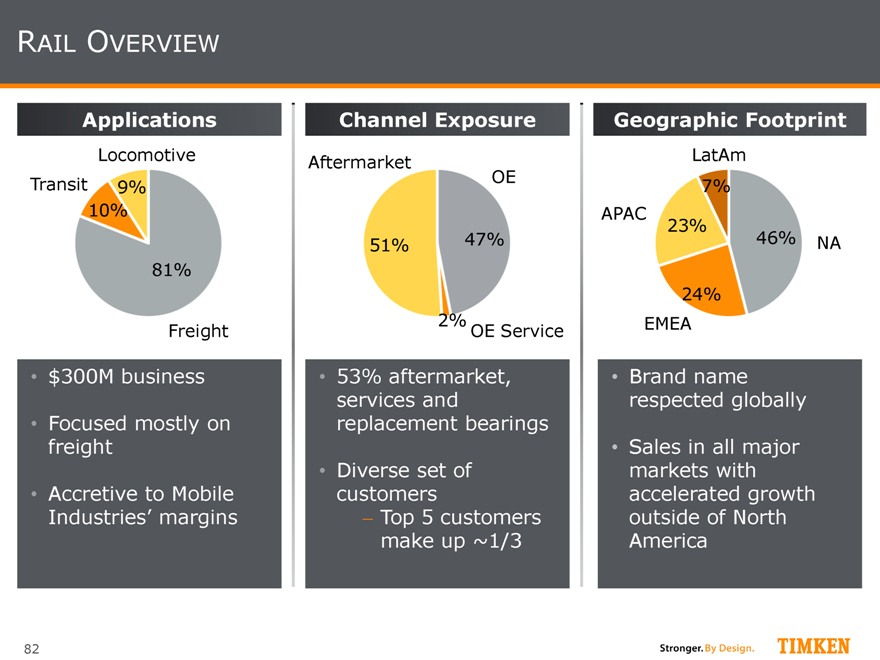
RAIL OVERVIEW
Applications
Locomotive Transit 9% 10%
81%
Freight
$300M business
Focused mostly on freight
Accretive to Mobile
Industries’ margins
Channel Exposure
Aftermarket
OE
51% 47%
2%
OE Service
53% aftermarket, services and replacement bearings
Diverse set of customers
Top 5 customers make up ~1/3
Geographic Footprint
LatAm 7% APAC
23%
46% NA
24%
EMEA
Brand name respected globally
Sales in all major markets with accelerated growth outside of North America
82
|
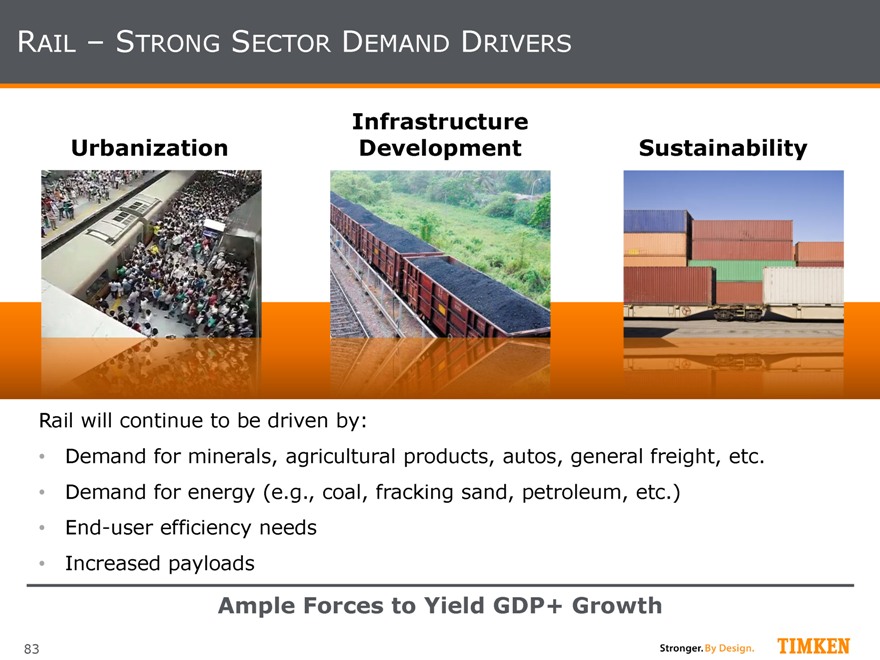
RAIL – STRONG SECTOR DEMAND DRIVERS
Urbanization
Infrastructure
Development Sustainability
Rail will continue to be driven by:
Demand for minerals, agricultural products, autos, general freight, etc.
Demand for energy (e.g., coal, fracking sand, petroleum, etc.)
End-user efficiency needs
Increased payloads
Ample Forces to Yield GDP+ Growth
83
|
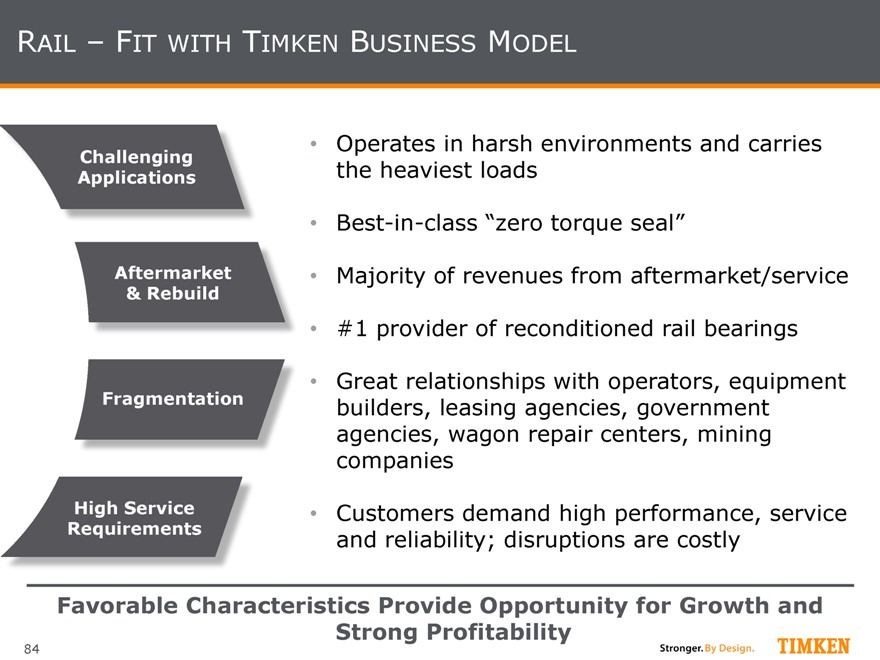
RAIL – FIT WITH TIMKEN BUSINESS MODEL
Operates in harsh environments and carries
Applications Challenging
the heaviest loads
Best-in-class “zero torque seal”
Aftermarket
Majority of revenues from aftermarket/service
& Rebuild
#1 provider of reconditioned rail bearings
Great relationships with operators, equipment
Fragmentation
builders, leasing agencies, government
agencies, wagon repair centers, mining
companies
High Service
Customers demand high performance, service
Requirements
and reliability; disruptions are costly
Favorable Characteristics Provide Opportunity for Growth and Strong Profitability
84
|
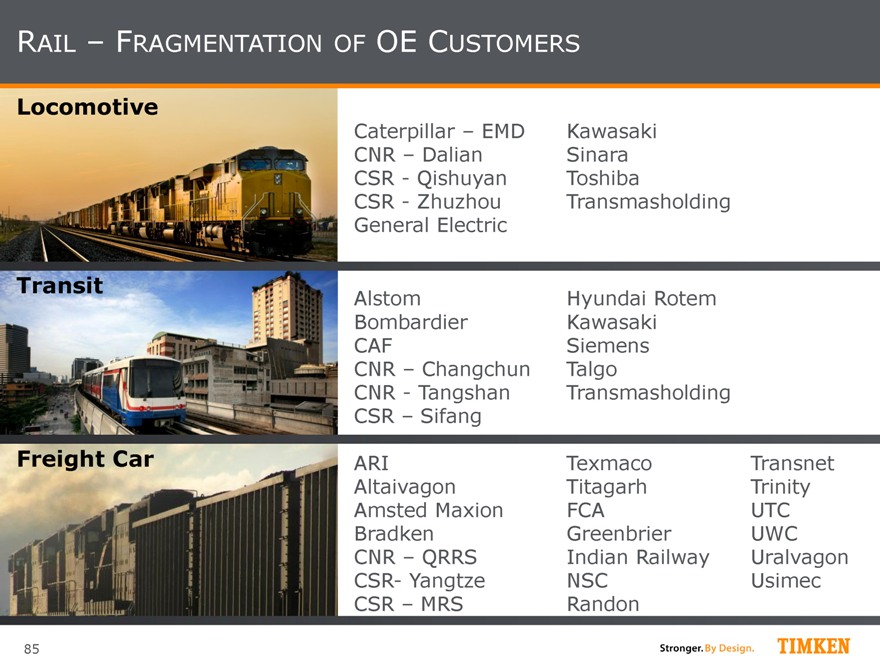
RAIL – FRAGMENTATION OF OE CUSTOMERS
Locomotive
Caterpillar – EMD Kawasaki CNR – Dalian Sinara CSR—Qishuyan Toshiba
CSR—Zhuzhou Transmasholding General Electric
Transit
Alstom Hyundai Rotem Bombardier Kawasaki CAF Siemens CNR – Changchun Talgo CNR—Tangshan Transmasholding CSR – Sifang
Freight Car ARI Texmaco Transnet Altaivagon Titagarh Trinity Amsted Maxion FCA UTC
Bradken Greenbrier UWC CNR – QRRS Indian Railway Uralvagon CSR- Yangtze NSC Usimec CSR – MRS Randon
85
|
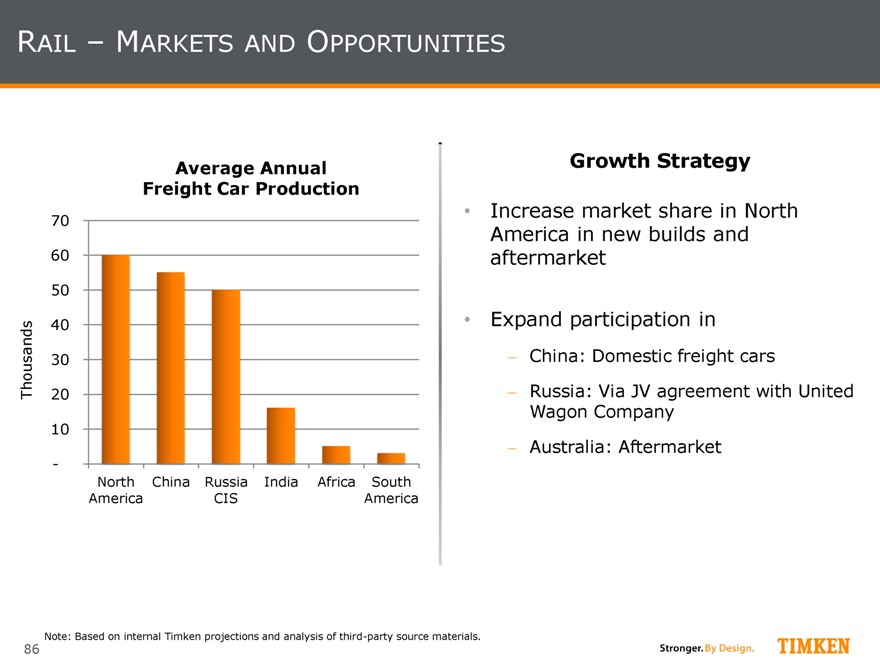
RAIL – MARKETS AND OPPORTUNITIES
Average Annual Freight Car Production
70 60 50
40 Thousands 30 20
10
-
North China Russia India Africa South
America CIS America
Growth Strategy
Increase market share in North America in new builds and aftermarket
Expand participation in
China: Domestic freight cars
Russia: Via JV agreement with United Wagon Company
Australia: Aftermarket
Note: Based on internal Timken projections and analysis of third-party source materials.
86
|
SUMMARY
Rail – A Strong and Vital Part of the Mobile Industries Portfolio
Continue to grow in concert with macro drivers
Focus on China and Russia freight car markets to drive growth
Profitable business that adds value to customers
Great fit with the Timken Business Model
Strong, deep customer relationships around the globe
87
|
Financial Review Phil Fracassa, CFO
|
DISCLAIMER
This presentation contains certain unaudited pro forma financial data derived from the historical consolidated financial statements and accounting records of the Company that have been adjusted to present the estimated impact from the removal of the TimkenSteel Corporation business from the historical financial results of the Company. This data does not necessarily reflect the financial position and results of operations that will be presented within the
Company’s consolidated financial statements subsequent to the completion of the planned spinoff of TimkenSteel Corporation. In addition, this data does not reflect what the financial position and results of operations would have been if the Company had actually operated without the TimkenSteel Corporation business during the periods shown nor are they necessarily indicative of the Company’s future results of operations or financial condition.
The assumptions and estimates used and adjustments derived from such assumptions are based on currently available information as of June 19, 2014, and management believes such assumptions and estimates are reasonable under the circumstances.
89
|
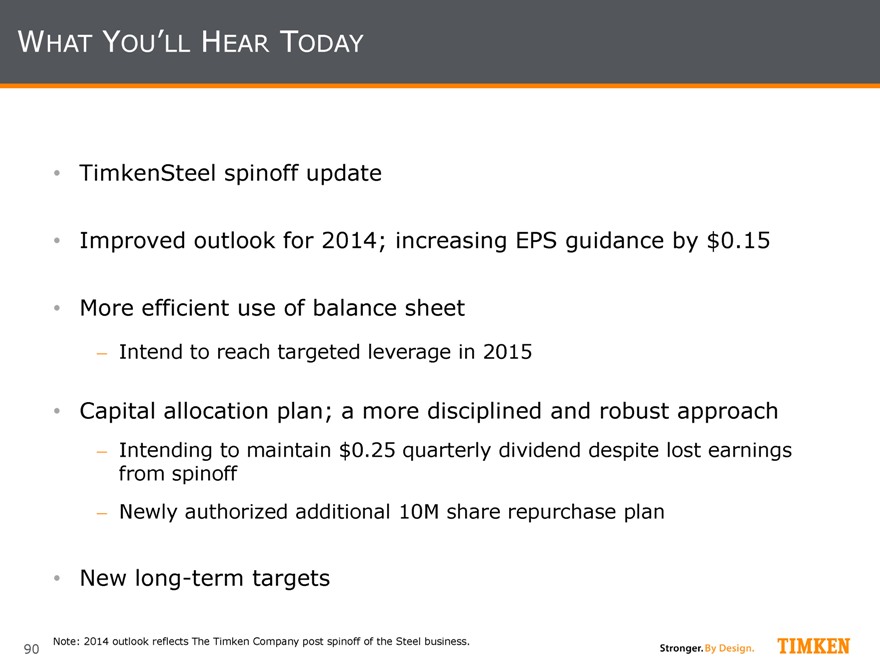
WHAT YOU’LL HEAR TODAY
TimkenSteel spinoff update
Improved outlook for 2014; increasing EPS guidance by $0.15
More efficient use of balance sheet
Intend to reach targeted leverage in 2015
Capital allocation plan; a more disciplined and robust approach
Intending to maintain $0.25 quarterly dividend despite lost earnings from spinoff
Newly authorized additional 10M share repurchase plan
New long-term targets
Note: 2014 outlook reflects The Timken Company post spinoff of the Steel business.
90
|
STEEL SPINOFF UPDATE
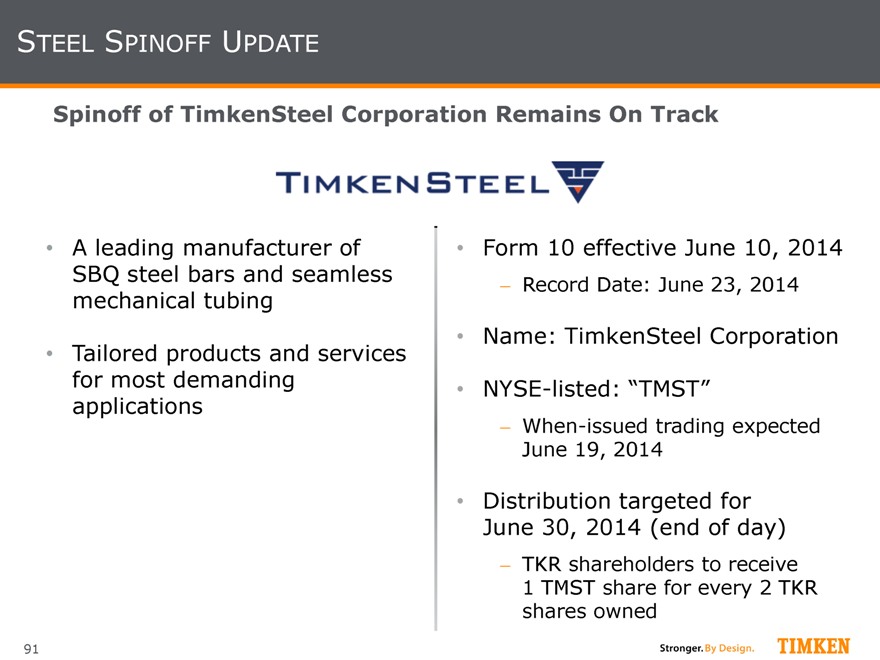
Spinoff of TimkenSteel Corporation Remains On Track
A leading manufacturer of SBQ steel bars and seamless mechanical tubing
Tailored products and services for most demanding applications
Form 10 effective June 10, 2014
Record Date: June 23, 2014
Name: TimkenSteel Corporation
NYSE-listed: “TMST”
When-issued trading expected June 19, 2014
Distribution targeted for June 30, 2014 (end of day)
TKR shareholders to receive
1 TMST share for every 2 TKR shares owned
91
|
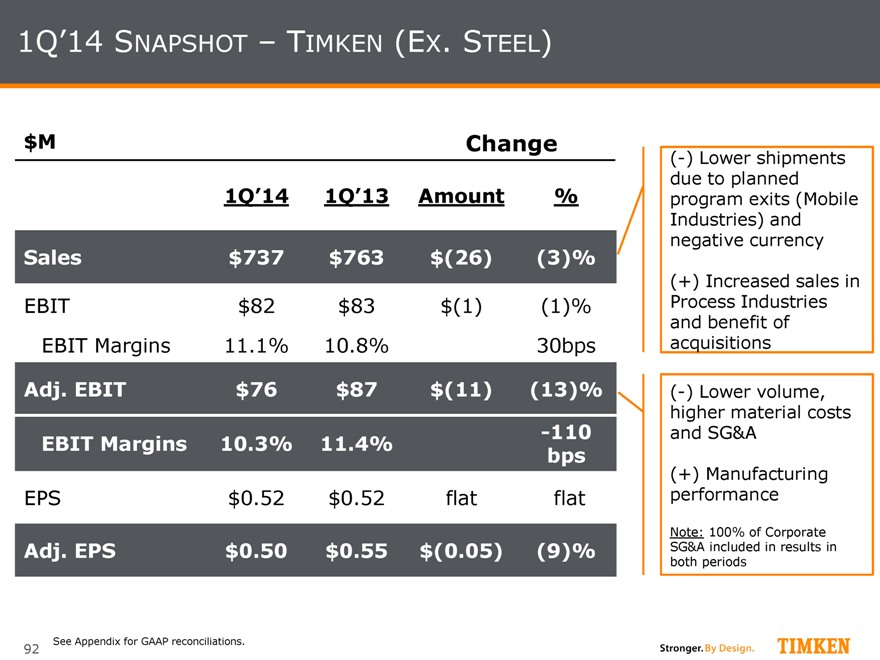
1Q’14 SNAPSHOT – TIMKEN (EX. STEEL)
$M
Change
1Q’14
1Q’13
Amount
%
Sales
$737
$763
$(26)
(3)%
EBIT
$82
$83
$(1)
(1)%
EBIT Margins
11.1%
10.8%
30bps
Adj. EBIT
$76
$87
$(11)
(13)%
-110
EBIT Margins
10.3%
11.4%
bps
EPS
$0.52
$0.52
flat
flat
Adj. EPS
$0.50
$0.55
$(0.05)
(9)%
(-) Lower shipments due to planned program exits (Mobile Industries) and negative currency
(+) Increased sales in Process Industries and benefit of acquisitions
(-) Lower volume, higher material costs and SG&A
(+) Manufacturing performance
Note: 100% of Corporate SG&A included in results in both periods
See Appendix for GAAP reconciliations.
92
|
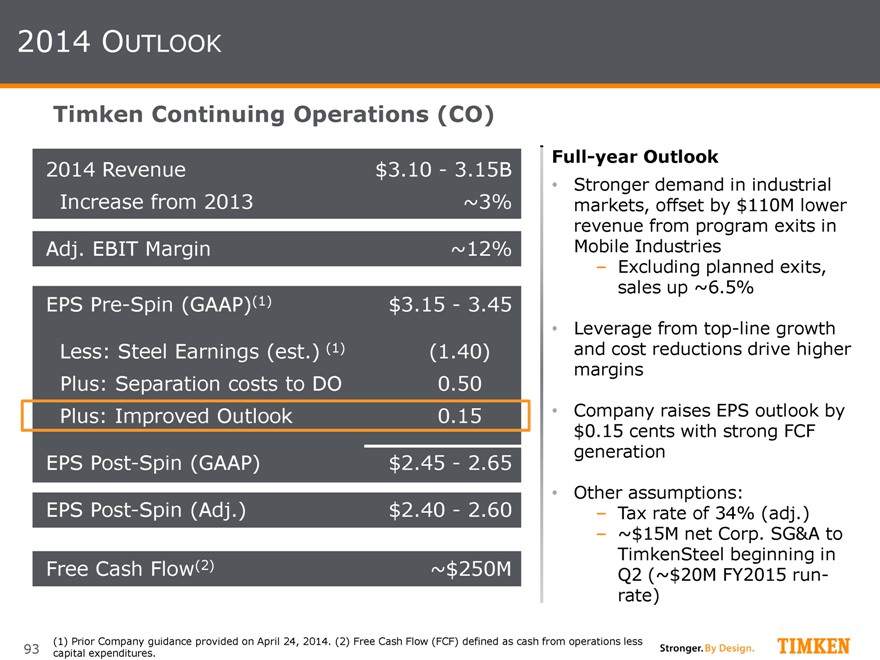
2014 OUTLOOK
Timken Continuing Operations (CO)
2014 Revenue
$3.10 -
3.15B
Increase from 2013
~3%
Adj. EBIT Margin
~12%
EPS
Pre-Spin (GAAP)(1)
$3.15
—
3.45
Less: Steel Earnings (est.) (1)
(1.40)
Plus: Separation costs to DO
0.50
Plus: Improved Outlook
0.15
EPS
Post-Spin(GAAP)
$2.45
—
2.65
EPS
Post-Spin(Adj.)
$2.40
—
2.60
Free Cash Flow(2)
~$250M
Full-year Outlook
Stronger demand in industrial markets, offset by $110M lower revenue from program exits in Mobile Industries
Excluding planned exits, sales up ~6.5%
Leverage from top-line growth and cost reductions drive higher margins
Company raises EPS outlook by
$0.15 cents with strong FCF generation
Other assumptions:
Tax rate of 34% (adj.)
~$15M net Corp. SG&A to TimkenSteel beginning in Q2 (~$20M FY2015 run-rate)
(1) Prior Company guidance provided on April 24, 2014. (2) Free Cash Flow (FCF) defined as cash from operations less capital expenditures. 93
|
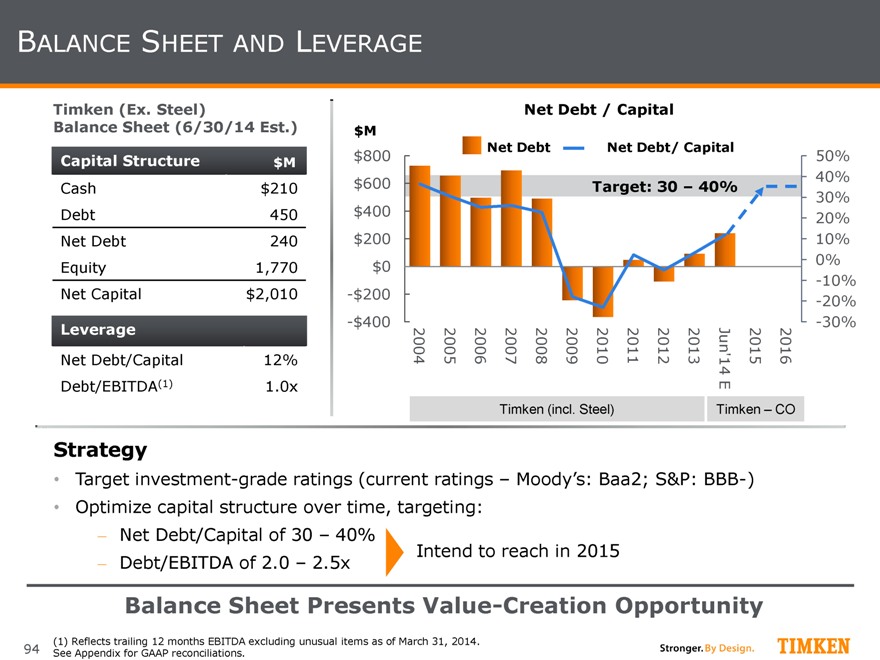
BALANCE SHEET AND LEVERAGE
Timken (Ex. Steel)
Balance Sheet (6/30/14 Est.)
Capital Structure
$M
Cash
$210
Debt
450
Net Debt
240
Equity
1,770
Net Capital
$2,010
Leverage
Net Debt/Capital
12%
Debt/EBITDA(1)
1.0x
Strategy
Target investment-grade ratings (current ratings – Moody’s: Baa2; S&P: BBB-)
Optimize capital structure over time, targeting:
Net Debt/Capital of 30 – 40%
Debt/EBITDA of 2.0 – 2.5x
Intend to reach in 2015
Balance Sheet Presents Value-Creation Opportunity
(1) Reflects trailing 12 months EBITDA excluding unusual items as of March 31, 2014. See Appendix for GAAP reconciliations.
$M $800 $600 $400 $200 $0
-$200
-$400
Timken (incl. Steel) Timken – CO
50% 40% 30% 20% 10% 0% -10% -20% -30%
Net Debt
/ Capital
Net Debt
Net Debt/ Capital
Target: 30 – 40%
2016 2015 Jun’14E 2013 2012 2011 2010 2009 2008 2007 2006 2005 2004
94
|
95
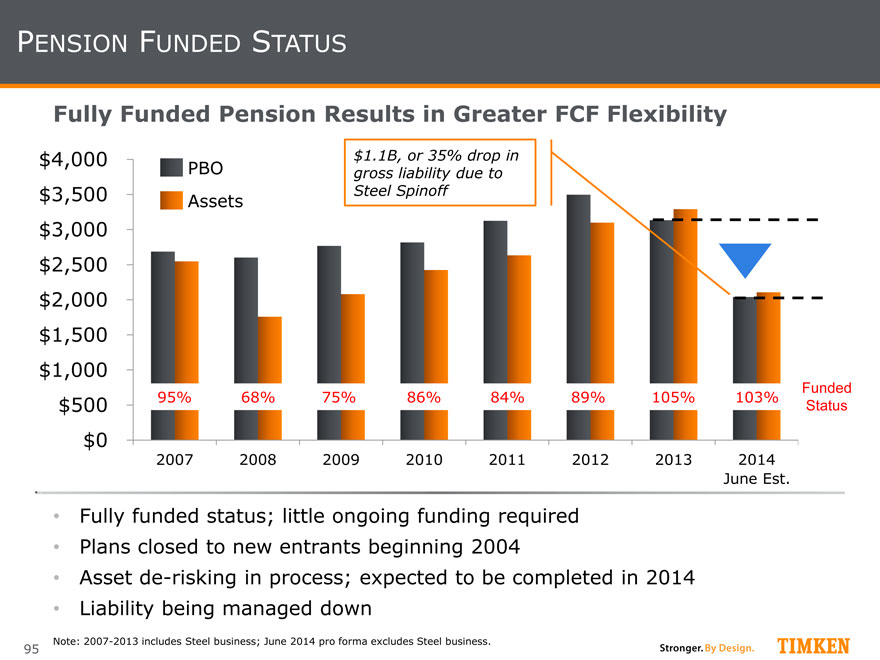
PENSION FUNDED STATUS
Fully funded status; little ongoing funding required
Plans closed to new entrants beginning 2004
Asset de-risking in process; expected to be completed in 2014
Liability being managed down
Fully Funded Pension Results in Greater FCF Flexibility
$0
$500
$1,000
$1,500
$2,000 $2,500
$3,000
$3,500
$4,000
2007
2008 2009
2010
2011
2012 2013
2014
Assets
PBO
95% 68%
75%
86%
84%
89%
105% 103%
June Est.
Funded
Status
Note: 2007-2013 includes Steel business; June 2014 pro forma excludes Steel business.
$1.1B, or 35% drop in gross liability due to Steel Spinoff
|
96
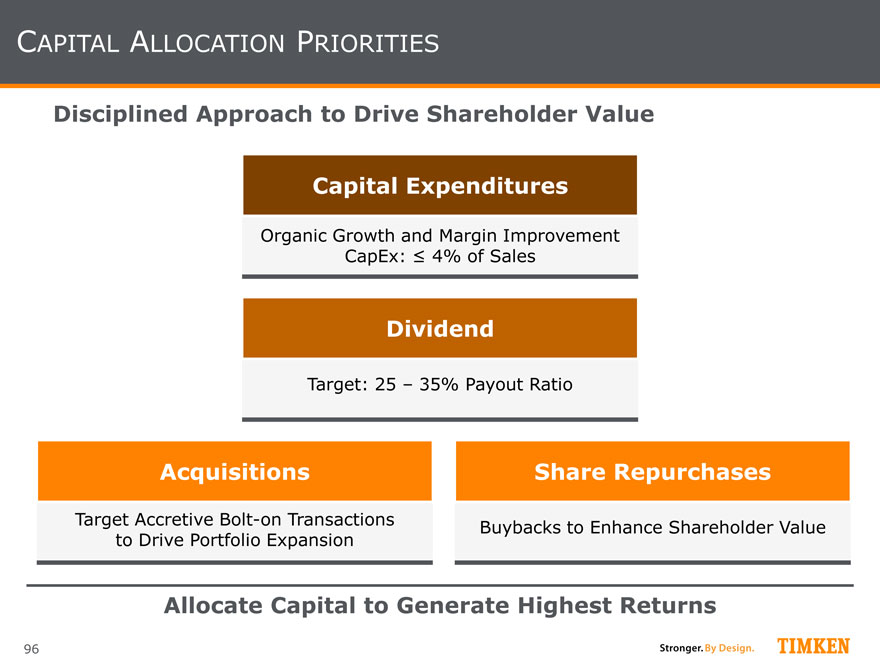
CAPITAL ALLOCATION PRIORITIES
Allocate Capital to Generate Highest Returns
Disciplined Approach to Drive Shareholder Value
Capital Expenditures
Organic Growth and Margin Improvement
CapEx: < 4% of Sales
Dividend
Target: 25 – 35% Payout Ratio
Share Repurchases
Buybacks to Enhance Shareholder Value
Acquisitions
Target Accretive Bolt-on Transactions
to Drive Portfolio Expansion
|
97
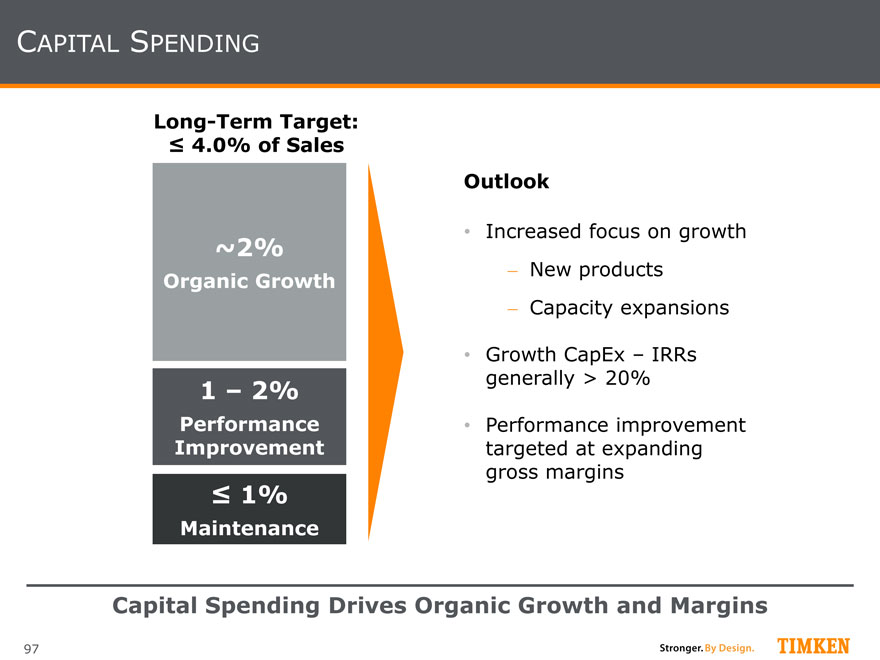
CAPITAL SPENDING
Capital Spending Drives Organic Growth and Margins
Outlook
Increased focus on growth
- New products
- Capacity expansions
Growth CapEx – IRRs generally > 20%
Performance improvement targeted at expanding gross margins
< 1%
Maintenance
1 – 2%
Performance Improvement
~2%
Organic Growth
Long-Term Target:
< 4.0% of Sales
|
98
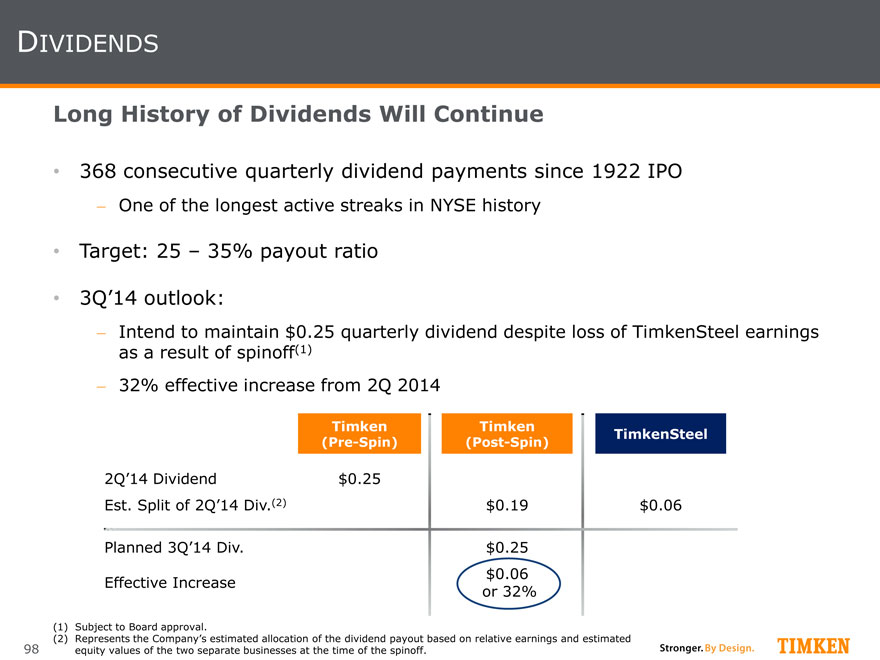
DIVIDENDS
368 consecutive quarterly dividend payments since 1922 IPO
- One of the longest active streaks in NYSE history
Target: 25 – 35% payout ratio
3Q’14 outlook:
- Intend to maintain $0.25 quarterly dividend despite loss of TimkenSteel earnings as a result of spinoff(1)
- 32% effective increase from 2Q 2014
Long History of Dividends Will Continue
Timken
(Pre-Spin)
Timken
(Post-Spin)
TimkenSteel
2Q’14 Dividend
$0.25
Est. Split of 2Q’14 Div.(2)
$0.19
$0.06
Planned 3Q’14 Div.
$0.25
Effective Increase
$0.06
or 32%
(1) Subject to Board approval.
(2) Represents the Company’s estimated allocation of the dividend payout based on relative earnings and estimated equity values of the two separate businesses at the time of the spinoff.
|
99
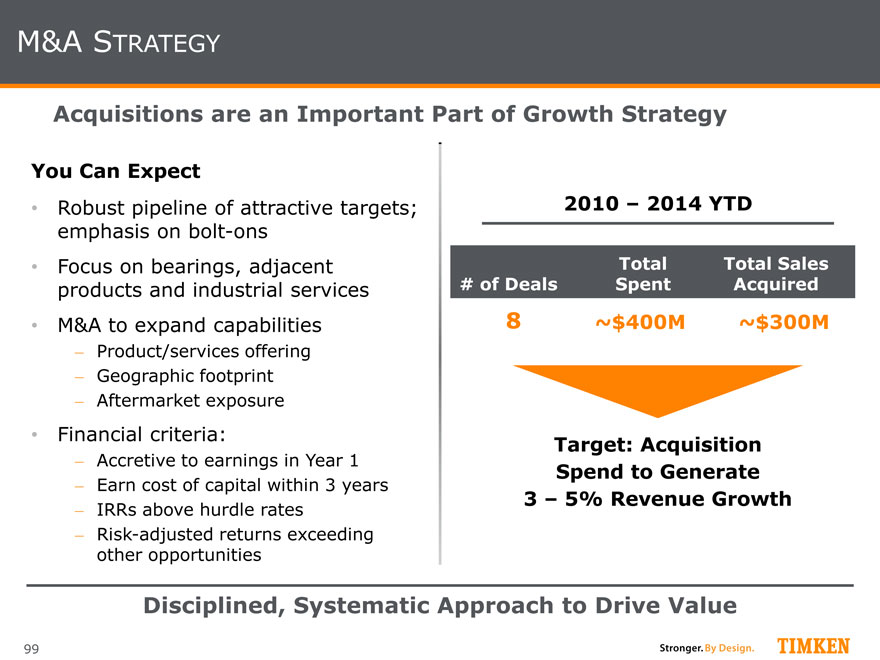
M&A STRATEGY
You Can Expect
Robust pipeline of attractive targets; emphasis on bolt-ons
Focus on bearings, adjacent products and industrial services
M&A to expand capabilities
- Product/services offering
- Geographic footprint
- Aftermarket exposure
Financial criteria:
- Accretive to earnings in Year 1
- Earn cost of capital within 3 years
- IRRs above hurdle rates
- Risk-adjusted returns exceeding other opportunities
Disciplined, Systematic Approach to Drive Value
Acquisitions are an Important Part of Growth Strategy
2010 – 2014 YTD
~$300M 8
Target: Acquisition
Spend to Generate
3 – 5% Revenue Growth
# of Deals Total Sales Acquired
Total
Spent
~$400M
|
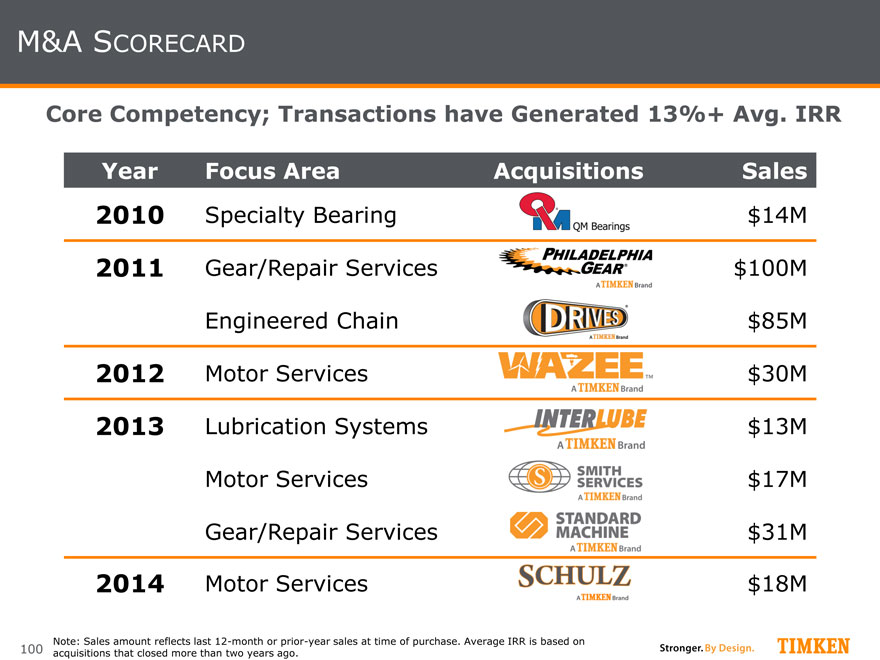
100
M&A SCORECARD
Year
Focus Area
Acquisitions
Sales
2010
Specialty Bearing
$14M
2011
Gear/Repair Services
$100M
Engineered Chain
$85M
2012
Motor Services
$30M
2013
Lubrication Systems
$13M
Motor Services
$17M
Gear/Repair Services
$31M
2014
Motor Services
$18M
Note: Sales amount reflects last 12-month or prior-year sales at time of purchase. Average IRR is based on acquisitions that closed more than two years ago.
|
101
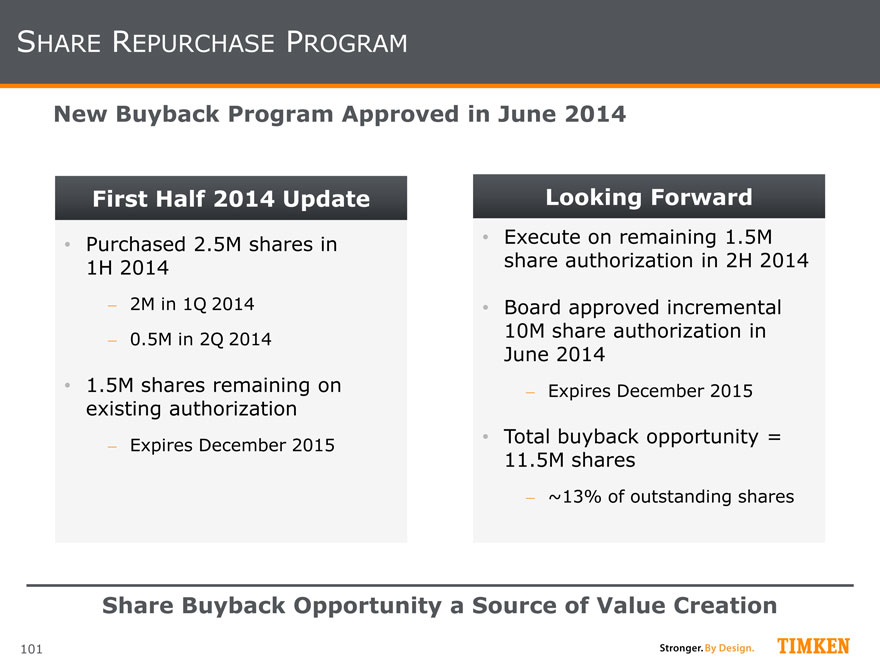
SHARE REPURCHASE PROGRAM
Share Buyback Opportunity a Source of Value Creation
New Buyback Program Approved in June 2014
Execute on remaining 1.5M share authorization in 2H 2014
Board approved incremental 10M share authorization in June 2014
- Expires December 2015
Total buyback opportunity = 11.5M shares
- ~13% of outstanding shares
Looking Forward
Purchased 2.5M shares in 1H 2014
- 2M in 1Q 2014
- 0.5M in 2Q 2014
1.5M shares remaining on existing authorization
- Expires December 2015
First Half 2014 Update
|
102
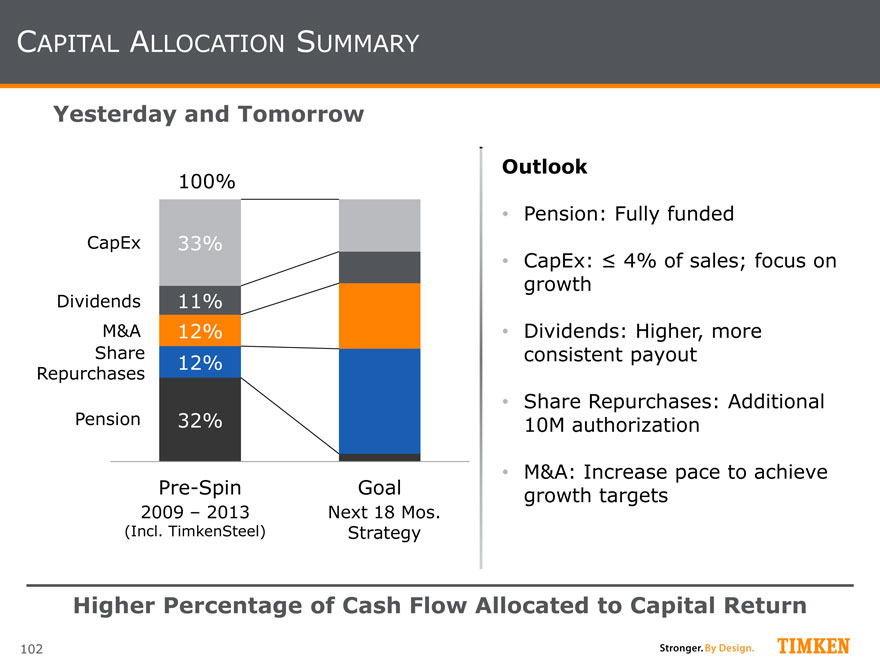
CAPITAL ALLOCATION SUMMARY
Higher Percentage of Cash Flow Allocated to Capital Return
Yesterday and Tomorrow
32% 12%
12% 11%
33%
Pre-Spin
Goal
Pension
Share Repurchases
CapEx
Dividends
M&A
100%
2009 – 2013
(Incl. TimkenSteel)
Outlook
Pension: Fully funded
CapEx: < 4% of sales; focus on growth
Dividends: Higher, more consistent payout
Share Repurchases: Additional 10M authorization
M&A: Increase pace to achieve growth targets
Next 18 Mos.
Strategy
|
103
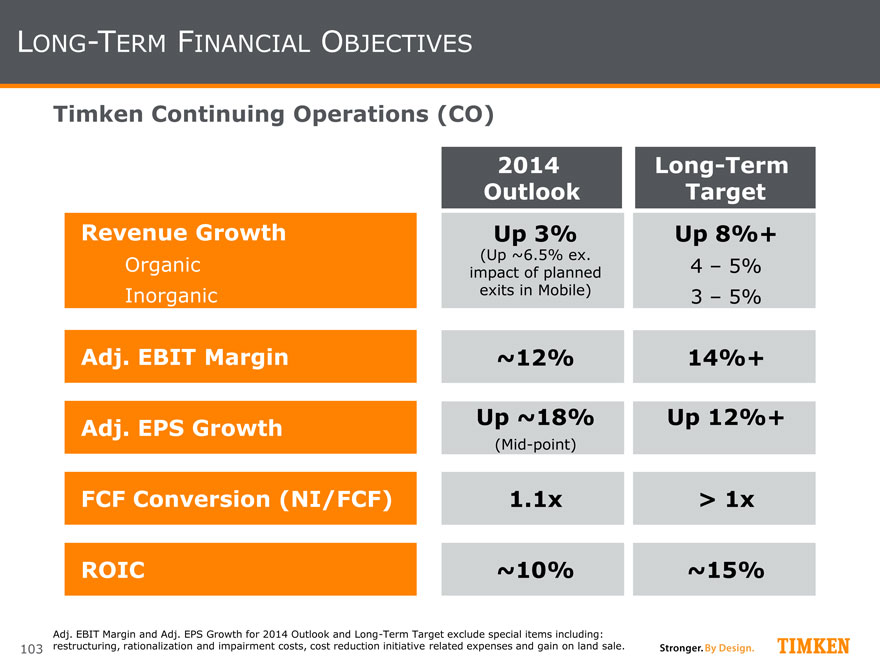
LONG-TERM FINANCIAL OBJECTIVES Timken Continuing Operations (CO)
(Up ~6.5% ex. impact of planned exits in Mobile)
(Mid-point) Adj. EBIT Margin
Revenue Growth
Organic
Inorganic
Adj. EPS Growth
FCF Conversion (NI/FCF)
ROIC Up 3%
Up 8%+
4 – 5%
3 – 5%
~12%
14%+
Up ~18%
Up 12%+
1.1x > 1x
~10%
~15%
2014
Outlook
Long-Term
Target
Adj. EBIT Margin and Adj. EPS Growth for 2014 Outlook and Long-Term Target exclude special items including: restructuring, rationalization and impairment costs, cost reduction initiative related expenses and gain on land sale.
|
104
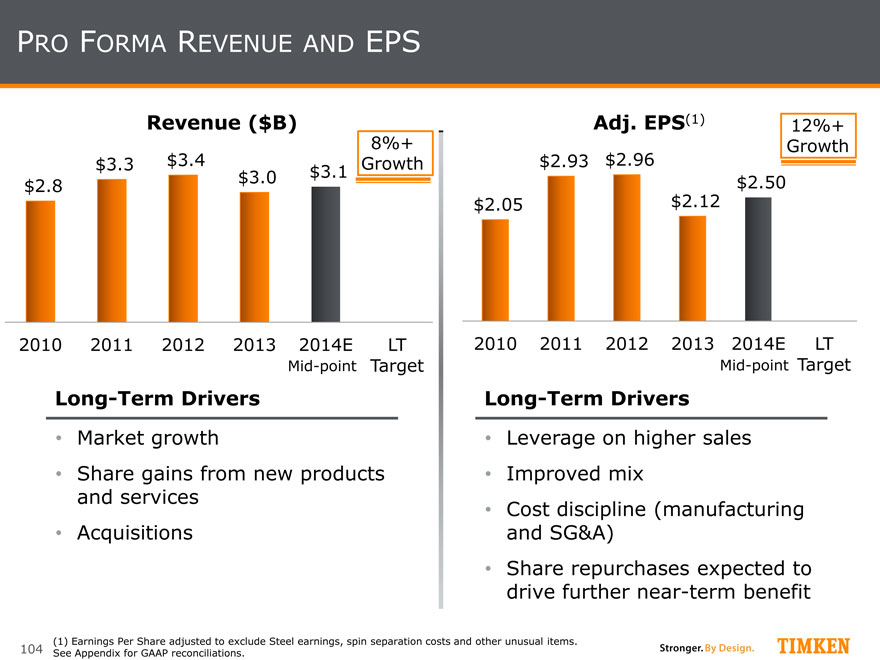
PRO FORMA REVENUE AND EPS
$2.8
$3.3
$3.4
$3.0
$3.1
2010
2011
2012 2013
2014E
LT Target
Revenue ($B)
Adj. EPS(1)
$2.05
$2.93
$2.96
$2.12
$2.50
2010
2011
2012
2013
2014E
LT Target
(1) Earnings Per Share adjusted to exclude Steel earnings, spin separation costs and other unusual items.
See Appendix for GAAP reconciliations. 8%+ Growth
12%+
Growth
Leverage on higher sales
Improved mix
Cost discipline (manufacturing and SG&A)
Share repurchases expected to drive further near-term benefit
Long-Term Drivers
Market growth
Share gains from new products and services
Acquisitions
Long-Term Drivers
Mid-point
Mid-point
|
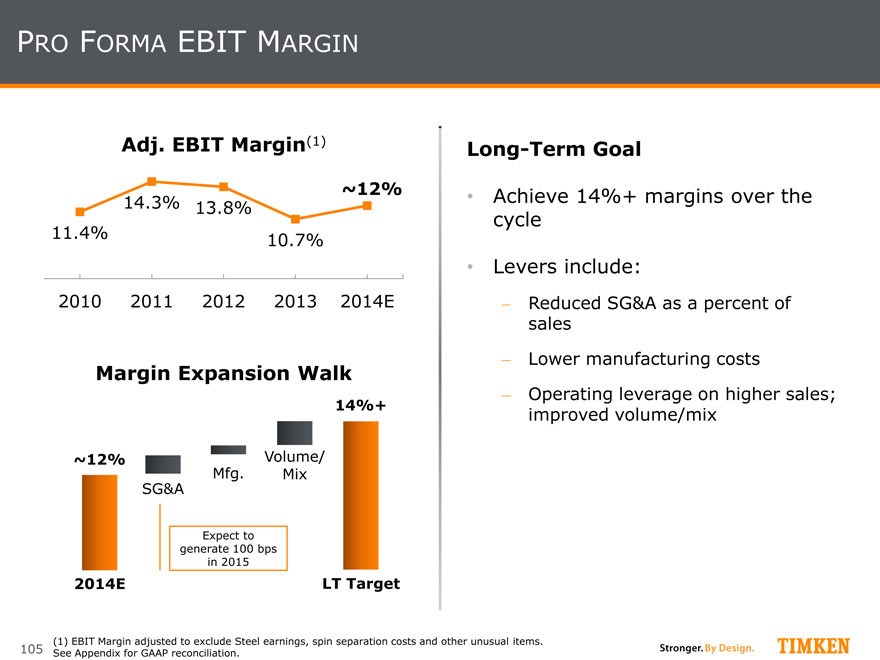
105
PRO FORMA EBIT MARGIN 11.4%
14.3%
13.8%
10.7%
2010
2011
2012
2013
2014E
Adj. EBIT Margin(1)
Long-Term Goal
Achieve 14%+ margins over the cycle
Levers include:
- Reduced SG&A as a percent of sales
- Lower manufacturing costs
- Operating leverage on higher sales; improved volume/mix
~12%
SG&A
2014E ~12%
LT Target
14%+
Mfg.
Volume/ Mix
Margin Expansion Walk
Expect to generate 100 bps in 2015 (1) EBIT Margin adjusted to exclude Steel earnings, spin separation costs and other unusual items. See Appendix for GAAP reconciliation.
|
106
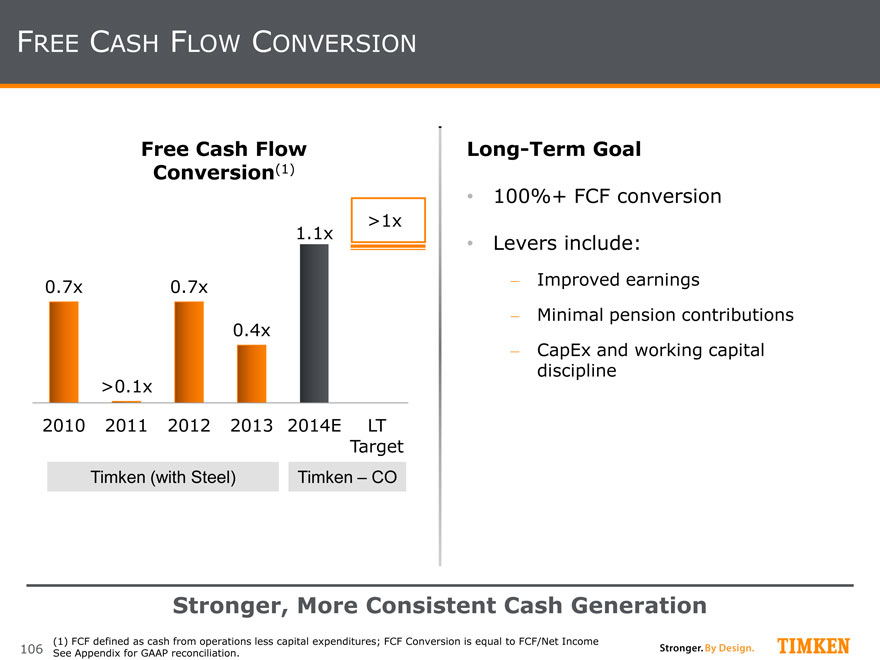
FREE CASH FLOW CONVERSION
0.7x
>0.1x
0.7x
0.4x
1.1x 2010
2011
2012
2013
2014E
LT Target
Free Cash Flow Conversion(1)
(1) FCF defined as cash from operations less capital expenditures; FCF Conversion is equal to FCF/Net Income
See Appendix for GAAP reconciliation.
Timken (with Steel)
Timken – CO
Long-Term Goal
100%+ FCF conversion
Levers include:
- Improved earnings
- Minimal pension contributions
- CapEx and working capital discipline
>1x
Stronger, More Consistent Cash Generation
|
107
KEY TAKE-AWAYS
Improved 2014 Outlook
- EPS: $2.40 - $2.60, excluding certain items(1)
A more disciplined and robust approach to capital allocation
- Intend to maintain $0.25 quarterly dividend despite lost earnings from spinoff
- 10M additional shares authorized for buyback through 2015
- Intend to reach targeted leverage in 2015
Strategy will drive strong sales and earnings growth going forward
- New long-term targets set
Well-Positioned to Deliver Top Quartile Shareholder Returns
A Compelling Investment
(1) Certain items include a gain on sale of land in Brazil and cost-reduction and plant rationalizations that net to $0.05 per share of expense.
|
Building on the Momentum
|
109
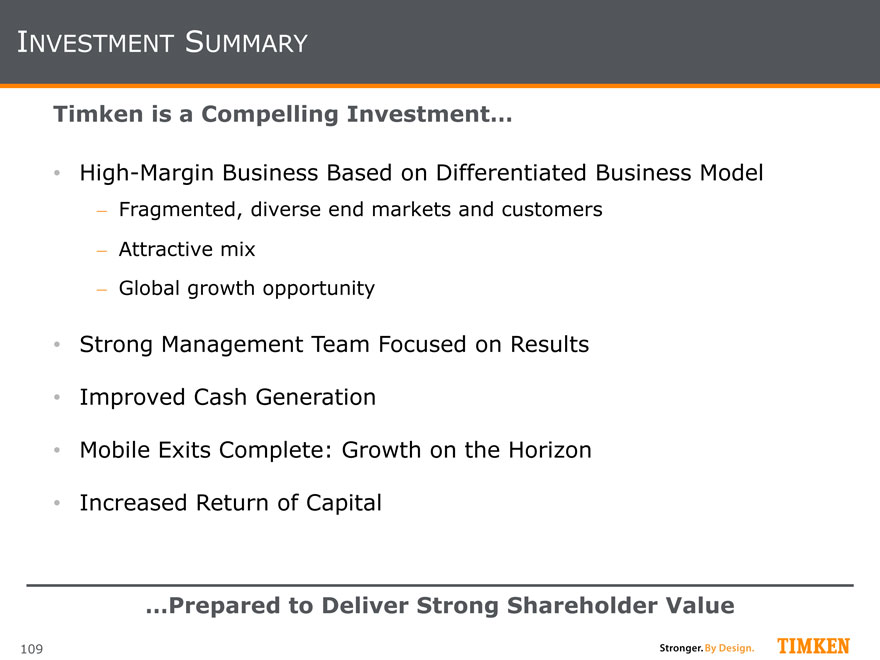
INVESTMENT SUMMARY
…Prepared to Deliver Strong Shareholder Value
Timken is a Compelling Investment…
High-Margin Business Based on Differentiated Business Model
- Fragmented, diverse end markets and customers
- Attractive mix
- Global growth opportunity
Strong Management Team Focused on Results
Improved Cash Generation
Mobile Exits Complete: Growth on the Horizon
Increased Return of Capital
|
Executive Bios
|
111
The great-grandson of The Timken Company’s original founder Henry Timken, John M. Timken, Jr., 62, was elected non-executive chairman of The Timken Company in May 2014. A private investor and successful entrepreneur, he has been a significant Timken shareholder for many years. Timken currently is co-founder and serves as a director of Amgraph Packaging, a national supplier of flexible package printing used by major food and beverage brands and private labels. His entrepreneurial activities cover a wide range of businesses and interests. Timken founded his first venture shortly after graduating from The College of Wooster, establishing Essex Racing Services. His company distributed Cosworth racing engines, Van Diemen racing cars, and provided both fabrication and performance racing engineering services. Beyond racing, his passion for business building has continued with involvement in ventures ranging from injection molding, to ophthalmic laboratories, to logistics and trucking. Timken also has owned a cable television business and established one of North America’s largest commercial mushroom farms. His ability as an investor to identify and help increase value across a range of businesses provides the Timken board with important input in evaluating and guiding the company in making important capital allocation decisions. Since joining the board in 1986, Timken has played a major role in the company’s strategic drive to add product lines that complement its bearing product portfolio, including the largest acquisition in 2003 of The Torrington Company. Originally from New London, Conn., Timken currently lives in Vermont, where he serves as a selectman for the town of Bridgewater.
JOHN M. TIMKEN JR. CHAIRMAN, BOARD OF DIRECTORS
|
112
Richard G. Kyle was named as the president and chief executive officer of The Timken Company by the board of directors in May 2014. Kyle was elected to the board of directors in 2013.
Kyle oversees all aspects of The Timken Company, which consists of the Aerospace, Process and Mobile industries segments. The company provides Timken® bearings and a broad range of other services and products—including transmissions, gearboxes, motors, lubrication systems and chain—all of which are used in diversified markets to keep the world in motion.
Kyle previously served as chief operating officer of the Bearings and Power Transmission Group, a position to which he was named in 2013. In 2012, he was named group president of Timken, responsible for the Aerospace and Steel segments as well as the engineering and technology organization.
He started his Timken career in 2006 as vice president of manufacturing, responsible for the company’s global bearings operations. He was named president of the Aerospace and Mobile Industries segments in 2008. During his tenure, he led Mobile Industries through significant changes, reshaping its product portfolio, market mix and operating capabilities, which yielded dramatic improvements in the company’s financial performance. Before joining Timken, Kyle held management positions with Cooper Industries and later was vice president of operations for a division of Hubbell, Inc.
A native of Mishawaka, Ind., Kyle received a bachelor’s degree in mechanical engineering from Purdue University and earned a master of business administration degree in management from Northwestern University’s Kellogg Graduate School of Management. He serves on the board of directors of the United Way of Greater Stark County.
RICHARD G. KYLE PRESIDENT AND CHIEF EXECUTIVE OFFICER
|
113
Philip D. Fracassa serves as chief financial officer of The Timken Company. Fracassa leads the company’s financial organization, including external reporting, treasury, tax, financial planning and analysis, internal audit, risk management and investor relations. In addition, he oversees information technology and enterprise services, and maintains leadership of the project to spin off the steel business from The Timken Company.
Fracassa previously served as senior vice president for corporate planning and development, a role to which he was named in 2012. He led the company in developing enterprise strategy, including identification and evaluation of growth opportunities.
Fracassa joined Timken in 2005, and has held several key finance positions, including senior vice president and group controller for the Bearings and Power Transmission Group, senior vice president of tax and treasury, and vice president of tax.
Prior to joining Timken, Fracassa was senior tax counsel and director of tax for Visteon Corporation. He began his career with what is now PricewaterhouseCoopers in Detroit and also served as a tax attorney with General Motors Corporation.
Fracassa is a member of Financial Executives International, the Manufacturers Alliance for Productivity and Innovation (MAPI) and the Association for Corporate Growth. He was included in Treasury & Risk magazine’s list of 40 distinguished finance executives under the age of 40 (2007) and top 100 most influential persons in finance (2009).
He is active in community affairs and currently serves as chairman of the board for the Canton Regional Chamber of Commerce.
Fracassa holds a bachelor’s degree in accounting and a juris doctor degree in law from the University of Detroit. In 2011, he completed the Advanced Management Program at INSEAD. He is a certified public accountant and licensed attorney in the state of Michigan.
PHILIP D. FRACASSA CHIEF FINANCIAL OFFICER
|
114
Christopher A. Coughlin is group president at The Timken Company.
Named to the position in 2012, he is responsible for the company’s Mobile and Process Industries segments. He also has corporate-wide responsibilities for quality assurance and advancement activities. The Mobile Industries business is focused on growing globally by serving the mining, heavy-truck, construction, agriculture, rail and light-vehicle equipment markets with a broad offering of high-performance power transmission products and related services. The Process Industries segment provides bearings and related products and services for heavy industry, power transmission, energy and global distribution market sectors.
In 2010, Coughlin became president of Process Industries and Supply Chain. He was responsible for distribution and global supply chain management for the Bearings and Power Transmission Group as well as for the company’s global purchasing organization.
In 2004, Coughlin was named to lead a multiyear initiative to streamline business processes and implement an enterprise resource planning system. He previously was based in Colmar, France, where he held a variety of management positions including vice president of industrial equipment, vice president of process industries and vice president of primary metals. Coughlin began his Timken career in 1984 in the company’s steel operations.
Coughlin serves on the board of directors of the American Bearing Manufacturers Association and the Akron Canton Regional Foodbank.
He earned a bachelor’s degree in metallurgical engineering from the University of Cincinnati and a master’s degree in business administration from Case Western Reserve University.
CHRISTOPHER A. COUGHLIN GROUP PRESIDENT
|
115
J. Ted Mihaila is senior vice president and controller and an officer of The Timken Company.
Mihaila directs the company’s finance and corporate shared services teams. His oversight of the two teams enables leverage of the services the company provides on an enterprise basis. Mihaila has responsibility for the compilation, analysis and reporting of accurate and timely actual and forecasted financial results. Under his guidance, the finance team provides information that enables company leaders to make strategic decisions about growth opportunities, investments and markets.
Mihaila previously served as vice president – business development and controller in the Industrial Group. He directed the development of long-term strategies and implementation of tactical plans to accelerate the growth of the company’s former Industrial Group through acquisitions and affiliations.
Mihaila has managed finances for various production facilities and business groups during his career at Timken. He was promoted to an accounting role in 1977 after joining the company in 1975. He was named to his current position in 2006.
Mihaila is an active member of the Manufacturers Alliance/MAPI Inc. Financial Council. He also serves on the board of Habitat for Humanity of Greater Stark County and the George W. Daverio School of Accountancy Advisory Board at The University of Akron. Mihaila is currently serving as an advisory board member of Walsh University – The DeVille School of Business.
Mihaila received a bachelor’s degree in accounting from The University of Akron and a master’s degree in business administration from Kent State University.
J. TED MIHAILA SENIOR VICE PRESIDENT & CONTROLLER
|

116
Richard M. Boyer is vice president of manufacturing for the Bearings & Power Transmission Group within The Timken Company.
Named to this position in 2012, Boyer is responsible for the operation of all global manufacturing facilities within the Mobile and Process Industries business unit. Additionally, he has oversight for the manufacturing advancement organization and the corporate purchasing function.
He joined Timken in 1984 and served nine years in the engineering and technology organizations before moving in 1993 to the Gaffney Plant in South Carolina, where he held various supervisory roles. In 1996, he was named project manager for the start-up of a new manufacturing facility in Winchester, Ky. In 2000, he was named manufacturing manager of the St. Clair Steel Plant in Eaton, Ohio. From 2001-03, he served as business development manager and then from 2003-07 he served as general manager of operations and supply chain for the precision steel components organization. In 2007, he served as manager of the Gambrinus Steel Plant in Canton, Ohio, before becoming director of manufacturing for 0-8 inch bearings in 2010.
Active in community affairs, Boyer serves on the executive board of directors for the Stark County affiliate of Junior Achievement.
Boyer holds a bachelor’s degree in mechanical engineering from The Ohio State University along with a master’s degree in mechanical engineering from The University of Akron and an executive master’s degree in business administration from Kent State University. He completed the EDGE executive development program for senior Timken leaders at the University of Virginia Darden School of Business in 2005.
RICHARD M. BOYER VICE PRESIDENT, MANUFACTURING
|
117
Shelly M. Chadwick is vice president of treasury for The Timken Company, which includes responsibility for investor relations. She was named to this position in January 2014.
Previously, Chadwick was controller of the process industries business unit at Timken, responsible for decision support and leadership of Bearing and Power Transmission group financial planning and analysis and original-equipment sales forecasting.
Chadwick joined Timken in 2011 and served as assistant controller, responsible for the accuracy and timeliness of the company’s financial results and external reporting requirements. In conjunction with business unit controllers, she ensured policies and procedures were in place for compliance with U.S. GAAP accounting regulations.
Prior to joining Timken in 2011, Chadwick was vice president of finance and chief financial officer at Eckart America Corporation and previously held financial leadership roles at Avery Dennison, Noveon Inc., and BF Goodrich.
She serves on the board of directors of ArtsinStark, a non-profit organization that raises awareness of the value of arts in the community. She is also treasurer for the local chapter of Zonta International, an organization focused on advancing the status of women worldwide.
Chadwick holds a bachelor’s degree in business management and finance from Westfield State University in Massachusetts and a master’s degree in general business administration from Anna Maria College, also in Massachusetts. She is a member of Financial Executives International. SHELLY M. CHADWICK VICE PRESIDENT, TREASURY
|
118
Michael J. Connors is vice president of the global industrial and automotive aftermarket and commercial vehicle OEM businesses at The Timken Company.
Connors leads the company’s efforts to profitably grow these businesses and drive global channel strategy and execution. His team works closely with the global distributor network to deliver bearing and power transmission products and related services to end-users.
Additionally, he leads the global service engineering team and has regional responsibility for Canada, South America, Middle East, Africa, Australia, ASEAN, Japan and South Korea. Connors was named to the position in 2009.
Beginning in 2007, Connors served as president of the Process Industries business segment. From 2004 to 2007, Connors served as vice president of industrial equipment. He also served in manufacturing management, including director of large-bore bearing manufacturing and vice president of manufacturing. In 2000, he served at the industrial facility in Torrington, Conn., where he held positions in marketing and business development. Connors also served as director of sales and marketing at NASTECH, a joint venture between The Torrington Company and NSK. He held leadership positions from 1992-1998 in product management and business unit management. From 1986-1992, he served as manufacturing manager in Honea Path, S.C. Connors joined The Timken Company in 1983.
Connors serves on the board of directors of the Boys and Girls Club in Massillon, Ohio.
He earned a bachelor’s degree in mechanical engineering from Worcester Polytechnic Institute in Worchester, Mass., and a master’s degree in business administration from the University of Hartford in Connecticut.
MICHAEL J. CONNORS VICE PRESIDENT, AFTERMARKET
|
119
Kari Groh is vice president – communications and public relations for Timken .
Named to the position in 2009, she is responsible for worldwide communications, directing the development of Timken messaging with customers, media, associates and shareholders. She oversees reputation management, brand strategy, marketing communications, corporate events, creative services and design, the corporate website and the company’s global intranet. She also has responsibility for directing Timken’s corporate citizenship strategy and community relations programs.
Groh began her career at Timken while pursuing a degree in journalism at The University of Akron. In 1981, she was named assistant editor of the TIMKEN magazine. Thereafter, she held a number of positions in communications . In 1992, she was named manager – public relations and marketing communications. Six years later, Groh was promoted to general manager in the company’s bearing business and then advanced through a series of sales and operating roles, with responsibility for global customer service, warehouse management and logistics for the aftermarket business. Prior to being named to her current position, she was general manager of organizational effectiveness.
Groh, who also holds an MBA degree from Ashland University, is a member of Team NEO Marketing Council, the Arthur W. Page Society, In Counsel with Women and the Northeast Ohio Senior Communicators Forum and serves as a board member of Stark State College in Canton, Ohio, and Women’s Impact Inc. She also frequently lectures on the topic of branding, working most often with The Signature Series, an executive leadership development program.
KARI GROH VICE PRESIDENT, COMMUNICATIONS & PUBLIC RELATIONS
|
120
Erik Paulhardt is vice president – Aerospace for The Timken Company.
Named to the position in 2012, he is responsible for advancing the company’s global position in commercial and military aviation, aerospace and aerospace aftermarket solutions. Paulhardt is responsible for six manufacturing locations and four aerospace business units.
In 2008, he was appointed to lead the company’s global rail business, including operations, sales and support functions. Prior to that, he served as general manager of the company’s health and positioning control team. Based in Keene, N.H., Paulhardt led the team’s successful transition from a focus on products to markets and was a board member for a Timken joint venture company.
Paulhardt has held various sales management and leadership positions since joining Timken in 1986.
He has been involved in community related activities including the Chamber of Commerce and advisory board for Cheshire Medical Center both in Keene, N.H. Paulhardt is currently serving on the board of trustees for The Ohio Aerospace Institute.
He received a bachelor’s degree in mechanical engineering from the University of Massachusetts and a master’s degree in business administration from Rensselaer Polytechnic Institute.
ERIK PAULHARDT VICE PRESIDENT, AEROSPACE
|
121
Carl D. Rapp is vice president of power systems at The Timken Company.
Named to this position in 2011, he leads the company’s Philadelphia Gear brand business as well as four other recently acquired companies which, along with Timken Bearing Services, comprise the power systems group. Under Rapp’s leadership, this group supplies and services the electrical-mechanical drive train system at the center of most industrial end-user operations.
Predominately focused on energy and marine defense markets, the Power Systems group offers comprehensive solutions to end users for their mission-critical mechanical applications. The group operates from 27 global locations and also serves customers in infrastructure sectors such as water management, mining, cement and paper.
Rapp previously served 10 years as president and chief executive officer of Philadelphia Gear Corp. Prior to joining Philadelphia Gear in 2001, he held senior-level positions in general management and sales, including senior vice president of sales and marketing for Strategic Distribution Inc., president of Carborundum Abrasives, and business unit manager for Norton Company’s Precision Abrasives Group (both divisions of the St.Gobain Company). Prior to this he completed a six-year expatriate assignment in Europe for Norton, in various project and product management roles.
Rapp holds a bachelor’s degree in economics and history from Trinity College in Hartford, Conn., a master’s degree in international relations from Boston University and completed the Executive Education Program at the Ross school of business at the University of Michigan.
CARL D. RAPP VICE PRESIDENT, POWER SYSTEMS
|
122
Brian J. Ruel is vice president of the Mobile Industries business segment of The The Timken Company.
Named to this position in 2012, Ruel leads the company’s efforts in continuing to its global grow with customers in the light vehicle systems, off-highway and rail sectors. Additionally, he leads international sales and marketing efforts to grow the company’s chain and auger business.
He previously served as vice president of the rail sector, leading the company’s rail team focused continued growth in passenger and freight rail around the world. He was named to the position in 2011.
Beginning in 2010, Ruel served as vice president of light vehicle systems. He was responsible for the company’s global bearing business in the light-vehicle systems market. He led all activity for both original-equipment manufacturers as well as the automotive component suppliers.
Ruel previously served as director of sales for light-vehicle systems, a role to which he was appointed in 2007. From 2004-07, he served as director of quality and customer satisfaction for the company’s automotive business. He joined Timken in 1984.
Ruel earned a bachelor’s degree in mechanical engineering from the University of New Hampshire. He is a graduate of the Executive Development for Global Excellence program at the University of Virginia’s Darden School of Business.
BRIAN J. RUEL VICE PRESIDENT, MOBILE INDUSTRIES
|
123
Steve D. Tschiegg is director – capital markets and investor relations at The Timken Company.
Tschiegg has responsibility for communicating the company’s financial results, performance and strategies to the financial community, as well as capital structure planning, new financings and refinancings, bank relationships and rating agency relations.
Prior to being named to his current position in 2008, Tschiegg was manager of investor relations. He also has held positions including senior financial analyst, principal – corporate finance and manager – global risk management in the company’s finance group.
Tschiegg joined Timken in 1997. He previously held several positions in the finance area at Ford Motor Company, including financial analysis – Engine Operations, new product business planning – Transmission & Chassis Operations and the most recent being supervisor – operations analysis at one of Ford’s engine manufacturing facilities.
Tschiegg received a bachelor’s degree in business administration and mathematics from Heidelberg College, a Master of Business Administration from Case Western Reserve University and completed the executive development for global excellence program at the Darden School of Business at the University of Virginia.
STEVE D. TSCHIEGG DIRECTOR, CAPITAL MARKETS & INVESTOR RELATIONS
|
124
Pat Burnham is manager of global media and corporate communications at The Timken Company.
Named to the position in June 2012, Burnham is responsible for leading the company’s global reputation and media relations efforts while also contributing expertise in corporate and business communications. As part of the communications leadership team, she plans and executes strategic corporate and marketing communications among the company’s external and stakeholders.
Before joining Timken in 2012, Burnham served as director of corporate communications at Swagelok Company, responsible for global internal communications for the manufacturer of highly engineered valves and fittings. Prior to this, she was vice president of public relations at Marcus Thomas LLC, an integrated marketing communications agency serving both consumer and business-to-business clients including Alcoa, Bendix and Milliken Chemical.
Burnham serves on the board of directors and the marketing committee of The Conservancy for Cuyahoga Valley National Park and on the special events committee of the Northeast Ohio chapter of the Alzheimer’s Association. She is a member of the Manufacturer’s Alliance for Productivity and Innovation (MAPI).
Burnham received a bachelor’s degree in both mass communication and marketing from St. Bonaventure University.
PATRICIA A. BURNHAM GLOBAL MANAGER, MEDIA RELATIONS & CORPORATE COMMUNICATIONS
|

Appendix: GAAP Reconciliation
|
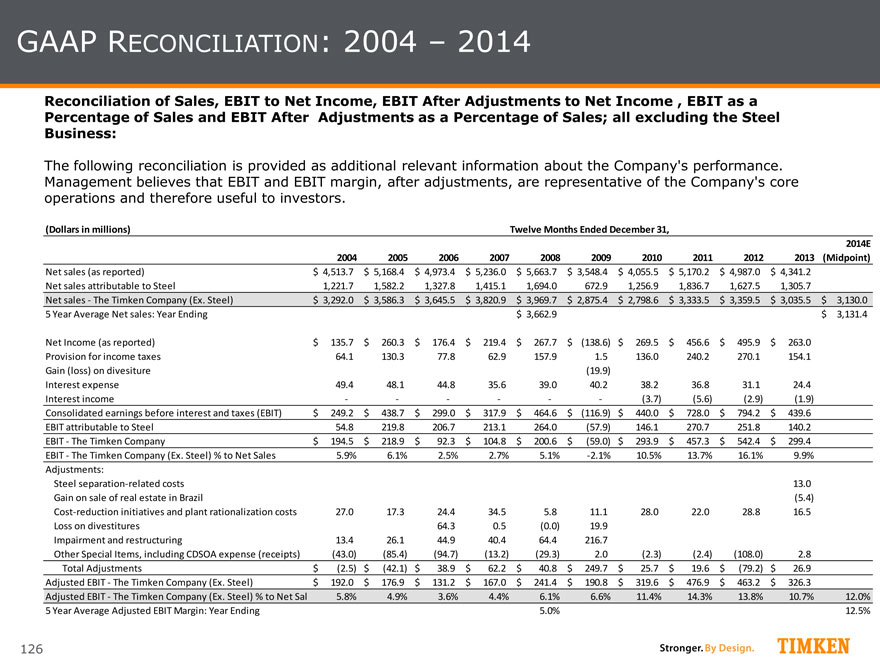
126
GAAP RECONCILIATION: 2004 – 2014
Reconciliation of Sales, EBIT to Net Income, EBIT After Adjustments to Net Income , EBIT as a Percentage of Sales and EBIT After Adjustments as a Percentage of Sales; all excluding the Steel Business:
The following reconciliation is provided as additional relevant information about the Company’s performance. Management believes that EBIT and EBIT margin, after adjustments, are representative of the Company’s core operations and therefore useful to investors. (Dollars in millions) 2004 2005 2006 2007 2008 2009 2010 2011 2012 2013 2014E (Midpoint) Net sales (as reported) 4,513.7 $ 5,168.4 $ 4,973.4 $ 5,236.0 $ 5,663.7 $ 3,548.4 $ 4,055.5 $5,170.2 $4,987.0 $4,341.2 $ Net sales attributable to Steel1, 221.7 1,582.2 1,327.8 1,415.1 1,694.0 672.9 1,256.9 1,836.7 1,627.5 1,305.7 Net sales—The Timken Company (Ex. Steel) 3,292.0 $3,586.3 $3,645.5 $3,820.9 $3,969.7 $2,875.4 $2,798.6 $3,333.5 $3,359.5 $3,035.5 $3,130.0 $5 Year Average Net sales: Year Ending 3,662.9 $3,131.4 $Net Income (as reported) 135.7 $260.3 $176.4 $219.4 $267.7 $(138.6) $269.5 $456.6 $495.9 $263.0 $ Provision for income taxes 64.1 130.3 77.8 62.9 157.9 1.5 136.0 240.2 270.1 154.1 Gain (loss) on divesiture(19.9) Interest expense49.4 48.1 44.8 35.6 39.0 40.2 38.2 36.8 31.1 24.4 Interest income— — — (3.7) (5.6) (2.9) (1.9) Consolidated earnings before interest and taxes (EBIT) 249.2 $438.7 $299.0 $317.9 $464.6 $(116.9) $440.0 $728.0 $794.2 $439.6 $ EBIT attributable to Steel54.8 219.8 206.7 213.1 264.0 (57.9) 146.1 270.7 251.8 140.2 EBIT—The Timken Company194.5 $218.9 $92.3 $104.8 $200.6 $(59.0) $293.9 $457.3 $542.4 $299.4 $ EBIT—The Timken Company (Ex. Steel) % to Net Sales 5.9% 6.1% 2.5% 2.7% 5.1% -2.1% 10.5% 13.7% 16.1% 9.9% Adjustments: Steel separation-related costs13.0 Gain on sale of real estate in Brazil(5.4) Cost-reduction initiatives and plant rationalization costs27.0 17.3 24.4 34.5 5.8 11.1 28.0 22.0 28.8 16.5 Loss on divestitures64.3 0.5 (0.0) 19.9 Impairment and restructuring13.4 26.1 44.9 40.4 64.4 216.7 Other Special Items, including CDSOA expense (receipts) (43.0) (85.4) (94.7) (13.2) (29.3) 2.0 (2.3) (2.4) (108.0) 2.8 Total Adjustments (2.5) $(42.1) $38.9 $62.2 $40.8 $249.7 $25.7 $19.6 $(79.2) $26.9 $Adjusted EBIT—The Timken Company (Ex. Steel)192.0 $176.9 $131.2 $167.0 $241.4 $190.8 $319.6 $476.9 $463.2 $326.3 $ Adjusted EBIT—The Timken Company (Ex. Steel) % to Net Sales 5.8% 4.9% 3.6% 4.4% 6.1% 6.6% 11.4% 14.3% 13.8% 10.7% 12.0% 5 Year Average Adjusted EBIT Margin: Year Ending 5.0% 12.5% Twelve Months Ended December 31,
|
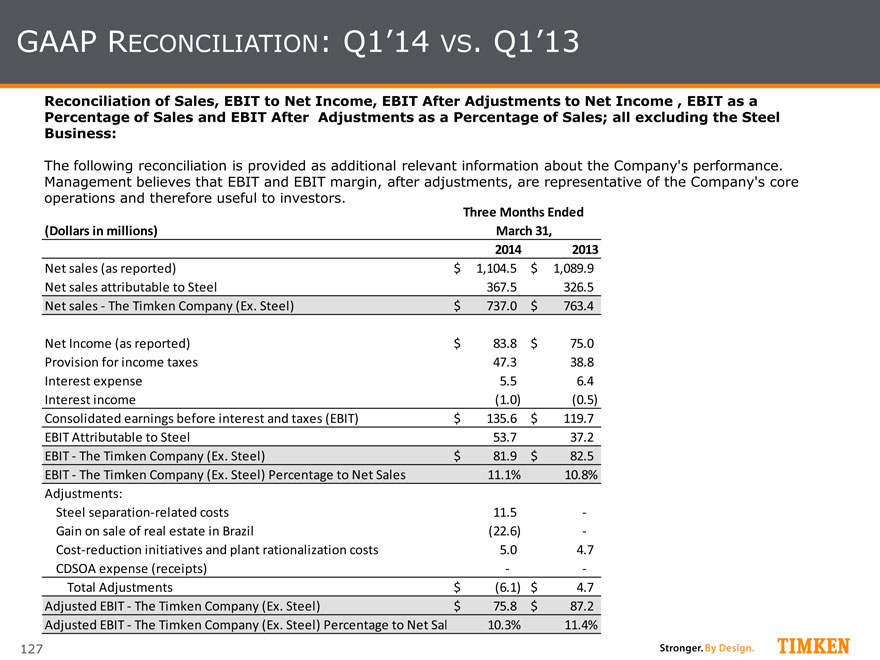
127
GAAP RECONCILIATION: Q1’14 VS. Q1’13
Reconciliation of Sales, EBIT to Net Income, EBIT After Adjustments to Net Income, EBIT as a Percentage of Sales and EBIT After Adjustments as a Percentage of Sales; all excluding the Steel Business:
The following reconciliation is provided as additional relevant information about the Company’s performance. Management believes that EBIT and EBIT margin, after adjustments, are representative of the Company’s core operations and therefore useful to investors. (Dollars in millions) 2014 2013 Net sales (as reported) 1,104.5 $ 1,089.9 $ Net sales attributable to Steel 367.5 326.5 Net sales—The Timken Company (Ex. Steel) 737.0 $ 763.4 $ Net Income (as reported) 83.8 $75.0 $ Provision for income taxes 47.3 38.8 Interest expense 5.5 6.4 Interest income (1.0) (0.5) Consolidated earnings before interest and taxes (EBIT) 135.6 $ 119.7 $ EBIT Attributable to Steel 53.7 37.2 EBIT—The Timken Company (Ex. Steel) 81.9 $ 82.5 $ EBIT—The Timken Company (Ex. Steel) Percentage to Net Sales 11.1% 10.8%Adjustments: Steel separation-related costs 11.5—Gain on sale of real estate in Brazil (22.6)—Cost-reduction initiatives and plant rationalization costs 5.0 4.7 CDSOA expense (receipts)— Total Adjustments (6.1) $ 4.7 $ Adjusted EBIT—The Timken Company (Ex. Steel) 75.8 $ 87.2 $ Adjusted EBIT—The Timken Company (Ex. Steel) Percentage to Net Sales 10.3% 11.4% Three Months Ended March 31,
|
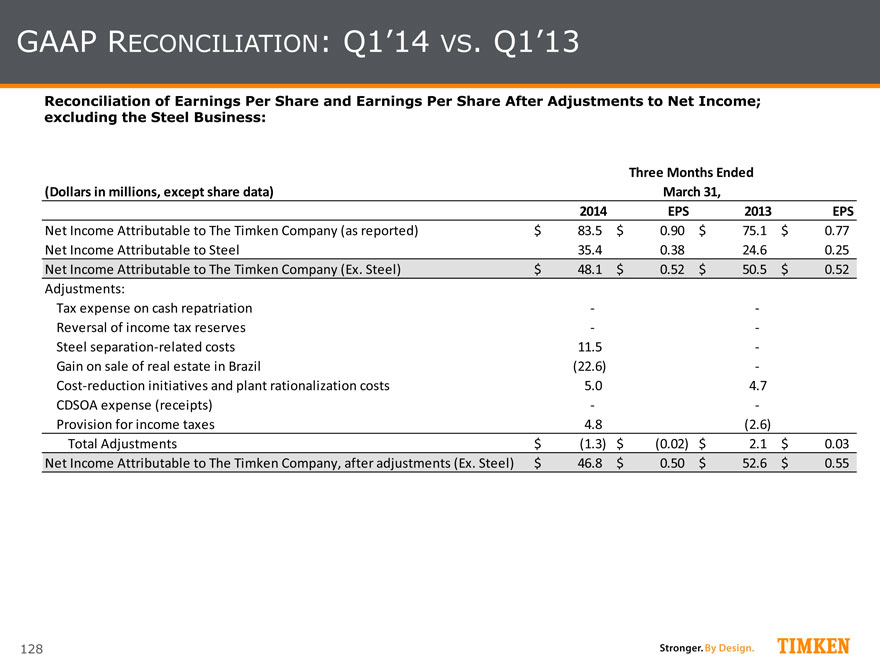
128
GAAP RECONCILIATION: Q1’14 VS. Q1’13
Reconciliation of Earnings Per Share and Earnings Per Share After Adjustments to Net Income; excluding the Steel Business: (Dollars in millions, except share data) 2014 EPS 2013 EPS Net Income Attributable to The Timken Company (as reported) 83.5 $ 0.90 $ 75.1 $ 0.77 $ Net Income Attributable to Steel 35.4 0.38 24.6 0.25 Net Income Attributable to The Timken Company (Ex. Steel) 48.1 $ 0.52 $ 50.5 $ 0.52 $ Adjustments: Tax expense on cash repatriation — Reversal of income tax reserves — Steel separation-related costs 11.5 — Gain on sale of real estate in Brazil (22.6) — Cost-reduction initiatives and plant rationalization costs 5.0 4.7 CDSOA expense (receipts) — Provision for income taxes 4.8 (2.6) Total Adjustments (1.3) $ (0.02) $ 2.1 $ 0.03 $ Net Income Attributable to The Timken Company, after adjustments (Ex. Steel) 46.8 $ 0.50 $ 52.6 $ 0.55 $ Three Months Ended March 31,
|
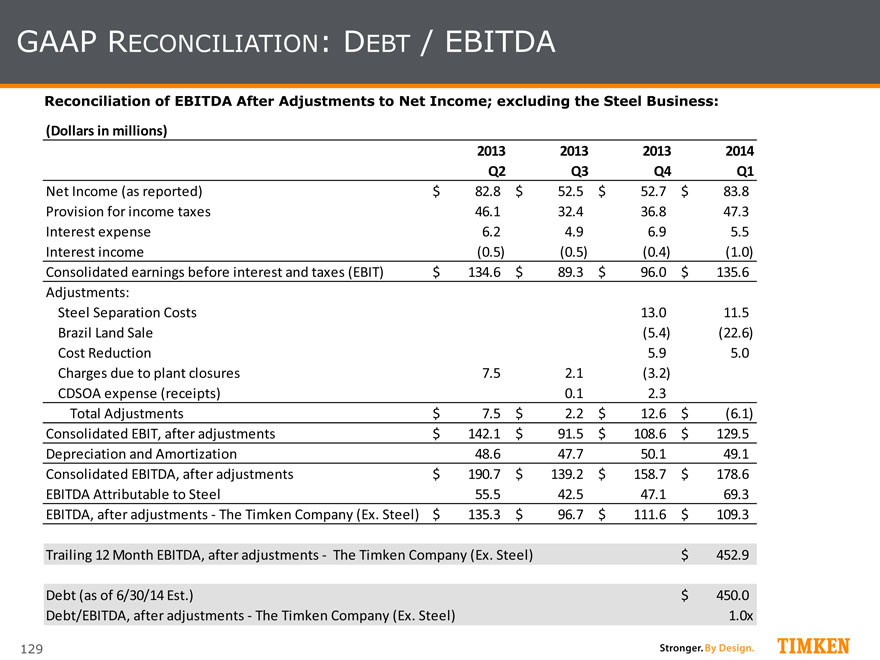
129
GAAP RECONCILIATION: DEBT / EBITDA
Reconciliation of EBITDA After Adjustments to Net Income; excluding the Steel Business: (Dollars in millions)2013201320132014Q2Q3Q4Q1Net Income (as reported)82.8$ 52.5$ 52.7$ 83.8$ Provision for income taxes46.1 32.4 36.8 47.3 Interest expense6.2 4.9 6.9 5.5 Interest income(0.5) (0.5) (0.4) (1.0) Consolidated earnings before interest and taxes (EBIT)134.6$ 89.3$ 96.0$ 135.6$ Adjustments: Steel Separation Costs13.0 11.5 Brazil Land Sale(5.4) (22.6) Cost Reduction5.9 5.0 Charges due to plant closures7.5 2.1 (3.2) CDSOA expense (receipts)0.1 2.3 Total Adjustments7.5$ 2.2$ 12.6$ (6.1)$ Consolidated EBIT, after adjustments142.1$ 91.5$ 108.6$ 129.5$ Depreciation and Amortization48.6 47.7 50.1 49.1 Consolidated EBITDA, after adjustments190.7$ 139.2$ 158.7$ 178.6$ EBITDA Attributable to Steel55.5 42.5 47.1 69.3 EBITDA, after adjustments—The Timken Company (Ex. Steel)135.3$ 96.7$ 111.6$ 109.3$ Trailing 12 Month EBITDA, after adjustments—The Timken Company (Ex. Steel)452.9$ Debt (as of 6/30/14 Est.)450.0$ Debt/EBITDA, after adjustments—The Timken Company (Ex. Steel)1.0x
|
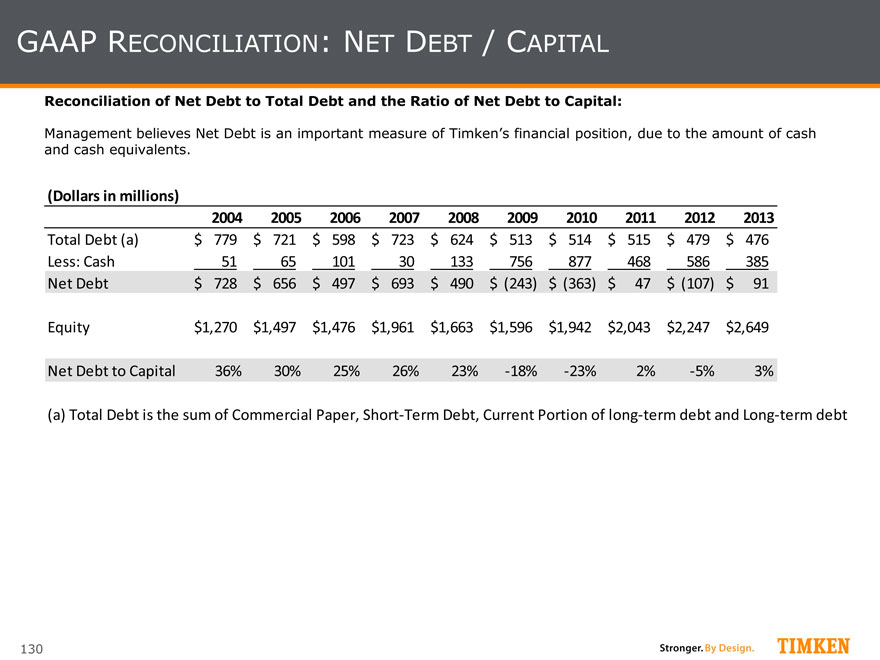
130
GAAP RECONCILIATION: NET DEBT / CAPITAL
Reconciliation of Net Debt to Total Debt and the Ratio of Net Debt to Capital:
Management believes Net Debt is an important measure of Timken’s financial position, due to the amount of cash and cash equivalents. (Dollars in millions)2004200520062007200820092010201120122013Total Debt (a)779$ 721$ 598$ 723$ 624$ 513$ 514$ 515$ 479$ 476$ Less: Cash51 65 101 30 133 756 877 468 586 385 Net Debt728$ 656$ 497$ 693$ 490$ (243)$ (363)$ 47$ (107)$ 91$ Equity1,270$ 1,497$ 1,476$ 1,961$ 1,663$ 1,596$ 1,942$ 2,043$ 2,247$ 2,649$ Net Debt to Capital36%30%25%26%23%-18%-23%2%-5%3%(a) Total Debt is the sum of Commercial Paper, Short-Term Debt, Current Portion of long-term debt and Long-term debt
|
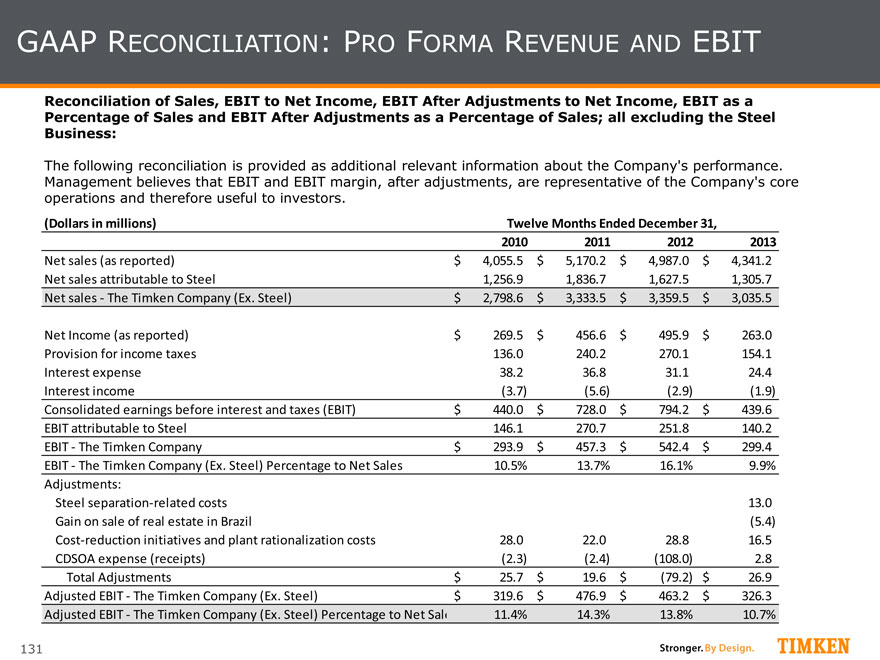
131
GAAP RECONCILIATION: PRO FORMA REVENUE AND EBIT
Reconciliation of Sales, EBIT to Net Income, EBIT After Adjustments to Net Income, EBIT as a Percentage of Sales and EBIT After Adjustments as a Percentage of Sales; all excluding the Steel Business:
The following reconciliation is provided as additional relevant information about the Company’s performance. Management believes that EBIT and EBIT margin, after adjustments, are representative of the Company’s core operations and therefore useful to investors. (Dollars in millions)2010201120122013Net sales (as reported)4,055.5$ 5,170.2$ 4,987.0$ 4,341.2$ Net sales attributable to Steel1,256.9 1,836.7 1,627.5 1,305.7 Net sales—The Timken Company (Ex. Steel)2,798.6$ 3,333.5$ 3,359.5$ 3,035.5$ Net Income (as reported)269.5$ 456.6$ 495.9$ 263.0$ Provision for income taxes136.0 240.2 270.1 154.1 Interest expense38.2 36.8 31.1 24.4 Interest income(3.7) (5.6) (2.9) (1.9) Consolidated earnings before interest and taxes (EBIT)440.0$ 728.0$ 794.2$ 439.6$ EBIT attributable to Steel146.1 270.7 251.8 140.2 EBIT—The Timken Company293.9$ 457.3$ 542.4$ 299.4$ EBIT—The Timken Company (Ex. Steel) Percentage to Net Sales10.5%13.7%16.1%9.9%Adjustments: Steel separation-related costs13.0 Gain on sale of real estate in Brazil(5.4) Cost-reduction initiatives and plant rationalization costs28.0 22.0 28.8 16.5 CDSOA expense (receipts)(2.3) (2.4) (108.0) 2.8 Total Adjustments25.7$ 19.6$ (79.2)$ 26.9$ Adjusted EBIT—The Timken Company (Ex. Steel)319.6$ 476.9$ 463.2$ 326.3$ Adjusted EBIT—The Timken Company (Ex. Steel) Percentage to Net Sales11.4%14.3%13.8%10.7%Twelve Months Ended December 31,
|
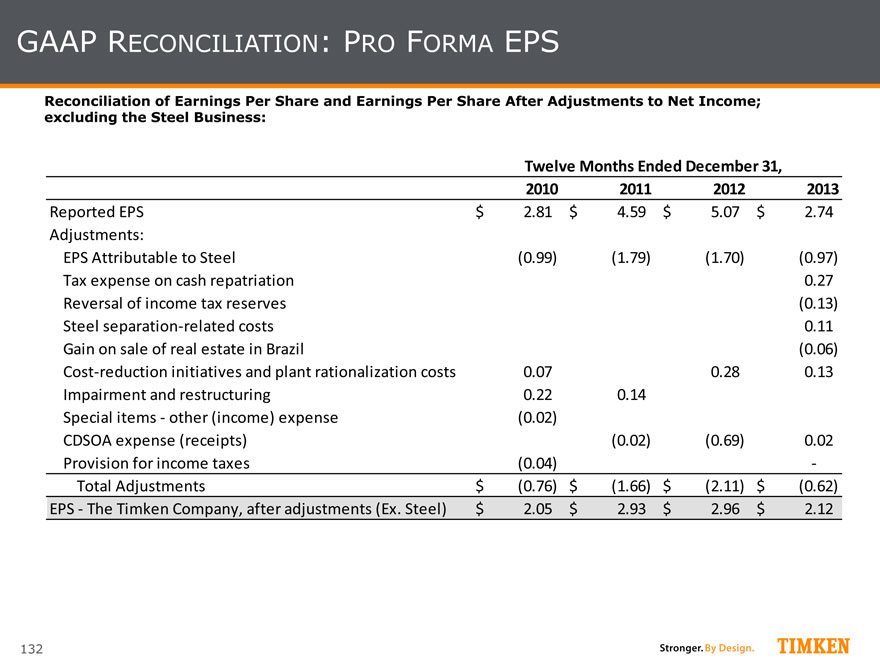
132
GAAP RECONCILIATION: PRO FORMA EPS
Reconciliation of Earnings Per Share and Earnings Per Share After Adjustments to Net Income; excluding the Steel Business: 2010 2011 2012 2013 Reported EPS 2.81 $4.59 $5.07 $2.74 $ Adjustments: EPS Attributable to Steel (0.99) (1.79) (1.70) (0.97) Tax expense on cash repatriation0.27 Reversal of income tax reserves(0.13) Steel separation-related costs0.11 Gain on sale of real estate in Brazil (0.06) Cost-reduction initiatives and plant rationalization costs0.07 0.28 0.13 Impairment and restructuring0.22 0.14 Special items—other (income) expense(0.02) CDSOA expense (receipts)(0.02) (0.69) 0.02 Provision for income taxes(0.04)—Total Adjustments (0.76) $(1.66) $(2.11) $(0.62) $ EPS—The Timken Company, after adjustments (Ex. Steel) 2.05 $2.93 $2.96 $2.12 $ Twelve Months Ended December 31,
|
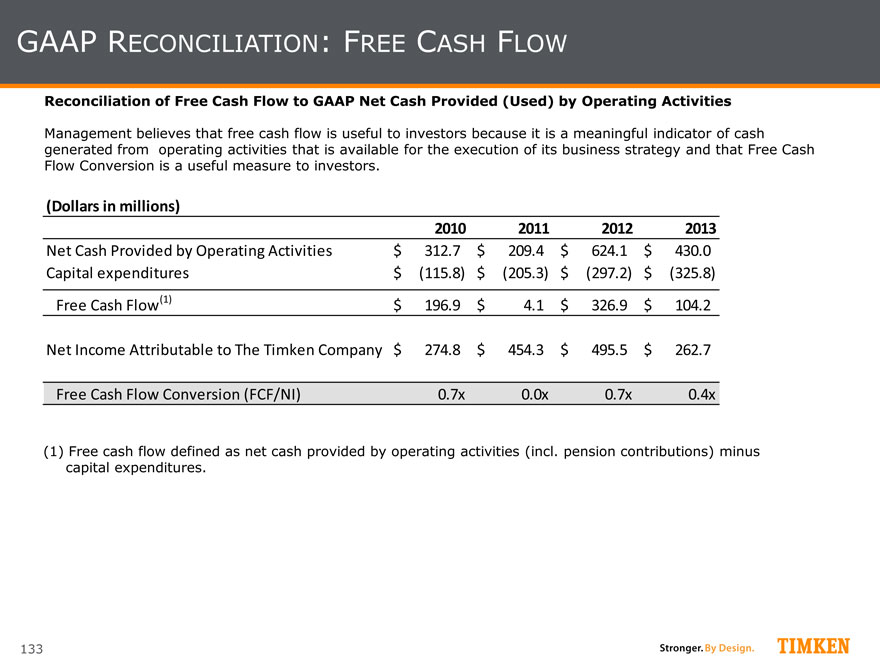
133
GAAP RECONCILIATION: FREE CASH FLOW
Reconciliation of Free Cash Flow to GAAP Net Cash Provided (Used) by Operating Activities
Management believes that free cash flow is useful to investors because it is a meaningful indicator of cash generated from operating activities that is available for the execution of its business strategy and that Free Cash Flow Conversion is a useful measure to investors.
(1) Free cash flow defined as net cash provided by operating activities (incl. pension contributions) minus capital expenditures. (Dollars in millions)2010201120122013Net Cash Provided by Operating Activities 312.7$ 209.4$ 624.1$ 430.0$ Capital expenditures(115.8)$ (205.3)$ (297.2)$ (325.8)$ Free Cash Flow(1)196.9$ 4.1$ 326.9$ 104.2$ Net Income Attributable to The Timken Company274.8$ 454.3$ 495.5$ 262.7$ Free Cash Flow Conversion (FCF/NI)0.7x0.0x0.7x0.4x
|

134
GAAP RECONCILIATION: SEGMENT ADJUSTED EBIT
Reconciliation of EBIT After Adjustments and EBIT as a Percentage of Sales:
The following reconciliation is provided as additional relevant information about the Company’s performance. Management believes that EBIT and EBIT margin, after adjustments, are representative of the Company’s core operations and therefore useful to investors.
* Special items include: restructuring, rationalization and impairment costs, cost reduction initiative related expenses and gain on land sale (Dollars in millions)2013Mobile IndustriesTotal net sales1,475$ Earnings before interest and taxes (EBIT)165$ EBIT Margin11.2%Special Items*(11)$ Adjusted EBIT—Excluding Special Items176$ Adjusted EBIT Margin11.9%Process Industries Total net sales1,236$ Earnings before interest and taxes (EBIT)202$ EBIT Margin16.4%Special Items*(5)$ Adjusted EBIT—Excluding Special Items207$ Adjusted EBIT Margin16.8%AerospaceTotal net sales330$ Earnings before interest and taxes (EBIT)27$ EBIT Margin8.1%Special Items*(3)$ Adjusted EBIT—Excluding Special Items30$ Adjusted EBIT Margin9.0%