Exhibit 99.2
|
Exhibit 99.2
THE TIMKEN COMPANY
2Q 2014 EARNINGS
JULY 31, 2014
|

EARNINGS CALL DETAILS
Timken 2Q 2014 Conference Call Schedule
Conference Call: Thursday – July 31, 2014
11:00 a.m. Eastern Time
Live Dial-In: 800-344-6698 or 785-830-7979
(Call in 10 minutes prior to be included.)
Conference ID: Timken Earnings Call
Replay: Replay Dial-In available through August 14, 2014:
888-203-1112 or 719-457-0820
(Replay available approx. two hours after the live call.)
Replay Passcode: 2219857
Live Webcast: www.timken.com/investors
2
|
FORWARD-LOOKING STATEMENTS SAFE HARBOR AND
NON-GAAP FINANCIAL INFORMATION
Certain statements in this presentation (including statements regarding the company’s forecasts, beliefs, estimates and expectations) that are not historical in nature are “forward-looking” statements within the meaning of the
Private Securities Litigation Reform Act of 1995. In particular, the statements related to Timken’s plans, outlook, future financial performance, targets, projected sales, cash flows, liquidity and expectations regarding the future financial performance of the company, including the information under the headings “2Q 2014 Highlights”, “DeltaX”, “Performance Improvement” and “2014 Full-Year Outlook” are forward-looking. The company cautions that actual results may differ materially from those projected or implied in forward-looking statements due to a variety of important factors, including: the company’s ability to respond to the changes in its end markets that could affect demand for the company’s products; unanticipated changes in business relationships with customers or their purchases from the company; changes in the financial health of the company’s customers, which may have an impact on the company’s revenues, earnings and impairment charges; fluctuations in raw-material and energy costs; the impact of the company’s last-in, first-out accounting; weakness in global or regional economic conditions and financial markets; changes in the expected costs associated with product warranty claims; the ability to integrate acquired companies to achieve satisfactory operating results; the impact on operations of general economic conditions; fluctuations in customer demand; the impact on the company’s pension obligations due to the changes in interest rates or investment performance, the company’s ability to complete and achieve the benefits of its announced plans, programs, initiatives and capital investments; the taxable nature of the spinoff; and the company’s ability to realize the potential benefits of the spinoff of the steel business and avoid possible indemnification liabilities under certain agreements it entered into with TimkenSteel Corporation in connection with the spinoff. Additional factors are discussed in the company’s filings with the Securities and Exchange Commission, including the company’s annual report on Form 10-K for the year ended Dec. 31, 2013, quarterly reports on Form 10-Q and current reports on Form 8-K. Except as required by the federal securities laws, the company undertakes no obligation to publicly update or revise any forward-looking statement, whether as a result of new information, future events or otherwise.
This presentation includes certain non-GAAP financial measures as defined by the rules and regulations of the Securities and Exchange Commission. Reconciliation of those measures to the most directly comparable GAAP equivalents are provided in the Appendix to this presentation.
3
|

AGENDA
2Q Business & Strategy Update
Rich Kyle – President & CEO
2Q Financial Review
Phil Fracassa – CFO
Q & A with Timken Management
Rich Kyle – President & CEO
Phil Fracassa – CFO
Steve Tschiegg – Director, Capital Markets & Investor Relations
4
|
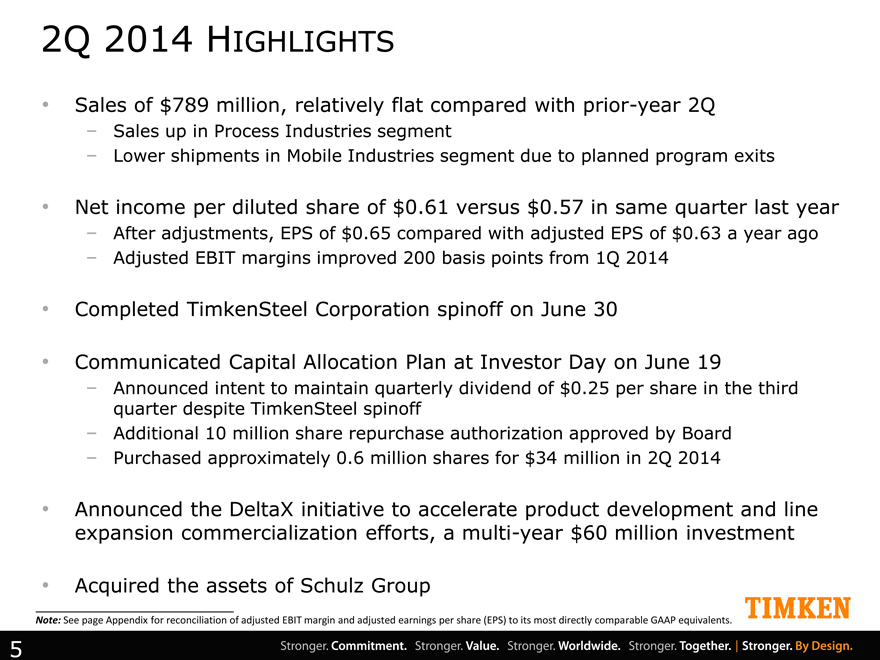
2Q 2014 HIGHLIGHTS
Sales of $789 million, relatively flat compared with prior-year 2Q
Sales up in Process Industries segment
Lower shipments in Mobile Industries segment due to planned program exits
Net income per diluted share of $0.61 versus $0.57 in same quarter last year
After adjustments, EPS of $0.65 compared with adjusted EPS of $0.63 a year ago
Adjusted EBIT margins improved 200 basis points from 1Q 2014
Completed TimkenSteel Corporation spinoff on June 30
Communicated Capital Allocation Plan at Investor Day on June 19
Announced intent to maintain quarterly dividend of $0.25 per share in the third quarter despite TimkenSteel spinoff
Additional 10 million share repurchase authorization approved by Board
Purchased approximately 0.6 million shares for $34 million in 2Q 2014
Announced the DeltaX initiative to accelerate product development and line expansion commercialization efforts, a multi-year $60 million investment
Acquired the assets of Schulz Group
Note: See page Appendix for reconciliation of adjusted EBIT margin and adjusted earnings per share (EPS) to its most directly comparable GAAP equivalents.
5
|
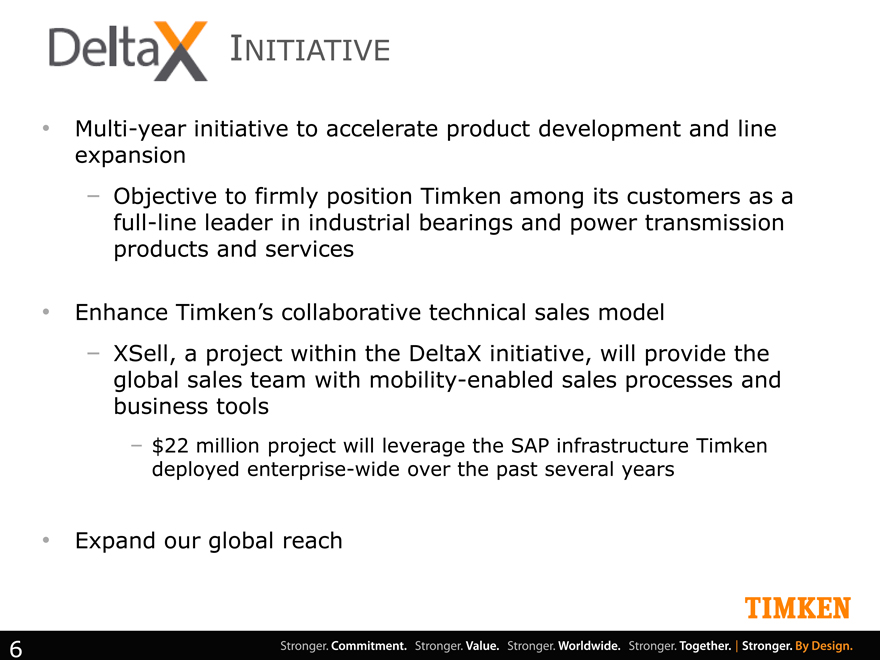
INITIATIVE
Multi-year initiative to accelerate product development and line expansion
Objective to firmly position Timken among its customers as a full-line leader in industrial bearings and power transmission products and services
Enhance Timken’s collaborative technical sales model
XSell, a project within the DeltaX initiative, will provide the global sales team with mobility-enabled sales processes and business tools
$22 million project will leverage the SAP infrastructure Timken deployed enterprise-wide over the past several years
Expand our global reach
6
|

SCHULZ GROUP ACQUISITION
Industrial Services: provides electric motor & generator repairs and motor rewinds for a broad range of commercial and industrial applications
U.S. Markets Sectors Served: nuclear, hydro and fossil, fuel power generator, water management, paper mills & general manufacturing
2013 sales of approx. $18 million
Based in New Haven, CT, with ~125 employees
Strategic Fit: advances industrial services capabilities, expanding geographic reach and servicing within the nuclear and hydro market sectors
The acquisitions of Philadelphia Gear, Wazee, Smith Services, Standard Machine, and now Schulz Group allow Timken to provide industrial services across US and Canada with a growing international presence
7
|

FINANCIAL REVIEW
|
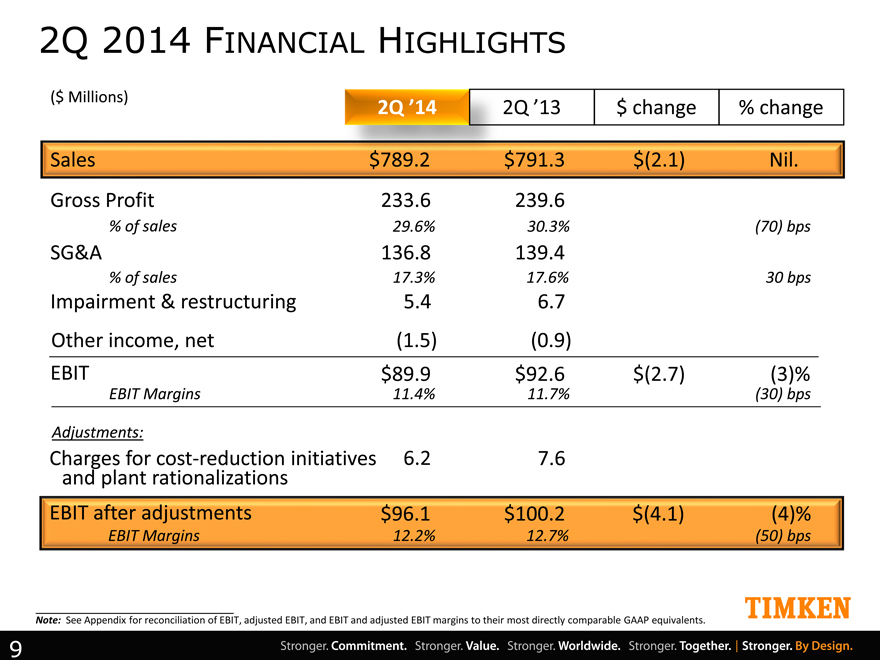
2Q 2014 FINANCIAL HIGHLIGHTS
($ Millions) 2Q ’14 2Q ’13 $ change % change
Sales $789.2 $791.3 $(2.1) Nil.
Gross Profit 233.6 239.6
% of sales 29.6% 30.3% (70) bps
SG&A 136.8 139.4
% of sales 17.3% 17.6% 30 bps
Impairment & restructuring 5.4 6.7
Other income, net (1.5) (0.9)
EBIT $89.9 $92.6 $(2.7) (3)%
EBIT Margins 11.4% 11.7% (30) bps
Adjustments:
Charges for cost-reduction initiatives 6.2 7.6
and plant rationalizations
EBIT after adjustments $ 96.1 $100.2 $(4.1) (4)%
EBIT Margins 12.2% 12.7% (50) bps
Note: See Appendix for reconciliation of EBIT, adjusted EBIT, and EBIT and adjusted EBIT margins to their most directly comparable GAAP equivalents.
9
|
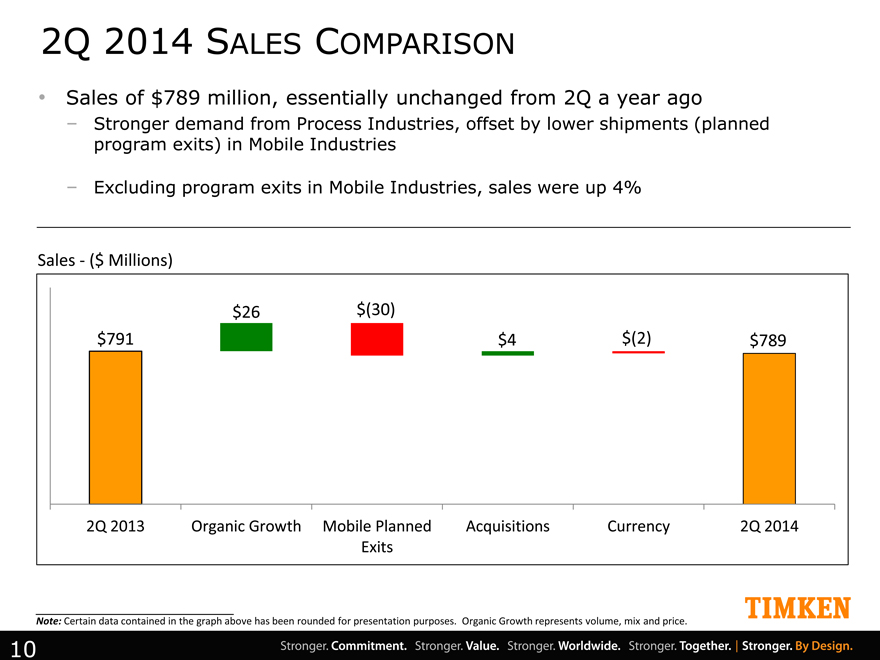
2Q 2014 SALES COMPARISON
Sales of $789 million, essentially unchanged from 2Q a year ago
Stronger demand from Process Industries, offset by lower shipments (planned program exits) in Mobile Industries
Excluding program exits in Mobile Industries, sales were up 4%
Sales - ($ Millions)
$26 $(30) $791 $4 $(2) $789
2Q 2013 Organic Growth Mobile Planned Acquisitions Currency 2Q 2014 Exits
Note: Certain data contained in the graph above has been rounded for presentation purposes. Organic Growth represents volume, mix and price.
10
|
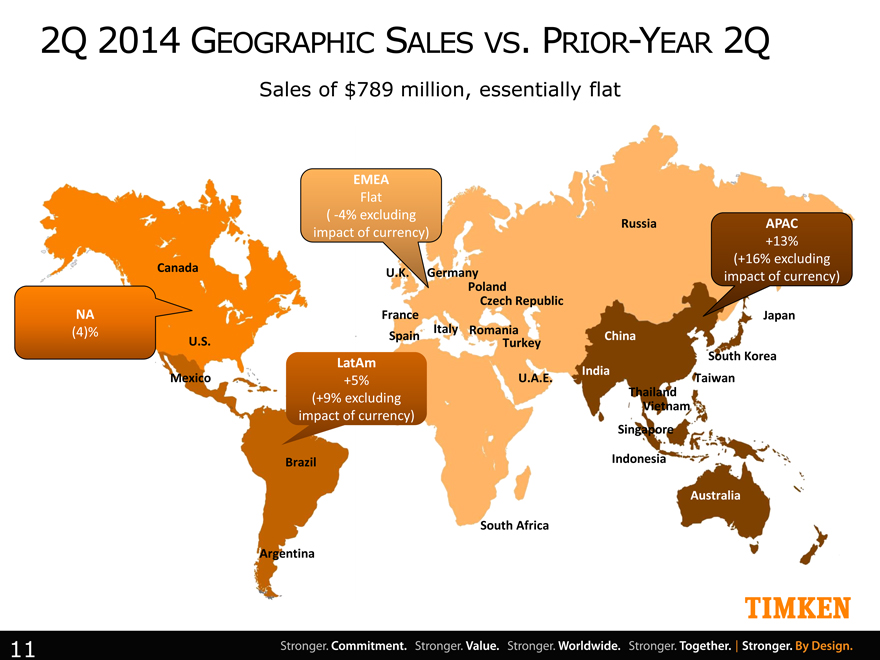
2Q 2014 GEOGRAPHIC SALES VS. PRIOR-YEAR 2Q
Sales of $789 million, essentially flat
EMEA
Flat
( -4% excluding impact of currency)
NA
(4)%
Canada
U.S.
Mexico
Spain
LatAm
+5%
(+9% excluding
impact of currency)
Brazil
Argentina
South Africa
U.K. Germany Poland
Czech Republic France Italy Romania Turkey
U.A.E. Russia
Japan China South Korea India Taiwan Thailand Vietnam
Singapore
Indonesia
Australia
APAC
+13% (+16% excluding impact of currency)
11
|
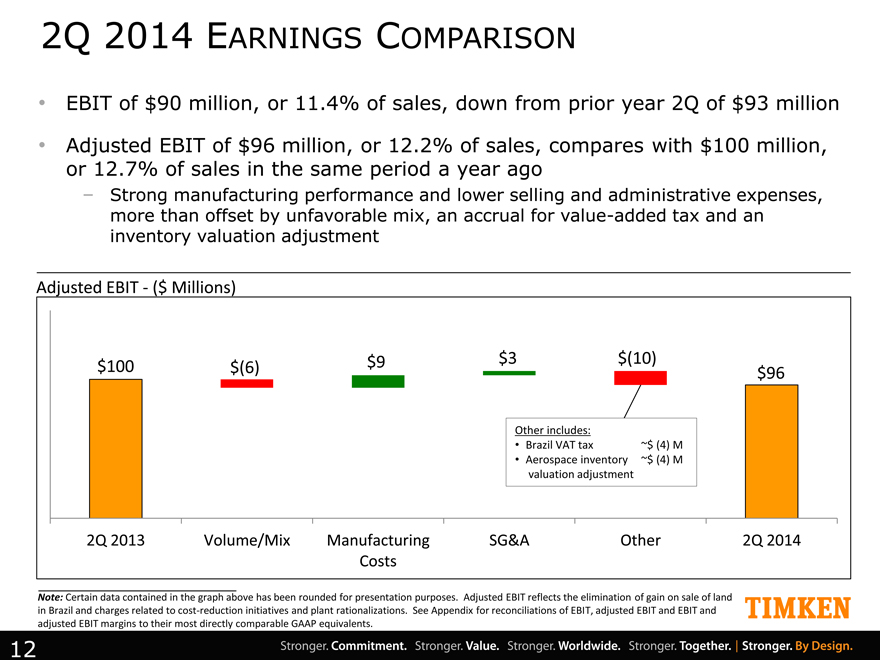
2Q 2014 EARNINGS COMPARISON
EBIT of $90 million, or 11.4% of sales, down from prior year 2Q of $93 million
Adjusted EBIT of $96 million, or 12.2% of sales, compares with $100 million, or 12.7% of sales in the same period a year ago
Strong manufacturing performance and lower selling and administrative expenses, more than offset by unfavorable mix, an accrual for value-added tax and an inventory valuation adjustment
Adjusted EBIT - ($ Millions)
$100 $(6) $9 $3 $(10) $96
Other includes:
Brazil VAT tax ~$ (4) M
Aerospace inventory ~$ (4) M
valuation adjustment
2Q 2013 Volume/Mix Manufacturing SG&A Other 2Q 2014
Costs
Note: Certain data contained in the graph above has been rounded for presentation purposes. Adjusted EBIT reflects the elimination of gain on sale of land in Brazil and charges related to cost-reduction initiatives and plant rationalizations. See Appendix for reconciliations of EBIT, adjusted EBIT and EBIT and adjusted EBIT margins to their most directly comparable GAAP equivalents.
12
|
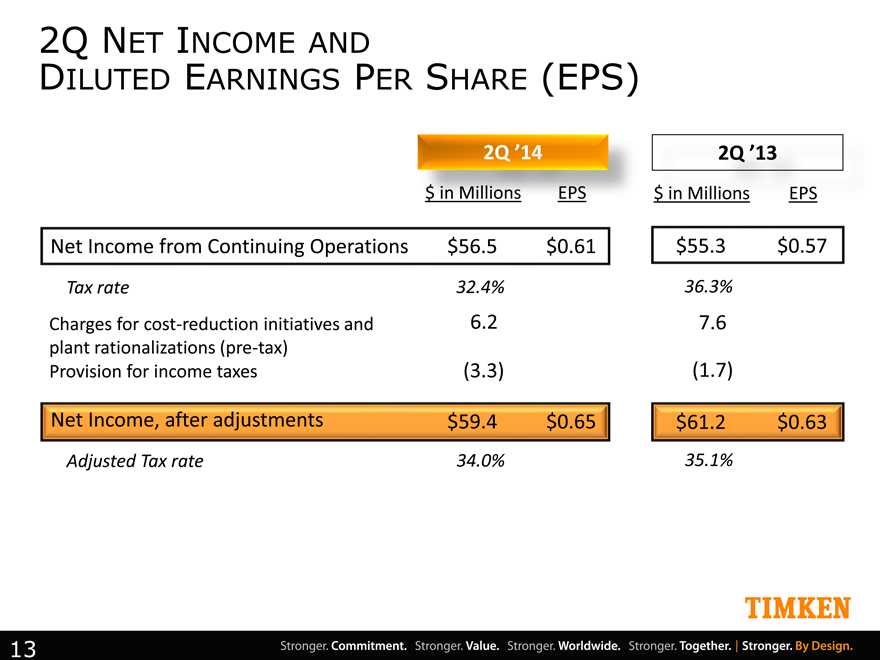
2Q NET INCOME AND
DILUTED EARNINGS PER SHARE (EPS)
2Q ’14 2Q ’13
$ in Millions EPS $ in Millions EPS
Net Income from Continuing Operations $56.5 $ 0.61
Tax rate 32.4% 36.3%
Charges for cost-reduction initiatives and 6.2 7.6
plant rationalizations (pre-tax)
Provision for income taxes (3.3) (1.7)
Net Income, after adjustments $59.4 $ 0.65 $61.2 $0.63
Adjusted Tax rate 34.0% 35.1%
13
|
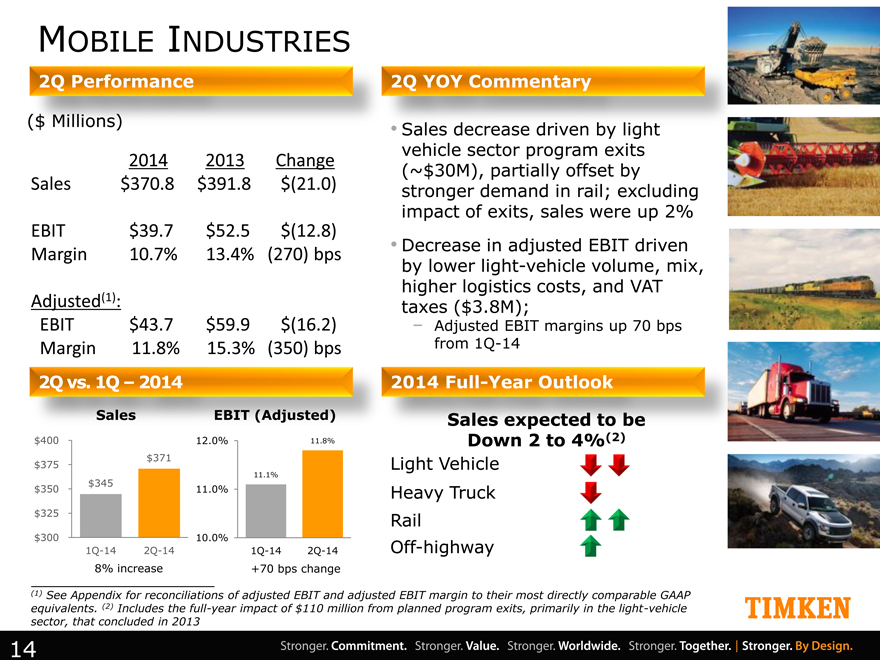
MOBILE INDUSTRIES
2014 2013 Change
Sales $370.8 $391.8 $(21.0)
EBIT $39.7 $52.5 $(12.8)
Margin 10.7% 13.4% (270) bps
Adjusted(1):
EBIT $43.7 $59.9 $(16.2)
Margin 11.8% 15.3% (350) bps
2Q vs. 1Q – 2014
Sales EBIT (Adjusted)
$400 12.0% 11.8%
$375 $ 371
11.1%
$ 345
$350 11.0%
$325
$300 10.0%
1Q-14 2Q-14 1Q-14 2Q-14
8% increase +70 bps change
2Q YOY Commentary
Sales decrease driven by light vehicle sector program exits
(~$30M), partially offset by stronger demand in rail; excluding impact of exits, sales were up 2%
Decrease in adjusted EBIT driven by lower light-vehicle volume, mix, higher logistics costs, and VAT taxes ($3.8M);
Adjusted EBIT margins up 70 bps from 1Q-14
2014 Full-Year Outlook
Down 2 to 4%
Light Vehicle Heavy Truck Rail Off-highway
(1) See Appendix for reconciliations of adjusted EBIT and adjusted EBIT margin to their most directly comparable GAAP equivalents. (2) Includes the full-year impact of $110 million from planned program exits, primarily in the light-vehicle sector, that concluded in 2013
2Q Performance ($ Millions) Sales expected to be Down 2 to 4%(2)
14
|
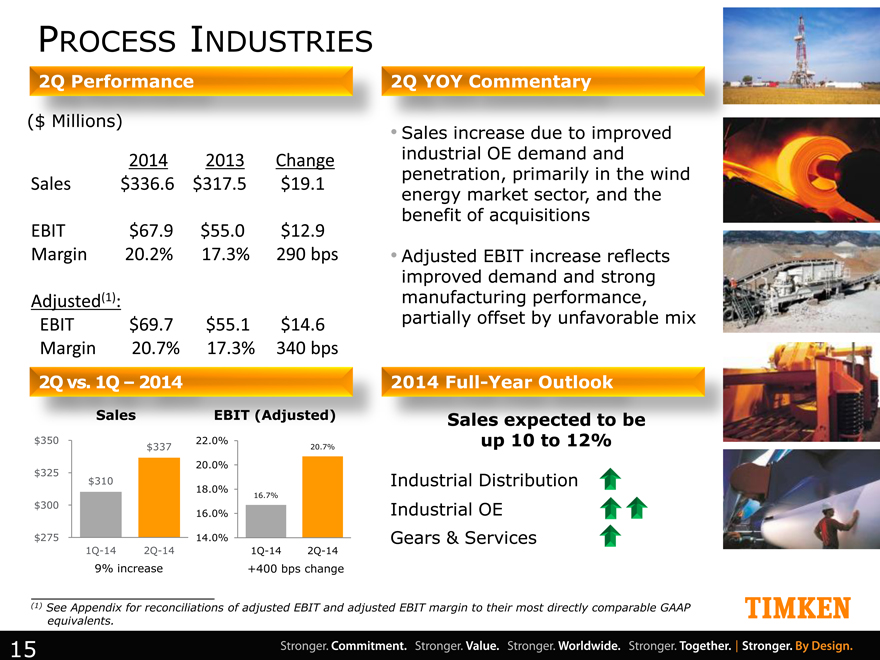
PROCESS INDUSTRIES
2Q Performance
2014 2013 Change
Sales $336.6 $317.5 $19.1
EBIT $67.9 $55.0 $12.9
Margin 20.2% 17.3% 290 bps
Adjusted(1):
EBIT $69.7 $55.1 $14.6
Margin 20.7% 17.3% 340 bps
2Q vs. 1Q – 2014
Sales EBIT (Adjusted)
$350 22.0%
$337 20.7%
20.0%
$325
$ 310
18.0% 16.7%
$300
16.0%
$275 14.0%
1Q-14 2Q-14 1Q-14 2Q-14
9% increase +400 bps change
2Q YOY Commentary
Sales increase due to improved industrial OE demand and penetration, primarily in the wind energy market sector, and the benefit of acquisitions Adjusted EBIT increase reflects improved demand and strong manufacturing performance, partially offset by unfavorable mix
2014 Full-Year Outlook
Sales expected to be up 10 to 12%
up 10 to 12%
Industrial Distribution Industrial OE
Gears & Services
See Appendix for reconciliations of adjusted EBIT and adjusted EBIT margin to their most directly comparable GAAP equivalents.
2Q Performance ($ Millions)
15
|
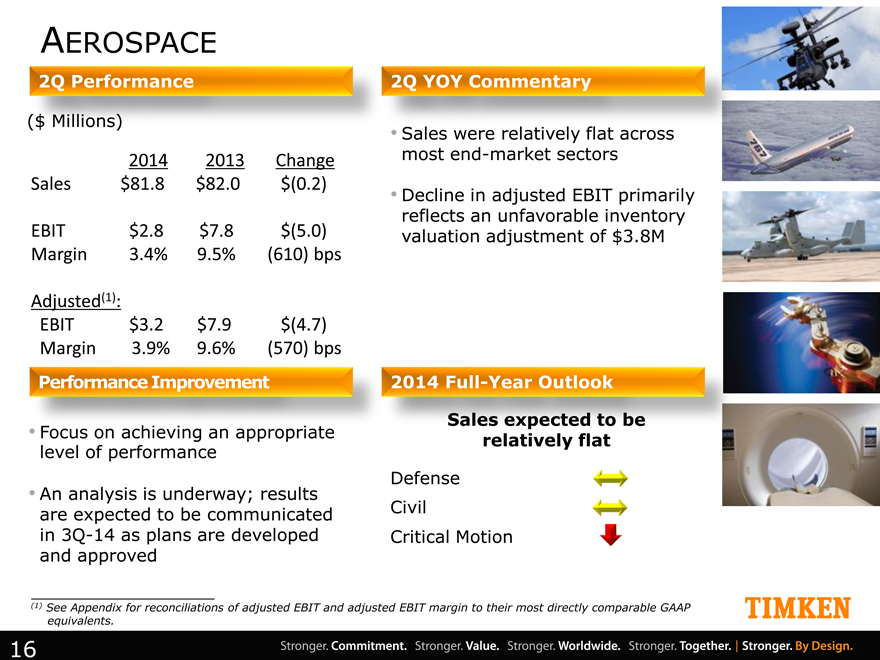
AEROSPACE
2Q Performance
2014 2013 Change
Sales $81.8 $82.0 $(0.2)
EBIT $2.8 $7.8 $(5.0)
Margin 3.4% 9.5% (610) bps
Adjusted(1):
EBIT $3.2 $7.9 $(4.7)
Margin 3.9% 9.6% (570) bps
Performance Improvement
Focus on achieving an appropriate
level of performance
An analysis is underway; results
are expected to be communicated
in 3Q-14 as plans are developed
and approved
2Q YOY Commentary
Sales were relatively flat across
most end-market sectors
Decline in adjusted EBIT primarily reflects an unfavorable inventory valuation adjustment of $3.8M
2014 Full-Year Outlook
relatively flat
Defense Civil Critical Motion
(1) See Appendix for reconciliations of adjusted EBIT and adjusted EBIT margin to their most directly comparable GAAP equivalents.
Sales expected to be relatively flat ($ Millions)
16
|
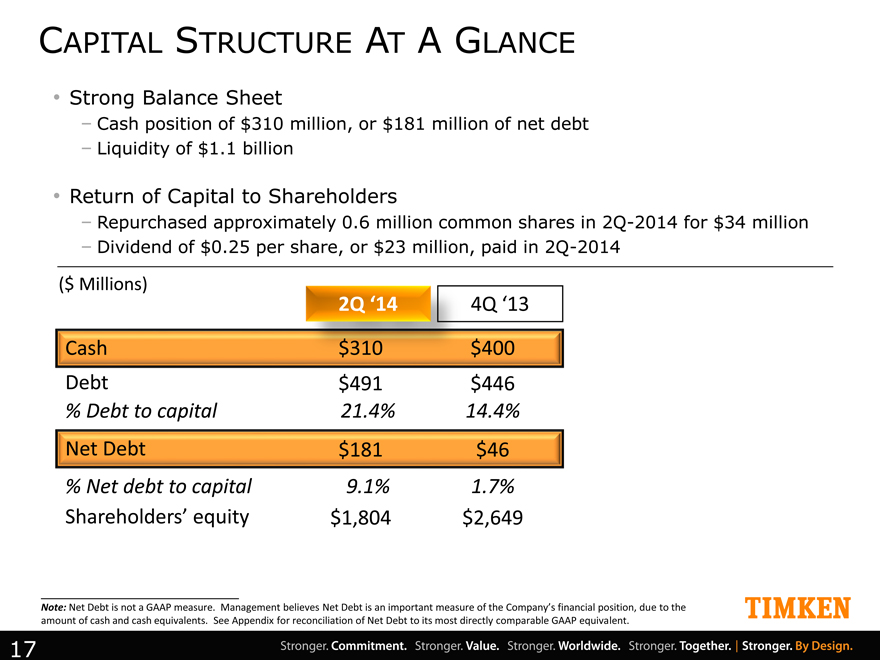
CAPITAL STRUCTURE AT A GLANCE
Strong Balance Sheet
Cash position of $310 million, or $181 million of net debt
Liquidity of $1.1 billion
Return of Capital to Shareholders
Repurchased approximately 0.6 million common shares in 2Q-2014 for $34 million
Dividend of $0.25 per share, or $23 million, paid in 2Q-2014
($ Millions)
2Q ‘14 4Q ‘13
Cash $310 $400
Debt $491 $446
% Debt to capital 21.4% 14.4%
Net Debt $181 $46
% Net debt to capital 9.1% 1.7%
Shareholders’ equity $1,804 $2,649
Note: Net Debt is not a GAAP measure. Management believes Net Debt is an important measure of the Company’s financial position, due to the amount of cash and cash equivalents. See Appendix for reconciliation of Net Debt to its most directly comparable GAAP equivalent.
17
|
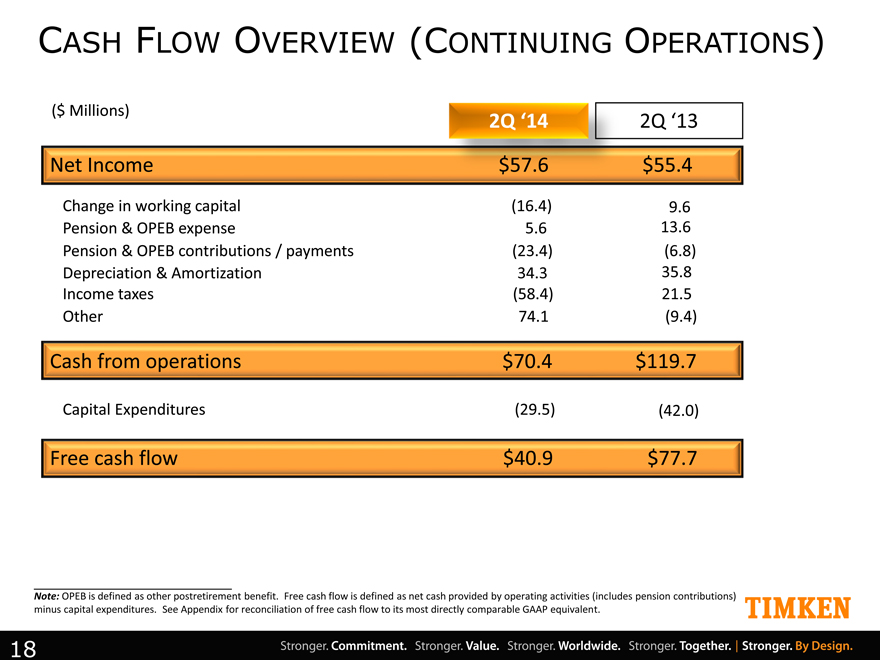
CASH FLOW OVERVIEW (CONTINUING OPERATIONS)
($ Millions) 2Q ‘14 2Q ‘13
Net Income $57.6 $55.4
Change in working capital (16.4) 9.6
Pension & OPEB expense 5.6 13.6
Pension & OPEB contributions / payments (23.4) (6.8)
Depreciation & Amortization 34.3 35.8
Income taxes (58.4) 21.5
Other 74.1 (9.4)
Cash from operations $70.4 $119.7
Capital Expenditures (29.5) (42.0)
Free cash flow $40.9 $77.7
Note: OPEB is defined as other postretirement benefit. Free cash flow is defined as net cash provided by operating activities (includes pension contributions) minus capital expenditures. See Appendix for reconciliation of free cash flow to its most directly comparable GAAP equivalent.
18
|
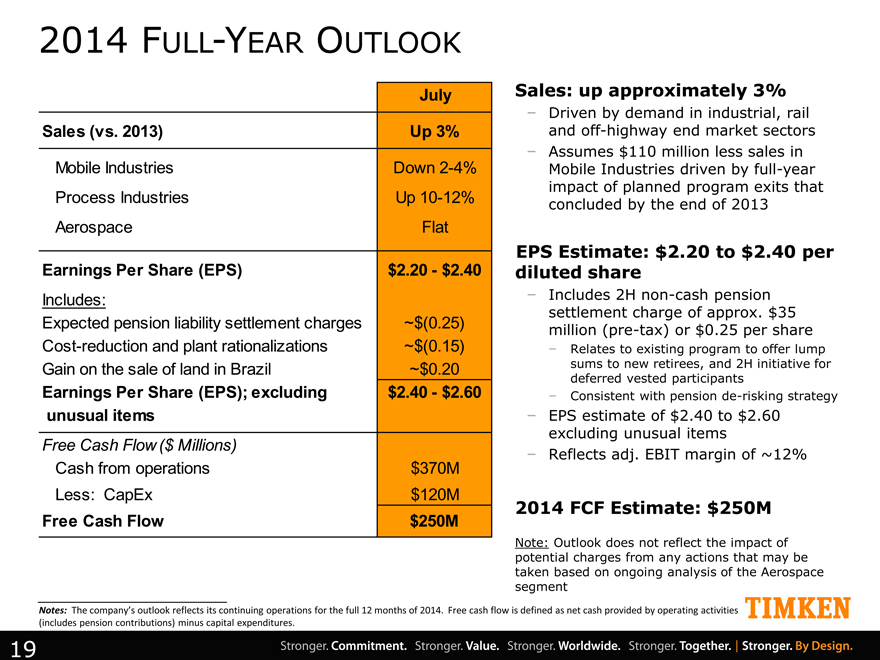
2014 FULL-YEAR OUTLOOK
July
Sales (vs. 2013) Up 3%
Mobile Industries Down 2-4%
Process Industries Up 10-12%
Aerospace Flat
Earnings Per Share (EPS) $2.20—$2.40
Includes:
Expected pension liability settlement charges ~$(0.25)
Cost-reduction and plant rationalizations ~$(0.15)
Gain on the sale of land in Brazil ~$0.20
Earnings Per Share (EPS); excluding $2.40—$2.60
unusual items
Free Cash Flow ($ Millions)
Cash from operations $370M
Less: CapEx $120M
Free Cash Flow $250M
Sales: up approximately 3%
Driven by demand in industrial, rail and off-highway end market sectors
Assumes $110 million less sales in Mobile Industries driven by full-year impact of planned program exits that concluded by the end of 2013
EPS Estimate: $2.20 to $2.40 per diluted share
Includes 2H non-cash pension settlement charge of approx. $35 million (pre-tax) or $0.25 per share
Relates to existing program to offer lump sums to new retirees, and 2H initiative for deferred vested participants
Consistent with pension de-risking strategy
EPS estimate of $2.40 to $2.60 excluding unusual items
Reflects adj. EBIT margin of ~12%
2014 FCF Estimate: $250M
Note: Outlook does not reflect the impact of potential charges from any actions that may be taken based on ongoing analysis of the Aerospace segment
Notes: The company’s outlook reflects its continuing operations for the full 12 months of 2014. Free cash flow is defined as net cash provided by operating activities (includes pension contributions) minus capital expenditures.
19
|
2Q 2014 EARNINGS
JULY 31, 2014
|

Appendix
|
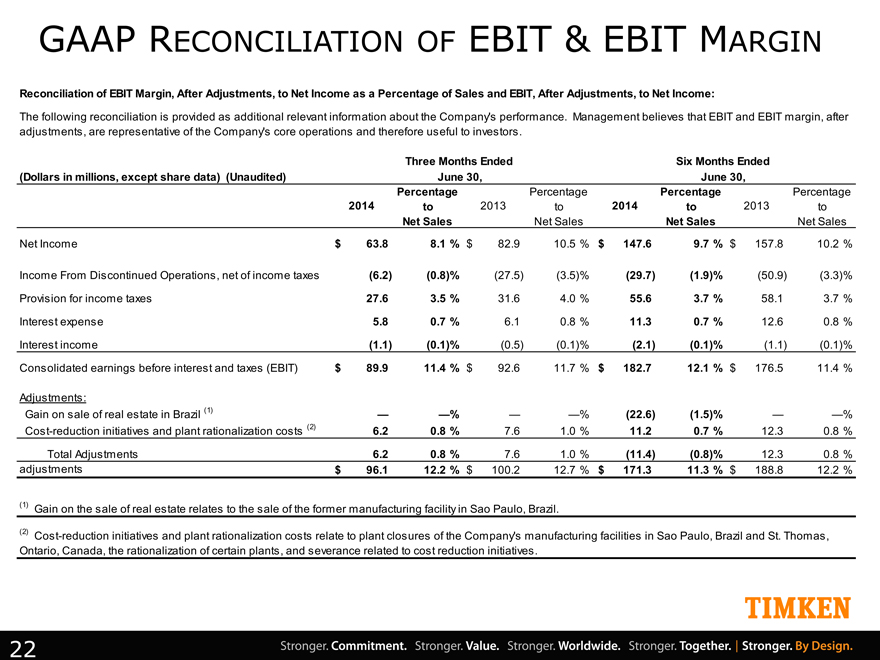
GAAP RECONCILIATION OF EBIT & EBIT MARGIN
Reconciliation of EBIT Margin, After Adjustments, to Net Income as a Percentage of Sales and EBIT, After Adjustments, to Net Income:
The following reconciliation is provided as additional relevant information about the Company’s performance. Management believes that EBIT and EBIT margin, after adjustments, are representative of the Company’s core operations and therefore useful to investors.
Three Months Ended Six Months Ended
(Dollars in millions, except share data) (Unaudited) June 30, June 30,
Percentage Percentage Percentage Percentage
2014 to 2013 to 2014 to 2013 to
Net Sales Net Sales Net Sales Net Sales
Net Income $ 63.8 8.1% $ 82.9 10.5% $ 147.6 9.7% $ 157.8 10.2%
Income From Discontinued Operations, net of income taxes(6.2)(0.8)%(27.5)(3.5)%(29.7)(1.9)%(50.9)(3.3)%
Provision for income taxes 27.6 3.5% 31.6 4.0% 55.6 3.7% 58.1 3.7%
Interest expense 5.8 0.7% 6.1 0.8% 11.3 0.7% 12.6 0.8%
Interest income(1.1)(0.1)%(0.5)(0.1)%(2.1)(0.1)%(1.1)(0.1)%
Consolidated earnings before interest and taxes (EBIT) $ 89.9 11.4% $ 92.6 11.7% $ 182.7 12.1% $ 176.5 11.4%
Adjustments:
Gain on sale of real estate in Brazil (1) — —% — —%(22.6)(1.5)% — —%
Cost-reduction initiatives and plant rationalization costs (2) 6.2 0.8% 7.6 1.0% 11.2 0.7% 12.3 0.8%
Total Adjustments 6.2 0.8% 7.6 1.0%(11.4)(0.8)% 12.3 0.8%
adjustments $ 96.1 12.2% $ 100.2 12.7% $ 171.3 11.3% $ 188.8 12.2%
(1) Gain on the sale of real estate relates to the sale of the former manufacturing facility in Sao Paulo, Brazil.
(2) Cost-reduction initiatives and plant rationalization costs relate to plant closures of the Company’s manufacturing facilities in Sao Paulo, Brazil and St. Thomas,
Ontario, Canada, the rationalization of certain plants, and severance related to cost reduction initiatives .
22
|
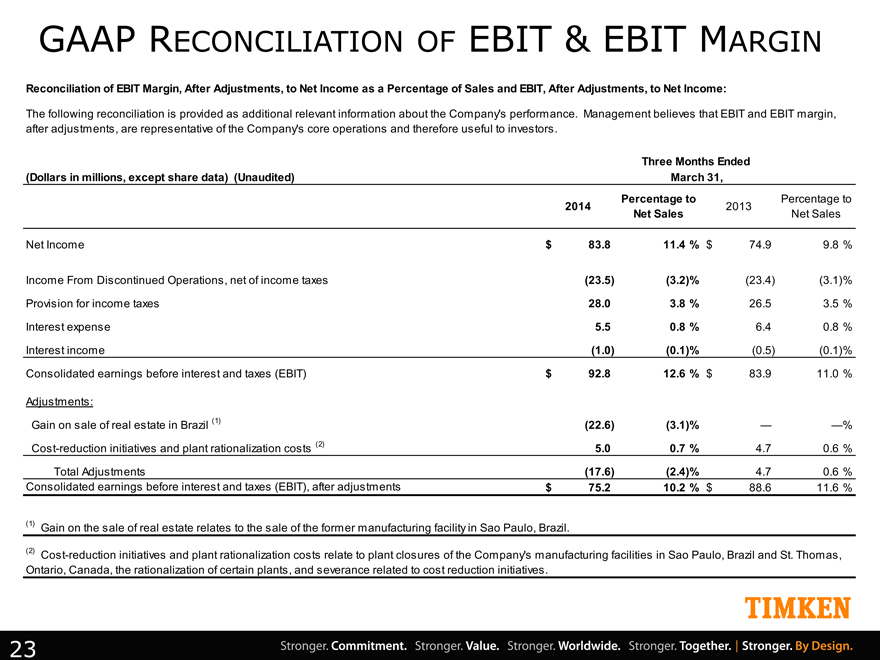
GAAP RECONCILIATION OF EBIT & EBIT MARGIN
Reconciliation of EBIT Margin, After Adjustments, to Net Income as a Percentage of Sales and EBIT, After Adjustments, to Net Income:
The following reconciliation is provided as additional relevant information about the Company’s performance. Management believes that EBIT and EBIT margin, after adjustments, are representative of the Company’s core operations and therefore useful to investors.
Three Months Ended
(Dollars in millions, except share data) (Unaudited) March 31,
Percentage to Percentage to
2014 2013
Net Sales Net Sales
Net Income $ 83.8 11.4% $ 74.9 9.8%
Income From Discontinued Operations, net of income taxes(23.5)(3.2)%(23.4)(3.1)%
Provision for income taxes 28.0 3.8% 26.5 3.5%
Interest expense 5.5 0.8% 6.4 0.8%
Interest income(1.0)(0.1)%(0.5)(0.1)%
Consolidated earnings before interest and taxes (EBIT) $ 92.8 12.6% $ 83.9 11.0%
Adjustments:
Gain on sale of real estate in Brazil (1)(22.6)(3.1)% — —%
Cost-reduction initiatives and plant rationalization costs (2) 5.0 0.7% 4.7 0.6%
Total Adjustments(17.6)(2.4)% 4.7 0.6%
Consolidated earnings before interest and taxes (EBIT), after adjustments $ 75.2 10.2% $ 88.6 11.6%
(1) Gain on the sale of real estate relates to the sale of the former manufacturing facility in Sao Paulo, Brazil.
(2) Cost-reduction initiatives and plant rationalization costs relate to plant closures of the Company’s manufacturing facilities in Sao Paulo, Brazil and St. Thomas,
Ontario, Canada, the rationalization of certain plants, and severance related to cost reduction initiatives .
23
|
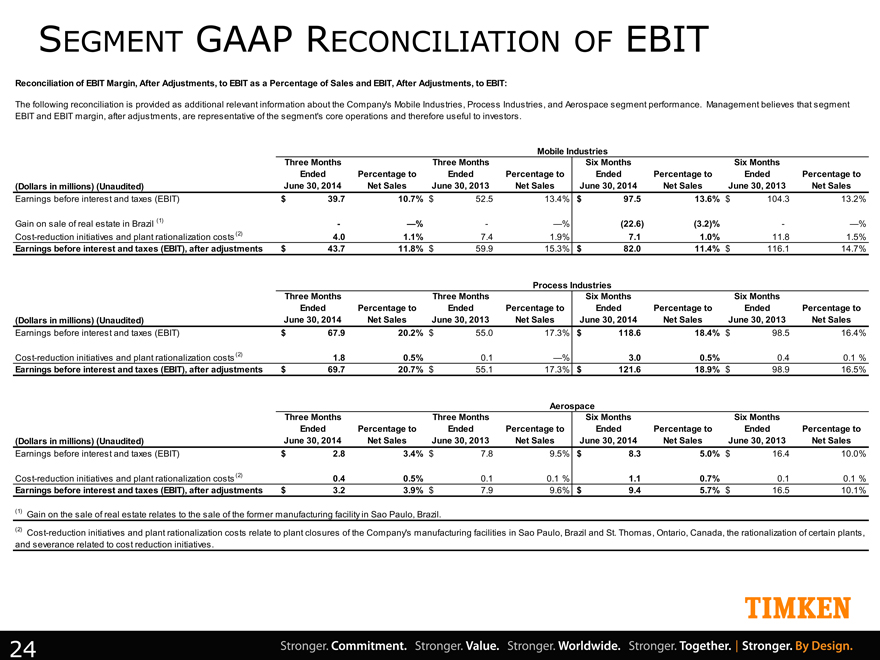
SEGMENT GAAP RECONCILIATION OF EBIT
Reconciliation of EBIT Margin, After Adjustments, to EBIT as a Percentage of Sales and EBIT, After Adjustments, to EBIT:
The following reconciliation is provided as additional relevant information about the Company’s Mobile Industries, Process Industries, and Aerospace segment performance. Management believes that segment
EBIT and EBIT margin, after adjustments, are representative of the segment’s core operations and therefore useful to investors.
Mobile Industries
Three Months Three Months Six Months Six Months
Ended Percentage to Ended Percentage to Ended Percentage to Ended Percentage to
(Dollars in millions) (Unaudited) June 30, 2014 Net Sales June 30, 2013 Net Sales June 30, 2014 Net Sales June 30, 2013 Net Sales
Earnings before interest and taxes (EBIT) $ 39.7 10.7% $ 52.5 13.4% $ 97.5 13.6% $ 104.3 13.2%
Gain on sale of real estate in Brazil (1)——%——%(22.6)(3.2)%——%
Cost-reduction initiatives and plant rationalization costs (2) 4.0 1.1% 7.4 1.9% 7.1 1.0% 11.8 1.5%
Earnings before interest and taxes (EBIT), after adjustments $ 43.7 11.8% $ 59.9 15.3% $ 82.0 11.4% $ 116.1 14.7%
Process Industries
Three Months Three Months Six Months Six Months
Ended Percentage to Ended Percentage to Ended Percentage to Ended Percentage to
(Dollars in millions) (Unaudited) June 30, 2014 Net Sales June 30, 2013 Net Sales June 30, 2014 Net Sales June 30, 2013 Net Sales
Earnings before interest and taxes (EBIT) $ 67.9 20.2% $ 55.0 17.3% $ 118.6 18.4% $ 98.5 16.4%
Cost-reduction initiatives and plant rationalization costs (2) 1.8 0.5% 0.1 —% 3.0 0.5% 0.4 0.1 %
Earnings before interest and taxes (EBIT), after adjustments $ 69.7 20.7% $ 55.1 17.3% $ 121.6 18.9% $ 98.9 16.5%
Aerospace
Three Months Three Months Six Months Six Months
Ended Percentage to Ended Percentage to Ended Percentage to Ended Percentage to
(Dollars in millions) (Unaudited) June 30, 2014 Net Sales June 30, 2013 Net Sales June 30, 2014 Net Sales June 30, 2013 Net Sales
Earnings before interest and taxes (EBIT) $ 2.8 3.4% $ 7.8 9.5% $ 8.3 5.0% $ 16.4 10.0%
Cost-reduction initiatives and plant rationalization costs (2) 0.4 0.5% 0.1 0.1 % 1.1 0.7% 0.1 0.1 %
Earnings before interest and taxes (EBIT), after adjustments $ 3.2 3.9% $ 7.9 9.6% $ 9.4 5.7% $ 16.5 10.1%
(1) Gain on the sale of real estate relates to the sale of the former manufacturing facility in Sao Paulo, Brazil.
(2) Cost-reduction initiatives and plant rationalization costs relate to plant closures of the Company’s manufacturing facilities in Sao Paulo, Brazil and St. Thomas, Ontario, Canada, the rationalization of certain plants,
and severance related to cost reduction initiatives.
24
|
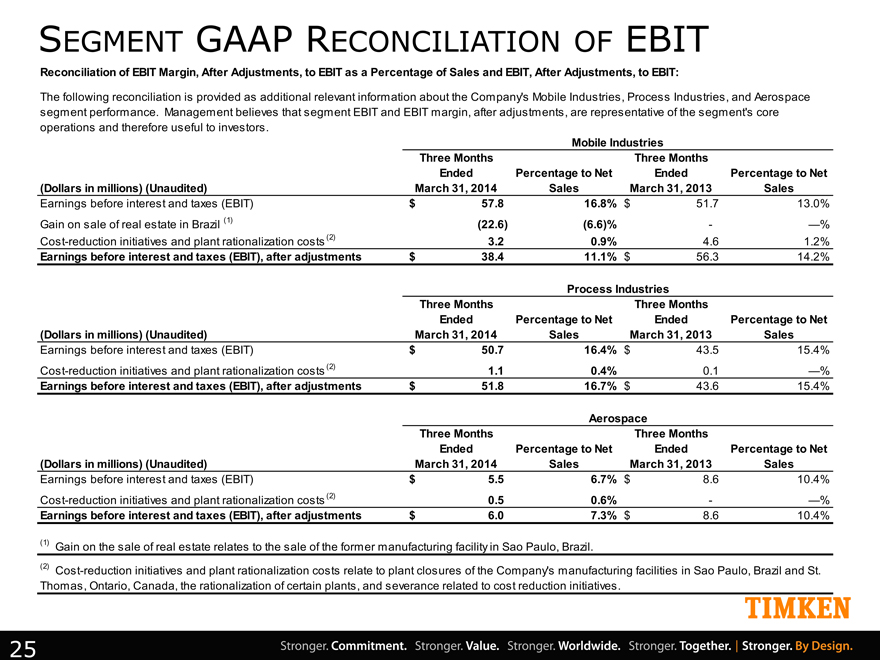
SEGMENT GAAP RECONCILIATION OF EBIT
Reconciliation of EBIT Margin, After Adjustments, to EBIT as a Percentage of Sales and EBIT, After Adjustments, to EBIT:
The following reconciliation is provided as additional relevant information about the Company’s Mobile Industries, Process Industries, and Aerospace
segment performance. Management believes that segment EBIT and EBIT margin, after adjustments, are representative of the segment’s core
operations and therefore useful to investors .
Mobile Industries
Three Months Three Months
Ended Percentage to Net Ended Percentage to Net
(Dollars in millions) (Unaudited) March 31, 2014 Sales March 31, 2013 Sales
Earnings before interest and taxes (EBIT) $ 57.8 16.8% $ 51.7 13.0%
Gain on sale of real estate in Brazil (1)(22.6)(6.6)%——%
Cost-reduction initiatives and plant rationalization costs (2) 3.2 0.9% 4.6 1.2%
Earnings before interest and taxes (EBIT), after adjustments $ 38.4 11.1% $ 56.3 14.2%
Process Industries
Three Months Three Months
Ended Percentage to Net Ended Percentage to Net
(Dollars in millions) (Unaudited) March 31, 2014 Sales March 31, 2013 Sales
Earnings before interest and taxes (EBIT) $ 50.7 16.4% $ 43.5 15.4%
Cost-reduction initiatives and plant rationalization costs (2) 1.1 0.4% 0.1 —%
Earnings before interest and taxes (EBIT), after adjustments $ 51.8 16.7% $ 43.6 15.4%
Aerospace
Three Months Three Months
Ended Percentage to Net Ended Percentage to Net
(Dollars in millions) (Unaudited) March 31, 2014 Sales March 31, 2013 Sales
Earnings before interest and taxes (EBIT) $ 5.5 6.7% $ 8.6 10.4%
Cost-reduction initiatives and plant rationalization costs (2) 0.5 0.6%——%
Earnings before interest and taxes (EBIT), after adjustments $ 6.0 7.3% $ 8.6 10.4%
(1) Gain on the sale of real estate relates to the sale of the former manufacturing facility in Sao Paulo, Brazil.
(2) Cost-reduction initiatives and plant rationalization costs relate to plant closures of the Company’s manufacturing facilities in Sao Paulo, Brazil and St.
Thomas, Ontario, Canada, the rationalization of certain plants, and severance related to cost reduction initiatives .
25
|
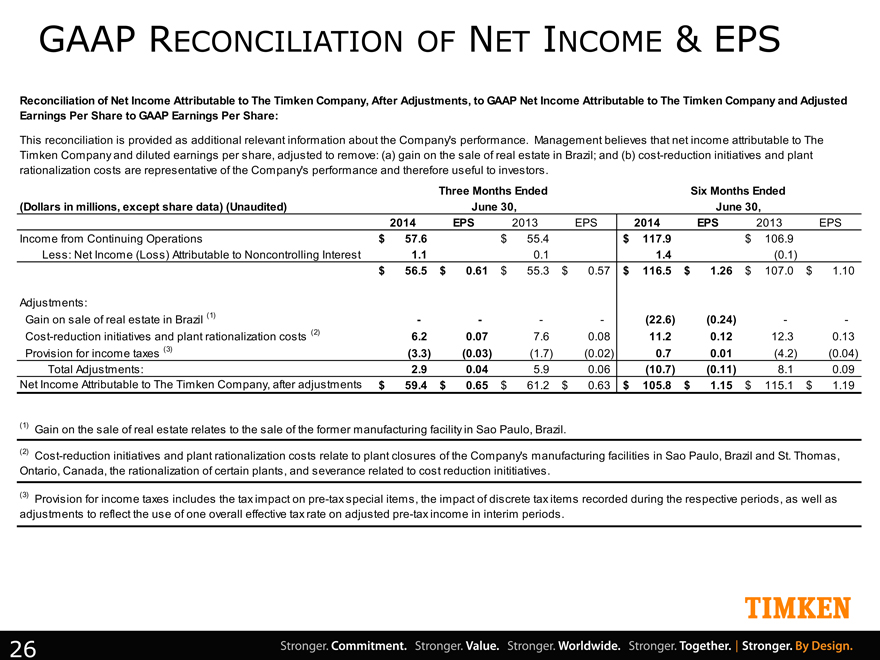
GAAP RECONCILIATION OF NET INCOME & EPS
Reconciliation of Net Income Attributable to The Timken Company, After Adjustments, to GAAP Net Income Attributable to The Timken Company and Adjusted
Earnings Per Share to GAAP Earnings Per Share:
This reconciliation is provided as additional relevant information about the Company’s performance. Management believes that net income attributable to The
Timken Company and diluted earnings per share, adjusted to remove: (a) gain on the sale of real estate in Brazil; and (b) cost-reduction initiatives and plant
rationalization costs are representative of the Company’s performance and therefore useful to investors .
Three Months Ended Six Months Ended
(Dollars in millions, except share data) (Unaudited) June 30, June 30,
2014 EPS 2013 EPS 2014 EPS 2013 EPS
Income from Continuing Operations $ 57.6 $ 55.4 $ 117.9 $ 106.9
Less: Net Income (Loss) Attributable to Noncontrolling Interest 1.1 0.1 1.4(0.1)
$ 56.5 $ 0.61 $ 55.3 $ 0.57 $ 116.5 $ 1.26 $ 107.0 $ 1.10
Adjustments:
Gain on sale of real estate in Brazil (1) — —(22.6)(0.24) —
Cost-reduction initiatives and plant rationalization costs (2) 6.2 0.07 7.6 0.08 11.2 0.12 12.3 0.13
Provision for income taxes (3)(3.3)(0.03)(1.7)(0.02) 0.7 0.01(4.2)(0.04)
Total Adjustments: 2.9 0.04 5.9 0.06(10.7)(0.11) 8.1 0.09
Net Income Attributable to The Timken Company, after adjustments $ 59.4 $ 0.65 $ 61.2 $ 0.63 $ 105.8 $ 1.15 $ 115.1 $ 1.19
(1) Gain on the sale of real estate relates to the sale of the former manufacturing facility in Sao Paulo, Brazil.
(2) Cost-reduction initiatives and plant rationalization costs relate to plant closures of the Company’s manufacturing facilities in Sao Paulo, Brazil and St. Thomas,
Ontario, Canada, the rationalization of certain plants, and severance related to cost reduction inititiatives .
(3) Provision for income taxes includes the tax impact on pre-tax special items, the impact of discrete tax items recorded during the respective periods, as well as
adjustments to reflect the use of one overall effective tax rate on adjusted pre-tax income in interim periods .
26
|
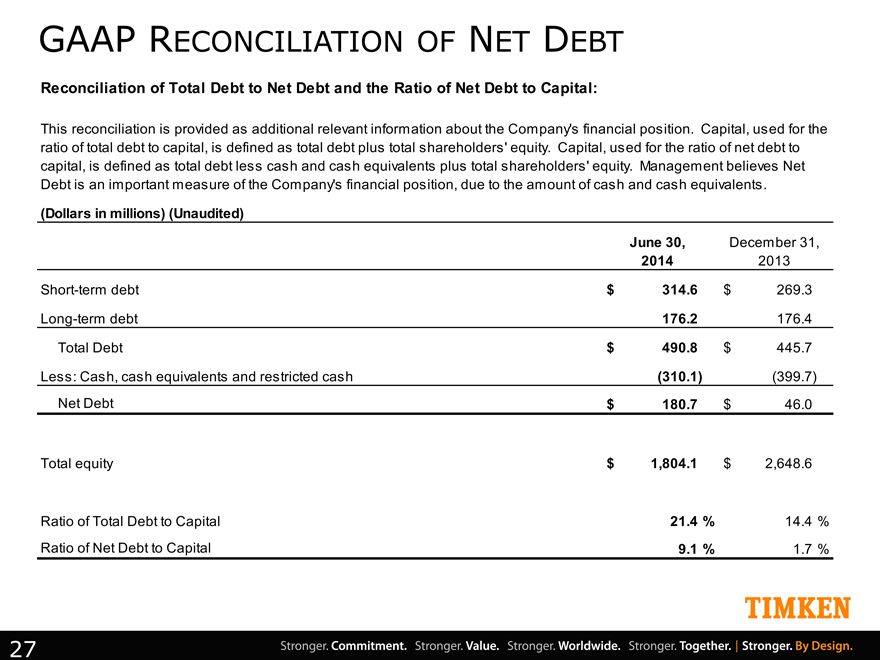
GAAP RECONCILIATION OF NET DEBT
Reconciliation of Total Debt to Net Debt and the Ratio of Net Debt to Capital:
This reconciliation is provided as additional relevant information about the Company’s financial position. Capital, used for the
ratio of total debt to capital, is defined as total debt plus total shareholders’ equity. Capital, used for the ratio of net debt to
capital, is defined as total debt less cash and cash equivalents plus total shareholders’ equity. Management believes Net
Debt is an important measure of the Company’s financial position, due to the amount of cash and cash equivalents .
(Dollars in millions) (Unaudited)
June 30, December 31,
2014 2013
Short-term debt $ 314.6 $ 269.3
Long-term debt 176.2 176.4
Total Debt $ 490.8 $ 445.7
Less: Cash, cash equivalents and restricted cash(310.1)(399.7)
Net Debt $ 180.7 $ 46.0
Total equity $ 1,804.1 $ 2,648.6
Ratio of Total Debt to Capital 21.4% 14.4%
Ratio of Net Debt to Capital 9.1% 1.7%
27
|
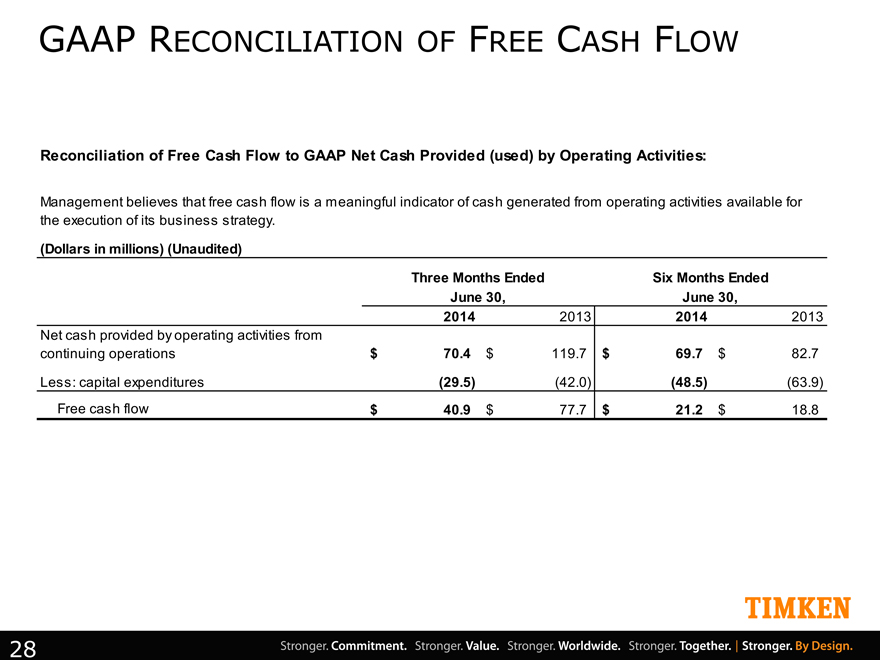
GAAP RECONCILIATION OF FREE CASH FLOW
Reconciliation of Free Cash Flow to GAAP Net Cash Provided (used) by Operating Activities:
Management believes that free cash flow is a meaningful indicator of cash generated from operating activities available for
the execution of its business strategy.
(Dollars in millions) (Unaudited)
Three Months Ended Six Months Ended
June 30, June 30,
2014 2013 2014 2013
Net cash provided by operating activities from
continuing operations $ 70.4 $ 119.7 $ 69.7 $ 82.7
Less: capital expenditures(29.5)(42.0)(48.5)(63.9)
Free cash flow $ 40.9 $ 77.7 $ 21.2 $ 18.8
28
|
TIMKEN