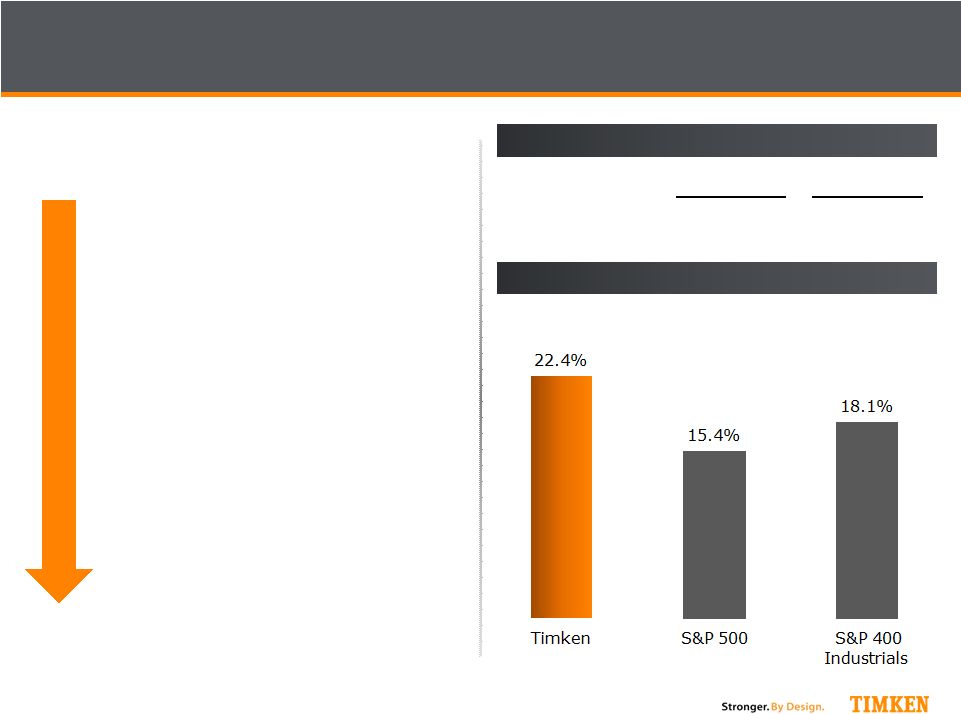
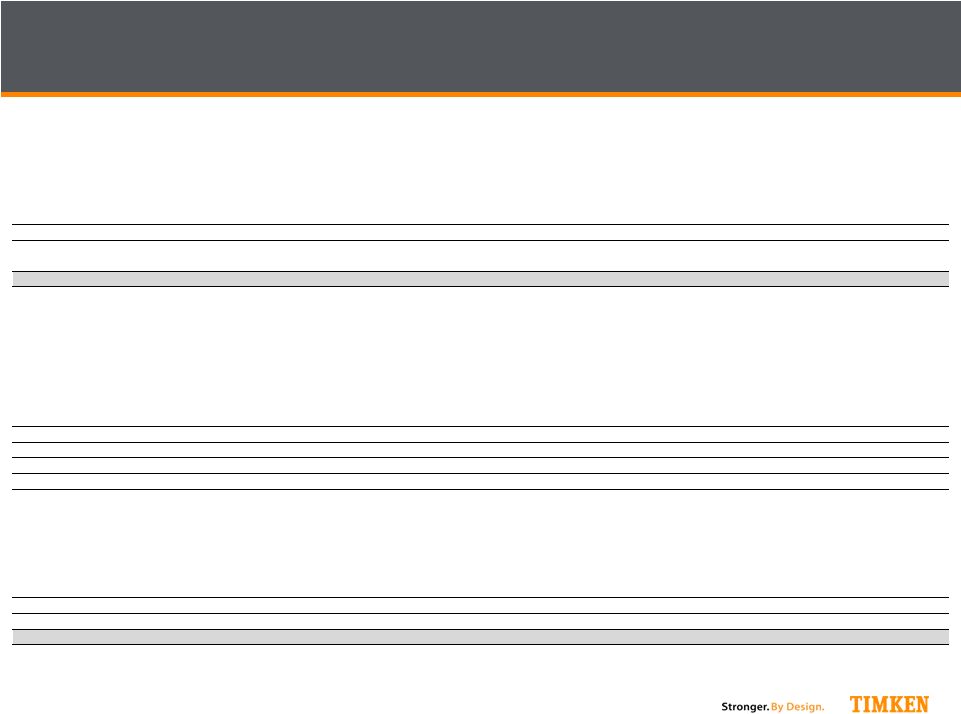
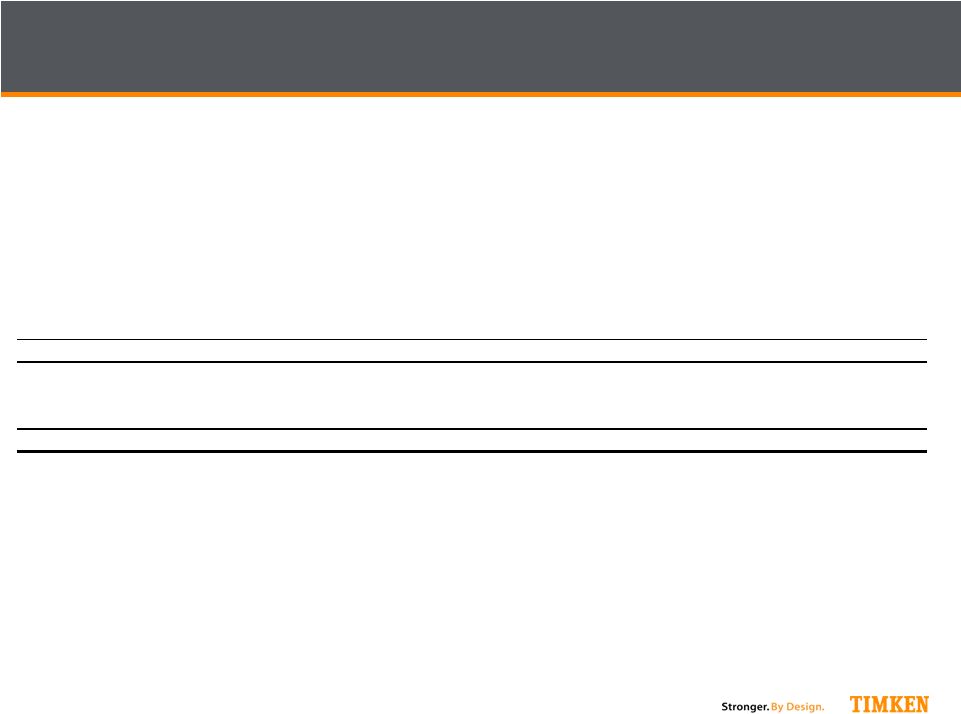
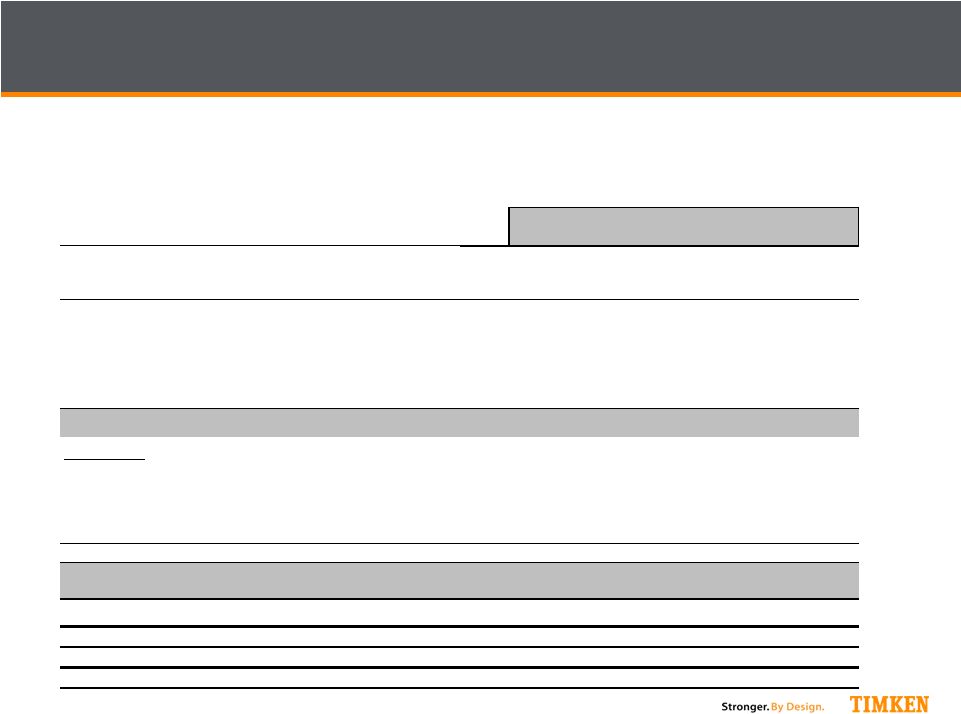
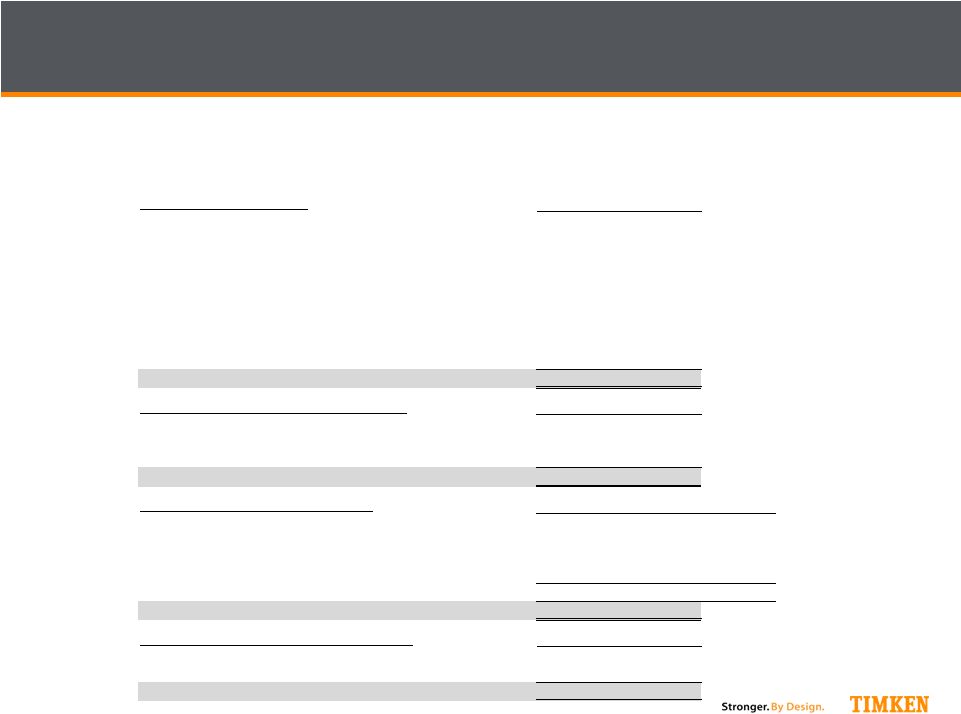
18 Reconciliation of Sales, EBIT to Net Income, EBIT After Adjustments to Net Income , EBIT as a Percentage of Sales and EBIT After Adjustments as a Percentage of Sales; all excluding the Steel Business: The following reconciliation is provided as additional relevant information about the Company's performance. Management believes that EBIT and EBIT margin, after adjustments, are representative of the Company's core operations and therefore useful to investors. (Dollars in millions) 2004 2005 2006 2007 2008 2009 2010 2011 2012 2013 2014 Net sales (as reported) 4,513.7 $ 5,168.4 $ 4,973.4 $ 5,236.0 $ 5,663.7 $ 3,548.4 $ 4,055.5 $ 5,170.2 $ Net sales attributable to TimkenSteel 1,221.7 1,582.2 1,327.8 1,415.1 1,694.0 672.9 1,256.9 1,836.6 Net sales - The Timken Company (pro forma) 3,292.0 $ 3,586.3 $ 3,645.5 $ 3,820.9 $ 3,969.7 $ 2,875.4 $ 2,798.6 $ 3,333.6 $ 3,359.5 $ 3,035.4 $ 3,076.2 $ 5 Year Average Net sales: Year Ending (2004-2008) 3,662.9 $ 5 Year Average Net sales: Year Ending (2010-2014) 3,120.7 $ Net Income (as reported) 135.7 $ 260.3 $ 176.4 $ 219.4 $ 267.7 $ (138.6) $ 269.5 $ 456.6 $ 495.9 $ 263.0 $ 173.3 $ Income from Discontinued Operations, net of income taxes (164.4) (87.5) (24.0) Provision for income taxes 64.1 130.3 77.8 62.9 157.9 1.5 136.0 240.2 186.3 114.6 54.7 Gain (loss) on divesiture (19.9) Interest expense 49.4 48.1 44.8 35.6 39.0 40.2 38.2 36.8 31.1 24.4 28.7 Interest income - - - - - - (3.7) (5.6) (2.9) (1.9) (4.4) Consolidated earnings before interest and taxes (EBIT) 249.2 $ 438.7 $ 299.0 $ 317.9 $ 464.6 $ (116.9) $ 440.0 $ 728.0 $ 546.0 $ 312.6 $ 228.3 $ EBIT attributable to TimkenSteel 54.8 219.8 206.7 213.1 264.0 (57.9) 146.1 265.3 - EBIT - The Timken Company 194.5 $ 218.9 $ 92.3 $ 104.8 $ 200.6 $ (59.0) $ 293.9 $ 462.7 $ 546.0 $ 312.6 $ 228.3 $ EBIT - The Timken Company (pro forma) % to Net Sales 5.9% 6.1% 2.5% 2.7% 5.1% -2.1% 10.5% 13.9% 16.3% 10.3% 7.4% Adjustments: Gain on sale of real estate in Brazil (5.4) (22.6) Cost-reduction initiatives and plant rationalization costs 27.0 17.3 24.4 34.5 5.8 11.1 28.0 22.0 37.1 14.8 14.6 Loss on divestitures 64.3 0.5 (0.0) 19.9 Impairment and restructuring 13.4 26.1 44.9 40.4 64.4 216.7 121.6 Pension settlement charges 7.2 33.7 Other Special Items, including CDSOA expense (receipts) (43.0) (85.4) (94.7) (13.2) (29.3) 2.0 (2.3) (2.4) (108.0) Total Adjustments (2.5) $ (42.1) $ 38.9 $ 62.2 $ 40.8 $ 249.7 $ 25.7 $ 19.6 $ (70.9) $ 16.6 $ 147.3 $ Adjusted EBIT - The Timken Company (pro forma) 192.0 $ 176.9 $ 131.2 $ 167.0 $ 241.4 $ 190.8 $ 319.6 $ 482.3 $ 475.1 $ 329.2 $ 375.6 $ Adjusted EBIT - The Timken Company (pro forma) % to Net Sales 5.8% 4.9% 3.6% 4.4% 6.1% 6.6% 11.4% 14.5% 14.1% 10.8% 12.2% 5 Year Average Adjusted EBIT Margin: Year Ending (2004-2008) 5.0% 5 Year Average Adjusted EBIT Margin: Year Ending (2010-2014) 12.6% Twelve Months Ended December 31, : 2004 – 2014 GAAP RECONCILIATION |
