QuickLinks -- Click here to rapidly navigate through this document
Tootsie Roll Industries, Inc. has been engaged in the manufacture and sale of candy for 106 years. Our products are primarily sold under the familiar brand names, Tootsie Roll, Tootsie Roll Pops, Caramel Apple Pops, Child's Play, Charms, Blow Pop, Blue Razz, Cella's chocolate covered cherries, Mason Dots, Mason Crows, Junior Mints, Charleston Chew, Sugar Daddy, Sugar Babies, Andes and Fluffy Stuff cotton candy.
We believe that the differences among companies are attributable to the caliber of their people, and therefore we strive to attract and retain superior people for each job.
We believe that an open family atmosphere at work combined with professional management fosters cooperation and enables each individual to maximize his or her contribution to the company and realize the corresponding rewards.
We do not jeopardize long-term growth for immediate, short-term results.
We maintain a conservative financial posture in the deployment and management of our assets.
We run a trim operation and continually strive to eliminate waste, minimize cost and implement performance improvements.
We invest in the latest and most productive equipment to deliver the best quality product to our customers at the lowest cost.
We seek to outsource functions where appropriate and to vertically integrate operations where it is financially advantageous to do so.
We view our well known brands as prized assets to be aggressively advertised and promoted to each new generation of consumers.

Melvin J. Gordon, Chairman and Chief Executive Officer and
Ellen R. Gordon, President and Chief Operating Officer.
![]()
1
Sales in 2002 were $393 million compared to 2001 sales of $392 million. Sales in both years are now being reported net of certain consumer and trade promotion expenses as required under the new accounting rules.
We were encouraged by sales growth in many of our core brands and key markets during the year, but these gains were mitigated by generally weak domestic economic conditions, retail bankruptcies, overall competitive activity and lower Mexican sales.
Financial Highlights
| | December 31, | |||
|---|---|---|---|---|
| | 2002 | 2001 | ||
| | (in thousands except per share data) | |||
Net Sales | $393,185 | $391,755 | ||
| Net Earnings | 66,388 | 65,687 | ||
Working Capital | 161,852 | 188,250 | ||
| Net Property, Plant and Equipment | 128,869 | 132,575 | ||
| Shareholders' Equity | 526,740 | 508,461 | ||
Average Shares Outstanding* | 51,553 | 51,947 | ||
| Per Share Items* | ||||
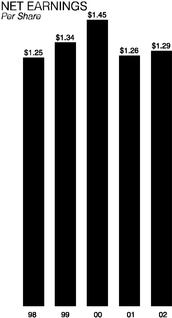
| Net Earnings | $1.29 | $1.26 | ||
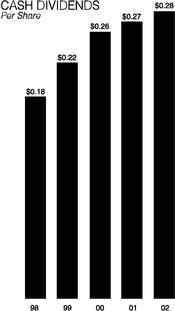
| Cash Dividends Paid | .28 | .27 | ||
*Adjusted for stock dividends.
Reported net earnings in 2002 were $66 million compared with prior year net earnings of $66 million. Earnings per share were $1.29 compared to $1.26 in 2001 reflecting the fewer shares outstanding in 2002.
In 2002, we adopted the new accounting rules that eliminated amortization of goodwill and intangibles. Without the favorable effect of this accounting change, and adjusting for the non-recurring items that occurred in 2001, earnings in 2002 would have
declined by $0.05 per share, principally due to higher ingredient costs and lower investment income.
Other key financial highlights of 2002 include:
- •
- Cash dividends were paid for the sixtieth consecutive year, and totaled $14 million.
- •
- The thirty-eighth consecutive annual stock dividend was distributed in April.
- •
- Capital projects totalling $14 million to increase efficiency, improve quality and to add capacity in support of growth items were approved, some of which will be expended in 2003.
- •
- 948,600 of the company's common shares were repurchased on the open market for a total of $32 million.
The company's balance sheet strengthened during 2002 despite the considerable financial resources committed to these activities. Cash and investments in marketable securities grew by $16 million during the year. We remain fully prepared to respond to investment opportunities, such as product development, capital projects and suitable business
acquisitions, as they may arise, and are actively pursuing all of these channels of opportunity.
Sales and Marketing
We have long recognized the competitive advantage of having strong brands. The backdrop of 2002 was a persistently slow domestic economy and large retailer bankruptcies. Such conditions, along with intense competition for retail space and the consumer's hard-earned dollars, increasingly highlighted the value and staying power of our core brands, most of which grew in 2002.
Our sales gains were the result of continued implementation of targeted promotional programs such as shippers, combo packs and bonus bags throughout the year. These programs are popular with both retailers and consumers and reinforce the attributes of quality and value that are so closely associated with our products.
In 2002, we experienced another strong Halloween sales period. Our bagged goods, including the popular Child's Play mixed product assortment, continued to sell well through the mass merchandise, drug and warehouse club classes of trade.
2
Our flagship brand, Tootsie Roll, continued to emphasize its branded value positioning both to the trade and to consumers. One offering that highlights this strategy is our Bonus Bag promotion, which features 15% more candy for free. Not only does this promotion attract consumer attention, but the trade is pleased with the rapid shelf turns it generates.

Tootsie Roll Midgee Bonus Bag
Line extensions represented another avenue of sales growth in 2002. Tootsie "Mini" Pops, a miniature replica of our famous Tootsie Pop—right down to the chewy, chocolatey Tootsie Roll center—were introduced in

Tootsie Pop Miniatures
large bags for Halloween. Building on the instant success of this item, seasonal offerings of Tootsie Pop Miniatures for Easter and Valentine were added to the line toward the end of 2002.
Andes new changemaker
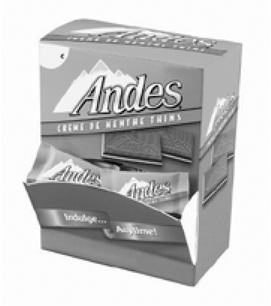
We extended the Andes line into the change-maker market by introducing a special piece size in an airtight, fin-sealed wrapper, suitable for individual retail sale. For Christmas, Andes mints were embossed with festive wreaths, Christmas trees and snowmen to create an exciting seasonal line extension. Both of these new Andes items retain the characteristic rectangular, multi-layered appearance and delicious crème de menthe flavor that typify the brand.
Our traditional boxed "theater" line, consisting of Dots, Crows, Junior Mints, Sugar Babies and Charleston "Mini" Chews contributed to sales growth in 2002. This "top shelf" assortment of jumbo, reclosable boxes now features Dots in three delicious flavors: Original, Tropical and Wildberry.

Junior Mints BIG BOX
The new "Big Box" of Junior Mints was another successful extension in the boxed category. This Big Box features vertically oriented graphics creating an exceptional consumer impression on the store shelf.
The newest addition to our Blow Pop line, Black Ice, was introduced in 2002. It features opaque crystalline hard candy surrounding a mysterious-looking black raspberry bubble gum center.

Black Ice Blow Pops
We also introduced Fluffy Stuff Cotton Candy Pops in 2002. They are traditional flat pops with flavor and package graphics that mirror our Fluffy Stuff cotton candy.
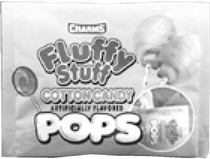
Fluffy Stuff Cotton Candy Pops
3
In response to rising packaging and ingredient costs, during the fourth quarter of 2002, we as well as others in the industry announced price increases that became effective in the first quarter of 2003. We believe that some of our fourth quarter sales growth was attributable to customer "buy-in" in anticipation of this increase.
U.S. Armed Forces
Our company has been honored by its long association with the military. Tootsie Rolls and Charms Squares have been included in military rations for many years, and in 2002 we had several new and gratifying contacts with the military.
In March, we took part in Operation Valentine, a morale-building mission for our soldiers in Afghanistan and elsewhere, by sending the troops more than 1 million pieces of candy.

Afghan child with Tootsie Rolls
The shipment was split between foot-long Tootsie Rolls, and limited edition Tootise Roll Midgees, in patriotic red, white and blue wrappers. This gift, which brought our soldiers a nostalgic reminder of home, was in turn shared with local children in those war-torn lands.

A Bosnian child receives a sweet gift
In the fall of 2002, we were greatly honored by the Marine and Army survivors of the Korean War battle of the Chosin Reservoir. Temperatures during this famous battle fell to 36 degrees below zero, and the troops survived for many days on Tootsie Rolls and Charms Squares because their rations had frozen solid.
In recognition of the bond that this experience created between the company and these brave soldiers we were named honorary members of the "Chosin Few," the only civilians to have ever been so honored.
Advertising and Public Relations
Our products again received extensive cable television exposure on the Food Network'sUnwrapped program. New segments featuring Andes Candies and Charms Dead Head pops were added to the series along with previous shows about Tootsie Pops and Blow Pops in a lollipop segment, Dots and Junior Mints in a piece about "movie candy," and Charleston Chew and Sugar Babies in a look at "retro" candy.
Exposure on this highly rated program, including periodic replays, is helpful in generating positive awareness of our products.

Blow Pop Lollipop Shop
Also in 2002, the Betty Crocker "Creepy Spider Cupcake Kit," featured Dots in a colorful and creative Halloween baking set, and the "Blow Pop Lollipop Shop" from Natural Science Industries, marketed a play set that enables a child to make their very own Blow Pop with a real bubble gum center!
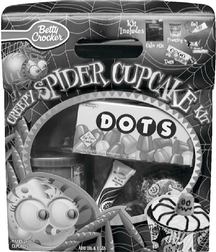
Creepy Spider Cupcake Mix
Many articles and stories appeared in newspapers and magazines during the year commenting favorably on the company and its well-known products. Notably, Chief Executive Magazine ranked our Chairman and Chief Executive Officer as one of the best performing executives in the food, beverage and tobacco industries for the third consecutive year.
4
Capital projects totalling $14 million were approved during the year to increase efficiency, improve quality and to support future growth. Most notably, during the year we commenced projects to significantly reengineer two major production lines. We view such ongoing investments in the company as being vital to maintaining our stature as one of the industry's most efficient producers.
We have stepped up our focus on the human element in our operations by providing targeted training to certain employee groups. This is designed to help them decrease costs and to eliminate unfavorable variances by modifying production activities to meet production needs more efficiently. We have also installed feedback systems to improve productivity and reduce or eliminate waste—a major priority within the company.
Purchasing
Although the Consumer Price Index only rose by 2.4% during the year, 2002 was a year of steady cost increases in many basic materials used by industry.
Of particular note in our industry, cocoa supplies from the Ivory Coast, the world's largest producer, were disrupted by civil war driving prices for this ingredient to a 17 year high.
Corn prices, and, in turn, corn syrup prices increased due to weather related crop reductions in the US. The domestic price of both raw and refined sugar increased due to USDA imposed marketing allotments.
In the area of packaging, printed film, which is made from plastic resins, rose during the year due to the rising price of oil. In addition the price of corrugated packaging increased as suppliers moved to cover their increased costs.
Although these cost increases affected our results in 2002, our hedging program shielded us from their full impact. We continue to use competitive bidding, hedging and forward purchase contracts to control costs and lock in prices at favorable levels when we feel it is prudent to do so.
Information Technology
The redevelopment of several core business applications was a major emphasis in 2002 and has neared completion. These new applications will give us state-of-the-art, web enabled tools which streamline current processes while they increase system flexibility to accommodate the ever-evolving requirements of our customers.
We also invested in additional processing and data storage hardware during the year. We view information technology as a key strategic tool, and are committed to deploying leading edge technology in this area.
International
Sales grew in Canada as volume gains more than offset devaluation of the Canadian dollar against the US dollar. Growth came from both expanded distribution of existing products and from new product introductions.
In Mexico, the focus in 2002 was on profitability rather than on volume. Accordingly, sales were lower but margins and operating income improved during the year.
Our export program through Tootsie Roll Worldwide continued to show growth during 2002. Our shipments increased during the year and actual in-market sales growth was encouraging.
New markets opened during the year have allowed us to expand our presence in untapped markets in Central America and the Middle East, while growth in some of our key Asian markets continued in 2002.
In Appreciation...
We wish to thank the many loyal employees, customers, suppliers, sales brokers and foreign distributors who have worked with us during these challenging times, as well as our shareholders who have been supportive through the many years.
We remain committed to growing our company in sales and in profitability and hope to extend the legacy of our famous brands to coming generations.
![]()
Melvin J. Gordon
Chairman of the Board and
Chief Executive Officer
![]()
Ellen R. Gordon
President and
Chief Operating Officer
5
Management's Discussion and Analysis of Financial
Condition and Results of Operations
(in thousands except per share, percentage and ratio figures)
FINANCIAL REVIEW
This financial review discusses the company's financial condition, results of operations, liquidity and capital resources, market risks and critical accounting policies. It should be read in conjunction with the Consolidated Financial Statements and related footnotes that follow this discussion.
FINANCIAL CONDITION
Our financial condition remained strong in 2002, bolstered by our profitable operations during the year.
Shareholder equity increased to $526,740 from $508,461 in the prior year, reflecting net earnings of $66,388 partially offset by stock repurchases of $32,314 and cash dividends of $14,304. The company has paid cash dividends for sixty consecutive years.
Shareholders also received a 3% stock dividend in 2002, the thirty-eighth consecutive year that one has been distributed.
Working capital was $161,852 in 2002, $26,398 lower than in 2001 because the proceeds from maturing investments were used to purchase investments with maturities greater than one year, causing a shift from current to non-current assets. Total cash and investments grew to $262,745 from $246,292 in the prior year, an increase of $16,453.
The company continues to maintain a conservative financial posture. Aside from an immaterial amount of operating leases, the company has no off-balance sheet financing arrangements, and our simple financial structure does not utilize any "special purpose entities" or other obscure financing arrangements.
We have sufficient capital, generated principally from operations, to respond to investment opportunities as they may arise. Accordingly, we continue to seek appropriate acquisitions to complement our existing business.
RESULTS OF OPERATIONS
2002 vs. 2001
Net sales increased in 2002 to $393,185 from $391,755 in 2001. Many of our core brands showed growth throughout the year. However, these gains were partially offset by lower Mexican sales, retail bankruptcies, competitive pressure and weak economic conditions that dampened retail traffic.
Effective January 1, 2002, the company adopted the new accounting requirements that treat certain consumer and trade promotions as a reduction in net sales rather than as an operating expense. The effect of the above was to reduce both net sales and operating expenses by $29,990 and $31,741 in 2002 and 2001, respectively.
Sales remained at the highest level in the third quarter due to successful Halloween promotions, although sales through the first nine months of 2002 were lower than in 2001 due to factors cited above. Sales went ahead in the fourth quarter, although we believe that some of the sales increase in the fourth quarter can be attributed to customer "buy-in" in anticipation of a price increase that became effective in the first quarter of 2003.
Sales in our Canadian operation increased due to further gains in distribution and successful promotions, while sales in Mexico declined as a result of a concentration on margin improvement and local competitive pressure.
Cost of goods sold increased from 55.3% to 56.1% of sales. The increase in cost of goods sold is due to higher raw materials cost and product mix in 2002, partially offset by a non-recurring inventory write down of $1,100 pre-tax and a plant closing charge of $1,500 pre-tax in the third and fourth quarters, respectively, of 2001.
Due to the seasonal nature of our business and corresponding variations in product mix, gross margins were lower in the second half of the year than in the first half.
6

Selling, marketing and administrative expense, declined as a percentage of sales to 19.3% in 2002 from 19.8% in 2001, due to cost containment measures and lower advertising expenditures. Both numbers are net of the reclassification of promotional expenses, which have been accounted for as a reduction of sales.
Effective January 1, 2002, the company adopted the new accounting rules pertaining to acquired goodwill and intangibles. This had the effect of eliminating the amortization of such goodwill and intangibles, which was $3,778 in the prior year. Accordingly, earnings from operations increased from $93,944 to $96,669.
Other income, consisting primarily of interest income, net of interest expense, was $4,019 in 2002 versus $6,843 in 2001 due to lower interest rates in 2002 and an investment capital gain in 2001. The effective tax rate was 34.1% in 2002 as compared to 34.8% in 2001.
Consolidated net earnings were $66,388 and $65,687 and earnings per share were $1.29 and $1.26 in 2002 and 2001, respectively. Earnings per share increased by a greater percentage than did earnings due to share repurchases. Average shares outstanding were 51,553 and 51,947 in 2002 and 2001, respectively.
Comparative earnings per share were affected by the aforementioned investment capital gain of $962 or $.02 per share, net of income tax, and nonrecurring charges of $1,803 or $.03 per share, net of income tax, in 2001. Excluding the effects of these nonrecurring adjustments in 2001 and adjusting for the effects of goodwill amortization, net earnings per share for 2002 and 2001 were $1.29 and $1.34, respectively, a decrease of $.05 per share or 4%.
2001 vs. 2000
Sales in 2001 were $391,755 a decrease of 1% from the $396,816 sales of 2000. Halloween sales once again made the third quarter our highest selling period, although third quarter and nine month 2001 sales declined from the prior year periods due to unfavorable economic conditions and increased competitive pressures. These adverse factors were somewhat offset by successful marketing and promotional programs in certain trade classes, sales of new products and by sales of brands acquired during 2000.
Cost of goods sold was $216,657 or 55.3% of sales in 2001 as compared to $207,100 or 52.2% of sales in 2000. The increase in cost of goods sold is due to product mix, lower profit margins of the brands acquired in 2000, and higher overhead costs from multiple plant locations, including increased energy costs.
In addition, the nonrecurring inventory adjustment of $1,100 and plant closing charge of $1,500 added to cost of goods sold in the third and fourth quarters, respectively. These charges, coupled with the seasonality nature of our business and product mix, caused gross margins for third and fourth quarters to fall below the 44.7% of sales averaged over the entire year.
Selling, marketing and administrative expense, as a percent of sales increased from 19.0% in 2000 to 19.8% in 2001 due to higher distribution and delivery expenses relating to higher fuel costs, and higher customer deductions.
Amortization of intangibles increased from $3,420 in 2000 to $3,778 in 2001, reflecting a full year of amortization associated with the brands acquired during 2000. As a result of the lower sales and higher costs discussed above, earnings from operations declined from $110,729 to $93,944.
Other income was $6,843 in 2001 versus $7,079 in 2000, due to lower interest rates, partially offset by the investment capital gain. The effective tax rate was 34.8% in 2001 versus 35.7% in 2000.
Consolidated net earnings were $65,687 and $75,737 and earnings per share were $1.26 and $1.45 in 2001 and 2000, respectively. Average shares outstanding declined to 51,947 from 52,394 due to share repurchases.
7
LIQUIDITY AND CAPITAL RESOURCES
Cash flows from operating activities were $71,203 in 2002, $78,584 in 2001 and $82,591 in 2000. The decline in 2002 versus 2001 is attributable to higher accounts receivable and inventories, partially offset by higher accounts payable and accrued liabilities. The decline in 2001 versus 2000 was due to lower net earnings partially offset by lower accounts receivable and higher depreciation and amortization.
Cash flows from investing activities in 2002 reflect capital expenditures of $10,308 and a net increase in marketable securities of $14,996. In 2001, capital expenditures were $14,148 and marketable securities increased by $2,686. In 2000, capital expenditures were $16,189, $74,293 was used for the purchase of Fluffy Stuff and Andes Candies, and marketable securities decreased by $26,305, which was used to help finance the acquisitions.
Cash flows from financing activities reflect share repurchases of $32,314, $1,932 and $32,945 in 2002, 2001 and 2000, respectively. In 2000 there were short-term borrowings of $43,625 related to the Andes acquisition, which were subsequently repaid.
Cash dividends of $14,610, $14,168 and $13,091 were paid in 2002, 2001 and 2000, respectively. 2002 was the sixtieth consecutive year in which we have paid cash dividends.
QUANTITATIVE AND QUALITATIVE DISCLOSURE OF MARKET RISK
The company is exposed to various market risks, including fluctuations in the prices of ingredients and packaging material. At December 31, 2002 the company had open contracts to purchase approximately half of its expected 2003 and 2004 sugar usage. We also invest in securities with maturities of generally up to four years, the majority of which are held to maturity, which limits the company's exposure to interest rate fluctuations. There was no material change in the company's market risk during 2002.
CRITICAL ACCOUNTING POLICIES
Preparation of the company's financial statements involves judgements due to uncertainties affecting the application of accounting policies, and the likelihood that different amounts would be reported under different conditions or using different assumptions. In the opinion of management, the company does not have any individual accounting policy that is "critical." However, following is a summary of the more significant accounting policies and methods used.
Revenue recognition, customer incentive programs, advertising and marketing
Revenue, net of applicable provisions for discounts, returns, allowances, and certain advertising and promotional costs, is recognized upon delivery of products to customers. Provisions for bad debts are recorded as selling, marketing and administrative expense. Provisions for allowances are based upon the terms of programs offered to customers, historical trends of deductions and customer credit quality. Such provisions have not been significant to the company's financial position or results of operations.
Intangible assets
Effective January 1, 2002 the company adopted SFAS No. 142, whereby goodwill and other indefinite lived assets are not amortized, but are instead subjected to regular testing for impairment. The methodologies used to estimate fair value in such tests require the use of significant judgements and assumptions, including projected cash flows and discount rates. The company's intangible assets consist primarily of trademarks and goodwill, the values of which the company has determined are not impaired.
Investments
The company invests in certain high-quality debt securities primarily Aa or better rated municipal bonds. The accounting for such investments is outlined in Note 1. No credit losses have been incurred on these investments.
Guarantees
The Financial Accounting Standards Board issued Interpretation No. 45 "Guarantor's Accounting and Disclosure Requirements for Guarantees, Including Indirect Guarantees of Indebtedness to Others" relating to the accounting for and disclosure of certain types of guarantees. The disclosure provisions are effective for financial statements with years ending after December 15, 2002. No disclosures were required for the company as a result of adoption of this standard, as it has no such guarantees outstanding.
Other Matters
In the opinion of management, other than contracts for raw materials, principally commodity hedges entered into in the ordinary course of business, the company does not have any significant contractual obligations or future commitments, and is not involved in any significant transactions with related parties.
The company provides split dollar life insurance benefits to certain executive officers and records an asset equal to the cumulative insurance premiums paid on the related policies. The company will fully recover the premiums paid under the terms of the plan. The Sarbanes-Oxley Act (the Act) amended the Securities Exchange Act of 1934 to generally prohibit both direct and indirect corporate loans to certain executive officers and directors of publicly traded companies, but does not directly address split dollar life insurance premiums. Accordingly, the company has ceased making premium payments with respect to existing policies while it evaluates the potential impact of the Act on the split dollar life insurance benefit plan. The cessation in insurance premiums has no impact on the amount recoverable of the split dollar life insurance asset, which was $58,263 at December 31, 2002.
8
CONSOLIDATED STATEMENT OF
Financial Position
| TOOTSIE ROLL INDUSTRIES, INC. AND SUBSIDIARIES | (in thousands) | |||
| Assets | December 31, | ||||||||
|---|---|---|---|---|---|---|---|---|---|
2002 | 2001 | ||||||||
CURRENT ASSETS: | |||||||||
| Cash and cash equivalents | $105,507 | $106,532 | |||||||
| Investments | 40,737 | 68,629 | |||||||
| Accounts receivable trade, less allowances of $2,005 and $2,037 | 22,686 | 20,403 | |||||||
| Other receivables | 4,073 | 3,329 | |||||||
| Inventories: | |||||||||
| Finished goods and work-in-process | 26,591 | 24,770 | |||||||
| Raw materials and supplies | 17,054 | 16,392 | |||||||
| Prepaid expenses | 3,819 | 4,269 | |||||||
| Deferred income taxes | 4,481 | 1,772 | |||||||
| Total current assets | 224,948 | 246,096 | |||||||
| PROPERTY, PLANT AND EQUIPMENT, at cost: | |||||||||
| Land | 8,297 | 8,354 | |||||||
| Buildings | 43,948 | 43,613 | |||||||
| Machinery and equipment | 196,706 | 189,528 | |||||||
| 248,951 | 241,495 | ||||||||
| Less—Accumulated depreciation | 120,082 | 108,920 | |||||||
| 128,869 | 132,575 | ||||||||
| OTHER ASSETS: | |||||||||
| Goodwill | 38,151 | 38,151 | |||||||
| Trademarks | 79,348 | 79,348 | |||||||
| Investments | 116,501 | 71,131 | |||||||
| Split dollar officer life insurance | 58,263 | 51,375 | |||||||
| 292,263 | 240,005 | ||||||||
| $646,080 | $618,676 | ||||||||
(The accompanying notes are an integral part of these statements.)
9
| (in thousands except per share data) | ||||
| Liabilities and Shareholders' Equity | December 31, | |||||||||
|---|---|---|---|---|---|---|---|---|---|---|
2002 | 2001 | |||||||||
CURRENT LIABILITIES: | ||||||||||
| Accounts payable | $ 12,505 | $ 9,223 | ||||||||
| Dividends payable | 3,579 | 3,536 | ||||||||
| Accrued liabilities | 35,825 | 34,295 | ||||||||
| Income taxes payable | 11,187 | 10,792 | ||||||||
| Total current liabilities | 63,096 | 57,846 | ||||||||
| NONCURRENT LIABILITIES: | ||||||||||
| Deferred income taxes | 19,654 | 16,792 | ||||||||
| Postretirement health care and life insurance benefits | 8,151 | 7,450 | ||||||||
| Industrial development bonds | 7,500 | 7,500 | ||||||||
| Deferred compensation and other liabilities | 20,939 | 20,627 | ||||||||
| Total noncurrent liabilities | 56,244 | 52,369 | ||||||||
| SHAREHOLDERS' EQUITY: | ||||||||||
| Common stock, $.69-4/9 par value— 120,000 and 120,000 shares authorized— 34,248 and 34,139, respectively, issued | 23,783 | 23,708 | ||||||||
| Class B common stock, $.69-4/9 par value— 40,000 and 40,000 shares authorized— 16,759 and 16,319, respectively, issued | 11,638 | 11,332 | ||||||||
| Capital in excess of par value | 355,658 | 323,981 | ||||||||
| Retained earnings, per accompanying statement | 148,705 | 161,345 | ||||||||
| Accumulated other comprehensive earnings (loss) | (11,052 | ) | (9,913 | ) | ||||||
| Treasury stock (at cost)— 55 shares and 53 shares, respectively | (1,992 | ) | (1,992 | ) | ||||||
| 526,740 | 508,461 | |||||||||
| $646,080 | $618,676 | |||||||||
10
CONSOLIDATED STATEMENT OF
Earnings, Comprehensive Earnings and Retained Earnings
| TOOTSIE ROLL INDUSTRIES, INC. AND SUBSIDIARIES | (in thousands except per share data) | |||||
| | For the year ended December 31, | |||||||
|---|---|---|---|---|---|---|---|---|
2002 | 2001 | 2000 | ||||||
Net sales | $393,185 | $391,755 | $396,816 | |||||
| Cost of goods sold | 220,765 | 216,657 | 207,100 | |||||
| Gross margin | 172,420 | 175,098 | 189,716 | |||||
| Selling, marketing and administrative expenses | 75,751 | 77,376 | 75,567 | |||||
| Amortization of intangible assets | — | 3,778 | 3,420 | |||||
| Earnings from operations | 96,669 | 93,944 | 110,729 | |||||
| Other income, net | 4,019 | 6,843 | 7,079 | |||||
| Earnings before income taxes | 100,688 | 100,787 | 117,808 | |||||
| Provision for income taxes | 34,300 | 35,100 | 42,071 | |||||
| Net earnings | $ 66,388 | $ 65,687 | $ 75,737 | |||||
Net earnings | $ 66,388 | $ 65,687 | $ 75,737 | |||||
| Other comprehensive earnings (loss) | (1,139 | ) | 277 | (1,250 | ) | |||
| Comprehensive earnings | $ 65,249 | $ 65,964 | $ 74,487 | |||||
Retained earnings at beginning of year | $161,345 | $180,123 | $158,619 | |||||
| Net earnings | 66,388 | 65,687 | 75,737 | |||||
| Cash dividends ($.28, $.27 and $.26 per share, respectively) | (14,304 | ) | (14,021 | ) | (13,350 | ) | ||
| Stock dividends | (64,724 | ) | (70,444 | ) | (40,883 | ) | ||
| Retained earnings at end of year | $148,705 | $161,345 | $180,123 | |||||
| Earnings per share | $ 1.29 | $ 1.26 | $ 1.45 | |||||
| Average common and class B common shares outstanding | 51,553 | 51,947 | 52,394 | |||||
(The accompanying notes are an integral part of these statements.)
11
CONSOLIDATED STATEMENT OF
Cash Flows
| TOOTSIE ROLL INDUSTRIES, INC. AND SUBSIDIARIES | (in thousands) | |||||
| | For the year ended December 31, | |||||||||||
|---|---|---|---|---|---|---|---|---|---|---|---|---|
| | 2002 | 2001 | 2000 | |||||||||
| CASH FLOWS FROM OPERATING ACTIVITIES: | ||||||||||||
| Net earnings | $ 66,388 | $ 65,687 | $ 75,737 | |||||||||
| Adjustments to reconcile net earnings to net cash provided by operating activities: | ||||||||||||
| Depreciation and amortization | 12,354 | 16,700 | 13,314 | |||||||||
| Gain on retirement of fixed assets | — | — | (46 | ) | ||||||||
| Purchase of trading securities | (2,481 | ) | (2,921 | ) | (2,290 | ) | ||||||
| Changes in operating assets and liabilities, excluding acquisitions: | ||||||||||||
| Accounts receivable | (2,887 | ) | 3,096 | (4,460 | ) | |||||||
| Other receivables | 115 | (2,100 | ) | 4,486 | ||||||||
| Inventories | (2,734 | ) | 910 | (768 | ) | |||||||
| Prepaid expenses and other assets | (6,902 | ) | (8,857 | ) | (7,903 | ) | ||||||
| Accounts payable and accrued liabilities | 5,049 | (224 | ) | (1,717 | ) | |||||||
| Income taxes payable and deferred | 485 | 4,402 | 5,691 | |||||||||
| Postretirement health care and life insurance benefits | 700 | 494 | 399 | |||||||||
| Deferred compensation and other liabilities | 312 | 1,206 | 337 | |||||||||
| Other | 804 | 191 | (189 | ) | ||||||||
| Net cash provided by operating activities | 71,203 | 78,584 | 82,591 | |||||||||
| CASH FLOWS FROM INVESTING ACTIVITIES: | ||||||||||||
| Acquisitions of businesses, net of cash acquired | — | — | (74,293 | ) | ||||||||
| Capital expenditures | (10,308 | ) | (14,148 | ) | (16,189 | ) | ||||||
| Purchase of held to maturity securities | (262,229 | ) | (240,609 | ) | (154,032 | ) | ||||||
| Maturity of held to maturity securities | 250,345 | 228,397 | 176,576 | |||||||||
| Purchase of available for sale securities | (35,217 | ) | (64,640 | ) | (78,993 | ) | ||||||
| Sale and maturity of available for sale securities | 32,105 | 74,166 | 82,754 | |||||||||
| Net cash used in investing activities | (25,304 | ) | (16,834 | ) | (64,177 | ) | ||||||
| CASH FLOWS FROM FINANCING ACTIVITIES: | ||||||||||||
| Issuance of notes payable | — | — | 43,625 | |||||||||
| Repayments of notes payable | — | — | (43,625 | ) | ||||||||
| Shares repurchased and retired | (32,314 | ) | (1,932 | ) | (32,945 | ) | ||||||
| Dividends paid in cash | (14,610 | ) | (14,168 | ) | (13,091 | ) | ||||||
| Net cash used in financing activities | (46,924 | ) | (16,100 | ) | (46,036 | ) | ||||||
| Increase (decrease) in cash and cash equivalents | (1,025 | ) | 45,650 | (27,622 | ) | |||||||
| Cash and cash equivalents at beginning of year | 106,532 | 60,882 | 88,504 | |||||||||
| Cash and cash equivalents at end of year | $105,507 | $106,532 | $ 60,882 | |||||||||
| Supplemental cash flow information: | ||||||||||||
| Income taxes paid | $ 34,099 | $ 30,490 | $ 35,750 | |||||||||
| Interest paid | $ 309 | $ 356 | $ 1,067 | |||||||||
(The accompanying notes are an integral part of these statements.)
12
Notes to Consolidated Financial Statements
($ in thousands except per share data)
TOOTSIE ROLL INDUSTRIES, INC. AND SUBSIDIARIES
NOTE 1—SIGNIFICANT ACCOUNTING POLICIES:
Basis of consolidation:
The consolidated financial statements include the accounts of Tootsie Roll Industries, Inc. and its wholly-owned subsidiaries (the company), which are primarily engaged in the manufacture and sale of candy products. All significant intercompany transactions have been eliminated.
The preparation of financial statements in conformity with generally accepted accounting principles requires management to make estimates and assumptions that affect the reported amounts of assets and liabilities and disclosure of contingent assets and liabilities at the date of the financial statements and the reported amounts of revenues and expenses during the reporting period. Actual results could differ from those estimates.
Certain reclassifications have been made to the prior year financial statements to conform to the current year presentation.
Revenue recognition and other accounting pronouncements:
Revenues are recognized when products are shipped and delivered to customers. Shipping and handling costs of $28,579, $28,069, and $26,661 in 2002, 2001 and 2000, respectively, are included in selling, marketing and administrative expenses. Accounts receivable are unsecured. Revenues from a major customer aggregated approximately 19.6%, 16.9% and 17.8% of total net sales during the years ended December 31, 2002, 2001 and 2000, respectively.
Emerging Issues Task Force Issue No. 00-25, "Vendor Income Statement Characterization of Consideration Paid to a Reseller of the Vendor's Products" and Issue No. 00-14, "Accounting for Certain Sales Incentives" require that cooperative advertising and certain sales incentives costs traditionally reported as selling, marketing and administrative expense be reclassified as a reduction of net sales beginning January 1, 2002. Prior period consolidated statements of earnings have been reclassified to reflect this change. As a result, $31,741 and $30,238 of such expenses were reclassified to a reduction of net sales for the years ended December 31, 2001 and 2000, respectively. These reclassifications did not affect the company's financial position, earnings from operations or net income.
Effective January 1, 2001, the company adopted SFAS 133 "Accounting for Certain Derivative Instruments and Certain Hedging Activities" and the related SFAS 138 "Accounting for Certain Derivative Instruments and Certain Hedging Activities" with no material effect on the company's results of operations or financial position. These standards require that derivative instruments be recorded on the balance sheet at fair value, and that changes therein be recorded either in earnings or other comprehensive earnings, depending on whether the derivative is designated and effective as part of a hedge transaction and, if so, the type of hedge transaction. Gains and losses on derivative instruments reported in other comprehensive earnings are reclassified to earnings in the periods in which earnings are affected by the hedged item.
From time to time, the company enters into commodities futures contracts that are intended and effective as hedges of market price risks associated with the anticipated purchase of certain raw materials (primarily sugar). To qualify as a hedge, the company evaluates a variety of characteristics of these transactions, including the probability that the anticipated transaction will occur. If the anticipated transaction were not to occur, the gain or loss would then be recognized in current earnings.
To qualify for hedge accounting, financial instruments must maintain a high correlation with the item being hedged throughout the hedged period. The company does not engage in trading or other speculative use of derivative instruments. The company does assume the risk that counter parties may not be able to meet the terms of their contracts. The company does not expect any losses as a result of counter party defaults, and at December 31, 2002 had open contracts to purchase approximately half of its expected 2003 and 2004 sugar usage.
The Financial Accounting Standards Board issued Interpretation No. 45 "Guarantor's Accounting and Disclosure Requirements for Guarantees, Including Indirect Guarantees of Indebtedness to Others" relating to the accounting for and disclosure of certain types of guarantees. The disclosure provisions are effective for financial statements with years ending after December 15, 2002. No disclosures were required for the company as a result of adoption of this standard, as it has no such guarantees outstanding.
During 2002, the Financial Accounting Standards Board finalized SFAS No. 146 "Accounting for Costs Associated with Exit or Disposal Activities" for exit and disposal activities that are initiated after December 31, 2002. This statement requires that a liability for a cost associated with an exit or disposal activity be recognized when the liability is incurred. The company does not expect adoption of this standard to have a material impact on its 2003 consolidated financial statements.
Cash and cash equivalents:
The company considers temporary cash investments with an original maturity of three months or less to be cash equivalents.
13
Investments:
Investments consist of various marketable securities with maturities of generally up to four years. The company classifies debt and equity securities as either held to maturity, available for sale or trading. Held to maturity securities represent those securities that the company has both the positive intent and ability to hold to maturity and are carried at amortized cost. Available for sale securities represent those securities that do not meet the classification of held to maturity, are not actively traded and are carried at fair value. Unrealized gains and losses on these securities are excluded from earnings and are reported as a separate component of shareholders' equity, net of applicable taxes, until realized. Trading securities relate to deferred compensation arrangements and are carried at fair value.
Inventories:
Inventories are stated at cost, not in excess of market. The cost of domestic inventories ($40,064 and $35,982 at December 31, 2002 and 2001, respectively) has been determined by the last-in, first-out (LIFO) method. The excess of current cost over LIFO cost of inventories approximates $5,137 and $4,261 at December 31, 2002 and 2001, respectively. The cost of foreign inventories ($3,581 and $5,180 at December 31, 2002 and 2001, respectively) has been determined by the first-in, first-out (FIFO) method.
Property, plant and equipment:
Depreciation is computed for financial reporting purposes by use of the straight-line method based on useful lives of 20 to 35 years for buildings and 5 to 20 years for machinery and equipment. Depreciation expense was $12,354, $14,148 and $10,069 in 2002, 2001 and 2000, respectively, including $744 relating to equipment disposals and $1,275 of equipment that was written down related to a plant closing in 2002 and 2001, respectively.
Carrying value of long-lived assets:
Effective January 1, 2002, the company adopted SFAS No. 144, "Accounting for the Impairment or Disposal of Long-Lived Assets." This statement requires that long-lived assets be reviewed for impairment as events or changes in circumstances occur indicating that the amount of the asset reflected in the company's balance sheet may not be recoverable. An estimate of undiscounted cash flows produced by the asset, or the appropriate group of assets, is compared to the carrying value to determine whether impairment exists. An impairment charge would then be recorded to write the carrying value down to its fair value. The determination of fair value involves the use of estimates of future cash flows that involve considerable management judgment and are based upon assumptions about expected future operating performance. The actual cash flows could differ from management's estimates due to changes in business conditions, operating performance, and economic conditions. No significant impairment charges were recorded by the company during 2002.
Postretirement health care and life insurance benefits:
The company provides certain postretirement health care and life insurance benefits. The cost of these postretirement benefits is accrued during employees' working careers. The company also provides split dollar life insurance benefits to certain executive officers. The company records an asset equal to the cumulative insurance premiums that will be recovered upon the death of a covered employee(s) or earlier under the terms of the plan. The Sarbanes-Oxley Act (the Act) amended the Securities Exchange Act of 1934 to generally prohibit corporate loans to certain executive officers and directors of publicly traded companies. This prohibition applies to both direct and indirect loans. Because the Act does not directly address split dollar life insurance premiums, the impact of the Act on the company's split dollar life insurance plan is not currently known. The company has ceased making premium payments with respect to existing policies and is considering the potential impact of the Act on the split dollar life insurance benefit plan. The cessation of insurance premiums has no impact on the amount recoverable of the split dollar life insurance asset.
Intangible assets:
On January 1, 2002, the company adopted SFAS 142, "Goodwill and Other Intangible Assets." As a result of its adoption, the company has reclassified $79,348 and $38,151 from intangible assets to trademarks and goodwill, respectively. All trademarks have been assessed by management to have indefinite lives because they are expected to generate cash flows indefinitely. Thus, the company has ceased amortization expense on all trademarks and goodwill as of January 1, 2002.
The company has identified its reporting units related to goodwill and completed its goodwill impairment tests as of January 1, 2002 which require that management compare the fair value of the reporting unit with its carrying value. The reporting units were not considered to be impaired. The company also completed its impairment test of the indefinite lived trademarks which required management to compare the fair value of the trademarks to the carrying value. The trademarks were not considered to be impaired.
The impairment tests performed require that the company determine the fair market value of its reporting units for comparison to the carrying value of such net assets to assess whether an impairment exists. The methodologies used to estimate fair market value involve the use of estimates and assumptions, including projected revenues, earnings, cash flows and discount rates.
In addition, the company is required to conduct an annual review of its goodwill and trademarks for potential impairment. In 2002, this review was completed and no impairment was found.
14
Comprehensive earnings:
Comprehensive earnings includes net earnings, foreign currency translation adjustments and unrealized gains/losses on commodity contracts and marketable securities.
Earnings per share:
A dual presentation of basic and diluted earnings per share is not required due to the lack of potentially dilutive securities under the company's simple capital structure. Therefore, all earnings per share amounts represent basic earnings per share.
NOTE 2—ACQUISITIONS:
During 2000, the company acquired the assets of two confectionery companies for $74,293 in cash, which was funded through existing cash and $38,800 of short term borrowings. The acquisition cost has been allocated to the assets acquired and liabilities assumed based on their respective appraised values as follows:
Current assets | $ | 6,304 | ||
| Property, plant and equipment | 29,400 | |||
| Intangible assets, primarily trademarks | 39,546 | |||
| Liabilities | (957 | ) | ||
| Total purchase price | $ | 74,293 | ||
The acquisitions were accounted for by the purchase method. Accordingly, the operating results of the acquired businesses have been included in the consolidated financial statements since the date of acquisition. The operating results of the acquired businesses did not have a material effect on the company's financial statements.
NOTE 3—ACCRUED LIABILITIES:
Accrued liabilities are comprised of the following:
| | December 31, | |||||
|---|---|---|---|---|---|---|
2002 | 2001 | |||||
| Compensation | $ | 11,211 | $ | 10,516 | ||
| Other employee benefits | 4,666 | 4,375 | ||||
| Taxes, other than income | 2,542 | 2,549 | ||||
| Advertising and promotions | 10,894 | 9,777 | ||||
| Other | 6,512 | 7,078 | ||||
| $ | 35,825 | $ | 34,295 | |||
NOTE 4—INCOME TAXES:
The domestic and foreign components of pretax income are as follows:
2002 | 2001 | 2000 | ||||||||
|---|---|---|---|---|---|---|---|---|---|---|
| Domestic | $ | 98,978 | $ | 98,827 | $ | 115,823 | ||||
| Foreign | 1,710 | 1,960 | 1,985 | |||||||
| $ | 100,688 | $ | 100,787 | $ | 117,808 | |||||
The provision for income taxes is comprised of the following:
2002 | 2001 | 2000 | ||||||||
|---|---|---|---|---|---|---|---|---|---|---|
| Current: | ||||||||||
| Federal | $ | 32,303 | $ | 27,588 | $ | 33,908 | ||||
| Foreign | 553 | 749 | 426 | |||||||
| State | 1,523 | 2,480 | 3,613 | |||||||
| 34,379 | 30,817 | 37,947 | ||||||||
| Deferred: | ||||||||||
| Federal | (286 | ) | 4,011 | 3,500 | ||||||
| Foreign | 176 | 52 | 346 | |||||||
| State | 31 | 220 | 278 | |||||||
| (79 | ) | 4,283 | 4,124 | |||||||
| $ | 34,300 | $ | 35,100 | $ | 42,071 | |||||
Deferred income taxes are comprised of the following:
| | December 31, | ||||||
|---|---|---|---|---|---|---|---|
2002 | 2001 | ||||||
| Workers' compensation | $ | — | $ | 527 | |||
| Reserve for uncollectible accounts | 475 | 432 | |||||
| Other accrued expenses | 3,629 | 1,199 | |||||
| VEBA funding | (469 | ) | (450 | ) | |||
| Other, net | 846 | 64 | |||||
| Net current deferred income tax asset | $ | 4,481 | $ | 1,772 | |||
| | December 31, | ||||||
|---|---|---|---|---|---|---|---|
2002 | 2001 | ||||||
| Depreciation | $ | 15,629 | $ | 15,309 | |||
| Postretirement benefits | (2,885 | ) | (2,570 | ) | |||
| Deductible goodwill and trademarks | 10,908 | 9,036 | |||||
| Deferred compensation | (7,205 | ) | (6,595 | ) | |||
| Accrued DISC commissions | 2,602 | 2,377 | |||||
| Foreign subsidiary tax loss carryforward | (411 | ) | (1,100 | ) | |||
| Other, net | 1,016 | 335 | |||||
| Net long-term deferred income tax liability | $ | 19,654 | $ | 16,792 | |||
15
At December 31, 2002, gross deferred tax assets and gross deferred tax liabilities were $17,847 and $33,020, respectively. The deferred tax assets are shown net of valuation allowances of $2,014 and $1,897 at December 31, 2002 and December 31, 2001, respectively, relating to prepaid taxes in a foreign jurisdiction.
The effective income tax rate differs from the statutory rate as follows:
2002 | 2001 | 2000 | |||||
|---|---|---|---|---|---|---|---|
| U.S. statutory rate | 35.0 | % | 35.0 | % | 35.0 | % | |
| State income taxes, net | 1.0 | 1.8 | 2.2 | ||||
| Amortization of intangible assets | — | 0.4 | 0.4 | ||||
| Exempt municipal bond interest | (1.8 | ) | (2.0 | ) | (1.8 | ) | |
| Other, net | (0.1 | ) | (0.4 | ) | (0.1 | ) | |
| Effective income tax rate | 34.1 | % | 34.8 | % | 35.7 | % | |
The company has not provided for U.S. federal or foreign withholding taxes on $6,506 and $6,883 of foreign subsidiaries' undistributed earnings as of December 31, 2002 and December 31, 2001, respectively, because such earnings are considered to be permanently reinvested. It is not practicable to determine the amount of income taxes that would be payable upon remittance of the undistributed earnings.
NOTE 5—GOODWILL AND OTHER INTANGIBLE ASSETS:
The company ceased amortizing its intangible assets in conjunction with the January 1, 2002 adoption of SFAS 142. The proforma effects of such adoption are as follows:
2002 | 2001 | 2000 | ||||||||
|---|---|---|---|---|---|---|---|---|---|---|
| Reported net income | $ | 66,388 | $ | 65,687 | $ | 75,737 | ||||
| Add back: goodwill amortization | — | 1,473 | 1,423 | |||||||
| Add back: trademark amortization | — | 2,305 | 1,996 | |||||||
| Tax effect | — | (927 | ) | (793 | ) | |||||
| Adjusted net income | $ | 66,388 | $ | 68,538 | $ | 78,363 | ||||
| Reported basic earnings per share | $ | 1.29 | $ | 1.26 | $ | 1.45 | ||||
| Goodwill amortization | — | .03 | .03 | |||||||
| Trademark amortization | — | .05 | .04 | |||||||
| Tax effect | — | (.02 | ) | (.02 | ) | |||||
| Adjusted basic earnings per share | $ | 1.29 | $ | 1.32 | $ | 1.50 | ||||
NOTE 6—SHARE CAPITAL AND CAPITAL IN EXCESS OF PAR VALUE:
| | | | Class B Common Stock | | | | |||||||||||||
|---|---|---|---|---|---|---|---|---|---|---|---|---|---|---|---|---|---|---|---|
| | Common Stock | Treasury Stock | | ||||||||||||||||
| | Capital in excess of par value | ||||||||||||||||||
Shares | Amount | Shares | Amount | Shares | Amount | ||||||||||||||
| | (000's) | | (000's) | | (000's) | | | ||||||||||||
| Balance at January 1, 2000 | 32,854 | $ | 22,815 | 15,707 | $ | 10,908 | (50 | ) | $ | (1,992 | ) | $ | 249,236 | ||||||
| Issuance of 3% stock dividend | 969 | 673 | 470 | 326 | (2 | ) | — | 39,742 | |||||||||||
| Conversion of Class B common shares to common shares | 121 | 84 | (121 | ) | (84 | ) | — | — | — | ||||||||||
| Purchase and retirement of common shares | (958 | ) | (665 | ) | — | — | — | — | (32,280 | ) | |||||||||
| Balance at December 31, 2000 | 32,986 | 22,907 | 16,056 | 11,150 | (52 | ) | (1,992 | ) | 256,698 | ||||||||||
| Issuance of 3% stock dividend | 986 | 685 | 480 | 333 | (1 | ) | — | 69,180 | |||||||||||
| Conversion of Class B common shares to common shares | 217 | 151 | (217 | ) | (151 | ) | — | — | — | ||||||||||
| Purchase and retirement of common shares | (50 | ) | (35 | ) | — | — | — | — | (1,897 | ) | |||||||||
| Balance at December 31, 2001 | 34,139 | 23,708 | 16,319 | 11,332 | (53 | ) | (1,992 | ) | 323,981 | ||||||||||
| Issuance of 3% stock dividend | 1,009 | 700 | 488 | 339 | (2 | ) | — | 63,332 | |||||||||||
| Conversion of Class B common shares to common shares | 48 | 33 | (48 | ) | (33 | ) | — | — | — | ||||||||||
| Purchase and retirement of common shares | (948 | ) | (658 | ) | — | — | — | — | (31,655 | ) | |||||||||
| Balance at December 31, 2002 | 34,248 | $ | 23,783 | 16,759 | $ | 11,638 | (55 | ) | $ | (1,992 | ) | $ | 355,658 | ||||||
The Class B Common Stock has essentially the same rights as Common Stock, except that each share of Class B Common Stock has ten votes per share (compared to one vote per share of Common Stock), is not traded on any exchange, is restricted as to transfer and is convertible on a share-for-share basis, at any time and at no cost to the holders, into shares of Common Stock which are traded on the New York Stock Exchange.
Average shares outstanding and all per share amounts included in the financial statements and notes thereto have been adjusted retroactively to reflect annual three percent stock dividends.
NOTE 7—INDUSTRIAL DEVELOPMENT BONDS:
Industrial development bonds are due in 2027. The average floating interest rate was 1.5% and 3.0% in 2002 and 2001, respectively.
16
NOTE 8—EMPLOYEE BENEFIT PLANS:
Pension plans:
The company sponsors defined contribution pension plans covering certain nonunion employees with over one year of credited service. The company's policy is to fund pension costs accrued based on compensation levels. Total pension expense for 2002, 2001 and 2000 approximated $2,867, $2,823 and $2,535, respectively. The company also maintains certain profit sharing and savings-investment plans. Company contributions in 2002, 2001 and 2000 to these plans were $709, $765 and $754, respectively.
The company also contributes to multi-employer defined benefit pension plans for its union employees. Such contributions aggregated $1,055, $859 and $787 in 2002, 2001 and 2000, respectively. The relative position of each employer associated with the multi-employer plans with respect to the actuarial present value of benefits and net plan assets is not determinable by the company.
Postretirement health care and life insurance benefit plans:
The company provides certain postretirement health care and life insurance benefits for corporate office and management employees. Employees become eligible for these benefits if they meet minimum age and service requirements and if they agree to contribute a portion of the cost. The company has the right to modify or terminate these benefits. The company does not fund postretirement health care and life insurance benefits in advance of payments for benefit claims.
The changes in the accumulated postretirement benefit obligation at December 31, 2002 and 2001 consist of the following:
| | December 31, | ||||||
|---|---|---|---|---|---|---|---|
| | 2002 | 2001 | |||||
| Benefit obligation, beginning of year | $ | 7,450 | $ | 6,956 | |||
| Net periodic postretirement benefit cost | 913 | 705 | |||||
| Benefits paid | (212 | ) | (211 | ) | |||
| Benefit obligation, end of year | $ | 8,151 | $ | 7,450 | |||
Net periodic postretirement benefit cost included the following components:
2002 | 2001 | 2000 | ||||||||
|---|---|---|---|---|---|---|---|---|---|---|
| Service cost—benefits attributed to service during the period | $ | 462 | $ | 351 | $ | 286 | ||||
| Interest cost on the accumulated postretirement benefit obligation | 481 | 422 | 341 | |||||||
| Amortization of unrecognized net gain | (30 | ) | (68 | ) | (109 | ) | ||||
| Net periodic postretirement benefit cost | $ | 913 | $ | 705 | $ | 518 | ||||
For measurement purposes, a 10.0% annual rate of increase in the per capita cost of covered health care benefits was assumed for 2002; the rate was assumed to decrease gradually to 5.5% for 2011 and remain at that level thereafter. The health care cost trend rate assumption has a significant effect on the amounts reported. The weighted-average discount rate used in determining the accumulated postretirement benefit obligation was 6.5% and 7.0% at December 31, 2002 and 2001, respectively.
Increasing or decreasing the health care trend rates by one percentage point in each year would have the following effect:
1% Increase | 1% Decrease | ||||||
|---|---|---|---|---|---|---|---|
| Effect on postretirement benefit obligation | $ | 1,589 | $ | (1,293 | ) | ||
| Effect on total of service and interest cost components | $ | 167 | $ | (133 | ) | ||
NOTE 9—OTHER INCOME, NET:
Other income (expense) is comprised of the following:
2002 | 2001 | 2000 | ||||||||
|---|---|---|---|---|---|---|---|---|---|---|
| Interest income | $ | 5,553 | $ | 6,556 | $ | 7,636 | ||||
| Interest expense | (309 | ) | (356 | ) | (866 | ) | ||||
| Dividend income | 3 | 55 | 421 | |||||||
| Foreign exchange losses | (206 | ) | (177 | ) | (42 | ) | ||||
| Royalty income | 371 | 403 | 225 | |||||||
| Miscellaneous, net | (1,393 | ) | 362 | (295 | ) | |||||
| $ | 4,019 | $ | 6,843 | $ | 7,079 | |||||
NOTE 10—COMMITMENTS:
Rental expense aggregated $941, $1,000 and $894 in 2002, 2001 and 2000, respectively.
Future operating lease commitments are not significant.
17
NOTE 11—COMPREHENSIVE INCOME:
Components of accumulated other comprehensive earnings (loss) are shown as follows:
Foreign Currency | Unrealized Gains (Losses) on Securities | Unrealized Gains (Losses) on Derivatives | Accumulated Other Comprehensive Earnings/(Loss) | ||||||||||
|---|---|---|---|---|---|---|---|---|---|---|---|---|---|
| Balance at January 1, 2000 | $ | (10,429 | ) | $ | 1,489 | $ | 0 | $ | (8,940 | ) | |||
| Change during period | (394 | ) | (856 | ) | — | (1,250 | ) | ||||||
| Balance at December 31, 2000 | (10,823 | ) | 633 | 0 | (10,190 | ) | |||||||
| Change during period | 846 | (184 | ) | (385 | ) | 277 | |||||||
| Balance at December 31, 2001 | (9,977 | ) | 449 | (385 | ) | (9,913 | ) | ||||||
| Change during period | (1,533 | ) | (465 | ) | 859 | (1,139 | ) | ||||||
| Balance at December 31, 2002 | $ | (11,510 | ) | $ | (16 | ) | $ | 474 | $ | (11,052 | ) | ||
The individual tax effects of each component of other comprehensive earnings (loss) for the year ended December 31, 2002 are shown as follows:
Before Tax Amount | Tax (Expense) Benefit | Net-of-Tax Tax Amount | ||||||||||
|---|---|---|---|---|---|---|---|---|---|---|---|---|
| Foreign currency translation adjustment | $ | (1,533 | ) | $ | — | $ | (1,533 | ) | ||||
| Unrealized gains (losses) on securities: | ||||||||||||
| Unrealized holding gains (losses) arising during 2002 | (798 | ) | 294 | (504 | ) | |||||||
| Less: reclassification adjustment for gains (losses) realized in earnings | (60 | ) | 21 | (39 | ) | |||||||
| Net unrealized gains | (738 | ) | 273 | (465 | ) | |||||||
| Unrealized gains (losses) on derivatives: | ||||||||||||
| Unrealized holding gains (losses) arising during 2002 | (65 | ) | 24 | (41 | ) | |||||||
| Less: reclassification adjustment for gains (losses) realized in earnings | (1,429 | ) | 529 | (900 | ) | |||||||
| Net unrealized gains | 1,364 | (505 | ) | 859 | ||||||||
| Other comprehensive earnings | $ | (907 | ) | $ | (232 | ) | $ | (1,139 | ) | |||
NOTE 12—DISCLOSURES ABOUT THE FAIR VALUE AND CARRYING AMOUNT OF FINANCIAL INSTRUMENTS:
The carrying amount approximates fair value of cash and cash equivalents because of the short maturity of those instruments. The fair values of investments are estimated based on quoted market prices. The fair value of the company's industrial development bonds approximates their carrying value because they have a floating interest rate. The carrying amount and estimated fair values of the company's financial instruments are as follows:
| | 2002 | 2001 | ||||||||||
|---|---|---|---|---|---|---|---|---|---|---|---|---|
Carrying Amount | Fair Value | Carrying Amount | Fair Value | |||||||||
| Cash and cash equivalents | $ | 105,507 | $ | 105,507 | $ | 106,532 | $ | 106,532 | ||||
| Investments held to maturity | 119,730 | 121,541 | 102,585 | 103,543 | ||||||||
| Investments available for sale | 22,226 | 22,226 | 22,253 | 22,253 | ||||||||
| Investments in trading securities | 15,281 | 15,281 | 14,922 | 14,922 | ||||||||
| Industrial development bonds | 7,500 | 7,500 | 7,500 | 7,500 | ||||||||
18
A summary of the aggregate fair value, gross unrealized gains, gross unrealized losses and amortized cost basis of the company's investment portfolio by major security type is as follows:
| | December 31, 2002 | December 31, 2001 | |||||||||||||||||||||||
|---|---|---|---|---|---|---|---|---|---|---|---|---|---|---|---|---|---|---|---|---|---|---|---|---|---|
| | | | Unrealized | | | Unrealized | |||||||||||||||||||
| Held to Maturity: | Amortized Cost | | Amortized Cost | Fair Value | |||||||||||||||||||||
| Fair Value | Gains | Losses | Gains | Losses | |||||||||||||||||||||
| Municipal bonds | $ | 134,425 | $ | 136,240 | $ | 1,815 | $ | — | $ | 127,667 | $ | 128,631 | $ | 964 | $ | — | |||||||||
| Unit investment trusts of municipal bonds | 505 | 502 | — | (3 | ) | 918 | 910 | — | (8 | ) | |||||||||||||||
| $ | 134,930 | $ | 136,742 | $ | 1,815 | $ | (3 | ) | $ | 128,585 | $ | 129,541 | $ | 964 | $ | (8 | ) | ||||||||
| Available for Sale: | |||||||||||||||||||||||||
| Municipal bonds | $ | 24,281 | $ | 24,275 | $ | — | $ | (6 | ) | $ | 23,679 | $ | 23,665 | $ | — | $ | (14 | ) | |||||||
| Mutual funds | 2,454 | 2,436 | — | (18 | ) | 2,454 | 3,179 | 725 | — | ||||||||||||||||
| $ | 26,735 | $ | 26,711 | $ | — | $ | (24 | ) | $ | 26,133 | $ | 26,844 | $ | 725 | $ | (14 | ) | ||||||||
Held to maturity securities of $15,200 and $26,000 and available for sale securities of $4,485 and $4,591 were included in cash and cash equivalents at December 31, 2002 and 2001, respectively. There were no securities with maturities greater than four years and gross realized gains and losses on the sale of available for sale securities in 2002 and 2001 were not significant.
NOTE 13—SUMMARY OF SALES, NET EARNINGS AND ASSETS BY GEOGRAPHIC AREA:
| | 2002 | 2001 | 2000 | ||||||||||||||||||||||||
|---|---|---|---|---|---|---|---|---|---|---|---|---|---|---|---|---|---|---|---|---|---|---|---|---|---|---|---|
| | United States | Mexico and Canada | Consoli- dated | United States | Mexico and Canada | Consoli- dated | United States | Mexico and Canada | Consoli- dated | ||||||||||||||||||
| Sales to unaffiliated customers | $ | 365,920 | $ | 27,265 | $ | 393,185 | $ | 362,290 | $ | 29,465 | $ | 391,755 | $ | 366,213 | $ | 30,603 | $ | 396,816 | |||||||||
| Sales between geographic areas | 4,978 | 2,892 | 3,649 | 2,731 | 3,626 | 3,343 | |||||||||||||||||||||
| $ | 370,898 | $ | 30,157 | $ | 365,939 | $ | 32,196 | $ | 369,839 | $ | 33,946 | ||||||||||||||||
| Net earnings | $ | 65,413 | $ | 975 | $ | 66,388 | $ | 65,370 | $ | 317 | $ | 65,687 | $ | 73,929 | $ | 1,808 | $ | 75,737 | |||||||||
| Total assets | $ | 627,436 | $ | 18,644 | $ | 646,080 | $ | 596,303 | $ | 22,373 | $ | 618,676 | $ | 540,697 | $ | 21,745 | $ | 562,442 | |||||||||
| Net assets | $ | 511,743 | $ | 14,997 | $ | 526,740 | $ | 489,552 | $ | 18,909 | $ | 508,461 | $ | 439,685 | $ | 19,011 | $ | 458,696 | |||||||||
Total assets are those assets associated with or used directly in the respective geographic area, excluding intercompany advances and investments. United States sales include exports to countries other than Mexico and Canada.
Report of Independent Accountants
To the Board of Directors and Shareholders of Tootsie Roll Industries, Inc.:
In our opinion, the accompanying consolidated statements of financial position and the related consolidated statements of earnings, comprehensive earnings and retained earnings and of cash flows present fairly, in all material respects, the financial position of Tootsie Roll Industries, Inc. and its subsidiaries at December 31, 2002 and 2001, and the results of their operations and their cash flows for each of the three years in the period ended December 31, 2002 in conformity with accounting principles generally accepted in the United States of America. These financial statements are the responsibility of the company's management; our responsibility is to express an opinion on these financial statements based on our audits. We conducted our audits of these statements in accordance with auditing standards generally accepted in the United States of America, which require that we plan and perform the audit to obtain reasonable assurance about whether the financial statements are free of material misstatement. An audit includes examining, on a test basis, evidence supporting the amounts and disclosures in the financial statements, assessing the accounting principles used and significant estimates made by management, and evaluating the overall financial statement presentation. We believe that our audits provide a reasonable basis for our opinion.
As described in Notes 1 and 5 to the consolidated financial statements, the company changed the manner in which it accounts for its goodwill and other intangible assets upon adoption of Statement of Financial Standards No. 142, "Goodwill and Other Intangible Assets" on January 1, 2002.
![]()
Chicago, Illinois
February 10, 2003
19
Quarterly Financial Data (Unaudited)
TOOTSIE ROLL INDUSTRIES, INC. AND SUBSIDIARIES
| | (Thousands of dollars except per share data) | |||||||||
|---|---|---|---|---|---|---|---|---|---|---|
| 2002 | First | Second | Third | Fourth | Total | |||||
| Net sales | $78,991 | $77,131 | $146,298 | $90,765 | $393,185 | |||||
| Gross margin | 35,831 | 35,755 | 61,960 | 38,874 | 172,420 | |||||
| Net earnings | 12,772 | 12,316 | 26,616 | 14,684 | 66,388 | |||||
| Net earnings per share | .25 | .24 | .51 | .29 | 1.29 | |||||
2001 | ||||||||||
| Net sales | $75,858 | $79,987 | $148,456 | $87,454 | $391,755 | |||||
| Gross margin | 36,194 | 36,623 | 65,979 | 36,302 | 175,098 | |||||
| Net earnings | 12,385 | 13,902 | 27,010 | 12,390 | 65,687 | |||||
| Net earnings per share | .24 | .27 | .52 | .23 | 1.26 | |||||
2000 | ||||||||||
| Net sales | $72,143 | $83,506 | $155,331 | $85,836 | $396,816 | |||||
| Gross margin | 35,195 | 41,339 | 72,683 | 40,499 | 189,716 | |||||
| Net earnings | 13,063 | 15,652 | 31,514 | 15,508 | 75,737 | |||||
| Net earnings per share | .25 | .30 | .60 | .30 | 1.45 | |||||
Net earnings per share is based upon average outstanding shares as adjusted for 3% stock dividends issued during the second quarter of each year. The sum of the per share amounts may not equal annual amounts due to rounding.
2002-2001 QUARTERLY SUMMARY OF TOOTSIE ROLL INDUSTRIES, INC. STOCK PRICE AND DIVIDENDS PER SHARE
STOCK PRICES*
| | 2002 | 2001 | ||||||||||
|---|---|---|---|---|---|---|---|---|---|---|---|---|
High | Low | High | Low | |||||||||
| 1st Qtr | $ | 45.99 | $ | 37.85 | $ | 51.10 | $ | 43.31 | ||||
| 2nd Qtr | $ | 47.97 | $ | 37.84 | $ | 48.89 | $ | 38.54 | ||||
| 3rd Qtr | $ | 38.97 | $ | 29.72 | $ | 40.55 | $ | 35.08 | ||||
| 4th Qtr | $ | 31.96 | $ | 29.51 | $ | 39.44 | $ | 36.35 | ||||
*NYSE — Composite Quotations
Estimated Number of shareholders at December 31, 2002 | 25,000 |
DIVIDENDS
2002 | 2001 | |||||
|---|---|---|---|---|---|---|
| 1st Qtr | $ | .0680 | $ | .0660 | ||
| 2nd Qtr | $ | .0700 | $ | .0680 | ||
| 3rd Qtr | $ | .0700 | $ | .0680 | ||
| 4th Qtr | $ | .0700 | $ | .0680 | ||
NOTE: In addition to the above cash dividends, a 3% stock dividend was issued on April 17, 2002 and April 18, 2001. Cash dividends are restated to reflect 3% stock dividends.
20
Five Year Summary of Earnings and Financial Highlights
| TOOTSIE ROLL INDUSTRIES, INC. AND SUBSIDIARIES | ||||||||||
| (Thousands of dollars except per share, percentage and ratio figures) | ||||||||||
(See Management's Comments starting on page 6) | |||||||||||||||||||
|---|---|---|---|---|---|---|---|---|---|---|---|---|---|---|---|---|---|---|---|
| 2002 | 2001 | 2000 | 1999 | 1998 | |||||||||||||||
Sales and Earnings Data (2) | |||||||||||||||||||
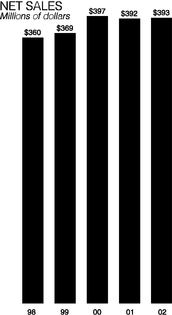
| Net sales | $ | 393,185 | $ | 391,755 | $ | 396,816 | $ | 369,335 | $ | 360,165 | |||||||||
| Gross margin | 172,420 | 175,098 | 189,716 | 176,774 | 172,548 | ||||||||||||||
| Interest expense | 309 | 356 | 866 | 453 | 756 | ||||||||||||||
| Provision for income taxes | 34,300 | 35,100 | 42,071 | 40,137 | 38,537 | ||||||||||||||
| Net earnings | 66,388 | 65,687 | 75,737 | 71,310 | 67,526 | ||||||||||||||
| % of sales | 16.9 | % | 16.8 | % | 19.1 | % | 19.3 | % | 18.7 | % | |||||||||
| % of shareholders' equity | 12.6 | % | 12.9 | % | 16.5 | % | 16.6 | % | 17.0 | % | |||||||||
Per Common Share Data (1)(2) | |||||||||||||||||||
| Net earnings | $ | 1.29 | $ | 1.26 | $ | 1.45 | $ | 1.34 | $ | 1.25 | |||||||||
| Cash dividends declared | .28 | .27 | .26 | .22 | .18 | ||||||||||||||
| Stock dividends | 3 | % | 3 | % | 3 | % | 3 | % | 3 | % | |||||||||
Additional Financial Data | |||||||||||||||||||
| Working capital | $ | 161,852 | $ | 188,250 | $ | 145,765 | $ | 168,423 | $ | 175,155 | |||||||||
| Net cash provided by operating activities | 71,203 | 78,584 | 82,591 | 72,935 | 77,735 | ||||||||||||||
| Net cash used in investing activities | 25,304 | 16,834 | 64,177 | 26,993 | 34,829 | ||||||||||||||
| Net cash used in financing activities | 46,924 | 16,100 | 46,036 | 38,182 | 22,595 | ||||||||||||||
| Property, plant & equipment additions | 10,308 | 14,148 | 16,189 | 20,283 | 14,878 | ||||||||||||||
| Net property, plant & equipment | 128,869 | 132,575 | 131,118 | 95,897 | 83,024 | ||||||||||||||
| Total assets | 646,080 | 618,676 | 562,442 | 529,416 | 487,423 | ||||||||||||||
| Long term debt | 7,500 | 7,500 | 7,500 | 7,500 | 7,500 | ||||||||||||||
| Shareholders' equity | 526,740 | 508,461 | 458,696 | 430,646 | 396,457 | ||||||||||||||
| Average shares outstanding (1) | 51,553 | 51,947 | 52,394 | 53,372 | 53,880 | ||||||||||||||
- (1)
- Adjusted for annual 3% stock dividends and the 2-for-1 stock split effective July 13, 1998.
- (2)
- Adjusted for the reclassification of certain selling, marketing and administrative expenses as a reduction of net sales.
21
Board of Directors | ||
Melvin J. Gordon(1) | Chairman of the Board and Chief Executive Officer | |
| Ellen R. Gordon(1) | President and Chief Operating Officer | |
| Charles W. Seibert(2)(3) | Retired Banker | |
| Lana Jane Lewis-Brent(2)(3) | President, Paul Brent Designer, Inc. | |
| Richard P. Bergeman(2)(3) | Retired Senior Vice President, Bestfoods | |
| (1)Member of the Executive Committee | ||
| (2)Member of the Audit Committee | ||
| (3)Member of the Compensation Committee | ||
Officers | ||
Melvin J. Gordon | Chairman of the Board and Chief Executive Officer | |
| Ellen R. Gordon | President and Chief Operating Officer | |
| G. Howard Ember, Jr. | Vice President, Finance & Asst. Secy. | |
| John W. Newlin, Jr. | Vice President, Manufacturing | |
| Thomas E. Corr | Vice President, Marketing & Sales | |
| James M. Hunt | Vice President, Physical Distribution | |
| Barry P. Bowen | Treasurer & Asst. Secy. | |
| Daniel P. Drechney | Controller | |
Offices, Plants | ||
Executive Offices | 7401 S. Cicero Ave. Chicago, Illinois 60629 www.tootsie.com | |
| Plants | Illinois Tennessee Massachusetts Wisconsin New York Mexico City | |
| Foreign Sales Offices | Mexico City, Mexico Mississauga, Ontario | |
Subsidiaries | ||
Andes Candies L.P. Andes Manufacturing LLC Andes Services LLC C.C. L.P., Inc. C.G.C. Corporation C.G.P., Inc. Cambridge Brands, Inc. Cambridge Brands Mfg., Inc. Cambridge Brands Services, Inc. Cella's Confections, Inc. Charms Company Charms L.P. Charms Marketing Company Henry Eisen Advertising Agency, Inc. J.T. Company, Inc. O'Tec Industries, Inc. | Tootsie Roll of Canada Ltd. Tootsie Roll Central Europe Ltd. The Tootsie Roll Company, Inc. Tootsie Roll Management, Inc. Tootsie Roll Mfg., Inc. Tootsie Rolls—Latin America, Inc. Tootsie Roll Worldwide Ltd. The Sweets Mix Company, Inc. TRI de Latino America S.A. de C.V. TRI Finance, Inc. TRI International Co. TRI-Mass., Inc. TRI Sales Co. TRI Sales Finance LLC Tutsi S.A. de C.V. World Trade & Marketing Ltd. | |
Other Information | ||||
Stock Exchange | New York Stock Exchange, Inc. (Since 1922) | |||
| Stock Identification | Ticker Symbol: TR CUSIP No. 890516 10-7 | |||
| Stock Transfer Agent and Stock Registrar | Mellon Investor Services LLC Overpeck Centre 85 Challenger Road Ridgefield Park, NJ 07660 1-800-851-9677 www.melloninvestor.com | |||
| Independent Accountants | PricewaterhouseCoopers LLP One North Wacker Chicago, IL 60606 | |||
| General Counsel | Becker Ross Stone DeStefano & Klein 317 Madison Avenue New York, NY 10017 | |||
| Annual Meeting | May 5, 2003 Mutual Building, Room 1200 909 East Main Street Richmond, VA 23219 |  | ||
Printed on recycled paper. | |||
22
Corporate Profile
Corporate Principles
To Our Shareholders
Management’s Discussion and Analysis of Financial Condition and Results of Operations
Consolidated Statement of Financial Position
Consolidated Statement of Earnings, Comprehensive Earnings and Retained Earnings
Consolidated Statement of Cash Flows
Notes to Consolidated Financial Statements
Report of Independent Accountants
Quarterly Financial Data (Unaudited)
Five Year Summary of Earnings and Financial Highlights