QuickLinks -- Click here to rapidly navigate through this document
Tootsie Roll Industries, Inc. has been engaged in the manufacture and sale of candy for 107 years. Our products are primarily sold under the familiar brand names, Tootsie Roll, Tootsie Roll Pops, Caramel Apple Pops, Child's Play, Charms, Blow Pop, Blue Razz, Cella's chocolate covered cherries, Mason Dots, Mason Crows, Junior Mints, Charleston Chew, Sugar Daddy, Sugar Babies, Andes and Fluffy Stuff cotton candy.
We believe that the differences among companies are attributable to the caliber of their people, and therefore we strive to attract and retain superior people for each job.
We believe that an open family atmosphere at work combined with professional management fosters cooperation and enables each individual to maximize his or her contribution to the company and realize the corresponding rewards.
We do not jeopardize long-term growth for immediate, short-term results.
We maintain a conservative financial posture in the deployment and management of our assets.
We run a trim operation and continually strive to eliminate waste, minimize cost and implement performance improvements.
We invest in the latest and most productive equipment to deliver the best quality product to our customers at the lowest cost.
We seek to outsource functions where appropriate and to vertically integrate operations where it is financially advantageous to do so.
We view our well known brands as prized assets to be aggressively advertised and promoted to each new generation of consumers.
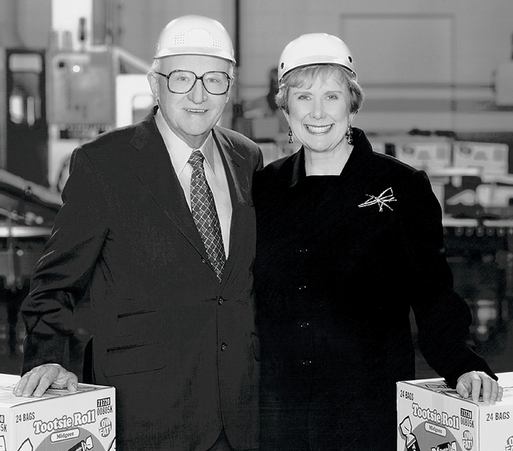
Melvin J. Gordon, Chairman and Chief Executive Officer and
Ellen R. Gordon, President and Chief Operating Officer.
![]()
1
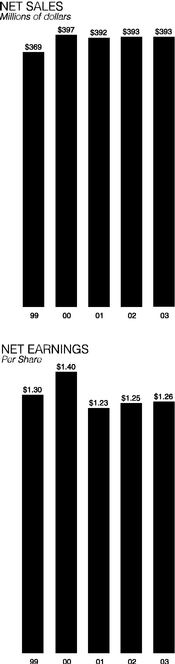
Sales in 2003 and 2002 were $393 million. Many of our core brands experienced encouraging sales growth. However, our overall sales results in 2003 were adversely influenced by domestic economic conditions, especially during the first half of the year, customer bankruptcies, the overall competitive environment and by lower Mexican sales. Selective price increases implemented in 2003 were partially offset by higher promotion expense.
| | December 31, | |||
|---|---|---|---|---|
| | 2003 | 2002 | ||
| | (in thousands except per share data) | |||
Net Sales | $392,656 | $393,185 | ||
| Net Earnings | 65,014 | 66,388 | ||
Working Capital | 180,818 | 161,852 | ||
| Net Property, Plant and Equipment | 129,163 | 128,869 | ||
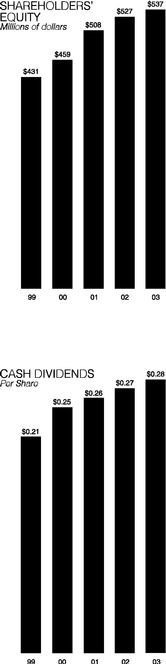
| Shareholders' Equity | 536,581 | 526,740 | ||
Average Shares Outstanding* | 51,784 | 53,070 | ||
| Per Share Items* | ||||
| Net Earnings | $1.26 | $1.25 | ||
| Cash Dividends Paid | .28 | .27 | ||
- *
- Adjusted for stock dividends.
Net earnings in 2003 were $65 million as compared to $66 million in 2002. On a per share basis, earnings increased from $1.25 in 2002 to $1.26 in 2003. The increase in earnings per share results from fewer shares outstanding in 2003 due to stock buybacks made during the year.
Some key financial highlights of 2003 include:
- •
- Capital expenditures were $12 million, primarily for projects that will support growth and to improve operating efficiencies.
- •
- 1.3 million shares of the company's common stock were purchased for a total of $40 million.
- •
- Cash dividends were paid for the sixty-first consecutive year, and totaled $14 million.
- •
- Our thirty-ninth consecutive annual 3% stock dividend was distributed in April.
As a result of our long-term history of dividend payment, the company was named a Mergent's "Dividend Achiever," a designation bestowed on just 2.5% of US listed dividend-paying stocks.
The sound operating results of the company, as well as our conservative financial posture, led to a further strengthening of our balance sheet in 2003. We are pleased to report that after giving effect to cash dividends, capital expenditures and stock buybacks, cash and marketable securities grew by $21 million during the year.
We are fully prepared to capitalize on appropriate investment opportunities as they may arise. These may include initiatives to develop niche products, investment in strategically or economically prudent capital projects and pursuit of complementary business acquisitions. We remain active in our search and evaluation of opportunities in each of these areas.
Sales and Marketing
The increasingly intense competitive environment faced by consumer product companies further heightens the importance of branded product offerings that represent a good value for the consumer. At the same time, retailers continue to demand products that generate sufficient sales volume and inventory turnover to maximize their return on investment. Our many famous brands continue to meet both consumer and retailer expectations.
In 2003, we continued to build upon past successes in several key areas. Carefully targeted promotional programs led to another strong Halloween selling season, particularly in the high volume drug and mass merchandiser classes of trade.
Packaged goods, including assortments of our most popular items, were once again successful in these channels. We also continued to expand our packaged goods business at the dollar price point in convenience stores and in other classes of trade.
2
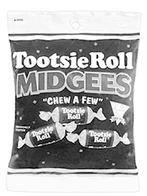
Tootsie Roll Midgees in a hanging bag
Our high value brands seem particularly well suited to this price point and we are expanding our product offerings and sales efforts accordingly.
Although our product recipes have remained consistent through the years, product configurations and packaging must change with the times. 2003 brought several examples of this.
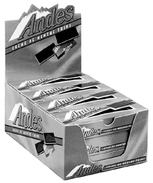
Andes new 14 count box
In the Andes line, we supplemented the traditional 28-count pack with both 12 and 14 count alternatives that were targeted to appeal to trade channels that had not traditionally carried this item.

Andes baking chips
We also introduced Andes baking chips, consisting of our delicious three layer crème de menthe Andes pieces broken into small chips for cookies, other baking and ice cream inclusions. These initiatives met with wide consumer acceptance.

Kiwi Berry Blast Blow Pops
Several new products were launched in 2003. Our Blow Pop line was expanded with the addition of Kiwi Berry Blast, a sweet strawberry-kiwi flavored hard candy outer shell surrounding a tart, kiwi flavored bubble gum center.

Hot Dots
In the Dots product line, we introduced Hot Dots, a spicy cinnamon-flavored version of this popular, chewy confection. This extension supports the Dots brand and expands our growing "theater box" business which includes four varieties of Dots along with Crows, Sugar Babies, Mini-Charleston Chews, and Junior Mints.
Seasonal sales were enhanced by new offerings of Miniature Tootsie Pops and "Cotton Tail" Fluffy Stuff cotton candy, as well as by increased seasonal distribution of Cella's chocolate covered cherries.
New Flag Banks
Our bank line, re-usable collectable fun banks filled with Tootsie Roll Midgees, grew through expanded distribution. We added the "Flag Banks" to our line, which feature patriotic red, white and blue graphics. We also experienced growth in military sales as Tootsie Rolls and Charms squares continued to be included in ration kits, offering our troops in Iraq and elsewhere in the world a sweet and nostalgic reminder of home.
Advertising and Public Relations
Television was once again utilized to convey our advertising message to consumers. During 2003, we focused on reinforcing the classic "How Many Licks?" theme to children via a national cable TV campaign directed toward cartoon and family programs. In response, we received an inflow of consumer mail advising just how many licks it does take. Of course, the variability in the answers we receive bolsters the conclusion reached by our icon, Mr. Owl, "the world may never know!"
Cable television brought additional exposure to several of our brands. Coverage on the popular Food Network series "Unwrapped" and on the Travel Channel has generated positive consumer feedback and, we believe, favorable awareness of the company and its products.
We also continued to learn of numerous articles and stories that appeared in newspapers throughout the country publicizing our products. Many of these are focused on seasonal themes such as "popular Halloween candies" or "what's new for the Easter season." Others highlighted consumer trends such as the current popularity of nostalgic "retro" products. This continued interest and coverage by the media reaffirms that our brands have stood the test of time and remain consumer favorites.
3
In terms of official recognition, Miniature Tootsie Pops were named "Product of the Year" in the seasonal category byProfessional Candy Buyer Magazine, a leading trade publication.
Manufacturing
During 2003, we continued working on projects that began during the prior year, including initiatives to significantly reengineer two major product lines. As these projects were drawing near to completion, several new capital projects were approved, primarily to add capacity in support of certain growing product lines and to improve operating efficiencies.
These projects are consistent with the objectives enumerated in our Corporate Principles. We remain committed to investing in our operations to deliver the best quality product to the consumer at the lowest possible cost, and we will continue to reexamine every facet of our operation in search of operational improvements.
Through the years, we have learned that the confluence of emerging trends in our business and evolving operating technologies will create a steady flow of investment opportunities. It is our judgment that the willingness and ability to capitalize on such opportunities is critical to the company's long-term prosperity.
Purchasing
As was the case in the prior year, 2003 was a year of generally low consumer price inflation. However, many basic commodities used in our industry increased in cost.
Cocoa prices remained high coming into the year due to a disruption in the supply of beans coming from the Ivory Coast, the world's largest producer. Although cocoa prices stabilized and even began to decline somewhat by mid-year, they remained at high levels by historical standards.
Corn syrup prices edged upwards during 2003 due to weather related shortfalls in the corn crop. Similarly, soybean oil prices increased toward the end of the year due to poor yields in the soybean crop. Sugar prices were higher in 2003 due to USDA marketing allotments that were imposed in 2002.
Our packaging costs were relatively stable in 2003 as compared to the prior year. Our use of competitive bidding, hedging and forward purchase contracts helped to shield the company from short-term market fluctuations for both packaging and ingredients, and enabled us to lock in the prices on many of our planned purchases at prudent levels.
Information Technology
In 2003, we completed a major phase of a project that will improve our ability to manage customer orders, promotional programs and finished goods inventories. This initiative utilizes state of the art, web-enabled tools to streamline business processes and increase system flexibility. Additional phases of this initiative that relate to several other key applications are under development.
We place significant emphasis on deploying leading edge practices and business systems to enhance our operations. We view information technology as a strategic tool to help us increase efficiency and meet the evolving demands of today's dynamic business environment.
International
We continued to execute our previously stated objective of building profitability in Mexico in 2003. Although sales declined, return on sales improved through the implementation of tighter cost containment measures and profit improvement programs.
Both sales and profits increased in the Export Division in 2003. Sales grew both through expanding distribution in established markets and by initiating distribution in several new markets. We continue to focus on developing profitable sales of our products in suitable markets throughout the world, and were encouraged by 2003 results.
In Appreciation
We wish to thank our many loyal employees, customers, foreign distributors, suppliers and sales brokers for helping us meet the challenges we faced in 2003. We also thank our shareholders for their support through the years. Finally, we are grateful to the consumers who have helped make Tootsie Roll a lasting part of Americana.
![]()
Melvin J. Gordon
Chairman of the Board and
Chief Executive Officer
![]()
Ellen R. Gordon
President and
Chief Operating Officer
4
Management's Discussion and Analysis of Financial
Condition and Results of Operations
(in thousands except per share, percentage and ratio figures)
FINANCIAL REVIEW
This financial review discusses the company's financial condition, results of operations, liquidity and capital resources, market risks and other matters. It should be read in conjunction with the Consolidated Financial Statements and related footnotes that follow this discussion.
FINANCIAL CONDITION
Our financial condition was strengthened by our operating results in 2003. Working capital grew by $18,966 or 12% to $180,818 in 2003 from $161,852 in 2002. This increase is due primarily to higher cash and short-term investments resulting from positive net cash flow during the year. In addition, $4,070 of the increase is due to investments that had maturities greater than one year as of year-end 2002 becoming current as of year-end 2003.
Shareholders equity increased to $536,581 in 2003 from $526,740 in 2002 primarily reflecting net earnings during the year, net of cash and stock dividends and treasury stock purchases. The company has paid cash dividends for sixty-one consecutive years and has distributed a stock dividend for thirty-nine consecutive years.
The company maintains a conservative financial posture and continues to be financed principally by funds generated from operations. We have a simple financial structure, and aside from an immaterial amount of operating leases, the company has no "off-balance sheet" financing arrangements.
As a result of the funds generated and built up over many years of profitable operations, we have sufficient capital and liquidity to respond to future investment opportunities. Accordingly, we continue to seek appropriate acquisitions to complement our existing business.
RESULTS OF OPERATIONS
2003 vs. 2002
Net sales were $392,656 in 2003 compared to $393,185 in 2002, a decrease of $529 or 0.1%. Sales benefited from successful marketing and promotional programs. These include Halloween sales programs that have traditionally made our third quarter the highest selling period of the year and did so again in 2003.
However, these gains were offset by sluggish U.S. economic conditions earlier in the year as well as lower sales in Mexico. Selective price increases also added to sales during the year, but these gains were partially offset by increased trade promotions and discounts, which are reflected as a reduction in net sales.
Cost of goods sold as a percentage of net sales was 56.7% and 56.5% for 2003 and 2002, respectively. Higher costs for our principal ingredients, including sugar, corn syrup, vegetable oil, cocoa and chocolate, and increased plant overhead costs incurred during 2003, were generally offset by the selective price increases discussed above and by product weight reductions (indirect price increases).
Due to the seasonal nature of our business and corresponding variations in product mix, gross margins were lower in the second half of the year than in the first half.
Selling, marketing and administrative expenses were $77,756 in 2003 as compared to $75,751 in 2002, an increase of 2.6%. We make every effort to control these costs and they were 19.8% of sales in 2003 versus 19.3% in the prior year.
5
Accordingly, earnings from operations were $92,353 in 2003, or $2,877 below the $95,230 attained in 2002. Other income was $5,594 in 2003 as compared to $5,458 in 2002. The increase of $136 is primarily attributable to the receipt of a $541 property tax refund in 2003, partially offset by lower interest income as higher yielding investments that matured during the year were reinvested at lower, current, market rates.
The consolidated effective tax rate favorably decreased from 34.1% in 2002 to 33.6% in 2003. This decline generally reflects a reduction in state and foreign income taxes.
Net earnings were $65,014 and $66,388 and earnings per share were $1.26 and $1.25 in 2003 and 2002, respectively. Earnings per share increased on lower net earnings due to share repurchases. Average shares outstanding declined from 53,070 in 2002 to 51,784 in 2003.
2002 vs. 2001
Net sales increased in 2002 to $393,185 from $391,755 in 2001. Many of our core brands showed growth throughout the year. However, these gains were partially offset by lower Mexican sales, retail bankruptcies, competitive pressure and weak economic conditions that dampened retail traffic.
Effective January 1, 2002 the company adopted the new accounting requirements that treat certain consumer and trade promotions as a reduction in net sales rather than as an operating expense. The effect of the above was to reduce both net sales and operating expenses by $29,990 and $31,741 in 2002 and 2001, respectively.
Third quarter sales exceeded the other quarters due to successful Halloween promotions, and, we believe, some of the fourth quarter sales increase can be attributed to customer "buy-in" in anticipation of a price increase that became effective in the first quarter of 2003.
Cost of goods sold as a percentage of sales increased from 55.6% to 56.5% of sales. The increase in cost of goods sold was due to higher raw materials cost and product mix in 2002, partially offset by a special inventory write down $1,100, pre-tax, and a plant closing charge of $1,500, pre-tax, in the third and fourth quarters, respectively, of 2001.
The inventory write down related to an isolated situation whereby one product was not produced to our specifications and was therefore "out of formula." Although this product did not pose a health risk, it did not meet the quality requirements that we have established for our brands and was destroyed.
Substantially all of the plant closing charge relates to the abandonment of equipment in connection with closing the company's smallest manufacturing plant and consolidation of this operation at a larger plant facility as part of a cost saving initiative.
Selling, marketing and administrative expense, declined as a percentage of sales to 19.3% in 2002 from 19.8% in 2001, due to cost containment measures and lower advertising expenditures. Both numbers are net of the reclassification of promotional expenses, which have been accounted for as a reduction of sales.
Effective January 1, 2002, the company adopted the new accounting rules pertaining to acquired goodwill and intangibles. This had the effect of eliminating the amortization of such goodwill and intangibles, which was $3,778 in the prior year. Accordingly, earnings form operations increased from $92,704 to $95,230.
Other income was $5,458 in 2002 versus $8,083 in 2001 due to lower interest rates in 2002 and an investment capital gain in 2001. The effective tax rate was 34.1% in 2002 as compared to 34.8% in 2001.
Consolidated net earnings were $66,388 and $65,687 and earnings per share were $1.25 and $1.23 in 2002 and 2001, respectively. Average shares outstanding were 53,070 and 53,464 in 2002 and 2001, respectively.
6
Comparative earnings per share were affected by the aforementioned 2001 investment capital gain of $962 or $.02 per share, net of income tax, and the aforementioned 2001 inventory write down and plant closing charges which aggregated $2,600 pre-tax and $1,803 or $.03 per share, net of income tax. Excluding the effects of these special items in 2001, and adjusting for the effects of goodwill amortization, net earnings per share for 2002 and 2001 were $1.25 and $1.30, respectively, a decrease of $.05 per share or 4%.
LIQUIDITY AND CAPITAL RESOURCES
Cash flows from operating activities were $83,466 in 2003, $75,473 in 2002 and $80,915 in 2001. Both the increase in 2003 and the decline in 2002 were principally attributable to changes in accounts receivable due to the timing of customer payments. Also, inventories declined in 2001, whereas they increased in both 2002 and 2003. This related to timing of production. These timing issues are immaterial and not reflective of any significant business trends.
Cash flows from investing activities in 2003 reflect capital expenditures of $12,150 and a net increase in marketable securities of $38,233. In 2002, capital expenditures were $10,308 and marketable securities increased by $19,263. In 2001, capital expenditures were $14,148 and marketable securities increased by $5,017.
Cash flows from financing activities reflect share repurchases of $40,096, $32,313 and $1,932 in 2003, 2002 and 2001, respectively. Cash dividends of $14,410, $14,614 and $14,168 were paid in 2003, 2002 and 2001, respectively. 2003 was the sixty-first consecutive year in which we have paid cash dividends.
MARKET RISKS
The company is exposed to market risks related to commodity prices for major ingredients, interest rates, equity prices and foreign exchange. Commodity price risks relate to primary ingredients including sugar, cocoa, corn syrup and soybean oil.
The company believes its competitors face similar risks, and the industry has historically adjusted prices to compensate for adverse fluctuations in commodity costs. To mitigate the impact of commodity cost fluctuations, the company enters into commodity futures contracts to hedge anticipated purchases of certain ingredients (primarily sugar). These contracts are effective as hedges under Statement of Financial Accounting Standards (SFAS) 133, "Accounting for Derivative Instruments and Hedging Activities." The unrealized gains and losses on such contracts are deferred as a component of accumulated other comprehensive earnings (loss) and are recognized as a component of cost of goods sold when the related inventory is sold.
Interest rate risks relate to the company's investments in debt securities (primarily municipal bonds) with maturities of generally up to four years. The majority of these are held to maturity, which limits the company's exposure to interest rate fluctuations.
Equity price risk relates to the company's investments in mutual funds.
Foreign exchange risk relates to the company's foreign operations and purchase commitments.
The company has no outstanding guarantees of the obligations of third parties and there was no material change in the company's market risks during 2003.
Commodities
At December 31, 2003, the company had open futures contracts to purchase approximately $12,184 of sugar in 2004 and 2005, which represents approximately half of the company's expected sugar usage in those years.
The potential change in fair value of commodity derivative instruments (primarily sugar futures contracts) held by the company, assuming a 10% change in the underlying commodity price, was $1,218. This analysis only includes commodity derivative instruments, and thereby, does not consider the offsetting effect of changes in the price of the underlying commodity. This amount is not significant compared with the net earnings and shareholders' equity of the company.
Equity price
At December 31, 2003, the company had investments in mutual funds of $21,243. These investments primarily relate to hedging deferred compensation liabilities, and any potential change in their fair value would be offset by a corresponding change in such liabilities.
Interest Rates
The maturities of the company's investments in debt securities (primarily municipal bonds) at December 31, 2003 are as follows:
| Less than 1 year | $ | 91,370 | |
| 1 - 2 years | 42,168 | ||
| 2 - 3 years | 49,957 | ||
| 3 - 4 years | 6,509 | ||
| Total | $ | 190,004 | |
Foreign Exchange
The company's operations outside of the United States represent less than 10% of its consolidated operations. The company does not use derivative financial instruments to hedge its foreign currency assets or liabilities or its overall investments in its foreign subsidiaries.
At times, the company uses forward foreign exchange contracts to mitigate its exposure related to firm commitments to purchase equipment from foreign vendors. However, the historical impact of such forward foreign exchange contracts has been insignificant.
7
CRITICAL ACCOUNTING POLICIES
Preparation of the company's financial statements involves judgments due to uncertainties affecting the application of accounting policies, and the likelihood that different amounts would be reported under different conditions or using different assumptions. In the opinion of management, the company does not have any individual accounting policy that is "critical." However, following is a summary of the more significant accounting policies and methods used.
Revenue recognition
Revenue, net of applicable provisions for discounts, returns, allowances, and certain advertising and promotional costs, is recognized when products are delivered to customers and collectibility is reasonably assured. Provisions for bad debts are recorded as selling, marketing and administrative expense. Such provisions have not been significant to the company's financial position or results of operations.
Intangible assets
Effective January 1, 2002 the company adopted SFAS No. 142, whereby goodwill and other indefinite lived assets are not amortized, but are instead subjected to regular testing for impairment. The company's intangible assets consist primarily of trademarks, the values of which the company has determined are not impaired.
Customer incentive programs, advertising and marketing
Advertising and marketing costs are recorded in the period to which such costs relate. The company does not defer the recognition of any amounts on its consolidated balance sheet with respect to such costs. Customer incentives and other promotional costs are recorded in the period in which these programs are offered, based on sales volumes, incentive program terms and estimates of utilization and redemption rates.
Investments
The company invests in certain high-quality debt securities primarily Aa or better rated municipal bonds. The accounting for such investments is outlined in Note 1. No credit losses have been incurred on these investments.
Guarantees
The Financial Accounting Standards Board issued Interpretation No. 45 relating to the accounting for and disclosure of certain types of guarantees. The disclosure provisions are effective for financial statements with years ending after December 15, 2002. No disclosures were required for the company as a result of adoption of this standard, as it has no such guarantees outstanding.
Other matters
In the opinion of management, other than contracts for raw materials, including commodity hedges and outstanding purchase orders for packaging, ingredients and supplies, all entered into in the ordinary course of business, the company does not have any significant contractual obligations or future commitments. The company's outstanding contractual commitments as of December 31, 2003, all of which are of a normal and recurring nature, are summarized in the accompanying chart.
Open Contractual Commitments as of December 31, 2003
| Payable in | Total | Less than 1 year | 1 to 3 Years | 3 to 5 Years | More than 5 Years | |||||
|---|---|---|---|---|---|---|---|---|---|---|
| Commodity hedges | $12,184 | $8,289 | $3,895 | $ — | $ — | |||||
| Purchase obligations | 40,810 | 40,810 | — | — | — | |||||
| Split dollar insurance | 8,298 | 2,805 | 4,344 | 1,149 | — | |||||
| Industrial development bonds | 7,500 | — | — | — | 7,500 | |||||
| Operating leases | 2,100 | 897 | 1,203 | — | — | |||||
| Total | $70,892 | $52,801 | $9,442 | $1,149 | $7,500 | |||||
Note: the above amounts exclude deferred income tax liabilities of $22,631, post retirement health care and life insurance benefits of $9,302 and deferred compensation and other liabilities of $26,396 because the timing of payments relating to these items cannot be reasonably determined.
The company provides split dollar insurance benefits to certain executive officers and records an asset equal to the cumulative premiums paid on the related policies as the company will fully recover these premiums under the terms of the plan.
The results of our operations and our financial condition are expressed in the following financial statements.
8
CONSOLIDATED STATEMENT OF
Financial Position
| TOOTSIE ROLL INDUSTRIES, INC. AND SUBSIDIARIES | (in thousands) |
| Assets | | | |||||||
|---|---|---|---|---|---|---|---|---|---|
| | December 31, | ||||||||
2003 | 2002 | ||||||||
CURRENT ASSETS: | |||||||||
| Cash and cash equivalents | $ 84,084 | $105,507 | |||||||
| Investments | 86,961 | 40,737 | |||||||
| Accounts receivable trade, less allowances of $1,970 and $2,005 | 18,131 | 22,686 | |||||||
| Other receivables | 3,076 | 4,073 | |||||||
| Inventories: | |||||||||
| Finished goods and work-in-process | 28,969 | 26,591 | |||||||
| Raw materials and supplies | 17,117 | 17,054 | |||||||
| Prepaid expenses | 4,416 | 3,819 | |||||||
| Deferred income taxes | 951 | 4,481 | |||||||
| Total current assets | 243,705 | 224,948 | |||||||
| PROPERTY, PLANT AND EQUIPMENT, at cost: | |||||||||
| Land | 8,265 | 8,297 | |||||||
| Buildings | 44,960 | 43,948 | |||||||
| Machinery and equipment | 206,697 | 196,706 | |||||||
| 259,922 | 248,951 | ||||||||
| Less—Accumulated depreciation | 130,759 | 120,082 | |||||||
| 129,163 | 128,869 | ||||||||
| OTHER ASSETS: | |||||||||
| Goodwill | 38,151 | 38,151 | |||||||
| Trademarks | 79,348 | 79,348 | |||||||
| Investments | 112,431 | 116,501 | |||||||
| Split dollar officer life insurance | 62,499 | 58,263 | |||||||
| 292,429 | 292,263 | ||||||||
| $665,297 | $646,080 | ||||||||
(The accompanying notes are an integral part of these statements.)
9
| (in thousands except per share data) | |
| Liabilities and Shareholders' Equity | | | ||||||||
|---|---|---|---|---|---|---|---|---|---|---|
| | December 31, | |||||||||
2003 | 2002 | |||||||||
CURRENT LIABILITIES: | ||||||||||
| Accounts payable | $ 11,947 | $ 12,505 | ||||||||
| Dividends payable | 3,589 | 3,579 | ||||||||
| Accrued liabilities | 38,834 | 35,825 | ||||||||
| Income taxes payable | 8,517 | 11,187 | ||||||||
| Total current liabilities | 62,887 | 63,096 | ||||||||
| NONCURRENT LIABILITIES: | ||||||||||
| Deferred income taxes | 22,631 | 19,654 | ||||||||
| Postretirement health care and life insurance benefits | 9,302 | 8,151 | ||||||||
| Industrial development bonds | 7,500 | 7,500 | ||||||||
| Deferred compensation and other liabilities | 26,396 | 20,939 | ||||||||
| Total noncurrent liabilities | 65,829 | 56,244 | ||||||||
| SHAREHOLDERS' EQUITY: | ||||||||||
| Common stock, $.69-4/9 par value— 120,000 and 120,000 shares authorized— 34,082 and 34,248, respectively, issued | 23,668 | 23,783 | ||||||||
| Class B common stock, $.69-4/9 par value— 40,000 and 40,000 shares authorized— 17,145 and 16,759, respectively, issued | 11,906 | 11,638 | ||||||||
| Capital in excess of par value | 357,922 | 355,658 | ||||||||
| Retained earnings, per accompanying statement | 156,786 | 148,705 | ||||||||
| Accumulated other comprehensive earnings (loss) | (11,709 | ) | (11,052 | ) | ||||||
| Treasury stock (at cost)— 56 shares and 55 shares, respectively | (1,992 | ) | (1,992 | ) | ||||||
| 536,581 | 526,740 | |||||||||
| $665,297 | $646,080 | |||||||||
10
CONSOLIDATED STATEMENT OF
Earnings, Comprehensive Earnings and Retained Earnings
| TOOTSIE ROLL INDUSTRIES, INC. AND SUBSIDIARIES | (in thousands except per share data) |
For the year ended December 31, | ||||||||
|---|---|---|---|---|---|---|---|---|
| | 2003 | 2002 | 2001 | |||||
Net sales | $392,656 | $393,185 | $391,755 | |||||
| Cost of goods sold | 222,547 | 222,204 | 217,897 | |||||
| Gross margin | 170,109 | 170,981 | 173,858 | |||||
| Selling, marketing and administrative expenses | 77,756 | 75,751 | 77,376 | |||||
| Amortization of intangible assets | — | — | 3,778 | |||||
| Earnings from operations | 92,353 | 95,230 | 92,704 | |||||
| Other income, net | 5,594 | 5,458 | 8,083 | |||||
| Earnings before income taxes | 97,947 | 100,688 | 100,787 | |||||
| Provision for income taxes | 32,933 | 34,300 | 35,100 | |||||
| Net earnings | $ 65,014 | $ 66,388 | $ 65,687 | |||||
Net earnings | $ 65,014 | $ 66,388 | $ 65,687 | |||||
| Other comprehensive earnings (loss) | (657 | ) | (1,139 | ) | 277 | |||
| Comprehensive earnings | $ 64,357 | $ 65,249 | $ 65,964 | |||||
Retained earnings at beginning of year | $148,705 | $161,345 | $180,123 | |||||
| Net earnings | 65,014 | 66,388 | 65,687 | |||||
| Cash dividends ($.28, $.27 and $.26 per share, respectively) | (14,362 | ) | (14,304 | ) | (14,021 | ) | ||
| Stock dividends | (42,571 | ) | (64,724 | ) | (70,444 | ) | ||
| Retained earnings at end of year | $156,786 | $148,705 | $161,345 | |||||
| Earnings per share | $ 1.26 | $ 1.25 | $ 1.23 | |||||
| Average common and class B common shares outstanding | 51,784 | 53,070 | 53,464 | |||||
(The accompanying notes are an integral part of these statements.)
11
CONSOLIDATED STATEMENT OF
Cash Flows
| TOOTSIE ROLL INDUSTRIES, INC. AND SUBSIDIARIES | (in thousands) |
| | For the year ended December 31, | |||||||||||
|---|---|---|---|---|---|---|---|---|---|---|---|---|
| | 2003 | 2002 | 2001 | |||||||||
| CASH FLOWS FROM OPERATING ACTIVITIES: | ||||||||||||
| Net earnings | $ 65,014 | $ 66,388 | $ 65,687 | |||||||||
| Adjustments to reconcile net earnings to net cash provided by operating activities: | ||||||||||||
| Depreciation and amortization | 11,379 | 12,354 | 16,700 | |||||||||
| Amortization of marketable securities | 2,534 | 1,407 | 1,012 | |||||||||
| Purchase of trading securities | (3,154 | ) | (2,602 | ) | (2,921 | ) | ||||||
| Changes in operating assets and liabilities: | ||||||||||||
| Accounts receivable | 4,266 | (2,886 | ) | 3,096 | ||||||||
| Other receivables | 490 | 619 | (2,100 | ) | ||||||||
| Inventories | (2,579 | ) | (2,734 | ) | 910 | |||||||
| Prepaid expenses and other assets | (4,864 | ) | (6,502 | ) | (8,857 | ) | ||||||
| Accounts payable and accrued liabilities | 2,582 | 5,052 | (224 | ) | ||||||||
| Income taxes payable and deferred | 3,827 | 318 | 4,402 | |||||||||
| Postretirement health care and life insurance benefits | 1,151 | 701 | 494 | |||||||||
| Deferred compensation and other liabilities | 2,651 | 2,554 | 2,342 | |||||||||
| Other | 169 | 804 | 374 | |||||||||
| Net cash provided by operating activities | 83,466 | 75,473 | 80,915 | |||||||||
| CASH FLOWS FROM INVESTING ACTIVITIES: | ||||||||||||
| Capital expenditures | (12,150 | ) | (10,308 | ) | (14,148 | ) | ||||||
| Purchase of held to maturity securities | (57,823 | ) | (64,956 | ) | (63,493 | ) | ||||||
| Maturity of held to maturity securities | 25,643 | 46,797 | 49,133 | |||||||||
| Purchase of available for sale securities | (57,578 | ) | (34,795 | ) | (64,640 | ) | ||||||
| Sale and maturity of available for sale securities | 51,525 | 33,691 | 73,983 | |||||||||
| Net cash used in investing activities | (50,383 | ) | (29,571 | ) | (19,165 | ) | ||||||
| CASH FLOWS FROM FINANCING ACTIVITIES: | ||||||||||||
| Shares repurchased and retired | (40,096 | ) | (32,313 | ) | (1,932 | ) | ||||||
| Dividends paid in cash | (14,410 | ) | (14,614 | ) | (14,168 | ) | ||||||
| Net cash used in financing activities | (54,506 | ) | (46,927 | ) | (16,100 | ) | ||||||
| Increase (decrease) in cash and cash equivalents | (21,423 | ) | (1,025 | ) | 45,650 | |||||||
| Cash and cash equivalents at beginning of year | 105,507 | 106,532 | 60,882 | |||||||||
| Cash and cash equivalents at end of year | $ 84,084 | $105,507 | $106,532 | |||||||||
| Supplemental cash flow information: | ||||||||||||
| Income taxes paid | $ 31,561 | $ 34,099 | $ 30,490 | |||||||||
| Interest paid | $ 172 | $ 309 | $ 356 | |||||||||
(The accompanying notes are an integral part of these statements.)
12
Notes to Consolidated Financial Statements($ in thousands except per share data)
TOOTSIE ROLL INDUSTRIES, INC. AND SUBSIDIARIES
NOTE 1—SIGNIFICANT ACCOUNTING POLICIES:
Basis of consolidation:
The consolidated financial statements include the accounts of Tootsie Roll Industries, Inc. and its wholly-owned subsidiaries (the company), which are primarily engaged in the manufacture and sale of candy products. All significant intercompany transactions have been eliminated.
The preparation of financial statements in conformity with generally accepted accounting principles in the United States of America requires management to make estimates and assumptions that affect the reported amounts of assets and liabilities and disclosure of contingent assets and liabilities at the date of the financial statements and the reported amounts of revenues and expenses during the reporting period. Actual results could differ from those estimates.
Certain reclassifications have been made to the prior year financial statements to conform to the current year presentation.
Revenue recognition and other accounting pronouncements:
Products are sold to customers based on accepted purchase orders which include quantity, sales price and other relevant terms of sale. Revenues are recognized when products are delivered to customers and collectibility is reasonably assured. Shipping and handling costs of $28,217, $28,579 and $28,069 in 2003, 2002 and 2001, respectively, are included in selling, marketing and administrative expenses. Accounts receivable are unsecured. Revenues from a major customer aggregated approximately 20.6%, 19.6% and 16.9% of total net sales during the years ended December 31, 2003, 2002 and 2001, respectively.
Emerging Issues Task Force (EITF) Issue No. 01-09, "Accounting for Consideration Given by a Vendor to a Customer (Including the Reseller of the Vendor's Product)" requires that cooperative advertising and certain sales incentives costs traditionally reported as selling, marketing and administrative expense be reclassified as a reduction of net sales beginning January 1, 2002. Prior period consolidated statements of earnings have been reclassified to reflect this change. As a result, $31,741 of such expenses were reclassified to a reduction of net sales for the year ended December 31, 2001, which did not affect the company's financial position, earnings from operations or net income.
In June 2002, the Financial Accounting Standards Board (FASB) issued Statement of Financial Accounting Standards No. 146, "Accounting for Costs Associated with Exit or Disposal Activities," the provisions of which are effective for exit or disposal activities that are initiated after December 31, 2002. In November 2002, the FASB issued Interpretation No. 45, "Guarantor's Accounting and Disclosure Requirements for Guarantees, Including Indirect Guarantees of Indebtedness of Others," which elaborates on the disclosures to be made by a guarantor about its obligations under certain guarantees that it has issued. In April 2003, the FASB issued Statement No. 149, "Amendment of Statement 133 on Derivative Instruments and Hedging Activities," which amends and clarifies financial accounting and reporting related to derivative instruments, including certain derivative instruments embedded in other contracts. In November 2002, the EITF published Issue No. 00-21, "Revenue Arrangements with Multiple Deliverables," which addresses certain aspects of the accounting by a vendor for arrangements under which it will perform multiple revenue-generating activities. In January 2003, the FASB issued FASB Interpretation No. 46, "Consolidation of Variable Interest Entities, an interpretation of ARB 51," which requires that variable interest entities be consolidated into the financial statements of the company that has the controlling financial interest.
The company believes that the above-discussed pronouncements are generally not applicable to the company's operations and to the extent that they may be applicable they are not expected to have a significant impact on the company's consolidated financial statements.
Cash and cash equivalents:
The company considers temporary cash investments with an original maturity of three months or less to be cash equivalents.
Investments:
Investments consist of various marketable securities with maturities of generally up to four years. The company classifies debt and equity securities as either held to maturity, available for sale or trading. Held to maturity securities represent those securities that the company has both the positive intent and ability to hold to maturity and are carried at amortized cost. Available for sale securities represent those securities that do not meet the classification of held to maturity, are not actively traded and are carried at fair value. Unrealized gains and losses on these securities are excluded from earnings and are reported as a separate component of shareholders' equity, net of applicable taxes, until realized. Trading securities relate to deferred compensation arrangements and are carried at fair value.
Hedging Activities:
From time to time, the company enters into commodities futures contracts that are intended and effective as hedges of market price risks associated with the anticipated
13
purchase of certain raw materials (primarily sugar). To qualify as a hedge, the company evaluates a variety of characteristics of these transactions, including the probability that the anticipated transaction will occur. If the anticipated transaction were not to occur, the gain or loss would then be recognized in current earnings.
The company's derivative instruments are being accounted for as cash flow hedges and are recorded on the balance sheet at fair value. Changes therein are recorded in other comprehensive earnings and are reclassified to earnings in the periods in which earnings are affected by the hedged item.
The company does not engage in trading or other speculative use of derivative instruments. The company does assume the risk that counter parties may not be able to meet the terms of their contracts. The company does not expect any losses as a result of counter party defaults.
At December 31, 2003, the company had open contracts to purchase approximately half of its expected 2004 and 2005 sugar usage. Such contracts are for periods not exceeding 22 months and substantially all amounts reported in accumulated other comprehensive earnings (loss) are expected to be reclassified to cost of goods sold. During the years ended December 31, 2003, 2002 and 2001, ineffectiveness related to cash flow hedges was not material.
Inventories:
Inventories are stated at cost, not in excess of market. The cost of domestic inventories ($42,735 and $40,064 at December 31, 2003 and 2002, respectively) has been determined by the last-in, first-out (LIFO) method. The excess of current cost over LIFO cost of inventories approximates $6,442 and $5,137 at December 31, 2003 and 2002, respectively. The cost of foreign inventories ($3,351 and $3,581 at December 31, 2003 and 2002, respectively) has been determined by the first-in, first-out (FIFO) method. Rebates, discounts and other cash consideration received from a vendor related to inventory purchases is reflected as a reduction in the cost of the related inventory item, and is therefore reflected in cost of sales when the related inventory item is sold.
Property, plant and equipment:
Depreciation is computed for financial reporting purposes by use of the straight-line method based on useful lives of 20 to 35 years for buildings and 5 to 20 years for machinery and equipment. Depreciation expense was $11,379, $12,354 and $14,148 in 2003, 2002 and 2001, respectively, including $744 relating to equipment disposals and $1,275 of equipment that was written down related to a plant closing in 2002 and 2001, respectively.
Carrying value of long-lived assets:
Effective January 1, 2002, the company adopted SFAS No. 144, "Accounting for the Impairment or Disposal of Long-Lived Assets." This statement requires that long-lived assets be reviewed for impairment as events or changes in circumstances occur indicating that the amount of the asset reflected in the company's balance sheet may not be recoverable. An estimate of undiscounted cash flows produced by the asset, or the appropriate group of assets, is compared to the carrying value to determine whether impairment exists. An impairment charge would then be recorded to write the carrying value down to its fair value. The determination of fair value involves the use of estimates of future cash flows that involve considerable management judgment and are based upon assumptions about expected future operating performance. The actual cash flows could differ from management's estimates due to changes in business conditions, operating performance, and economic conditions. No significant impairment charges were recorded by the company during 2002 or 2003.
Postretirement health care and life insurance benefits:
The company provides certain postretirement health care and life insurance benefits. The cost of these postretirement benefits is accrued during employees' working careers. The company also provides split dollar life insurance benefits to certain executive officers. The company records an asset equal to the cumulative insurance premiums that will be recovered upon the death of a covered employee(s) or earlier under the terms of the plan. Split dollar premiums paid were $4,237, $6,890 and $7,074 in 2003, 2002 and 2001, respectively.
Intangible assets:
On January 1, 2002, the company adopted SFAS 142, "Goodwill and Other Intangible Assets." As a result of its adoption, the company has reclassified $79,348 and $38,151 from intangible assets to trademarks and goodwill, respectively. All trademarks have been assessed by management to have indefinite lives because they are expected to generate cash flows indefinitely. Thus, the company has ceased amortization expense on all trademarks and goodwill as of January 1, 2002.
The company has identified its reporting units related to goodwill and completed its goodwill impairment tests as of January 1, 2002 which require that management compare the fair value of the reporting unit with its carrying value. The reporting units were not considered to be impaired. The company also completed its impairment test of the indefinite lived trademarks which required management to compare the fair value of the trademarks to the carrying value. The trademarks were not considered to be impaired.
The impairment tests performed require that the company determine the fair market value of its reporting units for comparison to the carrying value of such net assets to assess whether an impairment exists. The methodologies used to estimate fair market value involve the use of estimates and assumptions, including projected revenues, earnings, cash flows and discount rates.
In addition, the company is required to conduct an annual review of its goodwill and trademarks for potential impairment. In 2003 and 2002, this review was completed and no impairment was found.
14
Comprehensive earnings:
Comprehensive earnings includes net earnings, foreign currency translation adjustments and unrealized gains/losses on commodity contracts and marketable securities.
Earnings per share:
A dual presentation of basic and diluted earnings per share is not required due to the lack of potentially dilutive securities under the company's simple capital structure. Therefore, all earnings per share amounts represent basic earnings per share.
The Class B Common Stock has essentially the same rights as Common Stock, except that each share of Class B Common Stock has ten votes per share (compared to one vote per share of Common Stock), is not traded on any exchange, is restricted as to transfer and is convertible on a share-for-share basis, at any time and at no cost to the holders, into shares of Common Stock which are traded on the New York Stock Exchange.
NOTE 2—ACCRUED LIABILITIES:
Accrued liabilities are comprised of the following:
| | December 31, | |||||
|---|---|---|---|---|---|---|
| | 2003 | 2002 | ||||
| Compensation | $ | 12,213 | $ | 11,211 | ||
| Other employee benefits | 4,998 | 4,666 | ||||
| Taxes, other than income | 2,531 | 2,542 | ||||
| Advertising and promotions | 11,525 | 10,894 | ||||
| Other | 7,567 | 6,512 | ||||
| $ | 38,834 | $ | 35,825 | |||
NOTE 3—INDUSTRIAL DEVELOPMENT BONDS:
Industrial development bonds are due in 2027. The average floating interest rate was 1.2% and 1.5% in 2003 and 2002, respectively.
NOTE 4—INCOME TAXES:
The domestic and foreign components of pretax income are as follows:
| | 2003 | 2002 | 2001 | |||||||
|---|---|---|---|---|---|---|---|---|---|---|
| Domestic | $ | 96,170 | $ | 98,978 | $ | 98,827 | ||||
| Foreign | 1,777 | 1,710 | 1,960 | |||||||
| $ | 97,947 | $ | 100,688 | $ | 100,787 | |||||
The provision for income taxes is comprised of the following:
| | 2003 | 2002 | 2001 | |||||||
|---|---|---|---|---|---|---|---|---|---|---|
| Current: | ||||||||||
| Federal | $ | 27,904 | $ | 32,303 | $ | 27,588 | ||||
| Foreign | 485 | 553 | 749 | |||||||
| State | 1,202 | 1,523 | 2,480 | |||||||
| 29,591 | 34,379 | 30,817 | ||||||||
Deferred: | ||||||||||
| Federal | 3,465 | (286 | ) | 4,011 | ||||||
| Foreign | (252 | ) | 176 | 52 | ||||||
| State | 129 | 31 | 220 | |||||||
| 3,342 | (79 | ) | 4,283 | |||||||
| $ | 32,933 | $ | 34,300 | $ | 35,100 | |||||
Significant components of the company's net deferred tax liability at year end were as follows:
| | December 31, | |||||||
|---|---|---|---|---|---|---|---|---|
| | 2003 | 2002 | ||||||
| Deferred tax assets: | ||||||||
| Deferred compensation | $ | 8,855 | $ | 7,205 | ||||
| Post retirement benefits | 3,076 | 2,885 | ||||||
| Reserve for uncollectible accounts | 480 | 475 | ||||||
| Other accrued expenses | 2,337 | 4,388 | ||||||
| Foreign subsidiary tax loss carry forward | 157 | 411 | ||||||
| Foreign subsidiary tax credit carry forward | 2,098 | 2,432 | ||||||
| Inventory reserves | 1,080 | 1,299 | ||||||
| Other | 1,231 | 2,783 | ||||||
| 19,314 | 21,878 | |||||||
| Valuation reserve | (1,522 | ) | (2,014 | ) | ||||
| Total deferred tax assets | $ | 17,792 | $ | 19,864 | ||||
| Deferred tax liabilities: | ||||||||
| Depreciation | $ | 18,333 | $ | 16,313 | ||||
| Deductible goodwill and trademarks | 12,835 | 10,908 | ||||||
| Accrued export company commissions | 2,825 | 2,602 | ||||||
| VEBA funding | 460 | 469 | ||||||
| Inventory reserves | 2,629 | 2,292 | ||||||
| Other | 2,390 | 2,453 | ||||||
| Total deferred tax liabilities | $ | 39,472 | $ | 35,037 | ||||
| Net deferred tax liability | $ | 21,680 | $ | 15,173 | ||||
15
At December 31, 2003, gross amount of foreign subsidiary tax loss carry forwards expiring by year are as follows: $49 in 2005, $33 in 2009, $277 in 2011 and $83 in 2012.
Also at December 31, 2003, the amounts of the foreign subsidiary tax credit carry forwards expiring by year are as follows: $265 in 2004, $45 in 2005, $226 in 2007, $191 in 2008, $184 in 2009, $306 in 2010, $317 in 2011, $305 in 2012 and $259 in 2013. A valuation allowance has been established for these carry forward credits to reduce the future income tax benefits to amounts expected to be realized.
The effective income tax rate differs from the statutory rate as follows:
| | 2003 | 2002 | 2001 | ||||
|---|---|---|---|---|---|---|---|
| U.S. statutory rate | 35.0 | % | 35.0 | % | 35.0 | % | |
| State income taxes, net | 0.9 | 1.0 | 1.8 | ||||
| Amortization of intangible assets | — | — | 0.4 | ||||
| Exempt municipal bond interest | (1.6 | ) | (1.8 | ) | (2.0 | ) | |
| Other, net | (0.7 | ) | (0.1 | ) | (0.4 | ) | |
| Effective income tax rate | 33.6 | % | 34.1 | % | 34.8 | % | |
The company has not provided for U.S. federal or foreign withholding taxes on $7,663 and $6,506 of foreign subsidiaries' undistributed earnings as of December 31, 2003 and December 31, 2002, respectively, because such earnings are considered to be permanently reinvested. It is not practicable to determine the amount of income taxes that would be payable upon remittance of the undistributed earnings.
NOTE 5—GOODWILL AND OTHER INTANGIBLE ASSETS:
The company ceased amortizing its intangible assets in conjunction with the January 1, 2002 adoption of SFAS 142. The proforma effects of such adoption are as follows:
| | 2003 | 2002 | 2001 | |||||||
|---|---|---|---|---|---|---|---|---|---|---|
| Reported net income | $ | 65,014 | $ | 66,388 | $ | 65,687 | ||||
| Add back: goodwill amortization | — | — | 1,473 | |||||||
| Add back: trademark amortization | — | — | 2,305 | |||||||
| Tax effect | — | — | (927 | ) | ||||||
| Adjusted net income | $ | 65,014 | $ | 66,388 | $ | 68,538 | ||||
Reported basic earnings per share | $ | 1.26 | $ | 1.25 | $ | 1.23 | ||||
| Goodwill amortization | — | — | .03 | |||||||
| Trademark amortization | — | — | .04 | |||||||
| Tax effect | — | — | (.02 | ) | ||||||
| Adjusted basic earnings per share | $ | 1.26 | $ | 1.25 | $ | 1.28 | ||||
NOTE 6—SHARE CAPITAL AND CAPITAL IN EXCESS OF PAR VALUE:
| | | | Class B Common Stock | | | | |||||||||||||
|---|---|---|---|---|---|---|---|---|---|---|---|---|---|---|---|---|---|---|---|
| | Common Stock | Treasury Stock | | ||||||||||||||||
| | Capital in excess of par value | ||||||||||||||||||
| | Shares | Amount | Shares | Amount | Shares | Amount | |||||||||||||
| | (000's) | | (000's) | | (000's) | | | ||||||||||||
| Balance at January 1, 2001 | 32,986 | $ | 22,907 | 16,056 | $ | 11,150 | (52 | ) | $ | (1,992 | ) | $ | 256,698 | ||||||
| Issuance of 3% stock dividend | 986 | 685 | 480 | 333 | (1 | ) | — | 69,180 | |||||||||||
| Conversion of Class B common shares to common shares | 217 | 151 | (217 | ) | (151 | ) | — | — | — | ||||||||||
| Purchase and retirement of common shares | (50 | ) | (35 | ) | — | — | — | — | (1,897 | ) | |||||||||
| Balance at December 31, 2001 | 34,139 | 23,708 | 16,319 | 11,332 | (53 | ) | (1,992 | ) | 323,981 | ||||||||||
| Issuance of 3% stock dividend | 1,009 | 700 | 488 | 339 | (2 | ) | — | 63,332 | |||||||||||
| Conversion of Class B common shares to common shares | 48 | 33 | (48 | ) | (33 | ) | — | — | — | ||||||||||
| Purchase and retirement of common shares | (948 | ) | (658 | ) | — | — | — | — | (31,655 | ) | |||||||||
| Balance at December 31, 2002 | 34,248 | 23,783 | 16,759 | 11,638 | (55 | ) | (1,992 | ) | 355,658 | ||||||||||
| Issuance of 3% stock dividend | 1,017 | 706 | 502 | 349 | (1 | ) | — | 41,458 | |||||||||||
| Conversion of Class B common shares to common shares | 116 | 81 | (116 | ) | (81 | ) | — | — | — | ||||||||||
| Purchase and retirement of common shares | (1,299 | ) | (902 | ) | — | — | — | — | (39,194 | ) | |||||||||
| Balance at December 31, 2003 | 34,082 | $ | 23,668 | 17,145 | $ | 11,906 | (56 | ) | $ | (1,992 | ) | $ | 357,922 | ||||||
Average shares outstanding and all per share amounts included in the financial statements and notes thereto have been adjusted retroactively to reflect annual three percent stock dividends.
NOTE 7—OTHER INCOME, NET:
Other income (expense) is comprised of the following:
| | 2003 | 2002 | 2001 | |||||||
|---|---|---|---|---|---|---|---|---|---|---|
| Interest income | $ | 4,464 | $ | 5,553 | $ | 6,556 | ||||
| Interest expense | (172 | ) | (309 | ) | (356 | ) | ||||
| Dividend income | 1 | 3 | 55 | |||||||
| Foreign exchange losses | (78 | ) | (206 | ) | (177 | ) | ||||
| Royalty income | 542 | 371 | 403 | |||||||
| Capital gains | 112 | (35 | ) | 1,515 | ||||||
| Miscellaneous, net | 725 | 81 | 87 | |||||||
| $ | 5,594 | $ | 5,458 | $ | 8,083 | |||||
16
NOTE 8—EMPLOYEE BENEFIT PLANS:
Pension plans:
The company sponsors defined contribution pension plans covering certain nonunion employees with over one year of credited service. The company's policy is to fund pension costs accrued based on compensation levels. Total pension expense for 2003, 2002 and 2001 approximated $3,073, $2,867 and $2,823, respectively. The company also maintains certain profit sharing and savings-investment plans. Company contributions in 2003, 2002 and 2001 to these plans were $796, $709 and $765, respectively.
The company also contributes to multi-employer defined benefit pension plans for its union employees. Such contributions aggregated $1,048, $1,055 and $859 in 2003, 2002 and 2001, respectively. The relative position of each employer associated with the multi-employer plans with respect to the actuarial present value of benefits and net plan assets is not determinable by the company.
Deferred compensation
The company sponsors three deferred compensation plans for selected executives and other employees: (i) the Excess Benefit Plan, which restores retirement benefits lost due to IRS limitations on contributions to tax-qualified plans, (ii) the Supplemental Plan, which allows eligible employees to defer the receipt of eligible compensation until designated future dates and (iii) the Career Achievement Plan, which provides a deferred annual incentive award to selected executives. Participants in these plans earn a return on amounts due them based on several investment options, which mirror returns on underlying investments (primarily mutual funds). The company hedges its obligations under the plans by investing in the actual underlying investments. These investments are classified as trading securities and are carried at fair value. At December 31, 2003 and 2002, these investments totaled $22.0 million and $16.1 million, respectively. All gains and losses in these investments are equally offset by corresponding gains and losses in the company's deferred compensation liabilities.
Postretirement health care and life insurance benefit plans:
The company provides certain postretirement health care and life insurance benefits for corporate office and management employees. Employees become eligible for these benefits if they meet minimum age and service requirements and if they agree to contribute a portion of the cost. The company has the right to modify or terminate these benefits. The company does not fund postretirement health care and life insurance benefits in advance of payments for benefit claims.
The changes in the accumulated postretirement benefit obligation at December 31, 2003 and 2002 consist of the following:
| | December 31, | ||||||
|---|---|---|---|---|---|---|---|
| | 2003 | 2002 | |||||
| Benefit obligation, beginning of year | $ | 8,151 | $ | 7,450 | |||
| Net periodic postretirement benefit cost | 1,327 | 913 | |||||
| Benefits paid | (176 | ) | (212 | ) | |||
| Benefit obligation, end of year | $ | 9,302 | $ | 8,151 | |||
Net periodic postretirement benefit cost included the following components:
| | 2003 | 2002 | 2001 | |||||||
|---|---|---|---|---|---|---|---|---|---|---|
| Service cost—benefits attributed to service during the period | $ | 638 | $ | 462 | $ | 351 | ||||
| Interest cost on the accumulated postretirement benefit obligation | 604 | 481 | 422 | |||||||
| Amortization of unrecognized net gain | 85 | (30 | ) | (68 | ) | |||||
| Net periodic postretirement benefit cost | $ | 1,327 | $ | 913 | $ | 705 | ||||
For measurement purposes, a 9.5% annual rate of increase in the per capita cost of covered health care benefits was assumed for 2003; the rate was assumed to decrease gradually to 5.5% for 2011 and remain at that level thereafter. The health care cost trend rate assumption has a significant effect on the amounts reported. The weighted-average discount rate used in determining the accumulated postretirement benefit obligation was 6.0% and 6.5% at December 31, 2003 and 2002, respectively.
Increasing or decreasing the health care trend rates by one percentage point in each year would have the following effect on:
| | 1% Increase | 1% Decrease | |||||
|---|---|---|---|---|---|---|---|
| Postretirement benefit obligation | $ | 1,490 | $ | (1,218 | ) | ||
| Total of service and interest cost components | $ | 255 | $ | (203 | ) | ||
The company estimates that the 2004 plan contribution will be $193. In December 2003, the FASB issued a revised SFAS No. 132, "Employers' Disclosures about Pensions and Other Postretirement Benefits," which the company adopted in 2003. In January 2004, the FASB issued Staff Position No. 106-1, "Accounting and Disclosure Requirements Related to the Medicare Prescription Drug, Improvement and Modernization Act of 2003" (FSP 106-1). The company has elected to defer accounting for the effects of the Act, as permitted by FSP 106-1. Accordingly, the company's accumulated postretirement benefit obligation and net postretirement health care costs included in the consolidated financial statements and accompanying notes do not reflect the effects of the Act. Specific authoritative guidance on the accounting for the federal subsidy is pending and that guidance, when issued, could require the company to change previously reported information.
17
NOTE 9—COMMITMENTS:
Rental expense aggregated $962, $941 and $1,000 in 2003, 2002 and 2001, respectively.
Future operating lease commitments are not significant.
NOTE 10—SEGMENT AND GEOGRAPHIC INFORMATION:
The company operates as a single reportable segment encompassing the manufacture and sale of confectionery products and its principal operations and markets are located in the United States. The company also manufactures and sells confectionery products in Mexico, and exports products to Canada as well as to over 30 countries worldwide.
The following geographic data include net sales summarized on the basis of the location of the subsidiary making the sale, and long-lived assets based on their physical location.
| | 2003 | 2002 | 2001 | |||||||
|---|---|---|---|---|---|---|---|---|---|---|
| Net Sales: | ||||||||||
| United States | $ | 367,389 | $ | 365,920 | $ | 362,290 | ||||
| Foreign | 25,267 | 27,265 | 29,465 | |||||||
| $ | 392,656 | $ | 393,185 | $ | 391,755 | |||||
Long-lived assets: | ||||||||||
| United States | $ | 283,362 | $ | 297,894 | $ | 248,472 | ||||
| Foreign | 5,013 | 5,738 | 6,609 | |||||||
| $ | 288,375 | $ | 303,632 | $ | 255,081 | |||||
NOTE 11—DISCLOSURES ABOUT THE FAIR VALUE AND CARRYING AMOUNT OF FINANCIAL INSTRUMENTS:
The carrying amount approximates fair value of cash and cash equivalents because of the short maturity of those instruments. The fair values of investments are estimated based on quoted market prices. The fair value of the company's industrial development bonds approximates their carrying value because they have a floating interest rate.
During the third quarter 2003, the company transferred approximately $18 million of investments to a new money manager in order to better diversify its investment portfolio. The aforementioned also had the effect of reclassifying $18 million of investments from "held to maturity" to "available for sale". No gain or loss was recognized as a result of this transfer, and it is not expected to have material effect on the company's financial position or reported net earnings.
The carrying amount and estimated fair values of the company's financial instruments are as follows:
| | 2003 | 2002 | ||||||||||
|---|---|---|---|---|---|---|---|---|---|---|---|---|
| | Carrying Amount | Fair Value | Carrying Amount | Fair Value | ||||||||
| Cash and cash equivalents | $ | 84,084 | $ | 84,084 | $ | 105,507 | $ | 105,507 | ||||
| Investments held to maturity | 136,801 | 137,609 | 119,730 | 121,541 | ||||||||
| Investments available for sale | 41,346 | 41,346 | 22,226 | 22,226 | ||||||||
| Investments in trading securities | 21,243 | 21,243 | 15,281 | 15,281 | ||||||||
| Industrial development bonds | 7,500 | 7,500 | 7,500 | 7,500 | ||||||||
A summary of the aggregate fair value, gross unrealized gains, gross unrealized losses and amortized cost basis of the company's investment portfolio by major security type is as follows:
| | December 31, 2003 | ||||||||||||
|---|---|---|---|---|---|---|---|---|---|---|---|---|---|
| | | | Unrealized | ||||||||||
| Held to Maturity: | | | |||||||||||
| Amortized Cost | Fair Value | Gains | Losses | ||||||||||
| Municipal bonds | $ | 136,356 | $ | 137,170 | $ | 814 | $ | — | |||||
| Unit investment trusts of municipal bonds | 445 | 439 | — | (6 | ) | ||||||||
| $ | 136,801 | $ | 137,609 | $ | 814 | $ | (6 | ) | |||||
| Available for Sale: | |||||||||||||
| Municipal bonds | $ | 53,061 | $ | 53,202 | $ | 141 | $ | — | |||||
| Mutual funds | 2,454 | 3,075 | 621 | — | |||||||||
| $ | 55,515 | $ | 56,277 | $ | 762 | $ | — | ||||||
| | December 31, 2002 | ||||||||||||
|---|---|---|---|---|---|---|---|---|---|---|---|---|---|
| | | | Unrealized | ||||||||||
Held to Maturity: | Fair Value | ||||||||||||
| Amortized Cost | Gains | Losses | |||||||||||
| Municipal bonds | $ | 134,425 | $ | 136,240 | $ | 1,815 | $ | — | |||||
| Unit investment trusts of municipal bonds | 505 | 502 | — | (3 | ) | ||||||||
| $ | 134,930 | $ | 136,742 | $ | 1,815 | $ | (3 | ) | |||||
| Available for Sale: | |||||||||||||
| Municipal bonds | $ | 24,281 | $ | 24,275 | $ | — | $ | (6 | ) | ||||
| Mutual funds | 2,454 | 2,436 | — | (18 | ) | ||||||||
| $ | 26,735 | $ | 26,711 | $ | — | $ | (24 | ) | |||||
Held to maturity securities of $0 and $15,200 and available for sale securities of $14,931 and $4,485 were included in cash and cash equivalents at December 31, 2003 and 2002, respectively. There were no securities with maturities greater than four years and gross realized gains and losses on the sale of available for sale securities in 2003 and 2002 were not significant.
18
NOTE 12—COMPREHENSIVE INCOME:
The following table sets forth information with respect to accumulated other comprehensive income (loss):
| | Foreign Currency Translation Adjustment | Unrealized Gain (Loss) On Investments | Unrealized Gains (Losses) on Derivatives | Accumulated Other Comprehensive Earnings (Loss) | ||||||||||
|---|---|---|---|---|---|---|---|---|---|---|---|---|---|---|
| Balance at January 1, 2001 | $ | (10,823 | ) | $ | 633 | $ | 0 | $ | (10,190 | ) | ||||
| Unrealized gains (losses) | 846 | (316 | ) | (264 | ) | 266 | ||||||||
| (Gains) losses reclassified to net earnings | — | 23 | (346 | ) | (323 | ) | ||||||||
| Tax effect | — | 109 | 225 | 334 | ||||||||||
| Net of tax amount | 846 | (184 | ) | (385 | ) | 277 | ||||||||
| Balance at December 31, 2001 | (9,977 | ) | 449 | (385 | ) | (9,913 | ) | |||||||
| Unrealized gains (losses) | (1,533 | ) | (798 | ) | (65 | ) | (2,396 | ) | ||||||
| (Gains) losses reclassified to net earnings | — | 60 | 1,429 | 1,489 | ||||||||||
| Tax effect | — | 273 | (505 | ) | (232 | ) | ||||||||
| Net of tax amount | (1,533 | ) | (465 | ) | 859 | (1,139 | ) | |||||||
| Balance at December 31, 2002 | (11,510 | ) | (16 | ) | 474 | (11,052 | ) | |||||||
| Unrealized gains (losses) | (647 | ) | 784 | 890 | 1,027 | |||||||||
| (Gains) losses reclassified to net earnings | — | 2 | (1,690 | ) | (1,688 | ) | ||||||||
| Tax effect | — | (290 | ) | 294 | 4 | |||||||||
| Net of tax amount | (647 | ) | 496 | (506 | ) | (657 | ) | |||||||
| Balance at December 31, 2003 | $ | (12,157 | ) | $ | 480 | $ | (32 | ) | $ | (11,709 | ) | |||
Report of Independent Auditors
To the Board of Directors and Shareholders of Tootsie Roll Industries, Inc.:
In our opinion, the accompanying consolidated statements of financial position and the related consolidated statements of earnings, comprehensive earnings and retained earnings and of cash flows present fairly, in all material respects, the financial position of Tootsie Roll Industries, Inc. and its subsidiaries at December 31, 2003 and 2002, and the results of their operations and their cash flows for each of the three years in the period ended December 31, 2003 in conformity with accounting principles generally accepted in the United States of America. These financial statements are the responsibility of the company's management; our responsibility is to express an opinion on these financial statements based on our audits. We conducted our audits of these statements in accordance with auditing standards generally accepted in the United States of America, which require that we plan and perform the audit to obtain reasonable assurance about whether the financial statements are free of material misstatement. An audit includes examining, on a test basis, evidence supporting the amounts and disclosures in the financial statements, assessing the accounting principles used and significant estimates made by management, and evaluating the overall financial statement presentation. We believe that our audits provide a reasonable basis for our opinion.
As described in Notes 1 and 5 to the consolidated financial statements, the company changed the manner in which it accounts for its goodwill and other intangible assets upon adoption of Statement of Financial Accounting Standards No. 142, "Goodwill and Other Intangible Assets" on January 1, 2002.
![]()
Chicago, Illinois
February 11, 2004
19
Quarterly Financial Data (Unaudited)
TOOTSIE ROLL INDUSTRIES, INC. AND SUBSIDIARIES
| | (Thousands of dollars except per share data) | |||||||||
|---|---|---|---|---|---|---|---|---|---|---|
| 2003 | ||||||||||
| First | Second | Third | Fourth | Total | ||||||
| Net sales | $75,570 | $77,725 | $147,201 | $92,160 | $392,656 | |||||
| Gross margin | 32,601 | 35,541 | 61,932 | 40,035 | 170,109 | |||||
| Net earnings | 10,909 | 12,317 | 26,945 | 14,843 | 65,014 | |||||
| Net earnings per share | .21 | .24 | .52 | .29 | 1.26 | |||||
2002 | ||||||||||
| Net sales | $78,991 | $77,131 | $146,298 | $90,765 | $393,185 | |||||
| Gross margin | 35,505 | 35,411 | 61,560 | 38,505 | 170,981 | |||||
| Net earnings | 12,772 | 12,316 | 26,616 | 14,684 | 66,388 | |||||
| Net earnings per share | .24 | .23 | .50 | .28 | 1.25 | |||||
2001 | ||||||||||
| Net sales | $75,858 | $79,987 | $148,456 | $87,454 | $391,755 | |||||
| Gross margin | 35,817 | 36,417 | 65,600 | 36,024 | 173,858 | |||||
| Net earnings | 12,385 | 13,902 | 27,010 | 12,390 | 65,687 | |||||
| Net earnings per share | .23 | .26 | .51 | .23 | 1.23 | |||||
Net earnings per share is based upon average outstanding shares as adjusted for 3% stock dividends issued during the second quarter of each year. The sum of the per share amounts may not equal annual amounts due to rounding.
2003-2002 QUARTERLY SUMMARY OF TOOTSIE ROLL INDUSTRIES, INC. STOCK PRICE AND DIVIDENDS PER SHARE
STOCK PRICES*
| | 2003 | 2002 | ||||||||||
|---|---|---|---|---|---|---|---|---|---|---|---|---|
| | High | Low | High | Low | ||||||||
| 1st Qtr | $ | 30.91 | $ | 27.30 | $ | 45.99 | $ | 37.85 | ||||
| 2nd Qtr | $ | 32.37 | $ | 28.75 | $ | 47.97 | $ | 37.84 | ||||
| 3rd Qtr | $ | 32.05 | $ | 29.60 | $ | 38.97 | $ | 29.72 | ||||
| 4th Qtr | $ | 36.94 | $ | 32.08 | $ | 31.96 | $ | 29.51 | ||||
- *
- NYSE — Composite Quotations
| Estimated Number of shareholders at December 31, 2003: | |||
| Common Stock | 18,000 | ||
| Class B Common Stock | 5,000 | ||
DIVIDENDS
| | 2003 | 2002 | ||||
|---|---|---|---|---|---|---|
| 1st Qtr | $ | .0680 | $ | .0660 | ||
| 2nd Qtr | $ | .0700 | $ | .0680 | ||
| 3rd Qtr | $ | .0700 | $ | .0680 | ||
| 4th Qtr | $ | .0700 | $ | .0680 | ||
NOTE: In addition to the above cash dividends, a 3% stock dividend was issued on April 16, 2003 and April 17, 2002. Cash dividends are restated to reflect 3% stock dividends.
20
Five Year Summary of Earnings and Financial Highlights
| TOOTSIE ROLL INDUSTRIES, INC. AND SUBSIDIARIES | (Thousands of dollars except per share, percentage and ratio figures) |
(See Management's Comments starting on page 5)
| | 2003 | 2002 | 2001 | 2000 | 1999 | ||||||||||||||
|---|---|---|---|---|---|---|---|---|---|---|---|---|---|---|---|---|---|---|---|
Sales and Earnings Data (2) | |||||||||||||||||||
| Net sales | $ | 392,656 | $ | 393,185 | $ | 391,755 | $ | 396,816 | $ | 369,335 | |||||||||
| Gross margin (3) | 170,109 | 170,981 | 173,858 | 188,585 | 175,244 | ||||||||||||||
| Interest expense | 172 | 309 | 356 | 866 | 453 | ||||||||||||||
| Provision for income taxes | 32,933 | 34,300 | 35,100 | 42,071 | 40,137 | ||||||||||||||
| Net earnings | 65,014 | 66,388 | 65,687 | 75,737 | 71,310 | ||||||||||||||
| % of sales | 16.6 | % | 16.9 | % | 16.8 | % | 19.1 | % | 19.3 | % | |||||||||
| % of shareholders' equity | 12.1 | % | 12.6 | % | 12.9 | % | 16.5 | % | 16.6 | % | |||||||||
Per Common Share Data (1) | |||||||||||||||||||
| Net earnings | $ | 1.26 | $ | 1.25 | $ | 1.23 | $ | 1.40 | $ | 1.30 | |||||||||
| Cash dividends declared | .28 | .27 | .26 | .25 | .21 | ||||||||||||||
| Stock dividends | 3 | % | 3 | % | 3 | % | 3 | % | 3 | % | |||||||||
Additional Financial Data (3) | |||||||||||||||||||
| Working capital | $ | 180,818 | $ | 161,852 | $ | 188,250 | $ | 145,765 | $ | 168,423 | |||||||||
| Net cash provided by operating activities | 83,466 | 75,473 | 80,915 | 82,591 | 72,935 | ||||||||||||||
| Net cash used in investing activities | 50,383 | 29,571 | 19,165 | 64,177 | 26,993 | ||||||||||||||
| Net cash used in financing activities | 54,506 | 46,927 | 16,100 | 46,036 | 38,182 | ||||||||||||||
| Property, plant & equipment additions | 12,150 | 10,308 | 14,148 | 16,189 | 20,283 | ||||||||||||||
| Net property, plant & equipment | 129,163 | 128,869 | 132,575 | 131,118 | 95,897 | ||||||||||||||
| Total assets | 665,297 | 646,080 | 618,676 | 562,442 | 529,416 | ||||||||||||||
| Long term debt | 7,500 | 7,500 | 7,500 | 7,500 | 7,500 | ||||||||||||||
| Shareholders' equity | 536,581 | 526,740 | 508,461 | 458,696 | 430,646 | ||||||||||||||
| Average shares outstanding (1) | 51,784 | 53,070 | 53,464 | 53,911 | 54,889 | ||||||||||||||
- (1)
- Adjusted for annual 3% stock dividends.
- (2)
- Adjusted for the reclassification of certain selling, marketing and administrative expenses as a reduction of net sales.
- (3)
- Certain reclassifications have been made to prior year numbers to conform to current year presentation.
21
| Melvin J. Gordon(1) | Chairman of the Board and Chief Executive Officer | |
| Ellen R. Gordon(1) | President and Chief Operating Officer | |
| Charles W. Seibert(2)(3) | Retired Banker | |
| Lana Jane Lewis-Brent(2)(3) | President, Paul Brent Designer, Inc., an art publishing, design and licensing company | |
| Richard P. Bergeman(2)(3) | Retired Senior Vice President, Bestfoods |
- (1)
- Member of the Executive Committee
- (2)
- Member of the Audit Committee
- (3)
- Member of the Compensation Committee
Officers
| Melvin J. Gordon | Chairman of the Board and Chief Executive Officer | |
| Ellen R. Gordon | President and Chief Operating Officer | |
| G. Howard Ember, Jr. | Vice President, Finance & Chief Financial Officer | |
| John W. Newlin, Jr. | Vice President, Manufacturing | |
| Thomas E. Corr | Vice President, Marketing & Sales | |
| James M. Hunt | Vice President, Physical Distribution | |
| Barry P. Bowen | Treasurer & Asst. Secy. | |
| Daniel P. Drechney | Controller |
Offices, Plants
| Executive Offices | 7401 S. Cicero Ave. Chicago, Illinois 60629 www.tootsie.com | |
| Plants | Illinois Tennessee Massachusetts Wisconsin New York Mexico City | |
| Foreign Sales Offices | Mexico City, Mexico Mississauga, Ontario |
Subsidiaries
| Andes Candies L.P. Andes Manufacturing LLC Andes Services LLC C.C. L.P., Inc. C.G.C. Corporation C.G.P., Inc. Cambridge Brands, Inc. Cambridge Brands Mfg., Inc. Cambridge Brands Services, Inc. Cella's Confections, Inc. Charms Company Charms L.P. Charms Marketing Company Henry Eisen Advertising Agency, Inc. J.T. Company, Inc. O'Tec Industries, Inc. Tootsie Roll Brands, LLC | Tootsie Roll of Canada Ltd. Tootsie Roll Central Europe Ltd. The Tootsie Roll Company, Inc. Tootsie Roll Management, Inc. Tootsie Roll Mfg., Inc. Tootsie Rolls—Latin America, Inc. Tootsie Roll Worldwide Ltd. The Sweets Mix Company, Inc. TRI Captive Insurance Company, Inc. TRI de Latino America S.A. de C.V. TRI Finance, Inc. TRI International Co. TRI-Mass., Inc. TRI Sales Co. TRI Sales Finance LLC Tutsi S.A. de C.V. World Trade & Marketing Ltd. |
Other Information
| Stock Exchange | New York Stock Exchange, Inc. (Since 1922) | |||
| Stock Identification | Ticker Symbol: TR CUSIP No. 890516 10-7 | |||
| Stock Transfer Agent and Stock Registrar | Mellon Investor Services LLC Overpeck Centre 85 Challenger Road Ridgefield Park, NJ 07660 1-800-710-0932 www.melloninvestor.com | |||
| Independent Accountants | PricewaterhouseCoopers LLP One North Wacker Chicago, IL 60606 | |||
| General Counsel | Becker Ross Stone DeStefano & Klein 317 Madison Avenue New York, NY 10017 | |||
| Annual Meeting | May 3, 2004 Mutual Building, Room 1200 909 East Main Street Richmond, VA 23219 |  |
Printed on recycled paper. |
22