QuickLinks -- Click here to rapidly navigate through this document
U.S. Securities and Exchange Commission
Washington, D.C. 20549
Form 40-F/A
Amendment No. 1
o | REGISTRATION STATEMENT PURSUANT TO SECTION 12 OF THE SECURITIES EXCHANGE ACT OF 1934 | |
OR | ||
ý | ANNUAL REPORT PURSUANT TO SECTION 13(a) OR 15(d) OF THE SECURITIES EXCHANGE ACT OF 1934 | |
For the fiscal year endedDecember 31, 2012 Commission File Number1-8887
| TRANSCANADA PIPELINES LIMITED (Exact Name of Registrant as specified in its charter) |
Canada (Jurisdiction of incorporation or organization) |
4922, 4923, 4924, 5172 (Primary Standard Industrial Classification Code Number (if applicable)) |
Not Applicable (I.R.S. Employer Identification Number (if applicable)) |
TransCanada Tower, 450 - 1 Street S.W. Calgary, Alberta, Canada, T2P 5H1 (403) 920-2000 (Address and telephone number of Registrant's principal executive offices) |
TransCanada PipeLine USA Ltd., 717 Texas Street Houston, Texas, 77002-2761; (832) 320-5201 (Name, address (including zip code) and telephone number (including area code) of agent for service in the United States) |
Securities registered pursuant to section 12(b) of the Act: None
Securities registered pursuant to Section 12(g) of the Act: None
Securities for which there is a reporting obligation pursuant to Section 15(d) of the Act: Debt Securities
For annual reports, indicate by check mark the information filed with this Form:
| ý Annual Information Form | o Audited annual financial statements |
Indicate the number of outstanding shares of each of the issuer's classes of capital or common stock as of the close of the period covered by the annual report.
At December 31, 2012, 4,000,000 Cumulative Redeemable First Preferred Shares Series U
and 4,000,000 Cumulative Redeemable First Preferred Shares Series Y
were issued and outstanding.
738,507,894 common shares which are all owned by TransCanada Corporation
Indicate by check mark whether the Registrant (1) has filed all reports required to be filed by Section 13 or 15(d) of the Exchange Act during the preceding 12 months (or such shorter period that the Registrant was required to file such reports) and (2) has been subject to such filing requirements for the past 90 days. Yes ý No o
Indicate by check mark whether the Registrant has submitted electronically and posted on its corporate Web site, if any, every Interactive Data File required to be submitted and posted pursuant to Rule 405 of Regulation S-T (§232.405 of this chapter) during the preceding 12 months (or for such shorter period that the Registrant was required to submit and post such files). Yes o No o
The documents (or portions thereof) forming part of this Form 40-F are incorporated by reference into the following registration statements under theSecurities Act of 1933, as amended:
Form | Registration No. | |||
|---|---|---|---|---|
F-9 | 333-177789 | |||
TransCanada PipeLines Limited ("TCPL") is filing this Form 40-F/A Amendment No. 1 to its Annual Report on Form 40-F for the year ended December 31, 2012 which was filed with the Securities and Exchange Commission on February 15, 2013, to include TCPL's Annual Information Form for the year ended December 31, 2012.
Other than as expressly set forth above, this Form 40-F/A does not, and does not purport to, amend, update, or restate the information in any Item of the Form 40-F or reflect any events that have occurred after the Form 40-F was filed.
The Registrant undertakes to make available, in person or by telephone, representatives to respond to inquiries made by the Commission staff, and to furnish promptly, when requested to do so by the Commission staff, information relating to: the securities registered pursuant to Form 40-F; the securities in relation to which the obligation to file an Annual Report on Form 40-F arises; or transactions in said securities.
We disclose forward-looking information to help current and potential investors understand management's assessment of our future plans and financial outlook, and our future prospects overall.
Statements that areforward-looking are based on certain assumptions and on what we know and expect today and generally include words likeanticipate,expect,believe,may,will, should,estimate or other similar words.
Forward-looking statements in this document may include information about the following, among other things:
- •
- anticipated business prospects
- •
- our financial and operational performance, including the performance of our subsidiaries
- •
- expectations or projections about strategies and goals for growth and expansion
- •
- expected cash flows
- •
- expected costs for planned projects, including projects under construction and in development
- •
- expected schedules for planned projects (including anticipated construction and completion dates)
- •
- expected regulatory processes and outcomes
- •
- expected outcomes with respect to legal proceedings, including arbitration
- •
- expected capital expenditures and contractual obligations
- •
- expected operating and financial results
- •
- the expected impact of future commitments and contingent liabilities
- •
- expected industry, market and economic conditions.
Forward-looking statements do not guarantee future performance. Actual events and results could be significantly different because of assumptions, risks or uncertainties related to our business or events that happen after the date of this document.
2
Our forward-looking information is based on the following key assumptions, and subject to the following risks and uncertainties including the following:
Assumptions
- •
- inflation rates, commodity prices and capacity prices
- •
- timing of debt issuances and hedging
- •
- regulatory decisions and outcomes
- •
- foreign exchange rates
- •
- interest rates
- •
- tax rates
- •
- planned and unplanned outages and the use of our pipeline and energy assets
- •
- integrity and reliability of our assets
- •
- access to capital markets
- •
- anticipated construction costs, schedules and completion dates
- •
- acquisitions and divestitures.
Risks and uncertainties
- •
- our ability to successfully implement our strategic initiatives
- •
- whether our strategic initiatives will yield the expected benefits
- •
- the operating performance of our pipeline and energy assets
- •
- amount of capacity sold and rates achieved in our U.S. pipelines business
- •
- the availability and price of energy commodities
- •
- the amount of capacity payments and revenues we receive from our energy business
- •
- regulatory decisions and outcomes
- •
- outcomes of legal proceedings, including arbitration
- •
- performance of our counterparties
- •
- changes in the political environment
- •
- changes in environmental and other laws and regulations
- •
- competitive factors in the pipeline and energy sectors
- •
- construction and completion of capital projects
- •
- labour, equipment and material costs
- •
- access to capital markets
- •
- cybersecurity
- •
- interest and foreign exchange rates
- •
- weather
- •
- technological developments
- •
- economic conditions in North America as well as globally.
You can read more about these factors and others in reports we have filed with Canadian securities regulators and the U.S. Securities and Exchange Commission (SEC).
You should not put undue reliance on forward-looking information and should not use future-oriented information or financial outlooks for anything other than their intended purpose. We do not update our forward-looking statements due to new information or future events, unless we are required to by law.
3
Pursuant to the requirements of theExchange Act, the Registrant certifies that it meets all of the requirements for filing on Form 40-F/A and has duly caused this amendment to the Annual Report to be signed on its behalf by the undersigned, thereto duly authorized, in the City of Calgary, Province of Alberta, Canada.
| TRANSCANADA PIPELINES LIMITED | ||||
Per: | /s/ DONALD R. MARCHAND DONALD R. MARCHAND Executive Vice-President and Chief Financial Officer | |||
Date: February 27, 2013 | ||||
DOCUMENTS FILED AS PART OF THIS REPORT
13.1* | Management's Discussion and Analysis (included on pages 1 through 94 of the TCPL 2012 Management's Discussion and Analysis and Audited Consolidated Financial Statements). | ||
13.2* | 2012 Audited Consolidated Financial Statements (included on pages 95 through 151 of the TCPL 2012 Management's Discussion and Analysis and Audited Consolidated Financial Statements), including the auditors' report thereon and the Report of Independent Registered Public Accounting Firm on the effectiveness of TransCanada's Internal Control Over Financial Reporting as of December 31, 2012. | ||
13.3 | TCPL's Annual Information Form for the year ended December 31, 2012. | ||
* previously filed. | |||
EXHIBITS | |||
31.1 | Certification of Chief Executive Officer pursuant to Section 302 of theSarbanes-Oxley Act of 2002. | ||
31.2 | Certification of Chief Financial Officer pursuant to Section 302 of theSarbanes-Oxley Act of 2002. | ||
TransCanada PipeLines Limited
2012 Annual information form
February 11, 2013

Table of Contents
| Presentation of information | 2 | ||
| Forward-looking information | 2 | ||
| TransCanada PipeLines Limited | 4 | ||
| Corporate structure | 4 | ||
| Intercorporate relationships | 5 | ||
| General development of the business | 5 | ||
| Developments in the Natural Gas Pipelines business | 6 | ||
| Developments in the Oil Pipelines business | 9 | ||
| Developments in the Energy business | 11 | ||
| Business of TCPL | 13 | ||
| Natural Gas Pipelines business | 14 | ||
| Oil Pipelines business | 15 | ||
| Regulation of the Natural Gas and Oil Pipelines businesses | 16 | ||
| Energy business | 17 | ||
| General | 20 | ||
| Employees | 20 | ||
| Health, safety and environmental protection and social policies | 20 | ||
| Risk factors | 21 | ||
| Dividends | 21 | ||
| Description of capital structure | 22 | ||
| Share capital | 22 | ||
| Debt | 22 | ||
| Credit ratings | 23 | ||
| DBRS | 23 | ||
| Moody's | 23 | ||
| S&P | 24 | ||
| Market for securities | 24 | ||
| Common shares | 25 | ||
| Series 1 preferred shares | 25 | ||
| Series 3 preferred shares | 26 | ||
| Series 5 preferred shares | 26 | ||
| Series U preferred shares and Series Y preferred shares | 27 | ||
| Directors and officers | 28 | ||
| Directors | 28 | ||
| Board committees | 29 | ||
| Officers | 30 | ||
| Conflicts of interest | 31 | ||
| Corporate governance | 31 | ||
| Audit committee | 31 | ||
| Relevant education and experience of members | 31 | ||
| Pre-approval policies and procedures | 32 | ||
| External auditor service fees | 32 | ||
| Loans to directors and executive officers | 33 | ||
| Securities owned by directors | 33 | ||
| Compensation of directors | 33 | ||
| Executive compensation | 34 | ||
| Legal proceedings and regulatory actions | 34 | ||
| Transfer agent and registrar | 34 | ||
| Interest of experts | 34 | ||
| Additional information | 34 | ||
| Glossary | 35 | ||
| Schedule A | |||
| Schedule B | |||
| Schedule C | |||
| Schedule D | |||
| Appendices | |||
Unless the context indicates otherwise, a reference in this Annual Information Form (AIF) toTCPL or theCompany,we,us andour includes TCPL's parent, TransCanada Corporation (TransCanada) and the subsidiaries of TCPL through which its various business operations are conducted and a reference to "TransCanada" includes TransCanada Corporation and the subsidiaries of TransCanada Corporation, including TCPL. Where TCPL is referred to with respect to actions that occurred prior to its 2003 plan of arrangement with TransCanada, which is described below under the headingTransCanada PipeLines Limited – Corporate structure, these actions were taken by TCPL or its subsidiaries. The termsubsidiary, when referred to in this AIF, with reference to TCPL means direct and indirect wholly owned subsidiaries of, and legal entities controlled by, TransCanada or TCPL, as applicable.
Unless otherwise noted, the information contained in this AIF is given at or for the year ended December 31, 2012 (Year End). Amounts are expressed in Canadian dollars unless otherwise indicated. Information in relation to metric conversion can be found at Schedule A to this AIF. TheGlossary found at the end of this AIF contains certain terms defined throughout this AIF and abbreviations and acronyms that may not otherwise be defined in this document.
Certain portions of TCPL's Management's Discussion and Analysis dated February 11, 2013 (MD&A) are incorporated by reference into this AIF as stated below. The MD&A can be found on SEDAR (www.sedar.com) under TCPL's profile.
Financial information is presented in accordance with United States generally accepted accounting principles (U.S. GAAP). Effective January 1, 2012, TransCanada adopted U.S. GAAP for reporting purposes. For more information regarding TransCanada's adoption of U.S. GAAP, refer to theOther information – Critical accounting policiesandestimatesandOther information – Accounting changessections of the MD&A.
We use certain financial measures that do not have a standardized meaning under U.S. GAAP because we believe they improve our ability to compare results between reporting periods, and enhance understanding of our operating performance. Known as non-GAAP measures, they may not be comparable to similar measures provided by other companies. Refer to theAbout our business – Non-GAAP measures section of the MD&A for more information about the non-GAAP measures we use and a reconciliation to their GAAP equivalents, which section of the MD&A is incorporated by reference herein.
Forward-looking information
This AIF, including the MD&A disclosure incorporated by reference herein, contains certain information that is forward-looking and is subject to important risks and uncertainties. We disclose forward-looking information to help current and potential investors understand management's assessment of our future plans and financial outlook, and our future prospects overall.
Statements that are forward-looking are based on certain assumptions and on what we know and expect today and generally include words like anticipate, expect, believe, may, will, should, estimate or other similar words.
Forward-looking statements contained or incorporated by reference in this AIF may include information about the following, among other things:
- •
- anticipated business prospects
- •
- our financial and operational performance, including the performance of our subsidiaries
- •
- expectations or projections about strategies and goals for growth and expansion
- •
- expected cash flows
- •
- expected costs for planned projects, including projects under construction and in development
- •
- expected schedules for planned projects (including anticipated construction and completion dates)
- •
- expected regulatory processes and outcomes
- •
- expected outcomes with respect to legal proceedings, including arbitration
- •
- expected capital expenditures and contractual obligations
- •
- expected operating and financial results
- •
- the expected impact of future commitments and contingent liabilities
- •
- expected industry, market and economic conditions.
Forward-looking statements do not guarantee future performance. Actual events and results could be significantly different because of assumptions, risks or uncertainties related to our business or events that happen after the date of this AIF and other disclosure incorporated by reference herein.
2 -- TransCanada PipeLines Limited
Our forward-looking information is based on the following key assumptions, and subject to the following risks and uncertainties:
Assumptions
- •
- inflation rates, commodity prices and capacity prices
- •
- timing of debt issuances and hedging
- •
- regulatory decisions and outcomes
- •
- foreign exchange rates
- •
- interest rates
- •
- tax rates
- •
- planned and unplanned outages and the use of our pipeline and energy assets
- •
- integrity and reliability of our assets
- •
- access to capital markets
- •
- anticipated construction costs, schedules and completion dates
- •
- acquisitions and divestitures.
Risks and uncertainties
- •
- our ability to successfully implement our strategic initiatives
- •
- whether our strategic initiatives will yield the expected benefits
- •
- the operating performance of our pipeline and energy assets
- •
- amount of capacity sold and rates achieved in our U.S. pipelines business
- •
- the availability and price of energy commodities
- •
- the amount of capacity payments and revenues we receive from our energy business
- •
- regulatory decisions and outcomes
- •
- outcomes of legal proceedings, including arbitration
- •
- performance of our counterparties
- •
- changes in the political environment
- •
- changes in environmental and other laws and regulations
- •
- competitive factors in the pipeline and energy sectors
- •
- construction and completion of capital projects
- •
- labour, equipment and material costs
- •
- access to capital markets
- •
- cybersecurity
- •
- interest and foreign exchange rates
- •
- weather
- •
- technological developments
- •
- economic conditions in North America as well as globally.
You can read more about these factors and others in reports we have filed with Canadian securities regulators and the U.S. Securities and Exchange Commission (SEC).
You should not put undue reliance on forward-looking information and should not use future-oriented information or financial outlooks for anything other than their intended purpose. We do not update our forward-looking statements due to new information or future events, unless we are required to by law.
2012 Annual information form -- 3
TransCanada PipeLines Limited
CORPORATE STRUCTURE
TCPL's head office and registered office are located at 450 - 1st Street S.W., Calgary, Alberta, T2P 5H1.
TCPL is a Canadian public company. Significant dates and events are set forth below.
| Date | Event | |
| March 21, 1951 | Incorporated by Special Act of Parliament as Trans-Canada Pipe Lines Limited. | |
| April 19, 1972 | Continued under theCanada Corporations Act by Letters Patent, which included the alteration of its capital and change of name to TransCanada PipeLines Limited. | |
| June 1, 1979 | Continued under theCanada Business Corporations Act ("CBCA"). | |
| July 2, 1998 | Certificate of Arrangement issued in connection with the Plan of Arrangement with NOVA Corporation under which the companies merged and then split off the commodity chemicals business carried on by NOVA Corporation into a separate public company. | |
| January 1, 1999 | Certificate of Amalgamation issued reflecting TCPL's vertical short form amalgamation with a wholly owned subsidiary, Alberta Natural Gas Company Ltd. | |
| January 1, 2000 | Certificate of Amalgamation issued reflecting TCPL's vertical short form amalgamation with a wholly owned subsidiary, NOVA Gas International Ltd. | |
| May 4, 2001 | Restated TransCanada PipeLines Limited Articles of Incorporation filed. | |
| June 20, 2002 | Restated TransCanada PipeLines Limited By-Laws filed. | |
| May 15, 2003 | Certificate of Arrangement issued in connection with the plan of arrangement with TransCanada. TransCanada was incorporated pursuant to the provisions of the CBCA on February 25, 2003. The arrangement was approved by TCPL common shareholders on April 25, 2003 and following court approval, Articles of Arrangement were filed making the arrangement effective May 15, 2003. The common shareholders of TCPL exchanged each of their common shares of TCPL for one common share of TransCanada. The debt securities and preferred shares of TCPL remained obligations and securities of TCPL. TCPL continues to carry on business as the principal operating subsidiary of the TransCanada group of entities. | |
4 -- TransCanada PipeLines Limited
INTERCORPORATE RELATIONSHIPS
The following diagram presents the name and jurisdiction of incorporation, continuance or formation of TCPL's principal subsidiaries as at Year End. Each of the subsidiaries shown has total assets that exceeded 10 per cent of the total consolidated assets of TransCanada or revenues that exceeded 10 per cent of the total consolidated revenues of TransCanada as at Year End. TransCanada beneficially owns, controls or directs, directly or indirectly, 100 per cent of the voting shares in each of these subsidiaries, with the exception of TransCanada Keystone Pipeline, LP in which TransCanada indirectly holds 100 per cent of the partnership interests.
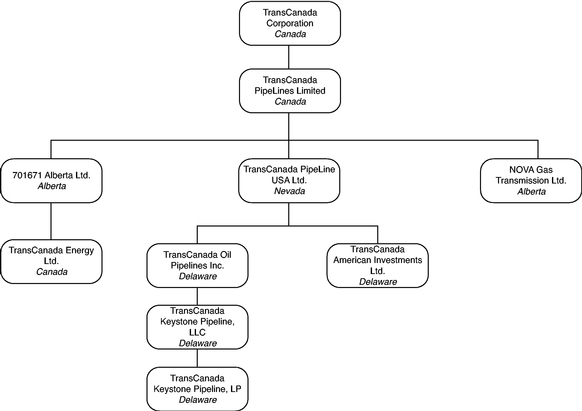
The above diagram does not include all of the subsidiaries of TCPL. The assets and revenues of excluded subsidiaries in the aggregate did not exceed 20 per cent of the total consolidated assets of TransCanada as at Year End or total consolidated revenues of TransCanada for the year then ended.
General development of the business
Our reportable business segments are Natural Gas Pipelines, Oil Pipelines and Energy. Natural Gas Pipelines and Oil Pipelines are principally comprised of the Company's respective natural gas and oil pipelines in Canada, the U.S. and Mexico as well as our regulated natural gas storage operations in the U.S. Energy includes the Company's power operations and the non-regulated natural gas storage business in Canada. Refer to theBusiness of TransCanada section below for further information regarding our Natural Gas Pipelines, Oil Pipelines and Energy businesses.
Summarized below are significant developments that have occurred in TransCanada's Natural Gas Pipelines, Oil Pipelines and Energy businesses, respectively, and the significant acquisitions, dispositions, events or conditions which have had an influence on that development, during the last three financial years.
2012 Annual information form -- 5
DEVELOPMENTS IN THE NATURAL GAS PIPELINES BUSINESS
| Date | Description of development | |
| Canadian Mainline | ||
| December 2010 | TransCanada filed an application with the National Energy Board (NEB) for approval of the interim 2011 tolls for the Canadian Mainline which contained certain changes to the tolling mechanism to reduce long haul tolls. The NEB decided not to approve the tolls as requested in the interim tolls application and set the then current 2010 tolls as interim tolls commencing January 1, 2011. | |
| January – February 2011 | TransCanada received approval for revised interim tolls, effective March 1, 2011 which increased interim tolls to more closely align with tolls calculated in accordance with the 2007-2011 settlement with stakeholders and more closely reflected the Canadian Mainline's costs and throughput for 2011. | |
| September 2011 | We filed a comprehensive restructuring proposal (Mainline Restructuring Proposal) with the NEB for the Canadian Mainline. The proposal is intended to enhance the competitiveness of the Canadian Mainline and transportation from the Western Canadian Sedimentary Basin (WCSB), and includes a request for 2012 and 2013 tolls that align with the proposed changes to our business structure and the terms and conditions of service on the Canadian Mainline. The NEB established interim tolls for 2012 based on the approved 2011 final tolls. | |
| November – December 2011 | TransCanada filed for and received approval to implement interim 2012 tolls on the Canadian Mainline effective January 1, 2012, at the same level as then approved 2011 final tolls. The NEB approved TransCanada's application for 2011 final tolls for the Canadian Mainline at the level of the tolls that were being charged on an interim basis. Final 2011 tolls were calculated in accordance with previously approved toll methodologies and were based on the principles contained in the 2007-2011 settlement with stakeholders, with adjustments to reduce toll impacts. Certain aspects of the 2011 revenue requirement were rolled into the Mainline Restructuring Proposal. | |
| May 2012 | We received NEB approval to build new pipeline facilities to provide Southern Ontario with additional natural gas supply from the Marcellus shale basin. | |
| May 2012 | The additional open season for firm transportation service on the Canadian Mainline, to bring additional Marcellus shale gas into Canada, closed. We were able to accommodate an additional 50 million cubic feet per day (MMcf/d) from the Niagara meter station to Kirkwall, Ontario, effective November 2012, with the potential for an additional 350 MMcf/d of incremental volume for November 2015, subject to finalizing precedent agreements with the interested parties. | |
| June 2012 | The NEB hearing on the Mainline Restructuring Proposal began and the hearing concluded in December 2012. A decision is not expected until late first quarter or early second quarter 2013. | |
| November 2012 | Natural gas supply from the Marcellus shale basin supply began moving in November 2012. | |
| Alberta System | ||
| February 2010 | TransCanada filed an application with the NEB for approval to construct and operate the Horn River pipeline. | |
| March 2010 | The North Central Corridor expansion of the Alberta System was completed. | |
| March 2010 | After a public hearing, the NEB approved TransCanada's application after a public hearing to construct and operate the Groundbirch pipeline project. | |
| June 2010 | TransCanada reached a three year settlement agreement with the Alberta System shippers and other interested parties and filed a 2010-2012 Revenue Requirement Settlement Application with the NEB. | |
| August 2010 | The NEB approved TransCanada's November 2009 application for the Alberta System's Rate Design Settlement and the commercial integration of the ATCO Pipelines system with the Alberta System. | |
| September 2010 | The NEB approved the Alberta System's 2010-2012 Revenue Requirement Settlement Application. | |
| October 2010 | The NEB approved final 2010 tolls for the Alberta System, which reflect the Alberta System 2010-2012 Revenue Requirement Settlement and Rate Design Settlement. | |
| December 2010 | The NEB approved the interim 2011 tolls for the Alberta System reflecting the 2010-2012 Revenue Requirement Settlement and continuing to transition to the toll methodology approved in the Rate Design Settlement. | |
| December 2010 | Groundbirch pipeline was completed and began transporting natural gas from the Montney shale gas formation into the Alberta System. | |
| January 2011 | TransCanada received approval from the NEB to construct the Horn River pipeline. | |
| March 2011 | TransCanada commenced construction of the $275 million Horn River pipeline. In addition, the Company executed an agreement to extend the Horn River pipeline by approximately 100 kilometers (km) (62 miles) at an estimated cost of $230 million. An application requesting approval to construct and operate this extension was filed with the NEB in October 2011. The total contracted volumes for Horn River, including the extension, are expected to be approximately 900 MMcf/d by 2020. | |
| August 2011 | The NEB approved construction of a 24 km (15 mile) extension of the Groundbirch pipeline and construction commenced. | |
6 -- TransCanada PipeLines Limited
| Date | Description of development | |
| October 2011 | Commercial integration of the Alberta System and ATCO Pipelines systems commenced. Under an agreement, the facilities of the Alberta System and ATCO Pipelines system are commercially operated as a single transmission system and transportation service is provided to customers by TransCanada pursuant to the Alberta System's tariff and suite of rates and services. The agreement further identifies distinct geographic areas within Alberta for the construction of new facilities by each of the Alberta System and ATCO Pipelines system. | |
| October 2011 | The NEB approved the construction of natural gas pipeline projects for the Alberta System with a capital cost of approximately $910 million. | |
| November – December 2011 | The regulatory decisions by which commercial integration of the Alberta System and ATCO Pipelines system was authorized are the subject of appeals to the Federal Court of Appeal. TransCanada continues to work with ATCO to gather information for the final stage of the integration which is to swap assets of equal value and will require approval by both the Alberta Utilities Commission and the NEB. | |
| May 2012 | The approximate $250 million Horn River project was completed, extending the Alberta System into the Horn River shale play in British Columbia (B.C.). | |
| June 2012 | The NEB approved the Leismer-Kettle River Crossover project, a 77 km (46 mile) pipeline to expand the Alberta System with the intent of increasing capacity to meet demand in northeastern Alberta. The expected cost of the expansion is an estimated $160 million. | |
| Third Quarter 2012 | During the first nine months of 2012, TransCanada continued to expand its Alberta System by completing and placing in-service twelve separate pipeline projects at a total cost of approximately $680 million. | |
| December 2012 | TransCanada was waiting for approval of approximately $330 million in additional projects, including the $100 million Chinchaga Expansion and the $230 million Komie North project that would extend the Alberta System further into the Horn River area. | |
| December 2012 | The current settlements for the Alberta and Foothills systems expired. Final tolls for 2013 will be determined through either new settlements or rate cases and any orders resulting from the NEB's decision on the Mainline Restructuring Proposal. | |
| January 2013 | The NEB issued its recommendation to the Governor-in-Council that the proposed Chinchaga Expansion component of the Komie North project be approved, but denied the proposed Komie North Extension component. All applications awaiting approval as of the end of 2012 have now been addressed. | |
| 2013 | We continue to advance pipeline development projects in B.C. and Alberta to transport new natural gas supply. We have filed applications with the NEB to expand the Alberta System to accommodate requests for additional natural gas transmission service throughout the northwest and northeast portions of the WCSB. In addition, subject to regulatory approvals, we propose to extend the Alberta System in northeast B.C. to connect both to the Prince Rupert Gas Transmission Project (as described below) and to additional North Montney gas supplies. Initial capital cost estimates are approximately $1 billion to $1.5 billion, with an in-service date targeted for the end of 2015. We have incremental firm commitments to transport approximately 3.4 billion cubic feet per day (Bcf/d) from western Alberta and northeastern B.C. by 2014. | |
| Coastal GasLink | ||
| June 2012 | We were selected by Shell Canada Limited (Shell) and its partners to design, build, own and operate the proposed Coastal GasLink project, an estimated $4 billion pipeline. The liquefied natural gas (LNG) Canada project is a joint venture led by Shell, with partners Korea Gas Corporation, Mitsubishi Corporation and PetroChina Company Limited. The approximate 650 km (404 mile) pipeline is expected to have an initial capacity of more than 1.7 Bcf/d and be placed in-service toward the end of the decade, subject to a final investment decision to be made by LNG Canada subsequent to obtaining final regulatory approvals. | |
| Prince Rupert Gas Transmission Project | ||
| January 2013 | We were selected by Progress Energy Canada Ltd. (Progress) to, subject to regulatory approvals, design, build, own and operate the proposed $5 billion Prince Rupert Gas Transmission Project. This proposed pipeline will transport natural gas primarily from the North Montney gas-producing region near Fort St John, B.C., to the proposed Pacific Northwest LNG export facility near Prince Rupert, B.C. We expect to finalize definitive agreements in early 2013, leading to an in-service date in late 2018. A final investment decision to construct the project is expected to be made by Progress following final regulatory approvals. | |
| Mexican Pipelines | ||
| June 2011 | The Guadalajara pipeline was completed. TransCanada and Mexico's Comisión Federal de Electricidad (CFE) have agreed to add a US$60 million compressor station to the pipeline. | |
| February 2012 | We signed a contract with the CFE for the approximately $500 million Tamazunchale Pipeline Extension Project. The project, which is supported by a 25-year contract with CFE, is a 30 inch pipeline with a capacity of 630 MMcf/d. Engineering, procurement and construction contracts have all been signed and construction related activities have begun. We expect the pipeline to be in-service in the first quarter of 2014. | |
| November 2012 | The CFE awarded us the Topolobampo pipeline. The project, which is supported by a 25-year contract with CFE, is a 30 inch pipeline with a capacity of 670 MMcf/d. We estimate total costs to be US$1 billion, and expect it to be in-service in | |
| mid-2016. | ||
2012 Annual information form -- 7
| Date | Description of development | |
| November 2012 | The CFE awarded us the Mazatlan pipeline, from El Oro to Mazatlan, Mexico. The project, which is supported by a 25-year contract with CFE and interconnects with the Topolobampo project, is a 24 inch pipeline with a capacity of 200 MMcf/d. We estimate total costs to be US$400 million, and expect it to be in-service in 2016. | |
| Alaska Pipeline Project | ||
| April 2010 | The Alaska Pipeline open season commenced. | |
| Third Quarter 2010 | Interested shippers on the proposed Alaska Pipeline Project submitted conditional commercial bids in the open season that closed in July 2010. The Alaska Pipeline Project team continued to work with shippers to resolve conditional bids received as part of the project's open season in working toward a U.S. Federal Energy Regulatory Commission (FERC) application deadline of October 2012 for the Alberta option that would extend from Prudhoe Bay to points near Fairbanks and Delta Junction, and then to the Alaska/Canada border where the pipeline would connect with a new pipeline in Canada. | |
| March 2012 | The Alaska North Slope producers (Exxon Mobil Corporation, ConocoPhillips and British Petroleum (BP)), along with TransCanada through its participation in the Alaska Pipeline Project, announced the companies have agreed on a work plan aimed at commercializing North Slope natural gas resources through an LNG option. This would involve construction of a natural gas pipeline from the North Slope to Valdez, Alaska where the gas would be liquefied and shipped to international markets. | |
| May 2012 | We received approval from the State of Alaska to suspend and preserve our activities on the Alaska/Alberta route and focus on the LNG alternative. This allowed us to defer our obligation to file for a FERC certificate for the Alberta route beyond fall 2012, our original deadline. | |
| July 2012 | The Alaska Pipeline Project announced a non-binding public solicitation of interest in securing capacity on a potential new pipeline system to transport Alaska's North Slope gas. The solicitation of interest took place between August 2012 and September 2012. There were a number of non-binding expressions of interest from potential shippers from a broad range of industry sectors in North America and Asia. | |
| ANR Pipeline | ||
| June 2012 | The FERC issued orders approving ANR's sale of its offshore assets to a newly created wholly owned subsidiary, TC Offshore LLC, allowing TC Offshore LLC to operate these assets as a stand-alone interstate pipeline. | |
| August 2012 | The FERC approved ANR Storage Company's settlement with its shippers. | |
| November 2012 | TC Offshore LLC began commercial operations. | |
| Gas Transmission Northwest LLC (GTN) | ||
| May 2011 | TransCanada closed the sale of a 25 per cent interest in each of GTN and Bison Pipeline LLC (Bison) to TC PipeLines, LP for a total transaction value of $605 million, which included US$81 million or 25 percent of GTN's outstanding debt. | |
| November 2011 | The FERC approved a settlement agreement between GTN and its shippers for new transportation rates to be effective January 2012 through December 2015. This settlement also requires GTN to file for new rates that are to be effective January 2016. | |
| Northern Border | ||
| January 2013 | Northern Border secured a final settlement agreement with its shippers that the FERC approved in December 2012, effective January 2013. The settlement rates for long-haul transportation are approximately 11 per cent lower than 2012 rates and depreciation was lowered from 2.4 to 2.2 per cent. The settlement also includes a three-year moratorium on filing cases or challenging the settlement rates but Northern Border must initiate another rate proceeding within five years. | |
| Great Lakes | ||
| July 2010 | The FERC approved, without modification, the settlement stipulation agreement reached among Great Lakes Gas Transmission Limited Partnership, active participants and the FERC trial staff. As approved, the stipulation and agreement applies to all current and future shippers on Great Lakes. This settlement requires Great Lakes to file for new rates by November 1, 2013. | |
| Bison | ||
| December 2010 | Construction of Bison pipeline was completed. | |
| January 2011 | Bison pipeline was placed into commercial service. | |
| May 2011 | TransCanada closed the sale of a 25 per cent interest in each of GTN and Bison to TC PipeLines, LP for a total transaction value of $605 million, which included US$81 million or 25 percent of GTN's outstanding debt. | |
Further information about developments in the Natural Gas Pipelines business can be found in the MD&A in theAbout our business – A long-term strategy, Natural Gas Pipelines – Results, Natural Gas Pipelines – Outlook, Natural Gas Pipelines – Understanding the Natural Gas Pipelines business andNatural Gas Pipelines – Significant events sections, which sections of the MD&A are incorporated by reference herein.
8 -- TransCanada PipeLines Limited
DEVELOPMENTS IN THE OIL PIPELINES BUSINESS
| Date | Description of development | |
| Gulf Coast Project | ||
| February 2012 | We announced that what had previously been the Cushing to U.S. Gulf Coast portion of the Keystone XL Pipeline has its own independent value to the marketplace, and that we plan to build it as the stand-alone Gulf Coast Project, which is not part of the Keystone XL Presidential Permit process. We expect the 36-inch pipeline to have an initial capacity of up to 700,000 barrels per day (Bbl/d), and an ultimate capacity of 830,000 Bbl/d. We estimate the total cost of the project to be US$2.3 billion, and as of Year End, construction was approximately 35 per cent complete. US$300 million of the total cost is expected to be spent on the Houston Lateral pipeline, a 76 km (47 mile) pipeline that will transport crude oil to Houston refineries. | |
| August 2012 | Construction on the Gulf Coast Project commenced. We expect to place the pipeline in-service at the end of 2013. | |
| Keystone XL Pipeline | ||
| March 2010 | The NEB approved TransCanada's application to construct and operate the Canadian portion of the Keystone U.S. Gulf Coast expansion. | |
| April 2010 | The U.S. Department of State (DOS) issued a Draft Environmental Impact Statement for Keystone XL. | |
| June 2010 | Keystone XL commenced operating at a reduced maximum operating pressure as the first section began delivering oil from Hardisty, Alberta to Wood River and Patoka in Illinois (Wood River/Patoka). | |
| December 2010 | The reduced maximum operating pressure restriction on the Canadian conversion section of the Wood River/Patoka section of Keystone was removed by the NEB following the completion of in-line inspections. | |
| Fourth Quarter 2010 | Construction of the second section of Keystone extending the pipeline from Steele City, Nebraska to Cushing, Oklahoma (the Cushing Extension) was completed, and line fill commenced in late 2010. | |
| January 2011 | Required operational modifications were completed on the Canadian conversion section of Keystone. As a result, the system was capable of operating at the approved design pressure. | |
| February 2011 | The commercial in-service of the Cushing Extension was achieved, and the Company also commenced recording earnings for the Wood River/Patoka section. | |
| May 2011 | Revised tolls came into effect for the Wood River/Patoka section. | |
| Second Quarter 2011 | The U.S. Department of Transportation Pipeline and Hazardous Materials Safety Administration issued a corrective action order on Keystone as a result of two above-ground incidents at pump stations in North Dakota and Kansas. TransCanada filed a re-start plan with the U.S. Pipeline and Hazardous Material Safety Administration which was approved in June 2011. | |
| August 2011 | TransCanada received a Final Environmental Impact Statement regarding the Keystone XL U.S. Presidential Permit application. | |
| November 2011 | The DOS announced that further analysis of route options for Keystone XL would need to be investigated, with a specific focus on the Sandhills area of Nebraska. | |
| December 2011 | TransCanada announced that it received additional binding commitments in support of Keystone XL following the conclusion of the Keystone Houston Lateral open season, which commenced in August 2011. | |
| February 2012 | TransCanada sent a letter to the DOS informing the DOS that TransCanada planned to file a Presidential Permit application in near future for Keystone XL. TransCanada also informed the DOS that the Cushing to U.S. Gulf Coast portion of the Keystone XL project would be constructed as the Gulf Coast Project and not as part of the Presidential Permit process. | |
| May 2012 | TransCanada filed revised fixed tolls for the Cushing Extension section of the Keystone Pipeline System with both the NEB and the FERC. The revised tolls, which reflect the final project costs of the Keystone Pipeline System, became effective July 1, 2012. | |
| May 2012 | We filed a Presidential Permit application (cross-border permit) with the DOS for Keystone XL to transport crude oil from the U.S./Canada border in Montana to Steele City, Nebraska. We continued to work collaboratively with the Nebraska Department of Environmental Quality (NDEQ) and various other stakeholders throughout 2012 to determine an alternative route in Nebraska that would avoid the Nebraska Sandhills. We had proposed an alternative route to the NDEQ in April 2012, and then modified the route in response to comments from the NDEQ and other stakeholders. | |
| September 2012 | TransCanada submitted a Supplemental Environmental Report to the NDEQ for the proposed re-route for Keystone XL in Nebraska, and provided an environmental report to the DOS, required as part of the DOS review of our cross-border permit application. | |
| January 2013 | The NDEQ issued its final evaluation report on our proposed re-route of Keystone XL to the Governor of Nebraska. The report noted that the proposed re-route avoids the Nebraska Sandhills, and that construction and operation of Keystone XL is expected to have minimal environmental impacts in Nebraska. In January, the Governor of Nebraska approved our proposed re-route. The DOS is now completing their environmental and National Interest Determination review process and we are awaiting their decision on our cross-border permit application. We estimate the total cost of the project to be US$5.3 billion and, as of Year End, had invested US$1.8 billion. We expect the pipeline to be in-service in late 2014 or early 2015, subject to regulatory approvals. | |
2012 Annual information form -- 9
| Date | Description of development | |
| Marketlink Projects | ||
| November 2010 | The open seasons for the Bakken Marketlink and Cushing Marketlink projects, which commenced in September 2010, closed successfully. | |
| October 2012 | We have commenced construction on the Cushing Marketlink receipt facilities and expect to begin transporting crude oil supply from the Permian Basin producing region in western Texas to the U.S. Gulf Coast in late 2013 after our Gulf Coast Project is placed in-service. Our Bakken Marketlink project will transport crude oil supply from the Williston Basin producing region in North Dakota and Montana to Cushing, Oklahoma on facilities that form part of Keystone XL which remains subject to regulatory approval. | |
| Keystone Hardisty Terminal | ||
| March 2012 | We launched and concluded a binding open season to obtain commitments from interested parties for the Keystone Hardisty Terminal. | |
| May 2012 | We announced that we had secured binding long-term commitments of more than 500,000 Bbl/d for the Keystone Hardisty Terminal, and are expanding the proposed two million barrel project to a 2.6 million barrel terminal at Hardisty, Alberta, due to strong commercial support. We expect the terminal to be operational in late 2014 and cost approximately $275 million. | |
| Northern Courier Pipeline | ||
| August 2012 | We announced that we had been selected by Fort Hills Energy Limited Partnership to design, build, own and operate the proposed Northern Courier Pipeline. We estimate total capital costs to be $660 million. The pipeline system is fully subscribed under long-term contract to service the Fort Hills mine, which is jointly owned by Suncor Energy Inc, Total E&P Canada Ltd. and Teck Resources Limited. The project is conditional on the Fort Hills project receiving sanctions by the owners of the Fort Hills mine and is subject to regulatory approval. | |
| Grand Rapids Pipeline | ||
| October 2012 | We announced that we had entered into binding agreements with Phoenix Energy Holdings Limited (Phoenix) to develop the Grand Rapids Pipeline in northern Alberta. The project, which includes crude oil and diluent lines, will have the capacity to move up to 900,000 Bbl/d of crude oil and 330,000 Bbl/d of diluent. We and Phoenix will each own 50 per cent of the project and we will operate the system, which is expected to cost $3 billion. Phoenix has entered into a long-term commitment to ship crude oil and diluent on this pipeline. We expect the Grand Rapids Pipeline system, subject to regulatory approvals, to be placed in-service in multiple stages, with initial crude oil service by mid-2015 and the complete system in-service by the second half of 2017. | |
| Canadian Mainline Conversion | ||
| Third Quarter 2012 | We have determined that it is technically and economically feasible to convert a portion of the Canadian Mainline natural gas pipeline system to crude oil service. We are actively pursuing this project and have begun soliciting input from stakeholders and prospective shippers to determine market acceptance. | |
Further information about developments in the Oil Pipelines business can be found in the MD&A in theAbout our business – A long-term strategy, Oil Pipelines – Results, Oil Pipelines – Outlook, Oil Pipelines – Understanding the Oil Pipelines business andOil Pipelines – Significant events sections, which sections of the MD&A are incorporated by reference herein.
10 -- TransCanada PipeLines Limited
DEVELOPMENTS IN THE ENERGY BUSINESS
| Date | Description of development | |
| Sundance | ||
| Second Quarter 2010 | Sundance B Unit 3 experienced an unplanned outage related to mechanical failure of certain generator components and was subject to a force majeure claim by TransAlta Corporation (TransAlta). The ASTC Power Partnership, which holds the Sundance B power purchase agreement (PPA), disputed the claim under the binding dispute resolution process provided in the PPA because we did not believe TransAlta's claim met the test of force majeure. We therefore recorded equity earnings from our 50 per cent ownership interest in ASTC Power Partnership as though this event were a normal plant outage. | |
| December 2010 | Sundance A Units 1 and 2 were withdrawn from service. | |
| January 2011 | Sundance A Units 1 and 2 were subject to a force majeure claim by TransAlta. | |
| February 2011 | TransAlta informed us that it was not economic to replace or repair Units 1 and 2, and that the Sundance A PPA should be terminated. We disputed both the force majeure and the economic destruction claims under the binding dispute resolution process provided in the PPA. | |
| July 2012 | An arbitration panel decided that the Sundance A PPA should not be terminated and ordered TransAlta to rebuild Units 1 and 2. The panel also limited TransAlta's force majeure claim from November 20, 2011 until the units can reasonably be returned to service. TransAlta announced that it expects the units to be returned to service in the fall of 2013. Since we considered the outages to be an interruption of supply, we accrued $188 million in pre-tax income between December 2010 and March 2012. The outcome of the decision was that we received approximately $138 million of this amount. We recorded the $50 million difference as a charge to second quarter 2012 earnings, of which $20 million related to amounts accrued in 2011. We will not record further revenue or costs from the PPA until the units are returned to service. The net book value of the Sundance A PPA recorded in Intangibles and Other Assets remains fully recoverable. | |
| November 2012 | An arbitration decision was reached with the arbitration panel granting partial force majeure relief to TransAlta with respect to Sundance B Unit, and we reduced our equity earnings by $11 million from the ASTC Power Partnership to reflect the amount that will not be recovered as result of the decision. | |
| Napanee Generating Station | ||
| December 2012 | We signed a contract with the Ontario Power Authority (OPA), to develop, own and operate a new 900 megawatt (MW) natural gas-fired power plant at Ontario Power Generation's Lennox site in Eastern Ontario in the town of Greater Napanee. The plant will replace the facility that was planned and subsequently cancelled in the community of Oakville, Ontario and will operate under a 20-year Clean Energy Supply contract with the OPA. We were reimbursed for $250 million of costs, mainly related to natural gas turbines that were purchased for the Oakville project, which will now be used at Napanee. We plan to invest approximately $1.0 billion in the Napanee facility. | |
| Cartier Wind | ||
| November 2011 | The Montagne-Sèche project and phase one of the Gros-Morne wind farm were completed. | |
| November 2012 | We placed the second phase of the Gros-Morne wind farm project in service, completing the 590 MW, five-phase Cartier Wind Project in Québec. All of the power produced by Cartier Wind is sold to Hydro-Québec Distribution (Hydro-Québec) under 20-year PPAs. | |
| Ontario Solar | ||
| December 2011 | We agreed to buy nine Ontario solar projects (combined capacity of 86 MW) from Canadian Solar Solutions Inc. (Canadian Solar), for approximately $476 million. Under the terms of the agreement, Canadian Solar will develop and build each of the nine solar projects using photovoltaic panels. We will buy each project once construction and acceptance testing are complete and commercial operation begins. All power produced will be sold under 20-year PPAs with the OPA under the Feed-in Tariff program in Ontario. We expect to close the acquisition of the first two projects (combined capacity of 20 MW) in the first half of 2013 for a total cost of approximately $125 million. We expect to acquire the other seven projects in 2013 to late 2014, subject to regulatory approvals. | |
| Bécancour | ||
| June 2011 | Hydro-Québec notified us it would exercise its option to extend the agreement to suspend all electricity generation from Bécancour throughout 2012. Under the original agreement, Hydro-Québec has the option, to extend the suspension on an annual basis until such time as regional electricity demand levels recover. We continue to receive capacity payments under the agreement similar to those that would have been received under the normal course of operation. | |
| June 2012 | Hydro-Québec notified us that it would exercise its option to extend the agreement to suspend all electricity generation from the Bécancour power plant through 2013. Under the suspension agreement, Hydro-Québec has the option (subject to certain conditions) to extend the suspension every year until regional electricity demand levels recover. We continue to receive capacity payments while generation is suspended. | |
2012 Annual information form -- 11
| Date | Description of development | |
| Bruce | ||
| February 2011 | The Bruce Power Refurbishment Implementation Agreement (the BPRIA) was amended to extend the suspension date for Bruce A contingent support payments from December 31, 2011 to June 1, 2012. Contingent support payments received from the OPA by Bruce A are equal to the difference between the fixed prices under the BPRIA and spot market prices. As a result of the amendment, all output from Bruce A was subject to spot prices effective June 1, 2012 until the restart of both Units 1 and 2 was complete. Bruce Power and the OPA had amended certain terms and conditions of the BPRIA in July 2009, which included: amendments to the Bruce B floor price mechanism, the removal of a support payment cap for Bruce A, an amendment to the capital cost-sharing mechanism, and addition of a provision for deemed generation payments to Bruce Power at the contracted prices under circumstances where generation from Bruce A and Bruce B is reduced due to system curtailments on the Independent Electricity System Operator controlled grid in Ontario. Under the original BPRIA, which was signed in 2005, Bruce A committed to refurbish and restart the then currently idle Units 1 and 2, extend the operating life of Unit 3 and replace the steam generators on Unit 4. Fuelling of both Unit 2 and Unit 1 has now been completed and the final phases of commissioning for Unit 2 are underway. Subject to regulatory approval, Bruce Power expects to commence commercial operations of Unit 2 in first quarter 2012 and commercial operations of Unit 1 in third quarter 2012. | |
| November 2011 | Bruce Power commenced the West Shift Plus outage as part of the life extension strategy for Unit 3. | |
| March 2012 | Bruce Power received authorization from the Canadian Nuclear Safety Commission to power up the Unit 2 reactor. | |
| May 2012 | An incident occurred within the Unit 2 electrical generator on the non-nuclear side of the plant which delayed the synchronization of Unit 2 to the Ontario electrical grid. As a result, Bruce Power submitted a force majeure claim to the OPA. | |
| June 2012 | Bruce Power returned Unit 3 to service after completing the $300 million West Shift Plus life extension outage, which began in 2011. Unit 4 is expected to return to service in late first quarter 2013 after the completion of an expanded outage investment program that began in August 2012. These investments should allow Units 3 and 4 to produce low cost electricity until at least 2021. | |
| August 2012 | TransCanada confirmed that Bruce Power's force majeure claim to the OPA related to Unit 2 (Bruce A) had been accepted. The claim was the result of a May 2012 event that delayed the synchronization of this unit to the Ontario power grid. With the acceptance of the force majeure claim, Bruce Power continued to receive the contracted price for power generated from the operating units at Bruce A after July 1, 2012. | |
| October 2012 | Unit 1 and 2 were returned to service following the completion of the refurbishment. The incident in May 2012 within the Unit 2 electrical generator on the non-nuclear side of the plant had delayed returning the units to service. Bruce Power's force majeure claim to the OPA was accepted in August, and it continued to receive the contracted price for power generated during the force majeure period. | |
| November 2012 | Both Units 1 and 2 have operated at reduced output levels following their return to service, and Bruce Power took Unit 1 offline for an approximate one month maintenance outage. Bruce Power expects the availability percentages for Units 1 and 2 to increase over time, however, these units have not operated for an extended period of time and may experience slightly higher forced outage rates and reduced availability percentages in 2013. Overall plant availability for Bruce A is expected to be approximately 90 per cent in 2013. | |
| Ravenswood | ||
| Third and Fourth Quarters 2011 | Spot prices for capacity sales in the New York Zone J market were negatively impacted by the manner in which the New York Independent System Operator (NYISO) applied pricing rules for a power plant that had recently began service in this market. We jointly filed two formal complaints with the FERC challenging how the NYISO applied its buy-side mitigation rules affecting bidding criteria associated with two new power plants that began service in the New York Zone J markets during the summer of 2011. | |
| June 2012 | The FERC addressed the first complaint, indicating it would take steps to increase transparency and accountability for future mitigation exemption tests (MET) and decisions. | |
| September 2012 | The FERC granted an order on the second complaint, directing the NYISO to retest the two new power plants as well as a transmission project currently under construction using an amended set of assumptions to more accurately perform the MET calculations, in accordance with existing rules and tariff provisions. The recalculation was completed in November 2012 and it was determined that one of the plants had been granted an exemption in error. That exemption was revoked and the plant is now required to offer its capacity at a floor price which has put upward pressure on capacity auction prices since December. The order was prospective only and has no impact on capacity prices for prior periods. | |
| CrossAlta | ||
| December 2012 | We acquired the remaining 40 per cent interests in the Crossfield Gas Storage facility and CrossAlta Gas Storage & Services Ltd. marketing company from BP for approximately $220 million. We now own and operate 100 per cent of the interests of CrossAlta. The acquisition added an additional 27 billion cubic feet (Bcf) of working gas storage capacity to our existing portfolio in Alberta. | |
| Coolidge | ||
| May 2011 | Coolidge power generating station was completed and placed in-service. | |
| Kibby Wind | ||
| October 2010 | The 22 turbine, 66 MW second phase of Kibby Wind was completed and placed in-service. | |
| Halton Hills | ||
| September 2010 | The 683 MW Halton Hills power plant was completed and placed in-service. | |
12 -- TransCanada PipeLines Limited
Further information about developments in the Energy business can be found in the MD&A in theAbout our business – A long-term strategy, Energy – Results, Energy – Outlook, Energy – Understanding the Energy business andEnergy – Significant events sections, which sections of the MD&A are incorporated by reference herein.
Business of TCPL
We are a leading North American energy infrastructure company focused on Natural Gas Pipelines, Oil Pipelines and Energy. At Year End and for the year then ended, Natural Gas Pipelines accounted for approximately 53 per cent of revenues and 47 per cent of TCPL's total assets, Oil Pipelines accounted for approximately 13 per cent of revenues and 21 per cent of TCPL's total assets and Energy accounted for approximately 34 per cent of revenues and 27 per cent of TCPL's total assets. The following table shows TCPL's revenues from operations by segment, classified geographically, for the years ended December 31, 2012 and 2011.
| Revenues from operations(millions of dollars) | 2012 | 2011 | |||
| Natural Gas Pipelines | |||||
| Canada – Domestic | $2,294 | $2,180 | |||
| Canada – Export(1) | 751 | 786 | |||
| United States | 1,112 | 1,207 | |||
| Mexico | 107 | 71 | |||
| 4,264 | 4,244 | ||||
| Oil Pipelines | |||||
| Canada – Domestic | – | – | |||
| Canada – Export(1) | 370 | 300 | |||
| United States | 669 | 527 | |||
| 1,039 | 827 | ||||
| Energy(2) | |||||
| Canada – Domestic | 1,233 | 1,749 | |||
| Canada – Export(1) | – | 1 | |||
| United States | 1,471 | 1,018 | |||
| 2,704 | 2,768 | ||||
| Total revenues(3) | $8,007 | $7,839 | |||
- (1)
- Exports include pipeline revenues attributable to deliveries to U.S. pipelines and power deliveries to U.S. markets.
- (2)
- Revenues include sales of natural gas.
- (3)
- Revenues are attributed to countries based on country of origin of product or service.
The following is a description of each of TCPL's three main areas of operations.
2012 Annual information form -- 13
NATURAL GAS PIPELINES BUSINESS
TransCanada delivers natural gas to local distribution companies, power generation facilities and other businesses across Canada, the U.S. and Mexico. Our Natural Gas Pipelines and related holdings are described below.
We are the operator of all of the following natural gas pipelines and storage assets except for Iroquois.
Length | Description | Effective ownership | ||||
| Canadian pipelines | ||||||
| Alberta System | 24,337 km (15,122 miles) | Gathers and transports natural gas within Alberta and Northeastern B.C., and connects with the Canadian Mainline, Foothills system and third-party pipelines | 100% | |||
| Canadian Mainline | 14,101 km (8,762 miles) | Transports natural gas from the Alberta/Saskatchewan border to the Québec/Vermont border, and connects with other natural gas pipelines in Canada and the U.S. | 100% | |||
| Foothills | 1,241 km (771 miles) | Transports natural gas from central Alberta to the U.S. border for export to the U.S. Midwest, Pacific northwest, California and Nevada | 100% | |||
| Trans Québec & Maritimes (TQM) | 572 km (355 miles) | Connects with Canadian Mainline near the Ontario/Québec border to transport natural gas to the Montreal to Québec City corridor, and connects with the Portland pipeline system that serves the northeast U.S. | 50% | |||
| U.S. pipelines | ||||||
| ANR Pipeline | 16,656 km (10,350 miles) | Transports natural gas from producing fields in Texas and Oklahoma, from offshore and onshore regions of the Gulf of Mexico and from the U.S. midcontinent, for delivery mainly to Wisconsin, Michigan, Illinois, Indiana and Ohio. Connects with Great Lakes | 100% | |||
| ANR Storage | 250 Bcf | Provides regulated underground natural gas storage service from facilities located in Michigan | ||||
| Bison | 487 km (303 miles) | Transports natural gas from the Powder River Basin in Wyoming to Northern Border in North Dakota. We effectively own 83.3 per cent of the system through the combination of our 75 per cent direct ownership interest and our 33.3 per cent interest in TC PipeLines, LP | 83.3% | |||
| GTN | 2,178 km (1,353 miles) | Transports natural gas from the WCSB and the Rocky Mountain region to Washington, Oregon and California. Connects with Tuscarora and Foothills. We effectively own 83.3 per cent of the system through the combination of our 75 per cent direct ownership interest and our 33.3 per cent interest in TC PipeLines, LP | 83.3% | |||
| Great Lakes | 3,404 km (2,115 miles) | Connects with ANR and the Canadian Mainline near Emerson, Manitoba, to transport natural gas to eastern Canada, and the U.S. upper Midwest. We effectively own 69.0 per cent of the system through the combination of our 53.6 per cent direct ownership interest and our 33.3 per cent interest in TC PipeLines, LP | 69% | |||
| Iroquois | 666 km (414 miles) | Connects with Canadian Mainline near Waddington, New York to deliver natural gas to customers in the U.S. northeast | 44.5% | |||
| North Baja | 138 km (86 miles) | Transports natural gas between Ehrenberg, Arizona and Ogilby, California, and connects with a third-party natural gas system on the California/Mexico border. We effectively own 33.3 per cent of the system through our 33.3 per cent interest in TC PipeLines, LP | 33.3% | |||
| Northern Border | 2,265 km (1,407 miles) | Transports natural gas through the U.S. Midwest, and connects with Foothills near Monchy, Saskatchewan. We effectively own 16.7 per cent of the system through our 33.3 per cent interest in TC PipeLines, LP | 16.7% | |||
| Portland | 474 km (295 miles) | Connects with TQM near East Hereford, Québec, to deliver natural gas to customers in the U.S. northeast | 61.7% | |||
| Tuscarora | 491 km (305 miles) | Transports natural gas from GTN at Malin, Oregon to Wadsworth, Nevada, and delivers gas in northeastern California and northwestern Nevada. We effectively own 33.3 per cent of the system through our 33.3 per cent interest in TC PipeLines, LP. | 33.3% | |||
14 -- TransCanada PipeLines Limited
Length | Description | Effective ownership | ||||
| Mexican pipelines | ||||||
| Guadalajara | 310 km (193 miles) | Transports natural gas from Manzanillo to Guadalajara in Mexico | 100% | |||
| Tamazunchale | 130 km (81 miles) | Transports natural gas from Naranjos, Veracruz in east central Mexico to Tamazunchale, San Luis Potos, Mexico | 100% | |||
| Under construction | ||||||
| Mazatlan Pipeline | 413 km (257 miles) | To deliver natural gas from El Oro to Mazatlan, Mexico. Connects to the Topolobampo Pipeline Project | 100% | |||
| Tamazunchale Pipeline Extension | 235 km (146 miles) | Extend existing terminus of the Tamazunchale Pipeline to deliver natural gas to power generating facilities in El Sauz, Queretaro, Mexico | 100% | |||
| Topolobampo Pipeline | 530 km (329 miles) | To deliver natural gas from Chihuahua to Topolobampo, Mexico | 100% | |||
| In development | ||||||
| Alaska Pipeline Project | 2,737 km (1,700 miles) | To transport natural gas from Prudhoe Bay to Alberta, or from Prudhoe Bay to LNG facilities in south-central Alaska. We have an agreement with ExxonMobil to jointly advance the projects | ||||
| Coastal GasLink | 650 km* (404 miles) | To deliver natural gas from the Montney gas-producing region near Dawson Creek, B.C. to LNG Canada's proposed LNG facility near Kitimat, B.C. | ||||
| Prince Rupert Gas Transmission Project | 750 km* (466 miles) | To deliver natural gas from North Montney gas producing region near Fort St. John, B.C. to the proposed Pacific Northwest LNG facility near Prince Rupert, B.C. | ||||
- *
- Pipe lengths are estimates as final route is still under design.
Further information about the Company's pipeline holdings, developments and opportunities and significant regulatory developments which relate to Natural Gas Pipelines can be found in the MD&A in theNatural Gas Pipelines – Results, Natural Gas Pipelines – Understanding the Natural Gas Pipelines business andNatural Gas Pipelines – Significant events sections, which sections of the MD&A are incorporated by reference herein.
OIL PIPELINES BUSINESS
TransCanada contracts and delivers North American crude oil supply to key U.S. markets. Our Oil Pipelines and related holdings are described below.
We are the operator of all of the following pipelines and properties.
| Length | Description | Ownership | ||||
| Oil pipelines | ||||||
| Keystone Pipeline System | 3,467 km (2,154 miles) | Transports crude oil from Hardisty, Alberta, to U.S. markets at Wood River and Patoka in Illinois, and to Cushing, Oklahoma | 100% | |||
| Under construction | ||||||
| Cushing Marketlink | Crude oil receipt facilities | To transport crude oil from the Permian Basin producing region in western Texas to the U.S. Gulf Coast refining market on facilities that form part of the Gulf Coast Project | 100% | |||
| Gulf Coast Project | 780 km (485 miles) | To transport crude oil from the hub at Cushing, Oklahoma to the U.S. Gulf Coast refinery market. Includes the 76 km (47 mile) Houston Lateral pipeline | 100% | |||
| Keystone Hardisty Terminal | Crude oil terminal | Crude oil terminal to be located at Hardisty, Alberta, providing Western Canadian producers with new crude oil batch accumulation tankage and pipeline infrastructure and access to the Keystone Pipeline System | 100% | |||
2012 Annual information form -- 15
| Length | Description | Ownership | ||||
| In development | ||||||
| Bakken Marketlink | Crude oil receipt facilities | To transport crude oil from the Williston Basin producing region in North Dakota and Montana to Cushing, Oklahoma on facilities that form part of Keystone XL | 100% | |||
| Canadian Mainline conversion | Conversion of a portion of the Canadian Mainline natural gas pipeline system to crude oil service, which will transport crude oil between Hardisty, Alberta and markets in eastern Canada | 100% | ||||
| Grand Rapids Pipeline | 500 km (300 miles) | To transport crude oil between the producing area northwest of Fort McMurray and the Edmonton/Heartland market region. Project is a partnership with Phoenix | 50% | |||
| Keystone XL | 1,897 km (1,179 miles) | Pipeline from Hardisty, Alberta to Steele City, Nebraska to expand capacity of the Keystone Pipeline System to 1.4 million Bbl/d. Awaiting U.S. Presidential Permit decision | 100% | |||
| Northern Courier Pipeline | 90 km (56 miles) | To transport bitumen and diluent between the Fort Hills mine site and the Voyageur Upgrader located north of Fort McMurray, Alberta | 100% | |||
Further information about the Company's pipeline holdings, developments and opportunities and significant regulatory developments which relate to Oil Pipelines can be found in the MD&A in theOil Pipelines – Results, Oil Pipelines – Understanding the Oil Pipelines business andOil Pipelines – Significant events sections, which sections of the MD&A are incorporated by reference herein.
REGULATION OF THE NATURAL GAS AND OIL PIPELINES BUSINESSES
Canada
Natural Gas Pipelines
Under the terms of theNational Energy Board Act (Canada), the Canadian Mainline, the Alberta System and other Canadian pipelines owned or operated by TransCanada (collectively, the Systems) are regulated by the NEB. The NEB sets tolls that provide TransCanada the opportunity to recover costs of transporting natural gas, including the return of capital (depreciation) and return on the average investment base for each of the Systems. In addition, new facilities on or associated with the Systems are approved by the NEB before construction begins and the NEB regulates the operations of each of the Systems. Net earnings of the Systems may be affected by changes in investment base, the allowed return on equity, and any incentive earnings.
Natural Gas Pipeline Projects
The Coastal GasLink Pipeline and the Prince Rupert Gas Transmission projects are being proposed and developed primarily under the regulatory regime administered by the B.C. Oil and Gas Commission (BCOGC) and the B.C. Environmental Assessment Office (BCEAO). The BCOGC is responsible for overseeing oil and gas operations in B.C., including exploration, development, pipeline transportation and reclamation. The BCEAO is an agency that manages the review of proposed major projects in B.C., as required by the B.C.Environmental Assessment Act. Both projects are also subject to the provisions of theCanadian Environmental Assessment Act. Pre-application activities are currently underway with the BCOGC and BCEAO as well as the Canadian Environmental Assessment Agency.
Oil Pipelines
The NEB regulates the terms and conditions of service, including rates, and the physical operation of the Canadian portion of the Keystone Pipeline System, including the Keystone Hardisty Terminal. NEB approval is also required for facility additions. The rates for transportation service on the Keystone Pipeline System are calculated in accordance with a methodology agreed to in transportation service agreements between Keystone and its shippers, and approved by the NEB.
Oil Pipeline Projects
The Northern Courier Pipeline and Grand Rapids Pipeline projects are being proposed and developed primarily under the regulatory regime administered by the Alberta Energy Resources Conservation Board (ERCB) and Alberta Environment and Sustainable Resource Development (ESRD). ERCB approval is required to construct and operate the pipelines and associated facilities. ESRD approval is required to construct and operate a tank terminal when the project involves the storage of more than 10,000 cubic meters (62,898 Bbl/d) of refined petroleum products. Pre-application activities are currently underway.
United States
Natural Gas Pipelines
TransCanada's wholly owned and partially owned U.S. pipelines are considerednatural gas companies operating under the provisions of theNatural Gas Act of 1938 and theNatural Gas Policy Act of 1978, and are subject to the jurisdiction of the FERC. The Natural Gas Act of 1938 grants the FERC authority over the construction and operation of pipelines and related facilities. The FERC also has authority to regulate rates for natural gas transportation and interstate commerce. The ANR System's natural gas storage facilities in Michigan are also regulated by FERC.
16 -- TransCanada PipeLines Limited
Oil Pipelines
The FERC also regulates the terms and conditions of service, including transportation rates, on the U.S. portion of the Keystone Pipeline System. Certain states in which Keystone Pipeline System has rights of way also regulate construction and siting of Keystone Pipeline System. The Keystone XL pipeline remains subject to the DOS decision on TransCanada's Presidential Permit application.
Mexico
Natural Gas Pipelines
TransCanada's pipelines in Mexico are regulated by the Comisión Reguladora de Energía or Energy Regulatory Commission (CRE). The CRE regulates the construction and operation of pipeline facilities including the approval of tariffs, services and related rates. However, the contracts underpinning the facilities in Mexico are long-term negotiated rate contracts and not subject to further regulatory approval.
ENERGY BUSINESS
TransCanada's Energy business includes a portfolio of power generation assets in Canada and the U.S., and unregulated natural gas storage assets in Alberta. This segment of our business includes the acquisition, development, construction, ownership and operation of electrical power generation plants, the purchase and marketing of electricity, the provision of electricity account services to energy and industrial customers, and the development, construction, ownership and operation of natural gas storage in Alberta. Our Energy assets and related holdings are described below.
We are the operator of all of our Energy assets, except for the Sheerness, Sundance A and Sundance B PPAs, Cartier Wind, Bruce A and B and Portlands Energy.
| Generating capacity (MW) | Type of fuel | Description | Location | Ownership | ||||||
| Canadian Power | ||||||||||
| 8,070 MW of power generation capacity (including facilities in development) | ||||||||||
| Western Power | ||||||||||
| 2,636 MW of power supply in Alberta and the western U.S. | ||||||||||
| Bear Creek | 80 | natural gas | Cogeneration plant | Grand Prairie, Alberta | 100% | |||||
| Cancarb | 27 | natural gas, waste heat | Facility fuelled by waste heat from an adjacent TransCanada facility that produces thermal carbon black, a by-product of natural gas | Medicine Hat, Alberta | 100% | |||||
| Carseland | 80 | natural gas | Cogeneration plant | Carseland, Alberta | 100% | |||||
| Coolidge(1) | 575 | natural gas | Simple-cycle peaking facility | Coolidge, Arizona | 100% | |||||
| Mackay River | 165 | natural gas | Cogeneration plant | Fort McMurray, Alberta | 100% | |||||
| Redwater | 40 | natural gas | Cogeneration plant | Redwater, Alberta | 100% | |||||
| Sheerness PPA | 756 | coal | PPA for entire output of facility | Hanna, Alberta | 100% | |||||
| Sundance A PPA | 560 | coal | PPA for entire output of facility | Wabamun, Alberta | 100% | |||||
| Sundance B PPA (Owned by ASTC Power Partnership(2)) | 353(3) | coal | PPA for entire output of facility | Wabamun, Alberta | 50% | |||||
| Eastern Power | ||||||||||
| 2,950 MW of power generation capacity (including facilities in development) | ||||||||||
| Bécancour | 550 | natural gas | Cogeneration plant | Trois-Rivières, Québec | 100% | |||||
| Cartier Wind | 366(3) | wind | Five wind power projects | Gaspésie, Québec | 62% | |||||
| Grandview | 90 | natural gas | Cogeneration plant | Saint John, New Brunswick | 100% | |||||
| Halton Hills | 683 | natural gas | Combined-cycle plant | Halton Hills, Ontario | 100% | |||||
| Portlands Energy | 275(3) | natural gas | Combined-cycle plant | Toronto, Ontario | 50% | |||||
2012 Annual information form -- 17
| Generating capacity (MW) | Type of fuel | Description | Location | Ownership | ||||||
| Bruce Power | ||||||||||
| 2,484 MW of power generation capacity through eight nuclear power units | ||||||||||
| Bruce A | 1,462(3) | nuclear | Four operating reactors | Tiverton, Ontario | 48.9% | |||||
| Bruce B | 1,022(3) | nuclear | Four operating reactors | Tiverton, Ontario | 31.6% | |||||
| U.S. Power | ||||||||||
| 3,755 MW of power generation capacity | ||||||||||
| Kibby Wind | 132 | wind | Wind farm | Kibby and Skinner Townships, Maine | 100% | |||||
| Ocean State Power | 560 | natural gas | Combined-cycle plant | Burrillville, Rhode Island | 100% | |||||
| Ravenswood | 2,480 | natural gas and oil | Multiple-unit generating facility using dual fuel-capable steam turbine, combined-cycle and combustion turbine technology | Queens, New York | 100% | |||||
| TC Hydro | 583 | hydro | 13 hydroelectric facilities, including stations and associated dams and reservoirs | New Hampshire, Vermont and Massachusetts (on the Connecticut and Deerfield rivers) | 100% | |||||
| Unregulated natural gas storage | ||||||||||
| 118 Bcf of non-regulated natural gas storage capacity | ||||||||||
| CrossAlta | 68 Bcf(4) | Underground facility connected to Alberta System | Crossfield, Alberta | 100% | ||||||
| Edson | 50 Bcf | Underground facility connected to Alberta System | Edson, Alberta | 100% | ||||||
| In development | ||||||||||
| Napanee | 900 | natural gas | Proposed combined-cycle plant | Greater Napanee, Ontario | 100% | |||||
| Ontario Solar | 86 | solar | Nine solar projects from Canadian Solar Solutions Inc. We expect to acquire the first two projects in the first half of 2013, and the remaining seven projects in 2013 to late 2014 | Southern Ontario and New Liskeard, Ontario | 100% | |||||
- (1)
- Located in Arizona, results reported in Canadian Power – Western Power.
- (2)
- We have a 50 per cent interest in ASTC Power Partnership, which has a PPA in place for 100 per cent of the production from the Sundance B power generating facilities.
- (3)
- Our share of power generation capacity.
- (4)
- Reflects the acquisition of an additional 27 Bcf of working gas storage capacity in December 2012.
18 -- TransCanada PipeLines Limited
We own or have the rights to approximately 2,600 MW of power supply in Alberta and Arizona, through three long-term PPAs, five natural gas-fired cogeneration facilities, and through Coolidge, a simple-cycle, natural gas peaking facility in Arizona.
Power purchased under long-term contracts is as follows:
| Type of contract | With | Expires | ||||
| Sheerness PPA | Power purchased under a 20-year PPA | ATCO Power and TransAlta Utilities Corporation | 2020 | |||
| Sundance A PPA | Power purchased under a 20-year PPA | TransAlta Utilities Corporation | 2017 | |||
| Sundance B PPA | Power purchased under a 20-year PPA (we own 50% through the ASTC Partnership) | TransAlta Utilities Corporation | 2020 | |||
Power sold under long-term contracts is as follows:
| Type of contract | With | Expires | ||||
| Coolidge | Power sold under a 20-year PPA | Salt River Project Agricultural Improvements & Power District | 2031 | |||
We own or are developing approximately 3,000 MW of power generation capacity in eastern Canada. All of the power produced by these assets is sold under contract. Disciplined maintenance of plant operations is critical to the results of our eastern power assets, where earnings are based on plant availability and performance.
Assets currently operating under long-term contracts are as follows:
| Type of contract | With | Expires | ||||
| Bécancour(1) | 20-year PPA Steam sold to an industrial customer | Hydro-Québec | 2026 | |||
| Cartier Wind | 20-year PPA | Hydro-Québec | 2032 | |||
| Grandview | 20-year tolling agreement to buy 100 per cent of heat and electricity output | Irving Oil | 2025 | |||
| Halton Hills | 20-year Clean Energy Supply contract | OPA | 2030 | |||
| Portlands Energy | 20-year Clean Energy Supply contract | OPA | 2029 | |||
- (1)
- Power generation has been suspended since 2008.
Assets currently in development are as follows:
| Type of contract | With | Expires | ||||
| Ontario Solar | 20-year Feed-in Tariff (FIT) contracts | OPA | 20 years from in-service date | |||
| Napanee | 20-year Clean Energy Supply contract | OPA | 20 years from in-service date | |||
We own approximately 3,800 MW of power generation capacity in New York and New England, including plants powered by natural gas, oil, hydro and wind.
We own or control 156 Bcf of non-regulated natural gas storage capacity in Alberta. This includes contracts for long-term, Alberta-based storage capacity from a third party, which expire in 2030, subject to early termination rights in 2015. This business operates independently from our regulated natural gas transmission business and from ANR's regulated storage business, which are included in our Natural Gas Pipelines segment.
Further information about the Company's Energy holdings and significant developments and opportunities in relation to Energy can be found in the MD&A in theEnergy – Results, Energy – Understanding the Energy businessand Energy – Significant events sections, which sections of the MD&A are incorporated by reference herein.
2012 Annual information form -- 19
General
EMPLOYEES
At Year End, TCPL had approximately 4,900 full time active employees, substantially all of whom were employed in Canada and the U.S., as set forth in the following table.
| Calgary | 2,247 | |
| Western Canada (excluding Calgary) | 495 | |
| Houston | 549 | |
| U.S. Midwest | 468 | |
| U.S. Northeast | 414 | |
| Eastern Canada | 268 | |
| U.S. Southeast/Gulf Coast | 275 | |
| U.S. West Coast | 80 | |
| Mexico and South America | 73 | |
| Total | 4,869 | |
HEALTH, SAFETY AND ENVIRONMENTAL PROTECTION AND SOCIAL POLICIES
The Health, Safety and Environment committee monitors compliance with our health, safety and environment (HSE) corporate policy through regular reporting from management. We have an integrated HSE management system that establishes a framework for managing HSE issues and is used to capture, organize and document our related policies, programs and procedures.
Our management system for HSE is modeled after international standards for environmental management systems, conforms to external industry consensus standards and voluntary regulatory programs, and complies with applicable legislative requirements and various other internal management systems. It follows a continuous improvement cycle organized into four key areas:
- •
- Planning: risk and regulatory assessment, objectives and targets, and structure and responsibility
- •
- Implementing: development and implementation of programs, procedures and practices aimed at operational risk management
- •
- Reporting: document and records management, communication and reporting, and
- •
- Action: ongoing audit and review of HSE performance.
The committee reviews HSE performance quarterly compared to previously set targets relating thereto, and taking into account incidents and highlights of performance in this regard during the relevant quarter, and reviews program plans and performance targets for subsequent years. It receives detailed reports on our operational risk management, including governance of these risks, operational performance and preventive maintenance, pipeline integrity, operational risk issues and applicable legislative developments. The committee also receives updates on any specific areas of operational risk management review currently being conducted by management.
Environmental policies
TransCanada's facilities are subject to federal, state, provincial, and local environmental statutes and regulations governing environmental protection, including, but not limited to, air emissions and greenhouse gas emissions, water quality, wastewater discharges and waste management. Such laws and regulations generally require facilities to obtain or comply with a wide variety of environmental registrations, licences, permits and other approvals and requirements. Failure to comply with these laws and regulations may result in the assessment of administrative, civil or criminal penalties, the imposition of remedial requirements and/or the issuance of orders respecting future operations. We have implemented inspection and audit programs designed to keep all of our facilities in compliance with environmental requirements.
Safety and asset integrity
As one of TransCanada's priorities, safety is an integral part of the way our employees work. Since 2008, we have sustained year over year improvement in our safety performance. Overall, TransCanada's incident frequency rates in 2012 continued to be better than most industry benchmarks.
The safety and integrity of our existing and newly-developed infrastructure is also a top priority. All new assets are designed, constructed and commissioned with full consideration given to safety and integrity, and are brought in-service only after all necessary requirements have been satisfied. Our pipeline safety record in 2012 continued to be better than industry benchmarks.
20 -- TransCanada PipeLines Limited
TransCanada routinely conducts emergency response field exercises to help ensure effective coordination between the Company, local emergency responders, regulatory agencies and members of the public in the event of an emergency. It also facilitates improving our emergency preparedness and response program and procedures.
Aboriginal, Native American and stakeholder engagement
TransCanada has a number of policies, guiding principles and practices in place to help manage stakeholder engagement. TransCanada has adopted a code of business ethics which applies to our employees that is based on the Company's four core values of integrity, collaboration, responsibility and innovation, which guide the interaction between and among the Company's employees and serve as a standard for TransCanada in our dealings with all stakeholders. The code may be viewed on our website (www.transcanada.com).
Our approach to stakeholder engagement is based on building relationships, mutual respect and trust while recognizing the unique values, needs and interests of each community. Key principles that guide TransCanada's engagement include: the Company's respect for the diversity of Aboriginal/Native American communities and recognition of the importance of the land to these communities; and our belief in engaging stakeholders from the earliest stages of our projects, through the project development process and into operations.
Risk factors
A discussion of the Company's risk factors can be found in the MD&A in theNatural Gas Pipelines – Business risks, Oil Pipelines – Business risks, Energy – Business risks andOther information – Risks and risk management sections, which sections of the MD&A are incorporated by reference into this AIF.
Dividends
All of TCPL's common shares are held by TransCanada and as a result, any dividends declared by TCPL on its common shares are paid to TransCanada. TCPL's Board has not adopted a formal dividend policy. The Board reviews the financial performance of TCPL quarterly and makes a determination of the appropriate level of dividends to be declared in the following quarter. Currently, TransCanada's payment of dividends is primarily funded from dividends it receives as the sole common shareholder of TCPL. Provisions of various trust indentures and credit arrangements to which TCPL is a party restrict TCPL's ability to declare and pay dividends to TransCanada and preferred shareholders under certain circumstances and, if such restrictions apply, they may, in turn, have an impact on TransCanada's ability to declare and pay dividends, on its common and preferred shares. In the opinion of TCPL management, such provisions do not currently restrict or alter TCPL's ability to declare or pay dividends.
The holders of TCPL's cumulative redeemable first preferred shares, series U (the Series U preferred shares) are entitled to receive as and when declared by the Board, fixed cumulative cash dividends at an annual rate of $2.80 per share, payable quarterly. The dividends declared per share on TCPL's respective common shares, Series U preferred shares, and cumulative redeemable first preferred shares, series Y (the Series Y preferred shares) during the past three completed financial years are set forth in the following table.
| 2012 | 2011 | 2010 | ||||
| Dividends declared on common shares(1) | $1.68 | $1.75 | $1.67 | |||
| Dividends declared on Series U preferred shares | $2.80 | $2.80 | $2.80 | |||
| Dividends declared on Series Y preferred shares | $2.80 | $2.80 | $2.80 | |||
- (1)
- TCPL dividends on its common shares are declared in an amount equal to the aggregate cash dividend paid by TransCanada to its public shareholders. The amounts presented reflect the aggregate amount divided by the total outstanding common shares of TCPL.
2012 Annual information form -- 21
Description of capital structure
SHARE CAPITAL
TCPL's authorized share capital consists of an unlimited number of common shares, of which 738,380,913 were issued and outstanding at Year End, and an unlimited number of first preferred shares and second preferred shares, issuable in series. There were 4,000,000 Series U preferred shares and 4,000,000 Series Y preferred shares issued and outstanding at Year End. The following is a description of the material characteristics of each of these classes of shares.
Common shares
As the holder of all of TCPL's common shares, TransCanada holds all the voting rights in those common shares.
Series U preferred shares
Subject to certain limitations, the Board may, from time to time, issue first preferred shares in one or more series and determine for any such series, its designation, number of shares and respective rights, privileges, restrictions and conditions. The first preferred shares as a class have, among others, the provisions described below.
The holders of the Series U preferred shares are entitled to receive dividends as set out above underDividends.
The first preferred shares of each series rank on a parity with the first preferred shares of every other series, and are entitled to preference over the common shares and any other shares ranking junior to the first preferred shares with respect to the payment of dividends, the repayment of capital and the distribution of assets of TCPL in the event of a liquidation, dissolution or winding up of TCPL.
TCPL is entitled to purchase for cancellation, some or all of the Series U preferred shares outstanding at the lowest price which such shares are obtainable, in the opinion of the Board, but not exceeding $50.00 per share plus costs of purchase. Furthermore, TCPL may redeem, on or after October 15, 2013, some or all of the Series U preferred shares upon payment for each share at $50.00 per share.
Except as provided by the CBCA or as referred to below, the holders of the first preferred shares will not have any voting rights nor will they be entitled to receive notice of or to attend shareholders' meetings unless and until TCPL fails to pay, in the aggregate, six quarterly dividends on the Series U preferred shares.
The provisions attaching to the first preferred shares as a class may be modified, amended or varied only with the approval of the holders of the first preferred shares as a class. Any such approval to be given by the holders of the first preferred shares may be given by the affirmative vote of the holders of not less than sixty-six and two-thirds per cent of the first preferred shares represented and voted at a meeting or adjourned meeting of such holders.
Series Y preferred shares
The rights, privileges, restrictions and conditions attaching to the Series Y preferred shares are substantially identical to those attaching to the Series U preferred shares, except that the Series Y preferred shares are redeemable by TCPL after March 5, 2014.
Debt
The following table sets out the issuances by TCPL of senior unsecured notes, medium term unsecured note debentures and junior subordinated notes with terms to maturity in excess of one year, during the 12 months ended December 31, 2012 to date.
| Date Issued | Issue Price per $1,000 Principal Amount of Notes | Aggregate Issue Price | ||
| March 2, 2012 | US$996.29 | US$498,145,000 | ||
| August 2, 2012 | US$999.21 | US$999,210,000 | ||
| January 15, 2013 | US$998.23 | US$745,297,500 | ||
There are no provisions associated with this debt that entitle debt holders to voting rights. From time to time, TCPL issues commercial paper for terms not exceeding nine months.
22 -- TransCanada PipeLines Limited
Credit ratings
The following table sets out the current credit ratings assigned to those outstanding classes of securities of the Company and TCPL which have been rated by DBRS Limited (DBRS), Moody's Investors Service, Inc. (Moody's) and Standard & Poors (S&P):
| DBRS | Moody's | S&P | ||||
| Senior unsecured debt | ||||||
| Debentures | A | A3 | A- | |||
| Medium-term notes | A | A3 | A- | |||
| Junior subordinated notes | BBB (high) | Baa1 | BBB | |||
| Preferred shares | Pfd-2 (low) | Baa2 | P-2 | |||
| Commercial paper | R-1 (low) | – | A-2 | |||
| Trending/rating outlook | Stable | Stable | Stable | |||
Credit ratings are intended to provide investors with an independent measure of credit quality of an issue of securities. Credit ratings are not recommendations to purchase, hold or sell securities and do not address the market price or suitability of a specific security for a particular investor. There is no assurance that any rating will remain in effect for any given period of time or that any rating will not be revised or withdrawn entirely by a rating agency in the future if, in its judgment, circumstances so warrant.
Each of the Company and TCPL paid fees to each of DBRS, Moody's and S&P for the credit ratings rendered their outstanding classes of securities noted above. Other than annual monitoring fees for the Company and TCPL and their rated securities, no additional payments were made to DBRS, Moody's and S&P in respect of any other services provided to us during the past two years.
The information concerning our credit ratings relates to our financing costs, liquidity and operations. The availability of our funding options may be affected by certain factors, including the global capital market environment and outlook as well as our financial performance. Our access to capital markets at competitive rates is dependent on our credit rating and rating outlook, as determined by credit rating agencies such as DBRS, Moody's and S&P, and if our ratings were downgraded TransCanada's financing costs and future debt issuances could be unfavorably impacted. A description of the rating agencies' credit ratings listed in the table above is set out below.
DBRS
DBRS has different rating scales for short- and long-term debt and preferred shares. High or low grades are used to indicate the relative standing within all rating categories other than AAA and D. The absence of either a high or low designation indicates the rating is in the middle of the category. The R-1 (low) rating assigned to TCPL's short-term debt is in the third highest of ten rating categories and indicates good credit quality. The capacity for payment of short-term financial obligations as they fall due is substantial. The overall strength is not as favourable as higher rating categories and may be vulnerable to future events, but any qualifying negative factors that exist are considered manageable. The A rating assigned to TCPL's senior unsecured debt is in the third highest of ten categories for long-term debt. Long-term debt rated A is good credit quality. The capacity for the payment of interest and principal is substantial, but of lesser credit quality than that of AA rated securities. Long term debt rated A may be vulnerable to future events but qualifying negative factors are considered manageable. The BBB (high) rating assigned to junior subordinated notes is in the fourth highest of the ten categories for long-term debt. Long-term debt rated BBB is of adequate credit quality. The capacity for the payment of interest and principal is considered acceptable, but it may be vulnerable to future events. The Pfd-2 (low) rating assigned to TCPL's and TransCanada's preferred shares is in the second highest of six rating categories for preferred shares. Preferred shares rated Pfd-2 are of satisfactory credit quality. Protection of dividends and principal is still substantial; however, earnings, the balance sheet and coverage ratios are not as strong as Pfd-1 rated companies. In general, Pfd-2 ratings correspond with companies whose long-term debt is rated in the A category.
MOODY'S
Moody's has different rating scales for short- and long-term obligations. Numerical modifiers 1, 2 and 3 are applied to each rating classification from Aa through Caa, with 1 being the highest and 3 being the lowest. The A3 rating assigned to TCPL's senior unsecured debt is in the third highest of nine rating categories for long-term obligations. Obligations rated A are considered upper medium grade and are subject to low credit risk. The Baa1 and Baa2 ratings assigned to TCPL's junior subordinated debt and preferred shares, respectively, are in the fourth highest of nine rating categories for long-term obligations, with the junior subordinated debt ranking slightly higher within the Baa rating category with a modifier of 1 as opposed to the modifier of 2 on the preferred shares. Obligations rated Baa are subject to moderate credit risk, are considered medium-grade, and as such, may possess certain speculative characteristics.
2012 Annual information form -- 23
S&P
S&P has different rating scales for short- and long-term obligations. Ratings from AA through CCC may be modified by the addition of a plus (+) or minus (-) sign to show the relative standing within a particular rating category. The A- rating assigned to TCPL's senior unsecured debt is in the third highest of ten rating categories for long-term obligations. An A rating indicates the obligor's capacity to meet its financial commitment is strong; however, the obligation is slightly more susceptible to the adverse effects of changes in circumstances and economic conditions than obligations in higher rated categories. As guarantor of a U.S. subsidiary's commercial paper program, TCPL has been assigned a commercial paper rating of A-2 which is the second highest of eight rating categories for short-term debt obligations. A short term debt rated A-2 is somewhat more susceptible to adverse effects of changes in economic conditions than higher rated categories; however, the capacity to meet all financial commitments remains satisfactory. The BBB and P-2 ratings assigned to TCPL's junior subordinated notes and TCPL's and TransCanada's preferred shares exhibits adequate protection parameters. However, adverse economic conditions or changing circumstances are more likely to lead to a weakened capacity of the obligor to meet its financial commitment on the obligation.
Market for securities
TransCanada holds all of the common shares of TCPL and these are not listed on a public market. During 2012 and 2013 to date, 13,663,868 common shares of TCPL were issued to TransCanada as set out in the following table:
| Date | Number of TCPL Common Shares | Price per TCPL Common Share | Aggregate Issuance Price | |||
| January 30, 2012 | 6,509,161 | $41.48 | $269,000,000 | |||
| January 17, 2013 | 7,154,707 | $48.22 | $345,000,000 | |||
TransCanada's common shares are listed on the Toronto Stock Exchange (TSX) and the New York Stock Exchange (NYSE) under the symbol TRP. TransCanada's cumulative redeemable first preferred shares, series 1, 3 and 5 have been listed for trading on the TSX since September 30, 2009, March 11, 2010 and June 29, 2010, under the symbols TRP.PR.A, TRP.PR.B, and TRP.PR.C, respectively. The following tables set out the reported monthly high, low, and month-end closing trading prices and monthly trading volumes of the common shares of TransCanada on the TSX and the NYSE, and the respective series 1, 3, and 5 preferred shares on the TSX, for the period indicated:
COMMON SHARES
| TSX (TRP) | NYSE (TRP) | |||||||||||||||
| Month | High ($) | Low ($) | Close ($) | Volume Traded | High (US$) | Low (US$) | Close (US$) | Volume Traded | ||||||||
| December 2012 | $47.44 | $45.30 | $47.02 | 22,542,514 | $47.78 | $45.69 | $47.32 | 8,599,319 | ||||||||
| November 2012 | $45.98 | $43.64 | $45.98 | 20,383,391 | $46.13 | $43.56 | $45.99 | 6,643,142 | ||||||||
| October 2012 | $45.45 | $43.16 | $44.97 | 23,049,914 | $46.58 | $43.54 | $45.23 | 4,749,881 | ||||||||
| September 2012 | $45.61 | $44.26 | $44.74 | 23,361,386 | $47.02 | $44.27 | $45.50 | 4,531,523 | ||||||||
| August 2012 | $46.29 | $44.36 | $44.40 | 25,112,761 | $46.76 | $44.84 | $45.07 | 7,970,340 | ||||||||
| July 2012 | $46.00 | $42.73 | $45.67 | 30,066,257 | $45.90 | $41.68 | $45.45 | 7,591,231 | ||||||||
| June 2012 | $43.30 | $41.47 | $42.67 | 27,804,268 | $42.56 | $39.87 | $41.90 | 8,808,940 | ||||||||
| May 2012 | $43.55 | $41.78 | $42.33 | 24,869,200 | $44.20 | $40.35 | $40.92 | 10,263,574 | ||||||||
| April 2012 | $43.80 | $42.10 | $43.46 | 26,627,021 | $44.50 | $41.93 | $43.98 | 10,157,804 | ||||||||
| March 2012 | $44.60 | $42.31 | $42.83 | 30,474,321 | $45.07 | $42.38 | $43.00 | 14,759,355 | ||||||||
| February 2012 | $43.69 | $41.02 | $43.57 | 27,988,166 | $44.21 | $41.13 | $43.98 | 10,105,156 | ||||||||
| January 2012 | $44.75 | $40.34 | $41.25 | 36,915,568 | $44.28 | $39.74 | $41.05 | 14,839,199 | ||||||||
24 -- TransCanada PipeLines Limited
SERIES 1 PREFERRED SHARES
| TSX (TRP.PR.A) | ||||||||
| Month | High ($) | Low ($) | Close ($) | Volume Traded | ||||
| December 2012 | $25.75 | $25.25 | $25.69 | 251,155 | ||||
| November 2012 | $25.70 | $25.21 | $25.33 | 345,144 | ||||
| October 2012 | $25.85 | $25.41 | $25.50 | 214,250 | ||||
| September 2012 | $25.95 | $25.46 | $25.81 | 94,025 | ||||
| August 2012 | $26.15 | $25.64 | $25.77 | 183,141 | ||||
| July 2012 | $26.03 | $25.50 | $25.80 | 103,746 | ||||
| June 2012 | $25.82 | $25.26 | $25.70 | 217,717 | ||||
| May 2012 | $26.24 | $25.40 | $25.50 | 203,126 | ||||
| April 2012 | $26.22 | $25.80 | $26.18 | 814,719 | ||||
| March 2012 | $26.46 | $25.60 | $25.80 | 173,582 | ||||
| February 2012 | $27.19 | $26.15 | $26.20 | 202,767 | ||||
| January 2012 | $27.17 | $26.15 | $26.57 | 352,329 | ||||
SERIES 3 PREFERRED SHARES
| TSX (TRP.PR.B) | ||||||||
| Month | High ($) | Low ($) | Close ($) | Volume Traded | ||||
| December 2012 | $24.47 | $24.14 | $24.43 | 321,065 | ||||
| November 2012 | $24.97 | $24.15 | $24.23 | 309,882 | ||||
| October 2012 | $25.10 | $24.82 | $24.96 | 423,217 | ||||
| September 2012 | $25.36 | $24.79 | $24.90 | 493,093 | ||||
| August 2012 | $25.69 | $25.20 | $25.33 | 110,019 | ||||
| July 2012 | $25.60 | $25.05 | $25.39 | 235,273 | ||||
| June 2012 | $25.25 | $24.96 | $25.12 | 384,867 | ||||
| May 2012 | $25.69 | $25.05 | $25.20 | 205,547 | ||||
| April 2012 | $25.66 | $25.30 | $25.43 | 543,553 | ||||
| March 2012 | $25.58 | $25.00 | $25.35 | 274,498 | ||||
| February 2012 | $26.15 | $25.35 | $25.36 | 407,748 | ||||
| January 2012 | $25.79 | $25.25 | $25.63 | 459,012 | ||||
2012 Annual information form -- 25
SERIES 5 PREFERRED SHARES
| TSX (TRP.PR.C) | ||||||||
| Month | High ($) | Low ($) | Close ($) | Volume Traded | ||||
| December 2012 | $26.07 | $25.61 | $25.95 | 156,765 | ||||
| November 2012 | $25.80 | $25.36 | $25.59 | 172,451 | ||||
| October 2012 | $25.64 | $25.30 | $25.43 | 217,288 | ||||
| September 2012 | $25.97 | $25.26 | $25.40 | 105,706 | ||||
| August 2012 | $25.98 | $25.59 | $25.85 | 212,511 | ||||
| July 2012 | $25.93 | $25.35 | $25.59 | 207,273 | ||||
| June 2012 | $25.80 | $25.39 | $25.48 | 136,967 | ||||
| May 2012 | $26.29 | $25.55 | $25.65 | 235,317 | ||||
| April 2012 | $25.94 | $25.43 | $25.80 | 286,584 | ||||
| March 2012 | $26.10 | $25.40 | $25.54 | 143,516 | ||||
| February 2012 | $26.60 | $25.69 | $25.99 | 118,814 | ||||
| January 2012 | $26.35 | $25.60 | $25.91 | 276,704 | ||||
In addition, the Series U preferred shares and Series Y preferred shares are listed on the TSX under the symbols TCA.PR.X, and TCA.PR.Y, respectively. The following table sets forth the reported monthly high and low trading prices and monthly trading volumes of the Series U preferred shares and the Series Y preferred shares.
SERIES U PREFERRED SHARES AND SERIES Y PREFERRED SHARES
| Series U (TCA.PR.X) | Series Y (TCA.PR.Y) | |||||||||||||||
| Month | High ($) | Low ($) | Close ($) | Volume Traded | High ($) | Low ($) | Close ($) | Volume Traded | ||||||||
| December 2012 | $52.40 | $51.51 | $51.70 | 35,283 | $52.90 | $52.06 | $52.32 | 33,641 | ||||||||
| November 2012 | $51.90 | $51.36 | $51.85 | 16,882 | $52.75 | $51.95 | $52.75 | 82,157 | ||||||||
| October 2012 | $51.93 | $51.32 | $51.75 | 32,824 | $52.25 | $51.75 | $51.90 | 24,895 | ||||||||
| September 2012 | $51.95 | $51.10 | $51.38 | 39,327 | $52.30 | $51.60 | $51.87 | 87,699 | ||||||||
| August 2012 | $51.42 | $50.82 | $51.19 | 22,125 | $51.80 | $51.15 | $51.60 | 44,849 | ||||||||
| July 2012 | $51.20 | $50.66 | $51.00 | 75,880 | $51.70 | $50.75 | $51.15 | 113,133 | ||||||||
| June 2012 | $52.35 | $50.00 | $50.55 | 29,642 | $52.47 | $51.26 | $51.35 | 36,612 | ||||||||
| May 2012 | $52.70 | $51.00 | $52.08 | 34,443 | $52.70 | $51.25 | $51.80 | 20,501 | ||||||||
| April 2012 | $52.41 | $52.05 | $52.20 | 31,752 | $53.25 | $52.00 | $52.21 | 16,090 | ||||||||
| March 2012 | $52.80 | $52.00 | $52.25 | 50,961 | $52.98 | $51.85 | $51.90 | 26,498 | ||||||||
| February 2012 | $52.80 | $52.00 | $52.80 | 60,574 | $52.75 | $52.06 | $52.50 | 79,172 | ||||||||
| January 2012 | $53.25 | $52.00 | $52.06 | 372,076 | $53.34 | $51.51 | $52.11 | 276,505 | ||||||||
26 -- TransCanada PipeLines Limited
As of February 11, 2013, the directors and officers of TransCanada as a group beneficially owned, or exercised control or direction, directly or indirectly, over an aggregate of 405,905 common shares of TransCanada. This constitutes less than one per cent of TransCanada's common shares. The Company collects this information from our directors and officers but otherwise we have no direct knowledge of individual holdings of TransCanada's securities.
DIRECTORS
The following table sets forth the names of the directors who serve on the Board, as of February 11, 2013 (unless otherwise indicated), together with their jurisdictions of residence, all positions and offices held by them with TransCanada, their principal occupations or employment during the past five years and the year from which each director has continually served as a director of TransCanada and, prior to the arrangement, with TCPL. Positions and offices held with TCPL are also held by such person at TransCanada. Each director holds office until the next annual meeting or until his or her successor is earlier elected or appointed.
| Name and place of residence | Principal occupation during the five preceding years | Director since | ||
| Kevin E. Benson DeWinton, Alberta Canada | Corporate director. Director, Calgary Airport Authority. President and Chief Executive Officer, Laidlaw International, Inc. (transportation services) from June 2003 to October 2007. | 2005 | ||
| Derek H. Burney(1), O.C. Ottawa, Ontario Canada | Senior strategic advisor at Norton Rose Canada LLP (law firm). Director, Paradigm Capital Inc. Advisory Board. Chair, Canwest Global Communications Corp. (communications) from August 2006 (director since April 2005) to October 2010. | 2005 | ||
| E. Linn Draper Lampasas, Texas U.S. | Corporate director. Director, Alliance Data Systems Corporation (data processing and services) and Alpha Natural Resources, Inc. (mining). Chair, NorthWestern Corporation (conducting business as NorthWestern Energy) (oil and gas). | 2005 | ||
| The Hon. Paule Gauthier, P.C., O.C., O.Q., Q.C. Québec, Québec Canada | Senior Partner, Stein Monast L.L.P. (law firm). Director, Metro Inc., Royal Bank of Canada and the Fondation du Musée national des beaux-arts du Québec. Director, Institut Québecois des Hautes Études Internationales, Laval University from August 2002 to June 2009, RBC Dexia Investors Trust until October 2011 and Care Canada from October 2010 to December 2011. | 2002 | ||
| Russell K. Girling Calgary, Alberta Canada | President and Chief Executive Officer, TransCanada since July 2010. Chief Operating Officer from July 2009 to June 2010 and President, Pipelines from June 2006 to June 2010. Director, Agrium Inc. | 2010 | ||
| S. Barry Jackson Calgary, Alberta Canada | Corporate director. Chair of the Board, TransCanada since April 2005. Chair, Nexen Inc. (oil and gas) and director, Laricina Energy Ltd. and WestJet Airlines Ltd. Director, Cordero Energy Inc. from April 2005 to September 2008. | 2002 | ||
| Paul L. Joskow New York, New York U.S. | Economist and President of the Alfred P. Sloan Foundation. Professor of Economics, Emeritus, Massachusetts Institute of Technology (MIT). Director, Exelon Corporation (energy), and a trustee of Putnam Mutual Funds. | 2004 | ||
| John A. MacNaughton(2)(3) C.M. Toronto, Ontario Canada | Corporate director. Chair, Business Development Bank of Canada from August 2007 to December 2012 and the Independent Nominating Committee of the Canada Employment Insurance Financing Board from July 2008 to January 2013. Member of the Prime Minister's Advisory Committee on the Public Service from May 2010 to January 2013. Chair, CNSX Markets Inc. (formerly the Canadian Trading and Quotation System Inc.) (stock exchange) from February 2006 to July 2010. Director, Nortel Networks Corporation and Nortel Networks Limited (the principal operating subsidiary of Nortel Networks Corporation) (technology) from June 2005 to September 2010. | 2006 | ||
| Paula Rosput Reynolds Seattle, Washington U.S. | President and Chief Executive Officer of PreferWest, LLC (business advisory group). Director, Anadarko Petroleum Corporation, Delta Air Lines, Inc. and BAE Systems plc. Vice Chair and Chief Restructuring Officer, American International Group Inc. (insurance and financial services) from October 2008 to September 2009. President and Chief Executive Officer, Safeco Corporation (insurance) from January 2006 to February 2008. | 2011 | ||
| Mary Pat Salomone(4)(5) Charlotte, North Carolina, U.S. | Senior Vice-President & Chief Operating Officer of The Babcock & Wilcox Company. Manager of Business Development from 2009 to 2010 and Manager of Strategic Acquisitions from 2008 to 2009, Babcock & Wilcox Nuclear Operations Group, Inc. Director, United States Enrichment Corporation from December 2011 to October 2012. | 2013 | ||
28 -- TransCanada PipeLines Limited
| Name and place of residence | Principal occupation during the five preceding years | Director since | ||
| W. Thomas Stephens(6) Greenwood Village, Colorado U.S. | Corporate director. Trustee, Putnam Mutual Funds. Chair and Chief Executive Officer, Boise Cascade, LLC (paper, forest products and timberland assets) from November 2004 to November 2008. Director, Boise Inc. from February 2008 to April 2010. | 2007(4) | ||
| D. Michael G. Stewart Calgary, Alberta Canada | Corporate director. Director, Canadian Energy Services & Technology Corp. (oil and gas) and Pengrowth Energy Corporation (oil & gas). Director, C&C Energia Ltd. from May 2010 to December 2012 and Orleans Energy Ltd. (oil & gas) from October 2008 to December 2010. Director, Pengrowth Corporation (the administrator of Pengrowth Energy Trust) from October 2006 to December 2010. Director, Canadian Energy Services Inc. (the general partner of Canadian Energy Services L.P.) from January 2006 to December 2009. | 2006 | ||
| Richard E. Waugh Toronto, Ontario Canada | Chief Executive Officer and director of The Bank of Nova Scotia (Scotiabank). Director Catalyst Inc. and Chair, Catalyst Canada Advisory Board. Director and President, International Monetary Conference. Vice-Chair, the Institute of International Finance. | 2012 | ||
- (1)
- Canwest Global Communications Corp. (Canwest) voluntarily entered into theCompanies' Creditors Arrangement Act (CCAA) and obtained an order from the Ontario Superior Court of Justice (Commercial Division) to start proceedings on October 6, 2009. Although no cease trade orders were issued, Canwest shares were de-listed by the TSX after the filing and started trading on the TSX Venture Exchange. Canwest emerged from CCAA protection, and Postmedia Network acquired its newspaper business on July 13, 2010 while Shaw Communications Inc. acquired its broadcast media business on October 27, 2010. Mr. Burney ceased to be a director of Canwest on October 27, 2010.
- (2)
- Nortel Networks Limited was the principal operating subsidiary of Nortel Networks Corporation (collectively referred to as Nortel). Mr. MacNaughton became a director of Nortel on June 29, 2005. Nortel was subject to a management cease trade order on April 10, 2006 issued by the Ontario Securities Commission (OSC) and other provincial securities regulators. The cease trade order related to a delay in filing some of Nortel's 2005 financial statements. The order was revoked by the OSC on June 8, 2006, and the other provincial securities regulators shortly after. On January 14, 2009, Nortel and some of its Canadian subsidiaries filed for creditor protection under CCAA.
- (3)
- Mr. MacNaughton resigned from the Board effective January 9, 2013.
- (4)
- Ms. Salomone joined the Board effective February 12, 2013.
- (5)
- Ms. Salomone was a director of Crucible Materials Corp. (Crucible) from May 2008 through May 1, 2009. On May 6, 2009, Crucible and one of its affiliates filed voluntary petitions for relief under Chapter 11 of the United States Bankruptcy Code in the U.S. Bankruptcy Court for the District of Delaware (the Bankruptcy Court). On August 26, 2010, the Bankruptcy Court entered an order confirming Crucible's Second Amended Chapter 11 Plan of Liquidation.
- (6)
- Mr. Stephens previously served on the Board from 2000 to 2005.
BOARD COMMITTEES
TransCanada has four committees of the Board: the Audit committee, the Governance committee, the Health, Safety and Environment committee and the Human Resources committee. The voting members of each of these committees, as of February 11, 2013, are identified below. Mr. MacNaughton was the Chair of the Governance committee and a member of the Audit committee until the date of his resignation effective January 9, 2013. Mr. Burney was appointed as the Chair of the Governance committee effective February 11, 2013.
| Director | Audit committee | Governance committee | Health, Safety and Environment committee | Human Resources committee | ||||
| Kevin E. Benson | Chair | ü | ||||||
| Derek H. Burney | ü | Chair | ||||||
| E. Linn Draper | Chair | ü | ||||||
| Paule Gauthier | ü | ü | ||||||
| S. Barry Jackson | ü | ü | ||||||
| Paul L. Joskow | ü | ü | ||||||
| Paula Rosput Reynolds | ü | ü | ||||||
| W. Thomas Stephens | ü | Chair | ||||||
| D. Michael G. Stewart | ü | ü | ||||||
| Richard E. Waugh | ü | |||||||
The respective charters of the Audit, Governance, Health, Safety and Environment and Human Resources committees can be found on our website (www.transcanada.com) underCorporate governance – Board committees. Information about the Audit committee can be found in this AIF under the headingAudit committee.
2012 Annual information form -- 29
OFFICERS
All of the executive officers and corporate officers of TCPL reside in Calgary, Alberta, Canada, with the exception of Mr. Hobbs who resides in Houston, Texas, U.S. References to positions and offices held with TCPL are also held by such person at TransCanada. As of the date hereof, the officers of TCPL, their present positions within TCPL and their principal occupations during the five preceding years are as follows:
Executive officers
| Name | Present position held | Principal occupation during the five preceding years | ||
| Russell K. Girling | President and Chief Executive Officer | Prior to July 2010, Chief Operating Officer since July 2009 and President, Pipelines since June 2006. | ||
| Wendy L. Hanrahan | Executive Vice-President, Corporate Services | Prior to May 2011, Vice-President, Human Resources since January 2005. | ||
| Karl R. Johannson | Executive Vice-President and President, Natural Gas Pipelines | Senior Vice-President, Canadian and Eastern U.S. Pipelines from January 2011 to October 2012. Senior Vice-President, Power Commercial from January 2006 to December 2010. | ||
| Gregory A. Lohnes(1) | Executive Vice-President, Operations and Major Projects | Prior to November 2012, Executive Vice-President and President, Natural Gas Pipelines. Prior to July 2010, Executive Vice-President and Chief Financial Officer since June 2006. | ||
| Donald R. Marchand | Executive Vice-President and Chief Financial Officer | Prior to July 2010, Vice-President, Finance and Treasurer since September 1999. | ||
| Dennis J. McConaghy | Executive Vice-President, Corporate Development | Prior to July 2010, Executive Vice-President, Pipeline Strategy and Development. | ||
| Sean McMaster | Executive Vice-President, Stakeholder Relations and General Counsel and Chief Compliance Officer | Prior to February 2012, Executive Vice-President, Corporate and General Counsel and Chief Compliance Officer. | ||
| Alexander J. Pourbaix | President, Energy and Oil Pipelines | President, Energy from July 2006 to July 2010 and Executive Vice-President, Corporate Development from July 2009 to July 2010. | ||
- (1)
- Mr. Lohnes has held the position of Executive Vice-President, Operations and Major Projects since November 2012, upon the retirement of Mr. Donald Wishart who held the position since July 2009.
Corporate officers
| Name | Present position held | Principal occupation during the five preceding years | ||
| Sean M. Brett | Vice-President and Treasurer | Prior to July 2010, Vice-President, Commercial Operations of TC PipeLines GP, Inc., and Director, LP Operations of TCPL. Prior to December 2009, Director, Joint Venture Management, Keystone Pipeline Project of TCPL. Prior to December 2008, Vice-President and Treasurer of TC PipeLines GP, Inc. | ||
| Ronald L. Cook | Vice-President, Taxation | Vice-President, Taxation since April 2002. | ||
| Lee G. Hobbs | President, U.S. Natural Gas Pipelines | Senior Vice-President and General Manager, U.S. Pipelines, Pipelines Division, TCPL, June 2009 to July 2010. Vice-President and General Manager, U.S. Pipelines Central, Pipelines Division, TCPL, March 2007 to June 2009. | ||
| Joel E. Hunter | Vice-President, Finance | Director, Corporate Finance, January 2008 to July 2010. | ||
| Christine R. Johnston(1) | Vice-President and Corporate Secretary | Vice-President, Finance Law from January 2010 to March 2012. Vice-President, Corporate Development Law from September 2009 to December 2009. Associate General Counsel, Corporate Development and Finance Law from September 2005 to September 2009. | ||
| Garry E. Lamb | Vice-President, Risk Management | Vice-President, Risk Management since October 2001. | ||
| G. Glenn Menuz | Vice-President and Controller | Vice-President and Controller since June 2006. | ||
- (1)
- Ms. Johnston has held the position of Vice-President and Corporate Secretary since March 2012, upon the retirement of Mr. Donald DeGrandis who had held the position of Corporate Secretary since June 2006.
30 -- TransCanada PipeLines Limited
CONFLICTS OF INTEREST
Directors and officers of TransCanada and its subsidiaries are required to disclose any existing or potential conflicts in accordance with TransCanada policies governing directors and officers and in accordance with the CBCA. The Board believes that it is important for it to be composed of qualified and knowledgeable directors. As a result, due to the specialized nature of the energy infrastructure business, some of the nominated directors are associated with or sit on the boards of companies that ship natural gas or crude oil through our pipeline systems. Transmission services on most of TransCanada's pipeline systems in Canada and the U.S. are subject to regulation and accordingly we generally cannot deny transportation services to a creditworthy shipper. The Governance committee monitors relationships among directors to ensure that business associations do not affect the Board's performance. If a director declares that they have an interest in a material contract or transaction that is being considered by the Board, the director leaves the meeting so the matter can be discussed and voted on.
Corporate governance
Information about TCPL's corporate governance, including the Company's Board committees and their charters, can be found on our website (www.transcanada.com) under the headingCorporate Governance and atSchedule B to this AIF, which is excerpted from TransCanada's Management Information Circular dated February 11, 2013 (TransCanada's Information Circular).
Audit committee
The Audit committee is responsible for assisting the Board in overseeing the integrity of our financial statements and our compliance with legal and regulatory requirements. It is also responsible for overseeing and monitoring the internal accounting and reporting process and the process, performance and independence of our internal and external auditors. The charter of the Audit committee can be found inSchedule C of this AIF and on our website (www.transcanada.com) under theCorporate Governance – Board committees page.
RELEVANT EDUCATION AND EXPERIENCE OF MEMBERS
The members of the Audit committee as of February 11, 2013 are Kevin E. Benson (Chair), Derek H. Burney, Paul L. Joskow, and D. Michael G. Stewart. Mr. Draper was a member of the Audit committee from May 1, 2009 to April 26, 2012 and became a member of the Human Resources committee effective April 27, 2012. Mr. MacNaughton was a member of the Audit committee from May 1, 2009 to January 9, 2013, the effective date of his retirement as a director of TCPL. Richard E. Waugh attends the Audit committee meetings as an observer and does not vote on any matters.
The Board believes that the composition of the Audit committee reflects a high level of financial literacy and expertise. Each member of the Audit committee has been determined by the Board to be independent and financially literate within the meaning of the definitions under Canadian and U.S. securities laws and the NYSE rules. In addition, the Board has determined that Mr. Benson is an Audit Committee Financial Expert as that term is defined under U.S. securities laws. The Board has made these determinations based on the education and breadth and depth of experience of each member of the Audit committee. The following is a description of the education and experience, apart from their respective roles as directors of TransCanada, of each member of the Audit committee that is relevant to the performance of his responsibilities as a member of the Audit committee.
Kevin E. Benson
Mr. Benson is a Chartered Accountant (South Africa) and was a member of the South African Society of Chartered Accountants. Mr. Benson was the President and Chief Executive Officer of Laidlaw International, Inc. until October 2007. In prior years, he has held several executive positions including one as President and Chief Executive Officer of The Insurance Corporation of British Columbia and has served on other public company boards and on the audit committees of certain of those boards.
Derek H. Burney
Mr. Burney earned a Bachelor of Arts (Honours) and Master of Arts from Queen's University. He is currently a senior strategic advisor at Norton Rose Canada LLP. Mr. Burney previously served as President and Chief Executive Officer of CAE Inc. and as Chair and Chief Executive Officer of Bell Canada International Inc. Mr. Burney was the lead director at Shell Canada Limited until May 2007 and was the Chair of Canwest Global Communications Corp. until October 2010. He has served on one other organization's audit committee, and has participated in Financial Reporting Standards Training offered by KPMG.
2012 Annual information form -- 31
E. Linn Draper
Dr. Draper holds a Bachelor of Science in Chemical Engineering from Rice University and a Ph.D. in Nuclear Science and Engineering from Cornell University. Dr. Draper was Chair, President and Chief Executive Officer of American Electric Power Co., Inc. until 2004. He previously served as Chair, President and Chief Executive Officer of Gulf States Utilities Company. Dr. Draper has served and continues to serve on several other public company boards.
Paul L. Joskow
Mr. Joskow earned a Bachelor of Arts with Distinction in Economics from Cornell University, a Masters of Philosophy in Economics from Yale University, and a Ph.D. in Economics from Yale University. He is currently the President of the Alfred P. Sloan Foundation and a Professor of Economics, Emeritus, at MIT. He has served on the boards of several public companies and other organizations and on the audit committees of most of those boards, including serving as a trustee of Putnam Mutual Funds since October 1997, where he served as the Chair of the audit committee from November 2002 until December 2005.
John A. MacNaughton
Mr. MacNaughton earned a Bachelor of Arts in Economics from the University of Western Ontario. During his term as a member of TransCanada's Audit committee, Mr. MacNaughton was the Chair of the Business Development Bank of Canada. He was Chair of CNSX Markets Inc. (formerly Canadian Trading and Quotation System Inc.) until July 2010. In prior years, Mr. MacNaughton held several executive positions including founding President and Chief Executive Officer of the Canadian Pension Plan Investment Board and President of Nesbitt Burns Inc. He has served on the audit committee of other public companies.
D. Michael G. Stewart
Mr. Stewart earned a Bachelor of Science (Honours) in Geological Science from Queen's University. Mr. Stewart has served and continues to serve on the boards of several public companies and other organizations and on the audit committees of certain of those boards. Mr. Stewart held a number of senior executive positions with Westcoast Energy Inc. including Executive Vice-President, Business Development. He has been active in the Canadian energy industry for over 39 years.
PRE-APPROVAL POLICIES AND PROCEDURES
TCPL's Audit committee has adopted a pre-approval policy with respect to permitted non-audit services. Under the policy, the Audit committee has granted pre-approval for specified non-audit services. For engagements of up to $250,000, approval of the Audit committee Chair is required, and the Audit committee is to be informed of the engagement at the next scheduled Audit committee meeting. For all engagements of $250,000 or more, pre-approval of the Audit committee is required. In all cases, regardless of the dollar amount involved, where there is a potential for conflict of interest involving the external auditor to arise on an engagement, the Audit committee must pre-approve the assignment.
To date, TCPL has not approved any non-audit services on the basis of the de-minimus exemptions. All non-audit services have been pre-approved by the Audit committee in accordance with the pre-approval policy described above.
EXTERNAL AUDITOR SERVICE FEES
The table below shows the services KPMG provided during the last two fiscal years and the fees we paid them:
| ($ millions) | 2012 | 2011 | ||
| Audit fees • audit of the annual consolidated financial statements • services related to statutory and regulatory filings or engagements • review of interim consolidated financial statements and information contained in various prospectuses and other offering documents | $5.7 | $6.9 | ||
| Audit-related fees • services related to the audit of the financial statements of certain TransCanada post-retirement and post-employment plans | 0.1 | 0.2 | ||
| Tax fees • Canadian and international tax planning and tax compliance matters, including the review of income tax returns and other tax filings | 0.5 | 0.4 | ||
| All other fees • review of information system design procedures • services related to vendor analytics and environmental compliance credits | 0.6 | 0.1 | ||
| Total fees | $6.9 | $7.6 | ||
32 -- TransCanada PipeLines Limited
Loans to directors and executive officers
As of the date of this AIF, none of our directors and executives had any loans from TransCanada or any of our subsidiaries. This is also true for:
- •
- former executives or directors of TransCanada or any of our subsidiaries
- •
- this year's nominated directors, and
- •
- any associate of a director, executive officer or nominated director.
None of the above owe money to another entity that is the subject of a guarantee, support agreement, letter of credit or other similar arrangement or understanding provided by TransCanada or any of our subsidiaries.
Securities owned by directors
The table below shows: the total value as of February 11, 2013 of each director's shares and deferred share units (DSUs) or shares of our affiliates outstanding at the end of 2012, including the DSUs credited as dividend equivalents until January 31, 2013.
None of the nominated directors (or all of our directors and executives as a group) own more than 1% of TransCanada shares, or any class of shares of its subsidiaries and affiliates.
| Director | TransCanada Common Shares | Deferred Share Units | ||
| K. Benson | 13,000 | 46,694 | ||
| D. Burney | 5,790 | 38,109 | ||
| E.L. Draper | — | 47,835 | ||
| P. Gauthier | 2,000 | 49,267 | ||
| R. Girling | 794,979 | — | ||
| S.B. Jackson | 39,000 | 90,148 | ||
| P.L. Joskow | 5,000 | 28,949 | ||
| J. MacNaughton | 50,000 | 35,712 | ||
| P. Rosput Reynolds | 2,500 | 3,653 | ||
| M.P. Salomone | — | — | ||
| W. T. Stephens | 1,800 | 17,745 | ||
| D.M.G. Stewart | 14,339 | 18,858 | ||
| R.E. Waugh | 29,150 | 4,043 | ||
Notes
- •
- Refer to theCompensation of directors section below for further information regarding the compensation of TransCanada's directors.
- •
- Mr. Girling is an employee of TCPL and participates in the Company's executive share unit program. He does not participate in the DSU program. Securities owned, controlled or directed include common shares that Mr. Girling has a right to acquire through exercise of stock options that are vested under the stock option plan, which is described inSchedule D to this AIF under the headingCompensation — Executive compensation. Directors as such do not participate in the stock option plan. Mr. Girling, as an employee of TCPL, has the right to acquire 699,294 common shares under vested stock options, which amount is included in this chart.
- •
- Mr. Girling's holdings include 4,000 shares held by his wife.
- •
- Mr. Stewart's holdings include 1,853 shares held by his wife.
- •
- Mr. Waugh's holdings include 4,150 shares held by his wife.
Compensation of directors
Information relating to the compensation of directors, including information regarding compensation paid by TCPL to directors in 2012, the Company's minimum share ownership guidelines and TCPL's share unit plan for non-employee directors, is provided inSchedule D to this AIF under the headingCompensation – Director compensation, which is excerpted from TransCanada's Information Circular.
2012 Annual information form -- 33
Executive compensation
Information relating to TCPL's compensation governance is provided inSchedule D to this AIF under the headingCompensation – Compensation governance, which is excerpted from TransCanada's Information Circular. Information relating to TCPL's executive compensation is provided inSchedule D to this AIF under the headingCompensation – Executive compensation, which is excerpted from TransCanada's Information Circular. Board and committee meetings of TransCanada and TCPL run concurrently. TCPL is the principal operating subsidiary of TransCanada.
Executive officers of TCPL also serve as executive officers of TransCanada. An aggregate remuneration is paid for serving as an executive of TCPL and for service as an executive officer of TransCanada. Since TransCanada does not hold any material assets directly other than the common shares of TCPL and receivables from certain of TransCanada's subsidiaries, all executive employee costs are assumed by TCPL according to a management services agreement between the two companies.
Legal proceedings and regulatory actions
TCPL and its subsidiaries are subject to various legal proceedings and regulatory actions arising in the normal course of business. While the final outcomes of such legal proceedings and regulatory actions cannot be predicted with certainty and there can be no assurance that such matters will be resolved in TCPL favour, it is the opinion of TCPL's management that the resolution of such proceedings and regulatory actions will not have a material impact on TCPL's consolidated financial position, results of operations or liquidity. We are not aware of any potential legal proceeding or action that would have a material impact on our consolidated financial position, results of operations or liquidity.
The most significant this year were the TransAlta Sundance A claims, which were resolved through a binding arbitration process that resulted in a decision in July 2012. For further information regarding the Sundance A claims, refer to theGeneral developments of the business – Developments of the Energy business section of this AIF above and theEnergy – Significant events section of the MD&A, which section is incorporated by reference herein.
Transfer agent and registrar
TCPL's transfer agent and registrar is Computershare Trust Company of Canada with its Canadian transfer facilities in the cities of Vancouver, Calgary, Toronto, Halifax and Montréal.
Interest of experts
TCPL's auditors, KPMG LLP, have confirmed that they are independent within the meaning of the Rules of Professional Conduct of the Institute of Chartered Accountants of Alberta.
Additional information
- 1.
- Additional information in relation to TCPL may be found under TCPL's profile on SEDAR (www.sedar.com).
- 2.
- Additional financial information is provided in TCPL's audited consolidated financial statements and MD&A for its most recently completed financial year.
34 -- TransCanada PipeLines Limited
Units of measure
| Bbl/d | Barrel(s) per day | |
| Bcf | Billion cubic feet | |
| Bcf/d | Billion cubic feet per day | |
| GWh | Gigawatt hours | |
| MMcf/d | Million cubic feet per day | |
| MW | Megawatt(s) | |
| MWh | Megawatt hours |
General terms and terms related to our operations
| bitumen | A thick, heavy oil that must be diluted to flow (also see: diluent). One of the components of the oil sands, along with sand, water and clay. | |
| Canadian Restructuring Proposal | Canadian Mainline business and services restructuring proposal and 2012 and 2013 Mainline final tolls application | |
| cogeneration facilities | Facilities that produce both electricity and useful heat at the same time. | |
| diluent | A thinning agent made up of organic compounds. Used to dilute bitumen so it can be transported through pipelines. | |
| FIT | Feed-in tariff | |
| force majeure | Unforeseeable circumstances that prevent a party to a contract from fulfilling it. | |
| fracking | Hydraulic fracturing. A method of extracting natural gas from shale rock. | |
| GHG | Greenhouse gas | |
| HSE | Health, safety and environment | |
| LNG | Liquefied natural gas | |
| MET | Mitigation exemption tests | |
| OM&A | Operating, maintenance and administration | |
| PJM Interconnection area (PJM) | A regional transmission organization that coordinates the movement of wholesale electricity in all or parts of 13 states and the District of Columbia | |
| PPA | Power purchase arrangement | |
| WCSB | Western Canada Sedimentary Basin |
Accounting terms
| AFUDC | Allowance for funds used during construction | |
| AOCI | Accumulated other comprehensive (loss)/income | |
| ARO | Asset retirement obligations | |
| ASU | Accounting Standards Updatepension | |
| DRP | Dividend reinvestment plan | |
| EBIT | Earnings before interest and taxes | |
| EBITDA | Earnings before interest, taxes, depreciation and amortization | |
| FASB | Financial Accounting Standards Board (U.S.) | |
| OCI | Other comprehensive (loss)/income | |
| RRA | Rate-regulated accounting | |
| ROE | Rate of return on common equity | |
| U.S. GAAP | U.S. generally accepted accounting principles |
Government and regulatory bodies
| CFE | Comisión Federal de Electricidad (Mexico) | |
| CRE | Comisión Reguladora de Energia, or Energy Regulatory Commission (Mexico) | |
| DOS | Department of State (U.S.) | |
| FERC | Federal Energy Regulatory Commission (U.S.) | |
| IEA | International Energy Agency | |
| ISO | Independent System Operator | |
| LMCI | Land Matters Consultation Initiative (Canada) | |
| NDEQ | Nebraska Department of Environmental Quality (U.S.) | |
| NEB | National Energy Board (Canada) | |
| OPA | Ontario Power Authority (Canada) | |
| RGGI | Regional Greenhouse Gas Initiative (northeastern U.S.) | |
| SEC | U.S. Securities and Exchange Commission |
2012 Annual information form -- 35
Schedule A
Metric conversion table
The conversion factors set out below are approximate factors. To convert from Metric to Imperial multiply by the factor indicated. To convert from Imperial to Metric divide by the factor indicated.
| Metric | Imperial | Factor | ||
| Kilometres (km) | Miles | 0.62 | ||
| Millimetres | Inches | 0.04 | ||
| Gigajoules | Million British thermal units | 0.95 | ||
| Cubic metres* | Cubic feet | 35.3 | ||
| Kilopascals | Pounds per square inch | 0.15 | ||
| Degrees Celsius | Degrees Fahrenheit | to convert to Fahrenheit multiply by 1.8, then add 32 degrees; to convert to Celsius subtract 32 degrees, then divide by 1.8 | ||
- *
- The conversion is based on natural gas at a base pressure of 101.325 kilopascals and at a base temperature of 15 degrees Celsius.
36 -- TransCanada PipeLines Limited
Governance
We believe that strong governance improves corporate performance and benefits all stakeholders.
This section discusses our approach to governance and describes our Board and how it works.
WHERE TO FIND IT | ||||
> | About our governance practices | 28 | ||
Board characteristics | 29 | |||
Governance philosophy | 31 | |||
Role and responsibilities of the Board | 33 | |||
Orientation and education | 38 | |||
Board effectiveness | 39 | |||
Communicating with the Board | 42 | |||
Shareholder proposals | 42 | |||
Board committees | 42 | |||
About our governance practices
Our Board and management are committed to the highest standards of ethical conduct and corporate governance.
TransCanada is a public company listed on the TSX and the NYSE, and we recognize and respect rules and regulations in both Canada and the U.S.
Our corporate governance practices comply with the Canadian governance guidelines, which include the governance rules of the TSX and Canadian Securities Administrators (CSA):
- •
- National Instrument 52-110,Audit Committees
- •
- National Policy 58-201,Corporate Governance Guidelines, and
- •
- National Instrument 58-101,Disclosure of Corporate Governance Practices (NI 58-101).
We also comply with the governance listing standards of the NYSE and the governance rules of the U.S. Securities and Exchange Commission (SEC) that apply to foreign private issuers.
Our governance practices comply with the NYSE standards for U.S. companies in all significant respects, except as summarized on our website (www.transcanada.com). As a non-U.S. company, we are not required to comply with most of the governance listing standards of the NYSE. As a foreign private issuer, however, we must disclose how our governance practices differ from those followed by U.S. companies that are subject to the NYSE standards.
We benchmark our policies and procedures against major North American companies to assess our standards and we adopt best practices as appropriate. Some of our best practices are derived from the NYSE rules and comply with applicable rules adopted by the SEC to meet the requirements of theSarbanes-Oxley Act of 2002 and theDodd-Frank Wall Street Reform and Consumer Protection Act.
28 -- TransCanada PipeLines Limited
BOARD CHARACTERISTICS
Our Board and its members exemplify strong principles of corporate governance:
- •
- an independent, non-executive Chair
- •
- an effective board size
- •
- all directors but one are independent
- •
- knowledgeable and experienced directors who ensure that we promote ethical behaviour throughout TransCanada
- •
- qualified directors who can make a meaningful contribution to the Board and the development of our business
- •
- significant share ownership requirements to align the directors' interests with those of our shareholders, and
- •
- annual assessments of Board, committee and director effectiveness.
Size and composition
TransCanada's articles state that the Board must have 10 to 20 directors.
We believe our Board must consist of qualified and knowledgeable directors, and include directors with direct experience in the oil and gas, pipelines and power sectors.
Independence
An independent board is a fundamental principle of governance. We believe that the majority of our directors must beindependent within the meaning of 'independence' in NI 58-101, and consistent with the independence criteria of the regulations of the SEC and rules of the NYSE.
The Governance committee and the Board review the independence of each Board member and nominated director against these criteria once a year. It also reviews family relationships and possible associations with companies that have relationships with TransCanada when it reviews director independence.
The Board has determined that all of the nominated directors are independent, except for Mr. Girling because of his role as President and CEO. None of the directors have a direct or indirect material relationship with TransCanada that could reasonably be expected to interfere with the exercise of their independent judgment.
2012 Annual information form -- 29
Independent Chair
The Chair is appointed by the Board, and serves in a non-executive capacity. We have had separate Chair and CEO positions since our incorporation in 2003 and at our predecessor company since 1994. Mr. Jackson has served as the independent non-executive Chair since April 30, 2005.
In 2012, the independent directors met separately before and after every regularly scheduled Board meeting. All of the directors meet with management as required.
Independent advice
The Board and each of its four standing committees can retain independent advisors to assist it in carrying out its duties and responsibilities.
Serving on other boards
Our directors are limited to serving on a total of six public company boards to ensure we do not have overboarding or interlocking relationships that would conflict with a director's independence or interfere with fulfilling their Board duties and responsibilities. We discuss the time commitment and duties and responsibilities with every candidate so they have a full understanding of the role and our expectations of directors. The Governance committee monitors director relationships to ensure their business associations do not hinder their role as a TransCanada director or Board performance overall.
The Board believes that it is important for it to be composed of qualified and knowledgeable directors. As a result, due to the specialized nature of the energy infrastructure business, some of the nominated directors are associated with or sit on the boards of companies that ship natural gas or crude oil through our pipeline systems. Transmission services on most of TransCanada's pipeline systems in Canada and the U.S. are subject to regulation and accordingly we generally cannot deny transportation services to a creditworthy shipper. The Governance committee monitors relationships among directors to ensure that business associations do not affect the Board's performance.
If a director declares that they have an interest in a material contract or transaction that is being considered by the Board, the director leaves the meeting so the matter can be discussed and voted on.
See the director profiles starting on page 16 for the other public company boards each nominated director serves on.
Independent of management
Our Corporate governance guidelines stipulate that the Board must meet at the end of each Board meeting,in-camera, without management present. Our Board has adopted the policy of holding in-camera sessions at each meeting of the Board and committees without management.
30 -- TransCanada PipeLines Limited
GOVERNANCE PHILOSOPHY
We believe that effective Corporate governance improves corporate performance and benefits all shareholders and that honesty and integrity are vital to ensuring good corporate governance.
The Board has formally adopted the Corporate governance guidelines recommended by the Governance committee. These guidelines address the structure and composition of the Board and its committees, and clarify the responsibilities of the Board and management.
Ethical business conduct
Our Code of business ethics (the Code) incorporates principles of good conduct and ethical and responsible behaviour to guide our decisions and actions and the way we conduct business.
The Code applies to all employees, officers and directors as well as contract workers of TransCanada and its wholly-owned subsidiaries and operated entities in countries where we conduct business. All employees (including executive officers) and directors must certify their compliance with the Code every year.
Any unusual behaviour or suspected violations of the Code must be reported immediately. Employees can report a concern to their supervisor, Corporate compliance, Internal audit, their Compliance coordinator, or to our Ethics help-line. The help-line allows anyone – employees, contractors, consultants, other stakeholders and the general public – to report a concern, confidentially and anonymously, about any perceived accounting irregularities, legal or ethical violations or other suspected breaches of the Code. The telephone number is published on our website and employee intranet, in other employee communications and in our Annual report. Our policy strictly prohibits reprisals or retaliation against anyone who files an ethics concern or complaint in good faith.
Internal audit handles most investigations, including any concerns about directors and senior management. Human resources professionals handle any concerns relating to human resource matters such as harassment.
The Audit committee monitors compliance with the Code and reports any significant violations to the Board. The committee follows formal procedures for receiving and reviewing complaints, determining a course of action and retaining the information on file. It also oversees the operation of the Ethics help-line as part of its responsibilities.
Any waiver of the Code for our executives and directors must be approved by the Board, or the appropriate Board committee, and disclosed publicly. There were no material departures from the Code in 2012.
The Code is posted on our website (www.transcanada.com).
2012 Annual information form -- 31
Conflicts of interest
The Code covers potential conflicts of interest.
Serving on other boards
The Board considers whether directors serving on the boards of all entities including public and private companies, Crown corporations and non-profit organizations pose any potential conflict. The Board reviewed these relationships and determined that they do not interfere with any of our director's ability to act in our best interests.
Our Code requires employees to receive consent before accepting a directorship with an entity that is not an affiliate. The CEO and executive vice-presidents (our executive leadership team) must receive the consent of the Governance committee. All other employees must receive the consent of their immediate supervisor.
Affiliates
The Board closely oversees relationships between TransCanada and any affiliates to avoid any potential conflicts of interest. This includes our relationship with TC PipeLines, LP, a master limited partnership listed on the NYSE.
Auditor independence
Pursuant to the Audit committee charter, the Audit committee reviews and approves our hiring policies for partners, employees and former partners and employees of our current and former external auditors to ensure auditor independence is maintained. The committee also monitors adherence to our policy.
Our Annual information form (AIF) includes more information about the Audit committee, including the committee charter. The 2012 AIF is available on our website (www.transcanada.com) and on SEDAR (www.sedar.com).
Majority voting
Our majority voting policy applies to electing a new Board when the number of nominated directors is the same as the number of director positions available. If, prior to a meeting, a nominated director receives more "withheld" proxy votes than 5% of the total votes cast by proxy, we will hold a vote by ballot for all directors. If a director receives more "withheld" than "for" votes cast by ballot, the director must resign from the Board. The Board will accept the resignation if there are no extenuating circumstances. We expect the Board to announce its decision to either accept or reject the director's resignation in a press release within 90 days after the annual meeting, and include its reasons for rejecting the resignation, if applicable.
This policy does not apply if there is a proxy contest over the election of directors.
Share ownership
We have share ownership requirements for our directors and executives to align their interests with those of our shareholders. Ownership levels are significant, and directors and executives must meet the requirements within five years of assuming their position. As of February 11, 2013, all of our directors met the share ownership requirements within the required time limits. Ms. Reynolds, who was appointed to the Board on November 30, 2011, and Ms. Salomone, who joined the Board on February 12, 2013, have five years from their respective appointment dates to meet the requirements.
SeeAligning the interests of directors and shareholders on page 54 andAligning the interests of executives and shareholders on page 70 for more information.
32 -- TransCanada PipeLines Limited
ROLE AND RESPONSIBILITIES OF THE BOARD
The Board's primary responsibilities are to foster TransCanada's long-term success, oversee our business affairs and management, and to act honestly, in good faith and in the best interests of TransCanada.
The Board's main objective is to promote our best interests to maximize long-term shareholder value and enhance shareholder returns.
The Board has key duties and responsibilities, delegates some duties to its four standing committees, and discharges others to management for managing the day-to-day affairs of the business.
Charters and position descriptions
The Board and each Board committee have adopted a charter that outlines its principal responsibilities.
They review the charters every year to ensure they reflect current developments in corporate governance and corporate practices, and approve any necessary changes.
The Board charter describes the:
- •
- composition and organization of the Board
- •
- duties and responsibilities for managing our affairs, and
- •
- oversight responsibilities for:
- •
- management and human resources
- •
- strategy and planning
- •
- financial and corporate issues
- •
- business and risk management, including compensation risk
- •
- policies and procedures
- •
- compliance reporting and corporate communications, and
- •
- general legal obligations, including its ability to use independent advisors as necessary.
The Board has also developed position descriptions for the Chair of the Board, each committee Chair and the CEO. The position descriptions for the Chair of the Board and the CEO are part of their terms of reference. The position descriptions for the Chair of each committee are contained in the committee charters.
SeeAppendix A for a copy of the Board charter. The Board charter, committee charters and position descriptions for the Chair of the Board and the CEO are posted on our website (www.transcanada.com).
2012 Annual information form -- 33
Strategic planning
We have a multi-year strategic plan that balances risk and reward.
The Board provides oversight and direction in the strategic planning process to ensure management develops corporate strategies that support our vision to be the leading energy infrastructure company in North America. We set annual corporate objectives to support our core strategies for achieving growth and creating value for shareholders. These are established with and approved by the Board every year.
The Board monitors management's progress toward achieving the strategic plan, and discusses a broad range of matters related to our strategy and business interests at each regularly scheduled meeting. Management also reports regularly on our operational and financial performance.
The Board generally holds a full day session on strategic planning every year and sessions on strategic matters throughout the year. See Meeting attendance on page 27 for more information about the meetings held in 2012 andOrientation and education on page 38 for more information about the strategic issues and planning sessions attended by Board members in 2012.
34 -- TransCanada PipeLines Limited
Risk oversight
The Governance committee oversees our risk management activities. It monitors the identified business risks using a risk matrix which categorizes the risks and shows the Board committee and executives responsible for specific oversight of each risk. The committee reviews TransCanada's key business risks with management at each committee meeting and the risk matrix with management annually to ensure there is proper Board and committee oversight according to the terms of their charters, and that we have management programs in place to mitigate those risks. It also recommends, along with the respective Board committee (or executive) assigned responsibility for specific risks, any enhancements to our risk management program and policies to the Board.
We manage risk by identifying the key business risks and categorizing them under six main areas:
- •
- corporate strategy
- •
- business strategy and execution
- •
- business opportunity
- •
- commercial operations
- •
- physical operations, and
- •
- general corporate risk (including compensation risk).
All of our executives are involved in the process and are accountable for developing plans and actions to prevent and/or mitigate the risks and to minimize any associated costs.
The Audit committee oversees financial risk, the Human Resources committee oversees human resources and compensation risk and the Health, Safety and Environment committee oversees operational safety and environmental risks.
The Audit committee oversees management's role in monitoring compliance with risk management policies and procedures and reviewing the adequacy of our financial risk management. Our financial risk management strategies, policies and limits are designed to ensure our risks and related exposures are in line with our business objectives and risk tolerance. Risks are managed within limits that are ultimately established by the Board, implemented by senior management and monitored by our risk management and internal audit groups.
2012 Annual information form -- 35
The Health, Safety and Environment committee monitors compliance with our HSE corporate policy through regular reporting from management. We have an integrated HSE management system that establishes a framework for managing HSE issues and is used to capture, organize and document our related policies, programs and procedures.
Our management system for HSE is modeled after international standards for environmental management systems, conforms to external industry consensus standards and voluntary regulatory programs, and complies with applicable legislative requirements and various other internal management systems. It follows a continuous improvement cycle organized into four key areas:
- •
- Planning: risk and regulatory assessment, objectives and targets, and structure and responsibility
- •
- Implementing: development and implementation of programs, procedures and practices aimed at operational risk management
- •
- Reporting: document and records management, communication and reporting, and
- •
- Action: ongoing audit and review of HSE performance.
The committee reviews HSE performance quarterly with comparison to previously set targets and takes into account incidents and highlights of performance during the relevant quarter, and reviews program plans and performance targets for subsequent years. It receives detailed reports on our operational risk management, including governance of these risks, operational performance and preventive maintenance, pipeline integrity, operational risk issues and applicable legislative developments. The committee also receives updates on any specific areas of operational risk management review being conducted by management.
Each year the committee's practice is to conduct a site visit and tour of at least one of our existing assets or projects under construction as part of its responsibility to monitor and review our HSE practices. The Board is invited to join the committee at its site visit and the Board also typically has a separate site visit each year.
SeeCompensation governance on page 47 for more information about how we manage our compensation risk.
36 -- TransCanada PipeLines Limited
Succession planning
The Human Resources committee oversees succession planning for management, and is directly responsible for developing the CEO succession plan and presenting it to the Board for discussion. Succession planning for the CEO position occurs over several years so potential candidates can grow into the role. It includes ongoing analysis of each potential candidate's performance, skills and experience, and an assessment of the personal attributes and characteristics that the committee and the Board believe are necessary for the role.
The CEO prepares an overview of the executive vice-president roles, noting the required skills and expertise for each position and the individual's areas of strength. He also prepares development plans for each executive to ensure ongoing performance is satisfactory, and presents them to the committee.
The CEO identifies potential future candidates for the executive vice-president positions, with input from the Human Resources committee. Each candidate is assessed based on their skills and experience and the competencies that are required for promotion to the senior executive level. Development opportunities are also identified so each candidate can receive additional or varied management experience, training, development and educational opportunities. The committee reviews each position and the performance assessment and competencies of potential successors at least once a year and makes recommendations to the Board for approval as appropriate.
Access to management
The Board has complete access to management, but gives reasonable advance notice to avoid disrupting the business and operations.
The Board encourages the executive leadership team to include key managers in Board meetings so they can share their expertise on specific matters. This gives the Board an opportunity to meet individuals who have the potential to assume more senior positions in the future, and for these individuals to gain exposure with the Board.
2012 Annual information form -- 37
ORIENTATION AND EDUCATION
New directors participate in an orientation program featuring sessions on corporate strategy, our main business issues, and historical and financial information about TransCanada. They also have an opportunity to visit and tour our facilities and project sites and meet with the executive leadership team and other directors. Our 2012 program included a site visit and sessions on strategic issues.
We tailor the sessions for each director based on individual needs and their specific areas of interest. New directors also meet with the Vice-President, Corporate Development and Strategy for an overview of the different areas of our business and operations and a discussion of key areas of interest. Briefing sessions are also held for new committee members.
Directors receive a reference manual with:
- •
- details about their duties and obligations as a member of the Board
- •
- information about our business and operations
- •
- copies of the Board and committee charters
- •
- copies of past public filings, and
- •
- documents from recent Board meetings.
The Governance committee reviews the orientation program and manual every year so they continue to meet our needs and those of new directors.
Continuing education helps strengthen a director's knowledge and understanding of the business, industry, governance and other issues. Senior management and external experts make presentations to the Board and committees from time to time on various topics related to the business, including changes to legal, regulatory and industry requirements.
The Governance committee develops the program every year based on current and emerging issues, our corporate objectives and input from other directors.
We also suggest seminars and education programs that may be relevant, and pay the registration fee and travel expenses as appropriate. We offer to pay annual fees for memberships with organizations that are appropriate and provide relevant publications and educational opportunities.
2012 director education program
| 2012 | Topic | Presented/hosted by | Attended by | |||
| February 13 | Strategic issues session – Solar generation | Senior Vice-President, Western Power and Gas Storage | All directors | |||
| Eastern Mainline oil pipeline project | Senior Vice-President, Oil Pipelines | |||||
| June 11-12 | Strategic planning session – a number of topics related to the direction of | ELT, led by Executive Vice-President, Corporate Development | All directors | |||
| overall corporate strategy | ||||||
| October 3 | Site visit to Parkway pipeline project near Toronto, Ontario including Maple compressor station | Executive Vice-President, Operations and Major Projects | Health, Safety and Environment committee | |||
| November 28 | Strategic issues session – Organizational capability update | Executive Vice-President, Corporate Services | All directors | |||
| 2013 Strategy and portfolio management | Executive Vice-President, Corporate Development | |||||
38 -- TransCanada PipeLines Limited
BOARD EFFECTIVENESS
The Governance committee assesses the performance of the Board, Board committees and individual directors every year and reports the results to the Board. The Chair of the Board conducts one-on-one interviews with each director, and each committee conducts a self-assessment led by its committee Chair.
Assessments focus on the effectiveness of the Board and each committee and solicit input from directors about areas for potential improvement. Interviews include questions about personal and individual peer performance. The Chair of the Board summarizes the interview responses and reports them to the Governance committee and the Board.
The Chair of the Governance committee interviews each director about the performance of the Chair of the Board based on the Chair's terms of reference, and presents the results to the Board for discussion.
The Chair of the Board also conducts interviews with each member of the executive leadership team every year and reports the results to the Board.
The Governance committee believes the interview process is the most effective way for directors to give feedback that can be reviewed by the entire Board. The committee also monitors developments in board governance and evolving best practices in corporate governance.
Financial literacy
The Board has determined that all members of the Audit committee arefinancially literate, which means each member can read and understand a set of financial statements that are generally comparable to ours in terms of breadth and complexity of accounting issues. You can find more information about their education and financial experience in the director profiles starting on page 16, in the Audit committee report on page 43 and in the AIF which is available on our website (www.transcanada.com) and on SEDAR (www.sedar.com).
2012 Annual information form -- 39
Board renewal
The Governance committee regularly assesses the skill set of each director, and reviews it against the director retirement schedule, their ages and the composition of each Board committee. The review also takes into account the desirability of maintaining a reasonable diversity of backgrounds, and character and behavioural qualities such as integrity.
The Governance committee, with input from the Chair of the Board and the CEO, is responsible for identifying suitable director candidates, and canvasses the entire Board for potential nominees. The committee is responsible for assessing the individuals and proposing the strongest candidates for nomination.
The committee looks for a mix of skills and experience required for overseeing our affairs. The Board considers personal characteristics such as gender, ethnic background and geographic residence when looking at diversity, however, candidates are nominated as directors based on their background and ability to contribute to the Board and committee meetings.
The committee ensures that the Board seeks expertise in the following key areas:
| • Accounting & Finance • Energy/Utilities • Engineering • Governance • Government • Health, Safety & Environment • International markets | • Law • Management/Leadership • Oil & Gas/Utilities • Operations • Regulatory, and • Risk management. |
Candidates who are being nominated for the first time must have experience in industries similar to ours, or experience in general business management or with corporations that are similar in size and scope. Candidates must also be willing to serve on the Board, able to devote the necessary time to fulfill their duties and responsibilities and be under 70 years old.
The committee recommends potential candidates based on their qualifications and independence and how these qualities balance with the skill set of the current Board, the structure and composition of the committees and the director retirement schedule. This assessment helps the Board determine the best mix of skills and experience to guide our business operations and our long-term strategy.
Director tenure
The Governance committee reviews factors like age, changes in principal occupation or other relevant circumstances that may trigger the resignation or retirement of a director.
Once a director turns 70, he or she will not stand for re-election at the next annual meeting, unless:
- •
- they have not served seven consecutive years and the Board recommends that the director stand for re-election every year until the end of the seven year period, or
- •
- the Board recommends that a director stand for re-election because of their specific skills and experience.
The graphs below show the composition of our Board by years of service as of the date of this circular and after the annual and special meeting, assuming all of the nominated directors are elected:
| Current composition | Post-meeting composition | |
 |  |
40 -- TransCanada PipeLines Limited
The table below lists the likely retirement dates of the current non-executive directors based on current age, the Board committees they serve on, their education and their areas of expertise. The Governance committee considers these factors and others when discussing Board renewal. Dr. Draper will retire on April 26, 2013 prior to the annual and special meeting.
| Retirement year | Director | Board committees | Education | Skills and experience | ||||
2013 | E. Linn Draper | Health, Safety & Environment (Chair) Human Resources | Ph.D. Nuclear Science B.Sc. Chemical Engineering | Energy/Utilities Engineering Management/Leadership Operations & HSE | ||||
| 2014 | Paule Gauthier | Health, Safety & Environment Human Resources | LL.M. LL.B. B.A. | Governance Government Law Regulatory | ||||
| W. Thomas Stephens | Human Resources (Chair) Health, Safety & Environment | M.Sc. Industrial Engineering | Building & Commercial products Engineering Forestry Management/Leadership Operations & HSE | |||||
| 2015 | Derek H. Burney | Audit Governance (Chair) | M.A. Political Science B.A. Political Science | Civil aviation & Defence Energy/Utilities Government Regulatory Telecommunications | ||||
| 2017 | Kevin E. Benson | Audit (Chair) Governance | B.A. Accounting | Accounting & Finance Economics Management/Leadership Transportation | ||||
| 2018 | Paul L. Joskow | Audit Governance | Ph.D. Economics M.A. Economics B.A. Economics | Accounting & Finance Economics Energy/Utilities Governance Government Regulatory | ||||
Richard E. Waugh | Governance | MBA B.Comm. | Banking International markets Management/Leadership | |||||
| 2022 | D. Michael G. Stewart | Audit Health, Safety & Environment | B.Sc. Geological Sciences | Energy Management/Leadership Oil & Gas Operations & HSE | ||||
| 2023 | S. Barry Jackson | Board Chair Governance Human Resources | B.Sc. Engineering | Engineering Management/Leadership Oil & Gas/Utilities Operations & HSE | ||||
| 2027 | Paula Rosput Reynolds | Health, Safety & Environment Human Resources | B.A. Economics | Economics Energy/Utilities Insurance Management/Leadership Risk management | ||||
| 2030 | Mary Pat Salomone | — | MBA B.A. Engineering | Energy/Utilities Engineering International markets Management/Leadership Operations & HSE | ||||
2012 Annual information form -- 41
COMMUNICATING WITH THE BOARD
Shareholder engagement allows us to hear directly from shareholders and other important stakeholders about any issues or concerns.
Shareholders, employees and others can contact the Board directly by writing to:
Chair of the Board of Directors
TransCanada Corporation
450 1st Street S.W.
Calgary, Alberta T2P 5H1
SHAREHOLDER PROPOSALS
According to Canadian law, shareholder proposals can only be considered for the annual meeting of common shareholders if they are submitted by a specific date. We did not receive any shareholder proposals for the 2013 annual and special meeting.
Our Corporate Secretary must receive any shareholder proposalsbefore 5:00 p.m. MDT on November 12, 2013 to be considered for the Management information circular for our 2014 annual meeting of common shareholders.
BOARD COMMITTEES
The Board has four standing committees:
- •
- Audit committee
- •
- Governance committee
- •
- Health, Safety and Environment committee, and
- •
- Human Resources committee.
Each of the Board committees is comprised entirely of independent directors.
The Governance committee is responsible for reviewing the composition of each committee and recommending any changes once new directors are appointed or elected to the Board. Each Board committee must consist entirely of independent directors, except for the Health, Safety and Environment committee, which must have a majority of independent directors. Each committee has the authority to retain advisors to help it carry out its responsibilities. The Board does not have an executive committee.
Each committee reviews its charter at least once a year, and recommends any changes to the Governance committee and the Board. You can find the committee charters on our website (www.transcanada.com).
The Audit and the Human Resources committees hold simultaneous meetings, as do the Governance and Health, Safety and Environment committees, so each committee has sufficient time to focus on its responsibilities. As a result, Mr. Jackson, the independent non-executive Chair of the Board, is a voting member of the Governance committee and the Human Resources committee, and is not a member of the Audit committee or the Health, Safety and Environment committee. Mr. Waugh attends the Audit committee meetings as an observer and does not vote on any matters at that committee.
The committees will be reconstituted after the annual and special meeting.
All meetings have time set aside for members to discuss the committee operations and responsibilities without management present.
42 -- TransCanada PipeLines Limited
Audit committee
| Members | Kevin E. Benson (Chair) Derek H. Burney Paul L. Joskow D. Michael G. Stewart | |||
(Mr. MacNaughton served as a member of the Audit committee from June 14, 2006 until January 9, 2013, the effective date of his resignation from the Board.) | ||||
| Meetings in 2012 | 5 regularly scheduled meetings (February, April, July, October, November) | |||
| Independent | 4 independent directors, 100% independent and financially literate. | |||
Mr. Benson, Chair of the Audit committee, is an "audit committee financial expert" as defined by the SEC in the U.S., and has the accounting or related financial management experience required under the NYSE rules. | ||||
| Mandate | The Audit committee is responsible for assisting the Board in overseeing the integrity of our financial statements and our compliance with legal and regulatory requirements. | |||
It is also responsible for overseeing and monitoring the internal accounting and reporting process and the process, performance and independence of our internal and external auditors. | ||||
The Audit committee meets in-camera with the Chief Financial Officer (CFO) at the beginning of each meeting, and also meets separately with the external and internal auditors and management. The committee also meets in-camera at the end of each meeting.
2012 highlights
- •
- Reviewed our 2012 interim and annual disclosure documents, including the unaudited interim and audited annual consolidated financial statements and related management's discussion and analysis (MD&A), AIF and any financial statements required by regulatory authorities and recommended them to the Board for approval.
- •
- Reviewed the appointment of the external auditors and estimated fees and recommended them to the Board for approval.
- •
- Reviewed the audit plans of the internal and external auditors and the non-audit services performed by KPMG relating to tax services and our pension plans.
- •
- Oversaw our financial reporting risks, including issues relating to materiality and risk assessment.
- •
- Received the external auditors' formal written statement of independence (which sets out all of its relationships with TransCanada) and its recommendations to management about our internal controls and procedures.
- •
- Recommended changes to the Canadian Pension Plan Statement of Investment Policies and Procedures as part of its annual review.
- •
- Reviewed the major accounting policies and estimates.
- •
- Recommended changes to the composition of third-party investment managers engaged to manage funds invested in the Canadian Pension Plan.
- •
- Monitored Canadian and U.S. financial reporting and legal and regulatory developments affecting our financial reporting process, controls and disclosure.
- •
- Reviewed the risk management policies, developments and reports relating to counterparty, insurance and market risks.
- •
- Recommended changes to the Code of business ethics to reflect industry best practices and consolidate our Code of business ethics for employees, Code of business ethics for contract workers and independent consultants and the Code of business ethics for directors into a single code.
- •
- Reviewed/recommended prospectuses/offering documents related to issuance of securities.
Our AIF includes more information about the Audit committee, including the committee charter, oversight responsibilities, each member's education and experience, and policies and procedures for pre-approving services. The 2012 AIF is available on our website (www.transcanada.com) and on SEDAR (www.sedar.com).
2012 Annual information form -- 43
Governance committee
| Members | Derek H. Burney (Chair) Kevin E. Benson S. Barry Jackson Paul L. Joskow Richard E. Waugh | |||
(Mr. MacNaughton served as Chair of the Governance committee from May 1, 2009 to January 9, 2013, the effective date of his resignation from the Board. Mr. Burney was appointed Chair of the Governance committee effective February 11, 2013.) | ||||
| Meetings in 2012 | 3 regularly scheduled meetings (February, April, October) | |||
| Independent | 5 independent directors, 100% independent | |||
| Mandate | The Governance committee is responsible for assisting the Board with maintaining strong governance policies and practices at TransCanada, reviewing the independence and financial literary of directors, managing director compensation and the Board assessment process, and overseeing our strategic planning process and risk management activities. | |||
It monitors the relationship between management and the Board, directors' share ownership levels, governance developments and emerging best practices. It is also responsible for identifying qualified candidates for the Board to consider as potential directors. | ||||
| It also recommends the meeting schedule for Board and committee meetings, site visits, and oversees matters related to the timing of our annual meeting. | ||||
The Governance committee meets in-camera at the beginning and end of each meeting.
2012 highlights
- •
- Reviewed the independence of each director according to our written criteria to give the Board guidance in its annual assessment of independence and the structure and composition of each committee and the other directorships held by Board members (including public and private companies, Crown corporations and non-profit organizations).
- •
- Oversaw our strategic planning process, including strategic issues to be considered and planning of our strategic issues and planning sessions in January, June and November.
- •
- Oversaw our risk management activities, including receiving updates on key business risks and making recommendations to the Board as appropriate.
- •
- Reviewed the identified principal risks with management to ensure we have proper Board and committee oversight and management programs in place to mitigate risks and our director share ownership requirements.
- •
- Reviewed our corporate governance guidelines and recommended appropriate changes to the Board for approval, including updating the fixed term membership policy to allow the Board to extend the renewable four year term of the Chair of the Board for such further period as may be deemed appropriate by the Board. The committee also recommended to the Board that the Chair terms of reference be amended to reflect this change. Based on a recommendation from the committee, the Board extended Mr. Jackson's term as Chair of the Board for a further two year term.
- •
- Reviewed say on pay updates and voting trends.
- •
- Monitored updates to securities regulation (regulation and legal updates affecting our policies, procedures and disclosure practices) and matters relating to the financial markets. The Governance committee continues to monitor legal developments in the U.S., emerging best practices in Canada and any legal or tax issues associated with a clawback policy to recoup executive compensation in the event we must restate our financial statements because of material non-compliance with any financial reporting requirements.
- •
- Oversaw the Board's retirement policy, Board renewal and the selection of new director candidates.
- •
- Reviewed the charters of the Board and other committees and recommended them with appropriate amendments to the Board for approval. The changes included amending the Board Charter to delete reference to approval of outside directorships of the executive leadership team as this falls within the Governance committee's responsibility.
44 -- TransCanada PipeLines Limited
Health, Safety and Environment committee
| Members | E. Linn Draper (Chair, retiring April 26, 2013) Paule Gauthier Paula Rosput Reynolds W. Thomas Stephens D. Michael G. Stewart | |||
| Meetings in 2012 | 3 regularly scheduled meetings (February, April and October) | |||
| Independent | 5 independent directors, 100% independent | |||
| Mandate | The Health, Safety and Environment committee is responsible for overseeing our health, safety, security and environmental practices and procedures. | |||
It monitors our compliance with applicable legislation and meeting industry standards, and oversees our policies and procedures to prevent or mitigate losses and to protect our assets, network and infrastructure from malicious acts, natural disasters or other crisis situations. | ||||
The Health, Safety and Environment committee meets in-camera with the Vice-President, Community, Safety and Environment and separately at the end of each meeting. The committee also meets in-camera at the beginning of each meeting as necessary.
2012 highlights
- •
- Received quarterly reports on our health, safety, security, environmental activities and performance, including governance activities, leadership objectives and emergency management and detailed reports and analysis on operational risk management, governance and performance, including regulatory compliance matters and pipeline integrity.
- •
- Visited the Maple compressor station in Ontario and met with the employee representatives of the eastern region joint health, safety and environment committee.
- •
- Viewed the Parkway pipeline project right of way in the greater Toronto area and discussed urban encroachment and safety measures.
- •
- Monitored Canadian and U.S. air emissions and greenhouse gas policies.
2012 Annual information form -- 45
Human Resources committee
| Members | W. Thomas Stephens (Chair) | |||
| E. Linn Draper (retiring April 26, 2013) Paule Gauthier S. Barry Jackson Paula Rosput Reynolds | ||||
| Meetings in 2012 | 3 regularly scheduled meetings (February, October, November) | |||
3 special meetings (January, April, September) | ||||
| Independent | 5 independent directors, 100% independent | |||
| Mandate | The Human Resources committee is responsible for assisting the Board with developing strong human resources policies and plans and succession planning, overseeing the compensation programs, and assessing the performance of the CEO and other members of the executive leadership team against pre-established objectives and recommending their compensation. | |||
It approves all non-executive long-term incentive awards, and any major changes to the compensation program and benefits plans for employees. It is also responsible for the benefits under our Canadian pension plans and reviewing our share ownership requirements for executives. | ||||
The Human Resources committee meets in-camera at the beginning and end of each meeting.
2012 highlights
- •
- Assessed the performance of the executive leadership team and recommended the 2012 executive compensation awards to the Board for approval.
- •
- Held special meetings on executive compensation in January, April and September.
- •
- Reviewed the long-term incentive mix for our executive leadership team and approved an adjustment to the weighting so that 50% of the value is allocated each to executive share units (ESUs) and stock options.
- •
- Reviewed the methodology for determining the fair value of stock options and approved the approach of using TransCanada's accounting value as determined under the Binomial valuation model.
- •
- Adopted relative total shareholder return as the single performance measure for the 2012 ESU grant, and adjusted the vesting terms by introducing a minimum payout of 50% of target while keeping the maximum payout at 150%.
- •
- Reviewed and approved amendments to the retirement provisions of the ESU and stock option plans.
The committee also undertook a number of other activities during the year, and these go into effect beginning in 2013:
- •
- Reviewed the form and structure of our short-term incentive plan and approved
- •
- adjustments to the relative weighting of corporate, business unit and individual performance ratings, and
- •
- adopted an additive methodology to determine short-term incentive awards.
- •
- Reviewed the mandate, independence, performance and compensation of, and reappointed, the external compensation consultant.
46 -- TransCanada PipeLines Limited
Schedule C
Charter of the Audit Committee
1. PURPOSE
The Audit Committee shall assist the Board of Directors (the "Board") in overseeing and monitoring, among other things, the:
- •
- Company's financial accounting and reporting process;
- •
- integrity of the financial statements
- •
- Company's internal control over financial reporting;
- •
- external financial audit process;
- •
- compliance by the Company with legal and regulatory requirements; and
- •
- independence and performance of the Company's internal and external auditors.
To fulfill its purpose, the Audit Committee has been delegated certain authorities by the Board of Directors that it may exercise on behalf of the Board.
2. ROLES AND RESPONSIBILITIES
I. Appointment of the Company's External Auditors
Subject to confirmation by the external auditors of their compliance with Canadian and U.S. regulatory registration requirements, the Audit Committee shall recommend to the Board the appointment of the external auditors, such appointment to be confirmed by the Company's shareholders at each annual meeting. The Audit Committee shall also recommend to the Board the compensation to be paid to the external auditors for audit services and shall pre-approve the retention of the external auditors for any permitted non-audit service and the fees for such service. The Audit Committee shall also be directly responsible for the oversight of the work of the external auditor (including resolution of disagreements between management and the external auditor regarding financial reporting) for the purpose of preparing or issuing an audit report or related work. The external auditor shall report directly to the Audit Committee.
The Audit Committee shall also receive periodic reports from the external auditors regarding the auditors' independence, discuss such reports with the auditors, consider whether the provision of non-audit services is compatible with maintaining the auditors' independence and the Audit Committee shall take appropriate action to satisfy itself of the independence of the external auditors.
II. Oversight in Respect of Financial Disclosure
The Audit Committee, to the extent it deems it necessary or appropriate, shall:
- (a)
- review, discuss with management and the external auditors and recommend to the Board for approval, the Company's audited annual consolidated financial statements, annual information form, management's discussion and analysis, all financial information in prospectuses and other offering memoranda, financial statements required by regulatory authorities, all prospectuses and all documents which may be incorporated by reference into a prospectus, including without limitation, the annual proxy circular, but excluding any pricing supplements issued under a medium term note prospectus supplement of the Company;
- (b)
- review, discuss with management and the external auditors and recommend to the Board for approval the release to the public of the Company's interim reports, including the consolidated financial statements, management's discussion and analysis and press releases on quarterly financial results;
- (c)
- review and discuss with management and external auditors the use of non-GAAP information and the applicable reconciliation;
- (d)
- review and discuss with management and external auditors financial information and earnings guidance provided to analysts and rating agencies; provided, however, that such discussion may be done generally (consisting of discussing the types of information to be disclosed and the types of presentations to be made). The Audit Committee need not discuss in advance each instance in which the Company may provide earnings guidance or presentations to rating agencies;
- (e)
- review with management and the external auditors major issues regarding accounting and auditing principles and practices, including any significant changes in the Company's selection or application of accounting principles, as well as major issues as to the adequacy of the Company's internal controls and any special audit steps adopted in light of material control deficiencies that could significantly affect the Company's financial statements;
2012 Annual information form -- 1
- (f)
- review and discuss quarterly reports from the external auditors on:
- (i)
- all critical accounting policies and practices to be used;
- (ii)
- all alternative treatments of financial information within generally accepted accounting principles that have been discussed with management, ramifications of the use of such alternative disclosures and treatments, and the treatment preferred by the external auditor;
- (iii)
- other material written communications between the external auditor and management, such as any management letter or schedule of unadjusted differences;
- (g)
- review with management and the external auditors the effect of regulatory and accounting initiatives as well as off-balance sheet structures on the Company's financial statements;
- (h)
- review with management, the external auditors and, if necessary, legal counsel, any litigation, claim or contingency, including tax assessments, that could have a material effect upon the financial position of the Company, and the manner in which these matters have been disclosed in the financial statements;
- (i)
- review disclosures made to the Audit Committee by the Company's CEO and CFO during their certification process for the periodic reports filed with securities regulators about any significant deficiencies in the design or operation of internal controls or material weaknesses therein and any fraud involving management or other employees who have a significant role in the Company's internal controls;
- (j)
- discuss with management the Company's material financial risk exposures and the steps management has taken to monitor and control such exposures, including the Company's risk assessment and risk management policies;
III. Oversight in Respect of Legal and Regulatory Matters
- (a)
- review with the Company's General Counsel legal matters that may have a material impact on the financial statements, the Company's compliance policies and any material reports or inquiries received from regulators or governmental agencies.
IV. Oversight in Respect of Internal Audit
- (a)
- review the audit plans of the internal auditors of the Company including the degree of coordination between such plans and those of the external auditors and the extent to which the planned audit scope can be relied upon to detect weaknesses in internal control, fraud or other illegal acts;
- (b)
- review the significant findings prepared by the internal audit department and recommendations issued by it or by any external party relating to internal audit issues, together with management's response thereto;
- (c)
- review compliance with the Company's policies and avoidance of conflicts of interest;
- (d)
- review the adequacy of the resources of the internal auditor to ensure the objectivity and independence of the internal audit function, including reports from the internal audit department on its audit process with subsidiaries and affiliates;
- (e)
- ensure the internal auditor has access to the Chair of the Audit Committee and of the Board and to the Chief Executive Officer and meet separately with the internal auditor to review with him or her any problems or difficulties he or she may have encountered and specifically:
- (i)
- any difficulties which were encountered in the course of the audit work, including restrictions on the scope of activities or access to required information, and any disagreements with management;
- (ii)
- any changes required in the planned scope of the internal audit; and
- (iii)
- the internal audit department responsibilities, budget and staffing;
and to report to the Board on such meetings;
V. Insight in Respect of the External Auditors
- (a)
- review the annual post-audit or management letter from the external auditors and management's response and follow-up in respect of any identified weakness, inquire regularly of management and the external auditors of any significant issues between them and how they have been resolved, and intervene in the resolution if required;
- (b)
- review the quarterly unaudited financial statements with the external auditors and receive and review the review engagement reports of external auditors on unaudited financial statements of the Company;
- (c)
- receive and review annually the external auditors' formal written statement of independence delineating all relationships between itself and the Company;
2 -- TransCanada PipeLines Limited
- (d)
- meet separately with the external auditors to review with them any problems or difficulties the external auditors may have encountered and specifically:
- (i)
- any difficulties which were encountered in the course of the audit work, including any restrictions on the scope of activities or access to required information, and any disagreements with management; and
- (ii)
- any changes required in the planned scope of the audit;
and to report to the Board on such meetings;
- (e)
- review with the external auditors the adequacy and appropriateness of the accounting policies used in preparation of the financial statements;
- (f)
- meet with the external auditors prior to the audit to review the planning and staffing of the audit;
- (g)
- receive and review annually the external auditors' written report on their own internal quality control procedures; any material issues raised by the most recent internal quality control review, or peer review, of the external auditors, or by any inquiry or investigation by governmental or professional authorities, within the preceding five years, and any steps taken to deal with such issues;
- (h)
- review and evaluate the external auditors, including the lead partner of the external auditor team;
- (i)
- ensure the rotation of the lead (or coordinating) audit partner having primary responsibility for the audit and the audit partner responsible for reviewing the audit as required by law, but at least every five years;
VI. Oversight in Respect of Audit and Non-Audit Services
- (a)
- pre-approve all audit services (which may entail providing comfort letters in connection with securities underwritings) and all permitted non-audit services, other than non-audit services where:
- (i)
- the aggregate amount of all such non-audit services provided to the Company constitutes not more than 5% of the total fees paid by the Company and its subsidiaries to the external auditor during the fiscal year in which the non-audit services are provided;
- (ii)
- such services were not recognized by the Company at the time of the engagement to be non-audit services; and
- (iii)
- such services are promptly brought to the attention of the Audit Committee and approved prior to the completion of the audit by the Audit Committee or by one or more members of the Audit Committee to whom authority to grant such approvals has been delegated by the Audit Committee;
- (b)
- approval by the Audit Committee of a non-audit service to be performed by the external auditor shall be disclosed as required under securities laws and regulations;
- (c)
- the Audit Committee may delegate to one or more designated members of the Audit Committee the authority to grant pre-approvals required by this subsection. The decisions of any member to whom authority is delegated to pre-approve an activity shall be presented to the Audit Committee at its first scheduled meeting following such pre-approval;
- (d)
- if the Audit Committee approves an audit service within the scope of the engagement of the external auditor, such audit service shall be deemed to have been pre-approved for purposes of this subsection;
VII. Oversight in Respect of Certain Policies
- (a)
- review and recommend to the Board for approval the implementation and amendments to policies and program initiatives deemed advisable by management or the Audit Committee with respect to the Company's codes of business ethics and Risk Management and Financial Reporting policies;
- (b)
- obtain reports from management, the Company's senior internal auditing executive and the external auditors and report to the Board on the status and adequacy of the Company's efforts to ensure its businesses are conducted and its facilities are operated in an ethical, legally compliant and socially responsible manner, in accordance with the Company's codes of business conduct and ethics;
- (c)
- establish a non-traceable, confidential and anonymous system by which callers may ask for advice or report any ethical or financial concern, ensure that procedures for the receipt, retention and treatment of complaints in respect of accounting, internal controls and auditing matters are in place, and receive reports on such matters as necessary;
- (d)
- annually review and assess the adequacy of the Company's public disclosure policy;
- (e)
- review and approve the Company's hiring policies for partners, employees and former partners and employees of the present and former external auditors (recognizing the Sarbanes-Oxley Act of 2002 does not permit the CEO, controller, CFO or chief accounting officer to have participated in the Company's audit as an employee of the external auditors during the preceding one-year period) and monitor the Company's adherence to the policy;
2012 Annual information form -- 3
VIII. Oversight in Respect of Financial Aspects of the Company's Canadian Pension Plans (the "Company's pension plans"), specifically:
- (a)
- provide advice to the Human Resources Committee on any proposed changes in the Company's pension plans in respect of any significant effect such changes may have on pension financial matters;
- (b)
- review and consider financial and investment reports and the funded status relating to the Company's pension plans and recommend to the Board on pension contributions;
- (c)
- receive, review and report to the Board on the actuarial valuation and funding requirements for the Company's pension plans;
- (d)
- review and approve annually the Statement of Investment Policies and Procedures ("SIP&P");
- (e)
- approve the appointment or termination of auditors and investment managers;
IX. U.S. Stock Plans
To review and approve the engagement and related fees of the auditor for any plan of a U.S. subsidiary that offers Company stock to employees as an investment option under the plan.
X. Oversight in Respect of Internal Administration
- (a)
- review annually the reports of the Company's representatives on certain audit committees of subsidiaries and affiliates of the Company and any significant issues and auditor recommendations concerning such subsidiaries and affiliates;
- (b)
- oversee the succession planning for the senior management in finance, treasury, tax, risk, internal audit and the controllers' group.
XI. Oversight Function
While the Audit Committee has the responsibilities and powers set forth in this Charter, it is not the duty of the Audit Committee to plan or conduct audits or to determine that the Company's financial statements and disclosures are complete and accurate or are in accordance with generally accepted accounting principles and applicable rules and regulations. These are the responsibilities of management and the external auditors. The Audit Committee, its Chair and any of its members who have accounting or related financial management experience or expertise, are members of the Board, appointed to the Audit Committee to provide broad oversight of the financial disclosure, financial risk and control related activities of the Company, and are specifically not accountable nor responsible for the day to day operation of such activities. Although designation of a member or members as an "audit committee financial expert" is based on that individual's education and experience, which that individual will bring to bear in carrying out his or her duties on the Audit Committee, designation as an "audit committee financial expert" does not impose on such person any duties, obligations or liability that are greater than the duties, obligations and liability imposed on such person as a member of the Audit Committee and Board in the absence of such designation. Rather, the role of any audit committee financial expert, like the role of all Audit Committee members, is to oversee the process and not to certify or guarantee the internal or external audit of the Company's financial information or public disclosure.
3. COMPOSITION OF AUDIT COMMITTEE
The Audit Committee shall consist of three or more Directors, a majority of whom are resident Canadians (as defined in the Canada Business Corporations Act), and all of whom are unrelated and/or independent for the purposes of applicable Canadian and United States securities law and applicable rules of any stock exchange on which the Company's securities are listed. Each member of the Audit Committee shall be financially literate and at least one member shall have accounting or related financial management expertise (as those terms are defined from time to time under the requirements or guidelines for audit committee service under securities laws and the applicable rules of any stock exchange on which the Company's securities are listed for trading or, if it is not so defined as that term is interpreted by the Board in its business judgment).
4. APPOINTMENT OF AUDIT COMMITTEE MEMBERS
The members of the Audit Committee shall be appointed by the Board from time to time, on the recommendation of the Governance Committee and shall hold office until the next annual meeting of shareholders or until their successors are earlier appointed or until they cease to be Directors of the Company.
4 -- TransCanada PipeLines Limited
5. VACANCIES
Where a vacancy occurs at any time in the membership of the Audit Committee, it may be filled by the Board on the recommendation of the Governance Committee.
6. AUDIT COMMITTEE CHAIR
The Board shall appoint a Chair of the Audit Committee who shall:
- (a)
- review and approve the agenda for each meeting of the Audit Committee and as appropriate, consult with members of management;
- (b)
- preside over meetings of the Audit Committee;
- (c)
- make suggestions and provide feedback from the Audit Committee to management regarding information that is or should be provided to the Audit Committee;
- (d)
- report to the Board on the activities of the Audit Committee relative to its recommendations, resolutions, actions and concerns; and
- (e)
- meet as necessary with the internal and external auditors.
7. ABSENCE OF AUDIT COMMITTEE CHAIR
If the Chair of the Audit Committee is not present at any meeting of the Audit Committee, one of the other members of the Audit Committee present at the meeting shall be chosen by the Audit Committee to preside at the meeting.
8. SECRETARY OF AUDIT COMMITTEE
The Corporate Secretary shall act as Secretary to the Audit Committee.
9. MEETINGS
The Chair, or any two members of the Audit Committee, or the internal auditor, or the external auditors, may call a meeting of the Audit Committee. The Audit Committee shall meet at least quarterly. The Audit Committee shall meet periodically with management, the internal auditors and the external auditors in separate executive sessions.
10. QUORUM
A majority of the members of the Audit Committee, present in person or by telephone or other telecommunication device that permit all persons participating in the meeting to speak to each other, shall constitute a quorum.
11. NOTICE OF MEETINGS
Notice of the time and place of every meeting shall be given in writing, facsimile communication or by other electronic means to each member of the Audit Committee at least 24 hours prior to the time fixed for such meeting; provided, however, that a member may in any manner waive a notice of a meeting. Attendance of a member at a meeting is a waiver of notice of the meeting, except where a member attends a meeting for the express purpose of objecting to the transaction of any business on the grounds that the meeting is not lawfully called.
12. ATTENDANCE OF COMPANY OFFICERS AND EMPLOYEES AT MEETING
At the invitation of the Chair of the Audit Committee, one or more officers or employees of the Company may attend any meeting of the Audit Committee.
13. PROCEDURE, RECORDS AND REPORTING
The Audit Committee shall fix its own procedure at meetings, keep records of its proceedings and report to the Board when the Audit Committee may deem appropriate but not later than the next meeting of the Board.
14. REVIEW OF CHARTER AND EVALUATION OF AUDIT COMMITTEE
The Audit Committee shall review its Charter annually or otherwise, as it deems appropriate and, if necessary, propose changes to the Governance Committee and the Board. The Audit Committee shall annually review the Audit Committee's own performance.
2012 Annual information form -- 5
15. OUTSIDE EXPERTS AND ADVISORS
The Audit Committee is authorized, when deemed necessary or desirable, to retain and set and pay the compensation for independent counsel, outside experts and other advisors, at the Company's expense, to advise the Audit Committee or its members independently on any matter.
16. RELIANCE
Absent actual knowledge to the contrary (which shall be promptly reported to the Board), each member of the Audit Committee shall be entitled to rely on (i) the integrity of those persons or organizations within and outside the Company from which it receives information, (ii) the accuracy of the financial and other information provided to the Audit Committee by such persons or organizations and (iii) representations made by management and the external auditors, as to any information technology, internal audit and other non-audit services provided by the external auditors to the Company and its subsidiaries.
6 -- TransCanada PipeLines Limited
Compensation
We are committed to high standards of corporate governance, including compensation governance.
This section tells you how the Board makes executive compensation decisions at TransCanada, and explains its decisions for 2012.
WHERE TO FIND IT | ||||
> | Compensation governance | 47 | ||
Expertise | 48 | |||
Compensation oversight | 49 | |||
External consultant | 51 | |||
> | Director compensation | 53 | ||
Compensation discussion and analysis | 53 | |||
2012 details | 56 | |||
> | Executive compensation | 61 | ||
Compensation discussion and analysis | 61 | |||
2012 details | 92 | |||
Compensation governance
The Board, the Human Resources committee and the Governance committee are responsible for the integrity of our compensation governance practices.
| Human Resources committee | Governance committee | |
| • W. Thomas Stephens (Chair) | • Derek H. Burney (Chair) | |
| • E. Linn Draper(retires April 26, 2013) | • Kevin E. Benson | |
| • Paule Gauthier | • S. Barry Jackson | |
| • S. Barry Jackson | • Paul L. Joskow | |
| • Paula Rosput Reynolds | • Richard E. Waugh |
The Board approves all matters related to executive and director compensation. The committees are responsible for reviewing compensation matters and making any recommendations. Both committees are entirely independent.
2012 Annual information form -- 47
EXPERTISE
Human resources and executive compensation
The Human Resources committee is responsible for executive compensation. It consists of five independent directors who have an appropriate mix of skills and experience in management, business, industry, human resources and public accountability for carrying out their responsibilities.
| Skills and experience | Number of directors | |
| Human resources/Compensation experience | 5 | |
| CEO experience (oil and gas, forest and paper products, utilities and insurance industries) | 4 | |
| Governance/Risk management experience | 3 | |
| Legal expertise | 1 | |
| Financial expertise | 1 | |
All of the members have experience as members of human resources or compensation committees of other public companies.
Mr. Stephens, the committee Chair, has also chaired the compensation committees of two other public companies. He is a former chief executive officer of four public companies, and has experience working with boards and compensation consultants in designing appropriate compensation programs.
Dr. Draper is a former chief executive officer of two U.S. public companies and is currently the Chair of the compensation committee of one other U.S. public company.
Mr. Jackson has also served as the Chair of the compensation committee for several public companies. As a former chief executive officer of a public oil and gas company, Mr. Jackson has experience in overseeing executive compensation programs and working closely with compensation consultants, and has been involved in all aspects of the design, implementation and administration of compensation programs as a senior executive and director.
Ms. Reynolds was the chief executive officer of two U.S. public companies and was responsible for overseeing compensation plans and their implementation, and has direct experience in designing detailed performance-based goals for executives.
Ms. Gauthier has legal expertise and experience in overseeing executive compensation programs as a member of compensation committees of public companies in banking and other industries.
In addition to the committee's collective experience in compensation matters, all of the members stay actively informed of trends and developments in compensation matters and the applicable legal and regulatory frameworks.
Governance
The Governance committee is responsible for director compensation and risk oversight. It consists of five independent directors who have a mix of skills and experience in business, risk, governance, human resources and compensation. Four of the members are currently or have been members of human resources or compensation committees of other public companies. Four of the members also have experience as a chief executive officer of one or more public companies, which has provided each of them with experience in oversight of and direct involvement in compensation matters.
You can find specific details about each director's background and experience in the director profiles starting on page 16, and more information about the committees starting on page 42.
48 -- TransCanada PipeLines Limited
COMPENSATION OVERSIGHT
Compensation oversight ensures executives and directors are compensated fairly, without incurring undue risk to TransCanada's business and operations.
The Board reviews our compensation policies and practices every year and considers the related risks, and makes any adjustments it deems necessary to ensure that our compensation policies are not reasonably likely to have a material adverse effect on TransCanada. It carries out this work directly or through the Human Resources committee and the Governance committee.
The Board has approved various compensation policies and practices to effectively identify and mitigate compensation risks and discourage members of the executive leadership team or others from taking inappropriate or excessive risks.
Multi-year strategic plan
We have a multi-year, corporate strategic plan that identifies our core strategies to help us achieve our vision of being the leading energy infrastructure company in North America:
- •
- maximize the full-life value of our infrastructure assets and commercial positions
- •
- commercially develop and build new asset investment programs
- •
- cultivate a focused portfolio of high quality development options, and
- •
- maximize our competitive strengths.
Executive compensation is closely linked to the strategic plan. Our annual corporate objectives support the strategic plan and are integrated in our compensation decision-making process. At the end of each year, the Board assesses our performance against the corporate objectives to determine the adjustment factor that is used in calculating short-term incentive awards for the executive leadership team and all other employees. The Board also ensures that the annual individual performance objectives for each member of the executive leadership team align with our corporate objectives and reflect performance areas that are specific to each role when it determines total direct compensation for each executive.
Compensation philosophy
Our compensation philosophy guides all compensation program design and decisions. Our approach to compensation is structured to meet four key objectives: pay for performance, be market competitive, align executives' interests with those of our shareholders and customers, and engage and retain our executives. In setting target compensation levels, each component – base salary, short-term and long-term incentives – as well as total direct compensation are determined with reference to median levels in our comparator group (see pages 69 through 77 for details).
Executive compensation is also designed to minimize risk as a significant portion of total direct compensation is variable or at-risk compensation. See pages 87 through 91 for the pay mix for each named executive.
Executive compensation structured to manage risk
The Human Resources committee and the Board have structured the executive compensation program to ensure that executives are compensated fairly and in a way that does not incur undue risk to TransCanada or encourage executives to take inappropriate risks.
- •
- Structured process: The committee has implemented a formal decision-making process that involves management, the committee and the Board. The committee uses a two-step review process for all compensation matters, reviewing and discussing items at an initial meeting before approving them at a subsequent meeting.
- •
- Benchmarking to ensure fairness: Director and executive compensation are reviewed every year, and benchmarked against comparator groups to assess competitiveness and fairness.
- •
- Modelling and stress testing: The committee uses modelling to stress test different compensation scenarios and potential future executive compensation. This includes an analysis of the potential effect of different
2012 Annual information form -- 49
corporate performance scenarios on previously awarded and outstanding compensation to assess whether the results are reasonable. The committee also uses modelling to assess the payments under the terms of the executives' employment agreements for severance and change of control situations.
- •
- Independent advice: Management uses an external compensation consultant to conduct a competitive compensation review every year of all executive positions. This provides the committee and the Board with a market reference point when they assess individual performance in the context of overall corporate performance. The committee has also retained its own external consultant to advise it on human resources matters.
- •
- Emphasis on long-term incentives: The committee and the Board place a significant emphasis on long-term incentives when determining the total direct compensation for the executive leadership team. Our long-term incentives include ESUs and stock options – both incentive plans encourage value creation over the long-term and align executives' interests with those of our shareholders.
- •
- Pre-established objectives: The Board approves pre-established corporate, business unit and individual objectives every year for each member of the executive leadership team. These are used to assess their performance and determine their compensation, and executives agree to these objectives as set out in their annual performance agreements and scorecards.
- •
- Performance-based compensation: Awards under the ESU plan are paid out based on our performance against objectives set for the three-year vesting period.
- •
- Fixed limits on variable compensation payments: Short-term incentive payouts could be adjusted from target up to a maximum factor of 2.0 for individual performance and up to 1.2 for corporate performance. Long-term incentive awards under the ESU plan are limited to a maximum payout of 1.5 times the final number of units accrued at the end of the vesting period. These limits can only be exceeded if the Board uses its discretion to recognize extraordinary performance.
- •
- Discretion: The Board completes a formal assessment, and can then use its discretion to increase or decrease any compensation awards if it deems it appropriate based on market factors or other extenuating circumstances.
Policies and guidelines to manage risk
The Governance committee, the Human Resources committee and the Board have instituted several policies to ensure that compensation risk is appropriately managed and that the interests of both directors and executives are aligned with those of our shareholders. These policies are derived from best practices in governance and legal requirements.
- •
- Share ownership requirements: We implemented share ownership requirements for both directors and executives in 2003, reflecting the Board's view that directors and executives can best represent the interests of shareholders more effectively if they have a significant investment in TransCanada.
- •
- Hedging prohibited: In 2011, the Governance committee amended our trading policy for employees and insiders to include an anti-hedging policy. It prohibits executives and directors, and any others they designate, from purchasing financial instruments designed to hedge or offset a decrease in the market value of equity securities granted as compensation. This includes prepaid variable forward contracts, equity swaps, collars and units of exchange funds.
- •
- Reimbursement: If there is an incidence of misconduct with our financial reporting and we must restate our financial statements because of material non-compliance with a financial reporting requirement, our CEO and CFO are required by law to reimburse TransCanada for incentive-based compensation related to the period the misconduct occurred. They must also reimburse us for any profits they realized from trading TransCanada securities during the 12 months following the issue of the misstated financial statements. The Governance committee continues to monitor legal developments in the U.S., emerging best practices in Canada and any legal or tax issues associated with a clawback policy to recoup executive compensation in the event we must
50 -- TransCanada PipeLines Limited
restate our financial statements because of material non-compliance with any financial reporting requirements.
- •
- Say on pay: We have implemented a non-binding advisory shareholder vote on our approach to executive compensation. We held say on pay votes at our annual shareholder meetings in 2010, 2011 and 2012. These advisory votes were approved by 86.77% of voting shareholders in 2010, 90.25% of voting shareholders in 2011 and 96.63% of voting shareholders in 2012 confirming that a significant majority of shareholders have accepted our approach to executive compensation.
- •
- Code of business ethics: To reflect industry best practices, in 2012 we consolidated our Code of business ethics for employees, Code of business ethics for contract workers and independent consultants and the Code of business ethics for directors into a single code. The Code incorporates principles of good conduct and ethical and responsible behaviour to guide our decisions and actions and the way we conduct business.
After considering the implications associated with our compensation policies and practices and completing a review of our policies and practices described above, the Board believes that:
- •
- we have the proper practices in place to effectively identify and mitigate potential risk, and
- •
- TransCanada's compensation policies and practices do not encourage any member of our executive leadership team, or any employee to take inappropriate or excessive risks, and are not reasonably likely to have a material adverse effect on our company.
In addition to our compensation policies and practices, our corporate values – Integrity, Collaboration, Responsibility and Innovation – also guide director, officer and employee behaviour, underpin our company culture and define the character of the organization we share and work in every day.
EXTERNAL CONSULTANT
TransCanada first retained Towers Watson in 2002 to provide human resources consulting services to management.
The Human Resources committee retains an individual consultant from Towers Watson as its independent advisor on human resources matters to help carry out its mandate. The consultant was originally retained in 2006. The committee obtains independent advice from the consultant to support its compensation review and decision-making and while the information is an important tool in the committee's processes, the committee is responsible for making its own decisions and recommendations to the Board, which reflect other factors and considerations discussed in theExecutive compensation discussion and analysis (CD&A) included herein. The committee engaged the consultant again in 2012 based on the quality of the advisory services on executive compensation matters.
As the Human Resources committee's consultant is from the same firm as management's consultant, TransCanada and Towers Watson have taken several steps to maintain the independence of the external consultant, including ensuring that the consultant's pay is not directly affected by any change in services provided to management or the Board committees.
The consultant:
- •
- is not the client relationship manager
- •
- is not involved in any client development activities related to increasing consulting services to us
- •
- only provides services to the Human Resources committee, and
- •
- has limited interactions with management unless they specifically relate to matters for the committee's review or approval.
2012 Annual information form -- 51
The Human Resources committee created a mandate for the consultant that includes:
- •
- advising on compensation levels for the CEO
- •
- assessing the CEO's recommendations on the compensation of the other named executives
- •
- attending all of its committee meetings (unless otherwise requested by the committee Chair)
- •
- providing data, analysis or opinion on compensation-related matters requested by the committee or its Chair, and
- •
- reporting to the committee on all matters related to executive compensation.
In 2012, the Human Resources committee adopted a pre-approval policy for fees paid to Towers Watson. Under the policy, the committee must pre-approve the fees and terms of service for TransCanada with any compensation consultant that also provides independent advice to the committee. The Chair of the committee is authorized to pre-approve the terms of engagement and additional fees up to $250,000 between scheduled meetings and must report any pre-approval to the committee. The table below shows the fees paid to Towers Watson in 2011 and 2012.
Executive compensation-related fees
| Towers Watson | 2012 | 2011 | ||
| Consulting to the Human Resources committee | $158,000 | $164,003 | ||
| Consulting to human resources management | ||||
| • compensation consulting and market data services for executives and non-executives | 156,000 | 197,000 | ||
| • benefit and pension actuarial consulting services for our Canadian and U.S. operations | 2,232,000 | 2,278,358 | ||
| Consulting to the Governance committee | ||||
| • preparing an annual report on director compensation | 33,000 | 32,000 | ||
| All other fees | – | – | ||
| Total fees | $2,579,000 | $2,671,361 | ||
52 -- TransCanada PipeLines Limited
Director compensation discussion and analysis
WHERE TO FIND IT | ||||
> | Director compensation discussion and analysis | 53 | ||
Approach | 53 | |||
Components | 55 | |||
> | 2012 details | 56 | ||
Director compensation table | 56 | |||
At-risk investment | 58 | |||
Incentive plan awards | 60 | |||
APPROACH
Our director compensation program reflects our size and complexity, and reinforces the importance we place on shareholder value. Director compensation includes annual retainers and meeting fees that are paid in cash and DSUs to link a significant portion of their compensation to the value of our shares (see Deferred share units, below for more information about the DSU plan).
The Board follows a formal performance assessment process to ensure directors are engaged and make meaningful contributions to the Board and committees they serve on. The Governance committee reviews director compensation at least once a year, and makes compensation recommendations to the Board for its review and approval. Recommendations take into consideration the directors' time commitment, duties and responsibilities, and director compensation practices at comparable companies.
Directors of TransCanada also serve as directors of TCPL. Board and committee meetings of TransCanada and TCPL run concurrently, and the director compensation described below is for serving on both Boards. TransCanada does not hold any material assets directly, other than TCPL common shares and receivables from some of our subsidiaries. As a result, TCPL assumes all directors' costs according to a Management services agreement between the two companies.
Benchmarking
Director compensation is benchmarked against two comparator groups. The companies in the custom comparator group are relatively consistent with the publicly-traded companies included in the executive compensation comparator group and this group provides an industry specific market reference point. Since directors tend to be recruited from a variety of industries, the general industry comparator group provides an additional market reference point of publicly-traded Canadian companies that are similar in size and scope to TransCanada. Total compensation is determined with reference to median levels in our comparator groups, so we can attract and retain qualified directors. Towers Watson conducts an independent review of director compensation every year, and prepares a report on compensation paid by our comparator companies. The Governance committee refers to the report when conducting its compensation review.
2012 comparator groups
| Custom comparator group | General industry comparator group | |
| ATCO Ltd. | Agrium Inc. | |
| Canadian Natural Resources Ltd. | Canadian National Railway Company | |
| Cenovus Energy Inc. | Canadian Pacific Railway Limited | |
| Enbridge Inc. | Cenovus Energy Inc. | |
| Encana Corporation | Enbridge Inc. | |
| Fortis Inc. | Encana Corporation | |
| Husky Energy Inc. | Maple Leaf Foods Inc. | |
| Imperial Oil Ltd. | Metro Inc. | |
| Nexen Inc. | National Bank of Canada | |
| Suncor Energy Inc. | Potash Corporation of Saskatchewan Inc. | |
| Talisman Energy Inc. | Resolute Forest Products Inc. | |
| TransAlta Corporation | Suncor Energy Inc. | |
| Talisman Energy Inc. | ||
| TELUS Corporation | ||
2012 Annual information form -- 53
Aligning the interests of directors and shareholders
The Board believes that directors can represent the interests of shareholders more effectively if they have a significant investment in TransCanada. Directors must hold at least six times their annual cash retainer ($420,000) in shares or DSUs within five years of joining the Board. The minimum was increased from five times in October 2011, to reinforce the importance of share ownership and more closely align the interests of directors and shareholders.
Directors can meet the requirements by purchasing TransCanada shares, participating in our dividend reinvestment plan or by directing all or a portion of their compensation to be paid in DSUs. We recalibrate the ownership values if the cash retainer is increased.
If their holdings fall below the minimum level because of fluctuations in our share price, we expect directors to attain the minimum threshold within a reasonable amount of time set by the Governance committee.
As President and CEO, Mr. Girling must instead meet our CEO share ownership requirement under the executive share ownership guidelines which is four times his base salary. Mr. Girling meets these ownership requirements (see page 87 for details).
As of February 11, 2013, all of our directors had met the share ownership requirements within the required time limits. Ms. Reynolds, who was appointed to the Board on November 30, 2011, and Ms. Salomone who joined the Board on February 12, 2013, have five years from their respective appointment dates to meet the requirements.
Deferred share units
DSUs are notional shares that have the same value as TransCanada shares. DSUs earn dividend equivalents as additional units, at the same rate as dividends paid on our shares.
Introduced in 1998, our DSU plan allows directors to choose to receive a portion of their retainers, meeting fees and travel fees in DSUs instead of cash. The plan also allows the Governance committee to use discretion to grant DSUs to directors as additional compensation (excluding employee directors such as our President and CEO). No discretionary grants of DSUs were made to directors in 2012.
Directors redeem their DSUs when they retire from the Board. Directors can redeem their DSUs for cash or shares purchased on the open market.
54 -- TransCanada PipeLines Limited
COMPONENTS
Directors receive annual retainers, meeting fees and travel fees when applicable. They are also reimbursed for out-of-pocket expenses they incur while attending meetings, and are paid a per diem for Board and committee activities outside of our meeting schedule. Directors who are U.S. residents receive the same amounts in U.S. dollars. Mr. Girling is an employee of TransCanada and is compensated in his role as President and CEO, and does not receive any director compensation. Both the annual Board retainer and the separate retainer for the Chair of the Board are paid in cash and DSUs according to the fee schedule below:
| 2012 compensation | ||||
| Retainers paid quarterly from the date the director is appointed to the Board and committees | ||||
| Board retainer | $155,000 per year | |||
| paid to each director except the Chair of the Board | ($70,000 cash + $85,000 in DSUs) | represented 1,921 DSUs for Canadian directors and 1,922 DSUs for U.S. directors in 2012 | ||
| Chair of the Board | $410,000 per year | |||
| receives a higher retainer because of his level of responsibility | ($180,000 in cash + $230,000 in DSUs) | represented 5,198 DSUs in 2012 | ||
| Committee retainer paid to each committee member except the Chair of the committee | $5,500 per year | |||
| Committee Chairs receive a higher committee retainer for additional duties and responsibilities | $12,000 per year | |||
| Meeting fees | ||||
| Chair of the Board | $3,000 per Board meeting chaired | |||
| Board and committee meetings | $1,500 per meeting | |||
| Travel fees | ||||
| if round trip travel is more than three hours | $1,500 per round trip | |||
| Other fees special assignments | $1,500 (per diem for additional activities) | no such fees were paid in 2012 | ||
DSUs are credited quarterly, in arrears, using the closing price of TransCanada shares on the TSX at the end of each quarter. In 2012, five directors chose to receive 100% of their retainer and meeting and travel fees in DSUs:
- •
- Kevin E. Benson
- •
- E. Linn Draper
- •
- S. Barry Jackson
- •
- John A. MacNaughton, and
- •
- Richard E. Waugh
There were no changes to director compensation in 2012.
Beginning in 2013, the mandatory DSU portion of the directors' annual compensation was increased by $15,000 from $85,000 to $100,000 and the mandatory DSU portion of the annual compensation for the Chair of the Board was increased by $30,000 from $230,000 to $260,000 to more closely align compensation to the market 50th percentile of our comparator groups and to continue to attract skilled directors to the Board.
2012 Annual information form -- 55
Director compensation – 2012 details
The table below shows total director compensation awarded, credited or paid in 2012.
DIRECTOR COMPENSATION TABLE
Name | Fees earned ($) | Share- based awards ($) | Option- based awards ($) | Non-equity incentive plan compensation ($) | Pension value ($) | All other compensation ($) | Total ($) | |||||||
| Kevin E. Benson | 114,500 | 85,000 | – | – | – | – | 199,500 | |||||||
| Derek H. Burney | 114,000 | 85,000 | – | – | – | – | 199,000 | |||||||
| Wendy K. Dobson (retired April 27, 2012) | 39,758 | 27,555 | – | – | – | – | 67,313 | |||||||
| E. Linn Draper (retiring April 26, 2013) | 122,015 | 85,000 | – | – | – | – | 207,015 | |||||||
| Paule Gauthier | 112,500 | 85,000 | – | – | – | – | 197,500 | |||||||
S. Barry Jackson | 208,500 | 230,000 | – | – | – | 23,301 | 461,801 | |||||||
| Paul L. Joskow | 112,500 | 85,000 | – | – | – | – | 197,500 | |||||||
| John A. MacNaughton (retired January 9, 2013) | 114,500 | 85,000 | – | – | – | – | 199,500 | |||||||
| David P. O'Brien (retired April 27, 2012) | 32,258 | 27,555 | – | – | – | – | 59,813 | |||||||
| Paula Rosput Reynolds | 112,701 | 85,000 | – | – | – | – | 197,701 | |||||||
| Mary Pat Salomone (joined February 12, 2013) | – | – | – | – | – | – | – | |||||||
| W. Thomas Stephens | 123,500 | 85,000 | – | – | – | – | 208,500 | |||||||
D. Michael G. Stewart | 108,000 | 85,000 | – | – | – | – | 193,000 | |||||||
| Richard E. Waugh (joined February 1, 2012) | 97,388 | 77,761 | – | – | – | — | 175,149 | |||||||
Notes
- •
- Fees earned includes Board and committee retainers, meeting fees and travel fees paid in cash, including the portion they chose to receive as DSUs.
- •
- Share-based awards include the portion of the Board retainer ($85,000) and the Board Chair retainer ($230,000) that we automatically pay in DSUs. There were no additional grants of DSUs in 2012.
- •
- In 2012, Mr. Jackson was reimbursed $17,673 for third-party office and other expenses, and received a reserved parking space valued at $5,628.
56 -- TransCanada PipeLines Limited
The table below is a breakdown of director compensation by component. It includes the total fees paid in cash and the DSUs awarded or credited as at the grant date, unless stated otherwise.
| Retainers | Meeting fees | Travel | Other | Totals | ||||||||||||||||
| Name | Board ($) | Committee ($) | Committee Chair ($) | Board meetings ($) | Committee meetings ($) | Travel fee ($) | Strategic planning sessions ($) | Fees paid in cash ($) | DSUs credited ($) | Total cash & DSUs credited ($) | ||||||||||
| Kevin E. Benson | 70,000 | 5,500 | 12,000 | 12,000 | 12,000 | 1,500 | 1,500 | – | 199,500 | 199,500 | ||||||||||
Derek H. Burney | 70,000 | 11,000 | – | 12,000 | 12,000 | 7,500 | 1,500 | 114,000 | 85,000 | 199,000 | ||||||||||
| Wendy K. Dobson (retired April 27, 2012) | 22,692 | 3,566 | – | 3,000 | 7,500 | 3,000 | – | 39,758 | 27,555 | 67,313 | ||||||||||
| E. Linn Draper (retiring April 26, 2013) | 70,000 | 5,515 | 12,000 | 12,000 | 12,000 | 9,000 | 1,500 | – | 207,015 | 207,015 | ||||||||||
| Paule Gauthier | 70,000 | 11,000 | – | 12,000 | 13,500 | 4,500 | 1,500 | 83,500 | 114,000 | 197,500 | ||||||||||
| S. Barry Jackson | 180,000 | – | – | 24,000 | – | 1,500 | 3,000 | – | 438,500 | 438,500 | ||||||||||
| Paul L. Joskow | 70,000 | 11,000 | – | 12,000 | 12,000 | 6,000 | 1,500 | 112,500 | 85,000 | 197,500 | ||||||||||
| John A. MacNaughton (retired January 9, 2013) | 70,000 | 5,500 | 12,000 | 10,500 | 12,000 | 3,000 | 1,500 | – | 199,500 | 199,500 | ||||||||||
| David P. O'Brien (retired April 27, 2012) | 22,692 | 3,566 | – | 1,500 | 4,500 | – | – | 9,566 | 50,247 | 59,813 | ||||||||||
| Paula Rosput Reynolds | 70,000 | 9,701 | – | 10,500 | 13,500 | 7,500 | 1,500 | 54,851 | 142,850 | 197,701 | ||||||||||
| Mary Pat Salomone (joined February 12, 2013) | – | – | – | – | – | – | – | – | – | – | ||||||||||
| W. Thomas Stephens | 70,000 | 5,500 | 12,000 | 10,500 | 13,500 | 10,500 | 1,500 | 100,900 | 107,600 | 208,500 | ||||||||||
D. Michael G. Stewart | 70,000 | 11,000 | – | 12,000 | 12,000 | 1,500 | 1,500 | 108,000 | 85,000 | 193,000 | ||||||||||
| Richard E. Waugh (joined February 1, 2012) | 64,038 | 4,850 | – | 10,500 | 12,000 | 4,500 | 1,500 | – | 175,149 | 175,149 | ||||||||||
Notes
- •
- DSUs credited includes the minimum portion of the Board retainer paid in DSUs ($230,000 for the Chair and $85,000 for the other directors) plus the portion of the retainers, meeting fees and travel fees directors chose to receive in DSUs in 2012. DSUs were paid quarterly based on $42.83, $42.67, $44.74 and $47.02, the closing prices of TransCanada shares on the TSX at the end of each quarter in 2012. Directors are able to redeem their DSUs when they retire from the Board.
- •
- Total cash & DSUs credited is the total dollar amount paid for duties performed on the TransCanada and TCPL boards.
- •
- Committee meeting fees for Mr. Waugh include $7,500 received for attending five Audit committee meetings as an observer. He also received $1,500 for attending one Governance committee meeting as an observer prior to becoming a member.
- •
- Committee meeting fees for Ms. Reynolds include $4,500 received for attending two Human Resources and one Health, Safety and Environment committee meeting as an observer prior to becoming a member of each committee.
2012 Annual information form -- 57
AT-RISK INVESTMENT
The table below shows:
- •
- the total value of each director's shares and DSUs or shares of our affiliates, including the DSUs credited as dividend equivalents until January 31, 2013
- •
- their holdings as a percentage of their annual cash retainer, and
- •
- the minimum equity investment required, as a multiple of their annual cash retainer.
The change in value represents the value of DSUs received in 2012, including dividend equivalents accrued until January 31, 2013, plus any additional shares acquired in 2012.
All of the directors have met the share ownership requirements within the required timeframe. Ms. Reynolds, who was appointed to the Board on November 30, 2011, and Ms. Salomone, who joined the Board on February 12, 2013, have five years from their respective appointment dates to meet the requirements. Mr. Girling meets the CEO ownership requirements under the executive share ownership guidelines. See pages 54 and 70 for more information about our share ownership requirements for directors and executives.
None of the nominated directors (or all of our directors and executives as a group) own more than 1% of TransCanada shares, or any class of shares of its subsidiaries and affiliates.
In the table:
- •
- DSUs include DSUs credited as dividend equivalents until January 31, 2013.
- •
- Total market value is the market value of TransCanada shares and DSUs, calculated using a closing share price on the TSX of $41.48 on February 13, 2012 and $48.25 on February 11, 2013. It includes DSUs credited as dividend equivalents until January 31, 2013.
- •
- Mr. Stewart's holdings include 1,853 shares held by his wife.
- •
- Mr. Waugh's holdings include 4,150 shares held by his wife.
58 -- TransCanada PipeLines Limited
At-risk investment table
| At-risk investment | Minimum investment required | |||||||||||||||
| Name | Date | Common shares | DSUs | Total common shares and DSUs | Total market value ($) | As a multiple of annual cash retainer | Total value of minimum investment | Multiple of annual cash retainer | ||||||||
| Kevin E. Benson | 2013 | 13,000 | 46,694 | 59,694 | 2,880,236 | 41.15 | 420,000 | 6x | ||||||||
| 2012 | 13,000 | 40,483 | 53,483 | 2,218,475 | 31.69 | 420,000 | 6x | |||||||||
| Change | – | 6,211 | 6,211 | 661,761 | 9.45 | |||||||||||
| Derek H. Burney | 2013 | 5,790 | 38,109 | 43,899 | 2,118,127 | 30.26 | 420,000 | 6x | ||||||||
| 2012 | 4,606 | 34,770 | 39,376 | 1,633,316 | 23.33 | 420,000 | 6x | |||||||||
| Change | 1,184 | 3,339 | 4,523 | 484,810 | 6.93 | |||||||||||
| E. Linn Draper | 2013 | – | 47,835 | 47,835 | 2,308,039 | 32.97 | 420,000 | 6x | ||||||||
| (retiring April 26, 2013) | 2012 | – | 41,413 | 41,413 | 1,717,811 | 24.54 | 420,000 | 6x | ||||||||
| Change | – | 6,422 | 6,422 | 590,228 | 8.43 | |||||||||||
| Paule Gauthier | 2013 | 2,000 | 49,267 | 51,267 | 2,473,633 | 35.34 | 420,000 | 6x | ||||||||
2012 | 2,000 | 44,854 | 46,854 | 1,943,504 | 27.76 | 420,000 | 6x | |||||||||
| Change | – | 4,413 | 4,413 | 530,129 | 7.57 | |||||||||||
| S. Barry Jackson | 2013 | 39,000 | 90,148 | 129,148 | 6,231,391 | 34.62 | 1,080,000 | 6x | ||||||||
| 2012 | 39,000 | 76,964 | 115,964 | 4,810,187 | 26.72 | 1,080,000 | 6x | |||||||||
| Change | – | 13,184 | 13,184 | 1,421,204 | 7.90 | |||||||||||
| Paul L. Joskow | 2013 | 5,000 | 28,949 | 33,949 | 1,638,039 | 23.40 | 420,000 | 6x | ||||||||
| 2012 | 5,000 | 25,956 | 30,956 | 1,284,055 | 18.34 | 420,000 | 6x | |||||||||
| Change | – | 2,993 | 2,993 | 353,984 | 5.06 | |||||||||||
John A. MacNaughton | 2013 | 50,000 | 35,712 | 85,712 | 4,135,604 | 59.08 | 420,000 | 6x | ||||||||
| (retired January 9, 2013) | 2012 | 50,000 | 29,912 | 79,912 | 3,314,750 | 47.35 | 420,000 | 6x | ||||||||
| Change | – | 5,800 | 5,800 | 820,854 | 11.73 | |||||||||||
| Paula Rosput Reynolds | 2013 | 2,500 | 3,653 | 6,153 | 296,882 | 4.24 | 420,000 | 6x | ||||||||
| 2012 | 2,500 | 334 | 2,834 | 117,554 | 1.68 | 420,000 | 6x | |||||||||
| Change | – | 3,319 | 3,319 | 179,328 | 2.56 | |||||||||||
| Mary Pat Salomone | 2013 | – | – | – | – | – | – | |||||||||
| (joined February 12, 2013) | 2012 | – | – | – | – | – | – | – | ||||||||
Change | – | – | – | – | – | |||||||||||
| W. Thomas Stephens | 2013 | 1,800 | 17,745 | 19,545 | 943,046 | 13.47 | 420,000 | 6x | ||||||||
| 2012 | 1,800 | 14,673 | 16,473 | 683,300 | 9.76 | 420,000 | 6x | |||||||||
| Change | – | 3,072 | 3,072 | 259,746 | 3.71 | |||||||||||
| D. Michael G. Stewart | 2013 | 14,339 | 18,858 | 33,197 | 1,601,755 | 22.88 | 420,000 | 6x | ||||||||
| 2012 | 13,801 | 16,249 | 30,050 | 1,246,474 | 17.81 | 420,000 | 6x | |||||||||
| Change | 538 | 2,609 | 3,147 | 355,281 | 5.08 | |||||||||||
| Richard E. Waugh | 2013 | 29,150 | 4,043 | 33,193 | 1,601,562 | 22.88 | 420,000 | 6x | ||||||||
| (joined February 1, 2012) | 2012 | 19,150 | – | 19,150 | 794,342 | 11.35 | 420,000 | 6x | ||||||||
| Change | 10,000 | 4,043 | 14,043 | 807,220 | 11.53 | |||||||||||
| Total | 2013 | 162,579 | 381,013 | 543,592 | 26,228,314 | |||||||||||
| 2012 | 150,857 | 325,608 | 476,465 | 19,763,768 | ||||||||||||
| Change | 11,722 | 55,405 | 67,127 | 6,464,546 | ||||||||||||
2012 Annual information form -- 59
Outstanding option-based and share-based awards
The table below shows all outstanding option-based and share-based awards previously granted to the directors that were outstanding at the end of 2012. Year-end values are based on $47.02, the closing price of TransCanada shares on the TSX at December 31, 2012.
| Option-based awards | Share-based awards | |||||||||||||
Name | Number of securities underlying unexercised options (#) | Option exercise price ($) | Option expiration date | Value of unexercised in-the-money options ($) | Number of shares or units of shares that have not vested (#) | Market or payout value of share-based awards that have not vested ($) | Market or payout value of vested share-based awards not paid out or distributed ($) | |||||||
| Kevin E. Benson | – | – | – | – | 46,694 | 2,195,565 | – | |||||||
| Derek H. Burney | – | – | – | – | 38,109 | 1,791,922 | – | |||||||
| Wendy K. Dobson (retired April 29, 2012) | – | – | – | – | – | – | 2,433,427 | |||||||
E. Linn Draper (retiring April 26, 2013) | – | – | – | – | 47,835 | 2,249,246 | – | |||||||
| Paule Gauthier | – | – | – | – | 49,267 | 2,316,546 | – | |||||||
| S. Barry Jackson | – | – | – | – | 90,148 | 4,238,778 | – | |||||||
| Paul L. Joskow | – | – | – | – | 28,949 | 1,361,194 | – | |||||||
| John A. MacNaughton (retired January 9, 2013) | – | – | – | – | 35,712 | 1,679,187 | – | |||||||
| David P. O'Brien (retired April 29, 2012) | – | – | – | – | – | – | – | |||||||
| Paula Rosput Reynolds | – | – | – | – | 3,653 | 171,806 | – | |||||||
Mary Pat Salomone (joined February 12, 2013) | – | – | – | – | – | – | – | |||||||
| W. Thomas Stephens | – | – | – | – | 17,745 | 834,370 | – | |||||||
| D. Michael Stewart | – | – | – | – | 18,858 | 886,731 | – | |||||||
| Richard E. Waugh (joined February 1, 2012) | – | – | – | – | 4,043 | 190,102 | – | |||||||
Notes
- •
- Number of shares or units of shares that have not vested includes the total number of DSUs, plus reinvested units earned as dividend equivalents on all outstanding DSUs until January 31, 2013.
- •
- The totalmarket or payout value of share-based awards that have not vested is $17,915,447.
60 -- TransCanada PipeLines Limited
Executive compensation discussion and analysis
WHERE TO FIND IT | ||||
> | Executive compensation discussion and analysis | 61 | ||
Executive summary | 61 | |||
Approach | 67 | |||
Components | 71 | |||
Compensation decisions in 2013 | 80 | |||
Payout of 2010 executive share unit award | 84 | |||
Executive profiles | 86 | |||
> | 2012 details | 92 | ||
Summary compensation table | 92 | |||
Incentive plan awards | 97 | |||
Equity compensation plan information | 100 | |||
Retirement benefits | 101 | |||
Termination and change of control | 102 | |||
EXECUTIVE SUMMARY
TransCanada's vision is to be the leading energy infrastructure company in North America, with a strong focus on pipelines and power generation opportunities located in regions where we have or can develop significant competitive advantages.
Our strategy for growth and value creation has four key elements:
- •
- maximize the full-life value of our infrastructure assets and commercial positions
- •
- commercially develop and build new asset investment programs
- •
- cultivate a focused portfolio of high-quality development options, and
- •
- maximize our competitive strengths.
We developed this strategy in 2000 – the fundamentals remain the same and we have focused on the steady and consistent implementation of this strategy.
Executive compensation is designed to 'pay for performance' by rewarding executives for delivering strong results that meet our corporate objectives and support our overall strategy. This CD&A explains our executive compensation program, our 2012 performance, the performance assessment by the Human Resources committee and the Board, and their compensation decisions for ournamed executives:
- •
- Russell K. Girling, President and CEO
- •
- Donald R. Marchand, Executive Vice-President and CFO
- •
- Alexander J. Pourbaix, President, Energy and Oil Pipelines
- •
- Gregory A. Lohnes, Executive Vice-President, Operations and Major Projects
- •
- Karl Johannson, President, Natural Gas Pipelines, and
- •
- Donald M. Wishart, (former) Executive Vice-President, Operations and Major Projects.
The named executives and three other executive vice-presidents make up our executive leadership team, with the exception of Mr. Wishart who stepped down from his position as Executive Vice-President, Operations and Major Projects on October 31, 2012. We retained Mr. Wishart in a part-time role beginning on November 1, 2012, and he will retire from TransCanada on December 31, 2013.
Performance results
To evaluate overall corporate performance for 2012, the committee and the Board looked at a number of quantitative and qualitative factors including financial and share performance, execution of ongoing projects and transactions, safety, operational performance and progress on key growth initiatives.
TransCanada experienced earnings challenges this year. Our comparable earnings per share of $1.89 was below our target of $2.20. This was due largely to delays in the refurbishment of Bruce Power's Units 1 and 2, decreased revenues from our U.S. natural gas pipelines, the Sundance A Power Purchase Agreement (PPA) force majeure, and the absence of a National Energy Board (NEB) decision with respect to the 2012-2013 Canadian Mainline tolls application.
This past year saw the resolution of several outstanding issues impacting our power assets, providing greater certainty for revenues in the coming years:
- •
- The Unit 3 West Shift Plus planned outage at Bruce Power was completed in June. This extended the life of Unit 3 until at least 2021.
- •
- An arbitration panel decided that TransCanada's PPA in the 560 megawatt (MW) Sundance A facility should not be terminated and ordered TransAlta Corporation to rebuild Sundance A Units 1 and 2. TransAlta Corporation announced that it expects the units to be returned to service in the fall of 2013.
2012 Annual information form -- 61
- •
- The U.S. Federal Energy Regulatory Commission ruled largely in our favor with respect to a formal complaint against the New York Independent System Operator determining they had improperly applied buyer-side market power mitigation rules which has negatively impacted New York capacity market prices since July of 2011. The ruling is expected to positively impact future capacity market prices for our Ravenswood generating station.
Usage patterns on the Canadian Mainline have changed significantly in recent years, with volumes from the Western Canada Sedimentary Basin (WCSB) falling by half while demand grows for short-haul transportation on the eastern end of the system. We have addressed this fundamental shift with a proposed restructuring of Canadian Mainline tolls and services that was the subject of an NEB hearing in 2012. Our comprehensive restructuring proposal would enhance the competitiveness of WCSB gas for western shippers and also addressed the changes in usage patterns across the system. We expect a decision on the application late first quarter or early second quarter of 2013.
We secured tolling settlements with our shippers for several of our U.S. natural gas pipelines, captured projects that will connect new natural gas supply and markets and restructured our offshore business to enhance its value.
We continued to execute well on the delivery of capital projects, with approximately $700 million delivered on time and on budget.
We announced that what had previously been the Cushing to U.S. Gulf Coast portion of the Keystone XL Pipeline had its own independent value to the marketplace, and that we plan to build it as the stand-alone Gulf Coast Project, which is not part of the Keystone XL Presidential Permit process. The pipeline will extend from Cushing, Oklahoma to the U.S. Gulf Coast. Construction began in August 2012 and we expect to place the pipeline in service in late 2013.
We were successful in securing over $9 billion of new projects in 2012:
- •
- We formed a partnership with Shell Canada Limited (Shell), called Coastal GasLink, to build and operate the proposed $4 billion pipeline to move Alberta System gas to Shell's proposed west coast LNG project near Kitimat, B.C.
- •
- We were awarded $1.9 billion for new pipeline infrastructure projects to meet the growing demand for natural gas in Mexico.
- •
- We were awarded oil pipeline projects totalling $4 billion (TransCanada's interest is $2.5 billion) including the Keystone Hardisty Terminal, the Grand Rapids Pipeline and the Northern Courier Pipeline.
- •
- We signed a contract with the Ontario Power Authority to develop, own and operate a new 900 MW natural gas-fired power plant in the eastern Ontario town of Greater Napanee. We plan to invest approximately $1.0 billion in the Napanee facility.
We accessed capital markets to meet our financing needs and managed our capital structure to maintain flexibility and to preserve our strong credit rating.
We believe we are well positioned to build on our long-term track record of sustainable earnings, cash flow and dividends to deliver attractive and sustainable returns to shareholders over the long-term.
62 -- TransCanada PipeLines Limited
Compensation highlights
The Human Resources committee and Board made the following executive compensation decisions in 2013:
- •
- Four of our named executives received an increase to base salary to maintain competitiveness with our comparator group and recognize proficiency in their roles. The average
annual increase was 4.5%. Mr. Girling's base salary positioning against our comparator group was unchanged from 2012 so it was maintained at the existing (2012) level.
- •
- The committee and the Board, after considering the performance results and their relative weighting (50% on financial results and 50% on operational, growth and other business considerations), determined that overall corporate performance for 2012 was below target and they assigned a corporate adjustment factor (CAF) of 0.90. The CAF is used in the determination of the short-term incentive awards for our named executives.
- •
- Long-term incentives for 2012 were awarded based on assessments by the Board and committee of each named executive's individual performance and potential to contribute to TransCanada's future success. Long-term incentive award targets and associated ranges for our executive leadership team were adjusted to more closely align to median levels in our comparator group and this resulted in higher awards to the named executives compared to 2012. Actual long-term incentive awards granted to the named executives averaged 96% of the target award levels.
- •
- The payout of the 2010 ESU grant was based on a performance multiplier of 1.11, reflecting overall performance above target compared to pre-established objectives over the three-year performance period. The named executives realized 165% of the original grant value awarded in 2010 largely due to the impact of total shareholder return of 47% for the three-year period ending December 31, 2012.
You can read more about the compensation decisions starting on page 80.
2012 Annual information form -- 63
Compensation vs. financial performance
The chart below compares our key financial results for the last five fiscal years tototal direct compensation awarded to the named executives for the same period. Total direct compensation includes base salary, the short-term incentive award (paid in the first quarter following the performance year) and the grant value of ESU and stock option awards.
The table below shows total direct compensation awarded to our named executives as a percentage of our comparable earnings for the last five fiscal years:
| 2008 | 2009 | 2010 | 2011 | 2012 | ||||||
| Total direct compensation awarded to the named executives (as a % of comparable earnings) | 1.4% | 1.4% | 1.1% | 1.1% | 1.3% | |||||
Notes
- •
- The non-GAAP measures for 2008 and 2009 are calculated using our financial statements prepared under Canadian generally accepted accounting principles (GAAP) applicable for such periods and are not necessarily comparable to the equivalent numbers prepared using U.S. GAAP in subsequent periods. SeeAppendix B for non-GAAP measures.
- •
- Total direct compensation for 2012 excludes Mr. Wishart, who stepped down from his position on October 31, 2012.
64 -- TransCanada PipeLines Limited
Compensation vs. total shareholder return
Our total shareholder return (TSR), the change in value of TransCanada shares plus reinvestment of dividends, has tracked favourably against the S&P/TSX Composite Total Returns Index over the last five years, delivering an annual compound return of 7.4% compared to 0.8% for the Index.
The chart below illustrates TSR, assuming an initial investment of $100 in TransCanada shares on December 31, 2007, and compares it to the return of the S&P/TSX Composite Total Returns Index and the trend in total direct compensation awarded to our named executives over the same period.
TSR is only one of the performance measures the Board considers when assessing performance and determining compensation for our named executives, so we do not necessarily expect there to be a direct correlation between TSR and total direct compensation awarded in a given period. In addition, the realized value of long-term compensation awarded in any given year is not guaranteed. A portion of it is equity-based, and its value is directly affected by changes in our share price.
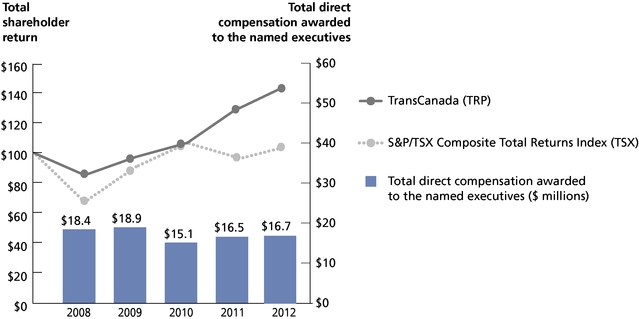
| At Dec. 31 | 2007 | 2008 | 2009 | 2010 | 2011 | 2012 | Compound annual growth | |||||||
TRP | $100.00 | $84.90 | $97.10 | $106.50 | $130.10 | $142.90 | 7.4% | |||||||
| TSX | $100.00 | $67.00 | $90.50 | $106.40 | $97.10 | $104.10 | 0.8% | |||||||
Note
- •
- Total direct compensation for 2012 excludes Mr. Wishart, who stepped down from his position effective October 31, 2012.
2012 Annual information form -- 65
Program changes
2012
The Board approved four changes to long-term incentives which went into effect at the beginning of 2012:
- •
- adjusted the weightings of the long-term incentive awards for our executive leadership team so that 50% of the grant value is allocated to ESUs and 50% to stock options
- •
- changed the methodology used to value stock option awards to the Binomial valuation model, which is a generally accepted valuation method for stock option awards. We use the Binomial valuation model to calculate TransCanada's accounting value, which we use for both compensation and financial reporting purposes
- •
- adopted relative TSR as the single performance measure for the ESU grant, and adjusted the vesting terms by introducing a minimum payout of 50% of target while keeping the maximum payout at 150%, and
- •
- amended the retirement provisions under the ESU and stock option plans such that:
- •
- unvested ESUs at the time of retirement continue to mature and the final award is prorated for the period of employment up to the retirement date, and
- •
- stock options continue to vest beyond the retirement date according to the terms of the plan, rather than immediate vesting on the date of retirement.
The Board adopted relative TSR as the single performance measure under the ESU plan to eliminate the duplication of measures included in the short-term incentive plan. Using relative TSR is also consistent with market practice and limits the discretion of the committee and the Board in assessing performance under that plan. The adoption of relative TSR and the adjusted weighting of ESUs and stock options more closely aligns executive compensation levels with long-term shareholder returns.
2013
The Board approved short and long-term incentive program changes, which go into effect starting in 2013:
- •
- with respect to the form and structure of our short-term incentive plan:
- •
- adjusted the relative weighting of corporate, business unit and individual performance ratings, with more emphasis placed on corporate performance in determining executive short-term incentive awards, and
- •
- adopted an additive methodology to determine short-term incentive awards to more closely align the plan leverage with market practice. You can read more about the short-term incentive changes on page 74
- •
- adjusted the long-term incentive award targets and associated ranges for our executive leadership team to more closely align to median levels in our comparator group.
The Board believes these changes are necessary so that our executive compensation program continues to meet our key compensation objectives as outlined in the next section.
66 -- TransCanada PipeLines Limited
APPROACH
TransCanada's executive compensation program is designed to meet four key objectives:
- •
- provide a compensation package that 'pays for performance' by rewarding executives for delivering on our corporate objectives and achieving our overall strategy
- •
- offer a level and type of compensation that is competitive with the market
- •
- align executives' interests with those of our shareholders and customers, and
- •
- attract, engage and retain our executives.
Compensation is also aligned with our risk management processes to ensure there is an appropriate balance between risk and reward.
Decision-making process
We follow a comprehensive decision-making process that involves management, the Human Resources committee and the Board, and takes into account market data, input from the CEO and independent advice from the committee's external consultant.
The Board makes all decisions affecting executive compensation based on the committee's recommendations.
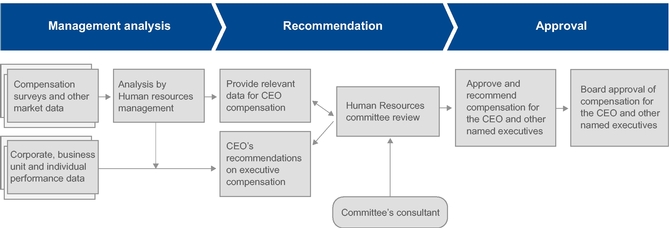
2012 Annual information form -- 67
Management analysis
Assessing the market
The committee and the Board recognize the importance of retaining executive talent for business continuity, managing stakeholder relationships, succession planning and achieving desired short and long-term corporate objectives.
Management works with its external consultant to analyze market data and provide relevant data and other information to the committee and the Board. This process includes benchmarking executive compensation against a comparator group of companies (see Benchmarking on page 69).
The committee and Board also consider compensation relative to other executives when determining compensation levels. This is especially important in situations where the market data for a particular role does not reflect the relative scope of the role at TransCanada.
Determining performance objectives
The Board approves annual corporate objectives to support our core strategies for achieving growth and creating value for shareholders. Our corporate performance scorecard incorporates these objectives, and they include a combination of financial measures and operational, growth and other business considerations and weightings approved by the Board.
The Board establishes annual performance objectives and relative weightings for the CEO and the other named executives. Objectives are aligned with the annual corporate objectives and reflect key performance areas of the role. The CEO's objectives include a corporate performance scorecard, personal objectives and leadership priorities. Objectives for the other named executives include business unit scorecards for their roles, as well as personal objectives and leadership priorities.
Recommendation
The committee and the Board assess the performance of the CEO.
The CEO assesses the performance of his direct reports, including the other named executives, and makes compensation recommendations to the committee.
The committee recommends compensation awards for the CEO and other named executives to the Board. The committee seeks independent advice from its external consultant and other advisors, but is responsible for making its own decisions and recommendations to the Board.
The committee bases its recommendations on the relevant performance period, and not on the number, term or current value of any outstanding compensation previously awarded or gains an executive may have realized in prior years. This includes ESUs, stock options or other forms of compensation. The committee believes that reducing or limiting grants or awards based on prior gains would unfairly penalize the executive and could detract from the incentive to continue to deliver strong performance. Similarly, it does not take into account the value of long-term incentive awards it grants in a given year to offset less-than-expected returns from awards granted in prior years.
Approval
The Board reviews the recommendations by the committee, and approves all executive compensation decisions.
68 -- TransCanada PipeLines Limited
Benchmarking
We benchmark our compensation for named executives against a comparator group of companies to stay competitive with the market. Management reviews the comparator group with its external consultant every year. The committee reviews and approves the comparator group every year.
Our 2012 comparator group consists of 24 Canadian companies representing two industry sectors:
| Oil & Gas | Pipeline & Utility | |
| BP Canada Energy Company | Alliance Pipeline Ltd. | |
| Canadian Natural Resources Ltd. | ATCO Ltd. | |
| Cenovus Energy Inc. | Capital Power Corporation | |
| Chevron Canada Ltd. | Enbridge Inc. | |
| ConocoPhillips Canada | EPCOR Utilities Inc. | |
| Devon Canada Corporation | FortisAlberta Inc. | |
| Encana Corporation | Kinder Morgan Canada Inc. | |
| ExxonMobil Canada Ltd. | Spectra Energy Corporation (Canada) | |
Husky Energy Inc. | TransAlta Corporation | |
| Imperial Oil Ltd. | ||
| Nexen Inc. | ||
| Shell Canada Ltd. | ||
| Suncor Energy Inc. | ||
| Syncrude Canada Ltd. | ||
| Talisman Energy Inc. | ||
Note
- •
- In April 2012, ConocoPhillips received approval to split into two companies. The refining company is called Phillips 66 and the oil producing company kept the ConocoPhillips name.
These Canadian-based energy companies are generally similar to us in size and scope and we compete with them for executive talent. All of the companies have capital intensive, long cycle businesses that operate either in the Canadian oil and gas industry or the North American pipeline, power and utility industry.
| Profiles At December 31, 2011 | TransCanada | Comparator group | ||||
| Industry | North American | North American pipelines, power, utilities | ||||
| pipelines, power | Canadian oil and gas | |||||
| Location | Calgary, Alberta | Mainly Alberta | ||||
Median | 75th percentile | |||||
| Revenue | $7.8 billion | $8.6 billion | $19.4 billion | |||
| Market capitalization at December 31, 2012 (Monthly closing price of shares × shares outstanding for the most recent quarter) | $33.2 billion | $19.8 billion | $33.6 billion | |||
| Assets | $47.3 billion | $20.3 billion | $30.1 billion | |||
| Employees | 4,314 | 3,067 | 5,276 | |||
Note
- •
- Comparator group scope information reflects 2011 data, unless otherwise noted, as this is the most current information available. For comparability, theTransCanada scope information reflects 2011 data as well.
2012 Annual information form -- 69
We benchmark each named executive position against similar positions in the comparator group. Competitive market data on the comparator group gives the committee and the Board an initial reference point for determining executive compensation.
Total direct compensation is generally set according to the following guidelines:
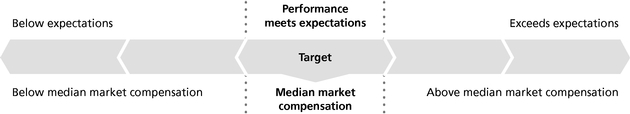
SeeComponents on page 71 for more information about total direct compensation.
Aligning the interests of executives and shareholders
We have share ownership requirements to align the interests of our executives and shareholders. The minimum requirements are significant and vary by executive level:
| Executive level | Required ownership (multiple of base salary) | |
| Chief Executive Officer | 4x | |
| Executive Vice-Presidents | 2x | |
| Senior Vice-Presidents | 1x | |
Executives have five years to meet the requirement, and can accumulate eligible shares and unvested ESUs to meet the requirements within the following limits:
| % of executive's total share ownership | ||
| Eligible shares • TransCanada shares • units of any TransCanada sponsored limited partnership | 50% or more | |
| Unvested ESUs | up to 50% | |
The committee reviews share ownership levels every year. It may use its discretion when assessing compliance if ownership levels fall below the minimum because of fluctuations in share price.
Executives must 'buy and hold' 50% of all stock options they exercise until they meet their share ownership requirement.
All of the named executives met their share ownership requirements in 2012. See theExecutive profilesstarting on page 86 for their current ownership.
70 -- TransCanada PipeLines Limited
COMPONENTS
Total direct compensation includes fixed and variable pay. Base salary is the only form of fixed compensation. Variable compensation includes our short and long-term incentive plans.
| Element | Form | Performance period | Objective | |||
| base salary (fixed) | cash | • one year | • provide a certain level of steady income • attract and retain executives | |||
| short-term incentive (variable) | cash | • one year | • motivate executives to achieve key annual business objectives • reward executives for relative contribution to TransCanada • align interests of executives and shareholders • attract and retain executives | |||
| long-term incentive (variable) | ESUs | • three-year term • vesting at the end of the term if performance conditions are met | • motivate executives to achieve medium-term business objectives • align interests of executives and shareholders • attract and retain executives | |||
| stock options | • seven-year term • one-third vest each year beginning on the first anniversary of the grant date | • motivate executives to achieve long-term sustainable business objectives • align interests of executives and shareholders • attract and retain executives | ||||
We also offer indirect compensation which includes retirement benefits, other benefits and perquisites. See pages 78 and 101 for more information.
2012 Annual information form -- 71
Fixed compensation
Base salary
Base salaries for executive positions are managed within a range where reference points, called guideposts, are generally aligned to median base salary levels in our comparator group. Management conducts a competitive market compensation review with its external consultant every year to align the base salary structure with the market and ensure that guideposts are aligned with reference to the pay levels at the market median.
Actual base salaries are determined within ±10% of the guidepost. Increases in base salary for the named executives are based on their performance, competitive market data and compensation relative to other executives. Base salary adjustments typically go into effect on March 1.
Variable or at-risk compensation
Variable compensation accounts for a significant portion of executive pay, and increases by executive level. Market data is used to establish short and long-term incentive targets for each executive role. Target awards are expressed as a percentage of base salary and are determined with reference to median market levels in our comparator group. While targets are reviewed annually against the competitive market data, they are not expected to change year-to-year unless the role changes or is reassessed against market conditions.
The table below shows the short-term incentive target and the long-term incentive target range for each named executive in 2012. Beginning in 2013, the Board approved an adjustment to the long-term incentive target ranges for our executive leadership team to more closely align with median levels in our comparator group. The new ranges for 2013 are summarized in the table below.
| Long-term incentive target range (% of base salary) | ||||||||||||||
| 2012 | 2013 | |||||||||||||
Short-term incentive target (% of base salary) | Minimum | Target | Maximum | Minimum | Target | Maximum | ||||||||
| President & Chief Executive Officer (Russell K. Girling) | 100% | 225% | 275% | 325% | 300% | 350% | 400% | |||||||
| Executive Vice-President & Chief Financial Officer (Donald R. Marchand) | 65% | 150% | 200% | 250% | 225% | 275% | 325% | |||||||
| President, Energy & Oil Pipelines (Alexander J. Pourbaix) | 75% | 200% | 250% | 300% | 275% | 325% | 375% | |||||||
| Executive Vice-President, Operations & Major Projects (Gregory A. Lohnes) | 65% | 150% | 200% | 250% | 225% | 275% | 325% | |||||||
| President, Natural Gas Pipelines (Karl Johannson) | 65% | 150% | 200% | 250% | 225% | 275% | 325% | |||||||
Executive Vice-President, Operations & Major Projects (former) (Donald M. Wishart) | 65% | 150% | 200% | 250% | – | – | – | |||||||
72 -- TransCanada PipeLines Limited
Short-term incentive
The short-term incentive plan is designed to attract and retain executives, and motivate them to achieve key annual business objectives. It rewards executives for their relative contributions to TransCanada and aligns interests of executives with shareholders.
Annual cash awards were made to the named executives based on a formula that takes into account:
- •
- base salary and the short-term incentive target – market competitive and expressed as a percentage of base salary – for each role
- •
- individual contributions and achievements – expressed as an individual performance adjustment factor (PAF) determined for each named executive, and
- •
- corporate performance against objectives – expressed as the CAF. Short-term incentive awards are paid as a lump sum cash payment in March following the performance year.

Individual performance
Each named executive is assessed based on performance for the year relative to performance standards and objectives established at the beginning of each year. Awards are calculated using the base salary in effect for the named executive on December 15 of the performance year. The committee and Board can use discretion to adjust the calculated amounts if circumstances warrant.
| Performance level | Individual PAF range | Description | ||
| Exceeds most or all standards | 1.8 - 2.0 | Tangible contributions to the business with several examples that had a significant impact beyond normal expectations | ||
| Exceeds some standards | 1.4 - 1.7 | Fully satisfactory effort with contributions beyond normal expectations | ||
| Meets standards | 0.9 - 1.3 | Fully satisfactory effort, either met all performance expectations or a combination of met, not met and exceeded expectations that when taken together produce an overall satisfactory outcome | ||
| Standards not met | 0 - 0.8 | Future success depends on improving level of performance – no payout | ||
2012 Annual information form -- 73
Corporate performance
The Board approves a CAF of 0 to 1.2 based on corporate performance against objectives established at the beginning of each year. A CAF of 1.0 reflects target performance. The assessment is based 50% on financial performance, and 50% on operational, growth and other business considerations.
| Performance level | CAF range | Description | ||
| Exceeds most or all standards and/or a transformational corporate event is achieved | 1.11 - 1.20 | Exceptional business results with several examples that had a significant impact beyond normal expectations and/or a corporate event that had a transformational impact | ||
| Exceeds some standards | 1.01 - 1.10 | Fully satisfactory results Met or exceeded all material performance standards, with several examples of significant positive business outcomes | ||
| Meets standards | 1.00 | Fully satisfactory results, either met all performance expectations or a combination of met, not met and exceeded expectations that when taken together produce an overall satisfactory outcome | ||
| Some standards not met | 0.50 - 0.99 | Did not meet some expectations Satisfactory performance but partial payout is appropriate | ||
| Standards not met | Below 0.50 | Unacceptable performance – no payout | ||
Short-term incentive changes in 2013
Beginning in 2013, the Board changed the methodology it will use to calculate short-term incentive awards as follows:
- •
- Awards will range from 0 to 200% of the short-term incentive target based on the level of corporate and business unit/individual performance. Awards will be 50% of the target if performance meets threshold standards, 100% for target performance, and 200% of the target for exceptional performance relative to pre-determined standards. There is no payout if overall performance is below the threshold.
- •
- Awards will be calculated based on corporate performance and business unit/individual performance. The corporate and business unit/individual factors will be weighted for each executive and then added together to determine the overall award.
- •
- As was previously the case, the Board has the discretion to increase or decrease the amount of the calculated award if circumstances warrant.
Annual cash awards will be made to the named executives based on the following formula:

74 -- TransCanada PipeLines Limited
Awards for 2013 performance will be based on the following target levels and performance weightings:
| Performance weighting | ||||||||
| Short-term incentive target (% of base salary) | Payout range (% of target) | Corporate | Business unit/ individual | |||||
| President & Chief Executive Officer (Russell K. Girling) | 100% | 0 – 200% | 75% | 25% | ||||
Executive Vice-President & Chief Financial Officer (Donald R. Marchand) | 65% | 0 – 200% | 50% | 50% | ||||
| President, Energy & Oil Pipelines (Alexander J. Pourbaix) | 75% | 0 – 200% | 50% | 50% | ||||
| Executive Vice-President, Operations & Major Projects (Gregory A. Lohnes) | 65% | 0 – 200% | 50% | 50% | ||||
| President, Natural Gas Pipelines (Karl Johannson) | 65% | 0 – 200% | 50% | 50% | ||||
Long-term incentive
Each executive role is assigned a target and an associated range for the long-term incentive award, expressed as a percentage of base salary. Each year, the committee and the Board grant long-term incentive awards to the named executives based on their assessment of individual performance and potential to contribute to TransCanada's future success.
Beginning in 2013, the Board approved an adjustment to the long-term incentive target ranges for our executive leadership team. For more details, seeVariable or at-risk compensation on page 72. As of 2012, the targeted allocation of long-term incentive awards for our executive leadership team is 50% each to ESUs and stock options. Mr. Girling's long-term incentive award allocation is adjusted as necessary to meet the limit under the terms of the stock option plan that no one participant can be awarded more than 20% of the total number of options granted in a given year.
Executive share units
These are notional share units granted under the ESU plan. ESUs accrue dividend equivalents and vest on December 31 at the end of the three-year performance period, depending on how well we perform against targets established at the beginning of the period.
ESU awards are paid out in a lump sum cash payment in the first quarter following the end of the performance period.
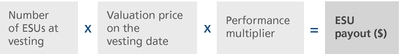
Notes
- •
- Number of ESUs at vesting is the number of ESUs originally granted plus ESUs earned as dividend equivalents during the three-year performance period.
- •
- Valuation price on the vesting date is the volume-weighted average closing price of TransCanada shares for the 20 trading days immediately prior to and including the vesting date (we used a 5-day weighted average prior to awards granted in 2012).
- •
- Starting in 2012, the committee and the Board approved a change to the ESU measures to adopt relative TSR as the single performance measure and adjust the vesting range to introduce a floor of 50% of target, while keeping the maximum award at 150% of target.
2012 Annual information form -- 75
The performance multiplier is determined based on the guidelines in the table below.Relative TSR is calculated using the 20-day volume weighted average share price at the end of the three-year performance period.
| If TransCanada's relative TSR is | Then the following ESUs vest for payment | |||
| At or below the 25th percentile of the ESU peer group (threshold) | 50% of ESUs vest | We calculate the number of ESUs that vest using a straight-line interpolation if performance is between: | ||
| At the 50th percentile of the ESU peer group (target) | 100% of ESUs vest | • threshold andtarget, or • target andmaximum | ||
| At or above the 75th percentile of the ESU peer group (maximum) | 150% of ESUs vest | |||
Prior to 2012, ESU awards were granted with multiple performance measures and relative weightings (see page 84 for more information).
The Board may use its discretion to adjust the performance multiplier if it deems it appropriate based on market factors or other extenuating circumstances.
The committee and Board amended the retirement provision under the plan, starting with the 2012 grant. Unvested units will continue to mature according to the terms of the plan rather than be paid out on a prorated basis at the time of retirement. The final award will be prorated for the period of employment up to the retirement date.
Stock options
Shareholders first approved our stock option plan in 1995, and the plan was last approved in 2010. We are required to bring the plan to shareholders for approval every three years. Under the terms of the plan, the committee approves the granting of stock options to our executive-level employees and no participant can be awarded more than 20% of the total number of stock options granted in a given year. In addition, the total number of shares that can be reserved for issuance to insiders, or issued to insiders within any one-year period, is limited to 10% or less of our issued and outstanding shares. There are no other restrictions on the number of options that may be granted to insiders.
Vesting
Stock options vest one third each year, beginning on the first anniversary of the grant date and have a seven-year term.
Certain executives are limited to trading TransCanada shares in four windows (known asopen trading windows), which are approved annually. If the expiry date of a stock option does not fall during an open trading window, or falls within the first five days of an open trading window, the expiry date is extended to 10 business days after the next window opens.
Exercise price
The exercise price of an option is the closing market price of TransCanada shares on the TSX on the last trading day immediately preceding the grant date. Option holders only benefit if the market value of our shares exceeds the exercise price at the time they exercise the options.
Adjustments
If, before the exercise of any option:
- •
- the shares are consolidated, subdivided, converted, exchanged, reclassified or in any way substituted, or
- •
- a stock dividend that is not in place of an ordinary course cash dividend is paid on the shares, the number of shares subject to such option will be adjusted under the terms of the plan when exercised.
76 -- TransCanada PipeLines Limited
More about the stock option plan
Options cannot be transferred or assigned to another person. A personal representative can exercise options on behalf of the holder if he or she dies or is unable to manage their affairs.
The committee has the authority to suspend or discontinue the plan at any time without shareholder approval. Management does not have this right, and cannot make changes to the plan. The committee can recommend to the Board for approval certain amendments to the plan, or any stock option grant without shareholder approval, provided they are to:
- •
- clarify an item
- •
- correct an error or omission
- •
- change the vesting date of an existing grant, or
- •
- change the expiry date of an outstanding option to an earlier date.
The committee and Board amended the retirement provision under the plan, starting with the 2012 grant. Outstanding stock options will continue to vest beyond the retirement date rather than vest immediately on the date of retirement. These stock options will expire on the original expiry date set by the committee or three years from the date of retirement (whichever is earlier). If there is less than six months between the vesting date and the expiry date, the expiry date is extended for six months from the final vesting date of the options.
We did not obtain shareholder approval for this amendment because it did not constitute an amendment under the plan or the rules of the TSX that required shareholder approval.
The committee cannot make any amendments to the plan that adversely affect the holders' rights relating to any previously granted options without their consent.
According to the rules of the TSX, the plan requires certain amendments to be approved by shareholders, including:
- •
- increasing the number of shares available for issue under the plan
- •
- lowering the exercise price of a previously granted option
- •
- canceling and reissuing an option, or
- •
- extending the expiry date of an option.
For more details on stock options, seeEquity compensation plan informationon page 100.
See theCompensation on termination table on page 103 for the effect of certain employment events on participants' entitlements under the plan.
2012 Annual information form -- 77
Retirement benefits
Defined benefit plan
Our Canadian defined benefit (DB) plan includes a registered pension plan and a supplemental pension plan for eligible employees.
Participation in the DB plan is mandatory once an employee has 10 years of continuous service. All of the named executives participate in the DB plan.
Normal retirement for participants is when they turn 60, or between 55 and 60 if their age and years of continuous service add up to 85 points. The retirement benefit is calculated as follows:

Notes
- •
- Highest average earnings is the average of an employee's best 36 consecutive months of pensionable earnings in their last 15 years of employment.Pensionable earnings means an employee's base salary plus the annual cash bonus up to a pre-established maximum, expressed as a percentage of base salary. This is 100% for the CEO and 60% for the other named executives, as determined by TransCanada. Pensionable earnings do not include any other forms of compensation.
- •
- YMPE is the Year's Maximum Pensionable Earnings under the Canada/Québec Pension Plan.
- •
- Final average YMPE is the average of the YMPE in effect for the latest calendar year from which earnings are included in employees'highest average earnings calculation plus the two previous years.
- •
- Credited service is the employee's years of credited pensionable service in the plan. Registered DB plans are subject to a maximum annual benefit accrual under theIncome Tax Act (Canada). As this is currently $2,697 for each year of credited service, participants cannot earn benefits in the registered plan on any compensation that is higher than approximately $169,000 per year.
Participants can retire between 55 and 60, but the benefit is reduced by 4.8% per year for each year until they reach age 60 or 85 points, whichever is earlier. They can retire 10 years prior to normal retirement age, however the benefit is reduced by an actuarial equivalence from age 55.
Although our DB plan is non-contributory, participants can decide to make pension contributions to an enhancement account for buying ancillary or 'add on' benefits within the registered pension plan. The DB plan is integrated with the Canada/Québec Pension Plan benefits.
78 -- TransCanada PipeLines Limited
Supplemental pension plan
The DB pension plan uses a hold harmless approach, where the maximum amount allowed under theIncome Tax Act (Canada) is paid from the registered pension plan and the remainder is paid from the supplemental pension plan. The supplemental pension plan is funded through a retirement compensation arrangement under the Income Tax Act (Canada). Currently there are approximately 600 participants in the supplemental pension plan (with pensionable earnings exceeding approximately $169,000 per year) including the named executives.
Contributions to the fund are subject to Board approval, and are based on an actuarial valuation of the supplemental pension plan obligations each year, calculated as though the plan were terminating at the beginning of the calendar year.
Effective 2012, solely at the discretion of the Board, our funding practice for the supplemental pension plan was revised to align it generally with the registered pension plan wherein annual funding approximates current year service cost accruals and the five-year amortization of deficits.
The DB plan does not generally recognize past service, but the committee has used its discretion in the past to grant additional years of credited service to senior executives under the supplemental pension plan. See theDefined benefit pension plan table and footnotes on page 101 for details.
All pension plan participants, including our named executives, receive the normal form of pension when they retire:
- •
- monthly pension for life, and 60% is paid to the spouse after the employee dies, or
- •
- if the employee is not married, the monthly pension is paid to the employee's beneficiary or estate for the balance of the 10 years, if the employee dies within 10 years of retirement.
Participants can choose a different form of payment, but must complete waivers, as required by law. Options include:
- •
- increasing the percentage of the pension value that continues after they die
- •
- adding a guarantee period to the pension, or
- •
- transferring the lump sum commuted value of the registered pension plan to a locked-in retirement account up to certain tax limits and the excess is paid in cash. Effective January 1, 2012, subject to company discretion, the supplemental pension plan commuted value may also be transferred and paid in cash.
Other benefits
All employees, including the named executives, receive other benefits such as traditional health and welfare programs that are based on competitive market practices and help to attract and retain talent.
Perquisites
Named executives receive a limited number of perquisites, including:
- •
- a flexible perquisite allowance of $4,500 that the executive can use at his discretion
- •
- a limited number of luncheon and/or recreational club memberships, based on business needs
- •
- a reserved parking space valued at $5,628, and
- •
- an annual car allowance of $18,000.
All perquisites provided to the named executives have a direct cost to TransCanada and are valued on this basis.
The committee also reviews the named executives' expenses and use of the corporate aircraft every year. The named executives can only use the corporate aircraft when it is integral to, and directly related to, performing their jobs.
2012 Annual information form -- 79
COMPENSATION DECISIONS IN 2013
The Board made a number of compensation decisions in 2013: base salary adjustments, short-term incentive awards for 2012 performance and long-term incentive awards based on their assessment of individual performance and to recognize potential contributions to TransCanada's future success. You can find more details in theExecutive profilesstarting on page 86.
The Board also determined the performance multiplier for the 2010 ESU awards to calculate the number of units that vest for payment for the three-year performance period ended December 31, 2012 (see page 84 for details).
Base salary
Every year, management conducts a market compensation review with its external consultant to align the guideposts with reference to median base salary levels in our comparator group. Four of our named executives received an increase to base salary to maintain competitiveness with our comparator group and recognize proficiency in their roles. The average annual increase was 4.5%. Mr. Girling's base salary positioning against our comparator group was unchanged so it was maintained at the existing (2012) level. Base salary adjustments go into effect on March 1, 2013.
Short-term incentive
Short-term incentives were determined in February 2013 for performance in 2012, based on individual and corporate performance. The Board also approved our 2013 annual corporate objectives, which continue to focus on financial, growth and operational results that support our core strategies.
Individual performance
The named executive's short-term incentive awards for 2012 performance were based on their target (expressed as a percent of base salary), key business results for the year, as well as corporate performance. You can find more details in the executive profiles that follow.
Corporate performance
The 2012 CAF was based 50% on our financial performance, and 50% on operational, growth and other business considerations. The tables below show our objectives and results for 2012.
After considering these performance results, the Board assigned a CAF of 0.90, which is below target. This rating provided context for the 2012 short-term incentive award for all employees.
80 -- TransCanada PipeLines Limited
Financial (50% weighting)
You can find definitions of these terms and more information about our financial and business performance in our 2012 MD&A (on www.transcanada.com and www.sedar.com).
| Key financial measures($Cdn, in millions) | Objectives | 2012 results | 2011 results | 2010 results | ||||
| Comparable earnings | 1,549 | 1,330 | 1,559 | 1,357 | ||||
| Funds generated from operations | 3,447 | 3,284 | 3,451 | 3,161 | ||||
| Comparable earnings before interest and taxes | 3,231 | 2,870 | 3,216 | 2,526 | ||||
| Key per share measures($Cdn) | ||||||||
| Comparable earnings per share – Basic | 2.20 | 1.89 | 2.22 | 1.97 | ||||
| Funds generated from operations per share – Basic | 4.90 | 4.66 | 4.92 | 4.58 | ||||
Notes
- •
- We calculatecomparable earnings per share andfunds generated from operations per share using the weighted average number of our shares outstanding: 705 million in 2012, 702 million in 2011 and 691 million in 2010.
- •
- Comparable earnings, comparable earnings before interest and taxes andcomparable earnings per share exclude specified items which are not considered part of the underlying operations during the year in which the items are recorded in net income. These specified items primarily include the valuation provision for the Mackenzie Gas Project recorded in 2010, the Sundance A PPA arbitration decision recorded in 2012 and unrealized gains and losses in each year from changes in the fair value of certain derivatives used to manage our exposure to certain financial and commodity price risks.
- •
- Comparable earnings, funds generated from operations, comparable earnings before interest and taxes, comparable earnings per share andfunds generated from operations per share are non-GAAP measures and do not have any standardized meanings prescribed by GAAP (see Appendix B for more information).
The Board considered that our 2012 performance was below the financial objectives that were set at the beginning of 2012. Comparable earnings and comparable earnings per share were below targets of $1,549 million and $2.20. This is due largely to delays in the refurbishment of Bruce Power's Units 1 and 2, lower revenues from our U.S. natural gas pipelines, the Sundance A PPA force majeure, and a delay until 2013 of the NEB's decision with respect to the 2012-2013 Canadian Mainline tolls application. Funds generated from operations and funds generated from operations per share were lower than our targets as a result of lower comparable earnings.
2012 Annual information form -- 81
Operational, growth and other business considerations (50% weighting)
| Core strategies | Results in 2012 | |
| Maximize the full-life value of our infrastructure assets and commercial positions | • Resolution of key issues including: • Sundance A arbitration decision requiring that the unit be rebuilt preserving future value | |
| • Favorable ruling on the treatment of capacity market price issues in New York | ||
| • Tolling settlements with Northern Border and ANR Storage Company | ||
| • Bruce Power West Shift Plus life extension outage on Unit 3 | ||
| • Shale gas connections on several pipeline systems | ||
| • Alberta System expansions – supply connections and oil sands market development | ||
| • Challenges: | ||
| • Delay of NEB decision with respect to the 2012-2013 Canadian Mainline tolls application | ||
| • Decline in ANR and Great Lakes revenues | ||
| Commercially develop and build new asset investment programs | • $700 million of major projects completed, largely on time and on budget • Bruce Power Units 1 and 2 successfully returned to commercial operation • Began construction of the Gulf Coast Project | |
| • Keystone XL Pipeline Nebraska permitting on schedule | ||
| • Challenges: | ||
| • Bruce Power Units 1 and 2 restarts completed but later than expected | ||
| Cultivate a focused portfolio of high quality development options | • Secured $4 billion (TransCanada interest $2.5 billion) in crude, bitumen and diluent pipeline projects • Awarded $1.9 billion in new infrastructure projects in Mexico | |
| • Formed the Coastal GasLink partnership with Shell to move Alberta System gas to their proposed west coast LNG project | ||
| • Signed a contract with the Ontario Power Authority to develop, own and operate the Napanee Generating Station, a 900 MW natural gas-fired power plant in eastern Ontario. The Napanee facility replaces a previous facility planned for Oakville that was cancelled by the Ontario government | ||
| Maximize our competitive strengths | • Strong stakeholder relationships • Top employee safety performance • Met or exceeded all asset reliability targets | |
| • Managed non-flow through costs to meet stretch targets | ||
| • Maintained 'A' grade credit rating and a strong balance sheet | ||
Based on these results, the Board determined that TransCanada's growth, operational and other performance met or exceeded expectations in 2012.
82 -- TransCanada PipeLines Limited
Long-term incentives
Long-term incentives were awarded in 2013 based on assessments by the Board and committee of each named executive's individual performance and potential to contribute to TransCanada's future success. The long-term incentive awards granted to our named executives were all within the target range.
Long-term incentives awarded in 2013 to our named executives were allocated 50% each to ESUs and stock options. Mr. Girling's long-term incentive award was allocated 58% to ESUs and 42% to stock options to meet the limit under the terms of the stock option plan that no one participant can be awarded more than 20% of the total number of options granted in a given year (see Mr. Girling's profile on page 87).
Executive share units
The committee and the Board approved a 2013 ESU grant as follows:
| Performance measure | Weighting | Measurement period | ||
| Relative TSR | 100% | January 1, 2013 to December 31, 2015 | ||
You can find more information about our ESU plan on page 75.
Stock options
The committee and Board approved a new valuation methodology to determine the value of stock option awards starting in 2012. We calculate TransCanada's accounting value for stock option awards using the Binomial valuation model, which is a generally accepted valuation method for stock options. The accounting value is used for both compensation and financial reporting purposes.
The committee and Board approved a grant of stock options on February 15, 2013, at an exercise price of $47.09. They reviewed the valuation prepared by management's external consultant when determining the number of stock options to grant to our named executives and used the following key assumptions to determine the option fair value:
- •
- an 18% volatility of the underlying shares (blend of historic and implied volatility)
- •
- a dividend yield of 3.65%
- •
- a risk-free interest rate of 1.65%, and
- •
- an expected life of 6.0 years based on historical data on exercising options.
You can find more information about our stock option valuation on page 95.
2012 Annual information form -- 83
PAYOUT OF 2010 EXECUTIVE SHARE UNIT AWARD
Performance multiplier
The ESU award granted in 2010 vested on December 31, 2012, and will be paid in March 2013. This award provided for vesting from 0 to 150% of units based on the Board's assessment of how well we performed against pre-established performance measures over the course of the three-year period. ESU payouts were calculated using a performance multiplier of 1.11. The Board considered the following results to determine the value at vesting:
| Performance level targets for 2010 ESU award | ||||||||||||||||
| Measure | Period | Threshold | Target | Maximum | Actual performance | Multiplier | Weighting | Weighted multiplier | ||||||||
| Absolute TSR | January 2010 to December 2012 | 14% | 24% | 39% | 47% | 1.5 | 30% | 0.45 | ||||||||
| Relative TSR against the peer | ||||||||||||||||
| group (see below) (based on $46.98, the 5-day volume weighted average closing price of TransCanada shares on the TSX at December 31, 2012) | January 2010 to December 2012 | at least the 25th percentile | at least the 50th percentile | at least the 75th percentile | P46 | 0.9 | 30% | 0.28 | ||||||||
| Earnings per share (comparable) | Cumulative annual results (2010 to 2012) | $5.88 | $6.24 | $6.73 | $6.08 | 0.8 | 6.25% | 0.05 | ||||||||
| Net income (excluding mark-to-market adjustments) (millions) | Cumulative annual results (2010 to 2012) | $4,055 | $4,301 | $4,645 | $4,104 | 0.6 | 6.25% | 0.04 | ||||||||
| Funds generated from operations per share (equity method) | Cumulative annual results (2010 to 2012) | $13.16 | $13.96 | $15.08 | $14.16 | 1.1 | 6.25% | 0.07 | ||||||||
| Funds generated from operations (millions) (equity method) | Cumulative annual results (2010 to 2012) | $9,069 | $9,620 | $10,389 | $9,896 | 1.2 | 6.25% | 0.07 | ||||||||
| Operational, growth and other business considerations | January 2010 to December 2012 | n/a | n/a | n/a | Meets target | 1.0 | 15% | 0.15 | ||||||||
| Performance multiplier | 1.11 | |||||||||||||||
Notes
- •
- Targets forcomparable earnings per share andfunds generated from operations per share were set in 2010 based on 689 million shares outstanding.
84 -- TransCanada PipeLines Limited
- •
- Comparable earnings per share andfunds generated from operations per share were calculated using the following weighted average shares outstanding: 691 million in 2010, 702 million in 2011, and 705 million in 2012.
- •
- Comparable earnings per share, funds generated from operations per share andfunds generated from operations are non-GAAP measures and do not have any standardized meanings prescribed by GAAP. You can find more information about these non-GAAP measures inAppendix B and in our 2012 MD&A.
- •
- Net income reflects net income attributable to common shares excluding mark-to-market adjustments.
- •
- ThePeer group for relative TSR consists of a group of publicly-traded peer companies that represents investment opportunities for equity investors seeking exposure to the North American pipeline, power and utility sector.
Peer group for relative TSR
| Canadian Utilities Ltd. | Enbridge Inc. | Southern Company | ||
| Dominion Resources Inc. | Entergy Corporation | Spectra Energy Corporation | ||
| DTE Energy Company | Exelon Corporation | TransAlta Corporation | ||
| Duke Energy Corporation | Fortis Inc. | Williams Companies Inc. | ||
| Emera Inc. | Sempra Energy | Xcel Energy Inc. | ||
Notes
- •
- Williams Companies (Williams) split its oil and gas production business in January 2012. The company's former exploration and production business, WPX Energy, Inc., trades on the NYSE. We have used a standard methodology to calculate the TSR for this company under a spin-off situation. The WPX transaction is treated as a dividend reinvested in Williams based on closing prices the day of the transaction.
- •
- Two peer companies originally approved for the 2010 grant were removed from our analysis: El Paso Corporation and Southern Union Company. Kinder Morgan Inc. completed its acquisition of El Paso Corporation in May 2012. Energy Transfer Equity, L.P. completed its merger with Southern Union Company in March 2012.
Our relative TSR was at about the median level (46th percentile). Over the three-year period our valuation metrics improved substantially relative to the peer group primarily due to our growing portfolio of commercially secured projects and positive future outlook. However, this was partially offset by the impact that lengthy regulatory proceedings, project delays and lower earnings had on our share price.
The Board determined thatOperational, growth and other business considerations over the three-year period met expectations. In addition to the 2012 results outlined on page 82, the Board also noted the following results for 2010 and 2011:
| Core strategies | Results in 2010 and 2011 | |
| Maximize the full-life value of our infrastructure assets and commercial positions | • Negotiated settlements with shippers on Alberta System, Foothills, ANR Storage, Tuscarora, Great Lakes, Northern Border and TransQuebec & Maritimes Pipeline • Secured additional supply and market connections on gas and oil pipelines | |
| Commercially develop and build new asset development programs | • Continued to successfully execute our large capital expenditure program • Most projects on time and, at or under budget | |
| • Completion of Keystone phases 1 and 2, Kibby Wind phases 1 and 2, Alberta System North Central Corridor, Bison pipeline, Halton Hills, Groundbirch and others | ||
| Cultivate a focused portfolio of high quality development options | • New projects included Canadian Solar, Hardisty Terminal, Bakken and Cushing marketlinks, Houston Lateral, and Horn River | |
| Maximize our competitive strengths | • Strong stakeholder relationships – under difficult circumstances (customers, media, government) • Breakthrough operational performance on several assets resulting in increased availability and lower costs • All safety and reliability targets were met or exceeded and operating costs were managed to below plan • Maintained 'A' credit rating | |
2012 Annual information form -- 85
Awards to named executives
The table below is a summary of the details of the original 2010 ESU award and the amount paid to each named executive when the award vested at the end of 2012:
| 2010 ESU award | 2010 ESU payout | |||||||||||
| Number of ESUs granted | Value of ESU award ($) | Number of ESUs at vesting (includes dividend equivalents to Dec. 31, 2012) | Performance multiplier | Value of ESU payout ($) | % of original award | |||||||
| Russell K. Girling | 58,708.415 | 2,100,000 | 66,435.017 | 3,464,440 | 165% | |||||||
| Donald R. Marchand | 6,933.184 | 248,000 | 7,845.662 | 409,134 | 165% | |||||||
Alexander J. Pourbaix | 41,934.582 | 1,500,000 | 47,453.584 | 1.11 | 2,474,600 | 165% | ||||||
| Gregory A. Lohnes | 17,193.179 | 615,000 | 19,455.969 | 1,014,586 | 165% | |||||||
| Karl Johannson | 11,182.555 | 400,000 | 12,654.283 | 659,893 | 165% | |||||||
| Donald M. Wishart | 30,402.572 | 1,087,500 | 34,403.848 | 1,794,085 | 165% | |||||||
Notes
- •
- Number of ESUs granted is the value of the ESU award divided by the valuation price of $35.77 (the volume-weighted average closing price of TransCanada shares on the TSX for the five trading days immediately prior to and including the grant date (January 1, 2010)).
- •
- Number of ESUs at vestingincludes an equivalent number of units for the final dividend that is declared as of December 31 but which has not been paid at the vesting date. The final dividend value is awarded in cash and has been converted to units and is reflected under Number of ESUs at vesting.
- •
- Value of ESU payout is calculated using the valuation price of $46.98 (the volume-weighted average closing price of TransCanada shares on the TSX for the five trading days immediately prior to and including the vesting date (December 31, 2012)).
EXECUTIVE PROFILES
This next section profiles each of the named executives, including their key results in 2012, details of their compensation for 2012 and the two previous fiscal years, their share ownership as at December 31, 2012, and base salary and long-term incentive awards for 2013.
86 -- TransCanada PipeLines Limited
 | Russell K. Girling PRESIDENT AND CHIEF EXECUTIVE OFFICER As President and Chief Executive Officer, Mr. Girling is responsible for our overall leadership and vision in developing with our Board our strategic direction, values and business plans. This includes overall responsibility for operating and growing our business while managing risk to create long-term sustainable value for our shareholders. |
2012 Key results
- •
- Secured significant new infrastructure projects that support future growth
- •
- Resolution of key issues (Sundance A, Ravenswood, Oakville)
- •
- Investor confidence leading to record share price
- •
- 2012 financial targets not met
- •
- Mr. Girling's performance is evaluated based on a combination of corporate performance, personal objectives and leadership.
- •
- The total short-term incentive award for 2012 performance was based on Mr. Girling's target of 100% of base salary. The Board considered Mr. Girling's key business results for the year (as noted) as well as corporate performance in determining the award.
- •
- Mr. Girling's 2012 short-term and long-term incentive awards as a percentage of 2012 base salary were 92% and 354%, respectively.
| Compensation(as at December 31) | 2012 | 2011 | 2010 | ||||
| Fixed | |||||||
| Base salary | $1,300,000 | $1,100,000 | $1,000,000 | ||||
| Variable | |||||||
| Short-term incentive | 1,200,000 | 1,350,000 | 1,100,000 | ||||
| Long-term incentive | |||||||
| ESUs | 2,530,000 | 2,700,000 | 2,100,000 | ||||
| Stock options | 2,070,000 | 900,000 | 1,254,000 | ||||
| Total direct compensation | $7,100,000 | $6,050,000 | $5,454,000 | ||||
| Change from last year | 17% | 11% | – | ||||
2012 Pay mix
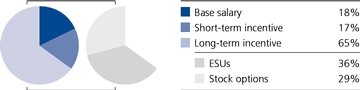
Share ownership
| Minimum level of ownership | Minimum value | Total ownership under the guidelines | Total ownership as a multiple of base salary | |||
| 4x | $5,200,000 | $7,243,433 | 5.6x | |||
2013 Compensation(as at March 1)
| Fixed | ||||||
| Base salary | $1,300,000 | |||||
| Variable (long-term incentive) | Long-term incentive mix | |||||
| ESUs | $3,000,000 | 58% | ||||
| Stock options | $2,200,000 | 42% | ||||
Mr. Girling's long-term incentive award was allocated 58% to ESUs and 42% to stock options to meet the limit under the terms of the stock option plan that no one participant can be awarded more than 20% of the total number of options granted in a given year.
Short-term incentive is attributed to the noted financial year, and is paid by March 15 of the following year.
Share ownership is based on the 20-day volume-weighted average closing price on the TSX of $46.13 for TransCanada shares, and $40.40 for units of TC PipeLines, LP on the NYSE as at December 31, 2012.
2012 Annual information form -- 87
 | Donald R. Marchand EXECUTIVE VICE-PRESIDENT AND CHIEF FINANCIAL OFFICER As Executive Vice-President and Chief Financial Officer, Mr. Marchand is responsible for financial reporting, taxation, finance, treasury, risk management and investor relations. |
2012 Key results
- •
- 'A' grade credit rating maintained
- •
- All financing requirements met with record low pricing
- •
- Shareholders/bondholders continue to support TransCanada as demonstrated through share price and credit spread performance
- •
- Successful transition to U.S. GAAP
- •
- Mr. Marchand's performance is evaluated based on a combination of business unit performance, personal objectives and leadership.
- •
- The total short-term incentive award for 2012 performance was based on Mr. Marchand's target of 65% of base salary. The Board considered Mr. Marchand's key business results for the year (as noted) as well as corporate performance in determining the award.
- •
- Mr. Marchand's 2012 short-term and long-term incentive awards as a percentage of 2012 base salary were 100% and 225%, respectively.
| Compensation(as at December 31) | 2012 | 2011 | 2010 | ||||
| Fixed | |||||||
| Base salary | $460,000 | $410,000 | $370,000 | ||||
| Variable | |||||||
| Short-term incentive | 460,000 | 450,000 | 299,250 | ||||
| Long-term incentive | |||||||
| ESUs | 517,500 | 525,000 | 248,000 | ||||
| Stock options | 517,500 | 175,000 | 320,400 | ||||
| Total direct compensation | $1,955,000 | $1,560,000 | $1,237,650 | ||||
| Change from last year | 25% | 26% | – | ||||
2012 Pay mix
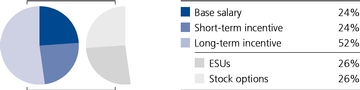
Share ownership
| Minimum level of ownership | Minimum value | Total ownership under the guidelines | Total ownership as a multiple of base salary | |||
| 2x | $920,000 | $1,009,593 | 2.2x | |||
2013 Compensation(as at March 1)
| Fixed | ||||||
| Base salary | $515,000 | |||||
| Variable (long-term incentive) | Long-term incentive mix | |||||
| ESUs | $708,131 | 50% | ||||
| Stock options | $708,130 | 50% | ||||
Short-term incentive is attributed to the noted financial year, and is paid by March 15 of the following year.
Share ownership is based on the 20-day volume-weighted average closing price on the TSX of $46.13 for TransCanada shares, and $40.40 for units of TC PipeLines, LP on the NYSE as at December 31, 2012.
88 -- TransCanada PipeLines Limited
 | Alexander J. Pourbaix PRESIDENT, ENERGY AND OIL PIPELINES As President, Energy and Oil Pipelines, Mr. Pourbaix is responsible for our power, non-regulated gas storage and oil pipeline businesses. |
2012 Key results
- •
- Secured $4 billion (TransCanada's interest $2.5 billion) of new oil pipeline projects
- •
- Resolution of key issues (Sundance A, Ravenswood, Oakville)
- •
- Bruce Power life extension programs completed on Units 3 and 4
- •
- Oil pipeline financial targets met, energy financial performance shortfall
- •
- Delay in restart of Bruce Power Units 1 and 2
- •
- Mr. Pourbaix's performance is evaluated based on a combination of business unit performance, personal objectives and leadership.
- •
- The total short-term incentive award for 2012 performance was based on Mr. Pourbaix's target of 75% of base salary. The Board considered Mr. Pourbaix's key business results for the year (as noted) as well as corporate performance in determining the award.
- •
- Mr. Pourbaix's 2012 short-term and long-term incentive awards as a percentage of 2012 base salary were 105% and 300%, respectively.
| Compensation(as at December 31) | 2012 | 2011 | 2010 | ||||
| Fixed | |||||||
| Base salary | $765,000 | $740,000 | $700,000 | ||||
| Variable | |||||||
| Short-term incentive | 800,000 | 1,050,000 | 798,000 | ||||
| Long-term incentive | |||||||
| ESUs | 1,147,500 | 1,665,000 | 1,500,000 | ||||
| Stock options | 1,147,500 | 555,000 | 649,600 | ||||
| Total direct compensation | $3,860,000 | $4,010,000 | $3,647,600 | ||||
| Change from last year | -4% | 10% | – | ||||
2012 Pay mix
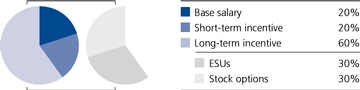
Share ownership
| Minimum level of ownership | Minimum value | Total ownership under the guidelines | Total ownership as a multiple of base salary | |||
| 2x | $1,530,000 | $2,160,848 | 2.8x | |||
2013 Compensation(as at March 1)
| Fixed | ||||||
| Base salary | $780,000 | |||||
| Variable (long-term incentive) | Long-term incentive mix | |||||
| ESUs | $1,267,500 | 50% | ||||
| Stock options | $1,267,500 | 50% | ||||
Short-term incentive is attributed to the noted financial year, and is paid by March 15 of the following year.
Share ownership is based on the 20-day volume-weighted average closing price on the TSX of $46.13 for TransCanada shares, and $40.40 for units of TC PipeLines, LP on the NYSE as at December 31, 2012.
2012 Annual information form -- 89
 | Gregory A. Lohnes EXECUTIVE VICE-PRESIDENT, OPERATIONS AND MAJOR PROJECTS (PRESIDENT, NATURAL GAS PIPELINES TO OCTOBER 31, 2012) As Executive Vice-President, Operations and Major Projects, Mr. Lohnes is responsible for designing, building, operating and maintaining all facilities and infrastructure. These responsibilities include engineering and technical services, project management, construction, field operations, community, safety and environment, and procurement and shared services. |
2012 Key results
as President, Natural Gas Pipelines
- •
- U.S. gas pipelines tolling settlements, including restructuring of offshore assets
- •
- Gas supply/market connections, capturing almost 100% of new gas in WCSB
- •
- Secured $1.9 billion in Mexican pipeline projects
- •
- Leadership of Canadian Mainline tolls application hearing process (decision delayed until 2013)
- •
- U.S. gas pipelines financial performance below targets
- •
- Mr. Lohnes' performance is evaluated based on a combination of business unit performance, personal objectives and leadership.
- •
- The total short-term incentive award for 2012 performance was based on Mr. Lohnes' target of 65% of base salary. The Board considered Mr. Lohnes' key business results for the year (as noted) as well as corporate performance in determining the award.
- •
- Mr. Lohnes' 2012 short-term and long-term incentive awards as a percentage of 2012 base salary were 82% and 196%, respectively.
| Compensation(as at December 31) | 2012* | 2011 | 2010 | ||||
| Fixed | |||||||
| Base salary | $575,000 | $510,000 | $500,000 | ||||
| Variable | |||||||
| Short-term incentive | 470,000 | 550,000 | 570,000 | ||||
| Long-term incentive | |||||||
| ESUs | 562,500 | 822,375 | 615,000 | ||||
| Stock options | 562,500 | 274,125 | 354,600 | ||||
| Total direct compensation | $2,170,000 | $2,156,500 | $2,039,600 | ||||
| Change from last year | 1% | 6% | – | ||||
| * In recognition of his appointment to Executive Vice-President, Operations and Major Projects on November 1, 2012, the Human Resources committee and Board increased Mr. Lohnes' annual base salary rate from $525,000 to $575,000. | |||||||
2012 Pay mix
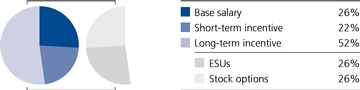
Share ownership
| Minimum level of ownership | Minimum value | Total ownership under the guidelines | Total ownership as a multiple of base salary | |||
| 2x | $1,150,000 | $1,536,119 | 2.7x | |||
2013 Compensation(as at March 1)
| Fixed | ||||||
| Base salary | $585,000 | |||||
| Variable (long-term incentive) | Long-term incentive mix | |||||
| ESUs | $658,125 | 50% | ||||
| Stock options | $658,125 | 50% | ||||
Short-term incentive is attributed to the noted financial year, and is paid by March 15 of the following year.
Share ownership is based on the 20-day volume-weighted average closing price on the TSX of $46.13 for TransCanada shares, and $40.40 for units of TC PipeLines, LP on the NYSE as at December 31, 2012.
90 -- TransCanada PipeLines Limited
 | Karl Johannson PRESIDENT, NATURAL GAS PIPELINES (SENIOR VICE-PRESIDENT, CANADIAN AND EASTERN U.S. NATURAL GAS PIPELINES TO OCTOBER 31, 2012) As President, Natural Gas Pipelines, Mr. Johannson is responsible for our natural gas pipeline and regulated natural gas storage businesses in Canada, the United States and Mexico. |
2012 Key results
as Senior Vice-President, Canadian and Eastern U.S. Natural Gas Pipelines
- •
- Supply and market connections in Alberta and N.E. British Columbia
- •
- Leadership of Canadian Mainline tolls applications process (decision delayed until 2013)
- •
- Alberta System component of Coastal GasLink project awarded in 2012
- •
- Met financial targets
- •
- Attracted new supply from Marcellus basin to the Canadian Mainline
- •
- Mr. Johannson's performance is evaluated based on a combination of business unit performance, personal objectives and leadership.
- •
- The total short-term incentive award for 2012 performance was prorated based on Mr. Johannson's target and base salary in his prior role as Senior Vice-President, Canadian and Eastern U.S. Natural Gas Pipelines and his target of 65% and base salary in his current role. The Board considered Mr. Johannson's key business results for the year (as noted) as well as corporate performance in determining the award.
- •
- Mr. Johannson's 2012 short-term and long-term incentive awards as a percentage of 2012 base salary were 87% and 168%, respectively.
| Compensation(as at December 31) | 2012* | 2011 | 2010 | ||||
| Fixed | |||||||
| Base salary | $465,000 | $360,000 | $350,000 | ||||
| Variable | |||||||
| Short-term incentive | 405,000 | 512,500 | 451,250 | ||||
| Long-term incentive | |||||||
| ESUs | 353,333 | 417,600 | 400,000 | ||||
| Stock options | 426,667 | 104,400 | 100,000 | ||||
| Total direct compensation | $1,650,000 | $1,394,500 | $1,301,250 | ||||
Change from last year | 18% | 7% | – | ||||
| * In recognition of his appointment to President, Natural Gas Pipelines on November 1, 2012, the Human Resources committee and Board increased Mr. Johannson's annual base salary rate from $365,000 to $465,000 and awarded him a special grant of stock options valued at $250,000. | |||||||
2012 Pay mix
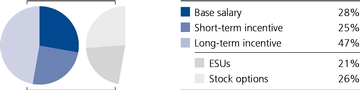
Share ownership
| Minimum level of ownership | Minimum value | Total ownership under the guidelines | Total ownership as a multiple of base salary | |||
| 2x | $930,000 | $1,360,060 | 2.9x | |||
2013 Compensation(as at March 1)
| Fixed | ||||||
| Base salary | $475,000 | |||||
| Variable (long-term incentive) | Long-term incentive mix | |||||
| ESUs | $558,135 | 50% | ||||
| Stock options | $558,134 | 50% | ||||
Short-term incentive is attributed to the noted financial year, and is paid by March 15 of the following year.
Share ownership is based on the 20-day volume-weighted average closing price on the TSX of $46.13 for TransCanada shares, and $40.40 for units of TC PipeLines, LP on the NYSE as at December 31, 2012.
2012 Annual information form -- 91
Executive compensation – 2012 details
All amounts are in Canadian dollars, unless otherwise indicated.
SUMMARY COMPENSATION TABLE
The table below is a summary of the compensation received by our named executives for the last three fiscal years ended December 31, 2012, 2011 and 2010.
| Non-equity incentive plan compensation | ||||||||||||||||||
Name and principal position | Year | Salary ($) | Share- based awards ($) | Option- based awards ($) | Annual incentive plans ($) | Long-term incentive plans ($) | Pension value ($) | All other compen- sation ($) | Total compen- sation ($) | |||||||||
| Russell K. Girling President & Chief Executive Officer | 2012 2011 2010 | 1,266,674 1,083,338 900,006 | 2,530,000 2,700,000 2,100,000 | 2,070,000 900,000 1,254,000 | 1,200,000 1,350,000 1,100,000 | 0 109,200 59,650 | 1,592,000 722,000 1,451,000 | 20,640 10,833 76,693 | 8,679,314 6,875,371 6,941,349 | |||||||||
Donald R. Marchand Executive Vice-President & Chief Financial Officer | 2012 2011 2010 | 451,674 403,338 320,004 | 517,500 525,000 248,000 | 517,500 175,000 320,400 | 460,000 450,000 299,250 | 0 31,080 30,560 | 356,000 241,000 639,000 | 86,784 4,033 3,075 | 2,389,458 1,829,451 1,860,289 | |||||||||
| Alexander J. Pourbaix President, Energy & Oil Pipelines | 2012 2011 2010 | 760,834 733,338 700,008 | 1,147,500 1,665,000 1,500,000 | 1,147,500 555,000 649,600 | 800,000 1,050,000 798,000 | 0 109,200 81,200 | 227,000 250,000 62,000 | 50,908 55,333 60,000 | 4,133,742 4,417,871 3,850,808 | |||||||||
Gregory A. Lohnes Executive Vice-President, Operations & Major Projects | 2012 2011 2010 | 530,834 508,334 465,006 | 562,500 822,375 615,000 | 562,500 274,125 354,600 | 470,000 550,000 570,000 | 0 33,600 40,125 | 533,000 119,000 414,000 | 10,968 5,083 4,563 | 2,669,802 2,312,517 2,463,294 | |||||||||
| Karl Johannson President, Natural Gas Pipelines | 2012 2011 2010 | 380,836 358,334 350,004 | 353,333 417,600 400,000 | 426,667 104,400 100,000 | 405,000 512,500 451,250 | 0 50,400 45,760 | 979,000 79,000 34,000 | 104,914 26,468 24,386 | 2,649,750 1,548,702 1,405,400 | |||||||||
Donald M. Wishart (Former) Executive Vice-President, Operations & Major Projects | 2012 2011 2010 | 540,000 600,000 587,502 | 750,000 1,125,000 1,087,500 | 750,000 375,000 362,500 | 409,550 660,000 641,250 | 0 50,400 43,750 | 74,000 76,000 280,000 | 51,349 48,000 26,875 | 2,574,899 2,934,400 3,029,377 | |||||||||
Notes
- •
- Mr. Lohnes was appointed Executive Vice-President, Operations and Major Projects on November 1, 2012. Amounts shown for 2012 include compensation earned for two months in his new position and 10 months in his previous position as President, Natural Gas Pipelines.
- •
- Mr. Johannson was promoted to President, Natural Gas Pipelines on November 1, 2012. Amounts shown for 2012 include compensation earned for two months in his new position and 10 months in his previous position as Senior Vice-President, Canadian and Eastern U.S. Gas Pipelines.
- •
- Mr. Wishart stepped down from his position as Executive Vice-President, Operations and Major Projects as of October 31, 2012. We retained Mr. Wishart in a part-time role as a special advisor beginning on November 1, 2012, and he will retire from TransCanada on December 31, 2013. Amounts shown for 2012 include compensation earned for two months in his new position and 10 months in his previous position.
92 -- TransCanada PipeLines Limited
- •
- Four of the six named executives were appointed to new positions on July 1, 2010. Amounts shown for 2010 include compensation earned for six months in the new position and six months in the previous position.
| Previous position | ||
| Mr. Girling | Chief Operating Officer | |
| Mr. Marchand | Vice-President, Finance & Treasurer | |
| Mr. Pourbaix | President, Energy & Executive Vice-President, Corporate Development | |
Mr. Lohnes | Executive Vice-President & Chief Financial Officer | |
- •
- When Mr. Girling was appointed President and CEO, he was also appointed to the Board as a director on July 1, 2010. Mr. Girling does not receive any director compensation.
- •
- Salary is the actual base salary earned during each of the three years. Mr. Wishart's 2012 salary reflects $500,000 earned from January 1, 2012 to October 31, 2012, in his capacity as Executive Vice-President, Operations & Major Projects. He earned $40,000 from November 1, 2012 to December 31, 2012, in his capacity as a part-time special advisor.
- •
- Share-based awards is the long-term incentive compensation that was awarded as ESUs. The number of ESUs granted is the value of the ESU award divided by the volume-weighted average closing price of TransCanada shares for the five trading days immediately prior to and including the grant date: $44.23 in 2012, $38.34 in 2011, and $35.77 for 2010.
- •
- Option-based awards is the long-term incentive compensation that was awarded as stock options. The exercise price is the closing market price of TransCanada shares on the TSX on the trading day immediately prior to the grant date: $41.95 in 2012, $37.93 in 2011 and $35.08 in 2010. SeeStock option valuation below for more information about the methodology.
- •
- Mr. Marchand: 47,500 stock options valued at $258,400
- •
- Mr. Pourbaix: 27,500 stock options valued at $149,600
- •
- Mr. Lohnes: 27,500 stock options valued at $149,600.
To recognize Mr. Johannson's promotion to President, Natural Gas Pipelines on November 1, 2012, the Board awarded him a special grant of 48,450 stock options on November 2, 2012, valued at $250,000 with an exercise price of $45.29.
To recognize Mr. Girling's promotion to President and CEO on July 1, 2010, the Board awarded him a special grant of 100,000 stock options on June 16, 2010, valued at $554,000 with an exercise price of $36.90.
The Board also awarded special grants of stock options on July 29, 2010, with an exercise price of $36.26 to three of the named executives to recognize their appointments on July 1, 2010:
- •
- Annual incentive plans is the short-term incentive award, paid as an annual cash bonus and attributable to the noted financial year. Payments are made in the first quarter of the following year.
- •
- Long-term incentive plans for 2010 and 2011 includes the value awarded from a grandfathered dividend-value plan under which grants are no longer made. The final dividend accrual was awarded for 2011. The Board determined an annual unit value of $1.68 per unit for 2011 and $1.07 per unit for 2010 be awarded. Amounts for 2010 were reduced by the following amounts to offset an unintended overpayment of the 2009 accrual paid in 2010:
- •
- $58,050 for Mr. Girling
- •
- $9,030 for Mr. Marchand
- •
- $7,740 for Mr. Johannson, and
- •
- $25,800 each for Mr. Pourbaix and Mr. Wishart.
SeeNon-equity long-term incentive plan below for more information about the plan.
- •
- Pension value includes the annual compensatory value from the DB pension plan. The annual compensatory value is the compensatory change in the accrued obligation and includes the service cost to TransCanada in 2012, plus compensation changes that were higher or lower than the base salary assumptions, and plan changes. SeeRetirement benefits below for more information.
- •
- All other compensation includes other compensation not reported in any other column for each named executive and includes:
- •
- payments to the named executives by any of our subsidiaries and affiliates (including directors' fees paid by affiliates and amounts paid for serving on management committees of entities that we hold an interest in). These include:
| 2012 | 2011 | 2010 | ||||
| Mr. Pourbaix | $43,500 | $48,000 | $60,000 | |||
| Mr. Wishart | 42,000 | 42,000 | 21,000 | |||
2012 Annual information form -- 93
- •
- matching contributions we made on behalf of the named executives under the employee stock savings plan:
| 2012 | 2011 | 2010 | ||||
| Mr. Girling | $12,178 | $10,833 | $9,000 | |||
| Mr. Marchand | 4,395 | 4,033 | 3,075 | |||
| Mr. Pourbaix | 7,408 | 7,333 | – | |||
| Mr. Lohnes | 5,107 | 5,083 | 4,563 | |||
| Mr. Johannson | 3,660 | 3,583 | 3,500 | |||
| Mr. Wishart | 5,349 | 6,000 | 5,875 | |||
- •
- cash payments if the named executive elected to receive the payment in lieu of his vacation entitlement from the previous year:
| 2012 | 2011 | 2010 | ||||
| Mr. Girling | $ 8,462 | $ – | $67,693 | |||
| Mr. Marchand | 7,096 | – | – | |||
Mr. Pourbaix | – | – | – | |||
| Mr. Lohnes | 1,962 | – | – | |||
| Mr. Johannson | 12,462 | 22,885 | 20,885 | |||
| Mr. Wishart | 4,000 | – | – | |||
- •
- Except for Mr. Marchand and Mr. Johannson, perquisites are not included because they are less than $50,000 and 10% of each named executive's total base salary in each of the three years. Perquisites for Mr. Marchand and Mr. Johannson in 2012 exceed this threshold. They include:
- •
- Mr. Marchand: a flexible perquisite allowance of $4,500, luncheon and club membership annual dues of $4,164, a reserved parking space valued at $5,628, a car allowance of $18,000 and a golf club share ownership of $43,000.
- •
- Mr. Johannson: a flexible perquisite allowance of $4,500, luncheon and club membership annual dues of $5,098, a reserved parking space valued at $5,628, a car allowance of $11,000, a residual value for a lease that expired under our discontinued executive auto lease program of $2,191 and a golf club share ownership of $60,375.
94 -- TransCanada PipeLines Limited
Additional notes to the summary compensation table
Stock option valuation
The amount underOption-based awards is calculated using the grant date fair value of the stock option award, as determined by the committee. For stock option grants prior to 2012, management's external consultant calculated a compensation value for TransCanada using the Binomial valuation model. The committee and Board used the higher of this compensation value or a 'floor-value' of 15% of the exercise price to determine the fair value of each stock option.
For accounting purposes, the grant date fair values determined for the annual stock option awards using the Black-Scholes model were $2.93 per stock option for 2011 and $6.04 per stock option for 2010. The fair value for the special stock option grant on July 29, 2010 was $4.04 and for the grant on June 16, 2010 was $4.63.
The committee and Board approved the Binomial valuation model as the methodology to determine stock option awards beginning in 2012. The Binomial valuation model is a generally accepted valuation method for stock options. Starting in 2012, the Binomial valuation model is used to calculate TransCanada's accounting value, which we now use for both compensation and financial reporting purposes. Each year, the committee and Board will review the valuation as prepared by management's external consultant. The value takes into account the historic and implied volatility of the underlying shares, dividend yield, risk-free interest rate, option term, vesting period, and expected life based on historical data on exercising options.
The table below is a summary of the binomial value, floor value (for grants in 2011 and 2010) and the final compensation value of the stock option awards granted in 2012, 2011 and 2010:
| Grant date | Exercise price ($) | Binomial value ($) | Floor value ($) | Compensation value of each stock option ($) | ||||
| November 2, 2012 | $45.29 | $5.16 | $ – | $5.16 | ||||
| February 17, 2012 | 41.95 | 5.37 | – | 5.37 | ||||
| February 18, 2011 | 37.93 | 2.30 | 5.69 | 5.69 | ||||
| July 29, 2010 | 36.26 | 2.61 | 5.44 | 5.44 | ||||
| June 16, 2010 | 36.90 | 2.66 | 5.54 | 5.54 | ||||
| February 26, 2010 | 35.08 | 2.32 | 5.26 | 5.26 | ||||
Total option exercises in 2012 (supplemental table)
The table below shows for each named executive:
- •
- the number of stock options exercised in 2012, and
- •
- the total value they realized when the options were exercised.
| Total stock options exercised (#) | Total value realized ($) | |||
| Russell K. Girling | 90,000 | $904,382 | ||
| Donald R. Marchand | 34,000 | 401,482 | ||
| Alexander J. Pourbaix | 90,000 | 896,887 | ||
| Gregory A. Lohnes | 64,000 | 774,376 | ||
| Karl Johannson | 40,000 | 453,007 | ||
| Donald M. Wishart | 55,000 | 573,314 | ||
2012 Annual information form -- 95
Non-equity long-term incentive plan
The 2010 and 2011 amounts underlong-term incentive plans in theSummary compensation table reflect the value awarded from a grandfathered dividend-value plan. Grants have not been made under the plan since 2003.
Under the plan, one unit from the dividend-value plan was granted in tandem with each stock option granted. The units had a term of 10 years from the date of the grant.
Each unit gave the holder the right to receive an annual unit value, as determined by the Board, in its discretion. The maximum annual unit value was equal to the dividend declared on one TransCanada common share in any year, and payments were made in the first quarter of the following year, generally by March 15. The last outstanding grant under this plan was eligible for the 2011 dividend accrual. The Board determined that $1.68 per unit (or 100% of the total declared dividend value in 2011) would be awarded for 2011. Payments for this final accrual were made in the first quarter of 2012.
The dividend-value plan was discontinued on December 31, 2011.
96 -- TransCanada PipeLines Limited
INCENTIVE PLAN AWARDS
Outstanding option-based and share-based awards
The table below shows all outstanding option-based and share-based awards previously granted to the named executives that were still outstanding at the end of 2012. Year-end values are based on $47.02, the closing price of TransCanada shares on the TSX at December 31, 2012.
| Option-based awards | Share-based awards | |||||||||||||
| Name | Number of securities underlying unexercised options (#) | Option exercise price ($) | Option expiration date | Value of unexercised in-the-money options ($) | Number of shares or units of shares that have not vested (#) | Market or payout value of share-based awards that have not vested ($) | Market or payout value of vested share-based awards not paid out or distributed ($) | |||||||
| Russell K. Girling | 100,000 | 33.08 | 12-Jun-2013 | 1,394,000 | 135,769 | 3,191,931 | – | |||||||
| 107,326 | 38.10 | 22-Feb-2014 | 957,348 | |||||||||||
| 83,857 | 39.75 | 25-Feb-2015 | 609,640 | |||||||||||
100,000 | 31.97 | 23-Feb-2016 | 1,505,000 | |||||||||||
| 100,000 | 31.93 | 14-Sep-2016 | 1,509,000 | |||||||||||
| 133,080 | 35.08 | 26-Feb-2017 | 1,588,975 | |||||||||||
| 100,000 | 36.90 | 16-Jun-2017 | 1,012,000 | |||||||||||
| 158,172 | 37.93 | 18-Feb-2018 | 1,437,783 | |||||||||||
| 385,475 | 41.95 | 17-Feb-2019 | 1,954,358 | |||||||||||
| Donald R. Marchand | 15,000 | 33.08 | 12-Jun-2013 | 209,100 | 27,001 | 634,785 | – | |||||||
| 13,368 | 38.10 | 22-Feb-2014 | 119,243 | |||||||||||
| 10,063 | 39.75 | 25-Feb-2015 | 73,158 | |||||||||||
| 12,000 | 31.97 | 23-Feb-2016 | 180,600 | |||||||||||
| 11,787 | 35.08 | 26-Feb-2017 | 140,737 | |||||||||||
| 47,500 | 36.26 | 29-Jul-2017 | 511,100 | |||||||||||
| 30,756 | 37.93 | 18-Feb-2018 | 279,572 | |||||||||||
| 96,369 | 41.95 | 17-Feb-2019 | 488,591 | |||||||||||
| Alexander J. Pourbaix | 107,326 | 38.10 | 22-Feb-2014 | 957,348 | 74,018 | 1,740,159 | – | |||||||
| 83,857 | 39.75 | 25-Feb-2015 | 609,640 | |||||||||||
| 100,000 | 31.97 | 23-Feb-2016 | 1,505,000 | |||||||||||
| 95,057 | 35.08 | 26-Feb-2017 | 1,134,981 | |||||||||||
| 27,500 | 36.26 | 29-Jul-2017 | 295,900 | |||||||||||
| 97,540 | 37.93 | 18-Feb-2018 | 886,639 | |||||||||||
| 213,687 | 41.95 | 17-Feb-2019 | 1,083,393 | |||||||||||
| Gregory A. Lohnes | 35,990 | 38.10 | 22-Feb-2014 | 321,031 | 36,458 | 857,135 | – | |||||||
| 30,608 | 39.75 | 25-Feb-2015 | 222,520 | |||||||||||
| 45,000 | 31.97 | 23-Feb-2016 | 677,250 | |||||||||||
| 38,973 | 35.08 | 26-Feb-2017 | 465,338 | |||||||||||
| 27,500 | 36.26 | 29-Jul-2017 | 295,900 | |||||||||||
48,177 | 37.93 | 18-Feb-2018 | 437,929 | |||||||||||
| 104,749 | 41.95 | 17-Feb-2019 | 531,077 | |||||||||||
| Karl Johannson | 15,424 | 38.10 | 22-Feb-2014 | 137,582 | 20,106 | 472,687 | – | |||||||
| 11,740 | 39.75 | 25-Feb-2015 | 85,350 | |||||||||||
| 18,000 | 31.97 | 23-Feb-2016 | 270,900 | |||||||||||
| 19,011 | 35.08 | 26-Feb-2017 | 226,991 | |||||||||||
| 18,348 | 37.93 | 18-Feb-2018 | 166,783 | |||||||||||
| 32,899 | 41.95 | 17-Feb-2019 | 166,798 | |||||||||||
| 48,450 | 45.29 | 2-Nov-2019 | 83,819 | |||||||||||
| Donald M. Wishart | 64,267 | 38.10 | 22-Feb-2014 | 573,262 | 49,416 | 1,161,772 | – | |||||||
| 50,314 | 39.75 | 25-Feb-2015 | 365,783 | |||||||||||
| 70,000 | 31.97 | 23-Feb-2016 | 1,053,500 | |||||||||||
68,916 | 35.08 | 26-Feb-2017 | 822,857 | |||||||||||
| 65,905 | 37.93 | 18-Feb-2018 | 599,076 | |||||||||||
| 139,665 | 41.95 | 17-Feb-2019 | 708,102 | |||||||||||
2012 Annual information form -- 97
Notes
- •
- Mr. Wishart stepped down from his position as Executive Vice-President, Operations and Major Projects on October 31, 2012. We retained him in a part-time role beginning on November 1, 2012, and he will retire from TransCanada on December 31, 2013. The values reported reflect all option-based and share-based awards previously awarded that were outstanding as at December 31, 2012.
- •
- Value of unexercised in-the-money options is based on outstanding vested and unvested stock options and the difference between the option exercise price and year-end closing price of our shares.
- •
- Number of shares or units of shares that have not vested includes the amount of the grant, plus reinvested units earned as dividend equivalents of all outstanding ESUs as at December 31, 2012.
- •
- Market or payout value of share-based awards that have not vested is the minimum payout value of all outstanding ESUs as at December 31, 2012. The value is calculated by multiplying 50% of the number of units that have not vested by the year-end closing price of our shares.
- •
- No value is shown forMarket or payout value of vested share-based awards not paid out or distributed. The ESU award granted in 2010 vested on December 31, 2012, and will be paid in March 2013. These awards are shown in the next table.
Incentive plan awards – value vested during the year
The table below shows the total value of all option-based and share-based awards previously granted to the named executives that vested in 2012. It also shows the total amount they earned from non-equity incentive plan awards in 2012.
| Name | Option-based awards – value vested during the year ($) | Share-based awards – value vested during the year ($) | Non-equity incentive plan compensation – value earned during the year ($) | |||
| Russell K. Girling | 1,488,693 | 3,464,440 | 1,200,000 | |||
| Donald R. Marchand | 245,986 | 409,134 | 460,000 | |||
| Alexander J. Pourbaix | 772,996 | 2,474,600 | 800,000 | |||
| Gregory A. Lohnes | 388,184 | 1,014,586 | 470,000 | |||
| Karl Johannson | 130,423 | 659,893 | 405,000 | |||
| Donald M. Wishart | 488,253 | 1,794,085 | 409,550 | |||
Notes
- •
- Option-based awards is the total value the named executives would have realized if they had exercised the stock options on the vesting date.
- •
- Share-based awards is the payout values of the 2010 ESU awards for the named executives. See thePayout of 2010 executive share unit award section for more information.
- •
- Non-equity incentive plan compensation is the short-term incentive award for 2012. This amount is shown underAnnual incentive plans in theSummary compensation table on page 92.
- •
- Mr. Wishart's option-based and share-based awards continue to vest per the plan provisions for active employees until he retires from TransCanada on December 31, 2013. The normal retirement plan provisions outlined on page 102 will then take effect. Values reported for Mr. Wishart reflect all option-based and share-based awards that vested during the year ended December 31, 2012.
98 -- TransCanada PipeLines Limited
Value of outstanding options at vesting (supplemental table)
The next table shows the details by grant for calculating the total value of the option-based awards in the table above. Stock options vest one-third each year, beginning on the first anniversary of the grant date. Theshare price on vesting date is the closing price for TransCanada shares on the TSX on the vesting date or the first trading day following that date.
| Name | Grant date | Total number of securities under options granted (#) | Option exercise price ($) | Number of options that vested in 2012 (#) | Share price on vesting date ($) | Value at vesting ($) | ||||||
Russell K. Girling | 18-Feb-2011 | 158,172 | 37.93 | 52,724 | 41.99 | 214,059 | ||||||
| 16-Jun-2010 | 100,000 | 36.90 | 33,334 | 42.27 | 179,004 | |||||||
| 26-Feb-2010 | 133,080 | 35.08 | 44,360 | 42.00 | 306,971 | |||||||
| 14-Sep-2009 | 100,000 | 31.93 | 33,333 | 45.30 | 445,662 | |||||||
| 23-Feb-2009 | 100,000 | 31.97 | 33,333 | 42.26 | 342,997 | |||||||
| Donald R. Marchand | 18-Feb-2011 | 30,756 | 37.93 | 10,252 | 41.99 | 41,623 | ||||||
| 29-Jul-2010 | 47,500 | 36.26 | 15,834 | 44.85 | 136,014 | |||||||
| 26-Feb-2010 | 11,787 | 35.08 | 3,929 | 42.00 | 27,189 | |||||||
| 23-Feb-2009 | 12,000 | 31.97 | 4,000 | 42.26 | 41,160 | |||||||
Alexander J. Pourbaix | 18-Feb-2011 | 97,540 | 37.93 | 32,513 | 41.99 | 132,003 | ||||||
| 29-Jul-2010 | 27,500 | 36.26 | 9,166 | 44.85 | 78,736 | |||||||
| 26-Feb-2010 | 95,057 | 35.08 | 31,685 | 42.00 | 219,260 | |||||||
| 23-Feb-2009 | 100,000 | 31.97 | 33,333 | 42.26 | 342,997 | |||||||
| Gregory A. Lohnes | 18-Feb-2011 | 48,177 | 37.93 | 16,059 | 41.99 | 65,200 | ||||||
| 29-Jul-2010 | 27,500 | 36.26 | 9,166 | 44.85 | 78,736 | |||||||
| 26-Feb-2010 | 38,973 | 35.08 | 12,991 | 42.00 | 89,898 | |||||||
| 23-Feb-2009 | 45,000 | 31.97 | 15,000 | 42.26 | 154,350 | |||||||
| Karl Johannson | 18-Feb-2011 | 18,348 | 37.93 | 6,116 | 41.99 | 24,831 | ||||||
| 26-Feb-2010 | 19,011 | 35.08 | 6,337 | 42.00 | 43,852 | |||||||
23-Feb-2009 | 18,000 | 31.97 | 6,000 | 42.26 | 61,740 | |||||||
| Donald M. Wishart | 18-Feb-2011 | 65,905 | 37.93 | 21,968 | 41.99 | 89,190 | ||||||
| 26-Feb-2010 | 68,916 | 35.08 | 22,972 | 42.00 | 158,966 | |||||||
| 23-Feb-2009 | 70,000 | 31.97 | 23,333 | 42.26 | 240,097 | |||||||
2012 Annual information form -- 99
EQUITY COMPENSATION PLAN INFORMATION
Securities authorized for issue under equity compensation plans
The table below shows the:
- •
- number of shares to be issued under the stock option plan when outstanding options are exercised
- •
- weighted average exercise price of the outstanding options, and
- •
- number of shares available for future issue under the option plan.
| at December 31, 2012 Plan category | Number of securities to be issued upon exercise of outstanding options (#) | Weighted-average exercise price of outstanding options ($) | Number of securities remaining available for future issuance under equity compensation plans (excluding securities reflected in the first column) (#) | |||
| Equity compensation plans approved by security holders | 7,434,426 | 37.69 | 2,446,489 | |||
| Equity compensation plans not approved by security holders | N/A | N/A | N/A | |||
| Total | 7,434,426 | 37.69 | 2,446,489 | |||
Our stock option plan is the only compensation arrangement under which our equity securities have been authorized for issue. Shareholders are being asked at the meeting to approve an increase in the number of shares reserved for issue under the plan by 10,000,000. If this increase is approved, a total of 44,000,000 TransCanada shares have been reserved for issue under the plan since its inception in 1995.
Stock option grants as a percentage of outstanding shares
| Dilution | Overhang | Burn rate | ||||||||||||
| Effective date | Total number of shares outstanding (A) | Total number of options outstanding (B) | Total reserve (C) | Total options granted during year (D) | Options outstanding as a % of shares outstanding (B / A) | % of stock options outstanding plus total reserve divided by total shares outstanding ((B + C) / A) | Grant as a % of shares outstanding (D / A) | |||||||
Dec. 31, 2010 | 696,229,000 | 8,409,695 | 5,331,242 | 1,366,872 | 1.21 | 1.97 | 0.20 | |||||||
| Dec. 31, 2011 | 703,861,065 | 7,093,124 | 4,388,112 | 970,018 | 1.01 | 1.63 | 0.14 | |||||||
| Dec. 31, 2012 | 705,461,386 | 7,434,426 | 2,446,489 | 1,978,458 | 1.05 | 1.40 | 0.28 | |||||||
| Feb. 15, 2013 | 705,944,387 | 8,890,624 | 507,290 | 1,939,199 | 1.26 | 1.33 | 0.27 | |||||||
If shareholders approve the increase in number of shares reserved for issue under the stock option plan by 10,000,000 the overhang will be 2.75%.
100 -- TransCanada PipeLines Limited
RETIREMENT BENEFITS
All of the named executives participate in our DB plan. The table below shows their benefits under the DB plan.
Defined benefit pension plan
| at December 31, 2012 | Annual benefits payable | Opening | Closing | |||||||||||
| Name | Number of years of credited service | At year end ($) | At age 65 ($) | present value of defined benefit obligation ($) | Compensatory change ($) | Non- compensatory change ($) | present value of defined benefit obligation ($) | |||||||
| Russell K. Girling | 17.00 | 582,000 | 1,085,000 | 7,250,000 | 1,592,000 | 1,838,000 | 10,680,000 | |||||||
| Donald R. Marchand | 18.92 | 187,000 | 331,000 | 2,515,000 | 356,000 | 614,000 | 3,485,000 | |||||||
| Alexander J. Pourbaix | 17.00 | 333,000 | 686,000 | 3,959,000 | 227,000 | 983,000 | 5,169,000 | |||||||
Gregory A. Lohnes | 19.33 | 262,000 | 379,000 | 3,585,000 | 533,000 | 645,000 | 4,763,000 | |||||||
| Karl Johannson | 17.00 | 133,000 | 242,000 | 1,729,000 | 979,000 | 508,000 | 3,216,000 | |||||||
| Donald M. Wishart | 15.46 | 252,000 | 280,000 | 3,577,000 | 74,000 | 585,000 | 4,236,000 | |||||||
Notes
- •
- In 2004, the committee approved arrangements for Mr. Girling, Mr. Pourbaix and Mr. Johannson to receive additional credited service to recognize their high potential and to retain them as employees. The credited service was received for years when they were not formally enrolled in the pension plan, but were employees of TransCanada. They each received an additional three years of credited service on September 8, 2007 after maintaining continuous employment with us. The additional credited service is recognized only in the supplemental pension plan for earnings exceeding the maximum set under the Income Tax Act (Canada).
- •
- Mr. Lohnes continued to accrue credited service in the registered pension plan and supplemental pension plan while employed in the United States from August 16, 2000 to August 31, 2006. Pensionable earnings were based on one U.S. dollar equal to one Canadian dollar, and included both the U.S. base salary and annual cash bonus up to the pre-established maximum amount.
- •
- Annual benefits payable at year end is the annual lifetime benefit, based on the years of credited service and the actual pensionable earnings history.
- •
- Annual benefits payable at age 65 is the annual lifetime benefit at age 65, based on the years of credited service at age 65 and the actual pensionable earnings history.
- •
- Opening and closing present value of defined benefit obligation is at December 31, 2011 and December 31, 2012, respectively. It represents actuarial assumptions and methods that are consistent with those used for calculating the pension obligations disclosed in our 2011 and 2012 consolidated financial statements. These assumptions reflect our best estimate of future events, and the values in the above table may not be directly comparable to similar estimates of pension obligations that may be disclosed by other corporations.
- •
- Compensatory change in the present value of the obligation includes the service cost to TransCanada in 2012, plus compensation changes that were higher or lower than the base salary assumption, and plan changes.
- •
- Non-compensatory change in the present value of the obligation includes the interest on the accrued obligation at the start of the year and changes in assumptions in the year.
- •
- Based on a retirement agreement between Mr. Wishart and TransCanada, it is expected that Mr. Wishart will retire on December 31, 2013. The annual lifetime benefit at January 1, 2014 based on years of credited service at December 31, 2013 and the actual earnings history as of December 31, 2012 is $256,000 (commencing at normal retirement date). If pension commencement was January 1, 2014, the amount would be $245,000.
2012 Annual information form -- 101
Accrued pension obligations
Our accrued obligation for the supplemental pension plan was approximately $285 million at December 31, 2012. The current service costs were approximately $5 million and the interest costs were approximately $12 million for a total of $17 million.
The accrued pension obligation is calculated using the method prescribed by the Canadian Institute of Chartered Accountants and is based on management's best estimate of future events that affect the cost of pensions, including assumptions about future base salary adjustments and bonuses.
You can find more information about the accrued obligations and assumptions in Note 20Employee future benefits to our 2012 consolidated financial statements, which are available on our website (www.transcanada.com) and on SEDAR (www.sedar.com).
TERMINATION AND CHANGE OF CONTROL
Termination
We have an employment agreement with each named executive, with the exception of Mr. Wishart who stepped down from his position effective October 31, 2012, that outlines the terms and conditions that apply if the executive leaves TransCanada. The table on the following page is a summary of the material terms and provisions if the executive resigns, is terminated, retires or dies. These do not apply when there is a change of control.
The general terms and provisions of ESUs are discussed under each event, however, the committee can use its discretion to decide how to treat unvested ESUs for executives who have an employment agreement. Each employment agreement includes a non-competition provision that applies for 12 months following the executive's separation date. If we require the named executive to comply with the provision, we will pay him an amount equal to the base salary as of the separation date plus the average bonus paid to him for the three years preceding the separation date.
Like all other employees, the named executives are eligible for retiree benefits if they are 55 or older with 10 or more years of continuous service on the separation date. Retiree benefits include:
- •
- a health spending account that can be used to pay for eligible health and dental expenses and/or to purchase private health insurance
- •
- a security plan that provides a safety net if there are significant medical expenses, and
- •
- life insurance that provides a death benefit of $10,000 to a designated beneficiary.
The employee stock plan, spousal and dependent life insurance, accident insurance, disability and payment of provincial health care premiums end at the separation date.
102 -- TransCanada PipeLines Limited
Compensation on termination
The table below shows how each named executive's compensation is treated if he leaves TransCanada.
| Base salary | Resignation | Payments end. | ||
| Termination without cause | Severance allowance includes a lump-sum payment of the base salary as of the separation date multiplied by thenotice period. | |||
| Termination with cause | ||||
| Retirement | Payments end. | |||
| Death | ||||
| Short-term incentive | Resignation | Not paid. | ||
| Termination without cause | Year of separation: Equals theaverage bonus pro-rated by the number of months in the current year prior to the separation date. | |||
Years after separation: Equals theaverage bonus multiplied by thenotice period. | ||||
| Termination with cause | Not paid. | |||
| Retirement | Year of separation: Equals theaverage bonus pro-rated by the | |||
| Death | number of months in the current year prior to the separation date. | |||
| ESUs | Resignation | Vested units are paid out, unvested units are forfeited. | ||
| Termination without cause | Vested units are paid out. | |||
Unvested units are forfeited, however the original grant value is generally paid out on a pro rata basis. | ||||
| Termination with cause | Vested units are paid out, unvested units are forfeited. | |||
| Retirement | Grants after January 1, 2012 | |||
| Vested units are paid out. Unvested units continue to vest and the value is assessed at the end of the term. The award is pro-rated for the period of employment up to the retirement date. | ||||
Grants before 2012 | ||||
| Vested units are paid out. Unvested units are forfeited, however the original grant value is generally paid out on a pro rata basis. | ||||
| Death | Vested units are paid out. | |||
Unvested units are forfeited, however the original grant value is generally paid out on a pro rata basis. | ||||
| Stock options | Resignation | Grants after January 1, 2010 | ||
| Vested stock options must be exercised by their expiry date or six months from the separation date (whichever is earlier). | ||||
No stock options vest after the last day of employment. | ||||
Grants before 2010 | ||||
| Outstanding stock options continue to vest for six months from the separation date and must be exercised by their expiry date or six months from the separation date (whichever is earlier). | ||||
| Termination without cause | Grants after January 1, 2007 Vested stock options must be exercised by their expiry date or six months from the separation date (whichever is earlier). | |||
No stock options vest after the last day of employment. | ||||
Grants before 2007 Outstanding stock options continue to vest during thenotice period and must be exercised by their expiry date or the end of thenotice period (whichever is earlier). | ||||
| Termination with cause | Grants after January 1, 2010 | |||
| Vested stock options must be exercised by their expiry date or six months from the separation date (whichever is earlier). | ||||
No stock options vest after the last day of employment. | ||||
Grants before 2010 | ||||
| Outstanding stock options continue to vest for six months from the separation date and must be exercised by their expiry date or six months from the separation date (whichever is earlier). | ||||
2012 Annual information form -- 103
| Stock options (cont'd) | Retirement | Grants after January 1, 2012 Outstanding stock options continue to vest and must be exercised by their expiry date or three years from the separation date (whichever is earlier). If there is less than six months between the vesting date and the expiry date, the expiry date is extended for six months from the final vesting date of the options. | ||
Grants before 2012 Outstanding stock options vest immediately and must be exercised by their expiry date or three years from the separation date (whichever is earlier). | ||||
| Death | Outstanding stock options vest immediately and must be exercised by their expiry date or the first anniversary of death (whichever is earlier). | |||
| Pension | Resignation | |||
| Termination without cause | ||||
| Termination with cause | Paid as a commuted value or monthly benefit according to the DB Plan, the supplemental plan, or both, as applicable. | |||
| Retirement | For termination without cause, credited service is provided for the applicablenotice period. | |||
| Death | ||||
| Benefits | Resignation | Coverage ends, or retiree benefits begin if eligible. | ||
Termination without cause | Coverage continues during the notice period (or an equivalent lump-sum payout is made) and, if eligible, service credit for the notice period for retiree benefits. | |||
| Termination with cause | Coverage ends, or retiree benefits begin if eligible. | |||
| Retirement | Retiree benefits begin. | |||
| Death | Coverage ends, or retiree benefits begin for a designated beneficiary if eligible. | |||
| Perquisites | Resignation | Payments end. | ||
| Termination without cause | A lump-sum cash payment equal to the corporate cost of the perquisite package in the one-year period preceding the separation date multiplied by the notice period. | |||
| Termination with cause | ||||
| Retirement | Payments end. | |||
| Death | ||||
| Other | Resignation | – | ||
| Termination without cause | Outplacement services. | |||
| Termination with cause | – | |||
| Retirement | – | |||
| Death | – | |||
Notes
- •
- Resignationincludes voluntary resignation but not resignation as a result of constructive dismissal. If a named executive resigns because of constructive dismissal, it is treated as termination without cause.
- •
- Theshort-term incentive award is not paid on resignation unless the Board uses its discretion.
- •
- Average bonus equals the average short-term incentive award paid to the named executive for the three years preceding the separation date.
- •
- Thenotice period is two years for each named executive.
104 -- TransCanada PipeLines Limited
Change of control
Under the terms of the employment agreements, achange of control includes an event where another entity becomes the beneficial owner of:
- •
- more than 20% of TransCanada's voting shares, or
- •
- more than 50% of the voting shares of TCPL (not including the voting shares of TCPL held by TransCanada). Other events can also constitute a change of control. The following is a summary of the terms and provisions that apply to the compensation of the named executives if there is a change of control:
Notice period
The notice period for each named executive is normally two years. If there is a change of control and the CEO is terminated by TransCanada within two years, his notice period is three years.
ESUs
All unvested ESUs are deemed vested and are paid out as a single, lump-sum cash payment if the named executive is terminated without cause and his separation date is within two years of a change of control.
Stock options
There is an accelerated vesting of stock options following a change of control.
The committee can use its discretion to accept or reject an agreement relating to the unvested stock options with the acquiring entity. If the committee rejects an agreement, there is accelerated vesting of any outstanding unvested stock options.
If, for any reason, we are unable to implement accelerated vesting (for example, our shares stop trading), we will pay the named executive a cash amount. This would be equal to the net amount of the compensation the named executive would have received if, on the date of a change of control, he had exercised all vested options and unvested options that would have had accelerated vesting.
Pension
A pensionable service credit for the applicable notice period is provided at the separation date rather than at the end of the notice period if the named executive's separation date is within two years of a change of control.
2012 Annual information form -- 105
Separation payments
The table below is a summary of the incremental payments that would be made to each named executive under the different separation events, with and without a deemed change of control. All payments have been calculated using December 31, 2012, as the separation date and the date of a change of control as if it applies. These amounts would be paid under the terms of the employment agreements.
They do not include certain amounts that would be provided under normal course, such as the value of:
- •
- any stock options or ESUs vesting as part of normal employment
- •
- pension benefits that would normally be provided following resignation, or
- •
- retiree benefits.
| Without a change of control | With a change of control | |||||||||
| Name | Termination with cause ($) | Termination without cause ($) | Retirement ($) | Death ($) | Termination without cause following a change of control ($) | |||||
| Russell K. Girling | – | 13,058,118 | 11,001,140 | 11,001,140 | 23,482,065 | |||||
| Donald R. Marchand | – | 2,825,140 | 1,798,654 | 1,798,654 | 4,237,337 | |||||
| Alexander J. Pourbaix | – | 8,621,101 | 6,978,947 | 6,978,947 | 12,757,445 | |||||
| Gregory A. Lohnes | – | 4,907,708 | 3,212,016 | 3,399,516 | 6,567,480 | |||||
| Karl Johannson | – | 3,639,890 | 1,947,517 | 1,947,517 | 4,625,759 | |||||
Notes
- •
- Mr. Wishart is no longer subject to an employment agreement, effective his last day as Executive Vice-President, Operations and Major Projects on October 31, 2012.
- •
- Mr. Johannson does not currently have a separation agreement. It is anticipated that in 2013, he will enter into an agreement containing substantially the same terms as the other named executives.
- •
- If we require the named executives to comply with the non-competition provision in their employment agreement, they would receive the following lump-sum payments:
| Mr. Girling | $2,416,675 | |
| Mr. Marchand | 799,758 | |
| Mr. Pourbaix | 1,627,667 | |
| Mr. Lohnes | 1,148,337 | |
| Mr. Johannson | 919,583 | |
- •
- Termination without cause following a change of control also applies if the named executive resigns because of constructive dismissal and the separation date is within two years of the date of a change of control.
- •
- The amounts from share-based compensation include the following assumptions for some separation events:
- •
- include additional units from reinvested dividends up to and including the fourth quarter of 2012, based on $46.98, the five-day volume-weighted average closing price of TransCanada shares on the TSX at December 31, 2012
- •
- the performance multiplier as determined by the committee and the Board.
Payouts of outstanding 2010 ESU awards
- •
- any incremental gain due to accelerated vesting
- •
- the difference between the exercise price and $47.02, the 2012 year-end closing price of TransCanada shares on the TSX.
Accelerated vesting of stock options
Every year the committee reviews the severance amounts calculated for each named executive under his employment agreement. The data represents the total value to be paid to the executive if he is terminated without cause, with and without a deemed change of control, and the additional payment for the non-competition provision.
106 -- TransCanada PipeLines Limited
LOANS TO DIRECTORS AND EXECUTIVES
As of the date of this circular, none of our directors or executives had any loans from TransCanada or any of our subsidiaries. This is also true for:
- •
- former executives or directors of TransCanada or any of our subsidiaries
- •
- this year's nominated directors, and
- •
- any associate of a director, executive officer or nominated director.
None of the above owe money to another entity that is the subject of a guarantee, support agreement, letter of credit or other similar arrangement or understanding provided by TransCanada or any of our subsidiaries.
DIRECTORS' AND OFFICERS' LIABILITY INSURANCE
TransCanada has purchased liability insurance to protect its directors and officers (or their heirs and legal representatives) against liabilities they may incur while performing their duties as directors and officers of TransCanada and/or its subsidiaries, subject to the limitations set out in theCanada Business Corporations Act.
The current policy has a combined limit of U.S.$175 million for personal (Side A) and corporate indemnity coverage (Side B). A stand alone Side A policy is also purchased with a limit of U.S.$25 million for losses TransCanada cannot indemnify directors and officers by law or otherwise. Side A claims require no deductible whereas a $5 million deductible is applied to Side B claims.
TransCanada paid a total premium of U.S.$1.7 million for the 2012-2013 insurance program.
ADDITIONAL INFORMATION
Shareholders can request a free copy of this circular, and the 2012 AIF and Annual report from our Corporate Secretary:
TransCanada Corporation
450 1st Street S.W.
Calgary, Alberta,
Canada T2P 5H1
Tel: 1.800.661.3805
For financial information about TransCanada, see our most recent annual audited consolidated financial statements and MD&A. Copies of these documents and materials related to corporate governance are available on our website (www.transcanada.com).
You can find more information about TransCanada on our website and on SEDAR (www.sedar.com).
2012 Annual information form -- 107
Appendix A
Charter of the Board of Directors
I. INTRODUCTION
- A.
- The Board's primary responsibility is to foster the long-term success of the Company consistent with the Board's responsibility to act honestly and in good faith with a view to the best interests of the Company.
- B.
- The Board of Directors has plenary power. Any responsibility not delegated to management or a committee of the Board remains with the Board. This Charter is prepared to assist the Board and management in clarifying responsibilities and ensuring effective communication between the Board and management.
II. COMPOSITION AND BOARD ORGANIZATION
- A.
- Nominees for directors are initially considered and recommended by the Governance committee of the Board, approved by the entire Board and elected annually by the shareholders of the Company.
- B.
- The Board must be comprised of a majority of members who have been determined by the Board to be independent. A member is independent if the member has no direct or indirect relationship which could, in the view of the Board, be reasonably expected to interfere with the exercise of a member's independent judgment.
- C.
- Directors who are not members of management will meet on a regular basis to discuss matters of interest independent of any influence from management.
- D.
- Certain of the responsibilities of the Board referred to herein may be delegated to committees of the Board. The responsibilities of those committees will be as set forth in their Charter, as amended from time to time.
III. DUTIES AND RESPONSIBILITIES
A. Managing the Affairs of the Board
The Board operates by delegating certain of its authorities, including spending authorizations, to management and by reserving certain powers to itself. Certain of the legal obligations of the Board are described in detail in Section IV. Subject to these legal obligations and to the Articles and By-laws of the Company, the Board retains the responsibility for managing its own affairs, including:
- i)
- planning its composition and size;
- ii)
- selecting its Chair;
- iii)
- nominating candidates for election to the Board;
- iv)
- determining independence of Board members;
- v)
- approving committees of the Board and membership of directors thereon;
- vi)
- determining director compensation; and
- vii)
- assessing the effectiveness of the Board, committees and directors in fulfilling their responsibilities.
B. Management and Human Resources
The Board has the responsibility for:
- i)
- the appointment and succession of the Chief Executive Officer (CEO) and monitoring CEO performance, approving CEO compensation and providing advice and counsel to the CEO in the execution of the CEO's duties;
- ii)
- approving a position description for the CEO;
- iii)
- reviewing CEO performance at least annually, against agreed-upon written objectives;
- iv)
- approving decisions relating to senior management, including the:
- a)
- appointment and discharge of officers of the Company and members of the senior executive leadership team;
- b)
- compensation and benefits for members of the senior executive leadership team;
- c)
- annual corporate and business unit performance objectives utilized in determining incentive compensation or other awards to officers; and
- d)
- employment contracts, termination and other special arrangements with senior executive officers, or other employee groups if such action is likely to have a subsequent material(1) impact on the Company or its basic human resource and compensation policies.
- (1)
- For purposes of this Charter, the term "material" includes a transaction or a series of related transactions that would, using reasonable business judgment and assumptions, have a meaningful impact on the Corporation. The impact could be relative to the Corporation's financial performance and liabilities as well as its reputation.
- v)
- taking all reasonable steps to ensure succession planning programs are in place, including programs to train and develop management;
- vi)
- approving certain matters relating to all employees, including:
- a)
- the annual salary policy/program for employees;
- b)
- new benefit programs or changes to existing programs that would create a change in cost to the Company in excess of $10,000,000 annually;
- c)
- Canadian pension fund investment guidelines and the appointment of pension fund managers; and
- d)
- material benefits granted to retiring employees outside of benefits received under approved pension and other benefit programs.
108 -- TransCanada PipeLines Limited
C. Strategy and Plans
The Board has the responsibility to:
- i)
- participate in strategic planning sessions to ensure that management develops, and ultimately approve, major corporate strategies and objectives;
- ii)
- approve capital commitment and expenditure budgets and related operating plans;
- iii)
- approve financial and operating objectives used in determining compensation;
- iv)
- approve the entering into, or withdrawing from, lines of business that are, or are likely to be, material to the Company;
- v)
- approve material divestitures and acquisitions; and
- vi)
- monitor management's achievements in implementing major corporate strategies and objectives, in light of changing circumstances.
D. Financial and Corporate Issues
The Board has the responsibility to:
- i)
- take reasonable steps to ensure the implementation and integrity of the Company's internal control and management information systems;
- ii)
- monitor operational and financial results;
- iii)
- approve annual financial statements and related Management's Discussion and Analysis, review quarterly financial results and approve the release thereof by management;
- iv)
- approve the Management Information Circular, Annual Information Form and documents incorporated by reference therein;
- v)
- declare dividends;
- vi)
- approve financings, changes in authorized capital, issue and repurchase of shares, issue and redemption of debt securities, listing of shares and other securities, issue of commercial paper, and related prospectuses and trust indentures;
- vii)
- recommend appointment of external auditors and approve auditors' fees;
- viii)
- approve banking resolutions and significant changes in banking relationships;
- ix)
- approve appointments, or material changes in relationships with corporate trustees;
- x)
- approve contracts, leases and other arrangements or commitments that may have a material impact on the Company;
- xi)
- approve spending authority guidelines; and
- xii)
- approve the commencement or settlement of litigation that may have a material impact on the Company.
E. Business and Risk Management
The Board has the responsibility to:
- i)
- take reasonable steps to ensure that management has identified the principal risks of the Company's businesses and implemented appropriate strategies to manage these risks, understands the principal risks and achieves a proper balance between risks and benefits;
- ii)
- review reports on capital commitments and expenditures relative to approved budgets;
- iii)
- review operating and financial performance relative to budgets or objectives;
- iv)
- receive, on a regular basis, reports from management on matters relating to, among others, ethical conduct, environmental management, employee health and safety, human rights, and related party transactions; and
- v)
- assess and monitor management control systems by evaluating and assessing information provided by management and others (e.g. internal and external auditors) about the effectiveness of management control systems.
F. Policies and Procedures
The Board has responsibility to:
- i)
- monitor compliance with all significant policies and procedures by which the Company is operated;
- ii)
- direct management to ensure the Company operates at all times within applicable laws and regulations and to the highest ethical and moral standards;
- iii)
- provide policy direction to management while respecting its responsibility for day-to-day management of the Company's businesses; and
- iv)
- review significant new corporate policies or material amendments to existing policies (including, for example, policies regarding business conduct, conflict of interest and the environment).
G. Compliance Reporting and Corporate Communications
The Board has the responsibility to:
- i)
- take all reasonable steps to ensure the Company has in place effective disclosure and communication processes with shareholders and other stakeholders and financial, regulatory and other recipients;
- ii)
- approve interaction with shareholders on all items requiring shareholder response or approval;
- iii)
- take all reasonable steps to ensure that the financial performance of the Company is adequately reported to shareholders, other security holders and regulators on a timely and regular basis;
- iv)
- take all reasonable steps to ensure that financial results are reported fairly and in accordance with generally accepted accounting principles;
- v)
- take all reasonable steps to ensure the timely reporting of any other developments that have significant and material impact on the Company; and
- vi)
- report annually to shareholders on the Board's stewardship for the preceding year (the Annual report).
2012 Annual information form -- 109
IV. GENERAL LEGAL OBLIGATIONS OF THE BOARD OF DIRECTORS
A. The Board is responsible for:
- i)
- directing management to ensure legal requirements have been met and documents and records have been properly prepared, approved and maintained;
- ii)
- approving changes in the By-laws and Articles of Incorporation, matters requiring shareholder approval, and agendas for shareholder meetings;
- iii)
- approving the Company's legal structure, name, logo, mission statement and vision statement; and
- iv)
- performing such functions as it reserves to itself or which cannot, by law, be delegated to committees of the Board or to management.
110 -- TransCanada PipeLines Limited
In our circular, we disclose the following non-GAAP measures as certain key financial metrics and performance goals:
- •
- comparable earnings
- •
- comparable earnings per share
- •
- comparable earnings before interest and taxes (comparable EBIT)
- •
- funds generated from operations (FGFO), and
- •
- funds generated from operations per share (FGFO per share).
These measures do not have a standardized meaning under U.S. generally accepted accounting principles (GAAP) and where applicable Canadian generally accepted accounting principles as defined in Part V of the Canadian Institute of Chartered Accountants Handbook and may therefore not be comparable to similar measures used by other companies.
We adjust these non-GAAP measures for specific items that are significant but do not reflect our operations in the year. In calculating these non-GAAP measures, we use our judgement and make informed decisions to identify specific items to exclude, some of which may occur again. Specific items include but are not limited to certain fair value adjustments relating to risk management activities, income tax refunds and adjustments, gains or losses on sales of assets, legal and bankruptcy settlements, and write-downs of assets and investments.
USING NON-GAAP MEASURES
We use these non-GAAP measures to improve our ability to compare financial results between reporting periods and to enhance our understanding of operating performance, liquidity and ability to generate funds to finance operations. We provide these non-GAAP measures as additional information on our operating performance, liquidity and ability to generate funds to finance operations.
See our 2012 Management Discussion & Analysis for:
- •
- a reconciliation ofcomparable earnings to net income attributable to shares in the Reconciliation of Non-GAAP Measures table, and
- •
- a reconciliation offunds generated from operations to net cash provided by operations, in the cash from operating activities table in the Financial condition section.
CALCULATING THE MEASURES
- •
- Comparable earnings does not include certain risk management activities that we engage in to reduce our exposure to certain financial and commodity price risks. These excluded activities provide effective economic hedges but do not meet the criteria for hedge accounting treatment and, therefore, changes in their fair values are recorded in net income each year. The unrealized gains or losses from changes in the fair value of these derivative contracts and natural gas inventory in storage are not considered to represent the underlying operations in the current year or the positive margin that will be realized when they are settled. As a result, we have excluded these amounts when determining comparable earnings. Comparable earnings also excludes specific items, including but not limited to the specific items listed above.
- •
- Comparable earnings per share is calculated by dividingComparable earnings by the weighted average number of shares outstanding for the year.
- •
- Comparable EBIT is a measure of our earnings from ongoing operations and consists of earnings before deducting interest and other financial charges, income taxes, net income attributable to non-controlling interests and preferred share dividends. Generally we use EBIT because it is a better measure of our performance. We also use EBIT to evaluate trends in each segment. EBIT comprises earnings before deducting interest and other financial charges, income taxes, net income attributable to non-controlling interest and preferred share dividends. EBIT includes income from equity investments.
- •
- FGFO consists of net cash provided by operations before changes in operating working capital and allows management to better measure consolidated operating cash flow, excluding fluctuations from working capital balances which may not necessarily reflect the underlying operations in the same period.
- •
- FGFO per share is calculated by dividing FGFO by the weighted average number of shares outstanding for the year.
2012 Annual information form -- 111
EXPLANATORY NOTE
UNDERTAKING
FORWARD-LOOKING INFORMATION
SIGNATURES