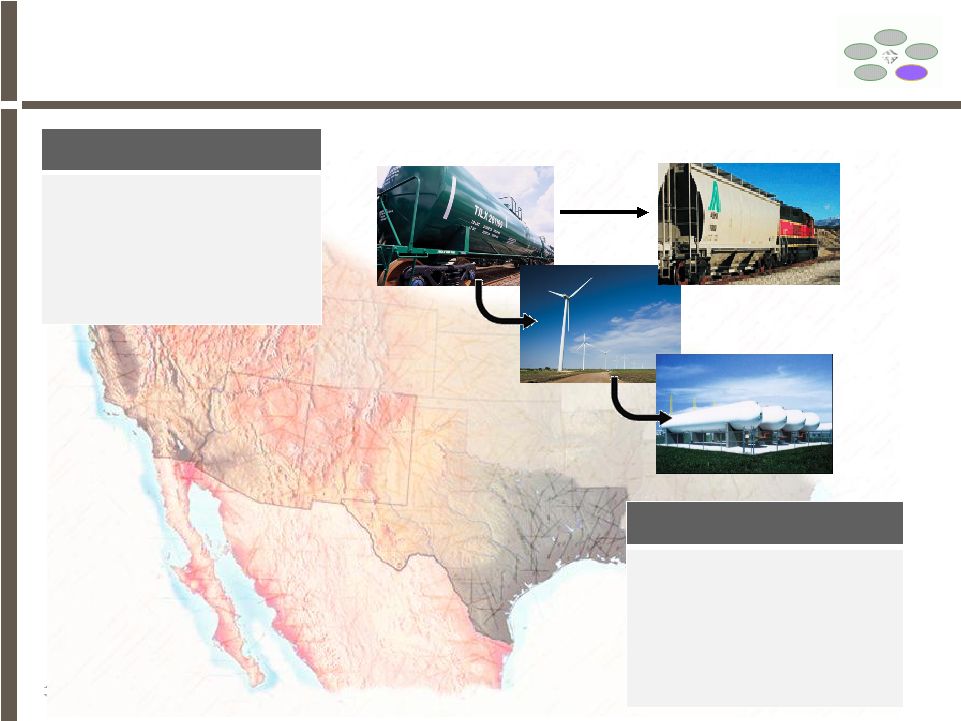
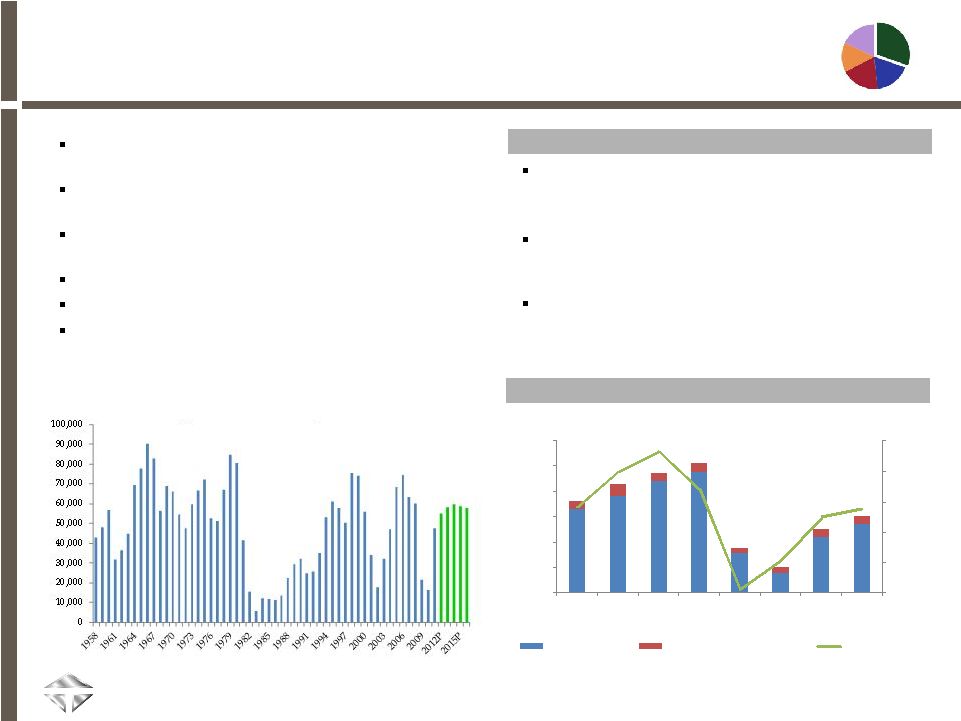
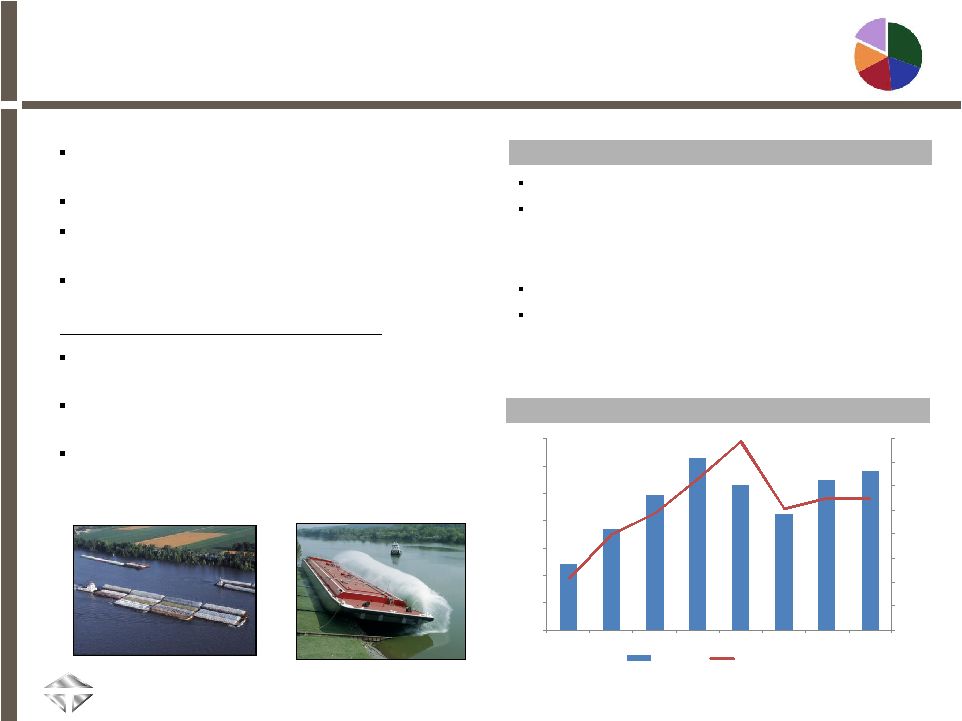
$241 $371 $493 $625 $527 $422 $549 $580 0% 3% 6% 9% 12% 15% 18% 21% 24% $- $100 $200 $300 $400 $500 $600 $700 2005 2006 2007 2008 2009 2010 2011 LTM 3/12 Revenues OP Margin 18 Revenues up 25.3% in LTM 3/31/12 vs. LTM 3/31/11 Profitability continues to be strong compared to historical averages for this business - Operating Profit margins increased from 6.5% in FY 2005 to 16.5% during LTM 3/31/12 (3) Backlog remained stable at $512mm at 3/31/12 Quickly recovered from 2 significant floods in Tennessee (in 2010) and Missouri (in 2011) that halted production levels for a period of time and impacted financial results in certain periods Inland Barge Group Tank Barges Hopper Barges Transports grain & coal Transports liquids ($mm) Leading manufacturer of barges that transport goods along U.S. inland waterways Largest U.S. manufacturer of fiberglass barge covers Multiple barge manufacturing facilities on inland waterways enable rapid delivery Barge transportation has a cost advantage in high-cost fuel environments 4,250 out of 17,996 hopper barges, or approximately 24%, are 20+ years old 1,152 out of 3,084 tank barges, or approximately 37%, are 20+ years old Over the past 10 years, 22% more barges were scrapped vs. built (9,306 scrapped vs. 7,630 built from 2001 – 2011) Leading manufacturer of barges that transport goods along U.S. inland waterways Largest U.S. manufacturer of fiberglass barge covers Multiple barge manufacturing facilities on inland waterways enable rapid delivery Barge transportation has a cost advantage in high-cost fuel environments 4,250 out of 17,996 hopper barges, or approximately 24%, are 20+ years old 1,152 out of 3,084 tank barges, or approximately 37%, are 20+ years old Over the past 10 years, 22% more barges were scrapped vs. built (9,306 scrapped vs. 7,630 built from 2001 – 2011) (1) (1) OP Margin excludes a $5.1mm net gain as a result of flood damage to the Tennessee barge plant (2) OP Margin excludes a $15.5 mm net gain as a result of flood damage to the Tennessee and Missouri barge plants (3) OP Margin excludes a $18.9 mm net gain as a result of flood damage to the Tennessee and Missouri barge plants, and the sale of leased barges (1) OP Margin excludes a $5.1mm net gain as a result of flood damage to the Tennessee barge plant (2) OP Margin excludes a $15.5 mm net gain as a result of flood damage to the Tennessee and Missouri barge plants (3) OP Margin excludes a $18.9 mm net gain as a result of flood damage to the Tennessee and Missouri barge plants, and the sale of leased barges (2) (3) Barge 18% Total Revenue $3.1B Inland Barge Group Historical Revenues and OP Margin Inland Barge Group Highlights Replacement demand driver (as of 12/31/11): |