Table of Contents
UNITED STATES SECURITIES AND EXCHANGE COMMISSION
Washington, D.C. 20549
FORM 20-F
o | REGISTRATION STATEMENT PURSUANT TO SECTION 12(b) OR (g) OF THE SECURITIES EXCHANGE ACT OF 1934 | |
OR | ||
þ | ANNUAL REPORT PURSUANT TO SECTION 13 OR 15(d) OF THE SECURITIES EXCHANGE ACT OF 1934 | |
| For the fiscal year ended December 31, 2009 | ||
OR | ||
o | TRANSITION REPORT PURSUANT TO SECTION 13 OR 15(d) OF THE SECURITIES EXCHANGE ACT OF 1934 | |
OR | ||
o | SHELL COMPANY REPORT PURSUANT TO SECTION 13 OR 15(d) OF THE SECURITIES EXCHANGE ACT OF 1934 | |
| Date of event requiring this shell company report | ||
| For the transition period from to | ||
Commission filenumber: 1-14251

SAP AG
(Exact name of Registrant as specified in its charter)
SAP CORPORATION
(Translation of Registrant’s name into English)
Federal Republic of Germany
(Jurisdiction of incorporation or organization)
Dietmar-Hopp-Allee 16
69190 Walldorf
Federal Republic of Germany
(Address of principal executive offices)
69190 Walldorf
Federal Republic of Germany
(Address of principal executive offices)
Wendy Boufford
c/o SAP Labs
3410 Hillview Avenue, Palo Alto, CA, 94304, United States of America
650-849-4000 (Tel)
650-849-2650 (Fax)
(Name, Telephone, Email and/or Facsimile number and Address of Company Contact Person)
c/o SAP Labs
3410 Hillview Avenue, Palo Alto, CA, 94304, United States of America
650-849-4000 (Tel)
650-849-2650 (Fax)
(Name, Telephone, Email and/or Facsimile number and Address of Company Contact Person)
Securities registered or to be registered pursuant to Section 12(b) of the Act:
Title of each class | Name of each exchange on which registered | |
| American Depositary Shares, each Representing one Ordinary Share, without nominal value | New York Stock Exchange | |
| Ordinary Shares, without nominal value | New York Stock Exchange* |
Securities registered or to be registered pursuant to Section 12(g) of the Act:None
Securities for which there is a reporting obligation pursuant to Section 15(d) of the Act:None
Indicate the number of outstanding shares of each of the issuer’s classes of capital or common stock as of the close of the period covered by the annual report:
| Ordinary Shares, without nominal value: (as of December 31, 2009)** | 1,226,039,608 |
Indicate by check mark if the registrant is a well-known seasoned issuer, as defined in Rule 405 of the Securities Act.
Yes þ | No o |
If this report is an annual or transition report, indicate by check mark if the registrant is not required to file reports pursuant to Section 13 or 15(d) of the Securities Exchange Act of 1934.
Yes o | No þ |
Note — Checking the box above will not relieve any registrant required to file reports pursuant to Section 13 or 15(d) of the Securities Exchange Act of 1934 from their obligations under those Sections.
Indicate by check mark whether the registrant (1) has filed all reports required to be filed by Section 13 or 15(d) of the Securities Exchange Act of 1934 during the preceding 12 months (or for such shorter period that the registrant was required to file such reports), and (2) has been subject to such filing requirements for the past 90 days.
Yes þ | No o |
Indicate by check mark whether the registrant has submitted electronically and posted on its Web site, if any, every Interactive Data File required to be submitted and posted pursuant to Rule 405 ofRegulation S-T (§232.405 of this chapter) during the preceding 12 months (or for such shorter period that the registrant was required to submit and post such files.)
Yes o | No o |
Indicate by check mark whether the registrant is a large accelerated filer, an accelerated filer, a non-accelerated filer, or a smaller reporting company. See the definitions of “large accelerated filer,” “accelerated filer” and “smaller reporting company” in Rule 12b-2 of the Exchange Act. (Check one):
Large accelerated filer þ | Accelerated filer o | Non-accelerated filer o (Do not check if a smaller reporting company) | Smaller Reporting company o |
Indicate by check mark which basis of accounting the registrant has used to prepare the financial statements included in this filing:
U.S. GAAP o International Financial Reporting Standards as issued by the International Accounting Standards Board þ Other o
If “Other” has been checked in response to the previous question, indicate by check mark which financial statement item the registrant has elected to follow.
Item 17 o | Item 18 o |
If this is an annual report, indicate by check mark whether the registrant is a shell company (as defined inRule 12b-2 of the Exchange Act).
Yes o | No þ |
| * | Listed not for trading or quotation purposes, but only in connection with the registration of American Depositary Shares representing such ordinary shares pursuant to the requirements of the Securities and Exchange Commission. |
** Including 37,262,465 treasury shares.
Table of Contents
[THIS PAGE INTENTIONALLY LEFT BLANK]
Table of Contents
TABLE OF CONTENTS
| Page | ||||
| 1 | ||||
| 2 | ||||
| 3 | ||||
| 3 | ||||
| 3 | ||||
| 5 | ||||
| 12 | ||||
| 12 | ||||
| 12 | ||||
| 12 | ||||
| 12 | ||||
| 13 | ||||
| 15 | ||||
| 15 | ||||
| 27 | ||||
| 27 | ||||
| 28 | ||||
| 30 | ||||
| 32 | ||||
| 33 | ||||
| 41 | ||||
| 43 | ||||
| 47 | ||||
| 47 | ||||
| 48 | ||||
| 50 | ||||
| 51 | ||||
| 51 | ||||
| 56 | ||||
| 56 | ||||
| 57 | ||||
| 57 | ||||
| 58 | ||||
| 58 | ||||
| 59 | ||||
| 60 | ||||
| 60 | ||||
| 60 | ||||
| 61 | ||||
| 61 | ||||
| 62 | ||||
| 63 | ||||
| 63 | ||||
i
Table of Contents
| Page | ||||
| 64 | ||||
| 65 | ||||
| 73 | ||||
| 80 | ||||
| 80 | ||||
| 82 | ||||
| 84 | ||||
| 84 | ||||
| 87 | ||||
| 87 | ||||
| 88 | ||||
| 88 | ||||
| 89 | ||||
| 90 | ||||
| 90 | ||||
| 91 | ||||
| 92 | ||||
| 92 | ||||
| 95 | ||||
| 105 | ||||
| 105 | ||||
| 106 | ||||
| 107 | ||||
| 108 | ||||
| 108 | ||||
| 110 | ||||
| 110 | ||||
| 110 | ||||
| 110 | ||||
| 111 | ||||
| 111 | ||||
| 111 | ||||
| 112 | ||||
| 112 | ||||
| 112 | ||||
| 113 | ||||
| 114 | ||||
| 114 | ||||
| 114 | ||||
| 118 | ||||
| 118 | ||||
| 119 | ||||
| 120 | ||||
| 125 | ||||
| 126 | ||||
| 126 | ||||
ii
Table of Contents
| Page | ||||||||
| 127 | ||||||||
| 127 | ||||||||
| 128 | ||||||||
| 128 | ||||||||
| 128 | ||||||||
| 128 | ||||||||
| 128 | ||||||||
| 129 | ||||||||
| 129 | ||||||||
| 129 | ||||||||
| 129 | ||||||||
| 129 | ||||||||
| 130 | ||||||||
| 130 | ||||||||
| 130 | ||||||||
| 131 | ||||||||
| 131 | ||||||||
| 131 | ||||||||
| 131 | ||||||||
| 135 | ||||||||
| 135 | ||||||||
| 135 | ||||||||
| 135 | ||||||||
| 137 | ||||||||
| Report of Independent Registered Public Accounting Firm | F-1 | |||||||
| SAP AG and Subsidiaries | F-3 | |||||||
| Consolidated Financial Statements | F-3 | |||||||
| Financial Statement Schedule I — Reconciliations from U.S. GAAP to IFRS for the Years Ended December 31, 2007 and 2006 | S-1 | |||||||
| Exhibit 1 | ||||||||
| Exhibit 4.6 | ||||||||
| Exhibit 12.1 | ||||||||
| Exhibit 12.2 | ||||||||
| Exhibit 12.3 | ||||||||
| Exhibit 13.1 | ||||||||
| Exhibit 13.2 | ||||||||
| Exhibit 13.3 | ||||||||
| Exhibit 15 | ||||||||
iii
Table of Contents
INTRODUCTION
SAP AG is a German stock corporation (Aktiengesellschaft) and is referred to in this Annual Report onForm 20-F, together with its subsidiaries, as SAP, or as “Company,” “Group,” “we,” “our,” or “us.” Our Consolidated Financial Statements included in “Item 18. Financial Statements” in this Annual Report onForm 20-F have been prepared in accordance with International Financial Reporting Standards as issued by the International Accounting Standards Board, referred to as IFRS throughout this report.
In this Annual Report onForm 20-F: (i) references to “US$,” “$,” or “dollars” are to U.S. dollars; (ii) references to “€” or “euro” are to the euro. Our financial statements are denominated in euros, which is the currency of our home country, Germany. Certain amounts that appear in this Annual Report onForm 20-F may not add up because of differences due to rounding.
Unless otherwise specified herein, euro financial data have been converted into dollars at the noon buying rate in New York City for cable transfers in foreign currencies as certified for customs purposes by the Federal Reserve Bank of New York (the “Noon Buying Rate”) on December 31, 2009, which was US$1.4332 per €1.00. No representation is made that such euro amounts actually represent such dollar amounts or that such euro amounts could have been or can be converted into dollars at that or any other exchange rate on such date or on any other dates. The rate used for the convenience translations also differs from the currency exchange rates used for the preparation of the Consolidated Financial Statements. This convenience translation is not a requirement under IFRS and, accordingly, our independent registered public accounting firm has not audited these US$ amounts. For information regarding recent rates of exchange between euro and dollars, see “Item 3. Key Information — Exchange Rates.” On March 10, 2010, the Noon Buying Rate for converting euro to dollars was US$1.3658 per €1.00.
Unless the context otherwise requires, references in this Annual Report onForm 20-F to ordinary shares are to SAP AG’s ordinary shares, without nominal value. References in this Annual Report onForm 20-F to “ADRs” are to SAP AG’s American Depositary Receipts, each representing one SAP ordinary share.
SAP, R/3, SAP NetWeaver, Duet, PartnerEdge, ByDesign, SAP Business ByDesign, and other SAP products and services mentioned herein as well as their respective logos are trademarks or registered trademarks of SAP AG in Germany and other countries. Business Objects and the Business Objects logo, BusinessObjects, BusinessObjects Explorer, Crystal Reports, Crystal Decisions, Web Intelligence, Xcelsius, and other Business Objects products and services mentioned herein as well as their respective logos are trademarks or registered trademarks of Business Objects S.A. in the United States and in other countries. Business Objects is an SAP company. All other product and service names mentioned are the trademarks of their respective companies. Data contained in this report serves informational purposes only. National product specifications may vary.
Throughout this Annual Report onForm 20-F, whenever a reference is made to our website, such reference does not incorporate by reference into this Annual Report the information contained on our website.
We intend to make this Annual Report onForm 20-F and other periodic reports publicly available on our Web site (www.sap.com) without charge immediately following our filing with the U.S. Securities and Exchange Commission (SEC). We assume no obligation to update or revise any part of this Annual Report onForm 20-F, whether as a result of new information, future events or otherwise, unless we are required to do so by law.
1
Table of Contents
FORWARD-LOOKING STATEMENTS
This Annual Report onForm 20-F contains forward-looking statements and information based on the beliefs of, and assumptions made by, our management using information currently available to them. Any statements contained in this Annual Report onForm 20-F that are not historical facts are forward-looking statements as defined in the U.S. Private Securities Litigation Reform Act of 1995. We have based these forward-looking statements on our current expectations, assumptions and projections about future conditions and events. As a result, our forward-looking statements and information are subject to uncertainties and risks. A broad range of uncertainties and risks, many of which are beyond our control, could cause our actual results and performance to differ materially from any projections expressed in or implied by our forward looking statements. These uncertainties and risks include, but are not limited to:
| • | claims and lawsuits against us that could result in adverse outcomes, including third party infringement claims; | |
| • | our ability to procure new licenses, renew existing maintenance agreements and to sell additional professional services, particularly with respect to our installed customer base; | |
| • | economic conditions in general and trends in our business, particularly the current global economic crisis and general global economic uncertainty; | |
| • | the effectiveness of our IT security measures and Internet-related privacy concerns and risks associated with undetected errors in our products; | |
| • | our ability to use our intellectual property and intellectual property licensed to us by third parties; | |
| • | competitive risks associated with new delivery and licensing models, such as Software as a Service (SaaS), Business Process Outsourcing (BPO) and cloud computing; | |
| • | our ability to obtain, license and enforce intellectual property rights; | |
| • | liquidity and the valuation of our financial assets, particularly on the increased risk of default on receivables and financial assets in the current economic climate; | |
| • | variances or slowdowns in our software license sales and its impact on our future maintenance and service revenue; | |
| • | our ability to effectively manage our headcount and our geographically dispersed employee base; | |
| • | our ability to successfully integrate newly acquired businesses; | |
| • | international economic and regulatory requirements and constraints, including governance-related regulations; | |
| • | more onerous corporate governance laws in both Germany and the United States; | |
| • | current and future accounting pronouncements and managements estimates and judgements made in order to comply with IFRS; | |
| • | our liquidity management; and | |
| • | our ability to protect our critical information or assets or safeguard our business operations against disruption. |
We describe these and other risks and uncertainties in more detail under “Item 3 Key Information — Risk Factors.”
If one or more of these uncertainties or risks materializes, or if management’s underlying assumptions prove incorrect, our actual results may differ materially from those described in or inferred from our forward-looking statements and information.
2
Table of Contents
The words “aim,” “anticipate,” “assume,” “believe,” “continue,” “could,” “counting on,” “is confident,” “estimate,” “expect,” “forecast,” “guidance,” “intend,” “may,” “outlook,” “plan,” “project,” “predict,” “seek,” “should,” “strategy,” “want,” “will,” “would,” and similar expressions as they relate to us are intended to identify such forward-looking statements. Such information includes, for example, the statements made in “Item 5. Operating and Financial Review and Prospects” and our quantitative and qualitative disclosures about market pursuant to IFRS 7 in “Item 18., Financial Statements,” but also appears in other parts of this Annual Report onForm 20-F. The factors that could affect our future financial results are discussed more fully under “Item 3. Key Information — Risk Factors,” as well as elsewhere in this Annual Report onForm 20-F and in our other filings with the SEC. Readers are cautioned not to place undue reliance on these forward-looking statements, which speak only as of the date of this Annual Report onForm 20-F. Except where legally required we undertake no obligation to publicly update or revise any forward-looking statements as a result of new information that we receive about conditions that existed upon issuance of this report, future events or otherwise, unless we are required to do so by law.
This Annual Report includes statistical data about the IT industry that comes from information published by sources including Gartner, Inc., or Gartner, a provider of market information and strategic information for the IT industry; International Data Group, or IDC, a provider of market information and advisory services for the information technology, telecommunications, and consumer technology markets; investment bank Goldman Sachs; financial services company UBS; Forrester Research, a major market research company, Altimeter Group, a digital strategies company; SiteIQ, a contact center outsourcing company; and TNS Infratest, an independent customer survey company. This type of data represents only the estimates of Gartner, IDC, Goldman Sachs, UBS, Forrester Research, Altimeter Group, SiteIQ and other sources of industry data. SAP does not adopt nor endorse any of the statistical information provided by sources such as Gartner, IDC, Goldman Sachs, UBS, Forrester Research, Altimeter Group, SiteIQ or other similar sources that is contained in this Annual Report onForm 20-F. In addition, although we believe that data from these companies are generally reliable, this type of data is inherently imprecise. We caution you not to place undue reliance on this data.
FINANCIAL MEASURES CITED IN THIS REVIEW
Reporting Standards
Since 2007, we have been required by German and European law to prepare Consolidated Financial Statements in accordance with IFRS. In addition to our reporting under IFRS we continued to prepare Consolidated Financial Statements under U.S. GAAP.
Beginning with our audited Consolidated Financial Statements as of and for the year ended December 31, 2009, we fully migrated to IFRS and discontinued preparing U.S. GAAP financial information as of the end of 2009. Therefore, our press release announcing our preliminary fourth quarter and full year 2009 financial results was the last document in which we provided U.S. GAAP financial information. Our 2009 Annual Report as well as our Annual Report onForm 20-F for fiscal year 2009 and for the subsequent years will only present IFRS financial statements. As such, our business outlook for 2010 announced on January 27, 2010, is for the first time on the basis of non-IFRS numbers derived from IFRS numbers. Concurrently with this change in our external financial communication, we modified our internal management reporting, planning and forecasting, and variable compensation plans, which are now aligned with the IFRS and non-IFRS numbers that we provide in our external communications.
Managing for Value
In 2009 and in 2008, we expressed our internal management reporting and operational objectives and targets in terms of financial measures derived from U.S. GAAP numbers, adjusted by eliminating currency and certain extraordinary effects including those related to acquisitions. We refer to these measures as constant currency non-GAAP measures. This non-GAAP information differs from our numbers reported according to
3
Table of Contents
U.S. GAAP. Starting in 2010, we base our internal management reporting and operational objectives and targets on constant currency non-IFRS measures as more fully described below.
We use various value-based performance measures to help promote our primary goal of sustained growth in corporate value and our ancillary goal of profitable revenue growth.
In 2009 and in 2008, for purposes of our internal management reporting, we eliminated a deferred support revenue write-down resulting from an acquisition, as well as recurring acquisition-related charges from certain key U.S. GAAP-derived measures we mainly used to manage our operational business, which are non-GAAP software and software-related service revenue, non-GAAP operating income and non-GAAP operating margin. In 2008, we focused on non-GAAP growth of software and software-related service revenue and non-GAAP operating margin, whereas in 2009 we had a stronger focus on non-GAAP operating income and non-GAAP operating margin and added the cash conversion rate as our group targeted measure. The cash conversion rate is the ratio of the net cash provided by operating activities from continuing operations to the income from continuing operations, based on U.S. GAAP. Starting in 2010, we will manage our operational business based on constant currency non-IFRS measures rather than the constant currency non-GAAP measures we used in 2009 and in 2008.
To compare rates of growth in underlying business volumes, we use measures both before and after we exclude currency effects from the numbers being compared by translating them at the exchange rates from the immediately preceding year, i.e. we translate the relevant 2009 numbers at 2008 exchange rates before comparing them to the relevant 2008 numbers. We refer to measures from which currency effects have been eliminated as constant currency measures. The following are some of the key measures we use before and after we exclude currency effects:
| • | Our software and software-related service revenue includes software and support revenue plus subscription and other software-related service revenue. The principal source of software revenue is the fees customers pay for software licenses. Software revenue is the key revenue driver because it tends to affect our other revenue streams. Generally, customers that buy software licenses also enter into maintenance contracts, and after the software sale these generate recurring software-related service revenue in the form of support revenue. Maintenance contracts cover support services, regular software maintenance, and software updates and enhancements. We also generate software-related service revenue when we provide software on subscription or obligatory hosting terms. Software revenue also tends to stimulate service revenue from consulting and training sales. | |
| • | In 2009 and 2008, we used non-GAAP operating margin and constant currency non-GAAP operating margin to measure our overall operational process efficiency and the performance of our core business (software licenses, support, and other software-related service revenue). Non-GAAP operating margin is the ratio of our non-GAAP operating income, which includes support revenue from an acquired company that would have been reported had it been an independent company and excludes acquisition-related charges, to total non-GAAP revenue, expressed as a percentage. See below for a discussion of the IFRS and non-IFRS measures we use beginning in 2010. |
The cash conversion rate is defined as the ratio of our net cash flows from operating activities from continuing operations to income from continuing operations (U.S. GAAP). The cash conversion rate measures the proportion of our income from continuing operations that is converted to cash flow.
We also use performance measures — mainly financial income, net and the effective Group tax rate — to manage non-operating items.
| • | Financial income, net provides insight especially into the return on liquid assets and capital investments and the cost of borrowed funds. To manage our financial income, net, we focus on cash flow, the composition of our liquid asset and capital investment portfolio, and the average rate of interest at which assets are invested. We also monitor average outstanding borrowings and the associated finance costs. |
4
Table of Contents
| • | Another aspect is management of working capital by controlling the days’ sales outstanding for receivables, DSO (defined as average number of days from the raised invoice to cash receipt from the customer) and the days’ payables outstanding for liabilities, DPO (defined as average number of days from the received invoice to cash payment to the vendor). | |
| • | In 2009 and in 2008 we defined our effective Group tax rate as the ratio of income taxes to income from continuing operations before income taxes (in accordance with U.S. GAAP), expressed as a percentage. Starting in 2010, we will calculate the effective Group tax rate on an IFRS basis. |
Earnings per share (EPS) is a measure of the overall performance of the Group, because it captures all operating and non-operating elements of profit. It represents the portion of profit after tax allocable to each SAP share outstanding (using the weighted average number of shares outstanding over the reporting period). EPS is influenced not only by our operating and non-operating business but also by the weighted average number of shares outstanding. We believe that stock repurchases and dividend distributions are a good means to return value to shareholders in accordance with the authorizations granted by them.
Our holistic view of the performance measures described above together with our associated analyses make up the information base we use for value-based management. We use planning and control processes to manage the compilation of these key measures and their availability to the decision makers.
The Company’s long-term strategic plans are the point of reference for our other planning and controlling processes, including creating a multi-year plan. We identify future growth and profitability drivers at a highly aggregated level. This process is intended to identify the best areas in which to target sustained investment. The next step is to evaluate multi-year plans for areas of development and for customer-facing and support functions, and to break them down by sales region. We allocate resources to achieve targets we derive from detailed annual plans. We also have processes in place to forecast on a quarterly basis, internal revenue and income, to quantify whether we have realized our goals and to identify any deviations from plan. We closely monitor the concerned units in the Group to analyze these developments and define any appropriate actions.
The entire network of planning, control, and reporting processes is implemented in integrated planning and information systems across all organizational units so that we can conduct the evaluations and analyses needed to make informed decisions.
Measures Used in this Report
We provided our 2009 outlook on the basis of certain non-GAAP measures as described above. Therefore, this report contains a comparison of our actual performance in 2009 against that outlook. Our outlook for 2010 is expressed in non-IFRS terms which are explained in the following section.
This introductory section provides:
| • | A reconciliation of the non-GAAP measures we used in 2009 and in 2008 to the related non-IFRS measures, and a reconciliation of those non-IFRS measures to the related IFRS measures. | |
| • | An explanation of the non-GAAP and non-IFRS measures we disclose in this report. We believe it is critical to provide these reconciliations and the explanatory information for both the relevant non-GAAP and non-IFRS measures to ensure transparency and clarity in our financial reporting particularly as we started providing our outlook based on non-IFRS measures instead of the non-GAAP measures beginning in 2010. |
5
Table of Contents
Reconciliations from IFRS to Non-IFRS to Non-GAAP Numbers for 2009 and 2008
The following tables reconcile from our IFRS numbers to the respective and most comparable non-IFRS numbers, and then reconcile from those non-IFRS numbers to the respective and most comparable non-GAAP numbers, in each case for 2009 and 2008. Due to rounding, numbers presented in these tables may not add up precisely to the totals we provide.
Reconciliation from IFRS to Non-IFRS to Non-GAAP
| 2009 | ||||||||||||||||||||||||||||
| Non-IFRS | ||||||||||||||||||||||||||||
| Constant | ||||||||||||||||||||||||||||
| Currency | ||||||||||||||||||||||||||||
| vs. Non- | Non- | |||||||||||||||||||||||||||
| Non-IFRS | GAAP | GAAP | ||||||||||||||||||||||||||
| Currency | Constant | Constant | Constant | |||||||||||||||||||||||||
| IFRS | Adjustment | Non-IFRS | Effect | Currency | Currency | Currency | ||||||||||||||||||||||
| € millions, unless otherwise stated | ||||||||||||||||||||||||||||
Revenue | ||||||||||||||||||||||||||||
| Software revenue | 2,607 | 0 | 2,607 | 17 | 2,624 | 0 | 2,624 | |||||||||||||||||||||
| Support revenue | 5,285 | 11 | 5,296 | −19 | 5,277 | 0 | 5,277 | |||||||||||||||||||||
| Subscription and other software-related service revenue | 306 | 0 | 306 | −7 | 299 | 0 | 299 | |||||||||||||||||||||
Software and software-related service revenue | 8,198 | 11 | 8,209 | −8 | 8,201 | 0 | 8,201 | |||||||||||||||||||||
| Consulting revenue | 2,074 | 0 | 2,074 | −11 | 2,063 | 0 | 2,063 | |||||||||||||||||||||
| Training revenue | 273 | 0 | 273 | 1 | 274 | 0 | 274 | |||||||||||||||||||||
| Other service revenue | 85 | 0 | 85 | 0 | 85 | 0 | 85 | |||||||||||||||||||||
Professional services and other service revenue | 2,432 | 0 | 2,432 | −11 | 2,421 | 0 | 2,421 | |||||||||||||||||||||
Other revenue | 42 | 0 | 42 | 0 | 42 | 0 | 42 | |||||||||||||||||||||
Total revenue | 10,672 | 11 | 10,683 | −19 | 10,664 | 0 | 10,664 | |||||||||||||||||||||
Total operating expenses | ||||||||||||||||||||||||||||
| Cost of software and software-related services | −1,714 | 240 | −1,474 | |||||||||||||||||||||||||
| Cost of professional services and other services | −1,851 | 4 | −1,847 | |||||||||||||||||||||||||
| Research and development | −1,591 | 4 | −1,587 | |||||||||||||||||||||||||
| Sales and marketing | −2,199 | 73 | −2,126 | |||||||||||||||||||||||||
| General and administration | −564 | 4 | −560 | |||||||||||||||||||||||||
| Restructuring | −198 | 4 | −194 | |||||||||||||||||||||||||
| Other income/expense, net | 33 | 0 | 33 | |||||||||||||||||||||||||
Total operating expenses | −8,084 | 327 | −7,756 | 36 | −7,720 | −11 | −7,731 | |||||||||||||||||||||
Operating profit and margin | ||||||||||||||||||||||||||||
Operating profit | 2,588 | 339 | 2,927 | 17 | 2,944 | −11 | 2,933 | |||||||||||||||||||||
Operating margin in % | 24.3 | 27.4 | 27.6 | 27.5 | ||||||||||||||||||||||||
6
Table of Contents
Reconciliation from IFRS to Non-IFRS to Non-GAAP
| 2008 | ||||||||||||||||||||
| Non-IFRS | ||||||||||||||||||||
| vs. Non- | Non- | |||||||||||||||||||
| IFRS | Adjustment | Non-IFRS | GAAP | GAAP | ||||||||||||||||
| € millions, unless otherwise stated | ||||||||||||||||||||
Revenue | ||||||||||||||||||||
| Software revenue | 3,606 | 0 | 3,606 | 0 | 3,606 | |||||||||||||||
| Support revenue | 4,602 | 157 | 4,759 | 0 | 4,759 | |||||||||||||||
| Subscription and other software-related service revenue | 258 | 0 | 258 | 0 | 258 | |||||||||||||||
Software and software-related service revenue | 8,466 | 157 | 8,623 | 0 | 8,623 | |||||||||||||||
| Consulting revenue | 2,498 | 0 | 2,498 | 0 | 2,498 | |||||||||||||||
| Training revenue | 434 | 0 | 434 | 0 | 434 | |||||||||||||||
| Other service revenue | 107 | 0 | 107 | 0 | 107 | |||||||||||||||
Professional services and other service revenue | 3,039 | 0 | 3,039 | 0 | 3,039 | |||||||||||||||
Other revenue | 70 | 0 | 70 | −1 | 69 | |||||||||||||||
Total revenue | 11,575 | 157 | 11,732 | −1 | 11,731 | |||||||||||||||
Total operating expenses | ||||||||||||||||||||
| Cost of software and software-related services | −1,743 | 290 | −1,453 | 0 | −1,453 | |||||||||||||||
| Cost of professional services and other services | −2,285 | −6 | −2,291 | −5 | −2,296 | |||||||||||||||
| Research and development | −1,627 | 12 | −1,615 | 1 | −1,614 | |||||||||||||||
| Sales and marketing | −2,546 | 90 | −2,456 | 2 | −2,454 | |||||||||||||||
| General and administration | −624 | 1 | −623 | 1 | −622 | |||||||||||||||
| Restructuring | −60 | 57 | −3 | 3 | 0 | |||||||||||||||
| Other income/expense, net | 11 | 0 | 11 | 0 | 11 | |||||||||||||||
Total operating expenses | −8,874 | 443 | −8,431 | 3 | −8,428 | |||||||||||||||
Operating profit and margin | ||||||||||||||||||||
Operating profit | 2,701 | 600 | 3,301 | 2 | 3,303 | |||||||||||||||
Operating margin in % | 23.3 | 28.1 | 28.2 | |||||||||||||||||
This report discloses certain financial measures, such as non-GAAP revenue, non-GAAP expenses,non-GAAP operating income, non-GAAP operating margin, non-IFRS revenue, non-IFRS expenses,non-IFRS operating profit, non-IFRS operating margin, constant currency revenue, and constant currency operating income measures that are not prepared in accordance with U.S. GAAP or IFRS and are therefore considered non-GAAP and non-IFRS financial measures. Our non-GAAP and non-IFRS financial measures may not correspond to non-GAAP and non-IFRS financial measures that other companies report. The non-GAAP and non-IFRS financial measures that we report should be considered in addition to, and not as substitutes for or superior to, revenue, operating income, operating margin, or other measures of financial performance prepared in accordance with U.S. GAAP or IFRS.
Explanations of Non-GAAP Measures
We believe that the supplemental historical and prospective non-GAAP financial information presented here provides useful supplemental information to investors because it is the same information used by our management in running our business and making financial, strategic and operational decisions — in addition to financial data prepared in accordance with U.S. GAAP or IFRS — to attain a more transparent understanding
7
Table of Contents
of our past performance and our future results. Beginning in 2008, we used these non-GAAP measures as defined below consistently in our planning and forecasting, reporting, compensation and external communication until the end of 2009. Specifically:
| • | Our management primarily used these non-GAAP measures rather than U.S. GAAP measures as the basis for making financial, strategic and operating decisions. | |
| • | The variable remuneration components of our board members and employees that are compensated with regard to our Group-targeted measures were based in 2009 on SAP’s achievement of its targets for non-GAAP operating income, non-GAAP operating margin at constant currencies and cash flow conversion ratio. | |
| • | The annual budgeting process involving all management units, which includes costs such as share-based compensation and restructuring, was based on non-GAAP revenue and non-GAAP operating income numbers rather than U.S. GAAP numbers. | |
| • | All monthly forecast and performance reviews with all senior managers globally were based on these non-GAAP measures, which are derived from U.S. GAAP measures rather than U.S. GAAP numbers. | |
| • | Both company-internal target setting and guidance provided to the capital markets were based on non-GAAP revenue and non-GAAP income measures rather than U.S. GAAP numbers. |
We believe that our non-GAAP measures are useful to investors for the following reasons:
| • | The non-GAAP measures provide investors with insight into management’s decision-making since management used these non-GAAP measures to run our business and make financial, strategic and operating decisions. | |
| • | The non-GAAP measures provide investors with additional information that enables a comparison ofyear-over-year operating performance by eliminating certain direct effects of acquisitions. |
Our non-GAAP financial measures reflect adjustments based on the items below:
Non-GAAP Revenue
Revenues in this report identified as non-GAAP revenue have been adjusted from the respective U.S. GAAP and IFRS numbers by including the full amount of support revenue that would have been recorded by the acquired entity had it remained a stand-alone entity but which we are not permitted to record as revenue under U.S. GAAP and IFRS due to fair value accounting for the support contracts in effect at the time of the respective acquisition.
Under U.S. GAAP and IFRS, we record at fair value the support contracts in effect at the time an entity was acquired. Consequently, our U.S. GAAP and IFRS support revenue, our U.S. GAAP and IFRS software and software-related service revenue, and our U.S. GAAP and IFRS total revenue for periods subsequent to acquisitions do not reflect the full amount of support revenue that would have been recorded for these support contracts absent the acquisition by SAP. Adjusting revenue numbers for this revenue impact (if significant) provides additional insight into the comparability across periods of our ongoing performance.
Non-GAAP Operating Expense
Operating expense figures in this report that are identified as non-GAAP operating expense have been adjusted by excluding the following acquisition-related charges:
| • | Amortization expense/impairment charges of intangibles acquired in business combinations and certain standalone acquisitions of intellectual property | |
| • | Expense from purchased in-process research and development |
8
Table of Contents
| • | Restructuring expenses and settlements of pre-existing relationships incurred in connection with a business combination | |
| • | Acquisition-related third-party costs (since our early adoption of SFAS 141R and the revision of IFRS 3) as of January 1, 2009, which are required to be expensed. The previous version of SFAS 141 and IFRS 3 required capitalization. |
Non-GAAP Operating Income and Non-GAAP Operating Margin
Operating income and operating margin in this report identified as non-GAAP operating income and non-GAAP operating margin have been adjusted from the respective operating income and operating margin as recorded under U.S. GAAP and IFRS by adjusting for the above-mentioned non-GAAP revenue and non-GAAP expenses.
We include these non-GAAP revenues and exclude these non-GAAP expenses for the purpose of calculating non-GAAP operating income and non-GAAP operating margin when evaluating the continuing operational performance of the Company because these expenses generally cannot be changed or influenced by management after the relevant acquisition other than by disposing of the acquired assets. Since management at levels below the Executive Board has no influence on these expenses, we generally do not consider these expenses for the purpose of evaluating the performance of management units. As we believe that our Company-wide performance measures need to be aligned with the measures generally applied by management at varying levels throughout the Company, we include these revenues and exclude these expenses when making decisions to allocate resources, both on a Company level and at lower levels of the organization. In addition, we use these non-GAAP measures to gain a better understanding of the Company’s comparative operating performance from period to period.
We believe that our non-GAAP financial measures described above have limitations, which include but are not limited to the following:
| • | The eliminated amounts may be material to us. | |
| • | Without being analyzed in conjunction with the corresponding U.S. GAAP or IFRS measures, the non-GAAP measures are not indicative of our present and future performance, foremost for the following reasons: |
| • | While our non-GAAP income numbers reflect the elimination of certain acquisition-related expenses, no eliminations are made for the additional revenues and other revenues that result from the acquisitions. | |
| • | The acquisition-related charges that we eliminate in deriving our non-GAAP income numbers are likely to recur should SAP enter into material business combinations in the future. | |
| • | The acquisition-related amortization expense that we eliminate in deriving our non-GAAP income numbers is a recurring expense that will impact our financial performance in future years. | |
| • | The revenue adjustment for the fair value accounting of the acquired entities’ support contracts and the expense adjustment for acquisition-related charges do not arise from a common conceptual basis. This is because the revenue adjustment aims to improve the comparability of the initial post-acquisition period with future post-acquisition periods while the expense adjustment aims to improve the comparability between post-acquisition periods and pre-acquisition periods. This should particularly be considered when evaluating our non-GAAP operating income and non-GAAP operating margin numbers as these combine our non-GAAP revenue and non-GAAP expenses despite the absence of a common conceptual basis. |
We believe, however, that the presentation of the non-GAAP measures in conjunction with the corresponding IFRS or U.S. GAAP measures, as well as the relevant reconciliations, provides useful information
9
Table of Contents
to management and investors regarding present and future business trends relating to our financial condition and results of operations. We therefore do not evaluate our growth and performance without considering both non-GAAP or non-IFRS measures and the relevant U.S. GAAP or IFRS measures. We caution the readers of this report to follow a similar approach by considering our non-GAAP or non-IFRS measures only in addition to, and not as a substitute for or superior to, revenues or other measures of our financial performance prepared in accordance with U.S. GAAP or IFRS.
Constant CurrencyPeriod-Over-Period Changes
We believe it is important for investors to have information that provides insight into our sales. Revenue measures determined under U.S. GAAP or IFRS provide information that is useful in this regard. However, both sales volume and currency effects impactperiod-over-period changes in sales revenue. We do not sell standardized units of products and services, so we cannot provide relevant information on sales volume by providing data on the changes in product and service units sold. To provide additional information that may be useful to investors in breaking down and evaluating changes in sales volume, we present information about our revenue and various values and components relating to operating income that are adjusted for foreign currency effects. We calculate constant currencyyear-over-year changes in non-GAAP revenue and non-GAAP operating income by translating foreign currencies using the average exchange rates from the previous year instead of the report year.
We believe that data on constant currencyperiod-over-period changes has limitations, particularly as the currency effects that are eliminated constitute a significant element of our revenue and expenses and may severely impact our performance. We therefore limit our use of constant currencyperiod-over-period changes to the analysis of changes in volume as one element of the full change in a financial measure. We do not evaluate our results and performance without considering both constant currencyperiod-over-period changes in non-GAAP revenue and non-GAAP operating income on the one hand and changes in revenue, expenses, income, or other measures of financial performance prepared in accordance with U.S. GAAP or IFRS on the other. We caution the readers of this report to follow a similar approach by considering data on constant currencyperiod-over-period changes only in addition to, and not as a substitute for or superior to, data on changes in revenue, expenses, income, or other measures of financial performance prepared in accordance with U.S. GAAP or IFRS.
Explanations of Non-IFRS Measures
Upon discontinuing our U.S. GAAP accounting and the full transition to IFRS, we have replaced our non-GAAP measures with non-IFRS measures beginning in 2010.
We have adjusted both our non-GAAP measures and our non-IFRS measures from the respective U.S. GAAP and IFRS numbers by:
| • | Including the full amount of support revenue that the acquired entity would have recognized had it remained a stand-alone entity but that we are not permitted to recognize as revenue under U.S. GAAP and IFRS as a result of fair value accounting for support contracts in effect at the time of the respective acquisition. | |
| • | Excluding acquisition-related charges. |
However, the adjustment amounts for acquisition-related charges differ between our non-GAAP measures and our non-IFRS measures, due to differences between U.S. GAAP and IFRS. Specifically:
| • | For acquisitions taking place up to the end of 2008, U.S. GAAP required that certain acquisition-related restructuring expenses be accounted for as liabilities assumed in a business combination; however, these expenses are required to be charged to expense under IFRS. Consequently, these acquisition-related restructuring expenses are eliminated only in our non-IFRS numbers. |
10
Table of Contents
| • | For acquisitions taking place up to the end of 2008, purchased in-process research and development was charged to expense immediately under U.S. GAAP, while being capitalized and amortized over the expected life under IFRS. Consequently, the immediate charge to expense is eliminated in our non-GAAP measures while only the amortization is eliminated in our non-IFRS measures. |
Starting on January 1, 2009, we aligned our accounting for acquisitions through the adoption of new accounting standards under both U.S. GAAP and IFRS. Therefore, we do not expect material differences for upcoming acquisitions with respect to acquisition-related restructuring expenses and purchased in-process research and development.
Additionally, our non-IFRS measures have been adjusted from the respective IFRS numbers for the results of the discontinued operations that qualify as such in all respects except that they do not represent a major line of business. We will refer to these activities as “discontinued activities.” Under U.S. GAAP, we present the results of operations of the TomorrowNow entities as discontinued operations. Under IFRS, results of discontinued operations may only be presented as discontinued operations if a separate major line of business or geographical area of operations is discontinued. Our TomorrowNow operations were not a separate major line of business and thus did not qualify for separate presentation under IFRS. We believe that this additional adjustment to our IFRS numbers for the results of our discontinued TomorrowNow activities is useful to investors for the following reasons:
| • | Despite the migration from U.S. GAAP to IFRS, we will continue to internally view the ceased TomorrowNow activities as discontinued activities and thus will continue to exclude potential future TomorrowNow results, which are expected to mainly comprise of expenses in connection with the Oracle lawsuit, from our internal management reporting, planning, forecasting, and compensation plans. Therefore, adjusting our non-IFRS measures for the results of the discontinued TomorrowNow activities provides insight into the financial measures that SAP will use internally beginning in 2010 with our migration to IFRS. | |
| • | By adjusting the non-IFRS numbers for the results from our discontinued TomorrowNow operations, the non-IFRS numbers are more comparable to the non-GAAP measures that SAP used through the end of 2009, which makes SAP’s performance measures before and after the full IFRS migration easier to compare. |
Free Cash Flow (IFRS)
We use our free cash flow measure to estimate the cash flow remaining after all expenditures required to maintain or expand the organic business have been paid off. This assists management with supplemental information to assess our liquidity needs. We calculate free cash flow as net cash flows from operating activities minus additions to non-current assets, excluding additions from acquisitions. Free cash flow should be considered in addition to, and not as a substitute for or superior to, cash flow or other measures of liquidity and financial performance prepared in accordance with U.S. GAAP or IFRS.
FREE CASH FLOW
| 2009 | 2008 | Change | ||||||||||
| € millions | ||||||||||||
| Net cash flows from operating activities | 3,015 | 2,158 | 40 | % | ||||||||
| Additions to non-current assets excluding additions from acquisitions | −225 | −339 | −34 | % | ||||||||
Free cash flow | 2,790 | 1,819 | 53 | % | ||||||||
11
Table of Contents
PART I
ITEM 1. IDENTITY OF DIRECTORS, SENIOR MANAGEMENT AND ADVISERS
Not applicable.
ITEM 2. OFFER STATISTICS AND EXPECTED TIMETABLE
Not applicable.
ITEM 3. KEY INFORMATION
SELECTED FINANCIAL DATA
The following table sets forth our selected consolidated financial data as of and for each the years in the four-year period ended December 31, 2009. The consolidated financial data has been derived from, and should be read in conjunction with, our Consolidated Financial Statements prepared in accordance with International Financial Reporting Standards as issued by the International Accounting Standards Board (IFRS), presented elsewhere in this document.
For an extended period of time prior to 2009, SAP’s primary financial reporting was prepared in accordance with United States Generally Accepted Accounting Principles (U.S. GAAP). During this period, all financial reporting for the purpose of theForm 20-F was based upon U.S. GAAP. In 2007, SAP adopted IFRS 1 and began including Consolidated Financial Statements based upon IFRS in its published Annual Report to Shareholders, but not in its Annual Report onForm 20-F. Beginning with our Annual Report onForm 20-F for the fiscal year 2009, SAP no longer prepares financial statements in accordance with U.S. GAAP.
Our selected financial data and our Consolidated Financial Statements are presented in euros. Financial data as of and for the year ended December 31, 2009 has been translated into U.S. dollars for the convenience of the reader.
12
Table of Contents
SELECTED FINANCIAL DATA: IFRS
Years Ended and as at December 31,
| Unaudited | ||||||||||||||||||||||||
| 2009(1) | 2009 | 2008 | 2007 | 2006 | 2005 | |||||||||||||||||||
| US$ | € | € | € | € | € | |||||||||||||||||||
| millions, unless otherwise stated | ||||||||||||||||||||||||
Income Statement Data: | ||||||||||||||||||||||||
| Total revenue | 15,295 | 10,672 | 11,575 | 10,256 | 9,402 | N/A | ||||||||||||||||||
| Operating profit | 3,709 | 2,588 | 2,701 | 2,698 | 2,503 | N/A | ||||||||||||||||||
| Profit after tax | 2,508 | 1,750 | 1,848 | 1,908 | 1,836 | N/A | ||||||||||||||||||
| Profit attributable to owners of parent | 2,505 | 1,748 | 1,847 | 1,906 | 1,835 | N/A | ||||||||||||||||||
| Earnings per share | ||||||||||||||||||||||||
| Basic in € | 2.11 | 1.47 | 1.55 | 1.58 | 1.50 | N/A | ||||||||||||||||||
| Diluted in € | 2.11 | 1.47 | 1.55 | 1.58 | 1.49 | N/A | ||||||||||||||||||
Other Data: | ||||||||||||||||||||||||
| Weighted-average number of shares outstanding | ||||||||||||||||||||||||
| Basic | 1,188 | 1,188 | 1,190 | 1,207 | 1,226 | N/A | ||||||||||||||||||
| Diluted | 1,189 | 1,189 | 1,191 | 1,210 | 1,231 | N/A | ||||||||||||||||||
Statement of Financial Position Data: | ||||||||||||||||||||||||
| Cash and cash equivalents | 2,700 | 1,884 | 1,280 | 1,608 | 2,399 | N/A | ||||||||||||||||||
Total assets(2) | 19,168 | 13,374 | 13,900 | 10,161 | 9,332 | N/A | ||||||||||||||||||
Total equity(3) | 12,169 | 8,491 | 7,171 | 6,478 | 6,123 | N/A | ||||||||||||||||||
| Issued capital | 1,757 | 1,226 | 1,226 | 1,246 | 1,268 | N/A | ||||||||||||||||||
Current bank loans(4)(5) | 6 | 4 | 2,319 | 25 | 24 | N/A | ||||||||||||||||||
Non-current bank loans(4)(5) | 1,002 | 699 | 2 | 2 | 2 | N/A | ||||||||||||||||||
| (1) | Amounts presented in US$ have been translated for the convenience of the reader at €1.00 to US$1.4332, the Noon Buying Rate for converting €1.00 into dollars on December 31, 2009. See “Item 3. Key Information— Exchange Rates” for recent exchange rates between the Euro and the dollar. This convenience translation is not a requirement under IFRS and, accordingly, our independent registered public accounting firm has not audited these US$ amounts. | |
| (2) | The large increase in total assets from 2007 to 2008 was due to the acquisition of Business Objects in 2008. See Note 4 to our Consolidated Financial Statements in “Item 18. Financial Statements” for more information on the acquistion of Business Objects. | |
| (3) | On December 15, 2006 there was a four-to-one stock split pursuant to German law that resulted in an increase to subscribed capital of approximately 950 million common shares. Furthermore, the 2007 and 2008 figures reflect cancellations of 23 million and 21 million treasury shares effective September 7, 2007 and September 4, 2008, respectively. See “Item 9. The Offer and Listing — General” for more detail on the cancellation of shares. | |
| (4) | The balances include financial debt, other bank loans and overdrafts. Current is defined as having a remaining life of one year or less; non-current is defined as having a remaining term exceeding one year. The significant increase in current debt during 2008 was due to financial debt incurred to finance the acquisition of Business Objects. |
EXCHANGE RATES
The prices for ordinary shares traded on German stock exchanges are denominated in euro. Fluctuations in the exchange rate between the euro and the dollar affect the dollar equivalent of the euro price of the ordinary shares traded on the German stock exchanges and, as a result, may affect the price of the ADRs traded
13
Table of Contents
on the NYSE in the United States. See “Item 9. The Offer and Listing” for a description of the ADRs. In addition, SAP AG pays cash dividends, if any, in euro. As a result, any exchange rate fluctuations will also affect the dollar amounts received by the holders of ADRs on the conversion into dollars of cash dividends paid in euro on the ordinary shares represented by the ADRs. Deutsche Bank Trust Company Americas is the depositary (the Depositary) for SAP AG’s ADR program. The deposit agreement with respect to the ADRs requires the Depositary to convert any dividend payments from euro into dollars as promptly as practicable upon receipt. For additional information on the Depositary and the fees associated with SAP’S ADR program see “Item 12 Description of Securities Other Than Equity Securities — American Depositary Shares.”
A significant portion of our revenue and expense is denominated in currencies other than the euro. Therefore, fluctuations in the exchange rate between the euro and the respective currencies to which we are exposed may materially affect our business, financial position, income or cash flows. See “Item 5. Operating and Financial Review and Prospects — Foreign Currency Exchange Rate Exposure for details on the impact of these exchange rate fluctuations.
The following table sets forth (i) the average, high and low Noon Buying Rates for the euro expressed as U.S. dollars per €1.00 for the past five years on an annual basis and (ii) the high and low Noon Buying Rates on a monthly basis from July 2009 through March 10, 2010.
Year | Average(1) | High | Low | |||||||||
| 2005 | 1.2400 | 1.3476 | 1.1667 | |||||||||
| 2006 | 1.2661 | 1.3327 | 1.1860 | |||||||||
| 2007 | 1.3797 | 1.4862 | 1.2904 | |||||||||
| 2008 | 1.4695 | 1.6010 | 1.2446 | |||||||||
| 2009 | 1.3955 | 1.5100 | 1.2547 | |||||||||
Month | High | Low | ||||||
| 2009 | ||||||||
| July | 1.4279 | 1.3852 | ||||||
| August | 1.4416 | 1.4075 | ||||||
| September | 1.4795 | 1.4235 | ||||||
| October | 1.5029 | 1.4532 | ||||||
| November | 1.5085 | 1.4658 | ||||||
| December | 1.5100 | 1.4243 | ||||||
| 2010 | ||||||||
| January | 1.4536 | 1.3870 | ||||||
| February | 1.3955 | 1.3476 | ||||||
| March (through March 10, 2010) | 1.3731 | 1.3516 | ||||||
| (1) | The average of the applicable Noon Buying Rates on the last day of each month during the relevant period. |
The Noon Buying Rate on March 10, 2010 was US$1.3658 per €1.00.
In 2009, the foreign currency translation effects resulting from a slightly weaker euro had a slight positive impact on our total revenue, while in 2008 and 2007, the strength of the euro reduced the euro value of revenue generated in other currencies during those years. Foreign currency translation effects from the strengthening value of the euro negatively impacted our total revenue by 4% in 2008 and 2007, respectively.
14
Table of Contents
DIVIDENDS
Dividends are jointly proposed by SAP AG’s Supervisory Board (Aufsichtsrat) and Executive Board (Vorstand) based on SAP AG’s year-end stand-alone statutory financial statements, subject to approval by the shareholders. Dividends are officially declared for the prior year at SAP AG’s Annual General Meeting of Shareholders. Dividends paid to holders of the ADRs may be subject to German withholding tax. See “Item 8. Financial Information — Other Financial Information — Dividend Policy” and “Item 10. Additional Information — Taxation,” for further information.
The following table sets forth in euro the annual dividends paid or proposed to be paid per ordinary share in respect of each of the years indicated. The amounts shown in the table for 2005 are retrospectively adjusted for the effect of the fourfold increase in the number of shares resulting from the capital increase effective December 15, 2006 pursuant to German law. One SAP ADR currently represents one SAP AG ordinary share. Accordingly, the final dividend per ADR is equal to the dividend for one SAP AG ordinary share and is dependent on the euro/U.S. dollar exchange rate. The table does not reflect tax credits that may be available to German taxpayers who receive dividend payments. If you own our ordinary shares or ADRs and if you are a U.S. resident, refer to “Item 10. Additional Information — Taxation,” for further information.
| Dividend Paid | ||||||||
| per Ordinary | ||||||||
| Share | ||||||||
Year Ended December 31, | € | US$ | ||||||
| 2005 | 0.36 | 0.43 | (1) | |||||
| 2006 | 0.46 | 0.62 | (1) | |||||
| 2007 | 0.50 | 0.77 | (1) | |||||
| 2008 | 0.50 | 0.68 | (1) | |||||
| 2009 (proposed) | 0.50 | (2) | 0.68 | (2)(3) | ||||
| (1) | Translated for the convenience of the reader from euro into U.S. dollars at the Noon Buying Rate for converting euro into U.S. dollars on the dividend payment date. The Depositary is required to convert any dividend payments received from SAP as promptly as practicable upon receipt. | |
| (2) | Subject to approval at the Annual General Meeting of Shareholders of SAP AG currently scheduled to be held on June 10, 2010. | |
| (3) | Translated for the convenience of the reader from euro into U.S. dollars at the Noon Buying Rate for converting euro into U.S. dollars on March 10, 2010 of US$1.3658 per €1.00. The dividend paid may differ due to changes in the exchange rate. |
The amount of dividends paid on the ordinary shares depends on the amount of profits to be distributed by SAP AG, which depends in part upon our performance. The timing and amount of future dividend payments will depend upon our future earnings, capital needs and other relevant factors in each case as proposed by the Executive Board and the Supervisory Board of SAP AG and approved at the Annual General Meeting of Shareholders.
RISK FACTORS
Economic, Political, and Regulatory Risk
The widespread uncertainty in the global economy and in political conditions has negatively impacted our business, financial position, income, and cash flows, and may continue to do so in the future.
Our customers’ willingness to invest in acquiring and implementing SAP products generally varies with economic and other business conditions. In the regions in which we do business and the industries in which our customers operate, persistent economic uncertainty may continue to have negative effects, including:
| • | Generally declining IT investment |
15
Table of Contents
| • | Decreased customer demand for our software and services, including delayed, cancelled and smaller orders | |
| • | Customers’ inability to obtain credit on acceptable terms, or at all, to finance purchases of our software and services | |
| • | Increased incidence of default and insolvency of customers, business partners, and key suppliers | |
| • | Increased default risk, which may lead to significant write-downs in the future | |
| • | Greater pressure on the prices of our products and services | |
| • | Pressure on our operating margin |
In 2009, the economic crisis negatively impacted our business. If current economic conditions persist or further worsen, we expect a sustained negative impact on our revenue growth, more defaults, and a consequent negative impact on our income. Moreover, continued or further economic deterioration could exacerbate the other risks we describe in this report.
Our global business activities subject us to regulatory requirements and economic and other risks that could harm our business, financial position, income, or cash flows.
We currently market our products and services in over 120 countries in the Americas, APJ, and EMEA regions. Sales in these countries are subject to risks inherent in international business operations. Among others, these risks include:
| • | Regional and local economic decline or instability and resulting market uncertainty | |
| • | General economic or political conditions in each country or region | |
| • | Conflict and overlap among different tax regimes | |
| • | Possible tax constraints impeding business operations in certain countries | |
| • | The management of an organization spread over various jurisdictions | |
| • | Exchange rate fluctuations | |
| • | Longer payment cycles | |
| • | Regulatory constraints such as import and export restrictions, competition law regimes, legislation governing the use of the Internet, additional requirements for the development, certification, and distribution of software and services, trade restrictions, changes in tariff and freight rates and travel and communication costs | |
| • | Expenses associated with the customization of our products on a local level and transacting business in the local currency | |
| • | Differing demands from works councils and labor unions in the different countries | |
| • | The higher cost of doing business internationally |
As we expand further into new regions and markets, these risks could intensify. One or more of these factors could negatively impact our operations globally or in one or more countries or regions. As a result, our business, financial position and reputation, income, or cash flows could be impacted.
Social and political instability caused, for example, by terrorist attacks, war or international hostilities, pandemic disease outbreaks, or natural disasters could negatively impact our business.
Terrorist attacks and other acts of violence or war, pandemic disease outbreaks, or natural disasters could have a negative impact on the world economy. The resultant social and political instability could contribute further to the current economic decline and economic and political uncertainty in many regions in which we do
16
Table of Contents
business. That could negatively impact our revenue and investment decisions, and those of our customers. Our corporate headquarters, which includes our main research and development departments and certain other critical business functions, is located in the German state of Baden-Württemberg. A catastrophic event affecting the northern part of Baden-Württemberg could have a highly material impact on our operations. Catastrophic events at other SAP centers, notably Buenos Aires (Argentina), São Paulo (Brazil), Shanghai (China), Prague (Czech Republic), Bangalore (India), Dublin (Ireland), Paris, Ra’anana (Israel), Tokyo, Mexico City, London, Vancouver (Canada), or Singapore, or at our U.S. locations in New York, Palo Alto (California), or Newtown Square (Pennsylvania), could also impact our operations. A catastrophic event that results in the loss of significant percentages of personnel or the destruction or disruption of operations at our headquarters or other key locations could affect our ability to provide normal business services and to generate the expected income.
Market Risks
If our established customers do not buy additional software products, renew maintenance agreements, or purchase additional professional services, our business, financial position, income, or cash flows could be negatively impacted.
Our large installed customer base traditionally generates additional new software, maintenance, consulting, and training revenue. In 2009, we continued to roll out SAP Enterprise Support, a wide-ranging set of value-adding support services that helps our customers operate their IT systems more effectively. To achieve our business goals, we depend materially on the success of our support portfolio and on our own ability to deliver high-quality services. If existing customers cancel or do not renew their maintenance contracts, or if they seek alternative offerings from other vendors or decide not to buy additional products and services, this will have a material negative impact on our business, financial position, income, or cash flows.
Our market share and income may decline due to the intense competition and consolidation in the software industry.
The software industry continues to evolve rapidly, due to consolidation and technological innovation. As a result, the market for our products and services remains intensely competitive. Over the last ten years, we have expanded from our traditional large ERP offerings to new products and services, which expose us to competitors varying in size, geographic location, and specialty. Competitors may gain market share because of acquisitions, or because the growing popularity of new development models, such as service-oriented architecture (SOA), and new delivery and licensing models, such as software as a service (SaaS), business process outsourcing (BPO), and cloud computing, enables them to also offer integrated package solutions that compete with ours. For example, IBM, Oracle, and Microsoft have acquired companies to extend their solutions portfolios or market share, which has increased competitive pressure on SAP. SaaS providers such as Salesforce.com, part of a growing SaaS ecosystem for applications, also compete with SAP for segment share. Current and potential competitors are establishing or may in the future establish or extend cooperative relationships among themselves or with third parties to better address their customers’ needs. This increased competition could result in increased price pressure, cost increases, and loss of market share for SAP.
Business Strategy Risks
Demand for our new products may not develop as planned and our midmarket strategy may not be successful.
Especially in the current economic climate, the demand for the products and services we have recently introduced, and customers’ acceptance of them, are subject to a high level of uncertainty. Gaining new midsize customers with the aim of building on our leading position in the midmarket is a key part of our strategy. In that context, introducing a new business model, expanding our partner ecosystem, and creating the infrastructure for volume business are all of great importance. Despite our efforts, demand for our products and services in the midmarket may fail to develop as planned, and this could have a material negative impact on our business,
17
Table of Contents
financial position, income, or cash flows. In addition, entering new market segments exposes us to the risks associated with developing and launching new products. For more information, see theProduct Riskssection.
If we fail to develop new relationships and enhance existing relationships with channel partners, software suppliers, system integrators, value-added resellers, and independent software vendors (ISVs) that contribute to the sale of our products and services, our business, financial position, income, or cash flows may be adversely impacted.
We have entered into cooperation agreements with channel partners and leading software and hardware vendors. Most of these agreements are of relatively short duration and are nonexclusive. The parties concerned typically maintain similar arrangements with our competitors, and some compete with us themselves. Additionally, we maintain a network of ISVs that develop their own business applications for the SAP NetWeaver technology platform. These third-party relationships carry numerous risks. For example:
| • | The relevant counterparties may not renew their agreements with us at all or on terms acceptable to us | |
| • | The relevant counterparties may fail to provide high-quality products and services | |
| • | The relevant counterparties may not devote sufficient resources to promote, sell, support, and integrate their products within our portfolio |
If one or more of these risks materialize, the marketing of and demand for our products and services may be negatively impacted and we may not be able to compete successfully with other software vendors, which could harm our reputation or negatively impact our business, financial position, income, or cash flows.
Human Capital Risks
If we do not effectively manage our geographically dispersed workforce, our business may not operate efficiently, and this could have a negative impact on our income.
Our success is dependent on appropriate alignment of our workforce planning process and location strategy with our mid-term strategy. Changes in headcount and infrastructure needs could result in a mismatch between our costs and revenue. Additionally, it is critical that we manage our geographically dispersed employee base well. If we do not manage our headcount and our geographically dispersed employee base effectively, our business may not operate efficiently and this could have a negative impact on our financial position, income, or cash flows.
If we are unable to attract and retain management and employees with specialized knowledge and technology skills, we may not be able to manage our operations effectively or develop successful new products and services.
Our highly qualified employees and managers provide the foundation for our continued success. Competition in our industry for highly skilled and specialized personnel and leaders is intense. If we are unable to attract well qualified personnel or if our highly skilled and specialized personnel leave SAP and qualified replacements are not available, we may not be able to manage our operations effectively or develop successful new products and services. This is particularly true as we continue to introduce new and innovative technology offerings. Hiring such personnel may also expose us to claims by other companies seeking to prevent their employees from working for a competitor.
Organizational and Governance-Related Risks
Both in Germany and in the United States, corporate governance laws have become much more onerous.
As a stock corporation domiciled in Germany with securities listed in Germany and the United States, we are subject to German, European, and U.S. governance-related regulatory requirements. The standards have
18
Table of Contents
become significantly more onerous in recent years, notably with the implementation of the Sarbanes-Oxley Act and more rigorous application of the Foreign Corrupt Practices Act in the United States, and the increasing degree of regulation in Germany. The rules are highly complex, and there can be no assurance that we will not be held in breach of regulatory requirements if, for example, individual employees behave fraudulently or negligently, or if we fail to comply with certain formal documentation requirements. Any related allegations of wrongdoing against us, whether merited or not, could have a material negative impact on our reputation as well as on the trading price of our common stock and ADRs.
Principal shareholders may be able to exert control over our future direction and operations.
If SAP AG’s principal shareholders and the holdings of entities controlled by them vote in the same manner, this could delay, prevent or facilitate a change in control of SAP or other significant changes to SAP AG or its capital structure. See “Item 7. Major Shareholders and Related-Party Transactions — Major Shareholders,” for further information.
Sales of ordinary shares by principal shareholders could adversely affect the price of our capital stock.
The sale of a large number of ordinary shares by any of the principal shareholders and related entities could have a negative effect on the trading price of our ADRs or our ordinary shares. We are not aware of any restrictions on the transferability of the shares owned by any of the principal shareholders or related entities.
U.S. judgments may be difficult or impossible to enforce against us or our Board members.
Currently, except for Bill McDermott and Vishal Sikka, all members of SAP AG’s Executive Board and all members of the Supervisory Board are non-residents of the United States. A substantial portion of the assets of SAP and our Board members are located outside the United States. As a result, it may not be possible to effect service of process within the United States uponnon-U.S. resident persons or SAP or to enforce againstnon-U.S. resident persons judgments obtained in U.S. courts predicated upon the civil liability provisions of the securities laws of the United States. In addition, awards of punitive damages in actions brought in the United States or elsewhere may be unenforceable in Germany.
SAP’s sustainability strategy may be difficult to maintain, and a failure by us to meet customer or partner expectations or generally accepted sustainability standards could have an adverse impact on our results of operations, our business, and our reputation.
For SAP, sustainability is a standard that guides our engagement in new business opportunities — holistically encompassing profitable growth, environmental value, and societal benefit. Therefore, we address sustainability risks, especially relating to climate change, corporate integrity, human resources management, the ethical behavior of suppliers, the accessibility, user-friendliness, and safety of our products, privacy and data protection in connection with the use of SAP products. If our sustainability strategy is not sufficient to meet the expectations of our customers and partners or generally accepted sustainability standards, this could harm our reputation and have an adverse impact on our business, income, financial position, or cash flows.
Communication and Information Risks
We may not be able to prevent unauthorized disclosure of our future strategies, technologies, and products, or of information that is subject to data protection or privacy law, and such disclosure may harm our business.
We have taken a range of measures in recent years to mitigate the risk that internal confidential communications and information about sensitive subjects, such as our future strategies, technologies, and products, or information that is subject to data protection or privacy law, are improperly or prematurely disclosed to the public. However, there is no guarantee that the protective mechanisms we have established will work in every case. Our competitive position could sustain serious damage if, for example, confidential information about the future direction of our product development became public knowledge, resulting in reduced revenue in the future. Any such premature disclosure could have a negative impact on our business, assets, income, or cash flows.
19
Table of Contents
Financial Risks
Our revenue mix may vary and may negatively impact our profit margins.
Variances or slowdowns in our software license sales may negatively impact current or future revenue from maintenance and services, since such revenue typically follows and is dependent on software sales. Any decrease in the percentage of our total revenue derived from software licensing could have a material negative impact on our business, financial position, income, or cash flows. We have introduced new licensing models such as on-demand and subscription models which typically result in revenue being recognized over an extended period. A significant portion of the related cost of developing, marketing, and providing our solutions to customers under such new models could be incurred prior to the recognition of revenue, thus impacting our profit margin in the short term.
The economic crisis has led to an increased risk of default on receivables and financial assets and may negatively impact our financial assets. A continuation or deepening of the economic crisis may lead to more such losses.
If we experience a higher risk of default on our receivables and financial assets, our business, financial position, income, or cash flows may be negatively impacted. SAP’s policy with regard to investment in financial assets is set out in our internal treasury guideline document, which is a collection of uniform rules that apply globally to all companies in the Group. Among its stipulations, it requires that we invest only in assets from issuers or funds with a rating of A- or better. The weighted average rating of our financial assets is in the range of AA- to A+. We pursue a policy of cautious investment characterized by wide portfolio diversification with a variety of counterparties, predominantly short-term investments, and the use of standard investment instruments. However, there can be no guarantee that those measures will prove successful.
Our future liquidity may be impacted by a negative development in the global economy.
We use global centralized financial management to control liquid assets, interest, and currencies. The primary aim is to maintain liquidity in the Group at a level that is adequate to meet our obligations. Our net liquidity on December 31, 2009, was €1.6 billion. In September 2009, we replaced our existing €1 billion syndicated credit facility, which was due to expire in November 2009. The new syndicated credit facility totals €1.5 billion and has a maturity of three years (September 2012). We also have other bilateral credit facilities on which we can draw if necessary. However, we cannot exclude the possibility that uncertainties in the credit market may lead to increased financing expenses and negatively affect our financial position, income, or cash flows.
Management’s use of estimates may affect our income and financial position.
To comply with IFRS, management is required to make many judgments, estimates, and assumptions. The facts and circumstances on which management bases these estimates and judgments, and management’s judgment of the facts and circumstances, may change from time to time and this may result in significant changes in the estimates, with a negative impact on our assets or income.
Current and future accounting pronouncements and other financial reporting standards, especially but not only concerning revenue recognition, may adversely affect the financial information we present.
We regularly monitor our compliance with all of the financial reporting standards that are applicable to us and any new pronouncements that are relevant to us. Findings of our monitoring activity or new financial reporting standards may require us to change our internal accounting policies, especially but not only concerning revenue recognition, to alter our operational policy so that it reflects new or amended financial reporting standards, or to restate our published financial accounts. We cannot exclude the possibility that this may have a material impact on our assets, income, or cash flows. For a summary of significant accounting policies, see theNotes to the Consolidated Financial Statementssection, Note 3.
20
Table of Contents
Our sales are subject to quarterly fluctuations and our sales forecasts may not be accurate, which could cause our revenue and results of operations to fall below our expectations.
Our revenue and operating results can vary and have varied in the past, sometimes substantially, from quarter to quarter. Our revenue in general, and in particular our software revenue, is difficult to forecast for a number of reasons, including:
| • | the relatively long sales cycles for our products; | |
| • | the large size and extended timing of individual license transactions; | |
| • | the timing of the introduction of new products or product enhancements by us or our competitors; | |
| • | changes in customer budgets; | |
| • | seasonality of a customer’s technology purchases; and | |
| • | other general economic, social and market conditions, such as the global economic crisis that emerged in late 2008 and continued through 2009. |
As many of our customers make and plan their IT purchasing decisions at or near the end of calendar quarters, and with a significant percentage of those decisions being made during the fourth quarter, even a small delay in purchasing decisions could have a material adverse effect on our results of operations. While our dependence on single, large scale sales transactions has decreased in recent years due to a relative increase in the number of license transactions and a decrease in average deal size concluded by SAP, we cannot guarantee that our results will not be adversely affected by the loss or delay of one or a few large sales, which continue to occur especially in the large enterprise segment.
We use a “pipeline” system to forecast sales and trends in our business. While this pipeline analysis may provide us with some guidance in business planning, budgeting and forecasting, these pipeline estimates do not necessarily always consistently correlate to revenue in a particular quarter and could cause us to improperly plan, budget or forecast. Because our operating expenses are based upon anticipated revenue levels and because a high percentage of our expenses are relatively fixed in the near term, any shortfall in anticipated revenue or delay in recognition of revenue could result in significant variations in our results of operations from quarter to quarter or year to year. Continued deterioration in global economic conditions would make it increasingly difficult for us to accurately forecast demand for our products and services, and could cause our revenue, results of operations and cash flows to fall short of our expectations and public forecasts, which could have a negative impact on our stock price.
In 2009, we limited our expenditures to respond to the global economic crisis. However, we may in the future increase the following expenditures in comparison to 2009 depending on, among other things, economic conditions, ongoing results and evolving business needs:
| • | expansion of our operations; | |
| • | research and development directed towards new products and product enhancements; and | |
| • | development of new distribution and resale channels, particularly for small and midsize enterprises. |
To the extent any future expenses precede or are not subsequently followed by increased revenue, our quarterly or annual operating results may be materially adversely affected and may vary significantly from preceding or subsequent periods.
The market price for our ADRs and ordinary shares may be volatile.
The trading prices of our ADRs and ordinary shares have experienced and may continue to experience significant volatility in response to various factors including, but not limited to:
| • | the announcement of new products or product enhancements by us or our competitors; |
21
Table of Contents
| • | technological innovation by us or our competitors; | |
| • | quarterly variations in our results of operations or results that fail to meet our or our financial analysts’ expectations; | |
| • | changes in revenue and revenue growth rates on a consolidated basis or for specific geographic areas, business units, products or product categories; | |
| • | changes in externally communicated guidance; | |
| • | changes in our capital structure, for example due to the potential future issuance of addition debt instruments; | |
| • | general market conditions specific to particular industries; | |
| • | litigation to which we are a party; | |
| • | general and country specific economic or political conditions (particularly wars, terrorist attacks, etc.); | |
| • | proposed and completed acquisitions or other significant transactions by us or our competitors; and | |
| • | general market conditions. |
Many of these factors are beyond our control. In the past, companies that have experienced volatility in the market price of their stock have been subject to shareholder lawsuits including securities class action litigation. Any such lawsuits against us, with or without merit, could result in substantial costs and the diversion of management’s attention and resources, resulting in a decline in our results of operations and our stock price.
Because we conduct operations throughout the world, our assets, income, or cash flows may be affected by currency and interest-rate fluctuations.
Our management and external accounting is in euros. Nevertheless, a significant portion of our business is conducted in currencies other than the euro. Approximately 64% of our consolidated revenue in 2009 was attributable to operations outside the euro area and was translated into euros. Consequently,period-over-period changes in the euro rates for particular currencies can significantly affect our reported revenue and income. In general, appreciation of the euro relative to another currency has a negative effect while depreciation of the euro has a positive effect. Variable-interest balance-sheet items are also subject to changes in interest rates, so there is the risk that these balance-sheet items may result in a negative impact on our income or cash flows. For more information about our currency and interest-rate risks and our related hedging activity, see the Notes to the Consolidated Financial Statements section, Note 26.
The cost of using derivative instruments to hedge share-based compensation plans may exceed the benefits of hedging them.
To reduce the impact of our STAR and SAP SOP share-based compensation plans on our income statement, we use derivative instruments to reduce risks resulting from future expenses associated with those plans. We decide on an individual basis if and to what extent we hedge this risk. However, we cannot exclude the possibility that the expense of hedging the STAR and SOP plans may exceed the benefit achieved by hedging them or that a decision not to hedge may prove disadvantageous.
Project Risks
Implementation of SAP software often involves a significant commitment of resources by our customers and is subject to a number of significant risks over which we often have no control.
These risks include, for example:
| • | Our SAP trained consultants may not be immediately available to assist customers in the implementation of our products. | |
| • | The features of the implemented software may not meet the expectations or the software may not fit the business model of the customer. |
22
Table of Contents
| • | Third-party consultants may not have the expertise or resources to successfully implement the software. | |
| • | Customer-specific factors may destabilize the implementation of the software. | |
| • | Customers and partners may not implement the measures offered by SAP to safeguard against technical risks. |
As a result of these and other risks, some of our customers have incurred significant third-party consulting costs in connection with the purchase and installation of SAP software products. Also, some customers’ implementation projects have taken longer than planned. We cannot guarantee that we can reduce or eliminate protracted installation or significant third-party consulting costs, that shortages of our trained consultants will not occur, or that our costs will not exceed the agreed fees on fixed-price contracts. Unsuccessful customer implementation projects could result in claims from customers, harm SAP’s reputation, and cause a loss of future revenues.
Product Risks
Undetected security flaws in our software may be exploited by other persons, damaging SAP or our customers.
Our products include security features that are intended to protect the privacy and integrity of our customers’ data. Despite these security features, our products may be vulnerable to attacks by unauthorized individuals or organizations succeeding, for example, in bypassing firewalls and misappropriating confidential information. Such attacks or other disruptions could jeopardize the security of information stored in and transmitted through the computer systems of our customers or business partners and lead to significant claims for damages against us. Resolving problems and claims associated with actual or alleged defects may be costly and may have a material impact on our reputation or operations.
We use technologies under license from third parties. Losing these technologies could delay implementation of our products or force us to pay higher license fees.
We have taken numerous third-party technologies under license and incorporated them into our products. We may be highly dependent on those technologies in the aggregate. There can be no assurance that the licenses for these third-party technologies will not be terminated, that the licenses will be available in the future on terms acceptable to us, or that we will be able to license third-party software for future products. Changes in or the loss of third-party licenses could lead to a material increase in the cost of licensing, or SAP software products may become unusable or materially reduced in their functionality. As a result, we may need to incur additional development or licensing costs to ensure the continued functionality of our products. The risk increases if we acquire a company or a company’s intellectual property assets that have been subject to third-party technology licensing and product standards less rigorous than our own.
If we are unable to keep up with rapid technological innovations, we may not be able to compete effectively.
Our future success depends in part on our ability to:
| • | Continue to enhance and expand our existing products and services; and | |
| • | Develop and introduce new products and provide new services that satisfy increasingly sophisticated customer requirements, keep pace with technological developments, and are accepted in the market. |
There can be no assurance that the product enhancements, new solutions, and services we develop will successfully anticipate and adequately reflect changing technologies and customer requirements. Nor can there be any assurance that we will bring new solutions, solution enhancements, and services to market before our competitors, or that we will be able to generate enough revenue to offset the significant research and development costs we incur in bringing the products and services to market. We may not anticipate and develop
23
Table of Contents
technological improvements. In addition, we may not succeed in adapting our products to technological change, changing regulatory requirements, emerging industry standards, and changing customer requirements. Finally, we may not succeed in producing high-quality products, enhancements, and releases in a timely and cost-effective manner to compete with applications and other technologies offered by our competitors.
Undetected defects or delays in new products and product enhancements may result in increased costs to us and reduced demand for our products.
To achieve customer acceptance, our new products and product enhancements often require long development and testing periods. Development work is subject to various risks. For example, scheduled market launches could be delayed, or products may not completely satisfy our stringent quality standards, meet market needs or the expectations of customers, or comply with local standards and requirements. New products may contain undetected defects or they may not be mature enough to process large volumes of data. In some circumstances, we may not be in a position to rectify such defects or entirely meet the expectations of customers. As a result, we may be faced with customer claims for cash refunds, damages, replacement software, or other concessions. The risk of defects and their adverse consequences may increase as we seek to introduce a variety of new software products simultaneously. Significant undetected defects or delays in introducing new products or product enhancements could affect market acceptance of SAP software products, and could have a material negative impact on our business and reputation.
The use of SAP software products by customers in business-critical applications and processes and the relative complexity of our software products entail a risk that customers or third parties may pursue warranty, performance, or other claims against us for actual or alleged defects in SAP software products, in our provision of services, or in our application hosting services. We have in the past been, and may in the future be, subject to warranty, performance, or other similar claims.
Although our contracts generally contain provisions designed to limit our exposure arising out of actual or alleged defects in SAP software products or in our provision of services, these provisions may not cover every eventuality or be effective under the applicable law. Regardless of its merits, any claim could entail substantial expense and require the devotion of significant time and attention by key management personnel. Publicity surrounding such claims could affect our reputation and the demand for our software.
Our SAP NetWeaver technology platform strategy may not succeed or may make some of our products less desirable.
The continued success of the SAP NetWeaver technology platform depends on our maintaining a dynamic network of independent software vendors developing their own business applications for SAP NetWeaver. In addition, as with any open platform design, the greater flexibility provided to customers to use data generated by non-SAP software might reduce customer demand to select and use certain SAP software products. If SAP NetWeaver is not well received by customers, if competitors develop superior technology, or if the solution has significant defects, there may be a material adverse impact on our business, financial position, income, or cash flows.
Other Operational Risks
Third parties may claim we infringe their intellectual property rights; that could result in damages being awarded against us and limit our ability to utilize certain technologies in the future.
Third parties have claimed, and may claim in the future, that we have infringed their intellectual property rights. We believe our software products will increasingly be subject to such claims as the number of products in our industry segment grows, and as we expand into new industry segments with our products, resulting in greater overlap in the functional scope of products. Any claims, with or without merit, and negotiations or litigation relating to such claims, could preclude us from utilizing certain technologies in our products, be time-consuming, result in costly litigation, or require us to pay damages to third parties and, under certain circumstances, pay fines. They could also require us to enter into royalty and licensing arrangements on terms that are not favorable to us,
24
Table of Contents
cause product shipment delays, subject our products to injunctions, require a complete or partial redesign of key products, result in delays to our customers’ investment decisions, and damage our reputation.
Software in general includes many components or modules that provide different features and perform different functions. Some of these features or functions may be subject to intellectual property rights. It can happen that rights of another party refer to technical aspects that are similar to one or more technologies in one or more of our products. SAP respects the intellectual property rights of third parties. We cannot exclude the possibility that intellectual property rights of third parties may preclude us from utilizing certain technologies in our products or require us to enter into royalty and licensing arrangements on unfavorable or expensive terms.
The software industry is making increasing use of open source software in its development work on solutions. We also integrate certain open source software components from third parties into our software. The open source license may require that the software code in those components or the software into which they are integrated be freely accessible under open source terms. While we take precautions to protect open source software, we cannot exclude the possibility that third-party claims may require us to make freely accessible under open source terms a product of ours or non-SAP software upon which we depend. We cannot exclude the possibility of a resultant material impact on our assets, financial position, or income.
Claims and lawsuits against us may have adverse outcomes.
A variety of claims and lawsuits are brought against us, including claims and lawsuits involving businesses we have acquired. Adverse outcomes in some or all of the claims and lawsuits pending against us might result in the award of significant damages or injunctive relief against us that could negatively impact our ability to conduct our business. We currently believe that resolving these pending claims and suits, individually or in the aggregate, will not have a material adverse effect on our business, financial position, income, or cash flows. However, the outcome of litigation and other claims is intrinsically subject to considerable uncertainty. Management’s view of the cases may also change in the future. Actual outcomes of litigation and other claims may differ from the assessments made by management in prior periods, which could result in a material negative impact on our business, financial position, income, cash flows, or reputation.
We might not integrate acquired companies effectively or successfully and our strategic alliances might not be successful.
To complement or expand our business, we have in the past made acquisitions of businesses, products, and technologies. We expect to continue to make such acquisitions in the future. Management’s negotiation of potential acquisitions and alliances and integration of acquired businesses, products, or technologies demands time, focus, and resources of management and of its workforce. Acquisitions carry many additional risks. These include, among others:
| • | It may not be possible to successfully integrate the acquired business, and its different business and licensing models. | |
| • | It may not be possible to integrate the acquired technologies or products with current products and technologies. | |
| • | It may not be possible to retain key personnel of the acquired business. | |
| • | We may assume material unknown liabilities of acquired companies, including legal or intellectual property contingencies or other significant risks that may not be detected by the due diligence process. | |
| • | We may incur debt or significant cash expenditures. | |
| • | We may have difficulty implementing, restoring, or maintaining internal controls, procedures, and policies. | |
| • | There may be a negative impact on relationships with customers, partners, or third-party providers of technology or products. |
25
Table of Contents
| • | We may have difficulty integrating the acquired company’s accounting, human resource, and other administrative systems. | |
| • | There may be regulatory constraints. | |
| • | The acquired business may have practices or policies that are incompatible with our compliance requirements. |
In addition, acquired businesses might not perform as anticipated, resulting in charges for the impairment of goodwill and other intangible assets. Such charges may have a significant negative impact on operating margins and income. Furthermore, we have entered into, and expect to continue to enter into, alliance arrangements for a variety of purposes including the development of new products and services. There can be no assurance that any such products or services will be successfully developed or that we will not incur significant unanticipated liabilities in connection with such arrangements. We may not be successful in overcoming these risks and we may therefore not benefit as anticipated from acquisitions or alliances. We cannot exclude the possibility that our business, financial position, income, or cash flows will be negatively impacted.
Our IT security measures may be breached or compromised and we may sustain unplanned IT system unavailability.
Our core processes, such as software development, sales and marketing, customer service, and financial transactions, rely on our IT infrastructure and IT applications. Outage of our infrastructure may be caused by malware or virus attacks, sabotage by hackers, natural disasters, or the failure of an underlying technology (such as the Internet). Such events could lead to a substantial denial of service or alteration or compromise of data from SAP, our customers, or our partners, giving rise to production downtime, recovery costs, and customer claims. A breach of our IT security measures and the resources we expend attempting to avoid such breaches could have a negative impact on our financial position or income.
We may not be able to obtain adequate title to or licenses in, or to enforce, intellectual property.
We use a variety of different means to protect our intellectual property. These include applying for patents, registering trademarks and other marks and copyright and rights of authorship, taking appropriate action to stop copyright and trademark infringement, entering into licensing, confidentiality, and nondisclosure agreements, and deploying protection technology. Despite our efforts, there can be no assurance that we can prevent third parties from obtaining, using, or selling without authorization what we regard as our proprietary technology and information. All of these measures afford only limited protection, and our proprietary rights could be challenged, invalidated, held unenforceable, or otherwise affected. Some intellectual property may be vulnerable to disclosure or misappropriation by employees, partners, or other third parties. There can also be no assurance that third parties will not independently develop technologies that are substantially equivalent or superior to our technology. Also, it may be possible for third parties to reverse-engineer or otherwise obtain and use technology and information that we regard as proprietary. Accordingly, we might not be able to protect our proprietary rights against unauthorized third-party copying or utilization, which could negatively impact our competitive position and result in reduced sales. Any legal action we bring to enforce our proprietary rights could be costly, distract management fromday-to-day operations, and lead to claims against us, which could negatively impact our income. Such actions by us could also involve enforcement against a partner or other third party, thereby adversely affecting our ability, and our customers’ ability, to use that partner or other third parties’ products. In addition, the laws and courts of certain countries may not offer effective means to enforce our intellectual property rights.
We may not be able to protect our critical information or assets or safeguard our business operations against disruption.
As a global software business, we are to a substantial extent dependent on the exchange of a wide range of information and on the availability of our communications and IT networks. We have implemented a number
26
Table of Contents
of barriers designed to ensure the security of our information, IT resources, and other assets. Nonetheless, there is a danger of industrial espionage and of misuse or theft of information or assets by trespassers in our facilities or by people who have gained authorized access to our facilities, systems, or information. Any misuse, theft, or breach of security could have a negative impact on our business, financial position, income, or cash flows.
Our insurance coverage may not be sufficient to prevent claim settlements from negatively impacting our financial position, income, or cash flows.
We maintain insurance coverage against a diverse portfolio of risks. Our objective is to ensure that financial effects of occurrences are excluded or minimized to the extent practicable at reasonable cost. Despite these measures, certain categories of risks are not currently insurable at reasonable cost. Even if we obtain insurance, our coverage may be subject to exclusions that limit or prevent our indemnification under the policies. Further, we cannot guarantee the ability of the insurance companies to meet their liabilities from claims. If this risk materializes, it may have a significant negative impact on our business, financial position, income, or cash flows.
We may incur losses in connection with venture capital investments.
We plan to continue investing in technology businesses. Many of these enterprises currently generate net losses and require additional capital outlay from their investors. Changes to planned business operations have in the past, and also may in the future, affect the performance of companies in which SAP holds investments, and that could negatively affect the value of our investments. Moreover, for tax purposes, the use of capital losses and impairments of equity securities is often restricted, which may negatively affect our effective tax rate.
ITEM 4. INFORMATION ABOUT SAP
Our legal corporate name is SAP AG. SAP AG is translated in English to SAP Corporation. SAP AG, formerly known as SAP Aktiengesellschaft Systeme, Anwendungen, Produkte in der Datenverarbeitung, was incorporated under the laws of the Federal Republic of Germany in 1972. Where the context requires in the discussion below, SAP AG refers to our predecessors, Systemanalyse und Programmentwicklung GbR(1972-1976) and SAP Systeme, Anwendungen, Produkte in der Datenverarbeitung GmbH(1976-1988). SAP AG became a stock corporation (Aktiengesellschaft) in 1988. Our principal executive offices, headquarters and registered office are located at Dietmar-Hopp-Allee 16, 69190 Walldorf, Germany. Our telephone number is +49-6227-7-47474.
In 2008, we acquired Business Objects. With that acquisition, we expanded our core solutions to address the needs of business users. In addition, as part of our legal entity rationalization activities, we have integrated certain Business Objects subsidiaries into the following significant SAP subsidiaries: SAP Deutschland AG &Co. KG, SAP (Schweiz) AG, SAP Japan Co., Ltd., SAP Australia Pty Ltd, SAP Canada Inc., SAP (UK) Limited, SAP America, Inc. and SAP France S.A.
For a (i) description of our principal capital expenditures and divestitures for the last three years, including the amount invested until the date of this Annual Report onForm 20-F and (ii) a discussion of our principal capital expenditures and divestitures currently in progress, including the distribution of these investments geographically and the method of financing, see “Item 4. Description of Property — Capital Expenditures.”
THE SAP GROUP OF COMPANIES
Founded in 1972, SAP is one of the leading international providers of business software and, based on market capitalization, we are the world’s third-largest independent software manufacturer. We have more than 95,000 customers in over 120 countries and employ more than 47,500 people at locations in more than 50 countries in the European, Middle East, and Africa (EMEA); Americas; and Asia Pacific Japan (APJ) regions. SAP is headquartered in Walldorf, Germany.
27
Table of Contents
Our core business is selling licenses for software solutions and related services. Our solutions, which cover standard business applications and technologies, as well as specific industry applications, are designed to help companies make their business processes more efficient and agile and create sustainable new value.
In 2009, the SAP product portfolio featured the following key software applications, which are delivered through multiple deployment and consumption options:
| • | SAP Business Suite software for large organizations and international corporations. The software supports core business operations ranging from supplier relationships to production to warehouse management, sales, and all administrative functions, through to customer relationships. There are specific solutions for industries, for instance, high tech, oil and gas, utilities, chemicals, healthcare, retail, consumer products, and the public sector. | |
| • | SAP BusinessAll-in-One solutions, the SAP Business ByDesign solution, and the SAP Business One application, which address the needs of small businesses and midsize companies. | |
| • | The SAP BusinessObjects portfolio, which covers a variety of demands from small to large companies with solutions for business users who need to analyze and report information, make informed strategic and tactical decisions, build business plans, and manage risk and compliance. | |
| • | SAP solutions for sustainability to help enable organizations’ sustainability initiatives. These solutions include the measurement of sustainability key performance indicators, energy and carbon management, and solutions for product safety, environment, health, and safety. | |
| • | The SAP NetWeaver technology platform, which integrates information and business processes across diverse technologies and organizational structures. |
In addition, we offer consulting, maintenance, and training services for our software solutions. We develop our products in close cooperation with customers and independent business partners.
Our management reporting breaks our activities down into three segments: Product, Consulting, and Training. For more information about our segments, see Note 29 in theNotes to the Consolidated Financial Statementssection.
All of the information in this Report relates to the situation on December 31, 2009, or the fiscal year ended on that date unless otherwise stated.
Sustainability
SAP is committed to improving its own operations to be more sustainable, and to delivering customer solutions to improve sustainability on a grand scale. Over the past 10 years, SAP has been recognized by the Dow Jones Sustainability Index for upholding ethical, environmental, social, and governance values in our products and services. For the last three years, the index has named SAP as the leader in the software sector. In 2008 ourSustainability Report, which is located on our website, we provide more detailed information about our efforts in corporate environmental, social, and economic performance, and about products and services of ours that support sustainable operations.
28
Table of Contents
The following table presents the key performance indicators that SAP uses to measure, review, and monitor its sustainability performance. The numbers for 2009 will be presented in a separate sustainability report, which will be published on our website in the near future.
| 2008 | ||||
Carbon footprint in kilotons(1) | 500 | |||
| Total electricity consumption in gigawatt hours | 326 | |||
| Data center energy in gigawatt hours | 167 | |||
| Employee turnover in % | 11.4 | |||
| Women in management (% of women in senior management) | 8.7 | |||
| Customer satisfaction (TRI*M Index, scale from -66 to +134) | 93 | |||
| (1) | In 2009, we improved the way we measure our carbon footprint by including more Scope 3 emissions from our logistics chain and from business travel in private vehicles and we improved our reporting on company cars and external data centers. This also involved correcting results from the past. |
In 2009, we used the following key performance indicators to measure, review, and monitor our sustainability performance:
| • | Carbon footprint: SAP’s goal is to reduce total greenhouse gas emissions to 2000 levels by 2020. This equates to lowering emissions by about 50% from 2007 levels. We selected 2000 as our target year even though we have almost doubled in size as a company over the last eight years, including our acquisitions (we had approximately 24,000 employees in 2000, compared to approximately 47,500 today). We therefore feel that striving for 2000 levels is ambitious. Based on our preliminary calculations, CO2 emissions for 2009 totaled approximately 425 kilotons, which represents a 15% decrease compared to 2008. | |
| • | Total electricity consumption: Our electricity consumption relates to our facilities and our data centers. SAP has around 400 locations in over 50 countries. We seek to follow sustainable design and facility management practices. We strive to achieve high energy and environmental standards for new office buildings. We are also making improvements to existing facilities to reduce our energy and water consumption and our waste. Together with the efforts of our employees, this has resulted in a decrease in electricity consumption of about 7% compared to 2008. | |
| • | Data center energy: We focus on reducing energy consumption in SAP data centers as well as on addressing the impact of SAP software on customers’ IT infrastructures. As we discover ways to make our own data centers more efficient, we can introduce these best practices to our customers to help them lower their own carbon footprint. Our efforts will also drive benchmarks for comparing IT efficiency. | |
| • | Employee turnover: A talented workforce is essential to corporate success, especially in the software industry, where intellectual property is crucial. We recognize that our people and their rich diversity and cultural wealth are our strongest assets. In fact, excellence in human resource management has always been a strategic priority for us. We are committed to attracting and retaining gifted people to foster innovation for the benefit of our customers and society. Turnover rate is the ultimate measure of our ability to retain the best talent. | |
| • | Women in management: Due to the low number of women choosing to study information technology (IT), the entire IT industry struggles to attract a sufficiently large group of women into our talent pipeline. We recognize that we need to make a conscious effort to look for candidates with diverse backgrounds for vacant positions. We track the number of women in management as a critical diversity metric. Currently, that number is not at satisfactory levels. In 2009, we therefore rolled out a program |
29
Table of Contents
| to increase the profile of women working at SAP as well as the advancement of women into leadership positions. |
| • | Customer satisfaction: One very important indicator of our success is customer satisfaction, which is a leading driver of future revenue and profitability. We monitor customer satisfaction on a quarterly basis. TNS Infratest, an independent agency, conducts a customer survey and reports the results to the Supervisory Board. Results are measured using the TRI*M Index. The TRI*M Index scale ranges from -66 to +134, with +134 being the best measure. In 2009, our overall customer satisfaction scores decreased slightly, after having improved for four consecutive years. In some regions, negative perceptions resulted from a change in our software support model. As a reaction to this, we have seen declining customer loyalty to SAP, particularly in Europe. As a consequence, we are engaging with user groups to articulate and measure the added value of the new support model. The second half of 2009 showed a stabilizing trend in customer satisfaction and loyalty. |
In addition to the key indicators presented in the table above we measure the following key performance indicators:
| • | Employee satisfaction: While the turnover rate is the ultimate measure of our ability to retain the best talent, employee commitment and employee satisfaction are important indicators of our ability to train and retain the best workforce. | |
| • | Business Health Culture Index: SAP’s health management service has developed a holistic and comprehensive program to meet the needs of our employees. Our extensive employee health program is focused on the needs of employees with sedentary, highly demanding intellectual jobs. The Business Health Culture Index measures the stress/satisfaction balance of employees, indicating organizational health and readiness to meet strategic objectives. | |
| • | Social investment: Our Clear Purpose engagement program coordinates our contributions in the areas of education; good governance and transparency; bridging the digital divide, and environmental stewardship. Our target for social investment is about 1% of our profit before tax and is comprised of corporate giving, technology donations, and SAP-sponsored volunteering. By applying our collective expertise and resources, our corporate social responsibility initiatives directly and indirectly impact many global and local programs. | |
| • | Renewable energy consumed: SAP is using more and more electricity from renewable sources. We purchase some of this green electricity from local utility companies and produce some using solar panels on SAP facilities. |
Mission and Strategy
Market
The market for business software is a global growth market. Factors such as constantly developing corporate-governance law and reporting regulations, increasingly globalized business and trade, the drive for sustainability, and the pressure of competition compel businesses to continuously adapt in a changing environment. They must not only bring innovative and competitive products to market, they must also continuously optimize their own structures, streamline processes, and extend customer and partner networks. Without leading-edge IT solutions, these are impossible challenges for companies — whether in the advanced economies or in developing countries and emerging economies.
Trends and Orientation
Companies face increasing complexity of entrepreneurial activities and need to rethink how they conduct business in today’s global, fast-paced, and volatile environment. To stay competitive and minimize risk,
30
Table of Contents
business leaders and their employees need to understand and successfully manage an ever-changing web of global markets, products, regulations, and partners. At the same time, openness and transparency have become business imperatives. Today’s customer marketplace and society are demanding transparency from companies.
The best businesses have a comprehensive view of what is happening within their environment and share key information with an extended business network of partners, suppliers, and customers. Now, more than ever, companies need clarity to refocus business strategies and streamline execution. In addition, they need transparency to demonstrate accountability and to protect their reputations.
Technology solutions can increase visibility across the organization and throughout the business network to ensure that organizations can close the gap between strategy and execution, linking decision-making systems to integrated,end-to-end processes.
Mission
Our mission is to help the world run better in order to create enduring prosperity for people everywhere. We help customers around the globe perform at a significantly higher level of effectiveness and efficiency by enabling closed-loop performance optimization to achieve profitable, sustainable growth. To succeed, we strive to build from our established leading position in the business software market and accelerate business and IT innovation for firms and industries. In reaching for this goal, we are also contributing to global economic development on a grand scale.
We offer both on-premise and on-demand solutions that help companies of all sizes close the gap between strategy and execution. Our portfolio of software and services can help customers attain the insight, efficiency, and flexibility that enables them to respond to changes in the business environment with more agility and effectiveness and capture the full benefits of business networks.
At the heart of our strategy stands accountability to our customers by helping them increase value and lower total cost of ownership. We intend to widen the market we address with additional valuable offerings for our customers including, for example, a growing portfolio of on-demand solutions, and software solutions scaled to the demands of small businesses and midsize companies.
Competition
In terms of software and software-related service revenue, we are the world market leader in business software applications. We define business application software as comprising enterprise resource planning and related applications. In the midmarket, we are also the worldwide market leader in terms of software and software-related service revenue. In the global market, our chief competitors are Oracle, Microsoft, and IBM. Whereas SAP concentrates on the business software segment, our competitors also address other segments of the IT market, such as database management applications (Oracle, IBM, Microsoft), operating systems (Microsoft, Oracle, IBM), desktop applications (Microsoft), IT services (IBM), and servers (Oracle).
Our competitors in the on-demand software segment include, among others, Salesforce.com and NetSuite. Unlike most competitors, SAP can also offer customers flexible models such as hybrids of the on-premise and on-demand models.
Our competitors in the business intelligence segment offering solutions that address the needs of business users include among others SAS Institute, Inc., Oracle (through its acquisition of Hyperion in 2007), and IBM (through its acquisition of Cognos in 2007).
On a regional level there are additional competitors, especially in the midmarket. These companies are more focused on certain industries and/or company sizes.
31
Table of Contents
Strategy for Growth
Our customer base includes many large global enterprises as well as midsize companies. Such global companies use the SAP portfolio to automate their business transactions, enabling better management and governance. In our traditional core business, we seek to win a greater share of our existing customers’ IT budget. We also aim to win new customers, for instance, companies that have been using competitor or custom software.
Our solutions for industries are crucial for the strength of our product portfolio. In 2009, we focused on strategic industries with exceptional growth potential, including, for example, banking, retail, utilities, and the public sector. Additionally, we introduced SAP solutions for sustainability focused on tackling energy consumption, greenhouse gas emissions, product safety, healthcare, and sustainability performance management.
Solutions to address the needs of business users remain a central element of our strategy for growth. In 2009, we focused efforts on further integrating products from our acquisition of Business Objects into our solutions portfolio.
The SAP Business ByDesign solution is designed to open up a new segment of the global market for us, smaller businesses with between 100 and 500 employees. They have distinctly different software needs: Getting their new IT solution running quickly, at minimum risk and predictable cost, is often more important for these customers than specific functional depth. Many such companies do not believe that their needs can be met by traditional software offerings or by the available on-demand solutions.
We intend to combine the following measures to help us realize our full growth potential:
| • | Organic growth: Our primary growth strategy is to continue to develop our own product portfolio and our own base of direct customers, focusing on rapid innovation and speed to market. | |
| • | Co-innovation: Collaborating with customers and partners remains one of our core policies. We continue to invest in our partner ecosystem to support the development of solutions built on the SAP NetWeaver technology platform and leverage partner sales forces to address the various market and customer segments. | |
| • | Focused acquisitions: With targeted strategic and “fill-in” acquisitions that add to our broad solution offerings, we gain specific technologies and capabilities to meet the needs of our customers. |
SOFTWARE AND SERVICE PORTFOLIO
Our portfolio of SAP software and services can help customers respond to changes in the business environment with more agility and effect, survive global competition, and grow profitably. The goal at the heart of our portfolio of software and services is therefore the best possible combination of efficiency, insight, and flexibility:
| • | Efficiency — Innovative business processes to optimize operations: SAP connects and streamlines processes across our customers’ businesses to drive efficiency and help enable business operations to achieve strategic goals. | |
| • | Insight — Improved decisions for greater success: SAP enables business people to make more insightful and timely strategic decisions based on better information in the context of specific business issues. | |
| • | Flexibility — Strategic and operational agility: With SAP software, customers can more easily pursue new strategies and capture the full benefits of business networks, because business processes are flexible and the platform is extensible. |
32
Table of Contents

Software Portfolio
SAP Business Suite
SAP Business Suite software can help customers execute and optimize their business and IT strategies by providing modular applications that improve their ability to perform theirend-to-end business processes within the organization and across the business network. The applications are designed to be extensible so that they work with other SAP and non-SAP software applications. Organizations and departments in all industries can incrementally deploy SAP Business Suite to address specific business challenges in line with their business priorities — without costly upgrades. SAP Business Suite software aims to provide better insight and visibility across organizations, improve operational effectiveness and efficiency, and increase the flexibility to address business change.
The SAP Business Suite software includes the following applications:
| • | The SAP ERP application is designed to optimize business and IT processes by reducing IT complexity, increasing adaptability, and delivering more IT value at a lower cost than traditional enterprise resource planning solutions. It can support mission-critical,end-to-end business processes for finance, human capital management, asset management, sales, procurement, and other essential corporate functions. SAP ERP can also support industry-specific processes by providing industry-specific business functions that can be activated selectively via the switch framework, keeping the application core stable and helping ensure maximum performance. | |
| • | The SAP Customer Relationship Management (SAP CRM) application provides a comprehensive application to help marketing, sales, and service professionals obtain complete customer intelligence that they can leverage to effectively manage customer relationships and customer-related processes. SAP CRM can enable multichannel customer interactions, including mobile smart phones, the Internet, and social media, and also offers a communications infrastructure that is designed to help |
33
Table of Contents
| connecting with other users anytime, anywhere. SAP offers customer relationship management solutions in both on-premise and on-demand deployment models. |
| • | The SAP Product Lifecycle Management (SAP PLM) application helps companies manage, track, and control all product-related information over the complete product and asset life cycle as well as throughout the extended supply chain. SAP PLM is designed to facilitate creativity and to free the process of product innovation from organizational constraints. | |
| • | The SAP Supplier Relationship Management (SAP SRM) application provides a procurement application that helps organizations in all industries improve their centralized sourcing and contract management and interact with suppliers through multiple channels. SAP SRM is designed to accelerate and optimize the entireend-to-endprocure-to-pay process by supporting integrated processes and by enforcing contract compliance, which can result in realizable savings. | |
| • | The SAP Supply Chain Management (SAP SCM) application helps companies adapt their supply-chain processes to the rapidly changing competitive environment. SAP SCM helps transform traditional supply chains from linear, sequential processes into open, configurable, responsive supply networks in which customer-centric, demand-driven companies can monitor and respond more smartly and quickly to demand and supply dynamics across a globally distributed environment. |
We first delivered enhancement packages for SAP Business Suite in 2007, providing regular updates for SAP ERP. This delivery model, which we introduced for the entire SAP Business Suite in 2008, is designed to make it simpler and faster for customers running SAP Business Suite applications to adopt new product functions, industry-specific features, and enterprise services. It also shields customers from some of the complexity of multiple upgrades and offers them an opportunity to reduce information technology (IT) costs by consolidating their systems on a single platform and reducing the number of separate software instances that need to be maintained. Our enhancement package model is also designed to give customers planning security.
Industry Solutions
SAP delivers distinct solution portfolios serving organizations in major industries and sectors. These solution portfolios deliver industry-specific functions along with best practices we have developed with our customers. Our industry solutions are designed to meet the needs of the major industry sectors listed below. The portfolio also includes applications for numerous subsectors and segments of these industries.
| Process Manufacturing Industries | Service Industries | |||
| • Chemicals• Life sciences• Mill products• Mining• Oil and gasDiscrete Manufacturing Industries• Aerospace and defense• Automotive• Engineering, construction, and operations• High tech• Industrial machinery and componentsConsumer Industries• Consumer products• Retail• Wholesale distribution | • Media• Professional services• Telecommunications• Transportation and logistics• UtilitiesFinancial Services Industries• Banking• InsurancePublic Service Industries• Defense and security• Healthcare• Higher education and research• Public sector |
34
Table of Contents
Solutions for Small Businesses and Midsize Companies
SAP offers a portfolio of solutions designed specifically to meet the needs of small businesses and midsize companies. Like large companies, these firms need to find ways to drive growth and increase profitability, and that begins with having access to the right information at the right time. This is essential for maintaining market competitiveness, building and preserving close relationships with customers and suppliers, and streamlining business processes to reduce bottlenecks and thus improve customer service. Optimizing cash flow is also essential to increase financial strength and the flexibility required to support business operations and growth. Because SAP recognizes that one size does not fit all, we provide a solution portfolio and release strategy to meet the needs of a broad range of small businesses and midsize companies.
SAP BusinessAll-in-One
SAP BusinessAll-in-One solutions are comprehensive and flexible business management software with built-in support for industry best practices. The solutions best fit the needs of midsize companies with 100 to 2,500 employees that are looking for a comprehensive, integrated industry solution to power their business end to end. In one configurable solution, SAP BusinessAll-in-One helps companies manage everything from financials, human resources, procurement, inventory, manufacturing, logistics, product development, and corporate services, to customer service, sales, and marketing. SAP BusinessAll-in-One solutions are available from a wide network of qualified partners that deliver more than 700 industry-specific solutions in more than 50 countries. SAP aims to provide all the deployment tools and methodologies that partners need to deliver fast, predictable implementation with low risk, low cost, and rapid time to value.
SAP Business One
The SAP Business One application provides a single, integrated solution for managing the entire business, including support for financials, sales, customer relationships, inventory, and operations. It is designed to fit the needs of small businesses typically with fewer than 100 employees that have outgrown their accounting-only systems and are looking to streamline their business operations with an integrated, on-premise solution. With SAP Business One, small businesses can streamline theirend-to-end operations, get instant and complete information, and accelerate profitable growth. With its published software development kit and over 550 industry-specific solutions and functional add-ons, SAP Business One can be tailored and extended to meet specific business processes and changing needs.
SAP Business ByDesign
SAP Business ByDesign is a single on-demand solution that comprises functions of SAP Business Suite and therefore delivers best practices for financial management, customer relationship management (CRM), human resources (HR), project management, procurement, and supply chain management. It is designed to fit companies with 100 to 500 employees that want the benefits of large-scale and integrated business management applications without a large and complex IT infrastructure. SAP Business ByDesign can unify multiple business operations. It can enable companies to implement preconfigured business processes to solve immediate problems.
SAP Business ByDesign is designed to enable customers to improve transparency and improve visibility across the business by unifying business processes. With better visibility, information, and processes, people can make faster, better-informed decisions. In addition, the solution can enable companies to comply with increasing regulatory demands. SAP Business ByDesign is designed to help customers increase employee productivity in all business operations by improving productivity and reducing software-related training needs with a single user interface, personalized business portals for each employee, and built-in help. SAP Business ByDesign provides analytics and dashboards that can facilitate smarter, faster decision-making. Collaboration features can enhance the way employees work together.
35
Table of Contents
SAP Business ByDesign is designed to help customers realize lower and more predictable IT costs by using an on-demand solution. It is managed, monitored, and maintained by SAP experts in hosted data centers. In addition, SAP Business ByDesign provides built-in service and support that can help to ensure smooth, predictable deployment and operation.
Currently, the solution is available in China, France, Germany, India, the United Kingdom, and the United States. We are controlling theramp-up process, carefully selecting new customers and working in close collaboration with them and with partners, and feeding their experience back into product development.
There are further solutions for small businesses and midsize companies in the SAP BusinessObjects portfolio. For more information, see theSAP BusinessObjects Portfoliosection.
Additional Solutions for Small Businesses and Midsize Companies
The SAP BusinessObjects portfolio also includes solutions specially designed for small businesses and midsize companies.
| • | SAP BusinessObjects Edge solutions are powerful and versatile business intelligence (BI) and enterprise performance management (EPM) solutions designed for midsize companies that can address several requirements from flexible ad-hoc reporting and analysis to dashboards, data visualization, data integration, and high data quality as well as budgeting, planning and consolidation, and strategy management. | |
| • | Xcelsius ispoint-and-click data visualization software designed for creating interactive dashboards and visual business models from Excel spreadsheets and corporate data sources to share via Microsoft Office, Adobe PDF, the Internet, and corporate portals — all without any programming. The Xcelsius software comprises two product groupings to meet two distinct needs: visual presentations and dashboarding. | |
| • | Crystal Reports software helps users design interactive reports from any data source and can enable them to answer business questions with fewer reports, and reduced IT costs. Documents created using Crystal Reports can be shared in an on-premise mode or in an on-demand mode. | |
| • | Crystal Reports Server is reporting and dashboard management software that can enable small businesses and midsize companies to securely view, interact with, and share reports and dashboards on the Internet, bye-mail, on corporate portals, and in Microsoft Office applications. It is designed to empower business users to get better insight into their business performance with access to summary dashboards and detailed reports — all in one place. | |
| • | The desktop edition of SAP BusinessObjects Interactive Analysis software is designed to provide ad-hoc query and analysis functions in a self-service environment for data-savvy business professionals. An intuitive interface enables customers to combine many types of data from different sources into interactive documents, and helps them uncover trusted, shareable answers to spontaneous and iterative business questions. | |
| • | The SAP BusinessObjects Access Control application, available in a version for midsize companies, is designed to enable efficient protection of information and prevention of fraud by controlling access and authorizations across the company. The application can help minimize the time and cost of enforcing segregation of duties across applications, and can help prevent improper access to IT systems. | |
| • | The SAP BusinessObjects Global Trade Services application, available in a version for midsize companies, can enable organizations to streamline complex export processes, automate compliance, ensure expedited customs clearance, and gain the visibility needed to optimize trade processes which can lower risk and minimize duties. The application is certified for electronic communication with multiple customs systems around the globe and fully integrates with SAP and non-SAP software. |
36
Table of Contents
SAP BusinessObjects Portfolio
The SAP BusinessObjects solutions aim to help business users optimize their business performance by supporting strategic targets of our customers, predictable results, and sound decisions.
Business Intelligence Solutions and Information Management Solutions
With the SAP BusinessObjects business intelligence (BI) solutions and SAP BusinessObjects information management (IM) solutions, companies can gain an intelligence platform that provides every constituent in a business network with trusted business information, helping them respond faster and make better, timelier decisions. These solutions can enable customers to implement BI and enterprise information management strategies for both SAP and non-SAP software environments, reflecting SAP’s commitment to openness and interoperability in heterogeneous software landscapes.
| • | SAP BusinessObjects BI solutions are available in both on-demand and on-premise deployment options. They include a flexible, scalable business intelligence platform with integrated services that are back-end, not user-facing. Examples of integrated platform services include security (who can access the system and what information they can see), load balancing (plug in extra servers, and work is shared across them), and scheduling (refresh reports during the night when system usage is low). The BI solutions also enable users to interact with business information and accurately answer ad hoc questions without advanced knowledge of the underlying data sources and structures. They can help customers access data across all sources and formats and deliver it as useful, consumable information inside and outside the organization. Customers can use these tools to uncover trends and patterns and solve business problems, to anticipate business changes, and to help reach organizational goals. Customers can also use BI solutions to support their forecasting of future business conditions, to track and analyze key business metrics via dashboards, to interact with sophisticated visual representations of information, and to take advantage of user-friendly capabilities that provide self-service access to critical business information. Self-service access enables business users to create reports and perform analyses themselves without depending on their IT support. | |
| • | SAP BusinessObjects IM solutions provide functions for data integration, data quality management, and metadata management — working seamlessly with functions in the SAP NetWeaver technology platform, such as data warehousing, master data management, and information life-cycle management to help build a trustworthy data foundation that offers agile support for business or IT initiatives. The solutions help enable world-class information management in both SAP and non-SAP software environments. Customers can access, profile, integrate, transform, move, or cleanse structured or unstructured data to deliver timely, unified, and high-quality information. With metadata management and text analysis solutions, customers can collect and unify data from disparate sources forend-to-end impact analysis. |
Enterprise Performance Management Solutions and Governance, Risk, and Compliance Solutions
SAP BusinessObjects enterprise performance management (EPM) solutions and governance, risk, and compliance (GRC) solutions enable customers to maximize business profitability, manage risk and compliance, and optimize corporate systems, people, and processes. These solutions are designed to integrate with non-SAP data sources or systems as well as SAP Business Suite applications, SAP BusinessObjects BI solutions, and SAP BusinessObjects IM solutions.
| • | SAP BusinessObjects EPM solutions help companies benefit from increased levels of strategic alignment, making performance more predictable and ultimately improve decision-making. SAP BusinessObjects EPM solutions are optimized for both SAP and non-SAP environments, across multiple lines of business including finance, the supply chain and procurement, and they include solutions for strategy management; planning, budgeting and forecasting; financial consolidation; and profitability |
37
Table of Contents
| and cost management. The solutions are integrated with SAP BusinessObjects BI solutions and SAP BusinessObjects GRC solutions to further help companies close the gap between strategy and execution. |
| • | SAP BusinessObjects GRC solutions enable companies to aggregate and manage the key risks of their business, automate controls across processes, and monitor risks and controls across disparate systems. The solutions can help increase visibility across risk and compliance initiatives, reduce cost, and manage risk across the enterprise. They can also help support sustainability efforts. |
Additional Solutions for Business Users
Business users need direct access to people, processes, and information to support theirday-to-day activities. The Duet and Alloy solutions are designed to provide direct access to SAP Business Suite software from the familiar Microsoft Office and IBM Lotus Notes software, respectively. As a result, business users can become more productive, their decision-making can improve, and their compliance with corporate policies can increase.
Solutions for Sustainability
Our vision for a sustainable enterprise is presented in a sustainability map that catalogs the full landscape of sustainability-related solutions and business processes. It serves as an anchor to our ongoing stakeholder engagement and as a guide to help us prioritize our solution road map.
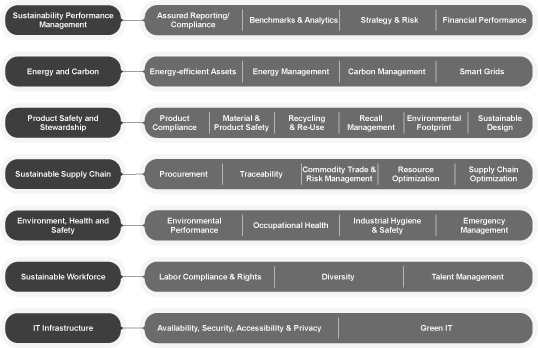
SAP already has a broad set of sustainability solutions, and we have committed significant resources to ensure increasing breadth and depth of coverage through organic development and partnership.
Solutions for Sustainability Performance Management
The SAP BusinessObjects Sustainability Performance Management application helps enterprises focus on strategic execution of their sustainability initiatives — balancing social, environmental, and economic
38
Table of Contents
performance. It provides a comprehensive sustainability reporting process, from reporting framework definition (for instance, in accordance with the Global Reporting Initiative) to data collection workflow and reporting.
The application helps reduce the time, cost, and errors associated with disclosure and enables enterprises to focus on identifying inefficiencies and opportunities for improvement. It provides predefined integration with SAP applications such as SAP Environment, Health, and Safety Management and SAP ERP applications, the SAP Carbon Impact on-demand solution, SAP BusinessObjects EPM solutions, and SAP BusinessObjects GRC solutions. It integrates with non-SAP software using Web services and guided data collection functions.
SAP BusinessObjects Sustainability Performance Management provides automated, accurate multidimensional reporting and planning for compliance, visibility, and control.
Solutions for Energy and Carbon Management
SAP Carbon Impact is an on-demand solution to assist enterprises in implementing strategies for reporting and profitably reducing their carbon and environmental footprint. The solution helps companies measure, mitigate, and monetize carbon emissions and other environmental impacts across business operations.
The SAP AMI Integration for Utilities software provides support for the processes that utilities need to handle complex billing arising from advanced metering infrastructure (AMI) and smart meters.
Customers use SAP Manufacturing Integration and Intelligence (SAP MII) to connect plant operating data held in control systems or data historians to dashboards and other analytical technologies. This allows rapid identification of energy usage, quality results, and other plant trends so companies can take quick action to optimize their operations.
Solutions for Environment, Health, and Safety
The SAP Environment, Health, and Safety Management (SAP EHS Management) application addresses industry needs for product safety, hazardous substances, and dangerous goods handling of products across a wide range of industries, including chemicals, consumer products and high tech. Companies can also use this software to manage compliance with European law concerning the registration, evaluation, authorization, and restriction of chemicals (REACH), which can help them secure the right to market their products. The SAP Recycling Administration application can help ensure compliance with worldwide recycling legislation for packaging, batteries, and waste electrical and electronic equipment.
SAP EHS Management can help companies comply with environmental laws and policies. It supports health and safety, industrial hygiene, and occupational health processes, and can help reduce associated costs, efforts, and risks on plant and corporate levels.
Customers are challenged to implement effective sustainability programs, because data must flow across business processes and because progress towards goals must be visible to drive results. SAP solutions for sustainability are already integrated with SAP Business Suite software. SAP BusinessObjects Integration software allows data from SAP applications and SAP BusinessObjects BI solutions to be displayed in interactive analytics and dashboards, so that customers can monitor operations and identify environment, health, and safety risks at their companies. Customers can then take action as needed within SAP applications to address those risks.
SAP NetWeaver
The SAP NetWeaver technology platform is a reliable, secure, and scalable foundation that can run mission-critical business processes for SAP applications. As the technical foundation for services-oriented architecture (SOA), SAP NetWeaver is designed to deliver a comprehensive set of modular, middleware functions to reduce IT complexity and increase business flexibility across heterogeneous IT landscapes. The platform can provide IT organizations the lowest cost of operation and optimal business availability for SAP
39
Table of Contents
applications through lifecycle management, identity management, secure communications, andend-to-end business activity monitoring.
SAP NetWeaver is designed to provide customers with a flexible way to integrate and extend business processes that run across SAP, SAP-certified partner-built, and custom-built applications by delivering prebuilt integration content, enterprise services, and deployment and model-driven tools. With support for business process management, mission-critical business processes can be monitored for efficiency, integrity, and security. Business users can also use SAP NetWeaver to define business rules to ensure consistent processes across the business network. Advanced user interface technologies, such as Web-based portals, enterprise search, desktop applications, and mobile devices can help improve user experience and efficiency with secure and personalized access to business applications and information.
Through integration with the SAP BusinessObjects portfolio, SAP NetWeaver aims to help customers implement an enterprise information management strategy to ensure trusted information. Customers can integrate, cleanse, manage, govern, and archive structured and unstructured data information to meet compliance mandates, promote business insight, and improve decision-making.
Options for Purchasing and Deploying Software
Recent technological developments and new purchasing models have made it possible for companies to adjust how they consume and deploy software. Recognizing the evolving needs of our customers, SAP delivers multiple options for consuming and deploying enterprise software by taking advantage of these new technologies and models. SAP bases its consumption and deployment options on the following guiding principles:
| • | Delivery of modular applications across multiple lines of business | |
| • | Integrated processes and information across solutions — regardless of deployment model | |
| • | Flexible, subscription-based models to enable even cost distribution | |
| • | Focused services for rapid implementations | |
| • | Extend solutions with the global ecosystem to increase value for customers |
SAP on-demand solutions help customers quickly and easily implement enterprise-wide business solutions, and reduce — or even eliminate — the need foron-site IT resources to manage infrastructure. They can help customers shift to operational expenses, create less volatile cash flows, and gradually scale the use of the solutions to match the needs of the organization. SAP delivers multiple levels of on-demand solutions aimed at empowering our customers to analyze business activities and improve business processes:
| • | Enterprise-wide processes for smaller organizations and subsidiaries drive efficient business processes across the entire organization with SAP Business ByDesign | |
| • | Process-based solutions addressline-of-business requirements for customer relationship management, sourcing, contract management, and carbon trading. Currently available on-demand solutions include SAP CRM, SAPE-Sourcing, SAP Contract Lifecycle Management, and SAP Carbon Impact | |
| • | Enterprise-level or department-level analysis and reporting with the SAP BusinessObjects BI OnDemand solution. This solution can store, share, browse, search, report, and analyze information at the level specified by the company |
SAP on-premise solutions aim to provide strategic value to our customers, includingend-to-end, industry-specific business processes and business and domain expertise embedded in the applications. However, business trends regarding new usage and pricing models of on-demand software have an impact on the overall system landscape of customers. As a result, we provide many options that aim to help our customers reduce costs and increase agility:
| • | Rapidly implementing new innovations using enhancement packages | |
| • | Leveraging virtualization technologies |
40
Table of Contents
| • | Using shared services implementations to realize economies of scale for common functions, such as purchasing | |
| • | Hosting applications through ecosystem partners to reduce IT costs for application maintenance | |
| • | Leveraging SAP Enterprise Support services to identify opportunities for improving efficiency and reducing IT costs |
Many SAP customers have indicated that they wish to continue to leverage their existing investments in on-premise applications while extending business capabilities in a rapid, cost-effective, and integrated manner using on-demand applications and other SAP capabilities. The ability of SAP solutions to integrate and combine can help customers to leverage the benefits of both on-demand and on-premise applications. With this approach, SAP customers can rely on a single vendor for all lines of business, rather than using multiple vendors with specializations for only a single department. SAP customers can gain the benefit of leveraging on-demand solutions that are complementary to SAP on-premise solutions to avoid additional integration costs and gain faster and more effective deployments of new business solutions. With SAP’s integrated, combined model, companies can continue to ensure process efficiency and business insight across all systems and data privacy and compliance — regardless of deployment model. SAP offers flexible license agreements (FLAs) and global enterprise agreements (GEAs) as long-term engagement models for our customers. An FLA provides flexible access to SAP solutions based on the agreed value of software and defined payments for a contract term. A GEA is a strategic relationship with SAP’s most important customers, in which defined customer goals are met and measured regularly. Both help align execution of customers’ IT to business strategy.
The SAP ecosystem also gives companies greater choice and flexibility by providing a combination of resources that help best address unique operational situations. Software, technology, and service partners extend deployment and consumption options for SAP customers by providing offerings that include:
| • | Business process outsourcing | |
| • | Applications that provide rapid deployment and accelerated results over virtual platforms | |
| • | A broad set of integrated complementary software applications | |
| • | Services that help customers accelerate commercial impact and deliver better results |
Finance Plan for SAP Solutions
Implementing business software solutions can represent a major investment. With a global partner of ours, Siemens Financial Services GmbH (SFS), we offer SAP Financing, a service that helps companies invest in SAP solutions. SAP Financing is offered to customers in more than 45 countries by SFS and other leading IT financing specialists. Interest in the plan, which is now a firmly established SAP Services offering, is high: It has helped arrange almost 2,000 finance deals since inception. SAP customers from all segments — small businesses, midsize companies, and large enterprises — are benefiting from the attractive financing solutions. The plan offers all of the popular finance models, with their various advantages: They can help conserve liquidity by avoiding initial investment and provide an alternative to credit from the bank. That gives customers more options and potential economic benefits.
Services Portfolio
The comprehensive SAP Services portfolio is designed to optimize our customers’ success, helping customers to manage their transformation to become more transparent about their business while lowering total cost of ownership. SAP provides a holistic approach with application lifecycle management, incorporating a broad array of methodologies, tools, and certified partner offerings to help our customers gain value from their SAP investment while meeting their business needs. The tight integration between our professional
41
Table of Contents
services and our support services aims to offer customers benefits at every level and in every stage of their solution life cycle. Customers’ feedback directly influences our product development.
The SAP Services portfolio includes consulting, education, custom development, support services, and managed services. The offerings are categorized into professional services and software-related services. Our professional services are provided by SAP Consulting and SAP Education. Software-related services are support services provided by SAP’s support units (SAP Active Global Support, SAP BusinessObjects Customer Assurance, and SME Service and Support) and custom development provided by the SAP Custom Development organization.
SAP Services has a local presence in more than 50 countries and runs more than 70 training centers, seven global support centers, and nine custom development centers in Europe, Asia, and the Americas. With around 19,000 SAP services professionals around the world, customers’ needs can be met around the clock to support SAP-centric solutions.
Software-Related Services
SAP Custom Development
The SAP Custom Development organization develops individualized, customer-specific solutions and business functions on the SAP platform covering the life cycle of services to develop and support custom solutions at every stage.
Support Services
To support customers’ increasingly complex solution landscapes and their respective needs, SAP offers several support packages.
SAP’s support units offer a range of services to support our customers before, during, and after implementation of our software solutions. We providearound-the-clock technical support in every region. The organizations also offer proactive, preventive support services to protect and enhance our customers’ investments in SAP technology and applications.
SAP Enterprise Support services are our comprehensive, proactive support and maintenance offering, providing our customers with an application life-cycle management approach that can help them manage increased IT complexity and integrate solutions across their IT ecosystems. Our main support product, SAP Enterprise Support, aims to ensure that our customers’ businesses can manage continuous and accelerated innovation with controllable impact on business operations. SAP Enterprise Support services provide an overall blueprint to help customers optimize the operation of their entire landscape. Mission-critical support provides continuous quality checks that analyze technical risks. We implement continuous improvement activities, maintain custom code, access the mission control center, and generate service-level agreements for corrective action. We aim to deliver the quality management methodology, processes, and tools needed to perform advanced testing and implement solutions deployment, operations, and continuous improvement initiatives using the SAP Solution Manager application management solution for all customers and partners.
SAP Standard Support delivers support services to enable continuous and effective IT operations. This level of support provides our customers with the services and tools to minimize the cost and risk associated with keeping IT systems up and running. SAP Standard Support ensures that customers’ SAP solutions run efficiently, and that they enable the technical execution of their business objectives by delivering improvements, quality management, knowledge transfer, and problem resolution.
The SAP MaxAttention support option expands SAP Enterprise Support, covering all stages of an SAP solution’s life cycle in a tailored format for customers — from planning and implementation to operations and optimization — with a full range of services that help organizations safeguard complex solutions, plan for new releases and upgrades, and implement continuous improvement practices for productive solution operations.
42
Table of Contents
SAP MaxAttention is designed to provide customers our highest level of customer support built on a dedicated engagement model with a technical support advisor and service-level agreements, supported by long-term commitments delivered by the SAP Active Global Support organization.
SAP Safeguarding services help our customers mitigate the technical risks of an implementation, integration, migration, or upgrade project. They smooth the go-live process and help customers prepare for live use of the software. Anon-site technical quality manager helps ensure that customers receive the support they need, that knowledge transfer takes place, and that our customers improve the performance, data consistency, and availability of their IT solution from SAP.
Professional Services
SAP Consulting
SAP Consulting offers planning, implementation, and optimization services for business solutions, and is designed to help customers gain the greatest value from their new or existing SAP software investments. The SAP Services portfolio includes business transformation services, such as Executive Advisory Services and Business Process and Platform Services, that support organizations in responding to business challenges in a rapidly changing business environment. Executive Advisory Services are business transformation services aimed to guide executives toward better insights by bridging IT and business processes. Business Process and Platform Services can help customers streamline their operations while taking advantage of SAP software to automate business processes on a business process platform. We advise and support customers on designing business processes and IT infrastructure and help customers with project management and solution implementation and integration. We also help customers optimize solutions and IT landscapes accommodating challenges from mergers and acquisitions or divestiture of business units.
SAP can also assist customers in minimizing the environmental impact of their data centers, supporting a “Green IT” approach. SAP can assist customers with professional services to minimize the number of servers through landscape consolidation and through work with technology partners to provide the most energy-efficient infrastructure, using virtualization and other techniques.
SAP Education
The offerings of SAP Education assist SAP customers and partners with knowledge transfer, maximizing the value they can create with their SAP solutions. SAP Education offerings include training needs analysis, certification assessments, learning software, and tools. We provide a consistent curriculum for learners around the world and deliver these offerings through a number of delivery models, including onlinee-learning, virtual live classroom, learning on demand, and classroom training. Every year, hundreds of thousands of individuals are trained by SAP Education, making it one of the largest IT training organizations in the world.
Other Services
Chief among the other services in the portfolio are SAP Managed Services offerings. The SAP Managed Services organization provides application management services and hosting services, running and managing SAP solutions on behalf of customers.
Partner Ecosystem
When customers choose SAP software, they also gain access to the SAP ecosystem, one of the leading business networks in the software industry. Its members are a host of software partners, system integrators and resellers, technology partners, developers, industry specialists and SAP software users.
43
Table of Contents
To provide customers access to a rich set of complementary hardware, software, and service solutions, SAP focuses on global and local partnership opportunities for numerous business areas and customer needs. Our rich partner community includes software and hardware partners and providers of outsourcing, content, hosting, education, and support services. Among them are well-known vendors, such as Adobe, Cisco, EMC, HP, IBM, Intel, Microsoft, Novell, and Research In Motion, as well as thousands of smaller companies.
| • | The SAP NetWeaver technology platform enables our partners to develop products and services that fit into our customers’ IT environments. At the same time, it is intended to help us increase revenue from the many vendors that license our technology platform. The SAP NetWeaver community continues to gain momentum, with independent software vendors (ISVs) currently developing more than 1,700 applications based on SAP NetWeaver. | |
| • | In April 2009, SAP announced the opening of SAP Co-Innovation Lab in Bangalore, complementing our global network of co-innovation labs. SAP Co-Innovation Lab offers an environment in which ISVs, system integrators, and technology partners can work with us and with customers on new technologies. | |
| • | In 2009, SAP continued to develop the breadth of offerings available on SAP EcoHub, an online solution marketplace enabling SAP customers to discover, evaluate and buy solutions from SAP partners to complement their existing IT landscapes from SAP. SAP EcoHub brings together the full scope of the SAP ecosystem by linking community content to information about offerings from SAP partners that are designed and selected to address specific business challenges SAP customers face. The additions to SAP EcoHub in 2009 included packaged offerings of software and services in specific regions, the addition of services partners and the delivery of SAP’s sustainability road map and associated products. |
Communities of Innovation
To encourage continuous co-innovation, collaboration, and ongoing improvement in a wide range of products, services, and business processes, we foster various communities of innovation — interactive networks of developers, customers, and partners that come together to collaborate on a variety of topics. These are some of the major communities in SAP Community Network:
| • | The SAP Developer Network (SDN) community offers nearly 2 million members in more than 200 countries the chance to trade experience and insights, pursue business opportunities, and learn from each other. It is the biggest innovation community associated with SAP. SDN includes discussion forums, blogs, wikis, software and tool downloads, ande-learning. A wealth of technical assets attracts more than half a million visitors to SDN every month. | |
| • | The Business Process Expert community is a business process community with more than 600,000 members covering 18 industries and a wide variety of horizontal subjects. Collaboration in the community, the sharing of best practices, and advanced training offerings are among the catalysts that can generate process innovation. Community members, including, for example, specialists on diverse industries, business and application consultants, CIOs, and business process experts, find ample opportunities to exchange ideas in moderated forums, wikis, and expert blogs. | |
| • | The Industry Value Network program provides a collaborative environment for ISVs, system integrators, and technology vendors to work together with SAP and our customers in various industries. There are now 16 different Industry Value Network groups. The work they do is designed to help companies develop solutions using enterprise services. | |
| • | The Enterprise Services Community program provides a forum in which customers, partners, and employees of SAP form collaborative groups focused on defining requirements for business process platforms and specifications for enterprise services. The community currently has over 340 members working more than 130 definition groups. So successful is this collaborative approach that the majority |
44
Table of Contents
| of the enterprise services included in the third enhancement package for SAP ERP software sprang from requests by customers and partners working together in the community. |
| • | Following the acquisition of Business Objects, SAP added the SAP BusinessObjects community to SAP Community Network. This community, with more than 295,000 members provides an environment for SAP BusinessObjects users and developers to share best practices and pursue innovation opportunities on SAP BusinessObjects offerings. | |
| • | In February 2009, SAP Community Network opened the SAP University Alliances community. With more than 85,000 members, this community focuses on bringing real-life SAP knowledge and skills into university classrooms. This is part of SAP’s corporate citizenship commitment to the education and mentoring of university students and graduates who are the business experts and IT leaders of the future. | |
| • | SAP Community Network launched a community job board in 2009, providing SAP developers and customers the ability to more easily network and identify job opportunities that take advantage of the rich SAP skill base in the SAP communities. | |
| • | In October 2009, SAP announced a partnership with leading social networking site LinkedIn. This partnership builds on the efforts to better highlight SAP product skills in the global marketplace by allowing SAP Community Network members to position their community involvement and overall SAP product knowledge on LinkedIn profiles. |
Independent market intelligence firms including Forrester, Gartner, and International Data Corporation (IDC) also report on our community strategy, mentioning the strategic edge and business advantages gained from SAP’s customer-centric network. In 2009, the communities from SAP were recognized by independent research organizations Altimeter Group and SiteIQ as leading the industry on criteria including overall engagement, quality of information and ease of use.
Sharing Knowledge Among Users
To share knowledge and influence SAP development efforts, our customers have established user groups in regions around the world. The two largest are the Americas’ SAP Users’ Group (ASUG), with more than 75,000 members, and the German-Speaking SAP User Group (DSAG), which has around 30,000 members in German-speaking countries. In 2007, SAP initiated a program that encouraged all of these groups to share their expertise and recommended practices with the wider user-group community. It kindled some valuable discussion, which, in the end, is good for all SAP stakeholders. An umbrella organization, SAP User Group Executive Network (SUGEN), embraces 12 national SAP user groups with the shared aim of defining priorities and agreeing plans of action to bring greater focus to the dialog between SAP and its user groups on the global plane.
Development Partnerships
In 2009, we continued to forge partnerships and shared projects that we believe will help shape our future, securing and enhancing global relationships. We now have 21 global services partners, more than 1,200 service partners worldwide, and 34 global technology partners, and the SAP solution extension offerings continue to grow. These are some examples:
| • | Continuing to identify opportunities to work with partners and bringing additional value to customers, SAP and Atos Origin, a global services partner, extended their partnership to focus on reducing customer risk and streamlining upgrading and go-live processes, for customers in key European countries including France, Germany, the Netherlands, Spain, and the United Kingdom. | |
| • | As adoption of SAP BusinessObjects solutions continued to grow among SAP’s installed base, we secured additional partnerships in an effort to complement the product offering. SAP signed a global |
45
Table of Contents
| sales agreement with APOS Systems. The agreement focuses on offering customers APOS’ extensions to SAP BusinessObjects XI solutions to enhance management, monitoring, and control of their deployments of this software. |
| • | As part of our release of SAP Business Suite 7 software, we secured certified system integrator partnerships with Atos Origin, Cap Gemini, IBM, and Wipro to drive adoption of SAP Business Suite and deliver certified consultants to the marketplace in 2009. | |
| • | To offer customers accelerated, unified access to detailed enterprise data for better business visibility, SAP and Teradata Corporation, the world’s largest company for data warehousing and enterprise analytics, agreed to provide the SAP NetWeaver Business Warehouse component on the Teradata database. With this agreement, customers using both SAP and Teradata products can benefit from an integratedend-to-end offering including data warehouse infrastructure and management as well as business intelligence tools. | |
| • | In support of SAP Enterprise Support services, SAP partners focused on certification and adoption of the Run SAP methodology. During the year, partners including IBM Global Business Services and EDS announced their certification in Run SAP methodology. | |
| • | SAP and IBM delivered Alloy, co-innovation software featuring SAP Business Suite and IBM Lotus Notes, to the marketplace. Alloy presents information and data from SAP software processes in the context of the desktop familiar to Lotus Notes users. | |
| • | As part of our global mobility product strategy, SAP entered into partnerships focused on enabling customers to bring the SAP Business Suite to mobile devices. We started a co-innovation offering with Sybase, focused on enabling mobile users to access SAP solutions for increased productivity and efficiency. In addition, we started a development project with the software manufacturer Syclo to deliver mobile asset and service management solutions to customers. | |
| • | The SAP ecosystem was a core component of the launch of the SAP BusinessObjects Explorer software in May. The company secured partners as contributors to the technology offering including Intel and Adobe. Partners that focused on providing hardware components to complement the software included Dell, Fujitsu, IBM, and HP. | |
| • | The IT consulting and outsourcing company Cognizant became a global services partner of SAP in May. This marked the evolution of a successful relationship between SAP and Cognizant. In SAP Co-Innovation Lab and the Cognizant Touchstone Center in Bangalore, we aim to develop and deliver value-added solutions across a variety of industries to provide our joint customers enhanced flexibility, agility, and efficiencies in their enterprise applications. | |
| • | We continued to add to our list of SAP solution extensions. Focused on identifying qualified products that easily integrate into existing SAP landscapes and meet criteria for global customer demand, we secured new offerings from partners to add to our price list. New solution extensions in 2009 include SAP Enterprise Inventory Optimization application by SmartOps, SAP Data Maintenance application for ERP by Vistex, and SAP Extended Enterprise Content Management application by Open Text. | |
| • | We continued to develop our partnership with Novell, focusing on GRC solutions. In October the companies announced their intention to deliver integrated GRC solutions through product integration and planning and a collaborativego-to-market strategy. The combination of SAP BusinessObjects GRC solutions and Novell’s security and identity products will bridge the gap between business process and IT security and controls. | |
| • | In April, our virtualization community shifted its focus to solutions addressing Green IT. Partners, customers, and manufacturers including AMD, Cisco, Citrix, EMC, HP, Intel, Network Appliance, Novell, Red Hat, Sun, and VMware agreed to work with SAP to directly identify and develop solutions that enable technology to assist companies in running their IT operations more efficiently. |
46
Table of Contents
| • | We broadened our relationship with Intel to optimize the operation of SAP Business One applications with the Intel Xeon Processor. This step in the relationship was designed to enable small businesses to achieve faster time to value for their IT investments, therefore saving costs. This combination offering was made available as industry-specific bundles delivered through original equipment manufacturers. | |
| • | Continuing to work with partners to better enable customers in the midmarket, we announced a collaborative fast-start program together with HP. This effort provides customers the SAP BusinessAll-in-One solution on HP hardware. | |
| • | In November 2009, several regional announcements were made affecting SAP’s global ecosystem. In Canada, SAP announced three new members of the SAP Extended Business program certified to deliver SAP BusinessAll-in-One solutions to midsize Canadian firms. In China, new offerings were announced for that country’s ecosystem, including content relevant for the Chinese market published via new online discussion areas, forums, wikis, and blogs for its SAP Community Network China. Meanwhile, in India, news of developments at the recently opened SAP Co-Innovation Lab in Bangalore included mention of three new solutions now available to the wider markets based on the joint development efforts of SAP and its partners at the lab. |
RESEARCH AND DEVELOPMENT
In order to capitalize on the power of diversity, SAP distributes the development of its software solutions across locations in strategic markets worldwide. In addition, together with leading universities, partners, and customers, we cultivate new IT trends and technologies on a global scale.
Worldwide Distribution of Development
SAP employs 14,813 people in software development centers in 11 countries. The largest of these SAP Labs is in Walldorf, Germany, followed by Bangalore, India and Palo Alto, California in the United States. With the integration of SAP BusinessObjects development centers, SAP now has three new development centers in Vancouver, Canada, Dublin, Ireland, and Paris, France.
Thinking globally and acting locally, the network of SAP Labs benefits from highly qualified employees with different cultural backgrounds. With their diverse expertise, these employees use our resources in an intelligent and efficient way, aiming to generate a significant and lasting competitive advantage for SAP.
We devised the structure of the SAP Labs network to accelerate product innovation and raise productivity. Due to the network’s flexibility, we can quickly react to new customer and market requirements. Furthermore, the global arrangement of our development organization enables us to develop products and services in collaboration with leading customers and partners worldwide.
47
Table of Contents
In 2009, SAP invested €1.6 billion (2008: €1.6 billion) in research and development for business software solutions.

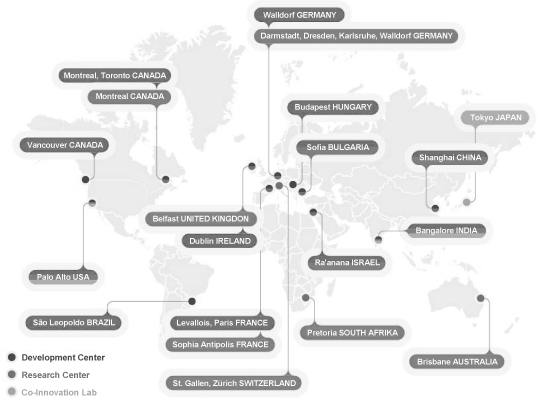
SAP Research
SAP Research, our global research organization, identifies and shapes emerging IT trends and generates breakthrough technologies through applied research. Its findings significantly contribute to our product portfolio and help us to maintain our technological edge. Each SAP Research center is collocated with either a partner university or an SAP development center, creating a solid foundation for collaborative research.
48
Table of Contents
The Global Research Network
SAP Research explores opportunities that have not yet been developed into products. A structured approach to research and trend management ensures that we generate the utmost value out of creativity to make innovation happen. The group plays a leading role in multiple research projects, collaborating with scientists and researchers throughout its co-innovation network, as well as with customers and partners. In addition, SAP Research constantly works on the transfer of customer-driven research results to improve our existing portfolio.
Prospective SAP solutions are turned into tangible experiences in “living labs.” The Future Public Security Center in Darmstadt, Germany, for example, demonstrates technological research results in real-world settings in the area of public safety. Users are introduced to new technologies at an early stage and play an active part in the research process. This research approach is also based on close collaboration with customers and partners.
Next Big Things
Through its exploration of various business areas and based on the findings of its research projects, SAP Research is able to identify potential “next big things” — maximum impact, next-generation technologies and applications. The following examples highlight some of these topics:
| • | Cloud computing is the generic umbrella term for flexible, IT-related services, such as storage, computing power, software development environments, and applications, combined with service delivery through the Internet to consumers and businesses. Clouds provide major opportunities for new business models by restructuring the value chains in the IT industry. In addition, cloud computing dramatically changes the dynamics for new service offerings since it considerably lowers the entry barriers for newcomers by shifting from huge initial capital investments to pay-what-you-use business models. The infrastructure demands of the visions for the “Internet of Services” and the “Internet of Things” can be met most economically by the cloud computing model. It is especially small, innovative companies that will use cloud computing as a scalable service. | |
| • | The Internet of Things fuses the digital world and the physical world by bringing together different concepts and technical components. Everyday objects and machines, even houses and industrial buildings, have sensors and can “communicate” with each other via the Internet. One practical dimension, introduced at SAP TechEd 2009 in Vienna, is the topic of product counterfeiting security or global brand protection service. Product counterfeiting, smuggling, and other illegal trading practices are evolving as fast as emerging trends and technologies worldwide and are increasingly finding their way into various business sectors such as the pharmaceutical industry and aircraft and automobile spare-parts manufacturing. In a joint venture called Original1 with partners Nokia and Giesecke & Devrient, we are developing the possibility for brand owners to use a service protecting their original products along the whole supply chain. Experts predict that the Internet of Things will lead to tremendous efficiency gains in many industries, such as manufacturing and energy supply. Applications, services, middleware components, networks, and endpoints will be structurally connected in entirely new ways. This will make new models possible for business processes, collaboration, miniaturization of devices, and in the area of mobile communications. | |
| • | Thanks to the Internet of Services, the ability to create a Web-based service industry is becoming a reality. In the future, people should be able to do more than buy books, book flights, or plan trips on the Internet. They should also be able to make appointments with their child’s pediatrician, coordinate exports to foreign countries, and provide consulting advice for businesses. In this type of virtual world, software and service providers, brokers, and users can collaborate using a service delivery platform to build flexible and dynamically-integrated applications. The platform supports the whole life cycle of a service offering from its creation and introduction to redesign with incorporated user feedback. SAP |
49
Table of Contents
| Research is looking to further explore services that can be managed using IT and, when combined, lend themselves into value-added services. |
| • | A further research focus area is the development of technologies for emerging economies. The overall aim is to engage in research activities that investigate the unique requirements of emerging economies in order to make a direct impact on their social and economic development. The research agenda includes innovative business solutions for very small businesses, thus giving preference to the identification and inception of new technologies. Such initiatives contribute to job creation (social impact) and poverty alleviation (economic impact). |
New Research Group
In July 2009, SAP Research established a new research group in Bangalore, the main campus of SAP Labs India. With its stellar development over the years, an ever-growing number of world-leading enterprises, and a long tradition of academic excellence, India offers a wealth of opportunities for innovation and is one of SAP’s key markets.
The researchers in Bangalore are focusing mostly on topics in the areas of decision support systems for text understanding, service infrastructures, and Web information quality.
Global Business Incubator
We started the Global Business Incubator in 2008 as the successor to SAP Inspire. This program, based in Palo Alto, California, in the United States, and Walldorf, Germany, focuses on creating innovative new businesses for SAP. The Global Business Incubator group accelerates the identification and commercialization of new business opportunities adjacent to SAP’s core business. By bringing together teams of internal and external entrepreneurs and using a milestone-gated funding process, the group “incubates” new businesses inside the company from idea to commercialization. The Global Business Incubator has been starting new initiatives since 2008 at the pace of roughly one per quarter.
Investments in Innovative Companies
SAP’s investment in other companies adds to the process of innovation by acting as a window on external innovation. Founded in 1996, SAP Ventures is the corporate venture capital arm of SAP, and invests in companies that develop promising technologies and applications.
SAP Ventures can make investment decisions that do not necessarily reflect our current business strategy and is therefore able to invest in entirely new fields that offer the prospect of high growth and profitability. The idea behind SAP Ventures is to bring substantial benefit to its portfolio companies by facilitating interaction between innovative young companies and the SAP ecosystem and to aid SAP in identifying disruptive trends, new market opportunities, and potential acquisition candidates, partners and suppliers.
SAP Ventures invests globally and has portfolio companies in Europe, India, and the United States. In 2009, SAP Ventures focused on digital media and online marketing and channeled investment in aspiring enterprises such as Tremor Media and Return Path. The SAP Ventures portfolio includes startups like Alfresco, Connectiva, Greenplum, iYogi, JasperSoft, LinkedIn, Loglogic, Newgen, Qumu, Right Hemisphere, and Vendavo.
The SAP NetWeaver Fund program, capitalized with US$125 million, aims to invest in companies to fuel innovation and growth within the SAP ecosystem and in technologies based on the SAP NetWeaver technology platform. Since the inception of the SAP NetWeaver Fund in 2006, SAP has made investments in several companies resulting in significant product development and co-innovation that has delivered value to our customers. The SAP NetWeaver Fund portfolio includes companies such as Nakisa, a leader in the visual workforce management market, and Innocentive, a provider of open innovation solutions for the enterprise.
50
Table of Contents
Committing Resources to Research and Development
We must continuously improve our portfolio of products if we wish to maintain and build on our current leading position as a vendor of business software. In 2009, our research and development (R&D) expense decreased slightly by 2% to €1,591 million (2008: €1,627 million), but we spent 14.9% of total revenue on R&D in 2009 (2008: 14.1%). The increase in the R&D quotient in spite of the cost-saving measures implemented in 2009 reflects our engagement in development. The R&D quotient was influenced by an 8% decrease in revenue and by a 5% reduction in the number of R&D employees. However, the personnel expense for the R&D employees was negatively impacted in 2009 by an increase in variable pay due to overachievement of Company goals.
R&D expenditures include expense for externally procured development services, in addition to HR costs. The importance of R&D was also reflected in the breakdown of employee profiles. At the end of 2009, our total full-time equivalent (FTE) count in development work was 14,813 (2008: 15,547). R&D employees account for 31% (prior year: 30%) of all SAP employees worldwide.
Development News and New Offerings
In 2009, we extended our solution portfolio focusing primarily on increasing integration between product lines to help our customers close the gap between strategy and execution. Working with our customers and partners, we created new capabilities in all core areas of our solutions portfolio: enterprise applications and industry solutions in SAP Business Suite, solutions for small businesses and midsize companies, solutions addressing the needs of business users, and the SAP NetWeaver technology platform. We also expanded our service offerings.
Expanded Offerings for Enterprise Applications and Industry Solutions
SAP Business Suite applications and all SAP industry solutions were improved to adapt to the accelerating rate of change of the market and customer expectations:
| • | SAP ERP: In May 2009, we delivered the fourth enhancement package for the SAP ERP application. Functional improvements provide stronger support for parallel accounting and reporting, treasury and risk management, and electronic payments. Human capital management capabilities were improved to support recruiting, learning, and performance management processes. Search, reporting, and self-service capabilities improved usability for casual and business users. Enhancement packages continue to enable our customers to add functions to their SAP applications without upgrades, reducing the total cost of managing or extending the capabilities of their enterprise processes. | |
| • | SAP Customer Relationship Management (SAP CRM): The new version of the SAP CRM application, SAP CRM 7.0, delivered in May 2009, is continuing to gain momentum with our customers, and is experiencing strong adoption by our customers’ users. SAP CRM is characterized by ease of use and adaptability to meet rapidly changing market conditions, combined with the power of integratedend-to-end sales, marketing, and service business processes (such as the new loyalty management capabilities), and we are becoming the solution of choice for SAP customers. We are continuing to grow thought leadership through several exciting innovations such as the mobility partnership with Sybase, social CRM, and communications-enabled business processes to help our customers stay current and ahead of their competition. | |
| • | SAP Supplier Relationship Management (SAP SRM): In February 2009, we announced the general availability of the latest version of the SAP SRM application, SAP SRM 7.0, as part of SAP Business Suite software. SAP SRM now extends compliance capabilities with enhancements to centralized sourcing and contract management, services procurement, catalog management, supplier enablement, usability, and accessibility to information. Furthermore, SAP supports SRM customers in complying with regulatory and internal guidelines. SAP SRM also helps fully deliver on the important procurement |
51
Table of Contents
| processes for our customers. We also plan to release new versions of the SAPE-Sourcing and SAP Contract Lifecycle Management on-demand solutions in 2010. These new versions are designed to improve the amount of negotiated savings, optimize cost visibility, increase sustainable savings, and provide more advanced on-demand support. |
| • | SAP Supply Chain Management (SAP SCM): In May 2009, a new version of SAP SCM became generally available with capabilities that leveragepoint-of-sales data to improve planning accuracy and visibility, provide new forecasting methods, and enable attribute- or characteristics-based planning. The supply network collaboration capabilities were enhanced to improve coordination and collaboration with contract manufacturers. We introduced major enhancements to warehouse and transportation management, such as graphical warehouse layout modeling, improved visualization, tighter integration of export controls, and increased utilization, through enhanced integrated processes. We expanded the radio-frequency identification (RFID) and auto-ID solution footprint of SAP SCM with support for serialization technology and the EPCIS standard, a global communications standard by EPCglobal that improves transparency in the tracking of goods. | |
| • | SAP Product Lifecycle Management (SAP PLM): With its fourth enhancement package generally available in May 2009, SAP PLM introduced a new user interface with simplified access to information within the context of specific roles to improve productivity, reduce training, eliminate manual activities, and make decisions more rapidly. This intuitive new user interface delivers information from units across an organization to establish a product-centric view. Direct collaboration capabilities within SAP PLM enable intercompany design networks with a sophisticated authorization concept. The result is a better and faster collaboration, which can improve the quality of product development resulting in fewer change cycles. Integrated product labeling helps companies to reduce the risk of product recalls caused by improper labeling and helps them save time by automating the various steps in the product-labeling process. |
New Developments for Small Businesses and Midsize Companies
We delivered innovative developments for our many customers in the small and midsize enterprise (SME) segment in 2009:
| • | SAP Business ByDesign: In July 2009, we delivered feature pack 2.0 for the SAP Business ByDesign solution. This new version, available in six key markets under controlled release, significantly expands functionality and provides more value to customers by offering business support for 35end-to-end process scenarios. Through integration with software from the SAP BusinessObjects portfolio, including Crystal Reports software and dashboards from Xcelsius software, executives of midsize companies can benefit from increased transparency into their business operation and can utilize comprehensive analytics to make decisions that can improve their business performance. This latest feature pack also integrates customer relationship management,order-to-cash with automated billing, project profitability and resource management, time and expense reimbursement,procure-to-pay, and service and repair. Finally, companies can collaborate more effectively internally, as well as with customers, suppliers, and partners through new groupware integration with Microsoft Office. For example, groupware integration with desktop tools such as Microsoft Office enables users to synchronize tasks, appointments, ande-mail and, for instance, export standard letters and listings to work on them in Microsoft Office applications. This helps companies work more effectively — internally and with their customers, vendors, and other business partners. | |
| • | SAP BusinessAll-in-One: In 2009, we continued to enhance the SAP BusinessAll-in-One solution to include integrated preconfigured SAP BusinessObjects solutions — in addition to the comprehensive, preconfigured best practices delivered for SAP CRM and SAP ERP applications in 2008. These solutions provide customers with instant access to trusted and timely data at the core of their business operations. Additionally, we continued investing in the SAP BusinessAll-in-One fast-start program by |
52
Table of Contents
| extending the solution configurator to configure CRM functions online. Partners participating in the SAP BusinessAll-in-One fast-start program can now deploy the solution configurator on their Web sites and feature their unique offerings to prospects. Several of our partners already have it live on their sites. Finally, we delivered the SAP BusinessObjects Data Integrator software for data migration to SAP BusinessAll-in-One. It helps reduce project risks and speed the implementation of SAP BusinessAll-in-One solutions. |
| • | SAP Business One: In 2009, we released enhancements to the 2007 version of the SAP Business One application that offer a bundle of legal enhancements, streamlined business processes, improved usability, built-in local best practices, and integration with Web-based CRM ande-commerce. | |
| • | SAP BusinessObjects Edge solutions: In April 2009, we launched new solutions, including SAP BusinessObjects Edge BI, our comprehensive business intelligence software for small businesses and midsize companies. Now, as part of SAP BusinessObjects Edge, BI midmarket companies can use SAP BusinessObjects Explorer software that helps business users quickly and easily explore information from diverse sources and instantly answer business questions. We also delivered the SAP BusinessObjects Edge Strategy Management application, which helps small businesses and midsize companies improve their performance and align execution with strategy by connecting goals, initiatives and metrics. We also delivered the SAP BusinessObjects Edge Planning and Consolidation application, which helps these organizations create, execute, and monitor budgets that are aligned to financial plans and resources. |
Expanded SAP BusinessObjects Portfolio
In 2009, we extended our portfolio of solutions to meet the needs of business users with new enhancements to the SAP BusinessObjects solutions and new versions of Duet and Alloy.
| • | SAP-BusinessObjects business intelligence (BI) solutions: In 2009, we delivered SAP BusinessObjects Explorer software. SAP BusinessObjects Explorer software, accelerated version for SAP NetWeaver Business Warehouse (SAP NetWeaver BW), combines intuitive information search and exploration functions with the high performance and scalability of SAP NetWeaver BW Accelerator, so it can empower the organization and put BI within the reach of more business users in a company. With immediate insights into vast amounts of data, users can improve their ability to make sound, timely decisions. | |
| • | The accelerated version of SAP BusinessObjects Explorer software delivers powerful functions, including: |
| • | Search across data fields and metadata: Users simply enter a few keywords to instantly find the most relevant information from across all data sources. They need no previous knowledge about what data exists or where to find it. | |
| • | Intuitive exploration of data and charts: The software complements results with contextually relevant details. The experience is comparable to Internet-style search and browsing an online store. Users do not need data models or data knowledge. | |
| • | Automated relevancy and chart generation: SAP BusinessObjects Explorer presents the most relevant search results first and automatically generates the chart that best represents the information. | |
| • | High performance and scalability: The combined software and hardware solution delivers the high performance and scalability that users need for immediate response and answers when they browse very large data sets. |
| • | SAP BusinessObjects information management (IM) solutions: In June 2009, we delivered enhancements to SAP BusinessObjects Data Federator and SAP BusinessObjects Data Services software. These |
53
Table of Contents
| solutions support both SAP and non-SAP software environments. They offer greater support for SAP customers by integrating with SAP NetWeaver BW. In addition, there is deeper integration between SAP BusinessObjects Data Services and the SAP NetWeaver Master Data Management component (SAP NetWeaver MDM) for improved data cleansing. We also delivered application-specific versions of SAP BusinessObjects Data Quality Management software to help customers solve data quality problems with SAP, Informatica, and Siebel applications. With the new version of SAP BusinessObjects Metadata Management software, customers can consolidate metadata to gain visibility into SAP NetWeaver BW objects. They can thus obtain information on data lineage and usage and conduct change impact analyses. |
| • | SAP BusinessObjects governance, risk, and compliance (GRC) solutions: We delivered a new version of the SAP BusinessObjects Global Trade Services application that continued the evolution of this product and focused on managing supply chain risk and compliance across all of an organization’s trade processes. Execution of our road map continued with new versions of the SAP BusinessObjects Process Control and SAP BusinessObjects Risk Management applications, built on the SAP NetWeaver technology platform. The process control application offers customers a comprehensive concept with which to realize automated control mechanisms that help them ensure compliance with numerous legal and regulatory requirements. The latest release of the risk management application enables companies to automatically monitor and proactively identify enterprise risks. The combination of these two solutions enables customers to take a risk-based approach to controls. These were our first applications to deliver embedded SAP BusinessObjects BI capabilities through integration with Crystal Reports and Xcelsius software — notably as part of our updating of SAP BusinessObjects Access Control. The first version of the SAP BusinessObjects Sustainability Performance Management application helps organizations define and communicate their sustainability objectives, appropriately manage risks, and report on sustainability performance. It does so by providing a reporting and management framework that enables organizations to focus on driving sustainability performance rather than data collection and report compilation. | |
| • | SAP BusinessObjects enterprise performance management (EPM) solutions: The release of SAP BusinessObjects EPM 7.5 delivered the second phase of our five-year road map and included new versions of the SAP BusinessObjects Planning and Consolidation application on both the SAP NetWeaver and Microsoft platforms to help customers streamline their planning, budgeting, and forecasting processes. A new version of the SAP BusinessObjects Strategy Management application was released with new visualization and reporting capabilities enabled by SAP BusinessObjects BI solutions. We enhanced the SAP BusinessObjects Financial Consolidation application with new accounting compliance features and rich integration with SAP ERP and SAP NetWeaver BW to further help companies meet demands for a faster, more accurate financial close process. We also released a new version of the SAP BusinessObjects Profitability and Cost Management application, which helps customers gain more insight into cost drivers and their effect on profitability. A second version of the SAP BusinessObjects Spend Performance Management application was released to help customers identify cost-saving opportunities and identify risk in the supply chain. In February 2009, we delivered the new SAP BusinessObjects XBRL Publishing solution by UBmatrix, designed to help customers meet new regulatory requirements for the electronic communication of financial and business data. Also in February, we launched the SAP BusinessObjects Supply Chain Performance Management application, which continues to extend our performance management vision beyond finance. It helps companies measurably improve supply chain effectiveness, create responsive supply chain networks, and deliver improved cost control. |
In addition to updates for SAP BusinessObjects solutions, we delivered the first version of Alloy software, a joint development with IBM, in March 2009. In October 2009, we delivered a new version of Duet software.
54
Table of Contents
Enhancements to SAP NetWeaver
Enhancements made to the SAP NetWeaver technology platform in 2009 focus on helping our customers run business applications efficiently, accelerate the design and integration of applications to enhance business processes, manage and access relevant data across the entire enterprise, and simplify the way users access applications and information.
| • | SAP NetWeaver Composition Environment: In May 2009, we released the first enhancement package for the SAP NetWeaver Composition Environment offering, which provides a lean, integrated, standards-based development, modeling, and runtime environment. Software developers and technical consultants can use the enhanced composite designer and composite life-cycle management capabilities to improve productivity. As part of this enhancement package, we also delivered the SAP NetWeaver Business Process Management component and the SAP NetWeaver Business Rules Management component — the next generation of tools for increasing process flexibility with new business process management and business rules management capabilities. Business process experts can use these tools to generate a consistent view of core and composite processes for both business and IT. | |
| • | SAP NetWeaver Process Integration (SAP NetWeaver PI): With the release of the first enhancement package for SAP NetWeaver Process Integration in May 2009, our customers can now take advantage of Enterprise Services Repository enhancements to improve SOA design governance. SAP NetWeaver PI also supports higher data volumes and centralized administration capabilities. | |
| • | SAP NetWeaver Information Lifecycle Management: SAP has delivered a three-pronged approach to information life-cycle management that meets the complex information management needs of today’s organizations: data archiving, which focuses on keeping the growth of data volume in check; retention management, which deals with the life cycle of data from the time it is created until it is destroyed; and a retention warehouse, which addresses the decommissioning of legacy applications and systems. | |
| • | SAP NetWeaver Identity Management: In 2009, we released a new version of SAP NetWeaver Identity Management. Key enhancements in this release include integration with SAP BusinessObjects Access Control for compliant user provisioning, standards-based integration (Service Provisioning Markup Language) with SAP Business Suite (employee scenarios) to enable business-driven identity management, identity services to enable access to identity management functions from external applications and SOA environments, and greater integration with the SAP NetWeaver infrastructure including Web Dynpro-based Web user interfaces for more consistentlook-and-feel and easier management. |
New Developments for Services
With expertise in a wide range of industries, the SAP Services organization continues to develop and deliver services to align IT and business strategies. These services enable customers to realize maximum benefits from IT investments more quickly, free up IT budget, and respond rapidly to market changes. From planning and implementation to running applications, SAP Services offerings support organizations along the entire application life cycle. Customers can leverage IT landscapes more effectively to optimize processes and drive innovation.
Additional service developments focus on giving customers an accurate view of where maximum value can be achieved, while consistently keeping business costs at a minimum. Leveraging best practices, tools, methodologies and repeatable, quick time to value, metric-driven offerings are key to our strategy. By doing this, SAP Services can deliver customer services that scale faster — significantly reducing implementation cost and ensuring customer satisfaction.
55
Table of Contents
| • | In April 2009, SAP and SAP User Group Executive Network (SUGEN) announced the rollout of the SUGEN SAP Enterprise Support program using key performance indicators (KPIs) to define and measure how SAP customers derive value from SAP Enterprise Support. | |
| • | In December 2009, SAP announced that the KPIs achieved under the program showed clear value to participating SAP customers. | |
| • | In January 2010, SAP announced a tiered support model for customers worldwide. This support offering includes SAP Enterprise Support services and the SAP Standard Support option, and will enable all customers to choose the option that best meets their requirements. |
ACQUISITIONS
In 2009, we reinforced our strategy of organic growth complemented by share or asset acquisitions aimed at enriching our product portfolio in terms of both technology and functions. We made the following acquisitions in 2009:
| • | In May, we acquired the assets of Sky Data Systems Inc., a U.S. company. Sky Data Systems specializes in mobile CRM solutions. | |
| • | In June, we acquired Clear Standards Inc., a U.S. company. Clear Standards provides enterprise carbon management solutions and helps organizations measure and control greenhouse gas emissions and other environmental impacts across internal operations. The software also supports sustainability reporting. Our objective in extending our product portfolio in the field of sustainability is to help our customers meet the carbon management requirements in this time of increasingly stringent government regulations and public expectations of better transparency. | |
| • | In June, we also acquired Highdeal S.A., a French company. Highdeal delivers sophisticated pricing, charging and rating solutions designed to support communication service providers. SAP has integrated the Highdeal solutions in a business process platform that provides customers with a comprehensive real-time transaction management system. | |
| • | In September, we acquired a majority of the shares of SAF AG, a Swiss public company. SAF develops ordering and forecasting software for the retail, logistics, and industrial sectors. The company employs an innovative conceptual demand chain management approach that allows the process chain to be controlled and optimized by its central driving force — the customers’ buying behavior. SAP offered SAF shareholders an amount of €11.50 per share, which represents a 9.5% premium according to the XETRA closing price of €10.50 for the SAF share on July 17, 2009, and a 33.9% premium to the volume-weighted average price of the SAF shares in XETRA trading on the Frankfurt Stock Exchange over the three months prior to the offer date. As of September 24, 2009, the aggregate number of SAF shares attributable to SAP amounted to 3,914,041 SAF shares in total; corresponding to approximately 70.67% of the share capital and the voting rights of SAF AG. As of March 10, 2010 the amount of share capital and the voting rights of SAF AG attributable to SAP had not changed significantly. | |
| • | In December we acquired the assets of SOALogix, Inc., a U.S. company. SOALogix specializes in packaged software to map information flows between employees, processes, and applications. Its product portfolio includes solutions for integrating industry-specific project management software with SAP applications for portfolio and project management. |
SEASONALITY
Our business has historically experienced the highest revenue in the fourth quarter of each year, due primarily to year-end capital purchases by customers. Such factors have resulted in 2009, 2008, and 2007 first quarter revenue being lower than revenue in the prior year’s fourth quarter. We believe that this trend will
56
Table of Contents
continue in the future and that our revenue will continue to peak in the fourth quarter of each year and decline from that level in the first quarter of the following year.
SALES, MARKETING AND DISTRIBUTION
SAP primarily uses its worldwide network of subsidiaries to market and distribute SAP’s products and services locally. Those subsidiaries have entered into license agreements with SAP AG pursuant to which the subsidiary acquires the right to sublicense SAP AG’s products to customers within a specific territory. Under these agreements, the subsidiaries retain a certain percentage of the revenue generated by the sublicensing activity. We began operating in the United States in 1988 through SAP America, Inc., a wholly owned subsidiary of SAP AG. Since then, the United States has become one of our most important markets.
In addition to our subsidiaries’ sales forces, we have developed an independent sales and support force through value-added resellers unrelated to SAP who assume responsibility for the licensing, implementation and some initial level of support of SAP solutions, particularly with regard to the SAP Business One application and qualified SAP BusinessAll-in-One partner solutions. We have also entered into partnerships with major system integration firms, telecommunication firms and computer hardware providers to offer certain SAP Business Suite applications.
We establish partnerships with hardware and software suppliers, systems integrators and third-party consultants with the goal of providing customers with a wide selection of third-party competencies. The role of the partner ranges from pre-sales consulting for business solutions to the implementation of our software products to project management and end-user training for customers and, in the case of certain hardware and software suppliers, to technology support. Beyond these partnerships, a significant amount of consulting and training regarding SAP products is handled by third-party organizations that have no formal relationship or partnership with SAP.
Traditionally, our sales model has been to charge a one-time, up front license fee for a perpetual license to our software (without any rights to future products) which is typically installed at the customer site. We now offer our solutions in a variety of ways which include on-demand, hosted solutions, and subscription-based models. Although revenues from these new types of models currently are not material, we expect these revenues to increase in the future.
Our marketing efforts cover large, multinational groups of companies as well as small and midsize enterprises. We believe our broad portfolio of solutions and services enables us to meet the needs of customers of all sizes and across industries.
Capitalizing on the possibilities of the Internet, we actively make use of online marketing. Some of our solutions can be tested online via the Internet demonstration and evaluation system, which also offers special services to introduce customers and prospects to new solutions and services.
INTELLECTUAL PROPERTY, PROPRIETARY RIGHTS AND LICENSES
We rely on a combination of the protections provided by applicable statutory and common law rights, including trade secret, copyright, patent, and trademark laws, license and non-disclosure agreements, and technical measures to establish and protect our proprietary rights in our products. For further details on risks related to SAP’s intellectual property rights, see “Item 3 Key Information — Risk Factors — Other Operational Risks.”
We may be dependent in the aggregate on technology that we license from third parties that is embedded into our products or that we resell to our customers. We have licensed and will continue to license numerous third-party software products that we incorporate intoand/or distribute with our existing products. We endeavor to protect ourselves in the respective agreements by obtaining certain rights in case such agreements are terminated.
57
Table of Contents
We are a party to certain patent cross-license agreements with certain third parties.
We are named as a defendant in various legal proceedings for alleged intellectual property infringements. See Note 24 to our Consolidated Financial Statements for a more detailed discussion of these legal proceedings.
ORGANIZATIONAL STRUCTURE
As of December 31, 2009, SAP AG was the parent of 163 subsidiaries. Our subsidiaries perform various tasks such as the distribution of SAP’s products and providing SAP services on a local basis, research and development, customer support, marketing, and administration. Our primary research and development facilities, the overall group strategy and the corporate administration functions are concentrated at our headquarters in Walldorf, Germany.
The following table illustrates our most significant subsidiaries based on revenues as of December 31, 2009:
| Ownership | Country of | |||||
Name of Subsidiary | % | Incorporation | Function | |||
Germany | ||||||
| SAP Deutschland AG & Co. KG, Walldorf | 100 | Germany | Sales, consulting and training | |||
Rest of EMEA | ||||||
| SAP (UK) Limited, Feltham | 100 | Great Britain | Sales, consulting and training | |||
| SAP (Schweiz) AG, Biel | 100 | Switzerland | Sales, consulting and training | |||
| SAP France S.A., Paris | 100 | France | Sales, consulting and training | |||
United States | ||||||
| SAP America, Inc., Newtown Square | 100 | USA | Sales, consulting and training | |||
Rest of Americas | ||||||
| SAP Canada Inc., Toronto | 100 | Canada | Sales, consulting, training, and research and development | |||
Japan | ||||||
| Sales, consulting, training, | ||||||
| SAP JAPAN Co., Ltd., Tokyo | 100 | Japan | and research and development | |||
Rest of APJ | ||||||
| SAP Australia Pty Limited, Sydney | 100 | Australia | Sales, consulting and training |
DESCRIPTION OF PROPERTY
Our principal office is located in Walldorf, Germany, where we own and occupy approximately 395,000 square meters of office space including our facilities in neighboring St. Leon-Rot. We also own and lease office space in various other locations in Germany, totaling approximately 130,000 square meters. In approximately 70 countries worldwide, we occupy roughly 1,300,000 square meters. The space in most locations other than our principal office in Germany is leased. We also own certain real properties in Newtown Square and Palo Alto, United States; Bangalore; and a few other locations in and outside of Germany.
The office space we occupy includes approximately 295,000 square meters in the EMEA region, excluding Germany, approximately 295,000 square meters in the region North and Latin America, and approximately 185,000 square meters in the APJ Region.
The space is being utilized for various corporate functions including research and development, customer support, sales and marketing, consulting, training, and administration. For a discussion on our property, plant, and equipment by geographic region see Note 29 to our Consolidated Financial Statements. Also see, “Item 6. Directors, Senior Management and Employees,” which discusses the numbers of our employees by business area and by geographic region, which may be used to approximate the productive capacity of our workspace in each region.
58
Table of Contents
We believe that our facilities are in good operating condition and adequate for our present usage. We do not have any significant encumbrances on our properties. We are currently undertaking construction activities in various locations to increase our capacity for future expansion of our business. Some of our significant construction activities are described below, under the heading “Capital Expenditures.”
Capital Expenditures
Principal Capital Expenditures and Divestitures Currently in Progress
In the US, we finalized the construction for the expansion of the U.S. Headquarters campus in Newtown Square, Pennsylvania where we had invested around € 100 million. The building has been occupied since the second quarter of 2009.
In 2008 we began construction of a guesthouse in our Walldorf, Germany location to save future travel costs for visiting SAP employees. We estimated the total cost of the construction to be approximately €17 million, of which we had paid approximately €14 million as of December 31, 2009. We funded the construction with internally generated cash flows. The construction was completed at the end of February 2010. Occupancy started in the middle of March 2010.
The construction of a new office building in St. Ingbert, Germany was also started in 2008. The building has been occupied since the middle of March 2010. The total investment was approximately €14 million.
In Brazil, we commenced construction for the expansion of the São Leopoldo office in the fourth quarter of 2007, which added 400 workspaces. Total costs were about €14 million. The building has been occupied since the second quarter of 2009.
In Singapore, we will commence a project in the second half of 2010 to consolidate three of our current offices into one new building. The project will involve moving approximately 830 employees to the new location. We estimate the total cost of this project to be approximately €11 million. We are funding this project with internally generated cash flows. We estimate that the consolidation of these offices will take place by the end of 2010.
We believe that our facilities are in good operating condition and adequate for our present usage. We do not have any significant encumbrances on our properties. We are currently undertaking construction activities in various locations to increase our capacity for future expansion of our business. Some of our significant construction activities are described below, under the heading “Capital Expenditures.”
Principal Capital Expenditures and Divestitures for the Last Three Years
Our capital expenditures for property, plant, and equipment amounted to €207 million for 2009 (2008: €344 million; 2007: €342 million). Capital expenditures in 2009 for property, plant, and equipment decreased compared to 2008 and 2007. This decrease was mainly due to a decrease in spending on real estate and buildings. For a related discussion on our property, plant, and equipment see Note 17 to our Consolidated Financial Statements in “Item 18. Financial Statements.”
Our capital expenditures for intangible assets such as software licenses, acquired technologies and customer contracts decreased significantly to €51 million in 2009 from €1,043 million in 2008 (2007: €238 million). Our investments allocated to goodwill also decreased significantly to €41 million in 2009 from €3,511 million in 2008 (2007: €520 million). The significant decrease from 2008 to 2009 as well as the increase in Goodwill and intangible assets from 2007 to 2008 was primarily attributable to the acquisition of Business Objects in 2008. For further details on acquisitions and related capital expenditures, see Note 4 and Note 16 to our Consolidated Financial Statements.
59
Table of Contents
The significant decreases in our capital expenditures in 2009 when comparing our investments in 2008 and 2007, aside from the acquisition of Business Objects in 2008, was primarily the result of the tightening of our budgets in response to the economic crisis.
For further details regarding capital expenditures by geographic region, see Note 29 to our Consolidated Financial Statements. For further information regarding the principal markets in which SAP competes, including a breakdown of total revenues by category of activity and geographic market for each of the last three years, see “Item 5 Operating and Financial Review and Prospects — Operating Results” of this Annual Report onForm 20-F.
ITEM 4A. UNRESOLVED STAFF COMMENTS
Not applicable.
| ITEM 5. | OPERATING AND FINANCIAL REVIEW AND PROSPECTS |
OVERVIEW
Our principal sources of revenue are sales of software products and related services. Software revenue is primarily derived from software license fees that customers pay to use SAP products. We derive support revenue from offering support services which provide the customer with unspecified upgrades, updates and enhancements and software support. Our professional service revenue consists of consulting, training and other service revenue; consulting revenue is primarily derived from the services rendered with respect to implementation of our software products and training revenue from rendering training for customer project teams and end-users, as well as training third-party consultants with respect to SAP software products. See “Item 4. Information about SAP — The Software and Service Portfolio” for a more detailed description of the products and services we offer.
Subscription revenues flow from contracts that have both a software element and a support element. Subscription contracts typically give our customers the use of current software and the right to unspecified future products. We typically charge a fixed monthly or quarterly fee for a definite term up to five years. Software rental revenue flows from software rental contracts, which include software and support service elements. Such contracts provide the customer with current software products and support but do not provide the right to receive unspecified future software products. Customers pay a periodic fee over the rental term and we recognize fees from software rental contracts ratably over the term of the arrangement. Our revenue from other software-related services includes revenue from our on-demand offerings, for example the SAP CRM on-demand solution, any future on-demand revenue from our new midmarket product SAP Business ByDesign, revenue from hosting contracts that do not entitle the customer to readily exit the arrangement, and revenue from software-related revenue-sharing arrangements, for example our share of revenue from collaboratively developed products.
We also report revenue from other services within professional services and other service revenue. This item includes revenue from non-mandatory hosting services, application management services (AMS), and sales commission received from third-parties. Non-mandatory hosting services revenue consists of revenue from hosting contracts from which the customer can readily exit if it wishes to run the software on its own systems.
The following discussion is provided to enable a better understanding of our operating results for the periods covered, including:
| • | the economic conditions that we believe impacted our performance in 2009; | |
| • | our outlook for 2009 compared to our actual performance (non-GAAP); | |
| • | a discussion of our operating results for 2009 compared to 2008 and for 2008 compared to 2007; |
60
Table of Contents
| • | the economic conditions we believe will impact our performance in 2010; and | |
| • | our operational targets for 2010 (non-IFRS). |
The preceding overview should be read in connection with the more detailed discussion and analysis of our financial condition and results of operations in this Item 5, “Item 3. Key Information — Risk Factors” and “Item 18. Financial Statements.”
ECONOMIC CONDITIONS
Global Economic Trends
For the global economy, 2009 was a year of crisis: The International Monetary Fund (IMF) calls it the deepest worldwide recession in recent history, while Credit Suisse, a major Swiss bank, refers to it as the new Great Depression. The United Nations also reports that the downturn was steep and simultaneous throughout the world.
Beginning in late 2008, many governments introduced stimulus measures of unprecedented dimensions, which helped to bring some respite in 2009 — from mid-year in the emerging economies, and during the final quarter in the advanced economies. Since then, international trade and global industrial output have begun to recuperate.
While recovery began earlier than originally expected, global economic output still declined in 2009, although only by a small single-digit percentage. There was considerable variation among the regions.
Within the Europe, Middle East, and Africa (EMEA) region, the upturn toward the end of 2009 was uneven. The European Central Bank (ECB) reported that while there was only slight improvement in the economies of Central and Eastern Europe, exports from the euro area started to pick up after mid-year — especially from Germany. At the beginning of 2009, its exports were still in decline. Government stimulus packages and the growth of trade were among the factors that encouraged economic recovery in the euro area.
An upturn also started in the Americas region in the second half of the year. The major impetus in the United States was governmental support for the economy, which prompted unexpectedly high levels of consumer spending. Above all, the government measures stimulated the markets for automobiles and homes. The third quarter saw a return to economic growth, and exports grew in response to increased demand from the emerging economies. Nonetheless, Credit Suisse calculates that at the end of 2009, overall economic activity in the United States was still well below the levels achieved in the years before the crisis. The ECB notes that rapidly rising imports and decreasing investment in commercial property weighed down the U.S. economy.
The overall economy of Latin America contracted in 2009 by a percentage in the lower single digits. However, the ECB believes there is sufficient evidence to support the view that most countries were in recovery by the end of the year. In November, Brazil even posted moderate single-digit growth in industrial production as compared with 2008.
The gap between emerging and advanced economies was especially wide in the Asia-Pacific region in 2009. The emerging economies implemented massive stimulus packages, which brought them continued growth through the year, albeit at a reduced pace. This was the first sign of an upturn that was to spread across the world. The Organisation for Economic Co-operation and Development (OECD) notes that in the emerging Asian economies there was already discussion by late 2009 about how and when government stimulus measures should be wound down.
On the other hand, Credit Suisse reports that the Japanese economy fared worse in 2009 than had initially been expected. Finding themselves in intense international competition to reduce costs, companies were reluctant to invest while they still had unutilized capacity. But the ECB believes that in recent months the mood has improved even in Japan, and that the economy has started to recover.
61
Table of Contents
The IT Market
The IT market was impacted by the global economic crisis in 2009. IT spending declined noticeably, as, wherever they could, businesses and retail customers postponed purchases and selected less expensive products or configurations. U.S. IT market analyst International Data Corporation (IDC) reports that the market reached bottom in the third quarter of 2009.
The hardware sector was affected more seriously than the software business. In the IT services segment, the effect was first felt a few months later, and recovery also occurred later than in the hardware and software sectors. According to IDC, sales in the software market grew only very little in 2009. They were flat in IT services, and declined sharply in the hardware segment. UBS, a major Swiss bank, reports that sales to consumers held up better than sales to companies.
However, analysts say the final quarter of 2009 marked the beginning of the economic recovery. For instance, investment bank Goldman Sachs reports that IT spending grew more quickly than expected. It believes the economic year was reverting to the normal cycle, in which companies spend what is left of their budget at the end of the year. In 2009, that was a relatively large amount because of cost-saving efforts in the first nine months.
In the EMEA region, the crisis affected the European countries most seriously. Until the third quarter, the IT sector in Europe contracted continuously as the hostile economic climate discouraged capital spending by companies. IDC reports that in Western Europe the market for software expanded only minimally over the full year, while the IT services market contracted a little. At the same time, spending on hardware decreased in the range of double-digit percentage points. Germany was particularly affected: Although in 2008 market analysts had still been predicting double-digit percentage growth there in 2009, actual growth was in the lower single digits from the beginning of the year. The downward trend continued, and from the third quarter it especially affected the IT services segment.
IDC reports that the contraction was dramatic in Central and Eastern Europe. There, the software and IT services segments suffered declines well into double-digit percentages, and the hardware market was the most seriously affected. By contrast, its analysts described the Middle East and Africa as oases of stability early in 2009. However, when oil prices decreased and international investors withdrew their funds in the second quarter, the crisis came to these regions as well. It was relatively harmless, though: Software spending declined slightly, services budgets grew slightly, and there was only a single-digit percentage decrease in hardware sales.
The IT market in the Americas region was also uneven in 2009. While the numbers from North America were comparable with those from other advanced economies, in Latin America there was double-digit percentage growth in the software segment, substantial growth in the services market, and only a little lost ground in the hardware sector. This was because while many companies planned fewer new IT projects, they did protect their established IT budgets. IDC reported signs that the market in the Americas region was stabilizing from the third quarter. In UBS’s analysis, low prices and government economic stimulus packages led to greater demand for software than had been expected. The impact of the recession on hardware and services spending was more sustained.
In the United States, the government’s wide-ranging measures to support the economy began to take effect from the third quarter, forestalling further contraction in the IT sector, according to IDC. Its market analysts report modest single-digit percentage growth in the software and services segments over the full year. Only the results from the hardware sector drove the IT market into negative territory, IDC reasons. Goldman Sachs presents a different analysis: It believes the software market suffered a double-digit percentage contraction at the bottom of the crisis in the second and third quarters. Goldman Sachs concludes that full-year spending on software declined more steeply in the United States than in the world as a whole, although sales in the fourth quarter were better than it had expected.
Nor did the APJ region escape the economic crisis in 2009. IDC says the difference there between advanced and emerging economies was very marked. In the emerging economies, IT budget growth merely slowed in response to the global economic downturn — and government economic stimulus packages were already
62
Table of Contents
bearing fruit as early as the third quarter. This was most noticeable in China, where low prices and government stimulation soon restored demand, according to UBS. The advanced economies that rely more on exports, notably Japan, recorded substantial decline. They also had the longest to wait for the upturn. IDC believes full-year sales decreased in every segment of the IT sector.
OUTLOOK FOR 2009
Performance Against Outlook for 2009 (Non-GAAP)
We expressed our 2009 operating income-related internal management goals and published outlook in non-GAAP terms. For this reason, in the following section we discuss performance against our outlook exclusively and expressly in terms of non-GAAP numbers derived from U.S. GAAP measures. All subsequent discussions in theOperating Resultssection are in terms of IFRS measures. As a result, the numbers in that section are not explicitly identified as IFRS measures.
Outlook for 2009 (Non-GAAP)
At the beginning of 2009, we projected that our 2009 non-GAAP operating margin, which excluded a nonrecurring deferred support revenue write-down from the acquisition of an acquired entity and acquisition-related charges, to be in the range of 24.5% to 25.5% at constant currencies. That included nonrecurring restructuring costs of between €200 million and €300 million, which we expected to incur as we reduced our workforce and which we expected would negatively impact our non-GAAP operating margin by approximately two to three percentage points.
Due to our results for the first half of 2009, we updated our outlook in July 2009 by increasing our expected non-GAAP operating margin to a range of 25.5% to 27.0% at constant currencies. Our July 2009 outlook included nonrecurring restructuring costs of €200 million, which we expected to incur as we reduced our workforce and which we expected would negatively impact our non-GAAP operating margin by approximately two percentage points. At the beginning of 2009, our non-GAAP operating margin outlook was based on the assumption that our 2009 non-GAAP software and software-related service revenue, which excludes a nonrecurring deferred support revenue write-down from an acquisition, would decline not more than 1% at constant currencies (2008: €8,623 million). In July 2009, we updated our assumption to the effect that our 2009 non-GAAP software and software-related service revenue would decline in a range of 4% to 6% at constant currencies.
In October 2009, we confirmed our outlook regarding the 2009 non-GAAP operating margin but decreased the underlying revenue assumption. We continued to expect our full-year 2009 non-GAAP operating margin to be in the range of 25.5% to 27.0% at constant currencies. The 2009 non-GAAP operating margin outlook was now based on the assumption that our 2009 non-GAAP software and software-related service revenue would decline in a range of 6% to 8% at constant currencies.
We announced in January 2009 and confirmed in April, July, and October, that in order to enable our Company to adapt its size to today’s market conditions and the broader impact of the global recession, we were implementing a global reduction of our workforce to 48,500 by year-end 2009, taking full advantage of attrition as a factor in reaching this goal. In January 2009, we also announced that we expected the reduction of our workforce to trigger one-time restructuring expenses of between €200 million and €300 million for 2009. In July, we clarified this one-time restructuring expense expectation by announcing total restructuring expenses for 2009 to be approximately €200 million.
At the beginning of 2009, we projected an effective tax rate of between 29.5% and 30.5% (based on U.S. GAAP income from continuing operations) for 2009 (2008: 30.0%). In October 2009, we updated our outlook for the 2009 effective tax rate to between 27.0% and 28.0%.
63
Table of Contents
To assist in understanding our 2009 performance as compared to our 2009 outlook a reconciliation from our non-GAAP financial measures to our U.S. GAAP financial measures is provided below. These non-GAAP measures reconcile to the nearest U.S. GAAP equivalents as follows:
| Support | Currency | Non-GAAP | ||||||||||||||||||||||
| Revenue Not | Effect on the | Fiancial | ||||||||||||||||||||||
| U.S. GAAP | Recorded | Acquisition- | Non-GAAP | Non-GAAP | Measure at | |||||||||||||||||||
| Financial | Under U.S. | Related | Financial | Financial | Constant | |||||||||||||||||||
| Measure | GAAP | Charges | Measure | Measure | Currency | |||||||||||||||||||
| € millions, except operating margin | ||||||||||||||||||||||||
| Software and software-related service revenue | 8,198 | 11 | n/a | 8,209 | −8 | 8,201 | ||||||||||||||||||
Total revenue(1) | 10,672 | 11 | n/a | 10,683 | −19 | 10,664 | ||||||||||||||||||
Operating income(1) | 2,639 | 11 | 264 | 2,915 | 18 | 2,933 | ||||||||||||||||||
| Operating margin in % | 24.7 | 0.1 | 2.5 | 27.3 | 0.2 | 27.5 | ||||||||||||||||||
| (1) | These financial measures are the numerator or the denominator in the calculation of our non-GAAP operating margin and the comparable U.S. GAAP operating margin, and are included in this table for the convenience of the reader. |
2009 Actual Performance Compared to Outlook (Non-GAAP)
Our 2009 non-GAAP operating margin on a constant currency basis was 27.5%, surpassing the outlook we provided at the beginning of 2009 (24.5% to 25.5%), updated in July (25.5% to 27.0%), and confirmed in October 2009. It was 0.7 percentage points narrower than the previous year’s non-GAAP operating margin of 28.2%. This contraction was due primarily to the slowdown in revenue brought about by the global financial crisis. In addition, restructuring expenses of €196 million resulting from the workforce reduction announced in early 2009 negatively impacted our non-GAAP operating margin by 1.8 percentage points. This operating margin result exceeded the outlook we confirmed in October 2009 for non-GAAP operating margin at constant currency, due to the fact that we surpassed our assumption for non-GAAP software and software-related service revenue on a constant currency basis with a 5%year-over-year decline. In addition, we realized this margin by continuing our comprehensive cost savings implemented in late 2008, which included a significant reduction of spending on external service providers, business travel, and other variable costs.
On a constant currency basis over the full year, our non-GAAP software and software-related service revenue declined 5% to €8,201 million (2008: €8,623 million), missing the assumptions provided in January (decline of 1%), meeting the updated assumption provided in July (decline in a range of 4% to 6%) and surpassing the assumption provided in October 2009 (decline in a range of 6% to 8%). This result was achieved due to abetter-than-expected result in software revenue in the fourth quarter of 2009.
We achieved an effective tax rate of 28.1% (based on U.S. GAAP income from continuing operations), which was lower than the effective tax rate projected in January of 2009 (29.5% to 30.5%) and slightly higher than our updated projection of October 2009 (27.0% to 28.0%).
OPERATING RESULTS (IFRS)
The following Operating Results section discusses, our results only in terms of IFRS measures. As a result, the numbers are not explicitly identified as IFRS measures. In addition, the 2008 and 2007 figures are different than the figures disclosed in our 2008 Annual Report onForm 20-F since our figures are now based on IFRS instead of U.S. GAAP.
64
Table of Contents
Our 2009 Results Compared to our 2008 Results (IFRS)
Revenue (IFRS)
| Change | ||||||||||||
| 2009 | 2008 | 2009 vs 2008 | ||||||||||
| € millions | ||||||||||||
| Software revenue | 2,607 | 3,606 | −28 | % | ||||||||
| Support revenue | 5,285 | 4,602 | 15 | % | ||||||||
| Subscription and other software-related service revenue | 306 | 258 | 19 | % | ||||||||
Software and software-related service revenue | 8,198 | 8,466 | −3 | % | ||||||||
| Consulting revenue | 2,074 | 2,498 | −17 | % | ||||||||
| Training revenue | 273 | 434 | −37 | % | ||||||||
| Other service revenue | 85 | 107 | −21 | % | ||||||||
Professional services and other service revenue | 2,432 | 3,039 | −20 | % | ||||||||
Other revenue | 42 | 70 | −40 | % | ||||||||
Total Revenue | 10,672 | 11,575 | −8 | % | ||||||||
Total Revenue
Total revenue decreased from €11,575 million in 2008 to €10,672 million in 2009, representing a decrease of €903 million or 8%. This entire decrease was caused by changes in volumes and prices. The decline mainly relates to a decrease in software revenue of €999 million or 28% as compared to 2008. This decrease was offset in part by increased support and subscription revenue, which resulted in software and software-related service revenue of €8,198 million in 2009. Software and software-related service revenue represented 77% of our total revenue in 2009 compared to 73% in 2008. Professional services and other service revenue contributed €2,432 million to our total revenue in 2009. This represents a decrease of 20% compared to 2008. Professional services and other service revenue accounted for 23% of our total revenue in 2009 compared to 26% in 2008. The other revenue component of total revenue was immaterial for both 2008 and 2009.
For an analysis of our total revenue by region and industry, see theRevenue by RegionandRevenue by Industrysections.
Software and Software-Related Service Revenue
Software revenue represents fees earned from the sale or license of software to customers. Support revenue represents fees earned from providing customers with technical support services and unspecified software upgrades, updates, and enhancements. Subscription and other software-related service revenue represents fees earned from subscriptions, software rentals, and other types of software-related service contracts.
In 2009, software and software-related service revenue decreased from €8,466 million in 2008 to €8,198 million, representing a decrease of €268 million or 3%. This entire decrease was caused by changes in volumes and prices.
Software revenue decreased from €3,606 million in 2008 to €2,607 million in 2009, representing a decrease of €999 million or 28%. The software revenue decline consists of a 27% decrease from changes in volumes and prices and a 1% decrease from currency effects.
In 2009, we continued to focus on our established product portfolio: SAP Business Suite, our platform-related products based on SAP NetWeaver, and the solutions aimed at business users primarily available in the SAP Business Objects portfolio. We continued to integrate our SAP BusinessObjects solutions with products from SAP Business Suite and SAP NetWeaver to provide added value to our customers.
65
Table of Contents
SAP Business Suite revenue contributed most to the overall decrease of software revenue with a 38% decrease, but a recovery started in the second half of 2009. Positive contribution to software revenue development came from customer development projects, which rose 35% compared to 2008.
Throughout 2009 our customer base remained relatively stable. Based on the number of deals closed, 37% of our software revenue in 2009 was attributable to contracts with new customers (2008: 32%). The total number of new software deals settled decreased by 10% to 42,639 (2008: 47,572). The value of software order entry declined 28% year over year. Based on the order entry value, the new customer share increased from 13% in 2008 to 17% in 2009.
Our stable customer base and the continued sale of software to existing and new customers throughout 2009 resulted in an increase in support revenue from €4,602 million in 2008 to €5,285 million in 2009, representing an increase of €683 million or 15%. The support revenue growth reflects a 14% increase from changes in volumes and prices and a 1% increase from currency effects.
Subscription and other software-related service revenue increased €48 million or 19% to €306 million compared to €258 million in 2008. The increase in revenue reflects a 16% increase from volumes and prices and a 3% increase from currency effects. The increase was primarily related to new general license agreements and flexible license agreements representing a foundation for future subscription and other software-related service revenue growth.
Professional Services and Other Service Revenue
Professional services and other service revenue consists primarily of consulting and training revenue. Consulting revenue is primarily derived from the implementation of our software products. Training revenue results mainly from providing educational services on the use of our software products and related topics to customers and partners.
Professional services and other service revenue decreased from €3,039 million in 2008 to €2,432 million in 2009, representing a decrease of €607 million or 20% entirely reflected by changes in volumes and prices. The decrease in professional services and other service revenue is mainly due to economic conditions, which caused our customers to decrease their spending on software, postpone implementation projects, and reduce training activities.
Consulting revenue decreased from €2,498 million in 2008 to €2,074 million in 2009, representing a decrease of 17% which is entirely due to changes in volumes and prices. Our 2009 consulting revenue declined primarily due to the economic conditions, which led to decreased customer spending on software investments, and continued strict cost control policies. In 2009, consulting contributed to 85% of our revenue result in professional services and other service revenue compared to 82% in 2008. Consulting revenue as a percentage of total revenue decreased to 19% in 2009 compared to 22% in 2008.
Training revenue decreased from €434 million in 2008 to €273 million in 2009, representing a decrease of 37% entirely due to changes in volumes and prices. The decline in training revenue resulted primarily from economic conditions, which led customers to implement tight cost controls on software projects and related user enabling. This led to a significant decrease of attendee rates in our training offerings.
Other service revenue mainly consists of revenue generated by the SAP Managed Services organization, which operates, manages and maintains SAP solutions. Other service revenue decreased from €107 million in 2008 to €85 million in 2009, representing a decrease of 21%. All of this decrease was caused by changes in volumes and prices.
66
Table of Contents
Revenue by Region and Industry (IFRS)
Revenue by Region
| Change in % | ||||||||||||
| 2009 | 2008 | 2009 vs 2008 | ||||||||||
| € millions | ||||||||||||
| Germany | 2,029 | 2,193 | −7 | % | ||||||||
| Rest of EMEA | 3,614 | 4,013 | −10 | % | ||||||||
| Total EMEA | 5,643 | 6,206 | −9 | % | ||||||||
| United States | 2,695 | 2,890 | −7 | % | ||||||||
| Rest of Americas | 925 | 990 | −7 | % | ||||||||
| Total Americas | 3,620 | 3,880 | −7 | % | ||||||||
| Japan | 476 | 515 | −8 | % | ||||||||
| Rest of APJ | 933 | 974 | −4 | % | ||||||||
| Total APJ | 1,409 | 1,489 | −5 | % | ||||||||
Total revenue | 10,672 | 11,575 | −8 | % | ||||||||
Revenue by Industry
| Change in % | ||||||||||||
| 2009 | 2008 | 2009 vs. 2008 | ||||||||||
| € millions | ||||||||||||
| Process Industries | 2,008 | 2,367 | −15 | % | ||||||||
| Discrete Industries | 2,127 | 2,434 | −13 | % | ||||||||
| Consumer Industries | 1,976 | 2,235 | −12 | % | ||||||||
| Service Industries | 2,516 | 2,706 | −7 | % | ||||||||
| Financial Services | 909 | 774 | 17 | % | ||||||||
| Public Services | 1,136 | 1,059 | 7 | % | ||||||||
Total revenue | 10,672 | 11,575 | −8 | % | ||||||||
Revenue by Region
We operate our business in three principal geographic regions: the Europe, Middle East, and Africa (EMEA) region; the Americas region, which comprises North and Latin America; and the Asia Pacific Japan (APJ) region, which comprises Japan, Australia, and other parts of Asia. We allocate revenue amounts to each region based on where the customer is located. For additional information with respect to operations by geographic region, see theNotes to the Consolidated Financial Statementssection, Note 29.
The EMEA Region
In 2009, 53% (2008: 54%) of our total revenue was derived from the EMEA region. Our total revenue from the EMEA region was €5,643 million, which represents a decline of 9% compared to 2008 (2008: €6,206). This decrease reflects a 7% decrease from changes in volumes and prices and a 2% decrease from currency effects. Total revenue in Germany decreased 7% to €2,029 million in 2009 (2008: €2,193 million). Germany contributed 36% to our total revenue from the EMEA region, which is a slight increase of 0.6 percentage points compared to 2008. Most of the rest of our EMEA revenue in 2009 originated from the United Kingdom, France, Switzerland, the Netherlands, Italy, and Spain.
67
Table of Contents
The Americas Region
Of our 2009 total revenue, 34% (2008: 34%) was recognized in the Americas region. Total revenue in the region decreased 7% to €3,620 million in 2009. Total revenue from the United States declined 7% in 2009, which represents a decrease of 10% from changes in volumes and prices and a 3% increase from currency effects. The United States contributed 74% (2008: 74%) of our total revenue from the Americas region. The rest of the Americas region saw a 7% decrease in total revenue to €925 million, which represents a decrease of 3% from changes in volumes and prices and a 4% decrease from currency effects. This revenue was principally generated in Canada, Brazil, and Mexico.
The APJ Region
In 2009, the APJ region contributed 13% (2008: 13%) to our total revenue, with most of this revenue being derived from Japan. In the APJ region, total revenue declined by 5% to €1,409 million in 2009. Revenue from Japan decreased 8% to €476 million, which represents 34% (2008: 35%) of our total revenue from the APJ region. The revenue decline in Japan reflects a 19% decrease due to changes in volumes and prices and an 11% increase from currency effects. The rest of the APJ region saw a decrease in total revenue of 4%, which was all caused by changes in volumes and prices. Revenue from the APJ region was principally generated in Australia, China, and India.
Revenue by Industry
We have identified six industry sectors on which to focus our development efforts in the key industries of our existing and potential customers. We provide best business practices and specific integrated business solutions to those industries. We allocate our customers to an industry at the outset of an initial arrangement. All subsequent revenues from a particular customer are recorded under that industry sector.
In comparison with total revenue change in 2009, we outperformed in the financial services industry sector with revenue of €909 million, which represents a growth rate of 17%, and in public services, where our total revenue amounted to €1,136 million, representing an increase of 7% compared to 2008. In financial services, we performed particularly well due to our increased industry focus in banking and insurance.
In our mature industry sectors, notably in the process and discrete manufacturing industries, the market was difficult as a result of the financial crisis. Customers reduced their spending, especially on new software and professional services. Compared to 2008, our total revenue from the process manufacturing industries declined 15%, and from the discrete manufacturing industries it declined 13%.
Operating Profit and Margin (IFRS)
Total Operating Expense
| Change | ||||||||||||
| 2009 | 2008 | 2009 vs. 2008 | ||||||||||
| € millions | ||||||||||||
| Cost of software and software-related services | −1,714 | −1,743 | −2 | % | ||||||||
| Cost of professional services and other services | −1,851 | −2,285 | −19 | % | ||||||||
| Research and development | −1,591 | −1,627 | −2 | % | ||||||||
| Sales and marketing | −2,199 | −2,546 | −14 | % | ||||||||
| General and administration | −564 | −624 | −10 | % | ||||||||
| Restructuring | −198 | −60 | >100 | % | ||||||||
| Other operating income/expense, net | 33 | 11 | >100 | % | ||||||||
Total operating expenses | −8,084 | −8,874 | −9 | % | ||||||||
68
Table of Contents
Operating Profit and Operating Margin
| Change | ||||||||||
| 2009 | 2008 | 2009 vs. 2008 | ||||||||
| € million, except for operating margin | ||||||||||
| Operating profit | 2,588 | 2,701 | −4% | |||||||
| Operating Margin in % | 24.3 | 23.3 | 1.0pp | |||||||
Cost-Containment Measures in 2009
We announced in January that to enable our company to adapt its size to market conditions and the broader impact of the global recession, we were implementing a global reduction of our workforce to 48,500 by year-end 2009, taking full advantage of attrition as a factor in reaching this goal. We confirmed the announcement in July and October. We expected the reduction of our workforce would trigger one-time restructuring expenses of between €200 million and €300 million for 2009. In July, we clarified this expectation, announcing total restructuring expenses for 2009 of approximately €200 million. In 2009, we actually incurred a restructuring charge of €198 million, which was recorded in total operating expenses. To counter these additional costs and to react to the global financial crisis, throughout 2009 we continued the cost-containment measures we initially implemented in the fourth quarter of 2008.
Total Operating Expenses
Our total operating expenses for 2009 decreased to €8,084 million compared to €8,874 million in 2008 representing a decrease of €790 million or 9%. The main driver for this decrease was the cost-containment measures implemented in the fourth quarter of 2008 and continued through 2009. These cost savings realized through the cost-containment measures were partially offset by the restructuring charges mentioned above and an increase in variable compensation, especially in Germany, in comparison to 2008.
Cost of Software and Software-Related Services
Cost of software and software-related services consists primarily of various customer support costs, cost of developing custom solutions that address customers’ unique business requirements and license fees and commissions paid to third parties for databases and the other complementary third-party products sublicensed by us to our customers.
The cost of software and software-related services decreased 2% from €1,743 million in 2008 to €1,714 million in 2009. As a percentage of software and software-related service revenue, cost of software and software-related services remained stable at 21% in 2009.
Throughout 2009 the support organization continued its efforts to improve the efficiency of our processes by continuing the focus of moving into low-cost locations (Bulgaria, China, and India). Approximately 23% of our global support resources were based in the low-cost locations at the end of 2009, which is an increase of 1.5 percentage points compared to 2008.
Cost of Professional Services and Other Services
Cost of professional services and other services consist primarily of consulting and training personnel expenses as well as expenses for third-party consulting and training resources. This item also includes sales and marketing expenses related to our professional services and other services resulting from sales and marketing efforts that cannot be clearly distinguished from providing the services.
69
Table of Contents
Cost of professional services and other services declined 19% from €2,285 million in 2008 to €1,851 million in 2009 as a result of strict cost controls. As a percentage of professional services and other services revenue, cost of professional services increased slightly from 75% in 2008 to 76% in 2009. Despite the strict cost controls on our professional services and other services, our decreased revenue in 2009 resulted in a contraction of our professional services and other services margin.
Research and Development
Our R&D expenses consist primarily of personnel expenses for our R&D employees, costs incurred for independent contractors retained by us to assist in our R&D activities, and amortization of computer hardware and software in our R&D activities.
R&D expenses in 2009 decreased by 2% to €1,591 million compared to €1,627 million in 2008. The decrease in R&D expense was mainly the result of a decline in third-party non-customer-related costs. As a percentage of total revenue, R&D expenses increased from 14% in 2008 to 15% in 2009. This increase was primarily due to a reduction in total revenue of 8%. This decline in revenue was partially offset by a R&D headcount reduction of 5%. Despite the reduction in R&D headcount, personnel expenses for the R&D employees increased due to an increase in variable compensation resulting from overachievement of our company targets in 2009.
Sales and Marketing
Sales and marketing costs consist mainly of personnel expenses and direct sales costs to support our sale and marketing lines of business in selling and marketing our products and services.
Sales and marketing expenses decreased 14% from €2,546 million in 2008 to €2,199 million in 2009. The decrease in sales and marketing expenses was mainly the result of lower personnel expenses due to headcount reduction and tight cost controls in all areas. As a percentage of total revenue, sales and marketing expenses decreased from 22% in 2008 to 21% in 2009.
General and Administration
Our general and administration (G&A) expenses consist mainly of personnel expenses to support our finance and administration functions.
G&A expenses decreased from €624 million in 2008 to €564 million in 2009. This represents a decrease of 10%. This decrease was driven by lower personnel expenses due to the reduction in headcount and cost savings in the area of non-customer-related third-party and travel expenses. As a percentage of total revenue, G&A expenses remained relatively stable compared to the 2008 at 5%.
Operating Profit
Our 2009 operating profit decreased by 4% to €2,588 million (2008: €2,701 million). We were able to achieve this result despite the slowdown in revenue (8%) brought about by the global financial crisis and the additional one-time impact from the restructuring charges (€198 million) incurred in 2009 due to the savings realized from the cost-containment measures, which partially offset the negative impacts on our margin.
Operating Margin
Our operating margin, which is the ratio of operating profit to total revenue, expressed as a percentage was 24.3%, one percentage point higher than in the previous year (2008: 23.3%). The €198 million in restructuring charges resulting from the reduction of positions announced in January 2009 negatively impacted our operating margin by 1.9 percentage points.
70
Table of Contents
Segment Discussions
Currently we have three reportable operating segments: Product, Consulting, and Training. Total revenue and profit figures for each of our operating segments differ from the respective revenue and profit figures classified in our Consolidated Statements of Income because of several differences between our internal management reporting and our external IFRS reporting. For further details of our segment reporting and a reconciliation from our internal management reporting to our external IFRS reporting, see theNotes to the Consolidated Financial Statementssection, Note 29.
| Change in % | ||||||||||
Product Segment | 2009 | 2008 | 2009 vs. 2008 | |||||||
| € millions, unless otherwise stated | ||||||||||
| External revenue | 7,846 | 8,366 | −6 | |||||||
| Segment expenses | −3,120 | −3,655 | −15 | |||||||
| Segment contribution | 4,726 | 4,711 | 0 | |||||||
Segment profitability | 60 | % | 56 | % | 4pp | |||||
| Change in % | ||||||||||
Consulting Segment | 2009 | 2008 | 2009 vs. 2008 | |||||||
| External revenue | 2,499 | 2,824 | −12 | |||||||
| Segment expenses | −1,724 | −2,040 | −15 | |||||||
| Segment contribution | 775 | 784 | −1 | |||||||
Segment profitability | 31 | % | 28 | % | 3pp | |||||
| Change in % | ||||||||||
Training Segment | 2009 | 2008 | 2009 vs. 2008 | |||||||
| External revenue | 332 | 525 | −37 | |||||||
| Segment expenses | −217 | −300 | −28 | |||||||
| Segment contribution | 115 | 225 | −49 | |||||||
Segment profitability | 35 | % | 43 | % | −8pp | |||||
Product Segment
The Product segment is primarily engaged in marketing and licensing our software products and providing support for them. Support includes technical support for our products, assistance in resolving problems, providing user documentation, unspecified software upgrades, updates, and enhancements. The Product segment also performs certain custom development projects. The Product segment includes the sales, marketing, and service and support lines of business.
Product segment revenue decreased 6% from €8,366 million in 2008 to €7,846 million in 2009. All of the decrease resulted from changes in volumes and prices. The reason for the decrease is that the decline in revenue from software solution licensing was greater than the increase in our support revenue. Software revenue as part of the total Product segment revenue decreased 29% from €3,356 million in 2008 to €2,373 million in 2009. The change in software revenue in the Product segment results entirely from changes in volumes and prices. Support revenue increased 10% from €4,596 million in 2008 to €5,076 million in 2009. This growth results entirely from changes in volumes and prices. Subscription and other software-related service revenue increased 18% from €257 million in 2008 to €304 million in 2009.
Product segment expenses decreased 15% from €3,655 million in 2008 to €3,120 million in 2009. Expenses from the sales line of business account for roughly 55% of the entire Product segment expenses, while expenses from the marketing line of business account for roughly 20% and expenses from the service and support line of business account for roughly 25% of overall Product segment expenses. The decrease in Product segment expenses was the result of our cost-containment measures.
71
Table of Contents
Product segment contribution increased from €4,711 million in 2008 to €4,726 million in 2009, or 60% of total segment revenue compared to 56% of total segment revenue in 2008.
Consulting Segment
The Consulting segment is primarily engaged in the implementation of our software products.
Consulting segment revenue decreased 12% from €2,824 million in 2008 to €2,499 million in 2009. This decrease was all caused by changes in volumes and prices. Geographically the EMEA region, North America, and the APJ region have all contributed to the segment revenue decline. In Latin America revenue also declined, but at a lower rate. We reacted to a decrease in demand for our consulting services by decreasing our Consulting segment resources by 11%. Our headcount reduction was highest in North America and the APJ region at 17% and 16%, respectively. We were able to mitigate this revenue decrease with cost savings realized from the reduction in third-party non-customer-related costs.
Consulting segment expenses decreased 15% from €2,040 million in 2008 to €1,724 million in 2009. This expense decrease is primarily the result of the reduction of our workforce, decreased purchase of third party services, and other savings realized from our cost-containment measures.
Consulting segment contribution decreased 1% from €784 million in 2008 to €775 million in 2009. Consulting segment profitability increased three percentage points to 31%.
Training Segment
The Training segment is primarily engaged in providing educational services on the use of our software products and related topics for customers and partners. Training services include traditional classroom training at SAP training facilities, customer and partner-specific training and end-user training, as well ase-learning.
Training segment revenue was €332 million in 2009, which represents a decrease of 37% from €525 million in 2008. This revenue decrease was due entirely to changes in volumes and prices. Our training revenue shortfall was especially high in the Americas region with a 47% decrease. Revenue decreased 31% in both the EMEA and APJ regions. The primary drivers for this revenue decline were in the area of traditional classroom training (40%) and in education consulting (53%).
Our Training segment expenses decreased 28%, from €300 million in 2008 to €217 million in 2009, mainly due to the decline in demand for our training services and to our cost-containment measures.
The Training segment contribution decreased 49% from €225 million in 2008 to €115 million in 2009. Training segment profitability decreased eight percentage points to 35%.
Financial Income, Net
Financial income, net, decreased to -€80 million (2008: -€50 million). Our finance income in 2009 was €32 million (2008: €72 million) and our finance costs were €101 million (2008: €123 million). Our finance income substantially comprised income from cash and cash equivalents and from other financial assets. Our 2009 finance costs arose principally in connection with the financing for our acquisition of Business Objects and with our issuance of private placement transactions (“schuldschein”) in 2009.
The decrease in finance costs in 2009 was mainly due to the repayment of our outstanding credit facility in connection with the Business Objects acquisition. Finance costs associated with our schuldschein transactions offset part of that effect. The decrease in finance income in 2009 resulted mainly from significant interest-rate reductions, which were only partly offset by an increase in average liquidity since 2008.
72
Table of Contents
Income Tax
Our effective tax rate decreased to 28.1% in 2009 from 29.6% in the previous year. The decrease in our effective tax rate and in our income tax expense in 2009 mainly resulted from nonrecurring acquisition-related items. For more information, see theNotes to the Consolidated Financial Statementssection, Note 11.
Our 2008 Results Compared to our 2007 Results (IFRS)
Revenue (IFRS)
| Change | ||||||||||||
| 2008 | 2007 | 2008 vs. 2007 | ||||||||||
| € millions | ||||||||||||
| Software revenue | 3,606 | 3,407 | 6 | % | ||||||||
| Support revenue | 4,602 | 3,852 | 19 | % | ||||||||
| Subscription and other software-related service revenue | 258 | 182 | 42 | % | ||||||||
Software and software-related service revenue | 8,466 | 7,441 | 14 | % | ||||||||
| Consulting revenue | 2,498 | 2,221 | 12 | % | ||||||||
| Training revenue | 434 | 410 | 6 | % | ||||||||
| Other service revenue | 107 | 113 | −5 | % | ||||||||
Professional services and other service revenue | 3,039 | 2,744 | 11 | % | ||||||||
Other revenue | 70 | 71 | −1 | % | ||||||||
Total Revenue | 11,575 | 10,256 | 13 | % | ||||||||
Total Revenue
As a result of our acquisition of Business Objects in January 2008, our revenue numbers for 2008 and 2007 are not fully comparable.
Total revenue increased from €10,256 million in 2007 to €11,575 million in 2008, representing an increase of €1,319 million or 13%. The revenue growth reflects a 17% increase from changes in volumes and prices and a 4% decrease from currency effects. This increase is mainly related to the strong performance in software and software-related service revenue, which grew by €1,025 million or 14% compared to 2007. A significant portion of this growth was due the acquisition of Business Objects. In 2008, software and software-related service revenue represented 73% of our total revenue, which was flat compared to 2007. Professional services and other service revenue contributed €295 million to the overall growth in 2008. This represents an increase of 11% compared to 2007. Professional services and other service revenue accounted for 26% of our total revenue compared to 27% in 2007.
Software and Software-Related Service Revenue
Software and software-related service revenue increased from €7,441 million in 2007 to €8,466 million in 2008, representing an increase of €1,025 million or 14%. A significant portion of this growth was due the acquisition of Business Objects. The revenue growth reflects an 18% increase from changes in volumes and prices and a 4% decrease from currency effects.
Software revenue rose from €3,407 million in 2007 to €3,606 million in 2008, accounting for an increase of €199 million, or 6%. The software revenue growth consists of a 10% increase from changes in volumes and prices and a 4% decrease from currency effects.
The strong performance in software and software-related service revenue for the full year 2008 was the result of well balanced growth in all regions. See section Revenue by Region and Industry for our results per region.
73
Table of Contents
The extension of our established product portfolio, SAP Business Suite and our platform-related products based on SAP NetWeaver, especially towards the business user solutions, led to an overall increase software revenue. In 2008, we continued to derive software revenue from our strong customer base. Nevertheless, the number of software contracts coming from new customers remained stable at 31%. Based on the order entry value, the new customer share decreased from 21% in 2007 to 13% in 2008 influenced fundamentally by lower deal sizes in the extended business user area.
The SAP NetWeaver-related revenue decreased from €997 million in 2007 to €942 million in 2008, representing a decrease of €55 million or 6%. The portion relating specifically to the underlying SAP NetWeaver stand-alone revenue increased by €55 million, or 17%, to €384 million in 2008 compared to €329 million in 2007. The decrease was mainly due to the global economic crisis that emerged during the second half of 2008 since we recorded a 31% increase during the first half of 2008.
Our stable customer base and the continued sale of software to existing and new customers throughout 2008 resulted in an increase in support revenue from €3,852 million in 2007 to €4,602 million in 2008, representing an increase of €750 million or 19%. The support revenue growth reflects a 23% increase from changes in volumes and prices and a 4% decrease from currency effects. The largest contributor to the 2008 increase in support revenue based on volume was the Americas region. See section Revenue by Region and Industry for our results per region.
Subscription and other software-related service revenue increased by €76 million or 42% to €258 million compared to €182 million in 2007. The increase was primarily due to the signing of new major subscription contracts.
Professional Services and Other Service Revenue
Professional services and other service revenue increased from €2,744 million in 2007 to €3,039 million in 2008, representing an increase of €295 million or 11%. This revenue growth reflects a 15% increase from changes in volumes and prices and a 4% decrease from currency effects.
Consulting revenue increased from €2,221 million in 2007 to €2,498 million in 2008, representing an increase of 12%. The consulting revenue growth reflects a 17% increase from changes in volumes and prices and a 5% decrease from currency effects. In 2008, consulting contributed strongly to the revenue growth in professional services and other service revenue representing a payoff for past headcount investments in the consulting area. Consulting revenue as a percentage of total revenue remained quite stable at 22% in 2008, contributing to SAP’s total revenue double-digit growth rate.
Training revenue increased from €410 million in 2007 to €434 million in 2008, representing an increase of 6%. The training revenue growth reflects a 10% increase from changes in volumes and prices and a 4% decrease from currency effects. Strong contribution to the growth in training revenue was achieved by higher demand forE-Learning andon-site customer training. The training business also benefited from growth in the certification area.
Other service revenue decreased from €113 million in 2007 to €107 million in 2008, representing a decrease of 5%. The other service revenue decline reflects a 2% decrease from changes in volumes and prices and a 3% decrease from currency effects. Other service revenue mainly consists of revenue generated by the SAP Managed Services organization, which operates, manages and maintains SAP solutions.
74
Table of Contents
Revenue by Region and Industry (IFRS)
Revenue by Region
| Change in % | ||||||||||||
| 2008 | 2007 | 2008 vs. 2007 | ||||||||||
| € millions | ||||||||||||
| Germany | 2,193 | 2,005 | 9 | % | ||||||||
| Rest of EMEA | 4,013 | 3,387 | 18 | % | ||||||||
| Total EMEA | 6,206 | 5,392 | 15 | % | ||||||||
| United States | 2,890 | 2,717 | 6 | % | ||||||||
| Rest of Americas | 990 | 872 | 14 | % | ||||||||
| Total Americas | 3,880 | 3,589 | 8 | % | ||||||||
| Japan | 515 | 447 | 15 | % | ||||||||
| Rest of APJ | 974 | 828 | 18 | % | ||||||||
| Total APJ | 1,489 | 1,275 | 17 | % | ||||||||
Total revenue | 11,575 | 10,256 | 13 | % | ||||||||
Revenue by Industry
| Change in % | ||||||||||||
| 2008 | 2007 | 2008 vs. 2007 | ||||||||||
| € millions | ||||||||||||
| Process Industries | 2,367 | 2,143 | 10 | % | ||||||||
| Discrete Industries | 2,434 | 2,224 | 9 | % | ||||||||
| Consumer Industries | 2,235 | 1,952 | 14 | % | ||||||||
| Service Industries | 2,706 | 2,372 | 14 | % | ||||||||
| Financial Services | 774 | 679 | 14 | % | ||||||||
| Public Services | 1,059 | 886 | 20 | % | ||||||||
Total revenue | 11,575 | 10,256 | 13 | % | ||||||||
Revenue by Region
The EMEA Region
In 2008, 54% (2007: 53%) of our total revenues were derived from the EMEA region. Our total revenues in the EMEA region grew to €6,206 million, or by 15%, in 2008. The EMEA region revenue growth reflects a 17% increase from changes in volumes and prices and a 2% decrease from currency effects. Revenues in Germany, SAP’s home market, increased by 9% to €2,193 million in 2008 (2007: €2,005 million). Germany contributed 35% (2007: 37%) of EMEA’s total revenues, which is a slight decrease of 2 percentage points compared to 2007. The remainder of revenues for the EMEA region in 2008 originated mainly from the following countries: the United Kingdom, France, Switzerland, the Netherlands, Italy and Russia.
The Americas Region
34% (2007: 35%) of our 2008 total revenues were recognized in the Americas region. Revenues increased by 8% to €3,880 million in 2008. Revenues from the United States grew by 6% in 2008, which represents a growth of 15% from changes in volumes and prices and a 9% decrease from currency effects. The United States contributed 74% (2007: 76%) of our total revenues in the Americas region. The rest of the Americas region increased revenues by 14% to €990 million, which represents growth of 19% from changes in volumes and prices
75
Table of Contents
and a 5% decrease from currency effects. These revenues were principally generated in Canada, Brazil and Mexico.
The APJ Region
In 2008, the Asia Pacific Japan region contributed 13% (2007: 12%) of our total revenues, with most of this revenue being derived mainly from the following major contributing countries: Japan, Australia, India, China and South Korea. In the Asia Pacific Japan region, revenues rose by 17% to €1,489 million in 2008. Japan increased by 15% to €515 million, which represents 35% (2007: 35%) of total revenues in the Asia Pacific Japan region. The revenue growth in Japan reflects a 6% increase from changes in volumes and prices and a 9% increase from currency effects. The rest of the Asia Pacific Japan region (Japan excluded) increased revenues by 18%, which represents a growth of 26% from changes in volumes and prices and an 8% decrease from currency effects.
Revenue by Industry
In 2008, our revenue grew in all six industry sectors. Total revenue increased 13%year-over-year. Sectors in which our growth was greater than average included Public Services, in which we achieved a 20% increase to €1,059 million in 2008. Our growth in Services was also stronger than average: Revenue in this sector increased 14% over the year to €2,706 million. We did slightly less well in the Process Industry sector, where our revenue grew 10%, and in Discrete Manufacturing, where our revenue grew 9%.
Operating Profit and Operating Margin (IFRS)
Total Operating Expense
| Change | ||||||||||||
| 2008 | 2007 | 2008 vs. 2007 | ||||||||||
| € millions | ||||||||||||
| Cost of software and software-related services | −1,743 | −1,350 | 29 | % | ||||||||
| Cost of professional services and other services | −2,285 | −2,091 | 9 | % | ||||||||
| Research and development | −1,627 | −1,461 | 11 | % | ||||||||
| Sales and marketing | −2,546 | −2,173 | 17 | % | ||||||||
| General and administration | −624 | −499 | 25 | % | ||||||||
| Restructuring | −60 | −2 | >100 | % | ||||||||
| Other operating income/expense, net | 11 | 18 | −39 | % | ||||||||
Total operating expenses | −8,874 | −7,558 | 17 | % | ||||||||
Operating Profit and Operating Margin
| Change | ||||||||||
| 2008 | 2007 | 2008 vs. 2007 | ||||||||
| € million, except for operating margin | ||||||||||
| Operating profit | 2,701 | 2,698 | 0% | |||||||
| Operating Margin in % | 23.3 | 26.3 | −3.0pp | |||||||
As a result of our acquisition of Business Objects in January 2008, our operating profit and operating margin numbers for 2008 and 2007 are not fully comparable.
Despite our response to the effects of the financial and economic crisis of introducing cost-saving measures, which resulted in a saving of more than €200 million in the final quarter of 2008, our total operating expenses for 2008 increased to €8,874 million compared to €7,558 million in 2007, representing an increase of
76
Table of Contents
€1,316 million or 17%. As described below, the main driver for this increase was the acquisition of Business Objects.
Cost of Software and Software-Related Services
The cost of software and software-related services increased from €1,350 million in 2007 to €1,743 million in 2008, or by 29%, which was mainly due the acquisition of Business Objects, but also due to the expansion of support resources, €32 million relating to license disputes and increased expenses for third-party license fees. As a percentage of software and software-related service revenue, cost of software and software-related services increased from 18% in 2007 to 21% in 2008.
Overall, the workforce in this area increased from 5,965 FTEs in 2007 to 6,466 FTEs in 2008, representing an increase of 8%. The support organization has continued its efforts to improve the efficiency of our processes by moving into low-cost locations (Bulgaria, China and India). Approximately 24% of our global support resources were based in the low-cost locations at the end of 2008, which is an increase of 2 percentage points compared to 2007.
Cost of Professional Services and Other Services
Cost of professional services and other services rose from €2,091 million in 2007 to €2,285 million in 2008, or 9%. As a percentage of professional services and other services revenue, cost of professional services and other service revenue decreased by one percentage point to 75%. The lower cost increase compared to a slightly higher revenue growth led to a positive professional services and other services margin development in 2008, although that improvement was mainly offset by increased costs resulting from our focused efforts to rapidly integrate the Business Objects professional services activities into our service portfolio. These increased costs negatively influenced our professional services and other services margin by 1.4 percentage points.
The increase in cost of professional services and other services was also due to increased personnel expenses, resulting from the integration of Business Objects employees.
Research and Development
R&D expenses in 2008 increased by 11% to €1,627 million compared to €1,461 million in 2007. As a percentage of total revenue, research and development expenses were 14% in 2008, which is consistent with 2007.
Our R&D expenses in 2008 increased mainly due to incremental headcount. The number of development employees increased by 2,596 FTE, or 20%, to 15,547 FTE as of December 31, 2008, primarily due to the Business Objects acquisition.
Sales and Marketing
Sales and marketing expenses increased from €2,173 million in 2007 to €2,546 million in 2008 or 17%. As a percentage of total revenue, sales and marketing expenses rose slightly from 21% in 2007 to 22% in 2008. The cost increase resulted primarily from the 2,391 FTE, or 29%, additional headcount adding up to 10,701 FTE. Of these, 2,184 FTE were integrated into our organization as a result of the acquisition of Business Objects.
General and Administration
General and administration (G&A) expenses increased from €499 million in 2007 to €624 million in 2008. This represents an increase of 25%. This increase was driven by increased personnel expenses and other headcount related costs mainly due to the acquisition of Business Objects. As a percentage of total revenue, G&A expenses remained flat from 2008 at 5% compared to 2007.
77
Table of Contents
The number of G&A employees increased by 447 FTE, or 16%, to 3,244 FTE in 2008. As in the prior year, we continued to expand our shared service centers in all regions to support efficient growth in this area.
Operating Profit
Our operating profit grew slightly to €2,701 million (2007: €2,698 million), which was not as great a percentage increase as the percentage increase in our total revenue. This was primarily caused by the slowdown in revenue growth brought about by the financial and economic crisis, the €35 million cost associated with acquiring Business Objects, and the discontinuation of the activities of TomorrowNow.
Operating Margin
At 23.3%, our operating margin, which is the ratio, expressed as a percentage, of operating profit to total revenue, was 3.0 percentage points lower than in the previous year (2007: 26.3%). Despite our thorough cost-containment measures in the final quarter of 2008, our operating margin decreased because the increase in our total revenue in 2008 was more than offset by the increase in operating expenses and acquisition-related charges in connection with the Business Objects acquisition.
Segment Discussions
| Change in % | ||||||||||
Product Segment | 2008 | 2007 | 2008 vs. 2007 | |||||||
| € millions, unless otherwise stated | ||||||||||
| External revenue | 8,366 | 7,369 | 14 | |||||||
| Segment expenses | −3,655 | −3,062 | 19 | |||||||
| Segment contribution | 4,711 | 4,307 | 9 | |||||||
Segment profitability | 56 | % | 58 | % | −2pp | |||||
| Change in % | ||||||||||
Consulting Segment | 2008 | 2007 | 2008 vs. 2007 | |||||||
| External revenue | 2,824 | 2,369 | 19 | |||||||
| Segment expenses | −2,040 | −1,738 | 17 | |||||||
| Segment contribution | 784 | 631 | 24 | |||||||
Segment profitability | 28 | % | 27 | % | 1pp | |||||
| Change in % | ||||||||||
Training Segment | 2008 | 2007 | 2008 vs. 2007 | |||||||
| External revenue | 525 | 493 | 6 | |||||||
| Segment expenses | −300 | −284 | 6 | |||||||
| Segment contribution | 225 | 209 | 8 | |||||||
Segment profitability | 43 | % | 42 | % | 1pp | |||||
Product Segment
Product segment revenue increased by 14% from €7,369 million in 2007 to €8,366 million in 2008, of which approximately €850 million was due to acquisitions. The increase was driven by an increase in customer licensing of our software solutions, which in turn contributed to an increase in support revenue. This growth reflects a 17% increase from changes in volumes and prices and a 3% decrease from currency effects. Approximately 98% of revenue within the product segment is derived from software and software-related service revenue. Approximately 2% of revenue within the product segment is derived from non-software related transactions (e.g., professional services, other services, and other revenues) initiated by employees of the product segment. Software revenue, as a part of the total product segment revenue increased by 3% from €3,269 million in 2007 to
78
Table of Contents
€3,356 million in 2008. This growth reflects a 7% increase from changes in volumes and prices and a 4% decrease from currency effects. Support revenue increased by 23% from €3,737 million in 2007 to €4,596 million in 2008. This growth reflects a 27% increase from changes in volumes and prices and a 4% decrease from currency effects. Subscription and other software-related service revenue increased by 42% from €181 million in 2007 to €257 million in 2008.
Product segment expenses increased by 19% from €3,062 million in 2007 to €3,655 million in 2008. Expenses from the sales line of business account for about half of the entire product segment expenses, while expenses from the marketing line of business account for roughly 20% and expenses from the service and support line of business account for roughly 30% of overall product segment expenses. The increase in product segment expenses results mainly from headcount growth of roughly 20%, predominantly due to the acquisition of Business Objects.
Product segment contribution increased by 9% from €4,307 million in 2007 to €4,711 million in 2008, or 56% of total segment revenue compared to 58% of total segment revenue in 2007.
Consulting Segment
Consulting segment revenue increased by 19% from €2,369 million in 2007 to €2,824 million in 2008. Of this increase, €131 million was due to acquisitions. This growth reflects a 24% increase from changes in volumes and prices and a 5% decrease from currency effects. Consulting segment expenses increased by 17% from €1,738 million in 2007 to €2,040 million in 2008. Consulting segment contribution increased by 24% from €631 million in 2007 to €784 million in 2008. Consulting segment profitability increased by 1 percentage point to 28%.
Geographically EMEA, Americas and APJ have all contributed to the growth in our consulting segment revenue while increased demand has been managed through a 10% increase in resources, predominantly in the global delivery organization which accounts for 30% of this headcount increase, and the newly introduced global hubs which have a focus on strategic solutions and industries. In addition to this increase in workforce, customer-related third party delivery costs have increased 3% to support the revenue growth. This growth reflects a 6% increase from changes in volumes and prices and 3% decrease from currency effects.
Training Segment
Training segment revenue was €525 million in 2008, which represents an increase of 6% from €493 million in 2007. This growth reflects an 11% increase from changes in volumes and prices and a 5% decrease from currency effects. The primary driver of this growth was traditional classroom training, where revenue growth of 16% was achieved. Revenue in the other sectors, such as academy and certification, customer specific training ande-learning, experienced marginal growth.
Of the €525 million training segment revenue recognized in 2008, €39 million resulted from businesses acquired in 2008. Of the core SAP business, before acquisitions, EMEA and APJ grew 6% and 18% respectively, while the Americas decreased by 18% from €192 million to €158 million. North America shrank by 22%, counteracting the 4% growth shown in Latin America.
Training segment expenses increased from €284 million in 2007 to €300 million in 2008, or 6% mainly due to acquisition-related headcount growth.
Training segment contribution increased by 8% from €209 million in 2007 to €225 million in 2008. Training segment margin increased by 1 percentage point to 43%.
79
Table of Contents
Financial Income, Net
In 2008, we incurred significantly higher finance costs than in 2007 due to an additional acquisition-related bank loan that was taken out in connection with the Business Objects acquisition. Our finance income/cost, net declined by approximately 138% in 2008, resulting in a net finance cost of €51 million. (2007: €135 million net finance income). Consequently, our financial income, net decreased from a net financial income of €124 million in 2007 to a net financial expense of €50 million in 2008.
Income Tax
Our effective tax rate decreased in 2008 to 29.6% from the previous year’s 32.4%. The decrease in our effective tax rate and the corresponding income tax expense in 2008 mainly results from a reduction of the German corporate income tax rate from 25% to 15% and from a reduction of trade tax under the 2008 German Business Tax Reform, effective January 1, 2008. See Note 11 to our Consolidated Financial Statements for more information on income tax.
OUTLOOK
Future Trends in the Global Economy
Many analysts agree that the nascent global upturn will continue in 2010. The reasons they give are the recovery on the financial markets and the return of consumer confidence in response, for example, to measures by governments in many countries to support and stimulate the economy.
However, they say the recovery is weak in the advanced economies and will not gain substantial momentum even in 2011. Output in the advanced economies at the end of 2011 will still be below pre-crisis levels. This recovery will therefore be slower than those of the past, they conclude. Nonetheless, the International Monetary Fund (IMF) and the Organisation for Economic Co-operation and Development (OECD) have revised their projections upward in their latest reports, as compared with their forecasts at the beginning of the fourth quarter of 2009.
In comparison, the emerging and developing economies are moving ahead strongly, they say. In these countries, the IMF predicts mid-range single-digit percentage growth in 2010 and even greater progress in 2011, driven chiefly by high levels of domestic demand. Major Swiss bank Credit Suisse sees particularly good prospects for Brazil, China, Korea, and India.
In sum, global economic growth in 2010 will not match previous periods of recovery, according to the European Central Bank (ECB). In the view of the ECB, sustained global growth will come not from temporary measures such as government stimulus packages but from a continued improvement in funding conditions.
Some growth is expected in the economies of the Europe, Middle East, and Africa (EMEA) region, but it is thought it will remain in the lower single-digit range until 2011 and output will stay below pre-crisis levels until then. The ECB says investment activity will continue to decline during this period, though at a progressively slower rate.
In the euro area, the situation remains problematic, because high unemployment is holding back consumer spending and compromising confidence in economic recovery, companies are struggling with underutilization of capacity, and government stimulus packages are only temporary. Nonetheless, growing overseas demand, notably in the emerging economies of Asia, is reviving export sales. What is true for the euro area is true for Germany in particular: The German economy is expanding appreciably in 2010, but not as strongly as in previous times of recovery.
The countries of Central and Eastern Europe, the Middle East, and Africa are said to be faring better. Credit Suisse, for example, is more optimistic than it was: It projects low single-digit percentage growth for 2010,
80
Table of Contents
and expects a stronger recovery in 2011. Petroleum-exporting countries may even benefit substantially from rising oil prices in 2010, it believes.
The signs are that the economy is also recovering in the Americas region in 2010. Whereas Latin America can expect growth in the middle of the single-digit range, the upturn in North America will prove to be modest, according to Credit Suisse. The U.S. economy is making progress, thanks primarily to the growth of demand in Asia. The steps taken to stimulate the economy are also proving successful, because according to the OECD the financial sector is recuperating and the housing market is stabilizing. The United Nations (UN) believes the United States will see growth near the bottom of the single-digit percentage range in 2010, and Credit Suisse also expects economic growth to be unusually slow for the beginning of a recovery.
The Asia Pacific region is an example of the difference in performance between emerging and developing economies on the one hand and advanced economies on the other. The IMF notes that emerging economies, most notably India and China, are in the vanguard of the global recovery, even though growth is slower than it was before the crisis. Credit Suisse expects high single-digit growth rates, reflecting another increase in domestic demand and double-digit percentage export growth.
On the other hand, the OECD and the UN report that the upturn in the advanced economies, such as Japan, is not expected to be strong. Japan is benefiting from an increase in demand from emerging economies in Asia, but domestic demand remains weak despite government stimulus measures. The prospects for 2011 are no better, according to Credit Suisse.
Whether these predictions turn out to be right depends chiefly on whether governments continue to take stimulative measures, the analysts say. Ending such measures too soon would jeopardize the recovery. Only the OECD urges that the stimulus packages should not be continued much longer because it believes withdrawing them would signal the end of the crisis.
The predictions are also subject to changes and trends in levels of unemployment and consumer spending, oil and other commodity prices, the health of the financial sector, and the strength of the euro. Recovery may be quicker or slower, depending on which way these factors affect confidence in the economy. Taken together, analysts see these risks as balancing one another.
IT Market Outlook for 2010
The IT market will be distinctly more positive in 2010 than in 2009, say analysts. They only differ in their views on the extent of the recovery. UBS, a major Swiss bank, foresees growth in the high single-digit percentage range in 2010. This is a downward revision from its earlier projections: Because the market was better than expected in 2009, it believes there is now less potential for 2010. IT market analysis firm International Data Corporation (IDC) is more circumspect, and expects market growth to be in the low single-digit range. Investment bank Goldman Sachs expects a slow improvement in the advanced economies — but not enough to make up the ground lost in 2009. It believes there may be double-digit growth in the emerging economies.
In any event, the IT industry will profit this year from the internal cost-saving measures implemented during the crisis and enter the economic recovery with lower internal costs. This is based on the assumption that the IT industry will be able to avoid significant cost increases resulting, for example, from new hirings or rehirings, during recovery. These companies will then be able to improve their liquidity for greater resilience against any renewed deterioration in the economic climate.
The driver of recovery in 2010 is expected to be the hardware sector, because many companies are replacing or upgrading their hardware. But many will also invest in new software, so the analysts are also optimistic about the software market in 2010. Goldman Sachs considers that software companies which launched new solutions or versions in 2009 have the best prospects.
The most important software trend in 2010, and the one with the most robust chances for the future, is software as a service (SaaS), according to Goldman Sachs. SaaS is a delivery model in which customers access the
81
Table of Contents
software they use from an Internet server, committing only very limited investments of their own. Goldman Sachs expects companies that offer SaaS to grow twice as quickly as others. It also believes mergers and acquisitions will consolidate the suppliers in the SaaS market over the next two to three years.
As hardware companies seek to add service offerings to their portfolio in 2010, the software services segment will also see more mergers and acquisitions, according to UBS. In consequence, it believes competition will stiffen in the services market, and that this will hold back growth in that segment. Current contracts in the services segment still include low-budget contracts from the crisis year, 2009.
IDC expects a recovery in small steps in the EMEA region in 2010 and 2011. This area can benefit from its existing technological landscape as a launch pad for expansion. However, recovery is expected to progress slowly in Western Europe: Prices are still under great pressure, and customers are reluctant to invest. IDC forecasts that in Germany, for example, spending growth in all segments of the IT market will be in the low single-digit percentage range. In Central and Eastern Europe and the Middle East, however, it expects that once the economic climate improves, there will be a much faster recovery in 2010.
IDC predicts that in 2010 the IT market in the Americas region will also recuperate from the crisis. In view of the unexpectedly positive economic trend at the end of 2009, IDC is even more optimistic now than it was last year, and expects single-digit expansion of all segments in the IT market.
Goldman Sachs believes prospects are especially good in the United States. It expects IT spending to grow more quickly than previously forecast, although companies will remain cautious about investing. IDC shares this view and forecasts modest single-digit expansion. In the software segment, cloud computing and SaaS are expected to provide vigorous revenue and profit growth. The software segment is also expected to benefit from the anticipated replacement of old hardware at many companies.
A slight expansion of the IT market has been apparent in the Asia Pacific region since the end of 2009, and is expected to gain momentum in 2010. The emerging and advanced economies are expected still to show very different rates of recovery. IDC believes the IT markets in the emerging economies, especially in China and India, will expand by high single-digit or possibly double-digit percentages in 2010. IDC notes that advanced economies — most notably Japan, which depends heavily on exports — are still laboring through the crisis. It expects only a limited recovery in the software services segment, and possibly further contraction in the software and hardware segments. This is because although industrial production is beginning to grow again there, unemployment remains high and consumer confidence low, impeding vigorous economic recovery.
All analysis of the IT market is based on the assumption that it will develop in a similar way as the economy as a whole. Whether matters develop as described depends on whether the underlying predictions about the progress of the economy are right. In particular, for the IT sector it depends on whether government stimulus packages continue and whether they are effective in increasing consumer demand.
FORECAST FOR SAP
Strategic Perspectives
SAP strives to enable growth — across businesses, across industries, across entire economies — and an enhanced level of optimization for value chains. Our ambition is to make businesses and institutions around the world more efficient and effective, thus allowing them to take on the challenge of achieving clarity within the enterprise. To do that, we strive to deliver performance optimization — not only for our customers, but for their entire business network.
Our strategy is to deliver superior software applications, services, and a global ecosystem that enable closed-loop performance optimization for companies of all sizes, thereby helping them to drive sustainable, profitable growth. We intend to help our customers achieve performance optimization by delivering solution and technology excellence, creating a more holistic customer experience, and enhancing our ecosystem to deliver whole solutions.
82
Table of Contents
Delivering Solution and Technology Excellence
SAP plans to evolve its tightly integrated packaged applications to ease adoption through increased modularity. Specifically, we intend to augment our extensible business process platform with point solutions that address specific industry or line of business needs, create a complementary information platform and performance optimization capabilities, deliver business process modeling capabilities to enable customers to develop their own solutions, and provide a scalable on-demand platform to ease deployment and consumption of new solutions.
Creating a More Holistic Customer Experience
SAP intends to develop the business model to more effectively support theend-to-end requirements of our customers, which includes delivering solutions focused on the needs of the lines of business and business users, providing new software purchasing models which align to the budgetary concerns of our customers, and continuing to cultivate and protect our relationship with our existing customers.
SAP intends to increase the level of engagement with the ecosystem to deliverend-to-end customer value with “whole solutions”. We believe that these whole solutions will bring together SAP solutions with partner offerings and broader community resources. In doing so, we will enable our ecosystem to effectively leverage the SAP platforms and hence create joint monetization and revenue opportunities.
Organic Growth and Targeted Acquisitions
Our strategy remains primarily focused on organic growth. As a result, we will continue to invest in product development work of our own, along with our investment in infrastructure, sales, and marketing. Our platform strategy also enables us to leverage the innovative potential of our partners for the use of our customers. In addition we expect to continue to make targeted acquisitions to improve our coverage in key strategic fields.
Operational Targets for 2010 (Non-IFRS)
We are providing the following outlook for 2010:
| • | We expect non-IFRS software and software-related service revenue to increase in the range 4% to 8% at constant currencies in 2010 (2009: €8.2 billion). | |
| • | We expect the non-IFRS operating margin to be in the range 30% to 31% at constant currencies in 2010 (2009: 27.4%). | |
| • | We project a corresponding increase in our operating profit. | |
| • | We project an effective tax rate of 27.5% to 28.5% (based on IFRS) for 2010 (2009: 28.1%). | |
| • | If the Annual General Meeting of Shareholders so resolves, in 2010 we will pay a dividend that provides a payout ratio of approximately 34%. | |
| • | Excepting acquisitions, our planned capital expenditures for 2010 will be covered in full by operating cash flow and will chiefly be spent on completing new office buildings at various locations as well as on IT equipment. |
Among the premises on which this outlook is based are those presented concerning economic conditions and our expectation that we will not benefit from any positive effects in 2010 from a major acquisition.
83
Table of Contents
Medium-Term Perspectives
We expect our business, our revenue, and our profit to grow, assuming there is a sustained recovery in the financial markets and assuming the current financial crisis does not result in longer-term consequences. Our strategy is to increase software and software-related service revenue, which comprises software and maintenance revenue and subscriptions and other software-related services, while also increasing our operating margin through greater efficiency across all sales channels, services, the support infrastructure, and research and development. We intend to achieve a non-IFRS operating margin of 35% in the mid-term.
We are seeing significant structural changes in the enterprise software space, and with anticipated change comes opportunity. Our objective is to bring to our customers the best business solutions, leveraging all relevant technology innovations and do this so that they are as reliable and easy to consume as possible.
We understand our customers want stability from the core business suite and lower cost to operate. As a result, we will continue our focus on innovation, and making our solutions more affordable and easier to use. We will continue innovating on multiple fronts, providing capabilities that are modular, which can be deployed side by side with the solutions that customers can already run. We intend to meet our promise of true value delivery to our customers.
FOREIGN CURRENCY EXCHANGE RATE EXPOSURE
Although our reporting currency is the euro, a significant portion of our business is conducted in currencies other than the euro. Movements in the exchange rates between the euro and the foreign currencies that many of our subsidiaries operate in may materially affect our business, financial position, income or cash flows. For additional information on foreign currencies, see Notes 3, 25 and 26 to our Consolidated Financial Statements in “Item 18. Financial Statements.”
Approximately 64% of our consolidated revenue in 2009 and approximately 64% in 2008 was attributable to operations in non-euro participating countries. As a result, those revenues had to be translated into euros for financial reporting purposes. Fluctuations in the value of the euro had a favorable impact on our total revenue of €18 million and our profit after tax of €1 million, whereas the euro had unfavorable impacts on our profit before tax of €12 million for 2009, and had unfavorable impacts on our total revenue of €402 million, profit before tax of €141 million and profit after tax of €122 million for 2008.
The impact of foreign currency exchange rate fluctuations discussed in the preceding paragraph is calculated by translating current period figures in local currency to euros at the monthly average exchange rate for the corresponding month in the prior year. Our revenue analysis, included within the “Operating Results,” section of this Item 5, discusses at times increases and decreases due to currency effects, which are calculated in the same manner.
LIQUIDITY AND CAPITAL RESOURCES
Our primary source of cash, cash equivalents and current investments are funds generated from our business operations. Over the past several years, our principal use of cash has been to support continuing operations and our capital expenditure requirements resulting from our growth, to pay dividends on our shares, to buy back SAP shares in the open market and to acquire businesses. Cash, cash equivalents and current investments are primarily held in euros and U.S. dollars as at December 31, 2009.
We use global centralized financial management to control liquid assets as well as monitor exposure to interest rates and currencies with the goal of maintaining adequate liquidity for the SAP Group. High levels of liquid assets and marketable securities provide a strategic reserve, helping keep SAP flexible, sound, and independent. In September 2009, we replaced our existing €1 billion syndicated credit facility, which was scheduled to mature in November 2009. The new syndicated credit facility amounts to €1.5 billion and has a
84
Table of Contents
maturity of 3 years (scheduled to mature in September 2012). This facility and our other bilateral lines of credit are currently available for additional liquidity if required.
We believe that our liquidity is sufficient to meet our present operational needs and, together with expected cash flows from operations, will support our currently planned capital expenditure requirements for the next twelve months. However, given the current uncertain economic environment, there can be no assurance that a further downturn in the economy worldwide, in a particular region, or in demand for our products and services in general, will not have a material adverse impact on our liquidity.
To complement or expand our business in the future, we have made and expect to make acquisitions of businesses, products and technologies, and to enter into joint venture arrangements. These acquisitions and joint venture arrangements may require additional financing.
Due to the current global economic conditions and the credit markets in particular, refinancing conditions have become more difficult. Therefore, we monitor funding options available in the capital markets and trends in the availability of funds, as well as the cost of such funding. Depending on our future cash needs and future market conditions, we might issue debt instruments available to us with a view to maintaining financial flexibility and limiting repayment risk.
Analysis of Total Net Group Liquidity
Total group liquidity consists of cash and cash equivalents (e.g. cash at banks, highly liquid investments with original maturity of three months or less, money market funds and time deposits), restricted cash and current investments (e.g. investments with original maturities of greater than three months and remaining maturities of less than one year) as reported in our IFRS Consolidated Financial Statements.
Total financial debt consists of current (e.g. overdrafts and current bank loans) and non-current bank liabilities (e.g. private placements and long-term bank loans).
Total net group liquidity results from total group liquidity less total financial debt. Total net group liquidity should be considered in addition to, and not as a substitute to cash and cash equivalents, other financial assets and financial liabilities included in the Consolidated Financial Statements as presented in accordance with IFRS.
The table below presents our total group liquidity, total financial debt and total net group liquidity as of December 31, 2009:
| 2009 | 2008 | Change in % | ||||||||||
| € millions | ||||||||||||
| Cash and cash equivalents | 1,884 | 1,280 | 47 | |||||||||
Current investments(1) | 400 | 382 | 5 | |||||||||
Total group liquidity(2) | 2,284 | 1,662 | 37 | |||||||||
| Current bank loans | 4 | 2,319 | −100 | |||||||||
| Non-current bank loans | 699 | 2 | >100 | |||||||||
Total financial debt | 703 | 2,321 | −70 | |||||||||
Total net group liquidity/debt | 1,581 | −659 | >100 | |||||||||
| (1) | Current investments are included within other financial assets on the statement of financial position. | |
| (2) | Total group liquidity mainly consisted of amounts held in U.S. dollars (approximately €153 million) and in euro (approximately €1,532 million) as of December 31, 2009. |
The increase in total group liquidity from 2008 was mainly due to proceeds from our operations. The decrease in total financial debt from 2008 was mainly due to the repayment of our outstanding credit facility in connection with the Business Objects acquisition, which was partially offset by the issuance of private placement transactions in 2009.
85
Table of Contents
Regarding the impact of cash and cash equivalents, current investments as well as our bank loans on our income statements see an analysis of our finance income, net in the section, “Item 5. Operating and Financial Review and Prospects — Finance Income, net.”
Analysis of Consolidated Statements of Cash Flow
| Years Ended December 31, | Change in % | Change in % | ||||||||||||||||||
| 2009 | 2008 | 2007 | 2009 vs. 2008 | 2008 vs. 2007 | ||||||||||||||||
| € millions | ||||||||||||||||||||
| Net cash provided by operating activities | 3,015 | 2,158 | 1,932 | 40 | 12 | |||||||||||||||
| Net cash used in investing activities | −299 | −3,766 | −1,391 | −92 | >100 | |||||||||||||||
| Net cash provided by/(used in) financing activities | −2,166 | 1,281 | −1,287 | >−100 | >100 | |||||||||||||||
Net cash provided by operating activities increased by €857 million or 40% in 2009 over 2008 mainly attributable to effective management of our working capital. On the other hand, the average collection period, which is measured in days sales outstanding, or DSO (defined as average number of days from revenue recognition to cash receipt from the customer) increased from 71 days in 2008 to 79 days in 2009, mainly as a result of the difficult economic environment in 2009, which led to an extension of payment terms and more late payments. Net cash used in investing activities decreased significantly from €3,766 million in 2008 to €299 million in 2009. The prior year figure resulted mainly from our acquisition of Business Objects. In 2009 we invested €225 million in our technology and business infrastructure by purchasing intangible assets and property, plant and equipment, a significant portion of which represented the purchase of vehicles, IT hardware and the cost of constructing office buildings. Net cash used in financing activities decreased by €3,447 million mainly due to repayment of the credit facility we entered into in connection with our acquisition of Business Objects. In addition, we issued private placement transactions (“Schuldschein”) totaling €697 million. The dividend distributed in 2009 was €594 million, unchanged since the previous year (2008: €594 million). We did not buy back any shares for treasury in 2009 (2008: €487 million).
Although profit after tax decreased slightly compared to 2007 net cash provided by operating activities increased by €226 million or 12% in 2008 over 2007. This was mainly attributable to effective management of our working capital. Net cash used in investing activities increased significantly from €1,391 million in 2007 to €3,766 million in 2008 mainly due to our acquisition of Business Objects in 2008. Also, in 2008 we invested €339 million in our technology and business infrastructure by purchasing intangible assets and property, plant and equipment, a significant portion of which represented the cost of constructing office buildings, the purchase of vehicles and IT hardware. Net cash provided by financing activities increased by €2,568 million mainly due to proceeds from the credit facility we entered into in connection with our acquisition of Business Objects, but also due to decreased spending on purchases of treasury stock (2008: €487 million; 2007: €1,005 million). The dividend distribution in 2008 was €594 million, an increase of 7% compared to the previous year (2007: €556).
Credit Lines
We are party to a revolving €1.5 billion syndicated credit facility agreement with an initial term of 3 years ending in September 2012. The use of the facility is not restricted by any financial covenants. Potential proceeds are for general corporate purposes. Borrowings under the facility bear interest of EURIBOR or LIBOR for the respective currency plus a margin ranging from 1.10% to 1.60% depending on the amount drawn. We are also required to pay a commitment fee of 0.44% per annum on unused amounts of the available credit. We entered into this credit facility to replace our existing credit facility which matured in November 2009. The facility amount was increased from €1 billion to €1.5 billion, which further enhances our financial flexibility. We did not, however, draw down the facility in 2009, neither did we ever draw down on the previous facility, nor do we
86
Table of Contents
currently intend to use the new facility. Consequently, there were no borrowings outstanding under the facility as at December 31, 2009.
As at December 31, 2009, SAP AG had additional available lines of credit totaling approximately €545 million. As at December 31, 2009, there were no borrowings outstanding under these lines of credit. Furthermore, certain of our foreign subsidiaries have lines of credit available that allow them to borrow funds in their respective local currencies at prevailing interest rates, generally to the extent SAP AG has guaranteed such amounts. As at December 31, 2009, approximately €51 million was available through such arrangements. Total aggregate borrowings of our foreign subsidiaries amounted to €6 million as at December 31, 2009.
OFF-BALANCE SHEET ARRANGEMENTS
Several entities of the SAP Group have entered into operating leases for office facilities, computer hardware and certain other equipment. These arrangements are sometimes referred to as a form of off-balance sheet financing. Rental expenses under these operating leases are set forth below under “Contractual Obligations.” We believe we do not have other forms of material off-balance sheet arrangements that would require disclosure other than those already disclosed.
CONTRACTUAL OBLIGATIONS
The table below presents our on- and off-balance sheet contractual obligations as of December 31, 2009:
| Payments due by period | ||||||||||||||||||||
| Less than | More than | |||||||||||||||||||
Contractual obligations | Total | 1 year | 1-3 years | 3-5 years | 5 years | |||||||||||||||
| € millions | ||||||||||||||||||||
Short-term debt obligations(1) | 4 | 4 | 0 | 0 | 0 | |||||||||||||||
Long-term debt obligations(1) | 778 | 23 | 464 | 291 | 0 | |||||||||||||||
Operating lease obligations(2) | 727 | 221 | 243 | 131 | 132 | |||||||||||||||
Purchase obligations(3) | 247 | 192 | 45 | 8 | 2 | |||||||||||||||
Other long-term liabilities reflected on the statement of financial positions(4) | 77 | 0 | 55 | 0 | 22 | |||||||||||||||
| Total | 1,833 | 440 | 807 | 430 | 156 | |||||||||||||||
| (1) | This represents bank loans and interest thereon. | |
| (2) | See Note 23 to our consolidated financial statements for additional information about operating lease obligations and the related rental expense. | |
| (3) | Purchase obligations represent agreements to purchase goods or services that are enforceable and legally binding on us that specify all significant terms, including: fixed or minimum quantities to be purchased; fixed, minimum or variable price provisions; and the approximate timing of the transaction. The outstanding obligations include the construction of facilities, office equipment and car purchase commitments, food and security services and other facility commitments. | |
| Our expected contributions to our pension and other post employment benefit plans are not included in the table above. We expect to contribute in 2010 statutory minimum and discretionary amounts of €1 million to our German defined benefit plans and €31 million to our foreign defined benefit plans, all of which are expected to be paid as cash contributions. Our contributions to our German and foreign defined contribution plans have ranged from €91 million to €132 million in 2007 through 2009; we expect similar contributions to be made in 2010. See Note 19a to our Consolidated Financial Statements for additional information on estimated future pension benefits to be paid. | ||
| (4) | Amounts mainly consist of employee-related liabilities (€12 million) derivatives (€27 million) and deferred rent (€33 million). Not included in the table are non-current tax payables of €239 million, which include provisions for uncertainties in income taxes. Other noncurrent liabilities on the statement of financial position such as pension and other post employment |
87
Table of Contents
| benefit liabilities, deferred compensation, deferred income and deferred tax liabilities are not included in this table. For additional information on liabilities see Notes 18 and 19b to our Consolidated Financial Statements. |
We expect to meet these contractual obligations with existing cash and our cash flows from operations. The timing of payments for the above contractual obligations is based on payment schedules for those obligations where set payments exist. For other obligations with no set payment schedules, estimates as to the most likely timing of cash payments have been made. The ultimate timing of these future cash flows may differ from these estimates.
Obligations under Indemnifications and Guarantees
Our software license agreements generally include certain provisions for indemnifying customers against liabilities if our software products infringe a third party’s intellectual property rights. In addition, we occasionally provide function or performance guarantees in routine consulting contracts and development arrangements. We also generally provide a six to twelve month warranty on our software. Our warranty liability is included in other provisions. For more information on other provisions see Note 19b to our Consolidated Financial Statements. For more information on obligations and contingent liabilities refer to Note 3 and Note 23 in our Consolidated Financial Statements.
RESEARCH AND DEVELOPMENT
For information on our R&D activities see “Item 4. Information about SAP — Research and Development.” For information on our R&D costs see “Item 5. Operating and Financial Review and Prospects — Operating Results” and for information related to our R&D employees see Item 6. Directors, Senior Management and Employees — Employees.”
CRITICAL ACCOUNTING ESTIMATES
Our Consolidated Financial Statements are prepared based on the accounting policies described in Note 3 to our Consolidated Financial Statements in this Annual Report onForm 20-F. The application of such policies requires management to make judgments, estimates and assumptions that affect the application of policies and the reported amounts of assets, liabilities, revenues and expenses in our Consolidated Financial Statements. We base our judgments, estimates and assumptions on historical and forecast information, as well as regional and industry economic conditions in which we or our customers operate, changes to which could adversely affect our estimates. Although we believe we have made reasonable estimates about the ultimate resolution of the underlying uncertainties, no assurance can be given that the final outcome of these matters will be consistent with what is reflected in our assets, liabilities, revenues and expenses. Actual results could differ from original estimates.
The accounting policies that most frequently require us to make judgments, estimates, and assumptions, and therefore are critical to understanding our results of operations, are:
| • | revenue recognition; | |
| • | valuation of trade receivable; | |
| • | accounting for share-based compensation; | |
| • | accounting for income tax; | |
| • | business combinations; |
88
Table of Contents
| • | subsequent accounting for goodwill and other intangibles; | |
| • | accounting for legal contingencies; and | |
| • | recognition of internally generated intangible assets from development. |
Our management periodically discusses these critical accounting policies with the Audit Committee of the Supervisory Board. See Note 3c to our Consolidated Financial Statements for further discussion on our critical accounting estimates and critical accounting policies.
NEW ACCOUNTING STANDARDS NOT YET ADOPTED
See Note 3e to our Consolidated Financial Statements for our discussion on new accounting standards not yet adopted.
89
Table of Contents
| ITEM 6. | DIRECTORS, SENIOR MANAGEMENT AND EMPLOYEES |
SUPERVISORY BOARD
The current members of the Supervisory Board of SAP AG, each member’s principal occupation, the year in which each was first elected and the year in which the term of each expires, respectively, are as follows:
| Year | Year | |||||||||||||
| First | Term | |||||||||||||
Name | Age | Principal Occupation | Elected | Expires | ||||||||||
Prof. Dr. h.c. mult. Hasso Plattner, Chairman(1)(2)(4)(6)(7)(8)(11) | 66 | Chairman of the Supervisory Board | 2003 | 2012 | ||||||||||
Pekka Ala-Pietilä(1)(7)(8)(11) | 53 | Co-founder and CEO Blyk Ltd. | 2002 | 2012 | ||||||||||
Prof. Dr. Wilhelm Haarmann(1)(2)(4)(5) | 59 | Attorney at Law, Certified Public Auditor and Certified Tax Advisor; HAARMANN Partnerschaftsgesellschaft, Rechtsanwälte, Steuerberater, Wirtschaftsprüfer | 1988 | 2012 | ||||||||||
Bernard Liautaud(7)(12) | 47 | General Partner, Balderton Capital | 2008 | 2012 | ||||||||||
Dr. h.c. Hartmut Mehdorn(1)(5)(6) | 67 | Independent Consultant | 1998 | 2012 | ||||||||||
Prof. Dr.-Ing. Dr. h.c. mult. Dr.-Ing. E.h. mult. Joachim Milberg(1)(2)(3)(4)(7)(8) | 66 | Chairman of the Supervisory Board of BMW AG | 2007 | 2012 | ||||||||||
Dr. Erhard Schipporeit(1)(3)(10)(11) | 61 | Management Consultant | 2005 | 2012 | ||||||||||
Prof. Dr.-Ing. Dr.-Ing. E.h. Klaus Wucherer(1)(7) | 65 | Managing Director of Dr. Klaus Wucherer Innovations- und Technologieberatung GmbH | 2007 | 2012 | ||||||||||
Lars Lamadé, Vice Chairman(4)(6)(9) | 38 | Employee, Project Manager Service & Support | 2002 | 2012 | ||||||||||
Thomas Bamberger(3)(9) | 42 | Employee, Chief Operating Officer Global Service & Support | 2007 | 2012 | ||||||||||
Panagiotis Bissiritsas(2)(5)(9) | 41 | Employee, Support Expert | 2007 | 2012 | ||||||||||
Willi Burbach(4)(7)(9) | 47 | Employee, Developer | 1993 | 2012 | ||||||||||
Peter Koop(4)(7)(9) | 43 | Employee, Industry Business Development Expert | 2007 | 2012 | ||||||||||
Christiane Kuntz-Mayr(7)(13) | 47 | Employee, Deputy Chairperson of the Works Council of SAP AG | 2009 | 2012 | ||||||||||
Dr. Gerhard Maier(2)(3)(9) | 56 | Employee, Development Project Manager | 1989 | 2012 | ||||||||||
Stefan Schulz(5)(6)(7)(9) | 40 | Employee, Development Project Manager | 2002 | 2012 | ||||||||||
| (1) | Elected by SAP AG’s shareholders on May 10, 2007. | |
| (2) | Member of the Compensation Committee. | |
| (3) | Member of the Audit Committee. | |
| (4) | Member of the General Committee. | |
| (5) | Member of the Finance and Investment Committee. | |
| (6) | Member of the Mediation Committee. | |
| (7) | Member of the Technology and Strategy Committee. | |
| (8) | Member of the Nomination Committee. | |
| (9) | Elected by SAP AG’s employees on April 23, 2007. | |
| (10) | Member of the Audit Committee and determined to be the Audit Committee financial expert. |
90
Table of Contents
| (11) | Member of the Special Committee. | |
| (12) | Elected by SAP AG’s shareholders on June 3, 2008, replaced August-Wilhelm Scheer who resigned from the Supervisory Board on the same day. | |
| (13) | Replaced Helga Classen who left the Supervisory Board on December 31, 2008. |
For detailed information on the Supervisory Board committees and their tasks, including the Audit Committee and Compensation Committee, please refer to “Item 10 Additional Information — Corporate Governance.”
Pursuant to the German Co-determination Act of 1976 (Mitbestimmungsgesetz), members of the Supervisory Board of SAP AG consist of eight representatives of the shareholders and eight representatives of the employees. Of the eight employee representatives, two must be nominated by the trade unions. The elected employees must be at least 18 years of age and must have been in the employment of SAP AG or one of its German subsidiaries for at least one year. They must also fulfill the other qualifications for election codified in Section 8 of the German Works Council Constitution Act. These qualifications include, among other things, not having been declared ineligible or debarred from holding public office by a court.
Certain current members of the Supervisory Board of SAP AG were members of supervisory boards and comparable governing bodies of enterprises other than SAP AG in Germany and other countries as of December 31, 2009. See Note 30 to our Consolidated Financial Statements for more detail. Apart from pension obligations towards employees, SAP AG has not entered into contracts with any member of the Supervisory Board that provide for benefits upon a termination of the employment or service of the member.
EXECUTIVE BOARD
The current members of the Executive Board, the year in which each member was first appointed and the year in which the term of each expires, respectively, are as follows:
| Year First | Year Current | |||||||
Name | Appointed | Term Expires | ||||||
| Bill McDermott, Co-CEO | 2008 | 2012 | ||||||
| Jim Hagemann Snabe, Co-CEO | 2008 | 2012 | ||||||
| Dr. Werner Brandt | 2001 | 2013 | ||||||
| Gerhard Oswald | 1996 | 2011 | ||||||
| Vishal Sikka | 2010 | 2012 | ||||||
The following changes occurred in the Executive Board in 2009 and 2010:
| • | Claus Heinrich left SAP on May 31, 2009. | |
| • | On June 1, 2009 Léo Apotheker became the sole CEO as Henning Kagermann retired from SAP as planned on May 31, 2009. | |
| • | In February 2010, Léo Apotheker resigned as a member of the Executive Board and CEO. | |
| • | In February 2010, Bill McDermott and Jim Hagemann Snabe became Co-CEOs, succeeding Léo Apotheker. | |
| • | In February 2010, Vishal Sikka became a member of the Executive Board. | |
| • | In February 2010, John Schwarz resigned as a member of the Executive Board. | |
| • | In February 2010, Gerhard Oswald became COO replacing Erwin Gunst who stepped down. |
91
Table of Contents
A description of the management responsibilities and backgrounds of the current members of the Executive Board are as follows:
Bill McDermott,Co-CEO(Vorstandssprecher), 48 years old, holds a master’s degree in business administration. He joined SAP in 2002 and became a member of its Executive Board on July 1, 2008. On February 7, 2010 he became Co-CEO alongside Jim Hagemann Snabe. He is responsible for global field operations and the Global Ecosystem & Partner Group.
Jim Hagemann Snabe,Co-CEO(Vorstandssprecher), 44 years old, holds a master degree in operational research. He joined SAP in 1990 and became a member of its Executive Board on July 1, 2008. On February 7, 2010 he became Co-CEO alongside Bill McDermott. He is responsible for product development. This includes solutions for large enterprises, small and medium size enterprises, and the technology platform.
Werner Brandt, CFO,56 years old, business administration graduate. Werner Brandt joined SAP in early 2001 as the Chief Financial Officer and member of the Executive Board. Prior to joining SAP, Werner Brandt was CFO and member of the Executive Board of Fresenius Medical Care AG since 1999. In this role, he was also responsible for labor relations. Before joining Fresenius Medical Care AG, Werner Brandt headed the finance function of the European operations of Baxter International Inc. He is responsible for global finance including shared services, global legal, global intellectual property, SAP Ventures and Corporate Development, Global HR (acting). Further, he is SAP’s Labor Relations Director (acting).
Gerhard Oswald, COO,56 years old, economics graduate. Gerhard Oswald joined SAP in 1981 and became a member of the Executive Board in 1996. He became Chief Operating Officer on February 11, 2010. In this position he is responsible for company operations and processes as well as internal IT. He is further responsible for global service and support.
Vishal Sikka, CTO, 42 years old, holds a PH.D. degree in computer science from Stanford University. He joined SAP in 2002 and became a member of its Executive Board on February 7, 2010 as the Chief Technology Officer. Before joining SAP he was area vice president for platform technologies at Peregrine Systems.
The members of the Executive Board of SAP AG as of December 31, 2009 that are members on other supervisory boards and comparable governing bodies of enterprises, other than SAP, in Germany and other countries, are set forth in Note 30 to our Consolidated Financial Statements. Apart from pension obligations, SAP AG has not entered into contracts with any member of the Executive Board that provide for benefits upon a termination of the employment of service of the member.
To our knowledge, there are no family relationships among the Supervisory Board and Executive Board members.
COMPENSATION REPORT
This compensation report outlines the criteria that we apply to determine compensation for Executive Board and Supervisory Board members, discloses the amount of compensation paid, and describes the compensation systems. It also contains information about Executive Board members’ share-based compensation plans, shares held by Executive Board and Supervisory Board members, and the directors’ dealings required to be disclosed in accordance with the German Securities Trading Act.
Compensation for Executive Board Members
Compensation System
In a departure from previous practice, in 2009 the Executive Board members’ compensation system was not set by the Compensation Committee of the Supervisory Board. Instead, the Compensation Committee prepared proposals, which (as is the case for individual Executive Board members’ total remuneration) were approved by the full Supervisory Board.
92
Table of Contents
Executive Board members’ compensation is intended to reflect the Group’s size and global presence as well as our economic and financial standing. The level is internationally competitive to reward committed, successful work in a dynamic environment.
The compensation of the Executive Board as a body is performance-based. It has three elements: a fixed element (salary), a performance-related element (directors’ profit-sharing), and a long-term incentive element (share-based compensation).
A compensation target is set for the total of fixed and performance-related elements. This target is reviewed and, if necessary, updated every year in light of our business performance and directors’ compensation at comparable companies on the international stage. Every year, the Supervisory Board sets the target performance-related compensation, reflecting the relevant values in SAP’s budget for that year. The number of virtual stock options issued to each member of the Executive Board in 2009 by way of share-based compensation was decided by the Compensation Committee on May 6, 2009, and reflected the fair value of the options.
The following criteria apply to the elements of Executive Board compensation for 2009:
| • | The fixed element is paid as a monthly salary. | |
| • | The amount of performance-related compensation to be paid out in respect of 2009 depended on the SAP Group’s achievement of its targets for (non-GAAP) operating margin, (non-GAAP) operating income, and the cash-flow conversion ratio (U.S. GAAP). | |
| • | On February 11, 2010, the Supervisory Board assessed SAP’s performance against the agreed targets and determined how much performance-related compensation was payable. The payment will be made after the Annual General Meeting of Shareholders in June 2010. | |
| • | The regular form of share-based compensation was the issue of virtual stock options under the terms of the 2009 stock option plan (SOP Performance Plan 2009). The terms and details of the SOP Performance Plan 2009 are described in Note 28 in theNotes to Consolidated Financial Statementssection. |
Clauses are included in the contracts of Executive Board members Bill McDermott and, with effect from 2009, John Schwarz to fix euro-denominated compensation in their local currencies.
Amount of Compensation
Executive Board members’ compensation was as follows in 2009:
| Regular | ||||||||||||||||||||
| Performance-Related | Long-Term | |||||||||||||||||||
| Fixed Elements | Element | Incentive Elements | ||||||||||||||||||
| Directors’ | Share-Based | |||||||||||||||||||
| Profit- | Compensation | |||||||||||||||||||
| Salary | Other(1) | Sharing | (SAP SOP 2009)(2) | Total | ||||||||||||||||
| € (000) | ||||||||||||||||||||
| Prof. Dr. Henning Kagermann (Co-CEO and Member until May 31, 2009) | 312.5 | 7.4 | 2,026.2 | — | 2,346.1 | |||||||||||||||
| Léo Apotheker (Co-CEO) | 750.0 | 137.3 | 4,862.8 | 950.0 | 6,700.1 | |||||||||||||||
| Dr. Werner Brandt | 455.0 | 19.1 | 2,950.1 | 577.0 | 4,001.2 | |||||||||||||||
| Erwin Gunst | 455.0 | 36.0 | 2,950.1 | 577.0 | 4,018.1 | |||||||||||||||
| Prof. Dr. Claus E. Heinrich (until May 31, 2009) | 189.6 | 9.3 | 658.8 | — | 857.7 | |||||||||||||||
Bill McDermott(3) | 900.4 | 74.9 | 2,776.7 | 577.0 | 4,329.0 | |||||||||||||||
| Gerhard Oswald | 455.0 | 437.5 | 2,950.1 | 577.0 | 4,419.6 | |||||||||||||||
John Schwarz(4) | 581.5 | 28.2 | 2,910.7 | 577.0 | 4,097.4 | |||||||||||||||
| Jim Hagemann Snabe | 455.0 | 131.1 | 2,950.1 | 577.0 | 4,113.2 | |||||||||||||||
Total | 4,554.0 | 880.8 | 25,035.6 | 4,412.0 | 34,882.4 | |||||||||||||||
93
Table of Contents
| (1) | Insurance contributions, benefits in kind, expenses for maintenance of two households due to work abroad, reimbursement legal and tax advice fees, leave compensation | |
| (2) | Fair value at the time of allocation | |
| (3) | Includes discrete payments arising through application of the fixed exchange-rate clause to the following items: salary for 2008: € 29,600; profit-sharing bonus for 2008: €53,200; salary for 2009: € 47,500; profit-sharing bonus for 2009: € 91,900 | |
| (4) | Includes discrete payments arising through application of the fixed exchange-rate clause to the following items: salary for 2009: € 5,000; profit-sharing bonus for 2009: €29,000 |
The values for regular share-based compensation in the table above result from the following allocations of virtual stock options granted in 2009 under the SOP Performance Plan 2009.
| 2009 Allocations | ||||||||||||||||||||||||||||
| Total Fair | ||||||||||||||||||||||||||||
| Value of | ||||||||||||||||||||||||||||
| Long-Term | ||||||||||||||||||||||||||||
| Fair Value | Incentive | Fair Value | ||||||||||||||||||||||||||
| per Right | Elements | per Right on | Total Value on | |||||||||||||||||||||||||
| at Time of | at Time of | Dec. 31, | Dec. 31, | |||||||||||||||||||||||||
| Quantity | Grant | Grant | 2009 | 2009 | ||||||||||||||||||||||||
| € | €(000) | € | €(000) | |||||||||||||||||||||||||
Prof. Dr. Henning Kagermann (CEO and Member until May 31, 2009)(1) | — | — | — | — | — | |||||||||||||||||||||||
| Léo Apotheker (Co-CEO) | 169,040 | 5.62 | 950.0 | 4.89 | 275.5 | |||||||||||||||||||||||
| Dr. Werner Brandt | 102,670 | 5.62 | 577.0 | 4.89 | 167.4 | |||||||||||||||||||||||
| Erwin Gunst | 102,670 | 5.62 | 577.0 | 4.89 | 167.4 | |||||||||||||||||||||||
Prof. Dr. Claus E. Heinrich(1) | — | — | — | — | — | |||||||||||||||||||||||
| Bill McDermott | 102,670 | 5.62 | 577.0 | 4.89 | 167.4 | |||||||||||||||||||||||
| Gerhard Oswald | 102,670 | 5.62 | 577.0 | 4.89 | 167.4 | |||||||||||||||||||||||
| John Schwarz | 102,670 | 5.62 | 577.0 | 4.89 | 167.4 | |||||||||||||||||||||||
| Jim Hagemann Snabe | 102,670 | 5.62 | 577.0 | 4.89 | 167.4 | |||||||||||||||||||||||
| Total | 785,060 | 4,412.0 | 1,279.9 | |||||||||||||||||||||||||
| 1) | Retired May 31, 2009. No allocations in 2009. |
The following table shows total Executive Board compensation in 2008, including SAP SOP 2007 stock options granted.
| Performance- | Regular Long-Term | |||||||||||||||||||
| Related | Incentive Elements | |||||||||||||||||||
| Element | Share-Based | |||||||||||||||||||
| Fixed Elements | Directors’ | Compensation | ||||||||||||||||||
Salary | Other(1) | Profit-Sharing | (SAP SOP 2007)(2) | Total | ||||||||||||||||
| €(000) | ||||||||||||||||||||
| Prof. Dr. Henning Kagermann (Co-CEO and member until May 31, 2009) | 750.0 | 15.7 | 2,606.1 | 948.4 | 4,320.2 | |||||||||||||||
| Léo Apotheker (Co-CEO) | 687.5 | 334.5 | 2,388.9 | 632.3 | 4,043.2 | |||||||||||||||
| Dr. Werner Brandt | 455.0 | 23.5 | 1,581.0 | 577.3 | 2,636.8 | |||||||||||||||
Erwin Gunst(3) | 227.5 | 18.1 | 790.5 | — | 1,036.1 | |||||||||||||||
| Prof. Dr. Claus E. Heinrich | 455.0 | 19.8 | 1,581.0 | 577.3 | 2,633.1 | |||||||||||||||
Bill McDermott(3) | 395.2 | 142.4 | 631.3 | — | 1,168.9 | |||||||||||||||
| Gerhard Oswald | 455.0 | 627.9 | 1,581.0 | 577.3 | 3,241.2 | |||||||||||||||
John Schwarz(4) | 424.9 | 14.3 | 1,295.2 | 577.3 | 2,311.7 | |||||||||||||||
Jim Hagemann Snabe(3) | 227.5 | 22.3 | 790.5 | — | 1,040.3 | |||||||||||||||
| Dr. Peter Zencke (member until Dec. 31, 2008) | 455.0 | 27.8 | 1,581.0 | 577.3 | 2,641.1 | |||||||||||||||
Total | 4,532.6 | 1,246.3 | 14,826.5 | 4,467.2 | 25,072.6 | |||||||||||||||
94
Table of Contents
| (1) | Insurance contributions, benefits in kind, expenses for maintenance of two households due to work abroad, compensation from seats on other governing bodies in the SAP Group, reimbursement of legal fees. | |
| (2) | Fair value at the time of allocation. | |
| (3) | Member of the Executive Board from July 1, 2008. (The table shows compensation since that date.) | |
| (4) | Member of the Executive Board from March 1, 2008. (The table shows compensation since that date.) |
Share-Based Compensation Under SAP SOP 2007
| 2008 Allocations | ||||||||||||||||||||
| Total Fair | ||||||||||||||||||||
| Value of | ||||||||||||||||||||
| Long-Term | ||||||||||||||||||||
| Fair Value | Incentive | Fair Value | ||||||||||||||||||
| per Right | Elements | per Right on | Total Value on | |||||||||||||||||
| at Time of | at Time of | Dec. 31, | Dec. 31, | |||||||||||||||||
| Quantity | Grant | Grant | 2008 | 2008 | ||||||||||||||||
| € | €(000) | € | €(000) | |||||||||||||||||
Prof. Dr. Henning Kagermann (Co-CEO and Member until May 31, 2009)(3) | 133,396 | 7.11 | 948.4 | 4.67 | 623.0 | |||||||||||||||
| Léo Apotheker (Co-CEO) | 88,933 | 7.11 | 632.3 | 4.67 | 415.3 | |||||||||||||||
| Dr. Werner Brandt | 81,200 | 7.11 | 577.3 | 4.67 | 379.2 | |||||||||||||||
Erwin Gunst(1) | — | — | — | — | — | |||||||||||||||
Prof. Dr. Claus E. Heinrich(4) | 81,200 | 7.11 | 577.3 | 4.67 | 379.2 | |||||||||||||||
Bill McDermott(1) | — | — | — | — | — | |||||||||||||||
| Gerhard Oswald | 81,200 | 7.11 | 577.3 | 4.67 | 379.2 | |||||||||||||||
John Schwarz(2) | 81,200 | 7.11 | 577.3 | 4.67 | 379.2 | |||||||||||||||
Jim Hagemann Snabe(1) | — | — | — | — | — | |||||||||||||||
Dr. Peter Zencke(5) | 81,200 | 7.11 | 577.3 | 4.67 | 379.2 | |||||||||||||||
Total | 628,329 | 4,467.2 | 2,934.3 | |||||||||||||||||
| (1) | Member of the Executive Board from July 1, 2008. (No allocations since that date.) | |
| (2) | Member of the Executive Board from March 1, 2008. (The table shows allocations since that date.) | |
| (3) | Retired May 31, 2009. Subject to expiration of term, options remain open under a two-year grace period. | |
| (4) | Retired May 31, 2009. The options can be exercised until end of term. | |
| (5) | Retired December 31, 2008. The options can be exercised until end of term. |
End-of-Service Benefits
NormalEnd-of-Service Undertakings
Retirement Pension Plan
Members of the Executive Board receive a retirement pension when they reach the retirement age of 60 and vacate their Executive Board seat or a disability pension if, before reaching the regular retirement age, they become subject to occupational disability or permanent incapacity. A surviving dependant’s pension is paid on the death of a former member of the Executive Board. The disability pension is 100% of the vested retirement pension entitlement and is payable until the beneficiary’s 60th birthday, after which it is replaced by a retirement pension. The surviving dependant’s pension is 60% of the retirement pension or vested disability pension entitlement at death. Entitlements are enforceable against SAP AG.
95
Table of Contents
The benefit payable has been agreed with the active Executive Board members. If service is ended prematurely, pension entitlement is reduced in proportion as the actual length of service stands in relation to the maximum possible length of service.
On January 1, 2000, SAP AG introduced a contributory retirement pension plan. At that time, the performance-based retirement plan was discontinued for Executive Board members. Entitlements accrued up to December 31, 1999, were unaffected. The pension benefits are derived from any accrued entitlements on December 31, 1999, under performance-based pension agreements and a salary-linked contribution for the period commencing January 1, 2000. The contribution is 4% of applicable compensation up to the applicable income threshold plus 14% of applicable compensation above the applicable income threshold. For this purpose, applicable compensation is 180% of annual base salary. The applicable income threshold is the statutory annual income threshold for the state pension plan in Germany (West), as amended from time to time.
Exceptional retirement pension agreements apply to the following Executive Board members:
| • | Léo Apotheker’s agreement provides only for a retirement pension, but not for a surviving dependant’s or disability pension. The pension contribution reflects his participation in the French social security system in that the employer contributions paid by SAP under the French social insurance plan are deducted from it. | |
| • | Henning Kagermann’s rights to retirement pension benefits were increased by further annual contributions because he remained a member of the Executive Board after his 60th birthday until his retirement on May 31, 2009. | |
| • | Bill McDermott has rights to future benefits under the pension plan of SAP America. The pension plan of SAP America is a cash balance plan that on retirement provides either monthly pension payments or a lump sum. The pension becomes available from the beneficiary’s 65th birthday. Subject to certain conditions, the plan also provides earlier payment or invalidity benefits. SAP also made contributions to a third-party pension plan for Bill McDermott. In 2009, SAP paid contributions totaling €199,600 (2008: €474,500). SAP’s contributions reflect Bill McDermott’s payments into this pension plan. The SAP America pension plan closed with effect from January 1, 2009. Interest continues to be paid on the earned rights to benefits. In view of these circumstances, SAP adjusted its payments to a non-SAP pension plan. | |
| • | Instead of paying for entitlements under the pension plan for Executive Board members, SAP pays equivalent amounts to a non-SAP pension plan for Jim Hagemann Snabe. In 2009, SAP paid contributions totaling €108,400 (2008: €92,100). | |
| • | SAP made no retirement pension plan contributions in respect of John Schwarz in 2008 and 2009. |
96
Table of Contents
The following table shows the change in total projected benefit obligation (PBO) and in the total accruals for pension obligations to Executive Board members:
| Prof. Dr. | ||||||||||||||||||||||||||||||||||||||||
| Henning | Léo | Prof. Dr. | ||||||||||||||||||||||||||||||||||||||
| Kagermann | Apotheker | Dr. Werner | Claus E. | Bill | Gerhard | |||||||||||||||||||||||||||||||||||
| (Co-CEO)(2) | (Co-CEO) | Brandt | Erwin Gunst(1) | Heinrich3) | McDermott | Oswald | Total | |||||||||||||||||||||||||||||||||
| €(000) | ||||||||||||||||||||||||||||||||||||||||
| PBO January 1, 2008 | 5,865.2 | 422.5 | 613.7 | 280.3 | 2,730.9 | 588.4 | 3,014.8 | 13,515.8 | ||||||||||||||||||||||||||||||||
| Less plan assets market value January 1, 2008 | 5,228.0 | 630.4 | 510.7 | 272.9 | 2,028.7 | 45.0 | 2,316.4 | 11,032.1 | ||||||||||||||||||||||||||||||||
Accrued January 1, 2008 | 637.2 | −207.9 | 103.0 | 7.4 | 702.2 | 543.4 | 698.4 | 2,483.7 | ||||||||||||||||||||||||||||||||
| PBO change in 2008 | −277.2 | 17.3 | 88.1 | 108.9 | 81.0 | 366.6 | 84.3 | 469.0 | ||||||||||||||||||||||||||||||||
| Plan assets change in 2008 | 277.2 | 28.4 | 113.3 | −224.8 | 282.6 | −11.7 | 320.2 | 785.2 | ||||||||||||||||||||||||||||||||
| PBO December 31, 2008 | 5,588.0 | 439.8 | 701.8 | 389.2 | 2,811.9 | 955.0 | 3,099.1 | 13,984.8 | ||||||||||||||||||||||||||||||||
| Less plan assets market value December 31, 2008 | 5,505.2 | 658.8 | 624.0 | 48.1 | 2,311.3 | 33.3 | 2,636.6 | 11,817.3 | ||||||||||||||||||||||||||||||||
Accrued December 31, 2008 | 82.8 | −219.0 | 77.8 | 341.1 | 500.6 | 921.7 | 462.5 | 2,167.5 | ||||||||||||||||||||||||||||||||
| PBO change in 2009 | 317.4 | 88.4 | 201.0 | 92.0 | −58.0 | 3.1 | 527.1 | 1,171.0 | ||||||||||||||||||||||||||||||||
| Plan assets change in 2009 | 255.0 | 29.2 | 31.1 | 97.4 | 436.2 | 9.2 | 237.6 | 1,095.7 | ||||||||||||||||||||||||||||||||
| PBO December 31, 2009 | 5,905.4 | 528.2 | 902.8 | 481.2 | 2,753.9 | 958.1 | 3,626.2 | 15,155.8 | ||||||||||||||||||||||||||||||||
| Less plan assets market value December 31, 2009 | 5,760.2 | 688.0 | 655.1 | 145.5 | 2,747.5 | 42.5 | 2,874.2 | 12,913.0 | ||||||||||||||||||||||||||||||||
Accrued December 31, 2009 | 145.2 | −159.8 | 247.7 | 335.7 | 6.4 | 915.6 | 752.0 | 2,242.8 | ||||||||||||||||||||||||||||||||
| (1) | When Erwin Gunst joined the Executive Board and his employment with SAP’s Switzerland affiliate ended, his vested plan funds were transferred to an external vested benefits account. | |
| (2) | Member of Executive Board and Co-CEO until May 31, 2009 | |
| (3) | Member of Executive Board until May 31, 2009 |
The following table shows the annual pension entitlement of each member of the Executive Board on reaching age 60 based on entitlements from SAP under performance-based and salary-linked plans vested on December 31, 2009:
| Vested on | Vested on | |||||||
| December 31, | December 31, | |||||||
| 2009 | 2008 | |||||||
| €(000) | ||||||||
Prof. Dr. Henning Kagermann(2) | 340.4(1 | ) | 334.9(1 | ) | ||||
| Léo Apotheker (Co-CEO) | 45.5 | 45.5 | ||||||
| Dr. Werner Brandt | 54.1 | 48.0 | ||||||
| Erwin Gunst | 34.4 | 32.8 | ||||||
Prof. Dr. Claus E. Heinrich(3) | 189.7 | 186.1 | ||||||
| Bill McDermott | 124.2 | 121.8 | ||||||
| Gerhard Oswald | 208.4 | 201.2 | ||||||
| (1) | Due to the extension of Henning Kagermann’s contract beyond his 60th birthday, these values represent the retirement pension entitlement that he received after his current Executive Board contract expired on May 31, 2009, based on the entitlements vested on May 31, 2009, and on December 31, 2008, respectively. |
97
Table of Contents
| (2) | Member of Executive Board and Co-CEO until May 31, 2009 | |
| (3) | Member of Executive Board until May 31, 2009 |
These are vested entitlements. To the extent that members continue to serve on the Executive Board and that therefore more contributions are made for them in the future, pension actually payable at age 60 will be more than shown in the table.
Postcontractual Noncompete Provisions
During the agreed12-month postcontractual noncompete period, Executive Board members receive abstention payments corresponding to 50% of their final average contractual compensation as members.
EarlyEnd-of-Service Undertakings
Severance Payments
The standard contract for all Executive Board members since January 1, 2006, provides that on termination before full term (for example, where the member’s appointment is revoked, where the member becomes occupationally disabled, or in connection with a change of control), SAP AG will pay to the member the outstanding part of the compensation target for the entire remainder of the term, appropriately discounted for early payment. A member has no claim to that payment if he or she leaves SAP for reasons for which he or she is responsible.
If an Executive Board member’s post on the Executive Board expires or ceases to exist because of, or as a consequence of, change or restructuring or due to a change of control, SAP AG and each Executive Board member has the right to terminate the employment contract within eight weeks of the occurrence by giving six months’ notice. A change of control is deemed to occur when a third party is required to make a mandatory takeover offer to the shareholders of SAP AG under the German Securities Acquisition and Takeover Act, when SAP AG merges with another company and becomes the subsumed entity, or when a control or profit transfer agreement is concluded with SAP AG as the dependent company. An Executive Board member’s contract can also be terminated before full term if his or her appointment as an SAP AG Executive Board member is revoked in connection with a change of control.
Postcontractual Noncompete Provisions
Abstention compensation for the postcontractual noncompete period as described above is also payable on early contract termination.
Payments to Retiring Executive Board Members in 2009
Henning Kagermann’s term of office on the Executive Board expired on May 31, 2009, as did the notice period in his contract of employment. He received the following payments in 2009 in connection with his retirement:
| • | Henning Kagermann receives monthly abstention compensation of €163,200, corresponding to 50% of his final average contractual compensation, in consideration of an agreed12-month postcontractual noncompete period. | |
| • | He receives a monthly retirement pension of €28,400. | |
| • | Upon termination of his employment contract, Henning Kagermann received compensation for unused leave totaling €1,199,400. |
98
Table of Contents
Claus Heinrich’s contract as an Executive Board member was ended with effect from May 31, 2009. He received the following payments in 2009 in connection with his retirement:
| • | Claus Heinrich received a payment of €4,120,600 in relation to the early termination of his contract, in accordance with the agreements on payments for early termination. | |
| • | Upon termination of his employment contract, Claus Heinrich received compensation for unused leave totaling €235,800. | |
| • | The terms of the stock-based compensation plan notwithstanding, it was agreed that Claus Heinrich may exercise his rights pertaining to allocations under SAP SOP 2007 without limitation until they expire. | |
| • | We have set aside the postcontractual noncompete provisions in his contract. |
Payments to Former Executive Board Members
In 2009, we paid pension benefits of €764,000 to Executive Board members who had retired before January 1, 2009 (2008: €763,000). At the end of the year, the PBO for former Executive Board members was €15,777,000 (2008: €11,367,000). Plan assets of €16,512,000 are available to service these obligations (2008: €12,646,000).
Additionally, until December 2009 former Executive Board member Peter Zencke received monthly abstention compensation of €98,700, corresponding to 50% of his final average contractual compensation, in consideration of an agreed12-month postcontractual noncompete period.
Executive Board Members’ Long-Term Incentives
Members of the Executive Board hold virtual stock options under the SOP Performance Plan 2009 and SAP SOP 2007, stock appreciation rights (STARs) under the Incentive Plan 2010, stock options under SAP SOP 2002, and stock options and convertible bonds under the LTI Plan 2000, which were granted to them in previous years. For information about the terms and details of these plans, see theNotes to the Consolidated Financial Statementssection, Note 28.
SOP PERFORMANCE PLAN 2009
The table below shows Executive Board members’ holdings, on December 31, 2009, of virtual stock options issued under the SOP Performance Plan 2009.
The strike price for an option varies with the performance of SAP stock over time against the TechPGI index. The gross profit per option is limited to €30.80, corresponding to 110% of the SAP share price on the date of issue.
The issued options have a term of five years and can only be exercised on specified dates after the two-year vesting period. Therefore, none of the options held could be exercised on December 31, 2009.
99
Table of Contents
SOP Performance Plan 2009 Stock Options
| Fair Value | ||||||||||||||||||||
| Holding on | Fair Value | per Unit on | Accrual on | |||||||||||||||||
| Year | December 31, | per Unit at | December 31, | December 31, | ||||||||||||||||
| Granted | 2009 | Time of Grant | 2009 | 2009 | ||||||||||||||||
| Quantity of | € | € | €(000) | |||||||||||||||||
| Options | ||||||||||||||||||||
Prof. Dr. Henning Kagermann (Co-CEO until May 31, 2009)(1) | 2009 | — | — | — | — | |||||||||||||||
| Léo Apotheker (Co-CEO) | 2009 | 169,040 | 5.62 | 4.89 | 275.5 | |||||||||||||||
| Dr. Werner Brandt | 2009 | 102,670 | 5.62 | 4.89 | 167.4 | |||||||||||||||
| Erwin Gunst | 2009 | 102,670 | 5.62 | 4.89 | 167.4 | |||||||||||||||
Prof. Dr. Claus E. Heinrich(1) | 2009 | — | — | — | — | |||||||||||||||
| Bill McDermott | 2009 | 102,670 | 5.62 | 4.89 | 167.4 | |||||||||||||||
| Gerhard Oswald | 2009 | 102,670 | 5.62 | 4.89 | 167.4 | |||||||||||||||
| John Schwarz | 2009 | 102,670 | 5.62 | 4.89 | 167.4 | |||||||||||||||
| Jim Hagemann Snabe | 2009 | 102,670 | 5.62 | 4.89 | 167.4 | |||||||||||||||
Total | 785,060 | 1,279.9 | ||||||||||||||||||
| (1) | Retired May 31, 2009. No allocations in 2009. |
SAP SOP 2007
The table below shows Executive Board members’ holdings, on December 31, 2009, of virtual stock options issued to them under the SAP SOP 2007 plan since its inception, including virtual stock options issued to them both during and before their respective membership of the Executive Board.
The strike price for an option is 110% of the base price. The premium of 10% on the base price is to discourage exercise of the options unless the market price of SAP stock has risen by at least 10% compared with the base price. The issued options have a term of five years and can only be exercised on specified dates after the two-year vesting period. The options issued in 2007 could be exercised with effect from June 2009, following expiration of the two-year vesting period.
100
Table of Contents
SAP SOP 2007 Stock Options
| Fair Value | ||||||||||||||||||||
| Holding on | Fair Value | per Unit on | Accrual on | |||||||||||||||||
| Year | December 31, | per Unit at | December 31, | December 31, | ||||||||||||||||
| Granted | 2009 | Time of Grant | 2009 | 2009 | ||||||||||||||||
| Quantity of | € | € | €(000) | |||||||||||||||||
| Options | ||||||||||||||||||||
Prof. Dr. Henning Kagermann (Co-CEO until May 31, 2009)(3) | 2007 | 118,637 | 8.00 | 3.09 | 366.6 | |||||||||||||||
| 2008 | 133,396 | 7.11 | 5.21 | 637.0 | ||||||||||||||||
| Léo Apotheker (Co-CEO) | 2007 | 79,093 | 8.00 | 3.09 | 244.4 | |||||||||||||||
| 2008 | 88,933 | 7.11 | 5.21 | 424.7 | ||||||||||||||||
| Dr. Werner Brandt | 2007 | 72,216 | 8.00 | 3.09 | 223.1 | |||||||||||||||
| 2008 | 81,200 | 7.11 | 5.21 | 387.8 | ||||||||||||||||
Erwin Gunst(1) | 2007 | 56,258 | 8.00 | 3.09 | 173.8 | |||||||||||||||
| 2008 | 70,284 | 7.11 | 5.21 | 335.7 | ||||||||||||||||
Prof. Dr. Claus E. Heinrich(4) | 2007 | 72,216 | 8.00 | 3.09 | 223.1 | |||||||||||||||
| 2008 | 81,200 | 7.11 | 5.21 | 387.8 | ||||||||||||||||
Bill McDermott(1) | 2007 | 62,508 | 8.00 | 3.09 | 193.1 | |||||||||||||||
| 2008 | 70,284 | 7.11 | 5.21 | 335.7 | ||||||||||||||||
| Gerhard Oswald | 2007 | 72,216 | 8.00 | 3.09 | 223.1 | |||||||||||||||
| 2008 | 81,200 | 7.11 | 5.21 | 387.8 | ||||||||||||||||
John Schwarz(2) | 2007 | — | — | — | — | |||||||||||||||
| 2008 | 81,200 | 7.11 | 5.21 | 387.8 | ||||||||||||||||
Jim Hagemann Snabe(1) | 2007 | 37,505 | 8.00 | 3.09 | 115.9 | |||||||||||||||
| 2008 | 56,228 | 7.11 | 5.21 | 268.5 | ||||||||||||||||
Total | 1,314,574 | 5,315.9 | ||||||||||||||||||
| (1) | Member from July 1, 2008. The holding was allocated before appointment to the Executive Board. | |
| (2) | Member from March 1, 2008. Only allocations since appointment to the Executive Board are shown. | |
| (3) | Retired May 31, 2009. Subject to expiration of term, options remain open under a two-year grace period. | |
| (4) | Retired May 31, 2009. The options can be exercised until end of term. |
Incentive Plan 2010
The additional nonrecurring share-based compensation awarded in 2006 comprises STARs for the Incentive Plan 2010 share-based compensation plan. The Incentive Plan 2010 is a share-based compensation plan intended to reward a substantial increase in our market capitalization. The Executive Board will qualify for payout under the plan only if, not later than the end of 2010, SAP’s average market capitalization during the last six months of a year is not less than 50% greater than its average value between July 1 and December 31, 2005, and SAP stock outperforms the S&P North Software-Software Index (which is the successor of the GSTI Software index) over the same period. Payouts are scaled as follows:
| • | If market capitalization does not increase by 50% or more, the Executive Board will not receive a payout. | |
| • | If market capitalization increases by more than 50% but less than 100%, target achievement will be measured progressively. | |
| • | If SAP’s market capitalization increases not less than twofold during the said period, the Executive Board will receive a payout of €100 million. |
101
Table of Contents
The STARs awarded to Executive Board members under this plan expire on December 31, 2010. For information about the terms and details of these plans, see theNotes to the Consolidated Financial Statementssection, Note 28.
Nonrecurring Share-Based Compensation: Incentive Plan 2010
| Fair Value per | ||||||||||||||||
| Original | Fair Value per | Unit on | Accrual on | |||||||||||||
| Quantity | Unit at Time of | December 31, | December 31, | |||||||||||||
| Granted | Grant | 2009 | 2009 | |||||||||||||
| Number of | € | € | €(000) | |||||||||||||
| Rights | ||||||||||||||||
Prof. Dr. Henning Kagermann (Co-CEO until May 31, 2009)(2) | 188,182 | 24.87 | 0.15 | 22.4 | ||||||||||||
| Léo Apotheker (Co-CEO) | 125,455 | 24.87 | 0.15 | 14.9 | ||||||||||||
| Dr. Werner Brandt | 62,727 | 24.87 | 0.15 | 7.5 | ||||||||||||
Erwin Gunst(1) | 28,815 | 14.02 | 0.15 | 3.4 | ||||||||||||
Prof. Dr. Claus E Heinrich(2) | 62,727 | 24.87 | 0.15 | 7.5 | ||||||||||||
Bill McDermott(1) | 45,345 | 14.02 | 0.15 | 5.4 | ||||||||||||
| Gerhard Oswald | 62,727 | 24.87 | 0.15 | 7.5 | ||||||||||||
Jim Hagemann Snabe(1) | 17,290 | 14.02 | 0.15 | 2.0 | ||||||||||||
Total | 593,268 | 70.6 | ||||||||||||||
| (1) | Member from July 1, 2008. These rights were allocated before appointment to the Executive Board. | |
| (2) | Retired May 31, 2009. Subject to expiration of term, options remain open under a two-year grace period. |
SAP SOP 2002
The table below shows Executive Board members’ December 31, 2009, holdings of stock options issued in previous years under the SAP SOP 2002 plan since its inception.
The strike price for an SAP SOP 2002 stock option is 110% of the base price of one SAP share. The base price is the arithmetic mean closing auction price for SAP stock in the Xetra trading system (or its successor system) over the five business days immediately before the issue date of that stock option. The strike price cannot be less than the closing auction price on the day before the issue date. The issued options have a term of five years and can only be exercised on specified dates after the two-year vesting period.
As a result of the issue on December 21, 2006, of bonus shares at aone-to-three ratio under a capital increase from corporate funds, on exercise each stock option now entitles its beneficiary to four shares. For better comparability with the price of SAP stock since implementation of the capital increase, the following table shows not the number (quantity) of options but the number (quantity) of shares to which they entitle the holder. Consequently, the strike prices shown are prices per share and not per option. The number of shares shown in the table is four times the number of options, and the strike price for an option is four times the strike price per share shown in the table.
In December 2009, the Supervisory Board agreed an amendment to the terms of SAP SOP 2002 for options granted in 2005. For details of the amendment, see theNotes to the Consolidated Financial Statementssection, Note 28.
The right to exercise options issued in 2004 expired in 2009.
102
Table of Contents
SAP SOP 2002 Stock Options
| Holding on | Rights | Holding on | ||||||||||||||||||||||||||||||||||
| January 1, 2009 | Exercised | Forfeited | December 31, 2009 | |||||||||||||||||||||||||||||||||
| Remaining | in 2009 | Price on | Shares(2) | Remaining | ||||||||||||||||||||||||||||||||
| Year | Strike Price | Quantity | Term in | Quantity of | Exercise | Quantity of | Quantity of | Term in | ||||||||||||||||||||||||||||
| Granted | per Share | of Shares | Years | Shares | Day | Shares | Shares | Years | ||||||||||||||||||||||||||||
| € | ||||||||||||||||||||||||||||||||||||
Prof. Dr. Henning Kagermann (Co-CEO and Member until May 31, 2009)(3) | 2004 | (2) | 37.50 | 200,000 | 0.13 | — | — | 200,000.00 | — | — | ||||||||||||||||||||||||||
| 2005 | 33.55 | 267,820 | 1.11 | — | — | — | 267,820 | 0.11 | ||||||||||||||||||||||||||||
| 2006 | 46.48 | 143,404 | 2.10 | — | — | — | 143,404 | 1.10 | ||||||||||||||||||||||||||||
| Léo Apotheker (Co-CEO) | 2004 | (2) | 37.50 | 112,000 | 0.13 | — | — | 112,000 | — | — | ||||||||||||||||||||||||||
| 2005 | 33.55 | 149,980 | 1.11 | — | — | — | 149,980 | 0.11 | ||||||||||||||||||||||||||||
| 2006 | 46.48 | 95,604 | 2.10 | — | — | — | 95,604 | 1.10 | ||||||||||||||||||||||||||||
| Dr. Werner Brandt | 2004 | (2) | 37.50 | 112,000 | 0.13 | — | — | 112,000 | — | — | ||||||||||||||||||||||||||
| 2005 | 33.55 | 149,980 | 1.11 | — | — | — | 149,980 | 0.11 | ||||||||||||||||||||||||||||
| 2006 | 46.48 | 87,292 | 2.10 | — | — | — | 87,292 | 1.10 | ||||||||||||||||||||||||||||
Erwin Gunst(1) | 2005 | 33.55 | 61,264 | 1.11 | — | — | — | 61,264 | 0.11 | |||||||||||||||||||||||||||
| 2006 | 46.48 | 44,596 | 2.10 | — | — | — | 44,596 | 1.10 | ||||||||||||||||||||||||||||
Prof. Dr. Claus E. Heinrich(3) | 2004 | (2) | 37.50 | 112,000 | 0.13 | — | — | 112,000 | — | — | ||||||||||||||||||||||||||
| 2005 | 33.55 | 149,980 | 1.11 | — | — | — | 149,980 | 0.11 | ||||||||||||||||||||||||||||
| 2006 | 46.48 | 87,292 | 2.10 | — | — | — | 87,292 | 1.10 | ||||||||||||||||||||||||||||
Bill McDermott(1) | 2006 | 46.48 | 77,296 | 2.10 | — | — | — | 77,296 | 1.10 | |||||||||||||||||||||||||||
| Gerhard Oswald | 2005 | 33.55 | 149,980 | 1.11 | — | — | — | 149,980 | 0.11 | |||||||||||||||||||||||||||
| 2006 | 46.48 | 87,292 | 2.10 | — | — | — | 87,292 | 1.10 | ||||||||||||||||||||||||||||
Jim Hagemann Snabe(1) | 2005 | 33.55 | 51,180 | 1.11 | — | — | — | 51,180 | 0.11 | |||||||||||||||||||||||||||
| 2006 | 46.48 | 37,164 | 2.10 | — | — | — | 37,164 | 1.10 | ||||||||||||||||||||||||||||
Total | 2,176,124 | 536,000 | 1,640,124 | |||||||||||||||||||||||||||||||||
| 1) | Member from July 1, 2008. These rights were allocated before appointment to the Executive Board. | |
| 2) | The options from the 2004 tranche were forfeited on February 16, 2009 (Plan end date). | |
| 3) | Retired May 31, 2009. Subject to expiration of term, options remain open under a two-year grace period. |
LTI Plan 2000
Beneficiaries under the LTI Plan 2000 could choose between convertible bonds and stock options. The chief difference was in the way the exercise or conversion price was determined. The bond conversion price depends on the closing price of SAP stock the day before the bond was issued, while the option strike price varies with the performance of SAP stock over time against the S&P North Software-Software Index (the successor of the GSTI Software index). The issued options have a term of ten years and could only be exercised in portions of one-third each on specified dates after two-year, three-year, or four-year vesting periods respectively.
The table below shows stock options held by members of the Executive Board on December 31, 2009, granted in earlier years under the LTI Plan 2000. The strike prices for LTI Plan 2000 stock options reflect the prices payable by an Executive Board member for one SAP common share on exercise of the option on December 31, 2009. The strike prices vary with the performance of SAP stock over time against the S&P North Software-Software Index. As a result of the issue on December 21, 2006, of bonus shares at aone-to-three ratio under a capital increase from corporate funds, on exercise each stock option now entitles its beneficiary to four shares. For better comparability with the price of SAP stock since implementation of the capital increase, the following table shows not the number (quantity) of options but the number (quantity) of shares to which they entitle the holder. Consequently, the strike prices shown are prices per share and not per option. The number of shares
103
Table of Contents
shown in the table is four times the number of options, and the strike price for an option is four times the strike price per share shown in the table.
LTI Plan 2000 Stock Options
| Rights | ||||||||||||||||||||||||||||||||
| Holding on | Exercised | Holding on | ||||||||||||||||||||||||||||||
| January 1, 2009 | in 2009 | December 31, 2009 | ||||||||||||||||||||||||||||||
| Remaining | Price on | Remaining | ||||||||||||||||||||||||||||||
| Year | Strike Price | Quantity | Term in | Quantity of | Exercise | Quantity of | Term in | |||||||||||||||||||||||||
| Granted | per Share | of Shares | Years | Shares | Date | Shares | Years | |||||||||||||||||||||||||
| € | € | |||||||||||||||||||||||||||||||
Prof. Dr. Henning Kagermann (Co-CEO and Member until May 31, 2009)(1) | 2000 | 18.65 | 112,128 | 1.14 | 112,128 | 34.55 | — | — | ||||||||||||||||||||||||
| 2001 | 22.67 | 157,500 | 2.14 | — | — | 157,500 | 1.14 | |||||||||||||||||||||||||
Léo Apotheker (Co-CEO)(2) | 2002 | 28.00 | 87,500 | 3.14 | — | — | 87,500 | 2.14 | ||||||||||||||||||||||||
Total | 357,128 | 112,128 | 245,000 | |||||||||||||||||||||||||||||
| (1) | Retired May 31, 2009. Subject to expiration of term, options remain open under a two-year grace period. | |
| (2) | Member from August 1, 2002. This holding was allocated before appointment to the Executive Board. |
The table below shows convertible bonds held by members of the Executive Board on December 31, 2009, granted in earlier years under the LTI Plan 2000. The strike prices for LTI Plan 2000 convertible bonds reflect the prices payable by an Executive Board member for one SAP share on conversion of the bond. The strike prices are fixed and correspond to the quoted price of one SAP share on the business day immediately preceding the grant of the convertible bond. As a result of the issue on December 21, 2006, of bonus shares at aone-to-three ratio under a capital increase from corporate funds, on conversion each bond now entitles its beneficiary to four shares. For better comparability with the price of SAP stock since implementation of the capital increase, the following table shows not the number (quantity) of convertible bonds but the number (quantity) of shares to which they entitle the holder. Consequently, the strike prices shown are prices per share and not per bond. The number of shares shown in the table is four times the number of bonds, and the strike price for a bond is four times the strike price per share shown in the table.
LTI Plan 2000 Convertible Bonds
| Rights | ||||||||||||||||||||||||||||||||
| Holding on | Exercised | Holding on | ||||||||||||||||||||||||||||||
| January 1, 2009 | in 2009 | December 31, 2009 | ||||||||||||||||||||||||||||||
| Remaining | Price on | Remaining | ||||||||||||||||||||||||||||||
| Year | Strike Price | Quantity | Term | Quantity of | Exercise | Quantity of | Term | |||||||||||||||||||||||||
| Granted | per Share | of Shares | in Years | Shares | Day | Shares | in Years | |||||||||||||||||||||||||
| € | € | |||||||||||||||||||||||||||||||
Prof. Dr. Henning Kagermann (Co-CEO and Member until May 31, 2009)(1) | 2000 | 72.58 | 89,700 | 1.14 | — | — | 89,700 | 0.14 | ||||||||||||||||||||||||
| 2001 | 47.81 | 126,000 | 2.14 | — | — | 126,000 | 1.14 | |||||||||||||||||||||||||
| 2002 | 37.88 | 360,000 | 3.14 | — | — | 360,000 | 2.14 | |||||||||||||||||||||||||
Léo Apotheker (Co-CEO)(2) | 2000 | 83.67 | 95,400 | 1.19 | — | — | 95,400 | 0.19 | ||||||||||||||||||||||||
| 2001 | 47.81 | 120,000 | 2.14 | — | — | 120,000 | 1.14 | |||||||||||||||||||||||||
| 2002 | 37.88 | 70,000 | 3.14 | — | — | 70,000 | 2.14 | |||||||||||||||||||||||||
| Dr. Werner Brandt | 2001 | 47.81 | 20,000 | 2.14 | — | — | 20,000 | 1.14 | ||||||||||||||||||||||||
| 2002 | 37.88 | 120,000 | 3.14 | — | — | 120,000 | 2.14 | |||||||||||||||||||||||||
Prof. Dr. Claus E Heinrich(1) | 2000 | 72.58 | 65,700 | 1.14 | — | — | 65,700 | 0.14 | ||||||||||||||||||||||||
| 2001 | 47.81 | 88,000 | 2.14 | — | — | 88,000 | 1.14 | |||||||||||||||||||||||||
| 2002 | 37.88 | 200,000 | 3.14 | — | — | 200,000 | 2.14 | |||||||||||||||||||||||||
| Gerhard Oswald | 2000 | 72.58 | 65,700 | 1.14 | — | — | 65,700 | 0.14 | ||||||||||||||||||||||||
| 2001 | 47.81 | 88,000 | 2.14 | — | — | 88,000 | 1.14 | |||||||||||||||||||||||||
Total | 1,508,500 | 1,508,500 | ||||||||||||||||||||||||||||||
104
Table of Contents
| (1) | Retired May 31, 2009. Subject to expiration of term, the convertible bonds remain open under a two-year grace period. | |
| (2) | Member from August 1, 2002. This holding was allocated before appointment to the Executive Board. |
Total Expense for Share-Based Compensation
In the report year and the prior year, total expense for the share-based compensation plans of Executive Board members was recorded as follows:
| 2009 | 2008 | |||||||
| €(000) | ||||||||
| Prof. Dr. Henning Kagermann (Co-CEO and Member until May 31, 2009) | 167,9 | 55.9 | ||||||
| Léo Apotheker (Co-CEO) | 376,3 | 37.3 | ||||||
| Dr. Werner Brandt | 351,8 | 98.9 | ||||||
Erwin Gunst(1) | 343,1 | 108.0 | ||||||
| Prof. Dr. Claus E. Heinrich | 184,5 | 98.9 | ||||||
Bill McDermott(1) | 339,3 | 97.4 | ||||||
| Gerhard Oswald | 351,8 | 98.9 | ||||||
John Schwarz(2) | 397,0 | 158.1 | ||||||
Jim Hagemann Snabe(1) | 318,3 | 95.2 | ||||||
Total | 2,830.0 | (3) | 848.6 | |||||
| (1) | Member of the Executive Board from July 1, 2008 | |
| (2) | Member of the Executive Board from March 1, 2008 | |
| (3) | Includes incremental expense of €430,000 resulting from the amendment of the exercise conditions for the 2005 grant of SAP SOP 2002 |
SHAREHOLDINGS AND TRANSACTIONS OF EXECUTIVE BOARD MEMBERS
No member of the Executive Board holds more than 1% of the common stock of SAP AG. Members of the Executive Board held a total of 15,336 SAP shares on December 31, 2009. On December 31, 2008, members of the Executive Board held a total of 88,527 SAP shares. The difference is due primarily to the retirement of two members.
The table below shows transactions by Executive Board members and persons closely associated with them notified to SAP pursuant to the German Securities Trading Act, section 15a, in 2009.
Transactions in SAP Shares
| Transaction Date | Transaction | Quantity | Unit Price | |||||||||||||
| € | ||||||||||||||||
| Werner Brandt | October 29, 2009 | Stock purchase | 1,000 | 31.95 | ||||||||||||
Executive Board: Other Information
We did not grant any compensation advance or credit to, or enter into any commitment for the benefit of, any member of our Executive Board in 2009 or the previous year.
As far as the law permits, SAP AG and its affiliated companies in Germany and elsewhere indemnify and hold harmless their respective directors and officers against and from the claims of third parties. To this end, we maintain directors’ and officers’ (D&O) group liability insurance. The policy is annual and is renewed from year to year. The insurance covers the personal liability of the insured group for financial loss caused by its
105
Table of Contents
managerial acts and omissions. The current D&O policy, which does not provide for an individual deductible, does not expire until March 31, 2010, so in 2009 no deductible, as envisaged in the German Corporate Governance Code of 2008, applied.
Compensation for Supervisory Board Members
Compensation System
Supervisory Board members’ compensation is governed by our Articles of Incorporation, section 16. Each member of the Supervisory Board receives, in addition to the reimbursement of his or her expenses, compensation composed of fixed elements and a variable element. The variable element depends on the dividend paid by SAP on common shares.
The fixed element is €75,000 for the chairperson, €50,000 for the deputy chairperson, and €37,500 for other members. For membership of a Supervisory Board committee, members receive additional fixed compensation of €2,500 (provided that the relevant committee meets during the fiscal year) and the chairperson of the committee receives €5,000. The fixed remuneration element is due for payment after the end of the fiscal year.
The variable compensation element is €8,000 for the chairperson, €6,000 for the deputy chairperson, and €4,000 for the other members of the Supervisory Board for each €0.01 by which the dividend distributed per share exceeds €0.25.
However, the aggregate compensation excluding compensation for committee memberships must not exceed €200,000 for the chairperson, €150,000 for the deputy chairperson, and €100,000 for other members.
Any member of the Supervisory Board having served for less than the entire fiscal year receives one-twelfth of their respective remuneration for each month of service commenced. This also applies to the higher compensation levels for the chairperson and deputy chairperson and to the additional compensation for committee chairs and memberships.
106
Table of Contents
Amount of Compensation
Subject to the resolution on the appropriation of retained earnings by the Annual General Meeting of Shareholders on June 8, 2010, the compensation paid to Supervisory Board members in respect of fiscal year 2009 will be as set out in the table below:
| 2009 | 2008 | |||||||||||||||||||||||||||||||
| Compensation | Compensation | |||||||||||||||||||||||||||||||
| Fixed | Variable | for Committee | Fixed | Variable | for Committee | |||||||||||||||||||||||||||
| Compensation | Compensation | Work | Total | Compensation | Compensation | Work | Total | |||||||||||||||||||||||||
| €(000) | ||||||||||||||||||||||||||||||||
| Prof. Dr. h.c. mult. Hasso Plattner (chairperson) | 75.0 | 125,0 | 20,0 | 220,0 | 75.0 | 125.0 | 25.0 | 225.0 | ||||||||||||||||||||||||
| Lars Lamadé (deputy chairperson) | 50.0 | 100,0 | 2,5 | 152,5 | 50.0 | 100.0 | 2.5 | 152.5 | ||||||||||||||||||||||||
| Pekka Ala-Pietilä | 37.5 | 62,5 | 5,0 | 105,0 | 37.5 | 62.5 | 7.5 | 107.5 | ||||||||||||||||||||||||
| Thomas Bamberger | 37.5 | 62,5 | 2,5 | 102,5 | 37.5 | 62.5 | 2.5 | 102.5 | ||||||||||||||||||||||||
| Panagiotis Bissiritsas | 37.5 | 62,5 | 5,0 | 105,0 | 37.5 | 62.5 | 5.0 | 105.0 | ||||||||||||||||||||||||
| Willi Burbach | 37.5 | 62,5 | 5,0 | 105,0 | 37.5 | 62.5 | 5.0 | 105.0 | ||||||||||||||||||||||||
| Helga Classen (until December 31, 2008) | 0,0 | 0,0 | 0,0 | 0,0 | 37.5 | 62.5 | 2.5 | 102.5 | ||||||||||||||||||||||||
| Prof. Dr. Wilhelm Haarmann | 37.5 | 62,5 | 10,0 | 110,0 | 37.5 | 62.5 | 9.0 | 109.0 | ||||||||||||||||||||||||
| Peter Koop | 37.5 | 62,5 | 4,8 | 104,8 | 37.5 | 62.5 | 2.5 | 102.5 | ||||||||||||||||||||||||
| Christiane Kuntz-Mayr (from January 1, 2009) | 37.5 | 62,5 | 2,3 | 102,3 | 0.0 | 0.0 | 0.0 | 0.0 | ||||||||||||||||||||||||
| Bernard Liautaud (from June 3, 2008) | 37.5 | 62,5 | 2,5 | 102,5 | 21.9 | 36.5 | 1.5 | 59.8 | ||||||||||||||||||||||||
| Dr. Gerhard Maier | 37.5 | 62,5 | 5,0 | 105,0 | 37.5 | 62.5 | 5.0 | 105.0 | ||||||||||||||||||||||||
| Dr. h.c. Hartmut Mehdorn | 37.5 | 62,5 | 2,5 | 102,5 | 37.5 | 62.5 | 1.5 | 101.5 | ||||||||||||||||||||||||
| Prof. Dr.-Ing. Dr. h.c. Dr.-Ing. E.h. Joachim Milberg | 37.5 | 62,5 | 10,0 | 110,0 | 37.5 | 62.5 | 11.5 | 111.5 | ||||||||||||||||||||||||
| Prof. Dr. Dr. h.c. August-Wilhelm Scheer (until April 4, 2008) | 0.0 | 0,0 | 0,0 | 0,0 | 12.5 | 20.8 | 2.5 | 35.8 | ||||||||||||||||||||||||
| Dr. Erhard Schipporeit | 37.5 | 62,5 | 7,5 | 107,5 | 37.5 | 62.5 | 7.5 | 107.5 | ||||||||||||||||||||||||
| Stefan Schulz | 37.5 | 62,5 | 5,0 | 105,0 | 37.5 | 62.5 | 5.0 | 105.0 | ||||||||||||||||||||||||
| Prof. Dr.-Ing. Dr.-Ing. E.h. Klaus Wucherer | 37.5 | 62,5 | 2,5 | 102,5 | 37.5 | 62.5 | 2.5 | 102.5 | ||||||||||||||||||||||||
Total | 650,0 | 1.100,0 | 92,1 | 1.842,1 | 646.9 | 1,094.8 | 98.3 | 1,840.0 | ||||||||||||||||||||||||
In addition, we reimburse to members of the Supervisory Board their expenses and the value-added tax payable on their compensation.
The total compensation of all Supervisory Board members in 2009 for work for SAP excluding compensation relating to the office of Supervisory Board member was €1,095,100 (2008: €1,050,300). Those amounts are composed entirely of remuneration received by employee representatives on the Supervisory Board relating to their position as SAP employees in 2008 and 2009 respectively.
Long-Term Incentives for the Supervisory Board
We do not offer members stock options or other share-based compensation for their Supervisory Board work. Any stock options or other share-based compensation received by employee-elected members relate to their position as SAP employees and not to their work on the Supervisory Board.
Shareholdings and Transactions of Supervisory Board Members
Supervisory Board chairperson Hasso Plattner and the companies he controlled held 127,186,143 SAP shares on December 31, 2009 (December 31, 2008: 128,987,982 SAP shares), representing 10.374% (2008: 10.523%) of
107
Table of Contents
SAP’s capital stock. No other member of the Supervisory Board held more than 1% of the SAP AG common stock at the end of 2009 or of the previous year. Members of the Supervisory Board held a total of 127,193,136 SAP shares on December 31, 2009 (December 31, 2008: 128,995,306 SAP shares).
The table below shows transactions by Supervisory Board members and persons closely associated with them notified to SAP pursuant to the German Securities Trading Act, section 15a, in 2009:
| Transactions in SAP Shares | ||||||||||||||||
| Transaction Date | Transaction | Quantity | Unit Price in € | |||||||||||||
| Dr. Gerhard Maier | August 17, 2009 | Stock sale | 6,384 | 32.65 | ||||||||||||
| Hasso Plattner GmbH & Co. Beteiligungs KG | September 14, 2009 | Stock sale | (1 | ) | (1 | ) | ||||||||||
| (1) | On September 14, 2009, the notifying party concluded a contract with a bank, which acts as commission agent, under which the notifying party is selling a total of €240,000,000 of SAP stock in monthly tranches of €15,000,000 until the term ends on December 31, 2010. The number of shares sold is the result of dividing the value sold by the share price current at the time of sale. |
Supervisory Board: Other Information
We did not grant any compensation advance or credit to, or enter into any commitment for the benefit of, any member of our Supervisory Board in 2009 or the previous year.
Hasso Plattner, the chairperson of the Supervisory Board, entered into a consulting contract with SAP after he joined the Supervisory Board in May 2003. The contract does not provide for any compensation. The only cost we incurred under the contract was the reimbursement of expenses.
As far as the law permits, we indemnify Supervisory Board members against, and hold them harmless from, claims brought by third parties. To this end, we maintain directors’ and officers’ group liability insurance. For more information about this insurance, see theExecutive Board: Other Informationsection.
EMPLOYEES
The average number of employees for 2009 were 48,471 FTEs worldwide (2008: 51,638; 2007: 42,303), which represented a decrease of 6% from 2008. Of the total headcount, 14,925 employees were based in Germany and 8,101 in the United States.
In October 2008, in response to the downturn of the economy, we implemented a headcount freeze under which recruiting was limited to rare exceptions. In January 2009 we announced our intention to reduce the number of positions globally to 48,500 by the end of the year, and to take advantage of any attrition during this time to assist in meeting our year end goal. Approximately 3,000 positions were eliminated under the cost-containment program announced at the beginning of 2009. In addition, roughly 1,000 employees left who were not covered by this program.
108
Table of Contents
The following tables set forth the average number of employees, measured in full-time equivalents by functional area and by geographic region, including employees from discontinued operations:
| Number of Employees (in Full-Time Equivalents) | ||||||||||||||||||||||||||||||||||||||||||||||||
| 2009 | 2008 | 2007 | ||||||||||||||||||||||||||||||||||||||||||||||
FTEs | EMEA | Americas | APJ | Total | EMEA | Americas | APJ | Total | EMEA | Americas | APJ | Total | ||||||||||||||||||||||||||||||||||||
| Software and software-related services | 3,228 | 1,264 | 1,868 | 6,360 | 3,284 | 1,405 | 1,912 | 6,601 | 3,006 | 999 | 1,759 | 5,764 | ||||||||||||||||||||||||||||||||||||
| Professional services and other services | 6,857 | 3,574 | 2,346 | 12,777 | 7,236 | 4,304 | 2,538 | 14,078 | 6,476 | 3,724 | 2,125 | 12,325 | ||||||||||||||||||||||||||||||||||||
| Research and Development | 8,606 | 2,566 | 3,869 | 15,041 | 8,542 | 2,710 | 4,034 | 15,286 | 7,624 | 1,700 | 3,113 | 12,437 | ||||||||||||||||||||||||||||||||||||
| Sales & Marketing | 4,315 | 3,600 | 1,800 | 9,715 | 4,649 | 4,143 | 2,014 | 10,806 | 3,578 | 3,040 | 1,320 | 7,938 | ||||||||||||||||||||||||||||||||||||
| General & Administration | 1,950 | 743 | 421 | 3,114 | 2,006 | 834 | 478 | 3,318 | 1,738 | 554 | 380 | 2,672 | ||||||||||||||||||||||||||||||||||||
| Infrastructure | 877 | 409 | 178 | 1,464 | 914 | 455 | 180 | 1,549 | 758 | 279 | 129 | 1,166 | ||||||||||||||||||||||||||||||||||||
| SAP Group | 25,833 | 12,156 | 10,482 | 48,471 | 26,631 | 13,851 | 11,156 | 51,638 | 23,180 | 10,296 | 8,826 | 42,302 | ||||||||||||||||||||||||||||||||||||
The actual net FTEs decreased by 3,960. The percentage decreases were 11% in the Americas region, 5% in the EMEA region and 9% in the Asia Pacific Japan region. We reduced 1,488 positions in the Americas region and 1,466 positions in the EMEA region in 2009. Of the 1,006 positions reduced in the Asia Pacific Japan region, most were in India (384) and Japan (273). Of the total headcount change in 2009, acquisitions accounted for additions of 232 FTEs worldwide.
Certain employees who are employed by SAP but who are not currently working or who work part-time while finishing a university degree are excluded from the above figures. Also, certain temporary employees are not included in the above figures. The number of such temporary employees is not material.
On a worldwide basis, we believe that our employee relations are excellent. Employees of SAP France S.A. and Business Objects S.A. are subject to a collective bargaining agreement.
On the legal entity level, the employees of SAP AG are represented by a works council with 37 members and the employees of SAP Germany are represented by a works council with 31 members. For different areas of co-determination the entity-level works councils have elected committees. By law, the works council is entitled to consultation, and in some areas, to co-determination rights concerning labor conditions at SAP AG and SAP Germany. Therefore, the implementation of some labor and employment measures may take longer and be more costly than in countries without a works council, but these processes offer the possibility of a better acceptance and understanding of measures by the employees. Other employee representatives include the group works council currently having six members (members of the Works’ Councils of SAP and SAP Germany); the representatives of severely disabled persons in all entities and on a group level (Germany); the Spokespersons Committee as the representation of the executives; and the employee representatives on the Supervisory Board.
On December 31 2009, as a result of the grouping of operational and R&D teams into one single legal entity called SAP France (formerly referred to as Business Objects S.A.), the French staffs of SAP France are represented by a French central works council and by two “secondary” works councils, one for R&D and one for operations. Such a representation is transitional and will last until new elections take place in the 4th quarter of 2010. The central works council is entitled to receive information and to be consulted on matters that are expected to have an impact on the Company structure or on the overall workforce. “Secondary” works councils are entitled to the same prerogatives for matters that are expected to have a specific impact at their own level i.e. (on operational or on R&D line of service).
SAP Labs France staffs are also represented by a French works council.
A French works council is responsible for protecting the employees’ collective interests by ensuring that management considers the interests of employees in making decisions on behalf of the company. In addition,
109
Table of Contents
the employees of our subsidiaries SAP Spain, SAP Belgium and SAP Netherlands are also represented by works councils. An employee consultation forum has been established at our SAP (U.K.) Limited subsidiary.
SHARE OWNERSHIP
Beneficial Ownership of Shares
The ordinary shares beneficially owned by the persons listed in Item 6. Directors, Senior Management and Employees — Compensation Report” are disclosed in “Item 7. Major Shareholders and Related-Party Transactions — Major Shareholders.”
SHARE-BASED COMPENSATION PLANS
Share-Based Compensation
We maintain certain share-based compensation plans. The share-based compensation from these plans result from cash-settled and equity-settled awards issued to employees. For more information on our share-based compensation plans refer to “Item 6. Directory, Senior Management and Employees — Compensation Report” and Note 28 to our Consolidated Financial Statements in “Item 18. Financial Statements.”
ITEM 7. MAJOR SHAREHOLDERS AND RELATED-PARTY TRANSACTIONS
MAJOR SHAREHOLDERS
The share capital of SAP AG consists of ordinary shares, which are issued only in bearer form. Accordingly, SAP AG generally has no way of determining who its shareholders are or how many shares a particular shareholder owns. SAP’s ordinary shares are traded in the United States by means of ADRs. Each ADR currently represents one SAP AG ordinary share. On March 10, 2010, based upon information provided by the Depositary there were 67,892,173 ADRs held of record by 906 registered holders. The ordinary shares underlying such ADRs represented 5.53% of the then-outstanding ordinary shares (including treasury stock). Because SAP’s ordinary shares are issued in bearer form only, we are unable to determine the number of ordinary shares directly held by persons with U.S. addresses.
The following table sets forth certain information regarding the beneficial ownership of the ordinary shares to the extent known to SAP as of March 10, 2010 of: (i) each person or group known by SAP AG to own beneficially 5% or more of the outstanding ordinary shares; and (ii) the beneficial ownership of all members of the Supervisory Board and all members of the Executive Board, individually and as a group, in each case as reported to SAP AG by such persons. There was, as far as we are able to tell given the nature of our shares, no significant change in the percentage ownership held by any major shareholder during the past three years. None of the major shareholders have special voting rights. On October 28, 2008, Capital Research and Management Company informed us that the level of their holdings exceeded 3% and was then 3.19%. On December 7, 2009 BlackRock Inc., New York, USA notified us as follows: The percentage of voting shares of BlackRock Financial Management, Inc., New York, USA exceeded 3% on December 1, 2009 and was then 3.13%. The percentage of voting shares of BlockRock Holdco 2, Inc., New York, USA exceeded 3% on December 1, 2009 and was then 3.13%.
110
Table of Contents
The percentage of voting shares of BlockRock, Inc., New York, USA exceeded 3% on December 1, 2009 and was then 3.21%.
| Ordinary Shares | ||||||||
| Beneficially Owned | ||||||||
| % of | ||||||||
Major Shareholders | Number | Outstanding | ||||||
Dietmar Hopp, collectively(1) | 75,273,200 | 6.136 | % | |||||
Hasso Plattner, Chairperson Supervisory Board, collectively(2) | 122,946,427 | 10.023 | % | |||||
Klaus Tschira, collectively(3) | 103,429,595 | 8.432 | % | |||||
| Executive Board Members as a group (5 persons) | 12,327 | 0.001 | % | |||||
| Supervisory Board Members as a group (16 persons) | 122,953,313 | 10.023 | % | |||||
Executive Board Members and Supervisory Board Members as a group (21 persons)(4) | 122,965,640 | 10.024 | % | |||||
Options and convertible bonds that are vested and exercisable within 60 days of March 10, 2010, held by Executive Board Members and Supervisory Board Members, collectively(5) | 145.037 | N/A | ||||||
| (1) | Represents 75,273,200 ordinary shares beneficially owned by Dietmar Hopp, including 3,404,000 ordinary shares owned by DH Besitzgesellschaft mbH & Co. KG (formerly known as Golf Club St. Leon-Rot GmbH & Co. Betriebs-oHG) of which DH Verwaltungs-GmbH is the general partner and 71,869,200 ordinary shares owned by Dietmar Hopp Stiftung, GmbH. Mr. Hopp exercises voting and dispositive powers of the ordinary shars held by such entities. The foregoing information is based solely on a Schedule 13G filed by Dietmar Hopp and Dietmar Hopp Stiftung, GmbH on February 16, 2010. |
| (2) | Includes Hasso Plattner Förderstiftung gGmbH and Hasso Plattner GmbH & Co. Beteiligungs-KG in which Hasso Plattner exercises sole voting and dispositive power. |
| (3) | Represents 103,429,595 ordinary shares beneficially owned by Dr. h. c. Klaus Tschira, including 67,860,955 ordinary shares owned by Klaus Tschira Stiftung gGmbH and 32,830,640 ordinary shares owned by Dr. h. c. Tschira Beteiligungs GmbH & Co. KG. Dr. Tschira exercises the voting and dispositive powers over the ordinary shares held by such entities. The foregoing information is based solely on a Schedule 13G filed by Dr. hc. Klaus Tschira, Dr. h. c. Tschira Beteiligungs GmbH & Co. KG, Dr. h. c. Tschira Verwaltungs GmbH and Klaus Tschira Stiftung gGmbH on February 10, 2010. |
| (4) | We believe each of the other members of the Supervisory Board and the Executive Board beneficially owns less than 1% of SAP AG’s ordinary shares as of March 10, 2010. |
| (5) | Includes 81,112 stock options and 63,925 convertible bonds. Each of these stock options and convertible bonds entitles the holder, if exercised or converted, to four SAP AG ordinary shares. |
We at present have no knowledge about any arrangements, the operation of which may at a subsequent date result in a change in control of the company.
RELATED-PARTY TRANSACTIONS
See Note 31 to our Consolidated Financial Statements in “Item 18. Financial Statements.”
ITEM 8. FINANCIAL INFORMATION
CONSOLIDATED FINANCIAL STATEMENTS AND FINANCIAL STATEMENT SCHEDULE
See “Item 18. Financial Statements,” pages F-1 through F-105 and pages S-1 through S-4.
111
Table of Contents
OTHER FINANCIAL INFORMATION
Legal Proceedings
We are subject to legal proceedings and claims, either asserted or unasserted, which arise in the ordinary course of business. Although the outcome of such proceedings and claims cannot be predicted with certainty, management does not believe that the outcome of any of the matters currently pending against us will have a material adverse effect on our business, results of operations, financial position or cash flows. Any litigation, however, involves potential risk and potentially significant litigation costs, and therefore there can be no assurance that any litigation which is now pending or which may arise in the future will not have such a material adverse effect on our business, financial position, income or cash flows.
See a detailed discussion of our legal proceedings in Note 24 to our Consolidated Financial Statements in Item 18. Financial Statements.”
Dividend Policy
Dividends are jointly proposed by SAP AG’s Supervisory Board and Executive Board based on SAP AG’s year-end stand-alone financial statements, subject to approval at the Annual General Meeting of Shareholders. Dividends are officially declared for the prior year at SAP AG’s Annual General Meeting of Shareholders. SAP AG’s Annual General Meeting of Shareholders usually convenes during the second quarter of each year. Since ordinary shares are in bearer form, dividends are usually remitted to the custodian bank on behalf of the shareholder within one business day following the Annual General Meeting of Shareholders. Record holders of the ADRs on the dividend record date will be entitled to receive payment of the dividend declared in respect of the year for which it is declared. Cash dividends payable to such holders will be paid to the Depositary in euro and, subject to certain exceptions, will be converted by the Depositary into U.S. dollars. The amount of dividends received by holders of ADRs may be affected by fluctuations in exchange rates (see “Item 3. Key Information — Exchange Rates”). The timing and amount of future dividend payments will depend upon our future earnings, capital needs and other relevant factors.
Significant Changes
In January 2010, SAP announced that it is offering a comprehensive tiered support model to customers worldwide. This offering includes SAP Enterprise Support services and the SAP Standard Support option and will enable customers to choose the option that best meets their requirements.
In February 2010, SAP announced various changes in the Executive Board which are described in detail in “Item 6. Directors, Senior Management and Employees — Executive Board.”
ITEM 9. THE OFFER AND LISTING
GENERAL
Our ordinary shares are officially listed on the Frankfurt Stock Exchange, the Berlin Stock Exchange and the Stuttgart Stock Exchange. The principal trading market for the ordinary shares is Xetra, the electronic dealing platform of Deutsche Boerse AG. The ordinary shares are issued only in bearer form.
ADRs representing SAP AG ordinary shares are listed on the New York Stock Exchange (NYSE) under the symbol “SAP,” and currently each ADR represents one ordinary share.
112
Table of Contents
TRADING ON THE FRANKFURT STOCK EXCHANGE AND THE NYSE
The table below sets forth, for the periods indicated, the high and low closing sales prices for the ordinary shares on the Xetra trading System of the Frankfurt Stock Exchange together with the closing highs and lows of the DAX, and the high and low closing sales prices for the ADRs on the NYSE (information is provided by Reuters):
| Ordinary Share (1) | DAX(2) | Price per ADR | ||||||||||||||||||||||
| High | Low | High | Low | High | Low | |||||||||||||||||||
| In € | In € | In US$ | ||||||||||||||||||||||
Annual Highs and Lows | ||||||||||||||||||||||||
2005 | 38.95 | 28.63 | 5,458.58 | 4,178.10 | 46.43 | 36.96 | ||||||||||||||||||
2006 | 46.86 | 34.56 | 6,611.81 | 5,292.14 | 57.00 | 43.57 | ||||||||||||||||||
2007 | 42.27 | 33.37 | 8,105.69 | 6,447.70 | 59.86 | 44.45 | ||||||||||||||||||
2008 | 39.93 | 23.45 | 7,949.11 | 4,127.41 | 58.98 | 29.70 | ||||||||||||||||||
2009 | 35.26 | 25.00 | 6,011.55 | 3,666.41 | 52.37 | 31.69 | ||||||||||||||||||
Quarterly Highs and Lows | ||||||||||||||||||||||||
2008 | ||||||||||||||||||||||||
| First Quarter | 34.88 | 29.96 | 7,949.11 | 6,182.30 | 51.93 | 45.77 | ||||||||||||||||||
| Second Quarter | 35.52 | 31.50 | 7,225.94 | 6,418.32 | 55.20 | 48.72 | ||||||||||||||||||
| Third Quarter | 39.93 | 32.38 | 6,609.63 | 5,807.08 | 58.98 | 51.40 | ||||||||||||||||||
| Fourth Quarter | 36.98 | 23.45 | 5,806.33 | 4,127.41 | 51.85 | 29.70 | ||||||||||||||||||
2009 | ||||||||||||||||||||||||
| First Quarter | 29.64 | 25.00 | 5,026.31 | 3,666.41 | 38.61 | 31.69 | ||||||||||||||||||
| Second Quarter | 31.25 | 27.00 | 5,144.06 | 4,131.07 | 44.87 | 35.73 | ||||||||||||||||||
| Third Quarter | 35.26 | 27.32 | 5,736.31 | 4,572.65 | 51.70 | 37.87 | ||||||||||||||||||
| Fourth Quarter | 35.08 | 30.09 | 6,011.55 | 5,353.35 | 52.37 | 44.28 | ||||||||||||||||||
Monthly Highs and Lows | ||||||||||||||||||||||||
2009 | ||||||||||||||||||||||||
| July | 33.00 | 27.32 | 5,360.66 | 4,572.65 | 47.25 | 37.87 | ||||||||||||||||||
| August | 34.06 | 32.58 | 5,557.09 | 5,201.61 | 49.01 | 45.88 | ||||||||||||||||||
| September | 35.26 | 33.17 | 5,736.31 | 5,301.42 | 51.70 | 47.83 | ||||||||||||||||||
| October | 35.08 | 30.80 | 5,854.14 | 5,414.96 | 52.37 | 45.27 | ||||||||||||||||||
| November | 32.91 | 31.30 | 5,804.82 | 5,353.35 | 49.09 | 46.00 | ||||||||||||||||||
| December | 33.00 | 30.09 | 6,011.55 | 5,647.84 | 48.19 | 44.28 | ||||||||||||||||||
2010 | ||||||||||||||||||||||||
| January | 35.35 | 32.18 | 6,048.30 | 5,540.33 | 51.19 | 45.14 | ||||||||||||||||||
| February | 34.05 | 31.12 | 5,722.05 | 5,434.34 | 47.46 | 42.81 | ||||||||||||||||||
| March (through March 10, 2010) | 34.08 | 33.45 | 5,936.72 | 5,713.51 | 46.48 | 45.27 | ||||||||||||||||||
| (1) | Share prices for 2006 and prior are retrospectively adjusted for the effect of the fourfold increase in the number of shares resulting from the capital increase which became effective December 15, 2006. |
| (2) | The DAX is a continuously updated, capital-weighted performance index of 30 German blue chip companies. In principle, the shares included in the DAX are selected on the basis of their stock exchange turnover and the issuer’s free-float market capitalization. Adjustments to the DAX are made for capital changes, subscription rights and dividends. |
On March 10, 2010, the closing sales price per ordinary share on the Frankfurt Stock Exchange (Xetra Trading System) was € 34.02 the closing sales price per ADR on the NYSE was US$46.48, as reported by Reuters.
113
Table of Contents
ITEM 10. ADDITIONAL INFORMATION
ARTICLES OF INCORPORATION
Organization and Register
SAP AG is a stock corporation organized in the Federal Republic of Germany under the Stock Corporation Act (Aktiengesetz). SAP AG is registered in the Commercial Register (Handelsregister) at the Lower Court of Mannheim, Germany, under the entry number “HRB 350269.” SAP AG publishes its official notices in the Internet version of the Federal Gazette (www.ebundesanzeiger.de).
Objects and Purposes
SAP’s Articles of Incorporation state that our objects involve, directly or indirectly, the development, production and marketing of products and the provision of services in the field of information technology, including:
| • | developing and marketing integrated product and service solutions fore-commerce; | |
| • | developing software for information technology and the licensing of its use to others; | |
| • | organization and deployment consulting, as well as user training, fore-commerce and other software solutions; | |
| • | selling, leasing, renting and arranging the procurement and provision of all other forms of use of information technology systems and related equipment; and | |
| • | making capital investments in enterprises active in the field of information technology to promote the opening and advancement of international markets in the field of information technology. |
SAP is authorized to act in all the business areas listed above and to delegate such activities to affiliated enterprises within the meaning of the German Stock Corporation Act; in particular SAP is authorized to delegate its business in whole or in part to such enterprises. SAP AG is authorized to establish branch offices in Germany and other countries, as well as to form, acquire or invest in other companies of the same or related kind and to enter into collaboration and joint venture agreements. SAP is further authorized to invest in enterprises of all kinds principally for the purpose of placing financial resources. SAP is authorized to dispose of investments, to consolidate the management of enterprises in which it participates, to enter into affiliation agreements with such enterprises, or limits its activities to manage its shareholdings.
CORPORATE GOVERNANCE
Introduction
SAP AG, as a German stock corporation, is governed by three separate bodies: the Supervisory Board, the Executive Board and the Annual General Meeting of Shareholders. Their rules are defined by German law and by SAP’s Articles of Incorporation (Satzung) and are summarized below. See “Item 16G. Differences in Corporate Governance Practices” for additional information on our corporate governance practices.
The Supervisory Board
The Supervisory Board appoints and removes the members of the Executive Board and oversees and advises the management of the corporation. At regular intervals it meets to discuss current business as well as business development and planning. The SAP Executive Board must consult with the Supervisory Board concerning the corporate strategy, which is developed by the Executive Board. The Supervisory Board maintains
114
Table of Contents
a list of transactions for which the Executive Board requires the Supervisory Board’s consent. Accordingly, the Supervisory Board must also approve the annual budget of SAP upon submission by the Executive Board and certain subsequent deviations from the approved budget. The Supervisory Board is also responsible for representing SAP AG in transactions between SAP AG and Executive Board members.
The Supervisory Board, based on a recommendation by its Audit Committee, provides its proposal for the election of the independent public accountant to the Annual General Meeting of Shareholders. The Supervisory Board is also responsible for monitoring the auditor’s independence, a task it has delegated to its audit committee.
The German Co-determination Act of 1976 (Mitbestimmungsgesetz) requires supervisory boards of corporations with more than 2,000 employees to consist of an equal number of representatives of the shareholders and representatives of the employees. The minimum total number of supervisory board members, and thus the minimum number of shareholder representatives and employee representatives, is legally fixed and depends on the number of employees employed by the corporation and its German subsidiaries. Our Supervisory Board currently consists of sixteen members, of which eight members have been elected by SAP AG’s shareholders at the Annual General Meeting of Shareholders and eight members which have been elected by the employees of the German SAP entities (i.e. entities of the SAP Group having their registered office in Germany).
Any Supervisory Board member elected by the shareholders at the Annual General Meeting of Shareholders may be removed by three-quarters of the votes cast at the Annual General Meeting of Shareholders. Any Supervisory Board member elected by the employees may be removed by three quarters of the votes cast by the employees of the German SAP entities.
The Supervisory Board elects a chairperson and a deputy chairperson among its members by a majority of vote of its members. If such majority is not reached on the first vote, the chairperson will be chosen solely by the members elected by the shareholders and the deputy chairperson will be chosen solely by the members elected by the employees. Unless otherwise provided by law, the Supervisory Board acts by simple majority. In the case of any deadlock the chairperson has the deciding vote.
The members of the Supervisory Board cannot be elected for a longer term than approximately 5 years. The term expires at the close of the Annual General Meeting of Shareholders giving its formal approval of the acts of the Supervisory Board and the Executive Board in the fourth fiscal year following the year in which the Supervisory Board was elected unless the Annual General Meeting of Shareholders specifies a shorter term of office when electing individual members of the Supervisory Board or the entire Supervisory Board. Re-election is possible. The Supervisory Board normally meets four times a year. The remuneration of the members of the Supervisory Board is determined by the Articles of Incorporation.
As stipulated in the German Corporate Governance Code (GCGC), an adequate number of our Supervisory Board members are independent. To be considered for appointment to the Supervisory Board and for as long as they serve, members must comply with certain criteria concerning independence, conflicts of interest and multiple memberships of management, supervisory and other governing bodies. They must be loyal to SAP in their conduct and must not accept any position in companies that are in competition with SAP. Members are subject to insider trading prohibition and the respective directors’ dealing rules of the German Securities Trading Act. A member of the Supervisory Board may not vote on matters relating to certain contractual agreements between such members and SAP AG. Further, as the compensation of the Supervisory Board members is laid down in the Articles of Incorporation, Supervisory Board members are unable to vote on their own compensation.
The Supervisory Board may appoint committees from among its members and may, to the extent permitted by law, entrust such committees with the authority to make decisions. Currently the Supervisory Board maintains the following committees:
The focus of theAudit Committee(Prüfungsausschuss) is the oversight of SAP’s external financial reporting as well as SAP’s risk management, internal controls (including internal controls over financial reporting), internal
115
Table of Contents
audit and compliance matters. Among the tasks of the Audit Committee are the discussion of SAP’s quarterly and yearend financial reporting prepared under German and U.S. regulations, including SAP’s Annual Report onForm 20-F. The Audit Committee proposes the appointment of the external auditor to the Supervisory Board, determines focus audit areas, discusses critical accounting policies and estimates with and reviews the audit reports issued and audit issues identified by the auditor and monitors the auditor’s independence. Both SAP’s Global Internal Audit Services (GIAS) and SAP’s Global Compliance Office (GCO) report upon request or at the occurrence of certain findings, but in any case at least once a year (GCO) or twice a year (GIAS), directly to the Audit Committee.
The Audit Committee has established procedures regarding the prior approval of all audit and non-audit services provided by our independent auditor. See “Item 16C. Principal Accountant Fees and Services” for details. Furthermore the Audit Committee monitors the effectiveness of our internal risk management and other monitoring processes that are or need to be established.
The Audit Committee is currently composed of 4 members: Erhard Schipporeit, Thomas Bamberger, Gerhard Maier and Joachim Milberg. The Supervisory Board has determined Erhard Schipporeit to be an audit committee financial expert as defined by the regulations of the SEC issued under Section 407 of the Sarbanes-Oxley Act as well as an independent financial expert as defined by the German Stock Corporation Act. See “Item 16A. Audit Committee Financial Expert” for details. He is also the chairperson of the Audit Committee.
TheGeneral Committee (Präsidialausschuss)coordinates the Supervisory Board agenda, meetings and deals with corporate governance issues. Furthermore, it was assigned the authority to approve the grant of virtual stock options under the SAP SOP 2009 performance plan to all recipients with the exception of Executive Board members.
TheCompensation Committee (Personalausschuss)deals with the employment contracts of Executive Board members. It prepares proposals for the Executive Board members’ compensation and the Executive Board compensation system for approval by the Supervisory Board.
TheFinance and Investment Committee (Finanz- und Investitionsausschuss)addresses general financing issues. Furthermore, it regularly discusses venture capital investments and other equity investments with the Executive Board and reports to the Supervisory Board on such investments. It is also responsible for the approval of such investments if the individual investment amount exceeds certain specified limits.
Required by the German Co-determination Act of 1976 (Mitbestimmungsgesetz), theMediation Committee (Vermittlungsausschuss)convenes only if the two-thirds majority required for appointing/revoking the appointment of Executive Board members is not attained. This committee has never held a meeting in SAP AG’s history.
TheStrategy and Technology Committee (Strategie- und Technologieausschuss)monitors technology transactions and provides the Supervisory Board with in-depth technical advice.
TheNomination Committee (Nominierungsausschuss)is exclusively composed of shareholder representatives and is responsible for identifying suitable candidates for membership of the Supervisory Board for recommendation to the Annual General Meeting of Shareholders.
TheSpecial Committee(Sonderausschuss), established on June 3, 2008, is tasked with coordinating and managing the Supervisory Board’s external legal advisors concerned with the investigation and analysis of the facts in connection with the legal action brought by Oracle Corporation.
The duties, procedures and committees of the Supervisory Board are specified in their respective bylaws which reflect the requirements of the German Stock Corporation Act and the GCGC.
According to the provisions of the Sarbanes-Oxley Act, SAP does not grant loans to the members of the Executive Board or the Supervisory Board.
116
Table of Contents
The Executive Board
The Executive Board manages the Company’s business, is responsible for preparing its strategy and represents it in dealings with third parties. The Executive Board reports regularly to the Supervisory Board about SAP operations and business strategies and prepares special reports upon request. A person may not serve on the Executive Board and on the Supervisory Board at the same time.
The Executive Board and the Supervisory Board must cooperate closely for the benefit of the Company. Without being asked, the Executive Board must provide to the Supervisory Board regular, prompt and comprehensive information about all of the essential issues affecting the SAP Group’s business progress and its potential business risks. Furthermore, the Executive Board must maintain regular contact with the chairperson of the Supervisory Board. The Executive Board must inform the chairperson of the Supervisory Board promptly about exceptional events that are of significance to SAP’s business. The chairperson must inform the Supervisory Board accordingly.
Pursuant to the Articles of Incorporation, the Executive Board must consist of at least 2 members. Currently, SAP AG’s Executive Board is composed of 5 members. Any 2 members of the Executive Board jointly or one member of the Executive Board and the holder of a special power of attorney (Prokurist) jointly may legally represent SAP AG. The Supervisory Board appoints each member of the Executive Board for a maximum term of 5 years, with the possibility of re-appointment. Under certain circumstances, a member of the Executive Board may be removed by the Supervisory Board prior to the expiration of that member’s term. A member of the Executive Board may not vote on matters relating to certain contractual agreements between such member and SAP AG, and may be liable to SAP AG if such member has a material interest in any contractual agreement between SAP and a third party which was not disclosed to and approved by the Supervisory Board. Further, as the compensation of the Executive Board members is set by the Supervisory Board, Executive Board members are unable to vote on their own compensation.
Under German law SAP AG’s Supervisory Board members and Executive Board members have a duty of loyalty and care towards SAP AG. They must exercise the standard of care of a prudent and diligent businessman and bear the burden of proving they did so if their actions are contested. Both bodies must consider the interest of SAP AG shareholders and our employees and, to some extent, the common interest. Those who violate their duties may be held jointly and severally liable for any resulting damages, unless they acted pursuant to a lawful resolution of the Annual General Meeting of Shareholders.
SAP has implemented a Code of Business Conduct for employees (see “Item 16B. Code of Ethics” for details). The employee code is equally applicable to managers and members of the Executive Board.
Under German law the Executive Board of SAP AG has to assess all major risks for the SAP Group. In addition, all measures taken by management to reduce and handle the risks have to be documented. Therefore, SAP’s management has adopted suitable measures such as implementing an enterprise-wide monitoring system to ensure that adverse developments endangering the corporate standing are recognized at a reasonably early point in time.
The Global Compliance Office (GCO), an extension of SAP’s Global Legal Department, was created by the SAP Executive Board in 2006 to oversee and coordinate legal and regulatory policy compliance at SAP. Effective March 1, 2007, the Company appointed a new Chief Global Compliance Officer who reports to the General Counsel, and also has direct communication channels and reporting obligations to the Executive Board and the Audit Committee of the Supervisory Board. The GCO manages a network of more than 100 local subsidiary Compliance Officers who act as the point of contact for local questions or issues under the SAP Code of Business Conduct for employees. The GCO provides training and communication to SAP employees to raise awareness and understanding of legal and regulatory compliance policies. Employee help lines are also supported in each region where questions can be raised or questionable conduct can be reported — without fear of repercussion.
117
Table of Contents
The Annual General Meeting of Shareholders
Shareholders of the Company exercise their voting rights at shareholders’ meetings. The Executive Board calls the Annual General Meeting of Shareholders, which must take place within the first eight months of each fiscal year. The Supervisory Board or the Executive Board may call an extraordinary meeting of the shareholders if the interests of the stock corporation so require. Additionally, shareholders of SAP AG holding in the aggregate a minimum of 5% of SAP AG’s issued share capital may call an extraordinary meeting of the shareholders. Shareholders as of the record date are entitled to attend and participate in shareholders’ meetings if they have provided timely notice of their intention to attend the meeting.
At the Annual General Meeting of Shareholders, the shareholders are asked, among other things, to formally approve the actions taken by the Executive Board and the Supervisory Board in the preceding fiscal year, to approve the distribution of the corporation’s profits, to appoint an independent auditor and to ratify amendments of our Articles of Incorporation. Shareholder representatives of the Supervisory Board are elected at the Annual General Meeting of Shareholders for a term of approximately five years. Shareholders may also be asked to resolve on measures to raise or reduce the capital of the Company. The Annual General Meeting of Shareholders can make management decisions only if requested to do so by the Executive Board.
CHANGE IN CONTROL
There are no provisions in the Articles of Incorporation of SAP AG that would have an effect of delaying, deferring or preventing a change in control of SAP AG and that would only operate with respect to a merger, acquisition or corporate restructuring involving it or any of its subsidiaries.
On January 1, 2002, the German Securities Purchase and Takeover Act (Wertpapiererwerbs- und Übernahmegesetz) became effective. It requires, among other things, that a bidder seeking control of a company with its corporate seat in Germany and traded on a European Union stock exchange must publish advance notice of a tender offer, submit a draft offer statement to the Federal Financial Supervisory Authority (Bundesanstalt für Finanzdienstleistungsaufsicht) for review, and obtain certification from a qualified financial institution that adequate financing is in place to complete the offer. Once a bidder has acquired shares representing 30% of the voting power of the target company, it must make an offer for all remaining shares. The Securities Purchase and Takeover Act requires the executive board of the target company to refrain from taking any measures that may frustrate the success of the takeover offer. However, the target executive board is permitted to take any action that a prudent and diligent management of a company that is not the target of a takeover bid would also take. Moreover, the target executive board may search for other bidders and, with the prior approval of the supervisory board, may take other defensive measures, provided that both boards act within the parameters of their general authority under the German Stock Corporation Act. An executive board may also adopt specific defensive measures if such measures have been approved by the supervisory board and were specifically authorized by the shareholders no later than 18 months in advance of a takeover bid by resolution of 75% of the votes cast.
Effective as of July 14, 2006 the German Implementation Act for the European Takeover Directive amended the German Purchase and Takeover Act. Under the European Takeover Directive member states may choose whether EU restrictions on frustrating action apply to companies that are registered in their territory. Germany decided to opt out and to retain its current restrictions on a board taking frustrating action (as described above). As required by the Directive if a country decides to opt out the German Purchase and Takeover Act grants companies the option of voluntarily applying the European standard by a change of the Articles of Incorporation (opt-in). SAP AG has not made use of this option.
CHANGE IN SHARE CAPITAL
Under German law, the capital stock may be increased in consideration of contributions in cash or in kind, or by establishing authorized capital or contingent capital or by an increase of the company’s capital
118
Table of Contents
reserves. Authorized capital provides the Executive Board with the flexibility to issue new shares for a period of up to five years. The Executive Board must obtain the approval of the Supervisory Board before issuing new shares with regard to the authorized capital. Contingent capital allows the issuance of new shares for specified purposes, including employee stock option plans and the issuance of shares upon conversion of convertible bonds and exercise of stock options. By law, the Executive Board may only issue new shares with regard to the contingent capital for the specified purposes. Capital increases require an approval by 75% of the issued shares present at the Annual General Meeting of Shareholders in which the increase is proposed, and requires an amendment to the Articles of Incorporation.
The share capital may be reduced by an amendment to the Articles of Incorporation approved by 75% of the issued shares present at the Annual General Meeting of Shareholders. In addition, the Executive Board of SAP AG is allowed to authorize a reduction of the company’s capital stock by canceling a defined number of repurchased treasury shares if this repurchasing and the subsequent reduction have already been approved by the Annual General Meeting of Shareholders.
The Articles of Incorporation do not contain conditions regarding changes in the share capital that are more stringent than those required by German law.
RIGHTS ACCOMPANYING OUR SHARES
There are no limitations imposed by German law or the Articles of Incorporation of SAP AG on the rights to own securities, including the rights of non-residents or foreign holders to hold the ADRs or ordinary shares, to exercise voting rights or to receive dividends or other payments on such shares.
According to the German stock corporation law, the rights of shareholders cannot be amended without shareholders’ consent. The Articles of Incorporation do not provide more stringent conditions regarding changes of the rights of shareholders than those required by German law.
Voting Rights
Each ordinary share represents one vote. Cumulative voting is not permitted under German law. SAP AG’s Articles of Incorporation provide that resolutions may be passed at the Annual General Meeting of Shareholders by the majority as required by law. This means that resolutions may be passed by a majority of votes cast, unless the law requires a higher vote. German law requires that the following matters, among others, be approved by the affirmative vote of 75% of the issued shares present at the Annual General Meeting of Shareholders in which the matter is proposed:
| • | changing the corporate purpose of the company set out in the articles of incorporation; | |
| • | capital increases and capital decreases; | |
| • | excluding preemptive rights of shareholders to subscribe for new shares; | |
| • | dissolution; | |
| • | a merger into, or a consolidation with, another company; | |
| • | a transfer of all or virtually all of the assets; and | |
| • | a change of corporate form. |
Dividend Rights
See “Item 3. Key Information — Dividends” and “Item 8. Financial Information — Dividend Policy.”
119
Table of Contents
Preemptive Rights
Shareholders have preemptive rights to subscribe (Bezugsrecht) for any issue of additional shares in proportion to their shareholdings in the issued capital. The preemptive rights may be excluded under certain circumstances by a shareholders’ resolution (approved by 75% of the issued shares present at the Annual General Meeting of Shareholders) or by the Executive Board authorized by such shareholders’ resolutions and subject to the consent of the Supervisory Board.
Liquidation
If SAP AG were to be liquidated, any liquidation proceeds remaining after all of our liabilities were paid would be distributed to our shareholders in proportion to their shareholdings.
Disclosure of Shareholdings
SAP AG’s Articles of Incorporation do not require shareholders to disclose their share holdings. The German Securities Trading Act (Wertpapierhandelsgesetz), however, requires holders of voting securities of SAP AG to notify SAP AG and the Federal Financial Supervisory Authority of the number or shares they hold if that number reaches, exceeds of falls below specified thresholds. These thresholds are 3%, 5%, 10%, 15%, 20%, 25%, 30%, 50% and 75% of the corporation’s outstanding voting rights.
In addition, the German Securities Trading Act also obliges anyone who holds, directly or indirectly, financial instruments that result in an entitlement to acquire, on one’s initiative alone and under a legally binding agreement, shares in SAP AG, to notify without undue delay to SAP AG and the Federal Financial Supervisory Authority if the thresholds mentioned above have been reached, exceeded or fallen below, with the exception of the 3% threshold. Furthermore, the German Risk Limitation Act (Risikobegrenzungsgesetz) provides for an aggregation of positions in voting rights and other financial instruments effective as of March 1, 2009.
Exchange Controls and Other Limitations Affecting Security Holders
The euro is a fully convertible currency. At the present time, Germany does not restrict the export or import of capital, except for investments in certain areas in accordance with applicable resolutions adopted by the United Nations and the European Union. However, for statistical purposes only, every individual or corporation residing in Germany (“Resident”) must report to the German Central Bank (Deutsche Bundesbank), subject only to certain immaterial exceptions, any payment received from or made to an individual or a corporation residing outside of Germany (“Non-Resident”) if such payment exceeds €12,500 (or the equivalent in a foreign currency). In addition, German Residents must report any claims against or any liabilities payable to Non-Residents if such claims or liabilities, in the aggregate, exceed €5 million (or the equivalent in a foreign currency) at the end of any calendar month. Residents are also required to report annually to the German Central Bank any shares or voting rights of 10% or more which they hold directly or indirectly in non-resident corporations with total assets of more than €3 million. Corporations residing in Germany with assets in excess of €3 million must report annually to the German Central Bank any shares or voting rights of 10% or more held directly or indirectly by a Non-Resident.
TAXATION
General
The following discussion is a summary of certain material German tax and U.S. federal income tax consequences of the acquisition, ownership and disposition of our ADRs or ordinary shares to a U.S. Holder. In general, a U.S. Holder (as hereinafter defined) is any beneficial owner of our ADRs or ordinary shares that (i) is a citizen or resident of the U.S. or a corporation organized under the laws of the U.S. or any political subdivision
120
Table of Contents
thereof, an estate whose income is subject to U.S. federal income tax regardless of its source or a trust, if a U.S. court can exercise primary supervision over its administration and one or more U.S. persons are authorized to control all substantial decisions of the trust; (ii) is not a resident of Germany for purposes of the income tax treaty between the U.S. and Germany (Convention between the Federal Republic of Germany and the United States of America for the Avoidance of Double Taxation and the Prevention of Fiscal Evasion with respect to Taxes on Income and Capital and to certain other Taxes, as amended by the Protocol of June 1, 2006 and as published in the German Federal Law Gazette 2008 vol. II pp. 611/851; the “Treaty”); (iii) owns the ADRs or ordinary shares as capital assets; (iv) does not hold the ADRs or ordinary shares as part of the business property of a permanent establishment or a fixed base in Germany; and (v) is fully entitled to the benefits under the Treaty with respect to income and gain derived in connection with the ADRs or ordinary shares.
THE FOLLOWING IS NOT A COMPREHENSIVE DISCUSSION OF ALL GERMAN TAX AND U.S. FEDERAL INCOME TAX CONSEQUENCES THAT MAY BE RELEVANT FOR U.S. HOLDERS OF OUR ADRS OR ORDINARY SHARES. THEREFORE, U.S. HOLDERS ARE STRONGLY URGED TO CONSULT THEIR OWN TAX ADVISORS REGARDING THE OVERALL GERMAN TAX AND U.S. FEDERAL INCOME TAX CONSEQUENCES OF THE ACQUISITION, OWNERSHIP AND DISPOSITION OF OUR ADRS OR ORDINARY SHARES IN LIGHT OF THEIR PARTICULAR CIRCUMSTANCES, INCLUDING THE EFFECT OF ANY STATE, LOCAL OR OTHER FOREIGN OR DOMESTIC LAWS.
German Taxation
The summary set out below is based on German tax laws, interpretations thereof and applicable tax treaties to which Germany is a party that are in force at the date of this Annual Report onForm 20-F and is subject to any changes in such authority occurring after that date, potentially with retroactive effect, that could result in German tax consequences different from those discussed below. This discussion is also based, in part, on representations of the Depositary and assumes that each obligation of the Deposit Agreement and any related agreements will be performed in accordance with its terms. For additional information on the Depository and the fees associated with SAP’S ADR program see “Item 12 Description of Securities Other Than Equity Securities — American Depository Shares.”
For purposes of applying German tax law and the applicable tax treaties to which Germany is a party, a holder of ADRs will generally be treated as owning the ordinary shares represented thereby.
German Taxation of Dividends
Under German income tax law from January 1, 2009 onwards, the full amount of dividends distributed by a company are generally subject to German withholding tax at a domestic rate of 25% plus a solidarity surtax of 5.5% (effectively 1.375% of dividends before withholding tax), resulting in an aggregate withholding tax rate from dividends of 26.375%. Corporate non-resident shareholders will generally be entitled to a refund in the amount of two fifths of the withholding tax (including solidarity surtax). This does not preclude a further reduction of withholding tax, if any, available under a relevant tax treaty.
Generally, for many non-resident shareholders the withholding tax rate is currently reduced under applicable income tax treaties. Rates and procedures may vary according to the applicable treaty. To reduce the withholding tax to the applicable treaty tax rate a non-resident shareholder must apply for a refund of withholding taxes paid. Claims for refund, if any, are made on a special German claim for refund form, which must be filed with the German Federal Tax Office (Bundeszentralamt für Steuern, D-53221 Bonn, Germany;http://www.bzst.bund.de). The relevant forms can be obtained from the German Federal Tax Office or from German embassies and consulates. For details, such non-resident shareholders are urged to consult their own tax advisors. Special rules apply for the refund to U.S. Holders (we refer to the below section “Refund Procedures for U.S. Holders”).
121
Table of Contents
Refund Procedures for U.S. Holders
Under the Treaty, a partial refund of the 25% withholding tax equal to 10% of the gross amount of the dividend and a full refund of the solidarity surtax can be obtained by a U.S. Holder. Thus, for each US$100 of gross dividends paid by SAP AG to a U.S. Holder, the dividends (which are dependent on the euro/dollar exchange rate at the time of payment) will be initially subject to a German withholding tax of US$26.375, of which US$11.375 may be refunded under the Treaty. As a result, a U.S. Holder effectively would receive a total dividend of US$85.
To claim the refund of amounts withheld in excess of the Treaty rate, a U.S. Holder must submit (either directly or, as described below, through the Data Medium Procedure participant) a claim for refund to the German tax authorities, with, in the case of a direct claim, the original bank voucher (or certified copy thereof) issued by the paying entity documenting the tax withheld, within four years from the end of the calendar year in which the dividend is received. Claims for refund are made on a special German claim for refund form, which must be filed with the German Federal Tax Office (Bundeszentralamt für Steuern, D-53221 Bonn, Germany). The German claim for refund form may be obtained from the German tax authorities at the same address where applications are filed, from the Embassy of the Federal Republic of Germany, 4645 Reservoir Road, N.W., Washington, D.C.20007-1998, or can be downloaded from the homepage of the German Federal Tax Office(http://www.bzst.bund.de).
U.S. Holders must also submit to the German tax authorities a certification of their U.S. residency status (IRS Form 6166). This certification can be obtained from the Internal Revenue Service by filing a request for certification (generally on an IRS Form 8802, which will not be processed unless a user fee is paid) with the Internal Revenue Service, P.O. Box 71052, Philadelphia, PA19176-6052. U.S. Holders should consult their own tax advisors regarding how to obtain an IRS Form 6166.
The former simplified refund procedure for U.S. Holders by the Depository is not available for dividends received after December 31, 2008 as it has been revoked by the German Ministry of Finance as of year-end 2008. Instead an IT-supported quick-refund procedure is available (the “Data Medium Procedure — DMP”) for dividends received after December 31, 2008. If the U.S. Holder’s bank or broker elects to participate in the DMP, it will perform administrative functions necessary to claim the Treaty refund for the beneficiaries. The refund beneficiaries must confirm to the DMP participant that they meet the conditions of the Treaty provisions and that they authorize the DMP participant to file applications and receive notices and payments on their behalf. Further each refund beneficiary must confirm that (i) it is the beneficial owner of the dividends received; (ii) it is resident in the U.S. in the meaning of the Treaty; (iii) it does not have its domicile, residence or place of management in Germany; (iv) the dividends received do not form part of a permanent establishment or fixed base in Germany; and (v) it commits, due to its participation in the DMP, not to claim separately for refund.
The beneficiaries also must provide an IRS Form 6166 certification with the DMP participant. The DMP participant is required to keep these documents in its files and prepare and file a combined claim for refund with the German tax authorities by electronic media. The combined claim provides evidence of a U.S. Holder’s personal data including its U.S. Tax Identification Number.
The German tax authorities reserve the right to audit the entitlement to tax refunds for several years following their payment pursuant to the Treaty in individual cases. The DMP participant must assist with the audit by providing the necessary details or by forwarding the queries to the respective refund beneficiaries.
The German tax authorities will issue refunds denominated in euros. In the case of shares held through banks or brokers participating in the Depository, the refunds will be issued to the Depository, which will convert the refunds to dollars. The resulting amounts will be paid to banks or brokers for the account of the U.S. Holders.
122
Table of Contents
German Taxation of Capital Gains
Under German income tax law, a capital gain derived from the sale or other disposition of ADRs or ordinary shares by a non-resident shareholder is subject to income tax in Germany only if such shareholder has held, directly or indirectly, ADRs or ordinary shares representing 1% or more of the registered share capital of a company at any time during the five-year period immediately preceding the sale or other disposition.
Generally, a capital gain derived from the sale or other disposition of ADRs or ordinary shares by a corporate non-resident shareholder is, in principle, exempt from corporation tax. However, a portion of 5% of a capital gain derived is treated as non-deductible business expenses. Therefore, effectively a portion of 95% of a capital gain derived from the sale or other disposition of ADRs or ordinary shares by a corporate non-resident shareholder is exempt and a portion of 5% of a capital gain derived is subject to corporation tax.
However, a U.S. Holder of ADRs or ordinary shares that qualifies for benefits under the Treaty is not subject to German income or corporation tax on the capital gain derived from the sale or other disposition of ADRs or ordinary shares.
German Gift and Inheritance Tax
Generally, a transfer of ADRs or ordinary shares by a non-resident shareholder at death or by way of gift will be subject to German gift or inheritance tax, respectively, if (i) the decedent or donor, or the heir, donee or other transferee is resident in Germany at the time of the transfer, or with respect to German citizens who are not resident in Germany, if the decedent or donor, or the heir, donee or other transferee has not been continuously outside of Germany for a period of more than five years; (ii) the ADRs or ordinary shares are part of the business property of a permanent establishment or a fixed base in Germany; or (iii) the ADRs or ordinary shares subject to such transfer form part of a portfolio that represents 10% or more of the registered share capital of a company and has been held, directly or indirectly, by the decedent or donor, respectively, actually or constructively together with related parties.
However, the right of the German government to impose gift or inheritance tax on a non-resident shareholder may be limited by an applicable estate tax treaty. In the case of a U.S. Holder, a transfer of ADRs or ordinary shares by a U.S. Holder at death or by way of gift generally will not be subject to German gift or inheritance tax by reason of the estate tax treaty between the U.S. and Germany (Convention between the Federal Republic of Germany and the United States of America for the Avoidance of Double Taxation with respect to Estate, Gift and Inheritance Taxes, German Federal Law Gazette 1982 II page 847, as amended by the Protocol of December 14, 1998 as published on December 21, 2000, German Federal Law Gazette 2001 II, page 65; the “Estate Tax Treaty”) so long as the decedent or donor, or the heir, donee or other transferee was not domiciled in Germany for purposes of the Estate Tax Treaty at the time the gift was made, or at the time of the decedent’s death, and the ADRs or ordinary shares were not held in connection with a permanent establishment or a fixed base in Germany. In general, the Estate Tax Treaty provides a credit against the U.S. federal gift or estate tax liability for the amount of gift or inheritance tax paid in Germany, subject to certain limitations, in a case where the ADRs or ordinary shares are subject to German gift or inheritance tax and U.S. federal gift or estate tax.
Other German Taxes
There are currently no German net worth, transfer, stamp or other similar taxes that would apply to a U.S. Holder on the acquisition, ownership, sale or other disposition of ADRs or ordinary shares.
U.S. Taxation
The following discussion applies to U.S. Holders only if the ADRs and ordinary shares are held as capital assets for tax purposes. It does not address tax considerations applicable to U.S. Holders that may be subject to
123
Table of Contents
special tax rules, such as dealers or traders in securities, financial institutions, insurance companies, tax-exempt entities, regulated investment companies, U.S. Holders that hold ordinary shares or ADRs as a part of a straddle, conversion transaction or other arrangement involving more than one position, U.S. Holders that own (or are deemed for U.S. tax purposes to own) 10% or more of the total combined voting power of all classes of voting stock of SAP AG, U.S. Holders that have a principal place of business or “tax home” outside the United States or U.S. Holders whose “functional currency” is not the dollar and U.S. Holders that hold ADRs or ordinary shares through partnerships or other pass-through entities.
The summary set out below is based upon the U.S. Internal Revenue Code of 1986, as amended (the “Code”), the Treaty and regulations, rulings and judicial decisions thereunder at the date of this Annual Report onForm 20-F. Any such authority may be repealed, revoked or modified, potentially with retroactive effect, so as to result in U.S. federal income tax consequences different from those discussed below. No assurance can be given that the conclusions set out below would be sustained by a court if challenged by the IRS. The discussion below is based, in part, on representations of the Depositary, and assumes that each obligation in the Deposit Agreement and any related agreements will be performed in accordance with its terms.
For U.S. federal income tax purposes, a U.S. Holder of ADRs will be considered to own the ordinary shares represented thereby. Accordingly, unless the context otherwise requires, all references in this section to ordinary shares are deemed to refer likewise to ADRs representing an ownership interest in ordinary shares.
U.S. Taxation of Dividends
Subject to the discussion below under “Passive Foreign Investment Company Considerations”, distributions made by SAP AG with respect to ordinary shares (other than distributions in liquidation and certain distributions in redemption of stock), including the amount of German tax deemed to have been withheld in respect of such distributions, will generally be taxed to U.S. Holders as ordinary dividend income.
As discussed above, a U.S. Holder may obtain a refund of German withholding tax under the Treaty to the extent that the German withholding tax exceeds 15% of the dividend distributed. Thus, for each US$100 of gross dividends paid by SAP AG to a U.S. Holder, the dividends (which are dependent on the euro/dollar exchange rate at the time of payment) will be initially subject to German withholding tax of US$25 plus US$1.375 solidarity surtax, and the U.S. Holder will receive US$73.625. A U.S. Holder who obtains the Treaty refund will receive an additional US$11.375 from the German tax authorities. For U.S. tax purposes, such U.S. Holder will be considered to have received a total distribution of US$100, which will be deemed to have been subject to German withholding tax of US$15 (15% of US$100) resulting in the net receipt of US$85.
In the case of a distribution in euro, the amount of the distribution generally will equal the dollar value of the euro distributed (determined by reference to the spot currency exchange rate on the date of receipt of the distribution, or receipt by the Depositary in the case of a distribution on ADRs), regardless of whether the holder in fact converts the euro into dollars, and the U.S. Holder will not realize any separate foreign currency gain or loss (except to the extent that such gain or loss arises on the actual disposition of foreign currency received).
Dividends paid by SAP AG generally will constitute “portfolio income” for purposes of the limitations on the use of passive activity losses (and, therefore, generally may not be offset by passive activity losses) and as “investment income” for purposes of the limitation on the deduction of investment interest expense. Dividends paid by SAP AG will not be eligible for the dividends received deduction generally allowed to U.S. corporations under Section 243 of the Code. Dividends paid by SAP AG to an individual after December 31, 2002 and received prior to January 1, 2011 are treated as “qualified dividends” subject to capital gains rates, i.e. at a maximum rate of 15%, if SAP AG was not in the prior year and, is not in the year in which the dividend is paid, a passive foreign investment company (“PFIC”). Based on our audited financial statements and relevant market and shareholder data, we believe that we were not treated as a PFIC for U.S. federal income taxes with respect to our 2009 tax year. In addition, based on our audited financial statements and our current expectations regarding the value and
124
Table of Contents
nature of our assets, the sources and nature of our income, and relevant market and shareholder data, we do not anticipate becoming a PFIC for the 2010 tax year.
U.S. Taxation of Capital Gains
In general, assuming that SAP AG at no time is a PFIC, upon a sale or exchange of ordinary shares to a person other than SAP AG, a U.S. Holder will recognize gain or loss in an amount equal to the difference between the amount realized on the sale or exchange and the U.S. Holder’s adjusted tax basis in the ordinary shares. Such gain or loss will be a capital gain or loss and will be considered a long-term capital gain (taxable at a reduced rate for individuals) if the ordinary shares were held for more than one year. The deductibility of capital losses is subject to significant limitations. Upon a sale of ordinary shares to SAP AG, a U.S. Holder may recognize a capital gain or loss or, alternatively, may be considered to have received a distribution with respect to the ordinary shares, in each case depending upon the application to such sale of the rules of Section 302 of the Code.
Deposit and withdrawal of ordinary shares in exchange for ADRs by a U.S. Holder will not result in its realization of gain or loss for U.S. federal income tax purposes.
U.S. Foreign Tax Credit
In general, in computing its U.S. federal income tax liability, a U.S. Holder may elect for each taxable year to claim a deduction or, subject to the limitations on foreign tax credits generally, a credit for foreign income taxes paid or accrued by it. For U.S. foreign tax credit purposes, subject to the applicable limitations under the foreign tax credit rules, German tax withheld from dividends paid to a U.S. Holder, up to the 15% provided under the Treaty, will be eligible for credit against the U.S. Holder’s federal income tax liability or, if the U.S. Holder has elected to deduct such taxes, may be deducted in computing taxable income.
For U.S. foreign tax credit purposes, dividends paid by SAP AG generally will be treated as foreign-source income and as “passive category income” (or in the case of certain holders, as “general category income”). Gains or losses realized by a U.S. Holder on the sale or exchange of ordinary shares generally will be treated asU.S.-source gain or loss.
Passive Foreign Investment Company Considerations
Special and adverse U.S. tax rules apply to a U.S. Holder that holds an interest in a passive foreign investment company (PFIC). Based on current projections concerning the composition of SAP AG’s income and assets, SAP AG does not believe that it will be treated as a PFIC for its current or future taxable years. However, because this conclusion is based on our current projections and expectations as to its future business activity, SAP AG can provide no assurance that it will not be treated as a PFIC in respect of its current or any future taxable years.
MATERIAL CONTRACTS
We are party to material contracts, as follows:
2009 Three-Year Revolving Credit Facility
To increase its financial flexibility, in September 2009 SAP AG negotiated a three-year €1.5 billion syndicated credit facility with a group of international banks. This facility replaced a €1 billion facility that had been available to SAP AG until that time. Neither the previous facility, which was established in 2004, nor the new facility has yet been drawn on. The credit facility agreement contains achange-of-control clause. This clause obliges SAP AG to notify the banks if it learns that in the meaning of the German Securities Acquisition and Takeover Act any person or any group of persons acting together has acquired control of more than 50% of
125
Table of Contents
the voting shares. If, on receiving the notification, banks that represent at least two-thirds of the credit volume so require, the banks have the right to cancel the credit facility and demand complete repayment of the outstanding debt. If no continuation agreement is reached, the credit facility would end and the obligation to repay would become effective at an ascertainable time.
This description is a summary of the Credit Facility and is qualified in its entirety by the Credit Facility, which is filed as Exhibit 4.6 to this Annual Report onForm 20-F.
Private Placement Transaction
In April and May 2009, SAP AG issued several tranches of a private placement transaction (“Schuldschein”) outside of the United States. The total schuldschein is for €697 million, with three-year and five-year tranches. The underlying agreements containchange-of-control clauses. These clauses give the lenders special termination rights if in the meaning of the German Securities Acquisition and Takeover Act any person or any group of persons acting together acquires control of more than 50% of the voting shares of SAP. If no continuation agreement is reached within 30 days after a change of control, the lenders would be entitled to declare the loan due and demand repayment of the outstanding debt without delay.
Other Material Contracts and Agreements
In agreements between SAP AG and various banks for bilateral credit facilities that totaled €545 million on December 31, 2009, we have agreed to material adverse change clauses permitting the banks to terminate if events occur that are materially adverse to SAP AG’s economic standing. A change of control could be considered materially adverse pursuant to those agreements. These clauses are customary. In the past, we have utilized these bilateral credit facilities only infrequently for a few days. We believe that in view of our current liquidity situation, termination of these credit facilities would not have a materially adverse effect, at least in the near term.
We have entered into relationships with various companies to jointly develop and market new software products. These relationships are governed by development and marketing agreements with the respective companies. Some of the agreements include provisions that, in the event of a change of control over one of the parties, give the other party a right to consent to the assignment of the agreement or to terminate it.
Agreements have been concluded with the members of the Executive Board concerning compensation in the event of a change of control. These agreements, which are encountered with increasing frequency in Germany and elsewhere, are described in the Compensation Report section. We have no analogous compensation agreements with employees.
DOCUMENTS ON DISPLAY
We are subject to the informational requirements of the Securities Exchange Act of 1934, as amended. In accordance with these requirements, we file reports and furnish other information as a foreign private issuer with the SEC. These materials, including this Annual Report onForm 20-F and the exhibits thereto, may be inspected and copied at the SEC’s Public Reference Room at 100 F Street, N.E., Room 1580, Washington, D.C. 20549. The SEC also maintains a Web site atwww.sec.gov that contains reports and other information regarding registrants that file electronically with the SEC. Our annual report and some of the other information submitted by us to the SEC may be accessed through this Web site. In addition, information about us is available at our Web site:www.sap.com.
ITEM 11. QUANTITATIVE AND QUALITATIVE DISCLOSURES ABOUT MARKET RISK
We are exposed to various financial risks, such as market risks, including changes in foreign currency exchange rates, interest rates and equity prices, as well as credit risk and liquidity risk. We manage these risks on
126
Table of Contents
a Group-wide basis. Selected derivatives are exclusively used for this purpose and not for speculation, which is defined as entering into derivative instruments without a corresponding underlying transaction. Financial risk management is done centrally. The risk management and hedging strategy is set by our Treasury guideline and other internal guidelines and is subject to continuous internal risk analysis. See Note 25 and 26 to our Consolidated Financial Statements for our quantitative and qualitative disclosures about market risk in “Item 18. Financial Statements.”
ITEM 12. DESCRIPTION OF SECURITIES OTHER THAN EQUITY SECURITIES
American Depositary Shares
Fees and Charges Payable by ADR Holders
Deutsche Bank Trust Company Americas is the Depositary for SAP AG’s ADR program. ADR holders may be required to pay the following charges:
| • | taxes and other governmental charges; | |
| • | registration fees as may be in effect from time to time for the registration of transfers of SAP ordinary shares on any applicable register to the Depositary or its nominee or the custodian or its nominee in connection with deposits or withdrawals under the Deposit Agreement; | |
| • | applicable air courier, cable, telex and facsimile expenses of the Depositary; | |
| • | expenses incurred by the Depositary in the conversion of foreign currency; | |
| • | $5.00 or less per 100 ADSs (or portion thereof) to the Depositary for the execution and delivery of ADRs (including in connection with the depositing of SAP ordinary shares or the exercising of rights) and the surrender of ADRs as well as for the distribution of other securities; | |
| • | a maximum aggregate service fee of U.S. $2.00 per 100 ADSs (or portion thereof) per calendar year to the Depositary for the services performed by the Depositary in administering the ADR program, including for processing any cash dividends and other cash distributions; and | |
| • | $5.00 or less per 100 ADSs (or portion thereof) to the Depositary for distribution of securities other than SAP ordinary shares or rights. |
These charges are described more fully in Section 5.9 of the Amended and Restated Deposit Agreement dated November 25, 2009, incorporated by reference as Exhibit 4.1.2 to this Annual Report onForm 20-F.
Applicable service fees are either deducted from any cash dividends or other cash distributions or charged separately to holders in a manner determined by the Depositary, depending on whether ADSs are registered in the name of investors (whether certificated or in book-entry form) or held in brokerage and custodian accounts (via DTC). In the case of distributions of securities other than SAP ordinary shares or rights, the Depositary charges the applicable ADS record date holder concurrent with the distribution. In the case of ADSs registered in the name of the investor, whether certificated or in book entry form, the Depositary sends invoices to the applicable record date ADS holders. For ADSs held in brokerage and custodian accounts via DTC, the Depositary may, if permitted by the settlement systems provided by DTC, collect the fees through those settlement systems from the brokers and custodians holding ADSs in their DTC accounts. The brokers and custodians who hold their clients’ ADSs in DTC accounts in such case may in turn charge their clients’ accounts the amount of the service fees paid to the Depositary.
In the event of a refusal to pay applicable fees, the Depositary may refuse the requested services until payment is received or may set off the amount of the service from any distribution to be made to the ADR holder, all in accordance with the Deposit Agreement.
127
Table of Contents
If any taxes or other governmental charges are payable by the holdersand/or beneficial owners of ADSs to the Depositary, the Depositary, the custodian or SAP may withhold or deduct from any distributions made in respect of the deposited SAP ordinary share and may sell for the account of the holderand/or beneficial owner any or all of the deposited ordinary shares and apply such distributions and sale proceeds in payment of such taxes (including applicable interest and penalties) or charges, with the holder and the beneficial owner thereof remaining fully liable for any deficiency.
Fees and Other Payments Payable by the Depositary to SAP
The Depositary has agreed to make certain payments to SAP as reimbursement for expenses incurred by SAP in connection with its ADR program and in support of SAP’s ongoing investor relations activities related to the ADR program. For the year ended December 31, 2009, the Depositary has made the following direct and indirect payments to SAP:
| • | US $72,531 for the 2009 NYSE ADR listing fees; and | |
| • | US $2,000,000 for investor relations activities related to the ADR program, including the production of annual reports andForm 20-F filings, 2010 NYSE listing fees, road shows, production of investor targeting, peer analysis, shareholder identification reports and perception studies, postage for mailing annual and interim reports and other communications to ADR holders and participation in retail investor activities, broker conferences, SAP sponsored analyst events and capital markets days. |
PART II
ITEM 13. DEFAULTS, DIVIDEND ARREARAGES AND DELINQUENCIES
None.
ITEM 14. MATERIAL MODIFICATIONS TO THE RIGHTS OF SECURITY HOLDERS AND USE OF PROCEEDS
None.
ITEM 15. CONTROLS AND PROCEDURES
EVALUATION OF DISCLOSURE CONTROLS AND PROCEDURES
Disclosure controls and procedures are controls and other procedures of SAP that are designed to ensure that information required to be disclosed by SAP in the reports that it files or submits under the Exchange Act is recorded, processed, summarized and reported within the time periods specified in the Commission’s rules and forms. Disclosure controls and procedures include, without limitation, controls and procedures designed to ensure that information required to be disclosed by SAP in the reports that it files or submits under the Exchange Act is accumulated and communicated to SAP management, including SAP’s principal executive and financial officers (i.e. SAP’s co-chief executive officers (Co-CEOs) and chief financial officer (CFO)), or persons performing similar functions, as appropriate to allow timely decisions regarding required disclosure. SAP’s management evaluated, with the participation of SAP’s Co-CEOs and CFO the effectiveness of SAP’s disclosure controls and procedures as of December 31, 2009. The evaluation was led by SAP’s Global Governance Risk & Compliance function, including dedicated “SOX Champions” in all of SAP’s major entities and business units with the participation of process owners, SAP’s key corporate senior management, senior management of each business group, and as indicated above under the supervision of SAP’s Co-CEOs and CFO. Based on the foregoing, SAP’s management, including SAP’s Co-CEOs and CFO, concluded that as of December 31, 2009, SAP’s disclosure controls and procedures were effective.
128
Table of Contents
MANAGEMENT’S ANNUAL REPORT ON INTERNAL CONTROL OVER FINANCIAL REPORTING
The management of SAP is responsible for establishing and maintaining adequate internal control over financial reporting as such term is defined inRules 13a-15(f) and15d-15(f) under the Securities Exchange Act of 1934. SAP’s internal control over financial reporting is a process designed under the supervision of SAP’s Co-CEOs and CFO to provide reasonable assurance regarding the reliability of financial reporting and the preparation of financial statements for external reporting purposes in accordance with International Financial Reporting Standards as issued by the International Accounting Standards Board.
SAP’s management assessed the effectiveness of the Company’s internal control over financial reporting as of December 31, 2009. In making this assessment, it used the criteria set forth by the Committee of Sponsoring Organizations of the Treadway Commission (COSO) in “Internal Control — Integrated Framework.”
Based on the assessment under these criteria, SAP management has concluded that, as of December 31, 2009, the Company’s internal control over financial reporting was effective.
KPMG AG Wirtschaftsprüfungsgesellschaft, our independent registered public accounting firm has issued its attestation report on the effectiveness of SAP’s internal control over financial reporting, which is included in Item 18. Financial Statements,” “Report of Independent Registered Public Accounting Firm.”
CHANGES IN INTERNAL CONTROL OVER FINANCIAL REPORTING
There has been no change in our internal control over financial reporting during the period covered by this Annual Report onForm 20-F that has materially affected, or is reasonably likely to materially affect, our internal control over financial reporting.
ITEM 16. [RESERVED]
ITEM 16A. AUDIT COMMITTEE FINANCIAL EXPERT
Our Supervisory Board determined that Erhard Schipporeit is an “audit committee financial expert,” as defined by the regulations of the Commission issued pursuant to Section 407 of the Sarbanes-Oxley Act of 2002 and meeting the requirements of Item 16A. He is “independent,” as such term is defined inRule 10A-3 under the Exchange Act.
ITEM 16B. CODE OF ETHICS
In 2003, SAP adopted a Code of Business Conduct that applies to all employees (including all personnel in the accounting and controlling departments) and the members of SAP’s Executive Board (including our CEO and CFO). Our Code of Business Conduct constitutes a “code of ethics” as defined in Item 16.B ofForm 20-F. Our Code of Business Conduct sets standards for all dealings with customers, partners, competitors and suppliers and includes, among others, regulations with regard to confidentiality, loyalty, preventing conflicts of interest, preventing bribery, and avoiding anti-competitive practices. International differences in culture, language, and legal and social systems make the adoption of uniform Codes of Business Conduct across an entire global company challenging. As a result, SAP has set forth a master code containing minimum standards. In turn, each company within the SAP Group has been required to adopt a similar code that meets at least these minimum standards, but may also include additional or more stringent rules of conduct. Newly acquired companies also are required to meet the minimum standards set forth in the Code of Business Conduct.
We have made our Code of Business Conduct publicly available by posting the full text on our Web site underwww.sap.com/corpgovernance(section “Policies and Statutes”).
129
Table of Contents
ITEM 16C. PRINCIPAL ACCOUNTANT FEES AND SERVICES
AUDIT FEES, AUDIT-RELATED FEES, TAX FEES AND ALL OTHER FEES
Refer to Note 32 to our Consolidated Financial Statements for information on fees paid to our independent registered public accounting firm, KPMG, for audit services and other professional services.
AUDIT COMMITTEE’S PRE-APPROVAL POLICIES AND PROCEDURES
As required under German law, our shareholders appoint our independent auditors to audit our financial statements, based on a proposal that is legally required to be submitted by the Supervisory Board. The Supervisory Board’s proposal is based on a proposal by the Audit Committee. See also the description under the heading “Corporate Governance” in “Item 10. Additional Information.”
In 2002 our Audit Committee adopted a policy with regard to the pre-approval of audit and non-audit services to be provided by our independent auditors. This policy, which is designed to assure that such engagements do not impair the independence of our auditors, was amended and expanded in 2003, 2007 and 2009 (changes in 2009 only related to information requirements). The policy requires prior approval of the Audit Committee for all services to be provided by our independent auditors for any entity of the SAP Group. With regard to non-audit services the policy distinguishes among three categories of services:
| 1. | “Prohibited services:” This category includes services that our independent auditors must not be engaged to perform. These are services that are not permitted by applicable law or that would be inconsistent with maintaining the auditors’ independence. | |
| 2. | “Services requiring universal approval:” Services of this category may be provided by our independent auditors up to a certain aggregate amount in fees per year that is determined annually by the Audit Committee. | |
| 3. | ‘‘Services requiring individual approval:” Services of this category may only be provided by our independent auditors if they have been individually (specifically) pre-approved by the Audit Committee or an Audit Committee member who is authorized by the Audit Committee to make such approvals. |
Our Chief Accounting Officer reviews all individual requests to engage our independent auditors as a service provider in accordance with this policy and determines the category to which the requested service belongs. All requests for engagements with expected fees over a specified limit are additionally reviewed by our CFO. Based on the determination of the category the request is (i) declined if it is a “prohibited service,” (ii) approved if it is a “service requiring universal approval” and the maximum aggregate amount fixed by the Audit Committee has not been reached or (iii) forwarded to the Audit Committee for individual approval if the “service requires individual approval” or is a “service requiring universal approval” and the maximum aggregate amount fixed by the Audit Committee has been exceeded.
Our Audit Committee’s pre-approval policies also include information requirements to ensure the Audit Committee is kept aware of the volume of engagements involving our independent auditors that were not individually pre-approved by the Audit Committee itself.
All services performed by our independent auditors in the last two fiscal years were authorized pursuant to our pre-approval policies.
Substantially all of the work performed to audit our Consolidated Financial Statements was performed by our principal accountant’s full-time, permanent employees.
130
Table of Contents
ITEM 16D. EXEMPTIONS FROM THE LISTING STANDARDS FOR AUDIT COMMITTEES
Rule 10A-3 of the Exchange Act requires that all members of our audit committee be independent, subject to certain exceptions. In accordance with German law, the Audit Committee consists of both employee and shareholder elected members.Rule 10A-3 provides an exception for an employee of a foreign private issuer such as SAP who is not an executive officer of that issuer and who is elected to the supervisory board or audit committee of that issuer pursuant to the issuer’s governing law. In this case, the employee is exempt from the independence requirements ofRule 10A-3 and is permitted to sit on the audit committee.
We rely on this exemption. Our Audit Committee includes two members who are non-executive employees of SAP AG, Thomas Bamberger and Gerhard Maier, who were named to our Supervisory Board pursuant to the German Co-determination Act (see Item 6 for details). We believe that the reliance on this exemption does not materially adversely affect the ability of our Audit Committee to act independently and to satisfy the other requirements ofRule 10A-3.
ITEM 16E. PURCHASES OF EQUITY SECURITIES BY THE ISSUER AND AFFILIATED PURCHASERS
We did not purchase any of our ordinary shares or ADRs in 2009. However, we typically purchase our ordinary shares under our supported Employee Discount Stock Purchase Programs, Long-Term Incentive Plans, Stock Option Plans and other share buy-back activities. The maximum number of shares that may yet be purchased as of December 31, 2009 were 85,341,496.
Purchases between January 1, 2009 and May 19, 2009 would have been made in accordance with the authorization to acquire and use treasury shares granted at the Annual General Meeting of Shareholders on June 3, 2008, pursuant to which the Executive Board was authorized to acquire, on or before November 30, 2009, up to 120 million shares of SAP.
Purchases between May 20, 2009 and December 31, 2009 would have been made in accordance with the authorization to acquire and use treasury shares granted at the Annual General Meeting of Shareholders on May 19, 2009, pursuant to which the Executive Board was authorized to acquire, on or before October 31, 2010, up to 120 million shares of SAP. The authorization from May 19, 2009 replaced the authorization from June 3, 2008.
Both authorizations were subject to the provision that the shares to be purchased, together with any other shares already acquired and held by SAP, do not account for more than 10% of SAP’s capital stock.
ITEM 16F. CHANGES IN REGISTRANTS’S CERTIFYING ACCOUNTANT
Not applicable.
ITEM 16G. DIFFERENCES IN CORPORATE GOVERNANCE PRACTICES
The following summarizes the principal ways in which our corporate governance practices differ from the New York Stock Exchange (NYSE) corporate governance rules applicable to U.S. domestic issuers (the NYSE Rules.)
Introduction
SAP is incorporated under the laws of Germany, with securities publicly traded on markets in Germany (Frankfurt Exchange) and the United States (NYSE).
The NYSE Rules permit foreign private issuers to follow applicable home country corporate governance practices in lieu of the NYSE corporate governance standards, subject to certain exceptions. Foreign private issuers electing to follow home country corporate governance rules are required to disclose the principal differences in their corporate governance practices from those required under the NYSE Rules. This Item 16G
131
Table of Contents
summarizes the principal ways in which SAP’s corporate governance practices differ from the NYSE Rules applicable to domestic issuers.
Legal Framework
The primary source of law relating to the corporate governance of a German stock corporation is the German Stock Corporation Act (Aktiengesetz). Additionally, the Securities Trading Act (Wertpapierhandelsgesetz), the German Securities Purchase and Take Over Act (Wertpapiererwerbs- und Übernahmegesetz), the Stock Exchange Admission Regulations, the German Commercial Code (Handelsgesetzbuch) and certain other German statutes contain corporate governance rules applicable to SAP. In addition to these mandatory rules, the German Corporate Governance Code (“GCGC”) summarizes the mandatory statutory corporate governance principles found in the German Stock Corporation Act and other provisions of German law. Further, the GCGC contains supplemental recommendations and suggestions for standards on responsible corporate governance intended to reflect generally accepted best practices.
The German Stock Corporation Act requires the executive and the supervisory board of exchange-listed companies like SAP to declare annually that the recommendations set forth in the GCGC have been and are being complied with, and to identify any recommendations not being applied. SAP has disclosed deviations from a few of the GCGC recommendations in its Declaration of Compliance on a yearly basis since 2003. Since 2004, these declarations are available on the SAP website (www.sap.com/about/governance/statutes/index.epx).
Significant Differences
We believe the following to be the significant differences between German corporate governance practices, as SAP has implemented them, and those applicable to domestic companies under the NYSE Rules.
German Stock Corporations are Required to have a Two-Tier Board System
SAP is governed by three separate bodies: (i) the Supervisory Board, which counsels, supervises and controls the Executive Board; (ii) the Executive Board, which is responsible for theday-to-day management of SAP; and (iii) the General Shareholders’ Meeting. The rules applicable to these governing bodies are defined by German law and by SAP’s Articles of Incorporation. This corporate structure differs from the unitary board of directors established by the relevant laws of all U.S. states and the NYSE Rules. Under the German Stock Corporation Act, the Supervisory Board and Executive Board are separate and no individual may be a member of both boards. See “Item 10. Additional Information — Corporate Governance” for additional information on the corporate structure.
Director Independence Rules
The NYSE Rules require that a majority of the members of the board of directors of a listed issuer and each member of its nominating, corporate governance, compensation and audit committee be “independent.” The NYSE Rules stipulate that no director qualifies as “independent” unless the board of directors has made an affirmative determination that the director has no material direct or indirect relationship with the listed company. However, under the NYSE Rules a director may still be deemed independent even if the director or a member of a director’s immediate family has received during a 12 month period within the prior three years up to $120,000 in direct compensation. In addition, a director may also be deemed independent even if a member of the director’s immediate family works for the company’s auditor in a non-partner capacity and not on the company’s audit. By contrast, the GCGC requires that the Supervisory Board ensure that proposed candidates are persons with the necessary knowledge, competencies and applicable experience, and that the Supervisory Board includes what it considers an adequate number of independent members. A Supervisory Board member is considered independent if he or she has no business or personal relations with SAP or its Executive Board that could give rise to a conflict of interest. The members of the Supervisory Board must have enough time to
132
Table of Contents
perform their board duties and must carry out their duties carefully and in good faith. For as long as they serve, they must comply with the criteria that are enumerated in relation to the selection of candidates for the Supervisory Board concerning independence, conflict of interest and multiple memberships of management, supervisory and other governing bodies. They must be loyal to SAP in their conduct and they must not accept appointment in companies that are in competition with SAP. Supervisory Board members must disclose any planned non-ordinary course business transactions with SAP to the Supervisory Board promptly. The Supervisory Board members cannot carry out such transactions before the Supervisory Board has given its permission. The Supervisory Board may grant its permission for any such transaction only if the transaction is based on terms and conditions that are standard for the type of transaction in question and if the transaction is not contrary to SAP’s interest. SAP complies with these GCGC director independence requirements.
German corporate law requires that for listed stock corporations at least one member of the Supervisory Board who has expert knowledge in the areas of financial accounting and audit of financial statements must be independent. Mr. Erhard Schipporeit who is the Chairman of SAP’s Audit Committee meets these requirements. However, German corporate law and the GCGC do not require the Supervisory Board to make an affirmative determination for each individual director that is independent or that a majority of Supervisory Board members or the members of a specific committee are independent.
The NYSE independence requirements are closely linked with risks specific to unitary boards of directors that are customary for U.S. companies. In contrast, the two-tier board structure requires a strict separation of the executive board and supervisory board. In addition, the supervisory board of large German stock corporations is subject to the principle of employee codetermination as outlined in the German Co-Determination Act of 1976 (Mitbestimmungsgesetz). As a result, the Supervisory Board of SAP AG consists of 16 members, of which eight have been elected by SAP AG’s shareholders at the Annual General Meeting and eight members have been elected by employees of SAP AG and its German subsidiaries. Typically, the chairperson of the supervisory board is a shareholder representative. In case of a tie vote, the supervisory board chairperson may cast the decisive tie-breaking vote. This board structure creates a different system of checks and balances, including employee participation, and cannot be directly compared with a unitary board system.
Audit Committee Independence
As a foreign private issuer, the NYSE Rules require SAP to establish an Audit Committee that satisfies the requirements ofRule 10A-3 of the Exchange Act with respect to audit committee independence. SAP is in compliance with these requirements. The Chairman of SAP’s Audit Committee and Mr. Joachim Milberg meet the independence requirements ofRule 10A-3 of the Exchange Act. The other two Audit Committee members, Messrs. Thomas Bamberger and Gerhard Maier, are employee representatives who are eligible for the exemption provided by Rule 10A-3 (b) (1) (iv) (C) (see Item 16.D for details).
The Audit Committee independence requirements are similar to the Board independence requirements under German corporate law and GCGC. See the section above under “Director Independent Rules” for the same elected member for the Audit committee. Nonetheless, SAP meets the NYSE Rules on audit committee independence applicable to foreign private issuers.
Rules on Non-Management Board Meetings are Different
Section 303 A.03 of the NYSE Rules stipulates that the non-management board of each listed issuer must meet at regularly scheduled executive sessions without the management. Under German corporate law and the GCGC the Supervisory Board is entitled but not required to exclude Executive Board members from its meetings. The Supervisory Board exercises this right temporarily during its meetings, for example when it discusses or decides Executive Board member affairs like the appointment of new Executive Board members.
133
Table of Contents
Rules on Establishing Committees Differ
Pursuant to Section 303 A.04 and 303 A.05 of the NYSE Rules listed companies are required to set up a Nominating/Corporate Governance Committee and a Compensation Committee, each composed entirely of independent directors and having a written charter specifying the committee’s purpose and responsibilities. In addition, each committee’s performance must be reviewed annually. With one exception, German corporate law does not mandate the creation of specific supervisory board committees. Required by the German Co-Determination Act of 1976 (Mitbestimmungsgesetz), the Mediation Committee (Vermittlungsausschuss) convenes only if the2/3 majority required for appointing/revoking the appointment of Executive Board Members is not attained. This committee has never been convened in SAP’s history. In addition, the GCGC recommends that the Supervisory Board establish an Audit Committee and a Nomination Committee. In addition to the legally required Mediation Committee, SAP has the following committees, which are in compliance with the GCGC: General Committee, Compensation Committee, Audit Committee, Strategy and Technology Committee, Finance and Investment Committee, Nomination Committee, and Special Committee (See “Item 10. Additional Information — Corporate Governance” for more information).
Rules on Shareholders’ Compulsory Approval are Different
Section 312 of the NYSE Rules requires U.S. companies to seek shareholder approval of all equity-compensation plans, including certain material revisions thereto (subject to certain exemptions as described in the rules), issuances of common stock, including convertible stock, if the common stock has, or will have upon issuance, voting power of or in excess of 20% of the then outstanding common stock, and issuances of common stock if they trigger a change of control.
According to the German Stock Corporation Act and other applicable German laws, shareholder approval is required for a broad range of matters, such as amendments to the articles of association, certain significant corporate transactions (including inter-company agreements and material restructurings), the offering of stock options and similar equity compensation to its employees by a way of a conditional capital increase or by using treasury shares (including significant aspects of such an equity compensation plan as well as the exercise thresholds), the issuance of new shares, the authorization to purchase the corporation’s own shares, and other essential issues, such as transfers of all, or substantially all, of the assets of the stock corporation, including shareholdings in subsidiaries.
Specific Principles of Corporate Governance
Under the NYSE Rules Section 303 A.09 listed companies must adopt and disclose corporate guidelines. Since October 2007, SAP has applied the recommended corporate governance standards of the GCGC rather than company-specific principles of corporate governance. The CGCG recommendations differ from the NYSE Standards primarily as outlined in this Item 16G.
Specific Code of Business Conduct
NYSE Rules Section 303 A.10 requires listed companies to adopt and disclose a code of business conduct and ethics for directors, officers and employees, and to disclose promptly any waivers of the code for directors or executive officers. Although not required under German law, SAP has adopted a Code of Business Conduct, which is equally applicable to employees, managers and members of the Executive Board. SAP complies with the requirement to disclose the Code of Business Conduct and any waivers of the code with respect to directors and executive officers.
134
Table of Contents
PART III
ITEM 17. FINANCIAL STATEMENTS
Not applicable.
ITEM 18. FINANCIAL STATEMENTS
The financial statements are included herein on pages F-1 through F-105. The financial statement schedule is included herein on pages S-1 through S-4.
The following are filed as part of this Annual Report onForm 20-F:
| • | Report of Independent Registered Public Accounting Firm. | |
| • | Consolidated Financial Statements |
| • | Consolidated Income Statements for the years ended 2009, 2008 and 2007. | |
| • | Consolidated Statements of Comprehensive Income for the years ended December 31, 2009, 2008 and 2007. | |
| • | Consolidated Statements of Financial Position as of December 31, 2009 and 2008. | |
| • | Consolidated Statements of Changes in Equity for the years ended December 31, 2009, 2008 and 2007. | |
| • | Consolidated Statements of Cash Flows for the years ended December 31, 2009, 2008 and 2007. | |
| • | Notes to the Consolidated Financial Statements. |
| • | Financial Statement Schedule I — Reconciliations from U.S. GAAP to IFRS for the years ended December 31, 2007 and 2006. |
ITEM 19. EXHIBITS
The following documents are filed as exhibits to this Annual Report onForm 20-F:
| 1 | Articles of Incorporation (Satzung) of SAP AG, as amended to date (English translation). | |||
| 2 | .1 | Form of global share certificate for ordinary shares (English translation).(1) | ||
| 2 | .2 | Form of American Depositary Receipt.(2) | ||
| 4 | .1 | Form of Amended and Restated Deposit Agreement among SAP AG, Deutsche Bank Trust Company Americas, as Depositary, and all owners and holders from time to time of American Depositary Receipts issued thereunder, including the form of American Depositary Receipts, dated as of December 3, 2004.(3) | ||
| 4 | .1.1 | Amendment No. 1 dated as of December 20, 2006 to Amended and Restated Deposit Agreement among SAP AG, Deutsche Bank Trust Company Americas, as Depository, and all owners and holders from time to time of American Depositary Receipts issued thereunder, including the form of American Depositary Receipts.(1) | ||
| 4 | .1.2 | Amended and Restated Deposit Agreement dated as of November 25, 2009 among SAP AG, Deutsche Bank Trust Company Americas as Depositary, and all owners and holders from time to time of American Depositary Receipts issued thereunder, including the form of American Depositary Receipts.(2) | ||
| 4 | .6 | Revolving Credit Facility dated September 16, 2009 by and among SAP AG (Borrower), Deutsche Bank AG, J.P. Morgan plc and The Royal Bank of Scotland plc (as lead arrangers and book runners). | ||
| 12 | .1 | Certification of Bill McDermott, Co-Chief Executive Officer, required byRule 13a-14(a) orRule 15d-14(a). |
135
Table of Contents
| 12 | .2 | Certification of Jim Hagemann Snabe, Co-Chief Executive Officer, required byRule 13a-14(a) orRule 15d-14(a). | ||
| 12 | .3 | Certification of Werner Brandt, Chief Financial Officer, required byRule 13a-14(a) orRule 15d-14(a). | ||
| 13 | .1 | Certification of Bill McDermott, Co-Chief Executive Officer, pursuant to 18 U.S.C. Section 1350, as adopted pursuant to Section 906 of the Sarbanes-Oxley Act of 2002. | ||
| 13 | .2 | Certification of Jim Hagemann Snabe, Co-Chief Executive Officer, pursuant to 18 U.S.C. Section 1350, as adopted pursuant to Section 906 of the Sarbanes-Oxley Act of 2002. | ||
| 13 | .3 | Certification of Werner Brandt, Chief Financial Officer, pursuant to 18 U.S.C. Section 1350, as adopted pursuant to Section 906 of the Sarbanes-Oxley Act of 2002. | ||
| 15 | Consent of Independent Registered Public Accounting Firm. |
| (1) | Incorporated by reference to the Annual Report onForm 20-F of SAP AG filed on March 22, 2006. | |
| (2) | Incorporated by reference to the Post Effective Amendment #1 to Registration Statement onForm F-6 of SAP AG filed on November 25, 2009. | |
| (3) | Incorporated by reference to the Current Report onForm 6-K of SAP AG, filed on December 13, 2004. |
136
Table of Contents
SIGNATURES
The Registrant hereby certifies that it meets all of the requirements for filing onForm 20-F and that it has duly caused and authorized the undersigned to sign this Annual Report on its behalf.
SAP AG
(Registrant)
| By: /s/ | BILL MCDERMOTT |
Name: Bill McDermott
Title: Co-Chief Executive Officer
Dated: March 25, 2010
| By: /s/ | JIM HAGEMANN SNABE |
Name: Jim Hagemann Snabe
Title: Co-Chief Executive Officer
Dated: March 25, 2010
| By: /s/ | WERNER BRANDT |
Name: Dr. Werner Brandt
Title: Chief Financial Officer
Dated March 25, 2010
137
Table of Contents
SAP AG AND SUBSIDIARIES
INDEX TO THE CONSOLIDATED FINANCIAL STATEMENTS
| Page | ||||
| F-1 | ||||
| F-3 | ||||
| F-4 | ||||
| F-5 | ||||
| F-6 | ||||
| F-7 | ||||
| F-8 to F-105 | ||||
| S-1-S-5 | ||||
Table of Contents
REPORT OF INDEPENDENT REGISTERED PUBLIC ACCOUNTING FIRM
The Supervisory Board of SAP AG:
We have audited the accompanying consolidated statements of financial position of SAP AG and subsidiaries (“SAP” or “the Company”) as of December 31, 2009 and 2008, and the related consolidated statements of income, comprehensive income, changes in equity, and cash flows for each of the years in the three-year period ended December 31, 2009. In connection with our audits of the consolidated financial statements, we also have audited the financial statement schedule. We also have audited SAP’s internal control over financial reporting as of December 31, 2009, based on criteria established inInternal Control — Integrated Frameworkissued by the Committee of Sponsoring Organizations of the Treadway Commission (COSO). SAP’s management is responsible for these consolidated financial statements, and the financial statement schedule, for maintaining effective internal control over financial reporting, and for its assessment of the effectiveness of internal control over financial reporting, included in the accompanying Management’s Annual Report on Internal Control Over Financial Reporting. Our responsibility is to express an opinion on these consolidated financial statements, and the financial statement schedule, and an opinion on the Company’s internal control over financial reporting based on our audits.
We conducted our audits in accordance with the standards of the Public Company Accounting Oversight Board (United States). Those standards require that we plan and perform the audits to obtain reasonable assurance about whether the financial statements are free of material misstatement and whether effective internal control over financial reporting was maintained in all material respects. Our audits of the consolidated financial statements included examining, on a test basis, evidence supporting the amounts and disclosures in the financial statements, assessing the accounting principles used and significant estimates made by management, and evaluating the overall financial statement presentation. Our audit of internal control over financial reporting included obtaining an understanding of internal control over financial reporting, assessing the risk that a material weakness exists, and testing and evaluating the design and operating effectiveness of internal control based on the assessed risk. Our audits also included performing such other procedures as we considered necessary in the circumstances. We believe that our audits provide a reasonable basis for our opinions.
A company’s internal control over financial reporting is a process designed to provide reasonable assurance regarding the reliability of financial reporting and the preparation of financial statements for external purposes in accordance with generally accepted accounting principles. A company’s internal control over financial reporting includes those policies and procedures that (1) pertain to the maintenance of records that, in reasonable detail, accurately and fairly reflect the transactions and dispositions of the assets of the company; (2) provide reasonable assurance that transactions are recorded as necessary to permit preparation of financial statements in accordance with generally accepted accounting principles, and that receipts and expenditures of the company are being made only in accordance with authorizations of management and directors of the company; and (3) provide reasonable assurance regarding prevention or timely detection of unauthorized acquisition, use, or disposition of the company’s assets that could have a material effect on the financial statements.
Because of its inherent limitations, internal control over financial reporting may not prevent or detect misstatements. Also, projections of any evaluation of effectiveness to future periods are subject to the risk that controls may become inadequate because of changes in conditions, or that the degree of compliance with the policies or procedures may deteriorate.
In our opinion, the consolidated financial statements referred to above present fairly, in all material respects, the financial position of SAP AG and subsidiaries as of December 31, 2009 and 2008, and the results of their operations and their cash flows for each of the years in the three-year period ended December 31, 2009, in conformity with International Financial Reporting Standards as issued by the International Accounting Standards Board (IASB). Also, in our opinion, the related financial statement schedule when considered in relation to the basic consolidated financial statements taken as a whole, presents fairly, in all material respects,
F-1
Table of Contents
the information set forth therein. Also in our opinion, SAP AG maintained, in all material respects, effective internal control over financial reporting as of December 31, 2009, based on criteria established inInternal Control — Integrated Frameworkissued by the COSO.
As discussed in Note 3 to the consolidated financial statements, on January 1, 2009 the Company changed its method of accounting for business combinations, non-controlling interests and customer loyalty programmes due to the adoption of IFRS 3Business Combinations(2008), International Accounting Standards 27Consolidated and Separate Financial Statements(2008), and International Financial Reporting Interpretation Committee (IFRIC) Interpretation 13Customer Loyalty Programmes.
KPMG AG
Wirtschaftsprüfungsgesellschaft
Mannheim, Germany
March 11, 2009
F-2
Table of Contents
SAP AG AND SUBSIDIARIES
CONSOLIDATED INCOME STATEMENTS OF SAP GROUP
for the years ended December 31,
for the years ended December 31,
| (Unaudited) | ||||||||||||||||||||
| Note | 2009(1) | 2009 | 2008 | 2007 | ||||||||||||||||
| US$ | € | € | € | |||||||||||||||||
| millions, unless otherwise stated | ||||||||||||||||||||
| Software revenue | 3,736 | 2,607 | 3,606 | 3,407 | ||||||||||||||||
| Support revenue | 7,574 | 5,285 | 4,602 | 3,852 | ||||||||||||||||
| Subscription and other software-related service revenue | 439 | 306 | 258 | 182 | ||||||||||||||||
Software and software-related service revenue | 11,749 | 8,198 | 8,466 | 7,441 | ||||||||||||||||
| Consulting revenue | 2,972 | 2,074 | 2,498 | 2,221 | ||||||||||||||||
| Training revenue | 391 | 273 | 434 | 410 | ||||||||||||||||
| Other service revenue | 122 | 85 | 107 | 113 | ||||||||||||||||
Professional services and other service revenue | 3,486 | 2,432 | 3,039 | 2,744 | ||||||||||||||||
Other revenue | 60 | 42 | 70 | 71 | ||||||||||||||||
Total revenue | (5 | ) | 15,295 | 10,672 | 11,575 | 10,256 | ||||||||||||||
| Cost of software and software-related services | (2,457 | ) | (1,714 | ) | (1,743 | ) | (1,350 | ) | ||||||||||||
| Cost of professional services and other services | (2,653 | ) | (1,851 | ) | (2,285 | ) | (2,091 | ) | ||||||||||||
| Research and development | (2,280 | ) | (1,591 | ) | (1,627 | ) | (1,461 | ) | ||||||||||||
| Sales and marketing | (3,152 | ) | (2,199 | ) | (2,546 | ) | (2,173 | ) | ||||||||||||
| General and administration | (808 | ) | (564 | ) | (624 | ) | (499 | ) | ||||||||||||
| Restructuring | (7 | ) | (284 | ) | (198 | ) | (60 | ) | (2 | ) | ||||||||||
| Other operating income/expense, net | (8 | ) | 47 | 33 | 11 | 18 | ||||||||||||||
Total operating expenses | (11,586 | ) | (8,084 | ) | (8,874 | ) | (7,558 | ) | ||||||||||||
Operating profit | 3,709 | 2,588 | 2,701 | 2,698 | ||||||||||||||||
| Other non-operating income/expense, net | (9 | ) | (105 | ) | (73 | ) | (27 | ) | 2 | |||||||||||
| Finance income | 46 | 32 | 72 | 142 | ||||||||||||||||
| Finance costs | (145 | ) | (101 | ) | (123 | ) | (7 | ) | ||||||||||||
| Other financial gains/losses, net | (10 | ) | (16 | ) | (11 | ) | 1 | (11 | ) | |||||||||||
Financial income, net | (115 | ) | (80 | ) | (50 | ) | 124 | |||||||||||||
Profit before tax | 3,490 | 2,435 | 2,624 | 2,824 | ||||||||||||||||
| Income tax expense | (11 | ) | (982 | ) | (685 | ) | (776 | ) | (916 | ) | ||||||||||
Profit after tax | 2,508 | 1,750 | 1,848 | 1,908 | ||||||||||||||||
| — Profit attributable to non-controlling interests | 3 | 2 | 1 | 2 | ||||||||||||||||
| — Profit attributable to owners of parent | 2,505 | 1,748 | 1,847 | 1,906 | ||||||||||||||||
Basic earnings per share, in € | (12 | ) | 2.11 | 1.47 | 1.55 | 1.58 | ||||||||||||||
Diluted earnings per share, in € | (12 | ) | 2.11 | 1.47 | 1.55 | 1.58 | ||||||||||||||
| (1) | The 2009 figures have been translated solely for the convenience of the reader at an exchange rate of US$1.4332 to €1.00, the Noon Buying Rate certified by the Federal Reserve Bank of New York on December 31, 2009. |
The accompanying Notes are an integral part of these Consolidated Financial Statements.
F-3
Table of Contents
SAP AG AND SUBSIDIARIES
for the years ended December 31,
| Note | 2009 | 2008 | 2007 | |||||||||||||
| € millions | ||||||||||||||||
Profit after tax | 1,750 | 1,848 | 1,908 | |||||||||||||
| Gains (losses) on exchange differences on translation, before tax | 76 | (63 | ) | (196 | ) | |||||||||||
| Reclassification adjustments on exchange differences on translation, before tax | (2 | ) | 0 | 0 | ||||||||||||
Exchange differences on translation | 74 | (63 | ) | (196 | ) | |||||||||||
Gains (losses) on remeasuringavailable-for-sale financial assets, before tax | (27 | ) | 15 | 1 | (2 | ) | ||||||||||
Reclassification adjustments onavailable-for-sale financial assets, before tax | (27 | ) | 0 | (3 | ) | (1 | ) | |||||||||
Available-for-sale financial assets | (27 | ) | 15 | (2 | ) | (3 | ) | |||||||||
| Gains (losses) on cash flow hedges, before tax | (26 | ) | (41 | ) | (15 | ) | 89 | |||||||||
| Reclassification adjustments on cash flow hedges, before tax | (26 | ) | 84 | (55 | ) | (85 | ) | |||||||||
Cash flow hedges | (26 | ) | 43 | (70 | ) | 4 | ||||||||||
Actuarial gains (losses) on defined benefit plans, before tax | (19a | ) | (6 | ) | (54 | ) | (4 | ) | ||||||||
Other comprehensive income, before tax | 126 | (189 | ) | (199 | ) | |||||||||||
Income tax relating to components of other comprehensive income | (11 | ) | (12 | ) | 39 | 4 | ||||||||||
Other comprehensive income after tax | 114 | (150 | ) | (195 | ) | |||||||||||
Total comprehensive income | 1,864 | 1,698 | 1,713 | |||||||||||||
| - attributable to non-controlling interests | 2 | 1 | 2 | |||||||||||||
| - attributable to owners of parent | 1,862 | 1,697 | 1,711 | |||||||||||||
The accompanying Notes are an integral part of these Consolidated Financial Statements.
F-4
Table of Contents
SAP AG AND SUBSIDIARIES
as at December 31,
| (Unaudited) | ||||||||||||||||
| Note | 2009(1) | 2009 | 2008 | |||||||||||||
| US$ | € | € | ||||||||||||||
| millions | ||||||||||||||||
Assets | ||||||||||||||||
Cash and cash equivalents | 2,700 | 1,884 | 1,280 | |||||||||||||
Other financial assets | (13 | ) | 697 | 486 | 588 | |||||||||||
Trade and other receivables | (14 | ) | 3,649 | 2,546 | 3,178 | |||||||||||
Other non-financial assets | (15 | ) | 211 | 147 | 126 | |||||||||||
Tax assets | (11 | ) | 275 | 192 | 399 | |||||||||||
Total current assets | 7,531 | 5,255 | 5,571 | |||||||||||||
Goodwill | (16 | ) | 7,157 | 4,994 | 4,975 | |||||||||||
Intangible assets | (16 | ) | 1,281 | 894 | 1,140 | |||||||||||
Property, plant, and equipment | (17 | ) | 1,965 | 1,371 | 1,405 | |||||||||||
Other financial assets | (13 | ) | 407 | 284 | 262 | |||||||||||
Trade and other receivables | (14 | ) | 75 | 52 | 41 | |||||||||||
Other non-financial assets | (15 | ) | 50 | 35 | 32 | |||||||||||
Tax assets | (11 | ) | 130 | 91 | 33 | |||||||||||
Deferred tax assets | (11 | ) | 570 | 398 | 441 | |||||||||||
Total non-current assets | 11,636 | 8,119 | 8,329 | |||||||||||||
Total assets | 19,168 | 13,374 | 13,900 | |||||||||||||
| Equity and Liabilities | ||||||||||||||||
Trade and other payables | (18 | ) | 914 | 638 | 599 | |||||||||||
Tax liabilities | (11 | ) | 179 | 125 | 363 | |||||||||||
| Bank loans | (18 | ) | 6 | 4 | 2,319 | |||||||||||
| Other financial liabilities | (18 | ) | 204 | 142 | 244 | |||||||||||
Financial liabilities | (18 | ) | 209 | 146 | 2,563 | |||||||||||
Other non-financial liabilities | (18 | ) | 2,260 | 1,577 | 1,428 | |||||||||||
Provisions | (19 | ) | 476 | 332 | 248 | |||||||||||
Deferred income | (20 | ) | 857 | 598 | 623 | |||||||||||
Total current liabilities | 4,896 | 3,416 | 5,824 | |||||||||||||
Trade and other payables | (18 | ) | 50 | 35 | 42 | |||||||||||
Tax liabilities | (11 | ) | 343 | 239 | 278 | |||||||||||
| Bank loans | (18 | ) | 1,002 | 699 | 2 | |||||||||||
| Other financial liabilities | (18 | ) | 43 | 30 | 38 | |||||||||||
Financial liabilities | (18 | ) | 1,045 | 729 | 40 | |||||||||||
Other non-financial liabilities | (18 | ) | 17 | 12 | 13 | |||||||||||
Provisions | (19 | ) | 284 | 198 | 232 | |||||||||||
Deferred tax liabilities | (11 | ) | 272 | 190 | 239 | |||||||||||
Deferred income | (20 | ) | 92 | 64 | 61 | |||||||||||
Total non-current liabilities | 2,103 | 1,467 | 905 | |||||||||||||
Total liabilities | 6,998 | 4,883 | 6,729 | |||||||||||||
Issued capital2 | 1,757 | 1,226 | 1,226 | |||||||||||||
Treasury shares | (1,892 | ) | (1,320 | ) | (1,362 | ) | ||||||||||
Share premium | 454 | 317 | 320 | |||||||||||||
Retained earnings | 12,284 | 8,571 | 7,422 | |||||||||||||
Other components of equity | (454 | ) | (317 | ) | (437 | ) | ||||||||||
Equity attributable to owners of parent | 12,149 | 8,477 | 7,169 | |||||||||||||
Non-controlling interests | 20 | 14 | 2 | |||||||||||||
Total equity | (21 | ) | 12,169 | 8,491 | 7,171 | |||||||||||
Equity and liabilities | 19,168 | 13,374 | 13,900 | |||||||||||||
| (1) | The 2009 figures have been translated solely for the convenience of the reader at an exchange rate of US$1.4332 to €1.00, the Noon Buying Rate certified by the Federal Reserve Bank of New York on December 31, 2009. | |
| (2) | Authorized — not issued or outstanding: 480 million no-par shares at December 31, 2009 and 2008; Authorized — issued and outstanding: 1,226 million no-par shares at December 31, 2009 and 2008 |
The accompanying Notes are an integral part of these Consolidated Financial Statements.
F-5
Table of Contents
SAP AG AND SUBSIDIARIES
as at December 31,
| Other Components of Equity | ||||||||||||||||||||||||||||||||||||||||
| Available- | Equity | |||||||||||||||||||||||||||||||||||||||
| for-Sale | Cash | Attributable | Non- | |||||||||||||||||||||||||||||||||||||
| Issued | Share | Retained | Exchange | Financial | Flow | Treasury | to Owners of | Controlling | Total | |||||||||||||||||||||||||||||||
| Capital | Premium | Earnings | Differences | Assets | Hedges | Shares | Parent | Interests | Equity | |||||||||||||||||||||||||||||||
| € millions | ||||||||||||||||||||||||||||||||||||||||
January 1, 2007 prior to IFRIC 13 adoption | 1,268 | 332 | 6,380 | (134 | ) | 4 | 6 | (1,742 | ) | 6,114 | 9 | 6,123 | ||||||||||||||||||||||||||||
| Cumulated difference from the first-time adoption of IFRIC 13 | (12 | ) | (12 | ) | (12 | ) | ||||||||||||||||||||||||||||||||||
January 1, 2007 after IFRIC 13 adoption | 1,268 | 332 | 6,368 | (134 | ) | 4 | 6 | (1,742 | ) | 6,102 | 9 | 6,111 | ||||||||||||||||||||||||||||
| Profit after tax | 1,906 | 1,906 | 2 | 1,908 | ||||||||||||||||||||||||||||||||||||
| Other comprehensive income | (196 | ) | (3 | ) | 4 | (195 | ) | (195 | ) | |||||||||||||||||||||||||||||||
| Share-based compensation | (40 | ) | (40 | ) | (40 | ) | ||||||||||||||||||||||||||||||||||
| Dividends | (556 | ) | (556 | ) | (556 | ) | ||||||||||||||||||||||||||||||||||
| Cancellation of treasury shares | (23 | ) | (796 | ) | 819 | |||||||||||||||||||||||||||||||||||
| Treasury shares transactions | 12 | (811 | ) | (799 | ) | (799 | ) | |||||||||||||||||||||||||||||||||
| Convertible bonds and stock options exercised | 1 | 43 | 44 | 44 | ||||||||||||||||||||||||||||||||||||
| Other | 1 | 1 | 1 | |||||||||||||||||||||||||||||||||||||
| Other changes non-controlling interests | 2 | 2 | (10 | ) | (8 | ) | ||||||||||||||||||||||||||||||||||
December 31, 2007 | 1,246 | 347 | 6,925 | (330 | ) | 1 | 10 | (1,734 | ) | 6,465 | 1 | 6,466 | ||||||||||||||||||||||||||||
| Profit after tax | 1,847 | 1,847 | 1 | 1,848 | ||||||||||||||||||||||||||||||||||||
| Other comprehensive income | (32 | ) | (63 | ) | (2 | ) | (53 | ) | (150 | ) | (150 | ) | ||||||||||||||||||||||||||||
| Share-based compensation | (34 | ) | (34 | ) | (34 | ) | ||||||||||||||||||||||||||||||||||
| Dividends | (594 | ) | (594 | ) | (594 | ) | ||||||||||||||||||||||||||||||||||
| Cancellation of treasury shares | (21 | ) | (723 | ) | 744 | |||||||||||||||||||||||||||||||||||
| Treasury shares transactions | (6 | ) | (372 | ) | (378 | ) | (378 | ) | ||||||||||||||||||||||||||||||||
| Convertible bonds and stock options exercised | 1 | 13 | 14 | 14 | ||||||||||||||||||||||||||||||||||||
| Other | (1 | ) | (1 | ) | (1 | ) | ||||||||||||||||||||||||||||||||||
December 31, 2008 | 1,226 | 320 | 7,422 | (393 | ) | (1 | ) | (43 | ) | (1,362 | ) | 7,169 | 2 | 7,171 | ||||||||||||||||||||||||||
| Profit after tax | 1,748 | 1,748 | 2 | 1,750 | ||||||||||||||||||||||||||||||||||||
| Other comprehensive income | (6 | ) | 74 | 14 | 32 | 114 | 114 | |||||||||||||||||||||||||||||||||
| Share-based compensation | (2 | ) | (2 | ) | (2 | ) | ||||||||||||||||||||||||||||||||||
| Dividends | (594 | ) | (594 | ) | (594 | ) | ||||||||||||||||||||||||||||||||||
| Treasury shares transactions | (6 | ) | 42 | 36 | 36 | |||||||||||||||||||||||||||||||||||
| Convertible bonds and stock options exercised | 5 | 5 | 5 | |||||||||||||||||||||||||||||||||||||
| Other | 1 | 1 | 1 | |||||||||||||||||||||||||||||||||||||
| Addition of non-controlling interests | 10 | 10 | ||||||||||||||||||||||||||||||||||||||
December 31, 2009 | 1,226 | 317 | 8,571 | (319 | ) | 13 | (11 | ) | (1,320 | ) | 8,477 | 14 | 8,491 | |||||||||||||||||||||||||||
The accompanying Notes are an integral part of these Consolidated Financial Statements.
F-6
Table of Contents
SAP AG AND SUBSIDIARIES
as at December 31,
| (Unaudited) | ||||||||||||||||
| 2009(1) | 2009 | 2008 | 2007 | |||||||||||||
| US$ | € | € | € | |||||||||||||
| millions | ||||||||||||||||
Profit after tax | 2,508 | 1,750 | 1,848 | 1,908 | ||||||||||||
| Adjustments to reconcile profit after tax to net cash provided by operating activities: | ||||||||||||||||
| Depreciation and amortization | 715 | 499 | 539 | 262 | ||||||||||||
| Gains/losses on disposals of non-current assets | (16 | ) | (11 | ) | 11 | 1 | ||||||||||
| Gains/losses on disposals of financial assets | (3 | ) | (2 | ) | (16 | ) | (1 | ) | ||||||||
| Impairment loss on financial assets recognized in profit | 14 | 10 | 15 | 8 | ||||||||||||
| Decrease/increase in sales and bad debt allowances on trade receivables | 92 | 64 | 76 | 0 | ||||||||||||
| Other adjustments for non-cash items | 20 | 14 | 52 | 45 | ||||||||||||
| Deferred income taxes | (56 | ) | (39 | ) | (91 | ) | 8 | |||||||||
| Decrease/increase in trade receivables | 850 | 593 | (48 | ) | (521 | ) | ||||||||||
| Decrease/increase in other assets | 294 | 205 | (12 | ) | (277 | ) | ||||||||||
| Decrease/increase in trade payables, provisions and other liabilities | (166 | ) | (116 | ) | (277 | ) | 375 | |||||||||
| Decrease/increase in deferred income | 69 | 48 | 61 | 124 | ||||||||||||
Net cash flows from operating activities | 4,321 | 3,015 | 2,158 | 1,932 | ||||||||||||
| Purchase of non-controlling interests | 0 | 0 | 0 | (48 | ) | |||||||||||
| Business combinations, net of cash and cash equivalents acquired | (105 | ) | (73 | ) | (3,773 | ) | (672 | ) | ||||||||
| Repayment of acquirees’ debt in business combinations | 0 | 0 | (450 | ) | 0 | |||||||||||
| Purchase of intangible assets and property, plant, and equipment | (322 | ) | (225 | ) | (339 | ) | (400 | ) | ||||||||
| Proceeds from sales of intangible assets or property, plant and equipment | 64 | 45 | 44 | 27 | ||||||||||||
| Cash transferred to restricted cash | 0 | 0 | (448 | ) | (550 | ) | ||||||||||
| Use of restricted cash | 0 | 0 | 1,001 | 0 | ||||||||||||
| Purchase of equity or debt instruments of other entities | (1,538 | ) | (1,073 | ) | (396 | ) | (788 | ) | ||||||||
| Proceeds from sales of equity or debt instruments of other entities | 1,472 | 1,027 | 595 | 1,040 | ||||||||||||
Net cash flows from investing activities | (429 | ) | (299 | ) | (3,766 | ) | (1,391 | ) | ||||||||
| Dividends paid | (851 | ) | (594 | ) | (594 | ) | (556 | ) | ||||||||
| Purchase of treasury shares | 0 | 0 | (487 | ) | (1,005 | ) | ||||||||||
| Proceeds from reissuance of treasury shares | 34 | 24 | 85 | 156 | ||||||||||||
| Proceeds from issuing shares (share-based compensation) | 9 | 6 | 20 | 44 | ||||||||||||
| Proceeds from private placement transaction | 0 | 0 | 0 | 0 | ||||||||||||
| Proceeds from borrowings | 999 | 697 | 3,859 | 47 | ||||||||||||
| Repayments of borrowings | (3,301 | ) | (2,303 | ) | (1,571 | ) | (48 | ) | ||||||||
| Purchase of equity-based derivative instruments (hedge for cash-settled share-based payment plans) | 0 | 0 | (55 | ) | 0 | |||||||||||
| Proceeds from the exercise of equity-based derivative financial instruments | 6 | 4 | 24 | 75 | ||||||||||||
Net cash flows from financing activities | (3,104 | ) | (2,166 | ) | 1,281 | (1,287 | ) | |||||||||
Effect of foreign exchange rates on cash and cash equivalents | 77 | 54 | (1 | ) | (45 | ) | ||||||||||
Net increase (decrease) in cash and cash equivalents | 866 | 604 | (328 | ) | (791 | ) | ||||||||||
Cash and cash equivalents at the beginning of the period | 1,834 | 1,280 | 1,608 | 2,399 | ||||||||||||
Cash and cash equivalents at the end of the period | 2,700 | 1,884 | 1,280 | 1,608 | ||||||||||||
| 1) | The 2009 figures have been translated solely for the convenience of the reader at an exchange rate of US$1.4332 to €1.00, the Noon Buying Rate certified by the Federal Reserve Bank of New York on December 31, 2009. | |
| (2) | Interest paid in 2009, 2008, and 2007 amounted to € 69 million, € 105 million, and €6 million, respectively, and interest received in 2009, 2008, and 2007 amounted to € 22 million, € 72 million and € 142 million, respectively. Income taxes paid in 2009, 2008, and 2007, net of refunds, were € 722 million, € 882 million, and € 811 million, respectively. |
The accompanying Notes are an integral part of these Consolidated Financial Statements.
F-7
Table of Contents
SAP AG AND SUBSIDIARIES
| (1) | GENERAL INFORMATION ABOUT CONSOLIDATED FINANCIAL STATEMENTS |
The accompanying Consolidated Financial Statements of SAP AG and its subsidiaries (collectively, “we,” “us,” “our,” “SAP,” “Group,” and “Company”) have been prepared in accordance with International Financial Reporting Standards (IFRS). The designation “IFRS” includes all standards issued by the International Accounting Standards Board (IASB) and related interpretations issued by the International Financial Reporting Interpretations Committee (IFRIC).
We have applied all standards and interpretations that were effective on and endorsed by the European Union (EU) as at December 31, 2009. There were no standards or interpretations impacting our Consolidated Financial Statements for the years ended December 31, 2009, 2008, and 2007 that were effective but not yet endorsed. Therefore our Consolidated Financial Statements comply with both IFRS as issued by the IASB and with IFRS as endorsed by the EU.
SAP’s Executive Board approved the Consolidated Financial Statements on March 10, 2010 for submission to the Company’s Supervisory Board.
All amounts included in the Consolidated Financial Statements are reported in millions of euros (€ millions) except where otherwise stated. Due to rounding, numbers presented throughout this document may not add up precisely to the totals we provide and percentages may not precisely reflect the absolute figures.
| (2) | SCOPE OF CONSOLIDATION |
The Consolidated Financial Statements include SAP AG and all entities that are controlled directly or indirectly by SAP AG. We fully consolidate one entity in which we hold only 49% of the voting shares, due to an agreement with the majority shareholder which provides that SAP fully controls the entity, receives all benefits, and incurs all risks. All other consolidated entities are majority-owned.
All SAP entities prepare their financial statements as at December 31. All financial statements were prepared applying the same Group IFRS accounting and valuation principles. Intercompany transactions and balances relating to consolidated entities have been eliminated.
The following table summarizes the change in the number of legal entities included in the Consolidated Financial Statements.
Overview of Legal Entities Consolidated in the Financial Statements
The additions relate to legal entities added in connection with acquisitions and foundations. The disposals are due to mergers and liquidations of consolidated or acquired legal entities.
F-8
Table of Contents
The 2009 changes in the scope of companies included in the Consolidated Financial Statements have no impact on the comparability with the 2008 Consolidated Financial Statements. In 2008, we acquired Business Objects, which was material to SAP and affected comparability with our 2007 Consolidated Financial Statements. For additional information on our business combinations and the effect on our Consolidated Financial Statements, see Note (4).
| (3) | SUMMARY OF SIGNIFICANT ACCOUNTING POLICIES |
| (3a) | Bases of Measurement |
The Consolidated Financial Statements have been prepared on the historical cost basis except for the following:
| • | Derivative financial instruments,available-for-sale financial assets (except for investments in certain equity instruments without a quoted market price), and liabilities for cash-settled share-based payment arrangements are measured at fair value | |
| • | Foreign exchange receivables and payables are translated at period-end exchange rates; and | |
| • | Pensions are measured according to IAS 19 Employee Benefits (IAS 19) as described in Note (19a) |
Where applicable, information about the methods and assumptions used in determining the respective measurement bases and fair values is disclosed in the Notes specific to that asset or liability.
| (3b) | Relevant Accounting Policies |
Reclassifications
We have reclassified and renamed certain items in our Consolidated Financial Statements, mainly to show our restructuring expenses separately on the face of our Consolidated Income Statements, to align our financial statements to the XBRL taxonomy for IFRS, and to combine immaterial line items. We have adjusted our prior years accordingly. We do not believe that these reclassifications have a material impact on our Consolidated Financial Statements for prior periods.
Acquisitions
We adopted IFRS 3 Business Combinations (IFRS 3 (2008)) with effect from January 1, 2009. We account for all business combinations using the acquisition method. The change in accounting policy was applied prospectively and had no material impact on earnings per share. We have applied the acquisition method for business combinations disclosed in Note (4). We measure the acquired assets and liabilities at their acquisition date fair values with limited exceptions as required by IFRS 3 (2008). The results of operations of acquired entities are included in our Consolidated Income Statements beginning at the respective acquisition date. If we do not acquire all shares of an entity we determine for each business combination transaction, whether we will measure any non-controlling interest at fair value or at the non-controlling interest’s proportionate share of the acquiree’s identifiable net assets.
Foreign Currencies
Assets and liabilities of our foreign subsidiaries, that use a functional currency other than the euro, are translated at the exchange rate on the date of the Statement of Financial Position. Revenues and expenses are translated at average rates of exchange computed on a monthly basis. Translation adjustments resulting from this process are charged or credited to other components of equity. Exchange differences from monetary items
F-9
Table of Contents
denominated in foreign currency transactions that are part of a long-term investment are also included in other components of equity.
Transactions in foreign currencies are translated to the respective functional currencies of Group entities at the exchange rates at the dates of the transactions. Monetary assets and liabilities that are denominated in foreign currencies are remeasured at the period-end closing rate with resulting gains and losses reflected in other non-operating income/expense, net in the Consolidated Income Statements. When a foreign operation is disposed of, the foreign currency translation adjustments applicable to that entity are recognized in profit or loss.
Operating cash flows are translated into euros using average rates of exchange computed on a monthly basis. Investing and financing cash flows are translated into euros using the exchange rates in effect at the time of the respective transaction. The effects on cash due to fluctuations in exchange rates are shown in a separate line in the Consolidated Statements of Cash Flows.
The exchange rates of key currencies affecting the Company were as follows:
Exchange Rates

Revenue Recognition
We derive our revenues from the sale or license of our software products and of support, subscription, consulting, development, training, and other services. The vast majority of our software arrangements include support services and many also include professional services and other elements.
Software and software-related service revenue as shown in our Consolidated Income Statements is the sum of our software revenue, support revenue, and revenue from subscriptions and other software-related services. Professional services and other service revenue as shown in our Consolidated Income Statements is the sum of our consulting revenue, training revenue, and other service revenue. Other revenue as shown in our Consolidated Income Statements mainly consists of revenue from SAP marketing events. Revenue information by segment and geographic region is disclosed in Note (29).
Software revenue represents fees earned from the sale or license of software to customers. Support revenue represents fees earned from providing customers with unspecified future software updates, upgrades, and enhancements, and technical product support. We recognize support revenues ratably over the term of the support arrangement. We do not separately sell technical support services or unspecified software upgrades, updates, and enhancements. Accordingly, we do not distinguish within software and software-related service revenue or within cost of software and software-related services the amounts attributable to technical support services and unspecified software upgrades, updates, and enhancements.
Subscription and other software-related service revenue represents fees earned from subscription and software rental arrangements, on-demand solutions, and other software-related services. Subscription contracts combine software and support service elements, as they provide the customer with current software products, rights to receive unspecified future software products, and rights to support services during the subscription
F-10
Table of Contents
term. Customers pay an annual fee for a defined subscription term, usually five years, and we recognize such fees ratably over the term of the arrangement beginning with the delivery of the first product.
Software rental contracts also combine software and support service elements. Such contracts provide the customer with current software products and support but not the right to receive unspecified future software products. Customers pay a periodic fee over the rental term and we recognize fees from software rental contracts ratably over the term of the arrangement.
Revenue from on-demand solutions relate to software hosting arrangements that provide the customer with the right to use certain software functionality but do not include the right to terminate the hosting contract and take possession of the software without significant penalty. On-demand solution revenues are generally recognized ratably over the term of the arrangement. Other software-related service revenue mainly consists of software-related revenue-sharing agreements with other software vendors.
We recognize consulting, training, and other professional services revenues when the respective services are performed. Consulting revenue primarily results from implementation support contracts to install and configure our software products. Consulting contracts do not usually involve significant production, modification, or customization of software and are recognized using the percentage of completion method of accounting. Training revenue results from contracts to provide educational services to customers and partners regarding the use of our software products.
Other service revenue consists of fees from cancelable hosting contracts, application management services (AMS), and referral fees. Cancelable hosting contracts allow the customer to terminate the arrangement at any time and to take possession of the software without significant penalty. Our AMS contracts provide post-implementation application support, optimization, and improvements to a customer’s IT solution. Fees from referral services are commissions from partners to which we have referred customers. Other service revenue is recognized when the respective services are performed.
Revenue from the sale of perpetual licenses is recognized in line with the requirements for selling goods stated in IAS 18 Revenue (IAS 18) when persuasive evidence of an arrangement exists, delivery has occurred, the risks and rewards of ownership have been transferred to the customer, the amount of revenue can be measured reliably, and collection of the related receivable is reasonably assured. The sale is recognized net of returns and allowances, trade discounts, and volume rebates.
As authorized by IAS 8 Accounting Policies, Changes in Accounting Estimates and Errors (IAS 8), we follow the guidance provided by FASB ASC Subtopic985-605, Software Revenue Recognition (formerly Statement of Position (SOP)97-2 Software Revenue Recognition), as amended, in order to determine the recognizable amount of license revenue in multiple-element arrangements. Revenue from multiple-element arrangements is recognized using the residual method of revenue recognition when company-specific objective evidence of fair value exists for all of the undelivered elements (for example, support services, consulting services, or other services) in the arrangement, but does not exist for one or more delivered elements (generally software). We determine the fair value of and allocate revenue to each undelivered element based on its respective company-specific objective evidence of fair value, which is the price charged when that element is sold separately or, for elements not yet sold separately, the price established by our management if it is probable that the price will not change before the element is sold separately. We allocate revenue to undelivered support services based on the rates charged to renew the support services annually after an initial period. Such renewal rates generally represent a fixed percentage of the discounted software license fee charged to the customer. The vast majority of our customers renew their annual support service contracts at these rates. We allocate revenue to future incremental discounts whenever customers are granted the right to license additional software at a higher discount than the one given for the initial software license arrangement, or to purchase or renew support or services at rates below company-specific objective evidence of fair value of the respective service.
F-11
Table of Contents
We defer revenue for all undelivered elements and recognize the residual amount of the arrangement fee attributable to the delivered elements, if any, when the revenue criteria described above have been met and company-specific objective evidence of fair value exists for the undelivered elements.
Revenue recognition for multiple-element arrangements consisting of software and consulting, training, or other professional services depends on:
| • | whether the arrangement involves significant production, modification, or customization of the software and | |
| • | whether the services are not available from third-party vendors and are therefore deemed essential to the software. |
If none of the features above is met, revenue for the software element and the other element are recognized separately. In contrast if one or both of these features are met the elements of the arrangement are not accounted for separately but the entire arrangement fee is recognized using the percentage of completion method, based on contract costs incurred to date as a percentage of total estimated project costs required to complete the service. If we do not have a sufficient basis to measure the progress of completion or to estimate the total contract revenues and costs, revenue is recognized only to the extent of contract cost incurred for which we believe recoverability to be probable. If the arrangement includes multiple elements, we exclude those elements from contract accounting (for example support services or hosting) that meet the criteria for separate recognition, provided that the elements have stand-alone value. When it becomes probable that total contract costs exceed total contract revenues in an arrangement, the expected losses are recognized immediately as an expense based on the costs attributable to the contract.
If at the outset of an arrangement we determine that the amount of revenue cannot be measured reliably, we defer revenue until the arrangement fee becomes due and payable by the customer. If at the outset of an arrangement we determine that collectability is not probable, we defer revenue recognition until the earlier of when collectability becomes probable or payment is received. If collectability becomes unlikely before all revenue from an arrangement is recognized, we stop recognizing revenue except to the extent of fees that have already been successfully collected. In general, our software license agreements do not include acceptance testing provisions. If an arrangement allows for customer acceptance testing of the software, we defer revenue until the earlier of customer acceptance or when the acceptance right lapses.
We usually sell or license software on a perpetual basis. Occasionally, we license software for a specified time. Revenue from short-term time-based licenses, which usually include support services during the license period, is recognized ratably over the license term. Revenue from multi-year time-based licenses that include support services, whether separately priced or not, is recognized ratably over the license term unless a substantive support service renewal rate exists, in which case the amount allocated to the delivered software is recognized based on the residual approach as software revenue once the basic criteria described above have been met.
We recognize revenue from arrangements involving resellers on evidence of sell-through by the reseller to the end-customer, because the inflow of the economic benefits associated with the arrangements to us is not probable before sell-through has occurred.
Sometimes we enter into joint development agreements with customers to leverage their industry expertise and provide standard software solutions for selected vertical markets. These customers generally contribute cash, resources, and industry expertise in exchange for license rights for the future solution. We recognize software revenue in conjunction with these arrangements based on the percentage of completion method as outlined above. We account forout-of-pocket expenses invoiced by SAP and reimbursed by customers as support, consulting, and training revenues, depending on the nature of the service for which theout-of-pocket expenses were incurred.
F-12
Table of Contents
If a customer is specifically identified as a bad debtor, we stop recognizing revenue except to the extent of fees that have already been collected.
Our contributions to resellers that allow our resellers to execute qualified and approved marketing activities are recognized as an offset to revenue unless we obtain a separate identifiable benefit for the contribution and the fair value of the benefit is reasonably estimable.
Cost of Software and Software-Related Services
Cost of software and software related services includes the cost incurred in producing the goods and providing the services that generate software and software-related service revenue. Consequently this line item includes employee expenses relating to these services, amortization of acquired intangibles, third party licenses, shipping andramp-up cost, etc.
Cost of Professional Services and Other Services
Cost of professional services and other services includes the cost incurred in providing the services that generate professional service and other service revenue. The item also includes sales and marketing expenses related to our professional services and other services that result from sales and marketing efforts that cannot be clearly separated from providing the services.
Research and Development
Research and development includes the costs incurred by activities related to the development of software solutions (new products, updates and enhancements) including resource and hardware costs for the development systems.
Development activities involve the application of research findings or other knowledge to a plan or design of new or substantially improved software products before the start of commercial use. Development expenditures are capitalized only if all of the following criteria are met:
| • | The development cost can be measured reliably | |
| • | The product is technically and commercially feasible | |
| • | Future economic benefits are probable | |
| • | We intend to complete development and market the product |
We have determined that these criteria are not cumulatively met until shortly before the products are available for sale. Development costs incurred after the recognition criteria are met have not been material. Consequently, all research and development costs are expensed as incurred.
Sales and Marketing
Sales and marketing includes costs incurred for the selling and marketing activities related to our software solutions and software-related service portfolio.
General and Administration
General and administration includes costs related to finance and administrative functions as long as they are not directly attributable to one of the other operating expense line items.
F-13
Table of Contents
Government Grants and Assistance
We record government grants when it is reasonably assured that we will comply with the relevant conditions and that the grant will be received. Our government grants generally represent subsidies for activities specified in the grant. As a result, government grants are recognized when earned as a reduction of the expenses recorded for the cost that the grants are intended to compensate. Government assistance that takes the form of a tax credit is recognized as a reduction of income tax.
Leases
We are a lessee of property, plant, and equipment, mainly buildings and vehicles, under operating leases that do not transfer to us the substantive risks and rewards of ownership. Rent expense on operating leases is recognized on a straight-line basis over the life of the lease including renewal terms if, at inception of the lease, renewal is reasonably assured.
Some of our operating leases contain lessee incentives, such as up-front payments of costs or free or reduced periods of rent. The incentives are amortized over the life of the lease and the rent expense is recognized on a straight-line basis over the life of the lease. The same applies to contractually-agreed future increases of rents.
Income Tax
Deferred taxes are accounted for under the liability method. We recognize deferred tax assets and liabilities for the future tax consequences attributable to differences between the carrying amounts of existing assets and liabilities in the Statements of Financial Position and their respective tax bases and on the carryforwards of unused tax losses and unused tax credits. Deferred tax assets are recognized to the extent that it is probable that future taxable income will be available against which the deductible temporary differences, unused tax losses, and unused tax credits can be utilized.
Deferred tax assets and liabilities are measured at the tax rates that are expected to apply to the period when the asset is realized or the liability is settled, based on tax rates (and tax laws) that have been enacted or substantively enacted by the end of the reporting period. The effect on deferred tax assets and liabilities of a change in tax rates is recognized in profit or loss, unless related to items directly recognized in equity, in the period that includes the respective enactment date.
The carrying amount of a deferred tax asset is reviewed at the end of each reporting period and is reduced to the extent that it is no longer probable that sufficient taxable profit will be available to allow the benefit of part or all of the deferred tax assets to be utilized.
Share-Based Compensation
Share-based compensation covers cash-settled and equity-settled awards issued to employees.
The fair values of both equity-settled and cash-settled awards are measured at grant date using an option-pricing model.
The fair value of equity-settled awards is not subsequently remeasured. The grant-date fair value of equity-settled awards is recognized as personnel expense in profit or loss over the period in which the employees become unconditionally entitled to the rights, with a corresponding increase in share premium. The amount recognized as an expense is adjusted to reflect the actual number of equity-settled awards options that ultimately vest.
For the share-based payment plans that are settled by paying cash rather than by issuing equity instruments, a liability is recorded for the rights granted reflecting the vested portion of the fair value of the
F-14
Table of Contents
rights at the reporting date. Personnel expense — including the effects of any changes in fair value of the awards — is accrued over the period the beneficiaries are expected to perform the related service (vesting period), with a corresponding increase in liabilities. Cash-settled awards are remeasured to fair value at each Statement of Financial Position date until the award is settled. Any changes in the fair value of the liability are recognized as personnel expense in profit or loss. The amount of unrecognized compensation expense related to non-vested share-based payment arrangements granted under our cash-settled plans is dependent on the final intrinsic value of the awards. The amount of unrecognized compensation expense is dependent on the future price of our common share which we cannot reasonably predict.
In the event we hedge our exposure to cash-settled awards, changes in the fair value of the respective hedging instruments are also recognized as personnel expense in profit or loss. The fair values for hedged programs are based on market data reflecting current market expectations.
For more information about our share-based compensation plans, see Note (28).
Other Components of Equity
Other components of equity include the following:
| • | Currency effects arising from the translation of the financial statements of our foreign operations as well as the currency effects from intercompany long-term monetary items for which settlement is neither planned nor likely to occur in the foreseeable future | |
| • | Unrealized gains and losses onavailable-for-sale financial assets | |
| • | Gains and losses on cash flow hedges comprised of the net change in fair value of the effective portion of the respective cash flow hedges that have not yet impacted profit or loss. |
Earnings per Share
We present basic and diluted earnings per share (EPS). Basic earnings per share is determined by dividing profit after tax attributable to equity holders of the parent by the weighted average number of common shares outstanding. Diluted earnings per share reflect the potential dilution that would occur if all “in the money” securities to issue common shares were exercised or converted.
Financial Assets
Our financial assets comprise cash and cash equivalents (highly liquid investments with original maturities of three months or less), loans and receivables, acquired equity and debt investments, and derivative financial instruments (derivatives) with positive fair values.
These assets are recognized and measured in accordance with IAS 39 Financial Instruments: Recognition and Measurement (IAS 39). Accordingly, financial assets are recognized in the Consolidated Statements of Financial Position if we have a contractual right to receive cash or other financial assets from another entity. Regular way purchases or sales of financial assets are recorded at the trade date. Financial assets are initially recognized at fair value plus, in the case of financial assets not at fair value through profit or loss, directly attributable transaction costs. Interest-free or below-market-rate loans and receivables are initially reflected at the present value of the expected future cash flows. The subsequent measurement depends on the classification of our financial assets to the following categories according to IAS 39:
| • | Loans and receivables: Loans and receivables are non-derivative financial assets with fixed or determinable payments that are neither quoted in an active market nor intended to be sold in the near term. This category comprises trade receivables, receivables and loans included in other financial assets, and cash and cash equivalents. We carry loans and receivables at amortized cost less impairment losses. Interest income from items assigned to this category is determined using the effective interest |
F-15
Table of Contents
| method if the time value of money is material. For further information on trade receivables see the Trade and other Receivables section. |
| • | Available-for-sale financial assets:Available-for-sale financial assets are non-derivative financial assets that are not assigned to any of the two other categories and mainly include equity investments and debt investments. If readily determinable from market data,available-for-sale financial assets are accounted for at fair value, with changes in fair value being reported net of tax in other components of equity. Fair value fluctuations are not recognized in profit or loss until the assets are sold or impaired.Available-for-sale financial assets for which no market price is available and whose fair value cannot be reliably estimated in the absence of an active market are carried at cost less impairment losses. | |
| • | Financial assets at fair value through profit or loss: Financial assets at fair value through profit or loss only comprise those financial assets that are held for trading as we do not designate financial assets at fair value through profit or loss on initial recognition. This category solely contains positive fair values from embedded and freestanding derivatives, except where hedge accounting is applied. All changes in the fair value of financial assets in this category are immediately recognized in profit or loss. For further information on derivatives see the Derivatives section. |
All financial assets not accounted for at fair value through profit or loss are assessed for impairment at each reporting date or if we become aware of objective evidence of impairment as a result of one or more events that indicate that the carrying amount of the asset may not be recoverable. Objective evidence includes but is not limited to a significant or prolonged decline of the fair value below its carrying amount, a high probability of insolvency, or a material breach of contract by the issuer such as a significant delay or a shortfall in payments due. Impairment charges in the amount of the difference of the assets’ carrying amount and the present value of the expected future cash flows or current fair value, respectively, are recognized in finance income, net. Foravailable-for-sale financial assets such impairment charges directly reduce the assets’ carrying amount while impairments on loans and receivables are recorded using allowance accounts. Account balances are charged off against the respective allowance after all collection efforts have been exhausted and the likelihood of recovery is considered remote. Impairment losses are reversed if the reason for the original impairment loss no longer exists. No such reversals are made foravailable-for-sale equity investments.
Income/expenses and gains/losses on financial assets consist of impairment charges and reversals, interest income and expenses, dividends, and gains and losses from the disposal of such assets. Dividend income is recognized when earned. Interest income is recognized based on the effective interest method. Neither dividend nor interest income are included in net gains/losses at the time of disposal. Financial assets are derecognized when contractual rights to receive cash flows from the financial assets expire or the financial assets are transferred together with all material risks and benefits.
Investments in Associates
Companies in which we do not have a controlling financial interest, but over which we can exercise significant operating and financial influence (associates) are accounted for using the equity method.
Derivatives
We account for derivatives and hedging activities in accordance with IAS 39 at fair value.
Derivatives without Designated Hedge Relationship
Many transactions constitute economic hedges and therefore contribute effectively to the securing of financial risks but do not qualify for hedge accounting under IAS 39. For the hedging of currency risks inherent in foreign currency denominated, recognized monetary assets and liabilities we do not designate ourheld-for-trading derivative financial instruments as accounting hedges, as the realized profits and losses from
F-16
Table of Contents
the underlying transactions are recognized in profit or loss in the same periods as the realized profits or losses from the derivatives.
Embedded Derivatives
We occasionally have contracts that require payment streams in currencies other than the functional currency of either party to the contract. Such embedded foreign currency derivatives are separated from the host contract and accounted for separately if the economic characteristics and risks of the host contract and the embedded derivative are not closely related, a separate instrument with the same terms as the embedded derivative would meet the definition of a derivative, and the combined instrument is not measured at fair value through profit or loss.
Derivatives with Designated Cash Flow Hedge Relationship
Derivatives which are part of a hedging relationship that qualifies for hedge accounting under IAS 39 are carried at their fair value. We designate and document the hedge relationship including the nature of the risk, the identification of the hedged item, the hedging instrument, and how we will assess the hedge effectiveness. The accounting for changes in fair value of the hedging instrument depends on the effectiveness of the hedging relationship. The effective portion of the unrealized gain or loss on the derivative instrument determined to be an effective hedge is recognized in other components of equity. We subsequently reclassify the portion of gains or losses in the Consolidated Statements of Comprehensive Income to the Consolidated Income Statements when the hedged transaction affects profit or loss. The ineffective portion of gains or losses is recognized in the Consolidated Income Statements immediately. For detailed information on our hedges, see Note (26).
Valuation and Testing of Effectiveness
The fair value of our derivatives is calculated by discounting the expected future cash flows using relevant interest rates, and spot rates over the remaining lifetime of the contracts.
Gains or losses on the spot price and the intrinsic values of the derivatives designated and qualifying as cash-flow hedges are recognized directly in other components of equity, while gains and losses on the interest element and on the time values excluded from the hedging relationship are recognized in profit or loss immediately.
The effectiveness of the hedging relationship is tested prospectively and retrospectively. Prospectively, we apply the critical terms match for our foreign currency hedges as currencies, maturities, and the amounts are identical for the forecasted transactions and the spot element of the forward exchange rate contract or intrinsic value of the currency options, respectively. For interest rate swaps, we also apply the critical terms match as the notional amounts, currencies, maturities, basis of the variable legs (EURIBOR), reset dates, and the dates of the interest and principal payments are identical for the debt instrument and the corresponding interest rate swaps. Therefore, over the life of the hedging instrument, the changes in cash flows of the hedging relationship components will offset the impact of fluctuations of the underlying forecasted transactions.
Retrospectively, effectiveness is tested on a cumulative basis applying the Dollar Offset Method by using the Hypothetical Derivative Method. Under this approach, the change in fair value of a constructed hypothetical derivative with terms reflecting the relevant terms of the hedged item is compared to the change in the fair value of the hedging instrument employing its relevant terms. The hedge is deemed highly effective if the results are within the range 80% to 125%.
F-17
Table of Contents
Trade and Other Receivables
| • | Trade receivables are recorded at invoiced amounts less sales allowances and an allowance for doubtful accounts. We record these allowances on a specific review of all significant outstanding invoices. When analyzing the recoverability of our trade receivables, we consider the following factors: |
| • | First, we consider the financial solvency of specific customers and record an allowance for specific customer balances when we believe it is probable that we will not collect the amount due according to the contractual terms of the arrangement. | |
| • | Second, we evaluate homogenous portfolios of trade receivables according to their default risk primarily based on the age of the receivable and historical loss experience, but also taking into consideration general market factors that might impact our trade receivable portfolio, such as the current economic crisis. We record a general bad debt allowance to record impairment losses for a portfolio of trade receivables when we believe that the age of the receivables indicates that it is probable that a loss has occurred and we will not collect some or all of the amounts due. |
| • | Account balances are charged off against the allowance after all collection efforts have been exhausted and the likelihood of recovery is considered remote. | |
| • | In our Consolidated Income Statements bad debt allowances for a portfolio of trade receivables are recorded as other operating expense, whereas bad debt allowances for specific customer balances are recorded in cost of software and software-related services or cost of professional services and other services, depending on the transaction from which the respective trade receivable results. Sales allowances are recorded as an offset to the respective revenue item. | |
| • | Included in trade receivables are unbilled receivables related to fixed-fee andtime-and-material consulting arrangements for contract work performed to date. |
Other Non-financial Assets
Other non-financial assets are recorded at amortized cost, which approximates fair value due to their short-term nature.
We capitalize the discount of our loans to employees as prepaid expenses and release it ratably to personnel expenses.
Goodwill
Goodwill represents the excess of the fair value of the consideration transferred, the amount of any non-controlling interest in the acquired business and the fair value of any previously held equity interest of the acquired business, over the fair value of the identifiable net assets acquired.
We do not amortize goodwill but test it for impairment at least annually and when events occur or changes in circumstances indicate that the recoverable amount of a cash-generating unit is less than its carrying value. In respect to at-equity investments, the carrying amount of goodwill is included in the carrying amount of the investment.
Intangible Assets
Purchased intangible assets with finite useful lives are recorded at acquisition cost and are amortized either based on expected usage or on a straight-line basis over their estimated useful lives ranging from two to 16 years. All of our intangible assets, with the exception of goodwill, have finite useful lives and are therefore subject to amortization.
F-18
Table of Contents
We recognize acquired in-process research and development projects as an intangible asset separate from goodwill if a project meets the definition of an asset. Amortization for these intangible assets starts when the projects are complete and the developed software is taken to the market. We typically amortize these intangibles over five years.
Property, Plant, and Equipment
Property, plant, and equipment are carried at acquisition cost plus the fair value of related asset retirement costs, if any and if reasonably estimable, and less accumulated depreciation. Interest incurred during the construction of qualifying assets is capitalized and amortized over the related assets’ estimated useful lives.
Property, plant, and equipment are depreciated over their expected useful lives, generally using the straight-line method. Land is not depreciated.
Useful Lives of Property, Plant, and Equipment
Leasehold improvements are depreciated using the straight-line method over the shorter of the term of the lease or the useful life of the asset. If a renewal option exists, the term used reflects the additional time covered by the option if exercise is reasonably assured when the leasehold improvement is first put into operation.
Impairment of Goodwill and Non-current Assets
The recoverable amount of goodwill is estimated each year at the same time. Furthermore, we review non-current assets, such as property, plant, equipment, and acquired intangible assets for impairment whenever events or changes in circumstances indicate that the carrying amount of an asset or group of assets may not be recoverable.
For the purpose of impairment testing, assets that cannot be tested individually are grouped together into the smallest group of assets that generates cash inflows from continuing use that are largely independent of the cash inflows of other assets or groups of assets (the cash-generating unit, or CGU). The recoverable amount of an asset or cash-generating unit is the greater of its value in use and its fair value less costs to sell. In assessing value in use, the estimated future cash flows are discounted to their present value using a pre-tax discount rate that reflects current market assessments of the time value of money and the risks specific to the asset.
Goodwill acquired in a business combination is allocated to segments that are expected to benefit from the synergies of the combination. This allocation represents our management approach. As a result, we measure impairment for goodwill at the segment level.
The Group’s corporate assets do not generate separate cash inflows. If there is an indication that a corporate asset may be impaired, then the recoverable amount is determined for the CGU to which the corporate asset belongs.
An impairment loss is recognized if the carrying amount of an asset or its CGU exceeds its estimated recoverable amount. Impairment losses are recognized in profit or loss.
F-19
Table of Contents
Impairment losses for non-current tangible and intangible assets recognized in the prior periods are assessed at each reporting date for indicators that the loss has decreased or no longer exists. Accordingly, if there is an indication that the reasons that caused the impairment no longer exist we would consider the need to reverse all or a portion of the impairment through profit or loss.
Contingent Assets
We carry insurance policies to offset the expenses associated with defending against litigation matters. We recognize these reimbursements in profit or loss when it is virtually certain that the reimbursement will be received and retained by us when we settle the related obligation.
Liabilities
Financial Liabilities
Financial liabilities include trade and other payables, bank loans and other financial liabilities which comprise derivative and non-derivative financial liabilities.
They are recognized and measured in accordance with IAS 39. Accordingly, financial liabilities are recognized in the Consolidated Financial Statements if we have a contractual obligation to transfer cash or another financial asset to another party. Financial liabilities are initially recognized at fair value, which in the case of financial liabilities not at fair value through profit or loss includes directly attributable transaction costs. If material, financial liabilities are discounted to present value based on prevailing market rates adjusted for credit risk, with the discount being recognized over time as interest expense. The subsequent measurement depends on the allocation of financial liabilities to the following categories according to IAS 39:
| • | Financial liabilities at fair value through profit or loss only comprise those financial liabilities that are held for trading as we do not designate financial liabilities at fair value through profit or loss on initial recognition. This category solely contains negative fair values from embedded and other derivatives, except where hedge accounting is applied. All changes in the fair value of financial liabilities in this category are immediately recognized in profit or loss. For further information on derivatives, see the Derivatives section. | |
| • | Financial liabilities at amortized cost include all non-derivative financial liabilities not quoted in an active market which are measured at amortized cost using the effective interest method. |
Expenses and gains/losses on financial liabilities consist of interest expenses, and gains and losses from the disposal of such liabilities. Interest expense is recognized based on the effective interest method.
Financial liabilities are derecognized when the contractual obligation is discharged, canceled or has expired.
Non-financial Liabilities
Other non-financial liabilities with fixed or determinable payments that are not quoted in an active market are mainly the result of obligations to employees and fiscal authorities and are generally measured at amortized cost.
Provisions
Provisions are recorded when it is more likely than not that we have a legal or constructive obligation to third parties as a result of a past event, the amount can be reasonably estimated, and it is probable that there will be an outflow of future economic benefits. We regularly adjust provisions as further information develops or circumstances change. Non-current provisions are reported at the present value of their expected settlement
F-20
Table of Contents
amounts as at the date of Statement of Financial Position. Discount rates are regularly adjusted to current market interest rates.
Our software contracts usually contain general warranty provisions guaranteeing that the software will perform according to SAP’s stated specifications for six to twelve months. At the time of the sale or license of our software covered by such warranty provisions, we record a provision for warranty obligations based on the historical average cost of fulfilling our obligations, which we classify as a current obligation.
A provision for restructuring is recognized when we have approved a detailed and formal restructuring plan and the restructuring has commenced or has been announced.
Post-Employment Benefits
We measure our pension-benefit liabilities and other post-employment benefits based on actuarial computations using theprojected-unit-credit method in accordance with IAS 19. The assumptions used to calculate pension liabilities and costs are shown in Note (19a). As a result of the actuarial calculation for each plan we recognize an asset or liability for the overfunded or underfunded status of the respective defined benefit plan. We classify a portion of the liability as current (determined on aplan-by-plan basis) if the amount by which the actuarial present value of benefits included in the benefit obligation payable within the next 12 months exceeds the fair value of plan assets. Changes in the amount of the defined benefit obligation or plan assets resulting from demographic and financial data different than originally assumed and from changes in assumptions can result in actuarial gains and losses. We recognize all actuarial gains and losses directly in retained earnings.
SAP’s pension benefits are classified as defined contribution plans if the payment to a separate fund relieves SAP of all obligations from the pension plan. Obligations for contributions to defined contribution pension plans are recognized as an expense in profit or loss when paid or due.
Deferred Income
Deferred income is recognized as software revenue, support revenue, professional service revenue, or other revenue, depending on the reasons for the deferral, once the basic applicable revenue recognition criteria have been met, for example, when the related services are performed or when the discounts are used.
Treasury Shares
Treasury shares are recorded at acquisition cost and are presented as a deduction from total equity. Gains and losses on the subsequent reissuance of treasury shares are credited or charged to share premium on an after-tax basis. On cancellation of treasury shares any excess over the calculated par value is charged to retained earnings.
Presentation in the Consolidated Statements of Cash Flows
We classify interest and taxes paid as well as interest and dividends received as cash flows from operating activities. Dividends paid are classified as financing activities.
| (3c) | Management Judgments and Sources of Estimation Uncertainty |
The preparation of the Consolidated Financial Statements in conformity with IFRS requires management to make judgments, estimates, and assumptions that affect the application of accounting policies and the reported amounts of assets, liabilities, revenues, and expenses, as well as disclosure of contingent assets and liabilities.
F-21
Table of Contents
We base our judgments, estimates, and assumptions on historical and forecast information, as well as regional and industry economic conditions in which we or our customers operate, changes to which could adversely affect our estimates. Although we believe we have made reasonable estimates about the ultimate resolution of the underlying uncertainties, no assurance can be given that the final outcome of these matters will be consistent with what is reflected in our assets, liabilities, revenues, and expenses. Actual results could differ from original estimates.
The accounting policies that most frequently require us to make judgments, estimates, and assumptions, and therefore are critical to understanding our results of operations, are:
| • | Revenue recognition | |
| • | Valuation of trade receivables | |
| • | Accounting for share-based compensation | |
| • | Accounting for income tax | |
| • | Accounting for business combinations | |
| • | Subsequent accounting for goodwill and other intangibles | |
| • | Accounting for legal contingencies | |
| • | Recognition of internally generated intangible assets from development |
Our management periodically discusses these critical accounting policies with the Audit Committee of the Supervisory Board.
Revenue Recognition
As described in the Revenue Recognition section of Note (3b), we do not recognize revenue before persuasive evidence of an arrangement exists, delivery has occurred, the risks and rewards of ownership have been transferred to the customer, the amount of revenue can be measured reliably, and collection of the related receivable is reasonably assured. The determination of whether the amount of revenue can be measured reliably or whether the fees are collectible is inherently judgmental as it requires estimates as to whether and to what extent subsequent concessions may be granted to customers and whether the customer is expected to pay the contractual fees. The timing and amount of revenue recognition can vary depending on what assessments have been made.
In most of our revenue-generating arrangements we sell to the customer more than one product solution or service. Additionally, we have ongoing relationships with many of our customers and often enter into several transactions with the same customer within close proximity in time. We therefore have to determine:
| • | Which arrangements with the same customer are to be accounted for as one arrangement | |
| • | Which deliverables under one arrangement are to be accounted for separately and | |
| • | How to allocate the total arrangement fee to the individual elements of one arrangement |
The determination of whether different arrangements with the same customer are to be accounted for as one arrangement is highly judgmental as it requires us to evaluate whether the arrangements are negotiated together or linked in any other way. The timing and amount of revenue recognition can vary depending on whether two arrangements are accounted for separately or as one arrangement.
We do not account separately for software and other deliverables under an arrangement if one of the other deliverables (such as consulting services) is deemed to be essential to the functionality of the software. The determination whether an undelivered element is essential to the functionality of the delivered element
F-22
Table of Contents
requires the use of judgment. The timing and amount of revenue recognition can vary depending on how that judgment is exercised because software revenue which may otherwise have been recognized up front is recognized over the term of providing the essential deliverable.
We also do not account separately for different deliverables under an arrangement if we have no basis for allocating the overall arrangement fee to the different elements of the arrangement. We believe that such allocation basis exists if we can demonstrate for each undelivered element of the arrangement a company-specific objective evidence of fair value as further defined in the Revenue Recognition section of Note (3b). Judgment is required in the determination of company-specific evidence of fair value which may impact the timing and amount of revenue recognized depending on:
| • | Whether company-specific evidence of fair value can be demonstrated for the undelivered elements of a software arrangement | |
| • | The approaches used to demonstrate company-specific evidence of fair value |
Additionally, our revenues would be significantly different if we applied a revenue allocation policy other than the residual method.
Revenues from consulting, other professional service, as well as custom software development projects are determined by applying the percentage of completion method of revenue recognition. The percentage of completion method requires us to make estimates about total revenues, total cost to complete the project, and the stage of completion. The assumptions, estimates, and uncertainties inherent in determining the stage of completion affect the timing and amounts of revenues recognized and expenses reported. If we do not have a sufficient basis to measure the progress of completion or to estimate the total contract revenues and costs, revenue recognition is limited to the amount of contract costs incurred. The determination of whether a sufficient basis to measure the progress of completion exists is judgmental. Changes in estimates of progress towards completion and of contract revenues and contract costs are accounted for as cumulativecatch-up adjustments to the reported revenues for the applicable contract.
Valuation of Trade Receivables
As described in the Trade and Other Receivables section in Note (3b), we account for impairments of trade receivables by recording sales allowances and allowances for doubtful accounts on an individual receivable basis and on a portfolio basis. The assessment of whether a receivable is collectible is inherently judgmental and requires the use of assumptions about customer defaults that could change significantly. Judgment is required when we evaluate available information about a particular customer’s financial situation to determine whether it is probable that a credit loss will occur and the amount of such loss is reasonably estimable and thus an allowance for that specific account is necessary. Basing the general allowance for the remaining receivables on our historical loss experience, too, is highly judgmental as history may not be indicative of future development, particularly in the unusual and extreme global economic circumstances resulting from the global financial crisis. Changes in our estimates about the allowance for doubtful accounts could materially impact the reported assets and expenses in our financial statements, and our net income could be adversely affected if actual credit losses exceed our estimates.
Accounting for Share-Based Compensation
As described in Note (28), we have issued both equity-settled as well as cash-settled share-based compensation plans.
We use certain assumptions in estimating the fair values for our share-based compensation plans, including expected future stock price volatility and expected option life (which represents our estimate of the average amount of time remaining until the options are exercised or expire unexercised). In addition, final payout for these plans also depends on our share price at the respective exercise dates. All these assumptions
F-23
Table of Contents
may significantly impact the fair value determination and thus the amount and timing of our share-based compensation expenses. Furthermore, the fair values of the options granted under our 2009 plans (STAR PP and SOP PP) are dependent on our outperformance against the Tech Peer Group Index (TechPGI) since grant date, the volatility and the expected correlation between the market price of this index, and our share price.
For the purpose of determining the estimated fair value of our stock options, we believe expected volatility is the most sensitive assumption. Regarding future payout under the plans, the development of our share price will be the most relevant factor. In respect to our plans granted in 2009 (SOP PP and STAR PP), we believe that future payout will be significantly impacted not only by our share price but also by the requirement to outperform the TechPGl. Changes in these factors could significantly affect the estimated fair values as calculated by the option-pricing model respectively future payout.
Accounting for Income Tax
We conduct operations and earn income in numerous foreign countries and are subject to changing tax laws in multiple jurisdictions within the countries in which we operate. Our ordinary business activities also include transactions where the ultimate tax outcome is uncertain, such as those involving revenue sharing and cost reimbursement arrangements between SAP Group entities. In addition, the amount of income tax we pay is generally subject to ongoing audits by domestic and foreign tax authorities. As a result, judgments are necessary in determining our worldwide income tax provisions. We have made reasonable estimates about the ultimate resolution of our tax uncertainties based on current tax laws and our interpretation thereof. Such judgments can have a material effect on our income tax expense, income tax provision, and net income.
The carrying amount of a deferred tax asset is reviewed at the end of each reporting period and is reduced to the extent that it is no longer probable that sufficient taxable profit will be available to allow the benefit of part or all of the deferred tax assets to be utilized. This assessment requires management judgments, estimates, and assumptions. In evaluating our ability to utilize our deferred tax assets, we consider all available positive and negative evidence, including our past operating results and our forecast of future taxable profit. Our judgments regarding future taxable profit are based on expectations of market conditions and other facts and circumstances. Any adverse change to the underlying facts or our estimates and assumptions could require that we reduce the carrying amount of our net deferred tax assets.
For further information on our income tax, see Note (11).
Accounting for Business Combinations
In our accounting for business combinations, judgment is required in identifying whether an intangible asset is identifiable, i.e. to be recorded separately from goodwill. Additionally, estimating the acquisition date fair values of the identifiable assets acquired and liabilities assumed involves considerable management judgment. The necessary measurements are based on information available at the acquisition date and are based on expectations and assumptions that have been deemed reasonable by management. These judgments, estimates, and assumptions can materially affect our results of operations for several reasons, among which are the following:
| • | Fair values assigned to assets subject to depreciation and amortization affects the amounts of depreciation and amortization to be recorded in operating profit in the periods following the acquisition. | |
| • | Subsequent negative changes in the estimated fair values of assets may result in additional expense from impairment charges. | |
| • | Subsequent changes in the estimated fair values of liabilities and provisions may result in additional expense (if increasing the estimated fair value) or additional income (if decreasing the estimated fair value). |
F-24
Table of Contents
Subsequent Accounting for Goodwill and Other Intangibles
As described in the Intangible Assets section in Note (3b), all our intangible assets other than goodwill have finite useful lives. Consequently, the depreciable amount of the intangible assets is allocated on a systematic basis over their useful lives. Judgment is required in:
| • | The determination of the useful life of an intangible asset as this determination is based on our estimates regarding the period over which the intangible asset is expected to produce economic benefits to us. | |
| • | The determination of the amortization method as IFRS requires the straight-line method to be used unless we can reliably determine the pattern in which the asset’s future economic benefits are expected to be consumed by us. |
Both, the amortization period and the amortization method have an impact on the amortization expenses that are recorded in each period.
In making impairment assessments for our intangible assets and goodwill, we use certain assumptions and estimates about future cash flows, which are complex and require significant judgment and assumptions about future developments. They can be affected by a variety of factors, including changes in our business strategy, our internal forecasts and estimation of our weighted-average cost of capital. Due to these factors, actual cash flows and values could vary significantly from the forecasted future cash flows and related values derived using the discounted cash flow method. Although we believe the assumptions and estimates we have made in the past have been reasonable and appropriate, different assumptions and estimates could materially affect our reported financial results.
Additionally, the results of goodwill impairment tests may depend on the allocation of goodwill to cash-generating units. This allocation is judgmental as it is based on our estimates regarding which cash-generating units are expected to benefit from the synergies of the respective business combination.
We did not record any significant impairment charges on our goodwill or intangible assets during fiscal year 2009. Although we do not currently have an indication of any significant impairment, there can be no assurance that impairment charges will not occur in the future. For more information, see Note (16).
Accounting for Legal Contingencies
As described in Note (24), currently we are involved in various claims and legal proceedings. We review the status of each significant matter on at least a quarterly basis and assess our potential financial and business exposures related to such matters. Significant judgment is required in the determination of whether a provision is to be recorded and what the appropriate amount for such provision should be. This judgment is particularly required in:
| • | The determination whether an obligation exists, | |
| • | The determination of the probability of outflow of economic benefits, | |
| • | The determination whether the amount of obligation is estimable, and | |
| • | The estimate of the obligation. |
Due to uncertainties relating to these matters, provisions are based on the best information available at the time.
At the end of each reporting period, we reassess the potential obligations related to our pending claims and litigation and adjust our respective provisions to reflect the current best estimate. In addition, we monitor and evaluate new information that we receive after the end of the respective reporting period but before the Consolidated Financial Statements are authorized for issue to determine whether this provides additional
F-25
Table of Contents
information regarding conditions that existed at the end of the reporting period. Such revisions to our estimates of the potential obligations could have a material impact on our results of operations and financial position. The effects of changes in estimates of potential liabilities related to our legal contingencies had no material impact on 2009, 2008, or 2007 results.
Recognition of Internally Generated Intangible Assets from Development
Under IFRS, internally generated intangible assets from the development phase are recognized if certain conditions are met. These conditions include the technical feasibility, intention to complete, the ability to use or sell the asset under development and the demonstration how the asset will generate probable future economic benefits. The cost of a recognized internally generated intangible asset comprises all directly attributable cost necessary to make the asset capable of being used as intended by management. In contrast, all expenditures arising from the research phase are expensed as incurred.
We believe that the determination whether internally generated intangible assets from development are to be recognized as intangible assets requires significant judgment, particularly in the following areas:
| • | The determination whether activities should be considered research activities or development activities; | |
| • | The determination whether the conditions for recognizing an intangible asset are met requires assumptions about future market conditions, customer demand and other developments; | |
| • | The term ‘technical feasibility’ is not defined in IFRS, and therefore the determination whether completing an asset is technically feasible requires a company-specific and necessarily judgmental approach; | |
| • | The determination of the future ability to use or sell the intangible asset arising from the development and the determination of probability of future benefits from sale or use, and | |
| • | The determination whether a cost is directly or indirectly attributable to an intangible asset and whether a cost is necessary for completing a development. |
| (3d) | New Accounting Standards Adopted / Early Adopted in the Current Period |
In March 2007, the IASB issued an amendment to IAS 23 Borrowing Costs (IAS 23). The amendment mainly relates to the elimination of the option to immediately recognize borrowing costs as an expense attributable to the acquisition, construction, or production of a qualifying asset. An entity is, therefore, required to capitalize borrowing costs as part of the cost of such qualifying assets defined as assets that take a substantial period of time to get ready for use or sale. IAS 23 does not require the capitalization of borrowing costs relating to assets measured at fair value, and inventories that are manufactured or produced in large quantities on a repetitive basis, even if they take a substantial period of time to get ready for use or sale. IAS 23 applies to borrowing costs relating to qualifying assets for which the commencement date for capitalization is on or after January 1, 2009. We have historically capitalized borrowing costs for qualifying assets. Therefore, the adoption of IAS 23 had no impact on our Consolidated Financial Statements.
In June 2007, the IFRIC issued IFRIC Interpretation 13 Customer Loyalty Programmes (IFRIC 13), which addresses accounting by entities that grant loyalty award credits (such as points or travel miles) to customers who buy goods or services. Specifically, it explains how such entities should account for their obligations to provide free or discounted goods or services to customers who redeem award credits. IFRIC 13 is effective for fiscal years beginning on or after January 1, 2009 and required to be applied retrospectively. As a result of the retrospective first-time application, we adjusted the January 1, 2007 retained earnings balance by €12 million. The effect on the Consolidated Income Statements as well as earnings per share was immaterial for the years ended December 31, 2009, 2008, and 2007.
F-26
Table of Contents
In September 2007, the IASB issued a revision to IAS 1 Presentation of Financial Statements (IAS 1). The standard separates owner and non-owner changes in equity. Therefore, the statement of changes in equity will include only details of transactions with owners, with all non-owner changes in equity presented in a reconciliation of each component of equity. IAS 1 sets overall requirements for the presentation of financial statements, guidelines for their structure and minimum requirements for their content. The revisions include non-mandatory changes in the titles of some of the financial statements to reflect their function more clearly (for example, the balance sheet is renamed to statement of financial position, the cash flow statement is renamed to the statement of cash flows and the statement of comprehensive income has been introduced). The statement of comprehensive income presents all items of recognized income and expense, either in one single statement, or in two linked statements. The revision of IAS 1 is effective for fiscal years beginning on or after January 1, 2009. The adoption of IAS 1 did not significantly change the current presentation of our Consolidated Financial Statements.
In January 2008, the IASB issued IFRS 2 (revised 2008) Vesting Conditions and Cancellations (IFRS 2). IFRS 2 amends IFRS 2 Share-Based Payment to clarify the terms “vesting condition” and “cancellations.” IFRS 2 is effective for fiscal years beginning on or after January 1, 2009. The adoption of IFRS 2 did not have a significant impact on our Consolidated Financial Statements.
In January 2008, the IASB issued the revised standards IFRS 3 Business Combinations (IFRS 3 (2008)) and IAS 27 Consolidated and Separate Financial Statements (IAS 27). The revisions result in several changes in the accounting for business combinations. One of those changes requires us to expense acquisition-related charges immediately, whereas the previous version of IFRS 3 required capitalization of these charges. IFRS 3 (2008) and IAS 27 are effective for fiscal years beginning on or after July 1, 2009, with early adoption permitted. SAP has decided to adopt these revisions as of January 1, 2009. The adoption of these revisions did not have a significant impact on our Consolidated Financial Statements.
In February 2008, the IASB issued an amendment to IAS 32 Financial Instruments: Disclosure and Presentation — Puttable Instruments and Obligations Arising on Liquidation (IAS 32). The purpose of the amendment is to provide detailed guidance on the presentation of puttable financial instruments and obligations arising only on liquidation in the Statement of Financial Position. The amendment of IAS 32 is effective for fiscal years beginning on or after January 1, 2009. The adoption of IAS 32 did not have an impact on our Consolidated Financial Statements.
In May 2008, the IASB issued Improvements to IFRSs — a collection of amendments to several International Financial Reporting Standards — as part of its program of annual improvements to its standards, which is intended to make necessary, but non-urgent, amendments to standards that will not be included as part of another major project. The amendments resulting from this standard are mainly effective for annual periods beginning on or after January 1, 2009. The adoption of these amendments did not have a significant impact on our Consolidated Financial Statements.
In July 2008, the IFRIC issued IFRIC Interpretation 16 Hedges of a Net Investment in a Foreign Operation (IFRIC 16), which provides interpretative guidance on several aspects of hedge accounting. IFRIC 16 is effective for fiscal years beginning on or after October 1, 2008. The adoption of IFRIC 16 did not have an impact on our Consolidated Financial Statements.
In October 2008, the IASB issued an amendment to IAS 39 Financial Instruments: Recognition and Measurement: Reclassification of Financial Assets (IAS 39). The amendment permits reclassification of some financial instruments out of the fair-value-through-profit-or-loss category (FVTPL) and out of the available-for- sale category. In the event of reclassification, additional disclosures are required under IFRS 7. IAS 39 is effective for fiscal years beginning on or after July 1, 2008. We did not reclassify any financial instruments based on the application of the amendment; therefore the adoption of the amendment to IAS 39 did not have an impact on our Consolidated Financial Statements.
F-27
Table of Contents
In January 2009, the IFRIC issued IFRIC Interpretation 18 Transfers of Assets from Customers (IFRIC 18), which clarifies the requirements of IFRSs for agreements in which an entity receives from a customer an item of property, plant, and equipment that the entity must then use either to connect the customer to a network or to provide the customer with ongoing access to a supply of goods or services. IFRIC 18 must be applied prospectively to transfers of assets from customers received on or after July 1, 2009. The adoption of IFRIC 18 did not have an impact on our Consolidated Financial Statements.
In March 2009, the IASB issued an amendment to IFRS 7 Improving Disclosures about Financial Instruments (IFRS 7). The amendments require enhanced disclosures about fair value measurements and liquidity risk. Among other things, the new disclosure requirements:
| • | Clarify that the existing IFRS 7 fair value disclosures must be made separately for each class of financial instrument | |
| • | Add disclosure for any change in the method of determining fair value and the reasons for the change | |
| • | Establish a three-level hierarchy for making fair value measurements: |
1. Quoted prices (unadjusted) in active markets for identical assets or liabilities (Level 1)
2. Inputs other than quoted prices included within Level 1 that are observable for the asset or liability, either directly (that is, as prices) or indirectly (that is, derived from prices) (Level 2)
3. Inputs for the asset or liability that are not based on observable market data (unobservable inputs) (Level 3)
| • | Add disclosure, for each fair value measurement in the statement of financial position, of which level in the hierarchy was used and any transfers between levels, with additional disclosures whenever level 3 is used including a measure of sensitivity to a change in input data | |
| • | Clarify that the current maturity analysis for non-derivative financial instruments should include issued financial guarantee contracts | |
| • | Add disclosure of a maturity analysis for derivative financial liabilities |
The amendment is effective for fiscal years beginning on or after January 1, 2009. Earlier application is permitted. The adoption resulted in additional disclosures but did not have an effect on any assets, liabilities, revenues, expenses, or cash flows.
In March 2009, the IASB issued Embedded Derivatives: Amendments to IFRIC 9 and IAS 39 (IFRIC 9). IFRIC 9 amends IFRIC 9 Reassessment of Embedded Derivatives and IAS 39 Financial Instruments: Recognition and Measurement to clarify the accounting treatment of embedded derivatives for entities that make use of the reclassification amendment issued by the IASB in October 2008 Financial Instruments: Recognition and Measurement: Reclassification of Financial Assets, which is described above. IFRIC 9 also clarifies that, on reclassification of a financial asset out of the fair value through profit or loss category, all embedded derivatives have to be assessed and, if necessary, separately accounted for in financial statements. The amendments apply retrospectively and are required to be applied for annual periods ending on or after June 30, 2009. The adoption of these amendments did not have an impact on our Consolidated Financial Statements since we have not made use of the reclassification amendment.
| (3e) | New Accounting Standards Not Yet Adopted |
In July 2008, the IASB issued an amendment to IAS 39 Financial Instruments: Recognition and Measurement: Eligible Hedged Items (IAS 39). The amendment addresses the designation of a one-sided risk in a hedged item and the designation of inflation in particular situations. The amendment applies to hedging relationships in the scope of IAS 39. The amendment is effective for fiscal years beginning on or after July 1, 2009. Earlier application is permitted. We do not expect that the amendment of IAS 39 will have a significant impact on our Consolidated Financial Statements.
F-28
Table of Contents
In April 2009, the IASB issued Improvements to IFRSs — a collection of amendments to several International Financial Reporting Standards — as part of its program of annual improvements to its standards, which is intended to make necessary, but non-urgent, amendments to standards that will not be included as part of another major project. The amendments resulting from this standard mainly have effective dates for annual periods beginning on or after January 1, 2010, although entities are permitted to adopt them earlier. The European Union has not yet endorsed these improvements. We do not expect these amendments to have a significant impact on our Consolidated Financial Statements.
In October 2009, the IASB issued amendments to IAS 32 Financial Instruments: Presentation (IAS 32), which addresses the accounting for rights issues (rights, options, or warrants to acquire a fixed number of the entity’s own equity instruments for a fixed amount of currencies) that are denominated in a currency other than the functional currency of the issuer. Previously such rights issues were accounted for as derivative liabilities. However, the amendment issued requires that, provided certain conditions are met, such rights issues are classified as equity regardless of the currency in which the exercise price is denominated. The amendments are effective for annual periods beginning on or after February 1, 2010, with earlier application permitted. We do not expect this amendment to have an impact on our Consolidated Financial Statements.
In November 2009, the IASB issued an amendment to IAS 24 (revised 2009) Related Party Disclosures (IAS 24). The purpose of the revision is to simplify the definition of a related party, clarifying its intended meaning and eliminating inconsistencies from the definition. In addition, IAS 24 provides a partial exemption from the disclosure requirements for government-related entities by focusing disclosure on significant transactions. The revision is effective for fiscal years beginning on or after January 1, 2011. Earlier application is permitted. IAS 24 has not yet been adopted by the European Union. We do not expect the revision of IAS 24 to have a significant impact on our Consolidated Financial Statements.
In November 2009, the IASB issued IFRS 9 Financial Instruments on the classification and measurement of financial assets. The new standard represents the first part of a three-part project to replace IAS 39 Financial Instruments: Recognition and Measurement (IAS 39) with IFRS 9 Financial Instruments (IFRS 9). IFRS 9 uses a single approach to determine whether a financial asset is measured at amortized cost or fair value, replacing the many different rules in IAS 39. The approach in IFRS 9 is based on how an entity manages its financial instruments (its business model) and the contractual cash flow characteristics of the financial assets. IFRS 9 is effective for fiscal years beginning on or after January 1, 2013. Earlier application is permitted. IFRS 9 has not yet been adopted by the European Union. We are currently determining what impact the adoption of IFRS 9 will have on our Consolidated Financial Statements.
In November 2009, the IASB issued an amendment to IFRIC 14 IAS 19 — The Limit on a Defined Benefit Asset, Minimum Funding Requirements and their Interaction (IFRIC 14). The amendments apply when an entity is subject to minimum funding requirements and makes an early payment of contributions to cover those requirements. The amendments require such an entity to treat the benefit of such an early payment as an asset. The amendments are effective for annual periods beginning on or after January 1, 2011, with early adoption permitted. The amendments must be applied retrospectively. The European Union has not yet endorsed IFRIC 14. We do not expect this amendment to have an impact on our Consolidated Financial Statements.
In November 2009, the IFRIC issued Extinguishing Financial Liabilities with Equity Instruments (IFRIC 19), which provides guidance on how to account for the extinguishment of a financial liability by the issuance of equity instruments. IFRIC 19 is effective for annual periods beginning on or after July 1, 2010, with early adoption permitted. The European Union has not yet endorsed these amendments. We do not expect this amendment to have an impact on our Consolidated Financial Statements.
F-29
Table of Contents
| (4) | BUSINESS COMBINATIONS |
In 2009, we concluded the following business combinations which are immaterial individually and in the aggregate to SAP:
Acquired Businesses
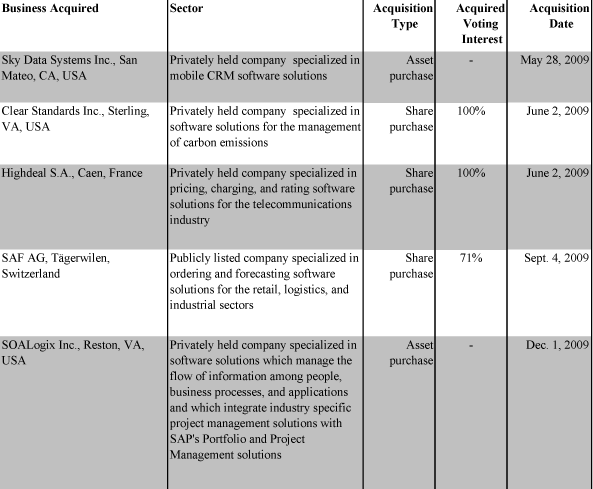
The results of these acquired businesses have been included in our Consolidated Income Statements since the respective acquisition dates. All of the acquired businesses developand/or sell software in specific areas of strategic interest to us. The aggregate consideration transferred of all acquisitions amounted to €68 million net of cash received, and was paid in cash. The acquisition-related cost recognized in general and administration expense is €2 million.
F-30
Table of Contents
The amounts recognized as of the acquisition dates for each major class of assets acquired and liabilities assumed were as follows:
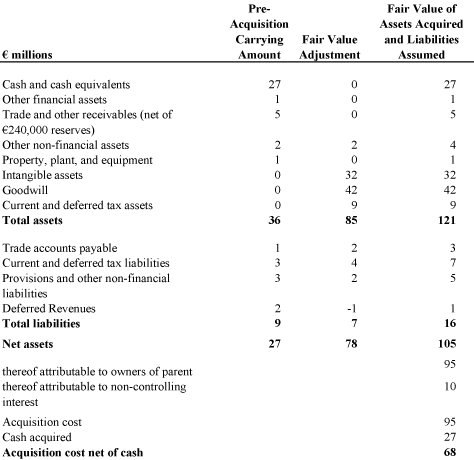
Total changes to goodwill amount to €41 million, of which €42 million are attributable to 2009 acquisitions. Due to a lower than expected contingent consideration payment the goodwill for an acquisition in previous years was reduced by €1 million.
The non-controlling interest related to our acquisition of SAF AG has been recognized at the proportionate share of the identifiable assets and liabilities. We have therefore elected not to recognize goodwill for the non-controlling interests of SAF AG.
Due to the fact that we integrate our acquired businesses into our overall operations very quickly and that some business combinations were concluded in the form of asset deals, the additional revenue and net operating result attributable to these entities since the acquisition date and included in the Consolidated Income Statements is not representative of the benefit these entities provide to SAP. Our revenue and profit after tax would not have been materially different from the numbers presented in our Consolidated Income Statements had January 1, 2009, been the acquisition date for all business combinations that occurred in 2009.
We have not yet finalized the purchase price allocation of our business combinations concluded during the second half of 2009, because we acquired intangible assets and contingent liabilities for which we are still evaluating our acquisition date fair value assumptions.
F-31
Table of Contents
We assigned the following amounts to identifiable intangible assets:
Identifiable Intangible Assets Acquired as Part of Business Combinations in 2009
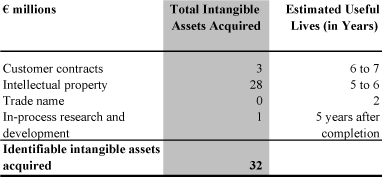
There were no identifiable intangible assets that have not been separately recorded.
Goodwill recognized for our 2009 business combinations were assigned to our Product, Consulting, and Training segment as follows:
Assignment of Acquired Goodwill to Segments
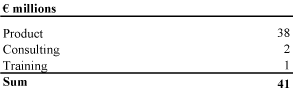
Factors that make up the goodwill recognized include synergies from combining the acquirees’ operations with our operations and the workforce of the acquirees, which do not qualify for separate recognition as intangible assets. We expect €3 million of the goodwill recognized in 2009 to be deductible for tax purposes.
F-32
Table of Contents
Prior Year Business Combinations
In 2008, we acquired the outstanding shares of two unrelated companies and the net assets of two other unrelated businesses. The results of these acquired businesses have been included in our Consolidated Income Statements since the respective acquisition dates. Business combinations in 2008 were as follows:
Prior Year Business Combinations
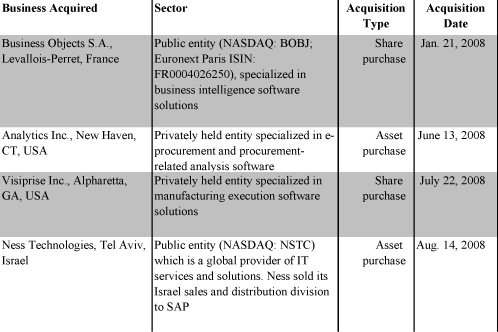
All transactions, except the acquisition of Business Objects, were immaterial to SAP individually and in the aggregate. All of the acquired businesses developedand/or sold software in specific areas of strategic interest to us. The aggregate purchase price of all business combinations, excluding Business Objects, amounted to
F-33
Table of Contents
€91 million net of cash received. This was paid in cash except for earn-out conditions which were recognized as liabilities. The purchase price was allocated as follows:
Purchase Price Allocation Prior Year (excl. Business Objects)
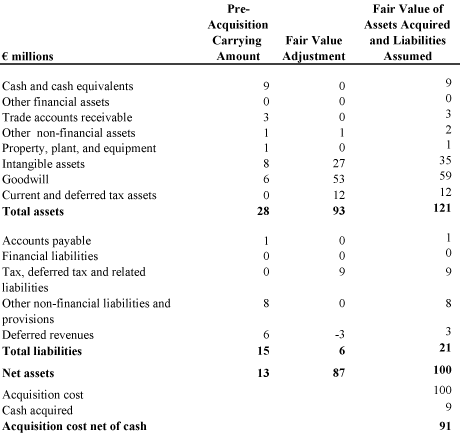
Due to the fact that we integrate our acquired businesses into our overall operations very quickly and that some business combinations were concluded in the form of asset deals, we cannot determine the additional revenue and net operating profit attributable to these entities since the acquisition date or for the full year.
Acquisition of Business Objects
Business Objects is a provider of business intelligence solutions. Through a combination of technology, consulting, education services, and its partner network, Business Objects provides information and business decision-making resources to small and large companies. Business Objects had dual headquarters in San José, California, and Levallois-Perret, France. Before our acquisition, its stock was traded on both the NASDAQ (in the form of American depositary receipts - ADRs) and the Euronext Paris stock exchanges. We acquired substantially all of the outstanding shares of Business Objects during the first two months of 2008, except a very small number of shares (0.02% of the share capital) that were held by employees and were restricted under local law. Our acquisition took the form of a tender offer under French and U.S. law for all Business Objects’ common stock, all ADRs representing Business Objects’ common stock, and all convertible bonds and warrants issued by Business Objects.
Under the terms of the tender offer agreement, we made a cash offer of €42.00 per share of common stock and the U.S. dollar equivalent of €42.00 per Business Objects ADR, determined using the euro to U.S. dollar
F-34
Table of Contents
exchange rate on settlement of the tender offers, of €50.65 per convertible bond, and a range of €12.01 to €24.96 per warrant, depending on the warrant grant date. After reaching the initial minimum tender condition of more than 50% on January 21, 2008, the tender offer period was reopened under the same conditions until January 29, resulting in an ownership level of more than 95%. This allowed SAP to commence an immediate squeeze-out acquisition of the outstanding shares of the remaining shareholders. The acquisition cost of €4.2 billion net of cash acquired was partly financed by a syndicated bank loan.
The following table shows the components of our acquisition cost for Business Objects:
Business Objects Acquisition Cost
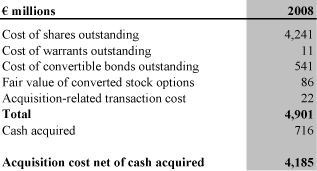
As part of the business combination, we purchased substantially all shares outstanding, all warrants, and all convertible bonds. The convertible bonds have been converted and the face value of the bond (€450 million) has been paid to SAP since the acquisition. In addition, we assumed Business Objects’ employee share-based payment programs without changing the parameters of these programs. The fair value of employee stock options assumed and awards exchanged was determined using a binomial based valuation model with the following assumptions: A risk-free interest rate of 3.42% to 3.74%, an expected volatility of 29%, and a dividend yield of 1.3%. For the purposes of purchase accounting, we used the cash offer price of €42 to determine the fair value of the exchanged Business Objects stock option awards. The fair value of unvested Business Objects options and restricted stock awards related to future service is being amortized based on the accelerated attribution method over the remaining service period, while the value of vested options is included in the total purchase price. Acquisition-related transaction costs include investment banking fees, legal fees, and other fees for external advisors directly related to the acquisition.
The assets acquired and liabilities assumed were recorded in the accompanying Consolidated Statement of Financial position at their estimated fair values as of the acquisition date, January 21, 2008. The excess of the acquisition cost of the business combination over the estimated fair values of the identifiable net assets acquired were recognized in goodwill. Factors that contributed to the recognition of goodwill of €3.5 billion were expected synergies from combining the activities of SAP and Business Objects, as well as assets, which cannot be recognized separately apart from goodwill because they are not identifiable (such as the quality and level of education of the workforce).
F-35
Table of Contents
The following table shows the allocation of the acquisition costs to the fair values of the assets acquired and liabilities assumed as of the acquisition date and the respective carrying amounts determined in accordance with IFRS immediately before the acquisition date:
Purchase Price Allocation of Business Objects

In 2009, new facts and circumstances arose that led us to change estimates underlying our original determination of the fair values of certain liabilities assumed in 2008. We consequently adjusted the carrying amounts of these liabilities to reflect the updated estimates. These adjustments resulted in the recognition of tax gains from reducing provisions relating to tax uncertainties (€48 million excluding accrued interest) which we recorded as a reduction in tax expense and operating gains from reducing employee-related liabilities (€18 million excluding accrued interest) which we recorded as a reduction in operating expenses. The release of related accrued interest of €13 million reduced our interest expense.
In connection with the acquisition we incurred restructuring costs resulting from severance and workforce relocation costs (€18 million), elimination of duplicate facilities (€35 million), and settlements with vendors to end service contracts (€2 million). Those costs were recognized in operating profit in 2008.
The following pro-forma financial information presents SAP’s results as if the acquisition had occurred at the beginning of 2008. These pro-forma results have been prepared for comparative purposes only. The pro-forma results are not necessarily indicative either of the results of operations that actually would have occurred had the acquisition been in effect at the beginning of the respective periods or of future results.
F-36
Table of Contents
Business Objects Pro - Forma Information

A loss after tax of the Business Objects group included in our profit after tax for 2008 amounted to €32 million. This amount does not include any revenue and results that SAP entities have generated with Business Objects products. The loss after tax contained the amortization of all acquired Business Objects intangibles, deferred revenue writedowns, and other impacts resulting from the acquisition.
This amount does not include the results of Business Objects entities that have been legally merged into SAP entities since the acquisition date.
In connection with the 2008 transactions discussed above, we assigned the following amounts to identifiable intangible assets:
Identifiable Intangible Assets Acquired as Part of Business Combinations in 2008
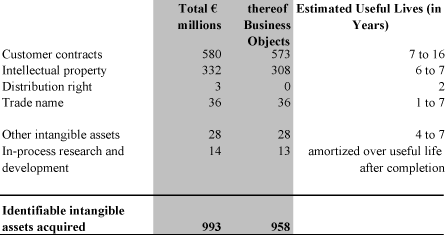
There were no identifiable intangible assets that have not been separately recorded. All in-process research and development assets were completed in 2008 and are now subject to amortization.
Goodwill additions in 2008 (including €-35 million adjustments for acquisitions of prior years) were assigned to our Product, Consulting, and Training segment as follows:
Assignment of Acquired Goodwill
to Segments
to Segments
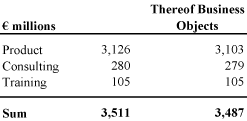
F-37
Table of Contents
Factors that made up the goodwill recognized included synergies from combining the acquirees’ operations with our operations and the workforce of the acquirees, which does not qualify for separate recognition as intangible assets.
| (5) | REVENUE |
Detailed information on our revenue recognition policies is disclosed in Note (3).
Revenue information by segment and geographic region is disclosed in Note (29).
Revenues from construction-type contracts (contract revenues) are included in software revenue and consulting revenue depending on the type of project. During fiscal years 2009, 2008, and 2007 we recognized €635 million, €634 million, and €559 million of contract revenue, respectively. The status of our construction projects in progress at the end of the reporting period was as follows:
Construction Projects in Progress
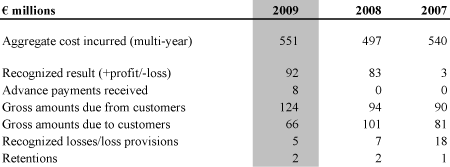
| (6) | EXPENSES BY NATURE AND HEADCOUNT |
Employee Compensation
Employee compensation comprises the following:
Employee Compensation
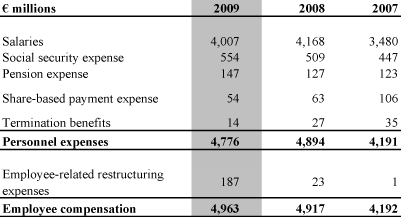
F-38
Table of Contents
Number of Employees
The average number of employees, measured in full-time equivalents and presented according to their function in SAP, was as follows:
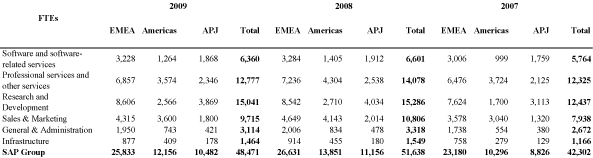
Depreciation and Amortization
Total depreciation and amortization expense for 2009, 2008, and 2007 was €499 million, €539 million, and €262 million, respectively.
Government Grants
During fiscal year 2009 we received €38 million (2008: €32 million; 2007: €16 million) of government grants and similar assistance, which we have offset against the related expenses. All conditions required to obtain these grants have either been met or are reasonably assured of being met.
In addition, we received conditional promises of a further €36 million, relating mostly to research and development expenses, that we have not recorded on December 31, 2009, because the conditions required to obtain them are not yet reasonably assured of being achieved.
| (7) | RESTRUCTURING |
In January 2009, we announced that we would continue with our cost-saving measures initiated in October 2008 and would reduce the workforce from 51,544 positions to 48,500 by year-end 2009.
As a result, we started to implement the restructuring plan in the first quarter of 2009 and continued with it throughout the year. Although part of the workforce reduction was achieved through attrition we eliminated 2,983 positions in 2009 by terminations and early retirement plans. Due to the reduced number of employees, we also consolidated certain facilities.
Employee- and facility-related restructuring expenses of €55 million that were recognized in 2008 related to restructuring activities incurred as a result of the acquisition of Business Objects. The remaining €5 million related to employee-related restructuring activities in connection with discontinuing our TomorrowNow activities.
F-39
Table of Contents
For additional information on the roll-forward of our restructuring provision, see Note (19b).
Restructuring Expenses
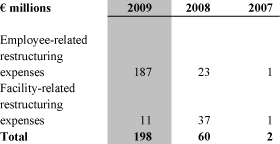
As restructuring expenses were material to our operations in 2009, we have presented those expenses separately in our Consolidated Income Statements in accordance with IAS 1.97. If not presented separately, these expenses would break down as follows:
Restructuring Expenses
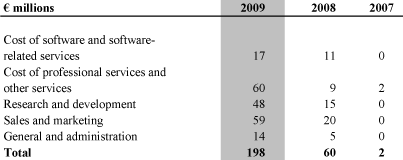
| (8) | OTHER OPERATING INCOME/EXPENSE, NET |
Other operating income/expense for the years ended December 31, was as follows:
Other Operating Income/Expenses
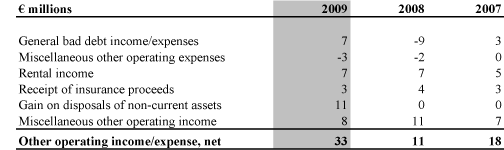
F-40
Table of Contents
| (9) | OTHER NON-OPERATING INCOME/EXPENSE, NET |
Other non-operating income/expense for the years ended December 31, was as follows:
Other Non-Operating Income/Expense, Net
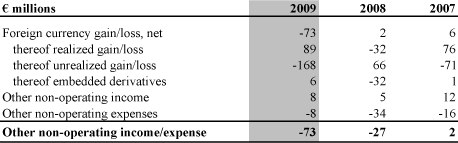
| (10) | FINANCIAL INCOME, NET |
Finance income and finance costs in 2009 amounted to €32 million (€72 million in 2008; €142 million in 2007) and €101 million (€123 million in 2008; €7 million in 2007), respectively. We derive finance income primarily from cash and cash equivalents and other financial assets. The increase in finance costs in 2008 was mainly due to the credit facility we entered into in connection with the acquisition of Business Objects.
Other financial gains/losses, net for the years ended December 31 were as follows:
Other financial Gains/Losses, Net
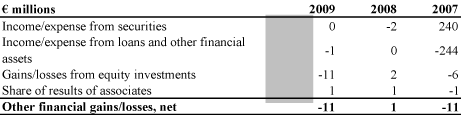
The line items income/expense from securities and income/expense from loans and other financial assets relate to €241 million of collateral held to secure financing investments in 2007.
For additional information about gains and losses from financial assets and financial liabilities recognized in profit or loss and other components of equity, see Note (27). For information about our hedging activities, see Note (26).
F-41
Table of Contents
| (11) | INCOME TAX |
Income tax expense for the years ended December 31 comprised the following components:
Income Tax Expense

Current tax expense includes €-59 million for prior years (2008: €14 million; 2007: €36 million).
Of the deferred tax expense (income) in 2009, 2008 and 2007, respectively, €-48 million, €-109 million and €9 million relate to the origination and reversal of temporary differences and €9 million, €18 million and €-1 million relate to unused tax losses.
In 2009, 2008, and 2007, the German government enacted several new tax laws. For us, the most significant effect resulted from the 2008 Business Tax Reform which was enacted in 2007 and led to a reduction of the German corporate income tax rate from 25% to 15%, effective January 1, 2008. The impact of the remaining tax law changes enacted in 2007, and of the tax laws enacted in 2008 and 2009, was not material to our Consolidated Financial Statements for the years ended December 31, 2009, 2008, and 2007.
Profit before tax consisted of the following:
Profit Before Tax
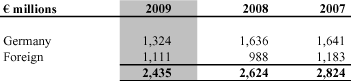
The effective income tax rate for the years ended December 31, 2009, 2008, and 2007, was 28.1%, 29.6% and 32.4%, respectively. The following table reconciles the expected income tax expense computed by applying our combined German corporate tax rate of 26.21% (2008: 26.33%; 2007: 35.49%) to the actual income tax expense. Our 2009 combined German corporate tax rate includes a corporate income tax rate of 15.00% (2008: 15.00%;
F-42
Table of Contents
2007: 21.91%; 2007 after the benefit of trade tax deductibility which ceased in 2008), plus a solidarity surcharge of 5.5% thereon, and trade taxes of 10.38% (2008: 10.50%; 2007: 12.38%).
Reconciliation of Tax Expense
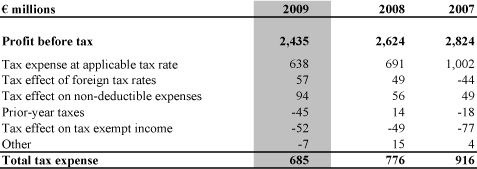
F-43
Table of Contents
Deferred tax assets and liabilities on a gross basis as at December 31, 2009 and 2008, are summarized (referring to the underlying items) as follows:
Deferred Tax Assets and Liabilities
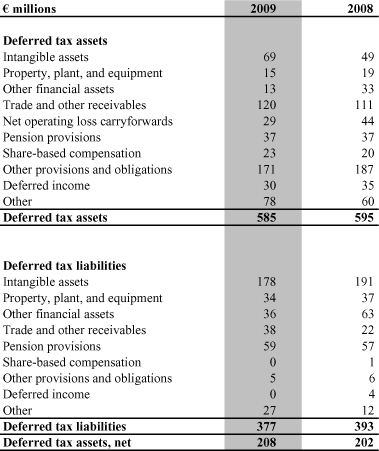
In assessing the realizability of deferred tax assets, we consider whether it is probable that some portion or all of the deferred tax assets will not be utilized. The ultimate utilization of deferred tax assets depends on the generation of future taxable income during the periods in which those temporary differences become deductible. Based on the level of historical taxable income and projections for future taxable income over the periods in which the deferred tax assets are recoverable, we believe it is probable that we will realize the benefits of these deductible differences, net of the existing valuation allowances at December 31, 2009. The amount of the deferred tax asset considered realizable, however, could be reduced in the near term if our estimates of future taxable income during the carryforward period are reduced.
At December 31, 2009, we had net operating loss carryforwards amounting to €301 million (2008: €395 million; 2007: €138 million). Deferred tax assets have not been recognized for tax loss carryforwards in the amount of €147 million (2008: €188 million; 2007: €51 million). As at December 31, 2009, €1 million (2008: €4 million; 2007: €1 million) of the unrecognized tax loss carryforwards expire in the following period and €138 million (2008: €176 million; 2007: €45 million) expire after one up to twenty years. The remaining unrecognized tax loss carryforwards in the amount of €8 million (2008: €8 million; 2007: €5 million) do not expire.
F-44
Table of Contents
We recognized deferred tax liabilities of €6 million (2008: €14 million) for income tax on future dividend distributions from foreign subsidiaries, which is based on €368 million (2008: €696 million) of cumulative undistributed profits of those foreign subsidiaries because such profits are intended to be repatriated. We have not recognized a deferred tax liability on approximately € 3.60 billion (2008: €2.76 billion) for undistributed profits of our foreign subsidiaries that arose in 2009 and prior years because we plan to indefinitely reinvest those undistributed profits. It is not practicable to estimate the amount of unrecognized tax liabilities for these undistributed foreign profits.
The proposed dividend payment of €0.50 per share for the year ended December 31, 2009, will not have any effects on the income tax of SAP AG.
Total income tax including the items charged or credited directly to related components of equity for the years ended December 31, 2009, 2008, and 2007, consists of the following:
Total Income Tax
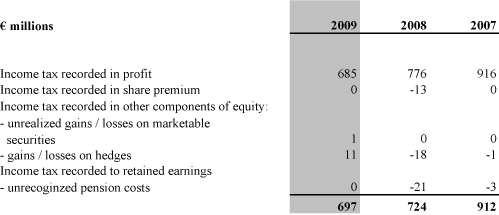
The income tax recorded in share premium is related to our equity-settled share-based compensation.
| (12) | EARNINGS PER SHARE |
Convertible bonds and stock options granted to employees under our share-based compensation programs are included in the diluted earnings per share calculations to the extent they have a dilutive effect. The dilutive impact is calculated using the treasury share method. The computation of diluted earnings per share does not include certain convertible bonds and stock options issued in connection with the SAP AG 2000 Long Term Incentive Plan (LTI 2000 Plan) and the SAP Stock Option Plan 2002 (SAP SOP 2002) because their effect is antidilutive. Such convertible bonds and stock options, if converted or exercised, represented 35.8 million SAP common shares in 2009 (2008: 43.6 million SAP common shares; 2007: 37.3 million SAP common shares). The number of outstanding stock options and convertible bonds is presented in Note (28).
F-45
Table of Contents
Earnings per Share

| (13) | OTHER FINANCIAL ASSETS |
Other Financial Assets
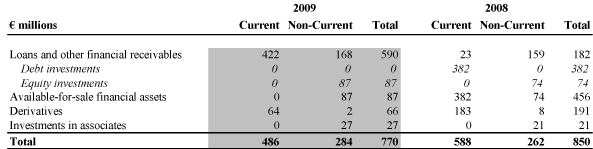
Loans and Other Financial Receivables
Loans and other financial receivables mainly consist of time deposits (2009: €405 million; 2008: €0 million), investments in insurance policies relating to pension assets (2009: €91 million; 2008: €81 million), loans to employees (2009: €50 million; 2008: €53 million) and other receivables (2009: €39 million; 2008: €44 million). These spread over the geographic areas as follows:
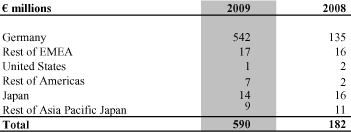
Most of our time deposits have a maturity of less than six months.
Investments in insurance policies relate to semiretirement and time accounts for which the corresponding liability is included in employee-related obligations (see Note 19b).
Loans to third parties are presented net of allowances for credit losses. Changes in the allowance for credit losses of third-party loans were not significant in any period presented.
F-46
Table of Contents
As at December 31, 2009, there were no loans and other financial receivables past due but not impaired. We have no indications as at the reporting date of impairments of loans and other financial receivables that are not past due and not impaired. For general information on financial risk and the nature of risk, see Note (25).
Available-for-Sale Financial Assets
The decline in debt investments, which at December 31, 2008 consisted mainly of investments in money market funds of €193 million and investment grade bonds of €189 million, is due to these investments reaching their maturity and being paid back in full.
Our equity investments consist of securities with and without quoted market prices. Our equity investments without quoted market prices primarily consist of venture capital investments with a carrying value of €62 million and €63 million as at December 31, 2009 and 2008, respectively.
Available-for-sale financial assets are denominated in the following currencies:
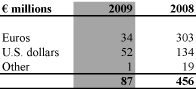
Sales of equity investments accounted for at cost were immaterial in all periods presented. As of December 31, 2009, we do not intend to dispose of any equity investments at cost in the near future. For information on fair value measurement with regard to our equity investments at cost, see Note (27).
In all periods presented, impairment charges relating to equity securities at fair value were immaterial. For our equity investments at cost, we recorded €11 million, €12 million, and €6 million, respectively, in losses related to impairments during 2009, 2008, and 2007.
Derivatives
Detailed information about our derivative financial instruments is presented in Note (26).
| (14) | TRADE AND OTHER RECEIVABLES |
Trade and Other Receivables
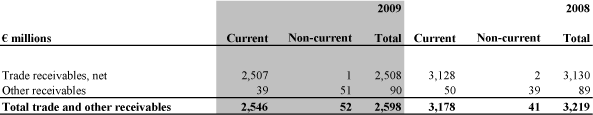
Trade receivables, net include unbilled receivables related to fixed-fee andtime-and-material consulting services of €211 million and €221 million as at December 31, 2009, and 2008, respectively.
F-47
Table of Contents
The carrying amounts of our trade receivables as at December 31 are as follows:
Carrying Amounts of Trade Receivables
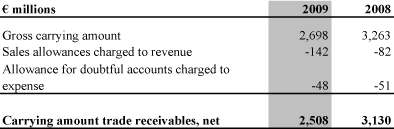
Changes in the allowance for doubtful accounts were as follows:
Increase (Decrease) in Allowance for Doubtful Accounts
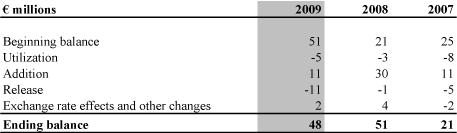
Concentrations of credit risks are limited due to our large customer base and its distribution across many different industries and countries worldwide. No single customer accounted for 10% or more of total revenue or total trade receivables, net in 2009, 2008, or 2007. The aging of trade receivables as at December 31 was:
Aging of Trade Receivables
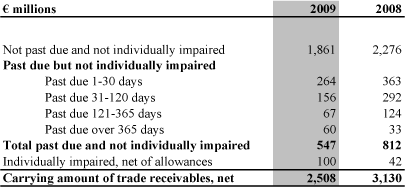
Total past due and not individually impaired trade receivables of €547 million and €812 million as at December 31, 2009, and 2008, respectively, consist of past due trade receivables which are not impaired on an individual receivable basis as outlined under Note (3b). Individually impaired trade receivables, net of allowances of €100 million and €42 million as at December 31, 2009, and 2008, respectively, consist of past due and not past due trade receivables that are fully or partly impaired on an individual receivables basis.
F-48
Table of Contents
We believe that the recorded sales and bad debt allowances adequately provide for the credit risk inherent in trade receivables.
For more information about financial risk and how we manage it, see Note (25) and (26).
| (15) | OTHER NON-FINANCIAL ASSETS |
Other Non-financial Assets
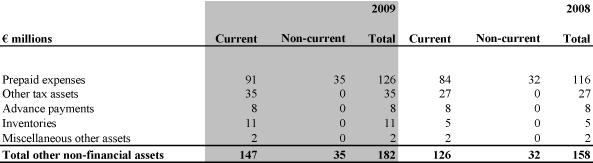
Prepaid expenses primarily consist of prepayments for operating leases, support services and software royalties that will be charged to expense in future periods.
F-49
Table of Contents
(16) GOODWILL AND INTANGIBLE ASSETS
Goodwill and Intangible Assets
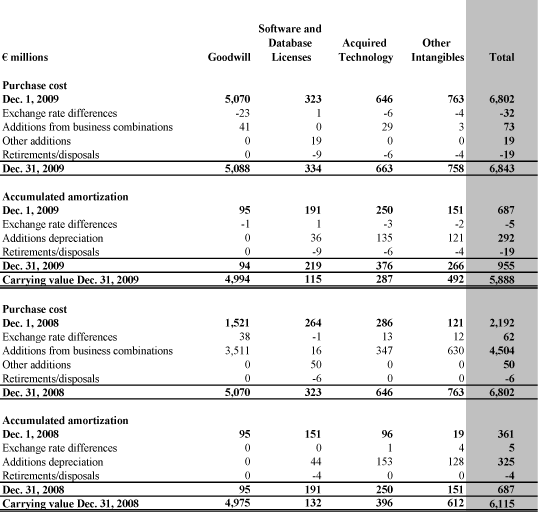
The additions to goodwill result from our acquisitions (€42 million) and adjustments to goodwill of previous acquisitions (€ -1 million). For more information about acquisitions, see Note (4). We do not have contractual commitments for the acquisition of intangibles.
Software and database licenses consist primarily of technology for internal use whereas acquired technology consists primarily of purchased software to be incorporated into our product offerings and in-process research and development. The additions to software and database licenses in 2009 and 2008 were individually acquired from third parties and include cross license agreements and patents, whereas the additions to acquired technology and other intangibles primarily result from our business combinations discussed in Note (4).
Other intangibles consist primarily of acquired trademark licenses and customer contracts.
F-50
Table of Contents
We carry the following significant intangible assets:
Significant Intangible Assets
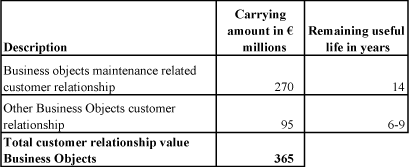
Amortization expenses of intangible assets are included in cost of software and software-related services, cost of professional services and other services, research and development, sales and marketing as well as general and administration based on usage. Impairment charges are recognized in other operating income.
For the purpose of impairment testing, goodwill is allocated to our reportable segments Product, Consulting and Training which represent the lowest level of cash-generating units within the Group at which the goodwill is monitored for internal management purposes.
The carrying amount of goodwill by reportable segment at December 31, 2009, and 2008, was as follows:
Goodwill by Segments

For more information about our segments see Note (29).
The recoverable amount of our cash-generating units, which equal our segments, has been determined based on the value in use calculation. The segments are in complementary businesses and consequently the recoverable amounts are based to a certain extent on the same key assumptions.
The key assumptions that we have used for purposes of goodwill impairment testing in 2009 are as follows:

F-51
Table of Contents
The calculations use cash flow projections based on actual operating results and a five-year business plan (2008: two-year business plan) approved by management. Cash flows for periods beyond this five-year business plan were extrapolated using a segment-specific growth rate. This growth rate does not exceed the long-term average growth rate for the market in which our cash-generating units operate. Our estimated cash flow projections are discounted to present value by means of a pre-tax discount rate between 10.75% and 11.15% (2008: 10.78% and 10.86%). The discount rate is based on a weighted average cost of capital approach (WACC).
Management believes that no reasonably possible change in any of the above key assumptions would cause the carrying value of any cash-generating unit to exceed its recoverable amount. Even if we applied a growth rate of only 0% for extrapolating cash flow projections beyond the years covered by our 2009 business plan (2008: value in use based on growth rates of 0%) for calculating thevalue-in-use for all cash-generating units, the calculated amounts would still exceed the carrying amounts.
| (17) | PROPERTY, PLANT, AND EQUIPMENT |
Property, Plant, and Equipment

F-52
Table of Contents
The additions and disposals in other property, plant, and equipment relate primarily to the replacement and purchase of computer hardware and cars acquired in the normal course of business.
Interest capitalized was not material to any period presented.
| (18) | TRADE AND OTHER PAYABLES, FINANCIAL LIABILITIES AND OTHER NON-FINANCIAL LIABILITIES |
Trade and other payables, financial liabilities and other non-financial liabilities classified based on due dates as at December 31 were as follows:
Trade and Other Payables, Financial Liabilities and Other Non-financial Liabilities

Liabilities are unsecured, except for the retention of title and similar rights customary in our industry. Effective interest rates on bank loans were 4.32% in 2009, 4.30% in 2008 and 8.03% in 2007.
| (19) | PROVISIONS |
Provisions based on due dates as at December 31 were as follows:
Provisions

| (19a) | Pension Plans and Similar Obligations |
We maintain several defined benefit and defined contribution plans for our employees in Germany and at foreign subsidiaries, which provide for old age, disability, and survivors’ benefits. The measurement dates for the domestic and foreign benefit plans are December 31. Individual benefit plans have also been established for
F-53
Table of Contents
members of our Executive Board. Furthermore, in certain countries we provide termination indemnity benefits to employees regardless of the cause for termination. These types of benefits are typically defined by law in these foreign countries.
The liabilities accrued for pensions and other similar obligations on December 31 consist of the following:
Liabilities Accrued for Pensions and Other Similar Obligations

Defined Benefit Pension Plans and Similar Obligations
The Consolidated Statements of Financial Position include the following significant components related to defined benefit pension plans as at December 31, 2009 and 2008, respectively:
Significant Components Related to Defined Benefit Pension Plans

Our domestic defined benefit plans provide participants with pension benefits that are based on the length of service and compensation of employees.
There is also a domestic employee-financed pension plan for which SAP guarantees a minimum return on investment which is equivalent to the return guaranteed by the insurer. Even though the risk that SAP would be liable for a return that cannot be met by the insurance company is very remote, these employee-financed plans do not qualify as defined contribution plans under IFRS and are included in domestic plan assets and plan liabilities.
Foreign defined benefit plans provide participants with pension benefits that are based on compensation levels, age, and length of service.
Certain of our foreign subsidiaries are required to provide to their employees termination indemnity benefits regardless of the reason for termination (retirement, voluntary, or involuntary). We treat these plans as defined benefit plans if the substance of the post-employment plan is a pension-type arrangement. Most of these arrangements provide the employee with a one-time payout based on compensation levels, age, and years of service on termination independent of the reason (retirement, voluntary, or involuntary).
Our subsidiaries in the United States decided in 2008 to freeze their defined benefit plan effective December 31, 2008, and instead offered additional and improved benefits under their defined contribution plan(401k-Plan regulations). As a result, we recognized a curtailment gain in the amount of €9 million related to the reduction of the defined benefit obligation in 2008.
F-54
Table of Contents
The following table shows the development of the present values of the defined benefit obligations and the fair value of the plan assets with a reconciliation of the funded status to net amounts:
Change in the Present Value of the DBO and the Fair Value of the Plan Assets
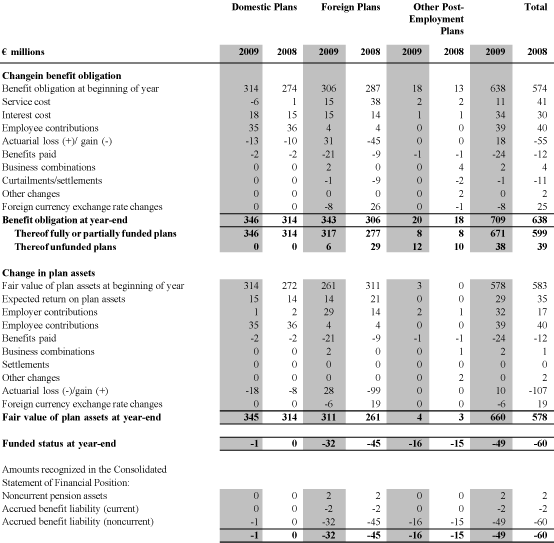
F-55
Table of Contents
The following weighted average assumptions were used for the actuarial valuation of our domestic and foreign pension liabilities as well as other post-employment benefit obligations as at the respective measurement date:
Actuarial Assumptions for Defined Benefit Liabilities

The assumed discount rates are derived from rates available on high-quality corporate bonds and government bonds for which the timing and amounts of payments match the timing and the amounts of our projected pension payments.
The components of total expense of defined benefit plans for the years 2009, 2008, and 2007 recognized in operating expense were as follows:
Total Expense of Defined Benefit Plans

Due to the fact that our domestic defined benefit plans primarily consist of an employee financed post-retirement plan that is fully financed with qualifying insurance policies, current service cost may turn into a credit. This results from the fact that initially the plan assets and benefit liability are independently calculated based on actuarial assumptions, but then IAS 19.104 is applied and adjusts the defined benefit liability to the fair value of the qualifying plan assets. This adjustment is reflected as service cost.
F-56
Table of Contents
We have recognized the following amounts of actuarial gains and losses for our defined benefit plans as other comprehensive income directly in retained earnings:
Actuarial Gains (Losses) on Defined Benefit Plans

For the calculation of the total expense for the years 2009, 2008, and 2007, the projection of the defined benefit obligation and the fair value of the plan assets as at December 31, 2009, 2008, and 2007, our actuary has used the following principal actuarial assumptions (expressed as weighted averages for our foreign and post-employment benefit plans):
Actuarial Assumptions for Total Expense

Pension Assets
Our investment strategy on domestic benefit plans is to invest all contributions in stable insurance policies. The expected rate of return on plan assets for our domestic benefit plans is calculated by reference to the expected returns achievable on the insured policies given the expected asset mix of the policies.
The expected return assumptions for our foreign plan assets are based on weighted average expected long-term rates of return for each asset class, estimated based on factors such as historical return patterns for each asset class and forecasts for inflation. We review historical return patterns and other relevant financial factors for appropriateness and reasonableness and make modifications to eliminate certain effects when
F-57
Table of Contents
considered necessary. Our foreign benefit plan asset allocation at December 31, 2009, and our target asset allocation for the year 2010 are as follows:
Plan Asset Allocation for Foreign Plans and Other Post-Employment Obligations
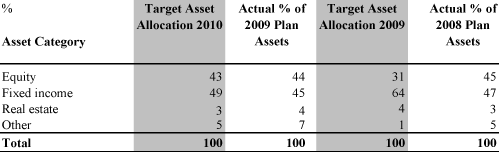
The investment strategies for foreign benefit plans vary according to the respective conditions in the country in which the benefit plans are situated. Generally, a long-term investment horizon has been adopted for all major foreign benefit plans. Our policy is to invest in a risk-diversified portfolio consisting of a mix of assets within the above target asset allocation range.
Expected Future Contributions and Benefits
Our expected contribution in 2010 is €1 million for domestic defined benefit plans and €31 million for foreign defined benefit plans, all of which is expected to be paid in cash.
The estimated future pension benefit payments to be made over the next 10 years by our domestic and foreign benefit plans for the years ended December 31 are as follows:
Estimated Future Pension Benefit Payments

F-58
Table of Contents
The amounts for the current year and three preceding years of pension obligation, plan assets, funded status, and experience adjustments are as follows:
Pension Obligation, Plan Assets, Funded Status and Experience Adjustments

Defined Contribution Pensions Plans
We also maintain domestic and foreign defined contribution plans. Amounts contributed by us under such plans are based on a percentage of the employees’ salaries or the amount of contributions made by employees. The expenses associated with defined contribution plans were €132 million in 2009, €100 million in 2008, and €91 million in 2007.
State Plans
In Germany, as well as some other countries, the legislator has established pension benefit arrangements that are operated by national or local government or a similar institution. The expenses associated with these plans were €120 million in 2009, €118 million in 2008, and €96 million in 2007.
| (19b) | Other Provisions |
Other provisions developed in the reporting year as follows:

Additions to our provisions also include interest components which are not material individually and in the aggregate.
F-59
Table of Contents
Provisions related to share-based compensationprograms comprise the obligations for our cash-settled share-based compensation which are described in detail in Note (28).
Other employee-related provisionsprimarily comprise obligations for time credits, severance payments, jubilee expenses, and semiretirement. While most of these employee-related provisions could be claimed within the next 12 months, we do not expect the related cash flows within this time period.
Customer-related provisionsinclude performance obligations as well as expected contract losses. The associated cash outflows are substantially short-term in nature.
Restructuring provisionsprimarily include personnel costs, which result from severance payments for employee terminations, and contract termination costs, including those relating to the termination of lease contracts. For more details, see Note (7). Prior year restructuring balances relate to restructuring activities incurred in connection with our acquisition of Business Objects (see Notes (4) and (7)) and the abandoning of TomorrowNow. The cash outflows associated with employee-related restructuring costs are substantially short- term in nature. The timing of the cash flows associated with facility-related provisions is dependent on the remaining term of the associated lease.
Warranty provisionsrepresent the estimated future cost of fulfilling our contractual obligations associated with sales of our software. We determine the warranty accrual based on the historical average cost of fulfilling our obligations under these commitments. The related outflow of economic benefits is of short-term nature.
Litigation-related provisionsrelate primarily to litigation matters described in Note (24). After taking legal advice, we have established provisions taking into account the facts of each case. The timing of the cash outflows associated with legal claims cannot be reasonably determined in all cases. We anticipate that part of the litigation-related expenses will be recovered through insurance. As of December 31, 2009, we have received €14 million from insurance policies (December 31, 2008: €6 million) which will be recognized when it is virtually certain that these amounts do not have to be repaid.
Other provisionsrelate mainly to asset retirement obligations associated with leased facilities and onerous contracts. For asset retirement obligations we record the present value of these obligations in the period in which the obligation is incurred. The associated cash outflows are generally expected to occur at the dates of exit of the facilities to which they relate, which are typically long-term in nature.
| (20) | DEFERRED INCOME |
Deferred income consists mainly of prepayments made by our customers for support services and professional services, fees from multiple element arrangements allocated to undelivered elements, and amounts recorded in purchase accounting at fair value for obligations to perform under acquired support contracts in connection with acquisitions.
F-60
Table of Contents
| (21) | TOTAL EQUITY |
Issued Capital
The following table shows the changes in the number and the value of issued shares and treasury shares. Each share of no-par issued capital has a nominal value of €1 per share.
Number of Shares
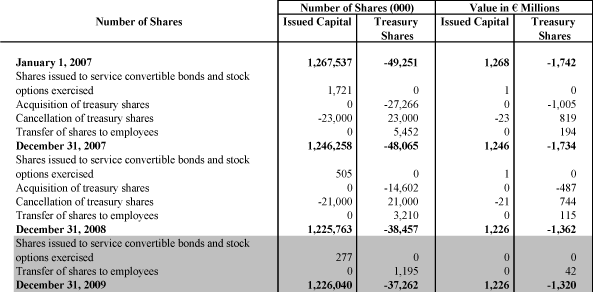
The change in issued capital due to convertible bonds and stock options exercised relates to the exercise of awards granted to employees under certain share-based payment plans.
Authorized Shares
The Articles of Incorporation authorize the Executive Board of SAP AG (the Executive Board) to increase the issued capital:
| • | Up to a total amount of €60 million through the issuance of new common shares in return for contributions in cash until May 11, 2010 (Authorized Capital I). The issuance is subject to the statutory subscription rights of existing shareholders. | |
| • | Up to a total amount of €180 million through the issuance of new common shares in return for contributions in cash until May 8, 2011 (Authorized Capital Ia). The issuance is subject to the statutory subscription rights of existing shareholders. | |
| • | Up to a total amount of €60 million through the issuance of new common shares in return for contributions in cash or in kind until May 11, 2010 (Authorized Capital II). Subject to certain preconditions and the consent of the Supervisory Board, the Executive Board is authorized to exclude the shareholders’ statutory subscription rights. | |
| • | Up to a total amount of €180 million through the issuance of new common shares in return for contributions in cash or in kind until May 8, 2011 (Authorized Capital IIa). Subject to certain preconditions and the consent of the Supervisory Board, the Executive Board is authorized to exclude the shareholders’ statutory subscription rights. |
F-61
Table of Contents
Contingent Shares
SAP AG’s issued capital is subject to a contingent increase of common shares. The contingent increase may be effected only to the extent that the holders of the convertible bonds and stock options that were issued by SAP AG under certain share-based payment plans (see Note 28) exercise their conversion or subscription rights. Contingent shares amounted to €208 million as at December 31, 2009, which is unchanged compared to the prior year.
Share Premium
Share premium represents all capital contributed to SAP with the proceeds resulting from the issuance of issued capital in excess of their calculated par value. Share premium arises mainly from issuance of issued capital, treasury shares transactions and share-based compensation transactions.
Retained Earnings
Retained earnings contain prior years’ undistributed profit after tax and unrecognized pension costs. Unrecognized pension costs comprise actuarial gains and losses relating to defined benefit pension plans and similar obligations.
Treasury Shares
By resolution of SAP AG’s Annual General Meeting of Shareholders held on May 19, 2009, the Executive Board of SAP AG was authorized to acquire, on or before October 31, 2010, up to 120 million shares in the Company on the condition that such share purchases, together with any previously acquired shares, do not account for more than 10% of SAP AG’s issued capital. Although treasury shares are legally considered outstanding, there are no dividend or voting rights associated with shares held in treasury. We may redeem or resell shares held in treasury or may use treasury shares for the purpose of servicing subscription rights and conversion rights under the Company’s share-based payment plans. Also, we may use the shares held in treasury as consideration in connection with the acquisition of other companies.
The Company purchased no SAP ADRs in 2009, 2008, or 2007 (each ADR represents one common share of SAP AG). The Company held no SAP ADRs as at December 31, 2009, 2008, and 2007 respectively.
Miscellaneous
Under the German Stock Corporation Act (Aktiengesetz), the total amount of dividends available for distribution to SAP AG’s shareholders is based on the earnings of SAP AG as reported in its statutory financial statements which are determined under the accounting rules stipulated by the German Commercial Code (Handelsgesetzbuch). For the year ended December 31, 2009, the Executive Board and the Supervisory Board of SAP AG intend to propose a dividend of € 0.50 per share (estimated to be 594 million €).
Dividends per share for both 2008 and 2007 were €0.50 and were paid in the succeeding year.
| (22) | ADDITIONAL CAPITAL DISCLOSURES |
The primary objective of our capital management is to ensure that we maintain a stable capital structure with the focus on total equity to uphold investor, creditor, and customer confidence and to ensure future development of our business. We are focused on keeping our total equity base solid to ensure independence, security, as well as a high financial flexibility through a favorable impact on the conditions of potential future borrowings, if required.
F-62
Table of Contents
We currently do not have a credit rating with any rating agency. Our debt ratio is at 37% (2008: 48%), and we do not believe that a rating would have a substantial effect on our current or future borrowing conditions and financing options.
Our goal is to continue to be able to return excess liquidity to our shareholders by distributing annual dividends as well as repurchasing treasury shares in future periods. The amount of future dividends and the extent of future purchases of treasury shares will be balanced with our effort to continue to maintain an adequate liquidity status.
Furthermore, we manage our financial liabilities, for example by entering into interest rate swaps on our borrowings.
The capital structure at the statement of financial position date was as follows:
Capital Structure

In 2009, repayment of the loan we entered into to finance the acquisition of Business Objects decreased our total liabilities. In the contrary, a “Schuldscheindarlehen” (SSD — a private placement transaction) totaling €697 million was placed on the euro-denominated capital markets in the first half of 2009.
We are predominantly equity-financed. This is also evident from the fact that bank loans and overdrafts represented only 5% of total assets as of December 31, 2009 (2008: 17%).
In 2009 and 2008, respectively, we were able to distribute €594 million in dividends from our 2008 and 2007 profit compared to €556 million distributed in 2007. Aside from the distributed dividend, in 2008 we also returned €487 million to our shareholders by repurchasing our own shares, compared to €1,005 million in 2007.
Commitments exist to reissue treasury shares or issue common shares in connection with our equity-settled share-based payment plans as described in Note (28). In all years presented we have satisfied and we expect to continue to satisfy commitments resulting from our equity-settled share-based payment plans through both reissuance of treasury shares and capital increases.
| (23) | OTHER FINANCIAL COMMITMENTS AND CONTINGENT LIABILITIES |
Other Financial Commitments
Operating Leases
Other financial commitments were €974 million, €1,112 million, and €850 million as at December 31, 2009, 2008 and 2007, respectively, and primarily comprise commitments under rental contracts and operating leases of
F-63
Table of Contents
€727 million, €863 million and €649 million as at December 31, 2009, 2008 and 2007, respectively. Those commitments relate primarily to the lease of office space, cars, and office equipment.
Purchase Commitments
In addition, contractual commitments for acquisition of property, plant, and equipment totaling €24 million in 2009 (€79 million in 2008; €97 million in 2007) exist. These commitments relate primarily to construction on new and existing facilities, office equipment and car purchase commitments. The remaining commitments totaling €223 million in 2009 (€170 million in 2008; €104 million in 2007) relate to marketing, consulting, maintenance, license agreements and other third-party agreements. Historically, the majority of such purchase commitments have been realized.
Commitments under operating leasing contracts and purchase obligations as at December 31, 2009, were as follows:
Other Financial Commitments
| Other Financial Commitments | ||||||||||
| € millions | Operating Leases | Purchase Commitments | ||||||||
| Due 2010 | 221 | 192 | ||||||||
| Due from 2011 to 2014 | 374 | 53 | ||||||||
| Due thereafter | 132 | 2 | ||||||||
As at December 31, 2009, the future minimum sublease payments were €13 million, €16 million, and €16 million for the years 2009, 2008, and 2007, respectively. Our sublease payments received were immaterial for all years reported.
Our rental and operating lease expense was €264 million, €274 million, and €210 million for the years 2009, 2008 and 2007, respectively.
Contingent Liabilities
In the normal course of business, we usually indemnify our customers against liabilities arising from a claim that our software products infringe a third party’s patent, copyright, trade secret, or other proprietary rights. In addition, we occasionally grant function or performance guarantees in routine consulting contracts or development arrangements. Also, our software license agreements generally include a clause guaranteeing that the software substantially conforms to the specifications as described in applicable documentation for a period of six to 12 months from delivery. Our product and service warranty liability, which is measured based on historical experience and evaluation, is included in other obligations (see Note (19b)).
For contingent liabilities related to litigation matters, see Note (24).
| (24) | LITIGATION AND CLAIMS |
We are subject to a variety of other claims and lawsuits that arise from time to time in the ordinary course of our business, including proceedings and claims that relate to companies which we have acquired, and claims that relate to customers demanding indemnification for proceedings initiated against them based on their use of SAP software. We will continue to vigorously defend against all claims and lawsuits against us. We record a provision for such matters when it is probable that we have a present obligation that results from a past event, is reliably estimable and the settlement of which is probable to require an outflow of resources embodying economic benefits. For further information regarding the development of the provisions recorded for litigations please refer to note (19b). We currently believe that resolving all claims and lawsuits against us, individually or in aggregate, did not and will not have a material adverse effect on our business, financial position, income, or cash flows.
F-64
Table of Contents
However, all claims and lawsuits involve risk and could lead to significant financial and reputational damage to the parties involved. Because of significant inherent uncertainties related to these matters, there can be no assurance that our business, financial position, income or cash flows will not be materially adversely affected nor can we reliably estimate the maximum possible loss in case of an unfavorable outcome.
Intellectual Property Litigation
In October 2006,U.S.-based Sky Technologies LLC (Sky) instituted legal proceedings in the United States against SAP and Oracle. Sky alleges that SAP’s products infringe one or more of the claims in each of five patents held by Sky. In its complaint, Sky seeks unspecified monetary damages and permanent injunctive relief. The legal proceedings have been re-activated and trial is scheduled for October 2010.
In January 2007, German-based CSB-Systems AG (CSB) instituted legal proceedings in Germany against SAP. CSB alleges that SAP’s products infringe one or more of the claims of a German patent and a German utility model held by CSB. In its complaint, CSB has set the amount in dispute at €1 million and is seeking permanent injunctive relief. Within these proceedings CSB is not precluded from requesting damages in excess of the amount in dispute. In July 2007, SAP filed its response in the legal proceedings including a nullity action and cancellation proceeding against the patent and utility model, respectively. The nullity hearing on the German patent was held in January 2009 and the German Court determined that the patent is invalid. The cancellation hearing for the utility model was held in May 2009 and the Court determined that the utility model was invalid. CSB is appealing, however, the infringement hearing has been stayed pending the appeals.
In March 2007,U.S.-based Oracle Corporation and certain of its subsidiaries (Oracle) instituted legal proceedings in the United States against TomorrowNow, Inc. and its parent company, SAP America, Inc. and SAP America’s parent company SAP AG (SAP). Oracle filed an amended complaint in June 2007, a second amended complaint in July 2008 and a third amended complaint in October 2008 and a fourth amended complaint in August 2009. SAP and TomorrowNow have answered the fourth amended complaint, subject to and as revised by the Court’s ruling on motion to dismiss the preceding third amended complaint. As amended, the lawsuit alleges copyright infringement, violations of the Federal Computer Fraud and Abuse Act and the California Computer Data Access and Fraud Act, unfair competition, intentional and negligent interference with prospective economic advantage, and civil conspiracy. The lawsuit alleges that SAP unlawfully copied and misappropriated proprietary, copyrighted software products and other confidential materials developed by Oracle to service its own customers. The lawsuit seeks injunctive relief and monetary damages including punitive damages in the billions of U.S. dollars. The trial has been re-scheduled for November 2010. Additionally, in June 2007, SAP became aware that the United States Department of Justice had opened an investigation concerning related issues and had issued subpoenas to SAP and TomorrowNow; SAP and TomorrowNow are cooperating with the investigation and are responding to the original subpoenas and additional subpoenas issued by the Department of Justice. In November 2009 a settlement conference was held. No settlement was reached. The next settlement conference is scheduled for June 2010. SAP has recorded a provision for these legal proceedings in the amount of US$100 million plus legal expenses as of December 31, 2009.
In April 2007,U.S.-based Versata Software, Inc. (formerly Trilogy Software, Inc.) (Versata) instituted legal proceedings in the United States against SAP. Versata alleges that SAP’s products infringe one or more of the claims in each of five patents held by Versata. In its complaint, Versata seeks unspecified monetary damages and permanent injunctive relief. The trial was held in August 2009. The jury returned a verdict in favor of Versata and awarded Versata US$138.6M for past damages. With prejudgment interest, approximately 167 Mio. USD is in dispute. The parties have filed post-trial motions and a hearing has been scheduled for March 2010.
In August 2007,U.S.-based elcommerce.com, Inc.(elcommerce) instituted legal proceedings in the United States against SAP. elcommerce alleges that SAP’s products infringe one or more of the claims in one patent held by elcommerce. In its complaint, elcommerce seeks unspecified monetary damages and permanent injunctiverelief. The Court in East Texas granted SAP’s request to transfer the litigation from East Texas to Pennsylvania. The trial in Pennsylvania has not yet been scheduled.
F-65
Table of Contents
In August 2007, Canadian-based JuxtaComm, Inc. (JuxtaComm) instituted legal proceedings in the United States against Business Objects and several other defendants. JuxtaComm alleges that Business Objects’ products infringe one or more of the claims in one patent held by JuxtaComm. In its complaint, JuxtaComm seeks unspecified monetary damages and permanent injunctive relief. SAP and JuxtaComm have resolved this dispute for an amount immaterial to SAP’s business, financial position, results of operations, and cash flows.
In November 2007,U.S.-based Diagnostic Systems Corp. (DSC) instituted legal proceedings in the United States against SAP and several other defendants. Among the defendants is Business Objects, which was sued by DSC prior to it being acquired by SAP. DSC alleges that SAP’s products infringe one or more of the claims in one patent held by DSC. In its complaint against SAP, DSC seeks unspecified monetary damages and permanent injunctive relief. In its complaint against Business Objects, which also alleges infringement of one or more claims in one DSC patent, DSC seeks unspecified monetary damages and permanent injunctive relief. The trial was scheduled for February 2010. SAP and DSC have resolved this dispute for an amount immaterial to SAP’s business, financial position, results of operations, and cash flows.
In May 2008,U.S.-based InfoMentis, Inc. (InfoMentis) instituted legal proceedings in the United States against SAP. InfoMentis alleges copyright infringement and unfair competition. The lawsuit seeks unspecified monetary damages and a permanent injunction. SAP filed its response in August 2008. The March 2010 trial date has been taken off the calendar and no new trial date has been set.
In July 2008,U.S.-based Implicit Networks (Implicit) instituted legal proceedings in the United States against SAP and several other defendants. Implicit alleges that SAP’s products infringe one or more of the claims of two patents held by Implicit. In its complaint, Implicit seeks unspecified monetary damages and permanent injunctive relief. SAP filed its response in November 2008. The legal proceedings have been transferred from Seattle, Washington to San Francisco, California. SAP and Implicit have resolved this dispute for an amount immaterial to SAP’s business, financial position, results of operations, and cash flows.
In July 2008 and July 2009,U.S.-based Aloft Media (Aloft) instituted legal proceedings in the United States against SAP and several other defendants. In the proceedings instituted in July 2008 Aloft alleges that SAP’s products infringe one or more of the claims of two patents held by Aloft. In its complaint, Aloft seeks unspecified monetary damages and permanent injunctive relief. SAP filed its response in October 2008. The trial was scheduled for June 2010. In the proceedings instituted in July 2009, Aloft alleges that SAP’s products infringe one or more of the claims of one patent held by Aloft. In its complaint, Aloft seeks unspecified monetary damages. SAP and Aloft have resolved this dispute for an amount immaterial to SAP’s business, financial position, results of operations, and cash flows.
In February 2010,U.S.-based TecSec, Inc. instituted legal proceedings in the United States against SAP. TecSec alleges that SAP’s products infringe one or more of the claims in five patents held by TecSec. In its complaint, TecSec seeks unspecified monetary damages and permanent injunctive relief. The trial has not yet been scheduled.
Other Litigation
In April 2008, South African-based Systems Applications Consultants (PTY) Limited (Securinfo) instituted legal proceedings in South Africa against SAP. Securinfo alleges that SAP has caused one of its subsidiaries to breach a software distribution agreement with Securinfo. In its complaint, Securinfo seeks damages of approximately €610 million euro plus interest. In September 2009, SAP filed a motion to dismiss. A trial date has not yet been set.
In April 2008,U.S.-based Wellogix, Inc. (Wellogix) instituted legal proceedings in the United States against SAP as well as several other defendants. Wellogix alleges several causes of action including, but not limited to, breach of joint venture/partnership agreement, breach of fiduciary duty, fraud, negligent misrepresentation, and misappropriation of confidential information. The lawsuit seeks unspecified monetary damages. SAP filed
F-66
Table of Contents
its responds in May 2008. In December 2008, the Court granted SAP’s motion to dismiss indicating the legal proceedings were improperly initiated in Texas. Wellogix has appealed. Wellogix has dropped its appeal.
In March 2008,U.S.-based Waste Management, Inc. and USA Waste Management Resources, LLC. (Waste Management) instituted legal proceedings in the United States against SAP alleging several causes of action, including but not limited to, fraud, negligent misrepresentation, and breach of contract. SAP filed an answer denying plaintiffs’ allegations and filed a counterclaim alleging breach of contract. In December 2009 the Court dismissed plaintiffs’ claim for negligent misrepresentation. In February 2010, SAP filed two motions for partial summary judgment. In response, Waste Management filed an amended petition re-writing their fraud allegations, asserting new claims, including but not limited to, civil conspiracy and joint enterprise, re-filed its claim for negligent misrepresentation to preserve its appeal rights, and filed various motions for partial summary judgment. In its amended petition, plaintiffs allege actual damages exceeding US$400 million and seeks an award of exemplary damages exceeding US$800 million. In March 2010, SAP filed special exceptions under Texas Rules of Civil Procedure to the amended petition. The parties continue to engage in motion practice and the trial is currently schedule for May 2010.
| (25) | FINANCIAL RISK FACTORS |
We are exposed to various financial risks, such as market risks, including changes in foreign currency exchange rates, interest rates, and equity prices, as well as credit risk and liquidity risk.
Foreign Currency Exchange Rate Risk
Foreign currency exchange rate risk is the risk of loss due to adverse changes in foreign currency exchange rates. Under IFRS, foreign currency exchange rate risks arise on account of monetary financial instruments denominated in currencies other than the functional currency where the non-functional currency is the respective risk variable; translation risks are not taken into consideration.
As a globally active enterprise, we are subject to risks associated with fluctuations in foreign currencies with regard to our ordinary operations. Since the Group’s entities mainly conduct their operating business in their respective functional currencies, our risk of exchange rate fluctuations from ongoing ordinary operations is not considered significant. However, occasionally we generate foreign currency-denominated receivables, payables, and other monetary statement of financial position items by transacting in a currency other than the functional currency with the majority then being hedged as described in Note (26).
In rare circumstances, transacting in a currency other than the functional currency also leads to embedded foreign currency derivatives being separated and measured at fair value through profit or loss.
In addition, SAP AG is exposed to risk associated with forecasted intercompany cash flows in foreign currencies resulting from intercompany royalty payments by the SAP Group’s entities linked to their external revenue. This leads to a centralization of the foreign currency exchange rate risk with SAP AG in Germany, as the royalties are mostly denominated in the respective subsidiary’s local currency while the functional currency of SAP AG is the euro. Here, the highest foreign currency exchange rate exposure relates to currencies of subsidiaries with significant operations for example the U.S. dollar, the pound sterling, the Japanese yen, the Swiss franc, the Canadian dollar, and the Australian dollar.
With regard to our investing and financing activities we are not exposed to any significant foreign currency exchange rate risk, as all such activities are conducted in the respective functional currency.
Interest-Rate Risk
Interest-rate risks result from changes in market interest rates which can cause changes in the fair values of fixed-rate instruments and in the interest to be paid or received for variable-rate instruments. This interest-rate risk arises for our investing and financing activities.
F-67
Table of Contents
As at December 31, 2009, our liquidity was mainly invested in current time deposits with fixed yields and money market funds with variable yields, held as cash equivalents and other financial assets. Since we do not account for the fixed-yield investments held at year-end at fair value, we are only exposed to a cash flow interest-rate risk with regard to our variable-rate investments, namely money market funds, in the euro zone and in the United States of America.
In 2009, financing activities focused on an interest-bearing private placement transaction (Schuldscheindarlehen, SSD), which closed in the second quarter of 2009, totaling €697 million with maturities of three and five years. The SSD has a €149.5 million fixed-rate tranche exposing us to a fair value risk of the liability and a €547.5 million variable-rate tranche, which gives rise to a cash-flow risk, as the interest payments are based on the prevailing EURIBOR rates. Hence, on the financing side, we are exposed to interest-rate risks mainly in the euro zone.
Equity-Price Risk
Equity-price risk is the risk of loss due to adverse changes in equity markets which we are exposed to with regard to our investments in equity securities and our share-based compensation plans.
Our investments consist of equity securities with and without quoted market prices in active markets classified asavailable-for-sale. Our investments in equity instruments with quoted market prices in active markets are monitored based on the current market value that is affected by the fluctuation in the volatile stock markets worldwide.
Also, we are exposed to risks resulting from future cash flows associated with share-based compensation granted to employees, which is described in detail in Note (28).
Credit Risk
Credit risk is the risk of economic loss of principal or financial rewards stemming from counterparty’s failure to repay or service debt according to the contractual obligations. In 2009, we entered into an agreement to insure part of our trade receivables against credit losses. Except for this, we have not concluded significant agreements reducing the overall credit risk exposure, such as master netting arrangements. Therefore, the total amounts recognized as cash and cash equivalents, short-term investments, loans and other financial receivables and derivative financial assets represent our maximum exposure to credit risks.
Liquidity Risk
Liquidity risk results from the potential inability to meet financial obligations, such as payments to suppliers or employees. A maturity analysis that provides the remaining contractual maturities of all our financial liabilities held at December 31, 2009, is shown in the table below. The cash flows for unrecognized but contractually agreed financial commitments are shown in Note (23). Financial liabilities for which repayment can be requested by the contract partner at any time are assigned to the earliest possible period. Variable interest payments were calculated using the last relevant interest rate fixed before December 31, 2009. As we settle our derivative contracts gross, we show the pay and receive legs separately for all our currency and interest rate derivatives, whether or not the fair value of the derivative is negative. The cash outflows for the currency derivatives are translated using the respective forward rate.
F-68
Table of Contents
Contractual Maturities of Financial Liabilities

The overall decrease of cash outflows for our non-derivative financial liabilities compared to year-end 2008 is due to the full repayment of a syndicated term loan in 2009.
The overall increase of cash outflows and inflows for our derivative financial liabilities is due to hedging an intercompany short-term loan in U.S. dollars.
F-69
Table of Contents
| (26) | FINANCIAL RISK MANAGEMENT |
We manage credit, liquidity, interest rate, equity price, and foreign currency exchange rate risks on a Group-wide basis. Selected derivatives are exclusively used for this purpose and not for speculation, which is defined as entering into derivative instruments without a corresponding underlying transaction. Financial risk management is done centrally. The risk management and hedging strategy is set by our Treasury guideline and other internal guidelines and is subject to continuous internal risk analysis.
In the following sections we provide details on the management of each respective financial risk and our risk exposure. For the presentation of market risk exposure, IFRS 7 requires sensitivity analyses that show the effects of hypothetical changes of relevant risk variables on profit or other components of equity. The periodic effects are determined by relating the hypothetical changes in the risk variables to the balance of financial instruments at the reporting date.
Foreign Currency Exchange Rate Risk Management
We continually monitor our exposure to currency fluctuation risks based on monetary items and forecasted transactions and pursue a Group-wide foreign currency exchange rate risk-management strategy using derivative financial instruments, primarily foreign exchange forward contracts, as appropriate, with the primary aim of reducing profit or loss volatility.
Currency Hedges without Designated Hedge Relationship
Foreign exchange forward contracts entered into by us to offset exposure relating to foreign currency-denominated monetary assets and liabilities from our operating activities are not designated as being in a hedge accounting relationship, because the realized currency gains and losses from the underlying transactions are recognized in profit in the same periods as the gains and losses from the derivatives.
In addition, currency hedges without a designated hedge relationship also contain foreign currency derivatives embedded in non-derivative host contracts that are separated and accounted for as derivatives according to the requirements of IAS 39.
Currency Hedges with Designated Hedge Relationship (Cash-Flow Hedges)
We enter into derivative instruments, primarily foreign exchange forward contracts, to hedge significant forecasted cash flows (royalties) from foreign subsidiaries denominated in foreign currencies, generally within a 40% to 80% range of the forecasted exposure out to 15 months. Specifically, we exclude the interest component and only designate the spot rate of the foreign exchange forward contracts as the hedging instrument to offset anticipated cash flows relating to the subsidiaries with significant operations, including the United States, the United Kingdom, Japan, Switzerland, Canada, and Australia. We generally use foreign exchange derivatives that have maturities of 15 months or less, which may be rolled over to provide continuous coverage until the applicable royalties are received.
In 2009, net losses totaling €18 million (2008: net losses of €32 million; 2007: net gains of €48 million) resulting from the change in the component of the derivatives designated as hedging instruments were taken directly to other components of equity.
For the years ended December 31, 2009, and 2008, no highly probable transaction designated as a hedged item in a foreign currency cash flow hedge relationship ceased to be probable of occurring. Therefore, we did not discontinue any of our cash flow hedge relationships. Also, we only identified immaterial ineffectiveness for these hedges in 2009 and no ineffectiveness in 2008 and 2007. In 2009, we reclassified net losses of €37 million (2008: net losses of €16 million; 2007: net losses of €38 million) out of other components of equity to profit or loss due to the hedged items affecting income. Generally, the cash flows of the forecasted transactions are expected to
F-70
Table of Contents
occur and affect profit or loss monthly within a time frame of 15 months from the statement of financial position date. It is estimated that €7 million of the net losses recognized directly in other components of equity at December 31, 2009, will be reclassified into profit during fiscal year 2010.
Foreign Currency Exchange Rate Exposure
In line with our internal risk reporting process, we use thevalue-at-risk method to quantify our risk positions and to manage foreign currency exchange rate risk. Our calculation of thevalue-at-risk not only includes all foreign currency-denominated financial instruments but also forecasted intercompany transactions that are scoped out of IFRS 7. As our internal calculation ofvalue-at-risk is not in line with the requirements of IFRS 7, we have opted to disclose our risk exposure based on a sensitivity analysis considering the following:
| • | Since the SAP Group’s entities generally operate in their functional currencies, the majority of our non-derivative monetary financial instruments such as cash, trade receivables, trade payables, loans to employees and third parties, bank liabilities, and other financial liabilities, are denominated in the respective entities’ functional currency. Thus, a foreign currency exchange rate risk in these transactions is non-existent. In exceptional cases and limited economic environments, operating transactions are denominated in currencies other than the functional currency, leading to a currency risk for the related monetary instruments. Where we hedge against currency impacts on cash flows, these foreign currency-denominated financial instruments are economically converted into the functional currency by the use of forward exchange contracts or options. Therefore, fluctuations in foreign currency exchange rates neither have a significant impact on profit nor on other components of equity with regard to our non-derivative monetary financial instruments. | |
| • | Income or expenses on the non-derivative monetary financial instruments discussed above are always recognized in the relevant entity’s functional currency. Therefore, fluctuations in foreign currency exchange rates neither have a significant impact on profit nor on other components of equity in this regard. | |
| • | Our free-standing derivatives designed for hedging currency risks almost completely balance the changes in the fair values of the hedged item attributable to exchange rate movements in the consolidated income statements in the same period. As a consequence, the hedged items and the hedging instruments are not exposed to currency risks with an effect on profit or other components of equity. |
Consequently, we are only exposed to foreign currency exchange rate fluctuations with regard to:
| • | Derivatives held within a designated cash-flow hedging relationship, and | |
| • | Foreign currency embedded derivatives. |
With respect to the nominal amounts, the data at year-end is not representative of the year as a whole. On average, our exposure to foreign currency exchange rate risk in 2009 was based on nominal amounts of €898 million, with a range of exposure on nominal amounts from a low of €819 million to a high of €960 million, which was also the year-end exposure.
The interest element which is not part of the assigned cash flow hedging relationship and is posted to profit is not affected by currency fluctuations. As we do not have a significant exposure to a single currency, we disclose our exposure to our major currencies (as described in Note (25)) in total. If, at December 31, 2009, the euro had gained (lost) 10% against all our major currencies, the effective portion of the foreign currency cash-flow hedge in other components of equity would have been €55 million higher (lower) (December 31, 2008: €68 million higher (lower); December 31, 2007: €64 million higher (lower)) than presented.
Any change in the value of our foreign-currency embedded derivatives is recorded in profit or loss. If, at December 31, 2009, the euro had gained (lost) 10% against the Swiss franc (which is the currency accounting for the majority of our respective exposure), the effect on other non-operating income would have been €38 million
F-71
Table of Contents
higher (lower) (December 31, 2008: €40 million higher (lower); December 31, 2007: €37 million higher (lower)) than presented.
Our sensitivity to foreign currency exchange rate fluctuations has decreased during the current period, mainly due to the reduction of the nominal amounts hedged in a cash-flow hedging relationship and the reduction of the volume of the underlying executory contracts of foreign-currency embedded derivatives.
Interest-Rate Risk Management
The primary aim of our interest-rate risk management is to reduce profit or loss volatility.
In order to hedge the cash-flow risk resulting from fluctuations in future interest payments related to the variable-rate SSD, we entered into interest rate payer swaps, thus economically converting the underlying floating rate of the SSD into a fixed rate, as the changes in the cash flows of the hedged items resulting from changes in EURIBOR are offset against the changes in the cash flows of the interest rate swaps. At December 31, 2009, the nominal volume of the interest rate derivatives covered the total volume of the variable-rate SSD. Hence, virtually all of our interest rate sensitive liabilities denominated in euros and of the total of our interest rate sensitive liabilities had a fixed interest rate.
Derivatives with Designated Hedge Relationship (Cash-Flow Hedges)
At December 31, 2009, we held interest rate derivatives with a designated hedge relationship that had a negative fair value of €5 million (2008: €16 million) for which net losses of €14 million of the 2009 financial year (2008: €15 million net losses of the 2008 financial year; 2007: €0 million) were recorded in other components of equity due to the designation as cash-flow hedging instruments. In 2009, we reclassified net losses of €26 million (2008: €0 million; 2007: €0 million) out of other components of equity to interest expense due to the hedged items affecting income. We did not record any ineffectiveness for these hedges for the fiscal years 2009, 2008, and 2007.
The following table shows the contractual maturities of the cash flows for the SSD interest payments:
Start Date | End Date | Nominal Volume | Reference Rate | |||
| April 9, 2009 | April 9, 2012 | €359.5 million | 3-month-EURIBOR | |||
| April 9, 2009 | April 9, 2014 | €158 million | 3-month-EURIBOR | |||
| June 2, 2009 | June 2, 2014 | €30 million | 3-month-EURIBOR |
Interest Rate Exposure
In order to reduce profit or loss volatility, we manage interest-rate risk by adding interest-rate-related derivative instruments to a given portfolio of debt financing.
Due to the short maturities of our investments, we do not have a significant interest-rate risk-related to financial assets (see Note (13)).
As noted above, we entered into derivative financial instruments to hedge the interest rate risk resulting from the variable interest-rate SSD.
A sensitivity analysis is provided to show our interest rate risk exposure at the statement of financial position date considering the following:
| • | Changes in interest rates only affect non-derivative fixed-rate financial instruments if they are recognized at fair value. As at December 31, 2009 we did not have non-derivative fixed-rate financial assets classified asavailable-for-sale or non-derivative fixed-rate financial liabilities designated as at fair value through profit or loss, an equity-related sensitivity calculation is not necessary. As our investment portfolio also contained fixed-rate financial assets from the euro zone during 2009, the data at year-end is not representative of the entire year of 2009. On average, our exposure to fair value |
F-72
Table of Contents
| risk in 2009 with regards to investing activities was based on investments of €77 million, with a range of exposure on investments from a high of €199 million to a low of €0 million, which was also theyear-end exposure. |
| • | Income or expenses for non-derivative financial instruments with variable interest are subject to interest rate risk if they are not hedged items in an effective hedging relationship. We therefore have no significant interest-rate risk arising from our financial liabilities and consider interest rate changes for our variable interest-rate investments in the profit-related sensitivity calculation. With respect to the invested amounts, the data at year-end is not representative of the year as a whole. On average, our exposure to cash flow interest rate risk in 2009 was based on investments of €847 million, with a range of exposure on investments from a high of €1.0 billion to a low of €330 million, which was also the year-end exposure. | |
| • | Due to the aforementioned designation of interest rate derivatives to a cash flow-hedge relationship, the respective interest rate changes affect the respective amounts recorded in other components of equity. The movements related to the interest rate swaps’ variable leg are not reflected in the sensitivity calculation as they offset the variable interest-rate payments for the credit facility. We therefore only consider interest rate sensitivity in discounting the interest rate swaps’ fixed leg cash flows in the equity-related sensitivity calculation for the interest swaps in a hedge relationship. With respect to the borrowing and therefore hedged amounts, the data at year-end is not representative for the year as a whole, as significant debt amounts from a syndicated term loan raised in connection with the acquisition of Business Objects were paid back in 2009. On average, our exposure to interest rate risk in 2009 with regard to financing activities was based on borrowings of €2.03 billion, with a range of exposure on borrowings from a high of €3.0 billion to a low of €697 million, which was also theyear-end exposure. |
While in the previous years we used a yield curve shift of +100/-100 basis points, the 2009 sensitivity analysis is — due to the current low interest level — based on a yield curve shift of +100/-20 basis points to avoid negative interest rates. If, on December 31, 2009, interest rates had been 100 basis points higher (20 basis points lower) (2008/2007: 100 basis points higher (lower)), this would not have had a material effect on:
| • | The gains/losses onavailable-for-sale financial assets positions in other components of equity. | |
| • | The financial income, net for our variable interest-rate investments. | |
| • | The effective portion of the interest rate cash-flow hedge in other components of equity. |
Only the sensitivity analysis for theavailable-for-sale financial assets is not representative for the year as a whole, as during 2009 we held fixed interest-rate financial assets.
Our sensitivity to interest rate fluctuations has decreased during the current period mainly due to the reduction of variable-rate debt instruments and liabilities.
Equity-Price Risk Management
Our equity investments in listed securities are affected by the fluctuation in the volatile stock markets worldwide. An assumed 20% increase (decrease) in equity prices as at December 31, 2009, would only have an insignificant impact on the value of our investments in marketable securities and the corresponding entries in other components of equity.
The equity investments in non-listed securities are monitored individually. Those securities are recognized at cost, because market values are generally not observable. They are subject to an annual impairment test.
In order to reduce profit or loss volatility, we hedge certain cash flow exposures associated with share-based compensation through the purchase of derivative instruments, but do not establish a designated hedge
F-73
Table of Contents
relationship. Based on the valuation of the share-based compensation hedges, share-based compensation expense increased €5 million (2008: increase of €41 million; 2007: increase of €31 million).
Credit Risk Management
To mitigate the credit risk for our investing activities, we conduct all our activities only with approved major financial institutions and issuers that carry high external ratings, as required by our internal treasury guideline. Among its stipulations, the guideline requires that we invest only in assets from issuers with a minimum rating of at least A-. The weighted average rating of our financial assets is in the range AA- to A+. We pursue a policy of cautious investments characterized by predominantly short-term investments, standard investment instruments, as well as a wide portfolio diversification by doing business with a variety of counterparties. This approach is assured by detailed guidelines for the management of financial risks, stipulating that the business volume with individual counterparties is restricted to a defined limit which depends on the lowest official long-term credit rating available by at least one of the major rating agencies, or participation in the German Depositors’ Guarantee Fund or any other protection scheme. We continuously monitor strict compliance with these counterparty limits.
The default risk of trade receivables is managed separately, mainly based on assessing the creditworthiness of customers through external ratings and our historical experience with respective customers, and it is partially covered by merchandise credit insurance. Outstanding receivables are continuously monitored locally. Credit risks are accounted for through individual and portfolio impairments (described in detail in Note (3)). The impact of trade receivables from single customers is mitigated by our large customer base and its distribution across many different industries and countries worldwide. For information about the credit quality of trade receivables, see Note (14). For information on the maximum exposure to credit risk, see Note (25).
To mitigate the credit risk for our derivative financial assets, we only purchase such instruments from approved major financial institutions that carry high external credit ratings as laid out in our internal treasury guideline. In addition, the concentration of credit risk that exists when counterparties are involved in similar activities by instrument, sector or geographic area is further mitigated by diversification of counterparties throughout the world and adherence to an internal limit system for each counterparty stipulating that the business volume with individual counterparties is restricted to a defined limit which depends on the lowest official long-term credit rating available by at least one of the major rating agencies, or participation in the German Depositors’ Guarantee Fund or any other protection scheme. The limit utilization is continuously monitored. As the premium for credit default swaps mainly depends on the market participants’ assessment of the creditworthiness of a debtor, we also closely observe the development of CDS spreads in the market to evaluate probable risk developments to timely react to changes if these should manifest.
Liquidity Risk Management
Our Group-wide liquidity is generally managed by our global treasury department with the primary aim of maintaining liquidity in the Group at a level that is adequate to meet our financial obligations.
Our primary source of liquidity is funds generated from our business operations, which have historically mainly provided the liquid funds needed to maintain our investing and financing strategy. Unless restricted by local regulations, subsidiaries pool their cash surplus to our global treasury department, which then arranges to fund other subsidiaries’ requirements or invest any net surplus in the market, seeking to optimize yields, while ensuring liquidity, by investing only with counterparties and issuers of high credit quality, as explained above. Hence, high levels of liquid assets and marketable securities provide a strategic reserve, helping keep SAP flexible, sound, and independent.
Apart from effective working capital and cash management, SAP has reduced its liquidity risk by arranging an adequate volume of available credit facilities with various financial institutions on which we can draw if necessary.
F-74
Table of Contents
As at October 1, 2007, SAP AG entered into a €5 billion credit facility with Deutsche Bank AG in connection with our acquisition of Business Objects S.A. As at December 31, 2008, there were borrowings of €2.3 billion outstanding under the facility. The credit facility was fully repaid in October 2009 before maturity date December 31, 2009.
As mentioned above, in the second quarter of 2009 SAP AG placed an SSD in the total volume of €697 million. In addition, in order to retain high financial flexibility, as at September 15, 2009, SAP AG entered into a €1.5 billion three-year revolving credit facility, effectively replacing the €1 billion syndicated revolving credit facility signed in November 2004. The use of the facility is not restricted by any financial covenants. Borrowings under the facility bear interest of EURIBOR or LIBOR for the respective currency plus a margin of 110 basis points to 160 basis points, depending on the amount drawn. We are also required to pay a commitment fee of 44 basis points per annum on the unused available credit. As at December 31, 2009, there were no borrowings outstanding under the facility.
Additionally, as at December 31, 2009 and 2008, SAP AG had available lines of credit totaling €545 million and €597 million, respectively. As at December 31, 2009 and 2008, there were no borrowings outstanding under these lines of credit. As at December 31, 2009 and 2008, certain subsidiaries had lines of credit available that allowed them to borrow in local currencies at prevailing interest rates up to €51 million and €52 million, respectively. Total aggregate borrowings under these lines of credit amounted to 6 million and €21 million as at December 31, 2009 and 2008, respectively.
| (27) | ADDITIONAL FAIR VALUE DISCLOSURES ON FINANCIAL INSTRUMENTS |
Fair Value of Financial Instruments
We use various types of financial instruments in the ordinary course of business which are grouped into the following categories: loans and receivables (L&R),available-for-sale (AFS), held for trading (HFT) and amortized cost (AC).
F-75
Table of Contents
The carrying amounts and fair values of our financial instruments as at December 31 were as follows:
Fair Values of Financial Instruments

Determination of Fair Values
IAS 39 defines fair value as the amount for which an asset could be exchanged, or a liability settled, between knowledgeable, willing parties in an arm’s length transaction. Accordingly, best evidence of fair value is quoted prices in an active market. Where market prices are not readily available, valuation techniques have to be used to establish fair value. We have classified our financial instruments into those that are subsequently measured at fair value and those which are measured at cost or amortized cost.
Financial Instruments Measured at Fair Value
Depending on the inputs used for determining fair value, we have categorized our financial instruments at fair value into a three-level fair value hierarchy as mandated by IFRS 7.
The fair value hierarchy gives the highest priority to quoted prices in active markets for identical assets or liabilities (Level 1) and the lowest priority to unobservable inputs (Level 3). The inputs used to measure fair value for one single instrument may fall into different levels of the fair value hierarchy. In such cases, the level in the fair value hierarchy within which the fair value measurement in its entirety falls has been determined based on the lowest level input that is significant to the fair value measurement in its entirety. Our assessment of the significance of a particular input to the fair value measurement in its entirety requires judgment, and considers factors specific to the asset or liability.
F-76
Table of Contents
The levels of the fair value hierarchy, its application to our financial assets and liabilities and the respective determination of fair value are described below:
| • | Level 1: Quoted prices in active markets for identical assets or liabilities. | |
| • | Available-for-sale debt and equity investments: The fair values of these marketable securities are based on quoted market prices as at December 31. | |
| • | Level 2: Inputs other than observable, either directly or indirectly, such as quoted prices in active markets for similar assets or liabilities, quoted prices for identical or similar assets or liabilities in markets that are not active, or other inputs that are observable or can be corroborated by observable market data for substantially the full term of the assets or liabilities. | |
| • | Derivative financial instruments: The fair value of foreign exchange forward contracts is based on discounting the expected future cash flows over the respective remaining term of the contracts using the respective deposit interest rates and spot rates. The fair value of the derivatives entered into to hedge our share-based compensation programs are calculated considering risk-free interest rates, the remaining term of the derivatives, the dividend yields, the stock price and the volatility of our share. Fair values of our derivative interest-rate contracts are calculated by discounting the expected future cash flows by taking the prevailing market and future rates for the remaining term of the contracts as a basis. | |
| • | Available-for-sale equity investments in public companies: Certain of our equity investments in public companies are restricted from being sold for a limited period. Therefore, fair value is determined based on quoted market prices as at December 31, deducting a discount for the disposal restriction based on the premium for a respective put option. | |
| • | Level 3: Unobservable inputs that are supported by little or no market activity and that are significant to the fair value of the assets or liabilities. | |
| • | Available-for-sale equity investments in private companies: For these investments in equity instruments primarily consisting of venture capital investments fair values could not readily be observed as they do not have a quoted market price in an active market. Also, calculating fair value by discounting estimated future cash flows is not possible as a determination of cash flows is not reliable. Therefore, for equity instruments in private companies, a Level 3 valuation technique is not applicable; such investments are accounted for at cost approximating fair value with impairment being assessed based on revenue multiples of similar companies and review of each investment’s cash position, financing needs, earnings and revenue outlook, operational performance, management and ownership changes, and competition. |
F-77
Table of Contents
The following table allocates those financial assets and liabilities that are measured at fair value in accordance with IAS 39 either through profit or loss or other components of equity as of December 31, 2009 to the three levels of the fair value hierarchy according to IFRS 7.
Classification of Financial Instruments
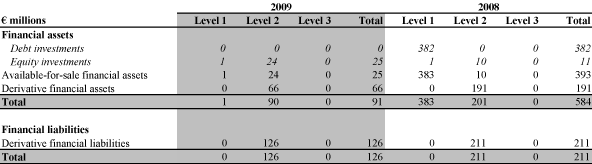
Financial Instruments Measured at Cost / at Amortized Cost
The fair values of these financial instruments are determined as follows:
| • | Cash and cash equivalents, trade receivables, other non-derivative financial assets: Because the financial assets are primarily short-term it is assumed that their carrying values approximate their fair values. Non- interest-bearing or below market-rate loans to third parties or employees are discounted to the present value of estimated future cash flows using the original effective interest rate the respective borrower would have to pay to a bank for a similar loan. | |
| • | Bank liabilities: As the majority of our bank liabilities are variable interest debts, their carrying values in general approximate their fair values. | |
| • | Accounts payable, and other non-derivative financial liabilities: Because these financial liabilities are mainly short-term, their fair values approximate their carrying values. |
Income and Expenses, Gains and Losses on Financial Instruments
Income and expenses, gains and losses on financial instruments presented in the categories defined in IAS 39 are as follows:
Net Gains/Losses on Financial Instruments
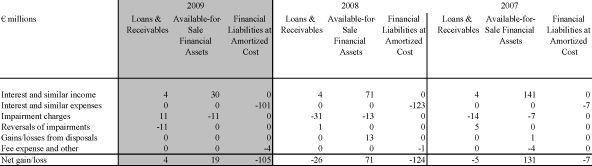
F-78
Table of Contents
The difference between the net gains/losses on financial instruments and the financial income, net of the respective year is due to:
| • | The financial income, net also contains a share of the result of associates while associates are not financial instruments and | |
| • | The net gains/losses on financial instruments containing income/expenses from the changes in the allowance for accounts receivables which are not included in financial income, net. |
For the unrealized gains/losses with regard to ouravailable-for-sale financial assets recognized in other components of equity and reclassified out of other components of equity, respectively, see our Consolidated Statements of Comprehensive Income.
(28) SHARE-BASED PAYMENT PLANS
SAP has granted awards under various equity-settled and cash-settled share-based compensation plans to its employees. In addition, the Company offers its employees in various countries the opportunity to buy its shares at a discount. All of these programs are described in the following sections.
| a) | Employee Discounted Stock Purchase Programs (EDSP) |
The Company offers its employees the opportunity to purchase its shares on a monthly basis at a discount of 15%. Employees may invest up to 10% of their gross salary in this plan. The compensation expense recognized in 2009 for this plan amounted to €2.8 million (2008: €3.3 million; 2007: €3.4 million). In addition, employees in Germany are granted the opportunity to receive a €260 discount on the purchase of SAP shares once a year under the Stock Award Program (Vermögensbeteiligung). The total expense recorded under this program in 2009 was €3.8 million (2008: €3.6 million; 2007: €3.3 million).
| b) | Cash-Settled Share-Based Payment Plans |
SAP’s stock appreciation rights are cash-settled share-based payment plans and include the following programs, which are described in detail below: Stock Appreciation Rights (STAR) program, STAR PP STAR Performance Plan 2009 (STAR PP), Incentive 2010, Virtual Stock Option Plan (SOP) program, SOP Performance Plan 2009 (SOP PP), and BO Rights (former Business Objects awards assumed in connection with Business Objects acquisition in 2008).
The following parameters and assumptions were used for the computation of the fair value at grant date:

F-79
Table of Contents
As of December 31, 2009, the valuation of our outstanding cash-settled plans was based on the following parameters and assumptions:

Expected volatilities of the SAP share price are based on implied volatilities from traded options with corresponding lifetimes and exercise prices. For the STAR PP and the SOP PP valuation, the expected volatility of the Tech Peer Group Index (ISIN DE000A0YKR94) (TechPGI) is based on the historical volatility derived from the index price history.
Expected life of the investments reflects both the contractual term and the expected, or historical, exercise behavior. Risk-free interest rate has a range that depends on the term and is derived from German government bonds. Dividend yield is based on expectations of future dividends.
In total, we recognized compensation expense of €49 million, €59 million, and €77 million for the years ended December 31, 2009, 2008, and 2007, respectively for our cash-settled programs.
F-80
Table of Contents
Changes in our plans for the years ended December 31, 2009, 2008, and 2007 were as follows:
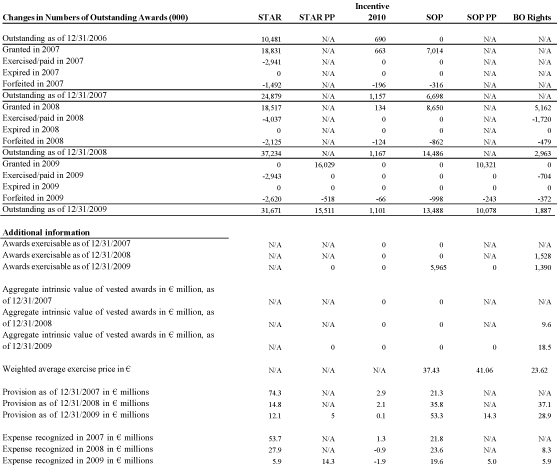
b.1) STAR Plans (STAR)
Under the STAR Plans we granted stock appreciation rights, the value of which was dependent on the quarterly performance of the SAP share.
The 2008, 2007, and 2006 STAR grant-base values of €32.69, €35.71, and €42.12, respectively, were based on the average fair market value of one common share over the 20 business days commencing the day after the announcement of the Company’s preliminary results for the preceding fiscal year. The valuation of the STARs is calculated quarterly over a period of two years. Each of the eight quarterly valuations is weighted as follows in determining the final STAR value:
F-81
Table of Contents
Weighting Factor for Valuation Calculation of STAR Awards Quarter Ended

The valuations for quarters ended December 31, are calculated on the basis of the amount by which the grant price is exceeded by the average fair market value of one common share, as quoted on the Frankfurt Stock Exchange, over the 20 consecutive business days following the announcement date of the Company’s preliminary annual results. The other quarterly valuations are calculated on the basis of the amount by which the grant price is exceeded by the average fair market value of one common share over the five consecutive business days following the announcement of the Company’s quarterly results. Because each quarterly valuation is conducted independently, it is unaffected by any other quarterly valuation.
The cash payout value of each STAR is calculated quarterly as follows: (i) 100% of the first €12.50 value appreciation for such quarter; (ii) 50% of the next €12.50 value appreciation; and (iii) 25% of any additional value appreciation. Beneficiaries will receive payments with respect to the 2008 STARs as follows: 50% on both March 31, 2010 and January 31, 2011. Under the terms of the 2007 STAR program, beneficiaries are scheduled to receive an initial payment of 50% on March 31, 2009, and a second installment on January 31, 2010. Beneficiaries will receive STAR payments provided that they are still employees of the Company on the payment dates, subject to certain exceptions.
The fair values of the STARs granted in 2007 are the same as the fair values of the derivatives that are entered into to hedge the compensation expense because the terms of the STAR awards and the derivatives are the same.
b.2) STAR Performance Plan 2009 (STAR PP)
Under the STAR Performance Plan we granted stock appreciation rights, the value of which depends on the quarterly performance of the SAP share relative to an industry-specific share price index.
The STAR PP grant value of €28.00 is based on the average fair market value of one common share over the 20 business days commencing the day after the announcement of the Company’s preliminary results for the preceding fiscal year. As for the STAR plans, the valuation of the STAR PP is calculated quarterly, over a period of two years, with a similar weighting allocated to each of the eight quarters.
The quarterly valuation under the STAR PP is based on the outperformance of the SAP stock price compared to the TechPGI, which includes 10 publicly traded companies in the software and hardware industry. For that purposes, the STAR PP agreement sets the initial value of the index (€97.54) as well as the SAP grant value (€28.00 per share). The quarterly valuation will be performed on eight defined target dates from June 10, 2009 to March 10, 2011. The outperformance of SAP stock price over the TechPGI price is measured over the last 10 trading days prior to the target date. The final STAR PP value will be the sum of the eight quarterly appreciations. The maximum total payout per STAR PP is capped at 110% of the STAR grant value.
F-82
Table of Contents
Beneficiaries will receive payments with respect to the STARs as follows: 50% on both March 31, 2011 and January 31, 2012, provided that they are still employees of the Company on the payment dates, subject to certain exceptions.
b.3) Incentive Plan 2010
Under the Incentive Plan 2010 we granted stock appreciation rights, the value of which was dependent on the multi-year performance of the SAP share relative to an industry-specific share price index.
These stock appreciation rights were granted to top performers and top executives under the Incentive Plan 2010. The plan provides for a maximum payout of €144.60 per right if the market capitalization of SAP AG doubles by December 31, 2010.
The rights will only be exercisable if SAP’s common share outperforms the S&P North Software-Software Indextm (formerly GSTI Software Index) during the period between the issue of the rights and December 31, 2010. If the increase between the grant value and the relevant actual market capitalization is below 200% of the base market capitalization, the payout per award will be based on the following scale:

b.4) SAP Stock Option Plan 2007 (SOP)
Under the SAP Stock Option Plan we granted virtual stock options, the value of which was dependent on the multi-year performance of the SAP share. The awards were granted to top executives and top performers.
The plan provides for cash settlement only and is available to top executives and top performers. The awards granted in 2008 and 2007 have a grant-base value of €32.69 and €35.71, respectively, which is based on the average fair market value of one common share over the 20 business days following the announcement date of the Company’s preliminary results for the preceding fiscal year.
Under the SOP Plan, beneficiaries receive stock appreciation rights based on the SAP share price, which give them the right to receive a certain amount of money by exercising the options under the terms and conditions of this plan. The plan provides for 11 predetermined exercise dates every calendar year (one date per month except in April) until the rights lapse.
Rights granted under this plan may be exercised after a vesting period of two years starting on the grant date. The contractual term of the virtual stock options is five years, that is, the rights will expire five years after the grant date if not exercised by the holder before that date.
The exercise price is 110% of the base value. Thus, the right can only be exercised if the share price at exercise exceeds the grant price by at least 10%. Monetary benefits will be capped at a share price of 200% of the exercise price (€78.56 for options granted in 2007, and €71.92 for options granted in 2008).
F-83
Table of Contents
b.5) SOP Performance Plan 2009 (SOP PP)
Under the SOP Performance Plan 2009 we grant virtual stock options, the value of which depends on the multi-year performance of the SAP share relative to an industry-specific share price index.
These rights were granted to top executives and top performers. The rights granted under this plan may be exercised after a vesting period of two years starting on the grant date and their contractual term is five years.
The future payout at exercise date will be based on the outperformance of the SAP share price since the grant date, which is compared with the TechPGI. For that purpose, the SOP PP 2009 agreement defines the initial value of the TechPGI (€97.54) as well as the SAP exercise price (€28.00 per share). As a consequence, exercise is only possible if the performance of the SAP share price since grant date has been better than the TechPGI performance. The plan provides for 12 predetermined exercise dates every calendar year (one date per month) until the rights lapse.
The employee benefit is capped at 110% of the exercise price, that is, €30.80.
b.6) Business Objects Cash-Settled Awards Replacing Pre-Acquisition Business Objects Awards (BO Rights)
Prior to being acquired by SAP, the employees of Business Objects companies were granted equity-settled awards giving rights to Business Objects shares. Following the Business Objects acquisition in 2008, the Business Objects shares were no longer publicly traded and mechanisms were implemented to allow the employees to cash out their awards either by receiving cash instead of Business Objects shares (cash payment mechanism or CPM) or by receiving Business Objects shares that they subsequently sell to SAP France (liquidity agreement mechanism or LAM). In substance, the implementation of CPM and LAM resulted in a conversion of the equity-settled awards to cash-settled share-based payment awards (replacing awards) which replaced the stock options and Restricted Stock Units (RSUs) originally granted (replaced awards).
The replaced awards had vesting periods in the range two to five years and contractual terms in the range two to ten years.
The replacing awards closely mirror the terms of the replaced awards (including conditions such as exercise price and vesting) except that
| • | The replaced awards were planned to be settled by issuing equity instruments whereas the replacing awards are settled in cash either via the CPM or via the LAM. | |
| • | The replaced awards were indexed to Business Objects’ share price whereas the replacing awards are indexed to SAP’s share price as follows: SAP’s offering price for Business Objects shares during the tender offer (€42) is divided by SAP AG’s share price at the tender offer closing date (€32.28) and the result is multiplied by the weighted average closing price of the SAP share during the 20 trading days preceding the exercise or disposition date. |
The benefit resulting from the stock option exercise or the RSU vesting is either paid directly to the employees (in countries where the CPM applies) or the employees continue to receive shares of Business Objects on stock options exercise or RSU vesting (in countries where the LAM applies). In these cases, the employees have a put option to resell the shares to SAP within 3 months from exercise, while SAP has a call option on these shares.
In both cases, these awards are accounted for as a cash-settled award because the obligation to the employee is ultimately settled in cash, both under the CPM and the LAM mechanism.
F-84
Table of Contents
| c) | Equity-Settled Share-Based Payment Plans |
Equity-settled plans include the Stock Option Plan 2002 (Note (28) c.1) and the Long Term Incentive Plan 2000 (Note (28) c.2).
As a result of the issuance on December 21, 2006, of bonus shares at aone-to-three ratio under a capital increase from corporate funds, on exercise each stock option issued under the Stock Option Plan 2002 or under the LTI 2000 Plan now entitles its beneficiary to four shares. For better comparability with the price of SAP stock since December 21, 2006, the following tables have been adjusted to show the number of shares to which the options or bonds entitle the holder rather than the number of rights. Consequently, the strike prices shown are prices per share and not per option. The number of shares shown in the table is four times the number of options, and the exercise price for an option is four times the price per share shown in the table.
c.1) Stock Option Plan 2002
Under the Stock Option Plan 2002 we granted stock options, the value of which was dependent on the multi-year performance of the SAP share. The last grants under the Stock Option Plan 2002 occurred in 2006. The awards were granted to top executives and top performers.
Each stock option granted under the SAP SOP 2002 plan entitles its holder to subscribe to four shares of the Company’s common stock by tendering payment of an exercise price per option equal to a base price and a premium of 10% of the base price. The base price is calculated as the average market price of SAP AG’s common share on the Frankfurt Stock Exchange during the five trading days preceding the issue of the respective stock option, calculated on the basis of the arithmetic mean of the closing auction prices of the stock. The options cannot be exercised at an exercise price that is less than the closing auction stock price on the day before the issue date. The contractual term of the stock options is five years. The fair value of such options was assessed using the Black-Scholes Merton option pricing model.
For options granted to members of the Executive Board during and after February 2004, the SAP SOP 2002 terms cap the subscription rights if the Supervisory Board determines that an option holder would make a windfall profit on exercising the rights. A windfall profit is defined for this purpose as a profit that, when combined with the profit from earlier exercises of awards issued to the option holder at the same issuing date, exceeds twice the product of (i) the number of awards received by the option holder and (ii) the exercise price.
F-85
Table of Contents
Activities in 2008 and 2009 under SAP SOP 2002 were as follows:
Activities Under — SAP SOP 2002
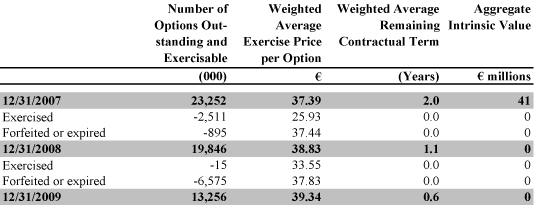
As all the options issued under SAP SOP 2002 were fully vested in prior years, we incurred no regularly scheduled compensation expense for this plan in 2009 (2008: €0.8 million; 2007: €26.0 million). The total intrinsic value of options exercised during the years ended December 31, 2009, 2008, and 2007 was less than €1 million, €21 million, and €59 million, respectively.
In December 2009, we modified the exercise conditions of SAP SOP 2002 of all of the remaining outstanding options (5,382,780) granted in March 2005. The final exercise date for this tranche was February 1, 2010. At the time the modification was implemented, we anticipated that the last exercise notice had to be submitted by December 15 due to the quiet period before publication of the fourth-quarter interim results. The terms of the original plan required that in cases where exercise notice had been given, the options had to be exercised even if the stock price fell below the exercise price subsequent to providing such notice. Participants risked taking a loss as a result of the long wait between the point when the notice was required to be provided and the actual exercise date. To prevent such losses, the procedure for exercising the options was amended for the final exercise date. Based on the amendment, these options will only be exercised if the resulting SAP shares can be sold for a price not lower than €33.66 (strike price of €33.55 plus 0.3% administration fees at the exercise date). Based on the provisions of IFRS 2, this plan amendment was measured at fair value at the modification date resulting in recording an incremental expense of €2.1 million in 2009.
F-86
Table of Contents
The following table summarizes information about stock options outstanding as at December 31, 2009 and 2008, under SAP SOP 2002:
Stock Options Outstanding unter SAP SOP 2002 as at December 31, 2009, and 2008

The weighted average share price of SAP AG common shares on the SAP SOP 2002 exercise dates in 2009, 2008, and 2007 was €34.19, €34.32 and €37.87, respectively.
c.2) Long Term Incentive 2000 Plan (LTI 2000 Plan)
Under the LTI 2000 Plan we granted convertible bonds, the value of which were dependent on the multi-year performance of the SAP share and stock options, the value of which were dependent on the multi-year performance of the SAP share relative to an industry-specific share price index. The last grants under the LTI 2000 Plan occurred in 2002. The awards were granted to top executives and top performers.
The LTI 2000 Plan offered a choice between convertible bonds, stock options, or a 50% mixture of each. Beneficiaries were offered 25% more units if they chose stock options than if they chose convertible bonds. Under the LTI 2000 Plan, each convertible bond having a €1 nominal value is convertible into four common shares over a maximum of 10 years, subject to service vesting requirements. The conversion price is equal to the market price of a common share as quoted on the Xetra trading system on the day immediately preceding the grant. Each stock option may be exercised in exchange for four common shares over a maximum of 10 years, subject to the same vesting requirements. The exercise price varies with the outperformance of the common share price appreciation against the appreciation of the S&P North Software-Software Indextm (formerly GSTI Software Index) from the day immediately preceding grant to the day on which the exercise price is determined. Both the convertible bonds and stock options vested as follows: 33% after two years from date of grant, 33% after three years, and 34% after four years. Forfeited convertible bonds or stock options are disqualified and may not be reissued.
In total, 49.2 million conversion and subscription rights were issued under the LTI 2000 Plan through March 14, 2002. At the 2002 Annual General Meeting of Shareholders, the Company’s shareholders revoked the authorization to issue further convertible bonds and stock options under the LTI 2000 Plan.
F-87
Table of Contents
A summary of the LTI 2000 Plan activity for both convertible bonds and stock options was as follows in 2008 and 2009:
Activities under the LTI Plan 2000

All convertible bonds and stock options outstanding as at December, 31, 2009 are exercisable.
F-88
Table of Contents
The following tables summarize information about stock options and convertible bonds outstanding as at December 31, 2009:
LTI 2000 Plan Awards Outstanding as at December 31, 2009

The weighted average share price of SAP AG common shares on the LTI 2000 Plan option exercise dates in 2009, 2008, and 2007 was €31.30, €35.59 and €37.97, respectively. The weighted average price of SAP AG common shares on the LTI 2000 Plan convertible bond exercise dates in 2008 and 2007 was €37.44 and €39.14, respectively (no exercise in 2009).
Due to the fact that all LTI 2000 Plans were fully vested during 2006, we recorded no compensation expense in 2007 and thereafter. The fair value of the options and convertible bonds granted under that plan was assessed using the Black-Scholes Merton option pricing model. The total intrinsic value of stock options exercised during the years ended December 31, 2009, 2008, and 2007 was €8.9 million, €5.1 million, and €4.9 million, respectively. The total intrinsic value of convertible bonds exercised during the years ended December 31, 2008 and 2007 was €0 million and €0.5 million, respectively (no exercise in 2009).
| (29) | SEGMENT AND GEOGRAPHIC INFORMATION |
Our internal reporting system produces reports in which business activities are presented in a variety of ways, for example, by line of business, geography and areas of responsibility of the individual Executive Board members (Board areas). Based on these reports, the Executive Board, which is responsible for assessing the performance of various company components and making resource allocation decisions as our Chief Operating Decision Maker (CODM), evaluates business activities in a number of different ways. We have determined that
F-89
Table of Contents
our lines of business constitute operating segments. We have three reportable operating segments which are organized based on products and services: Product, Consulting, and Training.
The Product segment is primarily engaged in marketing and licensing our software products, performing custom software development services for customers, and providing support services for our software products. The Consulting segment performs various professional services, mainly implementation of our software products. The Training segment provides educational services on the use of our software products and related topics for customers and partners.
Our management reporting system reports our inter-segment services as cost reductions and does not track them as internal revenue. Inter-segment services mainly represent utilization of manpower resources of one segment by another segment on aproject-by-project basis. Inter-segment services are charged based on internal cost rates including certain indirect overhead costs but without profit margin.
The accounting policies applied in the internal reporting to our CODM are based on accounting principles generally accepted in the United States, U.S. GAAP (continuing operations) and differ from IFRS accounting principles described in Note (3) as follows:
| • | The internal reporting to our CODM generally attributes revenue to the segment that is responsible for the related transaction regardless of revenue classification in our income statement. Thus, for example, the Training segment’s revenue includes certain amounts classified as software revenue in our Consolidated Income Statements. | |
| • | The internal reporting to our CODM excludes share-based compensation expenses and — since 2009 — restructuring costs on segment level. These expenses are managed and reviewed at Group level only. | |
| • | Differences in foreign currency translations result in deviations between the amounts reported internally to our CODM and the amounts reported in the Consolidated Financial Statements. | |
| • | The revenue numbers in the internal reporting to our CODM include the support revenue that would have been reflected by acquired entities had it remained a stand-alone entity but which are not reflected as revenue under IFRS as a result of purchase accounting for support contracts in effect at the time of an acquisition. | |
| • | The income measures in the internal reporting to our CODM include the full amount of support revenue and exclude the following acquisition-related charges: |
| — | Amortization expense/impairment charges of intangibles acquired in business combinations and certain stand-alone acquisitions of intellectual property. | |
| — | Expenses from purchased in-process research and development. | |
| — | Restructuring expenses and settlements of pre-existing relationships. | |
| — | Acquisition-related third-party costs that are required to be expensed. |
| • | In 2009 we have modified the disclosure of the allocation of depreciation and amortization expense to our segments. For comparison purposes, the 2008 and 2007 figures in the tables presented have been adjusted accordingly. |
F-90
Table of Contents
Segment Revenue and Results

F-91
Table of Contents
Reconciliation of Revenues and Segment Results
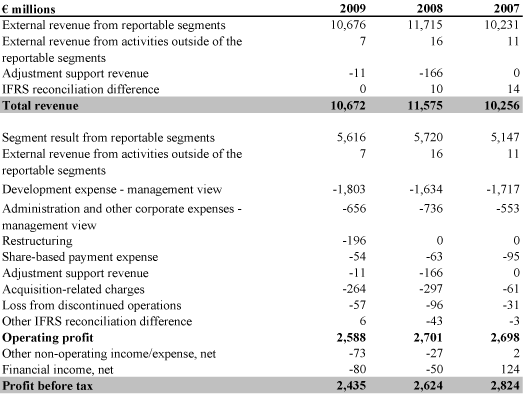
Segment Revenues
Since our segments are organized on the basis of products and services, the amounts of external revenue for the Product, Consulting, and Training segments are materially consistent with the amounts of Software and software-related service revenue, Consulting revenue, and Training revenue, respectively, as reported in the Consolidated Income Statements, except for the differences in accounting policies discussed above.
External revenue from activities outside of the reportable segments (2009: €7 million; 2008: €16 million; 2007: €11 million) mainly represents revenue incidental to our main business activities and minor currency translation differences.
Segment Result
Segment result reflects operating expenses directly attributable or reasonably allocable to the segments, including costs of revenue, and sales and marketing expenses. Costs that are not directly attributable or reasonably allocable to the segments such as administration and other corporate expenses are not included in the segment result. Development expense is excluded from the segment result because our CODM reviews segment performance without taking development expense into account.
Depreciation and amortization expenses reflected in the segment result include the amounts directly attributable to each segment.
Development expense and administration and other corporate expense disclosed in the reconciliation above are based on a management view and do not equal the amounts under the corresponding caption in the Consolidated Income Statements. The differences are mainly due to the fact that the management view focuses on organizational structures and cost centers rather than cost classification to functional areas.
F-92
Table of Contents
Segment Assets/Liabilities
Segment asset/liability information is not provided to our CODM. Goodwill by reportable segment is disclosed in Note (16).
Geographic Information
The following tables present revenue by location of customers and by location of SAP entities, which reflects the location of our subsidiary responsible for the sale, and information about certain long-lived assets detailed by geographic region.
Total Revenue by Location
| 1) | Europe, Middle East, Africa |
Software and Software-Related Service Revenue by Location
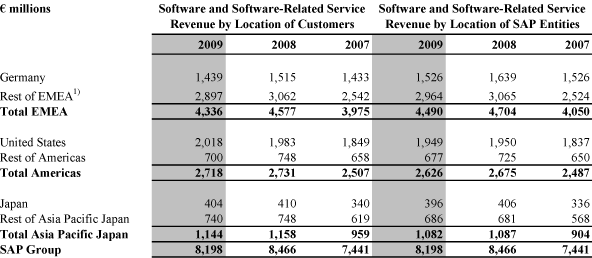
| 1) | Europe, Middle East, Africa |
F-93
Table of Contents
Software Revenue by Location

| 1) | Europe, Middle East, Africa |
Property, Plant, and Equipment and Intangible Assets

| 1) | Europe, Middle East, Africa |
F-94
Table of Contents
| (30) | BOARD OF DIRECTORS |
| Membership on supervisory boards and other comparable | ||
| governing bodies of enterprises, other than subsidiaries of | ||
| EXECUTIVE BOARD | SAP on December 31, 2009 | |
| Bill McDermott(from February 7, 2010) Co-Chief Executive Officer | Board of Directors, ANSYS, Inc., Canonsburg, PA, USA Board of Directors, Under Armour, Inc., Baltimore, MD, USA Board of Directors, PAETEC Communications, Inc., Fairport, NY, USA | |
| Jim Hagemann Snabe (from February 7, 2010) | ||
| Co-Chief Executive Officer | Board of Directors, Linkage A/S, Copenhagen, Denmark Board of Directors, Mannaz A/S, Horsholm, Denmark (until September 23, 2009) Board of Directors, Thrane & Thrane A/S, Lyngby, Denmark Supervisory Board, Crossgate AG, Munich, Germany | |
| Dr. Werner Brandt Chief Financial Officer Labor Relations Director (acting) | Supervisory Board, Deutsche Lufthansa AG, Frankfurt am Main, Germany Supervisory Board, QIAGEN N.V., Venlo, the Netherlands Supervisory Board, Heidelberger Druckmaschinen AG, Heidelberg, Germany | |
| Gerhard Oswald Chief Operating Officer | ||
| Vishal Sikka (from February 7, 2010) Chief Technology Officer | ||
| Prof. Dr. Claus E. Heinrich (until May 31, 2009) Labor Relations Director (until December 31, 2008) Global Human Resources (until December 31, 2008) Internal SAP IT Organisation (until December 31, 2008) SAP Labs Network (until December 31, 2008) | ||
| Prof. Dr. Henning Kagermann (until May 31, 2009) Co-Chief Executive Officer Overall responsibility for SAP’s strategy and business development, Internal Audit, Top Talent Management | Supervisory Board, Deutsche Bank AG, Frankfurt am Main, Germany Supervisory Board, Münchener Rückversicherungs-Gesellschaft AG, Munich, Germany Board of Directors, Nokia Corporation, Espoo, Finland Supervisory Board, Deutsche Post AG, Bonn, Germany (from March 10, 2009) Board of Directors, Wipro Ltd., Bangalore, India (from October 27, 2009) | |
| Erwin Gunst (until January 31, 2010) Chief Operating Officer Labor Relations Director Company Operations and Processes, Global Human Resources, Internal SAP IT, SAP Labs Network | ||
| Léo Apotheker (until February 7, 2010) Chief Executive Officer Overall responsibility for SAP’s strategy, Marketing, Industry Solutions, Internal Audit, Global Communications | Supervisory Board, AXA, Paris, France Supervisory Board, Schneider Electric, Rueil-Malmaison, France | |
| John Schwarz (until February 11, 2010) SAP BusinessObjects business unit, Global Ecosystem & Partner Group, Corporate Development | Board of Directors, Synopsys, Inc., Mountain View, CA, USA | |
F-95
Table of Contents
| Membership on other supervisory boards and comparable | ||
| SUPERVISORY BOARD | governing bodies of enterprises other than SAP on December 31, 2009 | |
| Prof. Dr. h.c. mult. Hasso Plattner(2),(4),(5),(7),(8),(9) Chairman | ||
| Lars Lamadé(1),(4),(7) Deputy Chairman Project Manager Service & Support | ||
| Pekka Ala-Pietilä(5),(8),(9) Co-founder and CEO Blyk Ltd. London, UK | Board of Directors, Pöyry Plc, Vantaa, Finland Board of Directors, CVON Group Limited, London, UK Board of Directors, CVON Limited, London, UK Board of Directors, CVON Innovations Limited, London, UK Board of Directors, Blyk Services Oy, Helsinki, Finland Board of Directors, CVON Innovation Services Oy, Turku, Finland Board of Directors, CVON Future Limited, London, UK Board of Directors, HelloSoft Inc., San José, USA Board of Directors, Blyk (NL) Ltd., London, UK Board of Directors, Blyk (DE) Ltd., London, UK Board of Directors, Blyk (ES) Ltd., London, UK Board of Directors, Blyk (BE) Ltd., London, UK Board of Directors, Blyk.nl NV, Amsterdam, Netherlands Board of Directors, Blyk.be SA, Hoeilaart, Belgium Board of Directors, Blyk International Ltd., London, UK (from December 10, 2009) | |
| Thomas Bamberger(1),(3) COO Global Service & Support | ||
| Panagiotis Bissiritsas(1),(2),(6) Support Expert | ||
| Willi Burbach(1),(5),(7) Developer | ||
| Prof. Dr. Wilhelm Haarmann(2),(6),(7) Attorney-at-law, certified public auditor, certified tax advisor HAARMANN Partnerschaftsgesellschaft, Rechtsanwälte, Steuerberater, Wirtschaftsprüfer, Frankfurt am Main, Germany | Supervisory Board, Aareon AG, Mainz, Germany (until July 1, 2009) Supervisory Board, Vodafone Holding GmbH, Düsseldorf, Germany | |
| Peter Koop(1),(5),(7) Industry Business Development Expert | ||
| Christiane Kuntz-Mayr(1),(5) Deputy Chairperson of the Works Council of SAP AG | ||
| Bernard Liautaud (5) General Partner Balderton Capital, London, UK | Board of Directors, Clinical Solutions Holdings Ltd., Basingstoke, Hampshire, UK Board of Directors, nlyte Software Ltd., London, UK Board of Directors, Talend SA, Suresnes, France Board of Directors der Cap Gemini, Paris, France (from April 30, 2009) Board of Directors, Quickbridge (UK) Ltd., London, UK Board of Directors, Scansafe, Inc., Delaware, USA (from July 6, 2009 until December 4, 2009) | |
| Dr. Gerhard Maier(1),(2),(3) Development Project Manager | ||
| Dr. h. c. Hartmut Mehdorn(4),(6) Independent Consultant | Supervisory Board, DB Netz AG, Frankfurt am Main, Germany (until April 30, 2009) Supervisory Board, DEVK Deutsche Eisenbahn Versicherung Lebensversicherungsverein a.G., and DEVK Deutsche Eisenbahn Versicherung Sach- und HUK-Versicherungsverein a.G., Cologne, Germany (until June 5, 2009) Supervisory Board, Dresdner Bank AG, Frankfurt am Main, Germany (until May 11, 2009) Board of Directors, Air Berlin PLC, Rickmansworth, UK (from July 1, 2009) Advisory Board, Fiege-Gruppe, Greven, Germany (from August 1, 2009) |
F-96
Table of Contents
| Prof. Dr.-Ing. Dr. h. c. Dr.-Ing. E. h. Joachim Milberg(2),(3),(5),(7),(8) Chairman of the Supervisory Board BMW AG, Munich, Germany | Supervisory Board, Bertelsmann AG, Gütersloh, Germany Supervisory Board, Festo AG, Esslingen, Germany Board of Directors, Deere & Company, Moline, Illinois, USA Supervisory Board, ZF Friedrichshafen AG, Friedrichshafen, Germany | |
| Dr. Erhard Schipporeit(3),(9) Management Consultant | Supervisory Board, Talanx AG, Hanover, Germany Supervisory Board, Deutsche Börse AG, Frankfurt am Main, Germany Supervisory Board, HDI V.a.G., Hanover, Germany Supervisory Board, Hannover Rückversicherung AG, Hanover, Germany Supervisory Board, Career Concept AG, Munich, Germany (until June 9, 209) Supervisory Board, TUI Travel PLC, London, UK Supervisory Board, Fuchs Petrolub AG, Mannheim Board of Directors, Fidelity Advisor World Funds, Bermuda (from October 1, 2009) Board of Directors, Fidelity Funds SICAV, Luxemburg (from October 1, 2009) | |
| Stefan Schulz(1),(4),(5),(6) Development Project Manager | ||
| Prof. Dr.-Ing. Dr.-Ing. E. h. Klaus Wucherer (5) Managing Director of Dr. Klaus Wucherer Innovations- und Technologieberatung GmbH, Erlangen, Germany | Supervisory Board, BSH Bosch und Siemens Hausgeräte GmbH, Munich, Germany Supervisory Board, Dürr AG, Bietigheim-Bissingen, Germany (from November 3, 2009) Supervisory Board, Infineon Technologies AG, Munich, Germany Supervisory Board, LEONI AG, Nürnberg, Germany | |
| Information as at December 31, 2009 | ||
| (1) Elected by the employees | (6) Member of the Company’s Finance and Investment Committee | |
| (2) Member of the Company’s Compensation Committee | (7) Member of the Company’s General Committee | |
| (3) Member of the Company’s Audit Committee | (8) Member of the Company’s Nomination Committee | |
| (4) Member of the Company’s Mediation Committee | (9) Member of the Company’s Special Committee | |
| (5) Member of the Company’s Technology and Strategy | ||
| Committee |
The total compensation of the Executive Board members for the years 2009, 2008, and 2007 is as follows:
Executive Board Compensation

The share-based compensation is based on the grant date fair value of the 785,060 virtual stock options (2008: 628,329; 2007: 486,594), issued to Executive Board members during the year. The expense in accordance with IFRS 2 for instruments held by Executive Board members in connection with share-based compensation was €3 million in 2009 (2008: €1 million; 2007: €4 million). In 2009, the projected benefit obligation for pensions to Executive Board members increased €1 million to €15 million (2008: €14 million; 2007: €17 million). The annual pension entitlement of the members of the Executive Board on reaching age 60 based on entitlements from performance-based and salary-linked plans amounted to €1 million as at December 31, 2009 (€1 million as at December 31, 2008; €1 million as at December 31, 2007).
Subject to the adoption of the dividend resolution by the shareholders at the Annual General Meeting of Shareholders on June 8, 2010, the total annual compensation of the Supervisory Board members amounted to
F-97
Table of Contents
€2 million (2008: €2 million; 2007: €2 million). This amount includes €1 million (2008: €1 million; 2007: €1 million) fixed, €1 million (2008: €1 million; 2007: €1 million) variable compensation, and €0.09 million (2008: €0.1 million; 2007: €0.08 million) committee remuneration. The Supervisory Board members do not receive any share-based compensation for their services. As far as members who are employee representatives on the Supervisory Board receive share-based compensation: such compensation is for their services as employees only and is unrelated to their status as members of the Supervisory Board.
During fiscal year 2009, payments to former Executive Board members were €1 million (2008: €1 million; 2007: €1 million). The projected benefit obligation of pensions as at December 31, 2009, for former Executive Board members was €16 million (2008: €12 million; 2007: €12 million).
SAP did not grant any compensation advance or credit to, or enter into any commitment for the benefit of any member of the Executive Board or Supervisory Board in fiscal year 2009, 2008, or 2007 other than the agreements described above.
On December 31, 2009, members of the Executive Board held a total of 15,336 SAP shares (December 31, 2008: 88,527; December 31, 2007: 86,515), and members of the Supervisory Board held a total of 127,193,136 SAP shares (December 31, 2008: 128,995,306; December 31, 2007: 128,993,710).
| (31) | RELATED PARTY TRANSACTIONS |
Certain Executive Board and Supervisory Board members of SAP AG currently hold, or held within the last year, positions of significant responsibility with other entities as presented in Note (30). We have relationships with certain of these entities in the ordinary course of business, whereby we buy and sell a wide variety of products and services at prices believed to be consistent with those negotiated at arm’s length between unrelated parties.
After his move from SAP’s Executive Board to SAP’s Supervisory Board in May 2003, Hasso Plattner entered into a contract with SAP AG under which he provides consulting services for SAP. The contract provides for the reimbursement ofout-of-pocket expenses only which were immaterial to SAP in all periods presented.
Hasso Plattner is the sole proprietor of H.P. Beteiligungs GmbH, which itself holds 90% of Bramasol, Inc., Palo Alto, United States. Bramasol is an SAP partner with which we generated revenues which were immaterial to SAP in all periods presented. The amounts charged to SAP for the services of Bramasol were immaterial to SAP in all periods presented.
Wilhelm Haarmann practices as a partner of the law firm HAARMANN Partnerschaftsgesellschaft in Frankfurt am Main, Germany. The amounts charged to SAP for the services of HAARMANN Partnerschaftsgesellschaft were immaterial to SAP in all periods presented.
| (32) | PRINCIPAL ACCOUNTANT FEES AND SERVICES |
At SAP AG’s Annual General Meeting of Shareholders held on May 19, 2009, SAP’s shareholders mandated KPMG AG Wirtschaftsprüfungsgesellschaft to serve as SAP AG’s independent auditor for 2009. KPMG
F-98
Table of Contents
AG Wirtschaftsprüfungsgesellschaft and other firms in the global KPMG network billed the following fees to SAP for audit and other professional services related to 2009 and the previous years:
Fees for Audit and Other Professional Services
Audit fees are the aggregate fees billed by KPMG for the audit of our Consolidated Financial Statements as well as audits of statutory financial statements of SAP AG and its subsidiaries. Audit-related fees are fees charged by KPMG for assurance and related services that are reasonably related to the performance of the audit or review of our financial statements and are not reported under audit fees. This category comprises fees billed for accounting advice on actual or contemplated transactions and other agreed procedures. Tax fees are fees for professional services rendered by KPMG for tax advice on transfer pricing, restructuring and tax compliance on current, past or contemplated transactions. The all other fees category includes other support services, such as training and advisory services on issues unrelated to accounting and taxes.
For services provided by KPMG AG Wirtschaftsprüfungsgesellschaft and its affiliates we recorded expenses of €3.1 million in 2009 (2008: €4.1 million; 2007: €2.7 million) of which €2.8 million (2008: €3.3 million; 2007: €2.5 million) relate to audit services, €0.2 million (2008: €0.4 million; 2007: €0.0 million) relate to audit related services, €0.1 million (2008: €0.2 million; 2007: €0.0 million) relate to tax services, and €0.0 million (2008: €0.1 million; 2007: €0.2 million) relate to other services.
(33) SUBSEQUENT EVENTS
After December 31, 2009, the following changes took place on our Executive Board:
| • | On February 7, 2010, we announced that the Supervisory Board had reached a mutual agreement with CEO Léo Apotheker not to extend his contract as a member of the Executive Board. Léo Apotheker resigned as CEO and from the Executive Board with immediate effect. | |
| • | On the same day, Bill McDermott (head of our global field organization) and Jim Hagemann Snabe (head of business solutions and technology) were appointed as Co-CEOs. | |
| • | At the same time, Vishal Sikka, our chief technology officer, was appointed to the Executive Board. | |
| • | Shortly thereafter, on February 11, 2010, SAP announced that Gerhard Oswald, Executive Board member responsible for our global service and support, had also been appointed chief operating officer, replacing Erwin Gunst, who stepped down for health reasons. | |
| • | At the same time, the Supervisory Board accepted the resignation of John Schwarz, the member of the Executive Board responsible for SAP BusinessObjects, our ecosystem, and corporate development, with immediate effect. |
F-99
Table of Contents
(34) SUBSIDIARIES, ASSOCIATES, AND OTHER EQUITY INVESTMENTS
| Profit/Loss(-) | Total Equity | Number of | ||||||||||||||||||
| Total Revenue | After Tax for | as of | Employees as | |||||||||||||||||
as of December 31, 2009 | Ownership | in 20091) | 20091) | 12/31/20091) | of 12/31/20092) | |||||||||||||||
| Name and Location of Company | % | €(000) | €(000) | €(000) | ||||||||||||||||
I. Subsidiaries | ||||||||||||||||||||
GERMANY | ||||||||||||||||||||
SAP Deutschland AG & Co. KG, Walldorf9) | 100,0 | 2.438.214 | 553.229 | 1.185.136 | 4.628 | |||||||||||||||
Steeb Anwendungssysteme GmbH, Abstatt8),9) | 100,0 | 62.584 | 2.660 | 11.984 | 202 | |||||||||||||||
SAP Puerto Rico GmbH, Walldorf7) | 100,0 | 12.694 | −1.612 | 822 | 31 | |||||||||||||||
SAP Passau GmbH & Co. KG, Passau9) | 100,0 | 2.679 | 93 | 93 | 0 | |||||||||||||||
SAF Germany GmbH, Konstanz3)4) | 70,9 | 1.003 | 80 | −421 | 0 | |||||||||||||||
| SAP Beteiligungs GmbH, Walldorf | 100,0 | 3 | 2 | 44 | 0 | |||||||||||||||
SAP Dritte Beteiligungs- und Vermögensverwaltung GmbH, Walldorf4),5),9) | 100,0 | 0 | 48.588 | 527.070 | 0 | |||||||||||||||
SAP Projektverwaltungs- und Beteiligungs GmbH, Walldorf4),5),9) | 100,0 | 0 | 19.775 | 329.179 | 0 | |||||||||||||||
| SAP Retail Solutions Beteiligungsgesellschaft mbH, Walldorf | 100,0 | 0 | 559 | 12.915 | 0 | |||||||||||||||
SAP Portals Europe GmbH, Walldorf4) | 100,0 | 0 | 479 | 123.234 | 0 | |||||||||||||||
| SAP Foreign Holdings GmbH, Walldorf | 100,0 | 0 | 156 | 183 | 0 | |||||||||||||||
OutlookSoft Deutschland GmbH, Walldorf4) | 100,0 | 0 | 38 | −128 | 0 | |||||||||||||||
Wicommunications GmbH, Munich4) | 100,0 | 0 | 0 | 50 | 0 | |||||||||||||||
| SAP Investment- und Beteiligungs GmbH, Walldorf | 100,0 | 0 | 0 | 33 | 0 | |||||||||||||||
| SAP Hosting Beteiligungs GmbH, St. Leon-Rot | 100,0 | 0 | 0 | 26 | 0 | |||||||||||||||
SAP Zweite Beteiligungs- und Vermögensverwaltung GmbH, Walldorf5),9) | 100,0 | 0 | 0 | 25 | 0 | |||||||||||||||
| SAP Vierte Beteiligungs- und Vermögensverwaltung GmbH, Walldorf | 100,0 | 0 | 0 | 25 | 0 | |||||||||||||||
SAP Portals Holding Beteiligungs GmbH, Walldorf4) | 100,0 | 0 | −3.761 | 925.295 | 0 | |||||||||||||||
SAP Erste Beteiligungs- und Vermögensverwaltung GmbH, Walldorf5),9) | 100,0 | 0 | −29.549 | 804.562 | 0 | |||||||||||||||
REST OF EUROPE, MIDDLE EAST, AFRICA | ||||||||||||||||||||
Business Objects Software Limited, Dublin, Ireland4) | 100,0 | 595.179 | 40.365 | 689.553 | 165 | |||||||||||||||
| SAP (UK) Limited, Feltham, United Kingdom | 100,0 | 511.257 | 169.698 | 53.892 | 1.040 | |||||||||||||||
| SAP France Holding S.A., Paris, France | 100,0 | 430.200 | 61.954 | 4.793.481 | 0 | |||||||||||||||
| SAP (Schweiz) AG, Biel, Switzerland | 100,0 | 422.569 | 61.558 | 95.729 | 546 | |||||||||||||||
| S.A.P. Nederland B.V., s-Hertogenbosch, the Netherlands | 100,0 | 314.003 | 45.440 | 285.142 | 407 | |||||||||||||||
SAP Italia Sistemi Applicazioni Prodotti in Data Processing S.p.A., Milan, Italy4) | 100,0 | 305.545 | 24.628 | 213.148 | 514 | |||||||||||||||
| SAP France S.A., Paris, France | 100,0 | 248.598 | 123.188 | 1.709.117 | 1.482 | |||||||||||||||
Spain4) | 100,0 | 225.282 | 28.221 | 150.445 | 362 | |||||||||||||||
| Limited Liability Company SAP CIS, Moscow, Russia | 100,0 | 197.626 | 19.773 | 109.594 | 467 | |||||||||||||||
SAP Belgium — Systems Applications and Products NV/SA, Brussels, Belgium4) | 100,0 | 172.912 | 13.235 | 85.300 | 254 | |||||||||||||||
| SAP Österreich GmbH, Vienna, Austria | 100,0 | 171.946 | 20.087 | 25.046 | 369 | |||||||||||||||
Systems Applications Products South Africa (Proprietary) Limited, Johannesburg, South Africa4)8) | 89,5 | 147.018 | 15.804 | 23.781 | 318 | |||||||||||||||
F-100
Table of Contents
| Profit/Loss(-) | Total Equity | Number of | ||||||||||||||||||
| Total Revenue | After Tax for | as of | Employees as | |||||||||||||||||
as of December 31, 2009 | Ownership | in 20091) | 20091) | 12/31/20091) | of 12/31/20092) | |||||||||||||||
| Name and Location of Company | % | €(000) | €(000) | €(000) | ||||||||||||||||
| SAP Danmark A/S, Copenhagen, Denmark | 100,0 | 136.501 | 18.036 | 42.051 | 159 | |||||||||||||||
| SAP Svenska Aktiebolag, Stockholm, Sweden | 100,0 | 99.866 | 6.005 | 23.513 | 123 | |||||||||||||||
| SAP ČR, spol. s r.o., Prague, Czech Republic | 100,0 | 93.644 | 12.784 | 35.192 | 221 | |||||||||||||||
| SAP Finland Oy, Espoo, Finland | 100,0 | 91.828 | 11.689 | 54.110 | 104 | |||||||||||||||
| SAP Norge AS, Lysaker, Norway | 100,0 | 59.398 | 3.071 | 27.278 | 93 | |||||||||||||||
| SAP Service and Support (Ireland) Limited, Dublin, Ireland | 100,0 | 54.731 | 1.639 | 25.692 | 639 | |||||||||||||||
| SAP Polska Sp. z o.o., Warsaw, Poland | 100,0 | 53.798 | 5.660 | 22.317 | 130 | |||||||||||||||
SAP Middle East and North Africa L.L.C., Dubai, United Arab Emirates7) | 49,0 | 52.596 | −9.148 | 37.041 | 102 | |||||||||||||||
| SAP Portugal — Sistemas, Aplicações e Produtos Informáticos, Sociedade Unipessoal, Lda., Paço de Arcos, Portugal | 100,0 | 50.632 | 3.883 | 22.436 | 95 | |||||||||||||||
Business Objects (UK) Limited, London, United Kingdom4) | 100,0 | 50.330 | 31.455 | 30.600 | 0 | |||||||||||||||
SAP Portals Israel Ltd., Ra’anana, Israel4) | 100,0 | 47.084 | 12.529 | 60.994 | 288 | |||||||||||||||
| SAP Hungary Rendszerek, Alkalmazások és Termékek az Adatfeldolgozásban Informatikai Kft., Budapest, Hungary | 100,0 | 45.634 | 3.374 | 17.785 | 361 | |||||||||||||||
| SAP Labs Israel Ltd., Ra’anana, Israel | 100,0 | 42.109 | 2.129 | 9.015 | 350 | |||||||||||||||
| SAP Türkiye Yazilim Üretim ve Ticaret A.S., Istanbul, Turkey | 100,0 | 36.044 | 2.225 | 13.711 | 54 | |||||||||||||||
| SAP Slovensko s.r.o., Bratislava, Slovakia | 100,0 | 35.524 | 2.289 | 16.865 | 133 | |||||||||||||||
| SAP HELLAS SYSTEMS APPLICATIONS AND DATA PROCESSING S.A, Athens, Greece | 100,0 | 32.566 | 2.159 | 5.522 | 56 | |||||||||||||||
| SAP LABS France S.A.S., Mougins, France | 100,0 | 25.269 | 1.597 | 10.911 | 181 | |||||||||||||||
Systems Applications Products Africa Region (Proprietary) Limited, Johannesburg, South Africa4)8) | 100,0 | 19.276 | −187 | 11.740 | 11 | |||||||||||||||
| SAP Labs Bulgaria EOOD, Sofia, Bulgaria | 100,0 | 17.804 | 811 | 3.568 | 432 | |||||||||||||||
| SAP Business Services Center Europe, s.r.o., Prague, Czech Republic | 100,0 | 17.043 | 1.165 | 5.547 | 289 | |||||||||||||||
| SAP Saudi Arabia Software Trading Limited, Riyadh, Kingdom of Saudi Arabia | 51,0 | 15.621 | 810 | 8.541 | 11 | |||||||||||||||
SAF Simulation, Analysis and Forecasting AG, Tägerwilen, Switzerland3) | 70,9 | 15.342 | 526 | 30.070 | 68 | |||||||||||||||
| SAP Romania SRL, Bucharest, Romania | 100,0 | 15.022 | 1.943 | 2.501 | 77 | |||||||||||||||
| SAP Saudi Arabia Software Services Limited, Riyadh, Kingdom of Saudi Arabia | 100,0 | 12.662 | 966 | 25.531 | 7 | |||||||||||||||
| SAP Israel Ltd., Ra’anana, Israel | 100,0 | 12.489 | −778 | −3.188 | 71 | |||||||||||||||
| SAP sistemi, aplikacije in produkti za obdelavo podatkov d.o.o., Ljubljana, Slovenia | 100,0 | 11.667 | 1.054 | 5.238 | 19 | |||||||||||||||
| Limited Liability Company SAP Ukraine, Kiev, Ukraine | 100,0 | 8.851 | −2.369 | −1.080 | 111 | |||||||||||||||
Highdeal S.A., Caen, France3) | 100,0 | 8.784 | −1.367 | 24.416 | 66 | |||||||||||||||
| SAP EMEA Inside Sales S.L., Barcelona, Spain | 100,0 | 8.582 | 442 | 1.201 | 70 | |||||||||||||||
| SAP d.o.o., Zagreb, Croatia | 100,0 | 8.438 | −822 | 607 | 18 | |||||||||||||||
SAP Labs Finland Oy, Espoo, Finland4)8) | 100,0 | 7.379 | 860 | 45.320 | 48 | |||||||||||||||
F-101
Table of Contents
| Profit/Loss(-) | Total Equity | Number of | ||||||||||||||||||
| Total Revenue | After Tax for | as of | Employees as | |||||||||||||||||
as of December 31, 2009 | Ownership | in 20091) | 20091) | 12/31/20091) | of 12/31/20092) | |||||||||||||||
| Name and Location of Company | % | €(000) | €(000) | €(000) | ||||||||||||||||
Merlin Systems Oy, Espoo, Finland4) | 100,0 | 7.246 | 161 | 1.401 | 22 | |||||||||||||||
| Limited Liability Company SAP Kazakhstan, Almaty, Kazakhstan | 100,0 | 7.152 | 271 | 1.102 | 9 | |||||||||||||||
Systems Applications Products Nigeria Limited, Abuja, Nigeria4) | 100,0 | 6.171 | 984 | 822 | 10 | |||||||||||||||
| SAP West Balkans d.o.o., Belgrade, Serbia | 100,0 | 6.071 | 38 | 989 | 30 | |||||||||||||||
| SAP Ireland Limited, Dublin, Ireland | 100,0 | 5.719 | −262 | −1.958 | 8 | |||||||||||||||
SAP CYPRUS Ltd, Nicosia, Cyprus4) | 100,0 | 2.893 | −14 | −1.821 | 2 | |||||||||||||||
SAP BULGARIA EOOD, Sofia, Bulgaria4) | 100,0 | 2.798 | 369 | 980 | 12 | |||||||||||||||
Crystal Decisions France S.A.S., Levallois-Perret, France4) | 100,0 | 2.575 | −56 | 7.324 | 0 | |||||||||||||||
| SAP UAB (Lithuania), Vilnius, Lithuania | 100,0 | 1.701 | −378 | 219 | 4 | |||||||||||||||
SAF Simulation, Analysis and Forecasting Slovakia s.r.o., Bratislava, Slovakia3),4) | 70,9 | 1.199 | 223 | 730 | 20 | |||||||||||||||
| SAP Estonia OÜ, Tallinn, Estonia | 100,0 | 1.140 | −6 | −1 | 1 | |||||||||||||||
| SAP Latvia SIA, Riga, Latvia | 100,0 | 838 | −363 | −646 | 1 | |||||||||||||||
SAP Public Serv. Hungary, Budapest, Hungary3) | 100,0 | 101 | 22 | 133 | 5 | |||||||||||||||
| Systems Applications Products (Africa) (Proprietary) Limited, Johannesburg, South Africa | 100,0 | 0 | 3.592 | 83.945 | 0 | |||||||||||||||
Armstrong Laing Limited, London, United Kingdom4) | 100,0 | 0 | 2.128 | 2.885 | 0 | |||||||||||||||
Crystal Decisions UK Limited, London, United Kingdom4) | 100,0 | 0 | 1.608 | 671 | 0 | |||||||||||||||
Crystal Decisions Holding Limited, Dublin, Ireland4) | 100,0 | 0 | 276 | 77.495 | 0 | |||||||||||||||
TomorrowNow (UK) Limited, Feltham, United Kingdom4) | 100,0 | 0 | 261 | −392 | 0 | |||||||||||||||
Business Objects Holding B.V., s-Hertogenbosch, the Netherlands4) | 100,0 | 0 | 254 | 35.973 | 0 | |||||||||||||||
Crystal Decisions (Ireland) Limited, Dublin, Ireland4) | 100,0 | 0 | 250 | 44.408 | 0 | |||||||||||||||
OutlookSoft EURL, Paris, France4) | 100,0 | 0 | 103 | −1.337 | 0 | |||||||||||||||
Set Analyzer UK Limited, London, United Kingdom4) | 100,0 | 0 | 78 | 978 | 0 | |||||||||||||||
Blue-Edge Software Limited, London, United Kingdom4) | 100,0 | 0 | 77 | 0 | 0 | |||||||||||||||
Edgewing Limited, London, United Kingdom4) | 100,0 | 0 | 9 | −378 | 0 | |||||||||||||||
SAP Nederland Holding B.V., s-Hertogenbosch, The Netherlands3) | 100,0 | 0 | 5 | 517.988 | 0 | |||||||||||||||
Maxware AS , Trondheim, Norway4) | 100,0 | 0 | 0 | 7.638 | 0 | |||||||||||||||
Wicom Communications AB, Enebyberg, Sweden4) | 100,0 | 0 | 0 | 9 | 0 | |||||||||||||||
Armstrong Laing (North America) Limited, London, United Kingdom4) | 100,0 | 0 | −1 | 1 | 0 | |||||||||||||||
Cartesis UK Limited, London, United Kingdom4) | 100,0 | 0 | −3 | 1.081 | 0 | |||||||||||||||
Visiprise UK Limited, Aberdeenshire, United Kingdom4) | 100,0 | 0 | −8 | 0 | 0 | |||||||||||||||
| SAP Commercial Services Ltd., Valetta, Malta | 100,0 | 0 | −14 | −5 | 0 | |||||||||||||||
| SAP Malta Investments Ltd., Valetta, Malta | 100,0 | 0 | −14 | −5 | 0 | |||||||||||||||
Inxight Software UK Limited, London, United Kingdom4) | 100,0 | 0 | −22 | 138 | 0 | |||||||||||||||
Ambin Properties (Proprietary) Limited, Johannesburg, South Africa4) | 100,0 | 0 | −50 | −412 | 0 | |||||||||||||||
F-102
Table of Contents
| Profit/Loss(-) | Total Equity | Number of | ||||||||||||||||||
| Total Revenue | After Tax for | as of | Employees as | |||||||||||||||||
as of December 31, 2009 | Ownership | in 20091) | 20091) | 12/31/20091) | of 12/31/20092) | |||||||||||||||
| Name and Location of Company | % | €(000) | €(000) | €(000) | ||||||||||||||||
Maxware UK Limited, Feltham, United Kingdom4) | 100,0 | 0 | −85 | 22 | 0 | |||||||||||||||
| TomorrowNow Nederland B.V., Amsterdam, the Netherlands | 100,0 | 0 | −434 | −2.901 | 2 | |||||||||||||||
OutlookSoft Italia S.r.l., Milan, Italy4) | 100,0 | −4 | −14 | 621 | 0 | |||||||||||||||
Millsgate Holding B.V., Amsterdam, the Netherlands4) | 100,0 | — | — | — | — | |||||||||||||||
AMERICAS | ||||||||||||||||||||
| SAP America, Inc., Newtown Square, Pennsylvania, USA | 100,0 | 2.757.437 | 253.588 | −169.097 | 5.097 | |||||||||||||||
| SAP Canada Inc., Toronto, Canada | 100,0 | 484.649 | 32.494 | 339.651 | 1.966 | |||||||||||||||
SAP LABS, LLC, Palo Alto, California, USA4) | 100,0 | 356.171 | 12.799 | 88.112 | 1.742 | |||||||||||||||
| SAP Brasil Ltda, São Paulo, Brazil | 100,0 | 272.156 | 16.507 | 90.085 | 816 | |||||||||||||||
SAP Public Services , Inc., Washington , D.C., USA4) | 100,0 | 269.441 | 26.918 | 215.015 | 218 | |||||||||||||||
| SAP Global Marketing , Inc., New York, USA | 100,0 | 180.515 | 3.320 | 15.713 | 429 | |||||||||||||||
| SAP México S.A. de C .V., Mexico City, Mexico | 100,0 | 170.809 | −11.786 | 28.385 | 353 | |||||||||||||||
SAP Industries, Inc., Scottsdale, Arizona, USA4),7) | 100,0 | 130.072 | 11.398 | 330.651 | 251 | |||||||||||||||
| SAP ARGENTINA S.A., Buenos Aires, Argentina | 100,0 | 88.080 | 2.450 | 15.172 | 432 | |||||||||||||||
SAP Governance Risk & Compliance, Inc., Palo Alto, California, USA4) | 100,0 | 54.750 | 17.192 | 351.595 | 95 | |||||||||||||||
Visiprise, LLC, Alpharetta, Georgia, USA4) | 100,0 | 44.633 | 9.496 | 94.055 | 151 | |||||||||||||||
SAP International, Inc., Miami, Florida, USA4) | 100,0 | 43.687 | 1.782 | 10.267 | 42 | |||||||||||||||
SAP Colombia S.A.S., Bogota, Colombia3) | 100,0 | 40.841 | 4.408 | −14.840 | 148 | |||||||||||||||
SAP Andina y del Caribe C.A., Caracas, Venezuela7) | 100,0 | 40.300 | −43.232 | −18.014 | 84 | |||||||||||||||
Business Objects Data Integration, Inc., Wilmington, Delaware, USA4) | 100,0 | 34.037 | 12.519 | 77.582 | 0 | |||||||||||||||
OutlookSoft Corporation, Stamford, Connecticut, USA4) | 100,0 | 33.097 | 8.396 | 262.273 | 0 | |||||||||||||||
SAP PERU S.A.C., Inc., Lima, Peru3) | 100,0 | 16.798 | −655 | −2.930 | 43 | |||||||||||||||
SAP Government Support & Services, Inc., Newtown Square, Pennsylvania, USA4) | 100,0 | 12.862 | 2.512 | 2.247 | 31 | |||||||||||||||
Frictionless Commerce, Inc., Newtown Square, Pennsylvania, USA4) | 100,0 | 4.176 | 1.135 | 33.675 | 0 | |||||||||||||||
SAF Simulation, Analysis and Forecasting U.S.A., Inc., Grapevine, Texas, USA3),4) | 70,9 | 3.804 | 76 | 116 | 13 | |||||||||||||||
Highdeal, Inc., New York, USA3),4) | 100,0 | 2.188 | 433 | −211 | 14 | |||||||||||||||
Clear Standards, Inc., Sterling, Virginia, USA3),4) | 100,0 | 51 | −1.317 | 16.018 | 15 | |||||||||||||||
HMS Software, LLC, Alpharetta, Georgia, USA4) | 100,0 | 541 | −275 | 42.330 | 0 | |||||||||||||||
Maxware, Inc., Newtown Square, Pennsylvania, USA4) | 100,0 | 229 | 145 | −72 | 0 | |||||||||||||||
SAP Georgia, LLC, Newtown Square, Pennsylvania, USA4) | 100,0 | 91 | −107 | 8.927 | 0 | |||||||||||||||
SAP Financial Inc., Toronto, Canada4) | 100,0 | 0 | 22.989 | 6.522 | 0 | |||||||||||||||
SAP Investments, Inc., Wilmington, Delaware, USA4) | 100,0 | 0 | 6.890 | 561.101 | 0 | |||||||||||||||
| 110405, Inc., Newtown Square, Pennsylvania, USA | 100,0 | 0 | 5 | 14.503 | 0 | |||||||||||||||
| Cartesis Canada, Inc., Toronto, Canada | 100,0 | 0 | 2 | 0 | 0 | |||||||||||||||
Business Objects Argentina S.R.L., Buenos Aires, Argentina4) | 100,0 | 0 | 0 | 81 | 0 | |||||||||||||||
Advance Info Systems, Inc., Toronto, Canada4) | 100,0 | 0 | 0 | 0 | 0 | |||||||||||||||
F-103
Table of Contents
| Profit/Loss(-) | Total Equity | Number of | ||||||||||||||||||
| Total Revenue | After Tax for | as of | Employees as | |||||||||||||||||
as of December 31, 2009 | Ownership | in 20091) | 20091) | 12/31/20091) | of 12/31/20092) | |||||||||||||||
| Name and Location of Company | % | €(000) | €(000) | €(000) | ||||||||||||||||
Business Objects Option, LLC, Wilmington, Delaware, USA4) | 100,0 | 0 | −20 | 57.006 | 0 | |||||||||||||||
Enterprise Performance Improvement Organizational Software Consultants, Inc., Toronto, Canada4) | 100,0 | 0 | −36 | 33 | 0 | |||||||||||||||
INEA Corporation USA, Wilmington, Delaware, USA4) | 100,0 | 0 | −415 | −5.519 | 0 | |||||||||||||||
TomorrowNow, Inc., Bryan, Texas, USA4) | 100,0 | 0 | −20.022 | −18.899 | 4 | |||||||||||||||
Inxight Federal Systems Group, Inc., Wilmington, Delaware, USA4) | 100,0 | −44 | −285 | 91 | 0 | |||||||||||||||
Khimetrics Canada, Inc., Montreal, Canada4) | 100,0 | — | — | — | — | |||||||||||||||
Liberia LLC, Wilmington, Delaware, USA3),4) | 100,0 | — | — | — | — | |||||||||||||||
ASIA PACIFIC JAPAN | ||||||||||||||||||||
| SAP JAPAN Co., Ltd., Tokyo, Japan | 100,0 | 494.540 | 29.251 | 326.856 | 1.140 | |||||||||||||||
| SAP Australia Pty Limited, Sydney, Australia | 100,0 | 341.950 | 34.758 | 136.889 | 524 | |||||||||||||||
| SAP (Beijing) Software System Co., Ltd., Beijing, China | 100,0 | 195.273 | 8.563 | 59.953 | 1.889 | |||||||||||||||
SAP INDIA PRIVATE LIMITED, Bangalore, India4) | 100,0 | 180.514 | 14.212 | 129.002 | 1.163 | |||||||||||||||
| SAP Asia Pte Limited, Singapore | 100,0 | 170.001 | 10.242 | 14.136 | 607 | |||||||||||||||
| SAP Labs India Private Limited, Bangalore, India | 100,0 | 111.079 | −6.668 | 17.358 | 4.082 | |||||||||||||||
| SAP Korea Limited, Seoul, South Korea | 100,0 | 74.395 | 4.422 | 17.283 | 181 | |||||||||||||||
| SAP Malaysia Sdn. Bhd., Kuala Lumpur, Malaysia | 100,0 | 44.485 | 3.829 | 14.766 | 129 | |||||||||||||||
| SAP TAIWAN CO., LTD., Taipei , Taiwan | 100,0 | 32.696 | 2.104 | 12.280 | 67 | |||||||||||||||
| SAP HONG KONG CO. LIMITED, Hong Kong, China | 100,0 | 25.148 | −277 | 4.494 | 62 | |||||||||||||||
| SAP New Zealand Limited, Auckland, New Zealand | 100,0 | 23.085 | 1.894 | 19.667 | 36 | |||||||||||||||
| Business Objects Software (Shanghai) Co., Ltd., Shanghai, China | 100,0 | 16.019 | 4.071 | 3.396 | 197 | |||||||||||||||
SAP SYSTEMS, APPLICATIONS AND PRODUCTS IN DATA PROCESSING (THAILAND) LTD., Bangkok, Thailand10) | 49,0 | 15.872 | −215 | 24.415 | 39 | |||||||||||||||
| PT SAP Indonesia, Jakarta, Indonesia | 100,0 | 14.812 | 4.473 | 16.881 | 45 | |||||||||||||||
| SAP PHILIPPINES, INC., Makati, Philippines | 100,0 | 13.543 | 1.584 | 5.630 | 33 | |||||||||||||||
Business Objects Australia Pty Limited, Sydney, Australia4) | 100,0 | 5.365 | −927 | 13.080 | 0 | |||||||||||||||
SAP R&D Center Korea, Inc., Seoul, South Korea4) | 100,0 | 4.697 | 192 | 13.710 | 55 | |||||||||||||||
TomorrowNow Australia Pty Limited, Sydney, Australia4) | 100,0 | 0 | 280 | 311 | 0 | |||||||||||||||
Business Objects Asia Pacific Pte Limited, Singapore4) | 100,0 | 0 | 91 | 33.584 | 0 | |||||||||||||||
| Business Objects Greater China Limited, Hong Kong, China | 100,0 | 0 | 75 | 368 | 0 | |||||||||||||||
| SAP INDIA (HOLDING) PTE LTD, Singapore | 100,0 | 0 | 3 | 259 | 0 | |||||||||||||||
Crystal Decisions (Hong Kong) Limited, Hong Kong, China4) | 100,0 | 0 | 0 | 68 | 0 | |||||||||||||||
Edgewing Australia Pty Limited, Sydney, Australia4) | 100,0 | 0 | −15 | 0 | 0 | |||||||||||||||
Business Objects Malaysia Sdn. Bhd., Kuala Lumpur, Malaysia4) | 100,0 | 0 | −16 | 217 | 0 | |||||||||||||||
TomorrowNow Singapore Pte Limited, Singapore4) | 100,0 | 0 | −107 | 79 | 0 | |||||||||||||||
F-104
Table of Contents
| Profit/Loss(-) | Total Equity | Number of | ||||||||||||||||||
| Total Revenue | After Tax for | as of | Employees as | |||||||||||||||||
as of December 31, 2009 | Ownership | in 20091) | 20091) | 12/31/20091) | of 12/31/20092) | |||||||||||||||
| Name and Location of Company | % | €(000) | €(000) | €(000) | ||||||||||||||||
II. INVESTMENTS IN ASSOCIATES | ||||||||||||||||||||
| RIB Software AG, Stuttgart, Germany | 7,15 | 29.900 | 5.900 | 42.300 | 220 | |||||||||||||||
ArisGlobal Holdings, LLC, Stamford, Connecticut, USA4) | 16,00 | 28.193 | 2.190 | 4.373 | 659 | |||||||||||||||
Procurement Negócios Eletrônicos S/A, Rio de Janeiro, Brazil4) | 17,00 | 9.693 | 550 | 13.101 | 0 | |||||||||||||||
| Original1 GmbH in Gründung, Frankfurt am Main, Germany | 40,00 | 0 | 0 | 25 | 0 | |||||||||||||||
| Greater Pacific Capital (Cayman), L.P., Grand Cayman, Cayman Islands | 5,35 | − | − | − | 0 | |||||||||||||||
| 1) | These figures are based on our local IFRS financial statements prior to eliminations resulting from consolidation and therefore do not reflect the contribution of these companies included in the Consolidated Financial Statements. The translation of the equity into group currency is based on period-end closing exchange rates, and on average exchange rates for revenue and net income/loss. | |
| 2) | As at December 31, 2009, including managing directors, in FTE. | |
| 3) | Consolidated for the first time in 2009. | |
| 4) | Wholly or majority-owned entity of a subsidiary. | |
| 5) | Entity with profit and loss transfer agreement. | |
| 6) | The remaining shares are held by a trustee. | |
| 7) | Restructured and/or renamed in 2009. | |
| 8) | Entity w ith profit and loss transfer agreement: Statement before the posting of prof it/loss transfer for previous year. | |
| 9) | Pursuant to HGB, section 264 (3) or section 264b, the subsidiaries are exempt from applying certain legal requirements to their statutory stand-alone financial statements including the requirement to prepare notes to the financial statements and a review of operations, the requirement of independent audit and the requirement of public disclosure. |
F-105
Table of Contents
| as of December 31, 2009 | ||||
| Name and Location of Company | ||||
III. OTHER EQUITY INVESTMENTS (ownership 5 or more percent) | ||||
| ABACO Mobile, Inc., Atlanta, Georgia, USA | ||||
| Apriso Corporation, Long Beach, California, USA | ||||
| Connectiva Systems, Inc., New York, USA | ||||
| Crossgate AG, Munich, Germany | ||||
| Dacos Software GmbH, Saarbrücken, Germany | ||||
| Deutsches Forschungszentrum für Künstliche Intelligenz GmbH, Kaiserslautern, Germany | ||||
| Ignite Technologies, Inc., Frisco, Texas, USA | ||||
| InnovationLab GmbH, Heidelberg, Germany | ||||
| iTAC Software AG, Dernbach, Germany | ||||
| iYogi Holdings Pvt. Ltd., Port Louis, Mauritius | ||||
| MVP Strategic Partnership Fund GmbH & Co. KG, Grünwald, Germany | ||||
| Onventis GmbH, Stuttgart, Germany | ||||
| Orbian Corporation Limited, Hamilton, Bermuda, United Kingdom | ||||
| Particle Computer GmbH i.L., Karlsruhe, Germany | ||||
| Post for Systems, Cairo, Egypt | ||||
| Powersim Corporation, Herndon, Virginia, USA | ||||
| QCLS Corporation, San Jose, California, USA | ||||
| Qumu, Inc., San Bruno, California, USA | ||||
| Realize Corporation, Tokyo, Japan | ||||
| Retail Solutions, Inc. (legal name: T3C, Inc.), Sunnyvale, California, USA | ||||
| Return Path, Inc., New York, USA | ||||
| Smart City Planning, Inc., Tokyo, Japan | ||||
| SupplyOn AG, Hallbergmoos, Germany | ||||
| Venture-Capital Beteiligung GbR mbH (in Liquidation), Stuttgart, Germany | ||||
| Zend Technologies Ltd., Ramat Gan, Israel | ||||
F-106
Table of Contents
Financial Statement Schedule I — Reconciliations from U.S. GAAP to IFRS for the Years Ended December 31, 2007 and 2006
Reconciliation from U.S. GAAP to IFRS
The Consolidated Financial Statements of SAP AG and its subsidiaries have been prepared in accordance with International Financial Reporting Standards (IFRS). Starting with the year ending December 31, 2007 we have prepared Consolidated Financial Statements based on IFRS as required by German and European law. The transition date to IFRS was January 1, 2006.
Up to and including fiscal year 2008, we prepared and published two sets of Consolidated Financial Statements, one based on IFRS and one based on U.S. GAAP. In prior years, through the year 2008, our Annual Report onForm 20-F included U.S. GAAP Consolidated Financial Statements. Beginning with our Consolidated Financial Statements as of and for the year ended December 31, 2009, we fully migrated to IFRS and discontinued preparation of U.S. GAAP financial information as of the end of 2009 for our Annual Report onForm 20-F.
We provide the following disclosures of our transition from U.S. GAAP to IFRS:
Basis of Transition to IFRS
Our effective date of transition to IFRS is January 1, 2006. As required by IFRS 1, we have applied all IFRS standards and interpretations that were effective as of December 31, 2007, our reporting date for the first IFRS Consolidated Financial Statements for the year ending December 31, 2007, consistently and retrospectively through the transition date, January 1, 2006. The resulting differences between the IFRS carrying amounts and the carrying amounts of the assets and liabilities in the Consolidated Balance Sheet under U.S. GAAP as at January 1, 2006, were recognized directly in equity at the date of transition to IFRS. However, IFRS 1 provides exemptions and exceptions, of which we applied the following:
Business Combination Exemption
We have applied the business combination exemption in IFRS 1 and therefore have not restated business combinations that took place prior to January 1, 2006 compared to U.S.GAAP, our previous GAAP. The goodwill arising from these prior acquisitions did not contain additional identifiable intangible assets that should have been separated under IFRS. We have adjusted goodwill from past business combinations for contingent considerations for which payment was estimated to be probable.
Employee Benefits Exemption
We have elected to recognize all actuarial gains and losses and vested past service cost as at January 1, 2006 in equity. All actuarial gains and losses not previously recognized through application of the corridor approach under U.S. GAAP have been recognized in equity at the date of transition.
Any actuarial gains and losses generated after January 1, 2006, have been recognized directly in retained earnings for all of our defined benefit plans as allowed under IAS 19.93A.
Cumulative Currency Translation Differences Exemption
We have elected to set the previously accumulated cumulative translation adjustment to zero as at January 1, 2006. This exemption has been applied to all subsidiaries in accordance with IFRS 1. The cumulative currency translation losses resulting from the translation of the financial statements of subsidiaries and associated companies were recognized in retained earnings.
S-1
Table of Contents
Reconciliation from U.S. GAAP to IFRS and Related Explanations
The following reconciliation and notes present the effect of major differences between U.S. GAAP and IFRS on shareholders’ equity and net income as of December 31, 2007 and 2006, respectively:
Reconciliation of equity from U.S. GAAP to IFRS
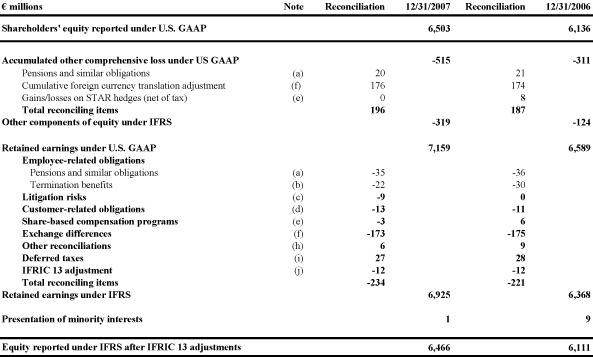
Reconciliation of net income
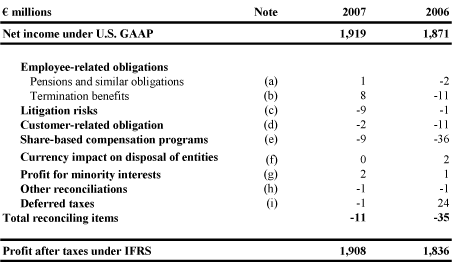
S-2
Table of Contents
| (a) | Pensions and Similar Obligations |
Under IFRS, pension costs and similar obligations are accounted for in accordance with IAS 19. Under U.S. GAAP, we accounted for our pension-benefit liabilities in accordance with FASB ASC Topic 715, Retirement Benefits (“Topic 715”). The differences between IFRS and U.S. GAAP relating to the accounting for pensions comprise the following:
| 1. | As allowed under IFR 1, we elected to recognize all cumulative actuarial gains and losses at January 1, 2006 (SAP’s transition date to IFRS) with a corresponding offset in retained earnings. The full recognition of the defined benefit obligation in the opening balance sheet led to a lower amount in retained earnings under IFRS. We also recognized actuarial gains and losses after the initial adoption of IFRS in retained earnings. In contrast, the derecognition of the additional minimum liability provided for in accordance with Topic 715, resulted in a lower amount in retained earnings under U.S. GAAP. | |
| 2. | Under U.S. GAAP, the cumulative actuarial gains and losses are presented as a component of other comprehensive income. Under IFRS, these are presented within retained earnings, thus resulting in a reclassification adjustment. |
| (b) | Termination Benefits |
Under IFRS, we account for our German semiretirement program and certain other termination benefits in accordance with IAS 19 “Employee Benefits” while under U.S. GAAP, we applied FASB ASC Topic 712, Nonretirement Postemployment Benefits and FASB ASC Topic 710, Compensation.
The bonus feature element (“Aufstockungsbetrag”) of the semiretirement provision is considered a termination benefit under IFRS, so the expected amount for the bonus feature has to be accrued at the time the early retirement agreement is signed. In addition, employers’ offers to encourage voluntary retirements qualify as termination benefits under IFRS, so obligations for probable bonus feature payments to employees are recorded based on management’s best estimate of the number of employees expected to enter into early retirement agreements. Under U.S. GAAP in contrast, only the benefits for the inactive period of contractually bound participants are ratably recognized over the period from signing an early retirement agreement to the end of employment as they are considered post-employment benefits.
| (c) | Litigation Risks |
Under IFRS, where appropriate we record a provision for the estimated litigation costs as part of the accrual of the respective lawsuit. Under U.S. GAAP in contrast, we recorded attorneys’ fees and other legal costs associated with litigation and claims when incurred.
| (d) | Customer-Related Obligations |
Under U.S. GAAP, we account for certain fixed fee consulting projects using the proportional performance method. Consequently, in case of loss projects we do not record any accruals for losses resulting from these projects. Instead, they are recognized as incurred.
Under IFRS, contract accounting is applied for all fixed fee consulting, development and other projects that meet the criteria of IAS 11. Under IFRS, generally the percentage of completion method is applied; in exceptional cases the zero profit margin approach. In general, our projects meet the criteria for applying the percentage of completion method, which also results in the accrual of estimated losses resulting from those projects.
S-3
Table of Contents
| (e) | Share-Based Compensation Programs |
Under U.S. GAAP, we have accounted for share-based compensation programs using the intrinsic value-based method according to Accounting Principles Board Opinion 25 Accounting for Stock Issued to Employees until December 31, 2005. As of January 1, 2006, we started applying the fair value recognition provisions of FASB ASC Topic 718, Compensation, Stock Compensation (“Topic 718”).
Under IFRS, all share-based payment programs are recorded at fair value. Equity-settled programs are recorded based on grant-date fair value, while liabilities for cash-settled programs are adjusted to current fair value at each reporting date. From January 1, 2006, onwards, the method of accounting for our share-based compensation programs is essentially the same under U.S. GAAP and IFRS.
For our cash-settled and equity-settled share-based payment arrangements we have not used the exemption of IFRS 1 in our opening balance sheet but adopted IFRS 2 Share-based payment retrospectively. As a result, the difference between the intrinsic value method and the fair value method was recorded in the opening balance sheet. Due to the fact that certain cash-settled share-based payment programs have been hedged, the increase in liabilities was offset by the recognized portion of the hedge instrument in Other components of equity.
| (f) | Exchange Differences |
The increase in accumulated other comprehensive income under U.S. GAAP compared to the amount of other components of equity under IFRS was the result of setting foreign currency losses to zero at January 1, 2006 (SAP’s transition date to IFRS) with a corresponding adjustment in retained earnings as allowed under IFRS 1.
| (g) | Change in Presentation of Minority Interest and Adjustments |
During the period in which we prepared our Consolidated Financial Statements on the basis of U.S. GAAP, minority interests were required to be presented as a separate line item between equity and liabilities in the Consolidated Statements of Financial Position and net income under U.S. GAAP only included the income attributable to SAP AG’s shareholders. Under IFRS, minority interests are included in shareholders’ equity. Profit after taxes under IFRS also includes the portion attributable to the minority interest holders.
| (h) | Other Reconciling Items |
Both, under U.S. GAAP and IFRS, a liability has to be recorded if it is probable that there will be future economic outflows based on past events and the amount of the obligation can be measured reliably. However, the interpretation of “probable” is not the same under IFRS and U.S. GAAP. While under IFRS probable means more likely than not, under U.S. GAAP probable indicates a higher probability than it does under IFRS. Therefore, we recognized certain provisions under IFRS we did not record under U.S. GAAP.
Loans granted to employees primarily consist of interest free or below-market-rate building loans to be recorded at present value. Under U.S. GAAP, we recognize the discount as employee expenses immediately when the loan is granted. IFRS requires capitalizing the discount as prepaid expenses and releasing it ratably over the term of the loan to employee expenses.
Restructuring obligations in certain scenarios include provisions for unused lease space which are recognized earlier under IFRS than under U.S. GAAP.
S-4
Table of Contents
| (i) | Deferred Taxes |
As the transition from U.S. GAAP to IFRS led to various changes in the valuation of balance sheet positions while the national statutory income tax values remained changed, we have recalculated deferred taxes in accordance with IAS 12 to reflect these valuation differences.
| (j) | IFRIC 13 adjustment |
In June 2007, the International Financial Reporting Interpretation Committee issued IFRIC Interpretation 13, Customer Loyalty Programmes (“IFRIC 13”), which addresses the accounting for loyalty award credits (such as “points” or “travel miles”) to customers who buy goods or services. Specifically, it explains how such entities should account for their obligations to provide free or discounted goods or services to customers who redeem award credits. IFRIC 13 became effective on January 1, 2009 and was required to be applied retrospectively. As a result of the retrospective first time application, we adjusted the January 1, 2006 retained earnings balance by €12 million. The effect on the Consolidated Income Statements was immaterial for the years ending December 31, 2007 and 2006, respectively.
S-5