UNITED STATES SECURITIES AND EXCHANGE COMMISSION
Washington, D.C. 20549
FORM 20-F
| | | |
| (Mark One) | | |
o | | REGISTRATION STATEMENT PURSUANT TO SECTION 12(b) OR (g)
OF THE SECURITIES EXCHANGE ACT OF 1934 |
þ | | ANNUAL REPORT PURSUANT TO SECTION 13 OR 15(d)
OF THE SECURITIES EXCHANGE ACT OF 1934
For the fiscal year ended December 31, 2008 |
o | | TRANSITION REPORT PURSUANT TO SECTION 13 OR 15(d)
OF THE SECURITIES EXCHANGE ACT OF 1934 |
| | | For the transition period from to |
o | | SHELL COMPANY REPORT PURSUANT TO SECTION 13 OR 15(d)
OF THE SECURITIES EXCHANGE ACT OF 1934 |
| | | Date of event requiring this shell company report |
Commission filenumber: 1-14251
SAP AG
(Exact name of Registrant as specified in its charter)
SAP CORPORATION
(Translation of Registrant’s name into English)
Federal Republic of Germany
(Jurisdiction of incorporation or organization)
Dietmar-Hopp-Allee 16
69190 Walldorf
Federal Republic of Germany
(Address of principal executive offices)
Wendy Boufford
c/o SAP Labs
3410 Hillview Avenue, Palo Alto, CA, 94304, United States of America
650-849-4000 (Tel)
604-974-4789 (Fax)
(Name, Telephone, Email and/or Facsimile number and Address of Company Contact Person)
Securities registered or to be registered pursuant to Section 12(b) of the Act:
| | | |
Title of each class | | Name of each exchange on which registered |
American Depositary Receipts, each representing
one Ordinary Share, without nominal value | | New York Stock Exchange |
| Ordinary Shares, without nominal value | | New York Stock Exchange* |
Securities registered or to be registered pursuant to Section 12(g) of the Act:None
Securities for which there is a reporting obligation pursuant to Section 15(d) of the Act:None
Indicate the number of outstanding shares of each of the issuer’s classes of capital or common stock as of the close of the period covered by the annual report:
| | | |
| Ordinary Shares, without nominal value (as of December 31, 2008)** | | 1,225,762,900 |
Indicate by check mark if the registrant is a well-known seasoned issuer, as defined in Rule 405 of the Securities Act.
If this report is an annual or transition report, indicate by check mark if the registrant is not required to file reports pursuant to Section 13 or 15(d) of the Securities Exchange Act of 1934.
Note — Checking the box above will not relieve any registrant required to file reports pursuant to Section 13 or 15(d) of the Securities Exchange Act of 1934 from their obligations under those Sections.
Indicate by check mark whether the registrant (1) has filed all reports required to be filed by Section 13 or 15(d) of the Securities Exchange Act of 1934 during the preceding 12 months (or for such shorter period that the registrant was required to file such reports), and (2) has been subject to such filing requirements for the past 90 days.
Indicate by check mark whether the registrant is a large accelerated filer, an accelerated filer, or a non-accelerated filer. See definition of “accelerated filer and large accelerated filer” inRule 12b-2 of the Exchange Act. (Check one):
Large accelerated filer þ Accelerated filer o Non-accelerated filer o
Indicate by check mark which basis of accounting the registrant has used to prepare the financial statements included in this filing:
U.S. GAAP þ International Financial Reporting Standards as issued by the International Accounting Standards Board o Other o
If “other” has been checked in response to the previous question, indicate by check mark which financial statement item the registrant has elected to follow.
If this is an annual report, indicate by check mark whether the registrant is a shell company (as defined inRule 12b-2 of the Exchange Act).
* Not for trading, but only in connection with the registration of American Depositary Shares representing such ordinary shares.
** Including 38,456,734 treasury shares.
[THIS PAGE INTENTIONALLY LEFT BLANK]
TABLE OF CONTENTS
| | | | | |
| | | Page |
| |
| | | 1 | |
| | | 2 | |
| | | 3 | |
| | | 7 | |
| | | 7 | |
| | | 7 | |
| | | 7 | |
| | | 7 | |
| | | 8 | |
| | | 9 | |
| | | 10 | |
| | | 26 | |
| | | 26 | |
| | | 29 | |
| | | 40 | |
| | | 40 | |
| | | 42 | |
| | | 42 | |
| | | 43 | |
| | | 44 | |
| | | 44 | |
| | | 45 | |
| | | 46 | |
| | | 46 | |
| | | 46 | |
| | | 49 | |
| | | 52 | |
| | | 61 | |
| | | 64 | |
| | | 67 | |
| | | 68 | |
| | | 73 | |
| | | 76 | |
| | | 76 | |
| | | 77 | |
| | | 79 | |
| | | 79 | |
| | | 80 | |
| | | 82 | |
| | | 96 | |
| | | 98 | |
| | | 98 | |
i
INTRODUCTION
SAP AG is a German stock corporation (Aktiengesellschaft) and is referred to in this Annual Report onForm 20-F, together with its subsidiaries, as SAP, or as “the Company,” “we,” “our,” or “us.” Our consolidated financial statements included in “Item 18. Financial Statements” in this Annual Report onForm 20-F have been prepared in accordance with generally accepted accounting principles in the United States of America, referred to as U.S. GAAP.
In this Annual Report onForm 20-F: (i) references to “US$,” “$,” or “dollars” are to U.S. dollars; (ii) references to “€” or “euro” are to the euro. Our financial statements are denominated in euros, which is the currency of our home country, Germany. Certain amounts that appear in this Annual Report onForm 20-F may not add up because of rounding adjustments.
Unless otherwise specified herein, euro financial data have been converted into dollars at the noon buying rate in New York City for cable transfers in foreign currencies as certified for customs purposes by the Federal Reserve Bank of New York (the “Noon Buying Rate”) on December 31, 2008, which was US$1.3919 per €1.00. No representation is made that such euro amounts actually represent such dollar amounts or that such euro amounts could have been or could be converted into dollars at that or any other exchange rate on such date or on any other dates. The rate used for the convenience translations also differs from the currency exchange rates used for the preparation of the Consolidated Financial Statements. For information regarding recent rates of exchange between euro and dollars, see “Item 3. Key Information — Exchange Rates.” On March 9, 2009, the Noon Buying Rate for converting euro to dollars was US$1.2565 per €1.00.
Unless the context otherwise requires, references in this Annual Report onForm 20-F to ordinary shares are to SAP AG’s ordinary shares, without nominal value. References in this Annual Report onForm 20-F to “ADRs” are to SAP AG’s American Depositary Receipts, each representing one SAP ordinary share.
SAP, R/3, SAP NetWeaver, Duet, PartnerEdge, ByDesign, SAP Business ByDesign, and other SAP products and services mentioned herein as well as their respective logos are trademarks or registered trademarks of SAP AG in Germany and other countries. Business Objects and the Business Objects logo, BusinessObjects, Crystal Reports, Crystal Decisions, Web Intelligence, Xcelsius, and other Business Objects products and services mentioned herein as well as their respective logos are trademarks or registered trademarks of Business Objects S.A. in the United States and in other countries. Business Objects is an SAP company. All other product and service names mentioned are the trademarks of their respective companies. Data contained in this document serves informational purposes only. National product specifications may vary.
Throughout this Annual Report onForm 20-F, whenever a reference is made to our website, such reference does not incorporate by reference into this Annual Report the information contained on our website.
1
FORWARD-LOOKING INFORMATION
This Annual Report onForm 20-F contains forward-looking statements and information based on the beliefs of, and assumptions made by, our management using information currently available to them. Any statements contained in this Annual Report onForm 20-F that are not historical facts are forward-looking statements as defined in the U.S. Private Securities Litigation Reform Act of 1995. We have based these forward-looking statements on our current expectations, assumptions and projections about future events. As a result, our forward-looking statements and information are subject to uncertainties and risks. A broad range of uncertainties and risks, many of which are beyond our control, could cause our actual results and performance to differ materially from any projections expressed in or implied by our forward looking statements. These uncertainties and risks include, but are not limited to:
| | |
| | • | economic conditions in general and trends in our business, particularly the current global economic crisis and general global economic uncertainty and any further deterioration of current conditions; |
| |
| | • | claims and lawsuits against us that could result in adverse outcomes, including third party infringement claims; |
| |
| | • | our ability to use intellectual property, including intellectual property licensed to us by third parties; |
| |
| | • | the success of our new SAP Enterprise Support offering; |
| |
| | • | our ability to obtain, license and enforce intellectual property rights; |
| |
| | • | our ability to successfully implement our business strategy, including our SAP Business ByDesign offering as well as our SAP NetWeaver platform strategy; |
| |
| | • | our ability to procure new licenses, renew existing maintenance agreements and to sell additional professional services, particularly with respect to our installed customer base; |
| |
| | • | consolidation, competition and rapid technological change in the software industry; |
| |
| | • | liquidity and the valuation of our financial assets, particularly in the current economic climate; |
| |
| | • | quarterly fluctuations in our sales and the related difficulty of accurately forecasting future revenue, particularly in the current economic climate; |
| |
| | • | currency fluctuations; |
| |
| | • | our ability to establish new relationships and enhance existing relationships with third party distributors, software suppliers, systems integrators and value-added resellers; |
| |
| | • | the effectiveness of our IT security measures and general IT system availability and Internet-related privacy concerns; |
| |
| | • | our ability to obtain and expand market acceptance of our services and products, and customer satisfaction with the implementation and installation of our products; |
| |
| | • | unauthorized or premature disclosure of our future strategies, technologies and products; |
| |
| | • | social and political instabilities, terrorist attacks or other acts of violence or war; |
| |
| | • | our ability to retain key personnel with specialized knowledge and technology skills; |
| |
| | • | our ability to effectively manage our headcount and our geographically dispersed employee base; |
| |
| | • | our ability to successfully integrate newly acquired businesses; |
| |
| | • | international regulatory and global political conditions; |
| |
| | • | our ability to obtain sufficient insurance coverage to avoid negative impacts on our financial position or results of operations resulting from the settlement of claims; and |
| |
| | • | other risks and uncertainties. |
2
We describe these and other risks and uncertainties in more detail under “Item 3 Key Information — Risk Factors.”
If one or more of these uncertainties or risks materializes, or if management’s underlying assumptions prove incorrect, our actual results may differ materially from those described in or inferred from our forward-looking statements and information.
The words “aim,” “anticipate,” “believe,” “continue,” “could,” “counting on,” “is confident,” “estimate,” “expect,” “forecast,” “intend,” “may,” “plan,” “project,” “predict,” “seek,” “should,” “strategy,” “want,” “will,” “would,” “guidance,” “outlook” and similar expressions as they relate to us are intended to identify such forward-looking statements. Such information includes, for example, the statements made in “Item 5. Operating and Financial Review and Prospects” and “Item 11. Quantitative and Qualitative Disclosures About Market Risk,” but also appears in other parts of this Annual Report onForm 20-F. The factors that could affect our future financial results are discussed more fully under “Item 3. Key Information — Risk Factors” as well as elsewhere in this Annual Report onForm 20-F and in our other filings with the U.S. Securities and Exchange Commission (“SEC”). Readers are cautioned not to place undue reliance on these forward-looking statements, which speak only as of the date of this Annual Report onForm 20-F. We undertake no obligation to publicly update or revise any forward-looking statements whether as a result of new information, future events or otherwise.
This Annual Report includes statistical data about the IT industry derived from information published by sources including: Gartner, Inc., or Gartner, a provider of market information and strategic information for the IT industry; International Data Group, or IDC, a provider of market information and advisory services for the information technology, telecommunications, and consumer technology markets; investment bank Goldman Sachs; financial services company UBS; and Forrester Research, a major market research company. This type of data represents only the estimates of Gartner, IDC, Goldman Sachs, UBS, Forrester Research and other sources of industry data. SAP does not adopt nor endorse any of the statistical information provided by sources such as Gartner, IDC, Goldman Sachs, UBS, Forrester Research or other similar sources that is contained in this Annual Report onForm 20-F. In addition, although we believe that data from these companies are generally reliable, this type of data is inherently imprecise. We caution you not to place undue reliance on this data.
EXPLANATION OF NON-GAAP FINANCIAL MEASURES
This document discloses certain financial measures, such as non-GAAP revenues, non-GAAP expenses, non-GAAP operating income, non-GAAP operating margin and constant currency revenue and operating income measures that are not prepared in accordance with U.S. GAAP and are therefore considered non-GAAP financial measures. Our non-GAAP financial measures may not correspond to non-GAAP financial measures that other companies report. The non-GAAP financial measures that we report should be considered as additional to, and not as substitutes for or superior to, revenue, operating income, cash flows, or other measures of financial performance prepared in accordance with U.S. GAAP. Our non-GAAP financial measures included in this document are reconciled to the nearest U.S. GAAP measures, except for projected 2009 figures for which we provide only a projected non-GAAP financial measure without reconciling to a corresponding projected U.S. GAAP measure because a reconciliation is not practicable due to the prospective nature of the information.
We believe that it is of interest to investors to receive certain supplemental historical and prospective non-GAAP financial information used by our management in running our business and making financial, strategic and operational decisions — in addition to financial data prepared in accordance with U.S GAAP — to attain a more transparent understanding of our past performance and our future results. Beginning in 2008, we use these non-GAAP measures consistently as defined below in our planning, forecasting, reporting, compensation and external communication. Specifically,
| | |
| | • | Our management uses these non-GAAP numbers rather than U.S. GAAP numbers as the basis for financial, strategic and operating decisions. |
3
| | |
| | • | The variable remuneration components of our board members and employees that are tied to our company’s growth and operating performance are based on SAP’s achievement of its targets for non-GAAP operating income, non-GAAP software and software-related revenue growth at constant currencies, and non-GAAP operating margin at constant currencies. |
| |
| | • | The annual budgeting process involving all management units is based on non-GAAP revenues and non-GAAP operating income numbers rather than U.S. GAAP numbers. |
| |
| | • | All monthly forecast and performance reviews with all senior managers globally are based on these non-GAAP measures rather than U.S. GAAP numbers. |
| |
| | • | Both company-internal target setting and guidance provided to the capital markets are based on non-GAAP revenues and non-GAAP income measures rather than U.S. GAAP numbers. |
We believe that our non-GAAP measures are useful to investors for the following reasons:
| | |
| | • | The non-GAAP measures provide investors with insight into management’s decision-making since management uses these non-GAAP measures to run our business and make financial, strategic and operating decisions. |
| |
| | • | The non-GAAP measures provide investors with additional information that enables a comparison of year-over-year operating performance by eliminating certain direct effects resulting from the acquisition of Business Objects. |
Our non-GAAP financial measures reflect adjustments based on the following items, as well as the related income tax effects:
Non-GAAP Revenue
Revenues in this document identified as “non-GAAP revenue” have been adjusted from the respective U.S. GAAP numbers by including the full amount of Business Objects support revenues that would have been reflected by Business Objects had it remained a stand-alone entity but which are not permitted to be reflected as revenues under U.S. GAAP as a result of fair value accounting for Business Objects support contracts in effect at the time of the Business Objects acquisition.
Under U.S. GAAP we record at fair value the Business Objects support contracts in effect at the time of the acquisition of Business Objects. Consequently, our U.S. GAAP support revenues, our U.S. GAAP software and software-related service revenues and our U.S. GAAP total revenues for periods subsequent to the Business Objects acquisition do not reflect the full amount of support revenue that Business Objects would have recorded for these support contracts absent the acquisition by SAP. Adjusting revenue numbers for this nonrecurring revenue impact provides additional insight into our ongoing performance: The support contracts are typically one-year contracts, and we expect customers will renew them, which would result in revenues from the support fees. However, we cannot provide absolute assurance that these contracts will be renewed.
Non-GAAP Operating Expense
We exclude acquisition-related charges, which are defined as follows:
| | |
| | • | Amortization expense of intangibles acquired in business combinations and certain standalone acquisitions of intellectual property; |
| |
| | • | Expense from purchased in-process research and development; and |
| |
| | • | Restructuring expenses as far as incurred in connection with a business combinations. |
4
Non-GAAP Operating Income and Non-GAAP Operating Margin
Operating income and operating margin in this document identified as “non-GAAP operating income” and “non-GAAP operating margin” have been adjusted from the respective operating income and operating margin numbers as recorded under U.S. GAAP by adjusting for the above mentioned non-GAAP revenues and expenses.
We include these non-GAAP revenues and exclude these non-GAAP expenses for the purpose of calculating non-GAAP operating income and non-GAAP operating margin when evaluating the continuing operational performance of the Company because these expenses generally cannot be changed or influenced by management after the acquisition other than by disposing of the acquired assets. As management at levels below the Executive Board has no influence on these expenses we generally do not consider these expenses for purposes of evaluating the performance of management units. As we believe that our Company-wide performance measures need to be aligned with the measures generally applied by management at varying levels throughout the Company we exclude these expenses when making decisions to allocate resources, both on a Company level and at lower levels of the organization. In addition, we use these non-GAAP measures to gain a better understanding of the Company’s comparative operating performance from period-to-period and as a basis for planning and forecasting future periods. Considering that management at all levels of the organization is heavily focused on our non-GAAP measures in our internal reporting and controlling, we believe that it is in the interest of our investors that they are provided with the same information.
We believe that our non-GAAP financial measures described above have limitations, which include but are not limited to the following:
| | |
| | • | The eliminated amounts may be material to us. |
| |
| | • | Without being analyzed in conjunction with the corresponding U.S. GAAP measures the non-GAAP measures are not indicative of our present and future performance, foremost for the following reasons: |
| | |
| | • | The additional insight into our potential future financial performance that our non-GAAP revenue numbers are intended to provide assumes that Business Objects customers renew their maintenance contracts. Projections of our future revenues made based on these numbers would be overstated if such maintenance renewals do not occur. |
| |
| | • | While our non-GAAP income numbers reflect the elimination of certain acquisition-related expenses, no eliminations are made for the additional revenues that result from the acquisitions. |
| |
| | • | The acquisition-related one-time charges that we eliminate in deriving our non-GAAP income numbers are likely to recur should SAP enter into material business combinations in the future. |
| |
| | • | The acquisition-related amortization expenses that we eliminate in deriving our non-GAAP income numbers are recurring expenses that will impact our financial performance in future years. |
| |
| | • | While our non-GAAP revenue numbers are adjusted for a one-time impact only, our non-GAAP expenses are adjusted for both one-time and recurring items. Additionally, the revenue adjustment for the fair value accounting for Business Objects support contracts and the expense adjustment for one-time and recurring acquisition-related charges do not arise from a common conceptual basis as the revenue adjustment aims at improving the comparability of the initial post-acquisition period with future post-acquisition periods while the expense adjustment aims at improving the comparability between post-acquisition periods and pre-acquisition periods. This should particularly be considered when evaluating our non-GAAP operating income and non-GAAP operating margin numbers as these combine our non-GAAP revenues and non-GAAP expenses despite the absence of a common conceptual basis. |
5
We believe, however, that the presentation of the non-GAAP measures in conjunction with the corresponding U.S. GAAP measures provides useful information to management and investors regarding present and future business trends relating to our financial condition and results of operations. We therefore do not evaluate our growth and performance without considering both non-GAAP measures and U.S. GAAP measures. We caution the readers of this document to follow a similar approach by considering our non-GAAP measures only in addition to, and not as a substitute for or superior to, revenues or other measures of our financial performance prepared in accordance with U.S. GAAP.
Constant Currency Period-Over-Period Changes
We believe it is important for investors to have information that provides insight into our sales. Revenue measures determined under U.S. GAAP provide information that is useful in this regard. However, both growth in sales volume and currency effects impact period-over-period changes in sales revenue. We do not sell standardized units of products and services, so we cannot provide data expressed in such units to present changes in the volume of products and services sold. To provide information that may be useful to investors in breaking down and evaluating sales volume changes, we do present information adjusted for foreign currency effects about revenue changes and various values and components relating to operating income. We calculate constant currency year-over-year changes in revenue and operating income by translating foreign currencies using the average exchange rates from the previous (comparator) year instead of the report year.
We believe that data on constant currency period-over-period changes has limitations, particularly because the currency effects that are eliminated constitute a significant element of our revenues and expenses and may materially affect our performance. We therefore limit our use of constant currency period-over-period changes to the analysis of changes in volume as one element of the full change in a financial measure. We do not evaluate our growth and performance without considering both constant currency period-over-period changes on the one hand and changes in revenues, expenses, profit, or other measures of financial performance prepared in accordance with U.S. GAAP on the other. We caution the readers of this report to follow a similar approach by considering constant currency period-over-period changes in measures of financial performance only in addition to, and not as a substitute for or superior to, changes in revenues, expenses, income or other measures prepared in accordance with U.S. GAAP.
6
PART I
ITEM 1. IDENTITY OF DIRECTORS, SENIOR MANAGEMENT AND ADVISERS
Not applicable.
ITEM 2. OFFER STATISTICS AND EXPECTED TIMETABLE
Not applicable.
ITEM 3. KEY INFORMATION
SELECTED FINANCIAL DATA
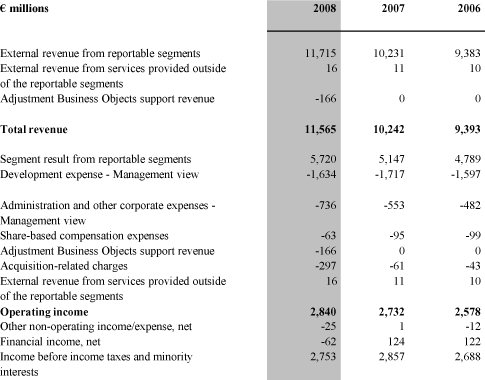
The following table presents selected consolidated financial information of SAP for the five most recent fiscal years. The selected consolidated financial information of SAP is a summary of, is derived from and is qualified by reference to, our consolidated financial statements, with the exception of the 2008 US$ amounts which are unaudited and are provided for the convenience of readers. The selected consolidated balance sheet data as of December 31, 2006, 2005 and 2004 and the selected consolidated income statement data for the years ended December 31, 2005 and 2004 are derived from our audited consolidated financial statements prepared under U.S. GAAP. However, we have not included our audited consolidated financial statements for those periods in this document. The € based selected consolidated balance sheet data as of December 31, 2008 and 2007 and the selected consolidated income statement data for the years ended December 31, 2008, 2007 and 2006 are derived from our audited consolidated financial statements, which are included in “Item 18. Financial Statements” and have been audited by KPMG AG Wirtschaftsprüfungsgesellschaft (“KPMG”), independent registered public accountants, whose report appears onpage F-1 of this Annual Report onForm 20-F.
| | | | | | | | | | | | | | | | | | | | | | | | | |
| | | Year Ended December 31, | |
| | | 2008 | | | 2008 | | | 2007 | | | 2006 | | | 2005 | | | 2004 | |
| | | US$(1) | | | € | | | € | | | € | | | € | | | € | |
| | | In millions, except earnings per share data | |
| |
Income Statement Data(2): | | | | | | | | | | | | | | | | | | | | | | | | |
| Total revenue | | | 16,097 | | | | 11,565 | | | | 10,242 | | | | 9,393 | | | | 8,509 | | | | 7,514 | |
| Operating income | | | 3,953 | | | | 2,840 | | | | 2,732 | | | | 2,578 | | | | 2,337 | | | | 2,018 | |
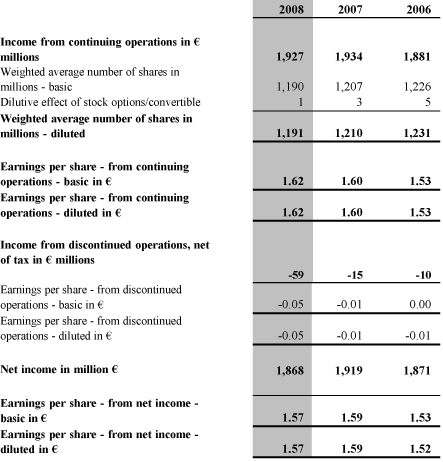
| Income from continuing operations | | | 2,682 | | | | 1,927 | | | | 1,934 | | | | 1,881 | | | | 1,502 | | | | 1,311 | |
| Net income | | | 2,600 | | | | 1,868 | | | | 1,919 | | | | 1,871 | | | | 1,496 | | | | 1,311 | |
| Earnings per share based on income from continuing operations | | | | | | | | | | | | | | | | | | | | | | | | |
| Basic | | | 2.25 | | | | 1.62 | | | | 1.60 | | | | 1.53 | | | | 1.21 | | | | 1.05 | |
| Diluted | | | 2.25 | | | | 1.62 | | | | 1.60 | | | | 1.53 | | | | 1.21 | | | | 1.05 | |
| Earnings per share based on net income | | | | | | | | | | | | | | | | | | | | | | | | |
| Basic | | | 2.18 | | | | 1.57 | | | | 1.59 | | | | 1.53 | | | | 1.21 | | | | 1.05 | |
| Diluted | | | 2.18 | | | | 1.57 | | | | 1.59 | | | | 1.52 | | | | 1.20 | | | | 1.05 | |
Other Data: | | | | | | | | | | | | | | | | | | | | | | | | |
| Weighted-average number of shares outstanding | | | | | | | | | | | | | | | | | | | | | | | | |
| Basic | | | 1,190 | | | | 1,190 | | | | 1,207 | | | | 1,226 | | | | 1,239 | | | | 1,243 | |
| Diluted | | | 1,191 | | | | 1,191 | | | | 1,210 | | | | 1,231 | | | | 1,243 | | | | 1,249 | |
7
| | | | | | | | | | | | | | | | | | | | | | | | | |
| | | Year Ended December 31, | |
| | | 2008 | | | 2008 | | | 2007 | | | 2006 | | | 2005 | | | 2004 | |
| | | US$(1) | | | € | | | € | | | € | | | € | | | € | |
| | | In millions, except earnings per share data | |
| |
Balance Sheet Data: | | | | | | | | | | | | | | | | | | | | | | | | |
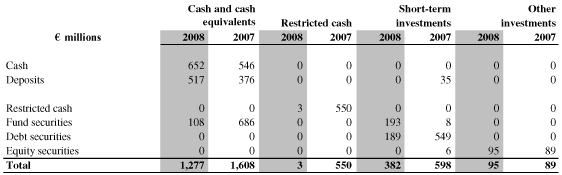
| Cash and cash equivalents | | | 1,777 | | | | 1,277 | | | | 1,608 | | | | 2,399 | | | | 2,064 | | | | 1,506 | |
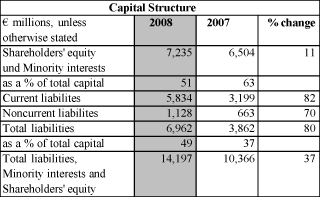
| Total assets | | | 19,761 | | | | 14,197 | | | | 10,366 | | | | 9,503 | | | | 9,040 | | | | 7,585 | |
| Shareholders’ equity | | | 10,068 | | | | 7,233 | | | | 6,503 | | | | 6,136 | | | | 5,782 | | | | 4,594 | |
Subscribed capital(3) | | | 1,706 | | | | 1,226 | | | | 1,246 | | | | 1,268 | | | | 316 | | | | 316 | |
Short-term financial debt(4) | | | 3,236 | | | | 2,325 | | | | 32 | | | | 31 | | | | 22 | | | | 26 | |
Long-term financial debt(4) | | | 3 | | | | 2 | | | | 2 | | | | 2 | | | | 9 | | | | 9 | |
| | |
| (1) | | Amounts presented in US$ have been translated for the convenience of the reader at €1.00 to US$1.3919, the Noon Buying Rate for converting €1.00 into dollars on December 31, 2008. See “— Exchange Rates” for recent exchange rates between the Euro and the dollar. This convenience translation is not included in our financial statements and, accordingly, our independent registered public accounting firm has not audited these US$ amounts. |
| |
| (2) | | All figures are based on continuing operations except for Net income. See Note 11 to our consolidated financial statements in “Item 18. Financial Statements” for further discussion on our discontinued operations. As these discontinued operations were acquired by us in 2005 the 2004 income statement data does not reflect any discontinued operations. |
| |
| (3) | | On December 15, 2006 there was a fourfold increase in the number of shares under a capital increase pursuant to German law that resulted in an increase to subscribed capital of approximately 950 million common shares. Furthermore, the 2007 and 2008 figures reflect cancellations of 23 million and 21 million treasury shares effective September 7, 2007 and September 3, 2008, respectively. See “Item 9. The Offer and Listing — General” for more detail of the share increase and the cancellation of shares. |
| |
| (4) | | The balances include financial debt representing bank loans, overdrafts and convertible bonds issued to facilitate settlement of share-based compensation plans (See “Item 6. Directors, Senior Management and Employees — Share-Based Compensation Plans.”). Short-term is defined as having a remaining life of one year or less; long-term is defined as having a remaining term exceeding one year. The significant increase in short-term debt during 2008 is due to debt incurred to finance the acquisition of Business Objects and the related incremental obligations under the Business Objects equity programs. |
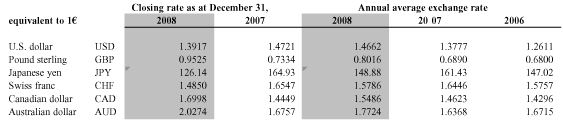
EXCHANGE RATES
The prices for ordinary shares traded on German stock exchanges are denominated in euro. Fluctuations in the exchange rate between the euro and the dollar affects the dollar equivalent of the euro price of the ordinary shares traded on the German stock exchanges and, as a result, may affect the price of the ADRs in the United States. See “Item 9. The Offer and Listing” for a description of the ADRs. In addition, SAP AG pays cash dividends, if any, in euro. As a result, any exchange rate fluctuations will also affect the dollar amounts received by the holders of ADRs on the conversion into dollars of cash dividends paid in euro on the ordinary shares represented by the ADRs. The deposit agreement with respect to the ADRs requires the depositary to convert any dividend payments from euro into dollars as promptly as practicable upon receipt.
A significant portion of our revenue and expenses is denominated in currencies other than the euro. Therefore, fluctuations in the exchange rate between the euro and the respective currencies to which we are exposed may materially affect our consolidated financial position, results of operations and cash flows. See “Item 5. Operating and Financial Review and Prospects — Foreign Currency Exchange Rate Exposure.” For our foreign currency risk and hedging strategy see “Item 11. Quantitative and Qualitative Disclosure About Market Risk — Foreign Currency Exchange Rate Risk.”
8
The following table sets forth the average, high and low Noon Buying Rates for the euro expressed as U.S. dollars per €1.00.
| | | | | | | | | | | | | |
Year | | Average(1) | | | High | | | Low | |
| |
| 2004 | | | 1.2478 | | | | 1.3625 | | | | 1.1801 | |
| 2005 | | | 1.2400 | | | | 1.3476 | | | | 1.1667 | |
| 2006 | | | 1.2661 | | | | 1.3327 | | | | 1.1860 | |
| 2007 | | | 1.3797 | | | | 1.4862 | | | | 1.2904 | |
| 2008 | | | 1.4695 | | | | 1.6010 | | | | 1.2446 | |
| | | | | | | | | |
Month | | High | | | Low | |
| |
| 2008 | | | | | | | | |
| July | | | 1.5923 | | | | 1.5559 | |
| August | | | 1.5569 | | | | 1.4660 | |
| September | | | 1.4737 | | | | 1.3939 | |
| October | | | 1.4058 | | | | 1.2446 | |
| November | | | 1.3039 | | | | 1.2525 | |
| December | | | 1.4358 | | | | 1.2634 | |
| 2009 | | | | | | | | |
| January | | | 1.3946 | | | | 1.2804 | |
| February | | | 1.3064 | | | | 1.2547 | |
| March (through March 9, 2009) | | | 1.2674 | | | | 1.2549 | |
| | |
| (1) | | The average of the applicable Noon Buying Rates on the last day of each month during the relevant period. |
The Noon Buying Rate on March 9, 2009 was US$1.2565 per €1.00.
DIVIDENDS
Dividends are jointly proposed by SAP AG’s Supervisory Board (Aufsichtsrat) and Executive Board (Vorstand) based on SAP AG’s year-end stand-alone statutory financial statements, subject to approval by the shareholders and are officially declared for the prior year at SAP AG’s Annual General Meeting of Shareholders. Dividends paid to holders of the ADRs may be subject to German withholding tax. See “Item 8. Financial Information — Other Financial Information — Dividend Policy” and “Item 10. Additional Information — Taxation.”
9
The following table sets forth in euro the annual dividends paid or proposed to be paid per ordinary share in respect of each of the years indicated. The amounts shown in the table for 2005 and prior years are retrospectively adjusted for the effect of the fourfold increase in the number of shares resulting from the capital increase effective December 15, 2006 pursuant to German law. One SAP ADR currently represents one SAP AG ordinary share. Accordingly, the final dividend per ADR is equal to the dividend for one SAP AG common share and is dependent on the euro/U.S. dollar exchange rate. The table does not reflect tax credits that may be available to German taxpayers who receive dividend payments. If you own our ordinary shares or ADRs and if you are a U.S. resident, refer to “Item 10. Additional Information — Taxation,” for further information.
| | | | | | | | | |
| | | Dividend Paid
| |
| | | per Ordinary
| |
| | | Share | |
Year Ended December 31, | | € | | | US$ | |
| |
| 2004 | | | 0.28 | | | | 0.35 | (1) |
| 2005 | | | 0.36 | | | | 0.43 | (1) |
| 2006 | | | 0.46 | | | | 0.62 | (1) |
| 2007 | | | 0.50 | | | | 0.77 | (1) |
| 2008 (proposed) | | | 0.50 | (2) | | | 0.63 | (2)(3) |
| | |
| (1) | | Translated for the convenience of the reader from euro into U.S. dollars at the Noon Buying Rate for converting euro into U.S. dollars on the dividend payment date. The depositary is required to convert any dividend payments received from SAP as promptly as practicable upon receipt. |
| |
| (2) | | Subject to approval of the Annual General Meeting of Shareholders of SAP AG to be held on May 19, 2009. |
| |
| (3) | | Translated for the convenience of the reader from euro into U.S. dollars at the Noon Buying Rate for converting euro into U.S. dollars on March 9, 2009 of US$1.2565 per €1.00. The depositary is required to convert any dividend payments received from SAP as promptly as practicable upon receipt. The dividend paid may differ due to changes in the exchange rate. |
The amount of dividends paid on the ordinary shares depends on the amount of profits to be distributed by SAP AG, which depends in part upon our performance. The timing and amount of future dividend payments will depend upon our future earnings, capital needs and other relevant factors in each case as proposed by the Executive Board and the Supervisory Board of SAP AG and approved at the Annual General Meeting of Shareholders.
RISK FACTORS
Economic, Political and Regulatory Risks
The current global economic crisis and general uncertainty in global economic conditions has caused, and may in the future cause, a reduction and deferral in demand for our products, negatively impacting our business, results of operations, financial condition and cash flows. Global economic conditions may worsen in the future, exacerbating this negative impact.
The purchase and implementation of SAP software products typically constitutes a significant portion of our customers’ overall corporate budgets. As a result, customer willingness to invest in acquiring and implementing SAP products generally varies with economic and other business conditions. Recently, economic conditions have deteriorated significantly in the regions in which we do business and in the industries in which our customers operate. Specifically, there has been a significant reduction in the availability of credit, increased rates of default and bankruptcy, decreased consumer spending and a substantial decline in most major equity markets. In addition, there has been nearly unprecedented volatility in global capital and banking markets as well as in currency markets in certain countries. As a result of deterioration in global economic conditions and
10
financial markets, we have experienced and expect to continue to experience for the foreseeable future a broad range of adverse effects, including but not limited to:
| | |
| | • | Decreased IT investments generally; |
| |
| | • | Decreased customer demand for our software and services, including order delays and cancellations; |
| |
| | • | Customers’ inability to obtain credit on acceptable terms, or at all, to finance purchases of our software and services; |
| |
| | • | Insolvency of customers, partners and key suppliers, leading to a negative impact on our business; |
| |
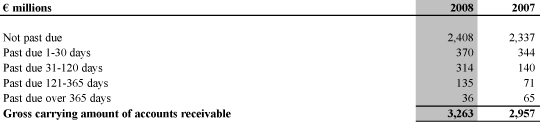
| | • | Increased risk in collectability of accounts receivable. For example, the global economic crisis has led to greater write-offs of accounts receivables for SAP in 2008 and may lead to greater write-offs in the future; |
| |
| | • | Increased reserves for doubtful accounts; |
| |
| | • | Increased price competition for our products and services; |
| |
| | • | Decreased customer confidence; and |
| |
| | • | Pressure on our operating margin. |
Continued deterioration of global economic conditions, including the severe recession in the United States and other countries and further disruptions in the credit and financial markets worldwide, will likely have a negative impact on our business, results of operations, financial condition and cash flows which could be significant. In particular, our profitability and cash flows might be significantly adversely affected by the current and any continuing deterioration of the economic conditions in Europe or the United States because we derive a substantial portion of our revenue from software licenses and services in those geographic regions. Additionally, an important feature of our long-term strategy for growth is to increase our offerings for the small and midsize enterprise segment. Consumer hesitancy or limited availability of finance may constrict the business operations of our customers and our channel, development, and implementation partners, and consequently impede our own operations. The consequences may include restrained or delayed investments, late payments, bad debts, and even insolvency among our customers and business partners. These have already had an effect on our revenue growth and incoming payments, and the impact may continue. In addition, our prices could come under more pressure due to more intense competition or deflation. If current economic conditions persist or worsen, we expect that our revenue growth and results of operations will continue to be negatively impacted. Finally, an extended period of further economic deterioration could exacerbate the other risks we describe in this Annual Report onForm 20-F.
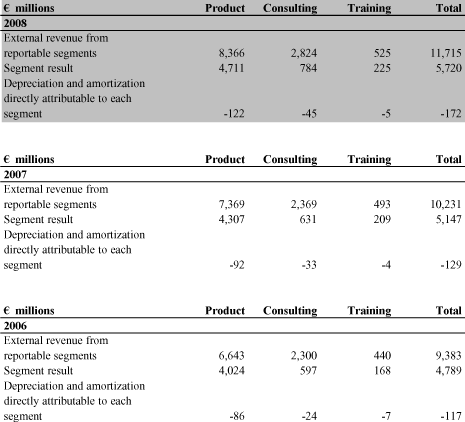
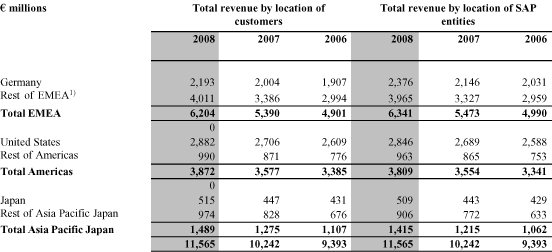
See “Item 4. Information About SAP — Business by Region” for information on the regions in which we operate and “Item 4. Information About SAP — Revenue by Industry Sector” for information on the industries in which our customers operate.
Continued deterioration of global economic conditions could make it increasingly difficult for us to accurately forecast demand for our products and services, and could cause our revenue and operating results to fall short of expectations.
Our revenue and operating results can vary and have varied in the past, from quarter to quarter. Our revenue in general, and in particular our software revenue, is difficult to forecast for a number of reasons. See the risk factor below entitled “Our sales are subject to quarterly fluctuations and our sales forecast may not be accurate” for additional details. Current economic conditions make it even more difficult for us to accurately forecast demand for our products and services. As a result, future quarterly revenue and operating results could fall below our expectations, likely resulting in a decline in our stock price.
11
Our global business activities subject us to economic, regulatory and other risks which could harm our business, operating results and financial condition.
Our products and services are currently marketed in over 120 countries in the Europe, Middle East and Africa (“EMEA”), North America and Latin America (“Americas”) and Asia Pacific Japan (“APJ”) regions. Sales in these regions are subject to risks inherent in transacting business globally, including, in particular:
| | |
| | • | general economic or political conditions in each country or region; |
| |
| | • | conflict and overlap among different tax structures; |
| |
| | • | potentially adverse tax consequences of doing business in a particular region; |
| |
| | • | the management of an organization spread over various jurisdictions; |
| |
| | • | exchange rate fluctuations; |
| |
| | • | longer payment cycles; |
| |
| | • | regulatory constraints such as import and export restrictions, competition law regimes, legislation governing the use of the Internet, additional requirements for the development and distribution of software and services, trade restrictions, changes in tariff and freight rates and travel and communication costs; |
| |
| | • | In Brazil, India, and China, and elsewhere, certain regulatory constraints in the form of, for example, special levies on cross-border royalty payments and bureaucratic import-control processes impede international goods traffic and business operations; |
| |
| | • | expenses associated with localizing our products and transacting business in the local currency; |
| |
| | • | different requirements of worker’s councils and labor unions across countries; and |
| |
| | • | higher costs of doing business internationally. |
As we expand further into new regions and markets, these risks could intensify. One or more of these factors could adversely impact our operations globally or in one or more particular countries or regions. As a result, our business, operating results and financial condition could be harmed.
Social and political instabilities including those caused by terrorist attacks, the risk of war or international hostilities, pandemic disease outbreaks and natural disasters could adversely impact our business.
Terrorist attacks and other acts of violence or war as well as the risk of pandemic disease outbreaks and natural disasters could have a negative impact on the world economy, contribute further to the current climate of economic decline and economic and political uncertainty in many regions in which we do business and affect our and our customers’ revenue and investment decisions over an extended period of time. Furthermore, such occurrences could make business continuity and business travel more difficult. This social and political instability could interfere with customers’ decision making processes and our ability to sell products and provide services to them.
12
Market Risks
Our future revenue is dependent in part upon our installed customer base continuing to license additional products, renew maintenance agreements and purchase additional professional services; a decision not to renew contracts or not to purchase more of our products or services could adversely impact our business.
Our large installed customer base traditionally has generated a large portion of our revenue. We have increased our customer base by acquiring other companies and by extending our channel partner ecosystem. Our support strategies are under constant review and development to assist us in addressing our customers’ broad range of requirements. In 2008 we rolled out SAP Enterprise Support services, which we believe is more extensive than the support offerings of many of our competitors. Customers with current contracts pay support fees that increase stepwise. Success in achieving our business goals depends significantly on the success of our maintenance (support) models and on our ability to deliver high-quality services. It is possible that existing customers decide not to renew their maintenance contracts with us or not to purchase more of our products or services in the future. Such decisions by customers could have a material adverse effect on our business and results of operations.
Consolidation in the software industry may result in unstable and/or decreased demand for our software and stronger peer companies in the long term.
The entire IT sector, including the software industry, has in recent years experienced a period of consolidation through mergers and acquisitions. We expect this trend to continue for the foreseeable future. Although consolidations in the software industry may create market opportunities for remaining entities, any consolidation could create uncertainty among existing and potential customers regarding future IT investment plans. In turn, this could diminish customer demand for our products and services and could result in longer sales cycles as customers determine which company best addresses their needs. Also, consolidated companies may emerge as stronger competitors with more resources, a larger customer base and a wider variety of product offerings than our own.
Due to intense competition, our market share and financial performance could decline.
The software industry has been and continues to be intensely competitive. The market for our products continues to be intensely competitive, with technology continuing to evolve rapidly. As part of our business strategy, over the last few years we have focused our efforts in areas where demand is expected to grow more rapidly. In particular, we have focused on the completion of our service-oriented architecture (SOA) road map, customer relationship management solutions, solutions for small and midsize enterprises, as well as industry-tailored solutions for specific industries such as retail and financial services. Our expansion from traditional large enterprise resource planning (ERP) product offerings to our new product and services offerings exposes us to competitors varying in size, geographic location and specialty. Current and potential competitors have established and may continue to establish cooperative relationships among themselves or with third parties to increase the ability of their products to address customer needs better than we do. Competition, with respect to pricing, product quality and functionalities/features, and consulting and support services, could increase substantially and result in price reductions, cost increases or loss of market share.
The continuing trend towards outsourcing business processes to external providers (business process outsourcing, or “BPO”) and other software-based services could result in increased competition for us with systems integrators, consulting firms, telecommunications firms, computer hardware and software vendors and other IT service providers.
13
The software application delivery model often referred to as “SaaS,” or software as a service, is popular particularly in the mid-market due to its low initial cost requirements and Web-based operability. Our on-demand solutions are targeted at midsize enterprises and we face strong competition in this SaaS arena.
In response to competition, we have been required in the past, and may be required in the future, to furnish additional discounts or other concessions to customers or otherwise modify our pricing practices. These developments have impacted and may increasingly negatively impact our revenue, earnings and market share.
Business Strategy Risks
Demand for our newly introduced products such as SAP Business ByDesign may not develop as planned and our mid-market strategy may not be successful.
We are investing significant resources in developing and marketing new and enhanced products and services. Demand for and customer acceptance of recently introduced products and services are subject to a high level of uncertainty, especially due to the current global economic crisis and the resulting global economic uncertainty.
Targeting midsize companies with the aim of building a leading position in the mid market is a key part of our strategy. To that end, expanding our network of business partners and creating the infrastructure for volume business are of great importance. To tap potential business in the lower mid-market, we have spent approximately €242 million beginning in 2007 through 2008 in sales channels, processes, infrastructure, and human resources, all oriented toward new customer relationships and a larger, more diversified partner ecosystem.
Our newly architectured mid-market solutions are in contrast to our traditional software solution offerings due to their different approach to market and different product appeal to a large mass of midsize companies that traditionally have not considered purchasing an integrated business application to support their core business functions.
Despite our efforts, demand for these products and services may not develop, which could have a material adverse effect on our business, financial position and results of operations or cash flows.
Any failure to develop new relationships and enhance existing relationships with third-party distributors, software suppliers, system integrators and value-added resellers that help sell our products and services may adversely affect our revenues.
We have entered into agreements with a number of leading suppliers of computer software and hardware and other technology providers to enable compatibility of certain of the products produced by such suppliers with our software products. Also, we have supplemented our consulting and support services (in the areas of product implementation, training and maintenance) through alliance partnerships with third-party hardware and software suppliers, systems integrators, and consulting firms. Most of these agreements and alliances are of relatively short duration and are non-exclusive. In addition, we have established relationships relating to the resale of certain of our software products by third parties. These third parties include value-added resellers and, in the area of application hosting services, certain computer hardware vendors, systems integrators and telecommunications providers. Our growth strategy includes commencing and maintaining relationships with independent software vendors and value added resellers for our products targeted at small and midsize enterprises. Most of these third parties and business partners have similar arrangements with our competitors. In addition, some of these third parties also produce their own standard application or technology integration software in competition with SAP.
There can be no assurance that these third parties or business partners will continue to cooperate with us when our agreements or partnerships expire or are up for renewal. In addition, there can be no assurance that these third parties and partners will devote sufficient resources to promote, sell, support and integrate our
14
products to enable us to compete successfully with other software vendors. Finally, there can be no assurance that these third parties and partners will provide high-quality products or services, or that actions taken or omitted to be taken by these parties will not adversely affect us. The failure to obtain high-quality products or services that enable us to compete successfully or to renew such agreements or partnerships could adversely affect our ability to continue to develop product enhancements and new solutions that keep pace with anticipated changes in hardware and software technology and telecommunications. In addition, any of these failures could adversely affect our ability to penetrate target markets; consequently, demand for our software products and services could decline.
Human Capital Risks
If we were to lose the services of members of management and employees who possess specialized knowledge and technology skills, we may not be able to manage our operations effectively or develop new products and services.
If our highly skilled and specialized personnel leave the Company and qualified replacements or new resources are not available or if we decide to invest in additional resources in certain areas we may not be able to manage our operations effectively to achieve our targets. Especially as we embark on the introduction of new and innovative technology offerings, we are relying on being able to build up and maintain a specialized workforce with deep technological know-how to ensure an optimal implementation of such new technologies in accordance with our customers’ demands. Most of our current employees, with the exception of selected managers, are subject to employment agreements or conditions that do not contain post-employment noncompete provisions and, in the case of most of our existing employees outside of Germany, permit the employees to terminate their employment on relatively short or no notice. There can be no assurance that we will continue to be able to attract or retain the personnel we require to develop and market new and enhanced products and to market and service our existing products and conduct our operations successfully. Further, recruiting of personnel may expose us to claims from other companies seeking to prevent their employees from working for a competitor.
If we do not effectively manage headcount as well as our geographically dispersed employee base, our business may not operate efficiently, and this could have an adverse impact on our results of operations.
Changes in employees and infrastructure might lead to a mismatch between our costs and revenues in the future. In January 2009 we announced our intention to reduce the number of positions globally to 48,500 by the end of the year, and to take advantage of any attrition during this time to assist in meeting our year end goal. If we do not manage our intended reduction in number of positions as planned, or if we are unable to manage effectively our geographically dispersed workforce, our business may not operate efficiently and this could have an adverse impact on our results of operations.
Organizational and Governance-Related Risks
We are subject to significantly increased governance-related regulatory requirements both in Germany and the United States.
As a stock corporation domiciled in Germany and listed in Germany and the United States, SAP is subject to governance-related regulatory requirements under both jurisdictions. These standards are among the highest standards worldwide and have grown considerably in the past few years. In the United States, the Sarbanes-Oxley Act of 2002 requires the establishment, ongoing assessment and certification of an effective system of internal control over financial reporting accompanied by stringent documentation efforts for companies and their external auditors. Also in the United States, the Foreign Corrupt Practices Act requires not
15
only accurate books and records, but also sufficient controls, policies and processes to ensure business is conducted without the influence of bribery and corruption on an international scale. Since the German federal government issued the “10-point program to strengthen corporate integrity and investor protection” in the past years, various new legislation was passed to improve investor protection, transparency and shareholder democracy. Additionally, most of our subsidiaries face increasing local regulatory requirements many of which have been expanded in recent years. Given the high level of complexity of these laws there can be no assurance that we will not be held in breach of certain regulatory requirements, for example, through fraudulent or negligent behavior of individual employees, our failure to comply with certain formal documentation requirements or otherwise. Any corresponding accusation against us, whether merited or not, may have a material adverse impact on our reputation as well as the trading price of our ordinary shares and ADRs.
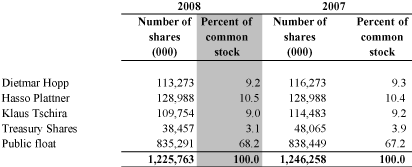
Principal shareholders may be able to exert control over our future direction and operations.
As of March 9, 2009, the beneficial holdings of SAP AG’s principal shareholders and the holdings of entities controlled by them constituted in the aggregate approximately 28% of the outstanding ordinary shares of SAP AG. If SAP AG’s principal shareholders and the holdings of entities controlled by them vote in the same manner, this could delay, prevent or facilitate a change in control of SAP or other significant changes to SAP AG or its capital structure. See “Item 7. Major Shareholders and Related-Party Transactions — Major Shareholders,” for further information.
Sales of ordinary shares by principal shareholders could adversely affect the price of our capital stock.
The sale of a large number of ordinary shares by any of the principal shareholders and related entities could have a negative effect on the trading price of our ADRs or our ordinary shares. We are not aware of any restrictions on the transferability of the shares owned by any of the principal shareholders or related entities.
U.S. judgments may be difficult or impossible to enforce against us or our Board members.
Currently, except for John Schwarz and Bill McDermott, all members of SAP AG’s Executive Board and all members of the Supervisory Board are non-residents of the United States. A substantial portion of the assets of SAP and our Board members are located outside the United States. As a result, it may not be possible to effect service of process within the United States uponnon-U.S. resident persons or SAP or to enforce againstnon-U.S. resident persons judgments obtained in U.S. courts predicated upon the civil liability provisions of the securities laws of the United States. In addition, awards of punitive damages in actions brought in the United States or elsewhere may be unenforceable in Germany.
SAP’s Sustainability Strategy may be difficult to maintain, and a failure by us to meet customer or partner expectations or generally accepted sustainability standards could have an adverse impact on our results of operations, our business and our reputation.
For SAP, sustainability is a standard that guides our engagement in new business opportunities — holistically encompassing profitable growth, environmental value, and societal benefit. Therefore, we address sustainability risks, especially relating to climate change, corporate integrity, human resources management, the ethical behavior of suppliers, the accessibility, user-friendliness, and safety of our products, privacy and data protection in connection with the use of SAP products, and the digital divide — the belief that people’s access to digital and information technology is dependent on social factors. If our sustainability practices are not sufficient to meet the expectations of our customers and partners or generally accepted sustainability standards, this could have an adverse impact on our results of operations, our business and our reputation.
16
Communication and Information Risks
Our IT security measures may be breached or compromised and we may sustain unplanned IT system unavailability.
The Internet is a public network, and data is sent over this network from many sources. We rely on encryption, authentication technology and firewalls to provide security for confidential information transmitted to and from us over the Internet. Anyone who circumvents our security measures could misappropriate proprietary information or cause interruptions in our services or operations. In the past, computer viruses and software programs that disable or impair computers have been distributed and have rapidly spread over the Internet. Computer viruses could be introduced into our systems or those of our customers or suppliers, which could disrupt our network or make it inaccessible to customers or suppliers. Our security measures may be inadequate to prevent security breaches, and our business would be harmed if we do not prevent them. In addition, we may be required to expend significant capital and other resources to protect against the threat of security breaches and to alleviate problems caused by breaches as well as by any unplanned unavailability of our internal IT systems.
Wide acceptance of the use of Internet-based transactions may be hindered due to privacy concerns and privacy breaches.
Consumers have significant concerns about secure transmissions of confidential information, especially financial information, over public networks like the Internet. This remains a significant obstacle to general acceptance ofe-commerce and certain aspects of our business, such as our on-demand business. Advances in computer capabilities, new discoveries in the field of cryptography or other events or developments could result in compromises or breaches of security such as those that have generated widespread media attention. Continued high-profile cases of inadvertent and unauthorized disclosure of personal information could have the effect of substantially reducing the use of the Web for commerce and communications and therefore could adversely impact our long-term strategy for growth.
We may not be able to prevent unauthorized or premature disclosure of our future strategies, technologies and products, resulting in competitive disadvantage.
We have established a range of IT security standards and organizational communication protocols to help ensure that internal, confidential communications and information about sensitive subjects such as our future strategies, technologies and products are not improperly or prematurely disclosed to the public. There is no guarantee that the established protective mechanisms will work in every case. SAP’s competitive position could be compromised considerably if confidential information about the future direction of our strategies, technologies or products becomes public knowledge.
Financial Risks
Our liquidity and the valuation of our financial assets may continue to be adversely impacted by the global economic downturn.
We use global centralized financial management to control liquid assets, interest, and currencies with the goal of maintaining Group liquidity at a level that is adequate to meet our obligations. Most SAP companies are included in our central cash management system. High levels of liquid assets and marketable securities provide a strategic reserve, helping keep SAP flexible, sound, and independent. We have a syndicated credit line, and other bilateral credit lines on which we can draw if necessary. Due to the current global economic conditions and the credit markets in particular, refinancing conditions have become markedly more difficult for the banks, which result in less advantageous borrowing terms for businesses. We cannot therefore exclude the possibility that the
17
risk of increased financing expense could materially affect our financial position, results of operations and cash flows.
SAP’s investment policy is set out in our internal treasury guideline document, which is a collection of rules that apply globally to all companies in the Group. Among its stipulations is a requirement that we invest only in assets from investment grade rated issuers. The weighted average rating of our financial assets is between “A” and “A+”. We pursue a policy of cautious investment characterized by wide portfolio diversification with a variety of counterparties, predominantly short-term investments, and standard investment instruments. We cannot, however, exclude the possibility that the current financial crisis could negatively affect our assets.
Because we conduct our operations throughout the world, our results of operations may be affected by currency fluctuations.
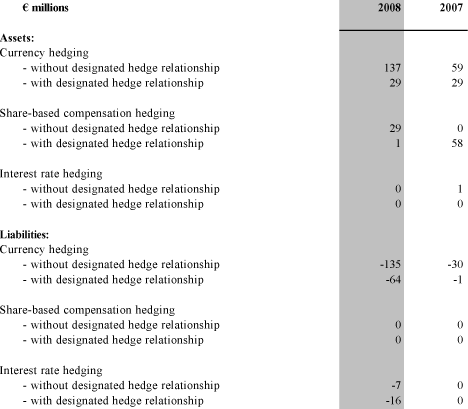
Although the euro has been our financial and reporting currency since January 1, 1999, a significant portion of our business is conducted in currencies other than the euro. Approximately 64% of our consolidated revenue in 2008 was attributable to operations in non-euro member states and translated into euro. As a consequence, period-to-period changes in the average exchange rate in a particular currency versus the euro can significantly affect reported revenue and operating results. In general, appreciation of the euro relative to another currency has a negative effect on reported results of operations, while depreciation of the euro has a positive effect, although such effects may be short term in nature. We continually monitor our exposure to currency risk and pursue a company-wide foreign exchange risk management policy. We have in the past and expect to continue in the future to at least partly hedge such risks with certain financial instruments. There can be no assurance that our hedging activities, if any, will be effective. See “Item 11. Quantitative and Qualitative Disclosures about Market Risk — Foreign Currency Exchange Rate Risk.”
Our sales are subject to quarterly fluctuations and our sales forecast may not be accurate.
Our revenue and operating results can vary and have varied in the past, sometimes substantially, from quarter to quarter. Our revenue in general, and in particular our software revenue, is difficult to forecast for a number of reasons, including:
| | |
| | • | the relatively long sales cycles for our products; |
| |
| | • | the large size and extended timing of individual license transactions; |
| |
| | • | the timing of the introduction of new products or product enhancements by us or our competitors; |
| |
| | • | changes in customer budgets; |
| |
| | • | seasonality of a customer’s technology purchases; and |
| |
| | • | other general economic and market conditions, such as the global economic crisis that emerged in late 2008. |
As many of our customers make and plan their IT purchasing decisions at or near the end of calendar quarters, and with a significant percentage of those decisions being made during the fourth quarter, even a small delay in purchasing decisions could have a material adverse effect on our results of operations. While our dependence on single, large scale sales transactions has decreased in recent years due to a relative increase in the number of license transactions concluded by SAP, mainly attributable to SAP’s strengthened focus on the small and midsize enterprises (SME) segment, there can be no assurance that our results will not be adversely affected by the loss or delay of one or a few large sales, which continue to occur especially in the large enterprise segment.
We use a “pipeline” system to forecast sales and trends in our business. Our sales personnel monitor the status of proposals, including the date when they estimate that a customer will make a purchase decision and the potential revenue from the sale. While this pipeline analysis may provide us with some guidance in business
18
planning, budgeting and forecasting, these pipeline estimates may not consistently correlate to revenue in a particular quarter and could cause us to improperly plan, budget or forecast. Because our operating expenses are based upon anticipated revenue levels and because a high percentage of our expenses are relatively fixed in the near term, any shortfall in anticipated revenue or delay in recognition of revenue could result in significant variations in our results of operations from quarter to quarter or year to year. A continued deterioration in global economic conditions would make it increasingly difficult for us to accurately forecast demand for our products and services, and could cause our revenue, results of operations and cash flows to fall short of expectations. We have increased over recent years, and plan to continue to increase in the future, the following expenditures:
| | |
| | • | expansion of our operations; |
| |
| | • | research and development directed towards new products and product enhancements; and |
| |
| | • | development of new distribution and resale channels, particularly for small and midsize enterprises. |
Such future increases in expenditures will depend, among other things, upon economic conditions, ongoing results and evolving business needs. To the extent such expenses precede or are not subsequently followed by increased revenue, our quarterly or annual operating results would be materially adversely affected and may vary significantly from preceding or subsequent periods.
The market price for our ADRs and ordinary shares may be volatile.
The trading prices of our ADRs and ordinary shares have experienced and may continue to experience significant volatility. The current trading prices of the ADRs and the ordinary shares reflect certain expectations about the future performance and growth of SAP, particularly on a quarterly basis. However, our revenue can vary and has varied, sometimes substantially, from quarter to quarter, causing significant variations in operating results and in growth rates compared to prior periods. Any shortfall in revenue or earnings from levels projected by us quarterly or from projections made by securities analysts has had and could have an immediate and significant adverse effect on the trading prices of the ADRs or the ordinary shares in any given period. Additionally, we may not be able to confirm our projections of any such shortfalls until late in the quarter or following the end of the quarter because license agreements are often executed late in a quarter. Finally, the stock prices for many companies in the software sector have experienced wide fluctuations, which have often not been directly related to an individual company’s operating performance. The trading prices of our ADRs and ordinary shares have in the past and could in the future fluctuate in response to various factors including, but not limited to:
| | |
| | • | the announcement of new products or product enhancements by us or our competitors; |
| |
| | • | technological innovation by us or our competitors; |
| |
| | • | quarterly variations in our results of operations; |
| |
| | • | changes in revenue and revenue growth rates on a consolidated basis or for specific geographic areas, business units, products or product categories; |
| |
| | • | speculation in the press or financial community; |
| |
| | • | general market conditions specific to particular industries; |
| |
| | • | litigation to which we are a party; |
| |
| | • | general and country specific economic or political conditions (particularly wars, terrorist attacks, etc.); and |
| |
| | • | proposed and completed acquisitions or other significant transactions by us or our competitors. |
19
Many of these factors are beyond our control. In the past, companies that have experienced volatility in the market price of their stock have been subject to shareholder lawsuits including securities class action litigation. Any such lawsuits against us, with or without merit, could result in substantial costs and the diversion of management’s attention and resources, resulting in a decline in our results of operations and our stock price.
Our revenue mix may vary and may negatively affect our profit margins.
We generally license our software products for an upfront license fee based on the number and types of users or other applicable metrics. Maintenance fees are typically established based on a specified percentage of the license fee. Variances or slowdowns in our licensing activity may negatively impact our current and future revenue from maintenance and services since such maintenance and services revenues typically follow and are dependent upon software sales. Historically, the profit margin from our services arrangements is lower than that of our software sales. Any decrease in the percentage of our total revenue derived from software licensing could have a material adverse effect on our business, financial position, results of operations or cash flows.
We have introduced new licensing models such as on-demand and subscription models which typically result in revenue being recognized over time. Although revenue from such new models is still relatively insignificant, we expect it to grow in the future. A significant portion of the related cost of developing, marketing and providing our solutions to customers under such new models could be incurred prior to the recognition of revenue, thus impacting our profit margin in the short term.
Management’s use of estimates may affect our results of operations and financial position.
Our financial statements are based upon the accounting policies as described in Note 3 to our consolidated financial statements in “Item 18. Financial Statements.” Such policies require management to make significant estimates, assumptions and judgments that affect the reported amounts of assets and liabilities, the disclosure of contingent assets and liabilities, and the reported amounts of revenues and expenses. Facts and circumstances used by management in making estimates and judgments may change from time to time and may result in significant variations, including adverse effects on our results of operations or financial position.
Revenue recognition accounting pronouncements and other financial reporting standards may adversely affect our reported financial information.
We regularly monitor our compliance with all of the financial reporting standards and any new pronouncements that are relevant to us. Findings of our monitoring activity or the pronouncement of new financial reporting standards may require us to change our revenue recognition or other financial reporting policies, to alter our operational policy to reflect new or amended financial reporting standards, or to restate our published financial reporting information. We cannot exclude the possibility that this may have a material impact on our financial position and results of operations. Our significant accounting policies are described in Note 3 to our consolidated financial statements in “Item 18. Financial Statements.”
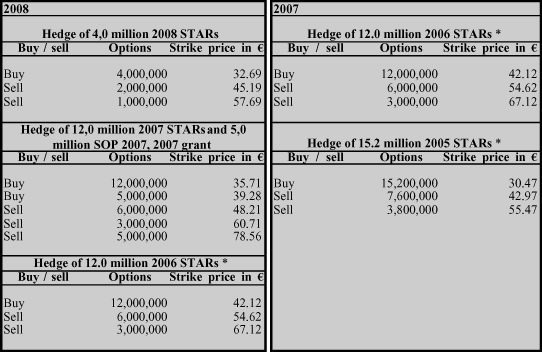
The cost of derivative instruments for hedging of share-based compensation plans may exceed the benefits of those arrangements.
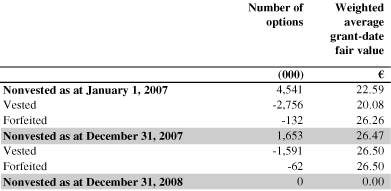
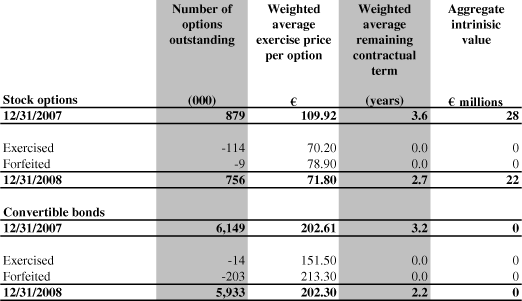
To reduce the volatility of the income statement impact of our share-based payment programs, we use derivative instruments to hedge risks resulting from future cash flows associated with STAR (stock appreciation rights) and SAP SOP (SAP stock option plan) plans. We cannot exclude the possibility that the expense of hedging the STAR and SOP plans will exceed the related benefits or that a decision not to hedge a particular cash flow stream will prove to be disadvantageous.
20
Project Risks
Customer implementation and installation of our products involves significant resources and is subject to significant risks.
Implementation of SAP software is a process that often involves a significant commitment of resources by our customers and is subject to a number of significant risks over which we may have little or no control. These risks include in particular:
| | |
| | • | shortage of our trained consultants available to assist customers in the implementation of our products; |
| |
| | • | requirements that do not meet customer expectations or the software does not fit to the business model of the customer; |
| |
| | • | third-party consultants do not have the know-how or resources to successfully implement the software; |
| |
| | • | the implementation of the software is destabilized by custom specific software development; and |
| |
| | • | the safeguarding measures offered by SAP are not implemented by customers and partners. |
Some of our customers have incurred significant third-party consulting costs and experienced protracted implementation times in connection with the purchase and installation of SAP software products. In addition, the success of new SAP software products introduced by us may be adversely impacted by the perceived or actual time and cost to implement the SAP software products. We cannot guarantee that we can reduce or eliminate protracted installation or significant third-party consulting costs, that shortages of our trained consultants will not occur, or that our costs to perform installation projects will not exceed the fees we receive when fixed fees are charged by us. Therefore, unsuccessful customer implementation projects could result in claims from customers, harm SAP’s reputation, and cause a loss of future revenues.
Product Risks
We depend on technology licensed to us by third parties, and the loss of this technology could delay implementation of our products or force us to pay higher license fees.
We license numerous third-party technologies that we incorporate into our existing products, on which, in the aggregate, we may be substantially dependent. There can be no assurance that the licenses for such third-party technologies will not be terminated, that the licenses will be available in the future on terms acceptable to us or that we will be able to license third-party software for future products. In addition, we may be unable to renegotiate acceptable third-party license terms to reflect changes in our pricing models. While we do not believe that one individual technology we license is material to our business, changes in or the loss of third-party licenses could lead to a material increase in the costs of licensing or to SAP software products becoming inoperable or their performance being materially reduced, with the result that we may need to incur additional development or licensing costs to ensure continued performance of our products. The risk increases if we acquire a company or a company’s intellectual property assets that have been subject to third-party technology licensing and product standards less rigorous than our own. We cannot exclude the possibility that adverse effects may result from a product of a business we acquire.
Undetected errors, shortcomings in our security features or delays in new products and product enhancements may result in increased costs to us and delayed demand for our products.
To achieve customer acceptance, our new products and product enhancements often require long development and testing periods. These development efforts are subject to multiple risks. For example,
21
scheduled market launches can be delayed and products may not completely satisfy our stringent quality standards or meet customer expectations, market needs, or comply with local standards and requirements. Generally, first releases are licensed to a controlled group of customers after a validation process. New products and product enhancements may contain a number of undetected errors, or bugs, or prove incapable of high volume data processing when they are released. There can be no assurance that all errors and requirements can be corrected to the customer’s satisfaction. As a result, we may be faced with customer claims for cash refunds, damages, replacement software or other concessions. The risk of errors and their adverse consequences may increase as we seek to introduce a variety of new software products simultaneously. Significant undetected errors or delays in introducing new products or product enhancements could affect market acceptance of SAP software products, and any such events could have a material adverse effect on SAP’s financial condition, cash flow, results of operations and reputation.
The use of SAP software products by customers in business-critical applications and processes and the relative complexity of some of our software products create the risk that customers or other third parties may pursue warranty, performance or other claims against us for actual or alleged failures of SAP software products, the provision of services or application hosting. We have in the past been, and may in the future continue to be, subject to such warranty, performance or other similar claims.
In addition, certain of our Internet browser-enabled products include security features that are intended to protect the privacy and integrity of customer data. Despite these security features, our products may be vulnerable to break-ins and similar problems caused by Internet users, such as hackers bypassing firewalls and misappropriating confidential information. Such break-ins or other disruptions could jeopardize the security of information stored in and transmitted through the computer systems of our customers. Addressing problems and claims associated with such actual or alleged failures could be costly and could have a material impact on our operations.
Although our agreements generally contain provisions designed to limit our exposure as a result of actual or alleged failures of SAP software products or the provision of services, such provisions may not cover every eventuality or be effective under applicable law. Any claim, regardless of its merits could entail substantial expense and require the devotion of significant time and attention by key management personnel. The accompanying publicity of any claim, regardless of its merits, could adversely affect the demand for our software and our reputation.
If we are unable to keep up with rapid technological changes, we may not be able to compete effectively.
Our future success depends in part upon our ability to:
| | |
| | • | continue to enhance and expand our existing products and services; |
| |
| | • | providebest-in-class business solutions and services; and |
| |
| | • | develop and introduce new products and provide new services that satisfy increasingly sophisticated customer requirements, keep pace with technological developments and are accepted in the market. |
There can be no assurance that we will be successful in anticipating and developing product enhancements or new solutions and services to adequately address changing technologies and customer requirements, that we will bring new solutions, solution enhancements or services to market in advance of our competitors or that we will be able to generate enough revenues to offset the significant research and development costs we incur in bringing these products and services to the market. We may fail to anticipate and develop technological improvements, to adapt our products to technological change, changing country-specific regulatory requirements, emerging industry standards and changing customer requirements or to produce high-quality products, enhancements and releases in a timely and cost-effective manner in order to compete with applications and other technologies offered by our competitors.
22
Our SAP NetWeaver platform strategy may not succeed or may make certain of our products less desirable.
Since the introduction of the SAP NetWeaver platform, we have been executing on our application platform vision. While we remain an enterprise application provider, the objectives of our platform strategy are to decrease the cost of integration, enable process flexibility and innovation, and help extend our partner ecosystem.
With solutions built on the SAP NetWeaver platform, we are targeting to enhance our position in the enterprise software industry by extending core applications.
To promote a broad adoption of the SAP NetWeaver platform, we are working with certified third-party independent software vendors (ISVs) that use SAP NetWeaver as a basis to develop and offer their own certified solutions. The continued success of the SAP NetWeaver technology platform depends critically on our maintaining a dynamic network of ISVs developing their own business applications for SAP NetWeaver. Any ISV-developed solutions with significant errors may reflect negatively on our reputation and thus indirectly impede our own business operations. In addition, as with any open platform design, the greater flexibility provided to customers to use data generated by non-SAP software may reduce customer demand for certain of our software products. The failure to receive acceptance from customers of the SAP NetWeaver platform, development by competitors of superior technology or significant errors in the solution could have a material adverse impact on our revenues, earnings and results of operations.
See Item 4. “Information about SAP — Description of the Business — Evolution of SAP Solutions,” for a more detailed description of SAP NetWeaver.
Other Operational Risks
We are subject to claims and lawsuits against us that may result in adverse outcomes.
We are subject to a variety of claims and lawsuits. Adverse outcomes in some or all of the claims pending against us might result in significant monetary damages or injunctive relief against us that could adversely affect our ability to conduct our business. While management currently believes that resolving all of these matters, individually or in the aggregate, will not have a material adverse impact on our business, financial position, income or cash flows, litigation and other claims are by their nature subject to uncertainties, and management’s view of these matters may change in the future. Actual outcomes of litigation and other claims may differ from the judgments made by management in prior periods, which could result in a material adverse impact on our financial position and results of operations, as well as SAP’s reputation. See Note 24 to our consolidated financial statements in “Item 18. Financial Statements” for more information.
Third parties may claim we infringe their intellectual property rights, which could result in damages being assessed against us and our ability to use certain technologies being limited in the future.
Third parties have claimed and may claim in the future that we have infringed their intellectual property rights. Our software products have been, and we believe will increasingly be, subject to such claims as the number of products in our industry segment grows, as we expand our products into new industry segments and as the functionality of products overlap. Any claims, with or without merit, could preclude us from utilizing certain technologies in our products, be time-consuming, result in costly litigation, require us to pay damages to third parties, require us to enter into royalty and licensing arrangements on terms that are not favorable to us, cause product shipment delays, subject our products to an injunction, require a complete or partial re-design of the relevant product, result in delays by customers in making spending decisions, or damage our reputation.
23
Additionally, the use of open-source software has become more prevalent in the development of software solutions in the software industry. Accordingly, we are selectively embedding in our software certain third-party open-source software components, which include software code subject to their respective open-source licenses that may require that the code be freely transferable. There can be no assurance that, in the future, a third party will not assert that our products or the third-party software we deploy must be made publicly available under the terms of an open-source license, resulting in the loss of our proprietary advantage in the affected product.
If we acquire other companies, we may not be able to integrate their operations effectively and, if we enter into strategic alliances, we may not work successfully with our alliance partners.
To complement or expand our business, we have made and expect to continue to make acquisitions of additional businesses, products and technologies. In addition, we have entered into, and expect to continue to enter into, a variety of alliance arrangements. Our current strategy for growth includes, but is not limited to, the acquisition of companies and businesses with the aim of strengthening our geographic reach, broadening our offerings in particular industries, or complementing our technology portfolio. Management’s negotiation of potential acquisitions or alliances, and management’s integration of acquired businesses, products or technologies could divert its time, focus and resources. In addition, some transactions in which we may encounter risks include:
| | |
| | • | inability to successfully integrate the acquired business, including integrating different business and licensing models; |
| |
| | • | inability to integrate the acquired technologies or products with current products and technologies; |
| |
| | • | potential disruption of ongoing business; |
| |
| | • | inability to retain key technical and managerial personnel of the acquired business; |
| |
| | • | dilution of existing equity holders caused by capital stock issuances to the stockholders of acquired companies; |
| |
| | • | assumption of unknown material liabilities of acquired companies; |
| |
| | • | incurrence of debt or significant cash expenditures; |
| |
| | • | difficulty in implementing, remediating or maintaining controls, procedures and policies; |
| |
| | • | potential adverse impact on relationships with partners or third-party providers of technology or products; |
| |
| | • | impairment of relationships with employees and customers; |
| |
| | • | integration of the acquired company’s accounting, human resource and other administrative systems; |
| |
| | • | regulatory constraints; and |
| |
| | • | problems with product quality, product architecture, legal contingencies, product development issues or other significant risks that may not be detected through the due diligence process. |
In addition, acquisitions of additional businesses may require an immediate charge to income for any in-process research and development costs of companies being acquired and amortization costs related to certain tangible and intangible assets that are acquired. Ultimately, certain acquired businesses may not perform as anticipated, resulting in charges for the impairment of goodwill and other intangible assets. Such write-offs and amortization charges may have a significant negative impact on operating margins and net income in the quarter in which the business combination is completed and subsequent periods. In addition, we have entered and expect to continue to enter into alliance arrangements for a variety of purposes including the development of new products and services. There can be no assurance that any such products or services will be successfully developed or that we will not incur significant unanticipated liabilities in connection with such arrangements.
24
We may not be successful in overcoming these risks or any other problems encountered in connection with any such transactions and may therefore not be able to receive the intended benefits of those acquisitions or alliances.
We may not be able to adequately obtain, license or enforce intellectual property rights.
We seek to protect our proprietary rights through a combination of applicable trade secret, copyright, patent and trademark laws, license and non-disclosure agreements and technical measures. All of these measures afford only limited protection and our proprietary rights could be challenged, invalidated, held unenforceable, or otherwise circumvented. Some proprietary rights may be vulnerable to disclosure or misappropriation by employees, partners, or other third parties. Despite our efforts, there can be no assurance that these protections will be adequate to prevent third parties from obtaining, using, or selling what we regard as our proprietary technology and information without authorization. There can also be no assurance that third parties will not independently develop technologies that are substantially equivalent or superior to our technology. Also, it may be possible for third parties to reverse engineer or otherwise obtain and use technology and information that we regard as proprietary. Accordingly, we might not be able to protect our proprietary rights against unauthorized third-party copying or utilization, which could adversely affect our competitive position and result in reduced sales. Any legal action we bring to enforce our proprietary rights could be costly, distract management from day-to-day operations, and lead to claims against us, which could adversely affect our operating results. In addition, such enforcement actions could involve a partner or vendor and adversely affect our ability, and our customers’ ability, to access that partner or vendor’s products. In addition, the laws and courts of certain countries may not offer effective means to enforce our intellectual property rights.
We may not be able to secure our business operations against disruption and to safeguard our assets.
We attach great importance, as a software company, to securing our business operations against disruption and to safeguarding our assets. We have a number of measures in place to ensure that our data and information technology, our physical assets, and our organization are secure against attack from without and within. There is nevertheless a risk that someone might misuse or steal property, plant, or equipment or gain unauthorized access to our facilities and to sensitive material, and might use such material to SAP’s detriment. Any such misuse, stealing or other security breach could negatively impact our assets, finances, or income.
Our insurance coverage may not be sufficient to avoid negative impacts on our financial position, results of operations and cash flows resulting from the settlement of claims.
We maintain adequate insurance coverage for protection against a diverse portfolio of risks. Our objective is to ensure that financial effects of risk occurrences are excluded or limited to the extent practicable at reasonable cost. Despite these measures, certain categories of risks are not currently insurable at reasonable cost. Even if we obtain insurance, our coverage may be subject to exclusions that limit or prevent our indemnification under those insurance policies. Further, we cannot guarantee the ability of the insurance companies to meet their claims liabilities. If this risk occurs, it may result in significant adverse impact on our financial position, results of operations and cash flows.
We may incur losses in connection with venture capital investments.
In the past we acquired and expect in the future to continue to acquire equity interests in technology-related companies. Many of these enterprises currently generate net losses and require additional capital outlay from their investors. Changes to planned business operations may possibly affect the performance of companies in which SAP holds investments, and that could negatively affect the value of our investments. Moreover, under German tax law, capital losses and impairments of equity securities are not tax-deductible, which may negatively affect our effective tax rate.
25
ITEM 4. INFORMATION ABOUT SAP
Our legal corporate name is SAP AG. SAP AG is translated in English to SAP Corporation. SAP AG, formerly known as SAP Aktiengesellschaft Systeme, Anwendungen, Produkte in der Datenverarbeitung, was incorporated under the laws of the Federal Republic of Germany in 1972. Where the context requires in the discussion below, SAP AG refers to our predecessors, Systemanalyse und Programmentwicklung GbR(1972-1976) and SAP Systeme, Anwendungen, Produkte in der Datenverarbeitung GmbH(1976-1988). SAP AG became a stock corporation (Aktiengesellschaft) in 1988. Our principal executive offices, headquarters and registered office are located at Dietmar-Hopp-Allee 16, 69190 Walldorf, Germany. Our telephone numberis +49-6227-7-47474.
In 2008, we acquired Business Objects. With that acquisition, we expanded our core solutions to address the needs of the business user. In addition, as part of our legal entity rationalization activities, we have integrated certain Business Objects subsidiaries into the following significant SAP subsidiaries: SAP Deutschland AG &Co. KG, SAP (Schweiz) AG, SAP Nederland B.V., SAP Brasil Ltda and SAP Japan Co., Ltd.
For a discussion of our principal capital expenditures and divestitures, see “Item 4. Description of Property — Capital Expenditures.
We intend to make this Annual Report onForm 20-F and other periodic reports publicly available on our Web site(www.sap.com) without charge immediately following our filing with the SEC. We assume no obligation to update or revise any part of this Annual Report onForm 20-F, whether as a result of new information, future events or otherwise, unless we are required to do so by law.
DESCRIPTION OF THE BUSINESS
Overview
SAP was founded in 1972. Our core business is selling licenses for software solutions and related support services. In addition, we offer consulting, training and other services for our software solutions. We develop and market our products and services in close cooperation with independent business partners.
As of December 31, 2008, we had more than 82,000 customers in over 120 countries and employed more than 51,500 individuals at locations in more than 50 countries in the EMEA, Americas, and Asia Pacific Japan regions. We are headquartered in Walldorf, Germany. As of December 31, 2008, SAP consisted of SAP AG and its network of 187 subsidiaries. We have three lines of business that constitute our reportable segments: product, consulting and training. We tailor our solutions to serve the needs of customers in 25 specific industries, for example banking, insurance, chemicals, healthcare, retail, consumer products, and the public sector. For a discussion of our geographic regions and industry sectors, see “Item 4. Information about SAP — Description of the Business — Revenue by Industry Sector,” and Note 28 to our consolidated financial statements in “Item 18. Financial Statements.”
The Company is listed on several exchanges, including the Frankfurt Stock Exchange and the New York Stock Exchange (NYSE) under the symbol “SAP.”
Evolution of SAP Solutions
With the vision to create standard application software for real-time business processing, we introduced the first generation of our software in 1973, initially consisting of a financial accounting application.
The SAP R/2 system, our second generation of application software, was then developed for mainframe, designed to handle different languages and currencies and to integrate many aspects of business, including distribution centers, field operations centers, corporate headquarters, and sales offices.
26
We recognized the demand for more decentralized business software solutions and designed the initial version of the SAP R/3 system, moving from mainframe computing to the three-tier architecture of database, application and user interface. Introduced in 1992, SAP R/3 quickly became the category leader in ERP systems. During the 1990s, we introduced several solutions built on SAP R/3 to provide capabilities tailored to specific industries.
In the early 2000s, we continued to expand our product offerings to include the SAP Business Suite family of business applications that help enterprises improve business operations ranging from supplier relationships, production and warehouse management to sales, administrative functions and customer relationships. We introduced the successor to SAP R/3 called the SAP ERP application, which is a component of SAP Business Suite.
We began in 2003 to adapt our portfolio of products to the new environment, mapping a route to a flexible new enterprise service-oriented architecture for software. A service-oriented architecture (SOA) is an industry term referring to a software architecture that supports the design, development, identification, and consumption of standardized services across the enterprise, thereby improving reusability of software components and creating agility in responding to change. The term “service” as used in “service-oriented architecture” means a Web service that is a self-contained functionality that can be accessed by applications across a network using mechanisms based on Web standards. An “enterprise service,” defined by us and our partners and customers, is a series of Web services combined with business logic that can be accessed and used repeatedly to support a particular business process. Aggregating Web services into business-level enterprise services provides more meaningful building blocks for composing applications to automate enterprise-scale business scenarios.
One key benefit of enterprise service-oriented architecture, or enterprise SOA, is the ability to rapidly map complex business processes with reusable enterprise services. Companies can use enterprise services to flexibly compose or alter applications as rapidly as their markets and business process needs change. Our platform for realizing enterprise SOA is the SAP NetWeaver technology platform. Together with the SAP NetWeaver technology platform and a repository of enterprise services, SAP ERP can serve as a business process platform, which is the unified environment that companies implement to perform their core business processes efficiently and to reorganize, extend, and create new business processes flexibly. In other words, SAP helps organizations establish their unique business process platform by delivering ready-to-execute software for business processes, reusable enterprise services that enable business process steps, and the technology to compose and deploy software that enables flexible business processes.
In 2007, SAP launched a new product, SAP Business ByDesign, a comprehensive, adaptable, on-demand business software solution for midsized companies. SAP Business ByDesign’s availability is restricted in a limited number of countries; we intend to introduce other deployment modes.
In recent years, SAP has built a portfolio of solutions addressing the needs of the business user. Business users comprise a segment of the global workforce that has historically remained outside of the enterprise software mainstream. In their roles as decision makers, business users are generally not directly involved in more structured business processes such as customer relationship management or supply chain management — although their roles often involve the supervision and analysis of these processes. In most cases, they operate in a less structured environment, drawing on information resources as diverse as spreadsheets and Internet sites. However, their efforts can be enhanced by tools and applications designed to help organize and manage information to optimize everyday business activities and improve the way employees work. To meet the needs of this group of users, SAP has delivered several enhancements to its core applications, such as embedded analytics in the SAP Business Suite. We have also developed new products to address the needs of such business users who wish to take advantage of enterprise information. Examples of such products include Duet. Introduced in 2006, Duet is the first product jointly developed and supported by SAP and Microsoft. Duet enables employees to interact quickly and easily with selected SAP business processes and data without leaving the familiar Microsoft Office environment. SAP also acquired Business Objects in early 2008. SAP and Business Objects quickly
27
embarked on a road map to transform their software for business users into the emerging market for business performance optimization — which helps organizations see and respond to business events in real time.
Mission and Strategy
Trends and Orientation
In the face of continuous, accelerated change in the business environment, executives must find ways to contend with shifting pressures to ensure sustained competitiveness and profitable growth. These rapid changes are driven by key transformational forces, such as global economic uncertainty, hypercompetition, a rising consumer power, and the quest for sustainability. Recently, the pervasive effect of these pressures on the global business environment has demonstrated that businesses have become more interconnected than ever before. Business models are evolving from linear value chains to collaborative networks with the customer at the center. Within the context of these business networks, each business focuses on what it does best while working closely with other companies to improve the overall customer experience. The business network is a new source of competitive advantage for companies because it increases and speeds innovation — not only between companies, but also with the end customer — and allows risks to be managed and shared with partners and suppliers.
The sharing of risks, knowledge, and processes is typical of collaborative relationships in a business network, and it benefits all of the collaborators. However, many companies are reluctant to adopt this approach because their strategic planning is isolated from their business operations. Technology solutions can help them close the gap between strategy and execution by linking decision-making systems to integrated, end-to-end processes that can be easily extended to business partners.
Mission
It is part of our mission to help customers resolve such difficulties and thereby enable them to achieve profitable, sustainable growth. To succeed, we wish to build from our established leading position in the business software market and accelerate business and IT innovation for firms and industries. In striving for this goal, we are also contributing to global economic development on a grand scale.
We offer solutions that help companies of all sizes close the gap between strategy and execution. They include the SAP Business Suite family of business applications, SAP NetWeaver, the SAP BusinessObjects portfolio, SAP’s offerings for small businesses and midsize companies, and solutions to help customers realize their sustainability goals. Our portfolio of SAP software and services can help customers attain the visibility, efficiency, and flexibility that enables them to respond to changes in the business environment with more agility and effect and capture the full benefits of business networks.
At the heart of our strategy stands customer value. We intend to widen the market we address with more attractive offerings for our customers including, for example, new data analysis and decision support solutions for business users, and software solutions scaled to small businesses and midsize companies.
Strategy for Growth
Our traditional core customer base includes many large global enterprises as well as midsize companies. Such global companies use the SAP Business Suite applications, SAP BusinessAll-in-One solutions, or SAP Business One to automate their business transactions, enabling better management and governance. In our traditional core business, we seek to win a greater share of our customers’ wallet. We also aim to win new customers, for instance companies that have been using custom software.
28
Our portfolios of solutions for 25 industries are a crucial factor in our success. In 2008, we focused on strategic industries with exceptional growth potential, including, for example, banking, retail, communications, and the public sector.
Delivering solutions for business users — process owners and decision makers — is a central element of our strategy for growth. In 2008, we concluded the acquisition of Business Objects and expanded our core solutions to address what we identify as the three key needs of decision makers in business. First, they need to make decisions more effectively based on a broader array of structured and unstructured data from sources both inside and outside the enterprise. Second, business users need better tools and applications to support collaborative decision making. Third, business users seek to build competitive advantage by creating and managing business networks with partners, suppliers, and customers. Our products focus on these needs to help individuals, teams, and companies better collaborate through business networks.
The SAP Business ByDesign solution is designed to open up a new segment of the global market for us, smaller businesses with between 100 and 500 employees. They have distinctly different software needs: Getting their new IT solution running quickly, at minimum risk and predictable cost, is often more important for these customers than specific functional depth. Many such companies do not believe that their needs can be met by traditional software offerings or by the available on-demand solutions.
The following measures will help us realize our full growth potential:
| | |
| | • | Organic growth: Our primary growth strategy is to continue to develop our own product portfolio and our own base of direct customers — by winning more customers and by selling more to our existing customers. |
| |
| | • | Co-innovation: Collaborating with customers and partners remains one of our central policies. We are investing more in our partner ecosystem. This supports the development of solutions built on the SAP NetWeaver technology platform and leverages sales forces to address the various market and customer segments. |
| |
| | • | Smart acquisitions: With targeted strategic and “fill-in” acquisitions that add to our broad solution offering for individual industries or across industries, we gain specific technologies and capabilities to meet the needs of our customers. |
THE SAP PORTFOLIO
We offer a portfolio of business software, technology, and related services and support to meet the long-term requirements and mission-critical needs of our customers. The main challenges facing our customers are the current global economic recession, hypercompetition, rapidly shifting consumer demand, the impact of international economic integration, the accelerating pace of innovation, and the quest for sustainability. To be equal to these challenges, companies and public administrations must link their strategic planning to their business operations, closing the gap between strategy and execution. This is where information technology solutions can help. They can link decision-making systems to integrated, end-to-end processes that can be easily extended to business partners.
Our portfolio of SAP software and services can help customers respond to changes in the business environment with more agility and effect, better capture the benefits of business networks, and thus grow profitably. The goal at the heart of our portfolio of software and services is therefore the best possible combination of efficiency, insight, and flexibility:
| | |
| | • | Efficiency — Innovative business processes to optimize operations: SAP connects and streamlines processes across our customers’ businesses to drive efficiency and help enable business operations to achieve strategic goals. |
| |
| | • | Insight — Improved decisions for greater success: SAP enables business people to make more insightful and timely strategic decisions based on better information in the context of specific business issues. |
29
| | |
| | • | Flexibility — Strategic and operational agility: With SAP software, customers can more easily pursue new strategies and capture the full benefits of business networks, because business processes are flexible and the business platform is extensible. |
In addition, at the end of October we started our Best-Run Now initiative, with special solution offerings to help businesses of all sizes in difficult times of economic uncertainty. It draws together software and service products to offer solutions that can help companies rapidly make a difference in areas such as liquidity, business intelligence (BI), procurement, and people management. Flexible financing options and support for implementation make it easier for customers to invest speedily.
We offer the following products and services:
| | |
| * | | depending on form of contract |
Solutions for Large Enterprises
SAP Business Suite
The flagship of our large-enterprise offerings is SAP Business Suite software. SAP Business Suite applications provide end-to-end business process support, reporting, and analytics. Its core applications, industry applications and supplementary applications are powered by the SAP NetWeaver technology platform. Companies use this platform to design, compose, or adapt processes to address the unique needs in their industry.
Core SAP Business Suite Applications
The cornerstone of SAP Business Suite is the SAP ERP application, an integrated enterprise resource planning application. SAP ERP addresses the core business software requirements of midsize businesses and large organizations around the world — in all industries and sectors. SAP ERP includes four individual solutions that support key functional areas: SAP ERP Financials, SAP ERP Human Capital Management, SAP ERP Operations, and SAP ERP Corporate Services.
The other components of SAP Business Suite are:
| | |
| | • | The SAP Customer Relationship Management (SAP CRM) application, which helps companies acquire and retain customers, build lasting relationships, and improve customer loyalty. Companies can |
30
| | |
| | | choose between ways to deploy the application: as an on-premise implementation, on-demand as Web-based CRM, or in a hybrid solution that combines both. As our customers’ business needs evolve, they can smoothly transition from one deployment option to another at any time. |
| | |
| | • | The SAP Product Lifecycle Management (SAP PLM) application, which helps companies manage, track, and control all product-related and project-related information over the complete product and asset life cycle and across the extended supply chain. SAP PLM integrates all product-related information needed to collaborate with business partners and supporting processes, including product innovation, design and engineering, quality and maintenance management, and control of environmental issues. |
| |
| | • | The SAP Supplier Relationship Management application (SAP SRM), which helps organizations in all industries accelerate and optimize the supply cycle by improving their vendor relationships. It provides strategic value through sustainable cost savings, contract compliance, and quick time-to-value. |
| |
| | • | The SAP Supply Chain Management (SAP SCM) application, which gives our customers a base for building transparent, flexible communities of companies. By integrating all partners in the supply chain, supply and demand can be synchronized along the chain, and materials and knowledge can flow freely among all of the partners concerned. That helps companies intelligently adapt to changing market conditions and proactively respond to shorter, less predictable product life cycles. |
We first delivered enhancement packages providing regular updates for SAP ERP in 2007. This unique delivery model, which we introduced for the entire SAP Business Suite in 2008, makes it simpler and faster for customers running SAP Business Suite applications to adopt new product functions, industry-specific features, and enterprise services. It also shields customers from the complexity of multiple upgrades and offers them an opportunity to reduce information technology (IT) costs by consolidating their systems on a single platform and reducing the number of separate software instances that need to be maintained.
Our enhancement package model also gives customers planning security. The SAP Business Suite applications are, and will for the next several years remain, a stable platform on which customers can, if they wish, regularly update their system. The packages provide a reliable software enhancement process that alleviates disruption and minimizes costs.
31
Industry Solutions for Large Enterprises
SAP Business Suite delivers distinct solution portfolios for 25 different industries, including for example banking and insurance, chemicals, healthcare, retail, consumer products, and the public sector. Each industry solution portfolio delivers powerful, industry-specific functions along with best practices we have developed with our customers. Our industry solutions are designed to meet the needs of the major industry sectors listed below. We also offer solutions for numerous subsectors.
| | | | | |
| | | Process Industries
• Chemicals
• Mill Products
• Oil & Gas
• Mining
Discrete Industries
• Aerospace & Defense
• Automotive
• Engineering, Construction & Operations
• High Tech
• Industrial Machinery & Components
Consumer Industries
• Consumer Products
• Retail
• Wholesale Distribution
• Life Sciences | | Service Industries
• Media
• Logistics Service Providers
• Airlines
• Telecommunications
• Utilities
• Professional Services
Financial Services
• Banking
• Insurance
Public Services
• Healthcare
• Higher Education & Research
• Public Sector
• Defense & Security |
Solutions for Small Businesses and Midsize Companies
SAP offers three solutions for small businesses and midsize companies that are easy to implement and use. They are designed to best fit the needs of small businesses and midsize companies that need solutions to help them manage customer relationships, supplier relationships, financial operations, and supply chains.
SAP BusinessAll-in-One
Midsize companies with industry-specific requirements can buy SAP BusinessAll-in-One solutions from our channel partners. Customers can deploy SAP BusinessAll-in-One on-premise or hosted by an SAP partner. If they choose hosting by an SAP partner, the software is operated, maintained, and monitored by experts in an external data center. The customer does not have any maintenance and update work — or any upfront capital investment. SAP BusinessAll-in-One is a complete package built on SAP ERP and SAP CRM, including SAP Best Practices and preconfigured business scenarios specially packaged for industry-specific implementation and use by midsize companies. Approximately 1,100 partners also offer 660 qualified SAP BusinessAll-in-One solutions with extra functions for specific microvertical markets and specific geographic regions. The SAP BusinessAll-in-One fast-start program provides the complete package together with an online solution configurator and special tools for rapid live implementation. It is currently the choice of approximately 13,450 customers in 50 countries.
SAP Business ByDesign
SAP Business ByDesign is specially designed for businesses with 100 to 500 employees that wish to benefit from a powerful enterprise solution but do not wish to run an extensive IT infrastructure. It enables companies to manage different business processes in harmony on one system. They can choose which business processes to include, and add more as and when they are required. SAP Business ByDesign offers preconfigured best-practice process support for financials, CRM, people management, procurement, project management, and the supply
32
chain through a single, consistent user interface. This solution is hosted on the Internet by SAP and provided to customers in on-demand mode for a monthly fee. It is a completely new business model for SAP. Currently it is available in China, France, Germany, India, the United States, and the United Kingdom. We are controlling theramp-up, carefully selecting new customers and working in close collaboration with them and with partners, and feeding their experience back into product development.
SAP Business One
The SAP Business One application is for small businesses, typically with fewer than 100 employees and 30 users, that are looking for an affordable, single system to cover core operations such as financials, sales, and customer support. Customers can deploy SAP Business One on-premise or hosted by a partner, typically in less than one month. The solution is sold and supported through a global network of approximately 1,200 certified partners. There are over 550 extensions available from independent software vendors (ISVs) and more than 40 country versions. By the end of 2008, SAP Business One had a base of approximately 22,600 customers.
SAP BusinessObjects Portfolio
Our solutions for business users help our customers toward broader insight, aligned strategy, and risk- and performance-optimized decisions. They close the gap between strategy and execution.
SAP BusinessObjects Solutions
| | |
| | • | SAP BusinessObjects BI solutions help simplify the ways that decision makers use information, enabling business users to access, format, analyze, navigate in, and share information across their organization. |
| |
| | • | SAP BusinessObjects information management (IM) solutions help organizations improve their data quality, understand and use information better, track data lineage for compliance purposes, and ensure consistent semantics across the business. |
| |
| | • | The SAP BusinessObjects intelligence platform is a BI platform with a wide scope that makes relevant BI available to users in accordance with their roles. The platform has functions to drive productivity and improves organization-wide decision-making processes. |
| |
| | • | SAP BusinessObjects enterprise performance management (EPM) solutions empower organizations to manage all financial and operational aspects of strategy, planning, budgeting, forecasting, reporting, and analytic requirements. |
| |
| | • | SAP BusinessObjects governance, risk, and compliance (GRC) solutions help ensure that customers have the proper processes and controls in place to realize transparent GRC. |
Additional Solutions for Business Users
Originally announced in April 2005, Duet software provides seamless access to SAP business process software and data using Microsoft Office on the business user’s desktop. Duet is the result of collaboration between Microsoft and us, and is our first joint product. In 2008, SAP and Microsoft deepened the relationship and jointly enhanced Duet with additional business scenarios, platform capabilities, and development tools.
Alloy software, which we developed with IBM, enables business users to access SAP software and information from within the familiar IBM Lotus Notes environment.
33
Business Intelligence Solutions for Midsize Companies
The SAP BusinessObjects portfolio comprises BI solutions for small businesses and midsize companies. The solutions are specifically designed to address the needs of businesses in that segment.
The Crystal Reports family of offerings is specially designed for small business that need a stable, easy reporting solution for all areas in their organization — a solution that can draw on virtually any source of data. Customers can use proven functions for designing, managing, visualizing, delivering, and scheduling reports. We can deliver it in on-premise mode — either on a server or as a single desktop application — or in on-demand mode.
SAP BusinessObjects Edge BI software is powerful, integrated BI software for midsize companies. It delivers solutions for operational reports,ad-hoc reporting and analysis, and dashboards, with powerful data integration and quality. Customers can start with options to address their immediate BI requirements and build their solution as their needs grow — at a low investment cost.
The SAP NetWeaver Technology Platform
IT organizations can use SAP NetWeaver to run business software, such as SAP Business Suite applications and SAP-certified partner solutions, from a single, unified technology platform. As the technical foundation for a service-oriented architecture (SOA), SAP NetWeaver helps IT organizations evolve their existing IT infrastructure into a business process platform and enhance the performance of their business processes.
It unifies numerous middleware functions into a single software environment to reduce IT complexity and increase business agility. The platform supports open standards, so companies can use it to integrate heterogeneous systems and data from diverse SAP and non-SAP sources. It can help organizations make their business processes reliable, secure, and scalable. SAP NetWeaver is a technology platform for modular composition of applications and for the delivery of solutions.
Solutions for Sustainability
We aim to enable companies to execute their sustainability strategies using SAP software solutions, thereby making a contribution to growing their corporate value, protecting their brands, and mitigating compliance risks. We see sustainability as anchored in a holistic approach to risk and opportunity from social, environmental, and economic perspectives. With our SAP BusinessObjects GRC solutions, we help customers better manage risk and compliance, especially with regard to financial processes, environmental concerns, and securing the global supply chain. Additionally, SAP Business Suite software provides business process efficiency, flexibility and insight, representing a sound foundation for an organization’s sustainability endeavors.
These are solutions that are specifically oriented to sustainability:
| | |
| | • | The SAP Supply Chain Management application is designed to help our customers achieve their sustainability objectives. Companies can use it to consolidate orders and optimize shipments, reducing CO2 emissions and overall energy consumption. |
| |
| | • | The SAP Environment, Health, and Safety Management (SAP EHS Management) application supports the management of environment, health, and safety, industrial hygiene, and occupational health processes as well as compliance for product safety, hazardous substances, dangerous goods, and waste management. In addition, SAP EHS Management helps ensure compliance with environmental laws and policies as well as reduce associated costs, efforts, and risks on plant and corporate levels. Companies can also use this software to manage compliance with European law concerning the registration, evaluation, authorization, and restriction of chemicals (REACH), which helps them secure the right to market their products. |
34
| | |
| | • | The SAP Recycling Administration application helps ensure compliance with worldwide recycling legislation for packaging, batteries, and waste electrical and electronic equipment. |
| |
| | • | The SAP BusinessObjects Risk Management application helps companies balance business opportunities and the associated financial, legal, and operational risks. By specifically monitoring high-impact risks to avoid incurring damaging market sanctions, companies can maximize corporate performance. |
Because SAP applications are integrated, they can efficiently support compliance. Integration with SAP and non-SAP software gives businesses increased visibility, supporting compliance functions across the enterprise and its network of business partners.
SAP Services Portfolio
The SAP Services organization provides a broad array of methodologies, tools, and certified partner offerings to meet our customers’ business needs. The SAP Services portfolio includes consulting, education, support, custom development, and managed services. The offerings are categorized into software-related services, and professional services and other services. Software-related services are support services provided by the SAP support units (SAP Active Global Support, SAP BusinessObjects — Customer Assurance, and SME Services) and custom development provided by the SAP Custom Development organization. Our professional services and other services are consulting, education, and managed services.
SAP Services has a local presence in more than 50 countries and runs 77 training centers, seven global support centers, and 10 custom development centers in Europe, Asia, and the Americas. The 20,000 SAP service experts provide 24x7 support for customer and partner SAP solution portfolios at a global level.
Software-Related Services
The SAP Custom Development organization develops custom solutions on the SAP platform that are tailored to meet customers’ unique business requirements. The service portfolio includes extending and enhancing existing SAP solutions and building new business solutions.
The SAP support units offer a range of services to support our customers before, during, and after implementation of our software solutions. We provide around-the-clock technical support. Moreover, the organization offers proactive, preventive support services to protect and enhance our customers’ current investments in SAP technology and applications. SAP Enterprise Support services are a key element in our offering, providing customers with holistic IT landscape support over the full life cycle of their application with the aim of optimizing the solution’s operation. This covers a wide range of software components: SAP products, custom developments (including developments released by SAP), and partner solutions. SAP Enterprise Support aims to reduce the total cost of operation for our customers by delivering accelerated innovation, protection of investment, and mission-critical support as a solution provider based on defined service level agreements. SAP Product Support, for our largest enterprise customers, provides the tools and methodologies to take charge of day-to-day support needs and to manage IT landscape holistically over the life cycle of SAP applications. From implementation to operation to change management, it helps to ensure that SAP solutions contribute to the business goals of our customers. The SAP Safeguarding support option helps our customers mitigate the technical risks of an implementation or upgrade and ensure smooth go-live and ongoing operations. The SAP MaxAttention support option delivers to our largest enterprise customers technical account management for their entire solution life cycle and implementation of end-to-end solution operations.
On-Demand Software Services
The market defines on-demand as a software delivery format in a one-to-many framework (one solution served to many customers) that can include different pricing options such as license fees with, optionally, service fees, or recurring subscription fees. It complements the traditional model by giving software vendors an
35
additional format in which to market software and create sustainable value for customers. Customers now have a choice of deployment modes (on premise and off premise) and of payment models (perpetual license with, optionally, recurring service fees or recurring subscription fees).
SAP on-demand software services focus on delivering the right solutions to meet customers’ needs. It is therefore crucial that our customers are able to choose between different deployment options to suit their different business needs. In the large enterprise space, we are currently seeing customers adopting on-demand models for business processes, such as for sales automation processes connected with on-premise ERP software functions, that are less mission-critical than, for example, core financial processes. As a result, we expect gradual adoption of on-demand solutions to be the norm, leading to hybrid landscapes with integration of on-demand and on-premise solutions. These adoption patterns are a key driver in our on-demand strategy — evidenced, for example, by our SAP CRM and SAPE-Sourcing on-demand solutions, and the SAP BusinessObjects Information OnDemand portal.
Professional Services and Other Services
The SAP Consulting organization offers planning, implementation, and optimization services for business solutions. We advise and support customers on designing business processes and IT infrastructure and help customers with project management and solution implementation and integration. We also help customers optimize solutions and IT landscapes for changing business needs.
The SAP Education organization provides the training, services, and tools required to assist SAP customers and partners in maximizing the value they can create with their SAP solutions. SAP Education offerings include training needs analysis, certification assessments, learning software and tools, and education in several delivery models, including classroom ande-learning.
The SAP Managed Services organization provides application management services and hosting services, running and managing SAP solutions on behalf of customers.
Newly Introduced Products and Product Versions
In 2008, we extended our solution portfolio, focusing primarily on increasing integration between the product lines to help our customers close the gap between strategy and execution. Working with our customers and partners, we created new solutions in all four core areas of our product portfolio: enterprise applications and industry solutions for large enterprises, the technology platform, solutions for small businesses and midsize companies, and applications for business users. We also made a number of strategic acquisitions to augment our portfolio of products.
Expanded Offerings for Enterprise Applications and Industry Solutions
SAP Business Suite applications and all SAP industry solutions were improved to adapt to the accelerating rate of change of the market and customer expectations:
| | |
| | • | SAP ERP: In May, we announced the general availability of the third enhancement package for the SAP ERP application. Functional improvements provide stronger support for financial close processes, treasury risk, cash management, and expense management. In addition, human capital management capabilities were improved to support end-to-end talent management processes. For organizations that operate global shared-service organizations, new facilities were delivered to support intracompany processes and collaboration. Enhancement packages enable our customers to add functions to their SAP software packages stepwise without upgrades, which reduces the total cost of managing their enterprise software implementation. |
| |
| | • | SAP Customer Relationship Management: Since the introduction of SAP CRM 2007 in December 2007, we have experienced significant market momentum on a global basis. In 2008, we further enhanced the |
36
| | |
| | | capabilities of SAP CRM by delivering new processes to meet industry-specific needs such as investigative case management for the public sector, loyalty management for consumer-focused industries, and service management for discrete industries. In addition, we partnered with Research In Motion (RIM) to extend SAP applications for business users by creating an SAP CRM application accessed from BlackBerry mobile devices. |
| | |
| | • | SAP Supplier Relationship Management: In June 2008, we introduced new versions of our SAPE-Sourcing, SAP Contract Lifecycle Management, and SAP Spend Analytics (now SAP BusinessObjects Spend Performance Management) applications. These new versions were designed to improve the amount of identified and negotiated savings, increasing sustained savings to our customers. In November 2008, the first customers started to use SAP SRM 7.0. SAP SRM now extends compliance capabilities with enhancements to centralized sourcing and contract management, services procurement, catalog management, supplier enablement, usability, and accessibility to information. SAP SRM also helps fully deliver on the complete source-to-pay process for our customers. |
| |
| | • | SAP Supply Chain Management: In 2008, we released a new version of SAP SCM with capabilities that leverage point-of-sales data to improve planning accuracy and visibility, provide new forecasting methods and enhanced collaboration with contract manufacturers, and enable attribute- or characteristics-based planning. There were also major enhancements to warehouse and transportation management, such as graphical warehouse layout modeling, improved visualization, tighter integration of export controls, and increased utilization through enhanced integrated processes. We have also expanded the radio-frequency identification (RFID) and auto-ID solution footprint of SAP SCM with support for serialization technology and the EPCIS standard, a global communications standard by EPCglobal that improves transparency in the tracking of goods. |
| |
| | • | SAP Product Lifecycle Management: SAP PLM now offers simplified access to information within the context of a specific role to help our customers improve productivity, reduce training, eliminate manual activities, and make decisions more rapidly. SAP PLM now includes an intuitive new user interface that delivers information in the context of the role requesting it. For example, the application now supports product-centric viewing. |
| |
| | • | SAP solutions for automatic identification (auto-ID) and serialization: With the release of the latest SAP Auto-ID Enterprise offering, we delivered several new functions in the fields of auto-ID and serialization technology. For example, SAP object event repository now conforms to the EPCIS standard. Delivery processing scenarios now fully support the U.S. Department of Defense item unique identification (IUID) schema, which enables the identification of all inventory items based on bar codes containing unique, fixed number sequences, as well as the electronic product code of EPCglobal and other serialization procedures. This release also includes significant performance enhancements to support high-volume processes. Enhancements to SAP ERP included support for unique item identification (UII) from supply chain to asset management. In addition, the SAP Event Management 7.0 application enhanced usability and flexibility in the Web Dynpro user interface. |
| |
| | • | SAP Manufacturing: By acquiring Visiprise, we improved manufacturing operations management capabilities by optimizing execution of manufacturing processes on the plant floor. This acquisition is a continuation of our investment in applications for the shop floor and leverages existing capabilities offered by the SAP Manufacturing Integration and Intelligence (SAP MII) application. Further enhancements included support for outsourced manufacturing, dynamic production planning across multiple plants, and advances in lean planning and operations management. We also made it easier to create composite applications for manufacturing operations that can significantly improve employee productivity. |
| |
| | • | Enterprise energy management: In July 2008, we delivered an enterprise energy management solution. It comprises functions from SAP MII, the plant information solution from OSIsoft, and the SAP Environment, Health, and Safety Management application. The solution enables companies to |
37
| | |
| | | gather information on the use of energy throughout the enterprise, identify areas for energy reduction, monitor the implementation of energy excellence projects, and make the results available throughout the enterprise. Companies can therefore use the enterprise energy management solution to cut their energy costs and emissions. |
SAP NetWeaver Technology Platform Enhanced
SAP NetWeaver helps companies standardize, consolidate, and optimize their IT landscape and develop innovative integrated business process solutions. With SAP NetWeaver, we enable IT departments to create a powerful business process platform based on the principles of SOA. Enhancements made to SAP NetWeaver in 2008 focus on helping our customers to simplify the way workers use IT, to accelerate the design and integration of applications for business processes, and to intelligently manage and access relevant data across the entire enterprise.
| | |
| | • | SAP NetWeaver Composition Environment: We released the first enhancement package for the SAP NetWeaver Composition Environment offering, providing a lean, integrated, standards-based development, modeling, and runtime environment. Software developers and technical consultants can use it to extend application logic and, depending on users’ needs, compose new views and applications based on SAP software. The enhancement package delivers the next generation of tools for increasing process flexibility with new business process management and business rules management capabilities. |
| |
| | • | SAP NetWeaver Identity Management: The SAP NetWeaver technology platform now contains embedded identity management capabilities to help companies save time and money by optimizing the administration of user accounts and passwords inside their business network. |
| |
| | • | SAP NetWeaver Master Data Management (SAP NetWeaver MDM): Adoption of the SAP NetWeaver MDM component continues to grow among companies in all industries and of all sizes. A new version was delivered in the fourth quarter of 2008. It offers extended flexibility for data modeling and support for complex objects, enabling the deployment of a single master data management repository for multiple data domains. SAP NetWeaver MDM now links with SAP BusinessObjects Data Services software through the MDM enrichment controller. It is thus a solution with innovative data-integration and data-quality capabilities. |
| |
| | • | SAP NetWeaver Information Lifecycle Management: SAP has developed a three-pronged approach to information life-cycle management that meets the complex IM needs of today’s organizations: data archiving, which focuses on keeping the growth of data volume in check; retention management, which deals with the life cycle of data from the time it is created until it is destroyed; and a retention warehouse, which addresses the decommissioning of legacy applications and systems. |
| |
| | • | SAP NetWeaver Enterprise Search: Launched in 2007, the SAP NetWeaver Enterprise Search application gives business users easy access to data in SAP systems, and intuitive links to find related information and act on the data they find. In 2008, we again significantly extended the range of information sources available and delivered a new user interface for SAP NetWeaver Enterprise Search. |
| |
| | • | SAP NetWeaver Mobile: In 2008; we introduced a new version of the mobile application platform, designed to enhance scalability of the platform as well as mobile device management and mobile security features. |
New Developments for Small Businesses and Midsize Companies
We delivered innovative developments for our customers in the small business and midsize company segment in 2008:
| | |
| | • | SAP Business One: In 2008, SAP Business One version 2007 was released into general availability. The new release offers many new financial and reporting capabilities that are designed to enable small |
38
| | |
| | | businesses to leverage local best practices and address local business customs. Further, we introduced an industry solutions program that allows our software solution partners to create tightly integrated solutions that extend the power of SAP Business One. Additionally, we enabled integration between SAP Business One and SAP NetWeaver, to make it easy for SAP Business One customers to connect with SAP Business Suite implementations used by their headquarter offices. |
| | |
| | • | SAP BusinessAll-in-One: In the second half of 2008, we released an enhanced version of SAP BusinessAll-in-One with new customer relationship management functions. By combining comprehensive, preconfigured SAP CRM and SAP ERP best practices, midsize companies can now manage their customers, their brands, and sales effectiveness together with core business operations in one solution. This new CRM offering can be added at any time to a customer’s SAP BusinessAll-in-One solution or deployed standalone, and is available from SAP and SAP channel partners. |
| |
| | • | SAP Business ByDesign: In October 2008, we released Feature Pack 1.2 for SAP Business ByDesign. This new release optimized quality, performance, and system stability. |
Broader Portfolio for Business Users
In 2008, we combined SAP applications for business users with Business Objects’ solutions to form a new SAP BusinessObjects portfolio of solutions. We expanded our applications and capabilities with innovative offerings to optimize enterprise performance management, promote good governance, risk management, and compliance, and improve enterprise-wide information flows.
| | |
| | • | SAP BusinessObjects IM solutions: Shipped in March 2008 as part of SAP BusinessObjects XI 3.0, our SAP BusinessObjects Data Services XI 3.0 information management solution was one of the first of its kind to combine data integration and data quality in a single product. It offers companies new ways to optimize performance, giving users access to the right information at the right time in an easy user interface. |
| |
| | • | SAP BusinessObjects intelligence platform: In 2008, we delivered two releases of the intelligence platform: SAP BusinessObjects XI 3.0 in March and SAP BusinessObjects XI 3.1 in September. SAP BusinessObjects XI 3.0 makes relevant BI available to users in accordance with their roles. The platform now also has new functions to drive productivity and improves organization-wide decision-making processes. Enhanced migration tools ease upgrades for customers. Moreover, SAP BusinessObjects solutions now work within practically any application environment: SAP BusinessObjects XI 3.1 added broader language support, integration with data sources from a variety of vendors — including HP, Microsoft, and Netezza — and native support for the 64-bit architecture many customers now use for their business applications. |
| |
| | • | SAP BusinessObjects BI solutions: In 2008, we provided the first platform to combine access to all information (whether it is structured in databases or unstructured text) and access for all people (whether they require reporting, query and analysis, dashboards and visualization, or predictive analysis) in a single environment. We also delivered the SAP BusinessObjects Edge BI 3.0 solutions, addressing the BI needs of midsize companies, and Crystal Reports Server 2008 software for small businesses. |
| |
| | • | SAP BusinessObjects GRC solutions: In 2008, we released new versions of the SAP BusinessObjects Access Control and SAP BusinessObjects Process Control (formerly SAP GRC Process Control) applications. SAP BusinessObjects Process Control automates control monitoring in both SAP and non-SAP systems to assist compliance, detects exceptions, and remedies issues with workflow-based processes. The new version of SAP BusinessObjects Access Control includes automated review and approval processes on employee access throughout the enterprise, automatic monitoring and detection of access violations, and reaffirmation of mitigation controls. In addition, we have added extended identity management integration and cross-platform capabilities for non-SAP applications. |
39
| | |
| | • | SAP BusinessObjects EPM solutions: In 2008, we delivered several new EPM solutions. The new version of the SAP BusinessObjects Planning and Consolidation application helps customers easily configure their planning and budgeting applications to run on SAP NetWeaver and is also optimized for the Microsoft SQL platform, supporting customers with diverse IT environments. A new version of our SAP BusinessObjects Strategy Management application is now integrated with SAP NetWeaver as well, adding more business context to the strategy management process and lowering the total cost of ownership for SAP customers. We released other new EPM solutions in a new version of the SAP BusinessObjects Spend Performance Management application, delivering actionable visibility into purchasing detail, a new version of the SAP BusinessObjects Financial Consolidation application, which helps organizations leverage their BI investment and enables users to quickly create and distributead-hocfinancial reports to key decision makers, and a new version of the SAP BusinessObjects Profitability and Cost Management application, which helps customers gain more precise insight into cost drivers and their effect on profitability. |
Jointly developed with Microsoft, Duet software enables business users to use SAP-based data and business process software in the familiar Microsoft Office environment. In December 2008, we delivered a new Duet version forramp-up, with extensions to all existing user processes and new capabilities for purchasing management, recruitment management, and workflow approvals. It comes with additional configuration tools for the system administrator and with more languages.
We developed the Alloy software in conjunction with IBM. It enables business users to access SAP software and information from within the familiar IBM Lotus Notes environment. Alloy is available from both companies from the first quarter of 2009.
SEASONALITY
As is common in the software industry, our business has historically experienced the highest revenue in the fourth quarter of each year, due primarily to year-end capital purchases by customers. Such factors have resulted in 2008, 2007, and 2006 first quarter revenue being lower than revenue in the prior year’s fourth quarter. We believe that this trend will continue in the future and that our revenue will continue to peak in the fourth quarter of each year and decline from that level in the first quarter of the following year.
BUSINESS BY REGION
We operate our business in three principal geographic regions, namely EMEA, which represents Europe, the Middle East and Africa, the Americas, which represents both North and South America, and Asia Pacific Japan (APJ), which represents Japan, Australia and other parts of Asia. We allocate revenue amounts to each region based on where the customer is located. See Note 28 to our consolidated financial statements in “Item 18. Financial Statements” for additional information with respect to operations by geographic region.
40
The following table sets forth, for the years indicated, the total revenue attributable to each of our three principal geographic regions:
| | | | | | | | | | | | | |
| | | 2008 | | | 2007 | | | 2006 | |
| | | € millions | |
| |
| Germany | | | 2,193 | | | | 2,004 | | | | 1,907 | |
| Rest of EMEA | | | 4,011 | | | | 3,386 | | | | 2,994 | |
| | | | | | | | | | | | | |
| Total EMEA | | | 6,204 | | | | 5,390 | | | | 4,901 | |
| | | | | | | | | | | | | |
| United States | | | 2,882 | | | | 2,706 | | | | 2,609 | |
| Rest of Americas | | | 990 | | | | 871 | | | | 776 | |
| | | | | | | | | | | | | |
| Total Americas | | | 3,872 | | | | 3,577 | | | | 3,385 | |
| | | | | | | | | | | | | |
| Japan | | | 515 | | | | 447 | | | | 431 | |
| Rest of APJ | | | 974 | | | | 828 | | | | 676 | |
| | | | | | | | | | | | | |
| Total APJ | | | 1,489 | | | | 1,275 | | | | 1,107 | |
| | | | | | | | | | | | | |
Total revenue | | | 11,565 | | | | 10,242 | | | | 9,393 | |
| | | | | | | | | | | | | |
EMEA. In 2008, 54% (2007: 53%) of our total revenues were derived from the EMEA region. Our total revenues in the EMEA region grew to €6,204 million or by 15% in 2008 (2007: 10%). The EMEA region revenue growth reflects a 17% (2007: 11%) increase from changes in volumes and prices and a 2% decrease from currency effects. Revenues in Germany, SAP’s home market, increased by 9% (2007: 5%) to €2,193 million in 2008 (2007: €2,004 million). Germany contributed 35% (2007: 37%) of EMEA’s total revenues, which is a slight decrease of 2 percentage points compared to 2007. The remainder of revenues for the EMEA region in 2008 originated mainly from the following countries: the United Kingdom, France, Switzerland, the Netherlands, Italy and Russia.
The number of our employees (full-time equivalents, or FTEs) in the EMEA region increased by 3,171 FTEs or 13%, from 23,654 as of December 31, 2007 to 26,825 as of December 31, 2008. This increase was mainly driven by the acquisition of Business Objects. In Germany, the number of FTEs increased by 6% to 15,582 as of December 31, 2008 compared to 14,749 as of December 31, 2007. See “Item 6. Directors, Senior Management and Employees — Employees.”
Americas. 33% (2007: 35%) of our 2008 total revenues were recognized in the Americas region. Revenues increased by 8% (2007: 6%) to €3,872 million in 2008. Revenues from the United States grew by 7% in 2008 (2007: 4%), which represents a growth of 14% (2007: 13%) from changes in volumes and prices and a 7% decrease from currency effects. The United States contributed 74% (2007: 76%) of our total revenues in the Americas region. The rest of the Americas region increased revenues by 14% (2007: 12%) to €990 million, which represents a growth of 20% (2007: 15%) from changes in volumes and prices and a 6% decrease from currency effects. These revenues were principally generated in Canada, Brazil and Mexico.
In the Americas region the FTEs increased by 27% from 10,629 as of December 31, 2007 to 13,457 at December 31, 2008. This increase was mainly driven by the acquisition of Business Objects.
APJ. In 2008, the Asia Pacific Japan region contributed 13% (2007: 12%) of our total revenues, with most of this revenue being derived mainly from the following major contributing countries: Japan, Australia, India, China and South Korea. In the Asia Pacific Japan region, revenues rose by 17% (2007: 15%) to €1,489 million in 2008. Japan increased by 15% (2007: 4%) to €515 million, which represents 35% (2007: 35%) of total revenues in the Asia Pacific Japan region. The Japan region revenue growth reflects a 6% (2007: 14%) increase from changes in volumes and prices and a 9% increase from currency effects. The rest of the Asia Pacific Japan region (Japan excluded) increased revenues by 18% (2007: 22%), which represents a growth of 26% (2007: 24%) from changes in volumes and prices and an 8% decrease from currency effects.
In the Asia Pacific Japan region, FTEs increased by 17% from 9,578 as of December 31, 2007 to 11,254 as of December 31, 2008. This increase was due principally to the acquisition of Business Objects.
41
REVENUE BY INDUSTRY SECTOR
We have identified six industry sectors to focus our product development efforts on the key industries of our existing and potential customers and to provide best business practices and specific integrated business solutions to those industries. We allocate our customers to an industry at the outset of an initial arrangement. All subsequent revenues from a particular customer are recorded under that industry sector. The following table sets forth the total revenues attributable to each of the six industry sectors for the years ended December 31, 2008, 2007, and 2006.
| | | | | | | | | | | | | |
| | | 2008 | | | 2007 | | | 2006 | |
| | | € millions | |
| |
| Process Industries | | | 2,365 | | | | 2,135 | | | | 1,995 | |
| Discrete Industries | | | 2,432 | | | | 2,222 | | | | 2,179 | |
| Consumer Industries | | | 2,234 | | | | 1,949 | | | | 1,665 | |
| Service Industries | | | 2,703 | | | | 2,371 | | | | 2,132 | |
| Financial Services | | | 773 | | | | 678 | | | | 590 | |
| Public Services | | | 1,058 | | | | 887 | | | | 832 | |
| | | | | | | | | | | | | |
Total revenue | | | 11,565 | | | | 10,242 | | | | 9,393 | |
| | | | | | | | | | | | | |
SALES, MARKETING AND DISTRIBUTION
SAP AG primarily uses its worldwide network of subsidiaries to market and distribute SAP’s products and services locally. Those subsidiaries have entered into license agreements with SAP AG pursuant to which the subsidiary acquires the right to sublicense SAP AG’s products to customers within a specific territory. Under these agreements, the subsidiaries retain a certain percentage of the revenue generated by the sublicensing activity. We began operating in the United States in 1988 through SAP America, Inc., a wholly owned subsidiary of SAP AG. Since then, the United States has become one of our most important markets. In certain countries, we have established distribution agreements with independent resellers rather than with subsidiaries.
In addition to our subsidiaries’ sales forces, we have developed an independent sales and support force through value-added resellers unrelated to SAP who assume responsibility for the licensing, implementation and support of SAP solutions, particularly with regard to the SAP Business One application and qualified SAP BusinessAll-in-One partner solutions. We have also entered into alliances with major system integration firms, telecommunication firms and computer hardware providers to offer certain SAP Business Suite applications.
We supplement certain of our consulting and support services through alliances with hardware and software suppliers, systems integrators and third-party consultants with the goal of providing customers with a wide selection of third-party competencies. The role of the alliance partner ranges from pre-sales consulting for business solutions to the implementation of our software products to project management and end-user training for customers and, in the case of certain hardware and software suppliers, to technology support.
Traditionally, our sales model has been to charge a one-time, up front license fee for a perpetual license to our software (without any rights to future products) which is typically installed at the customer site. We now offer our solutions in a variety of ways which include on-demand, hosted solutions, and subscription-based models. Although revenues from these new types of models currently are not material, we expect these revenues to increase in the future.
Our marketing efforts cover large, multinational groups of companies as well as small and midsize enterprises. We believe our broad portfolio of solutions and services enables us to meet the needs of customers of all sizes and across industries.
Capitalizing on the possibilities of the Internet, we actively make use of online marketing. Some of our solutions can be tested online via the Internet demonstration and evaluation system, which also offers special services to introduce customers and prospects to new solutions and services.
42
PARTNERSHIPS, ALLIANCES AND ACQUISITIONS
Partnerships and strategic alliances are a key element of our efforts to broaden the solutions and services offered to SAP customers and to extend the markets for our products and services. Our close collaboration with partners across the life cycle of a customer solution is a key element in enhancing customer satisfaction. We characterize our partnerships and strategic alliances into categories such as services, technology, software, hosting, content, education and support that together constitute what we refer to as the partner services network. Within most categories, our partners may achieve the status of a local or global partner. We expect our alliance partners to provide customers with joint strategic solutions. Our partners generally have a strong position in a particular line of business or cross-industry and complement the range of SAP solutions in these areas. Our partner network includes thousands of companies including independent software vendors (ISVs), systems integrators, and business process outsourcing (BPO) providers across all partner categories.
We have entered into agreements with a number of leading software, technology and services companies to cooperate and enable the software, technology and services offered by such suppliers to complement our software products and vice versa.
In May 2006, we announced the launch of a US$125 million global fund called the SAP NetWeaver Fund, which focuses on strategic investments in select companies that are committed to the SAP ecosystem and are building innovative solutions based on the SAP NetWeaver technology platform. To date, the fund has invested approximately one-fourth of the US$125 million in minority interests of six technology companies providing innovative solutions for various industries from manufacturing to life sciences. We account for these investments using the cost method unless we are able to significantly influence the operatingand/or financial decisions of the investee, in which case we use the equity method of accounting.
SAP’s acquisition strategy is to acquire complementary application offerings and solutions through strategic and “fill-in” acquisitions. These acquisitions give SAP access to innovative technologies while enabling SAP to continue to focus on organic growth.
In 2008, we acquired the outstanding shares of two unrelated companies and the net assets of two other unrelated businesses that developedand/or distributed software that is complementary to our business. We have integrated the acquired businesses into the SAP operations and solution offerings. We have retained the majority of the employees from the businesses we acquired. The financial results of these acquired businesses have been included in our financial statements since the respective acquisition dates. The amount of in-process research and development we expensed in 2008 as a result of these acquisitions was immaterial.
In early 2008 we acquired Business Objects, a leading provider of business intelligence solutions. We have successfully integrated Business Objects with SAP. The acquisition cost, net of cash held by Business Objects, amounted to approximately €4.2 billion. The combination of Business Objects solutions with SAP technologies enables SAP to offer a unique portfolio of products that can give business users — process owners and decision makers in business — the transparency they need for effective decision making.
The acquisition of Visiprise, Inc. (Visiprise) in July 2008 exemplifies our fundamental acquisition strategy as mentioned above. Visiprise was a privately-owned software vendor that developed and distributed manufacturing execution systems. The acquisition of Visiprise was another step in our strategy of helping manufacturing organizations close the gap between operational planning and production execution.
Other than the Business Objects acquisition, the acquisitions made in 2008 were immaterial to us individually and in the aggregate. For further information, see Note 4 to our consolidated financial statements in “Item 18. Financial Statements.”
There were no public takeover offers by third parties with respect to our shares in 2008 or 2007.
43
INTELLECTUAL PROPERTY, PROPRIETARY RIGHTS AND LICENSES
We rely on a combination of the protections provided by applicable trade secret, copyright, patent, and trademark laws, license and non-disclosure agreements, and technical measures to establish and protect our proprietary rights in our products. For further details on risks related to SAP’s intellectual property rights, see “Item 3 Key Information — Risk Factors — Other Operational Risks.”
We may be dependent in the aggregate on technology that we license from third parties that is embedded into our products or that we resell to our customers. We have licensed and will continue to license numerous third-party software products that we incorporate intoand/or distribute with our existing products. We endeavor to protect ourselves in the respective agreements by obtaining certain rights in case such agreements are terminated.
We are a party to certain patent cross-license agreements with certain third parties.
We are named as a defendant in various legal proceedings for alleged intellectual property infringements. See Note 24 to our consolidated financial statements in “Item 18. Financial Statements” for a more detailed discussion of these legal proceedings.
ORGANIZATIONAL STRUCTURE
As of December 31, 2008, SAP AG was the holding company of 187 subsidiaries. Our subsidiaries perform various tasks such as the distribution of SAP’s products and providing SAP services on a local basis. Our primary research and development facilities, the overall group strategy and the corporate administration functions are concentrated at our headquarters in Walldorf, Germany.
The following table illustrates our most significant subsidiaries based on revenues as of December 31, 2008:
| | | | | | | |
| | | Ownership
| | Country of
| | |
Name of Subsidiary | | % | | Incorporation | | Function |
| |
Germany | | | | | | |
| SAP Deutschland AG & Co. KG, Walldorf | | 100 | | Germany | | Sales, consulting and training |
Rest of Europe/Middle East/Africa | | | | | | |
| SAP (UK) Limited, Feltham | | 100 | | Great Britain | | Sales, consulting and training |
| SAP (Schweiz) AG, Biel | | 100 | | Switzerland | | Sales, consulting and training |
| SAP France S.A., Paris | | 100 | | France | | Sales, consulting and training |
| SAP ITALIA SISTEMI, APPLICAZIONI, PRODOTTI IN DATA PROCESSING S.P.A., Milan | | 100 | | Italy | | Sales, consulting and training |
| SAP Nederland B.V.,’s-Hertogenbosch | | 100 | | The Netherlands | | Sales, consulting and training |
| SAP CIS, Moscow | | 100 | | Russia | | Sales, consulting and training |
Americas | | | | | | |
| SAP America, Inc., Newtown Square | | 100 | | USA | | Sales, consulting and training |
| Business Objects Americas | | 100 | | USA | | Sales, consulting and training |
| SAP Canada Inc., Toronto | | 100 | | Canada | | Sales, consulting, training,
and research and development |
| SAP Public Services, Inc., Washington, D.C. | | 100 | | USA | | Sales, consulting and training |
| SAP Brasil Ltda. | | 100 | | Brasil | | Sales, consulting and training |
Asia/Pacific | | | | | | |
| SAP JAPAN Co., Ltd., Tokyo | | 100 | | Japan | | Sales, consulting training,
and research and
development |
| SAP Australia Pty Limited, Sydney | | 100 | | Australia | | Sales, consulting and training |
44
DESCRIPTION OF PROPERTY
Our principal office is located in Walldorf, Germany, where we own and occupy approximately 420,000 square meters of office space including our facilities in neighboring St. Leon-Rot. We also own and lease office space in various other locations in Germany, totaling approximately 115,000 square meters, and in 59 other countries worldwide, totaling approximately 705,000 square meters. The space in most locations other than our principal office in Germany is leased. We own certain real properties in Newtown Square and Palo Alto, United States; Bangalore, India; and a few other locations in and outside of Germany.
The office space we occupy includes approximately 275,000 square meters in the EMEA region, excluding Germany, approximately 240,000 square meters in the USA, and approximately 190,000 square meters in the APJ Region.
The space is being utilized for various corporate functions including research and development, customer support, sales and marketing, consulting, training, and administration. Note 28 to our consolidated financial statements in “Item 18. Financial Statements” discusses property, plant, and equipment by geographic region. “Item 6. Directors, Senior Management and Employees” discusses the numbers of our employees by business area and by geographic region, which may be used to approximate the productive capacity of our workspace in each region.
We believe that our facilities are in good operating condition and adequate for our present usage. We do not have any significant encumbrances on our properties. We are currently undertaking construction activities in various locations to increase our capacity for future expansion of our business. Some of our significant construction activities are described below, under the heading “Capital Expenditures.”
Capital Expenditures
We commenced the construction of a new office building at our Newtown Square location in the second quarter of 2007, which will add 850 workspaces and will increase our workspace by approximately 20,000 square meters. We estimate the total cost to be about €79 million, of which we had incurred approximately €55 million as of December 31, 2008. The construction is expected to be completed in May of 2009. We are funding the construction with internally generated cash flows.
In Germany we closed down our branch in Saarbrücken and started the consolidation of facilities with the branch in St. Ingbert. We estimate the total cost of this project to be approximately €14 million, of which we had paid approximately €6 million as of December 31, 2008. We are funding the construction in St. Ingbert with internally generated cash flows. We expect to complete this project within the second half of 2010.
In 2008 we began construction of a guesthouse in our Walldorf location to save future travel costs on visiting SAP employees. We estimate the total cost of the construction to be approximately €17 million, of which we had paid approximately €8 million as of December 31, 2008. We are funding the construction with internally generated cash flows. The construction is expected to be completed by the end of 2009.
In Brazil, we commenced construction for the expansion of the São Leopoldo office in the fourth quarter of 2007, which will add 400 workspaces. We estimate the total costs to be about €13 million, of which we had incurred approximately €5 million as of December 31, 2008. We are funding this project with internally generated cash flows. The construction at this location is expected to be completed in mid 2009.
Our capital expenditures for property, plant, and equipment amounted to €344 million for 2008 (2007: €342 million; 2006: €316 million). Capital expenditures in 2008 for property, plant, and equipment remained constant compared to 2007. The increase from 2006 to 2007 was in large part due to the construction of new buildings in Walldorf that were completed in 2007. For a related discussion on property, plant, and equipment, see Note 17 to our consolidated financial statements in “Item 18. Financial Statements.”
45
Our capital expenditures for intangible assets such as software licenses, acquired technologies and customer contracts increased significantly to €1,044 million in 2008 from €238 million in 2007 (2006: €189 million). Goodwill also increased significantly to €3,547 million in 2008 from €520 million in 2007 (2006: €407 million). The increase from 2007 to 2008 was primarily attributable to the acquisition of Business Objects. The increase from 2006 to 2007 was primarily attributable to the acquisition of the shares or net assets of various unrelated companies in 2007. For further details on acquisitions and related capital expenditures, see Note 4 and Note 16 to our consolidated financial statements in “Item 18. Financial Statements.”
For further details regarding capital expenditures by geographic region, see Note 28 to our consolidated financial statements in “Item 18. Financial Statements.”
ITEM 4A. UNRESOLVED STAFF COMMENTS
Not applicable.
ITEM 5. OPERATING AND FINANCIAL REVIEW AND PROSPECTS
OVERVIEW
Our principal sources of revenue are sales of software products and related services. Software revenue is primarily derived from software license fees that customers pay to use SAP products. We provide standard support for a fee based on a fixed percentage of the license fee paid by the customer and we also offer optional support services for additional coverage and scope. In 2008 SAP began offering Enterprise Support, which allows companies to take full advantage of the integration of SAP and non-SAP solutions, minimize risk, enable the acceleration of innovation and address solution lifecycle management. Our professional service revenue consists of consulting, training and other service revenue; consulting revenue is primarily derived from the services rendered with respect to implementation of our software products and training revenue from customer project teams and end-users, as well as training third-party consultants with respect to SAP software products. See “Item 4. Information about SAP — The SAP Portfolio” for a more detailed description of the products and services we offer.
Subscription revenues flow from contracts that have both a software element and a support element. Subscription contracts typically give our customers the use of current software and the right to unspecified future products. We charge a fixed monthly fee for a definite term, which is generally five years. Software rental revenue flows from software rental contracts, also with software and support elements — but here the customer receives the use of current products only. Our revenue from other software-related services includes revenue from our on-demand offerings, for example the SAP CRM on-demand solution, any future on-demand revenue from our new midmarket product SAP Business ByDesign, revenue from hosting contracts that do not entitle the customer to readily exit the arrangement, and revenue from software-related revenue-sharing arrangements, for example our share of revenue from collaboratively developed products.
We also report revenue from other services within professional services and other service revenue. This item includes revenue from non-mandatory hosting services, application management services (AMS), and sales commission received from third-parties. Non-mandatory hosting services revenue consists of revenue from hosting contracts from which the customer can readily exit if it wishes to run the software on its own systems.
In addition, we present in our Consolidated Statements of Income the results of discontinued operations. This presentation results from the wind-down of our TomorrowNow Group (“TN”), which consists of TomorrowNow, Inc. and its subsidiaries, and to cease providing third-party product-support services. TN is a subsidiary of SAP America, Inc., which is a wholly owned subsidiary of SAP AG. In our discussion in the following “Operating Results” section and the “Segment Discussions” section under this Item 5, revenue and expense figures are for our continuing operations, unless noted otherwise. The disposal of TN did not have a significant
46
impact on our results of operations. See Note 11 to our consolidated financial statements in “Item 18. Financial Statements” for more detail about discontinued operations.
The following discussion is provided to enable a better understanding of our operating results for the periods covered, including:
| | |
| | • | the key factors and trends that we believe impacted our performance in 2008; |
| |
| | • | our outlook for 2008 compared to our actual performance; |
| |
| | • | a discussion of our operating results for 2008 compared to 2007 and for 2007 compared to 2006 (including Segment Discussions); |
| |
| | • | the key factors and trends we believe will impact our performance in 2009; and |
| |
| | • | our outlook for 2009 (including Medium-Term Perspectives). |
The preceding overview should be read in connection with the more detailed discussion and analysis of our financial condition and results of operations in this Item 5, “Item 3. Key Information — Risk Factors” and “Item 18. Financial Statements.”
KEY FACTORS
2008 Global Economic Trends
The international financial crisis pervaded developments in the global economy during 2008. Its impact on the entire financial sector and on the real economy was apparent in pressure on the prices of commodities and of many capital goods, a marked decline in the price of many securities, corrections — in some places very substantial — in real estate prices, a loss of confidence among market participants, and a noticeable decline in demand, which the automotive industry felt especially keenly. In consequence, the economic outlook has deteriorated significantly, and businesses and consumers have accordingly adjusted their expectations. Falling commodity prices at the end of 2008 did nothing to improve overall market sentiment.
In January 2008, the International Monetary Fund (IMF) projected that global output, which is the global total value of all goods and services, would grow 4.2% in 2008; In January 2009, it revised that projection downward to 3.4%. In an early forecast, the IMF expected world trade in goods and services to increase 5.6% in 2008; it now believes world trade grew only 4.1% in 2008.
The European Central Bank (ECB) reported worsening economic trends in the second half of 2008. It observed that global inflationary pressures relaxed toward the end of the year, but that the impact of the turmoil on the financial markets was spreading across the world. The emerging and developing economies, which in past years had made a strong contribution to global economic growth, appear also to have been affected by deteriorating economic conditions. In January 2009, the IMF estimated that their combined 2008 output growth had declined to 6.3%.
According to the ECB, the economies of the United States and western Europe became increasingly subdued over the year. In North America, the sharp downturn in growth was primarily the result of the steep decline in consumer spending, the continuing correction of the housing market, and faltering investment in business plant, equipment, and software. In the economies in the euro area, 2008 saw ever tighter lending standards for business and slower growth in lending to consumers, the ECB reported. The Deutsche Bundesbank reports that in the second half of 2008, Germany was also significantly affected by the ailing global economy. Consumer spending and investment behavior were disrupted, which was reflected in a marked rise in the savings ratio toward the end of 2008.
Similarly, the economic situation in Japan was made worse in the second half of 2008 by sluggish domestic demand and a continuing decline in export activity, according to the ECB. Credit conditions did not tighten as much as in other industrialized countries. Nonetheless, the ECB assumes the Japanese economy slowed further
47
in the final quarter of 2008, because the deteriorating employment situation kept consumer spending in check and because exports again decreased as a result of the falling demand overseas for Japanese products.
According to the ECB’s analysis, the pace of growth again slackened appreciably in the emerging and developing economies in Asia during the third quarter of 2008. Although the global economic downturn spread and deepened in the second half of 2008, exports from the emerging countries in Asia were generally not severely affected. Rather, it was declining domestic demand, held back by evaporating consumer and business confidence that slowed economic growth.
Year-Over-Year Output Growth
| | | | | | | | | | | | | |
% | | 2007 | | | 2008e | | | 2009p | |
| |
| World | | | 5.2 | | | | 3.4 | | | | 0.5 | |
| Advanced economies | | | 2.7 | | | | 1.0 | | | | (2.0 | ) |
| United States | | | 2.0 | | | | 1.1 | | | | (1.6 | ) |
| Euro area | | | 2.6 | | | | 1.0 | | | | (2.0 | ) |
| Germany | | | 2.5 | | | | 1.3 | | | | (2.5 | ) |
| Developing Asia | | | 10.6 | | | | 7.8 | | | | 5.5 | |
| Japan | | | 2.4 | | | | (0.3 | ) | | | (2.6 | ) |
| e = Estimate; p = Projection | | | | | | | | | | | | |
| Source: IMF, January 2009 | | | | | | | | | | | | |
IT Market in 2008
In the assessment of International Data Corporation (IDC), a market research firm based in the United States, the effects of the international financial crisis on the real economy had a pronounced influence on global demand for IT — especially in the final quarter of 2008. Until as late as the summer, the global IT market had withstood relatively well the turmoil of the financial crisis and already receding economic growth — even though that market was beginning to show signs of reduced vigor. In the first half of the year, IDC also observed a flattening of the increase in demand for IT in the emerging economies, trending toward the lower levels of demand growth in the industrialized countries. While, in IDC’s analysis, demand in some industries, such as financial services, retail, and construction, remained weak, international IT spending growth was relatively constant into the third quarter of 2008. IDC attributes such robust growth in IT spending to the increasing complexity of the tasks that IT accomplishes for companies, and on the resultant efficiency gains.
However, as the credit crunch worsened, from mid-September companies showed much less willingness to invest in IT. Investment bank Goldman Sachs’s IT spending indicator suggested that IT capital expenditure growth was decelerating significantly, measured over the full year. By the end of 2008, the perception that economic growth was waning was already reflected in acutely reduced demand from companies for hardware and software, IDC observed.
Overall, in IDC’s analysis, 2008 was a relatively good year because the financial crisis did not affect the real economy until quite late. Year-over-year, worldwide spending on IT, excluding telecommunications, grew 6.9%. Breaking down 2008 spending growth by segment, IDC estimated that the biggest increase was achieved in packaged software (9.1%), while the weakest segment was hardware (4.9% growth). In its geographical breakdown, IDC estimated that spending grew most strongly in the AJP region (10.3%) and least strongly in the Americas region (3.9%).
48
IT Spending
Percentage Change Since Previous Year
| | | | | | | | | | | | | |
% | | 2007 | | | 2008e | | | 2009p | |
| |
| World | | | | | | | | | | | | |
| Total IT market | | | 12.5 | | | | 6.9 | | | | 0.5 | |
| Hardware | | | 13.0 | | | | 4.9 | | | | (3.6 | ) |
| Packaged software | | | 13.8 | | | | 9.1 | | | | 3.4 | |
| Application software | | | 14.4 | | | | 7.9 | | | | 2.7 | |
| Services | | | 11.2 | | | | 8.0 | | | | 3.4 | |
| Americas region | | | | | | | | | | | | |
| Total IT market | | | 8.7 | | | | 3.9 | | | | 0.6 | |
| Packaged software | | | 11.2 | | | | 5.7 | | | | 3.9 | |
| Application software | | | 10.0 | | | | 4.8 | | | | 3.6 | |
| Services | | | 6.5 | | | | 4.8 | | | | 3.5 | |
| EMEA region | | | | | | | | | | | | |
| Total IT market | | | 16.9 | | | | 8.4 | | | | 0.0 | |
| Packaged software | | | 19.0 | | | | 11.5 | | | | 1.9 | |
| Application software | | | 23.0 | | | | 10.9 | | | | 1.0 | |
| Services | | | 17.2 | | | | 9.1 | | | | 2.5 | |
| APJ region | | | | | | | | | | | | |
| Total IT market | | | 12.3 | | | | 10.3 | | | | 1.3 | |
| Packaged Software | | | 11.3 | | | | 16.2 | | | | 5.2 | |
| Application software | | | 11.0 | | | | 15.0 | | | | 4.3 | |
| Services | | | 9.4 | | | | 13.7 | | | | 5.4 | |
| e = Estimate; p = Projection | | | | | | | | | | | | |
| Source: IDC Black Book Q4, February 2009 | | | | | | | | | | | | |
OUTLOOK 2008
SAP Performance Against our Outlook for 2008
We expressed our 2008 operating income-related internal management goals and published outlook in non-GAAP terms. For this reason, in the following section we discuss performance against our outlook exclusively and expressly in terms of non-GAAP numbers. The subsequent discussion in this “Item 5. Operating and Financial Review and Prospects — Operating Results” is in terms of U.S. GAAP measures, except where otherwise noted.
Outlook for 2008
At the beginning of 2008, we provided an outlook of increasing non-GAAP software and software-related service revenue (2007: €7,427 million) in a range between 24% and 27% on a constant currency basis. We defined the measure as excluding a nonrecurring deferred support revenue write-down of approximately €180 million from the acquisition of Business Objects. We expected SAP’s business, excluding the contribution from Business Objects, to contribute 12 to 14 percentage points to this growth. In July 2008, we also announced that in view of our successful first-half year operations, we expected non-GAAP software and software-related service revenue growth to reach the upper end of the range that we had announced earlier. In October 2008 as a result of the
49
deteriorating global economic conditions, we decided we could no longer specifically forecast our non-GAAP at constant currency software and software-related service revenue growth for 2008. See below for our outlook given in October 2008.
At the beginning of 2008, we also projected that our constant-currency non-GAAP operating margin, which excludes a nonrecurring deferred support revenue write-down from the acquisition of Business Objects and acquisition-related charges, would be in a range between 27.5% and 28.0%. Non-GAAP operating margin is the ratio, expressed as a percentage, of non-GAAP operating income at constant currency to non-GAAP total revenue at constant currency. The non-GAAP operating margin outlook that we announced at the beginning of 2008 included accelerated investments of €175 to €225 million (2007: €125 million) in building a business around the new SAP Business ByDesign solution to address new, untapped segments in the mid-market. In April of 2008, we modified the rollout strategy for the SAP Business ByDesign solution to enable a more focused and controlledramp-up process. We announced that the accelerated investment in SAP Business ByDesign in 2008 would be reduced by approximately €100 million in view of the modified rollout strategy. We expected this would reinforce the non-GAAP operating margin improvement and lead to an operating margin in the range between 28.5% and 29.0%. In July 2008, we announced that we expected the full-year non-GAAP operating margin to be at the upper end of the range reinforced in April 2008. In October 2008 we modified our constant currency non-GAAP operating margin outlook further as the impact of the global economic crisis became more apparent. See below for our outlook given in October 2008.
In October, we adjusted our outlook for full-year 2008 non-GAAP software and software-related service revenues and non-GAAP operating margin. In light of the uncertain economic and business environment, in October 2008 we ceased providing an outlook for full-year 2008 non-GAAP software and software-related service revenues and modified our outlook for non-GAAP operating margin. At that time we gave the following outlook for full-year 2008:
| | |
| | • | With recent cost-savings initiatives in place, the Company expects full-year 2008 non-GAAP operating margin, which excludes a nonrecurring deferred support revenue write-down of €180 million from the acquisition of Business Objects and acquisition-related charges, to be around 28% at constant currencies if we can increase non-GAAP software and software-related service revenues, excluding a nonrecurring deferred support revenue write-down from the acquisition of Business Objects, in a range between 20% and 22% at constant currencies for the full year 2008. We believe that in the fourth quarter of 2008 we can save some €200 million compared to our originally forecasted costs. To this end we will stop all recruitment, considerably reduce spending on externally provided services, and make cuts in travel and other variable expenditure for the rest of 2008. |
| | |
| | • | We continue to project an effective tax rate of 31.0% to 31.5% (based on U.S. GAAP income from continuing operations) for 2008. |
| |
| | • | In our previous outlook (given in July 2008) we expected to hire 3,500 employees in 2008 (excluding additions from acquisitions). To date we have hired 1,500 new employees (given in October 2008; excluding new hires from acquisitions). Based on our revised outlook this amount should not significantly change through the end of the year. |
| |
| | • | We will continue in 2008 with our strategy of buying back shares in order to give back liquidity to our shareholders. We already bought back shares totaling €486.8 million as of September 30, 2008. |
| |
| | • | The investments in fixed assets (excluding acquisitions) planned for 2008 mainly comprise the completion of office buildings at several locations which can be fully financed with operating cash flow. Based on our cost saving programs we reduced the investments which were planned for the fourth quarter. Our financial position shall be further strengthened as a result. |
| |
| | • | This outlook is based among others on the presented assumptions regarding the global financial crisis which emerged in the second half of September. The global financial crisis resulted in a |
50
| | |
| | | clear and until this time unexpected change in the buying behavior of our customers. However, the outlook is also based on the assumption that the buying behavior will follow our normal seasonality of revenues; we expect the fourth quarter contributing the highest revenues of the year 2008. |
A reconciliation from our Non-GAAP financial measures to our U.S. GAAP financial measures is provided below. These non-GAAP measures reconcile to the nearest U.S. GAAP equivalents as follows:
| | | | | | | | | | | | | | | | | | | | | | | | | |
| | | | | | Business Objects
| | | | | | | | | | | | | |
| | | | | | Support
| | | | | | | | | Currency
| | | Non-GAAP
| |
| | | | | | Revenue Not
| | | | | | | | | Effect on the
| | | Financial
| |
| | | U.S. GAAP
| | | Recorded
| | | Acquisition-
| | | Non-GAAP
| | | Non-GAAP
| | | Measure at
| |
| | | Financial
| | | Under U.S.
| | | Related
| | | Financial
| | | Financial
| | | Constant
| |
2008 | | Measure | | | GAAP | | | Charges | | | Measure | | | Measure | | | Currency | |
| | | € millions, except operating margin | |
| |
| Software and software-related service revenue | | | 8,457 | | | | 166 | | | | — | | | | 8,623 | | | | 296 | | | | 8,919 | |
Total revenue(1) | | | 11,565 | | | | 166 | | | | — | | | | 11,731 | | | | 413 | | | | 12,144 | |
Operating income(1) | | | 2,840 | | | | 166 | | | | 297 | | | | 3,303 | | | | 147 | | | | 3,450 | |
| Operating margin | | | 24.6% | | | | 1.3% | | | | 2.3% | | | | 28.2% | | | | 0.2% | | | | 28.4% | |
| | |
| (1) | | These financial measures are the numerator or the denominator in the calculation of our non-GAAP operating margin and the comparable U.S. GAAP operating margin, and are included in this table for the convenience of the reader. |
2008 Non-GAAP Software and Software-Related Service Revenue — Early 2008 Outlook Compared to Actual Performance
On a constant currency basis over the full year, our non-GAAP software and software-related service revenue grew 20% (16% without adjustment for currency effects) to €8,919 million (2007: €7,427 million), which was below the revenue outlook we set at the beginning of the year. We did not meet our early 2008 revenue outlook due to the global economic crisis that emerged in the second half of 2008, which caused the demand for our software products to decrease steeply, particularly in the fourth quarter of 2008, as many customers declined to make investment decisions. Although demand for original SAP products fell more severely than the products of Business Objects, SAP’s business without the Business Objects results contributed 6 percentage points to non-GAAP software and software-related service revenue growth on a constant currency basis due primarily to the successes in the first half of the year. For the fifth year in succession, including the results of Business Objects, we achieved double-digit percentage growth in full-year non-GAAP software and software-related service revenue on a constant currency basis.
2008 Non-GAAP Operating Margin — Outlook Compared to Actual Performance
We achieved a non-GAAP operating margin of 28.4% on a constant currency basis, meeting the outlook we provided at the beginning of the year (27.5% to 28%) and the outlook provided in October 2008 (28.0%), but failing to meet the outlook provided in April 2008 and as revised in July 2008. This represented a 1.1 percentage-point improvement over the previous year’s corresponding 27.3% non-GAAP operating margin, despite the difficult economic conditions. In addition, we met the non-GAAP at constant currency operating margin outlook of 28% we defined in October 2008, even though the 20% year-over-year growth in our non-GAAP software and software-related service revenue that we achieved on a constant currency basis was at the lower end of the assumed range. We realized this success by implementing comprehensive cost savings, which included a stop on all recruitment and a significant reduction of spending on external service providers, business travel and other variable costs. Compared to the original forecast, we saved more than €200 million in the final quarter of 2008 with these measures, which were an immediate response to the deteriorating economic conditions.
51
OPERATING RESULTS
Total Revenue
| | | | | | | | | | | | | | | | | | | | | |
| | | | | | | | | | | | Change
| | | Change
| |
| | | 2008 | | | 2007 | | | 2006 | | | 2008 vs. 2007 | | | 2007 vs. 2006 | |
| | | € millions | | | | | | | |
| |
| Total revenue | | | 11,565 | | | | 10,242 | | | | 9,393 | | | | 13 | % | | | 9 | % |
As a result of our acquisition of Business Objects in January 2008, our numbers for 2008 and 2007 are not fully comparable.
2008 compared with 2007. Total revenue increased from €10,242 million in 2007 to €11,565 million in 2008, representing an increase of €1,323 million or 13%. The revenue growth reflects a 17% increase from changes in volumes and prices and a 4% decrease from currency effects. This increase is mainly related to the strong performance in software and software-related service revenue, which grew by €1,030 million or 14% compared to 2007. A significant portion of this growth was due the acquisition of Business Objects. In 2008, software and software-related service revenue represented 73% of our total revenue, which was flat compared to 2007. Professional services and other service revenue contributed €295 million to the overall growth in 2008. This represents an increase of 11% compared to 2007. Professional services and other service revenue accounted for 26% of our total revenue compared to 27% in 2007.
The average exchange rate for the U.S. dollar in 2008 was $1.47 per €1.00, compared to $1.38 per €1.00 in 2007. The rate evolved as follows for the period-end Noon Buying Rate expressed as dollars per €1.00.
| | | | | |
Date | | Period-End | |
| |
| December 2007 | | | 1.4603 | |
| March 2008 | | | 1.5805 | |
| June 2008 | | | 1.5748 | |
| September 2008 | | | 1.4081 | |
| December 2008 | | | 1.3919 | |
Ultimately the strength of the euro over the year reduced the euro value of revenue generated in other currencies. Foreign currency translation effects from the strengthening value of the euro during the year negatively impacted our total revenue by 4% in 2008.
2007 compared with 2006. Total revenue increased from €9,393 million in 2006 to €10,242 million in 2007, representing an increase of €849 million or 9%. The revenue growth reflects a 13% increase from changes in volumes and prices and a 4% decrease from currency effects. This increase is mainly related to the strong increase in software and software-related service revenue, which grew by €831 million or 13% compared to 2006. The revenue growth reflects a 17% increase from changes in volumes and prices and a 4% decrease from currency effects. In 2007, software and software-related service revenue represented 73% of our total revenue, which is an increase of 3 percentage points compared to 2006, in line with our goals. Professional services and other service revenue contributed €16 million to the overall growth in 2007. This represents an increase of 4% compared to 2006 from changes in volumes and prices and 3% decrease from currency effects.
The average exchange rate for the U.S. dollar in 2007 was $1.38 per €1.00, compared to $1.27 per €1.00 in 2006. The rate evolved as follows for the period-end Noon Buying Rate expressed as dollars per €1.00.
| | | | | |
Date | | Period-End | |
| |
| December 2006 | | | 1.3197 | |
| March 2007 | | | 1.3374 | |
| June 2007 | | | 1.3520 | |
| September 2007 | | | 1.4219 | |
| December 2007 | | | 1.4603 | |
52
Ultimately the strength of the euro over the year reduced the euro value of revenue generated in other currencies. Foreign currency translation effects from the strengthening value of the euro during the year negatively impacted our total consolidated revenue by 4% in 2007.
Software and software-related service revenue
| | | | | | | | | | | | | | | | | | | | | |
| | | | | | | | | | | | Change
| | | Change
| |
| | | 2008 | | | 2007 | | | 2006 | | | 2008 vs. 2007 | | | 2007 vs. 2006 | |
| | | € millions | | | | | | | |
| |
| Software revenue | | | 3,606 | | | | 3,407 | | | | 3,003 | | | | 6 | % | | | 13 | % |
| Support revenue | | | 4,593 | | | | 3,838 | | | | 3,464 | | | | 20 | % | | | 11 | % |
| Subscription and other software-related service revenue | | | 258 | | | | 182 | | | | 129 | | | | 42 | % | | | 41 | % |
Software and software-related service revenue | | | 8,457 | | | | 7,427 | | | | 6,596 | | | | 14 | % | | | 13 | % |
Software revenue represents fees earned from the sale or license of software to customers. Support revenue represents fees earned from providing customers with technical support services and unspecified software upgrades, updates and enhancements. Subscription and other software-related service revenue represents fees earned from subscriptions, software rentals, and other types of software-related service contracts.
2008 compared with 2007. Software and software-related service revenue increased from €7,427 million in 2007 to €8,457 million in 2008, representing an increase of €1,030 million or 14%. A significant portion of this growth was due the acquisition of Business Objects. The revenue growth reflects an 18% increase from changes in volumes and prices and a 4% decrease from currency effects.
Software revenue rose from €3,407 million in 2007 to €3,606 million in 2008, accounting for an increase of €199 million, or 6%. The software revenue growth consists of a 10% increase from changes in volumes and prices and a 4% decrease from currency effects.
The strong performance in software and software-related service revenue for the full year 2008 is the result of well balanced growth in all regions. Compared to 2007 the EMEA region grew by 15%. This growth represents an 18% increase from changes in volumes and prices and a 3% decrease from currency effects. The Americas region grew by 9%, which represents a 16% increase from changes in volumes and prices and a 7% decrease from currency effects and the region Asia Pacific Japan region by grew 21%, which represents a 23% increase from changes in volumes and prices and a 2% decrease from currency effects.
The extension of our established product portfolio, SAP Business Suite and our platform-related products based on SAP NetWeaver, especially towards the business user solutions, led to an overall software revenue growth rate of 6%. The software revenue growth reflects a 10% increase from increased volumes and prices and a 4% decrease from currency effects. In 2008, we continued to derive software revenue from our strong customer base. Nevertheless, the number of software contracts coming from new customers remained stable at 31%. Based on the order entry value, the new customer share decreased from 21% in 2007 to 13% in 2008 influenced fundamentally by lower deal sizes in the extended business user area.
The SAP NetWeaver-related revenue decreased from €997 million in 2007 to €942 million in 2008, representing a decrease of €55 million or 6%. The portion relating specifically to the underlying SAP NetWeaver stand-alone revenue increased by €55 million or 17% to €384 million in 2008 compared to €329 million in 2007. The decrease was mainly due to the global economic crisis that emerged during the second half of 2008 since we recorded a 31% increase during the first half of 2008.
Our stable customer base and the continued sale of software to existing and new customers throughout 2008 resulted in an increase in support revenue from €3,838 million in 2007 to €4,593 million in 2008, representing an increase of €755 million or 20%. The support revenue growth reflects a 23% increase from changes in volumes and prices and a 3% decrease from currency effects. The largest contributor to the 2008
53
increase in support revenue based on volume was the Americas region where our support revenue increased by 27%.
Subscription and other software-related service revenue increased by €76 million or 42% to €258 million compared to €182 million in 2007. The growth in revenue reflects a 43% increase from volumes and prices and 1% decrease from currency effects. The increase was primarily due to the settlement of new major subscription contracts.
2007 compared with 2006. Software and software-related service revenue increased from €6,596 million in 2006 to €7,427 million in 2007, representing an increase of €831 million or 13% A significant portion of this growth was due the acquisition of Business Objects. This growth represents a 17% increase from changes in volumes and prices and a 4% decrease from currency effects.
Software revenue increased from €3,003 million in 2006 to €3,407 million in 2007, representing an increase of €404 million, or 13%. This growth represents a 18% increase from changes in volumes and prices and a 5% decrease from currency effects. The currency effects were impacted by the stronger value of the euro compared to other currencies. This strong performance is the result of well balanced growth in all regions. Compared to 2006 the EMEA region grew by 14%. This growth represents a 15% increase from changes in volumes and prices and a 1% decrease from currency effects. The Americas region grew by 8%, which represents a 16% increase from changes in volumes and prices and a 8% decrease from currency effects and the Asia Pacific Japan region grew by 28%, which represents a 32% increase from changes in volumes and prices and a 4% decrease from currency effects.
In addition to the further increased licensing of our software solution SAP Business Suite and the platform related products utilizing our SAP NetWeaver platform technology, the growth in software revenue was also driven by increased sales of our business user solutions. In 2007 we continued to derive software revenue from our existing customer base. In both 2007 and 2006, approximately 31% of the number of new contracts came from new customers, with the remaining 69% coming from our installed customer base. Based on the value of orders received, the new customer share increased from 19% in 2006 to 21% in 2007.
The SAP NetWeaver-related revenue increased from €754 million in 2006 to €997 million in 2007, representing an increase of €243 million or 32%. The underlying SAP NetWeaver stand-alone revenue increased by €160 million or 95% to €329 million in 2007 compared to €169 million in 2006.
Thanks to our stable installed customer base and the continued sale of software to existing and new customers throughout 2007, support revenue increased from €3,464 million in 2006 to €3,838 million in 2007, representing an increase of €374 million or 11%. The support revenue growth reflects a 15% increase from changes in volumes and prices and a 4% decrease from currency effects. The largest contributor to the 2007 increase in support revenue based on volume was again the EMEA region where the support revenue increased by €219 million or 11%.
Subscription and other software-related service revenue increased by €53 million or 41% to €182 million compared to €129 million in 2006.
Professional services and other service revenue
| | | | | | | | | | | | | | | | | | | | | |
| | | | | | | | | | | | Change
| | | Change
| |
| | | 2008 | | | 2007 | | | 2006 | | | 2008 vs. 2007 | | | 2007 vs. 2006 | |
| | | € millions | | | | | | | |
| |
| Consulting revenue | | | 2,498 | | | | 2,221 | | | | 2,249 | | | | 12 | % | | | (1 | )% |
| Training revenue | | | 434 | | | | 410 | | | | 383 | | | | 6 | % | | | 7 | % |
| Other service revenue | | | 107 | | | | 113 | | | | 96 | | | | (5 | )% | | | 18 | % |
Professional services and other service revenue | | | 3,039 | | | | 2,744 | | | | 2,728 | | | | 11 | % | | | 1 | % |
54
2008 compared with 2007. Professional services and other service revenue increased from €2,744 million in 2007 to €3,039 million in 2008, representing an increase of €295 million or 11%. This revenue growth reflects a 15% increase from changes in volumes and prices and a 4% decrease from currency effects.
Consulting revenue increased from €2,221 million in 2007 to €2,498 million in 2008, representing an increase of 12%. The consulting revenue growth reflects a 17% increase from changes in volumes and prices and a 5% decrease from currency effects. In 2008, consulting contributed strongly to the revenue growth in professional services and other service revenue representing a pay off for past headcount investments in the consulting area. Consulting revenue as a percentage of total revenue remained quite stable at 22% in 2008, contributing to SAP’s total revenue double-digit growth rate.
Training revenue increased from €410 million in 2007 to €434 million in 2008, representing an increase of 6%. The training revenue growth reflects a 10% increase from changes in volumes and prices and a 4% decrease from currency effects. Strong contribution to the growth in training revenue was achieved by higher demand forE-Learning andon-site customer training. The training business also benefited from growth in the certification area.
Other service revenue decreased from €113 million in 2007 to €107 million in 2008, representing a decrease of 5%. The other service revenue decline reflects a 2% decrease from changes in volumes and prices and a 3% decrease from currency effects. Other service revenue mainly consists of revenue generated by the SAP Managed Services organization, which operates, manages and maintains SAP solutions.
2007 compared with 2006. Professional services and other service revenue increased slightly from €2,728 million in 2006 to €2,744 million in 2007, representing an increase of €16 million or 1%. This revenue growth reflects a 4% increase from changes in volumes and prices and a 3% decrease from currency effects.
Consulting revenue decreased from €2,249 million in 2006 to €2,221 million in 2007, representing a decrease of 1%. The consulting revenue growth reflects a 2% increase from changes in volumes and prices and a 3% decrease from currency effects. In 2007, consulting headcount grew by 12%; however, it required time to ramp up these new resources to a fully productive status. This effect, coupled with negative currency effects, contributed to the slight decline in consulting revenue.
Consulting revenue as a percentage of total revenue decreased from 24% in 2006 to 22% in 2007, caused by the continued growth of software and software-related services revenue, and the slight decline of consulting revenue year over year.
Training revenue increased from €383 million in 2006 to €410 million in 2007 or 7%. The growth reflects an 11% increase from changes in volumes and prices and a 4% decrease from currency effects. While traditional classroom training only grew marginally, most of the growth in training revenue was achieved in theE-Learning area. The training business also benefited from growth in the certification area.
Other service revenue increased from €96 million in 2006 to €113 million in 2007 or 18%. The other service revenue growth reflects a 23% increase from changes in volumes and prices and a 5% decrease from currency effects. Other service revenue mainly consists of revenue generated by the SAP Managed Services organization, which operates, manages and maintains SAP solutions. Most of the growth of SAP Managed Services revenue came from the EMEA region.
55
Total Operating Expenses and Operating Income
| | | | | | | | | | | | | | | | | | | | | |
| | | | | | | | | | | | Change
| | | Change
| |
| | | 2008 | | | 2007 | | | 2006 | | | 2008 vs. 2007 | | | 2007 vs. 2006 | |
| | | € millions | | | | | | | |
| |
| Total operating expenses | | | 8,725 | | | | 7,510 | | | | 6,815 | | | | 16% | | | | 10% | |
| Operating income | | | 2,840 | | | | 2,732 | | | | 2,578 | | | | 4% | | | | 6% | |
| Operating margin (Operating income as a percentage of total revenue) | | | 24.6% | | | | 26.7% | | | | 27.4% | | | | | | | | | |
As a result of our acquisition of Business Objects in January 2008, our numbers for 2008 and 2007 are not fully comparable.
2008 compared with 2007. Despite our response to the effects of the financial and economic crisis by introducing cost-saving measures, which resulted in a saving of more than €200 million in the final quarter of 2008, our total operating expenses for 2008 increased to €8,725 million compared to €7,510 million in 2007 representing an increase of €1,215 million or 16%. As described below the main driver for this increase was the acquisition of Business Objects.
For a more detailed analysis of the individual operating expense line items see the “Operating Expenses” section following this section. The increase in total operating expenses was mainly driven by the following:
| | |
| | • | In 2008 we increased our personnel expenses by €705 million or 17% to €4,879 million, which is the result of the overall headcount increase in 2008 of 7,675 FTE, including acquisitions, or 17% to 51,536 FTE as of December 31, 2008. Of this 17% Business Objects contributed 14 percentage points or 6,224 FTE. |
| |
| | • | In addition to the Business Objects acquisition the 2008 cost of software and software-related services increased due to payments for additional third-party licenses, the effects of license disputes, and further reinforcement of our support resources in the first half of the year. |
| |
| | • | The increase in our expenses for sales and marketing was steeper than the rise in our total revenue. This was principally due to our investment in expanding the field organization for our SAP BusinessObjects solutions. |
| |
| | • | The modest increase in cost of professional services and other services, research and development and general and administration expense could for the most part be attributed to expenses we incurred in several areas in connection with the acquisition of Business Objects. |
Increased operating expenses in 2008 coupled with the lower than expected revenue result due to the deteriorating economic conditions in the second half 2008, resulted in a decrease in operating income from 6% in 2007 to 4% in 2008.
2007 compared with 2006. At the beginning of the 2007, we explained in our outlook that we intended to invest about €300 million to €400 million over a period of eight quarters starting in early 2007 to build up a business around SAP Business ByDesign. Depending on when we actually made these investments, in 2007 we expected to reinvest the equivalent of about one to two operating margin percentage points in preparing for additional future growth opportunities. Therefore, we assumed our 2007 operating margin to be in the range 26.0% to 27.0%. In line with our outlook, the additional investment we had announced, which amounted to €125 million, reduced our operating margin by 1.2 percentage points. We spent the money on accelerated investments in enhancing IT infrastructure, building our sales and channel capability, and extending our marketing activity.
Total operating expenses for 2007 were €7,510 million compared to €6,815 million representing an increase of €695 million or 10%.
56
The increase in total operating expenses was mainly driven by the following:
| | |
| | • | In 2007 we increased our personnel expenses by €356 million or 9% to €4,174 million, which is the result of the overall headcount increase in 2007 of 4,663 FTE or 12% to 43,861 FTE as of December 31, 2007. We continued to keep a tight control on personnel expenses due to minimal fixed salary increases as well as by adding additional headcount primarily in the major emerging markets with modest salary levels. In total, 35% of the headcount increase in 2007 was realized in India, China and Bulgaria. The share of employees in these three countries increased from 14% in 2006 to 16% as of December 31, 2007. Personnel expenses as percentage of total operating expenses remained stable at 56%. |
| |
| | • | As a result of the strong increase in software and software-related service revenue, cost of purchased licenses (e.g. databases) increased in 2007 by 27%. |
| |
| | • | The incremental headcount and the increase in business activity in 2007 resulted in €54 million or 13% higher travel expenses compared to 2006. |
| |
| | • | Our accelerated investments in connection with SAP Business ByDesign. |
OPERATING EXPENSES
Cost of software and software-related services
| | | | | | | | | | | | | | | | | | | | | |
| | | | | | | | | | | | Change
| | | Change
| |
| | | 2008 | | | 2007 | | | 2006 | | | 2008 vs. 2007 | | | 2007 vs. 2006 | |
| | | € millions | | | | | | | |
| |
| Cost of software and software-related services | | | 1,646 | | | | 1,310 | | | | 1,091 | | | | 26% | | | | 20% | |
| As a percentage of software and software-related service revenue | | | 19% | | | | 18% | | | | 17% | | | | | | | | | |
Cost of software and software-related services consists primarily of:
| | |
| | • | Customer support costs which include: |
| | |
| | • | SAP Enterprise Support (e.g. End-to-end Solution Operations, Global support backbone, 7x 24 Root Cause Analysis (RCA), Custom Code Support, Support for Enhancement Packs, Pro-active Remote Service) |
| |
| | • | Support for Large Enterprises (LE) |
| |
| | • | Standard support (e.g. 24x7 customer problem resolution, remote service delivery) |
| |
| | • | SAP Premium Support (Increased value on standard services) |
| |
| | • | Optimized implementation and ongoing management of End-to-end Solution Operations (costs and risks control by managing customers applications end-to-end) |
| |
| | • | SAP MaxAttention Support (comprehensive support tailored to customer needs) |
| |
| | • | SAP Safeguarding (Reduced implementation or upgrade risk) |
| | |
| | • | Costs of developing custom solutions that address customers’ unique business requirements. |
| |
| | • | License fees and commissions paid to third parties for databases and the other complementary third-party products sublicensed by us to customers. |
2008 compared with 2007. The cost of software and software-related services increased from €1,310 million in 2007 to €1,646 million in 2008, or by 26%, which was mainly due the acquisition of Business Objects, but also due to the expansion of support resources, the €32 million effects of license disputes and increased expenses for third-party license fees. As a percentage of software and software-related service revenue, cost of software and software-related services increased from 18% in 2007 to 19% in 2008.
57
Overall, the workforce in this area increased from 5,831 FTEs in 2007 to 6,458 FTEs in 2008, representing an increase of 11%. The support organization has continued its efforts to improve the efficiency of our processes by moving into low-cost locations (Bulgaria, China and India). Approximately 24% of our global support resources were based in the low-cost locations at the end of 2008, which is an increase of 2 percentage points compared to 2007.
2007 compared with 2006. The cost of software and software-related services increased from €1,091 million in 2006 to €1,310 million in 2007, or by 20%, mainly due to the expansion of support resources and increased expenses for third-party license fees. As a percentage of software and software-related service revenue, cost of software and software-related services increased from 17% in 2006 to 18% in 2007. The decline of the software and software-related services margin was influenced in 2007 by 0.5 percentage points from our accelerated investments in SAP Business ByDesign.
Overall, the workforce in this area increased from 5,243 FTEs in 2006 to 5,831 FTEs in 2007, representing an increase of 11%. The support organization has continued its efforts to improve the efficiency of our processes by moving into low-cost locations (Bulgaria, China and India). Twenty-two percent of the support resources were based in the low-cost locations at the end of 2007, which is an increase of 2 percentage points compared to 2006.
Cost of professional services and other services
| | | | | | | | | | | | | | | | | | | | | |
| | | | | | | | | | | | Change
| | | Change
| |
| | | 2008 | | | 2007 | | | 2006 | | | 2008 vs. 2007 | | | 2007 vs. 2006 | |
| | | € millions | | | | | | | |
| |
| Cost of professional services and other services | | | 2,296 | | | | 2,091 | | | | 2,073 | | | | 10% | | | | 1% | |
| As a percentage of professional services and other service revenue | | | 76% | | | | 76% | | | | 76% | | | | | | | | | |
Cost of professional services and other services consists primarily of consulting and training personnel expenses as well as expenses for third-party consulting and training resources.
2008 compared with 2007. Cost of professional services and other services rose from €2,091 million in 2007 to €2,296 million in 2008, or 10%. As a percentage of professional services and other services revenue, cost of professional services and other service revenue remained steady at 76%. The lower cost increase compared to a slightly higher revenue growth led to a positive professional services and other services margin development in 2008, although that improvement was mainly offset by increased costs resulting from our focused efforts to rapidly integrate the Business Objects professional services activities into our service portfolio. These increased costs negatively influenced our professional services and other services margin by 1.4 percentage points.
The increase in cost of professional services and other services was also due to increased personnel expenses resulting from the integration of Business Objects employees.
2007 compared with 2006. Cost of services increased from €2,073 million in 2006 to €2,091 million in 2007, or 1%. As a percentage of service revenue, cost of services remained the same at 76% in both 2007 and 2006. The professional services and other services margin was influenced in 2007 by 0.5 percentage points from our accelerated investments in SAP Business ByDesign.
The slight increase in cost of professional services and other services was mainly driven by increased personnel expenses due to the hiring of new employees in consulting.
58
Research and Development
| | | | | | | | | | | | | | | | | | | | | |
| | | | | | | | | | | | Change
| | | Change
| |
| | | 2008 | | | 2007 | | | 2006 | | | 2008 vs. 2007 | | | 2007 vs. 2006 | |
| | | € millions | | | | | | | |
| |
| Research and development | | | 1,631 | | | | 1,458 | | | | 1,335 | | | | 12% | | | | 9% | |
| As a percentage of total revenue | | | 14% | | | | 14% | | | | 14% | | | | | | | | | |
Our research and development (R&D) expenses consist primarily of:
| | |
| | • | Personnel expenses related to our R&D employees; |
| |
| | • | Costs incurred for independent contractors retained by us to assist in our R&D activities; and |
| |
| | • | Amortization of computer hardware and software used in our R&D activities. |
2008 compared with 2007. R&D expenses in 2008 increased by 12% to €1,631 million compared to €1,458 million in 2007. As a percentage of total revenue, research and development expenses were 14% in 2008, which is consistent with 2007.
Our R&D expenses in 2008 increased mainly due to incremental headcount. The number of development employees increased by 2,596 FTE or 20% to 15,547 FTE as of December 31, 2008, primarily due to the Business Objects acquisition.
2007 compared with 2006. R&D expenses in 2007 increased by 9% to €1,458 million compared to €1,335 million in 2006. As a percentage of total revenue, R&D expenses were 14% in 2007, which is flat compared to 2006. Around 0.3 percentage points of the 14% increase were related to our accelerated investments in SAP Business ByDesign.
R&D expenses were mainly impacted by incremental headcount. The number of development employees increased by 1,150 FTE or 10% to 12,951 FTE as of December 31, 2007. The R&D organization has continued to build up development resources primarily in locations with modest salary levels, and 66% of the research and development headcount increase in 2007 was realized in India, China and Bulgaria. The share of development headcount based in these three locations increased in 2007 by 3 percentage points to 28%.
Sales and Marketing
| | | | | | | | | | | | | | | | | | | | | |
| | | | | | | | | | | | Change
| | | Change
| |
| | | 2008 | | | 2007 | | | 2006 | | | 2008 vs. 2007 | | | 2007 vs. 2006 | |
| | | € millions | | | | | | | |
| |
| Sales and marketing | | | 2,540 | | | | 2,162 | | | | 1,908 | | | | 17% | | | | 13% | |
| As a percentage of total revenue | | | 22% | | | | 21% | | | | 20% | | | | | | | | | |
2008 compared with 2007. Sales and marketing expenses increased from €2,162 million in 2007 to €2,540 million in 2008 or 17%. As a percentage of total revenue, sales and marketing expenses rose slightly from 21% in 2007 to 22% in 2008. The cost increase resulted primarily from the 2,419 FTE or 29% additional headcount adding up to 10,701 FTE. Of these, 2,184 FTE were integrated into our organization as a result of the acquisition of Business Objects.
2007 compared with 2006. Sales and marketing expenses increased from €1,908 million in 2006 to €2,162 million in 2007 or 13%. As a percentage of total revenue, sales and marketing expenses increased slightly from 20% in 2006 to 21% in 2007. The increase resulted primarily from the 1,232 FTE incremental headcount. In addition, around 0.4 percentage points of the 13% increase were related to our accelerated investments in the new business model for SAP Business ByDesign.
59
Overall employees in sales and marketing increased by 1,232 FTE or 17% to 8,282 FTE in 2007. This growth in 2007 was mainly driven by the sales area while marketing headcount remained almost flat. Around 43% of the sales headcount was hired in the Americas region.
General and Administration
| | | | | | | | | | | | | | | | | | | | | |
| | | | | | | | | | | | Change
| | | Change
| |
| | | 2008 | | | 2007 | | | 2006 | | | 2008 vs. 2007 | | | 2007 vs. 2006 | |
| | | € millions | | | | | | | |
| |
| General and administration | | | 623 | | | | 506 | | | | 464 | | | | 23% | | | | 9% | |
| As a percentage of total revenue | | | 5% | | | | 5% | | | | 5% | | | | | | | | | |
2008 compared with 2007. General and administration (G&A) expenses increased from €506 million in 2007 to €623 million in 2008. This represents an increase of 23%. This increase was driven by increased personnel expenses and other headcount related costs mainly due to the acquisition of Business Objects. As a percentage of total revenue, G&A expenses remained flat from 2007 at 5%.
The number of G&A employees increased by 447 FTE or 16% to 3,244 FTE in 2008. As in the prior year, we continued to expand our shared service centers in all regions to support efficient growth in this area.
2007 compared with 2006. G&A expenses increased from €464 million in 2006 to €506 million in 2007. This represents an increase of 9%. This increase was driven by increased personnel expenses and other headcount related costs due to the incremental headcount. As a percentage of total revenue, G&A expenses remained at 5% as they were in 2006.
The number of G&A employees increased by 325 FTE or 13% to 2,797 FTE in 2007. We continued to expand our shared service centers in all regions to support efficient growth in this area.
Financial Income/Expense, Net
| | | | | | | | | | | | | | | | | | | | | |
| | | | | | | | | | | | Change
| | | Change
| |
| | | 2008 | | | 2007 | | | 2006 | | | 2008 vs. 2007 | | | 2007 vs. 2006 | |
| | | € millions | | | | | | | |
| |
| Financial income/expense, net | | | (62 | ) | | | 124 | | | | 122 | | | | (150 | )% | | | 2% | |
| As a percentage of total revenue | | | (1 | )% | | | 1% | | | | 1% | | | | | | | | | |
Financial income/expense, net is comprised primarily of interest income/expense, net, income/(losses) from equity method investments, and gains/(losses) on sales of equity securities.
2008 compared with 2007. In 2008, we incurred significantly higher interest costs than in 2007 due to an additional acquisition-related bank loan that was taken out in connection with the Business Objects acquisition. Our interest income/expense, net declined by approximately 138% in 2008, resulting in a net interest expense of €51 million. (2007: €135 million net interest income). Consequently, our financial income/expense, net decreased from a net financial income of €124 million in 2007 to a net financial expense of €62 million in 2008.
2007 compared with 2006. In 2007, our net interest income rose 13% to €135 million (2006: €120 million), reflecting higher rates of interest. Impairment charges on minority investments had a minimal negative effect on financial income/expense, net. The hedging of stock appreciation rights (STARs) had no effect on financial income in 2007 (2006: €7 million unrealized gain). In the previous year, the fair value of instruments acquired to hedge anticipated STAR exposures increased before the instruments were designated as hedging the exposure of STARs granted, and the associated revaluation led to the unrealized gain. In 2007, we did not acquire instruments to hedge the anticipated exposure from STARs granted in 2007.
60
Income Taxes
| | | | | | | | | | | | | | | | | | | | | |
| | | | | | | | | | | | Change
| | | Change
| |
| | | 2008 | | | 2007 | | | 2006 | | | 2008 vs. 2007 | | | 2007 vs. 2006 | |
| | | € millions | | | | | | | |
| |
| Income taxes | | | 825 | | | | 921 | | | | 805 | | | | (10 | )% | | | 14% | |
| As a percentage of Income from continuing operations before income taxes | | | 30% | | | | 32% | | | | 30% | | | | | | | | | |
2008 compared with 2007. Our income taxes decreased by 10% in 2008 in comparison to 2007 and our effective tax rate decreased in 2008 to 30.0% from the previous year’s 32.2%. The decrease in our effective tax rate and the corresponding income tax expense in 2008 was the result of a reduction in the rate of corporation tax in Germany from 25% to 15%, effective January 1, 2008, and also a reduction in the rate of trade tax under the German business taxation reform. The decrease can also be attributed to the decline in income before income taxes, which decreased by 4%. The decrease in income before income taxes was mainly due to the reduction in financial income/expense, net and the decrease in other non-operating income/expense, net, which were subject to material negative currency effects. See Note 10 to our consolidated financial statements in “Item 18. Financial Statements,” for further details on income taxes.
2007 compared with 2006. Despite the positive effect of tax-free or low-tax investment in equities and financial assets, income tax rose 14% in 2007 while income from continuing operations before income taxes rose 6%, resulting in an effective tax rate of 32.2% as compared to 29.9% in 2006. Our 2006 effective tax rate was unusually low due to effects of the conclusion of tax audits.
SEGMENT DISCUSSIONS
Currently we have three reportable operating segments: product, consulting and training. Total revenue figures for each of our operating segments differ from the revenue figures classified in our consolidated statements of income because for segment reporting purposes, revenue is generally allocated to the segment that is responsible for the related transactions, regardless of the nature of the sales transaction. The segment contributions reflect only expenses directly attributable to the segments and do not represent the actual margins for the operating segments on a U.S. GAAP basis. Costs such as general and administrative, research and development, share-based compensation, and certain corporate expenses are not allocated to the segments and therefore are not reflected in the segment contribution results. See Note 28 to our consolidated financial statements in “Item 18. Financial Statements” for further details on our segments.
In 2008, operating expenses from share-based compensation plans were €63 million compared to €95 million in 2007 and €99 million in 2006. As noted above, costs related to share-based compensation programs do not impact segment results. These expenses are not recorded within operating segments.
Values in the following table are stated in millions of euros, except for percentage and percentage point figures:
| | | | | | | | | | | | | | | | | |
| | | | | | | | | | | | Change
| | Change
|
Product Segment | | 2008 | | | 2007 | | | 2006 | | | 2008 vs. 2007 | | 2007 vs. 2006 |
| |
| External revenue | | | 8,366 | | | | 7,369 | | | | 6,643 | | | 14% | | 11% |
| Segment expenses | | | (3,655 | ) | | | (3,062 | ) | | | (2,609 | ) | | 19% | | 17% |
| Segment contribution | | | 4,711 | | | | 4,307 | | | | 4,034 | | | 9% | | 7% |
Segment profitability | | | 56% | | | | 58% | | | | 61% | | | (2) percentage points | | (3) percentage points |
61
| | | | | | | | | | | | | | | | | |
| | | | | | | | | | | | Change
| | Change
|
Consulting Segment | | 2008 | | | 2007 | | | 2006 | | | 2008 vs. 2007 | | 2007 vs. 2006 |
| |
| External revenue | | | 2,824 | | | | 2,369 | | | | 2,300 | | | 19% | | 3% |
| Segment expenses | | | (2,040 | ) | | | (1,738 | ) | | | (1,704 | ) | | 17% | | 2% |
| Segment contribution | | | 784 | | | | 631 | | | | 596 | | | 24% | | 6% |
Segment profitability | | | 28% | | | | 27% | | | | 26% | | | 1 percentage
point | | 1 percentage point |
| | | | | | | | | | | | | | | | | |
| | | | | | | | | | | | Change
| | Change
|
Training Segment | | 2008 | | | 2007 | | | 2006 | | | 2008 vs. 2007 | | 2007 vs. 2006 |
| |
| External revenue | | | 525 | | | | 493 | | | | 440 | | | 6% | | 12% |
| Segment expenses | | | (300 | ) | | | (284 | ) | | | (273 | ) | | 5% | | 4% |
| Segment contribution | | | 225 | | | | 209 | | | | 167 | | | 8% | | 25% |
Segment profitability | | | 43% | | | | 42% | | | | 38% | | | 1 percentage
point | | 4 percentage points |
Product Segment
The product segment is primarily engaged in marketing and licensing our software products and providing support for our software products. Support includes technical support for our products, assistance in resolving problems, providing user documentation, unspecified software upgrades, updates and enhancements. The product segment also performs certain custom development projects. The product segment includes the sales, marketing and service and support lines of business.
2008 compared with 2007. Product segment revenue increased by 14% from €7,369 million in 2007 to €8,366 million in 2008, of which approximately €850 million was due to acquisitions. The increase was driven by an increased in customer licensing of our software solutions which in turn contributed to an increase in support revenue. This growth reflects a 17% increase from changes in volumes and prices and a 3% decrease from currency effects. Approximately 98% of revenue within the product segment is derived from software and software-related service revenue. Approximately 2% of revenue within the product segment is derived from non-software related transactions (e.g., professional services, other services, and other revenues) initiated by employees of the product segment. Software revenue as part of the total product segment revenue increased by 3% from €3,269 million in 2007 to €3,356 million in 2008. This growth reflects a 7% increase from changes in volumes and prices and a 4% decrease from currency effects. Support revenue increased by 23% from €3,737 million in 2007 to €4,596 million in 2008. This growth reflects a 27% increase from changes in volumes and prices and a 4% decrease from currency effects. Subscription and other software-related service revenue increased by 42% from €181 million in 2007 to €257 million in 2008.
Product segment expenses increased by 19% from €3,062 million in 2007 to €3,655 million in 2008. Expenses from the sales line of business account for about half of the entire product segment expenses, while expenses from the marketing line of business account for roughly 20% and expenses from the service and support line of business account for roughly 30% of overall product segment expenses. The increase in product segment expenses results mainly from headcount growth of roughly 20%, predominantly due to the acquisition of Business Objects.
Product segment contribution increased by 9% from €4,307 million in 2007 to €4,711 million in 2008, or 56% of total segment revenue compared to 58% of total segment revenue in 2007.
2007 compared with 2006. Product segment revenue increased by 11% from €6,643 million in 2006 to €7,369 million in 2007, driven by increased licensing of our software solutions which then contributed to an increase in support revenue. This growth reflects a 15% increase from changes in volumes and prices and a 4% decrease from currency effects. Approximately 98% of revenue within the product segment wass derived from software and software-related service revenue, with the remaining 2% derived from professional services and
62
other service revenue as well as other revenue. Software revenue as part of the total product segment revenue increased by 12% from €2,926 million in 2006 to €3,269 million in 2007. This growth reflects a 16% increase from changes in volumes and prices and a 4% decrease from currency effects. Support revenue increased by 9% from €3,413 million in 2006 to €3,737 million in 2007. This growth reflects a 14% increase from changes in volumes and prices and a 5% decrease from currency effects. Subscription and other software-related service revenue increased by 41% from €129 million in 2006 to €182 million in 2007. This growth reflects a 45% increase from changes in volumes and prices and a 4% decrease from currency effects.
Product segment expenses increased by 17% from €2,609 million in 2006 to €3,062 million in 2007. Expenses from the sales line of business accounted for about half of the entire product segment expenses, while expenses from the marketing line of business accounted for roughly one-fourth and expenses from the service and support of the line of business accounted also for roughly one-fourth of overall product segment expenses. The increase in product segment expenses resulted mainly from headcount growth — continued investment in aligning our operations to more volume business — and associated personnel travel and infrastructure expenses as well as additional third-party expenses.
Product segment contribution increased by 7% from €4,034 million in 2006 to €4,307 million in 2007, or 58% of total segment revenue compared to 61% of total segment revenue in 2006.
Consulting Segment
The consulting segment is primarily engaged in the implementation of our software products.
2008 compared with 2007. Consulting segment revenue increased by 19% from €2,369 million in 2007 to €2,824 million in 2008. Of this increase €131 million was due to acquisitions. This growth reflects a 24% increase from changes in volumes and prices and a 5% decrease from currency effects. Consulting segment expenses increased by 17% from €1,738 million in 2007 to €2,040 million in 2008. Consulting segment contribution increased by 24% from €631 million in 2007 to €784 million in 2008. The consulting segment profitability increased by 1 percentage point to 28%.
Geographically EMEA, Americas and APJ have all contributed to the strong top line growth in the consulting segments revenue while increased demand has been managed through a 10% increase in resources, predominantly in the global delivery organization which accounts for 30% of this headcount increase, and the newly introduced global hubs which have a focus on strategic solutions and industries. In addition to this increase in workforce, customer related third party delivery costs have increased 3% to support the revenue growth. This growth reflects a 6% growth from changes in volumes and prices and 3% decrease from currency effects.
2007 compared with 2006. Consulting segment revenue increased by 3% from €2,300 million in 2006 to €2,369 million in 2007. This growth reflects a 7% increase from changes in volumes and prices and a 4% decrease from currency effects. Consulting segment expenses increased by 2% from €1,704 million in 2006 to €1,738 million in 2007. Consulting segment contribution increased by 6% from €596 million in 2006 to €631 million in 2007. The consulting segment profitability increased by 1 percentage point to 27%.
Geographically, the strongest growth in 2007 came from the Americas region driven by increased activity in the United States. The increase in demand has been managed through increasing the local workforce by 15% and increased use of SAP’s global delivery resources enabling a reduction in third party delivery costs. The Asia Pacific Japan region also had strong growth in 2007, with activities in China and India increasing substantially. This demand has been met through increased use of global delivery resources, an increase in headcount together with the use of external resources. Consulting revenue in the EMEA region grew at a slower rate but showed significant increase in some areas such as Commonwealth of Independent States (CIS), the Nordic region, Benelux, Iberia, southeast European countries, and the Middle East, which all achieved double digit growth rates.
63
Training Segment
The training segment is primarily engaged in providing educational services on the use of our software products and related topics for customers and partners. Training services include traditional classroom training at SAP training facilities, customer and partner-specific training and end-user training, as well ase-learning.
2008 compared with 2007. Training segment revenue was €525 million in 2008, which represents an increase of 6% from €493 million in 2007. This growth reflects an 11% increase from changes in volumes and prices and a 5% decrease from currency effects. The primary driver of this growth was traditional classroom training, where revenue growth of 16% was achieved. Revenue in the other sectors such as academy and certification, customer specific training ande-learning experienced marginal growth.
Of the €525 million training segment revenue recognized in 2008, €39 million resulted from businesses acquired in 2008. Of the core SAP business, before acquisitions, EMEA and APJ grew 6% and 18% respectively while the Americas decreased by 18% from €192 million to €158 million. North America shrank by 22% counteracting the 4% growth shown in Latin America.
Training segment expenses increased from €284 million in 2007 to €300 million in 2008, or 5% mainly due to acquisition-related headcount growth.
Training segment contribution increased by 8% from €209 million in 2007 to €225 million in 2008. Training segment margin increased by 1 percentage point to 43%.
2007 compared with 2006. Training segment revenue was €493 million in 2007, which represents another strong increase of 12% from €440 million in 2006. This growth reflects a 16% increase from changes in volumes and prices and a 4% decrease from currency effects. While traditional classroom training grew rather marginally, strong revenue growth was achieved primarily ine-learning, academy training, and customer-specific training. Although it still represents a rather small proportion of 9% of total training revenue,e-learning continues to rise in popularity and grew significantly in 2007 by 181%.
Training segment expenses increased from €273 million in 2006 to €284 million in 2007, or 4%. The cost of internal and external resources increased to support the growing business.
Training segment contribution increased by 25% from €167 million in 2006 to €209 million in 2007. Training segment margin increased by 4 percentage points to 42%.
OUTLOOK 2009
Future Trends in the Global Economy for 2009
At the end of 2008, the IMF believed that after massive revaluations in the second half of the year, the prospects for global economic development would remain poor as the financial sector continued to contract. The Organisation for Economic Co-operation and Development (OECD) noted in November that it was extraordinarily difficult to make reliable predictions about the economy at the turn of 2008/2009.
As the IMF reported, it was widely held that conditions and developments on the international financial markets continued to pose a considerable risk for the global economy. Overvalued assets on the books of the banks and financial institutions and falling property prices had materially worsened global economic conditions, the IMF reported. It noted that companies were responding by reducing capacity and holding back investment in capital goods, and that the effects would be felt well into 2009.
According to the IMF’s January 2009 projections, in 2009 annual world output growth will decelerate to 0.5% from 3.4% in 2008. Compared to the previous year, the IMF expects significant decreases in output in the advanced economies (2%) and world trade (2.8%) in 2009. A sustained recovery will not be possible until the functionality of the financial sector is restored and the credit markets are unclogged, the IMF says. At the end of
64
November 2008, the OECD was already forecasting a 0.4% contraction in the economies of its member states in 2009.
The IMF’s January 2009 projections envisage a 1.6% reduction in U.S. gross domestic product (GDP) in 2009. In January 2009, the U.S. Congressional Budget Office also expected a contraction in the U.S. economy in 2009, with inflation-adjusted GDP falling 2.2% — and the longest and deepest recession in the United States since the Second World War. According to the ECB, restrictive credit terms, the shortage of work, weaker corporate balance sheets, and uncertain economic prospects are all discouraging U.S. households and businesses from spending. The continuing contraction of the housing market and decreased demand for exports also represent risks for the prospects of the U.S. economy, it reported.
The IMF, in its January 2009 report, projected a decline in euro area output of 2.0% in 2009. The ECB also projected at the end of 2008 that 2009 would see continuing weakness in the global economy and very subdued demand on the domestic market. Provided some of the gloom lifts from surrounding economies and some of the tension is resolved on the financial markets, the ECB envisages that the second half of 2009 could see the beginnings of a recovery in the euro area, encouraged by an easing of commodity prices. However, it believes the downside risks predominate. Chief among these are that the turbulence on the financial markets may have a greater impact on the real economy than previously foreseen and that global macroeconomic imbalances may stoke protectionism and other uncontrollable phenomena.
In its January 2009 report the IMF forecast that, like the euro area as a whole, Germany would experience significant economic decline in 2009, with GDP contracting 2.5%. The German central bank, the Deutsche Bundesbank, anticipated at the end of 2008 that early 2009 would see a considerable decrease in activity in the real economy in Germany. It noted that bailout measures instigated by governments in many countries represented a broad base on which control over the global crisis of confidence might be asserted, but that for the rest of 2009 the burdens on the economy would be heavy. The Deutsche Bundesbank did not believe the German economy would regain momentum until a revival in the global economy, expected in 2010.
Japan will also experience significant decline in 2009, with GDP contracting 2.6%, according to the January 2009 forecast published by the IMF. According to the ECB, the beginning of the year would be marked by slow consumer spending and weak export demand. In the countries in Asia with developing and emerging economies, according to the ECB growth would decline further in 2009 owing to the spreading global economic downturn, tight finance, the weak real estate market, and the delayed effects of earlier restrictive measures.
IT Market: Outlook for 2009
The gloomy prospects for the development of the global economy will continue to hamper demand for IT worldwide, according to research published at the beginning of 2009 by U.S. market research firm IDC. It believes businesses’ demand for IT will grow much more slowly. The influence of the wider economy will be stronger than usual and will only partly be offset by IT industry factors. UBS, a financial services company, also points to the close connection between economic growth and IT industry growth, calculating a historical correlation of 0.71 between global output growth and global IT spending growth.
IDC’s expectations for the growth of the IT market reflect deepening pessimism: In the summer of 2008, IDC was still expecting 5.9% growth in global IT spending in 2009, by February 2009 it had revised this prediction to 0.5%. It foresees the most significant decline in demand in the hardware segment. In February 2009, it projected hardware spending would decrease 3.6%. In the summer of 2008, IDC was expecting 6.2% growth in application software spending in 2009; by February 2009 it had revised this projection to 2.7%. In both the packaged software and the IT services segments, in February 2009 IDC projected 3.4% spending growth in 2009. In January 2009, Forrester Research, another major market research firm in the United States, predicted global IT spending would decline 3% in U.S. dollar terms in 2009, after seven years of continuous growth. The reasons it gives for this forecast are the impending recession in the United States, and currency effects. Like IDC, Forrester
65
also believes software will be the segment to perform best in the global IT market, with spending virtually unchanged.
IDC expects the turbulence on the financial markets to have a greater impact on the emerging markets, which have hitherto seen relatively strong growth in this sector. Notably, this would affect the economies of eastern Europe, including Russia, where the global shortage of credit and tighter lending standards would particularly impact companies’ IT spending. In the EMEA region, it projects that 2009 overall IT spending will be unchanged (0.0%) since the previous year, with growth in the services segment being the highlight at 2.5%. It expects a modest increase in demand for IT in 2009 in the Americas region: Here it predicts overall IT sales will rise 0.6%, led by packaged software spending and services spending increases of 3.9% and 3.5% respectively. In February 2009, IDC said it expected IT demand to hold up best in the APJ region. It believes spending will grow 1.3% there overall in 2009, helped by increases of 5.4% in services sales and 5.2% in packaged software sales.
In its discussion of future trends, IDC identifies several factors that could have a positive effect in the IT industry. For example, it suggests that convergence could buoy IT demand: convergence of the telephone network and the Internet, of IT and communications technologies, and of storage, routing, and processing in data centers. Convergence may drive new competitive dynamics and offer new applications and functions to customers. IDC reports that the resulting stricter legal and regulatory compliance demands should help sales of sophisticated GRC software, both for initial deployment and to replace older applications.
IDC sees a further positive factor in the transformation process that the software industry is just entering. That transformation includes basic architectures (such as SOA) and the way software is written and delivered. The associated new avenues for using software and new functions are expected to generate new demand. IDC says applications will become more complex as they grow more powerful. This would create space and edge for vendors offering applications and systems that help reduce complexity. IDC assumes that the transformation will take considerable time but will also spur short and medium term demand as companies transition from legacy systems to SOA-based solutions. It expects new software creation and delivery models to play a key role.
IDC also identifies the growing dynamism of IT as a short term factor: The rate at which the power and productivity of IT grows from version to version is accelerating. At the same time, applications markets are converging and the functional scope of individual applications is widening, reducing the attraction of highly specialized applications. This means the new solutions address functionally broader markets, which increases their chance of success. Finally, IDC notes that companies will continue to demand more data security, increasing the demand for IT solutions that satisfy their requirements in that respect. The more complex software grows, the more vulnerable it becomes to attack. This will draw companies toward powerful security solutions, IDC says. It expects this segment to grow significantly. IDC says the current economic problems will impede these trends but cannot stop them.
2009 Financial Outlook for SAP
Due to the continuing uncertainty surrounding our economic and business environment, we will not publish specific outlook guidance for our 2009 software and software-related service revenue.
| | |
| | • | We expect our 2009 non-GAAP operating margin, which excludes a nonrecurring deferred support revenue writedown from the acquisition of Business Objects of approximately €9 million and acquisition-related charges, to be in the range of 24.5% to 25.5% at constant currencies. That includes nonrecurring restructuring costs of between €200 million and €300 million that we expect to incur as we reduce our workforce and that we expect will negatively impact our non-GAAP operating margin by approximately 2 to 3 percentage points. Our 2009 non-GAAP operating margin outlook is based on the assumption that our 2009 non-GAAP software and software-related service revenue, which excludes a nonrecurring deferred support revenue writedown from the acquisition of Business Objects, will be unchanged or decline not more than 1% at constant currencies (2008: €8,623 million). |
| |
| | • | We expect a corresponding decrease in our operating income. |
66
| | |
| | • | We project an effective tax rate for 2009 of 29.5% to 30.5% (2008: 30.1%) based on U.S. GAAP income from continuing operations. |
| |
| | • | If the Annual General Meeting of Shareholders so resolves, in 2009 we will again pay a dividend that provides a payout ratio of about 32%. |
Excepting acquisitions, our planned capital expenditures for 2009 will be covered in full by operating cash flow and will chiefly be spent on completing new office buildings at various locations.
Among the premises on which this outlook is based are those presented concerning economic development and our expectation that we will not benefit from any positive effects in 2009 from a major acquisition. We also assume that our results in the first half of 2009, and especially in the first quarter, will hardly be comparable with our very good performance in the first half of 2008 before the beginning of the economic crisis.
Medium-Term Perspectives
We expect our business and revenue to continue to grow, assuming the current economic crisis does not have long-term consequences. Our strategy is to increase software and software-related service revenue, which comprises software and maintenance revenue and subscriptions and other software-related services.
The completion of our SOA development road map (which means all SAP solutions now run on a business process platform), the introduction of our SAP Business ByDesign solution, and our acquisition of Business Objects will open up potential for us to address more markets. We estimate that the total volume of the software and software-related services segment of the markets in which we now operate and will operate in the future will grow from currently about US$70 billion to about US$75 billion by 2010.
By 2010, we hope to increase our customer numbers to about 100,000. We expect 50% of our orders received to be for new products by 2010.
FOREIGN CURRENCY EXCHANGE RATE EXPOSURE
Although our reporting currency is the euro, a significant portion of our business is conducted in currencies other than the euro. International sales are primarily made through our subsidiaries in the respective regions and are generally denominated in the local currency, although in certain countries where foreign currency exchange rate exposure is considered high, some sales may be denominated in euro or U.S. dollars. Expenses incurred by our subsidiaries are generally denominated in the local currency. Accordingly, the functional currency of our subsidiaries is the local currency. Therefore, movements in the foreign currency exchange rates between the euro and the respective local currencies to which our subsidiaries in countries that do not participate in the euro are exposed, may materially affect our consolidated financial position, results of operations and cash flows. In general, appreciation of the euro relative to another currency has a negative effect on our results of operations, while depreciation of the euro has a positive effect. As a consequence, period-to-period changes in the average exchange rate in a particular currency can significantly affect our revenue, operating results and net income. The principal currencies in which our subsidiaries conduct business that are subject to the risks described in this paragraph include the U.S. dollar, the Japanese yen, the British pound, the Swiss franc, the Canadian dollar, and the Australian dollar. We enter into derivative instruments, primarily foreign exchange forward contracts, to protect our anticipated cash flows from foreign subsidiaries from the effects of foreign currency exchange fluctuations. See also “Item 11. Quantitative and Qualitative Disclosures About Market Risk — Foreign Currency Exchange Rate Risk” and Note 26 to our consolidated financial statements in “Item 18. Financial Statements.”
Approximately 64% of our consolidated revenue in 2008 and approximately 66% in 2007 was attributable to operations in non-euro participating countries and such revenues had to be translated into euros for financial reporting purposes. Fluctuations in the value of the euro had negative effects on our consolidated revenue of
67
€402 million, income before income taxes of €146 million and net income of €129 million for 2008, and had negative effects on our consolidated revenue of €365 million, income before income taxes of €118 million and net income of €99 million for 2007. See “Item 11. Quantitative and Qualitative Disclosures About Market Risk — Foreign Currency Exchange Rate Risk.”
The impact of foreign currency exchange rate fluctuations discussed in the preceding paragraph is calculated by translating current period figures in local currency to euros at the monthly average exchange rate for the corresponding month in the prior year. Throughout this Annual Report onForm 20-F, we discuss our financial performance without the effect of foreign currency fluctuations on a “constant currency basis,” which is calculated in the same manner.
CRITICAL ACCOUNTING POLICIES
Our consolidated financial statements are prepared based on the accounting policies described in Note 3 to our consolidated financial statements in “Item 18. Financial Statements” in this Annual Report onForm 20-F. The application of such policies may require management to make significant estimates, judgments and assumptions that can have a significant impact on amounts reported in our consolidated financial statements. We base our assumptions, judgments and estimates on historical experience and various other factors that we believe to be reasonable under the circumstances. Actual results could differ materially from these estimates under different assumptions or conditions. The accounting policies that most frequently require us to make significant estimates, judgments and assumptions, and therefore are critical to understanding our results of operations, are:
| | |
| | • | Revenue recognition; |
| |
| | • | Valuation of accounts receivable; |
| |
| | • | Accounting for share-based compensation; |
| |
| | • | Accounting for income taxes and uncertain income tax positions; |
| |
| | • | Valuation of acquired assets; and |
| |
| | • | Legal contingencies. |
Our management periodically discusses these critical accounting policies with the Audit Committee of the Supervisory Board. Historically, our significant estimates, judgments and assumptions relative to our critical accounting policies have not differed materially from actual results. Please refer to Note 3 to our consolidated financial statements in “Item 18. Financial Statements” for further discussion of our accounting policies.
Revenue Recognition
We derive our revenues from the sale or the license of our software products and of support services, subscriptions, consulting, development, training, and other professional services. The vast majority of our software is sold or licensed in multiple-element arrangements that include support services and often professional services, development, or other elements. We therefore license our software generally in multiple-element arrangements. We recognize revenue pursuant to the requirements of the American Institute of Certified Public Accountants (“AICPA”) Statement of Position97-2, Software Revenue Recognition(“SOP 97-2”), as amended, when persuasive evidence of an arrangement exists, delivery has occurred, the fee is fixed or determinable, and collectability is probable. If at the outset of an arrangement we determine that the arrangement fee is not fixed or determinable, revenue is deferred until the arrangement fee becomes due and payable by the customer. If at the outset of an arrangement we determine that collectability is not probable, revenue is deferred until payment is received or collectability has become probable. The determination of whether fees are fixed or determinable or whether the fees are collectible is inherently judgmental. As a result, the timing or amount of revenue recognition can vary depending on what assessments have been made.
68
Revenue on multiple-element arrangements is recognized using the residual method when company-specific objective evidence of fair value exists for all of the undelivered elements (for example, support services, consulting, or other services) in the arrangement, but does not exist for one or more delivered elements (for example, software). We allocate revenue to each undelivered element based on its respective company- or vendor-specific objective evidence of fair value (“VSOE”), which is the price charged when that element is sold separately or, for elements not yet sold separately, the price established by our management if it is probable that the price will not change before the element is sold separately. We allocate revenue to undelivered support services based on company-wide rates charged to renew the support services annually after an initial period. Such renewal rates generally represent a fixed currency amount or a fixed percentage of the discounted software license fee charged to the customer. The vast majority of our customers renew their annual support service contracts. We defer revenue for all undelivered elements based on their respective VSOEs and recognize the residual amount of the arrangement fee attributable to the delivered elements, if any, when the basic criteria inSOP 97-2 have been met. We review our VSOEs at least annually. If we are unable to establish or maintain a VSOE for one or more undelivered elements within a multiple-element arrangement, it could adversely impact our revenues, results of operations and financial position because we may have to defer all or a portion of the revenue from multiple-element arrangements.
We have ongoing relationships with many of our customers and often enter into several transactions with the same customer within close proximity in time. Therefore, it is critical to determine what constitutes a multiple-element arrangement with a particular customer. Also determining what constitutes a separate element in the arrangement may involve judgment; for example, a right to an incremental discount on a customer’s future purchases of software or services could become a separate element in a multiple-element arrangement which we need to separately account for if that incremental discount is considered to be significant.
If a multiple-element arrangement involves significant production, modification, or customization of the software, or is otherwise determined to contain elements (such as consulting services) that are deemed to be essential to the functionality of the software elements, software revenue, which might otherwise be recognized immediately, needs to be deferred and recognized as the essential services are provided. The determination of whether the arrangement involves significant production, modification, or customization of the software or whether an element is essential to the other elements could be complex and requires the use of judgment.
Also, the determination of the amount of revenue from custom joint development agreements, development services and consulting services to recognize in a given period typically is based on the amount of work completed up to that point. This requires us to make estimates about total cost to complete the project and the stage of completion. The assumptions, estimates, and uncertainties inherent in determining the stage of completion affect the timing and amounts of revenues and expenses reported. If we do not have a sufficient basis to measure the progress of completion or to estimate the total contract revenues and costs, revenue is recognized when the project is complete and, if applicable, final acceptance is received from the customer. Changes in estimates of progress towards completion and of contract revenues and contract costs are accounted for as cumulativecatch-up adjustments to the reported revenues for the applicable contract.
Valuation of Accounts Receivable
Accounts receivable are recorded at invoiced amounts less an allowance for doubtful accounts. The allowance for doubtful accounts represents our best estimate of the amount of probable credit losses in our existing accounts receivable portfolio. We determine the allowance for doubtful accounts using a two-step-approach. After giving consideration to the financial solvency of specific customers, we evaluate homogenous portfolios of receivables according to their default risk primarily based on the age of the receivable and historical loss experience, but also taking into consideration general market factors such as the current economic crisis and how that might impact our receivable portfolio. A continuation or worsening of the economic crisis may lead to additional write-offs.
69
We believe that the accounting estimate related to the establishment of the allowance for doubtful accounts is a critical accounting policy because the assessment of whether a receivable is collectible is inherently judgmental and requires the use of assumptions about customer defaults that could change significantly. Under U.S. GAAP, a valuation allowance must be recognized when it is probable that a credit loss will occur and the amount of such loss is reasonably estimable. Judgment is required when we evaluate available information about a particular customer’s financial situation to determine whether an allowance for that specific account is necessary. Basing the general allowance for the remaining receivables on our historical loss experience, too, is highly judgmental as history may not be indicative of future development, particularly in unusual and extreme global economic circumstances resulting from the global financial crisis. Changes in our estimates about the allowance for doubtful accounts could materially impact the reported assets and expenses in our financial statements and net income could be adversely affected if actual credit losses exceed our estimates.
Total accounts receivable at December 31, 2008 and 2007 were €3,130 million and €2,898 million, respectively, which were net of an allowance for bad debts of €51 million in 2008 and €21 million in 2007. Net amounts charged to expense/(income) to provide for allowances for doubtful accounts were €29 million, €6 million and €(40) million, during 2008, 2007, and 2006, respectively.
Specific customer credit loss risks are charged to the respective cost of software and maintenance or cost of service. Customer credit loss risks based on aging of the receivables are classified as general bad debt expense, which is included in “Other operating income/expense, net” as disclosed in Note 7 to our consolidated financial statements in “Item 18. Financial Statements.”
Charges for credit loss risks were as follows:
| | | | | | | | | | | | | |
| | | 2008 | | | 2007 | | | 2006 | |
| | | € millions | |
| |
| Specific customer credit loss risks | | | 20 | | | | 9 | | | | 3 | |
| Customer credit loss risks based on aging of the receivables — charged to expense/(income) | | | 9 | | | | (3 | ) | | | (43 | ) |
| | | | | | | | | | | | | |
| Total amounts charged to expense/(income) for allowances for doubtful accounts | | | 29 | | | | 6 | | | | (40 | ) |
| | | | | | | | | | | | | |
Accounts receivable written off against the allowance for doubtful accounts approximated €3 million, €8 million and €5 million during 2008, 2007, and 2006, respectively.
Accounting for Share-Based Compensation
As further explained in Note 27 to our consolidated financial statements in “Item 18 Financial Statements,” as of December 31, 2008 we had two share-based compensation plans classified as equity awards (SAP Stock Option Plan 2002 and Long Term Incentive 2000 Plan) and four share-based compensation plans that are classified as liability: STAR Plan; Incentive Plan 2010; Virtual Stock Option Plan 2007; and Business Objects Plan. Furthermore, we have various employee share purchase plans. Effective January 1, 2006, we adopted the fair value recognition provisions of SFAS 123 (revised 2004),Share-Based Payment (“SFAS 123R”), using the modified-prospective transition method. Accordingly, equity-classified awards are measured at grant date fair value and are not subsequently remeasured. Liability-classified awards are remeasured to fair value at each balance sheet date until the award is settled.
For the years presented in our consolidated financial statements in “Item 18 Financial Statements,” we did not change any plan terms of our existing share-based compensation plans. The historical Business Objects plans were modified by Business Objects in anticipation of the closing of our acquisition of Business Objects in accordance with local regulations to preserve the liquidity of the shares underlying the options and restricted stock units granted under these plans. Options and restricted stock units granted under the Business Objects plans included several plans, some of which related to employees of companies previously acquired by Business Objects. For further information, see Note 27 to our consolidated financial statements in “Item 18. Financial Statements.”
70
To estimate the fair values of our stock options and convertible bonds granted under the share-based compensation plans classified as equity awards (Stock Option Plan 2002 and Long Term Incentive 2000 Plan) we used the Black-Scholes-Merton option-pricing model. As described in Note 27 to our consolidated financial statements in “Item 18. Financial Statements,” this option-pricing model requires that we use a number of assumptions, including expected future stock price volatility and expected option life (which represents our estimate of the average amount of time remaining until the options are exercised or expire unexercised).
The last stock options granted under SAP SOP 2002 Plan and Long Term Incentive 2000 Plan were granted in 2006 and 2002, respectively. For options granted in 2006 and 2005, the expected life of the options was determined using the “simplified method” to be 3.5 years, which represented the average of the vesting period and the contractual term of the awards. This approach was used because we did not have sufficient information about the historical exercise behavior of equity-based options granted to our employees. For awards granted from 2002 to 2004, the expected term of the awards was determined to be 2.5 years. Expected volatilities are based on implied volatilities of traded options to purchase our common share granted in 2006 and 2005 and based on historical data for options granted between 2002 and 2004.
Additionally, our share price on the date of grant influences the option value. Even though the exercise price of most options equals or is connected to the quoted market price of our stock on the grant date, the higher the share price, the higher the option value.
We intend to continue using share-based compensation awards to attract and retain senior managers and select employees. However, we do not intend to grant any more options under equity-classified awards and instead intend to make use of share-based compensation awards classified as a liability.
For purposes of determining the estimated fair value of our stock options, we believe expected volatility is the most sensitive assumption. Changes in the volatility assumption could significantly impact the estimated fair values calculated by the Black-Scholes-Merton or other binomial option-pricing model.
Accounting for Income Taxes and Uncertain Income Tax Positions
We conduct operations and earn income in numerous foreign countries and are subject to changing tax laws in multiple jurisdictions within the countries in which we operate. In addition, there are numerous transactions where the ultimate tax outcome is uncertain such as those involving revenue sharing and cost reimbursement arrangements between SAP Group companies. Significant judgments are necessary in determining our worldwide income tax accruals and provisions in accordance with FIN 48, “Accounting for Uncertainty in Income Taxes — an interpretation of FASB Statement No. 109.” Although we believe we have made reasonable estimates about the ultimate resolution of our tax uncertainties based on current tax laws and our interpretation of current tax laws, no assurance can be given that the final tax outcome of these matters will be consistent with what is reflected in our historical income tax provisions and accruals. Such differences could have a material effect on our income tax provision and net income in the period in which such determinations are made.
We recognize deferred tax assets and liabilities for temporary differences between the book and tax bases of assets and liabilities using enacted tax rates in effect for the year in which we expect the differences to reverse. We record a valuation allowance to reduce the deferred tax assets to the amount that is more likely than not to be realized. In evaluating our ability to utilize our deferred tax assets, we consider all available positive and negative evidence, including our past operating results, our forecast of future taxable income. Our judgments regarding future taxable income are based upon expectations of market conditions and other facts and circumstances. Any adverse change to the underlying facts or our assumptions could require that we reduce the carrying value of our net deferred tax assets. Furthermore, our use of different estimates, assumptions and judgments in connection with tax planning strategies and tax uncertainties could result in materially different carrying values of our income tax asset and liability amounts and therefore could adversely impact our recorded income tax amounts.
71
As of December 31, 2008, we have cumulative undistributed earnings from certain foreign subsidiaries of approximately €2.764 million that are currently deemed to be permanently reinvested. Changes in economic or other circumstances may impact our decision to repatriate some or all of these undistributed earnings which would result in the recognition of additional income tax liabilities.
Valuation of acquired assets
We account for all business combinations using the purchase method of accounting which requires that the assets acquired and liabilities assumed be recorded at the date of acquisition at their estimated fair values. Any excess of the acquisition cost of the business combination over the estimated fair values of the identifiable net assets acquired (e.g. any tangible assets acquired, those intangible assets that are required to be recognized and reported separately from goodwill, and any liabilities assumed) is recorded as goodwill in the balance sheet and is generally denominated in the local currency of the related acquisition. Goodwill is allocated to our segments based on fair values.
In addition to assets acquired in business combinations, as part of our ongoing operations we purchase other intangible assets such as intellectual property. These acquired assets are reviewed for impairment when significant events occur or there are changes in circumstances that indicate that the carrying amount of these assets or asset groups may not be recoverable.
Estimating the fair value to be assigned to each class of assets acquired and liabilities assumed and the determination of the appropriate reporting units to which any goodwill should be allocated involves considerable management judgment. The necessary valuations are based on information available at the acquisition date and are based on expectations and assumptions that have been deemed reasonable by management. These judgments, estimates and assumptions can materially affect our results of operations.
In connection with the acquisition of Business Objects, we recognized goodwill of approximately €3.5 billion and identifiable intangible assets of approximately €1.0 billion. Factors that contributed to our recognition of goodwill in connection with the acquisition of Business Objects are expected synergies from combining the activities of the two companies as well as assets which cannot be recognized separately apart from goodwill because they are not identifiable (such as the quality and level of education of the workforce). The results of Business Objects have been included in the consolidated financial statements from the date of acquisition. In connection with the acquisition we incurred restructuring costs as a result of severance and relocation of workforce, the elimination of duplicate facilities, and contract terminations. Such costs have been recognized as liabilities of the acquired entities.
In accordance with Statement of Financial Accounting Standards No. 142,Goodwill and Other Intangible Assets(“SFAS 142”), we review the carrying amount of goodwill for impairment on an annual basis. Additionally, we perform an impairment assessment of goodwill and other intangible assets whenever events or changes in circumstances indicate that the carrying value of goodwill and other intangible assets may not be recoverable. In making that assessment, we use certain assumptions and estimates about future cash flows, which are complex and often subjective. They can be affected by a variety of factors, including changes in our business strategy, our internal forecasts and estimation of our weighted-average cost of capital.
Due to the above factors, actual cash flows and values could vary significantly from the forecasted future cash flows and related values derived using the discounted cash flow method. Although we believe the assumptions and estimates we have made in the past have been reasonable and appropriate, different assumptions and estimates could materially affect our reported financial results. We did not record any impairment charges on our goodwill or intangible assets during fiscal year 2008. However, the amount of goodwill and other intangible assets on our consolidated balance sheet has increased significantly in 2008, primarily as a result of the Business Objects acquisition. As of December 31, 2008, the carrying amounts of our goodwill and intangible assets, net were €5,009 million and €1,127 million, respectively (2007: €1,423 million and €403 million, respectively). Although we do not currently have an indication of any significant impairment,
72
there can be no assurance that impairment charges will not occur in the future. For more information, see Note 16 to our consolidated financial statements in “Item 18. Financial Statements.”
Legal Contingencies
Currently we are involved in various claims and legal proceedings. We review the status of each significant matter on at least a quarterly basis and assess our potential financial and business exposures related to such matters. We make a provision for a liability for such matters when it is both probable that a liability has been incurred and the amount of the loss can be reasonably estimated pursuant to SFAS No. 5,Accounting for Contingencies. Significant judgment is required in (a) the determination whether a liability has been incurred, (b) the determination of the probability of loss, (c) the determination whether the amount of a probable loss is reasonably estimable and (d) the estimate of the probable loss. Due to uncertainties relating to these matters, accruals are based only on the best information available at the time. As additional information becomes available, we reassess the potential liability related to our pending claims and litigation and may revise our estimates and any related accruals. Such revisions to our estimates of the potential liabilities could have a material impact on our results of operations and financial position. The effects of changes in estimates of potential liabilities related to our legal contingencies had no material impact on 2008, 2007 or 2006 results. See Note 24 to our consolidated financial statements in “Item 18 Financial Statements.”
NEW ACCOUNTING STANDARDS NOT YET ADOPTED
See Note 3 to our consolidated financial statements in “Item 18 Financial Statements.”
LIQUIDITY AND CAPITAL RESOURCES
Our primary source of cash, cash equivalents and short-term investments is funds generated from our business operations. Over the past several years, our principal use of cash has been to support continuing operations and our capital expenditure requirements resulting from our growth, to pay dividends on our shares, to buy back SAP shares in the open market and to acquire businesses. Cash and cash equivalents are primarily held in euro and U.S. dollars as of December 31, 2008.
We use global centralized financial management to control liquid assets as well as monitor exposure to interest rates and currencies with the goal of achieving adequate liquidity for the SAP Group. High levels of liquid assets and marketable securities provide a strategic reserve, helping keep SAP flexible, sound, and independent. The €1 billion syndicated credit facility and other, bilateral lines of credit are currently available for additional liquidity if required.
We believe that our working capital is sufficient to meet our present operational needs and, together with expected cash flows from operations, will support our currently planned capital expenditure requirements for the next twelve months. However, given the current uncertain economic environment, there can be no assurance that a further downturn in the economy worldwide, in a particular region, or in demand for our products and services in general, will not have a material adverse impact on our liquidity.
To complement or expand our business in the future, we have made and expect to make acquisitions of businesses, products and technologies, and to enter into joint venture arrangements. These acquisitions or joint venture arrangements may require additional financing. Due to the financial market crisis additional financing will generally be more difficult to obtain. Refinancing costs (credit spreads) have significantly increased during the last12-18 months.
In connection with our acquisition of Business Objects we entered into a €5 billion credit facility in October 2007 (subsequently reduced to €4.45 billion as of December 31, 2007 and further reduced to €2.95 billion in February 2008). The credit facility has to be repaid by December 31, 2009. As of March 9, 2009, we had outstanding borrowings of €2.3 billion on this credit facility.
73
Due to the current global economic conditions and the credit markets in particular, refinancing conditions have become markedly more difficult. Therefore, we monitor funding options available in the capital markets and trends in the availability of funds as well as the cost of such funding. Depending on our future cash needs and future market conditions, we might issue debt instruments available to us with a view to maintaining financial flexibility and limiting repayment risk.
The table below presents our cash and cash equivalents as well as short-term investments as of December 31:
| | | | | | | | | | | | | |
| | | 2008 | | | 2007 | | | % change | |
| | | € millions | | | | |
| |
| Cash and cash equivalents | | | 1,277 | | | | 1,608 | | | | (21 | )% |
Restricted cash(1) | | | 3 | | | | 550 | | | | (99 | )% |
| Short-term investments | | | 382 | | | | 598 | | | | (36 | )% |
| | | | | | | | | | | | | |
| Total | | | 1,662 | | | | 2,756 | | | | (40 | )% |
| |
| (1) | The restricted cash balance as of December 31, 2007 represents a security deposit that served as collateral for the credit facility entered into in connection with the acquisition of Business Objects. |
Cash and cash equivalents consist of cash at banks and highly liquid investments with original maturity of three months or less, including mainly money market funds and time deposits. Short-term investments consist of investments with original maturities of greater than three months and remaining maturities of less than one year, including time deposits, money market funds and other available-for-sale debt and marketable equity securities. Investments with maturities beyond one year or certain cost- and equity-method equity investments may be classified as short-term based on their highly liquid nature and because such marketable securities represent the investment of cash that is available for current operations. The decrease in cash and cash equivalents and short-term investments from 2007 was mainly due to the use of liquidity for acquisitions, continued repurchase of our own shares, dividend payments, and repayments of short-term debt. See Note 3 to our consolidated financial statements in “Item 18 Financial Statements” for a related discussion on how we define short-term investments.
Total net interest expenses amounted to €51 million in 2008 compared to net interest income of €135 million in 2007 and €120 million in 2006. The change is primarily due to strong increase in interest expenses following the credit facility we entered into in connection with the acquisition of Business Objects (€123 million in 2008 compared to €7 million in 2007 and €4 million in 2006). Interest income was also considerably lower due to a generally lower interest rate environment (€72 million in 2008 compared to €142 million in 2007 and €124 million in 2006). In addition to foreign currency exposure, we are generally exposed to fluctuations in the interest rates of many of the world’s leading industrialized countries. Our interest income and expense are most sensitive to fluctuations in the level of U.S. dollar and euro interest rates.
We operate globally and have subsidiaries in over 50 countries. Our foreign subsidiaries license SAP AG’s software products to local customers and remit a certain percentage of the revenue to SAP AG in Germany as license fees. We have experienced and expect to experience situations where the amount of funds transferred from our subsidiaries in certain countries to Germany are restricted due to economic or legal reasons. The impact of such restrictions on our intercompany transfers has been and is expected to be insignificant.
Cash, cash equivalents and short-term investments mainly consisted of amounts held in U.S. dollars (approximately €361 million) and in euro (approximately €764 million) as of December 31, 2008.
74
Analysis of Consolidated Statements of Cash Flow
| | | | | | | | | | | | | | | | | | | | | |
| | | Years ended December 31, | | | Change
| | | Change
| |
| | | 2008 | | | 2007 | | | 2006 | | | 2008 vs. 2007 | | | 2007 vs. 2006 | |
| | | | | | € millions | | | | | | | | | | |
| |
| Net cash provided by operating activities | | | 2,183 | | | | 1,950 | | | | 1,855 | | | | 12 | % | | | 5 | % |
| Net cash used in investing activities | | | (3,769 | ) | | | (1,392 | ) | | | (132 | ) | | | 171 | % | | | 955 | % |
| Net cash provided by/(used in) financing activities | | | 1,281 | | | | (1,287 | ) | | | (1,375 | ) | | | 200 | % | | | (6 | )% |
Cash provided by operating activities increased by €233 million or 12% in 2008 over 2007 mainly attributable to effective management of our working capital, for example, the cost-savings measures implemented in 2008. Consistent with the revenue growth (13% in 2008), our accounts receivable balance increased by €232 million or 8% in 2008 while our rolling12-month average collection period, which is measured in days sales outstanding, or DSO (defined as average number of days from revenue recognition to cash receipt from the customer) increased from 66 days in 2007 to 71 days in 2008, mainly as a result of the deteriorating economic conditions. Cash used in investing activities increased significantly from €1,392 million in 2007 to €3,769 million in 2008 mainly due to our acquisition of Business Objects which led to an increase of cash outflows for acquisitions by €3,101 million from €672 million in 2007 to €3,773 million in 2008. Also, in 2008 we invested €339 million in our technology and business infrastructure by purchasing intangible assets and property, plant and equipment, a significant portion of which represented the cost of constructing office buildings. Cash provided by financing activities increased by €2,568 million mainly due to proceeds from the credit facility we entered into in connection with our acquisition of Business Objects, but also due to decreased spending on purchases of treasury stock (2008: €487 million; 2007: €1,005 million).
Cash provided by operating activities increased by €95 million or 5% in 2007 over 2006, mainly due to the increase in net income. As total revenue grew, our accounts receivable balance increased by €455 million or 19% in 2007 while our rolling12-month average collection period, which is measured in DSO, was reduced from 68 days in 2006 to 66 days in 2007. Cash used in investing activities increased significantly from €132 million in 2006 to €1,392 million in 2007. This increase is partly due to a transfer of cash to restricted cash. The restricted cash was set up in 2007 as a security deposit that served as collateral for a credit facility entered into in connection with the acquisition of Business Objects. Also, the net inflow from short-term, equity, and other investments was significantly less than in 2006, because in 2006 we had liquidated and reallocated substantial amounts of such investments. In addition, cash outflow for acquisitions of unrelated companies increased to €672 million (2006: €504 million). Also, we continued to spend on intangible assets and property, plant and equipment, amounting to €401 million in 2007, a significant portion of which represented the cost of construction of office buildings. Cash used in financing activities decreased by €88 million or 6% in 2007, mainly because of a slightly lower amount used for purchases of treasury stock (2007: €1,005 million; 2006: €1,149 million).
Credit Lines
As of December 31, 2008, we had outstanding long-term financial debt of €2 million and outstanding short-term financial debt of approximately €2,325 million, consisting primarily of amounts borrowed under the €5 billion credit facility and other lines of credit as described below.
In October 2007 we entered into a €5 billion credit facility (subsequently reduced to €4.45 billion as of December 31, 2007 and further reduced to €2.95 billion in February 2008) in connection with the acquisition of Business Objects. The use of the facility is not restricted by any financial covenants. Borrowings under the facility bear interest of EURIBOR plus a margin of 0.25%. As of March 9, 2009, we had an outstanding borrowing of €2.3 billion on this credit facility.
Also, currently we are party to a revolving €1 billion syndicated credit facility agreement with an initial term of 5 years ending November 2009. The use of the facility is not restricted by any financial covenants.
75
Proceeds are for general corporate purposes. Borrowings under the facility bear interest of EURIBOR or LIBOR for the respective currency plus a margin ranging from 0.20% to 0.25% depending on the amount drawn. We are also required to pay a commitment fee of 0.07% per annum on unused amounts of the available credit. We entered into this credit facility to increase our financial flexibility. We did not, however, draw down the facility in 2008, nor do we currently intend to draw down on the facility. Consequently, there were no borrowings outstanding under the facility as of December 31, 2008.
As of December 31, 2008, SAP AG had additional available lines of credit totaling approximately €597 million. As of December 31, 2008, there were no borrowings outstanding under these lines of credit. Furthermore, certain of our foreign subsidiaries have lines of credit available that allow them to borrow funds in their respective local currencies at prevailing interest rates, generally to the extent SAP AG has guaranteed such amounts. As of December 31, 2008, approximately €52 million was available through such arrangements. Total aggregate borrowings under these lines of credit amounted to €21 million as of December 31, 2008.
Authorized Capital
We also have available sources of cash through authorized capital as outlined in Note 20 to our consolidated financial statements in “Item 18 Financial Statements.”
OFF-BALANCE SHEET ARRANGEMENTS
Several entities of the SAP Group have entered into operating leases for office facilities, computer hardware and certain other equipment. These arrangements are sometimes referred to as a form of off-balance sheet financing. Rental expenses under these operating leases are set forth below under “Contractual Obligations.”
We have not entered into any transactions, arrangements or other relationships with unconsolidated, variable interest entities, as such term is defined in FASB Interpretation No. 46 (Revised December 2003),Consolidation of Variable Interest Entities — an interpretation of ARB No. 51.We believe we do not have other forms of material off-balance-sheet arrangements that would require disclosure other than those already disclosed.
CONTRACTUAL OBLIGATIONS
The table below presents our on- and off-balance sheet contractual obligations as of December 31, 2008:
| | | | | | | | | | | | | | | | | | | | | |
| | | Payments due by period | |
Contractual obligations | | Total | | | Less than 1 year | | | 1-3 years | | | 3-5 years | | | More than 5 years | |
| | | € millions | |
| |
Short-term debt obligations(1) | | | 2,404 | | | | 2,404 | | | | — | | | | — | | | | — | |
Long-term debt obligations(1) | | | 2 | | | | — | | | | 2 | | | | — | | | | — | |
Operating lease obligations(2) | | | 863 | | | | 229 | | | | 334 | | | | 153 | | | | 147 | |
Purchase obligations(3) | | | 249 | | | | 189 | | | | 54 | | | | 4 | | | | 2 | |
Other long-term liabilities reflected on the balance sheet(4) | | | 133 | | | | — | | | | 67 | | | | — | | | | 66 | |
| | | | | | | | | | | | | | | | | | | | | |
| Total | | | 3,651 | | | | 2,822 | | | | 457 | | | | 157 | | | | 215 | |
| |
| (1) | This represents bank loans and interest thereon. |
| |
| (2) | See Note 23 to our consolidated financial statements in “Item 18. Financial Statements” for additional information about operating lease obligations and the related rental expense. |
| |
| (3) | Purchase obligations represent agreements to purchase goods or services that are enforceable and legally binding on us that specify all significant terms, including: fixed or minimum quantities to be purchased; fixed, minimum or variable price provisions; and the approximate timing of the transaction. The outstanding obligations include the |
76
| |
| construction of facilities, office equipment and car purchase commitments, food and security services and other facility commitments. |
Our expected contributions to our pension and other post employment benefit plans are not included in the table above. We expect to contribute in 2009 statutory minimum and discretionary amounts of €2 million to our German defined benefit plans and €29 million to our foreign defined benefit plans, all of which are expected to be paid as cash contributions. Our contributions to our German and foreign defined contribution plans have ranged from €86 million to €93 million in 2006 through 2008; we expect similar contributions to be made in 2009. See Note 19a to our consolidated financial statements in “Item 18. Financial Statements” for additional information on estimated future pension benefits to be paid.
| |
| (4) | Amounts mainly consist of employee-related liabilities (€57 million) and derivatives (€31 million) and deferred rent (€36 million). Not included in the table are noncurrent income taxes payable of €278 million, which includes provisions for uncertainties in income taxes. Other noncurrent liabilities on the balance sheet such as pension and other post employment benefit liabilities, deferred compensation, deferred income and deferred tax liabilities are not included in this table. For additional information on liabilities see Notes 18 and 19b to our consolidated financial statements in “Item 18 Financial Statements.” |
We expect to meet these contractual obligations with existing cash and our cash flows from operations. The timing of payments for the above contractual obligations is based on payment schedules for those obligations where set payments exist. For other obligations with no set payment schedules, estimates as to the most likely timing of cash payments have been made. The ultimate timing of these future cash flows may differ from these estimates.
Obligations under Indemnifications and Guarantees
Our software license agreements generally include certain provisions for indemnifying customers against liabilities if our software products infringe a third party’s intellectual property rights. To date, we have not incurred any material loss as a result of such indemnification obligations and have not recorded any liabilities related to such obligations.
In addition, we occasionally provide function or performance guarantees in routine consulting contracts and development arrangements. Based on historical experience and evaluation, we do not believe that any material loss resulting from these guarantees is probable. In addition, because the guarantees relate to our own performance, no related liability has been recorded. We also generally provide a six to twelve month warranty on our software. Due to the nature of these warranties, which relate to the performance of our software, we cannot reasonably estimate the maximum exposure to loss resulting from the warranties. Our warranty liability is included in Other obligations. See Note 19b to our consolidated financial statements in “Item 18 Financial Statements.”
As of December 31, 2008 and 2007, no guarantees were provided for performance or financial obligations of third parties.
RESEARCH AND DEVELOPMENT
The SAP product development units define the business functions and technical architecture of future software products and realize them in software code and software-related content such as models and methodologies.
SAP’s development labs, known as SAP Labs, are our global research and development organization with operations in various countries throughout the world. Next to our headquarters in Walldorf, Germany, our three largest development locations are in India, the United States and China. This regional diversification enhances the efficient use of local resources and allows for closer ties to the companies in our partner ecosystem as we jointly develop innovative products and services. The network of SAP Labs is designed to act quickly on new requirements from customers and the market and to accelerate product innovation and raise productivity.
77
Complementing the SAP Labs network, SAP Research is a group responsible for identifying emerging information technology trends, as well as researching and building prototypes for potential inclusion in SAP products. The fundamental business model of SAP Research is based on co-innovation through collaborative research with both academia and industry. SAP Research consists of 14 interconnected research centers on five continents. Each center is located in close proximity to an SAP development center or on a university campus. We believe that in the medium term we must continuously improve our portfolio of products if we are to maintain and build on our current leading position as a vendor of business software.
Research and development (R&D) expenses for the years ended December 31, 2008, 2007 and 2006 were €1,631 million, €1,458 million and €1,335 million, respectively. R&D expenses as a percentage of total revenue were 14%, 14% and 14% for the years ended December 31, 2008, 2007, and 2006, respectively.
The importance of R&D was also reflected in the breakdown of employee profiles. In 2008, our total FTE count in development work was 15,547 (2007: 12,951). This constitutes 30% of all SAP employees and represents a 20% rise in the number of R&D employees since the previous year. Our acquisition of Business Objects in 2008 contributed 1,697 new R&D employees or 13% of this increase.
The expenses for R&D include mainly employee salaries and the cost of externally procured development services.
78
ITEM 6. DIRECTORS, SENIOR MANAGEMENT AND EMPLOYEES
SUPERVISORY BOARD
The current members of the Supervisory Board of SAP AG, each member’s principal occupation, the year in which each was first elected and the year in which the term of each expires, respectively, are as follows:
| | | | | | | | | | | | | | | |
| | | | | | | Year
| | Year
|
| | | | | | | First
| | Term
|
Name | | Age | | Principal Occupation | | Elected | | Expires |
| |
Prof. Dr. h.c. mult. Hasso Plattner, Chairman(1)(2)(4)(6)(7)(8)(12) | | | 65 | | | Chairman of the Supervisory Board | | | 2003 | | | | 2012 | |
Pekka Ala-Pietilä(1)(7)(8)(12) | | | 52 | | | Co-founder and CEO Blyk Ltd. | | | 2002 | | | | 2012 | |
Prof. Dr. Wilhelm Haarmann(1)(2)(4)(5)(9) | | | 58 | | | Attorney at Law, Certified Public | | | 1988 | | | | 2012 | |
| | | | | | | Auditor and Certified Tax Advisor; HAARMANN Partnerschaftsgesellschaft, Rechtsanwälte, Steuerberater, Wirtschaftsprüfer | | | | | | | | |
Bernard Liautaud(7)(13) | | | 46 | | | General Partner, Balderton Capital | | | 2008 | | | | 2012 | |
Dr. h.c. Hartmut Mehdorn(1)(5)(6) | | | 66 | | | Chairperson of Executive Board, Deutsche Bahn AG | | | 1998 | | | | 2012 | |
Prof. Dr.-Ing. Dr. h.c. mult. Dr.-Ing. E.h. mult. Joachim Milberg(1)(2)(3)(4)(7)(8) | | | 65 | | | Chairman of the Supervisory Board of BMW AG | | | 2007 | | | | 2012 | |
Dr. Erhard Schipporeit(1)(3)(11)(12) | | | 60 | | | Management Consultant | | | 2005 | | | | 2012 | |
Prof. Dr.-Ing. Dr.-Ing. E.h. Klaus Wucherer(1)(7) | | | 64 | | | Managing Director of Dr. Klaus Wucherer Innovations- und Technologieberatung GmbH | | | 2007 | | | | 2012 | |
Lars Lamadé, Vice Chairman(4)(6)(10) | | | 37 | | | Employee, Project Manager Service & Support | | | 2002 | | | | 2012 | |
Thomas Bamberger(3)(10) | | | 41 | | | Employee, Chief Controlling Officer | | | 2007 | | | | 2012 | |
| | | | | | | Research & Breakthrough Innovation, Head of Operations Global Service & Support | | | | | | | | |
Panagiotis Bissiritsas(2)(5)(10) | | | 40 | | | Employee, Support Expert | | | 2007 | | | | 2012 | |
Willi Burbach(4)(7)(10) | | | 46 | | | Employee, Developer | | | 1993 | | | | 2012 | |
Peter Koop(4)(7)(10) | | | 42 | | | Employee, Industry Business Development Expert | | | 2007 | | | | 2012 | |
Christiane Kuntz-Mayr(7)(14) | | | 46 | | | Employee, Deputy Chairperson of the Works Council of SAP AG | | | 2009 | | | | 2012 | |
Dr. Gerhard Maier(2)(3)(10) | | | 55 | | | Employee, Development Project Manager | | | 1989 | | | | 2012 | |
Stefan Schulz(5)(6)(7)(10) | | | 39 | | | Employee, Development Project Manager | | | 2002 | | | | 2012 | |
| | |
| (1) | | Elected by SAP AG’s shareholders on May 10, 2007. |
| |
| (2) | | Member of the Compensation Committee. |
| |
| (3) | | Member of the Audit Committee. |
| |
| (4) | | Member of the General Committee. |
| |
| (5) | | Member of the Finance and Investment Committee. |
| |
| (6) | | Member of the Mediation Committee. |
79
| | |
| (7) | | Member of the Technology and Strategy Committee. |
| |
| (8) | | Member of the Nomination Committee |
| |
| (9) | | Until January 1, 2006, Wilhelm Haarmann practiced as a partner of Haarmann Hemmelrath which served as special German tax counsel to SAP AG and counseled SAP with regard to other legal matters. On January 1, 2006, he founded HAARMANN Partnerschaftsgesellschaft in Frankfurt. |
| | |
| (10) | | Elected by SAP AG’s employees on April 23, 2007. |
| |
| (11) | | Member of the Audit Committee and determined to be the Audit Committee financial expert. |
| |
| (12) | | Member of the Special Committee |
| |
| (13) | | Elected by SAP AG’s shareholders on June 3, 2008, replacing August-Wilhelm Scheer who resigned from the Supervisory Board on the same day. |
| |
| (14) | | Replacing Helga Classen who left the Supervisory Board on December 31, 2008 due to partial retirement. |
For detailed information on the Supervisory Board committees and their tasks, including the Audit Committee and Compensation Committee, please refer to “Item 10 Additional Information — Corporate Governance.”
Certain current members of the Supervisory Board of SAP AG were members of supervisory boards and comparable governing bodies of enterprises other than SAP AG in Germany and other countries as of December 31, 2008. See Note 29 to our consolidated financial statements included in “Item 18 Financial Statements” for more detail. Apart from pension obligations towards employees, SAP AG has not entered into contracts with any member of the Supervisory Board that provide for benefits upon a termination of the employment or service of the member.
Pursuant to the German Co-determination Act of 1976 (Mitbestimmungsgesetz), members of the Supervisory Board of SAP AG consist of eight representatives of the shareholders and eight representatives of the employees. Of the eight employee representatives, two must be nominated by the trade unions. The elected employees must be at least 18 years of age and must have been in the employment of SAP AG or one of its German subsidiaries for at least one year. They must also fulfill the other qualifications for election codified in Section 8 of the German Works Council Constitution Act. These qualifications include, among other things, not having been declared ineligible or debarred from holding public office by a court.
EXECUTIVE BOARD
The current members of the Executive Board, the year in which each member was first appointed and the year in which the term of each expires, respectively, are as follows:
| | | | | | | | | |
| | | Year First
| | | Year Current
| |
Name | | Appointed | | | Term Expires | |
| |
| Prof. Dr. Henning Kagermann, Co-CEO | | | 1991 | | | | 2009 | |
| Léo Apotheker, Co-CEO | | | 2002 | | | | 2010 | |
| Dr. Werner Brandt | | | 2001 | | | | 2013 | |
| Erwin Gunst | | | 2008 | | | | 2012 | |
| Prof. Dr. Claus Heinrich | | | 1996 | | | | 2009 | |
| Bill McDermott | | | 2008 | | | | 2012 | |
| Gerhard Oswald | | | 1996 | | | | 2010 | |
| John Schwarz | | | 2008 | | | | 2010 | |
| Jim Hageman Snabe | | | 2008 | | | | 2012 | |
The Executive Board members’ responsibilities are aligned along SAP’s value chain, spanning innovation, research and development, production, services, marketing, training, consulting and sales.
80
The following changes occurred in the Executive Board in 2008:
| | |
| | • | On February 19, 2008, we announced that Business Objects CEO John Schwarz was named member of the SAP Executive Board, effective March 1, 2008. |
| |
| | • | On April 2, 2008, we announced that the SAP Supervisory Board named then Deputy CEO Léo Apotheker as SAP’s Co-CEO alongside Henning Kagermann, with immediate effect. Henning Kagermann will step down as planned on May 31, 2009 at which time Léo Apotheker will be sole CEO. |
| |
| | • | Further on April 2, 2008, we announced that the SAP Supervisory Board appointed Erwin Gunst, Bill McDermott and Jim Hageman Snabe to the SAP Executive Board effective July 1, 2008. |
| |
| | • | On October 31, 2008, Claus Heinrich announced that he has decided to leave SAP on May 31, 2009. |
| |
| | • | On November 26, 2008, the SAP Supervisory Board named Erwin Gunst the next labor relations director of SAP AG, effective January 1, 2009, succeeding Claus Heinrich. |
| |
| | • | On December 31, 2008, Peter Zencke gave up this seat on the SAP Executive Board upon expiration of his contract. |
A description of the management responsibilities and backgrounds of the current members of the Executive Board are as follows:
Henning Kagermann, Co-CEO(Vorstandssprecher), 61 years old, physics graduate. Henning Kagermann joined SAP AG in 1982. He became a member of the Executive Board in 1991 and Co-CEO in 1998. In May 2003 he became sole CEO of the Executive Board. In April 2008 he again became Co-CEO when the SAP Supervisory Board named Léo Apotheker Co-CEO alongside Henning Kagermann. He has overall responsibility for SAP’s strategy and business development, and is further responsible for internal audit and top talent management.
Léo Apotheker, Co-CEO(Vorstandssprecher), 55 years old, business economist. Léo Apotheker first joined SAP in 1988 and became a member of the Executive Board in 2002. In April 2008 he became Co-CEO alongside Henning Kagermann. He is responsible for consulting, education, marketing, partner management, industry solutions, and global communications.
Werner Brandt,55 years old, business administration graduate. Werner Brandt joined SAP in early 2001 as the Chief Financial Officer and member of the Executive Board. Prior to joining SAP, Werner Brandt was CFO and member of the Executive Board of Fresenius Medical Care AG since 1999. In this role, he was also responsible for labor relations. Before joining Fresenius Medical Care AG, Werner Brandt headed the finance function of the European operations of Baxter International Inc. His responsibilities at SAP include finance and administration, shared services, global intellectual property, mergers & acquisitions, and SAP Ventures.
Erwin Gunst, 49 years old, holds a degree in commercial engineering. He joined SAP in 1988 and became Chief Operating Officer and member of its Executive Board on July 1, 2008. He is responsible for company operations and processes, global human resources (including labor relations), internal SAP IT, and the management of all SAP Labs worldwide.
Claus Heinrich,53 years old, business management and operations research graduate. Claus Heinrich joined SAP in 1987 and became a member of the Executive Board in 1996. On October 31, 2008, he announced that he will leave SAP on May 31, 2009.
Bill McDermott, 47 years old, holds a master’s degree in business administration. He joined SAP in 2002 and became a member of its Executive Board on July 1, 2008. He is responsible for global field operations.
Gerhard Oswald,55 years old, economics graduate. Gerhard Oswald joined SAP in 1981 and became a member of the Executive Board in 1996. He is responsible for global service and support.
John Schwarz, 58 years old, has diploma in business administration and a degree in computer science. John Schwarz joined SAP in 2008 and became a member of its Executive Board on March 1, 2008. He is chief executive officer (CEO) of Business Objects, a business unit within the SAP Group. He joined Business Objects in
81
September 2005 as its CEO. Prior to Business Objects, he was president and chief operating officer of Symantec Corporation. He is responsible for the SAP BusinessObjects business unit, the Global Ecosystem & Partner Group and for Corporate Business Development.
Jim Hagemann Snabe, 43 years old, holds a master degree in operational research. He joined SAP in 1990 and became a member of its Executive Board on July 1, 2008. He is responsible for product development. This includes solutions for large enterprises, small and medium size enterprises, and the technology platform.
The members of the Executive Board of SAP AG as of December 31, 2008 that are members on other supervisory boards and comparable governing bodies of enterprises, other than SAP, in Germany and other countries, are set forth in Note 29 to our consolidated financial statements in “Item 18 Financial Statements.” Apart from pension obligations, SAP AG has not entered into contracts with any member of the Executive Board that provide for benefits upon a termination of the employment of service of the member.
To our knowledge, there are no family relationships among the Supervisory Board and Executive Board members.
COMPENSATION
This compensation report outlines the criteria that we apply to determine compensation for Executive Board and Supervisory Board members, discloses the amount of compensation paid, and describes the compensation systems. It also contains information about Executive Board members’ share-based compensation plans, shares held by Executive Board and Supervisory Board members, and the directors’ dealings required to be disclosed in accordance with the German Securities Trading Act.
Compensation for Executive Board Members
Compensation System
Until and including 2008, the Executive Board members’ compensation system has been set by the Compensation Committee, a committee of the Supervisory Board chaired by Hasso Plattner (chairperson of the Supervisory Board). Its other members are Panagiotis Bissiritsas, Wilhelm Haarmann, Gerhard Maier, and Joachim Milberg. In the future, the full Supervisory Board will assume this responsibility, in accordance with the amended German Corporate Governance Code.
Executive Board members’ compensation is intended to reflect the Group’s size and global presence as well as our economic and financial standing. The level is internationally competitive to reward committed, successful work in a dynamic environment.
The compensation of the Executive Board as a body is performance-based. It has three elements: a fixed element (salary), a performance-related element (directors’ profit-sharing), and a long-term incentive element (share-based compensation).
A compensation target is set for the total of fixed and performance-related elements. We review the compensation target every year in the light of our business and directors’ compensation at comparable companies on the international stage. Every year, the Compensation Committee sets the target performance-related compensation, reflecting the relevant values in SAP’s budget for that year. The number of virtual stock options issued in 2008 to each individual member of the Executive Board by way of share-based compensation was decided by the Compensation Committee at its meeting on March 3, 2008, and reflected the fair value of the options.
The following criteria apply to the elements of Executive Board compensation for 2008:
| | |
| | • | The fixed element is paid as a monthly salary. |
| |
| | • | The amount of performance-related compensation to be paid out in respect of 2008 depends on the SAP Group’s achievement of its targets for (non-GAAP) operating income, (non-GAAP) software and |
82
| | |
| | | software-related service revenue growth at constant currencies, and the (non-GAAP) operating margin at constant currencies. |
| | |
| | • | On February 11, 2009, the Supervisory Board’s Compensation Committee assessed SAP’s performance against the agreed targets and determined how much performance-related compensation was payable. The payment will be made after the Annual General Meeting of Shareholders in May 2009. |
| |
| | • | The regular form of share-based compensation is the issue of virtual stock options under the terms of the 2007 stock option plan (SAP SOP 2007). For the terms and details of SAP SOP 2007, see Note 27 to our consolidated financial statements in “ITEM 18. Financial Statements.” |
Amount of Compensation
Executive Board members’ compensation was as follows in 2008:
| | | | | | | | | | | | | | | | | | | | | |
| | | | | | | | | Performance Related
| | | Long-Term
| | | | |
| | | Fixed Elements | | | Element | | | Incentive Elements | | | | |
| | | | | | | | | Directors’
| | | Share-Based
| | | | |
| | | | | | | | | Profit-
| | | Compensation
| | | | |
| | | Salary | | | Other(1) | | | Sharing | | | (SAP SOP 2007)(2) | | | Total | |
| | | €(000) | |
| |
| Prof. Dr. Henning Kagermann (Co-CEO) | | | 750.0 | | | | 15.7 | | | | 2,606.1 | | | | 948.4 | | | | 4,320.2 | |
| Léo Apotheker (Co-CEO) | | | 687.5 | | | | 334.5 | | | | 2,388.9 | | | | 632.3 | | | | 4,043.2 | |
| Dr. Werner Brandt | | | 455.0 | | | | 23.5 | | | | 1,581.0 | | | | 577.3 | | | | 2,636.8 | |
Erwin Gunst(3) | | | 227.5 | | | | 18.1 | | | | 790.5 | | | | — | | | | 1,036.1 | |
| Prof. Dr. Claus E. Heinrich | | | 455.0 | | | | 19.8 | | | | 1,581.0 | | | | 577.3 | | | | 2,633.1 | |
Bill McDermott(3) | | | 395.2 | | | | 142.4 | | | | 631.3 | | | | — | | | | 1,168.9 | |
| Gerhard Oswald | | | 455.0 | | | | 627.9 | | | | 1,581.0 | | | | 577.3 | | | | 3,241.2 | |
John Schwarz(4) | | | 424.9 | | | | 14.3 | | | | 1,295.2 | | | | 577.3 | | | | 2,311.7 | �� |
Jim Hagemann Snabe(3) | | | 227.5 | | | | 22.3 | | | | 790.5 | | | | — | | | | 1,040.3 | |
| Dr. Peter Zencke | | | 455.0 | | | | 143.5 | | | | 1,581.0 | | | | 577.3 | | | | 2,756.8 | |
| | | | | | | | | | | | | | | | | | | | | |
Total | | | 4,532.6 | | | | 1,362.0 | | | | 14,826.5 | | | | 4,467.2 | | | | 25,188.3 | |
| | | | | | | | | | | | | | | | | | | | | |
| | |
| 1) | | Insurance contributions, benefits in kind, expenses for maintenance of two households due to work abroad, compensation from seats on other governing bodies in the SAP Group, leave compensation, reimbursement of legal fees. |
| |
| 2) | | Fair value at the time of allocation. |
| |
| 3) | | Member of the Executive Board since July 1, 2008. (The table shows compensation since that date.) |
| |
| 4) | | Member of the Executive Board since March 1, 2008. (The table shows compensation since that date.) |
The total compensation of all Executive Board members in fiscal year 2008 for work for SAP excluding compensation relating to the office of Executive Board member was €8,741,300. This was primarily compensation earned as SAP employees before they took their Executive Board seats after the beginning of the year. It includes, among other elements, share-based compensation under SAP SOP 2007.
The values for regular share-based compensation in the table above result from the following allocations of SAP SOP 2007 virtual stock options granted in 2008.
83
The following table shows total Executive Board compensation in 2007, including SAP SOP 2007 stock options granted.
| | | | | | | | | | | | | | | | | | | | | | | | | | | | | |
| | | | | | | | | Performance
| | | | | | | | | | | | | |
| | | | | | | | | Related
| | | Long-Term
| | | | | | | | | | |
| | | Fixed Elements | | | Element | | | Incentive Elements | | | | | | | | | | |
| | | | | | | | | Directors’
| | | Share-Based
| | | | | | | | | | |
| | | | | | | | | Profit-
| | | Compensation
| | | | | | | | | | |
| | | Salary | | | Other1) | | | Sharing | | | (SAP SOP 2007)(2) | | | Total | | | | | | | |
| | | €(000) | |
| |
| Prof. Dr. Henning Kagermann (Co-CEO) | | | 728.5 | | | | 16.0 | | | | 4,219.7 | | | | 949.1 | | | | 5,913.3 | | | | | | | | | |
Shai Agassi (member until March 31, 2007)(4) | | | 161.3 | | | | 3.1 | | | | 446.8(3 | ) | | | — | | | | 611.2 | | | | | | | | | |
| Léo Apotheker (Co-CEO) | | | 485.6 | | | | 59.0 | | | | 2,813.1 | | | | 632.7 | | | | 3,990.4 | | | | | | | | | |
| Dr. Werner Brandt | | | 443.4 | | | | 41.3 | | | | 2,568.5 | | | | 577.7 | | | | 3,630.9 | | | | | | | | | |
| Prof. Dr. Claus E. Heinrich | | | 443.4 | | | | 20.2 | | | | 2,568.5 | | | | 577.7 | | | | 3,609.8 | | | | | | | | | |
| Gerhard Oswald | | | 443.4 | | | | 14.8 | | | | 2,568.5 | | | | 577.7 | | | | 3,604.4 | | | | | | | | | |
| Dr. Peter Zencke | | | 443.4 | | | | 28.0 | | | | 2,568.5 | | | | 577.7 | | | | 3,617.6 | | | | | | | | | |
| | | | | | | | | | | | | | | | | | | | | | | | | | | | | |
Total | | | 3,149.0 | | | | 182.4 | | | | 17,753.6 | | | | 3,892.6 | | | | 24,977.6 | | | | | | | | | |
| | | | | | | | | | | | | | | | | | | | | | | | | | | | | |
| | |
| 1) | | Insurance contributions, benefits in kind, expenses for maintenance of two households due to work abroad, compensation from seats on other governing bodies in the SAP Group. |
| |
| 2) | | Fair value at the time of allocation. |
| |
| 3) | | The portion of the directors’ profit-sharing for January through March 2007 was calculated on the basis of the actual directors’ profit-sharing paid in 2006. |
| |
| 4) | | Shai Agassi left the Executive Board on March 31, 2007. His employment contract with SAP ended on April 30, 2007. |
Share-Based Compensation Under SAP SOP 2007
| | | | | | | | | | | | | | | | | | | | | |
| | | 2008 Allocations | |
| | | | | | | | | Total Fair
| | | | | | | |
| | | | | | | | | Value of
| | | | | | | |
| | | | | | | | | Long-Term
| | | | | | | |
| | | | | | Fair Value
| | | Incentive
| | | Fair Value
| | | | |
| | | | | | per Right
| | | Elements
| | | per Right on
| | | Total Value on
| |
| | | | | | at Time of
| | | at Time of
| | | December 31,
| | | December 31,
| |
| | | Quantity | | | Grant | | | Grant | | | 2008 | | | 2008 | |
| | | | | | € | | | €(000) | | | € | | | €(000) | |
| |
| Prof. Dr. Henning Kagermann (Co-CEO) | | | 133,396 | | | | 7.11 | | | | 948.4 | | | | 4.67 | | | | 623.0 | |
| Léo Apotheker (Co-CEO) | | | 88,933 | | | | 7.11 | | | | 632.3 | | | | 4.67 | | | | 415.3 | |
| Dr. Werner Brandt | | | 81,200 | | | | 7.11 | | | | 577.3 | | | | 4.67 | | | | 379.2 | |
Erwin Gunst(1) | | | — | | | | — | | | | — | | | | — | | | | — | |
| Prof. Dr. Claus E. Heinrich | | | 81,200 | | | | 7.11 | | | | 577.3 | | | | 4.67 | | | | 379.2 | |
Bill McDermott(1) | | | — | | | | — | | | | — | | | | — | | | | — | |
| Gerhard Oswald | | | 81,200 | | | | 7.11 | | | | 577.3 | | | | 4.67 | | | | 379.2 | |
John Schwarz(2) | | | 81,200 | | | | 7.11 | | | | 577.3 | | | | 4.67 | | | | 379.2 | |
Jim Hagemann Snabe(1) | | | — | | | | — | | | | — | | | | — | | | | — | |
| Dr. Peter Zencke | | | 81,200 | | | | 7.11 | | | | 577.3 | | | | 4.67 | | | | 379.2 | |
| | | | | | | | | | | | | | | | | | | | | |
Total | | | 628,329 | | | | | | | | 4,467.2 | | | | | | | | 2,934.3 | |
| | | | | | | | | | | | | | | | | | | | | |
| | |
| 1) | | Member of the Executive Board since July 1, 2008. (No allocations were made after that date.) |
| |
| 2) | | Member of the Executive Board since March 1, 2008. (The table shows allocations since that date.) |
84
| | | | | | | | | | | | | | | | | | | | | |
| | | 2007 Allocations | |
| | | | | | | | | Total Fair
| | | | | | | |
| | | | | | | | | Value of
| | | | | | | |
| | | | | | | | | Long-Term
| | | | | | | |
| | | | | | Fair Value
| | | Incentive
| | | Fair Value
| | | | |
| | | | | | per Right
| | | Elements
| | | per Right on
| | | Total Value on
| |
| | | | | | at Time of
| | | at Time of
| | | December 31,
| | | December 31,
| |
| | | Quantity | | | Grant | | | Grant | | | 2007 | | | 2007 | |
| | | | | | € | | | €(000) | | | € | | | €(000) | |
| |
| Prof. Dr. Henning Kagermann (Co-CEO) | | | 118,637 | | | | 8.00 | | | | 949.1 | | | | 8.53 | | | | 1,012.0 | |
| Léo Apotheker (Co-CEO) | | | 79,093 | | | | 8.00 | | | | 632.7 | | | | 8.53 | | | | 674.7 | |
| Dr. Werner Brandt | | | 72,216 | | | | 8.00 | | | | 577.7 | | | | 8.53 | | | | 616.0 | |
| Prof. Dr. Claus E. Heinrich | | | 72,216 | | | | 8.00 | | | | 577.7 | | | | 8.53 | | | | 616.0 | |
| Gerhard Oswald | | | 72,216 | | | | 8.00 | | | | 577.7 | | | | 8.53 | | | | 616.0 | |
| Dr. Peter Zencke | | | 72,216 | | | | 8.00 | | | | 577.7 | | | | 8.53 | | | | 616.0 | |
| | | | | | | | | | | | | | | | | | | | | |
Total | | | 486,594 | | | | | | | | 3,892.6 | | | | | | | | 4,150.7 | |
| | | | | | | | | | | | | | | | | | | | | |
End-of-Service Undertakings
Retirement Pension Plan
Members of the Executive Board receive a retirement pension when they reach the retirement age of 60 and vacate their Executive Board seat or a disability pension if, before reaching the regular retirement age, they become subject to occupational disability or permanent incapacity. A surviving dependent’s pension is paid on the death of a former member of the Executive Board. The disability pension is 100% of the vested retirement pension entitlement and is payable until but not after the beneficiary’s 60th birthday. The surviving dependent’s pension is 60% of the retirement pension or vested disability pension entitlement at death. Entitlements are enforceable against SAP AG.
The benefit payable has been agreed with the active Executive Board members. If service is ended prematurely, pension entitlement is reduced in proportion as the actual length of service stands in relation to the maximum possible length of service.
On January 1, 2000, SAP AG introduced a contributory retirement pension plan. At that time, the performance-based retirement plan was discontinued for Executive Board members. Entitlements accrued up to December 31, 1999, were unaffected. The benefits are derived from any accrued entitlements on December 31, 1999, under performance-based pension agreements and a salary-linked contribution for the period commencing January 1, 2000. The contribution is 4% of applicable compensation up to the applicable income threshold plus 14% of applicable compensation above the applicable income threshold. For this purpose, applicable compensation is 90% of target annual salary. The applicable income threshold is the statutory annual income threshold for the state pension plan in Germany (West), as amended from time to time.
An exceptional agreement applies to Executive Board member Léo Apotheker. Léo Apotheker’s agreement provides only for a retirement pension, and the pension contribution reflects his participation in the French social security system. Henning Kagermann’s rights to retirement pension benefits will be increased by further annual contributions because he has remained a member of the Executive Board after his 60th birthday.
Executive Board member Bill McDermott has rights to future benefits under the pension plan of SAP America, Inc. The pension plan of SAP America, Inc. is a cash balance plan that provides on retirement either monthly pension payments or a lump sum. The pension becomes available from the beneficiary’s 65th birthday. Subject to certain conditions, the plan also provides earlier payment or invalidity benefits.
85
In addition, for the following members of the Executive Board SAP paid pension contributions to third parties in 2008.
| | | | | |
| | | In Fiscal Year 2008 | |
| | | €(000) | |
| |
| Bill McDermott | | | 474.5 | |
| Jim Hagemann Snabe | | | 92.1 | |
SAP made no retirement pension plan contributions in respect of Executive Board member John Schwarz in 2008.
The following table shows the change in total projected benefit obligation (PBO) and in the total accruals for pension obligations to Executive Board members:
| | | | | | | | | | | | | | | | | | | | | | | | | | | | | | | | | | | | | | | | | |
| | | Prof. Dr.
| | | | | | | | | | | | | | | | | | | | | | | | | | | | |
| | | Henning
| | | Léo
| | | | | | | | | | | | Prof. Dr.
| | | | | | | | | | | | | |
| | | Kagermann
| | | Apotheker
| | | | | | Dr. Werner
| | | | | | Claus E.
| | | Bill
| | | Gerhard
| | | Dr. Peter
| | | | |
| | | (Co-CEO) | | | (Co-CEO) | | | Shai Agassi | | | Brandt | | | Erwin Gunst(1) | | | Heinrich | | | McDermott | | | Oswald | | | Zencke | | | Total | |
| | | €(000) | |
| |
| PBO January 1, 2007 | | | 5,334.7 | | | | 445.4 | | | | 356.8 | | | | 593.3 | | | | — | | | | 3,015.3 | | | | — | | | | 3,284.3 | | | | 3,875.9 | | | | 16,905.7 | |
| Less plan assets market value January 1, 2007 | | | 4,582.5 | | | | 603.4 | | | | 246.4 | | | | 408.2 | | | | — | | | | 1,763.4 | | | | — | | | | 2,015.1 | | | | 2,947.0 | | | | 12,566.0 | |
| | | | | | | | | | | | | | | | | | | | | | | | | | | | | | | | | | | | | | | | | |
Accrued January 1, 2007 | | | 752.2 | | | | (158.0 | ) | | | 110.4 | | | | 185.1 | | | | — | | | | 1,251.9 | | | | — | | | | 1,269.2 | | | | 928.9 | | | | 4,339.7 | |
| PBO change in 2007 | | | 530.5 | | | | (22.9 | ) | | | (320.9 | ) | | | 20.4 | | | | — | | | | (284.4 | ) | | | — | | | | (269.5 | ) | | | (228.4 | ) | | | (575.2 | ) |
| Plan assets change in 2007 | | | 645.5 | | | | 27.0 | | | | (199.0 | ) | | | 102.5 | | | | — | | | | 265.3 | | | | — | | | | 301.3 | | | | 407.9 | | | | 1,550.5 | |
| PBO December 31, 2007 | | | 5,865.2 | | | | 422.5 | | | | 35.9 | | | | 613.7 | | | | 280.3 | | | | 2,730.9 | | | | 588.4 | | | | 3,014.8 | | | | 3,647.5 | | | | 17,199.2 | |
| Less plan assets market value December 31, 2007 | | | 5,228.0 | | | | 630.4 | | | | 47.4 | | | | 510.7 | | | | 272.9 | | | | 2,028.7 | | | | 45.0 | | | | 2,316.4 | | | | 3,354.9 | | | | 14,434.4 | |
| | | | | | | | | | | | | | | | | | | | | | | | | | | | | | | | | | | | | | | | | |
Accrued December 31, 2007 | | | 637.2 | | | | (207.9 | ) | | | (11.5 | ) | | | 103.0 | | | | 7.4 | | | | 702.2 | | | | 543.4 | | | | 698.4 | | | | 292.6 | | | | 2,764.8 | |
| PBO change in 2008 | | | (277.2 | ) | | | 17.3 | | | | — | | | | 88.1 | | | | 108.9 | | | | 81.0 | | | | 366.6 | | | | 84.3 | | | | (36.8 | ) | | | 432.2 | |
| Plan assets change in 2008 | | | 277.2 | | | | 28.4 | | | | — | | | | 113.3 | | | | (224.8 | ) | | | 282.6 | | | | (11.7 | ) | | | 320.2 | | | | 431.8 | | | | 1,217.0 | |
| PBO December 31, 2008 | | | 5,588.0 | | | | 439.8 | | | | — | | | | 701.8 | | | | 389.2 | | | | 2,811.9 | | | | 955.0 | | | | 3,099.1 | | | | 3,610.7 | | | | 17,595.5 | |
| Less plan assets market value December 31, 2008 | | | 5,505.2 | | | | 658.8 | | | | — | | | | 624.0 | | | | 48.1 | | | | 2,311.3 | | | | 33.3 | | | | 2,636.6 | | | | 3,786.7 | | | | 15,604.0 | |
| | | | | | | | | | | | | | | | | | | | | | | | | | | | | | | | | | | | | | | | | |
Accrued December 31, 2008 | | | 82.8 | | | | (219.0 | ) | | | — | | | | 77.8 | | | | 341.1 | | | | 500.6 | | | | 921.7 | | | | 462.5 | | | | (176.0 | ) | | | 1,991.5 | |
| | | | | | | | | | | | | | | | | | | | | | | | | | | | | | | | | | | | | | | | | |
| | |
| 1) | | When Erwin Gunst joined the Executive Board and his employment with SAP’s Switzerland affiliate ended, his vested plan funds were transferred to a vested benefits account. |
The following table shows the annual pension entitlement of each member of the Executive Board on reaching age 60 based on entitlements from performance-based and salary-linked plans vested on December 31, 2008:
| | | | | | | | | | | | | |
| | | Vested on
| | | Vested on
| | | Vested on
| |
| | | December 31,
| | | December 31,
| | | December 31,
| |
| | | 2008 | | | 2007 | | | 2006 | |
| | | €(000) | |
| |
| Prof. Dr. Henning Kagermann (Co-CEO) | | | 334.9 | (1) | | | 322.7 | (1) | | | 289.8 | |
| Léo Apotheker (Co-CEO) | | | 45.5 | | | | 45.5 | | | | 45.5 | |
| Dr. Werner Brandt | | | 48.0 | | | | 41.0 | | | | 34.4 | |
| Erwin Gunst | | | 32.8 | | | | — | | | | — | |
| Prof. Dr. Claus E. Heinrich | | | 186.1 | | | | 175.2 | | | | 165.5 | |
| Bill McDermott | | | 121.8 | | | | — | | | | — | |
| Gerhard Oswald | | | 201.2 | | | | 192.8 | | | | 184.6 | |
| Dr. Peter Zencke | | | 226.5 | | | | 216.9 | | | | 207.2 | |
| | |
| (1) | | Due to the extension of Henning Kagermann’s contract beyond his 60th birthday, this value represents the retirement pension entitlement that he would receive after his current Executive Board contract expires on May 31, 2009, based on the entitlements vested on December 31, 2008. |
86
These are vested entitlements. To the extent that members continue to serve on the Executive Board and that therefore more contributions are made for them in the future, pension actually payable at age 60 will be more than shown in the table.
In 2008, pension benefits of €763,000 were paid to former Executive Board members (2007: €743,000). On December 31, 2008, the PBO for former Executive Board members was €11,367,000 (2007: €11,587,000). Plan assets of €12,646,000 are available to service these obligations (2007: €11,811,000).
Postcontractual Noncompete Provisions
During the agreed12-month postcontractual noncompete period, Executive Board members receive abstention payments corresponding to 50% of their final average contractual compensation as members. SAP deducts the abstention compensation from any amount it owes the member under the pension plan.
End of Term in Office and of Employment Contract
Peter Zencke’s term of office on the Executive Board expired on December 31, 2008, as did the notice period in his contract of employment. In accordance with his contract, since retirement he has been receiving abstention payments for a12-month postcontractual noncompete period corresponding to 50% of his final average contractual compensation as a member.
Early Termination
The standard contract for all Executive Board members since January 1, 2006, provides that on termination before full term, SAP AG will pay to the member the outstanding part of the compensation target for the entire remainder of the term, appropriately discounted for early payment. A member has no claim to that payment if he or she leaves SAP for reasons for which he or she is responsible.
If an Executive Board member’s post on the Executive Board expires or ceases to exist because of, or as a consequence of, change or restructuring or due to a change of control, SAP AG and each Executive Board member has the right to terminate the employment contract within eight weeks of the occurrence by giving six months’ notice. A change of control is deemed to occur when a third party is required to make a mandatory takeover offer to the shareholders of SAP AG under the German Securities Acquisition and Takeover Act, when SAP AG merges with another company and becomes the subsumed entity, or when a control or profit transfer agreement is concluded with SAP AG as the dependent company. An Executive Board member’s contract can also be terminated before full term if his or her appointment as an SAP AG Executive Board member is revoked in connection with a change of control.
We have agreed payments of €4,120,600 for Claus Heinrich in relation to the ending of his contract with SAP on May 31, 2009, in accordance with the above agreements on payments made for early termination. He will receive €658,800 in respect of the portion of the directors’ profit-sharing bonus to which he is entitled for 2009. We have set aside the postcontractual noncompete provisions in his contract.
LONG-TERM INCENTIVES FOR THE EXECUTIVE BOARD
Members of the Executive Board hold virtual stock options under SAP SOP 2007, stock appreciation rights under the Incentive Plan 2010, stock options under SAP SOP 2002, and stock options and convertible bonds under the Long Term Incentive (LTI) Plan 2000 that were granted to them in previous years. For the terms and details of these plans, see Note 27 to our consolidated financial statements in “ITEM 18. Financial Statements.”
SAP SOP 2007
The table below shows Executive Board members’ holdings, on December 31, 2008, of virtual stock options issued to them under the SAP SOP 2007 plan since its inception, including virtual stock options issued to them both during and before their respective membership of the Executive Board.
87
The strike price for an option is 110% of the base price. The base price is the average closing price of one SAP share in the Frankfurt stock exchange Xetra trading system over the 20 consecutive business days immediately starting the day after the announcement of the Company’s preliminary annual results. The premium of 10%, which is payable in addition to the base price, serves the purpose of rendering the exercise of the option economically reasonable only after the stock exchange price of the SAP share has risen by at least 10% as compared with the price used to determine the base price. The issued options have a term of five years and can only be exercised on specified dates after the two-year vesting period. Therefore, none of the options held could be exercised on December 31, 2008.
SAP SOP 2007 Stock Options
| | | | | | | | | | | | | | | | | | | | | |
| | | | | | Holding on
| | | | | | | | | | |
| | | | | | December 31,
| | | | | | Fair Value
| | | | |
| | | | | | 2008 | | | Fair Value
| | | per Unit on
| | | Accrual on
| |
| | | Year
| | | Quantity of
| | | per Unit at
| | | December 31,
| | | December 31,
| |
| | | Granted | | | Options | | | Time of Grant | | | 2008 | | | 2008 | |
| | | | | | | | | € | | | € | | | €(000) | |
| |
| Prof. Dr. Henning Kagermann (Co-CEO) | | | 2007 | | | | 118,637 | | | | 8.00 | | | | 3.50 | | | | 363.3 | |
| | | | 2008 | | | | 133,396 | | | | 7.11 | | | | 4.67 | | | | 259.6 | |
| Léo Apotheker (Co-CEO) | | | 2007 | | | | 79,093 | | | | 8.00 | | | | 3.50 | | | | 242.2 | |
| | | | 2008 | | | | 88,933 | | | | 7.11 | | | | 4.67 | | | | 173.0 | |
| Dr. Werner Brandt | | | 2007 | | | | 72,216 | | | | 8.00 | | | | 3.50 | | | | 221.2 | |
| | | | 2008 | | | | 81,200 | | | | 7.11 | | | | 4.67 | | | | 158.0 | |
Erwin Gunst(1) | | | 2007 | | | | 56,258 | | | | 8.00 | | | | 3.50 | | | | 172.3 | |
| | | | 2008 | | | | 70,284 | | | | 7.11 | | | | 4.67 | | | | 136.8 | |
| Prof. Dr. Claus E. Heinrich | | | 2007 | | | | 72,216 | | | | 8.00 | | | | 3.50 | | | | 221.2 | |
| | | | 2008 | | | | 81,200 | | | | 7.11 | | | | 4.67 | | | | 158.0 | |
Bill McDermott(1) | | | 2007 | | | | 62,508 | | | | 8.00 | | | | 3.50 | | | | 191.4 | |
| | | | 2008 | | | | 70,284 | | | | 7.11 | | | | 4.67 | | | | 136.8 | |
| Gerhard Oswald | | | 2007 | | | | 72,216 | | | | 8.00 | | | | 3.50 | | | | 221.2 | |
| | | | 2008 | | | | 81,200 | | | | 7.11 | | | | 4.67 | | | | 158.0 | |
John Schwarz(2) | | | 2007 | | | | — | | | | — | | | | — | | | | — | |
| | | | 2008 | | | | 81,200 | | | | 7.11 | | | | 4.67 | | | | 158.0 | |
Jim Hagemann Snabe(1) | | | 2007 | | | | 37,505 | | | | 8.00 | | | | 3.50 | | | | 114.9 | |
| | | | 2008 | | | | 56,228 | | | | 7.11 | | | | 4.67 | | | | 109.4 | |
| Dr. Peter Zencke | | | 2007 | | | | 72,216 | | | | 8.00 | | | | 3.50 | | | | 221.2 | |
| | | | 2008 | | | | 81,200 | | | | 7.11 | | | | 4.67 | | | | 158.0 | |
| | | | | | | | | | | | | | | | | | | | | |
Total | | | | | | | 1,467,990 | | | | | | | | | | | | 3,574.5 | |
| | | | | | | | | | | | | | | | | | | | | |
| | |
| (1) | | Member since July 1, 2008; the holding was allocated before appointment to the Executive Board |
| |
| (2) | | Member since March 1, 2008 |
Incentive Plan 2010
The additional nonrecurring share-based compensation awarded in 2006 comprises STARs for the Incentive Plan 2010 share-based compensation plan. The plan is a nonrecurring incentive with a term of up to five years, intended to give more encouragement than previously for innovation and to ensure the Executive Board actions remain focused on a long-term goal. The Incentive Plan 2010 is a share-based compensation plan intended to reward a substantial increase in our market capitalization. The Executive Board will qualify for payout under the plan only if, not later than the end of 2010, SAP’s average market capitalization during the last six months of a year is not less than 50% greater than its average value between July 1 and December 31, 2005,
88
(base value: €44,794,067,259) and SAP stock outperforms the S&P North Software-Software Indextm (which is the successor of the GSTI Software index) over the same period. Payouts are scaled as follows:
| | |
| | • | If market capitalization does not increase by 50% or more, the Executive Board will not receive a payout. |
| |
| | • | If market capitalization increases by more than 50% but less than 100%, target achievement will be measured progressively. |
| |
| | • | If SAP’s market capitalization increases not less than twofold during the said period, the Executive Board will receive a payout of €100 million. |
The STARs awarded to Executive Board members under this plan expire on December 31, 2010. If the target 100% increase in market capitalization is reached at an earlier date, while at the same time the stock is outperforming the S&P North Software-Software Index, the plan ends at that earlier date. All payouts under the plan are cash; no new SAP shares will be issued. A beneficiary cannot exercise a STAR if he or she would take a windfall profit; that is, a substantial extraordinary unforeseen profit arising out of circumstances not intended by the Executive Board. All decisions in this regard or concerning appropriate reduction of plan payouts are at the sole discretion of the Compensation Committee of the Supervisory Board. For the terms and details of this plan, see Note 27 to our consolidated financial statements in “ITEM 18. Financial Statements.”
Nonrecurring Share-Based Compensation: Incentive Plan 2010
| | | | | | | | | | | | | | | | | |
| | | Original
| | | | | | | | | | |
| | | Quantity
| | | | | | Fair Value per
| | | | |
| | | Granted | | | Fair Value per
| | | Unit on
| | | Accrual on
| |
| | | Number of
| | | Unit at Time of
| | | December 31,
| | | December 31,
| |
| | | Rights | | | Grant | | | 2008 | | | 2008 | |
| | | | | | € | | | € | | | €(000) | |
| |
| Prof. Dr. Henning Kagermann (Co-CEO) | | | 188,182 | | | | 24.87 | | | | 3.09 | | | | 340.2 | |
| Léo Apotheker (Co-CEO) | | | 125,455 | | | | 24.87 | | | | 3.09 | | | | 226.8 | |
| Dr. Werner Brandt | | | 62,727 | | | | 24.87 | | | | 3.09 | | | | 113.4 | |
Erwin Gunst(1) | | | 28,815 | | | | 14.02 | | | | 3.09 | | | | 52.1 | |
| Prof. Dr. Claus E. Heinrich | | | 62,727 | | | | 24.87 | | | | 3.09 | | | | 113.4 | |
Bill McDermott(1) | | | 45,345 | | | | 14.02 | | | | 3.09 | | | | 82.0 | |
| Gerhard Oswald | | | 62,727 | | | | 24.87 | | | | 3.09 | | | | 113.4 | |
Jim Hagemann Snabe(1) | | | 17,290 | | | | 14.02 | | | | 3.09 | | | | 31.3 | |
| Dr. Peter Zencke | | | 62,727 | | | | 24.87 | | | | 3.09 | | | | 113.4 | |
| | | | | | | | | | | | | | | | | |
Total | | | 655,995 | | | | | | | | | | | | 1,186.0 | |
| | | | | | | | | | | | | | | | | |
| | |
| (1) | | Member since July 1, 2008; the rights were allocated before appointment to the Executive Board |
89
SAP SOP 2002
The table below shows Executive Board members’ December 31, 2008, holdings of stock options issued in previous years under the SAP SOP 2002 plan since its inception.
The strike prices for SAP SOP 2002 stock options are 110% of the base price of an SAP AG common share. The base price is the arithmetic mean closing auction price for SAP stock in the Xetra trading system (or its successor system) over the five business days immediately before the issue date of that stock option. The strike price cannot be less than the closing auction price on the day before the issue date. As a result of the issuance on December 21, 2006, of bonus shares at aone-to-three ratio under a capital increase from corporate funds, on exercise each stock option now entitles its beneficiary to four shares. For better comparability with the price of SAP stock since implementation of the capital increase, the following table shows not the number (quantity) of options but the number (quantity) of shares to which they entitle the holder. Consequently, the strike prices shown are prices per share and not per option. The number of shares shown in the table is four times the number of options, and the strike price for an option is four times the strike price per share shown in the table.
No rights expired or were forfeited in the report year.
SAP SOP 2002 Stock Options
| | | | | | | | | | | | | | | | | | | | | | | | | | | | | | | | | |
| | | | | | | | | | | | | | | Rights
| | | | | | | | | | |
| | | | | | | | | Holding on
| | | Exercised
| | | | | | | |
| | | | | | | | | January 1, 2008 | | | in 2008 | | | | | | Holding on December 31, 2008 | |
| | | | | | | | | | | | Remaining
| | | | | | Price on
| | | | | | Remaining
| |
| | | Year
| | | Strike Price
| | | Quantity
| | | Term in
| | | Quantity of
| | | Exercise
| | | Quantity of
| | | Term in
| |
| | | Granted | | | per Share | | | of Shares | | | Years | | | Shares | | | Day | | | Shares | | | Years | |
| | | | | | € | | | | | | | | | | | | € | | | | | | | |
| |
| Prof. Dr. Henning Kagermann (Co-CEO) | | | 2004 | | | | 37.50 | | | | 200,000 | | | | 1.13 | | | | — | | | | — | | | | 200,000 | | | | 0.13 | |
| | | | 2005 | | | | 33.55 | | | | 267,820 | | | | 2.11 | | | | — | | | | — | | | | 267,820 | | | | 1.11 | |
| | | | 2006 | | | | 46.48 | | | | 143,404 | | | | 3.10 | | | | — | | | | — | | | | 143,404 | | | | 2.10 | |
| Léo Apotheker (Co-CEO) | | | 2004 | | | | 37.50 | | | | 112,000 | | | | 1.13 | | | | — | | | | — | | | | 112,000 | | | | 0.13 | |
| | | | 2005 | | | | 33.55 | | | | 149,980 | | | | 2.11 | | | | — | | | | — | | | | 149,980 | | | | 1.11 | |
| | | | 2006 | | | | 46.48 | | | | 95,604 | | | | 3.10 | | | | — | | | | — | | | | 95,604 | | | | 2.10 | |
| Dr. Werner Brandt | | | 2004 | | | | 37.50 | | | | 112,000 | | | | 1.13 | | | | — | | | | — | | | | 112,000 | | | | 0.13 | |
| | | | 2005 | | | | 33.55 | | | | 149,980 | | | | 2.11 | | | | — | | | | — | | | | 149,980 | | | | 1.11 | |
| | | | 2006 | | | | 46.48 | | | | 87,292 | | | | 3.10 | | | | — | | | | — | | | | 87,292 | | | | 2.10 | |
Erwin Gunst(1) | | | 2005 | | | | 33.55 | | | | 61,264 | | | | 2.11 | | | | — | | | | — | | | | 61,264 | | | | 1.11 | |
| | | | 2006 | | | | 46.48 | | | | 44,596 | | | | 3.10 | | | | — | | | | — | | | | 44,596 | | | | 2.10 | |
| Prof. Dr. Claus E. Heinrich | | | 2004 | | | | 37.50 | | | | 112,000 | | | | 1.13 | | | | — | | | | — | | | | 112,000 | | | | 0.13 | |
| | | | 2005 | | | | 33.55 | | | | 149,980 | | | | 2.11 | | | | — | | | | — | | | | 149,980 | | | | 1.11 | |
| | | | 2006 | | | | 46.48 | | | | 87,292 | | | | 3.10 | | | | — | | | | — | | | | 87,292 | | | | 2.10 | |
Bill McDermott(1) | | | 2006 | | | | 46.48 | | | | 77,296 | | | | 3.10 | | | | — | | | | — | | | | 77,296 | | | | 2.10 | |
| Gerhard Oswald | | | 2005 | | | | 33.55 | | | | 149,980 | | | | 2.11 | | | | — | | | | — | | | | 149,980 | | | | 1.11 | |
| | | | 2006 | | | | 46.48 | | | | 87,292 | | | | 3.10 | | | | — | | | | — | | | | 87,292 | | | | 2.10 | |
Jim Hagemann Snabe(1) | | | 2005 | | | | 33.55 | | | | 51,180 | | | | 2.11 | | | | — | | | | — | | | | 51,180 | | | | 1.11 | |
| | | | 2006 | | | | 46.48 | | | | 37,164 | | | | 3.10 | | | | — | | | | — | | | | 37,164 | | | | 2.10 | |
| Dr. Peter Zencke | | | 2004 | | | | 37.50 | | | | 112,000 | | | | 1.13 | | | | — | | | | — | | | | 112,000 | | | | 0.13 | |
| | | | 2005 | | | | 33.55 | | | | 149,980 | | | | 2.11 | | | | — | | | | — | | | | 149,980 | | | | 1.11 | |
| | | | 2006 | | | | 46.48 | | | | 87,292 | | | | 3.10 | | | | — | | | | — | | | | 87,292 | | | | 2.10 | |
| | | | | | | | | | | | | | | | | | | | | | | | | | | | | | | | | |
Total | | | | | | | | | | | 2,525,396 | | | | | | | | | | | | | | | | 2,525,396 | | | | | |
| | | | | | | | | | | | | | | | | | | | | | | | | | | | | | | | | |
| | |
| (1) | | Member since July 1, 2008; the shares were allocated before appointment to the Executive Board |
LTI Plan 2000
Beneficiaries under the LTI Plan 2000 could choose between convertible bonds and stock options. The chief difference was in the way the exercise or conversion price was determined. The bond conversion price depends on the closing price of SAP stock the day before the bond was issued, while the option strike price varies with the performance of SAP stock over time against the S&P North Software-Software Index (the successor of the GSTI Software index).
90
The table below shows stock options held by members of the Executive Board on December 31, 2008, granted in earlier years under the LTI Plan 2000. The strike prices for LTI Plan 2000 stock options reflect the prices payable by an Executive Board member for one SAP common share on exercise of the option on December 31, 2008. The strike prices vary with the performance of SAP stock over time against the S&P North Software-Software Index. As a result of the issuance on December 21, 2006, of bonus shares at aone-to-three ratio under a capital increase from corporate funds, on exercise each stock option now entitles its beneficiary to four shares. For better comparability with the price of SAP stock since implementation of the capital increase, the following table shows not the number (quantity) of options but the number (quantity) of shares to which they entitle the holder. Consequently, the strike prices shown are prices per share and not per option. The number of shares shown in the table is four times the number of options, and the strike price for an option is four times the strike price per share shown in the table.
LTI Plan 2000 Stock Options
| | | | | | | | | | | | | | | | | | | | | | | | | | | | | | | | | |
| | | | | | | | | | | | Rights
| | | | | | | |
| | | | | | | | | Holding on
| | | Exercised in
| | | | | | Holding on December 31,
| |
| | | | | | | | | January 1, 2008 | | | 2008 | | | | | | 2008 | |
| | | | | | | | | | | | Remaining
| | | | | | Price on
| | | | | | Remaining
| |
| | | Year
| | | Strike Price
| | | Quantity
| | | Term in
| | | Quantity of
| | | Exercise
| | | Quantity of
| | | Term
| |
| | | Granted | | | per Share | | | of Shares | | | Years | | | Shares | | | Day2 | | | Shares | | | in Years | |
| | | | | | € | | | | | | | | | | | | € | | | | | | | |
| |
| Prof. Dr. Henning Kagermann (Co-CEO) | | | 2000 | | | | — | | | | 112,128 | | | | 2.14 | | | | — | | | | — | | | | 112,128 | | | | 1.14 | |
| | | | 2001 | | | | — | | | | 157,500 | | | | 3.14 | | | | — | | | | — | | | | 157,500 | | | | 2.14 | |
| Léo Apotheker (Co-CEO) | | | 2002 | | | | — | | | | 87,500 | | | | 4.14 | | | | — | | | | — | | | | 87,500 | | | | 3.14 | |
| Dr. Peter Zencke | | | 2000 | | | | — | | | | 27,924 | | | | 2.14 | | | | — | | | | — | | | | 27,924 | | | | 1.14 | |
| | | | 2001 | | | | — | | | | 73,700 | | | | 3.14 | | | | — | | | | — | | | | 73,700 | | | | 2.14 | |
| | | | | | | | | | | | | | | | | | | | | | | | | | | | | | | | | |
Total | | | | | | | | | | | 458,752 | | | | | | | | | | | | | | | | 458,752 | | | | | |
| | | | | | | | | | | | | | | | | | | | | | | | | | | | | | | | | |
| | |
| (1) | | No options were exercised in 2008, and the strike price is variable in accordance with the terms of the plan — being ascertained on the day an option is exercised — so there is no information to disclose here. |
| |
| (2) | | No options were exercised in 2009, so no strike price is shown. |
91
The table below shows convertible bonds held by members of the Executive Board on December 31, 2008, granted in earlier years under the LTI Plan 2000. The strike prices for LTI Plan 2000 convertible bonds reflect the prices payable by an Executive Board member for one SAP common share on conversion of the bond. The strike prices are fixed and correspond to the quoted price of one SAP share on the business day immediately preceding the grant of the convertible bond. As a result of the issuance on December 21, 2006, of bonus shares at aone-to-three ratio under a capital increase from corporate funds, on conversion each bond now entitles its beneficiary to four shares. For better comparability with the price of SAP stock since implementation of the capital increase, the following table shows not the number (quantity) of convertible bonds but the number (quantity) of shares to which they entitle the holder. Consequently, the strike prices shown are prices per share and not per bond. The number of shares shown in the table is four times the number of bonds, and the strike price for a bond is four times the strike price per share shown in the table.
LTI Plan 2000 Convertible Bonds
| | | | | | | | | | | | | | | | | | | | | | | | | | | | | | | | | |
| | | | | | | | | | | | Rights
| | | | | | Holding on
| |
| | | | | | | | | Holding on
| | | Exercised in
| | | | | | December 31,
| |
| | | | | | | | | January 1, 2008 | | | 2008 | | | | | | 2008 | |
| | | | | | | | | | | | Remaining
| | | | | | Price on
| | | | | | Remaining
| |
| | | Year
| | | Strike Price
| | | Quantity
| | | Term
| | | Quantity of
| | | Exercise
| | | Quantity
| | | Term
| |
| | | Granted | | | per Share | | | of Shares | | | in Years | | | Shares | | | Day | | | of Shares | | | in Years | |
| | | | | | € | | | | | | | | | | | | € | | | | | | | |
| |
| Prof. Dr. Henning Kagermann (Co-CEO) | | | 2000 | | | | 72.58 | | | | 89,700 | | | | 2.14 | | | | — | | | | — | | | | 89,700 | | | | 1.14 | |
| | | | 2001 | | | | 47.81 | | | | 126,000 | | | | 3.14 | | | | — | | | | — | | | | 126,000 | | | | 2.14 | |
| | | | 2002 | | | | 37.88 | | | | 360,000 | | | | 4.14 | | | | — | | | | — | | | | 360,000 | | | | 3.14 | |
| Léo Apotheker (Co-CEO) | | | 2000 | | | | 83.67 | | | | 95,400 | | | | 2.19 | | | | — | | | | — | | | | 95,400 | | | | 1.19 | |
| | | | 2001 | | | | 47.81 | | | | 120,000 | | | | 3.14 | | | | — | | | | — | | | | 120,000 | | | | 2.14 | |
| | | | 2002 | | | | 37.88 | | | | 70,000 | | | | 4.14 | | | | — | | | | — | | | | 70,000 | | | | 3.14 | |
| Dr. Werner Brandt | | | 2001 | | | | 47.81 | | | | 20,000 | | | | 3.14 | | | | — | | | | — | | | | 20,000 | | | | 2.14 | |
| | | | 2002 | | | | 37.88 | | | | 120,000 | | | | 4.14 | | | | — | | | | — | | | | 120,000 | | | | 3.14 | |
| Prof. Dr. Claus E. Heinrich | | | 2000 | | | | 72.58 | | | | 65,700 | | | | 2.14 | | | | — | | | | — | | | | 65,700 | | | | 1.14 | |
| | | | 2001 | | | | 47.81 | | | | 88,000 | | | | 3.14 | | | | — | | | | — | | | | 88,000 | | | | 2.14 | |
| | | | 2002 | | | | 37.88 | | | | 200,000 | | | | 4.14 | | | | — | | | | — | | | | 200,000 | | | | 3.14 | |
| Gerhard Oswald | | | 2000 | | | | 72.58 | | | | 65,700 | | | | 2.14 | | | | — | | | | — | | | | 65,700 | | | | 1.14 | |
| | | | 2001 | | | | 47.81 | | | | 88,000 | | | | 3.14 | | | | — | | | | — | | | | 88,000 | | | | 2.14 | |
| Dr. Peter Zencke | | | 2000 | | | | 72.58 | | | | 65,700 | | | | 2.14 | | | | — | | | | — | | | | 65,700 | | | | 1.14 | |
| | | | 2001 | | | | 47.81 | | | | 88,000 | | | | 3.14 | | | | — | | | | — | | | | 88,000 | | | | 2.14 | |
| | | | 2002 | | | | 37.88 | | | | 200,000 | | | | 4.14 | | | | — | | | | — | | | | 200,000 | | | | 3.14 | |
| | | | | | | | | | | | | | | | | | | | | | | | | | | | | | | | | |
Total | | | | | | | | | | | 1,862,200 | | | | | | | | | | | | | | | | 1,862,200 | | | | | |
| | | | | | | | | | | | | | | | | | | | | | | | | | | | | | | | | |
92
Total Expense for Share-Based Compensation
In the report year and the prior year total expense for the share-based compensation plans of Executive Board members was recorded as follows:
| | | | | | | | | |
| | | 2008 | | | 2007 | |
| | | €(000) | |
| |
| Prof. Dr. Henning Kagermann (Co-CEO) | | | 55.9 | | | | 1,047.5 | |
| Léo Apotheker (Co-CEO) | | | 37.3 | | | | 690.3 | |
| Dr. Werner Brandt | | | 98.9 | | | | 601.4 | |
Erwin Gunst(1) | | | 108.0 | | | | — | |
| Prof. Dr. Claus E. Heinrich | | | 98.9 | | | | 518.7 | |
Bill McDermott(1) | | | 97.4 | | | | — | |
| Gerhard Oswald | | | 98.9 | | | | 601.4 | |
John Schwarz(2) | | | 158.1 | | | | — | |
Jim Hagemann Snabe(1) | | | 95.2 | | | | — | |
| Dr. Peter Zencke | | | 98.9 | | | | 601.4 | |
Total | | | 947.5 | | | | 4,060.7 | |
| | |
| (1) | | Member of the Executive Board since July 1, 2008. |
| |
| (2) | | Member of the Executive Board since March 1, 2008. |
STOCK HELD BY EXECUTIVE BOARD MEMBERS
No member of the Executive Board holds more than 1% of the common stock of SAP AG. Members of the Executive Board held a total of 88,527 SAP shares on December 31, 2008. On December 31, 2007, members of the Executive Board held a total of 86,515 SAP shares.
The table below shows transactions by Executive Board members and persons closely associated with them notified to SAP pursuant to the German Securities Trading Act, section 15a, in 2008:
| | | | | | | | | | | | | | | | | |
| | | Transactions in SAP Shares |
| | | Transaction Date | | Transaction | | Quantity | | Unit Price € |
| |
| Léo Apotheker (Co-CEO) | | | October 29, 2008 | | | | Stock purchase | | | | 2,000 | | | | 26.35 | |
Executive Board: Other Information
We did not grant any compensation advance or credit to, or enter into any commitment for the benefit of, any member of our Executive Board in 2008 or the previous year.
As far as the law permits, SAP AG and SAP AG’s affiliated companies in Germany and elsewhere indemnify and hold harmless their respective directors and officers against and from the claims of third parties. To this end, we maintain directors’ and officers’ group liability insurance. The policy is annual and is renewed from year to year. The insurance covers the personal liability of the insured group for financial loss caused by its managerial acts and omissions. There is no individual deductible as envisaged in the German Corporate Governance Code. We believe the motivation and responsibility that the members of the Executive Board and Supervisory Board bring to their duties would not be improved by such a deductible element. For this reason, SAP regards a deductible as unnecessary for the insured group.
93
Compensation for Supervisory Board members
Compensation System
Supervisory Board members’ compensation is governed by our Articles of Incorporation, section 16. Each member of the Supervisory Board receives, in addition to the reimbursement of his or her expenses, compensation composed of fixed elements and a variable element. The variable element depends on the dividend paid by SAP on common shares.
The fixed element is €75,000 for the chairperson, €50,000 for the deputy chairperson, and €37,500 for other members. For membership of a Supervisory Board committee, members receive additional fixed compensation of €2,500 (provided that the relevant committee meets during the fiscal year) and the chairperson of the committee receives €5,000. The fixed remuneration element is due for payment after the end of the fiscal year.
The variable compensation element is €8,000 for the chairperson, €6,000 for the deputy chairperson, and €4,000 for the other members of the Supervisory Board for each €0.01 by which the dividend distributed per share exceeds €0.25. However, the aggregate compensation excluding compensation for committee memberships must not exceed €200,000 for the chairperson, €150,000 for the deputy chairperson, and €100,000 for other members.
Any member of the Supervisory Board having served for less than the entire fiscal year receives one-twelfth of their respective remuneration for each month of service commenced. This also applies to the higher compensation levels for the chairperson and deputy chairperson and to the additional compensation for committee chairs and memberships.
94
Amount of Compensation
Subject to the resolution on the appropriation of retained earnings by the Annual General Meeting of Shareholders on May 19, 2009, the compensation paid to Supervisory Board members in respect of fiscal year 2008 will be as set out in the table below:
| | | | | | | | | | | | | | | | | | | | | | | | | | | | | | | | | |
| | | 2008 | | | 2007 | |
| | | | | | | | | Compensation
| | | | | | | | | | | | Compensation
| | | | |
| | | Fixed
| | | Variable
| | | for Committee
| | | | | | Fixed
| | | Variable
| | | for Committee
| | | | |
| | | Compensation | | | Compensation | | | Work | | | Total | | | Compensation | | | Compensation | | | Work | | | Total | |
| | | €(000) | |
| |
| Prof. Dr. h.c. mult. Hasso Plattner (chairperson) | | | 75.0 | | | | 125.0 | | | | 25.0 | | | | 225.0 | | | | 75.0 | | | | 125.0 | | | | 15.0 | | | | 215.0 | |
| Lars Lamadé (deputy chairperson from May 10, 2007) | | | 50.0 | | | | 100.0 | | | | 2.5 | | | | 152.5 | | | | 49.0 | | | | 80.2 | | | | 2.5 | | | | 131.7 | |
| Pekka Ala-Pietilä | | | 37.5 | | | | 62.5 | | | | 7.5 | | | | 107.5 | | | | 37.5 | | | | 62.5 | | | | 2.5 | | | | 102.5 | |
| Thomas Bamberger (from May 10, 2007) | | | 37.5 | | | | 62.5 | | | | 2.5 | | | | 102.5 | | | | 25.0 | | | | 41.7 | | | | 1.7 | | | | 68.3 | |
| Panagiotis Bissiritsas (from May 10, 2007) | | | 37.5 | | | | 62.5 | | | | 5.0 | | | | 105.0 | | | | 25.0 | | | | 41.7 | | | | 3.3 | | | | 70.0 | |
| Willi Burbach | | | 37.5 | | | | 62.5 | | | | 5.0 | | | | 105.0 | | | | 37.5 | | | | 62.5 | | | | 4.2 | | | | 104.2 | |
| Helga Classen (deputy chairperson until May 10, 2007) | | | 37.5 | | | | 62.5 | | | | 2.5 | | | | 102.5 | | | | 45.8 | | | | 75.0 | | | | 2.5 | | | | 123.3 | |
| Prof. Dr. Wilhelm Haarmann | | | 37.5 | | | | 62.5 | | | | 9.0 | | | | 109.0 | | | | 37.5 | | | | 62.5 | | | | 7.5 | | | | 107.5 | |
| Bernhard Koller (until May 10, 2007) | | | 0.0 | | | | 0.0 | | | | 0.0 | | | | 0.0 | | | | 15.6 | | | | 26.0 | | | | 1.0 | | | | 42.7 | |
| Peter Koop (from May 10, 2007) | | | 37.5 | | | | 62.5 | | | | 2.5 | | | | 102.5 | | | | 25.0 | | | | 41.7 | | | | 1.6 | | | | 68.3 | |
| Christiane Kuntz-Mayr (until May 10, 2007) | | | 0.0 | | | | 0.0 | | | | 0.0 | | | | 0.0 | | | | 15.6 | | | | 26.0 | | | | 2.1 | | | | 43.8 | |
| Bernard Liautaud (from June 3, 2008) | | | 21.9 | | | | 36.5 | | | | 1.5 | | | | 59.8 | | | | 0.0 | | | | 0.0 | | | | 0.0 | | | | 0.0 | |
| Dr. Gerhard Maier | | | 37.5 | | | | 62.5 | | | | 5.0 | | | | 105.0 | | | | 37.5 | | | | 62.5 | | | | 5.0 | | | | 105.0 | |
| Dr. h.c. Hartmut Mehdorn | | | 37.5 | | | | 62.5 | | | | 1.5 | | | | 101.5 | | | | 37.5 | | | | 62.5 | | | | 0.0 | | | | 100.0 | |
| Prof. Dr.-Ing. Dr. h.c. Dr.-Ing. E.h. Joachim Milberg (from May 10, 2007) | | | 37.5 | | | | 62.5 | | | | 11.5 | | | | 111.5 | | | | 25.0 | | | | 41.7 | | | | 5.0 | | | | 71.7 | |
| Prof. Dr. Dr. h.c. August-Wilhelm Scheer (until April 4, 2008) | | | 12.5 | | | | 20.8 | | | | 2.5 | | | | 35.8 | | | | 37.5 | | | | 62.5 | | | | 7.5 | | | | 107.5 | |
| Dr. Barbara Schennerlein (until May 10, 2007) | | | 0.0 | | | | 0.0 | | | | 0.0 | | | | 0.0 | | | | 15.6 | | | | 26.0 | | | | 1.0 | | | | 42.7 | |
| Dr. Erhard Schipporeit | | | 37.5 | | | | 62.5 | | | | 7.5 | | | | 107.5 | | | | 37.5 | | | | 62.5 | | | | 5.0 | | | | 105.0 | |
| Stefan Schulz | | | 37.5 | | | | 62.5 | | | | 5.0 | | | | 105.0 | | | | 37.5 | | | | 62.5 | | | | 5.0 | | | | 105.0 | |
| Dr. Dieter Spöri (until May 10, 2007) | | | 0.0 | | | | 0.0 | | | | 0.0 | | | | 0.0 | | | | 15.6 | | | | 26.0 | | | | 1.0 | | | | 42.7 | |
| Dr. h.c. Klaus Tschira (until May 10, 2007) | | | 0.0 | | | | 0.0 | | | | 0.0 | | | | 0.0 | | | | 15.6 | | | | 26.0 | | | | 1.0 | | | | 42.7 | |
| Prof. Dr.-Ing. Dr.-Ing. E.h. Klaus Wucherer (from May 10, 2007) | | | 37.5 | | | | 62.5 | | | | 2.5 | | | | 102.5 | | | | 25.0 | | | | 41.7 | | | | 1.7 | | | | 68.3 | |
| | | | | | | | | | | | | | | | | | | | | | | | | | | | | | | | | |
Total | | | 646.9 | | | | 1,094.8 | | | | 98.3 | | | | 1,840.0 | | | | 672.9 | | | | 1,118.8 | | | | 76.3 | | | | 1,867.9 | |
| | | | | | | | | | | | | | | | | | | | | | | | | | | | | | | | | |
In addition, we reimburse to members of the Supervisory Board their expenses and the value-added tax payable on their compensation.
The total compensation of all Supervisory Board members in 2008 for work for SAP excluding compensation relating to the office of Supervisory Board member was €1,050,300.
95
Long-Term Incentives for the Supervisory Board
We do not offer members stock options or other share-based compensation for their Supervisory Board work. Any stock options or other share-based compensation received by employee-elected members relate to their position as SAP employees and not to their work on the Supervisory Board.
Supervisory Board Members’ Shareholdings
See Note 20 to our consolidated financial statements in “ITEM 18. Financial Statements,” which shows the shareholdings of Supervisory Board members Hasso Plattner (chairperson) and Klaus Tschira (who left the Supervisory Board in May 2007), and the companies they control, on December 31, 2008. No other member of the Supervisory Board held more than 1% of the SAP AG common stock at the end of 2008 or of the previous year. Members of the Supervisory Board held a total of 128,995,306 SAP shares on December 31, 2008. On December 31, 2007, members of the Supervisory Board held a total of 128,993,710 SAP shares.
The table below shows transactions by Supervisory Board members and persons closely associated with them notified to SAP pursuant to the German Securities Trading Act, section 15a, in 2008:
| | | | | | | | | | | | | | | | | |
| | | Transactions in SAP Shares | |
| | | Transaction Date | | Transaction | | Quantity | | | Unit Price in € | |
| |
| Dr. Elisabeth Strobl-Haarmann | | | March 13, 2008 | | | | Stock sale | | | | 4,490 | | | | 31.50 | |
| Prof. Dr.-Ing. Dr.-Ing. E.h. Klaus Wucherer | | | July 4, 2008 | | | | Stock purchase | | | | 1,500 | | | | 33.08 | |
Supervisory Board: Other Information
We did not grant any compensation advance or credit to, or enter into any commitment for the benefit of, any member of our Supervisory Board in 2008 or the previous year.
Hasso Plattner, the chairperson of the Supervisory Board, entered into a consulting contract with SAP after he joined the Supervisory Board in May 2003. The contract does not provide for any compensation. The only cost we incurred under the contract was the reimbursement of expenses.
As far as the law permits, we indemnify Supervisory Board members against, and hold them harmless from, claims brought by third parties. To this end, we maintain directors’ and officers’ group liability insurance. For more information about this insurance, see the Executive Board: Other Information section.
EMPLOYEES (continuing operations)
As of December 31, 2008, we had 51,536 FTEs worldwide (2007: 43,861; 2006: 39,198), which represented an increase of 17% from December 31, 2007, of which the acquisition of Business Objects contributed 14%. Of the total headcount, 15,582 employees were based in Germany and 9,214 in the United States.
Originally, we had planned to increase our workforce in 2008 by 4,000 FTEs (excluding additions through acquisitions). In October 2008, in response to the downturn of the economy, we implemented a head count freeze under which recruiting was limited to very rare exceptions. In January 2009 we announced our intention to reduce the number of positions globally to 48,500 by the end of the year, and to take advantage of any attrition during this time to assist in meeting our year end goal.
96
The following tables set forth the numbers of employees by functional area and by geographic region as of December 31, 2008, 2007 and 2006 in terms of FTEs (All headcount figures are based on continuing operations):
| | | | | | | | | | | | | | | | | | | | | | | | | | | | | | | | | | | | | | | | | | | | | | | | | |
| | | Employees as of December 31, continuing operations | |
| | | 2008 | | | 2007 | | | 2006 | |
FTEs | | EMEA | | | Americas | | | APJ | | | Total | | | EMEA | | | Americas | | | APJ | | | Total | | | EMEA | | | Americas | | | APJ | | | Total | |
| |
| Product | | | 3,266 | | | | 1,301 | | | | 1,891 | | | | 6,458 | | | | 3,022 | | | | 1,002 | | | | 1,807 | | | | 5,831 | | | | 2,840 | | | | 808 | | | | 1,595 | | | | 5,243 | |
| Service | | | 7,326 | | | | 4,142 | | | | 2,583 | | | | 14,051 | | | | 6,558 | | | | 3,893 | | | | 2,334 | | | | 12,785 | | | | 6,336 | | | | 3,363 | | | | 1,819 | | | | 11,518 | |
| Development | | | 8,687 | | | | 2,767 | | | | 4,093 | | | | 15,547 | | | | 7,787 | | | | 1,749 | | | | 3,415 | | | | 12,951 | | | | 7,507 | | | | 1,530 | | | | 2,764 | | | | 11,801 | |
| Sales & Marketing | | | 4,645 | | | | 4,014 | | | | 2,042 | | | | 10,701 | | | | 3,688 | | | | 3,129 | | | | 1,465 | | | | 8,282 | | | | 3,330 | | | | 2,604 | | | | 1,116 | | | | 7,050 | |
| General & Administration | | | 1,996 | | | | 788 | | | | 460 | | | | 3,244 | | | | 1,810 | | | | 571 | | | | 416 | | | | 2,797 | | | | 1,613 | | | | 523 | | | | 336 | | | | 2,472 | |
| Infrastructure | | | 905 | | | | 445 | | | | 185 | | | | 1,535 | | | | 789 | | | | 285 | | | | 141 | | | | 1,215 | | | | 713 | | | | 281 | | | | 120 | | | | 1,114 | |
| | | | | | | | | | | | | | | | | | | | | | | | | | | | | | | | | | | | | | | | | | | | | | | | | |
| SAP Group | | | 26,825 | | | | 13,457 | | | | 11,254 | | | | 51,536 | | | | 23,654 | | | | 10,629 | | | | 9,578 | | | | 43,861 | | | | 22,339 | | | | 9,109 | | | | 7,750 | | | | 39,198 | |
| | | | | | | | | | | | | | | | | | | | | | | | | | | | | | | | | | | | | | | | | | | | | | | | | |
We believe that hiring highly qualified professionals is essential to build the foundation for our future success and continued growth. Initial plans for 2008 called for 4,000 new jobs to be created. The actual net FTEs increased by 7,675. Of the total worldwide headcount increase in 2008, acquisitions accounted for 6,491 FTE, the majority of which was in the Americas region. The average number of FTE increased by 9,401 from 42,129 in 2007 to 51,530 in 2008. The percentage increases were 27% in the Americas region, 13% in the EMEA region, and 18% in the Asia Pacific Japan region. We filled 2,828 new positions in the Americas region and 3,171 new positions in the EMEA region in 2008. Of the 1,676 new positions in the Asia Pacific Japan region, most were in India (753) and China (428).
Certain employees who are employed by SAP but who are not currently working or who work part-time while finishing a university degree are excluded from the above figures. Also, certain temporary employees are not included in the above figures. The number of such temporary employees is not material.
On a worldwide basis, we believe that our employee relations are excellent. Employees of SAP France S.A. and Business Objects S.A. are subject to a collective bargaining agreement.
A German group works council with six members from the German subsidiaries at SAP’s headquarters in Walldorf represents SAP’s German employees. On the legal entity level, the SAP AG works council represents the employees of the AG with 31 members, the employees of SAP Germany are represented by a works council with 30 members. For different areas of co-determination the entity-level works councils have elected committees. By law the works council is entitled to consultation- and in some areas to co-determination- rights concerning labor conditions at SAP AG and SAP Germany. Therefore the implementation of some labor and employment measures may take longer and be more costly than in countries without a works council, but these processes offer the possibility of a better acceptance and understanding of measures by the employees. Other employee representatives include the group works council currently having six members (members of the works councils of SAP and SAP Germany), the representatives of severely disabled persons in all entities and on group level (Germany) and the spokes persons committee as the representation of the executives.
Each of SAP France S.A and Business Objects S.A are represented by a French works council. A French works council is responsible for protecting the employees’ collective interests by ensuring that management considers the interests of employees in making decisions on behalf of the company. A French works council is entitled to certain company information and to consult with management on matters that are expected to have an impact on company structure or on the employees it represents.
In addition, the employees of our subsidiaries SAP Spain and SAP Belgium are also represented by works councils.
97
SHARE OWNERSHIP
Beneficial Ownership of Shares
The ordinary shares beneficially owned by Hasso Plattner (Chairperson of the Supervisory Board) and Klaus Tschira and companies affiliated with the aforementioned individuals are disclosed in “Item 7. Major Shareholders and Related-Party Transactions — Major Shareholders.” We believe each of the other members of the Supervisory Board and the Executive Board beneficially owns less than 1% of SAP AG’s ordinary shares as of March 9, 2009.
SHARE-BASED COMPENSATION PLANS
SAP Stock Option Plan 2002
At the 2002 Annual General Meeting of Shareholders, the SAP AG shareholders approved the SAP SOP 2002. The SAP SOP 2002 provided for the issuance of stock options to the members of the SAP AG Executive Board, members of subsidiaries’ Executive Boards and to eligible executives and other top performers of SAP AG and its subsidiaries. The SAP SOP 2002 Plan was designed to replace the LTI 2000 Plan described below and was replaced in 2007 by the SOP 2007 Plan. The last stock options under the SAP SOP 2002 Plan were granted in 2006. See Note 27 to our consolidated financial statements in “Item 18. Financial Statements” for a more detailed discussion.
By resolution of SAP AG’s Annual General Meeting of Shareholders held on May 10, 2007, the Executive Board of SAP AG was authorized to acquire, on or before October 31, 2008, up to 120 million shares in the Company on the condition that such share purchases, together with any previously acquired shares, do not account for more than 10% of SAP AG’s capital stock. Such repurchased ordinary shares may, among other things, be used to satisfy our obligations upon conversion of the convertible bonds or exercise of the stock options under the LTI 2000 Plan and our obligations upon the exercise of stock options under the SAP SOP 2002. This resolution replaced the resolution of the Annual General Meeting of Shareholders of May 9, 2006, which authorized the Executive Board to acquire on or before October 31, 2007, up to 120 million shares in SAP to, among other things, satisfy our obligations upon conversion of the convertible bonds or exercise of the stock options under the LTI 2000 Plan and the exercise of stock options under the SAP SOP 2002. These repurchases of ordinary shares are expected to reduce the dilutive effects on earnings per share. As of March 9, 2009, we have repurchased 14,835 thousand ordinary shares and issued them to stock option holders who have exercised stock options under the SAP SOP 2002. The number of repurchased shares was adjusted to reflect the December 15, 2006 share issuance presented as a share split.
Long Term Incentive 2000 Plan
On January 18, 2000 SAP’s shareholders approved the LTI 2000 Plan. The LTI 2000 Plan is a share-based compensation program, providing members of the SAP AG Executive Board, members of subsidiaries’ executive boards and selected employees a choice between convertible bonds, stock options, or a 50% mixture of each. Under the LTI 2000 Plan, 15 million convertible bonds or 18.75 million stock options were originally authorized, and a maximum of 18.75 million ordinary shares (not adjusted for the December 15, 2006 share issuance presented as a share split) were authorized pursuant to a contingent capital increase for issuance upon conversion of the convertible bonds and exercise of the stock options granted under the LTI 2000 Plan. Upon conversion of the convertible bonds and exercise of the stock options, we will be required to provide ordinary shares in return for payment of the conversion or exercise price, as the case may be, which will be less than the market price for the ordinary shares at the time of such conversion or exercise.
By resolution of the Annual General Meeting of Shareholders on May 3, 2002, the authorization to issue convertible bonds and stock options under the LTI 2000 Plan, to the extent not yet made use of, was revoked. In
98
addition, the contingent capital for issuance upon conversion of the convertible bonds and exercise of the stock options granted under the LTI 2000 Plan was reduced to the amount necessary to secure all convertible bonds and stock options already granted under the LTI 2000 Plan. In total SAP AG issued approximately 8.68 million convertible bonds and approximately 3.63 million stock options under the LTI 2000 Plan.
The conversion price of the convertible bonds for four SAP AG ordinary shares will equal the closing price of the SAP AG ordinary share quoted in the Xetra trading system (or any successor system) of the Frankfurt Stock Exchange on the last trading day prior to the issue of the respective convertible bond (the day on which SAP AG or the credit institution managing the issue on behalf of SAP AG accepts the beneficiary’s subscription). Upon the exercise of the conversion rights, an additional payment is due for each four shares equal to the amount by which the conversion price of the shares exceeds the nominal amount of the converted bond of €1 for each convertible bond, which was payable upon granting of the convertible bonds and which is mandatory according to German Stock Corporation Law.
The exercise price of the stock options issued under the LTI 2000 Plan for one SAP AG ordinary share is calculated by reference to the outperformance. The outperformance is the percentage points by which the performance of the SAP AG ordinary share exceeds the performance of the S&P North Software Indextm (which is the successor of the GSTI Software Index). The initial value for determining the performance by the SAP AG ordinary shares is the closing price of the SAP AG ordinary shares quoted in the Xetra trading system (or any successor system) of the Frankfurt Stock Exchange on the last trading day prior to the issue of the stock option (the day on which SAP AG or the credit institution managing the issue for SAP AG accepts the beneficiary’s subscription). The initial value for determining the performance of the reference index is the last value recorded for the reference index on the same trading day on the Chicago Board Options Exchange. The final value for determining the performance of the SAP AG ordinary share is the closing price of SAP’s ordinary shares quoted in the Xetra trading system (or any successor system) of the Frankfurt Stock Exchange on the latest trading day prior to exercise of the subscription right attaching to the stock option. The final value for determining the performance of the reference index is the last value of the reference index on the same trading day on the Chicago Board Options Exchange. The initial value and the final value of the reference index will be translated from US$ to euro using the noon-fixing rate as published each day by the European Central Bank. Performance is the price change measured between the initial value and the final value, expressed as percentage points. In calculating the performance of the SAP AG ordinary share, the same adjustment rules for dividend payments, subscription rights, and other special rights are applied to the stock exchange prices used as are applied in determining the relevant reference index. The exercise price for one stock option is calculated by reference to the outperformance. The outperformance is the percentage points by which the performance of the SAP AG ordinary share exceeds the performance of the reference index, as follows: The exercise price is the final value as determined above, less the product of the initial value as determined above and the outperformance.
Beneficiaries under the LTI 2000 Plan may not exercise their conversion or subscription rights until a vesting period has elapsed. The vesting period for 33% of such rights ends two years after the issue date, for the next 33% three years after the issue date and for the balance four years after the issue date. Convertible bonds and stock options under the LTI 2000 Plan have a term of 10 years from the issue date, after which they become void.
As of March 9, 2009, we have repurchased 7,216 thousand ordinary shares and issued them to stock option holders who have exercised stock options under the LTI 2000 Plan. See the preceding section, SAP Stock Option Plan 2002, for further discussions regarding shares we are authorized to repurchase to satisfy our obligations under the LTI 2000 Plan and the SAP SOP 2002.
Stock Appreciation Rights (STAR) Plans
In March and April 2008, we granted approximately 18.5 million (2007: 18.7 million; 2006: 14.1 million) stock appreciation rights to selected employees who are not participants in the LTI 2000 Plan or SAP SOP 2002. The plan does not involve the issue or grant of options or shares. See Note 27 to our consolidated financial statements in “Item 18. Financial Statements” for a more detailed discussion.
99
Incentive Plan 2010
In January 2008 and January 2007 we granted 0.1 and 0.7 million stock appreciation rights (“rights”) to our top executives under the Incentive Plan 2010 respectively. In March 2006, we granted 0.7 million rights to the Executive Board members under the Incentive Plan 2010. The plan provides for a maximum payout of approximately €100 million for the tranche granted to the Executive Board members and approximately another €100 million for the tranche granted to the top executives, provided that the market capitalization of SAP AG doubles by December 31, 2010. Therefore, the maximum payout for the stock appreciation rights that have been granted to date under this plan amounts to approximately €200 million in the aggregate. The plan does not involve the issue or grant of options or shares. See Note 27 to our consolidated financial statements in “Item 18. Financial Statements” for a more detailed discussion.
Virtual Stock Option Plan 2007
In the first half of 2008 as well as in March 2007 we granted 8.7 and 7.0 million virtual stock options respectively (stock appreciation rights, “SOP 2007”). The plan’s terms envisage cash settlement only, and it is available to members of the SAP AG Executive Board, members of subsidiaries’ executive boards and eligible executives and other top performers of SAP AG and its subsidiaries. The program replaced the SAP SOP 2002 Plan, described above. The plan does not involve the issue or grant of options or shares. See Note 27 to our consolidated financial statements in “Item 18. Financial Statements” for a more detailed discussion.
German Employee Stock Purchase Plans
We maintain two employee stock purchase plans for our German employees: (i) an ongoing payroll deduction plan (the “German Payroll Deduction Plan”) and (ii) an annual purchase plan (the “German Annual Purchase Plan”). Under the German Payroll Deduction Plan, an eligible German employee is able to purchase ordinary shares through payroll deductions of up to 10% of the gross monthly salary of the employee and SAP contributions of 15% of the ordinary share purchase price as well as the assumption of ancillary purchase expenses. As soon as the amount available for an employee is sufficient together with our contribution to purchase an ordinary share, such purchase is effected at the market price and credited to the employee’s account. The acquired shares are not subject to a holding period. Under the German Annual Purchase Plan, eligible German employees may buy a determined number of ordinary shares per year on a set date. Under such plan, SAP contributes €260 per year. The employee provides any additional amounts, if necessary, to avoid the purchase of fractional shares. The acquired shares are transferred to an individual account of the participating employee, and they are not subject to a holding period. Employees must elect each year to participate in the German Annual Purchase Plan.
U.S. Employee Stock Purchase Plans
During 2008 we maintained two plans which allow for our U.S. employees to acquire equity securities of SAP AG as follows: (i) an employee non-discount purchase plan (the “U.S. Non-discount Plan”); and (ii) the ADR Stock Fund (the “ADR Stock Fund”) available under the SAP America, Inc. 401(k) Plan (“401(k) Plan”). Under the U.S. Non-discount Plan, an administrator makes open market purchases of ADRs for the accounts of participating employees on a semi-monthly basis. Such purchases are made out of amounts deducted from each participating employee’s eligible compensation. SAP does not make any contributions in connection with the U.S. Non-discount Plan. The ADR Stock Fund was introduced in 2000 as an investment option provided to certain U.S. employees under the 401(k) Plan. For 2007, U.S. employees could contribute up to 25% of their pretax and after tax payroll under the 401(k) Plan, and we would contribute 50% of the contributed amounts up to 6% of the pretax and after tax pay not to exceed $6,600 per year. Both employee and employer contributions are submitted to a plan administrator who provides various investment fund options at the election of each participant.
100
Other Foreign Stock Purchase Plans
Although we maintain and are in the process of introducing various employee stock purchase plans similar to our German and U.S. plans in the majority of our remaining foreign subsidiaries, the combined impact of these plans on our results of operations, net income and cash flows is not material.
Certain employees of Business Objects companies held equity awards giving rights to Business Objects shares (stock options and Restricted Stock Unit (RSU)) at the time of the acquisition by SAP. Due to a squeeze-out initiated by SAP France, the Business Objects shares were no longer publicly traded as of February 18, 2008. As part of the acquisition, the equity awards of the Business Objects employees were supplemented with certain mechanisms to allow the employees to cash out their equity awards, either by receiving cash instead of Business Objects shares (cash payment mechanism or CPM) or by receiving Business Objects shares that subsequently must be tendered to SAP (liquidity agreement mechanism or LAM) in accordance with local regulations. The new rights closely mirrored the economics of the previous entitlements. See Note 27 to our consolidated financial statements in “Item 18. Financial Statements,” for a more detailed discussion.
ITEM 7. MAJOR SHAREHOLDERS AND RELATED-PARTY TRANSACTIONS
MAJOR SHAREHOLDERS
The share capital of SAP AG consists of ordinary shares, which are issued only in bearer form. Accordingly, SAP AG generally has no way of determining who its shareholders are or how many shares a particular shareholder owns. SAP’s ordinary shares are traded in the United States by means of ADRs. Each ADR currently represents one SAP ordinary share. On March 9, 2009, based upon information provided by the ADR depositary, the Deutsche Bank Trust Company Americas, there were 93,339,185ADRs held of record by 17,245 registered holders. The ordinary shares underlying such ADRs represented 7.61% of the then-outstanding ordinary shares (including treasury stock). Because SAP’s ordinary shares are issued in bearer form only, we are unable to determine the number of ordinary shares directly held by persons with U.S. addresses.
However, under Section 21 of the German Securities Trading Act (Wertpapierhandelsgesetz), holders of voting securities of a German company admitted to official trading on a stock exchange within the European Union or the European Economic Area are obligated to notify the issuer of the securities of the level of their holdings whenever such holdings reach, exceed or fall below certain thresholds, which have been set at 3%, 5%, 10%, 15%, 20%, 25%, 30%, 50% and 75% of the issuer’s outstanding voting rights.
101
The following table sets forth certain information regarding the beneficial ownership of the ordinary shares to the extent known to SAP as of March 9, 2009 of: (i) each person or group known by SAP AG to own beneficially 5% or more of the outstanding ordinary shares; and (ii) the beneficial ownership of all members of the Supervisory Board and all members of the Executive Board, individually and as a group, in each case as reported to SAP AG by such persons. There was, as far as we are able to tell given the nature of our shares, no significant change in the percentage ownership held by any major shareholder during the past three years. None of the major shareholders have special voting rights.
| | | | | | | | | |
| | | Ordinary Shares
| |
| | | Beneficially Owned | |
| | | | | | % of
| |
Major Shareholders | | Number | | | Outstanding | |
| |
Dietmar Hopp, collectively(1) | | | 110,273,200 | | | | 8.996 | % |
Hasso Plattner, Chairperson Supervisory Board, collectively(2) | | | 128,987,982 | | | | 10.522 | % |
Klaus Tschira, collectively(3) | | | 109,754,305 | | | | 8.953 | % |
| Executive Board Members as a group (7 persons) | | | 88,527 | | | | 0.007 | % |
| Supervisory Board Members as a group (16 persons) | | | 128,994,969 | | | | 10.523 | % |
| | | | | | | | | |
Executive Board Members and Supervisory Board Members as a group (23 persons) | | | 129,083,496 | | | | 10.530 | % |
Options and convertible bonds that are vested and exercisable within 60 days of March 9, 2009, held by Executive Board Members and Supervisory Board Members, collectively(4) | | | 914,997 | | | | N/A | |
| |
| (1) | Includes Dietmar Hopp Stiftung GmbH and DH Besitzgesellschaft mbH & Co. KG in which Dietmar Hopp exercises sole voting and dispositive power. |
| |
| (2) | Includes Hasso Plattner Förderstiftung gGmbH and Hasso Plattner GmbH & Co. Beteiligungs-KG in which Hasso Plattner exercises sole voting and dispositive power. |
| |
| (3) | Includes Klaus Tschira Stiftung gGmbH and Dr. h. c. Tschira Beteiligungs GmbH & Co. KG in which Klaus Tschira exercises sole voting and dispositive power. |
| |
| (4) | Includes 511,147 stock options and 403,850 convertible bonds. Each of these stock options and convertible bonds entitles the holder, if exercised or converted, to four SAP AG ordinary shares. |
We at present have no knowledge about any arrangements, the operation of which may at a subsequent date result in a change in control of the company.
RELATED-PARTY TRANSACTIONS
See Note 30 in “Item 18. Financial Statements” for information on related-party transactions.
ITEM 8. FINANCIAL INFORMATION
CONSOLIDATED FINANCIAL STATEMENTS
See “Item 18. Financial Statements” and pages F-1 through F-95
OTHER FINANCIAL INFORMATION
Legal Proceedings
We are subject to legal proceedings and claims, either asserted or unasserted, which arise in the ordinary course of business. Although the outcome of such proceedings and claims cannot be predicted with certainty, management does not believe that the outcome of any of these matters will have a material adverse effect on our
102
business, results of operations, financial position or cash flows. Any litigation, however, involves potential risk and potentially significant litigation costs, and therefore there can be no assurance that any litigation which is now pending or which may arise in the future would not have such a material adverse effect on our business, financial position, income or cash flows.
See a detailed discussion of our legal proceedings in Note 24 to our consolidated financial statements in “Item 18. Financial Statements.”
Dividend Policy
Dividends are jointly proposed by SAP AG’s Supervisory Board and Executive Board based on SAP AG’s year-end stand-alone financial statements, subject to approval at the Annual General Meeting of Shareholders, and are officially declared for the prior year at SAP AG’s Annual General Meeting of Shareholders. SAP AG’s Annual General Meeting of Shareholders usually convenes during the second quarter of each year. Since ordinary shares are in bearer form, dividends are usually remitted to the custodian bank on behalf of the shareholder within one business day following the Annual General Meeting of Shareholders. Record holders of the ADRs on the dividend record date will be entitled to receive payment of the dividend declared in respect of the year for which it is declared. Cash dividends payable to such holders will be paid to the Depositary in euro and, subject to certain exceptions, will be converted by the Depositary into U.S. dollars. The amount of dividends received by holders of ADRs may be affected by fluctuations in exchange rates. See “Item 3. Key Information — Exchange Rates.” The timing and amount of future dividend payments will depend upon our future earnings, capital needs and other relevant factors.
Significant Changes
We acquired substantially all outstanding securities of Business Objects in 2008. In connection with the acquisition, we entered into a €5 billion credit facility in October 2007 (subsequently reduced to €4.45 billion as of December 31, 2007 and further reduced to €2.95 billion in February 2008). Funds available under the facility were not drawn until the first quarter of 2008. As of March 9, 2009, we had €2.3 billion drawn on this credit facility.
To enable us to adapt our size to today’s market conditions and the broader impact of the global recession, in January 2009 we announced our intention to reduce the number of positions globally to 48,500 by the end of the year, and to take advantage of any attrition during this time to assist in meeting our year end goal.
ITEM 9. THE OFFER AND LISTING
GENERAL
Our ordinary shares are officially listed on the Frankfurt Stock Exchange, the Berlin Stock Exchange and the Stuttgart Stock Exchange. In addition, the ordinary shares are traded in the over-the-counter markets (Freiverkehr) in Germany. The principal trading market for the ordinary shares is Xetra, the electronic dealing platform of the Frankfurt Stock Exchange. The ordinary shares are issued only in bearer form.
On December 15, 2006, the resolution of the May 9, 2006 Annual General Meeting of Shareholders to increase the Company’s subscribed capital from corporate funds (retained earnings and APIC) became effective. For each share they already held, SAP AG shareholders received three additional shares after the close of stock exchange business on December 20, 2006. The Company’s stock exchange listing was amended accordingly with effect from December 21, 2006. The new shares resulting from the subscribed capital increase were automatically credited to shareholders’ custody accounts. For financial statement purposes, the issuance of the additional shares is presented as a share split. Accordingly, earnings per share information for years prior to 2006 presented throughout this annual report have been retrospectively adjusted to reflect the December 15, 2006 share issuance. Other prior year share information, for example shares authorized, issued and outstanding, have not been retrospectively adjusted to reflect the December 15, 2006 share issuance because Section 8 of the German
103
Stock Corporation Act (AktG) requires that the Company’s shares maintain a per-share nominal value of at least €1, and the Company’s per-share nominal value of its issued and outstanding shares was already €1 before the December 15, 2006 share issuance.
With the change in share capital in December 2006 the previous ratio between the ADRs and the underlying ordinary shares of 4:1, meaning that four SAP ADRs were the equivalent of one SAP AG ordinary share, changed to 1:1, meaning that one SAP ADR represents one SAP ordinary share. Holders of SAP ADRs did not receive additional ADRs as a result of the capital increase.
On September 7, 2007, the Executive Board of SAP AG announced that it decided to decrease the Company’s capital stock by canceling 23,000,000 treasury shares, representing 1.8% of the capital stock before this corporate action.
On September 3, 2008, the Executive Board of SAP AG announced that it decided to decrease the Company’s capital stock by canceling 21,000,000 treasury shares, representing 1.7% of the capital stock before this corporate action.
As of December 31, 2008 the share capital of SAP AG was €1,225,762,900 representing 1,225,762,900 no-par ordinary shares.
ADRs representing SAP AG ordinary shares are listed on the New York Stock Exchange (“NYSE”) under the symbol “SAP” and currently each represents one ordinary share.
104
TRADING ON THE FRANKFURT STOCK EXCHANGE AND THE NYSE
The table below sets forth, for the periods indicated, the high and low closing sales prices for the ordinary shares on the Xetra trading System of the Frankfurt Stock Exchange, as provided by Reuters, together with the closing highs and lows of the DAX, and the high and low closing sales prices for the ADRs on the NYSE:
| | | | | | | | | | | | | | | | | | | | | | | | | |
| | | Price per
| | | | | | | |
| | | Ordinary Share(1) | | | DAX(2) | | | Price per ADR | |
| | | High | | | Low | | | High | | | Low | | | High | | | Low | |
| | | In € | | | In € | | | In US$ | |
| |
Annual Highs and Lows | | | | | | | | | | | | | | | | | | | | | | | | |
2004 | | | 35.68 | | | | 29.03 | | | | 4,261.79 | | | | 3,646.99 | | | | 45.45 | | | | 35.50 | |
2005 | | | 38.95 | | | | 28.63 | | | | 5,458.58 | | | | 4,178.10 | | | | 46.43 | | | | 36.96 | |
2006 | | | 46.86 | | | | 34.56 | | | | 6,611.81 | | | | 5,292.14 | | | | 57.00 | | | | 43.57 | |
2007 | | | 42.27 | | | | 33.37 | | | | 8,105.69 | | | | 6,447.70 | | | | 59.86 | | | | 44.45 | |
2008 | | | 39,93 | | | | 23,45 | | | | 7,949.11 | | | | 4,127.41 | | | | 58.98 | | | | 29.70 | |
Quarterly Highs and Lows | | | | | | | | | | | | | | | | | | | | | | | | |
2007 | | | | | | | | | | | | | | | | | | | | | | | | |
| First Quarter | | | 42.27 | | | | 33.37 | | | | 7,027.59 | | | | 6,447.70 | | | | 55.71 | | | | 44.45 | |
| Second Quarter | | | 38.15 | | | | 33.65 | | | | 8,090.49 | | | | 6,937.17 | | | | 51.35 | | | | 45.08 | |
| Third Quarter | | | 41.76 | | | | 36.61 | | | | 8,105.69 | | | | 7,270.07 | | | | 58.67 | | | | 49.85 | |
| Fourth Quarter | | | 41.66 | | | | 34.31 | | | | 8,076.12 | | | | 7,511.97 | | | | 59.86 | | | | 50.05 | |
2008 | | | | | | | | | | | | | | | | | | | | | | | | |
| First Quarter | | | 34.88 | | | | 29.96 | | | | 7,949.11 | | | | 6.182,30 | | | | 51.93 | | | | 45.77 | |
| Second Quarter | | | 35.52 | | | | 31.50 | | | | 7,225.94 | | | | 6,418.32 | | | | 55.20 | | | | 48.72 | |
| Third Quarter | | | 39.93 | | | | 32.38 | | | | 6,609.63 | | | | 5,807.08 | | | | 58.98 | | | | 51.40 | |
| Fourth Quarter | | | 36.98 | | | | 23.45 | | | | 5,806.33 | | | | 4,127.41 | | | | 51.85 | | | | 29.70 | |
Monthly Highs and Lows | | | | | | | | | | | | | | | | | | | | | | | | |
2008 | | | | | | | | | | | | | | | | | | | | | | | | |
| July | | | 37.26 | | | | 32.38 | | | | 6,536.09 | | | | 6,081.70 | | | | 58.98 | | | | 51.40 | |
| August | | | 38.71 | | | | 37.00 | | | | 6,609.63 | | | | 6,236.96 | | | | 58.56 | | | | 55.71 | |
| September | | | 39.93 | | | | 36.97 | | | | 6,518.47 | | | | 5,807.08 | | | | 58.13 | | | | 52.19 | |
| October | | | 36.98 | | | | 23.45 | | | | 5,806.33 | | | | 4,295.67 | | | | 51.85 | | | | 30.22 | |
| November | | | 29.44 | | | | 23.80 | | | | 5,278.04 | | | | 4,127.41 | | | | 38.38 | | | | 29.70 | |
| December | | | 27.74 | | | | 24.10 | | | | 4,810.20 | | | | 4,381.47 | | | | 36.27 | | | | 32.21 | |
2009 | | | | | | | | | | | | | | | | | | | | | | | | |
| January | | | 27.85 | | | | 25.91 | | | | 5,026.31 | | | | 4,178.94 | | | | 37.62 | | | | 33.30 | |
| February | | | 29.64 | | | | 25.52 | | | | 4,666.82 | | | | 3,843.74 | | | | 38.61 | | | | 32.14 | |
| March (through March 9, 2009) | | | 26.43 | | | | 25.00 | | | | 3,890.94 | | | | 3,666.41 | | | | 33.11 | | | | 31.69 | |
| |
| (1) | Share prices for 2006 and prior are retrospectively adjusted for the effect of the fourfold increase in the number of shares resulting from the capital increase which became effective December 15, 2006 (see the immediately preceding section “— General” for more detail of the share increase). |
| |
| (2) | The DAX is a continuously updated, capital-weighted performance index of 30 German blue chip companies. In principle, the shares included in the DAX are selected on the basis of their stock exchange turnover and the issuer’s market capitalization. Adjustments to the DAX are made for capital changes, subscription rights and dividends. |
On March 9, 2009, the closing sales price per ordinary share on the Frankfurt Stock Exchange was €25.59 as provided by Reuters, and the closing sales price per ADR on the NYSE was US$31.78, as reported on the NYSE Composite Tape.
105
ITEM 10. ADDITIONAL INFORMATION
ARTICLES OF INCORPORATION
Organization and Register
SAP AG is a stock corporation organized in the Federal Republic of Germany under the Stock Corporation Act (Aktiengesetz). SAP AG is registered in the Commercial Register (Handelsregister) at the Lower Court of Mannheim, Germany, under the entry number “HRB 350269.” SAP AG publishes its official notices in the Internet version of the Federal Gazette (www.ebundesanzeiger.de).
Objectives and purposes
Section 2 of SAP AG’s Articles of Incorporation states that our objectives involve, directly or indirectly, the development, production and marketing of products and the provision of services in the field of information technology, including:
| | |
| | • | developing and marketing integrated product and service solutions fore-commerce; |
| |
| | • | developing software for information technology and the licensing of its use to others; |
| |
| | • | organization and deployment consulting, as well as user training, fore-commerce and other software solutions; |
| |
| | • | selling, leasing, renting and arranging the procurement and provision of all other forms of use of information technology systems and related equipment; and |
| |
| | • | making capital investments in enterprises active in the field of information technology to promote the opening and advancement of international markets in the field of information technology. |
SAP AG is authorized to act in all the business areas listed above and to delegate such activities to affiliated enterprises within the meaning of the German Stock Corporation Act; in particular SAP AG is authorized to delegate its business in whole or in part to such enterprises. SAP AG is authorized to establish branch offices in Germany and other countries, as well as to form, acquire or invest in other companies of the same or related kind and to enter into collaboration and joint venture agreements. SAP AG is further authorized to invest in enterprises of all kinds principally for the purpose of placing financial resources. SAP AG is authorized to dispose of investments, to consolidate the management of enterprises in which it participates, to enter into affiliation agreements with such enterprises, or to do no more than manage its shareholdings.
CORPORATE GOVERNANCE
Introduction
The primary source of law relating to corporate governance of a German stock corporation is the German Stock Corporation Act. Other relevant rules impacting corporate governance are contained in the German Security Trading Act, Securities Purchase and Takeover Act, Stock Exchange Admission Regulations, Commercial Code and other statutes. In addition to these mandatory rules, in February 2002, a government commission appointed by the German Minister of Justice adopted the German Corporate Governance Code (“GCGC”), which has since been amended. The GCGC consists of recommended corporate governance standards. Section 161 of the Stock Corporation Act, however, requires the executive board and the supervisory board of exchange-listed companies, such as SAP AG, to declare annually that the recommendations set forth in the GCGC have been and are being complied with, or which of the recommendations are not being applied. SAP AG has disclosed deviations from the GCGC in the above-mentioned declaration of compliance on a yearly basis
106
since 2002 (Seewww.sap.com/about/governance/statutes/declarationofimplementation.epx). See “Item 16G. Differences in Corporate Governance Practices” for additional information on our corporate governance practices.
In December 2001, as one of the first German listed companies to do so, SAP published its own corporate governance rules — “SAP’s Principles of Corporate Governance.” Since the adoption of the GCGC in 2002, SAP has adjusted its own principles according to new national and international corporate governance standards as appropriate and as far as they were applicable to SAP. Due to these continual amendments, SAP’s Principles of Corporate Governance and the applicable German Law together with the GCGC have come to cover largely the same content. In October 2007, SAP therefore decided to discontinue its own Principles of Corporate Governance and instead makes reference to the GCGC as the basis of its corporate governance.
As a publicly traded company listed on the New York Stock Exchange, we are in compliance with the applicable regulations of the Corporate Governance Rules of the New York Stock Exchange as they apply to foreign private issuers.
The Global Compliance Office (GCO), an extension of SAP’s Global Legal Department, was created by the SAP Executive Board in 2006 to oversee and coordinate legal and regulatory policy compliance for the SAP Group companies. Effective March 1, 2007, the Company appointed a new Chief Global Compliance Officer who reports to the General Counsel, and also has direct communication channels and reporting obligations to the Executive Board and the Audit Committee of the Supervisory Board. The GCO manages a network of more than 100 local subsidiary Compliance Officers who act as the point of contact for local questions or issues under the SAP Code of Business Conduct for employees. The GCO provides training and communication to SAP employees to raise awareness and understanding of legal and regulatory compliance policies. Employee help lines are also supported in each region where questions can be raised or questionable conduct can be reported — without fear of repercussion.
SAP AG, as a German stock corporation, is governed by three separate bodies: the Supervisory Board, the Executive Board and the Annual General Meeting of Shareholders. Their rules are defined by German law and by SAP’s Articles of Incorporation (Satzung) and may be briefly summarized as follows:
The Supervisory Board
The Supervisory Board appoints and removes the members of the Executive Board and oversees and advises the management of the corporation. At regular intervals it meets to discuss current business as well as business development and planning. The SAP Executive Board must consult with the Supervisory Board concerning the corporate strategy, which is developed by the Executive Board. The Supervisory Board must also approve the annual budget of SAP upon submission by the Executive Board and certain subsequent deviations from the approved budget. The Supervisory Board is also responsible for representing SAP AG in transactions between SAP AG and Executive Board members.
The Supervisory Board, based on a recommendation by its Audit Committee, provides its proposal for the election of the independent public accountant to the Annual General Meeting of Shareholders. Prior to submitting this proposal and in accordance with the GCGC, the Supervisory Board must obtain a statement from the proposed independent public accountant confirming its independence. The Supervisory Board is also responsible for monitoring the auditor’s continued independence.
The German Co-determination Act of 1976 (Mitbestimmungsgesetz) requires supervisory boards of corporations with more than 2,000 employees to consist of an equal number of representatives of the shareholders and representatives of the employees. The minimum total number of supervisory board members, and thus the minimum number of shareholder representatives and employee representatives, is legally fixed and depends on the number of employees employed by the corporation and its German subsidiaries. Our Supervisory Board currently consists of sixteen members, of which eight members have been elected by SAP AG’s shareholders at the Annual General Meeting of Shareholders and eight members which have been elected by the employees of companies of the SAP Group having their registered office in Germany.
107
Any Supervisory Board member elected by the shareholders at the Annual General Meeting of Shareholders may be removed by three-quarters of the votes cast at the Annual General Meeting of Shareholders. Any Supervisory Board member elected by the employees may be removed by three quarters of the votes cast by the employees of companies of the SAP Group having their registered office in Germany.
The Supervisory Board elects a chairperson and a deputy chairperson among its members by a majority of vote of its members. If such majority is not reached on the first vote, the chairperson will be chosen solely by the members elected by the shareholders and the deputy chairperson will be chosen solely by the members elected by the employees. Unless otherwise provided by law, the Supervisory Board acts by simple majority. In the case of any deadlock the chairperson has the deciding vote.
The members of the Supervisory Board cannot be elected for a longer term than approximately 5 years. The term expires at the close of the Annual General Meeting of Shareholders giving its formal approval of the acts of Supervisory Board and Executive Board in the fourth fiscal year following the year in which the Supervisory Board was elected unless the Annual General Meeting of Shareholders specifies a shorter term of office when electing individual members of the Supervisory Board or the entire Supervisory Board. Re-election is possible. The Supervisory Board normally meets four times a year. The remuneration of the members of the Supervisory Board is determined by the Articles of Incorporation.
As stipulated in the GCGC, an adequate number of our Supervisory Board members are independent. To be considered for appointment to the Supervisory Board and for as long as they serve, members must comply with certain criteria concerning independence, conflicts of interest and multiple memberships of management, supervisory and other governing bodies. They must be loyal to SAP in their conduct and must not accept any position in companies that are in competition with SAP. Members are subject to the insider trading prohibitions and the respective directors’ dealing rules of the German Securities Trading Act. A member of the Supervisory Board may not vote on matters relating to certain contractual agreements between such member and SAP AG. Further, as the compensation of the Supervisory Board members is laid down in the Articles of Incorporation, Supervisory Board members are unable to vote on their own compensation.
The Supervisory Board may appoint committees from among its members and may, to the extent permitted by law, entrust such committees with the authority to make decisions. Currently the Supervisory Board maintains the following committees:
The focus of theAudit Committee(Prüfungsausschuss) is the oversight of SAP’s external financial reporting (including internal controls over financial reporting) as well as SAP’s risk management and compliance matters. Among the tasks of the Audit Committee are the discussion of SAP’s quarterly and year end financial reporting prepared under German and U.S. regulations, including SAP’s Annual Report onForm 20-F. The Audit Committee proposes the appointment of the external auditor and its compensation to the Supervisory Board, determines focus audit areas, discusses critical accounting policies with and reviews the audit reports issued and audit issues identified by the auditor and monitors the auditor’s independence. Both SAP’s Internal Audit Department and SAP’s Global Compliance Office (GCO) report upon request or at the occurrence of certain findings, but in any case at least once a year, directly to the Audit Committee.
The Audit Committee has established procedures regarding the prior approval of all audit and non-audit services provided by our independent auditor. See “Item 16C. Principal Accountant Fees and Services” for details. Furthermore the Audit Committee monitors the efficiency of our internal risk management and other monitoring processes that are or need to be established.
The Audit Committee is currently composed of 4 members: Erhard Schipporeit, Thomas Bamberger, Gerhard Maier and Joachim Milberg. The Supervisory Board has determined Erhard Schipporeit to be an audit committee financial expert as defined by the regulations of the Commission issued under Section 407 of the Sarbanes-Oxley Act. See “Item 16A. Audit Committee Financial Expert” for details. He is also the chairperson of the Audit Committee.
108
TheGeneral Committee (Präsidialausschuss)coordinates the Supervisory Board agenda, meetings and deals with corporate governance issues. Furthermore, it was assigned the authority to grant Virtual SAP SOP 2007/Grant 2008 stock options to all recipients with the exception of Executive Board members.
TheCompensation Committee (Personalausschuss)is responsible for concluding employment contracts with and for the arrangement of the remuneration of Executive Board members. It prepares proposals for the Executive Board compensation system including the main contract elements for approval and regular review by the full Supervisory Board and also grants Virtual SAP SOP 2007/Grant 2008 stock options to Executive Board members.
TheFinance and Investment Committee (Finanz- und Investitionsausschuss) addresses general financing issues. Furthermore, it regularly discusses venture capital investments and other equity investments with the Executive Board and reports to the Supervisory Board on such investments. It is also responsible for the approval of such investments if the individual investment amount exceeds certain specified limits.
Required by the German Co-determination Act of 1976 (Mitbestimmungsgesetz), theMediation Committee (Vermittlungsausschuss) convenes only if the two-thirds majority required for appointing/revoking the appointment of Executive Board members is not attained. This committee has never held a meeting in SAP AG’s history.
TheStrategy and Technology Committee (Strategie- und Technologieausschuss)monitors technology transactions and provides the Supervisory Board with in-depth technical advice.
TheNomination Committee (Nominierungsausschuss)is exclusively composed of shareholder representatives and is responsible for identifying suitable candidates for membership of the Supervisory Board for recommendation to the Annual General Meeting of Shareholders.
TheSpecial Committee(Sonderausschuss), established on June 3, 2008, is tasked with coordinating and managing the Supervisory Board’s external legal advisors concerned with the investigation and analysis of the facts in connection with the legal action brought by Oracle Corporation.
The duties, procedures and committees of the Supervisory Board are specified in their respective bylaws which reflect the requirements of the German Stock Corporation Act and the GCGC. Major decisions of the Executive Board require Supervisory Board approval.
According to the provisions of the Sarbanes-Oxley Act, SAP does not grant loans to the members of the Executive Board or the Supervisory Board.
The Executive Board
The Executive Board manages the Company’s business, is responsible for preparing its strategy and represents it in dealings with third parties. The Executive Board reports regularly to the Supervisory Board about SAP operations and business strategies and prepares special reports upon request. A person may not serve on the Executive Board and on the Supervisory Board at the same time.
The Executive Board and the Supervisory Board must cooperate closely for the benefit of the Company. Without being asked, the Executive Board must provide to the Supervisory Board regular, prompt and comprehensive information about all of the essential issues affecting the SAP Group’s business progress and its potential business risks. Furthermore, the Executive Board must maintain regular contact with the chairperson of the Supervisory Board. The Executive Board must inform the chairperson of the Supervisory Board promptly about exceptional events that are of significance to SAP’s business. The chairperson must inform the Supervisory Board accordingly.
Pursuant to the Articles of Incorporation, the Executive Board must consist of at least 2 members. Currently, SAP AG’s Executive Board is composed of 9 members. Any 2 members of the Executive Board jointly or one member of the Executive Board and the holder of a special power of attorney (Prokurist) jointly may legally represent SAP AG. The Supervisory Board appoints each member of the Executive Board for a maximum term of 5 years, with the possibility of re-appointment. Under certain circumstances, a member of the Executive
109
Board may be removed by the Supervisory Board prior to the expiration of that member’s term. A member of the Executive Board may not vote on matters relating to certain contractual agreements between such member and SAP AG, and may be liable to SAP AG if such member has a material interest in any contractual agreement between SAP and a third party which was not disclosed to and approved by the Supervisory Board. Further, as the compensation of the Executive Board members is set by the Supervisory Board, Executive Board members are unable to vote on their own compensation.
Under German law SAP AG’s Supervisory Board members and Executive Board members have a duty of loyalty and care towards SAP AG. They must exercise the standard of care of a prudent and diligent businessman and bear the burden of proving they did so if their actions are contested. Both bodies must consider the interest of SAP AG shareholders and our employees and, to some extent, the common interest. Those who violate their duties may be held jointly and severally liable for any resulting damages, unless they acted pursuant to a lawful resolution of the Annual General Meeting of Shareholders.
SAP has implemented a Code of Business Conduct for employees covering the following topics: conflict of interest, personal gain, bribery and corruption, confidentiality, financial concerns, conduct with customers, ventures, competitors and partners and trading in shares (addressing insider trading concerns). The employee code is equally applicable to managers and members of the Executive Board. See “Item 16B. Code of Ethics” for details.
Under German law the Executive Board of SAP AG has to assess all major risks for the SAP Group. In addition, all measures taken by management to reduce and handle the risks have to be documented. Therefore, SAP’s management has adopted suitable measures such as implementing an enterprise-wide monitoring system to ensure that adverse developments endangering the corporate standing are recognized at a reasonably early point in time.
The Annual General Meeting of Shareholders
Shareholders of the Company exercise their voting rights at shareholders’ meetings. The Executive Board calls the Annual General Meeting of Shareholders, which must take place within the first eight months of each fiscal year. The Supervisory Board or the Executive Board may call an extraordinary meeting of the shareholders if the interests of the stock corporation so require. Additionally, shareholders of SAP AG holding in the aggregate a minimum of 5% of SAP AG’s issued share capital may call an extraordinary meeting of the shareholders. Shareholders as of the record date are entitled to attend and participate in shareholders’ meetings if they have provided timely notice of their intention to attend the meeting.
At the Annual General Meeting of Shareholders, the shareholders are asked, among other things, to formally approve the actions taken by the Executive Board and the Supervisory Board in the preceding fiscal year, to approve the distribution of the corporation’s profits, to appoint an independent auditor and to ratify amendments of our Articles of Incorporation. Shareholder representatives of the Supervisory Board are elected at the Annual General Meeting of Shareholders for a term of approximately five years. Shareholders may also be asked to resolve on measures to raise or reduce the capital of the Company. The Annual General Meeting of Shareholders can make management decisions only if requested to do so by the Executive Board.
CHANGE IN CONTROL
There are no provisions in the Articles of Incorporation of SAP AG that would have an effect of delaying, deferring or preventing a change in control of SAP AG and that would only operate with respect to a merger, acquisition or corporate restructuring involving it or any of its subsidiaries.
On January 1, 2002, the German Securities Purchase and Takeover Act (Wertpapiererwerbs- und Übernahmegesetz) became effective. It requires, among other things, that a bidder seeking control of a company with its corporate seat in Germany and traded on a European Union stock exchange must publish advance notice of a tender offer, submit a draft offer statement to the Federal Financial Supervisory Authority (Bundesanstalt für
110
Finanzdienstleistungsaufsicht) for review, and obtain certification from a qualified financial institution that adequate financing is in place to complete the offer. Once a bidder has acquired shares representing 30% of the voting power of the target company, it must make an offer for all remaining shares. The Securities Purchase and Takeover Act requires the executive board of the target company to refrain from taking any measures that may frustrate the success of the takeover offer. However, the target executive board is permitted to take any action that a prudent and diligent management of a company that is not the target of a takeover bid would also take. Moreover, the target executive board may search for other bidders and, with the prior approval of the supervisory board, may take other defensive measures, provided that both boards act within the parameters of their general authority under the German Stock Corporation Act. An executive board may also adopt specific defensive measures if such measures have been approved by the supervisory board and were specifically authorized by the shareholders no later than 18 months in advance of a takeover bid by resolution of 75% of the votes cast.
Effective as of July 14, 2006 the German Implementation Act for the European Takeover Directive amended the German Purchase and Takeover Act. Under the European Takeover Directive member states may choose whether EU restrictions on frustrating action apply to companies that are registered in their territory. Germany decided to opt out and to retain its current restrictions on a board taking frustrating action (as described above). As required by the Directive if a country decides to opt out the German Purchase and Takeover Act grants companies the option of voluntarily applying the European standard by a change of the Articles of Incorporation (opt-in). SAP AG has not made use of this option. Furthermore, the German Commercial Act (Handelsgesetzbuch) was amended and companies listed in Germany are required to list in their Review of Group operations and Review of operations, among other things, (i) all material contracts with a change of control clause and (ii) all compensation agreements with members of the Executive Board or employees for the case of a change of control. SAP’s Review of Group operations, which is included in its annual report, is available on SAP’s Web site atwww.sap.com.
CHANGE IN SHARE CAPITAL
Under German law, the capital stock may be increased in consideration of contributions in cash or in kind, or by establishing authorized capital or contingent capital or by an increase of the company’s capital reserves. Authorized capital provides the Executive Board with the flexibility to issue new shares for a period of up to five years, generally to preserve liquidity. The Executive Board must obtain the approval of the Supervisory Board before issuing new shares with regard to the authorized capital. Contingent capital allows the issuance of new shares for specified purposes, including employee stock option plans and the issuance of shares upon conversion of convertible bonds and exercise of stock options. By law, the Executive Board may only issue new shares with regard to the contingent capital for the specified purposes. Capital increases require an approval by 75% of the issued shares present at the Annual General Meeting of Shareholders at which the increase is proposed and require an amendment to the Articles of Incorporation.
The share capital may be reduced by an amendment of the Articles of Incorporation approved by 75% of the issued shares present at the Annual General Meeting of Shareholders. In addition, the Executive Board of SAP AG is allowed to authorize a reduction of the company’s capital stock by canceling a defined number of repurchased treasury shares if this repurchasing and the subsequent reduction have already been approved by the Annual General Meeting of Shareholders.
The Articles of Incorporation do not contain conditions regarding changes in the share capital that are more stringent than those required by German law.
RIGHTS ACCOMPANYING OUR SHARES
There are no limitations imposed by German law or the Articles of Incorporation of SAP AG on the rights to own securities, including the rights of non-residents or foreign holders to hold the ADRs or ordinary shares, to exercise voting rights or to receive dividends or other payments on such shares.
111
According to the German stock corporation law, the rights of shareholders cannot be amended without shareholders’ consent. The Articles of Incorporation do not provide more stringent conditions regarding changes of the rights of shareholders than those required by German law.
Voting Rights
Each ordinary share represents one vote. Cumulative voting is not permitted under German law. SAP AG’s Articles of Incorporation provide that resolutions may be passed at the Annual General Meeting of Shareholders by the majority as required by law. This means that resolutions may be passed by a majority of votes cast, unless the law requires a higher vote. German law requires that the following matters, among others, be approved by the affirmative vote of 75% of the issued shares present at the general shareholders’ meeting at which the matter is proposed:
| | |
| | ��� | changing the corporate purpose of the company set out in the articles of incorporation; |
| |
| | • | capital increases and capital decreases; |
| |
| | • | excluding preemptive rights of shareholders to subscribe for new shares; |
| |
| | • | dissolution; |
| |
| | • | a merger into, or a consolidation with, another company; |
| |
| | • | a transfer of all or virtually all of the assets; and |
| |
| | • | a change of corporate form. |
Dividend Rights
See “Item 3. Key Information — Dividends” and “Item 8. Financial Information — Dividend Policy.”
Preemptive Rights
Shareholders have preemptive rights to subscribe (Bezugsrecht) for any issue of additional shares in proportion to their shareholdings in the issued capital. The preemptive rights may be excluded under certain circumstances by a shareholders’ resolution (approved by 75% of the issued shares present at the Annual General Meeting of Shareholders) or by the Executive Board authorized by such shareholders’ resolution and subject to the consent of the Supervisory Board.
Liquidation
If SAP AG were to be liquidated, any liquidation proceeds remaining after all of our liabilities were paid would be distributed to our shareholders in proportion to their shareholdings.
Disclosure of Shareholdings
SAP AG’s Articles of Incorporation do not require shareholders to disclose their share holdings. The German Securities Trading Act (Wertpapierhandelsgesetz), however, requires holders of voting securities of SAP AG to notify SAP AG and the Federal Financial Supervisory Authority of the number or shares they hold if that number reaches, exceeds of falls below specified thresholds. These thresholds are 3%, 5%, 10%, 15%, 20%, 25%, 30%, 50% and 75% of the corporation’s outstanding voting rights.
In addition, the German Securities Trading Act also obliges anyone who holds, directly or indirectly, financial instruments that result in an entitlement to acquire, on one’s initiative alone and under a legally binding agreement, shares in SAP AG, to notify without undue delay to SAP AG and the Federal Financial
112
Supervisory Authority if the thresholds mentioned above have been reached, exceeded or fallen below, with the exception of the 3% threshold. Furthermore, the German Risk Limitation Act (Risikobegrenzungsgesetz) provides for an aggregation of positions in voting rights and other financial instruments effective as of March 1, 2009.
Exchange Controls and Other Limitations Affecting Security Holders
The euro is a fully convertible currency. At the present time, Germany does not restrict the export or import of capital, except for investments in certain areas in accordance with applicable resolutions adopted by the United Nations and the European Union. However, for statistical purposes only, every individual or corporation residing in Germany (“Resident”) must report to the German Central Bank (Deutsche Bundesbank), subject only to certain immaterial exceptions, any payment received from or made to an individual or a corporation residing outside of Germany (“Non-Resident”) if such payment exceeds €12,500 (or the equivalent in a foreign currency). In addition, German Residents must report any claims against or any liabilities payable to Non-Residents if such claims or liabilities, in the aggregate, exceed €5 million (or the equivalent in a foreign currency) at the end of any calendar month. Residents are also required to report annually to the German Central Bank any shares or voting rights of 10% or more which they hold directly or indirectly in non-resident corporations with total assets of more than €3 million. Corporations residing in Germany with assets in excess of €3 million must report annually to the German Central Bank any shares or voting rights of 10% or more held directly or indirectly by a Non-Resident. For a discussion of the treatment of remittance of dividends, interest or other payments to Non-Resident holders of ADRs or ordinary shares, see below “— Taxation — German Taxation of Holders of ADRs or Ordinary Shares.”
TAXATION
General
The following discussion summarizes certain German tax and U.S. federal income tax consequences of the acquisition, ownership and disposition of ADRs or ordinary shares. Although the following discussion does not purport to describe all of the tax considerations that may be relevant to a prospective purchaser of ADRs or ordinary shares, this discussion: (i) summarizes the material German tax consequences to a holder of ADRs or ordinary shares, and (ii) summarizes certain material U.S. federal income tax consequences to a U.S. Holder (as hereinafter defined) of ADRs or ordinary shares that is not resident (in the case of an individual) or domiciled (in the case of a legal entity), as the case may be, in Germany (in either case, referred to herein as “not resident” or as a “non-resident”) and does not have a permanent establishment or fixed base located in Germany through which such ADRs or ordinary shares are held.
German Taxation of Holders of ADRs or Ordinary Shares
The following discussion generally summarizes the principal German tax consequences of the acquisition, ownership and disposition of ADRs or ordinary shares to a beneficial owner. This summary is based on the laws that are in force at the date of this Annual Report onForm 20-F and is subject to any changes in German law, or in any applicable double taxation conventions to which Germany is a party, occurring after such date. This discussion is also based, in part, on representations of the Depositary and assumes that each obligation of the Deposit Agreement and any related agreements will be performed in accordance with its terms.
The following discussion is not a complete analysis or listing of all potential German tax consequences to holders of ADRs or ordinary shares and does not address all tax considerations that may be relevant to all categories of potential purchasers or owners of ADRs or ordinary shares. In particular, the following discussion does not address the tax consequences for: (i) a person that owns, directly or indirectly, 1% or more of SAP AG’s shares; (ii) a holding which forms a part of a German permanent establishment of a person not resident in Germany; (iii) a person that is resident in Germany and at the same time resident in another country; or (iv) a pension fund.
113
OWNERS AND PROSPECTIVE PURCHASERS OF OUR ADRs OR ORDINARY SHARES ARE URGED TO CONSULT THEIR OWN TAX ADVISORS CONCERNING THE OVERALL GERMAN TAX CONSEQUENCES OF THE ACQUISITION, OWNERSHIP AND DISPOSITION THEREOF.
For purposes of applying German tax law and the double taxation conventions to which Germany is a party, a holder of ADRs will generally be treated as owning the ordinary shares represented thereby.
German Taxation of Dividends
For income tax purposes the half-income system applies with regard to the taxation of dividends until December 31, 2008 (from January 1, 2009 onwards the existing rules on the taxation of dividends and capital gains have been amended as discussed below under “Reform of the Taxation of Dividends and Capital Gains”). Under this system only half of the distributed profits of a corporation will be included in the personal income tax base of an individual shareholder resident in Germany. It is not possible to credit the corporation tax paid by the company against the shareholder’s income tax. For corporation tax purposes, effectively, a portion of 95% of the dividends received by corporate shareholders domiciled in Germany will be tax-exempt in order to avoid double taxation. These rules have some exceptions, which especially apply to financial and certain insurance institutions.
Based on these considerations the German taxation of dividends can be summarized as follows:
Under German income tax law, German corporations are required to withhold tax on dividends in an amount equal to 20% (25% for dividends distributed from January 1, 2009 onwards as discussed below under “Reform of the Taxation of Dividends and Capital Gains”) of the gross amount paid to resident and non-resident shareholders. As the basis for deduction of the withholding tax is the gross amount, withholding tax will be deducted on the taxable and tax-exempt portion of the dividend received. A 5.5% solidarity surtax on the German withholding tax is currently levied on dividend distributions paid by a German corporation, such as SAP AG. The solidarity surtax equals 1.1% (5.5% of 20%) of the gross amount of a cash dividend (1.375% (5.5% of 25%) for dividends distributed from January 1, 2009 onwards as discussed below under “Reform of the Taxation of Dividends and Capital Gains”). Certain persons resident in Germany (e.g., qualifying investment funds or tax-exempt organizations) may obtain a partial or full refund of such taxes.
For an individual holder of ordinary shares that is resident in Germany, according to German income tax law, half of the dividends received are subject to German income tax (for dividends distributed from January 1, 2009 onwards see below under “Reform of the Taxation of Dividends and Capital Gains”). The same is generally true for ADRs because each of them represents one ordinary share. For such a holder, the taxable amount will be the sum of: (i) half of the cash payment by SAP AG and (ii) half of the taxes withheld. For a corporate holder of ADRs or ordinary shares that is domiciled in Germany, according to German income tax law, dividends in principle are exempt from corporation tax. However, a portion of 5% of the dividends received is treated as non-deductible expenses. Therefore, effectively a portion of 95% of dividends received by a corporate holder of ADRs or ordinary shares that is resident in Germany is exempt and a portion of 5% of the dividends received is subject to corporation tax. These rules as regards the (partial) exemption for dividends from corporation tax have some exceptions, which especially apply to financial and certain insurance institutions.
Subject to certain conditions, the tax withheld on the gross amount will be eligible for credit against the holder’s income tax or corporation tax liability. Exceeding amounts are refunded upon filing and assessment of the tax return. For holders subject to German trade tax, such tax is imposed, in general, only on the amount of the dividends received, which is subject to income tax or corporation tax. On the portion of the dividends received which is exempt from income tax or corporation tax, trade tax will become due if the holder of ADRs or ordinary shares does not own at least 15% of the shares in the distributing corporation at the beginning of the tax year.
114
Refund of German Tax to U.S. Holders
A partial refund of the 20% withholding tax equal to 5% (for dividends distributed from January 1, 2009 onwards a partial refund of the 25% withholding tax equal to 10% as discussed below under “Reform of the Taxation of Dividends and Capital Gains”) of the gross amount of the dividend and a full refund of the solidarity surtax can be obtained by a U.S. Holder (as hereinafter defined) under theU.S.-German income tax treaty (Convention between the Federal Republic of Germany and the United States of America for the Avoidance of Double Taxation and the Prevention of Fiscal Evasion with respect to Taxes on Income and Capital and to certain other Taxes as recently amended by the Protocol of June 1, 2006 and as published in the German Federal Law Gazette 2008 vol. II pp. 611/851, the “Treaty”). Thus, for each US$100 of gross dividends paid by SAP AG to a U.S. Holder, the dividends (which are dependant on the euro/dollar exchange rate at the time of payment) after partial refund of the 20% (25% from January 1, 2009 onwards as discussed below under “Reform of the Taxation of Dividends and Capital Gains”) withholding tax and a refund of the solidarity surtax under the Treaty will be subject to a German withholding tax of US$15.
To claim the refund of amounts withheld in excess of the Treaty rate, a U.S. Holder must submit (either directly or, as described below, through the Depositary) a claim for refund to the German tax authorities, with, in the case of a direct claim, the original bank voucher (or certified copy thereof) issued by the paying entity documenting the tax withheld, within four years from the end of the calendar year in which the dividend is received. Claims for refund are made on a special German claim for refund form, which must be filed with the German tax authorities: Bundeszentralamt für Steuern, D-53221 Bonn, Germany;http://www.bzst.bund.de. The German claim for refund form may be obtained from the German tax authorities at the same address where applications are filed, or from the Embassy of the Federal Republic of Germany, 4645 Reservoir Road NW, Washington, D.C. 20007.
U.S. Holders must also submit to the German tax authorities a certification of their U.S. residency status (IRS Form 6166). This certification can be obtained from the Internal Revenue Service by filing a request for certification with the Internal Revenue Service, P.O. Box 42530, Philadelphia, PA19101-2530 or, by private delivery service to Citibank, Attention: IRS Lockbox Operations, 1617 Brett Road, New Castle, DE19720-2425. Requests for certification of U.S. residency status are to be made by filing Form 8802 Application for United States Residency Certification.
In accordance with arrangements under the Deposit Agreement, the Depositary (or a custodian as its designated agent) holds the ordinary shares and receives and distributes dividends to the U.S. Holders. The Depositary has agreed, to the extent practicable, to perform administrative functions necessary to obtain the refund of amounts withheld in excess of the Treaty rate for the benefit of U.S. Holders who supply the necessary documentation.
In order to claim a refund, the U.S. Holder should deliver an IRS Form 6166 certification to the Depositary along with the completed claim for refund form. In the case of ADRs held through a broker or other financial intermediary, the required documentation should be delivered to such broker or financial intermediary for forwarding to the Depositary. In all other cases, the U.S. Holders should deliver the required documentation directly to the Depositary. The Depositary will file the required documentation with the German tax authorities on behalf of the U.S. Holders.
The German tax authorities will issue the refunds, which will be denominated in euro, in the name of the Depositary. The Depositary will convert the refunds into dollars and issue corresponding refund checks to the U.S. Holders or their brokers.
Refund of German Tax to Holders of ADRs or Ordinary Shares in Other Countries
A holder of ADRs or ordinary shares resident in a country other than Germany or the United States that has entered into a double taxation convention with Germany may obtain a full or partial refund of German withholding taxes. Rates and procedures may vary according to the applicable treaty. Claims for refund, if any,
115
are made on a special German claim for refund form, which must be filed with the German tax authorities: Bundeszentralamt für Steuern, D-53221 Bonn, Germany;http://www.bzst.bund.de. For details, such holders are urged to consult their own tax advisors.
German Taxation of Capital Gains
Half of a capital gain derived from the sale or other disposition by an individual holder resident in Germany of ADRs or ordinary shares is subject to income tax if the ADRs or ordinary shares are held as part of his or her trade or business or if the ADRs or ordinary shares held as part of his or her private assets are sold within a period of one year after acquisition until December 31, 2008 (from January 1, 2009 onwards the existing rules on the taxation of dividends and capital gains have been amended as discussed below under “Reform of the Taxation of Dividends and Capital Gains”).
A capital gain derived from the sale or other disposition by a corporate holder domiciled in Germany of ADRs or ordinary shares is, in principle, exempt from corporation tax. However, a portion of 5% of a capital gain derived is treated as non-deductible business expenses. Therefore, effectively a portion of 95% of a capital gain derived from the sale or other disposition by a corporate holder domiciled in Germany of ADRs or ordinary shares is exempt and a portion of 5% of a capital gain derived is subject to corporation tax. These rules as regards the (partial) exemption from corporation tax have some exceptions, which especially apply to financial and certain insurance institutions.
Special rules apply for individual and corporate holders resident in Germany if the shares have been received in the course of a tax-exempt reorganization.
For holders subject to German trade tax, such tax is imposed in general only on the portion of the capital gain, which is subject to income tax or corporation tax.
A holder of ADRs or ordinary shares resident or domiciled in a country other than Germany is in general not subject to German income or corporation tax on the capital gain derived from the sale or other disposition of ADRs or ordinary shares.
Reform of the Taxation of Dividends and Capital Gains
From January 1, 2009 onwards, the existing rules on the taxation of dividends and capital gains have been amended if the holder of the shares is an individual resident in Germany and if he holds the shares in his or her private assets. In such a case dividends will be subject to an income tax of 25% (flat rate) plus solidarity surtax of 5.5% (total tax rate: 26.375%) plus, as the case may be, church tax. The same will apply to capital gains regardless of the period the shares will have been held before they will be sold, provided the shares have been acquired from January 1, 2009 onwards.
A portion of 40% of dividends and capital gains which an individual earns from shares constituting business assets will be exempted under the law effective from January 1, 2009. The remaining 60% of such income will be subject to income tax at individual income tax rates.
The existing rules will remain unchanged with respect to trade tax and the taxation of corporate shareholders.
Also, dividends distributed to non-resident shareholders will be subject to a withholding tax rate of 25% plus solidarity surtax of 5.5% (total tax rate: 26.375%) from January 1, 2009 onwards. Corporate non-resident shareholders will generally be entitled to a refund in the amount of two fifths of the withholding tax (including solidarity surtax). This does not preclude a further reduction of withholding tax, if any, available under a relevant tax treaty.
For many non-resident shareholders the withholding tax rate is currently reduced under applicable income tax treaties. E.g. for a U.S. Holder a partial refund of the withholding tax rate of 25% equal to 10% of the
116
gross amount of the dividend plus a full refund of the solidarity surtax can be obtained (for an example see below under “U.S. Taxation of U.S. Holders of Ordinary Shares or ADRs — Distributions”). To reduce the withholding tax to the applicable treaty tax rate a non-resident shareholder must apply for a refund of withholding taxes paid. With regard to the respective refund procedure we refer to the above sections “Refund of German Tax to U.S. Holders” and “Refund of German Tax to Holders of ADRs or Ordinary Shares in Other Countries.”
Other German Taxes
There are no German net worth, transfer, stamp or similar taxes on the holding, purchase or sale of ADRs or ordinary shares.
German Estate and Gift Taxes
A transfer of ADRs or ordinary shares by gift or by reason of death of a holder will be subject to German gift or inheritance tax, respectively, if the tax-free allowance is exceeded and one of the following persons is resident in Germany: the donor or transferor or his or her heir, or the donee or other beneficiary. If one of the aforementioned persons is resident in Germany and another is resident in a country having a treaty with Germany, regarding gift or inheritance taxes, different rules may apply. If none of the aforementioned persons is resident in Germany, the transfer is not subject to German gift or inheritance tax. For persons giving up German residence, special rules apply during the first five years, and under specific circumstances, during the first ten years, after the end of the year in which the person left Germany. In general, in the case of a U.S. Holder, a transfer of ADRs or ordinary shares by gift or by reason of death that would otherwise be subject to German gift or inheritance tax, respectively, will not be subject to such German tax by reason of theU.S.-German estate tax treaty (Convention between the Federal Republic of Germany and the United States of America for the Avoidance of Double Taxation with respect to Estate, Gift and Inheritance Taxes, German Federal Law Gazette 1982 II page 847, amended by the Protocol of September 15, 2000, German Federal Law Gazette 2000 II, page 1170 and as published on December 21, 2000, German Federal Law Gazette 2001 II, page 65) (the “Estate Tax Treaty”) unless the donor or transferor, or the heir, donee or other beneficiary, is domiciled in Germany for purposes of the Estate Tax Treaty at the time of the making of the gift or at the time of the donor’s or transferor’s death.
In general, the Estate Tax Treaty provides a credit against U.S. federal estate and gift tax liability for the amount of inheritance and gift tax paid in Germany, subject to certain limitations, in a case where the ADRs or ordinary shares are subject to German inheritance or gift tax and U.S. federal estate or gift tax.
U.S. Taxation of U.S. Holders of Ordinary Shares or ADRs
The following discussion generally summarizes certain U.S. federal income tax consequences of the acquisition, ownership and disposition of ADRs or ordinary shares to a beneficial owner: (i) who is an individual citizen or resident of the United States or a corporation organized under the laws of the United States or any political subdivision thereof, an estate whose income is subject to U.S. federal income tax regardless of its source or a trust, if a U.S. court can exercise primary supervision over its administration and one or more U.S. persons are authorized to control all substantial decisions of the trust; (ii) who is not resident in Germany for German tax purposes; (iii) whose holding of ADRs or ordinary shares does not form part of the business property or assets of a permanent establishment or fixed base in Germany; and (iv) who is fully entitled to the benefits of the Treaty in respect of such ADRs or ordinary shares (a “U.S. Holder”).
This summary deals only with ADRs and ordinary shares that are held as capital assets and does not address tax considerations applicable to U.S. Holders that may be subject to special tax rules, such as dealers or traders in securities, financial institutions, insurance companies, tax-exempt entities, regulated investment companies, U.S. Holders that hold ordinary shares or ADRs as a part of a straddle, conversion transaction or other arrangement involving more than one position, U.S. Holders that own (or are deemed for U.S. tax
117
purposes to own) 10% or more of the total combined voting power of all classes of voting stock of SAP AG, U.S. Holders that have a principal place of business or “tax home” outside the United States or U.S. Holders whose “functional currency” is not the dollar and U.S. Holders that hold ADRs or ordinary shares through partnerships or other pass-through entities.
The discussion below is based upon the U.S. Internal Revenue Code of 1986, as amended (the “Code”), the Treaty and regulations, rulings and judicial decisions there under at the date of this Annual Report onForm 20-F. Any such authority may be repealed, revoked or modified, perhaps with retroactive effect, so as to result in U.S. federal income tax consequences different from those discussed below. No assurance can be given that the conclusions set out below would be sustained by a court if challenged by the IRS. The discussion below is based, in part, on representations of the Depositary, and assumes that each obligation in the Deposit Agreement and any related agreements will be performed in accordance with its terms.
THE DISCUSSION SET OUT BELOW IS INTENDED ONLY AS A SUMMARY OF CERTAIN U.S. FEDERAL INCOME TAX CONSEQUENCES OF AN INVESTMENT IN ADRs OR ORDINARY SHARES. PROSPECTIVE INVESTORS ARE URGED TO CONSULT THEIR OWN TAX ADVISORS AS TO THE APPLICATION TO THEIR PARTICULAR SITUATION OF THE TAX CONSIDERATIONS DISCUSSED BELOW, AS WELL AS THE APPLICATION OF STATE, LOCAL OR FOREIGN TAX LAW. THE STATEMENTS OF U.S. TAX LAW SET OUT BELOW ARE BASED ON THE LAWS IN FORCE AND INTERPRETATIONS THEREOF AT THE DATE OF THIS ANNUAL REPORT ONFORM 20-F AND ARE SUBJECT TO ANY CHANGES OCCURRING AFTER THAT DATE.
For U.S. federal income tax purposes, a U.S. Holder of ADRs will be considered to own the ordinary shares represented thereby. Accordingly, unless the context otherwise requires, all references in this section to ordinary shares are deemed to refer likewise to ADRs representing an ownership interest in ordinary shares.
Distributions
Subject to the discussion below under “Passive Foreign Investment Company Considerations” distributions made by SAP AG with respect to ordinary shares (other than distributions in liquidation and certain distributions in redemption of stock), including the amount of German tax deemed to have been withheld in respect of such distributions, will be taxed to U.S. Holders as ordinary dividend income to the extent that such distributions do not exceed the current and accumulated earnings and profits of SAP AG as computed for U.S. federal income tax purposes. SAP AG does not maintain calculations of its earnings and profits under U.S. federal income tax principles. If SAP AG does not report to a U.S. Holder the portion of a distribution that exceeds earnings and profits, the distribution will generally be taxable as a dividend even if that distribution would otherwise be treated as a non-taxable return of capital or as capital gain under the rules described above.
As discussed above, a U.S. Holder may obtain a refund of German withholding tax to the extent that the German withholding tax exceeds 15% of the amount of the associated distribution. For example, if SAP AG distributes a cash dividend equal to US$100 to a U.S. Holder, the distribution currently will be subject to German withholding tax of US$20 plus US$1.10 surtax, and the U.S. Holder will receive US$78.90 (for dividends distributed from January 1, 2009 onwards withholding tax amounts to US$25 plus surtax of US$1.38 and the U.S. Holder will receive US$73.62 as generally described above under “Reform of the Taxation of Dividends and Capital Gains”). If the U.S. Holder obtains the Treaty refund, he will receive an additional US$6.10 (for dividends distributed from January 1, 2009 onwards US$11.38) from the German tax authorities. For U.S. tax purposes, such U.S. Holder will be considered to have received a total distribution of US$100, which will be deemed to have been subject to German withholding tax of US$15 (15% of US$100) resulting in the net receipt of US$85.
In the case of a distribution in euro, the amount of the distribution generally will equal the dollar value of the euro distributed (determined by reference to the spot currency exchange rate on the date of receipt of the distribution (receipt by the Depositary in the case of a distribution on ADRs)), regardless of whether the holder in fact converts the euro into dollars, and the U.S. Holder will not realize any separate foreign currency gain or loss (except to the extent that such gain or loss arises on the actual disposition of foreign currency received).
118
Dividends paid by SAP AG generally will constitute “portfolio income” for purposes of the limitations on the use of passive activity losses (and, therefore, generally may not be offset by passive activity losses) and as “investment income” for purposes of the limitation on the deduction of investment interest expense. Dividends paid by SAP AG will not be eligible for the dividends received deduction generally allowed to U.S. corporations under Section 243 of the Code. Dividends paid by SAP AG after December 31, 2002 are treated as qualified dividends subject to capital gains rates as provided by the Jobs and Growth Tax Reconciliation Act of 2003. These reduced rates are scheduled to expire for years beginning after December 31, 2010.
Sale or Exchange
In general, assuming that SAP AG at no time is a passive foreign investment company, upon a sale or exchange of ordinary shares to a person other than SAP AG, a U.S. Holder will recognize gain or loss in an amount equal to the difference between the amount realized on the sale or exchange and the U.S. Holder’s adjusted tax basis in the ordinary shares. Such gain or loss will be capital gain or loss and will be long-term capital gain (taxable at a reduced rate for individuals) if the ordinary shares were held for more than one year. The deductibility of capital losses is subject to significant limitations. Upon a sale of ordinary shares to SAP AG, a U.S. Holder may recognize capital gain or loss or, alternatively, may be considered to have received a distribution with respect to the ordinary shares, in each case depending upon the application to such sale of the rules of Section 302 of the Code.
Deposit and withdrawal of ordinary shares in exchange for ADRs by a U.S. Holder will not result in its realization of gain or loss for U.S. federal income tax purposes.
Foreign Tax Credit
In general, in computing its U.S. federal income tax liability, a U.S. Holder may elect for each taxable year to claim a deduction or, subject to the limitations on foreign tax credits generally, a credit for foreign income taxes paid or accrued by it. For U.S. foreign tax credit purposes, subject to the applicable limitations under the foreign tax credit rules, the 15% German tax that is treated as having been withheld from dividends paid to a U.S. Holder will be eligible for credit against the U.S. Holder’s federal income tax liability. Thus, in the numerical example set out above, a U.S. Holder who receives a cash distribution of US$85 from SAP AG (US$100 of the initial distribution net of US$20 of German withholding tax and US$1.10 of surtax plus the Treaty refund of US$6.10; for dividends distributed from January 1, 2009 onwards US$100 of the initial distribution net of US$25 of German withholding tax and US$1.38 of surtax plus the Treaty refund of US$11.38) will be treated as having been subject to German withholding tax in the amount of US$15 (15% of US$100) and will be able to claim the U.S. foreign tax credit, subject to applicable foreign tax credit limitations, in the amount of US$15.
For U.S. foreign tax credit purposes, dividends paid by SAP AG generally will be treated as foreign-source income and as “passive category income” (or in the case of certain holders, as “general category income”). Gains or losses realized by a U.S. Holder on the sale or exchange of ordinary shares generally will be treated asU.S.-source gain or loss.
The availability of foreign tax credits depends on the particular circumstances of each U.S. Holder. U.S. Holders are advised to consult their own tax advisors.
Passive Foreign Investment Company Considerations
Classification as a PFIC. Special and adverse U.S. tax rules apply to a U.S. Holder that holds an interest in a “passive foreign investment company” (a “PFIC”). In general, a PFIC is anynon-U.S. corporation, if (i) 75% or more of the gross income of such corporation for the taxable year is passive income (the “income test”) or (ii) the average percentage of assets (by value) held by such corporation during the taxable year that produce passive income (e.g., dividends, interest, royalties, rents and annuities) or that are held for the production of passive income is at least 50% (the “asset test”). A corporation that owns, directly or indirectly, at least 25% by
119
value of the stock of a second corporation must take into account its proportionate share of the second corporation’s income and assets in applying the income test and the asset test.
Based on current projections concerning the composition of SAP AG’s income and assets, SAP AG does not believe that it will be treated as a PFIC for its current or future taxable years. However, because this conclusion is based on our current projections and expectations as to its future business activity, SAP AG can provide no assurance that it will not be treated as a PFIC in respect of its current or any future taxable years.
Consequences of PFIC Status. If SAP AG is treated as a PFIC for any taxable year during which a U.S. Holder holds ordinary shares, then, subject to the discussion of the qualified electing fund (“QEF”) and “mark-to-market” rules below, such U.S. Holder generally will be subject to a special and adverse tax regime with respect to any gain realized on the disposition of the ordinary shares and with respect to certain “excess distributions” made to it by SAP AG. The adverse tax consequences include taxation of such gain or excess distribution at ordinary income rates and payment of an interest charge on tax, which is deemed to have been deferred with respect to such gain or excess distributions. Under the PFIC rules, excess distributions include dividends or other distributions received with respect to the ordinary shares, if the aggregate amount of such distributions in any taxable year exceeds 125% of the average amount of distributions from SAP AG made during a specified base period.
In some circumstances, a U.S. Holder may avoid certain of the unfavorable consequences of the PFIC rules by making a QEF election in respect of SAP AG. A QEF election effectively would require an electing U.S. Holder to include in income currently its pro rata share of the ordinary earnings and net capital gain of SAP AG. However, a U.S. Holder cannot elect QEF status with respect to SAP AG unless SAP AG complies with certain reporting requirements and there can be no assurance that SAP AG will provide such information.
A U.S. Holder that holds “marketable” stock in a PFIC may, in lieu of making a QEF election, also avoid certain unfavorable consequences of the PFIC rules by electing to mark the PFIC stock to market at the close of each taxable year. SAP AG expects that the ordinary shares will be “marketable” for this purpose. A U.S. Holder that makes the mark-to-market election will be required to include in income each year as ordinary income an amount equal to the excess, if any, of the fair market value of the stock at the close of the year over the U.S. Holder’s adjusted tax basis in the stock. If, at the close of the year, the U.S. Holder’s adjusted tax basis exceeds the fair market value of the stock, then the U.S. Holder may deduct any such excess from ordinary income, but only to the extent of net mark-to-market gains previously included in income. Any gain from the actual sale of the PFIC stock will be treated as ordinary income, and any loss will be treated as ordinary loss to the extent of net mark-to-market gains previously included in income.
Taxation of Holders of ADRs or Ordinary Shares in Other Countries
HOLDERS OR POTENTIAL HOLDERS OF ADRs OR ORDINARY SHARES WHO ARE RESIDENT OR OTHERWISE TAXABLE IN COUNTRIES OTHER THAN GERMANY AND THE UNITED STATES ARE URGED TO CONSULT THEIR OWN TAX ADVISORS CONCERNING THE OVERALL TAX CONSEQUENCES OF THE ACQUISITION, OWNERSHIP AND DISPOSITION OF ADRs OR ORDINARY SHARES.
MATERIAL CONTRACTS
Loan Facility
On October 7, 2007, we entered into a Tender Offer Agreement with Business Objects whereby we undertook to conduct concurrent tender offers in France and the United States for all outstanding securities of Business Objects. In connection with the tender offers, we entered into a € 5 billion loan facility (subsequently reduced to €4.45 billion as of December 31, 2007 and further reduced to €2.95 billion in February 2008) with Deutsche Bank AG serving as the Original Mandated Lead Arranger, Deutsche Bank Luxembourg S.A. serving as the Agent and Existing Lender and Deutsche Bank AG, Paris Branch serving as the Presenting Bank for purposes
120
of the French tender offer pursuant to a loan agreement that was amended and restated as of February 27, 2008 (the “Loan Facility”). Funds available under the Loan Facility were available only in connection with the financing of the tender offers. There is no further availability for drawings under the Loan Facility and the facility terminates on December 31, 2009.
The Loan Facility is not subject to any financial covenants. Borrowings under the Loan Facility bear interest of EURIBOR plus a margin of 0.25%. As of March 9, 2009, we had an outstanding borrowing of € 2.3 billion under the Loan Facility. The Loan Facility contains representations customary for credit facilities of this nature, including accuracy of financial statements; absence of material litigation; no violation of laws or material agreements; power and authority to enter into and perform the Loan Facility documentation; and material accuracy of information.
The Loan Facility also contains certain events of default customary for loan facilities of this nature, including non-payment of principal or interest when due; breach of covenants; material incorrectness of representations when made; bankruptcy and insolvency of SAP and its material subsidiaries; and cross-default of other material indebtedness. If any of these events of default occur and are not cured within applicable grace periods or waived, the agent under the Loan Facility will at the request, or may with the consent of the lenders owed a majority of the then aggregate unpaid principal amount of the borrowings declare all amounts under the Loan Facility immediately due and payable.
This description is a summary of the Loan Facility and is qualified in its entirety by the Loan Facility and related documents which are filed as Exhibit 4.4 and Exhibit 4.1.1 to our Annual Report onForm 20-F for the fiscal year ended December 31, 2007.
Credit Facility
On November 5, 2004, we entered into a Syndicated Multicurrency Revolving Credit Facility Agreement with an initial term of 5 years (the “Credit Agreement”) among SAP; the lenders named in the Credit Agreement; ABN AMRO Bank N.V., BNP Paribas, Deutsche Bank AG and J.P. Morgan plc as Mandated Lead Arrangers; and ABN AMRO N.V. London Branch as Agent (the “Agent”).
Under the Credit Agreement, we may borrow up to €1,000,000,000 for general corporate purposes, and amounts borrowed and prepaid as described below may be reborrowed. We are required to pay a commitment fee of 0.07% per annum on unused amounts of the available revolving credit facility. The Credit Agreement does not provide for any financial covenants.
Borrowings under the facility bear interest of EURIBOR or LIBOR for the respective currency plus a margin ranging from 0.20% to 0.25% depending on the amount drawn.
We may prepay at any time, at our option, in whole or in part (but not less than €20,000,000 at any time) any outstanding borrowings plus accrued interest upon up to five business days’ notice to the Agent. We are required to pay any related breakage costs in connection with prepaying.
The Credit Agreement contains representations customary for credit facilities of this nature, including accuracy of financial statements; absence of material litigation; no violation of laws or agreements; power and authority to enter into and perform the Credit Agreement and related finance documentation; and material accuracy of information.
The Credit Agreement also contains certain events of default customary for credit facilities of this nature, including non-payment of principal or interest when due; breach of covenants; material incorrectness of representations when made; bankruptcy and insolvency of SAP and its material subsidiaries; and cross-default of other material indebtedness. If any of these events of default occur and are not cured within applicable grace periods or waived, the Agent will at the request, or may with the consent of the lenders owed a majority of the then aggregate unpaid principal amount of the borrowings declare all amounts under the Credit Agreement immediately due and payable.
121
As of March 9, 2009, SAP has not made any borrowings under the Credit Agreement.
This description is a summary of the Credit Agreement and is qualified in its entirety by the Credit Agreement, which is filed as Exhibit 4.11 to our Annual Report onForm 20-F for the fiscal year ended December 31, 2004.
DOCUMENTS ON DISPLAY
We are subject to the informational requirements of the Securities Exchange Act of 1934, as amended. In accordance with these requirements, we file reports and furnish other information as a foreign private issuer with the SEC. These materials, including this Annual Report onForm 20-F and the exhibits thereto, may be inspected and copied at the SEC’s Public Reference Room at 100 F Street, N.E., Room 1580, Washington, D.C. 20549. The SEC also maintains a Web site atwww.sec.govthat contains reports and other information regarding registrants that file electronically with the SEC. Our annual report and some of the other information submitted by us to the SEC may be accessed through this Web site. In addition, information about us is available at our Web site:www.sap.com.
ITEM 11. QUANTITATIVE AND QUALITATIVE DISCLOSURES ABOUT MARKET RISK
We are exposed to various financial risks, including changes in foreign currency exchange rates, interest rates, equity prices and the creditworthiness of our counterparties.
We manage credit, liquidity, interest rate, equity price and foreign currency exchange rate risks on a Group-wide basis. Selected derivatives are exclusively used for this purpose and not for speculation which is defined as entering into derivative instruments without a corresponding underlying transaction. Financial risk management is done centrally. It is regulated by internal guidelines and undergoes continuous internal risk analysis.
For the presentation of market risks, we use sensitivity analyses that show the effects of hypothetical changes of relevant risk variables on income and other comprehensive income depending whether fair value fluctuations affect earnings or shareholders’ equity. The periodic effects are determined by relating the hypothetical changes in the risk variables to the balance of financial instruments at the reporting date.
The following discussion of our market risk exposure should be read in conjunction with the related Notes 25 and 26 to our consolidated financial statements in “Item 18. Financial Statements.”
FOREIGN CURRENCY EXCHANGE RATE RISK
Foreign currency exchange rate risk is the risk of loss due to adverse changes in foreign exchange rates. As a globally active enterprise, we are subject to risks associated with fluctuations in foreign currencies with regard to our ordinary operations. Foreign currency-denominated receivables, payables, debt, and other monetary balance sheet positions as well as future cash flows resulting from forecasted transactions, including intra-group transactions, are subject to currency risks. Risks from foreign currencies are continuously assessed. Most of these transactions are hedged to the extent that they influence our income and cash flows.
Under U.S. GAAP, foreign exchange risks arise on account of monetary financial instruments denominated in currencies other than the functional currency where the nonfunctional currency is the respective risk variable; translation risks are not taken into consideration. Because the individual Group entities mainly conduct their operating business in their own functional currencies, our risk of exchange rate fluctuations from ongoing ordinary operations is not considered significant.
With regard to our investing and financing activities we are not exposed to any significant foreign exchange risk as all activities are conducted in the respective functional currency.
122
We disclose our risk exposure based on a sensitivity analysis using the following assumptions:
According to our general policy not to invoice in currencies other than the entity’s functional currency, the majority of our nonderivative monetary financial instruments such as cash, accounts receivable, accounts payable, loans to employees and third parties, bank liabilities, and other financial liabilities are denominated in the respective entities’ functional currency. Thus, a foreign exchange risk in these transactions is nonexistent. In exceptional cases and limited economic environments, operating transactions are denominated in currencies other than the functional currency leading to a currency risk for the related monetary instruments. Where we hedge against currency impacts on cash flows, these foreign currency-denominated financial instruments are economically converted into the functional currency by the use of forward exchange contracts or options. Therefore, fluctuations in foreign currency exchange rates do not have a significant impact on profit and loss or shareholders’ equity with regard to our nonderivative monetary financial instruments.
Furthermore, income or expenses on the nonderivative monetary financial instruments discussed above are always recognized in the relevant entity’s functional currency. Therefore, fluctuations in foreign exchange rates have no significant impact on profit and loss or shareholders’ equity in this regard.
Our freestanding derivatives designed for hedging foreign currency exchange rate risks almost completely balance the changes in the fair values of the hedged item attributable to exchange rate movements in the income statement in the same period. As a consequence, the hedged items and the hedging instruments are not exposed to currency risks with an effect on profit or loss, or shareholders’ equity either.
Consequently, we are only exposed to foreign currency exchange rate fluctuations with regard to:
| | |
| | • | derivatives held within a designated cash-flow hedging relationship and |
| |
| | • | foreign currency embedded derivatives (which arise for instance due to a foreign-currency denominated contract in Switzerland). |
As all our cash-flow hedges in a hedge relationship are effective, the fluctuations in the respective currencies affect other comprehensive income. The interest element which is not part of the assigned hedging relationship and is posted to profit and loss is not affected by currency fluctuations. As we do not have a significant exposure to a single currency, we disclose our exposure to our major currencies in total. If, at December 31, 2008, the euro had gained (lost) 10% against all our major currencies, the unrealized foreign currency cash-flow hedge position in other comprehensive income would have been €65 million (December 31, 2007: €64 million) higher (lower) than presented.
Any change in the value of our foreign currency embedded derivatives is recorded in profit or loss. If, at December 31, 2008, the euro had gained (lost) 10 percent against the Swiss franc, the effect on other nonoperating income would have been €40 million (December 31, 2007: €37 million) higher (lower) than presented. If at December 31, 2008, the euro had gained (lost) 10 percent against all other currencies, the effect on other nonoperating income would have been €3 million (December 31, 2007: €3 million) lower (higher) (December 31, 2007: higher (lower)) than presented.
INTEREST RATE RISK
Interest-rate risks result from changes in market interest rates which can cause changes in the fair value of fixed-rate instruments and interest to be paid for variable-rate instruments.
This risk is negligible with regard to our operating activities. Interest rate risks arise on account of our investing activities in debt instruments and our financing activities in connection with financial liabilities. In order to create a balanced structure of fixed and variable financial cash flows, we manage interest-rate risk by adding interest rate-related derivative instruments to a given portfolio of investments and debt financing.
123
Due to the short maturities of our investments (all our debt securities are classified as current) we do not have a significant interest-rate risk related to financial assets. See Note 13 to our consolidated financial statements in “Item 18. Financial Statements” for a more detailed discussion.
We entered into derivative financial instruments to hedge the interest rate risk resulting from the variable interest rate credit facility in connection with the acquisition of Business Objects.
A sensitivity analysis is provided to show our interest rate risk exposure at the balance sheet date based on the following assumptions:
| | |
| | • | Changes in interest rates only affect nonderivative fixed-rate financial instruments if they are recognized at fair value. As we have classified our investments as available for sale we carry interest-rate sensitive debt investments at fair value with fair value changes recognized in other comprehensive income. For this reason, changes in prevailing market rates are included in the equity-related sensitivity calculation. |
| |
| | • | Income or expenses for nonderivative financial instruments with variable interest are subject to interest rate risk if they are not hedged items in an effective hedging relationship. We therefore have no significant interest-rate risk arising from our financial liabilities and consider interest rate changes for our variable rate debt investments in the earnings-related sensitivity calculation. |
| |
| | • | Due to the aforementioned designation of interest rate derivatives to a cash-flow hedge relationship, the respective interest rate changes affect the unrealized interest rate cash-flow hedge position in other comprehensive income. The movements related to the interest rate swaps’ variable leg are not reflected in the sensitivity calculation as they offset the variable interest payments for the credit facility. We therefore consider only changes from the interest rate swaps’ fixed leg in the equity-related sensitivity calculation for the interest swaps in a hedge relationship. |
| |
| | • | As the deal contingent interest rate payer swaps are freestanding derivatives with fair value fluctuations charged to profit or loss we include only changes from the interest rate swaps’ fixed leg in the earnings-related sensitivity calculation. The movements related to the interest rate swaps’ variable leg are not reflected in the sensitivity calculation as they offset the variable interest payments for the credit facility. |
If, at December 31, 2008, interest rates had been 100 basis points higher (lower), the unrealized gains/losses on marketable securities position in other components of equity would have been €0 million (December 31, 2007: €2 million) lower (higher) than presented.
If, at December 31, 2008, interest rates for our variable rate debt investments had been 100 basis points higher (lower), the financial income/expense, net would have been €3 million (December 31, 2007: €1 million) higher (lower) than presented.
If, at December 31, 2008, interest rates had been 100 basis points higher (lower), the Unrealized interest rate cash-flow hedge position in other comprehensive income would have been €1 million (December 31, 2007: €0 million) lower (higher) than presented.
If, at December 31, 2008, interest rates had been 100 basis points higher (lower), the impact on financial income/expense, net from deal contingent interest rate payer swaps would have been €0 million higher (lower) (December 31, 2007: €9 million higher and €7 million lower, respectively) than presented.
EQUITY PRICE RISK
Equity-price risk is the risk of loss due to adverse changes in equity markets. Our investments consist of listed and non-listed securities held for purposes other than trading and are classified as available for sale. Our equity investments in listed securities are accounted for at fair value with fair value changes recorded in other comprehensive income and are monitored based on the current market value that is affected by the fluctuations in the volatile stock markets worldwide. An assumed 20% increase (decrease) in equity prices as of December 31,
124
2008 would not have a material impact on the value of our investments in marketable securities (2007: €1 million) with corresponding entries in other comprehensive income.
The equity investments in non-listed securities are monitored individually. Those securities are recognized at cost, because market values are generally not observable. They are subject to an annual impairment test.
OTHER RISKS
Share-Based Compensation Hedging
We hedge certain cash flow exposures associated with both recognized and unrecognized share-based compensation through the purchase of derivative instruments from independent financial institutions.
See Notes 25, 26 and 27 to our consolidated financial statements in “Item 18. Financial Statements” for more information regarding our share-based compensation activities, including the detail of the derivative instruments we held as of December 31, 2008 as hedges.
Credit Risk
See Note 26 to our consolidated financial statements in “Item 18. Financial Statements” for a discussion of our credit risk exposure.
Liquidity Risk
See Note 26 to our consolidated financial statements in “Item 18. Financial Statements” for a discussion of our liquidity risk exposure. Also see “ITEM 5. Liquidity and Capital Resources” for more information on our liquidity risk.
ITEM 12. DESCRIPTION OF SECURITIES OTHER THAN EQUITY SECURITIES
Not applicable.
PART II
ITEM 13. DEFAULTS, DIVIDEND ARREARAGES AND DELINQUENCIES
None.
ITEM 14. MATERIAL MODIFICATIONS TO THE RIGHTS OF SECURITY HOLDERS AND USE OF PROCEEDS
None.
ITEM 15. CONTROLS AND PROCEDURES
EVALUATION OF DISCLOSURE CONTROLS AND PROCEDURES
Disclosure controls and procedures means controls and other procedures of SAP that are designed to ensure that information required to be disclosed by SAP in the reports that it files or submits under the Exchange Act is recorded, processed, summarized and reported within the time periods specified in the Commission’s rules and forms. Disclosure controls and procedures include, without limitation, controls and procedures designed to ensure that information required to be disclosed by SAP in the reports that it files or
125
submits under the Exchange Act is accumulated and communicated to SAP management, including SAP’s principal executive and financial officers (i.e. SAP’s co-chief executive officers (“Co-CEOs”) and chief financial officer (“CFO”)), or persons performing similar functions, as appropriate to allow timely decisions regarding required disclosure. SAP’s management evaluated, with the participation of SAP’s Co-CEOs, Henning Kagermann and Léo Apotheker, and CFO, Werner Brandt, the effectiveness of SAP’s disclosure controls and procedures as of December 31, 2008. The evaluation was led by SAP’s Global Governance Risk & Compliance function, including dedicated “SOX Champions” in all of SAP’s major entities and business units with the participation of process owners, SAP’s key corporate senior management, senior management of each business group, and as indicated above under the supervision of SAP’s Co-CEOs and CFO. Based on the foregoing, SAP’s management, including SAP’s Co-CEOs and CFO, concluded that as of December 31, 2008, SAP’s disclosure controls and procedures were effective.
MANAGEMENT’S ANNUAL REPORT ON INTERNAL CONTROL OVER FINANCIAL REPORTING
The management of SAP is responsible for establishing and maintaining adequate internal control over financial reporting as such term is defined inRules 13a-15(f) and15d-15(f) under the Securities Exchange Act of 1934. SAP’s internal control over financial reporting is a process designed under the supervision of SAP’s Co-CEOs and CFO to provide reasonable assurance regarding the reliability of financial reporting and the preparation of financial statements for external reporting purposes in accordance with accounting principles generally accepted in the United States of America.
SAP’s management assessed the effectiveness of the Company’s internal control over financial reporting as of December 31, 2008. In making this assessment, it used the criteria set forth by the Committee of Sponsoring Organizations of the Treadway Commission (COSO) in “Internal Control — Integrated Framework.”
Based on the assessment under these criteria, SAP management has concluded that, as of December 31, 2008, the Company’s internal control over financial reporting was effective.
KPMG AG Wirtschaftsprüfungsgesellschaft, our independent registered public accounting firm has issued its attestation report on the effectiveness of SAP’s internal control over financial reporting, which is included below under the heading “Report of Independent Registered Public Accounting Firm.”
CHANGE IN INTERNAL CONTROL OVER FINANCIAL REPORTING
There has been no change in our internal control over financial reporting during the period covered by this Annual Report onForm 20-F that has materially affected, or is reasonably likely to materially affect, our internal control over financial reporting.
REPORT OF INDEPENDENT REGISTERED PUBLIC ACCOUNTING FIRM
The Supervisory Board of SAP AG:
We have audited SAP AG’s internal control over financial reporting as of December 31, 2008, based on criteria established inInternal Control — Integrated Frameworkissued by the Committee of Sponsoring Organizations of the Treadway Commission (COSO). SAP AG’s management is responsible for maintaining effective internal control over financial reporting and for its assessment of the effectiveness of internal control over financial reporting, included in the accompanying Managements Annual Report on Internal Control Over Financial Reporting. Our responsibility is to express an opinion on the Company’s internal control over financial reporting based on our audit.
We conducted our audit in accordance with the standards of the Public Company Accounting Oversight Board (United States). Those standards require that we plan and perform the audit to obtain reasonable assurance about whether effective internal control over financial reporting was maintained in all material respects. Our audit included obtaining an understanding of internal control over financial reporting, assessing
126
the risk that a material weakness exists, and testing and evaluating the design and operating effectiveness of internal control based on the assessed risk. Our audit also included performing such other procedures as we considered necessary in the circumstances. We believe that our audit provides a reasonable basis for our opinion.
A company’s internal control over financial reporting is a process designed to provide reasonable assurance regarding the reliability of financial reporting and the preparation of financial statements for external purposes in accordance with generally accepted accounting principles. A company’s internal control over financial reporting includes those policies and procedures that (1) pertain to the maintenance of records that, in reasonable detail, accurately and fairly reflect the transactions and dispositions of the assets of the company; (2) provide reasonable assurance that transactions are recorded as necessary to permit preparation of financial statements in accordance with generally accepted accounting principles, and that receipts and expenditures of the company are being made only in accordance with authorizations of management and directors of the company; and (3) provide reasonable assurance regarding prevention or timely detection of unauthorized acquisition, use, or disposition of the company’s assets that could have a material effect on the financial statements.
Because of its inherent limitations, internal control over financial reporting may not prevent or detect misstatements. Also, projections of any evaluation of effectiveness to future periods are subject to the risk that controls may become inadequate because of changes in conditions, or that the degree of compliance with the policies or procedures may deteriorate.
In our opinion, SAP AG maintained, in all material respects, effective internal control over financial reporting as of December 31, 2008, based on criteria established inInternal Control — Integrated Frameworkissued by the Committee of Sponsoring Organizations of the Treadway Commission.
We also have audited, in accordance with the standards of the Public Company Accounting Oversight Board (United States), the consolidated balance sheets of SAP AG as of December 31, 2008 and 2007, and the related consolidated statements of income, shareholders’ equity, comprehensive income, and cash flows for each of the years in the three-year period ended December 31, 2008, and our report dated March 25, 2009 expressed an unqualified opinion on those consolidated financial statements.
KPMG AG Wirtschaftsprüfungsgesellschaft
Mannheim, Germany
March 25, 2009
ITEM 16. [RESERVED]
ITEM 16A. AUDIT COMMITTEE FINANCIAL EXPERT
Our Supervisory Board determined that Erhard Schipporeit is an “audit committee financial expert,” as defined by the regulations of the Commission issued pursuant to Section 407 of the Sarbanes-Oxley Act of 2002 and meeting the requirements of Item 16A. He is “independent,” as such term is defined inRule 10A-3 under the Exchange Act.
ITEM 16B. CODE OF ETHICS
In 2003, SAP adopted a Code of Business Conduct that applies to all employees (including all personnel in the accounting and controlling departments) and the members of SAP’s Executive Board (including our Co-CEOs and CFO). Our Code of Business Conduct constitutes a “code of ethics” as defined in Item 16.B ofForm 20-F. Our Code of Business Conduct sets standards for all dealings with customers, partners, competitors and suppliers and includes, among others, regulations with regard to confidentiality, loyalty, preventing
127
conflicts of interest and preventing bribery. International differences in culture, language, and legal and social systems make the adoption of uniform Codes of Business Conduct across an entire global company challenging. As a result, SAP has set forth a master code containing minimum standards. In turn, each company within the SAP Group has been required to adopt a similar code that meets at least these minimum standards, but may also include additional or more stringent rules of conduct. Newly acquired companies also are expected to meet the minimum standards set forth in the Code of Business Conduct.
We have made our Code of Business Conduct publicly available by posting the full text on our Web site underwww.sap.com/corpgovernance(section “Policies and Statutes”). The published Code of Business Conduct is the code of our parent company, SAP AG. It is identical to the master code.
ITEM 16C. PRINCIPAL ACCOUNTANT FEES AND SERVICES
AUDIT FEES, AUDIT-RELATED FEES, TAX FEES AND ALL OTHER FEES
Refer to Note 31 to our consolidated financial statements in “Item 18. Financial Statements” for information on fees paid to our independent registered public accounting firm, KPMG, for audit services and other professional services.
AUDIT COMMITTEE’S PRE-APPROVAL POLICIES AND PROCEDURES
As required under German law, our shareholders appoint our independent auditors to audit our financial statements, based on a proposal that is legally required to be submitted by the Supervisory Board. The Supervisory Board’s proposal is based on a proposal by the Audit Committee. See also the description under the heading “Corporate Governance” in “Item 10. Additional Information.”
In 2002 our Audit Committee adopted a policy with regard to the pre-approval of audit and non-audit services to be provided by our independent auditors. This policy, which is designed to assure that such engagements do not impair the independence of our auditors, was amended and expanded in 2003 and 2007. The policy requires prior approval of the Audit Committee for all services to be provided by our independent auditors for any entity of the SAP Group. With regard to non-audit services the policy distinguishes among three categories of services:
| | |
| | 1. | “Prohibited services:” This category includes services that our independent auditors must not be engaged to perform. These are services that are not permitted by applicable law or that would be inconsistent with maintaining the auditors’ independence. |
| |
| | 2. | “Services requiring universal approval:” Services of this category may be provided by our independent auditors up to a certain aggregate amount in fees per year that is determined annually by the Audit Committee. |
| |
| | 3. | “Services requiring individual approval:” Services of this category may only be provided by our independent auditors if they have been individually (specifically) pre-approved by the Audit Committee or an Audit Committee member who is authorized by the Audit Committee to make such approvals. |
Our Chief Accounting Officer reviews all individual requests to engage our independent auditors as a service provider in accordance with this policy and determines the category to which the requested service belongs. All requests for engagements with expected fees over a specified limit are additionally reviewed by our CFO. Based on the determination of the category the request is (i) declined if it is a “prohibited service,” (ii) approved if it is a “service requiring universal approval” and the maximum aggregate amount fixed by the Audit Committee has not been reached or (iii) forwarded to the Audit Committee for individual approval if the “service requires individual approval” or is a “service requiring universal approval” and the maximum aggregate amount fixed by the Audit Committee has been exceeded.
128
Our Audit Committee’s pre-approval policies also include information requirements to ensure the Audit Committee is kept aware of the volume of engagements involving our independent auditors that were not individually pre-approved by the Audit Committee itself.
All services performed by our independent auditors in the last two fiscal years were authorized pursuant to our pre-approval policies.
ITEM 16D. EXEMPTIONS FROM THE LISTING STANDARDS FOR AUDIT COMMITTEES
Rule 10A-3 of the Exchange Act requires that all members of our audit committee be independent, subject to certain exceptions. In accordance with German law, the Audit Committee consists of both employee and shareholder elected members.Rule 10A-3 provides an exception for an employee of a foreign private issuer such as SAP who is not an executive officer of that issuer and who is elected to the supervisory board or audit committee of that issuer pursuant to the issuer’s governing law. In this case, the employee is exempt from the independence requirements ofRule 10A-3 and is permitted to sit on the audit committee.
We rely on this exemption. Our Audit Committee includes two members who are non-executive employees of SAP AG, Thomas Bamberger and Gerhard Maier, who were named to our Supervisory Board pursuant to the German Co-determination Act (see Item 6 for details). We believe that the reliance on this exemption does not materially adversely affect the ability of our Audit Committee to act independently and to satisfy the other requirements ofRule 10A-3.
ITEM 16E. PURCHASES OF EQUITY SECURITIES BY THE ISSUER AND AFFILIATED PURCHASERS
The following table sets out information concerning purchases of our ordinary shares under our supported Employee Discount Stock Purchase programs, Long-Term Incentive Plan 2000, Stock Option Plan 2002 and other share buy-back activities.
| | | | | | | | | | | | | | | | | |
| | | | | | (b)
| | | (c)
| | | (d)
| |
| | | (a)
| | | Average
| | | Total Number of Shares
| | | Maximum Number of
| |
| | | Total Number
| | | Price Paid
| | | Purchased as Part of
| | | Shares that May Yet
| |
| | | of Shares
| | | per Share
| | | Publicly Announced
| | | Be Purchased Under
| |
Period | | Purchased | | | (in €) | | | Plans or Programs | | | the Plans or Programs | |
| |
| January 1/1/08 — 1/31/08 | | | 0 | | | | — | | | | 0 | | | | 77,023,001 | |
| February 2/1/08 — 2/28/08 | | | 3,339,428 | | | | 32,47 | | | | 3,339,428 | | | | 74,926,777 | |
| March 3/1/08 — 3/31/08 | | | 4,687,699 | | | | 31,98 | | | | 4,687,699 | | | | 70,324,007 | |
| April 4/1/08 — 4/30/08 | | | 0 | | | | — | | | | 0 | | | | 70,372,708 | |
| May 5/1/08 — 5/31/08 | | | 3,813,435 | | | | 32,58 | | | | 3,813,435 | | | | 66,606,519 | |
| June 6/1/08 — 6/30/08 | | | 0 | | | | — | | | | 0 | | | | 66,777,219 | |
| July 7/1/08 — 7/31/08 | | | 0 | | | | — | | | | 0 | | | | 66,868,806 | |
| August 8/1/08 — 8/31/08 | | | 2,361,207 | | | | 37,83 | | | | 2,361,207 | | | | 64,985,901 | |
| September 9/1/08 — 9/30/08 | | | 400,000 | | | | 37,32 | | | | 400,000 | | | | 83,915,467 | |
| October 10/1/08 — 10/31/08 | | | 0 | | | | — | | | | 0 | | | | 83,975,123 | |
| November 11/1/08 — 11/30/08 | | | 0 | | | | — | | | | 0 | | | | 84,049,348 | |
| December 12/1/08 — 12/31/08 | | | 0 | | | | — | | | | 0 | | | | 84,119,556 | |
| | | | | | | | | | | | | | | | | |
| Total | | | 14,601,769 | | | | 33,34 | | | | 14,601,769 | | | | | |
| | | | | | | | | | | | | | | | | |
Purchases between January 1, 2008 and June 3, 2008 were made in accordance with the authorization to acquire and use treasury shares granted at the Annual General Meeting of Shareholders on May 10, 2007, pursuant to which the Executive Board was authorized to acquire, on or before October 31, 2008, up to 120 million shares of SAP.
129
Purchases between June 4, 2008 and December 31, 2008 were made in accordance with the authorization to acquire and use treasury shares granted at the Annual General Meeting of Shareholders on June 3, 2008, pursuant to which the Executive Board was authorized to acquire, on or before November 30, 2009, up to 120 million shares of SAP. The authorization from June 3, 2008 replaced the authorization from May 10, 2007.
Both authorizations were subject to the provision that the shares to be purchased, together with any other shares already acquired and held by SAP, do not account for more than 10% of SAP’s capital stock.
All purchases were made in market transactions effected on the Frankfurt Stock Exchange via the electronic trading system Xetra.
We did not purchase our ADRs during 2008.
ITEM 16F. CHANGES IN REGISTRANTS’S CERTIFYING ACCOUNTANT
Not applicable.
ITEM 16G. DIFFERENCES IN CORPORATE GOVERNANCE PRACTICES
The following summarizes the principal ways in which our corporate governance practices differ from the New York Stock Exchange, “NYSE”, corporate governance rules applicable to U.S. domestic issuers, the “NYSE Rules.” Further information about the differences between our corporate governance practices and the NYSE Rules is available on the SAP website at (http://www.sap.com/about/governance/statutes/index.epx).
Introduction
SAP is incorporated under the laws of Germany, with securities publicly traded on markets in Germany (Frankfurt Exchange) and the United States (NYSE).
The NYSE Rules permit foreign private issuers to follow applicable home country corporate governance practices in lieu of the NYSE corporate governance standards, subject to certain exceptions. Foreign private issuers electing to follow home country corporate governance rules are required to disclose the principal differences in their corporate governance practices from those required under the NYSE Rules. This Item 16G summarizes the principal ways in which SAP’s corporate governance practices differ from the NYSE Rules applicable to domestic issuers.
Legal Framework
The primary source of law relating to the corporate governance of a German stock corporation is the German Stock Corporation Act (Aktiengesetz). Additionally, the Securities Trading Act (Wertpapierhandelsgesetz), the German Securities Purchase and Take Over Act (Wertpapiererwerbs- und Übernahmegesetz), the Stock Exchange Admission Regulations, the German Commercial Code (Handelsgesetzbuch) and certain other German statutes contain corporate governance rules applicable to SAP. In addition to these mandatory rules, the German Corporate Governance Code (“GCGC”) summarizes the mandatory statutory corporate governance principles found in the German Stock Corporation Act and other provisions of German law. Further, the GCGC contains supplemental recommendations and suggestions for standards on responsible corporate governance intended to reflect generally accepted best practices.
The German Stock Corporation Act requires the executive and the supervisory board of exchange-listed companies like SAP to declare annually that the recommendations set forth in the GCGC have been and are being complied with, and to identify any recommendations not being applied. SAP has disclosed deviations from a few of the GCGC recommendations in its Declaration of Compliance on a yearly basis since 2003. These declarations are available on the SAP website (www.sap.com/about/governance/statutes/index.epx).
130
Significant Differences
We believe the following to be the significant differences between German corporate governance practices, as SAP has implemented them, and those applicable to domestic companies under the NYSE Rules.
German Stock Corporations are Required to have a Two-Tier Board System
SAP is governed by three separate bodies: (i) the Supervisory Board, which counsels, supervises and controls the Executive Board; (ii) the Executive Board, which is responsible for the day-to-day management of SAP; and (iii) the General Shareholders’ Meeting. The rules applicable to these governing bodies are defined by German law and by SAP’s Articles of Incorporation. This corporate structure differs from the unitary board of directors established by the relevant laws of all U.S. states and the NYSE Rules. See “Item 10. Additional Information — Corporate Governance” for additional information on these rules.
Director Independence Rules
The NYSE Rules require that a majority of the members of the board of directors of a listed issuer and each member of its nominating, corporate governance, compensation and audit committee be “independent” and stipulate that no director qualifies as “independent” unless the board of directors has made an affirmative determination that the director has no material direct or indirect relationship with the listed company. However, under the NYSE Rules a director may still be deemed independent even if the director or a member of the director’s immediate family has received during a 12 month period within the prior three years up to $120,000 in direct compensation. In addition, a director may also be deemed independent even if a member of the director’s immediate family works for the company’s auditor in a non-partner capacity and not on the company’s audit. By contrast, the GCGC requires that the Supervisory Board ensure that proposed candidates are persons with the necessary knowledge, competencies and applicable experience, and that the Supervisory Board includes what it considers an adequate number of independent members. A Supervisory Board member is considered independent if he or she has no business or personal relations with SAP or its Executive Board that could give rise to a conflict of interest. The members of the Supervisory Board must have enough time to perform their board duties and must carry out their duties carefully and in good faith. For as long as they serve, they must comply with the criteria that are enumerated in relation to the selection of candidates for the Supervisory Board concerning independence, conflict of interest and multiple memberships of management, supervisory and other governing bodies. They must be loyal to SAP in their conduct and they must not accept appointment in companies that are in competition with SAP. Supervisory Board members must disclose any planned non-ordinary course business transactions with SAP to the Supervisory Board promptly. The Supervisory Board members cannot carry out such transactions before the Supervisory Board has given its permission. The Supervisory Board may grant its permission for any such transaction only if the transaction is based on terms and conditions that are standard for the type of transaction in question and if the transaction is not contrary to SAP’s interest. SAP complies with these GCGC director independence requirements.
German corporate law and the GCGC do not require the Supervisory Board to make an affirmative determination that individual directors are independent or that a majority of Supervisory Board members or the members of a specific committee are independent.
The NYSE independence requirements are closely linked with risks specific to unitary boards of directors that are customary for U.S. companies. In contrast, the two-tier board structure requires a strict separation of the executive board and supervisory board. In addition, the supervisory board of large German stock corporations is subject to the principle of employee codetermination as outlined in the German Co-Determination Act of 1976 (Mitbestimmungsgesetz). As a result, the Supervisory Board of SAP AG consists of 16 members, of which eight have been elected by SAP AG’s shareholders at the Annual General Meeting and eight members have been elected by employees of SAP AG and its German subsidiaries. Typically, the chairperson of the supervisory board is a shareholder representative. In case of a tie vote, the supervisory board chairperson may
131
cast the decisivetie-breaking vote. This board structure creates a different system of checks and balances, including employee participation, and cannot be directly compared with a unitary board system.
Audit Committee Independence
As a foreign private issuer, the NYSE Rules require SAP to establish an Audit Committee that satisfies the requirements ofRule 10A-3 of the Exchange Act with respect to audit committee independence. SAP is in compliance with these requirements. The Chairman of SAP’s Audit Committee and Mr. Joachim Milberg, recently elected to the Audit Committee, meet the independence requirements ofRule 10A-3 of the Exchange Act. The other two Audit Committee members, Messrs. Thomas Bamberger and Gerhard Maier, are employee representatives who are eligible for the exemption provided by Rule 10A-3 (b) (1) (iv) (C) (see Item 16.D for details).
Similar to the Board independence requirements under German corporate law and the GCGC, supervisory boards are not required to determine affirmatively that the audit committee members are independent. Nonetheless, SAP meets the NYSE Rules on audit committee independence applicable to foreign private issuers.
Rules on Non-Management Board Meetings are Different
Section 303 A.03 of the NYSE Rules stipulates that the non-management board of each listed issuer must meet at regularly scheduled executive sessions without the management. Under German corporate law and the GCGC the Supervisory Board is entitled but not required to exclude Executive Board members from its meetings. The Supervisory Board exercises this right temporarily during its meetings, for example when it discusses or decides Executive Board member affairs like the appointment of new Executive Board members.
Rules on Establishing Committees Differ
Pursuant to Section 303 A.04 and 303 A.05 of the NYSE Rules listed companies are required to set up a Nominating/Corporate Governance Committee and a Compensation Committee, each composed entirely of independent directors and having a written charter specifying the committee’s purpose and responsibilities. In addition, each committees’ performance must be reviewed annually. With one exception, German corporate law does not mandate the creation of specific supervisory board committees. Required by the German Co-Determination Act of 1976 (Mitbestimmungsgesetz), the Mediation Committee (Vermittlungsausschuss) convenes only if the2/3 majority required for appointing/revoking the appointment of Executive Board Members is not attained. This committee has never been convened in SAP’s history. In addition, the GCGC recommends that the Supervisory Board establish an Audit Committee and a Nomination Committee. In addition to the legally required Mediation Committee, SAP has the following committees, which are in compliance with the GCGC: General Committee, Compensation Committee, Audit Committee, Strategy and Technology Committee, Finance and Investment Committee, Nomination Committee, and Special Committee (See “Item 10. Additional Information — Corporate Governance” for more information).
Rules on Shareholders’ Compulsory Approval are Different
Section 312 of the NYSE Rules requires U.S. companies to seek shareholder approval of all equity-compensation plans, including certain material revisions thereto (subject to certain exemptions as described in the rules), issuances of common stock, including convertible stock, if the common stock has, or will have upon issuance, voting power of or in excess of 20% of the then outstanding common stock, and issuances of common stock if they trigger a change of control.
According to the German Stock Corporation Act and other applicable German laws, shareholder approval is required for a broad range of matters, such as amendments to the articles of association, certain
132
significant corporate transactions (including inter-company agreements and material restructurings), the offering of stock options and similar equity compensation to its employees by a way of a conditional capital increase or by using treasury shares (including significant aspects of such an equity compensation plan as well as the exercise thresholds), the issuance of new shares, the authorization to purchase the corporation’s own shares, and other material issues, such as transfers of all, or substantially all, of the assets of the stock corporation, including shareholdings in subsidiaries.
Specific Principles of Corporate Governance
Under the NYSE Rules Section 303 A.09 listed companies must adopt and disclose corporate guidelines. Since October 2007, SAP has applied the recommended corporate governance standards of the GCGC rather than company-specific principles of corporate governance. The CGCG recommendations differ from the NYSE Standards primarily as outlined in this Item 16G.
Specific Code of Business Conduct
NYSE Rules Section 303 A.10 requires listed companies to adopt and disclose a code of business conduct and ethics for directors, officers and employees, and to disclose promptly any waivers of the code for directors or executive officers. Although not required under German law, SAP has adopted a Code of Business Conduct, which is equally applicable to employees, managers and members of the Executive Board. SAP complies with the requirement to disclose the Code of Business Conduct and any waivers of the code with respect to directors and executive officers.
PART III
ITEM 17. FINANCIAL STATEMENTS
Not applicable.
ITEM 18. FINANCIAL STATEMENTS
Reference is made to pages F-1 through F-95, incorporated herein by reference.
The following consolidated financial statements are filed as part of this Annual Report onForm 20-F:
| | |
| | • | Report of Independent Registered Public Accounting Firm. |
| |
| | • | Consolidated Statements of Income for the years ended 2008, 2007 and 2006. |
| |
| | • | Consolidated Balance Sheets as of December 31, 2008 and 2007. |
| |
| | • | Consolidated Statements of Shareholders’ Equity for the years ended December 31, 2008, 2007 and 2006. |
| |
| | • | Consolidated Statements of Comprehensive Income for the years ended December 31, 2008, 2007 and 2006. |
| |
| | • | Consolidated Statements of Cash Flows for the years ended December 31, 2008, 2007 and 2006. |
| |
| | • | Notes to Consolidated Financial Statements. |
ITEM 19. EXHIBITS
The following documents are filed as exhibits to this Annual Report onForm 20-F:
| | | | | |
| | 1 | | | Articles of Incorporation (Satzung) of SAP AG, as amended to date (English translation).(1) |
| | 2 | .1 | | Form of global share certificate for ordinary shares (English translation).(1) |
133
| | | | | |
| | 2 | .2 | | Form of American Depositary Receipt.(2) |
| | 4 | .1 | | Form of Amended and Restated Deposit Agreement among SAP AG, Deutsche Bank Trust Company Americas, as Depositary, and all owners and holders from time to time of American Depositary Receipts issued thereunder, including the form of American Depositary Receipts, dated as of December 3, 2004.(3) |
| | 4 | .2 | | Amendment No. 1 dated as of December 20, 2006 to Amended and Restated Deposit Agreement among SAP AG, Deutsche Bank Trust Company Americas, as Depository, and all owners and holders from time to time of American Depositary Receipts issued thereunder, including the form of American Depositary Receipts.(2) |
| | 4 | .3 | | Tender Offer Agreement dated as of October 7, 2007 between SAP AG and Business Objects S.A.(4) |
| | 4 | .3.1 | | Assignment and Assumption Agreement dated as of October 22, 2007 between SAP AG and SAP France S.A.(4) |
| | 4 | .4 | | Amendment and Restatement Agreement relating to the €5,000,000,000 (subsequently reduced to €2,947,679,513.45) Syndicated Multicurrency Term Loan Facility Agreement dated October 1, 2007 by and among SAP AG (Borrower), Deutsche Bank AG, ABN Amro Bank N.V., Niederlassung Deutschland, BNP Paribas S.A., Commerzbank Aktiengesellschaft, J.P. Morgan plc and Sumitomo Mitsui Banking Corporation (Mandated Lead Arrangers), Deutsche Bank AG Paris Branch (Offer Guarantor), Deutsche Bank Luxemburg S.A. (Agent) and Certain Financial Institutions (Lenders).(5) |
| | 4 | .4.1 | | Accession Agreement relating to the €5,000,000,000 (subsequently reduced to €2,947,679,513.45) Syndicated Multicurrency Term Loan Facility Agreement dated October 1, 2007 by and among SAP AG (Borrower), Deutsche Bank AG, ABN Amro Bank N.V., Niederlassung Deutscheland, BNP PARIBAS S.A., Commerzbank Aktiengesellschaft, J.P. Morgan plc and Sumitomo Mitsui Banking Corporation (Mandated Lead Arrangers), Deutsche Bank AG Paris Branch (Offer Guarantor), certain financial institutions (Existing Lenders), certain financial institutions (New Lenders), and Deutsche Bank Luxembourg S.A. (Agent).(5) |
| | 8 | | | Subsidiaries, Equity Method Investments, and Other Investments of SAP AG. |
| | 12 | .1 | | Certification of Henning Kagermann, Co-Chief Executive Officer, required byRule 13a-14(a) orRule 15d-14(a). |
| | 12 | .2 | | Certification of Léo Apotheker, Co-Chief Executive Officer, required byRule 13a-14(a) orRule 15d-14(a). |
| | 12 | .3 | | Certification of Werner Brandt, Chief Financial Officer, required byRule 13a-14(a) orRule 15d-14(a). |
| | 13 | .1 | | Certification of Henning Kagermann, Co-Chief Executive Officer, pursuant to 18 U.S.C. Section 1350, as adopted pursuant to Section 906 of the Sarbanes-Oxley Act of 2002. |
| | 13 | .2 | | Certification of Léo Apotheker, Co-Chief Executive Officer, pursuant to 18 U.S.C. Section 1350, as adopted pursuant to Section 906 of the Sarbanes-Oxley Act of 2002. |
| | 13 | .3 | | Certification of Werner Brandt, Chief Financial Officer, pursuant to 18 U.S.C. Section 1350, as adopted pursuant to Section 906 of the Sarbanes-Oxley Act of 2002. |
| | 15 | | | Consent of Independent Registered Public Accounting Firm. |
| | |
| (1) | | Incorporated by reference to the Annual Report onForm 20-F of SAP AG filed on March 22, 2006. |
| |
| (2) | | Incorporated by reference to Post Effective Amendment No. 1 toForm F-6 filed on December 20, 2006. |
| |
| (3) | | Incorporated by reference to the Current Report onForm 6-K of SAP AG, filed on December 13, 2004. |
| |
| (4) | | Incorporated by reference to the Tender Offer Statement on Schedule TO filed with the SEC by SAP France S.A. on December 4, 2007. |
| |
| (5) | | Incorporated by reference to the Annual Report onForm 20-F of SAP AG filed on April 2, 2008. |
134
SIGNATURES
The Registrant hereby certifies that it meets all of the requirements for filing onForm 20-F and that it has duly caused and authorized the undersigned to sign this Annual Report on its behalf.
SAP AG
(Registrant)
| | |
| | By: /s/ | HENNING KAGERMANN |
Name: Prof. Dr. Henning Kagermann
Title: Co-Chief Executive Officer
Dated: March 26, 2009
Name: Léo Apotheker
Title: Co-Chief Executive Officer
Dated: March 26, 2009
Name: Dr. Werner Brandt
Title: Chief Financial Officer
Dated March 26, 2009
135
SAP AG AND SUBSIDIARIES
INDEX TO CONSOLIDATED FINANCIAL STATEMENTS
| | | | | |
| | | Page |
| |
| | | F-1 | |
| Consolidated Financial Statements: | | | | |
| | | F-2 | |
| | | F-3 | |
| | | F-4 | |
| | | F-5 | |
| | | F-6 | |
| | | F-7 | |
REPORT OF INDEPENDENT REGISTERED PUBLIC ACCOUNTING FIRM
The Supervisory Board of SAP AG:
We have audited the accompanying consolidated balance sheets of SAP AG and subsidiaries (“SAP” or “the Company”) as of December 31, 2008 and 2007, and the related consolidated statements of income, shareholders’ equity, comprehensive income, and cash flows for each of the years in the three-year period ended December 31, 2008. These consolidated financial statements are the responsibility of the Company’s management. Our responsibility is to express an opinion on these consolidated financial statements based on our audits.
We conducted our audits in accordance with the standards of the Public Company Accounting Oversight Board (United States). Those standards require that we plan and perform the audit to obtain reasonable assurance about whether the financial statements are free of material misstatement. An audit includes examining, on a test basis, evidence supporting the amounts and disclosures in the financial statements. An audit also includes assessing the accounting principles used and significant estimates made by management, as well as evaluating the overall financial statement presentation. We believe that our audits provide a reasonable basis for our opinion.
In our opinion, the consolidated financial statements referred to above present fairly, in all material respects, the financial position of SAP as of December 31, 2008 and 2007, and the results of their operations and their cash flows for each of the years in the three-year period ended December 31, 2008, in conformity with U.S. generally accepted accounting principles.
We also have audited, in accordance with the standards of the Public Company Accounting Oversight Board (United States), SAP’s internal control over financial reporting as of December 31, 2008, based on criteria established in Internal Control — Integrated Framework issued by the Committee of Sponsoring Organizations of the Treadway Commission (COSO), and our report dated March 25, 2009 expressed an unqualified opinion on the effectiveness of SAP’s internal control over financial reporting.
KPMG AG Wirtschaftsprüfungsgesellschaft
Mannheim, Germany
March 25, 2009
F-1
SAP AG AND SUBSIDIARIES
for the years ended December 31,
| | | | | | | | | | | | | | | | | | | | | |
| | | Note | | | 2008(1) | | | 2008 | | | 2007 | | | 2006 | |
| | | € millions, unless otherwise stated | |
| |
| Software revenue | | | | | | | 5,019 | | | | 3,606 | | | | 3,407 | | | | 3,003 | |
| Support revenue | | | | | | | 6,393 | | | | 4,593 | | | | 3,838 | | | | 3,464 | |
| Subscription and other software-related service revenue | | | | | | | 359 | | | | 258 | | | | 182 | | | | 129 | |
Software and software-related service revenue | | | | | | | 11,771 | | | | 8,457 | | | | 7,427 | | | | 6,596 | |
| Consulting revenue | | | | | | | 3,477 | | | | 2,498 | | | | 2,221 | | | | 2,249 | |
| Training revenue | | | | | | | 604 | | | | 434 | | | | 410 | | | | 383 | |
| Other service revenue | | | | | | | 149 | | | | 107 | | | | 113 | | | | 96 | |
Professional services and other service revenue | | | | | | | 4,230 | | | | 3,039 | | | | 2,744 | | | | 2,728 | |
Other revenue | | | | | | | 96 | | | | 69 | | | | 71 | | | | 69 | |
| | | | | | | | | | | | | | | | | | | | | |
Total revenue | | | (5 | ) | | | 16,097 | | | | 11,565 | | | | 10,242 | | | | 9,393 | |
| | | | | | | | | | | | | | | | | | | | | |
| Cost of software and software-related services | | | | | | | (2,291 | ) | | | (1,646 | ) | | | (1,310 | ) | | | (1,091 | ) |
| Cost of professional services and other services | | | | | | | (3,196 | ) | | | (2,296 | ) | | | (2,091 | ) | | | (2,073 | ) |
| Research and development | | | | | | | (2,270 | ) | | | (1,631 | ) | | | (1,458 | ) | | | (1,335 | ) |
| Sales and marketing | | | | | | | (3,535 | ) | | | (2,540 | ) | | | (2,162 | ) | | | (1,908 | ) |
| General and administration | | | | | | | (867 | ) | | | (623 | ) | | | (506 | ) | | | (464 | ) |
| Other operating income/expense, net | | | (7 | ) | | | 15 | | | | 11 | | | | 17 | | | | 56 | |
| | | | | | | | | | | | | | | | | | | | | |
Total operating expenses | | | | | | | (12,144 | ) | | | (8,725 | ) | | | (7,510 | ) | | | (6,815 | ) |
| | | | | | | | | | | | | | | | | | | | | |
Operating income | | | | | | | 3,953 | | | | 2,840 | | | | 2,732 | | | | 2,578 | |
| | | | | | | | | | | | | | | | | | | | | |
| Other non-operating income/expense, net | | | (8 | ) | | | (35 | ) | | | (25 | ) | | | 1 | | | | (12 | ) |
| Financial income/expense, net | | | (9 | ) | | | (86 | ) | | | (62 | ) | | | 124 | | | | 122 | |
Income from continuing operations before income taxes | | | | | | | 3,832 | | | | 2,753 | | | | 2,857 | | | | 2,688 | |
| | | | | | | | | | | | | | | | | | | | | |
| Income taxes | | | (10 | ) | | | (1,148 | ) | | | (825 | ) | | | (921 | ) | | | (805 | ) |
| Minority interests | | | | | | | (1 | ) | | | (1 | ) | | | (2 | ) | | | (2 | ) |
| | | | | | | | | | | | | | | | | | | | | |
Income from continuing operations | | | | | | | 2,682 | | | | 1,927 | | | | 1,934 | | | | 1,881 | |
| | | | | | | | | | | | | | | | | | | | | |
| Loss from discontinued operations, net of tax | | | (11 | ) | | | (82 | ) | | | (59 | ) | | | (15 | ) | | | (10 | ) |
| | | | | | | | | | | | | | | | | | | | | |
Net income | | | | | | | 2,600 | | | | 1,868 | | | | 1,919 | | | | 1,871 | |
| | | | | | | | | | | | | | | | | | | | | |
Earnings per share from continuing operations — basic in € | | | (12 | ) | | | 2.25 | | | | 1.62 | | | | 1.60 | | | | 1.53 | |
Earnings per share from continuing operations — diluted in € | | | (12 | ) | | | 2.25 | | | | 1.62 | | | | 1.60 | | | | 1.53 | |
Earnings per share from net income — basic in € | | | (12 | ) | | | 2.18 | | | | 1.57 | | | | 1.59 | | | | 1.53 | |
Earnings per share from net income — diluted in € | | | (12 | ) | | | 2.18 | | | | 1.57 | | | | 1.59 | | | | 1.52 | |
| | |
| (1) | | The 2008 figures have been translated solely for the convenience of the reader at an exchange rate of US$1.3919 to €1.00, the Noon Buying Rate certified by the Federal Reserve Bank of New York on December 31, 2008. |
The accompanying Notes are an integral part of these Consolidated Financial Statements.
F-2
SAP AG AND SUBSIDIARIES
as of December 31,
| | | | | | | | | | | | | | | | | |
| | | Note | | | 2008(1) | | | 2008 | | | 2007 | |
| | | € millions | |
| |
Cash and cash equivalents | | | (13 | ) | | | 1,777 | | | | 1,277 | | | | 1,608 | |
Restricted cash | | | (13 | ) | | | 4 | | | | 3 | | | | 550 | |
Short-term investments | | | (13 | ) | | | 532 | | | | 382 | | | | 598 | |
Accounts receivable, net | | | (14 | ) | | | 4,354 | | | | 3,128 | | | | 2,895 | |
Other assets | | | (15 | ) | | | 981 | | | | 705 | | | | 541 | |
Deferred income taxes | | | (10 | ) | | | 283 | | | | 203 | | | | 125 | |
Prepaid expenses/deferred charges | | | | | | | 117 | | | | 84 | | | | 76 | |
Assets held for sale | | | (11 | ) | | | 0 | | | | 0 | | | | 15 | |
| | | | | | | | | | | | | | | | | |
Current assets | | | | | | | 8,048 | | | | 5,782 | | | | 6,408 | |
Goodwill | | | (16 | ) | | | 6,972 | | | | 5,009 | | | | 1,423 | |
Intangible assets, net | | | (16 | ) | | | 1,569 | | | | 1,127 | | | | 403 | |
Property, plant and equipment | | | (17 | ) | | | 1,956 | | | | 1,405 | | | | 1,316 | |
Investments | | | (13 | ) | | | 132 | | | | 95 | | | | 89 | |
Accounts receivable, net | | | (14 | ) | | | 3 | | | | 2 | | | | 3 | |
Other assets | | | (15 | ) | | | 788 | | | | 566 | | | | 555 | |
Deferred income taxes | | | (10 | ) | | | 260 | | | | 187 | | | | 146 | |
Prepaid expenses/deferred charges | | | | | | | 33 | | | | 24 | | | | 23 | |
| | | | | | | | | | | | | | | | | |
Noncurrent assets | | | | | | | 11,713 | | | | 8,415 | | | | 3,958 | |
| | | | | | | | | | | | | | | | | |
Total assets | | | | | | | 19,761 | | | | 14,197 | | | | 10,366 | |
| | | | | | | | | | | | | | | | | |
Accounts payable | | | (18 | ) | | | 749 | | | | 538 | | | | 715 | |
Income tax obligations | | | | | | | 505 | | | | 363 | | | | 341 | |
Financial liabilities | | | (18 | ) | | | 3,583 | | | | 2,574 | | | | 82 | |
Other liabilities | | | (18 | ) | | | 2,068 | | | | 1,486 | | | | 1,374 | |
Provisions | | | (19 | ) | | | 298 | | | | 214 | | | | 154 | |
Deferred income taxes | | | (10 | ) | | | 67 | | | | 48 | | | | 47 | |
Deferred Income | | | (5 | ) | | | 850 | | | | 611 | | | | 477 | |
Liabilities held for sale | | | (11 | ) | | | 0 | | | | 0 | | | | 9 | |
| | | | | | | | | | | | | | | | | |
Current liabilities | | | | | | | 8,120 | | | | 5,834 | | | | 3,199 | |
Accounts payable | | | (18 | ) | | | 7 | | | | 5 | | | | 10 | |
Income tax obligations | | | | | | | 387 | | | | 278 | | | | 90 | |
Financial liabilities | | | (18 | ) | | | 50 | | | | 36 | | | | 6 | |
Other liabilities | | | (18 | ) | | | 131 | | | | 94 | | | | 73 | |
Provisions | | | (19 | ) | | | 692 | | | | 497 | | | | 369 | |
Deferred income taxes | | | (10 | ) | | | 219 | | | | 157 | | | | 73 | |
Deferred income | | | (5 | ) | | | 85 | | | | 61 | | | | 42 | |
Noncurrent liabilities | | | | | | | 1,570 | | | | 1,128 | | | | 663 | |
| | | | | | | | | | | | | | | | | |
Total liabilities | | | | | | | 9,690 | | | | 6,962 | | | | 3,862 | |
| | | | | | | | | | | | | | | | | |
Minority interests | | | | | | | 3 | | | | 2 | | | | 1 | |
Common stock, no par values | | | | | | | 1,706 | | | | 1,226 | | | | 1,246 | |
| Authorized — Not issued or outstanding: 480 million at December 31, 2008 and December 31, 2007 | | | | | | | | | | | | | | | | |
| Authorized — Issued and outstanding: 1.226 million and 1.246 million shares at December 31, 2008 and December 31, 2007 | | | | | | | | | | | | | | | | |
Treasury stock | | | | | | | (1,896 | ) | | | (1,362 | ) | | | (1,734 | ) |
Additional paid-in capital | | | | | | | 445 | | | | 320 | | | | 347 | |
Retained earnings | | | | | | | 10,730 | | | | 7,709 | | | | 7,159 | |
Accumulated other comprehensive loss | | | | | | | (919 | ) | | | (660 | ) | | | (515 | ) |
| | | | | | | | | | | | | | | | | |
Shareholders’ equity | | | (20 | ) | | | 10,068 | | | | 7,233 | | | | 6,503 | |
| | | | | | | | | | | | | | | | | |
Total liabilities and shareholders’ equity | | | | | | | 19,761 | | | | 14,197 | | | | 10,366 | |
| | | | | | | | | | | | | | | | | |
| | |
| (1) | | The 2008 figures have been translated solely for the convenience of the reader at an exchange rate of US$1.3919 to €1.00, the Noon Buying Rate certified by the Federal Reserve Bank of New York on December 31, 2008. |
The accompanying Notes are an integral part of these Consolidated Financial Statements.
F-3
SAP AG AND SUBSIDIARIES
for the years ended December 31,
| | | | | | | | | | | | | | | | | | | | | | | | | |
| | | | | | | | | | | | Accumulated
| | | | | | | |
| | | | | | Additional
| | | | | | other
| | | | | | | |
| | | Common
| | | paid-in
| | | Retained
| | | comprehensive
| | | Treasury
| | | | |
| | | stock | | | capital | | | earnings | | | income/loss | | | stock | | | Total | |
| | | € millions | |
| |
January 1, 2006 | | | 316 | | | | 352 | | | | 5,980 | | | | (91 | ) | | | (775 | ) | | | 5,782 | |
| Net Income | | | 0 | | | | 0 | | | | 1,871 | | | | 0 | | | | 0 | | | | 1,871 | |
| Other comprehensive income/loss, net of tax | | | 0 | | | | 0 | | | | 0 | | | | (220 | ) | | | 0 | | | | (220 | ) |
| | | | | | | | | | | | | | | | | | | | | | | | | |
Total comprehensive income/loss | | | 0 | | | | 0 | | | | 1,871 | | | | (220 | ) | | | 0 | | | | 1,651 | |
| | | | | | | | | | | | | | | | | | | | | | | | | |
Share-based compensation | | | 0 | | | | 18 | | | | 0 | | | | 0 | | | | 0 | | | | 18 | |
Dividends | | | 0 | | | | 0 | | | | (447 | ) | | | 0 | | | | 0 | | | | (447 | ) |
Cancellation of treasury stock | | | 0 | | | | 0 | | | | 0 | | | | 0 | | | | 0 | | | | 0 | |
Other treasury stock transactions | | | 0 | | | | 44 | | | | 0 | | | | 0 | | | | (967 | ) | | | (923 | ) |
Convertible bonds and stock options exercised | | | 1 | | | | 49 | | | | 0 | | | | 0 | | | | 0 | | | | 50 | |
Issuance of common stock | | | 951 | | | | (135 | ) | | | (816 | ) | | | 0 | | | | 0 | | | | 0 | |
Other | | | 0 | | | | 4 | | | | 1 | | | | 0 | | | | 0 | | | | 5 | |
| | | | | | | | | | | | | | | | | | | | | | | | | |
December 31, 2006 | | | 1,268 | | | | 332 | | | | 6,589 | | | | (311 | ) | | | (1,742 | ) | | | 6,136 | |
| | | | | | | | | | | | | | | | | | | | | | | | | |
| Net Income | | | 0 | | | | 0 | | | | 1,919 | | | | 0 | | | | 0 | | | | 1,919 | |
| Other comprehensive income/loss, net of tax | | | 0 | | | | 0 | | | | 0 | | | | (204 | ) | | | 0 | | | | (204 | ) |
| | | | | | | | | | | | | | | | | | | | | | | | | |
Total comprehensive income/loss | | | 0 | | | | 0 | | | | 1,919 | | | | (204 | ) | | | 0 | | | | 1,715 | |
| | | | | | | | | | | | | | | | | | | | | | | | | |
Share-based compensation | | | 0 | | | | (40 | ) | | | 0 | | | | 0 | | | | 0 | | | | (40 | ) |
Dividends | | | 0 | | | | 0 | | | | (556 | ) | | | 0 | | | | 0 | | | | (556 | ) |
Cancellation of treasury stock | | | (23 | ) | | | 0 | | | | (796 | ) | | | 0 | | | | 819 | | | | 0 | |
Other treasury stock transactions | | | 0 | | | | 12 | | | | 0 | | | | 0 | | | | (811 | ) | | | (799 | ) |
Convertible bonds and stock options exercised | | | 1 | | | | 43 | | | | 0 | | | | 0 | | | | 0 | | | | 44 | |
Other | | | 0 | | | | 0 | | | | 3 | | | | 0 | | | | 0 | | | | 3 | |
| | | | | | | | | | | | | | | | | | | | | | | | | |
December 31, 2007 | | | 1,246 | | | | 347 | | | | 7,159 | | | | (515 | ) | | | (1,734 | ) | | | 6,503 | |
| | | | | | | | | | | | | | | | | | | | | | | | | |
| Net Income | | | 0 | | | | 0 | | | | 1,868 | | | | 0 | | | | 0 | | | | 1,868 | |
| Other comprehensive income/loss, net of tax | | | 0 | | | | 0 | | | | 0 | | | | (145 | ) | | | 0 | | | | (145 | ) |
| | | | | | | | | | | | | | | | | | | | | | | | | |
Total comprehensive income/loss | | | 0 | | | | 0 | | | | 1,868 | | | | (145 | ) | | | 0 | | | | 1,723 | |
| | | | | | | | | | | | | | | | | | | | | | | | | |
Share-based compensation | | | 0 | | | | (34 | ) | | | 0 | | | | 0 | | | | 0 | | | | (34 | ) |
Dividends | | | 0 | | | | 0 | | | | (594 | ) | | | 0 | | | | 0 | | | | (594 | ) |
Cancellation of treasury stock | | | (21 | ) | | | 0 | | | | (723 | ) | | | 0 | | | | 744 | | | | 0 | |
Other treasury stock transactions | | | 0 | | | | (6 | ) | | | 0 | | | | 0 | | | | (372 | ) | | | (378 | ) |
Convertible bonds and stock options exercised | | | 1 | | | | 13 | | | | 0 | | | | 0 | | | | 0 | | | | 14 | |
Other | | | 0 | | | | 0 | | | | (1 | ) | | | 0 | | | | 0 | | | | (1 | ) |
| | | | | | | | | | | | | | | | | | | | | | | | | |
December 31, 2008 | | | 1,226 | | | | 320 | | | | 7,709 | | | | (660 | ) | | | (1,362 | ) | | | 7,233 | |
| | | | | | | | | | | | | | | | | | | | | | | | | |
This Statement is an integral part of Note 20.
F-4
SAP AG AND SUBSIDIARIES
for the years ended December 31,
| | | | | | | | | | | | | |
| | | 2008 | | | 2007 | | | 2006 | |
| | | € millions | |
| |
Net income | | | 1,868 | | | | 1,919 | | | | 1,871 | |
| | | | | | | | | | | | | |
Currency translation adjustments | | | (21 | ) | | | (194 | ) | | | (149 | ) |
| | | | | | | | | | | | | |
Unrealized holding gains/losses on marketable securities
(tax 2008: 1; 2007: 0; 2006: 0) | | | 1 | | | | (2 | ) | | | (8 | ) |
Reclassification adjustments on marketable securities for gains/losses included in net income
(tax 2008: -1; 2007: 0; 2006: -1) | | | (3 | ) | | | (1 | ) | | | 2 | |
| | | | | | | | | | | | | |
Net unrealized gains/losses on marketable securities | | | (2 | ) | | | (3 | ) | | | (6 | ) |
| | | | | | | | | | | | | |
Unrecognized pension costs
(tax 2008: 19; 2007: 1; 2006: 2) | | | (47 | ) | | | (1 | ) | | | (12 | ) |
| | | | | | | | | | | | | |
Unrealized foreign currency cash flow hedge and interest rate hedge gains/losses
(tax 2008: 13; 2007: -6; 2006: -15) | | | (50 | ) | | | 55 | | | | 41 | |
Reclassification foreign currency cash flow hedge and interest rate hedge adjustments for gains/losses included in net income
(tax 2008: 9; 2007: 4; 2006: 4) | | | (36 | ) | | | (43 | ) | | | (10 | ) |
| | | | | | | | | | | | | |
Net unrealized foreign currency cash flow hedge and interest rate hedge gains/losses | | | (86 | ) | | | 12 | | | | 31 | |
| | | | | | | | | | | | | |
Unrealized gains on STAR hedge
(tax 2008: -11; 2007: -3; 2006: -13) | | | 32 | | | | 10 | | | | 37 | |
Reclassification adjustments on STAR hedge for gains included in net income
(tax 2008: 6; 2007: 9; 2006: 39) | | | (19 | ) | | | (28 | ) | | | (111 | ) |
Net unrealized losses on STAR hedge | | | 13 | | | | (18 | ) | | | (74 | ) |
| | | | | | | | | | | | | |
Currency effects from intercompany long-term investment transactions | | | (38 | ) | | | (5 | ) | | | (26 | ) |
| | | | | | | | | | | | | |
Tax on income and expense items recognized directly in equity | | | 36 | | | | 5 | | | | 16 | |
| | | | | | | | | | | | | |
Other comprehensive income/loss | | | (145 | ) | | | (204 | ) | | | (220 | ) |
| | | | | | | | | | | | | |
Total comprehensive income | | | 1,723 | | | | 1,715 | | | | 1,651 | |
| | | | | | | | | | | | | |
The accompanying Notes are an integral part of these Consolidated Financial Statements.
F-5
SAP AG AND SUBSIDIARIES
CONSOLIDATED STATEMENTS OF CASH FLOWS
for the years ended December 31,
| | | | | | | | | | | | | | | | | |
| | | 2008(1) | | | 2008 | | | 2007 | | | 2006 | |
| | | € millions | |
| |
| Net income | | | 2,600 | | | | 1,868 | | | | 1,919 | | | | 1,871 | |
| Net loss from discontinued operations | | | 82 | | | | 59 | | | | 15 | | | | 10 | |
| Minority interests | | | 1 | | | | 1 | | | | 2 | | | | 2 | |
| | | | | | | | | | | | | | | | | |
Income from continuing operations before minority interests | | | 2,684 | | | | 1,928 | | | | 1,936 | | | | 1,883 | |
| | | | | | | | | | | | | | | | | |
| Adjustments to reconcile income from continuing operations before minority interests to net cash provided by operating activities: | | | | | | | | | | | | | | | | |
| Depreciation and amortization | | | 763 | | | | 548 | | | | 261 | | | | 214 | |
| Gains/losses from equity investees | | | (1 | ) | | | (1 | ) | | | 1 | | | | 1 | |
| Gains/losses on disposal of intangible assets and property, plant, and equipment | | | 6 | | | | 4 | | | | 1 | | | | (2 | ) |
| Gains on disposal of investments | | | (21 | ) | | | (15 | ) | | | (2 | ) | | | 0 | |
| Writedowns of financial assets | | | 21 | | | | 15 | | | | 8 | | | | 0 | |
| Allowances for doubtful accounts | | | 106 | | | | 76 | | | | 0 | | | | (40 | |
| Impacts of hedging for cash-settled share-based payment plans | | | 54 | | | | 39 | | | | 21 | | | | (79 | ) |
| Share-based compensation including income tax benefits | | | 26 | | | | 19 | | | | 13 | | | | 82 | |
| Excess tax benefit from share-based compensation | | | (10 | ) | | | (7 | ) | | | 0 | | | | (3 | ) |
| Deferred income taxes | | | (93 | | | | (67 | ) | | | 8 | | | | (2 | ) |
| Change in accounts receivable | | | (70 | ) | | | (50 | ) | | | (521 | ) | | | (230 | ) |
| Change in other assets | | | (164 | ) | | | (118 | ) | | | (322 | ) | | | (216 | ) |
| Change in accrued and other liabilities | | | (355 | ) | | | (255 | ) | | | 423 | | | | 130 | |
| Change in deferred income | | | 93 | | | | 67 | | | | 123 | | | | 117 | |
| | | | | | | | | | | | | | | | | |
Net cash provided by operating activities from continuing operations | | | 3,039 | | | | 2,183 | | | | 1,950 | | | | 1,855 | |
| | | | | | | | | | | | | | | | | |
| Acquisition of minority interests in subsidiaries | | | 0 | | | | 0 | | | | (48 | ) | | | 0 | |
| Business combinations, net of cash and cash equivalents acquired | | | (5,252 | ) | | | (3,773 | ) | | | (672 | ) | | | (504 | ) |
| Repayment of acquirees debt in business combinations | | | (626 | ) | | | (450 | ) | | | 0 | | | | 0 | |
| Purchase of intangible assets and property, plant, and equipment | | | (472 | ) | | | (339 | ) | | | (401 | ) | | | (365 | ) |
| Proceeds from disposal of intangible assets and property, plant, and equipment | | | 61 | | | | 44 | | | | 27 | | | | 29 | |
| Cash transferred to restricted cash | | | (628 | ) | | | (451 | ) | | | (550 | ) | | | 0 | |
| Use of restricted cash | | | 1,393 | | | | 1,001 | | | | 0 | | | | 0 | |
| Purchase of investments | | | (529 | ) | | | (380 | ) | | | (768 | ) | | | (2,055 | ) |
| Sales of investments | | | 806 | | | | 579 | | | | 1,025 | | | | 2,765 | |
| Purchase of other financial assets | | | (22 | ) | | | (16 | ) | | | (20 | ) | | | (17 | ) |
| Sales of other financial assets | | | 22 | | | | 16 | | | | 15 | | | | 15 | |
| | | | | | | | | | | | | | | | | |
Net cash used in investing activities from continuing operations | | | (5,246 | ) | | | (3,769 | ) | | | (1,392 | ) | | | (132 | ) |
| | | | | | | | | | | | | | | | | |
| Dividends paid | | | (827 | ) | | | (594 | ) | | | (556 | ) | | | (447 | ) |
| Purchase of treasury stock | | | (678 | ) | | | (487 | ) | | | (1,005 | ) | | | (1,149 | ) |
| Proceeds from reissuance of treasury stock | | | 118 | | | | 85 | | | | 156 | | | | 165 | |
| Proceeds from issuance of common stock (share-based compensation) | | | 18 | | | | 13 | | | | 44 | | | | 49 | |
| Excess tax benefit from share-based compensation | | | 10 | | | | 7 | | | | 0 | | | | 3 | |
| Repayment of bonds | | | 0 | | | | 0 | | | | 0 | | | | (1 | ) |
| Proceeds from short-term and long-term debt | | | 5,371 | | | | 3,859 | | | | 47 | | | | 44 | |
| Repayments of short-term and long-term debt | | | (2,187 | ) | | | (1,571 | ) | | | (48 | ) | | | (43 | ) |
| Proceeds from the exercise of equity-based derivative instruments (STAR hedge) | | | 33 | | | | 24 | | | | 75 | | | | 57 | |
| Purchase of equity-based derivative instruments (hedge for cash-settled share-based payment plans) | | | (77 | ) | | | (55 | ) | | | 0 | | | | (53 | ) |
| | | | | | | | | | | | | | | | | |
Net cash provided by/used in financing activities from continuing operations | | | 1,783 | | | | 1,281 | | | | (1,287 | ) | | | (1,375 | ) |
| | | | | | | | | | | | | | | | | |
Effect of foreign exchange rates on cash and cash equivalents | | | (1 | ) | | | (1 | ) | | | (49 | ) | | | (3 | ) |
| Net cash used in operating activities from discontinued operations | | | (35 | ) | | | (25 | ) | | | (12 | ) | | | (8 | ) |
| Net cash used in investing activities from discontinued operations | | | 0 | | | | 0 | | | | (1 | ) | | | (2 | ) |
| Net cash used in financing activities from discontinued operations | | | 0 | | | | 0 | | | | 0 | | | | 0 | |
Net cash used in discontinued operations | | | (35 | ) | | | (25 | ) | | | (13 | ) | | | (10 | ) |
Net change in cash and cash equivalents | | | (461 | ) | | | (331 | ) | | | (791 | ) | | | 335 | |
Cash and cash equivalents at the beginning of the period | | | 2,238 | | | | 1,608 | | | | 2,399 | | | | 2,064 | |
| | | | | | | | | | | | | | | | | |
Cash and cash equivalents at the end of the period | | | 1,777 | | | | 1,277 | | | | 1,608 | | | | 2,399 | |
| | | | | | | | | | | | | | | | | |
| | |
| (1) | | The 2008 figures have been translated solely for the convenience of the reader at an exchange rate of US$1.3919 to €1.00, the Noon Buying Rate certified by the Federal Reserve Bank of New York on December 31, 2008. |
The accompanying Notes are an integral part of these Consolidated Financial Statements.
F-6
SAP AG AND SUBSIDIARIES
NOTES TO CONSOLIDATED FINANCIAL STATEMENTS
The accompanying Consolidated Financial Statements of SAP AG and its subsidiaries (collectively, “we”, “our”, “SAP”, “Group”, or “Company”) have been prepared in accordance with generally accepted accounting principles in the United States of America (“U.S. GAAP”).
We are an international corporation with headquarters in Walldorf, Germany. We develop, market, and sell a variety of software solutions, primarily enterprise application software products for organizations including corporations, government agencies, and educational institutions. We also offer support, consulting, training and other services related to our software offering. For more information, see Note 28.
Certain amounts reported prior to 2007 were reclassified to conform to the new presentation in 2007. In the first quarter of 2007 we changed the presentation of our consolidated statements of income. We believe that the new presentation shows more transparently our potential new revenue streams. We renamed what we previously called Maintenance revenue to Support revenue; we renamed what we previously called Software and maintenance revenue to Software and software-related service revenue; and we now show Subscriptions and other software-related service revenue as a separate component within Software and software-related service revenue. This new item includes revenue from subscriptions, software rentals and time-based licenses, hosted and other on-demand solutions, and other software-related services. We also renamed what we previously called Service revenue to Professional services revenue. Furthermore, we now show revenue from Other services as an additional item within Professional services revenue. Finally, we reclassified and renamed various expense categories to correspond with the revised revenue items. For more information, see Note 5.
Amounts included in the Consolidated Financial Statements are reported in millions of euros (“millions”) unless otherwise stated.
Due to rounding, numbers presented throughout this document may not add up precisely to the totals we provide and percentages may not precisely reflect the absolute figures.
Except as otherwise indicated, the information presented in these Notes refers to our continuing operations. See Note 11 for further information about our discontinued operations.
We operate in a dynamic and rapidly changing environment that involves numerous risks and uncertainties, many of which are beyond our control. We derive a substantial portion of our revenue from software licenses and software-related services sold to customers in Germany, the United States, the United Kingdom, France, and Japan. Our future revenue and income may be adversely affected by a prolonged economic slowdown in any of these countries or elsewhere. For example, the current global financial crisis and general uncertainty in global economic conditions has caused, and may in the future cause, reduction and deferral in demand for our products, negatively impacting our business, results of operations, financial condition and cash flows. Global economic conditions may worsen in the future, exacerbating this negative impact. This deterioration of the global economic conditions could make it increasingly difficult for us to accurately forecast demand for our products and services, and could cause our revenue and operating results to fall short of expectations. Other risk factors include consolidation and intense competition in the software industry and in customer demand.
Our Consolidated Financial Statements are presented in euros, which is the functional currency of SAP AG. However, because a significant portion of our business is conducted in currencies other than the euro, our reported financial results are affected by foreign currency exchange rate changes. We continually monitor our exposure to foreign currency exchange risk and have a Company-wide foreign currency exchange risk policy under which we may hedge such risks with certain financial instruments. However, fluctuations in foreign currency exchange rates, especially the value of the U.S. dollar, pound sterling, Japanese yen, Swiss franc,
F-7
Canadian dollar, and Australian dollar could significantly impact our reported financial position and results of operations.
| |
| (2) | SCOPE OF CONSOLIDATION |
The Consolidated Financial Statements include SAP AG and all entities that are controlled directly or indirectly by SAP AG. We fully consolidate one entity in which we hold only 49% of the voting shares, due to an agreement with the majority shareholder which provides that SAP fully controls the entity, receives all benefits and incurs all risks. All other consolidated entities are majority-owned.
All SAP entities prepare their financial statements as at December 31. All financial statements were prepared applying the same Group U.S. GAAP accounting and valuation principles. Intercompany transactions and balances relating to consolidated entities have been eliminated.
The following table summarizes the change in the number of legal entities included in the Consolidated Financial Statements.
Overview of Legal Entities Consolidated in the Financial Statements
The changes in the scope of companies included in the Consolidated Financial Statements during 2008 have an effect on the comparability of the Consolidated Financial Statements presented. The additions relate to legal entities added in connection with acquisitions. The disposals are due to mergers and liquidations of consolidated or acquired legal entities. For additional information on our acquisitions and the effect on our Consolidated Financial Statements please see Note 4.
Associates
Companies in which we do not have a controlling financial interest but over which we can exercise significant operating and financial influence (associates) are accounted for using the equity method.
| |
| (3) | SUMMARY OF SIGNIFICANT ACCOUNTING POLICIES |
Use of Estimates
The preparation of the Consolidated Financial Statements requires us to make estimates and assumptions that affect the reported amounts of assets and liabilities, disclosure of contingent assets and liabilities at the date of the Consolidated Financial Statements, and the reported amounts of revenues and expenses during the reporting periods. In making our estimates, we consider historical and forecast information, as well as regional and industry economic conditions in which the Company or its customers operate, changes to which could adversely affect our estimates, in particular when assessing revenues and costs, the valuation and recoverability of receivables, investments and other assets, tax positions, provisions and contingent liabilities. Actual results could differ from original estimates.
F-8
Basis of Measurement
The Consolidated Financial Statements have been prepared based on the historical cost basis except for the following:
| | |
| | • | Derivative financial instruments,available-for-sale financial assets and liabilities for cash-settled share-based payment arrangements are measured at fair value; |
| |
| | • | Foreign exchange receivables and payables are translated at period-end exchange rates; and |
| |
| | • | Pensions are measured according to Statement of Financial Accounting Standards (SFAS) No. 158 (“SFAS 158”), Employers’ Accounting for Defined Benefit Pension and Other Postretirement Plans,as described in Note 19a. |
Where applicable, information about the methods and assumptions used in determining the respective measurement bases and fair values is disclosed in the Notes specific to that asset or liability.
Business Combinations
We account for all business combinations using the purchase method. We allocate the purchase price to the fair values of the assets acquired and liabilities assumed as of the date of acquisition. The results of operations of acquired entities are included in our Consolidated Statements of Income beginning at the respective acquisition date.
Foreign Currencies
The functional currencies of our subsidiaries are their local currencies. The assets and liabilities of our foreign operations where the functional currency is not the euro are translated into euros using period-end closing exchange rates. Items of income and expense are translated into euros using average exchange rates during the respective periods. The resulting foreign currency translation adjustments are included in Accumulated other comprehensive income/loss in the Consolidated Statements of Comprehensive Income (“SOCI”). Currency effects from intercompany long-term investments relate to intercompany foreign currency transactions that are of a long-term investment nature and are also included in Accumulated other comprehensive income/loss in the SOCI. When a foreign operation is disposed of, the foreign currency translation adjustments applicable to that entity are recognized in profit or loss.
Transactions in foreign currencies are translated to the respective functional currencies of Group entities at the exchange rates at the dates of the transactions. Monetary assets and liabilities that are denominated in foreign currencies other than the functional currency are remeasured at the period-end closing rate with resulting gains and losses reflected in Other non-operating income/expense, net in the Consolidated Statements of Income.
Operating cash flows are translated into euros using average exchange rates during the respective periods. Investing and financing cash flows are translated into euros using the exchange rates in effect at the time of the respective transaction. The effects on cash due to fluctuations in exchange rates are shown in a separate line in the Consolidated Statements of Cash Flows.
F-9
Exchange Rates
The exchange rates of key currencies affecting the Company were as follows:
Exchange Rates
Revenue Recognition
We derive our revenues from the sale or license of our software products and of support, subscription, consulting, development, training, and other services. The vast majority of our software arrangements include support services and many also include professional services and other elements.
Software and software-related service revenue as shown in our Consolidated Statements of Income is the sum of our software revenue, support revenue, and revenue from subscriptions and other software-related services. Professional services and other service revenue as shown in our Consolidated Statements of Income is the sum of our consulting revenue, training revenue, and other service revenue. Other revenue as shown in our Consolidated Statements of Income consists of income from SAP marketing events. Revenue information by segment and geographic region is disclosed in Note 28.
Software revenue represents fees earned from the sale or license of software to customers. Support revenue represents fees earned from providing customers with unspecified future software updates, upgrades, and enhancements, and technical product support. We recognize support revenues ratably over the term of the support service contract, usually one year. We do not separately sell technical support services or unspecified software upgrades, updates, and enhancements. Accordingly, we do not distinguish within Software and software-related service revenue or within Cost of software and software-related services the amounts attributable to technical support services and unspecified software upgrades, updates, and enhancements.
Subscription and other software-related service revenue represents fees earned from subscription and software rental arrangements, on-demand solutions, and other software-related services. Subscription contracts have both software and support service elements as they provide the customer with current software products, rights to receive unspecified software products in the future, and rights to support services. Customers pay an annual fee for a defined subscription term, usually five years, and we recognize such fees ratably over the term of the arrangement beginning with the delivery of the first product. Software rental contracts also have both software and support service elements. Such contracts, sometimes referred to as time-based license contracts, provide the customer with current software products and support but not the right to receive unspecified software products in the future. We recognize fees from software rental contracts ratably over the term of the arrangement. Revenue from on-demand solutions relate to hosted contracts that provide the customer with the right to use certain software functionality but not the right to exit the contract or take possession of the software without significant penalty. On-demand solution revenues are recognized ratably over the term of the arrangement. Other software-related services revenue mainly consists of software-related revenue-sharing agreements.
We recognize consulting, training, and other professional services revenues when the respective services are performed. Consulting revenue primarily results from implementation support contracts to install and
F-10
configure our software products. Such contracts do not usually involve significant production, modification, or customization of software so the consulting revenues are recognized on atime-and-materials basis or using the proportional performance method of accounting. Training revenue results from contracts to provide educational services to customers and partners regarding the use of our software products.
Other service revenue consists of fees from non-mandatory hosting contracts, application management services (AMS) and referral fees. Non-mandatory hosting contracts allow the customer to exit the arrangement at any time and to take possession of the software without significant penalty. Our AMS contracts provide post-implementation application support, optimization, and improvements to a customer’s SAP-centric IT solution to ensure availability and performance of the customer’s business processes. Fees from referral services are commissions from partners to which we have referred customers.
We recognize revenue pursuant to the requirements of the American Institute of Certified Public Accountants’ (“AICPA”) Statement of Position97-2, Software Revenue Recognition(“SOP 97-2”), as amended. Revenue on multiple-element arrangements is recognized using the residual method of revenue recognition when company-specific objective evidence of fair value exists for all of the undelivered elements (for example, support services, consulting, or other services) in the arrangement, but does not exist for one or more delivered elements (generally software). We allocate revenue to each undelivered element based on its respective company-specific objective evidence of fair value which is the price charged when that element is sold separately or, for elements not yet sold separately, the price established by our management if it is probable that the price will not change before the element is sold separately. We allocate revenue to undelivered support services based on company-wide rates charged to renew the support services annually after an initial period. Such renewal rates generally represent a fixed currency amount or a fixed percentage of the discounted software license fee charged to the customer; the vast majority of our customers renew their annual support service contract at these rates. We allocate revenue to future incremental discounts whenever customers are granted the right to license additional software at a higher discount than the one given for the initial software license arrangement or to purchase or renew support or services at rates below VSOE of fair value of the respective service as we believe such discounts are significant regardless of quantitative magnitude. We defer revenue for all undelivered elements and recognize the residual amount of the arrangement fee attributable to the delivered elements, if any, when the basic criteria inSOP 97-2 have been met.
UnderSOP 97-2, provided that the arrangement does not involve significant production, modification, or customization of the software, software revenue is recognized when all of the following four criteria have been met:
1. Persuasive evidence of an arrangement exists
2. Delivery has occurred,
3. The fee is fixed or determinable, and
4. Collectibility is probable.
If at the outset of an arrangement we determine that the arrangement fee is not fixed or determinable, revenue is deferred until the arrangement fee becomes due and payable by the customer. If at the outset of an arrangement we determine that collectibility is not probable, revenue is deferred until payment is received. Almost none of our software license agreements include acceptance testing provisions. If an arrangement allows for customer acceptance testing of the software, we defer revenue until the earlier of customer acceptance or when the acceptance right lapses.
We usually sell or license software on a perpetual basis. Occasionally, we license software for a specified time. Revenue from short-term time-based licenses, which usually include support services during the license period, is recognized ratably over the license term. We allocate a portion of short-term time-based license fees to support revenue based on the estimated fair value of the support services and allocate the remaining (residual) amount to software revenue. Revenue from multi-year time-based licenses that include support services,
F-11
whether separately priced or not, is recognized ratably over the license term unless a substantive support service renewal rate exists, in which case the amount allocated to the delivered software based on the residual method is recognized as software revenue once the basic criteria inSOP 97-2 have been met.
We recognize revenue from arrangements involving resellers on evidence of sell-through by the reseller to the end-customer. We have a history of honoring contingent rights if we become aware that a reseller has granted contingent rights to an end-customer, although we have no contractual obligation to do so. Accordingly, we do not recognize revenue for arrangements involving resellers until the earlier of the point at which a valid license agreement without contingencies has been agreed with the end-customer or the contingencies expire.
In multiple-element arrangements involving software and consulting, training, or other professional services that are not essential to the functionality of the software, the service revenues are accounted for separately from the software revenues. Revenues for arrangements that involve significant production, modification, or customization of the software and those in which the services are not available from third-party vendors and are therefore deemed essential to the software, are recognized, depending on the fee structure, on atime-and-material basis or using the percentage of completion method, based on direct labor costs incurred to date as a percentage of total estimated project costs required to complete the project. If we do not have a sufficient basis to measure the progress of completion or to estimate the total contract revenues and costs, revenue and costs are deferred until the project is complete and, if applicable, final acceptance is received from the customer. If the arrangement includes elements that do not qualify for contract accounting (for example support services and hosting) such elements are accounted for separately provided that the elements have stand-alone value and that company-specific objective evidence of fair value exists. When total cost estimates exceed revenues in an arrangement, the estimated losses are recognized immediately based on an average fully burdened daily rate applicable to the unit delivering the services, which consists of costs allocable to the arrangement.
Sometimes we enter into joint development agreements with customers to leverage their industry expertise and provide standard software solutions for selected vertical markets. These customers generally contribute cash, resources, and industry expertise in exchange for license rights for the future solution. We recognize software revenue in conjunction with these arrangements based on the percentage of completion method. If we do not have a sufficient basis to measure the progress towards completion, revenue is recognized when the project is complete and, if applicable, final acceptance is received from the customer. When total cost estimates exceed revenues in an arrangement, the estimated losses are recognized immediately based on an average fully burdened daily rate applicable to the unit delivering the services, which consists of costs allocable to the arrangement.
The assumptions, risks, and uncertainties inherent in the application of the percentage of completion method and the proportional performance method affect the timing and amounts of revenues and expenses reported. Numerous internal and external factors can affect estimates including direct labor rates, utilization, and efficiency variances. Changes in estimates of SAP’s progress towards completion and of contract revenues and contract costs are accounted for as cumulativecatch-up adjustments to the reported revenues for the applicable contract.
We account forout-of-pocket expenses invoiced by SAP and reimbursed by customers as support, consulting, and training revenues, depending on the nature of the service for which theout-of-pocket expenses were incurred.
If a customer is specifically identified as a bad debtor, we stop recognizing revenue except to the extent of fees that have already been collected.
We record sales net of applicable sales taxes.
F-12
Research and Development
Development activities involve a plan or design for the production of new or substantially improved products. We have determined that technological feasibility for our software products is reached shortly before the products are available for sale. Costs incurred after technological feasibility is established have not been material. Consequently, all research and development costs are expensed as incurred.
Government Grants
We record government grants when it is reasonably assured that we will comply with the relevant conditions and that the grant will be received. Our government grants generally represent subsidies for activities specified in the grant. As a result, government grants are recognized as a reduction of the related expense when earned.
Advertising Costs
Advertising costs are included in sales and marketing expense and are expensed as incurred. Our contributions to resellers that allow our resellers to execute qualified and approved marketing activities are recognized as an offset to revenue unless we obtain a separate identifiable benefit for the contribution and the fair value of the benefit is reasonably estimable.
Leases
We are a lessee of property, plant, and equipment, mainly buildings and vehicles, under operating leases that do not transfer to us the substantive risks and rewards of ownership. Rent expense on operating leases is recognized on a straight-line basis over the life of the lease including renewal terms if, at inception of the lease, renewal is reasonably assured.
Some of our operating leases contain lessee incentives, such as up-front payments of costs or free or reduced periods of rent. The incentives are amortized over the life of the lease and the rent expense is recognized on a straight-line basis over the life of the lease. The same applies to contractually agreed future increases of rents.
Income Taxes
Deferred taxes are accounted for under the asset and liability method. We recognize deferred tax assets and liabilities for the future tax consequences attributable to differences between the financial statement carrying amounts of existing assets and liabilities and their respective tax bases and on tax loss and tax credit carryforwards.
Deferred income tax assets and liabilities are measured using enacted tax rates expected to apply to taxable income in the years in which those temporary differences are expected to be recovered or settled. The effect on deferred tax assets and liabilities of a change in tax rates is recognized in profit or loss in the period that includes the enactment date.
We reduce deferred income tax assets by a valuation allowance to the extent that it is more likely than not that some portion or all of the deferred tax assets will not be realized.
Interest and penalties on income taxes are classified as income tax expense.
Since 2007 we have applied Financial Accounting Standards Board (FASB) Interpretation No. 48, Accounting for Uncertainty in Income Taxes — an Interpretation of FASB Statement 109 (“FIN 48”), which prescribes a recognition threshold and measurement attribute for the financial statement recognition and measurement of a tax position taken or expected to be taken in a tax return. Uncertain income tax positions
F-13
result in the recognition of tax provisions or the decrease of recognized tax assets based on the recognition threshold and measurement attributes of FIN 48. The benefit of a tax position is recognized only when it is more likely than not that the tax position will be sustained, based on the technical merits of the position, by a taxing authority having full knowledge of all relevant information. A tax position that meets the more-likely-than-not recognition threshold is measured as the largest amount of tax benefit that is greater than 50% likely of being realized on settlement with the taxing authority. For more information, see Note 10.
Share-Based Compensation
Share-based compensation covers cash-settled and equity-settled awards issued to employees. We account for these awards according to SFAS 123(R), Share-Based Payment (“SFAS 123(R)”).
Equity-settled awards are measured at grant-date fair values determined using the Black-Scholes-Merton option-pricing model. Such awards are not subsequently remeasured. The grant-date fair value of equity-settled awards is recognized as personnel expense on a straight-line basis over the period in which the employees become unconditionally entitled to the options, with a corresponding increase in additional paid-in capital. The amount recognized as an expense is adjusted to reflect the actual number of share options that ultimately vest.
The fair value of cash-settled awards is recognized as personnel expense using the accelerated attribution method over the period in which the employees become unconditionally entitled to payment with a corresponding increase in liabilities. Cash-settled awards are remeasured to fair value at each balance sheet date until the award is settled. Any changes in the fair value of the liability are recognized as personnel expense in profit or loss. The fair values for hedged programs are based on market data reflecting current market expectations.
For more information about our share-based compensation plans, see Note 27.
Comprehensive Income/Loss
Comprehensive income is comprised of Net income and Other comprehensive income/loss.
Other comprehensive income/loss includes foreign currency translation adjustments, unrealized gains and losses from intercompany long-term investment transactions, unrecognized pension cost, gains and losses from derivatives designated as cash flow hedges, gains and losses resulting from share-based compensation hedges, and unrealized gains and losses from debt securities and marketable equity securities classified asavailable-for-sale. Other comprehensive income/loss and comprehensive income are displayed separately in the SOCI as well as in Note 20.
Earnings per Share
We present basic and diluted earnings per share (EPS). Basic earnings per share is determined by dividing consolidated income from continuing operations, income/loss from discontinued operations and net income by the weighted average number of common shares outstanding. Diluted earnings per share reflect the potential dilution that would occur if all “in the money” securities to issue common shares were exercised or converted.
Cash and Cash Equivalents
Cash and cash equivalents consist of cash at banks and highly liquid investments with original maturities of three months or less.
F-14
Investments
Investments with original maturities of greater than three months and remaining maturities of less than one year are classified as short-term investments. Investments with maturities beyond one year may be classified as short term based on their highly liquid nature and because such marketable securities represent the investment of cash that is available for current operations.
Marketable debt and equity securities, other than investments accounted for by the equity method, are classified asavailable-for-sale. Securities classified asavailable-for-sale are accounted for at fair value with unrealized gains and losses being excluded from profit or loss and reported net of tax as a component of Other comprehensive income within shareholders’ equity. Gains or losses realized on sales of securities classified asavailable-for-sale are based on the average-cost method. We do not hold securities for trading purposes or to maturity, respectively.
Equity investments in privately held companies over which we do not have the ability to exercise significant influence or control are accounted for at cost. Gains or losses realized on sales of such investments are based on the average-cost method.
Investments accounted for under the equity method are initially recorded at acquisition cost and are subsequently adjusted for our proportionate share of the investees’ profit or loss, changes in the investees’ equity and for amortization of anystep-up in the value of the acquired assets over the investees’ book value. The excess of our initial investment in equity method companies over our ownership percentage in the underlying net assets of those companies is attributed to certain fair value adjustments with the remaining portion recognized as goodwill (“investor level goodwill”), which is not amortized.
All investments are evaluated for impairment at least annually or if we become aware of an event that indicates that the carrying amount of the asset may not be recoverable. To determine whether a decline in value below the carrying amount of an asset isother-than-temporary, we consider whether we have the ability and intent to hold a debt instrument until a market price recovery occurs or whether evidence indicating that the carrying value of the investment is recoverable outweighs evidence to the contrary. Evidence considered in this assessment includes the reasons for the decline in fair value, the severity and duration of the decline in realizable value below cost, changes in value subsequent to the balance sheet date, as well as forecasted performance of the investee. If a decline in value below the carrying amount is determined to beother-than-temporary, the asset is written down to fair value through an impairment charge recognized in Financial income, net and a new cost basis is established.
Dividend income is recognized when earned. Interest income is recognized based on the effective interest method.
Accounts Receivable
Accounts receivable are recorded at invoiced amounts less sales allowances and an allowance for doubtful accounts. Included in accounts receivable are unbilled receivables related to fixed-fee andtime-and-material consulting arrangements. The allowance for doubtful accounts is our best estimate of the amount of probable credit losses in our existing accounts receivable portfolio. We determine the allowance for doubtful accounts using a two-step approach: First, we consider the financial solvency of specific customers and record an allowance for specific customer balances when we believe it is probable that we will not collect the amount due according to the contractual terms of the arrangement. Second, we evaluate homogenous portfolios of receivables according to their default risk primarily based on the age of the receivable and historical loss experience, but also taking into consideration general market factors such as the current economic crisis and how that might impact our receivable portfolio. We record an allowance for a portfolio of receivables when we believe it is probable that a loss has occurred or that we will not collect some or all of the amounts due. Account balances are charged off against the allowance after all collection efforts have been exhausted and the likelihood of recovery is considered remote. Allowances for a portfolio of receivables are recorded as Other operating
F-15
income/expense whereas allowances for specific customer balances are recorded in Cost of software and software related services or Cost of professional services and other services, depending on the transaction to which the receivable relates. As accounts receivable do not bear interest, we discount receivables with a term exceeding one year to their present value using local market interest rates.
Financial and Other Assets
Included in Other financial assets are non-derivative and derivative financial assets. Other non-derivative financial assets with fixed or determinable payments that are not quoted in an active market are generally measured at amortized cost which approximates fair value either due to their short-term nature or due to the inclusion of interest. Non-interest-bearing or below-market-rate loans to employees and to third parties are discounted to the present value of estimated future cash flows. In the event of any delay or shortfall in payments due under employee or third-party loans, we perform an individual loan review to determine whether any impairment exists. The same applies if we become aware of any change in the debtor’s financial condition that indicates a delay or shortfall in payments may result. If it is probable that we will not be able to collect the amounts due according to the terms of the loan agreement an impairment charge is recorded on an allowance account based on our best estimate of the amount that will not be recoverable. Account balances are charged off against the allowance after all collection efforts have been exhausted and the likelihood of recovery is considered remote.
Investments held for employee-financed postemployment plans are recorded at their cash surrender values or fair market values depending on the assets held. Other assets are recorded at historical cost which approximates fair value due to their short-term nature or the inclusion of interest.
Inventories, consisting primarily of costs for office supplies and documentation, are immaterial to us and are therefore included in Other assets. We record inventories at the lower of purchase or production cost and market value. Production costs consist of direct salaries, materials, and production overhead.
Derivatives with positive fair values are recorded as an asset. For further information on derivatives see section “Derivatives”.
Derivatives
We account for derivatives and hedging activities in accordance with SFAS 133, Accounting for Derivative Instruments and Hedging Activities (“SFAS 133”), which requires all derivative financial instruments be recorded on the balance sheet at fair value.
Derivatives without designated hedge relationship
Many transactions constitute economic hedges and therefore contribute effectively to the securing of financial risks but do not qualify for hedge accounting under SFAS 133. For the hedging of currency risks inherent in foreign currency denominated, recognized monetary assets and liabilities we do not designate our derivative financial instruments as accounting hedges as the realized profits and losses from the underlying transactions are recognized in profit or loss at the same time as the realized profits and losses from the derivatives used as hedging instruments. Derivatives without a designated hedge relationship for the economic hedging of interest rate risks are classified as held for trading and recorded at fair value through profit or loss.
Embedded derivatives
We occasionally have contracts that require payment streams in currencies other than the functional currency of either party to the contract. Such embedded foreign currency derivatives are separated from the host contract and accounted for separately if the economic characteristics and risks of the host contract and the embedded derivative are not closely related, a separate instrument with the same terms as the embedded
F-16
derivative would meet the definition of a derivative, and the combined instrument is not measured at fair value through profit or loss.
Derivatives with designated hedge relationship (cash-flow hedge)
Derivatives which meet the requirements for hedge accounting as set out in SFAS 133 and which are part of an effective hedging relationship are initially recorded at their fair value. We designate and document the hedge relationship including the nature of the risk, the identification of the hedged item, the hedging instrument, and how we will assess the hedge effectiveness. Subsequently, derivatives within a hedging relationship are accounted for at fair values. The accounting for changes in fair value of the hedging instrument depends on the effectiveness of the hedging relationship. The effective portion of the unrealized gain or loss on the derivative component included in the cash-flow hedge relationship (included component) is reported net of tax in Other comprehensive income/loss. We subsequently reclassify the portion of gains or losses on the included component from equity to profit or loss when a financial asset or liability is recognized. The ineffective portion of gains or losses on the included component as well as all fair value changes resulting from the excluded components are reported in profit or loss. For detailed information on our hedges, see Note 25.
Valuation and testing of effectiveness
Derivatives are recorded at fair value in our Consolidated Balance Sheets. The fair value of the derivatives is calculated by discounting the expected future cash flows using relevant interest rates and spot rates over the remaining term of the contracts.
Gains or losses on the spot price and the intrinsic values of the derivatives designated and qualifying as cash flow hedges are recognized net of tax directly in Other comprehensive income/loss within shareholders’ equity whereas gains and losses on the interest element and on the time values excluded from the hedging relationship are recognized in profit or loss immediately.
The effectiveness of the hedging relationship is tested prospectively and retrospectively. Prospectively, we apply the critical terms match for our foreign currency hedges as currencies, maturity and the amounts are identical for the forecasted transactions and the spot element of the forward exchange rate contract or intrinsic value of the currency options, respectively. For interest rate swaps, we also apply the critical terms match as the notional amounts, currencies, maturity, basis of the variable leg (EURIBOR), reset dates and the dates of the interest and principal payments are identical for the debt instrument and the corresponding interest rate swaps. Therefore, over the life of the hedging instrument, the changes in cash flows of the hedging relationship components will offset the impact of fluctuations of the underlying forecasted transactions.
Retrospectively, effectiveness is tested on a cumulative basis applying the Dollar Offset Method by using the Hypothetical Derivative Method. Under this approach, the change in fair value of a constructed hypothetical derivative whose terms reflect those of the hedged item is compared to the change in the fair value of the hedging instrument based on the relevant spot rates at the time of hedge designation and the actual spot rates. The hedge is deemed highly effective if the results are within a range of 80% to 125%.
Goodwill
Goodwill represents the excess of the cost of an acquired entity over the fair values assigned to the tangible assets acquired, to those intangible assets that are required to be recognized and reported separately from goodwill, and to the liabilities assumed.
We do not amortize goodwill but test it for impairment at least annually and when events occur or changes in circumstances indicate the fair value of a reporting unit is less than its carrying value. In respect to at-equity investments, the carrying amount of goodwill is included in the carrying amount of the investment.
F-17
Other Intangible Assets
Purchased intangible assets with finite useful lives are recorded at acquisition cost, amortized on a straight-line basis over their estimated useful life of two to 16 years. All of our intangible assets, with the exception of goodwill, have finite useful lives and are therefore subject to amortization.
We expense immediately the fair value of acquired identifiable in-process research and development (“in-process R&D”), which represents acquired research and development efforts that have not reached technological feasibility and that have no alternative future use.
Property, Plant, and Equipment
Property, plant, and equipment are carried at acquisition cost plus the fair value of related asset retirement costs, if any and if reasonably estimable and less accumulated depreciation. Interest incurred during the construction of qualifying assets is capitalized and amortized over the related assets’ estimated useful lives.
Property, plant, and equipment are generally depreciated using the straight-line method. Land is not depreciated.
Useful lives
Leasehold improvements are depreciated using the straight-line method over the shorter of the term of the lease or the useful life of the asset. If a renewal option exists, the depreciation period reflects the additional time covered by the option if exercise is reasonably assured when the leasehold improvement is first put into operation.
Impairment of Long-Lived Assets
We review long-lived assets, such as property, plant, equipment, and acquired intangible assets for impairment, whenever events or changes in circumstances indicate that the carrying amount of an asset or group of assets may not be recoverable. We assess recoverability of assets to be held and used by comparing their carrying amount to the expected future undiscounted net cash flows the asset or related asset group are expected to generate. If an asset or group of assets is considered to be impaired, the impairment to be recognized is measured as the amount by which the carrying amount of the asset or group of assets exceeds fair value.
Assets and Liabilities Held for Sale
Long-lived assets and disposal groups, which represent assets to be disposed of together as a group in a single transaction and liabilities directly associated with those assets that we will also transfer in the transaction, are classified as held for sale beginning in the period we commit to sell the assets or disposal group as long as certain criteria are met including that the assets or disposal group are available for immediate sale in their present condition, that the sale of the assets or disposal group is probable and expected to be completed within one year, that we are actively seeking a buyer and that changes to the sales plan are unlikely. Long-lived assets and disposal groups held for sale are presented separately in the consolidated balance sheets and reported at the
F-18
lower of the carrying amount or fair value less costs to sell. Long-lived assets held for sale are not depreciated from the date they are no longer classified as held for use.
Discontinued Operations
Discontinued operations are reported when one of our components comprising operations and cash flows that can be clearly distinguished from the rest of SAP, operationally and for financial reporting purposes, have been disposed of or are classified as held for sale, and when both of the following criteria are met (1) the operations and cash flows of the component will be (or have been) eliminated from the ongoing operations of SAP as a result of the disposal transaction and (2) we will not have any significant continuing involvement in the operations of the component after the disposal transaction.
Prepaid Expenses and Deferred Charges
Prepaid expenses and deferred charges primarily consist of prepayments of operating leases, support services and software royalties which will be charged to expense in future periods.
Pension Benefit Liabilities
We measure our pension-benefit liabilities based on actuarial computations using theprojected-unit-credit method in accordance with SFAS 158, Employers’ Accounting for Defined Benefit Pension and Other Postretirement Plans — an amendment of FASB Statements No. 87, 88, 106, and 132(R) (“SFAS 158”), and SFAS 87, Employers’ Accounting for Pensions (“SFAS 87”). The assumptions used to calculate pension liabilities and costs are shown in Note 19a. SFAS 158 requires the recognition of an asset or liability for the overfunded or underfunded status of the respective defined benefit plan. Changes in the amount of the projected benefit obligation or plan assets resulting from demographic and financial data different than originally assumed and from changes in assumptions can result in actuarial gains and losses not yet recognized in our Consolidated Statements of Income. Amortization of an unrecognized net gain or loss is included as a component of our net periodic benefit plan cost for a year if, as of the beginning of the year, that unrecognized net gain or loss exceeds 10% of the greater of the projected benefit obligation or the fair value of that plan’s assets. In that case, the amount of amortization recognized is the resulting excess divided by the average remaining service period of the active employees expected to receive benefits under the plan. If unrecognized net gains or losses do not exceed 10% of the greater of the projected benefit obligation or the fair value of that plan’s assets these unrecognized net gains and losses are recognized as a separate component of other comprehensive income (OCI) net of tax.
SAP’s pension benefits are classified as defined contribution plans if the payment to a separate fund relieves SAP of all obligations from the pension plan. Obligations for contributions to defined contribution pension plans are recognized as an expense in profit or loss when they become due.
Provisions
Provisions are recorded when we have a legal or constructive obligation to third parties as a result of a past event, the amount can be reasonably estimated and it is probable that there will be an outflow of future economic benefits. We regularly adjust provisions for loss contingencies as further information develops or circumstances change. Noncurrent provisions are reported at the present value of their expected settlement amounts as at the balance sheet date. Discount rates are regularly adjusted to current market interest rates. Any legal costs expected to be incurred in connection with litigation cases are expensed as incurred.
Our software contracts usually contain general warranty provisions guaranteeing that the software will perform according to SAP’s stated specifications for six to twelve months. At the time of the sale or license of our software covered by such warranty provisions, we record an accrual for warranty costs based on the historical average cost of fulfilling our obligations and we classify these as a current obligation.
F-19
A provision for restructuring is recognized when we have approved a detailed and formal restructuring plan and the restructuring has commenced or has been announced. Restructuring liabilities resulting from business combinations are recognized upon acquisition as part of the purchase price allocation in accordance withEITF 95-3, Recognition of Liabilities in Connection with a Purchase Business Combination.
Accounts Payable, Financial and Other Liabilities
Trade payables due within one year are recognized at invoiced amounts and trade payables due beyond one year are discounted to present value based on prevailing market rates adjusted for credit risk.
Derivatives with negative fair values are recorded as a liability. For further information on derivatives see section “Derivatives”.
Deferred Income
Deferred income consists mainly of prepayments made by our customers for support services and professional services amounts deferred from software arrangements for discounts on undelivered elements and support renewal options granted to customers, and amounts recorded in purchase accounting at fair value for obligations to perform under acquired support contracts. Deferred income will be recognized as software revenue, support revenue, professional service revenue, or other revenue, depending on the reasons for the deferral, once the basic applicable revenue recognition criteria have been met, for example, when the related services are performed or when the discounts are used. The current portion of deferred income is expected to be recognized within the next 12 months.
Treasury Stock
Treasury shares are recorded at acquisition cost and are presented as a deduction from Shareholders’ equity. Gains and losses on the subsequent reissuance of treasury shares are credited or charged to Additional paid-in capital on an after-tax basis. On cancellation of treasury shares any excess over the calculated par value is charged to Retained earnings.
New Accounting Standards Not Yet Adopted
In September 2006, the FASB issued SFAS 157, Fair Value Measurements (“SFAS 157”), which provides a single definition of fair value, establishes a framework for measuring fair value, and requires expanded disclosures about fair value measurements. SFAS 157 is effective for financial statements issued for fiscal years beginning after November 15, 2007, and interim periods within those fiscal years. The provisions of SFAS 157 should be applied prospectively as of the beginning of the fiscal year in which it is initially applied. FSP FAS157-2 defers the effective date of SFAS 157 for nonfinancial assets and nonfinancial liabilities that are not remeasured at fair value on a recurring basis until fiscal years beginning after November 15, 2008, and interim periods within those fiscal years. We have adopted Statement 157 except for those items specifically deferred by FSPSFAS 157-2. Based on the analysis done so far, we do not expect the full adoption of SFAS 157 to have a material impact on our Consolidated Financial Statements.
In December 2007, the FASB issued SFAS 141 (revised 2007), Business Combinations (“SFAS 141R”), which requires acquirers of a business to recognize most identifiable assets acquired, including goodwill, the liabilities assumed, and any noncontrolling interest in the acquiree, at their full fair value on the acquisition date. SFAS 141R also establishes disclosure requirements to enable users of the financial statements to evaluate the nature and financial effects of the business combination. SFAS 141R is effective for fiscal years beginning after December 15, 2008 and is to be applied prospectively. Earlier application is prohibited. Historically, we have rarely entered into business combinations in which we did not fully acquire the target. Should this history continue, the main impacts from applying SFAS 141R will be those resulting from changes in acquired income tax
F-20
positions in accordance with FIN 48 and additional expenses resulting from the new guidance in SFAS 141R under which acquisition-related expenses and restructuring expenses can no longer be recorded as part of the purchase price in a business combination. The amount of these additional expenses mainly depends on the number and size of our future business combinations as well as the extent of use of third-party resources in the acquisition process.
In December 2007, the FASB issued SFAS 160, Noncontrolling Interests in Consolidated Financial Statements, an amendment of ARB No. 51 (“SFAS 160”), which establishes accounting and reporting standards for the noncontrolling (minority) interest in a subsidiary and for the deconsolidation of a subsidiary. It clarifies that a noncontrolling interest in a subsidiary is an ownership interest in the consolidated entity that should be reported as equity in the Consolidated Financial Statements and establishes a single method of accounting for changes in a parent’s ownership interest in a subsidiary that do not result in deconsolidation. SFAS 160 is effective for fiscal years beginning after December 15, 2008 and is to be applied prospectively, except for presentation and disclosure requirements which shall be applied retrospectively. Earlier application is prohibited. Noncontrolling interests in our consolidated financial statements are not material. Therefore we do not expect SFAS 160 to materially impact our consolidated financial statements.
In December 2007, the FASB ratifiedEITF 07-1, Accounting for Collaborative Arrangements(“EITF 07-1”), which defines collaborative arrangements and establishes reporting requirements for transactions between participants in the arrangement and third parties.EITF 07-1 also establishes the appropriate income statement presentation and classification for joint operating activities and payments between participants, as well as the sufficiency of the disclosure related to these arrangements.EITF 07-1 is effective for fiscal years beginning after December 15, 2008. We do not expect the adoption ofEITF 07-1 to have a significant impact on our Consolidated Financial Statements.
In March 2008, the FASB issued SFAS 161, Disclosures about Derivative Instruments and Hedging Activities, an amendment of FAS 133 (“SFAS 161”), which establishes the disclosure requirements for derivative instruments and for hedging activities. This Statement amends and expands the disclosure requirements of SFAS 133 with the intent to provide users of financial statements with an enhanced understanding of: (1) how and why an entity uses derivative instruments, (2) how derivative instruments and related hedged items are accounted for under Statement 133 and its related interpretations and (3) how derivative instruments and related hedged items affect an entity’s financial position, financial performance, and cash flows. SFAS 161 is effective for fiscal years beginning after November 15, 2008 and is to be applied prospectively. Early adoption is encouraged. We do not expect SFAS 161 to materially impact our consolidated financial statements with the exception of additional disclosures.
In April 2008, the FASB issued FSPFAS 142-3, Determination of the Useful Life of Intangible Assets(“FSP 142-3”), which amends the factors that should be considered in developing renewal or extension assumptions used to determine the useful life of a recognized intangible asset under SFAS 142, Goodwill and Other Intangible Assets. This new guidance applies prospectively to intangible assets that are acquired individually or with a group of other assets in business combinations and asset acquisitions.FSP 142-3 is effective for fiscal years beginning after December 15, 2008. Early adoption is prohibited. We do not expect the adoption ofFSP 142-3 to have a significant impact on our Consolidated Financial Statements.
In May 2008, the FASB issued SFAS 162, The Hierarchy of Generally Accepted Accounting Principles (“SFAS 162”), which identifies the sources of generally accepted accounting principles and provides a framework, or hierarchy, for selecting the principles to be used in preparing U.S. GAAP financial statements for nongovernmental entities. This Statement makes the GAAP hierarchy explicitly and directly applicable to preparers of financial statements, a step that recognizes preparers’ responsibilities for selecting the accounting principles for their financial statements. The hierarchy of authoritative accounting guidance is not expected to change current practice. This Statement is effective for fiscal years beginning after November 15, 2008.
In November 2008, the FASB ratifiedEITF 08-6, Equity Method Investment Accounting Considerations(“EITF 08-6”), which addresses questions about the potential effect of SFAS 141R and SFAS 160 on equity-method
F-21
accounting under Opinion 18. The primary issues are whether transaction costs for an investment in a new acquisition should be expensed as incurred or included in the investment’s cost basis, how to account for subsequent purchases and sales of additional ownership interests by the investee, and whether the investor must separately assess its share of the investee’s underlying assets for impairment.EITF 08-6 is effective for fiscal years beginning on or after December 15, 2008, and interim periods within those fiscal years, consistent with the effective dates of SFAS 141(R) and SFAS 160. We do not expect the adoption ofEITF 08-6 to have a significant impact on our Consolidated Financial Statements.
In November 2008, the FASB ratifiedEITF 08-7, Accounting for Defensive Intangible Assets(“EITF 08-7”), which pertains to the accounting for acquired intangible assets that the acquirer decides not to use, but intends to hold to prevent others from using them.EITF 08-7 is effective for fiscal years beginning on or after December 15, 2008, in order to coincide with the effective dates of SFAS 141(R). We do not expect the adoption ofEITF 08-7 to have a significant impact on our Consolidated Financial Statements.
In 2008, we acquired the outstanding shares of two unrelated companies and the net assets of two other unrelated businesses. The results of these acquired businesses have been included in our Consolidated Statements of Income since the respective acquisition dates. Acquisitions in 2008 were as follows:
All 2008 acquisitions except for the acquisition of Business Objects S.A. were immaterial individually and in the aggregate to SAP. All of the acquired businesses developedand/or sold software in specific areas with strategic interest to us. The aggregate purchase price of our 2008 acquisitions was paid in cash and, excluding Business Objects, amounted to €85 million net of cash received. The amount was allocated as follows: €34 million as identifiable intangible assets with estimated useful lives ranging from 1 to 12 years, €1 million as in-
F-22
process research and development which was expensed at the respective acquisition date since the respective acquired technologies had no alternative future use, and 3 million as net liabilities. The remaining €53 million was allocated to goodwill, of which €6 million is expected to be fully deductible for tax purposes over an amortization period of up to 15 years. In addition we recorded a €2 million settlement loss related to a reacquired distribution right in connection with one of the acquisitions.
We have not yet finalized the purchase price allocation for the transactions concluded during the second half of 2008, as we are still in the process of evaluating our assumptions for these acquisitions and particularly the assumed pre-acquisition contingencies related to tax and customer contracts.
Acquisition of Business Objects S.A.
Business Objects is a provider of business intelligence solutions. Through a combination of technology, consulting, education services, and its partner network, Business Objects provides information and business decision making resources to small and large companies. Business Objects has dual headquarters in San Jose, California and Levallois-Perret, France. Before the acquisition, its stock was traded on both the NASDAQ (via American depositary receipts) and Euronext Paris stock exchanges. We acquired substantially all of the outstanding shares of Business Objects during the first two months of 2008, except a very minor amount of shares (0.02% of share capital) held by employees that are restricted under local law. Our acquisition took the form of a tender offer under French and U.S. law for all Business Objects’ common stock, all American depositary shares representing Business Objects common stock, and all convertible bonds and warrants issued by Business Objects.
Under the terms and conditions of the tender offer agreement, we made a cash offer of €42.00 per share of common stock and the U.S. dollar equivalent of €42.00 per American depositary receipts share determined using the Euro to U.S. dollar exchange rate on settlement of the tender offers and of €50.65 per convertible bond, and a range of €12.01 to €24.96 per warrant, depending on the warrant grant date. After reaching the initial minimum tender condition of more than 50% as at January 21, 2008 the tender offer period was reopened under the same conditions until January 29, thereby resulting in an ownership level of more than 95%. This allowed SAP to commence an immediate “squeeze-out” acquisition of the outstanding shares of the remaining shareholders. The acquisition cost in the amount of €4.2 billion net of cash acquired has been financed partially by a syndicated bank loan.
The following table shows the components of our acquisition cost for Business Objects:
Business Objects Acquisition Cost
As part of the business combination, we purchased substantially all shares outstanding, all warrants, and all convertible bonds. The convertible bonds have been converted and the face value of the bond (450 million)
F-23
has been paid to SAP since the acquisition. In addition, we assumed Business Objects’ employee share-based payment programs without changing the parameters of these programs. The fair value of employee stock options assumed and awards exchanged was determined using a binomial based valuation model with the following assumptions: risk-free interest rate of 3.42%-3.74%, expected volatility of 29%, and a dividend yield of 1.3%. For the purposes of purchase accounting we have used the cash offer price of €42 for the valuation of the fair value of the exchanged Business Objects stock option awards. The fair value of unvested Business Objects options and restricted stock awards related to future service is being amortized on the basis of the accelerated attribution method over the remaining service period, while the value of vested options is included in the total purchase price. Acquisition related transaction costs include investment banking fees, legal and other fees for external advisors directly related to the acquisition.
The assets acquired and liabilities assumed were recorded in the accompanying consolidated balance sheet at their estimated fair values as of the acquisition date, January 21, 2008. The excess of the acquisition cost of the business combination over the estimated fair values of the identifiable net assets acquired has been recognized as goodwill. Factors that contributed to the recognition of goodwill of €3.5 billion are expected synergies from combining the activities of SAP and Business Objects as well as assets which cannot be recognized separately apart from goodwill because they are not identifiable (such as the quality and level of education of the workforce).
The following table shows all the allocation of the acquisition costs to the fair values of the assets acquired and liabilities assumed as of the acquisition date:
BOBJ Condensed Opening Balance sheet
In connection with the acquisition, we have incurred restructuring costs resulting from severance and workforce relocation payments (€18 million), elimination of duplicate facilities (€37 million), and settlements
F-24
with vendors to end service contracts (€3 million). Such costs have been recognized as liabilities of the acquired entity.
The allocation of the purchase price is based upon valuations and estimates as of the acquisition date.
The following pro forma financial information presents SAP’s results as if the acquisition had occurred at the beginning of the respective periods. These pro forma results have been prepared for comparative purposes only. The pro forma results are not necessarily indicative either of the results of operations that actually would have occurred had the acquisition been in effect at the beginning of the respective periods or of future results.
BOBJ ProForma
In connection with our 2008 transactions discussed above, we assigned the following amounts to identifiable intangible assets:
Identifiable Intangible Assets Acquired as part of business combinations in 2008
F-25
Goodwill adjustments in 2008 including the amounts recognized for our 2008 acquisitions, €3 million recognized for earn-out payments related to prior acquisitions, and €-35 million of adjustments to prior year purchase price allocations were assigned to our Product, Consulting, and Training segments as follows:
Assignment of acquired goodwill to segments
F-26
Prior year acquisitions
In 2007, we acquired the outstanding shares of five unrelated companies and the net assets of two other unrelated businesses. The results of these acquired businesses have been included in our Consolidated Statements of Income since the respective acquisition dates. Acquisitions in 2007 were as follows:
Prior year acquisitions
These transactions were immaterial individually to SAP. The acquired businesses developedand/or sold software in specific areas with strategic interest to us. Due to the fact that we integrate our acquired businesses into our overall operations very quickly and that some acquisitions were concluded in the form of asset deals, we cannot determine the additional revenues and net operating profit attributable to these entities since the acquisition date or for the full year.
The aggregate purchase price of these 2007 acquisitions was paid in cash and amounted to €671 million net of cash received and was allocated as follows: €172 million as identifiable intangible assets with estimated useful lives ranging from one to 12 years, €1 million as in-process research and development which was expensed at the respective acquisition date since the respective acquired technologies had no alternative future use, and €18 million net assets acquired. The remaining €480 million was allocated as goodwill, of which €205 million is expected to be fully deductible for tax purposes over an amortization period of up to 15 years. In addition, in 2007
F-27
we paid amounts related to achieved milestones and earn-out consideration relating to prior acquisitions and escrow returns with a net amount of €1 million, resulting in total net cash outflow of €672 million in 2007.
In 2007, we also acquired the remaining outstanding shares of our subsidiary SAP Systems Integration AG (“SAP SI”). We accounted for the acquisition of SAP SI shares using the purchase method. The aggregate purchase price for the SAP SI shares acquired in 2007 was €48 million, which was paid in cash. The purchase price was based on SAP’s cash offer of €38.83 per share which was made under the “squeeze-out” provisions of the German Stock Corporation Act, section 327a, paragraph 1. Those provisions entitled us, as the holder of at least 95% of the outstanding shares, to acquire for cash all remaining shares owned by the non-controlling shareholders. We allocated €9 million to minority interest, €2 million to identifiable intangible assets and €37 million of the aggregate purchase price to goodwill in the Consulting segment. The recorded goodwill is not tax deductible.
With the purchase of software licenses and support business or our exclusive partner SAP Arabia we also reacquired some contracts and rights, including our trademark and the existing exclusive distribution arrangement. The amount allocated to the reacquired software distribution right was €37 million (which is included in the above amount of acquired intangibles). The settlement of pre-existing rights and contracts resulted in a settlement loss of €3 million and was recognized in Cost of sales and marketing.
In connection with the 2007 transactions including the squeeze-out of SAP SI, we assigned the following amounts to identifiable intangible assets:
Identifiable intangible assets acquired as part of business combinations
(5) REVENUE
Revenue information by segment and geographic region is disclosed in Note 28.
Revenues from construction-type contracts (contract revenues) are included in software revenue and professional service revenue resulting from essential consulting services depending on the type of project.
Detailed information on our revenue recognition policies is disclosed in Note 3.
(6) FUNCTIONAL COSTS AND OTHER EXPENSES
The information provided below is classified by the type of expense. The Consolidated Statements of Income include these amounts in various categories based on the applicable functional area.
F-28
Personnel Expenses/Number of Employees
Personnel expenses were as follows:
Personnel Expenses
Expenses associated with our share-based compensation plans described in Note 27 are included in personnel expenses for all years presented.
The average number of employees, measured in full-time equivalents, was as follows:
Number of Employees
Government Grants
During the fiscal year 2008 we received €32 million (2007: €16 million, 2006: €11 million) of government grants and similar assistance which we have offset against our related expenses. All conditions required to obtain these grants have either been met or are reasonably assured of being met.
In addition we have received conditional promises of a further €44 million, which relate mostly to research- and development related expenses, which have not been recorded as at December 31, 2008 because the conditions required to obtain them are not yet reasonably assured of being achieved.
Advertising expenses
Advertising expenses amounted to €151 million, €165 million, and €172 million in 2008, 2007, and 2006 respectively.
F-29
(7) OTHER OPERATING INCOME/EXPENSE, NET
Other operating income/expense for the years ending December 31 was as follows:
Other Operating Income/Expense, Net
(8) OTHER NON-OPERATING INCOME/EXPENSE, NET
Other non-operating income/expense, net for the years ending December 31 was as follows:
Other Non-operating Income/Expense, Net
F-30
(9) FINANCIAL INCOME/EXPENSE, NET
Financial income, net for the years ending December 31 was as follows:
Financial Income/expense, Net
We derive interest income primarily from cash and cash equivalents, short-term investments, and other financial assets. The increase in interest expense is mainly due to the credit facility we entered into in connection with the acquisition of Business Objects S.A.
In the table above, income from securities and expenses for other financial assets and loans both include €0 million in 2008 (€241 million in 2007; €156 million in 2006) resulting from collateral held to secure financing investments made. While holding the collateral, we directly transfer to the debtor any income received on the collateral. Interest income received on the financing investment is included in interest income. We decide on acase-by-case basis whether to require collateral for our financial investments.
Information on gains and losses recognized directly in Accumulated other comprehensive income/loss or in profit and loss for our financial assets is given in Note 13 and for our financial liabilities in Note 18. For information about our hedging activities, see Note 25.
F-31
(10) INCOME TAXES
Income tax expense for the years ending December 31 comprised the following components:
Income Tax Expense
In 2008, 2007, and 2006, the German government enacted several new tax laws. Included was the 2008 Business Tax Reform which was enacted in 2007 and has major effects on corporations. For us the most significant effect results from a reduction of the German corporate income tax rate from 25% to 15%, effective January 1, 2008. For deferred tax purposes, this reduction of the corporate income tax rate in Germany was already taken into account in 2007, as deferred taxes are required to be calculated using the enacted tax rate applicable to the year in which the deferred tax item is expected to be realized or settled. The resulting effect on deferred taxes did not materially impact earnings.
The impact of the remaining tax law changes enacted in 2007, and the new tax laws enacted in 2008 and 2006, was not material to our consolidated financial statements for the years ending December 31, 2008, 2007, and 2006.
Income from continuing operations before income tax and minority interests consisted of the following:
Income from Continuing Operations
F-32
The effective income tax rate for the years ending December 31, 2008, 2007, and 2006, was 30.0%, 32.2%, and 29.9%, respectively. The following table reconciles the expected income tax expense computed by applying our combined German corporate tax rate of 26.33% (2007: 35.49%; 2006: 35.66%) to the actual income tax expense. Our 2008 combined German corporate tax rate includes a corporate income tax rate of 15.00%, (2007: 21.91%; 2006: 21.85%; 2007 and 2006 after the benefit of trade tax deductibility which ceased in 2008), plus a solidarity surcharge of 5.5% thereon, and trade taxes of 10.50% (2007: 12.38%; 2006: 12.61%).
Reconciliation of Income Tax Expense
F-33
Deferred income tax assets and liabilities as at December 31, 2008 and 2007 relate to the underlying items as follows:
Deferred Tax Assets and Liabilities
In assessing the realizability of deferred tax assets, we consider whether it is more likely than not that some portion or all of the deferred tax assets will not be realized. The ultimate realization of deferred tax assets depends on the generation of future taxable income during the periods in which those temporary differences become deductible. Based on the level of historical taxable income and projections for future taxable income over the periods in which the deferred tax assets are recoverable, we believe it is more likely than not that the Company will realize the benefits of these deductible differences, net of the existing valuation allowances as at December 31, 2008. The amount of the deferred tax asset considered realizable, however, could be reduced in the near term if our estimates of future taxable income during the carryforward period were reduced.
At December 31, 2008, certain of our foreign subsidiaries with continuing operations had net operating loss carryforwards amounting to €318 million (2007: €114 million), which may be used to offset future taxable income. Of this amount, €160 million relates to federal net operating loss carryforwards in the United States, of which €84 million expire during the years 2024 through 2028 if not used earlier, and €123 million relates to state net operating loss carryforwards in the United States, of which €70 million expire during the years 2024 through 2028 if not used earlier. The remaining amounts of the U.S. loss carryforwards are available to be used to offset federal and state taxable income, if any, over the next 15 years. Of the €35 million net operating loss carryforwards outside of the United States, €15 million relates to net operating loss carryforwards that will
F-34
expire if not used within one to seven years and €20 million relates to net operating loss carryforwards that will not expire and therefore can be utilized indefinitely.
Deferred tax assets as at December 31, 2008, and 2007 have been reduced by a valuation allowance of €33 million and €8 million respectively to a net amount that we believe is more likely than not to be realized.
We recognized deferred income tax liabilities of €14 million (2007: €17 million) for income taxes on future dividend distributions from foreign subsidiaries, which is based on €696 million (2007: €1,335 million) cumulative undistributed earnings of those foreign subsidiaries because such earnings are intended to be repatriated. We have not recognized a deferred income tax liability on approximately €2,764 million (2007: €2,249 million) for undistributed earnings of our foreign subsidiaries that arose in 2008 and prior years because we plan to indefinitely reinvest those undistributed earnings. It is not practicable to estimate the amount of unrecognized tax liabilities for these undistributed foreign earnings.
Total income taxes including the items charged or credited directly to related components of shareholders’ equity for the years ending December 31, 2008, 2007, and 2006 consist of the following:
Total Income Taxes
For information about the income tax impact of the components of Accumulated other comprehensive Income/loss, see Note 20.
At January 1, 2008, unrecognized income tax benefits relating to uncertain tax positions amounted to 96 million and were accounted for as income tax provisions. At December 31, 2008, uncertainties in income taxes had increased by €155 million to €251 million (thereof €241 million (2007: €96 million) would have an impact on the effective tax rate if recognized).
F-35
The amounts of unrecognized tax benefits are as follows:
Unrecognized Tax Benefits
The unrecognized income tax benefits at December 31, 2008 include €156 million related to Business Objects, which is net of €87 million related to 2008 settlements of Business Objects related tax contingencies.
As at December 31, 2008 interest and penalties related to unrecognized tax benefits shown in the statement of income amounted to €7 million (2007: €2 million). The respective provision for interest and penalties amounted to €37 million (2007: €4 million). This provision, that includes an increase in the amount of €32 million due to the acquisition of Business Objects, is shown as income tax obligation.
For the major tax jurisdictions and legal entities in Germany, fiscal years 2003 through 2008 and for the United States, fiscal years 2005 through 2008 remain subject to examination. It is reasonably possible that the total amounts of unrecognized tax benefits may increase or decrease within the next 12 months. However we do not anticipate that unrecognized income tax benefits will significantly change within 12 months of the reporting date.
(11) ASSETS AND LIABILITIES HELD FOR SALE AND DISCONTINUED OPERATIONS
In November 2007 we committed to a plan to sell the business of TomorrowNow, Inc., (TomorrowNow), a wholly owned subsidiary of SAP America, Inc. (a wholly owned subsidiary of SAP AG) and to cease engaging in the business model of providing support services relating to third-party software. Negotiations with several interested parties took place. The assets and liabilities of TomorrowNow, which included the assets and liabilities of TomorrowNow entities in Europe, Australia and Asia were expected to be sold within twelve months. Therefore, the assets and liabilities were classified as a disposal group held for sale and were presented separately in the Consolidated Balance Sheet as at December 31, 2007.
In the second half of 2008 we made a strategic decision to discontinue our search for potential buyers and to rather abandon the operations of TomorrowNow. We completed the abandonment of TomorrowNow in October 2008. As part of this process, the assets were either disposed of or fully depreciated since there is no continuing economic benefit. All operating liabilities were settled and any remaining liabilities not relating to the operations of TomorrowNow were assumed by the Group.
TomorrowNow was a distinct asset group with cash flows and operations that were separable from those of the rest of SAP. The operations of this disposal group had been accounted for as a part of the product segment. U.S. GAAP requires the results of operations of a component of an entity that either has been disposed of or is classified as held for sale to be removed from income from continuing operations and reported as discontinued
F-36
operations for all periods presented. The following table details the amounts reclassified to discontinued operations:
Results from Discontinued Operations
The following table details the major classes of assets and liabilities of the TomorrowNow disposal group held for sale at December 31, 2007:
Assets and Liabilities Held for Sale
(12) EARNINGS PER SHARE
Convertible bonds and stock options granted to employees under our share-based compensation programs are included in the diluted earnings per share calculations to the extent they have a dilutive effect. The dilutive impact is calculated using the treasury stock method. The computation of diluted earnings per share does not include certain convertible bonds and stock options issued in connection with the SAP AG 2000 Long Term Incentive Plan (“LTI 2000 Plan”) and the SAP Stock Option Plan 2002 (“SAP SOP 2002”) because their effect is antidilutive. Such convertible bonds and stock options, if converted or exercised, represented 43.6 million SAP common shares in 2008, 37.3 million SAP common shares in 2007 and 23.6 million SAP common shares in 2006. The number of outstanding stock options and convertible bonds is presented in Note 27.
F-37
Earnings per Share
| |
| (13) | CASH AND CASH EQUIVALENTS, RESTRICTED CASH AND INVESTMENTS |
Cash and cash equivalents, Restricted cash and Investments as at December 31 consisted of the following:
Cash and Cash Equivalents, Restricted Cash and Financial Assets
F-38
Restricted Cash
Funds classified as Restricted cash as at December 31, 2007 related to a security deposit that served as collateral for SAP’s credit facility entered into in connection with the acquisition of Business Objects S.A. as described in Note 4 and 18.
Debt Securities and Marketable Equity Securities
As at December 31, 2008 and 2007, all of our debt and marketable equity securities held as investments were classified as available-for-sale. Fund securities mainly comprise of investments in federal bonds from EU countries. Proceeds from sales of available-for-sale securities in 2008 were €478 million (2007: €45 million; 2006: €199 million). Gross gains realized from sales of available-for-sale securities in 2008 were €5 million (2007: €2 million; 2006: €0 million). Gross losses realized from sales of available-for-sale securities in 2008 were €2 million (2007: €1 million; 2006: €2 million). Due to these sales of available-for-sale securities we recognized in profit and loss gains of €5 million (2007: €2 million; 2006: €0 million) and losses of €2 million (2007: €1 million; 2006: €2 million) which had previously been included in Accumulated other comprehensive income/loss.
Amounts pertaining to marketable securities as at December 31 were as follows:
Securities
For the marketable securities in a loss position, the fair values are categorized according to the duration of the loss position as follows:
Marketable Securities in Loss Position
F-39
For the year ending December 31, 2008, we recorded other-than-temporary impairment charges related to marketable equity securities of €1 million (2007: €1 million; 2006: €0 million) and therefore removed unrealized losses recorded directly in Accumulated other comprehensive loss up to that point of €1 million (2007: €1 million; 2006: €0 million).
The marketable debt securities as at December 31, 2008, consisted of investment grade bonds. The decline in fair value of marketable debt securities in 2008 resulted from changes in general market conditions and not from changes in the creditworthiness of the underlying debtor. We determine these impairments to be temporary, in view of the short duration of the respective declines in value and our intention and ability to hold these investments for a reasonable period of time sufficient for a forecasted recovery.
The estimated year-end fair values of our debt securities (excluding debt-based funds), are presented by contractual maturity below. Expected maturities may differ from contractual maturities because borrowers may have the right to call or prepay obligations with or without penalty.
Debt Securities
Equity Securities at Cost
The carrying value of all equity securities at cost was €74 million and €69 million as at December 31, 2008, and 2007, respectively. Equity securities at cost, which primarily include venture capital investments, are not included in the table above as market values for those securities are generally not readily observable. In 2008, we sold two (2007: two; 2006: two) investments with a carrying value at the time of sale of €3 million (2007: €3 million; 2006: €2 million) and realized gains of €10 million (2007: €0 million; 2006: €0 million). As at December 31, 2008 we intend to dispose of one cost method investment in the near future. For information on fair value measurement with regard to our equity securities at cost, please see Note 26.
During 2008, 2007, and 2006, we recorded €12 million, €6 million, and €1 million, respectively, in charges related to other-than-temporary impairments of equity securities at cost.
Equity Method Investments
We account for the following companies under the equity method:
The excess of our initial investment in equity method companies over our ownership percentage in the underlying net assets of those companies amounted to €12 million as at December 31, 2008 (2007: €11 million) and is attributed to certain fair-value adjustments with the remaining portion recognized as goodwill. Although we own less than 20% of the voting stock of the investee company, we account for three investments using the equity method, because we can exercise significant influence over the operating and financial policies of these entities through holding seats on their boards or other means.
F-40
| |
| (14) | ACCOUNTS RECEIVABLE, NET |
Accounts receivable, net includes costs and estimated earnings in excess of billings on uncompleted contracts of €221 million and €162 million as at December 31, 2008, and 2007, respectively. We received advances of €470 million and €385 million as at December 31, 2008, and 2007, respectively.
The carrying amounts of our accounts receivable from customers as at December 31 were as follows:
Carrying Amounts of Accounts Receivable
Changes in the allowance for doubtful accounts were as follows:
Changes in the Allowance for Doubtful Accounts
Concentrations of credit risks are limited due to our large customer base and its dispersion across many different industries and countries worldwide. No single customer accounted for 5% or more of total revenues in 2008, 2007, or 2006 or of Accounts receivable, net in 2008 or 2007. The aging of Accounts receivable as at December 31 was:
Aging of Accounts Receivable Gross
At the outset of any customer arrangement we strictly assess the creditworthiness of the respective customer and only record revenue and the related receivable if collectibility is assured. Due to this approach and our short payment terms, we have no indication as at the reporting date of impairments of Accounts receivable that are not past due.
For accounts receivable past due, we determine the allowance for doubtful accounts using a two-step-approach described in Note 3. We therefore consider accounts receivable of €86 million (2007: €33 million) as
F-41
individually impaired in full or only partially mainly based on debtors’ financial difficulties and accounts receivable of €769 million (2007: €587 million) as collectively impaired based on the age of the receivables and our historical loss experience.
For more information about financial risk and how we manage it, see Note 26.
Other Assets
Investments in insurance policies relate to the employee-financed pension plans as presented in Note 19a. The corresponding liability for investments in other postemployment plans is included in employee-related obligations (see Note 19b).
Detailed information about our derivative financial instruments is presented in Note 25.
Loans granted to employees primarily consist of interest-free or below-market-rate building loans. Gross amounts of loans to employees were €64 million in 2008 and €63 million in 2007. The cumulative effect of discounting the employee loans based on the market interest rates in effect when the loans were granted was €11 million in 2008 and €11 million in 2007. Amortization of employee loan discounts amounted to €3 million in 2008 and €3 million in 2007, respectively. There have been no loans to employees or members of the Executive Board and Supervisory Board to assist them in exercising stock options or convertible bonds. There have been no significant defaults of loans to employees.
Miscellaneous other assets primarily consists of interest receivables, tax claims, short-term loans, and other items for which the recognized amounts are not material.
Loans to third parties are presented net of allowances for credit losses. Changes in the allowance for credit losses of third-party loans were not significant in all periods presented.
F-42
| |
| (16) | GOODWILL AND INTANGIBLE ASSETS |
Goodwill and Intangible Assets
F-43
The additions to goodwill result from our acquisitions (€3.579 million), contingent consideration paid for prior acquisitions (€3 million), and purchase price adjustments (€-35 million). For more information about our acquisitions, see Note 4. Due to our decision in the second half of 2008 to abandon our TomorrowNow operations, we recorded a loss on disposal for the goodwill in the amount of €6 million allocated to this disposal group. For more information on our discontinued operations, see Note 11.
All our intangible assets except goodwill are subject to amortization. Intangible assets consist of three major asset classes: Software and database licenses, Acquired technology, and Other intangibles.
Software and database licenses consist primarily of technology for internal use whereas Acquired technology consists primarily of purchased software to be incorporated into our product offerings. The additions to Software and database licenses in 2008 and 2007 were individually acquired from third parties, whereas the additions to Acquired technology and Other intangibles primarily result from our acquisitions discussed in Note 4.
Other intangibles consist primarily of acquired trademark licenses and customer contracts acquired as well as In-process research and development which is fully amortized upon acquisition. For more information, see Note 4.
The estimated aggregate amortization expense for our intangible assets recorded as at December 31, 2008, for each of the five succeeding years ending December 31, is as follows:
Estimated Future Amortization of Intangibles
The carrying amount of goodwill by reportable segment as at December 31, 2008 and 2007 was as follows:
Goodwill by Segments
For more information about our segments, see Note 28.
F-44
| |
| (17) | PROPERTY, PLANT, AND EQUIPMENT |
Property, Plant, and Equipment
F-45
The additions and disposals in Other property, plant, and equipment relate primarily to the renewal and purchase of computer hardware and cars acquired in the normal course of business.
Interest capitalized was not material in any period presented.
During 2008, 2007, and 2006, depreciation expense for Property, plant, and equipment was €214 million, €179 million, and €156 million, respectively. The majority of depreciation expense for all years presented related to assets classified as Other property, plant, and equipment.
| |
| (18) | ACCOUNTS PAYABLE, FINANCIAL LIABILITIES AND OTHER LIABILITIES |
Accounts payable, Financial liabilities and Other liabilities classified on due dates as at December 31 were as follows:
Accounts Payable, Financial Liabilities and Other Liabilities
| | | | | | | | | | | | | | | | | |
| | | 2008 | | 2007 |
| | | | | | | Term
| | | | | | | | Term
| | |
| | | less than
| | between 1
| | more than
| | Balance on
| | less than 1
| | between 1
| | more than
| | Balance on
|
| € millions | | 1 year | | and 5 years | | 5 years | | 31.12.2008 | | year | | and 5 years | | 5 years | | 31.12.2007 |
| |
| Payable to suppliers | | 506 | | 3 | | 0 | | 509 | | 688 | | 6 | | 0 | | 694 |
| Advance payments received | | 32 | | 2 | | 0 | | 34 | | 27 | | 4 | | 0 | | 31 |
| | | |
| | | |
Accounts payable | | 538 | | 5 | | 0 | | 543 | | 715 | | 10 | | 0 | | 725 |
| | | | | | | | | | | | | | | | | |
| Bank loans and overdraft | | 2,319 | | 1 | | 1 | | 2,321 | | 25 | | 2 | | 0 | | 27 |
| Other financial liabilities | | 255 | | 33 | | 0 | | 288 | | 57 | | 4 | | 0 | | 61 |
| | | |
| | | |
Financial liabilities | | 2,574 | | 34 | | 1 | | 2,609 | | 82 | | 6 | | 0 | | 88 |
| | | | | | | | | | | | | | | | | |
| Other employee-related liabilities | | 1,161 | | 6 | | 51 | | 1,218 | | 1,060 | | 6 | | 49 | | 1,115 |
| Other taxes | | 268 | | 0 | | 0 | | 268 | | 262 | | 0 | | 0 | | 262 |
| Miscellaneous other liabilities | | 57 | | 23 | | 15 | | 95 | | 52 | | 11 | | 7 | | 70 |
| | | |
| | | |
Other liabilities | | 1,486 | | 29 | | 66 | | 1,581 | | 1,374 | | 17 | | 56 | | 1,447 |
| | | |
| | | |
| | | 4,598 | | 68 | | 67 | | 4,733 | | 2,171 | | 33 | | 56 | | 2,260 |
| | | |
| | | |
Liabilities are unsecured, except for the retention of title and similar rights which are customary in our industry. Effective interest rates on bank loans were 4.30% in 2008, 8.03% in 2007, and 8.08% in 2006.
As at October 1, 2007, SAP AG entered into a €5 billion credit facility agreement with Deutsche Bank AG. The credit facility was entered into in connection with our acquisition of Business Objects S.A. The use of the facility is not restricted by any financial covenants. As at December 31, 2008, there were borrowings of €2.3 billion outstanding under the facility which bear interest of EURIBOR plus a margin of 0.25%. The credit facility matures at December 31, 2009. It can be repaid in full or in part at any time at our request, but at the latest at December 31, 2009.
As at November 5, 2004, SAP AG entered into a €1 billion syndicated revolving credit facility agreement with an initial term of five years. The use of the facility is not restricted by any financial covenants. Borrowings under the facility bear interest of EURIBOR or LIBOR for the respective currency plus a margin ranging from 0.20% to 0.25% depending on the amount drawn. We are also required to pay a commitment fee of 0.07% per annum on the unused available credit. As at December 31, 2008, and 2007, there were no borrowings outstanding under the facility.
Additionally, as at December 31, 2008, and 2007, SAP AG had available lines of credit totaling €597 million and €599 million, respectively. As at December 31, 2008 and 2007, there were no borrowings outstanding under these lines of credit.
As at December 31, 2008 and 2007, certain subsidiaries had lines of credit available that allowed them to borrow in local currencies at prevailing interest rates up to €52 million and €44 million, respectively. Total
F-46
aggregate borrowings under these lines of credit, which are guaranteed by SAP AG, amounted to 21 million as at December 31, 2008, and €27 million as at December 31, 2007.
A maturity analysis that provides the remaining contractual undiscounted cash flows of all our financial liabilities held at December 31, 2008 and those contractually agreed is shown in the table below. Financial liabilities for which repayment can be requested by the contract partner at any time are assigned to the earliest possible period. Variable interest payments were calculated using the last interest rate fixed before December 31, 2008. As we settle our derivative contracts gross, we separately show the pay and receive leg for all our currency and interest rate derivatives whether or not the fair value of the derivative is negative. The cash outflows for the currency derivatives are translated using the respective forward rate.
Contractual maturities of financial liabilities
F-47
Provisions based on due dates as at December 31 were as follows:
Provisions
| |
| a) | Pension Plans and Similar Obligations |
We maintain several defined benefit and defined contribution plans for our employees in Germany and at our foreign subsidiaries, which provide for old age, disability, and survivors’ benefits. We also have several immaterial foreign termination indemnity plans that meet the criteria of defined benefit plans included in foreign benefit plans. The measurement dates for the domestic and foreign benefit plans are December 31. Individual benefit plans have also been established for members of the Executive Board.
The liabilities accrued for pensions and other similar obligations on December 31 consist of the following:
Liabilities Accrued for Pensions and Other Similar Obligations
The increase in total liabilities accrued for pension plans mainly result from an increase in employee-financed plans. The related insurance contracts held by us resulted in an increase in Other assets by the same amount. For more information about our employee-financed pension plans, see the further information below.
The Consolidated Balance Sheets include the following significant components related to defined benefit pension plans as at December 31, 2008, and 2007:
F-48
Significant Components related to Defined Benefit Pension Plans
Defined Benefit Pension Plans and Similar Obligations
Our domestic defined benefit plans provide participants with pension benefits that are based on the length of service and compensation of employees. Foreign defined benefit plans provide participants with pension benefits that are based on compensation levels, age, and length of service.
Certain of our foreign subsidiaries are required to provide to their employees termination indemnity benefits regardless of the reason for termination. We treat these plans as defined benefit plans if the substance of the post-employment plan is a pension type-arrangement. Most of these arrangements provide the employee with a one-time payment based on compensation levels, age, and years of service on termination, regardless of the reason (retirement, voluntary or involuntary).
Our subsidiaries in the United States decided to “freeze” their defined benefit plan effective December 31, 2008 and offer additional and improved benefits under their defined contribution plan(401k-Plan regulations) instead. Beginning in 2009, eligible employees cannot continue to increase future retirement benefits through continued service to the company except for earning interest on their plan asset balance. We treat this defined benefit amendment as a curtailment in accordance with SFAS 88, Employers’ Accounting for Settlements and Curtailments of Defined Benefit Pension Plans and for Termination Benefits ( “SFAS 88”), due to the fact that future service of current employees will no longer qualify for benefits. As a result we reduced net loss included in other comprehensive income/loss in the amount of €9 million as offset to the reduction of the defined benefit obligation.
The following table presents the change in the present value of the defined benefit obligations and the fair value of the plan assets with a reconciliation of the funded status to net amounts recognized:
F-49
Change in the Present Value of the DBO and the Fair Value of the Plan Assets
The following weighted average assumptions were used for the actuarial valuation of our domestic and foreign pension liabilities as at the respective measurement date:
Actuarial Assumptions for Defined Benefit Liabilities
The components of our net periodic benefit cost and other amounts recognized in other comprehensive income for the years ending December 31 were as follows:
F-50
Cost of Defined Benefit Plans
Amounts not yet recognized as a component of net periodic pension cost that are included in accumulated other comprehensive income:
Unrecognized Pension Cost
We will amortize in 2009 actuarial gains and losses of our defined benefit plans from accumulated other comprehensive income into net periodic benefit cost in the amount of €6 million.
F-51
Our actuaries relied on the following principal actuarial assumptions (expressed as weighted averages for our foreign and other post-employment benefit plans) for 2008, 2007, and 2006 to calculate the net periodic benefit costs:
Actuarial Assumptions for Net Periodic Benefit Cost
Pension Assets
Our investment strategy on domestic benefit plans is to invest all contributions in stable insurance policies. The expected rate of return on plan assets for our domestic benefit plans is calculated by reference to the expected returns achievable on the insured policies given the expected asset mix of the policies. The assumed discount rates are derived from rates available on high-quality fixed-income investments for which the timing and amounts of payments match the timing and the amounts of our projected pension payments.
The expected return assumptions for our foreign plan assets are based on weighted average expected long-term rates of return for each asset class which are estimated based on factors such as historical return patterns for each asset class and forecasts for inflation. We review historical return patterns and other relevant financial factors for appropriateness and reasonableness and make modifications to eliminate certain effects when considered necessary. The assumed discount rates are derived from rates available on investment grade fixed-income investments for which the timing and amounts of payments match the timing and amounts of our projected pension payments. Our foreign benefit plan asset allocation as at December 31, 2008, and our target asset allocation, is as follows:
Plan Asset Allocation for Foreign Pension Plans
and Other Post-Employment Obligations
F-52
The investment strategies for foreign benefit plans vary according to the conditions of the country in which the benefit plans are maintained. Generally, a long-term investment horizon has been adopted for all major foreign benefit plans. Our policy is to invest in a risk-diversified portfolio consisting of a mix of assets within the target asset allocation range presented above.
Funded Status of Domestic and Foreign Plans
The projected benefit obligation, accumulated benefit obligation, and fair value of plan assets for our domestic and foreign defined benefit pension plans as well as post employment benefit plans with accumulated benefit obligations in excess of plan assets are as follows:
Funded Status of Plans with Accumulated Benefit
Obligation in excess of Plan Assets
F-53
Expected Future Contributions and Benefits
Our expected contribution in 2009 is €2 million for domestic defined benefit plans and €29 million for foreign defined benefit and post-employment benefit plans, all of which is expected to be paid as cash contributions.
The estimated future pension benefit payments to be made over the next 10 years by our domestic and foreign benefit plans for the years ending December 31 are as follows:
Estimated Future Pension Benefit Payments
Defined Contribution Pension Plans
We maintain domestic and foreign defined contribution plans. Amounts contributed by the Company under such plans are based on a percentage of the employees’ salary or the amount of contributions made by employees. The costs associated with defined contribution plans were €86 million, €93 million, and €92 million in 2008, 2007, and 2006 respectively.
Employee-Financed Pension Plan
In Germany we maintain an unqualified employee-financed pension plan, whereby employees may contribute a limited portion of their salary. We purchase and hold guaranteed fixed rate insurance contracts, which are recorded in Other assets (see Note 15) and are equal to the obligations under the plan (€282 million and €236 million on December 31, 2008, and 2007, respectively).
F-54
(19) PROVISIONS
b) Other Obligations
Other obligations as at December 31 were as follows:
Other Obligations
Obligations related to share-based compensation programs comprise the obligations for our cash-settled share-based compensation programs which are described in detail in Note 27.
Other employee-related obligations primarily comprise provisions for time credits, severance payments under ongoing post-employment benefit plans in accordance with SFAS 112, Employers’ Accounting for Postemployment Benefits (“SFAS 112”), jubilee expenses, and semiretirement.
Restructuring activities include contract termination costs and similar restructuring costs for unused lease space. We account for our restructuring activities in accordance with SFAS 146, Accounting for Costs Associated with Exit and Disposal Activities (“SAFS 146”). Our provision for unused lease space relates to costs that we will continue to incur for vacated space under various operating lease contracts that will have no future economic benefit. Restructuring costs are included in the Consolidated Statements of Income in the line item Other operating income/expense, net.
In connection with the acquisition of Business Objects S.A., we incurred costs related to certain exit activities of Business Objects and to involuntarily terminate or relocate employees of Business Objects. As such, and as described in detail in Note 4, we accrued restructuring costs in accordance withEITF 95-3, Recognition of Liabilities in Connection with the Purchase Business Combination(“EITF 95-3”) as part of the allocation of the purchase price for Business Objects.
The following table provides a roll forward of our restructuring obligations including amounts charged or credited to the Consolidated Statements of Income for each year presented:
F-55
Restructuring obligations
Warranty obligations represent the estimated future cost of fulfilling our contractual requirements associated with sales of our software. We determine the warranty accrual based on the historical average cost of fulfilling our obligations under these commitments. Changes in the warranty accruals in 2008 and 2007 are summarized below:
Changes in warranty accruals
F-56
Other obligations relate mainly to asset retirement obligations and the litigation matters described in Note 24. For asset retirement obligations we record the present value of these obligations in the period in which the obligation is incurred. The increase during the period of the discounted amount was not material.
Additions to our provisions also include interest components which are not material individually and in the aggregate.
| |
| (20) | SHAREHOLDERS’ EQUITY |
Common Stock
As at December 31, 2008, the capital stock of SAP AG consisted of 1,225,762,900 (2007: 1,246,258,408) shares of no-par common stock (including treasury stock), with a calculated nominal value of €1 per share.
In 2008 the number of common shares decreased by 21,000,000 shares (corresponding to 21,000,000) due to cancellation of shares in treasury stock, partially offset by an increase of 504.492 shares (corresponding to €504,492) as a result of the exercise of awards granted under certain share-based payment plans. In 2007 the number of common shares decreased by 23,000,000 shares (corresponding to €23,000,000) due to cancellation of shares in treasury stock, partially offset by an increase of 1,721,160 shares (corresponding to €1,721,160) as a result of the exercise of awards granted under certain share-based payment plans.
Shareholdings in SAP AG as at December 31, 2008, were as follows:
Shareholdings in SAP AG (> 5% directly or indirectly)
Authorized Capital
The Articles of Incorporation authorize the Executive Board of SAP AG (the “Executive Board”) to increase the Common stock:
| | |
| | • | Up to a total amount of €60 million through the issuance of new common shares in return for contributions in cash until May 11, 2010 (“Authorized Capital I”). The issuance is subject to the statutory subscription rights of existing shareholders. |
| |
| | • | Up to a total amount of €180 million through the issuance of new common shares in return for contributions in cash until May 8, 2011 (“Authorized Capital Ia”). The issuance is subject to the statutory subscription rights of existing shareholders. |
| |
| | • | Up to a total amount of €60 million through the issuance of new common shares in return for contributions in cash or in kind until May 11, 2010 (“Authorized Capital II”). This capital increase could also be executed as a result of a business combination. Subject to certain preconditions and the consent |
F-57
| | |
| | | of the Supervisory Board, the Executive Board is authorized to exclude the shareholders’ statutory subscription rights. |
| | |
| | • | Up to a total amount of €180 million through the issuance of new common shares in return for contributions in cash or in kind until May 8, 2011 (“Authorized Capital IIa”). This capital increase could also be executed as a result of a business combination. Subject to certain preconditions and the consent of the Supervisory Board, the Executive Board is authorized to exclude the shareholders’ statutory subscription rights. |
Contingent Capital
SAP AG’s common stock is subject to a contingent increase of common shares. The contingent increase may be affected only to the extent that the holders of the convertible bonds and stock options that were issued by SAP AG under certain share-based payment plans (see Note 27) exercise their conversion or subscription rights. Contingent Capital amounted to €208 Mio. as of December 31, 2008 compared to €209 Mio. as of December 31, 2007. The immaterial change relates solely to the exercise of subscription rights.
Treasury Stock
By resolution of SAP AG’s Annual General Meeting of Shareholders held on June 3, 2008, the Executive Board of SAP AG was authorized to acquire, on or before November 30, 2009, up to 120 million shares in the Company on the condition that such share purchases, together with any previously acquired shares, do not account for more than 10% of SAP AG’s Common stock. Although Treasury stock is legally considered outstanding, there are no dividend or voting rights associated with shares held in treasury. We may redeem or resell shares held in treasury or may use Treasury stock for the purpose of servicing subscription rights and conversion rights under the Company’s share-based payment plans. Also, we may use the shares held in treasury as consideration in connection with the acquisition of other companies.
As at December 31, 2008, we had acquired 38 million (2007: 48 million) of our own shares, representing €38 million (2007: €48 million) or 3.1% (2007: 3.9%) of common stock. In 2008, 15 million (2007: 27 million) shares in aggregate were acquired under the buyback program at an average price of approximately €33.34 (2007: €36.85) per share, representing €15 million (2007: €27 million) or 1.2% (2007: 2.2%) of common stock. We transferred 3 million shares to employees during the year (2007: 5 million shares) at an average price of €26.43 (2007: €28.13) per share and we reduced the number of common shares by 21 million shares (corresponding to €21 million) due to cancellation of shares in Treasury stock. The Company purchased no SAP American depositary receipts (“ADRs”) in 2008. (Each ADR represents one common share of SAP AG). The Company held no SAP ADRs as at December 31, 2008 and 2007, respectively.
F-58
Accumulated Other Comprehensive Income/Loss
Accumulated other comprehensive income/loss consisted of the following as at December 31:
Other Components of Equity
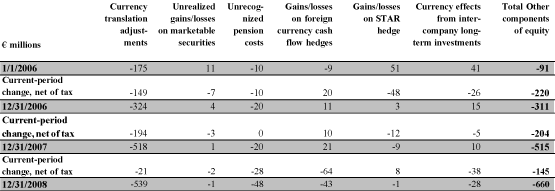
| | |
| | • | Currency translation adjustments comprise all foreign currency differences arising from the translation of the financial statements of foreign operations. |
| |
| | • | Unrealized gains and losses on marketable securities represent the net cumulative change between fair value and cost for available-for-sale financial assets since the respective acquisition date. |
| |
| | • | Unrecognized pension costs comprise actuarial gains and losses relating to defined benefit pension plans and similar obligations. |
| |
| | • | Gains and losses on foreign currency cash flow hedges comprise the net change in fair value of foreign currency cash flow hedges related to hedged transactions that have not impacted earnings, less the component of the financial instrument’s gain or loss that was excluded from the assessment of hedge effectiveness. In addition, gains and losses on the effective part of interest rate hedges are also included. |
| |
| | • | Gains and losses on STAR hedges comprise the net change in fair value of cash flow hedging instruments associated with the unrecognized portion of nonvested STARs (see Note 25). |
| |
| | • | Currency effects from intercompany long-term investments related to intercompany foreign currency transactions that are of a long-term investment nature. |
Miscellaneous
Under the German Stock Corporation Act (Aktiengesetz), the amount of dividends available for distribution to SAP AG’s shareholders is based on the earnings of SAP AG as reported in its statutory financial statements which are determined under the accounting rules stipulated by the German Commercial Code (Handelsgesetzbuch). For the year ending December 31, 2008, the Executive Board and the Supervisory Board of SAP AG propose a dividend distribution in 2009 of €0.50 per share.
Dividends per share for 2007 and 2006 were €0.50 and €0.46, respectively, and were paid in the immediately succeeding year in each case.
Additional Capital Disclosures
The primary objective of our capital management is to ensure that we maintain a stable capital structure with focus on shareholders’ equity to uphold investor, creditor and customer confidence and to ensure future development of our business. We are focused on keeping our shareholders’ equity base solid to ensure
F-59
independence, security, as well as a high financial flexibility through a favorable impact on the conditions of potential future borrowings if so required.
We currently do not have a credit rating with any rating agency. Our debt ratio is relatively low at 49% (2007: 37%), and we so far do not believe that a rating would have a substantial effect on our current or future borrowing conditions and financing possibilities.
Our goal is that we will continue to be able to return excess liquidity to our shareholders by distributing annual dividends as well as repurchasing treasury shares in future periods. The amount of future dividends and the extent of future purchases of treasury shares will be balanced with our effort to continue to maintain an adequate liquidity status for the group.
In order to maintain or adjust our capital structure, we use various instruments including share buybacks and the determination of the amount of dividends paid to shareholders.
Furthermore, we manage our financial liabilities, for example by entering into interest rate swaps on our borrowings.
The capital structure at the balance sheet date was as follows:
Capital Structure
Our net income growth mainly reinforced shareholders’ equity and minority interests in 2008, adding 730 million (2007: €367 million). The equity ratio (that is, the ratio of shareholders’ equity to total assets) decreased to 51% (2007: 63%). This decrease is due to the fact that our total liabilities increased 80%, mainly as a result of the loan that we entered into to finance the acquisition of Business Objects while our shareholders’ equity grew 11%. Our debt ratio (total debt as a portion of total assets) rose from 37% in 2007 to 49% in 2008.
We are predominantly equity-financed. This is also evident from the fact that bank loans and overdrafts represented only 16% of total assets as of December 31, 2008 (2007: 0.26%).
In 2008, we were able to distribute €594 million in dividends from our 2007 earnings (2007: €556 million). Aside from the distributed dividend, in 2008 we also returned €487 million to our shareholders by repurchasing our own shares (2007: €1,005 million).
Commitments exist to sell treasury stock or issue common shares in connection with our share-based payment plans as described in Note 27. We have satisfied in all years presented and expect to continue to satisfy commitments resulting from our share-based payment plans through both, treasury stock and capital increases.
F-60
| |
| (21) | SUPPLEMENTAL CASH FLOW INFORMATION |
Interest paid in 2008, 2007 and 2006 amounted to €105 million, €6 million and €4 million, respectively, while interest received in 2008, 2007 and 2006 amounted to €72 million, €142 million and €124 million, respectively. Income taxes paid in fiscal years 2008, 2007 and 2006, net of refunds, was €882 million, €811 million, and €866 million, respectively.
| |
| (22) | CONTINGENT LIABILITIES |
In the normal course of business, we usually indemnify our customers against liabilities arising from a claim that our software products infringe a third party’s patent, copyright, trade secret, or other proprietary rights. To date, we have not incurred any material loss as a result of such indemnification and have not recorded any material liabilities related to such obligations in the Consolidated Financial Statements.
We occasionally grant function or performance guarantees in routine consulting contracts or development arrangements. Also, our software license agreements generally include a clause guaranteeing that the software substantially conforms to the specifications as described in applicable documentation for a period of six to 12 months from delivery. Our product and service warranty liability, which is measured based on historical experience and evaluation, is included in Provisions (see Note 19b).
For contingent liabilities related to litigation matters, see Note 24.
As at December 31, 2008 and 2007, no guarantees were provided for the performance or financial obligations of third parties.
| |
| (23) | OTHER FINANCIAL COMMITMENTS |
Other financial commitments amounted to €1,112 million, €850 million and €849 million as at December 31, 2008, 2007, and 2006, respectively, and primarily comprise commitments under rental contracts and operating leases of €863 million, €649 million and €657 million as at December 31, 2008, 2007, and 2006, respectively. Those commitments relate primarily to the lease of office space, cars, and office equipment. As at December 31, 2008, the future minimum sublease payments expected to be received was €16 million. In addition, financial commitments existed in the form of purchase commitments totaling €79 million in 2008 (€97 million in 2007 and €74 million in 2006). These commitments relate primarily to construction on new and existing facilities, office equipment and car purchase commitments. The remaining commitments totaling €170 million in 2008 (€104 million in 2007 and €118 million in 2006) relate to various other third-party agreements. Historically, the majority of such purchase commitments have been realized. For financial commitments related to our pension plans, see Note 19a.
F-61
Commitments under operating lease contracts and purchase obligations as at December 31, 2008 were as follows:
Other Financial Commitments
Rent expense was €272 million, €209 million, and €181 million for the years 2008, 2007, and 2006, respectively.
| |
| (24) | LITIGATION AND CLAIMS |
Intellectual Property Litigation
In September 2006,U.S.-based i2 Technologies US, Inc. and i2 Technologies, Inc. (i2) instituted legal proceedings in the United States against SAP. i2 alleged that SAP’s products and services infringe one or more of the claims in each of seven patents held by i2. In its complaint, i2 sought unspecified monetary damages and permanent injunctive relief. In August 2007, SAP instituted legal proceedings in the United States against i2. In April 2008, SAP amended the complaint to add a third patent. SAP alleged, per the amended complaint, that i2’s products infringe one or more of the claims in each of three patents held by SAP. In its complaint, SAP sought unspecified monetary damages and permanent injunctive relief. In June 2008 SAP and i2 resolved this dispute. The terms of the settlement agreement provided SAP to make a one-time cash payment to i2 and for SAP to receive a license to all i2 patents.
In October 2006,U.S.-based Sky Technologies LLC (Sky) instituted legal proceedings in the United States against SAP and Oracle. Sky alleges that SAP’s products and services infringe one or more of the claims in each of five patents held by Sky. In its complaint, Sky seeks unspecified monetary damages and permanent injunctive relief. The claim construction hearing (Markman hearing) was held in June 2007. The legal proceedings have been stayed pending a decision from the Court of Appeals for the Federal Circuit with respect to an interlocutory appeal.
In January 2007, German-based CSB-Systems AG (CSB) instituted legal proceedings in Germany against SAP. CSB alleges that SAP’s products and services infringe one or more of the claims of a German patent and a German utility model held by CSB. In its complaint, CSB has set the amount in dispute at €1 million and is seeking permanent injunctive relief. Within these proceedings CSB is not precluded from requesting damages in excess of the amount in dispute. In July 2007, SAP filed its response in the legal proceedings including a nullity action and cancellation proceeding against the patent and utility model, respectively. The infringement hearing has been re-scheduled for May 2009. The nullity hearing on the German patent was held in January 2009 and the German Court determined that the patent is invalid. CSB may appeal.
F-62
In March 2007,U.S.-based Oracle Corporation and certain of its subsidiaries (“Oracle”) instituted legal proceedings in the United States against TomorrowNow, Inc. and its parent company, SAP America, Inc. and SAP America’s parent company SAP AG (“SAP”). Oracle filed an amended complaint in June 2007, a second amended complaint in July 2008 and a third amended complaint in October 2008. As amended, the lawsuit alleges copyright infringement, violations of the Federal Computer Fraud and Abuse Act and the California Computer Data Access and Fraud Act, unfair competition, intentional and negligent interference with prospective economic advantage, and civil conspiracy. The lawsuit alleges that SAP unlawfully copied and misappropriated proprietary, copyrighted software products and other confidential materials developed by Oracle to service its own customers. The lawsuit seeks injunctive relief and unspecified monetary damages including punitive damages. In July 2007, SAP and TomorrowNow filed their response to the first amended complaint. In October 2008, SAP and TomorrowNow filed a motion to dismiss in response to Oracle’s third amended complaint. The Court granted the motion in-part which eliminated certain plaintiffs from the lawsuit. Subsequently, in December 2008, SAP filed an answer to the third amended complaint as revised pursuant to the Court’s ruling on the motion to dismiss. The trial is scheduled for February 2010. Additionally, in June 2007, SAP became aware that the United States Department of Justice had opened an investigation concerning related issues and had issued subpoenas to SAP and TomorrowNow; SAP and TomorrowNow are cooperating with the investigation and are responding to the original subpoenas and additional subpoenas issued by the Department of Justice. In February 2009 a settlement conference was held. No settlement was reached.
In April 2007,U.S.-based Versata Software, Inc. (formerly Trilogy Software, Inc.) (Versata) instituted legal proceedings in the United States against SAP. Versata alleges that SAP’s products and services infringe one or more of the claims in each of five patents held by Versata. In its complaint, Versata seeks unspecified monetary damages and permanent injunctive relief. A first claim construction hearing (Markman hearing) was held in June 2008. A second Markman hearing is scheduled for March 2009. The trial has been scheduled for August 2009.
In August 2007,U.S.-based elcommerce.com, Inc. (elcommerce) instituted legal proceedings in the United States against SAP. elcommerce alleges that SAP’s products and services infringe one or more of the claims in one patent held by elcommerce. In its complaint, elcommerce seeks unspecified monetary damages and permanent injunctive relief. The trial has been scheduled for January 2011.
In August 2007, Canadian-based JuxtaComm, Inc. (JuxtaComm) instituted legal proceedings in the United States against Business Objects and several other defendants. JuxtaComm alleges that Business Objects’ products infringe one or more of the claims in one patent held by JuxtaComm. In its complaint, JuxtaComm seeks unspecified monetary damages and permanent injunctive relief. The trial has been scheduled for November 2009.
In November 2007,U.S.-based Diagnostic Systems Corp. (DSC) instituted legal proceedings in the United States against SAP and several other defendants. Among the defendants is Business Objects, which was sued by DSC prior to it being acquired by SAP. DSC alleges that SAP’s products and services infringe one or more of the claims in one patent held by DSC. In its complaint against SAP, DSC seeks unspecified monetary damages and permanent injunctive relief. In its complaint against Business Objects, which also alleges infringement of one or more claims in one DSC patent, DSC seeks unspecified monetary damages and permanent injunctive relief. The legal proceedings had been stayed pending a decision from the Court of Appeals for the Federal Circuit with respect to a Writ of Mandamus. In January 2009, the legal proceedings were re-activated. A trial date has not yet been set.
In May 2008,U.S.-based InfoMentis, Inc. (“InfoMentis”) instituted legal proceedings in the United States against SAP. InfoMentis alleges copyright infringement and unfair competition. The lawsuit seeks unspecified monetary damages and a permanent injunction. SAP filed its response in August 2008. A trial date has not yet been set.
F-63
In July 2008,U.S.-based Implicit Networks (Implicit) instituted legal proceedings in the United States against SAP and several other defendants. Implicit alleges that SAP’s products and services infringe one or more of the claims of two patents held by Implicit. In its complaint, Implicit seeks unspecified monetary damages and permanent injunctive relief. SAP filed its response in November 2008. A trial date has not yet been set.
In July 2008,U.S.-based Aloft Media (Aloft) instituted legal proceedings in the United States against SAP and several other defendants. Aloft alleges that SAP’s products and services infringe one or more of the claims of two patents held by Aloft. In its complaint, Aloft seeks unspecified monetary damages and permanent injunctive relief. SAP filed its response in October 2008. A trial date has not yet been set.
Other Litigation
In January 2008,U.S.-based Acorn Systems, Inc. (“Acorn”) instituted legal proceedings in the United States against SAP. Acorn filed an amended complaint in March 2008. As amended, the lawsuit alleges breach of contract, fraud and fraudulent inducement, negligent misrepresentation, misappropriation of trade secrets, violations of the Texas Free Enterprise and Antitrust Act of 1983, and unfair competition. The lawsuit seeks unspecified monetary damages, although Acorn alleges in the complaint that it has suffered at least $116 million in damages. In February 2008, SAP filed a response to the original complaint and, in March 2008, instituted legal proceedings against Acorn in the Commercial Court of Brussels asking the Court to declare, inter alia, that SAP had not breached the contract, that SAP did not commit fraud and that SAP had not misappropriated Acorn trade secrets. SAP and Acorn have resolved these disputes and SAP has made a payment to Acorn.
In April 2008, South African-based Systems Applications Consultants (PTY) Limited (Securinfo) instituted legal proceedings in South Africa against SAP. Securinfo alleges that SAP has caused one of its subsidiaries to breach a software distribution agreement with Securinfo. In its complaint, Securinfo seeks damages of approximately €610 million plus interest. In September 2008, SAP filed a motion to dismiss. A trial date has not yet been set.
In April 2008,U.S.-based Wellogix, Inc. (“Wellogix”) instituted legal proceedings in the United States against SAP as well as several other defendants. Wellogix alleges several causes of action including, but not limited to, breach of joint venture/partnership agreement, breach of fiduciary duty, fraud, negligent misrepresentation, and misappropriation of confidential information. The lawsuit seeks unspecified monetary damages. SAP filed its responds in May 2008. In December 2008, the Court granted SAP’s motion to dismiss indicating the legal proceedings were improperly initiated in Texas. Wellogix may appeal.
We are also subject to a variety of other claims and lawsuits that arise from time to time in the ordinary course of our business, including proceedings and claims that relate to companies which we have acquired. We will continue to vigorously defend against all claims and lawsuits against us. We make a provision for a liability for such matters when it is both probable that a liability has been incurred and the amount of the loss can be reasonably estimated. We currently believe that resolving all claims and lawsuits against us, individually or in aggregate, will not have a material adverse effect on our business, financial position, income, or cash flows. Consequently, the provisions currently recorded for these claims and lawsuits are neither individually nor in aggregate material to SAP. However, all claims and lawsuits involve risk and could lead to significant financial or reputational damage to the parties involved. Because of significant inherent uncertainties related to these matters, there can be no assurance that our business, financial position, income or cash flows will not be materially adversely affected nor can we reliably estimate the maximum possible loss in the case of an unfavorable outcome.
| |
| (25) | DERIVATIVE FINANCIAL INSTRUMENTS |
In order to reduce risks resulting from fluctuations in foreign-currency exchange rates, risks resulting from future cash flows associated with share-based compensation granted to employees and risks resulting from
F-64
variable interest payments we enter derivative financial instruments. The hedging strategy is set by our Treasury Guideline. The fair values of our derivative financial instruments were as follows:
Fair values of Derivative Financial Instruments
Currency Hedging
As a globally active enterprise, we are subject to risks associated with fluctuations in foreign currency exchange rates in our ordinary operations. Foreign currency-denominated receivables, payables, debt, and other balance sheet positions, and future cash flows resulting from anticipated transactions including intra-group transactions are subject to currency risks. We manage our currency risk exposure on a Group-wide basis using primarily foreign exchange forward contracts and currency options.
Derivatives without designated hedge relationship
Foreign exchange derivatives entered into by us to offset exposure due to foreign currency-denominated monetary assets and liabilities or anticipated cash flows which are not designated as being in a hedge accounting relationship are marked to market at each reporting period, with gains and losses recognized in profit or loss.
In addition, this line item contains foreign currency derivatives embedded in nonderivative host contracts that are separated and accounted for as derivatives according to the requirements of SFAS 133.
F-65
Derivatives with designated hedge relationship (cash-flow hedges)
We are exposed to risks associated with anticipated intercompany cash flows in foreign currencies resulting from intercompany royalty payments and operating expenses charged within the Group. Most of SAP AG’s subsidiaries have entered into license agreements with SAP AG pursuant to which each subsidiary has acquired the right to sublicense SAP AG software products to customers within a specific territory. Under these license agreements, the subsidiaries are generally required to pay SAP AG a royalty equivalent to a percentage of the software and support services fees charged by them to their customers within 30 days following the end of the month in which the subsidiary recognizes the revenue. These intercompany royalties payable to SAP AG are mostly denominated in the respective subsidiaries’ local currency. This leads to a centralization of the foreign currency risk with SAP AG in Germany as the royalties are to be paid in subsidiary’s local currency while the functional currency of SAP AG is the euro. In addition, operating expenses arising in entities purely dedicated to development activities are charged in their functional currencies to Business Objects USA and Business Objects Software Ireland leading to a centralization of foreign currency risk in those two entities.
We enter into derivative instruments, primarily foreign exchange forward contracts, to hedge significant anticipated cash flows in foreign currencies from foreign subsidiaries. Specifically, we exclude the interest and the time value component and only designate the spot price of the foreign exchange forward contracts and the intrinsic value of the currency options, respectively, as hedging instrument to offset anticipated cash flows relating to countries with significant operations, including the United States, the United Kingdom, Japan, Switzerland, Canada, and Australia. We generally use foreign exchange derivatives that have maturities of 15 months or less, which may be rolled over to provide continuing coverage until the applicable royalties are received.
In 2008, net losses totalling €32 million (2007: net gains of €48 million) resulting from the change in the component of the derivatives designated as hedging instruments were taken directly to Other comprehensive income.
For the years ending December 31, 2008 and 2007, no highly probable transaction designated as a hedged item in a cash flow hedge relationship ceased to be probable of occuring. Therefore, we did not discontinue any of our cash flow hedge relationships. Also, we did not identify any ineffectiveness for these hedges for the fiscal years 2008 and 2007 and thus did not record fair value changes in profit or loss. In 2008, we reclassified net losses of €16 million (2007: €38 million) out of other comprehensive income/loss to profit or loss due to the hedged items affecting income. Generally, the cash flows of the forecasted transactions are expected to occur and therefore affect profit and loss monthly within a timeframe of 15 months from the balance sheet date. It is estimated that €28 million of the net losses recognized in other comprehensive income on December 31, 2008 will be reclassified into earnings during fiscal year 2009.
Share-based compensation hedging
We hedge certain cash flow exposures associated with both recognized and unrecognized share-based compensation (see Note 27) through the purchase of derivative instruments from independent financial institutions.
As at December 31, 2008 and 2007, the following derivatives were designated as hedging instruments for the STAR 2008, 2007, and STAR 2006 programs, respectively, and for the SOP 2007 program.
F-66
Share-based compensation Hedges
| | |
| * | | with designated hedge relationship |
The terms of the derivative financial instruments are each designed to reflect the terms of the underlying share-based compensation program. For the STAR programs, the derivatives reflect the eight measurement dates and weighting factors applicable to the STAR program, as described in Note 27. The number of options expiring at each measurement date, reflect the respective weighting factor of that date. The payment date of each option reflects the payout date of the STAR program that it hedges. Viewed together, we will receive from the financial institution 100% of the first €12.50 in appreciation of the SAP AG stock price above the STAR exercise price, 50% of the next €12.50 appreciation of the SAP AG stock price above the STAR exercise price, and 25% of any additional appreciation of the SAP AG stock price above the STAR exercise price. For the SOP program, the derivative reflects the exercise hurdle of 110% of the base value as well as the cap at a stock price of 200% of the exercise price. The terms of these derivative financial instruments require cash settlement, and there are no settlement alternatives. These derivative financial instruments are accounted for as Other assets on our Consolidated Balance Sheets.
The fair value of our share-based compensation hedges is calculated considering risk-free interest rates, the remaining term of the derivatives, the dividend yields and the share price and the volatility of SAP stock.
The change in fair value of the derivatives in a designated hedge relationship attributable to the nonvested portion is recorded directly in Other comprehensive income with the resulting deferred tax liability recorded separately. The amount recognized directly in Other comprehensive income is used to offset compensation expense on the underlying share-based compensation programs recognized over the vesting period. The fair values of the derivative instruments related to the underlying share-based compensation programs are based on market data reflecting current market expectations.
In 2008, a net result of €0 million (2007: a net result of €0 million; 2006: a net gain of €7 million) was recorded in Financial income, net. Based on the valuation of the share-based compensation hedges, compensation expense was increased by €40 million (2007: increased by €19 million; 2006: reduced by 72 million).
F-67
In 2008, net gains of €22 million (2007: €7 million) were taken directly to Other comprehensive income/loss. For the years ending December 31, 2008 and 2007, no gains or losses were reclassified from Accumulated other comprehensive income as a result of the discontinuance of share-based compensation hedges because it was probable that the original forecasted transaction would not occur. We did not record any ineffectiveness for these hedges for the fiscal years 2008 and 2007. In 2008, we reclassified net losses of €13 million (2007: €19 million) out of other comprehensive income/loss to profit or loss due to the hedged items affecting income. We estimate that €1 million of net losses included in Accumulated other comprehensive income at December 31, 2008 will be reclassified into earnings during the next year.
Interest Rate Hedging
We have partly financed the acquisition of Business Objects S.A. by entering into a syndicated term loan facility. The interest payments related to this facility depend on the reference rate of EURIBOR. In order to hedge for the cash-flow risk resulting from fluctuations in future interest payments related to the syndicated term loan facility, we entered into several interest rate payer swaps as hedging instruments. Through the interest rate payer swaps, the underlying floating rate of the facility is economically converted into a fixed rate as the changes in the cash flows of the hedged items resulting from changes in EURIBOR are offset against the changes in the cash flows of the interest rate swaps. At December 31, 2008, the volume of the interest rate derivatives covered the total volume of the syndicated term loan facility.
Although all interest rate payer swaps we hold constitute effective economic hedges, not all qualify for hedge accounting treatment. In order to hedge for the risk in variable cash flows even before the acquisition date, we entered several deal contingent interest rate swaps which we kept after the acquisition date. Due to these interest rate derivatives being contingent with regard to uncertainty of the acquisition and the resulting facility, the derivatives did not qualify for hedge accounting treatment at year-end 2007.
Derivatives without designated hedge relationship
As the above mentioned deal contingent interest rate derivatives and the term facility have different parameters, a hedge accounting treatment was not established after the acquisition date. Hence, the deal contingent interest rate payer swaps are recorded at fair value with any changes in fair value charged to profit and loss and we recorded losses of €7 million in Financial income, net in the financial year 2008 (2007: gains of €1 million). At December 31, 2008, we had interest rate derivatives without designated hedge relationship with a negative fair value of €7 million (2007: positive fair value of €1 million).
Derivatives with designated hedge relationship — cash-flow hedges
At December 31, 2008, we had interest rate derivatives with a designated hedge relationship with a negative fair value of €16 million (2007: €0 million) for which net losses of €15 million of the 2008 financial year due to the designation as cash-flow hedging instruments were recorded in Other comprehensive income/loss. Due to the interest rate derivatives being contingent with regard to the acquisition of Business Objects, S.A., a hedge accounting relationship was not established at year end 2007 and changes in the fair value in 2007 were recorded in Financial income, net. Therefore, no amounts were removed from equity and included in profit and loss. We did not record any ineffectiveness for these hedges for the fiscal year 2008.
(26) FINANCIAL RISK MANAGEMENT
We are exposed to various financial risks, including changes in foreign currency exchange rates, interest rates, equity prices and the creditworthiness of our counterparties.
We manage credit, liquidity, interest rate, equity price and foreign currency exchange risks on a Group-wide basis. Selected derivatives are exclusively used for this purpose and not for speculation which is defined as entering into derivative instruments without a corresponding underlying transaction. Financial risk management is done centrally. It is regulated by internal guidelines and undergoes continuous internal risk analysis.
F-68
For the presentation of market risks, we use sensitivity analyses that show the effects of hypothetical changes of relevant risk variables on income and Other comprehensive income/loss depending whether fair value fluctuations affect earnings or Shareholders’ equity. The periodic effects are determined by relating the hypothetical changes in the risk variables to the balance of financial instruments at the reporting date.
Foreign Currency Exchange Risk
Foreign currency exchange risk is the risk of loss due to adverse changes in foreign exchange rates. As a globally active enterprise, we are subject to risks associated with fluctuations in foreign currencies with regard to our ordinary operations. Foreign currency-denominated receivables, payables, debt, and other monetary balance sheet positions as well as future cash flows resulting from forecasted transactions including intra-group transactions are subject to currency risks as described in Note 25. Risks from foreign currencies are continuously assessed. Most of these transactions are hedged to the extent that they influence our income and cash flows.
Under U.S. GAAP, foreign exchange risks arise on account of monetary financial instruments denominated in currencies other than the functional currency where the nonfunctional currency is the respective risk variable; translation risks are not taken into consideration. Because the individual Group entities mainly conduct their operating business in their own functional currencies, our risk of exchange rate fluctuations from ongoing ordinary operations is not considered significant.
With regard to our investing and financing activities we are not exposed to any significant foreign exchange risk as all activities are conducted in the respective functional currency.
We disclose our risk exposure based on a sensitivity analysis using the following assumptions:
According to our general policy not to invoice in currencies other than the entity’s’ functional currency, the majority of our nonderivative monetary financial instruments such as cash, accounts receivable, accounts payable, loans to employees and third parties, bank liabilities, and other financial liabilities are denominated in the respective entities’ functional currency. Thus, a foreign exchange risk in these transactions is nonexistent. In exceptional cases and limited economic environments, operating transactions are denominated in currencies other than the functional currency leading to a currency risk for the related monetary instruments. Where we hedge against currency impacts on cash flows, these foreign currency-denominated financial instruments are economically converted into the functional currency by the use of forward exchange contracts or options. Therefore, fluctuations in foreign currency exchange rates do not have a significant impact on profit and loss or shareholders equity with regard to our nonderivative monetary financial instruments.
Furthermore, income or expenses on the nonderivative monetary financial instruments discussed above are always recognized in the relevant entity’s functional currency. Therefore, fluctuations in foreign exchange rates have no significant impact on profit and loss or shareholders’ equity in this regard.
Our freestanding derivatives designed for hedging currency risks almost completely balance the changes in the fair values of the hedged item attributable to exchange rate movements in the income statement in the same period. As a consequence, the hedged items and the hedging instruments are not exposed to currency risks with an effect on profit or loss, or shareholders’ equity either.
Consequently, we are only exposed to foreign currency exchange rate fluctuations with regard to:
| | |
| | • | derivatives held within a designated cash-flow hedging relationship and |
| |
| | • | foreign currency embedded derivatives (which arise for instance due to a foreign-currency denominated contract in Switzerland). |
As all our cash-flow hedges in a hedge relationship are effective, the fluctuations in the respective currencies affect Other comprehensive income/loss. The interest element which is not part of the assigned hedging relationship and is posted to profit and loss is not affected by currency fluctuations. As we do not have a significant exposure to a single currency, we disclose our exposure to our major currencies (as described in Note 25) in total. If, at December 31, 2008, the euro had gained (lost) 10% against all our major currencies, the
F-69
Unrealized foreign currency cash-flow hedge position in Other comprehensive income/loss would have been €65 million (December 31, 2007: €64 million) higher (lower) than presented.
Any change in the value of our foreign currency embedded derivatives is recorded in profit or loss. If, at December 31, 2008, the euro had gained (lost) 10 percent against the Swiss franc, the effect on other nonoperating income would have been €40 million (December 31, 2007: €37 million) higher (lower) than presented. If at December 31, 2008, the euro had gained (lost) 10 percent against all other currencies, the effect on other nonoperating income would have been €3 million (December 31, 2007: 3 million) lower (higher) (December 31, 2007: higher (lower)) than presented.
Interest-Rate Risk
Interest-rate risks result from changes in market interest rates which can cause changes in the fair value of fixed-rate instruments and interest to be paid for variable-rate instruments.
This risk is negligible with regard to our operating activities. Interest rate risks arise on account of our investing activities in debt instruments and our financing activities in connection with financial liabilities. In order to create a balanced structure of fixed and variable financial cash flows, we manage interest-rate risk by adding interest rate-related derivative instruments to a given portfolio of investments and debt financing.
Due to the short maturities of our investments (all our debt securities are classified as current) we do not have a significant interest-rate risk related to financial assets (see Note 13).
As described in Note 25, we entered into derivative financial instruments to hedge the interest rate risk resulting from the variable interest rate credit facility in connection with the acquisition of Business Objects S.A.
A sensitivity analysis is provided to show our interest rate risk exposure at the balance sheet date based on the following assumptions:
| | |
| | • | Changes in interest rates only affect nonderivative fixed-rate financial instruments if they are recognized at fair value. As we have classified our investments as available for sale we carry interest-rate sensitive debt investments at fair value with fair value changes recognized in Other comprehensive income/loss. For this reason, changes in prevailing market rates are included in the equity-related sensitivity calculation. |
| |
| | • | Income or expenses for nonderivative financial instruments with variable interest are subject to interest rate risk if they are not hedged items in an effective hedging relationship. We therefore have no significant interest-rate risk arising from our financial liabilities and consider interest rate changes for our variable rate debt investments in the earnings-related sensitivity calculation. |
| |
| | • | Due to the aforementioned designation of interest rate derivatives to a cash-flow hedge relationship, the respective interest rate changes affect the Unrealized interest rate cash-flow hedge position in Other comprehensive income/loss. The movements related to the interest rate swaps’ variable leg are not reflected in the sensitivity calculation as they offset the variable interest payments for the credit facility. We therefore consider only changes from the interest rate swaps’ fixed leg in the equity-related sensitivity calculation for the interest swaps in a hedge relationship. |
| |
| | • | As the deal contingent interest rate payer swaps are freestanding derivatives with fair value fluctuations charged to profit or loss we include only changes from the interest rate swaps’ fixed leg in the earnings-related sensitivity calculation. The movements related to the interest rate swaps’ variable leg are not reflected in the sensitivity calculation as they offset the variable interest payments for the credit facility. |
If, at December 31, 2008, interest rates had been 100 basis points higher (lower), the unrealized gains/losses on marketable securities position in Other comprehensive income/loss would have been €0 million (December 31, 2007: €2 million) lower (higher) than presented.
F-70
If, at December 31, 2008, interest rates for our variable rate debt investments had been 100 basis points higher (lower), the financial income, net would have been €3 million (December 31, 2007: €1 million) higher (lower) than presented.
If, at December 31, 2008, interest rates had been 100 basis points higher (lower), the Unrealized interest rate cash-flow hedge position in other comprehensive income/loss would have been €1 million (December 31, 2007: €0 million) lower (higher) than presented.
If, at December 31, 2008, interest rates had been 100 basis points higher (lower), the impact on financial income, net from deal contingent interest rate payer swaps would have been €0 million higher (lower) (December 31, 2007: €9 million higher and €7 million lower, respectively) than presented.
Equity-Price Risk
Equity-price risk is the risk of loss due to adverse changes in equity markets. Our investments consist of listed and non-listed securities held for purposes other than trading and are classified as available for sale. Our equity investments in listed securities are accounted for at fair value with fair value changes recorded in Other comprehensive income/loss and are monitored based on the current market value that is affected by the fluctuations in the volatile stock markets worldwide. An assumed 20% increase (decrease) in equity prices as at December 31, 2008 would not have a material impact on the value of our investments in marketable securities (2007: €1 million) with corresponding entries in Other comprehensive income/loss.
The equity investments in non-listed securities are monitored individually. Those securities are recognized at cost, because market values are generally not observable. They are subject to an annual impairment test.
Credit Risk
Credit risk is the risk of economic loss of principal or financial rewards stemming from counterparty’s failure to repay or service debt according to the contractual obligations. We are exposed to credit-related losses through our operating and investing activities.
Credit risk from our operations comprises the default risk of customers and counterparties to derivatives we hold to hedge risks inherent in our operating activities. The default risk of customers is managed separately, mainly based on assessing creditworthiness through external ratings and our historical experience with respective customers. Outstanding debts are continuously monitored locally. Credit risks are taken into account through individual and portfolio impairments (described in detail in Note 3 and Note 14). In terms of the overall credit risk exposure from these operations, the impact of receivables from single customers is limited due to our large customer base and its distribution across many different industries and countries worldwide. To mitigate the credit risk we conduct all of our hedging activities with approved major financial institutions that carry high external credit ratings. In addition, the concentration of credit risk that exists when counterparties are involved in similar activities operating in the same industry and geographical area is further mitigated by diversification of counterparties throughout the world and by an internal limit system for each individual counterparty. The maximum exposure to credit risk from operating activities is limited to the carrying amounts of our accounts receivable and the derivative financial assets held to hedge operating risks.
Credit risk from our investing activities relates to cash and cash equivalents, debt investments and other nonderivative financial assets. In connection with the financial instruments discussed above, we are exposed to credit-related losses to the extent that banks or issuers of securities fail to fulfill their financial obligations. To mitigate this risk we conduct all our activities only with approved major financial institutions and issuers that carry high external ratings. In addition, we diversify our activities over multiple counterparties. This approach is assured by detailed guidelines for the management of financial risks stipulating that the business volume with each individual counterparty depends on the lowest official long-term credit rating available of at least one of the major rating agencies or participation in the German Depositor’s Guarantee Fund. In line with our risk
F-71
policy, investments are only allowed in approved investment grade instruments. The maximum exposure to credit risk from cash and cash equivalents, debt investments and other financial assets is equal to the carrying amount of these assets.
No significant agreements reducing the maximum exposure to credit risk had been concluded as at the reporting date.
Liquidity Risk
Liquidity risk results from the potential inability to meet financial obligations, such as payments to suppliers or employees. Our Group-wide liquidity is generally managed by our global treasury department through holding adequate volumes of cash, cash equivalents, short-term investments and maintaining credit facilities.
Our main source of liquidity is our operating business, generally generating those liquid funds needed to maintain our investing and financing strategy. Unless restricted by local regulations, subsidiaries pool their cash surplus to the global treasury which then arranges to fund other subsidiaries’ requirements or invest any net surplus in the market, seeking to optimize yield while ensuring liquidity by investing only with counterparties and issuers of high credit quality.
Apart from working capital and cash management, SAP has reduced its liquidity risk by arranging an adequate volume of available credit facilities with various financial institutions. For details, see Note 18.
Fair Value of Financial Instruments
We use various types of financial instruments in the ordinary course of business. We use the following categories: loans and receivables (L&R), available-for-sale (AFS), held for trading (HFT) and amortized cost (AC). We neither designate our financial assets and liabilities as at fair value through profit or loss nor hold financial assets to maturity.
The carrying amounts and fair values of our financial instruments were as follows:
Fair Values of Financial Instruments
F-72
All financial instruments presented in the table above are described in detail in Notes 13, 14, 15, 18, and 25. The fair values of these financial instruments are determined as follows:
| | |
| | • | Cash and cash equivalents, Accounts receivable, other nonderivative financial assets: Because the financial assets are primarily of short-term nature it is assumed that the fair values of these assets approximate their carrying values. Investments in insurance policies held for postemployment pension plans and semiretirement as well as prepaid pensions are valued at their cash surrender values. Non-interest-bearing or below market-rate loans to third parties or employees are discounted to the present value of estimated future cash flows using the original effective interest rate the respective borrower would have to pay to a bank for a similar loan. In case of bad debts and sales allowances the carrying amount is reduced accordingly. |
| |
| | • | Investments: The fair values of marketable securities are based on quoted market prices as at December 31. For non-listed equity securities fair values could not readily be observed due to the absence of an active market with market prices. Also, calculating fair values by discounting estimated future cash flows is not possible as a determination of cash flows is not reliable. Therefore, fair values for nonlisted equity securities are not presented. |
| |
| | • | Bank liabilities: As almost all our bank liabilities are variable interest debts their carrying values approximate their fair values. |
| |
| | • | Accounts payable and other nonderivative financial liabilities: Because these financial liabilities are mainly of short-term nature it is assumed that their fair values approximate their carrying values. |
| |
| | • | Derivative financial instruments: The fair value of foreign exchange forward contracts is based on discounting the expected future cash flows over the respective zero-coupon interest rates, spot rates and the remaining term of the contracts. The fair value of the derivatives entered into to hedge our share-based compensation programs are calculated considering risk-free interest rates, the remaining term of the derivatives, the dividend yields, the stock price and the volatility of our share. Fair values of our derivative interest rate contracts are calculated by discounting the expected future cash flows by taking the prevailing market rates for the remaining term of the contracts as a basis. |
| |
| | • | The fair values of nonderivative financial assets and liabilities and of derivative financial instruments are generally determined for each type of instrument on an individual basis. |
Determination of Fair Values
SFAS 157 Fair Value Measurements defines fair value as the price that would be received to sell an asset or pay to transfer a liability in an orderly transaction between market participants at the measurement date. In accordance with SFAS 157, we have categorized our recurring basis of financial assets and liabilities based on the priority of the inputs to the valuation technique, into a three-level fair value hierarchy.
The fair value hierarchy gives the highest priority to quoted prices in active markets for identical assets or liabilities (Level 1) and the lowest priority to unobservable inputs (Level 3). The inputs used to measure fair value may fall into different levels of the fair value hierarchy. In such cases, the level in the fair value hierarchy within which the fair value measurement in its entirety falls has been determined based on the lowest level input that is significant to the fair value measurement in its entirety. Our assessment of the significance of a particular input to the fair value measurement in its entirety requires judgment, and considers factors specific to the asset or liability.
The levels of the fair value hierarchy and its application to our financial assets and liabilities are described below:
| | |
| | • | Level 1: Quoted prices in active markets for identical assets or liabilities |
F-73
| | |
| | • | Level 2: Inputs other than observable, either directly or indirectly, such as quoted prices in active markets for similar assets or liabilities, quoted prices for identical or similar assets or liabilities in markets that are not active, or other inputs that are observable or can be corroborated by observable market data for substantially the full term of the assets or liabilities; or |
| |
| | • | Level 3: Unobservable inputs that are supported by little or no market activity and that are significant to the fair value of the assets or liabilities |
The following table allocates our financial assets and liabilities to the three levels of the fair value hierarchy according to SFAS 157:
Classification of Financial Instruments
F-74
Fair Value Measurements Using Significant Unobservable Inputs (Level 3)
Valuation Techniques — Level 1
Measures of fair value of our time deposits and available-for-sale debt securities were derived from quoted prices traded in active markets.
Valuation Techniques — Level 2
All our Level 2 assets and liabilities consist of derivative financial instruments. The fair value of the derivatives is calculated by discounting the expected future cash flows using relevant interest rates and spot rates over the remaining term of the contracts.
Valuation Techniques — Level 3
The investments in our equity securities recorded at cost consist primarily of venture capital investments. These investments are recorded at cost because market values for those securities are generally not readily obtainable. Our estimation of fair value for our Level 3 investments includes a comparison to similar companies based on revenue multiples and review of each companies’ cash position, financing needs, earnings and revenue outlook, operational performance, management and ownership changes and competition.
F-75
Assets and Liabilities Measured at Fair Value on a Nonrecurring Basis
Certain assets, including our equity method investments and goodwill, are measured at fair value on a nonrecurring basis and therefore are not included in the table above. These assets include equity method investments that are recognized at fair value at the end of the period to the extent that they are deemed to be other-than-temporarily impaired. During fiscal year 2008, we did not record any other-than-temporary impairments on those assets required to be measured at fair value on a nonrecurring basis.
(27) SHARE-BASED PAYMENT PLANS
Our total compensation expense recorded in connection with share-based payment plans for the year 2008 was €63 million (2007: €95 million; 2006: €99 million). The total income tax benefit recognized in the income statement for share-based payment plans was €48 million in 2008 (2007: €32 million; 2006: €13 million). The tax benefit realized from stock options exercised during the annual period was 24 million (2007: €19 million; 2006: €14 million).
| |
| a) | Employee Discounted Stock Purchase Programs |
The Company acquires SAP AG common shares for various employee stock purchase plans and transfers the shares to employees. We record the discounts provided to employees through such plans as compensation expense. The discounts provided to employees do not exceed 15%.
| |
| b) | Cash-Settled Share-Based Payment Plans |
| | |
| | b.1) | Stock Appreciation Rights (STAR) Plans |
In March and April 2008, we granted approximately 18.5 million (2007: 18.7 million; 2006: 14.1 million) stock appreciation rights (“2008 STARs”, “2007 STARs” and “2006 STARs” respectively) to selected employees who are not beneficiaries of the SOP 2007 Plan explained further below. The 2008, 2007 and 2006 STAR grant-base values of €32.69, €35.71 and €42.12, respectively, are based on the average fair market value of one common share over the 20 business days commencing the day after the announcement of the Company’s preliminary results for the preceding fiscal year. The valuation of the STARs is calculated quarterly over a period of two years. Each quarterly valuation is weighted as follows in determining the final valuation:
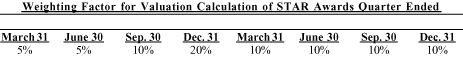
The valuations for quarters ending December 31 are calculated on the basis of the amount by which the grant price is exceeded by the average fair market value of one share of Common stock, as quoted on Xetra, the trading system of the Frankfurt Stock Exchange, over the 20 consecutive business days following the announcement date of the Company’s preliminary annual results. The other quarterly valuations are calculated on the basis of the amount by which the grant price is exceeded by the average fair market value of one share of common share, as quoted on Xetra, over the five consecutive business days following the announcement of the Company’s quarterly results. Because each quarterly valuation is conducted independently, it is unaffected by any other quarterly valuation.
The cash payout value of each STAR is calculated quarterly as follows: (i) 100% of the first €12.50 value appreciation for such quarter; (ii) 50% of the next €12.50 value appreciation; and (iii) 25% of any additional value appreciation. Beneficiaries will receive payments with respect to the 2008 STARs as follows: 50% on both March 31, 2010 and January 31, 2011. Under the terms of the 2007 STAR program, beneficiaries are scheduled to
F-76
receive an initial payment of 50% on March 31, 2009, and a second installment on January 31, 2010. Beneficiaries will receive STAR payments provided that they are still employees of the Company on the payment dates, subject to certain exceptions.
As our STAR plans are settled in cash, rather than by issuing equity instruments, a liability is recorded for such plans based on the current fair value of the STAR awards at the reporting date. The fair value of the STAR 2008 and 2007 awards was estimated using a Monte-Carlo valuation model.
Expected volatilities are based on implied volatilities from traded options on our stock with corresponding lifetimes and exercise prices. The fair value as at December, 31 was calculated on the basis of the following assumptions:
The fair value of the STAR 2006 awards was based on market data that reflect current market expectations. The fair value of the STAR awards is the same as the fair values of the derivatives that are entered into to hedge the compensation expense for the STAR 2007 awards — as described in Note 25 — because the terms of the STAR awards and the derivatives are the same. Compensation expense — including the effects of changes in the fair value of the STAR award — is accrued over the period in which the employee performs the related service (“vesting period”).
As at December 31, 2008, a STAR provision in the amount of €15 million (2007: €74 million; 2006: 132 million) was included in provisions in the Consolidated Balance Sheets. The related STAR expense was affected by the effects of the STAR hedge — as described in Note 25 — and therefore totaled 28 million (2007: €43 million, 2006: €28 million). The STAR provision as at December 31, 2008, and the related STAR expenses recorded during 2008, result from awards granted under the 2008, 2007, and 2006 STAR programs.
In 2008, we paid to employees €1 million related to STAR 2006 and €58 million related to STAR 2005. In 2007 we paid to employees €61 million related to STAR 2005 and €18 million related to STAR 2004.
The amount of unrecognized compensation expense related to nonvested share-based payment arrangements granted under the STAR plans is dependent on the final intrinsic value of the awards which itself depends on the future price of our common share which we cannot reasonably predict. The final payout amount will be recognized over a remaining period from December 31, 2008 of 2.1 years for STAR 2008, 1.1 years for STAR 2007, and 0.1 year for STAR 2006.
| | |
| | b. 2) | Incentive Plan 2010 |
In January 2008 and January 2007, the Company granted respectively 0.1 and 0.7 million stock appreciation rights (“rights”) to top executives under the Incentive Plan 2010. The plan provides for a maximum payout of €144.60 per right if the market capitalization of SAP AG doubles by December 31, 2010. The rights issued to the beneficiaries of this plan will automatically be exercised in case the conditions for exercise are met. The base value of the rights is the base market capitalization figure of 44,794,067,259, calculated as €144.60 (average Xetra closing price of the SAP AG stock in the period July 1 through December 31, 2005, prior to the capital increase as implemented on December 21, 2006) times 309,779,165 shares (number of issued shares minus the treasury shares on December 31, 2005, prior to the capital increase implemented on December 21, 2006).
F-77
For the Incentive Plan 2010, the relevant actual market capitalization is calculated by multiplying the average closing price of one SAP share in the Xetra trading system in the measurement period (July 1 through December 31 of each year) by the average number of SAP AG shares outstanding minus the average number of treasury shares in the measurement period of that year. The relevant actual market capitalization is calculated annually in the first month after the end of each measurement period, beginning in 2006 and ending in 2010.
The rights will only be exercisable if SAP’s common share outperforms the S&P North Software-Software Indextm (formerly GSTI Software Index) during the period between the issue of the rights and December 31, 2010, or December 31 of the year with the last measurement period if the rights are exercised before that date. Further, to be exercisable from 2006 through 2009, the actual market capitalization must not be less than 200% of the base value.
The rights are not exercisable if exercise would result in a windfall profit. The decision whether exercise results in a windfall profit will be made by the Supervisory Board’s compensation committee at its sole discretion.
If the relevant actual market capitalization is 200% (or more) of the base market capitalization and the other conditions are met, the payout value per right will be €144.60.
If the increase between the base value and the relevant actual market capitalization is below 200% of the base market capitalization, the payout per award will be based on the following scale:
Payout per Award
If the plan pays out, beneficiaries will receive the payments 12 months after the compensation committee has determined the exercise value.
The Incentive Plan 2010 is settled in cash rather than by issuing equity instruments, so a liability is recorded for the rights granted reflecting the fair value of the rights at the reporting date. Compensation expense — including the effects of any changes in fair value of the rights — is accrued over the period the beneficiaries are expected to perform the related service (“vesting period”).
The fair value of the rights is estimated using a Monte-Carlo valuation model. Expected volatilities are based on implied volatilities from traded options on our stock for options with a corresponding lifetime and
F-78
exercise price. The expected life is based on our estimate of the earliest point in time when the vesting conditions are collectively met. The fair value as at December, 31 was calculated using the following assumptions:
As at December 31, 2008 the provision for rights granted under the Incentive Plan 2010 amounted to 2 million (2007: €3 million; 2006: €2 million).
The amount of unrecognized compensation expense related to nonvested rights granted under the Incentive Plan 2010 depends on the final intrinsic value of the awards which itself depends on the future price of our common shares and certain other factors that we cannot influence or reasonably predict. The final payout amount will be recognized over a remaining period of up to two years from December 31, 2008.
| | |
| | b.3) | Virtual Stock Option Plan 2007 |
In the first half of 2008 as well as in 2007, the Company granted 8.7 and 7.0 million virtual stock options respectively (stock appreciation rights, “SAP SOP 2007”). The plan provides for cash settlement only and is available to members of the SAP AG Executive Board, members of subsidiaries’ executive boards, as well as to eligible executives and other top performers of SAP AG and its subsidiaries. The program replaced the SAP SOP 2002 Plan, described below. The awards granted in 2008 and 2007 have a respective grant-base value of €32.69 and €35.71, which is based on the average fair market value of one common share over the 20 business days following the announcement date of the Company’s preliminary results for the preceding fiscal year.
Under the SAP SOP 2007 Plan, beneficiaries receive stock appreciation rights (“Virtual Stock Options” or “rights”) based on the SAP share price, which gives them the right to receive a certain amount of money by exercise under the terms and conditions of this plan.
Rights granted under this plan may be exercised after a vesting period of two years starting on the grant date. The term of the Virtual Stock Options is five years, i.e. the rights will expire five years after the grant date if not exercised by the holder before that date.
The exercise price is 110% of the base value. Thus, the right can only be exercised if the share price at exercise exceeds the grant price by at least 10%. Monetary benefits will be capped at a share price of 200% of the exercise price.
The SAP SOP 2007 is settled in cash rather than by issuing equity instruments, so a liability is recorded on the basis of the current fair value of the outstanding Virtual Stock Options at the reporting date. The fair value of the rights is estimated using a binomial valuation method. Expected volatilities are based on implied volatilities from traded options on our stock with a corresponding lifetime and exercise price. The expected life of the options was determined to be 5 years. This assumption was made based on expected exercise behavior since
F-79
no reliable historical data was available. The fair values as at December, 31 were calculated using the following assumptions:
As at December 31, 2008, the provision for rights granted under the SAP SOP 2007 Plan amounted to 36 million (€21 million as at December 31, 2007).
The amount of unrecognized compensation expense related to nonvested rights granted under the SAP SOP 2007 Plan depends on the final intrinsic value of the awards which itself depends on the future price of our common share and certain other factors that we cannot influence or reasonably predict.
The final payout amount will be recognized over a remaining period from December 31, 2008 of 3.9 years for SOP 2007 granted in 2008, and of 3.1 years for SOP 2007 granted in 2007.
| | |
| | b.4) | Business Objects cash-settled awards based on former Business Objects option and Restricted Stock Unit plans |
Prior to being acquired by SAP, the employees of Business Objects companies were granted equity awards giving rights to Business Objects shares. Following the Business Objects acquisition described in Note 4, and the squeeze-out on February 18, 2008, the Business Objects shares were no longer publicly traded. Therefore, SAP implemented mechanisms to allow the employees to cash out their equity awards, either by receiving cash instead of Business Objects shares (cash payment mechanism or CPM) or by receiving Business Objects shares that they subsequently sell to SAP (liquidity agreement mechanism or LAM). The implementation of CPM and LAM resulted in substance in a conversion of the 5.1 million equity awards outstanding at February 18, 2008 to an equal number of cash settled share-based payment awards (replacing awards) to replace the stock options and Restricted Stock Units (RSUs) granted to them by Business Objects prior to SAP’s acquisition of Business Objects (replaced awards).
The replaced awards comprised the following categories of awards:
| | |
| | • | Stock options with a4-year monthly graded vesting schedule from grant date, subject to a minimum of one year of continued service with the Company. The contractual terms range from 7 — 10 years. The exercise price for one sub-category of the awards was equal to 100% of the closing price of the Business Objects stock as reported on the Eurolist by Euronext on the last trading day prior to the option grant date; while the other subcategory of awards the exercise price was 100% of the average of the opening share price as reported on such market over the 20 trading days immediately preceding the historical grant date. |
| |
| | • | International RSUs were subject to a3-year graded vesting schedule. These rights were provided free of charge to the employees (no exercise price). |
| |
| | • | French RSUs had a two-year vesting period followed by a two-year holding period. These rights were also provided to the employees free of charge (no exercise price). |
The replacing awards closely mirror the terms of the replaced awards (including conditions such as exercise price and vesting) except that
| | |
| | • | The replaced awards were planned to be settled by issuing equity instruments whereas the replacing awards are settled in cash either via the CPM or via the LAM mechanism. |
F-80
| | |
| | • | The replaced awards were indexed to Business Objects’ share price whereas the replacing awards are indexed to SAP’s stock price as follows: SAP’s offering price for Business Objects shares during the tender offer (€42) is divided by SAP AG’s share price at the tender offer closing date (€32.28) and the result is multiplied by the weighted average SAP share closing price during the 20 trading days preceding the exercise or disposition date. |
In countries where the CPM applies, the benefit resulting from the stock option exercise or the RSU vesting is usually paid directly to the employees by SAP.
In countries where the LAM applies an equity settlement was retained but supplemented by the LAM. In these cases, the employees continue to receive shares of Business Objects S.A. upon stock options exercise and RSU vesting and have a put option on these shares to resell the shares to SAP within 3 months from the exercise or vesting date, except for some stock options exercise subject to French tax law, for which the put option period is 2 years and 3 months. SAP has a call option on these shares.
In both cases, these awards are accounted for as a cash-settled award under SFAS 123R because the obligation to the employee will ultimately be settled in cash only, both under the CPM and the LAM mechanism.
As the replacing awards are settled in cash rather than by issuing equity instruments, a liability is recorded on the basis of the current fair value of the outstanding replacing awards at the reporting date. The fair value of the rights is estimated using a binomial valuation method. Expected volatilities are based on implied volatilities from traded options on our stock with a corresponding lifetime and exercise price. The expected life of the options was determined to be 3.7 years. This assumption was made based on historical exercise behavior of Business Objects employees.
The fair values as at December, 31 were calculated using the following assumptions:
As at December 31, 2008, the provision for rights granted under the Business Objects Plan amounted to 37 million.
In 2008 we paid to employees €36 million related to the Business Objects Plan.
The amount of unrecognized compensation expense related to nonvested rights granted under the Business Objects Plan depends on the final intrinsic value of the awards which itself depends on the future price of our common share and certain other factors that we cannot influence or reasonably predict.
The final payout amount will be recognized over a weighted average remaining vesting period from December 31, 2008 of 1.6 years.
F-81
c) Equity Settled Share-Based Payment Plans
| | |
| | c.1) | Stock Option Plan 2002 |
At the 2002 Annual General Meeting of Shareholders, the SAP AG shareholders approved the SAP SOP 2002 Plan, which provides for the issuance of stock options to members of the SAP AG Executive Board, members of subsidiaries’ executive boards, and to eligible executives and other top performers of SAP AG and its subsidiaries. The SAP SOP 2002 Plan was designed to replace the LTI 2000 Plan, described below. Under the SAP SOP 2002 Plan, the Executive Board was authorized to issue, on or before April 30, 2007, up to 19.0 million stock options. In 2007, the SAP SOP 2002 Plan was replaced by the SAP SOP 2007 Plan. The last stock options under the SAP SOP 2002 Plan were granted in 2006.
Each stock option granted under the SAP SOP 2002 Plan entitles its holder to subscribe to four shares of the Company’s common stock by tendering payment of an exercise price per option equal to a base price and a premium of 10% of the base price. The base price is calculated as the average market price of SAP AG’s common share on the Frankfurt Stock Exchange during the five trading days preceding the issue of the respective stock option, calculated on the basis of the arithmetic mean of the closing auction prices of the stock in the Xetra trading system. The options cannot be exercised at an exercise price that is less than the closing auction stock price on the day before the issue date. The term of the stock options is five years. Subscription rights cannot be exercised until the vesting period of two years has elapsed.
For options granted to members of the Executive Board during and after February 2004, the SAP SOP 2002 Plan’s terms cap the subscription rights if the Supervisory Board determines that an option holder would make a windfall profit on exercising the rights. A windfall profit is defined for this purpose as a profit that, when combined with the profit from earlier exercises of subscription rights issued to the option holder at the same issuing date, exceeds twice the product of (i) the number of subscription rights received by the option holder and (ii) the exercise price. Such profit is determined as the total of the differences, calculated individually for each exercised subscription right, between the closing price of the share on the exercise day and the exercise price. SAP AG has undertaken to reimburse to the option holders any expenses they may incur through fees, taxes, or deductions related to the cap. The cap will only be imposed if the Supervisory Board determines that the windfall profit results from significant extraordinary, unforeseeable developments for which the Executive Board is not responsible.
The fair value of the options granted under the SAP SOP 2002 Plan was estimated as at the date of grant using the Black-Scholes-Merton option-pricing model. For options granted 2006 and 2005, the expected life of the options was determined using the “simplified method” to be 3.5 years, which represented the average of the vesting period and the contractual term of the awards. This approach was used because we did not have sufficient information about the historical exercise behavior of equity-based options granted to our employees. For awards granted from 2002 to 2004, the expected term of the awards was determined to be 2.5 years. Expected volatilities are based on implied volatilities of traded options to purchase our common share granted in 2006 and 2005 and based on historical data for options granted between 2004 and 2002.
The fair values of the Company’s share-based awards granted under SAP SOP 2002 Plan were calculated using the following assumptions and plan terms:
F-82
Activities in 2008 under Stock Option Plan 2002 were as follows:
Activities under SAP SOP 2002
The weighted-average grant-date fair value of share options granted during the years 2006 and 2005 was €26.47 and €20.08, respectively. The total intrinsic value of options exercised during the years ending December 31, 2008, 2007, and 2006 was €21 million, €59 million, and €46 million, respectively. In 2008, 2007 and 2006, we recorded compensation expenses for SAP SOP 2002 in the amount of €1 million, €26 million and €55 million respectively.
A summary of the status of our nonvested options as at December 31, 2008, and changes during the year ending December 31, 2008, is presented below:
Status of Nonvested SAP SOP 2002 Options
As at December 31, 2008, no unrecognized cost related to nonvested options granted under the SAP SOP 2002 remained.
c.2) Long Term Incentive 2000 Plan
On January 18, 2000, SAP AG’s shareholders approved the LTI 2000 Plan. The LTI 2000 Plan is a share-based payment program providing members of the SAP AG Executive Board, members of subsidiaries’ executive boards and selected employees a choice between convertible bonds, stock options, or a 50% mixture of each. Beneficiaries were offered 25% more units if they chose stock options than if they chose convertible bonds. Under the LTI 2000 Plan, each convertible bond having a €1 nominal value is convertible into four common
F-83
shares over a maximum of 10 years, subject to service vesting requirements. The conversion price is equal to the market price of a common share as quoted on the Xetra trading system on the day immediately preceding the grant. Each stock option may be exercised in exchange for four common shares over a maximum of 10 years, subject to the same vesting requirements. The exercise price varies with the outperformance of the common share price appreciation against the appreciation of the S&P North Software-Software IndexTM (formerly GSTI Software Index) from the day immediately preceding grant to the day on which the exercise price is determined. Both the convertible bonds and stock options vest as follows: 33% after two years from date of grant, 33% after three years, and 34% after four years. Forfeited convertible bonds or stock options are disqualified and may not be reissued.
In total, 12.3 million conversion and subscription rights were issued under the LTI 2000 Plan through March 14, 2002. At the 2002 Annual General Meeting of Shareholders, the Company’s shareholders revoked the authorization to issue further convertible bonds and stock options under the LTI 2000 Plan.
A summary of the LTI 2000 Plan activity for both convertible bonds and stock options is as follows:
Summary of the LTI 2000 Plan
All convertible bonds and stock options outstanding as at December, 31, 2008 are exercisable.
Due to the fact that all LTI 2000 Plans were fully vested during 2006, we recorded no compensation expenses in 2008 or 2007. In 2006, we recorded compensation expenses for the LTI 2000 Plan in the amount of €11 million based on the fair value recognition provisions of SFAS 123R. The total intrinsic value of stock options exercised during the years ending December 31, 2008, 2007, and 2006 was €5 million, €5 million and €27 million respectively. The total intrinsic value of convertible bonds exercised during the years ending December 31, 2008, 2007, and 2006 was €0 million, €0 million, and €6 million, respectively.
| |
| (28) | SEGMENT AND GEOGRAPHIC INFORMATION |
Our internal reporting system produces reports in which business activities are presented in a variety of ways, for example, by line of business, geography and areas of responsibility of the individual Executive Board
F-84
members (Board areas). Based on these reports, the Executive Board, which is responsible for assessing the performance of various company components and making resource allocation decisions as a Chief Operating Decision Maker (CODM), evaluates business activities in a number of different ways. While neither the line of business structure, the geographic structure, nor the Board areas are identified as primary, we have determined that our lines of business constitute operating segments. We have three reportable operating segments which are organized based on products and services: Product, Consulting, and Training.
The Product segment is primarily engaged in marketing and licensing our software products, performing custom software development services for customers, and providing support services for our software products. The Consulting segment performs various professional services, mainly implementation of our software products. The Training segment provides educational services on the use of our software products and related topics for customers and partners.
Our management reporting system reports our inter-segment services as cost reductions and does not track them as internal revenues. Inter-segment services mainly represent utilization of manpower resources of one segment by another segment on aproject-by-project basis. Inter-segment services are charged based on internal cost rates including certain indirect overhead costs but without profit margin.
The accounting policies applied in the internal reporting to our CODM differ from our U.S. GAAP accounting policies as follows:
| | |
| | • | The internal reporting to our CODM generally attributes revenue to the segment that is responsible for the related transaction regardless of revenue classification in our income statement. Thus, for example, the Training segment’s revenue includes certain amounts classified as software revenue. Since our segments are organized on the basis of products and services, the amounts of external revenue for the Product, Consulting and Training segments are materially consistent with the amounts of Software and software-related service revenue, Consulting revenue, and Training revenue, respectively, as reported in the Consolidated Statements of Income. |
| |
| | • | The internal reporting to our CODM allocates expenses to the segments based on organizational structures and cost centers rather than cost classification to functional areas. |
| |
| | • | The internal reporting to our CODM excludes share-based compensation expenses. |
| |
| | • | Differences in foreign currency translations result in minor deviations between the amounts reported internally to our CODM and the amounts reported in the Consolidated Financial Statements. |
Starting in 2008 we have made certain changes in our internal management reporting which resulted in additional deviations between the amounts reported internally to our CODM and the amounts reported in our Consolidated Financial Statements.
| | |
| | • | In contrast to our U.S. GAAP revenue figures presented in our Consolidated Statements of Income, the revenue numbers in our management reporting system include the support revenue that would have been reflected by Business Objects had it remained a standalone entity but are not permitted to be reflected as revenue under U.S. GAAP as a result of fair value accounting for Business Objects support contracts in effect at the time of our acquisition of Business Objects. |
| |
| | • | In contrast to our U.S. GAAP income figures presented in our Consolidated Statements of Income, the income measures in our management reporting system include the full amount of Business Objects support revenue and exclude acquisition-related charges. Acquisition-related charges in this context comprise: |
| | |
| | — | Amortization expense of intangibles acquired in business combinations and standalone acquisitions of intellectual property. |
| |
| | — | Expenses from purchased in-process research and development. |
| |
| | — | Restructuring expenses incurred in connection with business combinations. |
F-85
In prior years, acquisition-related charges were partially included in the segment results, while the rest was shown under development expenses and administration and other corporate expenses. In 2008 we began excluding acquisition related charges from the segments in our management reporting system. Therefore we have adjusted the prior year figures in the tables below for comparison purposes. Instead the acquisition related charges are presented as a separate line item.
Segment Revenue and Results
F-86
Reconciliation of Revenues and Segment Results
Segment Revenues
Since our segments are organized on the basis of products and services, the amounts of external revenue for the Product, Consulting, and Training segments are materially consistent with the amounts of Software and software-related service revenue, Consulting revenue, and Training revenue, respectively, as reported in the Consolidated Statements of Income, except for the differences in accounting policies discussed above.
External revenue from services provided outside of the reportable segments (2008: €16 million, 2007: €11 million, 2006: €10 million) mainly represents revenue incidental to our main business activities and minor currency translation differences.
Segment Result
Segment result reflects operating expenses directly attributable or reasonably allocable to the segments, including costs of product, costs of services, and sales and marketing expenses. Costs that are not directly attributable or reasonably allocable to the segments such as administration and other corporate expenses are not included in the segment result. Development expense is excluded from the segment result because our internal management reporting measures the segment performance without taking development expense into account. In addition, for management purposes, share-based compensation expense, write-down of support revenue and acquisition-related charges are not included in the segment result.
Depreciation and amortization expenses reflected in the segment result include the amounts directly attributable to each segment and the depreciation and amortization portion of the facility and IT-related expenses allocated to each segment based on headcount, facility space and other measures.
F-87
A one-time effect of a change in estimate on allowance for doubtful accounts in 2006 was allocated to the Product segment, the Consulting segment, and the Training segment in the amounts of €30 million, 13 million, and €2 million, respectively.
Development expense and administration and other corporate expense are based on a management view and do not equal the amounts under the corresponding caption in the Consolidated Statements of Income. The differences are mainly due to the fact that the management view focuses on organizational structures and cost centers rather than cost classification to functional areas.
Segment Assets
Segment asset information is not provided to the CODM. Goodwill by reportable segment is disclosed in Note 16.
Geographic Information
The following tables present revenue by location of customers and by location of companies, which reflects the location of our subsidiary responsible for the sale, and information about certain long-lived assets detailed by geographic region.
Total Revenue by Location
1) Europe, Middle East, Africa
F-88
Software and Software-Related Service Revenue by Location
1) Europe, Middle East, Africa
Property, Plant, and Equipment and Intangible Assets
1) Europe, Middle East, Africa
F-89
The total compensation of the Executive Board members for fiscal year 2008 amounted to €25 million (2007: €25 million). This amount includes €5 million (2007: €3 million) fixed and €15 million (2007: 18 million) performance-related compensation as well as €4 million (2007: €4 million) share-based compensation and additional only in 2006 €17 million of nonrecurring share-based compensation. The share-based compensation corresponds to the grant date fair value of the 628,329 virtual stock options (2007: 486,594) issued to Executive Board members during the year. In 2008, the projected benefit obligation for pensions to Executive Board members increased €1 million to €18 million (2007: €17 million). The annual pension entitlement of the members of the Executive Board on reaching age 60 based on entitlements from performance-based and salary-linked plans amounted to €1 million as at December 31, 2008 (€1 million as at December 31, 2007).
Subject to the adoption of the dividend resolution by the shareholders at the Annual General Meeting of Shareholders on May 19, 2009, the total annual compensation of the Supervisory Board members was €2 million (2007: €2 million). This amount includes €1 million (2007: €1 million) fixed, €1 million (2007: €1 million) variable compensation, and €0.1 million (2007: €0.08 million) committee remuneration. The Supervisory Board members do not receive any share-based compensation for their services. As far as members who are employee representatives on the Supervisory Board receive share-based compensation, such compensation is for their services as employees only and is unrelated to their status as members of the Supervisory Board.
In 2008, the pension payments to former Executive Board members were €1 million (2007: €1 million). The projected benefit obligation of pensions as at December 31, 2008 for former Executive Board members was €12 million (2007: €12 million).
Payments of €4 million were agreed for Shai Agassi in relation to the ending of his contract with SAP on April 30, 2007.
Peter Zencke, who left SAP on December 31, 2008, will be paid abstention compensation corresponding to 50% of his final average contractual compensation during the continuance of a12-month postcontractual noncompeting period.
SAP did not grant any compensation advance or credit to, or enter into any commitment for the benefit of, any member of the Executive Board or Supervisory Board in fiscal year 2008, 2007, or 2006.
F-93
On December 31, 2008, members of the Executive Board held a total of 88,527 SAP shares (December 31, 2007: 86,515 SAP shares) and members of the Supervisory Board held a total of 128,995,306 SAP shares (December 31, 2007: 128,993,710 SAP shares).
Detailed information on the different elements of the compensation as well as on the number of shares owned by members of the Executive Board and the Supervisory Board are disclosed in SAP’s Compensation Report which is part of the Review of SAP Group Operations and of SAP’s Annual Report onForm 20-F both available on SAP’s Web site.
| |
| (30) | RELATED PARTY TRANSACTIONS |
Certain Executive Board and Supervisory Board members of SAP AG currently hold, or held within the last year, positions of significant responsibility with other entities as presented in Note 29. We have relationships with certain of these entities in the ordinary course of business, whereby we buy and sell a wide variety of products and services at prices we believe are consistent with those negotiated at arm’s length between unrelated parties.
After his move from SAP’s Executive Board to SAP’s Supervisory Board in May 2003, Hasso Plattner entered into a contract with SAP AG under which he provides consulting services for SAP. The contract provides for the reimbursement of out-of-pocket expenses only which were immaterial to SAP in all periods presented.
Hasso Plattner is the sole proprietor of H.P. Beteiligungs GmbH, which itself holds 90% of Bramasol, Inc., Palo Alto, United States. Bramasol is a SAP partner with which we generated revenues which were immaterial to SAP in all periods presented. The amounts charged to SAP for the services of Bramasol were also immaterial in all periods presented.
Wilhelm Haarmann practices as a partner of the law firm HAARMANN Partnerschaftsgesellschaft in Frankfurt. The amounts charged to SAP for the services of HAARMANN Partnerschaftsgesellschaft were immaterial to SAP in all periods presented.
| |
| (31) | PRINCIPAL ACCOUNTANT FEES AND SERVICES |
At SAP AG’s Annual General Meeting of Shareholders held on June 3, 2008, SAP’s shareholders mandated KPMG Deutsche Treuhand-Gesellschaft AG Wirtschaftsprüfungsgesellschaft, Berlin (since October 1, 2008 KPMG AG Wirtschaftsprüfungsgesellschaft), to serve as SAP AG’s independent auditors for the 2008 fiscal year. KPMG Germany and other firms in the global KPMG network billed the following fees to SAP for audit and other professional services related to 2008 and the two previous years:
Fees for Audit and other Professional Services
Audit fees are the aggregate fees billed by KPMG for the audit of our consolidated annual financial statements as well as audits of statutory financial statements of SAP AG and its subsidiaries. Audit-related fees are fees charged by KPMG for assurance and related services that are reasonably related to the performance of the audit or review of our financial statements and are not reported under Audit fees. This category comprises fees billed for accounting advice on actual or contemplated transactions and other agreed on procedures. Tax fees
F-94
are fees for professional services rendered by KPMG for tax advice on Group restructuring, transfer pricing, and other actual or contemplated transactions, tax compliance, and employee-related tax queries. The category All other fees includes other support services, such as training and expert advice on issues unrelated to accounting and taxes.
For services provided by KPMG Germany and its affiliates we recorded expenses of €4.1 million in 2008 (2007: €2.7 million, 2006: €2.9 million), of which €3.3 million (2007: €2.5 million, 2006: €2.5 million) relate to audit services, €0.4 million (2007: €0.0 million, 2006: €0.0 million) relate to audit related services, €0.2 million (2007: €0.0 million, 2006: €0.0 million) relate to tax services, and €0.1 million (2007: €0.2 million, 2006: €0.4 million) relate to other services. The increase since the previous year results from the greater number of KPMG affiliates involved.
At the end of January 2009, we announced our intention to continue the cost-reduction program and to take further measures to reduce costs. Additionally, to enable SAP to adapt its size to today’s market conditions and the effects of the global recession, we intend to reduce our workforce to 48,500 positions worldwide by the end of 2009, by means of nonreplacement wherever possible. We expect the restructuring associated with the reduction in positions to cost €200 million to €300 million in 2009 and to produce annual savings of some €300 million to €350 million beginning in 2010.
F-95