UNITED STATES SECURITIES AND EXCHANGE COMMISSION
Washington, D.C. 20549
FORM 20-F
| ☐ | REGISTRATION STATEMENT PURSUANT TO SECTION 12(b) OR (g) OF THE SECURITIES EXCHANGE ACT OF 1934 |
OR
| ☑ | ANNUAL REPORT PURSUANT TO SECTION 13 OR 15(d) OF THE SECURITIES EXCHANGE ACT OF 1934 For the fiscal year ended December 31, 2016 |
OR
| ☐ | TRANSITION REPORT PURSUANT TO SECTION 13 OR 15(d) OF THE SECURITIES EXCHANGE ACT OF 1934 |
OR
| ☐ | SHELL COMPANY REPORT PURSUANT TO SECTION 13 OR 15(d) OF THE SECURITIES EXCHANGE ACT OF 1934 |
Date of event requiring this shell company report
For the transition period from to
Commission filenumber: 1-14251
SAP SE
(Exact name of Registrant as specified in its charter)
SAP EUROPEAN COMPANY
(Translation of Registrant’s name into English)
Federal Republic of Germany
(Jurisdiction of incorporation or organization)
Dietmar-Hopp-Allee 16
69190 Walldorf
Federal Republic of Germany
(Address of principal executive offices)
Wendy Boufford
c/o SAP Labs
3410 Hillview Avenue, Palo Alto, CA, 94304, United States of America
650-849-4000 (Tel)
650-843-2041 (Fax)
(Name, Telephone, Email and/or Facsimile number and Address of Company Contact Person)
Securities registered or to be registered pursuant to Section 12(b) of the Act:
| | |
Title of each class | | Name of each exchange on which registered |
American Depositary Shares, each Representing one Ordinary Share, without nominal value | | New York Stock Exchange |
Ordinary Shares, without nominal value | | New York Stock Exchange* |
Securities registered or to be registered pursuant to Section 12(g) of the Act: None
Securities for which there is a reporting obligation pursuant to Section 15(d) of the Act: None
Indicate the number of outstanding shares of each of the issuer’s classes of capital or common stock as of the close of the period covered by the annual report:
Ordinary Shares, without nominal value: 1,228,504,232 (as of December 31, 2016)**
Indicate by check mark if the registrant is a well-known seasoned issuer, as defined in Rule 405 of the Securities Act.
Yes ☑ No ☐
If this report is an annual or transition report, indicate by check mark if the registrant is not required to file reports pursuant to Section 13 or 15(d) of the Securities Exchange Act of 1934.
Yes ☐ No ☑
Note — Checking the box above will not relieve any registrant required to file reports pursuant to Section 13 or 15(d) of the Securities Exchange Act of 1934 from their obligations under those Sections.
Indicate by check mark whether the registrant (1) has filed all reports required to be filed by Section 13 or 15(d) of the Securities Exchange Act of 1934 during the preceding 12 months (or for such shorter period that the registrant was required to file such reports), and (2) has been subject to such filing requirements for the past 90 days.
Yes ☑ No ☐
Indicate by check mark whether the registrant has submitted electronically and posted on its Web site, if any, every Interactive Data File required to be submitted and posted pursuant to Rule 405 of RegulationS-T (§232.405 of this chapter) during the preceding 12 months (or for such shorter period that the registrant was required to submit and post such files.)
Yes ☐ No ☐
Indicate by check mark whether the registrant is a large accelerated filer, an accelerated filer, or anon-accelerated filer. See definition of “accelerated filer and large accelerated filer” inRule 12b-2 of the Exchange Act. (Check one):
| | | | |
| Large accelerated filer ☑ | | Accelerated filer ☐ | | Non-accelerated filer ☐ |
Indicate by check mark which basis of accounting the registrant has used to prepare the financial statements included in this filing:
U.S. GAAP ☐ International Financial Reporting Standards as issued by the International Accounting Standards Board ☑ Other ☐
If “Other” has been checked in response to the previous question, indicate by check mark which financial statement item the registrant has elected to follow.
Item 17 ☐ Item 18 ☐
If this is an annual report, indicate by check mark whether the registrant is a shell company (as defined inRule 12b-2 of the Exchange Act).
Yes ☐ No ☑
| * | Listed not for trading or quotation purposes, but only in connection with the registration of American Depositary Shares representing such ordinary shares pursuant to the requirements of the Securities and Exchange Commission. |
| ** | Including 29,880,390 treasury shares. |
[THIS PAGE INTENTIONALLY LEFT BLANK]
i
ii
INTRODUCTION
SAP SE is a European Company (Societas Europaea, or “SE”) and is referred to in this report, together with its subsidiaries, as SAP, or as “Company,” “Group,” “we,” “our,” or “us.”
In this report: (i) references to “US$,” “$,” or “dollars” are to U.S. dollars; (ii) references to ‘‘€” or “euro” are to the euro. Our financial statements are denominated in euros, which is the currency of our home country, Germany. Certain amounts that appear in this report may not add up because of differences due to rounding.
Unless otherwise specified herein, euro financial data have been converted into dollars at the noon buying rate in New York City for cable transfers in foreign currencies as certified for customs purposes by the Federal Reserve Bank of New York (the “Noon Buying Rate”) on December 31, 2016, which was US$1.0552 per€1.00. No representation is made that such euro amounts actually represent such dollar amounts or that such euro amounts could have been or can be converted into dollars at that or any other exchange rate on such date or on any other date. The rate used for the convenience translations also differs from the currency exchange rates used for the preparation of the Consolidated Financial Statements. This convenience translation is not a requirement under International Financial Reporting Standards (IFRS) and, accordingly, our independent registered public accounting firm has not audited these US$ amounts. For information regarding recent rates of exchange between euro and dollars, see “Item 3. Key Information – Exchange Rates.” On February 10, 2017, the Noon Buying Rate for converting euro to dollars was US$1.0650 per€1.00.
Unless the context otherwise requires, references in this report to ordinary shares are to SAP SE’s ordinary shares, without nominal value. References in this report to “ADRs” are to SAP SE’s American Depositary Receipts, each representing one SAP ordinary share. References in this report to “ADSs” are to SAP SE’s American Depositary Shares, which are the deposited securities evidenced by the ADRs.
SAP, ABAP, Adaptive Server, Advantage Database Server, Afaria, Ariba, Business ByDesign, BusinessObjects, ByDesign, Concur, Crystal Reports, ExpenseIt, Fieldglass, hybris, PartnerEdge, PowerBuilder, PowerDesigner, Quadrem, R/3, Replication Server, SAP BusinessObjects Explorer, SAP Business Workflow, SAP EarlyWatch, SAP Fiori, SAP HANA, SAP HANA Vora, SAP Jam, SAP Lumira, SAP NetWeaver, SAP S/4HANA, SAPPHIRE, SAPPHIRE NOW, SQL Anywhere, Sybase, SuccessFactors, TheBest-Run Businesses Run SAP, TravelTrax, TripIt, TripLink, TwoGo, Web Intelligence and other SAP products and
services mentioned herein as well as their respective logos are trademarks or registered trademarks of SAP SE (or an SAP affiliate company) in Germany and other countries.
Throughout this report, whenever a reference is made to any website, such reference does not incorporate by reference into this report the information contained on such website.
We intend to make this report and other periodic reports publicly available on our web site (www.sap.com) without charge immediately following our filing with the U.S. Securities and Exchange Commission (SEC). We assume no obligation to update or revise any part of this report, whether as a result of new information, future events or otherwise, unless we are required to do so by law.
FORWARD-LOOKING STATEMENTS
This report contains forward-looking statements and information based on the beliefs of, and assumptions made by, our management using information currently available to them. Any statements contained in this report that are not historical facts are forward-looking statements as defined in the U.S. Private Securities Litigation Reform Act of 1995. We have based these forward-looking statements on our current expectations, assumptions, and projections about future conditions and events. As a result, our forward-looking statements and information are subject to uncertainties and risks. A broad range of uncertainties and risks, many of which are beyond our control, could cause our actual results and performance to differ materially from any projections expressed in or implied by our forward-looking statements. The uncertainties and risks include, but are not limited to:
| | – | | Uncertainty in the global economy, financial markets or political conditions could have a negative impact on our business, financial position, profit, and cash flows and put pressure on our operating profit. |
| | – | | Third parties have claimed, and might claim in the future, that we infringe their intellectual property rights, which could lead to damages being awarded against us and limit our ability to use certain technologies in the future. |
| | – | | Claims and lawsuits against us could have an adverse effect on our business, financial position, profit, cash flows and reputation. |
| | – | | We might not be able to obtain adequate title to, or licenses in, or to enforce intellectual property. |
We describe these and other risks and uncertainties in the Risk Factors section.
If one or more of these uncertainties or risks materializes, or if management’s underlying
1
assumptions prove incorrect, our actual results could differ materially from those described in or inferred from our forward-looking statements and information.
The words “aim,” “anticipate,” “assume,” “believe,” “continue,” “could,” “counting on,” “is confident,” “development,” “estimate,” “expect,” “forecast,” “future trends,” “guidance,” “intend,” “may,” “might,” “outlook,” “plan,” “project,” “predict,” “seek,” “should,” “strategy,” “want,” “will,” “would,” and similar expressions as they relate to us are intended to identify such forward-looking statements. Such statements include, for example, those made in theOperating Results section, our quantitative and qualitative disclosures about market risk pursuant to the International Financial Reporting Standards (IFRS), namely IFRS 7 and related statements in our Notes to the Consolidated Financial Statements; Expected Developments section; Risk Factors section; and other forward-looking information appearing in other parts of this report. To fully consider the factors that could affect our future financial results, both this report and our Integrated Report should be considered, as well as all of our other filings with the Securities and Exchange Commission (SEC). Readers are cautioned not to place undue reliance on these forward-looking statements, which speak only as of the date specified or the date of this report. We undertake no obligation to publicly update or revise any forward-looking statements as a result of new information that we receive about conditions that existed upon issuance of this report, future events, or otherwise unless we are required to do so by law.
This report includes statistical data about the IT industry and global economic trends that comes from information published by sources including Gartner, the European Central Bank (ECB); and the International Monetary Fund (IMF). This type of data represents only the estimates of Gartner, ECB, IMF, and other sources of industry data. SAP does not adopt or endorse any of the statistical information provided by sources such as Gartner, ECB, IMF, or other similar sources that is contained in this report. The data from these sources is subject to risks and uncertainties, and subject to change based on various factors, including those described above, in the Risk Factors section, and elsewhere in this report. These and other factors could cause our results to differ materially from those expressed in the estimates made by third parties and SAP. We caution readers not to place undue reliance on this data.
PERFORMANCE MANAGEMENT SYSTEM
We use various performance measures to help manage our performance with regard to our primary financial objectives, which are growth and profitability, and our primarynon-financial objectives, which are customer loyalty and employee engagement. We view growth and
profitability as indicators for our current performance, while customer loyalty and employee engagement are indicators for our future performance.
Measures We Use to Manage Our Financial Performance
Measures We Use to Manage Our Operating Financial Performance
In 2016, we used the following key measures to manage our operating financial performance:
Cloud subscriptions and support revenue(non-IFRS): This revenue driver comprises the main revenues of our fast-growing cloud business. We generate cloud subscriptions and support revenue when we provide software functionality in a cloud-based infrastructure (software as a service, or SaaS) to our customers; when we provide our customers with access to a cloud-based infrastructure to develop, run, and manage applications (platform as a service, or PaaS); and also when we provide hosting services for software hosted by SAP (infrastructure as a service, or IaaS). Cloud subscriptions and support revenue are also generated when providing additional premium cloud subscription support beyond the regular support, which is embedded in the basic cloud subscription fees as well as business network services to our customers. We use the cloud subscriptions and support revenue(non-IFRS) measure both at actual currency and at constant currency.
Cloud and software revenue(non-IFRS): We use cloud and software revenue(non-IFRS) and constant currency cloud and software revenue(non-IFRS) to measure our revenue growth. Our cloud and software revenue includes cloud subscriptions and support revenue plus software licenses and support revenue. Cloud subscriptions and support revenue and software revenue are our key revenue drivers because they tend to affect our other revenue streams. Generally, customers that buy software licenses also enter into related support contracts, and these generate recurring revenue in the form of support revenue after the software sale. Support contracts cover standardized support services that comprise unspecified future software updates and enhancements. Software licenses revenue as well as cloud subscriptions and support revenue also tend to stimulate services revenue earned from providing customers with professional services, premium engagement services, training services, messaging services, and payment services.
Total revenue(non-IFRS): We use nominal total revenue(non-IFRS) and constant currency total revenue(non-IFRS) to measure our growth. The total of cloud subscriptions and support revenue and software support
2
revenue divided by total revenue is the share of more predictable revenue. This measure provides additional insight into our sustained business success.
New cloud bookings: For our cloud activities, we also look at new cloud bookings. This measure reflects the committed order entry from new customers and from incremental purchases by existing customers for offerings that generate cloud subscriptions and support revenue. In this way, it is an indicator for cloud-related sales success in a given period and for secured future cloud subscriptions and support revenue. We focus primarily on the average contract value variant of the new cloud bookings measure that takes into account annualized amounts for multiyear contracts. Additionally, we internally monitor the total contract value variant of the new cloud bookings measure that takes into account the total committed order entry amounts regardless of contract durations. There are no comparable IFRS measures for these bookings metrics. In addition to new cloud bookings, we use the measure “cloud backlog” to evaluate our sales success in the cloud business. We define cloud backlog as a measure that represents the volume of business that, as of period end, is contracted but not yet billed.
Operating profit(non-IFRS): We use operating profit(non-IFRS) and constant currency operating profit(non-IFRS) to measure our overall operational process efficiency and overall business performance. See below for more information on the IFRS andnon-IFRS measures we use.
Cloud subscriptions and support gross margin(non-IFRS): We use our cloud subscriptions and support gross margin(non-IFRS) to measure our process efficiency in our cloud business. Cloud subscriptions and support gross margin(non-IFRS) is the ratio of our cloud subscriptions and support gross profit(non-IFRS) to cloud subscriptions and support revenue(non-IFRS), expressed as a percentage.
Measures We Use to Manage OurNon-Operating Financial Performance
We use the following measures to manage ournon-operating financial performance.
Financial income, net:This measure provides insight into the return on liquid assets and capital investments and the cost of borrowed funds. To manage our financial income, net, we focus on cash flow, the composition of our liquid assets and capital investment portfolio, and the average rate of interest at which assets are invested. We also monitor average outstanding borrowings and associated finance costs.
Days Sales Outstanding (DSO): We manage working capital by controlling the days sales outstanding (DSO) for operating receivables (defined as the average number of days from the raised invoice to cash receipt from the customer).
Measures We Use to Manage Overall Financial Performance
We use the following measures to manage our overall financial performance:
Earnings per share (EPS) (IFRS andnon-IFRS): EPS measures our overall performance because it captures all operating andnon-operating elements of profit as well as income tax expense. It represents the portion of profit after tax allocable to each SAP share outstanding. EPS is influenced not only by our operating andnon-operating business as well as income taxes but also by the number of shares outstanding.
Effective tax rate (IFRS andnon-IFRS): We define our effective tax rate as the ratio of income tax expense to profit before tax, expressed as a percentage.
Operating, investing, and financing cash flows and free cash flow: Our consolidated statement of cash flows provides insight as to how we generated and used cash and cash equivalents. When applied in conjunction with the other primary financial statements, it provides information that helps us evaluate the changes of our net assets, our financial structure (including our liquidity and solvency), and our ability to affect the amounts and timing of cash flows to adapt to changing circumstances and opportunities. We use our free cash flow measure to determine the cash flow remaining after all expenditures required to maintain or expand our organic business have been paid off. This measure provides management with supplemental information to assess our liquidity needs. We calculate free cash flow as net cash from operating activities minus purchases (other than purchases made in connection with business combinations) of intangible assets and property, plant, and equipment.
Measures We Use to Manage OurNon-Financial Performance
In 2016, we used the following key measures to manage ournon-financial performance in the areas of employee engagement, customer loyalty, and leadership trust:
Employee Engagement Index: We use this index to measure the motivation and loyalty of our employees, how proud they are of our company, and how strongly they identify with SAP. The index is derived from surveys conducted among our employees. Applying this measure is recognition that our growth strategy depends on engaged employees.
3
Customer Net Promoter Score (NPS): This score measures the willingness of our customers to recommend or promote SAP to others. It is derived from our annual customer survey that identifies, on a scale of 0–10, whether a customer is loyal and likely to recommend SAP to friends or colleagues, is neutral, or is unhappy. We introduced this measure in 2012, as we are convinced that we can achieve our financial goals only when our customers are loyal to, and satisfied with, SAP and our solutions. To derive the Customer NPS, we start with the percentage of “promoters” of SAP – those who give us a score of 9 or 10 on a scale of 0–10. We then subtract the percentage of “detractors” – those who give us a score of 0 to 6. The method ignores “passives,” who give us a score of 7 or 8.
Leadership Trust Score:We use this scoreto further enhance accountability and to measure our collective effort to foster a work environment based on trust. It is derived from a question in our annual global employee survey that gauges employees’ trust in our leaders. We measure leadership trust by using the same methodology as we do determining the Net Promoter Score (NPS).
Value-Based Management
Our holistic view of the performance measures described above, together with our associated analyses, comprises the information we use for value-based management. We use planning and control processes to manage the compilation of these key measures and their availability to our decision makers across various management levels.
SAP’s long-term strategic plans, including a multiyear financial plan through 2020, are the point of reference for our short-term and midterm planning and controlling processes. We initially identify future growth and profitability drivers at a highly aggregated level. In a first step, the resulting financial plan is broken down to (i) our deployment models “On Premise,” “Software as a Service/Platform as a Service,” “Infrastructure as a Service,” and “Business Networks”, and (ii) functions such as development, sales, or administration. In a second step, the planned total revenues and total expenses are allocated to the individual board areas.
Budget administration and control, including budget adjustments applied during the year to reflect changes in priorities, to achieve efficiency targets and to reflect endogenous and exogenous factors, are handled at board area level. It is then the individual board member’s responsibility to break down, in their board area, the allocated budgets and budget adjustments. The Executive Board’s efforts to assess the performance of the company and components thereof is also done on the level of the board areas. Based on an integrated portfolio process running in parallel to the budgeting process we ensure aligned investment behavior across board areas with regards to specific solutions or solution areas. In a final step, customer-facing revenue targets and cost of sales and marketing targets are broken down into sales regions.
Based on our detailed annual plans, we determine the budget for the respective year. We also have processes in place to forecast revenue and profit on a quarterly basis, to quantify whether we expect to realize our financial goals, and to identify any deviations from plan. We continuously monitor the concerned units in the Group to analyze these developments and define any appropriate actions. Our entire network of planning, control, and reporting processes is implemented in integrated planning and information systems, based on SAP software, across all organizational units so that we can conduct the evaluations and analyses needed to make informed decisions.
Non-IFRS Financial Measures Cited in This Report
As in previous years, we provided our 2016 financial outlook on the basis of certainnon-IFRS measures. Therefore, this report contains anon-IFRS based comparison of our actual performance in 2016 against our outlook in theFinancial Performance: Review and Analysis section.
Reconciliations of IFRS toNon-IFRS Financial Measures for 2016 and 2015
Due to rounding, the sum of the numbers presented in the following table might not precisely equal the totals we provide.
4
Reconciliation of IFRS toNon-IFRS Financial Measures for the Years Ended December 31
| | | | | | | | | | | | | | | | | | | | | | | | | | | | | | | | |
| € millions, unless otherwise stated | | 2016 | | | 2015 | |
| | | IFRS | | | Adj. | | | Non-IFRS | | | Currency Impact | | | Non-IFRS Constant Currency | | | IFRS | | | Adj. | | | Non-IFRS | |
Revenue measures | | | | | | | | | | | | | | | | | | | | | | | | | | | | | | | | |
Cloud subscriptions and support | | | 2,993 | | | | 2 | | | | 2,995 | | | | 12 | | | | 3,007 | | | | 2,286 | | | | 10 | | | | 2,296 | |
Software licenses | | | 4,860 | | | | 2 | | | | 4,862 | | | | 31 | | | | 4,893 | | | | 4,835 | | | | 1 | | | | 4,836 | |
Software support | | | 10,571 | | | | 1 | | | | 10,572 | | | | 82 | | | | 10,654 | | | | 10,093 | | | | 0 | | | | 10,094 | |
Software licenses and support | | | 15,431 | | | | 3 | | | | 15,434 | | | | 113 | | | | 15,546 | | | | 14,928 | | | | 2 | | | | 14,930 | |
Cloud and software | | | 18,424 | | | | 5 | | | | 18,428 | | | | 125 | | | | 18,553 | | | | 17,214 | | | | 11 | | | | 17,226 | |
Services | | | 3,638 | | | | 0 | | | | 3,638 | | | | 39 | | | | 3,678 | | | | 3,579 | | | | 0 | | | | 3,579 | |
Total revenue | | | 22,062 | | | | 5 | | | | 22,067 | | | | 164 | | | | 22,231 | | | | 20,793 | | | | 11 | | | | 20,805 | |
Operating expense measures | | | | | | | | | | | | | | | | | | | | | | | | | | | | | | | | |
Cost of cloud subscriptions and support | | | –1,313 | | | | 247 | | | | –1,066 | | | | | | | | | | | | –1,022 | | | | 232 | | | | –789 | |
Cost of software licenses and support | | | –2,182 | | | | 238 | | | | –1,944 | | | | | | | | | | | | –2,291 | | | | 283 | | | | –2,008 | |
Cost of cloud and software | | | –3,495 | | | | 485 | | | | –3,010 | | | | | | | | | | | | –3,313 | | | | 516 | | | | –2,797 | |
Cost of services | | | –3,089 | | | | 113 | | | | –2,976 | | | | | | | | | | | | –2,932 | | | | 167 | | | | –2,765 | |
Total cost of revenue | | | –6,583 | | | | 598 | | | | –5,985 | | | | | | | | | | | | –6,245 | | | | 683 | | | | –5,562 | |
Gross profit | | | 15,479 | | | | 603 | | | | 16,081 | | | | | | | | | | | | 14,548 | | | | 694 | | | | 15,242 | |
Research and development | | | –3,044 | | | | 201 | | | | –2,843 | | | | | | | | | | | | –2,845 | | | | 202 | | | | –2,643 | |
Sales and marketing | | | –6,265 | | | | 549 | | | | –5,716 | | | | | | | | | | | | –5,782 | | | | 462 | | | | –5,320 | |
General and administration | | | –1,005 | | | | 119 | | | | –886 | | | | | | | | | | | | –1,048 | | | | 116 | | | | –932 | |
Restructuring | | | –28 | | | | 28 | | | | 0 | | | | | | | | | | | | –621 | | | | 621 | | | | 0 | |
Other operating income/expense, net | | | –3 | | | | 0 | | | | –3 | | | | | | | | | | | | 1 | | | | 0 | | | | 1 | |
Total operating expenses | | | –16,928 | | | | 1,494 | | | | –15,434 | | | | –192 | | | | –15,626 | | | | –16,541 | | | | 2,084 | | | | –14,457 | |
Profit numbers | | | | | | | | | | | | | | | | | | | | | | | | | | | | | | | | |
Operating profit | | | 5,135 | | | | 1,498 | | | | 6,633 | | | | –28 | | | | 6,605 | | | | 4,252 | | | | 2,095 | | | | 6,348 | |
| Othernon-operating income/expense, net | | | –234 | | | | 0 | | | | –234 | | | | | | | | | | | | –256 | | | | 0 | | | | –256 | |
Finance income | | | 230 | | | | 0 | | | | 230 | | | | | | | | | | | | 241 | | | | 0 | | | | 241 | |
Finance costs | | | –268 | | | | 0 | | | | –268 | | | | | | | | | | | | –246 | | | | 0 | | | | –246 | |
Financial income, net | | | –38 | | | | 0 | | | | –38 | | | | | | | | | | | | –5 | | | | 0 | | | | –5 | |
Profit before tax | | | 4,863 | | | | 1,498 | | | | 6,361 | | | | | | | | | | | | 3,991 | | | | 2,095 | | | | 6,087 | |
Income tax expense | | | –1,229 | | | | –474 | | | | –1,703 | | | | | | | | | | | | –935 | | | | –651 | | | | –1,586 | |
Profit after tax | | | 3,634 | | | | 1,024 | | | | 4,658 | | | | | | | | | | | | 3,056 | | | | 1,445 | | | | 4,501 | |
Attributable to owners of parent | | | 3,646 | | | | 1,024 | | | | 4,671 | | | | | | | | | | | | 3,064 | | | | 1,445 | | | | 4,509 | |
Attributable tonon-controlling interests | | | –13 | | | | 0 | | | | –13 | | | | | | | | | | | | –8 | | | | 0 | | | | –8 | |
Key ratios | | | | | | | | | | | | | | | | | | | | | | | | | | | | | | | | |
Operating margin (in %) | | | 23.3 | | | | | | | | 30.1 | | | | | | | | 29.7 | | | | 20.5 | | | | | | | | 30.5 | |
Effective tax rate (in %) | | | 25.3 | | | | | | | | 26.8 | | | | | | | | | | | | 23.4 | | | | | | | | 26.1 | |
| Earnings per share, basic (in€) | | | 3.04 | | | | | | | | 3.90 | | | | | | | | | | | | 2.56 | | | | | | | | 3.77 | |
5
Explanation ofNon-IFRS Measures
Non-IFRS Adjustments by Functional Areas
| | | | | | | | | | | | | | | | | | | | | | | | | | | | | | | | | | | | | | | | |
| € millions | | 2016 | | | 2015 | |
| | | IFRS | | | Acqui-
sition-rel. | | | SBP1) | | | Restruc-
turing | | | Non-IFRS | | | IFRS | | | Acqui- sition-rel. | | | SBP1) | | | Restruc-
turing | | | Non-IFRS | |
| Cost of cloud and software | | | –3,495 | | | | 395 | | | | 89 | | | | 0 | | | | –3,010 | | | | –3,313 | | | | 441 | | | | 74 | | | | 0 | | | | –2,797 | |
| Cost of services | | | –3,089 | | | | 12 | | | | 101 | | | | 0 | | | | –2,976 | | | | –2,932 | | | | 54 | | | | 113 | | | | 0 | | | | –2,765 | |
| Research and development | | | –3,044 | | | | 10 | | | | 190 | | | | 0 | | | | –2,843 | | | | –2,845 | | | | 36 | | | | 166 | | | | 0 | | | | –2,643 | |
| Sales and marketing | | | –6,265 | | | | 257 | | | | 292 | | | | 0 | | | | –5,716 | | | | –5,782 | | | | 202 | | | | 260 | | | | 0 | | | | –5,320 | |
| General and administration | | | –1,005 | | | | 6 | | | | 113 | | | | 0 | | | | –886 | | | | –1,048 | | | | 4 | | | | 111 | | | | 0 | | | | –932 | |
| Restructuring | | | –28 | | | | 0 | | | | 0 | | | | 28 | | | | 0 | | | | –621 | | | | 0 | | | | 0 | | | | 621 | | | | 0 | |
| Other operating income/expense, net | | | –3 | | | | 0 | | | | 0 | | | | 0 | | | | –3 | | | | 1 | | | | 0 | | | | 0 | | | | 0 | | | | 1 | |
| Adjustments of total operating expenses | | | –16,928 | | | | 680 | | | | 785 | | | | 28 | | | | –15,434 | | | | –16,541 | | | | 738 | | | | 724 | | | | 621 | | | | –14,457 | |
1) Share-based payments (SBP)
We disclose certain financial measures, such as revenue(non-IFRS), operating expenses(non-IFRS), operating profit(non-IFRS), operating margin(non-IFRS), and earnings per share(non-IFRS), as well as constant currency revenue, expense, and profit that are not prepared in accordance with IFRS and are therefore considerednon-IFRS financial measures. Ournon-IFRS financial measures may not correspond tonon-IFRS financial measures that other companies report. Thenon-IFRS financial measures that we report should only be considered in addition to, and not as substitutes for, or superior to, our IFRS financial measures.
We believe that the disclosed supplemental historical and prospectivenon-IFRS financial information provides useful information to investors because management uses this information, in addition to financial data prepared in accordance with IFRS, to attain a more transparent understanding of our past performance and our anticipated future results. We use the revenue(non-IFRS) and profit(non-IFRS) measures consistently in our internal planning and forecasting, reporting, and compensation, as well as in our external communications, as follows:
| – | | Our management primarily uses thesenon-IFRS measures rather than IFRS measures as the basis for making financial, strategic, and operating decisions. |
| – | | The variable components of our Executive Board members’ and employees’ remuneration are based on revenue(non-IFRS), operating profit(non-IFRS), |
| | | as well as new cloud bookings measures rather than the respective IFRS measures. |
| – | | The annual budgeting process for all management units is based on revenue(non-IFRS) and operating profit(non-IFRS) numbers rather than the respective IFRS financial measures. |
| – | | All forecast and performance reviews with all senior managers globally are based on thesenon-IFRS measures, rather than the respective IFRS financial measures. |
| – | | Both our internal performance targets and the guidance we provided to the capital markets are based on revenue(non-IFRS) and profit(non-IFRS) measures rather than the respective IFRS financial measures. |
Ournon-IFRS financial measures reflect adjustments based on the items below, as well as adjustments for the related income tax effects.
Revenue(Non-IFRS)
Revenue items identified as revenue(non-IFRS) have been adjusted from the respective IFRS financial measures by including the full amount of software support revenue, cloud subscriptions and support revenue, and other similarly recurring revenue that we are not permitted to record as revenue under IFRS due to fair value accounting for the contracts in effect at the time of the respective acquisitions.
6
Under IFRS, we record at fair value the contracts in effect at the time entities were acquired. Consequently, our IFRS software support revenue, IFRS cloud subscriptions and support revenue, IFRS cloud and software revenue, and IFRS total revenue for periods subsequent to acquisitions do not reflect the full amount of revenue that would have been recorded by entities acquired by SAP had they remained stand-alone entities. Adjusting revenue numbers for this revenue impact provides additional insight into the comparability of our ongoing performance across periods.
Operating Expense(Non-IFRS)
Operating expense numbers that are identified as operating expenses(non-IFRS) have been adjusted by excluding the following expenses:
| – | | Acquisition-related charges |
| | ◾ | | Amortization expense/impairment charges of intangibles acquired in business combinations and certain stand-alone acquisitions of intellectual property (including purchasedin-process research and development) |
| | ◾ | | Settlements of preexisting business relationships in connection with a business combination |
| | ◾ | | Acquisition-related third-party expenses |
| – | | Share-based payment expenses |
| – | | Restructuring expenses, that is, expenses resulting from measures which comply with the definition of restructuring according to IFRS |
We exclude certain acquisition-related expenses for the purpose of calculating operating profit(non-IFRS), operating margin(non-IFRS), and earnings per share(non-IFRS) when evaluating SAP’s continuing operational performance because these expenses generally cannot be changed or influenced by management after the relevant acquisition other than by disposing of the acquired assets. Since management at levels below the Executive Board does not influence these expenses, we generally do not consider these expenses for the purpose of evaluating the performance of management units. For similar reasons we eliminate share-based payment expenses as these costs are impacted by share price developments and other factors outside our control. We also eliminate restructuring expenses because they are volatile and mostly cannot be influenced by management at levels below the Executive Board.
Operating Profit(Non-IFRS), Operating Margin(Non-IFRS), Effective Tax Rate(Non-IFRS), and Earnings per Share(Non-IFRS)
Operating profit, operating margin, effective tax rate, and earnings per share identified as operating profit(non-IFRS), operating margin(non-IFRS), effective tax rate(non-IFRS), and earnings per share(non-IFRS) have been adjusted from the respective IFRS measures by
adjusting for the aforementioned revenue(non-IFRS) and operating expenses(non-IFRS) and the income tax effects thereon.
Constant Currency Information
We believe it is important for investors to have information that provides insight into our sales. Revenue measures determined under IFRS provide information that is useful in this regard. However, both sales volume and currency effects impact period-over-period changes in sales revenue. We do not sell standardized units of products and services, so we cannot provide relevant information on sales volume by providing data on the changes in product and service units sold. To provide additional information that may be useful to investors in breaking down and evaluating changes in sales volume, we present information about our revenue and various values and components relating to operating profit that are adjusted for foreign currency effects.
We calculate constant currency revenue and operating profit measures by translating foreign currencies using the average exchange rates from the comparative period instead of the current period.
Free Cash Flow
Among others we use the measure free cash flow to manage our overall financial performance.
Free Cash Flow
| | | | | | | | | | | | |
| € millions | | 2016 | | | 2015 | | | D in % | |
| Net cash flows from operating activities | | | 4,628 | | | | 3,638 | | | | 27 | |
| Purchase of intangible assets and property, plant, and equipment (without acquisitions) | | | –1,001 | | | | –636 | | | | 57 | |
Free cash flow | | | 3,627 | | | | 3,001 | | | | 21 | |
Usefulness ofNon-IFRS Measures
We believe that ournon-IFRS measures are useful to investors for the following reasons:
| – | | Our revenue(non-IFRS), expense(non-IFRS), and profit(non-IFRS) measures as well as the measures “new cloud bookings” and “cloud backlog” (see above) provide investors with insight into management’s decision making because management uses these measures to run our business and make financial, strategic, and operating decisions. We include the revenue adjustments outlined above and exclude the expense adjustments outlined above when making decisions to allocate resources. In addition, we use thesenon-IFRS measures to facilitate comparisons of SAP’s operating performance from period to period. |
7
| – | | Thenon-IFRS measures provide investors with additional information that enables a comparison of year-over-year operating performance by eliminating certain direct effects of acquisitions, share-based compensation plans, and restructuring plans. |
| – | | Non-IFRS andnon-GAAP measures are widely used in the software industry. In many cases, inclusion of ournon-IFRS measures may facilitate comparison with our competitors’ correspondingnon-IFRS andnon-GAAP measures. |
Limitations ofNon-IFRS Measures
We believe that ournon-IFRS financial measures described above have limitations, including but not limited to, the following:
| – | | The eliminated amounts could be material to us. |
| – | | Without being analyzed in conjunction with the corresponding IFRS measures, thenon-IFRS measures are not indicative of our present and future performance, foremost for the following reasons: |
| | ◾ | | While our profit(non-IFRS) numbers reflect the elimination of certain acquisition-related expenses, no eliminations are made for the additional revenue or other income that results from the acquisitions. |
| | ◾ | | While we adjust for the fair value accounting of the acquired entities’ recurring revenue contracts, we do not adjust for the fair value accounting of deferred compensation items that result from commissions paid to the acquired company’s sales force and third parties for closing the respective customer contracts. |
| | ◾ | | The acquisition-related amortization expense that we eliminate in deriving our profit(non-IFRS) numbers is a recurring expense that will impact our financial performance in future years. |
| | ◾ | | The remaining acquisition-related charges that we eliminate in deriving our profit(non-IFRS) numbers are likely to recur should SAP enter into material business combinations in the future. Similarly, the restructuring expenses that we eliminate in deriving our profit(non-IFRS) numbers are likely to recur should SAP perform restructurings in the future. |
| | ◾ | | The revenue adjustment for the fair value accounting of the acquired entities’ contracts and the expense adjustment for acquisition-related charges do not arise from a common conceptual basis. This is because the revenue adjustment aims to improve the comparability of the initial post-acquisition period with future post-acquisition periods, while the expense adjustment aims to improve the comparability between post-acquisition periods andpre-acquisition periods. |
| | | This should particularly be considered when evaluating our operating profit(non-IFRS) and operating margin(non-IFRS) numbers as these combine our revenue(non-IFRS) and expenses(non-IFRS) despite the absence of a common conceptual basis. |
| | ◾ | | Our restructuring charges resulted in significant cash outflows in the past and could do so in the future. The same applies to our share-based payment expense because most of our share-based payments are settled in cash rather than shares. |
| | ◾ | | The valuation of our cash-settled share-based payments could vary significantly from period to period due to the fluctuation of our share price and other parameters used in the valuation of these plans. |
| | ◾ | | In the past, we have issued share-based payment awards to our employees every year and we intend to continue doing so in the future. Thus, our share-based payment expenses are recurring although the amounts usually change from period to period. |
We believe that constant currency measures have limitations, particularly as the currency effects that are eliminated constitute a significant element of our revenue and expenses and could materially impact our performance. Therefore, we limit our use of constant currency measures to the analysis of changes in volume as one element of the full change in a financial measure. We do not evaluate our results and performance without considering both constant currency and nominal measures in revenue(non-IFRS) and operating profit(non-IFRS) measures on the one hand, and changes in revenue, operating expenses, operating profit, or other measures of financial performance prepared in accordance with IFRS on the other. We caution the readers of our financial reports to follow a similar approach by considering nominal and constant currencynon-IFRS measures only in addition to, and not as a substitute for or superior to, changes in revenue, operating expenses, operating profit, or other measures of financial performance prepared in accordance with IFRS.
Despite these limitations, we believe that the presentation of ournon-IFRS measures and the corresponding IFRS measures, together with the relevant reconciliations, provide useful information to management and investors regarding present and future business trends relating to our financial condition and results of operations.
8
PART I
ITEM 1. IDENTITY OF DIRECTORS, SENIOR MANAGEMENT AND ADVISERS
Not applicable.
ITEM 2. OFFER STATISTICS AND EXPECTED TIMETABLE
Not applicable.
ITEM 3. KEY INFORMATION
SELECTED FINANCIAL DATA
The following table sets forth our selected consolidated financial data as of and for each of the years in the five-year period ended December 31, 2016. The consolidated financial data has been derived from, and should be read in conjunction with, our Consolidated Financial Statements prepared in accordance with International Financial Reporting Standards as issued by the International Accounting Standards Board (IFRS), presented in “Item 18. Financial Statements” of this report.
Our selected financial data and our Consolidated Financial Statements are presented in euros. Financial data as of and for the year ended December 31, 2016 has been translated into U.S. dollars for the convenience of the reader.
9
SELECTED FINANCIAL DATA: IFRS
| | | | | | | | | | | | | | | | | | | | | | | | |
| millions, unless otherwise stated | | 2016(1) US$ | | | 2016 € | | | 2015 € | | | 2014 € | | | 2013 € | | | 2012 € | |
| Income Statement Data: Years ended December 31, | | | | | | | | | | | | | | | | | | | | | | | | |
| Cloud subscriptions and support revenue | | | 3,158 | | | | 2,993 | | | | 2,286 | | | | 1,087 | | | | 696 | | | | 270 | |
| Software licenses and support revenue | | | 16,283 | | | | 15,431 | | | | 14,928 | | | | 13,228 | | | | 12,809 | | | | 12,532 | |
| Cloud and software revenue | | | 19,441 | | | | 18,424 | | | | 17,214 | | | | 14,315 | | | | 13,505 | | | | 12,801 | |
| Total revenue | | | 23,280 | | | | 22,062 | | | | 20,793 | | | | 17,560 | | | | 16,815 | | | | 16,223 | |
| Operating profit | | | 5,418 | | | | 5,135 | | | | 4,252 | | | | 4,331 | | | | 4,479 | | | | 4,041 | |
| Profit after tax | | | 3,834 | | | | 3,634 | | | | 3,056 | | | | 3,280 | | | | 3,325 | | | | 2,803 | |
| Profit attributable to owners of parent | | | 3,848 | | | | 3,646 | | | | 3,064 | | | | 3,280 | | | | 3,326 | | | | 2,803 | |
| Earnings per share(2) | | | | | | | | | | | | | | | | | | | | | | | | |
Basic in€ | | | 3.21 | | | | 3.04 | | | | 2.56 | | | | 2.75 | | | | 2.79 | | | | 2.35 | |
Diluted in€ | | | 3.21 | | | | 3.04 | | | | 2.56 | | | | 2.74 | | | | 2.78 | | | | 2.35 | |
| Other Data: | | | | | | | | | | | | | | | | | | | | | | | | |
| Weighted-average number of shares outstanding | | | | | | | | | | | | | | | | | | | | | | | | |
Basic | | | 1,198 | | | | 1,198 | | | | 1,197 | | | | 1,195 | | | | 1,193 | | | | 1,192 | |
Diluted | | | 1,199 | | | | 1,199 | | | | 1,198 | | | | 1,197 | | | | 1,195 | | | | 1,193 | |
| Statement of Financial Position Data: At December 31, | | | | | | | | | | | | | | | | | | | | | | | | |
| Cash and cash equivalents | | | 3,906 | | | | 3,702 | | | | 3,411 | | | | 3,328 | | | | 2,748 | | | | 2,477 | |
| Total assets(3) | | | 46,721 | | | | 44,277 | | | | 41,390 | | | | 38,565 | | | | 27,091 | | | | 26,306 | |
| Current financial liabilities(4) | | | 1,913 | | | | 1,813 | | | | 841 | | | | 2,561 | | | | 748 | | | | 802 | |
| Non-current financial liabilities(4) | | | 6,839 | | | | 6,481 | | | | 8,681 | | | | 8,980 | | | | 3,758 | | | | 4,446 | |
| Issued capital | | | 1,296 | | | | 1,229 | | | | 1,229 | | | | 1,229 | | | | 1,229 | | | | 1,229 | |
| Total equity | | | 27,854 | | | | 26,397 | | | | 23,295 | | | | 19,534 | | | | 16,048 | | | | 14,133 | |
(1) Amounts presented in US$ have been translated for the convenience of the reader at€1.00 to US$1.0552, the Noon Buying Rate for converting€1.00 into dollars on December 31, 2016. See “Item 3. Key Information — Exchange Rates” for recent exchange rates between the Euro and the dollar.
(2) Profit attributable to owners of parent is the numerator and weighted average number of shares outstanding is the denominator in the calculation of earnings per share. See Note (11) to our Consolidated Financial Statements for more information on earnings per share.
(3) The large increase in total assets from 2013 to 2014 was mainly due to the acquisition of Concur.
(4) The balances include primarily bonds, private placements and bank loans. Current is defined as having a remaining life of one year or less;non-current is defined as having a remaining term exceeding one year. The significant increase from 2013 to 2014 was due to a long-term bank loan and the issuance of a three-tranche Eurobond, both in connection with the Concur acquisition. See Note (17b) to our Consolidated Financial Statements for more information on our financial liabilities.
10
EXCHANGE RATES
The sales prices for our ordinary shares traded on German stock exchanges are denominated in euro. Fluctuations in the exchange rate between the euro and the U.S. dollar affect the dollar equivalent of the euro price of the ordinary shares traded on the German stock exchanges and, as a result, may affect the price of the ADRs traded on the NYSE in the United States. See “Item 9. The Offer and Listing” for a description of the ADRs. In addition, SAP SE pays cash dividends, if any, in euro. As a result, any exchange rate fluctuations will also affect the dollar amounts received by the holders of ADRs on the conversion into dollars of cash dividends paid in euro on the ordinary shares represented by the ADRs. Deutsche Bank Trust Company Americas is the depositary (the Depositary) for SAP SE’s ADR program. The deposit agreement with respect to the ADRs requires the Depositary to convert any dividend payments from euro into dollars as promptly as practicable upon receipt. For additional information on the Depositary and the fees associated with SAP’s ADR program see “Item 12. Description of Securities Other Than Equity Securities – American Depositary Shares.”
For details on the impact of exchange rate fluctuations see “Item 5. Operating and Financial Review and Prospects – Foreign Currency Exchange Rate Exposure”.
The following table sets forth (i) the average, high and low Noon Buying Rates for the euro expressed as U.S. dollars per€1.00 for the past five years on an annual basis and (ii) the high and low Noon Buying Rates on a monthly basis from July 2016 through and including February 10, 2017.
| | | | | | | | | | | | |
| Year | | Average(1) | | | High | | | Low | |
2012 | | | 1.2909 | | | | 1.3463 | | | | 1.2062 | |
2013 | | | 1.3303 | | | | 1.3816 | | | | 1.2774 | |
2014 | | | 1.3210 | | | | 1.3927 | | | | 1.2101 | |
2015 | | | 1.1032 | | | | 1.2015 | | | | 1.0524 | |
2016 | | | 1.1029 | | | | 1.1516 | | | | 1.0375 | |
| | | | | | | | |
| Month | | High | | | Low | |
2016 | | | | | | | | |
July | | | 1.1168 | | | | 1.0968 | |
August | | | 1.1334 | | | | 1.1078 | |
September | | | 1.1271 | | | | 1.1158 | |
October | | | 1.1212 | | | | 1.0866 | |
November | | | 1.1121 | | | | 1.0560 | |
December | | | 1.0758 | | | | 1.0375 | |
2017 | | | | | | | | |
January | | | 1.0794 | | | | 1.0416 | |
February (through February 10, 2017) | | | 1.0802 | | | | 1.0650 | |
(1) The average of the applicable Noon Buying Rates on the last day of each month during the relevant period.
The Noon Buying Rate on February 10, 2017 was US$1.0650 per€1.00.
DIVIDENDS
Dividend Distribution Policy
Dividends are jointly proposed by SAP SE’s Supervisory Board (Aufsichtsrat) and Executive Board (Vorstand) based on SAP SE’syear-end stand-alone statutory financial statements, subject to approval by the Annual General Meeting of Shareholders. Dividends are officially declared for the prior year at SAP SE’s Annual General Meeting of Shareholders. SAP SE’s Annual General Meeting of Shareholders usually convenes during the second quarter of each year. Beginning with the dividends payable for the 2016 fiscal year and in accordance with a recent change of the German Stock Corporation Act that aims to implement joint market standards in Europe for corporate actions processing, dividends will be remitted to the custodian bank on behalf of the shareholders on the third business day following the Annual General Meeting of Shareholders. Record holders of the ADRs on the dividend record date will be entitled to receive payment of the dividend declared in respect of the year for which it is declared. Cash dividends payable to such holders will be paid to the Depositary in euro and, subject to certain exceptions, will be converted by the Depositary into U.S. dollars.
Dividends paid to holders of the ADRs may be subject to German withholding tax. See “Item 8. Financial Information – Other Financial Information – Dividend Policy” and “Item 10. Additional Information – Taxation,” for further information.
11
Annual Dividends Paid and Proposed
The following table sets forth in euro the annual dividends paid or proposed to be paid per ordinary share in respect of each of the years indicated. One SAP ADR currently represents one SAP SE ordinary share. Accordingly, the final dividend per ADR is equal to the dividend for one SAP SE ordinary share and is dependent on the euro/U.S. dollar exchange rate. The table does not reflect tax credits that may be available to German taxpayers who receive dividend payments. If you own our ordinary shares or ADRs and if you are a U.S. resident, refer to “Item 10. Additional Information – Taxation,” for further information.
| | | | | | | | |
Year Ended
December 31, | | Dividend Paid per Ordinary Share | |
| | € | | | US$ | |
2012 | | | 0.85 | | | | 1.11 | (1) |
2013 | | | 1.00 | | | | 1.37 | (1) |
2014 | | | 1.10 | | | | 1.22 | (1) |
2015 | | | 1.15 | | | | 1.30 | (1) |
2016 (proposed) | | | 1.25 | (2) | | | 1.33 | (2),(3) |
(1) Translated for the convenience of the reader from euro into U.S. dollars at the Noon Buying Rate for converting euro into U.S. dollars on the dividend payment date. The Depositary is required to convert any dividend payments received from SAP as promptly as practicable upon receipt.
(2) Subject to approval at the Annual General Meeting of Shareholders of SAP SE currently scheduled to be held on May 10, 2017.
(3) Translated for the convenience of the reader from euro into U.S. dollars at the Noon Buying Rate for converting euro into U.S. dollars on February 10, 2017 of US$1.0650 per€1.00. The dividend paid may differ due to changes in the exchange rate.
The amount of dividends paid on the ordinary shares depends on the amount of profits to be distributed by SAP SE, which depends in part upon our financial performance. In addition, the amount of dividends received by holders of ADRs may be affected by fluctuations in exchange rates (see “Item 3. Key Information – Exchange Rates”). The timing, declaration, amount and payment of any future dividend will depend upon our future earnings, capital needs and other relevant factors, in each case as proposed by the Executive Board and the Supervisory Board of SAP SE and approved by the Annual General Meeting of Shareholders.
RISK FACTORS
Economic, Political, Social, and Regulatory Risk
Uncertainty in the global economy, financial markets, or political conditions could have a negative impact on our business, financial position, profit, as well as cash flows, and put pressure on our operating profit.
Our business is influenced by multiple risk factors that are both difficult to predict and beyond our influence and control. These factors include global economic and business conditions, and fluctuations in national currencies. Other examples are political developments and general regulations as well as budgetary constraints or shifts in spending priorities of national governments.
Macroeconomic developments, such as financial market volatility episodes, global economic crises, chronic fiscal imbalances, slowing economic conditions, or disruptions in emerging markets, could limit our customers’ ability and willingness to invest in our solutions or delay purchases. In addition, changes in the euro conversion rates for particular currencies might have an adverse effect on business activities with local customers and partners. Furthermore, political instability in regions such as Africa and the Middle East, political crises (including Brazil, Great Britain, Greece, Syria, Turkey, Ukraine, or Venezuela), sanctions (such as those placed on Russia), natural disasters, pandemic diseases (such as Ebola in West Africa) and terrorist attacks (including the attacks in Brussels, Belgium, in March 2016, or in Nice, France, in July 2016) could contribute to economic and political uncertainty.
These events could reduce the demand for SAP software and services, and lead to:
| – | | Delays in purchases, decreased deal size, or cancellations of proposed investments |
| – | | Potential lawsuits from customers due to denied provision of service as a result of sanctioned-party lists or export control issues |
| – | | Higher credit barriers for customers, reducing their ability to finance software purchases |
| – | | Increased number of bankruptcies among customers, business partners, and key suppliers |
| – | | Increased default risk, which might lead to significant impairment charges in the future |
| – | | Market disruption from aggressive competitive behavior, acquisitions, or business practices |
| – | | Increased price competition and demand for cheaper products and services |
Any one or more of these developments could reduce our ability to sell and deliver our software and services which could have an adverse effect on our business, financial position, profit, and cash flows.
12
Our international business activities and processes expose us to numerous and often conflicting laws and regulations, policies, standards or other requirements and sometimes even conflicting regulatory requirements, and to risks that could harm our business, financial position, profit, and cash flows.
We are a global company and currently market our products and services in more than 180 countries and territories in the Americas (Latin America and North America); Asia Pacific Japan (APJ); China, Hong Kong, Macau, and Taiwan (Greater China); Europe, Middle East, and Africa (EMEA); and Middle and Eastern Europe (MEE) regions. Our business in these countries is subject to numerous risks inherent in international business operations. Among others, these risks include:
| – | | Data protection and privacy regulations regarding access by government authorities to customer, partner, or employee data |
| – | | Data residency requirements (the requirement to store certain data only in and, in some cases, also to access such data only from within a certain jurisdiction) |
| – | | Conflict and overlap among tax regimes |
| – | | Possible tax constraints impeding business operations in certain countries |
| – | | Expenses associated with the localization of our products and compliance with local regulatory requirements |
| – | | Discriminatory or conflicting fiscal policies |
| – | | Operational difficulties in countries with a high corruption perception index |
| – | | Protectionist trade policies, import and export regulations, and trade sanctions and embargoes |
| – | | Works councils, labor unions, and immigration laws in different countries |
| – | | Difficulties enforcing intellectual property and contractual rights in certain jurisdictions |
| – | | Country-specific software certification requirements |
| – | | Challenges with effectively managing a large distribution network of third-party companies |
| – | | Compliance with various industry standards (such as Payment Card Industry Data Security Standard) |
| – | | Market volatilities or workforce restrictions due to changing laws and regulations resulting from political decisions (e.g. Brexit, government elections) |
As we expand into new countries and markets, these risks could intensify. The application of the respective local laws and regulations to our business is sometimes unclear, subject to change over time, and often conflicting among jurisdictions. Additionally, these laws and government approaches to enforcement are continuing to change and evolve, just as our products and services continually evolve. Compliance with these varying laws and regulations could involve significant
costs or require changes in products or business practices.Non-compliance could result in the imposition of penalties or cessation of orders due to allegednon-compliant activity. We do not believe we have engaged in any activities sanctionable under these laws and regulations, but governmental authorities could use considerable discretion in applying these statutes and any imposition of sanctions against us could be material. One or more of these factors could have an adverse effect on our operations globally or in one or more countries or regions, which could have an adverse effect on our business, financial position, profit, and cash flows.
Social and political instability caused by state-based conflicts, terrorist attacks, civil unrest, war, or international hostilities might disrupt SAP’s business operations.
Terrorist attacks (such as in Turkey, in March, June, August, and December 2016) as well as other acts of violence or war, civil, religious, and political unrest (such as in Turkey, Ukraine, and Venezuela; Israel, Libya, Syria, and in other parts of the Middle East; and parts of Africa); natural disasters (such as hurricanes, flooding, or similar events); or pandemic diseases (such as Ebola in West Africa) could have a significant adverse effect on the local economy and beyond. Such an event could lead, for example, to the loss of a significant number of our employees, or to the disruption or disablement of operations at our locations, and could affect our ability to provide business services and maintain effective business operations. Furthermore, this could have a significant adverse effect on our partners as well as our customers and their investment decisions, which could have an adverse effect on our reputation, business, financial position, profit, and cash flows.
Market Risks
Our established customers might not buy additional software solutions, subscribe to our cloud offerings, renew maintenance agreements, purchase additional professional services, or they might switch to other products or service offerings (including competitive products).
In 2016, we continued to depend materially on the success of our support portfolio and on our ability to deliver high-quality services. Traditionally, our large installed customer base generates additional new software, maintenance, consulting, and training revenue. Despite the high quality and service level of our transformed and expanded service offering in the area of premium support services, we might be unable to meet customer expectations with regards to delivery and value proposition. This might lead to a potentially adverse impact on customer experience. Existing customers might cancel or not renew their maintenance contracts, decide not to buy additional products and services, not
13
subscribe to our cloud offerings, or accept alternative offerings from other vendors. In addition, the increasing volume in our cloud business as well as the conversion of traditionalon-premise licenses to cloud subscriptions licenses and an increased complexity in our maintenance and support cycle across our diverse solutions and offerings could have a potential negative impact on our software and maintenance revenue streams. This could have an adverse effect on our business, financial position, profit, and cash flows.
The success of our cloud computing strategy depends on positive market perception and increasing market adoption of our cloud solutions and managed cloud services. Insufficient adoption of our solutions and services could lead to a loss of SAP’s position as a leading cloud company.
The market for cloud computing is increasing and shows strong growth relative to the market for ouron-premise solutions. To offer a broad cloud service portfolio and generate the associated business value for our customers, we continue to invest in innovation and acquisitions. Due to ongoing contracts and previous substantial investments to integrate traditionalon-premise enterprise software into their businesses, as well as concerns about data protection, total cost of ownership, functional capacities, migration, security and integration capabilities, and reliability, customers and partners might be reluctant or unwilling to migrate to the cloud.
Other factors that could affect the market acceptance, adoption and extension of cloud solutions and services include:
| – | | Concerns with entrusting a third-party to store and manage critical employee or company confidential data |
| – | | Customer concerns about security capabilities and reliability |
| – | | Customer concerns about the ability to scale operations for large enterprise customers |
| – | | Inadequate level of configurability or customizability of the software |
| – | | Missing integration scenarios betweenon-premise products andcloud-to-cloud solutions |
| – | | Failure to securely and successfully deliver cloud services by any cloud service provider could have a negative impact on customer trust in cloud solutions |
| – | | Strategic alliances among our competitors and / or their growth-related efficiency gains in the cloud area could lead to significantly increased competition in the market with regards to pricing and ability to integrate solutions |
| – | | Failure to get the full commitment of our partners might reduce speed and impact in market reach |
| – | | Failure to comply with increasing governance on data privacy and data residence |
| – | | Challenge in defining adequate solution packages and scope for all customer segments |
If organizations do not perceive the benefits of cloud computing, the market for cloud business might not develop further, or it might develop more slowly than we expect, either of which could have an adverse effect on our business, competitiveness, financial position, profit, reputation and cash flows.
Our market share and profit could decline due to increased competition, market consolidation and technological innovation as well as new business models in the software industry.
The software industry continues to evolve rapidly and is currently undergoing a significant shift due to innovations in the areas of enterprise mobility, machine learning, augmented and virtual reality, cybersecurity, Big Data, hyperconnectivity, the Internet of Things, digitization, supercomputing, cloud computing, and social media. While smaller innovative companies tend to create new markets organically, large traditional IT vendors tend to enter such markets mostly through acquisitions. SAP faces increased competition in its business environment from traditional, new and in particular cooperating competitors. This competition could cause price pressure, cost increases, and loss of market share, which could have an adverse effect on our business, financial position, profit, and cash flows.
Additionally, related to our Applications, Technology & Services segment, customers could change their buying behavior by accelerating their acceptance of cloud solutions to reduce their investments, which might have a temporary adverse effect on our operating results. Furthermore, the trend in the market to invest more in cloud solutions might lead to a risk of the potential loss of existingon-premise customers. It might also have a temporary adverse effect on our revenue due to the number of conversions fromon-premise licenses to cloud subscriptions from existing SAP customers in our installed base, as we recognize cloud subscriptions revenue over the respective service provision, and that typically ranges fromone-to-three years with some up to five years.
Business Strategy Risks
Demand for our new solutions might not develop as planned and our strategy on new business models and flexible consumption models might not be successful.
Our business consists of new software licenses, software license updates, Services and maintenance fees as well as of cloud subscriptions. Our customers are expecting
14
to take advantage of technological breakthroughs from SAP without compromising their previous IT investments. However, the introduction of new SAP solutions, technologies, and business models as well as delivery and consumption models is subject to uncertainties as to whether customers will be able to perceive the additional value and realize the expected benefits we deliver along our road maps. There is a risk that such uncertainties might lead customers to wait for proof of concepts or holistic integration scenarios through reference customers or more mature versions first, which might result in a lower level of adoption of our new solutions, technologies, business models, and flexible consumption models, or no adoption at all, possibly impacting customer satisfaction and retention. This could have an adverse effect on our business, financial position, profit, and cash flows.
Though downturns or upturns in cloud sales might not be immediately reflected in our operating results, any decline in our customer renewals would harm the future operating results of our cloud business.
We recognize cloud subscriptions revenue as we provide the respective services, which typically range fromone-to-three years with some up to five years. This revenue recognition and our increasing subscription revenues could have a temporary adverse effect on our financial position, profit, and cash flows.
To maintain or improve our operating results in the cloud business, it is important that our customers renew their agreements with us when the initial contract term expires and purchase additional modules or additional capacity. Our customers have no obligation to renew their subscriptions after the initial subscription period, and we cannot assure that customers will renew subscriptions at the same or at a higher level of service, or at all. Our customers’ renewal rates might decline or fluctuate as a result of various factors, including their satisfaction or dissatisfaction with our cloud solution and services portfolio; our ability to efficiently provide cloud services according to customer expectations and meeting the service level agreements, service availability and provisioning, the integration capabilities of our cloud solutions into their existing IT environment (including hybrid solutions combining both cloud andon-premise solutions); our customer support; concerns regarding stable, efficient, and secure cloud operations and compliance with legal and regulatory requirements; our pricing; the pricing of competing products or services; mergers and acquisitions affecting our customer base; global economic conditions; and reductions in our customers’ spending levels.
If our customers do not renew their subscriptions, if they renew on terms less favorable to us, or do not purchase additional modules or users, our revenue and billings might decline, and our operating results could be negatively impacted. This could have an adverse effect on our business, financial position, profit, and cash flows.
If we are unable to scale and enhance an effective partner ecosystem, revenue might not increase as expected.
An open and vibrant partner ecosystem is a fundamental pillar of our success and growth strategy. We have entered into partnership agreements that driveco-innovation on our platforms, profitably expand all our routes to market to optimize market coverage, optimize cloud delivery, and provide high-quality services capacity in all market segments. Partners play a key role in driving market adoption of our entire solutions portfolio, byco-innovating on our platforms, embedding our technology, and reselling and/or implementing our software.
If partners consider our products or services model less strategic and/or financially less attractive compared to our competition and/or less appropriate for their respective channel and target market, if partners fear direct competition by SAP or if SAP fails to establish and enable a network of qualified partners meeting our quality requirements and the requirements of our customers, then, among other things, partners might not:
| – | | Develop a sufficient number of new solutions and content on our platforms |
| – | | Provide high-quality products and services to meet customer expectations |
| – | | Drive growth of references by creating customer use cases and demo systems |
| – | | Embed our solutions sufficiently enough to profitably drive product adoption, especially with innovations such as SAP S/4HANA and SAP Cloud Platform (formerly called SAP HANA Cloud Platform) |
| – | | Enable and train sufficient resources to promote, sell, and support to scale to targeted markets |
| – | | Comply with applicable quality requirements expected by our customers, resulting in delayed, disrupted, or terminated sales and services |
| – | | Transform their business model in accordance with the transformation of SAP’s business model in a timely manner |
| – | | Renew their existing agreements with us or enter into new agreements on terms acceptable to us or at all |
| – | | Provide ability and capacity to meet customer expectations regarding service provisioning. |
15
If one or more of these risks materialize, this might have an adverse effect on the demand for our products and services as well as the partner’s loyalty and ability to deliver. As a result, we might not be able to scale our business to compete successfully with other software vendors, which could have an adverse effect on our reputation, business, financial position, profit, and cash flows.
Human Capital Risks
If we do not effectively manage our geographically dispersed workforce, we might not be able to run our business efficiently and successfully.
Our success is dependent on appropriate alignment of our internal and external workforce planning processes, adequate resource allocation and our location strategy with our general strategy. It is critical that we manage our internationally dispersed workforce effectively, taking short- and long-term workforce and skill requirements into consideration. This applies to the management of our internal as well as our external workforce. Changes in headcount and infrastructure needs as well as local legal or tax regulations could result in a mismatch between our expenses and revenue. Failure to manage our geographically dispersed workforce effectively could hinder our ability to run our business efficiently and successfully and could have an adverse effect on our business, financial position, profit, and cash flows.
If we are unable to attract, develop, and retain leaders and employees with specialized knowledge and technology skills, or are unable to achieve internal diversity and inclusion objectives, we might not be able to manage our operations effectively and successfully, or develop successful new solutions and services.
Our highly qualified workforce is the foundation for our continued success. In certain regions and specific technology and solution areas, we continue to set very high growth targets, specifically in countries and regions such as Africa, China, Latin America, and the Middle East. In the execution of SAP’s strategic priorities, we depend on highly skilled and specialized personnel and leaders, both male and female. Successful maintenance and expansion of our highly skilled and specialized workforce in the area of cloud is a key success factor for our transition to be the leading cloud company. The availability of such personnel as well as business experts is limited and, as a result, competition in our industry is intense and could expose us to claims by other
companies seeking to prevent their employees from working for a competitor. If we are unable to identify, attract, develop, motivate, adequately compensate, and retain well-qualified and engaged personnel, or if existing highly skilled and specialized personnel leave SAP and ready successors or adequate replacements are not available or we cannot allocate our workforce as required due to local regulations and associated restrictions, we might not be able to manage our operations effectively, which could have an adverse effect on our reputation, business, financial position, profit, and cash flows. Furthermore, we might not be able to develop, sell, or implement successful new solutions and services as planned. This is particularly true as we continue to introduce new and innovative technology offerings and expand our business in emerging markets. The lack of appropriate or inadequately executed benefit and compensation programs could limit SAP’s ability to attract or retain qualified employees and lead to financial losses. In addition, we might not be able to achieve our internal gender diversity objectives to increase the number of women in management from 18% in 2010 to 25% by end of 2017.
Organizational and Governance-Related Risks
Laws and regulatory requirements in Germany, the United States, and elsewhere continue to be very stringent.
As a European company domiciled in Germany with securities listed in Germany and the United States, we are subject to European, German, U.S., and other governance-related regulatory requirements. Changes in laws and regulations and related interpretations, including changes in accounting standards and taxation requirements, and increased enforcement actions, sanctions, for example United States sanction requirements for Iran, and penalties might alter the business environment in which we operate. Regulatory requirements have become significantly more stringent in recent years, and some legislation, such as the anticorruption legislation in Germany, the U.S. Foreign Corrupt Practices Act, the UK Bribery Act, and other local laws prohibiting corrupt payments by employees, vendors, distributors, or agents, is being applied more rigorously. Emerging markets are a significant focus of our international growth strategy. The nature of these markets presents a number of inherent risks. A failure by SAP to comply with applicable laws and regulations, or any related allegations of wrongdoing against us, whether merited or not, could have an adverse effect on our business, financial position, profit, cash flows and reputation.
16
Non-compliance with applicable data protection and privacy laws or failure to adequately meet the requirements of SAP’s customers with respect to our products and services could lead to civil liabilities and fines, as well as loss of customers and damage to SAP’s reputation.
As a global software and service provider, SAP is required to comply with local laws wherever SAP does business. Consequently, we must ensure that any legal requirements in connection with the provision of products and services are properly implemented. With regard to data protection requirements, in May 2016, the EU enacted a “General Data Protection Regulation” (GDPR), as a successor to the Data Protection Directive of 1995, with the aim of further harmonizing data protection laws across the EU. The GDPR will be directly applicable law in all EU and EEA member states as of May 25, 2018 after atwo-year transition period. Within limits, member states can supplement the GDPR with additional national rules. Overall, the GDPR does not introduce substantial new concepts. It rather focuses on stronger compliance requirements and enforces them vigorously on every business that processes personal data of individuals in the EU/EEA, regardless of where that business is established. Some of the new rules are subject to further definition by the authorities, though, and others leave room for interpretation.
Risks for SAP include:
| – | | Violations of the GDPR might be punished with financial penalties of up to the higher of€20 million or 4% of the responsible company’s annual global turnover. Further administrative measures include mandatory instructions by the data protection supervisory authorities relating to specific processing activities, up to their prohibition.Non-compliance might further lead to legal claims from affected individuals and consumer protection organizations. Where SAP processes data on behalf of its customers, violations might lead to damage claims from customers.Non-compliance further bears the risk of reputational losses if violations become publically known. |
| – | | Where member states can supplement the GDPR with additional national rules, there is a risk that data protection law will not be fully harmonized across Europe. As a consequence, SAP would have to continue to adapt its products and services to the individual national requirements. |
| – | | The data protection concepts of the GDPR do not adequately reflect the latest technological developments, such as big data and machine learning. If the GDPR cannot be interpreted in a way that allows for such technologies, or revised as necessary, SAP |
| | | might not be able to use and offer products and services that implement such technologies in the EU/EEA. |
Overall, these laws and regulations amend and supplement existing requirements regarding the processing of personal data that SAP and SAP customers must fulfill and which we must consequently address with our products and services, including cloud delivery. Failure to comply with applicable laws or to adequately address privacy concerns of customers, even if unfounded, could lead to investigations by supervisory authorities, civil liability, fines, (in the future, potentially calculated based on the Company’s annual revenue), loss of customers, damage to our reputation, and could have an adverse effect on our business, financial position, profit, and cash flows.
Failure to meet customer, partner, or other stakeholder expectations or generally accepted standards on climate change, energy constraints, and our social investment strategy could negatively impact SAP’s business, results of operations, and reputation.
Energy and emissions management are an integral component of our holistic management of social, environmental, and economic risks and opportunities. We have identified risks in these major areas:
| – | | Our own operations – energy management and other environmental issues such as carbon management, water use, and waste |
Because our customers, employees, and investors expect a reliable energy and carbon strategy, we have reemphasized our environmental policy and our previously communicated targets, especially our 2020 target for greenhouse gas emissions. In case these targets cannot be achieved, our customers might no longer recognize SAP for our environmental leadership and might buy other vendors’ products and services. Consequently, we could fail to achieve our revenue target. If we do not meet stakeholder expectations in the areas identified, our rating in sustainable investment indexes might decrease, which could have an adverse effect on our reputation, profit, and share price.
Unethical behavior andnon-compliance with our integrity standards due to intentional and fraudulent employee behavior could seriously harm our business, financial position, profit, and reputation.
SAP’s leadership position in the global market is founded on the long-term and sustainable trust of our
17
stakeholders worldwide. Our heritage is one of corporate transparency, open communication with financial markets, and adherence to recognized standards of business integrity. The SAP Code of Business Conduct, adopted by the Executive Board on January 29, 2003, and updated as necessary since then, memorialized and supplemented the already existing guidelines and expectations for the business behavior practiced at SAP.
However, we might encounter unethical behavior andnon-compliance with our integrity standards due to intentional and fraudulent behavior of individual employees, possibly in collusion with external third parties. In addition to intentional behavior, problems could also arise due to negligence in the adherence to rules and regulations, especially in countries with a high Corruption Perceptions Index and continuously increasing business activities in profoundly regulated industries such as public sector, healthcare, banking or insurance. Unethical behavior and misconduct attributable to SAP could not only lead to criminal charges, fines, and claims by injured parties, but also to financial loss, and severe reputational damage. This could have an adverse effect on our business, financial position, profit, and cash flows.
Principal shareholders may be able to exert control over our future direction and operations.
If SAP SE’s principal shareholders and the holdings of entities controlled by them vote in the same manner, this could delay, prevent or facilitate a change in control of SAP or other significant changes to SAP SE or its capital structure. See “Item 7. Major Shareholders and Related-Party Transactions – Major Shareholders” for further information.
U.S. judgments may be difficult or impossible to enforce against us or our Board members.
Currently, except for Bill McDermott, Robert Enslin, and Steve Singh all members of SAP SE’s Executive Board and all members of the Supervisory Board arenon-residents of the United States. A substantial portion of the assets of SAP and our Board members are located outside the United States. As a result, it may not be possible to effect service of process within the United States uponnon-U.S. resident persons or SAP or to enforce againstnon-U.S. resident persons judgments obtained in U.S. courts predicated upon the civil liability provisions of the securities laws of the United States. In addition, awards of punitive damages in actions brought in the United States or elsewhere might be unenforceable in Germany.
Communication and Information Risks
Our controls and efforts to prevent the unauthorized disclosure of confidential information might not be effective.
Confidential information and internal information related to topics such as our strategy, new technologies, mergers and acquisitions, unpublished financial results, customer data or personal data, could be prematurely or inadvertently disclosed and subsequently lead to market misperception and volatility. This could require us to notify multiple regulatory agencies and comply with applicable regulatory requirements and, where appropriate, the data owner, which could result in a loss of reputation for SAP. For example, leaked information during a merger or acquisition deal could cause the loss of our deal target, or our share price could react significantly in case of prematurely published financial results. This could have an adverse effect on our market position and lead to fines and penalties. In addition, this could have an adverse effect on our business, financial position, profit, and cash flows.
Financial Risks
Our sales are subject to quarterly fluctuations and our sales forecasts might not be accurate.
Our revenue and operating results can vary and have varied in the past, sometimes substantially, from quarter to quarter. Our revenue in general, and our software revenue in particular, is difficult to forecast for a number of reasons, including:
| – | | The relatively long sales cycles for our products |
| – | | The large size, complexity, and extended timing of individual customer transactions |
| – | | The introduction of licensing and deployment models such as cloud subscription models |
| – | | The timing of the introduction of new products and services or product and service enhancements by SAP or our competitors |
| – | | Changes in customer budgets |
| – | | Decreased software sales that could have an adverse effect on related maintenance and services revenue |
| – | | The timing, size, and length of customers’ services projects |
| – | | Deployment models that require the recognition of revenue over an extended period of time |
| – | | Adoption of, and conversion to, new business models leading to changed or delayed payment terms |
| – | | Seasonality of a customers’ technology purchases |
| – | | Limited visibility during the ongoing integration of acquired companies into their ability to accurately predict their sales pipelines and the likelihood that the projected pipeline will convert favorably into sales |
18
| – | | Other general economic, social, environmental, and market conditions, such as a global economic crisis and difficulties for countries with large debt |
Since many of our customers make their IT purchasing decisions near the end of calendar quarters, and with a significant percentage of those decisions being made during our fourth quarter, even a small delay in purchasing decisions for ouron-premise software could have an adverse effect on our revenue results for a given year. Our dependence on large transactions has decreased in recent years with a trend towards an increased number of transactions while the average deal size is more or less constant.
However, the loss or delay of one or a few large opportunities could have an adverse effect on our business, financial position, profit, and cash flows.
External factors could impact our liquidity and increase the default risk associated with, and the valuation of, our financial assets.
Macroeconomic factors such as an economic downturn could have an adverse effect on our future liquidity. We use a globally centralized financial management to control financial risk, such as liquidity, exchange rate, interest rate, counterparty, and equity price risks. The primary aim is to maintain liquidity in the SAP Group at a level that is adequate to meet our obligations at any time. Our total Group liquidity is supported by our strong operating cash flows, of which a large part is recurring, and by credit facilities from which we can draw if necessary. However, adverse macroeconomic factors could increase the default risk associated with the investment of our total Group liquidity including possible liquidity shortages limiting SAP’s ability to repay financial debt. This could have an impact on the value of our financial assets, which could have an adverse effect on our business, financial position, profit, and cash flows.
Management use of estimates could negatively affect our business, financial position, profit, and cash flows.
To comply with IFRS, management is required to make numerous judgments, estimates, and assumptions that affect the reported financial figures. The facts and circumstances, as well as assumptions on which management bases these estimates and judgments and management’s judgment regarding the facts and circumstances, might change over time and this could result in significant changes in the estimates and judgments and, consequently, in the reported financials.
There is a risk that such changes could have an adverse effect on our business, financial position, profit and cash flows.
Current and future accounting pronouncements and other financial reporting standards, especially but not only concerning revenue recognition, might negatively impact our financial results.
We regularly monitor our compliance with applicable financial reporting standards and review new pronouncements and drafts thereof that are relevant to us. As a result of new standards, changes to existing standards (including the new IFRS 15 on revenue from contracts with customers that we will need to adopt in 2018) and changes in their interpretation, we might be required to change our accounting policies, particularly concerning revenue recognition, to alter our operational policies so that they reflect new or amended financial reporting standards, or to restate our published financial statements. Such changes might have an adverse effect on our reputation, business, financial position, and profit, or cause an adverse deviation from our revenue and operating profit target.
As a globally operating company, SAP is subject to various financial risks, which could negatively impact our business, financial position, profit, and cash flows.
Because we are operating throughout the world, a significant portion of our business is conducted in foreign currencies. In 2016, approximately 71.6% of our revenue was attributable to operations in foreign currencies and therefore gets translated into our reporting currency, the euro. Consequently, period-over-period fluctuations can significantly impact our financial results. In general, an appreciation of the euro has an adverse effect while a depreciation has a positive effect. In addition to exchange rate risks, we are exposed to interest rate and share price fluctuations due to variable interest bearing assets and liabilities and share-based compensation plans for our employees and executives.
The market price for our ADRs and ordinary shares may be volatile.
The market prices of our ADRs and ordinary shares have experienced and may continue to experience significant volatility in response to various factors including, but not limited to:
| – | | unauthorized or inadvertent premature disclosure of confidential information, including information concerning pending acquisition negotiations or acquisition rumors; |
19
| – | | the announcement of new products or product enhancements by us or our competitors; |
| – | | technological innovation by us or our competitors; |
| – | | quarterly variations in our results or our competitors’ results of operations or results that fail to meet market expectations; |
| – | | changes in revenue and revenue growth rates on a consolidated basis or for specific geographic areas, business units, products or product categories; |
| – | | changes in our externally communicated outlook; |
| – | | changes in our capital structure, for example due to the potential future issuance of additional debt instruments; |
| – | | general market conditions specific to particular industries; |
| – | | litigation to which we are a party; |
| – | | general and country specific economic or political conditions (particularly wars, terrorist attacks, etc.); |
| – | | proposed and completed acquisitions or other significant transactions by us or our competitors; and |
| – | | general market conditions. |
Many of these factors are beyond our control. In the past, companies that have experienced volatility in the market price of their stock have been subject to shareholder lawsuits, including securities class action litigation. Any such lawsuits against us, with or without merit, could result in substantial costs and the diversion of management’s attention and resources, resulting in a decline in our results of operations and our stock price.
Project Risks
Implementation of SAP software and cloud-based service deliveries often involves a significant commitment of resources by our customers and is subject to a number of significant risks over which we often have no control.
A core element of our business is the successful implementation of software and service solutions to enable our customers to master complexity and help our customers’ business run at their best. The implementation of SAP software and cloud-based service deliveries is led by SAP, by partners, by customers, or by a combination thereof. Depending on various factors, such as the complexity of solutions, the customer’s implementation, integration and migration needs, or the resources required, SAP faces a number of different risks. For example, functional requirement changes, delays in timeline, or deviation from recommended best practices might occur during the course of a project. These scenarios have a direct impact on the project resource model and on securing adequate internal personnel or consultants in a timely manner and could therefore prove challenging.
Other aspects that could potentially affect our projects and deliveries, especially during the transition to the Cloud are security breaches or unauthorized access to confidential data, operational data center and infrastructure disruptions as well as local legislation with regards to data privacy.
As a result of these and other risks, SAP and/or some of our customers have incurred significant implementation costs in connection with the purchase and installation of SAP software products and solutions. Some customer implementations have taken longer than planned and failed to generate the profit originally expected. We cannot guarantee that we can reduce or eliminate protracted installation or significant third-party consulting costs, for example, that trained consultants will be readily available, that our costs will not exceed the fees agreed in fixed-price contracts, or that customers will be satisfied with the implementation of our software and solutions. Unsuccessful, lengthy, or costly customer implementation and integration projects could result in claims from customers, harm SAP’s reputation, and could have an adverse effect on our business, financial position, profit, and cash flows. Additionally, potentially new contracting models based on subscription models for services, support, and application management might lead to challenges from a financial position perspective including profit and cash flow.
Product and Technology Risks
Undetected security vulnerabilities shipped and deployed within our products might cause damage to SAP and our customers, and partners.
Customer systems or systems operated by SAP itself to provide services could potentially be compromised by vulnerabilities if they are exploited by hackers. This could lead to theft, destruction, or abuse of data, or systems could be rendered unusable (for example, due to distributed denial of service attacks). The detection of security vulnerabilities in our software, our customers’ systems, or SAP systems used in the provision of services, especially in case of exploitation, could prevent us from meeting our contractual obligations and subsequently might lead to customer claims and reputational damage, which might have an adverse effect on our business, financial position, profit, and cash flows.
Undetected defects in the introduction of new products, product enhancements and cloud offerings could increase our costs, and reduce customer demand.
Our development investment, including new product launches and enhancements, is subject to risks. For example, software products and services might not
20
completely meet our high-quality standards, including security standards; might not fulfill market needs or customer expectations; or might not comply with local standards and requirements. Furthermore, this risk also exists with respect to acquired companies’ technologies and products where we might not be able to manage these as quickly and successfully as expected. Therefore, market launches, entering new markets, or the introduction of new innovations could be delayed or not be successful.
In addition, new products and cloud offerings, including third-party technologies we have licensed and open source software components we use in those products, could contain undetected defects or they are detected, or not be mature enough from the customer’s point of view for business-critical solutions after shipment in spite of all due diligence SAP puts into quality and security. The detection and correction of any defects especially after delivery could be expensive and time-consuming and in some cases we might not be able to meet the expectations of customers regarding time and quality in the defect resolution process. In some circumstances, we might not be in a position to rectify such defects or entirely meet the expectations of customers, specifically as we are expanding our product portfolio into additional markets. As a result, we might have to fix defects in our software after shipment (so called security response) or in some cases even face customer claims for cash refunds, damages, replacement software, or other concessions. The risk of defects and their adverse consequences could increase as we seek to introduce a variety of new software products and product enhancements at a higher innovation rate. This is especially relevant for cloud products as delivery cycles are even shorter (up to daily deliveries) and our complete cloud product customer base could receive undetected defects simultaneously. Furthermore, for products that use third-party (not SAP) cloud services, we might not always be able to detect defects in advance. Significant undetected defects or delays in introducing new products or product enhancements could affect market acceptance of SAP software products and could have an adverse effect on our reputation, business, financial position, profit, and cash flows.
The use of existing SAP software products by customers in business-critical solutions and processes and the relative complexity and technical interdependency of our software products and services create a risk that customers or third parties might pursue warranty, performance, or other claims against us for actual or alleged defects in SAP software products, in our provision of services, or in our application hosting
services. We have in the past been, and might in the future be, subject to warranty, performance, or other similar claims.
Although our contracts generally contain provisions designed to limit our exposure due to actual or alleged defects in SAP software products or in our provision of services, these provisions might not cover every eventuality or be effective under the applicable law. Regardless of its merits, any claim could entail substantial expense and require the devotion of significant time and attention by key management personnel. Publicity surrounding such claims could affect our reputation and the demand for our software.
Changes in our rights to use software, cloud services, and technologies we license from third parties that are an integral part of SAP’s products and services could slow down time to market and influence our license pricing and therefore the competitiveness with other software vendors. Furthermore, it could diminish our software’s or cloud functional capabilities and therefore could jeopardize the stability of our solution portfolio offering.
The numerous third-party solutions we have licensed and certain open source software components we use have become an integral part of our product and service portfolio. We depend on those solutions for the functionality of our software and cloud services. Changes to, or the loss of, third-party licenses as well as open source licenses being construed could significantly increase the cost of these licenses and significantly reduce software or cloud functionality and/or usability or availability of SAP’s software or cloud offerings. As a result, we might incur additional development or license costs to ensure the continued functionality of our products, experience delays in our ability to offer or have to stop offering our products for sale, which could have an adverse effect on our business, financial position, profit, and cash flows. This risk increases with each of our acquisitions of a company or a company’s intellectual property assets that had been subject to third-party solution licensing, open source software and product standards less rigorous than our own.
If we are unable to keep up with rapid technological, process and service innovations, and new business models as well as changing market expectations, we might not be able to compete effectively.
Our future success depends upon our ability to keep pace with technological and process innovations and new business models, as well as our ability to develop
21
new products and services, enhance and expand our existing products and services portfolio, and integrate products and services we obtain through acquisitions. To be successful, we are required to adapt our products and ourgo-to-market approach to a cloud-based delivery and consumption model to satisfy changing customer demand and to ensure an appropriate level of adoption, customer satisfaction and retention.
We might not be successful in bringing new business models, solutions, solution enhancements, and/or services to market before our competitors or at equally favorable conditions. We might also face increasing competition from open source software initiatives, or comparable models in which competitors might provide software and intellectual property free and/or under terms and conditions unfavorable for SAP. In addition, we might not be able to generate enough revenue to offset the significant research and development costs we incur to deliver technological innovations or to offset the required infrastructure costs to deliver our solutions and services as part of our new business models. Moreover, we might not anticipate and develop technological improvements or succeed in adapting our products, services, processes, and business models to technological change, changing regulatory requirements, emerging industry standards, and changing requirements of our customers and partners. Finally, we might not succeed in producing high-quality products, enhancements, and releases in a timely and cost-effective manner to compete with our competitors, which could have an adverse effect on our reputation, business, financial position, profit, and cash flows.
Our technology and/or product strategy might not be successful or our customers and partners might not adopt our technology platforms and other innovations as expected.
We might not be successful in integrating our platforms and solutions, enabling the complete product and cloud service portfolio, harmonizing our user interface design and technology, integrating acquired technologies, or bringing new solutions based on the SAP HANA platform as well as SAP HANA Cloud Platform to the market as fast as expected, in particular, innovative applications such as SAP S/4HANA or new technologies such as Internet of Things or machine learning. In addition, we might not be able to compete or partner effectively in the area of cloud services and our new applications and services might not meet customer expectations possibly impacting customer satisfaction and retention. As a result, our partner organizations and customers might not adopt our technology platforms, applications, or cloud services quickly enough or they might consider
other competitive solutions in the market. This could have an adverse effect on our reputation, business, financial position, profit, and cash flows.
Our cloud offerings and related infrastructure might be subject to a security attack, become unavailable, or fail to perform properly.
The software used in our cloud portfolio is inherently complex and any defects in product functionality, data center operations, or system stability that cause interruptions in the availability of our application portfolio could result in the following:
| – | | Lost or delayed market acceptance and sales |
| – | | Breach of warranty or other contract breach or misrepresentation claims |
| – | | Sales credits or refunds to our customers or partners |
| – | | Loss of customers and/or partners |
| – | | Diversion of development and customer service resources |
| – | | Breach of data protection and privacy laws and regulations |
| – | | Customers considering competitive cloud offerings |
| – | | Loss of customer satisfaction and brand reputation |
The costs incurred in correcting any defects or errors might be substantial and could have an adverse effect on our reputation, business, financial position, profit, and cash flows. The availability of our cloud applications could be interrupted by a number of factors, resulting in customers’ inability to access their cloud applications or receive their service level, system outages or downtimes, failure of our network due to human or other errors, security breaches, or variability in user traffic for our cloud applications. Because of the large amount of data that we collect and manage, hardware failures, defects in our software, or errors in our systems could result in data loss or corruption, or cause the information that we collect to be incomplete or contain inaccuracies that our customers regard as significant. Additionally, any loss of the right to use hardware purchased or leased from third parties could result in delays in our ability to provide our cloud applications until equivalent technology is either developed by us or, if available, identified. Furthermore, our cooperation with partners in the area of cloud includes theco-location of data centers that might expose SAP to additional risks in the area of security and data protection, as well as the potential for breached service-level agreements by partners.
We have administrative, technical, and physical security measures in place as well as contracts that require third-party data centers to have appropriate security and data protection and privacy measures in place. In this context, customers might demand to use only specific and/or local data centers. However, if these security measures are breached as a result of third-party action, employee
22
error or malfeasance, or otherwise, and if, as a result, someone obtains unauthorized access to our customers’ data, which might include personally identifiable information regarding users, our reputation could be damaged, our business might suffer, local data protection and privacy laws or regulations might be breached, and we could incur significant liability.
In addition, our insurance coverage might not cover claims against us for loss or security breach of data or other indirect or consequential damages. Moreover, defending a suit, regardless of its merit, could be costly and time-consuming. In addition to potential liability, if we experience interruptions in the availability of our cloud applications, our reputation could be harmed and we could lose customers.
Operational Risks
Third parties have claimed, and might claim in the future, that we infringe their intellectual property rights, which could lead to damages being awarded against us and limit our ability to use certain technologies in the future.
We believe that we will continuously be subject to intellectual property infringement claims as our solution portfolio grows; as we acquire companies with increased use of third-party code including open source code; as we expand into new industries with our offerings, resulting in greater overlap in the functional scope of offerings; and asnon-practicing entities that do not design, manufacture, or distribute products increasingly assert intellectual property infringement claims.
Any claims, with or without merit, and negotiations or litigation relating to such claims, could preclude us from utilizing certain technologies in our products, be time-consuming, result in costly litigation, and require us to pay damages to third parties, stop selling or reconfigure our products and, under certain circumstances, pay fines and indemnify our customers, which could have an adverse effect on our business, financial profile, profit, cash flows, and reputation. They could also require us to enter into royalty and licensing arrangements on terms that are not favorable to us, cause product shipment delays, subject our products to injunctions, require a complete or partial redesign of products, result in delays to our customers’ investment decisions, and damage our reputation.
Software includes many components or modules that provide different features and perform different functions. Some of these features or functions might be subject to third-party intellectual property rights. The rights of another party could encompass technical aspects that are similar to one or more technologies in
one or more of our products. Intellectual property rights of third parties could preclude us from using certain technologies in our products or require us to enter into royalty and licensing arrangements on unfavorable or expensive terms.
The software industry is making increasing use of open source software in its development work on solutions. We also integrate certain open source software components from third parties into our software. Open source licenses might require that the software code in those components or the software into which they are integrated be freely accessible under open source terms. Third-party claims might require us to make freely accessible under open source terms one of our products or third-party (not SAP) software upon which we depend.
Claims and lawsuits against us could have an adverse effect on our business, financial position, profit, cash flows, and reputation.
Claims and lawsuits are brought against us, including claims and lawsuits involving businesses we have acquired. Adverse outcomes to some or all of the claims and lawsuits pending against us might result in the award of significant damages or injunctive relief against us that could hinder our ability to conduct our business and could have an adverse effect on our reputation, business, financial position, profit, and cash flows.
The outcome of litigation and other claims or lawsuits is intrinsically uncertain. Management’s view of the litigation might also change in the future. Actual outcomes of litigation and other claims or lawsuits could differ from the assessments made by management in prior periods, which are the basis for our accounting for these litigations and claims under IFRS.
We might not acquire and integrate companies effectively or successfully and our strategic alliances might not be successful.
To expand our business, we acquire businesses, products, and technologies, and we expect to continue to make acquisitions in the future. Over time certain of these acquisitions have increased in size and in strategic importance for SAP, Management negotiation of potential acquisitions and alliances and integration of acquired businesses, products, or technologies demands time, focus, and resources of management and of the workforce. Acquisitions of companies, businesses, and technology expose us to unpredictable operational difficulties, expenditures, and risks. These risks include, among others:
| – | | Selection of the wrong integration model for the acquired company and/or technology |
23
| – | | Failure to properly evaluate the acquired business and its different business and licensing models |
| – | | Incorrect assumptions during due diligence process leading to negative contribution with regards to an acquired company |
| – | | Failure to successfully integrate acquired technologies or solutions into SAP’s solution portfolio and strategy in a timely and profitable manner |
| – | | Failure to integrate the acquired company’s operations across SAP’s different cultures, languages, and local protocols, all within the constraints of applicable local laws |
| – | | Failure to meet the needs of the acquired company’s customers and partners in the combined company |
| – | | The diversion of management’s time and attention from daily operations |
| – | | Loss of key personnel of the acquired business |
| – | | Material unknown liabilities and contingent liabilities of acquired companies, including legal, tax, accounting, intellectual property, or other significant liabilities that might not be detected through the acquisition due diligence process |
| – | | Legal and regulatory constraints (such as contract obligations, privacy frameworks, and agreements) |
| – | | Difficulties in implementing, restoring, or maintaining internal controls, procedures, and policies |
| – | | Practices or policies of the acquired company that might be incompatible with our compliance requirements |
| – | | An adverse effect on relationships with existing customers, partners, or third-party providers of technology or products |
| – | | Difficulties in integrating the acquired company’s accounting, HR, and other administrative systems and coordination of the acquired company’s research and development (R&D), sales, and marketing functions |
| – | | Debt incurrence or significant cash expenditures |
| – | | Constraints in enforcing acquired companies’ compliance with existing SAP security standards in a timely manner |
| – | | Difficulties in customer implementation projects combining technologies and solutions from both SAP and the acquired company |
In addition, acquired businesses might not perform as anticipated, resulting in charges for the impairment of goodwill and other intangible assets on our statements of financial position. Such charges might have an adverse effect on our business, financial position, profit, and cash flows. We have entered into, and expect to continue to enter into, alliance arrangements for a variety of purposes, including the development of new products and services. There can be no assurance that any such products or services will be successfully developed or that we will not incur significant unanticipated liabilities in connection with such arrangements. We might not be
successful in overcoming these risks and we might therefore not benefit as anticipated from acquisitions or alliances.
We might not be able to obtain adequate title to, or licenses in, or to enforce, intellectual property.
Protecting and defending our intellectual property is crucial to our success. We use a variety of means to identify and monitor potential risks and to protect our intellectual property. These include applying for patents, registering trademarks and other marks and copyrights, implementing measures to stop copyright and trademark infringement, entering into licensing, confidentiality, andnon-disclosure agreements, and deploying protection technology. Despite our efforts, we might not be able to prevent third parties from obtaining, using, or selling without authorization what we regard as our proprietary technology and information. All of these measures afford only limited protection, and our proprietary rights could be challenged, invalidated, held unenforceable, or otherwise affected. Some intellectual property might be vulnerable to disclosure or misappropriation by employees, partners, or other third parties. Third parties might develop technologies that are substantially equivalent or superior to our technology. Finally, third parties might reverse-engineer or otherwise obtain and use technology and information that we regard as proprietary. Accordingly, we might not be able to protect our proprietary rights against unauthorized third-party copying or utilization, which could have an adverse effect on our competitive and financial positions, and result in reduced sales. Any legal action we bring to enforce our proprietary rights could also involve enforcement against a partner or other third party, which might have an adverse effect on our ability, and our customers’ ability, to use that partner’s or other third parties’ products. In addition, the laws and courts of certain countries might not offer effective means to enforce our intellectual property rights. This could have an adverse effect on our reputation, business, financial position, profit, and cash flows.
SAP’s business strategy focuses on certain business models that are highly dependent on a working cyberspace. A cybersecurity breach could have an adverse effect on our customers, our reputation, and our business.
The key cybersecurity risks currently applicable to us include state-driven economic espionage as well as competitor-driven industrial espionage, and criminal activities including, but not limited to, cyberattacks and “mega breaches” against cloud services and hostedon-premise software. This might result in, for example, disclosure of confidential information and intellectual property, defective products, production downtimes,
24
supply shortages, and compromised data (including personal data). A failure of our cybersecurity measures could impact our compliance with legal demands (for example, Sarbanes-Oxley Act, Payment Card Industry Data Security Standard, data privacy) and expose our business operations as well as service delivery to the described risks, for example, virtual attack, disruption, damage, and/or unauthorized access. Additionally, we could be subject to recovery costs, for example, as well as significant contractual and legal claims by customers, partners, authorities, and third-party service providers for damages against us, which could have an adverse effect on our reputation, business, financial position, profit, and cash flows.
We might not be able to protect our critical information and assets or to safeguard our business operations against disruption.
SAP is highly dependent on the exchange of a wide range of information across our global operations and on the availability of our infrastructure. With regards to our physical environment, we face several key security risks such as industrial and/or economic espionage, serious and organized crime, and other illegal activities, as well as violent extremism and terrorism. We might be endangered by threats including, but not limited to, social engineering, misuse, or theft of information or assets, or damage to assets by trespassers in our facilities or by people who have gained unauthorized physical access to our facilities, systems, or information. These could have an adverse effect on our business, financial profile, profit, and cash flows.
Our insurance coverage might not be sufficient and we might be subject to uninsured losses.
We maintain insurance coverage to protect us against a broad range of risks, at levels we believe are appropriate and consistent with current industry practice. Our objective is to exclude or minimize risk of financial loss at reasonable cost. However, we might incur losses that might be beyond the limits, or outside the scope, of coverage of our insurance and that might limit or prevent indemnification under our insurance policies. In addition, we might not be able to maintain adequate insurance coverage on commercially reasonable terms in the future. Further, certain categories of risks are currently not insurable at reasonable cost, which could have an adverse effect on our business, financial position, profit, and cash flows. Finally, there can be no assurance of the financial ability of the insurance companies to meet their claim payment obligations.
We could incur significant losses in connection with venture capital investments.
Through Sapphire Ventures (formerly SAP Ventures), our consolidated venture investment funds, we plan to continue investing in new and promising technology businesses. Many such investments initially generate net losses and require additional expenditures from their investors. Changes to planned business operations have, in the past affected, and might in the future affect, the performance of companies in which Sapphire Ventures holds investments, and that could have an adverse effect on the value of our investments in Sapphire Ventures, which could have an adverse effect on our business, financial position, profit, and cash flows. Furthermore, tax deductibility of capital losses and impairment in connection with equity securities are often restricted and could therefore have an adverse effect on our effective tax rate.
ITEM 4. INFORMATION ABOUT SAP
Our legal corporate name is SAP SE. SAP SE is translated in English to SAP European Company (Societas Europaea, or “SE”). SAP SE is organized in the Federal Republic of Germany under German and European law, see “Item 10. Additional Information.” Where the context requires in the discussion below, SAP SE also refers to our predecessor or previous legal forms and names, as the case may be, i.e. Systemanalyse und Programmentwicklung GbR (1972-1976), SAP Systeme, Anwendungen, Produkte in der Datenverarbeitung GmbH (1976-1988), “SAP Aktiengesellschaft Systeme, Anwendungen, Produkte in der Datenverarbeitung” (1988 – 2005) and “SAP AG” (2005 – 2014). Our principal executive offices, headquarters and registered office are located at Dietmar-Hopp-Allee 16, 69190 Walldorf, Germany. Our telephone number is+49-6227-7-47474.
As part of our activities to reduce the number of legal entities in the SAP group, in 2016 we integrated certain subsidiaries into the following significant SAP subsidiaries: SAP Deutschland SE & Co. KG, SAP (UK) Limited, SuccessFactors, Inc., Concur Technologies, Inc., and SAP China Co., Ltd.
For (i) a description of our principal capital expenditures and divestitures and the amount invested (including interests in other companies) since January 1, 2014 until the date of this report and (ii) information concerning our principal capital expenditures and divestitures currently in progress, including the distribution of these investments geographically and the method of financing, see “Item 4. Information About SAP – Description of Property – Capital Expenditures.”
25
OVERVIEW OF THE SAP GROUP
Our vision is to help the world run better and improve people’s lives. Together with our broad ecosystem of partners, this comes to life as we help our customers master complexity and innovate and transform to become sustainable digital businesses. SAP is involved in driving innovation in all fields of the digital economy, such as the Internet of Things, machine learning, and artificial intelligence. For more information on our vision and strategy, see the Strategy and Business Model section.
Founded in 1972, SAP is a global company headquartered in Walldorf, Germany. Our legal corporate name is SAP SE. SAP is the market leader in enterprise application software. Enterprise application software is computer software specifically developed to support and automate business processes. The company is also the fastest-growing major database company. Globally, more than 76% of all business transactions worldwide touch an SAP software system. With more than 345,000
customers in more than 180 countries, the SAP Group includes subsidiaries in all major countries and employs more than 84,100 people.
Our ordinary shares are listed on the Frankfurt Stock Exchange. American Depositary Receipts (ADRs) representing SAP SE ordinary shares are listed on the New York Stock Exchange (NYSE). SAP is a member of Germany’s DAX, the Dow Jones EURO STOXX 50, and the Dow Jones Sustainability Indexes. As at December 31, 2016, SAP was the most valuable company in the DAX based on market capitalization. For additional information regarding our stock, see the Investor Relations section.
As at December 31, 2016, SAP SE directly or indirectly controlled a worldwide group of 245 subsidiaries to develop, distribute, and provide our products, solutions, and services. For a list of our subsidiaries, associates, and other equity investments, see the Notes to the Consolidated Financial Statements, Note (33).
The following table sets forth our most significant subsidiaries based on total revenues in 2016. All of these subsidiaries are wholly owned by SAP SE.
| | |
| Name of Subsidiary | | Country of Incorporation |
Germany | | |
SAP Deutschland SE & Co. KG, Walldorf | | Germany |
Rest of EMEA | | |
SAP (UK) Limited, Feltham | | Great Britain |
SAP (Schweiz) AG, Biel | | Switzerland |
SAP France, Levallois Perret | | France |
SAP Nederland B.V.,‘s-Hertogenbosch | | The Netherlands |
SAP Italia Sistemi Applicazioni Prodotti in Data Processing S.p.A., Vimercate | | Italy |
United States | | |
SAP America, Inc., Newtown Square | | USA |
SAP Industries, Inc., Newtown Square | | USA |
SuccessFactors, Inc., South San Francisco | | USA |
Ariba, Inc., Palo Alto | | USA |
Concur Technologies, Inc., Bellevue | | USA |
Rest of Americas | | |
SAP Brasil Ltda, São Paulo | | Brazil |
Japan | | |
SAP Japan Co., Ltd., Tokyo | | Japan |
Rest of APJ | | |
SAP Australia Pty Ltd., Sydney | | Australia |
SAP China Co., Ltd., Shanghai | | China |
SAP India Private Limited, Bangalore | | India |
26
STRATEGY AND BUSINESS MODEL
Impact Through Innovation
SAP’s vision is to help the world run better and improve people’s lives. We strive to make our world a better, more sustainable place and help solve some of its most complex problems. Our innovations give us the power to help tackle these issues by giving our customers, partners, and consumers the tools they need to have an impact.
We execute on our vision by empowering our customers to become digital businesses through SAP technology, so they can address the challenges facing our world today and have an impact in three vital areas:
| – | | Economy: Economic empowerment comes from purpose-driven work. SAP software and technology enables customers to innovate and build strong industries and infrastructure and to protect the privacy of individuals and organizations. |
| – | | Society: Health, education, and public safety are critical for a vibrant society. SAP software and technology is addressing complex challenges around disease prevention and detection, as well as providing solutions for smarter government and smarter cities. |
| – | | Environment: Climate change touches everyone and will impact the lives of future generations. SAP software and technology is helping our customers make the world more energy efficient, and drive more sustainable supply chains around the world. |
The United Nations has defined 17 Sustainable Development Goals (SDGs) to transform the world’s economy, society, and environment. These goals are a universal call to action to end poverty, protect the planet, and ensure that all people enjoy peace and prosperity. We consider the most relevant of these goals in the context of our own vision and higher purpose and they inspire us to achieve this vision.
Achieving the Vision
Supporting our customers’ digital transformation
To execute our vision, we are helping customers meet the challenges of today’s changing world, and at the same time, enabling them to have a positive impact across the economy, society, and the environment.
Technology is transforming both our society and the way we do business. People and things are connected like never before. Entire industries are being disrupted by innovations that seemed unimaginable only a few years ago. Technology trends such as cloud computing, Big Data, the Internet of Things (IoT), and artificial intelligence go hand in hand with social trends that are changing how we live and work.
Organizations need to digitally transform their business processes and business models to be able to succeed in today’s marketplace. They need to become agile organizations that are laser focused on driving customer value. They also must become data-driven and run their business on real-time information to react to market and customer demands.
By providing a technology platform for innovation and digitalization, we help our customers with the challenges of digital transformation. Our solutions enable businesses, governments, andnon-profit organizations in more than 180 countries to become data-driven “live” businesses.
Our platform leverages existing SAP assets that are complemented by new cloud capabilities and the real-time applications available in our next-generation business suite SAP S/4HANA. Our solutions and services – combined with the talent and expertise of more than 84,100 colleagues and a broad global ecosystem of partners – puts us in a unique position to enable our more than 345,000 customers to fulfill their goals.
We want to build on the trust of our existing customers and earn the trust of new customers. For more information, see theCustomers section.
Executing on our strategy
In the past years, we have built our success in the business applications market by expanding our product portfolio to help companies meet the needs of the digital economy. We have organically innovated with groundbreaking technology such as SAP HANA and software such as SAP S/4HANA. We have also expanded our portfolio through acquisitions by integrating valuable assets in the cloud and business network spaces.
In 2016, we have increased our focus on innovation as it is the key to long-term success. Our strategy to be the most innovative cloud company powered by SAP HANA,
27
will help us deliver the digital innovation that our customers need. To execute on this strategy, we are focusing our efforts on the following key areas:
| – | | Continue to develop market-leading applications |
| – | | Scale our platform as the innovation platform for our ecosystem partners |
| – | | Invest in disruptive technologies |
| – | | Recruit and retain the right talent |
Continue to develop market-leading applications
Our core ERP software is the historic foundation of our strength. To maintain our market leadership position as this market rapidly shifts to the cloud, we will continue to innovate and offer the agility and flexibility our customers require.
We will continue to deliver market-leading applications for ERP, whether in the cloud or on premise. Further, we will continue to developbest-in class,line-of-business (LoB) cloud applications combined with real-time analytics, IoT capabilities, and industryadd-ons. Finally, we will leverage our expertise to deliver solutions to help small businesses and midsize companies be successful.
Scale our platform as the innovation platform for our ecosystem partners
We built an open cloud platform with cloud application programming interfaces (APIs), which means the platform can communicate with multiple sources to support a strong ecosystem – allowing developers from companies of all sizes to extend our applications or create new solutions for the digital economy. Moreover, as the rapidly growing data management and database market moves to the cloud, our cloud platform offers companies planning, predictive, visualization, and mobile capabilities.
We will continue to deliver transformational innovations in the platform, database, and analytics space. We want developers in our entire ecosystem and our customers to turn to SAP as their reference cloud platform and API hub. Finally, we want to ensure that security remains a trusted feature of all SAP platforms and applications.
Invest in disruptive technologies
To enable sustainable success, we must prepare for the future. We will continue to incubate disruptive technologies across a number of initiatives. We have begun incubating new businesses using an “open innovation” approach under the umbrella of the SAP.io program with focus on both internal and external startups. We are aggressively investing in making our business applications “intelligent” with machine learning. We are investing in delivering personalized medicine through a connected health platform – aligned with our vision of improving society and healthcare. At the same
time, we continue to create reliable security solutions across all of our products.
For more information about these investments, see theProducts, Research & Development, and Services section.
Recruit and retain the right talent
We cannot bring innovations to our customers without capable, driven employees. As we strive to be the best place to work in the enterprise software industry, we look to a diverse and engaged workforce to drive innovation and value for our customers. Recruiting the right talent and unleashing their innovative power is as crucial for SAP as continuing to develop the talent of existing employees to allow them to realize their full potential.
For more information, see the Employees section.
Keeping a balanced focus on growth
We take a balanced approach on how to grow. We will continue to focus on organic investments in technology and innovations to drive our short-term and midterm growth ambitions. We will continue to look at unleashing the full potential of our employees’ talent as well as strategic partnerships with our ecosystem to foster innovation.
Additionally, we may also acquire targeted“tuck-in” technologies to add to our broad solution offerings and improve coverage in key strategic markets. In 2016, SAP made the following smallertuck-in acquisitions:
| – | | Altiscale, a company providing high-performance, scalable BigData-as-a-service (BDaaS) solutions, will help SAP accelerate and operationalize the deployment of Big Data in the enterprise. |
| – | | Fedem Technology, a forward-thinking IoT company, will help SAP build next-generation,end-to-end IoT solutions that not only support predictive maintenance but also Industry 4.0 scenarios. |
| – | | Hipmunk, a leader in innovative travel search, will bring a consumer-like experience for business travelers. |
| – | | PLAT.ONE, a leading enterprise-grade IoT provider, will help SAP enhance complex IoT capabilities in SAP Cloud Platform (formerly called SAP HANA Cloud Platform). |
Investing in the next generation of technology leaders
For 20 years, through venture capital funds managed by Sapphire Ventures, SAP has supported entrepreneurs that aspire to build industry-leading businesses. Sapphire Ventures currently has over US$2 billion under management and has invested in more than 130 companies on five continents – in growth-stage
28
technology companies as well as early-stage venture capital funds. Sapphire Ventures pursues opportunities in which it can help fuel growth by adding expertise, relationships, geographic reach, and capital. It places a particular focus on companies in Europe, Israel, and the United States.
Additionally, we launched a new SAP.io Fund to focus on strategic, early stage investments aligned with our SAP.io innovation initiatives. This US$35 million fund will focus on “catalyzing” a startup ecosystem that can leverage or enrich SAP data sets, platform technologies, or business workflows. It is operated in partnership with Sapphire Ventures.
For more information about our consolidated investment funds, see the Notes to the Consolidated Financial Statements, Note (33).
Financial Business Model
We derive our revenue from fees charged to our customers for:
| – | | Support, professional services, development, training, and other services |
| – | | Licensing ofon-premise software products and solutions |
| – | | Use of our cloud solutions |
| – | | Activity in our business networks |
Measuring Our Success
We believe the most important indicators to measure our success comprise both financial andnon-financial indicators:
The table below provides an overview of the specific key performance indicators (KPIs) used to measure performance, as well as our goals and actual performance.
Outlook and Results for 2016
| | | | | | | | | | |
| Strategic Objective | | KPI | | 2016 Outlook*
(non-IFRS, at
constant currencies) | | | 2016 Achievement (non-IFRS, at
constant currencies) | |
Growth | | Cloud subscriptions and support revenue | | | €3.00bn to €3.05bn | | | | €3.01bn | |
| | | Cloud and software revenue | | | +6.5% to +8.5% | | | | +8% | |
Profitability | | Operating profit | | | €6.5bn to€6.7bn | | | | €6.60bn | |
Customer Loyalty | | Customer Net Promoter Score | | | 25% | | | | 19.2% | |
Employee Engagement | | Employee Engagement Index | | | 82% | | | | 85% | |
* The outlook was communicated in January 2016 and raised in October 2016.
Outlook for 2017 and Ambitions for 2020
| | | | | | | | | | | | | | |
Strategic
Objective | | KPI | | 2016 (non-IFRS) | | | 2017 Outlook
(non-IFRS, at
constant currencies) | | | 2020 Ambition (non-IFRS) | |
Growth | | Cloud subscriptions and support revenue | | | €2.99bn | | | | €3.8bn to €4.0bn | | | | €8.0bn to €8.5bn | |
| | Cloud and software revenue | | | €18.43bn | | | | +6% to +8% | | | | | |
| | Total revenue | | | €22.07bn | | | | €23.2 to €23.6bn | | | | €28bn to €29bn | |
| | | Share of more predictable revenue* | | | 61% | | | | | | | | 70% to 75% | |
Profitability | | Operating profit | | | €6.63bn | | | | €6.8bn to €7.0bn | | | | €8.5bn to €9.0bn | |
Customer Loyalty | | Customer Net Promoter Score | | | 19.2% | | | | 21% to 23% | | | | 35% to 40% | |
Employee Engagement | | Employee Engagement Index | | | 85% | | | | 84% to 86% | | | | 84% to 86% | |
* Support and cloud subscriptions – share of total revenue
29
SEASONALITY
Our business has historically experienced the highest revenue in the fourth quarter of each year, due primarily toyear-end capital purchases by customers. Such factors have resulted in 2016, 2015, and 2014 first quarter revenue being lower than revenue in the prior year’s fourth quarter. We believe that this trend will continue in the future and that our total revenue will continue to peak in the fourth quarter of each year and decline from that level in the first quarter of the following year. Unlike ouron-premise software revenues, ouron-premise support revenues and cloud subscriptions and support revenues are less subject to seasonality.
PRODUCTS, RESEARCH & DEVELOPMENT, AND SERVICES
Empowering Our Customers to Become Digital Businesses
In 2016, we continued to give top priority to supporting our customers on their individual paths into the digital economy, defining our strategy around the following cornerstones:
| – | | Enabling business with a digital data foundation |
| – | | Running business with modern business applications and business networks |
| – | | Differentiating business with a digital enterprise platform |
| – | | Steering business with real-time analytics |
| – | | Reinventing business with machine learning and theInternet of Things |
| – | | Making companies’ digital transformations possible with SAP Digital Business Services |
SAP HANA – Enabling Business with a Digital Data Foundation
SAP HANA is ourin-memory computing platform that lets companies accelerate business processes, deliver more business intelligence, and simplify their IT environment. SAP HANA removes the burden of maintaining separate legacy systems and siloed data, so companies can run live and business people can make better business decisions in the new digital economy. Emphasizing our cloud-first strategy, SAP HANA can be deployed on several public cloud infrastructures.
With our second version of SAP HANA, we launched a truly next-generation platform. It enables the reduction of time-consuming database and data management tasks and delivers intelligent applications that leverage advanced analytic processing and empowers all users with deeper insight into any data from anywhere.
Our cloud-first strategy requires a very strong offering to handle Big Data in the cloud. With SAP Cloud Platform Big Data Service, which is powered by SAP HANA, we run
multitenant-aware Hadoop systems and provideend-to-end capabilities to efficiently manage and scale Big Data initiatives.
Running Business with Modern Business Applications and Business Networks
SAP S/4HANA – Reimagining the Business Suite for the Digital Age
SAP S/4HANA, our next-generation business suite, allows our customers to embrace the digital economy. The digital core is the foundation for running a Live Business:
| – | | Immediate – Empowering business users with insights to act in the moment |
| – | | Intelligent – Going beyond automation to provide predictive suggestions |
| – | | Integrated – Connecting not only customer functions but also people, things, and businesses |
Based on SAP HANA, SAP S/4HANA software can store and process huge amounts of data while significantly reducing an organization’s data footprint. This means our customers can save time and cost.
Available in the cloud, on premise, or as a hybrid deployment, in 2016, SAP S/4HANA evolved from a finance-focused offering into a fulldigital-age ERP system. It enables insight and understanding so businesses can predict outcomes and use that data to make decisions live, which helps companies stay competitive in the digital economy. SAP S/4HANA can replace a traditional ERP solution across all lines of business (LoBs), such as finance, human resources, sales, service, procurement, manufacturing, asset management, supply chain, and research and development (R&D).
Customers recognize the benefits and power of SAP S/4HANA and, at the end of 2016, more than 5,400 customers had chosen the suite to support their digital transformation.
SAP S/4HANA Cloud – Delivering the Power of the Digital Core
In addition to ouron-premise suite SAP S/4HANA, we further strengthened our SAP S/4HANA Cloud offering, delivering the power of a digital core with the key benefits expected from asoftware-as-a-service solution. It provides the scalability, ease of management, and security required in today’s digital economy. A quarterly release cycle helps ensure that customers can benefit from regularly delivered innovations with minimum disruption to their business.
SAP S/4HANA Cloud is comprised of various solutions targeted to meet the specific business needs of our
30
customers and enable their journey to the cloud. For example, the SAP S/4HANA Enterprise Management Cloud solution provides a next-generation ERP suite in the cloud with integrated,end-to-end processes.
SAP S/4HANA Cloud was developed toco-exist in a heterogeneous system landscape with native integration to other SAP solutions and open interfaces for further integration and extensions using SAP Cloud Platform (formerly called SAP HANA Cloud Platform). The solution also supports specific industry and LoB requirements with preconfigured content from SAP Best Practices packages and uses the award-winning SAP Fiori user experience (UX) to provide simplified, role-based usability.
Extending Our Reach Through a Broad Ecosystem
SAP’s ecosystem and partners extend our reach in the marketplace. We work closely with more than 15,000 partners worldwide to provide SAP solutions for our customers. Partners continue to drive SAP S/4HANA and our solutions for small businesses and midsize enterprises (SMEs) – SAP Business ByDesign and SAP Business One – to prospects on behalf of SAP, accounting for more than 88% of all new SAP customers.
Innovating for LoBs and Industries
As a modular integrated suite, SAP S/4HANA is the backbone of a company. And, at the same time, we are building functional innovations for LoBs and industries to address our customers’ specific and evolving needs.
SAP covers 25 industries grouped in six industry sectors and 12 lines of business:
| | |
| Industry Sector | | Industry Portfolio |
Consumer | | SAP for Consumer Products |
| | SAP for Life Sciences |
| | SAP for Retail |
| | | SAP for Wholesale Distribution |
Discrete manufacturing | | SAP for Aerospace & Defense |
| | SAP for Automotive |
| | SAP for High Tech |
| | | SAP for Industrial Machinery & Components |
| | |
| Industry Sector | | Industry Portfolio |
Energy and natural resources | | SAP for Chemicals |
| | SAP for Mill Products |
| | SAP for Mining |
| | SAP for Oil & Gas |
| | | SAP for Utilities |
Financial services | | SAP for Banking |
| | | SAP for Insurance |
Public services | | SAP for Defense & Security |
| | SAP for Healthcare |
| | SAP for Higher Education & Research |
| | | SAP for Public Sector |
Services | | SAP for Engineering, Construction & Operations |
| | SAP for Media |
| | SAP for Professional Services |
| | SAP for Sports & Entertainment |
| | SAP for Telecommunications |
| | | SAP for Travel & Transportation |
Lines of Business | | Asset Management |
| | Commerce |
| | Finance |
| | Human Resources |
| | Manufacturing |
| | Marketing |
| | R&D/Engineering |
| | Sales |
| | Service |
| | Sourcing and Procurement |
| | Supply Chain |
| | | Sustainability |
31
In addition, we are building other functional innovations that serve specific lines of business, for example:
Human Capital Management
Our human capital management (HCM) offerings, including SAP SuccessFactors solutions, help organizations increase the value of their total workforce by developing, managing, engaging, and empowering their people. SAP SuccessFactors HCM Suite addresses a full range of HR needs and encompasses the following:
| – | | Core human resources – SAP SuccessFactors Employee Central and SAP SuccessFactors Employee Central Payroll solutions cover the administrative tasks required to manage an organization’s workforce. More specifically, this includes HR administration, payroll, position management, global benefits, time and attendance, shared services, and employee and manager self-service capabilities. The solutions act as the key source of employee and worker data and typically integrate with hundreds of external and internal systems, including SAP S/4HANA. At the end of 2016, customers for SAP SuccessFactors Employee Central numbered more than 1,580. |
| – | | Talent management – Our suite comprises solutions for all pillars of talent management, recruiting (marketing and management), onboarding, performance management, development, succession planning, compensation planning and administration, learning, and workforce analytics. |
We focus on delivering a simple and intuitive UX for our HCM suite through mobile device or desktop.
Customer Engagement and Commerce (CEC)
Today’s customers are digitally connected, socially networked, and individually empowered, changing the rules of engagement. Our integrated front-office suite encompasses a holistic offering across customer experience, commerce, marketing, sales, billing, and services.
By providing leading omnichannel customer engagement and commerce solutions across any touch point and channel, we enable organizations (bothbusiness-to-consumer andbusiness-to-business) to deliver contextual, consistent, and relevant experiences – regardless of channel or device – throughout the customer journey.
Connecting Companies with Business Networks
Our business networks arebest-in-class cloud applications that connect a global ecosystem of customers, suppliers, and partners. The products and services go beyond the four walls of a business to integrate and connect systems, services, partners, and data – creating more efficient, more powerful, and far
simpler ways to manage key business functions. They provide the outcomes and experiences business users need through open and connected platforms.
Included in the business networks portfolio are SAP’s market-leading Concur, SAP Ariba, and SAP Fieldglass solutions, which are at the center of our business network strategy.
Ariba Network is the world’s largest business network, with more than 2.5 million connected companies trading over US$885 billion of commerce on the network, which has grown its commerce volume close to 20% year-over-year. In 2016, we unveiled innovations that help businesses achieve efficient, intelligent connections and frictionless transactions across the entiresource-to-pay process:
| – | | Guided buying – A new buying experience automatically leads employees to goods and services they need to do their jobs and execute purchases in compliance with company policies. |
| – | | Light enablement – This interactivee-mail service eliminates the complexity that buyers face in onboarding and connecting suppliers, letting them send purchase orders and receive order confirmations and invoices in just a few clicks. |
| – | | Open platform – Ariba Network offers an open application-programming interface (API) capability that allows partners to add functionality and extend solutions for all industries and business needs. |
With more than 45 million users worldwide, our acquired company Concur is the world leader in travel and expense management solutions. In 2016, Concur continued to deliver on our vision of an open cloud platform for travel and expense management that enables an effortless experience for end users as well as finance departments. It provides total transparency into employee travel and spending, wherever and whenever it happens.
New innovations for travel, expense, and accounts payable automation in Concur solutions include:
| – | | User interface improvements and the addition of many region-specific partners to our ecosystem |
| – | | Integration with the SAP ERP Financials and Intuit Quickbooks solutions |
| – | | Expansion of global tax capabilities |
| – | | Additional features in the Concur Invoice solution to help ensure athree-way match between purchase, receipt, and invoicing |
SAP Fieldglass solutions help simplify procuring and managing external workforce services, connecting businesses in real time. In 2016, more than 3.1 million workers in approximately 135 countries were connected using the solution.
32
Market changes, including globalization and access to talent, have led many organizations to increasingly rely on contingent workers and service providers to achieve business goals. SAP Fieldglass cloud-based solutions also help companies engage and optimize all forms of talent. The software dynamically matches business needs with the right combination of resources while helping to ensure visibility, compliance, and cost control.
In 2016, we continued to redefine how work gets done in the enterprise, with innovations in SAP Fieldglass solutions including streamlined services procurement templates and extended flexible talent-sourcing capabilities.
Data Network
Our business data network offers a comprehensive, people-firstdata-as-a-service solution that provides real-time, industry-specific, and data-driven benchmarks built on the world’s largest repository of networked business data and enriched by key industrial and economic indicators. In 2016, we produced a beta version of the first data-driven service based on contingent workforce data. The highly personalized user experience helps customers discover their standing in the market so that they can take advantage of live recommendations and collaboration workflows that turn insights into action. Using data strategically in this way, customers can operate more efficiently and create new data-driven business models.
SAP Connected Health
Building on many years of work in the healthcare and life sciences industries, SAP has deepened its investment in these areas. In 2016, we launched a SAP Connected Health platform with trusted partners. The platform supports new developments such as using very large data sets to conductin-depth analysis of the human genome, proteome, and other biological data. It also enables a broad ecosystem of partners – including developers, researchers, and healthcare organizations – to accelerate the development and delivery of innovative, patient-centered solutions for improving health outcomes, reducing costs, and delivering connected healthcare services.
Building Better Solutions for Small and Midsize Enterprises
We offer a portfolio that extends the power of SAP HANA to support SMEs with their digital transformation that includes the followings solutions:
| – | | SAP Anywhere: Our front-office solution for small businesses has been on the market for just over a year in China, the United Kingdom, and the United States. Currently, more than 185 customers are running SAP Anywhere. |
| – | | SAP Business ByDesign: Our ERP cloud solution is targeted to the midmarket and subsidiaries of large enterprises. At the end of 2016, 99% of SAP Business ByDesign customers ran the solution on SAP HANA. |
| – | | SAP Business One: Our integrated ERP application is available on premise or through a partner-hosted cloud. Today, more than 2,000 SAP Business One customers run the application on SAP HANA. |
Our focus for SMEs, as with larger enterprises, is on cloud technology and simplified business processes for end users and partners.End-to-end accountability and increased investments in these core cloud ERP,on-premise ERP, and front-office solutions helps foster innovation and growth for the digital economy. Customers using SME solutions include small businesses and midsize companies in more than 100 countries.
Keeping User Experience in Focus
User experience (UX) is about meeting the user’s needs in the most effective and enjoyable way. Our understanding of how to create true innovation manifests itself in the award-winning SAP Fiori UX. The concept and design principles are key components in ourdesign-led development process, which helps ensure the delivery of SAP Fiori innovations through all SAP applications.
With SAP Fiori 2.0, users can get their work done faster and more effectively, with:
| – | | Direct access to relevant information and apps |
| – | | Transparency on items needing attention and timely notifications |
| – | | Support in deciding what needs to be done next |
| – | | Ability to perform quick and informed actions |
At the same time, our UX strategy focuses on empowering our customers and partners to design their own UX journey and execute on it – through a rich portfolio of services, educational offerings, and tools and technologies to design, develop, and deliver a simplified UX.
SAP Cloud Platform – Differentiating Business with a Digital Enterprise Platform
In the digital economy, in addition to standard applications, companies need a highly flexible platform that allows them to do the following:
| – | | Extend cloud andon-premise SAP applications |
| – | | Build new applications for differentiating LoB processes |
| – | | Integrate cloud andon-premise SAP applications |
With SAP Cloud Platform, ourin-memoryplatform-as-a-service, companies can rapidly build, run, and extend modern business applications. It offers comprehensive capabilities to help business users and
33
developers create better, more agile applications in less time. Customers can apply, among other things, mobile services, advanced analytic tools,state-of-the-art authentication mechanisms, and social functionality. For maximum flexibility, portability, and agility, we use open technologies.
SAP Cloud Platform is a digital enterprise platform offering the following:
| – | | Analytical capabilities |
| – | | Access to SAP applications, processes, and data |
| – | | Robust business services that customers and independent software vendors can consume to build solutions |
Furthermore, we are positioning the SAP Cloud Platform Integration service as the default integration infrastructure for SAP solutions, whether in the cloud or on premise. We deliver content to supportend-to-end integration scenarios. Being able to connect and integrate allbest-of-breed applications to our digital core and to any custom-built solution makes SAP Cloud Platform the center of gravity for a modular suite of business applications.
Close partnerships with customers and other leading technology companies are key to providingbest-in-class solutions. In 2016, we announced a strategic partnership with Apple Inc. to build a SAP Cloud Platform software development kit for iOS that enables businesses, designers, and developers to quickly and efficiently build their own native iOS apps for iPhones and iPads.
Steering Business with Real-Time Analytics
Business leaders need to be able to discover and communicate meaningful and actionable insights in data so they can make decisions in real time. Our analytics offerings help companies to apply analytics to business data to describe, predict, and improve business performance, recommend action, and guide decision making.
With SAP BW/4HANA, we launched next-generation data warehouse software, delivering a simpler and more powerful way to achieve real-time analytics by connecting historical data with live data stored in SAP and third-party software environments. This integrated data warehouse solution is optimized to fully leverage the SAP HANA platform and simplifies development, administration, and the user interface, resulting in enhanced business agility.
We consolidated analytical functionalities across our product portfolio in one cloud analytics solution – SAP
BusinessObjects Cloud. Built on SAP Cloud Platform, it helps companies overcome the challenge of point solutions and data silos spread throughout the organization with enterprise-wide access to analytics delivered through a public cloud experience.
For the SAP Digital Boardroom solution, which offers executive decision makers ease and elegance in accessing company data in real time, we released new industry-specific andLoB-specific content for consumer products, chemicals, engineering, construction, operations, and public sector, as well as HR, finance, and marketing LoBs.
Reinventing Business with the Internet of Things and Machine Learning
There is no topic that typifies the digital transformation more than the Internet of Things (IoT). The IoT is a network of physical objects with embedded sensors to detect their environment and interact with business processes and systems. This builds a foundation for entirely new business models and completely digitized, connected businesses. Intelligent sensors, ubiquitous connectivity, and unlimited data storage are driving innovation and leading to a deeper integration of people, processes, data, and things – in one connected world.
Our IoT solutions, now marketed under the new SAP Leonardo brand, help companies digitally transform their manufacturing, logistics, and asset management processes and respond to the needs of a digital business in a highly individualized, consumer-driven economy. We strive to become a trusted partner for IoT that helps our customers link sensor data with business processes and thereby add value. With ourend-to-end SAP Leonardo solutions for connected logistics, connected manufacturing, and connected assets, for example, we offer a comprehensive portfolio of standard IoT software, both cross-industry and industry specific. Furthermore, in November 2016, we announced the SAP IoT Application Enablement toolkit, providing services that allow our customers to build their own IoT applications.
Research and Innovation – Innovating for Future Growth
With businesses shifting, leading our customers through change is more important than ever before. We do this every day by empowering our employees and collaborating with our customers to develop world-class software and next-generation solutions. We further strengthened our global research and development (R&D) efforts in 2016 by investing in our SAP Labs network and expanding our SAP Innovation Center locations in India, Israel, and the United States.
34
Through the SAP Innovation Center concept, we explore unconventional ideas and develop inspiring proofs of concept in a startup-like environment. We strive to open up new markets for SAP software and accelerate the integration of emerging technologies into our core products. Some of these innovations include:
| – | | Machine learning – Making all existing SAP solutions intelligent, bringing machine-learning services and APIs to our platform, and building intelligent business solutions in new and adjacent markets.To emphasize the importance of this topic, we have introduced the new brand SAP Clea that represents our entire machine learning portfolio. |
| – | | Blockchain – Exploring the potential of digital finance to radically change how business transactions are conducted in the future and its impact on existing products and innovation potential of blockchain across industries. |
| – | | Future enterprise applications – Enabling companies to successfully lead the next economic revolution by developing game-changing business applications to process intangible assets, provide contextual user assistance, and manage new business models. |
We draw on the ideas of customers, partners, startups, academia, and, most importantly, our own employees. We want to foster organic innovation and support the transformation of great ideas into profitable business.
Investing in Research and Development
SAP’s strong commitment to R&D is reflected in our expenditures (see figure below).
Research and Development (IFRS)
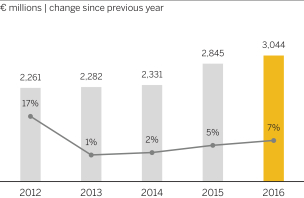
In 2016, ournon-IFRS R&D expense as a portion of total operating expenses increased from 18.3% to 18.4% year over year. Our IFRS R&D expense ratio increased from 17.2% to 18.0%. At the end of 2016, our total full-time equivalent (FTE) headcount in development work was 23,363 (2015: 20,938). Measured in FTEs, our R&D headcount was 28% of total headcount (2015: 27%).
Total R&D expense not only includes our own personnel costs but also the external cost of work and services
from the providers and cooperation partners we work with to deliver and enhance our products. We also incur external costs for the following:
| – | | Translating, localizing, and testing products |
| – | | Obtaining certification for products in different markets |
| – | | Patent attorney services and fees |
| – | | Professional development of our R&D workforce |
Patents
SAP actively seeks intellectual property protection for innovations and proprietary information. Our software innovations continue to strengthen our market position in business solutions and services. Our investment in R&D has resulted in numerous patents. As at December 31, 2016, SAP held a total of more than 8,000 validated patents worldwide. Of these, 841 were granted and validated in 2016.
While our intellectual property is important to our success, we believe our business as a whole is not dependent on one particular or a combination of patents.
Making Digital Transformation Possible with SAP Digital Business Services
SAP offers a comprehensive portfolio of services and support designed to help our customers deploy their software faster and more efficiently – so they can focus more on innovations and realize faster, greater ROI. We provide tailored support to our customers to help them run live in the digital economy.
Through our SAP Digital Business Services unit, SAP aims to standardize services, not recreate them each time – helping companies and organizations reimagine their businesses in the new economy using a digital business framework.
We are accelerating the realization of the digital enterprise with game-changing engagements for predictive maintenance and warranty, analytics to manage Big Data, and connected intelligent manufacturing, among others.
Innovations from SAP Digital Business Services
SAP Digital Business Services offers an entire portfolio of services. Some of our top innovations in 2016 to help customers transform to a digital business include:
| – | | SAP Value Assurance service packages for SAP S/4HANA |
| – | | Latest generation of SAP Solution Manager and SAP Model Company |
| – | | Next-generation support |
| – | | SAP Digital: Expanding the reach of SAP Store and messaging services |
35
SAP Value Assurance Service Packages
Our SAP Value Assurance service packages for SAP S/4HANA cover all project phases and scenarios to help customers migrate from SAP ERP to SAP S/4HANA. This includes:
| – | | Landscape transformation |
| – | | On-premise, cloud, and hybrid deployment options |
The approach consolidates services and embedded support in four distinct phases:
| – | | Plan and safeguard – Defining the implementation strategy, including dependencies and prerequisites for the target architecture |
| – | | Technical implementation – Focusing on the technical aspects of implementation, including data and system migration, high availability, and disaster recovery |
| – | | Migrate and implement – Implementing functions with preconfigured setup andready-to-use business process templates, and analyzing operational impact |
| – | | Innovate and optimize – Expanding the context of innovation beyond the digital core to reimagine business models across the enterprise |
The packages utilize the SAP Activate methodology, an innovation adoption framework that combines SAP Best Practices packages, implementation methodology, and guided configuration to help streamline deployment.
Partners also play a key role in innovation adoption. Our open engagement approach has motivated many of our larger services partners to focus more on establishing SAP S/4HANA as the digital core.
SAP Solution Manager and SAP Model Company
SAP Solution Manager manages SAP software implementations from cloud to on premise and hybrid, and is currently rolled out as the delivery platform for SAP Digital Business Services. It addresses both IT and business needs.
The solution gives customers real-time transparency, automation, and control to adopt and manage innovations. Process experts and solution architects can explore new industry models earlier, accessing all SAP Best Practices packages.
We also offer a new modeling environment. SAP Model Company is an accelerator service that helps simplify innovation adoption. It combines standard SAP software, SAP Best Practices packages, SAP Rapid Deployment solutions, and content from SAP Activate. Customers can develop repeatable implementation scenarios and access the latest innovations for their future projects. It helps to decrease effort and ensure project success on
time and within budget. The service enables customers to accelerate implementations, reduce total cost of ownership, and get up and running quickly.
It is aready-to-use solution that supports critical decision phases such as discovery and prototype. We provide the full system landscape with detailed business content and documentation and help lower time to value with versions specific to industries and lines of business.
Next-Generation Support
Traditional businesses are becoming digital enterprises. With more business processes “running live,” product support must be less reactive and much more proactive, predictive, and available at any moment; in other words, live support.
Our product support has implemented a next-generation support approach that includes real-time support. Named Expert Chat, this live support channel offers direct access to our experts, available for the majority of our solutions. Moreover, a universal, toll-free phone number harmonizes interaction with support across almost all of our products. We also offer customers a way to search for answers to product-related questions, by making knowledge located within SAP searchable using Google. Automating tasks with intelligent, context-sensitive tools provides customers with solutions proactively.
Customers also demand a seamless, omnichannel support experience. We plan to address this by implementing functions such asbuilt-in, mobile, and social media-enabled support.
In addition, we launched an SAP Preferred Care offering as a premium support option foron-premise customers transitioning to digital business models. It complements the already existing SAP Preferred Care Cloud offering. The offering is an enhancement to our foundation support offerings, namely SAP Enterprise Support, and includes:
| – | | Advanced service-level agreements |
SAP Digital
End users can buy both SAP and partner offerings usingone-click contracts and digital payments by credit card or PayPal. Customers can discover, try, buy, use, and renew solutions in a simple online interaction. In 2016, customers from 95 different countries placed more than 55,000 orders digitally.
At the same time, SAP also provides a wide variety of intelligent, interconnected messaging and communication services that reach 97% of the world’s
36
mobile subscribers and connect billions of things. Top social media companies rely on SAP solutions to reach their customers worldwide. In 2016, more than 350 billion messages passed through our networks.
We are incubating several new initiatives to more rapidly grow our digital business and expand into new areas – for example, integrating messaging services into our own applications.
A Partner on the Journey to Digital Transformation
SAP will continue to support our customers’ digital transformation through innovative software, ongoing R&D, and proactive services. By reimagining our business suite and providing world-class software, we empower businesses to continue to succeed in the new digital economy. Together, we are a force that helps further economic development, social progress, and minimizes environmental impact – and makes the world run better.
SECURITY, PRIVACY, AND DATA PROTECTION
Meeting Today’s Data Protection Challenges
Every day, organizations all around the world trust SAP with their data – either in their own premises, in the cloud, or on the move using mobile devices. Our customers need to know that we will keep that data safe, process it in a manner that complies with local legislation, and protect it from malicious use.
For this reason, data protection and security is of paramount importance to us. We have implemented safeguards to help enable the privacy rights of everyone whose data is processed by SAP, whether they are our customers, prospects, employees, or partners. In addition, we work towards compliance with all relevant legal requirements for data protection. Our global security officer and data protection and privacy officer report to our Executive Board and regularly monitor the compliance of all activities in these areas.
Facing Increasing Risks in IT Security
Safeguarding data is an increasingly challenging task today. Companies are collecting and storing more data than ever before from more and more sources. No longer is data locked away in anon-premise mainframe requiring physical security.
Data now proliferates outside the four walls of businesses with multiple endpoints exposed and vulnerable to attack. Moreover, the sheer number of and the sophistication of attacks facing businesses are at anall-time high. We are seeing the “commercialization of hacking” while new advanced persistent threats can bypass many traditional security protection techniques.
Establishing a Comprehensive Security Vision
At SAP, we want our customers and employees to be able to use our software and services anywhere, from any device, at any time, with confidence and trust. However, the growing risk and occurrence of cyberattacks reinforces the need to keep critical information systems secure.
Consequently, for SAP and for our customers, security means more than just meeting compliance demands. To secure the SAP software landscape, we offer a comprehensive portfolio of security products, services, and secure support as well as security consulting. They help our customers build security and privacy protection capabilities into their businesses.
Several of our security measures extend across all sectors of our company and thus to all of our products and services. These measures include, among other things, the regular training of employees on the subject of IT security and data protection, including the handling of confidential information and ensuring controlled and restrictive access to customer information. In addition, we have developed a three-pronged strategy focusing on the security of our products, operations, and organization:
Secure Products Strategy: Champion Product Security
Businesses use SAP applications to process mission-critical transactional data which can be highly attractive to cyber attackers. Our secure products strategy focuses on incorporating security features into our applications to minimize the risk of a security breach.
Our secure software development lifecycle is at the heart of this strategy. This provides a comprehensive methodological approach for incorporating security features into our applications. Before a release decision is made, our software is validated by independent IT security experts. This team then addresses any recommendations made before we release the application.
This approach conforms to the ISO/IEC 27034 standard for application security and is closely embedded into our ISO 9001-certified process framework for developing standard software.
Secure Operations Strategy: Running Secure Operations
Our secure operations strategy focuses on the security principles of “confidentiality, integrity, and availability” to ensure overall protection of our business, as well as our customers’ businesses. Our mission is to provide a comprehensiveend-to-end cloud and IT operations security framework – from system and data access and
37
system hardening to security patch management, security monitoring, andend-to-end incident handling. This involves the implementation of key security measures across all layers including physical assets as well as process-integrated controls.
Furthermore, our secure operations approach concentrates on the early identification of any deviations from the standards defined in our security framework. Deviations are identified through a combination of automated and manual reviews. Performed by third parties as well as by SAP colleagues, these reviews verify compliance with international standards and SAP global security standards.
Industry best-practice certifications are key success factors for our secure operations strategy. Many of our cloud solutions undergo Service Organization Control (SOC) audits ISAE3402, SSAE16 SOC I Type II, and SSAE16 SOC II Type II. The SOC standards are harmonized with a number of ISO certifications including ISO 9001, 27001, and 22301.
Secure Company Strategy: Taking a Holistic Approach to the Security of Our Business
At SAP, we take a holistic approach to the security of our company, encompassing processes, technology, and employees. At the heart of our secure company strategy is an efficient information security management system and a security governance model that brings together all of the different aspects of security. These include the following three main areas:
| – | | Security culture: Awareness and compliance with our security policy and standards are fostered through regular mandatory training, assessments, and reporting. |
| – | | Secure environments: Comprehensive physical security measures are in place to ensure the security of our data centers and development sites so that we can protect buildings and facilities effectively. |
| – | | Business continuity: A corporate continuity framework aimed at having robust governance in place at all times is reviewed on an annual basis to adapt to new or changed business needs. |
Complying with Data Protection and Privacy Legislation
When processing data about employees, applicants, customers, suppliers, and partners, SAP respects and protects their right to data protection and privacy while implementing appropriate security measures. We develop and support our data protection and privacy strategy in accordance with our business strategy.
To comply with applicable data protection laws, SAP has adopted a global data protection and privacy policy. It outlines a Group-wide minimum standard for handling
personal data in compliance with data protection and privacy laws. The policy defines requirements for all operational processes that affect the processing of or access to personal data, as well as providing clear responsibilities and organizational structures. We actively monitor changes to applicable laws and regulations so that we can update our standards on an ongoing basis.
We have also implemented a wide range of measures to protect data controlled by SAP and SAP customers from unauthorized access and processing, as well as from accidental loss or destruction. These include, among others, the implementation of our data protection management system in areas critical to data protection. This system is certified on a yearly basis by the British Standards Institute.
In 2016, SAP did not experience any significant incidents regarding breaches of customer privacy or losses of customer data. There were no incidents reported subject to the provisions of the German Federal Data Protection Act.
CUSTOMERS
Continuing to Build Strong Customer Relationships
Customer loyalty is one of our four corporate objectives, along with growth, profitability, and employee engagement. In 2016, our combinedon-premise and cloud Customer Net Promoter Score (Customer NPS) was 19.2% (2015: 22.4%). As we further harmonize processes in acquired entities, the customer segments used for customer surveys has not yet been completely harmonized across the SAP Group. Specifically, due to the nature of the business, the Concur customer sample includes a higher proportion of general business customers in comparison to other Group entities. As a result, Concur responses make up a large proportion of the total customer sample.
While we continue to have a positive Customer NPS, we did not reach our target of 25% in 2016. As a response to the feedback received from our customers throughout 2016, we have focused on improving the quality of ourfollow-up process to ensure a timely resolution of customer issues. We have provided more insight into how customers can migrate to our innovations without disrupting their business processes. With a sustained emphasis onfollow-up, we are targeting a combined Customer NPS of 21% to 23% in 2017, with our medium-term goal of reaching a combined Customer NPS of 35% to 40% by 2020.
For more information about the Customer NPS, see thePerformance Management Systemsection.
38
Continuing Strong Customer Demand
We help companies transform into digital businesses. In 2016, we saw customers do so by licensing or subscribing to the full range of SAP software, from comprehensive solutions for large enterprises to the latest mobile apps.
Some examples by region include the following customers:
North America and Latin America (Americas) Region
| – | | The Dow Chemical Company, based in the United States, has decided to deepen their relationship in SAP through the investment in SAP HANA, including a future state vision around SAP S/4HANA in support of their business objectives |
| – | | Hershey, headquartered in the United States, is upgrading to the SAP S/4HANA suite to achieve enterprise connectivity through access to actionable information at the right time for everyone, anywhere. The large chocolate manufacturer will gain real-time insights from both operational and other data and can simplify global business processes to drive efficiencies and scale. |
| – | | Itaú Unibanco Holding, based in Brazil and one of the top 20 banks in the world by market value, is currently using the SAP HANA platform. It recently added Ariba Network, through which Itaú joins the SAP marketplace forbusiness-to-business transactions. |
| – | | Live Nation, the global leader for live entertainment based in the United States, has purchased Concur Travel & Expense to meet the needs for anend-to-end travel solution from travel request, to online and agent assisted travel planning through to trip reimbursement. Important in the selection process was a full-featured mobile app, exceptionalend-user experience, robust analytics and reporting, the ability to integrate with existing Live Nation systems, and the flexibility to configure to their travel policy and business practices. |
| – | | Mexico Proyectos Y Desarollos chose SAP Ariba Buying, advanced edition, SAP Ariba Strategic Sourcing, and the SAP HANA platform to standardize operative, strategic sourcing, and management processes while achieving better corporate negotiations and reducing maverick purchases. The construction infrastructure company expects to transform procurement processes by leveraging technological innovation and fully achieve its functional and automatization needs. |
Asia Pacific Japan (APJ) Region
| – | | Cathay Pacific, based in Hong Kong, chose SAP S/4HANA and the SAP HANA platform to simplify its business process, enable operational-level reporting |
| | | directly from the airline company’s operational system, and provide the foundation for further system migrations. |
| – | | China National Chemical Corporation (ChemChina), China’s biggest chemical group and a Fortune Global 500 company, has invested heavily in overseas acquisitions. It chose SAP S/4HANA, the SAP HANA platform, the SAP NetWeaver Master Data Management component, and the SAP BusinessObjects Planning and Consolidation application to keep pace with rapid organizational expansion. Through this partnership, ChemChina is leveraging SAP’s leading technology to redefine its IT strategy, optimize IT infrastructure, improve efficiency and business insights, and prepare for a transition to Industry 4.0. |
| – | | NTUC Fairprice, one of Singapore’s largest retailers, chose the SAP HANA platform, SAP Payroll Processing, and SAP SuccessFactors Recruiting Posting solutions to improve employee productivity and engagement. As a customer-oriented retailer, the company also strives to boost productivity and raise overall customer-satisfaction levels by simplifying processes, automating manual practices, and obtaining detailed insights from integrated analytics. |
| – | | Rockland Distilleries in Sri Lanka has chosen the SAP Hybris Cloud for Customer solution over competitors to lead the company through its digital transformation journey. The solution will help increase the productivity of its salespeople and gather business insights that will enable it to make strategic and transformational decisions. |
| – | | Roy Hill Mining Operation is an independent iron ore operation with a project to become the largest single ore mine in Australia. The project is turning to SAP software, including SAP S/4HANA, the SAP Multiresource Scheduling application, and the SAP Integrated Business Planning solution, to view its inventory in real time, make informed decisions on maintenance activities, and manage its supply chain costs more effectively. |
Europe, Middle East, and Africa (EMEA) Region
| – | | Barry Callebaut, based in Switzerland, is one of the world’s leading suppliers of high-quality chocolate and cocoa products. It has implemented SAP solutions to integrate 65,000 small-scale cocoa farmers in Côte d’Ivoire, enable sustainable cocoa farming, and improve the livelihood of farmers, their families, and their communities. The company recently went live with the SAP Rural Sourcing Management solution, an integrated, cloud-based solution running on SAP Cloud Platform. It provides farming organizations with mobile and desktop access to important data immediately to help simplify and digitalize business processes. |
39
| – | | Bilfinger, a German industrial services provider, selected SAP SuccessFactors HCM Suite, including the SAP SuccessFactors Employee Central solution, to standardize HR processes and increase workforce transparency. A further aim is to establish a global talent management model and increase workforce performance. The solutions will help Bilfinger drive its strategic objectives for productivity, consolidation, and compliance. |
| – | | Inter Cars, the largest importer and distributor of automotive spare parts in Poland, chose the SAP Hybris Commerce Cloud solution to establish a full omnichannel platform that will address the business strategy and help the company achieve its goal to double its revenue within the next few years. |
| – | | L’OCCITANE, a French natural and organic ingredient-based cosmetics and well-being retailer, chose the SAP SuccessFactors Employee Central and SAP SuccessFactors Recruiting solutions to streamline human resources processes and gain global visibility into its workforce. It also expects to attract and hire top talents and develop a workforce that helps to support the company’s digital transformation and growth strategy. |
| – | | Targin, a large Russian multiproduct integrated oilfield service holding, will implement SAP S/4HANA as an introduction to the next generation of SAP software. SAP S/4HANA will support Targin in transforming its business enterprises and increasing the efficiency of its business processes to reduce downtime and increase inventory turnover and the company’s market share. |
Helping Customers Invest
To help companies invest in SAP solutions and associated services and hardware, SAP Payment services offers customers payment plans. SAP Payment services can help preserve liquidity, provide an alternative to credit from customers’ existing banking relationships, and balance their budgetary priorities, while giving them the flexibility to choose their preferred solution.
ENERGY AND EMISSIONS
Being a Front-Runner of a Greener Way of Working
As a role model for sustainable business operations, SAP takes its environmental responsibilities seriously. We believe that by running cleaner, greener operations, we can make a difference to our planet. In addition, we aim to enable our customers to reduce their overall carbon footprint through our software.
One of our goals is to reduce net greenhouse gas (GHG) emissions from our operations to levels of the year 2000 by 2020. This target includes all direct emissions from running our business as well as a selected subset of indirect emissions from supply chains and services.
A number of initiatives harness innovative technologies to help us run our operations in a way that minimizes our impact on the environment. In addition, our investment in renewable electricity certificates and carbon credits enables us to support sustainability projects across the globe.
Total Net Emissions
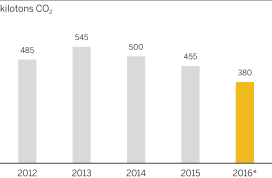
In addition to our long-term commitment for 2020, we have derived annual targets for our internal operational steering. In 2016, we outperformed our annual target to reduce our emissions to less than 400 kilotons (kt) of CO2. This result stems primarily from updating our emission factors as well as compensation with carbon emission offsets. Our focus on carbon emissions has contributed to a cumulative cost avoidance of€155 million in the past three years, compared to abusiness-as-usual scenario based on 2007. We avoided€73.6 million of this cost in 2016.
Committing to 100% Renewable Electricity
Our commitment to 100% renewable electricity is crucial to making our operations more sustainable. While SAP produces a small amount of renewable electricity through solar panels in some locations, we rely primarily on the purchase of renewable energy certificates (RECs) to achieve our target of 100% renewable electricity. We follow robust procurement guidelines for RECs to ensure that we only invest in environmentally friendly schemes.
40
Total Energy Consumption
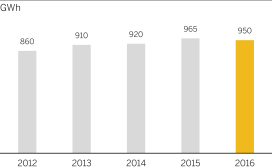
Strengthening Our “Green Cloud”
As more business moves to the cloud, data centers are a key part of how SAP provides solutions to our customers. By using our green cloud services, customers can significantly reduce their carbon footprint. However, data centers represent a significant part of our total GHG with energy consumption increasing as a growing number of customers sign up to our cloud services. For this reason, our data centers have become a primary focus of our carbon reduction efforts. We have introduced initiatives to drive efficiency and innovation around buildings, data center operations, and infrastructure. For example, in 2016, one of our main data centers in Rot, Germany, had a very efficient power usage effectiveness (PUE) of 1.35. In addition, we have tied our business strategy to our environmental strategy by creating a completely “green cloud” powered by 100% renewable electricity at SAP. Carbon neutrality is achieved by purchasing renewable electricity certificates and carbon emission offsets.
Total Data Center Electricity
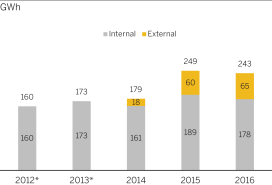
* We started reporting our external data center energy consumption in 2014.
Helping Our Customers Run Greener Operations
The vast majority of our overall emissions result from the use of our software. When our customers run SAP software on their hardware and on their premises, the resulting carbon footprint is about 20 times the size of our own net carbon footprint. To address this, we have developed a downstream emissions strategy to help our
customers, hardware providers, and others run greener operations. One of the most important ways we help our customers reduce their energy usage and emissions is by managing their SAP systems through cloud services provided by our carbon-neutral green cloud offerings. In addition, the solutions in our portfolio help enable our customers manage their resources, such as electricity, in an efficient manner.
The SAP HANA platform also plays a vital role in helping our customers to cut their carbon emissions. By combining the worlds of analytic and transactional data into one real-time,in-memory platform, it can help create much leaner operations, further simplifying the system landscape and reducing energy consumption.
SAP also works with customers to optimize theiron-premise landscapes so that they consume less energy. We achieve this by helping them to decommission legacy systems, archive unused data, and consolidate business applications, as well as virtualizing their system landscape.
Driving Environmental Initiatives Throughout SAP
We continuously pursue strategies to help us achieve our goal of reducing emissions at a time of ongoing growth in our business. Key initiatives for 2016 included the following:
| – | | Sustainable programming sessions |
In a new online training module, software developers and architects learn how to make a positive contribution to SAP’s sustainability goals in their daily programming work. Performance and sustainability go hand in hand as performance-optimized programming usually equates to energy-efficient programming. It also helps improveend-to-end response time and creates a great user experience for our customers.
As a result of our business expansion, the number of SAP employees eligible for a company car has increased annually. We want to ensure that the resulting growth in our car fleet does not undo our successes in cutting emissions. To help address this, SAP aims to increase the number of electric vehicles in our company car fleet to 20% by 2020.
All electric company cars charged at SAP are powered with 100% renewable electricity. In addition, in Germany, we provide employees with an incentive to switch to electric alternatives by offering a battery subsidy that offsets the costs of purchasing an electric vehicle.
| – | | Internal carbon pricing for business flights |
As first introduced in 2015, we continue with our program to reduce the impact of air travel by SAP employees. In addition to avoiding business flights, we invest in carbon emission offsets for air travel in nine
41
countries by charging an internal carbon price. This offset effort resulted in a compensation of 90 kt in 2016.
| – | | Investment in carbon credits |
In 2016, we continued to realize the benefits of our investment in the Livelihoods Fund, a unique investment fund whose returns consist of high-quality carbon credits. Several years ago, we made a commitment to invest€3 million covering a20-year participation in the fund that supports the sustainability of agricultural and rural communities worldwide. Livelihoods Funds have been designated the “Best Corporate Offsetting Program 2016” in voluntary carbon markets by theEnvironmental Finance magazine. In 2016, we received carbon credits from the fund, which helped us to offset our carbon footprint by 21 kt.
INTELLECTUAL PROPERTY, PROPRIETARY RIGHTS AND LICENSES
We rely on a combination of the protections provided by applicable statutory and common law rights, including trade secret, copyright, patent, and trademark laws, license andnon-disclosure agreements, and technical measures to establish and protect our proprietary rights in our products. For further details on risks related to SAP’s intellectual property rights, see “Item 3. Key Information – Risk Factors – Operational Risks.”
We may be dependent in the aggregate on technology that we license from third parties that is embedded into our products or that we resell to our customers. We have licensed and will continue to license numerous third-party software products that we incorporate into and/or distribute with our existing products. We endeavor to protect ourselves in the respective agreements by obtaining certain rights in case such agreements are terminated.
We are a party to patent cross-license agreements with several third parties.
We are named as a defendant or plaintiff in various legal proceedings for alleged intellectual property infringements. See Note (23) to our Consolidated Financial Statements for a more detailed discussion relating to certain of these legal proceedings.
DESCRIPTION OF PROPERTY
Our principal office is located in Walldorf, Germany, where we own and occupy approximately 440,000 square meters of office and datacenter space including our facilities in neighboring St.Leon-Rot. We also own and lease office space in various other locations in Germany, totaling approximately 130,000 square meters. In approximately 70 countries worldwide, we occupy roughly 1,670,000 square meters. The space in most locations other than our principal office in Germany is leased. We also own certain real properties in Newtown Square and Palo Alto (United States); Bangalore (India); Sao Leopoldo (Brazil); London (UK) and a few other locations in and outside of Germany.
The office and datacenter space we occupy includes approximately 320,000 square meters in the EMEA region, excluding Germany, approximately 410,000 square meters in the region North and Latin America, and approximately 370,000 square meters in the APJ Region.
The space is being utilized for various corporate functions including research and development, our data centers, customer support, sales and marketing, consulting, training, administration and messaging. Substantially all our facilities are being fully used or sublet. For a discussion on ournon-current assets by geographic region see Note (28) to our Consolidated Financial Statements. Also see, “Item 6. Directors, Senior Management and Employees – Employees,” which discusses the numbers of our employees, in FTE’s, by business area and by geographic region, which may be used to approximate the productive capacity of our workspace in each region.
We believe that our facilities are in good operating condition and adequate for our present usage. We do not have any significant encumbrances on our properties. We do not believe we are subject to any environmental issues that may affect our utilization of any of our material assets. We are currently undertaking construction activities in various locations to increase our capacity for future expansion of our business. Our significant construction activities are described below, under the heading “Principal Capital Expenditures and Divestitures Currently in Progress.”
42
Capital Expenditures
Principal Capital Expenditures and Divestitures Currently in Progress
In 2016, we continued with various construction projects and started new construction activities in several locations. The expansion of our data centers is an important aspect of our investments planned for 2017. We aim to extend our office space to cover future growth. We plan to cover all of these projects in full from operating cash flow. Our most important projects are listed below:
Construction Projects
| | | | | | | | | | | | | | |
| € millions |
Country | | Location of Facility | | Short Description | |
| Estimated
Total Cost |
| |
| Cost incurred by
December 31,
2016 |
| | Estimated Completion Date |
Germany | | Walldorf | | New office building for approx. 700 employees | | | 71 | | | | 8 | | | October 2018 |
Germany | | Walldorf | | New data center | | | 65 | | | | 9 | | | March 2018 |
India | | Bangalore | | New office building for approx. 2,500 employees | | | 60 | | | | 23 | | | July 2017 |
Israel | | Ra’anana | | New office building for approx. 800 employees | | | 63 | | | | 48 | | | April 2017 |
United States | | New York City | | Execution of leasehold improvements and consolidation of offices for approx. 450 employees | | | 52 | | | | 33 | | | March 2017 |
United States | | Colorado Springs, CO | | New data center | | | 122 | | | | 21 | | | January 2018 |
For more information about planned capital expenditures, see the Investment Goals section. There were no material divestitures within the reporting period.
Principal Capital Expenditures and Divestitures for the Last Three Years
Our principal capital expenditures for property, plant, and equipment amounted to€933 million in 2016 (2015:€580 million; 2014:€666 million). Principal capital expenditures in 2016 for property, plant, and equipment increased compared to 2015 mainly due to higher investments in data centers and replacement investments in hardware. Furthermore, compared to 2015, SAP had higher investments in office buildings. The decrease from 2014 to 2015 was mainly due to the lower replacement investments in hardware and fewer acquisition related additions. Principal capital expenditures for property, plant and equipment for the period from January 1, 2017 to the date of this report were€74 million.
Our capital expenditures for intangible assets such as acquired technologies and customer relationships amounted to€158 million in 2016 compared to€70 million in 2015 (2014:€1,954 million). Our investments allocated to goodwill increased to€57 million in 2016 from€27 million in 2015 (2014:€6,072 million). The respective increases in 2016 are
due to the fact that we executed several small acquisitions in 2016 compared to only one small acquisition in 2015, while the significant decrease from 2014 to 2015 was due to the significant acquisitions of Concur and Fieldglass in 2014. For further details on capital expenditures related to acquisitions, see Note (15) to our Consolidated Financial Statements.
For further information regarding the principal markets in which SAP conducts business, including a breakdown of total revenues by category of activity and geographic market for each of the last three years, see “Item 5. Operating and Financial Review and Prospects – Operating Results (IFRS)” of this report.
ITEM 4A. UNRESOLVED STAFF COMMENTS
Not applicable.
ITEM 5. OPERATING AND FINANCIAL REVIEW AND PROSPECTS
OVERVIEW
For information on our principal sources of revenue and how the different types of revenue are classified in our income statement refer to Note (3b) to our Consolidated Financial Statements, section Revenue Recognition.
43
See “Item 4. Information about SAP – Products, Research & Development, and Services” for a more detailed description of the products and services we offer.
The following discussion is provided to enable a better understanding of our operating results for the periods covered, including:
| – | | the factors that we believe impacted our performance in 2016; |
| – | | our outlook for 2016 compared to our actual performance(non-IFRS); |
| – | | a discussion of our operating results for 2016 compared to 2015 and for 2015 compared to 2014; |
| – | | the factors that we believe will impact our performance in 2017; and |
| – | | our operational targets for 2017(non-IFRS). |
The preceding overview should be read in conjunction with the more detailed discussion and analysis of our financial condition and results of operations in this Item 5, “Item 3. Key Information – Risk Factors” and “Item 18. Financial Statements.”
ECONOMY AND THE MARKET
Global Economic Trends
In its latest economic bulletin, the European Central Bank (ECB) concludes that the global economy grew steadily in 2016 at a similar pace as the year before, with relatively stable expansion in advanced economies and a slight improvement in emerging market economies. According to the ECB, acute uncertainty about the political and economic impact of the presidential election in the United States shaped global sentiment at the end of the year.
For the Europe, Middle East, and Africa (EMEA) region, the ECB reports that economic recovery in the euro area continued throughout 2016, supported by the ECB’s own monetary policy measures which it finds helped revitalize domestic demand in the euro area and reduce debt. According to its calculations, the real gross domestic product of the euro area countries grew 1.7% in 2016. The economies of many of the Central and Eastern Europe countries also performed well in 2016, the ECB writes. There were even signs of an economic rebound in Russia, but expansion there stayed slightly negative for the year as a whole.
In the North America and Latin America (Americas) region, continued low interest rate policies and improving labor markets stimulated the U.S. economy in 2016, the ECB reports, with economic activity in the United States improving markedly in the second half of 2016, following modest growth in the first half. In Brazil, the recession is believed to have slowly bottomed out in the second half of the year.
In the Asia Pacific Japan (APJ) region, soft foreign demand and weak private consumption caused Japan’s economy to advance at only a very modest pace, the ECB notes. In China, meanwhile, economic growth continued to slow in 2016 but, according to the ECB, eventually stabilized in the second half-year, supported by strong consumption and infrastructure spending.
The IT Market
According to Gartner Market Databook December 2016 by Gartner, a market research firm, “worldwide IT spending is forecast to grow 0.5% in 2016 on a constant-currency basis. However, currency rate changes will limit market growth to negative 0.6%. Software is the best-performing segment, with 6.9% growth in 2016 constant currency, while Emerging Asia/Pacific is the fastest-growing region/country, at 2.9%.”
In the Europe, Middle East, and Africa (EMEA) region, growth declined year-over-year in the Western European IT market from 3.6% to–0.1% and the Eastern European IT market declined from 15.8% to 1.8% (see table in paragraph “Expected Developments”: “Trends in the IT Market – Increased IT SpendingYear-Over-Year”, created by SAP on the basis of Gartner Market Databook, 4Q16 Update, 21 December 2016). According to the same table, software spending grew significantly faster than all other submarkets throughout the region.
The Americas region likewise recorded lower growth rates in IT spending than the previous year as can be seen in the table mentioned above. According to the same table, software spending nevertheless significantly outperformed IT spending as a whole.
In the Asia Pacific Japan (APJ) region, software spending grew faster than all other submarkets in the IT industry as well, documented in the table mentioned above.
Source: Gartner Market Databook, 4Q16 Update, 21 December 2016.
The Gartner Report described herein, (the “Gartner Report”) represents research opinion or viewpoints published, as part of a syndicated subscription service, by Gartner, Inc. (“Gartner”), and are not representations of fact. Each Gartner Report speaks as of its original publication date (and not as of the date of this Annual Report) and the opinions expressed in the Gartner Report are subject to change without notice.
Impact on SAP
In 2016, we once again succeeded in significantly expanding our business and outperformed the overall global economy and IT industry in 2016 with regards to revenue growth. Our good 2016 results are further evidence that our strategy of innovating across the core, the cloud, and business networks to help our customers become true digital enterprises is the right way forward.
44
In 2016, we again demonstrated that we are consistently pursuing our strategy for innovation and growth – and that globally, we are able to generate growth that few other IT companies can match – in three respects: in revenue from core business and cloud business, and in operating profit.
PERFORMANCE AGAINST OUR OUTLOOK FOR 2016(NON-IFRS)
Our 2016 operating profit-related internal management goals and published outlook were based on ournon-IFRS financial measures. For this reason, in the following section we discuss performance against our outlook only in terms ofnon-IFRS numbers derived from IFRS measures. The subsequent section about IFRS operating results discusses numbers only in terms of the International Financial Reporting Standards (IFRSs), so the numbers in that section are not expressly identified as IFRS numbers.
Outlook for 2016(Non-IFRS)
At the beginning of 2016, we projected that our 2016non-IFRS cloud subscriptions and support revenue would be between€2.95 billion and€3.05 billion at constant currencies (2015:€2.30 billion). We expected full-year 2016non-IFRS cloud and software revenue to increase by 6% to 8% at constant currencies (2015:€17.23 billion). We also expected our full-year operating profit(non-IFRS) for 2016 to end between€6.4 billion and€6.7 billion (2015:€6.35 billion) at constant
currencies. We anticipated an effective tax rate (IFRS) of between 22.5% and 23.5% (2015: 23.4%) and an effective tax rate(non-IFRS) of between 24.5% and 25.5% (2015: 26.1%).
In July 2016, we adjusted our outlook for the effective tax rate (IFRS) to between 27.0% and 28.0% and for the effective tax rate(non-IFRS) to between 28.0% and 29.0%. The increase in comparison to the previous outlook mainly resulted from tax effects relating to changes in foreign currency exchange rates in Venezuela and the fact that the execution of the originally planned consolidation of intellectual property rights held by SAP Group company hybris AG at the level of SAP SE in Germany could no longer be achieved at this point of time.
In October, based on the strong momentum in our cloud business, we raised our outlook for 2016non-IFRS cloud subscriptions and support revenue to a range of€3.00 billion to€3.05 billion at constant currencies. The upper end of this range represents a growth rate of 33% at constant currencies. Thanks to continued growth in our software license business, we were also able to increase our growth outlook for full-year 2016non-IFRS cloud and software revenue to 6.5% to 8.5% at constant currencies. In view of the greater revenues expected, we also adjusted our outlook for full-year operating profit(non-IFRS) for 2016 upward to range between€6.5 billion and€6.7 billion at constant currencies.
To assist in understanding our 2016 performance as compared to our 2016 outlook a reconciliation from our IFRS financial measures to ournon-IFRS financial measures is provided below. These IFRS financial measures reconcile to the nearestnon-IFRS equivalents as follows:
| | | | | | | | | | | | | | | | | | | | | | | | | | | | | | | | |
€ millions, except
operating margin | | IFRS
Financial
Measure | | | Recurring
Revenue not
Recorded
Under
IFRS | | | Acqui-
sition-
Related
Charges | | | Share- Based
Payments | | | Restruc-
turing | | | Non-IFRS
Financial
Measure | | | Currency
Effect on
the Non-
IFRS
Financial
Measure | | | Non-IFRS
Financial
Measure at
Constant
Currency | |
Cloud subscriptions and support revenue | | | 2,993 | | | | 2 | | | | NA | | | | NA | | | | NA | | | | 2,995 | | | | 12 | | | | 3,007 | |
Software licenses and support revenue | | | 15,431 | | | | 3 | | | | NA | | | | NA | | | | NA | | | | 15,434 | | | | 113 | | | | 15,546 | |
Cloud and software revenue | | | 18,424 | | | | 5 | | | | NA | | | | NA | | | | NA | | | | 18,428 | | | | 125 | | | | 18,553 | |
Total revenue | | | 22,062 | | | | 5 | | | | NA | | | | NA | | | | NA | | | | 22,067 | | | | 164 | | | | 22,231 | |
Operating profit | | | 5,135 | | | | 5 | | | | 680 | | | | 785 | | | | 28 | | | | 6,633 | | | | –28 | | | | 6,605 | |
Operating margin (in %)(1) | | | 23.3 | | | | 0 | | | | 3.1 | | | | 3.6 | | | | 0.1 | | | | 30.1 | | | | –0.3 | | | | 29.7 | |
(1) Operating profit is the numerator and total revenue is the denominator in the calculation of our IFRS operating margin and the comparablenon-IFRS operating margin; operating margin numbers are included in this table for the convenience of the reader.
45
2016 Actual Performance Compared to Outlook(Non-IFRS)
We achieved or exceeded the raised outlook for revenue and operating profit we published in October.
Comparison of Outlook and Results for 2016
| | | | | | | | | | | | |
| | | Outlook for 2016 (as reported in
Integrated Report
2015) | | | Revised Outlook for 2016 | | | Results for 2016 | |
Cloud subscriptions and support revenue (non-IFRS, at constant currencies) | |
| €2.95 billion
to€3.05 billion |
| |
| €3.00 billion
to €3.05 billion |
| | | €3.01 billion | |
Cloud and software revenue (non-IFRS, at constant currencies) | | | +6.0% to +8.0% | | | | +6.5% to +8.5% | | | | +8% | |
Operating profit (non-IFRS, at constant currencies) | |
| €6.40 billion
to€6.70 billion |
| |
| €6.50 billion
to€6.70 billion |
| | | €6.61 billion | |
Effective tax rate (IFRS) | | | 22.5% to 23.5% | | | | 27.0% to 28.0% | | | | 25.3% | |
Effective tax rate(non-IFRS) | | | 24.5% to 25.5% | | | | 28.0% to 29.0% | | | | 26.8% | |
Despite ongoing economic uncertainty throughout 2016, especially in Latin America, coupled with fears about the possible effects of the Brexit vote and the presidential election in the United States, our new and existing customers continued to show a strong willingness to invest in our solutions.
On a constant currency basis,non-IFRS cloud subscriptions and support revenue grew from€2.30 billion in 2015 to€3.01 billion in 2016. That represents an increase of 31% on a constant currency basis. We thus achieved our refined outlook range of€3.00 billion to€3.05 billion that we predicted in October.
Our new cloud bookings, which is the main measure for our cloud-related sales success and for future cloud subscriptions revenue, increased 31% in 2016 to€1.15 billion (2015:€874 million). In addition to this strong growth, our cloud backlog (unbilled future revenue based on existing customer contracts) climbed by 47% to€5.4 billion (2015:€3.7 billion). This reflects the unbilled committed future cloud subscriptions and support revenue that will drive strong cloud growth in 2017 and beyond.
Besides the cloud business, our traditionalon-premise business also showed a remarkable growth in 2016. Cloud and software revenue(non-IFRS) was€18.43 billion (2015:€17.23 billion). On a constant currency basis, the increase was 8% and therefore well above the midpoint of the increased outlook.
Our total revenue(non-IFRS) rose 6% in 2016 to€22.07 billion (2015:€20.81 billion). On a constant currency basis, the increase was 7%.
Operating expenses(non-IFRS) in 2016 were€15.43 billion (2015:€14.46 billion), an increase of 7%. On a constant currency basis, the increase was 8%.
Our expense base in 2016 continued to be impacted by the transformation to a fast-growing cloud business. In our outlook we expected the cloud subscriptions and support gross margin to be at least stable or to slightly increase compared to 2015. The cloud subscriptions gross margin for 2016 was 64.4%, a decrease of 1.2pp on a constant currency basis and with that below our expectations. The decrease is primarily due to the change in the cloud subscription revenue mix; the share of ourinfrastructure-as-a-service cloud offering (IaaS) that has a lower margin than the other cloud offerings,grew at above-average rates and thus impacted the overall gross margin. The cloud subscriptions gross margins of our cloud offerings developed heterogeneously in 2016:
Our cloud subscriptions gross margin(non-IFRS) in ourbusiness network businessincreased by 1% andresulted in approximately 76% for 2016, already close to our long-term ambition of approximately 80%. This excellent result is attributable to the continued positive gross margin development within the Concur and SAP Ariba portfolios.
The cloud subscriptions gross margin(non-IFRS) of ourinfrastructure-as-a-service cloud offering (IaaS)performed much better in 2016 than in 2015. In 2016 our cloud subscription gross margin is-5% which reflects an improvement of more than 104pp on a constant currency basis. In the last two quarters break-even was already reached, we are therefore in line with our expectations. Profitability in oursoftware-as-a-service/platform-as-a-service cloud offering (Saas/PaaS)
46
was approximately 62% for 2016 compared to our long-term ambition of approximately 80%. Affected by the incremental investments in our cloud infrastructure, cloud profitability fell by 8pp on a constant currency basis, mainly due to significant investments in the expansion of our data center and IT infrastructure as well as in the harmonization of our various public cloud offerings into one platform.
Efficiency improvements in both our cloud and traditionalon-premise business drove continued operating profit expansion.Non-IFRS operating profit in 2016 was€6.61 billion on a constant currency basis, reflecting an increase of 4%. As a result, we were able to surpass our excellent results from 2015, despite our continued investment in our business transformation during the reporting year. The positive development of
our operating profit was influenced by the effects of our global transformation program carried out in 2015 as well as by the cost-conscious hiring of highly educated young talents in our fast growth areas and locations that enabled us to increase our overall headcount by 7,197 full-time equivalents in 2016. With these additional resources, we continued to invest in our innovation and growth markets. Thus, constant currencynon-IFRS operating profit amounting to€6.61 billion was at the midpoint of our raised outlook range (€6.5 billion to€6.7 billion).
We achieved an effective tax rate (IFRS) of 25.3% and an effective tax rate(non-IFRS) of 26.8%, which is below the adjusted outlook of 27.0% to 28.0% (IFRS) and 28.0% to 29.0%(non-IFRS). This mainly results from taxes for prior years and from the regional allocation of income.
OPERATING RESULTS (IFRS)
This section on operating results (IFRS) discusses results only in terms of IFRS measures, so the IFRS numbers are not expressly identified as such.
Our 2016 Results Compared to Our 2015 Results (IFRS)
Revenue
| | | | | | | | | | | | |
| € millions | | 2016 | | | 2015 | | | Change in % 2016 vs 2015 | |
Cloud subscriptions and support | | | 2,993 | | | | 2,286 | | | | 31 | |
Software licenses | | | 4,860 | | | | 4,835 | | | | 1 | |
Software support | | | 10,571 | | | | 10,093 | | | | 5 | |
Software licenses and support | | | 15,431 | | | | 14,928 | | | | 3 | |
Cloud and software | | | 18,424 | | | | 17,214 | | | | 7 | |
Services | | | 3,638 | | | | 3,579 | | | | 2 | |
Total revenue | | | 22,062 | | | | 20,793 | | | | 6 | |
Total Revenue
Total revenue increased from€20,793 million in 2015 to€22,062 million in 2016, representing an increase of€1,269 million, or 6%.
Total Revenue
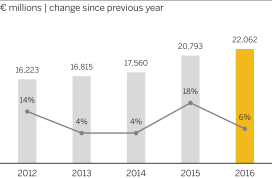
47
This increase reflects a 7% increase from changes in volumes and prices and a 1% decrease from currency effects. The growth in revenue resulted primarily from a€707 million increase in cloud subscriptions and support revenue. Furthermore, software support revenue rose€478 million. This growth is a result of continuously high software license revenue, which increased€25 million in 2016. Cloud and software revenue climbed to€18,424 million in 2016, an increase of 7%. Cloud and software revenue represented 84% of total revenue in 2016 (2015: 83%). Service revenue increased 2% from€3,579 million in 2015 to€3,638 million, which was 16% of total revenue, in 2016.
Revenue by Line Item
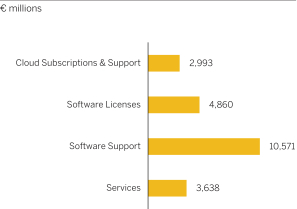
For more information about the breakdown of total revenue by region and industry, see Revenue by Region and Revenue by Industry below.
Cloud and Software Revenue
Software licenses revenue results from the fees earned from selling or licensing software to customers. Revenue from cloud subscriptions and support refers to the income earned from contracts that permit the customer to access specific software solutions hosted by SAP during the term of its contract with SAP. Support revenue represents fees earned from providing technical support services and unspecified software upgrades, updates, and enhancements to customers.
Cloud and Software
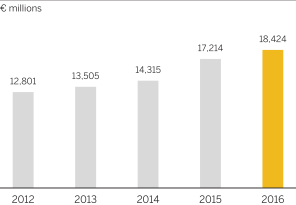
Cloud subscriptions and support revenue increased from€2,286 million in 2015 to€2,993 million in 2016.
Cloud Subscriptions and Support
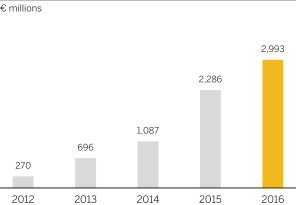
Despite a combination of a challenging macroeconomic and political environment and the accelerating industry shift to the cloud, we achieved a€25 million increase in software license revenue. This increase, from€4,835 million in 2015 to€4,860 million in 2016, reflects a 1% increase from changes in volumes and prices and a 1% decrease from currency effects.
Our customer base continued to expand in 2016. Based on the number of contracts concluded, 16% of the orders we received for software in 2016 were from new customers (2015: 13%). The total value of software orders received was stable year-over-year. The total number of software license contracts remained at the same level with 57,291 (2015: 57,439), while the average order value remained unchanged year-over-year. 29% of our software order entry in 2016 resulted from deals worth more than€5 million (2015: 27%), while 38% resulted from deals worth less than€1 million (2015: 40%).
Our stable customer base, continued investment in new software licenses by customers throughout 2016 and the previous year, and the continued interest in our support offerings resulted in an increase in software support revenue from€10,093 million in 2015 to€10,571 million in 2016. The SAP Enterprise Support offering was the largest contributor to our software support revenue. The€478 million, or 5%, growth in software support revenue reflects a 6% increase from new support business and a 1% decrease from currency effects. This growth is primarily attributable to SAP Product Support for Large Enterprises and SAP Enterprise Support. The acceptance rate for SAP Enterprise Support among new customers reached 100% in 2016 (2015: 99%).
Software licenses and software support revenue rose€503 million, or 3%, from€14,928 million in 2015 to€15,431 million in 2016. This increase reflects a 4% increase from changes in volumes and prices and a 1% decrease from currency effects.
48
We define predictable revenue as the sum of our software support revenue and our cloud subscriptions and support revenue. Compared to the previous year, our predictable revenue increased 10%, from€12,379 million to€13,564 million in 2016. Predictable revenue accounted for 61% of our total revenue in 2016 (2015: 60%).
Predictable Revenue
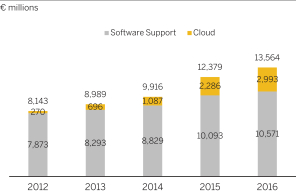
Cloud and software revenue grew from€17,214 million in 2015 to€18,424 million in 2016, an increase of 7%. This reflects an 8% increase from changes in volumes and prices and a 1% decrease from currency effects.
Services Revenue
Services revenue combines revenue from professional services, premium support services, training services,
messaging services and payment services. Professional services primarily relate to the installation and configuration of our cloud subscriptions andon-premise software products. Our premium support offering consists ofhigh-end support services tailored to customer requirements. Messaging services are primarily transmission of electronic text messages from one mobile phone provider to another. Payment services are primarily delivered in connection with our travel and expense management offerings.
Services revenue increased€59 million, or 2%, from€3,579 million in 2015 to€3,638 million in 2016. This increase reflects a 3% increase from changes in volumes and prices and a 1% decrease from currency effects.
A solid market demand led to a 1% increase of€26 million in consulting revenue and premium support revenue from€2,856 million in 2015 to€2,883 million in 2016. This increase reflects a 2% increase from changes in volumes and prices and a 1% decrease from currency effects. Consulting and premium support revenue contributed 79% of the total service revenue (2015: 80%). Consulting and premium support revenue contributed 13% of total revenue in 2016 (2015: 14%).
Revenue from other services increased€33 million, or 5%, to€756 million in 2016 (2015:€723 million). This reflects a 6% increase from changes in volumes and prices and a 1% decrease from currency changes.
49
Revenue by Region and Industry
| | | | | | | | | | | | |
| Revenue by Region | | | | | | | | | |
€ millions | | | 2016 | | | | 2015 | | |
| Change in % 2016
vs 2015 |
|
Germany | | | 3,034 | | | | 2,771 | | | | 9 | |
Rest of EMEA | | | 6,721 | | | | 6,409 | | | | 5 | |
EMEA | | | 9,755 | | | | 9,181 | | | | 6 | |
United States | | | 7,167 | | | | 6,750 | | | | 6 | |
Rest of Americas | | | 1,763 | | | | 1,678 | | | | 5 | |
Americas | | | 8,931 | | | | 8,428 | | | | 6 | |
Japan | | | 825 | | | | 667 | | | | 24 | |
Rest of APJ | | | 2,552 | | | | 2,517 | | | | 1 | |
APJ | | | 3,377 | | | | 3,185 | | | | 6 | |
SAP Group | | | 22,062 | | | | 20,793 | | | | 6 | |
| | | | | | | | | | | | |
| Revenue by Industry | | | | | | | | | |
| € millions | | 2016 | | | 2015 | | | Change in % 2016
vs 2015 | |
Energy & Natural Resources | | | 4,966 | | | | 4,834 | | | | 3 | |
Discrete Manufacturing | | | 3,880 | | | | 3,672 | | | | 6 | |
Consumer | | | 5,520 | | | | 4,934 | | | | 12 | |
Public Services | | | 2,137 | | | | 2,174 | | | | –2 | |
Financial Services | | | 1,928 | | | | 1,881 | | | | 2 | |
Services | | | 3,632 | | | | 3,298 | | | | 10 | |
Total revenue | | | 22,062 | | | | 20,793 | | | | 6 | |
Revenue by Region
Revenue by Region
(based on customer location)
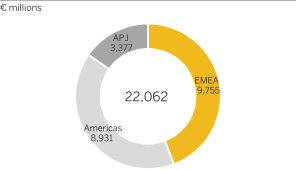
50
EMEA Region
In 2016, the EMEA region generated€9,755 million in revenue (2015:€9,181 million), which was 44% of total revenue (2015: 44%). This represents a year-over-year increase of 6%. Revenue in Germany increased 9% to€3,034 million in 2016 (2015:€2,771 million). Germany contributed 31% (2015: 30%) of all EMEA region revenue. The remaining revenue in the EMEA region was primarily generated in the United Kingdom, France, Switzerland, the Netherlands and Italy. Cloud and software revenue generated in the EMEA region in 2016 totaled€8,193 million (2015:€7,622 million). Cloud and software revenue represented 84% of all revenue in the region in 2016 (2015: 83%).
EMEA: Cloud and Software Revenue
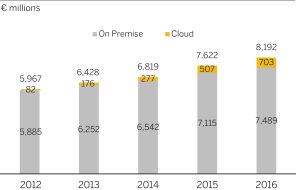
Cloud subscriptions revenue rose 39% to€703 million in 2016 (2015:€507 million). This growth reflects a 41% increase from changes in volumes and prices and a 3% decrease from currency effects. Software licenses and software support revenue rose 5% to€7,489 million in 2016 (2015:€7,115 million). This increase reflects a 7% increase from changes in volumes and prices and a 2% decrease from currency effects.
Americas Region
In 2016, 40% of our total revenue was generated in the Americas region (2015: 41%). Total revenue in the Americas region increased 6% to€8,931 million; revenue generated in the United States increased 6% to€7,167 million. This growth reflects a 6% increase from changes in volumes and prices and currency effect of 0%. The United States contributed 80% (2015: 80%) of all revenue generated in the Americas region. In the remaining countries of the Americas region, revenue increased 5% to€1,763 million. This increase reflects a
7% increase from changes in volumes and prices and a 2% decrease from currency effects. Revenue in the remaining countries of the Americas region was generated primarily in Mexico, Brazil and Canada. Cloud and software revenue generated in the Americas region in 2016 totaled€7,366 million (2015:€6,929 million). Cloud and software revenue represented 82% of all revenue in the Americas region in 2016 (2015: 82%).
Americas: Cloud and Software Revenue
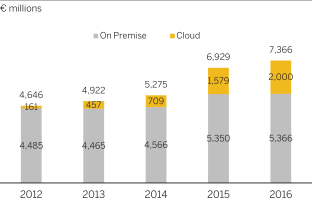
Cloud subscriptions revenue rose by 27% to€2,000 million in 2016 (2015:€1,579 million); currency effects were 0%. Software licenses and software support revenue in 2016 of€5,366 million was virtually unchanged compared to the prior year (2015:€5,350 million).
APJ Region
In 2016, 15% (2015: 15%) of our total revenue was generated in the APJ region. Total revenue in the APJ region increased 6% to€3,377 million. In Japan, revenue increased 24% to€825 million. Revenue from Japan was 24% (2015: 21%) of all revenue generated in the APJ region. The revenue growth in Japan was attributable to a 10% increase from changes in volumes and prices and a 13% increase from currency effects. In the remaining countries of the APJ region, revenue increased 1%. Revenue in the remaining countries of the APJ region was generated primarily in Australia, India and China. Cloud and software revenue in the APJ region totaled€2,865 million in 2016 (2015:€2,663 million). That was 85% of all revenue from the region (2015: 84%).
51
APJ: Cloud and Software Revenue
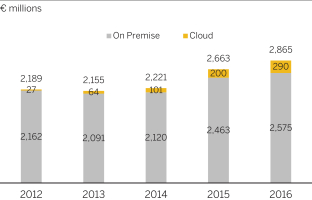
Cloud subscriptions revenue grew 45% to€290 million in 2016 (2015:€200 million). This growth reflects a 43% increase from changes in volumes and prices and a 1% increase from currency effects. Software licenses and software support revenue increased 5% to€2,575 million in 2016 (2015:€2,463 million). This growth reflects a 3% increase from changes in volumes and prices and a 1% increase from currency effects.
Revenue by Industry
We allocate our customers to one of our industries at the outset of an initial arrangement. All subsequent revenue from a particular customer is recorded under that industry sector.
Revenue by Industry
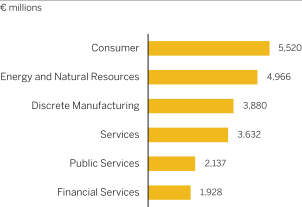
In 2016, we achieved above-average growth in the following industry sectors, measured by changes in total revenue: Consumer (€5,520 million, growing 12%); Services (€3,632 million, growing 10%); and Discrete Manufacturing (€3,880 million, growing 6%). Revenue from the other industry sectors was Financial Services (€1,928 million, growing 3%); Energy and Natural Resources (€4,966 million, growing 3%); and Public Services (€2,137 million, decreasing 2%).
Operating Profit and Operating Margin
| | | | | | | | | | | | | | | | | | | | |
| Total Operating Expenses | | | | | | | | | | | | | | | |
| € millions | | 2016 | | | % of total revenue(1) | | | 2015 | | | % of total revenue(2) | | | Change in % 2016 vs 2015 | |
Cost of cloud subscriptions and support | | | –1,313 | | | | 6 | | | | –1,022 | | | | 5 | | | | 29 | |
Cost of software licenses and support | | | –2,182 | | | | 10 | | | | –2,291 | | | | 11 | | | | –5 | |
Cost of cloud and software | | | –3,495 | | | | 16 | | | | –3,313 | | | | 16 | | | | 5 | |
Cost of services | | | –3,089 | | | | 14 | | | | –2,932 | | | | 14 | | | | 5 | |
Research and development | | | –3,044 | | | | 14 | | | | –2,845 | | | | 14 | | | | 7 | |
Sales and marketing | | | –6,265 | | | | 28 | | | | –5,782 | | | | 28 | | | | 8 | |
General and administration | | | –1,005 | | | | 5 | | | | –1,048 | | | | 5 | | | | –4 | |
Restructuring | | | –28 | | | | 0 | | | | –621 | | | | 3 | | | | –96 | |
Other operating income/expense, net | | | –3 | | | | 0 | | | | 1 | | | | 0 | | | | <–100 | |
Total operating expenses | | | –16,928 | | | | 77 | | | | –16,541 | | | | 80 | | | | 2 | |
(1) Total revenue for 2016:€22,062 million.
(2) Total revenue for 2015:€20,793 million.
52
| | | | | | | | | | | | |
| Operating Profit and Operating Margin | | | | | | | | | |
| € millions, except for operating margin | | 2016 | | | 2015 | | | Change in % 2016
vs 2015 | |
Operating profit | | | 5,135 | | | | 4,252 | | | | 21 | |
Operating margin (in %) | | | 23.3 | | | | 20.5 | | | | 2.8pp | |
SAP continued to invest in innovation and its cloud business and achieved a record revenue in 2016. Thanks to strong revenue growth and lower restructuring costs, our operating profit improved 21% to€5,135 million (2015:€4,252 million).
In 2016, our operating expenses increased€387 million or 2% to€16,928 million (2015:€16,541 million). The main contributors to that increase were our continued investment in sales activities and our greater revenue-related and investment-related cloud subscriptions and support costs.
The record revenue generated and significantly lower restructuring costs had a positive impact on our operating profit. Continuing investment in cloud infrastructure, in sales activities around the world, and in research and development also affected the results in 2016. The increased operating profit and the higher share price in 2016 pushed the cost of bonus payments to employees and share-based compensation higher. Our employee headcount (measured in full-time equivalents, or FTEs) increased by 7,197 year-over-year.
Operating Profit
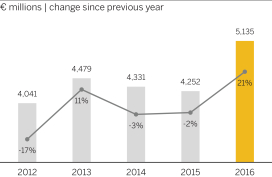
Operating Margin
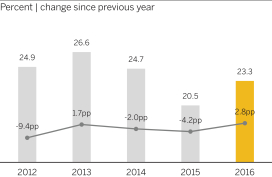
The increased operating expenses largely represent investments in the future and were offset by the increase in revenue.
As an overall result of these effects on operating profit, our operating margin widened 2.8pp to 23.3% in 2016 (2015: 20.5%).
Changes to the individual elements in our cost of revenue were as follows:
Cost of Cloud and Software
Cost of cloud and software consists primarily of customer support costs, cost of developing custom solutions that address customers’ specific business requirements, costs for deploying and operating cloud solutions, amortization expenses relating to intangibles, and license fees and commissions paid to third parties for databases and the other complementary third-party products sublicensed by us to our customers.
In 2016, the cost of cloud and software increased 5% to€3,495 million (2015:€3,313 million).
Main impact on costs was an additional€291 million year-over-year to extend our cloud business in response to the sustained strength of customer demand, with an associated increase in the expense of delivering and operating cloud applications. These investments contributed to revenue growth. Our margin on cloud subscriptions and support increased 0.8pp to 56.1% (2015: 55.3%). This improvement in margin was achieved primarily through strong growth in revenue. The investments in our cloud business were offset by the significant increase in cloud subscriptions and support revenue.
While software licenses and support revenue increased, savings in customer support, in the cost of developing custom solutions, and in license fees, enabled us to reduce our software and support costs by a total of€109 million year over year.
The gross margin on cloud and software, defined as cloud and software profit as a percentage of cloud and software revenue, widened to 81.0% in 2016 (2015: 80.8%). This change was mainly driven by the improved software license and support margin, which increased 1.2pp to 85.9% (2015; 84.7%).
53
Cost of Services
Cost of services consists primarily of the cost of consulting, premium services and training personnel and the cost ofbought-in consulting and training resources.
As of the second quarter of 2016, we changed the way sales and marketing expenses related to our service activities are classified in our income statement. For more information see the Notes to the Consolidated Financial Statements section,Note (3b).
Although we were able to increase our service revenue by 2% year over year to€3,638 million in 2016 (2015:€3,579 million), our service business continues to be greatly affected as we trend away from classic software licensing and consulting revenue toward more subscription revenue from cloud solutions. In addition, we continue to invest in our ONE Service organization and in our customerco-innovation projects. As a result, cost of services rose 5% to€3,089 million (2015:€2,932 million). Our gross margin on services, defined as services profit as a percentage of services revenue, narrowed to 15.1% (2015: 18.1%).
Research and Development Expense
Our research and development (R&D) expense consists primarily of the personnel cost of our R&D employees, costs incurred for independent contractors we retain to assist in our R&D activities, and amortization of the computer hardware and software we use for our R&D activities.
Due to growing personnel costs driven by a 12% increase in our R&D headcount by the end of the year, our R&D expense increased by 7% to€3,044 million in 2016 from€2,845 million in 2015. R&D expense as a percentage of total revenue thus increased to 13.8% in 2016 (2015: 13.7%). For more information, see “Item 4. Information about SAP –Products, Research & Development, and Services”.
Sales and Marketing Expense
Sales and marketing expense consists mainly of personnel costs, direct sales costs, and the cost of marketing our products and services.
Our sales and marketing expense rose 8% from€5,782 million in 2015 to€6,265 million in 2016. The increase was mainly the result of greater personnel costs as we expanded our global sales force, and of increased expenditure for bonus payments prompted by the strong revenue growth. The ratio of sales and marketing expense to total revenue, expressed as a percentage, increased to 28.4% year-over-year (2015: 27.8%), an increase of 0.6pp.
General and Administration Expense
Our general and administration expense consists mainly of personnel costs to support our finance and administration functions.
General and administration expense decreased 4% from€1,048 million in 2015 to€1,005 million in 2016. This decline in costs is primarily the result of careful cost management. Consequently, the ratio of general and administration expense to total revenue decreased in 2016 to 4.6% (2015: 5.0%).
Segment Information
In 2016, SAP had two reportable segments: the Applications, Technology & Services segment; and the SAP Business Network segment.
For more information about our segment reporting, see the Notes to the Consolidated Financial Statements, Note (28), and thePerformance Management Systemsection.
Applications, Technology & Services Segment
| | | | | | | | | | | | | | | | |
| € millions, unless otherwise stated | | 2016 | | | 2015 | | | Change in
% | | | Change in %
(Constant
Currency) | |
| (Non-IFRS) | | | | |
Cloud subscriptions and support revenue | | | 1,353 | | | | 932 | | | | 45 | | | | 47 | |
Cloud subscriptions and support margin (in %) | | | 51 | | | | 52 | | | | –2pp | | | | –1pp | |
Segment revenue | | | 19,920 | | | | 18,963 | | | | 5 | | | | 6 | |
Gross margin (in %) | | | 74 | | | | 74 | | | | –0pp | | | | –0pp | |
Segment profit | | | 8,031 | | | | 7,723 | | | | 4 | | | | 4 | |
Segment margin (in %) | | | 40 | | | | 41 | | | | –0pp | | | | –1pp | |
54
In 2016, the revenue increase in the Applications, Technology & Services segment was driven mainly by strong growth in software support revenue, which increased 5% (6% at constant currencies) to€10,464 million. As a consequence of continuous strong demand for our human capital management, customer engagement and commerce, and SAP HANA Enterprise Cloud offerings, cloud subscriptions and support revenue in the Applications, Technology & Services segment grew 45% (47% at constant currencies) to€1,353 million.
The increase of cloud subscriptions and support revenue and software support revenue resulted in an increase in the revenue share of more predictable revenue streams
in this segment of 2pp at constant currencies from 58% in 2015 to 59% in 2016. Software license revenue attributable to this segment increased 1% at constant currencies to€4,814 million (2015:€4,770 million).
The segment’s cost of revenue during the same time period increased 7% (8% at constant currencies) to€5,279 million (2015:€4,954 million). This increase in expenses was primarily the result of greater investment in expanding our cloud infrastructure and in providing and operating our cloud applications, as well as additional personnel expenses to support the growth of the cloud business.
SAP Business Network Segment
| | | | | | | | | | | | | | | | |
€ millions, unless otherwise stated (Non-IFRS) | | 2016 | | | 2015 | | | Change in
% | | | Change in %
(Constant
Currency) | |
| Cloud subscriptions and support revenue | | 1,595 | | | 1,337 | | | 19 | | | 19 | |
Cloud subscriptions and support margin (in %) | | | 76 | | | | 75 | | | | 1pp | | | | 1pp | |
Segment revenue | | | 1,925 | | | | 1,616 | | | | 19 | | | | 19 | |
Gross margin (in %) | | | 67 | | | | 68 | | | | –1pp | | | | –1pp | |
Segment profit | | | 338 | | | | 317 | | | | 7 | | | | 0 | |
Segment margin (in %) | | | 18 | | | | 20 | | | | –2pp | | | | –3pp | |
The segment’s cost of revenue increased 21% in 2016 (22% at constant currencies) to€631 million (2015:€520 million). The SAP Business Network segment achieved a segment gross profit of€1,295 million in 2016 (2015:€1,095 million), an increase of 18% (17% at constant currencies).
Financial Income, Net
Financial income, net, changed to–€38 million (2015:–€5 million). Our finance income was€230 million (2015:€241 million) and our finance costs were€268 million (2015:€246 million).
Finance income mainly consists of gains from disposal of equity securities totaling€164 million (2015:€176 million), interest income from loans and receivables, and other financial assets (cash, cash equivalents, and current investments) totaling€40 million (2015:€41 million), and income from derivatives totaling€29 million (2015:€30 million).
Finance costs mainly consist of interest expense on financial liabilities amounting to€108 million (2015:€135 million) and negative effects from derivatives amounting to€114 million (2015:€72 million). The decrease in finance costs is mainly due to lower average indebtedness. For more information about financing instruments, see the Notes to the Consolidated Financial Statements section,Note (17b).
Income Tax
Our effective tax rate increased to 25.3% in 2016 (2015: 23.4%). The increase in the effective tax rate mainly resulted from changes in taxes for prior years and the increase in the profit before taxes. For more information on income taxes, see the Notes to the Consolidated Financial Statements section,Note (10).
55
Our 2015 Results Compared to Our 2014 Results (IFRS)
Revenue
| | | | | | | | | | | | |
| € millions | | 2015 | | | 2014 | | | Change in % 2015
vs 2014 | |
Cloud subscriptions and support | | | 2,286 | | | | 1,087 | | | | >100 | |
Software licenses | | | 4,835 | | | | 4,399 | | | | 10 | |
Software support | | | 10,093 | | | | 8,829 | | | | 14 | |
Software licenses and support | | | 14,928 | | | | 13,228 | | | | 13 | |
Cloud and software | | | 17,214 | | | | 14,315 | | | | 20 | |
Services | | | 3,579 | | | | 3,245 | | | | 10 | |
Total revenue | | | 20,793 | | | | 17,560 | | | | 18 | |
Total Revenue
Total revenue increased from€17,560 million in 2014 to€20,793 million in 2015, representing an increase of€3,233 million, or 18%. This growth reflects a 10% increase from new business and a 9% increase from currency effects. The growth in revenue resulted primarily from a€1,264 million rise in support revenue, a€1,199 million increase in cloud subscriptions and support revenue, software license revenue increased€436 million and services revenue grew by€334 million. Cloud and software revenue climbed to€17,214 million in 2015, an increase of 20%. Cloud and software revenue represented 83% of total revenue in 2015 (2014: 82%). Service revenue increased 10% from€3,245 million in 2014 to€3,579 million, which was 17% of total revenue, in 2015.
For more information about the breakdown of total revenue by region and industry, see theRevenue by Region and Industry section below.
Cloud and Software Revenue
Software licenses revenue results from the fees earned from selling or licensing software to customers. Revenue from cloud subscriptions and support refers to the income earned from contracts that permit the customer to access specific software solutions hosted by SAP during the term of its contract with SAP. Software support revenue represents fees earned from providing technical support services and unspecified software upgrades, updates, and enhancements to customers.
Cloud subscriptions and support revenue increased from€1,087 million in 2014 to€2,286 million in 2015.
Despite a combination of a challenging macroeconomic and political environment and the accelerating industry shift to the cloud, we achieved a€436 million increase in software license revenue. This increase, from€4,399 million in 2014 to€4,835 million in 2015, reflects a 4% increase from new license business and a 6% increase from currency effects.
Our customer base continued to expand in 2015. Based on the number of contracts concluded, 13% of the orders we received for software in 2015 were from new customers (2014: 12%). The total value of software orders received increased 16% year-over-year. The total number of software license contracts increased 6% to 57,439 (2014: 54,120 contracts), while the average order value increased by 9%. Of all our software orders received in 2015, 27% were attributable to deals worth more than€5 million (2014: 22%), while 40% were attributable to deals worth less than€1 million (2014: 44%).
Our stable customer relations and continued investment in new software licenses by customers throughout 2015 and the previous year resulted in an increase in software support revenue from€8,829 million in 2014 to€10,093 million in 2015. The SAP Enterprise Support offering was the largest contributor to our software support revenue. The€1,264 million, or 14%, growth in
56
software support revenue reflects a 7% increase from new support business and an 8% increase from currency effects. This growth is primarily attributable to SAP Product Support for Large Enterprises and SAP Enterprise Support. The acceptance rate for SAP Enterprise Support among new customers slightly increased to 99% in 2015 (2014: 98%).
Software licenses and software support revenue rose€1,700 million, or 13%, from€13,228 million in 2014 to€14,928 million in 2015. This growth breaks down into a 6% increase from new software licenses and software support business and a 7% increase from currency effects.
Cloud and software revenue grew from€14,315 million in 2014 to€17,214 million in 2015, an increase of 20%. This reflects a 12% increase from new cloud and software business and a 9% increase from currency effects.
Services Revenue
Services Revenue combines revenue from professional services, premium support services, training services, messaging services and payment services.
Professional services primarily relate to the installation and configuration of our cloud subscriptions and
on-premise software products. Our premium support offering consists ofhigh-end support services tailored to customer requirements. Messaging services are primarily transmission of electronic text messages from one mobile phone provider to another. Payment services are delivered in connection with our travel and expense management offerings.
Services revenue increased€334 million, or 10%, from€3,245 million in 2014 to€3,579 million in 2015. This increase reflects a 2% increase from new services business and an 8% increase from currency effects.
A solid market demand led to an 8% increase of€222 million in consulting revenue and premium support revenue from€2,634 million in 2014 to€2,856 million in 2015. This increase reflects a 0% increase from new business and an 8% increase from currency effects. Consulting and premium support revenue contributed 80% of the total service revenue (2014: 81%). Consulting and premium support revenue contributed 14% of total revenue in 2015 (2014: 15%). Revenue from other services increased€112 million, or 18%, to€723 million in 2015 (2014:€611 million). This reflects a 9% increase from new business and a 10% increase from currency changes.
Revenue by Region and Industry
Revenue by Region
| | | | | | | | | | | | |
| € millions | | 2015 | | | 2014 | | | Change in % 2015 vs 2014 | |
Germany | | | 2,771 | | | | 2,570 | | | | 8 | |
Rest of EMEA | | | 6,409 | | | | 5,813 | | | | 10 | |
EMEA | | | 9,181 | | | | 8,383 | | | | 10 | |
United States | | | 6,750 | | | | 4,898 | | | | 38 | |
Rest of Americas | | | 1,678 | | | | 1,591 | | | | 5 | |
Americas | | | 8,428 | | | | 6,489 | | | | 30 | |
Japan | | | 667 | | | | 600 | | | | 11 | |
Rest of APJ | | | 2,517 | | | | 2,088 | | | | 21 | |
APJ | | | 3,185 | | | | 2,688 | | | | 18 | |
SAP Group | | | 20,793 | | | | 17,560 | | | | 18 | |
57
| | | | | | | | | | | | |
| Revenue by Industry | | | | | | | | | |
| € millions | | 2015 | | | 2014 | | | Change in % 2015 vs 2014 | |
Energy & Natural Resources | | | 4,834 | | | | 4,158 | | | | 16 | |
Discrete Manufacturing | | | 3,672 | | | | 3,051 | | | | 20 | |
Consumer | | | 4,934 | | | | 4,045 | | | | 22 | |
Public Services | | | 2,174 | | | | 1,786 | | | | 22 | |
Financial Services | | | 1,881 | | | | 1,697 | | | | 11 | |
Services | | | 3,298 | | | | 2,824 | | | | 17 | |
Total revenue | | | 20,793 | | | | 17,560 | | | | 18 | |
Revenue by Region
We break our operations down into three regions: the Europe, Middle East, and Africa (EMEA) region, the Americas region, and the Asia Pacific Japan (APJ) region. We allocate revenue amounts to each region based on where the customer is located. For more information about revenue by geographic region, see the Notes to the Consolidated Financial Statements section, Note (28).
EMEA Region
In 2015, the EMEA region generated€9,181 million in revenue, which was 44% of total revenue (2014:€8,383 million; 48%). This represents a year-over-year increase of 10%. Revenue in Germany increased 8% to€2,771 million in 2015 (2014:€2,570 million). Germany contributed 30% (2014: 31%) of all EMEA region revenue. The remaining revenue in the EMEA region was primarily generated in France, Italy, the Netherlands, Russia, Switzerland, and the United Kingdom. Cloud and software revenue generated in the EMEA region in 2015 totaled€7,622 million (2014:€6,819 million). Cloud and software revenue represented 83% of all revenue in the region in 2015 (2014: 81%). Cloud subscriptions revenue rose 83% to€507 million in 2015 (2014:€277 million). This growth reflects a 69% increase from new cloud business and a 14% increase from currency effects. Software licenses and software support revenue rose 9% to€7,115 million in 2015 (2014:€6,542 million). This growth reflects an 8% increase from new software license and software support business and a 1% increase from currency effects.
Americas Region
In 2015, 41% of our total revenue was generated in the Americas region (2014: 37%). Total revenue in the Americas region increased 30% to€8,428 million; revenue generated in the United States increased 38% to€6,750 million. This growth reflects a 16% increase from new business and a 22% increase from currency effects. The United States contributed 80% (2014: 75%) of all revenue generated in the Americas region. In the
remaining countries of the Americas region, revenue increased 5% to€1,678 million. This reflects a 3% increase from new business and a 2% increase from currency effects. This revenue was primarily generated in Brazil, Canada, and Mexico. Cloud and software revenue generated in the Americas region in 2015 totaled€6,929 million (2014:€5,276 million). Cloud and software revenue represented 82% of all revenue in the Americas region in 2015 (2014: 81%). Cloud subscriptions revenue rose by 123% to€1,579 million in 2015 (2014:€709 million); currency effects were 34%, growth in new cloud business was 89%. Software licenses and software support revenue rose 17% to€5,350 million in 2015 (2014:€4,566 million). This growth reflects a 2% increase from new business; currency effects were 15%.
APJ Region
In 2015, 15% (2014: 15%) of our total revenue was generated in the APJ region, with the strongest revenue growth being achieved in India. Total revenue in the APJ region increased 18% to€3,185 million. In Japan, revenue increased 11% to€667 million. Revenue from Japan was 21% (2014: 22%) of all revenue generated in the APJ region. The revenue growth in Japan was attributable to a 6% increase from new business and a 5% increase from currency effects. In the remaining countries of the APJ region, revenue increased 21%. Revenue in the remaining countries of the APJ region was generated primarily in Australia, China, and India. Cloud and software revenue in the APJ region totaled€2,663 million in 2015 (2014:€2,221 million). That was 84% of all revenue from the region (2014: 83%). Cloud subscriptions revenue grew 98% to€200 million in 2015 (2014:€101 million). This growth reflects an 82% increase from new cloud business and a 17% increase from currency effects. Software licenses and software support revenue increased 16% to€2,463 million in 2015 (2014:€2,120 million). This increase reflects an 8% increase from new business and an 8% increase from currency effects.
58
Revenue by Industry
We allocate our customers to one of our industries at the outset of an initial arrangement. All subsequent revenue from a particular customer is recorded under that industry sector.
In 2015, we achieved above-average growth in the following industry sectors, measured by changes in total revenue: Public Services (€2,174 million, at a growth
rate of 22%); Consumer (€4,934 million, at a growth rate of 22%); and Discrete Manufacturing (€3,672 million, at a growth rate of 20%). Revenue from the other industry sectors was Services (€3,298 million, at a growth rate of 17%); Energy & Natural Resources (€4,834 million, at a growth rate of 16%); and Financial Services (€1,881 million, at a growth rate of 11%).
Operating Profit and Operating Margin
| | | | | | | | | | | | | | | | | | | | |
| Total Operating Expenses | | | | | | | | | | | | | | | |
| € millions | | 2015 | | | % of total revenue(1) | | | 2014 | | | % of total revenue(2) | | | Change
in % 2015
vs 2014 | |
Cost of cloud subscriptions and support | | | –1,022 | | | | 5 | | | | –481 | | | | 3 | | | | >100 | |
Cost of software licenses and support | | | –2,291 | | | | 11 | | | | –2,076 | | | | 12 | | | | 10 | |
Cost of cloud and software | | | –3,313 | | | | 16 | | | | –2,557 | | | | 15 | | | | 30 | |
Cost of services | | | –2,932 | | | | 14 | | | | –2,426 | | | | 14 | | | | 21 | |
Research and development | | | –2,845 | | | | 14 | | | | –2,331 | | | | 13 | | | | 22 | |
Sales and marketing | | | –5,782 | | | | 28 | | | | –4,593 | | | | 26 | | | | 26 | |
General and administration | | | –1,048 | | | | 5 | | | | –892 | | | | 5 | | | | 17 | |
Restructuring | | | –621 | | | | 3 | | | | –126 | | | | 1 | | | | >100 | |
TomorrowNow and Versata litigation | | | 0 | | | | 0 | | | | –309 | | | | 2 | | | | <–100 | |
Other operating income/expense, net | | | 1 | | | | 0 | | | | 4 | | | | 0 | | | | –86 | |
Total operating expenses | | | –16,541 | | | | 80 | | | | –13,230 | | | | 75 | | | | 25 | |
(1) Total revenue for 2015:€20,793 million.
(2) Total revenue for 2014:€17,560 million.
| | | | | | | | | | | | |
| Operating Profit and Operating Margin | | | | | | | | | |
€ millions, except for operating margin | | | 2015 | | | | 2014 | | |
| Change in
% 2015 vs
2014 |
|
Operating profit | | | 4,252 | | | | 4,331 | | | | –2 | |
Operating margin (in %) | | | 20.5 | | | | 24.7 | | | | –4.2pp | |
SAP continued to invest in innovation and its cloud business and generated record turnover in 2015. The strong growth in revenue, however, also led to an increase in compensation payments to our employees, while the climbing stock price translated into higher share-based payment expenses. As a result, our operating profit declined slightly by 2% to€4,252 million (2014:€4,331 million).
In 2015, our operating expenses increased€3,311 million or 25% to€16,541 million (2014:€13,230 million). The main contributors to that increase were our acquisition of Concur in December 2014, our greater investment- and revenue-related cloud subscriptions and support costs, our continued investment in sales activities, and higher restructuring expenses.
59
The effect of acquisition-related expenses, which were€738 million (2014:€562 million), of restructuring expenses, which were€621 million (2014:€126 million), and of a€724 million expense for share-based payments (2014:€290 million) weighed more heavily on operating profit than in the previous year. The record revenue generated increased the cost of bonus payments, and the improving performance of the share price in 2015 pushed share-based payment expenses higher. Continuing investment in the cloud infrastructure, in sales activities around the world, and in research and development also affected operating profit. Our employee headcount (measured in full-time equivalents, or FTEs) increased by 2,579 year-over-year.
These short-term, negative effects on operating profit largely represent investments in the future and were in part offset by the increase in revenue.
The overall result of these effects on operating profit was a 4.2 percentage point narrowing of our operating margin in 2015 to 20.5% (2014: 24.7 %).
Changes to the individual elements in our cost of revenue were as follows:
Cost of Cloud and Software
Cost of cloud and software consists primarily of customer support costs, cost of developing custom solutions that address customers’ specific business requirements, costs for deploying and operating cloud solutions, amortization expenses relating to intangibles, and license fees and commissions paid to third parties for databases and the other complementary third-party products sublicensed by us to our customers.
In 2015, the cost of cloud and software increased 30% to€3,313 million (2014:€2,557 million).
Significant costs included an additional€539 million year-over-year to extend our cloud business in response to the sustained strength of customer demand, with an associated increase in the expense of delivering and operating cloud applications, a€164 million revenue-related increase in the license fees we pay to third parties, and a€74 million rise in the cost of providing custom development projects. These investments contributed to revenue growth. Our margin on cloud subscriptions and support narrowed 0.4 percentage points to 55.3% (2014: 55.8%). This decrease was primarily due to increasing expenses related to the extension of our cloud infrastructure. These expenses represent an investment in our fast-growing cloud business of the future, and were in part already offset by a significant increase in cloud subscriptions and support revenue.
The gross margin on cloud and software, defined as cloud and software profit as a percentage of cloud and software revenue, narrowed to 80.8% in 2015 (2014: 82.1%). This change is driven by the revenue mix effect with a rising cloud subscriptions and support revenue share while both cloud subscriptions and support margin as well as software license and support margin only changed marginally.
Cost of Services
Cost of services consists primarily of the cost of consulting, premium services and training personnel and the cost ofbought-in consulting and training resources.
Although we were able to increase our service revenue by 10% year-over-year to€3,579 million in 2015 (2014:€3,245 million), our service business continues to be greatly affected as we trend away from classic software licensing and consulting revenue toward more subscription revenue from cloud solutions. We were also investing in our SAP ONE Service organization. As a result, cost of service rose 21% to€2,932 million (2014:€2,426 million). Our gross margin on services, defined as services profit as a percentage of services revenue, narrowed to 18.1% (2014: 25.2%).
Research and Development Expense
Our research and development (R&D) expense consists primarily of the personnel cost of our R&D employees, costs incurred for independent contractors we retain to assist in our R&D activities, and amortization of the computer hardware and software we use for our R&D activities.
Due to growing personnel costs because of the 11% increase in our headcount by the end of the year, and the revenue-related year-over-year increase in compensation payments, our R&D expense increased by 22% to€2,845 million in 2015 from€2,331 million in 2014. R&D expense as a percentage of total revenue increased to 13.7% (2014: 13.3%). For more information, see the Products, Research & Development, and Services section.
Sales and Marketing Expense
Sales and marketing expense consists mainly of personnel costs, direct sales costs, and the cost of marketing our products and services.
Our sales and marketing expense rose 26% from€4,593 million in 2014 to€5,782 million in 2015. The increase was mainly the result of greater personnel costs as we expanded our global sales force, and of increased expenditure for bonus payments prompted by the strong revenue growth. The ratio of sales and marketing expense to total revenue, expressed as a percentage,
60
increased to 27.8% year-over-year (2014: 26.2%), an increase of 1.6 percentage points.
General and Administration Expense
Our general and administration expense consists mainly of personnel costs to support our finance and administration functions.
General and administration expense increased 17% from€892 million in 2014 to€1,048 million in 2015. That this expense grew less rapidly than revenue is primarily the
result of careful cost management. Consequently, the ratio of general and administration expense to total revenue dropped slightly in 2015 to 5.0% (2014: 5.1%).
Segment Information
The segment information below for 2015 and 2014 is presented based on the reportable segments Applications, Technology & Services and SAP Business Network. For more information, see the Notes to the Consolidated Financial Statements section, Note (28), and the Performance Management System section.
| | | | | | | | | | | | | | | | |
| Applications, Technology & Services Segment | | | | | | | | | | | | |
€ millions, unless otherwise stated (Non-IFRS) | | | 2015 | | | | 2014 | | |
| Change in
% |
| |
| Change in %
(Constant Currency) |
|
Cloud subscription and support revenue | | | 932 | | | | 564 | | | | 65 | | | | 46 | |
Cloud subscription and support margin (in %) | | | 52 | | | | 54 | | | | –2pp | | | | –5pp | |
Segment revenue | | | 18,963 | | | | 16,734 | | | | 13 | | | | 6 | |
Gross margin (in %) | | | 74 | | | | 75 | | | | –1pp | | | | –1pp | |
Segment profit | | | 7,723 | | | | 6,946 | | | | 11 | | | | 4 | |
Segment margin (in %) | | | 41 | | | | 42 | | | | –1pp | | | | –1pp | |
In 2015, Applications, Technology & Services segment revenue was mainly driven by strong growth in software support revenue, which increased 14% (7% at constant currencies) to€9,990 million, and a 10% increase in software licenses (5% at constant currencies) to€4,770 million. As a consequence of a continuous strong
demand for our human capital management, customer engagement and commerce, and SAP HANA Enterprise Cloud offerings, cloud subscriptions and support revenue in the Applications, Technology & Services segment grew 65% (46% at constant currencies) to€932 million (2014:€564 million).
| | | | | | | | | | | | | | | | |
| SAP Business Network Segment | | | | | | | | | | | | |
€ millions, unless otherwise stated (Non-IFRS) | | | 2015 | | | | 2014 | | |
| Change in
% |
| |
| Change in %
(Constant Currency) |
|
Cloud subscription and support revenue | | | 1,337 | | | | 515 | | | | >100 | | | | >100 | |
Cloud subscription and support margin (in %) | | | 75 | | | | 75 | | | | 0pp | | | | –1pp | |
Segment revenue | | | 1,616 | | | | 647 | | | | >100 | | | | >100 | |
Gross margin (in %) | | | 68 | | | | 67 | | | | 1pp | | | | 0pp | |
Segment profit | | | 317 | | | | 105 | | | | >100 | | | | >100 | |
Segment margin (in %) | | | 20 | | | | 16 | | | | 3pp | | | | 2pp | |
In 2015, revenue from the SAP Business Network segment, which combines all of our business network solutions, increased 150% (115% at constant currencies) to€1,616 million (2014:€647 million).
The SAP Business Network segment achieved an operating profit of€317 million in 2015, an increase of 203% (142% at constant currencies).
Financial Income, Net
Financial income, net, changed to–€5 million (2014:–€25 million). Our finance income was€241 million (2014:€127 million) and our finance costs were€246 million (2014:€152 million).
Finance income mainly consists of gains from disposal of equity securities and interest income from loans and
61
receivables, financial assets (cash, cash equivalents, and current investments), and income of derivatives.
Finance costs mainly consist of interest expense on financial liabilities (€135 million in 2015 compared to€93 million in 2014) due to higher average indebtedness and negative effects from derivatives (€72 million in 2015 compared to€28 million in 2014). For more information about financing instruments, see the Notes to the Consolidated Financial Statements section, Note (17b).
Income Tax
Our effective tax rate decreased to 23.4% in 2015 (2014: 24.7%). The year-over-year decrease in the effective tax rate mainly resulted from changes in taxes for prior years. For more information on income taxes, see the Notes to the Consolidated Financial Statements section, Note (10).
FOREIGN CURRENCY EXCHANGE RATE EXPOSURE
Although our reporting currency is the euro, a significant portion of our business is conducted in currencies other than the euro. Since the Group’s entities usually conduct their business in their respective functional currencies, our risk of exchange rate fluctuations from ongoing ordinary operations is not considered significant. However, occasionally we generate foreign-currency-denominated receivables, payables, and other monetary items by transacting in a currency other than the functional currency; to mitigate the extent of the associated foreign currency exchange rate risk, the majority of these transactions are hedged as described in Note (25) to our Consolidated Financial Statements. Also see Notes (3) and (24) for additional information on foreign currencies.
Approximately 73% of our total revenue in 2016 (2015: 74%) was attributable to operations innon-euro participating countries. We translated that revenue into euros for financial reporting purposes. Fluctuations in the exchange value of the euro had an unfavorable impact of€164 million on our total revenue for 2016, a favorable impact of€1,504 million on our total revenue for 2015 and an unfavorable impact of€143 million on our total revenue for 2014.
The impact of foreign currency exchange rate fluctuations discussed in the preceding paragraph is calculated by translating current period figures in transaction currency to euros at the monthly average exchange rate for the corresponding month in the prior year. Our revenue analysis, included in “Item 5. Operating and Financial Review and Prospects – Operating Results (IFRS)”, discusses at times the effect of currency movements which are calculated in the same manner.
LIQUIDITY AND CAPITAL RESOURCES
Overview
Global Financial Management
We use global centralized financial management to control liquid assets and monitor exposure to interest rates and currencies. The primary aim of our financial management is to maintain liquidity in the Group at a level that is adequate to meet our obligations. Most SAP companies have their liquidity managed centrally by the Group, so that liquid assets across the Group can be consolidated, monitored, and invested in accordance with Group policy. High levels of liquid assets help keep SAP flexible, sound, and independent. In addition, various credit facilities are currently available for additional liquidity, if required. For more information about these facilities, see theCredit Facilities section.
We manage credit, liquidity, interest rate, equity price, and foreign exchange rate risks on a Group-wide basis. We use selected derivatives exclusively for this purpose and not for speculation, which is defined as entering into a derivative instrument for which we do not have corresponding underlying transactions. The rules for the use of derivatives and other rules and processes concerning the management of financial risks are documented in our treasury guideline, which applies globally to all companies in the Group. For more information about the management of each financial risk and about our risk exposure, see the Notes to the Consolidated Financial Statements section,Notes (24) to(26).
Liquidity Management
Our primary source of cash, cash equivalents, and current investments is funds generated from our business operations. Over the past several years, our principal use of cash has been to support operations and our capital expenditure requirements resulting from our growth, to quickly repay financial debt, to acquire businesses, to pay dividends on our shares, and to buy back SAP shares on the open market. On December 31, 2016, our cash, cash equivalents, and current investments were primarily held in euros and U.S. dollars. We generally invest only in the financial assets of issuers or funds with a minimum credit rating of BBB, and pursue a policy of cautious investment characterized by wide portfolio diversification with a variety of counterparties, predominantly short-term investments, and standard investment instruments. Investments in financial assets of issuers with a credit rating lower than BBB were not material in 2016.
We believe that our liquid assets combined with our undrawn credit facilities are sufficient to meet our present operating needs and, together with expected cash flows from operations, will support debt repayments and our currently planned capital
62
expenditure requirements over the near term and medium term. It may also be necessary to enter into financing transactions when additional funds are required that cannot be wholly sourced from free cash flow (for example, to finance large acquisitions).
To expand our business, we have made acquisitions of businesses, products, and technologies. Depending on our future cash position and future market conditions, we might issue additional debt instruments to fund acquisitions, maintain financial flexibility, and limit repayment risk. Therefore, we continuously monitor funding options available in the capital markets and trends in the availability of funds, as well as the cost of such funding. In recent years, we were able to repay additional debt within a short period of time due to our persistently strong free cash flow. For more information about the financial debt, see theCash Flows and Liquiditysection.
Capital Structure Management
The primary objective of our capital structure management is to maintain a strong financial profile for investor, creditor, and customer confidence, and to
support the growth of our business. We seek to maintain a capital structure that will allow us to cover our funding requirements through the capital markets at reasonable conditions, and in so doing, ensure a high level of independence, confidence, and financial flexibility.
For more information about the capital structure and its analysis, see the Notes to the Consolidated Financial Statements section,Note (21).
The long-term credit rating for SAP SE is “A2” by Moody’s with stable outlook and “A” by Standard & Poor’s with positive outlook. Standard & Poor’s raised the outlook from stable to positive on August 12, 2016.
Our general intention is to remain in a position to return liquidity to our shareholders by distributing annual dividends totaling more than 35% of our profit after tax as well as repurchasing treasury shares in future. In absence of large acquisitions, our strong operating cash flow will generate excess cash in the next 6–12 months. Based on the actual acquisition volume and liquidity development we would consider a potential share buyback in the second half of 2017.
Financial Debts
Maturity Profile of Financial Debts

Financial debt on December 31, 2016 included amounts in euros (€6,150 million) and U.S. dollars (€1,660 million). Approximately 58% of financial debt was held at variable interest rates, partially swapped from fixed into variable using interest rate swaps.
In August 2016 we issued a€400 million Eurobond with a maturity of two years and variable interest rates(3-month EURIBOR plus 0.30%).
In 2017, the Company intends to repay two Eurobond tranches of€1,000 million in total as well as two U.S. private placement tranches of US$442.5 million in total when they mature.
Financial Debt
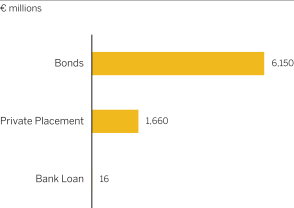
63
For more information about our financial debt, see the Notes to the Consolidated Financial Statements section,Note (17).
Cash Flows and Liquidity
Group Liquidity
| | | | | | | | | | | | |
| € millions | | 2016 | | | 2015 | | | D | |
Cash and cash equivalents | | | 3,702 | | | | 3,411 | | | | 291 | |
Current investments | | | 971 | | | | 148 | | | | 823 | |
Group liquidity | | | 4,673 | | | | 3,559 | | | | 1,114 | |
Current financial debt | | | –1,435 | | | | –567 | | | | –868 | |
Net liquidity 1 | | | 3,238 | | | | 2,992 | | | | 246 | |
Non-current financial debt | | | –6,390 | | | | –8,607 | | | | 2,217 | |
Net liquidity 2 | | | –3,153 | | | | –5,615 | | | | 2,462 | |
Group liquidity consists of cash and cash equivalents (for example, cash at banks, money market funds, and time deposits with original maturity of three months or less)
and current investments (for example, investments with original maturities of greater than three months and remaining maturities of less than one year included in other financial assets) as reported in our Consolidated Financial Statements. Net liquidity is Group liquidity less total financial debt as defined above.
Group liquidity on December 31, 2016, primarily comprised amounts in euros and U.S. dollars.
The increase in Group liquidity compared to 2015 was mainly due to cash inflows from our operations. They were offset by cash outflows for dividend payments and repayments of borrowings.
For information about the impact of cash, cash equivalents, current investments, and our financial liabilities on our income statements, see the analysis of our financial income, net, in theOperating Results (IFRS)section.
Group Liquidity Development
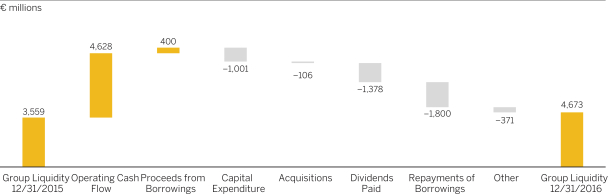
Analysis of Consolidated Statements of Cash Flows
| | | | | | | | | | | | | | | | | | | | |
| € millions | | Years ended December 31, | | | | | | | |
| | | 2016 | | | 2015 | | | 2014 | | | Change in % 2016 vs. 2015 | | | Change in % 2015 vs. 2014 | |
Net cash flows from operating activities | | | 4,628 | | | | 3,638 | | | | 3,499 | | | | 27 | | | | 4 | |
Net cash flows from investing activities | | | –1,799 | | | | –334 | | | | –7,240 | | | | >100 | | | | –95 | |
Net cash flows from financing activities | | | –2,705 | | | – | 3,356 | | | | 4,298 | | | | –19 | | | | <–100 | |
64
Analysis of Consolidated Statements of Cash Flows: 2016 compared to 2015
In 2016 cash inflows from operating activities increased by€990 million to€4,628 million (2015:€3,638 million). This result is primarily due to our revenue increase and higher profitability as well as€161 million lower payments to employees related to restructuring (2015:€476 million).
In 2016, days’ sales outstanding (DSO) for receivables, defined as the average number of days from the raised invoice to cash receipt from the customer, increased three days to 74 days (2015: 71 days).
Cash outflows from investment activities increased to€1,799 million in 2016 (2015:€334 million). The increase resulted from lower proceeds from sale of equity or debt instruments of other entities of€793 million in 2016 (2015:€1,880 million). Cash outflows from purchase of intangible assets and property, plant, and equipment increased by€365 million to€1,001 million in 2016. For more information about current and planned capital expenditures, see the Investment Goals section.
Net cash outflows from financing activities were€2,705 million in 2016, compared to net cash outflows of€3,356 million in 2015. The 2016 cash outflows resulted from repayments of€1,250 million bank loan that we had taken to finance the Concur acquisition. The repayment was partly refinanced through the issuance of a€400 million Eurobond. We also repaid a US$600 million U.S. private placements. Cash outflows in 2015 arose mainly from repayments of€1,270 million bank loan that we assumed in connection with our acquisition of Concur,€550 million Eurobonds and US$300 million U.S. private placements. We refinanced another portion of the bank loan through the issuance of a three-tranche Eurobond of€1,750 million in total.
The dividend payment of€1,378 million made in 2016 exceeded the amount of€1,316 million from the prior year resulting from the increased dividend paid per share from€1.10 to€1.15.
Analysis of Consolidated Statements of Cash Flows: 2015 Compared to 2014
Net cash provided by operating activities increased 4% year-over-year to€3,638 million in 2015 (2014:€3,499 million). Payments in connection with the restructuring of€204 million to employees and€272 million to insurance policies have offset partly thenon-recurring effect from litigations in 2014. In 2015, days’ sales outstanding (DSO) for receivables, defined as the average number of days from the raised invoice to cash receipt from the customer, increased six days to 71 days (2014: 65 days).
Cash outflows from investment activities decreased significantly to€334 million in 2015 (2014:€7,240 million). Cash outflows from purchase of intangible assets and property, plant, and equipment remained stable. Cash outflows in 2014 had resulted mainly from business combinations of Concur and Fieldglass.
Net cash outflows from financing activities were€3,356 million in 2015, compared to net cash inflows of€4,298 million in 2014. The 2015 cash outflows had resulted from repayments of€1,270 million bank loans,€550 million Eurobonds and US$300 million private placements. We refinanced another part of the Concur bank loan through the issuance of a three-tranche Eurobond of€1,750 million in total. Cash inflows in 2014 were the result of issuing a€2,750 million Eurobond and drawing two tranches (of€1,270 million and€3,000 million) of a bank loan. Cash outflows in 2014 arose chiefly from repayments of€1,086 million borrowings and US$1,160 million convertible bonds that we assumed in connection with our acquisition of Concur.
The dividend payment of€1,316 million made in 2015 exceeded the amount of€1,194 million in the prior year resulting from the increased dividend paid per share from€1.00 to€1.10.
Credit Facilities
Other sources of capital are available to us through various credit facilities, if required.
We are party to a committed€2.0 billion revolving credit facility contract which matures in November 2020. The credit facility may be used for general corporate purposes. A possible future utilization is not subject to any financial covenants. So far, we have not used and do not currently foresee any need to use, this credit facility.
As at December 31, 2016, SAP SE had additional available credit facilities totaling€474 million. Several of our foreign subsidiaries have credit facilities available that allow them to borrow funds at prevailing interest rates. As at December 31, 2016, approximately€25 million was available through such arrangements. There were immaterial borrowings outstanding under these credit facilities from our foreign subsidiaries as at December 31, 2016.
OFF-BALANCE SHEET ARRANGEMENTS
Several SAP entities have entered into operating leases for office space, hardware, cars and certain other equipment. These arrangements are sometimes referred to as a form ofoff-balance sheet financing. Rental expenses under these operating leases are set forth below under “Contractual Obligations.” We do not believe we have forms of materialoff-balance sheet arrangements that would require disclosure other than those already disclosed.
65
CONTRACTUAL OBLIGATIONS
The table below presents ouron- andoff-balance sheet contractual obligations as of December 31, 2016:
| | | | | | | | | | | | | | | | | | | | |
| Contractual obligations | | | | | Payments due by period | |
| € millions | | Total | | | Less than 1 year | | | 1-3 years | | | 3-5 years | | | More than 5 years | |
Financial liabilities(1) | | | 8,641 | | | | 1,739 | | | | 2,206 | | | | 1,057 | | | | 3,639 | |
Derivative financial liabilities(1) | | | 211 | | | | 168 | | | | 29 | | | | 14 | | | | 0 | |
Operating lease obligations(3) | | | 1,578 | | | | 316 | | | | 478 | | | | 312 | | | | 471 | |
Purchase obligations(3) | | | 823 | | | | 436 | | | | 189 | | | | 77 | | | | 121 | |
Capital contribution commitments(3) | | | 167 | | | | 167 | | | | 0 | | | | 0 | | | | 0 | |
Othernon-currentnon-financial liabilities(2) | | | 461 | | | | 0 | | | | 324 | | | | 16 | | | | 122 | |
Total | | | 11,881 | | | | 2,826 | | | | 3,226 | | | | 1,476 | | | | 4,353 | |
(1) For more information on financial liabilities and derivative financial liabilities see Note (24) to our Consolidated Financial Statements.
(2) For more information on othernon-currentnon-financial liabilities see Note (17c) to our Consolidated Financial Statements.
(3) See Note (22) to our Consolidated Financial Statements for additional information about operating lease obligations, purchase obligations, and capital contribution commitments. Our expected contributions to our pension and other post-employment benefit plans are not included in the table above. For more information on these contributions see Note (18a) to our Consolidated Financial Statements.
We expect to meet these contractual obligations with our existing cash, our cash flows from operations and our financing activities. The timing of payments for the above contractual obligations is based on payment schedules for those obligations where set payments exist. For other obligations with no set payment schedules, estimates for the most likely timing of cash payments have been made. The ultimate timing of these future cash flows may differ from these estimates.
Obligations under Indemnifications and Guarantees
Our software license agreements and our cloud subscription agreements generally include certain provisions for indemnifying customers against liabilities if our software products infringe a third party’s intellectual property rights. In addition, we occasionally provide function or performance guarantees in routine consulting contracts and development arrangements. We also generally provide a six to twelve month warranty on our software. Our warranty liability is included in other provisions. For more information on other provisions see Note (18b) to our Consolidated Financial Statements. For more information on obligations and contingent liabilities refer to Note (3) and Note (22) in our Consolidated Financial Statements.
RESEARCH AND DEVELOPMENT
For information on our R&D activities see “Item 4. Information about SAP – Products, Research & Development, and Services.” For information on our R&D costs see “Item 5. Operating and Financial Review and Prospects – Operating Results (IFRS)” and for
information related to our R&D employees see “Item 6. Directors, Senior Management and Employees – Employees.”
CRITICAL ACCOUNTING ESTIMATES
Our Consolidated Financial Statements are prepared based on the accounting policies described in Note (3) to our Consolidated Financial Statements in this report. The application of such policies requires management to make judgments, estimates and assumptions that affect the application of policies and the reported amounts of assets, liabilities, revenues and expenses in our Consolidated Financial Statements. We base our judgments, estimates and assumptions on historical and forecast information, as well as regional and industry economic conditions in which we or our customers operate, changes to which could adversely affect our estimates. Although we believe we have made reasonable estimates about the ultimate resolution of the underlying uncertainties, no assurance can be given that the final outcome of these matters will be consistent with what is reflected in our assets, liabilities, revenues and expenses. Actual results could differ from original estimates.
The accounting policies that most frequently require us to make judgments, estimates, and assumptions, and therefore are critical to understanding our results of operations, include the following:
| – | | valuation of trade receivables; |
| – | | accounting for share-based payments; |
66
| – | | accounting for income tax; |
| – | | accounting for business combinations; |
| – | | subsequent accounting for goodwill and intangible assets; |
| – | | accounting for legal contingencies; and |
| – | | recognition of internally generated intangible assets from development. |
Our management periodically discusses these critical accounting policies with the Audit Committee of the Supervisory Board. See Note (3c) to our Consolidated Financial Statements for further discussion on our critical accounting estimates and critical accounting policies.
NEW ACCOUNTING STANDARDS NOT YET ADOPTED
See Note (3e) to our Consolidated Financial Statements for our discussion on new accounting standards not yet adopted.
EXPECTED DEVELOPMENTS
Future Trends in the Global Economy
In its latest economic bulletin report, the European Central Bank (ECB) predicts that the global economy will continue to accelerate in 2017 although remain below itspre-crisis pace. It also expects the pace of expansion will remain relatively stable in 2017 in the advanced economies and improve slightly in the emerging economies. Adverse effects of low commodity prices on the commodity-exporting countries, the sustained realignment of the Chinese economy, and political and economic uncertainty in the United States could, however, dampen global prospects in 2017, the ECB warns.
Looking at the Europe, Middle East, and Africa (EMEA) region, the ECB believes that the euro area economy will continue to recover further in 2017.It suggests that increased investment by enterprises benefiting from favorable borrowing conditions and improved earnings could be key factors in this growth. The experts even forecast a surge in investment activity in the Central and Eastern European countries in 2017 and dynamic consumer spending, both of which should help drive economic development there. Russia’s economy should begin to expand again in 2017, for the first time since coming out of its recession, the ECB says.
With regards to the North America and Latin America (Americas) region, the ECB writes that while uncertainty about the future political and economic course of the United States following the inauguration of the new president is currently very high, it nevertheless anticipates a moderate increase in US economic growth in 2017. As for Brazil, it should be able to leave its recession behind it in 2017, the ECB says, though large fiscal consolidation needs will continue to weigh on the country.
In the Asia Pacific Japan (APJ) region, Japan’s economy is projected to continue to expand at the same restrained pace as the preceding year. The ECB predicts that the underlying economic momentum in Japan will remain weak. Lastly, economic growth in China is likely to continue to decelerate in 2017, primarily due a renewed slowdown in investment growth as Chinese enterprises cut back overcapacity, the ECB says.
67
Economic Trends – Year-Over-Year GDP Growth
| | | | | | | | | | | | |
| % | | 2015e | | | 2016e | | | 2017p | |
World | | | 3.2 | | | | 3.1 | | | | 3.4 | |
Advanced economies | | | 2.1 | | | | 1.6 | | | | 1.9 | |
Developing and emerging economies | | | 4.1 | | | | 4.1 | | | | 4.5 | |
Europe, Middle East, and Africa (EMEA) | | | | | | | | | | | | |
Euro area | | | 2.0 | | | | 1.7 | | | | 1.6 | |
Germany | | | 1.5 | | | | 1.7 | | | | 1.5 | |
Central and Eastern Europe | | | 3.7 | | | | 2.9 | | | | 3.1 | |
Middle East and North Africa | | | 2.5 | | | | 3.8 | | | | 3.1 | |
Sub-Saharan Africa | | | 3.4 | | | | 1.6 | | | | 2.8 | |
Americas | | | | | | | | | | | | |
United States | | | 2.6 | | | | 1.6 | | | | 2.3 | |
Canada | | | 0.9 | | | | 1.3 | | | | 1.9 | |
Central and South America, Caribbean | | | 0.1 | | | | –0.7 | | | | 1.2 | |
Asia Pacific Japan (APJ) | | | | | | | | | | | | |
Japan | | | 1.2 | | | | 0.9 | | | | 0.8 | |
Asian developing economies | | | 6.7 | | | | 6.3 | | | | 6.4 | |
China | | | 6.9 | | | | 6.7 | | | | 6.5 | |
e = estimate; p = projection
Source: International Monetary Fund (IMF), World Economic Outlook Update, A Shifting Global Economic Landscape, as of January 2017, p. 7.
The IT Market: The Outlook for 2017
“Worldwide IT spending is projected to total $3.5 trillion in 2017, a 2.7 percent increase from 2016,” according to a January 2017 Gartner Press Release by Gartner, a market research firm. “However, this growth rate is down from earlier projections of 3 percent. 2017 was poised to be a rebound year in IT spending. Some major trends have converged, including cloud, blockchain, digital business, and artificial intelligence. Normally, this would have pushed IT spending much higher than 2.7 percent growth. […] However, some of the political uncertainty in global markets has fostered await-and-see approach causing many enterprises to forestall IT investments. The range of spending growth from the high to low is much larger in 2017 than in past years. Normally, the economic environment causes some level of division, however, in 2017 this is compounded by the increased levels of uncertainty. […] The result of that uncertainty is a division between individuals and corporations that will spend more – due to opportunities arising – and those that will retract or pause IT spending.”
Gartner data indicate software will be the best-performing segment with software spending increasing
by 7.2% (see table below). “Buyer investments in digital business, intelligent automation, and services optimization and innovation continue to drive growth in the market, but buyer caution, fueled by broad economic challenges, remains a counter-balance to faster growth,” says Gartner.
Within the Europe, Middle East, and Africa (EMEA) region, the table below shows that IT spending in Western European countries will grow 1.5% in 2017, whereas Western European software spending will increase considerably by 6.2%.
According to the table below, IT spending in the Americas region will expand in 2017 by 2.6% in North America and 2.1% in Latin America.
IT spending in the Asia Pacific Japan (APJ) region is expected to expand by 3.0% (Mature Asia/Pacific without Japan) and 5.9% (Emerging Asia/Pacific without China) in 2017 (see table below). IT spending in Greater China is expected to grow 5.1% in 2017 (see table below).
68
Sources:
1) Gartner Market Databook, 4Q16 Update, 21 December 2016.
2) Gartner Says Worldwide IT Spending Forecast to Grow 2.7 Percent in 2017, Press Release, January 12, 2017 (http://www.gartner.com/newsroom/id/3568917).
The Gartner Reports described herein, (the “Gartner Reports”) represent research opinion or viewpoints published, as part of a syndicated subscription service, by Gartner, Inc. (“Gartner”), and are not representations of fact. Each Gartner Report speaks as of its original publication date (and not as of the date of this Annual Report) and the opinions expressed in the Gartner Reports are subject to change without notice.
Trends in the IT Market – Increased IT Spending Year-Over-Year
| | | | | | | | | | | | |
| % | | 2015e | | | 2016p | | | 2017p | |
World | | | | | | | | | | | | |
Total IT | | | 4.0 | | | | 0.5 | | | | 2.7 | |
Software | | | 9.1 | | | | 6.9 | | | | 7.2 | |
Services | | | 5.1 | | | | 4.5 | | | | 4.6 | |
Western Europe | | | | | | | | | | | | |
Total IT | | | 3.6 | | | | –0.1 | | | | 1.5 | |
Software | | | 9.6 | | | | 5.3 | | | | 6.2 | |
Services | | | 4.4 | | | | 3.8 | | | | 4.1 | |
Eastern Europe | | | | | | | | | | | | |
Total IT | | | 15.8 | | | | 1.8 | | | | 0.8 | |
Software | | | 10.8 | | | | 9.0 | | | | 8.8 | |
Services | | | 3.4 | | | | 3.5 | | | | 3.9 | |
Eurasia | | | | | | | | | | | | |
Total IT | | | 2.0 | | | | –2.4 | | | | 0.9 | |
Software | | | 14.1 | | | | 6.5 | | | | 7.9 | |
Services | | | 3.2 | | | | 0.9 | | | | 1.4 | |
Middle East and North Africa | | | | | | | | | | | | |
Total IT | | | 6.2 | | | | –0.2 | | | | 3.0 | |
Software | | | 11.4 | | | | 9.9 | | | | 10.1 | |
Services | | | 5.8 | | | | 4.0 | | | | 4.7 | |
Sub-Saharan Africa | | | | | | | | | | | | |
Total IT | | | 7.3 | | | | 1.6 | | | | 5.2 | |
Software | | | 13.2 | | | | 11.4 | | | | 11.4 | |
Services | | | 5.2 | | | | 5.3 | | | | 5.4 | |
North America | | | | | | | | | | | | |
Total IT | | | 3.0 | | | | 1.5 | | | | 2.6 | |
Software | | | 8.2 | | | | 7.2 | | | | 6.9 | |
Services | | | 6.0 | | | | 5.3 | | | | 5.3 | |
69
| | | | | | | | | | | | |
| % | | 2015e | | | 2016p | | | 2017p | |
Latin America | | | | | | | | | | | | |
Total IT | | | 4.7 | | | | –2.6 | | | | 2.1 | |
Software | | | 11.0 | | | | 7.4 | | | | 8.1 | |
Services | | | 6.9 | | | | 6.7 | | | | 6.9 | |
Mature Asia/Pacific(w/o Japan) | | | | | | | | | | | | |
Total IT | | | 4.9 | | | | 1.4 | | | | 3.0 | |
Software | | | 12.4 | | | | 9.3 | | | | 9.4 | |
Services | | | 4.4 | | | | 2.9 | | | | 2.6 | |
Emerging Asia/Pacific(w/o China) | | | | | | | | | | | | |
Total IT | | | 7.3 | | | | 2.9 | | | | 5.9 | |
Software | | | 11.4 | | | | 10.8 | | | | 11.1 | |
Services | | | 7.5 | | | | 9.6 | | | | 9.7 | |
Japan | | | | | | | | | | | | |
Total IT | | | 0.4 | | | | 0.3 | | | | 1.9 | |
Software | | | 7.4 | | | | 5.2 | | | | 5.5 | |
Services | | | 3.1 | | | | 2.2 | | | | 1.7 | |
Greater China (China/Taiwan/Hong Kong) | | | | | | | | | | | | |
Total IT | | | 4.8 | | | | 0.4 | | | | 5.1 | |
Software | | | 7.8 | | | | 8.4 | | | | 9.3 | |
Services | | | 5.7 | | | | 7.7 | | | | 8.1 | |
e = estimate, p = projection
Table created by SAP based on: Gartner Market Databook, 4Q16 Update, 21 December 2016, Table2-1 “RegionalEnd-User Spending on IT Products and Services in Constant U.S. Dollars, 2014–2020 (Millions of Dollars)”.
Impact on SAP
SAP expects to outperform the global economy and the IT industry again in 2017 in terms of revenue growth.
As last year, our 2016 results validate our strategy of innovating across the core, the cloud, and business networks to help our customers become true digital enterprises. Our innovation cycle for SAP S/4HANA is well underway and the completeness of our vision in the cloud continues to distinguish SAP from both legacy players and providers of cloud-based point solutions. We achieved all key performance indicators raised in our business outlook in October.
On this basis, we consider ourselves well-prepared for the future and expect profitable growth in 2017 as well. As such, we are raising our ambitious goals for 2020. Balanced in terms of regions as well as industries, we
remain well-positioned with our product offering to offset individual fluctuations in the global economy and IT market.
A comparison of our business outlook with forecasts for the global economy and IT industry shows that we can be successful even in a tough economic environment and increased geopolitical uncertainty, and will further strengthen our position as the market leader of enterprise application software.
Operational Targets for 2017(Non-IFRS)
Revenue and Operating Profit Outlook
The Company is providing the following 2017 outlook:
| – | | Based on the continued strong momentum in SAP’s cloud business the Company expects full year 2017non-IFRS cloud subscriptions and support revenue to be in a range of€3.8 billion –€4.0 billion at constant |
70
| | | currencies (2016:€2.99 billion), in line with the previous 2017 ambition which was raised at the beginning of 2016. The upper end of this range represents a growth rate of 34% at constant currencies. |
| – | | The Company expects full year 2017non-IFRS cloud & software revenue to increase by 6% – 8% at constant currencies (2016:€18.43 billion). |
| – | | The Company expects full year 2017non-IFRS total revenue in a range of€23.2 billion to€23.6 billion at constant currencies (2016:€22.07 billion). This is above the previous 2017 ambition which was raised at the beginning of 2016. |
| – | | The Company expects full-year 2017non-IFRS operating profit to be in a range of€6.8 billion –€7.0 billion at constant currencies (2016:€6.63 billion). This is above the previous 2017 ambition which was raised at the beginning of 2016. |
We expect our headcount to increase at a slightly lower pace than in 2016.
While our full-year 2017 business outlook is at constant currencies, actual currency reported figures are expected to continue to be impacted by currency exchange rate fluctuations.
We expect thatnon-IFRS total revenue will continue to depend largely on the revenue from cloud and software. However, the revenue growth we expect from this is below the outlook provided fornon-IFRS cloud subscriptions and support revenue. We expect the software license revenue in 2017 to decline by low tomid-single digit compared to 2016. However we will continuing to gain market share against our mainon-premise license competitors.
We continuously strive for profit expansion in all our reportable segments leading to a SAP Group profit expansion as outlined in the given 2017 outlook. For SAP’s managed-cloud offerings, we expect a positive gross margin result in 2017 according to outlined long-term 2020 planning.
The following table shows the estimates of the items that represent the differences between ournon-IFRS financial measures and our IFRS financial measures.
Non-IFRS Measures
| | | | | | | | |
| € millions | | Estimated
Amounts for 2017 | | | Actual
Amounts
for 2016 | |
Revenue adjustments | | | < 20 | | | | 5 | |
Share-based payment expenses | | | 770 to 1,020 | | | | 785 | |
Acquisition-related charges | | | 620 to 650 | | | | 680 | |
Restructuring | | | 30 to 50 | | | | 28 | |
We do not expect any Company-wide restructuring programs in 2017.
The Company expects a full-year 2017 effective tax rate (IFRS) of 26.0% to 27.0% (2016: 25.3%) and an effective tax rate(non-IFRS) of 27.0% to 28.0% (2016: 26.8%).
Goals for Liquidity and Finance
On December 31, 2016, we had a negative net liquidity. We believe that our liquid assets combined with our undrawn credit facilities are sufficient to meet our present operating financing needs also in 2017 and, together with expected cash flows from operations, will support debt repayments and our currently planned capital expenditure requirements over the near term and medium term.
In 2017, we expect a positive development of our operating cash flow, which we anticipate will reach up to€5.0 billion.
We intend to repay€1 billion Eurobonds when they mature in April 2017 as well as US$443 million U.S. private placements in October and November 2017.
In the absence of large acquisitions, we expect our strong operating cash flow will generate excess cash in the next6-12 months. Based on the actual acquisition volume and liquidity development we would consider a potential share buyback in the second half of 2017.
Investment Goals
Our planned capital expenditures for 2017 and 2018, other than from business combinations, mainly comprise the construction activities described. We expect investments from these activities of approximately€365 million in 2017 (an increase of 20% compared to the previous year), and approximately€250 million in 2018. These investments can be covered in full by operating cash flow.
71
SAP is not currently planning any significant acquisitions in 2017 and 2018 but will rather focus on organic growth, complemented by minor acquisitions. In 2017, we intend to spend up to€1.0 billion for smaller acquisitions.
Proposed Dividend
We intend to continue our dividend policy in 2017 as well, which is to pay a dividend totaling more than 35% of the prior year’s profit after tax.
Premises on Which Our Outlook Is Based
In preparing our outlook, we have taken into account all events known to us at the time we prepared this report that could influence SAP’s business going forward.
Among the premises on which this outlook is based are those presented concerning economic development and the assumption that there will be no effects from major acquisitions in 2017 and 2018.
Medium-Term Prospects
In this section, all numbers are based exclusively onnon-IFRS measures.
We expect to grow our more predictable revenue business while steadily increasing operating profit. Our strategic objectives are focused primarily on the following financial andnon-financial objectives: growth, profitability, customer loyalty, and employee engagement.
We raised our 2020 ambition to reflect the Company’s consistent fast growth in the cloud, solid software momentum, and operating profit expansion as well as the exchange rate development. Assuming an exchange rate environment comparable to 2016, SAP strives to reach the following in 2020:
| – | | €8.0 billion to€8.5 billion cloud subscriptions and support revenue (previously€7.5 billion to€8.0 billion) |
| – | | €28 billion to€29 billion total revenue (previously€26 billion to€28 billion) |
| – | | €8.5 billion to€9.0 billion operating profit (previously€8.0 billion to€9.0 billion) |
We continue to expect the share of more predictable revenue (defined as the total of cloud subscriptions & support revenue and software support revenue) to reach 70% to 75% in 2020.
By 2020, we expect our business network and public cloud offerings to generate approximately the same portion of cloud subscriptions and support revenue. Both of these offerings are expected to each generate, in 2020, cloud subscriptions and support revenues that are significantly higher than the cloud subscriptions and
support revenue generated from our private cloud offerings.
Our revenue growth trajectory through 2020 is expected to be driven by continued strong growth in the cloud, low tomid-single-digit declines in software revenue and continued growth in our software support revenue. This is all expected to drive high single-digit growth in cloud and software revenue through 2020.
We also strive for significantly improving, over the next few years, the profitability of our cloud business. In 2017, we will continue the investment phase of our cloud business. As of 2018, we expect to see the benefits from those efficiency-based investments and increasing cloud gross margin. We expect these improvements to continue in the following years to reach our envisioned long-term cloud subscriptions and support margin targets in 2020. These will continue to increase at different rates per cloud operations model: We expect the gross margin from our public cloud to reach approximately 80% (2016: 62.0%) in 2020. Likewise, we expect our business network gross margin to reach approximately 80% (2016: 75.9%) in 2020. The gross margin for our private cloud is expected to reach about 40% (2016:-5.4%) in 2020. The combined cloud gross margin is expected to be approximately 73% in 2020.
We also aim at further improving the profitability of ouron-premise software business. The gross margin for our software licenses and support is expected to remain at least stable at approximately 88% (2016: 87.4%) in 2020.
In addition, we expect our services gross margin to reach approximately 20% (2016: 18.2%) in 2020.
As we look to increase our profitability through 2020, our cost ratios (cost as a % of total revenue) are expected to develop as follows through 2020: Research and development is expected to decline slightly, Sales and marketing is expected to follow the growth of the business and General and administration is expected to remain stable.
Non-Financial Goals 2017 and Ambitions for 2020
In addition to our financial goals, we also focus on twonon-financial targets: customer loyalty and employee engagement.
For 2017 through to 2020, we aim to reach an Employee Engagement Index between 84% and 86% (2016: 85%).
We measure customer loyalty using the Customer Net Promoter Score (NPS). In 2017, we target achieving a combined Customer NPS of 21% to 23%, with our medium-term goal of reaching a combined Customer NPS of 35% to 40% by 2020 (2016: 19.2%).
72
ITEM 6. DIRECTORS, SENIOR MANAGEMENT AND EMPLOYEES
SUPERVISORY BOARD
The current members of the Supervisory Board of SAP SE, each member’s principal occupation, the year in which each was first elected and the year in which the term of each expires, respectively, are as follows:
| | | | | | | | | | | | | | |
| Name | | Age | | | Principal Occupation | | Year
First
Elected | | | Year
Term
Expires | |
| Prof. Dr. h.c. mult. Hasso Plattner, Chairman(1)(3)(6)(7)(10)(11) | | | 73 | | | Chairman of the Supervisory Board | | | 2003 | | | | 2019 | |
Pekka Ala-Pietilä(1)(5)(6)(7)(10) | | | 60 | | | Chairman of the Board of Directors, Huhtamäki Oyj | | | 2002 | | | | 2019 | |
Prof. Anja Feldmann(1)(6)(11) | | | 51 | | | Professor at the Electrical Engineering and Computer Science Faculty at the Technische Universität Berlin | | | 2012 | | | | 2019 | |
Prof. Dr. Wilhelm Haarmann(1)(3)(5)(10)(11) | | | 66 | | | Attorney at Law, Certified Public Auditor and Certified Tax Advisor; Linklaters LLP, Rechtsanwälte, Notare, Steuerberater | | | 1988 | | | | 2019 | |
Prof. Dr. Gesche Joost(2)(6)(11) | | | 42 | | | Professor for Design Research and Head of the Design Research Lab, University of Arts Berlin | | | 2015 | | | | 2019 | |
Bernard Liautaud(1)(3)(6)(7) | | | 54 | | | Managing Partner, Balderton Capital | | | 2008 | | | | 2019 | |
Dr. Erhard Schipporeit(1)(4)(9)(10) | | | 68 | | | Independent Management Consultant | | | 2005 | | | | 2019 | |
Jim Hagemann Snabe(1)(3)(5) | | | 50 | | | Supervisory Board Member | | | 2014 | | | | 2019 | |
Prof. Dr.-Ing. Dr.-Ing. E.h. Klaus Wucherer(1)(4) | | | 72 | | | Managing Director of Dr. Klaus Wucherer Innovations- und Technologieberatung GmbH | | | 2007 | | | | 2019 | |
Margret Klein-Magar, Vice Chairperson(3)(5)(6)(8) | | | 52 | | | Employee, Vice President Head of SAP Alumni Relations | | | 2012 | | | | 2019 | |
Panagiotis Bissiritsas(4)(5)(6)(8) | | | 48 | | | Employee, Support Expert | | | 2007 | | | | 2019 | |
Martin Duffek(4)(8)(11) | | | 41 | | | Employee, Product Manager | | | 2015 | | | | 2019 | |
Andreas Hahn(3)(6)(8) | | | 46 | | | Employee, Product Expert, IoT Standards | | | 2015 | | | | 2019 | |
Lars Lamadé(3)(8)(10)(11) | | | 45 | | | Employee, Head of Sponsorships | | | 2002 | | | | 2019 | |
Christine Regitz(6)(8)(11) | | | 51 | | | Employee, Vice President User Experience, Chief Product Expert | | | 2015 | | | | 2019 | |
Robert Schuschnig-Fowler(8)(11) | | | 57 | | | Employee, Account Manager, Senior Support Engineer, Deputy Chairman of SAP SE Works Council Europe, Member of Works Council SAP SE | | | 2015 | | | | 2019 | |
Dr. Sebastian Sick(3)(5)(8)(10) | | | 44 | | | Head of Company Law Unit, Hans Boeckler Foundation | | | 2015 | | | | 2019 | |
Pierre Thiollet(6)(8) | | | 55 | | | Employee, Webmaster, Member of the SAP France Works Council, Secretary of CHSCT (Hygiene, Security and Work Conditions Committee) | | | 2015 | | | | 2019 | |
(1) Elected by SAP SE’s shareholders on May 21, 2014.
(2) Elected by SAP SE’s shareholders on May 12, 2016.
(3) Member of the General and Compensation Committee.
(4) Member of the Audit Committee.
(5) Member of the Finance and Investment Committee.
(6) Member of the Technology and Strategy Committee.
(7) Member of the Nomination Committee.
(8) Appointed by the SAP SE Works Council Europe on May 6, 2015.
(9) Audit Committee financial expert.
(10) Member of the Special Committee.
(11) Member of the People and Organization Committee
73
For detailed information on the Supervisory Board committees and their tasks, including the Audit Committee and the General and Compensation Committee, please refer to “Item 10 Additional Information – Corporate Governance.”
Pursuant to the Articles of Incorporation of SAP SE and the Agreement on the Involvement of Employees in SAP SE, members of the Supervisory Board of SAP SE consist of nine representatives of the shareholders and nine representatives of the European employees. The current nine employees’ representatives were appointed by the SAP SE Works Council Europe on May 6, 2015.
Certain current members of the Supervisory Board of SAP SE were members of supervisory boards and comparable governing bodies of enterprises other than SAP SE in Germany and other countries as of December 31, 2016. See Note (29) to our Consolidated Financial Statements for more detail. Apart from pension obligations for employees, SAP SE has not entered into contracts with any member of the Supervisory Board that provide for benefits upon a termination of the employment or service of the member.
EXECUTIVE BOARD
The current members of the Executive Board, the year in which each member was first appointed and the year in which the term of each expires, respectively, are as follows:
| | | | | | | | |
| Name | | Year First
Appointed | | | Year Current
Term
Expires | |
Bill McDermott, CEO | | | 2008 | | | | 2021 | |
Robert Enslin | | | 2014 | | | | 2021 | |
Michael Kleinemeier | | | 2015 | | | | 2018 | |
Bernd Leukert | | | 2014 | | | | 2021 | |
Luka Mucic | | | 2014 | | | | 2021 | |
Stefan Ries | | | 2016 | | | | 2019 | |
Steve Singh | | | 2016 | | | | 2019 | |
The following changes occurred in the Executive Board in 2016:
| • | | As of April 1, 2016, Stefan Ries and Steve Singh were appointed to the Executive Board. |
| • | | On December 31, 2016, Gerhard Oswald retired from his position as Executive Board member at the end of his term. |
A description of the management responsibilities and backgrounds of the current members of the Executive Board are as follows:
Bill McDermott, CEO (Vorstandssprecher), 55 years old, holds a master’s degree in business administration. He joined SAP in 2002 and became a member of its Executive Board on July 1, 2008. On February 7, 2010 he became Co-CEO alongside Jim Hagemann Snabe and when Jim Hagemann Snabe concluded his role as Co-CEO in May 2014, Bill McDermott became sole CEO. Besides his duties as CEO, he is responsible for strategy, governance, business development, corporate development, global corporate affairs, corporate audit and global marketing. He represents SAP as a member of the European Roundtable of Chief Executive Officers, the U.S. Business Council and the World Economic Forum. Prior to joining SAP, he served as a global executive in several technology companies.
Robert Enslin, 54 years old, holds diplomas in data science as well as computer science and data management. He joined SAP in 1992 and became a member of the Executive Board in May 2014. He is president of Global Customer Operations and is responsible for global sales, industry & line of business (LoB) solutions sales, services sales, and sales operations. Before joining SAP, Robert Enslin spent 11 years in various roles in the IT industry.
Michael Kleinemeier, 60 years old, holds a degree in commercial management from the University of Paderborn. He first joined SAP in 1989 and became a member of the Executive Board in November 2015. He leads the Digital Business Services organization including global consulting delivery, all global and regional support and premium engagement functions, maintenance go-to-market, global user groups, and mobile services.
Bernd Leukert, 49 years old, holds a master’s degree in business administration with an emphasis on engineering and information technology. He joined SAP in 1994 and became a member of the Executive Board in May 2014. As SAP’s Chief Technology Officer he is responsible for the board area Products & Innovation including the global development organization, innovation & cloud delivery, product strategy, development services, and SAP Global Security. In addition, Bernd Leukert heads strategic innovation initiatives at SAP and is responsible for leading design and user experience for SAP.
Luka Mucic, 45 years old, holds master’s degrees in law and business administration. He joined SAP in 1996 and became Chief Financial Officer (CFO), and a member of the Executive Board in July 2014. He is responsible for finance and administration including investor relations and data protection and privacy. In addition, Luka Mucic is responsible for corporate IT and processes.
74
Stefan Ries, 50 years old, holds a master’s degree in economics. He first joined SAP in 2002 and became a member of the Executive Board in April 2016. He is Chief Human Resources Officer with global responsibility for Human Resources including HR strategy, business transformation, leadership development, and talent development. He also serves as Labor Relations Director.
Steve Singh, 55 years old, joined SAP in 2014 and became a member of the Executive Board in April 2016. He is President of Business Networks & Applications with end-to-end global responsibility for new growth areas of the company including SAP’s businesses of Concur, SAP Ariba, and SAP Fieldglass. He is also responsible for SAP’s Data Network business, SAP Health, as well as front-office and back-office solutions for small and midsize businesses that currently include SAP Anywhere, SAP Business One and SAP Business ByDesign.
The members of the Executive Board of SAP SE as of December 31, 2016 that are members on other supervisory boards and comparable governing bodies of enterprises, other than SAP, in Germany and other countries, are set forth in Note (29) to our Consolidated Financial Statements. SAP SE has not entered into contracts with any member of the Executive Board that provide for benefits upon a termination of the employment of service of the member, apart from pensions, benefits payable in the event of an early termination of service, and abstention compensation for the postcontractual noncompete period.
To our knowledge, there are no family relationships among the Supervisory Board and Executive Board members.
COMPENSATION REPORT
Compensation for Executive and Supervisory Board Members
This compensation report outlines the criteria that we applied for the year 2016 to determine compensation for Executive Board and Supervisory Board members, discloses the amount of compensation paid, and describes the compensation systems. It also contains information about share-based payment plans for Executive Board members and shares held by Executive Board and Supervisory Board members.
Compensation for Executive Board Members
Compensation System for 2016
The 2016 compensation for Executive Board members is intended to reflect SAP’s company size and global presence as well as our economic and financial standing. The compensation level is internationally competitive to reward committed, successful work in a dynamic business environment.
The compensation package for each Executive Board member is determined based on their individual role and performance. The package has three elements:
| – | | A fixed annual salary element |
| – | | A variable short-term incentive (STI) element to reward performance in the plan year |
| – | | A variable long-term incentive (LTI) element tied to the price of SAP shares to reward performance over multiple years |
The fixed annual salary and STI elements are paid in the currency of the Executive Board member’s home country, whereas compensation for the LTI element is paid in euros.
The Supervisory Board sets a compensation target for the sum of the fixed and the two variable elements. It reviews, and if appropriate, revises this compensation target every year. The review takes into account SAP’s business performance and the compensation paid to board members at comparable companies on the international stage. The following charts visualize the relation of the fixed and the variable compensation targets for the Executive Board members for 2016:
Compensation Scheme
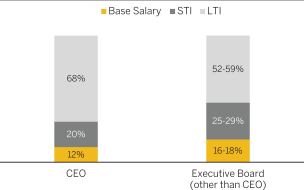
The amount of variable compensation depends on SAP’s performance against performance targets that the Supervisory Board sets for each plan year. The performance targets are key performance indicator (KPI) values aligned to the SAP budget for the plan year.
The following criteria apply to the elements of Executive Board compensation for 2016:
| – | | The fixed annual salary element is paid as a monthly salary. |
| – | | The variable STI element was determined under the STI 2016 plan. Under this plan, the STI compensation depends on the performance of the SAP Group against the predefined target values for three KPIs: non-IFRS constant currency cloud and software revenue growth; non-IFRS constant currency operating margin increase; and constant currency |
75
| | | new cloud bookings. In addition, the STI 2016 plan provides for a discretionary element that allows the Supervisory Board, after the end of the fiscal year 2016, to address not only an Executive Board member’s individual performance, but also SAP’s performance in terms of market position, innovative power, customer satisfaction, employee satisfaction (taking innovative HR strategy, HR excellence, leadership development and social partnership into consideration), and attractiveness as an employer. A threshold of 75% for the total target achievement level applies for the financial KPIs: if the sum of the weighted individual target achievements for the financial KPIs is below 75% (threshold), there is no payout for the pro rata target bonus. A cap of 175% applies for each financial KPI, and a cap of 200% applies for the discretionary KPI. Moreover, if there has been any extraordinary and unforeseeable event, the Supervisory Board can, at its reasonable discretion, retroactively adjust payouts up or down in the interest of SAP. |
| – | | On February 22, 2017, the Supervisory Board assessed SAP’s performance against the agreed targets and determined the amount of compensation payable under the STI 2016 plan. The STI 2016 plan will be paid out after the Annual General Meeting of Shareholders in May 2017. |
| – | | The variable LTI element was determined under the LTI 2016 plan effective January 1, 2016, however, the grant date of the tranche 2016 is March 24, 2016. The purpose of the LTI 2016 plan is to reflect the operating profit target achievement, to ensure long-term retention of our Executive Board members, and to |
| | | reward a share price outperformance by SAP as compared to a group of its peers (Peer Group). |
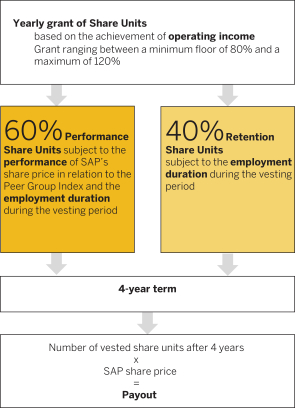
The LTI 2016 plan is an annual revolving remuneration element that is linked to the price of the SAP share. A grant amount determined by the Supervisory Board is converted into virtual shares, referred to as Share Units, by dividing the grant amount by the price of the SAP share (calculated on the basis of a defined average value). The grant amount is determined by the Supervisory Board in its discretion for each financial year at a level of between 80% and 120% of the contractual target amount; taking into account the achievement of the operating profit targets set for the preceding financial year.
The Share Units granted comprise 60% Performance Share Units (PSUs) and 40% Retention Share Units (RSUs). Both types of Share Units have a vesting period of (approximately) four years. Each Share Unit that finally vests entitles its holder to a (gross) payout corresponding to the price of one SAP share after the end of the holding period, but capped at three times the SAP share price applied for the conversion of the grant amount into Share Units. The number of PSUs that finally vests depends on the performance of the SAP share. If the increase of price of the SAP share over the vesting period of the PSUs exceeds the increase of a defined Peer Group Index over the same period, the number of PSUs is increased by a percentage equal to the outperformance expressed as percentage points. This percentage will be doubled if, in addition to the outperformance over the Peer Group Index, the price of
76
the SAP share at the end of the vesting period of the PSUs is higher than the price at the start of this period. The number of vested PSUs a member can attain in respect to a plan year is capped at 150% of their initial PSU allocation for that year. Conversely, if the increase of price of the SAP share over the vesting period of the PSUs is below the increase in the Peer Group Index, the number of PSUs is reduced by a percentage equal to the difference expressed as percentage points. All PSUs lapse if the difference exceeds 50%. If the service contract for the Executive Board member is terminated before the end of the third year following the year in which the Share Units were granted, both the RSUs and PSUs are forfeited in whole or in part, depending on the circumstances of the relevant resignation from office or termination of the service contract, as follows:
| – | | If the Executive Board member has resigned from office without cause and starts working for a competitor of SAP, whether on a free-lance basis or as an employee or otherwise prior to the end of the initial vesting period of the Share Units or the Supervisory Board terminates the Executive Board member’s service contract for cause, all Share Units are forfeited. |
| – | | A portion of the RSUs and PSUs are forfeited, if the Executive Board member has resigned from office without cause, but does not start working for a competitor of SAP prior to the end of the initial vesting period of the Share Units, or the Service Contract of the Executive Board member expires by mutual consent, is terminated by mutual consent, is terminated by the Executive Board member for cause or the Executive Board member retires. Expiration by mutual consent or termination by mutual consent occurs if the Executive Board member is not re-appointed or does not accept the reappointment or an extraordinary expiration is provided by the Service Contract of the Executive Board member, that is, in the case of a permanent inability to work. The portion of the RSUs and PSUs which forfeit equal the proportion of plan participation to the vesting period (for example, if the Executive Board member leaves with effect from December 31, 2016, three quarters of the Share Units granted in 2016 would be forfeited). The remaining Share Units will continue to be in effect. In addition, the number of remaining PSUs is adjusted subject to the performance of SAP’s share price in relation to the Peer Group Index. The same applies if the Executive Board member dies, however the Share Units are paid out pro rata temporis within 90 days after death on the basis of the then current SAP share price. |
| – | | In the event of a change of control as defined in the service contract of the Executive Board member, the following generally applies: The Share Units are paid out without undue delay within 90 days on a pro rata |
| | | temporis basis, plus 50% of the Share Units (which otherwise, under mere pro rata aspects, would be forfeited), on the basis of the then current SAP share price. In addition, the number – reduced on a pro rata temporis basis – of PSUs paid out may change with the relevant outperformance of the SAP share compared to the Peer Group Index as determined on the day the change of control event is effective. The remaining Share Units are forfeited. |
| – | | To compensate for disadvantages resulting from leaver rules under the LTI 2016 plan in comparison to the previous RSU Milestone Plan, all current Executive Board members will receive an individual equalization amount as an amendment to the leaver rules of the LTI 2016 plan. The equalization amount is the sum of partial amounts applicable for the years 2016 and 2017 and, in one case, also for the year 2018. The respective annual partial amount is subject to a target achievement of at least 60% of the operating profit target and an ongoing employment relationship of the respective year. In the event of termination, PSUs equal to this amount based on the then-applicable reference share price will be granted. PSUs which would otherwise be forfeited in the event of termination of the service contract for the Executive Board member will not be forfeited to the extent of this calculated amount. If the PSUs which would be forfeited in the termination year is lower than the equalization amount, PSUs from the preceding financial year and, if required, from earlier years which would otherwise be forfeited, will become non-forfeitable. |
Amount of Compensation for 2016
We present the Executive Board compensation disclosures in accordance with the recommendations of the German Corporate Governance Code (“GCGC”). Furthermore, the table below provides a reconciliation statement following the requirements of sections 314 and 315 of the German Commercial Code (Handelsgesetzbuch, or “HGB”) as specified in the German Accounting Standards (“GAS 17”).
Pursuant to the recommendations of the GCGC, the value of benefits granted for the year under review as well as the allocation, that is, the amounts disbursed for the year under review, are disclosed below based on the reference tables recommended in the GCGC.
In contrast to the disclosure rules stipulated in the German HGB and GAS 17, the GCGC includes the service cost according to IAS 19 in the Executive Board compensation and requires the additional disclosure of the target value for the one-year variable compensation and the maximum and minimum compensation amounts achievable for the variable compensation elements.
77
Executive Board Members’ Compensation
German Corporate Governance Code (Benefits Granted in 2015 and 2016)
| | | | | | | | | | | | | | | | | | | | | | | | | | | | | | | | | | | | | | | | | | | | | | | | |
Benefits Granted € thousands | | Bill McDermott CEO | | | Robert Enslin Member of the Executive Board | | | Michael Kleinemeier Member of the Executive Board | |
| | | 20161) | | | 2016
(Min) | | | 2016
(Max) | | | 20152) | | | 20161) | | | 2016
(Min) | | | 2016
(Max) | | | 20152) | | | 2016 | | | 2016
(Min) | | | 2016
(Max) | | | 2015 | |
| Fixed compensation | | | 1,403.0 | | | | 1,403.0 | | | | 1,403.0 | | | | 1,150.0 | | | | 854.0 | | | | 854.0 | | | | 854.0 | | | | 700.0 | | | | 700.0 | | | | 700.0 | | | | 700.0 | | | | 116.7 | |
Fringe benefits3) | | | 1,625.7 | | | | 1,625.7 | | | | 1,625.7 | | | | 1,258.0 | | | | 474.0 | | | | 474.0 | | | | 474.0 | | | | 103.3 | | | | 26.9 | | | | 26.9 | | | | 26.9 | | | | 0 | |
Total | | | 3,028.7 | | | | 3,028.7 | | | | 3,028.7 | | | | 2,408.0 | | | | 1,328.0 | | | | 1,328.0 | | | | 1,328.0 | | | | 803.3 | | | | 726.9 | | | | 726.9 | | | | 726.9 | | | | 116.7 | |
| One-year variable compensation | | | 2,382.1 | | | | 0 | | | | 4,317.6 | | | | 1,860.0 | | | | 1,441.8 | | | | 0 | | | | 2,613.3 | | | | 1,125.8 | | | | 1,125.8 | | | | 0 | | | | 2,040.5 | | | | 188.1 | |
| Multiyear variable compensation | | | | | | | | | | | | | | | | | | | | | | | | | | | | | | | | | | | | | | | | | | | | | | | | |
LTI 2016 Plan | | | 8,000.3 | | | | 0 | | | | 33,129.7 | | | | — | | | | 2,641.3 | | | | 0 | | | | 10,937.5 | | | | — | | | | 2,476.6 | | | | 0 | | | | 10,255.9 | | | | — | |
RSU Milestone Plan 2015 | | | — | | | | — | | | | — | | | | — | | | | — | | | | — | | | | — | | | | — | | | | — | | | | — | | | | — | | | | 315.0 | |
Total | | | 13,411.1 | | | | 3,028.7 | | | | 40,476.0 | | | | 4,268.0 | | | | 5,411.1 | | | | 1,328.0 | | | | 14,878.8 | | | | 1,929.1 | | | | 4,329.3 | | | | 726.9 | | | | 13,023.3 | | | | 619.8 | |
Service cost | | | 571.3 | | | | 571.3 | | | | 571.3 | | | | 682.4 | | | | 34.7 | | | | 34.7 | | | | 34.7 | | | | 308.0 | | | | 0 | | | | 0 | | | | 0 | | | | 0 | |
| Total according to GCGC | | | 13,982.4 | | | | 3,600.0 | | | | 41,047.3 | | | | 4,950.4 | | | | 5,445.8 | | | | 1,362.7 | | | | 14,913.5 | | | | 2,237.1 | | | | 4,329.3 | | | | 726.9 | | | | 13,023.3 | | | | 619.8 | |
|
| Reconciliation reporting of total compensation pursuant to Section 314(1)(6a) HGB in connection with GAS 17 | |
| Less granted annual variable target compensation | | | –2,382.1 | | | | | | | | | | | | –1,860.0 | | | | –1,441.8 | | | | | | | | | | | | –1,125.8 | | | | –1,125.8 | | | | | | | | | | | | –188.1 | |
| Plus allocated actual annual variable compensation | | | 2,486.9 | | | | | | | | | | | | 2,743.5 | | | | 1,505.2 | | | | | | | | | | | | 1,660.5 | | | | 1,175.3 | | | | | | | | | | | | 277.5 | |
| Less difference in measuring grant value | | | | | | | | | | | | | | | | | | | | | | | | | | | | | | | | | | | | | | | | | | | | | | | –51.8 | |
| Less service cost | | | –571.3 | | | | | | | | | | | | –682.4 | | | | –34.7 | | | | | | | | | | | | –308.0 | | | | 0 | | | | | | | | | | | | 0 | |
| Total compensation | | | 13,515.9 | | | | | | | | | | | | 5,151.5 | | | | 5,474.5 | | | | | | | | | | | | 2,463.8 | | | | 4,378.8 | | | | | | | | | | | | 657.4 | |
78
German Corporate Governance Code (Benefits Granted in 2015 and 2016)
| | | | | | | | | | | | | | | | | | | | | | | | | | | | | | | | | | | | | | | | | | | | | | | | |
Benefits
Granted € thousands | | Bernd Leukert Member of the Executive Board | | | Luka Mucic Member of the Executive Board | | | Gerhard Oswald Member of the Executive Board (until December 31, 2016) | |
| | | 2016 | | | 2016
(Min) | | | 2016
(Max) | | | 2015 | | | 2016 | | | 2016
(Min) | | | 2016
(Max) | | | 2015 | | | 2016 | | | 2016
(Min) | | | 2016
(Max) | | | 2015 | |
| Fixed compensation | | | 700.0 | | | | 700.0 | | | | 700.0 | | | | 700.0 | | | | 700.0 | | | | 700.0 | | | | 700.0 | | | | 700.0 | | | | 700.0 | | | | 700.0 | | | | 700.0 | | | | 700.0 | |
Fringe benefits3) | | | 12.4 | | | | 12.4 | | | | 12.4 | | | | 11.7 | | | | 12.1 | | | | 12.1 | | | | 12.1 | | | | 12.1 | | | | 105.4 | | | | 105.4 | | | | 105.4 | | | | 22.4 | |
Total | | | 712.4 | | | | 712.4 | | | | 712.4 | | | | 711.7 | | | | 712.1 | | | | 712.1 | | | | 712.1 | | | | 712.1 | | | | 805.4 | | | | 805.4 | | | | 805.4 | | | | 722.4 | |
| One-year variable compensation | | | 1,125.8 | | | | 0 | | | | 2,040.5 | | | | 1,125.8 | | | | 1,125.8 | | | | 0 | | | | 2,040.5 | | | | 1,125.8 | | | | 1,125.8 | | | | 0 | | | | 2,040.5 | | | | 1,125.8 | |
| Multiyear variable compensation | | | | | | | | | | | | | | | | | | | | | | | | | | | | | | | | | | | | | | | | | | | | | | | | |
LTI 2016 Plan | | | 2,789.6 | | | | 0 | | | | 11,551.8 | | | | — | | | | 2,476.6 | | | | 0 | | | | 10,255.9 | | | | — | | | | 2,086.2 | | | | 0 | | | | 8,639.3 | | | | — | |
RSU Milestone Plan 2015 | | | — | | | | — | | | | — | | | | — | | | | — | | | | — | | | | — | | | | — | | | | — | | | | — | | | | — | | | | — | |
Total | | | 4,627.8 | | | | 712.4 | | | | 14,304.7 | | | | 1,837.5 | | | | 4,314.5 | | | | 712.1 | | | | 13,008.5 | | | | 1,837.9 | | | | 4,017.4 | | | | 805.4 | | | | 11,485.2 | | | | 1,848.2 | |
| Service cost | | | 0 | | | | 0 | | | | 0 | | | | 0 | | | | 0 | | | | 0 | | | | 0 | | | | 0 | | | | 0 | | | | 0 | | | | 0 | | | | 0 | |
| Total according to GCGC | | | 4,627.8 | | | | 712.4 | | | | 14,304.7 | | | | 1,837.5 | | | | 4,314.5 | | | | 712.1 | | | | 13,008.5 | | | | 1,837.9 | | | | 4,017.4 | | | | 805.4 | | | | 11,485.2 | | | | 1,848.2 | |
|
| Reconciliation reporting of total compensation pursuant to Section 314(1)(6a) HGB in connection with GAS 17 | |
| Less granted annual variable target compensation | | | –1,125.8 | | | | | | | | | | | | –1,125.8 | | | | –1,125.8 | | | | | | | | | | | | –1,125.8 | | | | –1,125.8 | | | | | | | | | | | | –1,125.8 | |
| Plus allocated actual annual variable compensation | | | 1,175.3 | | | | | | | | | | | | 1,660.5 | | | | 1,175.3 | | | | | | | | | | | | 1,660.5 | | | | 1,175.3 | | | | | | | | | | | | 1,660.5 | |
| Less difference in measuring grant value | | | | | | | | | | | | | | | | | | | | | | | | | | | | | | | | | | | | | | | | | | | | | | | | |
| Less service cost | | | 0 | | | | | | | | | | | | 0 | | | | 0 | | | | | | | | | | | | 0 | | | | 0 | | | | | | | | | | | | 0 | |
| Total compensation | | | 4,677.3 | | | | | | | | | | | | 2,372.2 | | | | 4,364.0 | | | | | | | | | | | | 2,372.6 | | | | 4,066.9 | | | | | | | | | | | | 2,382.9 | |
79
German Corporate Governance Code (Benefits Granted in 2015 and 2016)
| | | | | | | | | | | | | | | | | | | | | | | | | | | | | | | | | | | | | | | | |
Benefits Granted € thousands | | Stefan Ries Member of the
Executive Board (from April 1, 2016) | | | Steve Singh Member of the Executive
Board (from April 1, 2016) | | | Total
Executive Board
Compensation | |
| | | 2016 | | | 2016
(Min) | | | 2016
(Max) | | | 2015 | | | 20161) | | | 2016
(Min) | | | 2016
(Max) | | | 2015 | | | 2016 | | | 2015 | |
Fixed compensation | | | 525.0 | | | | 525.0 | | | | 525.0 | | | | — | | | | 640.0 | | | | 640.0 | | | | 640.0 | | | | — | | | | 6,222.0 | | | | 4,066.7 | |
Fringe benefits3) | | | 13.5 | | | | 13.5 | | | | 13.5 | | | | — | | | | 6.1 | | | | 6.1 | | | | 6.1 | | | | — | | | | 2,276.1 | | | | 1,407.5 | |
Total | | | 538.5 | | | | 538.5 | | | | 538.5 | | | | — | | | | 646.1 | | | | 646.1 | | | | 646.1 | | | | — | | | | 8,498.1 | | | | 5,474.2 | |
One-year variable compensation | | | 845.9 | | | | 0 | | | | 1,533.2 | | | | — | | | | 1,083.3 | | | | 0 | | | | 1,963.5 | | | | — | | | | 10,256.3 | | | | 6,551.3 | |
Multiyear variable compensation | | | | | | | | | | | | | | | | | | | | | | | | | | | | | | | | | | | | | | | | |
LTI 2016 Plan | | | 1,532.1 | | | | 0 | | | | 6,491.3 | | | | — | | | | 1,939.7 | | | | 0 | | | | 8,218.0 | | | | — | | | | 23,942.4 | | | | — | |
RSU Milestone Plan 2015 | | | — | | | | — | | | | — | | | | — | | | | — | | | | — | | | | — | | | | — | | | | — | | | | 315.0 | |
Total | | | 2,916.5 | | | | 538.5 | | | | 8,563.0 | | | | — | | | | 3,669.1 | | | | 646.1 | | | | 10,827.6 | | | | — | | | | 42,696.8 | | | | 12,340.5 | |
Service cost | | | 0 | | | | 0 | | | | 0 | | | | — | | | | 0 | | | | 0 | | | | 0 | | | | — | | | | 606.0 | | | | 990.4 | |
Total according to GCGC | | | 2,916.5 | | | | 538.5 | | | | 8,563.0 | | | | — | | | | 3,669.1 | | | | 646.1 | | | | 10,827.6 | | | | — | | | | 43,302.8 | | | | 13,330.9 | |
|
| Reconciliation reporting of total compensation pursuant to Section 314(1)(6a) HGB in connection with GAS 17 | |
| Less granted annual variable target compensation | | | –845.9 | | | | | | | | | | | | — | | | | –1,083.3 | | | | | | | | | | | | — | | | | –10,256.3 | | | | –6,551.3 | |
| Plus allocated actual annual variable compensation | | | 883.1 | | | | | | | | | | | | — | | | | 1,131.0 | | | | | | | | | | | | — | | | | 10,707.4 | | | | 9,663.0 | |
| Less difference in measuring grant value | | | | | | | | | | | | | | | | | | | | | | | | | | | | | | | | | | | 0 | | | | –51.8 | |
| Less service cost | | | 0 | | | | | | | | | | | | — | | | | 0 | | | | | | | | | | | | — | | | | –606.0 | | | | –990.4 | |
Total compensation | | | 2,953.7 | | | | | | | | | | | | — | | | | 3,716.8 | | | | | | | | | | | | — | | | | 43,147.9 | | | | 15,400.4 | |
1) The value of the fixed and one-year variable elements is granted in U.S. dollars. For conversion purposes from U.S. dollars into euro, for fixed compensation the 2016 average exchange rate applies and for the one-year variable element the 2016 year-end exchange rate applies.
2) The value of the fixed and one-year variable elements is subject to a contractual exchange-rate clause applied at the end of the year, so the amounts actually paid may be greater.
3) Insurance contributions, benefits in kind, expenses for maintenance of two households, use of aircraft as well as tax and discrete payments arising through application of the fixed exchange-rate clause in 2016 for 2015.
4) Total grant value at time of grant according to GCGC (€315.000) deducted by the grant value calculated as required under section 314 of the German Commercial Code (€263.200).
The total Executive Board compensation for 2016 calculated as required under section 314 of the German Commercial Code amounted to€43,147,900. Including RSU Milestone Plan 2015 awards for 2015 granted in 2015 to Michael Kleinemeier (€263,200) upon his
appointment to the Executive Board, the total Executive Board compensation for 2015 calculated as required under section 314 of the German Commercial Code amounted to€15,400,400.
80
The share-based payment amounts included in the 2016 compensation result from the following RSUs and PSUs under the LTI 2016 Plan.
Share-Based Payment Under LTI 2016 Plan (Grants for 2016)
| | | | | | | | | | | | | | | | | | | | | | | | |
| | | Grants for 2016 | |
| | | Quantity | | | (RSU)
Retention
Share Units
(40%) | | | (PSU)
Performance
Share Units
(60%) | | | Grant
Value per
RSU at
Time of
Grant | | | Grant
Value per
PSU at
Time of
Grant | | | Total Grant
Value at
Time of
Grant | |
| | | | | | | | | | | | € | | | € | | | € thousands | |
Bill McDermott (CEO) | | | 122,423 | | | | 48,969 | | | | 73,454 | | | | 66.52 | | | | 64.57 | | | | 8,000 | |
Robert Enslin | | | 40,417 | | | | 16,167 | | | | 24,250 | | | | 66.52 | | | | 64.57 | | | | 2,641 | |
Michael Kleinemeier | | | 37,898 | | | | 15,159 | | | | 22,739 | | | | 66.52 | | | | 64.57 | | | | 2,477 | |
Bernd Leukert | | | 42,687 | | | | 17,075 | | | | 25,612 | | | | 66.52 | | | | 64.57 | | | | 2,790 | |
Luka Mucic | | | 37,898 | | | | 15,159 | | | | 22,739 | | | | 66.52 | | | | 64.57 | | | | 2,477 | |
| Gerhard Oswald (until December 31, 2016) | | | 31,924 | | | | 12,770 | | | | 19,154 | | | | 66.52 | | | | 64.57 | | | | 2,086 | |
Stefan Ries (from April 1, 2016) | | | 23,987 | | | | 9,595 | | | | 14,392 | | | | 65.77 | | | | 62.61 | | | | 1,532 | |
Steve Singh (from April 1, 2016) | | | 30,368 | | | | 12,147 | | | | 18,221 | | | | 65.77 | | | | 62.61 | | | | 1,940 | |
Total | | | 367,602 | | | | 147,041 | | | | 220,561 | | | | | | | | | | | | 23,942 | |
German Corporate Governance Code (Allocation)
| | | | | | | | | | | | | | | | | | | | | | | | |
Allocation € thousands | | Bill McDermott CEO | | | Robert Enslin Member of the
Executive Board | | | Michael Kleinemeier
Member of the
Executive Board | |
| | | 20161) | | | 2015 | | | 20161) | | | 2015 | | | 2016 | | | 2015 | |
Fixed compensation | | | 1,403.0 | | | | 1,150.0 | | | | 854.0 | | | | 700.0 | | | | 700.0 | | | | 116.7 | |
Fringe benefits2) | | | 1,625.7 | | | | 1,258.0 | | | | 474.0 | | | | 103.3 | | | | 26.9 | | | | 0 | |
Total | | | 3,028.7 | | | | 2,408.0 | | | | 1,328.0 | | | | 803.3 | | | | 726.9 | | | | 116.7 | |
| One-year variable compensation | | | 2,743.5 | | | | 2,036.7 | | | | 1,660.5 | | | | 817.3 | | | | 277.5 | | | | — | |
| Multiyear variable compensation | | | | | | | | | | | | | | | | | | | | | | | | |
RSU Milestone Plan 2015 | | | 9,244.7 | | | | — | | | | — | | | | — | | | | — | | | | — | |
SAP SOP 2011 | | | — | | | | — | | | | — | | | | — | | | | — | | | | — | |
Other | | | — | | | | — | | | | — | | | | — | | | | — | | | | — | |
Total | | | 15,016.9 | | | | 4,444.7 | | | | 2,988.5 | | | | 1,620.6 | | | | 1,004.4 | | | | 116.7 | |
Service cost | | | 571.3 | | | | 682.4 | | | | 34.7 | | | | 308.0 | | | | 0 | | | | 0 | |
Total | | | 15,588.2 | | | | 5,127.1 | | | | 3,023.2 | | | | 1,928.6 | | | | 1,004.4 | | | | 116.7 | |
81
German Corporate Governance Code (Allocation)
| | | | | | | | | | | | | | | | | | | | | | | | |
Allocation € thousands | | Bernd Leukert Member of the
Executive Board | | | Luka Mucic Member of the
Executive Board | | | Gerhard Oswald Member of the
Executive Board (until December 31, 2016) | |
| | | 2016 | | | 2015 | | | 2016 | | | 2015 | | | 2016 | | | 2015 | |
Fixed compensation | | | 700.0 | | | | 700.0 | | | | 700.0 | | | | 700.0 | | | | 700.0 | | | | 700.0 | |
Fringe benefits2) | | | 12.4 | | | | 11.7 | | | | 12.1 | | | | 12.1 | | | | 105.4 | | | | 22.4 | |
Total | | | 712.4 | | | | 711.7 | | | | 712.1 | | | | 712.1 | | | | 805.4 | | | | 722.4 | |
| One-year variable compensation | | | 1,660.5 | | | | 817.3 | | | | 1,660.5 | | | | 621.4 | | | | 1,660.5 | | | | 1,232.7 | |
| Multiyear variable compensation | | | | | | | | | | | | | | | | | | | | | | | | |
RSU Milestone Plan 2015 | | | — | | | | — | | | | — | | | | — | | | | 3,316.2 | | | | — | |
SAP SOP 2011 | | | — | | | | — | | | | — | | | | — | | | | — | | | | 1,126.7 | |
Other | | | — | | | | — | | | | — | | | | — | | | | — | | | | — | |
Total | | | 2,372.9 | | | | 1,529.0 | | | | 2,372.6 | | | | 1,333.5 | | | | 5,782.1 | | | | 3,081.8 | |
Service cost | | | 0 | | | | 0 | | | | 0 | | | | 0 | | | | 0 | | | | 0 | |
Total | | | 2,372.9 | | | | 1,529.0 | | | | 2,372.6 | | | | 1,333.5 | | | | 5,782.1 | | | | 3,081.8 | |
German Corporate Governance Code (Allocation)
| | | | | | | | | | | | | | | | | | | | | | | | |
Allocation € thousands | | Stefan Ries Member of the
Executive Board (from April 1, 2016) | | | Steve Singh Member of the
Executive Board (from April 1, 2016) | | | Total Executive Board
Compensation | |
| | | 2016 | | | 2015 | | | 20161) | | | 2015 | | | 2016 | | | 2015 | |
Fixed compensation | | | 525.0 | | | | — | | | | 640.0 | | | | — | | | | 6,222.0 | | | | 4,066.7 | |
Fringe benefits2) | | | 13.5 | | | | — | | | | 6.1 | | | | — | | | | 2,276.1 | | | | 1,407.5 | |
Total | | | 538.5 | | | | 0 | | | | 646.1 | | | | 0 | | | | 8,498.1 | | | | 5,474.2 | |
| One-year variable compensation | | | — | | | | — | | | | — | | | | — | | | | 9,663.0 | | | | 5,525.4 | |
| Multiyear variable compensation | | | | | | | | | | | | | | | | | | | | | | | | |
RSU Milestone Plan 2015 | | | — | | | | — | | | | — | | | | — | | | | 12,560.9 | | | | — | |
SAP SOP 2011 | | | — | | | | — | | | | — | | | | — | | | | — | | | | 1,126.7 | |
Other | | | — | | | | — | | | | — | | | | — | | | | — | | | | — | |
Total | | | 538.5 | | | | 0 | | �� | | 646.1 | | | | 0 | | | | 30,722.0 | | | | 12,126.3 | |
Service cost | | | 0 | | | | — | | | | 0 | | | | — | | | | 606.0 | | | | 990.4 | |
Total | | | 538.5 | | | | 0 | | | | 646.1 | | | | 0 | | | | 31,328.0 | | | | 13,116.7 | |
1) The value of the fixed and one-year variable elements is granted in U.S. dollars. For conversion purposes from U.S. dollars into euro, for fixed compensation the 2016 average exchange rate applies and for the one-year variable element the 2016 year-end exchange rate applies.
2) Insurance contributions, benefits in kind, expenses for maintenance of two households, use of aircraft as well as tax and discrete payments arising through application of the fixed exchange-rate clause in 2016 for 2015.
82
End-of-Service Benefits
Regular End-of-Service Undertakings
Retirement Pension Plan
The following retirement pension agreements apply to the individual members of the Executive Board:
| – | | Michael Kleinemeier, Bernd Leukert, Luka Mucic, Gerhard Oswald, and Stefan Ries receive a retirement pension when they reach the retirement age of 60 (62 for Board members appointed after January 1, 2012) and retire from their Executive Board seat; or a disability pension depending on health examination if, before reaching the regular retirement age, they become subject to occupational disability or permanent incapacity. A surviving dependent’s pension is paid on the death of a former member of the Executive Board. The disability pension is 100% of the vested retirement pension entitlement and is payable until the beneficiary’s 60th birthday, after which it is replaced by a retirement pension. The surviving dependent’s pension is 60% of the retirement pension or vested disability pension entitlement at death. Entitlements are enforceable against SAP SE. Current pension payments are reviewed annually for adjustments and, if applicable, increased according to the surplus in the pension liability insurance. If service is ended before the retirement age of 60 (62 for Board members appointed after January 1, 2012), pension entitlement is reduced in proportion as the actual length of service stands in relation to the maximum possible length of service. The applied retirement pension plan is contributory. The contribution is 4% of applicable compensation up to the applicable income threshold plus 14% of applicable compensation above the applicable income threshold. For this purpose, applicable compensation is 180% of annual base salary. The applicable income threshold is the |
| | | statutory annual income threshold for the state pension plan in Germany (West), as amended from time to time. Originally, Gerhard Oswald was under a performance-based retirement plan. This plan was discontinued when SAP introduced a contributory retirement pension plan in 2000. His pension benefits are derived from any accrued entitlements on December 31, 1999, under performance-based pension agreements and a salary-linked contribution for the period commencing January 1, 2000. Gerhard Oswald’s rights to retirement pension benefits increased by further annual contributions because he remained a member of the Executive Board after his 60th birthday until his retirement on December 31, 2016. |
| – | | Bill McDermott has rights to future benefits under the portion of the pension plan for SAP America classified as “Non-Qualified Retirement Plan” according to the U.S. Employee Retirement Income Security Act (ERISA). The “Non-Qualified” pension plan of SAP America is a cash balance plan that provides either monthly pension payments or a lump sum on retirement. The pension becomes available from the beneficiary’s 65th birthday. Subject to certain conditions, the plan also provides earlier payment or invalidity benefits. The “Non-Qualified” pension plan closed with effect from January 1, 2009. Interest continues to be paid on the earned rights to benefits within this plan. |
| – | | SAP made contributions to a third-party pension plan for Bill McDermott (2016:€571,300; 2015:€682,400) and Robert Enslin (2016:€34,700; 2015:€308,000). SAP’s contributions are based on payments by Bill McDermott and Robert Enslin into this pension plan. |
| – | | Steve Singh has no entitlements under the pension plan for Executive Board members. SAP made no retirement pension plan contributions to a third-party pension plan with respect to Steve Singh in 2016. |
83
Total Defined Benefit Obligations (DBO) and the Total Accruals for Pension Obligations to Executive Board Members
| | | | | | | | | | | | | | | | | | | | | | | | | | | | |
| € thousands | | Bill
McDermott (CEO) | | | Michael
Kleinemeier1) | | | Bernd
Leukert1) | | | Luka Mucic1) | | | Gerhard
Oswald | | | Stefan Ries1)
(from April 1,
2016) | | | Total | |
DBO January 1, 2015 | | | 1,212.5 | | | | — | | | | 123.2 | | | | 102.8 | | | | 7,221.4 | | | | — | | | | 8,659.9 | |
Less plan assets market value January 1, 2015 | | | — | | | | — | | | | 94.6 | | | | 67.8 | | | | 4,992.4 | | | | — | | | | 5,154.8 | |
| Accrued January 1, 2015 | | | 1,212.5 | | | | — | | | | 28.6 | | | | 35.0 | | | | 2,229.0 | | | | — | | | | 3,505.1 | |
DBO change in 2015 | | | 170.0 | | | | 29.7 | | | | 129.2 | | | | 129.9 | | | | –171.2 | | | | — | | | | 287.6 | |
Plan assets change in 2015 | | | — | | | | 25.4 | | | | 145.6 | | | | 138.0 | | | | 356.9 | | | | — | | | | 665.9 | |
DBO December 31, 2015 | | | 1,382.5 | | | | 29.7 | | | | 252.4 | | | | 232.7 | | | | 7,050.2 | | | | — | | | | 8,947.5 | |
Less plan assets market value December 31, 2015 | | | — | | | | 25.4 | | | | 240.2 | | | | 205.8 | | | | 5,349.3 | | | | — | | | | 5,820.7 | |
| Accrued December 31, 2015 | | | 1,382.5 | | | | 4.3 | | | | 12.2 | | | | 26.9 | | | | 1,700.9 | | | | — | | | | 3,126.8 | |
DBO change in 2016 | | | 76.7 | | | | 125.2 | | | | 199.2 | | | | 211.9 | | | | 920.7 | | | | 257.9 | | | | 1,791.6 | |
Plan assets change in 2016 | | | — | | | | 156.0 | | | | 149.5 | | | | 141.8 | | | | 378.6 | | | | 116.7 | | | | 942.6 | |
DBO December 31, 2016 | | | 1,459.2 | | | | 154.9 | | | | 451.6 | | | | 444.6 | | | | 7,970.9 | | | | 257.9 | | | | 10,739.1 | |
Less plan assets market value December 31, 2016 | | | — | | | | 181.4 | | | | 389.7 | | | | 347.6 | | | | 5,727.9 | | | | 116.7 | | | | 6,763.3 | |
| Accrued December 31, 2016 | | | 1,459.2 | | | | –26.5 | | | | 61.9 | | | | 97.0 | | | | 2,243.0 | | | | 141.2 | | | | 3,975.8 | |
1) The values shown here only reflect the pension entitlements that Michael Kleinemeier, Bernd Leukert, Luka Mucic, and Stefan Ries will receive from the retirement pension plan for Executive Board members.
The table below shows the annual pension entitlement earned during Executive Board membership of each member of the Executive Board on reaching the scheduled retirement age (60 for Executive Board members initially appointed before 2012 and 62 for Executive Board members initially appointed after January 1, 2012) based on entitlements from SAP under performance-based and salary-linked plans vested on December 31, 2016.
Annual Pension Entitlement
| | | | | | | | |
| € thousands | | Vested on
December 31,
2016 | | | Vested on
December 31,
2015 | |
Bill McDermott (CEO)1) | | | 106.5 | | | | 106.9 | |
Michael Kleinemeier | | | 5.2 | | | | 0.7 | |
Bernd Leukert | | | 14.0 | | | | 8.8 | |
Luka Mucic | | | 12.9 | | | | 7.8 | |
Gerhard Oswald2) | | | 327.4 | | | | 302.5 | |
Stefan Ries (from April 1, 2016) | | | 3.6 | | | | — | |
1) The rights shown here for Bill McDermott refer solely to rights under the pension plan for SAP America.
2) Due to the extension of Gerhard Oswald’s contract beyond June 30, 2014, these values represent the retirement pension entitlement that he receives after his current Executive Board contract expired on December 31, 2016, based on the entitlements vested on December 31, 2016 (December 31, 2015).
84
These are vested entitlements. To the extent that members continue to serve on the Executive Board and that therefore more contributions are made for them in the future, pensions actually payable at the scheduled retirement age will be higher than the amounts shown in the table.
Postcontractual Non-Compete Provisions
During the agreed 12-month postcontractual non-compete period, each Executive Board member receives abstention payments corresponding to 50% of the final average contractual compensation as agreed in the respective contract on an individual basis. Any other occupational income generated by the Executive Board member is deducted from their compensation in
accordance with section 74c of the German Commercial Code.
The following table presents the net present values of the postcontractual non-compete abstention payments. The net present values in the table reflect the discounted present value of the amounts that would be paid in the fictitious scenario in which the Executive Board members leave SAP at the end of their respective current contract terms and their final average contractual compensation prior to their departure equals the compensation in 2016. Actual postcontractual non-compete payments will likely differ from these amounts depending on the time of departure and the compensation levels and target achievements at the time of departure.
Net Present Values of the Postcontractual Non-Compete Abstention Payments
| | | | | | | | |
| € thousands | | Contract Term
Expires | | | Net Present Value
of Postcontractual
Non-Compete
Abstention
Payment1) | |
Bill McDermott (CEO) | | | March 31, 2021 | | | | 6,695.1 | |
Robert Enslin | | | March 31, 2021 | | | | 2,711.8 | |
Michael Kleinemeier | | | October 31, 2018 | | | | 2,190.4 | |
Bernd Leukert | | | March 31, 2021 | | | | 2,316.9 | |
Luka Mucic | | | March 31, 2021 | | | | 2,161.7 | |
Stefan Ries (from April 1, 2016) | | | March 31, 2019 | | | | 1,477.2 | |
Steve Singh (from April 1, 2016) | | | March 31, 2019 | | | | 1,858.8 | |
Total | | | | | | | 19,411.9 | |
1) For the purpose of this calculation, the following discount rates have been applied: Bill McDermott 0.22% (2015: 0.18%); Robert Enslin 0.22% (2015: 0.18%); Michael Kleinemeier -0.026% (2015: 0.50%); Bernd Leukert 0.22% (2015: 0.18%); Luka Mucic 0.22% (2015: 0.18%); Stefan Ries -0.01%; Steve Singh -0.01%.
Early End-of-Service Undertakings
Severance Payments
The standard contract for all Executive Board members provides that on termination before full term (for example, where the member’s appointment is revoked, where the member becomes occupationally disabled, or in connection with a change of control), SAP SE will pay to the member the outstanding part of the compensation target for the entire remainder of the term, appropriately discounted for early payment. A member has no claim to that payment if they have not served SAP as a member of the Executive Board for at least one year or if they leave SAP SE for reasons for which they are responsible. Upon the appointment of Stefan Ries and Steve Singh to the Executive Board, the Supervisory Board abstained from the waiting period of one year.
If an Executive Board member’s appointment to the Executive Board expires or ceases to exist because of, or as a consequence of, change or restructuring, or due to a change of control, SAP SE and each Executive Board member has the right to terminate the employment contract within eight weeks of the occurrence by giving six months’ notice. A change of control is deemed to occur when a third party is required to make a mandatory takeover offer to the shareholders of SAP SE under the German Securities Acquisition and Takeover Act, when SAP SE merges with another company and becomes the subsumed entity, or when a control or profit transfer agreement is concluded with SAP SE as the dependent company. An Executive Board member’s contract can also be terminated before full term if their appointment as an Executive Board member of SAP SE is revoked in connection with a change of control.
85
Postcontractual Non-Compete Provisions
Abstention compensation for the postcontractual non-compete period as described above is also payable on early contract termination.
Permanent Disability
In case of permanent disability, the contract will end at the end of the quarter in which the permanent inability to work was determined. The Executive Board member receives the monthly basic salary for a further 12 months starting from the date the permanent disability is determined.
Payments to Executive Board Members Retiring in 2016
Gerhard Oswald retired from his position as Executive Board member upon the end of his current term on December 31, 2016. He received the following payments in connection with his retirement:
| – | | For a period of 12 months following his retirement, he receives monthly abstention compensation for the postcontractual non-compete period totaling€1,922,193. |
| – | | Upon termination of his employment contract, Gerhard Oswald received compensation for unused leave totaling€151,061.12. |
| – | | We have entered into a consulting contract with Gerhard Oswald. Based on this contract, he will be available to the Executive Board and to the Chairman of the Supervisory Board as a strategic advisor |
| | | especially for customer-specific topics and events for SAP customers until the end of December 2018. |
Payments to Former Executive Board Members
In 2016, we paid pension benefits of€1,667,000 to Executive Board members who had retired before January 1, 2016 (2015:€1,580,000). At the end of the year, the DBO for former Executive Board members was€33.935.000 (2015:€32,758,000). Plan assets of€26.053.000 are available to meet these obligations (2015:€26,716,000).
Executive Board Members’ Holdings of Long-Term Incentives
Members of the Executive Board hold or held share-based payment rights throughout the year under the RSU Milestone Plan 2015 and the SAP SOP 2010 (which were granted in previous years). For information about the terms and details of these programs, see the Notes to the Consolidated Financial Statements section, Note (27).
LTI 2016 Plan
The table below shows Executive Board members’ holdings, on December 31, 2016, of Share Units issued to them under the LTI 2016 plan. The plan is an annual revolving cash-settled long-term incentive scheme with a payout after the vesting period.
LTI 2016 Plan (2016 Tranche)
| | | | | | | | | | | | | | | | | | | | | | | | | | | | | | | | |
| Quantity of Share Units | | Holding on
January 1,
2016 | | | Grants
in 2016 | | | Retention
Share
Units
(40%) | | | Performance
Share Units
(60%) | | | Exercised
Units | | | Forfeited
Units1) | | | Balanced
Performance
Share Units2) | | | Holding on
December 31,
2016 | |
Bill McDermott (CEO) | | | — | | | | 122,423 | | | | 48,969 | | | | 73,454 | | | | — | | | | — | | | | | | | | 122,423 | |
Robert Enslin | | | — | | | | 40,417 | | | | 16,167 | | | | 24,250 | | | | — | | | | — | | | | | | | | 40,417 | |
Michael Kleinemeier | | | — | | | | 37,898 | | | | 15,159 | | | | 22,739 | | | | — | | | | — | | | | | | | | 37,898 | |
Bernd Leukert | | | — | | | | 42,687 | | | | 17,075 | | | | 25,612 | | | | — | | | | — | | | | | | | | 42,687 | |
Luka Mucic | | | — | | | | 37,898 | | | | 15,159 | | | | 22,739 | | | | — | | | | — | | | | | | | | 37,898 | |
Gerhard Oswald (until December 31, 2016) | | | — | | | | 31,924 | | | | 12,770 | | | | 19,154 | | | | — | | | | –23,927 | | | | 17,038 | | | | 25,035 | |
Stefan Ries (from April 1, 2016) | | | — | | | | 23,987 | | | | 9,595 | | | | 14,392 | | | | — | | | | — | | | | | | | | 23,987 | |
Steve Singh (from April 1, 2016) | | | — | | | | 30,368 | | | | 12,147 | | | | 18,221 | | | | — | | | | — | | | | | | | | 30,368 | |
Total | | | — | | | | 367,602 | | | | 147,041 | | | | 220,561 | | | | — | | | | –23,927 | | | | 17,038 | | | | 360,713 | |
1) Forfeiture according to leaver rules
2) To balance disadvantages from leaver rules under the LTI 2016 Plan
86
RSU Milestone Plan 2015
The table below shows Executive Board members’ holdings, on December 31, 2016 and 2015, of RSUs issued to them under the RSU Milestone Plan 2015. The plan is a cash-settled long-term incentive scheme with a payout subsequent to a performance period of one year and an additional holding period of three years. The RSU
Milestone Plan 2015 consists of four plan tranches to be issued with respect to the calendar years 2012 through 2015. The RSUs allocated in 2013 have a remaining term of 0.08 years; the RSUs allocated in 2014 have a remaining term of 1.08 years; and the RSUs allocated in 2015 have a remaining term of 2.08 years.
RSU Milestone Plan 2015 – Rollforward 2015/2016
| | | | | | | | | | | | | | | | | | | | | | | | | | | | | | | | |
| Quantity of RSUs | | Holding on
January 1,
2015 | | | Grants
in 2015 | | | Performance
Related
Adjustment | | | Exercised
Units | | | Forfeited
Units | | | Holding on
December 31,
2015 | | | Exercised
Units
Tranche
2012 | | | Holding on
December 31,
2016 | |
Bill McDermott (CEO) | | | 255,050 | | | | 77,099 | | | | 36,568 | | | | | | | | — | | | | 368,717 | | | | –127,425 | | | | 241,292 | |
Robert Enslin | | | 14,148 | | | | 27,656 | | | | 12,329 | | | | — | | | | — | | | | 54,133 | | | | — | | | | 54,133 | |
Michael Kleinemeier (from November 1, 2015) | | | 0 | | | | 4,622 | | | | 599 | | | | — | | | | — | | | | 5,221 | | | | — | | | | 5,221 | |
Bernd Leukert | | | 14,148 | | | | 27,656 | | | | 13,922 | | | | — | | | | — | | | | 55,726 | | | | — | | | | 55,726 | |
Luka Mucic | | | 10,757 | | | | 27,656 | | | | 13,474 | | | | — | | | | — | | | | 51,887 | | | | — | | | | 51,887 | |
Gerhard Oswald | | | 91,490 | | | | 27,656 | | | | 13,117 | | | | | | | | — | | | | 132,263 | | | | –45,709 | | | | 86,554 | |
Total | | | 385,593 | | | | 192,345 | | | | 90,009 | | | | 0 | | | | 0 | | | | 667,947 | | | | –173,134 | | | | 494,813 | |
The RSUs held as of December 31, 2015, which were issued and not forfeited in 2015, reflect the number of RSUs multiplied by the total target achievement. The total target achievement consists of the addition of the target achievement of the financial KPIs of 112.96% and the adjustment factor based on individual plan participation.
RSU Milestone Plan 2015 – Rollforward 2014/2015
| | | | | | | | | | | | | | | | | | | | | | | | |
| Quantity of RSUs | | Holding on
January 1,
2014 | | | Grants in 2014 | | | Performance-
Related
Adjustment | | | Exercised
Units | | | Forfeited Units | | | Holding on
December 31,
2014 | |
Bill McDermott (CEO) | | | 195,562 | | | | 76,374 | | | | –16,886 | | | | — | | | | — | | | | 255,050 | |
| Dr. Werner Brandt (until June 30, 2014) | | | 70,151 | | | | 27,396 | | | | — | | | | — | | | | 27,396 | | | | 70,151 | |
| Gerhard Oswald | | | 70,151 | | | | 27,396 | | | | –6,057 | | | | — | | | | — | | | | 91,490 | |
| Dr. Vishal Sikka (until May 4, 2014)1) | | | 70,151 | | | | 27,396 | | | | — | | | | 70,151 | | | | 27,396 | | | | — | |
Robert Enslin (from May 4, 2014) | | | 0 | | | | 18,164 | | | | –4,016 | | | | — | | | | — | | | | 14,148 | |
Bernd Leukert (from May 4, 2014) | | | 0 | | | | 18,164 | | | | –4,016 | | | | — | | | | — | | | | 14,148 | |
Luka Mucic (from July 1, 2014) | | | 0 | | | | 13,811 | | | | –3,054 | | | | — | | | | — | | | | 10,757 | |
Total | | | 406,014 | | | | 208,701 | | | | –34,029 | | | | 70,151 | | | | 54,792 | | | | 455,743 | |
1) According to the termination agreement with Dr. Vishal Sikka, the 2012 grants were paid out after the close of the Annual General Meeting of Shareholders in 2016, based on a fixed share price of€52.96. The 2013 grants will be paid out after the close of the Annual General Meeting of Shareholders in 2017 based on a fixed share price of€58.69.
87
The RSUs held as of December 31, 2014, which were issued and not forfeited in 2014, reflect the number of RSUs multiplied by the 77.89% target achievement.
RSU Milestone Plan 2015 – Rollforward 2013/2014
| | | | | | | | | | | | | | | | | | | | | | | | |
| Quantity of RSUs | | Holding on
January 1,
2013 | | | Grants in 2013 | | | Performance-
Related
Adjustment | | | Exercised
Units | | | Forfeited Units | | | Holding on
December 31,
2013 | |
Bill McDermott (co-CEO) | | | 127,425 | | | | 73,289 | | | | –5,152 | | | | — | | | | — | | | | 195,562 | |
| Jim Hagemann Snabe (co-CEO)1) | | | 127,425 | | | | 73,289 | | | | –5,152 | | | | 195,562 | | | | — | | | | — | |
Dr. Werner Brandt | | | 45,709 | | | | 26,290 | | | | –1,848 | | | | — | | | | — | | | | 70,151 | |
Gerhard Oswald | | | 45,709 | | | | 26,290 | | | | –1,848 | | | | — | | | | — | | | | 70,151 | |
Dr. Vishal Sikka | | | 45,709 | | | | 26,290 | | | | –1,848 | | | | — | | | | — | | | | 70,151 | |
Total | | | 391,977 | | | | 225,448 | | | | –15,849 | | | | 195,562 | | | | 0 | | | | 406,014 | |
1) According to the termination agreement with Jim Hagemann Snabe, the 2012 and 2013 grants were paid out after the close of the Annual General Meeting of Shareholders on May 21, 2014, based on a fixed share price of€52.96 for the 2012 grants and€58.69 for the 2013 grants.
The RSUs held as of December 31, 2013, which were issued and not forfeited in 2013, reflect the number of RSUs multiplied by the 92.97% target achievement.
RSU Milestone Plan 2015 – Rollforward 2012/2013
| | | | | | | | | | | | | | | | | | | | | | | | |
| Quantity of RSUs | | Holding on
January 1,
2012 | | | Grants in 2012 | | | Performance-
Related
Adjustment | | | Exercised
Units | | | Forfeited Units | | | Holding on
December 31,
2012 | |
Bill McDermott (co-CEO) | | | — | | | | 95,414 | | | | 32,011 | | | | — | | | | — | | | | 127,425 | |
| Jim Hagemann Snabe (co-CEO) | | | — | | | | 95,414 | | | | 32,011 | | | | — | | | | — | | | | 127,425 | |
Dr. Werner Brandt | | | — | | | | 34,226 | | | | 11,483 | | | | — | | | | — | | | | 45,709 | |
Gerhard Oswald | | | — | | | | 34,226 | | | | 11,483 | | | | — | | | | — | | | | 45,709 | |
Dr. Vishal Sikka | | | — | | | | 34,226 | | | | 11,483 | | | | — | | | | — | | | | 45,709 | |
Total | | | — | | | | 293,506 | | | | 98,471 | | | | — | | | | — | | | | 391,977 | |
The RSUs held as of December 31, 2012, reflect the number of RSUs issued in 2012 multiplied by the 133.55% target achievement.
SAP SOP 2010
The table below shows Executive Board members’ holdings, on December 31, 2016, of virtual share options issued to them under the SAP SOP 2010 since its inception. The strike price for an option is 115% of the base price. The issued options have a term of seven years and can only be exercised on specified dates after the vesting period. The options issued in 2010 were exercisable beginning in September 2014 and the options issued in 2011 were exercisable beginning in June 2015.
88
SAP SOP 2010 Virtual Share Options
| | | | | | | | | | | | | | | | | | | | | | | | | | | | | | | | | | | | |
| | | Year
Granted | | | Holding on January 1, 2016 | | | Strike Price
per Option | | | Rights
Exercised
in 2016 | | | Price on
Exercise
Date | | | Forfeited
Rights | | | Holding on
December 31, 2016 | |
| | | | | | Quantity of
Options | | | Remaining
Term in
Years | | | € | | | Quantity of
Options | | | € | | | Quantity of
Options | | | Quantity of
Options | | | Remaining
Term in
Years | |
Bill McDermott (CEO) | | | 2010 | | | | 135,714 | | | | 1.69 | | | | 40.80 | | | | — | | | | — | | | | — | | | | 135,714 | | | | 0.69 | |
| | | | 2011 | | | | 112,426 | | | | 2.44 | | | | 48.33 | | | | — | | | | — | | | | — | | | | 112,426 | | | | 1.44 | |
Total | | | | | | | 248,140 | | | | | | | | | | | | 0 | | | | | | | | — | | | | 248,140 | | | | | |
Total Expense for Share-Based Payment
Total expense for the share-based payment plans of Executive Board members was recognized as follows.
Total Expense for Share-Based Payment
| | | | | | | | |
| € thousands | | 2016 | | | 2015 | |
Bill McDermott (CEO) | | | 6,525.3 | | | | 12,291.1 | |
Robert Enslin | | | 1,185.8 | | | | 1,851.2 | |
Michael Kleinemeier | | | 635.2 | | | | 364.7 | |
Bernd Leukert | | | 1,237.2 | | | | 2,208.6 | |
Luka Mucic | | | 1,123.5 | | | | 2,148.5 | |
Gerhard Oswald (until December 31, 2016) | | | 2,693.6 | | | | 3,445.6 | |
Stefan Ries (from April 1, 2016) | | | 367.5 | | | | — | |
Steve Singh (from April 1, 2016) | | | 465.3 | | | | — | |
Total | | | 14,233.4 | | | | 22,309.7 | |
The expense is recognized in accordance with IFRS 2 (Share-Based Payments) and consists exclusively of obligations arising from Executive Board activities.
Shareholdings of Executive Board Members
No member of the Executive Board holds more than 1% of the ordinary shares of SAP SE. Members of the Executive Board held a total of 85,985 SAP shares on December 31, 2016 (2015: 45,309 shares).
Executive Board: Other Information
We did not grant any compensation advance or credit to, or enter into any commitment for the benefit of, any member of our Executive Board in 2016 or the previous year.
As far as the law permits, SAP SE and its affiliated companies in Germany and elsewhere indemnify and hold harmless their respective directors and officers against and from the claims of third parties. To this end,
we maintain directors’ and officers’ (D&O) group liability insurance. The policy is annual and is renewed from year to year. The insurance covers the personal liability of the insured group for financial loss caused by its managerial acts and omissions. The current D&O policy includes an individual deductible for Executive Board members of SAP SE as required by section 93 (2) of the German Stock Corporation Act.
Compensation for Supervisory Board Members
Compensation System
Supervisory Board members’ compensation is governed by our Articles of Incorporation, section 16.
Each member of the Supervisory Board receives, in addition to the reimbursement of their expenses, an annual basic compensation of€165,000. The chairperson receives€275,000 and the deputy chairperson€220,000.
89
For membership of the Audit Committee, Supervisory Board members receive an additional fixed annual compensation of€16,500, and for membership of any other Supervisory Board committee€11,000, provided that the committee concerned has met in the year. The chairperson of the Audit Committee receives€27,500, and the chairpersons of the other committees receive€22,000. The fixed remuneration is payable after the end of the year.
Any members of the Supervisory Board having served for less than the entire year receive one-twelfth of the annual remuneration for each month of service commenced. This also applies to the increased compensation of the chairperson and the deputy chairperson(s) and to the remuneration for the chairperson and the members of a committee.
Supervisory Board Members’ Compensation in 2016
| | | | | | | | | | | | | | | | | | | | | | | | |
| € thousands | | | | | | | | 2016 | | | | | | | | | 2015 | |
| | | Fixed
Compen-
sation | | | Compen- sation for
Commit- tee Work | | | Total | | | Fixed
Compen-
sation | | | Compen- sation for
Commit- tee Work | | | Total | |
| Prof. Dr. h.c. mult. Hasso Plattner (chairperson) | | | 275.0 | | | | 88.0 | | | | 363.0 | | | | 275.0 | | | | 66.0 | | | | 341.0 | |
| Margret Klein-Magar (deputy chairperson) | | | 220.0 | | | | 33.0 | | | | 253.0 | | | | 215.4 | | | | 29.3 | | | | 244.8 | |
| Pekka Ala-Pietilä | | | 165.0 | | | | 33.0 | | | | 198.0 | | | | 165.0 | | | | 27.5 | | | | 192.5 | |
| Panagiotis Bissiritsas | | | 165.0 | | | | 38.5 | | | | 203.5 | | | | 165.0 | | | | 32.1 | | | | 197.1 | |
| Martin Duffek (from May 20, 2015) | | | 165.0 | | | | 27.5 | | | | 192.5 | | | | 110.0 | | | | 18.3 | | | | 128.3 | |
| Prof. Anja Feldmann | | | 165.0 | | | | 22.0 | | | | 187.0 | | | | 165.0 | | | | 22.0 | | | | 187.0 | |
| Prof. Dr. Wilhelm Haarmann | | | 165.0 | | | | 44.0 | | | | 209.0 | | | | 165.0 | | | | 44.0 | | | | 209.0 | |
| Andreas Hahn (from May 20, 2015) | | | 165.0 | | | | 22.0 | | | | 187.0 | | | | 110.0 | | | | 14.7 | | | | 124.7 | |
| Prof. Dr. Gesche Joost (from May 28, 2015) | | | 165.0 | | | | 22.0 | | | | 187.0 | | | | 110.0 | | | | 11.0 | | | | 121.0 | |
| Lars Lamadé | | | 165.0 | | | | 22.0 | | | | 187.0 | | | | 165.0 | | | | 22.0 | | | | 187.0 | |
| Bernard Liautaud | | | 165.0 | | | | 33.0 | | | | 198.0 | | | | 165.0 | | | | 22.0 | | | | 187.0 | |
| Christine Regitz (from May 20, 2015) | | | 165.0 | | | | 22.0 | | | | 187.0 | | | | 110.0 | | | | 14.7 | | | | 124.7 | |
| Dr. Erhard Schipporeit | | | 165.0 | | | | 27.5 | | | | 192.5 | | | | 165.0 | | | | 27.5 | | | | 192.5 | |
| Robert Schuschnig-Fowler (from May 20, 2015) | | | 165.0 | | | | 11.0 | | | | 176.0 | | | | 110.0 | | | | 7.3 | | | | 117.3 | |
| Dr. Sebastian Sick (from May 20, 2015) | | | 165.0 | | | | 22.0 | | | | 187.0 | | | | 110.0 | | | | 14.7 | | | | 124.7 | |
| Jim Hagemann Snabe | | | 165.0 | | | | 22.0 | | | | 187.0 | | | | 165.0 | | | | 22.0 | | | | 187.0 | |
| Pierre Thiollet (from May 20, 2015) | | | 165.0 | | | | 11.0 | | | | 176.0 | | | | 110.0 | | | | 7.3 | | | | 117.3 | |
| Prof. Dr.-Ing. Dr.-Ing. E.h. Klaus Wucherer | | | 165.0 | | | | 16.5 | | | | 181.5 | | | | 165.0 | | | | 16.5 | | | | 181.5 | |
| Former Supervisory Board members | | | NA | | | | NA | | | | NA | | | | 504.2 | | | | 59.6 | | | | 563.8 | |
Total | | | 3,135.0 | | | | 517.0 | | | | 3,652.0 | | | | 3,249.6 | | | | 478.5 | | | | 3,728.1 | |
In addition, we reimburse members of the Supervisory Board for their expenses and the value-added tax payable on their compensation.
In total, we received services from members of the Supervisory Board (including services from employee representatives on the Supervisory Board in their capacity as employees of SAP) in the amount of
€1,040,400 (2015:€1,282,800). This amount includes fees paid to Linklaters LLP in Frankfurt am Main, Germany (of which Supervisory Board member Wilhelm Haarmann is a partner), of€0 (2015:€224,500).
Long-Term Incentives for the Supervisory Board
We do not offer members of the Supervisory Board share-based payment for their Supervisory Board work.
90
Any share-based payment awards received by employee- elected members relate to their position as SAP employees and not to their work on the Supervisory Board.
Shareholdings of Supervisory Board Members
Supervisory Board chairperson Hasso Plattner and the companies he controlled held 87,860,661 SAP shares on December 31, 2016 (December 31, 2015: 90,248,789 SAP shares), representing 7.152% (2015: 7.346%) of SAP’s share capital. No other member of the Supervisory Board held more than 1% of the SAP SE share capital at the end of 2016 or of the previous year. Members of the Supervisory Board held a total of 87,875,732 SAP shares on December 31, 2016 (December 31, 2015: 90,262,686 SAP shares).
Supervisory Board: Other Information
We did not grant any compensation advance or credit to, or enter into any commitment for the benefit of, any member of our Supervisory Board in 2016 or the previous year.
Hasso Plattner, the chairperson of the Supervisory Board, entered into a consulting contract with SAP after joining the Supervisory Board in May 2003. The contract does not provide for any compensation. The only cost we incurred under the contract was the reimbursement of expenses.
As far as the law permits, we indemnify Supervisory Board members against, and hold them harmless from, claims brought by third parties. To this end, we maintain directors’ and officers’ (D&O) group liability insurance. The current D&O policy does not include an individual deductible for Supervisory Board members as envisaged in the German Corporate Governance Code.
EMPLOYEES
Headcount
Note (7) to our Consolidated Financial Statements presents the number of employees, measured in full-time equivalents by functional area and by geographic region.
Headcount and Personnel Expense
On December 31, 2016, we had 84,183 full-time equivalent (FTE) employees worldwide (December 31, 2015: 76,986). This represents an increase in headcount of 7,197 FTEs in comparison to 2015. The average number of employees in 2016 was 80,609 (2015: 75,180).
We define headcount in FTE as the number of people on permanent employment contract considering their staffing percentage. Students, individuals employed by SAP who are currently not working due to various reasons (such as maternity leave), and temporary employees with limited contracts of less than six months are excluded from our figures. The number of temporary employees is not material.
Our personnel expense per employee decreased to approximately€127,000 in 2016 (2015: approximately€135,000). This decrease in expense is primarily attributable to a significant decrease of employee-related restructuring expenses in 2016 compared to the previous year. The personnel expense per employee is defined as the overall personnel expense divided by the average number of employees. For more information about employee compensation and a detailed overview of the number of people we employ, see theNotes to the Consolidated Financial Statements section,Note (7).
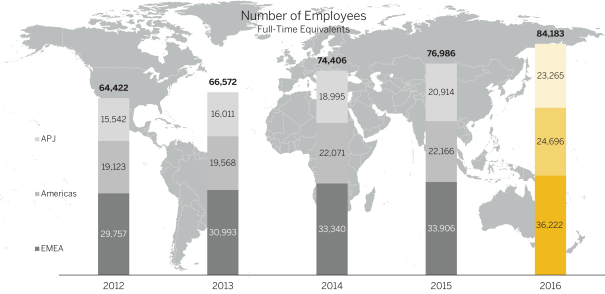
91
Employees by Functional Area
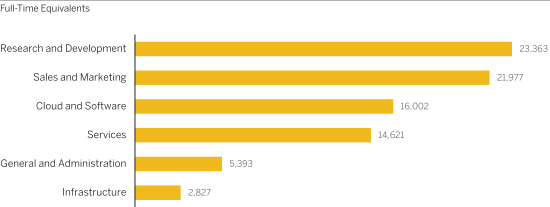
Employee and Labor Relations
On a worldwide basis, we believe that our employee and labor relations are excellent.
On a corporate level, employees of SAP in the European Economic Area are represented by the SAP SE Works Council (WoC) (Europe). By law and agreement with SAP the SAP SE WoC (Europe) is entitled to receive information on transnational matters and to consult with the Executive Board or a representative thereof. The SAP SE WoC (Europe) was established in November 2014 as a result of the legal transformation of SAP AG into SAP SE. The SAP SE WoC (Europe) replaced the European Works Council which was dissolved following the conversion.
On the legal entity level, the SAP SE works council (Germany) represents the employees of SAP SE. The employees of SAP Deutschland SE & Co. KG (SAP Germany) as well as the employees of SAP Business Compliance Services GmbH are represented by a separate works council. Other employee representatives include the group works council (members of the works councils of SAP SE, SAP Germany and SAP BCS GmbH), the representatives of severely disabled persons in all entities and on group level (Germany) and the spokespersons committee as the representation of the executives.
Employees of SAP France, SAP France Holding and SAP Labs France SAS are subject to a collective bargaining agreement. Each of SAP France, SAP France Holding, SAP Labs France SAS, Multiposting SAS France and b-process France are represented by a French works council. The represented unions negotiate agreements with SAP France and SAP Labs France SAS.
In addition, the employees of various other SAP entities, including SAP España – Sistemas, Aplicaciones y Productos en la Informática, S.A., SAP Belgium NV/SA., SAP Israel, SAP Nederland B.V., SAP Italia Sistemi Applicazioni Prodotti in Data Processing S.p.A., Concur (France) SAS, SAP Brasil Ltda, SAP sistemi, aplikacije in
produkti za obdelavo podatkov d.o.o.(Slovenia), SAP Romania SRL, SAP Argentina S.A., SAP Svenska Aktiebolag (Sweden), SAP UK Ltd. and SAP Ireland Ltd. are represented by works councils, worker representatives, employee consultation forums and/or unions. In addition, some of these employees are subject to a collective bargaining agreement.
SHARE OWNERSHIP
Beneficial Ownership of Shares
The ordinary shares beneficially owned by the persons listed in Item 6. Directors, Senior Management and Employees – Compensation Report” are disclosed in “Item 7. Major Shareholders and Related-Party Transactions – Major Shareholders.”
SHARE-BASED COMPENSATION PLANS
Share-Based Compensation
We maintain certain share-based compensation plans. The share-based compensation from these plans result from cash-settled and equity-settled awards issued to employees. For more information on our share-based compensation plans refer to “Item 6. Directors, Senior Management and Employees – Compensation Report” and Note (27) to our Consolidated Financial Statements.
ITEM 7. MAJOR SHAREHOLDERS AND RELATED-PARTY TRANSACTIONS
MAJOR SHAREHOLDERS
The share capital of SAP SE consists of ordinary shares, which are issued only in bearer form. Accordingly, SAP SE generally cannot determine the identity of its shareholders or how many shares a particular shareholder owns. SAP’s ordinary shares are traded in the United States by means of ADRs. Each ADR currently represents one SAP SE ordinary share. On February 10, 2017, based on information provided by the Depositary there were 44,214,531 ADRs held of record by 878 registered holders. The ordinary shares underlying such ADRs represented 3.60% of the then-outstanding ordinary shares (including treasury stock). Because SAP’s ordinary shares are issued in bearer form only, we
92
are unable to determine the number of ordinary shares directly held by persons with U.S. addresses.
The following table sets forth certain information regarding the beneficial ownership of the ordinary shares to the extent known to SAP as of February 10, 2017 of: (i) each person or group known by SAP SE to own beneficially 5% or more of the outstanding ordinary
shares; and (ii) the beneficial ownership of all members of the Supervisory Board and all members of the Executive Board, individually and as a group, in each case as reported to SAP SE by such persons. There was, as far as we are able to tell given the nature of our shares, no significant change in the percentage ownership held by any major shareholder during the past three years. None of the major shareholders have special voting rights.
| | | | | | | | |
| | | Ordinary Shares Beneficially Owned | |
| Major Shareholders | | Number | | | % of
Outstanding | |
Dietmar Hopp, collectively(1) | | | 65,273,200 | | | | 5.313 | |
Hasso Plattner, Chairperson Supervisory Board, collectively(2) | | | 87,478,436 | | | | 7.121 | |
Joint heirs of Klaus Tschira, collectively(3) | | | 75,189,595 | | | | 6.120 | |
Executive Board Members as a group (7 persons) | | | 76,571 | | | | 0.006 | |
Supervisory Board Members as a group (18 persons) | | | 87,494,088 | | | | 7.122 | |
Executive Board Members and Supervisory Board Members as a group (25 persons)(4) | | | 87,570,659 | | | | 7.128 | |
| Options and convertible bonds that are vested and exercisable within 60 days of February 10, 2017, held by Executive Board Members and Supervisory Board Members, collectively | | | 0 | | | | NA | |
(1) Represents 65,273,200 ordinary shares beneficially owned by Dietmar Hopp, including 3,404,000 ordinary shares owned by DH Besitzgesellschaft AG & Co. KG (formerly known as Golf Club St. Leon-Rot GmbH & Co. Betriebs-oHG) of which DH Verwaltungs-GmbH is the general partner and 61,869,200 ordinary shares owned by Dietmar Hopp Stiftung, GmbH. Mr. Hopp exercises voting and dispositive powers of the ordinary shares held by such entities. The foregoing information is based solely on a Schedule 13G filed by Dietmar Hopp and Dietmar Hopp Stiftung, GmbH on February 14, 2017.
(2) Includes HP Endowment GmbH & Co. KG in which Hasso Plattner exercises sole voting and dispositive power.
(3) Includes Klaus Tschira Stiftung gGmbH and Dr. h. c. Tschira Beteiligungs GmbH & Co. KG in which the joint heirs of Klaus Tschira exercise sole voting and dispositive power.
(4) We believe that, other than Hasso Plattner, each of the members of the Supervisory Board and the Executive Board beneficially owns less than 1% of SAP SE’s ordinary shares as of February 10, 2017.
Currently we are not aware of any arrangements, the operation of which may, at a subsequent date, result in a change in control of the company.
RELATED-PARTY TRANSACTIONS
For information on related-party transactions see Note (30) to our Consolidated Financial Statements.
ITEM 8. FINANCIAL INFORMATION
CONSOLIDATED FINANCIAL STATEMENTS AND FINANCIAL STATEMENT SCHEDULE
See “Item 18. Financial Statements” and pages F-1 through F-75.
OTHER FINANCIAL INFORMATION
Legal Proceedings
We are subject to a variety of legal proceedings and claims, either asserted or unasserted, which arise in the ordinary course of business, including claims and lawsuits involving businesses we have acquired.
Refer to Note (23) to our Consolidated Financial Statements for a detailed discussion of our material legal proceedings.
Dividend Policy
For more information on dividend policy see the disclosure in “Item 3. Key Information — Dividends”.
Significant Changes
The Supervisory Board of SAP SE appointed Stefan Ries and Steve Singh to the SAP Executive Board, with effect from April 1, 2016. Gerhard Oswald retired from his position as Executive Board member at the end of his term on December 31, 2016.
The Global Managing Board was dissolved on March 31, 2016.
93
ITEM 9. THE OFFER AND LISTING
GENERAL
Our ordinary shares are officially listed on the Frankfurt Stock Exchange, the Berlin Stock Exchange and the Stuttgart Stock Exchange. The principal trading market for the ordinary shares is Xetra, the electronic dealing platform of Deutsche Boerse AG.
ADRs representing SAP SE ordinary shares are listed on the New York Stock Exchange (NYSE) under the symbol “SAP,” and currently each ADR represents one ordinary share.
94
TRADING ON THE FRANKFURT STOCK EXCHANGE AND THE NYSE
The table below sets forth, for the periods indicated, the high and low closing sales prices for the ordinary shares on the Xetra trading System of the Frankfurt Stock Exchange together with the closing highs and lows of the DAX, and the high and low closing sales prices for the ADRs on the NYSE (information is provided by Reuters):
| | | | | | | | | | | | | | | | | | | | | | | | |
| | | Price per
Ordinary
Share in € | | | DAX(1)
in points | | | Price per ADR in US$ | |
| | | High | | | Low | | | High | | | Low | | | High | | | Low | |
Annual Highs and Lows | | | | | | | | | | | | | | | | | | | | | | | | |
2012 | | | 61.43 | | | | 41.45 | | | | 7,672.10 | | | | 5,969.40 | | | | 81.21 | | | | 53.25 | |
2013 | | | 64.80 | | | | 52.20 | | | | 9,589.39 | | | | 7,459.96 | | | | 87.14 | | | | 70.27 | |
2014 | | | 62.55 | | | | 50.90 | | | | 10,087.12 | | | | 8,571.95 | | | | 85.45 | | | | 64.14 | |
2015 | | | 74.85 | | | | 54.53 | | | | 12,374.73 | | | | 9,427.64 | | | | 80.91 | | | | 63.37 | |
2016 | | | 82.81 | | | | 64.90 | | | | 11,481.06 | | | | 8,752.87 | | | | 92.36 | | | | 72.02 | |
Quarterly Highs and Lows | | | | | | | | | | | | | | | | | | | | | | | | |
2015 | | | | | | | | | | | | | | | | | | | | | | | | |
First Quarter | | | 67.60 | | | | 54.53 | | | | 12,167.72 | | | | 9,469.66 | | | | 73.53 | | | | 63.56 | |
Second Quarter | | | 70.72 | | | | 62.60 | | | | 12,374.73 | | | | 10,944.97 | | | | 77.27 | | | | 70.23 | |
Third Quarter | | | 68.77 | | | | 55.89 | | | | 11,735.72 | | | | 9,427.64 | | | | 74.60 | | | | 63.37 | |
Fourth Quarter | | | 74.85 | | | | 57.12 | | | | 11,382.23 | | | | 9,509.25 | | | | 80.91 | | | | 64.16 | |
2016 | | | | | | | | | | | | | | | | | | | | | | | | |
First Quarter | | | 74.25 | | | | 64.90 | | | | 10,310.10 | | | | 8,752.87 | | | | 80.69 | | | | 73.68 | |
Second Quarter | | | 72.96 | | | | 65.20 | | | | 10,435.73 | | | | 9,268.66 | | | | 81.90 | | | | 72.02 | |
Third Quarter | | | 82.36 | | | | 66.70 | | | | 10,752.98 | | | | 9,373.26 | | | | 92.36 | | | | 74.16 | |
Fourth Quarter | | | 82.81 | | | | 75.84 | | | | 11,481.06 | | | | 10,259.13 | | | | 90.96 | | | | 81.61 | |
Monthly Highs and Lows | | | | | | | | | | | | | | | | | | | | | | | | |
2016 | | | | | | | | | | | | | | | | | | | | | | | | |
July | | | 78.41 | | | | 66.70 | | | | 10,337.50 | | | | 9,373.26 | | | | 87.39 | | | | 74.16 | |
August | | | 79.68 | | | | 77.05 | | | | 10,742.84 | | | | 10,144.34 | | | | 88.74 | | | | 85.87 | |
September | | | 82.36 | | | | 77.81 | | | | 10,752.98 | | | | 10,276.17 | | | | 92.36 | | | | 86.86 | |
October | | | 81.98 | | | | 78.57 | | | | 10,761.17 | | | | 10,414.07 | | | | 90.96 | | | | 86.13 | |
November | | | 80.87 | | | | 75.84 | | | | 10,735.14 | | | | 10,259.13 | | | | 86.71 | | | | 81.61 | |
December | | | 82.81 | | | | 76.94 | | | | 11,481.06 | | | | 10,513.35 | | | | 86.51 | | | | 81.91 | |
2017 | | | | | | | | | | | | | | | | | | | | | | | | |
January | | | 85.23 | | | | 82.43 | | | | 11,848.63 | | | | 11,521.04 | | | | 91.51 | | | | 86.30 | |
February (through February 10, 2017) | | | 86.28 | | | | 84.10 | | | | 11,666.97 | | | | 11,509.84 | | | | 92.52 | | | | 90.71 | |
(1) The DAX is a continuously updated, capital-weighted performance index of 30 German blue chip companies. In principle, the shares included in the DAX are selected on the basis of their stock exchange turnover and the issuer’s free-float market capitalization. Adjustments to the DAX are made for capital changes, subscription rights and dividends.
95
On February 10, 2017, the closing sales price per ordinary share on the Frankfurt Stock Exchange (Xetra Trading System) was€86.28 and the closing sales price per ADR on the NYSE was US $91.73 as reported by Reuters.
ITEM 10. ADDITIONAL INFORMATION
ARTICLES OF INCORPORATION
Organization and Register
SAP SE is a European Company (Societas Europaea, or “SE”) organized in the Federal Republic of Germany under German and European law, including Council Regulation (EC) No. 2157/2001 on the Statute for a European Company (the “SE Regulation”), the German Act on the Implementation of Council Regulation No. 2157/2001 of October 8, 2001 on the Statute for a European Company (Gesetz zur Ausführung der Verordnung (EG) Nr. 2157/2001 des Rates vom 8. Oktober 2001 über das Statut der Europäischen Gesellschaft (SE) – SE-Ausführungsgesetz; “SE-AG”) of December 22, 2004, and the German Stock Corporation Act (Aktiengesetz). SAP SE is registered in the Commercial Register (Handelsregister) at the Lower Court of Mannheim, Germany, under the entry number “HRB 719915.” SAP SE publishes its official notices in the Federal Gazette (www.bundesanzeiger.de).
Objects and Purposes
SAP’s Articles of Incorporation state that our objects involve, directly or indirectly, the development, production and marketing of products and the provision of services in the field of information technology, including:
| – | | developing and marketing integrated product and service solutions for e-commerce; |
| – | | developing software for information technology and the licensing of its use to others; |
| – | | organization and deployment consulting, as well as user training, for e-commerce and other software solutions; |
| – | | selling, leasing, renting and arranging the procurement and provision of all other forms of use of information technology systems and related equipment; and |
| – | | making capital investments in enterprises active in the field of information technology to promote the opening and advancement of international markets in the field of information technology. |
SAP is authorized to act in all the business areas listed above and to delegate such activities to affiliated entities within the meaning of the German Stock Corporation Act; in particular SAP is authorized to delegate its business in whole or in part to such entities. SAP SE is authorized to establish branch offices in Germany and other countries, as well as to form, acquire or invest in other companies of the same or related kind and to enter
into collaboration and joint venture agreements. SAP is further authorized to invest in enterprises of all kinds principally for investment purposes. SAP is authorized to dispose of investments, to consolidate the management of enterprises in which it participates, to enter into affiliation agreements with such entities, or to limit its activities to manage its shareholdings.
CORPORATE GOVERNANCE
Introduction
SAP SE, as a European Company with a two-tier board system, is governed by three separate bodies: the Supervisory Board, the Executive Board and the Annual General Meeting of Shareholders. Their rules are defined by European and German law, by the Agreement on the Involvement of Employees in SAP SE (“Employee Involvement Agreement”, or “EIA”), by the German Corporate Governance Code and by SAP’s Articles of Incorporation (Satzung) and are summarized below. See “Item 16G. Differences in Corporate Governance Practices” for additional information on our corporate governance practices.
The Supervisory Board
The Supervisory Board appoints and removes the members of the Executive Board and oversees and advises the management of the corporation. At regular intervals it meets to discuss current business as well as business development and planning. The SAP Executive Board must consult with the Supervisory Board concerning the corporate strategy, which is developed by the Executive Board. Types of transactions for which the Executive Board requires the Supervisory Board’s consent are listed in the Articles of Incorporation; in addition, the Supervisory Board has specified further types of transactions that require its consent. Accordingly, the Supervisory Board must also approve the annual budget of SAP upon submission by the Executive Board and certain subsequent deviations from the approved budget. The Supervisory Board is also responsible for representing SAP SE in transactions between SAP SE and Executive Board members.
The Supervisory Board, based on a recommendation by its Audit Committee, provides its proposal for the election of the external independent auditor to the Annual General Meeting of Shareholders. The Supervisory Board is also responsible for monitoring the auditor’s independence, a task it has delegated to its audit committee.
Pursuant to Article 40 (3) sentence 1 of the SE Regulation, the number of members of the supervisory board and the rules for determining this number are to be laid down in the articles of incorporation. Furthermore, pursuant to Section 17 (1) SE-AG, the size of supervisory boards of companies which, like SAP SE,
96
have a capital stock exceeding€ 10,000,000, is limited to 21 members. Moreover, the number of members must be divisible by three. In line with these provisions as well as the EIA, the Articles of Incorporation of SAP SE provide that the Supervisory Board shall be composed of 18 members. Furthermore, it is provided in the EIA that the shareholders of SAP SE have the possibility to reduce the size of the Supervisory Board in the future (i.e. at the earliest in the Annual General Meeting of Shareholders in 2018, with effect from the Annual General Meeting of Shareholders in 2019) to 12 members.
The current Supervisory Board of SAP SE consists of eighteen members, nine of whom are elected by the Annual General Meeting of Shareholders as shareholders’ representatives and the remaining nine are appointed as employees’ representatives by the SAP SE Works Council Europe or directly by the SAP workforce in Germany under the EIA (see below for details). Pursuant to Section 17(2) SE-AG, the Supervisory Board of SAP SE must have a minimum of 30% men and 30% women. This quota for the Supervisory Board must be observed for any new appointment to the Supervisory Board. Currently there are two women on the shareholder representatives’ side of the Supervisory Board and two women on the employee representatives’ side. Since the fixed quota applies only to new appointments to the Supervisory Board, the current members of the Supervisory Board remain unaffected by the quota until the end of their term. The term of office of all eighteen members will end upon the conclusion of the Annual General Meeting of Shareholders in 2019.
The procedure for the appointment of the employees’ representatives on the Supervisory Board of SAP SE is governed by the EIA. In accordance with the EIA, the nine seats on the first Supervisory Board reserved for employees’ representatives were allocated as follows: the first six seats were allocated to Germany, the seventh seat was allocated to France, the eighth seat was also allocated to Germany, and the ninth seat was allocated to a European country not represented by the first eight seats, as determined by the SAP SE Works Council Europe. The employees’ representatives for the first six seats allocated to Germany were determined by direct vote by all SAP employees with their principal place of employment in Germany. According to the EIA, the employees’ representative for the seventh seat allocated to France is generally determined according to the applicable provisions of French law on the election or appointment of employees’ representatives on a supervisory board. With regard to the eighth and ninth seat, members of the SAP SE Works Council Europe from Germany and Slovakia were appointed by the SE Works Council as employees’ representatives.
Any Supervisory Board member elected by the shareholders at the Annual General Meeting of
Shareholders may be removed by three-quarters of the votes cast at the Annual General Meeting of Shareholders. Any Supervisory Board member appointed in accordance with the EIA may be removed by the SAP SE Works Council Europe upon application by the body that nominated the respective employees’ representative for appointment by the SE Works Council or, in case the employees’ representative was directly elected, the majority of the employees entitled to vote.
The Supervisory Board elects a chairperson and one or two deputy chairperson(s) among its members by a majority of the votes cast. Only a shareholders’ representative may be elected as chairperson of the Supervisory Board. When electing the chairperson of the Supervisory Board, the oldest member in terms of age of the shareholders’ representatives on the Supervisory Board will chair the meeting and, in the event of a tied vote, will have the casting vote.
Unless otherwise mandatorily prescribed by law or the Articles of Incorporation, resolutions of the Supervisory Board are adopted by simple majority of the votes cast. In the event of a tie, the vote of the chairperson and, in the event that the chairperson does not participate in passing the resolution, the vote of the deputy chairperson, provided that he or she is a shareholders’ representative, will be decisive (casting vote).
The members of the Supervisory Board cannot be elected or appointed, as the case may be, for a term longer than six years. Other than for the employees’ representatives on the first Supervisory Board of SAP SE, the term expires at the close of the Annual General Meeting of Shareholders giving its formal approval of the acts of the Supervisory Board for the fourth fiscal year following the year in which the term of office of the Supervisory Board members commenced. Re-election is possible. Our Supervisory Board normally meets four times a year. The compensation of the members of the Supervisory Board is set in the Articles of Incorporation.
As stipulated in the German Corporate Governance Code (GCGC), an adequate number of our Supervisory Board members are independent. To be considered for appointment to the Supervisory Board and for as long as they serve, members must comply with certain criteria concerning independence, conflicts of interest and multiple memberships of management, supervisory and other governing bodies. They must be loyal to SAP in their conduct and must not accept any position in companies that are in competition with SAP. Members are subject to insider trading prohibitions and the respective directors’ dealing rules of the European Market Abuse Regulation (MAR). A member of the Supervisory Board may not vote on matters relating to certain contractual agreements between such member and SAP SE. Further, as the compensation of the
97
Supervisory Board members is set in the Articles of Incorporation, Supervisory Board members are unable to vote on their own compensation, with the exception that they are able to exercise voting rights in a General Meeting of Shareholders in connection with a resolution amending the Articles of Incorporation.
The Supervisory Board may appoint committees from among its members and may, to the extent permitted by law, entrust such committees with the authority to make decisions on behalf of the Supervisory Board. Currently the Supervisory Board maintains the following committees:
The Audit Committee
The focus of the Audit Committee (Prüfungsausschuss) is the oversight of SAP’s external financial reporting as well as SAP’s risk management, internal controls (including internal controls over the effectiveness of the financial reporting process), corporate audit and compliance matters. According to German Law SAP’s Audit Committee includes at least one independent member with specialist expertise in the fields of financial reporting or auditing. Among the tasks of the Audit Committee are the discussion of SAP’s quarterly and year end financial reporting prepared under German and U.S. regulations, including this report. The Audit Committee recommends to the Supervisory Board the appointment of the external independent auditor, determines focus audit areas, discusses critical accounting policies and estimates with and reviews the audit reports issued and audit issues identified by the auditor. The Audit Committee also negotiates the audit fees with the auditor and monitors the auditor’s independence and quality. SAP’s Corporate Audit, SAP’s Office of Legal Compliance and Integrity and SAP’s Risk Management Office report upon request or at the occurrence of certain findings, but in any case at least once a year (Office of Legal Compliance and Integrity and Risk Management Office) or twice a year (Corporate Audit), directly to the Audit Committee.
The Audit Committee has established procedures regarding the prior approval of all audit and non-audit services provided by our external independent auditor. See “Item 16C. Principal Accountant Fees and Services” for details.
The Audit Committee also does preparatory work for the full Supervisory Board’s deliberations and resolutions on the adoption of the annual financial statements, the approval of the consolidated annual financial statements and the Integrated Report, and on the dividend proposal. Furthermore, the Audit Committee and the Finance and Investment Committee jointly prepare the full Supervisory Board’s resolution to approve the group annual plan.
The Supervisory Board has determined Erhard Schipporeit, the Audit Committee’s chairperson, to be an audit committee financial expert as defined by the regulations of the SEC issued under Section 407 of the Sarbanes-Oxley Act as well as an independent financial expert as defined by the German Stock Corporation Act. See “Item 16A. Audit Committee Financial Expert” for details.
The General and Compensation Committee
The General and Compensation Committee (Präsidial- und Personalausschuss) coordinates the work of the Supervisory Board, prepares its meetings and deals with corporate governance issues. In addition, it carries out the preparatory work necessary for the personnel decisions made by the Supervisory Board, notably those concerning compensation for the Executive Board members and the conclusion, amendment and termination of the Executive Board members’ contracts of appointment.
The German Stock Corporation Act prohibits the Compensation Committee from deciding on the compensation of the Executive Board members on behalf of the Supervisory Board and requires that such decision is made by the entire Supervisory Board. This Act also provides the General Meeting of Shareholders with the right to vote on the system for the compensation of Executive Board members, such vote, however, not being legally binding for the Supervisory Board.
The Finance and Investment Committee
The Finance and Investment Committee (Finanz- und Investitionsausschuss) addresses general financing issues. Furthermore, it regularly discusses acquisitions of intellectual property and companies, venture capital investments and other investments with the Executive Board and reports to the Supervisory Board on such investments. It is also responsible for the approval of such investments if the individual investment amount exceeds certain specified limits, as well as – together with the Audit Committee – for the preparation of the full Supervisory Board’s resolution to approve the group annual plan.
The Technology and Strategy Committee
The Technology and Strategy Committee (Technologie-und Strategieausschuss) monitors technology transactions and provides the Supervisory Board with in-depth technical advice.
The Nomination Committee
The Nomination Committee (Nominierungsausschuss) is exclusively composed of shareholder representatives and is responsible for identifying suitable candidates for membership of the Supervisory Board for
98
recommendation to the Annual General Meeting of Shareholders.
The Special Committee
The Special Committee (Sonderausschuss) deliberates on matters arising out of substantial exceptional risks, such as major litigations.
The People and Organization Committee
The People and Organization Committee (Ausschuss für Mitarbeiter- und Organisationsangelegenheiten) deliberates and advises the Executive and Supervisory Board on key personnel matters and major organizational changes below the Executive Board level as well as equal opportunities for women at SAP.
The duties and procedures of the Supervisory Board and its committees are specified in their respective rules of procedure, if any, which reflect the requirements of European and German law, including the SE Regulation and the German Stock Corporation Act, the Articles of Incorporation and the recommendations of the GCGC.
According to the provisions of the Sarbanes-Oxley Act, SAP does not grant loans to the members of the Executive Board or the Supervisory Board.
The Executive Board
The Executive Board manages the Company’s business, is responsible for preparing its strategy and represents it in dealings with third parties. The Executive Board reports regularly to the Supervisory Board about SAP operations and business strategies and prepares special reports upon request. A person may not serve on the Executive Board and on the Supervisory Board at the same time.
The Executive Board and the Supervisory Board cooperate closely for the benefit of the Company. The Executive Board is required to provide the Supervisory Board regular, prompt and comprehensive information about all of the essential issues affecting the SAP Group’s business progress and its potential business risks. Furthermore, the Executive Board must maintain regular contact with the chairperson of the Supervisory Board and vice versa. The Executive Board must inform the chairperson of the Supervisory Board promptly about exceptional events that are of significance to SAP’s business. The Supervisory Board chairperson must inform the Supervisory Board accordingly and shall, if required, convene an extraordinary meeting of the Supervisory Board.
Pursuant to the Articles of Incorporation, the Executive Board must consist of at least two members. SAP SE’s Executive Board is currently comprised of seven members. Any two members of the Executive Board
jointly or one member of the Executive Board and the holder of a special power of attorney (Prokurist) jointly may legally represent SAP SE. The Supervisory Board appoints each member of the Executive Board for a maximum term of five years, with the possibility of re-appointment. Under certain circumstances, a member of the Executive Board may be removed by the Supervisory Board prior to the expiration of that member’s term. A member of the Executive Board may not vote on matters relating to certain contractual agreements between such member and SAP SE, and may be liable to SAP SE if such member has a material interest in any contractual agreement between SAP and a third party which was not previously disclosed to and approved by the Supervisory Board. Further, as the compensation of the Executive Board members is set by the Supervisory Board, Executive Board members are unable to vote on their own compensation, with the exception that they are able to exercise voting rights in a General Meeting of Shareholders resolving a non-binding vote on the system for the compensation of Executive Board members.
Under German law SAP SE’s Supervisory Board members and Executive Board members have a duty of loyalty and care towards SAP SE. They must exercise the standard of care of a prudent and diligent businessman and bear the burden of proving they did so if their actions are contested. Both bodies must consider the interest of SAP SE shareholders and our employees and, to some extent, the common good. Those who violate their duties may be held jointly and severally liable for any resulting damages, unless they acted pursuant to a lawful resolution of the Annual General Meeting of Shareholders.
SAP has implemented a Code of Business Conduct for employees (see “Item 16B. Code of Ethics” for details). The employee code is equally applicable to managers and members of the Executive Board. Its rules are observed as well by members of the Supervisory board as applicable.
Under German law the Executive Board of SAP SE has to assess all major risks for the SAP Group. In addition, all measures taken by management to reduce and handle the risks have to be documented. Therefore, SAP’s management has adopted suitable measures such as implementing an enterprise-wide risk monitoring system to ensure that adverse developments endangering the corporate standing are recognized at a reasonably early point in time.
The Office of Legal Compliance and Integrity was created by the SAP Executive Board in 2006 to oversee and coordinate legal and regulatory policy compliance at SAP. The Chief Global Compliance Officer heading the Office of Legal Compliance and Integrity directly reports to the CFO of SAP SE and also has direct communication channels and reporting obligations to the Audit
99
Committee of the Supervisory Board. The Office of Legal Compliance and Integrity manages a network of more than 100 local subsidiary Compliance Officers who act as the point of contact for local questions or issues under the SAP Code of Business Conduct for employees. The Office of Legal Compliance and Integrity provides training and communication to SAP employees to raise awareness and understanding of legal and regulatory compliance policies. Employee help lines are also supported in each region where questions can be raised or questionable conduct can be reported without fear of retaliation.
The Annual General Meeting of Shareholders
Shareholders of the Company exercise their voting rights at shareholders’ meetings. The Executive Board calls the Annual General Meeting of Shareholders, which must take place within the first six months of each fiscal year. The Supervisory Board or the Executive Board may call an extraordinary meeting of the shareholders if the interests of the stock corporation so require. Additionally, shareholders of SAP SE holding in the aggregate a minimum of 5% of SAP SE’s issued share capital may call an extraordinary meeting of the shareholders. Shareholders as of the record date are entitled to attend and participate in shareholders’ meetings if they have provided timely notice of their intention to attend the meeting.
At the Annual General Meeting of Shareholders, the shareholders are asked, among other things, to formally approve the actions taken by the Executive Board and the Supervisory Board in the preceding fiscal year, to approve the appropriation of the corporation’s distributable profits and to appoint an external independent auditor. Shareholder representatives of the Supervisory Board are generally elected at the Annual General Meeting of Shareholders for a term of approximately five years. Shareholders may also be asked to grant authorization to repurchase treasury shares, to resolve on measures to raise or reduce the capital of the Company or to ratify amendments of our Articles of Incorporation. The Annual General Meeting of Shareholders can make management decisions only if requested to do so by the Executive Board.
CHANGE IN CONTROL
There are no provisions in the Articles of Incorporation of SAP SE that would have an effect of delaying, deferring or preventing a change in control of SAP SE and that would only operate with respect to a merger, acquisition or corporate restructuring involving it or any of its subsidiaries.
According to the German Securities Acquisition and Takeover Act (Wertpapiererwerbs- und Übernahmegesetz) a bidder seeking control of a
company with its corporate seat in Germany or another state of the European Economic Area (EEA) and its shares being traded on an EEA stock exchange must publish an advance notice of its decision to make a tender offer, submit an offer statement to the Federal Financial Supervisory Authority (Bundesanstalt für Finanzdienstleistungsaufsicht) for review, and obtain certification from a qualified financial institution that adequate financing is in place to complete the offer. The offer statement must be published upon approval by the Federal Financial Supervisory Authority or expiry of a certain time period without such publication being prohibited by the Federal Financial Supervisory Authority. Once a shareholder has acquired shares representing at least 30% of the voting rights in an EEA-listed company, it must make an offer for all remaining shares. The Securities Acquisition and Takeover Act requires the executive board of the target company to refrain from taking any measures that may frustrate the success of the takeover offer. However, the target executive board is permitted to take any action that a prudent and diligent management of a company that is not the target of a takeover bid would also take. Moreover, the target executive board may search for other bidders and, with the prior approval of the supervisory board, may take other defensive measures, provided that both boards act within the parameters of their general authority under the German Stock Corporation Act. An executive board may also adopt specific defensive measures if such measures have been approved by the supervisory board and were specifically authorized by the general shareholders’ meeting no earlier than 18 months in advance of such measures by a resolution of at least 75% of the shares represented.
Under the European Takeover Directive of 2004 member states had to choose whether EU restrictions on defensive measures apply to companies that are registered in their territory. Germany decided to opt out and to retain its current restrictions on a board implementing defensive measures (as described above). As required by the Directive if a country decides to opt out the German Securities Acquisition and Takeover Act grants companies the option of voluntarily applying the European standard by a change of the Articles of Incorporation (opt-in). SAP SE has not made use of this option.
CHANGE IN SHARE CAPITAL
Under German law, the capital stock may be increased in consideration of contributions in cash or in kind, or by establishing authorized capital or contingent capital or by an increase of the company’s capital reserves. Authorized capital provides the Executive Board with the flexibility to issue new shares for a period of up to five years. The Executive Board must obtain the approval of the Supervisory Board before issuing new shares with
100
regard to the authorized capital. Contingent capital allows the issuance of new shares for specified purposes, including stock option plans for Executive Board members or employees and the issuance of shares upon conversion of convertible bonds and exercise of stock options. By law, the Executive Board may only issue new shares with regard to the contingent capital for the specified purposes. Capital increases require an approval by at least 75% of the valid votes cast at the General Meeting of Shareholders in which the increase is proposed, and requires an amendment to the Articles of Incorporation.
The share capital may be reduced by an amendment to the Articles of Incorporation approved by at least 75% of the valid votes cast at the General Meeting of Shareholders. In addition, the Executive Board of SAP SE is allowed to authorize a reduction of the company’s capital stock by canceling a defined number of repurchased treasury shares if this repurchasing and the subsequent reduction have already been approved by the General Meeting of Shareholders.
The Articles of Incorporation do not contain conditions regarding changes in the share capital that are more stringent than those provided by applicable European and German law.
RIGHTS ACCOMPANYING OUR SHARES
There are no limitations imposed by German law or the Articles of Incorporation of SAP SE on the rights to own securities, including the rights of non-residents or foreign holders to hold the ADRs or ordinary shares, to exercise voting rights or to receive dividends or other payments on such shares.
According to the German stock corporation law, the rights of shareholders cannot be amended without shareholders’ consent. The Articles of Incorporation do not provide more stringent conditions regarding changes of the rights of shareholders than those provided by applicable European and German law.
Voting Rights
Each ordinary SAP SE share represents one vote. Cumulative voting is not permitted under applicable European and German law. A corporation’s articles of incorporation may stipulate a majority necessary to pass a shareholders’ resolution differing from the majority provided by law, unless the law mandatorily requires a certain majority. Section 21 (1) of SAP SE’s Articles of Incorporation provides that resolutions may be passed at the General Meeting of Shareholders with a majority of valid votes cast, unless a larger majority is prescribed by law or the Articles of Incorporation. SAP SE’s Articles of Incorporation as well as applicable European and German law require that the following matters, among
others, be approved by at least 75% of the valid votes cast at the General Meeting of Shareholders in which the matter is proposed:
| – | | changing the corporate purpose of the company set out in the Articles of Incorporation; |
| – | | capital increases and capital decreases; |
| – | | excluding preemptive rights of shareholders to subscribe for new shares or for treasury shares; |
| – | | a merger into, or a consolidation with, another company; |
| – | | a transfer of all or virtually all of the assets; |
| – | | a change of corporate form, including re-conversion into a German stock corporation; |
| – | | a transfer of the registered seat to another EU member state; and |
| – | | any other amendment to the Articles of Incorporation (pursuant to section 21 (2) sentence 1 of the Articles of Incorporation). For any amendments of the Articles of Incorporation which require a simple majority for stock corporations established under German law, however, section 21 (2) sentence 2 of SAP SE’s Articles of Incorporation provides that the simple majority of the valid votes cast is sufficient if at least half of the subscribed capital is represented or, in the absence of such quorum, the majority prescribed by law (i.e. two thirds of the votes cast, pursuant to sec. 59 of the SE Regulation) is sufficient. |
Dividend Rights
See “Item 3. Key Information – Dividends.”
Preemptive Rights
Shareholders have preemptive rights to subscribe (Bezugsrecht) for any issue of additional shares in proportion to their shareholdings in the issued capital. The preemptive rights may be excluded under certain circumstances by a shareholders’ resolution (approved by at least 75% of the valid votes cast at the General Meeting of Shareholders) or by the Executive Board authorized by such shareholders’ resolutions and subject to the consent of the Supervisory Board.
Liquidation
If SAP SE were to be liquidated, any liquidation proceeds remaining after all of our liabilities were paid would be distributed to our shareholders in proportion to their shareholdings.
Disclosure of Shareholdings
SAP SE’s Articles of Incorporation do not require shareholders to disclose their share holdings. The German Securities Trading Act (Wertpapierhandelsgesetz), however, requires holders of voting securities of SAP SE to notify SAP SE and the Federal Financial Supervisory Authority of the number of shares they hold if that number reaches, exceeds or falls
101
below specified thresholds. These thresholds are 3%, 5%, 10%, 15%, 20%, 25%, 30%, 50% and 75% of the corporation’s outstanding voting rights. In respect of certificates representing shares, the notification requirement shall apply exclusively to the holder of the certificates. In addition, the German Securities Trading Act also obliges anyone who holds, directly or indirectly, financial instruments that convey an unconditional entitlement to acquire under a legally binding agreement, shares in SAP SE, to notify SAP SE and the Federal Financial Supervisory Authority if the thresholds mentioned above have been reached, exceeded or fallen below, with the exception of the 3% threshold. This notification obligation also exists for the holder of a financial instrument which merely de facto enables its holder or a third party to acquire shares in SAP SE, subject to the thresholds mentioned in the preceding sentence. In connection with this notification obligation positions in voting rights and other financial instruments have to be aggregated.
Exchange Controls and Other Limitations Affecting Security Holders
The euro is a fully convertible currency. At the present time, Germany does not restrict the export or import of capital, except for investments in certain areas in accordance with applicable resolutions adopted by the United Nations and the European Union. However, for statistical purposes only, every individual or corporation residing in Germany (“Resident”) must report to the German Central Bank (Deutsche Bundesbank), subject only to certain immaterial exceptions, any payment received from or made to an individual or a corporation residing outside of Germany (“Non-Resident”) if such payment exceeds€12,500 (or the equivalent in a foreign currency). In addition, German Residents (except for individuals and certain financial institutions) must report any accounts payable to or receivable from Non-Residents if such payables or receivables, in the aggregate, exceed€5 million (or the equivalent in a foreign currency) at the end of any calendar month. Furthermore, companies resident in Germany with accounts payable to or receivable from Non-Residents in excess of€500 million have to report any payables or receivables to/from Non-Residents arising from derivative instruments at the end of each calendar quarter. Residents are also required to report annually to the German Central Bank any shares or voting rights of 10% or more which they hold directly or indirectly in non-resident corporations with total assets of more than€3 million. Corporations residing in Germany with assets in excess of€3 million must report annually to the German Central Bank any shares or voting rights of 10% or more held directly or indirectly by a Non-Resident.
TAXATION
General
The following discussion is a summary of certain material German tax and U.S. federal income tax consequences of the acquisition, ownership and disposition of our ADRs or ordinary shares to a U.S. Holder. In general, a U.S. Holder (as hereinafter defined) is any beneficial owner of our ADRs or ordinary shares that (i) is a citizen or resident of the U.S. or a corporation organized under the laws of the U.S. or any political subdivision thereof, an estate whose income is subject to U.S. federal income tax regardless of its source or a trust, if a U.S. court can exercise primary supervision over its administration and one or more U.S. persons are authorized to control all substantial decisions of the trust; (ii) is not a resident of Germany for purposes of the income tax treaty between the U.S. and Germany (Convention between the Federal Republic of Germany and the United States of America for the Avoidance of Double Taxation and the Prevention of Fiscal Evasion with respect to Taxes on Income and Capital and to certain other Taxes, as amended by the Protocol of June 1, 2006 and as published in the German Federal Law Gazette 2008 vol. II pp. 611/851; the “Treaty”); (iii) owns the ADRs or ordinary shares as capital assets; (iv) does not hold the ADRs or ordinary shares as part of the business property of a permanent establishment or a fixed base in Germany; and (v) is fully entitled to the benefits under the Treaty with respect to income and gain derived in connection with the ADRs or ordinary shares.
THE FOLLOWING IS NOT A COMPREHENSIVE DISCUSSION OF ALL GERMAN TAX AND U.S. FEDERAL INCOME TAX CONSEQUENCES THAT MAY BE RELEVANT FOR U.S. HOLDERS OF OUR ADRs OR ORDINARY SHARES. THEREFORE, U.S. HOLDERS ARE STRONGLY URGED TO CONSULT THEIR OWN TAX ADVISORS REGARDING THE OVERALL GERMAN TAX AND U.S. FEDERAL INCOME TAX CONSEQUENCES OF THE ACQUISITION, OWNERSHIP AND DISPOSITION OF OUR ADRs OR ORDINARY SHARES IN LIGHT OF THEIR PARTICULAR CIRCUMSTANCES, INCLUDING THE EFFECT OF ANY STATE, LOCAL OR OTHER FOREIGN OR DOMESTIC LAWS.
German Taxation
The summary set out below is based on German tax laws, interpretations thereof and applicable tax treaties to which Germany is a party and that are in force at the date of this report; it is subject to any changes in such authority occurring after that date, potentially with retroactive effect, that could result in German tax consequences different from those discussed below. This discussion is also based, in part, on representations of the Depositary and assumes that each obligation of the Deposit Agreement and any related agreements will be performed in accordance with its terms. For
102
additional information on the Depository and the fees associated with SAP’s ADR program see “Item 12. Description of Securities Other Than Equity Securities – American Depository Shares.”
For purposes of applying German tax law and the applicable tax treaties to which Germany is a party, a holder of ADRs will generally be treated as owning the ordinary shares represented thereby.
German Taxation of Dividends
Under German income tax law, the full amount of dividends distributed by an incorporated company is generally subject to German withholding tax at a domestic rate of 25% plus a solidarity surtax of 5.5% thereon (effectively 1.375% of dividends before withholding tax), resulting in an aggregate withholding tax rate from dividends of 26.375%. From January 1, 2017, taxes are incurred on the third bank working day after the annual general meeting, or at a later date as may be stipulated by SAP’s articles of incorporation or by the annual general meeting’s decision on dividends. Non-resident corporate shareholders will generally be entitled to a refund in the amount of two-fifths of the withholding tax (including solidarity surtax thereon). This does not preclude a further reduction or refund of withholding tax, if any, available under a relevant tax treaty.
Generally, for many non-resident shareholders the withholding tax rate is currently reduced under applicable income tax treaties. Rates and refund procedures may vary according to the applicable treaty. To reduce the withholding tax to the applicable treaty tax rate a non-resident shareholder must apply for a refund of withholding taxes paid. Claims for refund, if any, are made on a special German claim for refund form, which must be filed with the German Federal Tax Office (Bundeszentralamt für Steuern, D-53221 Bonn, Germany; http://www.bzst.de). The relevant forms can be obtained from the German Federal Tax Office or from German embassies and consulates. For details, such non-resident shareholders are urged to consult their own tax advisors. Special rules apply for the refund to U.S. Holders (we refer to the below section “Refund Procedures for U.S. Holders”).
Refund Procedures for U.S. Holders
Under the Treaty, a partial refund of the 25% withholding tax equal to 10% of the gross amount of the dividend and a full refund of the solidarity surtax can be obtained by a U.S. Holder. Thus, for each US$100 of gross dividends paid by SAP SE to a U.S. Holder, the dividends (which are dependent on the euro/dollar exchange rate at the time of payment) will be initially subject to a German withholding tax of US$26.375, of which US$11.375 may be refunded under the Treaty. As a result, a U.S. Holder effectively would receive a total dividend of US$85
(provided the euro/dollar exchange rate at the time of payment of the dividend is the same as at the time of refund, otherwise the effective dividend may be higher or lower). Further relief of German withholding tax under the Treaty may be available for corporate U.S. Holders owning at least 10% of the voting stock of SAP or U.S. Holders qualifying as pension fund within the meaning of the Treaty, subject to further requirements being met.
To claim the refund of amounts withheld in excess of the Treaty rate, a U.S. Holder must submit (either directly or, as described below, through the Data Medium Procedure participant) a claim for refund to the German tax authorities, with, in the case of a direct claim, the original bank voucher (or certified copy thereof) issued by the paying entity documenting the tax withheld, within four years from the end of the calendar year in which the dividend is received. Claims for refund are made on a special German claim for refund form (Form E-USA), which must be filed with the German Federal Tax Office (Bundeszentralamt für Steuern, D-53221 Bonn, Germany). The German claim for refund form may be obtained from the German tax authorities at the same address where applications are filed, from the Embassy of the Federal Republic of Germany, 4645 Reservoir Road NW, Washington, DC 20007, or can be downloaded from the homepage of the German Federal Tax Office (http://www.bzst.de).
U.S. Holders must also submit to the German tax authorities a certification of their U.S. residency status (IRS Form 6166). This certification can be obtained from the Internal Revenue Service by filing a request for certification (generally on an IRS Form 8802, which will not be processed unless a user fee is paid) with the Internal Revenue Service, P.O. Box 71052, Philadelphia, PA 19176-6052. U.S. Holders should consult their own tax advisors regarding how to obtain an IRS Form 6166.
An IT-supported quick-refund procedure is available for dividends received (the “Data Medium Procedure – DMP”). If the U.S. Holder’s bank or broker elects to participate in the DMP, it will perform administrative functions necessary to claim the Treaty refund for the beneficiaries. The refund beneficiaries must confirm to the DMP participant that they meet the conditions of the Treaty provisions and that they authorize the DMP participant to file applications and receive notices and payments on their behalf. Further each refund beneficiary must confirm that (i) it is the beneficial owner of the dividends received; (ii) it is resident in the U.S. in the meaning of the Treaty; (iii) it does not have its domicile, residence or place of management in Germany; (iv) the dividends received do not form part of a permanent establishment or fixed base in Germany; and (v) it commits, due to its participation in the DMP, not to claim separately for refund.
103
The beneficiaries also must provide an IRS Form 6166 certification with the DMP participant. The DMP participant is required to keep these documents in its files and prepare and file a combined claim for refund with the German tax authorities by electronic media. The combined claim provides evidence of a U.S. Holder’s personal data including its U.S. Tax Identification Number.
The German tax authorities reserve the right to audit the entitlement to tax refunds for several years following their payment pursuant to the Treaty in individual cases. The DMP participant must assist with the audit by providing the necessary details or by forwarding the queries to the respective refund beneficiaries.
The German tax authorities will issue refunds denominated in euros. In the case of shares held through banks or brokers participating in the Depository, the refunds will be issued to the Depository, which will convert the refunds to dollars. The resulting amounts will be paid to banks or brokers for the account of the U.S. Holders.
German Taxation of Capital Gains
Under German income tax law, a capital gain derived from the sale or other disposition of ADRs or ordinary shares by a non-resident shareholder is subject to income tax in Germany only if such non-resident shareholder has held, directly or indirectly, ADRs or ordinary shares representing 1% or more of the registered share capital of a company at any time during the five-year period immediately preceding the sale or other disposition.
However, a U.S. Holder of ADRs or ordinary shares that qualifies for benefits under the Treaty is not subject to German income or corporate income tax on the capital gain derived from the sale or other disposition of ADRs or ordinary shares.
German Gift and Inheritance Tax
Generally, a transfer of ADRs or ordinary shares by a shareholder at death or by way of gift will be subject to German gift or inheritance tax, respectively, if (i) the decedent or donor, or the heir, donee or other transferee is resident in Germany at the time of the transfer, or with respect to German citizens who are not resident in Germany, if the decedent or donor, or the heir, donee or other transferee has not been continuously outside of Germany for a period of more than five years; (ii) the ADRs or ordinary shares are part of the business property of a permanent establishment or a fixed base in Germany; or (iii) the ADRs or ordinary shares subject to such transfer form part of a portfolio that represents 10% or more of the registered share capital of the Company and has been held, directly or indirectly, by the
decedent or donor, respectively, at the time of the transfer, actually or constructively together with related parties.
However, the right of the German government to impose gift or inheritance tax on a non-resident shareholder may be limited by an applicable estate tax treaty. In the case of a U.S. Holder, a transfer of ADRs or ordinary shares by a U.S. Holder at death or by way of gift generally will not be subject to German gift or inheritance tax by reason of the estate tax treaty between the U.S. and Germany (Convention between the Federal Republic of Germany and the United States of America for the Avoidance of Double Taxation with respect to Estate, Gift and Inheritance Taxes, German Federal Law Gazette 1982 vol. II page 846, as amended by the Protocol of December 14, 1998 and as published on December 21, 2000, German Federal Law Gazette 2001 vol. II, page 65; the “Estate Tax Treaty”) so long as the decedent or donor, or the heir, donee or other transferee was not domiciled in Germany for purposes of the Estate Tax Treaty at the time the gift was made, or at the time of the decedent’s death, and the ADRs or ordinary shares were not held in connection with a permanent establishment or a fixed base in Germany. In general, the Estate Tax Treaty provides a credit against the U.S. federal gift or estate tax liability for the amount of gift or inheritance tax paid in Germany, subject to certain limitations, in a case where the ADRs or ordinary shares are subject to German gift or inheritance tax and U.S. federal gift or estate tax.
Other German Taxes
There are currently no German net worth, transfer, stamp or other similar taxes that would apply to a U.S. Holder on the acquisition, ownership, sale or other disposition of our ADRs or ordinary shares.
U.S. Taxation
The following discussion applies to U.S. Holders only if the ADRs and ordinary shares are held as capital assets for tax purposes. It does not address tax considerations applicable to U.S. Holders that may be subject to special tax rules, such as dealers or traders in securities, financial institutions, insurance companies, tax-exempt entities, regulated investment companies, U.S. Holders that hold ordinary shares or ADRs as a part of a straddle, conversion transaction or other arrangement involving more than one position, U.S. Holders that own (or are deemed for U.S. tax purposes to own) 10% or more of the total combined voting power of all classes of voting stock of SAP SE, U.S. Holders that have a principal place of business or “tax home” outside the United States or U.S. Holders whose “functional currency” is not the dollar and U.S. Holders that hold ADRs or ordinary shares through partnerships or other pass-through entities.
104
The summary set out below is based upon the U.S. Internal Revenue Code of 1986, as amended (the “Code”), the Treaty and regulations, rulings and judicial decisions thereunder at the date of this report. Any such authority may be repealed, revoked or modified, potentially with retroactive effect, so as to result in U.S. federal income tax consequences different from those discussed below. No assurance can be given that the conclusions set out below would be sustained by a court if challenged by the IRS. The discussion below is based, in part, on representations of the Depositary, and assumes that each obligation in the Deposit Agreement and any related agreements will be performed in accordance with its terms.
For U.S. federal income tax purposes, a U.S. Holder of ADRs will be considered to own the ordinary shares represented thereby. Accordingly, unless the context otherwise requires, all references in this section to ordinary shares are deemed to refer likewise to ADRs representing an ownership interest in ordinary shares.
U.S. Taxation of Dividends
Subject to the discussion below under “Passive Foreign Investment Company Considerations”, distributions made by SAP SE with respect to ordinary shares (other than distributions in liquidation and certain distributions in redemption of stock), including the amount of German tax deemed to have been withheld in respect of such distributions, will generally be taxed to U.S. Holders as ordinary dividend income.
As discussed above, a U.S. Holder may obtain a refund of German withholding tax under the Treaty to the extent that the German withholding tax exceeds 15% of the dividend distributed. Thus, for each US$100 of gross dividends paid by SAP SE to a U.S. Holder, the dividends (which are dependent on the euro/dollar exchange rate at the time of payment) will be initially subject to German withholding tax of US$25 plus US$1.375 solidarity surtax, and the U.S. Holder will receive US$73.625. A U.S. Holder who obtains the Treaty refund will receive from the German tax authorities an additional amount in euro that would be equal to US$11.375. For U.S. tax purposes, such U.S. Holder will be considered to have received a total distribution of US$100, which will be deemed to have been subject to German withholding tax of US$15 (15% of US$100) resulting in the net receipt of US$85 (provided the euro/dollar exchange rate at the time of payment of the dividend is the same as at the time of refund, otherwise the effective dividend may be higher or lower).
In the case of a distribution in euro, the amount of the distribution generally will equal the dollar value of the euro distributed (determined by reference to the spot currency exchange rate on the date of receipt of the
distribution, or receipt by the Depositary in the case of a distribution on ADRs), regardless of whether the holder in fact converts the euro into dollars, and the U.S. Holder will not realize any separate foreign currency gain or loss (except to the extent that such gain or loss arises on the actual disposition of foreign currency received). However, a U.S. Holder may be required to recognize foreign currency gain or loss on the receipt of a refund in respect of German withholding tax to the extent the U.S. dollar value of the refund differs from the U.S. dollar equivalent of that amount on the date of receipt of the underlying dividend.
Dividends paid by SAP SE generally will constitute “portfolio income” for purposes of the limitations on the use of passive activity losses (and, therefore, generally may not be offset by passive activity losses) and as “investment income” for purposes of the limitation on the deduction of investment interest expense. Dividends paid by SAP SE will not be eligible for the dividends received deduction generally allowed to U.S. corporations under Section 243 of the Code. Dividends paid by SAP SE to an individual are treated as “qualified dividends” subject to capital gains rates, i.e. at a maximum rate of 20%, if SAP SE was not in the prior year and, is not in the year in which the dividend is paid, a passive foreign investment company (“PFIC”). Based on our audited financial statements and relevant market and shareholder data, we believe that we were not treated as a PFIC for U.S. federal income taxes with respect to our 2016 tax year. In addition, based on our audited financial statements and our current expectations regarding the value and nature of our assets, the sources and nature of our income, and relevant market and shareholder data, we do not anticipate becoming a PFIC for the 2017 tax year. With the enactment of The Health Care and Education Reconciliation Act of 2010, certain US holders who are individuals, trusts, or estates, must pay a Medicare tax at a rate of 3.8% on the lesser of (i) net investment income such as dividends and (ii) the excess of modified adjusted gross income over the statutory thresholds.
U.S. Taxation of Capital Gains
In general, assuming that SAP SE at no time is a PFIC, upon a sale or exchange of ordinary shares to a person other than SAP SE, a U.S. Holder will recognize gain or loss in an amount equal to the difference between the amount realized on the sale or exchange and the U.S. Holder’s adjusted tax basis in the ordinary shares. Such gain or loss will be a capital gain or loss and will be considered a long-term capital gain (taxable at a reduced rate for individuals) if the ordinary shares were held for more than one year. Capital gains may also be subject to the Medicare tax at a rate of 3.8%. The deductibility of capital losses is subject to significant limitations. Upon a sale of ordinary shares to SAP SE, a U.S. Holder may
105
recognize a capital gain or loss or, alternatively, may be considered to have received a distribution with respect to the ordinary shares, in each case depending upon the application to such sale of the rules of Section 302 of the Code.
Deposit and withdrawal of ordinary shares in exchange for ADRs by a U.S. Holder will not result in its realization of gain or loss for U.S. federal income tax purposes.
U.S. Information Reporting and Backup Withholding
Dividend payments made to holders and proceeds paid from the sale of shares or ADRs are subject to information reporting to the Internal Revenue Service and will be subject to backup withholding taxes (currently imposed at a 28% rate) unless the holder (i) is a corporation or other exempt recipient or (ii) provides a taxpayer identification number on a properly completed IRS Form W-9 and certifies that no loss of exemption from backup withholding has occurred. Holders that are not U.S. persons are not subject to information reporting or backup withholding. However, such a holder may be required to provide a certification of its non-U.S. status in connection with payments received within the United States or through a U.S.-related financial intermediary.
Backup withholding is not an additional tax and any amounts withheld as backup withholding may be credited against a holder’s U.S. federal income tax liability. A holder may obtain a refund of any excess amounts withheld under the backup withholding rules by timely filing the appropriate claim for refund with the Internal Revenue Service and furnishing any required information.
Shareholders may be subject to other U.S. information reporting requirements and should consult their own tax advisors for application of these reporting requirements to their own facts and circumstances.
U.S. Foreign Tax Credit
In general, in computing its U.S. federal income tax liability, a U.S. Holder may elect for each taxable year to claim a deduction or, subject to the limitations on foreign tax credits generally, a credit for foreign income taxes paid or accrued by it. For U.S. foreign tax credit purposes, subject to the applicable limitations under the foreign tax credit rules, German tax withheld from dividends paid to a U.S. Holder, up to the 15% provided under the Treaty, will be eligible for credit against the U.S. Holder’s federal income tax liability or, if the U.S. Holder has elected to deduct such taxes, may be deducted in computing taxable income.
For U.S. foreign tax credit purposes, dividends paid by SAP SE generally will be treated as foreign-source income and as “passive category income” (or in the case
of certain holders, as “general category income”). Gains or losses realized by a U.S. Holder on the sale or exchange of ordinary shares generally will be treated as U.S.-source gain or loss.
Passive Foreign Investment Company Considerations
Special and adverse U.S. tax rules apply to a U.S. Holder that holds an interest in a passive foreign investment company (PFIC). Based on current projections concerning the composition of SAP SE’s income and assets, SAP SE does not believe that it will be treated as a PFIC for its current or future taxable years. However, because this conclusion is based on our current projections and expectations as to its future business activity, SAP SE can provide no assurance that it will not be treated as a PFIC in respect of its current or any future taxable years.
MATERIAL CONTRACTS
See “Item 5. Operating and Financial Review and Prospects – Liquidity and Capital Resources”, for information on our credit facilities.
DOCUMENTS ON DISPLAY
We are subject to the informational requirements of the Securities Exchange Act of 1934, as amended. In accordance with these requirements, we file reports and furnish other information as a foreign private issuer with the SEC. These materials, including this report and the exhibits thereto, may be inspected and copied at the SEC’s Public Reference Room at 100 F Street, N.E., Room 1580, Washington, D.C. 20549. The SEC also maintains a Web site at www.sec.gov that contains reports and other information regarding registrants that file electronically with the SEC. This report as well as some of the other information submitted by us to the SEC may be accessed through this Web site. In addition, information about us is available at our Web site:www.sap.com.
ITEM 11. QUANTITATIVE AND QUALITATIVE DISCLOSURES ABOUT MARKET RISK
We are exposed to various financial risks, such as market risks, including changes in foreign currency exchange rates, interest rates and equity prices, as well as credit risk and liquidity risk. We manage these risks on a Group-wide basis. Selected derivatives are exclusively used for this purpose and not for speculation, which is defined as entering into derivative instruments without a corresponding underlying transaction. Financial risk management is done centrally. See Notes (24) and (25) to our Consolidated Financial Statements for our quantitative and qualitative disclosures about market risk.
106
ITEM 12. DESCRIPTION OF SECURITIES OTHER THAN EQUITY SECURITIES
AMERICAN DEPOSITARY SHARES
Fees and Charges Payable by ADR Holders
Deutsche Bank Trust Company Americas is the Depositary for SAP SE’s ADR program. ADR holders may be required to pay the following charges:
| – | | taxes and other governmental charges; |
| – | | registration fees as may be in effect from time to time for the registration of transfers of SAP ordinary shares on any applicable register to the Depositary or its nominee or the custodian or its nominee in connection with deposits or withdrawals under the Deposit Agreement; |
| – | | applicable air courier, cable, telex and facsimile expenses of the Depositary; |
| – | | expenses incurred by the Depositary in the conversion of foreign currency; |
| – | | US $5.00 or less per 100 ADSs (or portion thereof) to the Depositary for the execution and delivery of ADRs (including in connection with the depositing of SAP ordinary shares or the exercising of rights) and the surrender of ADRs; |
| – | | a maximum aggregate service fee of US $3.00 per 100 ADSs (or portion thereof) per calendar year to the Depositary for the services performed by the Depositary in administering the ADR program, including for processing any cash dividends and other cash distributions; and |
| – | | US $5.00 or less per 100 ADSs (or portion thereof) to the Depositary for distribution of securities other than SAP ordinary shares or rights. |
These fees may at any time and from time to time be changed by agreement between SAP SE and the Depositary. These charges are described more fully in Section 5.9 of the Amended and Restated Deposit Agreement dated as of November 25, 2009, as amended by Amendment No. 1 dated as of March 18, 2016 and as may be further amended from time to time, incorporated by reference as Exhibits 4.1.1 and 4.1.2 to this report.
Applicable service fees are either deducted from any cash dividends or other cash distributions or charged separately to holders in a manner determined by the Depositary, depending on whether ADSs are registered in the name of investors (whether certificated or in book-
entry form) or held in brokerage and custodian accounts (via DTC). In the case of distributions of securities other than SAP ordinary shares or rights, the Depositary charges the applicable ADS record date holder concurrent with the distribution. In the case of ADSs registered in the name of the investor, whether certificated or in book entry form, the Depositary sends invoices to the applicable record date ADS holders. For ADSs held in brokerage and custodian accounts via DTC, the Depositary may, if permitted by the settlement systems provided by DTC, collect the fees through those settlement systems from the brokers and custodians holding ADSs in their DTC accounts. The brokers and custodians who hold their clients’ ADSs in DTC accounts in such case may in turn charge their clients’ accounts the amount of the service fees paid to the Depositary.
In the event of a refusal to pay applicable fees, the Depositary may refuse the requested services until payment is received or may set off the amount of the service from any distribution to be made to the ADR holder, all in accordance with the Deposit Agreement.
If any taxes or other governmental charges are payable by the holders and/or beneficial owners of ADSs to the Depositary, the Depositary, the custodian or SAP may withhold or deduct from any distributions made in respect of the deposited SAP ordinary share and may sell for the account of the holder and/or beneficial owner any or all of the deposited ordinary shares and apply such distributions and sale proceeds in payment of such taxes (including applicable interest and penalties) or charges, with the holder and the beneficial owner thereof remaining fully liable for any deficiency.
Fees and Other Payments Payable by the Depositary to SAP
In connection with the ADR program, the Depositary has agreed to make certain payments to SAP and waive certain costs of providing ADR administrative and reporting services, including reporting of ADR program activity, distribution of information to investors and managing the ADR program. For the period beginning November 25, 2015 and ending November 24, 2016, the Depositary made direct and indirect payments to SAP in an aggregate amount of US $1,492,292.55 related to the ADR program.
107
PART II
ITEM 13. DEFAULTS, DIVIDEND ARREARAGES AND DELINQUENCIES
None.
ITEM 14. MATERIAL MODIFICATIONS TO THE RIGHTS OF SECURITY HOLDERS AND USE OF PROCEEDS
None.
ITEM 15. CONTROLS AND PROCEDURES
EVALUATION OF DISCLOSURE CONTROLS AND PROCEDURES
Disclosure controls and procedures are controls and other procedures of SAP that are designed to ensure that information required to be disclosed by SAP in the reports that it files or submits under the Exchange Act is recorded, processed, summarized and reported within the time periods specified in the Commission’s rules and forms. Disclosure controls and procedures include, without limitation, controls and procedures designed to ensure that information required to be disclosed by SAP in the reports that it files or submits under the Exchange Act is accumulated and communicated to SAP management, including SAP’s principal executive and financial officers (i.e. SAP’s chief executive officer (CEO) and chief financial officer (CFO)), or persons performing similar functions, as appropriate to allow timely decisions regarding required disclosure. SAP’s management evaluated, with the participation of SAP’s CEO and CFO the effectiveness of SAP’s disclosure controls and procedures as of December 31, 2016. The evaluation was led by SAP’s Global Governance Risk & Compliance function, including dedicated “SOX Champions” in all of SAP’s major entities and business units with the participation of process owners, SAP’s key corporate senior management, senior management of each business group, and as indicated above under the supervision of SAP’s CEO and CFO. Based on the foregoing, SAP’s management, including SAP’s CEO and CFO, concluded that as of December 31, 2016, SAP’s disclosure controls and procedures were effective.
MANAGEMENT’S ANNUAL REPORT ON INTERNAL CONTROL OVER FINANCIAL REPORTING
The management of SAP is responsible for establishing and maintaining adequate internal control over financial reporting as such term is defined in Rules 13a-15(f) and 15d-15(f) under the Securities Exchange Act of 1934. SAP’s internal control over financial reporting is a process designed under the supervision of SAP’s CEO and CFO to provide reasonable assurance regarding the reliability of financial reporting and the preparation of financial statements for external reporting purposes in
accordance with International Financial Reporting Standards as issued by the International Accounting Standards Board.
SAP’s management assessed the effectiveness of the Company’s internal control over financial reporting as of December 31, 2016. In making this assessment, it used the criteria set forth by the Committee of Sponsoring Organizations of the Treadway Commission (COSO) in “Internal Control – Integrated Framework (2013)”.
Based on the assessment under these criteria, SAP management has concluded that, as of December 31, 2016, the Company’s internal control over financial reporting was effective.
KPMG, our independent registered public accounting firm, has issued its attestation report on the effectiveness of SAP’s internal control over financial reporting, which is included in Item 18. Financial Statements, “Report of Independent Registered Public Accounting Firm.”
CHANGES IN INTERNAL CONTROL OVER FINANCIAL REPORTING
There has been no change in our internal control over financial reporting framework during the period covered by this report that has materially affected, or is reasonably likely to materially affect, our internal control over financial reporting.
ITEM 16. [RESERVED]
ITEM 16A. AUDIT COMMITTEE FINANCIAL EXPERT
Our Supervisory Board has determined that Erhard Schipporeit is an “audit committee financial expert”, as defined by the regulations of the Commission issued pursuant to Section 407 of the Sarbanes-Oxley Act of 2002 and meeting the requirements of Item 16A. He is “independent”, as such term is defined in Rule 10A-3 under the Exchange Act.
ITEM 16B. CODE OF ETHICS
In 2003, SAP adopted a Code of Business Conduct that applies to all employees (including all personnel in the accounting and controlling departments), managers and the members of SAP’s Executive Board (including our CEO and CFO). Our Code of Business Conduct constitutes a “code of ethics” as defined in Item 16.B of Form 20-F. Our Code of Business Conduct sets standards for all dealings with customers, partners, competitors and suppliers and includes, among others, regulations with regard to confidentiality, loyalty, preventing conflicts of interest, preventing bribery, data protection and privacy and avoiding anti-competitive practices. International differences in culture, language,
108
and legal and social systems make the adoption of uniform Codes of Business Conduct across an entire global company challenging. As a result, SAP has set forth a master code containing minimum standards. In turn, each company within the SAP Group has been required to adopt a similar code that meets at least these minimum standards, but may also include additional or more stringent rules of conduct. Newly acquired companies also are required to meet the minimum standards set forth in the Code of Business Conduct. SAP amends its Code of Business Conduct as necessary, including in February 2012 and most recently in December 2016.
We have made our amended Code of Business Conduct publicly available by posting the full text on our Web site under http://www.sap.com/corporate-en/investors/governance/policies-statutes.epx.
ITEM 16C. PRINCIPAL ACCOUNTANT FEES AND SERVICES
AUDIT FEES, AUDIT RELATED FEES, TAX FEES AND ALL OTHER FEES
Refer to Note (31) to our Consolidated Financial Statements for information on fees charged by our independent registered public accounting firm, KPMG, for audit services and other professional services.
AUDIT COMMITTEE’S PRE-APPROVAL POLICIES AND PROCEDURES
As required under German law, our shareholders appoint our external independent auditors to audit our financial statements, based on a proposal that is legally required to be submitted by the Supervisory Board. The Supervisory Board’s proposal is based on a recommendation by the Audit Committee. See also the description in “Item 10. Additional Information – Corporate Governance.”
In 2002 our Audit Committee adopted a policy with regard to the pre-approval of audit and non-audit services to be provided by our external independent auditors. This policy, which is designed to assure that such engagements do not impair the independence of our auditors, was amended and expanded in 2003, 2007 and 2009 (changes in 2009 only related to information requirements). The policy requires prior approval of the Audit Committee for all services to be provided by our external independent auditors for any entity of the SAP Group. With regard to non-audit services the policy distinguishes among three categories of services:
| – | | “Prohibited services:” This category includes services that our external independent auditors must not be engaged to perform. These are services that are not permitted by applicable law or that would be inconsistent with maintaining the auditors’ independence. |
| – | | “Services requiring universal approval:” Services of this category may be provided by our external independent auditors up to a certain aggregate amount in fees per year that is determined by the Audit Committee. |
| – | | “Services requiring individual approval:” Services of this category may only be provided by our external independent auditors if they have been individually (specifically) pre-approved by the Audit Committee or an Audit Committee member who is authorized by the Audit Committee to make such approvals. |
Our Chief Accounting Officer or individuals empowered by him review all individual requests to engage our external independent auditors as a service provider in accordance with this policy and determines the category to which the requested service belongs. All requests for engagements with expected fees over a specified limit are additionally reviewed by our CFO. Based on the determination of the category the request is (i) declined if it is a “prohibited service,” (ii) approved if it is a “service requiring universal approval” and the maximum aggregate amount fixed by the Audit Committee has not been reached or (iii) forwarded to the Audit Committee for individual approval if the “service requires individual approval” or is a “service requiring universal approval” and the maximum aggregate amount fixed by the Audit Committee has been exceeded.
Our Audit Committee’s pre-approval policies also include information requirements to ensure the Audit Committee is kept aware of the volume of engagements involving our external independent auditors that were not individually pre-approved by the Audit Committee itself.
Substantially all of the work performed to audit our Consolidated Financial Statements was performed by our principal accountant’s full-time, permanent employees.
ITEM 16D. EXEMPTIONS FROM THE LISTING STANDARDS FOR AUDIT COMMITTEES
Rule 10A-3 of the Exchange Act requires that all members of our audit committee be independent, subject to certain exceptions. In accordance with German law, the Audit Committee consists of both employee and shareholder elected members. Rule 10A-3 provides an exception for an employee of a foreign private issuer such as SAP who is not an executive officer of that issuer and who is elected to the supervisory board or audit committee of that issuer pursuant to the issuer’s governing law. In this case, the employee is exempt from the independence requirements of Rule 10A-3 and is permitted to sit on the audit committee.
109
We rely on this exemption. Our Audit Committee includes two employee representatives, Panagiotis Bissiritsas and Martin Duffek, who were appointed to our Supervisory Board pursuant to the Agreement on the Involvement of Employees in SAP SE (see “Item 6. Directors, Senior Management and Employees.” for details). We believe that our reliance on this exemption does not materially adversely affect the ability of our Audit Committee to act independently and to satisfy the other requirements of Rule 10A-3.
ITEM 16E. PURCHASES OF EQUITY SECURITIES BY THE ISSUER AND AFFILIATED PURCHASERS
At the Annual General Meeting of Shareholders on June 4, 2013, the Executive Board was authorized to acquire, on or before June 3, 2018, up to 120 million shares of SAP. The authorization from June 4, 2013 replaced the authorization from June 8, 2010.
The authorization is subject to the provision that the shares to be purchased, together with any other shares already acquired and held by SAP, do not account for more than 10% of SAP’s capital stock.
In 2016 there were no purchases made by us or on our behalf or on behalf of affiliates of SAP of SAP shares or SAP ADRs. The total number of SAP shares that SAP could purchase under existing repurchase programs was 92,970,033 as of December 31, 2016.
ITEM 16F. CHANGES IN REGISTRANT’S CERTIFYING ACCOUNTANT
Not applicable.
ITEM 16G. DIFFERENCES IN CORPORATE GOVERNANCE PRACTICES
The following summarizes the principal ways in which our corporate governance practices differ from the New York Stock Exchange (NYSE) corporate governance rules applicable to U.S. domestic issuers (the NYSE Rules).
INTRODUCTION
SAP is incorporated under the laws of the European Union and Germany, with securities publicly traded on markets in Germany, including the Frankfurt Exchange and in the United States on the NYSE.
The NYSE Rules permit foreign private issuers to follow applicable home country corporate governance practices in lieu of the NYSE corporate governance standards, subject to certain exceptions. Foreign private issuers electing to follow home country corporate governance rules are required to disclose the principal
differences in their corporate governance practices from those required under the NYSE Rules. This Item 16G summarizes the principal ways in which SAP’s corporate governance practices differ from the NYSE Rules applicable to domestic issuers.
LEGAL FRAMEWORK
The primary sources of law relating to the corporate governance of a European Company are the Council Regulation (EC) No. 2157/2001 on the Statute for a European Company (the “SE Regulation”), the German Act on the Implementation of Council Regulation No. 2157/2001 of October 8, 2001 on the Statute for a European Company (Gesetz zur Ausführung der Verordnung (EG) Nr. 2157/2001 des Rates vom 8. Oktober 2001 über das Statut der Europäischen Gesellschaft (SE) – SE-Ausführungsgesetz; “SE-AG”) of December 22, 2004, and the German Stock Corporation Act (Aktiengesetz). Additionally, European Market Abuse Regulation (MAR), the Securities Trading Act (Wertpapierhandelsgesetz), the German Securities Purchase and Take Over Act (Wertpapiererwerbs- und Übernahmegesetz), the Stock Exchange Admission Regulations, the German Commercial Code (Handelsgesetzbuch) and certain other German statutes contain corporate governance rules applicable to SAP. In addition to these mandatory rules, the German Corporate Governance Code (“GCGC”) summarizes the mandatory statutory corporate governance principles found in the German Stock Corporation Act and other provisions of German law. Further, the GCGC contains supplemental recommendations and suggestions for standards on responsible corporate governance intended to reflect generally accepted best practices.
The German Stock Corporation Act requires the executive and the supervisory board of publicly listed companies like SAP to declare annually that the recommendations set forth in the GCGC have been and are being complied with or which of the recommendations have not been or are not being complied with and why not. SAP has disclosed and reasoned deviations from a few of the GCGC recommendations in its Declaration of Implementation on a yearly basis since 2003. Declarations from 2012 forward are available on the SAP website.
SIGNIFICANT DIFFERENCES
We believe the following to be the significant differences between applicable European and German corporate governance practices, as SAP has implemented them, and those applicable to domestic companies under the NYSE Rules.
110
SAP SE IS A EUROPEAN COMPANY WITH A TWO-TIER BOARD SYSTEM
SAP is governed by three separate bodies: (i) the Supervisory Board, which counsels, supervises and controls the Executive Board; (ii) the Executive Board, which is responsible for the management of SAP; and (iii) the General Meeting of Shareholders. The rules applicable to these governing bodies are defined by European and German law and by SAP’s Articles of Incorporation. This corporate structure differs from the unitary board of directors established by the relevant laws of all U.S. states and the NYSE Rules. Under the SE Regulation and the German Stock Corporation Act, the Supervisory Board and Executive Board are separate and no individual may be a member of both boards. See “Item 10. Additional Information – Corporate Governance” for additional information on the corporate structure.
DIRECTOR INDEPENDENCE RULES
The NYSE Rules require that a majority of the members of the board of directors of a listed issuer and each member of its nominating, corporate governance, compensation and audit committee be “independent.” As a foreign private issuer, SAP is not subject to the NYSE board, compensation committee and corporate governance committee independence requirements but instead can elect to follow its home country rules. With respect to the audit committee, SAP is required to satisfy Rule 10A-3 of the Exchange Act, which provides certain exemptions from the audit committee independence requirements in the case of employee board representatives. The NYSE Rules stipulate that no director qualifies as “independent” unless the board of directors has made an affirmative determination that the director has no material direct or indirect relationship with the listed company. However, under the NYSE Rules a director may still be deemed independent even if the director or a member of a director’s immediate family has received during a 12 month period within the prior three years up to $120,000 in direct compensation. In addition, a director may also be deemed independent even if a member of the director’s immediate family works for the company’s auditor in a non-partner capacity and not on the company’s audit. By contrast, the GCGC requires that the Supervisory Board ensure that proposed candidates are persons with the necessary knowledge, competencies and applicable experience. Additionally, the Supervisory Board is required to implement and adhere to concrete director independence criteria, including a consideration of the total number of independent Supervisory Board members as defined in Section 5.4.2 of the Code. According to this definition, a Supervisory Board member will not be considered independent in particular if s/he has personal or business relations with the company, its executive bodies, a controlling shareholder
or an enterprise associated with any of the preceding persons and entities which could cause a substantial and sustained conflict of interest. The members of the Supervisory Board must have enough time to perform their board duties and must carry out their duties carefully and in good faith. For as long as they serve, they must comply with the criteria that are enumerated in relation to the selection of candidates for the Supervisory Board concerning independence, conflict of interest and multiple memberships of management, supervisory and other governing bodies. They must be loyal to SAP in their conduct and they must not accept appointment in companies that are in competition with SAP. Supervisory Board members must disclose any planned non-ordinary course business transactions with SAP to the Supervisory Board promptly. The Supervisory Board members cannot carry out such transactions before the Supervisory Board has given its permission. The Supervisory Board may grant its permission for any such transaction only if the transaction is based on terms and conditions that are standard for the type of transaction in question and if the transaction is not contrary to SAP’s interest. SAP complies with these GCGC director independence requirements.
Applicable European and German corporate law requires that for publicly listed stock corporations at least one member of the Supervisory Board must have expert knowledge in the areas of financial accounting and audit of financial statements and according to the GCGC the chairman of an Audit Committee shall be independent. Mr. Erhard Schipporeit who is the Chairman of SAP’s Audit Committee meets these requirements. However, applicable European and German corporate law and the GCGC do not require the Supervisory Board to make an affirmative determination for each individual member that is independent or that a majority of Supervisory Board members or the members of a specific committee are independent.
The NYSE independence requirements are closely linked with risks specific to unitary boards of directors that are customary for U.S. companies. In contrast, the two-tier board structure requires a strict separation of the executive board and supervisory board. In addition, the supervisory board of a European Company formed by conversion from a large German stock corporation which was subject to the principle of employee codetermination as outlined in the German Co-Determination Act of 1976 (Mitbestimmungsgesetz) is subject to at least the same level of employee participation which formerly existed in the German stock corporation that was converted to an SE. The terms of employee participation with regard to the Supervisory Board of SAP SE are, among others, set out in the Agreement on the Involvement of Employees in SAP SE. As a result, the Supervisory Board of SAP SE consists of
111
18 members, of which nine are representatives of SAP SE’s shareholders elected at the Annual General Meeting and nine members are representatives of the European employees. Only a shareholders’ representative may be elected as chairperson of the Supervisory Board. In case of a tied vote, the vote of the chairperson and, in the event that the chairperson does not participate in passing the resolution, the vote of the deputy chairperson, provided that he or she is a shareholders’ representative, will be decisive (casting vote). This board structure creates a different system of checks and balances, including employee participation, and cannot be directly compared with a unitary board system.
AUDIT COMMITTEE INDEPENDENCE
As a foreign private issuer, the NYSE Rules require SAP to establish an Audit Committee that satisfies the requirements of Rule 10A-3 of the Exchange Act with respect to audit committee independence. SAP is in compliance with these requirements. The Chairman of SAP’s Audit Committee and Prof. Dr. Klaus Wucherer meet the independence requirements of Rule 10A-3 of the Exchange Act. The other two Audit Committee members, Panagiotis Bissiritsas and Martin Duffek, are employee representatives who are eligible for the exemption provided by Rule 10 A-3 (b) (1) (iv) (C) (see “Item 16D Exemptions from the listing standards for audit committees” for details).
The Audit Committee independence requirements are similar to the Board independence requirements under applicable European and German corporate law and the GCGC. See the section above under “Director Independence Rules.” Nonetheless, SAP meets the NYSE Rules on audit committee independence applicable to foreign private issuers.
RULES ON NON-MANAGEMENT BOARD MEETINGS ARE DIFFERENT
Section 303 A.03 of the NYSE Rules stipulates that the non-management board of each listed issuer must meet at regularly scheduled executive sessions without the management. Under applicable European and German corporate law and the GCGC the Supervisory Board is entitled but not required to exclude Executive Board members from its meetings. The Supervisory Board exercises this right generally during its meetings.
RULES ON ESTABLISHING COMMITTEES DIFFER
Pursuant to Section 303 A.04 and 303 A.05 of the NYSE Rules listed companies are required to set up a Nominating/Corporate Governance Committee and a Compensation Committee, each composed entirely of independent directors and having a written charter specifying the committee’s purpose and responsibilities. In addition, each committee’s performance must be reviewed annually. Applicable European and German
corporate law does not mandate the creation of specific supervisory board committees. The GCGC recommends that the Supervisory Board establish an Audit Committee and a Nomination Committee. SAP has the following committees, which are in compliance with the GCGC: General and Compensation Committee, Audit Committee, Strategy and Technology Committee, Finance and Investment Committee, Nomination Committee, Special Committee and People and Organization Committee (See “Item 10. Additional Information – Corporate Governance” for more information).
RULES ON SHAREHOLDERS’ COMPULSORY APPROVAL ARE DIFFERENT
Section 312 of the NYSE Rules requires U.S. companies to seek shareholder approval of all equity-compensation plans, including certain material revisions thereto (subject to certain exemptions as described in the rules), issuances of common stock, including convertible stock, if the common stock has, or will have upon issuance, voting power of or in excess of 20% of the then outstanding common stock, and issuances of common stock if they trigger a change of control.
According to applicable European law, the German Stock Corporation Act and other applicable German laws, shareholder approval is required for a broad range of matters, such as amendments to the articles of association, certain significant corporate transactions (including inter-company agreements and material restructurings), the offering of stock options and similar equity compensation to its Executive Board members or its employees by a way of a conditional capital increase or by using treasury shares (including significant aspects of such an equity compensation plan as well as the exercise thresholds), the issuance of new shares, the authorization to purchase the corporation’s own shares, and other essential issues, such as transfers of all, or substantially all, of the assets of the stock corporation, including shareholdings in subsidiaries.
SPECIFIC PRINCIPLES OF CORPORATE GOVERNANCE
Under the NYSE Rules Section 303A.09 listed companies must adopt and disclose corporate guidelines. Since October 2007, SAP has applied, with few exceptions, the recommended corporate governance standards of the GCGC rather than company-specific principles of corporate governance. The GCGC recommendations differ from the NYSE Standards primarily as outlined in this Item 16G.
SPECIFIC CODE OF BUSINESS CONDUCT
NYSE Rules Section 303 A.10 requires listed companies to adopt and disclose a code of business conduct and ethics for directors, officers and employees, and to
112
disclose promptly any waivers of the code for directors or executive officers. Although not required under applicable European and German law, SAP has adopted a Code of Business Conduct, which is equally applicable to employees, managers and members of the Executive
Board. SAP complies with the requirement to disclose the Code of Business Conduct and any waivers of the code with respect to directors and executive officers. See “Item 16B. Code of Ethics” for details.
113
PART III
ITEM 17. FINANCIAL STATEMENTS
Not applicable.
ITEM 18. FINANCIAL STATEMENTS
The Consolidated Financial Statements are included herein on pages F-1 through F-75.
The following are filed as part of this report:
| | – | | Report of Independent Registered Public Accounting Firm. |
| | – | | Consolidated Financial Statements |
| | – | | Consolidated Income Statements for the years ended December 31, 2016, 2015, and 2014. |
| | – | | Consolidated Statements of Comprehensive Income for the years ended December 31, 2016, 2015 and 2014. |
| | – | | Consolidated Statements of Financial Position as of December 31, 2016 and 2015. |
| | – | | Consolidated Statements of Changes in Equity for the years ended December 31, 2016, 2015 and 2014. |
| | – | | Consolidated Statements of Cash Flows for the years ended December 31, 2016, 2015 and 2014. |
| | – | | Notes to the Consolidated Financial Statements. |
ITEM 19. EXHIBITS
The following documents are filed as exhibits to this report:
| 1 | Articles of Incorporation (Satzung) of SAP SE, effective as of May 12, 2016 (English translation).(1) |
| 2.1 | Form of global share certificate for ordinary shares (English translation).(2) |
Certain instruments which define rights of holders of long-term debt of SAP SE and its subsidiaries are not being filed because the total amount of securities authorized under each such instrument does not exceed 10% of the total consolidated assets of SAP SE and its subsidiaries. SAP SE and its subsidiaries hereby agree to furnish a copy of each such instrument to the Securities and Exchange Commission upon request.
| 4.1.1 | Amended and Restated Deposit Agreement dated as of November 25, 2009, by and among SAP SE, Deutsche Bank Trust Company Americas as Depositary, and all owners and holders from time to time of American Depositary Receipts issued thereunder.(3) |
| 4.1.2 | Amendment No. 1 dated March 18, 2016 to the Amended and Restated Deposit Agreement, by and among SAP SE, Deutsche Bank Trust Company Americas as Depositary, and all owners and holders from time to time of American Depositary Receipts issued thereunder, including the form of American Depositary Receipt.(4) |
| 8 | For a list of our subsidiaries see Note (33) to our Consolidated Financial Statements in “Item 18. Financial Statements”. |
| 12.1 | Certification of Bill McDermott, Chief Executive Officer, required by Rule 13a-14(a) or Rule 15d-14(a). |
| 12.2 | Certification of Luka Mucic, Chief Financial Officer, required by Rule 13a-14(a) or Rule 15d-14(a). |
| 13.1 | Certification of Bill McDermott, Chief Executive Officer, pursuant to 18 U.S.C. Section 1350, as adopted pursuant to Section 906 of the Sarbanes-Oxley Act of 2002. |
| 13.2 | Certification of Luka Mucic, Chief Financial Officer, pursuant to 18 U.S.C. Section 1350, as adopted pursuant to Section 906 of the Sarbanes-Oxley Act of 2002. |
| 15 | Consent of Independent Registered Public Accounting Firm. |
(1) Incorporated by reference to Exhibit 4.1 to SAP SE’s Form S-8 Registration Statement filed with the SEC on September 1, 2016.
(2) Incorporated by reference to Exhibit 2.1 to SAP SE’s 2014 Annual Report on Form 20-F filed with the SEC on March 20, 2015.
(3) Incorporated by reference to Exhibit 99.(a)(2) of Post Effective Amendment #1 to SAP SE’s Registration Statement on Form F-6 filed on November 25, 2009.
(4) Incorporated by reference to Exhibit 99.(a)(2) of Post Effective Amendment #2 to SAP SE’s Registration Statement on Form F-6 filed on March 18, 2016.
114
SIGNATURES
The Registrant hereby certifies that it meets all of the requirements for filing on Form 20-F and that it has duly caused and authorized the undersigned to sign this report on its behalf.
|
| SAP SE |
| (Registrant) |
By: /s/ BILL MCDERMOTT |
|
| Name: Bill McDermott |
| Title: Chief Executive Officer |
Dated: February 28, 2017
|
| By: /s/ LUKA MUCIC |
|
| Name: Luka Mucic |
| Title: Chief Financial Officer |
Dated: February 28, 2017
115
SAP SE AND SUBSIDIARIES
INDEX TO THE CONSOLIDATED FINANCIAL STATEMENTS
F-1
REPORT OF INDEPENDENT REGISTERED PUBLIC ACCOUNTING FIRM
The Supervisory Board of SAP SE:
We have audited the accompanying consolidated statements of financial position of SAP SE and subsidiaries (“SAP” or “the Company”) as of December 31, 2016 and 2015, and the related consolidated statements of income, comprehensive income, changes in equity, and cash flows for each of the years in the three-year period ended December 31, 2016. We also have audited SAP’s internal control over financial reporting as of December 31, 2016, based on criteria established in Internal Control – Integrated Framework (2013) issued by the Committee of Sponsoring Organizations of the Treadway Commission (COSO). SAP’s management is responsible for these consolidated financial statements, for maintaining effective internal control over financial reporting, and for its assessment of the effectiveness of internal control over financial reporting, included in the accompanying Management’s Annual Report on Internal Control Over Financial Reporting. Our responsibility is to express an opinion on these consolidated financial statements and an opinion on the Company’s internal control over financial reporting based on our audits.
We conducted our audits in accordance with the standards of the Public Company Accounting Oversight Board (United States). Those standards require that we plan and perform the audits to obtain reasonable assurance about whether the financial statements are free of material misstatement and whether effective internal control over financial reporting was maintained in all material respects. Our audits of the consolidated financial statements included examining, on a test basis, evidence supporting the amounts and disclosures in the financial statements, assessing the accounting principles used and significant estimates made by management, and evaluating the overall financial statement presentation. Our audit of internal control over financial reporting included obtaining an understanding of internal control over financial reporting, assessing the risk that a material weakness exists, and testing and evaluating the design and operating effectiveness of internal control based on the assessed risk. Our audits also included performing such other procedures as we considered necessary in the circumstances. We believe that our audits provide a reasonable basis for our opinions.
A company’s internal control over financial reporting is a process designed to provide reasonable assurance regarding the reliability of financial reporting and the preparation of financial statements for external purposes in accordance with generally accepted accounting principles. A company’s internal control over financial reporting includes those policies and procedures that (1) pertain to the maintenance of records that, in reasonable detail, accurately and fairly reflect the transactions and dispositions of the assets of the company; (2) provide reasonable assurance that transactions are recorded as necessary to permit preparation of financial statements in accordance with generally accepted accounting principles, and that receipts and expenditures of the company are being made only in accordance with authorizations of management and directors of the company; and (3) provide reasonable assurance regarding prevention or timely detection of unauthorized acquisition, use, or disposition of the company’s assets that could have a material effect on the financial statements.
Because of its inherent limitations, internal control over financial reporting may not prevent or detect misstatements. Also, projections of any evaluation of effectiveness to future periods are subject to the risk that controls may become inadequate because of changes in conditions, or that the degree of compliance with the policies or procedures may deteriorate.
In our opinion, the consolidated financial statements referred to above present fairly, in all material respects, the financial position of SAP SE and subsidiaries as of December 31, 2016 and 2015, and the results of their operations and their cash flows for each of the years in the three-year period ended December 31, 2016, in conformity with International Financial Reporting Standards as issued by the International Accounting Standards Board (IASB). Also in our opinion, SAP SE maintained, in all material respects, effective internal control over financial reporting as of December 31, 2016, based on criteria established in Internal Control – Integrated Framework (2013) issued by the COSO.
|
| /s/KPMG AG |
|
| Wirtschaftsprüfungsgesellschaft |
Mannheim, Germany
February 22, 2017
F-2
SAP SE AND SUBSIDIARIES
CONSOLIDATED FINANCIAL STATEMENTS
CONSOLIDATED INCOME STATEMENTS OF SAP GROUP
for the years ended December 31,
| | | | | | | | | | | | | | | | | | | | |
| millions, unless otherwise stated | | Notes | | | (Unaudited) 2016(1) US$ | | | 2016 € | | | 2015 € | | | 2014 € | |
Cloud subscriptions and support | | | | | | | 3,158 | | | | 2,993 | | | | 2,286 | | | | 1,087 | |
Software licenses | | | | | | | 5,128 | | | | 4,860 | | | | 4,835 | | | | 4,399 | |
Software support | | | | | | | 11,155 | | | | 10,571 | | | | 10,093 | | | | 8,829 | |
Software licenses and support | | | | | | | 16,283 | | | | 15,431 | | | | 14,928 | | | | 13,228 | |
Cloud and software | | | | | | | 19,441 | | | | 18,424 | | | | 17,214 | | | | 14,315 | |
Services | | | | | | | 3,839 | | | | 3,638 | | | | 3,579 | | | | 3,245 | |
Total revenue | | | (5) | | | | 23,280 | | | | 22,062 | | | | 20,793 | | | | 17,560 | |
| | | | | |
Cost of cloud subscriptions and support | | | | | | | –1,386 | | | | –1,313 | | | | –1,022 | | | | –481 | |
Cost of software licenses and support | | | | | | | –2,302 | | | | –2,182 | | | | –2,291 | | | | –2,076 | |
Cost of cloud and software | | | | | | | –3,688 | | | | –3,495 | | | | –3,313 | | | | –2,557 | |
Cost of services | | | | | | | –3,259 | | | | –3,089 | | | | –2,932 | | | | –2,426 | |
Total cost of revenue | | | | | | | –6,947 | | | | –6,583 | | | | –6,245 | | | | –4,983 | |
Gross profit | | | | | | | 16,333 | | | | 15,479 | | | | 14,548 | | | | 12,578 | |
Research and development | | | | | | | –3,212 | | | | –3,044 | | | | –2,845 | | | | –2,331 | |
Sales and marketing | | | | | | | –6,611 | | | | –6,265 | | | | –5,782 | | | | –4,593 | |
General and administration | | | | | | | –1,060 | | | | –1,005 | | | | –1,048 | | | | –892 | |
Restructuring | | | (6) | | | | –29 | | | | –28 | | | | –621 | | | | –126 | |
TomorrowNow and Versata litigation | | | (23) | | | | 0 | | | | 0 | | | | 0 | | | | –309 | |
Other operating income/expense, net | | | | | | | –4 | | | | –3 | | | | 1 | | | | 4 | |
Total operating expenses | | | | | | | –17,862 | | | | –16,928 | | | | –16,541 | | | | –13,230 | |
Operating profit | | | | | | | 5,418 | | | | 5,135 | | | | 4,252 | | | | 4,331 | |
| | | | | |
Other non-operating income/expense, net | | | (8) | | | | –247 | | | | –234 | | | | –256 | | | | 49 | |
Finance income | | | | | | | 243 | | | | 230 | | | | 241 | | | | 127 | |
Finance costs | | | | | | | –283 | | | | –268 | | | | –246 | | | | –152 | |
Financial income, net | | | (9) | | | | –40 | | | | –38 | | | | –5 | | | | –25 | |
Profit before tax | | | | | | | 5,131 | | | | 4,863 | | | | 3,991 | | | | 4,355 | |
| | | | | |
Income tax TomorrowNow and Versata litigation | | | | | | | 0 | | | | 0 | | | | 0 | | | | 86 | |
Other income tax expense | | | | | | | –1,297 | | | | –1,229 | | | | –935 | | | | –1,161 | |
Income tax expense | | | (10) | | | | –1,297 | | | | –1,229 | | | | –935 | | | | –1,075 | |
Profit after tax | | | | | | | 3,834 | | | | 3,634 | | | | 3,056 | | | | 3,280 | |
Attributable to owners of parent | | | | | | | 3,848 | | | | 3,646 | | | | 3,064 | | | | 3,280 | |
Attributable to non-controlling interests | | | | | | | –13 | | | | –13 | | | | –8 | | | | 0 | |
| | | | | |
| Earnings per share, basic (in€) | | | (11) | | | | 3.21 | | | | 3.04 | | | | 2.56 | | | | 2.75 | |
Earnings per share, diluted (in€) | | | (11) | | | | 3.21 | | | | 3.04 | | | | 2.56 | | | | 2.74 | |
(1) The 2016 figures have been translated solely for the convenience of the reader at an exchange rate of US$1.0552 to€1.00, the Noon Buying Rate certified by the Federal Reserve Bank of New York on December 31, 2016.
The accompanying Notes are an integral part of these Consolidated Financial Statements.
F-3
SAP SE AND SUBSIDIARIES
CONSOLIDATED STATEMENTS OF COMPREHENSIVE INCOME OF SAP GROUP
for the years ended December 31,
| | | | | | | | | | | | | | | | |
| € millions | | Notes | | | 2016 | | | 2015 | | | 2014 | |
Profit after tax | | | | | | | 3,634 | | | | 3,056 | | | | 3,280 | |
Items that will not be reclassified to profit or loss | | | | | | | | | | | | | | | | |
Remeasurements on defined benefit pension plans, before tax | | | | | | | –10 | | | | –19 | | | | –30 | |
Income tax relating to remeasurements on defined benefit pension plans | | | (10) | | | | 2 | | | | 2 | | | | 7 | |
Remeasurements on defined benefit pension plans, net of tax | | | | | | | –8 | | | | –17 | | | | –23 | |
| Other comprehensive income for items that will not be reclassified to profit or loss, net of tax | | | | | | | –8 | | | | –17 | | | | –23 | |
Items that will be reclassified subsequently to profit or loss | | | | | | | | | | | | | | | | |
Gains (losses) on exchange differences on translation, before tax | | | | | | | 865 | | | | 1,845 | | | | 1,161 | |
Reclassification adjustments on exchange differences on translation, before tax | | | | | | | –1 | | | | 0 | | | | 0 | |
Exchange differences, before tax | | | | | | | 864 | | | | 1,845 | | | | 1,161 | |
Income tax relating to exchange differences on translation | | | (10) | | | | –25 | | | | 16 | | | | 21 | |
Exchange differences, net of tax | | | (20) | | | | 839 | | | | 1,861 | | | | 1,182 | |
Gains (losses) on remeasuring available-for-sale financial assets, before tax | | | | | | | –18 | | | | 181 | | | | 130 | |
Reclassification adjustments on available-for-sale financial assets, before tax | | | | | | | –26 | | | | –53 | | | | –2 | |
Available-for-sale financial assets, before tax | | | (26) | | | | –44 | | | | 128 | | | | 128 | |
Income tax relating to available-for-sale financial assets | | | (10) | | | | 1 | | | | –2 | | | | 0 | |
Available-for-sale financial assets, net of tax | | | (20) | | | | –43 | | | | 125 | | | | 128 | |
Gains (losses) on cash flow hedges, before tax | | | | | | | –24 | | | | –59 | | | | –41 | |
Reclassification adjustments on cash flow hedges, before tax | | | | | | | 8 | | | | 74 | | | | 3 | |
Cash flow hedges, before tax | | | (25) | | | | –15 | | | | 15 | | | | –38 | |
Income tax relating to cash flow hedges | | | (10) | | | | 4 | | | | –4 | | | | 10 | |
Cash flow hedges, net of tax | | | (20) | | | | –11 | | | | 11 | | | | –28 | |
| Other comprehensive income for items that will be reclassified to profit or loss, net of tax | | | | | | | 785 | | | | 1,997 | | | | 1,282 | |
Other comprehensive income, net of tax | | | | | | | 777 | | | | 1,980 | | | | 1,259 | |
Total comprehensive income | | | | | | | 4,410 | | | | 5,036 | | | | 4,539 | |
Attributable to owners of parent | | | | | | | 4,423 | | | | 5,044 | | | | 4,539 | |
Attributable to non-controlling interests | | | | | | | –13 | | | | –8 | | | | 0 | |
The accompanying Notes are an integral part of these Consolidated Financial Statements.
F-4
SAP SE AND SUBSIDIARIES
CONSOLIDATED STATEMENTS OF FINANCIAL POSITION OF SAP GROUP
as at December 31,
| | | | | | | | | | | | | | | | |
| millions | | Notes | | | (Unaudited) 2016(1) US$ | | | 2016 € | | | 2015 € | |
Cash and cash equivalents | | | | | | | 3,906 | | | | 3,702 | | | | 3,411 | |
Other financial assets | | | (12) | | | | 1,186 | | | | 1,124 | | | | 351 | |
Trade and other receivables | | | (13) | | | | 6,251 | | | | 5,924 | | | | 5,274 | |
Other non-financial assets | | | (14) | | | | 613 | | | | 581 | | | | 468 | |
Tax assets | | | | | | | 245 | | | | 233 | | | | 235 | |
Total current assets | | | | | | | 12,202 | | | | 11,564 | | | | 9,739 | |
Goodwill | | | (15) | | | | 24,598 | | | | 23,311 | | | | 22,689 | |
Intangible assets | | | (15) | | | | 3,995 | | | | 3,786 | | | | 4,280 | |
Property, plant, and equipment | | | (16) | | | | 2,722 | | | | 2,580 | | | | 2,192 | |
Other financial assets | | | (12) | | | | 1,433 | | | | 1,358 | | | | 1,336 | |
Trade and other receivables | | | (13) | | | | 133 | | | | 126 | | | | 87 | |
Other non-financial assets | | | (14) | | | | 561 | | | | 532 | | | | 332 | |
Tax assets | | | | | | | 474 | | | | 450 | | | | 282 | |
Deferred tax assets | | | (10) | | | | 602 | | | | 570 | | | | 453 | |
Total non-current assets | | | | | | | 34,519 | | | | 32,713 | | | | 31,651 | |
Total assets | | | | | | | 46,721 | | | | 44,277 | | | | 41,390 | |
| | | | |
Trade and other payables | | | (17) | | | | 1,351 | | | | 1,281 | | | | 1,088 | |
Tax liabilities | | | | | | | 333 | | | | 316 | | | | 230 | |
Financial liabilities | | | (17) | | | | 1,913 | | | | 1,813 | | | | 841 | |
Other non-financial liabilities | | | (17) | | | | 3,903 | | | | 3,699 | | | | 3,407 | |
Provisions | | | (18) | | | | 193 | | | | 183 | | | | 299 | |
Deferred income | | | (19) | | | | 2,515 | | | | 2,383 | | | | 2,001 | |
Total current liabilities | | | | | | | 10,209 | | | | 9,674 | | | | 7,867 | |
Trade and other payables | | | (17) | | | | 134 | | | | 127 | | | | 81 | |
Tax liabilities | | | | | | | 385 | | | | 365 | | | | 402 | |
Financial liabilities | | | (17) | | | | 6,839 | | | | 6,481 | | | | 8,681 | |
Other non-financial liabilities | | | (17) | | | | 487 | | | | 461 | | | | 331 | |
Provisions | | | (18) | | | | 229 | | | | 217 | | | | 180 | |
Deferred tax liabilities | | | (10) | | | | 434 | | | | 411 | | | | 448 | |
Deferred income | | | (19) | | | | 151 | | | | 143 | | | | 106 | |
Total non-current liabilities | | | | | | | 8,658 | | | | 8,205 | | | | 10,228 | |
Total liabilities | | | | | | | 18,867 | | | | 17,880 | | | | 18,095 | |
Issued capital | | | | | | | 1,296 | | | | 1,229 | | | | 1,229 | |
Share premium | | | | | | | 632 | | | | 599 | | | | 558 | |
Retained earnings | | | | | | | 23,533 | | | | 22,302 | | | | 20,044 | |
Other components of equity | | | | | | | 3,530 | | | | 3,346 | | | | 2,561 | |
Treasury shares | | | | | | | –1,160 | | | | –1,099 | | | | –1,124 | |
Equity attributable to owners of parent | | | | | | | 27,832 | | | | 26,376 | | | | 23,267 | |
| | | | |
Non-controlling interests | | | | | | | 22 | | | | 21 | | | | 28 | |
Total equity | | | (20) | | | | 27,854 | | | | 26,397 | | | | 23,295 | |
Total equity and liabilities | | | | | | | 46,721 | | | | 44,277 | | | | 41,390 | |
(1) The 2016 figures have been translated solely for the convenience of the reader at an exchange rate of US$1.0552 to€1.00, the Noon Buying Rate certified by the Federal Reserve Bank of New York on December 31, 2016.
The accompanying Notes are an integral part of these Consolidated Financial Statements.
F-5
SAP SE AND SUBSIDIARIES
CONSOLIDATED STATEMENTS OF CHANGES IN EQUITY OF SAP GROUP
for the years ended December 31,
| | | | | | | | | | | | | | | | | | | | | | | | | | | | | | | | |
| € millions | | Equity Attributable to Owners of Parent | | | Non- Controlling
Interests | | | Total
Equity | |
| | | Issued
Capital | | | Share
Premium | | | Retained
Earnings | | | Other
Components
of Equity | | | Treasury
Shares | | | Total | | | |
Notes | | | (20) | | | | (20) | | | | (20) | | | | | | | | (20) | | | | | | | | | | | | | |
January 1, 2014 | | | 1,229 | | | | 551 | | | | 16,258 | | | | –718 | | | | –1,280 | | | | 16,040 | | | | 8 | | | | 16,048 | |
Profit after tax | | | | | | | | | | | 3,280 | | | | | | | | | | | | 3,280 | | | | | | | | 3,280 | |
Other comprehensive income | | | | | | | | | | | –23 | | | | 1,282 | | | | | | | | 1,259 | | | | | | | | 1,259 | |
Comprehensive income | | | | | | | | | | | 3,257 | | | | 1,282 | | | | | | | | 4,539 | | | | | | | | 4,539 | |
Share-based payments | | | | | | | 34 | | | | | | | | | | | | | | | | 34 | | | | | | | | 34 | |
Dividends | | | | | | | | | | | –1,194 | | | | | | | | | | | | –1,194 | | | | | | | | –1,194 | |
Reissuance of treasury shares under share-based payments | | | | | | | 29 | | | | | | | | | | | | 56 | | | | 85 | | | | | | | | 85 | |
Additions from business combinations | | | | | | | | | | | | | | | | | | | | | | | | | | | 26 | | | | 26 | |
Other changes | | | | | | | | | | | –4 | | | | | | | | | | | | –4 | | | | | | | | –4 | |
December 31, 2014 | | | 1,229 | | | | 614 | | | | 18,317 | | | | 564 | | | | –1,224 | | | | 19,499 | | | | 34 | | | | 19,534 | |
Profit after tax | | | | | | | | | | | 3,064 | | | | | | | | | | | | 3,064 | | | | –8 | | | | 3,056 | |
Other comprehensive income | | | | | | | | | | | –17 | | | | 1,997 | | | | | | | | 1,980 | | | | | | | | 1,980 | |
Comprehensive income | | | | | | | | | | | 3,047 | | | | 1,997 | | | | | | | | 5,044 | | | | –8 | | | | 5,036 | |
Share-based payments | | | | | | | –136 | | | | | | | | | | | | | | | | –136 | | | | | | | | –136 | |
Dividends | | | | | | | | | | | –1,316 | | | | | | | | | | | | –1,316 | | | | | | | | –1,316 | |
Reissuance of treasury shares under share-based payments | | | | | | | 80 | | | | | | | | | | | | 100 | | | | 180 | | | | | | | | 180 | |
Other changes | | | | | | | | | | | –4 | | | | | | | | | | | | –4 | | | | 2 | | | | –2 | |
December 31, 2015 | | | 1,229 | | | | 558 | | | | 20,044 | | | | 2,561 | | | | –1,124 | | | | 23,267 | | | | 28 | | | | 23,295 | |
Profit after tax | | | | | | | | | | | 3,646 | | | | | | | | | | | | 3,646 | | | | –13 | | | | 3,634 | |
Other comprehensive income | | | | | | | | | | | –8 | | | | 785 | | | | | | | | 777 | | | | | | | | 777 | |
Comprehensive income | | | | | | | | | | | 3,638 | | | | 785 | | | | | | | | 4,423 | | | | –13 | | | | 4,410 | |
Share-based payments | | | | | | | 16 | | | | | | | | | | | | | | | | 16 | | | | | | | | 16 | |
Dividends | | | | | | | | | | | –1,378 | | | | | | | | | | | | –1,378 | | | | | | | | –1,378 | |
Reissuance of treasury shares under share-based payments | | | | | | | 25 | | | | | | | | | | | | 25 | | | | 50 | | | | | | | | 50 | |
Other changes | | | | | | | | | | | –2 | | | | | | | | | | | | –2 | | | | 6 | | | | 4 | |
December 31, 2016 | | | 1,229 | | | | 599 | | | | 22,302 | | | | 3,346 | | | | –1,099 | | | | 26,376 | | | | 21 | | | | 26,397 | |
The accompanying Notes are an integral part of these Consolidated Financial Statements.
F-6
SAP SE AND SUBSIDIARIES
CONSOLIDATED STATEMENTS OF CASH FLOWS OF SAP GROUP
for the years ended December 31,
| | | | | | | | | | | | | | | | | | | | |
| millions | | Notes | | | (Unaudited) 2016(1) US$ | | | 2016 € | | | 2015 € | | | 2014 € | |
| Profit after tax | | | | | | | 3,834 | | | | 3,634 | | | | 3,056 | | | | 3,280 | |
| Adjustments to reconcile profit after taxes to net cash provided by operating activities: | | | | | | | | | | | | | | | | | | | | |
Depreciation and amortization | | | (15) | | | | 1,338 | | | | 1,268 | | | | 1,289 | | | | 1,010 | |
Income tax expense | | | (10) | | | | 1,297 | | | | 1,229 | | | | 935 | | | | 1,075 | |
Financial income, net | | | (9) | | | | 40 | | | | 38 | | | | 5 | | | | 25 | |
Decrease/increase in sales and bad debt allowances on trade receivables | | | | | | | 53 | | | | 51 | | | | 45 | | | | 47 | |
Other adjustments for non-cash items | | | | | | | 41 | | | | 39 | | | | –2 | | | | 70 | |
Decrease/increase in trade and other receivables | | | | | | | –713 | | | | –675 | | | | –844 | | | | –286 | |
Decrease/increase in other assets | | | | | | | –262 | | | | –248 | | | | –313 | | | | –329 | |
Decrease/increase in trade payables, provisions, and other liabilities | | | | | | | 541 | | | | 513 | | | | 757 | | | | 573 | |
Decrease/increase in deferred income | | | | | | | 389 | | | | 368 | | | | 218 | | | | 16 | |
| Cash outflows due to TomorrowNow and Versata litigation | | | | | | | 0 | | | | 0 | | | | 0 | | | | –555 | |
| Interest paid | | | | | | | –201 | | | | –190 | | | | –172 | | | | –130 | |
| Interest received | | | | | | | 84 | | | | 79 | | | | 82 | | | | 59 | |
| Income taxes paid, net of refunds | | | | | | | –1,558 | | | | –1,477 | | | | –1,420 | | | | –1,356 | |
| Net cash flows from operating activities | | | | | | | 4,884 | | | | 4,628 | | | | 3,638 | | | | 3,499 | |
Business combinations, net of cash and cash equivalents acquired | | | | | | | –112 | | | | –106 | | | | –39 | | | | –6,360 | |
Cash receipts from derivative financial instruments related to business combinations | | | | | | | 0 | | | | 0 | | | | 266 | | | | –111 | |
| Total cash flows for business combinations, net of cash and cash equivalents acquired | | | | | | | –112 | | | | –106 | | | | 226 | | | | –6,472 | |
| Purchase of intangible assets and property, plant, and equipment | | | | | | | –1,056 | | | | –1,001 | | | | –636 | | | | –737 | |
| Proceeds from sales of intangible assets or property, plant, and equipment | | | | | | | 67 | | | | 63 | | | | 68 | | | | 46 | |
| Purchase of equity or debt instruments of other entities | | | | | | | –1,634 | | | | –1,549 | | | | –1,871 | | | | –910 | |
| Proceeds from sales of equity or debt instruments of other entities | | | | | | | 837 | | | | 793 | | | | 1,880 | | | | 833 | |
| Net cash flows from investing activities | | | | | | | –1,899 | | | | –1,799 | | | | –334 | | | | –7,240 | |
| Dividends paid | | | (21) | | | | –1,454 | | | | –1,378 | | | | –1,316 | | | | –1,194 | |
| Proceeds from reissuance of treasury shares | | | | | | | 28 | | | | 27 | | | | 64 | | | | 51 | |
Proceeds from borrowings | | | | | | | 422 | | | | 400 | | | | 1,748 | | | | 7,503 | |
Cash receipts from swap contracts | | | | | | | 45 | | | | 43 | | | | 0 | | | | 0 | |
| Total cash flows from proceeds from borrowings | | | | | | | 467 | | | | 443 | | | | 1,748 | | | | 7,503 | |
| Repayments of borrowings | | | | | | | –1,899 | | | | –1,800 | | | | –3,852 | | | | –2,062 | |
| Transactions with non-controlling interests | | | | | | | 3 | | | | 3 | | | | 0 | | | | 0 | |
| Net cash flows from financing activities | | | | | | | –2,854 | | | | –2,705 | | | | –3,356 | | | | 4,298 | |
| Effect of foreign currency rates on cash and cash equivalents | | | | | | | 177 | | | | 167 | | | | 135 | | | | 23 | |
| Net decrease/increase in cash and cash equivalents | | | | | | | 307 | | | | 291 | | | | 83 | | | | 580 | |
| Cash and cash equivalents at the beginning of the period | | | (21) | | | | 3,599 | | | | 3,411 | | | | 3,328 | | | | 2,748 | |
| Cash and cash equivalents at the end of the period | | | (21) | | | | 3,906 | | | | 3,702 | | | | 3,411 | | | | 3,328 | |
(1) The 2016 figures have been translated solely for the convenience of the reader at an exchange rate of US$1.0552 to€1.00, the Noon Buying Rate certified by the Federal Reserve Bank of New York on December 31, 2016.
The accompanying Notes are an integral part of these Consolidated Financial Statement
F-7
SAP SE AND SUBSIDIARIES
NOTES TO THE CONSOLIDATED FINANCIAL STATEMENTS
(1) GENERAL INFORMATION ABOUT CONSOLIDATED FINANCIAL STATEMENTS
The accompanying Consolidated Financial Statements for 2016 of SAP SE and its subsidiaries (collectively, “we,” “us,” “our,” “SAP,” “Group,” and “Company”) have been prepared in accordance with International Financial Reporting Standards (IFRS).
We have applied all standards and interpretations that were effective on and endorsed by the European Union (EU) as at December 31, 2016. There were no standards or interpretations impacting our Consolidated Financial Statements for the years ended December 31, 2016, 2015, and 2014, that were effective but not yet endorsed. Therefore, our Consolidated Financial Statements comply with both IFRS as issued by the International Accounting Standards Board (IASB) and with IFRS as endorsed by the EU.
Our Executive Board approved the Consolidated Financial Statements on February 22, 2017, for submission to our Supervisory Board.
All amounts included in the Consolidated Financial Statements are reported in millions of euros (€ millions) except where otherwise stated. Due to rounding, numbers presented throughout this document may not add up precisely to the totals we provide and percentages may not precisely reflect the absolute figures.
(2) SCOPE OF CONSOLIDATION
Entities Consolidated in the Financial Statements
| | | | |
| | | Total | |
December 31, 2014 | | | 287 | |
Additions | | | 8 | |
Disposals | | | –40 | |
December 31, 2015 | | | 255 | |
Additions | | | 8 | |
Disposals | | | –18 | |
December 31, 2016 | | | 245 | |
The additions relate to legal entities added in connection with acquisitions and foundations. The disposals are mainly due to mergers and liquidations of legal entities.
(3) SUMMARY OF SIGNIFICANT ACCOUNTING POLICIES
(3a) Bases of Measurement
The Consolidated Financial Statements have been prepared on the historical cost basis except for the following:
| – | | Derivative financial instruments,available-for-sale financial assets, and liabilities for cash-settled share-based payments are measured at fair value. |
| – | | Monetary assets and liabilities denominated in foreign currencies are translated atperiod-end exchange rates. |
| – | | Post-employment benefits are measured according to IAS 19 (Employee Benefits) as described inNote (18a). |
Where applicable, information about the methods and assumptions used in determining the respective measurement bases is disclosed in the Notes specific to that asset or liability.
(3b) Relevant Accounting Policies
Reclassifications
Under the ONE Service approach, we combined premium support services and professional services under one comprehensive service offering. This combination triggered changes in our servicego-to-market methodology and setup, resulting in an organizational separation of services sales and services delivery. As a result of these changes, we now classify all sales expenses relating to our services offering, which were previously recognized as cost of services, as sales and marketing expenses. We take the view that this policy provides more reliable and more relevant information because it classifies sales and marketing expenses consistently across our product and services portfolio.
The new policy has been applied retrospectively to the prior periods presented. The effect on the financial year 2015 was an increase in sales and marketing expenses and a respective decrease in cost of services totalling€381 million (2014: €290 million).
Business Combinations and Goodwill
We decide on atransaction-by-transaction basis whether to measure thenon-controlling interest in the acquiree at fair value or at the proportionate share of the acquiree’s identifiable net assets. Acquisition-related costs are accounted as expense in the periods in which the costs are incurred and the services are received, with the expense being classified as general and administration expense.
F-8
Foreign Currencies
Income and expenses and operating cash flows of our foreign subsidiaries that use a functional currency other than the euro are translated at average rates of foreign exchange (FX) computed on a monthly basis. Exchange
differences resulting from foreign currency transactions are recognized in othernon-operating income/expense, net.
The exchange rates of key currencies affecting the Company were as follows:
Exchange Rates
| | | | | | | | | | | | | | | | | | | | | | | | |
| Equivalent to€1 | | Middle Rate
as at December 31 | | | Annual Average Exchange Rate | |
| | | | | 2016 | | | 2015 | | | 2016 | | | 2015 | | | 2014 | |
U.S. dollar | | | USD | | | | 1.0541 | | | | 1.0887 | | | | 1.1045 | | | | 1.1071 | | | | 1.3198 | |
Pound sterling | | | GBP | | | | 0.8562 | | | | 0.7340 | | | | 0.8206 | | | | 0.7255 | | | | 0.8037 | |
Japanese yen | | | JPY | | | | 123.40 | | | | 131.07 | | | | 119.77 | | | | 134.12 | | | | 140.61 | |
Swiss franc | | | CHF | | | | 1.0739 | | | | 1.0835 | | | | 1.0886 | | | | 1.0688 | | | | 1.2132 | |
Canadian dollar | | | CAD | | | | 1.4188 | | | | 1.5116 | | | | 1.4606 | | | | 1.4227 | | | | 1.4645 | |
Australian dollar | | | AUD | | | | 1.4596 | | | | 1.4897 | | | | 1.4850 | | | | 1.4753 | | | | 1.4650 | |
Revenue Recognition
Classes of Revenue
We derive our revenue from fees charged to our customers for (a) the use of our hosted cloud offerings, (b) licenses to ouron-premise software products, and (c) standardized and premium support services, consulting, customer-specificon-premise software development agreements, training, and other services.
Cloud and software revenue, as presented in our Consolidated Income Statements, is the sum of our cloud subscriptions and support revenue, our software licenses revenue, and our software support revenue.
| – | | Revenue from cloud subscriptions and support represents fees earned from providing customers with the following: |
| | ◾ | | Software-as-a-Service (SaaS), that is, a right to use software functionality in a cloud-based-infrastructure (hosting) provided by SAP, where the customer does not have the right to terminate the hosting contract and take possession of the software to run it on the customer’s own IT infrastructure or by a third-party hosting provider without significant penalty, or |
| | ◾ | | Platform-as-a-Service (PaaS), that is, access to a cloud-based infrastructure to develop, run, and manage applications, or |
| | ◾ | | Infrastructure-as-a-Service (IaaS), that is, hosting services for software hosted by SAP, where the customer has the right to terminate the hosting contract and take possession of the software at any time without significant penalty and related application management services, or |
| | ◾ | | Additional premium cloud subscription support beyond the regular support that is embedded in the basic cloud subscription fees, or |
| | ◾ | | Business Network Services, that is, connecting companies in a cloud-based-environment to perform business processes between the connected companies. |
| – | | Software licenses revenue represents fees earned from the sale or license of software to customers for use on the customer’s premises, in other words, where the customer has the right to take possession of the software for installation on the customer’s premises(on-premise software). Software licenses revenue includes revenue from both the sale of our standard software products and customer-specificon-premise software development agreements. |
| – | | Software support revenue represents fees earned from providing customers with standardized support services which comprise unspecified future software updates, upgrades, enhancements, and technical product support services foron-premise software products. We do not sell separately technical product support or unspecified software upgrades, updates, and enhancements. Accordingly, we do not distinguish within software support revenue or within cost of software support the amounts attributable to technical support services and unspecified software upgrades, updates, and enhancements. |
Services revenue as presented in our Consolidated Income Statements represents fees earned from providing customers with the following:
| – | | Professional services, that is, consulting services that primarily relate to the installation and configuration of our cloud subscriptions andon-premise software products |
| – | | Premium support services, that is,high-end support services tailored to customer requirements |
F-9
| – | | Messaging services (primarily transmission of electronic text messages from one mobile phone provider to another) |
| – | | Payment services in connection with our travel and expense management offerings. |
We account forout-of-pocket expenses invoiced by SAP and reimbursed by customers as cloud subscriptions and support, software support, or services revenue, depending on the nature of the service for which theout-of-pocket expenses were incurred.
Timing of Revenue Recognition
We do not start recognizing revenue from customer arrangements before evidence of an arrangement exists, the amount of revenue and associated costs can be measured reliably, collection of the related receivable is probable and the delivery has occurred, respectively the services have been rendered. If, for any of our product or service offerings, we determine at the outset of an arrangement that the amount of revenue cannot be measured reliably, we conclude that the inflow of economic benefits associated with the transaction is not probable, and we defer revenue recognition until the arrangement fee becomes due and payable by the customer. If, at the outset of an arrangement, we determine that collectability is not probable, we conclude that the inflow of economic benefits associated with the transaction is not probable, and we defer revenue recognition until the earlier of when collectability becomes probable or payment is received. If a customer is specifically identified as a bad debtor at a later point in time, we stop recognizing revenue from the customer except to the extent of the fees that have already been collected.
In general, we invoice fees for standard software upon contract closure and delivery. Periodical fixed fees for cloud subscription services and software support services are mostly invoiced yearly or quarterly in advance. Fees based on actual transaction volumes for cloud subscriptions and fees charged fornon-periodical services are invoiced as the services are delivered.
Cloud subscriptions and support revenue is recognized as the services are performed. Where a periodical fixed fee is agreed for the right to continuously access and use a cloud offering for a certain term, the fee is recognized ratably over the term covered by the fixed fee. Fees that are based on actual transaction volumes are recognized as the transactions occur. In general, our cloud subscriptions and support contracts include certainset-up activities. If theseset-up activities have stand-alone value, they are accounted for as distinct deliverables with the respective revenue being classified as service revenue and recognized as theset-up activity
is performed. If we conclude that suchset-up activities are not distinct deliverables, we do not account for them separately.
Revenue from the sale of perpetual licenses of our standardon-premise software products is recognized upon delivery of the software, that is, when the customer has access to the software. Occasionally, we licenseon-premise software for a specified period of time. Revenue from short-term time-based licenses, which usually include support services during the license period, is recognized ratably over the license term. Revenue from multi-year time-based licenses that include support services, whether separately priced or not, is recognized ratably over the license term unless a substantive support service renewal rate exists; if this is the case, the amount allocated to the delivered software is recognized as software licenses revenue based on the residual method once the basic criteria described above have been met.
In general, ouron-premise software license agreements include neither acceptance-testing provisions nor rights to return the software. If an arrangement allows for customer acceptance-testing of the software, we defer revenue until the earlier of customer acceptance or when the acceptance right lapses. If an arrangement allows for returning the software, we defer recognition of software revenue until the right to return expires.
We usually recognize revenue fromon-premise software arrangements involving resellers on evidence of sell-through by the reseller to the end customer, because the inflow of the economic benefits associated with the arrangements to us is not probable before sell-through has occurred.
Software licenses revenue from customer-specificon-premise software development agreements that qualify for revenue recognition by reference to the stage of completion of the contract activity is recognized using thepercentage-of-completion method based on contract costs incurred to date as a percentage of total estimated contract costs required to complete the development work.
Under our standardized support services, our performance obligation is to stand ready to provide technical product support and unspecified updates, upgrades, and enhancements on awhen-and-if-available basis. Consequently, we recognize support revenue ratably over the term of the support arrangement.
We recognize services revenue as the services are rendered. Usually, our professional services contracts and premium support services contracts do not involve significant production, modification, or customization of
F-10
software, and the related revenue is recognized as the services are provided using thepercentage-of-completion method of accounting. For messaging services, we measure the progress of service rendering based on the number of messages successfully processed and delivered except for fixed-price messaging arrangements, for which revenue is recognized ratably over the contractual term of the arrangement. Revenue from our training services is recognized when the customer consumes the respective classroom training. Foron-demand training services, whereby our performance obligation is to stand ready and provide the customer with access to the training courses and learning content services, revenue is recognized ratably over the contractual term of the arrangement.
Measurement of Revenue
Revenue is recognized net of returns and allowances, trade discounts, and volume rebates.
Our contributions to resellers that allow our resellers to execute qualified and approved marketing activities are recognized as an offset to revenue, unless we obtain a separate identifiable benefit for the contribution and the fair value of that benefit is reasonably estimable.
Multiple-Element Arrangements
We combine two or more customer contracts with the same customer and account for the contracts as a single arrangement if the contracts are negotiated as a package or otherwise linked.
We account for the different goods and services promised under our customer contracts as separate units of account (distinct deliverables) unless:
| – | | The contract involves significant production, modification, or customization of the cloud subscription oron-premise software; and |
| – | | The services are not available from third-party vendors and are therefore deemed essential to the cloud subscription oron-premise software. |
Goods and services that do not qualify as distinct deliverables are combined into one unit of account (combined deliverables).
The portion of the transaction fee allocated to one distinct deliverable is recognized in revenue separately under the policies applicable to the respective deliverable. For combined deliverables consisting of cloud offerings oron-premise software and other services, the allocated portion of the transaction fee is recognized using thepercentage-of-completion method, as outlined above, or over the cloud subscription term, if applicable, depending on which service term is longer.
We allocate the total transaction fee of a customer contract to the distinct deliverables under the contract based on their fair values. The allocation is done relative to the distinct deliverables’ individual fair values unless the residual method is applied as outlined below. Fair value is determined by company-specific objective evidence of fair value, which is the price charged consistently when that element is sold separately or, for elements not yet sold separately, the price established by our management if it is probable that the price will not change before the element is sold separately. Where company-specific objective evidence of fair value and third-party evidence of selling price cannot be established due to lacking stand-alone sales or lacking pricing consistency, we determine the fair value of a distinct deliverable by estimating its stand-alone selling price. Company-specific objective evidence of fair value and estimated stand-alone selling prices (ESP) for our major products and services are determined as follows:
| – | | We derive the company-specific objective evidence of fair value for our renewable support services from the rates charged to renew the support services annually after an initial period. Such renewal rates generally represent a fixed percentage of the discounted software license fee charged to the customer. The majority of our customers renew their annual support service contracts at these rates. |
| – | | Company-specific objective evidence of fair value for our service offerings is derived from our consistently priced historic sales. |
| – | | Company-specific objective evidence of fair value can generally not be established for our cloud subscriptions. ESP for these offerings is determined based on the rates agreed with the individual customers to apply if and when the subscription arrangement renews. We determine ESP by considering multiple factors which include, but are not limited to, the following: |
| | ◾ | | Substantive renewal rates stipulated in the cloud arrangement; and |
| | ◾ | | Gross margin expectations and expected internal costs of the respective cloud business model. |
| – | | For ouron-premise software offerings, company-specific objective evidence of fair value can generally not be established and representative stand-alone selling prices are not discernible from past transactions. We therefore apply the residual method to multiple-element arrangements that includeon-premise software. Under this method, the transaction fee is allocated to all undelivered elements in the amount of their respective fair values and the remaining amount of the arrangement fee is allocated to the delivered element. With this policy, we have considered the guidance provided by Financial Accounting Standards Board (FASB) Accounting Standards Codification (ASC) Subtopic |
F-11
| | | 985-605 (Software Revenue Recognition), where applicable, as authorized by IAS 8 (Accounting Policies, Changes in Accounting Estimates and Errors). |
We also consider FASB ASC985-605 in our accounting for options that entitle the customer to purchase, in the future, additionalon-premise software or services. We allocate revenue to future incremental discounts whenever customers are granted a material right, that is, the right to license additionalon-premise software at a higher discount than the one given within the initial software license arrangement, or to purchase or renew services at rates below the fair values established for these services. We also consider whether future purchase options included in arrangements for cloud subscription deliverables constitute a material right.
Cost of Cloud and Software
Cost of cloud and software includes the costs incurred in producing the goods and providing the services that generate cloud and software revenue. Consequently, this line item primarily includes employee expenses relating to these services, amortization of acquired intangibles, fees for third-party licenses, shipping,ramp-up cost, and depreciation of our property, plant, and equipment.
Cost of Services
Cost of services includes the costs incurred in providing the services that generate service revenue, such as consulting and training activities, messaging, as well as certain forms of hosting solutions for our customers and our partners.
Research and Development
Research and development includes the costs incurred by activities related to the development of software solutions (new products, updates, and enhancements) including resource and hardware costs for the development systems.
We have determined that the conditions for recognizing internally generated intangible assets from our software development activities are not met until shortly before the products are available for sale. Development costs incurred after the recognition criteria are met have not been material. Consequently, research and development costs are expensed as incurred.
Sales and Marketing
Sales and marketing includes costs incurred for the selling and marketing activities related to our software and cloud solutions as well as our service portfolio.
General and Administration
General and administration includes costs related to finance and administrative functions, human resources,
and general management as long as they are not directly attributable to one of the other operating expense line items.
Accounting for Uncertainties in Income Taxes
We measure current and deferred tax liabilities and assets for uncertainties in income taxes based on our best estimate of the most likely amount payable to or recoverable from the tax authorities, assuming that the tax authorities will examine the amounts reported to them and have full knowledge of all relevant information.
Share-Based Payments
Share-based payments cover cash-settled and equity-settled awards issued to our employees. The respective expenses are recognized as employee benefits expenses and classified in our Consolidated Income Statements according to the activities that the employees owning the awards perform.
Under certain programs, we grant our employees discounts on purchases of SAP shares. Since those discounts are not dependent on future services to be provided by our employees, the discount is recognized as an expense when the discounts are granted.
Where we hedge our exposure to cash-settled awards, changes in the fair value of the respective hedging instruments are also recognized as employee benefits expenses in profit or loss. The fair values of hedging instruments are based on market data reflecting current market expectations.
For more information about our share-based payments, seeNote (27).
Financial Assets
Our financial assets comprise cash and cash equivalents (highly liquid investments with original maturities of three months or less), loans and receivables, acquired equity and debt investments, and derivative financial instruments (derivatives) with positive fair values. Financial assets are only classified as financial assets at fair value through profit or loss if they are held for trading, as we do not designate financial assets at fair value through profit or loss. All other financial assets are classified as loans and receivables if we do not designate them asavailable-for-sale financial assets.
Regular-way purchases and sales of financial assets are recorded as at the trade date.
Among the other impairment indicators in IAS 39 (Financial Instruments: Recognition and Measurement), for an investment in an equity security, objective evidence of impairment includes a significant (more than 20%) or prolonged (a period of more than nine months)
F-12
decline in its fair value. Impairment losses on financial assets are recognized in financial income, net. Foravailable-for-sale financial assets, which arenon-derivative financial assets that are not assigned to loans and receivables or financial assets at fair value through profit or loss, impairment losses directly reduce an asset’s carrying amount, while impairments on loans and receivables are recorded using allowance accounts. Such allowance accounts are always presented together with the accounts containing the asset’s cost in other financial assets. Account balances are charged off against the respective allowance after all collection efforts have been exhausted and the likelihood of recovery is considered remote.
Derivatives
Derivatives Not Designated as Hedging Instruments
Many transactions constitute economic hedges, and therefore contribute effectively to the securing of financial risks but do not qualify for hedge accounting under IAS 39. To hedge currency risks inherent in foreign-currency denominated and recognized monetary assets and liabilities, we do not designate ourheld-for-trading derivative financial instruments as accounting hedges, because the profits and losses from the underlying transactions are recognized in profit or loss in the same periods as the profits or losses from the derivatives.
In addition, we occasionally have contracts that contain foreign currency embedded derivatives that are required to be accounted for separately.
Derivatives Designated as Hedging Instruments
We use derivatives to hedge foreign currency risk or interest rate risk and designate them as cash flow or fair value hedges if they qualify for hedge accounting under IAS 39. For more information about our hedges, seeNote (25).
a) Cash Flow Hedge
In general, we apply cash flow hedge accounting to the foreign currency risk of highly probable forecasted transactions and interest rate risk on variable rate financial liabilities.
With regard to foreign currency risk, hedge accounting relates to the spot price and the intrinsic values of the derivatives designated and qualifying as cash flow hedges, while gains and losses on the interest element and on those time values excluded from the hedging relationship as well as the ineffective portion of gains or losses are recognized in profit or loss as they occur.
b) Fair Value Hedge
We apply fair value hedge accounting for certain of our fixed rate financial liabilities.
Valuation and Testing of Effectiveness
The effectiveness of the hedging relationship is tested prospectively and retrospectively. Prospectively, we apply the critical terms match for our foreign currency hedges, as currencies, maturities, and the amounts are identical for the forecasted transactions and the spot element of the forward exchange rate contract or intrinsic value of the currency options, respectively. For interest rate swaps, we also apply the critical terms match, as the notional amounts, currencies, maturities, basis of the variable legs or fixed legs, respectively, reset dates, and the dates of the interest and principal payments are identical for the debt instrument and the corresponding interest rate swaps. Therefore, over the life of the hedging instrument, the changes in the designated components of the hedging instrument will offset the impact of fluctuations of the underlying hedged items.
The method of testing effectiveness retrospectively depends on the type of the hedge as described further below:
a) Cash Flow Hedge
Retrospectively, effectiveness is tested on a cumulative basis applying the dollar offset method by using the hypothetical derivative method. Under this approach, the change in fair value of a constructed hypothetical derivative with terms reflecting the relevant terms of the hedged item is compared to the change in the fair value of the hedging instrument employing its relevant terms. The hedge is deemed highly effective if the results are within the range 80% to 125%.
b) Fair Value Hedge
Retrospectively, effectiveness is tested using statistical methods in the form of a regression analysis, by which the validity and extent of the relationship between the change in value of the hedged items as the independent variable and the fair value change of the derivatives as the dependent variable is determined. The hedge is deemed highly effective if the determination coefficient between the hedged items and the hedging instruments exceeds 0.8 and the slope coefficient lies within a range of –0.8 to –1.25.
Trade and Other Receivables
Trade receivables are recorded at invoiced amounts less sales allowances and allowances for doubtful accounts. We record these allowances based on a specific review of all significant outstanding invoices. When analyzing the recoverability of our trade receivables, we consider the following factors:
| – | | First, we consider the financial solvency of specific customers and record an allowance for specific customer balances when we believe it is probable that we will not collect the amount due according to the contractual terms of the arrangement. |
F-13
| – | | Second, we evaluate homogenous portfolios of trade receivables according to their default risk primarily based on the age of the receivable and historical loss experience, but also taking into consideration general market factors that might impact our trade receivable portfolio. We record a general bad debt allowance to record impairment losses for a portfolio of trade receivables when we believe that the age of the receivables indicates that it is probable that a loss has occurred and we will not collect some or all of the amounts due. |
Account balances are written off, that is, charged off against the allowance after all collection efforts have been exhausted and the likelihood of recovery is considered remote.
In our Consolidated Income Statements, expenses from recording bad debt allowances for a portfolio of trade receivables are classified as other operating income/expense, net, whereas expenses from recording bad debt allowances for specific customer balances are classified as cost of cloud and software or cost of services, depending on the transaction from which the respective trade receivable results. Sales allowances are recorded as an offset to the respective revenue item.
Included in trade receivables are unbilled receivables related tofixed-fee andtime-and-material consulting arrangements for contract work performed to date.
OtherNon-Financial Assets
Othernon-financial assets are recorded at amortized cost. The capitalized contract cost mainly results from the capitalization of direct and incremental cost incurred when obtaining a customer cloud subscription contract. We amortize these assets on a straight-line basis over the period of providing the cloud subscriptions to which the assets relate.
Goodwill and Intangible Assets
We classify intangible assets according to their nature and use in our operation. Software and database licenses consist primarily of technology for internal use, whereas acquired technology consists primarily of purchased software to be incorporated into our product offerings andin-process research and development. Customer relationship and other intangibles consist primarily of customer contracts and acquired trademark licenses.
All our purchased intangible assets other than goodwill have finite useful lives. They are initially measured at acquisition cost and subsequently amortized either based on expected consumption of economic benefits or on a straight-line basis over their estimated useful lives ranging from two to 20 years.
Amortization for acquiredin-process research and development project assets starts when the projects are complete and the developed software is taken to the market. We typically amortize these intangibles over five to seven years.
Amortization expenses of intangible assets are classified as cost of cloud and software, cost of services, research and development, sales and marketing, and general and administration, depending on the use of the respective intangible assets.
The annual goodwill impairment test is performed at the level of our operating segments since there are no lower levels in SAP at which goodwill is monitored for internal management purposes. The test is performed at the same time for all operating segments.
Property, Plant, and Equipment
Property, plant, and equipment are carried at acquisition cost plus the fair value of related asset retirement costs if any and if reasonably estimable, less accumulated depreciation.
Property, plant, and equipment are depreciated over their expected useful lives, generally using the straight-line method.
Useful Lives of Property, Plant, and Equipment
| | |
Buildings | | Predominantly 25 to 50 years |
Leasehold improvements | | Based on the term of the lease contract |
| Information technology equipment | | 3 to 5 years |
| Office furniture | | 4 to 20 years |
| Automobiles | | 4 to 5 years |
Impairment of Goodwill andNon-Current Assets
Impairment losses, if any, are presented in other operating income/expense, net in profit or loss.
Liabilities
Financial Liabilities
Financial liabilities include trade and other payables, bank loans, issued bonds, private placements, and other financial liabilities that comprise derivative andnon-derivative financial liabilities. They are classified as financial liabilities at amortized cost and at fair value through profit or loss. The latter include only those financial liabilities that are held for trading, as we do not designate financial liabilities at fair value through profit or loss.
F-14
Customer funding liabilities are funds we draw from and make payments on behalf of our customers for customers’ employee expense reimbursements, related credit card payments, and vendor payments. We present these funds in cash and cash equivalents and record our obligation to make these expense reimbursements and payments on behalf of our customers as customer funding liabilities.
Expenses and gains/losses on financial liabilities mainly consist of interest expense, which is recognized based on the effective interest method.
Provisions
The employee-related provisions include, amongst others, long-term employee benefits. They are secured by pledged reinsurance coverage and are offset against the settlement amount of the secured commitment.
Post-Employment Benefits
The discount rates used in measuring our post-employment benefit assets and liabilities are derived from rates available on high-quality corporate bonds and government bonds for which the timing and amounts of payments match the timing and the amounts of our projected pension payments. The assumptions used to calculate pension liabilities and costs are disclosed inNote (18a). Net interest expense and other expenses related to defined benefit plans are recognized as employee benefits expenses and classified in our Consolidated Income Statements according to the activities that the employees owning the awards perform.
Since our domestic defined benefit pension plans primarily consist of an employee-financed post-retirement plan that is fully financed with qualifying insurance policies, current service cost may become a credit as a result of adjusting the defined benefit liability’s carrying amount to the fair value of the qualifying plan assets. Such adjustments are recorded in service cost.
Deferred Income
Deferred income is recognized as cloud subscriptions and support revenue, software licenses revenue, software support revenue, or services revenue, depending on the reason for the deferral, once the basic applicable revenue recognition criteria have been met. These criteria are met, for example, when the services are performed or when the discounts that relate to a material right granted in a purchase option are applied.
(3c) Management Judgments and Sources of Estimation Uncertainty
The preparation of the Consolidated Financial Statements in conformity with IFRS requires management to make judgments, estimates, and
assumptions that affect the application of accounting policies and the reported amounts of assets, liabilities, revenues, and expenses, as well as disclosure of contingent assets and liabilities.
We base our judgments, estimates, and assumptions on historical and forecast information, as well as on regional and industry economic conditions in which we or our customers operate, changes to which could adversely affect our estimates. Although we believe we have made reasonable estimates about the ultimate resolution of the underlying uncertainties, no assurance can be given that the final outcome of these matters will be consistent with what is reflected in our assets, liabilities, revenues, and expenses. Actual results could differ from original estimates.
The accounting policies that most frequently require us to make judgments, estimates, and assumptions, and therefore are critical to understanding our results of operations, include the following:
| – | | Valuation of trade receivables |
| – | | Accounting for share-based payments |
| – | | Accounting for income tax |
| – | | Accounting for business combinations |
| – | | Subsequent accounting for goodwill and intangible assets |
| – | | Accounting for legal contingencies |
| – | | Recognition of internally generated intangible assets from development |
Our management periodically discusses these critical accounting policies with the Audit Committee of the Supervisory Board.
Revenue Recognition
As described in the Revenue Recognition section ofNote (3b), we do not recognize revenue before the amount of revenue can be measured reliably, collection of the related receivable is probable, and the delivery has occurred or the services have been rendered. The determination of whether the amount of revenue can be measured reliably or whether the fees are collectible is inherently judgmental, as it requires estimates as to whether and to what extent subsequent concessions may be granted to customers and whether the customer is expected to pay the contractual fees. The timing and amount of revenue recognition can vary depending on what assessments have been made.
The application of thepercentage-of-completion method requires us to make estimates about total revenue, total cost to complete the project, and the stage of completion. The assumptions, estimates, and uncertainties inherent in determining the stage of completion affect the timing and amounts of revenue recognized.
F-15
In the accounting for our multiple-element arrangements, we have to determine the following:
| – | | Which contracts with the same customer are to be accounted for as one single arrangement |
| – | | Which deliverables under one contract are distinct and thus to be accounted for separately |
| – | | How to allocate the total arrangement fee to the distinct deliverables |
The determination of whether different contracts with the same customer are to be accounted for as one arrangement involves the use of judgment as it requires us to evaluate whether the contracts are negotiated together or linked in any other way. The timing and amount of revenue recognition can vary depending on whether two contracts are accounted for separately or as one single arrangement.
Under a multiple-element arrangement including a cloud subscription, oron-premise software, and other deliverables, we do not account for the cloud subscription, oron-premise software, and the other deliverables separately if one of the other deliverables (such as consulting services) is deemed to be essential to the functionality of the cloud subscription oron-premise software. The determination whether an undelivered element is essential to the functionality of the delivered element requires the use of judgment. The timing and amount of revenue recognition can vary depending on how that judgment is exercised, because revenue may be recognized over a longer service term.
In the area of allocating the transaction fee to the different deliverables under the respective customer contract, judgment is required in the determination of an appropriate fair value measurement which may impact the timing and amount of revenue recognized depending on the following:
| – | | Whether an appropriate measurement of fair value can be demonstrated for undelivered elements |
| – | | The approaches used to establish fair value |
Additionally, our revenue foron-premise software contracts would be significantly different if we applied a revenue allocation policy other than the residual method.
Valuation of Trade Receivables
As described in the Trade and Other Receivables section inNote (3b), we account for impairments of trade receivables by recording sales allowances and allowances for doubtful accounts on an individual receivable basis and on a portfolio basis. The assessment of whether a receivable is collectible involves the use of judgment and requires the use of assumptions about customer defaults that could change significantly. Judgment is required when we evaluate available information about a particular customer’s
financial situation to determine whether it is probable that a credit loss will occur and the amount of such loss is reasonably estimable and thus an allowance for that specific account is necessary. Basing the general allowance for the remaining receivables on our historical loss experience likewise requires the use of judgment, as history may not be indicative of future development. Changes in our estimates about the allowance for doubtful accounts could materially impact reported assets and expenses, and our profit could be adversely affected if actual credit losses exceed our estimates.
Accounting for Share-Based Payments
We use certain assumptions in estimating the fair values for our share-based payments, including expected share price volatility and expected option life (which represents our estimate of the average amount of time remaining until the options are exercised or expire unexercised). In addition, the final payout for plans may also depend on the achievement of performance indicators and on our share price on the respective exercise dates. Changes to these assumptions and outcomes that differ from these assumptions could require material adjustments to the carrying amount of the liabilities we have recognized for these share-based payments.
For the purpose of determining the estimated fair value of our share options, we believe expected volatility is the most sensitive assumption. Regarding future payout under our cash-settled plans, the SAP share price is the most relevant factor. Changes in these factors could significantly affect the estimated fair values as calculated by the option-pricing model, and the future payout. For more information, seeNote (27).
Accounting for Income Tax
We are subject to changing tax laws in multiple jurisdictions within the countries in which we operate. Our ordinary business activities also include transactions where the ultimate tax outcome is uncertain due to different interpretation of tax laws, such as those involving revenue sharing and cost reimbursement arrangements between SAP Group entities. In addition, the amount of income tax we pay is generally subject to ongoing audits by domestic and foreign tax authorities. As a result, judgment is necessary in determining our worldwide income tax provisions. We make our estimates about the ultimate resolution of our tax uncertainties based on current tax laws and our interpretation thereof. Changes to the assumptions underlying these estimates and outcomes that differ from these assumptions could require material adjustments to the carrying amount of our income tax provisions.
The assessment whether a deferred tax asset is impaired requires management judgment, as we need to estimate
F-16
future taxable profits to determine whether the utilization of the deferred tax asset is probable. In evaluating our ability to utilize our deferred tax assets, we consider all available positive and negative evidence, including the level of historical taxable income and projections for future taxable income over the periods in which the deferred tax assets are recoverable. Our judgment regarding future taxable income is based on assumptions about future market conditions and future profits of SAP. Changes to these assumptions and outcomes that differ from these assumptions could require material adjustments to the carrying amount of our deferred tax assets.
For more information about our income tax, seeNote (10).
Accounting for Business Combinations
In our accounting for business combinations, judgment is required in determining whether an intangible asset is identifiable, and should be recorded separately from goodwill. Additionally, estimating the acquisition date fair values of the identifiable assets acquired and liabilities assumed involves considerable management judgment. The necessary measurements are based on information available on the acquisition date and are based on expectations and assumptions that have been deemed reasonable by management. These judgments, estimates, and assumptions can materially affect our financial position and profit for several reasons, including the following:
| – | | Fair values assigned to assets subject to depreciation and amortization affect the amounts of depreciation and amortization to be recorded in operating profit in the periods following the acquisition. |
| – | | Subsequent negative changes in the estimated fair values of assets may result in additional expense from impairment charges. |
| – | | Subsequent changes in the estimated fair values of liabilities and provisions may result in additional expense (if increasing the estimated fair value) or additional income (if decreasing the estimated fair value). |
Subsequent Accounting for Goodwill and Intangible Assets
Judgment is required in determining the following:
| – | | The useful life of an intangible asset, as this is based on our estimates regarding the period over which the intangible asset is expected to produce economic benefits to us |
| – | | The amortization method, as IFRS requires the straight-line method to be used unless we can reliably determine the pattern in which the asset’s future economic benefits are expected to be consumed by us |
Both the amortization period and the amortization method have an impact on the amortization expense that is recorded in each period.
In making impairment assessments for our goodwill and intangible assets, the outcome of these tests is highly dependent on management’s assumptions regarding future cash flow projections and economic risks, which require significant judgment and assumptions about future developments. They can be affected by a variety of factors, including:
| – | | Changes in business strategy |
| – | | Estimation of weighted-average cost of capital |
Changes to the assumptions underlying our goodwill and intangible assets impairment assessments could require material adjustments to the carrying amount of our recognized goodwill and intangible assets as well as the amounts of impairment charges recognized in profit or loss.
The outcome of goodwill impairment tests may also depend on the allocation of goodwill to our operating segments. This allocation involves judgment as it is based on our estimates regarding which operating segments are expected to benefit from the synergies of business combinations.
For more information about goodwill and intangible assets, seeNote (15).
Accounting for Legal Contingencies
As described inNote (23), we are currently involved in various claims and legal proceedings. We review the status of each significant matter at least quarterly and assess our potential financial and business exposures related to such matters. Significant judgment is required in the determination of whether a provision is to be recorded and what the appropriate amount for such provision should be. Notably, judgment is required in the following:
| – | | Determining whether an obligation exists |
| – | | Determining the probability of outflow of economic benefits |
| – | | Determining whether the amount of an obligation is reliably estimable |
| – | | Estimating the amount of the expenditure required to settle the present obligation |
Due to uncertainties relating to these matters, provisions are based on the best information available at the time.
At the end of each reporting period, we reassess the potential obligations related to our pending claims and litigation and adjust our respective provisions to reflect the current best estimate. In addition, we monitor and
F-17
evaluate new information that we receive after the end of the respective reporting period but before the Consolidated Financial Statements are authorized for issue to determine whether this provides additional information regarding conditions that existed at the end of the reporting period. Changes to the estimates and assumptions underlying our accounting for legal contingencies and outcomes that differ from these estimates and assumptions could require material adjustments to the carrying amounts of the respective provisions recorded as well as additional provisions. For more information about legal contingencies, seeNotes (18b) and (23).
Recognition of Internally Generated Intangible Assets from Development
We believe that determining whether internally generated intangible assets from development are to be recognized as intangible assets requires significant judgment, particularly in the following areas:
| – | | Determining whether activities should be considered research activities or development activities. |
| – | | Determining whether the conditions for recognizing an intangible asset are met requires assumptions about future market conditions, customer demand, and other developments. |
| – | | The term “technical feasibility” is not defined in IFRS, and therefore determining whether the completion of an asset is technically feasible requires judgment and a company-specific approach. |
| – | | Determining the future ability to use or sell the intangible asset arising from the development and the determination of the probability of future benefits from sale or use. |
| – | | Determining whether a cost is directly or indirectly attributable to an intangible asset and whether a cost is necessary for completing a development. |
These judgments impact the total amount of intangible assets that we present in our balance sheet as well as the timing of recognizing development expenses in profit or loss.
(3d) New Accounting Standards Adopted in the Current Period
No new accounting standards adopted in 2016 had a material impact on our Consolidated Financial Statements. We have early adopted the amendments to IAS 7 (Statement of Cash Flows), which are aimed at improving the information provided to users of financial statements about an entity’s financing activities, as well as expanding the disclosures on net debt.
(3e) New Accounting Standards Not Yet Adopted
The standards and interpretations (relevant to the Group) that are issued, but not yet effective, up to the date of issuance of the Group’s financial statements are
disclosed below. The Group intends to adopt these standards, if applicable, when they become effective:
| – | | On May 28, 2014, the IASB issued IFRS 15 (Revenue from Contracts with Customers). The new revenue recognition standard will be effective for us starting January 1, 2018. We do not plan to adopt IFRS 15 early. The standard permits two possible transition methods for the adoption of the new guidance: (1) retrospectively to each prior reporting period presented in accordance with IAS 8 (Accounting Policies, Changes in Accounting Estimates and Errors), or (2) retrospectively with the cumulative effect of initially applying the standard recognized on the date of the initial application (cumulativecatch-up approach). We currently plan to adopt the new standard using the cumulativecatch-up approach. |
We are in the process of developing our future IFRS 15 revenue recognition policies and adjusting the relevant business processes to adopt these new policies. We have established a project across SAP’s operating segments. This project covers the implementation of a newSAP-based revenue accounting and reporting solution as well as the development of new revenue recognition policies. Besides this, we have established a globalroll-out and training approach for all of the relevant stakeholders within the organization. As part of this effort, we have identified several differences between our current accounting policies and the future IFRS15-based policies (as far as these have already been developed). Based on our analyses performed so far, these differences include:
| | ◾ | | Currently, if for any of our product or service offerings, we determine at the outset of an arrangement that the amount of revenue cannot be measured reliably, we conclude that the inflow of economic benefits associated with the transaction is not probable, and we defer revenue recognition until the arrangement fee becomes due and payable by the customer. Under our draft IFRS15-based policies, we need to estimate, at the outset of an arrangement, the potential impact on the transaction price from both uncertainties in the measurement of revenue and from collection uncertainties and recognize the remaining revenue earlier. |
| | ◾ | | IFRS 15 requires changes to the way we allocate a transaction price to individual performance obligations, which can impact both the classification and the timing of revenues. Among these differences are changes in the application of the residual approach under IFRS 15 and the residual method which we currently apply. While the residual method we currently use aims at allocating the transaction price between deliverables, the residual approach under IFRS 15 is used for estimating the standalone selling price |
F-18
| | | of a promised good or service and generally would not allow an allocation of little or no portion of the transaction price to a performance obligation. This difference may result in higher transaction price allocations toon-premise software performance obligations and thus in an earlier recognition of certain portions of the transaction price. |
| | ◾ | | We expect a revised recognition pattern foron-premise software subscription contracts, which combine the delivery of software and support service and the obligation to deliver, in the future, unspecified software products. Under our current policies, we recognize the entire fee ratably over the subscription term. In contrast, under IFRS15-, we would recognize a portion of the transaction price upon delivery of the initial software at the outset of the arrangement. |
| | ◾ | | Under our current policies, we do not account for options that allow the customer to purchase additional copies of an already-licensedon-premise software product as a separate element of an arrangement. In contrast, IFRS 15 provides that such options are accounted for as a separate performance obligation if they represent a material right. In such circumstancesIFRS 15 will result in allocating a portion of the transaction price to such options giving rise to the material right . This portion will be recognized upon exercise or forfeiture of the options, which may be later than the current revenue recognition timing. |
| | ◾ | | We are currently already capitalizing the cost to obtain a contract. We expect the capitalization amount to increase under IFRS 15 due to a broader definition of what is capitalizable as cost to obtain a contract. |
In addition to the effects on our Consolidated Statements of Income, we expect changes to our Consolidated Statements of Financial Position (in particular due to no separate balance sheet items for deferred revenues being presented anymore, the recognition of contract assets/contract liabilities, the differentiation between contract assets and trade receivables, and an impact in retained earnings from the initial adoption of IFRS 15) and changes in quantitative and qualitative disclosure to be added.The quantitative impact of IFRS 15 on our 2018 financial statements is currently neither known to us nor reasonably estimable, as we have not yet done the following:
| | ◾ | | Completed the analysis of the volume of contracts that will be affected by the different policy changes stemming from IFRS 15 upon adoption |
| | ◾ | | Performed estimates of the potential changes in business practices that may result from the adoption of the new policies |
| | ◾ | | Completed the identification of those contracts that will not be completed by the end of 2017 and |
| | | thus have to be restated under the cumulativecatch-up approach that we intend to use for transition to the new policies |
| | ◾ | | Finalized our accounting policy regarding the cost components to be included into the cost to fulfill a contract under IFRS 15. |
We will continue to assess all of the impacts that the application of IFRS 15 will have on our financial statements in the period of initial application, which will also significantly depend on our business andgo-to-market strategy in 2017. The impacts — if material — will be disclosed, including statements on if and how we apply any of the practical expedients available in the standard.
| – | | On January 13, 2016, the IASB issued IFRS 16 (Leases). The standard becomes effective in fiscal year 2019, with earlier application permitted for those companies that also apply IFRS 15. The new standard is a major revision of lease accounting; whereas the accounting by lessors remains substantially unchanged, the lease accounting by lessees will change significantly as all leases need to be recognized on a company’s balance sheet as assets and liabilities. For SAP, the vast majority of the impact is expected to come from our facility leases, and we are currently analyzing the effects of adopting the standard and whether or not those effects will be material. We are also currently evaluating to what extent we want to make use of the practical expedients included in the standard. The financial impact of the new standard will depend on the lease agreements in effect at the time of adoption. It is expected that operating profit will increase, as costs that were treated as rental expenses in the past will now be recorded as interest expense. It is also expected that total assets / liabilities will increase, asright-of-use assets / lease liabilities will have to be recorded for those items that were previously “off balance sheet.” Based on the limited assessment of the impact of IFRS 16 performed to date, we currently do not know and are not able to reasonably estimate the impact on our financial statements. |
| – | | On July 24, 2014, the IASB issued the fourth and final version of IFRS 9 (Financial Instruments), which will be applicable in fiscal year 2018 with earlier application permitted. We plan to adopt the new standard on the required effective date. |
Our preliminary assessment may be subject to changes, as we have not yet finalized our analysis and thus have not completed the determination of the impact on our Consolidated Financial Statements.
(a) Classification of financial assets
Under our current policies, we classify most of our debt and equity investments asavailable-for-sale financial assets. We expect that the majority of our debt investments will be measured at amortized cost
F-19
under IFRS 9, as we hold them to collect contractual cash flows which solely represent payments of principal and interest. Equity investments can be classified as either fair value through other comprehensive income (FVOCI) or fair value through profit or loss (FVTPL), and we have not yet made a decision in this regard. Consequently, we are unable to reasonably estimate the impact of the introduction of IFRS 9 on the accounting for our equity investments.
Loans, trade, and other financial receivables and contract assets are held to collect contractual cash flows and are expected to give rise to cash flows solely representing payments of principal and interest. Thus, we expect that these will continue to be measured at amortized cost.
Derivatives will continue to be measured at FVTPL.
However, we will continue to analyze the contractual cash flow characteristics of all instruments approved to be used and the related business model in more detail before reaching a final conclusion on the classification for IFRS 9.
(b) Financial liabilities
We have never designated any financial liabilities at FVTPL and have no current intention to do so. Thus, we believe that we will not have a material impact with regards to financial liabilities, considering that the only significant change that IFRS 9 brings to the accounting for financial liabilities is that for liabilities designated as at FVTPL, changes in the fair value attributable to changes in the credit risk of the liability must be presented in other comprehensive income (OCI).
(c) Impairment
We currently plan to apply the simplified impairment approach of IFRS 9 and record lifetime expected losses on all trade receivables and contract assets. The financial impact of the new standard will depend on the financial instruments recorded at the time of adoption. Based on the current status of our analysis, we are expecting offsetting effects, that is, increases and decreases in impairment under IFRS 9 and thus no material impact. This assessment might change based on the result of the more detailed analysis performed that considers all reasonable and supportable information, including forward-looking elements.
(d) Hedge accounting
We believe that all existing hedge relationships that we have currently designated in effective hedging relationships will still qualify for hedge accounting in the future, and thus we do not expect a significant impact as a result of applying IFRS 9. In contrast to IAS 39, where fair value changes related to the interest element are recognized in profit or loss immediately, IFRS 9 allows recording these costs of hedging in OCI. We have not yet made a decision related to the accounting for the interest element. Only after having made that decision will we be able to reasonably estimate the impact of these new requirements on our financial statements.
(4) BUSINESS COMBINATIONS
In 2016 and 2015, we did not conclude any significant business combinations.
(5) REVENUE
For detailed information about our revenue recognition policies, seeNote (3).
For revenue information by geographic region, seeNote (28).
Revenue from construction contracts (contract revenue) is mainly included in software revenue and services revenue depending on the type of contract. In 2016, contract revenue of€280 million was recognized for all our construction contracts (2015:€292 million, 2014:€285 million). The status of our construction contracts in progress at the end of the reporting period accounted for under IAS 11 (Construction Contracts) was as follows:
Construction Contracts in Progress
| | | | | | | | | | | | |
| € millions | | 2016 | | | 2015 | | | 2014 | |
| Aggregate cost recognized (multi-year) | | | 527 | | | | 294 | | | | 201 | |
Recognized result (+ profit/– loss; multi-year) | | – | 174 | | | | 20 | | | | 92 | |
| Gross amounts due to customers | | | 78 | | | | 41 | | | | 30 | |
Recognized loss stated for 2016 predominantly resulted from strategic customerco-innovation projects.
F-20
(6) RESTRUCTURING
Restructuring Expenses
| | | | | | | | | | | | |
| € millions | | 2016 | | | 2015 | | | 2014 | |
| Employee-related restructuring expenses | | | 33 | | | | 610 | | | | 119 | |
| Onerous contract-related restructuring expenses | | | –5 | | | | 11 | | | | 7 | |
Restructuring expenses | | | 28 | | | | 621 | | | | 126 | |
In 2016, except for limitedclose-out activities under our global restructuring plan executed in 2015, no significant new restructuring activities occurred.
Restructuring provisions primarily include personnel costs that result from severance payments for employee terminations and onerous contract costs. Prior-year restructuring provisions relate to restructuring activities incurred in connection with organizational changes and the integration of employees of our acquisitions in previous years.
If not presented separately in our income statement, restructuring expenses would break down by functional area as follows:
Restructuring Expenses by Functional Area
| | | | | | | | | | | | |
| € millions | | 2016 | | | 2015 | | | 2014 | |
Cost of cloud and software | | | 3 | | | | 80 | | | | 9 | |
Cost of services | | | 7 | | | | 218 | | | | 24 | |
Research and development | | | 7 | | | | 156 | | | | 24 | |
Sales and marketing | | | 10 | | | | 147 | | | | 41 | |
General and administration | | | 1 | | | | 20 | | | | 28 | |
Restructuring expenses | | | 28 | | | | 621 | | | | 126 | |
(7) EMPLOYEE BENEFITS EXPENSE AND HEADCOUNT
Employee Benefits Expense
| | | | | | | | | | | | |
| € millions | | 2016 | | | 2015 | | | 2014 | |
Salaries | | | 7,969 | | | | 7,483 | | | | 6,319 | |
Social security expense | | | 1,135 | | | | 1,067 | | | | 916 | |
Share-based payment expense | | | 785 | | | | 724 | | | | 290 | |
Pension expense | | | 270 | | | | 258 | | | | 211 | |
| Employee-related restructuring expense | | | 33 | | | | 610 | | | | 119 | |
| Termination benefits outside of restructuring plans | | | 37 | | | | 28 | | | | 22 | |
Employee benefits expense | | | 10,229 | | | | 10,170 | | | | 7,877 | |
Pension expense includes the amounts recorded for our defined benefit and defined contribution plans as described inNote (18a). Expenses for local state pension plans are included in social security expense.
The number of employees in the following table is broken down by function and by the regions EMEA (Europe, Middle East, and Africa), Americas (North America and Latin America), and APJ (Asia Pacific Japan). The information for prior periods has been restated to conform to current year presentation.
F-21
Number of Employees
| | | | | | | | | | | | | | | | | | | | | | | | | | | | | | | | | | | | | | | | | | | | | | | | |
Full-time
equivalents | | December 31, 2016 | | | December 31, 2015 | | | December 31, 2014 | |
| | EMEA | | | Americas | | | APJ | | | Total | | | EMEA | | | Americas | | | APJ | | | Total | | | EMEA | | | Americas | | | APJ | | | Total | |
| Cloud and software | | | 6,406 | | | | 4,184 | | | | 5,412 | | | | 16,002 | | | | 6,095 | | | | 3,920 | | | | 4,976 | | | | 14,991 | | | | 5,953 | | | | 3,983 | | | | 5,138 | | | | 15,074 | |
Services | | | 6,535 | | | | 4,119 | | | | 3,967 | | | | 14,621 | | | | 6,482 | | | | 3,812 | | | | 3,574 | | | | 13,868 | | | | 6,649 | | | | 3,834 | | | | 2,879 | | | | 13,361 | |
| Research and development | | | 10,525 | | | | 4,860 | | | | 7,977 | | | | 23,363 | | | | 9,676 | | | | 4,233 | | | | 7,029 | | | | 20,938 | | | | 9,049 | | | | 3,974 | | | | 5,885 | | | | 18,908 | |
| Sales and marketing | | | 8,542 | | | | 8,999 | | | | 4,435 | | | | 21,977 | | | | 7,683 | | | | 7,766 | | | | 3,974 | | | | 19,422 | | | | 7,712 | | | | 7,758 | | | | 3,776 | | | | 19,246 | |
| General and administration | | | 2,629 | | | | 1,746 | | | | 1,018 | | | | 5,393 | | | | 2,434 | | | | 1,653 | | | | 937 | | | | 5,024 | | | | 2,436 | | | | 1,643 | | | | 944 | | | | 5,023 | |
Infrastructure | | | 1,584 | | | | 788 | | | | 454 | | | | 2,827 | | | | 1,535 | | | | 783 | | | | 425 | | | | 2,743 | | | | 1,542 | | | | 879 | | | | 373 | | | | 2,794 | |
SAP Group (December 31) | | | 36,222 | | | | 24,696 | | | | 23,265 | | | | 84,183 | | | | 33,906 | | | | 22,166 | | | | 20,914 | | | | 76,986 | | | | 33,340 | | | | 22,071 | | | | 18,995 | | | | 74,406 | |
Thereof acquisitions | | | 37 | | | | 172 | | | | 0 | | | | 209 | | | | 73 | | | | 0 | | | | 0 | | | | 73 | | | | 814 | | | | 2,890 | | | | 1,831 | | | | 5,535 | |
SAP Group (months’ end average) | | | 34,932 | | | | 23,532 | | | | 22,145 | | | | 80,609 | | | | 33,561 | | | | 21,832 | | | | 19,788 | | | | 75,180 | | | | 31,821 | | | | 19,797 | | | | 16,725 | | | | 68,343 | |
Allocation of Share-Based Payment Expense
The allocation of expense for share-based payments, net of the effects from hedging these instruments, to the various functional areas is as follows:
Share-Based Payments
| | | | | | | | | | | | |
| € millions | | 2016 | | | 2015 | | | 2014 | |
Cost of cloud and software | | | 89 | | | | 74 | | | | 28 | |
Cost of services | | | 101 | | | | 113 | | | | 49 | |
Research and development | | | 190 | | | | 166 | | | | 71 | |
Sales and marketing | | | 292 | | | | 260 | | | | 80 | |
General and administration | | | 113 | | | | 111 | | | | 62 | |
Share-based payments | | | 785 | | | | 724 | | | | 290 | |
Thereof cash-settled share-based payments | | | 678 | | | | 637 | | | | 193 | |
Thereof equity-settled share-based payments | | | 107 | | | | 87 | | | | 96 | |
For more information about our share-based payments, seeNote (27).
(8) OTHERNON-OPERATING INCOME/EXPENSE, NET
OtherNon-Operating Income/Expense, Net
| | | | | | | | | | | | |
| € millions | | 2016 | | | 2015 | | | 2014 | |
| Foreign currency exchange gain/loss, net | | | –210 | | | | –230 | | | | 71 | |
Thereof from financial assets/liabilities at fair value through profit or loss | | | –38 | | | | –12 | | | | 83 | |
Thereof fromavailable-for-sale financial assets | | | –1 | | | | –1 | | | | 0 | |
Thereof from loans and receivables | | | 26 | | | | –213 | | | | –219 | |
Thereof from financial liabilities at amortized cost | | | –174 | | | | –2 | | | | 226 | |
Thereof fromnon-financial assets/liabilities | | | –17 | | | | –3 | | | | –13 | |
Miscellaneous income | | | 3 | | | | 1 | | | | 3 | |
Miscellaneous expense | | | –27 | | | | –27 | | | | –25 | |
| Othernon-operating income/expense, net | | | –234 | | | | –256 | | | | 49 | |
F-22
(9) FINANCIAL INCOME, NET
Financial Income, Net
| | | | | | | | | | | | |
| € millions | | 2016 | | | 2015 | | | 2014 | |
Finance income | | | 230 | | | | 241 | | | | 127 | |
Thereofavailable-for-sale financial assets (equity) | | | 164 | | | | 176 | | | | 30 | |
Finance costs | | | –268 | | | | –246 | | | | –152 | |
Thereof interest expense from financial liabilities at amortized cost | | | –108 | | | | –135 | | | | –93 | |
Thereof interest expense from derivatives | | | –114 | | | | –72 | | | | –28 | |
Financial income, net | | | –38 | | | | –5 | | | | –25 | |
(10) INCOME TAX
Tax Expense According to Region
| | | | | | | | | | | | |
| € millions | | 2016 | | | 2015 | | | 2014 | |
Current tax expense | | | | | | | | | | | | |
Germany | | | 853 | | | | 859 | | | | 770 | |
Foreign | | | 537 | | | | 408 | | | | 422 | |
Total current tax expense | | | 1,390 | | | | 1,267 | | | | 1,192 | |
Deferred tax expense/income | | | | | | | | | | | | |
Germany | | | –38 | | | | –74 | | | | 84 | |
Foreign | | | –123 | | | | –258 | | | | –201 | |
Total deferred tax income | | | –161 | | | | –332 | | | | –117 | |
Total income tax expense | | | 1,229 | | | | 935 | | | | 1,075 | |
Major Components of Tax Expense
| | | | | | | | | | | | |
| € millions | | 2016 | | | 2015 | | | 2014 | |
Current tax expense/income | | | | | | | | | | | | |
Tax expense for current year | | | 1,412 | | | | 1,278 | | | | 1,168 | |
Taxes for prior years | | | –22 | | | | –11 | | | | 24 | |
Total current tax expense | | | 1,390 | | | | 1,267 | | | | 1,192 | |
Deferred tax expense/income | | | | | | | | | | | | |
| Origination and reversal of temporary differences | | | –403 | | | | –428 | | | | –126 | |
| Unused tax losses, research and development tax credits, and foreign tax credits | | | 242 | | | | 96 | | | | 9 | |
Total deferred tax income | | | –161 | | | | –332 | | | | –117 | |
Total income tax expense | | | 1,229 | | | | 935 | | | | 1,075 | |
Profit Before Tax
| | | | | | | | | | | | |
| € millions | | 2016 | | | 2015 | | | 2014 | |
Germany | | | 3,109 | | | | 3,161 | | | | 3,338 | |
Foreign | | | 1,754 | | | | 830 | | | | 1,017 | |
Total | | | 4,863 | | | | 3,991 | | | | 4,355 | |
The following table reconciles the expected income tax expense, computed by applying our combined German tax rate of 26.4% (2015: 26.4%; 2014: 26.4%), to the actual income tax expense. Our 2016 combined German tax rate includes a corporate income tax rate of 15.0% (2015: 15.0%; 2014: 15.0%), plus a solidarity surcharge of 5.5% (2015: 5.5%; 2014: 5.5%) thereon, and trade taxes of 10.6% (2015: 10.6%; 2014: 10.6%).
F-23
Relationship Between Tax Expense and Profit Before Tax
| | | | | | | | | | | | |
€ millions, unless otherwise
stated | | 2016 | | | 2015 | | | 2014 | |
Profit before tax | | | 4,863 | | | | 3,991 | | | | 4,355 | |
| Tax expense at applicable tax rate of 26.4% (2015: 26.4%; 2014: 26.4%) | | | 1,284 | | | | 1,055 | | | | 1,151 | |
Tax effect of: | | | | | | | | | | | | |
Foreign tax rates | | | –105 | | | | –126 | | | | –117 | |
Non-deductible expenses | | | 78 | | | | 61 | | | | 63 | |
Tax exempt income | | | –106 | | | | –103 | | | | –86 | |
Withholding taxes | | | 112 | | | | 115 | | | | 111 | |
Research and development and foreign tax credits | | | –36 | | | | –31 | | | | –41 | |
Prior-year taxes | | | –43 | | | | –55 | | | | –10 | |
Reassessment of deferred tax assets, research and development tax credits, and foreign tax credits | | | 43 | | | | 43 | | | | 41 | |
Other | | | 2 | | | | –24 | | | | –37 | |
Total income tax expense | | | 1,229 | | | | 935 | | | | 1,075 | |
Effective tax rate (in %) | | | 25.3 | | | | 23.4 | | | | 24.7 | |
| | | | | | | | |
Recognized Deferred Tax Assets and Liabilities | |
| € millions | | 2016 | | | 2015 | |
Deferred tax assets | | | | | | | | |
Intangible assets | | | 81 | | | | 99 | |
Property, plant, and equipment | | | 32 | | | | 24 | |
Other financial assets | | | 18 | | | | 15 | |
Trade and other receivables | | | 72 | | | | 64 | |
Pension provisions | | | 108 | | | | 98 | |
Share-based payments | | | 207 | | | | 163 | |
Other provisions and obligations | | | 517 | | | | 431 | |
Deferred income | | | 118 | | | | 104 | |
Carryforwards of unused tax losses | | | 377 | | | | 621 | |
| Research and development and foreign tax credits | | | 235 | | | | 187 | |
Other | | | 102 | | | | 149 | |
Total deferred tax assets | | | 1,867 | | | | 1,955 | |
| | | | | | | | |
Recognized Deferred Tax Assets and Liabilities | |
| € millions | | 2016 | | | 2015 | |
| Deferred tax liabilities | | | | | | |
Intangible assets | | | 1,162 | | | | 1,234 | |
Property, plant, and equipment | | | 66 | | | | 62 | |
Other financial assets | | | 158 | | | | 389 | |
Trade and other receivables | | | 125 | | | | 93 | |
Pension provisions | | | 7 | | | | 5 | |
Share-based payments | | | 3 | | | | 4 | |
Other provisions and obligations | | | 122 | | | | 112 | |
Deferred income | | | 39 | | | | 40 | |
Other | | | 26 | | | | 11 | |
Total deferred tax liabilities | | | 1,708 | | | | 1,950 | |
Total deferred tax assets/
liabilities, net | | | 159 | | | | 5 | |
Items Not Resulting in a Deferred Tax Asset
| | | | | | | | | | | | |
| € millions | | 2016 | | | 2015 | | | 2014 | |
Unused tax losses | | | | | | | | | | | | |
Not expiring | | | 338 | | | | 279 | | | | 140 | |
Expiring in the following year | | | 32 | | | | 95 | | | | 63 | |
| Expiring after the following year | | | 649 | | | | 704 | | | | 672 | |
Total unused tax losses | | | 1,019 | | | | 1,078 | | | | 875 | |
| Deductible temporary differences | | | 33 | | | | 122 | | | | 96 | |
| Unused research and development and foreign tax credits | | | | | | | | | | | | |
Not expiring | | | 33 | | | | 34 | | | | 32 | |
Expiring in the following year | | | 1 | | | | 0 | | | | 0 | |
| Expiring after the following year | | | 30 | | | | 20 | | | | 22 | |
Total unused tax credits | | | 64 | | | | 54 | | | | 54 | |
€309 million (2015:€429 million; 2014:€441 million) of the unused tax losses relate to U.S. state tax loss carryforwards.
In 2016, subsidiaries that suffered a tax loss in either the current or the preceding period recognized deferred tax assets in excess of deferred tax liabilities amounting to€189 million (2015:€129 million; 2014:€73 million), because it is probable that sufficient future taxable profit will be available to allow the benefit of the deferred tax assets to be utilized.
F-24
We have not recognized a deferred tax liability on approximately€10.81 billion (2015:€9.95 billion) for undistributed profits of our subsidiaries, because we are in a position to control the timing of the reversal of the temporary difference and it is probable that such differences will not reverse in the foreseeable future.
Total Income Tax
| | | | | | | | | | | | |
| € millions | | 2016 | | | 2015 | | | 2014 | |
Income tax recorded in profit | | | 1,229 | | | | 935 | | | | 1,075 | |
| Income tax recorded in share premium | | | –5 | | | | –14 | | | | –3 | |
| Income tax recorded in other comprehensive income that will not be reclassified to profit and loss | | | | | | | | | | | | |
Remeasurements on defined benefit pension plans | | | –2 | | | | –2 | | | | –7 | |
| Income tax recorded in other comprehensive income that will be reclassified to profit and loss | | | | | | | | | | | | |
Available-for-sale financial assets | | | –1 | | | | 2 | | | | 0 | |
Cash flow hedges | | | –4 | | | | 4 | | | | –10 | |
Exchange differences | | | 25 | | | | –16 | | | | –21 | |
Total | | | 1,242 | | | | 909 | | | | 1,034 | |
We are subject to ongoing tax audits by domestic and foreign tax authorities. Currently, we are in dispute mainly with the German and only a few foreign tax authorities. The German dispute is in respect of intercompany financing matters and certain secured capital investments, while the few foreign disputes are in respect of intercompany financing matters and the deductibility of license fees and intercompany services. In all cases, we expect that a favorable outcome can only be achieved through litigation. For all of these matters, we have not recorded a provision as we believe that the tax authorities’ claims have no merit and that no adjustment is warranted. If, contrary to our view, the tax authorities were to prevail in their arguments before the court, we would expect to have an additional tax expense (including related interest expenses and penalties) of approximately€1,749 million (2015:€1,045 million) in total.
(11) EARNINGS PER SHARE
Earnings per Share
| | | | | | | | | | | | |
| € millions, unless otherwise stated | | 2016 | | | 2015 | | | 2014 | |
Profit attributable to equity holders of SAP SE | | | 3,646 | | | | 3,064 | | | | 3,280 | |
Issued ordinary shares1) | | | 1,229 | | | | 1,229 | | | | 1,229 | |
Effect of treasury shares1) | | | –30 | | | | –32 | | | | –34 | |
Weighted average shares outstanding, basic1) | | | 1,198 | | | | 1,197 | | | | 1,195 | |
Dilutive effect of share-based payments1) | | | 1 | | | | 2 | | | | 3 | |
Weighted average shares outstanding, diluted1) | | | 1,199 | | | | 1,198 | | | | 1,197 | |
Earnings per share, basic, attributable to equity holders of SAP SE
(in€) | | | 3.04 | | | | 2.56 | | | | 2.75 | |
Earnings per share, diluted, attributable to equity holders of SAP SE
(in€) | | | 3.04 | | | | 2.56 | | | | 2.74 | |
1) Number of shares in millions
F-25
(12) OTHER FINANCIAL ASSETS
Other Financial Assets
| | | | | | | | | | | | | | | | | | | | | | | | |
| € millions | | 2016 | | | 2015 | |
| | Current | | | Non-Current | | | Total | | | Current | | | Non-Current | | | Total | |
Loans and other financial receivables | | | 834 | | | | 266 | | | | 1,100 | | | | 195 | | | | 243 | | | | 437 | |
Debt investments | | | 195 | | | | 0 | | | | 195 | | | | 26 | | | | 0 | | | | 26 | |
Equity investments | | | 1 | | | | 952 | | | | 953 | | | | 1 | | | | 881 | | | | 882 | |
Available-for-sale financial assets | | | 196 | | | | 952 | | | | 1,148 | | | | 27 | | | | 881 | | | | 908 | |
Derivatives | | | 94 | | | | 102 | | | | 196 | | | | 129 | | | | 154 | | | | 283 | |
Investments in associates | | | 0 | | | | 38 | | | | 38 | | | | 0 | | | | 58 | | | | 58 | |
Total | | | 1,124 | | | | 1,358 | | | | 2,482 | | | | 351 | | | | 1,336 | | | | 1,687 | |
Loans and Other Financial Receivables
Loans and other financial receivables mainly consist of time deposits, investments in pension assets for which the corresponding liability is included in employee-related obligations (seeNote (18b)), other receivables, and loans to employees and third parties. The majority of our loans and other financial receivables are concentrated in Germany.
As at December 31, 2016, there were no loans and other financial receivables past due but not impaired. We have no indications of impairments of loans and other financial receivables that are not past due and not impaired as at the reporting date. For general information about financial risk and the nature of risk, seeNote (24).
Available-for-Sale Financial Assets
Ouravailable-for-sale financial assets consist of debt investments in bonds of mainly financial andnon-financial corporations and municipalities and equity investments in listed and unlisted securities, mainly held in U.S. dollars.
For more information about fair value measurement with regard to our equity investments, seeNote (26).
Derivatives
Detailed information about our derivative financial instruments is presented inNote (25).
(13) TRADE AND OTHER RECEIVABLES
Trade and Other Receivables
| | | | | | | | | | | | | | | | | | | | | | | | |
| € millions | | 2016 | | | 2015 | |
| | Current | | | Non-Current | | | Total | | | Current | | | Non-Current | | | Total | |
Trade receivables, net | | | 5,823 | | | | 2 | | | | 5,825 | | | | 5,198 | | | | 2 | | | | 5,199 | |
Other receivables | | | 101 | | | | 124 | | | | 225 | | | | 77 | | | | 86 | | | | 163 | |
Total | | | 5,924 | | | | 126 | | | | 6,050 | | | | 5,274 | | | | 87 | | | | 5,362 | |
F-26
Carrying Amounts of Trade Receivables
| | | | | | | | |
| € millions | | 2016 | | | 2015 | |
Gross carrying amount | | | 6,114 | | | | 5,428 | |
Sales allowances charged to revenue | | | –200 | | | | –153 | |
| Allowance for doubtful accounts charged to expense | | | –89 | | | | –75 | |
Carrying amount trade
receivables, net | | | 5,825 | | | | 5,199 | |
The changes in the allowance for doubtful accounts charged to expense were immaterial in all periods presented.
Aging of Trade Receivables
| | | | | | | | |
| € millions | | 2016 | | | 2015 | |
| Not past due and not individually impaired | | | 4,313 | | | | 3,918 | |
| Past due but not individually impaired | | | | | | | | |
Past due 1 to 30 days | | | 541 | | | | 473 | |
Past due 31 to 120 days | | | 493 | | | | 428 | |
Past due 121 to 365 days | | | 305 | | | | 257 | |
Past due over 365 days | | | 84 | | | | 38 | |
| Total past due but not individually impaired | | | 1,422 | | | | 1,196 | |
Individually impaired, net of allowances | | | 90 | | | | 85 | |
| Carrying amount of trade receivables, net | | | 5,825 | | | | 5,199 | |
For more information about financial risk and how we manage it, seeNotes (24) and (25).
(14) OTHERNON-FINANCIAL ASSETS
OtherNon-Financial Assets
| | | | | | | | | | | | | | | | | | | | | | | | |
| € millions | | 2016 | | | 2015 | |
| | Current | | | Non-Current | | | Total | | | Current | | | Non-Current | | | Total | |
Prepaid expenses | | | 257 | | | | 107 | | | | 364 | | | | 232 | | | | 83 | | | | 315 | |
Other tax assets | | | 123 | | | | 0 | | | | 123 | | | | 113 | | | | 0 | | | | 113 | |
Capitalized contract cost | | | 139 | | | | 424 | | | | 563 | | | | 77 | | | | 250 | | | | 327 | |
Miscellaneous other assets | | | 62 | | | | 0 | | | | 62 | | | | 46 | | | | 0 | | | | 46 | |
Total | | | 581 | | | | 532 | | | | 1,113 | | | | 468 | | | | 332 | | | | 800 | |
Prepaid expenses primarily consist of prepayments for operating leases, support services, and software royalties.
F-27
(15) GOODWILL AND INTANGIBLE ASSETS
Goodwill and Intangible Assets
| | | | | | | | | | | | | | | | | | | | |
| € millions | | Goodwill | | | Software and
Database
Licenses | | | Acquired
Technology/
IPRD | | | Customer
Relationship and
Other
Intangibles | | | Total | |
Historical cost | | | | | | | | | | | | | | | | | | | | |
January 1, 2015 | | | 21,099 | | | | 667 | | | | 2,587 | | | | 4,644 | | | | 28,997 | |
Foreign currency exchange differences | | | 1,666 | | | | 15 | | | | 204 | | | | 379 | | | | 2,264 | |
Additions from business combinations | | | 27 | | | | 0 | | | | 6 | | | | 5 | | | | 38 | |
Other additions | | | 0 | | | | 53 | | | | 0 | | | | 6 | | | | 59 | |
Retirements/disposals | | | 0 | | | | –8 | | | | –1 | | | | –1 | | | | –10 | |
December 31, 2015 | | | 22,792 | | | | 727 | | | | 2,796 | | | | 5,033 | | | | 31,348 | |
Foreign currency exchange differences | | | 566 | | | | 7 | | | | 71 | | | | 135 | | | | 779 | |
Additions from business combinations | | | 57 | | | | 0 | | | | 41 | | | | 22 | | | | 120 | |
Other additions | | | 0 | | | | 74 | | | | 0 | | | | 21 | | | | 95 | |
Retirements/disposals | | | 0 | | | | –17 | | | | –1 | | | | –92 | | | | –110 | |
December 31, 2016 | | | 23,415 | | | | 791 | | | | 2,907 | | | | 5,119 | | | | 32,232 | |
| | | | | | | | | | | | | | | | | | | | | |
Accumulated amortization | | | | | | | | | | | | | | | | | | | | |
January 1, 2015 | | | 99 | | | | 448 | | | | 1,357 | | | | 1,489 | | | | 3,393 | |
Foreign currency exchange differences | | | 4 | | | | 10 | | | | 84 | | | | 89 | | | | 187 | |
Additions amortization | | | 0 | | | | 76 | | | | 372 | | | | 361 | | | | 809 | |
Retirements/disposals | | | 0 | | | | –8 | | | | –1 | | | | –1 | | | | –10 | |
December 31, 2015 | | | 103 | | | | 526 | | | | 1,812 | | | | 1,938 | | | | 4,379 | |
Foreign currency exchange differences | | | 1 | | | | 5 | | | | 54 | | | | 59 | | | | 119 | |
Additions amortization | | | 0 | | | | 74 | | | | 321 | | | | 351 | | | | 746 | |
Retirements/disposals | | | 0 | | | | –16 | | | | –1 | | | | –92 | | | | –109 | |
December 31, 2016 | | | 104 | | | | 589 | | | | 2,186 | | | | 2,256 | | | | 5,135 | |
| | | | | | | | | | | | | | | | | | | | | |
Carrying amount | | | | | | | | | | | | | | | | | | | | |
December 31, 2015 | | | 22,689 | | | | 201 | | | | 984 | | | | 3,095 | | | | 26,969 | |
December 31, 2016 | | | 23,311 | | | | 202 | | | | 721 | | | | 2,863 | | | | 27,097 | |
Other additions to software and database licenses in 2016 and 2015 were individually acquired from third parties and include cross-license agreements and patents.
F-28
Significant Intangible Assets
| | | | | | | | | | | | |
| € millions, unless otherwise stated | | Carrying Amount | | | Remaining
Useful Life (in years) | |
| | 2016 | | | 2015 | | |
Business Objects – Customer relationships | | | 84 | | | | 104 | | | | 1 to 7 | |
Sybase – Customer relationships | | | 325 | | | | 400 | | | | 5 to 7 | |
SuccessFactors – Acquired technologies | | | 99 | | | | 148 | | | | 3 | |
SuccessFactors – Customer relationships | | | 353 | | | | 397 | | | | 9 | |
Ariba – Acquired technologies | | | 97 | | | | 137 | | | | 4 | |
Ariba – Customer relationships | | | 483 | | | | 530 | | | | 2 to 11 | |
hybris – Acquired technologies | | | 62 | | | | 100 | | | | 4 | |
hybris – Customer relationships | | | 106 | | | | 127 | | | | 1 to 11 | |
Fieldglass – Acquired technologies | | | 73 | | | | 89 | | | | 6 | |
Fieldglass – Customer relationships | | | 69 | | | | 74 | | | | 11 | |
Concur – Acquired technologies | | | 296 | | | | 387 | | | | 5 | |
Concur – Customer relationships | | | 1,281 | | | | 1,299 | | | | 14 to 18 | |
Total significant intangible assets | | | 3,328 | | | | 3,792 | | | | | |
Goodwill Impairment Testing
SAP had four operating segments in 2016, of which two are reportable segments. For more information about our segments, seeNote (28).
The carrying amount of goodwill has been allocated for impairment testing purposes to those operating segments expected to benefit from goodwill. Allocated goodwill tonon-reportable segments is not material and disclosed under “Other” — the carrying amount did not exceed the recoverable amount.
Goodwill by Reportable Operating Segment
| | | | | | | | | | | | | | | | |
| € millions | | Applications,
Technology &
Services | | | SAP Business
Network | | | Other | | | Total | |
January 1, 2016 | | | 15,497 | | | | 7,191 | | | | 0 | | | | 22,689 | |
Reallocation due to changes in segment composition | | | –33 | | | | 0 | | | | 33 | | | | 0 | |
Additions from business combinations | | | 25 | | | | 31 | | | | 0 | | | | 57 | |
Foreign currency exchange differences | | | 349 | | | | 216 | | | | 1 | | | | 566 | |
December 31, 2016 | | | 15,839 | | | | 7,439 | | | | 34 | | | | 23,311 | |
F-29
The key assumptions on which management based its cash flow projections for the period covered by the underlying business plans are as follows:
| | |
| Key Assumption | | Basis for Determining Values Assigned to Key Assumption |
Budgeted revenue growth | | Revenue growth rate achieved in the current fiscal year, adjusted for an expected increase in SAP’s addressable cloud, mobility, and database markets; expected growth in the established software applications and analytics markets. Values assigned reflect our past experience and our expectations regarding an increase in the addressable markets. |
Budgeted operating margin | | Operating margin budgeted for a given budget period equals the operating margin achieved in the current fiscal year, increased by expected efficiency gains. Values assigned reflect past experience, except for efficiency gains. |
Pre-tax discount rates | | Our estimated cash flow projections are discounted to present value usingpre-tax discount rates.Pre-tax discount rates are based on the weighted average cost of capital (WACC) approach. |
Terminal growth rate | | Our estimated cash flow projections for periods beyond the business plan were extrapolated using segment-specific terminal growth rates. These growth rates do not exceed the long-term average growth rates for the markets in which our segments operate. |
Key Assumptions
| | | | | | | | | | | | | | | | |
| Percent | | Applications,
Technology &
Services | | | SAP Business
Network | |
| | | 2016 | | | 2015 | | | 2016 | | | 2015 | |
| Budgeted revenue growth (average of the budgeted period) | | | 6.7 | | | | 4.5 | | | | 15.0 | | | | 16.2 | |
| Pre-tax discount rate | | | 10.4 | | | | 11.7 | | | | 11.7 | | | | 13.0 | |
| Terminal growth rate | | | 2.0 | | | | 3.0 | | | | 3.0 | | | | 3.0 | |
Applications, Technology & Services
The recoverable amount of the segment has been determined based on avalue-in-use calculation. The calculation uses cash flow projections based on actual operating results and a group-wide four-year (2015: five-year) business plan approved by management.
We believe that any reasonably possible change in any of the above key assumptions would not cause the carrying amount of our Applications, Technology & Services segment to exceed the recoverable amount.
SAP Business Network
The recoverable amount of the segment has been determined based on fair value less costs of disposal calculation. The fair value measurement was categorized as a level 3 fair value based on the inputs used in the valuation technique. The cash flow projections are based on actual operating results and specific estimates covering a nine-year (2015: nine-year) planning period and the terminal growth rate thereafter. The projected
results were determined based on management’s estimates and are consistent with the assumptions a market participant would make. The segment operates in a relatively immature area with significant growth rates projected for the near future. We therefore have a longer and more detailed planning period than one would apply in a more mature segment.
We are using a target operating margin of 34% (2015: 33%) for the segment at the end of the budgeted period as a key assumption, which is within the range of expectations of market participants (for example, industry analysts).
The recoverable amount exceeds the carrying amount by€6,404 million (2015:€1,764 million).
The following table shows amounts by which the key assumptions would need to change individually for the recoverable amount to be equal to the carrying amount:
Sensitivity to Change in Assumptions
| | | | | | | | |
| Percentage points | | SAP Business
Network | |
| | | | |
| | | 2016 | | | 2015 | |
Budgeted revenue growth (average of the budgeted period) | | | –6.9 | | | | –2.1 | |
Pre-tax discount rate | | | 4.4 | | | | 1.4 | |
Target operating margin at the end of the budgeted period | | | –15 | | | | 1 | ) |
1) The recoverable amount would equal the carrying amount if a margin of only 27% was achieved by 2022.
F-30
(16) PROPERTY, PLANT, AND EQUIPMENT
Property, Plant, and Equipment
| | | | | | | | | | | | | | | | |
| € millions | | Land and
Buildings | | | Other Property,
Plant, and
Equipment | | | Advance
Payments and
Construction
in Progress | | | Total | |
Historical cost | | | | | | | | | | | | | | | | |
December 31, 2015 | | | 1,053 | | | | 1,073 | | | | 66 | | | | 2,192 | |
December 31, 2016 | | | 1,137 | | | | 1,297 | | | | 146 | | | | 2,580 | |
Total additions (other than from business combinations) amounted to€933 million (2015:€580 million) and relate primarily to the replacement and purchase of computer hardware and vehicles acquired in the normal course of business and investments in data centers.
(17) TRADE AND OTHER PAYABLES, FINANCIAL LIABILITIES, AND OTHERNON-FINANCIAL LIABILITIES
(17a) Trade and Other Payables
Trade and Other Payables
| | | | | | | | | | | | | | | | | | | | | | | | |
| € millions | | 2016 | | | 2015 | |
| | Current | | | Non-
Current | | | Total | | | Current | | | Non-
Current | | | Total | |
Trade payables | | | 1,015 | | | | 0 | | | | 1,016 | | | | 893 | | | | 0 | | | | 893 | |
Advance payments received | | | 145 | | | | 0 | | | | 145 | | | | 110 | | | | 0 | | | | 110 | |
Miscellaneous other liabilities | | | 120 | | | | 127 | | | | 247 | | | | 85 | | | | 81 | | | | 166 | |
Trade and other payables | | | 1,281 | | | | 127 | | | | 1,408 | | | | 1,088 | | | | 81 | | | | 1,169 | |
Miscellaneous other liabilities mainly include deferral amounts for free rent periods and liabilities related to government grants.
F-31
(17b) Financial Liabilities
Financial Liabilities
| | | | | | | | | | | | | | | | | | | | | | | | | | | | | | | | | | | | | | | | |
| € millions | | 2016 | | | 2015 | |
| | | Nominal Volume | | | Carrying Amount | | | Nominal Volume | | | Carrying Amount | |
| | | Current | | | Non-
Current | | | Current | | | Non-
Current | | | Total | | | Current | | | Non-
Current | | | Current | | | Non-
Current | | | Total | |
Bonds | | | 1,000 | | | | 5,150 | | | | 996 | | | | 5,151 | | | | 6,147 | | | | 0 | | | | 5,750 | | | | 0 | | | | 5,733 | | | | 5,733 | |
Private placement transactions | | | 420 | | | | 1,240 | | | | 418 | | | | 1,298 | | | | 1,717 | | | | 551 | | | | 1,607 | | | | 551 | | | | 1,651 | | | | 2,202 | |
Bank loans | | | 16 | | | | 0 | | | | 16 | | | | 0 | | | | 16 | | | | 16 | | | | 1,250 | | | | 16 | | | | 1,245 | | | | 1,261 | |
Financial debt | | | 1,435 | | | | 6,390 | | | | 1,430 | | | | 6,450 | | | | 7,880 | | | | 567 | | | | 8,607 | | | | 567 | | | | 8,628 | | | | 9,195 | |
Derivatives | | | NA | | | | NA | | | | 152 | | | | 43 | | | | 194 | | | | NA | | | | NA | | | | 70 | | | | 58 | | | | 128 | |
Other financial liabilities | | | NA | | | | NA | | | | 231 | | | | –12 | | | | 219 | | | | NA | | | | NA | | | | 204 | | | | –5 | | | | 199 | |
Financial liabilities | | | | | | | | | | | 1,813 | | | | 6,481 | | | | 8,294 | | | | | | | | | | | | 841 | | | | 8,681 | | | | 9,522 | |
Financial liabilities are unsecured, except for the retention of title and similar rights customary in our industry. Effective interest rates on our financial debt (including the effects from interest rate swaps) were 1.25% in 2016, 1.30% in 2015, and 1.77% in 2014.
For an analysis of the contractual cash flows of our financial liabilities based on maturity, seeNote (24). For information about the risk associated with our financial liabilities, seeNote (25). For information about fair values, seeNote (26).
Bonds
| | | | | | | | | | | | | | | | | | | | | | | | | | |
| | | 2016 | | | 2015 | |
| | Maturity | | | Issue Price | | | Coupon Rate | | Effective
Interest Rate | | | Nominal
Volume (in respective
currency in
millions) | | | Carrying
Amount (in € millions) | | | Carrying
Amount (in € millions) | |
Eurobond 2 – 2010 | | | 2017 | | | | 99.780% | | | 3.50% (fix) | | | 3.59% | | | | €500 | | | | 496 | | | | 488 | |
Eurobond 6 – 2012 | | | 2019 | | | | 99.307% | | | 2.125% (fix) | | | 2.29% | | | | €750 | | | | 776 | | | | 774 | |
Eurobond 7 – 2014 | | | 2018 | | | | 100.000% | | | 0.000% (var.) | | | 0.08% | | | | €750 | | | | 749 | | | | 749 | |
Eurobond 8 – 2014 | | | 2023 | | | | 99.478% | | | 1.125% (fix) | | | 1.24% | | | | €1,000 | | | | 994 | | | | 993 | |
Eurobond 9 – 2014 | | | 2027 | | | | 99.284% | | | 1.75% (fix) | | | 1.86% | | | | €1,000 | | | | 990 | | | | 989 | |
Eurobond 10 – 2015 | | | 2017 | | | | 100.000% | | | 0.000% (var.) | | | 0.11% | | | | €500 | | | | 500 | | | | 499 | |
Eurobond 11 – 2015 | | | 2020 | | | | 100.000% | | | 0.000% (var.) | | | 0.07% | | | | €650 | | | | 648 | | | | 648 | |
Eurobond 12 – 2015 | | | 2025 | | | | 99.264% | | | 1.00% (fix) | | | 1.13% | | | | €600 | | | | 594 | | | | 593 | |
Eurobond 13 – 2016 | | | 2018 | | | | 100.000% | | | 0.000% (var.) | | | 0.03% | | | | €400 | | | | 400 | | | | 0 | |
Eurobonds | | | | | | | | | | | | | | | | | | | | | 6,147 | | | | 5,733 | |
All of our Eurobonds are listed for trading on the Luxembourg Stock Exchange.
F-32
Private Placement Transactions
| | | | | | | | | | | | | | | | | | | | | | | | |
| | | 2016 | | | 2015 | |
| | Maturity | | | Coupon Rate | | | Effective
Interest Rate | | | Nominal Volume (in respective
currency in
millions) | | | Carrying
Amount (in € millions) | | | Carrying
Amount (in € millions) | |
U.S. private placements | | | | | | | | | | | | | | | | | | | | | | | | |
Tranche 2 – 2010 | | | 2017 | | | | 2.95% (fix) | | | | 3.03% | | | | US$200 | | | | 189 | | | | 180 | |
Tranche 3 – 2011 | | | 2016 | | | | 2.77% (fix) | | | | 2.82% | | | | US$600 | | | | 0 | | | | 551 | |
Tranche 4 – 2011 | | | 2018 | | | | 3.43% (fix) | | | | 3.50% | | | | US$150 | | | | 141 | | | | 135 | |
Tranche 5 – 2012 | | | 2017 | | | | 2.13% (fix) | | | | 2.16% | | | | US$242.5 | | | | 229 | | | | 221 | |
Tranche 6 – 2012 | | | 2020 | | | | 2.82% (fix) | | | | 2.86% | | | | US$290 | | | | 278 | | | | 271 | |
Tranche 7 – 2012 | | | 2022 | | | | 3.18% (fix) | | | | 3.22% | | | | US$444.5 | | | | 439 | | | | 426 | |
Tranche 8 – 2012 | | | 2024 | | | | 3.33% (fix) | | | | 3.37% | | | | US$323 | | | | 334 | | | | 318 | |
Tranche 9 – 2012 | | | 2027 | | | | 3.53% (fix) | | | | 3.57% | | | | US$100 | | | | 107 | | | | 100 | |
Private placements | | | | | | | | | | | | | | | | | | | 1,717 | | | | 2,202 | |
The U.S. private placement notes were issued by one of our subsidiaries that has the U.S. dollar as its functional currency.
Bank Loans
| | | | | | | | | | | | | | | | | | | | | | | | |
| | | 2016 | | | 2015 | |
| | Maturity | | | Coupon
Rate | | | Effective
Interest Rate | | | Nominal Volume (in respective
currency in
millions) | | | Carrying
Amount (in € millions) | | | Carrying
Amount (in € millions) | |
Concur term loan – Facility B | | | 2017 | | | | NA | | | | NA | | | | €0 | | | | 0 | | | | 1,245 | |
Other loans | | | | | | | | | | | | | | | INR 1,051 | | | | 16 | | | | 16 | |
Bank loans | | | | | | | | | | | | | | | | | | | 16 | | | | 1,261 | |
(17c) OtherNon-Financial Liabilities
OtherNon-Financial Liabilities
| | | | | | | | | | | | | | | | | | | | | | | | |
| € millions | | 2016 | | | 2015 | |
| | Current | | | Non-Current | | | Total | | | Current | | | Non-Current | | | Total | |
Share-based payment liabilities | | | 602 | | | | 309 | | | | 911 | | | | 555 | | | | 205 | | | | 760 | |
Other employee-related liabilities | | | 2,545 | | | | 152 | | | | 2,697 | | | | 2,255 | | | | 126 | | | | 2,381 | |
Other taxes | | | 552 | | | | 0 | | | | 552 | | | | 597 | | | | 0 | | | | 597 | |
Othernon-financial liabilities | | | 3,699 | | | | 461 | | | | 4,160 | | | | 3,407 | | | | 331 | | | | 3,739 | |
For more information about our share-based payments, seeNote (27).
Other employee-related liabilities mainly relate to vacation obligations, bonus and sales commission obligations, as well as employee-related social security obligations.
F-33
Other taxes mainly comprise payroll tax liabilities and value-added tax liabilities.
(18) PROVISIONS
Provisions
| | | | | | | | | | | | | | | | | | | | | | | | |
| € millions | | 2016 | | | 2015 | |
| | Current | | | Non- Current | | | Total | | | Current | | | Non- Current | | | Total | |
Pension plans and similar obligations (see Note (18a)) | | | 0 | | | | 140 | | | | 140 | | | | 0 | | | | 117 | | | | 117 | |
Other provisions (see Note (18b)) | | | 183 | | | | 77 | | | | 260 | | | | 299 | | | | 63 | | | | 362 | |
Total | | | 183 | | | | 217 | | | | 400 | | | | 299 | | | | 180 | | | | 479 | |
(18a) Pension Plans and Similar Obligations
Defined Benefit Plans
The measurement dates for our domestic and foreign benefit plans are December 31.
Present Value of the Defined Benefit Obligations (DBO) and the Fair Value of the Plan Assets
| | | | | | | | | | | | | | | | | | | | | | | | | | | | | | | | |
| € millions | | Domestic Plans | | | Foreign Plans | | | Other Post-
Employment Plans | | | Total | |
| | 2016 | | | 2015 | | | 2016 | | | 2015 | | | 2016 | | | 2015 | | | 2016 | | | 2015 | |
Present value of the DBO | | | 854 | | | | 724 | | | | 369 | | | | 333 | | | | 98 | | | | 82 | | | | 1,321 | | | | 1,139 | |
Thereof fully or partially funded plans | | | 854 | | | | 724 | | | | 324 | | | | 293 | | | | 74 | | | | 61 | | | | 1,252 | | | | 1,078 | |
Thereof unfunded plans | | | 0 | | | | 0 | | | | 45 | | | | 40 | | | | 24 | | | | 21 | | | | 69 | | | | 61 | |
Fair value of the plan assets | | | 843 | | | | 716 | | | | 290 | | | | 265 | | | | 48 | | | | 42 | | | | 1,181 | | | | 1,023 | |
Net defined benefit liability (asset) | | | 11 | | | | 8 | | | | 79 | | | | 69 | | | | 50 | | | | 40 | | | | 140 | | | | 117 | |
| Amounts recognized in the Consolidated Statement of Financial Position: | | | | | | | | | | | | | | | | | | | | | | | | | | | | | | | | |
Non-current provisions | | | –11 | | | | –8 | | | | –79 | | | | –69 | | | | –50 | | | | –40 | | | | –140 | | | | –117 | |
Total | | | –11 | | | | –8 | | | | –79 | | | | –69 | | | | –50 | | | | –40 | | | | –140 | | | | –117 | |
€789 million (2015:€664 million) of the present value of the DBO of our domestic plans relate to plans that provide forlump-sum payments not based on final salary, and€316 million (2015:€287 million) of the present value of the DBO of our foreign plans relate to plans that provide for annuity payments not based on final salary.
The following weighted average assumptions were used for the actuarial valuation of our domestic and foreign pension liabilities as well as other post-employment benefit obligations as at the respective measurement date:
F-34
Actuarial Assumptions
| | | | | | | | | | | | | | | | | | | | | | | | | | | | | | | | | | | | |
| Percent | | Domestic Plans | | | Foreign Plans | | | Other Post-
Employment Plans | |
| | 2016 | | | 2015 | | | 2014 | | | 2016 | | | 2015 | | | 2014 | | | 2016 | | | 2015 | | | 2014 | |
Discount rate | | | 2.1 | | | | 2.7 | | | | 2.2 | | | | 0.6 | | | | 0.7 | | | | 1.1 | | | | 4.0 | | | | 4.0 | | | | 4.2 | |
Future salary increases | | | 2.5 | | | | 2.5 | | | | 2.5 | | | | 1.7 | | | | 1.7 | | | | 1.7 | | | | 6.0 | | | | 6.3 | | | | 3.8 | |
Future pension increases | | | 2.0 | | | | 2.0 | | | | 2.0 | | | | 0 | | | | 0 | | | | 0 | | | | 0.0 | | | | 0.0 | | | | 0 | |
Employee turnover | | | 2.0 | | | | 2.0 | | | | 2.0 | | | | 10.3 | | | | 10.3 | | | | 10.1 | | | | 8.6 | | | | 8.7 | | | | 1.3 | |
Inflation | | | 2.0 | | | | 2.0 | | | | 0 | | | | 1.4 | | | | 1.4 | | | | 1.3 | | | | 1.1 | | | | 1.0 | | | | 1.3 | |
The sensitivity analysis table shows how the present value of all defined benefit obligations would have been influenced by reasonably possible changes to above actuarial assumptions. The sensitivity analysis table presented below considers change in one actuarial assumption at a time, holding all other actuarial
assumptions constant. A reasonably possible change in actuarial assumptions of 50 basis points in either direction, except for the discount rate assumption, would not materially influence the present value of all defined benefit obligations.
Sensitivity Analysis
| | | | | | | | | | | | | | | | | | | | | | | | | | | | | | | | | | | | | | | | | | | | | | | | |
| € millions | | Domestic Plans | | | Foreign Plans | | | Other Post-
Employment Plans | | | Total | |
| | 2016 | | | 2015 | | | 2014 | | | 2016 | | | 2015 | | | 2014 | | | 2016 | | | 2015 | | | 2014 | | | 2016 | | | 2015 | | | 2014 | |
| Present value of all defined benefit obligations if: | | | | | | | | | | | | | | | | | | | | | | | | | | | | | | | | | | | | | | | | | | | | | | | | |
| Discount rate was 50 basis points higher | | | 800 | | | | 678 | | | | 725 | | | | 344 | | | | 311 | | | | 259 | | | | 93 | | | | 79 | | | | 44 | | | | 1,237 | | | | 1,068 | | | | 1,028 | |
| Discount rate was 50 basis points lower | | | 913 | | | | 775 | | | | 840 | | | | 398 | | | | 359 | | | | 296 | | | | 101 | | | | 87 | | | | 49 | | | | 1,412 | | | | 1,221 | | | | 1,185 | |
Total Expense of Defined Benefit Pension Plans
| | | | | | | | | | | | | | | | | | | | | | | | | | | | | | | | | | | | | | | | | | | | | | | | |
| € millions | | Domestic Plans | | | Foreign Plans | | | Other Post-
Employment Plans | | | Total | |
| | 2016 | | | 2015 | | | 2014 | | | 2016 | | | 2015 | | | 2014 | | | 2016 | | | 2015 | | | 2014 | | | 2016 | | | 2015 | | | 2014 | |
Current service cost | | | 7 | | | | 10 | | | | 3 | | | | 21 | | | | 21 | | | | 16 | | | | 10 | | | | 9 | | | | 6 | | | | 38 | | | | 40 | | | | 25 | |
Interest expense | | | 19 | | | | 17 | | | | 22 | | | | 3 | | | | 3 | | | | 5 | | | | 3 | | | | 3 | | | | 2 | | | | 25 | | | | 23 | | | | 29 | |
Interest income | | | –20 | | | | –17 | | | | –23 | | | | –2 | | | | –3 | | | | –5 | | | | –1 | | | | –2 | | | | –1 | | | | –23 | | | | –22 | | | | –29 | |
Past service cost | | | 0 | | | | 0 | | | | 0 | | | | 0 | | | | 0 | | | | 0 | | | | 0 | | | | 0 | | | | 0 | | | | 0 | | | | 0 | | | | 0 | |
Total expense | | | 6 | | | | 10 | | | | 3 | | | | 22 | | | | 21 | | | | 16 | | | | 12 | | | | 10 | | | | 7 | | | | 40 | | | | 41 | | | | 26 | |
Actual return on plan assets | | | 97 | | | | –76 | | | | 133 | | | | 1 | | | | 0 | | | | 10 | | | | 2 | | | | 2 | | | | 1 | | | | 100 | | | | –74 | | | | 144 | |
Our investment strategy on domestic benefit plans is to invest all contributions in stable insurance policies.
Our investment strategies for foreign benefit plans vary according to the conditions in the country in which the respective benefit plans are situated. Generally, a long-
term investment horizon has been adopted for all major foreign benefit plans. Although our policy is to invest in a risk-diversified portfolio consisting of a mix of assets, both the defined benefit obligation and plan assets can fluctuate over time, which exposes the Group to actuarial and market (investment) risks. Depending on the
F-35
statutory requirements in each country, it might be necessary to reduce any underfunding by addition of liquid assets.
Plan Asset Allocation
| | | | | | | | | | | | | | | | |
| € millions | | 2016 | | | 2015 | |
| | Quoted in an
Active Market | | | Not Quoted in
an Active Market | | | Quoted in an
Active Market | | | Not Quoted in
an Active Market | |
Asset category | | | | | | | | | | | | | | | | |
Equity investments | | | 118 | | | | 0 | | | | 93 | | | | 0 | |
Corporate bonds | | | 90 | | | | 0 | | | | 101 | | | | 0 | |
Government bonds | | | 5 | | | | 0 | | | | 5 | | | | 0 | |
Real estate | | | 49 | | | | 0 | | | | 43 | | | | 0 | |
Insurance policies | | | 0 | | | | 864 | | | | 0 | | | | 736 | |
Cash and cash equivalents | | | 11 | | | | 0 | | | | 9 | | | | 0 | |
Others | | | 44 | | | | 0 | | | | 36 | | | | 0 | |
Total | | | 317 | | | | 864 | | | | 287 | | | | 736 | |
Our expected contribution in 2017 to our domestic and foreign defined benefit pension plans is immaterial. The weighted duration of our defined benefit plans amounted to 14 years as at December 31, 2016, and 14 years as at December 31, 2015.
Total future benefit payments from our defined benefit plans as at December 31, 2016, are expected to be€1,583 million (2015:€1,432 million).Eighty-two percent of this amount has maturities of over five years.
Maturity Analysis
| | | | | | | | | | | | | | | | | | | | | | | | |
| € millions | | Domestic Plans | | | Foreign Plans | | | Other Post-Employment
Plans | |
| | | 2016 | | | | 2015 | | | | 2016 | | | | 2015 | | | | 2016 | | | | 2015 | |
Less than a year | | | 25 | | | | 19 | | | | 26 | | | | 26 | | | | 8 | | | | 2 | |
Between 1 and 2 years | | | 21 | | | | 18 | | | | 45 | | | | 43 | | | | 7 | | | | 2 | |
Between 2 and 5 years | | | 70 | | | | 65 | | | | 69 | | | | 63 | | | | 20 | | | | 8 | |
Over 5 years | | | 1,009 | | | | 935 | | | | 232 | | | | 223 | | | | 51 | | | | 28 | |
Total | | | 1,125 | | | | 1,037 | | | | 372 | | | | 355 | | | | 86 | | | | 40 | |
Defined Contribution Plans/State Plans
We also maintain domestic and foreign defined contribution plans. Amounts contributed by us under such plans are based on a percentage of the employees’ salaries or the amount of contributions made by employees. Furthermore, in Germany and some other countries, we make contributions to public pension plans that are operated by national or local government or a similar institution.
Total Expense of Defined Contribution Plans and State Plans
| | | | | | | | | | | | |
| € millions | | 2016 | | | 2015 | | | 2014 | |
Defined contribution plans | | | 234 | | | | 218 | | | | 188 | |
State plans | | | 484 | | | | 429 | | | | 360 | |
Total expense | | | 718 | | | | 647 | | | | 548 | |
F-36
(18b) Other Provisions
Other Provisions
| | | | | | | | | | | | | | | | | | | | | | | | | | | | |
| € millions | | 1/1/ 2016 | | | Addition | | | Accretion | | | Utilization | | | Release | | | Currency
Impact | | | 12/31/ 2016 | |
Employee-related provisions | | | 58 | | | | 57 | | | | 0 | | | | –39 | | | | –2 | | | | 0 | | | | 74 | |
Customer-related provisions | | | 61 | | | | 34 | | | | 0 | | | | –10 | | | | –1 | | | | 3 | | | | 87 | |
| Intellectual property-related provisions | | | 11 | | | | 7 | | | | 0 | | | | –10 | | | | 0 | | | | 1 | | | | 9 | |
Restructuring provisions | | | 184 | | | | 41 | | | | 0 | | | | –163 | | | | –13 | | | | 0 | | | | 49 | |
| Onerous contract provisions (other than from customer contracts) | | | 15 | | | | 0 | | | | 1 | | | | –14 | | | | 0 | | | | 0 | | | | 2 | |
Other provisions | | | 33 | | | | 8 | | | | 0 | | | | 0 | | | | –2 | | | | 0 | | | | 39 | |
Total other provisions | | | 362 | | | | 147 | | | | 1 | | | | –236 | | | | –18 | | | | 4 | | | | 260 | |
Thereof current | | | 299 | | | | | | | | | | | | | | | | | | | | | | | | 183 | |
Thereofnon-current | | | 63 | | | | | | | | | | | | | | | | | | | | | | | | 77 | |
Customer-related provisions include, among others, disputes with individual customers. Intellectual property-related provisions relate to litigation matters. Both classes of provisions are described inNote (23).
For more information about our restructuring plans, seeNote (6).
The cash outflows associated with employee-related restructuring costs are substantially short-term in nature.
Onerous contract provisions (other than from customer contracts) and other provisions comprise facility-related
and supplier-related provisions. The timing of the associated cash outflows is dependent on the remaining term of the underlying lease and of the supplier contract.
(19) DEFERRED INCOME
Deferred income consists mainly of prepayments made by our customers for cloud subscriptions and support; software support and services; fees from multiple-element arrangements allocated to undelivered elements; and amounts recorded in purchase accounting at fair value for obligations to perform under acquired customer contracts in connection with acquisitions.
Deferred Income
| | | | | | | | | | | | | | | | | | | | | | | | |
| € millions | | 2016 | | | 2015 | |
| | Current | | | Non-
Current | | | Total | | | Current | | | Non-
Current | | | Total | |
Deferred Income | | | 2,383 | | | | 143 | | | | 2,526 | | | | 2,001 | | | | 106 | | | | 2,107 | |
Thereof deferred revenue from cloud subscriptions and support | | | 1,271 | | | | 0 | | | | 1,271 | | | | 957 | | | | 0 | | | | 957 | |
F-37
(20) TOTAL EQUITY
Issued Capital
SAP SE has issuedno-par value bearer shares with a calculated nominal value of€1 per share. All of the shares issued are fully paid.
Number of Shares
| | | | | | | | |
| millions | | Issued
Capital | | | Treasury
Shares | |
January 1, 2014 | | | 1,229 | | | | –35 | |
| Reissuance of treasury shares under share-based payments | | | 0 | | | | 2 | |
December 31, 2014 | | | 1,229 | | | | –33 | |
| Reissuance of treasury shares under share-based payments | | | 0 | | | | 2 | |
December 31, 2015 | | | 1,229 | | | | –31 | |
| Reissuance of treasury shares under share-based payments | | | 0 | | | | 1 | |
December 31, 2016 | | | 1,229 | | | | –30 | |
Authorized Shares
The Articles of Incorporation authorize the Executive Board to increase the issued capital as follows:
| – | | By up to a total amount of€250 million by issuing newno-par value bearer shares against contributions in cash until May 19, 2020 (Authorized Capital I). The issuance is subject to the statutory subscription rights of existing shareholders. |
| – | | By up to a total amount of€250 million by issuing newno-par value bearer shares against contributions in cash or in kind until May 19, 2020 (Authorized Capital II). Subject to the consent of the Supervisory Board, the Executive Board is authorized to exclude the shareholders’ statutory subscription rights in certain cases. |
Contingent Shares
SAP SE’s share capital is subject to a contingent capital increase which may be effected only to the extent that the holders or creditors of convertible bonds or stock options issued or guaranteed by SAP SE or any of its directly or indirectly controlled subsidiaries under certain share-based payments exercise their conversion or subscription rights, and no other methods for servicing these rights are used. As at December 31, 2016,€100 million, representing 100 million shares, was still available for issuance (2015:€100 million).
Other Components of Equity
| | | | | | | | | | | | | | | | |
| € millions | | Exchange
Differences | | | Available-for- Sale Financial
Assets | | | Cash
Flow
Hedges | | | Total | |
January 1, 2014 | | | –820 | | | | 82 | | | | 20 | | | | –718 | |
| Other comprehensive income for items that will be reclassified to profit or loss, net of tax | | | 1,182 | | | | 128 | | | | –28 | | | | 1,282 | |
December 31, 2014 | | | 362 | | | | 211 | | | | –8 | | | | 564 | |
| Other comprehensive income for items that will be reclassified to profit or loss, net of tax | | | 1,861 | | | | 125 | | | | 11 | | | | 1,997 | |
December 31, 2015 | | | 2,222 | | | | 336 | | | | 3 | | | | 2,561 | |
| Other comprehensive income for items that will be reclassified to profit or loss, net of tax | | | 839 | | | | –43 | | | | –11 | | | | 785 | |
December 31, 2016 | | | 3,062 | | | | 292 | | | | –8 | | | | 3,345 | |
Treasury Shares
By resolution of SAP SE’s General Meeting of Shareholders held on June 4, 2013, the authorization granted by the General Meeting of Shareholders on June 8, 2010, regarding the acquisition of treasury shares was revoked to the extent it had not been exercised at that time, and replaced by a new authorization of the Executive Board of SAP SE to acquire, on or before June 3, 2018, shares of SAP SE representing a pro rata amount of capital stock of up to
€120 million in aggregate, provided that the shares purchased under the authorization, together with any other shares in the Company previously acquired and held by, or attributable to, SAP SE do not account for more than 10% of SAP SE’s issued share capital. Although treasury shares are legally considered outstanding, there are no dividend or voting rights associated with shares held in treasury. We may redeem or resell shares held in treasury, or we may use treasury shares for the purpose of servicing option or conversion
F-38
rights under the Company’s share-based payment plans. Also, we may use shares held in treasury as consideration in connection with mergers with, or acquisitions of, other companies.
Dividends
The total dividend available for distribution to SAP SE shareholders is based on the profits of SAP SE as reported in its statutory financial statements prepared under the accounting rules in the German Commercial Code (Handelsgesetzbuch). For the year ended December 31, 2016, the Executive Board intends to propose that a dividend of€1.25 per share (that is, an estimated total dividend of€1,498 million), be paid from the profits of SAP SE.
Dividends per share for 2015 and 2014 were€1.15 and€1.10 respectively and were paid in the succeeding year.
(21) ADDITIONAL CAPITAL DISCLOSURES
Capital Structure Management
The primary objective of our capital structure management is to maintain a strong financial profile for investor, creditor, and customer confidence, and to support the growth of our business. We seek to maintain a capital structure that will allow us to cover our funding requirements through the capital markets at reasonable conditions, and in so doing, ensure a high level of independence, confidence, and financial flexibility.
SAP SE’s long-term credit rating is “A2” by Moody’s with stable outlook, and “A” by Standard & Poor’s with positive outlook. Standard & Poor’s raised the outlook to positive in 2016.
Capital Structure
| | | | | | | | | | | | | | | | | | | | |
| | | 12/31/2016 | | | 12/31/2015 | | | D in % | |
| | € millions | | | % of Total Equity and
Liabilities | | | € millions | | | % of Total Equity and
Liabilities | | | | |
Equity | | | 26,397 | | | | 60 | | | | 23,295 | | | | 56 | | | | 13 | |
Current liabilities | | | 9,674 | | | | 22 | | | | 7,867 | | | | 19 | | | | 23 | |
Non-current liabilities | | | 8,205 | | | | 19 | | | | 10,228 | | | | 25 | | | | –20 | |
Liabilities | | | 17,880 | | | | 40 | | | | 18,095 | | | | 44 | | | | –1 | |
Total equity and liabilities | | | 44,277 | | | | 100 | | | | 41,390 | | | | 100 | | | | 7 | |
In 2016, we repaid€1,250 million in bank loans that we had taken to finance the Concur acquisition. The repayment was partly refinanced through the issuance of a€400 million Eurobond with a maturity of two years. We also repaid a US$600 million U.S. private placement tranche at maturity. Thus, the ratio of total financial debt to total equity and liabilities decreased by four percentage points to 18% at the end of 2016 (22% as at December 31, 2015).
Total financial debt consists of current andnon-current bank loans, bonds, and private placements. The changes in our financial debts are reconciled to the cash flows from liabilities arising from financing activities below. For more information about our financial debt, seeNote (17).
F-39
Reconciliation of Liabilities Arising from Financing Activities
| | | | | | | | | | | | | | | | | | | | | | | | |
| € millions | | 12/31/2015 | | | Cash Flows | | | Business
Combinations | | | Foreign
Currency | | | Fair Value
Changes | | | Other | | 12/31/2016 |
| Current financial debt | | | –567 | | | | 547 | | | | –6 | | | | 4 | | | | 0 | | | –1,413 | | –1,435 |
| Non-current financial debt | | | –8,607 | | | | 852 | | | | –2 | | | | –46 | | | | 0 | | | 1,413 | | –6,390 |
| Financial debt (nominal volume) | | | –9,175 | | | | 1,400 | | | | –8 | | | | –42 | | | | 0 | | | 0 | | –7,826 |
Basis adjustment | | | –64 | | | | 0 | | | | 0 | | | | 5 | | | | –27 | | | 0 | | –86 |
Transaction costs | | | 44 | | | | 0 | | | | 0 | | | | 0 | | | | 0 | | | –11 | | 32 |
| Financial debt (carrying amount) | | | –9,195 | | | | 1,400 | | | | –8 | | | | –37 | | | | –27 | | | –11 | | –7,880 |
Accrued interest | | | –45 | | | | 0 | | | | 0 | | | | 1 | | | | 0 | | | –1 | | –45 |
| Assets held to hedge financial debt | | | 100 | | | | –43 | | | | 0 | | | | –3 | | | | –6 | | | 0 | | 47 |
| Total liabilities from financing activities | | | –9,141 | | | | 1,357 | | | | –8 | | | | –40 | | | | –33 | | | –12 | | –7,878 |
While we continuously monitor the ratios presented in and below the capital structure table above, we actively manage our liquidity and structure of our financial indebtedness based on the ratios group liquidity and net liquidity.
Group Liquidity
| | | | | | | | | | | | |
| € millions | | 2016 | | | 2015 | | | D | |
| Cash and cash equivalents | | | 3,702 | | | | 3,411 | | | | 291 | |
| Current investments | | | 971 | | | | 148 | | | | 823 | |
| Group liquidity | | | 4,673 | | | | 3,559 | | | | 1,114 | |
| Current financial debt | | | –1,435 | | | | –567 | | | | –868 | |
| Net liquidity 1 | | | 3,238 | | | | 2,992 | | | | 246 | |
| Non-current financial debt | | | –6,390 | | | | –8,607 | | | | 2,217 | |
Net liquidity 2 | | | –3,153 | | | | –5,615 | | | | 2,462 | |
Distribution Policy
Our general intention is to remain in a position to return liquidity to our shareholders by distributing annual dividends totaling more than 35% of our profit after tax as well as by repurchasing treasury shares in future periods.
In 2016, we distributed€ 1,378 million in dividends from our 2015 profit (compared to€ 1,316 million in 2015 and€ 1,194 million in 2014 related to 2014 and 2013 profit, respectively), representing€ 1.15 per share.
As a result of our equity-settled share-based payments transactions (as described inNote (27)), we have commitments to grant SAP shares to employees. We intend to meet these commitments by reissuing treasury shares or to fulfill these obligations through an agent who administers the equity-settled programs and therefor purchases shares on the open market.
(22) OTHER FINANCIAL COMMITMENTS
Other Financial Commitments
| | | | | | | | |
| € millions | | 2016 | | | 2015 | |
Operating leases | | | 1,578 | | | | 1,347 | |
| Contractual obligations for acquisition of property, plant, and equipment and intangible assets | | | 227 | | | | 162 | |
Other purchase obligations | | | 596 | | | | 710 | |
Purchase obligations | | | 823 | | | | 872 | |
Capital contribution commitments | | | 167 | | | | 111 | |
Total | | | 2,568 | | | | 2,330 | |
Our operating leases relate primarily to the lease of office space, hardware, and vehicles, with remainingnon-cancelable lease terms between less than one year and 32 years. On a limited scale, the operating lease contracts include escalation clauses (based, for example, on the consumer price index) and renewal options. The contractual obligations for acquisition of property, plant,
F-40
and equipment and intangible assets relate primarily to the construction of new and existing facilities and to the purchase of hardware, software, patents, office equipment, and vehicles. The remaining obligations relate mainly to marketing, consulting, maintenance, license agreements, and other third-party agreements. Historically, the majority of such purchase obligations have been realized.
SAP invests and holds interests in other entities. On December 31, 2016, total commitments to make such equity investments amounted to€308 million (2015: €197 million), of which€141 million had been drawn (2015:€86 million). By investing in such equity investments, we are exposed to the risks inherent in the business areas in which these entities operate. Our maximum exposure to loss is the amount invested plus unavoidable future capital contributions.
Other Financial Commitments
| | | | | | | | | | | | |
| € millions | | December 31, 2016 | |
| | Operating Leases | | | Purchase Obligations | | | Capital Contribution
Commitments | |
Due 2017 | | | 316 | | | | 436 | | | | 167 | |
Due 2018 to 2021 | | | 790 | | | | 266 | | | | 0 | |
Due thereafter | | | 471 | | | | 121 | | | | 0 | |
Total | | | 1,578 | | | | 823 | | | | 167 | |
Our rental and operating lease expenses were€458 million,€386 million, and€291 million for the years 2016, 2015, and 2014, respectively.
(23) LITIGATION AND CLAIMS
We are subject to a variety of claims and lawsuits that arise from time to time in the ordinary course of our business, including proceedings and claims that relate to companies we have acquired, claims that relate to customers demanding indemnification for proceedings initiated against them based on their use of SAP software, and claims that relate to customers being dissatisfied with the products and services that we have delivered to them. We will continue to vigorously defend against all claims and lawsuits against us. We currently believe that resolving the claims and lawsuits pending as of December 31, 2016, will neither individually nor in the aggregate have a material adverse effect on our business, financial position, profit, or cash flows. Consequently, the provisions recorded for these claims and lawsuits as of December 31, 2016, are neither individually nor in the aggregate material to SAP.
However, the outcome of litigation and claims is intrinsically subject to considerable uncertainty. Management’s view of the litigation may also change in the future. Actual outcomes of litigation and claims may differ from the assessments made by management in prior periods, which could result in a material impact on our business, financial position, profit, cash flows, or reputation. Most of the lawsuits and claims are of a very individual nature and claims are either not quantified by the claimants or claim amounts quantified are, based on
historical evidence, not expected to be a good proxy for the expenditure that would be required to settle the case concerned. The specifics of the jurisdictions where most of the claims are located further impair the predictability of the outcome of the cases. Therefore, it is not practicable to reliably estimate the financial effect that these lawsuits and claims would have if SAP were to incur expenditure for these cases.
Among the claims and lawsuits are the following classes:
Intellectual Property-Related Litigation and Claims
Intellectual property-related litigation and claims are cases in which third parties have threatened or initiated litigation claiming that SAP violates one or more intellectual property rights that they possess. Such intellectual property rights may include patents, copyrights, and other similar rights.
The carrying amount of the provisions recognized for intellectual property-related litigation and claims and the change in the carrying amount in the reporting period are disclosed inNote (18b). The expected timing of any resulting outflows of economic benefits from these lawsuits and claims is uncertain and not estimable as it depends generally on the duration of the legal proceedings and settlement negotiations required to resolve them. Uncertainties about the amounts result primarily from the unpredictability of the outcomes of legal disputes in several jurisdictions. For more information, seeNote (3c).
Contingent liabilities exist from intellectual property-related litigation and claims for which no provision has
F-41
been recognized. Generally, it is not practicable to estimate the financial impact of these contingent liabilities due to the uncertainties around the litigation and claims, as outlined above. The total amounts claimed by plaintiffs in those intellectual property-related lawsuits or claims in which a claim has been quantified were not material to us as of December 31, 2016 and 2015. Based on our past experience, most of the intellectual property-related litigation and claims tend to be either dismissed in court or settled out of court for amounts significantly below the originally claimed amounts and not material to our consolidated financial statements.
Individual cases of intellectual property-related litigation and claims include the following:
In February 2010, United States-based TecSec, Inc. (TecSec) instituted legal proceedings in the United States against SAP (including its subsidiary Sybase) and many other defendants. TecSec alleged that SAP’s and Sybase’s products infringe one or more of the claims in five patents held by TecSec. In its complaint, TecSec seeks unspecified monetary damages and permanent injunctive relief. The lawsuit is proceeding but only with respect to one defendant. The trial for SAP (including its subsidiary Sybase) has not yet been scheduled – the lawsuit for SAP (including its subsidiary Sybase) remains stayed.
In April 2010, SAP instituted legal proceedings (a declaratory judgment action) in the United States against Wellogix, Inc. and Wellogix Technology Licensing, LLC (Wellogix). The lawsuit sought a declaratory judgment that six patents owned by Wellogix were invalid or not infringed by SAP. The legal proceedings were stayed pending the outcome of six reexaminations filed by SAP with the United States Patent and Trademark Office (USPTO). In response to SAP’s patent Declaratory Judgment action, Wellogixre-asserted trade secret misappropriation claims against SAP. The court granted SAP’s motion to dismiss based on improper venue for litigating the trade secret claims in the U.S. and Wellogix appealed that decision. In February 2015, SAP filed a declaratory judgment action in Frankfurt/Main, Germany, asking the German court to rule that SAP did not misappropriate any Wellogix trade secrets. In early 2016, the appeals court rejected Wellogix’s appeal. Inmid-2016, SAP’s patent declaratory judgment and reexaminations resulted in a final judgment invalidating all of Wellogix’s six asserted patents and the litigation was dismissed. The German trade secrets litigation remains pending.
Customer-Related Litigation and Claims
Customer-related litigation and claims include cases in which we indemnify our customers against liabilities arising from a claim that our products infringe a third
party’s patent, copyright, trade secret, or other proprietary rights. Occasionally, consulting or software implementation projects result in disputes with customers. Where customers are dissatisfied with the products and services that we have delivered to them in routine consulting contracts or development arrangements, we may grant functions or performance guarantees.
The carrying amount of the provisions recorded for customer-related litigation and claims and the development of the carrying amount in the reporting period are disclosed inNote (18b). The expected timing or amounts of any resulting outflows of economic benefits from these lawsuits and claims is uncertain and not estimable as they generally depend on the duration of the legal proceedings and settlement negotiations required to resolve the litigation and claims and the unpredictability of the outcomes of legal disputes in several jurisdictions. For more information, seeNote (3c).
Contingent liabilities exist from customer-related litigation and claims for which no provision has been recognized. Generally, it is not practicable to estimate the financial impact of these contingent liabilities due to the uncertainties around these lawsuits and claims outlined above.
Tax-Related Litigation and Claims
We are subject to ongoing audits by domestic and foreign tax authorities. In respect ofnon-income taxes, we, like many other companies operating in Brazil, are involved in various proceedings with Brazilian tax authorities regarding assessments and litigation matters on intercompany royalty payments and intercompany services. The total potential amount in dispute related to these matters for all applicable years is approximately€106 million (2015:€75 million). We have not recorded a provision for these matters, as we believe that we will prevail.
For information about incometax-related litigation, seeNote (10).
(24) FINANCIAL RISK FACTORS
We are exposed to various financial risks, such as market risks (including foreign currency exchange rate risk, interest rate risk, and equity price risk), credit risk, and liquidity risk.
Market Risk
a) Foreign Currency Exchange Rate Risk
As we are active worldwide, our ordinary operations are subject to risks associated with fluctuations in foreign currencies. Since the Group’s entities mainly conduct
F-42
their operating business in their own functional currencies, our risk of exchange rate fluctuations from ongoing ordinary operations is not considered significant. However, we occasionally generate foreign currency-denominated receivables, payables, and other monetary items by transacting in a currency other than the functional currency. To mitigate the extent of the associated foreign currency exchange rate risk, the majority of these transactions are hedged as described inNote (25).
In rare circumstances, transacting in a currency other than the functional currency also leads to embedded foreign currency derivatives being separated and measured at fair value through profit or loss.
In addition, the intellectual property (IP) holders in the SAP Group are exposed to risks associated with forecasted intercompany cash flows in foreign currencies. These cash flows arise out of royalty payments from subsidiaries to the respective IP holder. The royalties are linked to the subsidiaries’ external
revenue. This arrangement leads to a concentration of the foreign currency exchange rate risk with the IP holders, as the royalties are mostly denominated in the subsidiaries’ local currencies, while the functional currency of the IP holders with the highest royalty volume is the euro. The highest foreign currency exchange rate exposure of this kind relates to the currencies of subsidiaries with significant operations, for example the U.S. dollar, the pound sterling, the Japanese yen, the Swiss franc, the Brazilian real, and the Australian dollar.
Generally, we are not exposed to any significant foreign currency exchange rate risk with regard to our investing and financing activities, as such activities are normally conducted in the functional currency of the investing or borrowing entity. For more information, seeNote (25).
b) Interest Rate Risk
We are exposed to interest rate risk as a result of our investing and financing activities mainly in euros and U.S. dollars:
| | | | | | | | | | | | | | | | |
| € millions | | 2016 | | | 2015 | |
| | Cash Flow Risk | | | Fair Value Risk | | | Cash Flow Risk | | | Fair Value Risk | |
Investing activities | | | 3,308 | | | | 1,364 | | | | 3,078 | | | | 480 | |
Financing activities | | | 2,313 | | | | 5,567 | | | | 3,157 | | | | 6,038 | |
c) Equity Price Risk
We are exposed to equity price risk with regard to our investments in equity securities (2016:€952 million; 2015:€882 million) and our share-based payments (for the exposure from these plans, seeNote (27)).
Credit Risk
To reduce the credit risk in investments, we arrange to receive rights to collateral for certain investing activities in the full amount of the investment volume, which we would be allowed to make use of only in the case of default of the counterparty to the investment. In the absence of other significant agreements to reduce our credit risk exposure, the total amounts recognized as cash and cash equivalents, current investments, loans and other financial receivables, trade receivables, and derivative financial assets represent our maximum exposure to credit risks, except for the agreements mentioned above.
Liquidity Risk
The table below is an analysis of the remaining contractual maturities of all our financial liabilities held as at December 31, 2016. Financial liabilities for which repayment can be requested by the contract partner at any time are assigned to the earliest possible period. Variable interest payments were calculated using the latest relevant interest rate fixed as at December 31, 2016. As we generally settle our derivative contracts gross, we show the pay and receive legs separately for all our currency and interest rate derivatives, whether or not the fair value of the derivative is negative. The cash outflows for the currency derivatives are translated using the applicable forward rate.
For more information about the cash flows for unrecognized but contractually agreed financial commitments, seeNote (22).
F-43
Contractual Maturities ofNon-Derivative Financial Liabilities
| | | | | | | | | | | | | | | | | | | | | | | | | | | | |
| € millions | | Carrying
Amount | | | Contractual Cash Flows | |
| | 12/31/2016 | | | 2017 | | | 2018 | | | 2019 | | | 2020 | | | 2021 | | | Thereafter | |
Trade payables | | | –1,016 | | | | –1,016 | | | | 0 | | | | 0 | | | | 0 | | | | 0 | | | | 0 | |
Financial liabilities | | | –8,099 | | | | –1,739 | | | | –1,371 | | | | –835 | | | | –995 | | | | –62 | | | | –3,639 | |
Total ofnon-derivative financial liabilities | | | –9,115 | | | | –2,755 | | | | –1,371 | | | | –835 | | | | –995 | | | | –62 | | | | –3,639 | |
| | | | | | | | | | | | | | | | | | | | | | | | | | | | |
| € millions | | Carrying
Amount | | | Contractual Cash Flows | |
| | 12/31/2015 | | | 2016 | | | 2017 | | | 2018 | | | 2019 | | | 2020 | | | Thereafter | |
Trade payables | | | –893 | | | | –893 | | | | 0 | | | | 0 | | | | 0 | | | | 0 | | | | 0 | |
Financial liabilities | | | –9,395 | | | | –863 | | | | –2,778 | | | | –980 | | | | –836 | | | | –986 | | | | –3,683 | |
Total ofnon-derivative financial liabilities | | | –10,288 | | | | –1,756 | | | | –2,778 | | | | –980 | | | | –836 | | | | –986 | | | | –3,683 | |
Contractual Maturities of Derivative Financial Liabilities and Financial Assets
| | | | | | | | | | | | | | | | | | | | | | | | |
| € millions | | Carrying
Amount | | | Contractual Cash Flows | | | Carrying
Amount | | | Contractual Cash Flows | |
| | | 12/31/2016 | | | 2017 | | | Thereafter | | | 12/31/2015 | | | 2016 | | | Thereafter | |
Derivative financial liabilities | | | | | | | | | | | | | | | | | | | | | | | | |
Currency derivatives not designated as hedging instruments | | | –170 | | | | | | | | | | | | –117 | | | | | | | | | |
Cash outflows | | | | | | | –3,160 | | | | –43 | | | | | | | | –2,896 | | | | –58 | |
Cash inflows | | | | | | | 3,025 | | | | 0 | | | | | | | | 2,834 | | | | 0 | |
Currency derivatives designated as hedging instruments | | | –24 | | | | | | | | | | | | –10 | | | | | | | | | |
Cash outflows | | | | | | | –475 | | | | 0 | | | | | | | | –489 | | | | 0 | |
Cash inflows | | | | | | | 442 | | | | 0 | | | | | | | | 475 | | | | 0 | |
Total of derivative financial liabilities | | | –194 | | | | –168 | | | | –43 | | | | –128 | | | | –76 | | | | –58 | |
Derivative financial assets | | | | | | | | | | | | | | | | | | | | | | | | |
Currency derivatives not designated as hedging instruments | | | 35 | | | | | | | | | | | | 69 | | | | | | | | | |
Cash outflows | | | | | | | –1,902 | | | | 0 | | | | | | | | –3,010 | | | | 0 | |
Cash inflows | | | | | | | 1,938 | | | | 0 | | | | | | | | 3,073 | | | | 0 | |
Currency derivatives designated as hedging instruments | | | 12 | | | | | | | | | | | | 14 | | | | | | | | | |
Cash outflows | | | | | | | –241 | | | | 0 | | | | | | | | –266 | | | | 0 | |
Cash inflows | | | | | | | 252 | | | | 0 | | | | | | | | 275 | | | | 0 | |
Interest-rate derivatives designated as hedging instruments | | | 47 | | | | | | | | | | | | 100 | | | | | | | | | |
Cash outflows | | | | | | | –38 | | | | –83 | | | | | | | | –43 | | | | –225 | |
Cash inflows | | | | | | | 62 | | | | 112 | | | | | | | | 77 | | | | 300 | |
Total of derivative financial assets | | | 95 | | | | 71 | | | | 29 | | | | 183 | | | | 106 | | | | 75 | |
| Total of derivative financial liabilities and assets | | | –99 | | | | –97 | | | | –14 | | | | 55 | | | | 30 | | | | 17 | |
F-44
(25) FINANCIAL RISK MANAGEMENT
We manage market risks (including foreign currency exchange rate risk, interest rate risk, and equity price risk), credit risk, and liquidity risk on a Group-wide basis through our global treasury department. Our risk management and hedging strategy is set by our treasury guideline and other internal guidelines, and is subject to continuous internal risk analysis. Derivative financial instruments are only purchased to reduce risks and not for speculation, which is defined as entering into derivative instruments without a corresponding underlying transaction.
Foreign Currency Exchange Rate Risk Management
We continuously monitor our exposure to currency fluctuation risks based on monetary items and forecasted transactions and pursue a Group-wide strategy to manage foreign currency exchange rate risk, using derivative financial instruments, primarily foreign exchange forward contracts, as appropriate, with the primary aim of reducing profit or loss volatility. Most of the hedging instruments are not designated as being in a hedge accounting relationship. For more information, seeNote (3a).
Currency Hedges Designated as Hedging Instruments (Cash Flow Hedges)
We enter into derivative financial instruments, primarily foreign exchange forward contracts, to hedge significant forecasted cash flows (royalties) from foreign subsidiaries denominated in foreign currencies with a defined set of hedge ratios and a hedge horizon of up to 12 months, which is also the maximum maturity of the foreign exchange derivatives we use.
For all years presented, no previously highly-probable transaction designated as a hedged item in a foreign currency cash flow hedge relationship ceased to be probable. Therefore, we did not discontinue any of our cash flow hedge relationships. Also, we identified no ineffectiveness in all years reported. Generally, the cash flows of the hedged forecasted transactions are expected to occur and to be recognized in profit or loss monthly within a time frame of 12 months from the date of the statement of financial position.
Foreign Currency Exchange Rate Exposure
Our risk exposure is based on a sensitivity analysis considering the following:
| – | | The SAP Group’s entities generally operate in their functional currencies. In exceptional cases and limited economic environments, operating transactions are denominated in currencies other than the functional currency, leading to a foreign currency exchange rate risk for the related monetary instruments. Where |
| | | material, this foreign currency exchange rate risk is hedged. Therefore, fluctuations in foreign currency exchange rates neither have a significant impact on profit nor on other comprehensive income with regard to ournon-derivative monetary financial instruments and related income or expenses. |
| – | | Our free-standing derivatives designed for hedging foreign currency exchange rate risks almost completely balance the changes in the fair values of the hedged item attributable to exchange rate movements in the Consolidated Income Statements in the same period. As a consequence, the hedged items and the hedging instruments are not exposed to foreign currency exchange rate risks, and thereby have no effect on profit. |
Consequently, we are only exposed to significant foreign currency exchange rate fluctuations with regard to the following:
| – | | Derivatives held within a designated cash flow hedge relationship (excluding the interest element, which is not part of the assigned cash flow hedge relationships) affecting other comprehensive income |
| – | | Foreign currency embedded derivatives affecting othernon-operating expense, net. |
We calculate our sensitivity on an upward/downward shift of +/–25% of the foreign currency exchange rate between euro and Brazilian real and +/–10% of the foreign currency exchange rate between euro and all other major currencies (2015: upward/downward shift of +/–25% of the foreign currency exchange rate between euro and Brazilian real; +/–10% of the foreign currency exchange rate between euro and all other major currencies; 2014: upward shift for Swiss franc +20%, all other major currencies +10%, downward shift for all major currencies –10%). If on December 31, 2016, 2015, and 2014, the foreign currency exchange rates had been higher/lower as described above, this would not have had a material effect on othernon-operating expense, net and other comprehensive income.
Our foreign currency exposure as at December 31 (and ifyear-end exposure is not representative, also our average/high/low exposure) was as follows:
Foreign Currency Exposure
| | | | | | | | |
| € billions | | 2016 | | | 2015 | |
| Year-end exposure toward all our major currencies | | | 0.9 | | | | 1.0 | |
| Average exposure | | | 0.9 | | | | 1.1 | |
| Highest exposure | | | 1.0 | | | | 1.2 | |
| Lowest exposure | | | 0.8 | | | | 1.0 | |
F-45
Interest Rate Risk Management
The aim of our interest rate risk management is to reduce profit or loss volatility and optimize our interest result by creating a balanced structure of fixed and variable cash flows. We therefore manage interest rate risks by adding interest rate-related derivative instruments to a given portfolio of investments and debt financing.
Derivatives Designated as Hedging Instruments (Fair Value Hedges)
The majority of our investments are based on variable rates and/or short maturities (2016: 71%; 2015: 87%) while most of our financing transactions are based on fixed rates and long maturities (2016: 71%; 2015: 66%). To match the interest rate risk from our financing transactions to our investments, we use receiver interest rate swaps to convert certain fixed-rate financial liabilities to floating, and by this means secure the fair value of the swapped financing transactions. The desired fixed-floating mix of our net debt is set by the Treasury Committee. Including interest rate swaps, 42% (2015: 36%) of our total interest-bearing financial liabilities outstanding as at December 31, 2016, had a fixed interest rate.
None of the fair value adjustment from the receiver swaps, the basis adjustment on the underlying hedged items held in fair value hedge relationships, and the difference between the two recognized in financial income, net is material in any of the years presented.
Interest Rate Exposure
A sensitivity analysis is provided to show the impact of our interest rate risk exposure on profit or loss and equity in accordance with IFRS 7, considering the following:
| – | | Changes in interest rates only affect the accounting fornon-derivative fixed-rate financial instruments if they are recognized at fair value. Therefore, such interest rate changes do not change the carrying |
| | | amounts of ournon-derivative fixed-rate financial liabilities as we account for them at amortized cost. Investments in fixed-rate financial assets classified asavailable-for-sale were not material at eachyear-end reported. Thus, we do not consider any fixed-rate instruments in the equity-related sensitivity calculation. |
| – | | Income or expenses recorded in connection withnon-derivative financial instruments with variable interest rates are subject to interest rate risk if they are not hedged items in an effective hedge relationship. Thus, we take into consideration interest rate changes relating to our variable-rate financing and our investments in money market instruments in the profit-related sensitivity calculation. |
| – | | The designation of interest rate receiver swaps in a fair value hedge relationship leads to interest rate changes affecting financial income, net. The fair value movements related to the interest rate swaps are not reflected in the sensitivity calculation, as they offset the fixed interest rate payments for the bonds and private placements as hedged items. However, changes in market interest rates affect the amount of interest payments from the interest rate swap. As a consequence, those effects of market interest rates on interest payments are included in the profit-related sensitivity calculation. |
Due to the different interest rate expectations for the U.S. dollar and the euro area, we base our sensitivity analyses on a yield curve upward shift of +100/+50 basis points (bps) for the U.S. dollar/euro area (2015 and 2014: +100/+50 bps for the U.S. dollar/euro area) and a yield curve downward shift of –50 bps for both the U.S. dollar/euro area (2015: –50 bps; 2014: –50 bps).
If, on December 31, 2016, 2015, and 2014, interest rates had been higher/lower as described above, this would not have had a material effect on financial income, net for our variable interest rate investments and would have had the following effects on financial income, net.
Interest Rate Sensitivity
| | | | | | | | | | | | |
| € millions | | Effects on Financial Income, Net | |
| | 2016 | | | 2015 | | | 2014 | |
Derivatives held within a designated fair value hedge relationship | | | | | | | | | | | | |
Interest rates +100 bps in U.S. dollar area/+50 bps in euro area | | – | 46 | | | – | 105 | | | – | 116 | |
Interest rates –50 bps in U.S. dollar/euro area | | | 29 | | | | 62 | | | | 70 | |
Variable rate financing | | | | | | | | | | | | |
Interest rates +50 bps in euro area | | – | 21 | | | – | 39 | | | – | 65 | |
Interest rates –50 bps in euro area | | | 0 | | | | 19 | | | | 65 | |
F-46
Our interest rate exposure as at December 31 (and ifyear-end exposure is not representative, also our average/high/low exposure) was as follows:
Interest Rate Risk Exposure
| | | | | | | | | | | | | | | | | | | | | | | | | | | | | | | | |
| € billion | | 2016 | | | 2015 | |
| | Year-End | | | Average | | | High | | | Low | | | Year-End | | | Average | | | High | | | Low | |
Fair value interest rate risk | | | | | | | | | | | | | | | | | | | | | | | | | | | | | | | | |
From investments | | | 0.20 | | | | 0.08 | | | | 0.20 | | | | 0.03 | | | | 0.03 | | | | 0.05 | | | | 0.07 | | | | 0.03 | |
Cash flow interest rate risk | | | | | | | | | | | | | | | | | | | | | | | | | | | | | | | | |
From investments (including cash) | | | 3.31 | | | | 3.59 | | | | 4.38 | | | | 3.03 | | | | 3.08 | | | | 3.09 | | | | 3.37 | | | | 2.62 | |
From financing | | | 2.31 | | | | 2.94 | | | | 3.31 | | | | 2.31 | | | | 3.16 | | | | 3.73 | | | | 4.63 | | | | 3.16 | |
From interest rate swaps | | | 2.22 | | | | 2.59 | | | | 2.69 | | | | 2.22 | | | | 2.69 | | | | 2.67 | | | | 2.74 | | | | 2.64 | |
Equity Price Risk Management
Our listed equity investments are monitored based on the current market value that is affected by the fluctuations in the volatile stock markets worldwide. Unlisted equity investments are monitored based on detailed financial information provided by the investees. The fair value of our listed equity investments depends on the equity prices, while the fair value of the unlisted equity investments is influenced by various unobservable input factors. An assumed 10% increase (decrease) in equity prices and respective unobservable inputs as at December 31, 2016, would have increased (decreased) the value of our marketable equity investments and other comprehensive income by€84 million (€81 million) (2015: increased by€87 million (decreased by€84 million)).
We are exposed to equity price risk with regard to our share-based payments. In order to reduce resulting profit or loss volatility, we hedge certain cash flow exposures associated with these plans through the purchase of derivative instruments, but do not establish a designated hedge relationship. In our sensitivity analysis, we include the underlying share-based payments and the hedging instruments. Thus, we base the calculation on our net exposure to equity prices, as we believe that taking only the derivative instrument into account would not properly reflect our equity price risk exposure. An assumed 20% increase (decrease) in equity prices as at December 31, 2016, would have increased (decreased) our share-based payment expenses by€281 million (€252 million) (2015: increased by€200 million (decreased by€198 million); 2014: increased by€158 million (decreased by€80 million)).
Credit Risk Management
To mitigate the credit risk from our investing activities and derivative financial assets, we conduct all our
activities only with approved major financial institutions and issuers that carry high external ratings, as required by our internal treasury guideline. Among its stipulations, the guideline requires that we invest only in assets from issuers with a minimum rating of at least “BBB flat”. We only make investments in issuers with a lower rating in exceptional cases. Such investments were not material in 2016 and 2015. The weighted average rating of our financial assets is in the rangeA- to BBB+. We pursue a policy of cautious investments characterized by predominantly current investments, standard investment instruments, as well as a wide portfolio diversification by doing business with a variety of counterparties.
To further reduce our credit risk, we require collateral for certain investments in the full amount of the investment volume which we would be allowed to make use of in the case of default of the counterparty to the investment. As such collateral, we only accept bonds with at least investment grade rating level.
In addition, the concentration of credit risk that exists when counterparties are involved in similar activities by instrument, sector, or geographic area is further mitigated by diversification of counterparties throughout the world and adherence to an internal limit system for each counterparty. This internal limit system stipulates that the business volume with individual counterparties is restricted to a defined limit, which depends on the lowest official long-term credit rating available by at least one of the major rating agencies, the Tier 1 capital of the respective financial institution, or participation in the German Depositors’ Guarantee Fund or similar protection schemes. We continuously monitor strict compliance with these counterparty limits. As the premium for credit default swaps mainly depends on market participants’ assessments of the creditworthiness of a debtor, we also closely observe the
F-47
development of credit default swap spreads in the market to evaluate probable risk developments to timely react to changes if these should manifest.
The default risk of our trade receivables is managed separately, mainly based on assessing the creditworthiness of customers through external ratings and our past experience with the customers concerned. Outstanding receivables are continuously monitored locally. For more information, seeNote (3). The impact of default on our trade receivables from individual customers is mitigated by our large customer base and its distribution across many different industries, company sizes, and countries worldwide. For more information about our trade receivables, seeNote (13).For information about the maximum exposure to credit risk, seeNote (24).
Liquidity Risk Management
Our liquidity is managed by our global treasury department with the primary aim of maintaining liquidity at a level that is adequate to meet our financial obligations.
Generally, our primary source of liquidity is funds generated from our business operations. Our global treasury department manages liquidity centrally for all subsidiaries. Where possible, we pool their cash surplus so that we can use liquidity centrally for our business operation, for subsidiaries’ funding requirements, or to invest any net surplus in the market. With this strategy, we seek to optimize yields, while ensuring liquidity, by investing only with counterparties and issuers of high credit quality, as explained before. Hence, high levels of liquid assets and marketable securities provide a strategic reserve, helping keep SAP flexible, sound, and independent.
Apart from effective working capital and cash management, we have reduced the liquidity risk inherent
in managing ourday-to-day operations and meeting our financing responsibilities by arranging an adequate volume of available credit facilities with various financial institutions on which we can draw if necessary.
In order to retain high financial flexibility, on November 13, 2013, SAP SE entered into a€2.0 billion syndicated credit facility agreement with an initial term of five years plus twoone-year extension options. In 2015, the original term of this facility was extended for an additional period of one year to November 2020. The use of the facility is not restricted by any financial covenants. Borrowings under the facility bear interest of EURIBOR or LIBOR for the respective currency plus a margin of 22.5 basis points. We are also required to pay a commitment fee of 7.88 basis points per annum on the unused available credit. We have never drawn on the facility.
Additionally, as at December 31, 2016, and 2015, we had available lines of credit totaling€499 million and€520 million, respectively. There were immaterial borrowings outstanding under these lines of credit in all years presented.
(26) ADDITIONAL FAIR VALUE DISCLOSURES ON FINANCIAL INSTRUMENTS
Fair Value of Financial Instruments
We use various types of financial instruments in the ordinary course of business, which are classified as either: loans and receivables (L&R),available-for-sale (AFS),held-for-trading (HFT), or amortized cost (AC). For those financial instruments measured at fair value or for which fair value must be disclosed, we have categorized the financial instruments into a three-level fair value hierarchy depending on the inputs used to determine fair value and their significance for the valuation techniques.
F-48
Fair Values of Financial Instruments and Classification Within the Fair Value Hierarchy
| | | | | | | | | | | | | | | | | | | | | | | | | | | | | | | | |
| € millions | | Category | | | December 31, 2016 | |
| | | | | | Carrying
Amount | | | Measurement
Categories | | | Fair Value | |
| | | | | | | | | At
Amortized
Cost | | | At Fair
Value | | | Level 1 | | | Level 2 | | | Level 3 | | | Total | |
Assets | | | | | | | | | | | | | | | | | | | | | | | | | | | | | | | | |
Cash and cash equivalents1) | | | L&R | | | | 3,702 | | | | 3,702 | | | | | | | | | | | | | | | | | | | | �� | |
Trade and other receivables | | | | | | | 6,050 | | | | | | | | | | | | | | | | | | | | | | | | | |
Trade receivables1) | | | L&R | | | | 5,825 | | | | 5,825 | | | | | | | | | | | | | | | | | | | | | |
Other receivables2) | | | — | | | | 225 | | | | | | | | | | | | | | | | | | | | | | | | | |
Other financial assets | | | | | | | 2,482 | | | | | | | | | | | | | | | | | | | | | | | | | |
Available-for-sale financial assets | | | | | | | | | | | | | | | | | | | | | | | | | | | | | | | | |
Debt investments | | | AFS | | | | 195 | | | | | | | | 195 | | | | 195 | | | | | | | | | | | | 195 | |
Equity investments | | | AFS | | | | 953 | | | | | | | | 953 | | | | 153 | | | | 94 | | | | 706 | | | | 953 | |
Investments in associates2) | | | — | | | | 38 | | | | | | | | | | | | | | | | | | | | | | | | | |
Loans and other financial receivables | | | | | | | | | | | | | | | | | | | | | | | | | | | | | | | | |
Financial instruments related to employee benefit plans2) | | | — | | | | 144 | | | | | | | | | | | | | | | | | | | | | | | | | |
Other loans and other financial receivables | | | L&R | | | | 956 | | | | 956 | | | | | | | | | | | | 956 | | | | | | | | 956 | |
Derivative assets | | | | | | | | | | | | | | | | | | | | | | | | | | | | | | | | |
Designated as hedging instrument | | | | | | | | | | | | | | | | | | | | | | | | | | | | | | | | |
FX forward contracts | | | — | | | | 12 | | | | | | | | 12 | | | | | | | | 12 | | | | | | | | 12 | |
Interest rate swaps | | | — | | | | 47 | | | | | | | | 47 | | | | | | | | 47 | | | | | | | | 47 | |
Not designated as hedging instrument | | | | | | | | | | | | | | | | | | | | | | | | | | | | | | | | |
FX forward contracts | | | HFT | | | | 35 | | | | | | | | 35 | | | | | | | | 35 | | | | | | | | 35 | |
Call options for share-based payments | | | HFT | | | | 84 | | | | | | | | 84 | | | | | | | | 84 | | | | | | | | 84 | |
Call option on equity shares | | | HFT | | | | 17 | | | | | | | | 17 | | | | | | | | | | | | 17 | | | | 17 | |
F-49
Fair Values of Financial Instruments and Classification Within the Fair Value Hierarchy
| | | | | | | | | | | | | | | | | | | | | | | | | | | | | | | | |
| € millions | | Category | | | December 31, 2016 | |
| | | | | | Carrying
Amount | | | Measurement
Categories | | | Fair Value | |
| | | | | | | | | At
Amortized
Cost | | | At Fair
Value | | | Level 1 | | | Level 2 | | | Level 3 | | | Total | |
Liabilities | | | | | | | | | | | | | | | | | | | | | | | | | | | | | | | | |
Trade and other payables | | | | | | | –1,408 | | | | | | | | | | | | | | | | | | | | | | | | | |
Trade payables1) | | | AC | | | | –1,016 | | | | –1,016 | | | | | | | | | | | | | | | | | | | | | |
Other payables2) | | | — | | | | –392 | | | | | | | | | | | | | | | | | | | | | | | | | |
Financial liabilities | | | | | | | –8,294 | | | | | | | | | | | | | | | | | | | | | | | | | |
Non-derivative financial liabilities | | | | | | | | | | | | | | | | | | | | | | | | | | | | | | | | |
Loans | | | AC | | | | –16 | | | | –16 | | | | | | | | | | | | –16 | | | | | | | | –16 | |
Bonds | | | AC | | | | –6,147 | | | | –6,147 | | | | | | | | –6,374 | | | | | | | | | | | | –6,374 | |
Private placements | | | AC | | | | –1,717 | | | | –1,717 | | | | | | | | | | | | –1,744 | | | | | | | | –1,744 | |
Othernon-derivative financial liabilities | | | AC | | | | –219 | | | | –219 | | | | | | | | | | | | –219 | | | | | | | | –219 | |
Derivatives | | | | | | | | | | | | | | | | | | | | | | | | | | | | | | | | |
Designated as hedging instrument | | | | | | | | | | | | | | | | | | | | | | | | | | | | | | | | |
FX forward contracts | | | — | | | | –24 | | | | | | | | –24 | | | | | | | | –24 | | | | | | | | –24 | |
Interest rate swaps | | | — | | | | 0 | | | | | | | | 0 | | | | | | | | 0 | | | | | | | | 0 | |
Not designated as hedging instrument | | | | | | | | | | | | | | | | | | | | | | | | | | | | | | | | |
FX forward contracts | | | HFT | | | | –170 | | | | | | | | –170 | | | | | | | | –170 | | | | | | | | –170 | |
Total financial instruments, net | | | | | | | 2,533 | | | | 1,369 | | | | 1,149 | | | | –6,026 | | | | –944 | | | | 723 | | | | –6,248 | |
F-50
Fair Values of Financial Instruments and Classification Within the Fair Value Hierarchy
| | | | | | | | | | | | | | | | | | | | | | | | | | | | | | | | |
| € millions | | Category | | | December 31, 2015 | |
| | | | | | Carrying
Amount | | | Measurement
Categories | | | Fair Value | |
| | | | | | | | | At
Amortized
Cost | | | At Fair
Value | | | Level 1 | | | Level 2 | | | Level 3 | | | Total | |
Assets | | | | | | | | | | | | | | | | | | | | | | | | | | | | | | | | |
Cash and cash equivalents1) | | | L&R | | | | 3,411 | | | | 3,411 | | | | | | | | | | | | | | | | | | | | | |
Trade and other receivables | | | | | | | 5,362 | | | | | | | | | | | | | | | | | | | | | | | | | |
Trade receivables1) | | | L&R | | | | 5,199 | | | | 5,199 | | | | | | | | | | | | | | | | | | | | | |
Other receivables2) | | | — | | | | 163 | | | | | | | | | | | | | | | | | | | | | | | | | |
Other financial assets | | | | | | | 1,687 | | | | | | | | | | | | | | | | | | | | | | | | | |
Available-for-sale financial assets | | | | | | | | | | | | | | | | | | | | | | | | | | | | | | | | |
Debt investments | | | AFS | | | | 26 | | | | | | | | 26 | | | | 26 | | | | | | | | | | | | 26 | |
Equity investments | | | AFS | | | | 882 | | | | | | | | 882 | | | | 299 | | | | 21 | | | | 562 | | | | 882 | |
Investments in associates2) | | | — | | | | 58 | | | | | | | | | | | | | | | | | | | | | | | | | |
Loans and other financial receivables | | | | | | | | | | | | | | | | | | | | | | | | | | | | | | | | |
Financial instruments related to employee benefit plans2) | | | — | | | | 121 | | | | | | | | | | | | | | | | | | | | | | | | | |
Other loans and other financial receivables | | | L&R | | | | 316 | | | | 316 | | | | | | | | | | | | 316 | | | | | | | | 316 | |
Derivative assets | | | | | | | | | | | | | | | | | | | | | | | | | | | | | | | | |
Designated as hedging instrument | | | | | | | | | | | | | | | | | | | | | | | | | | | | | | | | |
FX forward contracts | | | — | | | | 14 | | | | | | | | 14 | | | | | | | | 14 | | | | | | | | 14 | |
Interest rate swaps | | | — | | | | 100 | | | | | | | | 100 | | | | | | | | 100 | | | | | | | | 100 | |
Not designated as hedging instrument | | | | | | | | | | | | | | | | | | | | | | | | | | | | | | | | |
FX forward contracts | | | HFT | | | | 69 | | | | | | | | 69 | | | | | | | | 69 | | | | | | | | 69 | |
Call options for share-based payments | | | HFT | | | | 94 | | | | | | | | 94 | | | | | | | | 94 | | | | | | | | 94 | |
Call option on equity shares | | | HFT | | | | 6 | | | | | | | | 6 | | | | | | | | | | | | 6 | | | | 6 | |
| Liabilities | | | | | | | | | | | | | | | | | | | | | | | | | | | | | | | | |
| Trade and other payables | | | | | | | –1,169 | | | | | | | | | | | | | | | | | | | | | | | | | |
Trade payables1) | | | AC | | | | –893 | | | | –893 | | | | | | | | | | | | | | | | | | | | | |
Other payables2) | | | — | | | | –276 | | | | | | | | | | | | | | | | | | | | | | | | | |
| Financial liabilities | | | | | | | –9,522 | | | | | | | | | | | | | | | | | | | | | | | | | |
Non-derivative financial liabilities | | | | | | | | | | | | | | | | | | | | | | | | | | | | | | | | |
Loans | | | AC | | | | –1,261 | | | | –1,261 | | | | | | | | | | | | –1,261 | | | | | | | | –1,261 | |
Bonds | | | AC | | | | –5,733 | | | | –5,733 | | | | | | | | –5,825 | | | | | | | | | | | | –5,825 | |
Private placements | | | AC | | | | –2,202 | | | | –2,202 | | | | | | | | | | | | –2,288 | | | | | | | | –2,288 | |
Othernon-derivative financial liabilities | | | AC | | | | –199 | | | | –199 | | | | | | | | | | | | –199 | | | | | | | | –199 | |
Derivatives | | | | | | | | | | | | | | | | | | | | | | | | | | | | | | | | |
Designated as hedging instrument | | | | | | | | | | | | | | | | | | | | | | | | | | | | | | | | |
FX forward contracts | | | — | | | | –10 | | | | | | | | –10 | | | | | | | | –10 | | | | | | | | –10 | |
Interest rate swaps | | | — | | | | 0 | | | | | | | | 0 | | | | | | | | 0 | | | | | | | | 0 | |
Not designated as hedging instrument | | | | | | | | | | | | | | | | | | | | | | | | | | | | | | | | |
FX forward contracts | | | HFT | | | | –117 | | | | | | | | –117 | | | | | | | | –117 | | | | | | | | –117 | |
| Total financial instruments, net | | | | | | | –232 | | | | –1,361 | | | | 1,064 | | | | –5,500 | | | | –3,261 | | | | 568 | | | | –8,192 | |
1) We do not separately disclose the fair value for cash and cash equivalents, trade receivables, and accounts payable as their carrying amounts are a reasonable approximation of their fair values.
2) Since the line items trade receivables, trade payables, and other financial assets contain both financial andnon-financial assets or liabilities (such as other taxes or advance payments), the carrying amounts ofnon-financial assets or liabilities are shown to allow a reconciliation to the corresponding line items in the Consolidated Statements of Financial Position.
F-51
Fair Values of Financial Instruments Classified According to IAS 39
| | | | | | | | | | | | | | | | |
| € millions | | Category | | | December 31, 2016 | |
| | | Carrying Amount | | | At Amortized Cost | | | At Fair Value | |
Financial assets | | | | | | | | | | | | | | | | |
At fair value through profit or loss | | | HFT | | | | 136 | | | | | | | | 136 | |
Available-for-sale | | | AFS | | | | 1,148 | | | | | | | | 1,148 | |
Loans and receivables | | | L&R | | | | 10,484 | | | | 10,484 | | | | | |
Financial liabilities | | | | | | | | | | | | | | | | |
At fair value through profit or loss | | | HFT | | | | –170 | | | | | | | | –170 | |
At amortized cost | | | AC | | | | –9,115 | | | | –9,115 | | | | | |
| | | | | | | | | | | | | | | | |
| € millions | | Category | | | December 31, 2015 | |
| | | Carrying Amount | | | At Amortized Cost | | | At Fair Value | |
Financial assets | | | | | | | | | | | | | | | | |
At fair value through profit or loss | | | HFT | | | | 169 | | | | | | | | 169 | |
Available-for-sale | | | AFS | | | | 908 | | | | | | | | 908 | |
Loans and receivables | | | L&R | | | | 8,926 | | | | 8,926 | | | | | |
Financial liabilities | | | | | | | | | | | | | | | | |
At fair value through profit or loss | | | HFT | | | | –117 | | | | | | | | –117 | |
At amortized cost | | | AC | | | | –10,288 | | | | –10,288 | | | | | |
Determination of Fair Values
It is our policy that transfers between the different levels of the fair value hierarchy are deemed to have occurred at the beginning of the period of the event or change in
circumstances that caused the transfer. A description of the valuation techniques and the inputs used in the fair value measurement is given below:
Financial Instruments Measured at Fair Value on a Recurring Basis
| | | | | | | | | | |
| | | Type | | Fair Value
Hierarchy | | Determination of Fair Value/
Valuation Technique | | Significant
Unobservable
Inputs | | Interrelationship
Between Significant
Unobservable Inputs
and Fair Value
Measurement |
| | | Other financial assets | | | | | | |
| | | Debt investments | | Level 1 | | Quoted prices in an active market | | NA | | NA |
| | Listed equity investments | | Level 1 | | Quoted prices in an active market | | NA | | NA |
| | | | Level 2 | | Quoted prices in an active market deducting a discount for the disposal restriction derived from the premium for a respective put option. | | NA | | NA |
F-52
| | | | | | | | | | |
| | | Type | | Fair Value
Hierarchy | | Determination of Fair Value/
Valuation Technique | | Significant
Unobservable
Inputs | | Interrelationship
Between Significant
Unobservable Inputs
and Fair Value
Measurement |
| | Unlisted equity investments | | Level 3 | | Market approach. Comparable company valuation using revenue multiples derived from companies comparable to the investee. | | Peer companies used (revenue multiples range from 3.9 to 8.3) Revenues of investees Discounts for lack of marketability (10% to 30%) | | The estimated fair value would increase (decrease) if: The revenue multiples were higher (lower) The investees’ revenues were higher (lower) The liquidity discounts were lower (higher). |
| | | | | | Market approach. Venture capital method evaluating a variety of quantitative and qualitative factors such as actual and forecasted results, cash position, recent or planned transactions, and market comparable companies. | | NA | | NA |
| | | | | | Last financing round valuations | | NA | | NA |
| | | | | | Liquidation preferences | | NA | | NA |
| | | | | | | Net asset value/Fair market value as reported by the respective funds | | NA | | NA |
| | | Call options for share-based payment plans | | Level 2 | | Monte-Carlo Model. Calculated considering risk-free interest rates, the remaining term of the derivatives, the dividend yields, the stock price, and the volatility of our share. | | NA | | NA |
| | | Call option on equity shares | | Level 3 | | Market approach. Company valuation using EBITDA multiples based on actual results derived from the investee. | | EBITDA multiples used EBITDA of the investee | | The estimated fair value would increase (decrease) if: The EBITDA multiples were higher (lower) The investees’ EBITDA were higher (lower) |
Other financial assets/ Financial liabilities | | | | |
| | | FX forward contracts | | Level 2 | | Discounted cash flow usingPar-Method. Expected future cash flows based on forward exchange rates are discounted over the respective remaining term of the contracts using the respective deposit interest rates and spot rates. | | NA | | NA |
| | | Interest-rate swaps | | Level 2 | | Discounted cash flow. Expected future cash flows are estimated based on forward interest rates from observable yield curves and contract interest rates, discounted at a rate that reflects the credit risk of the counterparty. | | NA | | NA |
F-53
Financial Instruments Not Measured at Fair Value
| | | | | | |
| | | Type | | Fair Value Hierarchy | | Determination of Fair Value/Valuation
Technique |
Financial liabilities | | | | |
| | | Fixed rate bonds (financial liabilities) | | Level 1 | | Quoted prices in an active market |
| | | Fixed rate private placements/ loans (financial liabilities) | | Level 2 | | Discounted cash flows. Future cash outflows for fixed interest and principal are discounted over the term of the respective contracts using the market interest rates as of the reporting date. |
For othernon-derivative financial assets/liabilities and variable rate financial debt, it is assumed that their carrying value reasonably approximates their fair values.
Transfers Between Levels 1 and 2
Transfers ofavailable-for-sale equity investments from Level 2 to Level 1 which occurred because disposal restrictions lapsed and deducting a discount for such
restriction was no longer necessary were not material in all years presented, while transfers from Level 1 to Level 2 did not occur at all.
Level 3 Disclosures
The following table shows the reconciliation from the opening to the closing balances for our unlisted equity investments and call options on equity shares classified as Level 3 fair values:
Reconciliation of Level 3 Fair Values
| | | | | | | | |
| € millions | | 2016 | | | 2015 | |
| | | Unlisted Equity Investments and
Call Options on Equity Shares | | | Unlisted Equity Investments and
Call Options on Equity Shares | |
| January 1 | | | 568 | | | | 400 | |
| Transfers | | | | | | | | |
Into Level 3 | | | 18 | | | | 12 | |
Out of Level 3 | | | –18 | | | | –80 | |
| Purchases | | | 156 | | | | 170 | |
| Sales | | | –168 | | | | –22 | |
| Gains/losses | | | | | | | | |
Included in financial income, net in profit and loss | | | 96 | | | | 9 | |
Included inavailable-for-sale financial assets in other comprehensive income | | | 48 | | | | 34 | |
Included in exchange differences in other comprehensive income | | | 22 | | | | 45 | |
| December 31 | | | 722 | | | | 568 | |
| Change in unrealized gains/losses in profit and loss for investments held at the end of the reporting period | | | 0 | | | | 0 | |
Changing the unobservable inputs to reflect reasonably possible alternative assumptions would not have a material impact on the fair values of our unlisted equity investments held asavailable-for-sale as of the reporting date.
(27) SHARE-BASED PAYMENTS
SAP has granted awards under various cash-settled and equity-settled share-based payment plans to employees and executives. Most of these awards are described in detail below. SAP has further share-based
F-54
payment plans not described below, which are individually and in aggregate, immaterial to our Consolidated Financial Statements.
a) Cash-Settled Share-Based Payments
SAP has made cash-settled share-based payments under the following plans: Long-Term Incentive Plan
(LTI) for the Executive Board 2015 and 2016, Stock Option Plan 2010 (SOP 2010 (2010–2015 tranches)), and Restricted Stock Unit Plan including Move SAP Plan (RSU (2013–2016 tranches)).
The valuation of our outstanding cash-settled plans was based on the following parameters and assumptions:
Fair Value and Parameters Used at Year End 2016 for Cash-Settled Plans
| | | | | | | | | | | | | | | | |
| | | LTI Plan 2016 (2016
Tranche) | | | LTI Plan 2015
(2012 – 2015
Tranches) | | | SOP 2010 (2010 – 2015
Tranches) | | | RSU (2013 – 2016
Tranches) | |
| Weighted average fair value as at 12/31/2016 | | | €74.54 | | | | €81.10 | | | | €20.94 | | | | €81.34 | |
| Information how fair value was measured at measurement date | | | | | | | | | | | | | | | | |
Option pricing model used | | | Binomial | | | | Other1) | | | | Monte Carlo | | | | Other1) | |
Share price | | | €82.81 | | | | €82.81 | | | | €82.81 | | | | €82.77 | |
Risk-free interest rate (depending on maturity) | | | –0.76% | | |
| –0.80% to
–0.84% |
| |
| –0.51% to
–0.83% |
| |
| –0.36% to
–0.84% |
|
Expected volatility | | | 21.2% | | | | NA | | |
| 22.3% to
51.0% |
| | | NA | |
Expected dividend yield | | | 1.45% | | | | 1.45% | | | | 1.46% | | | | 1.45% | |
| Weighted average remaining life of awards outstanding as at 12/31/2016 (in years) | | | 3.0 | | | | 1.4 | | | | 2.4 | | | | 1.2 | |
1) For these awards, the fair value is calculated by subtracting the net present value of expected future dividend payments, if any, until maturity of the respective award from the prevailing share price as of the valuation date.
Fair Value and Parameters Used at Year End 2015 for Cash-Settled Plans
| | | | | | | | | | | | | | | | |
| | | LTI Plan 2015
(2012 – 2015
Tranches) | | | EPP 2015
(2015
Tranche) | | | SOP 2010 (2010 – 2015
Tranches) | | | RSU (2013 – 2015
Tranches) | |
| Weighted average fair value as at 12/31/2015 | | | €71.45 | | | | €73.38 | | | | €16.06 | | | | €71.90 | |
| Information how fair value was measured at measurement date | | | | | | | | | | | | | | | | |
Option pricing model used | | | Other1) | | | | Other1) | | | | Monte Carlo | | | | Other1) | |
Share price | | | €73.38 | | | | €73.38 | | | | €73.38 | | | | €73.24 | |
Risk-free interest rate (depending on maturity) | |
| –0.25% to
–0.39% |
| | | NA | | |
| –0.03% to
–0.38% |
| |
| –0.16% to
–0.39% |
|
Expected volatility | | | NA | | | | NA | | |
| 22.0% to
41.9% |
| | | NA | |
Expected dividend yield | | | 1.56% | | | | NA | | | | 1.56% | | | | 1.56% | |
| Weighted average remaining life of options outstanding as at 12/31/2015 (in years) | | | 1.7 | | | | 0.1 | | | | 3.4 | | | | 1.2 | |
1) For these awards, the fair value is calculated by subtracting the net present value of expected future dividend payments, if any, until maturity of the respective award from the prevailing share price as of the valuation date.
For SOP 2010, expected volatility of the SAP share price is based on a blend of implied volatility from traded
options with corresponding lifetimes and exercise prices as well as historical volatility with the same expected life
F-55
as the options granted. For LTI 2016 Plan valuation, the Peer Group Index price at year end was US$179.57; the expected dividend yield of the index of 1.24% and the expected volatility of the index of 18%, and the expected correlation of the SAP share price and the index price of 39% are based on the historical data of SAP share price and the index price.
Expected remaining life of the options reflects both the contractual term and the expected, or historical, exercise behavior. The risk-free interest rate is derived from German government bonds with a similar duration. The SAP dividend yield is based on expected future dividends.
Changes in Numbers of Outstanding Awards Under Our Cash-Settled Plans
| | | | | | | | | | | | | | | | |
| thousands | | LTI 2016 Plan
(2016 Tranche) | | | LTI 2015 Plan
(2012 – 2015
Tranches) | | | SOP 2010 (2010 – 2015
Tranches) | | | RSU (2013 – 2016
Tranches) | |
12/31/2014 | | | 0 | | | | 591 | | | | 26,282 | | | | 2,228 | |
Granted | | | 0 | | | | 277 | | | | 10,866 | | | | 5,125 | |
Adjustment based upon KPI target achievement | | | 0 | | | | 109 | | | | NA | | | | 109 | |
Exercised | | | 0 | | | | 0 | | | | –6,585 | | | | –1,337 | |
Forfeited | | | 0 | | | | 0 | | | | –1,436 | | | | –548 | |
12/31/2015 | | | 0 | | | | 977 | | | | 29,127 | | | | 5,577 | |
Granted | | | 389 | | | | 0 | | | | 0 | | | | 9,104 | |
Adjustment based upon KPI target achievement | | | 0 | | | | 0 | | | | NA | | | | –66 | |
Exercised | | | 0 | | | | –294 | | | | –4,693 | | | | –2,659 | |
Forfeited | | | –12 | | | | 0 | | | | –1,059 | | | | –1,055 | |
12/31/2016 | | | 377 | | | | 684 | | | | 23,375 | | | | 10,901 | |
| | | | | | | | | | | | | | | | | |
Outstanding awards exercisable as at | | | | | | | | | | | | | | | | |
12/31/2015 | | | 0 | | | | 0 | | | | 4,120 | | | | 0 | |
12/31/2016 | | | 0 | | | | 0 | | | | 5,472 | | | | 0 | |
| | | | | | | | | | | | | | | | | |
Total carrying amount (in€ millions) of liabilities as at | | | | | | | | | | | | | | | | |
12/31/2015 | | | 0 | | | | 74 | | | | 283 | | | | 166 | |
12/31/2016 | | | 7 | | | | 58 | | | | 385 | | | | 436 | |
| | | | | | | | | | | | | | | | | |
Total intrinsic value of vested awards (in€ millions) as at | | | | | | | | | | | | | | | | |
12/31/2015 | | | 0 | | | | 76 | | | | 110 | | | | 0 | |
12/31/2016 | | | 2 | | | | 58 | | | | 154 | | | | 0 | |
| | | | | | | | | | | | | | | | | |
| Weighted average share price (in€) for share options exercised in | | | | | | | | | | | | | | | | |
2015 | | | NA | | | | NA | | | | 66.20 | | | | 65.83 | |
2016 | | | NA | | | | 72.55 | | | | 78.74 | | | | 74.74 | |
| | | | | | | | | | | | | | | | | |
Total expense (in€ millions) recognized in | | | | | | | | | | | | | | | | |
2014 | | | 0 | | | | 13 | | | | 29 | | | | 58 | |
2015 | | | 0 | | | | 28 | | | | 187 | | | | 193 | |
2016 | | | 7 | | | | 7 | | | | 183 | | | | 458 | |
F-56
a.1) Long-Term Incentive Plan (LTI 2016 Plan)
SAP implemented a new Long-Term Incentive (LTI) 2016 Plan for members of the Executive Board in 2016. The plan is linked to the absolute performance of the SAP share and its relative performance as indicated by the SAP share price compared to a group of peer companies (Peer Group Index). A grant amount determined by the Supervisory Board is converted into virtual shares, referred to as share units, by dividing the grant amount by the SAP share price (calculated on the basis of a defined average value). The grant amount is determined by the Supervisory Board in its discretion for each financial year at a level between 80% and 120% of the contractual target amount, taking into account the achievement of the operating profit target set for the preceding financial year.
The share units granted comprise 40% retention share units and 60% performance share units (PSUs). Both types of share units have a vesting period of (approximately) four years. Each share unit that finally vests entitles its holder to a (gross) payout corresponding to the price of one SAP share after the end of the holding period, but capped at three times the SAP share price applied for the conversion of the grant amount into share units.
The number of PSUs that finally vest depends on the absolute and relative performance of the SAP share. If the increase of the SAP share price over the vesting period of the PSUs exceeds the increase of the Peer Group Index over the same period, the number of PSUs increases by a percentage equal to the outperformance expressed as percentage points. This percentage will be doubled if, in addition to the outperformance against the Peer Group Index, the SAP share price at the end of the vesting period of the PSUs is higher than the price at the start of this period. The number of vested PSUs is capped at 150% of the initial PSU allocation for that year. Conversely, if the performance of the SAP share over the vesting period of the PSUs is below the performance of the Peer Group Index, the number of PSUs will be reduced by a percentage equal to the difference expressed as percentage points. All PSUs lapse if the difference exceeds 50%. If the service contract for the Executive Board member is terminated before the end of the third year following the year in which the Share Units were granted, the share units are forfeited in whole or in part, depending on the circumstances of the relevant resignation from office or termination of the service contract.
a.2) Long-Term Incentive Plan (LTI 2015 Plan)
The LTI 2015 Plan is linked to the SAP share price performance and the achievement of two financial key performance indicators (KPIs):non-IFRS total revenue andnon-IFRS operating profit, which are derived from
SAP’s 2015 financial KPIs. Under this plan, virtual shares, referred to as share units, were granted to participants. Participants are paid out in cash based on the number of share units that vest. All participants in the LTI 2015 Plan were members of our Global Managing Board.
The share unit allocation process took place at the beginning of each year based on SAP’s share price after the publication of its preliminary annual results for the last financial year prior to the performance period.
At the end of a given year, the number of share units that finally vest with plan participants depends on SAP’s actual performance for the given year, and might be higher or lower than the number of share units originally granted. If performance against both KPI targets reaches at least the defined threshold of 60% (80% for 2013 tranches), the share units vest. Depending on performance, the vesting can reach a maximum of 150% of the budgeted amount. If performance against either or both of those KPI targets does not reach the defined threshold of 60% (80% for 2013 tranches), no share units vest and share units granted for that year will be forfeited. The adjustment to the threshold of those performance indicators was made to reflect our updated expectations due to the accelerated shift to the cloud. For the year 2015, the RSUs granted at the beginning of the year vested with 112.96% achievement of the KPI targets for the LTI 2015 Plan.
The share units for members of the Global Managing Board under the LTI 2015 Plan are subject to a three-year holding period before payout, which started in 2016.
The LTI 2015 Plan includes a “look-back” provision, due to the fact that this plan is based on certain KPI targets in 2015. The number of share units vested under the 2015 tranche was adjusted to reflect the overall achievement for 2015, which differed from the value represented by the number of share units vested from the 2012 to 2014 tranches. However, share units that were already fully vested in prior years did not forfeit.
The final financial effect of each tranche of the LTI 2015 Plan will depend on the number of vested share units and the SAP share price, which is set directly after the announcement of the preliminary fourth-quarter and full-year results for the last financial year of the respective three-year holding period under the LTI 2015 Plan, and thus may be significantly above or below the budgeted amounts.
a.3) SAP Stock Option Plan 2010 (SOP 2010 (2010–2015 Tranches))
Under the SAP Stock Option Plan 2010, we granted members of the Senior Leadership Team/Global Executives and employees with an exceptional rating as
F-57
well as high potentials between 2010 and 2015, and only in 2010 and 2011 members of the Executive Board, cash-based virtual stock options, the value of which depends on the multi-year performance of the SAP share.
The grant-base value was based on the average fair market value of one ordinary share over the five business days prior to the Executive Board resolution date.
The virtual stock options granted under the SOP 2010 give the employees the right to receive a certain amount of money by exercising the options under the terms and conditions of this plan. After a three-year vesting period (four years for members of the Executive Board), the plan provides for 11 predetermined exercise dates every calendar year (one date per month except in April) until the rights lapse six years after the grant date (seven years for members of the Executive Board). Employees can exercise their virtual stock options only if they are employed by SAP; if they leave the Company, they forfeit. Executive Board members’ options arenon-forfeitable once granted – if the service agreement ends in the grant year, the number of options is reducedpro rata temporis. Any options not exercised at the end of their term expire.
The exercise price is 110% of the grant base value (115% for members of the Executive Board), which is€39.03 (€40.80) for the 2010 tranche,€46.23 (€48.33) for the 2011 tranche,€49.28 for the 2012 tranche,€59.85 for the 2013 tranche,€60.96 for the 2014 tranche, and€72.18 for the 2015 tranche.
Monetary benefits will be capped at 100% of the exercise price (150% for members of the SAP Executive Board).
a.4) Restricted Stock Unit Plan Including Move SAP Plan (RSU Plan (2013–2016 Tranches))
To retain and motivate executives and certain employees, we granted RSUs representing a contingent right to receive a cash payment determined by the market value of the same number of SAP SE shares (or SAP SE American Depositary Receipts on the New York Stock Exchange) and the number of RSUs that ultimately vest. Granted RSUs will vest in different tranches, either:
| – | | Over aone-to-three-year service period only, or |
| – | | Over aone-to-three-year service period and upon meeting certain key performance indicators (KPIs). |
The number of RSUs that will vest under the 2016 tranche with performance-based grants was mostly
contingent upon achievement of thenon-IFRS operating profit performance milestones in 2016. Depending on performance, the number of RSUs vesting ranges between 0% and 200% of the number initially granted. Performance against the KPI targets was 85.13% (2015: 112.96%) in 2016. The RSUs are paid out in cash upon vesting.
b) Equity-Settled Share-Based Payments
b.1) Own SAP Plan (Own)
Under the Own SAP Plan (Own) implemented in 2016, SAP offers its employees the opportunity to purchase, monthly, SAP shares without any holding period. Each eligible employee’s investment is limited to a percentage of the employee’s monthly base salary. SAP matches the employee investment by 40% and adds a subsidy of€20 per month fornon-executives. For the participation in 2016, employees receive a double matching contribution as well as a double subsidy. This plan is not open to members of the SAP Executive Board.
The number of shares purchased under this plan was 1.4 million in 2016.
b.2) Share Matching Plan (SMP)
Under the Share Matching Plan (SMP), SAP offered its employees the opportunity to purchase SAP shares at a discount of 40% between 2010 and 2015. The number of SAP shares an eligible employee could purchase through the SMP was limited to a percentage of the employee’s annual base salary. After a three-year holding period, the plan participants receive, from SAP, one free matching share for every three SAP shares acquired.
The terms for the members of the Senior Leadership Team and Global Executives were slightly different than those for the other employees. They did not receive a discount when purchasing the shares. However, after a three-year holding period, they receive two free matching SAP shares for every three SAP shares acquired. This plan was not open to members of the SAP Executive Board.
The weighted average remaining life of free matching shares outstanding is 0.9 years at year end 2016. The following table shows the parameters and assumptions used at grant date to determine the fair value of free matching shares, as well as the quantity of shares purchased and free matching shares:
F-58
Fair Value and Parameters at Grant Date for SMP
| | | | | | | | |
| | | 2015 | | | 2014 | |
Grant date | | | 6/5/2015 | | | | 6/4/2014 | |
Fair value of granted awards | | | €62.98 | | | | €52.49 | |
Information how fair value was measured at grant date | | | | | | | | |
Option pricing model used | | | Other1) | | | | Other1) | |
Share price | | | €66.31 | | | | €55.61 | |
Risk-free interest rate | | | –0.08% | | | | 0.13% | |
Expected dividend yield | | | 1.67% | | | | 1.87% | |
| Weighted average remaining life of awards outstanding at year end (in years) | | | 1.5 | | | | 0.9 | |
Number of investment shares purchased (in thousands) | | | 1,492 | | | | 1,550 | |
1) For these awards, the fair value is calculated by subtracting the net present value of expected future dividend payments, if any, until maturity of the respective award from the prevailing share price as of the valuation date.
Changes in Numbers of Outstanding Awards for Equity-Settled Plans
| | | | |
thousands | | | SMP | |
12/31/2014 | | | 3,935 | |
Granted | | | 551 | |
Exercised | | | –2,808 | |
Forfeited | | | –78 | |
12/31/2015 | | | 1,600 | |
Granted | | | 0 | |
Exercised | | | –444 | |
Forfeited | | | –105 | |
12/31/2016 | | | 1,051 | |
Recognized Expense for Equity-Settled Plans
| | | | | | | | | | | | |
| € millions | | 2016 | | | 2015 | | | 2014 | |
Own | | | 77 | | | | 0 | | | | 0 | |
SMP | | | 24 | | | | 80 | | | | 89 | |
Others | | | 6 | | | | 7 | | | | 7 | |
| Total | | | 107 | | | | 87 | | | | 96 | |
(28) SEGMENT AND GEOGRAPHIC INFORMATION
General Information
SAP has two reportable segments that are regularly reviewed by the Executive Board, which is responsible for assessing the performance of the Company and for making resource allocation decisions as the Chief Operating Decision Maker (CODM). One is the Applications, Technology & Services segment and the
other is the SAP Business Network segment. The segments are largely organized and managed separately according to their product and service offerings.
The Applications, Technology & Services segment derives its revenues primarily from the sale of software licenses, subscriptions to our cloud applications, and related services (mainly support services and various professional services and premium support services, as well as implementation services for our software products and education services on the use of our products).
The SAP Business Network segment derives its revenues mainly from transaction fees charged for the use of SAP’s cloud-based collaborative business networks and from services relating to the SAP Business Network (including cloud applications, professional services, and education services). Within the SAP Business Network segment, we mainly market and sell the cloud offerings developed by SAP Ariba, SAP Fieldglass, and Concur.
On April 1, 2016, we split the Applications, Technology & Services segment. The solutions SAP Anywhere, SAP Business One, and SAP Business ByDesign were combined into one organization, as together they provide complete front-office and back-office solutions for small andmedium-sized customers. This reallocation resulted in a new operating butnon-reportable segment since it does not exceed the quantitative thresholds in IFRS 8.13. We have retrospectively adjusted our revenue and results for the Applications, Technology & Services segment to reflect this change.
In addition, we established a further operating segment comprising SAP’s healthcare strategy and solutions, which also does not qualify as a reportable segment due to its size. Since this segment represents a new business
F-59
area to SAP, no significant adjustments to prior-year figures of other segments were made. Revenue and
expenses of bothnon-reportable segments are included in the reconciliation of segment revenue and results.
Revenue and Results of Segments
| | | | | | | | | | | | | | | | | | | | | | | | | | | | | | | | | | | | |
| € millions | | Applications, Technology & Services | | | SAP Business Network | | | Total Reportable Segments | |
| | | 2016 | | | 2015 | | | 2016 | | | 2015 | | | 2016 | | | 2015 | |
| | | Actual Currency | | | Constant Currency | | | Actual Currency | | | Actual Currency | | | Constant Currency | | | Actual Currency | | | Actual Currency | | | Constant Currency | | | Actual Currency | |
Cloud subscriptions and support | | | 1,353 | | | | 1,371 | | | | 932 | | | | 1,595 | | | | 1,589 | | | | 1,337 | | | | 2,948 | | | | 2,960 | | | | 2,268 | |
Software licenses | | | 4,784 | | | | 4,814 | | | | 4,770 | | | | 0 | | | | 0 | | | | –1 | | | | 4,783 | | | | 4,813 | | | | 4,770 | |
Software support | | | 10,464 | | | | 10,544 | | | | 9,990 | | | | 28 | | | | 28 | | | | 31 | | | | 10,492 | | | | 10,572 | | | | 10,021 | |
Software licenses and support | | | 15,247 | | | | 15,358 | | | | 14,760 | | | | 27 | | | | 27 | | | | 30 | | | | 15,275 | | | | 15,385 | | | | 14,790 | |
Cloud and software | | | 16,600 | | | | 16,729 | | | | 15,692 | | | | 1,622 | | | | 1,617 | | | | 1,367 | | | | 18,223 | | | | 18,346 | | | | 17,059 | |
Services | | | 3,319 | | | | 3,358 | | | | 3,271 | | | | 303 | | | | 304 | | | | 249 | | | | 3,622 | | | | 3,661 | | | | 3,520 | |
| Total segment revenue | | | 19,920 | | | | 20,087 | | | | 18,963 | | | | 1,925 | | | | 1,920 | | | | 1,616 | | | | 21,845 | | | | 22,007 | | | | 20,579 | |
Cost of cloud subscriptions and support | | | –667 | | | | –669 | | | | –444 | | | | –384 | | | | –385 | | | | –336 | | | | –1,051 | | | | –1,055 | | | | –781 | |
Cost of software licenses and support | | | –1,942 | | | | –1,956 | | | | –1,971 | | | | –1 | | | | –1 | | | | –1 | | | | –1,943 | | | | –1,957 | | | | –1,972 | |
Cost of cloud and software | | | –2,610 | | | | –2,626 | | | | –2,416 | | | | –385 | | | | –386 | | | | –337 | | | | –2,994 | | | | –3,012 | | | | –2,753 | |
Cost of services | | | –2,669 | | | | –2,718 | | | | –2,539 | | | | –246 | | | | –249 | | | | –183 | | | | –2,915 | | | | –2,967 | | | | –2,722 | |
Total cost of revenue | | | –5,279 | | | | –5,344 | | | | –4,954 | | | | –631 | | | | –635 | | | | –520 | | | | –5,909 | | | | –5,979 | | | | –5,474 | |
Segment gross profit | | | 14,641 | | | | 14,743 | | | | 14,009 | | | | 1,295 | | | | 1,285 | | | | 1,095 | | | | 15,936 | | | | 16,028 | | | | 15,104 | |
| Other segment expenses | | | –6,610 | | | | –6,704 | | | | –6,286 | | | | –957 | | | | –968 | | | | –779 | | | | –7,567 | | | | –7,672 | | | | –7,064 | |
Segment profit | | | 8,031 | | | | 8,039 | | | | 7,723 | | | | 338 | | | | 317 | | | | 317 | | | | 8,369 | | | | 8,356 | | | | 8,040 | |
F-60
Revenue and Results of Segments
| | | | | | | | | | | | | | | | | | | | | | | | | | | | | | | | | | | | |
| € millions | | Applications, Technology & Services | | | SAP Business Network | | | Total Reportable Segments | |
| | 2015 | | | 2014 | | | 2015 | | | 2014 | | | 2015 | | | 2014 | |
| | | Actual Currency | | | Constant Currency | | | Actual Currency | | | Actual Currency | | | Constant Currency | | | Actual Currency | | | Actual Currency | | | Constant Currency | | | Actual Currency | |
Cloud subscriptions and support | | | 932 | | | | 822 | | | | 564 | | | | 1,337 | | | | 1,151 | | | | 515 | | | | 2,268 | | | | 1,974 | | | | 1,080 | |
Software licenses | | | 4,770 | | | | 4,520 | | | | 4,324 | | | | –1 | | | | –1 | | | | 0 | | | | 4,770 | | | | 4,519 | | | | 4,324 | |
Software support | | | 9,990 | | | | 9,321 | | | | 8,748 | | | | 31 | | | | 26 | | | | 29 | | | | 10,021 | | | | 9,347 | | | | 8,777 | |
Software licenses and support | | | 14,760 | | | | 13,841 | | | | 13,072 | | | | 30 | | | | 25 | | | | 28 | | | | 14,790 | | | | 13,866 | | | | 13,100 | |
| Cloud and software | | | 15,692 | | | | 14,663 | | | | 13,636 | | | | 1,367 | | | | 1,176 | | | | 544 | | | | 17,059 | | | | 15,839 | | | | 14,180 | |
| Services | | | 3,271 | | | | 3,036 | | | | 3,098 | | | | 249 | | | | 214 | | | | 103 | | | | 3,520 | | | | 3,250 | | | | 3,201 | |
| Total segment revenue | | | 18,963 | | | | 17,699 | | | | 16,734 | | | | 1,616 | | | | 1,391 | | | | 647 | | | | 20,579 | | | | 19,090 | | | | 17,381 | |
Cost of cloud subscriptions and support | | | –444 | | | | –414 | | | | –258 | | | | –336 | | | | –293 | | | | –128 | | | | –781 | | | | –707 | | | | –386 | |
Cost of software licenses and support | | | –1,971 | | | | –1,809 | | | | –1,801 | | | | –1 | | | | –1 | | | | –3 | | | | –1,972 | | | | –1,810 | | | | –1,804 | |
Cost of cloud and software | | | –2,416 | | | | –2,223 | | | | –2,059 | | | | –337 | | | | –294 | | | | –131 | | | | –2,753 | | | | –2,517 | | | | –2,190 | |
Cost of services | | | –2,539 | | | | –2,401 | | | | –2,198 | | | | –183 | | | | –162 | | | | –82 | | | | –2,722 | | | | –2,563 | | | | –2,280 | |
Total cost of revenue | | | –4,954 | | | | –4,624 | | | | –4,257 | | | | –520 | | | | –456 | | | | –213 | | | | –5,474 | | | | –5,080 | | | | –4,470 | |
| Segment gross profit | | | 14,009 | | | | 13,075 | | | | 12,477 | | | | 1,095 | | | | 935 | | | | 434 | | | | 15,104 | | | | 14,010 | | | | 12,911 | |
| Other segment expenses | | | –6,286 | | | | –5,875 | | | | –5,531 | | | | –779 | | | | –682 | | | | –330 | | | | –7,064 | | | | –6,556 | | | | –5,861 | |
| Segment profit | | | 7,723 | | | | 7,200 | | | | 6,946 | | | | 317 | | | | 253 | | | | 105 | | | | 8,040 | | | | 7,453 | | | | 7,050 | |
Information about assets and liabilities and additions tonon-current assets by segment are not regularly provided to our Executive Board. Goodwill by reportable segment is disclosed inNote (15).
Measurement and Presentation
Our management reporting system reports our intersegment services as cost reductions and does not track them as internal revenue. Intersegment services mainly represent utilization of human resources of one segment by another segment on aproject-by-project basis. Intersegment services are charged based on internal cost rates including certain indirect overhead costs, excluding a profit margin.
Most of our depreciation and amortization expense affecting segment profits is allocated to the segments as part of broader infrastructure allocations and is thus not tracked separately on the operating segment level. Depreciation and amortization expense that is directly allocated to the operating segments is immaterial in all segments presented.
Our management reporting system produces a variety of reports that differ by the currency exchange rates used in the accounting for foreign-currency transactions and operations. Reports based on actual currencies use the same currency rates as are used in our financial statements. Reports based on constant currencies
F-61
report revenues and expenses using the average exchange rates from the previous year’s corresponding period.
We use an operating profit indicator to measure the performance of our operating segments. However, the accounting policies applied in the measurement of operating segment revenue and profit differ as follows from the IFRS accounting principles used to determine the operating profit measure in our income statement:
The measurements of segment revenue and results include the recurring revenues that would have been recorded by acquired entities had they remained stand-alone entities but which are not recorded as revenue under IFRS due to fair value accounting for customer contracts in effect at the time of an acquisition.
The expenses measures exclude:
| – | | Acquisition-related charges |
| | ◾ | | Amortization expense and impairment charges for intangibles acquired in business combinations and certain stand-alone acquisitions of intellectual |
| | | property (including purchasedin-process research and development) |
| | ◾ | | Settlements ofpre-existing relationships in connection with a business combination |
| | ◾ | | Acquisition-related third-party costs |
| – | | Share-based payment expenses |
| – | | Expenses from the TomorrowNow litigation and the Versata litigation |
Revenues and expenses of our new operating butnon-reportable segments are included in the reconciliation under the positions other revenue and other expenses, respectively.
In addition, certain corporate-level activities are not allocated to our segments, including finance, accounting, legal, human resources, and marketing. They are disclosed in the reconciliation under other revenue and other expenses respectively.
The segment information for prior periods has been restated to conform to the current year’s presentation.
Reconciliation of Revenue and Segment Results
| | | | | | | | | | | | | | | | | | | | |
| € millions | | 2016 | | | 2015 | | | 2014 | |
| | Actual Currency | | | Constant Currency | | | Actual Currency | | | Constant Currency | | | Actual Currency | |
Total segment revenue for reportable segments | | | 21,845 | | | | 22,007 | | | | 20,579 | | | | 19,090 | | | | 17,381 | |
Other revenue | | | 222 | | | | 224 | | | | 226 | | | | 209 | | | | 199 | |
Adjustment for currency impact | | | 0 | | | | –164 | | | | 0 | | | | 1,505 | | | | 0 | |
Adjustment of revenue under fair value accounting | | | –5 | | | | –5 | | | | –11 | | | | –11 | | | | –19 | |
Total revenue | | | 22,062 | | | | 22,062 | | | | 20,793 | | | | 20,793 | | | | 17,560 | |
| | | | | | | | | | | | | | | | | | | | | |
Total segment profit for reportable segments | | | 8,369 | | | | 8,356 | | | | 8,040 | | | | 7,453 | | | | 7,050 | |
Other revenue | | | 222 | | | | 224 | | | | 226 | | | | 209 | | | | 199 | |
Other expenses | | | –1,957 | | | | –1,975 | | | | –1,918 | | | | –1,759 | | | | –1,611 | |
Adjustment for currency impact | | | 0 | | | | 28 | | | | 0 | | | | 443 | | | | 0 | |
Adjustment for | | | | | | | | | | | | | | | | | | | | |
Revenue under fair value accounting | | | –5 | | | | –5 | | | | –11 | | | | –11 | | | | –19 | |
Acquisition-related charges | | | –680 | | | | –680 | | | | –738 | | | | –738 | | | | –562 | |
Share-based payment expenses | | | –785 | | | | –785 | | | | –724 | | | | –724 | | | | –290 | |
Restructuring | | | –28 | | | | –28 | | | | –621 | | | | –621 | | | | –126 | |
TomorrowNow and Versata litigation | | | 0 | | | | 0 | | | | 0 | | | | 0 | | | | –309 | |
Operating profit | | | 5,135 | | | | 5,135 | | | | 4,252 | | | | 4,252 | | | | 4,331 | |
Othernon-operating income/expense, net | | | –234 | | | | –234 | | | | –256 | | | | –256 | | | | 49 | |
Financial income, net | | | –38 | | | | –38 | | | | –5 | | | | –5 | | | | –25 | |
Profit before tax | | | 4,863 | | | | 4,863 | | | | 3,991 | | | | 3,991 | | | | 4,355 | |
F-62
Geographic Information
The amounts for revenue by region in the following tables are based on the location of customers. The regions in the following table are broken down into the regions
EMEA (Europe, Middle East, and Africa), Americas (North America and Latin America), and APJ (Asia Pacific Japan).
Revenue by Region
| | | | | | | | | | | | | | | | | | | | | | | | |
| € millions | | Cloud Subscriptions and Support Revenue | | | Cloud and Software Revenue | |
| | 2016 | | | 2015 | | | 2014 | | | 2016 | | | 2015 | | | 2014 | |
EMEA | | | 703 | | | | 507 | | | | 277 | | | | 8,193 | | | | 7,622 | | | | 6,819 | |
Americas | | | 2,000 | | | | 1,579 | | | | 709 | | | | 7,366 | | | | 6,929 | | | | 5,276 | |
APJ | | | 290 | | | | 200 | | | | 101 | | | | 2,865 | | | | 2,663 | | | | 2,221 | |
SAP Group | | | 2,993 | | | | 2,286 | | | | 1,087 | | | | 18,424 | | | | 17,214 | | | | 14,315 | |
Total Revenue by Region
| | | | | | | | | | | | |
| € millions | | 2016 | | | 2015 | | | 2014 | |
Germany | | | 3,034 | | | | 2,771 | | | | 2,570 | |
Rest of EMEA | | | 6,721 | | | | 6,409 | | | | 5,813 | |
EMEA | | | 9,755 | | | | 9,181 | | | | 8,383 | |
United States | | | 7,167 | | | | 6,750 | | | | 4,898 | |
Rest of Americas | | | 1,763 | | | | 1,678 | | | | 1,591 | |
Americas | | | 8,931 | | | | 8,428 | | | | 6,489 | |
Japan | | | 825 | | | | 667 | | | | 600 | |
Rest of APJ | | | 2,552 | | | | 2,517 | | | | 2,088 | |
APJ | | | 3,377 | | | | 3,185 | | | | 2,688 | |
SAP Group | | | 22,062 | | | | 20,793 | | | | 17,560 | |
Non-Current Assets by Region
| | | | | | | | |
| € millions | | 2016 | | | 2015 | |
Germany | | | 2,655 | | | | 2,395 | |
Rest of EMEA | | | 5,281 | | | | 7,574 | |
EMEA | | | 7,936 | | | | 9,969 | |
United States | | | 21,911 | | | | 19,124 | |
Rest of Americas | | | 165 | | | | 139 | |
Americas | | | 22,076 | | | | 19,264 | |
APJ | | | 685 | | | | 599 | |
SAP Group | | | 30,696 | | | | 29,832 | |
The table above showsnon-current assets excluding financial instruments, deferred tax assets, post-employment benefit assets, and rights arising under insurance contracts.
For information about the breakdown of our workforce by region, seeNote (7).
F-63
(29) BOARD OF DIRECTORS
Executive Board
Memberships on supervisory boards and other comparable governing bodies of enterprises, other than subsidiaries of SAP on December 31, 2016
Bill McDermott
Chief Executive Officer
Strategy, Governance, Business Development,
Corporate Development, Global Corporate Affairs, Corporate Audit and Global Marketing
Board of Directors, ANSYS, Inc., Canonsburg, PA, United States
Board of Directors, Under Armour, Inc., Baltimore, MD, United States
Board of Directors, Dell Secure Works, Atlanta, GA, United States (from April 21, 2016)
Robert Enslin
Global Customer Operations
Global Sales, Industry & LoB Solutions Sales, Services Sales, Sales Operations
Michael Kleinemeier
Digital Business Services
Global Consulting Delivery, Global and Regional Support and Premium Engagement Functions, MaintenanceGo-to-Market, Global User Groups, Mobile Services
Supervisory Board, innogy SE, Essen, Germany (from September 1, 2016)
Bernd Leukert
Chief Technology Officer
Products & Innovation
Global Development Organization, Innovation & Cloud Delivery, Product Strategy, Development Services, SAP Global Security
Supervisory Board, DFKI (Deutsches Forschungszentrum für Künstliche Intelligenz GmbH), Kaiserslautern, Germany
Luka Mucic
Chief Financial Officer
Global Finance and Administration including Investor Relations and Data Protection & Privacy, Corporate IT and Processes
Stefan Ries (from April 1, 2016)
Chief Human Resources Officer, Labor Relations Director
HR Strategy, Business Transformation, Leadership Development, Talent Development
Supervisory Board, Rhein-Neckar Loewen GmbH, Kronau, Germany
Steve Singh (from April 1, 2016)
Business Networks and Applications
Including Concur, SAP Ariba, SAP Fieldglass, SAP’s Data Network Business, SAP Health, as well as Front-Office and Back-Office Solutions for Small and Midsize Businesses that currently include SAP Anywhere, SAP Business One and SAP Business ByDesign
Chairman of the Board of Directors, Center ID, Bellevue, WA, United States
Board of Directors, ModuMetal, Inc., Seattle, WA, United States
Board of Directors, Talend, Redwood City, CA, United States (from October 4, 2016)
Chairman of the Board of Directors, Docker, Inc., San Francisco, CA, United States (from November 3, 2016)
Executive Board Members Who Left During 2016
Gerhard Oswald (until December 31, 2016)
Supervisory Board
Memberships on supervisory boards and other comparable governing bodies of enterprises, other than subsidiaries of SAP on December 31, 2016
Prof. Dr. h.c. mult. Hasso Plattner2), 4), 6), 7), 8)
Chairman
Margret Klein-Magar1), 2), 4), 5)
Deputy Chairperson
Vice President, Head of SAP Alumni Relations
Chairperson of the Spokespersons’ Committee of Senior Managers of SAP SE
PekkaAla-Pietilä4), 5), 6), 7)
Chairman of the Board of Directors, Huhtamäki Oyj, Espoo, Finland
Board of Directors, Pöyry Plc, Vantaa, Finland
Chairman of the Board of Directors, CVON Group Limited, London, United Kingdom
F-64
Board of Directors, CVON Limited, London, United Kingdom
Chairman of the Board of Directors, CVON Innovation Services Oy, Turku, Finland
Board of Directors, CVON Future Limited, London, United Kingdom
Chairman of the Board of Directors, BMA Platform International Ltd., London, United Kingdom
Chairman of the Board of Directors, Sanoma Corporation, Helsinki, Finland
Panagiotis Bissiritsas1), 3), 4), 5)
Support Expert
Martin Duffek1), 3), 8)
Product Manager
Prof. Anja Feldmann4), 8)
Professor at the Electrical Engineering and Computer Science Faculty at the Technische Universität Berlin
Prof. Dr. Wilhelm Haarmann2), 5), 7), 8)
Attorney-at-Law, Certified Public Auditor, Certified Tax Advisor
Linklaters LLP, Rechtsanwälte, Notare, Steuerberater, Frankfurt am Main, Germany
Andreas Hahn1), 2), 4)
Product Expert, IoT Standards
Prof. Dr. Gesche Joost4), 8)
Professor for Design Research and Head of the Design Research Lab, University of Arts Berlin
Supervisory Board, ClearVAT Aktiengesellschaft, Berlin, Germany (from March 31, 2016)
Lars Lamadé1), 2), 7), 8)
Head of Sponsorships
Managing Director, Rhein-Neckar Loewen GmbH, Kronau, Germany (until June 30, 2016)
Supervisory Board, Rhein-Neckar Loewen GmbH, Kronau, Germany (from August 30, 2016)
Bernard Liautaud2), 4), 6)
Managing Partner Balderton Capital, London, United Kingdom
Board of Directors, nlyte Software Ltd., London, United Kingdom
Board of Directors, Talend SA, Suresnes, France
Board of Directors, Wonga Group Ltd., London, United Kingdom
Board of Directors, SCYTL Secure Electronic Voting SA, Barcelona, Spain
Board of Directors, Vestiaire Collective SA, Levallois-Perret, France
Board of Directors, Dashlane, Inc., New York, NY, United States
Board of Directors, Recorded Future, Inc., Cambridge, MA, United States
Board of Directors, eWise Group, Inc., Redwood City, CA, United States
Board of Directors, Qubit Digital Ltd., London, United Kingdom
Board of Directors, Stanford University, Stanford, CA, United States
Board of Directors, Opbeat Inc., San Francisco, CA, United States
Board of Directors, Aircall.io, New York City, NY, United States
Christine Regitz1), 4), 8)
Vice President User Experience
Chief Product Expert
Dr. Erhard Schipporeit3), 7)
Independent Management Consultant
Supervisory Board, Talanx AG, Hanover, Germany
Supervisory Board, Deutsche Börse AG, Frankfurt am Main, Germany
Supervisory Board, HDI V.a.G., Hanover, Germany
Supervisory Board, Hannover Rückversicherung SE, Hanover, Germany
Supervisory Board, Fuchs Petrolub SE, Mannheim, Germany
Supervisory Board, BDO AG, Hamburg, Germany
Supervisory Board, RWE AG, Essen, Germany (from April 20, 2016)
Board of Directors, Fidelity Funds SICAV, Luxembourg (until February 26, 2016)
Robert Schuschnig-Fowler1), 8)
Account Manager, Senior Support Engineer
Deputy Chairman of SAP SE Works Council Europe
Member of Works Council SAP SE
Dr. Sebastian Sick1), 2), 5), 7)
Head of Company Law Unit, Hans Böckler Foundation
Supervisory Board, Georgsmarienhütte GmbH, Georgsmarienhütte, Germany
Jim Hagemann Snabe2), 5)
Supervisory Board Member
Board of Directors, Bang & Olufsen A/S, Struer, Denmark
F-65
Board of Directors, Danske Bank A/S, Copenhagen, Denmark (until March 17, 2016)
Board of Directors, A. P. Moller-Maersk A/S, Copenhagen, Denmark (from April 12, 2016)
Supervisory Board, Allianz SE, Munich, Germany
Supervisory Board, Siemens AG, Munich, Germany
Pierre Thiollet1), 4)
Webmaster (P&I)
Member of the SAP France Works Council
Secretary of CHSCT (Hygiene, Security and Work Conditions Committee)
Prof.Dr.-Ing.Dr.-Ing. E. h. Klaus Wucherer3)
Managing Director of Dr. Klaus Wucherer Innovations- und Technologieberatung GmbH, Erlangen, Germany
Deputy Chairman of the Supervisory Board, HEITEC AG, Erlangen, Germany
Deputy Chairman of the Supervisory Board, LEONI AG, Nuremberg, Germany
Chairman of the Supervisory Board, Festo AG & Co. KG, Esslingen, Germany
Information as at December 31, 2016
| 1) | Elected by the employees |
| 2) | Member of the Company’s General and Compensation Committee |
| 3) | Member of the Company’s Audit Committee |
| 4) | Member of the Company’s Technology and Strategy Committee |
| 5) | Member of the Company’s Finance and Investment Committee |
| 6) | Member of the Company’s Nomination Committee |
| 7) | Member of the Company’s Special Committee |
| 8) | Member of the Company’s People and Organization Committee |
Allocating the fair value of the share-based payments to the respective years they are economically linked to, the total compensation of the Executive Board members for the years 2016, 2015, and 2014 was as follows:
Executive Board Compensation
| | | | | | | | | | | | |
€ thousands | | | 2016 | | | | 2015 | | | | 2014 | |
| Short-term employee benefits | | | 19,206 | | | | 15,137 | | | | 16,196 | |
| Share-based payment1) | | | 23,942 | | | | 10,365 | | | | 8,098 | |
| Subtotal1) | | | 43,148 | | | | 25,502 | | | | 24,294 | |
| Post-employment benefits | | | 2,398 | | | | 1,278 | | | | 3,249 | |
Thereof defined-benefit | | | 1,792 | | | | 288 | | | | 2,276 | |
Thereof defined-contribution | | | 606 | | | | 990 | | | | 973 | |
Total1) | | | 45,546 | | | | 26,780 | | | | 27,543 | |
1) Portion of total executive compensation allocated to the respective year
The share-based payment amounts disclosed above for 2016 are based on the grant date fair value of the restricted share units (RSUs) and performance share units (PSUs), respectively, issued to Executive Board members during the year under the new LTI Plan 2016, effective January 1, 2016.
The Executive Board members already received, in 2012, the LTI grants for the years 2012 to 2015 subject to continuous service as member of the Executive Board in the respective years. Although these grants are linked to and thus, economically, compensation for the Executive Board members in the respective years, section 314 of the German Commercial Code (HGB) requires them to be included in the total compensation number for the year of grant. Upon his appointment to the Executive Board in 2015, Michael Kleinemeier received a grant related to 2015. Vesting of the LTI grants is dependent on the respective Executive Board member’s continuous service for the Company.
The share-based payment for 2015 as defined in section 314 of the German Commercial Code (HGB) amounts to€263,200 and 4,622 RSUs, respectively, based on the allocation for 2015 for Michael Kleinemeier, which was granted in 2015 in line with his appointment to the Executive Board.
Considering the grant date fair value of the RSUs allocated in 2015 instead of the economically allocated amount of share-based payments in the table above, the sum of short-term employee benefits and share-based payment amounts to€15,400,400 and the total Executive Board compensation amounts to€16,678,400.
Share-Based Payment for Executive Board Members
| | | | | | | | | | | | |
| | | 2016 | | | 2015 | | | 2014 | |
| Number of RSUs granted | | | 147,041 | | | | 192,345 | | | | 153,909 | |
| Number of PSUs granted | | | 220,561 | | | | NA | | | | NA | |
| Number of stock options granted | | | 0 | | | | 0 | | | | 0 | |
Total expense in
€ thousands | | | 14,233 | | | | 22,310 | | | | 11,133 | |
In the table above, the share-based payment expense is the amount recorded in profit or loss under IFRS 2 in the respective period.
F-66
The defined benefit obligation (DBO) for pensions to Executive Board members and the annual pension entitlement of the members of the Executive Board on reaching age 60 based on entitlements from performance-based and salary-linked plans were as follows:
Retirement Pension Plan for Executive Board Members
| | | | | | | | | | | | |
| € thousands | | 2016 | | | 2015 | | | 2014 | |
DBO December 31 | | | 10,739 | | | | 8,948 | | | | 11,273 | |
Annual pension entitlement | | | 470 | | | | 427 | | | | 475 | |
The total annual compensation of the Supervisory Board members for 2016 is as follows:
Supervisory Board Compensation
| | | | | | | | | | | | |
| € thousands | | 2016 | | | 2015 | | | 2014 | |
Total compensation | | | 3,652 | | | | 3,728 | | | | 3,227 | |
Thereof fixed compensation | | | 3,135 | | | | 3,250 | | | | 924 | |
Thereof committee remuneration | | | 517 | | | | 479 | | | | 515 | |
Thereof variable compensation | | | NA | | | | NA | | | | 1,788 | |
The Supervisory Board members do not receive any share-based payment for their services. As far as members who are employee representatives on the Supervisory Board receive share-based payment, such compensation is for their services as employees only and is unrelated to their status as members of the Supervisory Board.
Payments to/DBO for Former Executive Board Members
| | | | | | | | | | | | |
| € thousands | | 2016 | | | 2015 | | | 2014 | |
Payments | | | 1,667 | | | | 1,580 | | | | 3,462 | |
DBO December 31 | | | 33,935 | | | | 32,758 | | | | 33,764 | |
SAP did not grant any compensation advance or credit to, or enter into any commitment for the benefit of, any member of the Executive Board or Supervisory Board in 2016, 2015, or 2014.
Shareholdings of Executive and Supervisory Board Members
| | | | | | | | | | | | |
Number of SAP
shares | | 2016 | | | 2015 | | | 2014 | |
| Executive Board | | | 85,985 | | | | 45,309 | | | | 36,426 | |
| Supervisory Board | | | 87,875,732 | | | | 90,262,686 | | | | 107,467,372 | |
(30) RELATED PARTY TRANSACTIONS
Certain Supervisory Board members of SAP SE currently hold, or held within the last year, positions of significant responsibility with other entities. We have relationships with certain of these entities in the ordinary course of business, whereby we buy and sell products, assets, and services at prices believed to be consistent with those negotiated at arm’s length between unrelated parties.
Companies controlled by Hasso Plattner, chairman of our Supervisory Board and Chief Software Advisor of SAP, engaged in the following transactions with SAP: providing consulting services to SAP, receiving sport sponsoring from SAP, making purchases of SAP products and services.
Wilhelm Haarmann practices as a partner in the law firm Linklaters LLP in Frankfurt am Main, Germany. SAP occasionally purchased and purchases legal and similar services from Linklaters.
Occasionally, members of the Executive Board of SAP SE obtain services from SAP for which they pay a consideration consistent with those negotiated at arm’s length between unrelated parties.
All amounts related to the abovementioned transactions were immaterial to SAP in all periods presented.
In 2016, we entered into a consulting contract with Gerhard Oswald which applies from 2017 onwards. Compensation thereunder occurs if and when consulting services are rendered. No transactions occurred in all periods presented.
In total, we sold products and services to companies controlled by members of the Supervisory Board in the amount of€1 million (2015:€1 million), we bought products and services from such companies in the amount of€3 million (2015:€7 million), and we provided sponsoring and other financial support to such companies in the amount of€4 million (2015:€5 million). Outstanding balances at year end from transactions with such companies were€0 million (2015:€0 million) for amounts owed to such companies and€0 million (2015:€0 million) for amounts owed by such companies. All of these balances are unsecured and interest-free and settlement is expected to occur in cash. Commitments (the longest of which is for two years) made by us to purchase further goods or services from these companies and to provide further sponsoring and other financial support amount to€6 million as at December 31, 2016 (2015:€11 million).
In total, we sold services to members of the Executive Board and the Supervisory Board in the amount of€0 million (2015:€2 million), and we received services
F-67
from members of the Supervisory Board (including services from employee representatives on the Supervisory Board in their capacity as employees of SAP) in the amount of€1 million (2015:€1 million). Amounts owed to Supervisory Board members from these transactions were€0 million as at December 31, 2016 (2015:€0 million). All of these balances are unsecured and interest-free and settlement is expected to occur in cash.
For information about the compensation of our Executive Board and Supervisory Board members, seeNote (29).
(31) PRINCIPAL ACCOUNTANT FEES AND SERVICES
At the Annual General Meeting of Shareholders held on May 12, 2016, our shareholders elected KPMG AG
Wirtschaftsprüfungsgesellschaft as SAP’s independent auditor for 2016. KPMG AG Wirtschaftsprüfungsgesellschaft has been the company’s principal auditor since the fiscal year 2002. KPMG AG Wirtschaftsprüfungsgesellschaft and other firms in the global KPMG network charged the following fees to SAP for audit and other professional services related to 2016 and the previous years:
Fees for Audit and Other Professional Services
| | | | | | | | | | | | | | | | | | | | | | | | | | | | | | | | | | | | |
| € millions | | 2016 | | | 2015 | | | 2014 | |
| | | KPMG AG
(Germany) | | | Foreign
KPMG
Firms | | | Total | | | KPMG AG
(Germany) | | | Foreign
KPMG
Firms | | | Total | | | KPMG AG
(Germany) | | | Foreign
KPMG
Firms | | | Total | |
Audit fees | | | 3 | | | | 6 | | | | 9 | | | | 3 | | | | 6 | | | | 9 | | | | 2 | | | | 6 | | | | 8 | |
Audit-related fees | | | 0 | | | | 1 | | | | 1 | | | | 0 | | | | 0 | | | | 0 | | | | 0 | | | | 0 | | | | 0 | |
Tax fees | | | 0 | | | | 0 | | | | 0 | | | | 0 | | | | 0 | | | | 0 | | | | 0 | | | | 0 | | | | 0 | |
All other fees | | | 0 | | | | 0 | | | | 0 | | | | 0 | | | | 0 | | | | 0 | | | | 0 | | | | 0 | | | | 0 | |
Total | | | 3 | | | | 7 | | | | 10 | | | | 3 | | | | 6 | | | | 9 | | | | 2 | | | | 6 | | | | 8 | |
Audit fees are the aggregate fees charged by KPMG for auditing our consolidated financial statements and the statutory financial statements of SAP SE and its subsidiaries. Audit-related fees are fees charged by KPMG for assurance and related services that are reasonably related to the performance of the audit or review of our financial statements and are not reported under audit fees. Tax fees are fees for professional services rendered by KPMG for tax advice on transfer pricing, restructuring, and tax compliance on current,
past, or contemplated transactions. The All other fees category includes other support services, such as training and advisory services on issues unrelated to accounting and taxes.
(32) EVENTS AFTER THE REPORTING PERIOD
No events that have occurred since December 31, 2016, have a material impact on the Company’s Consolidated Financial Statements.
F-68
(33) SUBSIDIARIES AND OTHER EQUITY INVESTMENTS
Subsidiaries
| | | | | | | | | | | | | | | | | | | | | | | | |
| Name and Location of Company | | Owner-
ship | | | Total Revenue
in 20161) | | | Profit/Loss (-)
After Tax for
20161) | | | Total Equity as
at 12/31/20161) | | | Number of
Employees as
at 12/31/20162) | | | Foot-
note | |
| | | % | | | € thousands | | | € thousands | | | € thousands | | | | | | | |
Major Subsidiaries | | | | | | | | | | | | | | | | | | | | | | | | |
| Ariba, Inc., Palo Alto, CA, United States | | | 100.0 | | | | 1,023,469 | | | | 54,307 | | | | 3,873,318 | | | | 1,622 | | | | | |
| Concur Technologies, Inc., Bellevue, WA, United States | | | 100.0 | | | | 1,234,313 | | | | 1,153,819 | | | | 7,902,404 | | | | 3,183 | | | | | |
| LLC SAP CIS, Moscow, Russia | | | 100.0 | | | | 355,700 | | | | –5,498 | | | | 46,862 | | | | 793 | | | | | |
| SAP (Schweiz) AG, Biel, Switzerland | | | 100.0 | | | | 786,847 | | | | 67,996 | | | | 69,965 | | | | 647 | | | | | |
SAP (UK) Limited, Feltham,
United Kingdom | | | 100.0 | | | | 1,105,221 | | | | –35,297 | | | | –49,774 | | | | 1,618 | | | | 10 | ) |
| SAP America, Inc., Newtown Square, PA, United States | | | 100.0 | | | | 4,956,907 | | | | –328,262 | | | | 14,846,116 | | | | 7,188 | | | | | |
| SAP Asia Pte Ltd, Singapore, Singapore | | | 100.0 | | | | 417,768 | | | | –32,727 | | | | 1,100 | | | | 1,084 | | | | | |
| SAP Australia Pty Ltd, Sydney, Australia | | | 100.0 | | | | 607,333 | | | | –29,880 | | | | 160,155 | | | | 1,193 | | | | | |
| SAP Brasil Ltda, São Paulo, Brazil | | | 100.0 | | | | 525,837 | | | | –18,051 | | | | 1,201 | | | | 1,646 | | | | | |
| SAP Canada, Inc., Toronto, Canada | | | 100.0 | | | | 729,874 | | | | 46,015 | | | | 491,067 | | | | 2,814 | | | | | |
| SAP China Co., Ltd., Shanghai, China | | | 100.0 | | | | 928,530 | | | | 19,735 | | | | –50,993 | | | | 5,449 | | | | | |
| SAP Deutschland SE & Co. KG, Walldorf, Germany | | | 100.0 | | | | 3,540,233 | | | | 591,502 | | | | 1,394,437 | | | | 4,414 | | | | 7), 9) | |
| SAP France, Levallois Perret, France | | | 100.0 | | | | 1,115,631 | | | | 167,281 | | | | 1,578,559 | | | | 1,413 | | | | | |
| SAP Hungary Rendszerek, Alkalmazások és Termékek az Adatfeldolgozásban Informatikai Kft., Budapest, Hungary | | | 100.0 | | | | 74,569 | | | | 3,322 | | | | 15,431 | | | | 771 | | | | | |
| SAP India Private Limited, Bangalore, India | | | 100.0 | | | | 517,116 | | | | 17,410 | | | | 235,904 | | | | 1,769 | | | | | |
| SAP Industries, Inc., Newtown Square, PA, United States | | | 100.0 | | | | 651,352 | | | | 18,853 | | | | 576,370 | | | | 391 | | | | | |
| SAP Italia Sistemi Applicazioni Prodotti in Data Processing S.p.A., Vimercate, Italy | | | 100.0 | | | | 510,042 | | | | 22,544 | | | | 359,818 | | | | 645 | | | | | |
| SAP Japan Co., Ltd., Tokyo, Japan | | | 100.0 | | | | 834,955 | | | | 58,228 | | | | 603,097 | | | | 1,048 | | | | | |
| SAP Labs India Private Limited, Bangalore, India | | | 100.0 | | | | 353,016 | | | | 25,579 | | | | 54,091 | | | | 6,935 | | | | | |
| SAP Labs, LLC, Palo Alto, CA, United States | | | 100.0 | | | | 600,069 | | | | 22,505 | | | | 346,403 | | | | 2,017 | | | | | |
| SAP México S.A. de C.V., Mexico City, Mexico | | | 100.0 | | | | 367,521 | | | | 6,490 | | | | –9,492 | | | | 722 | | | | | |
| SAP Nederland B.V.,‘s-Hertogenbosch, the Netherlands | | | 100.0 | | | | 542,135 | | | | 37,085 | | | | 53,967 | | | | 557 | | | | 11 | ) |
| SAP Service and Support Centre (Ireland) Limited, Dublin, Ireland | | | 100.0 | | | | 128,234 | | | | 6,800 | | | | 37,917 | | | | 1,322 | | | | | |
| SuccessFactors, Inc., South San Francisco, CA, United States | | | 100.0 | | | | 1,004,094 | | | | 137,358 | | | | 3,402,419 | | | | 1,069 | | | | | |
F-69
| | | | | | | | |
| Name and Location of Company | | Owner-
ship | | | Foot-
note | |
| | | % | | | | |
Other Subsidiaries3) | | | | | | | | |
| “SAP Kazakhstan“ LLP, Almaty, Kazakhstan | | | 100.0 | | | | | |
| 110405, Inc., Newtown Square, PA, United States | | | 100.0 | | | | | |
| Altiscale, Inc., Palo Alto, CA, United States | | | 100.0 | | | | 4 | ) |
| Ambin Properties (Proprietary) Limited, Johannesburg, South Africa | | | 100.0 | | | | | |
| Ariba Czech s.r.o., Prague, Czech Republic | | | 100.0 | | | | | |
| Ariba India Private Limited, Gurgaon, India | | | 100.0 | | | | | |
| Ariba International Holdings, Inc., Wilmington, DE, United States | | | 100.0 | | | | | |
| Ariba International Singapore Pte Ltd, Singapore, Singapore | | | 100.0 | | | | | |
| Ariba International, Inc., Wilmington, DE, United States | | | 100.0 | | | | | |
| Ariba Investment Company, Inc., Wilmington, DE, United States | | | 100.0 | | | | | |
| Ariba Slovak Republic s.r.o., Košice, Slovakia | | | 100.0 | | | | | |
| Ariba Software Technology Services (Shanghai) Co., Ltd., Shanghai, China | | | 100.0 | | | | | |
| Ariba Technologies India Private Limited, Bangalore, India | | | 100.0 | | | | | |
Ariba Technologies Netherlands B.V., ‘s-Hertogenbosch, the Netherlands | | | 100.0 | | | | 11 | ) |
| Beijing Zhang Zhong Hu Dong Information Technology Co., Ltd., Beijing, China | | | 0 | | | | 5 | ) |
| b-process, Paris, France | | | 100.0 | | | | | |
Business Objects Holding B.V., ‘s-Hertogenbosch, the Netherlands | | | 100.0 | | | | 11 | ) |
| Business Objects Option LLC, Wilmington, DE, United States | | | 100.0 | | | | | |
| Business Objects Software (Shanghai) Co., Ltd., Shanghai, China | | | 100.0 | | | | | |
| Business Objects Software Limited, Dublin, Ireland | | | 100.0 | | | | | |
| Christie Partners Holding C.V., Utrecht, the Netherlands | | | 100.0 | | | | | |
| ClearTrip Inc. (Mauritius), Ebene, Mauritius | | | 54.2 | | | | | |
| ClearTrip Inc., George Town, Cayman Islands | | | 54.2 | | | | | |
| Cleartrip MEA FZ LLC, Dubai, United Arab Emirates | | | 54.2 | | | | | |
| ClearTrip Private Limited, Mumbai, India | | | 54.2 | | | | | |
| | | | | | | | |
| Name and Location of Company | | Owner-
ship | | | Foot-
note | |
| | | % | | | | |
| CNQR Operations Mexico S. de. R.L. de. C.V., San Pedro Garza Garcia, Mexico | | | 100.0 | | | | | |
| Concur (Austria) GmbH, Vienna, Austria | | | 100.0 | | | | | |
| Concur (Canada), Inc., Toronto, Canada | | | 100.0 | | | | | |
| Concur (France) SAS, Paris, France | | | 100.0 | | | | | |
| Concur (Germany) GmbH, Frankfurt am Main, Germany | | | 100.0 | | | | | |
| Concur (Italy) S.r.l., Milan, Italy | | | 100.0 | | | | | |
| Concur (Japan) Ltd.,Bunkyo-ku, Japan | | | 75.0 | | | | | |
| Concur (New Zealand) Limited, Wellington, New Zealand | | | 100.0 | | | | | |
| Concur (Philippines) Inc., Makati City, Philippines | | | 100.0 | | | | | |
| Concur (Switzerland) GmbH, Zurich, Switzerland | | | 100.0 | | | | | |
| Concur Czech (s.r.o.), Prague, Czech Republic | | | 100.0 | | | | | |
| Concur Holdings (France) SAS, Paris, France | | | 100.0 | | | | | |
| Concur Holdings (Netherlands) B.V., Amsterdam, the Netherlands | | | 100.0 | | | | 11 | ) |
| Concur Technologies (Australia) Pty. Limited, Sydney, Australia | | | 100.0 | | | | | |
| Concur Technologies (Hong Kong) Limited, Hong Kong, China | | | 100.0 | | | | | |
| Concur Technologies (India) Private Limited, Bangalore, India | | | 100.0 | | | | | |
| Concur Technologies (Singapore) Pte Ltd, Singapore, Singapore | | | 100.0 | | | | | |
| Concur Technologies (UK) Limited, London, United Kingdom | | | 100.0 | | | | 10 | ) |
| ConTgo Consulting Limited, London, United Kingdom | | | 100.0 | | | | 10 | ) |
| ConTgo Limited, London, United Kingdom | | | 100.0 | | | | 10 | ) |
| ConTgo MTA Limited, London, United Kingdom | | | 100.0 | | | | 10 | ) |
| ConTgo Pty. Ltd., Sydney, Australia | | | 100.0 | | | | | |
| Crystal Decisions (Ireland) Limited, Dublin, Ireland | | | 100.0 | | | | | |
| Crystal Decisions Holdings Limited, Dublin, Ireland | | | 100.0 | | | | | |
| Crystal Decisions UK Limited, London, United Kingdom | | | 100.0 | | | | | |
| EssCubed Procurement Pty. Ltd., Johannesburg, South Africa | | | 100.0 | | | | | |
| Extended Systems, Inc., Dublin, CA, United States | | | 100.0 | | | | | |
| Fedem Technology AS, Trondheim, Norway | | | 100.0 | | | | 4 | ) |
F-70
| | | | | | | | |
| Name and Location of Company | | Owner-
ship | | | Foot-
note | |
| | | % | | | | |
| Fieldglass AsiaPac Pty Ltd, Brisbane, Australia | | | 100.0 | | | | | |
| Fieldglass Europe Limited, London, United Kingdom | | | 100.0 | | | | 10 | ) |
| Financial Fusion, Inc., Dublin, CA, United States | | | 100.0 | | | | | |
| FreeMarkets Ltda., São Paulo, Brazil | | | 100.0 | | | | | |
| GlobalExpense (Consulting) Limited, London, United Kingdom | | | 100.0 | | | | | |
| GlobalExpense (UK) Limited, London, United Kingdom | | | 100.0 | | | | 10 | ) |
| Hipmunk, Inc., San Francisco, CA, United States | | | 100.0 | | | | 4 | ) |
| hybris (US) Corp., Wilmington, DE, United States | | | 100.0 | | | | | |
| hybris AG, Zug, Switzerland | | | 100.0 | | | | | |
| hybris GmbH, Munich, Germany | | | 100.0 | | | | 8 | ), 9) |
| hybris UK Limited, London, United Kingdom | | | 100.0 | | | | 10 | ) |
| Inxight Federal Systems Group, Inc., Wilmington, DE, United States | | | 100.0 | | | | | |
| LLC “SAP Labs“, Moscow, Russia | | | 100.0 | | | | | |
| LLC “SAP Ukraine”, Kiev, Ukraine | | | 100.0 | | | | | |
| Merlin Systems Oy, Espoo, Finland | | | 100.0 | | | | | |
| Multiposting SAS, Paris, France | | | 100.0 | | | | | |
| Multiposting Sp.z o.o., Warsaw, Poland | | | 100.0 | | | | | |
| Nihon Ariba K.K., Tokyo, Japan | | | 100.0 | | | | | |
| OutlookSoft Deutschland GmbH, Walldorf, Germany | | | 100.0 | | | | | |
| Plat.One Inc., Palo Alto, CA, United States | | | 100.0 | | | | 4 | ) |
| Plat.One Lab Srl, Bogliasco, Italy | | | 100.0 | | | | 4 | ) |
| Plateau Systems Australia Ltd, Brisbane, Australia | | | 100.0 | | | | | |
| Plateau Systems LLC, South San Francisco, CA, United States | | | 100.0 | | | | | |
| PT SAP Indonesia, Jakarta, Indonesia | | | 99.0 | | | | | |
| PT Sybase 365 Indonesia, Jakarta, Indonesia | | | 100.0 | | | | | |
| Quadrem Africa Pty. Ltd., Johannesburg, South Africa | | | 100.0 | | | | | |
| Quadrem Brazil Ltda., Rio de Janeiro, Brazil | | | 100.0 | | | | | |
| Quadrem Chile Ltda., Santiago de Chile, Chile | | | 100.0 | | | | | |
| Quadrem Colombia SAS, Bogotá, Colombia | | | 100.0 | | | | | |
| Quadrem International Ltd., Hamilton, Bermuda | | | 100.0 | | | | | |
| | | | | | | | |
| Name and Location of Company | | Owner-
ship | | | Foot-
note | |
| | | % | | | | |
| Quadrem Netherlands B.V., Amsterdam, the Netherlands | | | 100.0 | | | | 11 | ) |
| Quadrem Overseas Cooperatief U.A., Amsterdam, the Netherlands | | | 100.0 | | | | | |
| Quadrem Peru S.A.C., Lima, Peru | | | 100.0 | | | | | |
| Ruan Lian Technologies (Beijing) Co., Ltd., Beijing, China | | | 100.0 | | | | | |
| San Borja Partricipadoes LTDA, São Paulo, Brazil | | | 100.0 | | | | | |
| SAP (Beijing) Software System Co., Ltd., Beijing, China | | | 100.0 | | | | | |
| SAP Andina y del Caribe, C.A., Caracas, Venezuela | | | 100.0 | | | | | |
| SAP Argentina S.A., Buenos Aires, Argentina | | | 100.0 | | | | | |
| SAP Asia (Vietnam) Co., Ltd., Ho Chi Minh City, Vietnam | | | 100.0 | | | | | |
| SAP Azerbaijan LLC, Baku, Azerbaijan | | | 100.0 | | | | | |
| SAP Belgium NV/SA, Brussels, Belgium | | | 100.0 | | | | | |
| SAP Beteiligungs GmbH, Walldorf, Germany | | | 100.0 | | | | | |
| SAP Bulgaria EOOD, Sofia, Bulgaria | | | 100.0 | | | | | |
| SAP Business Compliance Services GmbH, Siegen, Germany | | | 100.0 | | | | | |
| SAP Business Services Center Nederland B.V.,‘s-Hertogenbosch, the Netherlands | | | 100.0 | | | | 11 | ) |
| SAP Chile Limitada, Santiago, Chile | | | 100.0 | | | | | |
| SAP China Holding Co., Ltd., Beijing, China | | | 100.0 | | | | | |
| SAP Colombia S.A.S., Bogotá, Colombia | | | 100.0 | | | | | |
| SAP Commercial Services Ltd., Valletta, Malta | | | 100.0 | | | | | |
| SAP Costa Rica, S.A., San José, Costa Rica | | | 100.0 | | | | | |
| SAP ČR, spol. s r.o., Prague, Czech Republic | | | 100.0 | | | | | |
| SAP Cyprus Limited, Nicosia, Cyprus | | | 100.0 | | | | | |
| SAP d.o.o., Zagreb, Croatia | | | 100.0 | | | | | |
| SAP Danmark A/S, Copenhagen, Denmark | | | 100.0 | | | | | |
| SAP Dritte Beteiligungs- und Vermögensverwaltungs GmbH, Walldorf, Germany | | | 100.0 | | | | | |
| SAP East Africa Limited, Nairobi, Kenya | | | 100.0 | | | | | |
| SAP Egypt LLC, Cairo, Egypt | | | 100.0 | | | | | |
| SAP EMEA Inside Sales S.L., Barcelona, Spain | | | 100.0 | | | | | |
F-71
| | | | | | | | |
| Name and Location of Company | | Owner-
ship | | | Foot-
note | |
| | | % | | | | |
| SAP Erste Beteiligungs- und Vermögensverwaltungs GmbH, Walldorf, Germany | | | 100.0 | | | | 8 | ), 9) |
| SAP España – Sistemas, Aplicaciones y Productos en la Informática, S.A., Madrid, Spain | | | 100.0 | | | | | |
| SAP Estonia OÜ, Tallinn, Estonia | | | 100.0 | | | | | |
| SAP Financial, Inc., Toronto, Canada | | | 100.0 | | | | | |
| SAP Finland Oy, Espoo, Finland | | | 100.0 | | | | | |
| SAP Foreign Holdings GmbH, Walldorf, Germany | | | 100.0 | | | | | |
| SAP France Holding, Levallois Perret, France | | | 100.0 | | | | | |
| SAP Fünfte Beteiligungs- und Vermögensverwaltungs GmbH, Walldorf, Germany | | | 100.0 | | | | 8 | ), 9) |
| SAP Global Marketing, Inc., New York, NY, United States | | | 100.0 | | | | | |
| SAP Hellas S.A., Athens, Greece | | | 100.0 | | | | | |
| SAP Holdings (UK) Limited, Feltham, United Kingdom | | | 100.0 | | | | 10 | ) |
| SAP Hong Kong Co., Ltd., Hong Kong, China | | | 100.0 | | | | | |
| SAP Hosting Beteiligungs GmbH, St.Leon-Rot, Germany | | | 100.0 | | | | | |
| SAP India (Holding) Pte Ltd, Singapore, Singapore | | | 100.0 | | | | | |
| SAP International Panama, S.A., Panama City, Panama | | | 100.0 | | | | | |
| SAP International, Inc., Miami, FL, United States | | | 100.0 | | | | | |
| SAP Investments, Inc., Wilmington, DE, United States | | | 100.0 | | | | | |
| SAP Ireland Limited, Dublin, Ireland | | | 100.0 | | | | | |
| SAP Ireland US-Financial Services Designed Activity Company, Dublin, Ireland | | | 100.0 | | | | | |
| SAP Israel Ltd., Ra’anana, Israel | | | 100.0 | | | | | |
| SAP Korea Ltd., Seoul, South Korea | | | 100.0 | | | | | |
| SAP Labs Bulgaria EOOD, Sofia, Bulgaria | | | 100.0 | | | | | |
| SAP Labs Finland Oy, Espoo, Finland | | | 100.0 | | | | | |
| SAP Labs France SAS, Mougins, France | | | 100.0 | | | | | |
| SAP Labs Israel Ltd., Ra’anana, Israel | | | 100.0 | | | | | |
| SAP Labs Korea, Inc., Seoul, South Korea | | | 100.0 | | | | | |
| SAP Latvia SIA, Riga, Latvia | | | 100.0 | | | | | |
| SAP Malaysia Sdn. Bhd., Kuala Lumpur, Malaysia | | | 100.0 | | | | | |
| | | | | | | | |
| Name and Location of Company | | Owner-
ship | | | Foot-
note | |
| | | % | | | | |
| SAP Malta Investments Ltd., Valletta, Malta | | | 100.0 | | | | | |
| SAP MENA FZ L.L.C., Dubai, United Arab Emirates | | | 100.0 | | | | 4 | ) |
| SAP Middle East and North Africa L.L.C., Dubai, United Arab Emirates | | | 49.0 | | | | 5 | ) |
| SAP National Security Services, Inc., Newtown Square, PA, United States | | | 100.0 | | | | | |
SAP Nederland Holding B.V., ‘s-Hertogenbosch, the Netherlands | | | 100.0 | | | | 11 | ) |
| SAP New Zealand Limited, Auckland, New Zealand | | | 100.0 | | | | | |
| SAP Norge AS, Lysaker, Norway | | | 100.0 | | | | | |
| SAP North West Africa Ltd, Casablanca, Morocco | | | 100.0 | | | | | |
| SAP Österreich GmbH, Vienna, Austria | | | 100.0 | | | | | |
| SAP PERU S.A.C., Lima, Peru | | | 100.0 | | | | | |
| SAP Philippines, Inc., Makati, Philippines | | | 100.0 | | | | | |
| SAP Polska Sp. z o.o., Warsaw, Poland | | | 100.0 | | | | | |
| SAP Portals Europe GmbH, Walldorf, Germany | | | 100.0 | | | | | |
| SAP Portals Holding Beteiligungs GmbH, Walldorf, Germany | | | 100.0 | | | | | |
| SAP Portals Israel Ltd., Ra’anana, Israel | | | 100.0 | | | | | |
| SAP Portugal – Sistemas, Aplicações e Produtos Informáticos, Sociedade Unipessoal, Lda., Porto Salvo, Portugal | | | 100.0 | | | | | |
| SAP Projektverwaltungs- und Beteiligungs GmbH, Walldorf, Germany | | | 100.0 | | | | 8 | ) |
| SAP Public Services Hungary Kft., Budapest, Hungary | | | 100.0 | | | | | |
| SAP Public Services, Inc., Washington, DC, United States | | | 100.0 | | | | | |
| SAP Puerto Rico GmbH, Walldorf, Germany | | | 100.0 | | | | 8 | ), 9) |
| SAP Retail Solutions Beteiligungsgesellschaft mbH, Walldorf, Germany | | | 100.0 | | | | | |
| SAP Romania SRL, Bucharest, Romania | | | 100.0 | | | | | |
| SAP Saudi Arabia Software Services Ltd, Riyadh, Kingdom of Saudi Arabia | | | 100.0 | | | | | |
| SAP Saudi Arabia Software Trading Ltd, Riyadh, Kingdom of Saudi Arabia | | | 75.0 | | | | | |
| SAP Sechste Beteiligungs- und Vermögensverwaltungs GmbH, Walldorf, Germany | | | 100.0 | | | | 8 | ), 9) |
| SAP Services s.r.o., Prague, Czech Republic | | | 100.0 | | | | | |
F-72
| | | | | | | | |
| Name and Location of Company | | Owner-
ship | | | Foot-
note | |
| | | % | | | | |
| SAP Siebte Beteiligungs- und Vermögensverwaltungs GmbH, Walldorf, Germany | | | 100.0 | | | | 4 | ) |
| SAP sistemi, aplikacije in produkti za obdelavo podatkov d.o.o., Ljubljana, Slovenia | | | 100.0 | | | | | |
| SAP Slovensko s.r.o., Bratislava, Slovakia | | | 100.0 | | | | | |
| SAP Software and Services LLC, Doha, Qatar | | | 49.0 | | | | 5 | ) |
| SAP Svenska Aktiebolag, Stockholm, Sweden | | | 100.0 | | | | | |
| SAP Systems, Applications and Products in Data Processing (Thailand) Ltd., Bangkok, Thailand | | | 100.0 | | | | | |
| SAP Taiwan Co., Ltd., Taipei, Taiwan | | | 100.0 | | | | | |
| SAP Technologies Inc., Palo Alto, CA, United States | | | 100.0 | | | | | |
| SAP Training and Development Institute FZCO, Dubai, United Arab Emirates | | | 100.0 | | | | | |
| SAP Türkiye Yazilim Üretim ve Ticaret A.Ş., Istanbul, Turkey | | | 100.0 | | | | | |
| SAP UAB, Vilnius, Lithuania | | | 100.0 | | | | | |
| SAP Ventures Investment GmbH, Walldorf, Germany | | | 100.0 | | | | 8 | ), 9) |
| SAP Vierte Beteiligungs- und Vermögensverwaltungs GmbH, Walldorf, Germany | | | 100.0 | | | | | |
| SAP West Balkans d.o.o., Belgrade, Serbia | | | 100.0 | | | | | |
| SAP Zweite Beteiligungs- und Vermögensverwaltungs GmbH, Walldorf, Germany | | | 100.0 | | | | 8 | ), 9) |
| Sapphire SAP HANA Fund of Funds, L.P., Wilmington, DE, United States | | | 0 | | | | 6 | ) |
| Sapphire Ventures Fund I, L.P., Wilmington, DE, United States | | | 0 | | | | 6 | ) |
| Sapphire Ventures Fund II, L.P., Wilmington, DE, United States | | | 0 | | | | 6 | ) |
| SAPV (Mauritius), Ebene, Mauritius | | | 0 | | | | 6 | ) |
| SAS Financière Multiposting, Paris, France | | | 100.0 | | | | | |
| SeeWhy (UK) Limited, Windsor, United Kingdom | | | 100.0 | | | | | |
| Shanghai SuccessFactors Software Technology Co., Ltd., Shanghai, China | | | 100.0 | | | | | |
| SuccessFactors (Philippines), Inc., Pasig City, Philippines | | | 100.0 | | | | | |
| SuccessFactors Asia Pacific Limited, Hong Kong, China | | | 100.0 | | | | | |
| | | | | | | | |
| Name and Location of Company | | Owner-
ship | | | Foot-
note | |
| | | % | | | | |
| SuccessFactors Australia Holdings Pty Ltd, Brisbane, Australia | | | 100.0 | | | | | |
| SuccessFactors Australia Pty Limited, Brisbane, Australia | | | 100.0 | | | | | |
| SuccessFactors Cayman, Ltd., Grand Cayman, Cayman Islands | | | 100.0 | | | | | |
| SuccessFactors International Holdings, LLC, San Mateo, CA, United States | | | 100.0 | | | | | |
| Sybase (UK) Limited, Maidenhead, United Kingdom | | | 100.0 | | | | | |
| Sybase 365 Ltd., Tortola, British Virgin Islands | | | 100.0 | | | | | |
| Sybase 365, LLC, Dublin, CA, United States | | | 100.0 | | | | | |
| Sybase Angola, LDA, Luanda, Angola | | | 100.0 | | | | | |
| Sybase Iberia S.L., Madrid, Spain | | | 100.0 | | | | | |
| Sybase India Ltd., Mumbai, India | | | 100.0 | | | | | |
| Sybase International Holdings Corporation, LLC, Dublin, CA, United States | | | 100.0 | | | | | |
| Sybase Philippines, Inc., Makati City, Philippines | | | 100.0 | | | | | |
| Sybase Software (China) Co., Ltd., Beijing, China | | | 100.0 | | | | | |
| Sybase Software (India) Private Ltd., Mumbai, India | | | 100.0 | | | | | |
| Sybase, Inc., Dublin, CA, United States | | | 100.0 | | | | | |
| Systems Applications Products (Africa Region) Proprietary Limited, Johannesburg, South Africa | | | 100.0 | | | | | |
| Systems Applications Products (Africa) Proprietary Limited, Johannesburg, South Africa | | | 100.0 | | | | | |
| Systems Applications Products (South Africa) Proprietary Limited, Johannesburg, South Africa | | | 70.0 | | | | | |
| Systems Applications Products Nigeria Limited, Victoria Island, Nigeria | | | 100.0 | | | | | |
| TechniData GmbH, Markdorf, Germany | | | 100.0 | | | | | |
| Technology Licensing Company, LLC, Atlanta, GA, United States | | | 100.0 | | | | | |
| TomorrowNow, Inc., Bryan, TX, United States | | | 100.0 | | | | | |
| Travel Technology, LLC, Atlanta, GA, United States | | | 100.0 | | | | | |
| TRX Data Service, Inc., Glen Allen, VA, United States | | | 100.0 | | | | | |
| TRX Europe Limited, London, United Kingdom | | | 100.0 | | | | 10 | ) |
F-73
| | | | | | | | |
| Name and Location of Company | | Owner-
ship | | | Foot-
note | |
| | | % | | | | |
| TRX Fulfillment Services, LLC, Atlanta, GA, United States | | | 100.0 | | | | | |
| TRX Luxembourg, S.a.r.l., Luxembourg City, Luxembourg | | | 100.0 | | | | | |
| TRX Technologies India Private Limited, Raman Nagar, India | | | 100.0 | | | | | |
| TRX Technology Services, L.P., Atlanta, GA, United States | | | 100.0 | | | | | |
| TRX UK Limited, London, United Kingdom | | | 100.0 | | | | 10 | ) |
| TRX, Inc., Bellevue, WA, United States | | | 100.0 | | | | | |
| Volume Integration, Inc., VA, United States | | | 100.0 | | | | 4 | ) |
1) These figures are based on our local IFRS financial statements prior to eliminations resulting from consolidation and therefore do not reflect the contribution of these companies included in the Consolidated Financial Statements. The translation of the equity into Group currency is based onperiod-end closing exchange rates, and on average exchange rates for revenue and net income/loss.
2) As at December 31, 2016, including managing directors, in FTE.
3) Figures for profit/loss after tax and total equity pursuant to HGB, section 285 and section 313 are not disclosed if they are of minor significance for a fair presentation of the profitability, liquidity, capital resources and financial position of SAP SE, pursuant to HGB, section 313 (2) sentence 3 no. 4 and section 286 (3) sentence 1 no. 1.
4) Consolidated for the first time in 2016.
5) Agreements with the other shareholders provide that SAP SE fully controls the entity.
6) SAP SE does not hold any ownership interests in four structured entities, SAPV (Mauritius), Sapphire SAP HANA Fund of Funds, L.P., Sapphire Ventures Fund I, L.P. and Sapphire Ventures Fund II, L.P. However, based on the terms of limited partnership agreements under which these entities were established, SAP SE is exposed to the majority of the returns related to their operations and has the current ability to direct these entities’ activities that affect these returns, in accordance with IFRS 10 (Consolidated Financial Statements). Accordingly, the results of operations are included in SAP’s consolidated financial statements.
7) Entity whose personally liable partner is SAP SE.
8) Entity with (profit and) loss transfer agreement.
9) Pursuant to HGB, section 264 (3) or section 264b, the subsidiary is exempt from applying certain legal requirements to their statutory stand-alone financial statements including the requirement to prepare notes to the financial statements and a review of operations, the requirement of independent audit and the requirement of public disclosure.
10) Pursuant to sections 479A to 479C of the UK Companies Act 2006, the entity is exempt from having its financial statements audited on the basis that SAP SE has provided a guarantee of the entity’s liabilities in respect of its financial year ended December 31, 2016.
11) Pursuant to article 2:403 of the Dutch Civil Code, the entity is exempt from applying certain legal requirements to their statutory stand-alone financial statements including the requirement to prepare the financial statements, the requirement of independent audit and the requirement of public disclosure on the basis that SAP SE has provided a guarantee of the entity’s liabilities in respect of its financial year ended December 31, 2016.
Other Equity Investments
| | | | |
| Name and Location of Company | | Owner-
ship | |
| | | % | |
| Joint Arrangements and Investments in Associates | | | | |
| China DataCom Corporation Limited, Guangzhou, China | | | 28.30 | |
| Convercent, Inc., Denver, CO, United States | | | 39.06 | |
| Evature Technologies (2009) Ltd., Ramat Gan, Israel | | | 30.46 | |
| Procurement Negócios Eletrônicos S/A, Rio de Janeiro, Brazil | | | 17.00 | |
| StayNTouch Inc., Bethesda, MD, United States | | | 46.77 | |
| Visage Mobile, Inc., San Francisco, CA, United States | | | 40.62 | |
Yapta, Inc., Seattle, WA , United States | | | 47.10 | |
|
| Name and Location of Company |
Equity Investments with Ownership of at Least 5% |
| Alchemist Accelerator Fund I LLC, San Francisco, CA, United States |
| All Tax Platform - Solucoes Tributarias S.A., São Paulo, Brazil |
| Alteryx, Inc., Irvine, CA, United States |
| Amplify Partners II L.P., Cambridge, MA, United States |
| Amplify Partners L.P., Cambridge, MA, United States |
| AP Opportunity Fund, LLC, Menlo Park, CA, United States |
| BY Capital 1 GmbH & Co. KG, Berlin, Germany |
| Canvas II, L.P., Portola Valley, CA, United States |
| Catchpoint Systems, Inc., New York, NY, United States |
| Char Software, Inc., Boston, MA, United States |
| Cloudhealth Technologies, Inc., Boston, MA, United States |
| Costanoa Venture Capital II L.P., Palo Alto, CA, United States |
| Costanoa Venture Capital QZ, LLC, Palo Alto, CA, United States |
| Cyphort, Inc., Santa Clara, CA, United States |
| Data Collective II L.P., San Francisco, CA, United States |
| Data Collective III L.P., San Francisco, CA, United States |
Data Collective IV, L.P., San Francisco, CA, United States |
Dharma Platform, Inc., Florida Ave NW, WA, United States |
EIT ICT Labs GmbH, Berlin, Germany |
FeedZai S.A., Lisbon, Portugal |
Follow Analytics, Inc., San Francisco, CA, United States |
GK Software AG, Schöneck, Germany |
| Greater Pacific Capital (Cayman) L.P., Grand Cayman, Cayman Islands |
| IDG Ventures USA III, L.P., San Francisco, CA, United States |
F-74
|
| Name and Location of Company |
| IEX Group, Inc., New York, NY, United States |
Inkling Systems, Inc., San Francisco, CA, United States |
| InnovationLab GmbH, Heidelberg, Germany innoWerft Technologie- und Gründerzentrum Walldorf Stiftung GmbH, Walldorf, Germany |
Integral Ad Science, Inc., New York, NY, United States |
Iron.io, Inc., San Francisco, CA, United States |
Jfrog, Ltd., Netanya, Israel |
Jibe, Inc., New York, NY, United States |
Kaltura, Inc., New York, NY, United States |
LeanData, Inc., Sunnyvale, CA, United States |
| Local Globe VII, L.P., St. Peter Port, Guernsey, Channel Islands |
| Local Globe VIII, L.P., St. Peter Port, Guernsey, Channel Islands |
Looker Data Sciences, Inc., Santa Cruz, CA, United States |
MuleSoft, Inc., San Francisco, CA, United States |
| MVP Strategic Partnership Fund GmbH & Co. KG, Grünwald, Germany |
Narrative Science, Inc., Chicago, IL, United States |
Nor1, Inc., Santa Clara, CA, United States |
Notation Capital, L.P., Brooklyn, NY, United States |
On Deck Capital, Inc., New York, NY, United States |
OpenX Software Limited, Pasadena, CA, United States |
Patent Quality, Inc., Bellevue, WA, United States |
|
| Name and Location of Company |
Point Nine Annex GmbH & Co. KG, Berlin, Germany |
Point Nine Capital Fund II GmbH & Co. KG, Berlin, Germany |
Point Nine Capital Fund III GmbH & Co. KG, Berlin, Germany |
Portworx Inc., Los Altos, CA , United States |
Post for Systems, Cairo, Egypt |
PubNub, Inc., San Francisco, CA, United States |
Realize Corporation, Tokyo, Japan |
Return Path, Inc., New York, NY, United States |
| Rome2rio Pty. Ltd., Albert Park, Australia |
SaaStr Fund I, L.P., Palo Alto, CA, United States |
Scytl, S.A., Barcelona, Spain |
Shasta Ventures V, L.P., Menlo Park, CA, United States |
Smart City Planning, Inc., Tokyo, Japan |
Socrata, Inc., Seattle, WA, United States |
Spring Mobile Solutions, Inc., Reston, VA, United States |
Storm Ventures V, L.P., Menlo Park, CA, United States |
SV Angel IV, L.P., San Francisco, CA, United States |
T3C Inc., Mountain View, CA, United States |
TableNow, Inc., San Francisco, CA, United States |
The Currency Cloud Group Limited, London, United Kingdom |
The SAVO Group Ltd., Chicago, IL, United States |
TidalScale, Inc., Santa Clara, CA, United States |
USV 2016, L.P., New York, NY, United States |
F-75