Table of Contents

2
Table of Contents
| 3 |
Table of Contents
Content
Since 2012, we have reported on our full-year financial, social, and environmental performance in one integrated report (“SAP Integrated Report”) available at www.sapintegratedreport.com. The SAP Integrated Report 2016 contains a comprehensive and integrated presentation of our performance in 2016 based on both financial andnon-financial measures and is available online.
The financial reporting presented in the SAP Integrated Report includes our Consolidated Financial Statements, our Combined Management Report, and certain financial measures derived from our management reporting. Thenon-financial information relates to topics derived from our materiality assessment including business conduct, climate and energy, human and digital rights, human capital, impact on society, and innovation.
The SAP Integrated Report is aligned with the content elements suggested in the International Integrated Reporting Framework of the International Integrated Reporting Council (IIRC).
Basis of Presentation
Our Combined Management Report is prepared in accordance with sections 315 and 315a of the German Commercial Code and German Accounting Standards No. 17 and 20. The Combined Management Report is also a management commentary complying with the International Financial Reporting Standards (IFRS) Practice Statement Management Commentary.
Our Consolidated Financial Statements are prepared in accordance with IFRS. Internal control over financial reporting ensures the reliability of the information presented in the Consolidated Financial Statements. Our executive management has confirmed the effectiveness of our internal controls over financial reporting.
The social and environmental data and information included in the SAP Integrated Report is prepared in accordance with the core option of the G4 Sustainability Reporting Guidelines of the Global Reporting Initiative (GRI). We apply the GRI principles for defining report content (sustainability context, stakeholder inclusiveness, materiality, and completeness). We consider the principle of sustainability context in a number of ways, such as by looking at global issues or trends including climate change and demographic shifts. For example, we assess our greenhouse gas emissions in the context of the emissions of the entire information and communications technology landscape, with particular focus on the abatement potential of the industry. When it comes to completeness, we recognize that while we comply with this principle in reporting on our own operations, we are still developing methodologies to reliably quantify our impact through our solutions. In addition, thenon-financial information is prepared by applying the principles of inclusiveness, materiality, and responsiveness.
Greenhouse gas data is prepared based on the Greenhouse Gas Protocol.
Data
All financial andnon-financial data and information for the reporting period is reported utilizing SAP software solutions and sourced from the responsible business units.
The reporting period is fiscal year 2016. The report encompasses SAP SE and all subsidiaries of the SAP Group. To make this report as current as possible, we have included relevant information available up to the auditor’s opinion and the responsibility statement dated February 22, 2017. The report is available in English and German.
Independent Audit and Assurance
KPMG AG Wirtschaftsprüfungsgesellschaft has audited our Consolidated Financial Statements and our Combined Management Report (see the Independent Auditor’s Report). Additionally, KPMG has provided assurance on selectednon-financial data and information in accordance with the International Standard on Assurance Engagements (ISAE) 3000 and 3410 (“Assurance Engagements on Greenhouse Gas Statements”), two pertinent standards for the assurance of sustainability reporting. Where our SAP Integrated Report makes reference to SAP’s public Web site, that Web site information is unaudited. Both the Independent Auditor’s Report and the Independent Assurance Report fornon-financial information are available in theIndependent Auditor’s Report section and theIndependent Assurance Report section.
For more information about our materiality assessment and related stakeholder engagement, see theMateriality section andStakeholder Engagement section.
Concept and Realization
This report was designed by SAP and created with SAP S/4HANA software and the SAP BusinessObjects Disclosure Management application.
| About This Report | 4 |
Table of Contents
Key Facts
€ millions, unless otherwise stated | 2016 | 2015 | D in % | |||||||||
| Revenues | ||||||||||||
Cloud subscriptions and support (IFRS) | 2,993 | 2,286 | 31 | |||||||||
Cloud subscriptions and support(non-IFRS) | 2,995 | 2,296 | 30 | |||||||||
Software licenses (IFRS) | 4,860 | 4,835 | 1 | |||||||||
Software licenses(non-IFRS) | 4,862 | 4,836 | 1 | |||||||||
Software support (IFRS) | 10,571 | 10,093 | 5 | |||||||||
Software support(non-IFRS) | 10,572 | 10,094 | 5 | |||||||||
Cloud and software (IFRS) | 18,424 | 17,214 | 7 | |||||||||
Cloud and software(non-IFRS) | 18,428 | 17,226 | 7 | |||||||||
Total revenue (IFRS) | 22,062 | 20,793 | 6 | |||||||||
Total revenue(non-IFRS) | 22,067 | 20,805 | 6 | |||||||||
Applications, Technology & Services Segment revenue | 19,920 | 18,963 | 5 | |||||||||
SAP Business Network Segment revenue | 1,925 | 1,616 | 19 | |||||||||
Share of predictable revenue (IFRS, in %) | 61 | 60 | 3 | |||||||||
Share of predictable revenue(non-IFRS, in %) | 61 | 60 | 3 | |||||||||
| Operating expenses | ||||||||||||
Cost of cloud subscriptions and support (IFRS) | -1,313 | -1,022 | 29 | |||||||||
Cost of cloud subscriptions and support(non-IFRS) | -1,066 | -789 | 35 | |||||||||
Cost of software licenses and support (IFRS) | -2,182 | -2,291 | -5 | |||||||||
Cost of software licenses and support(non-IFRS) | -1,944 | -2,008 | -3 | |||||||||
Cost of cloud and software (IFRS) | -3,495 | -3,313 | 5 | |||||||||
Cost of cloud and software(non-IFRS) | -3,010 | -2,797 | 8 | |||||||||
Total cost of revenue (IFRS) | -6,583 | -6,245 | 5 | |||||||||
Total cost of revenue(non-IFRS) | -5,985 | -5,562 | 8 | |||||||||
Research and development (IFRS) | -3,044 | -2,845 | 7 | |||||||||
| Profits and Margins | ||||||||||||
Cloud subscriptions and support margin (in % of corresponding revenue, IFRS) | 56.1 | 55.3 | 1 | |||||||||
Cloud subscriptions and support margin (in % of corresponding revenue,non-IFRS) | 64.4 | 65.6 | -2 | |||||||||
Software and support gross margin (IFRS, in %) | 85.9 | 84.7 | 1 | |||||||||
Software and support gross margin(non-IFRS, in %) | 87.4 | 86.6 | 1 | |||||||||
Cloud and software margin (in % of corresponding revenue, IFRS) | 81.0 | 80.8 | 0 | |||||||||
Cloud and software margin (in % of corresponding revenue,non-IFRS) | 83.7 | 83.8 | 0 | |||||||||
Total gross margin (in % of total revenue, IFRS) | 70.2 | 70.0 | 0 | |||||||||
Total gross margin (in % of total revenue,non-IFRS) | 72.9 | 73.3 | -1 | |||||||||
Applications, Technology & Services Segment gross margin (in % of corresponding revenue) | 74 | 74 | -1 | |||||||||
SAP Business Network Segment gross margin (in % of corresponding revenue) | 67 | 68 | -1 | |||||||||
Operating profit (IFRS) | 5,135 | 4,252 | 21 | |||||||||
Operating profit(non-IFRS) | 6,633 | 6,348 | 4 | |||||||||
Operating margin (in % of total revenue, IFRS) | 23.3 | 20.5 | 14 | |||||||||
Operating margin (in % of total revenue,non-IFRS) | 30.1 | 30.5 | -1 | |||||||||
Free cash flow | 3,627 | 3,001 | 21 | |||||||||
Net liquidity | -3,153 | -5,615 | -44 | |||||||||
Days’ sales outstanding (DSO, in days) | 74 | 71 | 4 | |||||||||
Equity ratio (total equity in % of total assets) | 60 | 56 | 6 | |||||||||
| Key Facts | 5 |
Table of Contents
€ millions, unless otherwise stated | 2016 | 2015 | D in % | |||||||||
Effective tax rate (IFRS, in %) | 25.3 | 23.4 | 8 | |||||||||
Effective tax rate(non-IFRS, in %) | 26.8 | 26.1 | 3 | |||||||||
| Order Entry | ||||||||||||
New cloud bookings | 1,147 | 874 | 31 | |||||||||
Deferred cloud subscriptions and support revenue (IFRS)1) | 1,271 | 957 | 33 | |||||||||
Orders - Number ofon-premise software deals (in transactions) | 57,291 | 57,439 | 0 | |||||||||
Share of software orders greater than € 5 million (in % of total software order entry) | 29 | 27 | 7 | |||||||||
Share of software orders less than € 1 million (in % of total software order entry) | 38 | 40 | -5 | |||||||||
| Key SAP Stock Facts | ||||||||||||
Earnings per share, basic (in €) | 3.04 | 2.56 | 19 | |||||||||
Earnings per share, basic(non-IFRS, in €) | 3.90 | 3.77 | 3 | |||||||||
Dividend per share2)(in €) | 1.25 | 1.15 | 9 | |||||||||
Market capitalization1) (in € billions) | 101.73 | 90.18 | 13 | |||||||||
| Employees and personnel expenses | ||||||||||||
Number of employees1), 3) | 84,183 | 76,986 | 9 | |||||||||
Personnel expenses per employee - excluding share-based payments (in € thousands) | 117 | 126 | -7 | |||||||||
Women working at SAP (in %) | 32 | 31 | 5 | |||||||||
Women in management1) (total, in % of total number of employees) | 24.5 | 23.6 | 4 | |||||||||
Employee Engagement Index (in %) | 85 | 82 | 4 | |||||||||
Business Health Culture Index (in %) | 78 | 75 | 4 | |||||||||
Leadership Trust Index (LTI, in %) | 57 | 52 | 10 | |||||||||
Employee retention (in %) | 93.7 | 91.8 | 2 | |||||||||
| Customer | ||||||||||||
Customer Net Promoter Score (in %) | 19.2 | 22.4 | -14 | |||||||||
| Environment | ||||||||||||
Net Greenhouse gas emissions (in kilotons) | 380 | 455 | -16 | |||||||||
Total energy consumption (in GWh) | 950 | 965 | -2 | |||||||||
Data center energy consumed (in GWh) | 243 | 249 | -2 | |||||||||
| 1) | Numbers based on atyear-end. |
| 2) | Numbers are based on the proposed dividend and on level of treasury stock atyear-end. |
| 3) | Full-time equivalents. |
| Key Facts | 6 |
Table of Contents

| To Our Stakeholders | 7 |
Table of Contents
Dear Stakeholders of SAP,
On behalf of the 84,000 employees of SAP, it is my distinct privilege to present the SAP Integrated Report 2016. Backed by a strong financial, social and environmental performance, we have never been more committed to our customers, colleagues, vision and strategy. As the platform company for digital business, we are focused onImpact Through Innovation. As a purpose driven company, we are focused on strengthening the economy, society and the environment for all people. Driven by our ambition and guided by our values, we believe that SAP’s best days are truly yet to come.
SAP’s Results
Since 2010, we have worked hard to earn results that speak for themselves. Our revenue, operating income, and market value have all more than doubled. Our customer count has tripled. We have progressed from a nascent cloud business to having the most cloud users in the business software industry. And most significantly, we have scaled aonce-in-a-generation new data architecture with SAP HANA.
We continued our momentum in 2016. We again delivered a trifecta of strong software sales, fast cloud growth and operating income expansion.Non-IFRS cloud revenue powered to 31% growth. Cloud and software grew 8%, IFRS operating profit was up 20%, whilenon-IFRS operating profit expanded to a record 6.6 billion euros. New cloud bookings surged 31% in the full year, which means that we have a three billion euro business growing more than 30%. The road ahead looks equally strong, as cloud backlog soared 47% to 5.4 billion euros, greatly enhancing the predictability of our future cloud revenue.
Our business is healthy and our company is happy. As a truly integrated report, we also showcasenon-financial indicators and their financial impact. For example, employee engagement is at anall-time high. Our employees are healthier than ever based on our Business Health Culture Index. Our colleagues are dedicating more time to serving their communities through our social sabbatical program and month of service. We beat our CO2 reduction target and continue to power data centers and facilities with 100% renewable energy. These factors have led us, for the 10th year in a row, to be the number one software
| To Our Stakeholders | Letter from the CEO | 8 |
Table of Contents
company in the Dow Jones Sustainability Index. Our commitment to diversity and inclusion has also never been stronger, which led us to become the first global IT company to earn EDGE certification for our focus on gender equality.
In the true spirit of our founders, especially our chairman Hasso Plattner, SAP is never content to rest on past success. We continue to pursue an aggressive innovation agenda and remain confident in our long-term ability to continue delivering profitable growth.
A Statement About Our Challenges and Opportunities
When we introduced a new operating principle in 2014 – Run Simple – many observers challenged us. SAP software, they said, is not particularly simple. This is true. SAP software is the most sophisticated software in the information technology industry. It runs the largest enterprises in business, healthcare, public services agencies and beyond. 76% of the world’s financial transactions touch an SAP system and nearly one trillion U.S. dollars in commerce is transacted across our cloud business networks. This is truly innovation at scale on a global basis.
So why did we make a bold move for “simple”? We did it because reducing complexity is the defining priority of this young century, while handling complexity is SAP’s45-year core competency.
Consider the following about the state of the world:
| ∎ | Businesses in every industry are confronting digital transformation. 55% of the companies listed in Fortune magazine’s 500 list actually lost money as they faced disruptive competition. On every topic, from customer engagement to finance and supply chain, businesses are immersed in a period of complex change. |
| ∎ | Technology is evolving faster than ever, challenging businesses to adopt early or risk inevitable decline. |
| ∎ | People are nervous about the implications of a new digital economy. As a result of this anxiety, the public debate has become more emotionally charged and intense than ever before. |
Taken together, this is an intense maze of circumstances. The challenge to SAP is therefore unmistakable. We must design and deliver technology that eliminates the wrath of complexity from the experiences of end users:
| ∎ | For consumers, who expect businesses to know them, to understand their preferences, and to personalize their experience; |
| ∎ | For employees, who want to understand the connection of their work to the results of their company, and; |
| ∎ | For citizens, who now more than ever want transparency and highly responsive public services. |
To the customers of SAP, we enthusiastically redouble our commitment to your success. We believe that addressing your complexity requires heightened empathy, intellectual curiosity and above all humility. Please measure us on our ability to understand your business strategy and challenges. Measure us on the clarity with which we guide your digital transformation and your innovation road map. Measure us on our ability to make you early adopters of machine learning, the Internet of Things, blockchain and other breakthrough innovations.
To the stakeholders of SAP, we respectfully request that you hold us accountable for our ability to remain a customer-driven growth company. Measure us on the success of our SAP Cloud Platform, our SAP S/4HANA digital ERP, our cloud business networks, and applications. Measure us on the high quality of our user experience and our commitment to design thinking and innovation. Measure us on modern services and support, hallmarks of our hard-earned reputation for customer loyalty. Measure us on our advocacy for human rights, environmental sustainability, and corporate social responsibility.
If our business results continue on the positive trajectory of the past seven years, you will know that we have kept these promises. Equally critical, if our social results such as employee engagement, diversity and sustainability continue, you will know that we stayed true to our vision to help the world run better and improve people’s lives. We remain ever grateful for your confidence, your trust, and your support.
Very truly yours,
Bill McDermott
CEO
SAP SE
| To Our Stakeholders | Letter from the CEO | 9 |
Table of Contents
Bill McDermott
Chief Executive Officer
Luka Mucic
Chief Financial Officer
Bernd Leukert
Products & Innovation
Robert Enslin
President, Global Customer Operations
| To Our Stakeholders | SAP Executive Board | 10 |
Table of Contents
Stefan Ries
Chief Human Resources Officer
Michael Kleinemeier
Digital Business Services
Steve Singh
Business Networks & Applications
Gerhard Oswald
Product, Quality & Enablement (retired December 31, 2016)
| To Our Stakeholders | SAP Executive Board | 11 |
Table of Contents
| 12.9% | €1.25 | €101.7 bn | ||
| Increase in SAP stock in 2016 | Recommended dividend per share | Market capitalization at end of 2016 |
An Up and Down Year for International Stock Markets
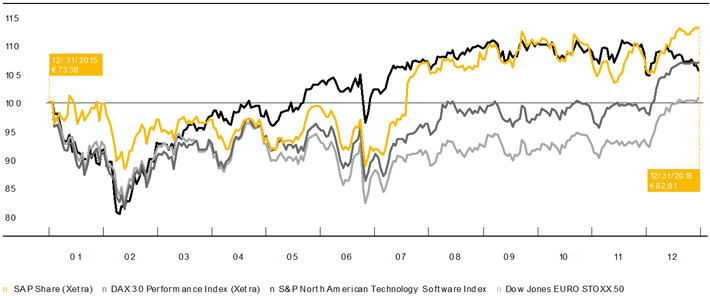
International stock markets endured another rollercoaster year in 2016, prompted, among other things, by China’s faltering economy, the UK vote to leave the EU, the presidential election in the United States, the referendum in Italy, the Federal Reserve’s interest rate decisions, strong exchange rate fluctuations, and low oil prices. SAP stock nevertheless held up well, crossing the €80 mark for the first time in its history. With an increase of 12.9% during the year, the stock outperformed major indices for the second year in a row. In comparison, the DAX 30 increased 6.9% and the EURO STOXX 50 increased around 0.7%.
SAP Stock Reaches NewAll-Time High
The DAX fell below 10,000 points at the beginning of the year as a result of China’s stock market crash and declining oil prices. SAP stock, meanwhile, reached its quarter peak of €74.25 on January 12 following publication of our preliminary full-year results for 2015. At the end of January, a strong euro and uncertainty about US interest rate policies strained the market further, pushing the DAX below 9,000 points. This in turn caused our share price to drop to €64.90, the lowest point of the year, on February 11.
SAP stock recovered after the announcement of our preliminary first-quarter results on April 20, climbing to €71.09. At the beginning of May, however, weak company results, a solid euro, and increasing concerns about a Brexit put the stock markets under renewed pressure and drove the DAX below the10,000-point mark again. By contrast, the price of SAP stock remained stable. On May 13, the day after the Annual General Meeting of Shareholders, it finished at €68.49, despite the €1.15ex-dividend effect.
The share price ultimately reached €72.96 on May 31, in the wake of a market recovery triggered by a falling euro and rising commodity prices. On June 23, however, the markets collapsed following Britain’s shocking vote to leave the EU – and SAP stock tumbled, falling to €66.40 on June 28, its lowest level since February.
Fear of the consequences of the Brexit continued to weigh on the markets until early July, when encouraging data on the US labor market and hopes of a further central bank stimulus package lifted market sentiment again. After publication of strong financial results for the second quarter on July 20, the price of SAP stock surged 5.7% to €75.72, its highest closing price ever at that point. Positive analyst estimates buoyed the SAP share price even higher, propelling it past the €80 mark for the first time ever in the Company’s history to close at €80.40 on September 2. At the end of September, the Federal Reserve’s decision not to raise interest rates had a positive impact on the overall market situation, pushing SAP stock to €82.36 on September 22.
Our stock continued to hover above the €80 mark during the first few days of October before a weak start to the reporting season and concerns about the Chinese economy depressed the markets anew. Publication of our strong third-quarter results on October 21 and an upward revision in our forecast, however, saw the SAP share price rise 3.7% to €81.98. In early November, uncertainty over the outcome of the presidential election in the USA determined the mood on global stock markets. SAP stock closed at €78.52 on November 1 in a somber market environment. Following the surprising election results on November 8, global stock markets reacted with initial panic but recovered quickly. At the beginning of December the decision against constitutional reform in Italy put further pressure on stocks. The promise of continued lose monetary policy from the ECB, however, subsequently pushed stocks higher. During this positive trend at the end of the year, the SAP stock closed the year on December 30 at a newall-time high of €82.81.
| To Our Stakeholders | Investor Relations | 12 |
Table of Contents
SAP Stock in Comparison to DAX 30, Dow Jones EURO STOXX 50, and S&P North American Technology Software Index December 31, 2015 (= 100%) to December 31, 2016
Percent
Providing transparency to investors
We are continuously engaged with the investment community through a number of channels. Over the course of the year, senior management at SAP and the Investor Relations (IR) team discussed our strategy and business development with institutional investors and analysts worldwide.
A particular highlight of our global IR program in 2016 was the Capital Markets Day held in New York City. At this exciting event, attended by more than 75 financial analysts and investors, the SAP Executive Board discussed the details of the strong strategic position of SAP in the market. The Executive Board also discussed the future outlook of the company and shared insights about the innovations that the company planned to bring into the market in 2016. Two SAP customers, Swiss Property and HP Enterprises also presented how SAP is helping them in their digital transformation journey. In addition, we hosted events forbuy-side analysts in Walldorf. We also held events for investors and financial analysts at the CeBIT fair in Hanover, Germany and at the SAPPHIRE NOW conference in Orlando, Florida. Furthermore, we maintained regular dialog with socially responsible investors (SRI), providing them with insights into our environmental, social, and corporate governance policies. SAP representatives spoke at various retail shareholder events. The Investor Relations team and the Treasury teams also maintained regular communication with the debt investor community.
Investors can access a wide range of information about SAP and its shares online. Our channels of communication include our Twitter feed @sapinvestor, the quarterly SAP INVESTOR magazine, and a text message service. Shareholders can reach the IR team directly through a telephone hotline and through ane-mail at investor@sap.com. We also publish an overview of the latest analyst assessments in collaboration with Vara Research.
We webcast all key investor events at which members of our Executive Board speak, and we post all relevant presentations on the Investor Relations Web site.
Key Facts About SAP Stock/SAP ADRs
| Listings | ||||
Germany | Berlin, Frankfurt, Stuttgart | |||
United States (ADRs) | New York Stock Exchange | |||
| IDs and symbols | ||||
WKN/ISIN | 716460/DE0007164600 | |||
NYSE (ADRs) | 803054204 (CUSIP) | |||
Reuters | SAPG.F or .DE | |||
Bloomberg | SAP GR | |||
| Weight (%) in indexes at 12/31/2016 | ||||
DAX 30 | 8.65 | |||
Prime All Share | 6.50 | |||
CDAX | 6.81 | |||
HDAX | 6.89 | |||
Dow Jones STOXX 50 | 2.38 | |||
Dow Jones EURO STOXX 50 | 3.75 |
| To Our Stakeholders | Investor Relations | 13 |
Table of Contents
Return on SAP Common Stock – WKN 716460/ISIN DE007164600
Percent, unless otherwise stated | ||||||||||||
| Initial investment €10,000 | ||||||||||||
| Date of investment | 12/31/2006 | 12/31/2011 | 12/31/2015 | |||||||||
| Period of investment | 10 years | 5 years | 1 year | |||||||||
| Value at 12/31/20161) (in €) | 24,153 | 22,162 | 11,475 | |||||||||
| Average annual return | 9.2 | 17.3 | 14.7 | |||||||||
| Performance comparators | ||||||||||||
DAX 30 Performance – total return index | 5.7 | 14.2 | 6.9 | |||||||||
REX General Bond – total return index | 4.3 | 2.8 | 2.3 | |||||||||
S&P 500 Composite – total return index | 9.4 | 19.5 | 15.3 | |||||||||
S&P North American Technology Software Index | 12.5 | 20.9 | 9.4 | |||||||||
| 1) | Assuming all dividends were reinvested |
| Source: | Datastream |
Return on SAP ADRs – 803054204 (CUSIP)
Percent, unless otherwise stated | ||||||||||||
| Initial investment US$10,000 | ||||||||||||
| Date of investment | 12/31/2006 | 12/31/2011 | 12/31/2015 | |||||||||
| Period of investment | 10 years | 5 years | 1 year | |||||||||
| Value at 12/31/20161) (in US$) | 18,642 | 17,657 | 11,100 | |||||||||
| Average annual return | 6.4 | 12.0 | 11.0 | |||||||||
| Performance comparators | ||||||||||||
S&P 500 Composite – total return index | 6.9 | 14.7 | 12.0 | |||||||||
| 1) | Assuming all dividends were reinvested |
| Source: | Datastream |
Rewarding our investors – Dividend payout of € 1.25 per share
We believe our shareholders should benefit appropriately from the profit the company made in 2016. In recent years, the payout has always been greater than 35% of profit after tax. We aim to continue our policy to pay a dividend totaling more than 35% of profit after tax in the future.
At the Annual General Meeting of Shareholders, the Executive Board and the Supervisory Board will recommend increasing the total dividend for fiscal year 2016 by 9% to € 1.25 per share (2015: € 1.15)
Capital stock unchanged
SAP’s capital stock as of December 31, 2016, was € 1,228,504,232 (2015: € 1,228,504,232). It is issued as 1,228,504,232 no–par shares, each with an attribute value of € 1 in relation to capital stock.
Shareholder structure
Applying the definition accepted on the Frankfurt Stock Exchange, which excludes treasury stock from the free float, as of December 31, 2016, the free float stood at 78.8% (December 31, 2015: 77.5%).
Shareholder Distribution
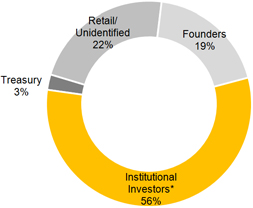
| * | 11% of these investors are classified as socially responsible investors (SRIs) |
| To Our Stakeholders | Investor Relations | 14 |
Table of Contents
We are a global company with an international shareholder base, so we need sound governance. Good corporate governance means managing the Company accountably and transparently to secure long-term value. We believe our shareholders, business partners, employees, and the financial markets reward good corporate governance with the increased trust they place in our Company.
Corporate Governance Principles at SAP
SAP is an international firm with European roots, having the legal form of a European company (Societas Europaea, or SE). Being an SE headquartered in Germany, we are now subject to European and German law for SEs while remaining subject to German stock corporation law. Major characteristics of our governance structure remain in place since the conversion, notably ourtwo-tier board comprising a Supervisory Board and an Executive Board, and parity for workforce representatives on the Supervisory Board. Because SAP SE is listed on a German stock exchange, our corporate governance is still based on the German Corporate Governance Code (the “Code” in this report). Every year, as required by the German Stock Corporation Act, section 161, the Executive Board and Supervisory Board issue a declaration stating whether SAP has implemented and is following the Code’s recommendations, and identifying any recommendations that the Company has not followed – with a full explanation of why it has not done so. Our latest section 161 declaration, published on October 29, 2016, is on the SAP Web site along with our declarations from previous years and links to the current and previous editions of the Code. As our 2016 declaration shows, we currently follow all but five of the 102 recommendations and all of the suggestions in the current Code.
Since SAP is also listed in the United States, we comply with the rules that apply tonon-U.S. companies listed on the New York Stock Exchange (NYSE). These include the requirements, as they apply to foreign private issuers, of the NYSE Corporate Governance Standards, the U.S. Sarbanes-Oxley Act of 2002, and the U.S. Securities and Exchange Commission (SEC).
Corporate Governance Statement
On February 21, 2017, the Executive Board published a corporate governance statement for 2016 pursuant to sections 315 (5) and 289a of the German Commercial Code. The statement is on the SAP Web site. It comprises the current declaration pursuant to the German Stock Corporation Act, section 161, certain details of our corporate governance practices, and an account of how the Executive Board and the Supervisory Board work, who serves on which Supervisory Board committees, and how those committees work. It also sets out the targets for the percentage of women on the Executive Board and the two management levels below Executive Board level.
Executive Board
The Executive Board currently has seven members. It is solely responsible for managing the Company. It has a duty to exercise its management powers in the interest of the Company and in pursuit of the sustained growth of corporate value. It discusses and agrees its strategy for the Company with the Supervisory Board, ensures compliance with the requirements of the law throughout the Group, and maintains effective risk management structures and internal risk controls. There is information about each member’s portfolio of responsibilities on the SAP Web site.
Supervisory Board
The size and composition of the Supervisory Board are governed not by the German Codetermination Act (which does not apply, because we are a European company) but by the Articles of Incorporation and the SAP SE Employee Involvement Agreement. Both documents are available on the SAP Web site.
The Supervisory Board has 18 members who, in equal numbers, represent the shareholders and the employees. It appoints, monitors, and advises the Executive Board. The Executive Board involves the Supervisory Board in decisions on matters of fundamental importance for the Company. The Supervisory Board has reserved to itself the approval of certain transactions of fundamental importance, as set out in the Articles of Incorporation and detailed in the Supervisory Board’s list of reserved categories of transactions. The Executive Board regularly provides the Supervisory Board with full and timely reports on all material matters of strategy, business planning, and performance, including any deviations of actual business performance from plan, risks, risk management, and corporate compliance. We provide our shareholders within-depth information about how the Executive Board and the Supervisory Board work, how the committees are composed, and how these committees work, in our corporate governance statement. For more information about the joint work of the Executive Board and the Supervisory Board and about the work of the Supervisory Board and its committees in 2016, see theReport by the Supervisory Board.
Composition of the Supervisory Board
The Supervisory Board members as a group possess the knowledge, ability, and expert experience required to properly perform its duties in our global IT company. At least one independent member has financial reporting and auditing expertise. The Supervisory Board has defined the following objectives for its own composition:
| ∎ | There should never be fewer than three people from the international stage on the shareholder representatives’ side of the Supervisory Board. |
| To Our Stakeholders | Corporate Governance Report | 15 |
Table of Contents
| ∎ | No employee, consultant, or director of a significant SAP competitor should be a Supervisory Board member. |
| ∎ | At least five shareholder representatives on the Supervisory Board should be independent members in the meaning of section 5.4.2 of the Code. |
| ∎ | No member of the Supervisory Board should be older than 75 years. |
We believe the current composition of the Supervisory Board fulfills all of these objectives. There is information about each member, the committees, and who serves on which committee, on the SAP Web site.
Independence of the Supervisory Board
We believe a sufficient degree of independence of our Supervisory Board members is essential for effective and responsible corporate management and control. Our Supervisory Board has a defined objective for its composition regarding the minimum number of independent members on the shareholder representative side, as recommended in the Code, section 5.4.1, paragraph 2. The objective is five such members. At its meeting on October 28, 2016, the Supervisory Board determined that all of its shareholder representative members are independent in the meaning of the Code, section 5.4.2 and that the number of independent members is sufficient in the meaning of that section. The Audit Committee is chaired by Erhard Schipporeit, who for many years was the chief financial officer of a DAX company that is also listed on a U.S. stock exchange and therefore qualifies as an independent financial expert in the meaning of the German Stock Corporation Act, section 100 (5).
Diversity in the Company
Starting 2016, a mandatory gender quota of 30% applies for new appointments to the Supervisory Board of SAP SE pursuant to the law on the equal participation of men and women in leadership positions (German Equal Leadership Opportunities for Women Act). There are currently two women on the shareholder representatives’ side of the Supervisory Board and two women on the employee representatives’ side. The mandatory quota applies to future appointments to the Supervisory Board; the mandates of the current members of the Supervisory Board remain unaffected until the end of their term.
The Executive Board currently has seven male members. Pursuant to the above Act, the Supervisory Board adopted by resolution at its meeting on March 19, 2015, a target of one for the number of Executive Board seats to be held by women by June 30, 2017.
The first and second management levels below the Executive Board are the Global Executive Team (GET) and the Senior Executive Team (SET), respectively. In accordance with the requirements of the Act, the Executive Board resolved on September 30, 2015, that the percentage of positions held by women on the first two management levels below the Executive Board should remain unchanged at 23% and 17%, respectively, to June 30, 2017.
The Executive Board continues to follow the recommendation in the Code that executive boards should generally have regard to diversity when appointing people to leadership positions, and in particular to employ appropriate numbers of women in such positions. In support of this, we maintain a diversity policy for company leadership appointments. SAP has set itself a target of increasing the overall percentage of positions in leadership held by women to 25% by 2017. It goes without saying that ability is still the primary selection criterion for any position at SAP. Globally, the percentage of leadership positions held by women at the end of 2016 was 24.5%.
Code of Business Conduct
SAP’s corporate governance includes our Code of Business Conduct for employees and members of the Executive Board. The Code of Business Conduct expresses the high standards that we require from our employees and Executive Board members and sets out the main principles that guide our business conduct toward customers, business partners, and shareholders. We see our Code of Business Conduct as the standard for our dealings involving customers, business partners, vendors, shareholders, and competitors. By following our Code of Business Conduct, we demonstrate a commitment against all forms of unfair competitive practice, corruption, and misrepresentation. Our global compliance organization monitors worldwide compliance with the Code of Business Conduct and other policies applying within the Group. It regularly reviews these internal policies, revises them if necessary, and delivers related employee training.
Applying International Corporate Governance Standards
SAP is a NYSE-listed company and we are therefore subject to certain U.S. financial legislation (including the Sarbanes-Oxley Act of 2002, among others) and to the applicable SEC and NYSE regulations. Besides implementing the requirements of the U.S. Sarbanes-Oxley Act, section 404, and other Sarbanes-Oxley Act requirements, including conducting an annual audit of our internal control over financial reporting, we comply with those of the corporate governance standards codified in the NYSE Listed Company Manual, section 303A, which bind foreign private issuers. The section 303A standards that apply to SAP include the requirement to have an audit committee composed of members who are independent in the meaning of the Sarbanes-Oxley Act, and related reporting requirements. Erhard Schipporeit, the chairperson of the Audit Committee, is an audit committee financial expert in the meaning of the Sarbanes-Oxley Act.
Annual General Meeting of Shareholders
Our shareholders exercise their rights, such as the rights to put questions to the management and to vote, at the Annual General Meeting of Shareholders. Shareholders and the public are able to watch a live broadcast of the entire Annual General Meeting of Shareholders on the Internet. They can vote their shares at the Meeting or instruct a proxy of their choice or one of the proxies provided for that purpose by
| To Our Stakeholders | Corporate Governance Report | 16 |
Table of Contents
SAP. Alternatively, they can participate online or vote by mail. The invitation to the Annual General Meeting of Shareholders includes full details and instructions. Every shareholder can access all of the paperwork on the SAP Web site in good time for the meeting.
Transparency, Communication, and Service for Shareholders
Our shareholders can obtain full and timely information about SAP on our Web site and can access current and historical Company data. Among other information, we post all of our financial reports, all relevant news about the Company’s governing bodies and their corporate governance documentation, information requiring ad hoc (current) disclosure, press releases, and news of notifiable directors’ dealings.
Financial Accounting, Risk Management, and Internal Control
We prepare the SAP SE financial statements in accordance with the German Commercial Code and our consolidated financial statements in accordance with International Financial Reporting Standards (IFRSs). We prepare a management report, as required by the German Commercial Code, and the Form20-F annual report in accordance with SEC requirements. The Executive Board is responsible for financial accounting. The Supervisory Board approves the SAP SE financial statements, the consolidated financial statements, and the combined management report. The SAP SE financial statements, the consolidated financial statements, and the combined management report are audited by KPMG AG Wirtschaftsprüfungsgesellschaft, the auditor elected for that purpose by the Annual General Meeting of Shareholders.
In addition to our annual financial statements, we also prepare quarterly statements for all four quarters in accordance with the rules and regulations of the Frankfurt Stock Exchange, as well a half-year financial report on June 30 pursuant to the legal requirements of the German Securities Trading Act. Our quarterly statements and half-year financial report are submitted to the Audit Committee of the Supervisory Board before they are published.
In German stock corporation and commercial law, there are special requirements for internal risk management that apply to SAP. To meet them, our global risk management system supports risk planning, identification, analysis, handling, and minimization. We maintain standard documentation of all our internal control structures, especially those that affect financial reporting, and continually evaluate their effectiveness. As a company listed on the NYSE, we instruct our auditor, KPMG, to conduct an annual audit of our internal control over financial reporting in accordance with the requirements of the U.S. Sarbanes-Oxley Act of 2002, section 404. The audit as of December 31, 2016, confirmed that our internal control is effective. In compliance with the reporting requirements in the German Commercial Code, sections 289 (5) and 315 (2)(5), the combined SAP SE and SAP Group management report contains full information about the principal features of the internal controls and risk management structure applying to SAP’s consolidated financial reporting.
Executive Board and Supervisory Board Shareholdings
Section 6.2, sentence 2, of the Code recommends that all directors’ shareholdings be reported in a corporate governance report, broken down by executive board and supervisory board memberships if the entire holdings exceed 1% of the shares issued by the Company. In fulfillment of this recommendation, see theCompensation Report in our combined management report for 2016, which contains the recommended information.
| To Our Stakeholders | Corporate Governance Report | 17 |
Table of Contents
Report by the Supervisory Board
Dear Shareholders,
In 2016, we dealt extensively with the status and the development of the Company and discharged the duties imposed on us by the law and by the Company’s Articles of Incorporation. We were consulted by the Executive Board throughout the year and kept the global management of the Company under continued observation and scrutiny for legal compliance, adherence to proper accounting principles, business focus, and efficiency. We agreed to the Company’s strategy with the Executive Board and regularly discussed with the Executive Board the Company’s progress toward executing it. We were directly involved when the Executive Board made any decision of fundamental importance to SAP.
We regularly received full and timely reports from the Executive Board, both from members in person and in written documents. They kept us up to date on the Company’s strategy, plans, business performance, risks, risk management, compliance (in other words, adherence to laws, to the Company’s Articles of Incorporation, and to internal policies), and on transactions of special significance for SAP. The Executive Board advised us when business deviated from plan or target, and why.
The content and scope of the Executive Board’s reports to us fully met our requirements for them. In addition, the Executive Board came to Supervisory Board meetings for discussion of the agenda items and to answer our questions. To ensure optimal performance of its duties, the Supervisory Board also deploys the latest SAP technologies. At our meetings, for example, we used the SAP Digital Boardroom, an innovative, analytical software solution that allows analysts to generate impressive graphics for all business area metrics in real time across multiple interactive computer screens. Thanks to this solution, we were always able to draw on current data andin-depth analyses during our discussions. We questioned and probed the Executive Board to satisfy ourselves that the information it gave to us was plausible. All transactions requiring approval by the Supervisory Board, whether by law, the Articles of Incorporation, or the Supervisory Board’s list of transactions requiring consent within the meaning of the German SE Implementation Act(SE-Ausführungsgesetz), section 19, were carefully examined and discussed with the Executive Board, focusing on the benefits, potential risks, and other effects of each transaction. The Supervisory Board agreed to all transactions for which its consent was sought by the Executive Board.
The CEO informed the Supervisory Board chairperson without delay of all important events that were significant for assessing SAP’s position and progress or for the management and governance of the Company. Moreover, the chairperson of the Supervisory Board met regularly with the CEO to discuss SAP’s strategy, planning, the Company’s business performance, risks, risk management, compliance, and other key topics and decisions. In this way, the chairperson of the Supervisory Board was also kept fully informed between meetings of the Supervisory Board and its committees.
Supervisory Board Meetings and Resolutions
In 2016, the Supervisory Board of SAP SE held four ordinary meetings and one extraordinary meeting at which we deliberated and resolved on all matters of relevance to the Company. We also adopted two resolutions by correspondence vote. No Supervisory Board member attended only half or less of the meetings of the Supervisory Board and of the committees to which the member belonged in the fiscal year. The average attendance rate for the Supervisory Board and committee meetings was 95%. The Supervisory Board and its committees also convened wholly or partly without the Executive Board as necessary to deliberate on items that pertained to the Executive Board or required internal discussion among Supervisory Board members alone. On this basis, the Executive Board withdrew temporarily from three of the plenary sessions, in particular. The Supervisory Board addressed the following key topics during the year:
Simplification of Processes, and the Company’s 2020 Strategy
The 2020 strategy, which has the goal to make SAP the world’s leading cloud company in terms of market share, market capitalization, and revenue, was discussed at length with the Executive Board at meetings of the Technology and Strategy Committee meetings and of the full Supervisory Board. At our meetings in February and July, the Executive Board apprised us of the various initiatives and projects for implementing this strategy. In July, we also heard an Executive Board report on the total cost of ownership (TCO) in the cloud area, and gave our constructive feedback on the plans presented. Likewise in our line of focus was the Run Simple initiative, SAP’s project for simplifying our internal processes and reducing complexity. We continuously monitored progress of this initiative throughout the year. When we met in July, the Executive Board reported on some of the results achieved thus far in SAP’s controlling, internal reporting, and other financial processes. As part of its simplification efforts, the Company also streamlined and optimized the process by which the SAP SE financial statements, the consolidated financial statements, and the integrated report are prepared, thus enabling SAP to publish our integrated report as early as February of the new year from now on. To accommodate this new timeline, the Supervisory Board adjusted its meeting schedule as of the new year and brought forward discussion of balance sheet-related topics from the March meeting to the February meeting.
| To Our Stakeholders | Report by the Supervisory Board | 18 |
Table of Contents
HR Topics and Executive Board Compensation
The Supervisory Board dealt with human resources (HR) matters and Executive Board compensation notably in its first two meetings of 2016. All HR and compensation topics were extensively prepared by the General and Compensation Committee and subsequently adopted by the full Supervisory Board.
At our ordinary meeting in February, we resolved the appointment of Stefan Ries and Steve Singh to the Executive Board effective April 1, 2016. The Executive Board explained its concept to dissolve the Global Managing Board and instead have various managers in global key roles more directly involved in crucial management tasks in the future. We acknowledged and endorsed this decision.
We also discussed Executive Board compensation for 2015 at the February meeting. Exercising our discretionary powers under the terms of the short-term incentive (STI) plan 2015, we determined performance against the defined targets. As well, we determined target achievement within theso-called performance period for the 2015 tranche of the RSU Milestone Plan 2015. Introduced in 2012, the RSU Milestone Plan 2015 is a long-term variable compensation element for SAP SE Executive Board members in which the members were granted a number of virtual shares (called restricted share units, or RSUs) for a given year (or “tranche”); the quantity of RSUs ultimately allocable for a plan tranche depends on SAP’s operating profit performance in the year it is allocated. When we met in February, we also deliberated on Executive Board compensation for 2016. We identified the key performance indicators (KPIs) and set the target numbers for each KPI in the STI 2016 plan and their relative weightings. In addition, we decided that, as of 2016, there should be greater differentiation in Executive Board members’ compensation based on the function and role of the individual Executive Board member. We therefore requested Ernst & Young GmbH Wirtschaftsprüfungsgesellschaft, the Company’s external compensation consultants, to carry out a benchmark analysis of the Executive Board appointment contracts based on a peer group of companies predefined by us. After comprehensive evaluation of this analysis, the General and Compensation Committee proposed a number of measures for consideration by the full Supervisory Board. The Supervisory Board, in turn, resolved at its March meeting to increase certain Executive Board members’ long-term incentive (LTI) plan based on their roles, and to generally pay fixed compensation and STI compensation elements in the currency of the Executive Board member’s home country. It subsequently approved the individual Executive Board compensation packages. The Supervisory Board, as required, evaluated the appropriateness of the Executive Board members’ compensation, and in each case found it to be appropriate in terms of amount, structure, objective criteria, and for each member’s responsibilities and tasks. Ahead of the meeting, we had received a certificate from Ernst & Young on the compensation’s appropriateness. For more information about the LTI Plan 2016 and other elements of the compensation package for Executive Board members, see theCompensation Report.
In our opinion, the complex transition to the cloud initiated by the Executive Board can only be successfully implemented with the long-term commitment of the Executive Board members to the Company. This is why we also agreed in our March meeting to prematurely reappoint Bill McDermott, Robert Enslin, Bernd Leukert, and Luka Mucic as members of the Executive Board for a term of five years. In August and November, the General and Compensation Committee prepared an amendment to the Executive Board appointment contracts with regards to the leaver provisions (that is, the provisions for when an Executive Board member steps down) under the LTI plan, which we adopted in an extraordinary telephone conference in December. We referred in both meetings to the aforementioned appropriateness certificate from Ernst & Young.
Other matters addressed at our meetings in 2016 included:
Meeting in February
At our February 18 meeting, the Executive Board gave us an overview of business in 2015 and presented information on SAP’s revenue growth in the individual business areas, regions, and product fields. It also explained SAP’s current market position. We discussed in detail the annual budget for 2016 as presented to us by the Executive Board, and approved same. In addition, we reviewed the results of the employee survey.
Meeting in March (Meeting to Discuss the Financial Statements)
At its ordinary meeting on March 24, the Supervisory Board turned its attention to SAP SE financial statements and the consolidated financial statements for 2015, the audits conducted by KPMG AG Wirtschaftsprüfungsgesellschaft (KPMG), and the Executive Board’s proposed resolution on the appropriation of retained earnings for 2015. The Audit Committee comprehensively prepared all topics for which it is responsible in connection with the financial statements and the consolidated financial statements for 2015, and reported particularly on the form and scope of its examination of the documents relating to the financial statements, which it recommended we approve. The auditor attended the meeting and reported in detail on the audit and its findings for each of the focus areas that had been agreed between the auditor and the Audit Committee. The auditor also related the discussions on those matters at the preceding meetings of the Audit Committee. The auditor then discussed the results of the audit with the Supervisory Board and answered our questions. The Supervisory Board approved the audit. There were no findings from our own examination, so we gave our consent to the SAP SE and consolidated financial statements for 2015. We checked and endorsed the Executive Board’s proposal to appropriate retained earnings in accordance with the Audit Committee’s recommendation. There were also a number of corporate governance matters on the meeting agenda. We decided on the resolutions we would propose for the agenda of the Annual General Meeting of Shareholders in May 2016. Our recommendation to the Annual General Meeting of Shareholders concerning the auditor to elect for 2016 followed the recommendation of the Audit Committee to us.
| To Our Stakeholders | Report by the Supervisory Board | 19 |
Table of Contents
We regularly reviewed and updated the list of transactions for which the Executive Board must obtain the Supervisory Board’s consent in accordance with the German SE Implementation Act, section 19. The Executive Board presented detailed information about the investment activities of SAP’s venture capital funds. The Supervisory Board approved the financing of two further venture capital funds with a total volume of US$1 billion, for investment in the respective funds by 2022 and 2023 respectively.
Meeting in July
At our ordinary meeting on July 14, we discussed the aforementioned strategy topics as well as the directors’ and officers’ (D&O) group liability insurance policies that we take out from year to year. We also agreed that deliberations on the budget process be made the subject of joint meetings between the Financial and Investment Committee and the Audit Committee from now on.
The Executive Board then gave us an account of business in the second quarter of 2016 and performance in the first half-year, reporting at our request particularly on revenue development in the various regions, on SAP’s competitive position in its core business and in the cloud, and on the progress in healthcare solutions. We also received updates on the business activities in the SAP Business Network operating segment and in the Internet of Things space.
Meeting in October
Our October 28 meeting was held at the SAP Innovation Center in Potsdam, SAP’s development center for new software technologies that opened in 2014. This gave the Supervisory Board members the opportunity to tour the facility, learn about the latest development projects, and gain insight into how SAP collaborates with its customers, other research institutes, and universities. At the meeting, the Executive Board reported on business and updated us on SAP’s current HR strategy. In agreement with the Executive Board, the Supervisory Board also adopted, for regular publication in October 2016, the annual declaration of implementation of the German Corporate Governance Code (the “Code”) pursuant to the German Stock Corporation Act, section 161. The Supervisory Board determined that it has a sufficient number of independent members. We were then given a comprehensive overview of SAP’s product strategy in the small business and midmarket segments. Finally, the Executive Board informed us about the organizational setup and work performed by SAP’s internal data protection department, explained how SAP is preparing for the new EU General Data Projection Regulation, and reported on other legal developments relevant for SAP in the area of data protection.
The Work of the Supervisory Board Committees
The committees made a key contribution to the work of the Supervisory Board and reported on their work to us, including their preparatory work on the relevant agenda items of the full Supervisory Board. The following committees were in place in 2016:
| ∎ | General and Compensation Committee: Hasso Plattner (chairperson), Wilhelm Haarmann, Andreas Hahn, Margret Klein-Magar, Lars Lamade, Bernard Liautaud, Sebastian Sick, Jim Hagemann Snabe |
| ∎ | Audit Committee: Erhard Schipporeit (chairperson), Panagiotis Bissiritsas, Martin Duffek, Klaus Wucherer |
| ∎ | Finance and Investment Committee: Wilhelm Haarmann (chairperson), PekkaAla-Pietilä, Panagiotis Bissiritsas, Margret Klein-Magar, Sebastian Sick, Jim Hagemann Snabe |
| ∎ | Technology and Strategy Committee: Hasso Plattner (chairperson), Christine Regitz (deputy chairperson), PekkaAla-Pietilä, Panagiotis Bissiritsas, Anja Feldmann, Andreas Hahn, Gesche Joost, Margret Klein-Magar, Bernard Liautaud, Pierre Thiollet |
| ∎ | People and Organization Committee: Hasso Plattner (chairperson), Martin Duffek, Anja Feldmann, Wilhelm Haarmann, Gesche Joost, Lars Lamade, Christine Regitz, Robert Schuschnig-Fowler |
| ∎ | Nomination Committee: Hasso Plattner (chairperson), PekkaAla-Pietilä, Bernard Liautaud |
| ∎ | Special Committee: Hasso Plattner (chairperson), PekkaAla-Pietilä, Wilhelm Haarmann, Lars Lamade, Erhard Schipporeit, Sebastian Sick |
Each of the committees was active in 2016 except the Special Committee.
For more information about the Supervisory Board committees and their duties, see SAP’s corporate governance statement pursuant to the German Commercial Code, section 289a, published on the SAP public Web site at www.sap.de/investor.
In 2016, the committees focused on the following topics:
| ∎ | TheGeneral and Compensation Committee held six meetings at which members attended in person (“physical meetings”) and one meeting by telephone conference. During its meetings, it prepared and recommended the Supervisory Board’s resolutions, notably those on Executive Board compensation and HR decisions described above. It also focused on the following matters: At the beginning of the year, it deliberated on the annual report it receives from the Company’s capital market compliance officer, including an overview of the changes to the rules on insider trading and directors’ dealings notifications under the new EU Market Abuse Regulation, which came into force on July 3, 2016. At the meeting in March, the Committee received a report from the corporate governance officer and adopted an update to its rules of procedure. In June, the Committee approved the conclusion of a consulting contract between the Company and the retiring Executive Board member Gerhard Oswald. In October, it prepared the Supervisory Board’s resolutions with respect to the submission of the declaration of implementation of the Code and ascertaining the independence of Supervisory Board members. It also discussed succession planning for the Executive Board. In the fiscal year ended, the Committee also approved the acceptance of outside supervisory board seats by three Executive Board members. |
| ∎ | TheAudit Committee held five physical meetings and four meetings by telephone conference. The telephone conference meetings were all ahead of the publication of quarterly financial reports for each |
| To Our Stakeholders | Report by the Supervisory Board | 20 |
Table of Contents
quarter. At these meetings, the Committee primarily deliberated on the course of business over the quarter concerned, the process by which the quarterly financial reports were prepared, the quarterly reports to be published, and insights gained from the auditor’s quarterly review of selected revenue-generating software agreements. The physical meetings in February and March concentrated on the SAP SE and consolidated financial reports for 2015 and the reporting process, the internal control structure for financial reporting, the most important accounting methods, and the audit. At the February meeting, the Committee also discussed the German Financial Reporting Enforcement Panel’s criteria and the internal audit service’s report for the previous year, organization and processes, and audit plan for 2016. At its meeting in March, the Committee did preparatory work on the Supervisory Board’s recommendations to the Annual General Meeting of Shareholders concerning the election of an auditor and the appropriation of retained earnings and discussed the Company’s compliance system. When it met in July, the Committee discussed the audit focus and fees with the auditor, dealt with the internal audit service’s work in the first half of the year and audit planning for the second half-year, and reviewed the Company’s internal controls. At its October meeting, the Committee discussed the report from the chief compliance officer and other compliance system matters and came to the conclusion that the compliance system was effective. As reported in more detail below, the Committee also held a joint meeting with the Finance and Investment Committee on the same day, to prepare the Supervisory Board’s February 2017 resolution concerning the Group annual plan. |
The auditor attended all physical meetings and telephone conference meetings of the Audit Committee and reported in depth on its audit work and on its quarterly reviews of selected software agreements.
| ∎ | TheFinance and Investment Committee held five physical meetings in 2016, of which one was a joint meeting with the Technology and Strategy Committee and one a joint meeting with the Audit Committee. At its February 17 meeting, representatives from Sapphire Ventures presented detailed information about the investment activities of the three SAP venture capital funds. The Committee recommended that the Supervisory Board approve the financing of two further venture capital funds totaling US$1 billion. It also discussed the annual report on SAP’s acquisitions. When it met on July 13, the Committee focused solely on a comprehensive evaluation of SAP by external analysts. It also held a joint meeting with the Technology and Strategy Committee on the same day. Matters discussed included a multiyear overview of the development of SAP’s major acquisitions, SAP’s strategic alignment and competitive environment, and the results of an analysis of SAP’s product portfolio. The Committee also approved by correspondence the Executive Board’s planned financing transactions. At its October meeting, the Committee examined the organizational structure, business environment, and equity investments of an SAP subsidiary that provides professional services to national security authorities, and were given an update on other equity investments and acquisition-related activities carried out by SAP in 2016. The focus of the joint meeting with the Audit Committee on October 25 was the presentation of and discussion on the preliminary Group annual plan for 2017, in preparation for the Supervisory Board meeting in February 2017, at which the full Supervisory Board resolved to approve the 2017 Group annual plan. |
| ∎ | TheTechnology and Strategy Committee held four meetings in 2016, one of which was a joint meeting with the Finance and Investment Committee. It discussed the key technology trends in the software industry in the years to come and SAP’s corporate and product strategies. At the Committee’s February 17 meeting, the Executive Board presented an overview of market development in 2015 and explained what it would mean for SAP’s business in 2016. Key topics included the strategic road map, development priorities, and market launch of our human capital management (HCM) software. The Committee also learned more about the SAP Startup Focus program, SAP’s initiative to support startups. The focus topics of the March 23 meeting were TCO of SAP S/4HANA, SAP’s strategy for analytics, and a status report on the Sybase acquisition. When the Committee met on October 27, it deliberated on the measures to position SAP Ariba products and learned more about the road map and platform architecture for machine learning. |
| ∎ | ThePeople and Organization Committee held two meetings in 2016. In September, it engaged in detailed discussions about the measures to recruit top talents, and asked management for an update on the current status of training and personal and professional development at SAP, so that it could see whether the Committee’s suggestions from the year before had been implemented. To this end, the Committee reviewed the technical learning offerings available through SAP Development University, SAP’s internal academy for the professional training of our software developers. The second meeting was held on December 6. The Committee was presented with the results of the SAP Strategy Survey, an employee survey conducted in the summer of 2016 regarding the implementation and employees’ understanding of the strategy. The Committee was also given an update on SAP’s collaboration with academia to promote young talents in a digitalized working world. Further topics at this meeting included the new employee stock plan and the expert career path at SAP. |
| ∎ | TheNomination Committee is composed exclusively of shareholder representatives. It met once, in March 2016, to prepare the Supervisory Board’s recommendation to the Annual General Meeting of Shareholders that Gesche Joost be elected shareholder representative on the Supervisory Board. It also reviewed its process for seeking suitable candidates for the Supervisory Board. |
Regular reports from the committees ensured that we were kept fully informed of all matters covered by the committees and were able to discuss them thoroughly.
Corporate Governance
SAP’s corporate governance officer monitored our compliance with those recommendations in the Code with which we claim to comply in SAP SE’s declaration, and reported in full to the General and Compensation Committee. For more information about compliance with the Code, see the Corporate Governance Report from the Executive Board and Supervisory Board.
| To Our Stakeholders | Report by the Supervisory Board | 21 |
Table of Contents
Members of the Executive Board and of the Supervisory Board had no conflicts of interest that sections 4.3.4 and 5.5.2 of the Code require to be disclosed to the Supervisory Board. Some Supervisory Board members currently have business dealings with SAP or hold senior positions or material equity in companies that currently have business dealings with SAP, or had done so in the course of the year. SAP’s business dealings with these persons or companies are or were at arm’s length. In our view, especially given the limited scope and materiality of those dealings, they did not affect the independence of the Supervisory Board members concerned and do not give rise to any substantial and not merely temporary conflict of interest in the meaning of the Code. There were a number of transactions involving members of the Executive Board in 2015 which were all consistent with industry standards and immaterial. These transactions were approved by the General and Compensation Committee during the year under review. The General and Compensation Committee also approved a consulting contract for Gerhard Oswald for after his retirement from the Company. The Company made no other contracts with members of the Executive Board or Supervisory Board that would have required a resolution of the Supervisory Board.
The Supervisory Board closely examined the Executive Board’s corporate governance statement pursuant to the German Commercial Code, section 289a. We approved the statement with the combined SAP Group and SAP SE management report.
SAP SE and Consolidated Financial Reports for 2016
KPMG audited the SAP SE and consolidated financial reports for 2016. The Annual General Meeting of Shareholders elected KPMG as the SAP SE and SAP Group auditor on Thursday, May 12, 2016. The Supervisory Board proposed the appointment of KPMG on the recommendation of the Audit Committee. Before proposing KPMG to the Annual General Meeting of Shareholders as auditor for the year, the chairperson of the Supervisory Board and the Audit Committee obtained confirmation from KPMG that circumstances did not exist that might prejudice or raise any doubt concerning its independence as the Company’s auditor. In that connection, KPMG informed us of the volume of the services that were not part of the audit which it had either provided to the Group in the past year or was engaged to provide in the year to come. The Supervisory Board has agreed with KPMG that the auditor should report to the Supervisory Board and record in the auditor’s report any fact found during the audit that is inconsistent with the declaration given by the Executive Board and the Supervisory Board concerning implementation of the German Corporate Governance Code. KPMG examined the SAP SE financial statements prepared in accordance with the German Commercial Code, the consolidated financial statements prepared in accordance with International Financial Reporting Standards (IFRSs) as required by the German Commercial Code, section 315a, and the combined SAP Group and SAP SE management report, and certified them without qualification. The auditor thus confirmed that, in its opinion and based on its audit in accordance with the applicable accounting principles, the SAP SE and consolidated financial statements give a true and fair view of the net assets, financial position, and results of operations of SAP SE and the SAP Group. The auditor also confirmed that the combined SAP SE and SAP Group management report is consistent with the corresponding financial statements and as a whole gives a suitable view of the position of SAP SE and the SAP Group and of foreseeable opportunities and risks. KPMG had completed its audit of SAP’s internal control over financial reporting and certified without qualification that it complies with the applicable U.S. standards. The auditor stated in its opinion that it considers SAP’s internal controls over financial reporting to be effective in all material respects. All Audit Committee and Supervisory Board members received the documents concerning the financial statements mentioned above, the audit reports prepared by KPMG, and the Executive Board’s proposal concerning the appropriation of retained earnings in good time.
On February 20, 2017, the Executive Board prepared the financial accounts of SAP SE and the Group for 2016, comprising the SAP SE financial statements, the consolidated financial statements, and the combined management report, and submitted them without delay to the Supervisory Board.
At the meeting of the Audit Committee on February 21, 2017, and at the meeting of the Supervisory Board on February 22, 2017, the Executive Board explained the financial statements of SAP SE and the SAP Group and its proposal concerning the appropriation of retained earnings. Members of the Executive Board answered questions from the Audit Committee and the Supervisory Board. At the Audit Committee meeting, they also explained the Annual Report on Form20-F.
After the Executive Board had explained them, the Audit Committee and the Supervisory Board reviewed the financial statement documents in the light of KPMG’s audit reports. The representatives of the auditor who attended presented full reports on the audit and the results of the audit to the Audit Committee and Supervisory Board meetings and explained the audit report. The auditor also reported that it had not identified any material weaknesses in our internal control and risk-management systems for financial reporting. Both the Audit Committee and the Supervisory Board asked detailed questions about the form, scope, and results of the audit. The Audit Committee reported to the Supervisory Board on its own review of the financial statements of SAP SE and the SAP Group, its discussions with the Executive Board and with the auditor, and its supervision of the financial reporting process. It confirmed that as part of its supervisory work, it had addressed the effectiveness of the SAP Group internal control, risk management, and internal auditing systems, and found the systems to be effective.
The Committee also reported that KPMG had told it that no circumstances had arisen that might give cause for concern about KPMG’s impartiality, and informed us about the services KPMG had provided that were not part of the audit. The Committee reported that it had examined the auditor’s independence, taking thenon-audit services it had rendered into consideration, and stated that in the Committee’s opinion the auditor possessed the required degree of independence.
| To Our Stakeholders | Report by the Supervisory Board | 22 |
Table of Contents
The Audit Committee and the Supervisory Board satisfied themselves that KPMG had conducted the audit properly. In particular, they concluded that both the audit reports and the audit itself fulfilled the legal requirements. On the basis of the report and the Audit Committee’s recommendation, the Supervisory Board approved the audit and, since there were no findings from our own examination, we gave our consent to the SAP SE financial statements, the consolidated financial statements, and the combined management report (including the Executive Board’s corporate governance statement pursuant to the German Commercial Code, section 289a). The financial statements and combined management report were thus formally adopted. The Supervisory Board’s opinion of the Company and the Group coincided with that of the Executive Board as set out in the combined management report. The Supervisory Board considered the proposal presented by the Executive Board concerning the appropriation of retained earnings. We had regard to the requirements of dividends policy, the effects on the liquidity of the Group, and the interests of the shareholders. We also discussed these matters with the auditor. We then endorsed the Executive Board’s proposal concerning the appropriation of retained earnings, in accordance with the Audit Committee’s recommendation. Finally, we approved this present report.
Changes on the Supervisory and Executive Boards
Stefan Ries and Steve Singh were appointed members of the Executive Board with effect from April 1, 2016.
After 36 years at SAP – 21 of which as member of the Executive Board – Gerhard Oswald retired from the Company and the Executive Board on December 31, 2016. He remains associated with SAP as a consultant so that SAP is still able to benefit from his experience and expertise. We thank Gerhard Oswald for his many years of valuable and constructive service to SAP.
Gesche Joost, who was initially appointed by the court as interim member of the Supervisory Board at the end of May 2015, was elected to the Supervisory Board as shareholder representative on May 12, 2016, by the Annual General Meeting of Shareholders.
The Supervisory Board thanks the Executive Board, the managing directors of the Group companies, and all of our employees for their hard work and dedication in 2016. We would also like to thank our customers and partners. Without them, our Company’s success would not be possible.
For the Supervisory Board
Professor Hasso Plattner
(Chairperson)
| To Our Stakeholders | Report by the Supervisory Board | 23 |
Table of Contents
Compensation for Executive and Supervisory Board Members
This compensation report outlines the criteria that we applied for the year 2016 to determine compensation for Executive Board and Supervisory Board members, discloses the amount of compensation paid, and describes the compensation systems. It also contains information about share-based payment plans for Executive Board members and shares held by Executive Board and Supervisory Board members.
Compensation for Executive Board Members
Compensation System for 2016
The 2016 compensation for Executive Board members is intended to reflect SAP’s company size and global presence as well as our economic and financial standing. The compensation level is internationally competitive to reward committed, successful work in a dynamic business environment.
The compensation package for each Executive Board member is determined based on their individual role and performance. The package has three elements:
| ∎ | A fixed annual salary element |
| ∎ | A variable short-term incentive (STI) element to reward performance in the plan year |
| ∎ | A variable long-term incentive (LTI) element tied to the price of SAP shares to reward performance over multiple years |
The fixed annual salary and STI elements are paid in the currency of the Executive Board member’s home country, whereas compensation for the LTI element is paid in euros.
The Supervisory Board sets a compensation target for the sum of the fixed and the two variable elements. It reviews, and if appropriate, revises this compensation target every year. The review takes into account SAP’s business performance and the compensation paid to board members at comparable companies on the international stage. The following charts visualize the relation of the fixed and the variable compensation targets for the Executive Board members for 2016:
Compensation Scheme
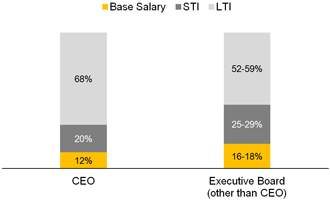
The amount of variable compensation depends on SAP’s performance against performance targets that the Supervisory Board sets for each plan year. The performance targets are key performance indicator (KPI) values aligned to the SAP budget for the plan year.
The following criteria apply to the elements of Executive Board compensation for 2016:
| ∎ | The fixed annual salary element is paid as a monthly salary. |
| ∎ | The variable STI element was determined under the STI 2016 plan. Under this plan, the STI compensation depends on the performance of the SAP Group against the predefined target values for three KPIs:non-IFRS constant currency cloud and software revenue growth;non-IFRS constant currency operating margin increase; and constant currency new cloud bookings. In addition, the STI 2016 plan provides for a discretionary element that allows the Supervisory Board, after the end of the fiscal year 2016, to address not only an Executive Board member’s individual performance, but also SAP’s performance in terms of market position, innovative power, customer satisfaction, employee satisfaction (taking innovative HR strategy, HR excellence, leadership development and social partnership into consideration), and attractiveness as an employer. A threshold of 75% for the total target achievement level applies for the financial KPIs: if the sum of the weighted individual target achievements for the financial KPIs is below 75% (threshold), there is no payout for the pro rata target bonus. A cap of 175% applies for each financial KPI, and a cap of 200% applies for the discretionary KPI. Moreover, if there has been any extraordinary and unforeseeable event, the Supervisory Board can, at its reasonable discretion, retroactively adjust payouts up or down in the interest of SAP. |
| ∎ | On February 22, 2017, the Supervisory Board assessed SAP’s performance against the agreed targets and determined the amount of compensation payable under the STI 2016 plan. The STI 2016 plan will be paid out after the Annual General Meeting of Shareholders in May 2017. |
| 1) | This compensation report is part of the audited management report |
| To Our Stakeholders | Compensation Report | 24 |
Table of Contents
| ∎ | The variable LTI element was determined under the LTI 2016 plan effective January 1, 2016, however, the grant date of the tranche 2016 is March 24, 2016. The purpose of the LTI 2016 plan is to reflect the operating profit target achievement, to ensure long-term retention of our Executive Board members, and to reward a share price outperformance by SAP as compared to a group of its peers (Peer Group). |
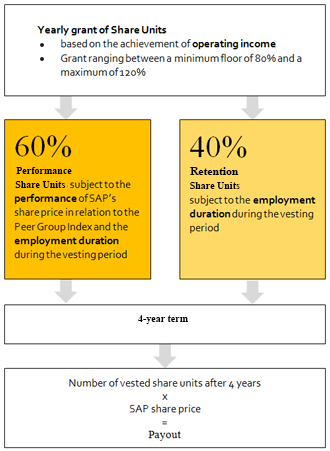
The LTI 2016 plan is an annual revolving remuneration element that is linked to the price of the SAP share. A grant amount determined by the Supervisory Board is converted into virtual shares, referred to as Share Units, by dividing the grant amount by the price of the SAP share (calculated on the basis of a defined average value). The grant amount is determined by the Supervisory Board in its discretion for each financial year at a level of between 80% and 120% of the contractual target amount; taking into account the achievement of the operating profit targets set for the preceding financial year.
The Share Units granted comprise 60% Performance Share Units (PSUs) and 40% Retention Share Units (RSUs). Both types of Share Units have a vesting period of (approximately) four years. Each Share Unit that finally vests entitles its holder to a (gross) payout corresponding to the price of one SAP share after the end of the holding period, but capped at three times the SAP share price applied for the conversion of the grant amount into Share Units. The number of PSUs that finally vests depends on the performance of the SAP share. If the increase of price of the SAP share over the vesting period of the PSUs exceeds the increase of a defined Peer Group Index over the same period, the number of PSUs is increased by a percentage equal to the outperformance expressed as percentage points. This percentage will be doubled if, in addition to the outperformance over the Peer Group Index, the price of the SAP share at the end of the vesting period of the PSUs is higher than the price at the start of this period. The number of vested PSUs a member can attain in respect to a plan year is capped at 150% of their initial PSU allocation for that year. Conversely, if the increase of price of the SAP share over the vesting period of the PSUs is below the increase in the Peer Group Index, the number of PSUs is reduced by a percentage equal to the difference expressed as percentage points. All PSUs lapse if the difference exceeds 50%. If the service contract for the Executive Board member is terminated before the end of the third year following the year in which the Share Units were granted, both the RSUs and PSUs are forfeited in whole or in part, depending on the circumstances of the relevant resignation from office or termination of the service contract, as follows:
| ∎ | If the Executive Board member has resigned from office without cause and starts working for a competitor of SAP, whether on a free-lance basis or as an employee or otherwise prior to the end of the initial vesting period of the Share Units or the Supervisory Board terminates the Executive Board member’s service contract for cause, all Share Units are forfeited. |
| ∎ | A portion of the RSUs and PSUs are forfeited, if the Executive Board member has resigned from office without cause, but does not start working for a competitor of SAP prior to the end of the initial vesting period of the Share Units, or the Service Contract of the Executive Board member expires by mutual consent, is terminated by mutual consent, is terminated by the Executive Board member for cause or the Executive Board member retires. Expiration by mutual consent or termination by mutual consent occurs if the Executive Board member is notre-appointed or does not accept the reappointment or an extraordinary expiration is provided by the Service Contract of the Executive Board member, that is, in the case of a permanent inability to work. The portion of the RSUs and PSUs which forfeit equal the proportion of plan participation to the vesting period (for example, if the Executive Board member leaves with effect from December 31, 2016, three quarters of the Share Units granted in 2016 would be forfeited). The remaining Share Units will continue to be in effect. In addition, the number of remaining PSUs is adjusted subject to the performance of SAP’s share price in relation to the Peer Group Index. The same applies if the Executive Board member dies, however the Share Units are paid out pro rata temporis within 90 days after death on the basis of the then current SAP share price. |
| ∎ | In the event of a change of control as defined in the service contract of the Executive Board member, the following generally applies: |
The Share Units are paid out without undue delay within 90 days on a pro rata temporis basis, plus 50% of the Share Units (which
| To Our Stakeholders | Compensation Report | 25 |
Table of Contents
otherwise, under mere pro rata aspects, would be forfeited), on the basis of the then current SAP share price. In addition, the number – reduced on a pro rata temporis basis – of PSUs paid out may change with the relevant outperformance of the SAP share compared to the Peer Group Index as determined on the day the change of control event is effective. The remaining Share Units are forfeited.
| ∎ | To compensate for disadvantages resulting from leaver rules under the LTI 2016 plan in comparison to the previous RSU Milestone Plan, all current Executive Board members will receive an individual equalization amount as an amendment to the leaver rules of the LTI 2016 plan. The equalization amount is the sum of partial amounts applicable for the years 2016 and 2017 and, in one case, also for the year 2018. The respective annual partial amount is subject to a target achievement of at least 60% of the operating profit target and an ongoing employment relationship of the respective year. In the event of termination, PSUs equal to this amount based on the then-applicable reference share price will be granted. PSUs which would otherwise be forfeited in the event of termination of the service contract for the Executive Board member will not be forfeited to the extent of this calculated amount. If the PSUs which would be forfeited in the termination year is lower than the equalization amount, PSUs from the preceding financial year and, if required, from earlier years which would otherwise be forfeited, will becomenon-forfeitable. |
Amount of Compensation for 2016
We present the Executive Board compensation disclosures in accordance with the recommendations of the German Corporate Governance Code (“GCGC”). Furthermore, the table below provides a reconciliation statement following the requirements of sections 314 and 315 of the German Commercial Code (Handelsgesetzbuch, or “HGB”) as specified in the German Accounting Standards (“GAS 17”).
Pursuant to the recommendations of the GCGC, the value of benefits granted for the year under review as well as the allocation, that is, the amounts disbursed for the year under review, are disclosed below based on the reference tables recommended in the GCGC.
In contrast to the disclosure rules stipulated in the German HGB and GAS 17, the GCGC includes the service cost according to IAS 19 in the Executive Board compensation and requires the additional disclosure of the target value for theone-year variable compensation and the maximum and minimum compensation amounts achievable for the variable compensation elements.
| To Our Stakeholders | Compensation Report | 26 |
Table of Contents
Executive Board Members’ Compensation
German Corporate Governance Code (Benefits Granted in 2015 and 2016)
Benefits Granted € thousands | Bill McDermott CEO | Robert Enslin Member of the Executive Board | Michael Kleinemeier Member of the Executive Board | |||||||||||||||||||||||||||||||||||||||||||||
| 20161) | 2016 (Min) | 2016 (Max) | 20152) | 20161) | 2016 (Min) | 2016 (Max) | 20152) | 2016 | 2016 (Min) | 2016 (Max) | 2015 | |||||||||||||||||||||||||||||||||||||
| Fixed compensation | 1,403.0 | 1,403.0 | 1,403.0 | 1,150.0 | 854.0 | 854.0 | 854.0 | 700.0 | 700.0 | 700.0 | 700.0 | 116.7 | ||||||||||||||||||||||||||||||||||||
| Fringe benefits3) | 1,625.7 | 1,625.7 | 1,625.7 | 1,258.0 | 474.0 | 474.0 | 474.0 | 103.3 | 26.9 | 26.9 | 26.9 | 0 | ||||||||||||||||||||||||||||||||||||
|
|
|
|
|
|
|
|
|
|
|
|
|
|
|
|
|
|
|
|
|
|
|
| |||||||||||||||||||||||||
| Total | 3,028.7 | 3,028.7 | 3,028.7 | 2,408.0 | 1,328.0 | 1,328.0 | 1,328.0 | 803.3 | 726.9 | 726.9 | 726.9 | 116.7 | ||||||||||||||||||||||||||||||||||||
| One-year variable compensation | 2,382.1 | 0 | 4,317.6 | 1,860.0 | 1,441.8 | 0 | 2,613.3 | 1,125.8 | 1,125.8 | 0 | 2,040.5 | 188.1 | ||||||||||||||||||||||||||||||||||||
| Multiyear variable compensation | ||||||||||||||||||||||||||||||||||||||||||||||||
LTI 2016 Plan | 8,000.3 | 0 | 33,129.7 | – | 2,641.3 | 0 | 10,937.5 | – | 2,476.6 | 0 | 10,255.9 | – | ||||||||||||||||||||||||||||||||||||
RSU Milestone Plan 2015 | – | – | – | – | – | – | – | – | – | – |
| – |
| 315.0 | ||||||||||||||||||||||||||||||||||
|
|
|
|
|
|
|
|
|
|
|
|
|
|
|
|
|
|
|
|
|
|
|
| |||||||||||||||||||||||||
| Total | 13,411.1 | 3,028.7 | 40,476.0 | 4,268.0 | 5,411.1 | 1,328.0 | 14,878.8 | 1,929.1 | 4,329.3 | 726.9 | 13,023.3 | 619.8 | ||||||||||||||||||||||||||||||||||||
| Service cost | 571.3 | 571.3 | 571.3 | 682.4 | 34.7 | 34.7 | 34.7 | 308.0 | 0 | 0 | 0 | 0 | ||||||||||||||||||||||||||||||||||||
|
|
|
|
|
|
|
|
|
|
|
|
|
|
|
|
|
|
|
|
|
|
|
| |||||||||||||||||||||||||
| Total according to GCGC | 13,982.4 | 3,600.0 | 41,047.3 | 4,950.4 | 5,445.8 | 1,362.7 | 14,913.5 | 2,237.1 | 4,329.3 | 726.9 | 13,023.3 | 619.8 | ||||||||||||||||||||||||||||||||||||
| Reconciliation reporting of total compensation pursuant to Section 314(1)(6a) HGB in connection with GAS 17 | ||||||||||||||||||||||||||||||||||||||||||||||||
| Less granted annual variable target compensation | -2,382.1 | -1,860.0 | -1,441.8 | -1,125.8 | -1,125.8 | -188.1 | ||||||||||||||||||||||||||||||||||||||||||
| Plus allocated actual annual variable compensation | 2,486.9 | 2,743.5 | 1,505.2 | 1,660.5 | 1,175.3 | 277.5 | ||||||||||||||||||||||||||||||||||||||||||
| Less difference in measuring grant value4) | -51.8 | |||||||||||||||||||||||||||||||||||||||||||||||
| Less service cost | -571.3 | -682.4 | -34.7 | -308.0 | 0 | 0 | ||||||||||||||||||||||||||||||||||||||||||
|
|
|
|
|
|
|
|
|
|
|
| |||||||||||||||||||||||||||||||||||||
| Total compensation | 13,515.9 | 5,151.5 | 5,474.5 | 2,463.8 | 4,378.8 | 657.4 | ||||||||||||||||||||||||||||||||||||||||||
| To Our Stakeholders | Compensation Report | 27 |
Table of Contents
German Corporate Governance Code (Benefits Granted in 2015 and 2016)
Benefits Granted € thousands | Bernd Leukert Member of the Executive Board | Luka Mucic Member of the Executive Board | Gerhard Oswald Member of the Executive Board (until December 31, 2016) | |||||||||||||||||||||||||||||||||||||||||||||
| 2016 | 2016 (Min) | 2016 (Max) | 2015 | 2016 | 2016 (Min) | 2016 (Max) | 2015 | 2016 | 2016 (Min) | 2016 (Max) | 2015 | |||||||||||||||||||||||||||||||||||||
| Fixed compensation | 700.0 | 700.0 | 700.0 | 700.0 | 700.0 | 700.0 | 700.0 | 700.0 | 700.0 | 700.0 | 700.0 | 700.0 | ||||||||||||||||||||||||||||||||||||
| Fringe benefits3) | 12.4 | 12.4 | 12.4 | 11.7 | 12.1 | 12.1 | 12.1 | 12.1 | 105.4 | 105.4 | 105.4 | 22.4 | ||||||||||||||||||||||||||||||||||||
| Total | 712.4 | 712.4 | 712.4 | 711.7 | 712.1 | 712.1 | 712.1 | 712.1 | 805.4 | 805.4 | 805.4 | 722.4 | ||||||||||||||||||||||||||||||||||||
| One-year variable compensation | 1,125.8 | 0 | 2,040.5 | 1,125.8 | 1,125.8 | 0 | 2,040.5 | 1,125.8 | 1,125.8 | 0 | 2,040.5 | 1,125.8 | ||||||||||||||||||||||||||||||||||||
| Multiyear variable compensation | ||||||||||||||||||||||||||||||||||||||||||||||||
LTI 2016 Plan | 2,789.6 | 0 | 11,551.8 | – | 2,476.6 | 0 | 10,255.9 | – | 2,086.2 | 0 | 8,639.3 | – | ||||||||||||||||||||||||||||||||||||
RSU Milestone Plan 2015 | – | – | – | – | – | – | – | – | – | – | – | – | ||||||||||||||||||||||||||||||||||||
|
|
|
|
|
|
|
|
|
|
|
|
|
|
|
|
|
|
|
|
|
|
|
| |||||||||||||||||||||||||
| Total | 4,627.8 | 712.4 | 14,304.7 | 1,837.5 | 4,314.5 | 712.1 | 13,008.5 | 1,837.9 | 4,017.4 | 805.4 | 11,485.2 | 1,848.2 | ||||||||||||||||||||||||||||||||||||
| Service cost | 0 | 0 | 0 | 0 | 0 | 0 | 0 | 0 | 0 | 0 | 0 | 0 | ||||||||||||||||||||||||||||||||||||
|
|
|
|
|
|
|
|
|
|
|
|
|
|
|
|
|
|
|
|
|
|
|
| |||||||||||||||||||||||||
| Total according to GCGC | 4,627.8 | 712.4 | 14,304.7 | 1,837.5 | 4,314.5 | 712.1 | 13,008.5 | 1,837.9 | 4,017.4 | 805.4 | 11,485.2 | 1,848.2 | ||||||||||||||||||||||||||||||||||||
| Reconciliation reporting of total compensation pursuant to Section 314(1)(6a) HGB in connection with GAS 17 | ||||||||||||||||||||||||||||||||||||||||||||||||
| Less granted annual variable target compensation | -1,125.8 | -1,125.8 | -1,125.8 | -1,125.8 | -1,125.8 | -1,125.8 | ||||||||||||||||||||||||||||||||||||||||||
| Plus allocated actual annual variable compensation | 1,175.3 | 1,660.5 | 1,175.3 | 1,660.5 | 1,175.3 | 1,660.5 | ||||||||||||||||||||||||||||||||||||||||||
| Less difference in measuring grant value | ||||||||||||||||||||||||||||||||||||||||||||||||
| Less service cost | 0 | 0 | 0 | 0 | 0 | 0 | ||||||||||||||||||||||||||||||||||||||||||
|
|
|
|
|
|
|
|
|
|
|
| |||||||||||||||||||||||||||||||||||||
| Total compensation | 4,677.3 | 2,372.2 | 4,364.0 | 2,372.6 | 4,066.9 | 2,382.9 | ||||||||||||||||||||||||||||||||||||||||||
| To Our Stakeholders | Compensation Report | 28 |
Table of Contents
German Corporate Governance Code (Benefits Granted in 2015 and 2016)
Benefits Granted € thousands | Stefan Ries Member of the Executive Board (from April 1, 2016) | Steve Singh Member of the Executive Board (from April 1, 2016) | Total Executive Board Compensation | |||||||||||||||||||||||||||||||||||||
| 2016 | 2016 (Min) | 2016 (Max) | 2015 | 20161) | 2016 (Min) | 2016 (Max) | 2015 | 2016 | 2015 | |||||||||||||||||||||||||||||||
| Fixed compensation | 525.0 | 525.0 | 525.0 | – | 640.0 | 640.0 | 640.0 | – | 6,222.0 | 4,066.7 | ||||||||||||||||||||||||||||||
| Fringe benefits3) | 13.5 | 13.5 | 13.5 | – | 6.1 | 6.1 | 6.1 | – | 2,276.1 | 1,407.5 | ||||||||||||||||||||||||||||||
|
|
|
|
|
|
|
|
|
|
|
|
|
|
|
|
|
|
|
| |||||||||||||||||||||
| Total | 538.5 | 538.5 | 538.5 | – | 646.1 | 646.1 | 646.1 | – | 8,498.1 | 5,474.2 | ||||||||||||||||||||||||||||||
| One-year variable compensation | 845.9 | 0 | 1,533.2 | – | 1,083.3 | 0 | 1,963.5 | – | 10,256.3 | 6,551.3 | ||||||||||||||||||||||||||||||
| Multiyear variable compensation | ||||||||||||||||||||||||||||||||||||||||
LTI 2016 Plan | 1,532.1 | 0 | 6,491.3 | – | 1,939.7 | 0 | 8,218.0 | – | 23,942.4 | – | ||||||||||||||||||||||||||||||
RSU Milestone Plan 2015 | – | – | – | – | – | – | – | – | – | 315.0 | ||||||||||||||||||||||||||||||
|
|
|
|
|
|
|
|
|
|
|
|
|
|
|
|
|
|
|
| |||||||||||||||||||||
| Total | 2,916.5 | 538.5 | 8,563.0 | – | 3,669.1 | 646.1 | 10,827.6 | – | 42,696.8 | 12,340.5 | ||||||||||||||||||||||||||||||
| Service cost | 0 | 0 | 0 | – | 0 | 0 | 0 | – | 606.0 | 990.4 | ||||||||||||||||||||||||||||||
|
|
|
|
|
|
|
|
|
|
|
|
|
|
|
|
|
|
|
| |||||||||||||||||||||
| Total according to GCGC | 2,916.5 | 538.5 | 8,563.0 | – | 3,669.1 | 646.1 | 10,827.6 | – | 43,302.8 | 13,330.9 | ||||||||||||||||||||||||||||||
| Reconciliation reporting of total compensation pursuant to Section 314(1)(6a) HGB in connection with GAS 17 | ||||||||||||||||||||||||||||||||||||||||
| Less granted annual variable target compensation | -845.9 | – | -1,083.3 | – | -10,256.3 | -6,551.3 | ||||||||||||||||||||||||||||||||||
| Plus allocated actual annual variable compensation | 883.1 | – | 1,131.0 | – | 10,707.4 | 9,663.0 | ||||||||||||||||||||||||||||||||||
| Less difference in measuring grant value4) | 0 | -51.8 | ||||||||||||||||||||||||||||||||||||||
| Less service cost | 0 | – | 0 | – | -606.0 | -990.4 | ||||||||||||||||||||||||||||||||||
|
|
|
|
|
|
|
|
|
|
|
| |||||||||||||||||||||||||||||
| Total compensation | 2,953.7 | – | 3,716.8 | – | 43,147.9 | 15,400.4 | ||||||||||||||||||||||||||||||||||
| 1) | The value of the fixed andone-year variable elements is granted in U.S. dollars. For conversion purposes from U.S. dollars into euro, for fixed compensation the 2016 average exchange rate applies and for theone-year variable element the 2016year-end exchange rate applies. |
| 2) | The value of the fixed andone-year variable elements is subject to a contractual exchange-rate clause applied at the end of the year, so the amounts actually paid may be greater. |
| 3) | Insurance contributions, benefits in kind, expenses for maintenance of two households, use of aircraft as well as tax and discrete payments arising through application of the fixed exchange-rate clause in 2016 for 2015. |
| 4) | Total grant value at time of grant according to GCGC (€ 315.000) deducted by the grant value calculated as required under section 314 of the German Commercial Code (€ 263.200). |
The total Executive Board compensation for 2016 calculated as required under section 314 of the German Commercial Code amounted to € 43,147,900. Including RSU Milestone Plan 2015 awards for 2015 granted in 2015 to Michael Kleinemeier (€ 263,200) upon his appointment to the Executive Board, the total Executive Board compensation for 2015 calculated as required under section 314 of the German Commercial Code amounted to € 15,400,400.
| To Our Stakeholders | Compensation Report | 29 |
Table of Contents
The share-based payment amounts included in the 2016 compensation result from the following RSUs and PSUs under the LTI 2016 Plan.
Share-Based Payment Under LTI 2016 Plan (Grants for 2016)
| Grants for 2016 | ||||||||||||||||||||||||
| Quantity | (RSU) Retention Share Units (40%) | (PSU) Performance Share Units (60%) | Grant Value per RSU at Time of Grant | Grant Value per PSU at Time of Grant | Total Grant Value at Time of Grant | |||||||||||||||||||
| € | € | € thousands | ||||||||||||||||||||||
| Bill McDermott (CEO) | 122,423 | 48,969 | 73,454 | 66.52 | 64.57 | 8,000 | ||||||||||||||||||
| Robert Enslin | 40,417 | 16,167 | 24,250 | 66.52 | 64.57 | 2,641 | ||||||||||||||||||
| Michael Kleinemeier | 37,898 | 15,159 | 22,739 | 66.52 | 64.57 | 2,477 | ||||||||||||||||||
| Bernd Leukert | 42,687 | 17,075 | 25,612 | 66.52 | 64.57 | 2,790 | ||||||||||||||||||
| Luka Mucic | 37,898 | 15,159 | 22,739 | 66.52 | 64.57 | 2,477 | ||||||||||||||||||
| Gerhard Oswald (until December 31, 2016) | 31,924 | 12,770 | 19,154 | 66.52 | 64.57 | 2,086 | ||||||||||||||||||
| Stefan Ries (from April 1, 2016) | 23,987 | 9,595 | 14,392 | 65.77 | 62.61 | 1,532 | ||||||||||||||||||
| Steve Singh (from April 1, 2016) | 30,368 | 12,147 | 18,221 | 65.77 | 62.61 | 1,940 | ||||||||||||||||||
|
|
|
|
|
|
|
| |||||||||||||||||
| Total | 367,602 | 147,041 | 220,561 | 23,942 | ||||||||||||||||||||
German Corporate Governance Code (Allocation)
Allocation € thousands | Bill McDermott CEO | Robert Enslin Member of the Executive Board | Michael Kleinemeier Member of the Executive Board | |||||||||||||||||||||
| 20161) | 2015 | 20161) | 2015 | 2016 | 2015 | |||||||||||||||||||
| Fixed compensation | 1,403.0 | 1,150.0 | 854.0 | 700.0 | 700.0 | 116.7 | ||||||||||||||||||
| Fringe benefits2) | 1,625.7 | 1,258.0 | 474.0 | 103.3 | 26.9 | 0 | ||||||||||||||||||
|
|
|
|
|
|
|
|
|
|
|
| |||||||||||||
| Total | 3,028.7 | 2,408.0 | 1,328.0 | 803.3 | 726.9 | 116.7 | ||||||||||||||||||
| One-year variable compensation | 2,743.5 | 2,036.7 | 1,660.5 | 817.3 | 277.5 | – | ||||||||||||||||||
| Multiyear variable compensation | ||||||||||||||||||||||||
RSU Milestone Plan 2015 | 9,244.7 | – | – | – | – | – | ||||||||||||||||||
SAP SOP 2011 | – | – | – | – | – | – | ||||||||||||||||||
| Other | – | – | – | – | – | – | ||||||||||||||||||
|
|
|
|
|
|
|
|
|
|
|
| |||||||||||||
| Total | 15,016.9 | 4,444.7 | 2,988.5 | 1,620.6 | 1,004.4 | 116.7 | ||||||||||||||||||
| Service cost | 571.3 | 682.4 | 34.7 | 308.0 | 0 | 0 | ||||||||||||||||||
|
|
|
|
|
|
|
|
|
|
|
| |||||||||||||
| Total | 15,588.2 | 5,127.1 | 3,023.2 | 1,928.6 | 1,004.4 | 116.7 | ||||||||||||||||||
| To Our Stakeholders|Compensation Report | 30 |
Table of Contents
German Corporate Governance Code (Allocation)
Allocation € thousands | Bernd Leukert Member of the Executive Board | Luka Mucic Member of the Executive Board | Gerhard Oswald Member of the Executive Board (until December 31, 2016) | |||||||||||||||||||||
| 2016 | 2015 | 2016 | 2015 | 2016 | 2015 | |||||||||||||||||||
| Fixed compensation | 700.0 | 700.0 | 700.0 | 700.0 | 700.0 | 700.0 | ||||||||||||||||||
| Fringe benefits2) | 12.4 | 11.7 | 12.1 | 12.1 | 105.4 | 22.4 | ||||||||||||||||||
|
|
|
|
|
|
|
|
|
|
|
| |||||||||||||
| Total | 712.4 | 711.7 | 712.1 | 712.1 | 805.4 | 722.4 | ||||||||||||||||||
| One-year variable compensation | 1,660.5 | 817.3 | 1,660.5 | 621.4 | 1,660.5 | 1,232.7 | ||||||||||||||||||
| Multiyear variable compensation | ||||||||||||||||||||||||
RSU Milestone Plan 2015 | – | – | – | – | 3,316.2 | – | ||||||||||||||||||
SAP SOP 2011 | – | – | – | – | – | 1,126.7 | ||||||||||||||||||
| Other | – | – | – | – | – | – | ||||||||||||||||||
|
|
|
|
|
|
|
|
|
|
|
| |||||||||||||
| Total | 2,372.9 | 1,529.0 | 2,372.6 | 1,333.5 | 5,782.1 | 3,081.8 | ||||||||||||||||||
| Service cost | 0 | 0 | 0 | 0 | 0 | 0 | ||||||||||||||||||
|
|
|
|
|
|
|
|
|
|
|
| |||||||||||||
| Total | 2,372.9 | 1,529.0 | 2,372.6 | 1,333.5 | 5,782.1 | 3,081.8 | ||||||||||||||||||
German Corporate Governance Code (Allocation)
Allocation € thousands | Stefan Ries Member of the Executive Board (from April 1, 2016) | Steve Singh Member of the Executive Board (from April 1, 2016) | Total Executive Board Compensation | |||||||||||||||||||||
| 2016 | 2015 | 20161) | 2015 | 2016 | 2015 | |||||||||||||||||||
| Fixed compensation | 525.0 | – | 640.0 | – | 6,222.0 | 4,066.7 | ||||||||||||||||||
| Fringe benefits2) | 13.5 | – | 6.1 | – | 2,276.1 | 1,407.5 | ||||||||||||||||||
|
|
|
|
|
|
|
|
|
|
|
| |||||||||||||
| Total | 538.5 | 0 | 646.1 | 0 | 8,498.1 | 5,474.2 | ||||||||||||||||||
| One-year variable compensation | – | – | – | – | 9,663.0 | 5,525.4 | ||||||||||||||||||
| Multiyear variable compensation | ||||||||||||||||||||||||
RSU Milestone Plan 2015 | – | – | – | – | 12,560.9 | – | ||||||||||||||||||
SAP SOP 2011 | – | – | – | – | – | 1,126.7 | ||||||||||||||||||
| Other | – | – | – | – | – | – | ||||||||||||||||||
|
|
|
|
|
|
|
|
|
|
|
| |||||||||||||
| Total | 538.5 | 0 | 646.1 | 0 | 30,722.0 | 12,126.3 | ||||||||||||||||||
| Service cost | 0 | – | 0 | – | 606.0 | 990.4 | ||||||||||||||||||
|
|
|
|
|
|
|
|
|
|
|
| |||||||||||||
| Total | 538.5 | 0 | 646.1 | 0 | 31,328.0 | 13,116.7 | ||||||||||||||||||
| 1) | The value of the fixed and one-year variable elements is granted in U.S. dollars. For conversion purposes from U.S. dollars into euro, for fixed compensation the 2016 average exchange rate applies and for theone-year variable element the 2016year-end exchange rate applies. |
| 2) | Insurance contributions, benefits in kind, expenses for maintenance of two households, use of aircraft as well as tax and discrete payments arising through application of the fixed exchange-rate clause in 2016 for 2015. |
| To Our Stakeholders | Compensation Report | 31 |
Table of Contents
End-of-Service Benefits
RegularEnd-of-Service Undertakings
Retirement Pension Plan
The following retirement pension agreements apply to the individual members of the Executive Board:
| ∎ | Michael Kleinemeier, Bernd Leukert, Luka Mucic, Gerhard Oswald, and Stefan Ries receive a retirement pension when they reach the retirement age of 60 (62 for Board members appointed after January 1, 2012) and retire from their Executive Board seat; or a disability pension depending on health examination if, before reaching the regular retirement age, they become subject to occupational disability or permanent incapacity. A surviving dependent’s pension is paid on the death of a former member of the Executive Board. The disability pension is 100% of the vested retirement pension entitlement and is payable until the beneficiary’s 60th birthday, after which it is replaced by a retirement pension. The surviving dependent’s pension is 60% of the retirement pension or vested disability pension entitlement at death. Entitlements are enforceable against SAP SE. Current pension payments are reviewed annually for adjustments and, if applicable, increased according to the surplus in the pension liability insurance. If service is ended before the retirement age of 60 (62 for Board members appointed after January 1, 2012), pension entitlement is reduced in proportion as the actual length of service stands in relation to the maximum possible length of service. The applied retirement pension plan is contributory. The contribution is 4% of applicable compensation up to the applicable income threshold plus 14% of applicable compensation above the applicable income threshold. For this purpose, applicable compensation is 180% of annual base salary. The applicable income threshold is the statutory annual income threshold for the state pension plan in Germany (West), as amended from time to time. Originally, Gerhard Oswald was under a performance-based retirement plan. This plan was discontinued when SAP introduced a contributory retirement pension plan in 2000. His pension benefits are derived from any accrued entitlements on December 31, 1999, under performance-based pension agreements and a salary-linked contribution for the period commencing January 1, 2000. Gerhard Oswald’s rights to retirement pension benefits increased by further annual contributions because he remained a member of the Executive Board after his 60th birthday until his retirement on December 31, 2016. |
| ∎ | Bill McDermott has rights to future benefits under the portion of the pension plan for SAP America classified as“Non-Qualified Retirement Plan” according to the U.S. Employee Retirement Income Security Act (ERISA). The“Non-Qualified” pension plan of SAP America is a cash balance plan that provides either monthly pension payments or a lump sum on retirement. The pension becomes available from the beneficiary’s 65th birthday. Subject to certain conditions, the plan also provides earlier payment or invalidity benefits. The“Non-Qualified” pension plan closed with effect from January 1, 2009. Interest continues to be paid on the earned rights to benefits within this plan. |
| ∎ | SAP made contributions to a third-party pension plan for Bill McDermott (2016: €571,300; 2015: €682,400) and Robert Enslin (2016: €34,700; 2015: €308,000). SAP’s contributions are based on payments by Bill McDermott and Robert Enslin into this pension plan. |
| ∎ | Steve Singh has no entitlements under the pension plan for Executive Board members. SAP made no retirement pension plan contributions to a third-party pension plan with respect to Steve Singh in 2016. |
| To Our Stakeholders | Compensation Report | 32 |
Table of Contents
Total Defined Benefit Obligations (DBO) and the Total Accruals for Pension Obligations to Executive Board Members
€ thousands | Bill McDermott (CEO) | Michael Kleinemeier1) | Bernd Leukert1) | Luka Mucic1) | Gerhard Oswald | Stefan Ries1) (from April 1, 2016) | Total | |||||||||||||||||||||
DBO January 1, 2015 | 1,212.5 | – | 123.2 | 102.8 | 7,221.4 | – | 8,659.9 | |||||||||||||||||||||
Less plan assets market value January 1, 2015 | – | – | 94.6 | 67.8 | 4,992.4 | – | 5,154.8 | |||||||||||||||||||||
|
|
|
|
|
|
|
|
|
|
|
|
|
| |||||||||||||||
| Accrued January 1, 2015 | 1,212.5 | – | 28.6 | 35.0 | 2,229.0 | – | 3,505.1 | |||||||||||||||||||||
DBO change in 2015 | 170.0 | 29.7 | 129.2 | 129.9 | -171.2 | – | 287.6 | |||||||||||||||||||||
Plan assets change in 2015 | – | 25.4 | 145.6 | 138.0 | 356.9 | – | 665.9 | |||||||||||||||||||||
DBO December 31, 2015 | 1,382.5 | 29.7 | 252.4 | 232.7 | 7,050.2 | – | 8,947.5 | |||||||||||||||||||||
Less plan assets market value December 31, 2015 | – | 25.4 | 240.2 | 205.8 | 5,349.3 | – | 5,820.7 | |||||||||||||||||||||
|
|
|
|
|
|
|
|
|
|
|
|
|
| |||||||||||||||
| Accrued December 31, 2015 | 1,382.5 | 4.3 | 12.2 | 26.9 | 1,700.9 | – | 3,126.8 | |||||||||||||||||||||
DBO change in 2016 | 76.7 | 125.2 | 199.2 | 211.9 | 920.7 | 257.9 | 1,791.6 | |||||||||||||||||||||
Plan assets change in 2016 | – | 156.0 | 149.5 | 141.8 | 378.6 | 116.7 | 942.6 | |||||||||||||||||||||
DBO December 31, 2016 | 1,459.2 | 154.9 | 451.6 | 444.6 | 7,970.9 | 257.9 | 10,739.1 | |||||||||||||||||||||
Less plan assets market value December 31, 2016 | – | 181.4 | 389.7 | 347.6 | 5,727.9 | 116.7 | 6,763.3 | |||||||||||||||||||||
|
|
|
|
|
|
|
|
|
|
|
|
|
| |||||||||||||||
| Accrued December 31, 2016 | 1,459.2 | –26.5 | 61.9 | 97.0 | 2,243.0 | 141.2 | 3,975.8 | |||||||||||||||||||||
| 1) | The values shown here only reflect the pension entitlements that Michael Kleinemeier, Bernd Leukert, Luka Mucic, and Stefan Ries will receive from the retirement pension plan for Executive Board members. |
The table below shows the annual pension entitlement earned during Executive Board membership of each member of the Executive Board on reaching the scheduled retirement age (60 for Executive Board members initially appointed before 2012 and 62 for Executive Board members initially appointed after January 1, 2012) based on entitlements from SAP under performance-based and salary-linked plans vested on December 31, 2016.
Annual Pension Entitlement
€ thousands | Vested on December 31, 2016 | Vested on December 31, 2015 | ||||||
| Bill McDermott (CEO)1) | 106.5 | 106.9 | ||||||
| Michael Kleinemeier | 5.2 | 0.7 | ||||||
| Bernd Leukert | 14.0 | 8.8 | ||||||
| Luka Mucic | 12.9 | 7.8 | ||||||
| Gerhard Oswald2) | 327.4 | 302.5 | ||||||
| Stefan Ries (from April 1, 2016) | 3.6 | – | ||||||
| 1) | The rights shown here for Bill McDermott refer solely to rights under the pension plan for SAP America. |
| 2) | Due to the extension of Gerhard Oswald’s contract beyond June 30, 2014, these values represent the retirement pension entitlement that he receives after his current Executive Board contract expired on December 31, 2016, based on the entitlements vested on December 31, 2016 (December 31, 2015). |
These are vested entitlements. To the extent that members continue to serve on the Executive Board and that therefore more contributions are made for them in the future, pensions actually payable at the scheduled retirement age will be higher than the amounts shown in the table.
PostcontractualNon-Compete Provisions
During the agreed12-month postcontractualnon-compete period, each Executive Board member receives abstention payments corresponding to 50% of the final average contractual compensation as agreed in the respective contract on an individual basis. Any other occupational income generated by the Executive Board member is deducted from their compensation in accordance with section 74c of the German Commercial Code.
The following table presents the net present values of the postcontractualnon-compete abstention payments. The net present values in the table reflect the discounted present value of the amounts that would be paid in the fictitious scenario in which the Executive Board members leave SAP at the end of their respective current contract terms and their final average contractual compensation prior to their departure equals the compensation in 2016. Actual postcontractualnon-compete payments will likely differ from these amounts depending on the time of departure and the compensation levels and target achievements at the time of departure.
| To Our Stakeholders | Compensation Report | 33 |
Table of Contents
Net Present Values of the PostcontractualNon-Compete Abstention Payments
€ thousands | Contract Term Expires | Net Present Value of Postcontractual Non-Compete Abstention Payment1) | ||||||
| Bill McDermott (CEO) | March 31, 2021 | 6,695.1 | ||||||
| Robert Enslin | March 31, 2021 | 2,711.8 | ||||||
| Michael Kleinemeier | October 31, 2018 | 2,190.4 | ||||||
| Bernd Leukert | March 31, 2021 | 2,316.9 | ||||||
| Luka Mucic | March 31, 2021 | 2,161.7 | ||||||
| Stefan Ries (from April 1, 2016) | March 31, 2019 | 1,477.2 | ||||||
| Steve Singh (from April 1, 2016) | March 31, 2019 | 1,858.8 | ||||||
|
| |||||||
| Total | 19,411.9 | |||||||
| 1) | For the purpose of this calculation, the following discount rates have been applied: Bill McDermott 0.22% (2015: 0.18%); Robert Enslin 0.22% (2015: 0.18%); Michael Kleinemeier-0.026% (2015: 0.50%); Bernd Leukert 0.22% (2015: 0.18%); Luka Mucic 0.22% (2015: 0.18%); Stefan Ries-0.01%; Steve Singh-0.01%. |
EarlyEnd-of-Service Undertakings
Severance Payments
The standard contract for all Executive Board members provides that on termination before full term (for example, where the member’s appointment is revoked, where the member becomes occupationally disabled, or in connection with a change of control), SAP SE will pay to the member the outstanding part of the compensation target for the entire remainder of the term, appropriately discounted for early payment. A member has no claim to that payment if they have not served SAP as a member of the Executive Board for at least one year or if they leave SAP SE for reasons for which they are responsible. Upon the appointment of Stefan Ries and Steve Singh to the Executive Board, the Supervisory Board abstained from the waiting period of one year.
If an Executive Board member’s appointment to the Executive Board expires or ceases to exist because of, or as a consequence of, change or restructuring, or due to a change of control, SAP SE and each Executive Board member has the right to terminate the employment contract within eight weeks of the occurrence by giving six months’ notice. A change of control is deemed to occur when a third party is required to make a mandatory takeover offer to the shareholders of SAP SE under the German Securities Acquisition and Takeover Act, when SAP SE merges with another company and becomes the subsumed entity, or when a control or profit transfer agreement is concluded with SAP SE as the dependent company. An Executive Board member’s contract can also be terminated before full term if their appointment as an Executive Board member of SAP SE is revoked in connection with a change of control.
PostcontractualNon-Compete Provisions
Abstention compensation for the postcontractualnon-compete period as described above is also payable on early contract termination.
Permanent Disability
In case of permanent disability, the contract will end at the end of the quarter in which the permanent inability to work was determined. The Executive Board member receives the monthly basic salary for a further 12 months starting from the date the permanent disability is determined.
Payments to Executive Board Members Retiring in 2016
Gerhard Oswald retired from his position as Executive Board member upon the end of his current term on December 31, 2016. He received the following payments in connection with his retirement:
| ∎ | For a period of 12 months following his retirement, he receives monthly abstention compensation for the postcontractualnon-compete period totaling € 1,922,193. |
| ∎ | Upon termination of his employment contract, Gerhard Oswald received compensation for unused leave totaling € 151,061.12. |
| ∎ | We have entered into a consulting contract with Gerhard Oswald. Based on this contract, he will be available to the Executive Board and to the Chairman of the Supervisory Board as a strategic advisor especially for customer-specific topics and events for SAP customers until the end of December 2018. |
Payments to Former Executive Board Members
In 2016, we paid pension benefits of € 1,667,000 to Executive Board members who had retired before January 1, 2016 (2015: € 1,580,000). At the end of the year, the DBO for former Executive Board members was € 33.935.000 (2015: € 32,758,000). Plan assets of € 26.053.000 are available to meet these obligations (2015: € 26,716,000).
Executive Board Members’ Holdings of Long-Term Incentives
Members of the Executive Board hold or held share-based payment rights throughout the year under the RSU Milestone Plan 2015 and the SAP SOP 2010 (which were granted in previous years). For information about the terms and details of these programs, see the Notes to the Consolidated Financial Statements section, Note (27).
LTI 2016 Plan
The table below shows Executive Board members’ holdings, on December 31, 2016, of Share Units issued to them under the LTI 2016 plan. The plan is an annual revolving cash-settled long-term incentive scheme with a payout after the vesting period.
| To Our Stakeholders | Compensation Report | 34 |
Table of Contents
LTI 2016 Plan (2016 Tranche)
Quantity of Share Units | Holding on January 1, 2016 | Grants in 2016 | Retention Share Units (40%) | Performance Share Units (60%) | Exercised Units | Forfeited Units1) | Balanced Performance Share Units2) | Holding on December 31, 2016 | ||||||||||||||||||||||||
| Bill McDermott (CEO) | – | 122,423 | 48,969 | 73,454 | – | – | 122,423 | |||||||||||||||||||||||||
| Robert Enslin | – | 40,417 | 16,167 | 24,250 | – | – | 40,417 | |||||||||||||||||||||||||
| Michael Kleinemeier | – | 37,898 | 15,159 | 22,739 | – | – | 37,898 | |||||||||||||||||||||||||
| Bernd Leukert | – | 42,687 | 17,075 | 25,612 | – | – | 42,687 | |||||||||||||||||||||||||
| Luka Mucic | – | 37,898 | 15,159 | 22,739 | – | – | 37,898 | |||||||||||||||||||||||||
| Gerhard Oswald (until December 31, 2016) | – | 31,924 | 12,770 | 19,154 | – | -23,927 | 17,038 | 25,035 | ||||||||||||||||||||||||
| Stefan Ries (from April 1, 2016) | – | 23,987 | 9,595 | 14,392 | – | – | 23,987 | |||||||||||||||||||||||||
| Steve Singh (from April 1, 2016) | – | 30,368 | 12,147 | 18,221 | – | – | 30,368 | |||||||||||||||||||||||||
|
|
|
|
|
|
|
|
|
|
|
|
|
|
|
| |||||||||||||||||
| Total | – | 367,602 | 147,041 | 220,561 | – | -23,927 | 17,038 | 360,713 | ||||||||||||||||||||||||
| 1) | Forfeiture according to leaver rules |
| 2) | To balance disadvantages from leaver rules under the LTI 2016 Plan |
RSU Milestone Plan 2015
The table below shows Executive Board members’ holdings, on December 31, 2016 and 2015, of RSUs issued to them under the RSU Milestone Plan 2015. The plan is a cash-settled long-term incentive scheme with a payout subsequent to a performance period of one year and an additional holding period of three years. The RSU Milestone Plan 2015 consists of four plan tranches to be issued with respect to the calendar years 2012 through 2015. The RSUs allocated in 2013 have a remaining term of 0.08 years; the RSUs allocated in 2014 have a remaining term of 1.08 years; and the RSUs allocated in 2015 have a remaining term of 2.08 years.
| To Our Stakeholders | Compensation Report | 35 |
Table of Contents
RSU Milestone Plan 2015 - Rollforward 2015/2016
Quantity of RSUs | Holding on January 1, 2015 | Grants in 2015 | Performance- Related Adjustment | Exercised Units | Forfeited Units | Holding on December 31, 2015 | Exercised Units Tranche 2012 | Holding on December 31, 2016 | ||||||||||||||||||||||||
| Bill McDermott (CEO) | 255,050 | 77,099 | 36,568 | – | 368,717 | -127,425 | 241,292 | |||||||||||||||||||||||||
| Robert Enslin | 14,148 | 27,656 | 12,329 | – | – | 54,133 | – | 54,133 | ||||||||||||||||||||||||
| Michael Kleinemeier (from November 1, 2015) | 0 | 4,622 | 599 | – | – | 5,221 | – | 5,221 | ||||||||||||||||||||||||
| Bernd Leukert | 14,148 | 27,656 | 13,922 | – | – | 55,726 | – | 55,726 | ||||||||||||||||||||||||
| Luka Mucic | 10,757 | 27,656 | 13,474 | – | – | 51,887 | – | 51,887 | ||||||||||||||||||||||||
| Gerhard Oswald | 91,490 | 27,656 | �� | 13,117 | – | 132,263 | -45,709 | 86,554 | ||||||||||||||||||||||||
|
|
|
|
|
|
|
|
|
|
|
|
|
|
|
| |||||||||||||||||
| Total | 385,593 | 192,345 | 90,009 | 0 | 0 | 667,947 | -173,134 | 494,813 | ||||||||||||||||||||||||
The RSUs held as of December 31, 2015, which were issued and not forfeited in 2015, reflect the number of RSUs multiplied by the total target achievement. The total target achievement consists of the addition of the target achievement of the financial KPIs of 112.96% and the adjustment factor based on individual plan participation.
RSU Milestone Plan 2015 - Rollforward 2014/2015
Quantity of RSUs | Holding on January 1, 2014 | Grants in 2014 | Performance- Related Adjustment | Exercised Units | Forfeited Units | Holding on December 31, 2014 | ||||||||||||||||||
| Bill McDermott (CEO) | 195,562 | 76,374 | -16,886 | – | – | 255,050 | ||||||||||||||||||
| Dr. Werner Brandt (until June 30, 2014) | 70,151 | 27,396 | – | – | 27,396 | 70,151 | ||||||||||||||||||
| Gerhard Oswald | 70,151 | 27,396 | -6,057 | – | 91,490 | |||||||||||||||||||
| Dr. Vishal Sikka (until May 4, 2014)1) | 70,151 | 27,396 | – | 70,151 | 27,396 | |||||||||||||||||||
| Robert Enslin (from May 4, 2014) | 0 | 18,164 | -4,016 | – | – | 14,148 | ||||||||||||||||||
| Bernd Leukert (from May 4, 2014) | 0 | 18,164 | -4,016 | – | – | 14,148 | ||||||||||||||||||
| Luka Mucic (from July 1, 2014) | 0 | 13,811 | -3,054 | – | – | 10,757 | ||||||||||||||||||
|
|
|
|
|
|
|
|
|
|
|
| |||||||||||||
| Total | 406,014 | 208,701 | -34,029 | 70,151 | 54,792 | 455,743 | ||||||||||||||||||
| 1) | According to the termination agreement with Vishal Sikka, the 2012 grants were paid out after the close of the Annual General Meeting of Shareholders in 2016, based on a fixed share price of €52.96. The 2013 grants will be paid out after the close of the Annual General Meeting of Shareholders in 2017 based on a fixed share price of €58.69. |
The RSUs held as of December 31, 2014, which were issued and not forfeited in 2014, reflect the number of RSUs multiplied by the 77.89% target achievement.
| To Our Stakeholders| Compensation Report | 36 |
Table of Contents
RSU Milestone Plan 2015 - Rollforward 2013/2014
Quantity of RSUs | Holding on January 1, 2013 | Grants in 2013 | Performance- Related Adjustment | Exercised Units | Forfeited Units | Holding on December 31, 2013 | ||||||||||||||||||
| Bill McDermott(co-CEO) | 127,425 | 73,289 | -5,152 | – | – | 195,562 | ||||||||||||||||||
| Jim Hagemann Snabe(co-CEO)1) | 127,425 | 73,289 | -5,152 | 195,562 | – | – | ||||||||||||||||||
| Dr. Werner Brandt | 45,709 | 26,290 | -1,848 | – | – | 70,151 | ||||||||||||||||||
| Gerhard Oswald | 45,709 | 26,290 | -1,848 | – | – | 70,151 | ||||||||||||||||||
| Dr. Vishal Sikka | 45,709 | 26,290 | -1,848 | – | – | 70,151 | ||||||||||||||||||
|
|
|
|
|
|
|
|
|
|
|
| |||||||||||||
| Total | 391,977 | 225,448 | -15,849 | 195,562 | 0 | 406,014 | ||||||||||||||||||
| 1) | According to the termination agreement with Jim Hagemann Snabe, the 2012 and 2013 grants were paid out after the close of the Annual General Meeting of Shareholders on May 21, 2014, based on a fixed share price of €52.96 for the 2012 grants and €58.69 for the 2013 grants. |
The RSUs held as of December 31, 2013, which were issued and not forfeited in 2013, reflect the number of RSUs multiplied by the 92.97% target achievement.
RSU Milestone Plan 2015 - Rollforward 2012/2013
Quantity of RSUs | Holding on January 1, 2012 | Grants in 2012 | Performance- Related Adjustment | Exercised Units | Forfeited Units | Holding on December 31, 2012 | ||||||||||||||||||
| Bill McDermott(co-CEO) | – | 95,414 | 32,011 | – | – | 127,425 | ||||||||||||||||||
| Jim Hagemann Snabe(co-CEO) | – | 95,414 | 32,011 | – | – | 127,425 | ||||||||||||||||||
| Dr. Werner Brandt | – | 34,226 | 11,483 | – | – | 45,709 | ||||||||||||||||||
| Gerhard Oswald | – | 34,226 | 11,483 | – | – | 45,709 | ||||||||||||||||||
| Dr. Vishal Sikka | – | 34,226 | 11,483 | – | – | 45,709 | ||||||||||||||||||
|
|
|
|
|
|
|
|
|
|
|
| |||||||||||||
| Total | – | 293,506 | 98,471 | – | – | 391,977 | ||||||||||||||||||
The RSUs held as of December 31, 2012, reflect the number of RSUs issued in 2012 multiplied by the 133.55% target achievement.
SAP SOP 2010
The table below shows Executive Board members’ holdings, on December 31, 2016, of virtual share options issued to them under the SAP SOP 2010 since its inception. The strike price for an option is 115% of the base price. The issued options have a term of seven years and can only be exercised on specified dates after the vesting period. The options issued in 2010 were exercisable beginning in September 2014 and the options issued in 2011 were exercisable beginning in June 2015.
| To Our Stakeholders| Compensation Report | 37 |
Table of Contents
SAP SOP 2010 Virtual Share Options
| Year Granted | Holding on January 1, 2016 | Strike Price per Option | Rights Exercised in 2016 | Price on Exercise Date | Forfeited Rights | Holding on December 31, 2016 | ||||||||||||||||||||||||||||||
| Quantity of Options | Remaining Term in Years | € | Quantity of Options | € | Quantity of Options | Quantity of Options | Remaining Term in Years | |||||||||||||||||||||||||||||
Bill McDermott | 2010 | 135,714 | 1.69 | 40.80 | – | – | – | 135,714 | 0.69 | |||||||||||||||||||||||||||
| (CEO) | 2011 | 112,426 | 2.44 | 48.33 | – | – | – | 112,426 | 1.44 | |||||||||||||||||||||||||||
|
|
|
|
|
|
|
| |||||||||||||||||||||||||||||
| Total | 248,140 | 0 | – | 248,140 | ||||||||||||||||||||||||||||||||
Total Expense for Share-Based Payment
Total expense for the share-based payment plans of Executive Board members was recognized as follows.
Total Expense for Share-Based Payment
€ thousands | 2016 | 2015 | ||||||
| Bill McDermott (CEO) | 6,525.3 | 12,291.1 | ||||||
| Robert Enslin | 1,185.8 | 1,851.2 | ||||||
| Michael Kleinemeier | 635.2 | 364.7 | ||||||
| Bernd Leukert | 1,237.2 | 2,208.6 | ||||||
| Luka Mucic | 1,123.5 | 2,148.5 | ||||||
| Gerhard Oswald (until December 31, 2016) | 2,693.6 | 3,445.6 | ||||||
| Stefan Ries (from April 1, 2016) | 367.5 | – | ||||||
| Steve Singh (from April 1, 2016) | 465.3 | – | ||||||
|
|
|
| |||||
| Total | 14,233.4 | 22,309.7 | ||||||
The expense is recognized in accordance with IFRS 2 (Share-Based Payments) and consists exclusively of obligations arising from Executive Board activities.
Shareholdings of Executive Board Members
No member of the Executive Board holds more than 1% of the ordinary shares of SAP SE. Members of the Executive Board held a total of 85,985 SAP shares on December 31, 2016 (2015: 45,309 shares).
Executive Board: Other Information
We did not grant any compensation advance or credit to, or enter into any commitment for the benefit of, any member of our Executive Board in 2016 or the previous year.
As far as the law permits, SAP SE and its affiliated companies in Germany and elsewhere indemnify and hold harmless their respective directors and officers against and from the claims of third parties. To this end, we maintain directors’ and officers’ (D&O) group liability insurance. The policy is annual and is renewed from year to year. The insurance covers the personal liability of the insured group for financial loss caused by its managerial acts and omissions. The current D&O policy includes an individual deductible for Executive Board members of SAP SE as required by section 93 (2) of the German Stock Corporation Act.
Compensation for Supervisory Board Members
Compensation System
Supervisory Board members’ compensation is governed by our Articles of Incorporation, section 16.
Each member of the Supervisory Board receives, in addition to the reimbursement of their expenses, an annual basic compensation of €165,000. The chairperson receives €275,000 and the deputy chairperson €220,000.
For membership of the Audit Committee, Supervisory Board members receive an additional fixed annual compensation of €16,500, and for membership of any other Supervisory Board committee €11,000, provided that the committee concerned has met in the year. The chairperson of the Audit Committee receives €27,500, and the chairpersons of the other committees receive €22,000. The fixed remuneration is payable after the end of the year.
Any members of the Supervisory Board having served for less than the entire year receiveone-twelfth of the annual remuneration for each month of service commenced. This also applies to the increased compensation of the chairperson and the deputy chairperson(s) and to the remuneration for the chairperson and the members of a committee.
| To Our Stakeholders| Compensation Report | 38 |
Table of Contents
Supervisory Board Members’ Compensation in 2016
€ thousands | 2016 | 2015 | ||||||||||||||||||||||
| Fixed Compensation | Compensation for Committee Work | Total | Fixed Compensation | Compensation for Committee Work | Total | |||||||||||||||||||
| Prof. Dr. h.c. mult. Hasso Plattner (chairperson) | 275.0 | 88.0 | 363.0 | 275.0 | 66.0 | 341.0 | ||||||||||||||||||
| Margret Klein-Magar (deputy chairperson) | 220.0 | 33.0 | 253.0 | 215.4 | 29.3 | 244.8 | ||||||||||||||||||
| PekkaAla-Pietilä | 165.0 | 33.0 | 198.0 | 165.0 | 27.5 | 192.5 | ||||||||||||||||||
| Panagiotis Bissiritsas | 165.0 | 38.5 | 203.5 | 165.0 | 32.1 | 197.1 | ||||||||||||||||||
| Martin Duffek (from May 20, 2015) | 165.0 | 27.5 | 192.5 | 110.0 | 18.3 | 128.3 | ||||||||||||||||||
| Prof. Anja Feldmann | 165.0 | 22.0 | 187.0 | 165.0 | 22.0 | 187.0 | ||||||||||||||||||
| Prof. Dr. Wilhelm Haarmann | 165.0 | 44.0 | 209.0 | 165.0 | 44.0 | 209.0 | ||||||||||||||||||
| Andreas Hahn (from May 20, 2015) | 165.0 | 22.0 | 187.0 | 110.0 | 14.7 | 124.7 | ||||||||||||||||||
| Prof. Dr. Gesche Joost (from May 28, 2015) | 165.0 | 22.0 | 187.0 | 110.0 | 11.0 | 121.0 | ||||||||||||||||||
| Lars Lamadé | 165.0 | 22.0 | 187.0 | 165.0 | 22.0 | 187.0 | ||||||||||||||||||
| Bernard Liautaud | 165.0 | 33.0 | 198.0 | 165.0 | 22.0 | 187.0 | ||||||||||||||||||
| Christine Regitz (from May 20, 2015) | 165.0 | 22.0 | 187.0 | 110.0 | 14.7 | 124.7 | ||||||||||||||||||
| Dr. Erhard Schipporeit | 165.0 | 27.5 | 192.5 | 165.0 | 27.5 | 192.5 | ||||||||||||||||||
| Robert Schuschnig-Fowler (from May 20, 2015) | 165.0 | 11.0 | 176.0 | 110.0 | 7.3 | 117.3 | ||||||||||||||||||
| Dr. Sebastian Sick (from May 20, 2015) | 165.0 | 22.0 | 187.0 | 110.0 | 14.7 | 124.7 | ||||||||||||||||||
| Jim Hagemann Snabe | 165.0 | 22.0 | 187.0 | 165.0 | 22.0 | 187.0 | ||||||||||||||||||
| Pierre Thiollet (from May 20, 2015) | 165.0 | 11.0 | 176.0 | 110.0 | 7.3 | 117.3 | ||||||||||||||||||
| Prof.Dr.-Ing.Dr.-Ing. E.h. Klaus Wucherer | 165.0 | 16.5 | 181.5 | 165.0 | 16.5 | 181.5 | ||||||||||||||||||
| Former Supervisory Board members | NA | NA | NA | 504.2 | 59.6 | 563.8 | ||||||||||||||||||
|
|
|
|
|
|
|
|
|
|
|
| |||||||||||||
| Total | 3,135.0 | 517.0 | 3,652.0 | 3,249.6 | 478.5 | 3,728.1 | ||||||||||||||||||
In addition, we reimburse members of the Supervisory Board for their expenses and the value-added tax payable on their compensation.
In total, we received services from members of the Supervisory Board (including services from employee representatives on the Supervisory Board in their capacity as employees of SAP) in the amount of €1,040,400 (2015: €1,282,800). This amount includes fees paid to Linklaters LLP in Frankfurt am Main, Germany (of which Supervisory Board member Wilhelm Haarmann is a partner), of €0 (2015: €224,500).
Long-Term Incentives for the Supervisory Board
We do not offer members of the Supervisory Board share-based payment for their Supervisory Board work. Any share-based payment awards received by employee-elected members relate to their position as SAP employees and not to their work on the Supervisory Board.
Shareholdings of Supervisory Board Members
Supervisory Board chairperson Hasso Plattner and the companies he controlled held 87,860,661 SAP shares on December 31, 2016 (December 31, 2015: 90,248,789 SAP shares), representing 7.152% (2015: 7.346%) of SAP’s share capital. No other member of the Supervisory Board held more than 1% of the SAP SE share capital at the end of 2016 or of the previous year. Members of the Supervisory Board held a total of 87,875,732 SAP shares on December 31, 2016 (December 31, 2015: 90,262,686 SAP shares).
| To Our Stakeholders| Compensation Report | 39 |
Table of Contents
Supervisory Board: Other Information
We did not grant any compensation advance or credit to, or enter into any commitment for the benefit of, any member of our Supervisory Board in 2016 or the previous year.
Hasso Plattner, the chairperson of the Supervisory Board, entered into a consulting contract with SAP after joining the Supervisory Board in May 2003. The contract does not provide for any compensation. The only cost we incurred under the contract was the reimbursement of expenses.
As far as the law permits, we indemnify Supervisory Board members against, and hold them harmless from, claims brought by third parties. To this end, we maintain directors’ and officers’ (D&O) group liability insurance. The current D&O policy does not include an individual deductible for Supervisory Board members as envisaged in the German Corporate Governance Code.
| To Our Stakeholders| Compensation Report | 40 |
Table of Contents
To the best of our knowledge, and in accordance with the applicable reporting principles, the Consolidated Financial Statements give a true and fair view of the assets, finances, and operating results of the SAP Group, and the management report of the Group and SAP SE includes a fair review of the development and performance of the business and the position of the Group and SAP SE, together with a description of the principal opportunities and risks associated with the expected development of the Group and SAP SE.
Walldorf, February 22, 2017
SAP SE
Walldorf, Germany
Executive Board of SAP SE
Bill McDermott
|
Robert Enslin
| |||
Michael Kleinemeier
|
Bernd Leukert
| |||
Luka Mucic
|
Stefan Ries
| |||
Steve Singh |
| To Our Stakeholders| Responsibility Statement | 41 |
Table of Contents
To SAP SE, Walldorf
Report on the Audit of Consolidated Financial Statements
Opinion on the Consolidated Financial Statements
We have audited the consolidated financial statements of SAP SE, Walldorf, and its subsidiaries (the Group), which comprise the consolidated statements of financial position as at December 31, 2016, consolidated income statements, consolidated statements of comprehensive income, consolidated statements of changes in equity and consolidated statements of cash flows for the fiscal year from January 1, 2016, to December 31, 2016, and notes to the consolidated financial statements, including a summary of significant accounting policies.
Pursuant to Section 322 (3) sentence 1 half sentence 2 HGB (“Handelsgesetzbuch”: German Commercial Code), we state that, in our opinion, based on our knowledge obtained in the audit, the accompanying consolidated financial statements comply in all material respects with IFRS as adopted by the EU and the supplementary requirements of German commercial law pursuant to Section 315a (1) of the German Commercial Code [HGB], as well as IFRS as adopted by the International Accounting Standards Board and give a true and fair view of the net assets and financial position of the Group as at December 31, 2016 as well as the results of operations for the fiscal year from January 1, 2016, to December 31, 2016, in accordance with these requirements.
Pursuant to Section 322 (3) sentence 1 HGB, we state that our audit of the consolidated financial statements has not led to any reservations with respect to the propriety of the consolidated financial statements.
Basis for Opinion on the Consolidated Financial Statements
We conducted our audit in accordance with Section 317 HGB and German generally accepted standards for the audit of financial statements promulgated by the German Institute of Public Auditors [IDW] as well as in supplementary compliance with International Standards on Auditing (ISA) and guidelines of the Public Company Accounting Oversight Board (United States). Our responsibilities under those standards and additional guidelines are further described in the “Auditor’s Responsibilities for the Audit of the Consolidated Financial Statements” section of our report. We are independent of the Group in accordance with the requirements of German commercial law and the rules of professional conduct, and we have fulfilled our other ethical responsibilities applicable in Germany in accordance with these requirements. We believe that the audit evidence we have obtained is sufficient and appropriate to provide a basis for our opinion.
Key Audit Matters
Key audit matters are those matters that, in our professional judgment, were of most significance in our audit of the consolidated financial statements for the fiscal year from January 1, 2016 to December 31, 2016. These matters were addressed in the context of our audit of the consolidated financial statements as a whole, and in forming our opinion thereon, but we do not provide a separate opinion on these matters.
Recognition of software licenses revenue
Refer toNote (3b) – Relevant Accounting Policies,Note (3c) – Management Judgments and Sources of Estimation Uncertainty, andNote (5) – Revenue.
The Financial Statement Risk
IFRS do not provide specific guidance on recognizing revenue for sales of software and software-related products and services. SAP defined detailed policies, procedures and processes to manage the accounting for its software arrangements. SAP’s revenue generating transactions and, consequently, SAP’s revenue recognition policies are complex. Applying them often requires significant judgment.
Significant judgments include the allocation of revenue from customer contracts to multiple deliverables and the application of the revenue recognition criteria under IAS 18, e.g., assessing whether the significant risks and rewards have been transferred to the buyer and whether the amount of revenue can be measured reliably.
Our Response
We evaluated the compliance of SAP’s accounting policies on software revenue recognition with the IFRS Framework and the individual applicable IFRSs. We considered the design and tested the operating effectiveness of the key controls implemented by SAP on the identification of multiple-element arrangements, the identification of deliverables and separate units of accounting, the identification of fair value for all relevant deliverables other thanon-premise software (due to the residual method being applied). For all software arrangements we considered to be individually substantial and for a sample of the remaining software arrangements, we also:
| ∎ | obtained an understanding of the transaction through inspection of the underlying contractual agreements and other related documents as well as discussions with SAP’s accounting and/or sales representatives; |
| To Our Stakeholders | Independent Auditor’s Report | 42 |
Table of Contents
| ∎ | obtained external confirmations of the key terms and conditions from the respective customers to corroborate the information relevant for the accounting that we received from SAP; |
| ∎ | assessed whether SAP appropriately identified all separate units of accounting and allocated the transaction price to such units based on either the relative fair value method or the residual method, as applicable, using the established fair values (see next paragraph); and |
| ∎ | evaluated whether the revenue recognition policies applicable to each separate unit of accounting were applied appropriately to ensure that revenue is recognized in the appropriate period. |
We evaluated the fair value assumptions for each deliverable that typically qualifies as a separate unit of accounting in SAP’s multiple-element arrangements by assessing the appropriateness of the methodology applied, testing mathematical accuracy of the underlying calculations and testing selections to corroborate the data underlying SAP’s calculations. We also assessed the appropriateness of the related disclosures in the consolidated financial statements.
Our Observations
SAP has developed an adequate framework for determining the accounting treatment for its software licenses revenue. Our testing did not identify any significant exceptions in the operation of controls. The disclosures appropriately describe this framework. For the vast majority of the software arrangements entered into during 2016, it was clear which of SAP’s revenue policies should apply. Where there was room for interpretation, SAP’s judgment was balanced and appropriate. We did not identify any material errors in calculations.
Income tax exposures
Refer to note (3b) – Relevant Accounting Policies, note (3c) – Management Judgments and Sources of Estimation Uncertainty, and note (10) – Income Tax.
The Financial Statement Risk
SAP operates in multiple tax jurisdictions with complexities of transfer pricing, changing tax laws, and intercompany financing transactions. The determination of provisions for tax contingencies requires SAP to make judgments on tax issues and develop estimates regarding SAP’s exposure to tax risks.
Our Response
SAP regularly engages external experts to provide tax opinions to support their own risk assessment. We involved our tax specialists to evaluate these tax opinions. Our specialists also assessed the correspondence with the relevant tax authorities and analyzed and evaluated the assumptions used to determine tax provisions based on our knowledge and experiences of the current application of the relevant legislation by authorities and courts. Through our international network we involved tax specialists with the appropriate knowledge on the respective local tax rules and regulations who reported the results of their assessment to us. We also assessed the adequacy of SAP’s disclosures about income taxes and uncertain tax positions.
Our Observations
SAP’s judgments as to the amounts recognized as tax expense and provisions for tax contingencies as at December 31, 2016 are appropriate. The disclosures provide a balanced description of the current status of tax claims and risks.
Goodwill impairment test for SAP Business Network
Refer toNote (3c) – Management Judgments and Sources of Estimation Uncertainty,Note (15) – Goodwill and Intangible Assets
The Financial Statement Risk
SAP performed the annual goodwill impairment test at the level of its operating segments as there are no lower levels within SAP at which goodwill is monitored for internal management purposes. SAP’s acquisitions led to a material goodwill in the SAP Business Network Segment in which SAP mainly markets and sells the cloud offering developed by SAP Ariba, SAP Fieldglass and Concur. Goodwill allocated to the SAP Business Network is material as of December 31, 2016 (16,8 % of consolidated balance sheet total) and the impairment test involves significant judgment. The key assumptions relate to the determination of the peer group, budgeted revenue growth, budgeted operating margins,pre-tax discount rates and terminal growth rates.
Our Response
SAP has implanted controls designed to ensure that the calculation of the recoverable amount (in the specific case fair value less cost of disposal) for SAP Business Network is appropriate. We tested the design and operating effectiveness of these controls. We involved our valuation specialists to assess the valuation methodologies applied and key assumptions used in measuring the fair value less cost to disposal and to test the mathematical accuracy of the discounted cash flow and other valuation models. We evaluated SAP’s assumptions by comparing the fair value estimates to our own expectations and performed independent sensitivity analysis for each key assumption.
Our Observations
Our testing did not identify any significant exceptions in the operation of controls. Based on our performed sensitivity analysis we concluded that SAP applied a balanced set of assumptions in determining the recoverable amount (fair value less cost of disposal). The valuation results for the goodwill of SAP Business Network are consistent with our internal projections. We did not identify any material errors in valuation methodologies applied or in the calculations made.
Information Other than the Consolidated Financial Statements and Auditor’s Report thereon
The Executive Board of SAP SE is responsible for the information other than the consolidated financial statements and auditor’s report thereon (the other information). The other information comprises the Integrated Report published on the website of SAP SE, including the Annual Report on Form20-F, except for the annual and consolidated
| To Our Stakeholders | Independent Auditor’s Report | 43 |
Table of Contents
financial statements, the combined group management report by the SAP Group and the management report of SAP SE and our auditor’s report thereon.
Our audit opinion on the consolidated financial statements does not cover the other information and we do not express, any form of assurance conclusion thereon, except for selected qualitative and quantitative sustainability disclosures for which we performed an independent assurance engagement and issued an Independent Assurance Report.
In connection with our audit of the consolidated financial statements, our responsibility is to read the other information, and doing so, consider whether the other information is materially inconsistent with the consolidated financial statements or our knowledge obtained in the audit or otherwise appears to be materially misstated. If, based on the work we have performed, we conclude that there is a material misstatement of this other information, we are required to report that fact. We have nothing to report in this regard.
Responsibilities of the Executive Board and the Supervisory Board for the Consolidated Financial Statements
The Executive Board of SAP SE is responsible for the preparation of the consolidated financial statements which comply with IFRS as adopted by the EU and the supplementary requirements of German commercial law pursuant to Section 315a (1) HGB as well as IFRS as adopted by the International Accounting Standards Board and give a true and fair view of the net assets, financial position and results of operations of the Group in accordance with these requirements. Furthermore, the Executive Board is responsible for such internal control as the Executive Board determines is necessary to enable the preparation of consolidated financial statements that are free from material misstatement, whether due to fraud or error.
In preparing the consolidated financial statements, the Executive Board is responsible for assessing the Group’s ability to continue as a going concern, disclosing, as applicable, matters related to going concern and using the going concern basis of accounting unless the Executive Board either intends to liquidate the Group or to cease operations, or has no realistic alternative but to do so.
The Supervisory Board is responsible for overseeing the Group’s financial reporting process for the preparation of the consolidated financial statements.
Auditor’s Responsibilities for the Audit of the Consolidated Financial Statements
Our objectives are to obtain reasonable assurance about whether the consolidated financial statements as a whole are free from material misstatement, whether due to fraud or error, and to issue an auditor’s report that includes our opinion on the consolidated financial statements. Reasonable assurance is a high level of assurance, but is not a guarantee that an audit conducted in accordance with Section 317 HGB and German generally accepted standards for the audit of financial statements promulgated by the German Institute of Public Auditors [IDW] as well as in supplementary compliance with ISA and guidelines of the Public Company Accounting Oversight Board (United States) will always detect a material misstatement when it exists. Misstatements can arise from fraud or error and are considered material if, individually or in the aggregate, they could reasonably be expected to influence the economic decisions of users taken on the basis of these consolidated financial statements.
As part of an audit in accordance with Section 317 HGB and German generally accepted standards for the audit of financial statements promulgated by the German Institute of Public Auditors [IDW] as well as in supplementary compliance with ISA and guidelines of the Public Company Accounting Oversight Board (United States), we exercise professional judgment and maintain professional skepticism throughout the audit. We also:
| ∎ | Identify and assess the risks of material misstatement of the consolidated financial statements, whether due to fraud or error, design and perform audit procedures responsive to those risks, and obtain audit evidence that is sufficient and appropriate to provide a basis for our opinion. The risk of not detecting a material misstatement resulting from fraud is higher than for one resulting from error, as fraud may involve collusion, forgery, intentional omissions, misrepresentations, or the override of internal control. |
| ∎ | Obtain an understanding of internal control relevant to the audit in order to design audit procedures that are appropriate in the circumstances. |
| ∎ | Evaluate the appropriateness of accounting policies used and the reasonableness of accounting estimates and related disclosures made by the Executive Board. |
| ∎ | Conclude on the appropriateness of the Executive Board’s use of the going concern basis of accounting and, based on the audit evidence obtained, whether a material uncertainty exists related to events or conditions that may cast significant doubt on the Group’s ability to continue as a going concern. If we conclude that a material uncertainty exists, we are required to draw attention in our auditor’s report to the related disclosures in the consolidated financial statements or, if such disclosures are inadequate, to modify our opinion. Our conclusions are based on the audit evidence obtained up to the date of our auditor’s report. However, future events or conditions may cause the Group to cease to continue as a going concern. |
| ∎ | Evaluate the overall presentation, structure and content of the consolidated financial statements, including the disclosures, and whether the consolidated financial statements represent the underlying transactions and events in a manner that the consolidated financial statements give a true and fair view of the net assets and financial position as well as the results of operations of the Group in accordance with IFRS as adopted by the EU and the supplementary requirements of German commercial law pursuant to Section 315a (1) HGB as well as IFRS as adopted by the International Accounting Standards Board. |
| ∎ | Obtain sufficient and appropriate audit evidence regarding the financial information of the entities or business activities within the |
| To Our Stakeholders | Independent Auditor’s Report | 44 |
Table of Contents
Group to express an opinion on the consolidated financial statements. We are responsible for the direction, supervision and performance of the group audit. We remain solely responsible for our audit opinion. |
We communicate with those charged with governance regarding, among other matters, the planned scope and timing of the audit and significant audit findings, including any significant deficiencies in internal control that we identify during our audit.
We also provide the Supervisory Board with a statement that we have complied with relevant ethical requirements regarding independence, and to communicate with them all relationships and other matters that may reasonably be thought to bear on our independence, and where applicable, related safeguards.
From the matters communicated with the Supervisory Board, we determine those matters that were of most significance in the audit of the consolidated financial statements of the current period and are therefore the key audit matters. We describe these matters in our report on the audit of the consolidated financial statements unless law or regulation precludes public disclosure about the matter.
Other Legal and Regulatory Requirements
Report on the Audit of the Group Management Report
Opinion on the Group Management Report
We have audited the combined group management report by the SAP Group and the management report of SAP SE, Walldorf (“Group Management Report”), for the fiscal year from January 1, 2016 to December 31, 2016.
In our opinion, based on our knowledge obtained in the audit, the accompanying Group Management Report as a whole provides a suitable view of the Group’s position. In all material respects, the Group Management Report is consistent with the consolidated financial statements, complies with the German statutory requirements and suitably presents the opportunities and risks of future development.
Pursuant to Section 322 (3) sentence 1 HGB, we state that our audit has not led to any reservations with respect to the propriety of the Group Management Report.
Basis for Opinion on the Group Management Report
We conducted our audit in accordance with Section 317 (2) HGB and German generally accepted standards for the audit of management reports promulgated by the German Institute of Public Auditors [IDW]. We believe that the audit evidence we have obtained is sufficient and appropriate to provide a basis for our opinion
Responsibilities of the Executive Board and the Supervisory Board for the Group Management Report
The Executive Board of SAP SE is responsible for the preparation of the Group Management Report, which as a whole provides a suitable view of the Group’s position, is consistent with the consolidated financial statements, complies with the German statutory requirements and suitably presents the opportunities and risks of future development. Furthermore, the Executive Board is responsible for such arrangements and measures (systems) as the Executive Board determines are necessary to enable the preparation of the Group Management Report in compliance with the requirements of German commercial law applicable pursuant to Section 315a (1) HGB, German Accounting Standards number 17 and 20 (GAS 17, GAS 20) and the International Financial Reporting Standard (IFRS) Practice Statement Management Commentary and for providing sufficient and appropriate evidence for the statements in the Group Management Report.
The Supervisory Board is responsible for overseeing the Group’s financial reporting process for the preparation of the Group Management Report.
Auditor’s Responsibilities for the Audit of the Group Management Report
Our objectives are to obtain reasonable assurance whether the Group Management Report as a whole provides a suitable view of the Group’s position, as well as, in all material respects, is consistent with the consolidated financial statements and our knowledge obtained in the audit, complies with the German statutory requirements, and suitably presents the opportunities and risks of future development and to issue an auditor’s report that includes our opinion on the Group Management Report.
Report on the System of Internal Control over Consolidated Financial Reporting pursuant to PCAOB
Opinion on the System of Internal Control over Consolidated Financial Reporting
We have audited the system of internal control over consolidated financial reporting of SAP SE, Walldorf, and its subsidiaries in place as at December 31, 2016. This control system is based on criteria set out in the Internal Control – Integrated Framework of the Committee of Sponsoring Organizations of the Treadway Commission (COSO) (version of 2013).
In our opinion, SAP maintained effective internal control over consolidated financial reporting as at December 31, 2016 based on the criteria set out in the Internal Control – Integrated Framework issued by COSO (in the version of 2013).
| To Our Stakeholders| Independent Auditor’s Report | 45 |
Table of Contents
Executive Board’s and Supervisory Board’s Responsibility for the System of Internal Control over Consolidated Financial Reporting
SAP SE’s Executive Board is responsible for maintaining an effective system of internal control over consolidated financial reporting and assessing its effectiveness, which is included in the Executive Board’s report on the system of internal control over consolidated financial reporting.
A company’s system of internal control over consolidated financial reporting is a process designed to provide reasonable assurance regarding the reliability of financial reporting in the consolidated financial statements and the preparation of financial statements for external purposes in accordance with generally accepted accounting principles. A company’s system of internal control over consolidated financial reporting includes policies and procedures to (1) ensure an accounting system that in reasonable detail accurately and fairly reflects the transactions and dispositions of the company’s assets, (2) provide reasonable assurance that transactions are recorded as necessary to permit preparation of financial statements in accordance with generally accepted accounting principles, and (3) provide reasonable assurance regarding prevention or timely detection of unauthorized acquisition, use or disposition of the company’s assets that could have a material effect on the financial statements.
Because of its inherent limitations, internal control over financial reporting may not prevent or detect material misstatements. Also, projections of any evaluation of effectiveness to future periods are subject to the risk that controls may become inadequate because of changes in conditions, or that the degree of compliance with the policies or procedures may deteriorate.
The Supervisory Board is responsible for overseeing the Group’s system of internal control over consolidated financial reporting.
Auditor’s Responsibility for the System of Internal Control over Consolidated Financial Reporting
Our responsibility is to express an opinion on the system of internal control over consolidated financial reporting based on our audit. We conducted our audit in accordance with the standards of the Public Company Accounting Oversight Board (United States). Those standards require that we plan and perform the audits to obtain reasonable assurance about whether effective internal control over consolidated financial reporting was maintained in all material respects. Our audit of internal control over consolidated financial reporting included obtaining an understanding of internal control over financial reporting, assessing the risk of material deficiencies in internal control, testing and evaluating the design and operating effectiveness of internal control based on this assessment, and performing such other procedures as we considered necessary in the circumstances.
We believe that the audit evidence we have obtained is sufficient and appropriate to provide a basis for our opinion.
Responsible Auditor
The engagement partner on the audit resulting in this independent auditor’s report is Dr. Bert Böttcher.
Mannheim, February 22, 2017
KPMG AG
Wirtschaftsprüfungsgesellschaft
| Dr. Böttcher | Herold | |
| Wirtschaftsprüfer | Wirtschaftsprüferin | |
| German Public Auditor | German Public Auditor |
| To Our Stakeholders| Independent Auditor’s Report | 46 |
Table of Contents

Combined Management Report | 47 |
Table of Contents
General Information About This Management Report
Basis of Presentation
This combined group management report by the SAP Group (collectively, “we,” “us,” “our,” “SAP,” “Group,” or “Company”) and the management report of SAP SE have been prepared in accordance with sections 289, 315, and 315a of the German Commercial Code and German Accounting Standards (GAS) No. 17 and 20. The management report is also a management commentary complying with the International Financial Reporting Standards (IFRS) Practice Statement Management Commentary. All of the information in this report relates to the situation as at December 31, 2016, or the fiscal year ended on that date, unless otherwise stated. The report contains references to additional information in other parts of the SAP Integrated Report that is available online. This additional information is not part of the management report.
Forward-Looking Statements
This management report contains forward-looking statements and information based on the beliefs of, and assumptions made by, our management using information currently available to them. Any statements contained in this report that are not historical facts are forward-looking statements as defined in the U.S. Private Securities Litigation Reform Act of 1995. We have based these forward-looking statements on our current expectations, assumptions, and projections about future conditions and events. As a result, our forward-looking statements and information are subject to uncertainties and risks, many of which are beyond our control. If one or more of these uncertainties or risks materializes, or if management’s underlying assumptions prove incorrect, our actual results could differ materially from those described in or inferred from our forward-looking statements and information. We describe these risks and uncertainties in theRisk Management and Risks section.
The words “aim,” “anticipate,” “assume,” “believe,” “continue,” “could,” “counting on,” “is confident,” “development,” “estimate,” “expect,” “forecast,” “future trends,” “guidance,” “intend,” “may,” “might,” “outlook,” “plan,” “project,” “predict,” “seek,” “should,” “strategy,” “want,” “will,” “would,” and similar expressions as they relate to us are intended to identify such forward-looking statements. Such statements include, for example, those made in theOperating Results section, our quantitative and qualitative disclosures about market risk pursuant to the International Financial Reporting Standards (IFRS), namely IFRS 7 and related statements in our Notes to the Consolidated Financial Statements;Expected Developments and Opportunities section;Risk Management and Risks section; and other forward-looking information appearing in other parts of this report. To fully consider the factors that could affect our future financial results, both this report and our Annual Report on Form20-F should be considered, as well as all of our other filings with the Securities and Exchange Commission (SEC). Readers are cautioned not to place undue reliance on these forward-looking statements, which speak only as of the date specified or the date of this report. We undertake no obligation to publicly update or revise any forward-looking statements as a result of new information that we receive about conditions that existed upon issuance of this report, future events, or otherwise unless we are required to do so by law.
This report includes statistical data about the IT industry and global economic trends that comes from information published by sources including Gartner, the European Central Bank (ECB); and the International Monetary Fund (IMF). This type of data represents only the estimates of Gartner, ECB, IMF, and other sources of industry data. SAP does not adopt or endorse any of the statistical information provided by sources such as Gartner, ECB, IMF, or other similar sources that is contained in this report. The data from these sources is subject to risks and uncertainties, and subject to change based on various factors, including those described above, in theRisk Management and Risks section, and elsewhere in this report. These and other factors could cause our results to differ materially from those expressed in the estimates made by third parties and SAP. We caution readers not to place undue reliance on this data.
Combined Management Report | General Information About This Management Report | 48 |
Table of Contents
| >76% | >345,000 | >180 | ||
| of worldwide transactions touch an SAP system | customers worldwide | countries where SAP customers are located |
Our vision is to help the world run better and improve people’s lives. Together with our broad ecosystem of partners, this comes to life as we help our customers master complexity and innovate and transform to become sustainable digital businesses. SAP is involved in driving innovation in all fields of the digital economy, such as the Internet of Things, machine learning, and artificial intelligence. For more information on our vision and strategy, see theStrategy and Business Model section.
Founded in 1972, SAP is a global company headquartered in Walldorf, Germany. Our legal corporate name is SAP SE. SAP is the market leader in enterprise application software1. The company is also the fastest-growing major database company. Globally, more than 76% of all business transactions worldwide touch an SAP software system. With more than 345,000 customers in more than 180 countries, the SAP Group includes subsidiaries in all major countries and employs more than 84,100 people.
Our ordinary shares are listed on the Frankfurt Stock Exchange. American Depositary Receipts (ADRs) representing SAP SE ordinary shares are listed on the New York Stock Exchange (NYSE). SAP is a member of Germany’s DAX, the Dow Jones EURO STOXX 50, and the Dow Jones Sustainability Indexes. As at December 31, 2016, SAP was the most valuable company in the DAX based on market capitalization. For additional information regarding our stock, see theInvestor Relations section.
As at December 31, 2016, SAP SE directly or indirectly controlled a worldwide group of 245 subsidiaries to develop, distribute, and provide our products, solutions, and services. For a list of our subsidiaries, associates, and other equity investments, see the Notes to the Consolidated Financial Statements,Note (34).
| 1 | Enterprise application software is computer software specifically developed to support and automate business processes |
| Combined Management Report | Overview of the SAP Group | 49 |
Table of Contents
Impact Through Innovation
SAP’s vision is to help the world run better and improve people’s lives. We strive to make our world a better, more sustainable place and help solve some of its most complex problems. Our innovations give us the power to help tackle these issues by giving our customers, partners, and consumers the tools they need to have an impact.
We execute on our vision by empowering our customers to become digital businesses through SAP technology, so they can address the challenges facing our world today and have an impact in three vital areas:
| ∎ | Economy: Economic empowerment comes from purpose-driven work. SAP software and technology enables customers to innovate and build strong industries and infrastructure and to protect the privacy of individuals and organizations. |
| ∎ | Society: Health, education, and public safety are critical for a vibrant society. SAP software and technology is addressing complex challenges around disease prevention and detection, as well as providing solutions for smarter government and smarter cities. |
| ∎ | Environment: Climate change touches everyone and will impact the lives of future generations. SAP software and technology is helping our customers make the world more energy efficient, and drive more sustainable supply chains around the world. |
The United Nations has defined 17 Sustainable Development Goals (SDGs) to transform the world’s economy, society, and environment. These goals are a universal call to action to end poverty, protect the planet, and ensure that all people enjoy peace and prosperity. We consider the most relevant of these goals in the context of our own vision and higher purpose and they inspire us to achieve this vision.
Achieving the Vision
Supporting our customers’ digital transformation
To execute our vision, we are helping customers meet the challenges of today’s changing world, and at the same time, enabling them to have a positive impact across the economy, society, and the environment.
Technology is transforming both our society and the way we do business. People and things are connected like never before. Entire industries are being disrupted by innovations that seemed unimaginable only a few years ago. Technology trends such as cloud computing, Big Data, the Internet of Things (IoT), and artificial intelligence go hand in hand with social trends that are changing how we live and work.
Organizations need to digitally transform their business processes and business models to be able to succeed in today’s marketplace. They need to become agile organizations that are laser focused on driving
| Combined Management Report | Strategy and Business Model | 50 |
Table of Contents
customer value. They also must become data-driven and run their business on real-time information to react to market and customer demands.
By providing a technology platform for innovation and digitalization, we help our customers with the challenges of digital transformation. Our solutions enable businesses, governments, andnon-profit organizations in more than 180 countries to become data-driven “live” businesses.
Our platform leverages existing SAP assets that are complemented by new cloud capabilities and the real-time applications available in our next-generation business suite SAP S/4HANA. Our solutions and services – combined with the talent and expertise of more than 84,100 colleagues and a broad global ecosystem of partners – puts us in a unique position to enable our more than 345,000 customers to fulfill their goals.
We want to build on the trust of our existing customers and earn the trust of new customers. For more information, see theCustomers section.
Executing on our strategy
In the past years, we have built our success in the business applications market by expanding our product portfolio to help companies meet the needs of the digital economy. We have organically innovated with groundbreaking technology such as SAP HANA and software such as SAP S/4HANA. We have also expanded our portfolio through acquisitions by integrating valuable assets in the cloud and business network spaces.
In 2016, we have increased our focus on innovation as it is the key to long-term success. Our strategy to be the most innovative cloud company powered by SAP HANA, will help us deliver the digital innovation that our customers need. To execute on this strategy, we are focusing our efforts on the following key areas:
| ∎ | Continue to develop market-leading applications |
| ∎ | Scale our platform as the innovation platform for our ecosystem partners |
| ∎ | Invest in disruptive technologies |
| ∎ | Recruit and retain the right talent |
Continue to develop market-leading applications
Our core ERP software is the historic foundation of our strength. To maintain our market leadership position as this market rapidly shifts to the cloud, we will continue to innovate and offer the agility and flexibility our customers require.
We will continue to deliver market-leading applications for ERP, whether in the cloud or on premise. Further, we will continue to developbest-in class,line-of-business (LoB) cloud applications combined with real-time analytics, IoT capabilities, and industryadd-ons. Finally, we will leverage our expertise to deliver solutions to help small businesses and midsize companies be successful.
Scale our platform as the innovation platform for our ecosystem partners
We built an open cloud platform with cloud application programming interfaces (APIs), which means the platform can communicate with multiple sources to support a strong ecosystem – allowing developers from companies of all sizes to extend our applications or create new solutions for the digital economy. Moreover, as the rapidly growing data management and database market moves to the cloud, our cloud platform offers companies planning, predictive, visualization, and mobile capabilities.
We will continue to deliver transformational innovations in the platform, database, and analytics space. We want developers in our entire ecosystem and our customers to turn to SAP as their reference cloud platform and API hub. Finally, we want to ensure that security remains a trusted feature of all SAP platforms and applications.
Invest in disruptive technologies
To enable sustainable success, we must prepare for the future. We will continue to incubate disruptive technologies across a number of initiatives. We have begun incubating new businesses using an “open innovation” approach under the umbrella of the SAP.io program with focus on both internal and external startups. We are aggressively investing in making our business applications “intelligent” with machine learning. We are investing in delivering personalized medicine through a connected health platform – aligned with our vision of improving society and healthcare. At the same time, we continue to create reliable security solutions across all of our products.
For more information about these investments, see theProducts, Research & Development, and Services section.
Recruit and retain the right talent
We cannot bring innovations to our customers without capable, driven employees. As we strive to be the best place to work in the enterprise software industry, we look to a diverse and engaged workforce to drive innovation and value for our customers. Recruiting the right talent and unleashing their innovative power is as crucial for SAP as continuing to develop the talent of existing employees to allow them to realize their full potential.
For more information, see theEmployees and Social Investments section.
Keeping a balanced focus on growth
We take a balanced approach on how to grow. We will continue to focus on organic investments in technology and innovations to drive our short-term and midterm growth ambitions. We will continue to look at unleashing the full potential of our employees’ talent as well as strategic partnerships with our ecosystem to foster innovation.
Additionally, we may also acquire targeted“tuck-in” technologies to add to our broad solution offerings and improve coverage in key strategic markets. In 2016, SAP made the following smallertuck-in acquisitions:
| Combined Management Report | Strategy and Business Model | 51 |
Table of Contents
| ∎ | Altiscale, a company providing high-performance, scalable BigData-as-a-service (BDaaS) solutions, will help SAP accelerate and operationalize the deployment of Big Data in the enterprise. |
| ∎ | Fedem Technology, a forward-thinking IoT company, will help SAP build next-generation,end-to-end IoT solutions that not only support predictive maintenance but also Industry 4.0 scenarios. |
| ∎ | Hipmunk, a leader in innovative travel search, will bring a consumer-like experience for business travelers. |
| ∎ | PLAT.ONE, a leading enterprise-grade IoT provider, will help SAP enhance complex IoT capabilities in SAP Cloud Platform (formerly called SAP HANA Cloud Platform). |
Investing in the next generation of technology leaders
For 20 years, through venture capital funds managed by Sapphire Ventures, SAP has supported entrepreneurs that aspire to build industry-leading businesses. Sapphire Ventures currently has over US$2 billion under management and has invested in more than 130 companies on five continents – in growth-stage technology companies as well as early-stage venture capital funds. Sapphire Ventures pursues opportunities in which it can help fuel growth by adding expertise, relationships, geographic reach, and capital. It places a particular focus on companies in Europe, Israel, and the United States.
Additionally, we launched a new SAP.io Fund to focus on strategic, early stage investments aligned with our SAP.io innovation initiatives. This US$35 million fund will focus on “catalyzing” a startup ecosystem that can leverage or enrich SAP data sets, platform technologies, or business workflows. It is operated in partnership with Sapphire Ventures.
For more information about our consolidated investment funds, see the Notes to the Consolidated Financial Statements,Note (34).
Financial Business Model
We derive our revenue from fees charged to our customers for:
| ∎ | Support, professional services, development, training, and other services |
| ∎ | Licensing ofon-premise software products and solutions |
| ∎ | Use of our cloud solutions |
| ∎ | Activity in our business networks |
Measuring Our Success
We believe the most important indicators to measure our success comprise both financial andnon-financial indicators:
| ∎ | Growth |
| ∎ | Profitability |
| ∎ | Customer loyalty |
| ∎ | Employee engagement |
The table below provides an overview of the specific key performance indicators (KPIs) used to measure performance, as well as our goals and actual performance.
Outlook and Results for 2016
Strategic Objective | KPI | 2016 Outlook* (non-IFRS, at constant currencies) | 2016 Achievement (non-IFRS, at constant currencies) | |||
| Growth | Cloud subscriptions and support revenue | €3.00bn to €3.05bn | €3.01bn | |||
| Cloud and software revenue | +6.5% to +8.5% | +8% | ||||
| Profitability | Operating profit | €6.5bn to €6.7bn | €6.60bn | |||
| Customer Loyalty | Customer Net Promoter Score | 25% | 19.2% | |||
| Employee Engagement | Employee Engagement Index | 82% | 85% |
| * | The outlook was communicated in January 2016 and raised in October 2016. |
| Combined Management Report | Strategy and Business Model | 52 |
Table of Contents
Outlook for 2017 and Ambitions for 2020
Strategic Objective | KPI | 2016 (non-IFRS) | 2017 Outlook (non-IFRS, at constant currencies) | 2020 Ambition (non-IFRS) | ||||
| Growth | Cloud subscriptions and support revenue | €2.99bn | €3.8bn to €4.0bn | €8.0bn to €8.5bn | ||||
| Cloud and software revenue | €18.43bn | +6% to +8% | ||||||
| Total revenue | €22.07bn | €23.2 to €23.6bn | €28bn to €29bn | |||||
| Share of more predictable revenue* | 61% | 70% to 75% | ||||||
| Profitability | Operating profit | €6.63bn | €6.8bn to €7.0bn | €8.5bn to €9.0bn | ||||
| Customer Loyalty | Customer Net Promoter Score | 19.2% | 21% to 23% | 35% to 40% | ||||
| Employee Engagement | Employee Engagement Index | 85% | 84% to 86% | 84% to 86% |
| * | Support and cloud subscriptions – share of total revenue |
| Combined Management Report | Strategy and Business Model | 53 |
Table of Contents
Products, Research & Development, and Services
>5,400 SAP S/4HANA customers | >2.5 m connected companies using Ariba Network | €3,044 m R&D expense in 2016 (IFRS) |
Empowering Our Customers to Become Digital Businesses
In 2016, we continued to give top priority to supporting our customers on their individual paths into the digital economy, defining our strategy around the following cornerstones:
| ∎ | Enabling business with a digital data foundation |
| ∎ | Running business with modern business applications and business networks |
| ∎ | Differentiating business with a digital enterprise platform |
| ∎ | Steering business with real-time analytics |
| ∎ | Reinventing business with machine learning and theInternet of Things |
| ∎ | Making companies’ digital transformations possible with SAP Digital Business Services |
SAP HANA – Enabling Business with a Digital Data Foundation
SAP HANA is ourin-memory computing platform that lets companies accelerate business processes, deliver more business intelligence, and simplify their IT environment. SAP HANA removes the burden of maintaining separate legacy systems and siloed data, so companies can run live and business people can make better business decisions in the new digital economy. Emphasizing our cloud-first strategy, SAP HANA can be deployed on several public cloud infrastructures.
With our second version of SAP HANA, we launched a truly next-generation platform. It enables the reduction of time-consuming database and data management tasks and delivers intelligent applications that leverage advanced analytic processing and empowers all users with deeper insight into any data from anywhere.
Our cloud-first strategy requires a very strong offering to handle Big Data in the cloud. With SAP Cloud Platform Big Data Service, which is powered by SAP HANA, we run multitenant-aware Hadoop systems and provideend-to-end capabilities to efficiently manage and scale Big Data initiatives.
Running Business with Modern Business Applications and Business Networks
SAP S/4HANA – Reimagining the Business Suite for the Digital Age
SAP S/4HANA, our next-generation business suite, allows our customers to embrace the digital economy. The digital core is the foundation for running a Live Business:
| ∎ | Immediate – Empowering business users with insights to act in the moment |
| ∎ | Intelligent – Going beyond automation to provide predictive suggestions |
| ∎ | Integrated – Connecting not only customer functions but also people, things, and businesses |
Based on SAP HANA, SAP S/4HANA software can store and process huge amounts of data while significantly reducing an organization’s data footprint. This means our customers can save time and cost.
Available in the cloud, on premise, or as a hybrid deployment, in 2016, SAP S/4HANA evolved from a finance-focused offering into a fulldigital-age ERP system. It enables insight and understanding so businesses can predict outcomes and use that data to make decisions live, which helps companies stay competitive in the digital economy. SAP S/4HANA can replace a traditional ERP solution across all lines of business (LoBs), such as finance, human resources, sales, service, procurement, manufacturing, asset management, supply chain, and research and development (R&D).
| Combined Management Report | Products, Research & Development, and Services | 54 |
Table of Contents
Customers recognize the benefits and power of SAP S/4HANA and, at the end of 2016, more than 5,400 customers had chosen the suite to support their digital transformation.
SAP S/4HANA Cloud – Delivering the Power of the Digital Core
In addition to ouron-premise suite SAP S/4HANA, we further strengthened our SAP S/4HANA Cloud offering, delivering the power of a digital core with the key benefits expected from asoftware-as-a-service solution. It provides the scalability, ease of management, and security required in today’s digital economy. A quarterly release cycle helps ensure that customers can benefit from regularly delivered innovations with minimum disruption to their business.
SAP S/4HANA Cloud is comprised of various solutions targeted to meet the specific business needs of our customers and enable their journey to the cloud. For example, the SAP S/4HANA Enterprise Management Cloud solution provides a next-generation ERP suite in the cloud with integrated,end-to-end processes.
SAP S/4HANA Cloud was developed toco-exist in a heterogeneous system landscape with native integration to other SAP solutions and open interfaces for further integration and extensions using SAP Cloud Platform (formerly called SAP HANA Cloud Platform). The solution also supports specific industry and LoB requirements with preconfigured content from SAP Best Practices packages and uses the award-winning SAP Fiori user experience (UX) to provide simplified, role-based usability.
Extending Our Reach Through a Broad Ecosystem
SAP’s ecosystem and partners extend our reach in the marketplace. We work closely with more than 15,000 partners worldwide to provide SAP solutions for our customers. Partners continue to drive SAP S/4HANA and our solutions for small businesses and midsize enterprises (SMEs) – SAP Business ByDesign and SAP Business One – to prospects on behalf of SAP, accounting for more than 88% of all new SAP customers.
Innovating for LoBs and Industries
As a modular integrated suite, SAP S/4HANA is the backbone of a company. And, at the same time, we are building functional innovations for LoBs and industries to address our customers’ specific and evolving needs.
SAP covers 25 industries grouped in six industry sectors and 12 lines of business:
Industry Sector | Industry Portfolio | |
| Consumer | SAP for Consumer Products | |
| SAP for Life Sciences | ||
| SAP for Retail | ||
| SAP for Wholesale Distribution | ||
| Discrete manufacturing | SAP for Aerospace & Defense | |
| SAP for Automotive | ||
| SAP for High Tech | ||
| SAP for Industrial Machinery & Components | ||
| Energy and natural resources | SAP for Chemicals | |
| SAP for Mill Products | ||
| SAP for Mining | ||
| SAP for Oil & Gas | ||
| SAP for Utilities | ||
| Financial services | SAP for Banking | |
| SAP for Insurance | ||
| Public services | SAP for Defense & Security | |
| SAP for Healthcare | ||
| SAP for Higher Education & Research | ||
| SAP for Public Sector | ||
| Services | SAP for Engineering, Construction & Operations | |
| SAP for Media | ||
| SAP for Professional Services | ||
| SAP for Sports & Entertainment | ||
| SAP for Telecommunications | ||
| SAP for Travel & Transportation | ||
| Lines of Business | Asset Management | |
| Commerce | ||
| Finance | ||
| Human Resources | ||
| Manufacturing | ||
| Marketing | ||
| R&D/Engineering | ||
| Sales | ||
| Service | ||
| Sourcing and Procurement | ||
| Supply Chain | ||
| Sustainability |
In addition, we are building other functional innovations that serve specific lines of business, for example:
Human Capital Management
Our human capital management (HCM) offerings, including SAP SuccessFactors solutions, help organizations increase the value of their total workforce by developing, managing, engaging, and empowering their people. SAP SuccessFactors HCM Suite addresses a full range of HR needs and encompasses the following:
| ∎ | Core human resources – SAP SuccessFactors Employee Central and SAP SuccessFactors Employee Central Payroll solutions cover the administrative tasks required to manage an organization’s workforce. More specifically, this includes HR administration, payroll, position management, global benefits, time and attendance, shared services, and employee and manager self-service capabilities. The solutions act as the key source of employee and worker data and typically integrate with hundreds of external and internal systems, including SAP S/4HANA. At the end of 2016, customers for SAP SuccessFactors Employee Central numbered more than 1,580. |
| Combined Management Report | Products, Research & Development, and Services | 55 |
Table of Contents
| ∎ | Talent management – Our suite comprises solutions for all pillars of talent management, recruiting (marketing and management), onboarding, performance management, development, succession planning, compensation planning and administration, learning, and workforce analytics. |
We focus on delivering a simple and intuitive UX for our HCM suite through mobile device or desktop.
Customer Engagement and Commerce (CEC)
Today’s customers are digitally connected, socially networked, and individually empowered, changing the rules of engagement. Our integrated front-office suite encompasses a holistic offering across customer experience, commerce, marketing, sales, billing, and services.
By providing leading omnichannel customer engagement and commerce solutions across any touch point and channel, we enable organizations (bothbusiness-to-consumer andbusiness-to-business) to deliver contextual, consistent, and relevant experiences – regardless of channel or device – throughout the customer journey.
Connecting Companies with Business Networks
Our business networks arebest-in-class cloud applications that connect a global ecosystem of customers, suppliers, and partners. The products and services go beyond the four walls of a business to integrate and connect systems, services, partners, and data – creating more efficient, more powerful, and far simpler ways to manage key business functions. They provide the outcomes and experiences business users need through open and connected platforms.
Included in the business networks portfolio are SAP’s market-leading Concur, SAP Ariba, and SAP Fieldglass solutions, which are at the center of our business network strategy.
Ariba Network is the world’s largest business network, with more than 2.5 million connected companies trading over US$885 billion of commerce on the network, which has grown its commerce volume close to 20% year-over-year. In 2016, we unveiled innovations that help businesses achieve efficient, intelligent connections and frictionless transactions across the entiresource-to-pay process:
| ∎ | Guided buying – A new buying experience automatically leads employees to goods and services they need to do their jobs and execute purchases in compliance with company policies. |
| ∎ | Light enablement – This interactivee-mail service eliminates the complexity that buyers face in onboarding and connecting suppliers, letting them send purchase orders and receive order confirmations and invoices in just a few clicks. |
| ∎ | Open platform – Ariba Network offers an open application-programming interface (API) capability that allows partners to add functionality and extend solutions for all industries and business needs. |
With more than 45 million users worldwide, our acquired company Concur is the world leader in travel and expense management solutions. In 2016, Concur continued to deliver on our vision of an open cloud platform for travel and expense management that enables an effortless experience for end users as well as finance departments. It provides total transparency into employee travel and spending, wherever and whenever it happens.
New innovations for travel, expense, and accounts payable automation in Concur solutions include:
| ∎ | User interface improvements and the addition of many region-specific partners to our ecosystem |
| ∎ | Integration with the SAP ERP Financials and Intuit Quickbooks solutions |
| ∎ | Expansion of global tax capabilities |
| ∎ | Additional features in the Concur Invoice solution to help ensure athree-way match between purchase, receipt, and invoicing |
SAP Fieldglass solutions help simplify procuring and managing external workforce services, connecting businesses in real time. In 2016, more than 3.1 million workers in approximately 135 countries were connected using the solution.
Market changes, including globalization and access to talent, have led many organizations to increasingly rely on contingent workers and service providers to achieve business goals. SAP Fieldglass cloud-based solutions also help companies engage and optimize all forms of talent. The software dynamically matches business needs with the right combination of resources while helping to ensure visibility, compliance, and cost control.
In 2016, we continued to redefine how work gets done in the enterprise, with innovations in SAP Fieldglass solutions including streamlined services procurement templates and extended flexible talent-sourcing capabilities.
Data Network
Our business data network offers a comprehensive, people-firstdata-as-a-service solution that provides real-time, industry-specific, and data-driven benchmarks built on the world’s largest repository of networked business data and enriched by key industrial and economic indicators. In 2016, we produced a beta version of the first data-driven service based on contingent workforce data. The highly personalized user experience helps customers discover their standing in the market so that they can take advantage of live recommendations and collaboration workflows that turn insights into action. Using data strategically in this way, customers can operate more efficiently and create new data-driven business models.
| Combined Management Report | Products, Research & Development, and Services | 56 |
Table of Contents
SAP Connected Health
Building on many years of work in the healthcare and life sciences industries, SAP has deepened its investment in these areas. In 2016, we launched a SAP Connected Health platform with trusted partners. The platform supports new developments such as using very large data sets to conductin-depth analysis of the human genome, proteome, and other biological data. It also enables a broad ecosystem of partners – including developers, researchers, and healthcare organizations – to accelerate the development and delivery of innovative, patient-centered solutions for improving health outcomes, reducing costs, and delivering connected healthcare services.
Building Better Solutions for Small and Midsize Enterprises
We offer a portfolio that extends the power of SAP HANA to support SMEs with their digital transformation that includes the followings solutions:
| ∎ | SAP Anywhere: Our front-office solution for small businesses has been on the market for just over a year in China, the United Kingdom, and the United States. Currently, more than 185 customers are running SAP Anywhere. |
| ∎ | SAP Business ByDesign:Our ERP cloud solution is targeted to the midmarket and subsidiaries of large enterprises. At the end of 2016, 99% of SAP Business ByDesign customers ran the solution on SAP HANA. |
| ∎ | SAP Business One: Our integrated ERP application is available on premise or through a partner-hosted cloud. Today, more than 2,000 SAP Business One customers run the application on SAP HANA. |
Our focus for SMEs, as with larger enterprises, is on cloud technology and simplified business processes for end users and partners.End-to-end accountability and increased investments in these core cloud ERP,on-premise ERP, and front-office solutions helps foster innovation and growth for the digital economy. Customers using SME solutions include small businesses and midsize companies in more than 100 countries.
Keeping User Experience in Focus
User experience (UX) is about meeting the user’s needs in the most effective and enjoyable way. Our understanding of how to create true innovation manifests itself in the award-winning SAP Fiori UX. The concept and design principles are key components in ourdesign-led development process, which helps ensure the delivery of SAP Fiori innovations through all SAP applications.
With SAP Fiori 2.0, users can get their work done faster and more effectively, with:
| ∎ | Direct access to relevant information and apps |
| ∎ | Transparency on items needing attention and timely notifications |
| ∎ | Support in deciding what needs to be done next |
| ∎ | Ability to perform quick and informed actions |
At the same time, our UX strategy focuses on empowering our customers and partners to design their own UX journey and execute on it – through a rich portfolio of services, educational offerings, and tools and technologies to design, develop, and deliver a simplified UX.
SAP Cloud Platform – Differentiating Business with a Digital Enterprise Platform
In the digital economy, in addition to standard applications, companies need a highly flexible platform that allows them to do the following:
| ∎ | Extend cloud andon-premise SAP applications |
| ∎ | Build new applications for differentiating LoB processes |
| ∎ | Integrate cloud andon-premise SAP applications |
With SAP Cloud Platform, ourin-memoryplatform-as-a-service, companies can rapidly build, run, and extend modern business applications. It offers comprehensive capabilities to help business users and developers create better, more agile applications in less time. Customers can apply, among other things, mobile services, advanced analytic tools,state-of-the-art authentication mechanisms, and social functionality. For maximum flexibility, portability, and agility, we use open technologies.
SAP Cloud Platform is a digital enterprise platform offering the following:
| ∎ | Analytical capabilities |
| ∎ | Access to SAP applications, processes, and data |
| ∎ | Robust business services that customers and independent software vendors can consume to build solutions |
Furthermore, we are positioning the SAP Cloud Platform Integration service as the default integration infrastructure for SAP solutions, whether in the cloud or on premise. We deliver content to supportend-to-end integration scenarios. Being able to connect and integrate allbest-of-breed applications to our digital core and to any custom-built solution makes SAP Cloud Platform the center of gravity for a modular suite of business applications.
Close partnerships with customers and other leading technology companies are key to providingbest-in-class solutions. In 2016, we announced a strategic partnership with Apple Inc. to build a SAP Cloud Platform software development kit for iOS that enables businesses, designers, and developers to quickly and efficiently build their own native iOS apps for iPhones and iPads.
Steering Business with Real-Time Analytics
Business leaders need to be able to discover and communicate meaningful and actionable insights in data so they can make decisions in real time. Our analytics offerings help companies to apply analytics to business data to describe, predict, and improve business performance, recommend action, and guide decision making.
| Combined Management Report | Products, Research & Development, and Services | 57 |
Table of Contents
With SAP BW/4HANA, we launched next-generation data warehouse software, delivering a simpler and more powerful way to achieve real-time analytics by connecting historical data with live data stored in SAP and third-party software environments. This integrated data warehouse solution is optimized to fully leverage the SAP HANA platform and simplifies development, administration, and the user interface, resulting in enhanced business agility.
We consolidated analytical functionalities across our product portfolio in one cloud analytics solution – SAP BusinessObjects Cloud. Built on SAP Cloud Platform, it helps companies overcome the challenge of point solutions and data silos spread throughout the organization with enterprise-wide access to analytics delivered through a public cloud experience.
For the SAP Digital Boardroom solution, which offers executive decision makers ease and elegance in accessing company data in real time, we released new industry-specific andLoB-specific content for consumer products, chemicals, engineering, construction, operations, and public sector, as well as HR, finance, and marketing LoBs.
Reinventing Business with the Internet of Things and Machine Learning
There is no topic that typifies the digital transformation more than the Internet of Things (IoT). The IoT is a network of physical objects with embedded sensors to detect their environment and interact with business processes and systems. This builds a foundation for entirely new business models and completely digitized, connected businesses. Intelligent sensors, ubiquitous connectivity, and unlimited data storage are driving innovation and leading to a deeper integration of people, processes, data, and things – in one connected world.
Our IoT solutions, now marketed under the new SAP Leonardo brand, help companies digitally transform their manufacturing, logistics, and asset management processes and respond to the needs of a digital business in a highly individualized, consumer-driven economy. We strive to become a trusted partner for IoT that helps our customers link sensor data with business processes and thereby add value. With ourend-to-end SAP Leonardo solutions for connected logistics, connected manufacturing, and connected assets, for example, we offer a comprehensive portfolio of standard IoT software, both cross-industry and industry specific. Furthermore, in November 2016, we announced the SAP IoT Application Enablement toolkit, providing services that allow our customers to build their own IoT applications.
Research and Innovation – Innovating for Future Growth
With businesses shifting, leading our customers through change is more important than ever before. We do this every day by empowering our employees and collaborating with our customers to develop world-class software and next-generation solutions. We further strengthened our global research and development (R&D) efforts in 2016 by investing in our SAP Labs network and expanding our SAP Innovation Center locations in India, Israel, and the United States.
Through the SAP Innovation Center concept, we explore unconventional ideas and develop inspiring proofs of concept in a startup-like environment. We strive to open up new markets for SAP software and accelerate the integration of emerging technologies into our core products. Some of these innovations include:
| ∎ | Machine learning– Making all existing SAP solutions intelligent, bringing machine-learning services and APIs to our platform, and building intelligent business solutions in new and adjacent markets.To emphasize the importance of this topic, we have introduced the new brand SAP Clea that represents our entire machine learning portfolio. |
| ∎ | Blockchain– Exploring the potential of digital finance to radically change how business transactions are conducted in the future and its impact on existing products and innovation potential of blockchain across industries. |
| ∎ | Future enterprise applications– Enabling companies to successfully lead the next economic revolution by developing game-changing business applications to process intangible assets, provide contextual user assistance, and manage new business models. |
We draw on the ideas of customers, partners, startups, academia, and, most importantly, our own employees. We want to foster organic innovation and support the transformation of great ideas into profitable business.
Investing in Research and Development
SAP’s strong commitment to R&D is reflected in our expenditures (see figure below).
Research and Development [IFRS]
€ millions | change since previous year
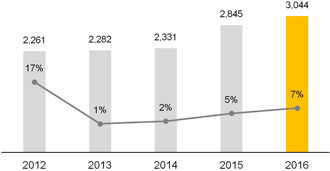
In 2016, ournon-IFRS R&D expense as a portion of total operating expenses increased from 18.3% to 18.4% year over year. Our IFRS R&D expense ratio increased from 17.2% to 18.0%. At the end of 2016, our total full-time equivalent (FTE) headcount in development work was 23,363 (2015: 20,938). Measured in FTEs, our R&D headcount was 28% of total headcount (2015: 27%).
Total R&D expense not only includes our own personnel costs but also the external cost of work and services from the providers and cooperation partners we work with to deliver and enhance our products. We also incur external costs for the following:
| ∎ | Translating, localizing, and testing products |
| Combined Management Report | Products, Research & Development, and Services | 58 |
Table of Contents
| ∎ | Obtaining certification for products in different markets |
| ∎ | Patent attorney services and fees |
| ∎ | Strategy consulting |
| ∎ | Professional development of our R&D workforce |
Patents
SAP actively seeks intellectual property protection for innovations and proprietary information. Our software innovations continue to strengthen our market position in business solutions and services. Our investment in R&D has resulted in numerous patents. As at December 31, 2016, SAP held a total of more than 8,000 validated patents worldwide. Of these, 841 were granted and validated in 2016.
While our intellectual property is important to our success, we believe our business as a whole is not dependent on one particular or a combination of patents.
Making Digital Transformation Possible with SAP Digital Business Services
SAP offers a comprehensive portfolio of services and support designed to help our customers deploy their software faster and more efficiently – so they can focus more on innovations and realize faster, greater ROI. We provide tailored support to our customers to help them run live in the digital economy.
Through our SAP Digital Business Services unit, SAP aims to standardize services, not recreate them each time – helping companies and organizations reimagine their businesses in the new economy using a digital business framework.
We are accelerating the realization of the digital enterprise with game-changing engagements for predictive maintenance and warranty, analytics to manage Big Data, and connected intelligent manufacturing, among others.
Innovations from SAP Digital Business Services
SAP Digital Business Services offers an entire portfolio of services. Some of our top innovations in 2016 to help customers transform to a digital business include:
| ∎ | SAP Value Assurance service packages for SAP S/4HANA |
| ∎ | Latest generation of SAP Solution Manager and SAP Model Company |
| ∎ | Next-generation support |
| ∎ | SAP Digital: Expanding the reach of SAP Store and messaging services |
SAP Value Assurance Service Packages
Our SAP Value Assurance service packages for SAP S/4HANA cover all project phases and scenarios to help customers migrate from SAP ERP to SAP S/4HANA. This includes:
| ∎ | System conversion |
| ∎ | Landscape transformation |
| ∎ | New implementations |
| ∎ | On-premise, cloud, and hybrid deployment options |
The approach consolidates services and embedded support in four distinct phases:
| ∎ | Plan and safeguard – Defining the implementation strategy, including dependencies and prerequisites for the target architecture |
| ∎ | Technical implementation – Focusing on the technical aspects of implementation, including data and system migration, high availability, and disaster recovery |
| ∎ | Migrate and implement – Implementing functions with preconfigured setup andready-to-use business process templates, and analyzing operational impact |
| ∎ | Innovate and optimize – Expanding the context of innovation beyond the digital core to reimagine business models across the enterprise |
The packages utilize the SAP Activate methodology, an innovation adoption framework that combines SAP Best Practices packages, implementation methodology, and guided configuration to help streamline deployment.
Partners also play a key role in innovation adoption. Our open engagement approach has motivated many of our larger services partners to focus more on establishing SAP S/4HANA as the digital core.
SAP Solution Manager and SAP Model Company
SAP Solution Manager manages SAP software implementations from cloud to on premise and hybrid, and is currently rolled out as the delivery platform for SAP Digital Business Services. It addresses both IT and business needs.
The solution gives customers real-time transparency, automation, and control to adopt and manage innovations. Process experts and solution architects can explore new industry models earlier, accessing all SAP Best Practices packages.
We also offer a new modeling environment. SAP Model Company is an accelerator service that helps simplify innovation adoption. It combines standard SAP software, SAP Best Practices packages, SAP Rapid Deployment solutions, and content from SAP Activate. Customers can develop repeatable implementation scenarios and access the latest innovations for their future projects. It helps to decrease effort and ensure project success on time and within budget. The service enables customers to accelerate implementations, reduce total cost of ownership, and get up and running quickly.
It is aready-to-use solution that supports critical decision phases such as discovery and prototype. We provide the full system landscape with detailed business content and documentation and help lower time to value with versions specific to industries and lines of business.
| Combined Management Report | Products, Research & Development, and Services | 59 |
Table of Contents
Next-Generation Support
Traditional businesses are becoming digital enterprises. With more business processes “running live,” product support must be less reactive and much more proactive, predictive, and available at any moment; in other words, live support.
Our product support has implemented a next-generation support approach that includes real-time support. Named Expert Chat, this live support channel offers direct access to our experts, available for the majority of our solutions. Moreover, a universal, toll-free phone number harmonizes interaction with support across almost all of our products. We also offer customers a way to search for answers to product-related questions, by making knowledge located within SAP searchable using Google. Automating tasks with intelligent, context-sensitive tools provides customers with solutions proactively.
Customers also demand a seamless, omnichannel support experience. We plan to address this by implementing functions such asbuilt-in, mobile, and social media-enabled support.
In addition, we launched an SAP Preferred Care offering as a premium support option foron-premise customers transitioning to digital business models. It complements the already existing SAP Preferred Care Cloud offering. The offering is an enhancement to our foundation support offerings, namely SAP Enterprise Support, and includes:
| ∎ | Advanced service-level agreements |
| ∎ | Additional services |
| ∎ | Dedicated contacts |
SAP Digital
End users can buy both SAP and partner offerings usingone-click contracts and digital payments by credit card or PayPal. Customers can discover, try, buy, use, and renew solutions in a simple online interaction. In 2016, customers from 95 different countries placed more than 55,000 orders digitally.
At the same time, SAP also provides a wide variety of intelligent, interconnected messaging and communication services that reach 97% of the world’s mobile subscribers and connect billions of things. Top social media companies rely on SAP solutions to reach their customers worldwide. In 2016, more than 350 billion messages passed through our networks.
We are incubating several new initiatives to more rapidly grow our digital business and expand into new areas – for example, integrating messaging services into our own applications.
A Partner on the Journey to Digital Transformation
SAP will continue to support our customers’ digital transformation through innovative software, ongoing R&D, and proactive services. By reimagining our business suite and providing world-class software, we empower businesses to continue to succeed in the new digital economy. Together, we are a force that helps further economic development, social progress, and minimizes environmental impact – and makes the world run better.
| Combined Management Report | Products, Research & Development, and Services | 60 |
Table of Contents
Security, Privacy, and Data Protection
Meeting Today’s Data Protection Challenges
Every day, organizations all around the world trust SAP with their data – either in their own premises, in the cloud, or on the move using mobile devices. Our customers need to know that we will keep that data safe, process it in a manner that complies with local legislation, and protect it from malicious use.
For this reason, data protection and security is of paramount importance to us. We have implemented safeguards to help enable the privacy rights of everyone whose data is processed by SAP, whether they are our customers, prospects, employees, or partners. In addition, we work towards compliance with all relevant legal requirements for data protection. Our global security officer and data protection and privacy officer report to our Executive Board and regularly monitor the compliance of all activities in these areas.
Facing Increasing Risks in IT Security
Safeguarding data is an increasingly challenging task today. Companies are collecting and storing more data than ever before from more and more sources. No longer is data locked away in anon-premise mainframe requiring physical security.
Data now proliferates outside the four walls of businesses with multiple endpoints exposed and vulnerable to attack. Moreover, the sheer number of and the sophistication of attacks facing businesses are at anall-time high. We are seeing the “commercialization of hacking” while new advanced persistent threats can bypass many traditional security protection techniques.
Establishing a Comprehensive Security Vision
At SAP, we want our customers and employees to be able to use our software and services anywhere, from any device, at any time, with confidence and trust. However, the growing risk and occurrence of cyberattacks reinforces the need to keep critical information systems secure.
Consequently, for SAP and for our customers, security means more than just meeting compliance demands. To secure the SAP software landscape, we offer a comprehensive portfolio of security products, services, and secure support as well as security consulting. They help our customers build security and privacy protection capabilities into their businesses.
Several of our security measures extend across all sectors of our company and thus to all of our products and services. These measures include, among other things, the regular training of employees on the subject of IT security and data protection, including the handling of confidential information and ensuring controlled and restrictive access to customer information. In addition, we have developed a three-pronged strategy focusing on the security of our products, operations, and organization:
Secure Products Strategy: Champion Product Security
Businesses use SAP applications to process mission-critical transactional data which can be highly attractive to cyber attackers. Our secure products strategy focuses on incorporating security features into our applications to minimize the risk of a security breach.
Our secure software development lifecycle is at the heart of this strategy. This provides a comprehensive methodological approach for incorporating security features into our applications. Before a release decision is made, our software is validated by independent IT security experts. This team then addresses any recommendations made before we release the application.
This approach conforms to the ISO/IEC 27034 standard for application security and is closely embedded into our ISO 9001-certified process framework for developing standard software.
Secure Operations Strategy: Running Secure Operations
Our secure operations strategy focuses on the security principles of “confidentiality, integrity, and availability” to ensure overall protection of our business, as well as our customers’ businesses. Our mission is to provide a comprehensiveend-to-end cloud and IT operations security framework – from system and data access and system hardening to security patch management, security monitoring, andend-to-end incident handling. This involves the implementation of key security measures across all layers including physical assets as well as process-integrated controls.
Furthermore, our secure operations approach concentrates on the early identification of any deviations from the standards defined in our security framework. Deviations are identified through a combination of automated and manual reviews. Performed by third parties as well as by SAP colleagues, these reviews verify compliance with international standards and SAP global security standards.
Industry best-practice certifications are key success factors for our secure operations strategy. Many of our cloud solutions undergo
| Combined Management Report | Security, Privacy, and Data Protection | 61 |
Table of Contents
Service Organization Control (SOC) audits ISAE3402, SSAE16 SOC I Type II, and SSAE16 SOC II Type II. The SOC standards are harmonized with a number of ISO certifications including ISO 9001, 27001, and 22301.
Secure Company Strategy: Taking a Holistic Approach to the Security of Our Business
At SAP, we take a holistic approach to the security of our company, encompassing processes, technology, and employees. At the heart of our secure company strategy is an efficient information security management system and a security governance model that brings together all of the different aspects of security. These include the following three main areas:
| ∎ | Security culture: Awareness and compliance with our security policy and standards are fostered through regular mandatory training, assessments, and reporting. |
| ∎ | Secure environments: Comprehensive physical security measures are in place to ensure the security of our data centers and development sites so that we can protect buildings and facilities effectively. |
| ∎ | Business continuity: A corporate continuity framework aimed at having robust governance in place at all times is reviewed on an annual basis to adapt to new or changed business needs. |
Complying with Data Protection and Privacy Legislation
When processing data about employees, applicants, customers, suppliers, and partners, SAP respects and protects their right to data protection and privacy while implementing appropriate security measures. We develop and support our data protection and privacy strategy in accordance with our business strategy.
To comply with applicable data protection laws, SAP has adopted a global data protection and privacy policy. It outlines a Group-wide minimum standard for handling personal data in compliance with data protection and privacy laws. The policy defines requirements for all operational processes that affect the processing of or access to personal data, as well as providing clear responsibilities and organizational structures. We actively monitor changes to applicable laws and regulations so that we can update our standards on an ongoing basis.
We have also implemented a wide range of measures to protect data controlled by SAP and SAP customers from unauthorized access and processing, as well as from accidental loss or destruction. These include, among others, the implementation of our data protection management system in areas critical to data protection. This system is certified on a yearly basis by the British Standards Institute.
In 2016, SAP did not experience any significant incidents regarding breaches of customer privacy or losses of customer data. There were no incidents reported subject to the provisions of the German Federal Data Protection Act.
| Combined Management Report | Security, Privacy, and Data Protection | 62 |
Table of Contents
>345,000 customers around the world | 19.2% Customer Net Promoter Score 2016 |
Continuing to Build Strong Customer Relationships
Customer loyalty is one of our four corporate objectives, along with growth, profitability, and employee engagement. In 2016, our combinedon-premise and cloud Customer Net Promoter Score (Customer NPS) was 19.2% (2015: 22.4%). As we further harmonize processes in acquired entities, the customer segments used for customer surveys has not yet been completely harmonized across the SAP Group. Specifically, due to the nature of the business, the Concur customer sample includes a higher proportion of general business customers in comparison to other Group entities. As a result, Concur responses make up a large proportion of the total customer sample.
While we continue to have a positive Customer NPS, we did not reach our target of 25% in 2016. As a response to the feedback received from our customers throughout 2016, we have focused on improving the quality of ourfollow-up process to ensure a timely resolution of customer issues. We have provided more insight into how customers can migrate to our innovations without disrupting their business processes. With a sustained emphasis onfollow-up, we are targeting a combined Customer NPS of 21% to 23% in 2017, with our medium-term goal of reaching a combined Customer NPS of 35% to 40% by 2020.
For more information about the Customer NPS, see thePerformance Management System section.
Continuing Strong Customer Demand
We help companies transform into digital businesses. In 2016, we saw customers do so by licensing or subscribing to the full range of SAP software, from comprehensive solutions for large enterprises to the latest mobile apps.
Some examples by region include the following customers:
North America and Latin America (Americas) Region
| ∎ | The Dow Chemical Company, based in the United States, has decided to deepen their relationship in SAP through the investment in SAP HANA, including a future state vision around SAP S/4HANA in support of their business objectives |
| ∎ | Hershey, headquartered in the United States, is upgrading to the SAP S/4HANA suite to achieve enterprise connectivity through access to actionable information at the right time for everyone, anywhere. The large chocolate manufacturer will gain real-time insights from both operational and other data and can simplify global business processes to drive efficiencies and scale. |
| ∎ | Itaú Unibanco Holding, based in Brazil and one of the top 20 banks in the world by market value, is currently using the SAP HANA platform. It recently added Ariba Network, through which Itaú joins the SAP marketplace forbusiness-to-business transactions. |
| ∎ | Live Nation, the global leader for live entertainment based in the United States, has purchased Concur Travel & Expense to meet the needs for anend-to-end travel solution from travel request, to online and agent assisted travel planning through to trip reimbursement. Important in the selection process was a full-featured mobile app, exceptionalend-user experience, robust analytics and reporting, the ability to integrate with existing Live Nation systems, and the flexibility to configure to their travel policy and business practices. |
| ∎ | Mexico Proyectos Y Desarollos chose SAP Ariba Buying, advanced edition, SAP Ariba Strategic Sourcing, and the SAP HANA platform to standardize operative, strategic sourcing, and management processes while achieving better corporate negotiations and reducing maverick purchases. The construction infrastructure company expects to transform procurement processes by leveraging technological innovation and fully achieve its functional and automatization needs. |
Asia Pacific Japan (APJ) Region
| ∎ | Cathay Pacific, based in Hong Kong, chose SAP S/4HANA and the SAP HANA platform to simplify its business process, enable |
| Combined Management Report | Customers | 63 |
Table of Contents
operational-level reporting directly from the airline company’s operational system, and provide the foundation for further system migrations. |
| ∎ | China National Chemical Corporation (ChemChina), China’s biggest chemical group and a Fortune Global 500 company, has invested heavily in overseas acquisitions. It chose SAP S/4HANA, the SAP HANA platform, the SAP NetWeaver Master Data Management component, and the SAP BusinessObjects Planning and Consolidation application to keep pace with rapid organizational expansion. Through this partnership, ChemChina is leveraging SAP’s leading technology to redefine its IT strategy, optimize IT infrastructure, improve efficiency and business insights, and prepare for a transition to Industry 4.0. |
| ∎ | NTUC Fairprice, one of Singapore’s largest retailers, chose the SAP HANA platform, SAP Payroll Processing, and SAP SuccessFactors Recruiting Posting solutions to improve employee productivity and engagement. As a customer-oriented retailer, the company also strives to boost productivity and raise overall customer-satisfaction levels by simplifying processes, automating manual practices, and obtaining detailed insights from integrated analytics. |
| ∎ | Rockland Distilleries in Sri Lanka has chosen the SAP Hybris Cloud for Customer solution over competitors to lead the company through its digital transformation journey. The solution will help increase the productivity of its salespeople and gather business insights that will enable it to make strategic and transformational decisions. |
| ∎ | Roy Hill Mining Operation is an independent iron ore operation with a project to become the largest single ore mine in Australia. The project is turning to SAP software, including SAP S/4HANA, the SAP Multiresource Scheduling application, and the SAP Integrated Business Planning solution, to view its inventory in real time, make informed decisions on maintenance activities, and manage its supply chain costs more effectively. |
Europe, Middle East, and Africa (EMEA) Region
| ∎ | Barry Callebaut, based in Switzerland, is one of the world’s leading suppliers of high-quality chocolate and cocoa products. It has implemented SAP solutions to integrate 65,000 small-scale cocoa farmers in Côte d’Ivoire, enable sustainable cocoa farming, and improve the livelihood of farmers, their families, and their communities. The company recently went live with the SAP Rural Sourcing Management solution, an integrated, cloud-based solution running on SAP Cloud Platform. It provides farming organizations with mobile and desktop access to important data immediately to help simplify and digitalize business processes. |
| ∎ | Bilfinger, a German industrial services provider, selected SAP SuccessFactors HCM Suite, including the SAP SuccessFactors Employee Central solution, to standardize HR processes and increase workforce transparency. A further aim is to establish a global talent management model and increase workforce performance. The solutions will help Bilfinger drive its strategic objectives for productivity, consolidation, and compliance. |
| ∎ | Inter Cars, the largest importer and distributor of automotive spare parts in Poland, chose the SAP Hybris Commerce Cloud solution to establish a full omnichannel platform that will address the business strategy and help the company achieve its goal to double its revenue within the next few years. |
| ∎ | L’OCCITANE, a French natural and organic ingredient-based cosmetics and well-being retailer, chose the SAP SuccessFactors Employee Central and SAP SuccessFactors Recruiting solutions to streamline human resources processes and gain global visibility into its workforce. It also expects to attract and hire top talents and develop a workforce that helps to support the company’s digital transformation and growth strategy. |
| ∎ | Targin, a large Russian multiproduct integrated oilfield service holding, will implement SAP S/4HANA as an introduction to the next generation of SAP software. SAP S/4HANA will support Targin in transforming its business enterprises and increasing the efficiency of its business processes to reduce downtime and increase inventory turnover and the company’s market share. |
Helping Customers Invest
To help companies invest in SAP solutions and associated services and hardware, SAP Payment services offers customers payment plans. SAP Payment services can help preserve liquidity, provide an alternative to credit from customers’ existing banking relationships, and balance their budgetary priorities, while giving them the flexibility to choose their preferred solution.
| Combined Management Report | Customers | 64 |
Table of Contents
We use various performance measures to help manage our performance with regard to our primary financial objectives, which are growth and profitability, and our primarynon-financial objectives, which are customer loyalty and employee engagement. We view growth and profitability as indicators for our current performance, while customer loyalty and employee engagement are indicators for our future performance.
Measures We Use to Manage Our Financial Performance
Measures We Use to Manage Our Operating Financial Performance
In 2016, we used the following key measures to manage our operating financial performance:
Cloud subscriptions and support revenue(non-IFRS): This revenue driver comprises the main revenues of our fast-growing cloud business. We generate cloud subscriptions and support revenue when we provide software functionality in a cloud-based infrastructure (software as a service, or SaaS) to our customers; when we provide our customers with access to a cloud-based infrastructure to develop, run, and manage applications (platform as a service, or PaaS); and also when we provide hosting services for software hosted by SAP (infrastructure as a service, or IaaS). Cloud subscriptions and support revenue are also generated when providing additional premium cloud subscription support beyond the regular support, which is embedded in the basic cloud subscription fees as well as business network services to our customers. We use the cloud subscriptions and support revenue(non-IFRS) measure both at actual currency and at constant currency.
Cloud and software revenue(non-IFRS): We use cloud and software revenue(non-IFRS) and constant currency cloud and software revenue(non-IFRS) to measure our revenue growth. Our cloud and software revenue includes cloud subscriptions and support revenue plus software licenses and support revenue. Cloud subscriptions and support revenue and software revenue are our key revenue drivers because they tend to affect our other revenue streams. Generally, customers that buy software licenses also enter into related support contracts, and these generate recurring revenue in the form of support revenue after the software sale. Support contracts cover standardized support services that comprise unspecified future software updates and enhancements. Software licenses revenue as well as cloud subscriptions and support revenue also tend to stimulate services revenue earned from providing customers with professional services, premium engagement services, training services, messaging services, and payment services.
Total revenue(non-IFRS): We use nominal total revenue(non-IFRS) and constant currency total revenue(non-IFRS) to measure our growth. The total of cloud subscriptions and support revenue and software support revenue divided by total revenue is the share of more predictable revenue. This measure provides additional insight into our sustained business success.
New cloud bookings: For our cloud activities, we also look at new cloud bookings. This measure reflects the committed order entry from new customers and from incremental purchases by existing customers for offerings that generate cloud subscriptions and support revenue. In this way, it is an indicator for cloud-related sales success in a given period and for secured future cloud subscriptions and support revenue. We focus primarily on the average contract value variant of the new cloud bookings measure that takes into account annualized amounts for multiyear contracts. Additionally, we internally monitor the total contract value variant of the new cloud bookings measure that takes into account the total committed order entry amounts regardless of contract durations. There are no comparable IFRS measures for these bookings metrics. In addition to new cloud bookings, we use the measure “cloud backlog” to evaluate our sales success in the cloud business. We define cloud backlog as a measure that represents the volume of business that, as of period end, is contracted but not yet billed.
Operating profit(non-IFRS): We use operating profit(non-IFRS) and constant currency operating profit(non-IFRS) to measure our overall operational process efficiency and overall business performance. See below for more information on the IFRS andnon-IFRS measures we use.
Cloud subscriptions and support gross margin(non-IFRS): We use our cloud subscriptions and support gross margin(non-IFRS) to measure our process efficiency in our cloud business. Cloud subscriptions and support gross margin(non-IFRS) is the ratio of our cloud subscriptions and support gross profit(non-IFRS) to cloud subscriptions and support revenue(non-IFRS), expressed as a percentage.
| Combined Management Report | Performance Management System | 65 |
Table of Contents
Measures We Use to Manage OurNon-Operating Financial Performance
We use the following measures to manage ournon-operating financial performance.
Financial income, net: This measure provides insight into the return on liquid assets and capital investments and the cost of borrowed funds. To manage our financial income, net, we focus on cash flow, the composition of our liquid assets and capital investment portfolio, and the average rate of interest at which assets are invested. We also monitor average outstanding borrowings and associated finance costs.
Days Sales Outstanding (DSO): We manage working capital by controlling the days sales outstanding (DSO) for operating receivables (defined as the average number of days from the raised invoice to cash receipt from the customer).
Measures We Use to Manage Overall Financial Performance
We use the following measures to manage our overall financial performance:
Earnings per share (EPS) (IFRS andnon-IFRS): EPS measures our overall performance because it captures all operating andnon-operating elements of profit as well as income tax expense. It represents the portion of profit after tax allocable to each SAP share outstanding. EPS is influenced not only by our operating andnon-operating business as well as income taxes but also by the number of shares outstanding.
Effective tax rate (IFRS andnon-IFRS): We define our effective tax rate as the ratio of income tax expense to profit before tax, expressed as a percentage.
Operating, investing, and financing cash flows and free cash flow: Our consolidated statement of cash flows provides insight as to how we generated and used cash and cash equivalents. When applied in conjunction with the other primary financial statements, it provides information that helps us evaluate the changes of our net assets, our financial structure (including our liquidity and solvency), and our ability to affect the amounts and timing of cash flows to adapt to changing circumstances and opportunities. We use our free cash flow measure to determine the cash flow remaining after all expenditures required to maintain or expand our organic business have been paid off. This measure provides management with supplemental information to assess our liquidity needs. We calculate free cash flow as net cash from operating activities minus purchases (other than purchases made in connection with business combinations) of intangible assets and property, plant, and equipment.
Measures We Use to Manage OurNon-Financial Performance
In 2016, we used the following key measures to manage ournon-financial performance in the areas of employee engagement, customer loyalty, and leadership trust:
Employee Engagement Index: We use this index to measure the motivation and loyalty of our employees, how proud they are of our company, and how strongly they identify with SAP. The index is derived from surveys conducted among our employees. Applying this measure is recognition that our growth strategy depends on engaged employees.
Customer Net Promoter Score (NPS): This score measures the willingness of our customers to recommend or promote SAP to others. It is derived from our annual customer survey that identifies, on a scale of 0–10, whether a customer is loyal and likely to recommend SAP to friends or colleagues, is neutral, or is unhappy. We introduced this measure in 2012, as we are convinced that we can achieve our financial goals only when our customers are loyal to, and satisfied with, SAP and our solutions. To derive the Customer NPS, we start with the percentage of “promoters” of SAP – those who give us a score of 9 or 10 on a scale of 0–10. We then subtract the percentage of “detractors” – those who give us a score of 0 to 6. The method ignores “passives,” who give us a score of 7 or 8.
Leadership Trust Score:We use this scoreto further enhance accountability and to measure our collective effort to foster a work environment based on trust. It is derived from a question in our annual global employee survey that gauges employees’ trust in our leaders. We measure leadership trust by using the same methodology as we do determining the Net Promoter Score (NPS).
Value-Based Management
Our holistic view of the performance measures described above, together with our associated analyses, comprises the information we use for value-based management. We use planning and control processes to manage the compilation of these key measures and their availability to our decision makers across various management levels.
SAP’s long-term strategic plans, including a multiyear financial plan through 2020, are the point of reference for our short-term and midterm planning and controlling processes. We initially identify future growth and profitability drivers at a highly aggregated level. In a first step, the resulting financial plan is broken down to (i) our deployment models “On Premise,” “Software as a Service/Platform as a Service,” “Infrastructure as a Service,” and “Business Networks”, and (ii) functions such as development, sales, or administration. In a second step, the planned total revenues and total expenses are allocated to the individual board areas. Budget administration and control, including budget adjustments applied during the year to reflect changes in priorities, to achieve efficiency targets and to reflect endogenous and exogenous factors, are handled at board area level. It is then the individual board member’s responsibility to break down, in their board area, the allocated budgets and budget adjustments. The Executive
| Combined Management Report | Performance Management System | 66 |
Table of Contents
Board’s efforts to assess the performance of the company and components thereof is also done on the level of the board areas. Based on an integrated portfolio process running in parallel to the budgeting process we ensure aligned investment behavior across board areas with regards to specific solutions or solution areas. In a final step, customer-facing revenue targets and cost of sales and marketing targets are broken down into sales regions.
Based on our detailed annual plans, we determine the budget for the respective year. We also have processes in place to forecast revenue and profit on a quarterly basis, to quantify whether we expect to realize our financial goals, and to identify any deviations from plan. We continuously monitor the concerned units in the Group to analyze these developments and define any appropriate actions. Our entire network of planning, control, and reporting processes is implemented in integrated planning and information systems, based on SAP software, across all organizational units so that we can conduct the evaluations and analyses needed to make informed decisions.
Non-IFRS Financial Measures Cited in This Report
As in previous years, we provided our 2016 financial outlook on the basis of certainnon-IFRS measures. Therefore, this report contains anon-IFRS based comparison of our actual performance in 2016 against our outlook in theFinancial Performance: Review and Analysissection.
Reconciliations of IFRS toNon-IFRS Financial Measures for 2016 and 2015
Due to rounding, the sum of the numbers presented in the following table might not precisely equal the totals we provide.
| Combined Management Report | Performance Management System | 67 |
Table of Contents
Reconciliation of IFRS toNon-IFRS Financial Measures for the Years Ended December 31
|
| |||||||||||||||||||||||||||||||
€ millions, unless otherwise stated | 2016 | 2015 | ||||||||||||||||||||||||||||||
| IFRS | Adj. | Non-IFRS | Currency Impact | Non-IFRS Constant Currency | IFRS | Adj. | Non-IFRS | |||||||||||||||||||||||||
| Revenue measures | ||||||||||||||||||||||||||||||||
Cloud subscriptions and support | 2,993 | 2 | 2,995 | 12 | 3,007 | 2,286 | 10 | 2,296 | ||||||||||||||||||||||||
Software licenses | 4,860 | 2 | 4,862 | 31 | 4,893 | 4,835 | 1 | 4,836 | ||||||||||||||||||||||||
Software support | 10,571 | 1 | 10,572 | 82 | 10,654 | 10,093 | 0 | 10,094 | ||||||||||||||||||||||||
Software licenses and support | 15,431 | 3 | 15,434 | 113 | 15,546 | 14,928 | 2 | 14,930 | ||||||||||||||||||||||||
|
|
|
|
|
|
|
|
|
|
|
|
|
|
|
| |||||||||||||||||
Cloud and software | 18,424 | 5 | 18,428 | 125 | 18,553 | 17,214 | 11 | 17,226 | ||||||||||||||||||||||||
|
|
|
|
|
|
|
|
|
|
|
|
|
|
|
| |||||||||||||||||
Services | 3,638 | 0 | 3,638 | 39 | 3,678 | 3,579 | 0 | 3,579 | ||||||||||||||||||||||||
|
|
|
|
|
|
|
|
|
|
|
|
|
|
|
| |||||||||||||||||
| Total revenue | 22,062 | 5 | 22,067 | 164 | 22,231 | 20,793 | 11 | 20,805 | ||||||||||||||||||||||||
| Operating expense measures | ||||||||||||||||||||||||||||||||
Cost of cloud subscriptions and support | -1,313 | 247 | -1,066 | -1,022 | 232 | -789 | ||||||||||||||||||||||||||
Cost of software licenses and support | -2,182 | 238 | -1,944 | -2,291 | 283 | -2,008 | ||||||||||||||||||||||||||
Cost of cloud and software | -3,495 | 485 | -3,010 | -3,313 | 516 | -2,797 | ||||||||||||||||||||||||||
Cost of services | -3,089 | 113 | -2,976 | -2,932 | 167 | -2,765 | ||||||||||||||||||||||||||
|
|
|
|
|
|
|
|
|
|
|
| |||||||||||||||||||||
Total cost of revenue | -6,583 | 598 | -5,985 | -6,245 | 683 | -5,562 | ||||||||||||||||||||||||||
|
|
|
|
|
|
|
|
|
|
|
| |||||||||||||||||||||
Gross profit | 15,479 | 603 | 16,081 | 14,548 | 694 | 15,242 | ||||||||||||||||||||||||||
Research and development | -3,044 | 201 | -2,843 | -2,845 | 202 | -2,643 | ||||||||||||||||||||||||||
Sales and marketing | -6,265 | 549 | -5,716 | -5,782 | 462 | -5,320 | ||||||||||||||||||||||||||
General and administration | -1,005 | 119 | -886 | -1,048 | 116 | -932 | ||||||||||||||||||||||||||
Restructuring | -28 | 28 | 0 | -621 | 621 | 0 | ||||||||||||||||||||||||||
Other operating income/expense, net | -3 | 0 | -3 | 1 | 0 | 1 | ||||||||||||||||||||||||||
|
|
|
|
|
|
|
|
|
|
|
|
|
|
|
| |||||||||||||||||
| Total operating expenses | -16,928 | 1,494 | -15,434 | -192 | -15,626 | -16,541 | 2,084 | -14,457 | ||||||||||||||||||||||||
|
|
|
|
|
|
|
|
|
|
|
|
|
|
|
| |||||||||||||||||
| Profit numbers | ||||||||||||||||||||||||||||||||
| Operating profit | 5,135 | 1,498 | 6,633 | -28 | 6,605 | 4,252 | 2,095 | 6,348 | ||||||||||||||||||||||||
| Othernon-operating income/expense, net | -234 | 0 | -234 | -256 | 0 | -256 | ||||||||||||||||||||||||||
Finance income | 230 | 0 | 230 | 241 | 0 | 241 | ||||||||||||||||||||||||||
Finance costs | -268 | 0 | -268 | -246 | 0 | -246 | ||||||||||||||||||||||||||
| Financial income, net | -38 | 0 | -38 | -5 | 0 | -5 | ||||||||||||||||||||||||||
| Profit before tax | 4,863 | 1,498 | 6,361 | 3,991 | 2,095 | 6,087 | ||||||||||||||||||||||||||
Income tax expense | -1,229 | -474 | -1,703 | -935 | -651 | -1,586 | ||||||||||||||||||||||||||
| Profit after tax | 3,634 | 1,024 | 4,658 | 3,056 | 1,445 | 4,501 | ||||||||||||||||||||||||||
Attributable to owners of parent | 3,646 | 1,024 | 4,671 | 3,064 | 1,445 | 4,509 | ||||||||||||||||||||||||||
Attributable tonon-controlling interests | -13 | 0 | -13 | -8 | 0 | -8 | ||||||||||||||||||||||||||
| Key ratios | ||||||||||||||||||||||||||||||||
| Operating margin (in %) | 23.3 | 30.1 | 29.7 | 20.5 | 30.5 | |||||||||||||||||||||||||||
| Effective tax rate (in %) | 25.3 | 26.8 | 23.4 | 26.1 | ||||||||||||||||||||||||||||
| Earnings per share, basic (in €) | 3.04 | 3.90 | 2.56 | 3.77 | ||||||||||||||||||||||||||||
| Combined Management Report | Performance Management System | 68 |
Table of Contents
Explanation ofNon-IFRS Measures
| Non-IFRS Adjustments by Functional Areas | ||||||||||||||||||||||||||||||||||||||||
€ millions | 2016 | 2015 | ||||||||||||||||||||||||||||||||||||||
| IFRS | Acquisition-rel. | SBP1) | Restructuring | Non-IFRS | IFRS | Acquisition-rel. | SBP1) | Restructuring | Non-IFRS | |||||||||||||||||||||||||||||||
| Cost of cloud and software | -3,495 | 395 | 89 | 0 | -3,010 | -3,313 | 441 | 74 | 0 | -2,797 | ||||||||||||||||||||||||||||||
| Cost of services | -3,089 | 12 | 101 | 0 | -2,976 | -2,932 | 54 | 113 | 0 | -2,765 | ||||||||||||||||||||||||||||||
| Research and development | -3,044 | 10 | 190 | 0 | -2,843 | -2,845 | 36 | 166 | 0 | -2,643 | ||||||||||||||||||||||||||||||
| Sales and marketing | -6,265 | 257 | 292 | 0 | -5,716 | -5,782 | 202 | 260 | 0 | -5,320 | ||||||||||||||||||||||||||||||
| General and administration | -1,005 | 6 | 113 | 0 | -886 | -1,048 | 4 | 111 | 0 | -932 | ||||||||||||||||||||||||||||||
| Restructuring | -28 | 0 | 0 | 28 | 0 | -621 | 0 | 0 | 621 | 0 | ||||||||||||||||||||||||||||||
| Other operating income/expense, net | -3 | 0 | 0 | 0 | -3 | 1 | 0 | 0 | 0 | 1 | ||||||||||||||||||||||||||||||
|
|
|
|
|
|
|
|
|
|
|
|
|
|
|
|
|
|
|
| |||||||||||||||||||||
| Adjustments of total operating expenses | -16,928 | 680 | 785 | 28 | -15,434 | -16,541 | 738 | 724 | 621 | -14,457 | ||||||||||||||||||||||||||||||
| 1) | Share-based payments (SBP) |
We disclose certain financial measures, such as revenue(non-IFRS), operating expenses(non-IFRS), operating profit(non-IFRS), operating margin(non-IFRS), and earnings per share(non-IFRS), as well as constant currency revenue, expense, and profit that are not prepared in accordance with IFRS and are therefore considerednon-IFRS financial measures. Ournon-IFRS financial measures may not correspond tonon-IFRS financial measures that other companies report. Thenon-IFRS financial measures that we report should only be considered in addition to, and not as substitutes for, or superior to, our IFRS financial measures.
We believe that the disclosed supplemental historical and prospectivenon-IFRS financial information provides useful information to investors because management uses this information, in addition to financial data prepared in accordance with IFRS, to attain a more transparent understanding of our past performance and our anticipated future results. We use the revenue(non-IFRS) and profit(non-IFRS) measures consistently in our internal planning and forecasting, reporting, and compensation, as well as in our external communications, as follows:
| ∎ | Our management primarily uses thesenon-IFRS measures rather than IFRS measures as the basis for making financial, strategic, and operating decisions. |
| ∎ | The variable components of our Executive Board members’ and employees’ remuneration are based on revenue(non-IFRS), operating profit(non-IFRS), as well as new cloud bookings measures rather than the respective IFRS measures. |
| ∎ | The annual budgeting process for all management units is based on revenue(non-IFRS) and operating profit(non-IFRS) numbers rather than the respective IFRS financial measures. |
| ∎ | All forecast and performance reviews with all senior managers globally are based on thesenon-IFRS measures, rather than the respective IFRS financial measures. |
| ∎ | Both our internal performance targets and the guidance we provided to the capital markets are based on revenue(non-IFRS) and profit(non-IFRS) measures rather than the respective IFRS financial measures. |
Ournon-IFRS financial measures reflect adjustments based on the items below, as well as adjustments for the related income tax effects.
Revenue(Non-IFRS)
Revenue items identified as revenue(non-IFRS) have been adjusted from the respective IFRS financial measures by including the full amount of software support revenue, cloud subscriptions and support revenue, and other similarly recurring revenue that we are not permitted to record as revenue under IFRS due to fair value accounting for the contracts in effect at the time of the respective acquisitions.
Under IFRS, we record at fair value the contracts in effect at the time entities were acquired. Consequently, our IFRS software support revenue, IFRS cloud subscriptions and support revenue, IFRS cloud and software revenue, and IFRS total revenue for periods subsequent to acquisitions do not reflect the full amount of revenue that would have been recorded by entities acquired by SAP had they remained stand-alone entities. Adjusting revenue numbers for this revenue impact provides additional insight into the comparability of our ongoing performance across periods.
Operating Expense(Non-IFRS)
Operating expense numbers that are identified as operating expenses(non-IFRS) have been adjusted by excluding the following expenses:
| ∎ | Acquisition-related charges |
| – | Amortization expense/impairment charges of intangibles acquired in business combinations and certain stand-alone acquisitions of intellectual property (including purchasedin-process research and development) |
| – | Settlements of preexisting business relationships in connection with a business combination |
| Combined Management Report | Performance Management System | 69 |
Table of Contents
| – | Acquisition-related third-party expenses |
| ∎ | Share-based payment expenses |
| ∎ | Restructuring expenses, that is, expenses resulting from measures which comply with the definition of restructuring according to IFRS |
We exclude certain acquisition-related expenses for the purpose of calculating operating profit(non-IFRS), operating margin(non-IFRS), and earnings per share(non-IFRS) when evaluating SAP’s continuing operational performance because these expenses generally cannot be changed or influenced by management after the relevant acquisition other than by disposing of the acquired assets. Since management at levels below the Executive Board does not influence these expenses, we generally do not consider these expenses for the purpose of evaluating the performance of management units. For similar reasons we eliminate share-based payment expenses as these costs are impacted by share price developments and other factors outside our control. We also eliminate restructuring expenses because they are volatile and mostly cannot be influenced by management at levels below the Executive Board.
Operating Profit(Non-IFRS), Operating Margin(Non-IFRS), Effective Tax Rate(Non-IFRS), and Earnings per Share(Non-IFRS)
Operating profit, operating margin, effective tax rate, and earnings per share identified as operating profit(non-IFRS), operating margin(non-IFRS), effective tax rate(non-IFRS), and earnings per share(non-IFRS) have been adjusted from the respective IFRS measures by adjusting for the aforementioned revenue(non-IFRS) and operating expenses(non-IFRS) and the income tax effects thereon.
Constant Currency Information
We believe it is important for investors to have information that provides insight into our sales. Revenue measures determined under IFRS provide information that is useful in this regard. However, both sales volume and currency effects impact period-over-period changes in sales revenue. We do not sell standardized units of products and services, so we cannot provide relevant information on sales volume by providing data on the changes in product and service units sold. To provide additional information that may be useful to investors in breaking down and evaluating changes in sales volume, we present information about our revenue and various values and components relating to operating profit that are adjusted for foreign currency effects.
We calculate constant currency revenue and operating profit measures by translating foreign currencies using the average exchange rates from the comparative period instead of the current period.
Free Cash Flow
Among others we use the measure free cash flow to manage our overall financial performance.
Free Cash Flow
€ millions | 2016 | 2015 | D in % | |||||||||
| Net cash flows from operating activities | 4,628 | 3,638 | 27 | |||||||||
| Purchase of intangible assets and property, plant, and equipment (without acquisitions) | -1,001 | -636 | 57 | |||||||||
|
|
|
|
|
| |||||||
| Free cash flow | 3,627 | 3,001 | 21 | |||||||||
Usefulness ofNon-IFRS Measures
We believe that ournon-IFRS measures are useful to investors for the following reasons:
| ∎ | Our revenue(non-IFRS), expense(non-IFRS), and profit(non-IFRS) measures as well as the measures “new cloud bookings” and “cloud backlog” (see above) provide investors with insight into management’s decision making because management uses these measures to run our business and make financial, strategic, and operating decisions. We include the revenue adjustments outlined above and exclude the expense adjustments outlined above when making decisions to allocate resources. In addition, we use thesenon-IFRS measures to facilitate comparisons of SAP’s operating performance from period to period. |
| ∎ | Thenon-IFRS measures provide investors with additional information that enables a comparison of year-over-year operating performance by eliminating certain direct effects of acquisitions, share-based compensation plans, and restructuring plans. |
| ∎ | Non-IFRS andnon-GAAP measures are widely used in the software industry. In many cases, inclusion of ournon-IFRS measures may facilitate comparison with our competitors’ correspondingnon-IFRS andnon-GAAP measures. |
Limitations ofNon-IFRS Measures
We believe that ournon-IFRS financial measures described above have limitations, including but not limited to, the following:
| ∎ | The eliminated amounts could be material to us. |
| ∎ | Without being analyzed in conjunction with the corresponding IFRS measures, thenon-IFRS measures are not indicative of our present and future performance, foremost for the following reasons: |
| – | While our profit(non-IFRS) numbers reflect the elimination of certain acquisition-related expenses, no eliminations are made for the additional revenue or other income that results from the acquisitions. |
| – | While we adjust for the fair value accounting of the acquired entities’ recurring revenue contracts, we do not adjust for the fair value accounting of deferred compensation items that result from commissions paid to the acquired company’s sales force and third parties for closing the respective customer contracts. |
| – | The acquisition-related amortization expense that we eliminate in deriving our profit(non-IFRS) numbers is a recurring expense that will impact our financial performance in future years. |
| – | The remaining acquisition-related charges that we eliminate in deriving our profit(non-IFRS) numbers are likely to recur should SAP enter into material business combinations in the future. |
| Combined Management Report | Performance Management System | 70 |
Table of Contents
Similarly, the restructuring expenses that we eliminate in deriving our profit(non-IFRS) numbers are likely to recur should SAP perform restructurings in the future. |
| – | The revenue adjustment for the fair value accounting of the acquired entities’ contracts and the expense adjustment for acquisition-related charges do not arise from a common conceptual basis. This is because the revenue adjustment aims to improve the comparability of the initial post-acquisition period with future post-acquisition periods, while the expense adjustment aims to improve the comparability between post-acquisition periods andpre-acquisition periods. This should particularly be considered when evaluating our operating profit(non-IFRS) and operating margin(non-IFRS) numbers as these combine our revenue(non-IFRS) and expenses(non-IFRS) despite the absence of a common conceptual basis. |
| – | Our restructuring charges resulted in significant cash outflows in the past and could do so in the future. The same applies to our share-based payment expense because most of our share-based payments are settled in cash rather than shares. |
| – | The valuation of our cash-settled share-based payments could vary significantly from period to period due to the fluctuation of our share price and other parameters used in the valuation of these plans. |
| – | In the past, we have issued share-based payment awards to our employees every year and we intend to continue doing so in the future. Thus, our share-based payment expenses are recurring although the amounts usually change from period to period. |
We believe that constant currency measures have limitations, particularly as the currency effects that are eliminated constitute a significant element of our revenue and expenses and could materially impact our performance. Therefore, we limit our use of constant currency measures to the analysis of changes in volume as one element of the full change in a financial measure. We do not evaluate our results and performance without considering both constant currency and nominal measures in revenue(non-IFRS) and operating profit(non-IFRS) measures on the one hand, and changes in revenue, operating expenses, operating profit, or other measures of financial performance prepared in accordance with IFRS on the other. We caution the readers of our financial reports to follow a similar approach by considering nominal and constant currencynon-IFRS measures only in addition to, and not as a substitute for or superior to, changes in revenue, operating expenses, operating profit, or other measures of financial performance prepared in accordance with IFRS.
Despite these limitations, we believe that the presentation of ournon-IFRS measures and the corresponding IFRS measures, together with the relevant reconciliations, provide useful information to management and investors regarding present and future business trends relating to our financial condition and results of operations.
| Combined Management Report | Performance Management System | 71 |
Table of Contents
Employees and Social Investments
| 84,183 | 78% | 85% | ||
| employees at SAP (in FTEs) | Business Health Culture Index | Employee Engagement Index |
Supporting Customers by Nurturing Our Employees
Our employees play a pivotal role in helping our customers succeed in the new digital economy. Our employees empower our customers to Run Simple and work more innovatively. At the same time, they enable SAP to become “the most innovative cloud company powered by SAP HANA.”
We believe that by providing an environment where our people can engage, develop their skills, and draw on the support they need to create and innovate, SAP can help to make the world run better. For this reason, we are fully committed to nurturing our people at every stage of their career at SAP.
An HR Strategy Designed Specifically for Our People
Our human resources (HR) strategy uses cloud technology to help us Run Simple. It helps us change the way we hire new talent, and to transform the way we develop and retain our employees. At the same time, it allows us to create a culture at SAP that is able to deal with the complexity, speed, and scope of a digital workplace. This culture inspires innovation, leads change, and ultimately creates employee satisfaction. Our HR team stays focused on delivering a seamless, simple employee experience by following three guiding principles: customer satisfaction, simplification, and standardization.
Listening to Our Employees
The People Survey 2016 results are extraordinarily positive. Employee satisfaction went up in nearly all aspects and questionnaire topics. This especially holds true for one of our most important dimensions, the Employee Engagement Index (EEI). In 2016, we see a significant increase of the EEI by three percentage points to 85%.
Employee Engagement Index
Percent
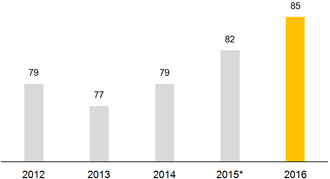
| * | The EEI score for 2015 was recalculated from 81% to 82% based on updated questions. This calculation method has been applied moving forward. |
Ensuring that our employees are highly engaged remains one of our company-wide strategic goals. For 2017 through to 2020, we aim to reach an Employee Engagement Index between 84% and 86%.
A change by one percentage point of the EEI would have an impact of €45 million to €55 million on SAP’s operating profit. For more information on how we calculate this impact, see theConnectivity of Financial andNon-Financial Indicators section of the SAP Integrated Report online.
The People Survey 2015 results revealed two focus areas for 2016: simplification and innovation. In 2016, we started a company-wide “Run Simple at SAP” initiative to help the business improve processes and services, as well as numerous efforts to boost and promote innovation initiatives. Conducted from October to November, our People Survey 2016 revealed moderate improvements in both simplification and innovation. We will continue with simplification and innovation as our company-wide focus areas in 2017.
| Combined Management Report| Employees and Social Investments | 72 |
Table of Contents
In the second half of 2016, we also conducted a strategy dialog survey to assess the degree to which employees understand and believe in our strategy, our culture, and our leadership, as well as the capability to drive innovation. This survey revealed that while we already have the right innovation mindset, many of the internal innovation tools available are not yet widely known within the company.
In addition, we also measure our Business Health Culture Index (BHCI) based on our People Survey. The BHCI assesses the degree to which our workplace culture supports people’s well-being, work-life balance, and organizational health.
In 2016, the positive trend of the BHCI continued with a score of 78% compared to 75% in 2015. This encouraging result shows that a health-focused culture has impacted employees in a positive way.
Business Health Culture Index
Percent
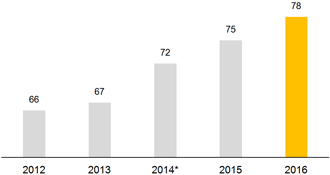
| * | The BHCI score for 2014 was recalculated based on two updated questions. This calculation method has been applied moving forward. |
Getting the Right Talent in the Right Place at the Right Time
While we increased our overall hiring volume successfully in 2016, increasing the number of “early talent” hires (people with professional experience of up to two years) has also been a key priority for us. In 2016, approximately one third of all external hires fell into this category.
At the same time, continued recognition of SAP as an employer of choice contributed to our success in meeting our hiring targets in 2016. SAP won many awards across the globe in the areas of diversity, inclusion, employer attractiveness, and people satisfaction. For a comprehensive list of awards given to SAP in 2016, see theRecognition section of the SAP Integrated Report online.

Selection of employer branding awards SAP received in 2016
Collaborating with Educational Institutions
Our collaboration with educational institutions is key to recruiting early talent. SAP works closely with over 3,100 universities on international events such as studentmeet-ups and info days. In addition, we run a number of coding events such as SAP InnoJam, as well as a broad variety of activities and events through our SAP University Alliances program.
SAP also runs a vocational training program that allows students to work towards their university degree while gaining valuable business experience at the same time. As of the end of 2016, more than 1,000 vocational training students were enrolled in the program. Overall, we measured a conversion rate (number of these types of students who stayed with SAP after completing their dual studies) for vocational training students of 82% in 2016.
Connecting with Refugee Communities
As a company with employees of approximately 80 different nationalities working in Germany alone, we are open to talented people from all communities. As part of our “Engaging with Refugees” program, we are working on a number of initiatives that promote cultural integration through training and recruitment. For example, SAP joined Germany’s “Wir zusammen” (“We together”) initiative, which provides an Internet platform to support the efforts of participating companies to integrate refugees into the German labor market. In 2016, SAP offered 100 internships and 14 vocational training positions to refugees in Germany. In 2017, SAP will again offer up to 100 additional internships and 10 vocational training positions to candidates who are refugees.
In addition, 2016 saw the launch of Refugee Code Week, empowering young people and inspiring refugee communities withjob-relevant coding skills. In collaboration with the United Nations Refugee Agency (UNHCR), the event introduced more than 10,000 refugees and nationals in Egypt, Jordan, Lebanon, and Turkey to coding basics, Web development, and software skills in the SAP Business One application. The most promising students are referred to SAP partner ReBootKAMP (RBK.org) for an intensive16-week training program and assistance in securing job placements.
Investing in Talent Development
At SAP, we believe that everyone is a talent and we invest in the professional development of all our employees. We continue to build development offerings for specific groups such as early talents, experts, and fast-track employees. To provide career development support, we also introduced career counselling sessions that are delivered either in person or virtually.
| Combined Management Report| Employees and Social Investments | 73 |
Table of Contents
In addition, we launched SAP Talk to 8,100 early-adopter employees in 2016. This approach provides a new,state-of-the-art way of managing performance at SAP, helping foster a continuous dialog on professional development between managers and employees. We plan to roll out SAP Talk to all SAP employees in 2017.
Our overall retention rate in 2016 was 93.7% compared with 91.8% in 2015. We define retention as the ratio of the average number of employees minus voluntary attrition to the average number of employees (in full-time equivalents, or FTEs). High retention is something we are aiming for as reflected in all our activities to drive high employee engagement.
Engaging Our People Through Impactful and Inspirational Leadership
Our investment in developing our leaders is delivering results according to our People Survey. Living up to our SAP leadership principles and building trust with employees has become a key ingredient of successful leadership performance. By the end of 2016, 57.6% of leaders at SAP completed our flagship leadership development program. Leaders who completed this had higher employee engagement and leadership trust scores. In 2016, leadership trust reached 57% (2015: 52%) and we are committed to keep this high score moving forward.
Our Leadership Principles:
| ∎ | Drive Simplicity |
| ∎ | Develop Amazing Talent |
| ∎ | Ensure Customer Success |
Making Learning a Compelling Experience for Everyone
We support employees at all levels and roles as they strive to achieve their long-term career aspirations. Our learning strategy is based on the principle that much of employee learning and development happens outside formal training such as coaching, mentoring, rotational programs, andon-the-job-guided development experiences. This is why we are transitioning to a continuous learning model with a strong focus on more informal learning activities.
To achieve this, we make high-quality learning opportunities easily accessible to all employees through our cloud-based learning management system (SAP SuccessFactors solution). In 2016, we provisioned 1.3 million courses to 90.7% of our employees. We also initiated a new tuition assistance program to help employees as they pursue additional educational and professional certification opportunities.
Self-paced online programs that include language learning as well as technical and soft-skills training courses are open to all employees. In addition, the online programs enable employees to build impactful development plans that meet their career goals. Our innovativepeer-to-peer learning portfolio includes coaching, mentoring, job shadowing, and facilitation opportunities. In 2016, we hosted many live and virtual “learning culture” workshops throughout the world, as an opportunity to foster the exchange of ideas between peers and managers.
Creating an Environment That Drives Innovation, Performance, and Engagement
SAP aims to create a working environment that helps drive innovation, high performance, and employee satisfaction. We do so by providing, among others, the following benefits and activities:
| ∎ | SAP Shares program: Introduced in 2016, this equity program consists of two different plans, ensuring closer market alignment. The “Own SAP” plan enables employees to purchase shares with preferred conditions and build value by becoming an SAP shareholder. The “Move SAP” plan is a restricted stock unit plan that rewards selected employees and executives for their contribution to the success of the company. For more information, see theNotes to the Consolidated Financial Statements section,Note (27). |
| ∎ | Hasso Plattner Founders’ Award: In its third year, this prestigious award provides the highest internal employee recognition at SAP for delivering on our vision and strategy. In 2016, the award went to the “Skills for Africa” initiative, which helps fill the skills gap in the IT sector in Africa. |
| ∎ | Intrapreneurship program: Open to all global employees, this program attracted more than 830 entries from over 1,500 employees in 2016. It enables employees to act as entrepreneurs and transform innovative ideas into profitable businesses in new markets. |
| ∎ | SAP SuccessFactors solutions: To make our employees’ lives easier when dealing with HR matters, we continue to transform and simplify our entire HR IT landscape by implementing SAP SuccessFactors solutions. In this context, approximately 160 HR experts supported sales teams in deals related to our own human capital management solutions. Also in 2016, we announced the Klaus Tschira Human Resources Innovation Award, an annual program for SAP partners and customers that have contributed a unique and innovative solution in the field of human resources. |
| ∎ | People Weeks: In 2016, SAP again sponsored atwo-week event designed for employees to exchange ideas and cultivate a greater connection across cultures, genders, and generations. Under the motto “You in the Digital Workplace,” the event reached over 27,000 employees in 124 locations and 58 countries. |
| ∎ | “How We Run”: Launched in 2015 to showcase the behavioral values that provide the foundation to SAP’s corporate culture, our “How We Run” behaviors initiative has received widespread support and adoption among SAP employees worldwide. |
| Combined Management Report| Employees and Social Investments | 74 |
Table of Contents
Our “How We Run” Behaviors
Promoting Inclusion, Well-Being, and Social Innovation
An inclusive, bias-free culture inspires greater innovation and helps us to better connect with and serve our customers. It also fosters employee engagement, and makes SAP a more attractive workplace.
Closing the Gender Gap
As the first multinational technology company, SAP was awarded the Economic Dividends for Gender Equality (EDGE) certificate in 2016. It recognizes our global commitment to gender diversity and equality in the workplace and reinforces SAP’s publicly stated goal to fill 25% of its management positions with women by the end of 2017. We have made great strides toward our goal, increasing the proportion of female managers from 23.6% in 2015 to 24.5% in 2016.
Throughout 2016, SAP sponsored and hosted numerous events focused on attracting, developing, and supporting women. These included major events in China, Colombia, Germany, Saudi Arabia, the United States and other countries. Additional ongoing initiatives supporting women at SAP include the Women’s Professional Growth Webinar series, the Business Women’s Network, and the Women@SAP online community. In addition, we offer executive sponsorships for women at SAP and the Leadership Excellence Acceleration Program (LEAP), a highly respected and award-winning development program that helps prepare high-potential women for leadership roles at SAP.
Creating an Inclusive Environment
Working closely with ethnicity-based employee network groups such as the Black Employee Network (BEN), and Latinos@SAP, SAP launched several important initiatives in 2016 in the United States. An example is Project Propel, a program designed to enable U.S. educational institutions that have historically served minorities to build the next generation of technology talent. The program focuses on providing students with critical digital enterprise skills that are in demand in the SAP ecosystem.
In addition, we participate in a wide range of activities to create a more inclusive environment throughout the organization, including:
| ∎ | Focus on Insight – Diversity and Inclusion curriculum: A global learning curriculum launched for all employees in September 2016 to ensure that everyone at SAP understands the importance and benefits of a diverse workplace. |
| ∎ | Business Beyond Bias: Launched in August 2016, this initiative includes significant investment in programs and technology that support greater diversity. This helps eliminate bias not only at SAP but also in customer and partner organizations. |
| ∎ | White House Tech Inclusion Pledge: SAP is one of the largest global technology companies to participate in this pledge, announced during former President Obama’s Global Entrepreneurship Innovation Summit 2016 in Silicon Valley. |
| ∎ | Autism at Work program: 107 employees with Autism Spectrum Disorder currently work at SAP. Launched in Argentina this year, we have implemented the Autism at Work program in nine countries. |
| ∎ | Global Pride@SAP employee network: This network has grown to more than 8,000 members, sponsoring numerous activities and initiatives that support lesbian, gay, bisexual, and transgender (LGBT) people and their allies. |
Caring for the Health and Well-Being of Our Employees
We believe that the way we care for our people is closely linked to our business success. When people feel healthy, respected, and cared for, it results in higher productivity, engagement, innovation, and customer satisfaction.
A caring culture enables our employees to live to their full potential and accelerates our ability to achieve our goals. Consequently, we invest in extensive employee benefits, programs, and services that truly make people’s lives better. These include:
| ∎ | Employee Assistance Program (EAP): This program helps employees to deal better with life’s challenges by providing free, confidential, and impartial expert advice and support, 24 hours a day, seven days a week. |
| ∎ | Corporate Oncology Program (COPE): Available in Canada, Germany, United Kingdom, and the United States, the program provides SAP employees facing cancer with access to an individual molecular genetic tumor analysis and interpretation. |
| ∎ | Health checkup: Aone-day,one-on-one health checkup program for executives. |
| ∎ | Take Charge of Your Health and Well-Being program: This program empowers employees to take better care of their health and well-being. |
| ∎ | Health Ambassador Network: This global network strengthens our focus on health in SAP office locations and helps identify best practices. |
| ∎ | Local health and well-being offerings: Services such as skin screening,on-site fitness centers and activity classes, mindfulness practice, eyesight testing, and health awareness sessions are also available to employees in various office locations. |
Combined Management Report| Employees and Social Investments | 75 |
Table of Contents
Engaging in Social Investments
As our vision to help the world run better and improve people’s lives shows, we are passionate about making a positive impact on people’s lives, both in our communities and in the wider world. As SAP guides our customers through digital transformation, our social investments focus on ensuring that today’s young people – regardless of background – get the skills they need to thrive and lead in this digital economy.
Our strategy is based on two main focus areas. We aim to increase the capacity of innovative social enterprises that put young people on the path to successful careers. In addition, we aim to build a skilled workforce for the IT sector through training and workforce development programs. In 2016, we donated €22.3 million to charitable organizations.
Improving Lives, Sharing Experience
As part of our social investment commitment, SAP encourages its employees to contribute their time and talent to support social causes. Whether by offering individualhands-on support, or business coaching and mentoring, we run a number of initiatives that help make a real difference to people’s lives in the communities in which they live and work.
An annual highlight is our “Month of Service” program. This year, more than 22,000 employees in 42 countries volunteered almost 142,000 hours to this program alone. While passing on valuable skills and helping the world to run better, employees taking part in these programs benefit from what can be an incredibly rewarding experience. In addition to making a positive social impact, they develop leadership skills, learn about new markets, and grow their professional network.
Extending Code Week Initiatives
In 2016, SAP extended our successful Code Week initiatives to bring digital literacy to thousands of young people who may not otherwise have the opportunities to learn software coding skills.
Now in its second year, Africa Code Week saw thousands of coding activities organized across 30 African countries and through openSAP coursework. Africa Code Week demonstrates the power of public-private partnerships: Hundreds of schools, teachers, ministers, community centers, businesses, andnon-profit organizations work together towards the common goal of ensuring Africa’s children are not left out of the digital economy. In 2016, the program reached 426,000 children in Africa.
Supporting Our Social Sabbatical Portfolio
With four unique programs across the award-winning social sabbatical portfolio, we offer employees at all levels the opportunity to extend their skills, expertise, andknow-how. Participation in the program challenges employees to solve concrete business challenges fornon-profit organizations and social enterprises in either their home or emerging markets.
By volunteering their time and talent for assignments that last between two and six weeks, our employees strengthen their leadership competencies, cross-industryknow-how, and intercultural sensitivity. They achieve all this while ensuring their “client” is better able to deliver on their social mission.
Recent projects include building strategic plans for social entrepreneurship incubators and strengthening the internal capabilities ofnon-profit organizations focused on STEM education and digital literacy. As such, we worked with the Dreamoval Foundation in Accra, Ghana, to support the development of a growth strategy to strengthen the IT skills of 170,000 teachers to help improve educational outcomes across the country.
In 2016, we also extended our social sabbatical portfolio to joint projects with SAP customers. In July, a joint team of volunteers from SAP and GlaxoSmithKline plc designed and implemented an integrated database for Partners in Health, anon-profit organization based in Kigali, Rwanda. Additional social sabbatical collaboration with customers is planned for 2017.
Through our social sabbatical portfolio, 213 SAP employees provided 58,808 hours of pro bono service to 71 organizations in 15 countries in 2016.
Changing the Game for Underprivileged Youths with the KickApp Cup
To ignite passion for IT, we need to be creative about how to reach young people. We developed a creative approach, harnessing the power of soccer to bring people together while spreading a passion for IT.
The first annual KickApp Cup brought together 200 young community leaders from disadvantaged backgrounds to work closely with 180 SAP developers and coaches. Their aim: to develop a prototype app that would helpnon-profit organizations tackle issues such as monitoring attendance or tracking social impact.
Regional competitions took place at SAP Labs locations worldwide including Brazil, Germany, Hungary, India, Israel, and the United States. The teams coded together, played soccer and had fun, while competing to attend the finals in Lyon, France, and Heidelberg, Germany, to present their app prototypes.
The event was organized in collaboration with streetfootballworld, anon-governmental organization (NGO) whose mission is to use soccer as a tool to drive social change. The best ideas from each team were then combined to create a final app that was presented during the 16th streetfootballworld Festival at the European soccer championships (UEFA EURO 2016).
Combined Management Report| Employees and Social Investments | 76 |
Table of Contents
Gaining International Recognition for Award-Winning Programs
SAP received significant recognition in 2016 for the innovative nature of its social investment programs. For more information, see theRecognition section of the SAP Integrated Report online.
Headcount and Personnel Expense
On December 31, 2016, we had 84,183 full-time equivalent (FTE) employees worldwide (December 31, 2015: 76,986). This represents an increase in headcount of 7,197 FTEs in comparison to 2015. The average number of employees in 2016 was 80,609 (2015: 75,180).
We define headcount in FTE as the number of people on permanent employment contract considering their staffing percentage. Students, individuals employed by SAP who are currently not working due to various reasons (such as maternity leave), and temporary employees with limited contracts of less than six months are excluded from our figures. The number of temporary employees is not material.
Our personnel expense per employee decreased to approximately €127,000 in 2016 (2015: approximately €135,000). This decrease in expense is primarily attributable to a significant decrease of employee-related restructuring expenses in 2016 compared to the previous year. The personnel expense per employee is defined as the overall personnel expense divided by the average number of employees. For more information about employee compensation and a detailed overview of the number of people we employ, see theNotes to the Consolidated Financial Statements section,Note (7).
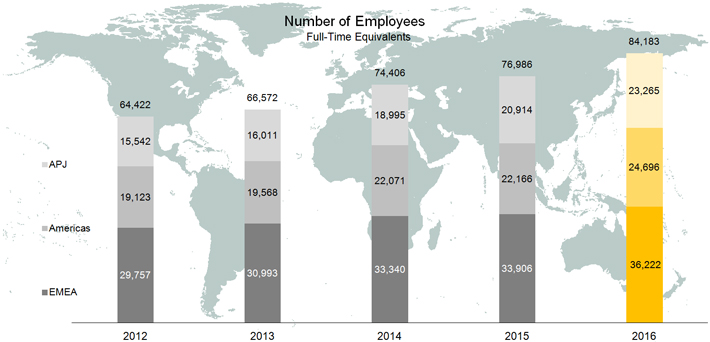
Employees by Functional Area
Full-Time Equivalents
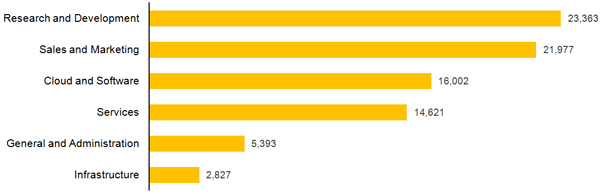
| Combined Management Report| Employees and Social Investments | 77 |
Table of Contents
| 380 kt | 950 GWh | 100% | ||
| carbon emissions | energy consumption | renewable electricity |
Being a Front-Runner of a Greener Way of Working
As a role model for sustainable business operations, SAP takes its environmental responsibilities seriously. We believe that by running cleaner, greener operations, we can make a difference to our planet. In addition, we aim to enable our customers to reduce their overall carbon footprint through our software.
One of our goals is to reduce net greenhouse gas (GHG) emissions from our operations to levels of the year 2000 by 2020. This target includes all direct emissions from running our business as well as a selected subset of indirect emissions from supply chains and services.
A number of initiatives harness innovative technologies to help us run our operations in a way that minimizes our impact on the environment. In addition, our investment in renewable electricity certificates and carbon credits enables us to support sustainability projects across the globe.
Total Net Emissions
kilotons CO2
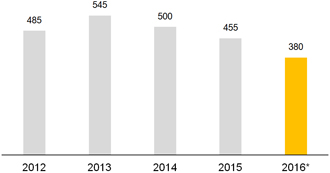
| * | For more information on the calculation method of the 2016 CO2emissions, see ourNotes to Environmental Performance Reporting section on the GHG footprint in the SAP Integrated Report online. |
In addition to our long-term commitment for 2020, we have derived annual targets for our internal operational steering. In 2016, we outperformed our annual target to reduce our emissions to less than 400 kilotons (kt) of CO2. This result stems primarily from updating our emission factors as well as compensation with carbon emission offsets. Our focus on carbon emissions has contributed to a cumulative cost avoidance of €155 million in the past three years, compared to abusiness-as-usual scenario based on 2007. We avoided €73.6 million of this cost in 2016.
Committing to 100% Renewable Electricity
Our commitment to 100% renewable electricity is crucial to making our operations more sustainable. While SAP produces a small amount of renewable electricity through solar panels in some locations, we rely primarily on the purchase of renewable energy certificates (RECs) to achieve our target of 100% renewable electricity. We follow robust procurement guidelines for RECs to ensure that we only invest in environmentally friendly schemes.
Total Energy Consumption
GWh
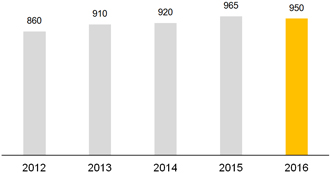
Strengthening Our “Green Cloud”
As more business moves to the cloud, data centers are a key part of how SAP provides solutions to our customers. By using our green cloud services, customers can significantly reduce their carbon footprint. However, data centers represent a significant part of our total GHG with energy consumption increasing as a growing number of customers
| Combined Management Report | Energy and Emissions | 78 |
Table of Contents
sign up to our cloud services. For this reason, our data centers have become a primary focus of our carbon reduction efforts. We have introduced initiatives to drive efficiency and innovation around buildings, data center operations, and infrastructure. For example, in 2016, one of our main data centers in Rot, Germany, had a very efficient power usage effectiveness (PUE) of 1.35. In addition, we have tied our business strategy to our environmental strategy by creating a completely “green cloud” powered by 100% renewable electricity at SAP. Carbon neutrality is achieved by purchasing renewable electricity certificates and carbon emission offsets.
Total Data Center Electricity
GWh
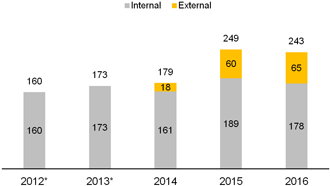
| * | We started reporting our external data center energy consumption in 2014. |
Helping Our Customers Run Greener Operations
The vast majority of our overall emissions result from the use of our software. When our customers run SAP software on their hardware and on their premises, the resulting carbon footprint is about 20 times the size of our own net carbon footprint. To address this, we have developed a downstream emissions strategy to help our customers, hardware providers, and others run greener operations. One of the most important ways we help our customers reduce their energy usage and emissions is by managing their SAP systems through cloud services provided by our carbon-neutral green cloud offerings. In addition, the solutions in our portfolio help enable our customers manage their resources, such as electricity, in an efficient manner.
The SAP HANA platform also plays a vital role in helping our customers to cut their carbon emissions. By combining the worlds of analytic and transactional data into one real-time,in-memory platform, it can help create much leaner operations, further simplifying the system landscape and reducing energy consumption.
SAP also works with customers to optimize theiron-premise landscapes so that they consume less energy. We achieve this by helping them to decommission legacy systems, archive unused data, and consolidate business applications, as well as virtualizing their system landscape.
Driving Environmental Initiatives Throughout SAP
We continuously pursue strategies to help us achieve our goal of reducing emissions at a time of ongoing growth in our business. Key initiatives for 2016 included the following:
| ∎ | Sustainable programming sessions |
In a new online training module, software developers and architects learn how to make a positive contribution to SAP’s sustainability goals in their daily programming work. Performance and sustainability go hand in hand as performance-optimized programming usually equates to energy-efficient programming. It also helps improveend-to-end response time and creates a great user experience for our customers.
| ∎ | Electric vehicles |
As a result of our business expansion, the number of SAP employees eligible for a company car has increased annually. We want to ensure that the resulting growth in our car fleet does not undo our successes in cutting emissions. To help address this, SAP aims to increase the number of electric vehicles in our company car fleet to 20% by 2020.
All electric company cars charged at SAP are powered with 100% renewable electricity. In addition, in Germany, we provide employees with an incentive to switch to electric alternatives by offering a battery subsidy that offsets the costs of purchasing an electric vehicle.
| ∎ | Internal carbon pricing for business flights |
As first introduced in 2015, we continue with our program to reduce the impact of air travel by SAP employees. In addition to avoiding business flights, we invest in carbon emission offsets for air travel in nine countries by charging an internal carbon price. This offset effort resulted in a compensation of 90 kt in 2016.
| ∎ | Investment in carbon credits |
In 2016, we continued to realize the benefits of our investment in the Livelihoods Fund, a unique investment fund whose returns consist of high-quality carbon credits. Several years ago, we made a commitment to invest €3 million covering a20-year participation in the fund that supports the sustainability of agricultural and rural communities worldwide. Livelihoods Funds have been designated the “Best Corporate Offsetting Program 2016” in voluntary carbon markets by theEnvironmental Finance magazine. In 2016, we received carbon credits from the fund, which helped us to offset our carbon footprint by 21 kt.
| Combined Management Report | Energy and Emissions | 79 |
Table of Contents
Financial Performance: Review and Analysis
| Up 7% | Up 20% | Up 31% | ||
| cloud and software revenue (IFRS) | operating profit (IFRS) | new cloud bookings |
Economy and the Market
Global Economic Trends
In its latest economic bulletin, the European Central Bank (ECB) concludes that the global economy grew steadily in 2016 at a similar pace as the year before, with relatively stable expansion in advanced economies and a slight improvement in emerging market economies. According to the ECB, acute uncertainty about the political and economic impact of the presidential election in the United States shaped global sentiment at the end of the year.
For the Europe, Middle East, and Africa (EMEA) region, the ECB reports that economic recovery in the euro area continued throughout 2016, supported by the ECB’s own monetary policy measures which it finds helped revitalize domestic demand in the euro area and reduce debt. According to its calculations, the real gross domestic product of the euro area countries grew 1.7% in 2016. The economies of many of the Central and Eastern Europe countries also performed well in 2016, the ECB writes. There were even signs of an economic rebound in Russia, but expansion there stayed slightly negative for the year as a whole.
In the North America and Latin America (Americas) region, continued low interest rate policies and improving labor markets stimulated the U.S. economy in 2016, the ECB reports, with economic activity in the United States improving markedly in the second half of 2016, following modest growth in the first half. In Brazil, the recession is believed to have slowly bottomed out in the second half of the year.
In the Asia Pacific Japan (APJ) region, soft foreign demand and weak private consumption caused Japan’s economy to advance at only a very modest pace, the ECB notes. In China, meanwhile, economic growth continued to slow in 2016 but, according to the ECB, eventually stabilized in the second half-year, supported by strong consumption and infrastructure spending.
The IT Market
According to Gartner Market Databook December 2016 by Gartner, a market research firm, “worldwide IT spending is forecast to grow 0.5% in 2016 on a constant-currency basis. However, currency rate changes will limit market growth to negative 0.6%. Software is the best-performing segment, with 6.9% growth in 2016 constant currency, while Emerging Asia/Pacific is the fastest-growing region/country, at 2.9%.”
In the Europe, Middle East, and Africa (EMEA) region, growth declined year-over-year in the Western European IT market from 3.6% to –0.1% and the Eastern European IT market declined from 15.8% to 1.8% (see table in paragraph “Expected Developments and Opportunities”: “Trends in the IT Market – IT spendingYear-on-Year”, created by SAP on the basis of Gartner Market Databook, 4Q16 Update, 21 December 2016). According to the same table, software spending grew significantly faster than all other submarkets throughout the region.
The Americas region likewise recorded lower growth rates in IT spending than the previous year as can be seen in the table mentioned above. According to the same table, software spending nevertheless significantly outperformed IT spending as a whole.
In the Asia Pacific Japan (APJ) region, software spending grew faster than all other submarkets in the IT industry as well, documented in the table mentioned above.
Source: Gartner Market Databook, 4Q16 Update, 21 December 2016.
The Gartner Report described herein, (the “Gartner Report”) represents research opinion or viewpoints published, as part of a syndicated subscription service, by Gartner, Inc. (“Gartner”), and are not representations of fact. Each Gartner Report speaks as of its original publication date (and not as of the date of this Annual Report) and the opinions expressed in the Gartner Report are subject to change without notice.
| Combined Management Report | Financial Performance: Review and Analysis | 80 |
Table of Contents
Impact on SAP
In 2016, we once again succeeded in significantly expanding our business and outperformed the overall global economy and IT industry in 2016 with regards to revenue growth. Our good 2016 results are further evidence that our strategy of innovating across the core, the cloud, and business networks to help our customers become true digital enterprises is the right way forward.
In 2016, we again demonstrated that we are consistently pursuing our strategy for innovation and growth – and that globally, we are able to generate growth that few other IT companies can match – in three respects: in revenue from core business and cloud business, and in operating profit.
Overall Financial Position
Executive Board’s Assessment
In 2016, we delivered strong software sales, fast cloud growth, and operating profit expansion. We saw exceptional growth in our cloud and software business and reached above the midpoint of the full year outlook which we raised in October. SAP’s rapidly expanding cloud business combined with solid growth in support revenue continued to drive the share of more predictable revenue.
The strong cloud growth was driven throughout our broad cloud portfolio. Mainly due to our strong top line result, we generated an operating profit which was at the midpoint of our raised guidance range.
We made substantial progress in transforming our Company by shifting investments fromnon-core activities to strategic growth areas, enabling us to capture the tremendous growth opportunities in the market. We expanded our addressable market, acquired best in class assets, and innovated a new generation of ERP with SAP S/4HANA. Our strong cloud backlog and the high software support renewal rates combined with our robust pipeline positions us for yet another year of growth in 2017 and allowed us to confidently raise our high-level 2020 ambition.
Influence of Accounting Policies on Our Financial Position
For more information about our accounting policies, see the Notes to the Consolidated Financial Statements section,Note (3).
There are nooff-balance sheet financial instruments, such assale-and-lease-back transactions, asset-backed securities, and liabilities related to structured entities, which are not disclosed in our Consolidated Financial Statements.
Performance Against Our Outlook for 2016(Non-IFRS)
Our 2016 operating profit-related internal management goals and published outlook were based on ournon-IFRS financial measures. For this reason, in the following section we discuss performance against our outlook only in terms ofnon-IFRS numbers derived from IFRS measures. The subsequent section about IFRS operating results discusses numbers only in terms of the International Financial Reporting Standards (IFRSs), so the numbers in that section are not expressly identified as IFRS numbers.
Outlook for 2016(Non-IFRS)
At the beginning of 2016, we projected that our 2016non-IFRS cloud subscriptions and support revenue would be between €2.95 billion and €3.05 billion at constant currencies (2015: €2.30 billion). We expected full-year 2016non-IFRS cloud and software revenue to increase by 6% to 8% at constant currencies (2015: €17.23 billion). We also expected our full-year operating profit(non-IFRS) for 2016 to end between €6.4 billion and €6.7 billion (2015: €6.35 billion) at constant currencies. We anticipated an effective tax rate (IFRS) of between 22.5% and 23.5% (2015: 23.4%) and an effective tax rate(non-IFRS) of between 24.5% and 25.5% (2015: 26.1%).
In July 2016, we adjusted our outlook for the effective tax rate (IFRS) to between 27.0% and 28.0% and for the effective tax rate(non-IFRS) to between 28.0% and 29.0%. The increase in comparison to the previous outlook mainly resulted from tax effects relating to changes in foreign currency exchange rates in Venezuela and the fact that the execution of the originally planned consolidation of intellectual property rights held by SAP Group company hybris AG at the level of SAP SE in Germany could no longer be achieved at this point of time.
In October, based on the strong momentum in our cloud business, we raised our outlook for 2016non-IFRS cloud subscriptions and support revenue to a range of €3.00 billion to €3.05 billion at constant currencies. The upper end of this range represents a growth rate of 33% at constant currencies. Thanks to continued growth in our software license business, we were also able to increase our growth outlook for full-year 2016non-IFRS cloud and software revenue to 6.5% to 8.5% at constant currencies. In view of the greater revenues expected, we also adjusted our outlook for full-year operating profit(non-IFRS) for 2016 upward to range between €6.5 billion and €6.7 billion at constant currencies.
2016 Actual Performance Compared to Outlook(Non-IFRS)
We achieved or exceeded the raised outlook for revenue and operating profit we published in October.
| Combined Management Report | Financial Performance: Review and Analysis | 81 |
Table of Contents
Comparison of Outlook and Results for 2016
| Outlook for 2016 (as reported in Integrated Report 2015) | Revised Outlook for 2016 | Results for 2016 | ||||||||||
| Cloud subscriptions and support revenue(non-IFRS, at constant currencies) | | €2.95 billion to €3.05 billion |
| | €3.00 billion to €3.05 billion |
| €3.01 billion | |||||
| Cloud and software revenue(non-IFRS, at constant currencies) | +6.0% to +8.0% | +6.5% to +8.5% | +8% | |||||||||
| Operating profit(non-IFRS, at constant currencies) | | €6.40 billion to €6.70 billion |
| | €6.50 billion to €6.70 billion |
| €6.61 billion | |||||
| Effective tax rate (IFRS) | 22.5% to 23.5% | 27.0% to 28.0% | 25.3% | |||||||||
| Effective tax rate(non-IFRS) | 24.5% to 25.5% | 28.0% to 29.0% | 26.8% | |||||||||
Despite ongoing economic uncertainty throughout 2016, especially in Latin America, coupled with fears about the possible effects of the Brexit vote and the presidential election in the United States, our new and existing customers continued to show a strong willingness to invest in our solutions.
On a constant currency basis,non-IFRS cloud subscriptions and support revenue grew from €2.30 billion in 2015 to €3.01 billion in 2016. That represents an increase of 31% on a constant currency basis. We thus achieved our refined outlook range of €3.00 billion to €3.05 billion that we predicted in October.
Our new cloud bookings, which is the main measure for our cloud-related sales success and for future cloud subscriptions revenue, increased 31% in 2016 to €1.15 billion (2015: €874 million). In addition to this strong growth, our cloud backlog (unbilled future revenue based on existing customer contracts) climbed by 47% to €5.4 billion (2015: €3.7 billion). This reflects the unbilled committed future cloud subscriptions and support revenue that will drive strong cloud growth in 2017 and beyond.
Besides the cloud business, our traditionalon-premise business also showed a remarkable growth in 2016. Cloud and software revenue(non-IFRS) was €18.43 billion (2015: €17.23 billion). On a constant currency basis, the increase was 8% and therefore well above the midpoint of the increased outlook.
Our total revenue(non-IFRS) rose 6% in 2016 to €22.07 billion (2015: €20.81 billion). On a constant currency basis, the increase was 7%.
Operating expenses(non-IFRS) in 2016 were €15.43 billion (2015: €14.46 billion), an increase of 7%. On a constant currency basis, the increase was 8%.
Our expense base in 2016 continued to be impacted by the transformation to a fast-growing cloud business. In our outlook we expected the cloud subscriptions and support gross margin to be at least stable or to slightly increase compared to 2015. The cloud subscriptions gross margin for 2016 was 64.4%, a decrease of 1.2pp on a constant currency basis and with that below our expectations. The decrease is primarily due to the change in the cloud subscription revenue mix; the share of ourinfrastructure-as-a-service cloud offering (IaaS) that has a lower margin than the other cloud offerings,grew at above-average rates and thus impacted the overall gross margin. The cloud subscriptions gross margins of our cloud offerings developed heterogeneously in 2016:
Our cloud subscriptions gross margin(non-IFRS) in ourbusiness network businessincreased by 1% andresulted in approximately 76% for 2016, already close to our long-term ambition of approximately 80%. This excellent result is attributable to the continued positive gross margin development within the Concur and SAP Ariba portfolios.
The cloud subscriptions gross margin(non-IFRS) of ourinfrastructure-as-a-service cloud offering (IaaS)performed much better in 2016 than in 2015. In 2016 our cloud subscription gross margin is-5% which reflects an improvement of more than 104pp on a constant currency basis. In the last two quarters break-even was already reached, we are therefore in line with our expectations. Profitability in oursoftware-as-a-service/platform-as-a-service cloud offering (Saas/PaaS)was approximately 62% for 2016 compared to our long-term ambition of approximately 80%. Affected by the incremental investments in our cloud infrastructure, cloud profitability fell by 8pp on a constant currency basis, mainly due to significant investments in the expansion of our data center and IT infrastructure as well as in the harmonization of our various public cloud offerings into one platform.
Efficiency improvements in both our cloud and traditionalon-premise business drove continued operating profit expansion.Non-IFRS operating profit in 2016 was €6.61 billion on a constant currency basis, reflecting an increase of 4%. As a result, we were able to surpass our excellent results from 2015, despite our continued investment in our business transformation during the reporting year. The positive development of our operating profit was influenced by the effects of our global transformation program carried out in 2015 as well as by the cost-conscious hiring of highly educated young talents in our fast growth areas and locations that enabled us to increase our overall headcount by 7,197 full-time equivalents in 2016. With these additional resources, we continued to invest in our innovation and growth markets. Thus, constant currencynon-IFRS operating profit amounting to €6.61 billion was at the midpoint of our raised outlook range (€6.5 billion to €6.7 billion).
Combined Management Report | Financial Performance: Review and Analysis | 82 |
Table of Contents
We achieved an effective tax rate (IFRS) of 25.3% and an effective tax rate(non-IFRS) of 26.8%, which is below the adjusted outlook of 27.0% to 28.0% (IFRS) and 28.0% to 29.0%(non-IFRS). This mainly results from taxes for prior years and from the regional allocation of income.
Operating Results (IFRS)
This section on operating results (IFRS) discusses results only in terms of IFRS measures, so the IFRS numbers are not expressly identified as such.
We break our operations down into three regions: the Europe, Middle East, and Africa (EMEA) region, the Americas region, and the Asia Pacific Japan (APJ) region. We allocate revenue amounts to each region based on where the customer is located. For more information about revenue by geographic region, see the Notes to the Consolidated Financial Statements section,Note (28).
Revenue
Total Revenue
Total revenue increased from €20,793 million in 2015 to €22,062 million in 2016, representing an increase of €1,269 million, or 6%.
Total Revenue
€ millions | change since previous year
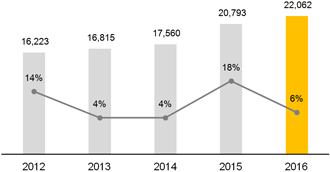
This increase reflects a 7% increase from changes in volumes and prices and a 1% decrease from currency effects. The growth in revenue resulted primarily from a €707 million increase in cloud subscriptions and support revenue. Furthermore, software support revenue rose €478 million. This growth is a result of continuously high software license revenue, which increased €25 million in 2016. Cloud and software revenue climbed to €18,424 million in 2016, an increase of 7%. Cloud and software revenue represented 84% of total revenue in 2016 (2015: 83%). Service revenue increased 2% from €3,579 million in 2015 to €3,638 million, which was 16% of total revenue, in 2016.
Revenue by Line Item
€ millions
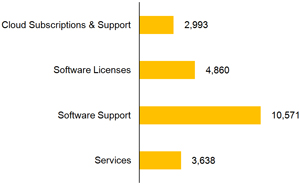
For more information about the breakdown of total revenue by region and industry, see Revenue by Region and Revenue by Industry below.
Cloud and Software Revenue
Software licenses revenue results from the fees earned from selling or licensing software to customers. Revenue from cloud subscriptions and support refers to the income earned from contracts that permit the customer to access specific software solutions hosted by SAP during the term of its contract with SAP. Support revenue represents fees earned from providing technical support services and unspecified software upgrades, updates, and enhancements to customers.
Cloud and Software
€ millions
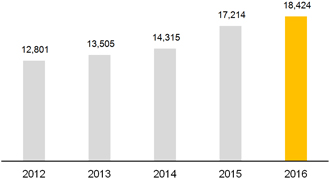
Cloud subscriptions and support revenue increased from €2,286 million in 2015 to €2,993 million in 2016.
| Combined Management Report | Financial Performance: Review and Analysis | 83 |
Table of Contents
Cloud Subscriptions and Support
€ millions
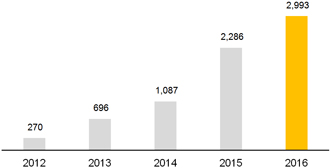
Despite a combination of a challenging macroeconomic and political environment and the accelerating industry shift to the cloud, we achieved a €25 million increase in software license revenue. This increase, from €4,835 million in 2015 to €4,860 million in 2016, reflects a 1% increase from changes in volumes and prices and a 1% decrease from currency effects.
Our customer base continued to expand in 2016. Based on the number of contracts concluded, 16% of the orders we received for software in 2016 were from new customers (2015: 13%). The total value of software orders received was stable year-over-year. The total number of software license contracts remained at the same level with 57,291 (2015: 57,439), while the average order value remained unchanged year-over-year. 29% of our software order entry in 2016 resulted from deals worth more than €5 million (2015: 27%), while 38% resulted from deals worth less than €1 million (2015: 40%).
Our stable customer base, continued investment in new software licenses by customers throughout 2016 and the previous year, and the continued interest in our support offerings resulted in an increase in software support revenue from €10,093 million in 2015 to €10,571 million in 2016. The SAP Enterprise Support offering was the largest contributor to our software support revenue. The €478 million, or 5%, growth in software support revenue reflects a 6% increase from new support business and a 1% decrease from currency effects. This growth is primarily attributable to SAP Product Support for Large Enterprises and SAP Enterprise Support. The acceptance rate for SAP Enterprise Support among new customers reached 100% in 2016 (2015: 99%).
Software licenses and software support revenue rose €503 million, or 3%, from €14,928 million in 2015 to €15,431 million in 2016. This increase reflects a 4% increase from changes in volumes and prices and a 1% decrease from currency effects.
We define predictable revenue as the sum of our software support revenue and our cloud subscriptions and support revenue. Compared to the previous year, our predictable revenue increased 10%, from €12,379 million to €13,564 million in 2016. Predictable revenue accounted for 61% of our total revenue in 2016 (2015: 60%).
Predictable Revenue
€ millions
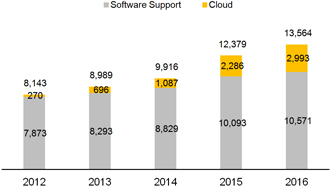
Cloud and software revenue grew from €17,214 million in 2015 to €18,424 million in 2016, an increase of 7%. This reflects an 8% increase from changes in volumes and prices and a 1% decrease from currency effects.
Services Revenue
Services revenue combines revenue from professional services, premium support services, training services, messaging services and payment services. Professional services primarily relate to the installation and configuration of our cloud subscriptions andon-premise software products. Our premium support offering consists ofhigh-end support services tailored to customer requirements. Messaging services are primarily transmission of electronic text messages from one mobile phone provider to another. Payment services are primarily delivered in connection with our travel and expense management offerings.
Services revenue increased €59 million, or 2%, from €3,579 million in 2015 to €3,638 million in 2016. This increase reflects a 3% increase from changes in volumes and prices and a 1% decrease from currency effects.
A solid market demand led to a 1% increase of €26 million in consulting revenue and premium support revenue from €2,856 million in 2015 to €2,883 million in 2016. This increase reflects a 2% increase from changes in volumes and prices and a 1% decrease from currency effects. Consulting and premium support revenue contributed 79% of the total service revenue (2015: 80%). Consulting and premium support revenue contributed 13% of total revenue in 2016 (2015: 14%).
Revenue from other services increased €33 million, or 5%, to €756 million in 2016 (2015: €723 million). This reflects a 6% increase from changes in volumes and prices and a 1% decrease from currency changes.
| Combined Management Report | Financial Performance: Review and Analysis | 84 |
Table of Contents
Revenue by Region and Industry
Revenue by Region
Revenue by Region
[based on customer location]
€ millions
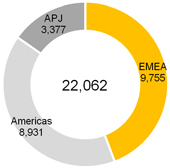
EMEA Region
In 2016, the EMEA region generated €9,755 million in revenue (2015: €9,181 million), which was 44% of total revenue (2015: 44%). This represents a year-over-year increase of 6%. Revenue in Germany increased 9% to €3,034 million in 2016 (2015: €2,771 million). Germany contributed 31% (2015: 30%) of all EMEA region revenue. The remaining revenue in the EMEA region was primarily generated in the United Kingdom, France, Switzerland, the Netherlands and Italy. Cloud and software revenue generated in the EMEA region in 2016 totaled €8,193 million (2015: €7,622 million). Cloud and software revenue represented 84% of all revenue in the region in 2016 (2015: 83%).
EMEA: Cloud and Software Revenue
€ millions
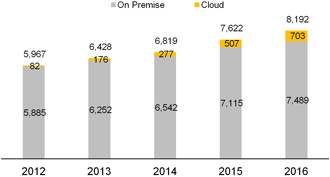
Cloud subscriptions revenue rose 39% to €703 million in 2016 (2015: €507 million). This growth reflects a 41% increase from changes in volumes and prices and a 3% decrease from currency effects. Software licenses and software support revenue rose 5% to €7,489 million in 2016 (2015: €7,115 million). This increase reflects a 7% increase from changes in volumes and prices and a 2% decrease from currency effects.
Americas Region
In 2016, 40% of our total revenue was generated in the Americas region (2015: 41%). Total revenue in the Americas region increased 6% to €8,931 million; revenue generated in the United States increased 6% to €7,167 million. This growth reflects a 6% increase from changes in volumes and prices and currency effect of 0%. The United States contributed 80% (2015: 80%) of all revenue generated in the Americas region. In the remaining countries of the Americas region, revenue increased 5% to €1,763 million. This increase reflects a 7% increase from changes in volumes and prices and a 2% decrease from currency effects. Revenue in the remaining countries of the Americas region was generated primarily in Mexico, Brazil and Canada. Cloud and software revenue generated in the Americas region in 2016 totaled €7,366 million (2015: €6,929 million). Cloud and software revenue represented 82% of all revenue in the Americas region in 2016 (2015: 82%).
Americas: Cloud and Software Revenue
€ millions
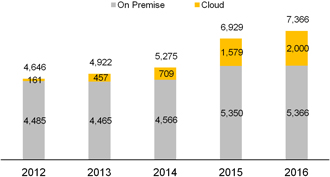
Cloud subscriptions revenue rose by 27% to €2,000 million in 2016 (2015: €1,579 million); currency effects were 0%. Software licenses and software support revenue in 2016 of €5,366 million was virtually unchanged compared to the prior year (2015: €5,350 million).
APJ Region
In 2016, 15% (2015: 15%) of our total revenue was generated in the APJ region. Total revenue in the APJ region increased 6% to €3,377 million. In Japan, revenue increased 24% to €825 million. Revenue from Japan was 24% (2015: 21%) of all revenue generated in the APJ region. The revenue growth in Japan was attributable to a 10% increase from changes in volumes and prices and a 13% increase from currency effects. In the remaining countries of the APJ region, revenue increased 1%. Revenue in the remaining countries of the APJ region was generated primarily in Australia, India and China. Cloud and software revenue in the APJ region totaled €2,865 million in 2016 (2015: €2,663 million). That was 85% of all revenue from the region (2015: 84%).
| Combined Management Report | Financial Performance: Review and Analysis | 85 |
Table of Contents
APJ: Cloud and Software Revenue
€ millions
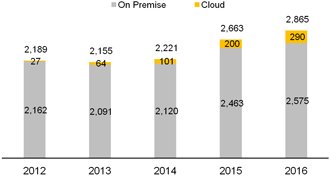
Cloud subscriptions revenue grew 45% to €290 million in 2016 (2015: €200 million). This growth reflects a 43% increase from changes in volumes and prices and a 1% increase from currency effects. Software licenses and software support revenue increased 5% to €2,575 million in 2016 (2015: €2,463 million). This growth reflects a 3% increase from changes in volumes and prices and a 1% increase from currency effects.
Revenue by Industry
We allocate our customers to one of our industries at the outset of an initial arrangement. All subsequent revenue from a particular customer is recorded under that industry sector.
Revenue by Industry
€ millions
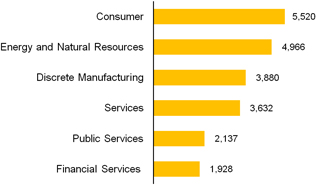
In 2016, we achieved above-average growth in the following industry sectors, measured by changes in total revenue: Consumer (€5,520 million, growing 12%); Services (€3,632 million, growing 10%); and Discrete Manufacturing (€3,880 million, growing 6%). Revenue from the other industry sectors was Financial Services (€1,928 million, growing 3%); Energy and Natural Resources (€4,966 million, growing 3%); and Public Services (€2,137 million, decreasing 2%).
Operating Profit and Operating Margin
SAP continued to invest in innovation and its cloud business and achieved a record revenue in 2016. Thanks to strong revenue growth and lower restructuring costs, our operating profit improved 21% to €5,135 million (2015: €4,252 million).
In 2016, our operating expenses increased €387 million or 2% to €16,928 million (2015: €16,541 million). The main contributors to that increase were our continued investment in sales activities and our greater revenue-related and investment-related cloud subscriptions and support costs.
The record revenue generated and significantly lower restructuring costs had a positive impact on our operating profit. Continuing investment in cloud infrastructure, in sales activities around the world, and in research and development also affected the results in 2016. The increased operating profit and the higher share price in 2016 pushed the cost of bonus payments to employees and share-based compensation higher. Our employee headcount (measured in full-time equivalents, or FTEs) increased by 7,197 year-over-year.
Operating Profit
€ millions | change since previous year
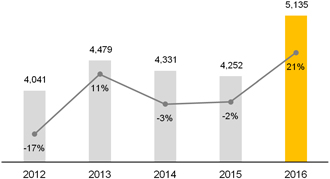
Operating Margin
Percent | change since previous year
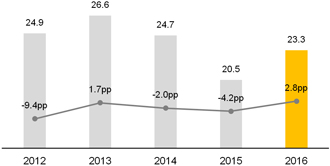
| Combined Management Report | Financial Performance: Review and Analysis | 86 |
Table of Contents
The increased operating expenses largely represent investments in the future and were offset by the increase in revenue.
As an overall result of these effects on operating profit, our operating margin widened 2.8pp to 23.3% in 2016 (2015: 20.5%).
Changes to the individual elements in our cost of revenue were as follows:
Cost of Cloud and Software
Cost of cloud and software consists primarily of customer support costs, cost of developing custom solutions that address customers’ specific business requirements, costs for deploying and operating cloud solutions, amortization expenses relating to intangibles, and license fees and commissions paid to third parties for databases and the other complementary third-party products sublicensed by us to our customers.
In 2016, the cost of cloud and software increased 5% to €3,495 million (2015: €3,313 million).
Main impact on costs was an additional €291 million year-over-year to extend our cloud business in response to the sustained strength of customer demand, with an associated increase in the expense of delivering and operating cloud applications. These investments contributed to revenue growth. Our margin on cloud subscriptions and support increased 0.8pp to 56.1% (2015: 55.3%). This improvement in margin was achieved primarily through strong growth in revenue. The investments in our cloud business were offset by the significant increase in cloud subscriptions and support revenue.
While software licenses and support revenue increased, savings in customer support, in the cost of developing custom solutions, and in license fees, enabled us to reduce our software and support costs by a total of €109 million year over year.
The gross margin on cloud and software, defined as cloud and software profit as a percentage of cloud and software revenue, widened to 81.0% in 2016 (2015: 80.8%). This change was mainly driven by the improved software license and support margin, which increased 1.2pp to 85.9% (2015; 84.7%).
Cost of Services
Cost of services consists primarily of the cost of consulting, premium services and training personnel and the cost ofbought-in consulting and training resources.
As of the second quarter of 2016, we changed the way sales and marketing expenses related to our service activities are classified in our income statement. For more information see the Notes to the Consolidated Financial Statements section,Note (3b).
Although we were able to increase our service revenue by 2% year over year to €3,638 million in 2016 (2015: €3,579 million), our service business continues to be greatly affected as we trend away from classic software licensing and consulting revenue toward more subscription revenue from cloud solutions. In addition, we continue to invest in our ONE Service organization and in our customerco-innovation projects. As a result, cost of services rose 5% to €3,089 million (2015: €2,932 million). Our gross margin on services, defined as services profit as a percentage of services revenue, narrowed to 15.1% (2015: 18.1%).
Research and Development Expense
Our research and development (R&D) expense consists primarily of the personnel cost of our R&D employees, costs incurred for independent contractors we retain to assist in our R&D activities, and amortization of the computer hardware and software we use for our R&D activities.
Due to growing personnel costs driven by a 12% increase in our R&D headcount by the end of the year, our R&D expense increased by 7% to €3,044 million in 2016 from €2,845 million in 2015. R&D expense as a percentage of total revenue thus increased to 13.8% in 2016 (2015: 13.7%). For more information, see theProducts, Research & Development, and Servicessection.
Sales and Marketing Expense
Sales and marketing expense consists mainly of personnel costs, direct sales costs, and the cost of marketing our products and services.
Our sales and marketing expense rose 8% from €5,782 million in 2015 to €6,265 million in 2016. The increase was mainly the result of greater personnel costs as we expanded our global sales force, and of increased expenditure for bonus payments prompted by the strong revenue growth. The ratio of sales and marketing expense to total revenue, expressed as a percentage, increased to 28.4% year-over-year (2015: 27.8%), an increase of 0.6pp.
General and Administration Expense
Our general and administration expense consists mainly of personnel costs to support our finance and administration functions.
General and administration expense decreased 4% from €1,048 million in 2015 to €1,005 million in 2016. This decline in costs is primarily the result of careful cost management. Consequently, the ratio of general and administration expense to total revenue decreased in 2016 to 4.6% (2015: 5.0%).
Segment Information
In 2016, SAP had two reportable segments: the Applications, Technology & Services segment; and the SAP Business Network segment.
For more information about our segment reporting, see the Notes to the Consolidated Financial Statements,Note(28), and thePerformance Management System section.
| Combined Management Report | Financial Performance: Review and Analysis | 87 |
Table of Contents
Applications, Technology & Services Segment
€ millions, unless otherwise stated (Non-IFRS) | 2016 | 2015 | D in % | D in % (Constant Currency) | ||||||||||||
| Cloud subscriptions and support revenue | 1,353 | 932 | 45 | 47 | ||||||||||||
| Cloud subscriptions and support margin (in %) | 51 | 52 | –2pp | –1pp | ||||||||||||
| Segment revenue | 19,920 | 18,963 | 5 | 6 | ||||||||||||
| Gross margin (in %) | 74 | 74 | –0pp | –0pp | ||||||||||||
| Segment profit | 8,031 | 7,723 | 4 | 4 | ||||||||||||
| Segment margin (in %) | 40 | 41 | –0pp | –1pp | ||||||||||||
In 2016, the revenue increase in the Applications, Technology & Services segment was driven mainly by strong growth in software support revenue, which increased 5% (6% at constant currencies) to €10,464 million. As a consequence of continuous strong demand for our human capital management, customer engagement and commerce, and SAP HANA Enterprise Cloud offerings, cloud subscriptions and support revenue in the Applications, Technology & Services segment grew 45% (47% at constant currencies) to €1,353 million.
The increase of cloud subscriptions and support revenue and software support revenue resulted in an increase in the revenue share of more predictable revenue streams in this segment of 2pp at constant currencies from 58% in 2015 to 59% in 2016. Software license revenue attributable to this segment increased 1% at constant currencies to €4,814 million (2015: €4,770 million).
The segment’s cost of revenue during the same time period increased 7% (8% at constant currencies) to €5,279 million (2015: €4,954 million). This increase in expenses was primarily the result of greater investment in expanding our cloud infrastructure and in providing and operating our cloud applications, as well as additional personnel expenses to support the growth of the cloud business.
SAP Business Network Segment
€ millions, unless otherwise stated (Non-IFRS) | 2016 | 2015 | D in % | D in % (Constant Currency) | ||||||||||||
| Cloud subscriptions and support revenue | 1,595 | 1,337 | 19 | 19 | ||||||||||||
| Cloud subscriptions and support margin (in %) | 76 | 75 | 1pp | 1pp | ||||||||||||
| Segment revenue | 1,925 | 1,616 | 19 | 19 | ||||||||||||
| Gross margin (in %) | 67 | 68 | –1pp | –1pp | ||||||||||||
| Segment profit | 338 | 317 | 7 | 0 | ||||||||||||
| Segment margin (in %) | 18 | 20 | –2pp | –3pp | ||||||||||||
The segment’s cost of revenue increased 21% in 2016 (22% at constant currencies) to €631 million (2015: €520 million). The SAP Business Network segment achieved a segment gross profit of €1,295 million in 2016 (2015: €1,095 million), an increase of 18% (17% at constant currencies).
Financial Income, Net
Financial income, net, changed to –€38 million (2015: –€5 million). Our finance income was €230 million (2015: €241 million) and our finance costs were €268 million (2015: €246 million).
Finance income mainly consists of gains from disposal of equity securities totaling €164 million (2015: €176 million), interest income from loans and receivables, and other financial assets (cash, cash equivalents, and current investments) totaling €40 million (2015: €41 million), and income from derivatives totaling €29 million (2015: €30 million).
Finance costs mainly consist of interest expense on financial liabilities amounting to €108 million (2015: €135 million) and negative effects from derivatives amounting to €114 million (2015: €72 million). The decrease in finance costs is mainly due to lower average indebtedness. For more information about financing instruments, see the Notes to the Consolidated Financial Statements section,Note (17b).
Income Tax
Our effective tax rate increased to 25.3% in 2016 (2015: 23.4%). The increase in the effective tax rate mainly resulted from changes in taxes for prior years and the increase in the profit before taxes. For more information on income taxes, see the Notes to the Consolidated Financial Statements section,Note (10).
| Combined Management Report | Financial Performance: Review and Analysis | 88 |
Table of Contents
Profit After Tax and Earnings per Share
Profit after tax increased to €3,634 million in 2016 (2015: €3,056 million).
Profit after Tax
€ millions | change since previous year
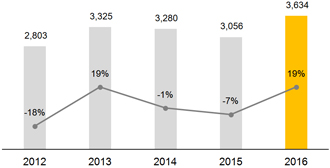
Basic earnings per share increased to €3.04 (2015: €2.56). The number of shares outstanding increased to 1,198 million in 2016 (2015: 1,197 million).
Earnings per Share
€ | change since previous year

Dividend
We believe our shareholders should benefit appropriately from the profit the Company made in 2016. In recent years, the payout has always been greater than 35% of profit after tax. We aim to continue our policy to pay a dividend totaling more than 35% of profit after tax in the future.
The Executive Board and the Supervisory Board will recommend to the Annual General Meeting of Shareholders that the total dividend will be increased by 9% to €1.25 per share (2015: €1.15). Based on this recommendation, the overall dividend payout ratio (which here means total distributed dividend as a percentage of profit) would be 41% (2015: 45%).
| Combined Management Report | Financial Performance: Review and Analysis | 89 |
Table of Contents
If the shareholders approve this recommendation and if treasury shares remain at the 2016 closing level, the total amount distributed in dividends would be €1,498 million. The actual amount distributed may be different from this total because the number of shares held in treasury may change before the Annual General Meeting of Shareholders. In 2016, we distributed €1,378 million in dividends from our 2015 profit after tax. In 2016 and 2015, we did not repurchase any SAP treasury shares.
Dividend per Share
€ | change since previous year
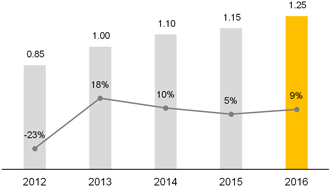
Finances (IFRS)
Overview
Global Financial Management
We use global centralized financial management to control liquid assets and monitor exposure to interest rates and currencies. The primary aim of our financial management is to maintain liquidity in the Group at a level that is adequate to meet our obligations. Most SAP companies have their liquidity managed centrally by the Group, so that liquid assets across the Group can be consolidated, monitored, and invested in accordance with Group policy. High levels of liquid assets help keep SAP flexible, sound, and independent. In addition, various credit facilities are currently available for additional liquidity, if required. For more information about these facilities, see theCredit Facilities section.
We manage credit, liquidity, interest rate, equity price, and foreign exchange rate risks on a Group-wide basis. We use selected derivatives exclusively for this purpose and not for speculation, which is defined as entering into a derivative instrument for which we do not have corresponding underlying transactions. The rules for the use of derivatives and other rules and processes concerning the management of financial risks are documented in our treasury guideline, which applies globally to all companies in the Group. For more information about the management of each financial risk and about our risk exposure, see the Notes to the Consolidated Financial Statements section,Notes (24) to(26).
Liquidity Management
Our primary source of cash, cash equivalents, and current investments is funds generated from our business operations. Over the past several years, our principal use of cash has been to support operations and our capital expenditure requirements resulting from our growth, to quickly repay financial debt, to acquire businesses, to pay dividends on our shares, and to buy back SAP shares on the open market. On December 31, 2016, our cash, cash equivalents, and current investments were primarily held in euros and U.S. dollars. We generally invest only in the financial assets of issuers or funds with a minimum credit rating of BBB, and pursue a policy of cautious investment characterized by wide portfolio diversification with a variety of counterparties, predominantly short-term investments, and standard investment instruments. Investments in financial assets of issuers with a credit rating lower than BBB were not material in 2016.
We believe that our liquid assets combined with our undrawn credit facilities are sufficient to meet our present operating needs and, together with expected cash flows from operations, will support debt repayments and our currently planned capital expenditure requirements over the near term and medium term. It may also be necessary to enter into financing transactions when additional funds are required that cannot be wholly sourced from free cash flow (for example, to finance large acquisitions).
To expand our business, we have made acquisitions of businesses, products, and technologies. Depending on our future cash position and future market conditions, we might issue additional debt instruments to fund acquisitions, maintain financial flexibility, and limit repayment risk. Therefore, we continuously monitor funding options available in the capital markets and trends in the availability of funds, as well as the cost of such funding. In recent years, we were able to repay additional debt within a short period of time due to our persistently strong free cash flow. For more information about the financial debt, see theCash Flows and Liquidity section.
Capital Structure Management
The primary objective of our capital structure management is to maintain a strong financial profile for investor, creditor, and customer confidence, and to support the growth of our business. We seek to maintain a capital structure that will allow us to cover our funding requirements through the capital markets at reasonable conditions, and in so doing, ensure a high level of independence, confidence, and financial flexibility.
For more information about the capital structure and its analysis, see theAnalysis of Consolidated Statement of Financial Position section and Notes to the Consolidated Financial Statements section, Note (21).
The long-term credit rating for SAP SE is “A2” by Moody’s with stable outlook and “A” by Standard & Poor’s with positive outlook. Standard & Poor’s raised the outlook from stable to positive on August 12, 2016.
Our general intention is to remain in a position to return liquidity to our shareholders by distributing annual dividends totaling more than 35% of our profit after tax as well as repurchasing treasury shares in future.
| Combined Management Report | Financial Performance: Review and Analysis | 90 |
Table of Contents
In absence of large acquisitions, our strong operating cash flow will generate excess cash in the next 6–12 months. Based on the actual acquisition volume and liquidity development we would consider a potential share buyback in the second half of 2017.
Credit Facilities
Other sources of capital are available to us through various credit facilities, if required.
We are party to a committed €2.0 billion revolving credit facility contract which matures in November 2020. The credit facility may be used for general corporate purposes. A possible future utilization is not subject to any financial covenants. So far, we have not used and do not currently foresee any need to use, this credit facility.
As at December 31, 2016, SAP SE had additional available credit facilities totaling €474 million. Several of our foreign subsidiaries have credit facilities available that allow them to borrow funds at prevailing interest rates. As at December 31, 2016, approximately €25 million was available through such arrangements. There were immaterial borrowings outstanding under these credit facilities from our foreign subsidiaries as at December 31, 2016.
Financial Debts
Maturity Profile of Financial Debts
€ millions
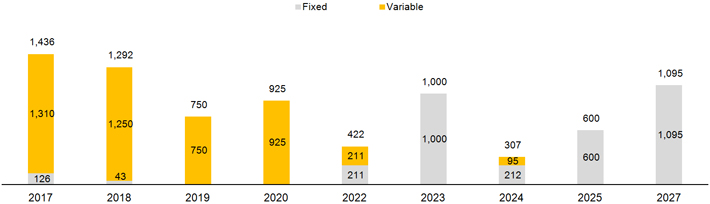
Financial debt on December 31, 2016 included amounts in euros (€6,150 million) and U.S. dollars (€1,660 million). Approximately 58% of financial debt was held at variable interest rates, partially swapped from fixed into variable using interest rate swaps.
In August 2016 we issued a €400 million Eurobond with a maturity of two years and variable interest rates(3-month EURIBOR plus 0.30%).
In 2017, the Company intends to repay two Eurobond tranches of €1,000 million in total as well as two U.S. private placement tranches of US$442.5 million in total when they mature.
Financial Debt
€ millions
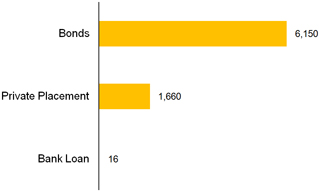
For more information about our financial debt, see the Notes to the Consolidated Financial Statements section,Note (17).
| Combined Management Report | Financial Performance: Review and Analysis | 91 |
Table of Contents
Cash Flows and Liquidity
Group Liquidity
€ millions | 2016 | 2015 | D | |||||||||
| Cash and cash equivalents | 3,702 | 3,411 | 291 | |||||||||
| Current investments | 971 | 148 | 823 | |||||||||
|
|
|
|
|
| |||||||
| Group liquidity | 4,673 | 3,559 | 1,114 | |||||||||
| Current financial debt | -1,435 | -567 | -868 | |||||||||
|
|
|
|
|
| |||||||
| Net liquidity 1 | 3,238 | 2,992 | 246 | |||||||||
| Non-current financial debt | -6,390 | -8,607 | 2,217 | |||||||||
|
|
|
|
|
| |||||||
| Net liquidity 2 | -3,153 | -5,615 | 2,462 | |||||||||
Group liquidity consists of cash and cash equivalents (for example, cash at banks, money market funds, and time deposits with original maturity of three months or less) and current investments (for example, investments with original maturities of greater than three months and remaining maturities of less than one year included in other financial assets) as reported in our Consolidated Financial Statements. Net liquidity is Group liquidity less total financial debt as defined above.
Group liquidity on December 31, 2016, primarily comprised amounts in euros and U.S. dollars.
The increase in Group liquidity compared to 2015 was mainly due to cash inflows from our operations. They were offset by cash outflows for dividend payments and repayments of borrowings.
For information about the impact of cash, cash equivalents, current investments, and our financial liabilities on our income statements, see the analysis of our financial income, net, in the Operating Results (IFRS) section.
Group Liquidity Development
€ millions
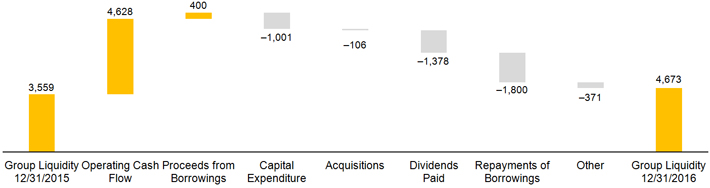
Analysis of Consolidated Statements of Cash Flow
Analysis of Consolidated Statements of Cash Flow
€ millions | 2016 | 2015 | D in % | |||||||||
| Net cash flows from operating activities | 4,628 | 3,638 | 27 | |||||||||
| Net cash flows from investing activities | -1,799 | -334 | >100 | |||||||||
| Net cash flows from financing activities | -2,705 | -3,356 | -19 | |||||||||
In 2016 cash inflows from operating activities increased by €990 million to €4,628 million (2015: €3,638 million). This result is primarily due to our revenue increase and higher profitability as well as €161 million lower payments to employees related to restructuring (2015: €476 million).
In 2016, days’ sales outstanding (DSO) for receivables, defined as the average number of days from the raised invoice to cash receipt from the customer, increased three days to 74 days (2015: 71 days).
| Combined Management Report | Financial Performance: Review and Analysis | 92 |
Table of Contents
Cash outflows from investment activities increased to €1,799 million in 2016 (2015: €334 million). The increase resulted from lower proceeds from sale of equity or debt instruments of other entities of €793 million in 2016 (2015: €1,880 million). Cash outflows from purchase of intangible assets and property, plant, and equipment increased by €365 million to €1,001 million in 2016. For more information about current and planned capital expenditures, see theAssets section andtheInvestment Goals section.
Net cash outflows from financing activities were €2,705 million in 2016, compared to net cash outflows of €3,356 million in 2015. The 2016 cash outflows resulted from repayments of €1,250 million bank loan that we had taken to finance the Concur acquisition. The repayment was partly refinanced through the issuance of a €400 million Eurobond. We also repaid a US$600 million U.S. private placements. Cash outflows in 2015 arose mainly from repayments of €1,270 million bank loan that we assumed in connection with our acquisition of Concur, €550 million Eurobonds and US$300 million U.S. private placements. We refinanced another portion of the bank loan through the issuance of a three-tranche Eurobond of €1,750 million in total.
The dividend payment of €1,378 million made in 2016 exceeded the amount of €1,316 million from the prior year resulting from the increased dividend paid per share from €1.10 to €1.15.
| Combined Management Report | Financial Performance: Review and Analysis | 93 |
Table of Contents
Assets (IFRS)
Analysis of Consolidated Statements of Financial Position
Total assets increased by 7% year-over-year to €44,277 million.
Assets
Percent
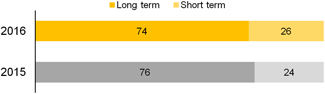
Total current assets increased by 19% in 2016 from €9,739 million to €11,564 million. This was mainly due to an increase in trade and other receivables to €5,924 million (2015: €5,274 million) on the one hand, which stemmed from our strong business in the last quarter of 2016. On the other hand it was due to investments in financial assets (2016: €1,124 million; 2015: €351 million).
Investment in Goodwill, Intangible Assets or Property, Plant, and Equipment
(incl. Capitalizations Due to Acquisitions)
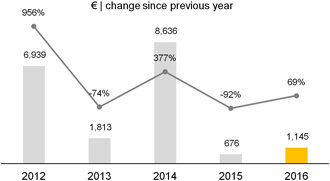
Totalnon-current assets increased by 3% in 2016 to €32,713 million compared to the previous year’s figure of €31,651 million. This change was mainly due to foreign exchange related revaluations.
Liabilities
Percent
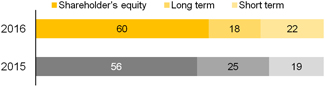
Current liabilities increased by 23% to €9,674 million in 2016 as compared to the prior year (€7,867 million) which was mainly due to reclassifications fromnon-current to current financial liabilities to reflect the respective maturity profile.
Totalnon-current liabilities decreased by €2,023 million in 2016 to €8,205 million compared to the previous year figure of €10,228 million, which was (beside of the aforementioned reclassification on financial liabilities) mainly due to a repayment of our outstanding bank loan.
For more information about financing activities in 2016, see theFinances (IFRS) section.
Thus, the equity ratio (that is, the ratio of shareholders’ equity to total assets) improved to 60% (prior year: 56%).
Equity Ratio
Percent | change since previous year
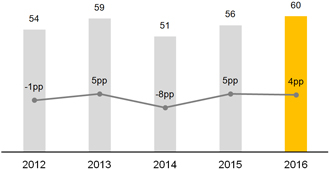
Principal Capital Expenditures and Divestitures Currently in Progress
In 2016, we continued with various construction projects and started new construction activities in several locations. The expansion of our data centers is an important aspect of our investments planned for 2017. We aim to extend our office space to cover future growth. We plan to cover all of these projects in full from operating cash flow. Our most important projects are listed below:
| Combined Management Report | Financial Performance: Review and Analysis | 94 |
Table of Contents
Construction Projects
€millions | ||||||||||||||
Country | Location of Facility | Short Description | Estimated Total Cost | Cost incurred by December 31, 2016 | Estimated Completion Date | |||||||||
| Germany | Walldorf | New office building for approx. 700 employees | 71 | 8 | October 2018 | |||||||||
| Germany | Walldorf | New data center | 65 | 9 | March 2018 | |||||||||
| India | Bangalore | New office building for approx. 2,500 employees | 60 | 23 | July 2017 | |||||||||
| Israel | Ra’anana | New office building for approx. 800 employees | 63 | 48 | April 2017 | |||||||||
| United States | New York City | Execution of leasehold improvements and consolidation of offices for approx. 450 employees | 52 | 33 | March 2017 | |||||||||
| United States | Colorado Springs, CO | New data center | 122 | 21 | January 2018 | |||||||||
For more information about planned capital expenditures, see theInvestment Goals section. There were no material divestitures within the reporting period.
Competitive Intangibles
The resources that are the basis for our current as well as future success do not appear on the Consolidated Financial Statements. This is apparent from a comparison of the market capitalization of SAP SE (based on all outstanding shares), which was €101.7 billion at the end of 2016 (2015: €90.1 billion), with the book value of our equity on the Consolidated Financial Statements, which was €26.4 billion (2015: €23.3 billion). This means that the market capitalization of our equity is nearly four times higher than the book value. The difference is mainly due to certain internally generated intangible resources that the applicable accounting standards do not allow to be recorded (at all or at fair value) in the Consolidated Financial Statements. They include customer capital (our customer base and customer relations); employees and their knowledge and skills; our ecosystem of partners; software we developed ourselves; our ability to innovate; the brands we have built up, in particular, the SAP brand itself; and our organization.
As of December 31, 2016, SAP was the most valuable company in Germany in terms of market capitalization based on all outstanding shares.
According to the Interbrand “Best Global Brands” annual survey, SAP ranked as the 22nd most valued brand in the world (2015: 26th). We went from number 26 to 22 on the list in just one year. Against other German brands, the SAP brand ranks third behindMercedes-Benz and BMW, and ninth globally against other IT brands. The SAP brand grew faster than major competitors. Interbrand determined our brand value to be US$ 21.3 billion, an increase of 13% compared to the previous year (2015: US$18.8 billion).
The results of our current and past investment in research and development are also a significant element in our competitive intangibles.
Our customer capital continued to grow in 2016. At the end of 2016, we had more than 345,000 customers (2015: 300,000) in various market segments. The U.S. magazineForbes revealed in its World’s Most Valuable Brands report that 98% of the 100 most valued brands, 87% of the Forbes Global 2000 companies, and 100% of the Dow Jonestop-scoring sustainability companies are SAP customers. To help us improve insight into our customers’ view of SAP, in 2012, we began measuring our Customer Net Promoter Score (NPS), a metric that gives a more complete picture of customer loyalty as it answers the question of how likely our customers would be to recommend SAP. For more information about our new customers and the Customer NPS, see theCustomers section.
Employee-related activities increased the value of our employee base and our own software. For more information, see theEmployees and Social Investment section, and theProducts, Research & Development, and Services section.
Report on the Economic Position of SAP SE
SAP SE is headquartered in Walldorf, Germany, and is the parent company of the SAP Group, which comprises 246 companies. SAP SE is the Group holding company and employs most of the Group’s Germany-based development and service and support personnel.
As the owner of the intellectual property in most SAP software, SAP SE derives its revenue mainly from software license fees paid by its subsidiaries for the right to market SAP solutions and bears the group-wide research and development expenses for the most part.
The SAP SE annual financial statements are prepared in accordance with the reporting standards in the German Commercial Code in the amended version of the Accounting Directive Implementation Act
| Combined Management Report | Financial Performance: Review and Analysis | 95 |
Table of Contents
BilRUG and the German Stock Corporation Act. The full SAP SE annual financial report and unqualified audit report are submitted to the operator of theElektronischer Bundesanzeiger (Online German Federal Gazette) for publication and inclusion in theUnternehmensregister (German Business Register). It is available from SAP SE on request.
The first time adoption of changed reporting standards according to BilRUG led to disclosure changes in our income statement. The definition of revenues has been expanded such that the recognition of income under revenues no longer requires that the income results from sales of the products and goods or from the provision of services that are typical of the company’s line of business. So income formerly shown as other operating income is now shown as revenue.
Intercompany royalty reimbursement claims from subsidiaries from the years 2012 to 2015 in the amount of €153 million reduced in the current year both, receivables from affiliated companies and revenue, but relate to other fiscal periods. Resulting taxes of €37 million reduced tax provisions and tax expenses.
In order to improve the presentation of the income situation, expenses for licenses and commissions are no longer shown as other operating expenses. Due to the predominantly revenue-generating nature of these expenses a separate disclosure under cost of services and materials is applied.
Income
The income statement uses the nature of expense method and presents amounts in millions of euros.
The following income statement shows the reconciliation of prior-year figures shown in the financial statements 2015 to the adjusted previous-year figures, taking into account the disclosure changes described above. The comments to income refers to the changes in relation to the adjusted previous-year figures.
SAP SE Income Statement – German Commercial Code (Short Version)
€millions | 2016 | 2015 adjusted | Reconciliation | 2015 | ||||||||||||
Total revenue | 12,578 | 10,876 | 10 | 10,866 | ||||||||||||
Other operating income | 1,218 | 1,709 | -10 | 1,719 | ||||||||||||
Cost of services and materials | -7,337 | -5,263 | -1,232 | -4,031 | ||||||||||||
Personnel expenses | -1,838 | -1,763 | 0 | -1,763 | ||||||||||||
Depreciation and amortization | -263 | -263 | 0 | -263 | ||||||||||||
Other operating expenses | -2,143 | -2,723 | 1,232 | -3,955 | ||||||||||||
|
|
|
|
|
|
|
| |||||||||
| Operating profit | 2,215 | 2,573 | 0 | 2,573 | ||||||||||||
|
|
|
|
|
|
|
| |||||||||
| Finance income | 1,155 | 929 | 0 | 929 | ||||||||||||
|
|
|
|
|
|
|
| |||||||||
| Income before taxes | 3,370 | 3,502 | 0 | 3,502 | ||||||||||||
|
|
|
|
|
|
|
| |||||||||
| Income taxes | -760 | -824 | 0 | -824 | ||||||||||||
|
|
|
|
|
|
|
| |||||||||
| Income after taxes | 2,610 | 2,678 | 0 | 2,678 | ||||||||||||
| Other taxes | -15 | -14 | 0 | -14 | ||||||||||||
|
|
|
|
|
|
|
| |||||||||
| Net income | 2,595 | 2,664 | 0 | 2,664 | ||||||||||||
The total revenue of SAP SE in 2016 was €12,578 million (2015: €10,876 million), an increase of 16%. Product revenue increased 26% to €10,157 million (2015: €8,051 million). As in previous years, product revenue was primarily generated from license fees paid by subsidiaries of SAP SE.
The disproportionate rise of SAP SE product revenue compared to SAP Group’s increase of cloud and software revenues, is mainly due to license fees paid for distribution and utilization rights of IP held by affiliated companies. In December 2015, SAP SE concluded license agreements granting SAP SE as of January 2016 world-wide distribution and utilization rights of those IP. This mainly concerns the IP rights of our acquisitions from the past years: Ariba, Concur, Fieldglass, SuccessFactors, and Sybase.
Within the scope of these license agreements, SAP SE was granted the right to further develop the existing technology, too. As a result, the volume ofIP-related SAP SE services, which had previously been charged to the former IP distributers, decreased, leading to a decrease of other revenues by 15% to €1,927 million (2015: €2.280 million).
SAP SE operating profit decreased 14% to €2,215 million (2015: €2,573 million). Other operating income decreased €491 million to €1,218 million (2015: €1,709 million). The year-over-year decrease is primarily due to a decrease in gains from currency effects. SAP SE cost of services and materials increased 39% to €7,337 million (2015: €5,263 million). The granted IP rights led to an increase in expenses for licenses and commissions by €947 million to €2.179 million (2015: €1,232 million) and mainlyIP-related research and development costs resulted in a rise of services received by €1,130 million to €5,137 million (2015: €4,007 million).
| Combined Management Report | Financial Performance: Review and Analysis | 96 |
Table of Contents
SAP SE personnel expenses, mainly the labor cost of software developers, service and support employees, and administration staff employed by SAP SE, increased 4% to €1,838 million (2015: €1,763 million). Other operating expenses decreased 21% to €2,143 million (2015: €2,723 million). This decrease is mainly attributable to €402 million lower losses from currency effects and a €247 million decrease in restructuring costs. The effect was partly offset by a €39 million increase in costs for maintenance and service.
Finance income was €1,155 million (2015: €929 million), an increase of €226 million compared with the previous year. The increase is primarily due to a €230 million higher income from profit transfer agreements and an increase of €5 million in net interest income. These were partly offset by an increase of €7 million in write-downs of financial assets.
SAP SE income before taxes decreased €132 million to €3,370 million (2015: €3,502 million). Income taxes decreased 8% to €760 million (2015: €824 million). After deducting taxes, the resultant net income is €2,595 million (2015: €2,664 million), a decrease of €69 million year-over-year.
Assets and Financial Position
In 2016, SAP SE total assets closed at €32,706 million (2015: €30,953 million).
SAP SE Balance Sheet – German Commercial Code (Short Version)
€millions | 12/31/2016 | 12/31/2015 | ||||||
| Assets | ||||||||
Intangible assets | 147 | 184 | ||||||
Property, plant, and equipment | 1,111 | 998 | ||||||
Financial assets | 25,338 | 25,257 | ||||||
| Fixed assets | 26,596 | 26,439 | ||||||
Inventories | 2 | 2 | ||||||
Accounts receivable and other assets | 4,637 | 3,872 | ||||||
Marketable securities | 150 | 0 | ||||||
Liquid assets | 970 | 360 | ||||||
| Short-term assets | 5,759 | 4,234 | ||||||
| Prepaid expenses and deferred charges | 205 | 173 | ||||||
| Deferred taxes | 144 | 106 | ||||||
| Surplus arising from offsetting | 2 | 1 | ||||||
|
|
|
| |||||
| Total assets | 32,706 | 30,953 | ||||||
| Equity and liabilities | ||||||||
| Shareholders’ equity | 15,291 | 14,024 | ||||||
| Provisions | 1,339 | 1,247 | ||||||
| Liabilities | 16,069 | 15,679 | ||||||
| Deferred income | 7 | 3 | ||||||
|
|
|
| |||||
| Total shareholders’ equity and liabilities | 32,706 | 30,953 | ||||||
Owing to investments in IT infrastructure property, plant and equipment rose by €113 million to €1,111 million (2015: €998 million). Financial assets increased €81 million compared with the previous year to €25,338 million (2015: €25,257 million), due mainly to capital contributions and loans to subsidiaries.
The increase of €765 million in accounts receivable and other assets was principally the result of higher receivables from affiliated companies mainly due to higher product revenue and higher tax receivables. Liquid assets and marketable securities increased by €760 million to €1.120 million (2015: €360 million).
SAP SE shareholders’ equity rose 9% to €15,291 million (2015: €14,024 million). Against outflows of €1,378 million associated with the payment of the 2015 dividend, there was a €2,595 million increase in net income and an inflow of €50 million from the issuance of shares to service the share-based payments of employees. The equity ratio (that is, the ratio of shareholders’ equity to total assets) increased from 45% in 2015 to 47% in 2016.
Combined Management Report | Financial Performance: Review and Analysis | 97 |
Table of Contents
Provisions increased €92 million to €1,339 million (2015: €1,247 million). Other provisions increased €110 million to €953 million (2015: €843 million) primarily as a result of additions to the other employee-related liabilities and provision for losses from derivative forward contracts. Reserves for tax decreased €17 million to €381 million (2015: €398 million).
Liabilities increased €390 million to €16,069 million (2015: €15,679 million). This increase is mainly attributable to contrasting effects: On the one hand, SAP SE issued new debt in the amount of €400 million and liabilities to affiliated companies increased €1.130 million, primarily due to increased cash contributions by subsidiaries through SAP SE centralized management of finance and liquidity; on the other hand, SAP SE repaid €1,250 million in liabilities to banks.
Opportunities and Risks
SAP SE is subject to materially the same opportunities and risks as the SAP Group. For more information, see theRisk Management and Risks section as well as theExpected Developments and Opportunities section.
| Combined Management Report | Financial Performance: Review and Analysis | 98 |
Table of Contents
Corporate Governance Fundamentals
Corporate Governance Statement
The German Commercial Code, section 315 (5) in connection with section 289a, requires that as a listed company, SAP SE publish a corporate governance statement either as part of our management report or on our Web site. The Executive Board of SAP SE filed the corporate governance statement on February 21, 2017, and published it on our public Web site atwww.sap.com/corporate-en/investors/governance.
For more information about the corporate governance of SAP, see theCorporate Governance Report section.
Changes in Management
The Global Managing Board was dissolved on March 31, 2016.
As of April 1, 2016, Stefan Ries and Steve Singh were appointed to the Executive Board. Stefan Ries continued in his role as Chief Human Resources Officer and also took on the position of SAP Labor Relations Director. Steve Singh continued to lead the Business Networks & Applications group. In addition, he took over responsibility for SAP’s solutions forsmall-to-medium-sized businesses, the SAP Connected Health strategy and solutions, and theData-as-a-Service (DaaS) business.
Gerhard Oswald retired from his position as Executive Board member upon the end of his term on December 31, 2016.
Information Concerning Takeovers
Information required under the German Commercial Code, sections 289 (4) and 315 (4), with an explanatory report:
| ∎ | Composition of share capital: For information about the composition of SAP SE share capital as at December 31, 2016, see the Notes to the Consolidated Financial Statements,Note (20). Each share entitles the bearer to one vote. American depositary receipts (ADRs) representing our shares are listed on the New York Stock Exchange in the United States. ADRs are certificates representingnon-U.S. shares and are traded on U.S. stock exchanges instead of the underlying shares. One SAP ADR corresponds to one SAP share. |
| ∎ | Restrictions applying to share voting rights or transfers:SAP shares are not subject to transfer restrictions except thelock-up period under the SAP Share Matching Plan (SMP), described below. SAP held 29,880,390 treasury shares as at December 31, 2016, see the Notes to the Consolidated Financial Statements,Note (20). Treasury shares do not carry voting rights or dividend rights or other rights. Shares issued under the employee SMP are partly subject to contractual transfer restrictions for a three-yearlock-up period unless the plan member’s employment with SAP is ended under certain circumstances during that period. Until thatlock-up period has expired, participating employees are not ordinarily allowed to dispose of the shares they have acquired under the plan. We are not aware of any other restrictions applying to share voting rights or to share transfers. |
| ∎ | Shareholdings that exceed 10% of the voting rights: We are not aware of any direct or indirect SAP SE shareholdings that exceed 10% of the voting rights. |
| ∎ | Shares with special rights conferring powers of control: No SAP shareholder has special rights conferring powers of control. |
| ∎ | Type of control over voting rights applying to employee shareholders who do not directly exercise their control rights: As with other shareholders, employee holders of SAP shares exercise their control rights in accordance with the law and the Articles of Incorporation. In votes on the formal approval of their acts at the Annual General Meeting of Shareholders, employee representatives on the Supervisory Board, as all other members of the Supervisory Board, are prohibited from exercising the voting rights associated with their shares. |
| ∎ | Requirements concerning appointments and dismissals of members of the Executive Board and amendments to the Articles of Incorporation: Conditions for the appointment and dismissal of members of the Executive Board and amendment to the Articles of Incorporation reflect the relevant provisions of applicable European and German law, including Council Regulation (EC) No. 2157/2001 on the Statute for a European Company (“SE Regulation”) and the German Stock Corporation Act. Under the Articles of Incorporation, the Executive Board consists of at least two members who are appointed for a period of not more than five years by the Supervisory Board in accordance with the SE Regulation, articles 39 and 46. The number of members of the Executive Board is decided by the Supervisory Board. Executive Board members may be reappointed for, or their term of office extended by, a maximum of five years. A simple majority of the Supervisory Board membership is required for Executive Board appointments. In the event of a tie, the chairperson of the Supervisory Board has the deciding vote. The Supervisory Board can appoint a chairperson of the Executive Board and one or more deputy chairpersons from among the members of the Executive Board. The Supervisory Board can revoke appointments to the Executive Board in |
| Combined Management Report | Corporate Governance Fundamentals | 99 |
Table of Contents
accordance with the SE Regulation, article 9, and the German Stock Corporation Act, section 84, if compelling reasons exist, such as gross negligence on the part of the Executive Board member. If the Executive Board is short of a required member, one may be appointed in urgent cases by a court in accordance with the SE Regulation, article 9, and the German Stock Corporation Act, section 85. In accordance with the SE Regulation, article 59, and the German Stock Corporation Act, section 179, an amendment of the Articles of Incorporation requires a resolution of the General Meeting of Shareholders with a majority of at least three-quarters of the valid votes cast. For any amendments of the Articles of Incorporation that require a simple majority for stock corporations established under German law, however, the simple majority of the valid votes cast is sufficient if at least half of the subscribed capital is represented or, in the absence of such quorum, the majority prescribed by law (that is,two-thirds of the votes cast, pursuant to article 59 of the SE Regulation) is sufficient. Section 11 (2) of the Articles of Incorporation authorizes the Supervisory Board to amend the Articles of Incorporation where such amendments only concern the wording. |
| ∎ | Power to issue and repurchase shares: The Annual General Meeting of Shareholders on May 12, 2016, granted powers to the Executive Board, subject to the consent of the Supervisory Board, to issue convertible and/or warrant-linked bonds, profit-sharing rights and/or income bonds (or combinations of these instruments), and to grant conversion or option rights in respect of SAP SE shares representing a total attributable portion of the share capital of not more than €100 million secured by a corresponding amount of contingent capital. These powers will expire on May 11, 2021. The Executive Board is also authorized until May 19, 2020, to increase the share capital by not more than €250 million by issuing new shares against contributions in cash and to increase the share capital by not more than €250 million by issuing new shares against contributions in cash or in kind. For more information about the different tranches of authorized capital and the aforementioned contingent capital, see the Articles of Incorporation, section 4. The Annual General Meeting of Shareholders on June 4, 2013, granted a power to the Executive Board in accordance with the German Stock Corporation Act, section 71 (1)(8), to buy back for treasury on or before June 3, 2018, SAP SE shares attributable in total to not more than €120 million of the share capital. The power is subject to the proviso that the shares repurchased, together with any shares that were previously acquired and are still held by SAP in treasury and any other shares controlled by SAP, must not in total exceed 10% of SAP’s share capital. Executive Board powers, such as those described to issue and repurchase stock and to grant rights of conversion and subscription to shares of SAP, are widely followed common practice among German companies such as SAP. They give the Executive Board the flexibility it needs, in particular, the option to use SAP shares as consideration in equity investments, raise funds on the financial markets at short notice on favorable terms, or return value to shareholders during the course of the year. |
| ∎ | Material agreements with change of control provisions: SAP SE has concluded the following material agreements with provisions that take effect in the event of a change of control, whether following a takeover bid or otherwise: |
The terms of SAP’s syndicated €2 billion revolving credit facility include achange-of-control clause. For more information about this syndicated credit facility, see the Notes to the Consolidated Financial Statements,Note (25). This clause obliges SAP SE to notify the banks in case of a change of control. If, on receiving the notification, banks that represent at leasttwo-thirds of the credit volume so require, the banks have the right to cancel the credit facility and demand complete repayment of the outstanding debt. If no continuation agreement is reached, the credit facility would end and the obligation to repay would become effective at an ascertainable time.
In agreements between SAP SE and various banks for bilateral credit facilities that totaled €474 million as at December 31, 2016, we have agreed to termination rights of the banks in certain cases including a change of control. We believe that in view of our current liquidity situation, termination of these credit facilities would not have a material adverse effect, at least in the near term.
Of SAP’s total amount of Eurobonds of €6.15 billion outstanding as of December 31, 2016, €5.25 billion were issued under a debt issuance program. For more information about SAP’s Eurobonds, see the Notes to the Consolidated Financial Statements,Note (17b). Under the terms agreed with the buyers, we are required to notify the buyers of any change of control without delay. If there is a change of control and SAP is consequently assigned a lower credit rating within a defined period, buyers are entitled to demand repayment.
Under the terms of our U.S. private placements totaling US$1.75 billion, we are required to offer lenders repayment of outstanding debt if there is a change of control and SAP is consequently assigned a lower credit rating within a defined period. For more information about these private placements, see the Notes to the Consolidated Financial Statements section,Note (17b). Lenders would have at least 30 days to accept the offer.
We have entered into relationships with other companies to jointly develop and market new software products. These relationships are governed by development and marketing agreements with the respective companies. Some of the agreements include provisions that, in the event of a change of control over one of the parties, give the other party a right to consent to the assignment of the agreement or to terminate it.
| ∎ | Change of control provisions in Executive Board compensation agreements: Agreements have been concluded with the members of the Executive Board concerning compensation in the event of a change of control. These agreements, which are customary in Germany and elsewhere, are described in the compensation report, which is an integral part of this management report. We have no analogous compensation agreements with our other employees. |
| Combined Management Report | Corporate Governance Fundamentals | 100 |
Table of Contents
Our Risk Management
Internal Control and Risk Management System
As a global company, SAP is exposed to a broad range of risks across our business operations. As a consequence, our Executive Board has established comprehensive internal control and risk management structures that enable us to identify and analyze risks early and take appropriate action. Our risk management and internal control system is designed to identify potential events that could negatively impact the Company and to provide reasonable assurance regarding the operating effectiveness over our financial reporting while ensuring the achievement of the Company objectives, specifically our ability to achieve our financial, operational, or strategic goals as planned.
This system comprises numerous control mechanisms and is an important element of our corporate decision-making process; it is therefore implemented as an integral part of SAP’s business processes across the entire Group. We have adopted an integrated risk management and internal control approach to ensure that our global risk management efforts are effective while also enabling us to aggregate risks and report on them transparently,
Due to our public listings in both Germany and the United States, we are subject to both German and U.S. regulatory requirements that relate to risk management and internal controls over financial reporting, such as provisions in the German Stock Corporation Act, section 91 (2) and the U.S. Sarbanes-Oxley Act (SOX) of 2002, specifically sections 302 and 404. Hence, our Executive Board has established an early warning system (risk management system) to ensure compliance with applicable regulations and an effective management of risks.
Our risk management system is based on three pillars, which include a dedicated risk management policy and a standardized risk management methodology as well as a global risk management organization. Our internal control system consists of the internal control and risk management system for financial reporting (ICRMSFR) that also covers the broader business environment. In 2016, we adjusted existing control designs to adequately address the changed risk environment and continued to automate our internal control landscape leveraging continuous control monitoring and continuous auditing activities in selected business areas. Using the current Committee of Sponsoring Organizations of the Treadway Commission (COSO) framework of 2013, we define and implement internal controls along the value chain on a process and subprocess level to ensure that sound business objectives are set in line with the organization’s strategic, operational, financial, and compliance goals. In addition, we have a governance model in place across risk management and the internal control system to ensure both systems are effective, as well as a central software solution to store, maintain, and report all risk-relevant information.
Risk Management Policy and Framework
The risk management policy issued by our Executive Board governs how we handle risk in line with the Company’s risk appetite and defines a methodology that is applied uniformly across all parts of the Group. The policy is regularly updated and stipulates who is responsible for conducting risk management activities and defines reporting and monitoring structures. Our global corporate audit function conducts regular audits to assess the effectiveness of our risk management system. Every year, SAP’s external auditor assesses if the SAP SE early risk identification system is adequate to identify risks that might endanger our ability to continue as a going concern. SAP’s enterprise risk management covers risks in the areas of strategy, operational business, financial reporting, and compliance. As of today, the risk management system analyzes risks and only assesses or analyzes opportunities where it is deemed appropriate.
Risk Management Methodology and Reporting
The following describes the key elements of the risk management process as part of SAP’s risk management policy: risk planning, identification, analysis, response, monitoring, and reporting.
Risk planning and risk identification for both internal and external risks are conducted in cooperation between risk managers and the business units or subsidiaries across the Group. We use various techniques to identify risks. For example, we have identified risk indicators and developed a comprehensive risk catalog that includes risk mitigation strategies for known product, solution, and project risks. Risk identification takes place at various levels of our organization to ensure that common risk trends are identified andend-to-end risk management across organizational borders is enabled. We apply both a qualitative and quantitative risk analysis as well as other risk analysis methods such as sensitivity analyses and simulation techniques.
To determine which risks pose the highest threat to the viability of the SAP Group, we classify them as “high,” “medium,” or “low” based on the likelihood that a risk will occur within the assessment horizon as well as the impact the risk would have on SAP’s business objectives if it were to occur. The scales for measuring these two indicators are given in the following tables.
| Combined Management Report | Risk Management and Risks | 101 |
Table of Contents
Probability/Likelihood of Occurrence | Description | |
| 1% to 19% | Remote | |
| 20% to 39% | Unlikely | |
| 40% to 59% | Likely | |
| 60% to 79% | Highly Likely | |
| 80% to 99% | Near Certainty |
In this framework, we define a remote risk as one that will occur only under exceptional circumstances and a near certain risk as one that can be expected to occur within the specified time horizon. The period for analyzing our risks correlates with the respectively associated business activities considering a relevant forecast horizon of up to one year, and up to 2020 where applicable. The period for analyzing the risks that could be possible threats to the Group’s ability to continue as a going concern is eight rolling quarters.
Impact Level | Impact Definition | |
| Insignificant | Negligible negative impact on business, financial position, profit, and cash flows | |
| Minor | Limited negative impact on business, financial position, profit, and cash flows | |
| Moderate | Some potential negative impact on business, financial position, profit, and cash flows | |
| Major | Considerable negative impact on business, financial position, profit, and cash flows | |
| Business Critical | Detrimental negative impact on business, financial position, profit, and cash flows |
Based on the combination of the likelihood that a risk will occur and its impact on SAP’s reputation, business, financial position, profit, and cash flow, we classify the risks as “high,” “medium,” or “low.”
 | Insignificant | Minor | Moderate | Major | Business Critical | |||||||
| 80-99% | L | M | H | H | H | |||||||
| 60-79% | L | M | M | H | H | |||||||
| 40-59% | L | L | M | M | H | |||||||
| 20-39% | L | L | L | M | M | |||||||
| 1–19% | L | L | L | L | M | |||||||
| Impact | ||||||||||||
| L = Low Risk | M = Medium Risk | H = High Risk | ||||||||||
Risk analysis is followed by risk response and risk monitoring. The risk exposure and the risk description, as well as the appropriateness of agreed responses, are validated by the accountable management. Our risk managers work in close cooperation with the business owners, ensuring that effective strategies are implemented to address risks. Business owners are responsible for continuously monitoring the risks and the effectiveness of mitigation strategies, with support from the respective risk managers. Risks might be reduced by taking active steps based on risk approval. To provide greater risk transparency and enable appropriate decision-making for business owners, we have established a risk delegation of authority (RDOA) for relevant parts of the organization as deemed appropriate. RDOA is a risk management decision-making hierarchy that helps business owners gain timely insight into projects and processes with the greatest risk, so they are better able to review the relevant information, understand the risk profile and associated mitigation strategies, and determine if their approval is warranted. Depending on the exposure, approval is required at different levels of the Company, up to and including the Executive Board.
All identified and relevant risks are reported at the local, regional, and global levels in accordance with our risk management policy. At local, regional, and global levels, we have established executive risk councils that regularly discuss risks and countermeasures and that monitor the success of risk mitigation. In addition, the Executive Board is informed quarterly about individual risks based on clearly defined qualitative reporting criteria. Newly identified or existing significant risks that are above a defined threshold, a qualitative criteria or with a potential significant impact are also reported to the chairperson of the Supervisory Board and to the Audit Committee of the Supervisory Board. This includes any risks to the ability to continue as a going concern.
We also have a process in place that analyzes those risks with respect to potential effects on liquidity, excessive indebtedness, and insolvency, which could be possible threats to the Group’s ability to continue as a going concern.
| Combined Management Report | Risk Management and Risks | 102 |
Table of Contents
Risk Management Organization
Our global risk management organization (Global GRC) ensures the Group-wide systematic identification, assessment, management, and monitoring of operational, financial, compliance, and strategic risks as well as opportunities. In addition, the Global GRC function is responsible for the standardized internal risk reporting to risk committees on different levels within the Company in line with the internal GRC Risk Reporting Standard, including the Executive Board, the chairperson of the Supervisory Board and the Audit Committee of the Supervisory Board, along with the external risk reporting. Furthermore, Global GRC is responsible for the regular maintenance and implementation of our risk management policy.
Operational, financial, and strategic risk management is uniformly implemented at SAP. Independent GRC risk managers are assigned to each of SAP’s important business units and business activities and to selected strategic initiatives. All GRC risk managers, together with assigned risk contacts in the business units, continuously identify and assess risks associated with material business operations using a uniform approach and monitor the implementation and effectiveness of the measures chosen to mitigate risks. Further financial risk management activities are performed by our global treasury function, and risk management of compliance risks is performed by our Legal Compliance & Integrity Office.
During the merger and acquisition and post-merger integration phase, newly acquired companies are subject to risk management performed by our Corporate Development M&A function. Furthermore, as long as they are not integrated, existing risk management structures are maintained or enhanced within the acquired companies for purposes of compliance with legal requirements.
Risk managers are responsible for supporting and monitoring the implementation of risk management across the Group that is both effective and compliant with regulatory requirements and SAP’s global risk management policy. Based on our risk management policy, all risks and risk-related matters must be reported to the Global GRC organization.
The head of Global GRC, who reports to the Group CFO, is responsible for SAP’s internal control and risk management program, and provides regular updates to the Audit Committee of the Supervisory Board. The overall risk profile of the Group is consolidated by the head of Global GRC,
Internal Control and Risk Management System for Financial Reporting
The purpose of our system of internal control over financial reporting is to provide reasonable assurance that our financial reporting is reliable and in compliance with applicable generally accepted accounting principles. Because of the inherent limitations of internal control over financial reporting, it might not prevent or bring to light all potential misstatements in our financial statements.
SAP’s internal control and risk management system for financial reporting (ICRMSFR) is based on our Group-wide risk management methodology. The ICRMSFR includes organizational, control, and monitoring structures designed to ensure that data and information concerning our business are collected, compiled, and analyzed in accordance with applicable laws and properly reflected in the IFRS Consolidated Financial Statements.
Our ICRMSFR also includes policies, procedures, and measures designed to ensure compliance of SAP’s financial reports with applicable laws and standards. We analyze new statutes, standards, and other pronouncements concerning IFRS accounting and its impact on our financial statements and ICRMSFR. Failure to adhere to these new statutes, standards, and other pronouncements would present a substantial risk to the compliance of our financial reporting. Finally, the ICRMSFR has both preventive and detective controls, including, for example, automated andnon-automated reconciliations, segregated duties withtwo-person responsibility, authorization concepts in our software systems, and corresponding monitoring measures.
Our Corporate Financial Reporting (CFR) department codifies all accounting policies in our global group accounting and revenue recognition guidelines. These policies, the corporate closing schedule, and our process handbooks together define the closing process. Under this closing process, we prepare, predominately through centralized and outsourced services, the financial statements of all SAP legal entities for consolidation by our CFR department. The CFR department and other corporate departments assist in the efforts to comply with Group accounting policies and monitor the accounting work. The department also conducts reviews of our accounting processes and books.
We have outsourced some work, such as valuing projected benefit obligations and share-based payment obligations, quarterly tax calculations for most entities, and purchase price allocations in the context of asset acquisitions and business combinations. We have also outsourced the preparation of the local statutory financial statements for most of our subsidiaries. The employees who work on SAP’s financial reporting receive training in the respective policies and processes.
Based on an analysis of the design and operating effectiveness of our respective internal controls over financial reporting, a committee presents the results of the assessment on the ICRMSFR effectiveness with respect to our IFRS Consolidated Financial Statements as at December 31 each year to the Group CFO. The committee meets regularly to set the annual scope for the test of effectiveness, to evaluate any possible weaknesses in the controls, and to determine measures to address them adequately. During its own meetings, the Audit Committee of the Supervisory Board regularly scrutinizes the resulting assessments of the effectiveness of the internal controls over financial reporting with respect to the IFRS consolidated financial statements.
The assessment of the effectiveness of the ICRMSFR related to our IFRS consolidated financial statements was that on December 31, 2016, the Group had an effective internal control system over financial reporting in place.
| Combined Management Report | Risk Management and Risks | 103 |
Table of Contents
Additionally, and in compliance with German commercial law requirements in Germany, SAP maintains an effective internal control system beyond financial reporting. This is supported through automated controls (continuous control monitoring) as part of our business processes.
Risk Management and Internal Control Governance
Our Executive Board is responsible for ensuring the effectiveness of the risk management and internal control system. The effectiveness of both systems and their implementation in the different Executive Board areas is monitored by each board member. We regularly provide a status on the risk management and the internal control system to the Audit Committee. Key risks are reported quarterly to the chairperson of the Supervisory Board and to the Audit Committee of the Supervisory Board. The Audit Committee of the Supervisory Board regularly monitors the effectiveness of SAP’s risk management and internal control system. At the direction of our Audit Committee, the Corporate Audit department regularly audits various aspects of the risk management system and its effectiveness. Additional reassurance is obtained through the external audit of the effectiveness of our internal control system over financial reporting and the early warning system.
Software Solution Deployed
We use our own risk management software, SAP solutions for GRC powered by SAP HANA, to effectively support the governance process. Risk managers record and address identified risks using our risk management software to help create transparency across all known risks that exist in the Group, as well as to facilitate risk management and the associated risk reporting. Our continuous controls monitoring activities are performed utilizing our GRC software as well. This information is available to managers through a mobile app as well as regularly issued reports, and is consolidated and aggregated for the quarterly risk report to the Executive Board. The solution also supports the risk-based approach of the ICRMSFR.
| Combined Management Report | Risk Management and Risks | 104 |
Table of Contents
Risk Factors
The following sections outline risk factors that we have identified and track using our risk management software (SAP solutions for GRC) powered by SAP HANA. They are presented below at a more aggregated level as compared to their use in internal controlling, but are broken down by the same risk categories we use in our internal risk management system reporting structure. An overview of the risk factors presented below is outlined in the following table. It categorizes the risk factors according to our framework detailed in theRisk Management Methodology and Reporting section.
Overview Risk Factors
| Probability | Impact | Risk Level | Evolution1) | |||||
| Economic, Political, Social, and Regulatory Risk | ||||||||
Global Economy | likely | business critical | high | ® | ||||
International Business Activities | unlikely | major | medium | ® | ||||
Environmental, Social, and Political Instability | unlikely | business critical | medium | ® | ||||
| Market Risks | ||||||||
Maintenance Business and Support | unlikely | business critical | medium | ® | ||||
Market Development for Cloud | unlikely | business critical | medium | ® | ||||
Market Share and Profit | unlikely | major | medium | ® | ||||
| Business Strategy Risks | ||||||||
Demand for New and Existing Solutions | remote | business critical | medium | ® | ||||
Cloud Business Model | remote | business critical | medium | ® | ||||
Relationships with Partners | unlikely | major | medium | ® | ||||
| Human Capital Risks | ||||||||
Managing the Geographically Dispersed Workforce | remote | major | low | ® | ||||
Attract, Develop, and Retain People | unlikely | major | medium | ® | ||||
| Organizational and Governance-Related Risks | ||||||||
Corporate Governance Laws and Regulations | unlikely | major | medium | ® | ||||
Data Protection and Privacy | unlikely | business critical | medium | ® | ||||
Climate Change, Energy, and Emissions | unlikely | moderate | low | ® | ||||
Ethical Behavior | unlikely | major | medium | k | ||||
| Communication and Information Risks | ||||||||
Unauthorized Disclosure of Information | remote | business critical | medium | ® | ||||
| Financial Risks | ||||||||
Quarterly Sales Fluctuations | unlikely | moderate | low | ® | ||||
Liquidity | remote | major | low | m | ||||
Management Use of Estimates | unlikely | moderate | low | ® |
| Combined Management Report | Risk Management and Risks | 105 |
Table of Contents
| Probability | Impact | Risk Level | Evolution1) | |||||
Compliance with Accounting Pronouncements | unlikely | major | medium | ® | ||||
Currency, Interest Rate and Share Price Fluctuations | remote | major | low | ® | ||||
| Project Risks | ||||||||
Implementation Projects | unlikely | major | medium | ® | ||||
| Product and Technology Risks | ||||||||
Product Security | unlikely | business critical | medium | ® | ||||
Undectected Defects in Products | unlikely | business critical | medium | ® | ||||
Third-Party Licensing | likely | major | medium | ® | ||||
Innovation | remote | business critical | medium | ® | ||||
Technology and Product Strategy | unlikely | business critical | medium | ® | ||||
Operation of SAP Cloud Data Centers | unlikely | business critical | medium | ® | ||||
| Operational Risks | ||||||||
Infringement of Intellectual Property | likely | business critical | high | ® | ||||
Lawsuits | likely | business critical | high | ® | ||||
Mergers and Acquisitions | unlikely | business critical | medium | ® | ||||
Enforcement of Intellectual Property | likely | business critical | high | ® | ||||
Cybersecurity | unlikely | business critical | medium | ® | ||||
Business Operations | unlikely | major | medium | ® | ||||
Insurance | remote | business critical | medium | ® | ||||
Venture Capital | remote | minor | low | ® | ||||
| Icon: | decreased î | |||||||
| unchanged ® | ||||||||
| increased ì |
| 1) | Evolution: Risk Level compared with previous year. |
All described risks are applicable to a different extent to our reportable segments (Applications, Technology & Services and SAP Business Network) unless otherwise noted.
SAP SE is the parent company of the SAP Group. Consequently, the risks described below also apply, directly or indirectly, to SAP SE.
Economic, Political, Social, and Regulatory Risk
Uncertainty in the global economy, financial markets, or political conditions could have a negative impact on our business, financial position, profit, as well as cash flows, and put pressure on our operating profit.
Our business is influenced by multiple risk factors that are both difficult to predict and beyond our influence and control. These factors include global economic and business conditions, and fluctuations in national currencies. Other examples are political developments and general regulations as well as budgetary constraints or shifts in spending priorities of national governments.
Macroeconomic developments, such as financial market volatility episodes, global economic crises, chronic fiscal imbalances, slowing economic conditions, or disruptions in emerging markets, could limit our customers’ ability and willingness to invest in our solutions or delay purchases. In addition, changes in the euro conversion rates for particular currencies might have an adverse effect on business activities with local customers and partners. Furthermore, political instability in
| Combined Management Report | Risk Management and Risks | 106 |
Table of Contents
regions such as Africa and the Middle East, political crises (including Brazil, Great Britain, Greece, Syria, Turkey, Ukraine, or Venezuela), sanctions (such as those placed on Russia), natural disasters, pandemic diseases (such as Ebola in West Africa) and terrorist attacks (including the attacks in Brussels, Belgium, in March 2016, or in Nice, France, in July 2016) could contribute to economic and political uncertainty.
These events could reduce the demand for SAP software and services, and lead to:
| ∎ | Delays in purchases, decreased deal size, or cancellations of proposed investments |
| ∎ | Potential lawsuits from customers due to denied provision of service as a result of sanctioned-party lists or export control issues |
| ∎ | Higher credit barriers for customers, reducing their ability to finance software purchases |
| ∎ | Increased number of bankruptcies among customers, business partners, and key suppliers |
| ∎ | Increased default risk, which might lead to significant impairment charges in the future |
| ∎ | Market disruption from aggressive competitive behavior, acquisitions, or business practices |
| ∎ | Increased price competition and demand for cheaper products and services |
Any one or more of these developments could reduce our ability to sell and deliver our software and services which could have an adverse effect on our business, financial position, profit, and cash flows.
SAP has established measures and conducted scenario analyses to address and mitigate the described risks and adverse effects to the extent possible. We offer our customers standard software and product packages that are fast and easy to install, as well as financially attractive financing, software licensing, and subscription models. Our ongoing shift to a higher share of cloud subscriptions and software support revenue streams will lead to more predictable streams over time providing increased stability against financial volatility. Furthermore, we continue to apply cost discipline internally and have a conservative financial planning policy. Additionally, SAP is continuously reshaping its organizational structure and processes to increase efficiency.
We estimate the probability of occurrence of this risk to be likely. Therefore, we cannot completely exclude the possibility that it will have a business-critical impact on our business, financial position, profit, and cash flows. This could exacerbate the other risks we describe in this report or cause a negative deviation from our revenue and operating profit target. We classify this risk as a high risk.
Our international business activities and processes expose us to numerous, sometimes even conflicting laws and regulations, policies, standards or other requirements, and to risks that could harm our business, financial position, profit, and cash flows.
We are a global company and currently market our products and services in more than 180 countries and territories in the Americas (Latin America and North America); Asia Pacific Japan (APJ); and Europe, Middle East, and Africa (EMEA) regions. Our business in these countries is subject to numerous risks inherent in international business operations. Among others, these risks include:
| ∎ | Data protection and privacy regulations regarding access by government authorities to customer, partner, or employee data |
| ∎ | Data residency requirements (the requirement to store certain data only in and, in some cases, also to access such data only from within a certain jurisdiction) |
| ∎ | Conflict and overlap among tax regimes |
| ∎ | Possible tax constraints impeding business operations in certain countries |
| ∎ | Expenses associated with the localization of our products and compliance with local regulatory requirements |
| ∎ | Discriminatory or conflicting fiscal policies |
| ∎ | Operational difficulties in countries with a high corruption perception index |
| ∎ | Protectionist trade policies, import and export regulations, and trade sanctions and embargoes |
| ∎ | Works councils, labor unions, and immigration laws in different countries |
| ∎ | Difficulties enforcing intellectual property and contractual rights in certain jurisdictions |
| ∎ | Country-specific software certification requirements |
| ∎ | Challenges with effectively managing a large distribution network of third-party companies |
| ∎ | Compliance with various industry standards (such as Payment Card Industry Data Security Standard) |
| ∎ | Market volatilities or workforce restrictions due to changing laws and regulations resulting from political decisions (e.g. Brexit, government elections) |
As we expand into new countries and markets, these risks could intensify. The application of the respective local laws and regulations to our business is sometimes unclear, subject to change over time, and often conflicting among jurisdictions. Additionally, these laws and government approaches to enforcement are continuing to change and evolve, just as our products and services continually evolve. Compliance with these varying laws and regulations could involve significant costs or require changes in products or business practices.Non-compliance could result in the imposition of penalties or cessation of orders due to allegednon-compliant activity. We do not believe we have engaged in any activities sanctionable under these laws and regulations, but governmental authorities could use considerable discretion in applying these statutes and any imposition of sanctions against us could be material. One or more of these factors could have an adverse effect on our operations globally or in one or more countries or regions, which could have an adverse effect on our business, financial position, profit, and cash flows.
We address these risks with various measures depending on the circumstances on which SAP will not compromise, including, for example, a strong legal and compliance office presence in the main countries, compliance safeguards supported and monitored by SAP legal teams and the Legal Compliance & Integrity Office, maintaining
| Combined Management Report | Risk Management and Risks | 107 |
Table of Contents
an effective data protection and privacy office and associated policy, receiving guidance from external economics consultants, law firms, tax advisors, and authorities in the concerned countries, and taking legal actions when necessary.
Although we estimate the probability of occurrence of this risk to be unlikely, we cannot completely exclude the possibility that this risk could have a major impact on our business, financial position, profit, and cash flows, or cause a negative deviation from our revenue and operating profit target. We classify this risk as a medium risk.
Social and political instability caused by state-based conflicts, terrorist attacks, civil unrest, war, or international hostilities might disrupt SAP’s business operations.
Terrorist attacks (such as in Turkey, in March, June, August, and December 2016) as well as other acts of violence or war, civil, religious, and political unrest (such as in Turkey, Ukraine, and Venezuela; Israel, Libya, Syria, and in other parts of the Middle East; and parts of Africa); natural disasters (such as hurricanes, flooding, or similar events); or pandemic diseases (such as Ebola in West Africa) could have a significant adverse effect on the local economy and beyond. Such an event could lead, for example, to the loss of a significant number of our employees, or to the disruption or disablement of operations at our locations, and could affect our ability to provide business services and maintain effective business operations. Furthermore, this could have a significant adverse effect on our partners as well as our customers and their investment decisions, which could have an adverse effect on our reputation, business, financial position, profit, and cash flows.
Our mitigation measures have been designed and implemented to minimize such adverse effects. In an effort to ensure continuous operations of all business processes, we have been implementing and operating a worldwide business continuity management and crisis management system. To enable effective response and minimize possible losses in case of crisis situations, we have installed local crisis management teams at our main locations, supplemented by regional crisis management teams for the Americas (including Latin America and North America), APJ (including Greater China), and EMEA regions, and a global crisis management team.
To protect our key IT infrastructure (especially our data centers), critical business systems, and processes from material adverse effects in crisis situations, disaster recovery and business continuity plans have been developed that include implementation of data redundancies and daily data backup strategies. To verify and improve our approach, ourIT-related organizations have been certified to the internationally recognized ISO 22301:2013 (Business Continuity Management) standard with regards to the Applications, Technology & Services segment. In addition, our corporate headquarters, which houses certain critical business functions, is located in the German state ofBaden-Württemberg. This area has historically been free of natural disasters.
With regards to the relevance of current and anticipated political crisis situations and acts of violence impacting SAP’s business, we believe that the likelihood of this risk materializing is unlikely; however, we cannot exclude the possibility of such a risk occurring and having a business-critical impact on our reputation, business, financial position, profit, and cash flows, or causing a negative deviation from our revenue and operating profit target. We classify this risk as a medium risk.
Market Risks
Our established customers might not buy additional software solutions, subscribe to our cloud offerings, renew maintenance agreements, purchase additional professional services, or they might switch to other products or service offerings (including competitive products).
In 2016, we continued to depend materially on the success of our support portfolio and on our ability to deliver high-quality services. Traditionally, our large installed customer base generates additional new software, maintenance, consulting, and training revenue. Despite the high quality and service level of our transformed and expanded service offering in the area of premium support services, we might be unable to meet customer expectations with regards to delivery and value proposition. This might lead to a potentially adverse impact on customer experience. Existing customers might cancel or not renew their maintenance contracts, decide not to buy additional products and services, not subscribe to our cloud offerings, or accept alternative offerings from other vendors. In addition, the increasing volume in our cloud business as well as the conversion of traditionalon-premise licenses to cloud subscriptions licenses and an increased complexity in our maintenance and support cycle across our diverse solutions and offerings could have a potential negative impact on our software and maintenance revenue streams. This could have an adverse effect on our business, financial position, profit, and cash flows.
Working closely with SAP user groups, we continuously demonstrate the business value and the benefits of our solution, service and support portfolio in terms of innovation, quality, and high service level as well as through customer references and success stories. Additionally, we continuously monitor the performance and the perceived value of our services and the satisfaction of our customers. We implement mitigating steps where required and deliberately invest into alignments and improvements in order to benefit our customers.
The SAP Digital Business Services organization is combining responsibility for services and support in regards to the Applications, Technology & Services segment. This organization offers a wide range of support, including premium support services (SAP MaxAttention and SAP ActiveEmbedded), and professional services to increase business benefit for our customers. For the SAP Business Network segment, we continue the established service and support models.
With regards to our volume in cloud business as well as the conversion of traditionalon-premise licenses to cloud subscriptions licenses, we estimate the probability of this risk materializing to be unlikely. However, we cannot completely exclude the possibility that it could have a business-critical impact on our business, financial position, profit, and cash flows, or cause a negative deviation from our revenue. We classify this risk as a medium risk.
| Combined Management Report | Risk Management and Risks | 108 |
Table of Contents
The success of our cloud computing strategy depends on positive market perception and increasing market adoption of our cloud solutions and managed cloud services. Insufficient adoption of our solutions and services could lead to a loss of SAP’s position as a leading cloud company.
The market for cloud computing is increasing and shows strong growth relative to the market for ouron-premise solutions. To offer a broad cloud service portfolio and generate the associated business value for our customers, we continue to invest in innovation and acquisitions. Due to ongoing contracts and previous substantial investments to integrate traditionalon-premise enterprise software into their businesses, as well as concerns about data protection, total cost of ownership, functional capacities, migration, security and integration capabilities, and reliability, customers and partners might be reluctant or unwilling to migrate to the cloud.
Other factors that could affect the market acceptance, adoption and extension of cloud solutions and services include:
| ∎ | Concerns with entrusting a third-party to store and manage critical employee or company confidential data |
| ∎ | Customer concerns about security capabilities and reliability |
| ∎ | Customer concerns about the ability to scale operations for large enterprise customers |
| ∎ | Inadequate level of configurability or customizability of the software |
| ∎ | Missing integration scenarios betweenon-premise products andcloud-to-cloud solutions |
| ∎ | Failure to securely and successfully deliver cloud services by any cloud service provider could have a negative impact on customer trust in cloud solutions |
| ∎ | Strategic alliances among our competitors and / or their growth-related efficiency gains in the cloud area could lead to significantly increased competition in the market with regards to pricing and ability to integrate solutions |
| ∎ | Failure to get the full commitment of our partners might reduce speed and impact in market reach |
| ∎ | Failure to comply with increasing governance on data privacy and data residence |
| ∎ | Challenge in defining adequate solution packages and scope for all customer segments |
If organizations do not perceive the benefits of cloud computing, the market for cloud business might not develop further, or it might develop more slowly than we expect, either of which could have an adverse effect on our business, competitiveness, financial position, profit, reputation and cash flows.
In addition to measures to communicate the business value of our cloud solutions to the market, we invest significantly in infrastructure and processes in an effort to ensure secure operations of our cloud solutions including the adaption of cloud service delivery to local and/or specific market requirements (such as local or regional data centers) and compliance with all local legal regulations regarding data protection and privacy as well as data security.
Although we estimate the probability of occurrence of this risk to be unlikely, we cannot completely exclude the possibility that this risk could have a business-critical impact on our reputation, business, financial position, profit, and cash flows, or cause a negative deviation from our revenue and operating profit target. We classify the risk as a medium risk.
Our market share and profit could decline due to increased competition, market consolidation and technological innovation as well as new business models in the software industry.
The software industry continues to evolve rapidly and is currently undergoing a significant shift due to innovations in the areas of enterprise mobility, machine learning, augmented and virtual reality, cybersecurity, Big Data, hyperconnectivity, the Internet of Things, digitization, supercomputing, cloud computing, and social media. While smaller innovative companies tend to create new markets organically, large traditional IT vendors tend to enter such markets mostly through acquisitions. SAP faces increased competition in its business environment from traditional, new and in particular cooperating competitors. This competition could cause price pressure, cost increases, and loss of market share, which could have an adverse effect on our business, financial position, profit, and cash flows.
Additionally, related to our Applications, Technology & Services segment, customers could change their buying behavior by accelerating their acceptance of cloud solutions to reduce their investments, which might have a temporary adverse effect on our operating results. Furthermore, the trend in the market to invest more in cloud solutions might lead to a risk of the potential loss of existingon-premise customers. It might also have a temporary adverse effect on our revenue due to the number of conversions fromon-premise licenses to cloud subscriptions from existing SAP customers in our installed base, as we recognize cloud subscriptions revenue over the respective service provision, and that typically ranges fromone-to-three years with some up to five years.
We believe we will be able to protect our leadership in the market by continuing to execute successfully on our customer-centric innovation strategy, which is driven by a mix of organic growth, targeted acquisitions, and attractive cloud solution offerings. To compete successfully in the market, we continuously enhance our global processes and adjust our organizational structures. Furthermore, in the Application, Technology, and Services segment, we have policies in place to effectively manage conversions fromon-premise software arrangements to cloud arrangements.
Although we estimate the probability of this risk unlikely with major impact, we cannot completely exclude the possibility that this risk could have a major impact on our business, financial position, profit, and cash flows, or cause a negative deviation from our revenue and operating profit target. We classify this risk as a medium risk.
| Combined Management Report | Risk Management and Risks | 109 |
Table of Contents
Business Strategy Risks
Demand for our new solutions might not develop as planned and our strategy on new business models and flexible consumption models might not be successful.
Our business consists of new software licenses, software license updates, Services and maintenance fees as well as of cloud subscriptions. Our customers are expecting to take advantage of technological breakthroughs from SAP without compromising their previous IT investments. However, the introduction of new SAP solutions, technologies, and business models as well as delivery and consumption models is subject to uncertainties as to whether customers will be able to perceive the additional value and realize the expected benefits we deliver along our road maps. There is a risk that such uncertainties might lead customers to wait for proof of concepts or holistic integration scenarios through reference customers or more mature versions first, which might result in a lower level of adoption of our new solutions, technologies, business models, and flexible consumption models, or no adoption at all, possibly impacting customer satisfaction and retention. This could have an adverse effect on our business, financial position, profit, and cash flows.
To mitigate this risk, SAP is balancing the distribution of our strategic investments by evolving and protecting our core businesses and simultaneously developing new solutions, technologies, and business models for markets, such as those in analytics, applications, and database and technology. Furthermore, we continuously demonstrate the benefits of our solution and services portfolio throughend-to-end integration scenarios, homogeneous and compelling user interfaces, customer references and success stories as well as the provision of support excellence to ensure customer satisfaction with and after the implementation of our solution.
We estimate the probability of occurrence of this risk to be remote, but cannot completely exclude the possibility that this risk could have a business-critical impact on our business, financial position, profit, and cash flows, or cause a negative deviation from our revenue and operating profit target. Furthermore, unsuccessful launches of flagship products/offerings could negatively affect market perception. We classify this risk as a medium risk.
Though downturns or upturns in cloud sales might not be immediately reflected in our operating results, any decline in our customer renewals would harm the future operating results of our cloud business.
We recognize cloud subscriptions revenue as we provide the respective services, which typically range fromone-to-three years with some up to five years. This revenue recognition and our increasing subscription revenues could have a temporary adverse effect on our financial position, profit, and cash flows.
To maintain or improve our operating results in the cloud business, it is important that our customers renew their agreements with us when the initial contract term expires and purchase additional modules or additional capacity. Our customers have no obligation to renew their subscriptions after the initial subscription period, and we cannot assure that customers will renew subscriptions at the same or at a higher level of service, or at all. Our customers’ renewal rates might decline or fluctuate as a result of various factors, including their satisfaction or dissatisfaction with our cloud solution and services portfolio; our ability to efficiently provide cloud services according to customer expectations and meeting the service level agreements, service availability and provisioning, the integration capabilities of our cloud solutions into their existing IT environment (including hybrid solutions combining both cloud andon-premise solutions); our customer support; concerns regarding stable, efficient, and secure cloud operations and compliance with legal and regulatory requirements; our pricing; the pricing of competing products or services; mergers and acquisitions affecting our customer base; global economic conditions; and reductions in our customers’ spending levels.
If our customers do not renew their subscriptions, if they renew on terms less favorable to us, or do not purchase additional modules or users, our revenue and billings might decline, and our operating results could be negatively impacted. This could have an adverse effect on our business, financial position, profit, and cash flows.
We share our overall long-term cloud strategy and our integration road map with our customers and continuously implement improvements to enhance our cloud solutions, including instant provisioning, a consumer-grade user experience, and a fast time to value, among others. To continuously improve our services, we closely monitor all issues and work together with customers to perform a root-cause analysis and provide solutions to identified problems. We have a strong focus on providing our cloud services efficiently and according to customer expectations, including service provisioning, quality, and security as well as data protection and privacy.
Furthermore, we are continuously improving and adapting cloud services delivery and license models to local and/or specific market requirements (such as local or regional data centers, customer expectations, and in accordance with legal and regulatory requirements).
Although we estimate the probability of occurrence of this risk to be remote, we cannot completely exclude the possibility that this risk could have a business-critical impact on our business, financial position, profit, and cash flows, or cause a negative deviation from our revenue and operating profit target. We classify this risk as a medium risk.
If we are unable to scale and enhance an effective partner ecosystem, revenue might not increase as expected.
An open and vibrant partner ecosystem is a fundamental pillar of our success and growth strategy. We have entered into partnership agreements that driveco-innovation on our platforms, profitably expand all our routes to market to optimize market coverage, optimize cloud delivery, and provide high-quality services capacity in all market segments. Partners play a key role in driving market adoption of our entire solutions portfolio, byco-innovating on our platforms, embedding our technology, and reselling and/or implementing our software.
| Combined Management Report | Risk Management and Risks | 110 |
Table of Contents
If partners consider our products or services model less strategic and/or financially less attractive compared to our competition and/or less appropriate for their respective channel and target market, if partners fear direct competition by SAP or if SAP fails to establish and enable a network of qualified partners meeting our quality requirements and the requirements of our customers, then, among other things, partners might not:
| ∎ | Develop a sufficient number of new solutions and content on our platforms |
| ∎ | Provide high-quality products and services to meet customer expectations |
| ∎ | Drive growth of references by creating customer use cases and demo systems |
| ∎ | Embed our solutions sufficiently enough to profitably drive product adoption, especially with innovations such as SAP S/4HANA and SAP Cloud Platform (formerly called SAP HANA Cloud Platform) |
| ∎ | Enable and train sufficient resources to promote, sell, and support to scale to targeted markets |
| ∎ | Comply with applicable quality requirements expected by our customers, resulting in delayed, disrupted, or terminated sales and services |
| ∎ | Transform their business model in accordance with the transformation of SAP’s business model in a timely manner |
| ∎ | Renew their existing agreements with us or enter into new agreements on terms acceptable to us or at all |
| ∎ | Provide ability and capacity to meet customer expectations regarding service provisioning. |
If one or more of these risks materialize, this might have an adverse effect on the demand for our products and services as well as the partner’s loyalty and ability to deliver. As a result, we might not be able to scale our business to compete successfully with other software vendors, which could have an adverse effect on our reputation, business, financial position, profit, and cash flows.
SAP continues to invest in long-term, mutually beneficial relationships and agreements with partners. We continue to develop and enhance a wide range of partner programs to retain existing and attract new partners of all types. We offer training opportunities to a wide range of resources for our partners and additionally provide demo solutions to enable partners to lead business value discussions on cloud andon-premise solutions with customers. A thorough certification process for third-party solutions has been designed and established to ensure consistent high-quality and seamless integration.
We estimate the probability of occurrence of this risk to be unlikely, and we cannot exclude the possibility that this risk could have a major impact on our reputation, business, financial position, profit, and cash flows, or cause a negative deviation from our revenue and operating profit target if it were to materialize. We classify this risk as a medium risk.
Human Capital Risks
If we do not effectively manage our geographically dispersed workforce, we might not be able to run our business efficiently and successfully.
Our success is dependent on appropriate alignment of our internal and external workforce planning processes, adequate resource allocation and our location strategy with our general strategy. It is critical that we manage our internationally dispersed workforce effectively, taking short- and long-term workforce and skill requirements into consideration. This applies to the management of our internal as well as our external workforce. Changes in headcount and infrastructure needs as well as local legal or tax regulations could result in a mismatch between our expenses and revenue. Failure to manage our geographically dispersed workforce effectively could hinder our ability to run our business efficiently and successfully and could have an adverse effect on our business, financial position, profit, and cash flows.
We focus on mitigating this risk through a range of activities including succession management; workforce planning (which aims to achieve diversity and the right mix of talent and to take account of demographic changes); outsourcing; external short-term staffing; employer branding; career management (such as offering opportunities for short-term assignments and opportunities to improve skills, competencies, and qualifications); and extended benefit programs – for example, a performance-oriented remuneration system, an employer-financed pension plan in certain countries, and long-term incentive plans.
We estimate this risk to be a remote possibility, but we cannot completely exclude the possibility of this risk to have a major impact on our business, financial position, profit, and cash flows, or cause a negative deviation from our revenue and operating profit target. We classify this risk as a low risk.
If we are unable to attract, develop, and retain leaders and employees with specialized knowledge and technology skills, or are unable to achieve internal diversity and inclusion objectives, we might not be able to manage our operations effectively and successfully, or develop successful new solutions and services.
Our highly qualified workforce is the foundation for our continued success. In certain regions and specific technology and solution areas, we continue to set very high growth targets, specifically in countries and regions such as Africa, China, Latin America, and the Middle East. In the execution of SAP’s strategic priorities, we depend on highly skilled and specialized personnel and leaders, both male and female. Successful maintenance and expansion of our highly skilled and specialized workforce in the area of cloud is a key success factor for our transition to be the leading cloud company. The availability of such personnel as well as business experts is limited and, as a result, competition in our industry is intense and could expose us to claims by other companies seeking to prevent their employees from working for a competitor. If we are unable to identify, attract, develop, motivate, adequately compensate, and retain well-qualified and engaged personnel, or if existing highly skilled and specialized personnel leave
| Combined Management Report | Risk Management and Risks | 111 |
Table of Contents
SAP and ready successors or adequate replacements are not available or we cannot allocate our workforce as required due to local regulations and associated restrictions, we might not be able to manage our operations effectively, which could have an adverse effect on our reputation, business, financial position, profit, and cash flows. Furthermore, we might not be able to develop, sell, or implement successful new solutions and services as planned. This is particularly true as we continue to introduce new and innovative technology offerings and expand our business in emerging markets. The lack of appropriate or inadequately executed benefit and compensation programs could limit SAP’s ability to attract or retain qualified employees and lead to financial losses. In addition, we might not be able to achieve our internal gender diversity objectives to increase the number of women in management from 18% in 2010 to 25% by end of 2017.
These risks notwithstanding, we continue to believe our leading market position, employer brand, and extended benefit programs will enable us to hire top talent internationally with the potential to contribute to SAP’s growing business success in the future. We address the risk of an adverse effect on our business operations from a failure to recruit the employees we need or from the loss of leaders and employees by seeking to build employee and leadership strengths through a range of targeted professional development, mentoring, and coaching programs, a gender diversity program, in September 2016, globally awarded with the Economic Dividends for Gender Equality (EDGE) certificate in recognition for commitment to gender equality in the workplace, and a special focus on accelerated high-potential employee development that aims to develop talent as well as leadership talent, in particular. A strong focus on succession planning for leadership and key positions seeks to ensure sustainable leadership and to safeguard the business from disruption caused by staff turnover.
Although the risks related to failure to attract, develop, and retain talent could materialize, we believe that this is unlikely and that the impact on our reputation, business, financial position, profit, and cash flows, or potential negative deviation from our revenue and operating profit target would be major. We classify this risk as a medium risk.
Organizational and Governance-Related Risks
Laws and regulatory requirements in Germany, the United States, and elsewhere continue to be very stringent.
As a European company domiciled in Germany with securities listed in Germany and the United States, we are subject to European, German, U.S., and other governance-related regulatory requirements. Changes in laws and regulations and related interpretations, including changes in accounting standards and taxation requirements, and increased enforcement actions, sanctions, for example United States sanction requirements for Iran, and penalties might alter the business environment in which we operate. Regulatory requirements have become significantly more stringent in recent years, and some legislation, such as the anticorruption legislation in Germany, the U.S. Foreign Corrupt Practices Act, the UK Bribery Act, and other local laws prohibiting corrupt payments by employees, vendors, distributors, or agents, is being applied more rigorously. Emerging markets are a significant focus of our international growth strategy. The nature of these markets presents a number of inherent risks. A failure by SAP to comply with applicable laws and regulations, or any related allegations of wrongdoing against us, whether merited or not, could have an adverse effect on our business, financial position, profit, cash flows and reputation.
It is difficult to assess the precise potential risk, because there is a wide variety of complex legal and regulatory requirements that apply, and therefore an equally wide variety of potentialnon-compliance scenarios exist.
However, we continuously monitor new and increased regulatory requirements, updated or new enforcement trends, and publicly available information on compliance issues in the computer software industry, the emerging markets where we invest our resources, and in the business environment in general to cope with an increase in regulation enforcement efforts of certain countries or state-driven protectionism. Based on this information and any other available sources, we continuously update and refresh our compliance programs to improve our effectiveness and to ensure that our employees understand and comply with the SAP Code of Business Conduct. This process is coordinated by our Legal Compliance and Integrity Office, a team of dedicated resources who are tasked with managing our policy-related compliance measures. Our chief compliance officer coordinates policy implementation, training, and enforcement efforts throughout SAP. Those efforts are monitored and tracked to allow trending and risk analysis and to ensure consistent policy application throughout the SAP Group. Despite our comprehensive compliance programs and established internal controls, intentional efforts of individuals to circumvent controls or engage in fraud for personal gains cannot always be prevented.
With regards to the increase of regulation enforcement efforts we have already experienced and continue to expect as well as state-driven protectionism, we estimate the likelihood of this risk to be unlikely. We cannot completely exclude the possibility that this risk could have a major impact on our reputation, business, financial position, profit, and cash flows, or cause a negative deviation from our revenue and operating profit target. We classify this risk as a medium risk.
| Combined Management Report | Risk Management and Risks | 112 |
Table of Contents
Non-compliance with applicable data protection and privacy laws or failure to adequately meet the requirements of SAP’s customers with respect to our products and services could lead to civil liabilities and fines, as well as loss of customers and damage to SAP’s reputation.
As a global software and service provider, SAP is required to comply with local laws wherever SAP does business. Consequently, we must ensure that any legal requirements in connection with the provision of products and services are properly implemented. With regard to data protection requirements, in May 2016, the EU enacted a “General Data Protection Regulation” (GDPR), as a successor to the Data Protection Directive of 1995, with the aim of further harmonizing data protection laws across the EU. The GDPR will be directly applicable law in all EU and EEA member states as of May 25, 2018 after atwo-year transition period. Within limits, member states can supplement the GDPR with additional national rules. Overall, the GDPR does not introduce substantial new concepts. It rather focuses on stronger compliance requirements and enforces them vigorously on every business that processes personal data of individuals in the EU/EEA, regardless of where that business is established. Some of the new rules are subject to further definition by the authorities, though, and others leave room for interpretation.
Risks for SAP include:
| ∎ | Violations of the GDPR might be punished with financial penalties of up to the higher of €20 million or 4% of the responsible company’s annual global turnover. Further administrative measures include mandatory instructions by the data protection supervisory authorities relating to specific processing activities, up to their prohibition.Non-compliance might further lead to legal claims from affected individuals and consumer protection organizations. Where SAP processes data on behalf of its customers, violations might lead to damage claims from customers.Non-compliance further bears the risk of reputational losses if violations become publically known. |
| ∎ | Where member states can supplement the GDPR with additional national rules, there is a risk that data protection law will not be fully harmonized across Europe. As a consequence, SAP would have to continue to adapt its products and services to the individual national requirements. |
| ∎ | The data protection concepts of the GDPR do not adequately reflect the latest technological developments, such as big data and machine learning. If the GDPR cannot be interpreted in a way that allows for such technologies, or revised as necessary, SAP might not be able to use and offer products and services that implement such technologies in the EU/EEA. |
Overall, these laws and regulations amend and supplement existing requirements regarding the processing of personal data that SAP and SAP customers must fulfill and which we must consequently address with our products and services, including cloud delivery. Failure to comply with applicable laws or to adequately address privacy concerns of customers, even if unfounded, could lead to investigations by supervisory authorities, civil liability, fines, (in the future, potentially calculated based on the Company’s annual revenue), loss of customers, damage to our reputation, and could have an adverse effect on our business, financial position, profit, and cash flows.
To mitigate risks due to legalnon-compliance, SAP actively monitors changes to applicable laws and regulations so that we can take adequate measures and certify our existing standards and policies on an ongoing basis. We have implemented a wide range of measures to protect data controlled by SAP and our customers from unauthorized access and processing, as well as from accidental loss or destruction. This includes, among others, a continuous enhancement of our data center operations worldwide, also taking into account local and/or sector-specific market and legal requirements. We have implemented a certified data protection management system in areas critical to data protection, such as digital business services, human resources (HR), marketing, products and innovation, and custom development, whereby implementation is audited internally as well as externally by the British Standard Institutions on an annual basis. Furthermore, customers are provided with security certifications (such as ISO/IEC 27001), security white papers, and reports from our independent auditors and certification bodies.
With regard to the GDPR, the Data Protection & Privacy (DPP) team initiated a project that established a working group across all board areas. The aim of this project is to constructively assist all SAP business units to ensure compliance with the GDPR. DPP and Government Relations (GR) teams continue to work together and actively voice our opinion through industry-recognized associations. This is in addition to DPP‘s direct involvement with the European Commission and data protection authorities of member states. Such actions intend to achieve ause-oriented and forward-looking interpretation of the law while balancing protection of personal privacy as well as aiming to enhance European competitiveness.
We estimate this risk to be unlikely, and cannot rule out the possibility of it having a business-critical impact on our business, financial position, profit, and cash flows, and causing damage to our reputation, or causing a negative deviation from our revenue and operating profit target. We classify this risk as a medium risk.
Failure to meet customer, partner, or other stakeholder expectations or generally accepted standards on climate change, energy constraints, and our social investment strategy could negatively impact SAP’s business, results of operations, and reputation.
Energy and emissions management are an integral component of our holistic management of social, environmental, and economic risks and opportunities. We have identified risks in these major areas:
| ∎ | Our solutions |
| ∎ | Our own operations – energy management and other environmental issues such as carbon management, water use, and waste |
| Combined Management Report | Risk Management and Risks | 113 |
Table of Contents
Because our customers, employees, and investors expect a reliable energy and carbon strategy, we have reemphasized our environmental policy and our previously communicated targets, especially our 2020 target for greenhouse gas emissions. In case these targets cannot be achieved, our customers might no longer recognize SAP for our environmental leadership and might buy other vendors’ products and services. Consequently, we could fail to achieve our revenue target. If we do not meet stakeholder expectations in the areas identified, our rating in sustainable investment indexes might decrease, which could have an adverse effect on our reputation, profit, and share price.
In recent years, SAP has shown that it is possible to take a proactive position on social and environmental issues while delivering robust financial growth. As a result, we received great recognition for our sustainability efforts. As a proof point for SAP’s sustainability performance, we continue to be listed in the most prominent and recognized sustainability indexes, such as the Dow Jones Sustainability Indices and the CDP Climate Performance and Disclosure Leadership Indices. In 2016, SAP’s greenhouse gas emissions added up to 380 kilotons CO2, which means we did meet our greenhouse gas emissions target of 400 kilotons by 20 kilotons. If we do not meet our greenhouse gas emissions target for 2020, we might fail to meet expectations regarding our energy and emission performance.
We believe that the risk of failing to meet expectations regarding our energy and emission strategy is unlikely to occur and that if the risk were to occur, it would only have a moderate impact on our reputation, business, financial position, profit, and cash flows, as well as on the achievement of our revenue and operating profit target. We classify this risk as a low risk.
Unethical behavior andnon-compliance with our integrity standards due to intentional and fraudulent employee behavior could seriously harm our business, financial position, profit, and reputation.
SAP’s leadership position in the global market is founded on the long-term and sustainable trust of our stakeholders worldwide. Our heritage is one of corporate transparency, open communication with financial markets, and adherence to recognized standards of business integrity. The SAP Code of Business Conduct, adopted by the Executive Board on January 29, 2003, and updated as necessary since then, memorialized and supplemented the already existing guidelines and expectations for the business behavior practiced at SAP.
However, we might encounter unethical behavior andnon-compliance with our integrity standards due to intentional and fraudulent behavior of individual employees, possibly in collusion with external third parties. In addition to intentional behavior, problems could also arise due to negligence in the adherence to rules and regulations, especially in countries with a high Corruption Perceptions Index and continuously increasing business activities in profoundly regulated industries such as public sector, healthcare, banking or insurance. Unethical behavior and misconduct attributable to SAP could not only lead to criminal charges, fines, and claims by injured parties, but also to financial loss, and severe reputational damage. This could have an adverse effect on our business, financial position, profit, and cash flows.
To help prevent this, we instituted a comprehensive compliance management system (CMS), which is based on the three pillars of prevention, detection, and reaction. Our CMS program comprises several educational, counseling, control, and investigative instruments. The objective is to minimize and mitigate the risk of unethical behavior, whether intentional or negligent.
The SAP Code of Business Conduct is mandatory and applies to every SAP employee. It provides legal compliance guidance on how to avoid unethical behavior and solve dilemma situations. On an annual basis, the SAP Code of Business Conduct isre-confirmed by SAP’s workforce (except where disallowed by local legal regulations). We also rolled out and enforced various additional compliance policies aimed at managing third parties and preventing misuse of third-party payments for illegal purposes; ensuring controls around travel, entertainment, gift, and expense policies; and promoting a commitment to business with integrity through our partner and vendor ecosystems. These efforts are flanked by continuous education includinge-learning and classroom training to target audiences as identified by compliance risk assessment. The overall CMS approach by SAP is continuously monitored internally and externally, and adapted accordingly, if needed.
Although we estimate the probability of occurrence of intentional or negligent major unethical conduct to be unlikely, we cannot exclude the possibility that this risk could materialize. In that event, this risk could have a major impact on our reputation, business, financial position, profit, and cash flows and could cause a negative deviation from our operating profit target. We classify this risk as a medium risk.
Communication and Information Risks
Our controls and efforts to prevent the unauthorized disclosure of confidential information might not be effective.
Confidential information and internal information related to topics such as our strategy, new technologies, mergers and acquisitions, unpublished financial results, customer data or personal data, could be prematurely or inadvertently disclosed and subsequently lead to market misperception and volatility. This could require us to notify multiple regulatory agencies and comply with applicable regulatory requirements and, where appropriate, the data owner, which could result in a loss of reputation for SAP. For example, leaked information during a merger or acquisition deal could cause the loss of our deal target, or our share price could react significantly in case of prematurely published financial results. This could have an adverse effect on our market position and lead to fines and penalties. In addition, this could have an adverse effect on our business, financial position, profit, and cash flows.
We take a wide range of actions to prevent unauthorized disclosure of information, including procedural and organizational measures. These measures include mandatory compliance base line trainings for all employees (including fundamentals within security awareness, data privacy and data protection, compliance and communication), social engineering tests, standards for safe internal and external
| Combined Management Report | Risk Management and Risks | 114 |
Table of Contents
communication, and technical security features in our IT hardware and communication channels, such as mandatory encryption of sensitive data.
Additionally, we combined organizationally all security groups into one global security unit. This combined organization strengthens the security capabilities and offers a wide range of policies, guidelines and support on executing the success of SAP’s security measures.
With the digital transformation, the increased use of cloud solutions and social media by employees, a continual adoption of internal security measures is meaningful to achieve and maintain an effective and appropriate level of data protection and privacy and to reinforce the position of SAP as a trusted partner for its customers.
Although we estimate the likelihood of occurrence of this risk to be remote, we cannot completely exclude the possibility that this risk could have a business-critical impact on our reputation, business, financial position, profit, and cash flows, or cause a negative deviation from our operating profit target. We classify this risk as a medium risk.
Financial Risks
Our sales are subject to quarterly fluctuations and our sales forecasts might not be accurate.
Our revenue and operating results can vary and have varied in the past, sometimes substantially, from quarter to quarter. Our revenue in general, and our software revenue in particular, is difficult to forecast for a number of reasons, including:
| ∎ | The relatively long sales cycles for our products |
| ∎ | The large size, complexity, and extended timing of individual customer transactions |
| ∎ | The introduction of licensing and deployment models such as cloud subscription models |
| ∎ | The timing of the introduction of new products and services or product and service enhancements by SAP or our competitors |
| ∎ | Changes in customer budgets |
| ∎ | Decreased software sales that could have an adverse effect on related maintenance and services revenue |
| ∎ | The timing, size, and length of customers’ services projects |
| ∎ | Deployment models that require the recognition of revenue over an extended period of time |
| ∎ | Adoption of, and conversion to, new business models leading to changed or delayed payment terms |
| ∎ | Seasonality of a customers’ technology purchases |
| ∎ | Limited visibility during the ongoing integration of acquired companies into their ability to accurately predict their sales pipelines and the likelihood that the projected pipeline will convert favorably into sales |
| ∎ | Other general economic, social, environmental, and market conditions, such as a global economic crisis and difficulties for countries with large debt |
Since many of our customers make their IT purchasing decisions near the end of calendar quarters, and with a significant percentage of those decisions being made during our fourth quarter, even a small delay in purchasing decisions for ouron-premise software could have an adverse effect on our revenue results for a given year. Our dependence on large transactions has decreased in recent years with a trend towards an increased number of transactions while the average deal size is more or less constant.
However, the loss or delay of one or a few large opportunities could have an adverse effect on our business, financial position, profit, and cash flows.
We use a “pipeline” system for forecasting sales and trends in our business. Pipeline analysis informs and guides our business planning, budgeting, and forecasting, but pipeline estimates do not necessarily consistently correlate to revenue in a particular quarter, potentially due to one or more of the reasons outlined above. The reliability of our plans, budgets, and forecasts might therefore be compromised. Because our operating expenses are based upon anticipated revenue levels and a high percentage of our expenses are relatively fixed in the near term, any shortfall in anticipated revenue or delay in revenue recognition could result in significant variations in our operating results from quarter to quarter or year to year. Continued deterioration in global economic conditions would make it increasingly difficult for us to accurately forecast demand for our products and services, and could cause our revenue, operating results, and cash flows to fall short of our expectations and public forecasts. This could have an adverse effect on our stock price. To the extent any future expenditure fails to generate the anticipated increase in revenue, our quarterly or annual operating results might be subject to an adverse effect and might vary significantly compared to preceding or subsequent periods. As we recognize cloud subscriptions and support revenue over the respective service period that typically ranges fromone-to-three years with some up to five years, the relevance and impact of sales fluctuations decrease along with the growing importance of these revenues.
Although we estimate the probability of occurrence of this risk to be unlikely, we cannot completely exclude the possibility that this risk could have a moderate impact on our business, financial position, profit, and cash flows, or cause a negative deviation from our revenue and operating profit target. We classify this risk as a low risk.
External factors could impact our liquidity and increase the default risk associated with, and the valuation of, our financial assets.
Macroeconomic factors such as an economic downturn could have an adverse effect on our future liquidity. We use a globally centralized financial management to control financial risk, such as liquidity, exchange rate, interest rate, counterparty, and equity price risks. The primary aim is to maintain liquidity in the SAP Group at a level that is adequate to meet our obligations at any time. Our total Group liquidity is supported by our strong operating cash flows, of which a large part is recurring, and by credit facilities from which we can draw if necessary. However, adverse macroeconomic factors could increase the default risk associated with the investment of our total Group liquidity
| Combined Management Report | Risk Management and Risks | 115 |
Table of Contents
including possible liquidity shortages limiting SAP’s ability to repay financial debt. This could have an impact on the value of our financial assets, which could have an adverse effect on our business, financial position, profit, and cash flows.
SAP’s investment policy with regards to total Group liquidity is set out in our internal treasury guideline, which is a collection of uniform rules that apply globally to all companies in the SAP Group. Amongst others, it requires that we invest, with limited exceptions, only in assets and funds rated BBB flat or better. The weighted average rating of the investments of our total Group liquidity is in the area of A–. We continue to pursue a policy of cautious investment characterized by wide portfolio diversification with a variety of counterparties, predominantly short-term investments, and standard investment instruments.
Although we estimate the probability of occurrence of this risk to be remote, there can be no assurance that the prescribed measures will be successful or that uncertainty in global economic conditions could not have a major impact on our business, financial position, profit, cash flows, or operating profit target. We classify this decreased risk as a low risk.
Management use of estimates could negatively affect our business, financial position, profit, and cash flows.
To comply with IFRS, management is required to make numerous judgments, estimates, and assumptions that affect the reported financial figures. The facts and circumstances, as well as assumptions on which management bases these estimates and judgments and management’s judgment regarding the facts and circumstances, might change over time and this could result in significant changes in the estimates and judgments and, consequently, in the reported financials. There is a risk that such changes could have an adverse effect on our business, financial position, profit and cash flows.
We have a number of control procedures in place to make sure that our estimates and judgments are adequate. For example, we applytwo-person verification to significant estimating.
Although we estimate the probability of occurrence of the risk to be unlikely, we cannot completely exclude the possibility of a moderate impact on our business, financial position, profit, and cash flows, or a negative deviation from our revenue and operating profit target. We classify this risk as a low risk.
Current and future accounting pronouncements and other financial reporting standards, especially but not only concerning revenue recognition, might negatively impact our financial results.
We regularly monitor our compliance with applicable financial reporting standards and review new pronouncements and drafts thereof that are relevant to us. As a result of new standards, changes to existing standards (including the new IFRS 15 on revenue from contracts with customers that we will need to adopt in 2018) and changes in their interpretation, we might be required to change our accounting policies, particularly concerning revenue recognition, to alter our operational policies so that they reflect new or amended financial reporting standards, or to restate our published financial statements. Such changes might have an adverse effect on our reputation, business, financial position, and profit, or cause an adverse deviation from our revenue and operating profit target.
Although we estimate the probability of occurrence of the risk to be unlikely, we cannot completely exclude the possibility of a major impact. We classify this risk as a medium risk.
As a globally operating company, SAP is subject to various financial risks, which could negatively impact our business, financial position, profit, and cash flows.
Because we are operating throughout the world, a significant portion of our business is conducted in foreign currencies. In 2016, approximately 73% of our revenue was attributable to operations in foreign currencies and therefore gets translated into our reporting currency, the euro. Consequently, period-over-period fluctuations can significantly impact our financial results. In general, an appreciation of the euro has an adverse effect while a depreciation has a positive effect. In addition to exchange rate risks, we are exposed to interest rate and share price fluctuations due to variable interest bearing assets and liabilities and share-based compensation plans for our employees and executives.
We continuously monitor our exposure to all of these financial risks and have implemented adequate procedures to mitigate them. For example, we pursue a group-wide foreign exchange risk management strategy to hedge balance sheet items and expected cash flows in foreign currencies by using derivative financial instruments as appropriate. We have a balanced maturity profile and mixture of fixed and floating interest rate arrangements in place to hedge against interest rate risk and use derivative instruments to reduce the impact of our share-based compensation plans on our income statement and cash flow.
Nevertheless, financial risks could negatively impact our business, financial position, profit, and cash flows. We believe the likelihood of such a risk with a material adverse effect on our financial results is remote and if the risk were to occur, its impact on our business, financial position, profit, and cash flows could be major. We classify this risk as a low risk
For more information about risks arising from financial instruments, including our currency and interest rate risks and our related hedging activity, see the Notes to the Consolidated Financial Statements section,Notes (24) to(25).
| Combined Management Report | Risk Management and Risks | 116 |
Table of Contents
Project Risks
Implementation of SAP software and cloud-based service deliveries often involves a significant commitment of resources by our customers and is subject to a number of significant risks over which we often have no control.
A core element of our business is the successful implementation of software and service solutions to enable our customers to master complexity and help our customers’ business run at their best. The implementation of SAP software and cloud-based service deliveries is led by SAP, by partners, by customers, or by a combination thereof. Depending on various factors, such as the complexity of solutions, the customer’s implementation, integration and migration needs, or the resources required, SAP faces a number of different risks. For example, functional requirement changes, delays in timeline, or deviation from recommended best practices might occur during the course of a project. These scenarios have a direct impact on the project resource model and on securing adequate internal personnel or consultants in a timely manner and could therefore prove challenging.
Other aspects that could potentially affect our projects and deliveries, especially during the transition to the Cloud are security breaches or unauthorized access to confidential data, operational data center and infrastructure disruptions as well as local legislation with regards to data privacy.
As a result of these and other risks, SAP and/or some of our customers have incurred significant implementation costs in connection with the purchase and installation of SAP software products and solutions. Some customer implementations have taken longer than planned and failed to generate the profit originally expected. We cannot guarantee that we can reduce or eliminate protracted installation or significant third-party consulting costs, for example, that trained consultants will be readily available, that our costs will not exceed the fees agreed in fixed-price contracts, or that customers will be satisfied with the implementation of our software and solutions. Unsuccessful, lengthy, or costly customer implementation and integration projects could result in claims from customers, harm SAP’s reputation, and could have an adverse effect on our business, financial position, profit, and cash flows. Additionally, potentially new contracting models based on subscription models for services, support, and application management might lead to challenges from a financial position perspective including profit and cash flow.
Our customers continue to follow project approaches to optimize their IT solutions in anon-disruptive manner. Our projects also include risk management processes that are integrated into SAP project management methods intended to safeguard implementations with coordinated risk and quality management programs. As part of our processes, we make adequate financial planning provisions for the remaining individual risks.
We estimate the probability of this risk to be unlikely, but we cannot completely exclude the possibility that this risk could have a major negative impact on our reputation, business, financial position, profit, and cash flows, or cause a negative deviation from our revenue and operating profit target. We classify this risk as a medium risk.
Product and Technology Risks
Undetected security vulnerabilities shipped and deployed within our products might cause damage to SAP and our customers, and partners.
Customer systems or systems operated by SAP itself to provide services could potentially be compromised by vulnerabilities if they are exploited by hackers. This could lead to theft, destruction, or abuse of data, or systems could be rendered unusable (for example, due to distributed denial of service attacks). The detection of security vulnerabilities in our software, our customers’ systems, or SAP systems used in the provision of services, especially in case of exploitation, could prevent us from meeting our contractual obligations and subsequently might lead to customer claims and reputational damage, which might have an adverse effect on our business, financial position, profit, and cash flows.
We have implemented a software security development lifecycle as a mandatory integral part of our software development process. For the Applications, Technology & Services segment we systematically align our software security development lifecycle to the recommendations of ISO/IEC 27034, applying methods to develop secure software in all development phases starting early in the design phase. This includes industry best practices such as security risk identification, threat modeling, a comprehensive security testing strategy, mandatory security training for all developers, and security validation of our products, patches, and services before shipment.
SAP has a software security response process in place to rapidly react to detected vulnerabilities and provide fixes. We have also improved theroll-out procedures for security-relevant notes, patches, and service packs to ensure easy and fast consumption on the customer side. However, with regards to the Applications, Technology & Services segment, there is a risk that customers do not upgrade or patch their business systems on a timely basis according to SAP’s recommendations.
We cannot completely exclude the possibility of a negative impact on our customers’ and partners’ or our own operations globally or in one or more countries or regions. We estimate the probability of occurrence of the risk of severe damages to customers and SAP to be unlikely. If such an occurrence happens, it could have a business-critical impact on our reputation, business, financial position, profit, and cash flows as well as on the achievement of our revenue and operating profit target. We classify this risk as a medium risk.
Undetected defects in the introduction of new products, product enhancements and cloud offerings could increase our costs, and reduce customer demand.
Our development investment, including new product launches and enhancements, is subject to risks. For example, software products and services might not completely meet our high-quality standards, including security standards; might not fulfill market needs or customer expectations; or might not comply with local standards and requirements. Furthermore, this risk also exists with respect to acquired companies’ technologies and products where we might not be able to manage these as quickly and successfully as expected. Therefore, market launches, entering new markets, or the introduction of new innovations could be delayed or not be successful.
| Combined Management Report | Risk Management and Risks | 117 |
Table of Contents
In addition, new products and cloud offerings, including third-party technologies we have licensed and open source software components we use in those products, could contain undetected defects or they are detected, or not be mature enough from the customer’s point of view for business-critical solutions after shipment in spite of all due diligence SAP puts into quality and security. The detection and correction of any defects especially after delivery could be expensive and time-consuming and in some cases we might not be able to meet the expectations of customers regarding time and quality in the defect resolution process. In some circumstances, we might not be in a position to rectify such defects or entirely meet the expectations of customers, specifically as we are expanding our product portfolio into additional markets. As a result, we might have to fix defects in our software after shipment (so called security response) or in some cases even face customer claims for cash refunds, damages, replacement software, or other concessions. The risk of defects and their adverse consequences could increase as we seek to introduce a variety of new software products and product enhancements at a higher innovation rate. This is especially relevant for cloud products as delivery cycles are even shorter (up to daily deliveries) and our complete cloud product customer base could receive undetected defects simultaneously. Furthermore, for products that use third-party (not SAP) cloud services, we might not always be able to detect defects in advance. Significant undetected defects or delays in introducing new products or product enhancements could affect market acceptance of SAP software products and could have an adverse effect on our reputation, business, financial position, profit, and cash flows.
The use of existing SAP software products by customers in business-critical solutions and processes and the relative complexity and technical interdependency of our software products and services create a risk that customers or third parties might pursue warranty, performance, or other claims against us for actual or alleged defects in SAP software products, in our provision of services, or in our application hosting services. We have in the past been, and might in the future be, subject to warranty, performance, or other similar claims.
Although our contracts generally contain provisions designed to limit our exposure due to actual or alleged defects in SAP software products or in our provision of services, these provisions might not cover every eventuality or be effective under the applicable law. Regardless of its merits, any claim could entail substantial expense and require the devotion of significant time and attention by key management personnel. Publicity surrounding such claims could affect our reputation and the demand for our software.
We counter these risks using a broad range of techniques, including project management, project monitoring, product standards and governance, and rigid and regular quality assurance measures certified to ISO 9001:2008, applicable to the Applications, Technology & Services segment. Additionally, we are introducing a new and improved risk-based secure software development lifecycle with all the trainings, tools, and processes in place to develop secure software. This spans from specific security training curriculums for our developers, threat modelling at the beginning of every development project to identify potential risks early on to centrally provided security tools (for example, static and dynamic analysis tools), a holistic security testing strategy to validate the state of security for every product before market introduction. In addition, direct customer feedback is considered in the market release decision process. Delivering high-quality software products is a priority and part of our core business. Our strong investment and permanent efforts lead to a generally high level of quality of our products, which is made transparent in the defined quality perception and support index and confirmed by our constantly high customer satisfaction ratings as measured by customer quality perception reporting.
With regards to the increased volume of open source software components used in our software products and services as well as in the products and services of our acquired companies, we see a probability of this risk to materialize but rate the probability as unlikely. We cannot completely exclude the possibility that this risk, if it were to occur, could have a business-critical impact on our reputation, business, financial position, profit, and cash flows, or cause a negative deviation from our revenue and operating profit target. We classify this risk as a medium risk.
Changes in our rights to use software, cloud services, and technologies we license from third parties that are an integral part of SAP’s products and services could slow down time to market and influence our license pricing and therefore the competitiveness with other software vendors. Furthermore, it could diminish our software’s or cloud functional capabilities and therefore could jeopardize the stability of our solution portfolio offering.
The numerous third-party solutions we have licensed and certain open source software components we use have become an integral part of our product and service portfolio. We depend on those solutions for the functionality of our software and cloud services. Changes to, or the loss of, third-party licenses as well as open source licenses being construed could significantly increase the cost of these licenses and significantly reduce software or cloud functionality and/or usability or availability of SAP’s software or cloud offerings. As a result, we might incur additional development or license costs to ensure the continued functionality of our products, experience delays in our ability to offer or have to stop offering our products for sale, which could have an adverse effect on our business, financial position, profit, and cash flows. This risk increases with each of our acquisitions of a company or a company’s intellectual property assets that had been subject to third-party solution licensing, open source software and product standards less rigorous than our own.
We strive to execute appropriate due diligence and contract management processes and to continuously monitor development projects through our product implementation lifecycle process and monitoring as part of our cloud deployment.
We believe that the probability of occurrence of this risk is likely and we cannot exclude the possibility of a major impact on our business, financial position, profit, and cash flows, or the possibility of a negative deviation from our revenue and operating profit target. We classify this risk as a medium risk.
| Combined Management Report | Risk Management and Risks | 118 |
Table of Contents
If we are unable to keep up with rapid technological, process and service innovations, and new business models as well as changing market expectations, we might not be able to compete effectively.
Our future success depends upon our ability to keep pace with technological and process innovations and new business models, as well as our ability to develop new products and services, enhance and expand our existing products and services portfolio, and integrate products and services we obtain through acquisitions. To be successful, we are required to adapt our products and ourgo-to-market approach to a cloud-based delivery and consumption model to satisfy changing customer demand and to ensure an appropriate level of adoption, customer satisfaction and retention.
We might not be successful in bringing new business models, solutions, solution enhancements, and/or services to market before our competitors or at equally favorable conditions. We might also face increasing competition from open source software initiatives, or comparable models in which competitors might provide software and intellectual property free and/or under terms and conditions unfavorable for SAP. In addition, we might not be able to generate enough revenue to offset the significant research and development costs we incur to deliver technological innovations or to offset the required infrastructure costs to deliver our solutions and services as part of our new business models. Moreover, we might not anticipate and develop technological improvements or succeed in adapting our products, services, processes, and business models to technological change, changing regulatory requirements, emerging industry standards, and changing requirements of our customers and partners. Finally, we might not succeed in producing high-quality products, enhancements, and releases in a timely and cost-effective manner to compete with our competitors, which could have an adverse effect on our reputation, business, financial position, profit, and cash flows.
We will continue to align our organization, processes, products, delivery and consumption models, and services to changing markets and customer and partner demands. We develop new technology and new solutions such as the next-generation suite SAP S/4HANA or the next-generation business warehouse BW/4HANA. Furthermore, we explore future trends as well as the latest technologies e.g. through our network of innovation centers under the leadership of our chief innovation officer and adopt it if there is a clear business opportunity for SAP and if it provides value to our customers. To ensure that we remain competitive in the future, we conduct wide-ranging market and technology analyses and research projects, often in close cooperation with our customers and partners. We strive for strategic acquisitions with the potential to drive innovation and contribute to achieving our growth target.
We believe that the likelihood of this risk materializing is remote; however, we cannot exclude the business-critical impact this risk would have on our reputation, business, financial position, profit, and cash flows, or the potential negative deviation from our revenue and operating profit target if it were to materialize. We classify this risk as a medium risk.
Our technology and/or product strategy might not be successful or our customers and partners might not adopt our technology platforms and other innovations as expected.
We might not be successful in integrating our platforms and solutions, enabling the complete product and cloud service portfolio, harmonizing our user interface design and technology, integrating acquired technologies, or bringing new solutions based on the SAP HANA platform as well as SAP HANA Cloud Platform to the market as fast as expected, in particular, innovative applications such as SAP S/4HANA or new technologies such as Internet of Things or machine learning. In addition, we might not be able to compete or partner effectively in the area of cloud services and our new applications and services might not meet customer expectations possibly impacting customer satisfaction and retention. As a result, our partner organizations and customers might not adopt our technology platforms, applications, or cloud services quickly enough or they might consider other competitive solutions in the market. This could have an adverse effect on our reputation, business, financial position, profit, and cash flows.
We believe that we will be able to deliver additional business value with minimum disruption to our customers if we can successfully drive the integration and convergence of our technology platform offerings, SAP S/4HANA, as well as acquired technologies, enable our current product portfolio for SAP HANA, develop new solutions based on SAP HANA, and offer comprehensive cloud-based services, extendable with SAP HANA Cloud Platform. We enable and encourage partners to leverage SAP technology by providing guidance about business opportunities, architecture, and technology, as well as a comprehensive certification program designed to ensure that relevant third-party solutions are of consistently high quality.
We believe that the likelihood of this risk materializing is unlikely. If this risk were to occur, its impact on our reputation, business, financial position, profit, cash flows, and revenue and operating profit target would be business-critical. We classify this risk as a medium risk.
Our cloud offerings and related infrastructure might be subject to a security attack, become unavailable, or fail to perform properly.
The software used in our cloud portfolio is inherently complex and any defects in product functionality, data center operations, or system stability that cause interruptions in the availability of our application portfolio could result in the following:
| ∎ | Lost or delayed market acceptance and sales |
| ∎ | Breach of warranty or other contract breach or misrepresentation claims |
| ∎ | Sales credits or refunds to our customers or partners |
| ∎ | Loss of customers and/or partners |
| ∎ | Diversion of development and customer service resources |
| ∎ | Breach of data protection and privacy laws and regulations |
| ∎ | Customers considering competitive cloud offerings |
| ∎ | Loss of customer satisfaction and brand reputation |
| Combined Management Report | Risk Management and Risks | 119 |
Table of Contents
The costs incurred in correcting any defects or errors might be substantial and could have an adverse effect on our reputation, business, financial position, profit, and cash flows. The availability of our cloud applications could be interrupted by a number of factors, resulting in customers’ inability to access their cloud applications or receive their service level, system outages or downtimes, failure of our network due to human or other errors, security breaches, or variability in user traffic for our cloud applications. Because of the large amount of data that we collect and manage, hardware failures, defects in our software, or errors in our systems could result in data loss or corruption, or cause the information that we collect to be incomplete or contain inaccuracies that our customers regard as significant. Additionally, any loss of the right to use hardware purchased or leased from third parties could result in delays in our ability to provide our cloud applications until equivalent technology is either developed by us or, if available, identified. Furthermore, our cooperation with partners in the area of cloud includes theco-location of data centers that might expose SAP to additional risks in the area of security and data protection, as well as the potential for breached service-level agreements by partners.
We have administrative, technical, and physical security measures in place as well as contracts that require third-party data centers to have appropriate security and data protection and privacy measures in place. In this context, customers might demand to use only specific and/or local data centers. However, if these security measures are breached as a result of third-party action, employee error or malfeasance, or otherwise, and if, as a result, someone obtains unauthorized access to our customers’ data, which might include personally identifiable information regarding users, our reputation could be damaged, our business might suffer, local data protection and privacy laws or regulations might be breached, and we could incur significant liability.
In addition, our insurance coverage might not cover claims against us for loss or security breach of data or other indirect or consequential damages. Moreover, defending a suit, regardless of its merit, could be costly and time-consuming. In addition to potential liability, if we experience interruptions in the availability of our cloud applications, our reputation could be harmed and we could lose customers.
Our mitigation measures have been designed and implemented to minimize such adverse effects. We continuously invest in protecting the integrity and security of our products and services as well as internal and external data that is managed within our data centers. We are consolidating and harmonizing our data centers and our data protection measures, including implementing security information and event management solutions as well as network access control enforcement and we monitor and invest to continuously improve our disaster recovery and business continuity capabilities, to run a homogeneous landscape that supports the complex infrastructure, application, and security requirements so that we can deliver the required service level for cloud services.
Although we estimate the probability of occurrence of this risk to be unlikely, we cannot completely exclude the possibility that any disruption of our cloud operations could result in a business-critical impact on our reputation, business, financial position, profit, cash flows, and revenue and operating profit target. We classify this risk as a medium risk.
Operational Risks
Third parties have claimed, and might claim in the future, that we infringe their intellectual property rights, which could lead to damages being awarded against us and limit our ability to use certain technologies in the future.
We believe that we will continuously be subject to intellectual property infringement claims as our solution portfolio grows; as we acquire companies with increased use of third-party code including open source code; as we expand into new industries with our offerings, resulting in greater overlap in the functional scope of offerings; and asnon-practicing entities that do not design, manufacture, or distribute products increasingly assert intellectual property infringement claims.
Any claims, with or without merit, and negotiations or litigation relating to such claims, could preclude us from utilizing certain technologies in our products, be time-consuming, result in costly litigation, and require us to pay damages to third parties, stop selling or reconfigure our products and, under certain circumstances, pay fines and indemnify our customers, which could have an adverse effect on our business, financial profile, profit, cash flows, and reputation. They could also require us to enter into royalty and licensing arrangements on terms that are not favorable to us, cause product shipment delays, subject our products to injunctions, require a complete or partial redesign of products, result in delays to our customers’ investment decisions, and damage our reputation.
Software includes many components or modules that provide different features and perform different functions. Some of these features or functions might be subject to third-party intellectual property rights. The rights of another party could encompass technical aspects that are similar to one or more technologies in one or more of our products. Intellectual property rights of third parties could preclude us from using certain technologies in our products or require us to enter into royalty and licensing arrangements on unfavorable or expensive terms.
The software industry is making increasing use of open source software in its development work on solutions. We also integrate certain open source software components from third parties into our software. Open source licenses might require that the software code in those components or the software into which they are integrated be freely accessible under open source terms. Third-party claims might require us to make freely accessible under open source terms one of our products or third-party (not SAP) software upon which we depend.
SAP continues to participate in standards organizations and increases the use of such standards in its products. Participation in standards organizations might require the licensing of SAP’s intellectual property to contributors to the standard and to all standards implementers, including competitors, on anon-discriminatory basis in accordance with licensing terms defined by standards organizations. Within the software-related standards field, there is a trend toward expanding the
| Combined Management Report | Risk Management and Risks | 120 |
Table of Contents
scope of licensing obligations and narrowing an intellectual property owner’s right to revoke a license if sued by a licensee. In certain situations, limitations on SAP’s rights to revoke a license could reduce SAP’s ability to assert a patent infringement claim against a third-party. Assertion of patents inadvertently licensed through standards could expose SAP to third-party claims.
Our Legal Compliance & Integrity Office sets and manages internal policies related to our Code of Business Conduct including the handling of third-party intellectual property. Corporate Audit monitors compliance with these policies through various investigations. Our Global GRC organization works closely with both the Legal Compliance & Integrity Office and Corporate Audit and is responsible for the management and reporting of potential risks associated with third-party intellectual property.
We consider the probability of this risk materializing to be likely, and that any claims concerning intellectual property rights of third parties, open source requirements, or certain standards could have a business-critical impact on our business, financial position, profit, cash flows and reputation, as well as on the achievement of our revenue and operating profit target, and could also exacerbate the other risks we describe in this report. We classify this risk as a high risk.
We are named as a defendant in various legal proceedings for alleged intellectual property infringements. For more information and a more detailed report relating to certain of these legal proceedings, see the Notes to the Consolidated Financial Statements,Note (23).
Claims and lawsuits against us could have an adverse effect on our business, financial position, profit, cash flows, and reputation.
Claims and lawsuits are brought against us, including claims and lawsuits involving businesses we have acquired. Adverse outcomes to some or all of the claims and lawsuits pending against us might result in the award of significant damages or injunctive relief against us that could hinder our ability to conduct our business and could have an adverse effect on our reputation, business, financial position, profit, and cash flows.
The outcome of litigation and other claims or lawsuits is intrinsically uncertain. Management’s view of the litigation might also change in the future. Actual outcomes of litigation and other claims or lawsuits could differ from the assessments made by management in prior periods, which are the basis for our accounting for these litigations and claims under IFRS.
We consider the probability of occurrence of this risk to be likely, and cannot exclude its business-critical impact on our reputation, business, financial position, profit, cash flows, and revenue and operating profit target if it were to materialize. We classify this risk as a high risk.
For more information and a more detailed report relating to certain of these legal proceedings, see the Notes to the Consolidated Financial Statements,Note (23).
We might not acquire and integrate companies effectively or successfully and our strategic alliances might not be successful.
To expand our business, we acquire businesses, products, and technologies, and we expect to continue to make acquisitions in the future. Over time certain of these acquisitions have increased in size and in strategic importance for SAP, Management negotiation of potential acquisitions and alliances and integration of acquired businesses, products, or technologies demands time, focus, and resources of management and of the workforce. Acquisitions of companies, businesses, and technology expose us to unpredictable operational difficulties, expenditures, and risks. These risks include, among others:
| ∎ | Selection of the wrong integration model for the acquired company and/or technology |
| ∎ | Failure to properly evaluate the acquired business and its different business and licensing models |
| ∎ | Incorrect assumptions during due diligence process leading to negative contribution with regards to an acquired company |
| ∎ | Failure to successfully integrate acquired technologies or solutions into SAP’s solution portfolio and strategy in a timely and profitable manner |
| ∎ | Failure to integrate the acquired company’s operations across SAP’s different cultures, languages, and local protocols, all within the constraints of applicable local laws |
| ∎ | Failure to meet the needs of the acquired company’s customers and partners in the combined company |
| ∎ | The diversion of management’s time and attention from daily operations |
| ∎ | Loss of key personnel of the acquired business |
| ∎ | Material unknown liabilities and contingent liabilities of acquired companies, including legal, tax, accounting, intellectual property, or other significant liabilities that might not be detected through the acquisition due diligence process |
| ∎ | Legal and regulatory constraints (such as contract obligations, privacy frameworks, and agreements) |
| ∎ | Difficulties in implementing, restoring, or maintaining internal controls, procedures, and policies |
| ∎ | Practices or policies of the acquired company that might be incompatible with our compliance requirements |
| ∎ | An adverse effect on relationships with existing customers, partners, or third-party providers of technology or products |
| ∎ | Difficulties in integrating the acquired company’s accounting, HR, and other administrative systems and coordination of the acquired company’s research and development (R&D), sales, and marketing functions |
| ∎ | Debt incurrence or significant cash expenditures |
| ∎ | Constraints in enforcing acquired companies’ compliance with existing SAP security standards in a timely manner |
| ∎ | Difficulties in customer implementation projects combining technologies and solutions from both SAP and the acquired company |
In addition, acquired businesses might not perform as anticipated, resulting in charges for the impairment of goodwill and other intangible
| Combined Management Report | Risk Management and Risks | 121 |
Table of Contents
assets on our statements of financial position. Such charges might have an adverse effect on our business, financial position, profit, and cash flows. We have entered into, and expect to continue to enter into, alliance arrangements for a variety of purposes, including the development of new products and services. There can be no assurance that any such products or services will be successfully developed or that we will not incur significant unanticipated liabilities in connection with such arrangements. We might not be successful in overcoming these risks and we might therefore not benefit as anticipated from acquisitions or alliances.
We counter these acquisition-related risks with many different methodological and organizational measures. These include technical, operational, financial, and legal due diligence on the company or assets to be acquired and a holistic evaluation of material transaction and integration risks. The methods we use depend on the integration scenario. Our integration planning is detailed and standardized, and carried out by a dedicated integration team. We therefore believe we have minimized this risk.
Although we estimate this risk to be unlikely, we cannot completely exclude the possibility that this risk could have a business-critical impact on our business, financial position, profit, cash flows, and revenue and operating profit target. We classify this risk as a medium risk.
We might not be able to obtain adequate title to, or licenses in, or to enforce, intellectual property.
Protecting and defending our intellectual property is crucial to our success. We use a variety of means to identify and monitor potential risks and to protect our intellectual property. These include applying for patents, registering trademarks and other marks and copyrights, implementing measures to stop copyright and trademark infringement, entering into licensing, confidentiality, andnon-disclosure agreements, and deploying protection technology. Despite our efforts, we might not be able to prevent third parties from obtaining, using, or selling without authorization what we regard as our proprietary technology and information. All of these measures afford only limited protection, and our proprietary rights could be challenged, invalidated, held unenforceable, or otherwise affected. Some intellectual property might be vulnerable to disclosure or misappropriation by employees, partners, or other third parties. Third parties might develop technologies that are substantially equivalent or superior to our technology. Finally, third parties might reverse-engineer or otherwise obtain and use technology and information that we regard as proprietary. Accordingly, we might not be able to protect our proprietary rights against unauthorized third-party copying or utilization, which could have an adverse effect on our competitive and financial positions, and result in reduced sales. Any legal action we bring to enforce our proprietary rights could also involve enforcement against a partner or other third party, which might have an adverse effect on our ability, and our customers’ ability, to use that partner’s or other third parties’ products. In addition, the laws and courts of certain countries might not offer effective means to enforce our intellectual property rights. This could have an adverse effect on our reputation, business, financial position, profit, and cash flows.
We rely on a combination of the protections provided by applicable statutory and common law rights, including trade secret, copyright, patent, and trademark laws, license andnon-disclosure agreements, and technical measures to establish and protect our proprietary rights in our products. We have established various internal programs, such as internal policies, processes, and monitoring, to assess and manage the risks associated with standards organizations, open source, and third-party intellectual property.
We might be dependent in the aggregate on technology that we license from third parties that is embedded in our products or that we resell to our customers. We have licensed and will continue to license numerous third-party software products that we incorporate into and/or distribute with our existing products. We endeavor to protect ourselves in the respective agreements by obtaining certain rights in case such agreements are terminated.
We are party to certain patent cross-license agreements with third parties.
We estimate the probability of this risk occurring as likely, and that it could have a business-critical impact on our reputation, business, financial position, profit, cash flows, and revenue and operating profit target. We classify this risk as a high risk.
SAP’s business strategy focuses on certain business models that are highly dependent on a working cyberspace. A cybersecurity breach could have an adverse effect on our customers, our reputation, and our business.
The key cybersecurity risks currently applicable to us include state-driven economic espionage as well as competitor-driven industrial espionage, and criminal activities including, but not limited to, cyberattacks and “mega breaches” against cloud services and hostedon-premise software. This might result in, for example, disclosure of confidential information and intellectual property, defective products, production downtimes, supply shortages, and compromised data (including personal data). A failure of our cybersecurity measures could impact our compliance with legal demands (for example, Sarbanes-Oxley Act, Payment Card Industry Data Security Standard, data privacy) and expose our business operations as well as service delivery to the described risks, for example, virtual attack, disruption, damage, and/or unauthorized access. Additionally, we could be subject to recovery costs, for example, as well as significant contractual and legal claims by customers, partners, authorities, and third-party service providers for damages against us, which could have an adverse effect on our reputation, business, financial position, profit, and cash flows.
To address the increasing cybersecurity threats, we are continuously adapting and modifying our security procedures. We have multiple security measures in place, such as technical IT security measures, identity and access management, and mandatory security and compliance training. In addition, our security governance model clearly
| Combined Management Report | Risk Management and Risks | 122 |
Table of Contents
defines security management accountabilities for all security areas regarding product security and corporate security, which enables us to respond quickly to identified cybersecurity risks. We have a global security function as well as an independent security audit department within the Corporate Audit organization in place appropriately addressing potential security threats.
Although we still consider the occurrence of this risk to be unlikely, we cannot completely exclude the possibility that this risk could have a business-critical impact on our business, financial position, profit, cash flows, and reputation as well as revenue and operating profit target. We classify this risk as a medium risk.
We might not be able to protect our critical information and assets or to safeguard our business operations against disruption.
SAP is highly dependent on the exchange of a wide range of information across our global operations and on the availability of our infrastructure. With regards to our physical environment, we face several key security risks such as industrial and/or economic espionage, serious and organized crime, and other illegal activities, as well as violent extremism and terrorism. We might be endangered by threats including, but not limited to, social engineering, misuse, or theft of information or assets, or damage to assets by trespassers in our facilities or by people who have gained unauthorized physical access to our facilities, systems, or information. These could have an adverse effect on our business, financial profile, profit, and cash flows.
To minimize these risks, we have implemented several technical and organizational measures designed to safeguard our information, IT and facility infrastructure, and other assets. These measures include, for example, physical access control systems at facilities, multilevel access controls, closed-circuit television surveillance, security personnel in all critical areas, and recurring social engineering tests for SAP premises and data centers. Access to information and information systems is controlled using authorization concepts. Managers and employees are regularly sensitized to the issues and given mandatory security and compliance training. We keep these measures under continuous review to mitigate current threats.
Although we estimate the probability of occurrence of this risk to be unlikely, we cannot completely exclude the possibility that any misuse, theft, or breach of security could have a major impact on our business, financial position, profit, and cash flows as well as on our revenue and operating profit target. Due to our strategic transformation into cloud business operations, we classify this risk as a medium risk.
Our insurance coverage might not be sufficient and we might be subject to uninsured losses.
We maintain insurance coverage to protect us against a broad range of risks, at levels we believe are appropriate and consistent with current industry practice. Our objective is to exclude or minimize risk of financial loss at reasonable cost. However, we might incur losses that might be beyond the limits, or outside the scope, of coverage of our insurance and that might limit or prevent indemnification under our insurance policies. In addition, we might not be able to maintain adequate insurance coverage on commercially reasonable terms in the future. Further, certain categories of risks are currently not insurable at reasonable cost, which could have an adverse effect on our business, financial position, profit, and cash flows. Finally, there can be no assurance of the financial ability of the insurance companies to meet their claim payment obligations.
In view of the scope of our insurance coverage and our selection of insurers, and because we keep our insurance programs under constant review, we believe that the likelihood of this risk materializing is remote.
However, we cannot exclude the possibility of a business-critical impact on our business, financial position, profit, cash flows, and operating profit target if the risk were to occur. We classify this risk as a medium risk.
We could incur significant losses in connection with venture capital investments.
Through Sapphire Ventures (formerly SAP Ventures), our consolidated venture investment funds, we plan to continue investing in new and promising technology businesses. Many such investments initially generate net losses and require additional expenditures from their investors. Changes to planned business operations have, in the past affected, and might in the future affect, the performance of companies in which Sapphire Ventures holds investments, and that could have an adverse effect on the value of our investments in Sapphire Ventures, which could have an adverse effect on our business, financial position, profit, and cash flows. Furthermore, tax deductibility of capital losses and impairment in connection with equity securities are often restricted and could therefore have an adverse effect on our effective tax rate.
To address this risk, Sapphire Ventures diversifies its portfolio and manages our investments actively. In addition, our venture capital activities have a limited scope.
We believe that the likelihood of this risk materializing is remote and that if the risk were to occur, its potential impact on our business, financial position, profit, cash flows, and operating profit target would be minor. We classify this risk as a low risk.
Consolidated Risk Profile
SAP consolidates and aggregates all risks reported by the different business units and functions following our risk management policy, monitored by a Group-wide risk management governance function.
In 2016, we recognized only minor changes in the percentages of all reported risks categorized as “high” or “medium” in our risk-level matrix. The number of risks categorized as “high” accounted for 11% (2015: 11%) of all reported risks, while the risks categorized as “medium” accounted for 67% (2015: 68%) of all risks reported in the Risk Factors section.
| Combined Management Report | Risk Management and Risks | 123 |
Table of Contents
In our view, considering their likelihood of occurrence and impact level, the risks described in our aggregated Risk Report do not individually or cumulatively threaten our ability to continue as a going concern. Management remains confident that the Group’s earnings strength forms a solid basis for our future business development and provides the necessary resource to pursue the opportunities available to the Group. Because of our strong position in the market, our technological leadership, our highly motivated employees, and our structured processes for early risk identification, we are confident that we can continue to successfully counter the challenges arising from the risks in our risk profile in 2017.
| Combined Management Report | Risk Management and Risks | 124 |
Table of Contents
Expected Developments and Opportunities
Future Trends in the Global Economy
In its latest economic bulletin report, the European Central Bank (ECB) predicts that the global economy will continue to accelerate in 2017 although remain below itspre-crisis pace. It also expects the pace of expansion will remain relatively stable in 2017 in the advanced economies and improve slightly in the emerging economies. Adverse effects of low commodity prices on the commodity-exporting countries, the sustained realignment of the Chinese economy, and political and economic uncertainty in the United States could, however, dampen global prospects in 2017, the ECB warns.
Looking at the Europe, Middle East, and Africa (EMEA) region, the ECB believes that the euro area economy will continue to recover further in 2017.It suggests that increased investment by enterprises benefiting from favorable borrowing conditions and improved earnings could be key factors in this growth. The experts even forecast a surge in investment activity in the Central and Eastern European countries in 2017 and dynamic consumer spending, both of which should help drive economic development there. Russia’s economy should begin to expand again in 2017, for the first time since coming out of its recession, the ECB says.
With regards to the North America and Latin America (Americas) region, the ECB writes that while uncertainty about the future political and economic course of the United States following the inauguration of the new president is currently very high, it nevertheless anticipates a moderate increase in US economic growth in 2017. As for Brazil, it should be able to leave its recession behind it in 2017, the ECB says, though large fiscal consolidation needs will continue to weigh on the country.
In the Asia Pacific Japan (APJ) region, Japan’s economy is projected to continue to expand at the same restrained pace as the preceding year. The ECB predicts that the underlying economic momentum in Japan will remain weak. Lastly, economic growth in China is likely to continue to decelerate in 2017, primarily due a renewed slowdown in investment growth as Chinese enterprises cut back overcapacity, the ECB says.
Economic Trends – Year-Over-Year GDP Growth
% | 2015e | 2016e | 2017p | |||||||||
| World | 3.2 | 3.1 | 3.4 | |||||||||
| Advanced economies | 2.1 | 1.6 | 1.9 | |||||||||
| Developing and emerging economies | 4.1 | 4.1 | 4.5 | |||||||||
| Europe, Middle East, and Africa (EMEA) | ||||||||||||
| Euro area | 2.0 | 1.7 | 1.6 | |||||||||
| Germany | 1.5 | 1.7 | 1.5 | |||||||||
| Central and Eastern Europe | 3.7 | 2.9 | 3.1 | |||||||||
Middle East and North Africa | 2.5 | 3.8 | 3.1 | |||||||||
| Sub-Saharan Africa | 3.4 | 1.6 | 2.8 | |||||||||
| Americas | ||||||||||||
| United States | 2.6 | 1.6 | 2.3 | |||||||||
| Canada | 0.9 | 1.3 | 1.9 | |||||||||
| Central and South America, Caribbean | 0.1 | -0.7 | 1.2 | |||||||||
| Asia Pacific Japan (APJ) | ||||||||||||
| Japan | 1.2 | 0.9 | 0.8 | |||||||||
| Asian developing economies | 6.7 | 6.3 | 6.4 | |||||||||
| China | 6.9 | 6.7 | 6.5 | |||||||||
e = estimate; p = projection
Source: International Monetary Fund (IMF), World Economic Outlook Update, A Shifting Global Economic Landscape, as of January 2017, p. 7.
The IT Market: The Outlook for 2017
“Worldwide IT spending is projected to total $3.5 trillion in 2017, a 2.7 percent increase from 2016,” according to a January 2017 Gartner Press Release by Gartner, a market research firm. “However, this growth rate is down from earlier projections of 3 percent.2017 was poised to be a rebound year in IT spending. Some major trends have converged, including cloud, blockchain, digital business, and artificial intelligence. Normally, this would have pushed IT spending much higher than 2.7 percent growth. […] However, some of the political uncertainty in global markets has fostered await-and-see approach causing many enterprises to forestall IT investments. The range of spending growth from the high to low is much larger in 2017 than in past years. Normally, the economic environment causes some level of division, however, in 2017 this is compounded by the increased levels of uncertainty. […] The result of that uncertainty is a division between individuals and corporations that will spend more – due to opportunities arising – and those that will retract or pause IT spending.”
| Combined Management Report | Expected Developments and Opportunities | 125 |
Table of Contents
Gartner data indicate software will be the best-performing segment with software spending increasing by 7.2% (see table below). “Buyer investments in digital business, intelligent automation, and services optimization and innovation continue to drive growth in the market, but buyer caution, fueled by broad economic challenges, remains a counter-balance to faster growth,” says Gartner.
Within the Europe, Middle East, and Africa (EMEA) region, the table below shows that IT spending in Western European countries will grow 1.5% in 2017, whereas Western European software spending will increase considerably by 6.2%.
According to the table below, IT spending in the Americas region will expand in 2017 by 2.6% in North America and 2.1% in Latin America.
IT spending in the Asia Pacific Japan (APJ) region is expected to expand by 3.0% (Mature Asia/Pacific without Japan) and 5.9% (Emerging Asia/Pacific without China) in 2017 (see table below). IT spending in Greater China is expected to grow 5.1% in 2017 (see table below).
Sources:
1) Gartner Market Databook, 4Q16 Update, 21 December 2016.
2) Gartner Says Worldwide IT Spending Forecast to Grow 2.7 Percent in 2017, Press Release, January 12, 2017 (http://www.gartner.com/newsroom/id/3568917 ).
The Gartner Reports described herein, (the “Gartner Reports”) represent research opinion or viewpoints published, as part of a syndicated subscription service, by Gartner, Inc. (“Gartner”), and are not representations of fact. Each Gartner Report speaks as of its original publication date (and not as of the date of this Annual Report) and the opinions expressed in the Gartner Reports are subject to change without notice.
Trends in the IT Market – Increased IT Spending Year-Over-Year
% | 2015e | 2016p | 2017p | |||||||||
| World | ||||||||||||
| Total IT | 4.0 | 0.5 | 2.7 | |||||||||
Software | 9.1 | 6.9 | 7.2 | |||||||||
Services | 5.1 | 4.5 | 4.6 | |||||||||
| Western Europe | ||||||||||||
| Total IT | 3.6 | -0.1 | 1.5 | |||||||||
Software | 9.6 | 5.3 | 6.2 | |||||||||
Services | 4.4 | 3.8 | 4.1 | |||||||||
| Eastern Europe | ||||||||||||
| Total IT | 15.8 | 1.8 | 0.8 | |||||||||
Software | 10.8 | 9.0 | 8.8 | |||||||||
Services | 3.4 | 3.5 | 3.9 | |||||||||
| Eurasia | ||||||||||||
| Total IT | 2.0 | -2.4 | 0.9 | |||||||||
Software | 14.1 | 6.5 | 7.9 | |||||||||
Services | 3.2 | 0.9 | 1.4 | |||||||||
| Middle East and North Africa | ||||||||||||
| Total IT | 6.2 | -0.2 | 3.0 | |||||||||
Software | 11.4 | 9.9 | 10.1 | |||||||||
Services | 5.8 | 4.0 | 4.7 | |||||||||
| Sub-Saharan Africa | ||||||||||||
| Total IT | 7.3 | 1.6 | 5.2 | |||||||||
Software | 13.2 | 11.4 | 11.4 | |||||||||
Services | 5.2 | 5.3 | 5.4 | |||||||||
| North America | ||||||||||||
| Total IT | 3.0 | 1.5 | 2.6 | |||||||||
Software | 8.2 | 7.2 | 6.9 | |||||||||
Services | 6.0 | 5.3 | 5.3 | |||||||||
| Latin America | ||||||||||||
| Total IT | 4.7 | -2.6 | 2.1 | |||||||||
Software | 11.0 | 7.4 | 8.1 | |||||||||
Services | 6.9 | 6.7 | 6.9 | |||||||||
Mature Asia/Pacific (w/o Japan) | ||||||||||||
| Total IT | 4.9 | 1.4 | 3.0 | |||||||||
Software | 12.4 | 9.3 | 9.4 | |||||||||
Services | 4.4 | 2.9 | 2.6 | |||||||||
Emerging Asia/Pacific (w/o China) | ||||||||||||
| Total IT | 7.3 | 2.9 | 5.9 | |||||||||
Software | 11.4 | 10.8 | 11.1 | |||||||||
Services | 7.5 | 9.6 | 9.7 | |||||||||
| Japan | ||||||||||||
| Total IT | 0.4 | 0.3 | 1.9 | |||||||||
Software | 7.4 | 5.2 | 5.5 | |||||||||
Services | 3.1 | 2.2 | 1.7 | |||||||||
| Greater China (China/ Taiwan/Hong Kong) | ||||||||||||
| Total IT | 4.8 | 0.4 | 5.1 | |||||||||
Software | 7.8 | 8.4 | 9.3 | |||||||||
Services | 5.7 | 7.7 | 8.1 | |||||||||
e = estimate, p = projection
Table created by SAP based on: Gartner Market Databook, 4Q16 Update, 21 December 2016, Table2-1 “RegionalEnd-User Spending on IT Products and Services in Constant U.S. Dollars, 2014–2020 (Millions of Dollars)”.
| Combined Management Report | Expected Developments and Opportunities | 126 |
Table of Contents
Impact on SAP
SAP expects to outperform the global economy and the IT industry again in 2017 in terms of revenue growth.
As last year, our 2016 results validate our strategy of innovating across the core, the cloud, and business networks to help our customers become true digital enterprises. Our innovation cycle for SAP S/4HANA is well underway and the completeness of our vision in the cloud continues to distinguish SAP from both legacy players and providers of cloud-based point solutions. We achieved all key performance indicators raised in our business outlook in October.
On this basis, we consider ourselves well-prepared for the future and expect profitable growth in 2017 as well. As such, we are raising our ambitious goals for 2020. Balanced in terms of regions as well as industries, we remain well-positioned with our product offering to offset individual fluctuations in the global economy and IT market.
A comparison of our business outlook with forecasts for the global economy and IT industry shows that we can be successful even in a tough economic environment and increased geopolitical uncertainty, and will further strengthen our position as the market leader of enterprise application software.
Operational Targets for 2017(Non-IFRS)
Revenue and Operating Profit Outlook
The Company is providing the following 2017 outlook:
| ∎ | Based on the continued strong momentum in SAP’s cloud business the Company expects full year 2017non-IFRS cloud subscriptions and support revenue to be in a range of €3.8 billion – €4.0 billion at constant currencies (2016: €2.99 billion), in line with the previous 2017 ambition which was raised at the beginning of 2016. The upper end of this range represents a growth rate of 34% at constant currencies. |
| ∎ | The Company expects full year 2017non-IFRS cloud & software revenue to increase by 6% – 8% at constant currencies (2016: €18.43 billion). |
| ∎ | The Company expects full year 2017non-IFRS total revenue in a range of €23.2 billion to €23.6 billion at constant currencies (2016: €22.07 billion). This is above the previous 2017 ambition which was raised at the beginning of 2016. |
| ∎ | The Company expects full-year 2017non-IFRS operating profit to be in a range of €6.8 billion – €7.0 billion at constant currencies (2016: €6.63 billion). This is above the previous 2017 ambition which was raised at the beginning of 2016. |
We expect our headcount to increase at a slightly lower pace than in 2016.
While our full-year 2017 business outlook is at constant currencies, actual currency reported figures are expected to continue to be impacted by currency exchange rate fluctuations.
We expect thatnon-IFRS total revenue will continue to depend largely on the revenue from cloud and software. However, the revenue growth we expect from this is below the outlook provided fornon-IFRS cloud subscriptions and support revenue. We expect the software license revenue in 2017 to decline by low tomid-single digit compared to 2016. However we will continuing to gain market share against our mainon-premise license competitors.
We continuously strive for profit expansion in all our reportable segments leading to a SAP Group profit expansion as outlined in the given 2017 outlook. For SAP’s managed-cloud offerings, we expect a positive gross margin result in 2017 according to outlined long-term 2020 planning.
The following table shows the estimates of the items that represent the differences between ournon-IFRS financial measures and our IFRS financial measures.
Non-IFRS Measures
€ millions | Estimated Amounts for 2017 | Actual Amounts for 2016 | ||||||
| Revenue adjustments | < 20 | 5 | ||||||
| Share-based payment expenses | 770 to 1,020 | 785 | ||||||
| Acquisition-related charges | 620 to 650 | 680 | ||||||
| Restructuring | 30 to 50 | 28 | ||||||
We do not expect any Company-wide restructuring programs in 2017.
The Company expects a full-year 2017 effective tax rate (IFRS) of 26.0% to 27.0% (2016: 25.3%) and an effective tax rate(non-IFRS) of 27.0% to 28.0% (2016: 26.8%).
Goals for Liquidity and Finance
On December 31, 2016, we had a negative net liquidity. We believe that our liquid assets combined with our undrawn credit facilities are sufficient to meet our present operating financing needs also in 2017 and, together with expected cash flows from operations, will support debt repayments and our currently planned capital expenditure requirements over the near term and medium term.
| Combined Management Report | Expected Development and Opportunities | 127 |
Table of Contents
In 2017, we expect a positive development of our operating cash flow, which we anticipate will reach up to €5.0 billion.
We intend to repay €1 billion Eurobonds when they mature in April 2017 as well as US$443 million U.S. private placements in October and November 2017.
In the absence of large acquisitions, we expect our strong operating cash flow will generate excess cash in the next6-12 months. Based on the actual acquisition volume and liquidity development we would consider a potential share buyback in the second half of 2017.
Investment Goals
Our planned capital expenditures for 2017 and 2018, other than from business combinations, mainly comprise the construction activities described in theAssets (IFRS) section of this report. We expect investments from these activities of approximately €365 million in 2017 (an increase of 20% compared to the previous year), and approximately €250 million in 2018. These investments can be covered in full by operating cash flow.
SAP is not currently planning any significant acquisitions in 2017 and 2018 but will rather focus on organic growth, complemented by minor acquisitions. In 2017, we intend to spend up to €1.0 billion for smaller acquisitions.
Proposed Dividend
We intend to continue our dividend policy in 2017 as well, which is to pay a dividend totaling more than 35% of the prior year’s profit after tax.
Premises on Which Our Outlook Is Based
In preparing our outlook, we have taken into account all events known to us at the time we prepared this report that could influence SAP’s business going forward.
Among the premises on which this outlook is based are those presented concerning economic development and the assumption that there will be no effects from major acquisitions in 2017 and 2018.
Outlook for SAP SE
The primary source of revenue for SAP SE is the license fees it charges subsidiaries for the right to market and maintain SAP software solutions. Consequently, the performance of SAP SE in operating terms is closely tied to the cloud and software revenue of the SAP Group.
We expect SAP SE product revenue to increase at constant currencies generally in line with the 6% to 8% constant-currency rise innon-IFRS cloud and software revenue anticipated for the SAP Group in 2017.
Assuming there are no special effects relating to acquisitions or internal corporate restructuring measures in 2017, we also expect the operating profit of SAP SE to increase slightly.
Provided the SAP Group continues to hit its revenue and profit targets, we expect SAP SE to sustain revenue and operating income growth into the medium term.
We believe SAP SE, the parent company of the SAP Group, will receive investment income in the form of profit transfers and dividends again in the future. The growth we expect from the SAP Group should have a positive effect on SAP SE investment income.
The outlook projections for the SAP Group in respect of liquidity, finance, investment, and dividend are equally applicable to SAP SE.
Among the assumptions underlying this outlook are those presented above concerning the economy and our expectations for the performance of the SAP Group.
Medium-Term Prospects
In this section, all numbers are based exclusively onnon-IFRS measures.
We expect to grow our more predictable revenue business while steadily increasing operating profit. Our strategic objectives are focused primarily on the following financial andnon-financial objectives: growth, profitability, customer loyalty, and employee engagement.
We raised our 2020 ambition to reflect the Company’s consistent fast growth in the cloud, solid software momentum, and operating profit expansion as well as the exchange rate development. Assuming an exchange rate environment comparable to 2016, SAP strives to reach the following in 2020:
| ∎ | €8.0 billion to €8.5 billion cloud subscriptions and support revenue (previously €7.5 billion to €8.0 billion) |
| ∎ | €28 billion to €29 billion total revenue (previously €26 billion to €28 billion) |
| ∎ | €8.5 billion to €9.0 billion operating profit (previously €8.0 billion to €9.0 billion) |
We continue to expect the share of more predictable revenue (defined as the total of cloud subscriptions & support revenue and software support revenue) to reach 70% to 75% in 2020.
By 2020, we expect our business network and public cloud offerings to generate approximately the same portion of cloud subscriptions and support revenue. Both of these offerings are expected to each generate, in 2020, cloud subscriptions and support revenues that are significantly higher than the cloud subscriptions and support revenue generated from our private cloud offerings.
Our revenue growth trajectory through 2020 is expected to be driven by continued strong growth in the cloud, low tomid-single-digit declines in software revenue and continued growth in our software support revenue. This is all expected to drive high single-digit growth in cloud and software revenue through 2020.
| Combined Management Report | Expected Developments and Opportunities | 128 |
Table of Contents
We also strive for significantly improving, over the next few years, the profitability of our cloud business. In 2017, we will continue the investment phase of our cloud business. As of 2018, we expect to see the benefits from those efficiency-based investments and increasing cloud gross margin. We expect these improvements to continue in the following years to reach our envisioned long-term cloud subscriptions and support margin targets in 2020. These will continue to increase at different rates per cloud operations model: We expect the gross margin from our public cloud to reach approximately 80% (2016: 62.0%) in 2020. Likewise, we expect our business network gross margin to reach approximately 80% (2016: 75.9%) in 2020. The gross margin for our private cloud is expected to reach about 40% (2016:-5.4%) in 2020. The combined cloud gross margin is expected to be approximately 73% in 2020.
We also aim at further improving the profitability of ouron-premise software business. The gross margin for our software licenses and support is expected to remain at least stable at approximately 88% (2016: 87.4%) in 2020.
In addition, we expect our services gross margin to reach approximately 20% (2016: 18.2%) in 2020.
As we look to increase our profitability through 2020, our cost ratios (cost as a % of total revenue) are expected to develop as follows through 2020: Research and development is expected to decline slightly, Sales and marketing is expected to follow the growth of the business and General and administration is expected to remain stable.
Non-Financial Goals 2017 and Ambitions for 2020
In addition to our financial goals, we also focus on twonon-financial targets: customer loyalty and employee engagement.
For 2017 through to 2020, we aim to reach an Employee Engagement Index between 84% and 86% (2016: 85%).
We measure customer loyalty using the Customer Net Promoter Score (NPS). In 2017, we target achieving a combined Customer NPS of 21% to 23%, with our medium-term goal of reaching a combined Customer NPS of 35% to 40% by 2020 (2016: 19.2%).
Opportunities
Our customers rely on SAP as the trusted partner in their digital business transformation, not only for providingin-memory technology, standardizedon-premise and cloud solutions, and access to business networks, but also for helping them drive new business outcomes and enabling business model innovations. To meet these expectations, we must grow consistently and accelerate the pace of our own business transformation by exploiting new opportunities.
We have established a framework for opportunity management by evaluating and analyzing four key areas: current markets, competitive landscapes, external scenarios, and technological trends. Additionally, we have delved into customer and product segmentation, growth drivers, and industry-specific success factors. Based on these combined insights, our Executive Board defines our market strategies. Our shareholder value relies heavily upon a fine balance of risk mitigation and value-driven opportunities. Therefore, our strong governance model ensures that decisions are based on return, investment required, and risk mitigation. We rely on the talent and resources within SAP and our entire ecosystem.
As far as opportunities are likely to occur, we have incorporated them into our business plans, our outlook for 2017, and our medium-term prospects outlined in this report. Therefore, the following section focuses on future trends or events that might result in an uplift of our outlook and medium-term prospects, if they develop better than we have anticipated in our forecasts.
SAP SE is the parent company of the SAP Group and earns most of its revenue from software license fees, subscriptions fees, and dividends paid by affiliates. Consequently, the opportunities described below also apply – directly or indirectly – to SAP SE.
Opportunities from Economic Conditions
Economic conditions have a clear influence on our business, financial position, profit, and cash flows. Should the global economy experience a more sustained growth than is reflected in our plans today, our revenue and profit may exceed our current outlook and medium-term prospects.
Our midterm planning is based on unchanged market conditions in emerging markets. Should their stability increase again, this would be an upside to our midterm planning.
For more information about future trends in the global economy and the IT market outlook as well as their potential influence on SAP, see theExpected Developments and Opportunities section.
Opportunities from Research and Development Traction
Our continued growth through innovation is based on our ability to leverage research and development (R&D) resources effectively. We continue to improve our development processes through design thinking and lean methodologies. We are accelerating innovation cycles especially in the area of cloud solutions and engaging more closely with our customers to ensure accuracy and success. In addition, we have generated a new structure that enables innovations in a startup-like environment and ecosystem.
While speed is a key strength, we also focus on ease of adoption and providing compelling returns. This allows our customers to easily consume technologies and software applications with immediate benefits for their businesses. If we make innovations available faster than currently anticipated, or if customers adopt the innovations faster than currently expected, for example, shifting faster to managed clouds for enterprise resource planning, or shifting faster to our new SAP S/4HANA solutions, this could positively impact our revenue, profit, and cash flows, and result in their exceeding our stated outlook and medium-term prospects.
| Combined Management Report | Expected Development Opportunities | 129 |
Table of Contents
For more information about future opportunities in research and development for SAP, see theProducts, Research and Development, and Services section as well as the Expected Developments and Opportunities section.
Opportunities from Our Strategy for Profitable Growth
SAP strives to generate profitable growth across our portfolio of products, solutions, and services to keep or improve its market position. Our aim is to continue to expand our addressable market to €320 billion in 2020, based on new assets in our SAP Business Network Segment, our new technologies and innovations, and the extension of our cloud portfolio.
We see opportunities in growing product and market areas, such asin-memory computing, cloud, mobile, business networks, social media, Big Data, the Internet of Things, machine learning, artificial intelligence, predictive analytics and especially all business developments that are targeted at the digital business transformation which is key to our strategy. In addition to organic developments andtuck-in acquisitions, large strategic acquisitions in particular may boost our revenue and profits significantly. Furthermore, SAP seeks to establish new business models and leverage our expanding ecosystem of partners to achieve scale and maximize opportunities.
Our strong assets in applications and analytics, as well as database and technology, continue to offer solid multiyear growth opportunities as we bring innovative technologies with simplified consumption to our installed base and continue to addnet-new customers. Unexpected portfolio growth may positively impact our revenue, profit, and cash flows, and result in their exceeding our stated outlook and medium-term prospects. Specifically, SAP HANA, cloud offerings, and SAP S/4HANA solutions, could create even more demand than is reflected in our stated outlook and medium-term prospects. Further upside potential is possible by higher than expected renewal rates of our cloud solutions.
For more information about future opportunities for SAP, see theStrategy and Business Model section as well as theExpected Developments and Opportunities section.
Opportunities from Our Partner Ecosystem
SAP continues to grow and develop a global partner ecosystem. To increase market coverage, we want to enhance our portfolio and spur innovation with the specified objective of increasing the partner revenue contribution to SAP’s overall revenue target. In addition to strengthening our core, we leverage our entire ecosystem to drive adoption of SAP HANA, cloud solutions, SAP S/4HANA, and SAP Cloud Platform (formerly called SAP HANA Cloud Platform). This includes strategic partnerships across all areas: third-party software vendors, systems integrators, service providers, and infrastructure providers. As a result, we are creating an ever-stronger setup, where SAP, along with our customers and partners,co-innovate and develop new innovative solutions on and with SAP HANA. Should the business of our partners develop better than currently expected, our indirect sales (partner revenue) could grow stronger than reflected in our outlook and medium-term prospects. This may positively impact our revenue, profit, and cash flows, and result in their exceeding our stated medium-term prospects.
Opportunities from Our Employees
Our employees drive our innovation, provide the value to our customers, and consistently promote our growth and profitability. In 2016, we significantly increased the number of full-time employees in key strategic areas to support our growth ambitions. We anticipate improvements in employee productivity as a result of our continued endeavors in design-thinking principles. As described in theEmployees and Social Investment section, we continuously invest in our talents to increase engagement, collaboration, social innovation, and health.
To ensure continuous innovation and sustained business success, we need to continuously tap into the global talent pool and bring the best and brightest talent to SAP. To do so, we aim to further strengthen our brand perception in the market and optimize our recruiting experience to emphasize our mission to help the world run better and improve people’s lives. Furthermore, we will maximize mobile channels and innovative talent strategies to tap into new talent pools.
Our outlook and medium-term prospects are based on certain assumptions regarding employee turnover and our Business Health Culture Index (as defined in theEmployees and Social Investment section). Should these develop better than expected there might be an upside to employee productivity and engagement. In turn, this might positively impact our revenue, profit, and cash flows, and result in their exceeding our stated medium-term prospects.
For more information about future opportunities from our employees, see theEmployees and Social Performance section.
Opportunities from Our Customer Engagement
SAP goes to market by region, customer segments, line of business, and industry. We evolve and invest in ourgo-to-market coverage model to effectively sell industry-specific solutions while increasing our engagement with customers. We focus on the dynamic and fast-changing landscape each industry faces as technology evolves.
We offer unique services that support a significant return on investment, and continue to actively look at new opportunities to increase the value we deliver to our customers.
In general, our outlook and medium-term prospects are based on certain assumptions regarding the success of ourgo-to-market approaches. If the actualgo-to-market success exceeds these assumptions, this could positively impact our revenue, profit, and cash flows, and result in their exceeding our stated medium-term prospects.
| Combined Management Report | Expected Developments and Opportunities | 130 |
Table of Contents
Events After the Reporting Period
For information about events after the reporting period see the Notes to the Consolidated Financial Statements section,Note (33).
| Combined Management Report | Events After the Reporting Period | 131 |
Table of Contents
 | Consolidated Financial Statements IFRS and Notes |
 132 |
Table of Contents
Consolidated Financial Statements IFRS
Consolidated Income Statements of SAP Group for the Years Ended December 31
€ millions, unless otherwise stated | Notes | 2016 | 2015 | 2014 | ||||||||||||
Cloud subscriptions and support | 2,993 | 2,286 | 1,087 | |||||||||||||
Software licenses | 4,860 | 4,835 | 4,399 | |||||||||||||
Software support | 10,571 | 10,093 | 8,829 | |||||||||||||
Software licenses and support | 15,431 | 14,928 | 13,228 | |||||||||||||
|
|
|
|
|
| |||||||||||
Cloud and software | 18,424 | 17,214 | 14,315 | |||||||||||||
Services | 3,638 | 3,579 | 3,245 | |||||||||||||
|
|
|
|
|
| |||||||||||
| Total revenue | (5) | 22,062 | 20,793 | 17,560 | ||||||||||||
Cost of cloud subscriptions and support | -1,313 | -1,022 | -481 | |||||||||||||
Cost of software licenses and support | -2,182 | -2,291 | -2,076 | |||||||||||||
Cost of cloud and software | -3,495 | -3,313 | -2,557 | |||||||||||||
Cost of services | -3,089 | -2,932 | -2,426 | |||||||||||||
Total cost of revenue | -6,583 | -6,245 | -4,983 | |||||||||||||
Gross profit | 15,479 | 14,548 | 12,578 | |||||||||||||
Research and development | -3,044 | -2,845 | -2,331 | |||||||||||||
Sales and marketing | -6,265 | -5,782 | -4,593 | |||||||||||||
General and administration | -1,005 | -1,048 | -892 | |||||||||||||
Restructuring | (6) | -28 | -621 | -126 | ||||||||||||
TomorrowNow and Versata litigation | (23) | 0 | 0 | -309 | ||||||||||||
Other operating income/expense, net | -3 | 1 | 4 | |||||||||||||
| Total operating expenses | -16,928 | -16,541 | -13,230 | |||||||||||||
|
|
|
|
|
| |||||||||||
| Operating profit | 5,135 | 4,252 | 4,331 | |||||||||||||
|
|
|
|
|
| |||||||||||
| Othernon-operating income/expense, net | (8) | -234 | -256 | 49 | ||||||||||||
Finance income | 230 | 241 | 127 | |||||||||||||
Finance costs | -268 | -246 | -152 | |||||||||||||
| Financial income, net | (9) | -38 | -5 | -25 | ||||||||||||
|
|
|
|
|
| |||||||||||
| Profit before tax | 4,863 | 3,991 | 4,355 | |||||||||||||
Income tax TomorrowNow and Versata litigation | 0 | 0 | 86 | |||||||||||||
Other income tax expense | -1,229 | -935 | -1,161 | |||||||||||||
Income tax expense | (10) | -1,229 | -935 | -1,075 | ||||||||||||
|
|
|
|
|
| |||||||||||
| Profit after tax | 3,634 | 3,056 | 3,280 | |||||||||||||
Attributable to owners of parent | 3,646 | 3,064 | 3,280 | |||||||||||||
Attributable tonon-controlling interests | -13 | -8 | 0 | |||||||||||||
| Earnings per share, basic (in €) | (11) | 3.04 | 2.56 | 2.75 | ||||||||||||
| Earnings per share, diluted (in €) | (11) | 3.04 | 2.56 | 2.74 | ||||||||||||
The accompanying Notes are an integral part of these Consolidated Financial Statements.
| Consolidated Financial Statements IFRS and Notes | 133 |
Table of Contents
Consolidated Statements of Comprehensive Income of SAP Group for the Years Ended December 31
€ millions | Notes | 2016 | 2015 | 2014 | ||||||||||||
| Profit after tax | 3,634 | 3,056 | 3,280 | |||||||||||||
| Items that will not be reclassified to profit or loss | ||||||||||||||||
Remeasurements on defined benefit pension plans, before tax | -10 | -19 | -30 | |||||||||||||
Income tax relating to remeasurements on defined benefit pension plans | (10 | ) | 2 | 2 | 7 | |||||||||||
Remeasurements on defined benefit pension plans, net of tax | -8 | -17 | -23 | |||||||||||||
|
|
|
|
|
| |||||||||||
| Other comprehensive income for items that will not be reclassified to profit or loss, net of tax | -8 | -17 | -23 | |||||||||||||
| Items that will be reclassified subsequently to profit or loss | ||||||||||||||||
Gains (losses) on exchange differences on translation, before tax | 865 | 1,845 | 1,161 | |||||||||||||
Reclassification adjustments on exchange differences on translation, before tax | -1 | 0 | 0 | |||||||||||||
Exchange differences, before tax | 864 | 1,845 | 1,161 | |||||||||||||
Income tax relating to exchange differences on translation | (10 | ) | -25 | 16 | 21 | |||||||||||
Exchange differences, net of tax | (20 | ) | 839 | 1,861 | 1,182 | |||||||||||
Gains (losses) on remeasuringavailable-for-sale financial assets, before tax | -18 | 181 | 130 | |||||||||||||
Reclassification adjustments onavailable-for-sale financial assets, before tax | -26 | -53 | -2 | |||||||||||||
Available-for-sale financial assets, before tax | (26 | ) | -44 | 128 | 128 | |||||||||||
Income tax relating toavailable-for-sale financial assets | (10 | ) | 1 | -2 | 0 | |||||||||||
Available-for-sale financial assets, net of tax | (20 | ) | -43 | 125 | 128 | |||||||||||
Gains (losses) on cash flow hedges, before tax | -24 | -59 | -41 | |||||||||||||
Reclassification adjustments on cash flow hedges, before tax | 8 | 74 | 3 | |||||||||||||
Cash flow hedges, before tax | (25 | ) | -15 | 15 | -38 | |||||||||||
Income tax relating to cash flow hedges | (10 | ) | 4 | -4 | 10 | |||||||||||
Cash flow hedges, net of tax | (20 | ) | -11 | 11 | -28 | |||||||||||
|
|
|
|
|
| |||||||||||
| Other comprehensive income for items that will be reclassified to profit or loss, net of tax | 785 | 1,997 | 1,282 | |||||||||||||
| Other comprehensive income, net of tax | 777 | 1,980 | 1,259 | |||||||||||||
|
|
|
|
|
| |||||||||||
| Total comprehensive income | 4,410 | 5,036 | 4,539 | |||||||||||||
Attributable to owners of parent | 4,423 | 5,044 | 4,539 | |||||||||||||
Attributable tonon-controlling interests | -13 | -8 | 0 | |||||||||||||
The accompanying Notes are an integral part of these Consolidated Financial Statements.
| Consolidated Financial Statements IFRS and Notes | Consolidated Financial Statements IFRS | 134 |
Table of Contents
Consolidated Statements of Financial Position of SAP Group as at December 31
€ millions | Notes | 2016 | 2015 | |||||||||
Cash and cash equivalents | 3,702 | 3,411 | ||||||||||
Other financial assets | (12 | ) | 1,124 | 351 | ||||||||
Trade and other receivables | (13 | ) | 5,924 | 5,274 | ||||||||
Othernon-financial assets | (14 | ) | 581 | 468 | ||||||||
Tax assets | 233 | 235 | ||||||||||
|
|
|
| |||||||||
Total current assets | 11,564 | 9,739 | ||||||||||
Goodwill | (15 | ) | 23,311 | 22,689 | ||||||||
Intangible assets | (15 | ) | 3,786 | 4,280 | ||||||||
Property, plant, and equipment | (16 | ) | 2,580 | 2,192 | ||||||||
Other financial assets | (12 | ) | 1,358 | 1,336 | ||||||||
Trade and other receivables | (13 | ) | 126 | 87 | ||||||||
Othernon-financial assets | (14 | ) | 532 | 332 | ||||||||
Tax assets | 450 | 282 | ||||||||||
Deferred tax assets | (10 | ) | 570 | 453 | ||||||||
|
|
|
| |||||||||
Totalnon-current assets | 32,713 | 31,651 | ||||||||||
|
|
|
| |||||||||
| Total assets | 44,277 | 41,390 | ||||||||||
| Consolidated Financial Statements IFRS and Notes | Consolidated Financial Statements IFRS | 135 |
Table of Contents
Consolidated Statements of Financial Position of SAP Group as at December 31
€ millions | Notes | 2016 | 2015 | |||||||||
Trade and other payables | (17 | ) | 1,281 | 1,088 | ||||||||
Tax liabilities | 316 | 230 | ||||||||||
Financial liabilities | (17 | ) | 1,813 | 841 | ||||||||
Othernon-financial liabilities | (17 | ) | 3,699 | 3,407 | ||||||||
Provisions | (18 | ) | 183 | 299 | ||||||||
Deferred income | (19 | ) | 2,383 | 2,001 | ||||||||
|
|
|
| |||||||||
Total current liabilities | 9,674 | 7,867 | ||||||||||
Trade and other payables | (17 | ) | 127 | 81 | ||||||||
Tax liabilities | 365 | 402 | ||||||||||
Financial liabilities | (17 | ) | 6,481 | 8,681 | ||||||||
Othernon-financial liabilities | (17 | ) | 461 | 331 | ||||||||
Provisions | (18 | ) | 217 | 180 | ||||||||
Deferred tax liabilities | (10 | ) | 411 | 448 | ||||||||
Deferred income | (19 | ) | 143 | 106 | ||||||||
Totalnon-current liabilities | 8,205 | 10,228 | ||||||||||
|
|
|
| |||||||||
Total liabilities | 17,880 | 18,095 | ||||||||||
Issued capital | 1,229 | 1,229 | ||||||||||
Share premium | 599 | 558 | ||||||||||
Retained earnings | 22,302 | 20,044 | ||||||||||
Other components of equity | 3,346 | 2,561 | ||||||||||
Treasury shares | -1,099 | -1,124 | ||||||||||
Equity attributable to owners of parent | 26,376 | 23,267 | ||||||||||
Non-controlling interests | 21 | 28 | ||||||||||
|
|
|
| |||||||||
Total equity | (20 | ) | 26,397 | 23,295 | ||||||||
|
|
|
| |||||||||
| Total equity and liabilities | 44,277 | 41,390 | ||||||||||
The accompanying Notes are an integral part of these Consolidated Financial Statements.
| Consolidated Financial Statements IFRS and Notes | Consolidated Financial Statements IFRS | 136 |
Table of Contents
Consolidated Statements of Changes in Equity of SAP Group for the Years Ended December 31
€ millions | Equity Attributable to Owners of Parent | Non- Controlling Interests | Total Equity | |||||||||||||||||||||||||||||
| Issued Capital | Share Premium | Retained Earnings | Other Components of Equity | Treasury Shares | Total | |||||||||||||||||||||||||||
Notes | (20) | (20) | (20) |
| (20) |
|
|
| ||||||||||||||||||||||||
| January 1, 2014 | 1,229 | 551 | 16,258 | -718 | -1,280 | 16,040 | 8 | 16,048 | ||||||||||||||||||||||||
Profit after tax | 3,280 | 3,280 | 3,280 | |||||||||||||||||||||||||||||
Other comprehensive income | -23 | 1,282 | 1,259 | 1,259 | ||||||||||||||||||||||||||||
| Comprehensive income | 3,257 | 1,282 | 4,539 | 4,539 | ||||||||||||||||||||||||||||
| Share-based payments | 34 | 34 | 34 | |||||||||||||||||||||||||||||
| Dividends | -1,194 | -1,194 | -1,194 | |||||||||||||||||||||||||||||
| Reissuance of treasury shares under share-based payments | 29 | 56 | 85 | 85 | ||||||||||||||||||||||||||||
| Additions from business combinations | 26 | 26 | ||||||||||||||||||||||||||||||
| Other changes | -4 | -4 | -4 | |||||||||||||||||||||||||||||
|
|
|
|
|
|
|
|
|
|
|
|
|
|
|
| |||||||||||||||||
| December 31, 2014 | 1,229 | 614 | 18,317 | 564 | -1,224 | 19,499 | 34 | 19,534 | ||||||||||||||||||||||||
Profit after tax | 3,064 | 3,064 | -8 | 3,056 | ||||||||||||||||||||||||||||
Other comprehensive income | -17 | 1,997 | 1,980 | 1,980 | ||||||||||||||||||||||||||||
| Comprehensive income | 3,047 | 1,997 | 5,044 | -8 | 5,036 | |||||||||||||||||||||||||||
| Share-based payments | -136 | -136 | -136 | |||||||||||||||||||||||||||||
| Dividends | -1,316 | -1,316 | -1,316 | |||||||||||||||||||||||||||||
| Reissuance of treasury shares under share-based payments | 80 | 100 | 180 | 180 | ||||||||||||||||||||||||||||
| Other changes | -4 | -4 | 2 | -2 | ||||||||||||||||||||||||||||
|
|
|
|
|
|
|
|
|
|
|
|
|
|
|
| |||||||||||||||||
| December 31, 2015 | 1,229 | 558 | 20,044 | 2,561 | -1,124 | 23,267 | 28 | 23,295 | ||||||||||||||||||||||||
Profit after tax | 3,646 | 3,646 | -13 | 3,634 | ||||||||||||||||||||||||||||
Other comprehensive income | -8 | 785 | 777 | 777 | ||||||||||||||||||||||||||||
| Comprehensive income | 3,638 | 785 | 4,423 | -13 | 4,410 | |||||||||||||||||||||||||||
| Share-based payments | 16 | 16 | 16 | |||||||||||||||||||||||||||||
| Dividends | -1,378 | -1,378 | -1,378 | |||||||||||||||||||||||||||||
| Reissuance of treasury shares under share-based payments | 25 | 25 | 50 | 50 | ||||||||||||||||||||||||||||
| Other changes | -2 | -2 | 6 | 4 | ||||||||||||||||||||||||||||
|
|
|
|
|
|
|
|
|
|
|
|
|
|
|
| |||||||||||||||||
| December 31, 2016 | 1,229 | 599 | 22,302 | 3,346 | -1,099 | 26,376 | 21 | 26,397 | ||||||||||||||||||||||||
The accompanying Notes are an integral part of these Consolidated Financial Statements.
| Consolidated Financial Statements IFRS and Notes | Consolidated Financial Statements IFRS | 137 |
Table of Contents
Consolidated Statements of Cash Flows of SAP Group for the Years Ended December 31
€ millions | Notes | 2016 | 2015 | 2014 | ||||||||||||
| Profit after tax | 3,634 | 3,056 | 3,280 | |||||||||||||
| Adjustments to reconcile profit after taxes to net cash provided by operating activities: | ||||||||||||||||
Depreciation and amortization | (15 | ) | 1,268 | 1,289 | 1,010 | |||||||||||
Income tax expense | (10 | ) | 1,229 | 935 | 1,075 | |||||||||||
Financial income, net | (9 | ) | 38 | 5 | 25 | |||||||||||
Decrease/increase in sales and bad debt allowances on trade receivables | 51 | 45 | 47 | |||||||||||||
Other adjustments fornon-cash items | 39 | -2 | 70 | |||||||||||||
Decrease/increase in trade and other receivables | -675 | -844 | -286 | |||||||||||||
Decrease/increase in other assets | -248 | -313 | -329 | |||||||||||||
Decrease/increase in trade payables, provisions, and other liabilities | 513 | 757 | 573 | |||||||||||||
Decrease/increase in deferred income | 368 | 218 | 16 | |||||||||||||
| Cash outflows due to TomorrowNow and Versata litigation | 0 | 0 | -555 | |||||||||||||
| Interest paid | -190 | -172 | -130 | |||||||||||||
| Interest received | 79 | 82 | 59 | |||||||||||||
| Income taxes paid, net of refunds | -1,477 | -1,420 | -1,356 | |||||||||||||
|
|
|
|
|
| |||||||||||
| Net cash flows from operating activities | 4,628 | 3,638 | 3,499 | |||||||||||||
Business combinations, net of cash and cash equivalents acquired | -106 | -39 | -6,360 | |||||||||||||
Cash receipts from derivative financial instruments related to business combinations | 0 | 266 | -111 | |||||||||||||
| Total cash flows for business combinations, net of cash and cash equivalents acquired | -106 | 226 | -6,472 | |||||||||||||
| Purchase of intangible assets and property, plant, and equipment | -1,001 | -636 | -737 | |||||||||||||
| Proceeds from sales of intangible assets or property, plant, and equipment | 63 | 68 | 46 | |||||||||||||
| Purchase of equity or debt instruments of other entities | -1,549 | -1,871 | -910 | |||||||||||||
| Proceeds from sales of equity or debt instruments of other entities | 793 | 1,880 | 833 | |||||||||||||
|
|
|
|
|
| |||||||||||
| Net cash flows from investing activities | -1,799 | -334 | -7,240 | |||||||||||||
| Dividends paid | (21 | ) | -1,378 | -1,316 | -1,194 | |||||||||||
| Proceeds from reissuance of treasury shares | 27 | 64 | 51 | |||||||||||||
Proceeds from borrowings | 400 | 1,748 | 7,503 | |||||||||||||
Cash receipts from swap contracts | 43 | 0 | 0 | |||||||||||||
| Total cash flows from proceeds from borrowings | 443 | 1,748 | 7,503 | |||||||||||||
| Repayments of borrowings | -1,800 | -3,852 | -2,062 | |||||||||||||
| Transactions withnon-controlling interests | 3 | 0 | 0 | |||||||||||||
|
|
|
|
|
| |||||||||||
| Net cash flows from financing activities | -2,705 | -3,356 | 4,298 | |||||||||||||
| Effect of foreign currency rates on cash and cash equivalents | 167 | 135 | 23 | |||||||||||||
| Net decrease/increase in cash and cash equivalents | 291 | 83 | 580 | |||||||||||||
|
|
|
|
|
| |||||||||||
| Cash and cash equivalents at the beginning of the period | (21 | ) | 3,411 | 3,328 | 2,748 | |||||||||||
|
|
|
|
|
| |||||||||||
| Cash and cash equivalents at the end of the period | (21 | ) | 3,702 | 3,411 | 3,328 | |||||||||||
The accompanying Notes are an integral part of these Consolidated Financial Statements.
| Consolidated Financial Statements IFRS and Notes | Consolidated Financial Statements IFRS | 138 |
Table of Contents
(1) General Information About Consolidated Financial Statements
The accompanying Consolidated Financial Statements for 2016 of SAP SE and its subsidiaries (collectively, “we,” “us,” “our,” “SAP,” “Group,” and “Company”) have been prepared in accordance with International Financial Reporting Standards (IFRS).
We have applied all standards and interpretations that were effective on and endorsed by the European Union (EU) as at December 31, 2016. There were no standards or interpretations impacting our Consolidated Financial Statements for the years ended December 31, 2016, 2015, and 2014, that were effective but not yet endorsed. Therefore, our Consolidated Financial Statements comply with both IFRS as issued by the International Accounting Standards Board (IASB) and with IFRS as endorsed by the EU.
Our Executive Board approved the Consolidated Financial Statements on February 22, 2017, for submission to our Supervisory Board.
All amounts included in the Consolidated Financial Statements are reported in millions of euros (€ millions) except where otherwise stated. Due to rounding, numbers presented throughout this document may not add up precisely to the totals we provide and percentages may not precisely reflect the absolute figures.
Entities Consolidated in the Financial Statements
| Total | ||||
| December 31, 2014 | 287 | |||
| Additions | 8 | |||
| Disposals | -40 | |||
|
| |||
| December 31, 2015 | 255 | |||
| Additions | 8 | |||
| Disposals | -18 | |||
|
| |||
| December 31, 2016 | 245 | |||
The additions relate to legal entities added in connection with acquisitions and foundations. The disposals are mainly due to mergers and liquidations of legal entities.
(3) Summary of Significant Accounting Policies
(3a) Bases of Measurement
The Consolidated Financial Statements have been prepared on the historical cost basis except for the following:
| ∎ | Derivative financial instruments,available-for-sale financial assets, and liabilities for cash-settled share-based payments are measured at fair value. |
| ∎ | Monetary assets and liabilities denominated in foreign currencies are translated atperiod-end exchange rates. |
| ∎ | Post-employment benefits are measured according to IAS 19 (Employee Benefits) as described inNote (18a). |
Where applicable, information about the methods and assumptions used in determining the respective measurement bases is disclosed in the Notes specific to that asset or liability.
(3b) Relevant Accounting Policies
Reclassifications
Under the ONE Service approach, we combined premium support services and professional services under one comprehensive service offering. This combination triggered changes in our servicego-to-market methodology and setup, resulting in an organizational separation of services sales and services delivery. As a result of these changes, we now classify all sales expenses relating to our services offering, which were previously recognized as cost of services, as sales and marketing expenses. We take the view that this policy provides more reliable and more relevant information because it classifies sales and marketing expenses consistently across our product and services portfolio.
The new policy has been applied retrospectively to the prior periods presented. The effect on the financial year 2015 was an increase in sales and marketing expenses and a respective decrease in cost of services totalling €381 million (2014: €290 million).
Business Combinations and Goodwill
We decide on atransaction-by-transaction basis whether to measure thenon-controlling interest in the acquiree at fair value or at the proportionate share of the acquiree’s identifiable net assets. Acquisition-related costs are accounted as expense in the periods in which the costs are incurred and the services are received, with the expense being classified as general and administration expense.
Foreign Currencies
Income and expenses and operating cash flows of our foreign subsidiaries that use a functional currency other than the euro are
| Consolidated Financial Statements IFRS and Notes | Notes | 139 |
Table of Contents
translated at average rates of foreign exchange (FX) computed on a monthly basis. Exchange differences resulting from foreign currency transactions are recognized in othernon-operating income/expense, net.
The exchange rates of key currencies affecting the Company were as follows:
Exchange Rates
Equivalent to €1 | Middle Rate as at December 31 | Annual Average Exchange Rate | ||||||||||||||||||||||
| 2016 | 2015 | 2016 | 2015 | 2014 | ||||||||||||||||||||
| U.S. dollar | USD | 1.0541 | 1.0887 | 1.1045 | 1.1071 | 1.3198 | ||||||||||||||||||
| Pound sterling | GBP | 0.8562 | 0.7340 | 0.8206 | 0.7255 | 0.8037 | ||||||||||||||||||
| Japanese yen | JPY | 123.40 | 131.07 | 119.77 | 134.12 | 140.61 | ||||||||||||||||||
| Swiss franc | CHF | 1.0739 | 1.0835 | 1.0886 | 1.0688 | 1.2132 | ||||||||||||||||||
| Canadian dollar | CAD | 1.4188 | 1.5116 | 1.4606 | 1.4227 | 1.4645 | ||||||||||||||||||
| Australian dollar | AUD | 1.4596 | 1.4897 | 1.4850 | 1.4753 | 1.4650 | ||||||||||||||||||
Revenue Recognition
Classes of Revenue
We derive our revenue from fees charged to our customers for (a) the use of our hosted cloud offerings, (b) licenses to ouron-premise software products, and (c) standardized and premium support services, consulting, customer-specificon-premise software development agreements, training, and other services.
Cloud and software revenue, as presented in our Consolidated Income Statements, is the sum of our cloud subscriptions and support revenue, our software licenses revenue, and our software support revenue.
| ∎ | Revenue from cloud subscriptions and support represents fees earned from providing customers with the following: |
| – | Software-as-a-Service (SaaS), that is, a right to use software functionality in a cloud-based-infrastructure (hosting) provided by SAP, where the customer does not have the right to terminate the hosting contract and take possession of the software to run it on the customer’s own IT infrastructure or by a third-party hosting provider without significant penalty, or |
| – | Platform-as-a-Service (PaaS), that is, access to a cloud-based infrastructure to develop, run, and manage applications, or |
| – | Infrastructure-as-a-Service (IaaS), that is, hosting services for software hosted by SAP, where the customer has the right to terminate the hosting contract and take possession of the software at any time without significant penalty and related application management services, or |
| – | Additional premium cloud subscription support beyond the regular support that is embedded in the basic cloud subscription fees, or |
| – | Business Network Services, that is, connecting companies in a cloud-based-environment to perform business processes between the connected companies. |
| ∎ | Software licenses revenue represents fees earned from the sale or license of software to customers for use on the customer’s premises, in other words, where the customer has the right to take possession of the software for installation on the customer’s premises(on-premise software). Software licenses revenue includes revenue from both the sale of our standard software products and customer-specificon-premise software development agreements. |
| ∎ | Software support revenue represents fees earned from providing customers with standardized support services which comprise unspecified future software updates, upgrades, enhancements, and technical product support services foron-premise software products. We do not sell separately technical product support or unspecified software upgrades, updates, and enhancements. Accordingly, we do not distinguish within software support revenue or within cost of software support the amounts attributable to technical support services and unspecified software upgrades, updates, and enhancements. |
Services revenue as presented in our Consolidated Income Statements represents fees earned from providing customers with the following:
| ∎ | Professional services, that is, consulting services that primarily relate to the installation and configuration of our cloud subscriptions andon-premise software products |
| ∎ | Premium support services, that is,high-end support services tailored to customer requirements |
| ∎ | Training services |
| ∎ | Messaging services (primarily transmission of electronic text messages from one mobile phone provider to another) |
| ∎ | Payment services in connection with our travel and expense management offerings. |
We account forout-of-pocket expenses invoiced by SAP and reimbursed by customers as cloud subscriptions and support, software support, or services revenue, depending on the nature of the service for which theout-of-pocket expenses were incurred.
Timing of Revenue Recognition
We do not start recognizing revenue from customer arrangements before evidence of an arrangement exists, the amount of revenue and associated costs can be measured reliably, collection of the related receivable is probable and the delivery has occurred, respectively the services have been rendered. If, for any of our product or service offerings, we determine at the outset of an arrangement that the amount of revenue cannot be measured reliably, we conclude that the inflow of economic benefits associated with the transaction is not probable, and we defer revenue recognition until the arrangement fee
| Consolidated Financial Statements IFRS and Notes | Notes | 140 |
Table of Contents
becomes due and payable by the customer. If, at the outset of an arrangement, we determine that collectability is not probable, we conclude that the inflow of economic benefits associated with the transaction is not probable, and we defer revenue recognition until the earlier of when collectability becomes probable or payment is received. If a customer is specifically identified as a bad debtor at a later point in time, we stop recognizing revenue from the customer except to the extent of the fees that have already been collected.
In general, we invoice fees for standard software upon contract closure and delivery. Periodical fixed fees for cloud subscription services and software support services are mostly invoiced yearly or quarterly in advance. Fees based on actual transaction volumes for cloud subscriptions and fees charged fornon-periodical services are invoiced as the services are delivered.
Cloud subscriptions and support revenue is recognized as the services are performed. Where a periodical fixed fee is agreed for the right to continuously access and use a cloud offering for a certain term, the fee is recognized ratably over the term covered by the fixed fee. Fees that are based on actual transaction volumes are recognized as the transactions occur. In general, our cloud subscriptions and support contracts include certainset-up activities. If theseset-up activities have stand-alone value, they are accounted for as distinct deliverables with the respective revenue being classified as service revenue and recognized as theset-up activity is performed. If we conclude that suchset-up activities are not distinct deliverables, we do not account for them separately.
Revenue from the sale of perpetual licenses of our standardon-premise software products is recognized upon delivery of the software, that is, when the customer has access to the software. Occasionally, we licenseon-premise software for a specified period of time. Revenue from short-term time-based licenses, which usually include support services during the license period, is recognized ratably over the license term. Revenue from multi-year time-based licenses that include support services, whether separately priced or not, is recognized ratably over the license term unless a substantive support service renewal rate exists; if this is the case, the amount allocated to the delivered software is recognized as software licenses revenue based on the residual method once the basic criteria described above have been met.
In general, ouron-premise software license agreements include neither acceptance-testing provisions nor rights to return the software. If an arrangement allows for customer acceptance-testing of the software, we defer revenue until the earlier of customer acceptance or when the acceptance right lapses. If an arrangement allows for returning the software, we defer recognition of software revenue until the right to return expires.
We usually recognize revenue fromon-premise software arrangements involving resellers on evidence of sell-through by the reseller to the end customer, because the inflow of the economic benefits associated with the arrangements to us is not probable before sell-through has occurred.
Software licenses revenue from customer-specificon-premise software development agreements that qualify for revenue recognition by reference to the stage of completion of the contract activity is recognized using thepercentage-of-completion method based on contract costs incurred to date as a percentage of total estimated contract costs required to complete the development work.
Under our standardized support services, our performance obligation is to stand ready to provide technical product support and unspecified updates, upgrades, and enhancements on awhen-and-if-available basis. Consequently, we recognize support revenue ratably over the term of the support arrangement.
We recognize services revenue as the services are rendered. Usually, our professional services contracts and premium support services contracts do not involve significant production, modification, or customization of software, and the related revenue is recognized as the services are provided using thepercentage-of-completion method of accounting. For messaging services, we measure the progress of service rendering based on the number of messages successfully processed and delivered except for fixed-price messaging arrangements, for which revenue is recognized ratably over the contractual term of the arrangement. Revenue from our training services is recognized when the customer consumes the respective classroom training. Foron-demand training services, whereby our performance obligation is to stand ready and provide the customer with access to the training courses and learning content services, revenue is recognized ratably over the contractual term of the arrangement.
Measurement of Revenue
Revenue is recognized net of returns and allowances, trade discounts, and volume rebates.
Our contributions to resellers that allow our resellers to execute qualified and approved marketing activities are recognized as an offset to revenue, unless we obtain a separate identifiable benefit for the contribution and the fair value of that benefit is reasonably estimable.
Multiple-Element Arrangements
We combine two or more customer contracts with the same customer and account for the contracts as a single arrangement if the contracts are negotiated as a package or otherwise linked.
We account for the different goods and services promised under our customer contracts as separate units of account (distinct deliverables) unless:
| ∎ | The contract involves significant production, modification, or customization of the cloud subscription oron-premise software; and |
| ∎ | The services are not available from third-party vendors and are therefore deemed essential to the cloud subscription oron-premise software. |
Goods and services that do not qualify as distinct deliverables are combined into one unit of account (combined deliverables).
| Consolidated Financial Statements IFRS and Notes | Notes | 141 |
Table of Contents
The portion of the transaction fee allocated to one distinct deliverable is recognized in revenue separately under the policies applicable to the respective deliverable. For combined deliverables consisting of cloud offerings oron-premise software and other services, the allocated portion of the transaction fee is recognized using thepercentage-of-completion method, as outlined above, or over the cloud subscription term, if applicable, depending on which service term is longer.
We allocate the total transaction fee of a customer contract to the distinct deliverables under the contract based on their fair values. The allocation is done relative to the distinct deliverables’ individual fair values unless the residual method is applied as outlined below. Fair value is determined by company-specific objective evidence of fair value, which is the price charged consistently when that element is sold separately or, for elements not yet sold separately, the price established by our management if it is probable that the price will not change before the element is sold separately. Where company-specific objective evidence of fair value and third-party evidence of selling price cannot be established due to lacking stand-alone sales or lacking pricing consistency, we determine the fair value of a distinct deliverable by estimating its stand-alone selling price. Company-specific objective evidence of fair value and estimated stand-alone selling prices (ESP) for our major products and services are determined as follows:
| ∎ | We derive the company-specific objective evidence of fair value for our renewable support services from the rates charged to renew the support services annually after an initial period. Such renewal rates generally represent a fixed percentage of the discounted software license fee charged to the customer. The majority of our customers renew their annual support service contracts at these rates. |
| ∎ | Company-specific objective evidence of fair value for our service offerings is derived from our consistently priced historic sales. |
| ∎ | Company-specific objective evidence of fair value can generally not be established for our cloud subscriptions. ESP for these offerings is determined based on the rates agreed with the individual customers to apply if and when the subscription arrangement renews. We determine ESP by considering multiple factors which include, but are not limited to, the following: |
| – | Substantive renewal rates stipulated in the cloud arrangement; and |
| – | Gross margin expectations and expected internal costs of the respective cloud business model. |
| ∎ | For ouron-premise software offerings, company-specific objective evidence of fair value can generally not be established and representative stand-alone selling prices are not discernible from past transactions. We therefore apply the residual method to multiple-element arrangements that includeon-premise software. Under this method, the transaction fee is allocated to all undelivered elements in the amount of their respective fair values and the remaining amount of the arrangement fee is allocated to the delivered element. With this policy, we have considered the guidance provided by Financial Accounting Standards Board (FASB) Accounting Standards Codification (ASC) Subtopic985-605 (Software Revenue Recognition), where applicable, as authorized by IAS 8 (Accounting Policies, Changes in Accounting Estimates and Errors). |
We also consider FASB ASC985-605 in our accounting for options that entitle the customer to purchase, in the future, additionalon-premise software or services. We allocate revenue to future incremental discounts whenever customers are granted a material right, that is, the right to license additionalon-premise software at a higher discount than the one given within the initial software license arrangement, or to purchase or renew services at rates below the fair values established for these services. We also consider whether future purchase options included in arrangements for cloud subscription deliverables constitute a material right.
Cost of Cloud and Software
Cost of cloud and software includes the costs incurred in producing the goods and providing the services that generate cloud and software revenue. Consequently, this line item primarily includes employee expenses relating to these services, amortization of acquired intangibles, fees for third-party licenses, shipping,ramp-up cost, and depreciation of our property, plant, and equipment.
Cost of Services
Cost of services includes the costs incurred in providing the services that generate service revenue, such as consulting and training activities, messaging, as well as certain forms of hosting solutions for our customers and our partners.
Research and Development
Research and development includes the costs incurred by activities related to the development of software solutions (new products, updates, and enhancements) including resource and hardware costs for the development systems.
We have determined that the conditions for recognizing internally generated intangible assets from our software development activities are not met until shortly before the products are available for sale. Development costs incurred after the recognition criteria are met have not been material. Consequently, research and development costs are expensed as incurred.
Sales and Marketing
Sales and marketing includes costs incurred for the selling and marketing activities related to our software and cloud solutions as well as our service portfolio.
General and Administration
General and administration includes costs related to finance and administrative functions, human resources, and general management as long as they are not directly attributable to one of the other operating expense line items.
Accounting for Uncertainties in Income Taxes
We measure current and deferred tax liabilities and assets for uncertainties in income taxes based on our best estimate of the most likely amount payable to or recoverable from the tax authorities, assuming that the tax authorities will examine the amounts reported to them and have full knowledge of all relevant information.
| Consolidated Financial Statements IFRS and Notes | Notes | 142 |
Table of Contents
Share-Based Payments
Share-based payments cover cash-settled and equity-settled awards issued to our employees. The respective expenses are recognized as employee benefits expenses and classified in our Consolidated Income Statements according to the activities that the employees owning the awards perform.
Under certain programs, we grant our employees discounts on purchases of SAP shares. Since those discounts are not dependent on future services to be provided by our employees, the discount is recognized as an expense when the discounts are granted.
Where we hedge our exposure to cash-settled awards, changes in the fair value of the respective hedging instruments are also recognized as employee benefits expenses in profit or loss. The fair values of hedging instruments are based on market data reflecting current market expectations.
For more information about our share-based payments, seeNote (27).
Financial Assets
Our financial assets comprise cash and cash equivalents (highly liquid investments with original maturities of three months or less), loans and receivables, acquired equity and debt investments, and derivative financial instruments (derivatives) with positive fair values. Financial assets are only classified as financial assets at fair value through profit or loss if they are held for trading, as we do not designate financial assets at fair value through profit or loss. All other financial assets are classified as loans and receivables if we do not designate them asavailable-for-sale financial assets.
Regular-way purchases and sales of financial assets are recorded as at the trade date.
Among the other impairment indicators in IAS 39 (Financial Instruments: Recognition and Measurement), for an investment in an equity security, objective evidence of impairment includes a significant (more than 20%) or prolonged (a period of more than nine months) decline in its fair value. Impairment losses on financial assets are recognized in financial income, net. Foravailable-for-sale financial assets, which arenon-derivative financial assets that are not assigned to loans and receivables or financial assets at fair value through profit or loss, impairment losses directly reduce an asset’s carrying amount, while impairments on loans and receivables are recorded using allowance accounts. Such allowance accounts are always presented together with the accounts containing the asset’s cost in other financial assets. Account balances are charged off against the respective allowance after all collection efforts have been exhausted and the likelihood of recovery is considered remote.
Derivatives
Derivatives Not Designated as Hedging Instruments
Many transactions constitute economic hedges, and therefore contribute effectively to the securing of financial risks but do not qualify for hedge accounting under IAS 39. To hedge currency risks inherent in foreign-currency denominated and recognized monetary assets and liabilities, we do not designate ourheld-for-trading derivative financial instruments as accounting hedges, because the profits and losses from the underlying transactions are recognized in profit or loss in the same periods as the profits or losses from the derivatives.
In addition, we occasionally have contracts that contain foreign currency embedded derivatives that are required to be accounted for separately.
Derivatives Designated as Hedging Instruments
We use derivatives to hedge foreign currency risk or interest rate risk and designate them as cash flow or fair value hedges if they qualify for hedge accounting under IAS 39. For more information about our hedges, seeNote (25).
a) Cash Flow Hedge
In general, we apply cash flow hedge accounting to the foreign currency risk of highly probable forecasted transactions and interest rate risk on variable rate financial liabilities.
With regard to foreign currency risk, hedge accounting relates to the spot price and the intrinsic values of the derivatives designated and qualifying as cash flow hedges, while gains and losses on the interest element and on those time values excluded from the hedging relationship as well as the ineffective portion of gains or losses are recognized in profit or loss as they occur.
b) Fair Value Hedge
We apply fair value hedge accounting for certain of our fixed rate financial liabilities.
Valuation and Testing of Effectiveness
The effectiveness of the hedging relationship is tested prospectively and retrospectively. Prospectively, we apply the critical terms match for our foreign currency hedges, as currencies, maturities, and the amounts are identical for the forecasted transactions and the spot element of the forward exchange rate contract or intrinsic value of the currency options, respectively. For interest rate swaps, we also apply the critical terms match, as the notional amounts, currencies, maturities, basis of the variable legs or fixed legs, respectively, reset dates, and the dates of the interest and principal payments are identical for the debt instrument and the corresponding interest rate swaps. Therefore, over the life of the hedging instrument, the changes in the designated components of the hedging instrument will offset the impact of fluctuations of the underlying hedged items.
The method of testing effectiveness retrospectively depends on the type of the hedge as described further below:
a) Cash Flow Hedge
Retrospectively, effectiveness is tested on a cumulative basis applying the dollar offset method by using the hypothetical derivative method. Under this approach, the change in fair value of a constructed hypothetical derivative with terms reflecting the relevant terms of the hedged item is compared to the change in the fair value of the hedging instrument employing its relevant terms. The hedge is deemed highly effective if the results are within the range 80% to 125%.
| Consolidated Financial Statements IFRS and Notes | Notes | 143 |
Table of Contents
b) Fair Value Hedge
Retrospectively, effectiveness is tested using statistical methods in the form of a regression analysis, by which the validity and extent of the relationship between the change in value of the hedged items as the independent variable and the fair value change of the derivatives as the dependent variable is determined. The hedge is deemed highly effective if the determination coefficient between the hedged items and the hedging instruments exceeds 0.8 and the slope coefficient lies within a range of –0.8 to –1.25.
Trade and Other Receivables
Trade receivables are recorded at invoiced amounts less sales allowances and allowances for doubtful accounts. We record these allowances based on a specific review of all significant outstanding invoices. When analyzing the recoverability of our trade receivables, we consider the following factors:
| ∎ | First, we consider the financial solvency of specific customers and record an allowance for specific customer balances when we believe it is probable that we will not collect the amount due according to the contractual terms of the arrangement. |
| ∎ | Second, we evaluate homogenous portfolios of trade receivables according to their default risk primarily based on the age of the receivable and historical loss experience, but also taking into consideration general market factors that might impact our trade receivable portfolio. We record a general bad debt allowance to record impairment losses for a portfolio of trade receivables when we believe that the age of the receivables indicates that it is probable that a loss has occurred and we will not collect some or all of the amounts due. |
Account balances are written off, that is, charged off against the allowance after all collection efforts have been exhausted and the likelihood of recovery is considered remote.
In our Consolidated Income Statements, expenses from recording bad debt allowances for a portfolio of trade receivables are classified as other operating income/expense, net, whereas expenses from recording bad debt allowances for specific customer balances are classified as cost of cloud and software or cost of services, depending on the transaction from which the respective trade receivable results. Sales allowances are recorded as an offset to the respective revenue item.
Included in trade receivables are unbilled receivables related tofixed-fee andtime-and-material consulting arrangements for contract work performed to date.
OtherNon-Financial Assets
Othernon-financial assets are recorded at amortized cost. The capitalized contract cost mainly results from the capitalization of direct and incremental cost incurred when obtaining a customer cloud subscription contract. We amortize these assets on a straight-line basis over the period of providing the cloud subscriptions to which the assets relate.
Goodwill and Intangible Assets
We classify intangible assets according to their nature and use in our operation. Software and database licenses consist primarily of technology for internal use, whereas acquired technology consists primarily of purchased software to be incorporated into our product offerings andin-process research and development. Customer relationship and other intangibles consist primarily of customer contracts and acquired trademark licenses.
All our purchased intangible assets other than goodwill have finite useful lives. They are initially measured at acquisition cost and subsequently amortized either based on expected consumption of economic benefits or on a straight-line basis over their estimated useful lives ranging from two to 20 years.
Amortization for acquiredin-process research and development project assets starts when the projects are complete and the developed software is taken to the market. We typically amortize these intangibles over five to seven years.
Amortization expenses of intangible assets are classified as cost of cloud and software, cost of services, research and development, sales and marketing, and general and administration, depending on the use of the respective intangible assets.
The annual goodwill impairment test is performed at the level of our operating segments since there are no lower levels in SAP at which goodwill is monitored for internal management purposes. The test is performed at the same time for all operating segments.
Property, Plant, and Equipment
Property, plant, and equipment are carried at acquisition cost plus the fair value of related asset retirement costs if any and if reasonably estimable, less accumulated depreciation.
Property, plant, and equipment are depreciated over their expected useful lives, generally using the straight-line method.
Useful Lives of Property, Plant, and Equipment
| Buildings | Predominantly 25 to 50 years | |
| Leasehold improvements | Based on the term of the lease contract | |
| Information technology equipment | 3 to 5 years | |
| Office furniture | 4 to 20 years | |
| Automobiles | 4 to 5 years |
Impairment of Goodwill andNon-Current Assets
Impairment losses, if any, are presented in other operating income/expense, net in profit or loss.
| Consolidated Financial Statements IFRS and Notes | Notes | 144 |
Table of Contents
Liabilities
Financial Liabilities
Financial liabilities include trade and other payables, bank loans, issued bonds, private placements, and other financial liabilities that comprise derivative andnon-derivative financial liabilities. They are classified as financial liabilities at amortized cost and at fair value through profit or loss. The latter include only those financial liabilities that are held for trading, as we do not designate financial liabilities at fair value through profit or loss.
Customer funding liabilities are funds we draw from and make payments on behalf of our customers for customers’ employee expense reimbursements, related credit card payments, and vendor payments. We present these funds in cash and cash equivalents and record our obligation to make these expense reimbursements and payments on behalf of our customers as customer funding liabilities.
Expenses and gains/losses on financial liabilities mainly consist of interest expense, which is recognized based on the effective interest method.
Provisions
The employee-related provisions include, amongst others, long-term employee benefits. They are secured by pledged reinsurance coverage and are offset against the settlement amount of the secured commitment.
Post-Employment Benefits
The discount rates used in measuring our post-employment benefit assets and liabilities are derived from rates available on high-quality corporate bonds and government bonds for which the timing and amounts of payments match the timing and the amounts of our projected pension payments. The assumptions used to calculate pension liabilities and costs are disclosed inNote (18a). Net interest expense and other expenses related to defined benefit plans are recognized as employee benefits expenses and classified in our Consolidated Income Statements according to the activities that the employees owning the awards perform.
Since our domestic defined benefit pension plans primarily consist of an employee-financed post-retirement plan that is fully financed with qualifying insurance policies, current service cost may become a credit as a result of adjusting the defined benefit liability’s carrying amount to the fair value of the qualifying plan assets. Such adjustments are recorded in service cost.
Deferred Income
Deferred income is recognized as cloud subscriptions and support revenue, software licenses revenue, software support revenue, or services revenue, depending on the reason for the deferral, once the basic applicable revenue recognition criteria have been met. These criteria are met, for example, when the services are performed or when the discounts that relate to a material right granted in a purchase option are applied.
(3c) Management Judgments and Sources of Estimation Uncertainty
The preparation of the Consolidated Financial Statements in conformity with IFRS requires management to make judgments, estimates, and assumptions that affect the application of accounting policies and the reported amounts of assets, liabilities, revenues, and expenses, as well as disclosure of contingent assets and liabilities.
We base our judgments, estimates, and assumptions on historical and forecast information, as well as on regional and industry economic conditions in which we or our customers operate, changes to which could adversely affect our estimates. Although we believe we have made reasonable estimates about the ultimate resolution of the underlying uncertainties, no assurance can be given that the final outcome of these matters will be consistent with what is reflected in our assets, liabilities, revenues, and expenses. Actual results could differ from original estimates.
The accounting policies that most frequently require us to make judgments, estimates, and assumptions, and therefore are critical to understanding our results of operations, include the following:
| ∎ | Revenue recognition |
| ∎ | Valuation of trade receivables |
| ∎ | Accounting for share-based payments |
| ∎ | Accounting for income tax |
| ∎ | Accounting for business combinations |
| ∎ | Subsequent accounting for goodwill and intangible assets |
| ∎ | Accounting for legal contingencies |
| ∎ | Recognition of internally generated intangible assets from development |
Our management periodically discusses these critical accounting policies with the Audit Committee of the Supervisory Board.
Revenue Recognition
As described in the Revenue Recognition section ofNote (3b), we do not recognize revenue before the amount of revenue can be measured reliably, collection of the related receivable is probable, and the delivery has occurred or the services have been rendered. The determination of whether the amount of revenue can be measured reliably or whether the fees are collectible is inherently judgmental, as it requires estimates as to whether and to what extent subsequent concessions may be granted to customers and whether the customer is expected to pay the contractual fees. The timing and amount of revenue recognition can vary depending on what assessments have been made.
The application of thepercentage-of-completion method requires us to make estimates about total revenue, total cost to complete the project, and the stage of completion. The assumptions, estimates, and uncertainties inherent in determining the stage of completion affect the timing and amounts of revenue recognized.
| Consolidated Financial Statements IFRS and Notes | Notes | 145 |
Table of Contents
In the accounting for our multiple-element arrangements, we have to determine the following:
| ∎ | Which contracts with the same customer are to be accounted for as one single arrangement |
| ∎ | Which deliverables under one contract are distinct and thus to be accounted for separately |
| ∎ | How to allocate the total arrangement fee to the distinct deliverables |
The determination of whether different contracts with the same customer are to be accounted for as one arrangement involves the use of judgment as it requires us to evaluate whether the contracts are negotiated together or linked in any other way. The timing and amount of revenue recognition can vary depending on whether two contracts are accounted for separately or as one single arrangement.
Under a multiple-element arrangement including a cloud subscription, oron-premise software, and other deliverables, we do not account for the cloud subscription, oron-premise software, and the other deliverables separately if one of the other deliverables (such as consulting services) is deemed to be essential to the functionality of the cloud subscription oron-premise software. The determination whether an undelivered element is essential to the functionality of the delivered element requires the use of judgment. The timing and amount of revenue recognition can vary depending on how that judgment is exercised, because revenue may be recognized over a longer service term.
In the area of allocating the transaction fee to the different deliverables under the respective customer contract, judgment is required in the determination of an appropriate fair value measurement which may impact the timing and amount of revenue recognized depending on the following:
| ∎ | Whether an appropriate measurement of fair value can be demonstrated for undelivered elements |
| ∎ | The approaches used to establish fair value |
Additionally, our revenue foron-premise software contracts would be significantly different if we applied a revenue allocation policy other than the residual method.
Valuation of Trade Receivables
As described in the Trade and Other Receivables section inNote (3b), we account for impairments of trade receivables by recording sales allowances and allowances for doubtful accounts on an individual receivable basis and on a portfolio basis. The assessment of whether a receivable is collectible involves the use of judgment and requires the use of assumptions about customer defaults that could change significantly. Judgment is required when we evaluate available information about a particular customer’s financial situation to determine whether it is probable that a credit loss will occur and the amount of such loss is reasonably estimable and thus an allowance for that specific account is necessary. Basing the general allowance for the remaining receivables on our historical loss experience likewise requires the use of judgment, as history may not be indicative of future development. Changes in our estimates about the allowance for doubtful accounts could materially impact reported assets and expenses, and our profit could be adversely affected if actual credit losses exceed our estimates.
Accounting for Share-Based Payments
We use certain assumptions in estimating the fair values for our share-based payments, including expected share price volatility and expected option life (which represents our estimate of the average amount of time remaining until the options are exercised or expire unexercised). In addition, the final payout for plans may also depend on the achievement of performance indicators and on our share price on the respective exercise dates. Changes to these assumptions and outcomes that differ from these assumptions could require material adjustments to the carrying amount of the liabilities we have recognized for these share-based payments.
For the purpose of determining the estimated fair value of our share options, we believe expected volatility is the most sensitive assumption. Regarding future payout under our cash-settled plans, the SAP share price is the most relevant factor. Changes in these factors could significantly affect the estimated fair values as calculated by the option-pricing model, and the future payout. For more information, see Note (27).
Accounting for Income Tax
We are subject to changing tax laws in multiple jurisdictions within the countries in which we operate. Our ordinary business activities also include transactions where the ultimate tax outcome is uncertain due to different interpretation of tax laws, such as those involving revenue sharing and cost reimbursement arrangements between SAP Group entities. In addition, the amount of income tax we pay is generally subject to ongoing audits by domestic and foreign tax authorities. As a result, judgment is necessary in determining our worldwide income tax provisions. We make our estimates about the ultimate resolution of our tax uncertainties based on current tax laws and our interpretation thereof. Changes to the assumptions underlying these estimates and outcomes that differ from these assumptions could require material adjustments to the carrying amount of our income tax provisions.
The assessment whether a deferred tax asset is impaired requires management judgment, as we need to estimate future taxable profits to determine whether the utilization of the deferred tax asset is probable. In evaluating our ability to utilize our deferred tax assets, we consider all available positive and negative evidence, including the level of historical taxable income and projections for future taxable income over the periods in which the deferred tax assets are recoverable. Our judgment regarding future taxable income is based on assumptions about future market conditions and future profits of SAP. Changes to these assumptions and outcomes that differ from these assumptions could require material adjustments to the carrying amount of our deferred tax assets.
For more information about our income tax, seeNote (10).
Accounting for Business Combinations
In our accounting for business combinations, judgment is required in determining whether an intangible asset is identifiable, and should be
| Consolidated Financial Statements IFRS and Notes | Notes | 146 |
Table of Contents
recorded separately from goodwill. Additionally, estimating the acquisition date fair values of the identifiable assets acquired and liabilities assumed involves considerable management judgment. The necessary measurements are based on information available on the acquisition date and are based on expectations and assumptions that have been deemed reasonable by management. These judgments, estimates, and assumptions can materially affect our financial position and profit for several reasons, including the following:
| ∎ | Fair values assigned to assets subject to depreciation and amortization affect the amounts of depreciation and amortization to be recorded in operating profit in the periods following the acquisition. |
| ∎ | Subsequent negative changes in the estimated fair values of assets may result in additional expense from impairment charges. |
| ∎ | Subsequent changes in the estimated fair values of liabilities and provisions may result in additional expense (if increasing the estimated fair value) or additional income (if decreasing the estimated fair value). |
Subsequent Accounting for Goodwill and Intangible Assets
Judgment is required in determining the following:
| ∎ | The useful life of an intangible asset, as this is based on our estimates regarding the period over which the intangible asset is expected to produce economic benefits to us |
| ∎ | The amortization method, as IFRS requires the straight-line method to be used unless we can reliably determine the pattern in which the asset’s future economic benefits are expected to be consumed by us |
Both the amortization period and the amortization method have an impact on the amortization expense that is recorded in each period.
In making impairment assessments for our goodwill and intangible assets, the outcome of these tests is highly dependent on management’s assumptions regarding future cash flow projections and economic risks, which require significant judgment and assumptions about future developments. They can be affected by a variety of factors, including:
| ∎ | Changes in business strategy |
| ∎ | Internal forecasts |
| ∎ | Estimation of weighted-average cost of capital |
Changes to the assumptions underlying our goodwill and intangible assets impairment assessments could require material adjustments to the carrying amount of our recognized goodwill and intangible assets as well as the amounts of impairment charges recognized in profit or loss.
The outcome of goodwill impairment tests may also depend on the allocation of goodwill to our operating segments. This allocation involves judgment as it is based on our estimates regarding which operating segments are expected to benefit from the synergies of business combinations.
For more information about goodwill and intangible assets, seeNote (15).
Accounting for Legal Contingencies
As described in Note (23), we are currently involved in various claims and legal proceedings. We review the status of each significant matter at least quarterly and assess our potential financial and business exposures related to such matters. Significant judgment is required in the determination of whether a provision is to be recorded and what the appropriate amount for such provision should be. Notably, judgment is required in the following:
| ∎ | Determining whether an obligation exists |
| ∎ | Determining the probability of outflow of economic benefits |
| ∎ | Determining whether the amount of an obligation is reliably estimable |
| ∎ | Estimating the amount of the expenditure required to settle the present obligation |
Due to uncertainties relating to these matters, provisions are based on the best information available at the time.
At the end of each reporting period, we reassess the potential obligations related to our pending claims and litigation and adjust our respective provisions to reflect the current best estimate. In addition, we monitor and evaluate new information that we receive after the end of the respective reporting period but before the Consolidated Financial Statements are authorized for issue to determine whether this provides additional information regarding conditions that existed at the end of the reporting period. Changes to the estimates and assumptions underlying our accounting for legal contingencies and outcomes that differ from these estimates and assumptions could require material adjustments to the carrying amounts of the respective provisions recorded as well as additional provisions. For more information about legal contingencies, seeNotes (18b) and (23).
Recognition of Internally Generated Intangible Assets from Development
We believe that determining whether internally generated intangible assets from development are to be recognized as intangible assets requires significant judgment, particularly in the following areas:
| ∎ | Determining whether activities should be considered research activities or development activities. |
| ∎ | Determining whether the conditions for recognizing an intangible asset are met requires assumptions about future market conditions, customer demand, and other developments. |
| ∎ | The term “technical feasibility” is not defined in IFRS, and therefore determining whether the completion of an asset is technically feasible requires judgment and a company-specific approach. |
| ∎ | Determining the future ability to use or sell the intangible asset arising from the development and the determination of the probability of future benefits from sale or use. |
| ∎ | Determining whether a cost is directly or indirectly attributable to an intangible asset and whether a cost is necessary for completing a development. |
These judgments impact the total amount of intangible assets that we present in our balance sheet as well as the timing of recognizing development expenses in profit or loss.
| Consolidated Financial Statements IFRS and Notes | Notes | 147 |
Table of Contents
(3d) New Accounting Standards Adopted in the Current Period
No new accounting standards adopted in 2016 had a material impact on our Consolidated Financial Statements. We have early adopted the amendments to IAS 7 (Statement of Cash Flows), which are aimed at improving the information provided to users of financial statements about an entity’s financing activities, as well as expanding the disclosures on net debt.
(3e) New Accounting Standards Not Yet Adopted
The standards and interpretations (relevant to the Group) that are issued, but not yet effective, up to the date of issuance of the Group’s financial statements are disclosed below. The Group intends to adopt these standards, if applicable, when they become effective:
| ∎ | On May 28, 2014, the IASB issued IFRS 15 (Revenue from Contracts with Customers). The new revenue recognition standard will be effective for us starting January 1, 2018. We do not plan to adopt IFRS 15 early. The standard permits two possible transition methods for the adoption of the new guidance: (1) retrospectively to each prior reporting period presented in accordance with IAS 8 (Accounting Policies, Changes in Accounting Estimates and Errors), or (2) retrospectively with the cumulative effect of initially applying the standard recognized on the date of the initial application (cumulativecatch-up approach). We currently plan to adopt the new standard using the cumulativecatch-up approach. |
We are in the process of developing our future IFRS 15 revenue recognition policies and adjusting the relevant business processes to adopt these new policies. We have established a project across SAP’s operating segments. This project covers the implementation of a newSAP-based revenue accounting and reporting solution as well as the development of new revenue recognition policies. Besides this, we have established a globalroll-out and training approach for all of the relevant stakeholders within the organization. As part of this effort, we have identified several differences between our current accounting policies and the future IFRS15-based policies (as far as these have already been developed). Based on our analyses performed so far, these differences include:
| - | Currently, if for any of our product or service offerings, we determine at the outset of an arrangement that the amount of revenue cannot be measured reliably, we conclude that the inflow of economic benefits associated with the transaction is not probable, and we defer revenue recognition until the arrangement fee becomes due and payable by the customer. Under our draft IFRS15-based policies, we need to estimate, at the outset of an arrangement, the potential impact on the transaction price from both uncertainties in the measurement of revenue and from collection uncertainties and recognize the remaining revenue earlier. |
| - | IFRS 15 requires changes to the way we allocate a transaction price to individual performance obligations, which can impact both the classification and the timing of revenues. Among these differences are changes in the application of the residual approach under IFRS 15 and the residual method which we currently apply. While the residual method we currently use aims at allocating the transaction price between deliverables, the residual approach under IFRS 15 is used for estimating the standalone selling price of a promised good or service and generally would not allow an allocation of little or no portion of the transaction price to a performance obligation. This difference may result in higher transaction price allocations toon-premise software performance obligations and thus in an earlier recognition of certain portions of the transaction price. |
| - | We expect a revised recognition pattern foron-premise software subscription contracts, which combine the delivery of software and support service and the obligation to deliver, in the future, unspecified software products. Under our current policies, we recognize the entire fee ratably over the subscription term. In contrast, under IFRS15-, we would recognize a portion of the transaction price upon delivery of the initial software at the outset of the arrangement. |
| - | Under our current policies, we do not account for options that allow the customer to purchase additional copies of an already-licensedon-premise software product as a separate element of an arrangement. In contrast, IFRS 15 provides that such options are accounted for as a separate performance obligation if they represent a material right. In such circumstances IFRS 15 will result in allocating a portion of the transaction price to such options giving rise to the material right . This portion will be recognized upon exercise or forfeiture of the options, which may be later than the current revenue recognition timing. |
| - | We are currently already capitalizing the cost to obtain a contract. We expect the capitalization amount to increase under IFRS 15 due to a broader definition of what is capitalizable as cost to obtain a contract. |
In addition to the effects on our Consolidated Statements of Income, we expect changes to our Consolidated Statements of Financial Position (in particular due to no separate balance sheet items for deferred revenues being presented anymore, the recognition of contract assets/contract liabilities, the differentiation between contract assets and trade receivables, and an impact in retained earnings from the initial adoption of IFRS 15) and changes in quantitative and qualitative disclosure to be added. The quantitative impact of IFRS 15 on our 2018 financial statements is currently neither known to us nor reasonably estimable, as we have not yet done the following:
| - | Completed the analysis of the volume of contracts that will be affected by the different policy changes stemming from IFRS 15 upon adoption |
| - | Performed estimates of the potential changes in business practices that may result from the adoption of the new policies |
| - | Completed the identification of those contracts that will not be completed by the end of 2017 and thus have to be restated under the cumulativecatch-up approach that we intend to use for transition to the new policies |
| - | Finalized our accounting policy regarding the cost components to be included into the cost to fulfill a contract under IFRS 15. |
We will continue to assess all of the impacts that the application of IFRS 15 will have on our financial statements in the period of initial application, which will also significantly depend on our business and
| Consolidated Financial Statements IFRS and Notes | Notes | 148 |
Table of Contents
go-to-market strategy in 2017. The impacts – if material – will be disclosed, including statements on if and how we apply any of the practical expedients available in the standard.
| ∎ | On January 13, 2016, the IASB issued IFRS 16 (Leases). The standard becomes effective in fiscal year 2019, with earlier application permitted for those companies that also apply IFRS 15. The new standard is a major revision of lease accounting; whereas the accounting by lessors remains substantially unchanged, the lease accounting by lessees will change significantly as all leases need to be recognized on a company’s balance sheet as assets and liabilities. For SAP, the vast majority of the impact is expected to come from our facility leases, and we are currently analyzing the effects of adopting the standard and whether or not those effects will be material. We are also currently evaluating to what extent we want to make use of the practical expedients included in the standard. The financial impact of the new standard will depend on the lease agreements in effect at the time of adoption. It is expected that operating profit will increase, as costs that were treated as rental expenses in the past will now be recorded as interest expense. It is also expected that total assets / liabilities will increase, asright-of-use assets / lease liabilities will have to be recorded for those items that were previously “off balance sheet.” Based on the limited assessment of the impact of IFRS 16 performed to date, we currently do not know and are not able to reasonably estimate the impact on our financial statements. |
| ∎ | On July 24, 2014, the IASB issued the fourth and final version of IFRS 9 (Financial Instruments), which will be applicable in fiscal year 2018 with earlier application permitted. We plan to adopt the new standard on the required effective date. |
Our preliminary assessment may be subject to changes, as we have not yet finalized our analysis and thus have not completed the determination of the impact on our Consolidated Financial Statements.
(a) Classification of financial assets
Under our current policies, we classify most of our debt and equity investments asavailable-for-sale financial assets. We expect that the majority of our debt investments will be measured at amortized cost under IFRS 9, as we hold them to collect contractual cash flows which solely represent payments of principal and interest. Equity investments can be classified as either fair value through other comprehensive income (FVOCI) or fair value through profit or loss (FVTPL), and we have not yet made a decision in this regard. Consequently, we are unable to reasonably estimate the impact of the introduction of IFRS 9 on the accounting for our equity investments.
Loans, trade, and other financial receivables and contract assets are held to collect contractual cash flows and are expected to give rise to cash flows solely representing payments of principal and interest. Thus, we expect that these will continue to be measured at amortized cost.
Derivatives will continue to be measured at FVTPL.
However, we will continue to analyze the contractual cash flow characteristics of all instruments approved to be used and the related business model in more detail before reaching a final conclusion on the classification for IFRS 9.
(b) Financial liabilities
We have never designated any financial liabilities at FVTPL and have no current intention to do so. Thus, we believe that we will not have a material impact with regards to financial liabilities, considering that the only significant change that IFRS 9 brings to the accounting for financial liabilities is that for liabilities designated as at FVTPL, changes in the fair value attributable to changes in the credit risk of the liability must be presented in other comprehensive income (OCI).
(c) Impairment
We currently plan to apply the simplified impairment approach of IFRS 9 and record lifetime expected losses on all trade receivables and contract assets. The financial impact of the new standard will depend on the financial instruments recorded at the time of adoption. Based on the current status of our analysis, we are expecting offsetting effects, that is, increases and decreases in impairment under IFRS 9 and thus no material impact. This assessment might change based on the result of the more detailed analysis performed that considers all reasonable and supportable information, including forward-looking elements.
(d) Hedge accounting
We believe that all existing hedge relationships that we have currently designated in effective hedging relationships will still qualify for hedge accounting in the future, and thus we do not expect a significant impact as a result of applying IFRS 9. In contrast to IAS 39, where fair value changes related to the interest element are recognized in profit or loss immediately, IFRS 9 allows recording these costs of hedging in OCI. We have not yet made a decision related to the accounting for the interest element. Only after having made that decision will we be able to reasonably estimate the impact of these new requirements on our financial statements.
| Consolidated Financial Statements IFRS and Notes | Notes | 149 |
Table of Contents
In 2016 and 2015, we did not conclude any significant business combinations.
For detailed information about our revenue recognition policies, seeNote (3).
For revenue information by geographic region, seeNote (28).
Revenue from construction contracts (contract revenue) is mainly included in software revenue and services revenue depending on the type of contract. In 2016, contract revenue of €280 million was recognized for all our construction contracts (2015: €292 million, 2014: €285 million). The status of our construction contracts in progress at the end of the reporting period accounted for under IAS 11 (Construction Contracts) was as follows:
Construction Contracts in Progress
€ millions | 2016 | 2015 | 2014 | |||||||||
| Aggregate cost recognized (multi-year) | 527 | 294 | 201 | |||||||||
| Recognized result (+ profit/– loss; multi-year) | -174 | 20 | 92 | |||||||||
| Gross amounts due to customers | 78 | 41 | 30 | |||||||||
Recognized loss stated for 2016 predominantly resulted from strategic customerco-innovation projects.
Restructuring Expenses
€ millions | 2016 | 2015 | 2014 | |||||||||
| Employee-related restructuring expenses | 33 | 610 | 119 | |||||||||
| Onerous contract-related restructuring expenses | -5 | 11 | 7 | |||||||||
|
|
|
|
|
| |||||||
| Restructuring expenses | 28 | 621 | 126 | |||||||||
In 2016, except for limitedclose-out activities under our global restructuring plan executed in 2015, no significant new restructuring activities occurred.
Restructuring provisions primarily include personnel costs that result from severance payments for employee terminations and onerous contract costs. Prior-year restructuring provisions relate to restructuring activities incurred in connection with organizational changes and the integration of employees of our acquisitions in previous years.
If not presented separately in our income statement, restructuring expenses would break down by functional area as follows:
Restructuring Expenses by Functional Area
€ millions | 2016 | 2015 | 2014 | |||||||||
| Cost of cloud and software | 3 | 80 | 9 | |||||||||
| Cost of services | 7 | 218 | 24 | |||||||||
| Research and development | 7 | 156 | 24 | |||||||||
| Sales and marketing | 10 | 147 | 41 | |||||||||
| General and administration | 1 | 20 | 28 | |||||||||
|
|
|
|
|
| |||||||
| Restructuring expenses | 28 | 621 | 126 | |||||||||
(7) Employee Benefits Expense and Headcount
Employee Benefits Expense
€ millions | 2016 | 2015 | 2014 | |||||||||
| Salaries | 7,969 | 7,483 | 6,319 | |||||||||
| Social security expense | 1,135 | 1,067 | 916 | |||||||||
| Share-based payment expense | 785 | 724 | 290 | |||||||||
| Pension expense | 270 | 258 | 211 | |||||||||
| Employee-related restructuring expense | 33 | 610 | 119 | |||||||||
| Termination benefits outside of restructuring plans | 37 | 28 | 22 | |||||||||
|
|
|
|
|
| |||||||
| Employee benefits expense | 10,229 | 10,170 | 7,877 | |||||||||
Pension expense includes the amounts recorded for our defined benefit and defined contribution plans as described inNote (18a). Expenses for local state pension plans are included in social security expense.
The number of employees in the following table is broken down by function and by the regions EMEA (Europe, Middle East, and Africa), Americas (North America and Latin America), and APJ (Asia Pacific Japan). The information for prior periods has been restated to conform to current year presentation.
| Consolidated Financial Statements IFRS and Notes | Notes | 150 |
Table of Contents
Number of Employees
Full-time equivalents | December 31, 2016 | December 31, 2015 | December 31, 2014 | |||||||||||||||||||||||||||||||||||||||||||||
| EMEA | Americas | APJ | Total | EMEA | Americas | APJ | Total | EMEA | Americas | APJ | Total | |||||||||||||||||||||||||||||||||||||
| Cloud and software | 6,406 | 4,184 | 5,412 | 16,002 | 6,095 | 3,920 | 4,976 | 14,991 | 5,953 | 3,983 | 5,138 | 15,074 | ||||||||||||||||||||||||||||||||||||
| Services | 6,535 | 4,119 | 3,967 | 14,621 | 6,482 | 3,812 | 3,574 | 13,868 | 6,649 | 3,834 | 2,879 | 13,361 | ||||||||||||||||||||||||||||||||||||
| Research and development | 10,525 | 4,860 | 7,977 | 23,363 | 9,676 | 4,233 | 7,029 | 20,938 | 9,049 | 3,974 | 5,885 | 18,908 | ||||||||||||||||||||||||||||||||||||
| Sales and marketing | 8,542 | 8,999 | 4,435 | 21,977 | 7,683 | 7,766 | 3,974 | 19,422 | 7,712 | 7,758 | 3,776 | 19,246 | ||||||||||||||||||||||||||||||||||||
| General and administration | 2,629 | 1,746 | 1,018 | 5,393 | 2,434 | 1,653 | 937 | 5,024 | 2,436 | 1,643 | 944 | 5,023 | ||||||||||||||||||||||||||||||||||||
| Infrastructure | 1,584 | 788 | 454 | 2,827 | 1,535 | 783 | 425 | 2,743 | 1,542 | 879 | 373 | 2,794 | ||||||||||||||||||||||||||||||||||||
|
|
|
|
|
|
|
|
|
|
|
|
|
|
|
|
|
|
|
|
|
|
|
| |||||||||||||||||||||||||
| SAP Group (December 31) | 36,222 | 24,696 | 23,265 | 84,183 | 33,906 | 22,166 | 20,914 | 76,986 | 33,340 | 22,071 | 18,995 | 74,406 | ||||||||||||||||||||||||||||||||||||
Thereof acquisitions | 37 | 172 | 0 | 209 | 73 | 0 | 0 | 73 | 814 | 2,890 | 1,831 | 5,535 | ||||||||||||||||||||||||||||||||||||
|
|
|
|
|
|
|
|
|
|
|
|
|
|
|
|
|
|
|
|
|
|
|
| |||||||||||||||||||||||||
| SAP Group (months’ end average) | 34,932 | 23,532 | 22,145 | 80,609 | 33,561 | 21,832 | 19,788 | 75,180 | 31,821 | 19,797 | 16,725 | 68,343 | ||||||||||||||||||||||||||||||||||||
Allocation of Share-Based Payment Expense
The allocation of expense for share-based payments, net of the effects from hedging these instruments, to the various functional areas is as follows:
Share-Based Payments
€ millions | 2016 | 2015 | 2014 | |||||||||
| Cost of cloud and software | 89 | 74 | 28 | |||||||||
| Cost of services | 101 | 113 | 49 | |||||||||
| Research and development | 190 | 166 | 71 | |||||||||
| Sales and marketing | 292 | 260 | 80 | |||||||||
| General and administration | 113 | 111 | 62 | |||||||||
|
|
|
|
|
| |||||||
| Share-based payments | 785 | 724 | 290 | |||||||||
Thereof cash-settled share-based payments | 678 | 637 | 193 | |||||||||
Thereof equity-settled share-based payments | 107 | 87 | 96 | |||||||||
For more information about our share-based payments, seeNote (27).
(8) OtherNon-Operating Income/Expense, Net
OtherNon-Operating Income/Expense, Net
€ millions | 2016 | 2015 | 2014 | |||||||||
| Foreign currency exchange gain/loss, net | -210 | -230 | 71 | |||||||||
Thereof from financial assets/liabilities at fair value through profit or loss | -38 | -12 | 83 | |||||||||
Thereof fromavailable-for-sale financial assets | -1 | -1 | 0 | |||||||||
Thereof from loans and receivables | 26 | -213 | -219 | |||||||||
Thereof from financial liabilities at amortized cost | -174 | -2 | 226 | |||||||||
Thereof fromnon-financial assets/liabilities | -17 | -3 | -13 | |||||||||
| Miscellaneous income | 3 | 1 | 3 | |||||||||
| Miscellaneous expense | -27 | -27 | -25 | |||||||||
|
|
|
|
|
| |||||||
| Othernon-operating income/expense, net | -234 | -256 | 49 | |||||||||
| Consolidated Financial Statements IFRS and Notes | Notes | 151 |
Table of Contents
Financial Income, Net
€ millions | 2016 | 2015 | 2014 | |||||||||
| Finance income | 230 | 241 | 127 | |||||||||
|
|
|
|
|
| |||||||
Thereofavailable-for-sale financial assets (equity) | 164 | 176 | 30 | |||||||||
|
|
|
|
|
| |||||||
| Finance costs | -268 | -246 | -152 | |||||||||
Thereof interest expense from financial liabilities at amortized cost | -108 | -135 | -93 | |||||||||
Thereof interest expense from derivatives | -114 | -72 | -28 | |||||||||
|
|
|
|
|
| |||||||
| Financial income, net | -38 | -5 | -25 | |||||||||
Tax Expense According to Region
€ millions | 2016 | 2015 | 2014 | |||||||||
| Current tax expense | ||||||||||||
| Germany | 853 | 859 | 770 | |||||||||
| Foreign | 537 | 408 | 422 | |||||||||
|
|
|
|
|
| |||||||
| Total current tax expense | 1,390 | 1,267 | 1,192 | |||||||||
| Deferred tax expense/income | ||||||||||||
| Germany | -38 | -74 | 84 | |||||||||
| Foreign | -123 | -258 | -201 | |||||||||
|
|
|
|
|
| |||||||
| Total deferred tax income | -161 | -332 | -117 | |||||||||
|
|
|
|
|
| |||||||
| Total income tax expense | 1,229 | 935 | 1,075 | |||||||||
Major Components of Tax Expense
€ millions | 2016 | 2015 | 2014 | |||||||||
| Current tax expense/income | ||||||||||||
| Tax expense for current year | 1,412 | 1,278 | 1,168 | |||||||||
| Taxes for prior years | -22 | -11 | 24 | |||||||||
|
|
|
|
|
| |||||||
| Total current tax expense | 1,390 | 1,267 | 1,192 | |||||||||
| Deferred tax expense/income | ||||||||||||
| Origination and reversal of temporary differences | -403 | -428 | -126 | |||||||||
| Unused tax losses, research and development tax credits, and foreign tax credits | 242 | 96 | 9 | |||||||||
|
|
|
|
|
| |||||||
| Total deferred tax income | -161 | -332 | -117 | |||||||||
|
|
|
|
|
| |||||||
| Total income tax expense | 1,229 | 935 | 1,075 | |||||||||
Profit Before Tax
€ millions | 2016 | 2015 | 2014 | |||||||||
| Germany | 3,109 | 3,161 | 3,338 | |||||||||
| Foreign | 1,754 | 830 | 1,017 | |||||||||
|
|
|
|
|
| |||||||
| Total | 4,863 | 3,991 | 4,355 | |||||||||
The following table reconciles the expected income tax expense, computed by applying our combined German tax rate of 26.4% (2015: 26.4%; 2014: 26.4%), to the actual income tax expense. Our 2016 combined German tax rate includes a corporate income tax rate of 15.0% (2015: 15.0%; 2014: 15.0%), plus a solidarity surcharge of 5.5% (2015: 5.5%; 2014: 5.5%) thereon, and trade taxes of 10.6% (2015: 10.6%; 2014: 10.6%).
| Consolidated Financial Statements IFRS and Notes | Notes | 152 |
Table of Contents
Relationship Between Tax Expense and Profit Before Tax
€ millions, unless otherwise stated | 2016 | 2015 | 2014 | |||||||||
| Profit before tax | 4,863 | 3,991 | 4,355 | |||||||||
| Tax expense at applicable tax rate of 26.4% (2015: 26.4%; 2014: 26.4%) | 1,284 | 1,055 | 1,151 | |||||||||
| Tax effect of: | ||||||||||||
Foreign tax rates | -105 | -126 | -117 | |||||||||
Non-deductible expenses | 78 | 61 | 63 | |||||||||
Tax exempt income | -106 | -103 | -86 | |||||||||
Withholding taxes | 112 | 115 | 111 | |||||||||
Research and development and foreign tax credits | -36 | -31 | -41 | |||||||||
Prior-year taxes | -43 | -55 | -10 | |||||||||
Reassessment of deferred tax assets, research and development tax credits, and foreign tax credits | 43 | 43 | 41 | |||||||||
Other | 2 | -24 | -37 | |||||||||
|
|
|
|
|
| |||||||
| Total income tax expense | 1,229 | 935 | 1,075 | |||||||||
|
|
|
|
|
| |||||||
| Effective tax rate (in %) | 25.3 | 23.4 | 24.7 | |||||||||
Recognized Deferred Tax Assets and Liabilities
€ millions | 2016 | 2015 | ||||||
| Deferred tax assets | ||||||||
| Intangible assets | 81 | 99 | ||||||
| Property, plant, and equipment | 32 | 24 | ||||||
| Other financial assets | 18 | 15 | ||||||
| Trade and other receivables | 72 | 64 | ||||||
| Pension provisions | 108 | 98 | ||||||
| Share-based payments | 207 | 163 | ||||||
| Other provisions and obligations | 517 | 431 | ||||||
| Deferred income | 118 | 104 | ||||||
| Carryforwards of unused tax losses | 377 | 621 | ||||||
| Research and development and foreign tax credits | 235 | 187 | ||||||
| Other | 102 | 149 | ||||||
|
|
|
| |||||
| Total deferred tax assets | 1,867 | 1,955 | ||||||
| Deferred tax liabilities | ||||||||
| Intangible assets | 1,162 | 1,234 | ||||||
| Property, plant, and equipment | 66 | 62 | ||||||
| Other financial assets | 158 | 389 | ||||||
| Trade and other receivables | 125 | 93 | ||||||
| Pension provisions | 7 | 5 | ||||||
| Share-based payments | 3 | 4 | ||||||
| Other provisions and obligations | 122 | 112 | ||||||
| Deferred income | 39 | 40 | ||||||
| Other | 26 | 11 | ||||||
|
|
|
| |||||
| Total deferred tax liabilities | 1,708 | 1,950 | ||||||
|
|
|
| |||||
| Total deferred tax assets/liabilities, net | 159 | 5 | ||||||
Items Not Resulting in a Deferred Tax Asset
€ millions | 2016 | 2015 | 2014 | |||||||||
| Unused tax losses | ||||||||||||
| Not expiring | 338 | 279 | 140 | |||||||||
| Expiring in the following year | 32 | 95 | 63 | |||||||||
| Expiring after the following year | 649 | 704 | 672 | |||||||||
|
|
|
|
|
| |||||||
| Total unused tax losses | 1,019 | 1,078 | 875 | |||||||||
| Deductible temporary differences | 33 | 122 | 96 | |||||||||
| Unused research and development and foreign tax credits | ||||||||||||
| Not expiring | 33 | 34 | 32 | |||||||||
| Expiring in the following year | 1 | 0 | 0 | |||||||||
| Expiring after the following year | 30 | 20 | 22 | |||||||||
|
|
|
|
|
| |||||||
| Total unused tax credits | 64 | 54 | 54 | |||||||||
€309 million (2015: €429 million; 2014: €441 million) of the unused tax losses relate to U.S. state tax loss carryforwards.
In 2016, subsidiaries that suffered a tax loss in either the current or the preceding period recognized deferred tax assets in excess of deferred tax liabilities amounting to €189 million (2015: €129 million; 2014: €73 million), because it is probable that sufficient future taxable profit will be available to allow the benefit of the deferred tax assets to be utilized.
We have not recognized a deferred tax liability on approximately €10.81 billion (2015: €9.95 billion) for undistributed profits of our
| Consolidated Financial Statements IFRS and Notes | Notes | 153 |
Table of Contents
subsidiaries, because we are in a position to control the timing of the reversal of the temporary difference and it is probable that such differences will not reverse in the foreseeable future.
Total Income Tax
€ millions | 2016 | 2015 | 2014 | |||||||||
| Income tax recorded in profit | 1,229 | 935 | 1,075 | |||||||||
| Income tax recorded in share premium | -5 | -14 | -3 | |||||||||
| Income tax recorded in other comprehensive income that will not be reclassified to profit and loss | ||||||||||||
Remeasurements on defined benefit pension plans | -2 | -2 | -7 | |||||||||
| Income tax recorded in other comprehensive income that will be reclassified to profit and loss | ||||||||||||
Available-for-sale financial assets | -1 | 2 | 0 | |||||||||
Cash flow hedges | -4 | 4 | -10 | |||||||||
Exchange differences | 25 | -16 | -21 | |||||||||
|
|
|
|
|
| |||||||
| Total | 1,242 | 909 | 1,034 | |||||||||
We are subject to ongoing tax audits by domestic and foreign tax authorities. Currently, we are in dispute mainly with the German and only a few foreign tax authorities. The German dispute is in respect of intercompany financing matters and certain secured capital investments, while the few foreign disputes are in respect of intercompany financing matters and the deductibility of license fees and intercompany services. In all cases, we expect that a favorable outcome can only be achieved through litigation. For all of these matters, we have not recorded a provision as we believe that the tax authorities’ claims have no merit and that no adjustment is warranted. If, contrary to our view, the tax authorities were to prevail in their arguments before the court, we would expect to have an additional tax expense (including related interest expenses and penalties) of approximately €1,749 million (2015: €1,045 million) in total.
Earnings per Share
€ millions, unless otherwise stated | 2016 | 2015 | 2014 | |||||||||
| Profit attributable to equity holders of SAP SE | 3,646 | 3,064 | 3,280 | |||||||||
| Issued ordinary shares1) | 1,229 | 1,229 | 1,229 | |||||||||
| Effect of treasury shares1) | -30 | -32 | -34 | |||||||||
| Weighted average shares outstanding, basic1) | 1,198 | 1,197 | 1,195 | |||||||||
| Dilutive effect of share-based payments1) | 1 | 2 | 3 | |||||||||
| Weighted average shares outstanding, diluted1) | 1,199 | 1,198 | 1,197 | |||||||||
|
|
|
|
|
| |||||||
| Earnings per share, basic, attributable to equity holders of SAP SE (in €) | 3.04 | 2.56 | 2.75 | |||||||||
|
|
|
|
|
| |||||||
| Earnings per share, diluted, attributable to equity holders of SAP SE (in €) | 3.04 | 2.56 | 2.74 | |||||||||
| 1) | Number of shares in millions |
| Consolidated Financial Statements IFRS and Notes | Notes | 154 |
Table of Contents
Other Financial Assets
€ millions | 2016 | 2015 | ||||||||||||||||||||||
| Current | Non-Current | Total | Current | Non-Current | Total | |||||||||||||||||||
| Loans and other financial receivables | 834 | 266 | 1,100 | 195 | 243 | 437 | ||||||||||||||||||
Debt investments | 195 | 0 | 195 | 26 | 0 | 26 | ||||||||||||||||||
Equity investments | 1 | 952 | 953 | 1 | 881 | 882 | ||||||||||||||||||
| Available-for-sale financial assets | 196 | 952 | 1,148 | 27 | 881 | 908 | ||||||||||||||||||
| Derivatives | 94 | 102 | 196 | 129 | 154 | 283 | ||||||||||||||||||
| Investments in associates | 0 | 38 | 38 | 0 | 58 | 58 | ||||||||||||||||||
|
|
|
|
|
|
|
|
|
|
|
| |||||||||||||
| Total | 1,124 | 1,358 | 2,482 | 351 | 1,336 | 1,687 | ||||||||||||||||||
Loans and Other Financial Receivables
Loans and other financial receivables mainly consist of time deposits, investments in pension assets for which the corresponding liability is included in employee-related obligations (seeNote (18b)), other receivables, and loans to employees and third parties. The majority of our loans and other financial receivables are concentrated in Germany.
As at December 31, 2016, there were no loans and other financial receivables past due but not impaired. We have no indications of impairments of loans and other financial receivables that are not past due and not impaired as at the reporting date. For general information about financial risk and the nature of risk, seeNote (24).
Available-for-Sale Financial Assets
Ouravailable-for-sale financial assets consist of debt investments in bonds of mainly financial andnon-financial corporations and municipalities and equity investments in listed and unlisted securities, mainly held in U.S. dollars.
For more information about fair value measurement with regard to our equity investments, seeNote (26).
Derivatives
Detailed information about our derivative financial instruments is presented inNote (25).
(13) Trade and Other Receivables
Trade and Other Receivables
€ millions | 2016 | 2015 | ||||||||||||||||||||||
| Current | Non-Current | Total | Current | Non-Current | Total | |||||||||||||||||||
| Trade receivables, net | 5,823 | 2 | 5,825 | 5,198 | 2 | 5,199 | ||||||||||||||||||
| Other receivables | 101 | 124 | 225 | 77 | 86 | 163 | ||||||||||||||||||
|
|
|
|
|
|
|
|
|
|
|
| |||||||||||||
| Total | 5,924 | 126 | 6,050 | 5,274 | 87 | 5,362 | ||||||||||||||||||
Carrying Amounts of Trade Receivables
€ millions | 2016 | 2015 | ||||||
| Gross carrying amount | 6,114 | 5,428 | ||||||
| Sales allowances charged to revenue | -200 | -153 | ||||||
| Allowance for doubtful accounts charged to expense | -89 | -75 | ||||||
|
|
|
| |||||
| Carrying amount trade receivables, net | 5,825 | 5,199 | ||||||
The changes in the allowance for doubtful accounts charged to expense were immaterial in all periods presented.
| Consolidated Financial Statements IFRS and Notes | Notes | 155 |
Table of Contents
Aging of Trade Receivables
€ millions | 2016 | 2015 | ||||||
| Not past due and not individually impaired | 4,313 | 3,918 | ||||||
| Past due but not individually impaired | ||||||||
Past due 1 to 30 days | 541 | 473 | ||||||
Past due 31 to 120 days | 493 | 428 | ||||||
Past due 121 to 365 days | 305 | 257 | ||||||
Past due over 365 days | 84 | 38 | ||||||
|
|
|
| |||||
| Total past due but not individually impaired | 1,422 | 1,196 | ||||||
| Individually impaired, net of allowances | 90 | 85 | ||||||
|
|
|
| |||||
| Carrying amount of trade receivables, net | 5,825 | 5,199 | ||||||
For more information about financial risk and how we manage it, seeNotes (24) and (25).
(14) OtherNon-Financial Assets
OtherNon-Financial Assets
€ millions | 2016 | 2015 | ||||||||||||||||||||||
| Current | Non-Current | Total | Current | Non-Current | Total | |||||||||||||||||||
| Prepaid expenses | 257 | 107 | 364 | 232 | 83 | 315 | ||||||||||||||||||
| Other tax assets | 123 | 0 | 123 | 113 | 0 | 113 | ||||||||||||||||||
| Capitalized contract cost | 139 | 424 | 563 | 77 | 250 | 327 | ||||||||||||||||||
| Miscellaneous other assets | 62 | 0 | 62 | 46 | 0 | 46 | ||||||||||||||||||
|
|
|
|
|
|
|
|
|
|
|
| |||||||||||||
| Total | 581 | 532 | 1,113 | 468 | 332 | 800 | ||||||||||||||||||
Prepaid expenses primarily consist of prepayments for operating leases, support services, and software royalties.
| Consolidated Financial Statements IFRS and Notes | Notes | 156 |
Table of Contents
(15) Goodwill and Intangible Assets
Goodwill and Intangible Assets
€ millions | Goodwill | Software and Database Licenses | Acquired Technology/ IPRD | Customer Relationship and Other Intangibles | Total | |||||||||||||||
| Historical cost | ||||||||||||||||||||
| January 1, 2015 | 21,099 | 667 | 2,587 | 4,644 | 28,997 | |||||||||||||||
| Foreign currency exchange differences | 1,666 | 15 | 204 | 379 | 2,264 | |||||||||||||||
| Additions from business combinations | 27 | 0 | 6 | 5 | 38 | |||||||||||||||
| Other additions | 0 | 53 | 0 | 6 | 59 | |||||||||||||||
| Retirements/disposals | 0 | -8 | -1 | -1 | -10 | |||||||||||||||
| December 31, 2015 | 22,792 | 727 | 2,796 | 5,033 | 31,348 | |||||||||||||||
| Foreign currency exchange differences | 566 | 7 | 71 | 135 | 779 | |||||||||||||||
| Additions from business combinations | 57 | 0 | 41 | 22 | 120 | |||||||||||||||
| Other additions | 0 | 74 | 0 | 21 | 95 | |||||||||||||||
| Retirements/disposals | 0 | -17 | -1 | -92 | -110 | |||||||||||||||
|
|
|
|
|
|
|
|
|
| |||||||||||
| December 31, 2016 | 23,415 | 791 | 2,907 | 5,119 | 32,232 | |||||||||||||||
| Accumulated amortization | ||||||||||||||||||||
| January 1, 2015 | 99 | 448 | 1,357 | 1,489 | 3,393 | |||||||||||||||
| Foreign currency exchange differences | 4 | 10 | 84 | 89 | 187 | |||||||||||||||
| Additions amortization | 0 | 76 | 372 | 361 | 809 | |||||||||||||||
| Retirements/disposals | 0 | -8 | -1 | -1 | -10 | |||||||||||||||
| December 31, 2015 | 103 | 526 | 1,812 | 1,938 | 4,379 | |||||||||||||||
| Foreign currency exchange differences | 1 | 5 | 54 | 59 | 119 | |||||||||||||||
| Additions amortization | 0 | 74 | 321 | 351 | 746 | |||||||||||||||
| Retirements/disposals | 0 | -16 | -1 | -92 | -109 | |||||||||||||||
|
|
|
|
|
|
|
|
|
| |||||||||||
| December 31, 2016 | 104 | 589 | 2,186 | 2,256 | 5,135 | |||||||||||||||
| Carrying amount | ||||||||||||||||||||
|
|
|
|
|
|
|
|
|
| |||||||||||
| December 31, 2015 | 22,689 | 201 | 984 | 3,095 | 26,969 | |||||||||||||||
|
|
|
|
|
|
|
|
|
| |||||||||||
| December 31, 2016 | 23,311 | 202 | 721 | 2,863 | 27,097 | |||||||||||||||
Other additions to software and database licenses in 2016 and 2015 were individually acquired from third parties and include cross-license agreements and patents.
| Consolidated Financial Statements IFRS and Notes | Notes | 157 |
Table of Contents
Significant Intangible Assets
| € millions, unless otherwise stated | Carrying Amount | Remaining Useful Life (in years) | ||||||||||
| 2016 | 2015 | |||||||||||
| Business Objects – Customer relationships | 84 | 104 | 1 to 7 | |||||||||
| Sybase – Customer relationships | 325 | 400 | 5 to 7 | |||||||||
| SuccessFactors – Acquired technologies | 99 | 148 | 3 | |||||||||
| SuccessFactors – Customer relationships | 353 | 397 | 9 | |||||||||
| Ariba – Acquired technologies | 97 | 137 | 4 | |||||||||
| Ariba – Customer relationships | 483 | 530 | 2 to 11 | |||||||||
| hybris – Acquired technologies | 62 | 100 | 4 | |||||||||
| hybris – Customer relationships | 106 | 127 | 1 to 11 | |||||||||
| Fieldglass – Acquired technologies | 73 | 89 | 6 | |||||||||
| Fieldglass – Customer relationships | 69 | 74 | 11 | |||||||||
| Concur – Acquired technologies | 296 | 387 | 5 | |||||||||
| Concur – Customer relationships | 1,281 | 1,299 | 14 to 18 | |||||||||
|
|
|
| |||||||||
| Total significant intangible assets | 3,328 | 3,792 | ||||||||||
Goodwill Impairment Testing
SAP had four operating segments in 2016, of which two are reportable segments. For more information about our segments, seeNote (28).
The carrying amount of goodwill has been allocated for impairment testing purposes to those operating segments expected to benefit from goodwill. Allocated goodwill tonon-reportable segments is not material and disclosed under “Other” – the carrying amount did not exceed the recoverable amount.
Goodwill by Reportable Operating Segment
€ millions | Applications, | SAP Business Network | Other | Total | ||||||||||||
| January 1, 2016 | 15,497 | 7,191 | 0 | 22,689 | ||||||||||||
| Reallocation due to changes in segment composition | -33 | 0 | 33 | 0 | ||||||||||||
| Additions from business combinations | 25 | 31 | 0 | 57 | ||||||||||||
| Foreign currency exchange differences | 349 | 216 | 1 | 566 | ||||||||||||
|
|
|
|
|
|
|
| |||||||||
| December 31, 2016 | 15,839 | 7,439 | 34 | 23,311 | ||||||||||||
| Consolidated Financial Statements IFRS and Notes | Notes | 158 |
Table of Contents
The key assumptions on which management based its cash flow projections for the period covered by the underlying business plans are as follows:
Key Assumption | Basis for Determining Values Assigned to Key Assumption | |
| Budgeted revenue growth | Revenue growth rate achieved in the current fiscal year, adjusted for an expected increase in SAP’s addressable cloud, mobility, and database markets; expected growth in the established software applications and analytics markets. Values assigned reflect our past experience and our expectations regarding an increase in the addressable markets. | |
| Budgeted operating margin | Operating margin budgeted for a given budget period equals the operating margin achieved in the current fiscal year, increased by expected efficiency gains. Values assigned reflect past experience, except for efficiency gains. | |
| Pre-tax discount rates | Our estimated cash flow projections are discounted to present value usingpre-tax discount rates.Pre-tax discount rates are based on the weighted average cost of capital (WACC) approach. | |
| Terminal growth rate | Our estimated cash flow projections for periods beyond the business plan were extrapolated using segment-specific terminal growth rates. These growth rates do not exceed the long-term average growth rates for the markets in which our segments operate. | |
Key Assumptions
Percent | Applications, Technology & Services | SAP Business Network | ||||||||||||||
| 2016 | 2015 | 2016 | 2015 | |||||||||||||
| Budgeted revenue growth (average of the budgeted period) | 6.7 | 4.5 | 15.0 | 16.2 | ||||||||||||
| Pre-tax discount rate | 10.4 | 11.7 | 11.7 | 13.0 | ||||||||||||
| Terminal growth rate | 2.0 | 3.0 | 3.0 | 3.0 | ||||||||||||
Applications, Technology & Services
The recoverable amount of the segment has been determined based on avalue-in-use calculation. The calculation uses cash flow projections based on actual operating results and a group-wide four-year (2015: five-year) business plan approved by management.
We believe that any reasonably possible change in any of the above key assumptions would not cause the carrying amount of our Applications, Technology & Services segment to exceed the recoverable amount.
SAP Business Network
The recoverable amount of the segment has been determined based on fair value less costs of disposal calculation. The fair value measurement was categorized as a level 3 fair value based on the inputs used in the valuation technique. The cash flow projections are based on actual operating results and specific estimates covering a nine-year (2015: nine-year) planning period and the terminal growth rate thereafter. The projected results were determined based on management’s estimates and are consistent with the assumptions a market participant would make. The segment operates in a relatively immature area with significant growth rates projected for the near future. We therefore have a longer and more detailed planning period than one would apply in a more mature segment.
We are using a target operating margin of 34% (2015: 33%) for the segment at the end of the budgeted period as a key assumption, which is within the range of expectations of market participants (for example, industry analysts).
The recoverable amount exceeds the carrying amount by €6,404 million (2015: €1,764 million).
The following table shows amounts by which the key assumptions would need to change individually for the recoverable amount to be equal to the carrying amount:
Sensitivity to Change in Assumptions
Percentage points | SAP Business Network | |||||||
|
| |||||||
| 2016 | 2015 | |||||||
| Budgeted revenue growth (average of the budgeted period) | -6.9 | -2.1 | ||||||
| Pre-tax discount rate | 4.4 | 1.4 | ||||||
| Target operating margin at the end of the budgeted period | -15 | 1 | ) | |||||
| 1) | The recoverable amount would equal the carrying amount if a margin of only 27% was achieved by 2022. |
| Consolidated Financial Statements IFRS and Notes | Notes | 159 |
Table of Contents
(16) Property, Plant, and Equipment
Property, Plant, and Equipment
€ millions | Land and | Other Property, | Advance | Total | ||||||||||||
| Historical cost | ||||||||||||||||
| December 31, 2015 | 1,053 | 1,073 | 66 | 2,192 | ||||||||||||
|
|
|
|
|
|
|
| |||||||||
| December 31, 2016 | 1,137 | 1,297 | 146 | 2,580 | ||||||||||||
Total additions (other than from business combinations) amounted to €933 million (2015: €580 million) and relate primarily to the replacement and purchase of computer hardware and vehicles acquired in the normal course of business and investments in data centers.
(17) Trade and Other Payables, Financial Liabilities, and OtherNon-Financial Liabilities
(17a) Trade and Other Payables
Trade and Other Payables
€ millions | 2016 | 2015 | ||||||||||||||||||||||
| Current | Non-Current | Total | Current | Non-Current | Total | |||||||||||||||||||
| Trade payables | 1,015 | 0 | 1,016 | 893 | 0 | 893 | ||||||||||||||||||
| Advance payments received | 145 | 0 | 145 | 110 | 0 | 110 | ||||||||||||||||||
| Miscellaneous other liabilities | 120 | 127 | 247 | 85 | 81 | 166 | ||||||||||||||||||
|
|
|
|
|
|
|
|
|
|
|
| |||||||||||||
| Trade and other payables | 1,281 | 127 | 1,408 | 1,088 | 81 | 1,169 | ||||||||||||||||||
Miscellaneous other liabilities mainly include deferral amounts for free rent periods and liabilities related to government grants.
| Consolidated Financial Statements IFRS and Notes | Notes | 160 |
Table of Contents
(17b) Financial Liabilities
Financial Liabilities
€ millions | 2016 | 2015 | ||||||||||||||||||||||||||||||||||||||
| Nominal Volume | Carrying Amount | Nominal Volume | Carrying Amount | |||||||||||||||||||||||||||||||||||||
| Current | Non-Current | Current | Non-Current | Total | Current | Non-Current | Current | Non-Current | Total | |||||||||||||||||||||||||||||||
Bonds | 1,000 | 5,150 | 996 | 5,151 | 6,147 | 0 | 5,750 | 0 | 5,733 | 5,733 | ||||||||||||||||||||||||||||||
Private placement transactions | 420 | 1,240 | 418 | 1,298 | 1,717 | 551 | 1,607 | 551 | 1,651 | 2,202 | ||||||||||||||||||||||||||||||
Bank loans | 16 | 0 | 16 | 0 | 16 | 16 | 1,250 | 16 | 1,245 | 1,261 | ||||||||||||||||||||||||||||||
|
|
|
|
|
|
|
|
|
|
|
|
|
|
|
|
|
|
|
| |||||||||||||||||||||
| Financial debt | 1,435 | 6,390 | 1,430 | 6,450 | 7,880 | 567 | 8,607 | 567 | 8,628 | 9,195 | ||||||||||||||||||||||||||||||
| Derivatives | NA | NA | 152 | 43 | 194 | NA | NA | 70 | 58 | 128 | ||||||||||||||||||||||||||||||
| Other financial liabilities | NA | NA | 231 | -12 | 219 | NA | NA | 204 | -5 | 199 | ||||||||||||||||||||||||||||||
|
|
|
|
|
|
|
|
|
|
|
| |||||||||||||||||||||||||||||
| Financial liabilities | 1,813 | 6,481 | 8,294 | 841 | 8,681 | 9,522 | ||||||||||||||||||||||||||||||||||
Financial liabilities are unsecured, except for the retention of title and similar rights customary in our industry. Effective interest rates on our financial debt (including the effects from interest rate swaps) were 1.25% in 2016, 1.30% in 2015, and 1.77% in 2014.
For an analysis of the contractual cash flows of our financial liabilities based on maturity, seeNote (24). For information about the risk associated with our financial liabilities, seeNote (25). For information about fair values, seeNote (26).
Bonds
| 2016 | 2015 | |||||||||||||||||||||||||
| Maturity | Issue Price | Coupon Rate | Effective Interest Rate | Nominal Volume (in respective currency in millions) | Carrying Amount (in € millions) | Carrying Amount (in € millions) | ||||||||||||||||||||
| Eurobond 2 – 2010 | 2017 | 99.780 | % | 3.50% (fix) | 3.59 | % | €500 | 496 | 488 | |||||||||||||||||
| Eurobond 6 – 2012 | 2019 | 99.307 | % | 2.125% (fix) | 2.29 | % | €750 | 776 | 774 | |||||||||||||||||
| Eurobond 7 – 2014 | 2018 | 100.000 | % | 0.000% (var.) | 0.08 | % | €750 | 749 | 749 | |||||||||||||||||
| Eurobond 8 – 2014 | 2023 | 99.478 | % | 1.125% (fix) | 1.24 | % | €1,000 | 994 | 993 | |||||||||||||||||
| Eurobond 9 – 2014 | 2027 | 99.284 | % | 1.75% (fix) | 1.86 | % | €1,000 | 990 | 989 | |||||||||||||||||
| Eurobond 10 – 2015 | 2017 | 100.000 | % | 0.000% (var.) | 0.11 | % | €500 | 500 | 499 | |||||||||||||||||
| Eurobond 11 – 2015 | 2020 | 100.000 | % | 0.000% (var.) | 0.07 | % | €650 | 648 | 648 | |||||||||||||||||
| Eurobond 12 – 2015 | 2025 | 99.264 | % | 1.00% (fix) | 1.13 | % | €600 | 594 | 593 | |||||||||||||||||
| Eurobond 13 – 2016 | 2018 | 100.000 | % | 0.000% (var.) | 0.03 | % | €400 | 400 | 0 | |||||||||||||||||
|
|
|
| |||||||||||||||||||||||
| Eurobonds | 6,147 | 5,733 | ||||||||||||||||||||||||
All of our Eurobonds are listed for trading on the Luxembourg Stock Exchange.
| Consolidated Financial Statements IFRS and Notes | Notes | 161 |
Table of Contents
Private Placement Transactions
| 2016 | 2015 | |||||||||||||||||||||
| Maturity | Coupon Rate | Effective Interest Rate | Nominal Volume (in respective currency in millions) | Carrying Amount (in € millions) | Carrying Amount (in € millions) | |||||||||||||||||
| U.S. private placements | ||||||||||||||||||||||
Tranche 2 – 2010 | 2017 | 2.95% (fix) | 3.03 | % | US$200 | 189 | 180 | |||||||||||||||
Tranche 3 – 2011 | 2016 | 2.77% (fix) | 2.82 | % | US$600 | 0 | 551 | |||||||||||||||
Tranche 4 – 2011 | 2018 | 3.43% (fix) | 3.50 | % | US$150 | 141 | 135 | |||||||||||||||
Tranche 5 – 2012 | 2017 | 2.13% (fix) | 2.16 | % | US$242.5 | 229 | 221 | |||||||||||||||
Tranche 6 – 2012 | 2020 | 2.82% (fix) | 2.86 | % | US$290 | 278 | 271 | |||||||||||||||
Tranche 7 – 2012 | 2022 | 3.18% (fix) | 3.22 | % | US$444.5 | 439 | 426 | |||||||||||||||
Tranche 8 – 2012 | 2024 | 3.33% (fix) | 3.37 | % | US$323 | 334 | 318 | |||||||||||||||
Tranche 9 – 2012 | 2027 | 3.53% (fix) | 3.57 | % | US$100 | 107 | 100 | |||||||||||||||
|
|
|
| |||||||||||||||||||
| Private placements | 1,717 | 2,202 | ||||||||||||||||||||
The U.S. private placement notes were issued by one of our subsidiaries that has the U.S. dollar as its functional currency.
Bank Loans
| 2016 | 2015 | |||||||||||||||||||||||
| Maturity | Coupon Rate | Effective Interest Rate | Nominal Volume (in respective currency in millions) | Carrying Amount (in € millions) | Carrying Amount (in € millions) | |||||||||||||||||||
| Concur term loan – Facility B | 2017 | NA | NA | €0 | 0 | 1,245 | ||||||||||||||||||
| Other loans | INR 1,051 | 16 | 16 | |||||||||||||||||||||
|
|
|
| |||||||||||||||||||||
| Bank loans | 16 | 1,261 | ||||||||||||||||||||||
|
| |||||||||||||||||||||||
(17c) OtherNon-Financial Liabilities
OtherNon-Financial Liabilities
€ millions | 2016 | 2015 | ||||||||||||||||||||||
| Current | Non- Current | Total | Current | Non- Current | Total | |||||||||||||||||||
| Share-based payment liabilities | 602 | 309 | 911 | 555 | 205 | 760 | ||||||||||||||||||
| Other employee-related liabilities | 2,545 | 152 | 2,697 | 2,255 | 126 | 2,381 | ||||||||||||||||||
| Other taxes | 552 | 0 | 552 | 597 | 0 | 597 | ||||||||||||||||||
|
|
|
|
|
|
|
|
|
|
|
| |||||||||||||
| Othernon-financial liabilities | 3,699 | 461 | 4,160 | 3,407 | 331 | 3,739 | ||||||||||||||||||
For more information about our share-based payments, seeNote (27).
Other employee-related liabilities mainly relate to vacation obligations, bonus and sales commission obligations, as well as employee-related social security obligations.
Other taxes mainly comprise payroll tax liabilities and value-added tax liabilities.
| Consolidated Financial Statements IFRS and Notes | Notes | 162 |
Table of Contents
Provisions
€ millions | 2016 | 2015 | ||||||||||||||||||||||
| Current | Non- Current | Total | Current | Non- Current | Total | |||||||||||||||||||
| Pension plans and similar obligations (see Note (18a)) | 0 | 140 | 140 | 0 | 117 | 117 | ||||||||||||||||||
| Other provisions (see Note (18b)) | 183 | 77 | 260 | 299 | 63 | 362 | ||||||||||||||||||
|
|
|
|
|
|
|
|
|
|
|
| |||||||||||||
| Total | 183 | 217 | 400 | 299 | 180 | 479 | ||||||||||||||||||
(18a) Pension Plans and Similar Obligations
Defined Benefit Plans
The measurement dates for our domestic and foreign benefit plans are December 31.
Present Value of the Defined Benefit Obligations (DBO) and the Fair Value of the Plan Assets
€ millions | Domestic Plans | Foreign Plans | Other Post- Employment Plans | Total | ||||||||||||||||||||||||||||
| 2016 | 2015 | 2016 | 2015 | 2016 | 2015 | 2016 | 2015 | |||||||||||||||||||||||||
| Present value of the DBO | 854 | 724 | 369 | 333 | 98 | 82 | 1,321 | 1,139 | ||||||||||||||||||||||||
Thereof fully or partially funded plans | 854 | 724 | 324 | 293 | 74 | 61 | 1,252 | 1,078 | ||||||||||||||||||||||||
Thereof unfunded plans | 0 | 0 | 45 | 40 | 24 | 21 | 69 | 61 | ||||||||||||||||||||||||
|
|
|
|
|
|
|
|
|
|
|
|
|
|
|
| |||||||||||||||||
| Fair value of the plan assets | 843 | 716 | 290 | 265 | 48 | 42 | 1,181 | 1,023 | ||||||||||||||||||||||||
|
|
|
|
|
|
|
|
|
|
|
|
|
|
|
| |||||||||||||||||
| Net defined benefit liability (asset) | 11 | 8 | 79 | 69 | 50 | 40 | 140 | 117 | ||||||||||||||||||||||||
| Amounts recognized in the Consolidated Statement of Financial Position: | ||||||||||||||||||||||||||||||||
| Non-current provisions | -11 | -8 | -79 | -69 | -50 | -40 | -140 | -117 | ||||||||||||||||||||||||
|
|
|
|
|
|
|
|
|
|
|
|
|
|
|
| |||||||||||||||||
| Total | -11 | -8 | -79 | -69 | -50 | -40 | -140 | -117 | ||||||||||||||||||||||||
€789 million (2015: €664 million) of the present value of the DBO of our domestic plans relate to plans that provide forlump-sum payments not based on final salary, and €316 million (2015: €287 million) of the present value of the DBO of our foreign plans relate to plans that provide for annuity payments not based on final salary.
The following weighted average assumptions were used for the actuarial valuation of our domestic and foreign pension liabilities as well as other post-employment benefit obligations as at the respective measurement date:
Actuarial Assumptions
Percent | Domestic Plans | Foreign Plans | Other Post- Employment Plans | |||||||||||||||||||||||||||||||||
| 2016 | 2015 | 2014 | 2016 | 2015 | 2014 | 2016 | 2015 | 2014 | ||||||||||||||||||||||||||||
| Discount rate | 2.1 | 2.7 | 2.2 | 0.6 | 0.7 | 1.1 | 4.0 | 4.0 | 4.2 | |||||||||||||||||||||||||||
| Future salary increases | 2.5 | 2.5 | 2.5 | 1.7 | 1.7 | 1.7 | 6.0 | 6.3 | 3.8 | |||||||||||||||||||||||||||
| Future pension increases | 2.0 | 2.0 | 2.0 | 0 | 0 | 0 | 0.0 | 0.0 | 0 | |||||||||||||||||||||||||||
| Employee turnover | 2.0 | 2.0 | 2.0 | 10.3 | 10.3 | 10.1 | 8.6 | 8.7 | 1.3 | |||||||||||||||||||||||||||
| Inflation | 2.0 | 2.0 | 0 | 1.4 | 1.4 | 1.3 | 1.1 | 1.0 | 1.3 | |||||||||||||||||||||||||||
| Consolidated Financial Statements IFRS and Notes | Notes | 163 |
Table of Contents
The sensitivity analysis table shows how the present value of all defined benefit obligations would have been influenced by reasonably possible changes to above actuarial assumptions. The sensitivity analysis table presented below considers change in one actuarial assumption at a time, holding all other actuarial assumptions constant. A reasonably possible change in actuarial assumptions of 50 basis points in either direction, except for the discount rate assumption, would not materially influence the present value of all defined benefit obligations.
Sensitivity Analysis
€ millions | Domestic Plans | Foreign Plans | Other Post- Employment Plans | Total | ||||||||||||||||||||||||||||||||||||||||||||
| 2016 | 2015 | 2014 | 2016 | 2015 | 2014 | 2016 | 2015 | 2014 | 2016 | 2015 | 2014 | |||||||||||||||||||||||||||||||||||||
| Present value of all defined benefit obligations if: | ||||||||||||||||||||||||||||||||||||||||||||||||
| Discount rate was 50 basis points higher | 800 | 678 | 725 | 344 | 311 | 259 | 93 | 79 | 44 | 1,237 | 1,068 | 1,028 | ||||||||||||||||||||||||||||||||||||
| Discount rate was 50 basis points lower | 913 | 775 | 840 | 398 | 359 | 296 | 101 | 87 | 49 | 1,412 | 1,221 | 1,185 | ||||||||||||||||||||||||||||||||||||
Total Expense of Defined Benefit Pension Plans
| € millions | Domestic Plans | Foreign Plans | Other Post- Employment Plans | Total | ||||||||||||||||||||||||||||||||||||||||||||
| 2016 | 2015 | 2014 | 2016 | 2015 | 2014 | 2016 | 2015 | 2014 | 2016 | 2015 | 2014 | |||||||||||||||||||||||||||||||||||||
| Current service cost | 7 | 10 | 3 | 21 | 21 | 16 | 10 | 9 | 6 | 38 | 40 | 25 | ||||||||||||||||||||||||||||||||||||
| Interest expense | 19 | 17 | 22 | 3 | 3 | 5 | 3 | 3 | 2 | 25 | 23 | 29 | ||||||||||||||||||||||||||||||||||||
| Interest income | -20 | -17 | -23 | -2 | -3 | -5 | -1 | -2 | -1 | -23 | -22 | -29 | ||||||||||||||||||||||||||||||||||||
| Past service cost | 0 | 0 | 0 | 0 | 0 | 0 | 0 | 0 | 0 | 0 | 0 | 0 | ||||||||||||||||||||||||||||||||||||
|
|
|
|
|
|
|
|
|
|
|
|
|
|
|
|
|
|
|
|
|
|
|
| |||||||||||||||||||||||||
| Total expense | 6 | 10 | 3 | 22 | 21 | 16 | 12 | 10 | 7 | 40 | 41 | 26 | ||||||||||||||||||||||||||||||||||||
| Actual return on plan assets | 97 | -76 | 133 | 1 | 0 | 10 | 2 | 2 | 1 | 100 | -74 | 144 | ||||||||||||||||||||||||||||||||||||
Our investment strategy on domestic benefit plans is to invest all contributions in stable insurance policies.
Our investment strategies for foreign benefit plans vary according to the conditions in the country in which the respective benefit plans are situated. Generally, a long-term investment horizon has been adopted for all major foreign benefit plans. Although our policy is to invest in a risk-diversified portfolio consisting of a mix of assets, both the defined benefit obligation and plan assets can fluctuate over time, which exposes the Group to actuarial and market (investment) risks. Depending on the statutory requirements in each country, it might be necessary to reduce any underfunding by addition of liquid assets.
| Consolidated Financial Statements IFRS and Notes | Notes | 164 |
Table of Contents
Plan Asset Allocation
€ millions | 2016 | 2015 | ||||||||||||||
| Quoted in an Active Market | Not Quoted in an Active Market | Quoted in an Active Market | Not Quoted in an Active Market | |||||||||||||
| Asset category | ||||||||||||||||
| Equity investments | 118 | 0 | 93 | 0 | ||||||||||||
| Corporate bonds | 90 | 0 | 101 | 0 | ||||||||||||
| Government bonds | 5 | 0 | 5 | 0 | ||||||||||||
| Real estate | 49 | 0 | 43 | 0 | ||||||||||||
| Insurance policies | 0 | 864 | 0 | 736 | ||||||||||||
| Cash and cash equivalents | 11 | 0 | 9 | 0 | ||||||||||||
| Others | 44 | 0 | 36 | 0 | ||||||||||||
|
|
|
|
|
|
|
| |||||||||
| Total | 317 | 864 | 287 | 736 | ||||||||||||
Our expected contribution in 2017 to our domestic and foreign defined benefit pension plans is immaterial. The weighted duration of our defined benefit plans amounted to 14 years as at December 31, 2016, and 14 years as at December 31, 2015.
Total future benefit payments from our defined benefit plans as at December 31, 2016, are expected to be €1,583 million (2015: €1,432 million).Eighty-two percent of this amount has maturities of over five years.
Maturity Analysis
€ millions | Domestic Plans | Foreign Plans | Other Post- Employment Plans | |||||||||||||||||||||
| 2016 | 2015 | 2016 | 2015 | 2016 | 2015 | |||||||||||||||||||
| Less than a year | 25 | 19 | 26 | 26 | 8 | 2 | ||||||||||||||||||
| Between 1 and 2 years | 21 | 18 | 45 | 43 | 7 | 2 | ||||||||||||||||||
| Between 2 and 5 years | 70 | 65 | 69 | 63 | 20 | 8 | ||||||||||||||||||
| Over 5 years | 1,009 | 935 | 232 | 223 | 51 | 28 | ||||||||||||||||||
|
|
|
|
|
|
|
|
|
|
|
| |||||||||||||
| Total | 1,125 | 1,037 | 372 | 355 | 86 | 40 | ||||||||||||||||||
Defined Contribution Plans/State Plans
We also maintain domestic and foreign defined contribution plans. Amounts contributed by us under such plans are based on a percentage of the employees’ salaries or the amount of contributions made by employees. Furthermore, in Germany and some other countries, we make contributions to public pension plans that are operated by national or local government or a similar institution.
Total Expense of Defined Contribution Plans and State Plans
€ millions | 2016 | 2015 | 2014 | |||||||||
| Defined contribution plans | 234 | 218 | 188 | |||||||||
| State plans | 484 | 429 | 360 | |||||||||
|
|
|
|
|
| |||||||
| Total expense | 718 | 647 | 548 | |||||||||
| Consolidated Financial Statements IFRS and Notes | Notes | 165 |
Table of Contents
(18b) Other Provisions
Other Provisions
€ millions | 1/1/ 2016 | Addition | Accretion | Utilization | Release | Currency Impact | 12/31/ 2016 | |||||||||||||||||||||
| Employee-related provisions | 58 | 57 | 0 | -39 | -2 | 0 | 74 | |||||||||||||||||||||
| Customer-related provisions | 61 | 34 | 0 | -10 | -1 | 3 | 87 | |||||||||||||||||||||
| Intellectual property-related provisions | 11 | 7 | 0 | -10 | 0 | 1 | 9 | |||||||||||||||||||||
| Restructuring provisions | 184 | 41 | 0 | -163 | -13 | 0 | 49 | |||||||||||||||||||||
| Onerous contract provisions (other than from customer contracts) | 15 | 0 | 1 | -14 | 0 | 0 | 2 | |||||||||||||||||||||
| Other provisions | 33 | 8 | 0 | 0 | -2 | 0 | 39 | |||||||||||||||||||||
|
|
|
|
|
|
|
|
|
|
|
|
|
| |||||||||||||||
| Total other provisions | 362 | 147 | 1 | -236 | -18 | 4 | 260 | |||||||||||||||||||||
Thereof current | 299 | 183 | ||||||||||||||||||||||||||
Thereofnon-current | 63 | 77 | ||||||||||||||||||||||||||
Customer-related provisions include, among others, disputes with individual customers. Intellectual property-related provisions relate to litigation matters. Both classes of provisions are described inNote (23).
For more information about our restructuring plans, seeNote (6).
The cash outflows associated with employee-related restructuring costs are substantially short-term in nature.
Onerous contract provisions (other than from customer contracts) and other provisions comprise facility-related and supplier-related provisions. The timing of the associated cash outflows is dependent on the remaining term of the underlying lease and of the supplier contract.
Deferred income consists mainly of prepayments made by our customers for cloud subscriptions and support; software support and services; fees from multiple-element arrangements allocated to undelivered elements; and amounts recorded in purchase accounting at fair value for obligations to perform under acquired customer contracts in connection with acquisitions
Deferred Income
€ millions | 2016 | 2015 | ||||||||||||||||||||||
| Current | Non- Current | Total | Current | Non- Current | Total | |||||||||||||||||||
| Deferred Income | 2,383 | 143 | 2,526 | 2,001 | 106 | 2,107 | ||||||||||||||||||
Thereof deferred revenue from cloud subscriptions and support | 1,271 | 0 | 1,271 | 957 | 0 | 957 | ||||||||||||||||||
| Consolidated Financial Statements IFRS and Notes | Notes | 166 |
Table of Contents
Issued Capital
SAP SE has issuedno-par value bearer shares with a calculated nominal value of €1 per share. All of the shares issued are fully paid.
Number of Shares
millions | Issued Capital | Treasury Shares | ||||||
| January 1, 2014 | 1,229 | -35 | ||||||
| Reissuance of treasury shares under share-based payments | 0 | 2 | ||||||
|
|
|
| |||||
| December 31, 2014 | 1,229 | -33 | ||||||
| Reissuance of treasury shares under share-based payments | 0 | 2 | ||||||
|
|
|
| |||||
| December 31, 2015 | 1,229 | -31 | ||||||
| Reissuance of treasury shares under share-based payments | 0 | 1 | ||||||
|
|
|
| |||||
| December 31, 2016 | 1,229 | -30 | ||||||
Authorized Shares
The Articles of Incorporation authorize the Executive Board to increase the issued capital as follows:
| ∎ | By up to a total amount of €250 million by issuing newno-par value bearer shares against contributions in cash until May 19, 2020 (Authorized Capital I). The issuance is subject to the statutory subscription rights of existing shareholders. |
| ∎ | By up to a total amount of €250 million by issuing newno-par value bearer shares against contributions in cash or in kind until May 19, 2020 (Authorized Capital II). Subject to the consent of the Supervisory Board, the Executive Board is authorized to exclude the shareholders’ statutory subscription rights in certain cases. |
Contingent Shares
SAP SE’s share capital is subject to a contingent capital increase which may be effected only to the extent that the holders or creditors of convertible bonds or stock options issued or guaranteed by SAP SE or any of its directly or indirectly controlled subsidiaries under certain share-based payments exercise their conversion or subscription rights, and no other methods for servicing these rights are used. As at December 31, 2016, €100 million, representing 100 million shares, was still available for issuance (2015: €100 million).
Other Components of Equity
€ millions | Exchange Differences | Available-for-Sale Financial Assets | Cash Flow Hedges | Total | ||||||||||||
| January 1, 2014 | -820 | 82 | 20 | -718 | ||||||||||||
| Other comprehensive income for items that will be reclassified to profit or loss, net of tax | 1,182 | 128 | -28 | 1,282 | ||||||||||||
|
|
|
|
|
|
|
| |||||||||
| December 31, 2014 | 362 | 211 | -8 | 564 | ||||||||||||
| Other comprehensive income for items that will be reclassified to profit or loss, net of tax | 1,861 | 125 | 11 | 1,997 | ||||||||||||
|
|
|
|
|
|
|
| |||||||||
| December 31, 2015 | 2,222 | 336 | 3 | 2,561 | ||||||||||||
| Other comprehensive income for items that will be reclassified to profit or loss, net of tax | 839 | -43 | -11 | 785 | ||||||||||||
|
|
|
|
|
|
|
| |||||||||
| December 31, 2016 | 3,062 | 292 | -8 | 3,345 | ||||||||||||
Treasury Shares
By resolution of SAP SE’s General Meeting of Shareholders held on June 4, 2013, the authorization granted by the General Meeting of Shareholders on June 8, 2010, regarding the acquisition of treasury shares was revoked to the extent it had not been exercised at that time, and replaced by a new authorization of the Executive Board of SAP SE to acquire, on or before June 3, 2018, shares of SAP SE representing a pro rata amount of capital stock of up to €120 million in aggregate, provided that the shares purchased under the authorization, together with any other shares in the Company previously acquired and held by, or attributable to, SAP SE do not account for more than 10% of SAP SE’s issued share capital. Although treasury shares are legally considered outstanding, there are no dividend or voting rights associated with shares held in treasury. We may redeem or resell shares held in treasury, or we may use treasury shares for the purpose of servicing option or conversion rights under the Company’s share-based payment plans. Also, we may use shares held in treasury as consideration in connection with mergers with, or acquisitions of, other companies.
Dividends
The total dividend available for distribution to SAP SE shareholders is based on the profits of SAP SE as reported in its statutory financial statements prepared under the accounting rules in the German Commercial Code (Handelsgesetzbuch). For the year ended December 31, 2016, the Executive Board intends to propose that a dividend of €1.25 per share (that is, an estimated total dividend of €1,498 million), be paid from the profits of SAP SE.
| Consolidated Financial Statements IFRS and Notes | Notes | 167 |
Table of Contents
Dividends per share for 2015 and 2014 were €1.15 and €1.10 respectively and were paid in the succeeding year.
(21) Additional Capital Disclosures
Capital Structure Management
The primary objective of our capital structure management is to maintain a strong financial profile for investor, creditor, and customer confidence, and to support the growth of our business. We seek to maintain a capital structure that will allow us to cover our funding requirements through the capital markets at reasonable conditions, and in so doing, ensure a high level of independence, confidence, and financial flexibility.
SAP SE’s long-term credit rating is “A2” by Moody’s with stable outlook, and “A” by Standard & Poor’s with positive outlook. Standard & Poor’s raised the outlook to positive in 2016.
Capital Structure
| 12/31/2016 | 12/31/2015 | |||||||||||||||||||
| € millions | % of Total Equity and Liabilities | € millions | % of Total Equity and Liabilities | D in % | ||||||||||||||||
| Equity | 26,397 | 60 | 23,295 | 56 | 13 | |||||||||||||||
Current liabilities | 9,674 | 22 | 7,867 | 19 | 23 | |||||||||||||||
Non-current liabilities | 8,205 | 19 | 10,228 | 25 | -20 | |||||||||||||||
| Liabilities | 17,880 | 40 | 18,095 | 44 | -1 | |||||||||||||||
|
|
|
|
|
|
|
|
|
| |||||||||||
| Total equity and liabilities | 44,277 | 100 | 41,390 | 100 | 7 | |||||||||||||||
In 2016, we repaid €1,250 million in bank loans that we had taken to finance the Concur acquisition. The repayment was partly refinanced through the issuance of a €400 million Eurobond with a maturity of two years. We also repaid a US$600 million U.S. private placement tranche at maturity. Thus, the ratio of total financial debt to total equity and liabilities decreased by four percentage points to 18% at the end of 2016 (22% as at December 31, 2015).
Total financial debt consists of current andnon-current bank loans, bonds, and private placements. The changes in our financial debts are reconciled to the cash flows from liabilities arising from financing activities below. For more information about our financial debt, seeNote (17).
Reconciliation of Liabilities Arising from Financing Activities
€ millions | 12/31/2015 | Cash Flows | Business Combinations | Foreign Currency | Fair Value Changes | Other | 12/31/2016 | |||||||||||||||||||||
| Current financial debt | -567 | 547 | -6 | 4 | 0 | -1,413 | -1,435 | |||||||||||||||||||||
| Non-current financial debt | -8,607 | 852 | -2 | -46 | 0 | 1,413 | -6,390 | |||||||||||||||||||||
|
|
|
|
|
|
|
|
|
|
|
|
|
| |||||||||||||||
| Financial debt (nominal volume) | -9,175 | 1,400 | -8 | -42 | 0 | 0 | -7,826 | |||||||||||||||||||||
| Basis adjustment | -64 | 0 | 0 | 5 | -27 | 0 | -86 | |||||||||||||||||||||
| Transaction costs | 44 | 0 | 0 | 0 | 0 | -11 | 32 | |||||||||||||||||||||
|
|
|
|
|
|
|
|
|
|
|
|
|
| |||||||||||||||
| Financial debt (carrying amount) | -9,195 | 1,400 | -8 | -37 | -27 | -11 | -7,880 | |||||||||||||||||||||
| Accrued interest | -45 | 0 | 0 | 1 | 0 | -1 | -45 | |||||||||||||||||||||
| Assets held to hedge financial debt | 100 | -43 | 0 | -3 | -6 | 0 | 47 | |||||||||||||||||||||
|
|
|
|
|
|
|
|
|
|
|
|
|
| |||||||||||||||
| Total liabilities from financing activities | -9,141 | 1,357 | -8 | -40 | -33 | -12 | -7,878 | |||||||||||||||||||||
| Consolidated Financial Statements IFRS and Notes | Notes | 168 |
Table of Contents
While we continuously monitor the ratios presented in and below the capital structure table above, we actively manage our liquidity and structure of our financial indebtedness based on the ratios group liquidity and net liquidity.
Group Liquidity
€ millions | 2016 | 2015 | D | |||||||||
Cash and cash equivalents | 3,702 | 3,411 | 291 | |||||||||
Current investments | 971 | 148 | 823 | |||||||||
|
|
|
|
|
| |||||||
| Group liquidity | 4,673 | 3,559 | 1,114 | |||||||||
Current financial debt | -1,435 | -567 | -868 | |||||||||
|
|
|
|
|
| |||||||
| Net liquidity 1 | 3,238 | 2,992 | 246 | |||||||||
Non-current financial debt | -6,390 | -8,607 | 2,217 | |||||||||
|
|
|
|
|
| |||||||
| Net liquidity 2 | -3,153 | -5,615 | 2,462 | |||||||||
Distribution Policy
Our general intention is to remain in a position to return liquidity to our shareholders by distributing annual dividends totaling more than 35% of our profit after tax as well as by repurchasing treasury shares in future periods.
In 2016, we distributed €1,378 million in dividends from our 2015 profit (compared to €1,316 million in 2015 and €1,194 million in 2014 related to 2014 and 2013 profit, respectively), representing €1.15 per share.
As a result of our equity-settled share-based payments transactions (as described inNote (27)), we have commitments to grant SAP shares to employees. We intend to meet these commitments by reissuing treasury shares or to fulfill these obligations through an agent who administers the equity-settled programs and therefor purchases shares on the open market.
(22) Other Financial Commitments
Other Financial Commitments
€ millions | 2016 | 2015 | ||||||
| Operating leases | 1,578 | 1,347 | ||||||
| Contractual obligations for acquisition of property, plant, and equipment and intangible assets | 227 | 162 | ||||||
| Other purchase obligations | 596 | 710 | ||||||
| Purchase obligations | 823 | 872 | ||||||
| Capital contribution commitments | 167 | 111 | ||||||
|
|
|
| |||||
| Total | 2,568 | 2,330 | ||||||
Our operating leases relate primarily to the lease of office space, hardware, and vehicles, with remainingnon-cancelable lease terms between less than one year and 32 years. On a limited scale, the operating lease contracts include escalation clauses (based, for example, on the consumer price index) and renewal options. The contractual obligations for acquisition of property, plant, and equipment and intangible assets relate primarily to the construction of new and existing facilities and to the purchase of hardware, software, patents, office equipment, and vehicles. The remaining obligations relate mainly to marketing, consulting, maintenance, license agreements, and other third-party agreements. Historically, the majority of such purchase obligations have been realized.
SAP invests and holds interests in other entities. On December 31, 2016, total commitments to make such equity investments amounted to €308 million (2015: €197 million), of which €141 million had been drawn (2015: €86 million). By investing in such equity investments, we are exposed to the risks inherent in the business areas in which these entities operate. Our maximum exposure to loss is the amount invested plus unavoidable future capital contributions.
Other Financial Commitments
€ millions | December 31, 2016 | |||||||||||
| Operating Leases | Purchase Obligations | Capital Contribution Commitments | ||||||||||
| Due 2017 | 316 | 436 | 167 | |||||||||
| Due 2018 to 2021 | 790 | 266 | 0 | |||||||||
| Due thereafter | 471 | 121 | 0 | |||||||||
|
|
|
|
|
| |||||||
| Total | 1,578 | 823 | 167 | |||||||||
Our rental and operating lease expenses were €458 million, €386 million, and €291 million for the years 2016, 2015, and 2014, respectively.
We are subject to a variety of claims and lawsuits that arise from time to time in the ordinary course of our business, including proceedings
| Consolidated Financial Statements IFRS and Notes | Notes | 169 |
Table of Contents
and claims that relate to companies we have acquired, claims that relate to customers demanding indemnification for proceedings initiated against them based on their use of SAP software, and claims that relate to customers being dissatisfied with the products and services that we have delivered to them. We will continue to vigorously defend against all claims and lawsuits against us. We currently believe that resolving the claims and lawsuits pending as of December 31, 2016, will neither individually nor in the aggregate have a material adverse effect on our business, financial position, profit, or cash flows. Consequently, the provisions recorded for these claims and lawsuits as of December 31, 2016, are neither individually nor in the aggregate material to SAP.
However, the outcome of litigation and claims is intrinsically subject to considerable uncertainty. Management’s view of the litigation may also change in the future. Actual outcomes of litigation and claims may differ from the assessments made by management in prior periods, which could result in a material impact on our business, financial position, profit, cash flows, or reputation. Most of the lawsuits and claims are of a very individual nature and claims are either not quantified by the claimants or claim amounts quantified are, based on historical evidence, not expected to be a good proxy for the expenditure that would be required to settle the case concerned. The specifics of the jurisdictions where most of the claims are located further impair the predictability of the outcome of the cases. Therefore, it is not practicable to reliably estimate the financial effect that these lawsuits and claims would have if SAP were to incur expenditure for these cases.
Among the claims and lawsuits are the following classes:
Intellectual Property-Related Litigation and Claims
Intellectual property-related litigation and claims are cases in which third parties have threatened or initiated litigation claiming that SAP violates one or more intellectual property rights that they possess. Such intellectual property rights may include patents, copyrights, and other similar rights.
The carrying amount of the provisions recognized for intellectual property-related litigation and claims and the change in the carrying amount in the reporting period are disclosed inNote (18b). The expected timing of any resulting outflows of economic benefits from these lawsuits and claims is uncertain and not estimable as it depends generally on the duration of the legal proceedings and settlement negotiations required to resolve them. Uncertainties about the amounts result primarily from the unpredictability of the outcomes of legal disputes in several jurisdictions. For more information, seeNote (3c).
Contingent liabilities exist from intellectual property-related litigation and claims for which no provision has been recognized. Generally, it is not practicable to estimate the financial impact of these contingent liabilities due to the uncertainties around the litigation and claims, as outlined above. The total amounts claimed by plaintiffs in those intellectual property-related lawsuits or claims in which a claim has been quantified were not material to us as of December 31, 2016 and 2015. Based on our past experience, most of the intellectual property-related litigation and claims tend to be either dismissed in court or settled out of court for amounts significantly below the originally claimed amounts and not material to our consolidated financial statements.
Individual cases of intellectual property-related litigation and claims include the following:
In February 2010, United States-based TecSec, Inc. (TecSec) instituted legal proceedings in the United States against SAP (including its subsidiary Sybase) and many other defendants. TecSec alleged that SAP’s and Sybase’s products infringe one or more of the claims in five patents held by TecSec. In its complaint, TecSec seeks unspecified monetary damages and permanent injunctive relief. The lawsuit is proceeding but only with respect to one defendant. The trial for SAP (including its subsidiary Sybase) has not yet been scheduled – the lawsuit for SAP (including its subsidiary Sybase) remains stayed.
In April 2010, SAP instituted legal proceedings (a declaratory judgment action) in the United States against Wellogix, Inc. and Wellogix Technology Licensing, LLC (Wellogix). The lawsuit sought a declaratory judgment that six patents owned by Wellogix were invalid or not infringed by SAP. The legal proceedings were stayed pending the outcome of six reexaminations filed by SAP with the United States Patent and Trademark Office (USPTO). In response to SAP’s patent Declaratory Judgment action, Wellogixre-asserted trade secret misappropriation claims against SAP. The court granted SAP’s motion to dismiss based on improper venue for litigating the trade secret claims in the U.S. and Wellogix appealed that decision. In February 2015, SAP filed a declaratory judgment action in Frankfurt/Main, Germany, asking the German court to rule that SAP did not misappropriate any Wellogix trade secrets. In early 2016, the appeals court rejected Wellogix’s appeal. Inmid-2016, SAP’s patent declaratory judgment and reexaminations resulted in a final judgment invalidating all of Wellogix’s six asserted patents and the litigation was dismissed. The German trade secrets litigation remains pending.
Customer-Related Litigation and Claims
Customer-related litigation and claims include cases in which we indemnify our customers against liabilities arising from a claim that our products infringe a third party’s patent, copyright, trade secret, or other proprietary rights. Occasionally, consulting or software implementation projects result in disputes with customers. Where customers are dissatisfied with the products and services that we have delivered to them in routine consulting contracts or development arrangements, we may grant functions or performance guarantees.
The carrying amount of the provisions recorded for customer-related litigation and claims and the development of the carrying amount in the reporting period are disclosed inNote (18b). The expected timing or amounts of any resulting outflows of economic benefits from these lawsuits and claims is uncertain and not estimable as they generally depend on the duration of the legal proceedings and
| Consolidated Financial Statements IFRS and Notes | Notes | 170 |
Table of Contents
settlement negotiations required to resolve the litigation and claims and the unpredictability of the outcomes of legal disputes in several jurisdictions. For more information, seeNote (3c).
Contingent liabilities exist from customer-related litigation and claims for which no provision has been recognized. Generally, it is not practicable to estimate the financial impact of these contingent liabilities due to the uncertainties around these lawsuits and claims outlined above.
Tax-Related Litigation and Claims
We are subject to ongoing audits by domestic and foreign tax authorities. In respect ofnon-income taxes, we, like many other companies operating in Brazil, are involved in various proceedings with Brazilian tax authorities regarding assessments and litigation matters on intercompany royalty payments and intercompany services. The total potential amount in dispute related to these matters for all applicable years is approximately €106 million (2015: €75 million). We have not recorded a provision for these matters, as we believe that we will prevail.
For information about incometax-related litigation, seeNote (10).
We are exposed to various financial risks, such as market risks (including foreign currency exchange rate risk, interest rate risk, and equity price risk), credit risk, and liquidity risk.
Market Risk
a) Foreign Currency Exchange Rate Risk
As we are active worldwide, our ordinary operations are subject to risks associated with fluctuations in foreign currencies. Since the Group’s entities mainly conduct their operating business in their own functional currencies, our risk of exchange rate fluctuations from ongoing ordinary operations is not considered significant. However, we occasionally generate foreign currency-denominated receivables, payables, and other monetary items by transacting in a currency other than the functional currency. To mitigate the extent of the associated foreign currency exchange rate risk, the majority of these transactions are hedged as described inNote (25).
In rare circumstances, transacting in a currency other than the functional currency also leads to embedded foreign currency derivatives being separated and measured at fair value through profit or loss.
In addition, the intellectual property (IP) holders in the SAP Group are exposed to risks associated with forecasted intercompany cash flows in foreign currencies. These cash flows arise out of royalty payments from subsidiaries to the respective IP holder. The royalties are linked to the subsidiaries’ external revenue. This arrangement leads to a concentration of the foreign currency exchange rate risk with the IP holders, as the royalties are mostly denominated in the subsidiaries’ local currencies, while the functional currency of the IP holders with the highest royalty volume is the euro. The highest foreign currency exchange rate exposure of this kind relates to the currencies of subsidiaries with significant operations, for example the U.S. dollar, the pound sterling, the Japanese yen, the Swiss franc, the Brazilian real, and the Australian dollar.
Generally, we are not exposed to any significant foreign currency exchange rate risk with regard to our investing and financing activities, as such activities are normally conducted in the functional currency of the investing or borrowing entity. For more information, seeNote (25).
b) Interest Rate Risk
We are exposed to interest rate risk as a result of our investing and financing activities mainly in euros and U.S. dollars:
| € millions | 2016 | 2015 | ||||||||||||||
| Cash Flow Risk | Fair Value Risk | Cash Flow Risk | Fair Value Risk | |||||||||||||
| Investing activities | 3,308 | 1,364 | 3,078 | 480 | ||||||||||||
| Financing activities | 2,313 | 5,567 | 3,157 | 6,038 | ||||||||||||
c) Equity Price Risk
We are exposed to equity price risk with regard to our investments in equity securities (2016: €952 million; 2015: €882 million) and our share-based payments (for the exposure from these plans, seeNote (27)).
Credit Risk
To reduce the credit risk in investments, we arrange to receive rights to collateral for certain investing activities in the full amount of the investment volume, which we would be allowed to make use of only in the case of default of the counterparty to the investment. In the absence of other significant agreements to reduce our credit risk exposure, the total amounts recognized as cash and cash equivalents, current investments, loans and other financial receivables, trade receivables, and derivative financial assets represent our maximum exposure to credit risks, except for the agreements mentioned above.
Liquidity Risk
The table below is an analysis of the remaining contractual maturities of all our financial liabilities held as at December 31, 2016. Financial liabilities for which repayment can be requested by the contract partner at any time are assigned to the earliest possible period. Variable interest payments were calculated using the latest relevant interest
| Consolidated Financial Statements IFRS and Notes | Notes | 171 |
Table of Contents
rate fixed as at December 31, 2016. As we generally settle our derivative contracts gross, we show the pay and receive legs separately for all our currency and interest rate derivatives, whether or not the fair value of the derivative is negative. The cash outflows for the currency derivatives are translated using the applicable forward rate.
For more information about the cash flows for unrecognized but contractually agreed financial commitments, seeNote (22).
Contractual Maturities ofNon-Derivative Financial Liabilities
€ millions | Carrying Amount |
|
|
|
| Contractual Cash Flows | ||||||||||||||||||||||
| 12/31/2016 | 2017 | 2018 | 2019 | 2020 | 2021 | Thereafter | ||||||||||||||||||||||
| Trade payables | -1,016 | -1,016 | 0 | 0 | 0 | 0 | 0 | |||||||||||||||||||||
| Financial liabilities | -8,099 | -1,739 | -1,371 | -835 | -995 | -62 | -3,639 | |||||||||||||||||||||
|
|
|
|
|
|
|
|
|
|
|
|
|
| |||||||||||||||
| Total ofnon-derivative financial liabilities | -9,115 | -2,755 | -1,371 | -835 | -995 | -62 | -3,639 | |||||||||||||||||||||
€ millions | Carrying Amount |
|
|
|
| Contractual Cash Flows | ||||||||||||||||||||||
| 12/31/2015 | 2016 | 2017 | 2018 | 2019 | 2020 | Thereafter | ||||||||||||||||||||||
| Trade payables | -893 | -893 | 0 | 0 | 0 | 0 | 0 | |||||||||||||||||||||
| Financial liabilities | -9,395 | -863 | -2,778 | -980 | -836 | -986 | -3,683 | |||||||||||||||||||||
|
|
|
|
|
|
|
|
|
|
|
|
|
| |||||||||||||||
| Total ofnon-derivative financial liabilities | -10,288 | -1,756 | -2,778 | -980 | -836 | -986 | -3,683 | |||||||||||||||||||||
Contractual Maturities of Derivative Financial Liabilities and Financial Assets
€ millions | Carrying Amount | Contractual Cash Flows | Carrying Amount | Contractual Cash Flows | ||||||||||||||||||||
| 12/31/2016 | 2017 | Thereafter | 12/31/2015 | 2016 | Thereafter | |||||||||||||||||||
| Derivative financial liabilities | ||||||||||||||||||||||||
Currency derivatives not designated as hedging instruments | -170 | -117 | ||||||||||||||||||||||
Cash outflows | -3,160 | -43 | -2,896 | -58 | ||||||||||||||||||||
Cash inflows | 3,025 | 0 | 2,834 | 0 | ||||||||||||||||||||
Currency derivatives designated as hedging instruments | -24 | -10 | ||||||||||||||||||||||
Cash outflows | -475 | 0 | -489 | 0 | ||||||||||||||||||||
Cash inflows | 442 | 0 | 475 | 0 | ||||||||||||||||||||
|
|
|
|
|
|
|
|
|
|
|
| |||||||||||||
| Total of derivative financial liabilities | -194 | -168 | -43 | -128 | -76 | -58 | ||||||||||||||||||
| Consolidated Financial Statements IFRS and Notes | Notes | 172 |
Table of Contents
Contractual Maturities of Derivative Financial Liabilities and Financial Assets
€ millions | Carrying Amount | Contractual Cash Flows | Carrying Amount | Contractual Cash Flows | ||||||||||||||||||||
| 12/31/2016 | 2017 | Thereafter | 12/31/2015 | 2016 | Thereafter | |||||||||||||||||||
| Derivative financial assets | ||||||||||||||||||||||||
Currency derivatives not designated as hedging instruments | 35 | 69 | ||||||||||||||||||||||
Cash outflows | -1,902 | 0 | -3,010 | 0 | ||||||||||||||||||||
Cash inflows | 1,938 | 0 | 3,073 | 0 | ||||||||||||||||||||
Currency derivatives designated as hedging instruments | 12 | 14 | ||||||||||||||||||||||
Cash outflows | -241 | 0 | -266 | 0 | ||||||||||||||||||||
Cash inflows | 252 | 0 | 275 | 0 | ||||||||||||||||||||
Interest-rate derivatives designated as hedging instruments | 47 | 100 | ||||||||||||||||||||||
Cash outflows | -38 | -83 | -43 | -225 | ||||||||||||||||||||
Cash inflows | 62 | 112 | 77 | 300 | ||||||||||||||||||||
|
|
|
|
|
|
|
|
|
|
|
| |||||||||||||
| Total of derivative financial assets | 95 | 71 | 29 | 183 | 106 | 75 | ||||||||||||||||||
|
|
|
|
|
|
|
|
|
|
|
| |||||||||||||
| Total of derivative financial liabilities and assets | -99 | -97 | -14 | 55 | 30 | 17 | ||||||||||||||||||
(25) Financial Risk Management
We manage market risks (including foreign currency exchange rate risk, interest rate risk, and equity price risk), credit risk, and liquidity risk on a Group-wide basis through our global treasury department. Our risk management and hedging strategy is set by our treasury guideline and other internal guidelines, and is subject to continuous internal risk analysis. Derivative financial instruments are only purchased to reduce risks and not for speculation, which is defined as entering into derivative instruments without a corresponding underlying transaction.
Foreign Currency Exchange Rate Risk Management
We continuously monitor our exposure to currency fluctuation risks based on monetary items and forecasted transactions and pursue a Group-wide strategy to manage foreign currency exchange rate risk, using derivative financial instruments, primarily foreign exchange forward contracts, as appropriate, with the primary aim of reducing profit or loss volatility. Most of the hedging instruments are not designated as being in a hedge accounting relationship. For more information, seeNote (3a).
Currency Hedges Designated as Hedging Instruments (Cash Flow Hedges)
We enter into derivative financial instruments, primarily foreign exchange forward contracts, to hedge significant forecasted cash flows (royalties) from foreign subsidiaries denominated in foreign currencies with a defined set of hedge ratios and a hedge horizon of up to 12 months, which is also the maximum maturity of the foreign exchange derivatives we use.
For all years presented, no previously highly-probable transaction designated as a hedged item in a foreign currency cash flow hedge relationship ceased to be probable. Therefore, we did not discontinue any of our cash flow hedge relationships. Also, we identified no ineffectiveness in all years reported. Generally, the cash flows of the hedged forecasted transactions are expected to occur and to be recognized in profit or loss monthly within a time frame of 12 months from the date of the statement of financial position.
Foreign Currency Exchange Rate Exposure
Our risk exposure is based on a sensitivity analysis considering the following:
| ∎ | The SAP Group’s entities generally operate in their functional currencies. In exceptional cases and limited economic environments, operating transactions are denominated in currencies other than the functional currency, leading to a foreign currency exchange rate risk for the related monetary instruments. Where material, this foreign currency exchange rate risk is hedged. Therefore, fluctuations in foreign currency exchange rates neither have a significant impact on profit nor on other comprehensive income with regard to ournon-derivative monetary financial instruments and related income or expenses. |
| ∎ | Our free-standing derivatives designed for hedging foreign currency exchange rate risks almost completely balance the changes in the fair values of the hedged item attributable to exchange rate movements in the Consolidated Income Statements in the same period. As a consequence, the hedged items and the hedging instruments are not exposed to foreign currency exchange rate risks, and thereby have no effect on profit. |
Consequently, we are only exposed to significant foreign currency exchange rate fluctuations with regard to the following:
| ∎ | Derivatives held within a designated cash flow hedge relationship (excluding the interest element, which is not part of the assigned cash flow hedge relationships) affecting other comprehensive income |
| ∎ | Foreign currency embedded derivatives affecting othernon-operating expense, net. |
Consolidated Financial Statements IFRS and Notes | Notes | 173 |
Table of Contents
We calculate our sensitivity on an upward/downward shift of +/–25% of the foreign currency exchange rate between euro and Brazilian real and +/–10% of the foreign currency exchange rate between euro and all other major currencies (2015: upward/downward shift of +/–25% of the foreign currency exchange rate between euro and Brazilian real; +/–10% of the foreign currency exchange rate between euro and all other major currencies; 2014: upward shift for Swiss franc +20%, all other major currencies +10%, downward shift for all major currencies –10%). If on December 31, 2016, 2015, and 2014, the foreign currency exchange rates had been higher/lower as described above, this would not have had a material effect on othernon-operating expense, net and other comprehensive income.
Our foreign currency exposure as at December 31 (and ifyear-end exposure is not representative, also our average/high/low exposure) was as follows:
Foreign Currency Exposure
€ billions | 2016 | 2015 | ||||||
| Year-end exposure toward all our major currencies | 0.9 | 1.0 | ||||||
| Average exposure | 0.9 | 1.1 | ||||||
| Highest exposure | 1.0 | 1.2 | ||||||
| Lowest exposure | 0.8 | 1.0 | ||||||
Interest Rate Risk Management
The aim of our interest rate risk management is to reduce profit or loss volatility and optimize our interest result by creating a balanced structure of fixed and variable cash flows. We therefore manage interest rate risks by adding interest rate-related derivative instruments to a given portfolio of investments and debt financing.
Derivatives Designated as Hedging Instruments (Fair Value Hedges)
The majority of our investments are based on variable rates and/or short maturities (2016: 71%; 2015: 87%) while most of our financing transactions are based on fixed rates and long maturities (2016: 71%; 2015: 66%). To match the interest rate risk from our financing transactions to our investments, we use receiver interest rate swaps to convert certain fixed-rate financial liabilities to floating, and by this means secure the fair value of the swapped financing transactions. The desired fixed-floating mix of our net debt is set by the Treasury Committee. Including interest rate swaps, 42% (2015: 36%) of our total interest-bearing financial liabilities outstanding as at December 31, 2016, had a fixed interest rate.
None of the fair value adjustment from the receiver swaps, the basis adjustment on the underlying hedged items held in fair value hedge relationships, and the difference between the two recognized in financial income, net is material in any of the years presented.
Interest Rate Exposure
A sensitivity analysis is provided to show the impact of our interest rate risk exposure on profit or loss and equity in accordance with IFRS 7, considering the following:
| ∎ | Changes in interest rates only affect the accounting fornon-derivative fixed-rate financial instruments if they are recognized at fair value. Therefore, such interest rate changes do not change the carrying amounts of ournon-derivative fixed-rate financial liabilities as we account for them at amortized cost. Investments in fixed-rate financial assets classified asavailable-for-sale were not material at eachyear-end reported. Thus, we do not consider any fixed-rate instruments in the equity-related sensitivity calculation. |
| ∎ | Income or expenses recorded in connection withnon-derivative financial instruments with variable interest rates are subject to interest rate risk if they are not hedged items in an effective hedge relationship. Thus, we take into consideration interest rate changes relating to our variable-rate financing and our investments in money market instruments in the profit-related sensitivity calculation. |
| ∎ | The designation of interest rate receiver swaps in a fair value hedge relationship leads to interest rate changes affecting financial income, net. The fair value movements related to the interest rate swaps are not reflected in the sensitivity calculation, as they offset the fixed interest rate payments for the bonds and private placements as hedged items. However, changes in market interest rates affect the amount of interest payments from the interest rate swap. As a consequence, those effects of market interest rates on interest payments are included in the profit-related sensitivity calculation. |
Due to the different interest rate expectations for the U.S. dollar and the euro area, we base our sensitivity analyses on a yield curve upward shift of +100/+50 basis points (bps) for the U.S. dollar/euro area (2015 and 2014: +100/+50 bps for the U.S. dollar/euro area) and a yield curve downward shift of –50 bps for both the U.S. dollar/euro area (2015: –50 bps; 2014: –50 bps).
If, on December 31, 2016, 2015, and 2014, interest rates had been higher/lower as described above, this would not have had a material effect on financial income, net for our variable interest rate investments and would have had the following effects on financial income, net.
| Consolidated Financial Statements IFRS and Notes | Notes | 174 |
Table of Contents
Interest Rate Sensitivity
€ millions | Effects on Financial Income, Net | |||||||||||
| 2016 | 2015 | 2014 | ||||||||||
| Derivatives held within a designated fair value hedge relationship | ||||||||||||
Interest rates +100 bps in U.S. dollar area/+50 bps in euro area | -46 | -105 | -116 | |||||||||
Interest rates -50 bps in U.S. dollar/euro area | 29 | 62 | 70 | |||||||||
| Variable rate financing | ||||||||||||
Interest rates +50 bps in euro area | -21 | -39 | -65 | |||||||||
Interest rates -50 bps in euro area | 0 | 19 | 65 | |||||||||
Our interest rate exposure as at December 31 (and ifyear-end exposure is not representative, also our average/high/low exposure) was as follows:
Interest Rate Risk Exposure
€billion | 2016 | 2015 | ||||||||||||||||||||||||||||||
| Year-End | Average | High | Low | Year-End | Average | High | Low | |||||||||||||||||||||||||
| Fair value interest rate risk | ||||||||||||||||||||||||||||||||
From investments | 0.20 | 0.08 | 0.20 | 0.03 | 0.03 | 0.05 | 0.07 | 0.03 | ||||||||||||||||||||||||
| Cash flow interest rate risk | ||||||||||||||||||||||||||||||||
From investments (including cash) | 3.31 | 3.59 | 4.38 | 3.03 | 3.08 | 3.09 | 3.37 | 2.62 | ||||||||||||||||||||||||
From financing | 2.31 | 2.94 | 3.31 | 2.31 | 3.16 | 3.73 | 4.63 | 3.16 | ||||||||||||||||||||||||
From interest rate swaps | 2.22 | 2.59 | 2.69 | 2.22 | 2.69 | 2.67 | 2.74 | 2.64 | ||||||||||||||||||||||||
Equity Price Risk Management
Our listed equity investments are monitored based on the current market value that is affected by the fluctuations in the volatile stock markets worldwide. Unlisted equity investments are monitored based on detailed financial information provided by the investees. The fair value of our listed equity investments depends on the equity prices, while the fair value of the unlisted equity investments is influenced by various unobservable input factors. An assumed 10% increase (decrease) in equity prices and respective unobservable inputs as at December 31, 2016, would have increased (decreased) the value of our marketable equity investments and other comprehensive income by €84 million (€81 million) (2015: increased by €87 million (decreased by €84 million)).
We are exposed to equity price risk with regard to our share-based payments. In order to reduce resulting profit or loss volatility, we hedge certain cash flow exposures associated with these plans through the purchase of derivative instruments, but do not establish a designated hedge relationship. In our sensitivity analysis, we include the underlying share-based payments and the hedging instruments. Thus, we base the calculation on our net exposure to equity prices, as we believe that taking only the derivative instrument into account would not properly reflect our equity price risk exposure. An assumed 20% increase (decrease) in equity prices as at December 31, 2016, would have increased (decreased) our share-based payment expenses by €281 million (€252 million) (2015: increased by €200 million (decreased by €198 million); 2014: increased by €158 million (decreased by €80 million)).
Credit Risk Management
To mitigate the credit risk from our investing activities and derivative financial assets, we conduct all our activities only with approved major financial institutions and issuers that carry high external ratings, as required by our internal treasury guideline. Among its stipulations, the guideline requires that we invest only in assets from issuers with a minimum rating of at least “BBB flat”. We only make investments in issuers with a lower rating in exceptional cases. Such investments were not material in 2016 and 2015. The weighted average rating of our financial assets is in the rangeA- to BBB+. We pursue a policy of cautious investments characterized by predominantly current investments, standard investment instruments, as well as a wide portfolio diversification by doing business with a variety of counterparties.
| Consolidated Financial Statements IFRS and Notes | Notes | 175 |
Table of Contents
To further reduce our credit risk, we require collateral for certain investments in the full amount of the investment volume which we would be allowed to make use of in the case of default of the counterparty to the investment. As such collateral, we only accept bonds with at least investment grade rating level.
In addition, the concentration of credit risk that exists when counterparties are involved in similar activities by instrument, sector, or geographic area is further mitigated by diversification of counterparties throughout the world and adherence to an internal limit system for each counterparty. This internal limit system stipulates that the business volume with individual counterparties is restricted to a defined limit, which depends on the lowest official long-term credit rating available by at least one of the major rating agencies, the Tier 1 capital of the respective financial institution, or participation in the German Depositors’ Guarantee Fund or similar protection schemes. We continuously monitor strict compliance with these counterparty limits. As the premium for credit default swaps mainly depends on market participants’ assessments of the creditworthiness of a debtor, we also closely observe the development of credit default swap spreads in the market to evaluate probable risk developments to timely react to changes if these should manifest.
The default risk of our trade receivables is managed separately, mainly based on assessing the creditworthiness of customers through external ratings and our past experience with the customers concerned. Outstanding receivables are continuously monitored locally. For more information, seeNote (3). The impact of default on our trade receivables from individual customers is mitigated by our large customer base and its distribution across many different industries, company sizes, and countries worldwide. For more information about our trade receivables, seeNote (13). For information about the maximum exposure to credit risk, seeNote (24).
Liquidity Risk Management
Our liquidity is managed by our global treasury department with the primary aim of maintaining liquidity at a level that is adequate to meet our financial obligations.
Generally, our primary source of liquidity is funds generated from our business operations. Our global treasury department manages liquidity centrally for all subsidiaries. Where possible, we pool their cash surplus so that we can use liquidity centrally for our business operation, for subsidiaries’ funding requirements, or to invest any net surplus in the market. With this strategy, we seek to optimize yields, while ensuring liquidity, by investing only with counterparties and issuers of high credit quality, as explained before. Hence, high levels of liquid assets and marketable securities provide a strategic reserve, helping keep SAP flexible, sound, and independent.
Apart from effective working capital and cash management, we have reduced the liquidity risk inherent in managing ourday-to-day operations and meeting our financing responsibilities by arranging an adequate volume of available credit facilities with various financial institutions on which we can draw if necessary.
In order to retain high financial flexibility, on November 13, 2013, SAP SE entered into a €2.0 billion syndicated credit facility agreement with an initial term of five years plus twoone-year extension options. In 2015, the original term of this facility was extended for an additional period of one year to November 2020. The use of the facility is not restricted by any financial covenants. Borrowings under the facility bear interest of EURIBOR or LIBOR for the respective currency plus a margin of 22.5 basis points. We are also required to pay a commitment fee of 7.88 basis points per annum on the unused available credit. We have never drawn on the facility.
Additionally, as at December 31, 2016, and 2015, we had available lines of credit totaling €499 million and €520 million, respectively. There were immaterial borrowings outstanding under these lines of credit in all years presented.
(26) Additional Fair Value Disclosures on Financial Instruments.
Fair Value of Financial Instruments
We use various types of financial instruments in the ordinary course of business, which are classified as either: loans and receivables (L&R),available-for-sale (AFS),held-for-trading (HFT), or amortized cost (AC). For those financial instruments measured at fair value or for which fair value must be disclosed, we have categorized the financial instruments into a three-level fair value hierarchy depending on the inputs used to determine fair value and their significance for the valuation techniques.
| Consolidated Financial Statements IFRS and Notes | Notes | 176 |
Table of Contents
Fair Values of Financial Instruments and Classification Within the Fair Value Hierarchy
€ millions | December 31, 2016 | |||||||||||||||||||||||||||||||
| Carrying Amount | Measurement Categories | Fair Value | ||||||||||||||||||||||||||||||
| Category | At Amortized Cost | At Fair Value | Level 1 | Level 2 | Level 3 | Total | ||||||||||||||||||||||||||
| Assets | ||||||||||||||||||||||||||||||||
Cash and cash equivalents1) | L&R | 3,702 | 3,702 | |||||||||||||||||||||||||||||
Trade and other receivables | 6,050 | |||||||||||||||||||||||||||||||
Trade receivables1) | L&R | 5,825 | 5,825 | |||||||||||||||||||||||||||||
Other receivables2) | – | 225 | ||||||||||||||||||||||||||||||
| Other financial assets | 2,482 | |||||||||||||||||||||||||||||||
Available-for-sale financial assets | ||||||||||||||||||||||||||||||||
Debt investments | AFS | 195 | 195 | 195 | 195 | |||||||||||||||||||||||||||
Equity investments | AFS | 953 | 953 | 153 | 94 | 706 | 953 | |||||||||||||||||||||||||
Investments in associates2) | – | 38 | ||||||||||||||||||||||||||||||
Loans and other financial receivables | ||||||||||||||||||||||||||||||||
Financial instruments related to employee benefit plans2) | – | 144 | ||||||||||||||||||||||||||||||
Other loans and other financial receivables | L&R | 956 | 956 | 956 | 956 | |||||||||||||||||||||||||||
Derivative assets | ||||||||||||||||||||||||||||||||
Designated as hedging instrument | ||||||||||||||||||||||||||||||||
FX forward contracts | – | 12 | 12 | 12 | 12 | |||||||||||||||||||||||||||
Interest rate swaps | – | 47 | 47 | 47 | 47 | |||||||||||||||||||||||||||
Not designated as hedging instrument | ||||||||||||||||||||||||||||||||
FX forward contracts | HFT | 35 | 35 | 35 | 35 | |||||||||||||||||||||||||||
Call options for share-based payments | HFT | 84 | 84 | 84 | 84 | |||||||||||||||||||||||||||
Call option on equity shares | HFT | 17 | 17 | 17 | 17 | |||||||||||||||||||||||||||
| Consolidated Financial Statements IFRS and Notes | Notes | 177 |
Table of Contents
Fair Values of Financial Instruments and Classification Within the Fair Value Hierarchy
€ millions | December 31, 2016 | |||||||||||||||||||||||||||||
| Carrying Amount | Measurement Categories | Fair Value | ||||||||||||||||||||||||||||
| Category | At Amortized Cost | At Fair Value | Level 1 | Level 2 | Level 3 | Total | ||||||||||||||||||||||||
| Liabilities | ||||||||||||||||||||||||||||||
| Trade and other payables | -1,408 | |||||||||||||||||||||||||||||
Trade payables1) | AC | -1,016 | -1,016 | |||||||||||||||||||||||||||
Other payables2) | – | -392 | ||||||||||||||||||||||||||||
| Financial liabilities | -8,294 | |||||||||||||||||||||||||||||
Non-derivative financial liabilities | ||||||||||||||||||||||||||||||
Loans | AC | -16 | -16 | -16 | -16 | |||||||||||||||||||||||||
Bonds | AC | -6,147 | -6,147 | -6,374 | -6,374 | |||||||||||||||||||||||||
Private placements | AC | -1,717 | -1,717 | -1,744 | -1,744 | |||||||||||||||||||||||||
Othernon-derivative financial liabilities | AC | -219 | -219 | -219 | -219 | |||||||||||||||||||||||||
Derivatives | ||||||||||||||||||||||||||||||
Designated as hedging instrument | ||||||||||||||||||||||||||||||
FX forward contracts | – | -24 | -24 | -24 | -24 | |||||||||||||||||||||||||
Interest rate swaps | – | 0 | 0 | 0 | 0 | |||||||||||||||||||||||||
Not designated as hedging instrument | ||||||||||||||||||||||||||||||
FX forward contracts | HFT | -170 | -170 | -170 | -170 | |||||||||||||||||||||||||
|
|
|
|
|
|
|
|
|
|
|
|
|
|
| ||||||||||||||||
| Total financial instruments, net | 2,533 | 1,369 | 1,149 | -6,026 | -944 | 723 | -6,248 | |||||||||||||||||||||||
| Consolidated Financial Statements IFRS and Notes | Notes | 178 |
Table of Contents
Fair Values of Financial Instruments and Classification Within the Fair Value Hierarchy
€ millions | December 31, 2015 | |||||||||||||||||||||||||||||||
| Carrying Amount | Measurement Categories | Fair Value | ||||||||||||||||||||||||||||||
| Category | At Amortized Cost | At Fair Value | Level 1 | Level 2 | Level 3 | Total | ||||||||||||||||||||||||||
| Assets | ||||||||||||||||||||||||||||||||
| Cash and cash equivalents1) | L&R | 3,411 | 3,411 | |||||||||||||||||||||||||||||
| Trade and other receivables | 5,362 | |||||||||||||||||||||||||||||||
Trade receivables1) | L&R | 5,199 | 5,199 | |||||||||||||||||||||||||||||
Other receivables2) | – | 163 | ||||||||||||||||||||||||||||||
| Other financial assets | 1,687 | |||||||||||||||||||||||||||||||
Available-for-sale financial assets | ||||||||||||||||||||||||||||||||
Debt investments | AFS | 26 | 26 | 26 | 26 | |||||||||||||||||||||||||||
Equity investments | AFS | 882 | 882 | 299 | 21 | 562 | 882 | |||||||||||||||||||||||||
Investments in associates2) | – | 58 | ||||||||||||||||||||||||||||||
Loans and other financial receivables | ||||||||||||||||||||||||||||||||
Financial instruments related to employee benefit plans2) | – | 121 | ||||||||||||||||||||||||||||||
Other loans and other financial receivables | L&R | 316 | 316 | 316 | 316 | |||||||||||||||||||||||||||
Derivative assets | ||||||||||||||||||||||||||||||||
Designated as hedging instrument | ||||||||||||||||||||||||||||||||
FX forward contracts | – | 14 | 14 | 14 | 14 | |||||||||||||||||||||||||||
Interest rate swaps | – | 100 | 100 | 100 | 100 | |||||||||||||||||||||||||||
Not designated as hedging instrument | ||||||||||||||||||||||||||||||||
FX forward contracts | HFT | 69 | 69 | 69 | 69 | |||||||||||||||||||||||||||
Call options for share-based payments | HFT | 94 | 94 | 94 | 94 | |||||||||||||||||||||||||||
Call option on equity shares | HFT | 6 | 6 | 6 | 6 | |||||||||||||||||||||||||||
| Consolidated Financial Statements IFRS and Notes | Notes | 179 |
Table of Contents
Fair Values of Financial Instruments and Classification Within the Fair Value Hierarchy
€ millions | December 31, 2015 | |||||||||||||||||||||||||||||||
| Carrying Amount | Measurement Categories | Fair Value | ||||||||||||||||||||||||||||||
| Category | At Amortized Cost | At Fair Value | Level 1 | Level 2 | Level 3 | Total | ||||||||||||||||||||||||||
| Liabilities | ||||||||||||||||||||||||||||||||
| Trade and other payables | -1,169 | |||||||||||||||||||||||||||||||
Trade payables1) | AC | -893 | -893 | |||||||||||||||||||||||||||||
Other payables2) | – | -276 | ||||||||||||||||||||||||||||||
| Financial liabilities | -9,522 | |||||||||||||||||||||||||||||||
Non-derivative financial liabilities | ||||||||||||||||||||||||||||||||
Loans | AC | -1,261 | -1,261 | -1,261 | -1,261 | |||||||||||||||||||||||||||
Bonds | AC | -5,733 | -5,733 | -5,825 | -5,825 | |||||||||||||||||||||||||||
Private placements | AC | -2,202 | -2,202 | -2,288 | -2,288 | |||||||||||||||||||||||||||
Othernon-derivative financial liabilities | AC | -199 | -199 | -199 | -199 | |||||||||||||||||||||||||||
Derivatives | ||||||||||||||||||||||||||||||||
Designated as hedging instrument | ||||||||||||||||||||||||||||||||
FX forward contracts | – | -10 | -10 | -10 | -10 | |||||||||||||||||||||||||||
Interest rate swaps | – | 0 | 0 | 0 | 0 | |||||||||||||||||||||||||||
Not designated as hedging instrument | ||||||||||||||||||||||||||||||||
FX forward contracts | HFT | -117 | -117 | -117 | -117 | |||||||||||||||||||||||||||
|
|
|
|
|
|
|
|
|
|
|
|
|
| |||||||||||||||||||
| Total financial instruments, net | -232 | -1,361 | 1,064 | -5,500 | -3,261 | 568 | -8,192 | |||||||||||||||||||||||||
1) We do not separately disclose the fair value for cash and cash equivalents, trade receivables, and accounts payable as their carrying amounts are a reasonable approximation of their fair values. 2) Since the line items trade receivables, trade payables, and other financial assets contain both financial andnon-financial assets or liabilities (such as other taxes or advance payments), the carrying amounts ofnon-financial assets or liabilities are shown to allow a reconciliation to the corresponding line items in the Consolidated Statements of Financial Position. | ||||||||||||||||
Fair Values of Financial Instruments Classified According to IAS 39
€ millions | December 31, 2016 | |||||||||||||||
| Category | Carrying Amount | At Amortized Cost | At Fair Value | |||||||||||||
| Financial assets | ||||||||||||||||
At fair value through profit or loss | HFT | 136 | 136 | |||||||||||||
Available-for-sale | AFS | 1,148 | 1,148 | |||||||||||||
Loans and receivables | L&R | 10,484 | 10,484 | |||||||||||||
| Financial liabilities | ||||||||||||||||
At fair value through profit or loss | HFT | -170 | -170 | |||||||||||||
At amortized cost | AC | -9,115 | -9,115 | |||||||||||||
| Consolidated Financial Statements IFRS and Notes | Notes | 180 |
Table of Contents
€ millions | December 31, 2015 | |||||||||||||||
| Category | Carrying Amount | At Amortized Cost | At Fair Value | |||||||||||||
| Financial assets | ||||||||||||||||
At fair value through profit or loss | HFT | 169 | 169 | |||||||||||||
Available-for-sale | AFS | 908 | 908 | |||||||||||||
Loans and receivables | L&R | 8,926 | 8,926 | |||||||||||||
| Financial liabilities | ||||||||||||||||
At fair value through profit or loss | HFT | -117 | -117 | |||||||||||||
At amortized cost | AC | -10,288 | -10,288 | |||||||||||||
Determination of Fair Values
It is our policy that transfers between the different levels of the fair value hierarchy are deemed to have occurred at the beginning of the period of the event or change in circumstances that caused the transfer. A description of the valuation techniques and the inputs used in the fair value measurement is given below:
Financial Instruments Measured at Fair Value on a Recurring Basis
Type | Fair Value | Determination of Fair Value/ Valuation Technique | Significant Unobservable Inputs | Interrelationship Between | ||||
| Other financial assets | ||||||||
| Debt investments | Level 1 | Quoted prices in an active market | NA | NA | ||||
| Listed equity investments | Level 1 | Quoted prices in an active market | NA | NA | ||||
| Level 2 | Quoted prices in an active market deducting a discount for the disposal restriction derived from the premium for a respective put option. | NA | NA | |||||
| Unlisted equity investments | Level 3 | Market approach. Comparable company valuation using revenue multiples derived from companies comparable to the investee. | Peer companies used (revenue multiples range from 3.9 to 8.3) Revenues of investees Discounts for lack of marketability (10% to 30%) | The estimated fair value would increase (decrease) if: The revenue multiples were higher (lower) The investees’ revenues were higher (lower) The liquidity discounts were lower (higher). | ||||
| Market approach. Venture capital method evaluating a variety of quantitative and qualitative factors such as actual and forecasted results, cash position, recent or planned transactions, and market comparable companies. | NA | NA | ||||||
| Last financing round valuations | NA | NA | ||||||
| Liquidation preferences | NA | NA | ||||||
| Net asset value/Fair market value as reported by the respective funds | NA | NA | ||||||
| Consolidated Financial Statements IFRS and Notes | Notes | 181 |
Table of Contents
Type | Fair Value | Determination of Fair Value/ Valuation Technique | Significant Unobservable Inputs | Interrelationship Between | ||||
| Other financial assets (continued) | ||||||||
| Call options for share-based payment plans | Level 2 | Monte-Carlo Model. Calculated considering risk-free interest rates, the remaining term of the derivatives, the dividend yields, the stock price, and the volatility of our share. | NA | NA | ||||
| Call option on equity shares | Level 3 | Market approach. Company valuation using EBITDA multiples based on actual results derived from the investee. | EBITDA multiples used EBITDA of the investee | The estimated fair value would increase (decrease) if: The EBITDA multiples were higher (lower) The investees’ EBITDA were higher (lower) | ||||
Other financial assets/ Financial liabilities | ||||||||
| FX forward contracts | Level 2 | Discounted cash flow usingPar-Method. Expected future cash flows based on forward exchange rates are discounted over the respective remaining term of the contracts using the respective deposit interest rates and spot rates. | NA | NA | ||||
| Interest-rate swaps | Level 2 | Discounted cash flow. Expected future cash flows are estimated based on forward interest rates from observable yield curves and contract interest rates, discounted at a rate that reflects the credit risk of the counterparty. | NA | NA | ||||
Financial Instruments Not Measured at Fair Value
Type | Fair Value | Determination of Fair Value/ Valuation Technique | ||
| Financial liabilities | ||||
Fixed rate bonds (financial liabilities) | Level 1 | Quoted prices in an active market | ||
Fixed rate private placements/ loans (financial liabilities) | Level 2 | Discounted cash flows. Future cash outflows for fixed interest and principal are discounted over the term of the respective contracts using the market interest rates as of the reporting date. | ||
For othernon-derivative financial assets/liabilities and variable rate financial debt, it is assumed that their carrying value reasonably approximates their fair values.
Transfers Between Levels 1 and 2
Transfers ofavailable-for-sale equity investments from Level 2 to Level 1 which occurred because disposal restrictions lapsed and deducting a discount for such restriction was no longer necessary were not material in all years presented, while transfers from Level 1 to Level 2 did not occur at all.
| Consolidated Financial Statements IFRS and Notes | Notes | 182 |
Table of Contents
Level 3 Disclosures
The following table shows the reconciliation from the opening to the closing balances for our unlisted equity investments and call options on equity shares classified as Level 3 fair values:
Reconciliation of Level 3 Fair Values
€ millions | 2016 | 2015 | ||||||
| Unlisted Equity Investments and Call Options on Equity Shares | Unlisted Equity Investments and Call Options on Equity Shares | |||||||
| January 1 | 568 | 400 | ||||||
| Transfers | ||||||||
Into Level 3 | 18 | 12 | ||||||
Out of Level 3 | -18 | -80 | ||||||
| Purchases | 156 | 170 | ||||||
| Sales | -168 | -22 | ||||||
| Gains/losses | ||||||||
Included in financial income, net in profit and loss | 96 | 9 | ||||||
Included inavailable-for-sale financial assets in other comprehensive income | 48 | 34 | ||||||
Included in exchange differences in other comprehensive income | 22 | 45 | ||||||
|
|
|
| |||||
| December 31 | 722 | 568 | ||||||
| Change in unrealized gains/losses in profit and loss for investments held at the end of the reporting period | 0 | 0 | ||||||
Changing the unobservable inputs to reflect reasonably possible alternative assumptions would not have a material impact on the fair values of our unlisted equity investments held asavailable-for-sale as of the reporting date.
SAP has granted awards under various cash-settled and equity-settled share-based payment plans to employees and executives. Most of these awards are described in detail below. SAP has further share-based payment plans not described below, which are individually and in aggregate, immaterial to our Consolidated Financial Statements.
a) Cash-Settled Share-Based Payments
SAP has made cash-settled share-based payments under the following plans: Long-Term Incentive Plan (LTI) for the Executive Board 2015 and 2016, Stock Option Plan 2010 (SOP 2010 (2010–2015 tranches)), and Restricted Stock Unit Plan including Move SAP Plan (RSU (2013–2016 tranches)).
Consolidated Financial Statements IFRS and Notes | Notes | 183 |
Table of Contents
The valuation of our outstanding cash-settled plans was based on the following parameters and assumptions:
Fair Value and Parameters Used at Year End 2016 for Cash-Settled Plans
| LTI Plan 2016 (2016 Tranche) | LTI Plan 2015 (2012 – 2015 Tranches) | SOP 2010 (2010 – 2015 Tranches) | RSU (2013 –2016 Tranches) | |||||||||||||
| Weighted average fair value as at 12/31/2016 | €74.54 | €81.10 | €20.94 | €81.34 | ||||||||||||
| Information how fair value was measured at measurement date | ||||||||||||||||
Option pricing model used | Binomial | Other1) | Monte Carlo | Other1) | ||||||||||||
Share price | €82.81 | €82.81 | €82.81 | €82.77 | ||||||||||||
Risk-free interest rate (depending on maturity) | -0.76% | | -0.80% to -0.84% |
| | -0.51% to -0.83% |
| | -0.36% to -0.84% |
| ||||||
Expected volatility | 21.2% | NA | | 22.3% to 51.0% | | NA | ||||||||||
Expected dividend yield | 1.45% | 1.45% | 1.46% | 1.45% | ||||||||||||
| Weighted average remaining life of awards outstanding as at 12/31/2016 (in years) | 3.0 | 1.4 | 2.4 | 1.2 | ||||||||||||
1) For these awards, the fair value is calculated by subtracting the net present value of expected future dividend payments, if any, until maturity of the respective award from the prevailing share price as of the valuation date.
Fair Value and Parameters Used at Year End 2015 for Cash-Settled Plans
| ||||||||
| LTI Plan 2015 (2012 – 2015 Tranches) | EPP 2015 (2015 Tranche) | SOP 2010 (2010 – 2015 Tranches) | RSU (2013 –2015 Tranches) | |||||||||||||
| Weighted average fair value as at 12/31/2015 | €71.45 | €73.38 | €16.06 | €71.90 | ||||||||||||
| Information how fair value was measured at measurement date | ||||||||||||||||
Option pricing model used | Other1) | Other1) | Monte Carlo | Other1) | ||||||||||||
Share price | €73.38 | €73.38 | €73.38 | €73.24 | ||||||||||||
Risk-free interest rate (depending on maturity) | | -0.25% to -0.39% |
| NA | | -0.03% to -0.38% |
| | -0.16% to -0.39% |
| ||||||
Expected volatility | NA | NA | | 22.0% to 41.9% | | NA | ||||||||||
Expected dividend yield | 1.56% | NA | 1.56% | 1.56% | ||||||||||||
| Weighted average remaining life of options outstanding as at 12/31/2015 (in years) | 1.7 | 0.1 | 3.4 | 1.2 | ||||||||||||
1) For these awards, the fair value is calculated by subtracting the net present value of expected future dividend payments, if any, until maturity of the respective award from the prevailing share price as of the valuation date. | ||||||||
For SOP 2010, expected volatility of the SAP share price is based on a blend of implied volatility from traded options with corresponding lifetimes and exercise prices as well as historical volatility with the same expected life as the options granted. For LTI 2016 Plan valuation, the Peer Group Index price at year end was US$179.57; the expected dividend yield of the index of 1.24% and the expected volatility of the index of 18%, and the expected correlation of the SAP share price and the index price of 39% are based on the historical data of SAP share price and the index price.
Expected remaining life of the options reflects both the contractual term and the expected, or historical, exercise behavior. The risk-free interest rate is derived from German government bonds with a similar duration. The SAP dividend yield is based on expected future dividends.
| Consolidated Financial Statements IFRS and Notes | Notes | 184 |
Table of Contents
Changes in Numbers of Outstanding Awards Under Our Cash-Settled Plans
thousands | LTI 2016 Plan (2016 Tranche) | LTI 2015 Plan (2012–2015 Tranches) | SOP 2010 (2010–2015 Tranches) | RSU (2013–2016 Tranches) | ||||||||||||
| 12/31/2014 | 0 | 591 | 26,282 | 2,228 | ||||||||||||
Granted | 0 | 277 | 10,866 | 5,125 | ||||||||||||
Adjustment based upon KPI target achievement | 0 | 109 | NA | 109 | ||||||||||||
Exercised | 0 | 0 | -6,585 | -1,337 | ||||||||||||
Forfeited | 0 | 0 | -1,436 | -548 | ||||||||||||
|
|
|
|
|
|
|
| |||||||||
| 12/31/2015 | 0 | 977 | 29,127 | 5,577 | ||||||||||||
Granted | 389 | 0 | 0 | 9,104 | ||||||||||||
Adjustment based upon KPI target achievement | 0 | 0 | NA | -66 | ||||||||||||
Exercised | 0 | -294 | -4,693 | -2,659 | ||||||||||||
Forfeited | -12 | 0 | -1,059 | -1,055 | ||||||||||||
|
|
|
|
|
|
|
| |||||||||
| 12/31/2016 | 377 | 684 | 23,375 | 10,901 | ||||||||||||
| Outstanding awards exercisable as at | ||||||||||||||||
12/31/2015 | 0 | 0 | 4,120 | 0 | ||||||||||||
|
|
|
|
|
|
|
| |||||||||
12/31/2016 | 0 | 0 | 5,472 | 0 | ||||||||||||
| Total carrying amount (in € millions) of liabilities as at | ||||||||||||||||
12/31/2015 | 0 | 74 | 283 | 166 | ||||||||||||
|
|
|
|
|
|
|
| |||||||||
12/31/2016 | 7 | 58 | 385 | 436 | ||||||||||||
| Total intrinsic value of vested awards (in € millions) as at | ||||||||||||||||
12/31/2015 | 0 | 76 | 110 | 0 | ||||||||||||
|
|
|
|
|
|
|
| |||||||||
12/31/2016 | 2 | 58 | 154 | 0 | ||||||||||||
| Weighted average share price (in €) for share options exercised in | ||||||||||||||||
2015 | NA | NA | 66.20 | 65.83 | ||||||||||||
|
|
|
|
|
|
|
| |||||||||
2016 | NA | 72.55 | 78.74 | 74.74 | ||||||||||||
| Total expense (in € millions) recognized in | ||||||||||||||||
2014 | 0 | 13 | 29 | 58 | ||||||||||||
2015 | 0 | 28 | 187 | 193 | ||||||||||||
|
|
|
|
|
|
|
| |||||||||
2016 | 7 | 7 | 183 | 458 | ||||||||||||
a.1) Long-Term Incentive Plan (LTI 2016 Plan)
SAP implemented a new Long-Term Incentive (LTI) 2016 Plan for members of the Executive Board in 2016. The plan is linked to the absolute performance of the SAP share and its relative performance as indicated by the SAP share price compared to a group of peer companies (Peer Group Index). A grant amount determined by the Supervisory Board is converted into virtual shares, referred to as share units, by dividing the grant amount by the SAP share price (calculated on the basis of a defined average value). The grant amount is determined by the Supervisory Board in its discretion for each financial year at a level between 80% and 120% of the contractual target amount, taking into account the achievement of the operating profit target set for the preceding financial year.
| Consolidated Financial Statements IFRS and Notes | Notes | 185 |
Table of Contents
The share units granted comprise 40% retention share units and 60% performance share units (PSUs). Both types of share units have a vesting period of (approximately) four years. Each share unit that finally vests entitles its holder to a (gross) payout corresponding to the price of one SAP share after the end of the holding period, but capped at three times the SAP share price applied for the conversion of the grant amount into share units.
The number of PSUs that finally vest depends on the absolute and relative performance of the SAP share. If the increase of the SAP share price over the vesting period of the PSUs exceeds the increase of the Peer Group Index over the same period, the number of PSUs increases by a percentage equal to the outperformance expressed as percentage points. This percentage will be doubled if, in addition to the outperformance against the Peer Group Index, the SAP share price at the end of the vesting period of the PSUs is higher than the price at the start of this period. The number of vested PSUs is capped at 150% of the initial PSU allocation for that year. Conversely, if the performance of the SAP share over the vesting period of the PSUs is below the performance of the Peer Group Index, the number of PSUs will be reduced by a percentage equal to the difference expressed as percentage points. All PSUs lapse if the difference exceeds 50%. If the service contract for the Executive Board member is terminated before the end of the third year following the year in which the Share Units were granted, the share units are forfeited in whole or in part, depending on the circumstances of the relevant resignation from office or termination of the service contract.
a.2) Long-Term Incentive Plan (LTI 2015 Plan)
The LTI 2015 Plan is linked to the SAP share price performance and the achievement of two financial key performance indicators (KPIs):non-IFRS total revenue andnon-IFRS operating profit, which are derived from SAP’s 2015 financial KPIs. Under this plan, virtual shares, referred to as share units, were granted to participants. Participants are paid out in cash based on the number of share units that vest. All participants in the LTI 2015 Plan were members of our Global Managing Board.
The share unit allocation process took place at the beginning of each year based on SAP’s share price after the publication of its preliminary annual results for the last financial year prior to the performance period.
At the end of a given year, the number of share units that finally vest with plan participants depends on SAP’s actual performance for the given year, and might be higher or lower than the number of share units originally granted. If performance against both KPI targets reaches at least the defined threshold of 60% (80% for 2013 tranches), the share units vest. Depending on performance, the vesting can reach a maximum of 150% of the budgeted amount. If performance against either or both of those KPI targets does not reach the defined threshold of 60% (80% for 2013 tranches), no share units vest and share units granted for that year will be forfeited. The adjustment to the threshold of those performance indicators was made to reflect our updated expectations due to the accelerated shift to the cloud. For the year 2015, the RSUs granted at the beginning of the year vested with 112.96% achievement of the KPI targets for the LTI 2015 Plan.
The share units for members of the Global Managing Board under the LTI 2015 Plan are subject to a three-year holding period before payout, which started in 2016.
The LTI 2015 Plan includes a “look-back” provision, due to the fact that this plan is based on certain KPI targets in 2015. The number of share units vested under the 2015 tranche was adjusted to reflect the overall achievement for 2015, which differed from the value represented by the number of share units vested from the 2012 to 2014 tranches. However, share units that were already fully vested in prior years did not forfeit.
The final financial effect of each tranche of the LTI 2015 Plan will depend on the number of vested share units and the SAP share price, which is set directly after the announcement of the preliminary fourth-quarter and full-year results for the last financial year of the respective three-year holding period under the LTI 2015 Plan, and thus may be significantly above or below the budgeted amounts.
a.3) SAP Stock Option Plan 2010 (SOP 2010 (2010–2015 Tranches))
Under the SAP Stock Option Plan 2010, we granted members of the Senior Leadership Team/Global Executives and employees with an exceptional rating as well as high potentials between 2010 and 2015, and only in 2010 and 2011 members of the Executive Board, cash-based virtual stock options, the value of which depends on the multi-year performance of the SAP share.
The grant-base value was based on the average fair market value of one ordinary share over the five business days prior to the Executive Board resolution date.
The virtual stock options granted under the SOP 2010 give the employees the right to receive a certain amount of money by exercising the options under the terms and conditions of this plan. After a three-year vesting period (four years for members of the Executive Board), the plan provides for 11 predetermined exercise dates every calendar year (one date per month except in April) until the rights lapse six years after the grant date (seven years for members of the Executive Board). Employees can exercise their virtual stock options only if they are employed by SAP; if they leave the Company, they forfeit. Executive Board members’ options arenon-forfeitable once granted – if the service agreement ends in the grant year, the number of options is reducedpro rata temporis. Any options not exercised at the end of their term expire.
The exercise price is 110% of the grant base value (115% for members of the Executive Board), which is €39.03 (€40.80) for the 2010 tranche, €46.23 (€48.33) for the 2011 tranche, €49.28 for the 2012 tranche, €59.85 for the 2013 tranche, €60.96 for the 2014 tranche, and €72.18 for the 2015 tranche.
| Consolidated Financial Statements IFRS and Notes | Notes | 186 |
Table of Contents
Monetary benefits will be capped at 100% of the exercise price (150% for members of the SAP Executive Board).
a.4) Restricted Stock Unit Plan Including Move SAP Plan (RSU Plan (2013–2016 Tranches))
To retain and motivate executives and certain employees, we granted RSUs representing a contingent right to receive a cash payment determined by the market value of the same number of SAP SE shares (or SAP SE American Depositary Receipts on the New York Stock Exchange) and the number of RSUs that ultimately vest. Granted RSUs will vest in different tranches, either:
| – | Over aone-to-three-year service period only, or |
| – | Over aone-to-three-year service period and upon meeting certain key performance indicators (KPIs). |
The number of RSUs that will vest under the 2016 tranche with performance-based grants was mostly contingent upon achievement of thenon-IFRS operating profit performance milestones in 2016. Depending on performance, the number of RSUs vesting ranges between 0% and 200% of the number initially granted. Performance against the KPI targets was 85.13% (2015: 112.96%) in 2016. The RSUs are paid out in cash upon vesting.
b) Equity-Settled Share-Based Payments
b.1) Own SAP Plan (Own)
Under the Own SAP Plan (Own) implemented in 2016, SAP offers its employees the opportunity to purchase, monthly, SAP shares without any holding period. Each eligible employee’s investment is limited to a percentage of the employee’s monthly base salary. SAP matches the employee investment by 40% and adds a subsidy of €20 per month fornon-executives. For the participation in 2016, employees receive a double matching contribution as well as a double subsidy. This plan is not open to members of the SAP Executive Board.
The number of shares purchased under this plan was 1.4 million in 2016.
b.2) Share Matching Plan (SMP)
Under the Share Matching Plan (SMP), SAP offered its employees the opportunity to purchase SAP shares at a discount of 40% between 2010 and 2015. The number of SAP shares an eligible employee could purchase through the SMP was limited to a percentage of the employee’s annual base salary. After a three-year holding period, the plan participants receive, from SAP, one free matching share for every three SAP shares acquired.
The terms for the members of the Senior Leadership Team and Global Executives were slightly different than those for the other employees. They did not receive a discount when purchasing the shares. However, after a three-year holding period, they receive two free matching SAP shares for every three SAP shares acquired. This plan was not open to members of the SAP Executive Board.
The weighted average remaining life of free matching shares outstanding is 0.9 years at year end 2016. The following table shows the parameters and assumptions used at grant date to determine the fair value of free matching shares, as well as the quantity of shares purchased and free matching shares:
Fair Value and Parameters at Grant Date for SMP
| 2015 | 2014 | |||||||
| Grant date | 6/5/2015 | 6/4/2014 | ||||||
| Fair value of granted awards | €62.98 | €52.49 | ||||||
| Information how fair value was measured at grant date | ||||||||
Option pricing model used | Other1) | Other1) | ||||||
Share price | €66.31 | €55.61 | ||||||
Risk-free interest rate | -0.08% | 0.13% | ||||||
Expected dividend yield | 1.67% | 1.87% | ||||||
|
|
|
| |||||
| Weighted average remaining life of awards outstanding at year end (in years) | 1.5 | 0.9 | ||||||
|
|
|
| |||||
| Number of investment shares purchased (in thousands) | 1,492 | 1,550 | ||||||
| 1) | For these awards, the fair value is calculated by subtracting the net present value of expected future dividend payments, if any, until maturity of the respective award from the prevailing share price as of the valuation date. |
| Consolidated Financial Statements IFRS and Notes | Notes | 187 |
Table of Contents
Changes in Numbers of Outstanding Awards for Equity-Settled Plans
thousands | SMP | |||
| 12/31/2014 | 3,935 | |||
Granted | 551 | |||
Exercised | -2,808 | |||
Forfeited | -78 | |||
|
| |||
| 12/31/2015 | 1,600 | |||
Granted | 0 | |||
Exercised | -444 | |||
Forfeited | -105 | |||
|
| |||
| 12/31/2016 | 1,051 | |||
Recognized Expense for Equity-Settled Plans
€ millions | 2016 | 2015 | 2014 | |||||||||
Own | 77 | 0 | 0 | |||||||||
SMP | 24 | 80 | 89 | |||||||||
Others | 6 | 7 | 7 | |||||||||
|
|
|
|
|
| |||||||
| Total | 107 | 87 | 96 | |||||||||
(28) Segment and Geographic Information
General Information
SAP has two reportable segments that are regularly reviewed by the Executive Board, which is responsible for assessing the performance of the Company and for making resource allocation decisions as the Chief Operating Decision Maker (CODM). One is the Applications, Technology & Services segment and the other is the SAP Business Network segment. The segments are largely organized and managed separately according to their product and service offerings.
The Applications, Technology & Services segment derives its revenues primarily from the sale of software licenses, subscriptions to our cloud applications, and related services (mainly support services and various professional services and premium support services, as well as implementation services for our software products and education services on the use of our products).
The SAP Business Network segment derives its revenues mainly from transaction fees charged for the use of SAP’s cloud-based collaborative business networks and from services relating to the SAP Business Network (including cloud applications, professional services, and education services). Within the SAP Business Network segment, we mainly market and sell the cloud offerings developed by SAP Ariba, SAP Fieldglass, and Concur.
On April 1, 2016, we split the Applications, Technology & Services segment. The solutions SAP Anywhere, SAP Business One, and SAP Business ByDesign were combined into one organization, as together they provide complete front-office and back-office solutions for small andmedium-sized customers. This reallocation resulted in a new operating butnon-reportable segment since it does not exceed the quantitative thresholds in IFRS 8.13. We have retrospectively adjusted our revenue and results for the Applications, Technology & Services segment to reflect this change.
In addition, we established a further operating segment comprising SAP’s healthcare strategy and solutions, which also does not qualify as a reportable segment due to its size. Since this segment represents a new business area to SAP, no significant adjustments to prior-year figures of other segments were made. Revenue and expenses of bothnon-reportable segments are included in the reconciliation of segment revenue and results.
| Consolidated Financial Statements IFRS and Notes | Notes | 188 |
Table of Contents
Revenue and Results of Segments
€ millions | Applications, Technology & Services | SAP Business Network | Total Reportable Segments | |||||||||||||||||||||||||||||||||
| 2016 | 2015 | 2016 | 2015 | 2016 | 2015 | |||||||||||||||||||||||||||||||
| Actual Currency | Constant Currency | Actual Currency | Actual Currency | Constant Currency | Actual Currency | Actual Currency | Constant Currency | Actual Currency | ||||||||||||||||||||||||||||
Cloud subscriptions and support | 1,353 | 1,371 | 932 | 1,595 | 1,589 | 1,337 | 2,948 | 2,960 | 2,268 | |||||||||||||||||||||||||||
Software licenses | 4,784 | 4,814 | 4,770 | 0 | 0 | -1 | 4,783 | 4,813 | 4,770 | |||||||||||||||||||||||||||
Software support | 10,464 | 10,544 | 9,990 | 28 | 28 | 31 | 10,492 | 10,572 | 10,021 | |||||||||||||||||||||||||||
Software licenses and support | 15,247 | 15,358 | 14,760 | 27 | 27 | 30 | 15,275 | 15,385 | 14,790 | |||||||||||||||||||||||||||
| Cloud and software | 16,600 | 16,729 | 15,692 | 1,622 | 1,617 | 1,367 | 18,223 | 18,346 | 17,059 | |||||||||||||||||||||||||||
| Services | 3,319 | 3,358 | 3,271 | 303 | 304 | 249 | 3,622 | 3,661 | 3,520 | |||||||||||||||||||||||||||
|
|
|
|
|
|
|
|
|
|
|
|
|
|
|
|
|
| |||||||||||||||||||
| Total segment revenue | 19,920 | 20,087 | 18,963 | 1,925 | 1,920 | 1,616 | 21,845 | 22,007 | 20,579 | |||||||||||||||||||||||||||
Cost of cloud subscriptions and support | -667 | -669 | -444 | -384 | -385 | -336 | -1,051 | -1,055 | -781 | |||||||||||||||||||||||||||
Cost of software licenses and support | -1,942 | -1,956 | -1,971 | -1 | -1 | -1 | -1,943 | -1,957 | -1,972 | |||||||||||||||||||||||||||
Cost of cloud and software | -2,610 | -2,626 | -2,416 | -385 | -386 | -337 | -2,994 | -3,012 | -2,753 | |||||||||||||||||||||||||||
Cost of services | -2,669 | -2,718 | -2,539 | -246 | -249 | -183 | -2,915 | -2,967 | -2,722 | |||||||||||||||||||||||||||
|
|
|
|
|
|
|
|
|
|
|
|
|
|
|
|
|
| |||||||||||||||||||
Total cost of revenue | -5,279 | -5,344 | -4,954 | -631 | -635 | -520 | -5,909 | -5,979 | -5,474 | |||||||||||||||||||||||||||
| Segment gross profit | 14,641 | 14,743 | 14,009 | 1,295 | 1,285 | 1,095 | 15,936 | 16,028 | 15,104 | |||||||||||||||||||||||||||
| Other segment expenses | -6,610 | -6,704 | -6,286 | -957 | -968 | -779 | -7,567 | -7,672 | -7,064 | |||||||||||||||||||||||||||
| Segment profit | 8,031 | 8,039 | 7,723 | 338 | 317 | 317 | 8,369 | 8,356 | 8,040 | |||||||||||||||||||||||||||
| Consolidated Financial Statements IFRS and Notes | Notes | 189 |
Table of Contents
Revenue and Results of Segments
€ millions | Applications, Technology & Services | SAP Business Network | Total Reportable Segments | |||||||||||||||||||||||||||||||||
| 2015 | 2014 | 2015 | 2014 | 2015 | 2014 | |||||||||||||||||||||||||||||||
| Actual Currency | Constant Currency | Actual Currency | Actual Currency | Constant Currency | Actual Currency | Actual Currency | Constant Currency | Actual Currency | ||||||||||||||||||||||||||||
Cloud subscriptions and support | 932 | 822 | 564 | 1,337 | 1,151 | 515 | 2,268 | 1,974 | 1,080 | |||||||||||||||||||||||||||
Software licenses | 4,770 | 4,520 | 4,324 | -1 | -1 | 0 | 4,770 | 4,519 | 4,324 | |||||||||||||||||||||||||||
Software support | 9,990 | 9,321 | 8,748 | 31 | 26 | 29 | 10,021 | 9,347 | 8,777 | |||||||||||||||||||||||||||
Software licenses and support | 14,760 | 13,841 | 13,072 | 30 | 25 | 28 | 14,790 | 13,866 | 13,100 | |||||||||||||||||||||||||||
| Cloud and software | 15,692 | 14,663 | 13,636 | 1,367 | 1,176 | 544 | 17,059 | 15,839 | 14,180 | |||||||||||||||||||||||||||
| Services | 3,271 | 3,036 | 3,098 | 249 | 214 | 103 | 3,520 | 3,250 | 3,201 | |||||||||||||||||||||||||||
|
|
|
|
|
|
|
|
|
|
|
|
|
|
|
|
|
| |||||||||||||||||||
| Total segment revenue | 18,963 | 17,699 | 16,734 | 1,616 | 1,391 | 647 | 20,579 | 19,090 | 17,381 | |||||||||||||||||||||||||||
Cost of cloud subscriptions and support | -444 | -414 | -258 | -336 | -293 | -128 | -781 | -707 | -386 | |||||||||||||||||||||||||||
Cost of software licenses and support | -1,971 | -1,809 | -1,801 | -1 | -1 | -3 | -1,972 | -1,810 | -1,804 | |||||||||||||||||||||||||||
Cost of cloud and software | -2,416 | -2,223 | -2,059 | -337 | -294 | -131 | -2,753 | -2,517 | -2,190 | |||||||||||||||||||||||||||
Cost of services | -2,539 | -2,401 | -2,198 | -183 | -162 | -82 | -2,722 | -2,563 | -2,280 | |||||||||||||||||||||||||||
Total cost of revenue | -4,954 | -4,624 | -4,257 | -520 | -456 | -213 | -5,474 | -5,080 | -4,470 | |||||||||||||||||||||||||||
| Segment gross profit | 14,009 | 13,075 | 12,477 | 1,095 | 935 | 434 | 15,104 | 14,010 | 12,911 | |||||||||||||||||||||||||||
| Other segment expenses | -6,286 | -5,875 | -5,531 | -779 | -682 | -330 | -7,064 | -6,556 | -5,861 | |||||||||||||||||||||||||||
|
|
|
|
|
|
|
|
|
|
|
|
|
|
|
|
|
| |||||||||||||||||||
| Segment profit | 7,723 | 7,200 | 6,946 | 317 | 253 | 105 | 8,040 | 7,453 | 7,050 | |||||||||||||||||||||||||||
Information about assets and liabilities and additions tonon-current assets by segment are not regularly provided to our Executive Board. Goodwill by reportable segment is disclosed inNote (15).
Measurement and Presentation
Our management reporting system reports our intersegment services as cost reductions and does not track them as internal revenue. Intersegment services mainly represent utilization of human resources of one segment by another segment on aproject-by-project basis. Intersegment services are charged based on internal cost rates including certain indirect overhead costs, excluding a profit margin.
Most of our depreciation and amortization expense affecting segment profits is allocated to the segments as part of broader infrastructure allocations and is thus not tracked separately on the operating segment level. Depreciation and amortization expense that is directly allocated to the operating segments is immaterial in all segments presented.
Our management reporting system produces a variety of reports that differ by the currency exchange rates used in the accounting for foreign-currency transactions and operations. Reports based on actual currencies use the same currency rates as are used in our financial statements. Reports based on constant currencies report revenues and expenses using the average exchange rates from the previous year’s corresponding period.
We use an operating profit indicator to measure the performance of our operating segments. However, the accounting policies applied in the measurement of operating segment revenue and profit differ as follows from the IFRS accounting principles used to determine the operating profit measure in our income statement:
The measurements of segment revenue and results include the recurring revenues that would have been recorded by acquired entities had they remained stand-alone entities but which are not recorded as revenue under IFRS due to fair value accounting for customer contracts in effect at the time of an acquisition.
The expenses measures exclude:
| ∎ | Acquisition-related charges |
| – | Amortization expense and impairment charges for intangibles acquired in business combinations and certain stand-alone acquisitions of intellectual property (including purchasedin-process research and development) |
| – | Settlements ofpre-existing relationships in connection with a business combination |
| – | Acquisition-related third-party costs |
| Consolidated Financial Statements IFRS and Notes | Notes | 190 |
Table of Contents
| – | Share-based payment expenses |
| – | Restructuring expenses |
| – | Expenses from the TomorrowNow litigation and the Versata litigation |
Revenues and expenses of our new operating butnon-reportable segments are included in the reconciliation under the positions other revenue and other expenses, respectively.
In addition, certain corporate-level activities are not allocated to our segments, including finance, accounting, legal, human resources, and marketing. They are disclosed in the reconciliation under other revenue and other expenses respectively.
The segment information for prior periods has been restated to conform to the current year’s presentation.
Reconciliation of Revenue and Segment Results
€ millions | 2016 | 2015 | 2014 | |||||||||||||||||
| Actual Currency | Constant Currency | Actual Currency | Constant Currency | Actual Currency | ||||||||||||||||
Total segment revenue for reportable segments | 21,845 | 22,007 | 20,579 | 19,090 | 17,381 | |||||||||||||||
Other revenue | 222 | 224 | 226 | 209 | 199 | |||||||||||||||
Adjustment for currency impact | 0 | -164 | 0 | 1,505 | 0 | |||||||||||||||
Adjustment of revenue under fair value accounting | -5 | -5 | -11 | -11 | -19 | |||||||||||||||
|
|
|
|
|
|
|
|
|
| |||||||||||
| Total revenue | 22,062 | 22,062 | 20,793 | 20,793 | 17,560 | |||||||||||||||
Total segment profit for reportable segments | 8,369 | 8,356 | 8,040 | 7,453 | 7,050 | |||||||||||||||
Other revenue | 222 | 224 | 226 | 209 | 199 | |||||||||||||||
Other expenses | -1,957 | -1,975 | -1,918 | -1,759 | -1,611 | |||||||||||||||
Adjustment for currency impact | 0 | 28 | 0 | 443 | 0 | |||||||||||||||
Adjustment for | ||||||||||||||||||||
Revenue under fair value accounting | -5 | -5 | -11 | -11 | -19 | |||||||||||||||
Acquisition-related charges | -680 | -680 | -738 | -738 | -562 | |||||||||||||||
Share-based payment expenses | -785 | -785 | -724 | -724 | -290 | |||||||||||||||
Restructuring | -28 | -28 | -621 | -621 | -126 | |||||||||||||||
TomorrowNow and Versata litigation | 0 | 0 | 0 | 0 | -309 | |||||||||||||||
|
|
|
|
|
|
|
|
|
| |||||||||||
| Operating profit | 5,135 | 5,135 | 4,252 | 4,252 | 4,331 | |||||||||||||||
Othernon-operating income/expense, net | -234 | -234 | -256 | -256 | 49 | |||||||||||||||
Financial income, net | -38 | -38 | -5 | -5 | -25 | |||||||||||||||
|
|
|
|
|
|
|
|
|
| |||||||||||
| Profit before tax | 4,863 | 4,863 | 3,991 | 3,991 | 4,355 | |||||||||||||||
| Consolidated Financial Statements IFRS and Notes | Notes | 191 |
Table of Contents
Geographic Information
The amounts for revenue by region in the following tables are based on the location of customers. The regions in the following table are broken down into the regions EMEA (Europe, Middle East, and Africa), Americas (North America and Latin America), and APJ (Asia Pacific Japan).
Revenue by Region
€ millions | Cloud Subscriptions and Support Revenue | Cloud and Software Revenue | ||||||||||||||||||||||
| 2016 | 2015 | 2014 | 2016 | 2015 | 2014 | |||||||||||||||||||
| EMEA | 703 | 507 | 277 | 8,193 | 7,622 | 6,819 | ||||||||||||||||||
| Americas | 2,000 | 1,579 | 709 | 7,366 | 6,929 | 5,276 | ||||||||||||||||||
| APJ | 290 | 200 | 101 | 2,865 | 2,663 | 2,221 | ||||||||||||||||||
|
|
|
|
|
|
|
|
|
|
|
| |||||||||||||
| SAP Group | 2,993 | 2,286 | 1,087 | 18,424 | 17,214 | 14,315 | ||||||||||||||||||
Total Revenue by Region
€ millions | 2016 | 2015 | 2014 | |||||||||
| Germany | 3,034 | 2,771 | 2,570 | |||||||||
| Rest of EMEA | 6,721 | 6,409 | 5,813 | |||||||||
| EMEA | 9,755 | 9,181 | 8,383 | |||||||||
| United States | 7,167 | 6,750 | 4,898 | |||||||||
| Rest of Americas | 1,763 | 1,678 | 1,591 | |||||||||
| Americas | 8,931 | 8,428 | 6,489 | |||||||||
| Japan | 825 | 667 | 600 | |||||||||
| Rest of APJ | 2,552 | 2,517 | 2,088 | |||||||||
| APJ | 3,377 | 3,185 | 2,688 | |||||||||
|
|
|
|
|
| |||||||
| SAP Group | 22,062 | 20,793 | 17,560 | |||||||||
Non-Current Assets by Region
€ millions | 2016 | 2015 | ||||||
| Germany | 2,655 | 2,395 | ||||||
| Rest of EMEA | 5,281 | 7,574 | ||||||
| EMEA | 7,936 | 9,969 | ||||||
| United States | 21,911 | 19,124 | ||||||
| Rest of Americas | 165 | 139 | ||||||
| Americas | 22,076 | 19,264 | ||||||
| APJ | 685 | 599 | ||||||
|
|
|
| |||||
| SAP Group | 30,696 | 29,832 | ||||||
The table above showsnon-current assets excluding financial instruments, deferred tax assets, post-employment benefit assets, and rights arising under insurance contracts.
For information about the breakdown of our workforce by region, seeNote (7).
| Consolidated Financial Statements IFRS and Notes | Notes | 192 |
Table of Contents
Executive Board
Memberships on supervisory boards and other comparable governing bodies of enterprises, other than subsidiaries of SAP on December 31, 2016
Bill McDermott
Chief Executive Officer
Strategy, Governance, Business Development,
Corporate Development, Global Corporate Affairs, Corporate Audit and Global Marketing
Board of Directors, ANSYS, Inc., Canonsburg, PA, United States
Board of Directors, Under Armour, Inc., Baltimore, MD, United States
Board of Directors, Dell Secure Works, Atlanta, GA, United States (from April 21, 2016)
Robert Enslin
Global Customer Operations
Global Sales, Industry & LoB Solutions Sales, Services Sales, Sales Operations
Michael Kleinemeier
Digital Business Services
Global Consulting Delivery, Global and Regional Support and Premium Engagement Functions, MaintenanceGo-to-Market, Global User Groups, Mobile Services
Supervisory Board, innogy SE, Essen, Germany (from September 1, 2016)
Bernd Leukert
Chief Technology Officer
Products & Innovation
Global Development Organization, Innovation & Cloud Delivery, Product Strategy, Development Services, SAP Global Security
Supervisory Board, DFKI (Deutsches Forschungszentrum für Künstliche Intelligenz GmbH), Kaiserslautern, Germany
Luka Mucic
Chief Financial Officer
Global Finance and Administration including Investor Relations and Data Protection & Privacy, Corporate IT and Processes
Stefan Ries (from April 1, 2016)
Chief Human Resources Officer, Labor Relations Director
HR Strategy, Business Transformation, Leadership Development, Talent Development
Supervisory Board, Rhein-Neckar Loewen GmbH, Kronau, Germany
Steve Singh (from April 1, 2016)
Business Networks and Applications
Including Concur, SAP Ariba, SAP Fieldglass, SAP’s Data Network Business, SAP Health, as well as Front-Office and Back-Office Solutions for Small and Midsize Businesses that currently include SAP Anywhere, SAP Business One and SAP Business ByDesign
Chairman of the Board of Directors, Center ID, Bellevue, WA, United States
Board of Directors, ModuMetal, Inc., Seattle, WA, United States
Board of Directors, Talend, Redwood City, CA, United States (from October 4, 2016)
Chairman of the Board of Directors, Docker, Inc., San Francisco, CA, United States (from November 3, 2016)
Executive Board Members Who Left During 2016
Gerhard Oswald (until December 31, 2016)
Supervisory Board
Memberships on supervisory boards and other comparable governing bodies of enterprises, other than subsidiaries of SAP on December 31, 2016
Prof. Dr. h.c. mult. Hasso Plattner2), 4), 6), 7), 8)
Chairman
Margret Klein-Magar1), 2), 4), 5)
Deputy Chairperson
Vice President, Head of SAP Alumni Relations
Chairperson of the Spokespersons’ Committee of Senior Managers of SAP SE
| Consolidated Financial Statements IFRS and Notes | Notes | 193 |
Table of Contents
PekkaAla-Pietilä4), 5), 6), 7)
Chairman of the Board of Directors, Huhtamäki Oyj,
Espoo, Finland
Board of Directors, Pöyry Plc, Vantaa, Finland
Chairman of the Board of Directors, CVON Group Limited, London, United Kingdom
Board of Directors, CVON Limited, London, United Kingdom
Chairman of the Board of Directors, CVON Innovation Services Oy, Turku, Finland
Board of Directors, CVON Future Limited, London, United Kingdom
Chairman of the Board of Directors, BMA Platform International Ltd., London, United Kingdom
Chairman of the Board of Directors, Sanoma Corporation, Helsinki, Finland
Panagiotis Bissiritsas1), 3), 4), 5)
Support Expert
Martin Duffek1), 3), 8)
Product Manager
Prof. Anja Feldmann4), 8)
Professor at the Electrical Engineering and Computer Science Faculty at the Technische Universität Berlin
Prof. Dr. Wilhelm Haarmann2), 5), 7), 8)
Attorney-at-Law, Certified Public Auditor, Certified Tax Advisor
Linklaters LLP, Rechtsanwälte, Notare, Steuerberater, Frankfurt am Main, Germany
Andreas Hahn1), 2), 4)
Product Expert, IoT Standards
Prof. Dr. Gesche Joost4), 8)
Professor for Design Research and Head of the Design Research Lab, University of Arts Berlin
Supervisory Board, ClearVAT Aktiengesellschaft, Berlin, Germany (from March 31, 2016)
Lars Lamadé1), 2), 7), 8)
Head of Sponsorships
Managing Director, Rhein-Neckar Loewen GmbH, Kronau, Germany (until June 30, 2016)
Supervisory Board, Rhein-Neckar Loewen GmbH, Kronau, Germany (from August 30, 2016)
Bernard Liautaud2), 4), 6)
Managing Partner Balderton Capital, London, United Kingdom
Board of Directors, nlyte Software Ltd., London, United Kingdom
Board of Directors, Talend SA, Suresnes, France
Board of Directors, Wonga Group Ltd., London, United Kingdom
Board of Directors, SCYTL Secure Electronic Voting SA, Barcelona, Spain
Board of Directors, Vestiaire Collective SA, Levallois-Perret, France
Board of Directors, Dashlane, Inc., New York, NY, United States
Board of Directors, Recorded Future, Inc., Cambridge, MA, United States
Board of Directors, eWise Group, Inc., Redwood City, CA, United States
Board of Directors, Qubit Digital Ltd., London, United Kingdom
Board of Directors, Stanford University, Stanford, CA, United States
Board of Directors, Opbeat Inc., San Francisco, CA, United States
Board of Directors, Aircall.io, New York City, NY, United States
Christine Regitz1), 4), 8)
Vice President User Experience
Chief Product Expert
Dr. Erhard Schipporeit3), 7)
Independent Management Consultant
Supervisory Board, Talanx AG, Hanover, Germany
Supervisory Board, Deutsche Börse AG, Frankfurt am Main, Germany
Supervisory Board, HDI V.a.G., Hanover, Germany
Supervisory Board, Hannover Rückversicherung SE, Hanover, Germany
Supervisory Board, Fuchs Petrolub SE, Mannheim, Germany
Supervisory Board, BDO AG, Hamburg, Germany
Supervisory Board, RWE AG, Essen, Germany (from April 20, 2016)
Board of Directors, Fidelity Funds SICAV, Luxembourg (until February 26, 2016)
Robert Schuschnig-Fowler1), 8)
Account Manager, Senior Support Engineer
Deputy Chairman of SAP SE Works Council Europe
Member of Works Council SAP SE
| Consolidated Financial Statements IFRS and Notes | Notes | 194 |
Table of Contents
Dr. Sebastian Sick1), 2), 5), 7)
Head of Company Law Unit, Hans Böckler Foundation
Supervisory Board, Georgsmarienhütte GmbH, Georgsmarienhütte, Germany
Jim Hagemann Snabe2), 5)
Supervisory Board Member
Board of Directors, Bang & Olufsen A/S, Struer, Denmark
Board of Directors, Danske Bank A/S, Copenhagen, Denmark (until March 17, 2016)
Board of Directors, A. P. Moller-Maersk A/S, Copenhagen, Denmark (from April 12, 2016)
Supervisory Board, Allianz SE, Munich, Germany
Supervisory Board, Siemens AG, Munich, Germany
Pierre Thiollet1), 4)
Webmaster (P&I)
Member of the SAP France Works Council
Secretary of CHSCT (Hygiene, Security and Work Conditions Committee)
Prof.Dr.-Ing.Dr.-Ing. E. h. Klaus Wucherer3)
Managing Director of Dr. Klaus Wucherer Innovations- und Technologieberatung GmbH, Erlangen, Germany
Deputy Chairman of the Supervisory Board, HEITEC AG, Erlangen, Germany
Deputy Chairman of the Supervisory Board, LEONI AG, Nuremberg, Germany
Chairman of the Supervisory Board, Festo AG & Co. KG, Esslingen, Germany
Information as at December 31, 2016
| 1) | Elected by the employees |
| 2) | Member of the Company’s General and Compensation Committee |
| 3) | Member of the Company’s Audit Committee |
| 4) | Member of the Company’s Technology and Strategy Committee |
| 5) | Member of the Company’s Finance and Investment Committee |
| 6) | Member of the Company’s Nomination Committee |
| 7) | Member of the Company’s Special Committee |
| 8) | Member of the Company’s People and Organization Committee |
Allocating the fair value of the share-based payments to the respective years they are economically linked to, the total compensation of the Executive Board members for the years 2016, 2015, and 2014 was as follows:
Executive Board Compensation
€ thousands | 2016 | 2015 | 2014 | |||||||||
| Short-term employee benefits | 19,206 | 15,137 | 16,196 | |||||||||
| Share-based payment1) | 23,942 | 10,365 | 8,098 | |||||||||
| Subtotal1) | 43,148 | 25,502 | 24,294 | |||||||||
| Post-employment benefits | 2,398 | 1,278 | 3,249 | |||||||||
Thereof defined-benefit | 1,792 | 288 | 2,276 | |||||||||
Thereof defined-contribution | 606 | 990 | 973 | |||||||||
|
|
|
|
|
| |||||||
| Total1) | 45,546 | 26,780 | 27,543 | |||||||||
| 1) | Portion of total executive compensation allocated to the respective year |
The share-based payment amounts disclosed above for 2016 are based on the grant date fair value of the restricted share units (RSUs) and performance share units (PSUs), respectively, issued to Executive Board members during the year under the new LTI Plan 2016, effective January 1, 2016.
The Executive Board members already received, in 2012, the LTI grants for the years 2012 to 2015 subject to continuous service as member of the Executive Board in the respective years. Although these grants are linked to and thus, economically, compensation for the Executive Board members in the respective years, section 314 of the German Commercial Code (HGB) requires them to be included in the total compensation number for the year of grant. Upon his appointment to the Executive Board in 2015, Michael Kleinemeier received a grant related to 2015. Vesting of the LTI grants is dependent on the respective Executive Board member’s continuous service for the Company.
The share-based payment for 2015 as defined in section 314 of the German Commercial Code (HGB) amounts to €263,200 and 4,622 RSUs, respectively, based on the allocation for 2015 for Michael Kleinemeier, which was granted in 2015 in line with his appointment to the Executive Board.
Considering the grant date fair value of the RSUs allocated in 2015 instead of the economically allocated amount of share-based payments in the table above, the sum of short-term employee benefits and share-based payment amounts to €15,400,400 and the total Executive Board compensation amounts to €16,678,400.
| Consolidated Financial Statements IFRS and Notes | Notes | 195 |
Table of Contents
Share-Based Payment for Executive Board Members
| 2016 | 2015 | 2014 | ||||||||||
| Number of RSUs granted | 147,041 | 192,345 | 153,909 | |||||||||
| Number of PSUs granted | 220,561 | NA | NA | |||||||||
| Number of stock options granted | 0 | 0 | 0 | |||||||||
| Total expense in € thousands | 14,233 | 22,310 | 11,133 | |||||||||
In the table above, the share-based payment expense is the amount recorded in profit or loss under IFRS 2 in the respective period.
The defined benefit obligation (DBO) for pensions to Executive Board members and the annual pension entitlement of the members of the Executive Board on reaching age 60 based on entitlements from performance-based and salary-linked plans were as follows:
Retirement Pension Plan for Executive Board Members
€ thousands | 2016 | 2015 | 2014 | |||||||||
| DBO December 31 | 10,739 | 8,948 | 11,273 | |||||||||
| Annual pension entitlement | 470 | 427 | 475 | |||||||||
The total annual compensation of the Supervisory Board members for 2016 is as follows:
Supervisory Board Compensation
€ thousands | 2016 | 2015 | 2014 | |||||||||
| Total compensation | 3,652 | 3,728 | 3,227 | |||||||||
Thereof fixed compensation | 3,135 | 3,250 | 924 | |||||||||
Thereof committee remuneration | 517 | 479 | 515 | |||||||||
Thereof variable compensation | NA | NA | 1,788 | |||||||||
The Supervisory Board members do not receive any share-based payment for their services. As far as members who are employee representatives on the Supervisory Board receive share-based payment, such compensation is for their services as employees only and is unrelated to their status as members of the Supervisory Board.
Payments to/DBO for Former Executive Board Members
€ thousands | 2016 | 2015 | 2014 | |||||||||
| Payments | 1,667 | 1,580 | 3,462 | |||||||||
| DBO December 31 | 33,935 | 32,758 | 33,764 | |||||||||
SAP did not grant any compensation advance or credit to, or enter into any commitment for the benefit of, any member of the Executive Board or Supervisory Board in 2016, 2015, or 2014.
Shareholdings of Executive and Supervisory Board Members
Number of SAP shares | 2016 | 2015 | 2014 | |||||||||
| Executive Board | 85,985 | 45,309 | 36,426 | |||||||||
| Supervisory Board | 87,875,732 | 90,262,686 | 107,467,372 | |||||||||
Detailed information about the different elements of the compensation as well as the number of shares owned by members of the Executive Board and the Supervisory Board are disclosed in the Compensation Report, which is part of our Management Report and of our Annual Report on Form20-F, both of which are available on SAP’s Web site.
(30) Related Party Transactions
Certain Supervisory Board members of SAP SE currently hold, or held within the last year, positions of significant responsibility with other entities. We have relationships with certain of these entities in the ordinary course of business, whereby we buy and sell products, assets, and services at prices believed to be consistent with those negotiated at arm’s length between unrelated parties.
Companies controlled by Hasso Plattner, chairman of our Supervisory Board and Chief Software Advisor of SAP, engaged in the following transactions with SAP: providing consulting services to SAP, receiving sport sponsoring from SAP, making purchases of SAP products and services.
Wilhelm Haarmann practices as a partner in the law firm Linklaters LLP in Frankfurt am Main, Germany. SAP occasionally purchased and purchases legal and similar services from Linklaters.
Occasionally, members of the Executive Board of SAP SE obtain services from SAP for which they pay a consideration consistent with those negotiated at arm’s length between unrelated parties.
All amounts related to the abovementioned transactions were immaterial to SAP in all periods presented.
In 2016, we entered into a consulting contract with Gerhard Oswald which applies from 2017 onwards. Compensation thereunder occurs if and when consulting services are rendered. No transactions occurred in all periods presented.
| Consolidated Financial Statements IFRS and Notes | Notes | 196 |
Table of Contents
In total, we sold products and services to companies controlled by members of the Supervisory Board in the amount of €1 million (2015: €1 million), we bought products and services from such companies in the amount of €3 million (2015: €7 million), and we provided sponsoring and other financial support to such companies in the amount of €4 million (2015: €5 million). Outstanding balances at year end from transactions with such companies were €0 million (2015: €0 million) for amounts owed to such companies and €0 million (2015: €0 million) for amounts owed by such companies. All of these balances are unsecured and interest-free and settlement is expected to occur in cash. Commitments (the longest of which is for two years) made by us to purchase further goods or services from these companies and to provide further sponsoring and other financial support amount to €6 million as at December 31, 2016 (2015: €11 million).
In total, we sold services to members of the Executive Board and the Supervisory Board in the amount of €0 million (2015: €2 million), and we received services from members of the Supervisory Board (including services from employee representatives on the Supervisory Board in their capacity as employees of SAP) in the amount of €1 million (2015: €1 million). Amounts owed to Supervisory Board members from these transactions were €0 million as at December 31, 2016 (2015: €0 million). All of these balances are unsecured and interest-free and settlement is expected to occur in cash.
For information about the compensation of our Executive Board and Supervisory Board members, seeNote (29).
(31) Principal Accountant Fees and Services
At the Annual General Meeting of Shareholders held on May 12, 2016, our shareholders elected KPMG AG Wirtschaftsprüfungsgesellschaft as SAP’s independent auditor for 2016. KPMG AG Wirtschaftsprüfungsgesellschaft has been the company’s principal auditor since the fiscal year 2002. Dr. Böttcher has signed as auditor responsible for the audit since the fiscal year 2013, and Ms. Herold has signed as auditor since the fiscal year 2016. KPMG AG Wirtschaftsprüfungsgesellschaft and other firms in the global KPMG network charged the following fees to SAP for audit and other professional services related to 2016 and the previous years:
Fees for Audit and Other Professional Services
€ millions | 2016 | 2015 | 2014 | |||||||||||||||||||||||||||||||||
| KPMG AG (Germany) | Foreign KPMG Firms | Total | KPMG AG (Germany) | Foreign KPMG Firms | Total | KPMG AG (Germany) | Foreign KPMG Firms | Total | ||||||||||||||||||||||||||||
| Audit fees | 3 | 6 | 9 | 3 | 6 | 9 | 2 | 6 | 8 | |||||||||||||||||||||||||||
| Audit-related fees | 0 | 1 | 1 | 0 | 0 | 0 | 0 | 0 | 0 | |||||||||||||||||||||||||||
| Tax fees | 0 | 0 | 0 | 0 | 0 | 0 | 0 | 0 | 0 | |||||||||||||||||||||||||||
| All other fees | 0 | 0 | 0 | 0 | 0 | 0 | 0 | 0 | 0 | |||||||||||||||||||||||||||
|
|
|
|
|
|
|
|
|
|
|
|
|
|
|
|
|
| |||||||||||||||||||
| Total | 3 | 7 | 10 | 3 | 6 | 9 | 2 | 6 | 8 | |||||||||||||||||||||||||||
Audit fees are the aggregate fees charged by KPMG for auditing our consolidated financial statements and the statutory financial statements of SAP SE and its subsidiaries. Audit-related fees are fees charged by KPMG for assurance and related services that are reasonably related to the performance of the audit or review of our financial statements and are not reported under audit fees. Tax fees are fees for professional services rendered by KPMG for tax advice on transfer pricing, restructuring, and tax compliance on current, past, or contemplated transactions. The All other fees category includes other support services, such as training and advisory services on issues unrelated to accounting and taxes.
(32) German Code of Corporate Governance
The German federal government published the German Code of Corporate Governance in February 2002 and introduced a commission that amends the Code from time to time. The Code contains statutory requirements and a number of recommendations and suggestions. Only the legal requirements are binding for German companies. With regard to the recommendations, the German Stock Corporation Act, section 161, requires that every year listed companies publicly state the extent to which they have implemented them. Companies can deviate from the suggestions without having to make any public statements.
In 2016 and 2015, our Executive Board and Supervisory Board issued the required declarations of implementation. The declaration for 2016 was issued on October 29, 2016. These statements are available on our Web site:www.sap.com/corporate-en/investors/governance.
(33) Events After the Reporting Period
No events that have occurred since December 31, 2016, have a material impact on the Company’s Consolidated Financial Statements.
| Consolidated Financial Statements IFRS and Notes | Notes | 197 |
Table of Contents
(34) Subsidiaries and Other Equity Investments
Subsidiaries
Name and Location of Company | Ownership | Total Revenue in 20161) | Profit/ Loss (-) After Tax for 20161) | Total Equity as at 12/31/20161) | Number of Employees as at 12/31/20162) | Footnote | ||||||||||||||||||
| % | € thousands | € thousands | € thousands | |||||||||||||||||||||
| Major Subsidiaries | ||||||||||||||||||||||||
| Ariba, Inc., Palo Alto, CA, United States | 100.0 | 1,023,469 | 54,307 | 3,873,318 | 1,622 | |||||||||||||||||||
| Concur Technologies, Inc., Bellevue, WA, United States | 100.0 | 1,234,313 | 1,153,819 | 7,902,404 | 3,183 | |||||||||||||||||||
| LLC SAP CIS, Moscow, Russia | 100.0 | 355,700 | -5,498 | 46,862 | 793 | |||||||||||||||||||
| SAP (Schweiz) AG, Biel, Switzerland | 100.0 | 786,847 | 67,996 | 69,965 | 647 | |||||||||||||||||||
| SAP (UK) Limited, Feltham, United Kingdom | 100.0 | 1,105,221 | -35,297 | -49,774 | 1,618 | 10 | ) | |||||||||||||||||
| SAP America, Inc., Newtown Square, PA, United States | 100.0 | 4,956,907 | -328,262 | 14,846,116 | 7,188 | |||||||||||||||||||
| SAP Asia Pte Ltd, Singapore, Singapore | 100.0 | 417,768 | -32,727 | 1,100 | 1,084 | |||||||||||||||||||
| SAP Australia Pty Ltd, Sydney, Australia | 100.0 | 607,333 | -29,880 | 160,155 | 1,193 | |||||||||||||||||||
| SAP Brasil Ltda, São Paulo, Brazil | 100.0 | 525,837 | -18,051 | 1,201 | 1,646 | |||||||||||||||||||
| SAP Canada, Inc., Toronto, Canada | 100.0 | 729,874 | 46,015 | 491,067 | 2,814 | |||||||||||||||||||
| SAP China Co., Ltd., Shanghai, China | 100.0 | 928,530 | 19,735 | -50,993 | 5,449 | |||||||||||||||||||
| SAP Deutschland SE & Co. KG, Walldorf, Germany | 100.0 | 3,540,233 | 591,502 | 1,394,437 | 4,414 | 7),9 | ) | |||||||||||||||||
| SAP France, Levallois Perret, France | 100.0 | 1,115,631 | 167,281 | 1,578,559 | 1,413 | |||||||||||||||||||
| SAP Hungary Rendszerek, Alkalmazások és Termékek az Adatfeldolgozásban Informatikai Kft., Budapest, Hungary | 100.0 | 74,569 | 3,322 | 15,431 | 771 | |||||||||||||||||||
| SAP India Private Limited, Bangalore, India | 100.0 | 517,116 | 17,410 | 235,904 | 1,769 | |||||||||||||||||||
| SAP Industries, Inc., Newtown Square, PA, United States | 100.0 | 651,352 | 18,853 | 576,370 | 391 | |||||||||||||||||||
| SAP Italia Sistemi Applicazioni Prodotti in Data Processing S.p.A., Vimercate, Italy | 100.0 | 510,042 | 22,544 | 359,818 | 645 | |||||||||||||||||||
| SAP Japan Co., Ltd., Tokyo, Japan | 100.0 | 834,955 | 58,228 | 603,097 | 1,048 | |||||||||||||||||||
| SAP Labs India Private Limited, Bangalore, India | 100.0 | 353,016 | 25,579 | 54,091 | 6,935 | |||||||||||||||||||
| SAP Labs, LLC, Palo Alto, CA, United States | 100.0 | 600,069 | 22,505 | 346,403 | 2,017 | |||||||||||||||||||
| SAP México S.A. de C.V., Mexico City, Mexico | 100.0 | 367,521 | 6,490 | -9,492 | 722 | |||||||||||||||||||
| SAP Nederland B.V.,‘s-Hertogenbosch, the Netherlands | 100.0 | 542,135 | 37,085 | 53,967 | 557 | 11 | ) | |||||||||||||||||
| SAP Service and Support Centre (Ireland) Limited, Dublin, Ireland | 100.0 | 128,234 | 6,800 | 37,917 | 1,322 | |||||||||||||||||||
| SuccessFactors, Inc., South San Francisco, CA, United States | 100.0 | 1,004,094 | 137,358 | 3,402,419 | 1,069 | |||||||||||||||||||
| Consolidated Financial Statements IFRS and Notes | Notes | 198 |
Table of Contents
Name and Location of Company | Ownership | Footnote | ||||||
| % | ||||||||
| Other Subsidiaries3) | ||||||||
| “SAP Kazakhstan“ LLP, Almaty, Kazakhstan | 100.0 | |||||||
| 110405, Inc., Newtown Square, PA, United States | 100.0 | |||||||
| Altiscale, Inc., Palo Alto, CA, United States | 100.0 | 4 | ) | |||||
| Ambin Properties (Proprietary) Limited, Johannesburg, South Africa | 100.0 | |||||||
| Ariba Czech s.r.o., Prague, Czech Republic | 100.0 | |||||||
| Ariba India Private Limited, Gurgaon, India | 100.0 | |||||||
| Ariba International Holdings, Inc., Wilmington, DE, United States | 100.0 | |||||||
| Ariba International Singapore Pte Ltd, Singapore, Singapore | 100.0 | |||||||
| Ariba International, Inc., Wilmington, DE, United States | 100.0 | |||||||
| Ariba Investment Company, Inc., Wilmington, DE, United States | 100.0 | |||||||
| Ariba Slovak Republic s.r.o., Košice, Slovakia | 100.0 | |||||||
| Ariba Software Technology Services (Shanghai) Co., Ltd., Shanghai, China | 100.0 | |||||||
| Ariba Technologies India Private Limited, Bangalore, India | 100.0 | |||||||
| Ariba Technologies Netherlands B.V.,‘s-Hertogenbosch, the Netherlands | 100.0 | 11 | ) | |||||
| Beijing Zhang Zhong Hu Dong Information Technology Co., Ltd., Beijing, China | 0 | 5 | ) | |||||
| b-process, Paris, France | 100.0 | |||||||
| Business Objects Holding B.V.,‘s-Hertogenbosch, the Netherlands | 100.0 | 11 | ) | |||||
| Business Objects Option LLC, Wilmington, DE, United States | 100.0 | |||||||
| Business Objects Software (Shanghai) Co., Ltd., Shanghai, China | 100.0 | |||||||
| Business Objects Software Limited, Dublin, Ireland | 100.0 | |||||||
| Christie Partners Holding C.V., Utrecht, the Netherlands | 100.0 | |||||||
| ClearTrip Inc. (Mauritius), Ebene, Mauritius | 54.2 | |||||||
| ClearTrip Inc., George Town, Cayman Islands | 54.2 | |||||||
| Cleartrip MEA FZ LLC, Dubai, United Arab Emirates | 54.2 | |||||||
| ClearTrip Private Limited, Mumbai, India | 54.2 | |||||||
| CNQR Operations Mexico S. de. R.L. de. C.V., San Pedro Garza Garcia, Mexico | 100.0 | |||||||
| Concur (Austria) GmbH, Vienna, Austria | 100.0 | |||||||
| Concur (Canada), Inc., Toronto, Canada | 100.0 | |||||||
| Concur (France) SAS, Paris, France | 100.0 | |||||||
| Concur (Germany) GmbH, Frankfurt am Main, Germany | 100.0 | |||||||
| Concur (Italy) S.r.l., Milan, Italy | 100.0 | |||||||
| Concur (Japan) Ltd.,Bunkyo-ku, Japan | 75.0 | |||||||
| Concur (New Zealand) Limited, Wellington, New Zealand | 100.0 | |||||||
| Concur (Philippines) Inc., Makati City, Philippines | 100.0 | |||||||
| Concur (Switzerland) GmbH, Zurich, Switzerland | 100.0 | |||||||
| Concur Czech (s.r.o.), Prague, Czech Republic | 100.0 | |||||||
| Concur Holdings (France) SAS, Paris, France | 100.0 | |||||||
| Concur Holdings (Netherlands) B.V., Amsterdam, the Netherlands | 100.0 | 11 | ) | |||||
| Concur Technologies (Australia) Pty. Limited, Sydney, Australia | 100.0 | |||||||
| Concur Technologies (Hong Kong) Limited, Hong Kong, China | 100.0 | |||||||
| Concur Technologies (India) Private Limited, Bangalore, India | 100.0 | |||||||
| Concur Technologies (Singapore) Pte Ltd, Singapore, Singapore | 100.0 | |||||||
| Concur Technologies (UK) Limited, London, United Kingdom | 100.0 | 10 | ) | |||||
| ConTgo Consulting Limited, London, United Kingdom | 100.0 | 10 | ) | |||||
| ConTgo Limited, London, United Kingdom | 100.0 | 10 | ) | |||||
| ConTgo MTA Limited, London, United Kingdom | 100.0 | 10 | ) | |||||
| ConTgo Pty. Ltd., Sydney, Australia | 100.0 | |||||||
| Crystal Decisions (Ireland) Limited, Dublin, Ireland | 100.0 | |||||||
| Crystal Decisions Holdings Limited, Dublin, Ireland | 100.0 | |||||||
| Crystal Decisions UK Limited, London, United Kingdom | 100.0 | |||||||
| EssCubed Procurement Pty. Ltd., Johannesburg, South Africa | 100.0 | |||||||
| Extended Systems, Inc., Dublin, CA, United States | 100.0 | |||||||
| Fedem Technology AS, Trondheim, Norway | 100.0 | 4 | ) | |||||
| Fieldglass AsiaPac Pty Ltd, Brisbane, Australia | 100.0 | |||||||
| Fieldglass Europe Limited, London, United Kingdom | 100.0 | 10 | ) | |||||
| Financial Fusion, Inc., Dublin, CA, United States | 100.0 | |||||||
| FreeMarkets Ltda., São Paulo, Brazil | 100.0 | |||||||
| GlobalExpense (Consulting) Limited, London, United Kingdom | 100.0 | |||||||
| GlobalExpense (UK) Limited, London, United Kingdom | 100.0 | 10 | ) | |||||
| Hipmunk, Inc., San Francisco, CA, United States | 100.0 | 4 | ) | |||||
| hybris (US) Corp., Wilmington, DE, United States | 100.0 | |||||||
| hybris AG, Zug, Switzerland | 100.0 | |||||||
| hybris GmbH, Munich, Germany | 100.0 | 8),9 | ) | |||||
| hybris UK Limited, London, United Kingdom | 100.0 | 10 | ) | |||||
| Inxight Federal Systems Group, Inc., Wilmington, DE, United States | 100.0 | |||||||
| LLC “SAP Labs“, Moscow, Russia | 100.0 | |||||||
| Consolidated Financial Statements IFRS and Notes | Notes | 199 |
Table of Contents
Name and Location of Company | Ownership | Footnote | ||||||
| % | ||||||||
| LLC “SAP Ukraine”, Kiev, Ukraine | 100.0 | |||||||
| Merlin Systems Oy, Espoo, Finland | 100.0 | |||||||
| Multiposting SAS, Paris, France | 100.0 | |||||||
| Multiposting Sp.z o.o., Warsaw, Poland | 100.0 | |||||||
| Nihon Ariba K.K., Tokyo, Japan | 100.0 | |||||||
| OutlookSoft Deutschland GmbH, Walldorf, Germany | 100.0 | |||||||
| Plat.One Inc., Palo Alto, CA, United States | 100.0 | 4 | ) | |||||
| Plat.One Lab Srl, Bogliasco, Italy | 100.0 | 4 | ) | |||||
| Plateau Systems Australia Ltd, Brisbane, Australia | 100.0 | |||||||
| Plateau Systems LLC, South San Francisco, CA, United States | 100.0 | |||||||
| PT SAP Indonesia, Jakarta, Indonesia | 99.0 | |||||||
| PT Sybase 365 Indonesia, Jakarta, Indonesia | 100.0 | |||||||
| Quadrem Africa Pty. Ltd., Johannesburg, South Africa | 100.0 | |||||||
| Quadrem Brazil Ltda., Rio de Janeiro, Brazil | 100.0 | |||||||
| Quadrem Chile Ltda., Santiago de Chile, Chile | 100.0 | |||||||
| Quadrem Colombia SAS, Bogotá, Colombia | 100.0 | |||||||
| Quadrem International Ltd., Hamilton, Bermuda | 100.0 | |||||||
| Quadrem Netherlands B.V., Amsterdam, the Netherlands | 100.0 | 11 | ) | |||||
| Quadrem Overseas Cooperatief U.A., Amsterdam, the Netherlands | 100.0 | |||||||
| Quadrem Peru S.A.C., Lima, Peru | 100.0 | |||||||
| Ruan Lian Technologies (Beijing) Co., Ltd., Beijing, China | 100.0 | |||||||
| San Borja Partricipadoes LTDA, São Paulo, Brazil | 100.0 | |||||||
| SAP (Beijing) Software System Co., Ltd., Beijing, China | 100.0 | |||||||
| SAP Andina y del Caribe, C.A., Caracas, Venezuela | 100.0 | |||||||
| SAP Argentina S.A., Buenos Aires, Argentina | 100.0 | |||||||
| SAP Asia (Vietnam) Co., Ltd., Ho Chi Minh City, Vietnam | 100.0 | |||||||
| SAP Azerbaijan LLC, Baku, Azerbaijan | 100.0 | |||||||
| SAP Belgium NV/SA, Brussels, Belgium | 100.0 | |||||||
| SAP Beteiligungs GmbH, Walldorf, Germany | 100.0 | |||||||
| SAP Bulgaria EOOD, Sofia, Bulgaria | 100.0 | |||||||
| SAP Business Compliance Services GmbH, Siegen, Germany | 100.0 | |||||||
| SAP Business Services Center Nederland B.V.,‘s-Hertogenbosch, the Netherlands | 100.0 | 11 | ) | |||||
| SAP Chile Limitada, Santiago, Chile | 100.0 | |||||||
| SAP China Holding Co., Ltd., Beijing, China | 100.0 | |||||||
| SAP Colombia S.A.S., Bogotá, Colombia | 100.0 | |||||||
| SAP Commercial Services Ltd., Valletta, Malta | 100.0 | |||||||
| SAP Costa Rica, S.A., San José, Costa Rica | 100.0 | |||||||
| SAP ČR, spol. s r.o., Prague, Czech Republic | 100.0 | |||||||
| SAP Cyprus Limited, Nicosia, Cyprus | 100.0 | |||||||
| SAP d.o.o., Zagreb, Croatia | 100.0 | |||||||
| SAP Danmark A/S, Copenhagen, Denmark | 100.0 | |||||||
| SAP Dritte Beteiligungs- und Vermögensverwaltungs GmbH, Walldorf, Germany | 100.0 | |||||||
| SAP East Africa Limited, Nairobi, Kenya | 100.0 | |||||||
| SAP Egypt LLC, Cairo, Egypt | 100.0 | |||||||
| SAP EMEA Inside Sales S.L., Barcelona, Spain | 100.0 | |||||||
| SAP Erste Beteiligungs- und Vermögensverwaltungs GmbH, Walldorf, Germany | 100.0 | 8),9 | ) | |||||
| SAP España – Sistemas, Aplicaciones y Productos en la Informática, S.A., Madrid, Spain | 100.0 | |||||||
| SAP Estonia OÜ, Tallinn, Estonia | 100.0 | |||||||
| SAP Financial, Inc., Toronto, Canada | 100.0 | |||||||
| SAP Finland Oy, Espoo, Finland | 100.0 | |||||||
| SAP Foreign Holdings GmbH, Walldorf, Germany | 100.0 | |||||||
| SAP France Holding, Levallois Perret, France | 100.0 | |||||||
| SAP Fünfte Beteiligungs- und Vermögensverwaltungs GmbH, Walldorf, Germany | 100.0 | 8),9 | ) | |||||
| SAP Global Marketing, Inc., New York, NY, United States | 100.0 | |||||||
| SAP Hellas S.A., Athens, Greece | 100.0 | |||||||
| SAP Holdings (UK) Limited, Feltham, United Kingdom | 100.0 | 10 | ) | |||||
| SAP Hong Kong Co., Ltd., Hong Kong, China | 100.0 | |||||||
| SAP Hosting Beteiligungs GmbH, St.Leon-Rot, Germany | 100.0 | |||||||
| SAP India (Holding) Pte Ltd, Singapore, Singapore | 100.0 | |||||||
| SAP International Panama, S.A., Panama City, Panama | 100.0 | |||||||
| SAP International, Inc., Miami, FL, United States | 100.0 | |||||||
| SAP Investments, Inc., Wilmington, DE, United States | 100.0 | |||||||
| SAP Ireland Limited, Dublin, Ireland | 100.0 | |||||||
| SAP Ireland US-Financial Services Designed Activity Company, Dublin, Ireland | 100.0 | |||||||
| SAP Israel Ltd., Ra’anana, Israel | 100.0 | |||||||
| SAP Korea Ltd., Seoul, South Korea | 100.0 | |||||||
| SAP Labs Bulgaria EOOD, Sofia, Bulgaria | 100.0 | |||||||
| SAP Labs Finland Oy, Espoo, Finland | 100.0 | |||||||
| SAP Labs France SAS, Mougins, France | 100.0 | |||||||
| SAP Labs Israel Ltd., Ra’anana, Israel | 100.0 | |||||||
| SAP Labs Korea, Inc., Seoul, South Korea | 100.0 | |||||||
| Consolidated Financial Statements IFRS and Notes | Notes | 200 |
Table of Contents
Name and Location of Company | Ownership | Footnote | ||||||
| % | ||||||||
| SAP Latvia SIA, Riga, Latvia | 100.0 | |||||||
| SAP Malaysia Sdn. Bhd., Kuala Lumpur, Malaysia | 100.0 | |||||||
| SAP Malta Investments Ltd., Valletta, Malta | 100.0 | |||||||
| SAP MENA FZ L.L.C., Dubai, United Arab Emirates | 100.0 | 4 | ) | |||||
| SAP Middle East and North Africa L.L.C., Dubai, United Arab Emirates | 49.0 | 5 | ) | |||||
| SAP National Security Services, Inc., Newtown Square, PA, United States | 100.0 | |||||||
| SAP Nederland Holding B.V.,‘s-Hertogenbosch, the Netherlands | 100.0 | 11 | ) | |||||
| SAP New Zealand Limited, Auckland, New Zealand | 100.0 | |||||||
| SAP Norge AS, Lysaker, Norway | 100.0 | |||||||
| SAP North West Africa Ltd, Casablanca, Morocco | 100.0 | |||||||
| SAP Österreich GmbH, Vienna, Austria | 100.0 | |||||||
| SAP PERU S.A.C., Lima, Peru | 100.0 | |||||||
| SAP Philippines, Inc., Makati, Philippines | 100.0 | |||||||
| SAP Polska Sp. z o.o., Warsaw, Poland | 100.0 | |||||||
| SAP Portals Europe GmbH, Walldorf, Germany | 100.0 | |||||||
| SAP Portals Holding Beteiligungs GmbH, Walldorf, Germany | 100.0 | |||||||
| SAP Portals Israel Ltd., Ra’anana, Israel | 100.0 | |||||||
| SAP Portugal – Sistemas, Aplicações e Produtos Informáticos, Sociedade Unipessoal, Lda., Porto Salvo, Portugal | 100.0 | |||||||
| SAP Projektverwaltungs- und Beteiligungs GmbH, Walldorf, Germany | 100.0 | 8 | ) | |||||
| SAP Public Services Hungary Kft., Budapest, Hungary | 100.0 | |||||||
| SAP Public Services, Inc., Washington, DC, United States | 100.0 | |||||||
| SAP Puerto Rico GmbH, Walldorf, Germany | 100.0 | 8 | ),9) | |||||
| SAP Retail Solutions Beteiligungsgesellschaft mbH, Walldorf, Germany | 100.0 | |||||||
| SAP Romania SRL, Bucharest, Romania | 100.0 | |||||||
| SAP Saudi Arabia Software Services Ltd, Riyadh, Kingdom of Saudi Arabia | 100.0 | |||||||
| SAP Saudi Arabia Software Trading Ltd, Riyadh, Kingdom of Saudi Arabia | 75.0 | |||||||
| SAP Sechste Beteiligungs- und Vermögensverwaltungs GmbH, Walldorf, Germany | 100.0 | 8 | ),9) | |||||
| SAP Services s.r.o., Prague, Czech Republic | 100.0 | |||||||
| SAP Siebte Beteiligungs- und Vermögensverwaltungs GmbH, Walldorf, Germany | 100.0 | 4 | ) | |||||
| SAP sistemi, aplikacije in produkti za obdelavo podatkov d.o.o., Ljubljana, Slovenia | 100.0 | |||||||
| SAP Slovensko s.r.o., Bratislava, Slovakia | 100.0 | |||||||
| SAP Software and Services LLC, Doha, Qatar | 49.0 | 5 | ) | |||||
| SAP Svenska Aktiebolag, Stockholm, Sweden | 100.0 | |||||||
| SAP Systems, Applications and Products in Data Processing (Thailand) Ltd., Bangkok, Thailand | 100.0 | |||||||
| SAP Taiwan Co., Ltd., Taipei, Taiwan | 100.0 | |||||||
| SAP Technologies Inc., Palo Alto, CA, United States | 100.0 | |||||||
| SAP Training and Development Institute FZCO, Dubai, United Arab Emirates | 100.0 | |||||||
| SAP Türkiye Yazilim Üretim ve Ticaret A.Ş., Istanbul, Turkey | 100.0 | |||||||
| SAP UAB, Vilnius, Lithuania | 100.0 | |||||||
| SAP Ventures Investment GmbH, Walldorf, Germany | 100.0 | 8 | ),9) | |||||
| SAP Vierte Beteiligungs- und Vermögensverwaltungs GmbH, Walldorf, Germany | 100.0 | |||||||
| SAP West Balkans d.o.o., Belgrade, Serbia | 100.0 | |||||||
| SAP Zweite Beteiligungs- und Vermögensverwaltungs GmbH, Walldorf, Germany | 100.0 | 8 | ),9) | |||||
| Sapphire SAP HANA Fund of Funds, L.P., Wilmington, DE, United States | 0 | 6 | ) | |||||
| Sapphire Ventures Fund I, L.P., Wilmington, DE, United States | 0 | 6 | ) | |||||
| Sapphire Ventures Fund II, L.P., Wilmington, DE, United States | 0 | 6 | ) | |||||
| SAPV (Mauritius), Ebene, Mauritius | 0 | 6 | ) | |||||
| SAS Financière Multiposting, Paris, France | 100.0 | |||||||
| SeeWhy (UK) Limited, Windsor, United Kingdom | 100.0 | |||||||
| Shanghai SuccessFactors Software Technology Co., Ltd., Shanghai, China | 100.0 | |||||||
| SuccessFactors (Philippines), Inc., Pasig City, Philippines | 100.0 | |||||||
| SuccessFactors Asia Pacific Limited, Hong Kong, China | 100.0 | |||||||
| SuccessFactors Australia Holdings Pty Ltd, Brisbane, Australia | 100.0 | |||||||
| SuccessFactors Australia Pty Limited, Brisbane, Australia | 100.0 | |||||||
| SuccessFactors Cayman, Ltd., Grand Cayman, Cayman Islands | 100.0 | |||||||
| SuccessFactors International Holdings, LLC, San Mateo, CA, United States | 100.0 | |||||||
| Sybase (UK) Limited, Maidenhead, United Kingdom | 100.0 | |||||||
| Sybase 365 Ltd., Tortola, British Virgin Islands | 100.0 | |||||||
| Sybase 365, LLC, Dublin, CA, United States | 100.0 | |||||||
| Sybase Angola, LDA, Luanda, Angola | 100.0 | |||||||
| Sybase Iberia S.L., Madrid, Spain | 100.0 | |||||||
| Sybase India Ltd., Mumbai, India | 100.0 | |||||||
| Sybase International Holdings Corporation, LLC, Dublin, CA, United States | 100.0 | |||||||
| Sybase Philippines, Inc., Makati City, Philippines | 100.0 | |||||||
| Consolidated Financial Statements IFRS and Notes | Notes | 201 |
Table of Contents
Name and Location of Company | Ownership | Footnote | ||||||
| % | ||||||||
| Sybase Software (China) Co., Ltd., Beijing, China | 100.0 | |||||||
| Sybase Software (India) Private Ltd., Mumbai, India | 100.0 | |||||||
| Sybase, Inc., Dublin, CA, United States | 100.0 | |||||||
| Systems Applications Products (Africa Region) Proprietary Limited, Johannesburg, South Africa | 100.0 | |||||||
| Systems Applications Products (Africa) Proprietary Limited, Johannesburg, South Africa | 100.0 | |||||||
| Systems Applications Products (South Africa) Proprietary Limited, Johannesburg, South Africa | 70.0 | |||||||
| Systems Applications Products Nigeria Limited, Victoria Island, Nigeria | 100.0 | |||||||
| TechniData GmbH, Markdorf, Germany | 100.0 | |||||||
| Technology Licensing Company, LLC, Atlanta, GA, United States | 100.0 | |||||||
| TomorrowNow, Inc., Bryan, TX, United States | 100.0 | |||||||
| Travel Technology, LLC, Atlanta, GA, United States | 100.0 | |||||||
| TRX Data Service, Inc., Glen Allen, VA, United States | 100.0 | |||||||
| TRX Europe Limited, London, United Kingdom | 100.0 | 10 | ) | |||||
| TRX Fulfillment Services, LLC, Atlanta, GA, United States | 100.0 | |||||||
| TRX Luxembourg, S.a.r.l., Luxembourg City, Luxembourg | 100.0 | |||||||
| TRX Technologies India Private Limited, Raman Nagar, India | 100.0 | |||||||
| TRX Technology Services, L.P., Atlanta, GA, United States | 100.0 | |||||||
| TRX UK Limited, London, United Kingdom | 100.0 | 10 | ) | |||||
| TRX, Inc., Bellevue, WA, United States | 100.0 | |||||||
| Volume Integration, Inc., VA, United States | 100.0 | 4 | ) | |||||
| 1) | These figures are based on our local IFRS financial statements prior to eliminations resulting from consolidation and therefore do not reflect the contribution of these companies included in the Consolidated Financial Statements. The translation of the equity into Group currency is based onperiod-end closing exchange rates, and on average exchange rates for revenue and net income/loss. |
| 2) | As at December 31, 2016, including managing directors, in FTE. |
| 3) | Figures for profit/loss after tax and total equity pursuant to HGB, section 285 and section 313 are not disclosed if they are of minor significance for a fair presentation of the profitability, liquidity, capital resources and financial position of SAP SE, pursuant to HGB, section 313 (2) sentence 3 no. 4 and section 286 (3) sentence 1 no. 1. |
| 4) | Consolidated for the first time in 2016. |
| 5) | Agreements with the other shareholders provide that SAP SE fully controls the entity. |
| 6) | SAP SE does not hold any ownership interests in four structured entities, SAPV (Mauritius), Sapphire SAP HANA Fund of Funds, L.P., Sapphire Ventures Fund I, L.P. and Sapphire Ventures Fund II, L.P. However, based on the terms of limited partnership agreements under which these entities were established, SAP SE is exposed to the majority of the returns related to their operations and has the current ability to direct these entities’ activities that affect these returns, in accordance with IFRS 10 (Consolidated Financial Statements). Accordingly, the results of operations are included in SAP’s consolidated financial statements. |
| 7) | Entity whose personally liable partner is SAP SE. |
| 8) | Entity with (profit and) loss transfer agreement. |
| 9) | Pursuant to HGB, section 264 (3) or section 264b, the subsidiary is exempt from applying certain legal requirements to their statutory stand-alone financial statements including the requirement to prepare notes to the financial statements and a review of operations, the requirement of independent audit and the requirement of public disclosure. |
| 10) | Pursuant to sections 479A to 479C of the UK Companies Act 2006, the entity is exempt from having its financial statements audited on the basis that SAP SE has provided a guarantee of the entity’s liabilities in respect of its financial year ended December 31, 2016. |
| 11) | Pursuant to article 2:403 of the Dutch Civil Code, the entity is exempt from applying certain legal requirements to their statutory stand-alone financial statements including the requirement to prepare the financial statements, the requirement of independent audit and the requirement of public disclosure on the basis that SAP SE has provided a guarantee of the entity’s liabilities in respect of its financial year ended December 31, 2016. |
Other Equity Investments
Name and Location of Company | Ownership | |||
| % | ||||
| Joint Arrangements and Investments in Associates | ||||
| China DataCom Corporation Limited, Guangzhou, China | 28.30 | |||
| Convercent, Inc., Denver, CO, United States | 39.06 | |||
| Evature Technologies (2009) Ltd., Ramat Gan, Israel | 30.46 | |||
| Procurement Negócios Eletrônicos S/A, Rio de Janeiro, Brazil | 17.00 | |||
| StayNTouch Inc., Bethesda, MD, United States | 46.77 | |||
| Visage Mobile, Inc., San Francisco, CA, United States | 40.62 | |||
| Yapta, Inc., Seattle, WA , United States | 47.10 | |||
Name and Location of Company | ||||
| Equity Investments with Ownership of at Least 5% | ||||
| Alchemist Accelerator Fund I LLC, San Francisco, CA, United States | ||||
| All Tax Platform - Solucoes Tributarias S.A., São Paulo, Brazil | ||||
| Alteryx, Inc., Irvine, CA, United States | ||||
| Amplify Partners II L.P., Cambridge, MA, United States | ||||
| Amplify Partners L.P., Cambridge, MA, United States | ||||
| AP Opportunity Fund, LLC, Menlo Park, CA, United States | ||||
| BY Capital 1 GmbH & Co. KG, Berlin, Germany | ||||
| Canvas II, L.P., Portola Valley, CA, United States | ||||
| Catchpoint Systems, Inc., New York, NY, United States | ||||
| Char Software, Inc., Boston, MA, United States | ||||
| Cloudhealth Technologies, Inc., Boston, MA, United States | ||||
| Costanoa Venture Capital II L.P., Palo Alto, CA, United States | ||||
| Costanoa Venture Capital QZ, LLC, Palo Alto, CA, United States | ||||
| Cyphort, Inc., Santa Clara, CA, United States | ||||
Consolidated Financial Statements IFRS and Notes | Notes | 202 |
Table of Contents
Name and Location of Company |
| Data Collective II L.P., San Francisco, CA, United States |
| Data Collective III L.P., San Francisco, CA, United States |
| Data Collective IV, L.P., San Francisco, CA, United States |
| Dharma Platform, Inc., Florida Ave NW, WA, United States |
| EIT ICT Labs GmbH, Berlin, Germany |
| FeedZai S.A., Lisbon, Portugal |
| Follow Analytics, Inc., San Francisco, CA, United States |
| GK Software AG, Schöneck, Germany |
| Greater Pacific Capital (Cayman) L.P., Grand Cayman, Cayman Islands |
| IDG Ventures USA III, L.P., San Francisco, CA, United States |
| IEX Group, Inc., New York, NY, United States |
| Inkling Systems, Inc., San Francisco, CA, United States |
| InnovationLab GmbH, Heidelberg, Germany |
| innoWerft Technologie- und Gründerzentrum Walldorf Stiftung GmbH, Walldorf, Germany |
| Integral Ad Science, Inc., New York, NY, United States |
| Iron.io, Inc., San Francisco, CA, United States |
| Jfrog, Ltd., Netanya, Israel |
| Jibe, Inc., New York, NY, United States |
| Kaltura, Inc., New York, NY, United States |
| LeanData, Inc., Sunnyvale, CA, United States |
| Local Globe VII, L.P., St. Peter Port, Guernsey, Channel Islands |
| Local Globe VIII, L.P., St. Peter Port, Guernsey, Channel Islands |
| Looker Data Sciences, Inc., Santa Cruz, CA, United States |
| MuleSoft, Inc., San Francisco, CA, United States |
| MVP Strategic Partnership Fund GmbH & Co. KG, Grünwald, Germany |
| Narrative Science, Inc., Chicago, IL, United States |
| Nor1, Inc., Santa Clara, CA, United States |
| Notation Capital, L.P., Brooklyn, NY, United States |
| On Deck Capital, Inc., New York, NY, United States |
| OpenX Software Limited, Pasadena, CA, United States |
| Patent Quality, Inc., Bellevue, WA, United States |
| Point Nine Annex GmbH & Co. KG, Berlin, Germany |
| Point Nine Capital Fund II GmbH & Co. KG, Berlin, Germany |
| Point Nine Capital Fund III GmbH & Co. KG, Berlin, Germany |
| Portworx Inc., Los Altos, CA , United States |
| Post for Systems, Cairo, Egypt |
| PubNub, Inc., San Francisco, CA, United States |
| Realize Corporation, Tokyo, Japan |
| Return Path, Inc., New York, NY, United States |
| Rome2rio Pty. Ltd., Albert Park, Australia |
| SaaStr Fund I, L.P., Palo Alto, CA, United States |
| Scytl, S.A., Barcelona, Spain |
| Shasta Ventures V, L.P., Menlo Park, CA, United States |
| Smart City Planning, Inc., Tokyo, Japan |
| Socrata, Inc., Seattle, WA, United States |
| Spring Mobile Solutions, Inc., Reston, VA, United States |
| Storm Ventures V, L.P., Menlo Park, CA, United States |
| SV Angel IV, L.P., San Francisco, CA, United States |
| T3C Inc., Mountain View, CA, United States |
| TableNow, Inc., San Francisco, CA, United States |
| The Currency Cloud Group Limited, London, United Kingdom |
| The SAVO Group Ltd., Chicago, IL, United States |
| TidalScale, Inc., Santa Clara, CA, United States |
| USV 2016, L.P., New York, NY, United States |
Walldorf, February 22, 2017
SAP SE
Walldorf, Baden
The Executive Board
| Bill McDermott | Robert Enslin | |
| Michael Kleinemeier | Bernd Leukert | |
| Luka Mucic | Stefan Ries | |
| Steve Singh | ||
Consolidated Financial Statements IFRS and Notes | Notes | 203 |
Table of Contents
Management’s Annual Report on Internal Control over Financial Reporting in the Consolidated Financial Statements
U.S. law requires that management submit a report on the effectiveness of internal control over financial reporting in the consolidated financial statements. For 2016, that report is as follows:
The management of SAP is responsible for establishing and maintaining adequate internal control over financial reporting as such term is defined in Rules 13a–15(f) and 15d–15(f) under the U.S. Securities Exchange Act of 1934. SAP’s internal control over financial reporting is a process designed under the supervision of SAP’s CEO and CFO to provide reasonable assurance regarding the reliability of financial reporting and the preparation of financial statements for external reporting purposes in accordance with International Financial Reporting Standards (IFRS) as issued by the International Accounting Standards Board (IASB).
SAP’s management assessed the effectiveness of the Company’s internal control over financial reporting as at December 31, 2016. In making this assessment, it used the criteria set forth by the Committee of Sponsoring Organizations of the Treadway Commission (COSO) in Internal Control — Integrated Framework (2013).
Based on the assessment under these criteria, SAP management has concluded that, as at December 31, 2016, the Company’s internal control over financial reporting was effective.
KPMG AG Wirtschaftsprüfungsgesellschaft, our independent registered public accounting firm, has issued its attestation report on the effectiveness of SAP’s internal control over financial reporting. It is included in the independent auditor’s report on the Consolidated Financial Statements as at December 31, 2016.
Consolidated Financial Statements IFRS and Notes | Management’s Annual Report on Internal Control over Financial Reporting in the Consolidated Financial Statements | 204 |
Table of Contents
 | Additional Information on Economic, Environmental and Social Performance |
| Management’s Annual Report on Internal Control over Financial Reporting in the Consolidated Financial Statements | 205 |
Table of Contents
Connectivity of Financial andNon-Financial Indicators1)
Gaining a Holistic View of Our Performance
Integrated reporting is based on the idea that social, environmental, and economic performance are interrelated, with each creating tangible impacts on the others. To achieve a truly integrated strategy, we must understand these connections and work to support them throughout SAP. Figure 1 below shows how different elements connect.
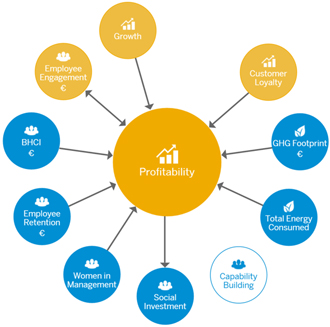
Figure 1: Connectivity between Social, Environmental, and Economic Performance
| 1) | The information in the section Connectivity of Financial andNon-Financial Indicators is not in scope of the Independent Assurance Report from KPMG. |
Putting a Value onNon-Financial Performance Indicators
At SAP, we put a monetary value on how our operating profit is affected by selectednon-financial indicators that measure, for example, how well we engage with our employees and inspire them to commit to our vision and strategy, support a healthy business culture, and succeed in reducing our carbon emissions.
To achieve this quantification, we createdcause-and-effect chains that show how specific actions we take at SAP lead to shifts in behavior. This behavior impacts on our business and has a financial consequence.
Such analysis establishes more than just a correlation betweennon-financial indicators and financial impact. It also reveals why and how something such as employee engagement ultimately leads to gains or losses in business performance. We believe that such insights are a prerequisite for fully modeling the financial impact ofnon-financial performance.
UsingCause-and-Effect Analysis
To create and validate these chains of cause and effect, we turned to both internal and external stakeholders. We started with those inside SAP, meeting in small groups that rigorously examined the impacts of activities related to each of ournon-financial indicators.
Next, we conferred with external stakeholders, including academics, financial investors, and industry peers, to vet our findings. Finally, we used real data from SAP to translate ourcause-and-effect chains into a quantified impact on operating profit.
Additional Information on Economic, Environmental and Social Performance Connectivity of Financial and Non-Financial Indicators | 206 |
Table of Contents
Documenting Financial Impact
Since 2014, SAP has used techniques such as linear regression analysis to document the financial impact of fournon-financial indicators. We assess each indicator to see what a change of one percentage point (or 1% for carbon emissions) would mean for our operating profit. The results for 20162 are below:
Non-Financial Indicator | Increase in Operating Profit (€ million, non-IFRS) | |||
| Business Health Culture Index | 80 to 90 (for a change by 1 pp) | |||
| Employee engagement | 45 to 55 (for a change by 1 pp) | |||
| Retention | 50 to 60 (for a change by 1 pp) | |||
| Carbon emissions | 5 (for a reduction by 1%) | |||
Case Study: Documenting the Financial Impact of a Healthy Work Culture
Our Business Health Culture Index assesses the health of both our organizational culture and our employees. Figure 2 shows how activities that support health at SAP strengthen our organizational culture and help our employees perform at their best. For example, we see that flexibility improves stress resilience and enhances the work- life balance. This leads to greater productivity, resulting in a higher operating profit.
Cause-and-Effect Chain for the Business Health Culture Index (BHCI)
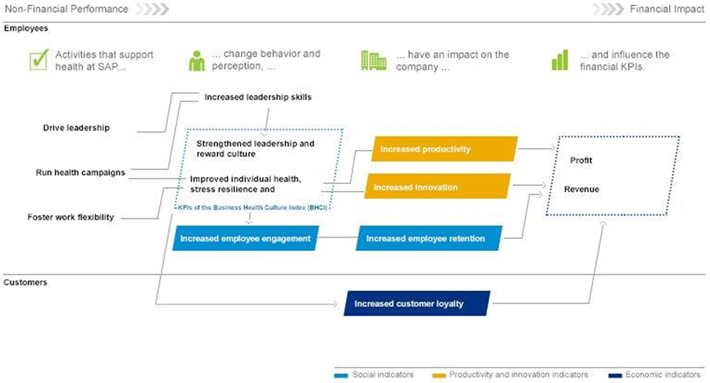
Figure 2: Impact Pathway of the Business Health Culture Index
Case Study: Calculating ROI for Our “Join In – Stay Fit!” Health Initiative
As part of the “Join In – Stay Fit!” program at SAP Germany, we implemented a number of measures to improve the work-life balance of our staff. These include workshops that raise health awareness and provide tips for employees on how to change unhealthy behavior.
Before and after the launch of the program, we mapped direct and indirect costs related to this activity. We also measured the impact of the program on employees’ work-life balance as well as its impact on the BHCI. In 2015, the program resulted in an ROI of 3.9 for the year of the investment. This means that operating profit increased €3.90 for every €1 invested during that year.
Promoting Sustainability Measures as a Way to Boost Financial Performance
Documenting the financial impact ofnon-financial indicators helps us move closer to achieving our sustainability goals. Rather than simply stating the business case for social or environmental change, we now have the numbers to back it up.
Our findings help us to shift the conversation for business leaders, investors, employees, and other key stakeholders, and firmly establishnon-financial indicators as playing a crucial role in our financial success. As a result, engaging employees or reducing our emissions is no longer seen as anice-to-have, but rather as essential to carrying out a successful business strategy.
Moving forward, we are promoting the use of sustainability measures as a way to improve financial performance, both inside and outside of
| 2 | These results reflect the quantification of a gross effect related to a change in a particular key performance indicator. They do not allow for any net impact measurement. The evaluation of required investment to change thenon-financial indicator is excluded from the scope of analysis. The economic gross impact of a single indicator includes interdependencies with other indicators, hence our results do not allow for a cumulative effect across all indicators included in this report. All calculations are based onnon-IFRS figures (as shown in our Integrated Report 2016). |
Additional Information on Economic, Environmental and Social Performance Connectivity of Financial and Non-Financial Indicators | 207 |
Table of Contents
SAP. By embedding this approach into our decision making and quarterly business reviews, our sustainability performance steers our business along with factors such as revenue and cost. Our goal is for all senior business leaders at SAP to recognize – and be held accountable for – the fact that improving such measures as employee engagement also boosts financial performance.
EmbeddingNon-Financial Performance Indicators into Our Solutions
We continue to share our methodology with our customers to help them win in the marketplace. We know that companies achieve higher operating profit – resulting from both greater cost efficiency as well as revenue growth – by addressing economic, social, and environmental considerations. More importantly, these companies are better equipped to lead in the future, as they navigate the world’s most pressing challenges and help to bring about long-term sustainable change.
Currently, our connectivity model focuses predominantly on internal issues within SAP. However, we are working to enhance our model to include the social, environmental, and economic impacts of SAP software and services when they are used by our customers.
Using the connectivity model, we have been able to embednon-financial key performance indicators into our solutions. We see this in our SAP Digital Boardroom offering built on the SAP BusinessObjects Cloud solution, for example. By incorporating this connection into our software, the integrated approach to financial andnon-financial performance not only helps SAP but also our customers. In this way, we can turn our vision into reality: enabling our customers to use our technology to make the world a better place.
Details: How OurNon-Financial and Financial Performance Indicators Are Interconnected
Employee Engagement
Employee engagement is the level of employee commitment, pride, and loyalty, as well as the feeling of employees of being advocates for their company.
Capability Building > Employee Engagement
Because it is closely linked to how much a company develops its employees and supports their careers, internal hiring to management and expert positions positively affects employees’ commitment and loyalty. This hypothesis was confirmed by a study by Bedarkar & Pandita (2014), which identified “career opportunities” as the key driver of employee engagement.3
Social Investment > Employee Engagement
Mueller et al. (2012) have found that employees’ perception of a company’s commitment to corporate social responsibility is positively linked to their own commitment to the organization.4
Employee Engagement > Profitability
Since 2014, we have used real data from SAP to analyze and proof the financial impact of employee engagement. Now we can show what a change by one percentage point of employee engagement would mean for SAP’s operating profit, as detailed in theDocumenting Financial Impact section.
Profitability > Employee Engagement
In our view, a high operating profit, as great business news, can raise employee morale, encourage identification with our vision, and thus drive employee engagement. On the other hand, we believe that a high profit can also have a negative impact on employee engagement. For example, if cost savings and budget cuts were implemented to reach an ambitious profit target, employees might feel constrained and dissatisfied.
Business Health Culture Index (BHCI) > Employee Engagement
Since 2014, we have been using real data from SAP to analyze and prove the financial impact of the BHCI. We have been able to prove a significant positive correlation between the BHCI and employee engagement. (The BHCI positively influences the Leadership Trust Index, which positively influences the Employee Engagement Index; all correlations are significant).
Employee Engagement > Employee Retention
Since 2014, we have been using real data from SAP to analyze and prove the financial impact of employee engagement. We have been able to prove a significant positive correlation between employee engagement and employee retention.
Greenhouse Gas (GHG) Footprint > Employee Engagement
We believe that lowering SAP’s GHG footprint can have a positive impact on employee engagement because loyalty should rise as employees see their company act responsibly towards the environment. However, because lowering emissions also brings certain restrictions, such as on business travel, it may also have a negative impact on employee engagement.
Employee Engagement > GHG Footprint
We believe that engaged employees are likely to want to help SAP achieve our own target in lowering GHG emissions. Yet another possible outcome is that a higher level of employee engagement may lead to more business activity requiring travel and therefore could lead to an increase in GHG emissions.
| 3 | Bedarkar, M., Pandita, D. (2014): A Study on the drivers of employee engagement impacting employee performance. In: Procedia – Social and Behavioral Sciences, Vol. 133, pp.106-115. |
| 4 | Mueller, K., Hattrup, K., Spiess, S.,Lin-Hi, N. (2012): The effects of corporate social responsibility on employees’ affective commitment: A cross-cultural investigation. In: Journal of Applied Psychology, Vol. 97(6), pp. 1186-1200. |
Additional Information on Economic, Environmental and Social Performance Connectivity of Financial and Non-Financial Indicators | 208 |
Table of Contents
Employee Engagement > Growth
Since 2014, we have been using real data from SAP to analyze and prove the financial impact of employee engagement. We have been able to prove a significant positive correlation between employee engagement and revenue.
Growth > Employee Engagement
We believe that higher revenue has a positive impact on a company’s work environment, thereby increasing employee pride and loyalty. This is also stated in a study of Harter et al. (2010), which states that improving financial performance appears to increase general satisfaction and some specific work perceptions.5
Business Health Culture Index (BHCI)
The BHCI is a score for readiness of employees to accept change, in particular, their perception of affiliation and purpose, leadership, recognition, empowerment, reward, stress level, and life balance at SAP.
Women in Management > BHCI
We believe that a balance of men and women in management roles helps create a more balanced working environment, one in which diversity is valued and people feel free to express their individual styles. It is our expectation that such an environment will positively affect our BHCI.
BHCI > Women in Management
McKinsey (2013) found that different elements of the BHCI, such as flexible working hours, the ability to work from home, and career flexibility, can make it easier for employees to balance work and family life.6 This leads us to conclude that the higher our BHCI, the more attractive SAP becomes to women who are also seeking management positions.
BHCI > Profitability
Since 2014, we have been using real data from SAP to analyze and prove the financial impact of the BHCI. Now we can show what a change by one percentage point of the BHCI would mean for SAP’s operating profit, as detailed in theDocumenting Financial Impact section.
Social Investment > BHCI
We believe that by supporting our employees in engaging in activities with a positive social impact, such as skills-based volunteering, we are enhancing the meaning they find in work. This sense of purpose can help create a richer and more rewarding work environment that reduces stress and promotes satisfaction and well-being.
BHCI > Employee Engagement
Since 2014, we have been using real data from SAP to analyze and prove the financial impact of the BHCI. We have been able to prove a significant positive correlation between the BHCI and employee engagement. (The BHCI positively influences the Leadership Trust Index, which positively influences the Employee Engagement Index; all correlations are significant).
BHCI > Growth
Since 2014, we have been using real data from SAP to analyze and prove the financial impact of the BHCI. We have been able to prove a significant positive correlation between the BHCI and revenue.
GHG Footprint > BHCI
Many of SAP’s GHG emissions are caused by business travel and commuting, which we believe can have both negative and positive impacts on employee health. Some people may experience greater stress from more travel because they have less time to spend at home, suffer from jetlag, or lose valuable working time; others may enjoy travel, enabling them to experience other places and cultures as well as meet new people.
BHCI > Customer Loyalty
Since 2014, we have been using real data from SAP to analyze and prove the financial impact of the BHCI. We have been able to prove a significant positive correlation between the BHCI and customer loyalty.
Employee Retention
Employee retention is the ratio of the average headcount (expressed in full-time equivalents), minus employee-initiated terminations (turnover), divided by the average headcount, taking into account the past 12 months.
Capability Building > Employee Retention
According to the Global Workforce Study (2012) the “chances to advance the career” is the second-most important driver of employee retention.7By promoting and thus growing from within, SAP creates career opportunities for our employees. In turn, it is our expectation that this opportunity leads to an increase in employee retention.
Employee Engagement > Employee Retention
Since 2014, we have been using real data from SAP to analyze and prove the financial impact of employee engagement. We have been able to prove a significant positive correlation between employee engagement and employee retention.
Employee Retention > Growth
Meifert (2005) stated a clear relationship between employee retention and a company’s revenue and margin.8
Employee Retention > Customer Loyalty
Koys (2001) has found evidence that employee turnover has a negative impact on customer satisfaction.9 We believe this effect stems from the
| 5 | Harter, J., Schmidt, F., Asplund, J., Kilham, E., Agrawal, S. (2010): Causal Impact of Employee Work Perceptions on the Bottom Line of Organizations. In: Perspectives on Psychological Science, Vol. 5(4), pp.378-389. |
| 6 | McKinsey & Company (2013): Women Matter. Gender diversity in top management: Moving corporate culture, moving boundaries. Available at: http://www.mckinsey.com/~/media/McKinsey/Global%20Themes/Women%20matter/WomenMatter%202013%20Report%20(8).ashx [Accessed 16 Dec. 2016]. |
| 7 | Towers Watson (2012): Global Workforce Study. Geld, Karriere, Sicherheit? Was Mitarbeiter motiviert und in ihrem Unternehmen hält. Available at: https://www.towerswatson.com/de-AT/Insights/IC-Types/Survey-Research-Results/2012/07/Towers-Watson-Global-Workforce-Study-2012-Deutschlandergebnisse [Accessed 16 Dec. 2016]. |
| 8 | Meifert, M. (2005): Mitarbeiterbindung: eine empirische Analyse betrieblicher Weiterbildner in deutschen Großunternehmen. München and Mering: Hampp Verlag. |
| 9 | Koys, D. (2001): The effects of employee satisfaction, organizational citizenship behavior, and turnover on organizational effectiveness: A unit-level, longitudinal study. In: Personnel Psychology, Vol. 54(1), pp.101-114. |
Additional Information on Economic, Environmental and Social Performance Connectivity of Financial and Non-Financial Indicators | 209 |
Table of Contents
fact that experienced employees work more efficiently, have better product knowledge, and can build trusting relationships with colleagues and customers, so therefore have the ability to better serve customers’ needs.
Employee Retention > Profitability
We have been using real data from SAP to analyze and prove the financial impact of employee retention. Now we can show what a change by one percentage point of employee retention would mean for SAP’s operating profit, as detailed in theDocumenting Financial Impactsection.
Women in Management
“Women in Management” means the share of women in management positions (managing teams, managing managers, board members) as compared to the total number of managers.
Capability Building > Women in Management
Like many of our IT industry peers, SAP has less women than men in senior positions. Given our significant pool of talent, we assume that internal promotions will increase the percentage of women in management positions.
Women in Management > BHCI
We believe that a balance of men and women in management helps create a more balanced working environment, one in which diversity is valued and people feel free to express their individual styles. It is our expectation that such an environment will positively affect our BHCI.
BHCI > Women in Management
McKinsey (2013) found that different elements of the BHCI, such as flexible working hours, the ability to work from home, and career flexibility, can make it easier for employees to balance work and family life.10 This leads us to conclude that the higher our BHCI, the more attractive SAP becomes to women who are also seeking management positions.
Women in Management > Growth
Studies show that companies with a relatively high percentage of women in upper management or as board members achieve stronger financial performance compared to those with a relatively low percentage (Catalyst, 2013).11 We believe that having more women in management positions will increase our revenue as it helps us better serve our diverse customer base.
Women in Management > Customer Loyalty
Diversity programs – including those focused on the promotion of women to management positions – have a direct and positive impact on customer satisfaction (Catalyst, 2013).12
Women in Management > Profitability
Studies show that companies with a high level of gender diversity outperform companies with an average level in terms of return on equity (11.4% versus an average 10.3%); operating results (EBIT 11.1% versus 5.8%); and stock price increases (64% versus 47% over the period 2005–2007) (McKinsey, 2007).13 It is therefore likely that a higher share of women in management positions will result in a higher profit for SAP.
Social Investment
Social investment reflects SAP’s activities in volunteering and technology as well as cash donations.
Social Investment > BHCI
We believe that by supporting our employees in engaging in activities with a positive social impact, such as skills-based volunteering, we are enhancing the meaning they find in work. This sense of purpose helps create a richer and more rewarding work environment that reduces stress and promotes satisfaction and well-being.
Social Investment > Employee Engagement
Mueller et al. (2012) have found that employees’ perception of a company’s commitment to corporate social responsibility is positively linked to their own commitment to the organization.14
Social Investment > Growth
A study by Muritala (2013) suggests that corporate social responsibility (or what we characterize as social investment) is likely to have a positive impact on an organization’s financial performance.15 In our experience, social investments do, in fact, have a positive impact on our ability to acquire new customers, especially in emerging markets.
Profitability > Social Investment
It is a common best practice for companies to invest a certain percentage of their annual profits in programs and activities that create a positive social impact. We believe that higher profit is therefore likely to lead SAP to make greater social investments.
Capability Building
Capability building is the internal hiring rate (promotions only) into management or expert positions as compared to the external hiring rate into such positions.
Capability Building > Employee Retention
According to the Global Workforce Study (2012) the “chances to advance the career” is the second-most important driver of employee retention.16 By promoting and thus growing from within, SAP creates career opportunities for our employees. In turn, it is our expectation that this opportunity leads to an increase in employee retention.
| 10 | McKinsey & Company (2013): Women Matter. Gender diversity in top management: Moving corporate culture, moving boundaries. Available at: http://www.mckinsey.com/~/media/McKinsey/Global%20Themes/Women%20matter/WomenMatter%202013%20Report%20(8).ashx [Accessed 16 Dec. 2016]. |
| 11 | Catalyst Information Center (2013): Why Diversity Matters. Available at: http://www.catalyst.org/system/files/why_diversity_matters_catalyst_0.pdf [Accessed 16 Dec. 2016]. |
| 12 | Catalyst Information Center (2013): Why Diversity Matters. Available at: http://www.catalyst.org/system/files/why_diversity_matters_catalyst_0.pdf [Accessed 16 Dec. 2016]. |
| 13 | McKinsey & Company (2007): Women Matter. Gender diversity, a corporate performance driver. Available at: http://www.mckinsey.com/~/media/McKinsey/Business%20Functions/Organization/Our%20Insights/Women%20matter/ Women_matter_oct2007_english.ashx [Accessed 16 Dec. 2016]. |
| 14 | Mueller, K., Hattrup, K., Spiess, S.,Lin-Hi, N. (2012): The effects of corporate social responsibility on employees’ affective commitment: A cross-cultural investigation. In: Journal of Applied Psychology, Vol. 97(6), pp. 1186-1200. |
| 15 | Muritala, T. (2013): Does CSR Improve Organization Financial Performance? Evidence from Nigeria Using Triangulation Analysis. In: Economics and Applied Informatics, Issue 3, pp.41-46. |
| 16 | Towers Watson (2012): Global Workforce Study. Geld, Karriere, Sicherheit? Was Mitarbeiter motiviert und in ihrem Unternehmen hält. Available at: https://www.towerswatson.com/de-AT/Insights/IC-Types/Survey-Research-Results/2012/07/Towers-Watson-Global-Workforce-Study-2012-Deutschlandergebnisse [Accessed 16 Dec. 2016]. |
Additional Information on Economic, Environmental and Social Performance Connectivity of Financial and Non-Financial Indicators | 210 |
Table of Contents
Capability Building > Employee Engagement
Because it is closely linked to how much a company develops its employees and supports their careers, internal hiring to management and expert positions positively affects employees’ commitment and loyalty. This hypothesis was confirmed by a study by Bedarkar & Pandita (2014), which identified “career opportunities” as the key driver of employee engagement.17
Capability Building > Women in Management
Like many of our IT industry peers, SAP has less women than men in senior positions. Given our significant pool of talent, we assume that internal promotions will increase the percentage of women in management positions.
Growth
Growth is one of our strategic objectives. We measure it through several KPIs, for example total revenue that SAP receives from the sale of our products and services.
Social Investment > Growth
A study by Muritala (2013) suggests that corporate social responsibility (or what we characterize as social investment) is likely to have a positive impact on an organization’s financial performance.18 In our experience, social investments do, in fact, have a positive impact on our ability to acquire new customers, especially in emerging markets.
Women in Management > Growth
Studies show that companies with a relatively high percentage of women in upper management ranks or as board members achieve stronger financial performance compared to those with a relatively low percentage (Catalyst, 2013).19 We believe that having more women in management positions will increase our revenue as it helps us to better serve our diverse customer base.
BHCI > Growth
Since 2014, we have been using real data from SAP to analyze and prove the financial impact of the BHCI. We have been able to prove a significant positive correlation between the BHCI and revenue.
Employee Retention > Growth
Meifert (2005) stated a clear relationship between employee retention and the company’s revenue and margin.20
GHG Footprint > Growth
Lowering SAP’s GHG footprint could have a positive impact on SAP’s revenue because customers increasingly ask their suppliers to act sustainably. This reasoning is supported by a study by PwC (2013) confirming the existence of a positive correlation between a company’s environmental performance and financial performance.21
Employee Engagement > Growth
Since 2014, we have been using real data from SAP to analyze and prove the financial impact of employee engagement. We have been able to prove a significant positive correlation between employee engagement and revenue.
Growth > Employee Engagement
We believe that a higher revenue will have a positive impact on a company’s work environment, thereby increasing employee pride and loyalty. This is also stated in a study of Harter et al. (2010), stating that improving financial performance appears to increase general satisfaction and some specific work perceptions.22
Customer Loyalty > Growth
Reichheld (2003) found a strong correlation between companies’ Net Promoter Score results and their revenue growth rates.23 We support this view as we believe that loyal SAP customers are likely to recommend SAP products to other companies, which is likely to result in increased sales and stronger revenue.
Growth > Profitability
Profit (or loss) is the total of income less expenses; if revenue as the main part of total income grows at a higher rate than costs, it will lead to greater profit.
Profitability
Profitability is one of our strategic objectives. We measure it through operating profit. Profit (or loss) is the total of income less expenses.
BHCI > Profitability
Since 2014, we have been using real data from SAP to analyze and prove the financial impact of the BHCI. Now we can show what a change by one percentage point of the BHCI would mean for SAP’s operating profit, as detailed in theDocumenting Financial Impactsection.
Employee Engagement > Profitability
Since 2014, we have been using real data from SAP to analyze and prove the financial impact of employee engagement. Now we can show what a change by one percentage point of employee engagement would mean for SAP’s operating profit, as detailed in theDocumenting Financial Impactsection.
Profitability > Employee Engagement
In our view, high profits, as great business news, can raise employee morale, encourage identification with our vision, and help increase employee engagement. On the other hand, we believe that a high profit expectation can also have a negative impact on employee
| 17 | Bedarkar, M., Pandita, D. (2014): A Study on the drivers of employee engagement impacting employee performance. In: Procedia – Social and Behavioral Sciences, Vol. 133, pp.106-115. |
| 18 | Muritala, T. (2013): Does CSR Improve Organization Financial Performance? Evidence from Nigeria Using Triangulation Analysis. In: Economics and Applied Informatics, Issue 3, pp.41-46. |
| 19 | Catalyst Information Center (2013): Why Diversity Matters. Available at: http://www.catalyst.org/system/files/why_diversity_matters_catalyst_0.pdf [Accessed 16 Dec. 2016]. |
| 20 | Meifert, M. (2005): Mitarbeiterbindung: eine empirische Analyse betrieblicher Weiterbildner in deutschen Großunternehmen. München and Mering: Hampp Verlag. |
| 21 | PwC (2013): Busting the carbon budget – Low Carbon Economy Index 2013. Available at:https://www.pwc-wissen.de/pwc/de/shop/publikationen/Low+Carbon+Economy+Index+2013/?card=12994 [Accessed 16 Dec. 2016]. |
| 22 | Harter, J., Schmidt, F., Asplund, J., Kilham, E., Agrawal, S. (2010): Causal Impact of Employee Work Perceptions on the Bottom Line of Organizations. In: Perspectives on Psychological Science, Vol. 5(4), pp.378-389. |
| 23 | Reichheld, F. (2003): The One Number You Need to Grow. In: Harvard Business Review, Vol. 81(12), pp.46-54. |
Additional Information on Economic, Environmental and Social Performance Connectivity of Financial and Non-Financial Indicators | 211 |
Table of Contents
engagement. If cost savings and budget cuts are implemented to reach an ambitious profit target, employees might feel constrained and dissatisfied.
Women in Management > Profitability
Studies show that companies with a high level of gender diversity outperform companies with an average level in terms of return on equity (11.4% versus an average 10.3%); operating results (EBIT 11.1% versus 5.8%); and stock price increases (64% versus 47% over the period 2005–2007) (McKinsey, 2007).24 It is therefore likely that a higher share of women in management positions will result in a higher profit for SAP.
Profitability > Social Investment
It is a common best practice for companies to invest a certain percentage of their annual profits in programs and activities that create a positive social impact. We believe that a higher profit is therefore likely to lead SAP to make greater social investments.
Employee Retention > Profitability
We have been using real data from SAP to analyze and prove the financial impact of employee retention. Now we can show what a change by one percentage point of employee retention would mean for SAP’s operating profit, as detailed in the Documenting Financial Impact section.
Total Energy Consumed > Profitability
We have found that reduced energy consumption is strongly correlated with a reduction in costs. Therefore, any cost avoidance achieved has a positive impact on our profit.
Growth > Profitability
Profit (or loss) is the total of income less expenses; if revenue as the main part of total income grows at a higher rate than costs, it will lead to greater profit.
Customer Loyalty > Profitability
We believe that positive experiences among our customers can significantly increase business with existing customers, as well as help attract new customers. Both results can lower the cost of sales, thereby increasing our profit.
GHG Footprint > Profitability
Since 2014, we have been using real data from SAP to analyze and prove the financial impact of our GHG footprint. Now we can show what a reduction of SAP’s carbon emissions by one percentage point would mean for SAP’s operating profit, as detailed in theDocumenting Financial Impact section.
Customer Loyalty
Customer loyalty is measured with the Net Promoter Score: Percentage of customers that are likely to recommend SAP to friends or colleagues minus the percentage of customers that are unlikely to do so.
Women in Management > Customer Loyalty
Diversity programs – including those focused on the promotion of women to management positions – have a direct and positive impact on customer satisfaction (Catalyst, 2013).25
Employee Retention > Customer Loyalty
Koys (2001) has found evidence that employee turnover has a negative impact on customer satisfaction.26 We believe this effect stems from the fact that experienced employees work more efficiently, have better product knowledge, and can build trusting relationships with colleagues and customers, so therefore have the ability to better serve customers’ needs.
GHG Footprint > Customer Loyalty
We believe that lowering SAP’s carbon emissions has a positive reputational effect, thereby enhancing SAP’s standing with its customers.
Customer Loyalty > Growth
Reichheld (2003) found a strong correlation between companies’ Net Promoter Score results and their revenue growth rates.27 We support this view as we believe that loyal SAP customers are likely to recommend SAP products to other companies, which is likely to result in increased sales and stronger revenue.
Customer Loyalty > Profitability
We believe that positive experiences among our customers can significantly increase business with existing customers, as well as help attract new customers. Both results can lower the cost of sales, thereby increasing our profit.
BHCI > Customer Loyalty
Since 2014, we have been using real data from SAP to analyze and prove the financial impact of the BHCI. We have been able to prove a significant positive correlation between the BHCI and customer loyalty.
GHG Footprint
Our GHG footprint is the sum of all greenhouse gas emissions measured and reported, including renewable energy and third-party reductions, for example, offsets.
GHG Footprint > BHCI
Many of SAP’s GHG emissions are caused by business travel and commuting, which we believe can have both negative and positive impacts on employee health. Some people may experience greater stress from more travel because they have less time to spend at home, suffer from jetlag, or lose valuable working time; others may enjoy travel, enabling them to experience other places and cultures as well as meet new people.
| 24 | McKinsey & Company (2007): Women Matter. Gender diversity, a corporate performance driver. Available at: http://www.mckinsey.com/~/media/McKinsey/Business%20Functions/Organization/Our%20Insights/Women%20matter/ Women_matter_oct2007_english.ashx [Accessed 16 Dec. 2016]. |
| 25 | Catalyst Information Center (2013): Why Diversity Matters. Available at: http://www.catalyst.org/system/files/why_diversity_matters_catalyst_0.pdf [Accessed 16 Dec. 2016]. |
| 26 | Koys, D. (2001): The effects of employee satisfaction, organizational citizenship behavior, and turnover on organizational effectiveness: A unit-level, longitudinal study. In: Personnel Psychology, Vol. 54(1), pp.101-114. |
| 27 | Reichheld, F. (2003): The One Number You Need to Grow. In: Harvard Business Review, Vol. 81(12), pp.46-54. |
Additional Information on Economic, Environmental and Social Performance Connectivity of Financial and Non-Financial Indicators | 212 |
Table of Contents
GHG Footprint > Employee Engagement
We believe that lowering SAP’s GHG footprint can have a positive impact on employee engagement because loyalty should rise as employees see their company act responsibly towards the environment. However, because lowering emissions also brings certain restrictions, such as on business travel, it may also have a negative impact on employee engagement.
Employee Engagement > GHG Footprint
We believe that engaged employees are likely to want to help SAP achieve our target in lowering GHG emissions. Yet another possible outcome is that a higher level of employee engagement may lead to more business activity requiring travel and therefore could lead to an increase in GHG emissions.
GHG Footprint > Growth
Lowering SAP’s GHG footprint could have a positive impact on SAP’s revenue because customers increasingly ask their suppliers to act sustainably. This reasoning is supported by a study by PwC (2013) confirming the existence of a positive correlation between a company’s environmental performance and financial performance.28
GHG Footprint > Customer Loyalty
We believe that lowering SAP’s carbon emissions has a positive effect on our reputation, thereby enhancing SAP’s standing with our customers.
Total Energy Consumed > GHG Footprint
The emissions caused by SAP’s energy consumption add directly to the corporate carbon footprint if they are not reduced through offsets or – for electricity consumption – renewable energy certificates (RECs).
GHG Footprint > Profitability
Since 2014, we have been using real data from SAP to analyze and prove the financial impact of the GHG footprint. Now we can show what a reduction of SAP’s carbon emissions by one percentage would mean for SAP’s operating profit, as detailed in theDocumenting Financial Impact section.
Total Energy Consumed
Total energy consumed is the sum of all energy consumed through SAP’s own operations, including energy from renewable sources.
Total Energy Consumed > Profitability
We have found that reduced energy consumption is strongly correlated with a reduction in costs. The thus achieved cost avoidance has a positive impact on our profit.
Total Energy Consumed > GHG Footprint
The emissions caused by SAP’s energy consumption add directly to the corporate carbon footprint if they are not reduced through offsets or – for electricity consumption – renewable energy certificates (RECs).
| 28 | PwC (2013): Busting the carbon budget – Low Carbon Economy Index 2013. Available at:https://www.pwc-wissen.de/pwc/de/shop/publikationen/Low+Carbon+Economy+Index+2013/?card=12994 [Accessed 16 Dec. 2016]. |
Additional Information on Economic, Environmental and Social Performance Connectivity of Financial and Non-Financial Indicators | 213 |
Table of Contents
Defining Key Priorities for Our Reporting
By understanding which environmental, social, and governance issues are key priorities for our stakeholders, we are better able to allocate time, budget, and resources accordingly within our integrated reporting and efforts towards realizing our corporate vision. Based on our existing material aspects, in 2016, we completed a new materiality assessment to help identify and validate those topics which are the most relevant to our stakeholders such as employees, investors, and customers. The assessment also highlights those topics which contribute most to value creation both in our own operations and in those of our customers.
Our new process combines the GRI G4 standards for sustainability reporting and the International Integrated Reporting Framework. Key stages are detailed below.
Identification
During this stage, we drew up a long list of potential topics based on guidance from GRI G4 and the Sustainability Accounting Standards Board (SASB), as well as our existing material aspects. We also considered a materiality assessment for the ICT industry by the GlobalE-Sustainability Initiative (GeSI) as well as the United Nations’ Sustainable Development Goals (SDGs).
When identifying our key topics and their boundaries, we looked first at areas related to our operations and supply chain. Second, we looked at topics related to how our software can help our customers contribute to the achievement of the SDGs.
Prioritization
During the prioritization stage we looked at the extent to which each individual topic affects our ability to create value at SAP. We assessed whether this value was financial, operational, strategic, reputational, or regulatory. All topics that were identified as delivering value in three or more areas were then included on our short list of seven categories, as follows:
| ∎ | Business conduct |
| ∎ | Climate and energy |
| ∎ | Financial performance |
| ∎ | Human and digital rights |
| ∎ | Human capital |
| ∎ | Innovation |
| ∎ | Impact on society |
Next, we conducted semi-structured interviews with selected stakeholders to validate the shortlisted topics. We asked stakeholders to rate topics on a scale from 0 to 5 (where 0 is not important at all and 5 is very important) based on the following questions for the first six categories:
| ∎ | To what degree does this topic influence SAP’s ability to create value? |
| ∎ | How important is that topic for you to engage into a business relationship with SAP? |
To assess the category “impact on society,” we asked stakeholders the following questions:
| ∎ | How high is the potential of SAP to enable our customers to achieve the SDGs? |
| ∎ | How important is our ability to help achieve the SDGs for you to engage in a business relationship with SAP? |
We have included in our materiality matrix all topics with stakeholder ratings in the upper 50% for both questions.
Validation
The results of the materiality analysis were reviewed and confirmed by our steering committee for integrated reporting and our sustainability advisory panel. It was also reviewed by our chief financial officer, who is the board sponsor for sustainability and integrated reporting.
Review
Feedback on and analysis of the SAP Integrated Report 2016 will serve as an input for future materiality assessments.
Additional Information on Economic, Environmental and Social Performance Materiality | 214 |
Table of Contents
Results
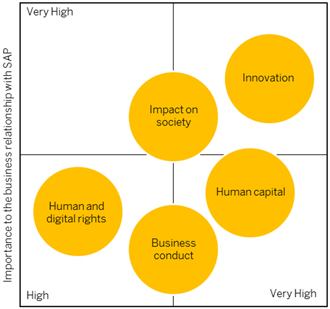
Influence on SAP’s ability to create value
(as an organization through SAP solutions)
Materiality Matrix (in Addition to Financial Performance)
Key points of our results include:
| ∎ | Financial performance was seen as a mandatory part of reporting and was often not expressly discussed as a result. However, this category received high individual scores. |
| ∎ | The innovation, business conduct, and human capital categories received the highest scores and response rates. |
| ∎ | In evaluating our impact on society through the SAP portfolio, our stakeholders identified the following seven SDGs as material: |
| – | SDG 9 Industry, innovation, and infrastructure |
| – | SDG 3 Good health and well-being |
| – | SDG 8 Decent work and economic growth |
| – | SDG 13 Climate action |
| – | SDG 17 Global partnerships |
| – | SDG 12 Responsible consumption and production |
| – | SDG 4 Quality education |
| ∎ | The climate and energy category had the lowest response rates. In response to this, we have reduced the volume of our reporting on this category. We have only included a short description of our environmental targets and our progress in achieving them. |
Understanding the Relevance of Our Material and Other Reported Aspects
Each of our material aspects has significant impact on the business success of SAP as described below.
Business Conduct
For more information, see theBusiness Conduct section.
Climate and Energy
For more information, see theEnergy and Emissions section.
Financial Performance
Not only do we create financial value for SAP and our shareholders, we also create wealth for a broad range of stakeholders. We do this through employee wages and benefits, payments to our value chain and ecosystem, and tax payments to local governments and economies, for example.
Human and Digital Rights
For more information, see theSecurity and Privacy section and theHuman Rights and Labor Standards section.
Human Capital
Nothing has a greater impact on our long-term success than the creativity, talent, and commitment of our people. Their ability to innovate and understand the needs of our customers delivers sustainable value to our company and our society. Successful strategies to attract, retain, develop, lead, and engage our employees are therefore critical to driving a diverse culture of innovation, sustained growth, and profitability.
Impact on Society
We believe that digital technologies will enable companies and organizations to tackle some of the world’s most complex, intractable problems. These include issues that are highlighted within the United Nations’ 17 SDGs, such as abolishing poverty and reducing global carbon emissions. Through our solutions, we provide customers, partners, and consumers with the tools that help them make a difference. This may be through empowering those disadvantaged in society through financial services, providing personalized medicine, building infrastructure, or combating climate change.
As well as creating positive impacts through our solutions, we are equipping young people all over the world with the skills they need to tackle society‘s problems and thrive in the digital economy. By engaging talent, leveraging technology, and building strong partnerships, we can build the workforce of the future.
Innovation and Customer Loyalty
To realize our vision of helping the world run better and improving people’s lives, we help our customers operate more efficiently, protect the safety of their products, manage their employees, and become more effective overall. Our customers inspire everything we do, from the first spark of innovation to the design and completion of new products, as well as to how we serve their needs over time. Innovation throughout the company helps us realize our vision and serve our customers’ needs.
Additional Information on Economic, Environmental and Social Performance Materiality | 215 |
Table of Contents
Our future business success, specifically in the cloud business, depends on customer loyalty. We view customer loyalty as being so critical to our own success that we have made it one of our four company-wide strategic goals, in addition to employee engagement, growth, and profitability.
Additional Information on Economic, Environmental and Social Performance Materiality | 216 |
Table of Contents
For SAP, stakeholder engagement and collaboration are deeply embedded into our process of innovation and the development of our products and services. Before we can design a new solution, we must first understand the issue we are addressing. For this reason, design thinking andco-innovation are essential.
To be able to innovate, we regularly engage with the stakeholder groups described in the table below, including our sustainability advisory panel. We selected these groups as they are critical to our value creation.
For the materiality assessment conducted in 2016, we specifically spoke to stakeholder representatives of academia, auditors, customers, employees, and investors. For the results of this dialog, see theMateriality section.
Stakeholder Group | How We Engage | Additional Information | ||
| Customers | Our customer-facing organizations, such as sales, consulting, education, and support, have multiple touch points with customers on a daily basis. In addition to the sales engagement cycle, we engage customers through industry value networks,co-innovation projects, customer councils, and customer-organized user groups throughout the world. Our Customer Engagement Initiative provides early insight into SAP product planning, allowing our customers to influence and collaborate around our product development cycle. We also gather customer feedback regularly through our “SAP Listens” customer and partner feedback program. | For more information about our customer surveys, see theCustomers section. | ||
| Employees | We survey employees annually, conducting pulse checks throughout the year.
The Supervisory Board comprises 50% employee representation, and management regularly engages with employee works councils.
In addition, the Executive Board answers employees’ questions inall-hands meetings that take place every quarter. In quarterly coffee corner sessions, senior executives explain our strategy to employees and answer their questions directly. Through topic-related discussion blogs, executives engage regularly with employees, foster open discussion, and receive focused feedback globally. | For the results of our latest employee survey and action items resulting from it, see theListening to Our Employees section. | ||
| Financial analysts and investors | Our Investor Relations team and the Executive Board conductone-to-one briefings with financial analysts and institutional investors, as well as hold investor road shows, quarterly earnings calls, a Capital Market Day, and the Annual General Meeting of Shareholders. Our Investor Relations team also engages with the sustainable investment community in close cooperation with the Sustainability team, and the Global Treasury team interacts regularly with debt investors. | For more information about our dialog with investors, see theInvestor Relations section. | ||
| Governments | We advise certain governments and administrations worldwide on critical IT topics, such as digitalization, cloud computing, and Big Data, which play a key role in creating efficiencies and spurring economic growth. | |||
| Industry analysts | Our Analyst Relations team, the Executive Board, and executives interact with IT analysts on a frequent basis. | We updated IT analysts on topics such as SAP HANA, enterprise applications, industry solutions, cloud solutions, ecosystem, and | ||
Additional Information on Economic, Environmental and Social Performance Stakeholder Engagement | 217 |
Table of Contents
Stakeholder Group | How We Engage | Additional Information | ||
| services. The latest industry positioning material integrates economic, social, and environmental impact creation. | ||||
| Non-governmental organizations (NGOs) and academia | Our dialog with NGOs,not-for-profit organizations, and academic institutions helps us understand how we can help address today’s most pressing issues with our solutions and what is expected from us as a corporation. | We work extensively with academia through the SAP University Alliances program, providing students at more than 3,100 universities withhands-on experience in working with SAP software and solutions. | ||
| Partners | Our partners are also key to our growth, as theyco-innovate solutions with us, and sell and implement solutions at customer sites. The spirit of cooperation and engagement is exemplified by the online SAP Community. | As with customers, we also gather partner feedback regularly through our “SAP Listens” customer and partner feedback program. | ||
| Sustainability advisory panel | Our sustainability advisory panel consists of expert representatives from our customers, investors, partners, NGOs, and academia. | Our sustainability advisory panel met in 2016 with SAP senior executives from the areas of strategy, solutions, finance, and administration, including Luka Mucic, our chief financial officer (CFO) and board sponsor for sustainability, and Michael Kleinemeier, member of the Executive Board. The group discussed the further integration of sustainability into SAP solutions, ways to support business transformations, and the key areas in which our digitalization strategy can play an especially important role in creating a sustainable future.
Members of the sustainability advisory panel provided input into our materiality assessment and reviewed the results. | ||
Additional Information on Economic, Environmental and Social Performance Stakeholder Engagement | 218 |
Table of Contents
Championing Excellence in Business Conduct
In our business, trust is everything. We know that to engage with SAP fully, our customers must first trust that our business practices adhere to the highest standards of compliance and integrity.
All too often we see the impact of poor business conduct in the wider business community. Corrupt and unethical practices irreparably damage brand reputations and lead to punitive financial penalties for the organizations involved. Such behavior undermines the rule of international law and is also linked to poverty and irreversible environmental damage across the globe.
New fraud and corruption schemes are discovered all the time in an ever-changing business environment. Therefore, SAP must constantly adapt our approach to compliance to incorporate new best practices and meet new challenges.
Establishing Clear and Comprehensive Standards
We have developed a compliance management system for enforcing ethical business conduct. This includes detailed policies and procedures to ensure that SAP does business the right way.
Audited regularly, the system encompasses all aspects of compliance management. From the analysis of compliance risks and defining objectives to running compliance programs as well as ongoing monitoring, this comprehensive framework enables us to maintain a responsible compliance organization.
Fostering a Culture of Compliance
To help foster a corporate culture where compliance is taken seriously, we needed to establish a common understanding of what we mean by compliance. We did this by creating a code of business conduct that summarizes our standards. The code contains guidelines for all SAP employees worldwide as they perform their daily work.
Approved by the Executive Board at SAP, the code sets the standard for our dealings with customers, partners, competitors, and vendors. It is adapted locally and translated into local languages.
Key areas covered by the code of business conduct include:
| ∎ | Prohibition of bribery and corruption in all its forms, including facilitation or “grease payments” |
| ∎ | Gifts and business entertainment limits |
| ∎ | Full, fair, and accurate accounting |
| ∎ | Conflicts of interest |
| ∎ | Confidentiality |
| ∎ | Anti-competitive practices |
| ∎ | Data protection and privacy rights |
Setting High Expectations Across All Business Activities
SAP has established a number of policies to maintain the highest standards of business conduct including in the following areas:
| ∎ | Regulation of the appointment and remuneration of sales agents |
| ∎ | Charitable and political donations |
| ∎ | Global intellectual property |
| ∎ | Group accounting and revenue recognition |
| ∎ | Segregation of duty |
| ∎ | Export control and sanctions laws |
| ∎ | Data protection and privacy |
Additional policies or commitments related to sustainability are under the responsibility of the respective lines of business and can be found at sap.com.
Providing Comprehensive Training
A code of business conduct is only effective if everyone knows about it. That is why we strive to make sure all of our employees receive full training on the standards that we expect.
In 2016, we introduced mandatory online training for all employees worldwide. In total, more than 79,200 employees (93% of SAP staff) received this training. Here is a full breakdown of our training activities is presented in the table below.
Region | Training sessions completed by employees, in % | Training sessions completed by employees, in headcount | ||||||
| Americas | 93 | 22,882 | ||||||
| APJ | 89 | 20,778 | ||||||
| EMEA | 96 | 35,578 | ||||||
Our training program covers a wide range of topics around business conduct. These include guidelines on anti-corruption, competition law, governance for customer commitments, intellectual property, and information security.
E-learning modules are available in nine different languages. In addition, our legal compliance and integrity office also holds classroom training sessions. Employees from across the SAP organization take part, from customer-facing staff to individuals in supporting roles such
Additional Information on Economic, Environmental and Social Performance Business Conduct | 219 |
Table of Contents
as corporate affairs and marketing. In addition, general compliance information on relevant policies is included in the onboarding sessions for new hired run by our HR organization.
Communicating Our Standards
Quarterly newsletters provide employees with information on a range of compliance-related topics. These communications include details of cases that have recently been highlighted in the media as well as presenting hypothetical scenarios that provide people with opportunities for self-reflection. In addition, the newsletters provide links to other relevant sources of information such as our whistleblower reporting system, legal compliance and integrity office, corporate audit department, and SAP global policies.
We ask business ethics and compliance-related questions in our annual People Survey. Through the SAP Corporate Portal, we run company-wide polls on a variety of compliance-related questions throughout the year. In addition, employees can use the portal at any time for quick and easy access to all global policies along with guidelines and additional information.
Colleagues within the legal compliance and integrity office carry out ongoing programs of calls and meetings to raise awareness of business conduct issues throughout the organization. Meanwhile, regulare-mail communications with subsidiaries and the availability of information in local languages help to promote leading standards of business conduct across every part of the SAP ecosystem.
Analyzing Compliance Risk
At SAP, we want to address issues before they become problems. For this reason, we believe that analysis of compliance risk is key to maintaining the highest standards of business conduct.
On an ongoing basis, we review SAP business units for potential bribery or corruption. For example, in 2016, we collected quantitative data about 154 SAP entities supporting 142 countries. This data includes revenue information, number of employees, percentage of public sector business, number of fraud allegations or incidents, changes or updates to relevant laws, and other quantitative information. Based on this information and management input, we determine a risk ranking for each country.
Our assessment also helps us create a general risk profile for subsidiary locations. Through analysis of our quantitative data, we determine which countries require our highest attention.
Our legal compliance and integrity office works closely with our global governance, risk, and compliance organization to identify areas where a risk assessment is needed. We then drive compliance mitigation programs if necessary. Generally, we find that our primary compliance risks are related to corruption, antitrust issues, export controls, and intellectual property. For more information, see ourRisk Report section.
Enforcing Policies
SAP is committed to ensuring that our compliance policies are strictly enforced, and that any infringements are quickly flagged and acted upon. To achieve this, we have built an effective global network of compliance professionals who act as our ambassadors at country level for business conduct.
The legal compliance and integrity office oversees the development of our code of business conduct, as well as all other related policies and our anti-corruption program. Global compliance officers are based at SAP headquarters and in our most important markets, especially where there are local language needs. In addition, compliance officers at local subsidiaries assess issues and escalate them to the global level if necessary.
In addition to making regular reports to the CFO and the Executive Board, the chief global compliance officer provides at the least annual reports to the audit committee of the Supervisory Board. Matters of significance are brought to the attention of the Executive Board and the audit committee of the Supervisory Board when required.
Employees at all levels of the organization are required to disclose conflicts of interest to the legal compliance and integrity office. Disclosures are then followed up with guidance or mitigation if necessary.
Facilitating Reporting and Remediation
If employees are concerned that our code of business conduct has been breached, or if they need advice on a compliance issue, they can access support in a number of ways. They can:
| ∎ | Call our governance hotline at +49 62277-40022 |
| ∎ | E-mail the legal compliance and integrity office at global-compliance-office@sap.com |
| ∎ | Contact with local compliance officers viae-mail or telephone |
| ∎ | Use the anonymous online whistleblower tool |
Employees can find information on how to report compliance issues in SAP Corporate Portal, and new hires are informed of reporting channels during the new hire process. External stakeholders without access to SAP Corporate Portal can find the hotline number ande-mail address on SAP.com. In addition, reporting channels are described in our codes of conduct for partners and suppliers. Most of these reporting mechanisms are available 24x7, and concerns are treated as confidentially as possible in light of subsequent investigation.
All concerns are investigated, and remedial action is taken if necessary. This may include termination of employment.
Taking a Proactive Stance Against Corruption
SAP is proactively working in collaboration with the wider business community to fight against corruption and the negative impacts it creates. SAP is a member of the German chapter of Transparency International, anon-profit,non-partisan organization that combats corruption in government and international business and development.
Additional Information on Economic, Environmental and Social Performance Business Conduct | 220 |
Table of Contents
In addition, we are active in the Alliance for Integrity (AfIn). AfIn is a business-driven, multistakeholder initiative promoting economic integrity and compliance in business. It was initiated by a number of multinational companies, business associations, the German Federal Ministry for Economic Cooperation and Development (BMZ), the Society for International Cooperation (GIZ), the German Global Compact Network and sequa, anon-profit development organization. The focus of the initiative is on implementing collective action on the ground.
Additional Information on Economic, Environmental and Social Performance Business Conduct | 221 |
Table of Contents
Sustainability Management and Policies
Putting Sustainability at the Heart of Our Strategy
At SAP, we strive to promote sustainability in everything we do. We believe that it is not enough to simply have a sustainability strategy but that, instead, our overall corporate strategy must itself be sustainable. Only by achieving this can we fulfill our vision to help the world run better and improve people’s lives.
To address this, we have integrated sustainability management efforts across our entire business.
Led by our chief sustainability officer, a dedicated team responsible for our sustainability performance works to embed sustainability into our corporate strategy and promotes new sustainability initiatives across the organization. Our chief financial officer (CFO) is the sponsor for sustainability on the Executive Board and we also have a dedicated sustainability contact for each area of the business. These contacts are responsible for embedding sustainability in their business practices, for example, by setting relevant targets and implementing related programs. They are held accountable for their achievements in review meetings with the CFO and the chief sustainability officer that take place twice a year.
Managing Our Response to Our Material and Other Reported Aspects
SAP has dedicated personnel addressing the material aspects identified in our materiality analysis with staff remuneration linked to each aspect. For each topic, we look at ways that we can manage our response, and how we can evaluate whether our approach is effective.
Business Conduct
For information about our management approach, see theBusiness Conduct section.
Climate and Energy
Our global environmental policy promotes a more productive use of resources by providing transparency in environmental issues, driving efficiency, and leveraging transformational strategies. It also outlines our environmental goals that are described in theEnergy and Emissions section.
Our chief sustainability officer and their dedicated sustainability organization coordinate our response to climate change. Facilities management staff design and operate our facilities based on robust environmental standards. In addition, our IT operations personnel are continuously looking at issues around the working environment and the amount of energy consumed in our data centers. We assess our environmental performance in quarterly management reviews.
This year, we continued to roll out our global environmental management system based on the ISO 14001 standard. We plan that the system will cover operations affecting about 70% of employees globally by 2018. At the end of 2016, 46 sites in 26 countries (49% of employees) have implemented ISO 14001.
Financial Performance
The Executive Board retains ultimate responsibility for revenue growth, profitability, and the financial stability of SAP. For more information, see theCorporate Governance Report section and theReport by the Supervisory Board section.
Human and Digital Rights
For information about our management approach, see theSecurity and Privacy section and theHuman Rights section.
Human Capital
Overall global responsibility for our human resources strategy lies with our chief human resources officer who is a member of the Executive Board.
Our key policies include a global health and safety management policy and a diversity and inclusion policy. The global health and safety management policy is an integral part of our long-term commitment to sustainability. It provides a framework that supports business processes, leadership behavior, and culture by addressing, integrating, and leveraging health, occupational safety, well-being, and stress management topics. The objective is to nurture our employees’ long-term employability, engagement, and creativity in developing sustainable value for our organization, for our customers, and for themselves.
The diversity and inclusion policy provides a framework for diversity and inclusion at SAP. As such, it supports our business goals and our “how we run” philosophy by helping employees flourish in an inclusive and authentic working environment.
For more information about our management approach, see theEmployees and Social Investment section.
Additional Information on Economic, Environmental and Social Performance Sustainability Management and Policies | 222 |
Table of Contents
Impact on Society
This aspect covers two key areas. The first is the contribution we make towards the fulfilment of the United Nations Sustainable Development Goals (SDGs) through our software solutions and our social investments. The second is our efforts to make the world a better place through our corporate social responsibility (CSR) programs.
Our contribution to the SDGs is coordinated by our corporate strategy, sustainability, and marketing professionals and teams. We have started to map our existing engagement with customers to the SDGs in theHow Our Vision Comes to Life brochure.
Our global CSR policy offers all SAP employees the opportunity to volunteer for up to eight working hours at a CSR event. In 2016, our goal was to impact 1.5 million lives through our global CSR programs. We set a target of 250,000 volunteering hours, with 40% based on skills and professional expertise. We overachieved these targets with almost 339,000 volunteering hours (thereof 57% skills-based) and about 3.2 million lives impacted.
There is a global governance committee that guides the strategic direction of our overall CSR strategy. In addition, every SAP region has a CSR governance committee that approves all major CSR partnerships, as well as advising the regional CSR leadership. On a group level, we ensure that donations are made in an appropriate manner through financial and compliance control processes. Led by our head of global CSR, our global CSR team is part of the Office of the CEO and corporate affairs organization. To ensure meaningful and relevant execution of our companywide CSR strategy, we appoint a regional CSR lead for each of our six major SAP market units.
All of our major CSR programs are monitored for social impact. For example, in our global SAP Social Sabbatical program, we survey thenon-profit organization or social business involved to determine whether our team has met the agreed deliverables. To capture long-term impact, the evaluation is also repeated six months after our team’s departure. As with every volunteering initiative, we adjust our CSR offerings according to the feedback we receive. For more information, see theEngaging in Social Investments section.
Innovation and Customer Loyalty
Our Customer Experience Council regularly reviews and prioritizes our activities related to driving improvements in customer experience. For more information about our customer loyalty goals, see theCustomers section.
As innovation happens everywhere at SAP, each Executive Board member is responsible for innovation in their area. For example, our Executive Board member responsible for products and innovation oversees our software innovation efforts. We have a team of development and solution management professionals who create SAP solutions specifically for sustainability. In addition, another team of experts designs and integrates sustainability into new or existing industry orline-of-business (LoB) solutions. For more information about our latest innovations, see theProducts, Research & Development, and Services section.
Changing Our Behavior and Culture
In our efforts to become a more sustainable organization, SAP is focusing on two key areas: our processes and our people. To achieve our goals, we need to challenge behavior and find new ways of thinking.
The engagement of our employees is essential, as their ideas and commitment help drive change throughout SAP. SAP runs a number of programs to help employees understand how sustainability is connected to our vision to help the world run better and improve people’s lives.
In 2016, we encouraged open dialog through coffee corner sessions, virtualall-hands meetings, and social media. During these sessions, employees also heard about specific customer impact stories and role models within the SAP organization. In addition, SAP now includes sustainability in its onboarding training for new hires as well as management training.
We also keep our employees updated on global trends such as the ratification of the SDGs in 2016. Employees can explore how SAP contributes to the SDGs through our customers and our own operations through the new interactive Web bookSAP and the UN Global Goals and a related iPad app, as well as the online course “Sustainability Through Digital Transformation.”
Focusing on Transparency and Building Awareness
Change starts with transparency and awareness. Since 2016, our Executive and Supervisory Boards have access to our own SAP Digital Boardroom solution. It provides access to key financial andnon-financial data, including human capital indicators, that gives a holistic and detailed overview of our performance.
In addition, every employee can access a dashboard detailing our environmental and social performance. For example, data on employee retention and women in management helps create transparency on the social performance of our company. The My SAP Footprint app also provides employees with statistics about their personal impact through activities such as driving a company car or using electronic equipment.
We measure the success of our initiatives through our annual People Survey. In 2016, 92% of our employees agreed with the statement “It is important for SAP to pursue sustainability” compared to 90% in 2015 and 77% in 2009. Furthermore, 82% of our employees stated, “I actively contribute to sustainability goals at SAP.” This is up from 80% in 2015 and 46% in 2009.
Nurturing a Network of Sustainability Champions
While sustainability requires strong leadership, it cannot be mandated from the top. To help drive progress with sustainability initiatives, we need the support of employees in every part of SAP.
Additional Information on Economic, Environmental and Social Performance Sustainability Management and Policies | 223 |
Table of Contents
To address this, we have a global internal network of more than 100 sustainability champions who represent different regions and lines of business at SAP. They dedicate 10% of their work time to promoting sustainability. Not only do they act as role models, but they also tailor sustainability to local and LoB needs and interests as well as share best practices.
Additional Information on Economic, Environmental and Social Performance Sustainability Management and Policies | 224 |
Table of Contents
Human Rights and Labor Standards
Upholding High Standards
At SAP, we believe that we have a responsibility to respect human rights throughout all our business operations. Upholding high labor standards supports diversity and helps us to attract and keep top talent. Providing fair, ethical conditions for our employees also results in greater innovation and productivity.
SAP is a signatory of the United Nations Global Compact. This is a voluntary undertaking to align our strategies and operations with universal principles on human rights, labor, the environment, and anticorruption.
By integrating human rights considerations into our standard business practices, we also support the values of the Universal Declaration of Human Rights, the OECD Guidelines for Multinational Enterprises, and the International Labor Organization Declaration on Fundamental Principles and Rights at Work. To ensure that our commitment to human rights translates into practice, we take guidance from the United Nations “Protect, Respect and Remedy” framework.
Making a Commitment
The SAP Global Human Rights Commitment Statement details our response to the international standards mentioned above. Based on the SAP Code of Business Conduct and approved by our Executive Board, the statement focuses on three main areas: our employees, our ecosystem of partners and suppliers, and our solutions.
Our commitment statement applies to all our operations and subsidiaries globally and is reviewed on a regular basis. It also contains references to our other guidelines such as health and safety management, and data protection and privacy.
Enforcing Our Standards
Our sustainability organization is responsible for making sure that we fulfil our human rights commitments across the business. The team works with colleagues from human resources (HR), procurement, and product development to manage an integrated approach.
To assess our human rights measures, we consider external benchmarks, performance ratings, audit results, and stakeholder feedback. In addition, since 2012, we conduct regular internal audits to verify that our subsidiaries adhere to our standards and to check internal compliance with this policy. In 2016, we conducted a labor audit at our SAP India and SAP Labs India locations in Bangalore. There were no material findings within the audit. However, areas for improvement were identified and include improvement of security escorts, comprehensive distribution of access cards, as well as improvement inair-conditioning.
Respecting the Rights of Our Employees
We have a long-standing policy of nondiscrimination in our dealings with employees and provide training on human rights issues that are most relevant to our business. These include security, privacy, and antidiscrimination.
We encourage any employees who feel they are subjected to conduct that violates our antidiscrimination policies to report it. They can reach out confidentially to their managers, HR officers, a compliance office, or colleagues who are trained to be part of our internal mediation pool.
In addition, our global ombudsperson investigates employee complaints and mediates fair settlements. The ombudsperson also helps the Executive Board analyzeHR-related complaints and consider ways to address potential issues before they occur.
Further Measures to Ensuring Fair Labor Practices
At SAP, we strive for constructive labor relations across the world, working within each country’s requirements. We currently have works councils in place in Belgium, Germany, Ireland, Italy, the Netherlands, Slovenia, Spain, and the United Kingdom. In addition, we have a European works council that represents employees from all SAP subsidiaries in Europe.
These councils consist of both elected union members andnon-union members, and are consulted by SAP management on topics that define the work environment and work processes. These include HR initiatives, talent development, payment and benefits, equal opportunities, changes in work or IT processes, privacy protection, and health and safety protection.
Collective bargaining agreements with unions are only made in countries where legally required. Overall, about 50% of employees are represented by works councils, an independent trade union, or are covered by collective bargaining agreements.
Maintaining High Standards Across Our Supply Chain
We expect all of our business partners to respect human rights and to avoid complicity in human rights abuses. Our codes of conduct for suppliers and partners require them to uphold labor rights and to provide a safe and healthy work environment for all employees.
Additional Information on Economic, Environmental and Social Performance Human Rights and Labor Standards | 225 |
Table of Contents
We work collaboratively with our suppliers and partners on the implementation of these codes. In addition, we may carry outon-site audits to assess performance.
Respecting Human Rights Throughout Our Product Lifecycle
As a business software company, we are committed to respecting and protecting human rights throughout the lifecycle of our products – from design through development to use. We develop innovative solutions that help customers embed human rights standards into their business and supply chain strategies. We also develop solutions that help to advance human rights in areas such as healthcare, education, and public services. For example, our healthcare solution SAP Medical Research Insights delivers software that addresses the areas of patient care, cancer research and cancer prevention.
When designing any solution, our development teams ensure that the product complies with human rights standards. For example, accessibility is a key area of focus and we follow Web content accessibility guidelines such as Section 508 to ensure inclusive design in all our software.
The protection of personal information is another key area of focus for our development teams. To help ensure that our products enable our customers to respect digital rights, we adhere to robust privacy and security standards. These are defined in our global product development, quality, product standards, and data protection and privacy policies.
Additional Information on Economic, Environmental and Social Performance Human Rights and Labor Standards | 226 |
Table of Contents
Making Our Supply Chain More Sustainable
A significant part of our social and environmental impact is delivered through our supply chain. That is why we work hard to find new ways to ensure that our procurement activities meet high sustainability standards.
This year, we have looked at the way we recruit our supplier base in order to increase opportunities for a wide range of businesses to compete for supply of products and services to SAP. We have also engaged with our suppliers to define higher standards of conduct, and to encourage new thinking when it comes to sustainability.
What We Buy and Where We Buy It From
At SAP, we consider our suppliers to be key partners in our business success. In 2016, we spent € 4.8 billion in transactions with more nearly 19,000 suppliers worldwide.
Suppliers by Category
Percent of total spend
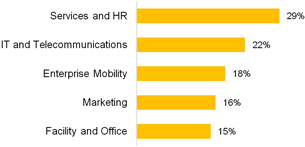
Supplier Locations by Region
Percent of total spend
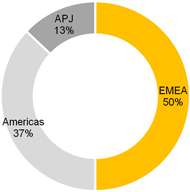
Promoting Supplier Diversity
Including more diverse businesses – that is, minority enterprises defined by gender, ethnicity, disability, sexual orientation, age, religion, and other characteristics – into our supplier base has become a key priority for SAP. We believe that our commitment to an inclusive, bias-free culture in our workplace should be mirrored in our approach to our supplier base. In addition, through their flexibility and a high innovation potential, we believe that diverse businesses bring significant added value to SAP.
To address this, we developed a supplier diversity program this year. Driven by our Global Procurement Organization (GPO), the program is an integral part of our supplier management program. It strives to ensure that diverse businesses have a fair chance at competing for contracts and are treated equally with other SAP suppliers. Targeted to reach a 5% spend ratio for diversity suppliers in selected countries by 2020, the GPO will proactively involve diversity suppliers in selected categories in defined countries into our sourcing process.
Demonstrating our commitment to supplier diversity, SAP became a corporate member of the following minority supplier organizations in 2016:
| ∎ | Minority Supplier Development U.K. (MSDUK) |
| ∎ | WeConnect International |
Upholding High Standards Across Our Supply Chain
Today’s digital networks help us connect with an increasing number of global suppliers, quickly and easily. However, with supply networks becoming more complex, companies face even greater challenges in ensuring their suppliers uphold high ethical standards.
To help address this, we are developing an innovative SAP Ariba solution for supplier risk management that enables companies to identify and manage their response to a range of supplier-related risks. Our GPO is collaborating with the SAP Ariba product development teams to finalize and implement this cloud solution. With the SAP Ariba Supplier Risk Insights solution, organizations can establish due diligence, ongoing monitoring, and remediation processes to proactively address risks across thesource-to-pay process and the full supplier base.
This innovative solution provides buyers with a command center that helps them monitor all relevant risk information. It also offers daily alerts and notifications to buyers based on their preferences. Sustainability risks covered by the solution include unethical practice, workplace discrimination, workplace safety neglect, the use of child labor, human trafficking, and environmental disasters such as oil spills and radioactive contamination.
Additional Information on Economic, Environmental and Social Performance Sustainable Procurement | 227 |
Table of Contents
In addition, our GPO worked on a pilot project with the SAP Ariba team and the Made in a Free World organization to identify the areas of greatest risk of forced and child labor in our supply chain. As part of this project, we requested information about our suppliers’ supply chains and analysis of this data is helping us to pinpoint potential risk areas for further investigation.
We are also strengthening the enforceability of the code of conduct for suppliers and it is now an integral part of our standard contracts. It is also included in our global terms and conditions.
Driving Innovative Sustainability Projects
SAP works closely with suppliers to find new ways to make our supply chain more sustainable. We have a number of ongoing projects that minimize our impact on the environment in areas such as enterprise mobility, catering, office supplies, and SAP events.
Our chief procurement officer and chief sustainability officer meet each quarter to discuss progress and challenges related to embedding sustainability in our procurement practices.
Additional Information on Economic, Environmental and Social Performance Sustainable Procurement | 228 |
Table of Contents
| 160 tons | 3 kt | ca. 1.05 m m³ | ||
| e-waste recycled | municipal waste(non-recycled) | in water consumption |
Taking a Global Approach
Our waste and water strategy ensures that we minimize the impact SAP has on our environment. By promoting company-wide initiatives, we keep waste out of landfills and reduce the amount of water we use in locations worldwide. A global approach combined with local targets and initiatives ensures that we optimize our environmental performance.
Taking steps to recycle our waste and save water also contributes to our business performance. Through ongoing initiatives at SAP sites, we reduce our operational costs while engaging our employees in our efforts.
Managing OurE-Waste
Our single largest source of waste comes from the data center servers, IT equipment, PCs, peripherals, and range of mobile devices that we use to develop our software. Our servers and IT equipment are either resold or recycled in an environmentally friendly manner depending on their condition. In 2016, we continued our engagement with one of the world’s most sustainable companies as oure-waste disposal partner. This partner adheres to ISO 14001 standards and ensures that we have one uniform disposal process fore-waste. This way we were able to recycle 160 tons ofe-waste this year. We plan to expand this recycling process for our servers to our Americas region in 2017.
In addition, we support the reuse of “gently used” IT equipment internally through used-equipment shops in some country locations. A sustainable procurement program complements our waste reduction efforts by offering sustainably produced IT equipment. Besidese-waste, we estimate that we generated approximately 3 kilotons (kt) of waste in our offices, cafeterias, and product packaging worldwide in 2016. The vast decrease compared to 2015 stems primarily from adjusting our extrapolation factor which is used to calculate waste quantities from sites where actual data is not available.
Municipal Waste (non-recycled)
kilotons
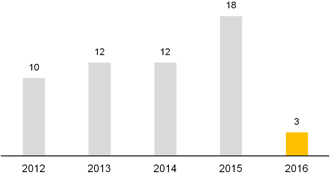
Composting Food Waste
SAP also runs comprehensive recycling programs for cafeterias at its sites worldwide. For example, we process leftover food from our headquarters in Walldorf, Germany, in an external composting plant.
Our SAP Labs location in Bangalore, India, has installed an “organic waste converter.” This recycles organic waste from cafeteria operations into odor-free, homogenized compost. Our cafeterias in Palo Alto, CA, and Newtown Square, PA, in the United States have comprehensive composting programs in place with the byproducts used to fertilize theon-site gardens.
Cutting Down on Landfill Waste
In 2016, we continued to roll out zero waste diversion programs at offices across the globe as part of our ISO 14001 program with specific targets to achieve and maintain landfill diversion at or above 90%. This approach focuses on eliminating the need to send waste to landfill, by changing processes or promoting the reuse of materials.
We reduced our paper usage by almost 30% since 2009 through our global printing optimization initiative. Among other improvements, this sets printers to produce double-sided,black-and-white printouts as a default. This year we have also made significant advances in paperless
Additional Information on Economic, Environmental and Social Performance Waste and Water | 229 |
Table of Contents
contracting. By using the SAP Signature Management application from DocuSign to enable electronic signatures, we have been able to handle 31,472 pages of contract, cutting down on paper contracts significantly.
Changing Working Behavior
We have also successfully changed working behavior to significantly reduce the amount of pages that our employees print. A secure pull-printing system requires that employees bring their ID badges to a printing device to activate a job. This makes people think about whether the printout is really needed. With more than 76,000 employees currently using this system, our printing volume has reduced by 15.4 million pages in total since 2014.
SAP employees can access a printing dashboard that shows the company’s progress in reducing paper consumption at global, regional, and country levels.
Using Water Efficiently
While our operations are not water-intensive, we continue to use water as efficiently as possible. As part of our efficiency efforts, we use rain andrun-off water for irrigation and toilets in Walldorf, Germany, and other office locations.
Global Water Usage
Thousand cubic meters
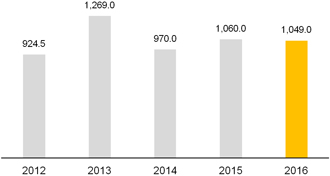
A few of our offices are located in areas with significant water scarcity. In locations such as Ra’anana, Israel, or in Bangalore, we have been addressing this issue with dedicated water management efforts. These range from the reuse of treated sewage water to employee awareness campaigns.
Additional Information on Economic, Environmental and Social Performance Waste and Water | 230 |
Table of Contents
SAP has developed trusting relationships with governments worldwide by exploring the potential for information and communications technology (ICT) to spur economic growth, create jobs, and address societal challenges.
SAP engages with governments around the globe on a number of public policy issues, including the creation of reasonable framework conditions for new technologies or business models such as cloud computing, the Internet of Things, and Big Data.
SAP supports global best practices to ensure cybersecurity and the protection of personal data to build trust in digital technologies. SAP favors global policy frameworks and international standards that enable the free flow of data across borders and the free trade of digital products and services.
SAP believes in transparency in the political process. Accordingly, we are registered in the European Transparency Register for interest representatives. In the United States, our company is registered and reports in compliance with the Lobbying Disclosure Act.
Political Contributions
SAP does not support any political parties. Under the laws of the United States, a number of SAP employees continue to exercise their right to create a political action committee (PAC). The SAP America PAC is an independent, registered, and strictly regulated organization that allows eligible employees in the United States to support political candidates at the state and federal level. Consistent with U.S. law, SAP SE exercises no control over or influence on the SAP America PAC. SAP America PAC expenditures are transparent and available on the U.S. Federal Election Commission Web site.
Additional Information on Economic, Environmental and Social Performance Public Policy | 231 |
Table of Contents
In 2016, we received the following awards and recognition for our performance and efforts related to sustainability:
| ∎ | Dow Jones Sustainability IndicesSAP ranked as software sector lead for the 10th consecutive year. |
| ∎ | FTSE4GOOD |
| ∎ | NASDAQ OMX CRD Global Sustainability 50 Index |
| ∎ | Newsweek Global 500 Green Ranking |
| ∎ | Ethibel Sustainability Index (ESI) Excellence Europe and Ethibel Sustainability Index (ESI) Excellence Global |
| ∎ | Good Company Ranking |
SAP ranks thirdamong DAX30 companies.
| ∎ | Building Public Trust Award for Innovation in Integrated Reporting |
| ∎ | oekom Prime Rating |
| ∎ | CDPA-rating |
SAP is the sector leader for IT and telecommunication services in the DACH (Germany, Austria, and Switzerland) region.
| ∎ | AAA ranking by MSCI |
Our social investment programs were recognized with the following awards:
| ∎ | “Germany – Land of Ideas” initiative |
SAP was recognized as the “Public Favorite” for the development of a free massive open online course (MOOC) on the openSAP platform to help volunteers teach German language classes to refugees. Developed in partnership with Germany’s largest welfare organizationDer Paritätische Wohlfahrtsverband, the “You Can Do It Too! German for Asylum Seekers” course helped guide nearly 10,000 volunteers in their efforts to set up or teach German classes in their community.
| ∎ | Civic 50 listing |
SAP America was recognized for its strong commitment to employee volunteerism and community, earned in part for our Early College High Schools initiative. This gives high-need students the opportunity to earn both a high school and post-secondary degree in a business-related or technology-related field. Students receive academic and real-world job training, as well as access to mentoring, which provides them with a simpler path to jobs in the technology sector.
| ∎ | International Association for Volunteer Effort (IAVE) Inspiring Practice Award |
Every two years, IAVE recognizes a global company that has created a high impact volunteer initiative. In November, SAP received this award for our SAP Social Sabbatical program.
| ∎ | MIT Inclusive Innovation Competition |
SAP received this top corporate honor for our Africa Code Week initiative.
| ∎ | C4F award (“Education of the Future” category) |
SAP received this award from the World Communications Forum in Davos for our work on Africa Code Week.
In addition, SAP received numerous awards for being a globally recognized employer of choice:
| ∎ | Global EDGE certificate |
| ∎ | HRC Foundation’s 2016 Corporate Equality Index |
| ∎ | Glassdoor Best Places to Work (4x) as well as Highest Rated CEO (2x) |
| ∎ | Fortune magazine ranked SAP #41 on their 2016 list of 50 Best Workplaces for Diversity |
| ∎ | Top Employer regional certificate for Middle East, Europe, and China (12 Top Employer wins) |
| ∎ | Forbes list of America’s Best Large Employers of 2016 |
| ∎ | BrandZ top 100 most valuable brand and top 20 most valuable B2B brand |
| ∎ | Top Companies Leadership Index for Women in Tech; Anita Borg Institute |
| ∎ | First for Best Companies to Start Your Career;Você S/A magazine |
| ∎ | Asia Recruitment Awards (14 wins) |
| ∎ | The Firm Awards winner: |
| – | Best Diversity and Inclusion Recruitment Strategy |
| – | Best Emerging Talent Recruitment Programme |
| ∎ | The Recruiter Awards: SAP was honored as a winner and as “highly commended” for three categories: |
| – | Winner: Most Effective Employer Brand Development |
| – | Highly Commended: Best Candidate Experience, Autism At Work |
| – | Highly Commended: Innovation in Recruitment, Autism At Work |
| ∎ | The Employer Brand Management Awards 2016 winners: |
| – | Gold: Best Diversity Branding |
| – | Gold: Innovation in Employer Branding, Autism at Work Program |
| – | Silver: Best Digital Campaign |
| – | Silver: Best Communication of the Employer Brand to an External Audience |
| – | Bronze: Best Ongoing Commitment to Employer Brand |
| – | Bronze: Innovation in Employer Branding, Employment Brand Menu |
| ∎ | #1 in Online Social Media and Talent Communication in Europe by Potentialpark |
| ∎ | 10 Great Place to Work Awards |
| ∎ | Among best companies for graduates (in multiple countries) by trendence |
Additional Information on Economic, Environmental and Social Performance Recognition | 232 |
Table of Contents
To better understand and enable sustainable performance on a global level, both for our company and customers, SAP subscribes to and routinely engages in a range of third-party organizations, including:
| ∎ | Alliance for Integrity |
| ∎ | Association of Climate Change Officers |
| ∎ | Bitkom e.V. |
| ∎ | Business for Social Responsibility |
| ∎ | CEB Inc. |
| ∎ | Cellular Telephone Industries Association |
| ∎ | Deutschland sicher im Netz e.V. |
| ∎ | DIGITALEUROPE |
| ∎ | Dublin Chamber of Commerce |
| ∎ | econsense |
| ∎ | European Centre for Women and Technology |
| ∎ | European Roundtable of Industrialists |
| ∎ | Federation of German Industries |
| ∎ | Financial Women’s Association |
| ∎ | Information Technology Industry Council |
| ∎ | International Integrated Reporting Council |
| ∎ | Mechanical Engineering Industry Association |
| ∎ | National Defense Industrial Association |
| ∎ | Organization for International Investment |
| ∎ | Plattform Industrie 4.0 |
| ∎ | Russian-German Chamber of Commerce |
| ∎ | Schmalenbach-Gesellschaft für Betriebswirtschaft e.V. |
| ∎ | The Business Council |
| ∎ | The Conference Board, Inc. |
| ∎ | The Sustainability Consortium |
| ∎ | The Wall Street Journal CEO Council |
| ∎ | Transatlantic Business Council |
| ∎ | Transparency International Germany |
| ∎ | United Nations Global Compact (since 2000) |
| ∎ | U.S. Chamber of Commerce |
| ∎ | World Economic Forum |
Additional Information on Economic, Environmental and Social Performance Memberships | 233 |
Table of Contents
Non-Financial Notes: Social Performance
General Information About Social Indicators
Boundaries
Our boundaries take two different perspectives: SAP as a company, which includes all our legal entities and operations and supply chain, and SAP as a solution provider enabling our customers. These boundaries are listed in detail in the GRI G4 Content Index.
Social Indicators
Data for our social indicators is collected and reported on a quarterly or annual basis and is subject to external assurance for annual reporting.
Employee Retention
We define employee retention as a ratio that puts emphasis on employee-initiated turnover – in other words, we seek to measure how many employees choose to stay with SAP. We derive our retention rate by starting with our average number of employees expressed in full-time equivalents (FTEs) in a given year and subtracting employee-initiated turnover. We then divide this figure by our average number of employees in that year to obtain our retention rate. As opposed to keeping a low turnover rate – which companies generally seek to do – we aim to keep our retention rate high. A higher retention rate signifies that fewer employees are choosing to leave SAP.
We do not differentiate between gender when we analyze retention and turnover rates.
Women in Management
We define “women in management” as the share of women in management positions as compared to the total number of managers.
At SAP, we differentiate between the following categories of managers:
| ∎ | Managers managing teams: Refers to managing teams of at least one employee or vacant positions |
| ∎ | Managers managing managers: Refers to managing managers that manage teams |
| ∎ | Board members |
Business Health Culture Index
The Business Health Culture Index (BHCI) measures the general cultural conditions in an organization that enable employees to stay healthy and balanced. The index covers questions concerning how employees rate their personal well-being and the working conditions at SAP, including our leadership culture. The BHCI is an indicator as to what extent SAP successfully offers employees a working environment that promotes health supporting their long-term employability and their active engagement in reaching our ambitious corporate goals.
The BHCI is calculated based on the results of an employee survey (“People Survey”) conducted annually. All employees were invited to take part in the 2016 People Survey and 64,889 employees participated (response rate: 76%).
The BHCI score for 2014 was recalculated from 70% to 72% based on two updated questions in the people survey concerning work-life balance. The changes were carried out to simplify the questionnaire and to better compare with against external benchmarks.
Employee Engagement
We define employee engagement as a score for the level of employee commitment, pride, and loyalty, as well as our employees’ feeling of advocacy for SAP.
It is calculated based on the results of an employee survey that is conducted annually (see BHCI).
In 2015, we simplified our Employee Engagement Index and recalculated our score for 2015 from 81% to 82%. This calculation method has been applied moving forward.
Customer Loyalty
We measure customer loyalty using the Customer Net Promoter Score (NPS). The NPS is derived from the following survey question “How likely would you be to recommend SAP to friends or colleagues?” Customers choose from a range of 0 to 10. Customers that choose a 9 or 10 are considered Promoters. Passives answer the question with a rating of 7 or 8, and Detractors with a rating of 6 or less.
The Customer NPS is calculated using the following formula: NPS = % of Promoters – % of Detractors. Passives are not included in the calculation. The NPS can range from –100% to 100%.
We aim to include at least 70% of all eligible direct customers from all regions and industries in the annual survey. From each company, multiple roles (decision makers, influencers, end users) are invited to provide feedback. In 2016, approximately 29% of invited customers (accounts) participated in the survey.
Additional Information on Economic, Environmental and Social Performance Non-Financial Notes: Social Performance | 234 |
Table of Contents
In 2015, customers who purchased SAP Hybris and Concur solutions were included for the first time; in 2016, we also added customers of Fieldglass and Ariba to our global process. As we further harmonize processes in acquired entities, the customer segments used for customer surveys has not yet been completely harmonized across the SAP Group. Specifically, due to the nature of the business, the Concur customer sample includes a higher proportion of general business customers in comparison to other Group entities. As a result, Concur responses make up a large proportion of the total customer sample.
Our Customer NPS accounting policy helps ensure that SAP achieves a trustworthy consolidated NPS for ouron-premise and cloud-based services.
Additional Information on Economic, Environmental and Social Performance Non-Financial Notes: Social Performance | 235 |
Table of Contents
Non-Financial Notes: Environmental Performance
A Detailed View of Our Emissions
We look at our energy usage and emissions throughout our entire value chain, gaining insights to help us manage our environmental performance and, in turn, help our customers do the same. The activities and trends behind our results for 2016 are detailed below. This includes information about the areas in which we consume the most purchased electricity, as well as the impact caused by the use of our products.
Our gross carbon footprint for 2016 was 682 kilotons CO2e (704 kilotons CO2e in 2015). Our gross carbon footprint includes all GHG emission categories in Scope 1, 2, as well as selected categories of 3 as outlined in figure 1. Our net carbon footprint is calculated by reducing purchased renewable energy certificates and carbon offsets from our gross carbon footprint in the respective reporting period.
Direct Emissions (Scope 1)
Consumption of fuel for our company cars remains the single greatest contributor to our Scope 1 emissions. In 2016, we continued to enhance our car policy by linking emissions caps to efficiency improvements of the automotive industry. In addition, we focused on greater shifts in commuting habits. We continued the global rollout of TwoGo by SAP, ourcar-sharing solution, which is now available in 110 SAP locations worldwide. To increase the scale and attractiveness of TwoGo, we make the solution available to the public free of charge. As part of our initiative to increase the proportion of electric vehicles in our car fleet to 20% by 2020, we continue to offer incentives to our employees to purchase electrical cars. As an example of additional transportation alternatives for our employees, we established a company bike program in Germany, where employees have the opportunity to select between using a bicycle or a company car to commute to work. A further commuting alternative to a company car in Germany is participation in a national reduced train fare program called “BahnCard 100.”
Indirect Emissions (Scope 2)
Our purchased electricity powers everything from our data centers to our buildings throughout the world. Whenever we refer to our green cloud, we mean our cloud is carbon neutral due to purchasing 100% renewable electricity certificates and compensation by offsets, at SAP. We continued a wide range of efficiency projects to reduce our energy usage, including facility upgrades and new LEED certifications. We also expanded the management of our environmental performance through ISO 14001.
We are one of the global corporations that have signed on to the RE100 initiative. Led by The Climate Group in partnership with CDP (formerly Carbon Disclosure Project), the goal of the RE100 campaign is to have 100 of the world’s most influential businesses committed to 100% renewable electricity.
Upstream Emissions (Scope 3)
Only selected upstream emissions such as business flights, paper consumption, andco-locations of data centers are directly measured and hence included in our corporate target. The additional upstream emissions products and services or grey energy of our buildings are based on an estimate. Together, our upstream emissions including these estimates are responsible for about 15% of SAP’s total carbon footprint.
As it is expected that the emissions from external data centers(co-locations) will continue to grow in the future, SAP committed to a green cloud strategy, to compensate the emissions with renewable electricity certificates.
Downstream Emissions (Scope 3)
The vast majority of our overall emissions stem from the use of our software. When SAP software runs on our customers’ hardware and on their premises, the resulting carbon footprint is about 20 times the size of our own net carbon footprint. Given that we cannot control our customers’ IT landscapes because they usually contain many elements not related to SAP software, we share this responsibility with others.
Offsets
Our investment in Livelihoods Funds has provided us with 21 kilotons of high-quality carbon credits, which we used to compensate Scope 3 emissions in 2016.
We continued offsetting carbon emissions for business flights in 2016. In addition to avoiding overall business flights, we began to offset selected business flights in the second half of 2015. This offset effort resulted in a compensation of 90 kilotons of CO2e in 2016.
Additional Information on Economic, Environmental and Social Performance Non-Financial Notes: Environmental Performance | 236 |
Table of Contents
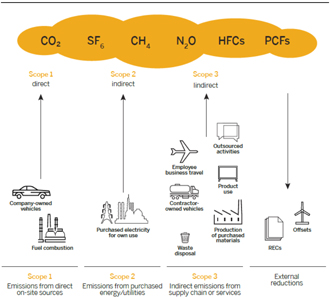
General Information About EnvironmentalNon-Financial Indicators
Boundaries
Our boundaries take two different perspectives: SAP as a company, which includes all our legal entities and operations and supply chain, and SAP as a solution provider enabling our customers. These boundaries are listed in detail in the GRI G4 Content Index.
Environmental Indicators
Data for our environmental indicators is collected and reported on a quarterly basis and is subject to external assurance for annual reporting.
Reporting on total energy consumed, data center energy, and renewable energy is based on the data collected for the calculation of our greenhouse gas (GHG) footprint. Therefore, the same reporting principles apply as for the GHG footprint.
All numbers are based on the metric system. Whenever we state “tons,” we mean metric tons.
The indicators greenhouse gas emissions per employee and total energy consumed per employee are calculated on the basis of an average number of employees. This average is calculated by adding the FTEs at the end of each quarter and then dividing the result by four.
Greenhouse Gas Footprint
We define the GHG footprint or carbon footprint as the sum of all greenhouse gas emissions measured and reported for SAP, including the compensation with renewable energy or offsets. SAP’s preparation of the GHG footprint is based on the Corporate Accounting and Reporting Standard (Scope 1 and 2) and the Corporate Value Chain (Scope 3) Standard of the World Resources Institute/World Business Council for Sustainable Development. This approach conforms with the requirements of GRI G4 indicators EN3, EN4, EN15, EN16, and EN17.
Reporting Principles
SAP reports our net greenhouse gas emissions according to the GHG Protocol Scope 2 and the location-based method. The recently introduced market-based method is an amendment to the GHG Protocol Scope 2 and will be considered starting 2017. For 2016 we continue to apply the location-based emissions instead of a dual reporting (location and market based).
In 2016 we updated our emissions and extrapolation factors for the categories stationary combustion facilities, corporate cars, corporate jets, business flights, rental cars, train travel, business trips with private cars, employee commuting as well as paper consumption, leading to a 10% downward impact on SAP’s 2016 gross CO2 emissions.
Organizational Boundaries
SAP defines our organizational boundaries by applying the operational control approach as set out in the GHG Protocol.
Operational control is established when SAP has the full authority to introduce and implement its operating policies. The emissions of all operations over which the company has operational control and all owned, leased facilities,co-location data centers, and vehicles that the company occupies or operates are accounted for in the GHG footprint, being based on either measurements or, where no measured data is available, on estimations and extrapolations.
A portion of SAP’s leased facilities operates under full-service or multitenant leases, where the building owner or manager pays for the utilities directly and SAP does not have access to actual energy consumption information. SAP includes these facilities in our definition of operational control and accounts for them by estimating related energy consumption.
To support the growing demand for SAP’s cloud offerings, we subcontract computation power in local third-party data centers. Carbon emissions are approximated and included based on the consumed computation power.
In most instances, however, SAP has 100% ownership of our subsidiaries. Accordingly, the difference between applying the control versus the equity approach is about 0.6% based on SAP revenue. If additional investments in associates were included, the difference would be even smaller, about 0.5%.
Methodology
We are reporting all our GHG emissions in CO2 equivalents (CO2e), including the impact from CH4, N2O, and HFCs in our Scope 1 and 2 emissions. As SF6 and PFCs mainly occur in chemical processes, they are not relevant for us.
Additional Information on Economic, Environmental and Social Performance Non-Financial Notes: Environmental Performance | 237 |
Table of Contents
Below you will find the different parameters contributing to our carbon footprint:
Scope 1
| ∎ | Stationary Combustion Facilities: Inclusion of CH4 and N2O; stable values (kWh/m²) instead of actual average consumption are used for extrapolation of buildings where no measured data is available (60% measured data). In cases where no specific information is available, natural gas reported by local sites is assumed to be reported in Lower Heating Value. |
| ∎ | Refrigerants Facilities: Refrigerant data is reported for completeness of our carbon footprint, but HFC emissions are fully estimated (0% measured data) based on the number of server units and office space with an A/C system; all refrigerants are assumed to be HFC134a. |
| ∎ | Mobile Combustion Corporate Cars: Inclusion of CH4 and N2O; in 2016, 31 countries reported actual fuel data (90% data coverage); for other countries stable values (liters/car) are used for extrapolation based on the number of corporate cars reported. The stable values for extrapolation are based on SAP’s 2015 carbon footprint data. |
| ∎ | Refrigerants Corporate Cars: Refrigerant emissions are based on a rough estimate of HFC emissions per car and are extrapolated based on the number of corporate cars reported (0% measured data). |
| ∎ | Mobile Combustion Corporate Jets: Inclusion of CH4 and N2O (100% data coverage) |
Scope 2
| ∎ | Electricity Office: Updated CO2 conversion factors and inclusion of CH4 and N2O based on country specific grid factors; stable values (kWh/m²) instead of actual average consumption are used for the extrapolation of buildings where no measured data is available (70% data coverage). The stable values are based on SAP’s 2015 carbon footprint data. |
| ∎ | Electricity Data Centers: Updated CO2 conversion factors and inclusion of CH4 and N2O based on country specific grid factors; electricity consumption for internal data centers is extrapolated based on the number of server units (80% data coverage). The stable values are based on SAP’s 2015 carbon footprint data. |
| ∎ | Purchased Chilled and Hot Water, Steam: Inclusion of CH4 and N2O based on global emission grid factors (45% data coverage). |
Scope 3
The following scope 3 GHG emissions are included in our corporate GHG target:
| ∎ | Business Flights: Average emission factors for business flights are calculated based on short, medium, and long-haul flights; extrapolation of CO2 is based on the actual distance travelled and the net (excluding tax) costs (55% data coverage), emission factors for business flights do not consider the radiative forcing factors. |
| ∎ | Rental Cars: Average emission factors from rental cars are calculated based on actual distance traveled and these factors are used for extrapolation based on the costs (90% data coverage). |
| ∎ | Train Travel: Average emission factors from train travel are calculated based on an actual distance traveled and these factors are used for extrapolation based on the costs (30% data coverage). |
| ∎ | Business Trips with Private Cars: Carbon calculation is based on distance traveled with a private car, extrapolation is based on FTE. Train and company car trips are excluded from this activity type (60% data coverage). |
| ∎ | Employee Commuting: A system-integrated commuting survey about the distance to work and the mode of transport is conducted annually for SAP globally. The survey responses are the basis for carbon calculation of employee commuting in the following year. More than 30,000 employees responded to the survey in 2016. Commuting fornon-responding employees and quarterly updates are extrapolated based on the number of FTEs excluding those employees who own a company car. |
| ∎ | Electricity External Data Centers: Updated CO2 conversion factors and inclusion of CH4 and N2O based on country specific grid factors; electricity consumption for external data centers is extrapolated based on the data center capacity, a utilization and power usage effectiveness (PUE) factor. As the utilization and PUE factor is not available for all external data centers, the average of all provided factors is used as estimate for external data centers with missing information. |
| ∎ | Logistics: Calculation is based on the actual number of parcels and mail sent from our logistics center in Germany and is extrapolated globally. |
| ∎ | Data Download: Carbon calculation is based on the data volume downloaded by our customers globally (100% data coverage). |
| ∎ | Paper Consumption: Calculation for emissions caused by the consumption of printing paper is based on printer tracker data (100% data coverage). |
An external data center is a local computing center with server units running SAP software that is operated by an external partner. Those emissions are classified as Scope 3.SAP-owned andSAP-managed data centers, coming from acquisitions are classified as Scope 2 GHG emissions.
Additionally, we annually measure and publish the following Scope 3 GHG emissions based on the GHG Protocol’s Corporate Value Chain (Scope 3) Accounting and Reporting Standard. These GHG emissions are not included in our corporate target and are meant to be for indicative purpose only.
Upstream
Due to the link of our upstream emissions to operating expenses, for 2016, we extrapolated our upstream figures by multiplying our four key contributors to our upstream emissions from 2015 with the year-over-year increase of operating expenses between 2015 and 2016.
Downstream
| ∎ | Use of Sold Products: Resource need per year is determined using a landscape simulation. It is extrapolated globally based on the number of productive installations and power usage effectiveness (PUE). We use a PUE factor of 1.9, representing a commonly used global average. Emissions are calculated using a global electricity |
Additional Information on Economic, Environmental and Social Performance Non-Financial Notes: Environmental Performance | 238 |
Table of Contents
emission factor. Due to the special characteristics of software products, an assessment of resource need per year was chosen. This deviates from the minimum boundaries as defined by the GHG Protocol’s Corporate Value Chain (Scope 3) Accounting and Reporting Standard, which requires assessment and disclosure of “directuse-phase emissions of sold products over their expected lifetime.” The calculation covers all of our major solutions, includingon-premise software. Cloud solutions are not included, as they are part of our Scope 2 emissions. Mobile solutions (e.g. SAP apps running on customer IT equipment) are also not included. Calculation parameters will be adapted when significant technology changes occur. |
Not included: Upstream Transportation and Distribution (due to data complexity and de minimis); Upstream Leased Assets (not applicable); Processing of Sold Products (not applicable);End-of-Life Treatment of Sold Products (not applicable); Downstream Leased Assets (not applicable); Franchises (not applicable); and Investments (not applicable).
External Reduction
| ∎ | Renewable Electricity: Purchased renewable electricity is already deducted from our Scope 2 emissions in the net carbon footprint; CO2, CH4, and N2O conversions are based on grid specific factors from the origin of renewable electricity; data is only valid with an official certificate or written confirmation of the electricity supplier (100% data coverage). |
| ∎ | Offsets: Purchased offsets are reported separately based on the carbon reduction amount purchased. SAP ensures that the GHG emission reductions from offsets are credible and that they meet four key accounting principles: |
| – | Real: The quantified GHG reductions will represent actual emission reductions that have already occurred. |
| – | Additional: The GHG reductions will be surplus to regulation and beyond what would have happened in the absence of the project or in abusiness-as-usual scenario based on a performance standard methodology. |
| – | Permanent: The GHG reductions will be permanent or have guarantees to ensure that any losses are replaced in the future. |
| – | Verifiable: The GHG reductions will result from projects whose performance can be readily and accurately quantified, monitored, and verified. |
A requirement for offsets is that the minimum standard (Voluntary Carbon Standard, or VCS) is applied. In 2016, our strategic investment in the Livelihoods Funds has provided us with 21 kilotons of offsets which are included in our overall net carbon footprint.
CO2 Emission Factors
The calculation of the above emissions is based on factors for conversion and extrapolation provided, among others, by IEA, WRI, US EPA, UK DEFRA, DEHSt, Environment Canada, GHG Protocol, and SAP’s own measurements.
Where relevant, our CO2 emission factors consider all CO2 equivalents (CO2e) for all greenhouse gases. Global Warming Potential factors are based on the Fifth Assessment Report of the Intergovernmental Panel on Climate Change (IPCC).
Comparability
SAP uses a significance threshold of 5% for structural or organizational changes and 1% for methodology changes of total current year emissions. A structural or organizational change that increases or decreases the total inventory by 5% or more will trigger an adjustment of historic years. A structural or organizational change that increases or decreases the total inventory by less than 5% will be considered insignificant and thus no adjustment will be made.
Additionally, we annually measure the cumulative cost avoidance of our carbon emissions, compared to abusiness-as-usual scenario. In 2015, we introduced a cumulative cost avoidance calculation based on a triennial rolling method. This leads to additional comparability and we will continue to calculate our cumulative cost avoidance with the triennial rolling approach.
Error Correction
If a significant error is found in the base year inventory, it will be corrected. If a significant error is found which does not affect the base year but has an impact on this year’s or last year’s emissions, it will be corrected. An error is significant if it affects SAP’s gross carbon footprint by more than 1%. No restatement due to error correction of historical data was necessary in 2016.
Renewable Energy
We define renewable energy as electricity coming from renewable energy sources such as wind, solar, hydro, and geothermal. The shares of renewable energy used by SAP are calculated by adding the amount of renewable energy specifically sourced, produced onsite by our own solar cells, and covered by Renewable Energy Certificates (RECs). We have developed a quality standard that defines key criteria for the procurement of RECs to drive change in the electricity market and to avoid the risk caused bylow-quality products. The key characteristics of our renewable energy purchasing guidelines are as follows:
| ∎ | Type of renewable electricity: SAP considers solar, wind, biogas, geothermal, and hydro power as renewable electricity. |
| ∎ | Installation: The power plant producing the renewable energy shall not be older than 10 years. In case of a renovation of an old power plant, the10-year rule applies only to the additional electricity output due to efficiency increase. Furthermore, SAP does not consider RECs from government supported power plants. |
| ∎ | Vintage: The renewable electricity must be produced in the same year or the year before with regard to the reporting period it will be applied. |
| ∎ | Accounting: To calculate the carbon reduction achieved by the RECs, SAP will use the grid-specific emissions factor. As RECs are considered independently to the electricity delivered physically to our facilities, the carbon reduction achieved through their procurement can be allocated to any location globally. |
Additional Information on Economic, Environmental and Social Performance Non-Financial Notes: Environmental Performance | 239 |
Table of Contents
All energy outside the aforementioned categories falls within conventional energy. We define conventional energy as electricity coming from the standard electricity grid. The electricity grid provides a country-specific energy mix including all available sources, either fossil, nuclear, or renewable. Energy from renewable sources as part of the local grid is calculated as conventional energy and not displayed as part of renewable energy.
Data Center Energy
We define data center energy as the sum of electricity consumed to provide internal and external computation power in SAP data centers and contracted third party data centers. A data center is any global, regional, or local computing center (location with any number of server units) that is part of our global IT infrastructure strategy. In 2016, we continued analyzing and reporting internal and external data center energy consumption intensity against ournon-IFRS revenue.
Data center energy consumption per euro is calculated by dividing the electricity consumption of all internal and external data centers measured for the calculation of our GHG footprint.
We will continuously improve data quality of energy consumption of external data centers.
Total Energy Consumed
We define total energy consumed as the sum of all energy consumed throughSAP-own operations, including energy from renewable sources. It is calculated based on the consumption data obtained through our measurements for the GHG footprint and is the sum of energy consumption from stationary combustion facilities, mobile combustion corporate cars, mobile combustion corporate jets, electricity offices, electricity data centers, and purchased chilled water, purchased hot water, and purchased steam.
Water
By water, we mean total freshwater withdrawn for our facilities. Data is based on estimations from sites and is largely extrapolated. Data was provided (estimated) for 60% of the total space; remaining data is extrapolated based on square meter footage.
Waste
By waste, we meannon-recyclable waste produced in our offices and data centers. Data on municipal waste was provided (estimated) for about 50% of the total space.
Additional Information on Economic, Environmental and Social Performance Non-Financial Notes: Environmental Performance | 240 |
Table of Contents
GRI Index and UN Global Compact Communication on Progress
The social and environmental data and information included in the SAP Integrated Report 2016 is prepared in accordance with the core option of the international guidelines G4 of the Global Reporting Initiative (GRI).
General Standard | Links and Content | External Assurance | UN Global Compact | |||
| Strategy and Analysis | ||||||
| G4-1 | Letter from the CEO | |||||
| Organizational Profile | ||||||
| G4-3 | Overview of the SAP Group | Ö | ||||
| G4-4 | Products, R&D, and Services | Ö | ||||
| G4-5 | Overview of the SAP Group | Ö | ||||
| G4-6 | Overview of the SAP Group | Ö | ||||
| G4-7 | Overview of the SAP Group | Ö | ||||
| G4-8 | Overview of the SAP Group; Customers | Ö | ||||
| G4-9 | Headcount and Personnel Expense; Subsidiaries and Other Equity Investments; Consolidated Financial Statements IFRS; Financial Performance: Review and Analysis | Ö | ||||
| G4-10 | Chart Generator; Headcount and Personnel Expense | 6 | ||||
| G4-11 | Human Rights and Labor Standards | Ö | 3 | |||
| G4-12 | Sustainable Procurement | Ö | ||||
| G4-13 | There were no changes with significant impacts regarding our own organization or our supply chain. | Ö | ||||
| G4-14 | We support a precautionary approach towards environmental management. While we see little apparent risk for our own operations, we do see an opportunity to help our customers anticipate and manage this risk in a more agile and responsive fashion through effective product lifecycle management and sustainable design. | Ö | 7 | |||
| G4-15 | Memberships | Ö | ||||
| G4-16 | Memberships | Ö | ||||
| Identified Material Aspects and Boundaries | ||||||
| G4-17 | Subsidiaries and Other Equity Investments; All entities are covered by the report. | Ö | ||||
| G4-18 | Materiality; About This Report | Ö | ||||
| G4-19 | Materiality | Ö | ||||
Additional Information on Economic, Environmental and Social Performance GRI Index and UN Global Compact Communication on Progress | 241 |
Table of Contents
General Standard | Links and Content | External Assurance | UN Global Compact | |||
| G4-20 | GRI Content Index; Non-Financial Notes: Environmental Performance; Non-Financial Notes: Social Performance | Ö | ||||
| G4-21 | GRI Content Index; Non-Financial Notes: Environmental Performance; Non-Financial Notes: Social Performance | Ö | ||||
| G4-22 | Non-Financial Notes: Environmental Performance; Non-Financial Notes: Social Performance | Ö | ||||
| G4-23 | Non-Financial Notes: Environmental Performance; Non-Financial Notes: Social Performance | Ö | ||||
| Stakeholder Engagement | ||||||
| G4-24 | Stakeholder Engagement | Ö | ||||
| G4-25 | Stakeholder Engagement | Ö | ||||
| G4-26 | Stakeholder Engagement | Ö | ||||
| G4-27 | Stakeholder Engagement | Ö | ||||
| Report Profile | ||||||
| G4-28 | About This Report | Ö | ||||
| G4-29 | March 20, 2016 | Ö | ||||
| G4-30 | Annual Reporting Cycle | Ö | ||||
| G4-31 | Investor Services | |||||
| G4-32 | About This Report; GRI Content Index; Independent Assurance Report | Ö | ||||
| G4-33 | Independent Assurance Report; Management’s Acknowledgement of the SAP Integrated Report 2016 | Ö | ||||
| Governance | ||||||
| G4-34 | Report by the Supervisory Board; Sustainability Management and Policies | Ö | ||||
| Ethics and Integrity | ||||||
| G4-56 | Business Conduct | Ö | 10 | |||
DMA and Indicators | Links and Content | Omissions | External | Boundaries | UN Global Compact Principles | |||||
| Material Aspect: Business Conduct | ||||||||||
| DMA | Sustainability Management and Policies; Business Conduct | Ö | 10 | |||||||
| SO3 | Business Conduct | Ö | SAP | 10 | ||||||
| SO4 | Business Conduct | Ö | SAP | 10 | ||||||
| SO5 | There were no confirmed incidents of corruption in 2016. | Ö | SAP | 10 | ||||||
| SO6 | Public Policy; Business Conduct | Ö | SAP | 10 | ||||||
| SO7 | Litigation and Claims | Ö | SAP | |||||||
| Material Aspect: Climate and Energy | ||||||||||
| DMA | Sustainability Management and Policies; Energy and Emissions | Ö | 8 | |||||||
Additional Information on Economic, Environmental and Social Performance GRI Index and UN Global Compact Communication on Progress | 242 |
Table of Contents
DMA and Indicators | Links and Content | Omissions | External | Boundaries | UN Global Compact Principles | |||||
EC2 | SAP provides details on risks and opportunities related to climate change through the CDP (www.cdp.net) | SAP and external parties | 7 | |||||||
EN3 | Energy and Emissions; Chart Generator; Non-Financial Notes: Environmental Performance | Ö | SAP | 7, 8 | ||||||
EN5 | Energy and Emissions; Chart Generator; Non-Financial Notes: Environmental Performance | Ö | SAP | 8 | ||||||
EN6 | Energy and Emissions | Ö | SAP | 8 | ||||||
EN8 | Waste and Water | Our operations are not water-intensive. Therefore, we do not report on the sources of water withdrawal. | Ö | SAP | 7, 8 | |||||
EN15 | Energy and Emissions; Chart Generator; Non-Financial Notes: Environmental Performance | Ö | SAP | 7, 8 | ||||||
EN16 | Energy and Emissions; Chart Generator; Non-Financial Notes: Environmental Performance | Ö | SAP | 7, 8 | ||||||
EN17 | Energy and Emissions; Chart Generator; Non-Financial Notes: Environmental Performance | Ö | External parties | 7, 8 | ||||||
EN18 | Chart Generator | SAP and external parties | 8 | |||||||
EN19 | Energy and Emissions; Chart Generator; Non-Financial Notes: Environmental Performance | Ö | SAP and external parties | 8, 9 | ||||||
EN23 | Waste and Water | Our operations are not waste-intensive. Therefore, we do not report on the different types of waste and disposal methods. | Ö | SAP | 8 | |||||
| Material Aspect: Financial Performance | ||||||||||
DMA | Sustainability Management and Policies; Expected Developments and Opportunities; Report by the Supervisory Board We are working on understanding the impact our solutions have on our customers’ success and document this in case studies. SAP does not conduct community assessment programs. | Ö | ||||||||
Growth and Profitability | Financial Performance: Review and Analysis | Ö | SAP | |||||||
EC8 | Strategy and Business Model; www.sap.com/purpose | Ö | External parties | 9 | ||||||
| Material Aspect: Human Capital Management | ||||||||||
Additional Information on Economic, Environmental and Social Performance GRI Index and UN Global Compact Communication on Progress | 243 |
Table of Contents
DMA and Indicators | Links and Content | Omissions | External | Boundaries | UN Global Compact Principles | |||||
| DMA | Sustainability Management and Policies; Human Rights and Labor Standards | Ö | 1, 2, 6 | |||||||
| Employee Engagement | Employees and Social Investments | Ö | SAP | |||||||
| Business Health Culture Index | Employees and Social Investments | Ö | SAP | |||||||
| Leadership | Employees and Social Investments | Ö | SAP | |||||||
| LA1 | Employees and Social Investments; Chart Generator | A breakdown of new employee hires by age group and gender as well as total numbers is proprietary information for SAP. | Ö | SAP | 6 | |||||
| LA6 | In Germany, we measure the accident rate with a “1000-Mann-Quote” (TMQ). This is calculated as the number of reportable accidents × 1000 employees/number of full-time equivalents. Reportable accidents are work-related and include commuting accidents that result in more than three days of absence from work. In 2016, the TMQ was 3.6 (3.4 in 2015). We also measure the accident rate per one million working hours. In 2016, this value slightly increased to 2.3 reportable accidents per one million working hours (2.2 in 2015). | Injuries, diseases, lost days, or absenteeism are not a material issue for SAP as we track our Business Health Culture Index on a global basis. | SAP | |||||||
| LA12 | Employees and Social Investments; Chart Generator | Ö | SAP | 6 | ||||||
| LA13 | SAP does not tolerate discrimination on any basis, which includes our commitment to equal pay for men and women for work of equal value. | Ö | SAP | 6 | ||||||
| Material Aspect: Innovation | ||||||||||
| DMA | Sustainability Management and Policies; Non-Financial Notes: Social Performance | Ö | ||||||||
| LA9 | Our learning strategy is also based on the principle that much of employee learning and development happens outside formal training through peer-based interaction such as coaching, mentoring, rotational programs andon-the-job-guided development experiences. As a result, we have decided to no longer report on the number of formal training hours per employee because it does not provide meaningful insights. | Ö | SAP | |||||||
Additional Information on Economic, Environmental and Social Performance GRI Index and UN Global Compact Communication on Progress | 244 |
Table of Contents
DMA and Indicators | Links and Content | Omissions | External | Boundaries | UN Global Compact Principles | |||||
| LA10 | Employees and Social Investments; For continued employability and managing career endings, SAP has dedicated staff to support generational intelligence. These experts work on continuously improving processes and designing programs for sustaining employability as long as possible; providing training for cross-generation collaboration; managing career endings in a flexible way (for example, part-time options); and keeping employees connected with the company after retirement. SAP also participates in external research studies and networks on workforce demographics to share and learn about best practices in this field. | Ö | SAP | |||||||
| LA11 | Employees and Social Investments | Ö | SAP | |||||||
| PR5 | Customers | Ö | SAP | |||||||
| R&D and Local Innovation | Products, R&D, and Services | Ö | SAP | |||||||
| Material Aspect: Human and Digital Rights | ||||||||||
| DMA | Security and Privacy; Human Rights and Labor Standards | Ö | ||||||||
| PR8 | Security and Privacy | Ö | SAP and external parties | 1 | ||||||
| HR4 | Human Rights and Labor Standards; We are not aware of any operations or suppliers in which the right to exercise freedom of association and collective bargaining may be at significant risk. | Ö | SAP and external parties | 3 | ||||||
| HR5 | Human Rights and Labor Standards; We are not aware of any operations or suppliers as having significant risk for incidents of child labor. | Ö | SAP and external parties | 5 | ||||||
| HR6 | Human Rights and Labor Standards; We are not aware of any operations or suppliers as having significant risk for incidents of forced or compulsory labor. | Ö | SAP and external parties | 4 | ||||||
| Material Aspect: Impact on Society | ||||||||||
| DMA | Sustainability Management and Policies | Ö | ||||||||
| UN Sustainable Development Goals | Strategy and Business Model | Ö | External parties | |||||||
| Social Investments | Employees and Social Investments | Ö | SAP and external parties | |||||||
Additional Information on Economic, Environmental and Social Performance GRI Index and UN Global Compact Communication on Progress | 245 |
Table of Contents
Management’s Acknowledgement of the SAP Integrated Report 2016
The International Integrated Reporting (<IR>) Framework launched by the International Integrated Reporting Council in December 2013 has a provision that an integrated report should include a statement in which management acknowledges its responsibility for the report. Our respective statement for 2016 is as follows:
The SAP Integrated Report 2016 is only available online. The Executive Board is aware of its responsibility to ensure the integrity of our integrated report. The members of the Executive Board have applied their collective mind to the preparation and presentation of our integrated report.
Similar to previous reports, our SAP Integrated Report 2016 is structured along the content elements suggested in the <IR> Framework. We have applied the Guiding Principles of the <IR> Framework, but we also must ensure our compliance with legal requirements, such as the provisions regarding financial reporting in the German Commercial Code as set out in detail in the German Accounting Standard 20 Group Management Report, while balancing other reporting standards such as the G4 guidelines of the Global Reporting Initiative (GRI), with the <IR> Framework.
Our Executive Board has reviewed the SAP Integrated Report 2016, including the consolidated financial statements, the combined management report, as well as the other additional content related to the GRI G4 Content Index.
Our Executive Board believes that the integrated report is presented in accordance with the <IR> Framework as far as possible given the aforementioned restrictions. Should the aforementioned restrictions ever cease to apply, we will continue to strive for further alignment with the <IR> Framework in future reports.
Additional Information on Economic, Environmental and Social Performance Management’s Acknowledgement of the SAP Integrated Report 2016 | 246 |
Table of Contents
To the executive board of SAP SE, Walldorf
We have performed an independent assurance engagement on selected qualitative and quantitative sustainability disclosures of the Integrated Report 2016 (further: “the Report”) of SAP SE, Walldorf (further “SAP”), published under http://www.sap.com/integrated-reports/2016/en.html.
For the performance indicators Business Health Culture Index, Employee Engagement, Employee Retention, Women in Management, Customer Net Promoter Score, Greenhouse Gas Emissions (Scope 1 and 2 as well as selected Scope 3 emissions including business flights and employee commuting), Renewable Energy and Total Energy Consumed, including the explanatory notes thereto, a reasonable assurance engagement was performed.
For the disclosures on materiality and stakeholder engagement, the disclosures on management approaches for the material aspects Business Conduct, Climate and Energy, Human and Digital Rights, Human Capital, Innovation and Customer Loyalty, as well as for the other qualitative and quantitative sustainability disclosures in relation to these material aspects, a limited assurance engagement was performed.
The qualitative and quantitative sustainability disclosures included in the scope of our assurance engagement are marked in the GRI G4 Content Index, published online underhttp://www.sap.com/integrated-reports/2016/en/about/gri-index-and-united-nations-global-compact.html with the following symbol:Ö
It was not part of our engagement to review product or service related information, references to external information sources, expert opinions and future-related statements in the Report.
Management´s Responsibility for the Report
The legal representatives of SAP are responsible for the preparation of the Report in accordance with the Reporting Criteria. SAP applies the principles and standard disclosures of the G4 Sustainability Reporting Guidelines of the Global Reporting Initiative in combination with the Corporate Accounting and Reporting Standard (Scope 1 and 2) and the Corporate Value Chain (Scope 3) Standard of the World Resources Institute / World Business Council for Sustainable Development, as well as internally developed definitions, as described in the‘Non-Financial Notes: Social Performance’ and the‘Non-Financial Notes: Environmental Performance’ as Reporting Criteria.
This responsibility includes the selection and application of appropriate methods to prepare the Report and the use of assumptions and estimates for individual qualitative and quantitative sustainability disclosures which are reasonable under the circumstances. Furthermore, this responsibility includes designing, implementing and maintaining systems and processes relevant for the preparation of the Report in a way that is free of – intended or unintended – material misstatements.
Independence and quality assurance on the part of the auditing firm
We have complied with the independence and other ethical requirements of the Code of Ethics for Professional Accountants issued by the International Ethics Standards Board for Accountants (IESBA-Code), which is founded on fundamental principles of integrity, objectivity, professional competence and due care, confidentiality and professional behavior.
The quality assurance system of the KPMG AG Wirtschaftsprüfungsgesellschaft is based on the International Standard on Quality Control 1 “Quality Control for Audit, Assurance and Related Service Practices” (ISQC 1) and, in addition on national statutory requirements and professional standards, especially the Professional Code for Certified Accountants as well as the joint statement of WPK (Chamber of Public Accountants) and IDW (Institute of Public Auditors in Germany): Requirements for quality assurance in the auditing practice (VO 1/2006).
Practitioner’s Responsibility
Our responsibility is to express a conclusion based on our work performed and the evidence obtained on the qualitative and quantitative sustainability disclosures marked in the GRI G4 Content Index with the following symbol:Ö
Nature and extent of the assurance engagement
We conducted our work in accordance with the International Standard on Assurance Engagements (ISAE) 3000 (Revised): “Assurance Engagements other than Audits or Reviews of Historical Financial Information” and the International Standard on Assurance Engagements (ISAE) 3410: “Assurance Engagements on Greenhouse Gas Statements” of the International Auditing and Assurance Standards Board (IAASB). These standards require that we comply with our professional duties and plan and perform the assurance engagement to obtain a reasonable level of assurance to conclude that
Additional Information on Economic, Environmental and Social Performance Independent Assurance Report | 247 |
Table of Contents
the above mentioned performance indicators are prepared, in all material respects, in accordance with the aforementioned Reporting Criteria respectively to obtain a limited level of assurance to preclude that the above mentioned qualitative and quantitative sustainability disclosures are not prepared, in all material respects, in accordance with the aforementioned Reporting Criteria. In a limited assurance engagement the evidence gathering procedures are more limited than in a reasonable assurance engagement and therefore less assurance is obtained than in a reasonable assurance engagement. The choice of audit procedures is subject to the auditor’s own judgement. This includes the assessment of the risk of material misstatement in the Report under consideration of the Reporting Criteria.
Within the scope of our engagement, we performed amongst others the following procedures when conducting the limited assurance:
| ∎ | An evaluation of the approach to determining material sustainability topics and respective boundaries, including results of stakeholder engagement. |
| ∎ | A risk analysis, including a media search, to identify relevant information on SAP’s sustainability performance in the reporting period. |
| ∎ | Reviewing the suitability of the internally developed definitions. |
| ∎ | Evaluation of the design and implementation of the systems and processes for the collection, processing and control of the qualitative and quantitative sustainability disclosures included in the scope of this engagement, including the consolidation of the data. |
| ∎ | Inquiries of personnel on corporate level responsible for providing the data and information, carrying out internal control procedures and consolidating the data and information, |
| ∎ | �� | Evaluation of internal and external documentation, to determine whether the qualitative and quantitative sustainability disclosures are supported by sufficient evidence. |
| ∎ | An analytical review of the data and trend explanations submitted by all sites for consolidation at corporate level. |
| ∎ | Reviewing the consistency of GRI G4in-accordance option ‘Core’ as declared by SAP with the qualitative and quantitative sustainability disclosures presented in the Report. |
| ∎ | Evaluation of the overall presentation of the selected qualitative and quantitative sustainability disclosures in the Report. |
In addition, we conducted the following procedures to obtain reasonable assurance:
| ∎ | An evaluation of the design and implementation, and tests of the operating effectiveness of the systems and methods used to collect and process the data, including the aggregation of these data into the performance indicators as presented in the Report. |
| ∎ | Auditing internal and external documentation in order to determine in detail whether the performance indicators for the business year 2016 correspond with the underlying sources, and whether all the relevant information contained in such underlying sources has been included in the Report. |
| ∎ | Location visits to Walldorf and St. Leon Rot (both Germany) and a remote visit to Palo Alto (USA) to assess the quality of information management systems and the reliability of the data as reported to corporate level. |
Conclusions
Based on the procedures performed and evidence received to obtain reasonable assurance, the performance indicators Business Health Culture Index, Employee Engagement, Employee Retention, Women in Management, Customer Net Promoter Score, Greenhouse Gas Emissions (Scope 1 and 2 as well as selected Scope 3 emissions including business flights and employee commuting), Renewable Energy and Total Energy Consumed, published in the SAP Integrated Report 2016, including the explanatory notes thereto, are, in all material respects, presented in accordance with the Reporting Criteria.
Based on the procedures performed and evidence received to obtain limited assurance, nothing has come to our attention that causes us to believe that the disclosures on materiality and stakeholder engagement, the disclosures on management approaches for the material aspects Business Conduct, Climate and Energy, Human and Digital Rights, Customer Loyalty and Innovation, as well as the other qualitative and quantitative sustainability disclosures in relation to these material aspects, published in the SAP Integrated Report 2016, are, in all material respects, not prepared in accordance with the Reporting Criteria.
Purpose of the assurance report
This assurance report is issued based on an assurance engagement agreed upon with SAP. The assurance engagement to obtain reasonable respectively limited assurance is conducted on behalf of SAP and the assurance report is solely for information purposes of SAP on the results of the assurance engagement.
Limited liability
This assurance report must not be used as basis for (financial) decision-making by third parties of any kind. We have responsibility only towards SAP. We do not assume any responsibility towards third parties.
Frankfurt am Main, February 22, 2017
KPMG AG Wirtschaftsprüfungsgesellschaft
| Simone Fischer | ppa. Thea Renner | |
| Wirtschaftsprüferin | ||
| (German Public Auditor) |
Additional Information on Economic, Environmental and Social Performance Independent Assurance Report | 248 |
Table of Contents
 | Additional Information |
| Five-Year Summary | 250 | |||||
| Glossary | 254 | |||||
| Financial Calendar and Addresses | 264 | |||||
| Financial and Sustainability Publications | 265 | |||||
| Publication Details | 266 | |||||
| Additional Information | 249 |
Table of Contents
€ millions, unless otherwise stated | 2016 | 2015 | 2014 | 2013 | 2012 | |||||||||||||||
| Revenues | ||||||||||||||||||||
Cloud subscriptions and support (IFRS) | 2,993 | 2,286 | 1,087 | 696 | 270 | |||||||||||||||
Non-IFRS adjustments | 2 | 10 | 14 | 61 | 73 | |||||||||||||||
Cloud subscriptions and support(non-IFRS) | 2,995 | 2,296 | 1,101 | 757 | 343 | |||||||||||||||
Software licenses (IFRS) | 4,860 | 4,835 | 4,399 | NA | NA | |||||||||||||||
Non-IFRS adjustments | 2 | 1 | 0 | NA | NA | |||||||||||||||
Software licenses(non-IFRS) | 4,862 | 4,836 | 4,399 | NA | NA | |||||||||||||||
Software support (IFRS) | 10,571 | 10,093 | 8,829 | NA | NA | |||||||||||||||
Non-IFRS adjustments | 1 | 0 | 5 | NA | NA | |||||||||||||||
Software support(non-IFRS) | 10,572 | 10,094 | 8,834 | NA | NA | |||||||||||||||
Cloud and software (IFRS) | 18,424 | 17,214 | 14,315 | 13,505 | 12,801 | |||||||||||||||
Non-IFRS adjustments | 5 | 11 | 19 | 82 | 81 | |||||||||||||||
Cloud and software(non-IFRS) | 18,428 | 17,226 | 14,334 | 13,587 | 12,883 | |||||||||||||||
Services (IFRS =non-IFRS) | 3,638 | 3,579 | 3,245 | 3,310 | 3,421 | |||||||||||||||
Total revenue (IFRS) | 22,062 | 20,793 | 17,560 | 16,815 | 16,223 | |||||||||||||||
Non-IFRS adjustments | 5 | 11 | 19 | 82 | 81 | |||||||||||||||
Total revenue(non-IFRS) | 22,067 | 20,805 | 17,580 | 16,897 | 16,304 | |||||||||||||||
Share of predictable revenue (IFRS, in %) | 61 | 60 | 56 | NA | NA | |||||||||||||||
Share of predictable revenue(non-IFRS, in %) | 61 | 60 | 57 | NA | NA | |||||||||||||||
| Operating expenses | ||||||||||||||||||||
Cost of cloud subscriptions and support (IFRS) | -1,313 | -1,022 | -481 | -314 | NA | |||||||||||||||
Non-IFRS adjustments | 247 | 232 | 88 | 97 | NA | |||||||||||||||
Cost of cloud subscriptions and support(non-IFRS) | -1,066 | -789 | -393 | -218 | NA | |||||||||||||||
Cost of software licenses and support (IFRS) | -2,182 | -2,291 | -2,076 | -2,056 | NA | |||||||||||||||
Non-IFRS adjustments | 238 | 283 | 258 | 263 | NA | |||||||||||||||
Cost of software licenses and support(non-IFRS) | -1,944 | -2,008 | -1,818 | -1,793 | NA | |||||||||||||||
Cost of cloud and software (IFRS) | -3,495 | -3,313 | -2,557 | -2,370 | -2,339 | |||||||||||||||
Non-IFRS adjustments | 485 | 516 | 346 | 360 | 411 | |||||||||||||||
Cost of cloud and software(non-IFRS) | -3,010 | -2,797 | -2,211 | -2,011 | -1,929 | |||||||||||||||
Cost of services (IFRS) | -3,089 | -2,932 | -2,426 | -2,660 | -2,734 | |||||||||||||||
Non-IFRS adjustments | 113 | 167 | 122 | 128 | 132 | |||||||||||||||
Cost of services(non-IFRS) | -2,976 | -2,765 | -2,304 | -2,533 | -2,602 | |||||||||||||||
Total cost of revenue (IFRS) | -6,583 | -6,245 | -4,983 | -5,031 | -5,073 | |||||||||||||||
Non-IFRS adjustments | 598 | 683 | 467 | 487 | 542 | |||||||||||||||
Total cost of revenue(non-IFRS) | -5,985 | -5,562 | -4,515 | -4,543 | -4,531 | |||||||||||||||
Research and development (IFRS) | -3,044 | -2,845 | -2,331 | -2,282 | -2,261 | |||||||||||||||
Research and development (in % of total revenue, IFRS) | 13.8 | 13.7 | 13.3 | 13.6 | 13.9 | |||||||||||||||
Research and development (in % of total operating expenses, IFRS) | 18.0 | 17.2 | 17.6 | 18.5 | 18.6 | |||||||||||||||
Sales and marketing (IFRS) | -6,265 | -5,782 | -4,593 | -4,131 | -3,912 | |||||||||||||||
General and administration (IFRS) | -1,005 | -1,048 | -892 | -866 | -949 | |||||||||||||||
Depreciation and amortization (IFRS) | -1,268 | -1,289 | -1,010 | -951 | -863 | |||||||||||||||
| Additional Information | Five-Year Summary | 250 |
Table of Contents
€ millions, unless otherwise stated | 2016 | 2015 | 2014 | 2013 | 2012 | |||||||||||||||
| Profits and Margins | ||||||||||||||||||||
Cloud subscriptions and support margin (in % of corresponding revenue, IFRS) | 56.1 | 55.3 | 55.8 | 54.8 | NA | |||||||||||||||
Cloud subscriptions and support margin (in % of corresponding revenue,non-IFRS) | 64.4 | 65.6 | 64.3 | 71.2 | NA | |||||||||||||||
Cloud and software margin (in % of corresponding revenue, IFRS) | 81.0 | 80.8 | 82.1 | 82.4 | 81.7 | |||||||||||||||
Cloud and software margin (in % of corresponding revenue,non-IFRS) | 83.7 | 83.8 | 84.6 | 85.2 | 85.0 | |||||||||||||||
Services margin (in % of corresponding revenue, IFRS) | 15.1 | 18.1 | 25.2 | 19.6 | 20.1 | |||||||||||||||
Services margin (in % of corresponding revenue,non-IFRS) | 18.2 | 22.7 | 29.0 | 23.5 | 23.9 | |||||||||||||||
Software and support gross margin (IFRS, in %) | 85.9 | 84.7 | 84.3 | NA | NA | |||||||||||||||
Software and support gross margin(non-IFRS, in %) | 87.4 | 86.6 | 86.3 | NA | NA | |||||||||||||||
Total gross margin (in % of total revenue, IFRS) | 70.2 | 70.0 | 71.6 | 70.1 | 68.7 | |||||||||||||||
Total gross margin (in % of total revenue,non-IFRS) | 72.9 | 73.3 | 74.3 | 73.1 | 72.2 | |||||||||||||||
Operating profit (IFRS) | 5,135 | 4,252 | 4,331 | 4,479 | 4,041 | |||||||||||||||
Non-IFRS adjustments | 1,498 | 2,095 | 1,307 | 1,003 | 1,150 | |||||||||||||||
Operating profit(non-IFRS) | 6,633 | 6,348 | 5,638 | 5,482 | 5,192 | |||||||||||||||
Operating margin (in % of total revenue, IFRS) | 23.3 | 20.5 | 24.7 | 26.6 | 24.9 | |||||||||||||||
Operating margin (in % of total revenue,non-IFRS) | 30.1 | 30.5 | 32.1 | 32.4 | 31.8 | |||||||||||||||
Financial income, net | -38 | -5 | -25 | -66 | -72 | |||||||||||||||
Profit before tax (PBT) | 4,863 | 3,991 | 4,355 | 4,396 | 3,796 | |||||||||||||||
PBT margin (in % of revenues) | 22 | 19 | 25 | 26 | 23 | |||||||||||||||
Income tax expense | -1,229 | -935 | -1,075 | -1,071 | -993 | |||||||||||||||
Profit after tax | 3,634 | 3,056 | 3,280 | 3,325 | 2,803 | |||||||||||||||
Effective tax rate (IFRS, in %) | 25.3 | 23.4 | 24.7 | 24.4 | 26.2 | |||||||||||||||
Effective tax rate(non-IFRS, in %) | 26.8 | 26.1 | 26.1 | 25.9 | 27.5 | |||||||||||||||
Return on equity (profit after tax in percentage of average equity) | 15 | 14 | 18 | 22 | 21 | |||||||||||||||
| Order Entry | ||||||||||||||||||||
New cloud bookings | 1,147 | 874 | 436 | NA | NA | |||||||||||||||
Deferred cloud subscriptions and support revenue (IFRS)7) | 1,271 | 957 | 689 | 443 | 317 | |||||||||||||||
Orders – Number ofon-premise software deals (in transactions) | 57,291 | 57,439 | 54,120 | 55,909 | 59,289 | |||||||||||||||
Share of software orders greater than € 5 million (in % of total software order entry) | 29 | 27 | 22 | 24 | 28 | |||||||||||||||
Share of software orders less than € 1 million (in % of total software order entry) | 38 | 40 | 44 | 44 | 43 | |||||||||||||||
| Non-IFRS Adjustments | ||||||||||||||||||||
Revenue adjustments | 5 | 11 | 19 | 82 | 81 | |||||||||||||||
Adjustment for acquisition-related charges | 680 | 738 | 562 | 555 | 537 | |||||||||||||||
Adjustment for share-based payment expenses | 785 | 724 | 290 | 327 | 522 | |||||||||||||||
Adjustment for restructuring | 28 | 621 | 126 | 70 | 8 | |||||||||||||||
Adjustment for TomorrowNow and Versata litigation | 0 | 0 | 309 | -31 | 0 | |||||||||||||||
| Segment results | ||||||||||||||||||||
Applications, Technology & Services Segment | ||||||||||||||||||||
Segment revenue | 19,920 | 18,963 | 16,734 | NA | NA | |||||||||||||||
Gross margin (in % of corresponding revenue) | 74 | 74 | 75 | NA | NA | |||||||||||||||
Segment profit | 8,031 | 7,723 | 6,946 | NA | NA | |||||||||||||||
Segment margin (Segment profit in % of Segment revenue) | 40 | 41 | 42 | NA | NA | |||||||||||||||
SAP Business Network Segment | ||||||||||||||||||||
Segment revenue | 1,925 | 1,616 | 647 | NA | NA | |||||||||||||||
Gross margin (in % of corresponding revenue) | 67 | 68 | 67 | NA | NA | |||||||||||||||
Segment profit | 338 | 317 | 105 | NA | NA | |||||||||||||||
Segment margin (Segment profit in % of Segment revenue) | 18 | 20 | 16 | NA | NA | |||||||||||||||
| Additional Information | Five-Year Summary | 251 |
Table of Contents
€ millions, unless otherwise stated | 2016 | 2015 | 2014 | 2013 | 2012 | |||||||||||||||
| Liquidity and cash flow | ||||||||||||||||||||
Net cash flows from operating activities | 4,628 | 3,638 | 3,499 | 3,832 | 3,822 | |||||||||||||||
Net cash flows from investing activities | -1,799 | -334 | -7,240 | -1,781 | -5,964 | |||||||||||||||
Net cash flows from financing activities | -2,705 | -3,356 | 4,298 | -1,589 | -194 | |||||||||||||||
Free cash flow | 3,627 | 3,001 | 2,762 | 3,266 | 3,281 | |||||||||||||||
Free cash flow in % of total revenue | 16 | 14 | 16 | 19 | 20 | |||||||||||||||
Cash conversion rate (net cash flows from operating activities in % of profit after tax) | 127 | 119 | 107 | 115 | 136 | |||||||||||||||
Cash and cash equivalents | 3,702 | 3,411 | 3,328 | 2,748 | 2,477 | |||||||||||||||
Short-term investments | 971 | 148 | 95 | 93 | 15 | |||||||||||||||
Group liquidity (cash and cash equivalents/short-term investments/restricted cash) | 4,673 | 3,559 | 3,423 | 2,841 | 2,492 | |||||||||||||||
Financial debts (due to banks, private placements, bonds) | 7,826 | 9,174 | 11,093 | 4,308 | 4,994 | |||||||||||||||
Net liquidity | -3,153 | -5,615 | -7,670 | -1,467 | -2,502 | |||||||||||||||
Days’ sales outstanding (DSO, in days) | 74 | 71 | 65 | 62 | 59 | |||||||||||||||
| Assets, equity and liabilities | ||||||||||||||||||||
Trade and other receivables | 6,050 | 5,362 | 4,443 | 3,962 | 4,006 | |||||||||||||||
Total current assets | 11,564 | 9,739 | 8,999 | 7,351 | 6,928 | |||||||||||||||
Goodwill | 23,311 | 22,689 | 21,000 | 13,690 | 13,192 | |||||||||||||||
Totalnon-current assets | 32,713 | 31,651 | 29,566 | 19,739 | 19,378 | |||||||||||||||
Total current liabilities (including deferred income) | 9,674 | 7,867 | 8,574 | 6,347 | 6,546 | |||||||||||||||
Totalnon-current liabilities (including deferred income) | 8,205 | 10,228 | 10,457 | 4,695 | 5,627 | |||||||||||||||
Total equity (includingnon-controlling interests) | 26,397 | 23,295 | 19,534 | 16,048 | 14,133 | |||||||||||||||
Total assets | 44,277 | 41,390 | 38,565 | 27,091 | 26,306 | |||||||||||||||
Equity ratio (total equity in % of total assets) | 60 | 56 | 51 | 59 | 54 | |||||||||||||||
Debt ratio (total liabilities2) in % of total assets) | 40 | 44 | 49 | 41 | 46 | |||||||||||||||
Investments in goodwill, intangible assets or property, plant, and equipment (including capitalizations due to acquisitions) | 1,145 | 676 | 8,636 | 1,813 | 6,939 | |||||||||||||||
| Key SAP Stock Facts | ||||||||||||||||||||
Issued shares7) (in millions) | 1,229 | 1,229 | 1,229 | 1,229 | 1,229 | |||||||||||||||
Earnings per share, basic (in €) | 3.04 | 2.56 | 2.75 | 2.79 | 2.35 | |||||||||||||||
Earnings per share, basic(non-IFRS, in €) | 3.90 | 3.77 | 3.50 | 3.35 | 3.01 | |||||||||||||||
Earnings per share, diluted (in €) | 3.04 | 2.56 | 2.74 | 2.78 | 2.35 | |||||||||||||||
Dividend per share3)(in €) | 1.25 | 1.15 | 1.10 | 1.00 | 0.85 | |||||||||||||||
Total dividend distributed3) | 1,498 | 1,378 | 1,315 | 1,194 | 1,013 | |||||||||||||||
Total dividend distributed in % of profit after tax3) | 41 | 45 | 40 | 36 | 36 | |||||||||||||||
SAP share price7) (in €) | 82.81 | 73.38 | 58.26 | 62.31 | 60.69 | |||||||||||||||
SAP share price – peak (in €) | 82.81 | 74.85 | 62.55 | 64.80 | 61.43 | |||||||||||||||
SAP share price – low (in €) | 64.90 | 54.53 | 50.90 | 52.20 | 41.45 | |||||||||||||||
Market capitalization7) (in € billions) | 101.73 | 90.18 | 71.60 | 76.50 | 74.70 | |||||||||||||||
Return on SAP shares4) 1-year investment period (in %) | 14.70 | 25.87 | -4.80 | 4.20 | 52.10 | |||||||||||||||
Return on SAP shares4) 5-year investment period (in %) | 17.30 | 13.99 | 13.90 | 21.80 | 13.10 | |||||||||||||||
Return on SAP shares4) 10-year investment period (in %) | 9.20 | 6.72 | 7.40 | 7.90 | 13.80 | |||||||||||||||
| Additional Information | Five-Year Summary | 252 |
Table of Contents
€ millions, unless otherwise stated | 2016 | 2015 | 2014 | 2013 | 2012 | |||||||||||||||
| Employees and personnel expenses | ||||||||||||||||||||
Number of employees5), 7) | 84,183 | 76,986 | 74,406 | 66,572 | 64,422 | |||||||||||||||
Number of employees, annual average5) | 80,609 | 75,180 | 68,343 | 65,409 | 61,134 | |||||||||||||||
Number of employees in research and development5), 7) | 23,363 | 20,938 | 18,908 | 17,804 | 18,012 | |||||||||||||||
Personnel expenses | 10,229 | 10,170 | 7,877 | 7,489 | 7,286 | |||||||||||||||
Personnel expenses – excluding share-based payments | 9,444 | 9,446 | 7,587 | 7,162 | 6,764 | |||||||||||||||
Personnel expenses per employee – excluding share-based payments (in € thousands) | 117 | 126 | 111 | 109 | 111 | |||||||||||||||
Operating profit per employee (in € thousands) | 64 | 57 | 63 | 68 | 66 | |||||||||||||||
Women working at SAP (in %) | 32 | 31 | 31 | 31 | 30 | |||||||||||||||
Women in management7) (total, in % of total number of employees) | 24.5 | 23.6 | 21.3 | 21.2 | 20.8 | |||||||||||||||
Women managing managers6), 7) (in %) | 20.8 | 19.2 | 15.9 | 14.3 | 14.5 | |||||||||||||||
Women managing teams6), 7) (in %) | 25.9 | 25.3 | 23.3 | 21.7 | 21.1 | |||||||||||||||
Employee Engagement Index (in %) | 85 | 82 | 79 | 77 | 79 | |||||||||||||||
Business Health Culture Index10) (BHCI, in %) | 78 | 75 | 72 | 67 | 66 | |||||||||||||||
Leadership Trust Index (LTI, in %) | 57 | 52 | 47 | 29 | NA | |||||||||||||||
Employee retention (in %) | 93.7 | 91.8 | 93.5 | 93.5 | 94.0 | |||||||||||||||
Total turnover rate (in %) | 8 | 11 | 9 | 8 | 7 | |||||||||||||||
| Customer | ||||||||||||||||||||
Customer Net Promoter Score9) (in %) | 19.2 | 22.4 | 19.1 | 12.1 | 8.9 | |||||||||||||||
| Environment | ||||||||||||||||||||
Net Greenhouse gas emissions (in kilotons) | 380 | 455 | 500 | 545 | 485 | |||||||||||||||
Greenhouse gas emissions per employee5) (in tons) | 4.7 | 6.0 | 7.3 | 8.3 | 7.9 | |||||||||||||||
Greenhouse gas emissions per € revenue (in grams) | 17.3 | 21.9 | 28.4 | 32.4 | 30.0 | |||||||||||||||
Total energy consumption (in GWh) | 950 | 965 | 920 | 910 | 860 | |||||||||||||||
Energy consumed per employee5) (in kWh) | 11,800 | 12,500 | 13,400 | 13,900 | 14,000 | |||||||||||||||
Data center energy consumed (in GWh) | 243 | 249 | 179 | 173 | 160 | |||||||||||||||
Data center energy per € revenue8) (in kWh) | 11 | 12 | 10 | NA | NA | |||||||||||||||
Renewable energy sourced (in %) | 100 | 100 | 100 | 43 | 51 | |||||||||||||||
| 1) | SAP Group. Amounts for 2012 to 2016 according to IFRS, unless otherwise stated. |
| 2) | As sum of current andnon-current liability. |
| 3) | Numbers are based on the proposed dividend and on level of treasury stock atyear-end. |
| 4) | Average Annual Return. Assuming all dividends are reinvested. |
| 5) | Full-time equivalents. |
| 6) | Relates to different levels of management position. |
| 7) | Numbers based on atyear-end. |
| 8) | Data center energy consumption normalized against € revenue combines a relative measure of required energy to develop and operate solution in internal and external data center. |
| 9) | Due to changes in sampling, the 2015 Customer NPS is not fully comparable to the prior year’s score. |
| 10) | The BHCI score for 2014 was recalculated from 70% to 72% based on two updated questions in the people survey concerning work-life balance. |
| Additional Information | Five-Year Summary | 253 |
Table of Contents
A
Africa Code Week –SAP-led corporate social responsibility initiative initiated in 2015 in cooperation with partners. Planned as an annual event, children in African countries where SAP has a market are introduced to computer programming to increase awareness of, and interest in, the software development career field. The initiative has been extended to other participant groups, including an innovative Refugee Code Week in 2016.
analytics – Discovery and communication of meaningful patterns in data. It is applied to business data to describe, predict, and improve business performance; recommend action; and guide decision making across all organizations and functions in a company. Analytics helps companies gain new insight and understanding of their business performance based on data and statistical methods. See “analytics solutions from SAP.”
analytics solutions from SAP – See “SAP BusinessObjects Analytics.”
application – Software that enables organizations to address specific business needs and to perform certain business processes or activities. An application may comprise one software product or multiple software products, components, or instances.
Ariba – See “SAP Ariba.”
Ariba Network – Business commerce network where companies of all sizes can connect to their trading partners anywhere, at any time from any application or device to buy, sell, and manage their cash more efficiently and effectively than ever before. Companies around the world use the Ariba Network to simplify interenterprise commerce and enhance the results they deliver. See “business network.”
B
best practice – A management concept that involves devising a method of process that most effectively produces a desired outcome. SAP applications use business best practices to help customers automate common business processes through software and technology. See “SAP Best Practices.”
Big Data – The large volume of data created by billions of connected devices and people generating a tremendous amount of information about their behavior, location, and activity. This availability of massive amounts of data requires companies to rethink technology architecture and database structures.
Business Health Culture Index – A score for the general cultural conditions in an organization that enable employees to stay healthy and balanced. The index is calculated based on the results of regular employee surveys.
business intelligence (BI) – Software that enables users to analyze an organization’s raw data and make fact-based decisions.BI-related processes include data mining, analytical processing, querying, and reporting. Business intelligence offerings from SAP include SAP BusinessObjects BI solutions, SAP Crystal Reports, SAP BusinessObjects Dashboards, and SAP BusinessObjects Lumira, as well as the SAP BusinessObjects BI platform.
business network – An online service that connects businesses and their systems to those of their trading partners and enables new processes and information and insight sharing only possible in a digital environment. See “Ariba Network.”
business process – Set of logically related activities performed within an organization to complete a defined business task. SAP provides software and technology that enable and support business processes. Order processing and payroll are typical examples.
business user – Employees who spend significant time finding and sharing information, collaborating with others, coordinating projects, devising strategy or operational tactics, and coming up with new ideas based on information gathered from multiple sources. Also called knowledge or information workers or business consumers.
C
carbon credit – A tradable certificate that allows the holder to emit one ton of CO2 or the respective equivalent of any other greenhouse gas.
carbon neutral – A goal or state of emitting net zero greenhouse gases for certain activities. This includes reducing emissions, but also using renewable electricity certificates or carbon credits.
carbon offset or greenhouse gas (GHG) offset – A unit of carbon dioxide-equivalent (CO2 equivalent) that is reduced, avoided, or sequestered to compensate for emissions occurring elsewhere.
cloud computing – Generic term for flexible,IT-related services available through, or hosted on, the Internet for consumers and business, including storage, computing power, software development environments, and applications, combined with service delivery. Accessed as needed “in the cloud,” these services eliminate the need forin-house IT resources. See “cloud service model.”
cloud deployment models – The different infrastructure, software lifecycle management, and licensing models used for deploying software, that is, where the software is running and how much control and flexibility a customer has.
cloud service model –“As-a-service” offerings where cloud services are offered as infrastructure as a service (IaaS), platform as a service (PaaS), or software as a service (SaaS).
| Additional Information | Glossary | 254 |
Table of Contents
cloud solutions from SAP – Category used to communicate all of cloud software related to the cloud, including platform, managed services, solutions, technology, and infrastructure, public cloud applications, managed cloud applications delivered via SAP HANA Enterprise Cloud, and SAP Cloud Platform. It includes offerings branded with SAP, SAP SuccessFactors, and SAP Ariba solutions, among others. It can be used in conjunction with the messaging statement “SAP Cloud powered by SAP HANA.”
component – Modular piece of software offering functions accessible via interfaces.
Concur Technologies – Acquired by SAP in 2014, this travel and expense management company helps customers manage business resources, processes, and spend through the world’s largest business network in the cloud for comprehensive travel and expense management. The Concur platform offers an integrated system for expense, invoice, travel, and spend intelligence in the cloud.
connectivity – A framework which describes the interrelatedness of SAP’s social, environmental, and economic performance. Based on statistical analysis, it allows us to quantify the impact ofnon-financial measures on the operating profit offering a holistic understanding of SAP’s value creation.
corporate social responsibility – SAP’s corporate social responsibility (CSR) program is about how the company creates social impact for people, both inside and outside SAP, to help make society more sustainable and the world run better.
customer engagement lifecycle – Model that provides an integrated framework of practices to help create and deliver customer value. The phases of the customer engagement lifecycle represent the common route followed by the SAP and the customer teams in the process of identifying, delivering, operating, and managing solutions that best fit the customer’s needs.
Customer Net Promoter Score (NPS) – Describes the willingness of customers to recommend or promote an organization or company to others. It is defined as the percentage of customers that are likely to recommend an organization or company to friends or colleagues (promoters) minus the percentage of customers that are unlikely to do so.
D
data center – A physical facility used to house computer systems and associated components.
data center energy – The amount of energy consumed in SAP’s own and external data centers. An external data center is a local computing center with server units running SAP software that is operated by an external partner.
data warehouse – An electronic collection of information organized for easy access by computer programs.
design thinking – A methodology for routine innovation that brings together the right side of the brain (creative) with the left side of the brain (analytical).
digital core – An integrated system that enables customers to predict, simulate, plan, and even anticipate future business outcomes in a digital economy. This digital core is realized by SAP through SAP S/4HANA, providing the framework that allows customers to run an entire enterprise in the cloud – such as finance, procurement, sales, inventory management, project system, and product lifecycle management. In this way, companies can achieve the real-time visibility they need into all mission-critical business processes and processes around their customers, suppliers, workforce, Big Data, and the Internet of Things.
digital transformation – Concept that refers to the changes associated with the application of digital technology in all aspects of society. Digital technologies empower customers and consumers in a way they never could before, transforming their relationship with brands and products. Businesses need to meet these new challenges or will miss the potential business success to be realized in the digital economy.
E
ecosystem – Construct encompassing SAP and its customers and partners that extends the value SAP provides to its customers. By bringing together community-based insight, innovative partner solutions, and industry-leading collaboration andco-innovation, it enables customers to extract the greatest possible value from their SAP investments.
electronic waste(e-waste) – Electronic products that are discarded by consumers or companies, such as computers, computer monitors, or mobile devices.
Employee Engagement Index – A score for the level of employee commitment, pride, and loyalty, as well as the feeling of employees of being advocates for their company. The index is calculated based on the results of regular employee surveys.
employee retention – The ratio of the average headcount (expressed in full-time equivalents/FTEs) minus employee-initiated terminations (turnover) divided by the average headcount, taking into account the past 12 months.
end-to-end process – Set of activities supporting defined management, core, or support processes. Customers can use these activities as a reference to map their own processes.
| Additional Information | Glossary | 255 |
Table of Contents
end-to-end solution – Software solution that drives strategic business outcomes and directly contribute to a business priority in an industry, line of business, or technology area. These solutions are structured into solution capabilities that comprise a number of individual software products, instances, and/or license materials.End-to-end solutions provide a business scope with a comprehensive value proposition.
enterprise mobility – Term used in business and industry to refer to the concept and approach to making a business mobile where employees can perform business-related tasks through mobile devices. At SAP, we use “enterprise mobility” as our umbrella term for an overall mobile strategy.
enterprise resource planning – See “SAP ERP.”
environmental impact – A positive or negative change to the natural environment.
F
Fieldglass – Company acquired by SAP in May 2014 and fully integrated in SAP. Our solutions for contingent workforce management are marketed under the SAP Fieldglass brand. See “SAP Fieldglass.”
G
greenhouse gas footprint – The sum of all greenhouse gas emissions measured and reported, including renewable energy and third-party reductions, for example, offsets.
H
Hadoop – Part of the Apache project sponsored by the Apache Software Foundation, this open source, Java-based programming framework supports the processing of large data sets in a distributed computing environment. As open source technology, Hadoop is an efficient distributed file system that enables the analysis and processing of very large volumes of data from a great number of varied, structured, and unstructured sources. SAP Distribution for Hadoop software provides redistribution of Apache Hadoop developed by Hortonworks.
Hasso Plattner Founders’ Award – Introduced in 2014, an employee award that signifies the highest employee recognition at SAP, awarded annually by the CEO to an individual or a team.
How We Run – SAP’s set of corporate values that sets behaviors that describe what makes SAP unique.
hybrid cloud – Deployment model that uses resources comprised of a mix of two or more distinct cloud deployment models that are integrated by standardized or proprietary technology enabling data and application portability. Also called “hybrid cloud deployment model.”
hybrid landscape – A mix ofon-premise and any cloud deployment model(s). Alternatively referred to as an “on premise to cloud” or “hybrid environment.”
hybris – See “SAP Hybris.”
I
industry – An economic sector characterized by a typical value chain, business processes, and set of products and services that the companies operating in it have in common. At SAP, “industries” is also used as a term to differentiate betweenlines-of-business functions such as marketing, procurement, and finance, and those functions specific to an industry.
industry portfolios – Software portfolios that address the business needs of 25 different industries.
infrastructure as a service (IaaS) – Processing, storage, network, other computing resources and typically a defined level of support for consumers to deploy software (such as operating systems and applications). IaaS consumers do not manage underlying cloud infrastructure but may control networking components (such as host firewalls).
in-memory computing – A major advance in information technology that creates a dramatic change in computing, analytics, and data storage. Combining advances in multicore processing with more affordable servers,in-memory computing allows information to be stored in the main memory rather than in relational databases to greatly accelerate processing times. It disrupts the traditional IT stack comprised of hardware, middleware, and software, where disk-based relational databases can become bottlenecks.
in-memory database – Database that keeps all active records in main memory rather than on disk. Accessingin-memory records is considerably faster than retrieving them from the disk, significantly increasing performance. SAP HANA is SAP’s groundbreaking database that allows businesses to take advantage ofin-memory computing. See “SAP HANA.”.
K
key performance indicator (KPI) – Performance figure for which threshold values are defined and against which validation is executed.
L
Leadership Trust Score – Based on the Net Promoter Score (NPS) methodology that results from a question in our annual global employee survey that gauges employees’ trust in our leaders. It measures our collective effort to foster a work environment based on trust. We use this scoreto further enhance accountability for our leaders and executive management.
| Additional Information | Glossary | 256 |
Table of Contents
lean – Set of manufacturing principles that first defines customer value, then reorganizes every step required to design, order, build, deliver, and maintain this value across all the organizations and units. As a result, firms can do more with less, respond more quickly to customer needs, create jobs that are more rewarding for employees, and reduce their impact on the environment.
line of business (LoB) – Internal organizational area or business unit in a company (division) that combines all responsibilities for a particular product, group, or set of processes. Examples include sales, purchasing, human resources, finance, marketing, and so on. A line of business is a typical high-level business capability in a company.
line-of-business portfolios – SAP offers software portfolios that address the needs of organizations in 12 lines of business, or functional areas. The following solution portfolios are currently available: SAP for Asset Management, SAP for Commerce, SAP for Finance, SAP for Human Resources, SAP for Manufacturing, SAP for Marketing, SAP for R&D/Engineering, SAP for Sales, SAP for Service, SAP for Sourcing and Procurement, SAP for Supply Chain Management, and SAP for Sustainability.
Live Business – SAP’s campaign platform that refers to our vision of a seamless digital business that enables our customers to Run Simple by sensing, responding to, learning from, adapting to, and predicting business data in real time.
M
machine learning – Technology that enables computers to learn from large amounts of data without being explicitly programmed. SAP Clea is the new name given to the SAP portfolio of offerings including machine learning technology. See “SAP Clea.”
maintenance – Software support comprising support for legal changes and corrections delivered through the SAP Notes tool, support packages, problem support, and access to information and online service channels – depending on the maintenance phase.
managed cloud – Deployment model that implies resources are dedicated to one customer and accessed through a VPN. The infrastructure is owned, managed, and operated by the cloud provider in the cloud provider’s data center. SAP HANA Enterprise Cloud is SAP’s managed cloud service.
mobile apps – Applications for mobile devices available for download, demo, and purchase on SAP Store, App Store, and other online stores. Mobile apps are categorized as either business/product in focus or as consumer-focused. At SAP, our mobile apps are task-oriented or allow access to existingon-premise software.
O
on premise – A deployment model where a software license is purchased and deployed on the servers at the premises of the customer. The customer manages and controls the software.
open source – Software based on the concept of software developers coming together to build a virtual community and solving a common problem by developing working software that everyone has a right to change. Successful development projects under the open source model include Linux – a free operating system supported by SAP.
P
People Survey – SAP’s annual employee survey that allows employees to provide feedback about issues that impact them.
platform as a service (PaaS) – Cloud infrastructure, operating system, programming languages, libraries, services, tools and typically a defined level of support for consumers to deploy consumer-created or acquired applications. PaaS consumers do not manage underlying cloud infrastructure but have control over deployed applications.
powered by SAP HANA – An SAP offering powered by SAP HANA runs on the SAP HANA platform. More than 100 SAP applications are currently “powered by SAP HANA.” Partner solutions or applications that are powered by SAP HANA are certified by SAP to run on the SAP HANA platform. These applications take advantage of distinctive capabilities of SAP HANA to deliver key benefits, such as simpler administration, reduced overhead, and better business intelligence over conventional traditional technology platforms.
private cloud – Deployment model that implies resources are dedicated to one customer and accessed through the Internet. The infrastructure is owned, managed and operated by the customer, a third-party, or both, and is on the premises of the customer, cloud provider, or a third party. SAP indicates private cloud deployments using the term “private option.”
product – A high-levelnon-versioned software offering that contains functionality and business logic to address a business need. An individual software product comprises software product versions.
product footprint – The environmental impact of products, processes, or services by production, usage, and disposal.
public cloud – Provides consumers access to a provider’s software applications running on a cloud infrastructure. The resources are located on the premises of the cloud provider, not of the customer, and are shared by multiple customers accessing them through the Internet.
R
release – SAP software product that has a version number, is shipped at a particular time, and has defined maintenance phases.
| Additional Information | Glossary | 257 |
Table of Contents
renewable energy – The shares and types of electricity obtained from renewable sources such as hydro, wind, solar, geothermal, and biomass. It is calculated by adding the amount of renewable energy specifically sourced, producedon-site by our own solar cells and covered by Renewable Energy Certificates (RECs).
road map – Product timeline that has a variety of objectives, including communication to customers, users, or other parties interested in the timing of future product releases; the features planned for those releases; general prioritization of features; and in some cases, the requirements of features in enough detail that current and prospective customers can give feedback on the feature itself and the product’s direction.
Run Simple – SAP’s operating principle that refers to how SAP solutions and services help SAP customers run at their best by addressing complexity and innovating for future growth as well as how SAP can radically simplify the way business is conducted.
S
SAP Activate – Innovation adoption framework introduced for SAP S/4HANA that combines SAP Best Practices, methodology, and guided configuration delivered with a reference landscape. The SAP Activate methodology is the SAP guidance for implementation, enhancements, upgrades, orco-innovation of SAP solutions starting with SAP S/4HANA. It enables cost-effective, agile, and fast delivery of the SAP solution to the customer and supports deployments in the cloud, on premise, or in hybrid deployment.
SAP ActiveEmbedded – Enhanced engagement services for optimizing solutions and accelerating adoption of technologies without disrupting customer businesses
SAP Anywhere – An HTML5 solution that runs in the cloud designed for smaller companies with up to 50 employees that need a seamless and affordable way to manage their customer interactions in a single front-office system. Accessible through a Web browser on a desktop, laptop, or mobile device, it delivers a consistent customer experience with the seamless integration of marketing, sales, and commerce activities. See also “SAP SME Solutions.”
SAP Ariba – Category of offerings resulting from the acquisition of Ariba in October 2012. All cloud-related supplier assets of SAP and Ariba are now consolidated under the SAP Ariba brand. SAP Ariba solutions include those for procurement, financials, and sourcing, as well as the Ariba Network.
SAP Best Practices – Packages that provide proven methods and tools for organizations to implement best business practices in key areas and a range of industries using SAP software. The packages deliver methodology, documentation, and preconfiguration that enable rapid, reliable deployment with quick return on investment.
SAP Business ByDesign – Adaptable, cloud-based business management solution delivered in the cloud, ideally suited for growing midsize companies as well as for subsidiaries of larger corporations. It is a complete, integrated suite that can run an entire enterprise – financials, human resources, sales, procurement, customer service, and supply chain. The latest versions enable partners and customers to extend the system capabilities or build cloud-based applications using SAP Business ByDesign Studio.
SAP BusinessObjects Analytics – Connotes all of SAP’son-premise software solutions that help customers achieve the power of collective insight in Big Data by empowering them with the right information at the right time to make insightful business decisions, anticipate change, and uncover new opportunities. SAP BusinessObjects Analytics solutions cover the areas of business intelligence, enterprise performance management, and governance, risk, and compliance. Formerly called analytics solutions from SAP.
SAP BusinessObjects Cloud – A single solution encompassing analytics capabilities offered by SAP in the cloud including what was previously available in SAP Cloud for Planning. These capabilities, together with additional planning and analysis capabilities, have been integrated into this offering. SAP BusinessObjects Cloud is software as a service (SaaS) built natively on SAP Cloud Platform that provides all analytics capabilities for all users in one product. Customers are able to subscribe to SAP BusinessObjects Cloud as a single solution with specific capabilities that can be licensed separately or together. Formerly called SAP Cloud for Analytics.
SAP Business One – Application designed especially for small businesses with up to 100 employees, providing a single, integrated solution for managing the entire business across financials, sales, customer relationships, purchasing, inventory, analytics, and operations.
SAP BW/4HANA – SAP’s next-generation data warehouse solution built entirely on SAP HANA. It provides a simple set of objects that is well suited for modelling an agile and flexible layered architecture of a modern data warehouse. SAP BW/4HANA manages data from SAP applications or other systems, structured or unstructured, and allows accessing all models through an open SQL interface. SAP BW/4HANA comes withstate-of-the-art user interfaces for administrators, developers, and end users as well as processes optimized for SAP HANA that leverages huge amounts of data in real time for competitive advantage. It is not a legal successor of any SAP BW solution.
SAP Clea – The new name and solution/technology brand for the SAP portfolio of offerings that include machine learning technology. Current applications include SAP Clea for Resume Matching; SAP Clea for Cash Application; SAP Clea for Service Ticket Intelligence; SAP Clea for Brand Intelligence; and SAP Clea for Customer Management Insights.
SAP Cloud for Planning – See “SAP BusinessObjects Cloud.”
SAP Cloud Platform – An open cloud platform that is the foundation for running applications and analytics today and allows developers to build custom applications in the cloud as either stand-alone or connected toon-premise solutions. It includes infrastructure, application, and
| Additional Information | Glossary | 258 |
Table of Contents
database services in a subscription model. Separately licensed, it is part of SAP Cloud powered by SAP HANA. Formerly called SAP HANA Cloud Platform.
SAP Cloud Platform Big Data Service – Standalone Big Data solution that combines SAP Cloud Platform technology with Apache Hadoop, Apache Spark, Apache Hive, and Apache Pig. The offering provides servers, networking, and software configured for performance, reliability, and security to ease the process of procuring and provisioning hardware, installing and configuring Hadoop, integrating in other tools, and managing clusters in production. Formerly called Altiscale Data Cloud before SAP acquired the company Altiscale.
SAP Cloud Platform Integration – Technology that integrates cloud applications withon-premise solutions from SAP and other vendors. Based on a multitenant cloud infrastructure, it allows customers to unite business processes and data in a secure, reliable environment. Formerly SAP HANA Cloud Integration.
SAP Cloud powered by SAP HANA – Messaging statement that refers to all of SAP offerings related to the cloud, including platforms, services, applications, technology, and infrastructure. It is not the name of a single offering or a category of solutions. SAP Cloud always refers to more than just the software and technology, but our approach to become “the innovative cloud company powered by SAP HANA.” See “cloud solutions from SAP.”
SAP Community Network – Online portal with nearly two million members in more than 200 countries, providing individuals with the opportunity to trade experience and insights, pursue business opportunities, and learn from each other. SAP offers distinct communities in the network that offer information, trusted resources, andco-innovation.
SAP Enterprise Support – Services that provide proactive support in addition to all features of SAP Standard Support services. These proactive support services encompass tools, processes, and services that enable continuous improvement, holistic application lifecycle management for continuous innovation, business and operational process improvements, and levers to address the total cost of operation (TCO).
SAP ERP – Application designed to optimize business and IT processes by reducing IT complexity, increasing adaptability, and delivering more IT value at a lower cost than traditional ERP solutions. It can support mission-critical,end-to-end business processes for finance, human capital management, asset management, sales, procurement, and other essential corporate functions. SAP ERP can also support industry-specific processes by providing industry-specific business functions that can be activated selectively via the switch framework, keeping the application core stable and helping ensure maximum performance.
SAP Fiori user experience (UX) – As of May 2014, SAP Fiori UX is the user experience for SAP software. Based on modern design principles, it represents a consumer-like, consistent experience across devices, including tablets and smartphones.
SAP for Aerospace & Defense (SAP for A&D) – Solution portfolio specifically designed to meet the needs of the aerospace and defense industry. It offers capabilities for maintenance, repair and overhaul, airline operations, defense, manufacturing, contract and program management, and business acquisitions.
SAP for Automotive – Solution portfolio designed to meet the specific needs of the automotive industry. Its capabilities help link complex business processes into a logical flow, maximizing efficiency and profitability and satisfying customers’ expectations.
SAP for Banking – Solution portfolio that enables banks to obtain all customer information at a glance and offers a full complement of high-performance capabilities for strategic planning, financial accounting, costing, and enterprise-wide control. It also features key industry-specific applications for profitability management, risk management, customer relationship management, and integrated customer account systems.
SAP for Chemicals – Solution portfolio that delivers support for specific processes and tools that chemical companies require. Industry-specific capabilities include recipe management, batch management, and version control.
SAP for Consumer Products – Solution portfolio that supports the integration of every step of the consumer product value chain – from suppliers to consumers. Key capabilities include mobile and Internet sales, trade promotion management, inventory management, brand and channel management, and demand signal management.
SAP for Defense & Security – Solution portfolio that offers a variety of capabilities that meet the critical needs of the defense and security sector. Key industry-specific capabilities include acquisition and materials management; force planning; maintenance, repair, and overhaul (MRO); personnel and organization; infrastructure management; planning and support for deployed operations;in-service support; and line maintenance.
SAP for Engineering, Construction & Operations (SAP for EC&O) – Solution portfolio designed to meet the specific requirements of project-oriented enterprises that offers capabilities for industrial plant construction, construction of commercial and private buildings, and shipbuilding.
SAP for Healthcare – Solution portfolio for hospitals and clinics to manage a variety of required administrative and clinical processes.
SAP for Higher Education and Research (SAP for HE&R) – Solution portfolio that supports organizational processes and unique needs of public and private universities, multicampus institutions, research agencies, and medical colleges, including campus management, grants management, student lifecycle management, financials, operations, human capital management, procurement, analytics, research, and asset management.
| Additional Information | Glossary | 259 |
Table of Contents
��
SAP for High Tech – Solution portfolio that meets the demands of high-tech industries, including RosettaNet support.
SAP for Industrial Machinery & Components (SAP for IM&C) – Solution portfolio that coordinates the entire scope of business activities (estimating, order entry, project management, and production planning) for the industrial sector and supports areas ranging from maintenance and services to billing and profitability analysis.
SAP for Insurance – Solution portfolio that integrates steps in the insurance business process, including capabilities for customer contact, policy and product management, collections and disbursement, and claims management.
SAP for Life Sciences – Solution portfolio that meets the requirements of pharmaceutical, biotechnology, and diagnostics companies, as well as manufacturers of medical devices and products.
SAP for Media – Solution portfolio that supports processes specific to the media industry with capabilities that include sales and distribution, advertising management, product development, and intellectual property management.
SAP for Mill Products – Solution portfolio for manufacturers of building materials, the paper and timber industry, metal and primary metal producers, and textile and furniture manufacturers.
SAP for Mining – Solution portfolio that supports processes specific to the mining industry, including mining operations and asset performance; sales and supply chain management; operational risk and compliance; as well as human resources; finance; procurement; and IT management.
SAP for Oil & Gas (SAP for O&G) – Solution portfolio that meets the demands of oil and gas companies of all sizes.
SAP for Professional Services – Solution portfolio that delivers integrated tools, best practices, and support for automated processes designed specifically for the demands of the professional services industry, including management consultancies as well as accounting and legal firms.
SAP for Public Sector – Solution portfolio for public administration, providing an electronic framework that enables online communication through various applications for the public, government authorities, and related entities.
SAP for Retail – Solution portfolio that offers multichannel applications designed specifically to provide the best retail services to a large customer base.
SAP for Sports & Entertainment – Solution portfolio that comprises solutions for sports teams, leagues, and venues, designed to help them deepen fan engagement, driveon-field performance, and optimize business efficiency.
SAP for Telecommunications – Solution portfolio that provides telecommunications enterprises of all types and sizes a range of industry-specific capabilities, including support for convergent invoicing and contract accounting.
SAP for Transportation & Logistics – Solution portfolio that covers the unique business needs of postal services, railways, airlines, and toll collection companies, as well as logistics service providers, to optimize supply chain and planning.
SAP for Utilities – Solution portfolio for all supply and energy industries, with capabilities ranging from call centers and Internet communications to consumption billing.
SAP for Wholesale Distribution – Solution portfolio that addresses the needs of midsize and large wholesale distribution businesses in a wide range of segments. Industry-specific capabilities support new business models and strategies that meet the needs of an important supply sector.
SAP HANA – Flexible, data-agnostic,in-memory platform that helps organizations analyze their business operations, using huge volumes of detailed transactional and analytic information from virtually any data source. The platform provides the foundation for innovative applications that take advantage of anin-memory database and calculation engine, allowing customers to conduct complex planning, forecasting, and simulation based on real-time data. Software products built for SAP HANA have been specifically designed or at least adapted to take advantage of the enhanced capabilities of the SAP HANA platform.
SAP HANA Enterprise Cloud – This service enables customers to access solutions in the cloud. It contains managed cloud applications,in-memory infrastructure, managed services, and SAP Cloud Platform through an additional license, to build custom applications in the cloud.On-premise applications from SAP can be delivered to customers via SAP HANA Enterprise Cloud.
SAP HANA Vora – Anin-memory, massively distributed data processing engine for Hadoop that provides simple business-orientedscale-out processing of data. This engine allows distributed Hadoop data to be analyzed together with enterprise data using the SAP HANA platform.
SAP Hybris – Unified brand resulting from the acquisition of hybris in August 2013. Alle-commerce solutions from SAP and hybris are now consolidated under the SAP Hybris brand. SAP Hybris solutions help businesses sell more goods, services, and digital content through every touch point, channel, and device.
SAP Hybris Cloud for Customer – A cloud-based offering of CRM applications and tools developed for sales, service, and marketing teams that provides an overview of yourend-to-end business, as well as deep customer insight and personalized engagement, so that they can deliver a relevant experience at every step of your customer’s journey. It also offersdesigned-in social collaboration to help transform social
| Additional Information |Glossary | 260 |
Table of Contents
media conversations into business insight. The offering currently includes SAP Hybris Cloud for Sales, SAP Hybris Cloud for Service, SAP Hybris Marketing Cloud, and SAP Hybris Cloud for Social Engagement solutions. An Edge edition is available for small and midsize enterprises.
SAP Hybris Commerce – A solution that offers customers a platform enabled for the cloud that supports product content management and unified commerce processes. It gives a business a single view of its customers, products, and orders, and its customers a single view of the business. It combines functionality. Formerly available in two separate solutions, SAP hybris B2B Commerce and SAP hybris B2C Commerce, which were combined in April 2015.
SAP.io – SAP’s startup incubation engine and related program that helps innovators inside and outside of SAP build products, find customers, and ultimately change industries. The SAP.io team works with the best entrepreneurs, developers, designers, and data scientists to upend how business works.
SAP Leonardo – The new SAP brand for our new innovative portfolio for Internet of Things (IoT) solutions. SAP Leonardo IoT solutions enable companies to not only realize a digital transformation of existingend-to-end business processes, but also allows them to adopt new business models to run digitally. It extends digital core with adaptive applications, Big Data applications, and connectivity to enable new business processes, new business models, and new work environments.
SAP Month of Service – Held annually in October, SAP’s signature corporate volunteerism effort offers SAP employees around the world opportunities to come together to support social change in their communities.
SAP NetWeaver – A comprehensive technology platform designed to efficiently develop, run, and extend business applications. SAP NetWeaver provides foundation and enterprise software, including the SAP Business Warehouse application, and the SAP NetWeaver Application Server, SAP Enterprise Portal, and SAP Process Orchestration components. It facilitates the easy integration of SAP software with heterogeneous system environments, third-party solutions, and external business partners. See “technology platform.”
SAP PartnerEdge – Global,partner-to-partner business collaboration network where SAP partners can share expertise, development capabilities, solutions, and knowledge to extend their market reach. In late 2012, SAP’s extranet for partners, SAP Channel Partner Portal, merged with SAP PartnerEdge. The combined site, available at www.sappartneredge.com now gives partners access to information, product and business news, tools, training, and business resources to order products. Partners can also manage their relationship with SAP and collaborate with other SAP partners through SAP PartnerEdge.
SAP Payment service – Service that helps companies invest in SAP solutions implemented by a strategic partner of SAP: Siemens Financial Services GmbH (SFS). SFS targets the financing service chiefly at midsize companies. Depending on local conditions, the SFS plan leases solutions to customers and provides loan finance. Formerly called SAP Financing service.
SAPPHIRE NOW – SAP’s signature business technology event and the largest SAP customer-driven conference is held annually in several locations around the globe. The global event in the United States isco-located with the Americas’ SAP Users’ Group (ASUG) annual conference. Attendees discover new initiatives, solutions, products, and services, as well as unique access to the latest business strategies and industry best practices from SAP customers, partners, executives, and industry experts to help them drive business results across all levels.
Sapphire Ventures – Name of independent venture firm spun off from SAP, providing the agility of astart-up while allowing companies to tap into SAP’s global enterprise ecosystem of customers and partners. The firm partners with outstanding entrepreneurs and venture firms worldwide to build industry-leading businesses. Formerly called SAP Ventures.
SAP Rapid Deployment solutions – Packages of preconfigured software and predefined services with content including best practices, templates, tools, and business user enablement with predetermined scope, time, and costs. Because the solutions are installed quickly, customers can benefit from crucial software functionality within as little as 12 weeks, helping lower the total cost of implementation and giving customers immediate and tangible value.
SAP road maps – Available for industries, lines of business, and technology, SAP road maps highlight the SAP solutions available today, planned innovation, and the SAP vision for the future.
SAP S/4HANA – Launched in February 2015, SAP’s next-generation business suite offered exclusively on the SAP HANA platform, withon-premise and cloud deployment editions, designed with the role-based user experience of SAP Fiori. Cloud editions are available for marketing, project services, and the enterprise.
SAP S/4HANA Enterprise Management – A core solution that covers all mission-critical business processes of an enterprise. It is natively built on the SAP HANA platform, designed with SAP Fiori user experience (UX), and delivered in the cloud and on premise. It is a core element of the new SAP S/4HANALine-of-Business (LoB) Solutions.
SAP S/4HANA Finance – A global financial solution powered by SAP HANA offering a complete choice of deployment (cloud, on premise, hybrid). It is part of the modular SAP S/4HANALine-of-Business (LoB) Solutions.
SAP S/4HANALine-of-Business Solutions – Solutions that combine the core capabilities included in the SAP S/4HANA Enterprise Management solution with the solutions in the SAP portfolio (on premise and cloud) for a specific line of business.
SAP SME Solutions – A subset of the portfolio of SAP solutions for small businesses and midsize companies. It is essentially a family name
| Additional Information |Glossary | 261 |
Table of Contents
for four specific offerings: SAP Anywhere, SAP Business One, SAP Business ByDesign, and SAP BusinessAll-in-One. By consolidating these four offerings under one umbrella name, we focus on a portfolio of SME offerings that helps our customers choose the best solution for their business size and needs.
SAP Solution Manager – Application management solution that enables customers to manage their SAP andnon-SAP applications better. With SAP Solution Manager, customers can centralize, enhance, automate, and improve the management of their entire system landscape, thus reducing total cost of ownership. The solution includes features such as diagnostics, testing, root cause analysis, and solution monitoring.
SAP solutions for customer engagement and commerce – Category of solutions that help businesses create experiences that engage customers like never before and can lead to more effective marketing promotions, increased revenue share of new customers, reduced customer churn, increased revenue growth, and improvedcart-to-order conversion rate.
SAP solutions for small businesses and midsize companies – Category of solutions that combine business management and business intelligence software for small and midsize enterprises (SMEs). It currently includes SAP SME Solutions, SAP BusinessObjects Edge solutions, Edge editions or existing SAP software products, and other SME services. As with large enterprises, these firms seek to streamline business processes, cut costs, drive growth, and increase profitability by receiving the right information at the right time – across all operations.
SAP solutions for sustainability – Category of solutions that helps companies measure sustainability key performance indicators; energy and carbon management; and environment, health, and safety. SAP solutions for sustainability help organizations tackle energy consumption and greenhouse gas emissions, as well as support efforts in product safety, healthcare, and sustainability performance management.
SAP Store – Public online store (www.sapstore.com) where you can discover, download, and buy SAP solutions, services, mobile apps, demos, and free trials from SAP and partners.
SAP SuccessFactors – Unified brand resulting from the acquisition of SuccessFactors in August 2013. All cloud HR assets of SAP and SuccessFactors are now consolidated under the SAP SuccessFactors brand. SAP SuccessFactors solutions help businesses sell more goods, services, and digital content through every touch point, channel, and device.
SAP SuccessFactors Employee Central – The foundation of the SAP SuccessFactors HCM Suite of solutions, The offering is core HR software delivered securely as a service from the cloud. It offers one global system of record, complete workforce overview combining HR and talent data, powerful analytics, and social collaboration fine-tuned to meet local needs.
SAP SuccessFactors Employee Central Payroll – A cloud solution that extends the SAP SuccessFactors HCM suite to include payroll accounting and management.
SAP SuccessFactors HCM Suite – Suite of HR solutions for talent management, core HR, collaboration, and workforce analytics. The cloud-based suite provides solutions to bridge the gap between strategy and execution with tools to hire, reward, and develop the right people with the right skills to grow a business sustainably.
SAP University Alliances – Program that introduces students to the exciting technologies shaping business today, and designed to connect students around the world interested in SAP solutions, careers, and research opportunities. Students participate in classroom sessions, app development, networking opportunities, events, and more. The SAP University Alliances community provides connections between university leaders and students, SAP customers and partners, and SAP internal experts.
SAP Ventures – see “Sapphire Ventures.”
Scope 1 (emissions) – Direct greenhouse gas emissions from sources that are owned or controlled by the reporting company, for example, fuel burned in corporate cars.
Scope 2 (emissions) – Indirect greenhouse gas emissions from consumption of purchased electricity, heat, or steam.
Scope 3 (emissions) – Indirect emissions that are a consequence of the activities of the reporting company, but occur from sources owned or controlled by another company, such as business flights.
service – A service provided to a customer by SAP (or SAP partners). Examples: education consulting; data management services
social enterprise – An organization with an aim to achieve wider social, environmental, or community objectives through its business activities
software as a service (SaaS) – Software that is provided literally “as a service.” Software applications are delivered and managed remotely over a secure Internet connection and a standard Web browser. Access is charged on a subscription basis usually on a dedicated time basis and with expandable feature access options. Typically a defined level of support is included. See “cloud computing.”
solution – A solution enables a customer to meet a challenge or take advantage of an opportunity and are built or assembled by flexibly combining software products and technology. SAP solutions may include support for best business practices and be aided by consulting and ongoing support. They may also be enhanced or extended by applications and services from partners.
SuccessFactors – See “SAP SuccessFactors.”
| Additional Information |Glossary | 262 |
Table of Contents
sustainability – A method of creating social, environmental, and economic value for long-term business success and responsible global development.
T
technology platform – The technical foundation for a business-driven software architecture that increases the adaptability, flexibility, openness, and cost-efficiency of IT operations and enables organizations to become more agile in responding to change. See “SAP NetWeaver.”
total energy consumed – The sum of all energy consumed through SAP’s own operations, including energy from renewable sources and energy consumed by external data centers delivering our cloud offerings.
U
United Nations Global Compact (UN Global Compact) – A policy initiative for businesses that are committed to aligning their operations and strategies with ten universally accepted principles in the areas of human rights, labor standards, environment, and anti-corruption.
UN Sustainable Development Goals – A set of 17 global development goals by the United Nations which are aimed to ensure an environmentally, socially and economically sustainable future by tackling adverse challenges to humanity like poverty, hunger and inequality.
user experience (UX) – In general terms, UX represents the quality of a user’s interaction with and perceptions of a system. At SAP, our UX is a characteristic of solutions or products that use SAP Fiori UX technology and follow SAP Fiori UX guidelines to offer a next-generation experience to our users.
V
version – Variant of a software product that is specific to audience, operating system, device, or database. Depending on context, may also refer to a specific product release.
W
women in management – Phrase used to refer to the percentage of women in management positions (managing teams, managing managers, executive boards) as compared to the total number of managers, expressed by the number of individuals and not full-time equivalents (FTEs).
works council – As dictated by the German Works Council Constitution Act, a works council is a legal body for representing employees’ interests to the employer and codetermining the works in private companies. On June 21, 2006, the SAP AG employees working in Germany elected its first works council. A European works council was created in the spring of 2012. The SAP AG works council evolved to become the SAP SE works council in 2014 to reflect the legal entity of SAP SE.
| Additional Information |Glossary | 263 |
Table of Contents
Financial Calendar and Addresses
Financial Calendar
2017
February 28
Publication of SAP Integrated Report
April 25
Results for the first quarter of 2017
May 10
Annual General Meeting of Shareholder, Mannheim, Germany
May 15
Dividend Payment
July 20
Results for the second quarter of 2017
October 19
Results for the third quarter of 2017
2018
January 30
Preliminary results for fiscal year 2017
May 17
Annual General Meeting of Shareholders, Mannheim, Germany
May 22
Dividend Payment
Addresses
Group Headquarters
SAP SE
Dietmar-Hopp-Allee 16
69190 Walldorf
Germany
Tel. +49 6227 74 74 74
Fax +49 6227 75 75 75
E-mail info@sap.com
Web site www.sap.com
The addresses of all our international subsidiaries and sales partners are available on our public Web site at www.sap.com/directory/main.html.
For more information about the matters discussed in the report, contact:
Investor Relations
Tel. +49 6227 76 73 36
Fax +49 6227 74 08 05
E-mail investor@sap.com
Web site www.sap.com/investor
Press
Tel. +49 6227 74 63 15
E-mail press@sap.com
Web sitewww-sap.com/press
| Additional Information | Financial Calendar and Addresses | 264 |
Table of Contents
Financial and Sustainability Publications
We present our financial, social, and environmental performance in the 2016 SAP Integrated Report, which is available at www.sapintegratedreport.com. This Excerpt from the Integrated Report 2016 comprises all of the information required by accounting and disclosure standards applicable to us.
The following publications are available in English at www.sap.com/investor, or in German at www.sap.de/investor:
| ∎ | SAP Group Annual Report (IFRS, in English and German) |
| ∎ | Annual Report on Form20-F (IFRS, in English) |
| ∎ | SAP Integrated Report in PDF format |
| ∎ | SAP SE Statutory Financial Statements and Review of Operations (HGB, in German) |
| ∎ | Interim Reports (in English and German) |
| ∎ | Quarterly Statements (in English and German) |
| ∎ | XBRL versions of the annual and interim reports |
| ∎ | SAP INVESTOR, SAP’s quarterly shareholder magazine (German only) |
Complete information on the governance of SAP is available at www.sap.com/corpgovernance. Materials include:
| ∎ | Information about the management of the company, including the directors on the governing bodies |
| ∎ | Details of the directors’ dealings in SAP shares |
| ∎ | Shareholder meeting documents and ballot results |
| ∎ | Articles of Incorporation |
| ∎ | Agreement on the Involvement of Employees in SAP SE |
| ∎ | German Code of Corporate Governance |
| ∎ | Declaration of Implementation pursuant to the German Stock Corporation Act, Section 161 |
| ∎ | Code of Business Conduct for Employees |
| ∎ | Corporate Governance Statement pursuant to the German Commercial Code, Section 289a |
| ∎ | Corporate Governance Report |
Additional SAP policies are made public at www.sap.com/corporate-sustainability:
| ∎ | SAP Human Rights Commitment |
| ∎ | SAP Global Health and Safety Management Policy |
| ∎ | SAP Environmental Policy |
| ∎ | SAP Supplier Code of Conduct |
| ∎ | SAP Partner Code of Conduct |
| Additional Information | Financial Calendar and Addresses | 265 |
Table of Contents
Publisher
SAP SE
Investor Relations
Concept and Realization
SAP Integrated Report project team with the support of
SAP software
Photography Executive Board
Andreas Pohlmann, Munich, Germany
Printing
ABC Druck, Heidelberg, Germany
Copyright
SAP SE
Dietmar-Hopp-Allee 16
69190 Walldorf
Germany
© 2017 SAP SE or an SAP affiliate company. All rights reserved.
No part of this publication may be reproduced or transmitted in any form or for any purpose without the express permission of SAP SE or an SAP affiliate company.
SAP and other SAP products and services mentioned herein as well as their respective logos are trademarks or registered trademarks of SAP SE or an SAP affiliate company in Germany and other countries.
Please see www.sap.com/about/legal/copyright.html for additional trademark information and notices.
| Additional Information | Publication Details | 266 |