Exhibit 99.1

| | |
| For Further Information: | | |
| At Medallion Financial Corp. | | At Zlokower Company |
| 437 Madison Avenue, New York, NY 10022 | | Public Relations |
| Andrew Murstein, President | | Harry Zlokower |
| Larry D. Hall, CFO | | David Closs |
| (212) 328-2100, or 1-877-Medallion | | (212) 447-9292 |
FOR IMMEDIATE RELEASE
MEDALLION ANNOUNCES SECOND QUARTER EARNINGS
Medallion Loans Year Over Year Grow by 24%
Total Assets Year Over Year Grow by 42%
Net Investment Income is Highest in Over 3 Years at $0.14 Per Share
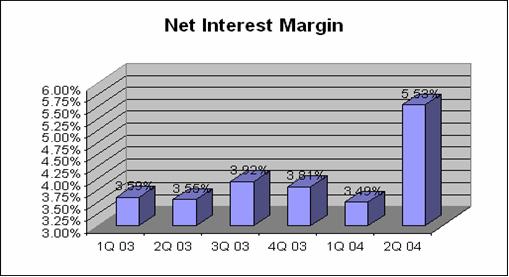
Net Interest Margin is Highest Ever at 5.53%
Stock Repurchase Program Extended
NEW YORK, N.Y. – August 5, 2004 -Medallion Financial Corp. (NASDAQ: TAXI), a specialty commercial finance company with a leading position servicing the taxi industry, targeted niche markets, and owner of the largest taxicab rooftop advertising company in the world, announced net investment income for the 2004 second quarter of $2,573,000 or $0.14 per diluted share of common stock, compared to $312,000 or $0.02 per share in the 2003 second quarter.
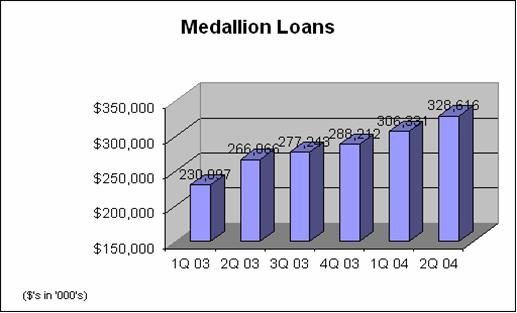
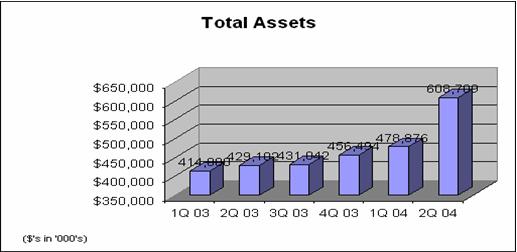
Medallion loans grew to $328,616,000, up 7% from $306,331,000 in the 2004 first quarter, and up 24% from $266,066,000 in the prior year quarter. Commercial loans increased to $122,406,000, up 16% from both the 2004 first quarter and the prior year quarter. Total assets increased 27% from the first quarter and 42% in the prior year quarter to $608,709,000, including the results of the previously announced recreational vehicle and marine portfolio purchase by Medallion Bank. Managed assets increased 18% from the first quarter and 20% in the prior year quarter to $748,893,000, the highest amount in over three years.
(more)
Medallion Announces Second Quarter Earnings, Page 2
Net increase in net assets resulting from operations was $249,000 or $0.01 per share in the quarter, compared to $755,000 or $0.04 per share in the prior year second quarter, primarily reflecting the large gains from the sale of the Company’s investment in Select Comfort Corp. (NASDAQ: SCSS) in the 2003 second quarter, and the lower results in Medallion’s Taxi Media subsidiary for the 2004 second quarter.
Andrew Murstein, President of Medallion Financial, stated, “We are extremely pleased with our second quarter results. Our improved net investment income demonstrates the power of our asset growth and improved leverage on our bottom line. Our loan demand is robust and we expect continued growth ahead. Medallion Bank is performing better than anticipated. It has contributed significantly to our earnings since opening for business only six months ago. We finally have a low cost dependable funding source to fund our high quality loan products. With the addition of our new RV/Marine portfolio acquisition, our interest rate yield increased by over 200 basis points in the quarter, to 8.58% from 6.39% in the 2004 first quarter. Our cost of funds remained near its lowest levels at 3.05%. As a result, our net interest margin jumped to 5.53%, which is the highest is has been since the Company went public over eight years ago.”
Larry Hall, Medallion Financial’s CFO, stated, “We are making progress in achieving our goal of improved leverage on our balance sheet. With over $150,000,000 of equity, we remain leveraged at less than 3 to 1, up from less than 2 to 1 in the prior quarter, far less than most other finance companies and banks which typically have leverage of more than twice this amount. As we continue to grow our balance sheet, the benefits of improved leverage should allow our earnings to increase. Credit quality also remains good, as total delinquencies over 90 days past due decreased from 6.8% one year ago, to 5.7% last quarter, to 4.8% this quarter. In the commercial loan category, delinquencies over 90 days past due decreased by over $4,600,000 from the prior year period.”
Mr. Hall continued, “Finally, we continue to have liquidity to meet anticipated strong loan demand. We have approximately $100,000,000 combined in unused borrowing facilities and
(more)
Medallion Announces Second Quarter Earnings, Page 3
cash on hand. While much progress has been achieved, and our stock price has increased significantly from its low of two years ago, we believe our stock remains undervalued, especially given the multiples to book value the marketplace is currently assigning to other financial companies. Therefore, we plan on continuing our focus on reducing our operating expense ratio, and, as we believe we have excess capital, reducing our equity to assets ratio with the goal of improving our return on shareholder’s equity. In addition, we plan to continue our stock repurchase program begun last year in a further effort to enhance shareholder value. We are optimistic that the foregoing will be recognized in the marketplace in the periods ahead.”
Medallion also announced that its Board of Directors has declared and will pay a cash dividend of $0.08 per share. The dividend will be payable on August 26, 2004 to shareholders of record on August 12, 2004. The Company has now declared $0.16 per share of dividends for the 2004 six months, up from $0.04 for the 2003 six months.
About Medallion Financial
Medallion Financial Corp. is a specialty finance company with a leading position in the origination and servicing of loans financing the purchase of taxicab medallions and related assets. The Company also originates and services loans financing small businesses and other targeted industries and niches, and operates the largest taxicab rooftop advertising business in the world. The Company and its subsidiaries have lent over $1 billion to the taxicab industry and small business.
# # # #
Please note that this press release contains forward-looking statements that involve risks and uncertainties relating to business performance, cash flow, costs, sales, net investment income, earnings, and growth. Medallion’s actual results may differ significantly from the results discussed in such forward-looking statements. Factors that might cause such a difference include, but are not limited to, those factors discussed under the heading “Investment Considerations,” in Medallion’s 2003 Annual Report on Form 10-K.
(Financial Tables Follow)
Medallion Financial Corporation
Consolidated Income Statements
| | | | | | | | | | | | |
| | | Quarter Ended
| |
| | | June 30, 2004
| | | March 31,
2004
| | | June 30, 2003
| |
Total investment income | | $ | 10,400,888 | | | $ | 6,485,248 | | | $ | 6,468,097 | |
Total interest expense | | | 3,656,395 | | | | 2,897,692 | | | | 3,197,815 | |
Net interest income | | | 6,744,493 | | | | 3,587,556 | | | | 3,270,282 | |
Gain on sale of loans | | | 185,163 | | | | 213,278 | | | | 526,769 | |
Other income | | | 671,371 | | | | 550,264 | | | | 739,232 | |
Total noninterest income | | | 856,534 | | | | 763,542 | | | | 1,266,001 | |
Salaries and benefits | | | 2,302,759 | | | | 2,401,722 | | | | 2,438,868 | |
Professional fees | | | 549,073 | | | | 454,532 | | | | 268,346 | |
Costs of debt extinguishment | | | — | | | | — | | | | (88,616 | ) |
Other operating expenses | | | 2,175,953 | | | | 1,511,606 | | | | 1,605,998 | |
Total operating expenses | | | 5,027,785 | | | | 4,367,860 | | | | 4,224,596 | |
Net investment income (loss) before income taxes | | | 2,573,242 | | | | (16,762 | ) | | | 311,687 | |
Income tax provision | | | 1,062,997 | | | | 45,100 | | | | 9,304 | |
Net investment income (loss) after income taxes | | | 1,510,245 | | | | (61,862 | ) | | | 302,383 | |
Net realized gains (losses) on investments | | | (315,328 | ) | | | (199,234 | ) | | | 8,214,032 | |
Net change in unrealized depreciation on investments | | | (946,054 | ) | | | (1,118,591 | ) | | | (7,761,295 | ) |
Net realized/unrealized gain (loss) on investments | | | (1,261,382 | ) | | | (1,317,825 | ) | | | 452,737 | |
Net increase (decrease) in net assets resulting from operations | | $ | 248,863 | | | $ | (1,379,687 | ) | | $ | 755,120 | |
Weighted average shares | | | | | | | | | | | | |
Basic | | | 18,141,427 | | | | 18,219,999 | | | | 18,242,728 | |
Diluted | | | 18,540,419 | | | | 18,219,999 | | | | 18,378,685 | |
Net investment income (loss) before income taxes per share | | | | | | | | | | | | |
Basic | | $ | 0.14 | | | $ | (0.00 | ) | | $ | 0.02 | |
Diluted | | | 0.14 | | | | (0.00 | ) | | | 0.02 | |
Net increase (decrease) in net assets per share | | | | | | | | | | | | |
Basic | | $ | 0.01 | | | $ | (0.08 | ) | | $ | 0.04 | |
Diluted | | | 0.01 | | | | (0.08 | ) | | | 0.04 | |
Declared dividends per share | | $ | 0.08 | | | $ | 0.08 | | | $ | 0.03 | |
Medallion Financial Corporation
Consolidated Balance Sheets
| | | | | | |
| | | June 30, 2004
| | December 31,
2003
|
ASSETS | | | | | | |
Medallion loans | | $ | 328,616,457 | | $ | 288,211,557 |
Commercial loans | | | 122,405,715 | | | 85,970,205 |
Consumer loans | | | 72,438,909 | | | — |
Investment securities | | | 6,190,937 | | | — |
Equity investments | | | 5,026,303 | | | 4,976,763 |
Net investments | | | 534,678,321 | | | 379,158,525 |
Investments in and loans to Media | | | 2,660,883 | | | 3,614,485 |
Total investments | | | 537,339,204 | | | 382,773,010 |
Cash | | | 40,463,935 | | | 47,675,537 |
Accrued interest receivable | | | 2,924,600 | | | 1,727,719 |
Servicing fee receivable | | | 2,460,629 | | | 2,663,468 |
Fixed assets, net | | | 1,104,639 | | | 1,351,887 |
Goodwill, net | | | 5,007,583 | | | 5,007,583 |
Other assets | | | 19,408,459 | | | 15,295,253 |
Total assets | | $ | 608,709,049 | | $ | 456,494,457 |
LIABILITIES AND SHAREHOLDERS’ EQUITY | | | | | | |
Accounts payable and accrued expenses | | $ | 7,429,244 | | $ | 5,726,830 |
Accrued interest payable | | | 1,333,045 | | | 1,197,248 |
Floating rate borrowings | | | 218,394,740 | | | 230,519,057 |
Fixed rate borrowings | | | 224,134,268 | | | 56,935,000 |
Total liabilities | | | 451,291,297 | | | 294,378,135 |
Total shareholders’ equity | | | 157,417,752 | | | 162,116,322 |
Total liabilities and shareholders’ equity | | $ | 608,709,049 | | $ | 456,494,457 |
Number of common shares outstanding | | | 18,145,793 | | | 18,242,178 |
Net asset value per share | | $ | 8.68 | | $ | 8.89 |
Total managed loans | | $ | 663,644,849 | | $ | 549,068,762 |
Total managed assets | | | 748,892,817 | | | 631,381,457 |
Selected Financial Charts