| As filed with the Securities and Exchange Commission on December 9, 2004 |
UNITED STATES
SECURITIES AND EXCHANGE COMMISSION
Washington, D.C. 20549
FORM N-CSR
CERTIFIED SHAREHOLDER REPORT OF REGISTERED MANAGEMENT INVESTMENT COMPANIES
Investment Company Act file number 811-9094
Leuthold Funds, Inc.
(Exact name of registrant as specified in charter)
100 N. Sixth Street, Suite 412A, Minneapolis, MN 55403
(Address of principal executive offices) (Zip code)
Steven C. Leuthold
100 N. Sixth Street, Suite 412A, Minneapolis, MN 55403
(Name and address of agent for service)
612-332-9141
Registrant's telephone number, including area code
Date of fiscal year end: September 30
Date of reporting period: September 30, 2004
Item 1. Report to Stockholders.
Annual Report
September 30, 2004
The Leuthold Funds
Leuthold Core Investment Fund
Leuthold Select Industries Fund
Grizzly Short Fund
The Leuthold Funds
Dear Fellow Shareholders:
First we'd like to thank all of you for your support over the last twelve months. Our three mutual funds have experienced over $141 million in net new inflow over this period, with almost two thousand new accounts. Your confidence in our three funds is most appreciated.
Secondly, we want you to know that Leuthold Funds has not in any way been implicated in the ongoing investigations relating to questionable and illegal mutual fund practices. While the negative publicity relating to these investigations has certainly damaged the image of the mutual fund industry, the Leuthold Funds remain completely untainted.
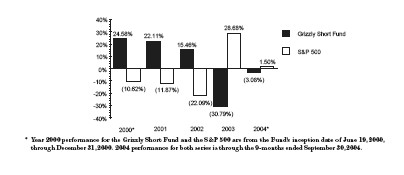
A year ago in this annual letter we were estimating, based on past market cycles, that the S&P 500, over the next 18-months, might move up 20%-25% from September 2003 closing levels. A year later, through September 30th 2004, the S&P 500 was up 13.86%, still short of last year's 18-month target, while the tech-heavy NASDAQ index gained a lagging 6.71%. Over the 12-months ended September 30th, our flexible Leuthold Core asset allocation fund appreciated 16.03%,and the Leuthold Select Industries all-equity fund gained 17.88%,both nicely exceeding the gain in the S&P 500. However, our ‘bear market' Grizzly Short Fund (always 100% short) lost 15.34%, close to the same percentage that the S&P 500 gained (+13.86%).
| | w | As we have often warned Grizzly Fund shareholders, it is very difficult (some would say impossible) to profit with an all short stock portfolio during a bull market. Per the Prospectus, the Grizzly Short Fund (typically employed for hedging or speculative purposes) is always 100% short, regardless of our own market opinion. |
THE INVESTMENT OUTLOOK
Since the end of the Funds' fiscal year (September 30th), the stock market has been climbing. Once the election uncertainty was behind us, the rise accelerated. (Bush was obviously the stock market's favorite.) Over a year ago, we had estimated an 18-month upside target for the S&P 500 of 1250-1290 (based on studies of past bull market performance, 1900-to-date). Currently this index stands at 1184 (as of November 18th).Thus per our historical model, the potential upside from current levels is a quite modest 5%-10%.
| | w | The current economic expansion is now three years old compared to the median length of 3-1/2 years since WWII. (However, the two expansions prior to the current expansion averaged nine years in duration.) |
| | w | Post WWII economic history also indicates that new bear markets in stocks get underway before an economic expansion ends - an average of 6-7 months sooner. This is why the stock market is considered a "lead indicator" for the economy. |
Of course, models based on the stock market and economic history are far from precise. Nevertheless, as students of history, we are considerably more cautious in our investment outlook for the next 12-months. Over the last two years the stock market has made a major move. Today, even factoring in 10%-15% earnings growth in 2005, stock market traditional valuation measures are somewhat high. While the current economic expansion continues to look healthy and strong, history also warns us that this economic expansion is no spring chicken and could possibly peak later in 2005.
The Leuthold Funds
On a total return, cumulative basis, the S&P 500 is now up 58.16% from its October 9, 2002 lows through November 18, 2004, while the Leuthold Select Industries Fund is up 89.31%, and even the relatively lower risk Leuthold Core Investment Fund is up 70.71% over the same time frame.
| | w | In summary, we've come a long way, baby! While not yet bearish in terms of the 2005 stock market outlook, we are increasingly cautious. |
Currently the shorter term stock market outlook seems quite positive considering the economy, earnings momentum, and seasonal equity inflows. Still, investors in the Leuthold Select Industries Fund should keep in mind that this Fund, per its Prospectus, remains fully invested in stocks. If the stock market turns down later in 2005, our Select Industries Fund may go down as much or more (on the other hand the Grizzly Short Fund could do very well).
| | w | All things considered, in the current environment we believe the most appropriate Fund for long-term investors would seem to be our flagship Fund, the Leuthold Core Investment Fund. |
Leuthold Core Investment Fund: This Fund's strategy is to be flexible, value-oriented, and risk-averse. The Leuthold Core Investment Fund adjusts asset class exposure, based on underlying market dynamics and trends, in order to avoid undue risk, and attempt to take advantage of areas that appear poised to outperform. Assets are actively allocated between stocks, bonds, money market instruments, and foreign securities. When appropriate, the Fund may also hedge by selling short certain securities when our disciplines indicate potential underlying market weakness. While at times individual allocations may appear unorthodox, these individual pieces assemble to carry out the Fund's g uiding principles: preservation of capital and minimization of risk.
| | w | Through October 31, 2004, Morningstar has again awarded this Fund an overall Five-Star rating within the "Moderate Allocation" category containing 657 funds. |
| | w | The Morningstar rating is based on historical risk-adjusted performance calculated from the Fund's 3- 5- and 10-year (if applicable) average annual returns, with a Five-Star rating being the highest, and awarded to the top 10% of funds in a category. The Fund is also rated "Five-Stars" for both the 3-year and 5-year periods ended October 31, 2004, out of 657 and 503 funds, respectively, within the Moderate Allocation category. Rating subject to change each month. |
Leuthold Select Industries Fund: Unlike the Leuthold Core Investment Fund, we cannot apply our asset allocation dexterity in this Fund. The Leuthold Select Industries Fund is mandated to remain 100% invested in stocks at all times. This attribute results in the potential for considerable volatility, undoubtedly higher risk, and the probability investors will lose money when the stock market declines significantly.
| | w | The Morningstar rating for the Leuthold Select Industries Fund is Four-Stars "overall" and for the 3-year period as of October 31,2004,compared to 622 funds within the category of "Mid-Cap Growth". This ‘star' rating is based on historical risk-adjusted performance, calculated from the Fund's 3- 5-and 10-year (if applicable) average annual returns.(The top 10% of funds in a category receive 5 stars, the next 22.5% receive 4 stars, middle 35% receive 3 stars, next 22.5% receive 2 stars, and the bottom 10% receives 1 star.) Ratings are subject to change each mont h. |
The Leuthold Funds
The Select Industries Fund strategy is based on industry group selection, rotation, and sector concentrations. It is driven by a top-down, quantitative evaluation of over 140 equity-industry groups, attempting to detect where there may be collective strength, while exposing areas that appear vulnerable.
| | w | The element of sector/industry group concentrations results in this Fund's higher volatility profile, being potentially more risky while offering potentially more reward. |
Grizzly Short Fund: This is a 100% short stock fund, which benefits when stock prices decline. Even when our firm is bullish toward the stock market, this Fund's policy and Prospectus mandate that the portfolio remains 100% short. While this appears incongruous or even absurd, this Fund is designed to be a special purpose Fund: a tool for sophisticated users. Those who employ this Fund are typically traders and other speculators anticipating the market to decline (even if we don't) or those who want to hedge their market risk, including so-called "neutral" investors.
| | w | The Grizzly Short Fund typically maintains approximately equally-weighted short positions in about 50 individual stocks, initially selected per a 13 factor quantitative discipline. Each position is monitored daily and subject to a set of short covering disciplines (average individual stock holding period is about 13-weeks). |
A LOOK IN THE REAR VIEW MIRROR
| | w | In this section we summarize and provide an overview of the performance (good and bad) of our three Leuthold Funds. |
Leuthold Core Investment Fund
This is our flagship Fund, with current assets (November 18, 2004) of $550 million. As previously noted, for the year ending September 30th,the Fund posted a total return of +16.03% compared to +13.86% for the S&P 500. Most of this positive return came from the common stock commitments, both in "Emerging Market" equities, and the "Select Industries" portion of the portfolio. For the year, an average of 8% of assets was invested in emerging market equities, with 61% on average in the Select Industries equity allocation.
For the 12-months ended September 30th, our equity commitment in emerging market equities resulted in a 38% gain, while the Select Industries portion of the equity exposure added close to 18%.
| | w | The "Select Industries" portion of the equity exposure in the Core Fund is a mirror image of the Leuthold Select Industries Fund. For more details, see our commentary on the Select Industries Fund performance. |
Our Core Fund's normal minimum guideline for fixed income is 30% of assets. But, with interest rates so low, we have remained resolute in our opinion that there is little reward left with bond market investments, and we continued to avoid traditional fixed income exposure most of the year. High Yield bonds comprised a high 16% of portfolio assets in early 2003, but this holding was reduced each month from November 2003 to February 2004, and ultimately eliminated in March. In our view, the higher yields on this type of bond no longer compensated for the inherently higher credit risk.
Over the past year, however, we continued to build holdings in High Yield Utility common stocks to 9% by September 30, 2004. We view this holding as a fixed income proxy. (Note that this 9% allocation is not obvious in the Schedule of Investments later in this report. The Schedule incorporates these fixed income proxy-stocks under the
The Leuthold Funds
"common stock" section along with other Utility-sector stocks that are held within our more ‘customary' equity exposure.)
REITs, also held in 2003 as a fixed income proxy, were eliminated from the portfolio in early 2004. This looked like a smart move for a few months, but proved to be premature. We did not include Treasury bonds or High Quality Corporate bonds in the portfolio during the year because the prevailing low yields on these bonds did not, in our opinion, justify the risk involved when (if) interest rates moved up.
Over the last year, we continued to tactically employ a fixed-income hedge (shorting T-bonds and T-Zeros). This is a position that profits from rising interest rates, and we believe the odds are much more favorable for rates to rise than remain at historically low levels. During the year, as bonds yields refused to "yield," we hedged as yields moved lower, and lifted the hedge, locking in a gain, as yields edged back up. This bond hedge (short) was put on in May 2003 and closed in early June 2004. The hedge was again initiated at the beginning of September 2004, and remains in effect at this time.
From time to time during the year, we also employed a tactical hedge to adjust our equity exposure, as a means for moderating stock market risk. At September 30, 2004, the equity hedge represented 4.7% of assets, with the fixed income hedge representing 8% of assets. The net impact of equity hedging activities on portfolio performance over the last 12-months proved to be negligible.
Our newest, rather unusual, asset class investment is a holding in Physical Industrial Metals. We introduced this investment to the Core Fund at the start of January and continue to view it as an outstanding long-term opportunity - maybe a 3-4 year play. The basis behind this investment is a global supply/demand imbalance. We believe global demand for these metals will continue to be strong, with China being a significant factor. On the supply side, we have experienced a decade of under-investment as depressed metals prices caused companies to reduce production and shutter mi nes during the 1990s.It could be a number of years before production can be increased enough to satisfy the growing global demand.
We have purchased and are warehousing (in London Metal Exchange warehouses) the following metals for the Leuthold Core Investment Fund shareholders: Copper, Aluminum, Zinc, Nickel, Silver, Lead, Tin, and Palladium. This 6.7% Physical Metals holding was a contributor to the Core Fund's out-performance compared to the S&P 500 for the 12-months ended September 30,2004,with the metals recording over an 18% unrealized gain.
Over the last 12-months the Leuthold Core Investment Fund's +16.03% total return beat the S&P 500 by over 2%. But our primary objective is not to beat some market index. It is not difficult to achieve positive results investing in stocks during a strong rising market, but our normal maximum limit of 70% in equity exposure can make it difficult for the Core Fund to match or exceed a stock market index that is 100% invested in stocks. Our primary objective is to make and keep positive returns for our investors. This means attempting to reduce risk when market conditions are looking less favorable or downright dire, as they were in 2000-2002.
The last five years shows how productive our approach can be. But it is no assurance we will do as well in future unfavorable stock market periods.
| | w | Over the last five years (ended September 30, 2004), the Leuthold Core Investment Fund has a very wide performance advantage compared to the stock market. The Core Fund's cumulative total return gain of +65.76% (+10.65% annualized), compares to the S&P 500's cumulative total return loss of -6.36% (-1.31% annualized), and the Lipper Flexible Fund Index's cumulative total return gain of +6.01% (+1.18% annualized). |
The Leuthold Funds
Leuthold Select Industries Fund
As previously noted, this all equity Fund was up 17.88% for the year ending September 30, 2004, compared to a 13.86% gain for the S&P 500. This latest 12-month gain for the Select Industries Fund compares with its 38.67% gain for the previous 12-month period (September 30,2002 - September 30,2003).
| | w | Since inception (June 19, 2000) through September 30, 2004, the Leuthold Select Industries Fund has produced a cumulative total return gain of +22.60% (+4.88% annualized) compared to a cumulative total return loss of -19.84% for the S&P 500 (-5.04% annualized). |
A year ago, as of September 30, 2003, the Leuthold Select Industries Fund was heavily weighted in Technology and Health Care stocks. The combined weight of these two sectors made up a big 60% of portfolio exposure. Back then, another 18% was invested in Industrial Metals stocks,a portfolio holding initiated way back in mid-2002.
Through the past year, the composition of the Leuthold Select Industries Fund has changed considerably in terms of equity sector concentrations. The biggest change was a huge reduction in Technology stocks. Our quantitative assessment of the Technology sector began to deteriorate late last year, triggering the sales of our Tech-focused stock groups. We currently have a mere 1% in Tech stocks, versus 24% of assets a year ago.
| | w | This portfolio modification likely rescued the Leuthold Select Industries Fund from damaging losses YTD,and our 12-month results (ending September 30, 2004) would have been drastically reduced had our disciplines not led us to decrease technology exposure. |
The best equity industry group gains for this Fund (and the Core Fund's "Select Industries"equity exposure), for the 12-months ending September 30th, were Industrial Metals stocks (+44%), Unregulated Energy Producers (+33%), Health Care Cost Containment (+28%), and Oil & Gas Exploration (+23%). All four of these groups remain in the equity portfolio at this time.
Our biggest disappointment was a 32% realized loss from our investment in a package of Alternative Energy Technology stocks (no longer in portfolio). Other disappointments included a 10% loss in Consumer Electronics (also no longer in the portfolio), and a 7% loss in the "Undervalued & Unloved"stock group (a value-based driven screen).
On an individual stock basis, the Fund's most positive gain contributors, combining weighting and performance, were BHP Billiton, Phelps Dodge, Inco, CYTEC,and Nextel. All but Nextel currently remain in the portfolio.
The Select Industries Fund's worst loss contributors were Nam Tai Electonics, Plug Power, Mastec, FuelCell Energy,and Pharmaceutical Resources….none of these remain in the portfolio.
Grizzly Short Fund
Two years ago, when our market opinion turned positive in early October 2002, we warned that we expected the Grizzly Short Fund to suffer, and investors should expect to lose money holding this Fund. The Grizzly Short Fund is a vehicle intended to be used to speculate, to regulate stock market risk, or used in other complex portfolio strategies employed by sophisticated investors.
Over the last twelve-months ending September 30,2004, the Grizzly Short Fund lost 15.34%, compared to the S&P 500 gain of 13.86%. Throughout the year, the heaviest weighted sector concentrations of stocks sold short were: Technology, Consumer Discretionary, and Health Care. A year ago, the heaviest weighted sectors included Consumer Discretionary,Financials,and Materials;and there was significantly less exposure to Technology and Health Care stocks.
The Leuthold Funds
In addition,one year ago,there were small allocations to the Energy sector and to Consumer Staples,but the disciplines led to a scaling back of exposure to these sectors over the last 12-months,and there was no exposure within either sector as of September 30,2004. As with a year ago,the Grizzly Short Fund also has no exposure to the Utilities sector.
Across the board,the Grizzly Short Fund had net losses in all of its broad sector concentrations for the last twelve months, but its reduced exposure to Materials and Energy,and its avoidance of Utility sector stocks, likely helped in curbing what could have been significantly bigger losses, as these three sectors were among the top four performing sectors for the year-to-date ending September 30,2004.
In terms of industry group concentrations, the biggest portfolio losses were from short sale holdings in Industrial Metals, Paper Packaging, and Hotels.While there is still exposure to the Hotels group, the Industrial Metals exposure was closed out in the 4th quarter of 2003,and Paper Packaging stocks were covered during the 3rd quarter of 2004.
On the positive side, industry group short exposure that produced some favorable results, and helped to diminish the intensity of the 12-month loss,included Airlines,Specialty Stores,Investment Brokers,Internet Retail,and Systems Software.
Please keep in mind that the Grizzly Short Fund has extremely high turnover. Sector concentrations and industry group exposure can fluctuate day to day, and there are limitations as to how much of the portfolio can be weighted within each area.The portfolio is constructed of roughly equal positions across a package of typically 50-60 stocks.
| | w | These characteristics make it difficult to clarify any prevailing Fund performance drivers or trends, outside of general sector,and sometimes industry group,concentrations. |
The year-by-year results are volatile,and,while the advantage for employing a short selling strategy during down-market years is evident, the extreme down-side risk of short-selling in a rising market is also unmistakable, as demonstrated below.You should expect to lose money during rising market conditions.
The Leuthold Funds
Note: The Grizzly Short Fund has only been available since June 19, 2000, which was near the on-set of a brutal 3-year long bear market. In 2003, the Grizzly Short Fund proceeded to suffer dearly, as the stock market recovered. Yet, despite the poor performance in 2003, since inception the Grizzly Short Fund performance is still positive on an annualized and cumulative basis:
| | | Inception 6/19/00 through 9/30/04 | |
Total Return: | | Cumulative | | Annualized | |
| Grizzly Short Fund | | | +17.83 | % | | +3.91 | % |
| S&P 500 | | | -19.84 | % | | -5.04 | % |
| Russell 2000 | | | +16.23 | % | | +3.58 | % |
| NASDAQ | | | -51.69 | % | | -15.65 | % |
| | w | Investors who are not experienced in short selling and adjusting market risk should consider the Leuthold Core Investment Fund.The Core Fund has the flexibility to overlay this same short strategy as a hedge over a portion of its portfolio,but only when management's assessment of the stock market is cautious or negative. It is not a permanent feature of the Core Fund. |
The risks of short selling aside, our primary message this year concerning the prospects for the Grizzly Short Fund, is that the bull market might be entering its topping out phase in 2005. We see deteriorating market indicators within the categories of Attitudinal, Valuations, and Supply/Demand. A transition to a trend of stock market weakness is a more constructive environment for the Grizzly Short Fund strategy. There is certainly no assurance that the Grizzly Short Fund is poised for net gains in the coming year, but history indicates that in terms of duration and magnitude, additional upside opportunities for the stock market may now be limited.
IN CLOSING
Looking ahead, it should be evident from this letter that our outlook for stocks is considerably more cautious than it has been for the last two years. While no market action ever exactly mirrors the results of the past, it is important to recognize that financial history is a vast early-warning system. In addition, for us, our quantitative disciplines for each of our strategies are the guiding principles, designed to remove emotions and severely restrict judgments based on a Portfolio Manager's personal bias.
Although only Leuthold's name is on the front door, we would like you to keep in mind that all our strategies have been team-managed; involving the same professionals since the years the Funds were introduced. The Portfolio Managers and three other Chartered Financial Analysts make up the investment strategy committee. This structure allows for an improved flow of insight and opinion from a mixture of backgrounds and experience. While our team approach eliminates the risks associated with a ‘one man show', it also serves as a function of checks-and-balances for ensuring adherence to the investment disciplines.Portfolio decisions must align with the methodologies.
The Leuthold Funds
Our firm is employee-owned and operated. With no exception, every employee is an investor in one or more of the Leuthold Funds. In fact, because of our conviction that the Leuthold Core Investment Fund, in particular, is an exceptionally prudent retirement-account holding for all seasons, our firm's 401(k) plan does not have a menu of choices, and all employee contributions are invested in our Leuthold Core Investment Fund. Most employees have also allocated personal investments to the Grizzly Short Fund and/or the Leuthold Select Industries Fund.
…Yes,we eat what we cook.
Sincerely,
 |  |
| Steve Leuthold | James Floyd,CFA |
| Portfolio Team Leader | Co-Portfolio |
| Manager | |
| | |
 |  |
| Andrew Engel,CFA | Chuck Zender Co- |
| Portfolio Manager | Co-Portfolio Manager |
The Leuthold Funds
Expense Example - September 30,2004
As a shareholder of The Leuthold Funds ("the Funds"), you incur ongoing costs, including management fees; service fees; and other Fund expenses. This example is intended to help you understand your ongoing costs (in dollars) of investing in the Funds and to compare costs with the ongoing costs of investing in other mutual funds.
The Example is based on an investment of $1,000 invested at the beginning of the period and held of the entire period (April 1,2004 - September 30,2004).
Actual Expenses
The first line of the table below provides information about actual account values and actual expenses. Although the Funds charge no sales load or transactions fees, you will be assessed fees for outgoing wire transfers, returned checks or stop payment orders at prevailing rates charged by U.S.Bancorp Fund Services, LLC, the Funds' transfer agent. If you request a redemption be made by wire transfer, currently a $15.00 fee is charged by the Funds' transfer agent. To the extent that the Funds invest in shares of other investment companies as part of its investment strategy, you will indirectly bear your proportionate share of any fees and expenses charged by the underlying funds in which the Fund invests in addition to the expenses of the Fund. Actual expenses of the underlying funds are expected to vary among the various underlying funds. These expenses are not included in the example below. The example includes, but is not limited to, management fees, shareholder servicing fees, fund accounting, custody and transfer agent fees. However, the example below does not include portfolio trading commissions and related expenses, interest expense or dividends on short positions taken by the Funds and other extraordinary expenses as determined under U.S. generally accepted accounting principles. You may use the information in this line, together with the amount you invested, to estimate the expenses that you paid over the period. Simply divide your account value by $1,000 (for example, an $8,600 account value divided by $1,000 = 8.6), then multiply the result by the number in the first line under the heading entitled "Expenses Paid During Period" to estimate the expenses you paid on your account during this period.
Hypothetical Example for Comparison Purposes
The second line of the table below provides information about hypothetical account values and hypothetical expenses based on the Funds'actual expense ratios and an assumed rate of return of 5% per year before expenses, which is not the Funds' actual return. The hypothetical account values and expenses may not be used to estimate the actual ending account balance or expenses you paid for the period. You may use this information to compare the ongoing costs of investing in the Funds and other funds. To do so, compare this 5% hypothetical example with the 5% hypothetical examples that appear in the shareholder reports of the other funds.
Please note that the expenses shown in the table are meant to highlight your ongoing costs only and do not reflect any transactional costs, such as sales charge (loads). Therefore, the second line of the table is useful in comparing ongoing costs only, and will not help you determine the relative total costs of owning different funds. In addition, if these transactional costs were included, your costs would have been higher.
The Leuthold Funds
Expense Example Tables
Leuthold Core Investment Fund
| | | Beginning AccountValue April 1,2004 | | Ending AccountValue September 30,2004 | | Expenses Paid During Period* April 1,2004 - September 30,2004 | |
| Actual** | | $ | 1,000.00 | | $ | 988.10 | | $ | 12.43 | |
| | | | | | | | | | | |
Hypothetical (5% return before expenses)*** | | | 1,000.00 | | | 1,037.50 | | | 12.73 | |
| * | Expenses are equal to the Fund's annualized expense ratio of 1.25%, multiplied by the average account value over the period, multiplied by 183/365 to reflect the one-half year period. |
| ** | Including dividends and interest on short positions,your actual expenses paid during the period would be $13.22. |
| *** | Including dividends and interest on short positions,your hypothetical expenses paid during the period would be $13.54. |
Leuthold Select Industries Fund
| | | Beginning Account Value April 1,2004 | | Ending Account Value September 30,2004 | | Expenses Paid During Period* April 1,2004 - September 30,2004 | |
| Actual | | $ | 1,000.00 | | $ | 976.70 | | $ | 15.81 | |
| | | | | | | | | | | |
Hypothetical (5% return before expenses) | | | 1,000.00 | | | 1,034.00 | | | 16.27 | |
| | * | Expenses are equal to the Fund's annualized expense ratio of 1.60%, multiplied by the average account value over the period, multiplied by 183/365 to reflect the one-half year period. |
Grizzly Short Fund
| | | Beginning Account Value April 1,2004 | | Ending Account Value September 30,2004 | | Expenses Paid During Period* April 1,2004 - September 30,2004 | |
| Actual** | | $ | 1,000.00 | | $ | 972.70 | | $ | 22.98 | |
| | | | | | | | | | | |
Hypothetical (5% return before expenses)*** | | | 1,000.00 | | | 1,026.70 | | | 23.61 | |
| * | Expenses are equal to the Fund's annualized expense ratio of 2.33%, multiplied by the average account value over the period, multiplied by 183/365 to reflect the one-half year period. |
| ** | Including dividends and interest on short positions,your actual expenses paid during the period would be $40.94. |
| *** | Including dividends and interest on short positions,your hypothetical expenses paid during the period would be $42.07. |
The Leuthold Funds
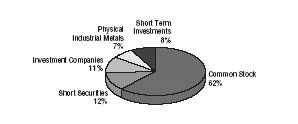
Leuthold Core Investment
Fund Allocation of Portfolio
Holdings September 30,2004
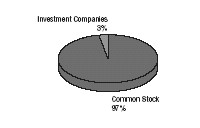
Leuthold Select Industries
Fund Allocation of Portfolio
Holdings September 30,2004
The Leuthold Funds
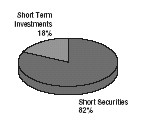
Grizzly Short Fund
Allocation of Portfolio Holdings
September 30,2004
Leuthold Core Investment Fund | | | |
| | | | |
Components of Portfolio Holdings | | | |
| | | | |
| Common Stock | | $ | 326,470,456 | |
| Short Securities | | | 65,138,560 | |
| Investment Companies | | | 57,127,509 | |
| Physical Industrial Metals | | | 34,444,665 | |
| Short Term Investments | | | 44,458,753 | |
| Total | | $ | 527,639,943 | |
| | | | | |
| | | | | |
Leuthold Select Industries Fund | | | | |
| | | | | |
Components of Portfolio Holdings | | | | |
| | | | | |
| Common Stock | | $ | 20,071,637 | |
| Investment Companies | | | 611,341 | |
| Total | | $ | 20,682,978 | |
| | | | | |
| | | | | |
Grizzly Short Fund | | | | |
| | | | | |
Components of Portfolio Holdings | | | | |
| | | | | |
| Short Securities | | $ | 21,365,460 | |
| Short Term Investments | | | 4,619,791 | |
| Total | | $ | 25,985,251 | |
The Leuthold Funds
Leuthold Core Investment Fund
Average Annual Rate of Return For Periods Ended September 30,2004 | |
| | | 1 year | | 3 year | | 5 year | | Since Inception | |
| Leuthold Core Investment Fund | | | 16.03 | % | | 13.44 | % | | 10.64 | % | | 10.96 | % |
| Lipper Flexible Fund Index | | | 11.02 | % | | 4.75 | % | | 1.18 | % | | 4.98 | % |
| S&P 500 Index | | | 13.87 | % | | 4.05 | % | | -1.31 | % | | 9.03 | % |
The Lipper Flexible Fund Index is an equally weighted index of the largest 30 mutual funds within the Flexible Portfolio investment objective, as defined by Lipper.
The S&P 500 Index is an unmanaged capitalization-weighted index of 500 stocks designed to measure performance of the broad domestic economy through changes in the aggregate market value of the 500 stocks which represent all major industries.
This chart assumes an initial gross investment of $10,000 made on 11/20/95 (commencement of operations). Returns shown include the reinvestment of all dividends. The Fund's past performance is not necessarily an indication of its future performance. It may perform better or worse in the future. The graph and the table do not reflect the deduction of taxes that a shareholder would pay on Fund distributions or the redemption of shares.
The Leuthold Funds
Leuthold Select Industries Fund
Average Annual Rate of Return For Periods Ended September 30, 2004 | |
| | | | | | | | |
| | | 1 year | | 3 Year | | Since Inception | |
| Leuthold Select Industries Fund | | | 17.88 | % | | 7.17 | % | | 4.87 | % |
| Russell 2000 Index | | | 18.77 | % | | 13.71 | % | | 3.50 | % |
| S&P 500 Index | | | 13.87 | % | | 4.05 | % | | -5.04 | % |
The S&P 500 Index is an unmanaged capitalization-weighted index of 500 stocks designed to measure performance of the broad domestic economy through changes in the aggregate market value of the 500 stocks which represent all major industries.
The Russell 2000 Index is comprised of the smallest 2000 companies in the Russell 3000 Index,representing approximately 11% of the Russell 3000 total market capitalization.
This chart assumes an initial gross investment of $10,000 made on 6/19/00 (commencement of operations). Returns shown include the reinvestment of all dividends. The Fund's past performance is not necessarily an indication of its future performance. It may perform better or worse in the future. The graph and the table do not reflect the deduction of taxes that a shareholder would pay on Fund distributions or the redemption of shares.
The Leuthold Funds
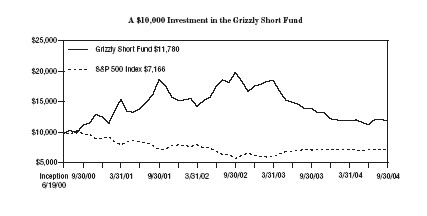
Grizzly Short Fund
Average Annual Rate of Return For Periods Ended
September 30, 2004 | |
| | | | | | | | |
| | | 1 year | | 3 Year | | Since Inception | |
| Grizzly Short Fund | | | -15.34 | % | | -14.26 | % | | 3.90 | % |
| Russell 2000 Index | | | 18.77 | % | | 13.71 | % | | 3.50 | % |
| S&P 500 Index | | | 13.87 | % | | 4.05 | % | | -5.04 | % |
The S&P 500 Index is an unmanaged capitalization-weighted index of 500 stocks designed to measure performance of the broad domestic economy through changes in the aggregate market value of the 500 stocks which represent all major industries.
The Russell 2000 Index is comprised of the smallest 2000 companies in the Russell 3000 Index,representing approximately 11% of the Russell 3000 total market capitalization.
This chart assumes an initial gross investment of $10,000 made on 6/19/00 (commencement of operations). Returns shown include the reinvestment of all dividends. The Fund's past performance is not necessarily an indication of its future performance. It may perform better or worse in the future. The graph and the table do not reflect the deduction of taxes that a shareholder would pay on Fund distributions or the redemption of shares.
Statements of Assets and Liabilities | | | | | | | |
September 30, 2004 | | | | | | | |
| | | Leuthold Core | | Leuthold Select | | Grizzly | |
| | | Investment Fund | | Industries Fund | | Short Fund | |
| ASSETS: | | | | | | | |
| | | | | | | | | | | |
Investments, at value (cost $406,724,947, $18,081,539 and $4,619,791,respectively) | | $ | 462,501,383 | | $ | 20,682,978 | | $ | 4,619,791 | |
| Cash | | | 2,272,644 | | | 50,494 | | | — | |
| Receivable for fund shares sold | | | 1,581,276 | | | 35,249 | | | 134,066 | |
| Receivable for investments sold | | | 1,513,040 | | | 39,470 | | | 861,134 | |
| Deposit for short sales | | | 46,168,043 | | | — | | | 16,613,381 | |
| Receivable from broker for proceeds on securities sold short | | | 64,874,804 | | | — | | | 22,132,030 | |
| Interest receivable | | | 37,378 | | | 109 | | | 6,229 | |
| Dividends receivable | | | 264,518 | | | 11,175 | | | — | |
| Other receivables | | | 13,475 | | | 43 | | | 5,059 | |
| Other assets | | | 19,373 | | | 8,307 | | | 16,748 | |
| Total assets | | | 579,245,934 | | | 20,827,825 | | | 44,388,438 | |
| LIABILITIES: | | | | | | | | | | |
| | | | | | | | | | | |
Securities sold short, at value (proceeds $65,186,859,$0 and $22,132,030,respectively) | | | 65,138,560 | | | — | | | 21,365,460 | |
| Payable for investments purchased | | | 1,258,416 | | | — | | | 1,130,831 | |
| Payable for fund shares purchased | | | 571,580 | | | — | | | 50,461 | |
| Payable to Adviser for advisory fees | | | 369,685 | | | 6,087 | | | 23,019 | |
| Dividends payable | | | 23,631 | | | — | | | 21,717 | |
| Accrued expenses and other liabilities | | | 428,699 | | | 45,557 | | | 42,089 | |
| Total liabilities | | | 67,790,571 | | | 51,644 | | | 22,633,577 | |
| NET ASSETS | | $ | 511,455,363 | | $ | 20,776,181 | | $ | 21,754,861 | |
| | | | | | | | | | | |
| NET ASSETS CONSIST OF: | | | | | | | | | | |
| Capital stock | | $ | 434,001,672 | | $ | 19,763,744 | | $ | 28,238,812 | |
| Accumulated undistributed net investment income | | | 56,786 | | | — | | | — | |
| Accumulated net realized gain (loss) on investments | | | 21,572,170 | | | (1,589,002 | ) | | (7,250,521 | ) |
| Net unrealized appreciation on | | | | | | | | | | |
| investments and short positions | | | 55,824,735 | | | 2,601,439 | | | 766,570 | |
| Total net assets | | $ | 511,455,363 | | $ | 20,776,181 | | $ | 21,754,861 | |
| | | | | | | | | | | |
Shares outstanding (1,000,000,000 shares of $0.0001 par value authorized) | | | 33,008,783 | | | 1,694,135 | | | 2,878,988 | |
Net Asset Value, Redemption Price and Offering Price Per Share | | $ | 15.49 | | $ | 12.26 | | $ | 7.56 | |
See notes to the financial statements.
The Leuthold Funds
Statements of Operations | | | | | | | |
For the Year Ended September 30, 2004 | | | | | | | |
| | | Leuthold Core | | Leuthold Select | | Grizzly | |
| | | Investment Fund | | Industries Fund | | Short Fund | |
| INVESTMENT INCOME: | | | | | | | |
Dividend income (net of foreign taxes withheld of $25,792,$1,891,and $0,respectively) | | $ | 5,749,883 | | $ | 146,586 | | $ | — | |
| Interest income | | | 458,303 | | | 1,381 | | | 230,358 | |
| Total investment income | | | 6,208,186 | | | 147,967 | | | 230,358 | |
| EXPENSES: | | | | | | | | | | |
| Investment advisory fee (Note 3) | | | 4,173,133 | | | 214,063 | | | 222,420 | |
| Administration fee | | | 353,843 | | | 26,305 | | | 28,206 | |
| Transfer agent fees and expenses | | | 120,170 | | | 9,659 | | | 18,675 | |
| Legal fees | | | 43,111 | | | 2,275 | | | 5,523 | |
| Audit fees | | | 68,599 | | | 2,864 | | | 2,999 | |
| Fund accounting fees and expenses | | | 83,093 | | | 33,347 | | | 40,045 | |
| Custody fees | | | 97,548 | | | 6,670 | | | 3,504 | |
| Shareholder servicing fees and expenses | | | 371,841 | | | 21,406 | | | 17,794 | |
| Federal and state registration | | | 44,121 | | | 22,623 | | | 26,276 | |
| Reports to shareholders | | | 149,232 | | | 7,693 | | | 9,324 | |
| Directors' fees and expenses | | | 17,031 | | | 817 | | | 1,153 | |
| Other | | | 103,420 | | | 2,039 | | | 1,031 | |
Total expenses before dividends and interest on short positions | | | 5,625,142 | | | 349,761 | | | 376,950 | |
| Dividends and interest on short positions | | | 732,450 | | | — | | | 264,202 | |
| Reimbursement to Adviser | | | — | | | 18,219 | | | — | |
| Total expenses | | | 6,357,592 | | | 367,980 | | | 641,152 | |
| NET INVESTMENT LOSS | | | (149,406 | ) | | (220,013 | ) | | (410,794 | ) |
REALIZED AND UNREALIZED GAINS (LOSSES) ON INVESTMENTS AND SHORT POSITIONS: | | | | | | | | | | |
| Net realized gain (loss) on: | | | | | | | | | | |
| Investments | | | 35,691,111 | | | 4,385,562 | | | — | |
| Investment companies | | | 9,343,742 | | | (7,291 | ) | | — | |
| Short positions | | | (9,735 | ) | | — | | | (3,839,386 | ) |
| | | | | | | | | | | |
Net unrealized appreciation (depreciation) during the period on: | | | | | | | | | | |
| Investments | | | 8,341,724 | | | (974,846 | ) | | — | |
| Investment companies | | | 2,939,025 | | | — | | | — | |
| Short positions | | | (402,096 | ) | | — | | | 292,836 | |
Net realized and unrealized gain (loss) on investments and short positions | | | 55,903,771 | | | 3,403,425 | | | (3,546,550 | ) |
NET INCREASE (DECREASE) IN NET ASSETS RESULTING FROM OPERATIONS | | $ | 55,754,365 | | $ | 3,183,412 | | $ | (3,957,344 | ) |
See notes to the financial statements.
The Leuthold Funds
Leuthold Core Investment Fund | | | | | |
Statements of Changes in Net Assets | | | | | |
| | | Year ended | | Year ended | |
| | | September 30, 2004 | | September 30, 2003 | |
| OPERATIONS: | | | | | |
| Net investment income (loss) | | $ | (149,406 | ) | | 1$,235,964 | |
Net realized gain (loss) on investments and short positions | | | 45,025,118 | | | (2,040,818 | ) |
Net unrealized appreciation on investments and short positions during the period | | | 10,878,653 | | | 55,553,193 | |
| Net increase in net assets from operations | | | 55,754,365 | | | 54,748,339 | |
| DISTRIBUTIONS TO SHAREHOLDERS: | | | | | | | |
| From net investment income | | | — | | | (1,218,285 | ) |
| Distributions in excess of net investment income | | | (1,375,265 | ) | | — | |
| Total distributions | | | (1,375,265 | ) | | (1,218,285 | ) |
| CAPITAL SHARE TRANSACTIONS: | | | | | | | |
| Proceeds from shares sold | | | 356,586,660 | | | 206,312,698 | |
| Proceeds from shares issued to holders in | | | | | | | |
| reinvestment of dividends | | | 1,311,149 | | | 1,158,170 | |
| Cost of shares redeemed | | | (218,424,742 | ) | | (59,760,973 | ) |
| Net increase in net assets from capital share transactions | | | 139,473,067 | | | 147,709,895 | |
| TOTAL INCREASE IN NET ASSETS: | | | 193,852,167 | | | 201,239,949 | |
| NET ASSETS | | | | | | | |
| Beginning of year | | | 317,603,196 | | | 116,363,247 | |
End of year (including accumulated undistributed net investment income of $56,786 and $171,444,respectively) | | $ | 511,455,363 | | $ | 317,603,196 | |
| | | | | | | | |
| CHANGES IN SHARES OUTSTANDING: | | | | | | | |
| Shares sold | | | 23,776,833 | | | 17,135,329 | |
| Shares issued to holders in reinvestment of dividends | | | 85,640 | | | 102,684 | |
| Shares redeemed | | | (14,579,563 | ) | | (5,208,752 | ) |
| Net increase | | | 9,282,910 | | | 12,029,261 | |
See notes to the financial statements.
The Leuthold Funds
Leuthold Select Industries Fund
Statements of Changes in Net Assets
| | | Year ended | | Year ended | |
| | | September 30, 2004 | | September 30, 2003 | |
| OPERATIONS: | | | | | |
| Net investment loss | | $ | (220,013 | ) | $ | (188,621 | ) |
| Net realized gain (loss) on investments | | | 4,378,271 | | | (1,031,496 | ) |
Net unrealized appreciation (depreciation) on investments during the period | | | (974,846 | ) | | 5,219,440 | |
| Net increase in net assets from operations | | | 3,183,412 | | | 3,999,323 | |
| CAPITAL SHARE TRANSACTIONS: | | | | | | | |
| Proceeds from shares sold | | | 22,154,402 | | | 15,473,384 | |
| Cost of shares redeemed | | | (21,777,041 | ) | | (12,399,247 | ) |
| Net increase in net assets from capital share transactions | | | 377,361 | | | 3,074,137 | |
| TOTAL INCREASE IN NET ASSETS: | | | 3,560,773 | | | 7,073,460 | |
| NET ASSETS | | | | | | | |
| Beginning of year | | | 17,215,408 | | | 10,141,948 | |
End of year (including accumulated undistributed net investment income of $0 and $0,respectively) | | $ | 20,776,181 | | $ | 17,215,408 | |
| | | | | | | | |
| CHANGES IN SHARES OUTSTANDING: | | | | | | | |
| Shares sold | | | 1,846,812 | | | 1,703,460 | |
| Shares redeemed | | | (1,807,710 | ) | | (1,401,435 | ) |
| Net increase | | | 39,102 | | | 302,025 | |
See notes to the financial statements.
The Leuthold Funds
Grizzly Short Fund
Statements of Changes in Net Assets
| | | Year ended | | Year ended | |
| | | September 30, 2004 | | September 30, 2003 | |
| OPERATIONS: | | | | | |
| Net investment loss | | $ | (410,794 | ) | $ | (333,318 | ) |
| Net realized loss on short positions | | | (3,839,386 | ) | | (2,390,342 | ) |
Net unrealized appreciation (depreciation) on short positions during the period | | | 292,836 | | | (1,774,927 | ) |
| Net decrease in net assets from operations | | | (3,957,344 | ) | | (4,498,587 | ) |
| DISTRIBUTIONS TO SHAREHOLDERS: | | | | | | | |
| From net realized gains | | | — | | | (2,503,486 | ) |
| Return of capital | | | — | | | (245,686 | ) |
| Total distributions | | | — | | | (2,749,172 | ) |
| CAPITAL SHARE TRANSACTIONS: | | | | | | | |
| Proceeds from shares sold | | | 51,376,204 | | | 55,461,839 | |
Proceeds from shares issued to holders in reinvestment of dividends | | | — | | | 2,627,172 | |
| Cost of shares redeemed | | | (47,996,737 | ) | | (60,558,254 | ) |
Net increase (decrease) in net assets from capital share transactions | | | 3,379,467 | | | (2,469,243 | ) |
| TOTAL DECREASE IN NET ASSETS: | | | (577,877 | ) | | (9,717,002 | ) |
| NET ASSETS | | | | | | | |
| Beginning of year | | | 22,332,738 | | | 32,049,740 | |
End of year (including accumulated undistributed net investment income of $0 and $0,respectively) | | $ | 21,754,861 | | $ | 22,332,738 | |
| | | | | | | | |
| CHANGES IN SHARES OUTSTANDING: | | | | | | | |
| Shares sold | | | 6,478,560 | | | 5,357,466 | |
| Shares issued to holders in reinvestment of dividends | | | — | | | 222,220 | |
| Shares redeemed | | | (6,101,106 | ) | | (5,340,456 | ) |
| Net increase | | | 377,454 | | | 239,230 | |
See notes to the financial statements.
The Leuthold Funds
Leuthold Core Investment Fund | | | | | | | | | |
Financial Highlights | | | | | | | | | | | |
| | | | | | | | | | | | |
| | | Years ended September 30, | |
| | | 2004 | | 2003 | | 2002 | | 2001 | | 2000 | |
Per Share Data: | | | | | | | | | | | |
| Net asset value, beginning of year | | $ | 13.39 | | $ | 9.95 | | $ | 10.92 | | $ | 12.74 | | $ | 11.12 | |
| Income (loss) from investment operations: | | | | | | | | | | | | | | | | |
Net investment income (1) | | | — | | | 0.09 | | | 0.20 | | | 0.38 | | | 0.52 | |
Net realized and unrealized gains (losses) on investments and short positions | | | 2.15 | | | 3.44 | | | (0.97 | ) | | (1.09 | ) | | 1.75 | |
| Total from investment operations | | | 2.15 | | | 3.53 | | | (0.77 | ) | | (0.71 | ) | | 2.27 | |
| Less distributions: | | | | | | | | | | | | | | | | |
| From net investment income | | | — | | | (0.09 | ) | | (0.20 | ) | | (0.37 | ) | | (0.51 | ) |
| In excess of net investment income | | | (0.05 | ) | | — | | | — | | | (0.01 | ) | | — | |
| From net realized gains | | | — | | | — | | | — | | | (0.73 | ) | | (0.14 | ) |
| Total distributions | | | (0.05 | ) | | (0.09 | ) | | (0.20 | ) | | (1.11 | ) | | (0.65 | ) |
| Net asset value, end of year | | $ | 15.49 | | $ | 13.39 | | $ | 9.95 | | $ | 10.92 | | $ | 12.74 | |
| | | | | | | | | | | | | | | | | |
| Total return | | | 16.03 | % | | 35.60 | % | | -7.21 | % | | -6.16 | % | | 20.98 | % |
| Supplemental data and ratios: | | | | | | | | | | | | | | | | |
| Net assets, end of year | | $ | 511,455,363 | | $ | 317,603,196 | | $ | 116,363,247 | | $ | 116,712,715 | | $ | 87,074,651 | |
| Ratio of expenses to average net assets: | | | | | | | | | | | | | | | | |
Before expense reimbursement (2) | | | 1.37 | % | | 1.31 | % | | 1.25 | % | | 1.25 | % | | 1.36 | % |
After expense reimbursement (2) | | | 1.37 | % | | 1.31 | % | | 1.25 | % | | 1.25 | % | | 1.35 | % |
| Ratio of net investment | | | | | | | | | | | | | | | | |
| income (loss) to average net assets: | | | | | | | | | | | | | | | | |
Before expense reimbursement (3) | | | -0.03 | % | | 0.71 | % | | 1.85 | % | | 3.00 | % | | 4.53 | % |
After expense reimbursement (3) | | | -0.03 | % | | 0.71 | % | | 1.85 | % | | 3.00 | % | | 4.54 | % |
Portfolio turnover rate (4) | | | 132.96 | % | | 89.59 | % | | 132.77 | % | | 122.21 | % | | 129.74 | % |
| (1) | Net investment income per share is calculated using ending balances prior to consideration of adjustments for permanent book and tax differences. |
| (2) | The ratio of expenses to average net assets includes dividends on short positions. The before expense reimbursement and after expense reimbursement ratios excluding dividends on short positions were 1.21% and 1.21%, respectively, for the year ended September 30, 2004, 1.21% and 1.21%, respectively, for the year ended September 30, 2003, 1.21% and 1.21%, respectively, for the year ended September 30, 2002, 1.24% and 1.24%, respectively, for the year ended September 30, 2001, 1.26% and 1.25%, respectively, for the year ended September 30, 2000. |
| (3) | The net investment income (loss) ratios include dividends on short positions. |
| (4) | The portfolio turnover ratio excludes purchases and sales of short positions as the Adviser does not intend to hold the short positions for more than one year. |
See notes to the financial statements.
The Leuthold Funds
Leuthold Select Industries Fund
Financial Highlights
| | | | | June 19,2000(1) | |
| | | Years ended September 30, | | through | |
| | | 2004 | | 2003 | | 2002 | | 2001 | | September 30,2000 | |
Per Share Data: | | | | | | | | | | | |
| Net asset value, beginning of year | | $ | 10.40 | | $ | 7.50 | | $ | 9.96 | | $ | 11.96 | | $ | 10.00 | |
| Income (loss) from investment operations: | | | | | | | | | | | | | | | | |
Net investment loss (2) | | | (0.13 | ) | | (0.11 | ) | | (0.15 | ) | | (0.06 | ) | | (0.01 | ) |
Net realized and unrealized gains (losses) on investments | | | 1.99 | | | 3.01 | | | (2.31 | ) | | (1.94 | ) | | 1.97 | |
| Total from investment operations | | | 1.86 | | | 2.90 | | | (2.46 | ) | | (2.00 | ) | | 1.96 | |
| Less distributions: | | | | | | | | | | | | | | | | |
| From net investment income | | | — | | | — | | | — | | | —(3 | ) | | — | |
| Total distributions | | | — | | | — | | | — | | | — | | | — | |
| Net asset value, end of year | | $ | 12.26 | | $ | 10.40 | | $ | 7.50 | | $ | 9.96 | | $ | 11.96 | |
| | | | | | | | | | | | | | | | | |
| Total return | | | 17.88 | % | | 38.67%(6 | ) | | -24.70 | % | | -16.72 | % | | 19.60%(4 | ) |
| Supplemental data and ratios: | | | | | | | | | | | | | | | | |
| Net assets, end of year | | $ | 20,776,181 | | $ | 17,215,408 | | $ | 10,141,948 | | $ | 13,883,463 | | $ | 2,314,133 | |
| Ratio of expenses to average net assets: | | | | | | | | | | | | | | | | |
| Before expense reimbursement or recovery | | | 1.63 | % | | 1.80 | % | | 1.90 | % | | 2.22 | % | | 15.98%(5 | ) |
| After expense reimbursement or recovery | | | 1.72 | % | | 1.95 | % | | 1.95 | % | | 1.95 | % | | 1.95%(5 | ) |
| Ratio of net investment loss to average net assets: | | | | | | | | | | | | | | | | |
| Before expense reimbursement or recovery | | | -0.94 | % | | -1.41 | % | | -1.17 | % | | -1.08 | % | | -14.57%(5 | ) |
| After expense reimbursement or recovery | | | -1.03 | % | | -1.56 | % | | -1.22 | % | | -0.81 | % | | -0.54%(5 | ) |
| Portfolio turnover rate | | | 165.86 | % | | 184.71 | % | | 383.66 | % | | 127.32 | % | | 27.11%(4 | ) |
| (1) | Commencement of operations. |
| (2) | Net investment loss per share is calculated using ending balances prior to consideration of adjustments for permanent book and tax differences. |
| (3) | Less than one cent per share. |
| (6) | As described in Note 3 to the financial statements, during the year ended September 30,2003,the Fund incurred certain losses as a result of a trading error. The Investment Adviser reimbursed the Fund for the amount of the loss which impacted the total return by 0.27%. |
See notes to the financial statements.
The Leuthold Funds
Grizzly Short Fund
Financial Highlights
| | | | | June 19,2000(1) | |
| | | Years ended September 30, | | through | |
| | | 2004 | | 2003 | | 2002 | | 2001 | | September 30,2000 | |
Per Share Data: | | | | | | | | | | | |
| Net asset value, beginning of year | | $ | 8.93 | | $ | 14.17 | | $ | 14.74 | | $ | 11.01 | | $ | 10.00 | |
| Income (loss) from investment operations: | | | | | | | | | | | | | | | | |
Net investment income (loss) (2) | | | (0.14 | ) | | (0.13 | ) | | (0.05 | ) | | 0.58 | | | 0.14 | |
Net realized and unrealized gains (losses) on short positions | | | (1.23 | ) | | (3.76 | ) | | 0.67 | | | 5.57 | | | 1.00 | |
| Total from investment operations | | | (1.37 | ) | | (3.89 | ) | | 0.62 | | | 6.15 | | | 1.14 | |
| Less distributions: | | | | | | | | | | | | | | | | |
| From net investment income | | | — | | | — | | | (0.03 | ) | | (0.58 | ) | | (0.13 | ) |
| From net realized gains | | | — | | | (1.25 | ) | | (1.16 | ) | | (1.84 | ) | | — | |
| Return of capital | | | — | | | (0.10 | ) | | — | | | — | | | — | |
| Total distributions | | | — | | | (1.35 | ) | | (1.19 | ) | | (2.42 | ) | | (0.13 | ) |
| Net asset value, end of year | | $ | 7.56 | | $ | 8.93 | | $ | 14.17 | | $ | 14.74 | | $ | 11.01 | |
| | | | | | | | | | | | | | | | | |
| Total return | | | -15.34 | % | | -29.68 | % | | 5.80 | % | | 67.79 | % | | 11.40%(3 | ) |
| Supplemental data and ratios: | | | | | | | | | | | | | | | | |
| Net assets, end of year | | $ | 21,754,861 | | $ | 22,332,738 | | $ | 32,049,740 | | $ | 19,986,043 | | $ | 2,343,978 | |
| Ratio of expenses to average net assets: | | | | | | | | | | | | | | | | |
Before expense reimbursement or recovery (5) | | | 3.60 | % | | 3.49 | % | | 2.85 | % | | 3.92 | % | | 16.28%(4 | ) |
After expense reimbursement or recovery (5) | | | 3.60 | % | | 3.61 | % | | 3.37 | % | | 2.96 | % | | 2.75%(4 | ) |
| Ratio of net investment income (loss) | | | | | | | | | | | | | | | | |
| to average net assets: | | | | | | | | | | | | | | | | |
Before expense reimbursement or recovery (6) | | | -2.31 | % | | -1.75 | % | | -0.17 | % | | 3.79 | % | | -5.00%(4 | ) |
After expense reimbursement or recovery (6) | | | -2.31 | % | | -1.87 | % | | -0.69 | % | | 4.75 | % | | 8.53%(4 | ) |
Portfolio turnover rate (7) | | | 0 | % | | 0 | % | | 0 | % | | 0 | % | | 0 | % |
| (1) | Commencement of operations. |
| (2) | Net investment income (loss) per share is calculated using ending balances prior to consideration of adjustments for permanent book and tax differences. |
| (5) | The ratio of expenses to average net assets includes dividends on short positions. The before expense reimbursement or recovery and after expense reimbursement or recovery ratios excluding dividends on short positions were 2.12% and 2.12%, respectively, for the year ended September 30, 2004, 1.95% and 2.07%, respectively, for the year ended September 30, 2003, 1.98% and 2.50%, respectively, for the year ended September 30, 2002, 3.46% and 2.50% respectively, for the year ended September 30, 2001,and 16.05% and 2.50%, respectively, for the period ended September 30,2000. |
| (6) | The net investment income (loss) ratios include dividends on short positions. |
| (7) | The portfolio turnover ratios exclude purchases and sales of short positions as the Adviser does not intend to hold the short positions for more than one year. |
See notes to the financial statements.
The Leuthold Funds
Leuthold Core Investment Fund
Schedule of Investments
September 30, 2004
| | | Shares | | Value | |
COMMON STOCKS 63.8% | | | | | |
Aerospace & Defense 6.6% | | | | | |
L-3 Communications Holdings, Inc. | | | 110,740 | | $ | 7,419,580 | |
| Lockheed Martin Corp. | | | 179,880 | | | 10,033,706 | |
| Raytheon Co. | | | 278,590 | | | 10,580,848 | |
| United Technologies Corp | | | 61,736 | | | 5,764,908 | |
| | | | | | | 33,799,042 | |
Aluminum 2.4% | | | | | | | |
| Alcan, Inc.(b) | | | 128,957 | | | 6,164,144 | |
| Alcoa, Inc. | | | 187,740 | | | 6,306,187 | |
| | | | | | | 12,470,331 | |
Consumer Electronics 0.7% | | | | | | | |
| Garmin Ltd.(b) | | | 76,784 | | | 3,320,908 | |
Diversified Chemicals 0.3% | | | | | | | |
| FMC Corp.(a) | | | 36,006 | | | 1,748,812 | |
Diversified Metals & Mining 7.4% | | | | | | | |
| BHP Billiton Ltd. | | | 665,880 | | | 13,817,010 | |
| Inco Ltd. (a) (b) | | | 215,585 | | | 8,418,594 | |
| Phelps Dodge Corp. | | | 67,924 | | | 6,251,046 | |
| Rio Tinto PLC | | | 76,362 | | | 8,296,731 | |
Southern Peru Copper Corp. (b) | | | 24,329 | | | 1,256,836 | |
| | | | | | | 38,040,217 | |
Drug Retail 0.6% | | | | | | | |
| NeighborCare, Inc. (a) | | | 111,519 | | | 2,827,007 | |
Electric Utilities 11.6% | | | | | | | |
| Ameren Corp. | | | 124,701 | | | 5,754,951 | |
| Centerpoint Energy, Inc | | | 395,810 | | | 4,100,592 | |
| Cinergy Corp. | | | 249,297 | | | 9,872,161 | |
| Cleco Corp. | | | 45,283 | | | 780,679 | |
| Consolidated Edison, Inc. | | | 116,078 | | | 4,879,919 | |
| | | Shares | | Value | |
Electric Utilities 11.6% (Continued) | | | | | |
| DPL, Inc. | | | 234,851 | | $ | 4,833,234 | |
| DTE Energy Co. | | | 116,156 | | | 4,900,622 | |
Duquesne Light Holdings, Inc. | | | 74,463 | | | 1,337,355 | |
| Hawaiian Electric Industries | | | 56,136 | | | 1,489,849 | |
| OGE Energy Corp. | | | 77,627 | | | 1,958,529 | |
| Pepco Holdings, Inc. | | | 190,078 | | | 3,782,552 | |
| PPL Corp. | | | 98,300 | | | 4,637,794 | |
| Progress Energy, Inc. | | | 155,185 | | | 6,570,533 | |
| TECO Energy, Inc. | | | 342,775 | | | 4,637,746 | |
| | | | | | | 59,536,516 | |
Gas Utilities 0.8% | | | | | | | |
| Atmos Energy Corp. | | | 56,615 | | | 1,426,132 | |
| NiSource, Inc. | | | 131,623 | | | 2,765,399 | |
| | | | | | | 4,191,531 | |
Health Care Equipment 2.4% | | | | | | | |
| Cytyc Corp. (a) | | | 341,308 | | | 8,242,588 | |
| Diagnostic Products Corp | | | 100,269 | | | 4,097,994 | |
| | | | | | | 12,340,582 | |
Health Care Facilities 4.7% | | | | | | | |
| Beverly Enterprises, Inc. (a) | | | 135,848 | | | 1,028,370 | |
Community Health Systems, Inc. (a) | | | 90,284 | | | 2,408,777 | |
| HCA, Inc. | | | 144,708 | | | 5,520,610 | |
| Manor Care, Inc. | | | 165,521 | | | 4,959,009 | |
| Province Healthcare Co. (a) | | | 263,351 | | | 5,509,303 | |
United Surgical Partners International, Inc. (a) | | | 29,532 | | | 1,014,424 | |
Universal Health Services, Inc. | | | 82,574 | | | 3,591,969 | |
| | | | | | | 24,032,462 | |
See notes to the financial statements.
The Leuthold Funds
Leuthold Core Investment Fund
Schedule of Investments (Continued)
September 30, 2004
| | | Shares | | Value | |
Health Care Services 4.9% | | | | | | | |
American Healthways, Inc. (a) | | | 104,769 | | $ | 3,049,826 | |
| Cerner Corp. (a) | | | 134,020 | | | 5,797,705 | |
| DaVita, Inc. (a) | | | 131,629 | | | 4,100,243 | |
| LabOne, Inc. (a) | | | 41,626 | | | 1,216,728 | |
Laboratory Corp Of America Holdings (a) | | | 77,487 | | | 3,387,732 | |
Medco Health Solutions, Inc. (a) | | | 45,001 | | | 1,390,531 | |
Pediatrix Medical Group, Inc. (a) | | | 60,330 | | | 3,309,101 | |
| RehabCare Group, Inc. (a) | | | 36,282 | | | 835,574 | |
| Renal Care Group, Inc. (a) | | | 60,330 | | | 1,944,436 | |
| | | | | | | 25,031,876 | |
Industrial Machinery 0.8% | | | | | | | |
| Briggs & Stratton Corp. | | | 51,989 | | | 4,221,507 | |
Integrated Oil & Gas 0.9% | | | | | | | |
| Marathon Oil Corp. | | | 109,397 | | | 4,515,908 | |
IT Consulting & Other Services 0.4% | | | | | | | |
| Infosys Technologies Ltd (a) | | | | | | 1,862,536 | |
Life & Health Insurance 6.4% | | | | | | | |
| Aflac, Inc. | | | 56,674 | | | 2,222,188 | |
| Jefferson-Pilot Corp. | | | 56,475 | | | 2,804,549 | |
| Lincoln National Corp. | | | 72,705 | | | 3,417,135 | |
| Manulife Financial Corp. (b) | | | 135,956 | | | 5,953,513 | |
| Metlife, Inc. | | | 218,066 | | | 8,428,251 | |
| Prudential Financial, Inc. | | | 187,262 | | | 8,808,804 | |
| UICI | | | 30,095 | | | 985,310 | |
| | | | | | | 32,619,750 | |
| | | Shares | | Value | |
Multi-Utilities & Unregulated Power 5.7% | | | | | |
| Dynegy, Inc.- Class A (a) | | | 1,323,042 | | $ | 6,601,980 | |
| Equitable Resources, Inc. | | | 27,001 | | | 1,466,424 | |
| Oneok, Inc. | | | 303,197 | | | 7,889,186 | |
| Reliant Energy, Inc. (a) | | | 668,552 | | | 6,237,590 | |
| The AES Corp. (a) | | | 683,600 | | | 6,829,164 | |
| | | | | | | 29,024,344 | |
Oil & Gas Exploration & Production 4.4% | | | | | | | |
| Chesapeake Energy Corp. | | | 190,272 | | | 3,012,006 | |
| Newfield Exploration Co. (a) | | | 50,205 | | | 3,074,554 | |
| Noble Energy, Inc. | | | 53,580 | | | 3,120,499 | |
Pioneer Natural Resources Co. | | | 129,823 | | | 4,476,297 | |
Plains Exploration & Production Co. (a) | | | 79,034 | | | 1,885,751 | |
Spinnaker Exploration Co. (a) | | | 68,346 | | | 2,394,844 | |
| XTO Energy, Inc. | | | 144,848 | | | 4,704,663 | |
| | | | | | | 22,668,614 | |
Oil & Gas Refining & Marketing & Transportation 1.9% | | | | | | | |
| Teekay Shipping Corp. (b) | | | 80,440 | | | 3,466,160 | |
| Williams Cos, Inc. | | | 510,063 | | | 6,171,762 | |
| | | | | | | 9,637,922 | |
Precious Metals & Minerals 0.6% | | | | | | | |
| Apex Silver Mines Ltd. (a) (b) | | | 26,579 | | | 576,765 | |
| Hecla Mining Co. (a) | | | 345,105 | | | 2,567,581 | |
| | | | | | | 3,144,346 | |
See notes to the financial statements.
The Leuthold Funds
Leuthold Core Investment Fund
Schedule of Investments
(Continued) September 30, 2004
| | | Shares | | Value | |
Reinsurance 0.3% | | | | | | | |
RenaissanceRe Holdings Ltd. (b) | | | 27,845 | | $ | 1,436,245 | |
Total Common Stocks (Cost $285,998,315) | | | | | | 326,470,456 | |
PHYSICAL INDUSTRIAL METALS 6.7% | | | | | | | |
Physical Metals 1.2% | | | | | | | |
| Aluminum (a) (c) | | | 375 | | | 698,437 | |
| Copper (a) (c) | | | 250 | | | 784,375 | |
| Nickel (a) (c) | | | 24 | | | 397,920 | |
| Palladium (a) (c) | | | 4,400 | | | 974,600 | |
| Silver (a) (c) | | | 380,400 | | | 2,622,858 | |
| Zinc (a) (c) | | | 500 | | | 546,250 | |
| | | | | | | 6,024,440 | |
Prepaid Forward Contracts 5.5% | | | | | | | |
| Aluminum (a) (c) | | | 750 | | | 1,287,000 | |
| Aluminum (a) (c) | | | 3,550 | | | 6,539,100 | |
| Copper (a) (c) | | | 225 | | | 566,437 | |
| Copper (a) (c) | | | 2,425 | | | 7,213,163 | |
| Lead (a) (c) | | | 1,825 | | | 1,673,525 | |
| Nickel (a) (c) | | | 42 | | | 590,100 | |
| Nickel (a) (c) | | | 270 | | | 4,433,400 | |
| Tin (a) (c) | | | 220 | | | 2,003,100 | |
| Zinc (a) (c) | | | 3,700 | | | 4,114,400 | |
| | | | | | | 28,420,225 | |
Total Physical Industrial Metals (Cost $29,569,119) | | | | | | 34,444,665 | |
INVESTMENT COMPANIES 11.2% | | | | | | | |
Bond Funds 0.9% | | | | | | | |
T Rowe Price HighYield Fund | | | 634,504 | | | 4,454,218 | |
| | | Shares | | Value | |
Emerging Country Funds 9.4% | | | | | | | |
Acadian Emerging Markets Portfolio | | | 143,283 | | $ | 2,541,844 | |
| Asia Tigers Fund, Inc. | | | 11,239 | | | 112,390 | |
Delaware Pooled Trust - The Emerging Markets Portfolio | | | 188,237 | | | 2,514,851 | |
Fidelity Advisor Emerging Asia Fund | | | 507 | | | 7,008 | |
Fidelity Latin America Fund | | | 240,590 | | | 4,217,538 | |
| ING Russia Fund (a) | | | 228,080 | | | 5,446,546 | |
iShares MSCI Brazil Index Fund | | | 177,545 | | | 3,293,460 | |
iShares MSCI Emerging Markets Index Fund | | | 13,670 | | | 2,358,075 | |
iShares MSCI Malaysia Index Fund | | | 102,712 | | | 691,252 | |
iShares MSCI Taiwan Index Fund | | | 148,746 | | | 1,591,582 | |
| Korea Equity Fund,Inc.(a) | | | 7,200 | | | 39,096 | |
Latin American Discovery Fund, Inc. | | | 5,300 | | | 78,546 | |
| Matthews China Fund (a) | | | 564,273 | | | 7,882,887 | |
| Matthews Korea Fund (a) | | | 1,007,329 | | | 4,089,756 | |
Matthews Pacific Tiger Fund (a) | | | 204,975 | | | 2,867,606 | |
Nicholas Applegate Emerging Countries Fund (a) | | | 141,877 | | | 2,128,152 | |
T Rowe Price International Funds - Latin America Fund | | | 112,969 | | | 1,502,494 | |
| Templeton China World Fund | | | 68,578 | | | 1,292,010 | |
| The Brazil Fund Inc. | | | 13,416 | | | 354,987 | |
See notes to the financial statements.
The Leuthold Funds
Leuthold Core Investment Fund
Schedule of Investments
(Continued) September 30, 2004
| | | Shares | | Value | |
Emerging Country Funds 9.4% (Continued) | | | | | | | |
The Brazilian Equity Fund Inc. | | | 2,000 | | $ | 14,420 | |
| The Greater China Fund Inc. | | | 3,000 | | | 46,470 | |
| The Korea Fund Inc. | | | 87,864 | | | 1,813,513 | |
| The Singapore Fund Inc. | | | 1,600 | | | 13,552 | |
| The Taiwan Fund Inc.(a) | | | 46,903 | | | 524,376 | |
US Global Investors Accolade Funds - Eastern European Fund | | | 107,066 | | | 2,844,740 | |
| | | | | | | 48,267,151 | |
Index Funds 0.9% | | | | | | | |
Nasdaq-100 Index Tracking Stock | | | 62,875 | | | 2,210,056 | |
| SPDR Trust Series 1 | | | 19,650 | | | 2,196,084 | |
| | | | | | | 4,406,140 | |
| Total Investment Companies | | | | | | | |
| (Cost $46,698,760) | | | | | | 57,127,509 | |
| | | | | Value | |
SHORT TERM INVESTMENTS 8.7% | | | | | | | |
| American Family Demand Note | | | | | | | |
| 1.45% | | | 5,453,034 | | $ | 5,453,034 | |
| U.S.Bank, N.A. | | | | | | | |
| 1.59% | | | 20,854,527 | | | 20,854,527 | |
| US Bank CP | | | | | | | |
| 0.00% due 10/01/2004 | | | 11,000,000 | | | 11,000,000 | |
Wisconsin Corporate Central Credit Union | | | | | | | |
| 1.51% | | | 7,151,192 | | | 7,151,192 | |
| Total Short Term Investments | | | | | | | |
| (Cost $44,458,753) | | | | | | 44,458,753 | |
Total Investments 90.4% (Cost $406,724,947) | | | | | | 462,501,383 | |
Other Assets in Excess of Liabilities 9.6% | | | | | | 48,953,980 | |
Total Net Assets 100.0% | | | | | $ | 511,455,363 | |
Percentages are stated as a percent of net assets.
| (a) | Non income producing investment. |
| (c) | Quantity represented in tons. |
See notes to the financial statements.
The Leuthold Funds
Leuthold Core Investment Fund
Securities Sold Short
September 30, 2004
| | | Shares | | Value | |
COMMON STOCKS 4.7% | | | | | | | |
Advertising 0.1% | | | | | | | |
| Lamar Advertising Co. (a) | | | 12,987 | | $ | 540,389 | |
Airlines 0.2% | | | | | | | |
| AMR Corp. (a) | | | 21,594 | | | 158,284 | |
| JetBlue Airways Corp. (a) | | | 17,819 | | | 372,773 | |
| Northwest Airlines Corp. (a) | | | 20,084 | | | 164,890 | |
| Southwest Airlines Co. | | | 35,034 | | | 477,163 | |
| | | | | | | 1,173,110 | |
Apparel Retail 0.1% | | | | | | | |
| Ross Stores, Inc. | | | 20,853 | | | 488,794 | |
Application Software 0.3% | | | | | | | |
| Fair Isaac Corp. | | | 19,329 | | | 564,407 | |
| Mercury Interactive Corp. (a) | | | 5,134 | | | 179,074 | |
| Quest Software, Inc. (a) | | | 42,584 | | | 473,534 | |
| The Reynolds & Reynolds Co. | | | 22,500 | | | 555,075 | |
| | | | | | | 1,772,090 | |
Asset Management & Custody Banks 0.1% | | | | | | | |
| Janus Capital Group, Inc. | | | 29,296 | | | 398,718 | |
Automobile Manufacturers 0.1% | | | | | | | |
| Ford Motor Co. | | | 31,259 | | | 439,189 | |
Biotechnology 0.4% | | | | | | | |
| Alkermes, Inc. (a) | | | 40,718 | | | 469,886 | |
Human Genome Sciences, Inc. (a) | | | 41,074 | | | 448,117 | |
| ICOS Corp. (a) | | | 21,896 | | | 528,569 | |
| NPS Pharmaceuticals, Inc. (a) | | | 8,003 | | | 174,305 | |
| Protein Design Labs, Inc. (a) | | | 25,044 | | | 490,362 | |
| | | | | | | 2,111,239 | |
Broadcasting & Cable TV 0.2% | | | | | | | |
| Cablevision Systems Corp. (a) | | | 9,211 | | | 186,799 | |
| Cumulus Media, Inc. (a) | | | 11,628 | | | 167,327 | |
| | | Shares | | Value | |
Broadcasting & Cable TV 0.2% (Continued) | | | | | | | |
EchoStar Communications Corp.(a) | | | 13,742 | | $ | 427,651 | |
Univision Communications, Inc. (a) | | | 15,252 | | | 482,116 | |
| | | | | | | 1,263,893 | |
Communications Equipment 0.4% | | | | | | | |
Advanced Fibre Communications, Inc. (a) | | | 29,900 | | | 475,410 | |
| Avaya, Inc. (a) | | | 36,997 | | | 515,738 | |
| Corning, Inc. (a) | | | 42,282 | | | 468,485 | |
| Tekelec (a) | | | 29,447 | | | 491,176 | |
| | | | | | | 1,950,809 | |
Computer Hardware 0.1% | | | | | | | |
| Dell, Inc.(a) | | | 14,195 | | | 505,342 | |
Consumer Finance 0.1% | | | | | | | |
| SLM Corp. | | | 11,779 | | | 525,343 | |
Data Processing & Outsourced Services 0.2% | | | | | | | |
Automatic Data Processing, Inc. | | | 11,326 | | | 467,990 | |
| Paychex, Inc. | | | 13,591 | | | 409,769 | |
| | | | | | | 877,759 | |
Electronic Equipment Manufacturers 0.1% | | | | | | | |
| National Instruments Corp. | | | 16,614 | | | 502,906 | |
Employment Services 0.1% | | | | | | | |
| Monster Worldwide, Inc.(a) | | | 22,756 | | | 560,708 | |
Environmental Services 0.1% | | | | | | | |
Allied Waste Industries, Inc. (a) | | | 47,128 | | | 417,083 | |
Health Care Services 0.1% | | | | | | | |
| Caremark Rx, Inc.(a) | | | 15,705 | | | 503,659 | |
See notes to the financial statements.
The Leuthold Funds
Leuthold Core Investment Fund
Securities Sold Short (Continued)
September 30, 2004
| | | Shares | | Value | |
Hotels,Resorts & Cruise Lines 0.2% | | | | | | | |
| Carnival Corp. (b) | | | 10,571 | | $ | 499,903 | |
| Hilton Hotels Corp. | | | 26,328 | | | 496,019 | |
| | | | | | | 995,922 | |
Housewares & Specialties 0.1% | | | | | | | |
| Newell Rubbermaid, Inc. | | | 18,725 | | | 375,249 | |
Industrial Machinery 0.1% | | | | | | | |
| SPX Corp. | | | 11,024 | | | 390,250 | |
Internet Retail 0.0% | | | | | | | |
| IAC/InterActiveCorp (a) | | | 7,550 | | | 166,251 | |
| Priceline.com, Inc. (a) | | | 8,758 | | | 194,165 | |
| | | | | | | 360,416 | |
Internet Software & Services 0.1% | | | | | | | |
| CNET Networks, Inc. (a) | | | 44,849 | | | 410,368 | |
Investment Banking & Brokerage 0.0% | | | | | | | |
| The Charles Schwab Corp. | | | 19,480 | | | 179,021 | |
Life & Health Insurance 0.1% | | | | | | | |
| UnumProvident Corp. | | | 32,014 | | | 502,300 | |
Movies & Entertainment 0.1% | | | | | | | |
| Regal Entertainment Group | | | 20,688 | | | 395,141 | |
Paper Products 0.2% | | | | | | | |
| Bowater, Inc. | | | 12,534 | | | 478,673 | |
| International Paper Co. | | | 12,534 | | | 506,499 | |
| | | | | | | 985,172 | |
Pharmaceuticals 0.2% | | | | | | | |
| Nektar Therapeutics (a) | | | 37,259 | | | 539,510 | |
Valeant Pharmaceuticals International | | | 20,990 | | | 506,279 | |
| | | | | | | 1,045,789 | |
Publishing 0.2% | | | | | | | |
| Dow Jones & Co, Inc. | | | 11,779 | | | 478,345 | |
| | | Shares | | Value | |
Publishing 0.2% (Continued) | | | | | | | |
| Knight-Ridder, Inc. | | | 6,644 | | $ | 434,850 | |
| | | | | | | 913,195 | |
Real Estate Investment Trusts 0.2% | | | | | | | |
| Equity Residential | | | 17,517 | | | 543,027 | |
First Industrial Realty Trust, Inc. | | | 13,440 | | | 495,936 | |
| | | | | | | 1,038,963 | |
Semiconductors 0.1% | | | | | | | |
| Altera Corp.(a) | | | 25,210 | | | 493,360 | |
Lattice Semiconductor Corp. (a) | | | 23,255 | | | 114,182 | |
| | | | | | | 607,542 | |
Specialty Chemicals 0.1% | | | | | | | |
| Ferro Corp. | | | 19,027 | | | 414,979 | |
Specialty Stores 0.1% | | | | | | | |
| Office Depot, Inc.(a) | | | 27,332 | | | 410,800 | |
Wireless Telecommunication Services 0.2% | | | | | | | |
| Crown Castle | | | | | | | |
| International Corp.(a) | | | 33,373 | | | 496,590 | |
| Nextel Partners, Inc.(a) | | | 34,732 | | | 575,857 | |
| | | | | | | 1,072,447 | |
Total Common Stocks (Cost $23,908,483) | | | | | | 24,128,585 | |
See notes to the financial statements.
The Leuthold Funds
Leuthold Core Investment Fund
Securities Sold Short (Continued) September 30, 2004
| | | | | Value | |
U.S.TREASURY OBLIGATIONS 8.0% | | | | | | | |
0.00% due 11/15/2015 to 08/15/2025 | | | 93,411,000 | | $ | 41,009,975 | |
Total U.S.Treasury Obligations (Cost $41,278,376) | | | | | | 41,009,975 | |
Total Securities Sold Short 12.7% (Proceeds $65,186,859) | | | | | $ | 65,138,560 | |
Percentages are stated as a percent of net assets. (a) Non income producing security.
See notes to the financial statements.
The Leuthold Funds
Leuthold Select Industries Fund
Schedule of Investments September 30, 2004
| | | Shares | | Value | |
COMMON STOCKS 96.6% | | | | | | | |
Aerospace & Defense 11.7% | | | | | | | |
| General Dynamics Corp. | | | 4,205 | | $ | 429,330 | |
| L-3 Communications | | | | | | | |
| Holdings, Inc. | | | 3,737 | | | 250,379 | |
| Lockheed Martin Corp. | | | 7,842 | | | 437,427 | |
| Northrop Grumman Corp. | | | 7,900 | | | 421,307 | |
| Raytheon Co. | | | 12,385 | | | 470,382 | |
| United Technologies Corp. | | | 4,444 | | | 414,981 | |
| | | | | | | 2,423,806 | |
Aluminum 4.1% | | | | | | | |
| Alcan, Inc.(b) | | | 8,729 | | | 417,246 | |
| Alcoa, Inc. | | | 12,739 | | | 427,903 | |
| | | | | | | 845,149 | |
Auto Parts & Equipment 0.8% | | | | | | | |
| Dana Corp. | | | 9,608 | | | 169,966 | |
Automobile Manufacturers 0.9% | | | | | | | |
| General Motors Corp. | | | 4,271 | | | 181,432 | |
Biotechnology 0.5% | | | | | | | |
| OraSure Technologies, Inc. (a) | | | 15,657 | | | 98,639 | |
Consumer Electronics 1.1% | | | | | | | |
| Garmin Ltd. (b) | | | 5,290 | | | 228,793 | |
Department Stores 0.8% | | | | | | | |
| Federated Department Stores | | | 3,469 | | | 157,597 | |
Diversified Metals & Mining 12.5% | | | | | | | |
| BHP Billiton Ltd. | | | 45,207 | | | 938,045 | |
| Inco Ltd. (a) (b) | | | 15,081 | | | 588,913 | |
| Phelps Dodge Corp. | | | 4,623 | | | 425,455 | |
| Rio Tinto PLC | | | 5,189 | | | 563,785 | |
| Southern Peru Copper Corp. (b) | | | 1,698 | | | 87,719 | |
| | | | | | | 2,603,917 | |
| | | Shares | | Value | |
Drug Retail 0.9% | | | | | | | |
| NeighborCare, Inc. (a) | | | 7,815 | | $ | 198,110 | |
Electric Utilities 4.4% | | | | | | | |
| American Electric | | | | | | | |
| Power Co, Inc. | | | 5,957 | | | 190,386 | |
| Cleco Corp. | | | 3,177 | | | 54,771 | |
| DPL, Inc. | | | 16,421 | | | 337,944 | |
| PPL Corp. | | | 6,859 | | | 323,608 | |
| | | | | | | 906,709 | |
Health Care Equipment 4.4% | | | | | | | |
| Cytyc Corp. (a) | | | 23,847 | | | 575,905 | |
| Diagnostic Products Corp. | | | 7,024 | | | 287,071 | |
| Trinity Biotech PLC (a) | | | 15,298 | | | 45,894 | |
| | | | | | | 908,870 | |
Health Care Facilities 8.0% | | | | | | | |
| Beverly Enterprises, Inc. (a) | | | 9,703 | | | 73,452 | |
Community Health Systems, Inc. (a) | | | 6,454 | | | 172,193 | |
| HCA, Inc. | | | 10,513 | | | 401,071 | |
Health Management Associates, Inc. | | | 9,403 | | | 192,103 | |
| LifePoint Hospitals, Inc. (a) | | | 4,377 | | | 131,354 | |
| Manor Care, Inc. | | | 11,974 | | | 358,741 | |
| Province Healthcare Co. (a) | | | 5,136 | | | 107,445 | |
| Triad Hospitals, Inc. (a) | | | 4,654 | | | 160,284 | |
United Surgical Partners International, Inc. (a) | | | 2,115 | | | 72,650 | |
| | | | | | | 1,669,293 | |
Health Care Services 9.5% | | | | | | | |
| American Healthways, Inc. (a) | | | 7,316 | | | 212,969 | |
| Cerner Corp. (a) | | | 9,396 | | | 406,471 | |
| DaVita, Inc. (a) | | | 9,232 | | | 287,577 | |
The Leuthold Funds
Leuthold Select Industries Fund
Schedule of Investments (Continued) September 30, 2004
| | | Shares | | Value | |
Health Care Services 9.5% (Continued) | | | | | |
| IDX Systems Corp. (a) | | | 7,318 | | $ | 237,469 | |
| LabOne, Inc. (a) | | | 2,654 | | | 77,576 | |
| Laboratory Corp Of | | | | | | | |
| America Holdings (a) | | | 5,417 | | | 236,831 | |
| Medco Health | | | | | | | |
| Solutions, Inc. (a) | | | 3,147 | | | 97,242 | |
| Pediatrix Medical | | | | | | | |
| Group, Inc. (a) | | | 4,230 | | | 232,016 | |
| RehabCare Group, Inc. (a) | | | 2,533 | | | 58,335 | |
| Renal Care Group, Inc. (a) | | | 4,201 | | | 135,398 | |
| | | | | | | 1,981,884 | |
IT Consulting & Other Services 0.6% | | | | | | | |
| Infosys Technologies Ltd (a) | | | 2,286 | | | 129,388 | |
Life & Health Insurance 8.6% | | | | | | | |
| Aflac, Inc. | | | 4,053 | | | 158,918 | |
| Lincoln National Corp. | | | 5,198 | | | 244,306 | |
| Manulife Financial Corp. (b) | | | 5,192 | | | 227,358 | |
| Metlife, Inc. | | | 10,484 | | | 405,207 | |
| Prudential Financial, Inc. | | | 9,362 | | | 440,388 | |
| Torchmark Corp. | | | 4,555 | | | 242,235 | |
| UICI | | | 2,123 | | | 69,507 | |
| | | | | | | 1,787,919 | |
Managed Health Care 1.9% | | | | | | | |
| Pacificare Health Systems (a) | | | 10,963 | | | 402,342 | |
Multi-line Insurance 1.7% | | | | | | | |
| Hartford Financial | | | | | | | |
| Services Group, Inc. | | | 5,725 | | | 354,549 | |
| | | | | | | | |
Multi-Utilities & Unregulated Power 9.8% | | | | | | | |
| Dynegy, Inc.- Class A (a) | | | 92,557 | | | 461,859 | |
| Equitable Resources, Inc. | | | 1,884 | | | 102,320 | |
| Oneok, Inc. | | | 21,766 | | | 566,351 | |
| | | Shares | | Value | |
Multi-Utilities & | | | | | | | |
Unregulated Power 9.8% (Continued) | | | | | | | |
| Reliant Energy, Inc. (a) | | | 45,823 | | $ | 427,529 | |
| The AES Corp. (a) | | | 47,919 | | | 478,711 | |
| | | | | | | 2,036,770 | |
Oil & Gas Exploration & Production 7.7% | | | | | | | |
| Chesapeake Energy Corp. | | | 13,273 | | | 210,111 | |
| Newfield Exploration Co. (a) | | | 3,504 | | | 214,585 | |
| Noble Energy, Inc. | | | 3,741 | | | 217,876 | |
| Pioneer Natural Resources Co. | | | 9,058 | | | 312,320 | |
| Plains Exploration & | | | | | | | |
| Production Co. (a) | | | 5,517 | | | 131,636 | |
| Spinnaker Exploration Co. (a) | | | 4,862 | | | 170,364 | |
| XTO Energy, Inc. | | | 10,395 | | | 337,630 | |
| | | | | | | 1,594,522 | |
Oil & Gas Refining & Marketing | | | | | | | |
& Transportation 3.3% | | | | | | | |
| Teekay Shipping Corp. (b) | | | 5,966 | | | 257,075 | |
| Williams Cos, Inc. | | | 35,755 | | | 432,635 | |
| | | | | | | 689,710 | |
Other Diversified Financial Services 0.9% | | | | | | | |
| J.P.Morgan Chase & Co. | | | 5,010 | | | 199,047 | |
Precious Metals & Minerals 1.1% | | | | | | | |
| Apex Silver Mines Ltd. (a) (b) | | | 1,859 | | | 40,340 | |
| Hecla Mining Co. (a) | | | 24,147 | | | 179,654 | |
| | | | | | | 219,994 | |
| Property & Casualty Insurance 0.9% | | | | | | | |
| ACE Ltd. (b) | | | 4,571 | | | 183,114 | |
Reinsurance 0.5% | | | | | | | |
| RenaissanceRe Holdings Ltd. (b) | | | 1,941 | | | 100,117 | |
Total Common Stocks (Cost $17,493,591) | | | | | | 20,071,637 | |
See notes to the financial statements.
The Leuthold Funds
Leuthold Select Industries Fund
Schedule of Investments (Continued) September 30, 2004
| | | Shares | | Value | |
INVESTMENT COMPANIES 3.0% | | | | | | | |
Index Funds 3.0% | | | | | | | |
| Nasdaq-100 Index | | | | | | | |
| Tracking Stock | | | 8,849 | | $ | 311,042 | |
| SPDR Trust Series 1 | | | 2,687 | | | 300,299 | |
| | | | | | | 611,341 | |
Total Investment Companies (Cost $587,948) | | | | | | 611,341 | |
Total Investments 99.6% (Cost $18,081,539) | | | | | | 20,682,978 | |
Other Assets in Excess of Liabilities 0.4% | | | | | | 93,203 | |
Total Net Assets 100.0% | | | | | $ | 20,776,181 | |
Percentages are stated as a percent of net assets.
| (a) | Non income producing security. |
See notes to the financial statements.
The Leuthold Funds
Grizzly Short Fund
Schedule of Investments September 30, 2004
| | | | | Value | |
SHORT TERM INVESTMENTS 21.2% | | | | | | | |
| U.S.Bank,N.A. | | | | | | | |
| 1.59% | | $ | 4,619,791 | | $ | 4,619,791 | |
Total Short Term Investments (Cost $4,619,791) | | | | | | 4,619,791 | |
Total Investments 21.2% (Cost $4,619,791) | | | | | | 4,619,791 | |
Other Assets in Excess of Liabilities 78.8% | | | | | | 17,135,070 | |
Total Net Assets 100.0% | | | | | $ | 21,754,861 | |
See notes to the financial statements.
The Leuthold Funds
Grizzly Short Fund
Securities Sold Short September 30, 2004
| | | Shares | | Value | |
COMMON STOCKS 98.2% | | | | | | | |
Advertising 2.3% | | | | | | | |
| Lamar Advertising Co.(a) | | | 11,952 | | $ | 497,323 | |
Airlines 4.7% | | | | | | | |
| AMR Corp.(a) | | | 19,535 | | | 143,192 | |
| JetBlue Airways Corp.(a) | | | 16,133 | | | 337,502 | |
| Northwest Airlines Corp.(a) | | | 16,768 | | | 137,665 | |
| Southwest Airlines Co. | | | 30,282 | | | 412,441 | |
| | | | | | | 1,030,800 | |
Apparel Retail 2.0% | | | | | | | |
| Ross Stores, Inc. | | | 18,611 | | | 436,242 | |
Application Software 7.2% | | | | | | | |
| Fair Isaac Corp. | | | 17,499 | | | 510,971 | |
| Mercury Interactive Corp.(a) | | | 4,400 | | | 153,472 | |
| Quest Software, Inc.(a) | | | 38,160 | | | 424,339 | |
| The Reynolds & Reynolds Co. | | | 19,830 | | | 489,206 | |
| | | | | | | 1,577,988 | |
Asset Management & Custody Banks | | | | | | | |
| Janus Capital Group, Inc. | | | 25,631 | | | 348,838 | |
Automobile Manufacturers 1.8% | | | | | | | |
| Ford Motor Co. | | | 28,427 | | | 399,399 | |
Biotechnology 8.5% | | | | | | | |
| Alkermes, Inc.(a) | | | 35,079 | | | 404,811 | |
Human Genome Sciences, Inc.(a) | | | 37,379 | | | 407,805 | |
| ICOS Corp.(a) | | | 19,788 | | | 477,682 | |
| NPS Pharmaceuticals, Inc.(a) | | | 6,415 | | | 139,719 | |
| Protein Design Labs, Inc.(a) | | | 21,786 | | | 426,570 | |
| | | | | | | 1,856,587 | |
Broadcasting & Cable TV 5.0% | | | | | | | |
| Cablevision Systems Corp.(a) | | | 8,297 | | | 168,263 | |
| | | Shares | | Value | |
Broadcasting & Cable TV 5.0% (Continued) | | | | | |
| Cumulus Media, Inc.(a) | | | 9,251 | | $ | 133,122 | |
EchoStar Communications Corp.(a) | | | 11,121 | | | 346,086 | |
Univision Communications, Inc.(a) | | | 13,782 | | | 435,649 | |
| | | | | | | 1,083,120 | |
Communications Equipment 8.3% | | | | | | | |
Advanced Fibre Communications, Inc.(a) | | | 28,370 | | | 451,083 | |
| Avaya, Inc.(a) | | | 33,162 | | | 462,279 | |
| Corning, Inc.(a) | | | 38,387 | | | 425,328 | |
| Tekelec (a) | | | 27,471 | | | 458,216 | |
| | | | | | | 1,796,906 | |
Computer Hardware 2.1% | | | | | | | |
| Dell, Inc.(a) | | | 13,153 | | | 468,247 | |
Consumer Finance 2.1% | | | | | | | |
| SLM Corp. | | | 10,144 | | | 452,422 | |
Data Processing & Outsourced Services 3.5% | | | | | | | |
| | | | | | | | |
Automatic Data Processing, Inc. | | | 9,803 | | | 405,060 | |
| Paychex, Inc. | | | 11,804 | | | 355,891 | |
| | | | | | | 760,951 | |
Electronic Equipment Manufacturers 2.1% | | | | | | | |
| National Instruments Corp. | | | 14,828 | | | 448,844 | |
Employment Services 2.3% | | | | | | | |
| Monster Worldwide, Inc.(a) | | | 20,082 | | | 494,820 | |
Environmental Services 1.7 % | | | | | | | |
Allied Waste Industries, Inc.(a) | | | 41,591 | | | 368,080 | |
See notes to the financial statements.
The Leuthold Funds
Grizzly Short Fund
Securities Sold Short (Continued) September 30, 2004
| | | | | | |
| | | Shares | | Value | |
Health Care Services 2.1% | | | | | | | |
| Caremark Rx, Inc.(a) | | | 14,481 | | $ | 464,406 | |
Hotels,Resorts & Cruise Lines 3.9% | | | | | | | |
| Carnival Corp.(b) | | | 8,935 | | | 422,536 | |
| Hilton Hotels Corp. | | | 22,681 | | | 427,310 | |
| | | | | | | 849,846 | |
Housewares & Specialties 1.4% | | | | | | | |
| Newell Rubbermaid, Inc. | | | 15,015 | | | 300,901 | |
Industrial Machinery 1.6% | | | | | | | |
| SPX Corp. | | | 9,951 | | | 352,265 | |
Internet Retail 1.4% | | | | | | | |
| IAC/InterActiveCorp (a) | | | 6,525 | | | 143,680 | |
| Priceline.com, Inc.(a) | | | 7,194 | | | 159,491 | |
| | | | | | | 303,171 | |
Internet Software & Services 1.6% | | | | | | | |
| CNET Networks, Inc.(a) | | | 38,011 | | | 347,801 | |
Investment Banking & Brokerage0.7% | | | | | | | |
| The Charles Schwab Corp. | | | 16,816 | | | 154,539 | |
Life & Health Insurance2.1% | | | | | | | |
| UnumProvident Corp. | | | 29,053 | | | 455,842 | |
Movies & Entertainment 1.7% | | | | | | | |
| Regal Entertainment Group | | | 18,846 | | | 359,959 | |
Paper Products 3.8% | | | | | | | |
| Bowater, Inc. | | | 10,189 | | | 389,118 | |
| International Paper Co. | | | 10,793 | | | 436,145 | |
| | | | | | | 825,263 | |
Pharmaceuticals 4.3% | | | | | | | |
| Nektar Therapeutics (a) | | | 32,922 | | | 476,710 | |
Valeant Pharmaceuticals International | | | 18,989 | | | 458,015 | |
| | | | | | | 934,725 | |
| | | Shares | | Value | |
Publishing 3.5% | | | | | |
| Dow Jones & Co, Inc. | | | 9,281 | | $ | 376,901 | |
| Knight-Ridder, Inc. | | | 5,981 | | | 391,457 | |
| | | | | | | 768,358 | |
Real Estate Investment Trusts 4.3% | | | | | | | |
| | | | | | | | |
| Equity Residential | | | 15,826 | | | 490,606 | |
First Industrial Realty Trust, Inc. | | | 12,359 | | | 456,047 | |
| | | | | | | 946,653 | |
Semiconductors 2.6% | | | | | | | |
| Altera Corp.(a) | | | 23,355 | | | 457,057 | |
Lattice Semiconductor Corp.(a) | | | 20,257 | | | 99,462 | |
| | | | | | | 556,519 | |
Specialty Chemicals 1.7% | | | | | | | |
| Ferro Corp. | | | 16,588 | | | 361,784 | |
Specialty Stores 1.7% | | | | | | | |
| Office Depot, Inc.(a) | | | 24,399 | | | 366,717 | |
Wireless Telecommunication Services 4.6% | | | | | | | |
Crown Castle International Corp.(a) | | | 30,243 | | | 450,016 | |
| Nextel Partners, Inc.(a) | | | 32,939 | | | 546,128 | |
| | | | | | | 996,144 | |
Total Common Stocks (Cost $22,132,030) | | | | | | 21,365,460 | |
Total Securities Sold Short 98.2% (Proceeds $22,132,030) | | | | | $ | 21,365,460 | |
Percentages are stated as a percent of net assets. (a) Non income producing security.
(b) Foreign security.
See notes to the financial statements.
The Leuthold Funds
Notes to the Financial Statements
| | 1. | ORGANIZATIONAND SIGNIFICANT ACCOUNTING POLICIES |
Leuthold Funds, Inc. (the "Company") was incorporated on August 30, 1995, as a Maryland Corporation and is registered as an open-end management investment company under the Investment Company Act of 1940. The Company consists of three series (the "Funds"): Leuthold Core Investment Fund, Leuthold Select Industries Fund and Grizzly Short Fund. The investment objective of the Leuthold Core Investment Fund is to seek total return consistent with prudent investment risk over the long term. The investment objective of the Leuthold Select Industries Fund and Grizzly Short Fund is capital appreciation. The Leuthold Core Investment Fund commenced operations on November 20, 1995 and the Leuthold Select Industries Fund and Grizzly Short Fund commenced operations on June 19,2000.
The following is a summary of significant accounting policies consistently followed by the Funds.
| | a) | Investment Valuation - Common stocks and closed-end investment companies that are listed on a securities exchange are valued at the last quoted sales price on the day the valuation is made. Price information on listed stocks is taken from the exchange where the security is primarily traded. Options and securities which are listed on an exchange but which are not traded on the valuation date are valued at the most recent bid prices. Securities sold short which are listed on an exchange but which are not traded on the valuation date are valued at the average of the current bid and asked prices. Securities sold short which are not listed on an exchange but for which market quotations are readily available are valued at the average of the current bid and asked prices. |
Unlisted securities for which market quotations are readily available are valued at the latest quoted bid price. Debt securities are valued at the latest bid prices furnished by independent pricing services. Other assets, including investments in open-end investment companies, and securities for which no quotations are readily available are valued at fair value as determined in good faith by the Board of Directors. Some of the factors which may be considered by the Board of Directors in determining fair value are fundamental analytical data relating to the investment; the nature and duration of any restrictions on disposition; trading in similar securities of the same issuer or comparable companies; information from broker dealers; and an evaluation of the forces that influence the market in which the securities are purchased and sold. The use of fair value pricing by a Fund may cause the net asset value of its shares to differ significantly from the net asset value that would be calculated without regard to such considerations. Short-term instruments (those with remaining maturities of 60 days or less) are valued at amortized cost, which approximates market.
The Leuthold Core Investment Fund may enter into physical industrial metals forward contracts obligating the Fund to receive physical industrial metals at a specified future date. Forward contracts are valued daily and unrealized appreciation or depreciation is recorded daily as the difference between the closing price of the physical industrial metals and the closing forward value applied to the face amount of the contract. A realized gain or loss is recorded at the time the metals received from the forward contract are sold.
The Leuthold Funds
| | b) | Federal Income Taxes - Provision for federal income taxes or excise taxes has not been made since the Funds have elected to be taxed as "regulated investment companies"and intend to distribute substantially all taxable income to shareholders and otherwise comply with the provisions of the Internal Revenue Code applicable to regulated investment companies. |
Distributions from net realized gains for book purposes may include short-term capital gains which are included as ordinary income to shareholders for tax purposes. The tax character of distributions paid during the fiscal years ended September 30, 2004 and 2003 was as follows:
| | | 2004 | |
| | | | | | | | | | |
| | | | | | | Long | | | |
| | | | | Return | | Term | | | |
| | | Ordinary | | of | | Capital | | | |
| | | Income | | Capital | | Gain | | Total | |
| | | | | | | | | | |
Leuthold Core Investment Fund | | | — | | | — | | $ | 1,375,265 | | $ | 1,375,265 | |
Leuthold Select Industries Fund | | | — | | | — | | | — | | | | |
| Grizzly Short Fund | | | — | | | — | | | — | | | | |
| | | 2003 | |
| | | | | Return | | | |
| | | Ordinary | | of | | | |
| | | Income | | Capital | | Total | |
| | | | | | | | | | | |
Leuthold Core Investment Fund | | $ | 1,218,285 | | | — | | $ | 1,218,285 | |
Leuthold Select Industries Fund | | | — | | | — | | | — | |
| Grizzly Short Fund | | | 2,503,486 | | $ | 245,686 | | | 2,749,172 | |
At September 30, 2004, the components of accumulated earnings (deficit) on a tax basis were as follows:
| | | Leuthold | | Leuthold | | | |
| | | Core | | Select | | Grizzly | |
| | | Investment | | Industries | | Short | |
| | | Fund | | Fund | | Fund | |
Undistributed ordinary income | | | — | | | — | | | — | |
Undistributed long-term capital gain | | $ | 21,756,769 | | | — | | | — | |
| | | | | | | | | | | |
| | | 21,756,769 | | | — | | | — | |
Capital loss carryover and post-October losses | | | — | | | (1,491,414 | ) | | (6,963,096 | ) |
| | | 55,696,922 | | | 2,503,851 | | | 479,145 | |
Accumulated earnings (deficit) | | $ | 77,453,691 | | $ | 1,012,437 | | $ | (6,483,951 | ) |
Net investment income and realized gains and losses for federal income tax purposes may differ from that reported on the financial statements because of permanent book-to-tax differences. Accounting principles generally accepted in the United States ("GAAP") requires that permanent differences between financial reporting and tax reporting be reclassified between various components of net assets. These differences are primarily due to net operating losses, REIT adjustments and tax equalization.
On the Statement of Assets and Liabilities, the following adjustments were made:
| | | Accumulated | | Accumulated | | | |
| | | Net | | Realized | | | |
| | | Investment | | Gains or | | Capital | |
| | | Loss | | Losses | | Stock | |
Leuthold Core Investment Fund | | $ | 1,410,013 | | $ | (11,530,423 | ) | $ | 10,120,410 | |
Leuthold Select Industries Fund | | | 220,013 | | | — | | | (220,013 | ) |
| Grizzly Short Fund | | | 410,794 | | | — | | | (410,794 | ) |
The Leuthold Funds
The Funds intend to utilize provisions of the federal income tax laws which allow the Funds to carry realized capital losses forward for eight years following the year of loss and offset such losses against any future realized capital gains. At September 30, 2004, the Funds had the following capital loss carryforwards available for federal income tax purposes.
| | | Leuthold | | | |
| | | Select | | Grizzly | |
| | | Industries | | Short | |
Expiration Date | | Fund | | Fund | |
| 2011 | | $ | 1,491,414 | | | — | |
| 2012 | | | — | | $ | 3,491,478 | |
The Funds also intend to defer and treat the following post-October losses incurred during the period from November 1, 2003 to September 30, 2004 as arising in the fiscal year ending September 30,2005:
| | | Post-October Loss Deferred | |
| Grizzly Short Fund | | $ | 3,471,618 | |
| | c) | Distributions to Shareholders - Dividends from net investment income, if any, are declared and paid quarterly. Distributions of net realized capital gains,if any,are declared and paid at least annually. |
| | d) | Use of Estimates - The preparation of financial statements in conformity with GAAP requires management to make estimates and assumptions that affect the reported amounts of assets and liabilities and disclosure of contingent assets and liabilities at the date of the financial statements and the reported amounts of revenues and expenses during the reporting period. Actual results could differ from those estimates. |
| | e) | Short Positions - For financial statement purposes, an amount equal to the settlement amount is included in the Statements of Assets and Liabilities as an asset and an equivalent liability. The amount of the liability is subsequently marked-to-market to reflect the current value of the short position. Subsequent fluctuations in the market prices of securities sold, but not yet purchased, may require purchasing the securities at prices which could differ from the amount reflected in the Statements of Assets and Liabilities. The Funds are liable for any dividends or interest payable on securities while those securities are in a short position. As collateral for its short positions, the Funds are required under the Investment Company Act of 1940 to maintain segregated assets consisting of cash, cas h equivalents or liquid securities. These segregated assets are valued consistent with Note 1a above. The amount of segregated assets are required to be adjusted daily to reflect changes in the market value of the securities sold short. The Leuthold Core Investment Fund and Grizzly Short Fund's receivable from broker for proceeds on securities sold short is with one major security dealer. The Funds do not require this broker to maintain collateral in support of the receivable from broker for proceeds on securities sold short. |
| | f) | Other - Investment and shareholder transactions are recorded on the trade date. The Funds determine the gain or loss realized from the investment transactions by comparing the original cost of the security lot sold with the net sales proceeds. Dividend income is recognized on the ex-dividend date or as soon as information is available to the Funds, and interest income is recognized on an accrual basis. Discounts and premiums on bonds are amortized over the life of the respective bond. |
The Leuthold Funds
| g) | Expenses - Expenses that directly relate to one of the Funds are charged directly to that Fund. Other operating expenses of the Company, such as directors fees and expenses, insurance expense, audit fees and legal fees are allocated between the three series of the Company based on the relative net asset value of the individual series. |
| 2. | INVESTMENT TRANSACTIONS |
Purchases and sales of investment securities, other than short-term investments and short sales, for the year ended September 30, 2004 are summarized below. There were no purchases or sales of long-term U.S.Government Securities.
| | | Purchases | | Sales | |
| Leuthold Core Investment Fund | | $ | 548,727,234 | | $ | 521,535,152 | |
| Leuthold Select Industries Fund | | | 35,110,374 | | | 34,694,812 | |
| Grizzly Short Fund | | | — | | | — | |
At September 30,2004,gross unrealized appreciation and depreciation of investments and cost of investments (excluding short positions) for tax purposes were as follows:
| | | Leuthold | | Leuthold | | | |
| | | Core | | Select | | Grizzly | |
| | | Investment | | Industries | | Short | |
| | | Fund | | Fund | | Fund | |
| | $ | 406,852,760 | | $ | 18,179,127 | | $ | 4,619,791 | |
| Appreciation | | | 59,624,423 | | | 3,060,217 | | | — | |
| Depreciation | | | (3,975,800 | ) | | (556,366 | ) | | — | |
Net unrealized appreciation | | $ | 55,648,623 | | $ | 2,503,851 | | | — | |
The differences between book and tax basis unrealized appreciation (depreciation) are primarily attributable to the tax deferral of losses on wash sales, mark-to-market adjustments on Passive Foreign Investment Companies (PFIC's) and return of capital distributions from real estate investment trusts (REITs).
| | 3. | INVESTMENTADVISORYAND OTHER AGREEMENTS |
The Funds have entered into Investment Advisory Agreements with Leuthold Weeden Capital Management, LLC. Pursuant to its advisory agreements with the Funds, the Investment Adviser is entitled to receive a fee, calculated daily and payable monthly, at annual rates of 0.90%, 1.00% and 1.25%, for the Leuthold Core Investment Fund, Leuthold Select Industries Fund and Grizzly Short Fund, respectively, as applied to each Funds' daily net assets.
The Investment Adviser has agreed to waive its advisory fee and/or reimburse the Funds' other expenses, including organization expenses, to the extent necessary to ensure that the Funds' total operating expenses (exclusive of interest, taxes, brokerage commissions, dividends and interest on short positions and other costs incurred in connection with the purchase or sale of portfolio securities, and extraordinary items) do not exceed the following rates, based on each Fund's average daily net assets:
| Leuthold Core Investment Fund | 1.25% |
| Leuthold Select Industries Fund | 1.60%1 |
| Grizzly Short Fund | 2.50% |
| | 1 | Effective February 1, 2004 the expense limitation cap of the Leuthold Select Industries Fund was reduced from 1.95% to 1.60%. |
Any waiver or reimbursement is subject to later adjustments to allow the Investment Adviser to recoup amounts previously waived or reimbursed to the extent actual fees and expenses for a fiscal period
The Leuthold Funds
are less than each Fund's expense limitation cap, provided, however, that the Investment Adviser shall only be entitled to recoup such amounts for a period of three years from the date such amount was waived or reimbursed.Waived/reimbursed expenses subject to potential recovery by year of expiration are as follows:
Leuthold Select Industries Fund | |
Year of Expiration | | Recoverable Amount | |
| 9/30/05 | | $ | 7,400 | |
| 9/30/06 | | | 2,419 | |
| 9/30/07 | | | 14,764 | |
U.S. Bancorp Fund Services, LLC serves as transfer agent, administrator and accounting services agent for the Funds. U.S.Bank, N.A.serves as custodian for the Funds.
For the year ended September 30, 2004, the Leuthold Core Investment Fund, Leuthold Select Industries Fund and Grizzly Short Fund paid Weeden & Co.,L.P., an affiliate of the Adviser, $1,543,938, $71,622 and $103,351, respectively, for brokerage commissions.
During the year ended September 30, 2003, the Leuthold Select Industries Fund received a reimbursement from the Investment Adviser related to certain losses incurred as a result of a trading error. The amount of the loss and corresponding reimbursement was $34,914 or $0.02 per share based on shares outstanding as of September 30,2003.
The Funds enter into contracts that contain a variety of indemnifications. The Funds' maximum exposure under these arrangements is unknown. However, the Funds have not had prior claims or losses pursuant to these contracts and expect the risk of loss to be remote.
The Leuthold Funds
REPORT OF INDEPENDENT REGISTERED PUBLIC ACCOUNTING FIRM
To the Shareholders and Board of
Directors Leuthold Funds, Inc.
We have audited the accompanying statements of assets and liabilities, including the schedules of investments, of Leuthold Funds, Inc. (consisting of Leuthold Core Investment Fund, Leuthold Select Industries Fund and Grizzly Short Fund) (the "Funds") as of September 30, 2004, and the related statement of operations for the year then ended and the statements of changes in net assets for each of the two years in the period then ended and the financial highlights for each of the three years in the period then ended. These financial statements and financial highlights are the responsibility of the Funds' management. Our responsibility is to express an opinion on these financial statements and financial highlights based on our audits. The financial highlights for periods presented through September 30, 20 01, were audited by other auditors whose report dated October 25, 2001 expressed an unqualified opinion on those financial highlights.
We conducted our audits in accordance with standards of the Public Company Accounting Oversight Board (United States). Those standards require that we plan and perform the audit to obtain reasonable assurance about whether the financial statements and financial highlights are free of material misstatement. An audit includes examining,on a test basis, evidence supporting the amounts and disclosures in the financial statements and financial highlights. Our procedures included confirmation of securities owned as of September 30,2004, by correspondence with the custodian and brokers or by other appropriate auditing procedures where replies from brokers were not received. An audit also includes assessing the accounting principles used and significant estimates made by management, as well as evaluating the ov erall financial statement presentation. We believe that our audits provide a reasonable basis for our opinion.
In our opinion, the financial statements and financial highlights audited by us as referred to above present fairly, in all material respects, the financial position of each of the respective funds constituting Leuthold Funds, Inc.at September 30, 2004, the results of their operations for the year then ended and changes in their net assets for each of the two years in the period then ended, and the financial highlights for each of the three years in the period then ended, in conformity with U.S. generally accepted accounting principles.
Minneapolis,Minnesota
November 19,2004
The Leuthold Funds
ADDITIONAL INFORMATION
| 1. | SHAREHOLDER NOTIFICATION OF FEDERAL TAX STATUS (UNAUDITED) |
The Leuthold Core Investment Fund designates $1,375,265 (100%) of total distributions paid during the fiscal year ended September 30, 2004 as net capital gain distributions eligible for long-term capital gain rates for individual shareholders.
For the fiscal year ended September 30,2004, certain dividends paid by the Leuthold Core Investment Fund may be subject to a maximum tax rate of 15% ("qualified dividend income"), as provided for by Internal Revenue Code Section 1(h). The Fund intends to designate the maximum eligible amount of its distributions as qualified dividend income. The Fund has received qualified dividend income from its investments of $5,404,507. Complete information will be computed and reported in conjunction with your 2004 Form 1099-DIV.
| 2. | ADDITIONAL DISCLOSURE REGARDING FUND DIRECTORS AND OFFICERS (UNAUDITED) |
Independent Directors | | | | | | | | | | |
| | | | | | | | | | | |
Name, Age and Address | | the Company | | Term of Office and Length of Time Served | | Principal Occupation During Past Five Years | | # of Portfolios in Fund Complex Overseen By Director | | Other Directorships Held by Director |
John S.Chipman (76)2121 W.49th StreetMinneapolis,MN 55409 | | Director | | Indefinite Term,8 Years Served | | Professor of Economics at the University of Minnesota since 1981. Guest Professor at the University of Konstanz,Germany from 1986 to 1991 and was awarded an honorary doctorate from such institution in 1991. | | 3 | | None |
| | | | | | | | | | | |
Lawrence L.Horsch (68)1404 Hilltop RidgeHoulton,WI 54082 | | Director | | Indefinite Term,8 Years Served | | Member of the Board of Directors of Boston Scientific Corp., a public company engaged in developing, producing and marketing medical devices from February,1995 to May 2003.Mr. Horsch served in various capacities with SCIMED Life Systems,Inc.,including Acting Chief Financial Officer from 1994 to 1995,Chairman of the Board from 1977 to 1994, and as a director from 1977 to 1995. He has also served as Chairman of Eagle Management & Financial Corp.,a management consulting firm,since 1990. | | 3 | | Chairman of the Board of Directors of Medical/CV Inc. |
| | | | | | | | | | | |
Paul M.Kelnberger (60)8208 Galway RoadWoodbury,MN 55125 | | Director | | Indefinite Term,8 Years Served | | Consultant;Partner, Johnson,West & Co., PLC, from 1975 to 2002. | | 3 | | None |
The Leuthold Funds
Interested Directors (and Officers)
Name,Age and Address | | theTrust | | Term of Office and Length of Time Served | | Principal Occupation During Past FiveYears | | # of Portfolios in Fund Complex Overseen By Trustee | | Trustee |
Steven C.Leuthold (65)100 N.Sixth StreetSuite 412AMinneapolis,MN 55403 | | | | Indefinite Term,8 Years Served | | Chief executive officer of the managing member of Leuthold Weeden Capital Management,LLC (the "Adviser"). He has also been a Portfolio Manager for the predecessors to the Adviser, Leuthold & Anderson,Inc.(since 1987) and Leuthold, Weeden & Associates,L.P.(since 1991). | | 3 | | None |
| | | | | | | | | | | |
Edward C.Favreau (51)100 N.Sixth StreetSuite 412AMinneapolis,MN 55403 | | Director andVice President | | Indefinite Term,4 Years Served | | Manager of Marketing and Sales of the Adviser since July, 1999. Prior to joining the Adviser, Mr.Favreau served as Vice President and Sales Manager of U.S.Bancorp Investments Inc. (formerly First Bank Investment Services) from June, 1993 until July, 1999. Prior to that time Mr.Favreau served in various capacities for U.S.Bank from July,1988 until June,1993. | | 3 | | None |
| | | | | | | | | | | |
David R.Cragg (33)100 N.Sixth StreetSuite 412AMinneapolis,MN 55403 | | Vice Presidentand Secretary | | Indefinite Term,4 Years Served | | Manager of Compliance of the Adviser since January, 1999. Prior to joining the Adviser, Mr.Cragg served as Operations Manager of Piper Trust Company from November,1997 until January,1999. Prior to that time, Mr.Cragg served in various capacities for Piper Trust Company from February, 1993 until November, 1997. | | 3 | | None |
The Statement of Additional Information includes additional information about the Fund's Directors and is available free of charge upon request by calling the Fund toll free at (800) 273-6886.
| 3. | AVAILABILITY OF PROXY VOTING INFORMATION |
Information regarding how the Funds vote proxies relating to portfolio securities is available without charge upon request by calling toll-free at (800) 273-6886 or by accessing the Funds'website at www.leutholdfunds.com and the SEC's website at www.sec.gov. Information regarding how the Funds voted proxies relating to portfolio securities during the twelve months ending June 30, 2004 is available through the Funds'website at www.leutholdfunds.com and on the SEC's website at www.sec.gov.
The Leuthold Funds
InvestmentAdviser:
Leuthold Weeden Capital Management,LLC, Minnesota
Administrator, TransferAgent, Dividend Paying Agent, Shareholder Servicing Agent:
U.S.Bancorp Fund Services,LLC, Wisconsin
Custodian:
U.S.Bank,N.A.,Ohio
Counsel:
Foley & Lardner, Wisconsin
Independent Registered PublicAccounting Firm:
Ernst & Young LLP, Minnesota
Beginning with the Funds' second and fourth quarters ending after July 9, 2004, the Funds will file complete schedules of portfolio holdings with the SEC on Form N-Q. The Form N-Q will be available without charge, upon request, by calling 1-800-273-6886 or by accessing the SEC's website, at www.sec.gov.
This report is authorized for distribution only when preceded or accompanied by a current prospectus.
Item 2. Code of Ethics.
The registrant has adopted a code of ethics that applies to the registrant’s principal executive officer and principal financial officer. The registrant has not made any amendments to its code of ethics during the period covered by this report. The registrant has not granted any waivers from any provisions of the code of ethics during the period covered by this report. A copy of the registrant’s Code of Ethics is filed herewith.
Item 3. Audit Committee Financial Expert.
The registrant’s board of directors has determined that there is at least one audit committee financial expert serving on its audit committee. Paul M. Kelnberger is the “audit committee financial expert” and is considered to be “independent” as each term is defined in Item 3 of Form N-CSR.
Item 4. Principal Accountant Fees and Services.
The registrant has engaged its principal accountant to perform audit services, audit-related services, tax services and other services during the past two fiscal years. “Audit services” refer to performing an audit of the registrant's annual financial statements or services that are normally provided by the accountant in connection with statutory and regulatory filings or engagements for those fiscal years. “Audit-related services” refer to the assurance and related services by the principal accountant that are reasonably related to the performance of the audit. “Tax services” refer to professional services rendered by the principal accountant for tax compliance, tax advice, and tax planning. The following table details the aggregate fees billed for each of the last two fiscal years for audit fees, audit-related fees, tax fees and other fees by the principal accountant.
| | FYE 12/31/2004 | FYE 12/31/2003 |
| Audit Fees | $51,000 | $44,028 |
| Audit-Related Fees | $ - | $ 6,000 |
| Tax Fees | $ 5,000 | $ 4,500 |
| All Other Fees | $ 1,000 | $ - |
The audit committee has adopted pre-approval policies and procedures that require the audit committee to pre-approve all audit and non-audit services of the registrant, including services provided to any entity affiliated with the registrant. All of the principal accountant’s hours spent on auditing the registrant’s financial statements were attributed to work performed by full-time permanent employees of the principal accountant. (If more than 50 percent of the accountant’s hours were spent to audit the registrant's financial statements for the most recent fiscal year, state how many hours were attributed to work performed by persons other than the principal accountant's full-time, permanent employees.)
The following table indicates the non-audit fees billed by the registrant’s accountant for services to the registrant and to the registrant’s investment adviser (and any other controlling entity, etc.—not sub-adviser) for the last two years. The audit committee of the board of trustees/directors has considered whether the provision of non-audit services that were rendered to the registrant's investment adviser is compatible with maintaining the principal accountant's independence and has concluded that the provision of such non-audit services by the accountant has not compromised the accountant’s independence.
| Non-Audit Related Fees | FYE 12/31/2004 | FYE 12/31/2003 |
| Registrant | $6,000 | $4,500 |
| Registrant’s Investment Adviser | $ - | $ - |
Item 5. Audit Committee of Listed Registrants.
Not applicable to open-end investment companies.
Item 6. Schedule of Investments.
Schedule of Investments is included as part of the report to shareholders filed under Item 1 of this Form.
Item 7. Disclosure of Proxy Voting Policies and Procedures for Closed-End Management Investment Companies.
Not applicable to open-end investment companies.
Item 8. Purchases of Equity Securities by Closed-End Management Investment Company and Affiliated Purchases.
Not applicable to open-end investment companies.
Item 9. Submission of Matters to a Vote of Security Holders.
Not Applicable.
Item 10. Controls and Procedures.
| (a) | The Registrant’s President/Chief Executive Officer and Treasurer/Chief Financial Officer have concluded that the Registrant's disclosure controls and procedures (as defined in Rule 30a-3(c) under the Investment Company Act of 1940 (the “1940 Act”)) are effective as of a date within 90 days of the filing date of the report that includes the disclosure required by this paragraph, based on the evaluation of these controls and procedures required by Rule 30a-3(b) under the 1940 Act and Rules 15d-15(b) under the Securities Exchange Act of 1934, as amended. |
| (b) | There were no significant changes in the Registrant's internal controls over financial reporting that occurred during the Registrant's last fiscal half-year that has materially affected, or is reasonably likely to materially affect, the Registrant's internal control over financial reporting. |
Item 11. Exhibits.
| (a) | (1) Any code of ethics or amendment thereto, that is subject of the disclosure required by Item 2, to the extent that the registrant intends to satisfy Item 2 requirements through filing an exhibit. Filed herewith. |
(2) Certifications pursuant to Section 302 of the Sarbanes-Oxley Act of 2002. Filed herewith.
(3) Any written solicitation to purchase securities under Rule 23c-1 under the Act sent or given during the period covered by the report by or on behalf of the registrant to 10 or more persons. Not applicable to open-end investment companies.
| (b) | Certification pursuant to Section 906 of the Sarbanes-Oxley Act of 2002. Furnished herewith. |
SIGNATURES
Pursuant to the requirements of the Securities Exchange Act of 1934 and the Investment Company Act of 1940, the registrant has duly caused this report to be signed on its behalf by the undersigned, thereunto duly authorized.
(Registrant) Leuthold Funds, Inc.
By (Signature and Title) /s/ Steven C. Leuthold
Steven C. Leuthold, President
Date December 7, 2004
Pursuant to the requirements of the Securities Exchange Act of 1934 and the Investment Company Act of 1940, this report has been signed below by the following persons on behalf of the registrant and in the capacities and on the dates indicated.
By (Signature and Title)* /s/ Steven C. Leuthold
Steven C. Leuthold, President
Date December 7, 2004
By (Signature and Title)* /s/ David R. Cragg
David R. Cragg, Treasurer
Date December 7, 2004
* Print the name and title of each signing officer under his or her signature.