Washington, D.C. 20549
The Leuthold Funds
Dear Fellow Shareholders:
At the outset, we’d like to thank all of you for your support over the last twelve months. Our family of mutual funds continues to grow, and 2006 saw the launch of two new mutual funds.These latest Funds offer new and current shareholders viable alternatives to our Leuthold Core Investment Fund and Leuthold Select Industries Fund, both of which are now closed to additional investment (although capital gains and dividends may continue to be reinvested).Thus far, we have been very encouraged by the interest in the new “successor”Funds.Your continued confidence in our investment management is most appreciated.
We are also encouraged that our longstanding investment strategies and disciplines continue to gain recognition and acceptance by individual and professional investors. Much of our investment process is the result of decades of exhaustive research focusing on the capital markets.As a research-intensive firm, we expend much effort to determine how asset prices respond under different conditions, in order to make rational and informed investment decisions. These endeavors have helped us to achieve a successful long term track record and we are confident that our ongoing research, our conviction in the philosophies,and adherence to the disciplines will allow us to carry on this success going forward.
A year ago, we expected that the next twelve months would become a period of transition for the stock market. Although this did not come to fruition,our defensive orientation did not cost us much in terms of performance.Over the 12-months ended September 30, 2006, our Leuthold Core Investment Fund appreciated 6.64%, and the Leuthold Select Industries Fund gained 8.67%, both falling short of the 10.80% gain in the S&P 500 (total returns).The final stretch of the Funds’fiscal year (ending September 30) was characterized by a strong rally led by large cap stocks.This put indexes like the Dow Jones Industrial Average and S&P 500 well ahead of the rest of the market in terms of YTD performance. In terms of the last twelve months, other measures such as the S&P 400 Mid Cap Index (+6.55% total return) and the S&P 600 Small Cap Index (+7.18% total return) fell much closer to the performance of our own Funds. Our ‘bear market’ Grizzly Short Fund (always 100% short) lost 10.23% total return, which was close to the same percentage that the S&P 500 gained (+10.80% total return).
| Ø | As we have often warned Grizzly Fund shareholders, it is very difficult (some would say impossible) to profit with an all-short stock portfolio during a rising market. Per the Prospectus, the Grizzly Short Fund (typically employed for hedging or speculative purposes) is always 100% short, regardless of our own market opinion. |
THE INVESTMENT OUTLOOK
In late September 2006, our composite analysis of over 180 market indicators led us to conclude that overall conditions within the U.S. stock market warranted a more aggressive structure within our flexible asset allocation portfolio. This move has served us well so far. Since the end of the Funds’fiscal year (September 30), the stock market has continued to rise,and has been regularly achieving new cyclical bull market highs.
The Leuthold Funds
However, we are viewing the current strength in the stock market with an eye of caution, and our bullishness toward the U.S.stock market might be considered somewhat “tactical”in nature. Although an assessment of our quantitative model suggests that there is additional upside in the stock market, there are also signs that the bull market is quite mature. Beyond the intermediate term, forward visibility for corporate earnings growth, the economy,inflation and interest rates have become more nebulous than a year ago.While we currently cannot predict how long we will stay positive on the stock market,we can say with certainty that the quantitative disciplines,based on our “weight of the evidence”approach to assessing the health of the market, will continue to guide our future asset allocation decisions.
As of the stock market’s closing level on November 6, 2006, the S&P 500 stood at about 1380, which brings the cumulative bull market gains in this cycle to about 78% (price only;measured from early October 2002).This compares to a 61% average gain when looking at previous bull market cycles in the twentieth century. This is not to say that the gains in the current cycle are excessive or overextended, but our long term cycle studies do suggest that we are somewhat beyond what could be considered an “average”stock market recovery.
| Ø | The current economic expansion is now five years old, compared to the median length of 3-1/2 years since WWII. (However,the two expansions prior to the current expansion averaged nine years in duration.) |
| Ø | Post WWII economic history also indicates that new bear markets in stocks get underway before an economic expansion ends - typically 6-12 months sooner.This is why the stock market is considered a “leading indicator”for the economy. |
Of course, models based purely on the stock market and economic history are far from precise and thus can only be considered as proxies for what might be considered “typical”or “normal.”Nevertheless,as students of market history, we continue to be aware that current stock market and economic cycles could be considered “later-stage”when compared to past cycles.
While various economic indicators continue to point to a growing economy,we are firmly aware of the growing list of risks that could eventually forestall further economic growth. Some of these risks include a weakening housing market,costly energy prices,higher interest rates,a contraction of the global monetary base,and an increasingly hostile geo-political climate.
History also warns us that this economic expansion is now beyond what would be considered “normal”in terms of duration,thus it would not be unusual for a recession to occur sometime in 2007 by historical standards.Certainly,past experience demonstrates that market and economic cycles can extend beyond their long term averages,but we believe a heightened sense of skepticism is clearly appropriate when the current market cycle extends beyond historical norms.
On a total return,cumulative basis,the S&P 500 is now up 91.1% from its October 9,2002,low through November 6, 2006, while the Leuthold Select Industries Fund is up 170.6%, and even the relatively lower risk Leuthold Core Investment Fund is up 118.7% over the same timeframe.
| Ø | In summary,we are currently bullish in our outlook for the stock market,and the evidence before us suggests that equities may finish 2006 on a strong note. However, our current outlook should be considered tactical at this point. How long we remain bullish on the U.S. stock market will hinge on future“weight of the evidence”assessments of our quantitative market analysis. |
The Leuthold Funds
Investors in the Leuthold Select Industries Fund should keep in mind that this Fund, per its Prospectus, remains fully invested in stocks. If a bear market develops in the coming year, our Select Industries Fund may go down as much or more than the market averages. (On the other hand, the Grizzly Short Fund may do very well.)
| Ø | All things considered,for those interested in a flexible,diversified holding,we believe our flagship asset allocation strategy is the most appropriate for long-term investors and retirement account assets.Investments can be made in this strategy through our Leuthold Asset Allocation Fund (the successor to the now-closed Leuthold Core Investment Fund). |
Leuthold Core Investment Fund: This Fund’s strategy is flexible, value-oriented, and risk-averse. The Leuthold Core Investment Fund adjusts asset class exposure, based on underlying market dynamics and trends, in order to avoid undue risk,and attempts to take advantage of areas that appear poised to outperform.Assets are actively allocated between stocks, bonds, money market instruments, and foreign securities.When appropriate, the Fund may also hedge by selling short certain securities when our disciplines indicate potential underlying market weakness.While at times individual allocations may appear unorthodox, they are intended to come together as complementing positions in an effort to carry out the Fund’s guiding principles:make and keep positive returns.
| Ø | Through September 30,2006,Morningstar rated this Fund “Five-Stars Overall”within the “Moderate Allocation”category containing 808 funds. |
| Ø | The Morningstar rating is based on historical risk-adjusted performance calculated from the Fund’s 3- 5- and 10-year (if applicable) average annual returns, with a Five-Star rating being the highest, and awarded to the top 10% of funds in a category. The Fund is also rated “Five-Stars”for both the 3-year,5-year and 10-year periods ended September 30,2006,out of 808,627,and 319 funds, respectively, within the Moderate Allocation category. |
Ratings subject to change each month.The ‘star’rating is based on historical risk-adjusted performance, calculated from the Fund’s 3- 5- and 10-year (if applicable) average annual returns.(The top 10% of funds in a category receive 5 stars,the next 22.5% receive 4 stars,middle 35% receive 3 stars,next 22.5% receive 2 stars,and the bottom 10% receive 1 star.)
Leuthold Asset Allocation Fund: This is the successor Fund to the now-closed Leuthold Core Investment Fund, which began trading on May 24, 2006.The strategy and objective of this Fund are identical to those of the Leuthold Core Investment Fund in terms of flexibility, asset class exposure, disciplines and risk aversion. The only difference between the two portfolios is in the construction of the domestic equity allocation.
| Ø | The Leuthold Asset Allocation Fund uses a multi-strategy approach for domestic equity selection.The balance of the strategies employed allows us to construct an equity portfolio that has risk-reward characteristics that we believe are suitable for an asset allocation portfolio. |
| Ø | The Select Equities strategy is a bottom-up, stock-based quantitative model that ranks stocks on a bi-weekly basis.This strategy is also available as a stand-alone all-equity mutual fund. |
| Ø | The Undervalued and Unloved equity strategy is a “value”stock screening methodology that has been in existence for over 25 years.This stock screen has previously been employed (and may continue to be employed going forward) in the Core Investment Fund when value-type stock exposure is targeted. |
The Leuthold Funds
Leuthold Select Industries Fund: Unlike the Leuthold Core Investment Fund and Leuthold Asset Allocation Fund,we cannot apply our asset allocation dexterity in this Fund.The Leuthold Select Industries Fund is mandated to remain 100% invested in stocks at all times. This attribute results in the potential for considerable volatility, undoubtedly higher risk,and the probability investors will lose money when the stock market declines.
| Ø | Through September 30, 2006, Morningstar rated this Fund “Four-Stars Overall”within the “Mid-Cap Growth”category containing 821 funds. |
| Ø | The Fund is rated “Five-Stars”by Morningstar for the 3-year period ended September 30,2006, out of 821 funds in the Mid-Cap Growth category.Also, the Fund is rated “Four-Stars”by Morningstar for the 5-year period ended September 30, 2006, out of 637 funds within the Mid-Cap Growth category. |
Ratings subject to change each month.The ‘star’rating is based on historical risk-adjusted performance, calculated from the Fund’s 3- 5- and 10-year (if applicable) average annual returns.(The top 10% of funds in a category receive 5 stars,the next 22.5% receive 4 stars,middle 35% receive 3 stars,next 22.5% receive 2 stars,and the bottom 10% receive 1 star.)
The Select Industries Fund strategy is based on industry stock selection, industry group rotation, and sector concentrations. It is driven by a quantitative evaluation of stocks spanning almost 140 equity-industry groups, attempting to detect where there may be collective strength and emerging leadership potential, while exposing areas that appear vulnerable.
| Ø | The element of sector/industry group concentrations results in this Fund’s higher volatility profile, being potentially more risky while offering potentially more reward. |
Leuthold Select Equities Fund: This is the successor Fund to the now-closed Leuthold Select Industries Fund,which began trading on May 24,2006.The Leuthold Select Equities Fund is mandated to remain 100% invested in stocks at all times.This attribute results in the potential for considerable volatility, undoubtedly higher risk, and the probability investors will lose money when the stock market declines significantly.
Where the Fund differs from the Leuthold Select Industries Fund is in its approach to equity selection.Whereas the Select Industries employs a top-down industry group approach as the primary driver to portfolio construction, the Leuthold Select Equities Fund uses a quantitative bottom-up, stock picking strategy.While the Select Equities Fund can, at times, result in similar sector and/or industry group over-weights, the overlap of specific equity securities between the two strategies is minimal.
| Ø | The Select Equities Fund typically maintains approximately equally-weighted positions in about 50 individual stocks, selected per a multi-factor quantitative discipline.This model is run on a bi-weekly basis.The strategy is based on a stock rating system that was originally developed by The Leuthold Group in the late-1980s. |
Grizzly Short Fund: This is an actively managed Fund that is 100% short a group of individual stocks. Short-selling strategies are aimed at profiting when stock prices decline. Even when our firm is bullish toward the stock market, the Grizzly Short Fund’s policy mandates the portfolio to target 100% short exposure, regardless of the trend of the market.Because of this,shareholders should anticipate they will most likely lose money investing in this Fund when stock prices,in general,are in a rising trend.
The Leuthold Funds
The Grizzly Short Fund is a tool for sophisticated investors.This Fund is often used by traders and other speculators anticipating the market may decline, in order to tactically regulate stock market risk, or used in varying degrees with other complex portfolio strategies.This is not a Fund for buy and hold investors!
| Ø | The Grizzly Short Fund typically maintains approximately equally-weighted short positions in about 50 individual stocks, initially selected per a multi-factor quantitative discipline. Each position is monitored daily and subject to a set of short covering disciplines. |
A LOOK IN THE REAR VIEW MIRROR
| Ø | In this section we provide an overview of the performance (good and bad) of the Leuthold Funds that traded for the entire fiscal year ended September 30, 2006. |
Leuthold Core Investment Fund
This is our flagship Fund,with current assets (November 6,2006) of about $1.6 billion.As previously noted,for the fiscal year ended September 30, the Fund posted a total return of +6.64% compared to +10.80% for the S&P 500. Despite a lower than normal equity exposure for a good portion of the year,a fair amount of the positive return for the Core Fund came from our common stock commitments,both in “Emerging Market”equities,and the “Select Industries” portion of the portfolio. For the year, an average of 5.5% of assets was invested in emerging market equities, with 45% on average in the Select Industries equity allocation. For the 12-months ended September 30 our equity commitment in emerging market equities resulted in a 21% gain, while the Select Industries portion of the equity exposure added almost 10%.
In late-September, as a result of improvement in the readings of our disciplined “weight of the evidence”market analysis,our equity exposure was increased back up to near our normal guideline minimum of 70%.As it stands,equity exposure remains near these 70% target maximums.
Our Core Fund’s normal minimum guideline for fixed income is 30% of assets. For the majority of the year, our comparative analysis had suggested that attractive fixed income opportunities on a risk-reward basis were in relatively short supply, leading us to have a lower than minimum exposure to fixed income securities. For the year, we had an average 16% of portfolio assets allocated to fixed income,which was about half our normal minimum percentage.
One area of the bond market that continued to offer an attractive risk-reward profile was in corporate automotive bonds (now limited to GMAC issues).We originally established a position in these bonds back in May 2005, as the auto industry was hit with a steady stream of bad news and debt downgrades.This investment paid off quickly and we sold the GMAC position at about a 20% gain.However,another tactical opportunity presented itself and we re-established a position in GMAC bonds (currently a 12% portfolio position).This position was up about 12% from purchase,as of the end of September.
The balance of our fixed income position is comprised of 5 year T-notes, which from a risk/reward perspective, appeared to be much more attractive than anything of longer duration, such as 10 year Treasuries. During the fiscal year, we had added exposure to this position, which currently stands at about 9% of portfolio assets. For the year, this position was moderately additive to portfolio performance as of the end of September 2006, gaining about 1.8% on a total return basis.We had been looking to add to this position in recent months, however yields moved away from us and we have put the purchase on hold until a more favorable opportunity presents itself.
The Leuthold Funds
For much of the year, we had employed a tactical hedge to adjust our equity exposure, as a means for moderating stock market risk. At certain times during the year, our assessment of market risk resulted in us moving toward our normal minimum in terms of equity exposure.But as of late-September 2006,the equity hedge had been eliminated as our outlook for the stock market had improved.Today,we have no equity hedges in place,and have taken steps to move toward an aggressive level of equity exposure. In retrospect, our caution during the year was premature, although it did not cost us very much in terms of performance.
We continue to see a favorable secular story unfolding for Industrial Metals.We introduced this investment to the Core Fund in mid-2002 (through industrial metals stocks) and originally viewed it as an outstanding long-term opportunity - perhaps a four to five-year play. The basis behind this investment continues to be a global supply/demand imbalance.We believe global demand for these metals will continue to be strong, with growth in the Pacific-Rim being a significant driver. On the supply side, we had experienced a decade of under-investment as depressed metals prices caused companies to reduce production and shutter mines during the 1990s. It could be a number of years before production can be increased enough to satisfy the growing global demand.
As you are most likely aware, Refco Inc., one of the largest global commodities firms, filed for bankruptcy shortly after the previous fiscal year ended September 30, 2005. Refco had held a small percentage of our Core Fund’s assets (Physical Industrial Metals positions).We are continuing to diligently pursue the return of these assets using all legal avenues available,to seek a favorable outcome on behalf of our shareholders.As expected, the bankruptcy proceedings have been prolonged. Nevertheless, we believe that we are making some progress. The Refco, Inc. debtors have prepared a plan which contemplates the disposition of their assets and the resolution of outstanding claims. The Refco, Inc. debtors are currently soliciting acceptances of the plan from creditors with the goal of having the plan approved by the end of the year.We do not know if the plan will be approved. In the meantime,the Core Fund values the affected assets pursuant to its fair value pricing policy. In order to continue to attempt to benefit from our bullish long-term outlook for Industrial Metals, we established an Industrial Metals proxy within the portfolio, using a group of Industrial Metals stocks.This Industrial Metals proxy held steady at about 5% of assets during the year, and returned 64% for the 12-months ended September 30, 2006.
Our positions in Emerging Market equities also continued to benefit performance during the fiscal year. For the year, we had an average of 5.5% of assets deployed here, which is slightly above our normal minimum core position (5%).At the end of September, we increased our exposure in Emerging Market equities to 8%, encouraged not only by improved performance, but by the fact that much of the previous speculative froth in this asset class had cleared . For the 12-month period ended September 30,2006,our Emerging Market positions had gained 21%.
In January 2006,we enhanced our global equity exposure by initiating a small position in Japanese equities,using a package of open-end mutual funds and exchange traded funds (ETFs).Our investment here was built on the premise that Japan will continue to benefit from a secular recovery and restructuring within its own financial system.Although we expect that the Japanese economy will be subject to cyclical fits and starts, we suspect that the longer term prospects for Japan continue to be bullish.
The Leuthold Funds
Over the last 12-months ended September 30, 2006, the Leuthold Core Investment Fund’s +6.64% total return lagged the S&P 500 by about 400 basis points. However, keep in mind our primary objective is not to beat some market index. It is not difficult to achieve positive results investing in stocks during a strong rising market,but our normal maximum limit of 70% in equity exposure can make it difficult for the Core Fund to match or exceed a stock market index that is 100% invested in stocks.Our primary objective is to make and keep positive returns for our investors. This means attempting to reduce risk when market conditions are looking less favorable or downright dire,as they were in 2000-2002.
The last five years shows how productive our approach can be. But it is no assurance we will do as well in future unfavorable stock market periods.
| Ø | Over the last five years (ended September 30, 2006), the Leuthold Core Investment Fund has a very wide performance advantage compared to the stock market. The Core Fund’s cumulative total return gain of +84.13% (+12.99% annualized), compares to the S&P 500’s cumulative total return gain of 40.08% (+6.97% annualized), and the Lipper Flexible Fund Index cumulative total return gain of +40.06% (+6.97% annualized). |
Leuthold Asset Allocation Fund
This is the successor Fund to our flagship Leuthold Core Investment Fund,with current assets (November 6,2006) of about $106.9 million.This “new”Leuthold Asset Allocation Fund uses a different U.S. stock selection strategy, but otherwise will follow the very same asset allocation directives and use the same asset class investment vehicles as the Leuthold Core Investment Fund.As previously noted,this Fund was launched on May 24,2006 and thus does not have a full year of investment performance to discuss in this annual review.
Leuthold Select Industries Fund
As previously noted, this all-equity Fund was up 8.67% total return for the year ended September 30, 2006, compared to a 10.80% total return gain for the S&P 500.This latest 12-month gain for the Select Industries Fund compares with its 31.08% total return gain for the previous 12-month period (September 30, 2004 - September 30, 2005).
| Ø | Since inception (June 19, 2000) through September 30, 2006, the Leuthold Select Industries Fund has produced a cumulative total return gain of +74.63% (+9.39% annualized) compared to a cumulative total return loss of -0.31% for the S&P 500 (-1.98% annualized). |
A year ago, as of September 30, 2005, the Leuthold Select Industries Fund was heavily weighted in Health Care, Basic Materials and Transportation stocks.The combined weight of these three sectors made up 60% of portfolio assets, including group positions in Industrial Metals, Health Care Cost Containment, Big Pharmaceuticals, Biotechnology,Generic Pharmaceuticals,Railroads,and Airlines.
Over the past year, the Leuthold Select Industries Fund has reduced exposure to the Health Care sector somewhat, although we continue to hold “Big Pharmaceuticals”stocks as a 15% position, currently, and another 6% invested in Life Sciences Tools & Services.While our exposure to Transportation stocks remains as it did a year ago (12%), our exposure here is now fully concentrated in Airlines stocks, since Railroads were eliminated in early September. Our exposure in Materials is now concentrated in two groups. Our Industrial Metals group, at 15% of portfolio assets, represents our largest single group holding. Additionally, we have another 6% of assets in Industrial Gases,bringing our total Materials exposure to about 21%.
The Leuthold Funds
More recently, the portfolio has increased exposure to “value”stocks.Value, as an investment theme, has become a more significant presence within our portfolio. In recent months, we have added two groups that employ quantitative screening methodologies that seek to identify stocks with “value”attributes. During this time, we have also increased exposure to the Big Pharmaceuticals stocks, which are also considered to have “value”characteristics. Combined, these three group positions represent about 41% of portfolio assets as of September 30,2006.
It is worth noting that, four of the ten group positions held in the Select Industries portfolio on September 30, 2005, remained in the portfolio one year later, including Industrial Metals, Big Pharma, Airlines, and Life/Health Insurance. Each of these long-term group positions were among the portfolio’s top performance contributors during the twelve months ended September 30, 2006. Not only does this demonstrate that sector rotation strategies do not necessarily result in a high rate of turnover, but also shows how our quantitative approach to industry group selection can be successful in helping us to identify areas of longer-term leadership potential in the stock market.
| Ø | About 52% of the current portfolio mix as of September 30, 2006, was composed of industry groups that had been activated in the portfolio for more than one year. |
The best equity industry group gains for this Fund (and the Core Fund’s “Select Industries”equity exposure), for the 12-months ended September 30, were Airlines stocks (+66%), Industrial Metals (+35%), Life & Health Insurance (+18%), Big Pharma (+19%), Railroads (+14%), and Computer Storage & Peripherals (+10%). Five of these top six group performers remain in the equity portfolio as of fiscal year end.
Our biggest disappointment was a 15% realized loss from our investment in Home Entertainment Software stocks.This group position had,by far,the biggest negative impact on portfolio performance.Other group positions that were adverse to performance included Biotechnology (-7%), Fertilizers & Agricultural Products (-6%), and Independent Power Producers (-3%). None of these group positions remain in the portfolio as of the fiscal year end on September 30, 2006.
Leuthold Select Equities Fund
This is the alternative Fund to the Leuthold Select Industries Fund, which was closed to further investment.The Leuthold Select Equities Fund has current assets (November 6, 2006) of about $5.0 million.As previously noted, this Fund was launched on May 24, 2006 and thus does not have a full year of investment performance to discuss in this annual review.
Grizzly Short Fund
As noted earlier, one year ago we estimated that the coming 12-month period would become increasingly difficult for traditional 100% long-stock investment strategies and for the market indexes in general.After all, the bull market had passed its 3-year anniversary in early October 2005,and measured up to the duration of past bull market cycles,we considered the 3-year mark as being relatively mature.From that point,we expected the market was more likely poised to transition to the next phase of the rotation - a cyclical bear market for stocks - which would have been more conducive to finding opportunities with the short-selling strategy of our Grizzly Short Fund.
The Leuthold Funds
In retrospect, we were premature in our expectation for the stock market to become increasingly vulnerable, and the bull market maintained a strong upper hand for the majority of the 12-months ended September 30, 2006.Needless to say,for a strategy designed to profit in down market conditions,this was not a constructive period for profiting with the Grizzly Short Fund.
| | • | For the 2006 fiscal year,the actively managed Grizzly Short Fund turned in a total return loss of -10.23% for the 12-months ended September 30, 2006. |
| | • | On a relative basis1,the Grizzly Fund loss compares favorably to the +13.13% total return gain in the DJIA and the +10.80% total return gain of the S&P 500 for the same 12-month period ended September 30, 2006. The Grizzly Fund loss is comparable to the inverse of the +9.98% total return gain of the Russell 2000 for the same 12-month period ended September 30, 2006. However, it notably underperformed over that period when measured up to the S&P Mid Cap index (+6.55% total return), and we believe the Mid Cap index is a more realistic yardstick in view of the stock characteristics of the Grizzly Short Fund. |
| | 1 | For a practical relative assessment of Grizzly Short Fund performance,one should compare the Fund’s performance to the inverse of traditional long-stock index results. For example, if the S&P 500 gains 5%,investors employing an S&P 500 index short would expect to lose about 5%.If the Grizzly Short Fund loses 3% over the same time frame, this would be considered relatively value-added for a short-selling strategy, since it is a smaller loss than the loss incurred by the index short. If the Grizzly Short Fund loses more than an index gains,it is not value-added over an index short. |
Please keep in mind that the Grizzly Short Fund has extremely high turnover, and sector concentrations and industry group exposure can fluctuate day to day. The individual stock positions are similarly weighted across the portfolio,and there are limitations as to how much of the portfolio can be concentrated within a particular sector or sub-industry group therein.
| Ø | Those features combined with the Fund’s quantitative methodology make it unrealistic to attribute specific performance dynamics to isolated short positions. Sector concentrations and stock market themes are more practical portfolio characteristics to use when reviewing Grizzly Short Fund performance drivers. |
Additional Comments Related to the Grizzly Short Fund
As this is written, one month into the new fiscal year, we have a relatively positive outlook for stocks in coming months.If our assessment is correct,the Grizzly Short Fund may continue to suffer losses as a consequence of its 100% short-stock mandate.At the same time, there are a number of conditions that could trigger a damaging, rapid stock market retreat.In terms of the economy,we have become increasingly concerned that the consumer driven expansion is going to come under pressure from the cumulative consequences of higher debt servicing, higher energy costs, and a softer housing market.These may eventually begin to have a notable effect on the consumer’s ability to spend.A slowing economy could become increasingly apparent as the year winds down, and a contraction could develop sometime in 2007.These,among other considerations,lead us to view the stock market as possibly having upside potential only on a tactical basis.
The Leuthold Funds
| Ø | Longer-term, we have doubts about the sustainability of an extended bull market run-up in stocks. The Grizzly Short Fund is a vehicle that endeavors to offer portfolio defense, however, not just in negative market conditions,but also in uncertain and transitioning market environments. |
Investors who are not experienced in short-selling and adjusting market risk should consider the Leuthold Asset Allocation Fund.The Leuthold Asset Allocation Fund is the successor to the now-closed Leuthold Core Investment Fund. It has the flexibility to overlay the short-selling strategy of the Grizzly Fund as a hedge against stock market declines when the Advisor views the stock market as overvalued and vulnerable to a downside correction.
The year-by-year results are volatile with the Grizzly Short Fund,and while the advantage for employing a short-selling strategy during down-market years is evident, we cannot stress the importance of being aware of the extreme down-side risk of short-selling in rising market conditions. As the past 12-months’ Grizzly Short Fund performance demonstrates,you should expect to lose money during rising market conditions.
IN CLOSING
Looking ahead to the next twelve months,it should be evident from this letter that while our outlook for the stock market over the near term (3-6 months) has improved, we continue to have lingering concerns about the sustainability of the bull market in the longer term. Nevertheless, it is our disciplines, not our gut feelings, which will determine the course of our investment strategies over the coming twelve months.While no market cycle will exactly mimic the progression of a prior cycle, it is important to recognize that financial history is a vast early-warning system. In addition, our quantitative disciplines are the guiding principles for our investment strategies, designed to remove emotions, severely restrict judgments, and diminish the potential for personal bias to come into play with portfolio decisions.We believe that adherence to these disciplines allow us to identify opportunities and attempt to protect assets in both up and down market cycles.
The Leuthold Funds
Our firm is majority employee-owned and operated.And, as we mentioned last year, although Steve Leuthold is the portfolio team leader, we would like you to keep in mind that all our strategies are team-managed; typically involving all of the same professionals since each Fund’s inception,and in most cases the same investment professionals have been involved for many years prior,responsible for the research behind the development of the Fund concepts.The Portfolio Managers and other Chartered Financial Analysts make up the investment strategy committee.This structure allows for an improved flow of insight and opinion from a mixture of backgrounds and experience.While our team approach eliminates the risks associated with a ‘one man show’, it also serves as a function of checks-and-balances for ensuring adherence to the investment disciplines.Portfolio decisions must always align with the methodologies.
Sincerely,
 | |  | |  |
Steve Leuthold Portfolio Team Leader | | Andy Engel,CFA Co-Portfolio Manager | | Eric Bjorgen,CFA Co-Portfolio Manager |
| | | | | |
| | | | | |
 | |  | | |
Chuck Zender Co-Portfolio Manager | | Matt Paschke,CFA Co-Portfolio Manager | | |
The Leuthold Funds
Expense Example - September 30,2006 (Unaudited)
As a shareholder of the funds, you incur two types of costs: (1) transaction costs, including sales charges (loads) on purchase payments, reinvested dividends, or other distributions; redemption fees; and exchange fees; and (2) ongoing costs, including management fees; distribution and/or service fees; and other Fund expenses. This example is intended to help you understand your ongoing costs (in dollars) of investing in the Funds and to compare costs with the ongoing costs of investing in other mutual funds.
The Example is based on an investment of $1,000 invested at the beginning of the period and held the entire period (April 1,2006 - September 30,2006).
Actual Expenses
The first line of the table below provides information about actual account values and actual expenses. Although the Funds charge no sales load (the Core Investment Fund and the Asset Allocation Fund charge a 2% redemption fee for redemptions made within five business days after a purchase), you will be assessed fees for outgoing wire transfers, returned checks or stop payment orders at prevailing rates charged by U.S. Bancorp Fund Services, LLC, the Funds’ transfer agent. If you request a redemption be made by wire transfer, currently a $15.00 fee is charged by the Funds’ transfer agent. To the extent that the Funds invest in shares of other investment companies as part of its investment strategy,you will indirectly bear your proportionate share of any fees and expenses charged by the underlying funds in which a Fund invests in addition to the expenses of the Fund. Actual expenses of the underlying funds are expected to vary by fund. These expenses are not included in the example below. The example includes, but is not limited to, management fees, shareholder servicing fees, fund accounting, custody and transfer agent fees. However, the example below does not include portfolio trading commissions and related expenses, interest expense or dividends on short positions taken by the Funds and extraordinary expenses as determined under generally accepted accounting principles. You may use the information in this line, together with the amount you invested, to estimate the expenses that you paid over the period. Simply divide your account value by $1,000 (for example, an $8,600 account value divided by $1,000 = 8.6),then multiply the result by the number in the first line under the heading entitled “Expenses Paid During Period”to estimate the expenses you paid on your account during this period.
Hypothetical Example for Comparison Purposes
The second line of the table below provides information about hypothetical account values and hypothetical expenses based on the Funds’actual expense ratios and an assumed rate of return of 5% per year before expenses, which is not the Funds’actual return. The hypothetical account values and expenses may not be used to estimate the actual ending account balance or expenses you paid for the period. You may use this information to compare the ongoing costs of investing in the Funds and other funds. To do so, compare this 5% hypothetical example with the 5% hypothetical examples that appear in the shareholder reports of the other funds.
Please note that the expenses shown in the table are meant to highlight your ongoing costs only and do not reflect any transactional costs, such as sales charges (loads), redemption fees, or exchange fees. Therefore, the second line of the table is useful in comparing ongoing costs only, and will not help you determine the relative costs of owning different funds. In addition,if these transactional costs were included,your costs would have been higher.
The Leuthold Funds
Expense Example Tables (Unaudited)
Leuthold Core Investment Fund - Retail Class
| | | Beginning | Ending | Expenses Paid |
| | | AccountValue | AccountValue | During Period* |
| | | April 1,2006 | September 30,2006 | April 1,2006 - September 30,2006 |
| Actual** | | $1,000.00 | $ 994.00 | $7.11 |
| | | | | |
| Hypothetical (5% return | | | |
| before expenses)*** | 1,000.00 | 1,017.93 | 7.20 |
| | | | | |
| * | Expenses are equal to the Fund’s annualized expense ratio of 1.42%, multiplied by the average account value over the period, multiplied by 183/365 to reflect the one-half year period. |
| ** | Excluding dividends and interest on short positions, your actual cost of investment in the Fund would be $5.47 and the Fund’s annualized expense ratio would be 1.10%. |
| *** | Excluding dividends and interest on short positions, your hypothetical cost of investment in the Fund would be $5.54 and the Fund’s annualized expense ratio would be 1.10%. |
| | | | | |
Leuthold Core Investment Fund - Institutional Class | | | |
| | | Beginning | Ending | Expenses Paid |
| | | AccountValue | AccountValue | During Period* |
| | | April 1,2006 | September 30,2006 | April 1,2006 - September 30,2006 |
| Actual** | | $1,000.00 | $ 993.40 | $6.61 |
| | | | | |
| Hypothetical (5% return | | | |
| before expenses)*** | 1,000.00 | 1,018.44 | 6.69 |
| | | | | |
| * | Expenses are equal to the Fund’s annualized expense ratio of 1.32%, multiplied by the average account value over the period, multiplied by 183/365 to reflect the one-half year period. |
| ** | Excluding dividends and interest on short positions, your actual cost of investment in the Fund would be $4.97 and the Fund’s annualized expense ratio would be 1.00. |
| *** | Excluding dividends and interest on short positions, your hypothetical cost of investment in the Fund would be $5.04 and the Fund’s annualized expense ratio would be 1.00. |
| | | | | |
Leuthold Select Industries Fund | | | |
| | | Beginning | Ending | Expenses Paid |
| | | AccountValue | AccountValue | During Period* |
| | | April 1,2006 | September 30,2006 | April 1,2006 - September 30,2006 |
| Actual | | $1,000.00 | $ 959.00 | $6.56 |
| | | | | |
| Hypothetical (5% return | | | |
| before expenses) | 1,000.00 | 1,018.37 | 6.76 |
| | | | | |
| * | Expenses are equal to the Fund’s annualized expense ratio of 1.34%, multiplied by the average account value over the period, multiplied by 183/365 to reflect the one-half year period. |
The Leuthold Funds
Expense Example Tables (Unaudited) (Continued)
Grizzly Short Fund
| | | Beginning | Ending | Expenses Paid |
| | | AccountValue | AccountValue | During Period* |
| | | April 1,2006 | September 30,2006 | April 1,2006 - September 30,2006 |
| Actual** | | $1,000.00 | $ 976.80 | $14.42 |
| | | | | |
| Hypothetical (5% return | | | |
| before expenses)*** | 1,000.00 | 1,010.48 | 14.66 |
| | | | | |
| * | Expenses are equal to the Fund’s annualized expense ratio of 2.91%, multiplied by the average account value over the period, multiplied by 183/365 to reflect the one-half year period. |
| ** | Excluding dividends and interest on short positions, your actual cost of investment in the Fund would be $7.85 and the Fund’s annualized expense ratio would be 1.59%. |
| | | | | |
| *** | Excluding dividends and interest on short positions, your hypothetical cost of investment in the Fund would be $8.01 and the Fund’s annualized expense ratio would be 1.59% |
| | | | | |
LeutholdAssetAllocation Fund | | | |
| | | Beginning | Ending | Expenses Paid |
| | | AccountValue | AccountValue | During Period* |
| | | May 24,2006(1) | September 30,2006 | May 24,2006(1) - September 30,2006 |
| Actual** | | $1,000.00 | $ 973.00 | $5.97 |
| | | | | |
| Hypothetical (5% return | | | |
| before expenses)*** | 1,000.00 | 1,011.48 | 6.09 |
| | | | | |
| * | Expenses are equal to the Fund’s annualized expense ratio of 1.73%, multiplied by the average account value over the period, multiplied by 130/365 to reflect the number of days in the period. |
| ** | Excluding dividends and interest on short positions, your actual cost of investment in the Fund would be $5.19 and the Fund’s annualized expense ratio would be 1.50%. |
| *** | Excluding dividends and interest on short positions, your hypothetical cost of investment in the Fund would be $5.29 and the Fund’s annualized expense ratio would be 1.50%. |
| | | | | |
| (1) | Commencement of Operations | | | |
| | | | | |
Leuthold Select Equities Fund | | | |
| | | Beginning | Ending | Expenses Paid |
| | | AccountValue | AccountValue | During Period* |
| | | May 24,2006(1) | September 30,2006 | May 24,2006(1) - September 30,2006 |
| Actual | | $1,000.00 | $ 915.00 | $6.21 |
| | | | | |
| Hypothetical (5% return | | | |
| before expenses) | 1,000.00 | 1,011.05 | 6.52 |
| | | | | |
| * | Expenses are equal to the Fund’s annualized expense ratio of 1.85%, multiplied by the average account value over the period, multiplied by130/365 to reflect the number of days in the period. | | | |
| (1) | Commencement of Operations | | | |
The Leuthold Funds
Leuthold Core Investment Fund
Allocation of Portfolio Holdings
September 30, 2006*
Leuthold Select Industries Fund
Allocation of Portfolio Holdings
September 30, 2006*
Grizzly Short Fund
Allocation of Portfolio Holdings
September 30, 2006*
| | * | Excludes short term investments. |
The Leuthold Funds
LeutholdAssetAllocation Fund
Allocation of Portfolio Holdings
September 30, 2006*
Leuthold Select Equities Fund
Allocation of Portfolio Holdings
September 30, 2006*
| | * | Excludes short term investments. |
The Leuthold Funds
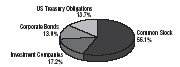
Leuthold Core Investment Fund | | |
| | | |
Components of Portfolio Holdings* | | |
| Common Stock | | $767,587,932 |
| Investment Companies | | 199,081,269 |
| Physical Industrial Metals | | 290,460 |
| Corporate Bonds | | 191,390,887 |
| US Treasury Obligations | | 156,467,538 |
| Investments Subject to Bankruptcy Proceedings | | 47,398,738 |
| | Total: | $1,362,216,824 |
| | | |
| | | |
Leuthold Select Industries Fund | | |
| | | |
Components of Portfolio Holdings* | | |
| Common Stock | | $75,030,489 |
| | Total: | $75,030,489 |
| | | |
| | | |
Grizzly Short Fund | | |
| | | |
Components of Portfolio Holdings* | | |
| Short Securities: | | |
| Common Stock | | $47,765,412 |
| | Total | $47,765,412 |
| | | |
| | | |
LeutholdAssetAllocation Fund | | |
| | | |
Components of Portfolio Holdings* | | |
| Common Stock | | $33,513,750 |
| Investment Companies | | 10,297,072 |
| Corporate Bonds | | 7,767,264 |
| US Treasury Obligations | | 8,153,485 |
| | Total: | $59,731,571 |
| | | |
| | | |
Leuthold Select Equities Fund | | |
| | | |
Components of Portfolio Holdings* | | |
| Common Stock | | $3,147,886 |
| | Total: | $3,147,886 |
| | | |
| * Excludes short term investments. | | |
The Leuthold Funds
Leuthold Core Investment Fund - Retail Class
Average Annual Rate of Return For Periods Ended September 30,2006 |
| | | | | |
| | 1Year | 3Year | 5Year | 10Year |
| Leuthold Core Investment Fund - | | | | |
| Retail Class | 6.64% | 13.53% | 12.99% | 11.64% |
| Lipper Flexible Fund Index | 8.47% | 10.60% | 6.97% | 6.72% |
| S&P 500 Index | 10.80% | 12.30% | 6.97% | 8.58% |
A $10,000 Investment in the Leuthold Core Investment Fund - Retail Class
The Lipper Flexible Fund Index is an equally weighted index of the largest 30 mutual funds within the Flexible Portfolio investment objective, as defined by Lipper.
The S&P 500 Index is an unmanaged capitalization-weighted index of 500 stocks designed to measure performance of the broad domestic economy through changes in the aggregate market value of the 500 stocks which represent all major industries.
This chart assumes an initial gross investment of $10,000 made on 9/30/96. Returns shown include the reinvestment of all dividends. The Fund’s past performance is not necessarily an indication of its future performance. It may perform better or worse in the future. The graph and the table do not reflect the deduction of taxes that a shareholder would pay on Fund distributions or the redemption of shares.
The Leuthold Funds
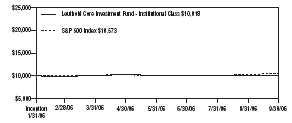
Leuthold Core Investment Fund - Institutional Class
Average Annual Rate of Return For Periods Ended September 30,2006 |
| | 1Year | 3Year | 5Year | Since Inception |
| Leuthold Core Investment Fund - | | | | |
| Institutional Class | n/a | n/a | n/a | 0.17% |
| Lipper Flexible Fund Index | 8.47% | 10.60% | 6.97% | 7.22% |
| S&P 500 Index | 10.80% | 12.30% | 6.97% | 8.25% |
A $10,000 Investment in the Leuthold Core Investment Fund - Institutional Class
The Lipper Flexible Fund Index is an equally weighted index of the largest 30 mutual funds within the Flexible Portfolio investment objective, as defined by Lipper.
The S&P 500 Index is an unmanaged capitalization-weighted index of 500 stocks designed to measure performance of the broad domestic economy through changes in the aggregate market value of the 500 stocks which represent all major industries.
This chart assumes an initial gross investment of $10,000 made on 1/31/06 (commencement of operations). Returns shown include the reinvestment of all dividends. The Fund’s past performance is not necessarily an indication of its future performance. It may perform better or worse in the future. The graph and the table do not reflect the deduction of taxes that a shareholder would pay on Fund distributions or the redemption of shares.
The Leuthold Funds
Leuthold Select Industries Fund
Average Annual Rate of Return For Periods Ended September 30,2006 |
| | 1Year | 3Year | 5Year | Since Inception |
| Leuthold Select Industries Fund | 8.67% | 18.86% | 11.88% | 9.28% |
| Russell 2000 Index | 9.92% | 15.48% | 13.78% | 8.70% |
| S&P 500 Index | 10.80% | 12.30% | 6.97% | 8.25% |
A $10,000 Investment in the Leuthold Select Industries Fund
The S&P 500 Index is an unmanaged capitalization-weighted index of 500 stocks designed to measure performance of the broad domestic economy through changes in the aggregate market value of the 500 stocks which represent all major industries.
The Russell 2000 Index is comprised of the smallest 2000 companies in the Russell 3000 Index,representing approximately 11% of the Russell 3000 total market capitalization.
This chart assumes an initial gross investment of $10,000 made on 6/19/00 (commencement of operations). Returns shown include the reinvestment of all dividends. The Fund’s past performance is not necessarily an indication of its future performance. It may perform better or worse in the future. The graph and the table do not reflect the deduction of taxes that a shareholder would pay on Fund distributions or the redemption of shares.
The Leuthold Funds
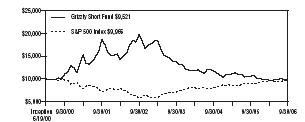
Grizzly Short Fund
Average Annual Rate of Return For Periods Ended September 30,2006 |
| | | | | |
| | 1Year | 3Year | 5Year | Since Inception |
| Grizzly Short Fund | (10.23%) | (11.89%) | (12.62%) | (0.78%) |
| Russell 2000 Index | 9.92% | 15.48% | 13.78% | 8.70% |
| S&P 500 Index | 10.80% | 12.30% | 6.97% | 8.25% |
A $10,000 Investment in the Grizzly Short Fund
The S&P 500 Index is an unmanaged capitalization-weighted index of 500 stocks designed to measure performance of the broad domestic economy through changes in the aggregate market value of the 500 stocks which represent all major industries.
The Russell 2000 Index is comprised of the smallest 2000 companies in the Russell 3000 Index,representing approximately 11% of the Russell 3000 total market capitalization.
This chart assumes an initial gross investment of $10,000 made on 6/19/00 (commencement of operations). Returns shown include the reinvestment of all dividends. The Fund’s past performance is not necessarily an indication of its future performance. It may perform better or worse in the future. The graph and the table do not reflect the deduction of taxes that a shareholder would pay on Fund distributions or the redemption of shares.
The Leuthold Funds
LeutholdAssetAllocation Fund
Average Annual Rate of Return For Periods Ended September 30,2006 |
| | | | | |
| | 1Year | 3Year | 5Year | Since Inception |
| Leuthold Asset Allocation Fund | n/a | n/a | n/a | (2.70%) |
| Lipper Flexible Fund Index | 8.47% | 10.60% | 6.97% | 8.66% |
| S&P 500 Index | 10.80% | 12.30% | 6.97% | 8.25% |
A $10,000 Investment in the Leuthold Asset Allocation Fund
The Lipper Flexible Fund Index is an equally weighted index of the largest 30 mutual funds within the Flexible Portfolio investment objective, as defined by Lipper.
The S&P 500 Index is an unmanaged capitalization-weighted index of 500 stocks designed to measure performance of the broad domestic economy through changes in the aggregate market value of the 500 stocks which represent all major industries.
This chart assumes an initial gross investment of $10,000 made on 5/24/06 (commencement of operations). Returns shown include the reinvestment of all dividends. The Fund’s past performance is not necessarily an indication of its future performance. It may perform better or worse in the future. The graph and the table do not reflect the deduction of taxes that a shareholder would pay on Fund distributions or the redemption of shares.
The Leuthold Funds
Leuthold Select Equities Fund
Average Annual Rate of Return For Periods Ended September 30,2006 |
| | | | | |
| | 1Year | 3Year | 5Year | Since Inception |
| Leuthold Select Equities Fund | n/a | n/a | n/a | (8.50%) |
| Russell 2000 Index | 9.92% | 15.48% | 13.78% | 8.70% |
| S&P 500 Index | 10.80% | 12.30% | 6.97% | 8.25% |
A $10,000 Investment in the Leuthold Select Equities Fund
The S&P 500 Index is an unmanaged capitalization-weighted index of 500 stocks designed to measure performance of the broad domestic economy through changes in the aggregate market value of the 500 stocks which represent all major industries.
The Russell 2000 Index is comprised of the smallest 2000 companies in the Russell 3000 Index,representing approximately 11% of the Russell 3000 total market capitalization.
This chart assumes an initial gross investment of $10,000 made on 5/24/06 (commencement of operations). Returns shown include the reinvestment of all dividends. The Fund’s past performance is not necessarily an indication of its future performance. It may perform better or worse in the future. The graph and the table do not reflect the deduction of taxes that a shareholder would pay on Fund distributions or the redemption of shares.
The Leuthold Funds
Statements of Assets and Liabilities | | | | | | | | | | | |
September 30, 2006 | | | | | | | | | | | |
| | | | | | | | | | | | |
| | | Leuthold Core | | Leuthold Select | | Grizzly | | Leuthold Asset | | Leuthold Select | |
| | | Investment Fund | | Industries Fund | | Short Fund | | Allocation Fund | | Equities Fund | |
| ASSETS: | | | | | | | | | | | |
| Investments,at value (cost $1,449,616,916, | | | | | | | | | | | | | | | | |
| $79,201,532,$20,900,610,$73,070,403 | | | | | | | | | | | | | | | | |
| and $3,252,280,respectively) | | $ | 1,627,372,502 | | $ | 89,978,649 | | $ | 20,900,610 | | $ | 74,067,108 | | $ | 3,241,488 | |
| Repurchase agreements | | | | | | | | | | | | | | | | |
| (cost $266,166,344, $15,833,656, | | | | | | | | | | | | | | | | |
| $0, $0 and $0, respectively) | | | 266,166,344 | | | 15,833,656 | | | — | | | — | | | — | |
| Cash | | | 342,773,014 | | | 3,722 | | | 27,814,886 | | | 8,379,994 | | | — | |
| Receivable for fund shares sold | | | 337,340 | | | 2,216 | | | 247,014 | | | 2,306,103 | | | 20,000 | |
| Receivable for investments sold | | | 34,590,082 | | | 3,720,719 | | | 479,029 | | | — | | | — | |
| Deposit for short sales | | | — | | | — | | | 45,093,786 | | | — | | | — | |
| Receivable from broker for proceeds | | | | | | | | | | | | | | | | |
| on securities sold short | | | — | | | — | | | 47,332,211 | | | — | | | — | |
| Interest receivable | | | 6,096,460 | | | 159 | | | 2,682 | | | 268,483 | | | 244 | |
| Dividends receivable | | | 488,539 | | | 56,560 | | | — | | | 26,868 | | | 516 | |
| Receivable from Adviser | | | — | | | — | | | — | | | — | | | 20,594 | |
| Other assets | | | 172,381 | | | 34,934 | | | 65,024 | | | 27,821 | | | 17,616 | |
| Total Assets | | | 2,277,996,662 | | | 109,630,615 | | | 141,935,242 | | | 85,076,377 | | | 3,300,578 | |
| LIABILITIES: | | | | | | | | | | | | | | | | |
| Collateral on securities loaned | | | 494,957,377 | | | 29,443,937 | | | — | | | — | | | — | |
| Securities sold short,at market value | | | | | | | | | | | | | | | | |
| (proceeds $0,$0,$47,332,211,$0 | | | | | | | | | | | | | | | | |
| and $0,respectively) | | | — | | | — | | | 47,765,412 | | | — | | | — | |
| Payable for investments purchased | | | 134,911,191 | | | 3,545,455 | | | 27,814,859 | | | 7,412,673 | | | — | |
| Payable for fund shares purchased | | | 2,188,907 | | | 164,766 | | | 17,346,281 | | | 38 | | | — | |
| Advisory fees payable | | | 1,229,638 | | | 64,268 | | | 105,282 | | | 44,061 | | | — | |
| Payable to Custodian (See Note 5) | | | 13,508,289 | | | — | | | — | | | — | | | — | |
| Dividends payable | | | 127,567 | | | — | | | 39,212 | | | 3,567 | | | — | |
| Accrued expenses and | | | | | | | | | | | | | | | | |
| other liabilities | | | 1,562,830 | | | 142,064 | | | 141,203 | | | 43,008 | | | 18,863 | |
| Total Liabilities | | | 648,485,799 | | | 33,360,490 | | | 93,212,249 | | | 7,503,347 | | | 18,863 | |
| NET ASSETS | | $ | 1,629,510,863 | | $ | 76,270,125 | | $ | 48,722,993 | | | 77,573,030 | | $ | 3,281,715 | |
See notes to the financial statements.
The Leuthold Funds
Statements of Assets and Liabilities (Continued) | | | | | | | | | | | |
September 30, 2006 | | | | | | | | | | | |
| | | Leuthold Core | | Leuthold Select | | Grizzly | | Leuthold Asset | | Leuthold Select | |
| | | Investment Fund | | Industries Fund | | Short Fund | | Allocation Fund | | Equities Fund | |
| NET ASSETS CONSIST OF: | | | | | | | | | | | |
| Capital stock | | $ | 1,452,436,460 | | $ | 64,956,767 | | $ | 74,289,427 | | $ | 77,436,446 | | $ | 3,396,961 | |
| Accumulated net investment income | | | 2,990,325 | | | 334,218 | | | 77,613 | | | 262,386 | | | — | |
| Accumulated net realized | | | | | | | | | | | | | | | | |
| gain (loss) on investments | | | (3,671,508 | ) | | 202,023 | | | (25,210,846 | ) | | (1,122,507 | ) | | (104,454 | ) |
| Net unrealized appreciation (depreciation) | | | | | | | | | | | | | | | | |
| on investments and short positions | | | 177,755,586 | | | 10,777,117 | | | (433,201 | ) | | 996,705 | | | (10,792 | ) |
| Total Net Assets | | $ | 1,629,510,863 | | $ | 76,270,125 | | $ | 48,722,993 | | $ | 77,573,030 | | $ | 3,281,715 | |
| Retail Class Shares | | | | | | | | | | | | | | | | |
| Net assets | | $ | 1,490,923,347 | | $ | 76,270,125 | | $ | 48,722,993 | | $ | 77,573,030 | | $ | 3,281,715 | |
| Shares outstanding (1,000,000,000 | | | | | | | | | | | | | | | | |
| shares of $.0001 par value authorized) | | | 85,457,840 | | | 4,421,376 | | | 8,567,871 | | | 7,973,228 | | | 358,577 | |
| Net Asset Value,Redemption Price | | | | | | | | | | | | | | | | |
and Offering Price Per Share(1) | | $ | 17.45 | | $ | 17.25 | | $ | 5.69 | | $ | 9.73 | | $ | 9.15 | |
| | | | | | | | | | | | | | | | | |
| Institutional Class Shares | | | | | | | | | | | | | | | | |
| Net assets | | $ | 138,587,516 | | | n/a | | | n/a | | | n/a | | | n/a | |
| Shares outstanding (1,000,000,000 | | | | | | | | | | | | | | | | |
| shares of $.0001 par value authorized) | | | 7,950,096 | | | n/a | | | n/a | | | n/a | | | n/a | |
| Net Asset Value,Redemption Price | | | | | | | | | | | | | | | | |
and Offering Price Per Share(1) | | $ | 17.43 | | | n/a | | | n/a | | | n/a | | | n/a | |
| | | | | | | | | | | | | | | | | |
| | | | | | | | | | | | | | | | | |
| (1) Redemption price may differ from NAV if redemption fee is applied. | | | | | | | | | | | | | | | | |
See notes to the financial statements.
The Leuthold Funds
Statements of Operations For the Period Ended September 30,2006 | | | | | | | | | | | |
| | | Leuthold Core | | Leuthold Select | | Grizzly | | Leuthold Asset | | Leuthold Select | |
| | | Investment Fund | | Industries Fund | | Short Fund | | Allocation Fund | | Equities Fund | |
| | | | | | | | | | | | |
| | | | | | | | | | | | |
| INVESTMENT INCOME: | | | | | | | | | | | |
| Dividend income (net of foreign taxes | | | | | | | | | | | |
| withheld of $206,569,$21,605, | | | | | | | | | | | |
| $0,$467 and $55,respectively) | | $ | 14,848,064 | | $ | 1,221,622 | | $ | — | | $ | 80,579 | | $ | 7,732 | |
| Interest income | | | 45,544,588 | | | 64,133 | | | 7,218,625 | | | 346,076 | | | 2,389 | |
| Total investment income | | | 60,392,652 | | | 1,285,755 | | | 7,218,625 | | | 426,655 | | | 10,121 | |
| EXPENSES: | | | | | | | | | | | | | | | | |
| Investment advisory fee (Note 3) | | | 13,901,806 | | | 820,908 | | | 1,061,508 | | | 85,664 | | | 6,934 | |
| Administration fee | | | 826,250 | | | 60,874 | | | 44,727 | | | 4,008 | | | 1,628 | |
| Transfer agent fees and expenses | | | 285,706 | | | 15,469 | | | 11,461 | | | 688 | | | 512 | |
| Legal fees | | | 122,463 | | | 7,569 | | | 7,758 | | | 8,812 | | | 10,280 | |
| Audit fees | | | 94,671 | | | 18,996 | | | 28,385 | | | 19,360 | | | 19,128 | |
| Fund accounting fees and expenses | | | 228,981 | | | 16,249 | | | 13,384 | | | 1,216 | | | 128 | |
| Custody fees | | | 137,182 | | | 13,317 | | | 3,254 | | | 216 | | | 128 | |
| Shareholder servicing fees | | | | | | | | | | | | | | | | |
| and expenses - Retail Class | | | 1,476,338 | | | 82,091 | | | 84,921 | | | — | | | — | |
| Federal and state registration | | | 137,580 | | | 37,343 | | | 33,992 | | | 2,136 | | | 2,048 | |
| Reports to shareholders | | | 401,994 | | | 32,704 | | | 37,391 | | | 216 | | | 128 | |
| Directors’fees and expenses | | | 55,165 | | | 3,134 | | | 4,194 | | | 304 | | | 128 | |
| Distribution (Rule 12b-1) fees | | | — | | | — | | | — | | | 23,796 | | | 1,733 | |
| Other | | | 149,868 | | | 6,265 | | | 4,247 | | | 128 | | | 128 | |
| Total expenses before dividends | | | | | | | | | | | | | | | | |
| and interest on short positions | | | 17,818,004 | | | 1,114,919 | | | 1,335,222 | | | 146,544 | | | 42,903 | |
| Dividends and interest on short positions | | | 4,703,924 | | | — | | | 1,151,738 | | | 21,495 | | | — | |
| Securities lending credit (See Note 9) | | | (1,156,366 | ) | | (45,220 | ) | | — | | | — | | | — | |
| Reimbursement from Adviser | | | — | | | — | | | — | | | (3,770 | ) | | (30,075 | ) |
| Recoupment by Adviser | | | — | | | 15,762 | | | — | | | — | | | — | |
| Total expenses | | | 21,365,562 | | | 1,085,461 | | | 2,486,960 | | | 164,269 | | | 12,828 | |
| NET INVESTMENT INCOME (LOSS) | | | 39,027,090 | | | 200,294 | | | 4,731,665 | | | 262,386 | | | (2,707 | ) |
See notes to the financial statements.
The Leuthold Funds
Statements of Operations (Continued) For the Period Ended September 30,2006 | | | | | | | | | | | |
| | | Leuthold Core | | Leuthold Select | | Grizzly | | Leuthold Asset | | Leuthold Select | |
| | | Investment Fund | | Industries Fund | | Short Fund | | Allocation Fund | | Equities Fund | |
| | | | | | | | | | | | |
| REALIZED AND UNREALIZED | | | | | | | | | | | |
| GAINS (LOSSES) ON INVESTMENTS | | | | | | | | | | | |
| AND SHORT POSITIONS: | | | | | | | | | | | |
| Net realized gain (loss) on: | | | | | | | | | | | |
| Investments | | $ | 73,182,713 | | $ | 770,223 | | $ | — | | $ | (293,313 | ) | $ | (103,110 | ) |
| Investment companies | | | (226,718 | ) | | (1,271 | ) | | — | | | 23,682 | | | (1,344 | ) |
| Short positions | | | (56,590,635 | ) | | — | | | (13,935,068 | ) | | (852,876 | ) | | — | |
| Net unrealized appreciation (depreciation) | | | | | | | | | | | | | | | | |
| during the year on: | | | | | | | | | | | | | | | | |
| Investments | | | 22,114,064 | | | 3,759,420 | | | — | | | 953,519 | | | (10,792 | ) |
| Investment companies | | | 9,153,296 | | | — | | | — | | | 43,186 | | | | |
| Short positions | | | 2,269,247 | | | — | | | (1,241,976 | ) | | — | | | — | |
| Net realized and unrealized gain (loss) | | | | | | | | | | | | | | | | |
| on investments and short positions | | | 49,901,967 | | | 4,528,372 | | | (15,177,044 | ) | | (125,802 | ) | | (115,246 | ) |
| NET INCREASE (DECREASE) | | | | | | | | | | | | | | | | |
| IN NET ASSETS RESULTING | | | | | | | | | | | | | | | | |
| FROM OPERATIONS | | $ | 88,929,057 | | $ | 4,728,666 | | $ | (10,445,379 | ) | $ | 136,584 | | $ | (117,953 | ) |
See notes to the financial statements.
The Leuthold Funds
Leuthold Core Investment Fund | | | | | |
Statements of Changes in Net Assets | | | | | |
| | | Year Ended | | Year Ended | |
| | | September 30,2006 | | September 30,2005 | |
| OPERATIONS: | | | | | |
| Net investment income | | $ | 39,027,090 | | $ | 4,979,428 | |
| Net realized gain on investments and short positions | | | 16,365,360 | | | 35,979,042 | |
| Net unrealized appreciation on investments and short positions | | | 33,536,607 | | | 88,394,244 | |
| Net increase in net assets from operations | | | 88,929,057 | | | 129,352,714 | |
| DISTRIBUTIONS TO SHAREHOLDERS: | | | | | | | |
| From net investment income - Retail Class | | | (36,214,922 | ) | | (4,971,989 | ) |
| From net investment income - Institutional Class | | | (2,287,242 | ) | | — | |
| From net realized gains - Retail Class | | | (52,860,537 | ) | | (22,205,065 | ) |
| From net realized gains - Institutional Class | | | — | | | — | |
| Total distributions | | | (91,362,701 | ) | | (27,177,054 | ) |
| CAPITAL SHARE TRANSACTIONS: | | | | | | | |
| Proceeds from shares sold - Retail Class | | | 720,319,818 | | | 625,650,100 | |
| Proceeds from shares sold - Institutional Class | | | 141,259,594 | | | — | |
| Proceeds from shares issued to holders in | | | | | | | |
| reinvestment of dividends - Retail Class | | | 83,593,622 | | | 25,864,690 | |
| Proceeds from shares issued to holders in | | | | | | | |
| reinvestment of dividends - Institutional Class | | | 1,940,121 | | | — | |
| Cost of shares redeemed - Retail Class * | | | (426,785,031 | ) | | (152,198,762 | ) |
| Cost of shares redeemed - Institutional Class ** | | | (1,330,668 | ) | | — | |
| Net increase in net assets from capital share transactions | | | 518,997,456 | | | 499,316,028 | |
| TOTAL INCREASE IN NET ASSETS | | | 516,563,812 | | | 601,491,688 | |
| NET ASSETS | | | | | | | |
| Beginning of year | | | 1,112,947,051 | | | 511,455,363 | |
| End of year (including accumulated net investment | | | | | | | |
| income (loss) of $2,990,325 and $(1,986),respectively) | | $ | 1,629,510,863 | | $ | 1,112,947,051 | |
| | | | | | | | |
| CHANGES IN SHARES OUTSTANDING: | | | | | | | |
| Shares sold -Retail Class | | | 41,144,127 | | | 38,393,557 | |
| Shares sold - Institutional Class | | | 7,914,236 | | | — | |
| Shares issued to holders in reinvestment | | | | | | | |
| of dividends - Retail Class | | | 4,897,534 | | | 1,634,749 | |
| Shares issued to holders in reinvestment | | | | | | | |
| of dividends -Institutional Class | | | 110,999 | | | — | |
| Shares redeemed - Retail Class | | | (24,179,738 | ) | | (9,441,172 | ) |
| Shares redeemed - Institutional Class | | | (75,139 | ) | | — | |
| Net increase in shares outstanding | | | 29,812,019 | | | 30,587,134 | |
| | | | | | | | |
| * Net of redemption fees of (Retail Class): | | $ | 10,163 | | $ | 596 | |
| ** Net of redemption fees of (Institutional Class): | | $ | 360 | | $ | — | |
See notes to the financial statements.
The Leuthold Funds
Leuthold Select Industries Fund | | | | | |
Statements of Changes in Net Assets | | | | | |
| | | Year Ended | | Year Ended | |
| | | September 30,2006 | | September 30,2005 | |
| OPERATIONS: | | | | | |
| Net investment income (loss) | | $ | 200,294 | | $ | (48,040 | ) |
| Net realized gain on investments | | | 768,952 | | | 1,874,242 | |
| Net unrealized appreciation | | | | | | | |
| on investments during the year | | | 3,759,420 | | | 4,416,258 | |
| Net increase in net assets from operations | | | 4,728,666 | | | 6,242,460 | |
| DISTRIBUTIONS TO SHAREHOLDERS: | | | | | | | |
| From net investment income | | | (186,217 | ) | | — | |
| From net realized gains | | | (525,301 | ) | | — | |
| Total distributions | | | (711,518 | ) | | — | |
| CAPITAL SHARE TRANSACTIONS: | | | | | | | |
| Proceeds from shares sold | | | 102,719,187 | | | 23,393,521 | |
| Proceeds from shares issued to holders | | | | | | | |
| in reinvestment of dividends | | | 656,576 | | | — | |
| Cost of shares redeemed | | | (62,320,268 | ) | | (19,214,680 | ) |
| Net increase in net assets | | | | | | | |
| from capital share transactions | | | 41,055,495 | | | 4,178,841 | |
| TOTAL INCREASE IN NET ASSETS | | | 45,072,643 | | | 10,421,301 | |
| NET ASSETS | | | | | | | |
| Beginning of year | | | 31,197,482 | | | 20,776,181 | |
| End of year (including accumulated net investment | | | | | | | |
| income (loss) of $334,218 and $(167),respectively) | | $ | 76,270,125 | | $ | 31,197,482 | |
| | | | | | | | |
| CHANGES IN SHARES OUTSTANDING: | | | | | | | |
| Shares sold | | | 6,048,563 | | | 1,645,141 | |
| Shares issued to holders in reinvestment of dividends | | | 39,412 | | | — | |
| Shares redeemed | | | (3,608,089 | ) | | (1,397,786 | ) |
| Net increase in shares outstanding | | | 2,479,886 | | | 247,355 | |
See notes to the financial statements.
The Leuthold Funds
Grizzly Short Fund | | | | | |
Statements of Changes in Net Assets | | | | | |
| | | Year Ended | | Year Ended | |
| | | September 30,2006 | | September 30,2005 | |
| OPERATIONS: | | | | | |
| Net investment income (loss) | | $ | 4,731,665 | | $ | 489,851 | |
| Net realized loss on short positions | | | (13,935,068 | ) | | (4,025,257 | ) |
| Net unrealized appreciation (depreciation) | | | | | | | |
| on short positions during the year | | | (1,241,976 | ) | | 42,205 | |
| Net decrease in net assets from operations | | | (10,445,379 | ) | | (3,493,201 | ) |
| DISTRIBUTIONS TO SHAREHOLDERS: | | | | | | | |
| From net investment income | | | (4,654,052 | ) | | (489,851 | ) |
| From return of capital | | | - | | | (19,224 | ) |
| Total distributions | | | (4,654,052 | ) | | (509,075 | ) |
| CAPITAL SHARE TRANSACTIONS: | | | | | | | |
| Proceeds from shares sold | | | 145,206,015 | | | 100,788,121 | |
| Proceeds from shares issued to holders | | | | | | | |
| in reinvestment of dividends | | | 3,524,411 | | | 379,718 | |
| Cost of shares redeemed | | | (139,592,870 | ) | | (64,235,556 | ) |
| Net increase in net assets | | | | | | | |
| from capital share transactions | | | 9,137,556 | | | 36,932,283 | |
| TOTAL INCREASE (DECREASE) IN NET ASSETS | | | (5,961,875 | ) | | 32,930,007 | |
| NET ASSETS | | | | | | | |
| Beginning of year | | | 54,684,868 | | | 21,754,861 | |
| End of year (including accumulated net investment | | | | | | | |
| income (loss) of $77,613 and $0,respectively) | | $ | 48,722,993 | | $ | 54,684,868 | |
| | | | | | | | |
| CHANGES IN SHARES OUTSTANDING: | | | | | | | |
| Shares sold | | | 22,951,853 | | | 14,381,712 | |
| Shares issued to holders in reinvestment of dividends | | | 589,588 | | | 54,895 | |
| Shares redeemed | | | (23,115,132 | ) | | (9,174,033 | ) |
| Net increase in shares outstanding | | | 426,309 | | | 5,262,574 | |
See notes to the financial statements.
The Leuthold Funds
LeutholdAssetAllocation Fund | | | |
Statement of Changes in Net Assets | | | |
| | | | |
| | | Period from May 24,2006(1) | |
| | | through | |
| | | September 30,2006 | |
| OPERATIONS: | | | |
| Net investment income | | $ | 262,386 | |
| Net realized loss on short positions | | | (1,122,507 | ) |
| Net unrealized appreciation | | | | |
| on investments and short positions during the period | | | 996,705 | |
| Net increase in net assets from operations | | | 136,584 | |
| CAPITAL SHARE TRANSACTIONS: | | | | |
| Proceeds from shares sold | | | 78,545,320 | |
| Proceeds from shares issued to holders | | | | |
| in reinvestment of dividends | | | — | |
| Cost of shares redeemed | | | (1,108,874 | ) |
| Net increase in net assets | | | | |
| from capital share transactions | | | 77,436,446 | |
| TOTAL INCREASE IN NET ASSETS | | | 77,573,030 | |
| NET ASSETS | | | | |
| Beginning of period | | | — | |
| End of period (including accumulated net investment | | | | |
| income of $262,386) | | $ | 77,573,030 | |
| | | | | |
| CHANGES IN SHARES OUTSTANDING: | | | | |
| Shares sold | | | 8,087,502 | |
| Shares issued to holders in reinvestment of dividends | | | — | |
| Shares redeemed | | | (114,274 | ) |
| Net increase in shares outstanding | | | 7,973,228 | |
| | | | | |
| | | | | |
| (1) Commencement of operations. | | | | |
See notes to the financial statements.
The Leuthold Funds
Leuthold Select Equities Fund | | | |
Statement of Changes in Net Assets | | | |
| | | | |
| | | Period from May 24,2006(1) through September 30,2006 | |
| | | | |
| OPERATIONS: | | | |
| Net investment loss | | $ | (2,707 | ) |
| Net realized loss on short positions | | | (104,454 | ) |
| Net unrealized depreciation | | | | |
| on investments during the period | | | (10,792 | ) |
| Net decrease in net assets from operations | | | (117,953 | ) |
| CAPITAL SHARE TRANSACTIONS: | | | | |
| Proceeds from shares sold | | | 3,704,493 | |
| Proceeds from shares issued to holders | | | | |
| in reinvestment of dividends | | | — | |
| Cost of shares redeemed | | | (304,825 | ) |
| Net increase in net assets | | | | |
| from capital share transactions | | | 3,399,668 | |
| TOTAL INCREASE IN NET ASSETS | | | 3,281,715 | |
| NET ASSETS | | | | |
| Beginning of period | | | — | |
| End of period | | $ | 3,281,715 | |
| | | | | |
| CHANGES IN SHARES OUTSTANDING: | | | | |
| Shares sold | | | 391,304 | |
| Shares issued to holders in reinvestment of dividends | | | — | |
| Shares redeemed | | | (32,727 | ) |
| Net increase in shares outstanding | | | 358,577 | |
| | | | | |
| | | | | |
| (1) Commencement of operations. | | | | |
See notes to the financial statements.
The Leuthold Funds
Leuthold Core Investment Fund - Retail | | | | | | | | | | | |
Financial Highlights | | | | | | | | | | | |
| | | Years ended September 30, | |
| | | 2006 | | 2005 | | 2004 | | 2003 | | 2002 | |
Per Share Data: | | | | | | | | | | | |
| Net asset value,beginning of year | | $ | 17.50 | | $ | 15.49 | | $ | 13.39 | | $ | 9.95 | | $ | 10.92 | |
| Income (loss) from investment operations: | | | | | | | | | | | | | | | | |
Net investment income(1) | | | 0.43 | | | 0.09 | | | — | | | 0.09 | | | 0.20 | |
| Net realized and unrealized gains (losses) | | | | | | | | | | | | | | | | |
| on investments and short positions | | | 0.68 | | | 2.65 | | | 2.15 | | | 3.44 | | | (0.97 | ) |
| Total from investment operations | | | 1.11 | | | 2.74 | | | 2.15 | | | 3.53 | | | (0.77 | ) |
| Less distributions: | | | | | | | | | | | | | | | | |
| From net investment income | | | (0.42 | ) | | (0.09 | ) | | — | | | (0.09 | ) | | (0.20 | ) |
| In excess of net investment income | | | — | | | — | | | (0.05 | ) | | — | | | — | |
| From net realized gains | | | (0.74 | ) | | (0.64 | ) | | — | | | — | | | — | |
| Total distributions | | | (1.16 | ) | | (0.73 | ) | | (0.05 | ) | | (0.09 | ) | | (0.20 | ) |
| Net asset value,end of year | | $ | 17.45 | | $ | 17.50 | | $ | 15.49 | | $ | 13.39 | | $ | 9.95 | |
| | | | | | | | | | | | | | | | | |
| Total return | | | 6.64 | % | | 18.26 | % | | 16.03 | % | | 35.60 | % | | (7.21 | %) |
| Supplemental data and ratios: | | | | | | | | | | | | | | | | |
| Net assets,end of year | | $ | 1,490,923,347 | | $ | 1,112,947,051 | | $ | 511,455,363 | | $ | 317,603,196 | | $ | 116,363,247 | |
| Ratio of expenses to average net assets: | | | | | | | | | | | | | | | | |
Before expense reimbursement(2) | | | 1.39 | % | | 1.74 | % | | 1.37 | % | | 1.31 | % | | 1.25 | % |
After expense reimbursement(2) | | | 1.39 | % | | 1.74 | % | | 1.37 | % | | 1.31 | % | | 1.25 | % |
| Ratio of net investment income (loss) | | | | | | | | | | | | | | | | |
| to average net assets: | | | | | | | | | | | | | | | | |
Before expense reimbursement(3) | | | 2.51 | % | | 0.67 | % | | (0.03 | %) | | 0.71 | % | | 1.85 | % |
After expense reimbursement(3) | | | 2.51 | % | | 0.67 | % | | (0.03 | %) | | 0.71 | % | | 1.85 | % |
Portfolio turnover rate(4) | | | 86.40 | % | | 163.88 | % | | 132.96 | % | | 89.59 | % | | 132.77 | % |
| (1) | Net investment income per share is calculated using ending balances prior to consideration of adjustments for permanent book and tax differences. |
(2) | The ratio of expenses to average net assets includes dividends on short positions. The before expense reimbursement and after expense reimbursement ratios excluding dividends on short positions were 1.08% and 1.08%,respectively,for the year ended September 30,2006,1.19% and 1.19%,respectively,for the year ended September 30,2005,1.21% and 1.21%,respectively,for the year ended September 30,2004,1.21% and 1.21%,respectively,for the year ended September 30,2003,1.21% and 1.21%,respectively,for the year ended September 30,2002. |
| (3) | The net investment income (loss) ratios include dividends on short positions. |
| (4) | The portfolio turnover ratio excludes purchases and sales of short positions as the Adviser does not intend to hold the short positions for more than one year. |
See notes to the financial statements.
The Leuthold Funds
Leuthold Core Investment Fund - Institutional | | | |
Financial Highlights | | | |
| | | Period from | |
| | | January 31,2006(1) | |
| | | to September 30,2006 | |
Per Share Data: | | | |
| Net asset value,beginning of period | | $ | 17.74 | |
| Income (loss) from investment operations: | | | | |
Net investment income(2) | | | 0.30 | |
| Net realized and unrealized gains (losses) | | | | |
| on investments and short positions | | | (0.27 | ) |
| Total from investment operations | | | 0.03 | |
| Less distributions: | | | | |
| From net investment income | | | (0.34 | ) |
| Total distributions | | | (0.34 | ) |
| Net asset value,end of period | | $ | 17.43 | |
| | | | | |
| Total return | | | 0.17%(6 | ) |
| Supplemental data and ratios: | | | | |
| Net assets,end of period | | $ | 138,587,516 | |
| Ratio of expenses to average net assets: | | | | |
Before expense reimbursement(3) | | | 1.32%(7 | ) |
After expense reimbursement(3) | | | 1.32%(7 | ) |
| Ratio of net investment income (loss) to average net assets: | | | | |
Before expense reimbursement(4) | | | 2.83%(7 | ) |
After expense reimbursement(4) | | | 2.83%(7 | ) |
Portfolio turnover rate(5) | | | 86.40%(7 | ) |
| (1) | Commencement of share class operations. |
| (2) | Net investment income per share is calculated using ending balances prior to consideration of adjustments for permanent book and tax differences. |
| (3) | The ratio of expenses to average net assets include dividends on short positions. The before expense reimbursement and after expense reimbursement ratios excluding dividends on short positions were 0.99% and 0.99%,respectively,for the period ended September 30,2006. |
| (4) | The net investment income (loss) ratios include dividends on short positions. |
| (5) | The portfolio turnover ratio excludes purchases and sales of short positions as the Adviser does not intend to hold the short positions for more than one year. |
See notes to the financial statements.
The Leuthold Funds
Leuthold Select Industries Fund Financial Highlights | | | | | | | | | | | |
| | | Years ended September 30, | |
| | | 2006 | | 2005 | | 2004 | | 2003 | | 2002 | |
Per Share Data: | | | | | | | | | | | |
| Net asset value,beginning of year | | $ | 16.07 | | $ | 12.26 | | $ | 10.40 | | $ | 7.50 | | $ | 9.96 | |
| Income from investment operations: | | | | | | | | | | | | | | | | |
Net investment income (loss)(1) | | | 0.04 | | | (0.02 | ) | | (0.13 | ) | | (0.11 | ) | | (0.15 | ) |
| Net realized and unrealized | | | | | | | | | | | | | | | | |
| gains (losses) on investments | | | 1.34 | | | 3.83 | | | 1.99 | | | 3.01 | | | (2.31 | ) |
| Total from investment operations | | | 1.38 | | | 3.81 | | | 1.86 | | | 2.90 | | | (2.46 | ) |
| Less distributions: | | | | | | | | | | | | | | | | |
| From net investment income | | | (0.03 | ) | | — | | | — | | | — | | | — | |
| From net realized gains | | | (0.17 | ) | | — | | | — | | | — | | | — | |
| Total distributions | | | (0.20 | ) | | — | | | — | | | — | | | — | |
| Net asset value,end of year | | $ | 17.25 | | $ | 16.07 | | $ | 12.26 | | $ | 10.40 | | $ | 7.50 | |
| Total return | | | 8.67 | % | | 31.08 | % | | 17.88 | % | | 38.67 | % | | (24.70 | %) |
| Supplemental data and ratios: | | | | | | | | | | | | | | | | |
| Net assets,end of year | | $ | 76,270,125 | | $ | 31,197,482 | | $ | 20,776,181 | | $ | 17,215,408 | | $ | 10,141,948 | |
| Ratio of expenses to average net assets: | | | | | | | | | | | | | | | | |
| Before expense reimbursement or recovery | | | 1.30 | % | | 1.56 | % | | 1.63 | % | | 1.80 | % | | 1.90 | % |
| After expense reimbursement or recovery | | | 1.32 | % | | 1.60 | % | | 1.72 | % | | 1.95 | % | | 1.95 | % |
| Ratio of net investment income (loss) | | | | | | | | | | | | | | | | |
| to average net assets: | | | | | | | | | | | | | | | | |
| Before expense reimbursement or recovery | | | 0.26 | % | | -0.16 | % | | (0.94 | %) | | (1.41 | %) | | (1.17 | %) |
| After expense reimbursement or recovery | | | 0.24 | % | | -0.20 | % | | (1.03 | %) | | (1.56 | %) | | (1.22 | %) |
| Portfolio turnover rate | | | 179.88 | % | | 156.11 | % | | 165.86 | % | | 184.71 | % | | 383.66 | % |
| | | | | | | | | | | | | | | | | |
(1) Net investment income (loss) per share is calculated using ending balances prior to consideration of adjustments for permanent book and tax differences. | | | | |
See notes to the financial statements.
The Leuthold Funds
Grizzly Short Fund | | | | | | | | | | | |
Financial Highlights | | | | | | | | | | | |
| | | Years ended September 30, | |
| | | 2006 | | 2005 | | 2004 | | 2003 | | 2002 | |
Per Share Data: | | | | | | | | | | | |
| Net asset value,beginning of year | | $ | 6.72 | | $ | 7.56 | | $ | 8.93 | | $ | 14.17 | | $ | 14.74 | |
| Income from investment operations: | | | | | | | | | | | | | | | | |
Net investment income (loss)(1) | | | 0.36 | | | 0.08 | | | (0.14 | ) | | (0.13 | ) | | (0.05 | ) |
| Net realized and unrealized | | | | | | | | | | | | | | | | |
| gains (losses) on short positions | | | (1.04 | ) | | (0.84 | ) | | (1.23 | ) | | (3.76 | ) | | 0.67 | |
| Total from investment operations | | | (0.68 | ) | | (0.76 | ) | | (1.37 | ) | | (3.89 | ) | | 0.62 | |
| Less distributions: | | | | | | | | | | | | | | | | |
| From net investment income | | | (0.35 | ) | | (0.08 | ) | | — | | | — | | | (0.03 | ) |
| From net realized gains | | | — | | | — | | | — | | | (1.25 | ) | | (1.16 | ) |
| Return of capital | | | — | | | —(5 | ) | | — | | | (0.10 | ) | | — | |
| Total distributions | | | (0.35 | ) | | (0.08 | ) | | — | | | (1.35 | ) | | (1.19 | ) |
| Net asset value,end of year | | $ | 5.69 | | $ | 6.72 | | $ | 7.56 | | $ | 8.93 | | $ | 14.17 | |
| | | | | | | | | | | | | | | | | |
| Total return | | | (10.23 | %) | | (10.00 | %) | | (15.34 | %) | | (29.68 | %) | | 5.80 | % |
| Supplemental data and ratios: | | | | | | | | | | | | | | | | |
| Net assets,end of year | | $ | 48,722,993 | | $ | 54,684,868 | | $ | 21,754,861 | | $ | 22,332,738 | | $ | 32,049,740 | |
| Ratio of expenses to average net assets: | | | | | | | | | | | | | | | | |
Before expense reimbursement or recovery(2) | | | 2.93 | % | | 2.94 | % | | 3.60 | % | | 3.49 | % | | 2.85 | % |
After expense reimbursement or recovery(2) | | | 2.93 | % | | 2.94 | % | | 3.60 | % | | 3.61 | % | | 3.37 | % |
| Ratio of net investment income (loss) | | | | | | | | | | | | | | | | |
| to average net assets: | | | | | | | | | | | | | | | | |
Before expense reimbursement or recovery(3) | | | 5.57 | % | | 1.66 | % | | (2.31 | %) | | (1.75 | %) | | (0.17 | %) |
After expense reimbursement or recovery(3) | | | 5.57 | % | | 1.66 | % | | (2.31 | %) | | (1.87 | %) | | (0.69 | %) |
Portfolio turnover rate(4) | | | 0 | % | | 0 | % | | 0 | % | | 0 | % | | 0 | % |
| (1) | Net investment income (loss) per share is calculated using ending balances prior to consideration of adjustments for permanent book and tax differences. |
| (2) | The ratio of expenses to average net assets include dividends on short positions. The before expense reimbursement or recovery and after expense reimbursement or recovery ratios excluding dividends on short positions were 1.57% and 1.57%,respectively,for the year ended September 30, 2006,1.77% and 1.77%,respectively,for the year ended September 30,2005,2.12% and 2.12%,respectively,for the year ended September 30, 2004,1.95% and 2.07%,respectively,for the year ended September 30,2003,1.98% and 2.50% respectively,for the year ended September 30,2002. |
| (3) | The net investment income (loss) ratios include dividends on short positions. |
| (4) | The portfolio turnover ratios exclude purchases and sales of short positions as the Adviser does not intend to hold the short positions for more than one year. |
| (5) | Less than one cent per share. |
See notes to the financial statements.
The Leuthold Funds
Leuthold Asset Allocation Fund | | | |
Financial Highlights | | | |
| | | Period from | |
| | | May 24,2006(1) | |
| | | through | |
| | | September 30,2006 | |
Per Share Data: | | | |
| Net asset value,beginning of period | | $ | 10.00 | |
| Income (loss) from investment operations: | | | | |
Net investment income(2) | | | 0.03 | |
| Net realized and unrealized losses | | | | |
| on investments and short positions | | | (0.30 | ) |
| Total from investment operations | | | (0.27 | ) |
| Net asset value,end of period | | $ | 9.73 | |
| | | | | |
| Total return | | | (2.70%)(6 | ) |
| Supplemental data and ratios: | | | | |
| Net assets,end of period | | $ | 77,573,030 | |
| Ratio of expenses to average net assets: | | | | |
Before expense reimbursement(3) | | | 1.78%(7 | ) |
After expense reimbursement(3) | | | 1.73%(7 | ) |
| Ratio of net investment income (loss) to average net assets: | | | | |
Before expense reimbursement(4) | | | 2.71%(7 | ) |
After expense reimbursement(4) | | | 2.76%(7 | ) |
Portfolio turnover rate(5) | | | 26.83%(7 | ) |
| (1) | Commencement of operations. |
| (2) | Net investment income per share is calculated using ending balances prior to consideration of adjustments for permanent book and tax differences. |
| (3) | The ratio of expenses to average net assets include dividends on short positions. The before expense reimbursement and after expense reimbursement ratios excluding dividends on short positions were 1.55% and 1.50%,respectively,for the period ended September 30,2006. |
| (4) | The net investment income (loss) ratios include dividends on short positions. |
| (5) | The portfolio turnover ratio excludes purchases and sales of short positions as the Adviser does not intend to hold the short positions for more than one year. |
See notes to the financial statements.
The Leuthold Funds
Leuthold Select Equities Fund | | | |
Financial Highlights | | | |
| | | Period from | |
| | | May 24,2006(1) | |
| | | through | |
| | | September 30,2006 | |
Per Share Data: | | | |
| Net asset value,beginning of period | | $ | 10.00 | |
| Income (loss) from investment operations: | | | | |
Net investment income(2) | | | (0.01 | ) |
| Net realized and unrealized losses | | | | |
| on investments | | | (0.84 | ) |
| Total from investment operations | | | (0.85 | ) |
| Net asset value,end of period | | $ | 9.15 | |
| | | | | |
| Total return | | | (8.50%)(3 | ) |
| Supplemental data and ratios: | | | | |
| Net assets,end of period | | $ | 3,281,715 | |
| Ratio of expenses to average net assets: | | | | |
| Before expense reimbursement | | | 6.20%(4 | ) |
| After expense reimbursement | | | 1.85%(4 | ) |
| Ratio of net investment income (loss) to average net assets: | | | | |
| Before expense reimbursement | | | (4.74%)(4 | ) |
| After expense reimbursement | | | (0.39%)(4 | ) |
| Portfolio turnover rate | | | 88.00%(4 | ) |
| (1) | Commencement of operations. |
| (2) | Net investment income per share is calculated using ending balances prior to consideration of adjustments for permanent book and tax differences. |
See notes to the financial statements.
The Leuthold Funds
Leuthold Core Investment Fund
Schedule of Investments
September 30, 2006
| | | | | | Market | |
| | | | Shares | | Value† | |
| | COMMON STOCKS 47.10% | | | | | |
| | Aerospace & Defense 0.80% | | | | | |
| | L-3 Communications | | | | | |
| | Holdings,Inc. | | 167,196 | $ | 13,096,463 | |
| | Airlines 4.53% | | | | | |
| | AMR Corp.(a) (e) | | 981,819 | | 22,719,291 | |
| | Continental | | | | | |
| | Airlines,Inc.(a) (e) | | 764,916 | | 21,654,772 | |
| | Southwest Airlines Co.(e) | | 936,530 | | 15,602,590 | |
| | U S Airways | | | | | |
| | Group,Inc.(a) (e) | | 311,721 | | 13,818,592 | |
| | | | | | 73,795,245 | |
| | Auto Components 0.21% | | | | | |
| | Magna International, | | | | | |
| | Inc.(b) (e) | | 47,271 | | 3,452,201 | |
| | Biotechnology 0.65% | | | | | |
| | Gilead Sciences,Inc.(a) (e) | | 113,483 | | 7,796,282 | |
| | Kendle International, | | | | | |
| | Inc.(a) | | 89,760 | | 2,874,115 | |
| | | | | | 10,670,397 | |
| | Building Products 0.20% | | | | | |
| | Masco Corp. | | 121,067 | | 3,319,657 | |
| | Chemicals 3.08% | | | | | |
| | Air Products & | | | | | |
| | Chemicals,Inc. | | 170,862 | | 11,340,111 | |
| | Airgas,Inc. | | 181,063 | | 6,549,049 | |
| | Ashland Inc New | | 78,347 | | 4,996,972 | |
| | Eastman Chemical Co.(e) | | 125,320 | | 6,769,786 | |
| | Lyondell Chemical Co.(e) | | 145,493 | | 3,691,157 | |
| | OM Group,Inc.(a) (e) | | 98,917 | | 4,346,413 | |
| | Praxair,Inc.(e) | | 210,390 | | 12,446,672 | |
| | | | | | 50,140,160 | |
| | | | | | Market | |
| | | | Shares | | Value† | |
| | Commercial Banks 0.84% | | | | | |
| | National City Corp.(e) | | 182,338 | $ | 6,673,571 | |
| | Wachovia Corp.(e) | | 126,234 | | 7,043,857 | |
| | | | | | 13,717,428 | |
| | Communications Equipment 0.40% | | | | | |
| | Nice Sys Ltd.- ADR (a) | | 235,519 | | 6,516,811 | |
| | Diversified Financial Services 0.46% | | | | |
| | J.P.Morgan Chase & Co. | | 158,111 | | 7,424,893 | |
| | Diversified Telecommunication Services 0.43% | | | | | |
| | Embarq Corp. | | 71,623 | | 3,464,405 | |
| | Telefonos de Mexico | | | | | |
| | SA de CV - ADR (e) | | 135,802 | | 3,473,815 | |
| | | | | | 6,938,220 | |
| | Electric Utilities 0.47% | | | | | |
| | Cleco Corp.(e) | | 303,471 | | 7,659,608 | |
| | Electronic Equipment & Instruments 0.20% | | | |
| | L-1 Identity Solutions, | | | | | |
| | Inc.(a) (e) | | 197,639 | | 2,579,189 | |
| | OSI Systems,Inc.(a) | | 36,978 | | 724,769 | |
| | | | | | 3,303,958 | |
| | Health Care Equipment & Supplies 0.46% | | | | | |
| | Analogic Corp. | | 22,952 | | 1,177,897 | |
| | Illumina,Inc.(a) (e) | | 111,156 | | 3,672,594 | |
| | Steris Corp.(e) | | 110,933 | | 2,669,048 | |
| | | | | | 7,519,539 | |
| | Health Care Providers & Services 1.64% | | | | | |
| | Aetna,Inc. | | 109,543 | | 4,332,426 | |
| | Laboratory Corp Of | | | | | |
| | America Holdings (a) (e) | | 141,899 | | 9,304,317 | |
| | Magellan Health | | | | | |
| | Services,Inc.(a) (e) | | 70,718 | | 3,012,587 | |
See notes to the financial statements.
The Leuthold Funds
Leuthold Core Investment Fund
Schedule of Investments (Continued)
September 30, 2006
| | | | | | Market | |
| | | | Shares | | Value† | |
| | Health Care Providers | | | | | |
| | & Services 1.64% (Continued) | | | | | |
| | Molina Healthcare, | | | | | |
| | Inc.(a) (e) | | 90,767 | $ | 3,209,521 | |
| | Pharmaceutical Product | | | | | |
| | Development,Inc. | | 192,690 | | 6,877,106 | |
| | | | | | 26,735,957 | |
| | Household Durables 0.41% | | | | | |
| | Furniture Brands | | | | | |
| | International,Inc.(e) | | 173,178 | | 3,297,309 | |
| | Kimball International,Inc. | | 173,412 | | 3,346,852 | |
| | | | | | 6,644,161 | |
| | Insurance 5.44% | | | | | |
| | Aegon NV - ADR | | 291,999 | | 5,480,819 | |
| | Lincoln National Corp. | | 85,807 | | 5,326,899 | |
| | Manulife Financial | | | | | |
| | Corp.(b) (e) | | 499,835 | | 16,124,677 | |
| | Metlife,Inc.(e) | | 358,300 | | 20,308,444 | |
| | Nationwide Financial | | | | | |
| | Services | | 155,561 | | 7,482,484 | |
| | Prudential Financial,Inc. | | 269,462 | | 20,546,477 | |
| | Safety Insurance | | | | | |
| | Group,Inc. | | 54,738 | | 2,663,551 | |
| | The St.Paul Travelers | | | | | |
| | Companies Inc. | | 227,550 | | 10,669,820 | |
| | | | | | 88,603,171 | |
| | IT Services 0.22% | | | | | |
| | Accenture Ltd.(e) | | 112,247 | | 3,559,352 | |
| | Life Science Tools & Services 1.70% | | | | | |
| | Covance,Inc.(a) (e) | | 53,853 | | 3,574,762 | |
| | Fisher Scientific | | | | | |
| | International (a) | | 92,639 | | 7,248,075 | |
| | | | | | Market | |
| | | | Shares | | Value† | |
| | | | | | | |
| | Life Science Tools | | | | | |
| | & Services 1.70% (Continued) | | | | | |
| | Millipore Corp.(a) (e) | | 52,340 | $ | 3,208,442 | |
| | PerkinElmer,Inc. | | 157,745 | | 2,986,113 | |
| | Thermo Electron | | | | | |
| | Corp.(a) (e) | | 186,735 | | 7,344,288 | |
| | Waters Corp.(a) (e) | | 74,254 | | 3,362,221 | |
| | | | | | 27,723,901 | |
| | Metals & Mining 14.09% | | | | | |
| | Alcan,Inc.(b) | | 144,085 | | 5,744,669 | |
| | Alcoa,Inc.(e) | | 381,252 | | 10,690,306 | |
| | Aluminum Corp of | | | | | |
| | China Ltd.- ADR (e) | | 41,301 | | 2,631,700 | |
| | BHP Billiton | | | | | |
| | Ltd.- ADR (e) | | 484,534 | | 18,354,148 | |
| | Century Aluminum | | | | | |
| | Co.(a) (e) | | 135,041 | | 4,544,130 | |
| | Cia Vale do Rio Doce - | | | | | |
| | ADR (e) | | 595,988 | | 12,849,501 | |
| | Inco Ltd.(b) | | 655,396 | | 49,987,052 | |
| | Ipsco,Inc.(b) | | 35,056 | | 3,038,303 | |
| | PAN American | | | | | |
| | Silver Corp.(a) (b) (e) | | 107,108 | | 2,092,890 | |
| | Phelps Dodge Corp.(e) | | 411,854 | | 34,884,034 | |
| | Rio Tinto PLC - ADR (e) | | 192,292 | | 36,464,332 | |
| | Southern Copper Corp. | | 314,564 | | 29,097,170 | |
| | Titanium Metals | | | | | |
| | Corp.(a) (e) | | 635,575 | | 16,067,336 | |
| | United States Steel Corp.(e) | | 55,081 | | 3,177,072 | |
| | | | | | 229,622,643 | |
See notes to the financial statements.
The Leuthold Funds
Leuthold Core Investment Fund
Schedule of Investments (Continued)
September 30, 2006
| | | | | | Market | |
| | | | Shares | | Value† | |
| | Multiline Retail 0.23% | | | | |
| | Family Dollar | | | | | |
| | Stores,Inc.(e) | | 127,744 | $ | 3,735,235 | |
| | Multi-Utilities & Unregulated Power 0.94% | | | | | |
| | Oneok,Inc. | | 406,754 | | 15,371,234 | |
| | Oil & Gas 1.16% | | | | | |
| | Anadarko Petroleum Corp. | | 70,673 | | 3,097,598 | |
| | ChevronTexaco Corp.(e) | | 103,606 | | 6,719,885 | |
| | Exxon Mobil Corp.(e) | | 98,631 | | 6,618,140 | |
| | Harvest Natural | | | | | |
| | Resources,Inc.(a) | | 243,492 | | 2,520,142 | |
| | | | | | 18,955,765 | |
| | Pharmaceuticals 6.23% | | | | | |
| | Abbott Laboratories | | 202,739 | | 9,845,006 | |
| | AstraZeneca | | | | | |
| | PLC - ADR (e) | | 224,416 | | 14,026,000 | |
| | Bristol-Myers Squibb Co. | | 416,018 | | 10,367,168 | |
| | Eli Lilly & Co.(e) | | 123,684 | | 7,049,988 | |
| | GlaxoSmithKline | | | | | |
| | PLC ADR | | 212,895 | | 11,332,401 | |
| | Johnson & Johnson (e) | | 199,781 | | 12,973,778 | |
| | Merck & Co.,Inc.(e) | | 237,777 | | 9,962,856 | |
| | Novartis AG - ADR | | 222,565 | | 13,006,699 | |
| | Pfizer,Inc. | | 237,167 | | 6,726,056 | |
| | Wyeth | | 121,134 | | 6,158,453 | |
| | | | | | 101,448,405 | |
| | Road & Rail 0.95% | | | | | |
| | Canadian National | | | | | |
| | Railway Co.(b) | | 211,665 | | 8,877,230 | |
| | Canadian Pacific | | | | | |
| | Railway Ltd.(b) | | 132,609 | | 6,595,972 | |
| | | | | | 15,473,202 | |
| | | | | | Market | |
| | | | Shares | | Value† | |
| | Software 0.78% | | | | | |
| | Cognos,Inc.(a) (b) (e) | | 71,405 | $ | 2,606,282 | |
| | Informatica Corp.(a) (e) | | 241,527 | | 3,282,352 | |
| | Mentor Graphics Corp.(a) | | 272,447 | | 3,836,054 | |
| | Verint Systems,Inc.(a) | | 98,182 | | 2,950,369 | |
| | | | | | 12,675,057 | |
| | Specialty Retail 0.23% | | | | | |
| | Autozone,Inc.(a) (e) | | 36,804 | | 3,801,853 | |
| | Telecommunication Equipment 0.11% | | | | | |
| | Essex Corp.(a) (e) | | 105,832 | | 1,841,477 | |
| | Textiles, Apparel & Luxury Goods 0.24% | | | | | |
| | Fossil,Inc.(a) | | 178,363 | | 3,841,939 | |
| | Total Common Stocks | | | | | |
| | (Cost $623,391,950) | | | | 767,587,932 | |
| | INVESTMENT COMPANIES 12.22% | | | | | |
| | Exchange Traded Funds 7.34% | | | | | |
| | iShares China 25 Fund | | 127,579 | | 10,378,552 | |
| | iShares MSCI Brazil | | | | | |
| | Index Fund (e) | | 301,949 | | 11,649,193 | |
| | iShares MSCI Emerging | | | | | |
| | Markets Index Fund (e) | | 113,070 | | 10,941,784 | |
| | iShares MSCI Japan | | | | | |
| | Index Fund (e) | | 3,986,206 | | 53,973,229 | |
| | iShares MSCI Malaysia | | | | | |
| | Index Fund (e) | | 557,443 | | 4,270,013 | |
| | iShares MSCI South | | | | | |
| | Africa Fund (e) | | 57,057 | | 5,206,451 | |
| | iShares MSCI South | | | | | |
| | Korea Index Fund (e) | | 170,240 | | 7,873,600 | |
| | iShares MSCI Taiwan | | | | | |
| | Index Fund | | 375,930 | | 4,811,904 | |
See notes to the financial statements.
The Leuthold Funds
Leuthold Core Investment Fund
Schedule of Investments (Continued)
September 30, 2006
| | | | | | Market | |
| | | | Shares | | Value† | |
| | Exchange Traded Funds 7.34% (Continued) | | | | | |
| | iShares S&P Latin | | | | | |
| | America Fund (e) | | 73,744 | $ | 10,484,922 | |
| | | | | | 119,589,648 | |
| | Mutual Funds 4.88% | | | | | |
| | Fidelity Japan Fund | | 442,428 | | 7,366,423 | |
| | ING Russia Fund (a) | | 266,610 | | 14,210,301 | |
| | Matthews China Fund | | 1,221,243 | | 23,301,317 | |
| | Matthews India Fund (a) | | 520,031 | | 6,984,013 | |
| | Matthews Japan Fund | | 217,383 | | 3,767,252 | |
| | Matthews Korea Fund | | 1,480,128 | | 9,620,831 | |
| | US Global Investors | | | | | |
| | Accolade Funds - | | | | | |
| | Eastern European Fund | | 327,466 | | 14,241,484 | |
| | | | | | 79,491,622 | |
| | Total Investment Companies | | | | | |
| | (Cost $173,171,804) | | | | 199,081,269 | |
| | PHYSICAL INDUSTRIAL METALS 0.02% | | | | | |
| | Physical Metals 0.02% | | | | | |
| | | | Kilograms | | | |
| | Indium (a) | | 412 | | 290,460 | |
| | Total Physical Industrial Metals | | | | | |
| | (Cost $420,240) | | | | 290,460 | |
| | | | Principal | | | |
| | | | Amount | | | |
| | CORPORATE BONDS 11.75% | | | | | |
| | Consumer Finance 4.66% | | | | | |
| | General Motors | | | | | |
| | Acceptance | | | | | |
| | Corporation (e) | | | | | |
| | 7.750%,01/19/2010 | $ | 74,000,000 | | 75,823,656 | |
| | | | Principal | | Market | |
| | | | Amount | | Value† | |
| | Diversified Financial Services 3.75% | | | | | |
| | General Motors | | | | | |
| | Acceptance | | | | | |
| | Corporation (e) | | | | | |
| | 5.625%,05/15/2009 | $ | 62,712,000 | $ | 61,154,924 | |
| | Non-depository Credit Institutions 3.34% | | | | | |
| | General Motors | | | | | |
| | Acceptance | | | | | |
| | Corporation (e) | | | | | |
| | 7.250%,03/02/2011 | | 54,103,000 | | 54,412,307 | |
| | Total Corporate Bonds | | | | | |
| | (Cost $184,333,142) | | | | 191,390,887 | |
| | U.S. TREASURY OBLIGATIONS 9.60% | | | | | |
| | U.S. Treasury Note 4.61% | | | | | |
| | 4.875%,04/30/2011 (e) | | 74,278,000 | | 75,104,937 | |
| | U.S. Treasury Note 4.99% | | | | | |
| | 4.250%,10/15/2010 (e) | | 82,386,000 | | 81,362,601 | |
| | Total U.S.Treasury Obligations | | | | 156,467,538 | |
| | (Cost $154,865,770) | | | | | |
| | INVESTMENTS SUBJECT TO | | | | | |
| | BANKRUPTCY PROCEEDINGS 2.91% | | | | | |
| | (see Note 7) (a) (d) | | | | | |
| | (Cost $48,278,331) | | | | 47,398,738 | |
| | SHORT TERM INVESTMENTS 2.23% | | | | | |
| | Commercial Paper 2.14% | | | | | |
| | U.S.Bank N.A. | | | | | |
| | 5.26%, 10/02/2006 | | 34,962,000 | | 34,956,960 | |
| | Variable Rate Demand Notes 0.09% | | | | | |
| | U.S.Bank,N.A. | | | | | |
| | 4.949% (c) | | 1,407,685 | | 1,407,685 | |
| | Total Short Term Investments | | | | | |
| | (Cost $36,364,646) | | | | 36,364,645 | |
See notes to the financial statements.
The Leuthold Funds
Leuthold Core Investment Fund
Schedule of Investments (Continued)
September 30, 2006
| | | | Principal | | Market | |
| | | | Amount | | Value† | |
| | INVESTMENTS PURCHASED | | | | | |
| | WITH PROCEEDS FROM | | | | | |
| | SECURITIES LENDING | | | | | |
| | COLLATERAL (See Note 9) 30.37% | | | | | |
| | Commercial Paper 14.03% | | | | | |
| | Antalis Funding, | | | | | |
| | 5.31%,10/06/06 (f) | $ | 25,484,012 | $ | 25,457,749 | |
| | CCN Independence IV | | | | | |
| | LLC,5.46%,04/16/07 (f) | | 7,550,818 | | 7,550,818 | |
| | Chesham Financial, | | | | | |
| | 5.43%,10/02/06 (f) | | 25,484,012 | | 25,472,480 | |
| | Concord Minutemen | | | | | |
| | Capital Co., | | | | | |
| | 5.33%,10/17/06 (f) | | 23,596,307 | | 23,596,307 | |
| | Fenway Funding, | | | | | |
| | 5.32%,10/02/06 (f) | | 23,596,307 | | 23,512,933 | |
| | Kar Atlantic, | | | | | |
| | 5.32%,10/20/06 (f) | | 8,494,670 | | 8,457,152 | |
| | Laguna Corp., | | | | | |
| | 5.33%,10/23/06 (f) | | 24,540,159 | | 24,424,548 | |
| | Lakeside Funding LLC, | | | | | |
| | 5.33%,10/10/06 (f) | | 9,438,523 | | 9,438,523 | |
| | Mint II LLC, | | | | | |
| | 5.35%,10/26/06 (f) | | 19,820,898 | | 19,738,729 | |
| | Mitten GMAC | | | | | |
| | Commercial Mortgage, | | | | | |
| | 5.32%,10/10/06 (f) | | 16,045,489 | | 15,984,070 | |
| | Ocala Funding LLC, | | | | | |
| | 5.32%,10/27/06 (f) | | 3,775,409 | | 3,758,734 | |
| | Rams Funding LLC, | | | | | |
| | 5.32%,10/06/06 (f) | | 9,438,523 | | 9,403,784 | |
| | | | Principal | | Market | |
| | | | Amount | | Value† | |
| | Commercial Paper 14.03% (Continued) | | | | | |
| | Rams Funding LLC, | | | | | |
| | 5.32%,10/17/06 (f) | $ | 3,691,406 | $ | 3,675,646 | |
| | Rams Funding LLC, | | | | | |
| | 5.32%,10/20/06 (f) | | 11,326,227 | | 11,277,871 | |
| | Thornburg Mortgage | | | | | |
| | Capital LLC, | | | | | |
| | 5.33%,10/17/06 (f) | | 7,550,818 | | 7,515,246 | |
| | Thornburg Mortgage | | | | | |
| | Capital LLC, | | | | | |
| | 5.32%,10/24/06 (f) | | 9,438,523 | | 9,398,226 | |
| | Total Commercial Paper | | | | | |
| | (Cost $228,662,816) | | | | 228,662,816 | |
| | | | Shares | | | |
| | MUTUAL FUNDS 0.01% | | | | | |
| | AIM Short Term | | | | | |
| | Liquid Asset Fund | | 128,217 | | 128,217 | |
| | Total Mutual Fund | | | | | |
| | (Cost $128,217) | | | | 128,217 | |
| | | | Principal | | | |
| | | | Amount | | | |
| | REPURCHASE AGREEMENTS 16.33% | | | | | |
| | CS First Boston | | | | | |
| | Repurchase Agreement, | | | | | |
| | 5.39%,9/29/06,maturing | | | | | |
| | 10/2/06 (Collateralized by | | | | | |
| | Freddie Mac | | | | | |
| | Collateralized Mortgage | | | | | |
| | Obligations,value | | | | | |
| | $9,587,561,6.00%, | | | | | |
| | 06/15/20 to 01/15/26) | $ | 9,438,523 | $ | 9,438,523 | |
See notes to the financial statements.
The Leuthold Funds
Leuthold Core Investment Fund
Schedule of Investments (Continued)
September 30, 2006
| | | | Principal | | Market | |
| | | | Amount | | Value† | |
| | REPURCHASE | | | | | |
| | AGREEMENTS 16.33% (Continued) | | | | | |
| | CS First Boston | | | | | |
| | Repurchase Agreement, | | | | | |
| | 5.39%,9/29/06,maturing | | | | | |
| | 10/2/06 (Collateralized by | | | | | |
| | U.S.Government Agency | | | | | |
| | Issues,value $11,508,841, | | | | | |
| | 0.00% to 6.00%, | | | | | |
| | 11/15/18 to 08/15/36) | $ | 11,326,227 | $ | 11,326,227 | |
| | CS First Boston | | | | | |
| | Repurchase Agreement, | | | | | |
| | 5.40%,9/29/06,maturing | | | | | |
| | 10/2/06 (Collateralized by | | | | | |
| | non-U.S.Government | | | | | |
| | debt securities,value | | | | | |
| | $24,665,797,6.00%, | | | | | |
| | 08/31/36 ) | | 23,596,307 | | 23,596,307 | |
| | CS First Boston | | | | | |
| | Repurchase Agreement, | | | | | |
| | 5.43%,9/29/06,maturing | | | | | |
| | 10/2/06 (Collateralized by | | | | | |
| | non-U.S.Government | | | | | |
| | debt securities,value | | | | | |
| | $34,517,625,6.50%, | | | | | |
| | 08/31/36) | | 33,034,830 | | 33,034,830 | |
| | | | Principal | | Market | |
| | | | Amount | | Value† | |
| | REPURCHASE | | | | | |
| | AGREEMENTS 16.33% (Continued) | | | | | |
| | Goldman Sachs | | | | | |
| | Repurchase Agreement, | | | | | |
| | 5.53%,9/29/06,maturing | | | | | |
| | 10/2/06 (Collateralized | | | | | |
| | by non-U.S.Government | | | | | |
| | debt securities,value | | | | | |
| | $43,340,753,1.00%, | | | | | |
| | 06/23/11) | $ | 42,473,353 | $ | 42,473,353 | |
| | Merrill Lynch Repurchase | | | | | |
| | Agreement,5.35%, | | | | | |
| | 9/29/06,maturing | | | | | |
| | 10/2/06 (Collateralized | | | | | |
| | by non-U.S.Government | | | | | |
| | debt securities,to value | | | | | |
| | $33,488,467,0.00% | | | | | |
| | 9.25%,11/11/09 | | | | | |
| | to 04/25/32) | | 33,034,830 | | 33,034,830 | |
| | Merrill Lynch Repurchase | | | | | |
| | Agreement,5.35%, | | | | | |
| | 9/29/06,maturing | | | | | |
| | 10/02/06 (Collateralized | | | | | |
| | by U.S.Government | | | | | |
| | Agency Issues,value | | | | | |
| | $47,965,156,4.50%, | | | | | |
| | 06/01/21) | | 47,192,614 | | 47,192,614 | |
See notes to the financial statements.
The Leuthold Funds
Leuthold Core Investment Fund
Schedule of Investments (Continued)
September 30, 2006
| | | | Principal | | Market | |
| | | | Amount | | Value† | |
| | REPURCHASE | | | | | |
| | AGREEMENTS 16.33% (Continued) | | | | | |
| | Morgan Stanley | | | | | |
| | Repurchase Agreement, | | | | | |
| | 5.40%,9/29/06,maturing | | | | | |
| | 10/02/06 (Collateralized by | | | | | |
| | Fannie Mae Mortgage | | | | | |
| | Obligations,value | | | | | |
| | $67,391,053,0.00% | | | | | |
| | to 6.31%,10/25/16 | | | | | |
| | to 03/25/36) | $ | 66,069,660 | $ | 66,069,660 | |
| | Total Repurchase Agreements | | | | | |
| | (Cost $266,166,344) | | | | 266,166,344 | |
| | Total Investments | | | | | |
| | Purchased with Proceeds | | | | | |
| | from Securities | | | | | |
| | Lending Collateral | | | | | |
| | (Cost $494,957,377) | | | | 494,957,377 | |
| | Total Investments 116.20% | | | | | |
| | (Cost $1,715,783,260) | | | | 1,893,538,846 | |
| | Liabilities in Excess of | | | | (264,027,983) | |
| | Other Assets (16.20)% | | | | | |
| | Total Net Assets 100.00% | | | $ | 1,629,510,863 | |
| | | | | | | |
Percentages are stated as a percent of net assets.
ADR - American Depository Receipt
(a) Non income producing security.
(b) Foreign issue security.
(c) Variable rate security. The rate shown is the rate in effect on September 30,2006.
(d) Prepaid forward contract was executed as of October 19,2005 and based on the counterparty’s bankruptcy,the Fund has not received delivery on the executed value of the contract. The contract is currently being fair valued based on a valuation approach approved by the Fund’s Board of Directors.
(e) All or a portion of this security is on loan.
(f) Restricted as defined in Rule 144(a) of the Securities Act of 1933. Such securities are treated as liquid securities. The market value of these securities total $228,662,816 or 14.03% of total net assets.
| † | See Note 1a of accompanying Notes to Financial Statements regarding valuation of securities. |
See notes to the financial statements.
The Leuthold Funds
Leuthold Select Industries Fund
Schedule of Investments
September 30, 2006
| | | | | | Market | |
| | | | Shares | | Value† | |
| | COMMON STOCKS 98.37% | | | | | |
| | Aerospace & Defense 1.90% | | | | | |
| | L-3 Communications | | | | | |
| | Holdings,Inc.(d) | | 18,491 | $ | 1,448,400 | |
| | Airlines 10.49% | | | | | |
| | AMR Corp.(a) (d) | | 101,340 | | 2,345,008 | |
| | Continental | | | | | |
| | Airlines,Inc.(a) (d) | | 85,127 | | 2,409,945 | |
| | Southwest Airlines Co. | | 104,718 | | 1,744,602 | |
| | U S Airways | | | | | |
| | Group,Inc.(a) (d) | | 33,885 | | 1,502,122 | |
| | | | | | 8,001,677 | |
| | Auto Components 0.50% | | | | | |
| | Magna Intl,Inc.(d) | | 5,189 | | 378,953 | |
| | Biotechnology 1.54% | | | | | |
| | Gilead Sciences,Inc.(a) (d) | | 12,373 | | 850,025 | |
| | Kendle International, | | | | | |
| | Inc.(a) | | 10,191 | | 326,316 | |
| | | | | | 1,176,341 | |
| | Building Products 0.49% | | | | | |
| | Masco Corp. | | 13,565 | | 371,952 | |
| | Chemicals 7.25% | | | | | |
| | Air Products & | | | | | |
| | Chemicals,Inc. | | 18,602 | | 1,234,615 | |
| | Airgas,Inc. | | 19,653 | | 710,849 | |
| | Ashland Inc New | | 9,059 | | 577,783 | |
| | Eastman Chemical Co.(d) | | 13,992 | | 755,848 | |
| | Lyondell Chemical Co.(d) | | 16,499 | | 418,580 | |
| | OM Group,Inc.(a) (d) | | 10,859 | | 477,144 | |
| | Praxair,Inc.(d) | | 22,889 | | 1,354,113 | |
| | | | | | 5,528,932 | |
| | | | | | Market | |
| | | | Shares | | Value† | |
| | Commercial Banks 1.99% | | | | | |
| | National City Corp.(d) | | 20,219 | $ | 740,015 | |
| | Wachovia Corp.(d) | | 13,911 | | 776,234 | |
| | | | | | 1,516,249 | |
| | Communications Equipment 1.37% | | | | | |
| | Nice Sys Ltd.- ADR (a) | | 37,793 | | 1,045,732 | |
| | Diversified Financial Services 1.08% | | | | | |
| | J.P.Morgan Chase & Co. | | 17,470 | | 820,391 | |
| | Diversified Telecommunication Services 1.02% | | | | | |
| | Embarq Corp. | | 8,026 | | 388,218 | |
| | Telefonos de Mexico | | | | | |
| | SA de CV - ADR (d) | | 15,217 | | 389,251 | |
| | | | | | 777,469 | |
| | Electric Utilities 1.11% | | | | | |
| | Cleco Corp.(d) | | 33,564 | | 847,155 | |
| | Electronic Equipment & Instruments 0.45% | | | | | |
| | L-1 Identity | | | | | |
| | Solutions,Inc.(a) (d) | | 21,271 | | 277,587 | |
| | OSI Systems,Inc.(a) | | 3,315 | | 64,974 | |
| | | | | | 342,561 | |
| | Health Care Equipment & Supplies 1.11% | | | | | |
| | Analogic Corp. | | 2,669 | | 136,973 | |
| | Illumina,Inc.(a) (d) | | 12,617 | | 416,866 | |
| | Steris Corp. | | 12,132 | | 291,896 | |
| | | | | | 845,735 | |
| | Health Care Providers & Services 3.87% | | | | | |
| | Aetna,Inc. | | 12,275 | | 485,476 | |
| | Laboratory Corp Of | | | | | |
| | America Holdings (a) (d) | | 15,143 | | 992,927 | |
| | Magellan Health | | | | | |
| | Services,Inc.(a) (d) | | 7,924 | | 337,562 | |
See notes to the financial statements.
The Leuthold Funds
Leuthold Select Industries Fund
Schedule of Investments (Continued)
September 30, 2006
| | | | | | Market | |
| | | | Shares | | Value† | |
| | Health Care Providers & | | | | | |
| | Services 3.87% (Continued) | | | | | |
| | Molina Healthcare,Inc.(a) | | 10,502 | $ | 371,351 | |
| | Pharmaceutical Product | | | | | |
| | Development,Inc. | | 21,514 | | 767,835 | |
| | | | | | 2,955,151 | |
| | Household Durables 0.97% | | | | | |
| | Furniture Brands | | | | | |
| | International,Inc.(d) | | 19,012 | | 361,988 | |
| | Kimball International, | | | | | |
| | Inc.(d) | | 19,735 | | 380,886 | |
| | | | | | 742,874 | |
| | Insurance 12.52% | | | | | |
| | Aegon NV - ADR | | 32,100 | | 602,512 | |
| | Lincoln National Corp. | | 9,420 | | 584,793 | |
| | Manulife Financial Corp.(b) | | 51,762 | | 1,669,842 | |
| | Metlife,Inc.(d) | | 38,498 | | 2,182,067 | |
| | Nationwide | | | | | |
| | Financial Services | | 17,227 | | 828,619 | |
| | Prudential Financial,Inc. | | 29,096 | | 2,218,570 | |
| | Safety Insurance Group,Inc. | | 6,227 | | 303,006 | |
| | The St.Paul Travelers | | | | | |
| | Companies Inc. | | 24,647 | | 1,155,698 | |
| | | | | | 9,545,107 | |
| | IT Services 0.52% | | | | | |
| | Accenture Ltd.(d) | | 12,578 | | 398,848 | |
| | Life Science Tools & Services 4.09% | | | | | |
| | Covance,Inc.(a) | | 6,146 | | 407,971 | |
| | Fisher Scientific | | | | | |
| | International (a) | | 10,353 | | 810,019 | |
| | Millipore Corp.(a) (d) | | 5,904 | | 361,915 | |
| | PerkinElmer,Inc. | | 17,874 | | 338,355 | |
| | | | | | Market | |
| | | | Shares | | Value† | |
| | | | | | | |
| | Life Science Tools & | | | | | |
| | Services 4.09% (Continued) | | | | | |
| | Thermo Electron | | | | | |
| | Corp.(a) (d) | | 20,867 | $ | 820,699 | |
| | Waters Corp.(a) | | 8,411 | | 380,850 | |
| | | | | | 3,119,809 | |
| | Metals & Mining 20.58% | | | | | |
| | Aluminum Corp of China | | | | | |
| | Ltd.- ADR (d) | | 4,534 | | 288,906 | |
| | BHP Billiton Ltd.- ADR (d) | | 53,784 | | 2,037,338 | |
| | Century Aluminum | | | | | |
| | Co.(a) (d) | | 14,825 | | 498,861 | |
| | Cia Vale do Rio Doce - | | | | | |
| | ADR (d) | | 67,329 | | 1,451,613 | |
| | Inco Ltd.(b) | | 42,959 | | 3,276,483 | |
| | Ipsco,Inc.(b) | | 3,928 | | 340,440 | |
| | PAN American | | | | | |
| | Silver Corp.(a) (b) (d) | | 10,353 | | 202,298 | |
| | Phelps Dodge Corp.(d) | | 22,160 | | 1,876,952 | |
| | Rio Tinto PLC - ADR (d) | | 15,904 | | 3,015,876 | |
| | Southern Copper Corp. | | 19,968 | | 1,847,040 | |
| | Titanium Metals Corp.(a) | | 20,219 | | 511,136 | |
| | United States Steel Corp.(d) | | 6,047 | | 348,791 | |
| | | | | | 15,695,734 | |
| | Multiline Retail 0.55% | | | | | |
| | Family Dollar Stores,Inc.(d) | | 14,314 | | 418,541 | |
| | Multi-Utilities & Unregulated Power 2.18% | | | | | |
| | Oneok,Inc. | | 44,077 | | 1,665,670 | |
| | Oil & Gas 2.79% | | | | | |
| | Anadarko Petroleum Corp.(d) | | 7,918 | | 347,046 | |
| | ChevronTexaco Corp.(d) | | 11,609 | | 752,960 | |
| | Exxon Mobil Corp.(d) | | 11,052 | | 741,589 | |
See notes to the financial statements.
The Leuthold Funds
Leuthold Select Industries Fund
Schedule of Investments (Continued)
September 30, 2006
| | | | | | Market | |
| | | | Shares | | Value† | |
| | Oil & Gas 2.79% (Continued) | | | | | |
| | Harvest Natural | | | | | |
| | Resources,Inc.(a) | | 27,661 | $ | 286,291 | |
| | | | | | 2,127,886 | |
| | Pharmaceuticals 14.65% | | | | | |
| | Abbott Laboratories | | 22,160 | | 1,076,090 | |
| | AstraZeneca PLC - ADR | | 24,020 | | 1,501,250 | |
| | Bristol-Myers Squibb Co. | | 45,777 | | 1,140,763 | |
| | Eli Lilly & Co. | | 13,182 | | 751,374 | |
| | GlaxoSmithKline | | | | | |
| | PLC ADR (d) | | 23,867 | | 1,270,440 | |
| | Johnson & Johnson | | 22,677 | | 1,472,644 | |
| | Merck & Co.,Inc.(d) | | 26,643 | | 1,116,342 | |
| | Novartis AG - ADR | | 24,544 | | 1,434,351 | |
| | Pfizer,Inc. | | 26,285 | | 745,443 | |
| | Wyeth | | 13,102 | | 666,106 | |
| | | | | | 11,174,803 | |
| | Road & Rail 2.20% | | | | | |
| | Canadian National | | | | | |
| | Railway Co.(b) | | 22,889 | | 959,965 | |
| | Canadian Pacific | | | | | |
| | Railway Ltd.(b) | | 14,396 | | 716,057 | |
| | | | | | 1,676,022 | |
| | Software 1.78% | | | | | |
| | Cognos,Inc.(a) (b) | | 7,845 | | 286,343 | |
| | Informatica Corp.(a) (d) | | 25,987 | | 353,163 | |
| | Mentor Graphics Corp.(a) | | 28,617 | | 402,927 | |
| | Verint Systems,Inc.(a) | | 10,595 | | 318,380 | |
| | | | | | 1,360,813 | |
| | Specialty Retail 0.56% | | | | | |
| | Autozone,Inc.(a) (d) | | 4,124 | | 426,009 | |
| | | | | | | |
| | | | | | Market | |
| | | | Shares | | Value† | |
| | | | | | | |
| | Telecommunication Equipment 0.25% | | | | | |
| | Essex Corp.(a) | | 11,080 | $ | 192,792 | |
| | | | | | | |
| | Textiles,Apparel & Luxury Goods 0.56% | | | | | |
| | Fossil,Inc.(a) | | 19,911 | | 428,883 | |
| | Total Common Stocks | | | | | |
| | (Cost $64,253,372) | | | | 75,030,489 | |
| | | | | | | |
| | | | Principal | | | |
| | | | Amount | | | |
| | | | | | | |
| | SHORT TERM INVESTMENTS 1.75% | | | | | |
| | Commercial Paper 1.75% | | | | | |
| | U.S.Bank,N.A. | | | | | |
| | 5.264%, 10/02/2006 | $ | 1,338,000 | | 1,337,807 | |
| | Variable Rate Demand Notes 0.00% | | | | | |
| | U.S.Bank,N.A. | | | | | |
| | 4.949%(c) | | 72 | | 72 | |
| | | | | | | |
| | Total Short Term Investments | | | | | |
| | (Cost $1,337,879) | | | | 1,337,879 | |
| | INVESTMENTS PURCHASED | | | | | |
| | WITH PROCEEDS FROM | | | | | |
| | SECURITIES LENDING | | | | | |
| | COLLATERAL (See Note 9) 38.61% | | | | | |
| | Commercial Paper 17.84% | | | | | |
| | Antalis Funding, | | | | | |
| | 5.31%,10/06/06 (c) (e) | | 1,515,988 | | 1,514,426 | |
| | CCN Independence IV | | | | | |
| | LLC,5.46%,04/16/07 (e) | | 449,182 | | 449,182 | |
| | Chesham Financial, | | | | | |
| | 5.43%,10/02/06 (c) (e) | | 1,515,988 | | 1,515,302 | |
| | Concord Minutemen | | | | | |
| | Capital Co.,5.33%, | | | | | |
| | 10/17/06 (e) | | 1,403,693 | | 1,403,693 | |
| | Fenway Funding, | | | | | |
| | 5.32%,10/02/06 (c) (e) | | 1,403,693 | | 1,398,733 | |
See notes to the financial statements.
The Leuthold Funds
Leuthold Select Industries Fund
Schedule of Investments (Continued)
September 30, 2006
| | | | Principal | | Market | |
| | | | Amount | | Value† | |
| | Commercial Paper 17.84% (Continued) | | | | | |
| | Kar Atlantic, | | | | | |
| | 5.32%,10/20/06 (c) (e) | $ | 505,330 | $ | 503,098 | |
| | Laguna Corp., | | | | | |
| | 5.33%,10/23/06 (c) (e) | | 1,459,841 | | 1,452,963 | |
| | Lakeside Funding LLC, | | | | | |
| | 5.33%,10/10/06 (e) | | 561,477 | | 561,477 | |
| | Mint II LLC, | | | | | |
| | 5.35%,10/26/06 (c) (e) | | 1,179,102 | | 1,174,214 | |
| | Mitten GMAC | | | | | |
| | Commercial Mortgage, | | | | | |
| | 5.32%,10/10/06 (c) (e) | | 954,511 | | 950,858 | |
| | Ocala Funding LLC, | | | | | |
| | 5.32%,10/27/06 (c) (e) | | 224,591 | | 223,599 | |
| | Rams Funding LLC, | | | | | |
| | 5.32%,10/06/06 (c) (e) | | 561,477 | | 559,411 | |
| | Rams Funding LLC, | | | | | |
| | 5.32%,10/17/06 (c) (e) | | 219,594 | | 218,656 | |
| | Rams Funding LLC, | | | | | |
| | 5.32%,10/20/06 (c) (e) | | 673,773 | | 670,896 | |
| | Thornburg Mortgage | | | | | |
| | Capital LLC, | | | | | |
| | 5.33%,10/17/06 (c) (e) | | 449,182 | | 447,066 | |
| | Thornburg Mortgage | | | | | |
| | Capital LLC, | | | | | |
| | 5.32%,10/24/06 (c) (e) | | 561,477 | | 559,080 | |
| | Total Commercial Paper | | | | | |
| | (Cost $13,602,654) | | | | 13,602,654 | |
| | | | Shares | | | |
| | MUTUAL FUND 0.01% | | | | | |
| | AIM Short Term | | | | | |
| | Liquid Asset Fund | | 7,627 | | 7,627 | |
| | Total Mutual Fund | | | | | |
| | (Cost $7,627) | | | | 7,627 | |
| | | | Principal | | Market | |
| | | | Amount | | Value† | |
| | REPURCHASE AGREEMENTS 20.76% | | | | | |
| | CS First Boston | | | | | |
| | Repurchase Agreement, | | | | | |
| | 5.39%,9/29/06,maturing | | | | | |
| | 10/02/06 (Collateralized by | | | | | |
| | Freddie Mac Collateralized | | | | | |
| | Mortgage Obligations, | | | | | |
| | value $570,343,6.00%, | | | | | |
| | 06/15/20 to 01/15/26) | $ | 561,477 | $ | 561,477 | |
| | CS First Boston | | | | | |
| | Repurchase Agreement, | | | | | |
| | 5.39%,9/29/06,maturing | | | | | |
| | 10/02/06 (Collateralized by | | | | | |
| | U.S.Government Agency | | | | | |
| | Issues,value $684,636, | | | | | |
| | 0.00% to 6.00%, | | | | | |
| | 11/15/18 to 08/15/36) | | 673,773 | | 673,773 | |
| | CS First Boston | | | | | |
| | Repurchase Agreement, | | | | | |
| | 5.40%,9/29/06,maturing | | | | | |
| | 10/02/06 (Collateralized by | | | | | |
| | non-U.S.Government | | | | | |
| | debt securities,value | | | | | |
| | $1,467,315,6.00%, | | | | | |
| | 08/31/36 ) | | 1,403,693 | | 1,403,693 | |
| | CS First Boston | | | | | |
| | Repurchase Agreement, | | | | | |
| | 5.43%,9/29/06,maturing | | | | | |
| | 10/02/06 (Collateralized by | | | | | |
| | non-U.S.Government | | | | | |
| | debt securities,value | | | | | |
| | $2,053,378,6.50%, | | | | | |
| | 08/31/36) | | 1,965,170 | | 1,965,170 | |
See notes to the financial statements.
The Leuthold Funds
Leuthold Select Industries Fund
Schedule of Investments (Continued)
September 30, 2006
| | | | Principal | | Market | |
| | | | Amount | | Value† | |
| | REPURCHASE | | | | | |
| | AGREEMENTS 20.76% (Continued) | | | | | |
| | Goldman Sachs | | | | | |
| | Repurchase Agreement, | | | | | |
| | 5.53%,9/29/06,maturing | | | | | |
| | 10/02/06 (Collateralized by | | | | | |
| | non-U.S.Government | | | | | |
| | debt securities,value | | | | | |
| | $2,578,247,1.00%, | | | | | |
| | 06/23/11) | $ | 2,526,647 | $ | 2,526,647 | |
| | Merrill Lynch Repurchase | | | | | |
| | Agreement,5.35%,9/29/06, | | | | | |
| | maturing 10/02/06 | | | | | |
| | (Collateralized by non-U.S. | | | | | |
| | Government debt securities, | | | | | |
| | value $1,992,156,0.00% to | | | | | |
| | 9.25%,11/11/09 | | | | | |
| | to 04/25/32) | | 1,965,170 | | 1,965,170 | |
| | Merrill Lynch Repurchase | | | | | |
| | Agreement,5.35%,9/29/06, | | | | | |
| | maturing 10/02/06 | | | | | |
| | (Collateralized by U.S. | | | | | |
| | Government Agency Issues, | | | | | |
| | value $2,853,343,4.50%, | | | | | |
| | 06/01/21) | | 2,807,386 | | 2,807,386 | |
| | | | Principal | | Market | |
| | | | Amount | | Value† | |
| | REPURCHASE | | | | | |
| | AGREEMENTS 20.76% (Continued) | | | | | |
| | Morgan Stanley | | | | | |
| | Repurchase Agreement, | | | | | |
| | 5.40%,9/29/06,matured | | | | | |
| | 10/02/06 (Collateralized by | | | | | |
| | Fannie Mae Mortgage Obligations, | | | | | |
| | value $4,008,947,0.00% | | | | | |
| | to 6.31%,10/25/16 to | | | | | |
| | 03/25/36) | $ | 3,930,340 | $ | 3,930,340 | |
| | Total Repurchase Agreements | | | | | |
| | (Cost $15,833,656) | | | | 15,833,656 | |
| | Total Investments | | | | | |
| | Purchased with Proceeds | | | | | |
| | from Securities | | | | | |
| | Lending Collateral | | | | | |
| | (Cost $29,443,937) | | | | 29,443,937 | |
| | Total Investments 138.73% | | | | | |
| | (Cost $95,035,188) | | | | 105,812,305 | |
| | Liabilities in Excess of | | | | | |
| | Other Assets (38.73)% | | | | (29,542,180) | |
| | Total Net Assets 100.00% | | | $ | 76,270,125 | |
Percentages are stated as a percent of net assets.
ADR - American Depository Receipt
(a) Non income producing security.
(b) Foreign issue security.
(c) Variable rate security. The rate shown is the rate in effect on September 30,2006.
(d) All or a portion of this security is on loan.
(e) Restricted as defined in Rule 144(a) of the Securities Act of 1933. Such securities are treated as liquid securities. The market value of these securities total $13,602,654 or 17.84% of total net assets.
| † | See Note 1a of accompanying Notes to Financial Statements regarding valuation of securities. |
See notes to the financial statements.
The Leuthold Funds
Grizzly Short Fund
Schedule of Investments
September 30, 2006
| | | | Principal | | Market | |
| | | | Amount | | Value† | |
| | SHORT TERM INVESTMENTS 42.90% | | | | | |
| | Commercial Paper 22.37% | | | | | |
| | U.S.Bank,N.A. | | | | | |
| | 5.264%, 10/02/2006 | $ | 10,902,000 | $ | 10,900,428 | |
| | Variable Rate Demand Notes 20.53% | | | | | |
| | U.S.Bank,N.A. | | | | | |
| | 4.949% | | 10,000,182 | | 10,000,182 | |
| | Total Short Term Investments | | | | | |
| | (Cost $20,900,610) | | | | 20,900,610 | |
| | Total Investments 42.90% | | | | | |
| | (Cost $20,900,610) | | | | 20,900,610 | |
| | Other Assets in Excess | | | | | |
| | of Liabilities 57.10% | | | | 27,822,383 | |
| | Total Net Assets 100.00% | | | $ | 48,722,993 | |
| | | | | | | |
| | | | | | | |
| | † See Note 1a of accompanying Notes to Financial Statements | |
| | regarding valuation of securities. | | | |
See notes to the financial statements.
The Leuthold Funds
Grizzly Short Fund
Schedule of Securities Sold Short
September 30, 2006
| | | | | | Market | |
| | | | Shares | | Value† | |
| | COMMON STOCKS 98.03% | | | | | |
| | Advertising 3.33% | | | | | |
| | Interpublic Group | | | | | |
| | of Companies,Inc.(a) | | 73,852 | $ | 731,135 | |
| | RH Donnelley Corp.(a) | | 16,881 | | 893,005 | |
| | | | | | 1,624,140 | |
| | Apparel & Accessories 1.42% | | | | | |
| | Quiksilver,Inc.(a) | | 56,984 | | 692,356 | |
| | Application Software 1.77% | | | | | |
| | Parametric | | | | | |
| | Technology Corp.(a) | | 49,447 | | 863,345 | |
| | Auto Parts & Equipment 1.39% | | | | | |
| | Gentex Corp. | | 47,744 | | 678,442 | |
| | Automobile Manufacturers 1.33% | | | | | |
| | Ford Motor Co. | | 80,180 | | 648,656 | |
| | Banks…Regional 1.53% | | | | | |
| | Marshall & Ilsley Corp. | | 15,491 | | 746,356 | |
| | Biotechnology 1.62% | | | | | |
| | Pdl Biopharma,Inc.(a) | | 41,220 | | 791,424 | |
| | Broadcasting & Cable TV 2.99% | | | | | |
| | NTL Inc. | | 26,146 | | 664,893 | |
| | XM Satellite Radio | | | | | |
| | Holdings,Inc.- Class A (a) | | 61,520 | | 792,993 | |
| | | | | | 1,457,886 | |
| | Casinos & Gambling 1.60% | | | | | |
| | Boyd Gaming Corp. | | 20,338 | | 781,793 | |
| | Computer Hardware 2.91% | | | | | |
| | Avid Technology,Inc.(a) | | 18,466 | | 672,532 | |
| | Diebold,Inc. | | 17,101 | | 744,406 | |
| | | | | | 1,416,938 | |
| | Consumer Finance 1.40% | | | | | |
| | SLM Corp. | | 13,138 | | 682,913 | |
| | | | | | Market | |
| | | | Shares | | Value† | |
| | Data Processing & Outsourced Services 1.55% | | | | | |
| | Fidelity National | | | | | |
| | Information Services | | 20,380 | $ | 754,060 | |
| | Electric Utilities 1.64% | | | | | |
| | FPL Group,Inc. | | 17,712 | | 797,040 | |
| | Electrical Components & Equipment 1.55% | | | | | |
| | American Power | | | | | |
| | Conversion Corp. | | 34,350 | | 754,326 | |
| | Electronic Equipment Manufacturers 2.40% | | | | | |
| | Lg Philip LCD Co., | | | | | |
| | Ltd.- ADR (a) | | 41,156 | | 682,778 | |
| | Massey Energy Co. | | 23,197 | | 485,745 | |
| | | | | | 1,168,523 | |
| | Electronic Manufacturing Services 1.52% | | | | | |
| | Flextronics | | | | | |
| | International Ltd.(a) | | 58,660 | | 741,462 | |
| | Fertilizers & Agricultural Chemicals 3.32% | | | | | |
| | Mosaic Co.(a) | | 47,873 | | 809,054 | |
| | Potash Corp | | | | | |
| | of Saskatchewan | | 7,771 | | 809,660 | |
| | | | | | 1,618,714 | |
| | Gas Utilities 2.92% | | | | | |
| | AGL Resources,Inc. | | 20,350 | | 742,775 | |
| | Equitable Resources,Inc. | | 19,493 | | 681,865 | |
| | | | | | 1,424,640 | |
| | Health Care Cost Equipment 1.38% | | | | | |
| | Omnicare,Inc. | | 15,634 | | 673,669 | |
| | Health Care Equipment 3.22% | | | | | |
| | Boston Scientific Corp.(a) | | 45,639 | | 675,001 | |
| | Mentor Corp. | | 17,752 | | 894,523 | |
| | | | | | 1,569,524 | |
See notes to the financial statements.
The Leuthold Funds
Grizzly Short Fund
Schedule of Securities Sold Short (Continued)
September 30, 2006
| | | | | | Market | |
| | | | Shares | | Value† | |
| | Home Entertainment Software 4.28% | | | | | |
| | Activision,Inc.(a) | | 47,278 | $ | 713,898 | |
| | Electronic Arts,Inc.(a) | | 12,150 | | 676,512 | |
| | THQ,Inc.(a) | | 23,815 | | 694,684 | |
| | | | | | 2,085,094 | |
| | Homebuilding 4.52% | | | | | |
| | Centex Corp. | | 14,619 | | 769,252 | |
| | Hovnanian | | | | | |
| | Enterprises,Inc.(a) | | 23,716 | | 695,827 | |
| | Standard-Pacific Corp. | | 31,410 | | 738,135 | |
| | | | | | 2,203,214 | |
| | Indexes 4.72% | | | | | |
| | Alexander & Baldwin,Inc. | | 18,064 | | 801,500 | |
| | Nasdaq-100 Index | | | | | |
| | Tracking Stock | | 36,840 | | 1,497,547 | |
| | | | | | 2,299,047 | |
| | Internet Retail 1.48% | | | | | |
| | Amazon.Com,Inc.(a) | | 22,378 | | 718,781 | |
| | Internet Software & Services 3.31% | | | | | |
| | Valueclick,Inc.(a) | | 44,002 | | 815,797 | |
| | VeriSign,Inc.(a) | | 39,557 | | 799,051 | |
| | | | | | 1,614,848 | |
| | Metal & Glass Containers 3.25% | | | | | |
| | Crown Holdings,Inc.(a) | | 52,449 | | 975,551 | |
| | Owens-Illinois,Inc.(a) | | 39,492 | | 608,967 | |
| | | | | | 1,584,518 | |
| | Multi-Line Insurance 1.50% | | | | | |
| | American International | | | | | |
| | Group,Inc. | | 11,008 | | 729,390 | |
| | Multi-Utilities 1.48% | | | | | |
| | Energy East Corp. | | 30,357 | | 720,068 | |
| | | | | | Market | |
| | | | Shares | | Value† | |
| | Oil & Gas Exploration & Production 1.48% | | | | | |
| | Pioneer Natural | | | | | |
| | Resources Co. | | 18,466 | $ | 722,390 | |
| | Oil & Gas Storage & Transport 1.37% | | | | | |
| | Williams Cos,Inc. | | 27,978 | | 667,835 | |
| | Packaged Foods 1.43% | | | | | |
| | Tyson Foods,Inc. | | 43,898 | | 697,100 | |
| | Photographic Products 1.60% | | | | | |
| | Eastman Kodak Co. | | 34,697 | | 777,213 | |
| | Property & Casualty Insurance 3.61% | | | | | |
| | The Allstate Corp. | | 12,554 | | 787,512 | |
| | XL Capital Ltd. | | 14,152 | | 972,242 | |
| | | | | | 1,759,754 | |
| | Publishing & Printing 1.20% | | | | | |
| | The Reader’s Digest | | | | | |
| | Association,Inc. | | 45,029 | | 583,576 | |
| | Real Estate Management | | | | | |
| | & Development 1.47% | | | | | |
| | The St Joe Co. | | 13,061 | | 716,657 | |
| | Reinsurance 3.20% | | | | | |
| | Everest Re Group Ltd. | | 7,368 | | 718,601 | |
| | Montpelier Re | | | | | |
| | Holdings Ltd. | | 43,300 | | 839,587 | |
| | | | | | 1,558,188 | |
| | Semiconductor Equipment 3.17% | | | | | |
| | Entegris,Inc.(a) | | 67,366 | | 734,963 | |
| | Tessera | | | | | |
| | Technologies,Inc.(a) | | 23,261 | | 809,018 | |
| | | | | | 1,543,981 | |
| | Semiconductors 3.31% | | | | | |
| | Intel Corp. | | 41,858 | | 861,019 | |
See notes to the financial statements.
The Leuthold Funds
Grizzly Short Fund
Schedule of Securities Sold Short (Continued)
September 30, 2006
| | | | | | Market | |
| | | | Shares | | Value† | |
| | Semiconductors 3.31% (Continued) | | | | | |
| | International | | | | | |
| | Rectifier Corp.(a) | | 21,533 | $ | 750,210 | |
| | | | | | 1,611,229 | |
| | Specialized Consumer Services 1.36% | | | | | |
| | H&R Block,Inc. | | 30,447 | | 661,918 | |
| | Systems Software 3.33% | | | | | |
| | CA,Inc. | | 33,983 | | 805,057 | |
| | Microsoft Corp. | | 29,993 | | 819,709 | |
| | | | | | 1,624,766 | |
| | Thrifts & Mortgage Finance 3.57% | | | | | |
| | NewYork Community | | | | | |
| | Bancorp,Inc. | | 58,219 | | 953,627 | |
| | People’s Bank/ | | | | | |
| | Bridgeport CT | | 19,805 | | 784,476 | |
| | | | | | 1,738,103 | |
| | Water Utilities 1.13% | | | | | |
| | Aqua America,Inc. | | 25,055 | | 549,707 | |
| | Wireless Telecom Services 1.46% | | | | | |
| | Sprint Corp. | | 41,506 | | 711,828 | |
| | Total Securities Sold Short | | | | | |
| | (Proceeds $47,332,211) | | | $ | 47,765,412 | |
| | | | | | | |
| | | | | | | |
| | Percentages are stated as a percent of net assets. | | | |
| | (a) Non Income Producing | | | | |
| | † See Note 1a of accompanying Notes to Financial Statements | |
| | regarding valuation of securities. | | | | |
See notes to the financial statements.
The Leuthold Funds
Leuthold Asset Allocation Fund
Schedule of Investments
September 30, 2006
| | | | | | Market | |
| | | | Shares | | Value† | |
| | COMMON STOCKS 43.20% | | | | | |
| | Aerospace & Defense 0.37% | | | | | |
| | Lockheed Martin Corp. | | 3,338 | $ | 287,268 | |
| | Airlines 0.62% | | | | | |
| | Skywest,Inc. | | 19,509 | | 478,361 | |
| | Auto Components 0.63% | | | | | |
| | Magna Intl,Inc. (c) | | 6,698 | | 489,155 | |
| | Beverages 0.43% | | | | | |
| | Hansen Natural Corp.(a) | | 10,269 | | 333,537 | |
| | Capital Markets 0.79% | | | | | |
| | The Bear Stearns | | | | | |
| | Companies Inc. | | 2,118 | | 296,732 | |
| | Greenhill & Co,Inc. | | 4,750 | | 318,345 | |
| | | | | | 615,077 | |
| | Chemicals 6.95% | | | | | |
| | Airgas,Inc. | | 8,023 | | 290,192 | |
| | Ashland Inc New | | 21,603 | | 1,377,839 | |
| | Eastman Chemical Co. | | 26,794 | | 1,447,412 | |
| | Lyondell Chemical Co. | | 35,717 | | 906,140 | |
| | OM Group,Inc.(a) | | 31,150 | | 1,368,731 | |
| | | | | | 5,390,314 | |
| | Commercial Banks 1.03% | | | | | |
| | Banco Bradesco S A - ADR | | 9,114 | | 303,952 | |
| | National City Corp. | | 13,482 | | 493,441 | |
| | | | | | 797,393 | |
| | Consumer Finance 0.46% | | | | | |
| | The First Marblehead | | | | | |
| | Corporation | | 5,135 | | 355,650 | |
| | Distributors 0.49% | | | | | |
| | WESCO | | | | | |
| | International,Inc.(a) | | 6,611 | | 383,636 | |
| | | | | | Market | |
| | | | Shares | | Value† | |
| | Diversified Financial Services 1.00% | | | | | |
| | Citigroup,Inc. | | 10,046 | $ | 498,985 | |
| | J.P.Morgan Chase & Co. | | 5,969 | | 280,304 | |
| | | | | | 779,289 | |
| | Diversified Telecommunication Services 0.72% | | | | | |
| | AT&T,Inc. | | 8,665 | | 282,132 | |
| | Qwest Communications | | | | | |
| | International (a) | | 31,579 | | 275,369 | |
| | | | | | 557,501 | |
| | Electric Utilities 1.71% | | | | | |
| | Allegheny Energy,Inc.(a) | | 6,996 | | 281,029 | |
| | Cleco Corp. | | 41,277 | | 1,041,832 | |
| | | | | | 1,322,861 | |
| | Electrical Equipment 0.76% | | | | | |
| | General Cable Corp.(a) | | 8,023 | | 306,559 | |
| | Genlyte Group,Inc.(a) | | 3,979 | | 283,305 | |
| | | | | | 589,864 | |
| | Electronic Equipment & Instruments 0.44% | | | | | |
| | Garmin Ltd. | | 6,932 | | 338,143 | |
| | Energy Equipment & Services 1.48% | | | | | |
| | Helix Energy Solutions | | | | | |
| | Group,Inc.(a) | | 8,537 | | 285,136 | |
| | Schlumberger Ltd. | | 5,006 | | 310,522 | |
| | Tenaris SA - ADR | | 8,280 | | 292,946 | |
| | Weatherford | | | | | |
| | International Ltd.(a) | | 6,290 | | 262,419 | |
| | | | | | 1,151,023 | |
| | Food & Staples Retailing 0.32% | | | | | |
| | Supervalu,Inc. | | 8,366 | | 248,052 | |
See notes to the financial statements.
The Leuthold Funds
Leuthold Asset Allocation Fund
Schedule of Investments (Continued)
September 30, 2006
| | | | | | Market | |
| | | | Shares | | Value† | |
| | Food Products 0.34% | | | | | |
| | Archer-Daniels- | | | | | |
| | Midland Co. | | 6,996 | $ | 265,009 | |
| | Household Durables 1.13% | | | | | |
| | Furniture Brands | | | | | |
| | International,Inc. | | 46,055 | | 876,887 | |
| | Insurance 5.63% | | | | | |
| | ACE Ltd. | | 19,011 | | 1,040,472 | |
| | Chubb Corp. | | 19,262 | | 1,000,853 | |
| | Lincoln National Corp. | | 16,999 | | 1,055,298 | |
| | Old Republic | | | | | |
| | International Corp. | | 44,880 | | 994,092 | |
| | Safety Insurance | | | | | |
| | Group,Inc. | | 5,719 | | 278,287 | |
| | | | | | 4,369,002 | |
| | Investment Banking & Brokerage 0.37% | | | | | |
| | Knight Capital | | | | | |
| | Group,Inc.(a) | | 15,854 | | 288,543 | |
| | Machinery 2.34% | | | | | |
| | Bucyrus International, | | | | | |
| | Inc.- Class A | | 6,033 | | 255,920 | |
| | Caterpillar,Inc. | | 4,044 | | 266,095 | |
| | Dover Corp. | | 5,777 | | 274,061 | |
| | Gardner Denver,Inc.(a) | | 8,665 | | 286,638 | |
| | Joy Global,Inc. | | 5,648 | | 212,421 | |
| | Reliance Steel & | | | | | |
| | Aluminum Co. | | 4,365 | | 140,291 | |
| | Terex Corp.(a) | | 8,344 | | 377,316 | |
| | | | | | 1,812,742 | |
| | Media 0.32% | | | | | |
| | Focus Media Hldg | | | | | |
| | Ltd.- ADR (a) | | 4,300 | | 249,056 | |
| | | | | | Market | |
| | | | Shares | | Value† | |
| | Metals & Mining 5.98% | | | | | |
| | Alcan,Inc. (c) | | 6,226 | $ | 248,231 | |
| | Alcoa,Inc. | | 16,560 | | 464,342 | |
| | Allegheny | | | | | |
| | Technologies,Inc. | | 3,145 | | 195,588 | |
| | Inco Ltd. (c) | | 11,810 | | 900,749 | |
| | Phelps Dodge Corp. | | 8,922 | | 755,693 | |
| | Rio Tinto PLC - ADR | | 2,311 | | 438,235 | |
| | Southern Copper Corp. | | 9,178 | | 848,965 | |
| | Titanium | | | | | |
| | Metals Corp.(a) | | 31,194 | | 788,584 | |
| | | | | | 4,640,387 | |
| | Multiline Retail 0.37% | | | | | |
| | JC Penney Co Inc | | | | | |
| | Holding Co. | | 4,172 | | 285,323 | |
| | Multi-Utilities & Unregulated Power0.37% | | | | | |
| | Oneok,Inc. | | 7,538 | | 284,861 | |
| | Oil & Gas 1.16% | | | | | |
| | BG Group PLC - ADR | | 4,236 | | 258,269 | |
| | ChevronTexaco Corp. | | 4,138 | | 268,391 | |
| | Harvest Natural | | | | | |
| | Resources,Inc.(a) | | 35,841 | | 370,954 | |
| | | | | | 897,614 | |
| | Personal Products 0.35% | | | | | |
| | NBTY,Inc.(a) | | 9,178 | | 268,640 | |
| | Pharmaceuticals 1.89% | | | | | |
| | AstraZeneca Plc - ADR | | 4,429 | | 276,813 | |
| | King Pharmaceuticals, | | | | | |
| | Inc.(a) | | 18,549 | | 315,889 | |
| | Merck & Co.,Inc. | | 20,918 | | 876,464 | |
| | | | | | 1,469,166 | |
See notes to the financial statements.
The Leuthold Funds
LeutholdAssetAllocation Fund
Schedule of Investments (Continued)
September 30, 2006
| | | | | | Market | |
| | | | Shares | | Value† | |
| | Real Estate Management & | | | | | |
| | Development 0.94% | | | | | |
| | Cb Richard Ellis | | | | | |
| | Group,Inc.(a) | | 16,303 | $ | 401,054 | |
| | Jones Lang LaSalle,Inc. | | 3,851 | | 329,183 | |
| | | | | | 730,237 | |
| | Road & Rail 0.69% | | | | | |
| | Amerco,Inc.(a) | | 3,915 | | 290,297 | |
| | Swift Transportation | | | | | |
| | Co.,Inc.(a) | | 10,398 | | 246,641 | |
| | | | | | 536,938 | |
| | Semiconductor & Semiconductor | | | | | |
| | Equipment 0.38% | | | | | |
| | MEMC Electronic | | | | | |
| | Materials,Inc.(a) | | 8,023 | | 293,883 | |
| | Software 0.43% | | | | | |
| | Amdocs Ltd.(a) | | 8,472 | | 335,491 | |
| | Specialty Retail 1.20% | | | | | |
| | AnnTaylor | | | | | |
| | Stores Corp.(a) | | 6,804 | | 284,816 | |
| | Circuit City Stores,Inc. | | 12,131 | | 304,609 | |
| | Guess ?,Inc.(a) | | 7,060 | | 342,622 | |
| | | | | | 932,047 | |
| | Telecommunication Services 0.71% | | | | | |
| | Rcn Corp.(a) | | 19,427 | | 549,784 | |
| | Textiles,Apparel & Luxury Goods 0.40% | | | | | |
| | Gildan Activewear, | | | | | |
| | Inc.(a) | | 6,418 | | 311,016 | |
| | Total Common Stocks | | | | | |
| | (Cost $32,702,502) | | | | 33,513,750 | |
| | | | | | Market | |
| | | | Shares | | Value† | |
| | INVESTMENT COMPANIES 13.28% | | | | | |
| | Exchange Traded Funds 9.85% | | | | | |
| | iShares China 25 Fund | | 19,093 | $ | 1,553,216 | |
| | iShares MSCI Brazil | | | | | |
| | Index Fund | | 13,537 | | 522,257 | |
| | iShares MSCI Emerging | | | | | |
| | Markets Index Fund | | 3,748 | | 362,694 | |
| | iShares MSCI Japan | | | | | |
| | Index Fund | | 126,186 | | 1,708,558 | |
| | iShares MSCI Malaysia | | | | | |
| | Index Fund | | 24,992 | | 191,439 | |
| | iShares MSCI South | | | | | |
| | Africa Fund | | 2,558 | | 233,418 | |
| | iShares MSCI South | | | | | |
| | Korea Index Fund | | 17,974 | | 831,298 | |
| | iShares MSCI Taiwan | | | | | |
| | Index Fund | | 17,573 | | 224,934 | |
| | iShares S&P Latin | | | | | |
| | America Fund | | 3,306 | | 470,047 | |
| | SPDR Trust Series 1 | | 11,538 | | 1,541,246 | |
| | | | | | 7,639,107 | |
| | Mutual Funds 3.43% | | | | | |
| | Fidelity Japan Fund | | 20,087 | | 334,455 | |
| | ING Russia Fund (a) | | 11,948 | | 636,812 | |
| | Japan Smaller | | | | | |
| | Captlztn Fd,Inc. | | 46,405 | | 570,781 | |
| | Matthews India Fund (a) | | 23,314 | | 313,105 | |
| | Matthews Japan Fund | | 9,639 | | 167,039 | |
| | US Global Investors | | | | | |
| | Accolade Funds - | | | | | |
| | Eastern European Fund | | 14,619 | | 635,773 | |
| | | | | | 2,657,965 | |
| | Total Investment Companies | | | | | |
| | (Cost $10,253,899) | | | | 10,297,072 | |
See notes to the financial statements.
The Leuthold Funds
LeutholdAssetAllocation Fund
Schedule of Investments (Continued)
September 30, 2006
| | | | Principal | | Market | |
| | | | Amount | | Value† | |
| | CORPORATE BONDS 10.01% | | | | | |
| | Diversified Financial Services 10.01% | | | | | |
| | General Motors | | | | | |
| | Acceptance Corp. | | | | | |
| | 7.750%,01/19/2010 | $ | 2,943,000 | $ | 3,015,527 | |
| | General Motors | | | | | |
| | Acceptance Corp. | | | | | |
| | 7.250%,03/02/2011 | | 2,162,000 | | 2,174,360 | |
| | General Motors | | | | | |
| | Acceptance Corporation | | | | | |
| | 5.625%,05/15/2009 | | 2,643,000 | | 2,577,377 | |
| | | | | | 7,767,264 | |
| | Total Corporate Bonds | | | | | |
| | (Cost $7,693,344) | | | | 7,767,264 | |
| | U.S. TREASURY OBLIGATIONS 10.51% | | | | | |
| | U.S. Treasury Note 10.51% | | | | | |
| | 3.750%,05/15/2008 | | 1,700,000 | | 1,673,504 | |
| | 4.250%,10/15/2010 | | 3,364,000 | | 3,322,213 | |
| | 4.875%,04/30/2011 | | 3,123,000 | | 3,157,768 | |
| | | | | | 8,153,485 | |
| | Total U.S.Treasury Obligations | | | | | |
| | (Cost $8,085,121) | | | | 8,153,485 | |
| | | | Principal | | Market | |
| | | | Amount | | Value† | |
| | SHORT TERM INVESTMENTS 18.48% | | | | | |
| | Commercial Paper 18.48% | | | | | |
| | U.S.Bank,N.A. | | | | | |
| | 5.26%, 10/02/2006 | $ | 14,337,000 | $ | 14,334,933 | |
| | Variable Rate Demand Notes 0.00% | | | | | |
| | U.S.Bank,N.A. | | | | | |
| | 4.949% (b) | | 604 | | 604 | |
| | Total Short Term Investments | | | | | |
| | (Cost $14,335,537) | | | | 14,335,537 | |
| | Total Investments 95.48% | | | | | |
| | (Cost $73,070,403) | | | | 74,067,108 | |
| | Other Assets in Excess | | | | | |
| | of Liabilities 4.52% | | | | 3,505,922 | |
| | Total Net Assets 100.00% | | | | $77,573,030 | |
| | | | | | | |
| | | | | | | |
| | Percentages are stated as a percent of net assets. | | |
| | ADR - American Depository Receipt | | | |
| | (a) Non Income Producing | | | | | |
| | (b) Variable rate security. The rate shown is the rate in effect on September 30,2006. | |
| | (c) Foreign issue security. | | | | | |
| | † See Note 1a of accompanying Notes to Financial Statements regarding valuation of securities. | |
See notes to the financial statements.
The Leuthold Funds
Leuthold Select Equities Fund
Schedule of Investments
September 30, 2006
| | | | | | Market | |
| | | | Shares | | Value† | |
| | COMMON STOCKS 95.92% | | | | | |
| | Aerospace & Defense 2.00% | | | | | |
| | Lockheed Martin Corp. | | 761 | $ | 65,492 | |
| | Beverages 2.29% | | | | | |
| | Hansen Natural Corp.(a) | | 2,312 | | 75,094 | |
| | Capital Markets 4.22% | | | | | |
| | The Bear Stearns | | | | | |
| | Companies Inc. | | 477 | | 66,828 | |
| | Greenhill & Co,Inc. | | 1,069 | | 71,644 | |
| | | | | | 138,472 | |
| | Chemicals 1.99% | | | | | |
| | Airgas,Inc. | | 1,806 | | 65,323 | |
| | Commercial Banks 2.09% | | | | | |
| | Banco Bradesco S A - ADR | | 2,052 | | 68,434 | |
| | Consumer Finance 2.44% | | | | | |
| | The First Marblehead | | | | | |
| | Corporation | | 1,156 | | 80,064 | |
| | Distributors 2.63% | | | | | |
| | WESCO International, | | | | | |
| | Inc.(a) | | 1,488 | | 86,349 | |
| | Diversified Financial Services 1.92% | | | | | |
| | J.P.Morgan Chase & Co. | | 1,344 | | 63,114 | |
| | Diversified Telecommunication Services 3.82% | | | | | |
| | AT&T,Inc. | | 1,951 | | 63,525 | |
| | Qwest Communications | | | | | |
| | International (a) | | 7,109 | | 61,990 | |
| | | | | | 125,515 | |
| | Electric Utilities 1.95% | | | | | |
| | Allegheny Energy,Inc.(a) | | 1,592 | | 63,951 | |
| | | | | | Market | |
| | | | Shares | | Value† | |
| | Electrical Equipment 4.05% | | | | | |
| | General Cable Corp.(a) | | 1,806 | $ | 69,007 | |
| | Genlyte Group,Inc.(a) | | 896 | | 63,795 | |
| | | | | | 132,802 | |
| | Electronic Equipment & Instruments 2.32% | | | | | |
| | Garmin Ltd. | | 1,561 | | 76,146 | |
| | Energy Equipment & Services 7.90% | | | | | |
| | Helix Energy Solutions | | | | | |
| | Group,Inc.(a) | | 1,922 | | 64,195 | |
| | Schlumberger Ltd. | | 1,127 | | 69,908 | |
| | Tenaris SA - ADR | | 1,864 | | 65,948 | |
| | Weatherford International | | | | | |
| | Ltd.(a) | | 1,416 | | 59,075 | |
| | | | | | 259,126 | |
| | Food Products 1.82% | | | | | |
| | Archer-Daniels-Midland Co. | | 1,575 | | 59,661 | |
| | Investment Banking & Brokerage 1.98% | | | | | |
| | Knight Capital Group,Inc.(a) | | 3,569 | | 64,956 | |
| | Machinery 12.43% | | | | | |
| | Bucyrus International, | | | | | |
| | Inc.- Class A | | 1,358 | | 57,606 | |
| | Caterpillar,Inc. | | 910 | | 59,878 | |
| | Dover Corp. | | 1,300 | | 61,672 | |
| | Gardner Denver,Inc.(a) | | 1,951 | | 64,539 | |
| | Joy Global,Inc. | | 1,272 | | 47,840 | |
| | Reliance Steel & | | | | | |
| | Aluminum Co. | | 983 | | 31,594 | |
| | Terex Corp.(a) | | 1,878 | | 84,923 | |
| | | | | | 408,052 | |
| | Media 1.71% | | | | | |
| | Focus Media Hldg | | | | | |
| | Ltd.- ADR (a) | | 968 | | 56,067 | |
See notes to the financial statements.
The Leuthold Funds
Leuthold Select Equities Fund
Schedule of Investments (Continued)
September 30, 2006
| | | | | | Market | |
| | | | Shares | | Value† | |
| | Metals & Mining 5.24% | | | | | |
| | Allegheny Technologies,Inc. | | 708 | $ | 44,031 | |
| | Southern Copper Corp. | | 665 | | 61,512 | |
| | Titanium Metals Corp.(a) | | 2,630 | | 66,486 | |
| | | | | | 172,029 | |
| | Multiline Retail 1.96% | | | | | |
| | JC Penney Co Inc Holding Co. | | 939 | | 64,218 | |
| | Oil & Gas 1.77% | | | | | |
| | Bg PLC - ADR | | 954 | | 58,165 | |
| | Personal Products 1.84% | | | | | |
| | NBTY,Inc.(a) | | 2,066 | | 60,472 | |
| | Pharmaceuticals 6.02% | | | | | |
| | AstraZeneca Plc - ADR | | 997 | | 62,313 | |
| | King Pharmaceuticals, | | | | | |
| | Inc.(a) | | 4,176 | | 71,117 | |
| | Merck & Co.,Inc. | | 1,532 | | 64,191 | |
| | | | | | 197,621 | |
| | Real Estate Management & | | | | | |
| | Development 5.01% | | | | | |
| | Cb Richard Ellis | | | | | |
| | Group,Inc.(a) | | 3,670 | | 90,282 | |
| | Jones Lang LaSalle,Inc. | | 867 | | 74,111 | |
| | | | | | 164,393 | |
| | Road & Rail 3.68% | | | | | |
| | Amerco,Inc.(a) | | 881 | | 65,326 | |
| | Swift Transportation | | | | | |
| | Co.,Inc.(a) | | 2,341 | | 55,529 | |
| | | | | | 120,855 | |
| | Semiconductor & Semiconductor | | | | | |
| | Equipment 2.02% | | | | | |
| | MEMC Electronic | | | | | |
| | Materials,Inc.(a) | | 1,806 | | 66,154 | |
| | | | | | Market | |
| | | | Shares | | Value† | |
| | Software 2.30% | | | | | |
| | Amdocs Ltd.(a) | | 1,907 | $ | 75,517 | |
| | Specialty Retail 6.39% | | | | | |
| | AnnTaylor Stores Corp.(a) | | 1,532 | | 64,130 | |
| | Circuit City Stores,Inc. | | 2,731 | | 68,575 | |
| | Guess ?,Inc.(a) | | 1,589 | | 77,114 | |
| | | | | | 209,819 | |
| | Textiles, Apparel & Luxury Goods 2.13% | | | | | |
| | Gildan Activewear,Inc.(a) | | 1,445 | | 70,025 | |
| | Total Common Stocks | | | | | |
| | (Cost $3,158,678) | | | | 3,147,886 | |
| | | | Principal | | | |
| | | | Amount | | | |
| | SHORT TERM INVESTMENTS 2.85% | | | | | |
| | Variable Rate Demand Notes 2.85% | | | | | |
| | U.S.Bank,N.A. | | | | | |
| | 4.949% (b) | $ | 93,602 | | 93,602 | |
| | Total Short Term Investments | | | | | |
| | (Cost $93,602) | | | | 93,602 | |
| | Total Investments 98.77% | | | | | |
| | (Cost $3,252,280) | | | | 3,241,488 | |
| | Other Assets in Excess | | | | | |
| | of Liabilities 1.23% | | | | 40,227 | |
| | Total Net Assets 100.00% | | | | $3,281,715 | |
| | | | | | | |
| | | | | | | |
| | Percentages are stated as a percent of net assets. | | | | | |
| | ADR - American Depository Receipt | | | | | |
| | (a) Non Income Producing | | | | | |
| | (b) Variable rate security. The rate shown is the rate in effect on September 30,2006. | | |
| | † See Note 1a of accompanying Notes to Financial Statements regarding valuation of securities. | |
| | | | | | | |
See notes to the financial statements.
Notes to the Financial Statements
| 1. | ORGANIZATIONAND SIGNIFICANT ACCOUNTING POLICIES |
Leuthold Funds, Inc. (the “Company”) was incorporated on August 30, 1995, as a Maryland Corporation and is registered as an open-end management investment company under the Investment Company Act of 1940. The Company consists of five series (the “Funds”): Leuthold Core Investment Fund, Leuthold Select Industries Fund, Grizzly Short Fund, Leuthold Asset Allocation Fund and Leuthold Select Equities Fund. The investment objective of the Leuthold Core Investment Fund and the Leuthold Asset Allocation Fund is to seek total return consistent with prudent investment risk over the long term. The investment objective of the Leuthold Select Industries Fund, Grizzly Short Fund and the Leuthold Select Equities Fund is capital appreciation. The Leuthold Core Investment Fund commenced operations on November 20, 1995. Effective January 31, 2006 the Leuthold Core Investment Fund issued a new class of Institutional Shares, which are not subject to the 0.10% shareholder servicing fee that the Retail Shares are subject to, as described in the Funds’ prospectus. Leuthold Select Industries Fund and Grizzly Short Fund commenced operations on June 19, 2000. Leuthold Asset Allocation Fund and Leuthold Select Equities Fund commenced operations on May 24,2006.
The following is a summary of significant accounting policies consistently followed by the Funds.
| a) | Investment Valuation - Securities listed on a national securities exchange are valued at the last sale price on the day the valuation is made, and securities that are traded on the Nasdaq National Market or the Nasdaq Smallcap Market are valued at the Nasdaq Official Closing Price. Price information on listed stocks is taken from the exchange where the security is primarily traded. Securities which are listed on an exchange but which are not traded on the valuation date are valued at the most recent bid prices. Securities sold short which are listed on an exchange but which are not traded on the valuation date are valued at the average of the current bid and asked prices. Unlisted securities for which market quotations are readily available are valued at the latest quoted bid price. Other investment assets, including investments in open-end investment companies, and securities for which no quotations are readily available are valued at fair value as determined in good faith by the Board of Directors and the Funds’ Fair Value Pricing Committee. Short-term instruments (those with remaining maturities of 60 days or less) are valued at amortized cost, which approximates market. Some of the factors which may be considered by the Board of Directors and the Funds’ Fair Value Pricing Committee in determining fair value are fundamental analytical data relating to the investment; the nature and duration of any restrictions on disposition; trading in similar securities of the same issuer or comparable companies; information from broker dealers; and an evaluation of the forces that influence the market in which the securities are purchased and sold. The use of fair value pricing by a Fund may cause the net asset value of its shares to differ significantly from the net asset value that would be calculated without regard to such considerations. |
The Leuthold Core Investment Fund may invest directly in metals such as aluminum,copper,zinc, lead, nickel, tin, silver, palladium and other industrial and precious metals. Metals listed on the London Metals Exchange are valued at the last sale price on the valuation date.
Metals not traded on an exchange are valued at the mid-point between the closing bid and ask prices as obtained from a commonly used reputable pricing source. The prices of such metals may be subject to substantial price fluctuations and may be affected by broad economic, financial and political factors, including inflation, metal sales by governments or international agencies, speculation, changes in industrial and commercial demand, currency devaluations or revaluations,trade imbalances and governmental prohibitions or restrictions. Further, investments in metals can present concerns such as delivery, storage and maintenance,possible illiquidity and the unavailability of accurate market valuations. Investments in metals earn no investment income and may involve higher custody and transaction costs than investments in securities.
The Leuthold Core Investment Fund may enter into physical industrial metals forward contracts obligating the Fund to receive physical industrial metals at a specified future date. The forward contracts are valued based on closing prices for the forward contracts and the physical industrial metals which are received daily from the London Metal Exchange and unrealized appreciation or depreciation is recorded daily as the difference between the closing price of the physical industrial metals and the closing forward value applied to the face amount of the contract. A realized gain or loss is recorded at the time the metals received from the forward contract are sold.
| b) | Federal Income Taxes - Provision for federal income taxes or excise taxes has not been made since the Funds have elected to be taxed as “regulated investment companies”and intend to distribute substantially all taxable income to shareholders and otherwise comply with the provisions of the Internal Revenue Code applicable to regulated investment companies. |
Distributions from net realized gains for book purposes may include short-term capital gains which are included as ordinary income to shareholders for tax purposes. The tax character of distributions paid during the fiscal periods ended September 30, 2006 and 2005 was as follows:
| | 2006 |
| | | | Long | | |
| | | | Term | | |
| | Ordinary | | Capital | | |
| | Income | | Gain | | Total |
| Leuthold Core | | | | | |
| Investment | | | | | |
| Fund | $51,668,568 | | $39,694,133 | | $91,362,701 |
| Leuthold Select | | | | | |
| Industries | | | | | |
| Fund | 186,217 | | 525,301 | | 711,518 |
| Grizzly Short | | | | | |
| Fund | 4,654,052 | | — | | 4,654,052 |
| | 2005 |
| | | | | | Long | | |
| | | | Return | | Term | | |
| | Ordinary | | of | | Capital | | |
| | Income | | Capital | | Gain | | Total |
| Leuthold Core | | | | | | | |
| Investment | | | | | | | |
| Fund | $4,923,247 | | — | | $22,253,807 | | $27,177,054 |
| Grizzly Short | | | | | | | |
| Fund | 489,851 | | $19,224 | | — | | 509,075 |
At September 30, 2006, the components of accumulated earnings (deficit) on a tax basis were as follows:
The Leuthold Funds
| | | Leuthold | | Leuthold | | |
| | | Core | | Select | | Grizzly |
| | | Investment | | Industries | | Short |
| | | Fund | | Fund | | Fund |
| Undistributed | | | | | | |
| ordinary income | $ | 3,480,176 | $ | 380,849 | $ | 77,613 |
| Undistributed | | | | | | |
| long-term | | | | | | |
| capital gain | | 1,673,444 | | 422,051 | | — |
| Distributable | | | | | | |
| earnings | $ | 5,153,620 | $ | 802,900 | $ | 77,613 |
| Capital loss | | | | | | |
| carryover and | | | | | | |
| post-October | | | | | | |
| losses | | — | | — | | (23,104,949) |
| Other | | | | | | |
| accumulated losses | | — | | (40,711) | | — |
| Unrealized | | | | | | |
| appreciation | | | | | | |
| (depreciation) | | 171,920,783 | | 10,551,169 | | (2,539,098) |
| Accumulated | | | | | | |
| earnings (deficit) | $ | 177,074,403 | $ | 11,313,358 | $ | (25,566,434) |
| | | | | | | |
| | | Leuthold | | Leuthold |
| | | Asset | | Select |
| | | Allocation | | Equities |
| | | Fund | | Fund |
| Undistributed ordinary income | $ | 262,386 | | — |
| Distributable earnings | $ | 262,386 | | — |
| Capital loss carryover and | | | | |
| post-October losses | | (1,031,881) | | $(104,454) |
| Unrealized appreciation | | | | |
| (depreciation) | | 906,079 | | (10,792) |
| Accumulated earnings (deficit) | $ | 136,584 | | $(115,246) |
| | | | | |
Net investment income and realized gains and losses for federal income tax purposes may differ from that reported on the financial statements because of permanent book-to-tax differences. U.S. Generally Accepted Accounting Principles (“GAAP”) requires that permanent differences between financial reporting and tax reporting be reclassified between various components of net assets. These differences are primarily due to net operating losses, and differences from passive foreign investment companies.
On the Statements of Assets and Liabilities, the following adjustments were made:
| | Accumulated | | Accumulated | | |
| | Net | | Realized | | |
| | Investment | | Gains or | | Capital |
| | Income (Loss) | | Losses | | Stock |
| Leuthold Core | | | | | |
| Investment Fund $ | 2,467,385 | $ | (2,467,386) | $ | 1 |
| Leuthold Select | | | | | |
| Industries Fund | 320,308 | | (320,308) | | — |
| Leuthold Select | | | | | |
| Equities Fund | 2,707 | | — | | (2,707) |
The Funds intend to utilize provisions of the federal income tax laws which allow the Funds to carry realized capital losses forward for eight years following the year of loss and offset such losses against any future realized capital gains. At September 30, 2006, the Funds had the following capital loss carryforwards available for federal income tax purposes.
| | | Grizzly |
Expiration Date | | Short Fund |
| 9/30/2012 | | $3,491,478 |
| 9/30/2013 | | $3,481,269 |
| 9/30/2014 | | $4,650,299 |
The Grizzly Short Fund, Leuthold Asset Allocation Fund and Leuthold Select Equities Fund intend to defer and treat $11,481,903, $1,031,881 and $104,454, respectively, of post-October losses incurred during the fiscal period ended September 30, 2006 as arising in the fiscal year ending September 30,2007.
| c) | Distributions to Shareholders - Dividends from net investment income, if any, are declared and paid quarterly. Distributions of net realized capital gains,if any,are declared and paid at least annually. |
| d) | Use of Estimates - The preparation of financial statements in conformity with U.S. Generally Accepted Accounting Principles (“GAAP”) requires management to make estimates and assumptions that affect the reported amounts of assets and liabilities and disclosure of contingent assets and liabilities at the date of the financial statements and the reported amounts of revenues and expenses during the reporting period. Actual results could differ from those estimates. |
The Leuthold Funds
| e) | Short Positions - For financial statement purposes, an amount equal to the settlement amount is included in the Statements of Assets and Liabilities as an asset and an equivalent liability. The amount of the liability is subsequently marked-to-market to reflect the current value of the short position. Subsequent fluctuations in the market prices of securities sold, but not yet purchased, may require purchasing the securities at prices which could differ from the amount reflected in the Statements of Assets and Liabilities. The Funds are liable for any dividends or interest payable on securities while those securities are in a short position. As collateral for its short positions, the Funds are required under the Investment Company Act of 1940 to maintain segregated assets consisting of cash, cash equivalents or liquid securities. These segregated assets are valued consistent with Note 1a above. The amount of segregated assets are required to be adjusted daily to reflect changes in the market value of the securities sold short. The Leuthold Core Investment Fund, Grizzly Short Fund and Leuthold Asset Allocation Fund’s receivable from broker for proceeds on securities sold short is with one major security dealer. The Funds do not require this broker to maintain collateral in support of the receivable from broker for proceeds on securities sold short. |
| f) | Other - Investment and shareholder transactions are recorded on the trade date. The Funds determine the gain or loss realized from the investment transactions by comparing the original cost of the security lot sold with the net sales proceeds. Dividend income is recognized on the ex-dividend date or as soon as information is available to the Funds, and interest income is recognized on an accrual basis. Discounts and premiums on bonds are amortized over the life of the respective bond. |
| g) | Expenses - Expenses that directly relate to one of the Funds are charged directly to that Fund. |
Other operating expenses of the Company, such as Directors fees and expenses,insurance expense and legal fees are allocated between the five series of the Company based on the relative net asset value of the individual series.
| h) | Counterparty risk - Counterparty risk may arise as the result of the failure of a counterparty to a securities contract to comply with the terms of the contract. Potential counterparty risk is measured by the creditworthiness of the counterparty and additional risk may arise from unanticipated events affecting the value of the underlying security. |
| 2. | INVESTMENT TRANSACTIONS |
Purchases and sales of investment securities, other than short-term investments and short sales, for the period ended September 30, 2006 are summarized below.
| | Purchases | | Sales |
| Leuthold Core Investment Fund | $1,484,530,433 | | $1,001,719,454 |
| Leuthold Select Industries Fund | 182,516,413 | | 142,916,353 |
| Leuthold Asset Allocation Fund | 65,077,175 | | 6,080,399 |
| Leuthold Select Equities Fund | 4,909,954 | | 1,646,822 |
Purchases and sales of long-term U.S. Government Securities are summarized below.
| | Purchases | | Sales |
| Leuthold Core Investment Fund | $154,795,039 | | $— |
| Leuthold Asset Allocation Fund | 8,082,237 | | — |
At September 30, 2006, gross unrealized appreciation and depreciation of investments and cost of investments (excluding short positions) for tax purposes were as follows:
The Leuthold Funds
| | | Leuthold | | Leuthold | | |
| | | Core | | Select | | Grizzly |
| | | Investment | | Industries | | Short |
| | | Fund | | Fund | | Fund |
| Cost of | | | | | | |
| Investments | $ | 1,717,570,745 | $ | 95,261,136 | $ | 20,900,610 |
| Appreciation | | 205,360,611 | | 11,948,661 | | — |
| Depreciation | | (29,583,308) | | (1,397,492) | | (—) |
| Net unrealized | | | | | | |
| appreciation | $ | 175,777,303 | $ | 10,551,169 | $ | — |
| | | | | | | |
| | | Leuthold | | Leuthold |
| | | Asset | | Select |
| | | Allocation | | Equities |
| | | Fund | | Fund |
| Cost of Investments | $ | 73,098,245 | $ | 3,252,280 |
| Appreciation | | 1,639,925 | | 110,421 |
| Depreciation | | (671,062) | | (121,213) |
| Net unrealized | | | | |
| appreciation (depreciation) | $ | 968,863 | $ | (10,792) |
| | | | | |
The differences between book and tax basis unrealized appreciation (depreciation) are primarily attributable to the tax deferral of losses on wash sales and mark-to-market adjustments on Passive Foreign Investment Companies (PFIC’s).
| 3. | INVESTMENT ADVISORY AND OTHER AGREEMENTS |
The Funds have entered into an Investment Advisory Agreement (“advisory agreement”) with Leuthold Weeden Capital Management (“Investment Advisor”). Pursuant to its advisory agreement with the Funds, the Investment Adviser is entitled to receive a fee, calculated daily and payable monthly, at annual rates of 0.90%, 1.00%, 1.25%, 0.90% and 1.00%, for the Leuthold Core Investment Fund, Leuthold Select Industries Fund,Grizzly Short Fund, Leuthold Asset Allocation Fund and Leuthold Select Equities Fund, respectively, as applied to each Fund’s daily net assets.
The Investment Adviser has agreed to waive its advisory fee and/or reimburse the Funds’ other expenses, including organization expenses, to the extent necessary to ensure that the Funds’ total operating expenses (exclusive of interest, taxes, brokerage commissions, dividends and interest on short positions and other costs incurred in connection with the purchase or sale of portfolio securities, and extraordinary items) do not exceed the following rates, based on each Fund’s average daily net assets:
| Leuthold Core Investment Fund | 1.25% |
| Leuthold Select Industries Fund | 1.60% |
| Grizzly Short Fund | 2.50% |
| Leuthold Asset Allocation Fund | 1.50% |
| Leuthold Select Equities Fund | 1.85% |
Any waiver or reimbursement is subject to later adjustments to allow the Investment Adviser to recoup amounts previously waived or reimbursed to the extent actual fees and expenses for a fiscal period are less than each Fund’s expense limitation, provided, however, that the Investment Adviser shall only be entitled to recoup such amounts for a period of three years from the date such amount was waived or reimbursed.
| Leuthold Asset Allocation Fund |
| Year of Expiration | | Recoverable Amount |
| 9/30/09 | | $3,770 |
| | | |
| Leuthold Select Equities | | Fund |
| Year of Expiration | | Recoverable Amount |
| 9/30/09 | | $30,075 |
U.S. Bancorp Fund Services, LLC serves as transfer agent, administrator and accounting services agent for the Funds. U.S.Bank,N.A.serves as custodian for the Funds.
For the year ended September 30,2006,the Leuthold Core Investment Fund, Leuthold Select Industries Fund, Grizzly Short Fund and Leuthold Asset Allocation Fund paid Weeden & Co., L.P., an affiliate of the Adviser, $2,344,962, $114,213, $239,320 and $18,160,respectively,for brokerage commissions.
The Leuthold Funds
Each of the Leuthold Asset Allocation Fund and the Leuthold Select Equities Fund has adopted a distribution plan pursuant to Rule 12b-1 under the Investment Company Act, whereby Leuthold Funds, Inc. serves as distributor. This plan allows each Fund to use up to 0.25% of its average daily net assets to pay sales,distribution and other fees for the sale of its shares and for services provided to investors. Each Fund may pay all or a portion of this fee to any securities dealer, financial institution or any other person who renders personal service to the Fund’s shareholders, assists in the maintenance of the Fund’s shareholder accounts or who renders assistance in distributing or promoting the sale of shares of the Fund pursuant to a written agreement approved by the Board of Directors. To the extent such fee is not paid to such persons, each of the Funds may use the fee for its expenses of distribution of its shares,including,but not limited to,payment by the Fund of the cost of preparing, printing and distributing Prospectuses and Statements of Additional Information to prospective investors and of implementing and operating the Plan.
The Leuthold Core Investment Fund, Leuthold Select Industries Fund, Leuthold Asset Allocation Fund and Leuthold Select Equities Fund each have an uncommitted, unsecured revolving credit facility for temporary emergency purposes, including the meeting of redemption requests that otherwise might require the untimely disposition of securities. The available advances under the revolving credit facility for each fund are as follows:
| Leuthold Core Investment Fund | $50,000,000 |
| Leuthold Select Industries Fund | $22,500,000 |
| Leuthold Asset Allocation Fund | $1,725,000 |
| Leuthold Select Equities Fund | $500,000 |
The interest rate on the outstanding principal amount is equal to the prime rate less 2%. The Funds did not borrow on the lines of credit during the period ended September 30, 2006. Preceding the established lines of credit, the Funds’ custodian could, in its sole discretion, advance funds to the Funds to facilitate the settlement of a Fund’s transactions in the Fund’s custody account, repayable immediately upon demand. As of September 30, 2006, the Leuthold Core Investment Fund had $13,508,289 payable to the custodian for such advances.
The Funds enter into contracts that contain a variety of indemnifications. The Funds’ maximum exposure under these arrangements is unknown. However, the Funds have not had prior claims or losses pursuant to these contracts and expect the risk of loss to be remote.
| 7. | INVESTMENTS HELD WITH REFCO CAPITAL MARKETS LTD |
As of September 30, 2006, the Leuthold Core Investment Fund (“Core Fund”) held certain investments with Refco Capital Markets, LTD (“Refco Capital”) totaling $47,398,738, or 2.91% of net assets composed of the following:
| Cash | $ | 161,595 |
| Silver | | 4,656,722 |
| Palladium | | 1,858,674 |
| Prepaid Forward Contracts | | 40,721,747 |
On October 13, 2005, Refco Capital imposed a moratorium on customer withdrawals due in part to liquidity concerns. On October 17, 2005, Refco, Inc. and certain of its subsidiaries including Refco Capital (the “Debtors”) filed voluntary petitions for reorganization relief under Chapter 11 of the Bankruptcy Code. The Core Fund became a party to a settlement agreement as part of a group of creditors and customers of Refco Capital. The U.S. Bankruptcy Court approved this Refco Capital Settlement Agreement on September 18, 2006.
The Leuthold Funds
Subsequently, a number of significant parties involved in the Refco, Inc. bankruptcy reached a broader settlement (the “Global Settlement”) that, among other things, incorporated the Refco Capital Settlement Agreement and allocated the remaining assets of the Debtors to the various creditor constituencies. The terms of the Global Settlement are being incorporated into a chapter 11 plan (the “Plan”) and disclosure statement that are intended to be submitted to all creditors of the Debtors in late October, 2006. The parties believe that the Bankruptcy Court will likely consider approval of the Plan on or before December 15, 2006.
Due to the above factors, the Core Fund implemented its fair valuation procedures with respect to the impacted investments as of October 13, 2005. The fair value pricing procedures consider several factors including the status of the bankruptcy legal proceedings to date, market price and trading activities of certain publicly traded debt of Refco, Inc., current values for the silver and palladium positions, illiquidity of the impacted investments, and a settlement of a matter related to Refco Capital with another party. The implementation of the fair valuation process did not have a significant impact on the Core Fund, but there continues to be a high degree of uncertainty with these investment positions and the timing of any settlement payouts as a result of the court proceedings. The ultimate outcome of these legal proceedings will have a direct impact on the amounts recovered by the Core Fund for the impacted investments.
The Funds may invest up to 5% of its net assets in securities for which there is no readily available market (“illiquid securities”). The 5% limitation includes securities whose disposition would be subject to legal restrictions (“restricted securities”). Illiquid and restricted securities often have a market value lower than the market price of unrestricted securities of the same issuer and are not readily marketable without some time delay. This could result in a Fund being unable to realize a favorable price upon disposition of such securities and in some cases might make disposition of such securities at the time desired by the Fund impossible.
| 9. | LENDING PORTFOLIO SECURITIES |
The Funds may lend portfolio securities constituting up to 30% of its total assets to unaffiliated broker-dealers, banks or other recognized institutional borrowers of securities,provided that the borrower at all times maintains cash, U.S. government securities or equivalent collateral or provides an irrevocable letter of credit in favor of the Fund equal in value to at least 100% of the value of the securities loaned. The Funds have entered into a securities lending arrangement with U.S. Bancorp Asset Management, N.A. (the “Custodian”) and under the terms of the arrangement, the Custodian is authorized to loan securities on behalf of the Funds to approved borrowers. In exchange, the Funds receive cash collateral in the amount of at least 102% of the value of the securities loaned. The cash collateral is invested in short term instruments as noted in the Schedules of Investments. The primary risk in securities lending is a default by the borrower during a sharp rise in price of the borrowed security resulting in a deficiency in the collateral posted by the borrower. The Funds will seek to minimize this risk by requiring that the value of the securities loaned will be computed each day and additional collateral be furnished each day if required.
The Leuthold Funds
The arrangement provides that after predetermined rebates to borrowers, 70% of the net securities lending revenue shall be solely paid as credits to the Funds to be used as an offset against custody costs and other charges incurred by the Funds from the custodian, administration, fund accounting and transfer agent fees and shall not,in any event,be paid as cash to the Funds. The Custodian shall be paid a fee for administering a securities lending program for the Funds, equal to the remaining 30% of the net securities lending revenues generated under the agreement.
As of September 30, 2006, the Leuthold Core Investment Fund and the Leuthold Select Industries Fund had loaned securities which were collateralized by cash. The cash collateral received was invested in securities as listed in each Fund’s Schedules of Investments. Income earned from these investments is allocated to each Fund based on each Fund’s portion of the total cash collateral received. Securities lending credits are disclosed in the Funds’ Statements of Operations.
As of September 30, 2006, the value of securities loaned and collateral held were as follows:
| | MarketValue | | |
| | of Securities | | |
| | Loaned | | Collateral |
| Leuthold Core Investment Fund | $480,439,457 | | $494,957,377 |
| Leuthold Select Industries Fund | 28,466,443 | | 29,443,937 |
| 10. | NEWACCOUNTING PRONOUNCEMENTS |
In June 2006, the Financial Accounting Standards Board (FASB) issued FASB Interpretation No. 48 -Accounting for Uncertainty in Income Taxes, that requires the tax effects of certain tax positions to be recognized.These tax positions must meet a “more likely than not” standard that based on their technical merits, have a more than 50 percent likelihood of being sustained upon examination. FASB Interpretation No. 48 is effective for fiscal periods beginning after December 15, 2006. At adoption, the financial statements must be adjusted to reflect only those tax positions that are more likely than not of being sustained. Management of the Funds is currently evaluating the impact that FASB Interpretation No. 48 will have on the Funds’ financial statements.
In September 2006, the Financial Accounting Standards Board (FASB) issued Statement on Financial Accounting Standards No. 157,“Fair Value Measurements” (FAS 157).This standard clarifies the definition of fair value for financial reporting, establishes a framework for measuring fair value and requires additional disclosures about the use of fair value measurements. FAS 157 is effective for financial statements issued for fiscal years beginning after November 15, 2007 and interim periods within those fiscal years. As of September 30, 2006, ,the Funds do not believe the adoption of FAS 157 will impact the amounts reported in the financial statements, however, additional disclosures will be required about the inputs used to develop the measurements of fair value and the effect of certain of the measurements reported in the statement of operations for a fiscal period.
The Leuthold Funds
REPORT OF INDEPENDENT REGISTERED PUBLIC ACCOUNTING FIRM
To the Shareholders and Board of Directors
Leuthold Funds,Inc.
We have audited the accompanying statements of assets and liabilities, including the schedules of investments, of Leuthold Funds, Inc. (consisting of Leuthold Core Investment Fund, Leuthold Select Industries Fund, Grizzly Short Fund, Leuthold Asset Allocation Fund and Leuthold Select Equities Fund) (the “Funds”) as of September 30, 2006, and the related statements of operations, changes in net assets and financial highlights for each of the periods indicated therein. These financial statements and financial highlights are the responsibility of the Funds’ management. Our responsibility is to express an opinion on these financial statements and financial highlights based on our audits.
We conducted our audits in accordance with standards of the Public Company Accounting Oversight Board (United States). Those standards require that we plan and perform the audits to obtain reasonable assurance about whether the financial statements and financial highlights are free of material misstatement. We were not engaged to perform an audit of the Funds’internal control over financial reporting. Our audits included consideration of internal control over financial reporting as a basis for designing audit procedures that are appropriate in the circumstances, but not for the purpose of expressing an opinion on the effectiveness of the Funds’ internal control over financial reporting. Accordingly, we express no such opinion. An audit includes examining, on a test basis, evidence supporting the amounts and disclosures in the financial statements and financial highlights, assessing the accounting principles used and significant estimates made by management, and evaluating the overall financial statement presentation. Our procedures included confirmation of securities owned as of September 30,2006,by correspondence with the custodian and brokers. We believe that our audits provide a reasonable basis for our opinion.
In our opinion,the financial statements and financial highlights audited by us as referred to above present fairly,in all material respects,the financial position of each of the respective funds constituting Leuthold Funds,Inc.at September 30,2006,the results of their operations,changes in their net assets and their financial highlights for each of the periods indicated therein,in conformity with U.S. generally accepted accounting principles.
Minneapolis,Minnesota
November 22,2006
The Leuthold Funds
ADDITIONAL INFORMATION
SHAREHOLDER NOTIFICATION OF FEDERAL TAX STATUS (UNAUDITED)
The percentage of dividend income distributed for the year ended September 30, 2006, which is designated as qualified dividend income under the Jobs and Growth Tax Relief Reconciliation Act of 2003,is as follows: Leuthold Core Investment Fund 26% and Leuthold Select Industries Fund 100%.
The percentage of dividend income distributed for the year ended September 30, 2006, designated as qualified dividends received deduction available to corporate shareholders, is as follows (unaudited): Leuthold Core Investment Fund 20% and Leuthold Select Industries Fund 100%.
For the year ended September 30, 2006, the Leuthold Core Investment Fund and the Leuthold Select Industries Fund designated $39,694,133 and $525,301,respectively,as long-term capital gains dividends.
ADDITIONAL INFORMATION FOR FOREIGN SHAREHOLDERS ONLY (UNAUDITED)
The Leuthold Core Investment Fund, Leuthold Select Industries Fund, and Grizzly Short Fund designate 59%, 4%, and 100%, respectively, of their ordinary distributions paid as qualified interest related dividends under the Internal Revenue Code Section 871(k)(1)(c) for the year ended September 30,2006.
The Leuthold Core Investment Fund designated $13,166,404 (25%) of the ordinary distributions paid as short-term capital gain distributions under the Internal Revenue Code Section 871(k)(2)(c) for the year ended September 30,2006.
INVESTMENT ADVISORY AGREEMENT DISCLOSURE
On April 24, 2006,the Board of Directors of Leuthold Funds,Inc.approved the investment advisory agreements for the Leuthold Asset Allocation Fund and the Leuthold Select Equities Fund with Leuthold Weeden Capital Management. Prior to approving the agreements,the Board considered:
• the nature,extent and quality of the services to be provided by Leuthold Weeden Capital Management;
• the investment strategies and performance history of Leuthold Weeden Capital Management;
• the cost of the services to be provided and profits to be realized by Leuthold Weeden Capital Management, from its relationship with the Funds;
• the extent to which economies of scale would be realized as the Funds grew and whether fee levels reflect any such economies of scale;
• the proposed expense ratios of the Funds;and
• the manner in which portfolio transactions for the Funds would be conducted,including the use of soft dollars.
In considering the nature, extent and quality of the services provided by Leuthold Weeden Capital Management, the Board considered the Adviser’s quality of investment management provided to the existing Funds,the Adviser’s management history and the Adviser’s ability to attract investors for the Funds. The Board concluded that the approval of the investment advisory agreements was in the best interest of the Funds’ shareholders.
The Board considered the presentation from the Adviser on the investment strategies for the Funds and reviewed the investment performance of the existing Funds compared with those of the existing Funds’ peer groups and relevant benchmarks. The Board concluded that the performance of the existing Funds was satisfactory in comparison to performance of similar funds.
The Leuthold Funds
The Board considered the proposed cost of services to be provided by the Adviser,including reports provided by the Funds’ administrator comparing the Funds’ proposed investment advisory fees to those of other comparable mutual funds. The Board concluded that the investment advisory fees were within the range of the industry averages.
The Board considered the extent to which economies of scale would be realized as the Funds grow, including a consideration of breakpoints in the investment advisory agreement fee schedule. The Board concluded that the existing fee schedule was acceptable.
The Board compared the Funds’ proposed expense ratios to those of other comparable mutual funds. After review, the Board concluded that the proposed expense ratios of the Funds were within the range of comparable mutual funds.
The Board discussed the manner in which portfolio transactions for the Funds would be conducted, including the use of soft dollars. Based on these discussions, the Board concluded that the research and services obtained by Leuthold Weeden Capital Management, would be beneficial to the Funds and that Leuthold Weeden Capital Management,would execute the Funds’portfolio transactions in a manner designed to obtain best execution for the Funds.
ADDITIONAL DISCLOSURE REGARDING FUND DIRECTORS AND OFFICERS (UNAUDITED)
Independent Directors | | | | | |
| | | | | | |
| | | | | # of | |
| | | | | Portfolios in | Other |
| | Position(s) | Term of Office | | Fund Complex | Directorships |
| Name,Age | Held with | and Length of | Principal Occupation | Overseen By | Held by |
| and Address | the Company | Time Served | During Past Five Years | Director | Director |
| John S.Chipman (80) | Director | Indefinite Term, | Regents Professor of Economics at the University | 5 | None |
| 2121 W.49th Street | | 10 Years Served | of Minnesota since 1981. Guest Professor at the | | |
| Minneapolis,MN 55409 | | | University of Konstanz,Germany from 1986 | | |
| | | | to 1991 and was awarded an honorary doctorate | | |
| | | | from such institution in 1991. | | |
| | | | | | |
| Lawrence L.Horsch (71) | Director | Indefinite Term, | Member of the Board of Directors of Boston | 5 | Chairman of |
| 1404 Hilltop Ridge | | 10 Years Served | Scientific Corp.,a public company engaged in | | the Board of |
| Houlton,WI 54082 | | | developing, producing and marketing medical | | Directors of |
| | | | devices from February,1995 to May 2003.Mr. | | Medical/CV |
| | | | Horsch served in various capacities with SCIMED | | Inc. |
| | | | Life Systems,Inc.,including Acting Chief Financial | | |
| | | | Officer from 1994 to 1995,Chairman of the Board | | |
| | | | from 1977 to 1994,and as a director from 1977 to | | |
| | | | 1995. He has also served as Chairman of Eagle | | |
| | | | Management & Financial Corp.,a management | | |
| | | | consulting firm,since 1990. | | |
The Leuthold Funds
Interested Directors (and Officers)
| | | | | # of | |
| | | | | Portfolios in | Other |
| | Position(s) | Term of Office | | Fund Complex | Trusteeships |
| Name,Age | Held with | and Length of | Principal Occupation | Overseen By | Held by |
| and Address | theTrust | Time Served | During Past FiveYears | Trustee | Trustee |
| Paul M.Kelnberger (63) | Director | Indefinite Term, | CPA.Partner,Johnson,West & Co.,PLC,from 1975 | 5 | None |
| 8208 Galway Road | | 10 Years Served | to 2002. Currently serving as a consultant to | | |
| Woodbury,MN 55125 | | | Johnson,West & Co.,PLC. | | |
| | | | | | |
| Steven C.Leuthold (68) | Director, | Indefinite Term, | Chief investment officer of the managing member | 5 | None |
| 100 N.Sixth Street | President | 10 Years Served | of Leuthold Weeden Capital Management (the | | |
| Suite 412A | and Treasurer | | “Adviser”). He has also been a Portfolio Manager for | | |
| Minneapolis,MN 55403 | | | the predecessors to the Adviser,Leuthold & Anderson, | | |
| | | | Inc.(since 1987) and Leuthold,Weeden & Associates, | | |
| | | | L.P.(since 1991). | | |
| | | | | | |
| Edward C.Favreau (54) | Director and | Indefinite Term, | Manager of Marketing and Sales of the Adviser since | 5 | None |
| 100 N.Sixth Street | Vice President | 6 Years Served | July,1999. Prior to joining the Adviser, Mr.Favreau | | |
| Suite 412A | | | served as Vice President and Sales Manager of U.S. | | |
| Minneapolis,MN 55403 | | | Bancorp Investments Inc.(formerly First Bank | | |
| | | | Investment Services) from June,1993 until July,1999. | | |
| | | | Prior to that time Mr.Favreau served in various | | |
| | | | capacities for U.S.Bank from July,1988 until June,1993. | | |
| | | | | | |
| David R.Cragg (37) | Vice President | Indefinite Term, | Manager of Operations of the Adviser since January, | 5 | None |
| 100 N.Sixth Street | and Secretary | 6 Years Served | 1999. Prior to joining the Adviser,Mr.Cragg served as | | |
| Suite 412A | | | Operations Manager of Piper Trust Company from | | |
| Minneapolis,MN 55403 | | | November,1997 until January,1999. Prior to that | | |
| | | | time,Mr.Cragg served in various capacities for Piper | | |
| | | | Trust Company from February,1993 until November, | | |
| | | | 1997. | | |
| | | | | | |
| Roger A.Peters (45) | Chief | Indefinite Term, | Chief Compliance Officer of the Adviser since October, | 5 | None |
| 100 N.Sixth Street | Compliance | 9 Months Served | 2005. Prior to joining the Adviser,Mr.Peters served as | | |
| Suite 412A | Officer and | | Vice President,Commercial Product Management for | | |
| Minneapolis,MN 55403 | Assistant | | U.S.Bank from November,2003 through February, | | |
| | Secretary | | 2005. Mr.Peters also served as Operations Manager for | | |
| | | | Lowry Hill from December,2001 through July,2003. | | |
| | | | Mr.Peters served as Product Manager for American | | |
| | | | Express from September,1999 through December,2001. | | |
| | | | | | |
| Glenn R.Larson (41) | Assistant | Indefinite Term, | Compliance Officer of the Adviser since February,2005. | 5 | None |
| 100 N.Sixth Street | Secretary | 3 Months Served | Prior to joining the Adviser,Mr.Larson served as a | | |
| Suite 412A | | | Compliance Representative of U.S.Bancorp Investments, | | |
| Minneapolis,MN 55403 | | | Inc.from July,2003 until February,2005. Prior to that | | |
| | | | time,Mr.Larson served as Compliance Analyst of Securian | | |
| | | | Financial Services,Inc.from June,1999 to July,2003. | | |
The Statement of Additional Information includes additional information about the Funds’Directors and is available free of charge upon request by calling the Funds toll free at (800) 273-6886.
The Leuthold Funds
AVAILABILITY OF PROXY VOTING INFORMATION
Information regarding how the Funds vote proxies relating to portfolio securities is available without charge upon request by calling toll-free at (800) 273-6886 or by accessing the Funds’ website at www.leutholdfunds.com. Information regarding how the Funds voted proxies relating to portfolio securities during the most recent twelvemonth period ended June 30 is available without charge upon request by calling toll-free at (800) 273-6886 or on the SEC’s website at www.sec.gov.
The Leuthold Funds
InvestmentAdviser:
Leuthold Weeden Capital
Management, Minnesota
Administrator, TransferAgent,
Dividend Paying Agent,
Shareholder Servicing Agent:
U.S.Bancorp Fund Services,LLC,
Wisconsin
Custodian:
U.S.Bank,N.A.,Wisconsin
Counsel:
Foley & Lardner,LLP, Wisconsin
Independent Registered
PublicAccounting Firm:
Ernst & Young LLP, Minnesota
The Funds are required to file their complete schedules of portfolio holdings with the SEC for their first and third fiscal quarters on Form N-Q. Once filed, the Fund’s Form N-Q is available without charge, upon request on the SEC’s website (http://www.sec.gov) and may be available by calling 1-800-273-6886. You can also obtain copies of Form N-Q by (i) visiting the SEC’s Public Reference Room in Washington, DC (information on the operation of the Public Reference Room may be obtained by calling 1-800-SEC-0330);(ii) sending your request and a duplicating fee to the SEC’s Public Reference Room, Washington, DC 20549-0102; or (iii) sending your request electronically to publicinfosec.gov.
This report is authorized for distribution only when preceded or accompanied by a current prospectus.
Annual Report
September 30, 2006
The Leuthold Funds
Leuthold
Core Investment Fund
Leuthold
Select Industries Fund
Grizzly
Short Fund
Leuthold
Asset Allocation Fund
Leuthold
Select Equities Fund
Item 2. Code of Ethics.
The registrant has adopted a code of ethics that applies to the registrant’s principal executive officer and principal financial officer. The registrant has not made any amendments to its code of ethics during the period covered by this report. The registrant has not granted any waivers from any provisions of the code of ethics during the period covered by this report. A copy of the registrant’s Code of Ethics is filed herewith.
The registrant’s board of directors has determined that there is at least one audit committee financial expert serving on its audit committee. Paul Kelnberger is the “audit committee financial expert” and is considered to be “independent” as each term is defined in Item 3 of Form N-CSR.
The registrant has engaged its principal accountant to perform audit services, audit-related services, tax services and other services during the past two fiscal years. “Audit services” refer to performing an audit of the registrant's annual financial statements or services that are normally provided by the accountant in connection with statutory and regulatory filings or engagements for those fiscal years. “Audit-related services” refer to the assurance and related services by the principal accountant that are reasonably related to the performance of the audit. “Tax services” refer to professional services rendered by the principal accountant for tax compliance, tax advice, and tax planning. No “other services” were provided by the principal accountant. The following table details the aggregate fees billed or expected to be billed for each of the last two fiscal years for audit fees, audit-related fees, tax fees and other fees by the principal accountant.
Not applicable to registrants who are not listed issuers (as defined in Rule 10A-3 under the Securities Exchange Act of 1934).
Schedule of Investments is included as part of the report to shareholders filed under Item 1 of this Form.
Not applicable to open-end investment companies.
Not applicable to open-end investment companies.
Not applicable to open-end investment companies.
Not Applicable.
Pursuant to the requirements of the Securities Exchange Act of 1934 and the Investment Company Act of 1940, the registrant has duly caused this report to be signed on its behalf by the undersigned, thereunto duly authorized.
Steven C. Leuthold, President
Pursuant to the requirements of the Securities Exchange Act of 1934 and the Investment Company Act of 1940, this report has been signed below by the following persons on behalf of the registrant and in the capacities and on the dates indicated.
Steven C. Leuthold, President
David R. Cragg, Treasurer