Annual Report
September 30, 2008
The Leuthold Funds
Leuthold Asset Allocation Fund
Leuthold Select Equities Fund
Leuthold Undervalued & Unloved Fund
Leuthold Global Fund
Grizzly Short Fund
Leuthold Core Investment Fund
Leuthold Select Industries Fund
This page is intentionally left blank
The Leuthold Funds
Dear Fellow Shareholders:
At the outset, we’d like to thank all of you for your continued support over the last twelve months. It is our privilege to serve our shareholders, and your confidence and trust is something every member of the Leuthold Weeden Capital Management team works hard to build and maintain each day.
As you are well aware, the most recent 12-month period has been remarkably challenging.The world economy is in the midst of unraveling the excesses created by a credit bubble years in the making.The problems are complex, but can be traced back to several root causes including: the excess use of leverage, overly accommodative interest rates, aggressive and irresponsible lending practices, a housing bubble, and an overabundance of low-quality securitized assets. The fallout continues. Equity markets across the globe have continued to experience dramatic losses in the period following the end of our Funds’ fiscal year (which ended 9/30/08).
It now appears that the concerted efforts of central banks and governments across the globe are beginning to show progress in combating the paralysis of the credit markets, and restoring confidence in the global economy. Much work lies ahead; however, the structural changes and “creative destruction” resulting from this crisis should, in time, pave the way for a fundamentally stronger global economy.
When we write these annual reports to our shareholders, we hope each year to write of a 12-month period marked with impressive returns and report on portfolio strategies executed with remarkable prescience and foresight. Of course, the reality of investing over the long-term means there are occasional “off” years—times when mistakes are made, and periods where market conditions can be described as “extraordinarily bad.” This has been one of those years. While the majority of our strategies performed better than their stated benchmarks this past year, we feel no sense of victory when our funds post substantial losses. This is especially true for our asset allocation strategies, which endeavor to mitigate portfolio risk when market conditions are poor.
While we were cautious about the stock market going into 2008, we clearly became bullish too early in the year. Our work failed to fully recognize the precarious state of the global financial system, and the speed at which the failures of several high profile U.S. financial institutions would lead to a pandemic global crisis. We are not proud of the past year, and are keenly aware our shareholders expect better from us. But rather than being immobilized by past mistakes, we are absolutely committed to learn from them. There are valuable lessons to be gleaned from this current period of market turmoil, and the strength of our longer term track record indicates how we have successfully used past experience and market history to our advantage in generating superior returns.
We are encouraged, and yes, amazed that our shareholders have been so overwhelmingly supportive during this tumultuous market period. We cannot state how much your continued confidence means to us. As significant investors in our own family of funds, we are invested alongside all of you, and fully appreciate and understand how difficult the recent months have been. But be assured we are resolute and focused in our efforts to manage our funds with the same diligence and care that helped us build a solid reputation and long-term track record of investment excellence.
COMMENTARY FROM STEVE LEUTHOLD
During my 47 years in the investment business I’ve seen and survived a number of stock market crises and panics, first the crash of 1962 when the stock ticker ran four hours late. Then the 1973-1974 bear market when the S&P 500 fell 48% and the average stock fell 70%. In October of 1987 the market fell over 20% in a single session, more than twice as much as the largest daily decline in October 2008. Then in 2000-2002 came the “tech wreck” with the S&P 500 down 49% and Tech stocks down 75% or more.
THE CURRENT STOCK MARKET CRISIS AND PANIC
As of October 27, the S&P 500 is down 46% from its October 2007 peak with the stock markets in Emerging Countries down an average of 66% (China down 75%). Like the periods cited above, this is a time of extreme investor anxiety. Like the periods cited above, it is our opinion, that it is absolutely the wrong time to bail out of the market. Emotion is the investor’s greatest enemy, be it greed, or in this case, fear.
Consider The Following
The current market decline (-46%) is one of the three greatest market declines in the last 60 years. The other two were 2000-2002 (down 49%) and 1973-1974 (down 48%).
The global liquidity crisis, the probable cause of the last half of the current decline, has peaked and is now easing thanks to the concerted efforts of governments around the world, including new support from governments in China, Russia, and the Middle East.
Economies in the U.S., Europe, and Japan are now in recessions with the U.S. recession getting underway about a year ago (in our view). However, the stock market is the most reliable leading economic indicator (according to the National Bureau of Economic Research) turning up about midway into a recession.
…If the current U.S. recession is about 20 months in duration (our estimate), it would be the longest recession since WWII (average being 11 months). As a lead economic indicator the stock market would begin to rebound in November 2008, per our historical economic time clock.
Today’s stock market, per our valuation benchmarks (P/E ratios, Price to Sales ratio, Price to Cash Flow ratio, et. al.) is quite undervalued, in the low 15% of our 60 year valuation history.
…From current valuation levels the stock market has historically returned an average of 40% over the subsequent two years and 66% over the subsequent 3 years.
CONCLUSIONS
I. This Is A Terrible Time To Reduce Or Liquidate Stock Market Holdings
If you do sell now, a year from now you will most likely view yourself as timid and foolish, probably selling out at or close to a major bear market bottom.
…Since 1900 the market rebounded an average of 47% in the 12 months following a bear market bottom and 60% over the next two years.
…Since WWII the average rebound has been 34% over the subsequent 12 months and 51% over the next two years.
Of course, these calculations are based on actual past bear market lows. In the current situation we can’t say the low has been achieved (nobody rings a bell). But to us it certainly appears the low is close at hand.
AT THIS POINT: We feel that this is not the time to reduce any equity fund holdings be they U.S. focus or foreign focus.
…The exceptions, in our opinion, are our Grizzly Short Fund or other short funds. For these bear market funds, it is now time to do some selling.
II. We FeelThatThis IsTheTimeToAddTo Stock Market Investments
I know it takes courage, but as our historical market analysis indicates, today appears to be the best buying opportunity in the last six or seven years.
If your normal maximum equity exposure is 70% in your 401(k) or personal portfolio, you should now be at 60% in stocks, moving to the 70% maximum by the end of November.
If your maximum is 100% equities you should now be at 80% equity exposure, moving up to 95% by the end of November.
--Steve Leuthold
FUND OVERVIEWS
Leuthold Core Investment Fund (closed to new and additional investment): This Fund’s strategy is flexible and value-oriented. The Leuthold Core Investment Fund adjusts asset class exposure based on underlying market dynamics and trends, in order to avoid undue risk, and attempt to take advantage of areas that appear poised to outperform. Assets are actively allocated between stocks, bonds, money market instruments, and foreign securities. The Fund may also hedge by selling short certain securities when our disciplines indicate potential underlying market weakness. While at times individual allocations may appear unorthodox, they are intended to come together as complementing positions in an effort to carry out the Fund’s guiding principles.
> | Through September 30, 2008, Lipper rankings placed this Fund’s 5-year performance in the top 12% of funds included within their “Flexible Portfolio Funds” category which contained 87 funds for that time frame. |
> | The Leuthold Core Investment Fund uses the Leuthold Select Industries Fund as the primary vehicle for its U.S. traded equity component. This Fund’s methodology is outlined below. |
> | The investment guideline of the Leuthold Core Investment Fund is 30%-70% equity exposure and 30%-70% fixed income exposure. Under extreme market conditions, there may be a departure from the basic guidelines. Our Major Trend Index is utilized to gauge the overall health of the global equity markets and our equity exposure. This index, which we have published weekly since 1975, is designed to recognize major market trends rather than intermediate moves and has over 190 individual components. |
Leuthold Asset Allocation Fund: This successor to the now-closed Leuthold Core Investment Fund began trading on May 24, 2006. The strategy and objective of this Fund are identical to those of the Leuthold Core Investment Fund in terms of guiding disciplines, flexibility, asset class exposure, and risk aversion. The only difference between the two portfolios is in the stock selection approach employed for the primary domestic equity allocation.
> | The Leuthold Asset Allocation Fund currently uses a multi-strategy approach for domestic equity selection (Leuthold Select Equities and Leuthold Undervalued & Unloved, each described below). The balance of the strategies employed allows us to construct an equity portfolio that has the risk/reward characteristics we believe are suitable for an asset allocation portfolio. |
> | The Select Equities strategy is a bottom-up, stock-based quantitative model that ranks stocks on a bi-weekly basis. This strategy is also available as a stand-alone all-equity mutual fund. |
> | The Undervalued and Unloved equity strategy is a “value” stock screening methodology developed by The Leuthold Group in the mid-1970s. This stock screen has previously been employed in the Core Investment Fund at times when value-type stock exposure was targeted. This strategy is also available as a stand-alone all-equity mutual fund. |
Leuthold Global Fund: This asset allocation strategy can be considered the “global” equivalent of the Leuthold Core Investment Fund. The Fund began trading on April 30th, 2008, and thus does not yet have a long-term performance track record. The strategy and objective of this Fund are similar to that of the Leuthold Core Investment Fund in terms of guiding disciplines, flexibility, asset class exposure, and risk aversion. The primary difference in the Leuthold Global Fund is that it invests in foreign traded securities as well as U.S. traded securities including stocks, bonds, and other asset classes.
> | The Leuthold Global Fund currently uses a top-down industry group approach for its equity selection (similar to the Leuthold Select Industries equity strategy employed by the Leuthold Core Investment Fund). This allows us to construct a global equity portfolio based on industry group leadership trends rather than the traditional country-focused strategies typically employed by other global fund managers. We believe a focus on industry, rather than country, over-weights and under-weights provides better opportunities to generate superior returns as the global economy becomes increasingly interdependent. |
| > | Our Global Fund invests mainly in global stocks, bonds, and money market instruments. When appropriate, as disciplines dictate, the Fund may also sell short certain securities. |
| > | The investment guideline of the Leuthold Global Fund is 30%-70% equity exposure and 30%-70% fixed income exposure. Under extreme market conditions, there may be a departure from the basic core guidelines. Our Global Major Trend Index is utilized to gauge the overall health of the global equity markets. This index, derived from our Major Trend Index used in the Leuthold Core Investment and Asset Allocation Funds, is designed to recognize major market trends rather than intermediate moves, combining almost 170 individual components. |
Leuthold Select Industries Fund (closed to new and additional investment): Unlike our asset allocation strategies, this Fund is mandated to remain 100% invested in stocks at all times. This attribute results in the potential for considerable volatility, higher risk, and the probability that investors will lose money when the stock market declines significantly.
| > | Through September 30, 2008, Lipper ranked this Fund’s 5-year performance in the top 3% of Funds included within their “Mid-Cap Growth” category which contained 325 funds for that time frame. |
The Select Industries Fund strategy is based on industry group rotation, industry stock selection, and sector concentrations. Driven by a quantitative evaluation of over 150 equity-industry groups, it attempts to detect collective strength and emerging leadership potential, while exposing areas that appear vulnerable.
| > | The element of sector/industry group concentrations results in this Fund’s higher volatility profile, being potentially more risky while offering potentially more reward. |
Leuthold Select Equities Fund: This is the successor to the now-closed Leuthold Select Industries Fund, and it began trading on May 24, 2006. The Leuthold Select Equities Fund is mandated to remain 100% invested in stocks at all times. This attribute results in the potential for considerable volatility, higher risk, and the probability investors will lose money when the stock market declines.
The Fund differs from the Leuthold Select Industries Fund in its approach to equity selection. Whereas the Select Industries employs a top-down industry group approach as the primary driver of portfolio construction, the Leuthold Select Equities Fund uses a quantitative bottom-up, stock picking strategy. While the Select Equities Fund can, at times, result in similar sector and/or industry group overweights to the Select Industries Fund, the overlap of specific equity securities between the two Funds is expected to be minimal.
| > | The Select Equities Fund typically maintains approximately equally-weighted positions in about 50 individual stocks, selected per a multi-factor quantitative discipline. This model is run on a bi-weekly basis. The strategy is based on a stock rating system that was originally developed by The Leuthold Group in the late-1980s. |
Leuthold Undervalued & Unloved Fund: This actively managed Fund employs a“value” stock screening methodology developed by The Leuthold Group in the mid-1970s that seeks to identify stocks with low expectations built into the price. This stock screen has previously been employed in the Core Investment Fund when value-type stock exposure was targeted. The Fund was launched on November 14, 2006.
Grizzly Short Fund: This actively managed Fund is 100% short individual stocks. Short-selling strategies are aimed at profiting when stock prices decline. Even when our firm is bullish toward the stock market, the Grizzly Short Fund’s policy mandates the portfolio to target 100% exposure in stocks sold short. Because of this, shareholders should anticipate they will most likely lose money investing in this Fund when stock prices, in general, are in a rising trend.
The Grizzly Short Fund is a tool for sophisticated users. Traders, sophisticated investors, and speculators who anticipate the market may decline will employ the Grizzly Short Fund to tactically regulate stock market risk. It is also used in varying degrees with other multifaceted portfolio strategies. This is not a Fund for buy and hold investors!
| > | The Grizzly Short Fund typically maintains approximately equally-weighted short positions in about 50 individual stocks, initially selected by a multi-factor quantitative discipline. Each position is monitored daily and subject to a set of short covering disciplines. |
A LOOK IN THE REAR VIEW MIRROR
| > | An overview of the performance (good and bad) of the Leuthold Funds for the entire fiscal year ended 9/30/08. |
Leuthold Core Investment Fund (closed to new and additional investment)
This is our flagship asset allocation strategy, with current assets of about $1.4 billion. For the fiscal year ended September 30th, the Fund posted a total return loss of -11.48%, compared to -21.97% total return loss for the S&P 500. The Core Fund’s allocation to stocks during the fiscal year averaged about 47%, thus a considerable amount of the Fund’s performance advantage compared to the S&P 500 came from lower than normal equity exposure throughout the year. The majority of common stock commitments are in the “Select Industries” portion of the portfolio, with the remainder primarily in “Emerging Market” equities and, on occasion, exchange traded funds (“ETFs”).
Fund performance was adversely affected by increasing our net equity exposure much too early.
While the initial increase to 50% net equity exposure back in mid-January did not have a major impact on portfolio performance, the subsequent increase to 60% in mid-August came just ahead of a substantial down leg in the broad stock market. While the moves were made in concert with an improvement in the reading of our Major Trend Index, the increased equity exposure put us on the wrong side of the market.
For the year, an average of 6.3% of assets was invested in emerging market equities, with 52% on average in the Select Industries equity allocation. As of September 30, 2008, our equity commitment in emerging market equities stood at 9% of total assets, while the Select Industries portion of the equity exposure stood at 49% (additional details on performance attribution for the Select Industries stocks appear later in this section). Another 5% of assets were invested in equity ETFs bringing total equity exposure to 63%. In retrospect, our equity exposure was much too aggressive, considering the subsequent sharp declines the stock market has experienced since mid-September.
At certain times in the most recent fiscal year, we employed short equity hedges in varying amounts to reduce our net equity exposure. During the 4th quarter of 2007, equity hedges were used to reduce equity exposure to the normal guideline minimum of 30% due to the continued bearish readings of our Major Trend Index. In mid-January, we began lifting the equity hedges due to market valuations achieving long-term median levels, suggesting an opportune time to increase equity exposure. As the Major Trend Index continued to improve in the first and second quarters of 2008, the equity hedges continued to be reduced until they were eliminated in mid-May when our Major Trend Index work turned positive on the stock market.
We held a small but successful 1% short position in Brokerage stocks in November and December of 2007. This was a tactical component within our short hedges, and was eliminated when the equity hedges were reduced in mid-January.
Our Core Fund’s normal minimum guideline for Fixed Income is 30% of assets. Throughout the year, our comparative analysis has suggested that attractive fixed income opportunities on a risk/reward basis were somewhat limited, leading us to have a lower than normal minimum exposure to fixed income securities throughout the year. For the year, we had an average 11% of portfolio assets allocated to fixed income.
From late 2007 to early 2008, our fixed income position included U.S. Treasury Notes which, from a risk/reward perspective, appeared to be much more attractive than any longer durations, such as 10 year Treasuries. During the fiscal year, we maintained an average 5% exposure to this position, which was eliminated in February with a moderate gain. More recently, investors’ “flight to quality” as the financial markets have unraveled has resulted in yields plunging to historically low levels.
Other fixed income positions have been less successful. In late February, we introduced positions in Australian and Brazilian Bonds. While initially successful, both fixed income positions were adversely impacted by declines in both the Aussie dollar and Brazilian real during the third quarter of 2008. This caused these fixed income investments to decline since they are denominated in their respective local currencies.
In other asset classes, our positions in Pipeline Master Limited Partnerships were a relatively short-lived investment that failed to deliver positive returns. The position was initiated in late-February 2008 and was deactivated in June. This was initiated in an attempt to enhance total return at a time when there were few attractive fixed income alternatives. Although the package of Pipeline MLPs we purchased yielded between 5%-8%, the price declines eradicated any income benefit that would have been derived if we had held the position.
Performance from Emerging Market Equities proved to be a disappointment for much of the fiscal year. We had an average 6.3% of assets deployed here, which is somewhat above our normal minimum position (5%). In early June, we had increased exposure in emerging markets by 2%, and added another 3% in late-August. Both moves were premature as emerging market equities have posted significant losses in subsequent periods.
For the 12-month period ended September 30, 2008, our Emerging Market positions had fallen 32%. We are disappointed with the Portfolio losses in the fiscal year ended 9/30/08; however, our performance during the last five years shows how productive our approach can be over the longer term. But there is no assurance we will do as well in future unfavorable stock market periods.
| > | Over the last five years (ended September 30, 2008), the Leuthold Core Investment Fund has a very wide performance advantage compared to the stock market. The Core Fund’s cumulative total return gain of +61.03% (+10.00% annualized), compares to the S&P 500’s cumulative total return gain of +28.66% (+5.17% annualized), and the Lipper Flexible Fund Index cumulative total return gain of +32.77% (+5.83% annualized). |
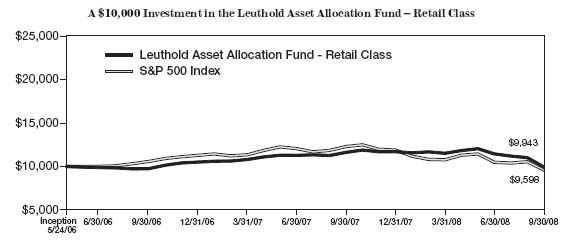
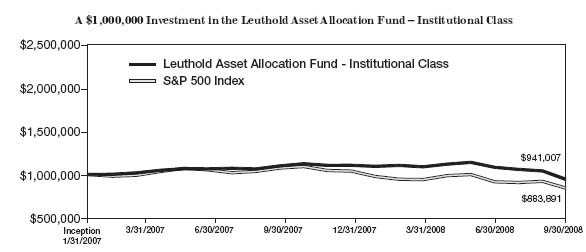
LeutholdAssetAllocation Fund
This is the successor Fund to our now closed Leuthold Core Investment Fund, with current assets of about $1.9 billion. The Leuthold Asset Allocation Fund uses a different U.S. stock selection strategy, but otherwise follows the very same asset allocation directives and asset class investment vehicles as the Leuthold Core Investment Fund. Hence, for details on asset allocation shifts and performance review of the various asset classes for the last 12 months, please refer to the preceding discussion of the Leuthold Core Investment Fund portfolio details.
As noted earlier, this Fund was launched on May 24, 2006 and thus does not yet have a long-term performance track record. However, during the 12-month period ending September 30, 2008, the Leuthold Asset Allocation Fund generated a total return loss of -14.45% compared to a -21.97% total return loss for the S&P 500.
Unlike the Leuthold Core Investment Fund, the Leuthold Asset Allocation Fund employs a dual strategy approach for its U.S. traded equity exposure. This currently includes a combination of the Leuthold Select Equities stock selection and the Leuthold Undervalued & Unloved stock screening approach. Both are bottom-up, quantitative methodologies and each generally contributes a different type of stock market exposure.
The Leuthold Select Equities approach is a quantitative strategy that identifies momentum-based stock market leadership using a bottom-up stock picking discipline which employs growth, value, and technical inputs. The Leuthold Undervalued & Unloved stock selection is a “value” screening methodology which attempts to identify stocks with low expectations by Wall Street. Individually, these two strategies are quite different but, used in tandem, they allow us to construct an equity portfolio with overall characteristics appropriate for an asset allocation strategy, and afford us the flexibility to adjust the mix to align with our market outlook. Details on the key performance drivers for both of these equity strategies are presented below in the discussions covering the“Leuthold Select Equities Fund” and “Leuthold Undervalued & Unloved Fund.”
Leuthold Global Fund
As previously mentioned, this Fund began trading on April 30th, 2008, and thus does not yet have a full year of performance to discuss in this annual review. This is our newest Fund, and is available as both a retail and institutional class fund. This Fund offers investors a global alternative to our domestically focused tactical asset allocation strategies–the Leuthold Core Investment Fund and the Leuthold Asset Allocation Fund.
Leuthold Select Industries Fund (closed to new and additional investment)
As previously noted, this all-equity Fund was down -18.90% on a total return basis for the year ended September 30, 2008, compared to a -21.97% total return loss for the S&P 500. This 12 month loss for the Leuthold Select Industries Fund compares to a 22.99% total return gain for the previous fiscal year period (October 1, 2006 – September 30, 2007).
| > | Since inception (June 19, 2000) through September 30, 2008, the Leuthold Select Industries Fund has produced a cumulative total return gain of +84.30% (+7.66% annualized) compared to a cumulative total return loss of -9.43% for the S&P 500 (-1.19% annualized). |
As of September 30, 2007, the Leuthold Select Industries Fund was heavily exposed to three market sectors: Energy, Telecom, and Materials. The combined weight of these sectors made up 53% of portfolio assets, and each of these sector concentrations represented significant overweights compared to their respective sector weightings in the S&P 500.
Over the past year, the Fund has substantially increased exposure to the Health Care sector. This includes a 19% position in Biotechnology, an 8% position in Pharmaceuticals, and a 6% position in Health Care Facilities. We continue to have a market overweight in the Energy sector, which includes a 13% position in Oil & Gas Drilling and a 4% position in Oil & Gas Refining and Marketing. Portfolio exposure has been increased in Consumer Staples (currently 9% vs. 2% a year ago), and Information Technology (currently 14% vs. 1% a year ago). Portfolio exposure has been decreased in Materials (1% vs. 15% a year ago), and Financials (currently 2% vs. 10% a year ago).
Perhaps one of the most significant changes over the last 12 months was the deactivation of the Industrial Metals group in Q2. The group had been a portfolio position for nearly six years and returned 427% during this time. Fortunately, these gains were preserved because of our timely exit from this position in early June before the sharp sell-off that caused many of these stocks to decline by more than 60% from their highs.
For the fiscal year ended 9/30/08, the Select Industries Fund (and the Core Fund’s “Select Industries” equity exposure), declined somewhat less than the S&P 500. Group positions in Oil & Gas Refiners, Green Wave, Managed Health Care (now deactivated), and Regional Banks (now deactivated) were among the performance detractors. However, our group position in Hyper Markets & Super Centers was additive to Portfolio performance during the year.
A year ago,“global growth” had emerged as a dominant theme. Group holdings in Energy, Metals & Mining, Telecom, and Auto Parts & Equipment stocks were each considered to be beneficiaries of strong global demand. Currently, there is less emphasis on international companies in the portfolio with 93% of assets now invested in U.S. domiciled companies. This compares to 78% a year ago when there was a greater portfolio emphasis on U.S. traded foreign companies.
| > | Of the ten group holdings in the Fund one year ago, only the Oil & Gas Drilling position remains. During the last year, we have seen a higher level of rotation within our industry group leadership analysis, which tends to occur when the U.S. stock market is transitioning into a new recovery phase of the market cycle. |
Leuthold Select Equities Fund
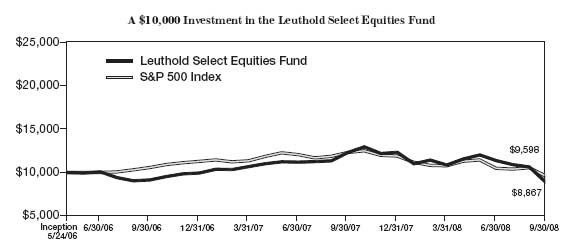
This is the successor Fund to the Leuthold Select Industries Fund, and has current assets of about $13 million. This all-equity Fund was down -27.98% total return for the year ended September 30, 2008, compared to a -21.97% total return loss for the S&P 500.
| > | Since inception (May 24, 2006) through September 30, 2008, the Leuthold Select Equities Fund has produced a cumulative total return loss of -4.99% compared to a cumulative total return loss of -1.25% for the S&P 500. |
Performance in the most recent 12-month period ended September 30, 2008, was handicapped by exposure to concentrations in the Industrials, Energy, Materials, and Information Technology sectors. Although the contribution was small, positions in the Utilities sector were additive to performance in a year when most of the broader stock market declined. In retrospect, it was a very difficult year for this strategy since it seeks out enduring market leadership and momentum trends. During the second half of the fiscal year, market leadership trends were short-lived, volatile, and quickly reversed course, causing some previous winners to sharply decline.
Although fewer in number, some stock positions did work well over the last 12 months. Positions in industries such as Consumer Electronics Retail, Biotechnology, Health Care Services, and Systems Software booked gains during the fiscal year ended 9/30/08. Historically, this Portfolio outperforms the broad market during periods of market strength, and underperforms during periods of market weakness.
Leuthold Undervalued & Unloved Fund
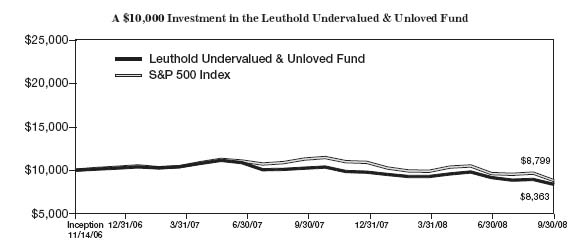
This Fund offers Value investors a long-term strategy, seeking to identify stocks that have low expectations built into the price, was launched on November 14, 2006, and has current assets of about $16 million. During the 12 months ending September 30, 2008, the Fund generated a total return loss of -18.23% compared to a -21.97% total return loss for the S&P 500.
| > | Since its launch, the Leuthold Undervalued & Unloved Fund has lost -9.06% on a total return basis. This is compared to the -9.14% total return loss on the Russell 3000 Value Index over the same period. |
Although performance has fallen in line with our Value Index benchmarks, market conditions since the mid-November 2006 launch have led to growth stocks outperforming value stocks in the nearly two year period since the Fund was launched. Also, the Fund typically has heavier exposure to Financials stocks, an area of the market that has underperformed for much of the last two years.
Despite this, the portfolio had some solid performers. Certain Health Care stocks performed well, including positions in the Health Care Facilities and Health Care Distributors industries. Also, some positions in the Energy sector provided positive returns for the fiscal year ended 9/30/08. They include positions in the Oil & Gas Exploration and Production and the Oil & Gas Equipment & Services industries.
Unfortunately, these strong gains were offset by some notable decliners in the 12-month period ended September 30, 2008. These include positions in a diverse array of industries such as Homebuilders, Property & Casualty Insurance, and Technology Distributors. Historically, this strategy tends to have a big portfolio emphasis in the Financial sector; however, our exposure to this sector in the last fiscal year fell from 31% at the end of the last fiscal year to 24% currently. Our investments here were focused mainly on Insurance companies, many of which declined less than other Financials stocks.
The first half of the fiscal year was less than favorable for “value” stocks; however, we expect to see the Fund continue to outperform the broad stock market if conditions in the economy continue to deteriorate (perhaps, if only declining less than the broad market) as one of the key goals of this Fund is to identify stocks with low expectations, and therefore have less potential to disappoint investors when these expectations are not met.
Grizzly Short Fund
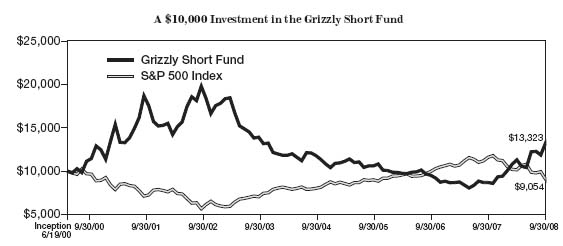
As noted earlier, one year ago we estimated that the coming 12-month period would become increasingly difficult for traditional 100% long-stock investment strategies and for the market indexes in general. As confirmed by recent cyclical lows in several broad market indexes, the environment for equities deteriorated in the 12 months ended 9/30/08 more than we anticipated. Needless to say, as a strategy designed to profit in down market conditions, this was a constructive period for the Grizzly Short Fund.
| • | For the fiscal year ended 9/30/08, the actively managed Grizzly Short Fund turned in a total return gain of +53.43%. |
| • | On a relative basis(1), the Grizzly Short Fund gain compares favorably to the -21.97% total return loss of the S&P 500 and the S&P Mid Cap index total return loss of -17.83%. We believe the Mid Cap index is a more realistic benchmark considering the characteristics of the Grizzly Short Fund. |
1For a practical relative assessment of Grizzly Short Fund performance, one should compare the Fund’s performance to the inverse of traditional long-stock index results. For example, if the S&P 500 gains 5%, investors employing an S&P 500 index short would expect to lose about 5%. If the Grizzly Short Fund loses 3% over the same time frame, this would be considered relatively value-added for a short-selling strategy, since it is a smaller loss than the loss incurred by the index short. If the Grizzly Short Fund loses more than an index gains, it is not value-added over an index short.
Please keep in mind that the Grizzly Short Fund has extremely high turnover, and sector concentrations and industry group exposure can fluctuate from day to day. The individual stock positions are similarly weighted across the portfolio, and there are limitations on how much of the portfolio can be concentrated within a particular sector or sub-industry group therein.
| > | Those features, combined with the Fund’s quantitative methodology, make it unrealistic to attribute specific performance dynamics to isolated short positions. Sector concentrations and stock market themes are more practical portfolio characteristics to use when reviewing Grizzly Short Fund performance drivers. |
The Grizzly Short Fund’s positive performance for the 12 months ended 9/30/08 is the expected consequence of having a 100% short portfolio while the stock market, in general, was declining. While a declining stock market environment is the fundamental basis behind the significant net gains from the Grizzly Short Fund for the year ended 9/30/08, the following concentrations and themes were among the most significant contributors to performance over the last year.
The Grizzly Short Fund’s three heaviest portfolio sector weights boosted performance throughout the last 12 months (period ended 9/30/08). These included stocks from the Financials, Consumer Discretionary, and InformationTechnology sectors.
Specifically, Financial stocks related to Thrifts & Mortgage Finance, Investment Banking & Brokerage, and MultiLine Insurance industries were big contributors to net gains in the Grizzly Short Fund during the 12-month period ended 9/30/08. As for the Consumer Discretionary sector, the portfolio benefited from heavier exposure to Hotels, Resorts, and Cruise Lines, Casinos & Gaming, Automobile Manufacturers, and Airlines. Information Technology sector short positions in Semiconductors, and Communications Equipment were big contributors to the Fund’s positive performance for the year.
At the sector level, the Grizzly Short Fund had portfolio losses in industries that were less unified around sector themes. Health Care Equipment, Coal & Consumable Fuels, Construction & Engineering, and Systems Software represent specific industries among the top performance detractors for the Grizzly Short Fund in the 12-month period ended September 30, 2008.
Additional Comments Related to the Grizzly Short Fund
Our most recent assessment of our broad market composite leaves us “bullish” in our outlook for the stock market going forward. If the stock market does strengthen in coming quarters, we would expect this short-selling strategy to underperform.
��
Investors who are not experienced in short-selling and adjusting market risk should consider the Leuthold Asset Allocation Fund. The Leuthold Asset Allocation Fund is the successor to the Leuthold Core Investment Fund and has the flexibility to overlay the short-selling strategy of the Grizzly Short Fund as a hedge against stock market declines when the Advisor views the stock market as overvalued and vulnerable to a downside correction.
The Fund’s year-by-year results are volatile, and while the advantage for employing a short-selling strategy during down-market years is evident, we cannot stress enough the importance of being aware of the extreme down-side risk of short-selling in rising market conditions, therefore you should expect to lose money during rising market conditions.
IN CLOSING
Looking ahead to the next twelve months, we believe the U.S. stock market is at or near its ultimate low for this cycle. From a risk/reward perspective, our evaluation of the list of stock market positives versus negatives suggests that much, if not all, of the downside risk in the U.S. and global economies has now been discounted into stock prices. As a forward looking mechanism, the stock market will rebound well ahead of any perceptible improvement in the global economy. For investors with longer term time horizons, the declines we have seen so far have resulted in stock market valuations that are the cheapest they have been in over two decades.
Nevertheless, it is our disciplines, not our gut feelings, which will determine the course of our investment strategies over the coming twelve months. While no market cycle will exactly mimic the progression of a prior cycle, it is important to recognize that financial history can serve as a vast early-warning system. In addition, our quantitative disciplines are the guiding principles for our investment strategies, designed to remove emotions, severely restrict judgments, and diminish the potential for personal bias to come into play with portfolio decisions. We believe that adherence to these disciplines allows us to identify opportunities and attempt to protect assets in both up and down market cycles.
Our firm is majority employee-owned and has a high level of employee investment in our funds. As we’ve noted in the past, although Leuthold’s name is on the door, please keep in mind that all our strategies are team-managed, often-times by the same professionals since each Fund’s inception. In most cases, the same investment professionals are responsible for the research behind the development of the Fund concepts and sit on our Investment Strategy Committee. This structure allows for an improved flow of insight and opinion from a mixture of backgrounds and experience. While our team approach eliminates the risks associated with a “one man show,” it also serves as a function of checks-and-balances for ensuring adherence to the investment disciplines. Portfolio decisions must always align with the methodologies.
We thank you for your continued support.
Sincerely,
 | |  | |  |
| Steve Leuthold | | Andy Engel, CFA | | James Floyd, CFA |
| Portfolio Team Leader | | Co-Portfolio Manager | | Co-Portfolio Manager |
| | | | | |
 | |  | |  |
| Chuck Zender | | Matt Paschke, CFA | | Eric Bjorgen, CFA |
| Co-Portfolio Manager | | Co-Portfolio Manager | | Co-Portfolio Manager |
| | | | | |
 | | | | |
| Doug Ramsey, CFA, CMT | | | | |
| Co-Portfolio Manager | | | | |
The Leuthold Funds
Expense Example – September 30, 2008 (Unaudited)
As a shareholder of the Funds, you incur two types of costs: (1) transaction costs, including reinvested dividends, or other distributions; redemption fees; and exchange fees; and (2) ongoing costs, including management fees; distribution and/or service fees; and other Fund expenses. This example is intended to help you understand your ongoing costs (in dollars) of investing in the Funds and to compare costs with the ongoing costs of investing in other mutual funds.
The Example is based on an investment of $1,000 invested at the beginning of the period and held the entire period (April 1, 2008 – September 30, 2008).
Actual Expenses
The first line of the following table provides information about actual account values and actual expenses. Although the Funds charge no sales load (the Core Investment Fund, Asset Allocation Fund, Undervalued & Unloved Fund, and Global Fund charge a 2% redemption fee for redemptions made within five business days after a purchase), you will be assessed fees for outgoing wire transfers, returned checks or stop payment orders at prevailing rates charged by U.S. Bancorp Fund Services, LLC, the Funds’ transfer agent. If you request a redemption be made by wire transfer, currently a $15.00 fee is charged by the Funds’ transfer agent. To the extent that the Funds invest in shares of other investment companies as part of its investment strategy, you will indirectly bear your proportionate share of any fees and expenses charged by the underlying funds in which a Fund invests in addition to the expenses of the Fund. Actual expenses of the underlying funds are expected to vary by fund. These expenses are not included in the example below. The example includes, but is not limited to, management fees, shareholder servicing fees, fund accounting, custody, and transfer agent fees. However, the example below does not include portfolio trading commissions and related expenses, interest expense, and extraordinary expenses as determined under generally accepted accounting principles. You may use the information in this line, together with the amount you invested, to estimate the expenses that you paid over the period. Simply divide your account value by $1,000 (for example, an $8,600 account value divided by $1,000 = 8.6), then multiply the result by the number in the first line under the heading entitled “Expenses Paid During Period” to estimate the expenses you paid on your account during this period.
Hypothetical Example for Comparison Purposes
The second line of the following table provides information about hypothetical account values and hypothetical expenses based on the Funds’ actual expense ratios and an assumed rate of return of 5% per year before expenses, which is not the Funds’ actual return. The hypothetical account values and expenses may not be used to estimate the actual ending account balance or expenses you paid for the period. You may use this information to compare the ongoing costs of investing in the Funds and other funds. To do so, compare this 5% hypothetical example with the 5% hypothetical examples that appear in the shareholder reports of the other funds.
Please note that the expenses shown in the table are meant to highlight your ongoing costs only and do not reflect any transactional costs, such as redemption fees or exchange fees. Therefore, the second line of the table is useful in comparing ongoing costs only, and will not help you determine the relative costs of owning different funds. In addition, if these transactional costs were included, your costs would have been higher.
The Leuthold Funds
Expense Example Tables (Unaudited)
Leuthold Core Investment Fund - Retail Class
| | Beginning | | Ending | | Expenses Paid |
| | AccountValue | | AccountValue | | During Period* |
| | April 1, 2008 | | September 30, 2008 | | April 1, 2008 - September 30, 2008 |
| Actual** | $1,000.00 | | $859.10 | | $5.28 |
| Hypothetical (5% return | | | | | |
| before expenses)*** | 1,000.00 | | 1,019.35 | | 5.70 |
| * | Expenses are equal to the Fund’s annualized expense ratio of 1.13%, multiplied by the average account value over the period, multiplied by 183/366 to reflect the one-half year period. |
| ** | Excluding dividends and interest on short positions, your actual cost of investment in the Fund would be $5.13 and the Fund’s annualized expense ratio would be 1.10%. |
| *** | Excluding dividends and interest on short positions, your hypothetical cost of investment in the Fund would be $5.54 and the Fund’s annualized expense ratio would be 1.10%. |
Leuthold Core Investment Fund - Institutional Class
| | Beginning | | Ending | | Expenses Paid |
| | AccountValue | | AccountValue | | During Period* |
| | April 1, 2008 | | September 30, 2008 | | April 1, 2008 - September 30, 2008 |
| Actual** | $1,000.00 | | $869.40 | | $4.81 |
| Hypothetical (5% return | | | | | |
| before expenses)*** | 1,000.00 | | 1,019.85 | | 5.20 |
| * | Expenses are equal to the Fund’s annualized expense ratio of 1.03%, multiplied by the average account value over the period, multiplied by 183/366 to reflect the one-half year period. |
| ** | Excluding dividends and interest on short positions, your actual cost of investment in the Fund would be $4.66 and the Fund’s annualized expense ratio would be 1.00%. |
| *** | Excluding dividends and interest on short positions, your hypothetical cost of investment in the Fund would be $5.04 and the Fund’s annualized expense ratio would be 1.00%. |
Leuthold Select Industries Fund
| | Beginning | | Ending | | Expenses Paid |
| | AccountValue | | AccountValue | | During Period* |
| | April 1, 2008 | | September 30, 2008 | | April 1, 2008 - September 30, 2008 |
| Actual | $1,000.00 | | $882.30 | | $6.12 |
| Hypothetical (5% return | | | | | |
| before expenses) | 1,000.00 | | 1,018.50 | | 6.57 |
| * | Expenses are equal to the Fund’s annualized expense ratio of 1.30%, multiplied by the average account value over the period, multiplied by 183/366 to reflect the one-half year period. |
The Leuthold Funds
Expense Example Tables (Unaudited)
Grizzly Short Fund
| | Beginning | | Ending | | Expenses Paid |
| | AccountValue | | AccountValue | | During Period* |
| | April 1, 2008 | | September 30, 2008 | | April 1, 2008 - September 30, 2008 |
| Actual** | $1,000.00 | | $1,178.50 | | $17.18 |
| Hypothetical (5% return | | | | | |
| before expenses)*** | 1,000.00 | | 1,009.23 | | 15.85 |
| * | Expenses are equal to the Fund’s annualized expense ratio of 3.16%, multiplied by the average account value over the period, multiplied by 183/366 to reflect the one-half year period. |
| ** | Excluding dividends and interest on short positions, your actual cost of investment in the Fund would be $8.23 and the Fund’s annualized expense ratio would be 1.51%. |
| *** | Excluding dividends and interest on short positions, your hypothetical cost of investment in the Fund would be $7.62 and the Fund’s annualized expense ratio would be 1.51%. |
Leuthold Asset Allocation Fund - Retail Class
| | Beginning | | Ending | | Expenses Paid |
| | AccountValue | | AccountValue | | During Period* |
| | April 1, 2008 | | September 30, 2008 | | April 1, 2008 - September 30, 2008 |
| Actual** | $1,000.00 | | $863.50 | | $5.91 |
| Hypothetical (5% return | | | | | |
| before expenses)*** | 1,000.00 | | 1,018.66 | | 6.40 |
| * | Expenses are equal to the Fund’s annualized expense ratio of 1.27%, multiplied by the average account value over the period, multiplied by 183/366 to reflect the one-half year period. |
| ** | Excluding dividends and interest on short positions, your actual cost of investment in the Fund would be $5.77 and the Fund’s annualized expense ratio would be 1.24%. |
| *** | Excluding dividends and interest on short positions, your hypothetical cost of investment in the Fund would be $6.25 and the Fund’s annualized expense ratio would be 1.24%. |
Leuthold Asset Allocation Fund - Institutional Class
| | Beginning | | Ending | | Expenses Paid |
| | AccountValue | | AccountValue | | During Period* |
| | April 1, 2008 | | September 30, 2008 | | April 1, 2008 - September 30, 2008 |
| Actual** | $1,000.00 | | $863.50 | | $5.41 |
| Hypothetical (5% return | | | | | |
| before expenses)*** | 1,000.00 | | 1,019.19 | | 5.87 |
| * | Expenses are equal to the Fund’s annualized expense ratio of 1.16%, multiplied by the average account value over the period, multiplied by 183/366 to reflect the one-half year period. |
| ** | Excluding dividends and interest on short positions, your actual cost of investment in the Fund would be $5.28 and the Fund’s annualized expense ratio would be 1.13%. |
| *** | Excluding dividends and interest on short positions, your hypothetical cost of investment in the Fund would be $5.72 and the Fund’s annualized expense ratio would be 1.13%. |
The Leuthold Funds
Expense Example Tables (Unaudited)
Leuthold Select Equities Fund
| | Beginning | | Ending | | Expenses Paid |
| | AccountValue | | AccountValue | | During Period* |
| | April 1, 2008 | | September 30, 2008 | | April 1, 2008 - September 30, 2008 |
| Actual | $1,000.00 | | $815.70 | | $8.02 |
Hypothetical (5% return before expenses) | 1,000.00 | | 1,016.17 | | 8.91 |
| * | Expenses are equal to the Fund’s annualized expense ratio of 1.77%, multiplied by the average account value over the period, multiplied by 183/366 to reflect the one-half year period. |
Leuthold Undervalued & Unloved Fund
| | Beginning | | Ending | | Expenses Paid |
| | AccountValue | | AccountValue | | During Period* |
| | April 1, 2008 | | September 30, 2008 | | April 1, 2008 - September 30, 2008 |
| Actual | $1,000.00 | | $902.00 | | $7.13 |
Hypothetical (5% return before expenses) | 1,000.00 | | 1,017.50 | | 7.57 |
| * | Expenses are equal to the Fund’s annualized expense ratio of 1.50%, multiplied by the average account value over the period, multiplied by 183/366 to reflect the one-half year period. |
Leuthold Global Fund - Retail Class
| | Beginning | | Ending | | Expenses Paid |
| | AccountValue | | AccountValue | | During Period* |
| | July 1, 2008** | | September 30, 2008 | | July 1, 2008 - September 30, 2008 |
| Actual | $1,000.00 | | $859.60 | | $4.28 |
Hypothetical (5% return before expenses) | 1,000.00 | | 1,007.97 | | 4.62 |
| * | Expenses are equal to the Fund’s annualized expense ratio of 1.50%, multiplied by the average account value over the period, multiplied by 183/366 to reflect the one-half year period. |
| ** | Inception date of the Fund. |
Leuthold Global Fund - Institutional Class
| | Beginning | | Ending | | Expenses Paid |
| | AccountValue | | AccountValue | | During Period* |
| | May 1, 2008** | | September 30, 2008 | | April 30, 2008** - September 30, 2008 |
| Actual*** | $1,000.00 | | $851.00 | | $6.23 |
Hypothetical (5% return before expenses)*** | 1,000.00 | | 1,014.17 | | 6.78 |
| * | Expenses are equal to the Fund’s annualized expense ratio of 1.50%, multiplied by the average account value over the period, multiplied by 183/366 to reflect the one-half year period. |
| ** | Inception date of the Fund. |
| *** | Excluding dividends and interest on short positions, your actual cost of investment in the Fund would be $6.19 and the Fund’s annualized expense ratio would be 1.60%. |
| **** | Excluding dividends and interest on short positions, your actual cost of investment in the Fund would be $6.74 and the Fund’s annualized expense ratio would be 1.60%. |
The Leuthold Funds
(Unaudited)
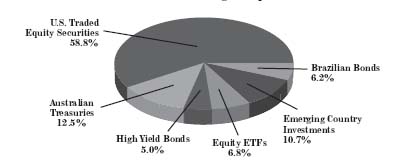
| | Leuthold Core Investment Fund | |
| | Allocation of Portfolio Holdings • September 30, 2008* | |
| | | |
| | | |
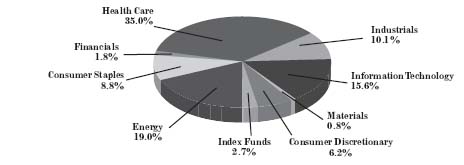
| | Leuthold Select Industries Fund | |
| | Allocation of Portfolio Holdings • September 30, 2008* | |
| | | |
| | | |
| | Grizzly Short Fund | |
| | Allocation of Portfolio Holdings • September 30, 2008* | |
| | | |
* Excludes short-term investments
The Leuthold Funds
(Unaudited)
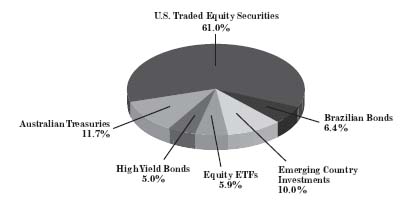
| | Leuthold Asset Allocation Fund | |
| | Allocation of Portfolio Holdings • September 30, 2008* | |
| | | |
| | | |
| | Leuthold Select Equities Fund | |
| | Allocation of Portfolio Holdings • September 30, 2008* | |
| | | |
* Excludes short-term investments
The Leuthold Funds
(Unaudited)
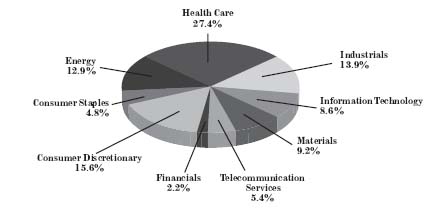
| | Leuthold Undervalued & Unloved Fund | |
| | Allocation of Portfolio Holdings • September 30, 2008* | |
| | | |
| | | |
| | Leuthold Global Fund | |
| | Allocation of Portfolio Holdings • September 30, 2008* | |
| | | |
* Excludes short-term investments
The Leuthold Funds
| | | | MarketValue | |
| Leuthold Core Investment Fund (Unaudited) | | | | |
Components of Portfolio Holdings* | | | | |
| Brazilian Bonds | | | $ | 72,179,305 | |
| Emerging Country Investments | | | | 123,861,323 | |
| Equity ETFs | | | | 78,459,783 | |
| HighYield Bonds | | | | 58,132,749 | |
| Australian Treasuries | | | | 144,736,254 | |
| U.S.Traded Equity Securities | | | | 681,728,533 | |
| | Total: | | $ | 1,159,097,947 | |
| Leuthold Select Industries Fund (Unaudited) | | | | |
Components of Portfolio Holdings* | | | | |
| Energy | | | $ | 7,850,649 | |
| Consumer Staples | | | | 3,624,089 | |
| Financials | | | | 737,564 | |
| Health Care | | | | 14,490,797 | |
| Industrials | | | | 4,165,897 | |
| Information Technology | | | | 6,458,851 | |
| Materials | | | | 341,729 | |
| Consumer Discretionary | | | | 2,580,213 | |
| Index Funds | | | | 1,100,732 | |
| | Total: | | $ | 41,350,521 | |
| Grizzly Short Fund (Unaudited) | | | | |
Components of Portfolio Holdings* | | | | |
| Short Securities: | | | | |
| Consumer Discretionary | | | $ | 35,720,676 | |
| Consumer Staples | | | | 5,870,740 | |
| Financials | | | | 15,571,482 | |
| Health Care | | | | 10,649,168 | |
| Industrials | | | | 8,089,131 | |
| Information Technology | | | | 16,426,203 | |
| Materials | | | | 7,435,918 | |
| Telecommunication Services | | | | 9,602,711 | |
| Utilities | | | | 5,228,319 | |
| | Total: | | $ | 114,594,348 | |
* Excludes short-term investments
| | | | MarketValue | |
| LeutholdAssetAllocation Fund (Unaudited) | | | | |
Components of Portfolio Holdings* | | | | |
| Brazilian Bonds | | | $ | 99,166,285 | |
| Emerging Country Investments | | | | 154,097,844 | |
| Equity ETFs | | | | 91,197,845 | |
| HighYield Bonds | | | | 77,240,731 | |
| Australian Treasuries | | | | 180,560,659 | |
| U.S.Traded Equity Securities | | | | 941,967,426 | |
| | Total: | | $ | 1,544,230,790 | |
| Leuthold Select Equities Fund (Unaudited) | | | | |
Components of Portfolio Holdings* | | | | |
| Consumer Discretionary | | | $ | 3,296,897 | |
| Consumer Staples | | | | 1,017,907 | |
| Energy | | | | 2,713,665 | |
| Health Care | | | | 5,776,594 | |
| Industrials | | | | 2,937,746 | |
| Information Technology | | | | 1,798,826 | |
| Materials | | | | 1,945,882 | |
| Telecommunication Services | | | | 1,141,407 | |
| Financials | | | | 464,871 | |
| | Total: | | $ | 21,093,795 | |
| Leuthold Undervalued & Unloved Fund (Unaudited) | | | | |
Components of Portfolio Holdings* | | | | |
| Consumer Discretionary | | | $ | 2,052,616 | |
| Consumer Staples | | | | 1,631,551 | |
| Energy | | | | 2,185,798 | |
| Financials | | | | 5,561,466 | |
| Health Care | | | | 3,061,512 | |
| Industrials | | | | 1,576,302 | |
| Information Technology | | | | 1,219,488 | |
| Materials | | | | 1,194,883 | |
| Utilities | | | | 1,645,363 | |
| | Total: | | $ | 20,128,979 | |
* Excludes short-term investments
| | | | MarketValue | |
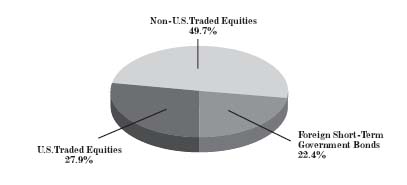
| Leuthold Global Fund (Unaudited) | | | | |
Components of Portfolio Holdings* | | | | |
| U.S. Traded Equities | | | $ | 16,343,642 | |
| Non-U.S. Traded Equities | | | | 29,093,000 | |
| Foreign Short-Term Government Bonds | | | | 13,108,327 | |
| | Total: | | $ | 58,544,969 | |
* Excludes short-term investments
The Leuthold Funds
Leuthold Core Investment Fund - Retail Class
Average Annual Rate of Return For Periods Ended
September 30, 2008
| | 1 Year | | 3 Year | | 5 Year | | 10 Year |
| Leuthold Core Investment Fund-Retail Class | (11.48%) | | 5.48% | | 10.00% | | 9.38% |
| Lipper Flexible Fund Index | (15.68%) | | 2.10% | | 5.83% | | 3.89% |
| S&P 500 Index | (21.97%) | | 0.22% | | 5.17% | | 3.06% |