Washington, D.C. 20549
Leuthold Funds, Inc.
33 S. Sixth Street, Suite 4600, Minneapolis, MN 55402
33 S. Sixth Street, Suite 4600, Minneapolis, MN 55402
Item 1. Reports to Stockholders.
Annual Report
September 30, 2011
The Leuthold Funds
Leuthold Core Investment Fund
Leuthold Asset Allocation Fund
Leuthold Global Fund
Leuthold Select Industries Fund
Leuthold Global Industries Fund
Leuthold Global Clean Technology Fund
Leuthold Hedged Equity Fund
Grizzly Short Fund
This page is intentionally left blank
Please do not print this text
| The Leuthold Funds |
| Table of Contents |
| Letter to Shareholders | 1 |
| | |
| Expense Examples | 19 |
| | |
| Allocation of Portfolio Holdings | 24 |
| | |
| Components of Portfolio Holdings | 28 |
| | |
| Investment Graphs | 30 |
| | |
| Statements of Assets and Liabilities | 44 |
| | |
| Statements of Operations | 48 |
| | |
| Statements of Changes in Net Assets | 52 |
| | |
| Financial Highlights | 60 |
| | |
| Schedule of Investments | |
| | |
| Leuthold Core Investment Fund | 74 |
| | |
| Leuthold Asset Allocation Fund | 83 |
| | |
| Leuthold Global Fund | 92 |
| | |
| Leuthold Select Industries Fund | 102 |
| | |
| Leuthold Global Industries Fund | 105 |
| | |
| Leuthold Global Clean Technology Fund | 109 |
| | |
| Leuthold Hedged Equity Fund | 112 |
| | |
| Grizzly Short Fund | 118 |
| | |
| Notes to the Financial Statements | 122 |
| | |
| Report of Independent Registered Public Accounting Firm | 135 |
| | |
| Additional Information | 136 |
| | |
| Directors and Officers | 138 |
This page is intentionally left blank
Please do not print this text
Dear Fellow Shareholders:
Leuthold Weeden was established in 1987 by Steve Leuthold, whose reputation for insightful research had been firmly established for decades. Steve’s proprietary calculations, contrarian views, and market insights are well followed and widely regarded throughout the industry. He has had a huge influence on those of us who work with him. It takes a special, forward-thinking mentality to share knowledge generously and cultivate talent. Steve built a team and culture that is broad and deep, ensuring the reputation and honor Leuthold Weeden was founded on will continue into the future.
Over the years Steve broadened responsibilities of portfolio management teams and solidified the fact that Leuthold Weeden isn’t a one-man show. His approach has been to foster genuine collaboration across disciplines and quantitative methodologies. Recently Steve turned over his Chief Investment Officer responsibilities to Leuthold veteran Doug Ramsey. But Steve is still very much part of the collaborative process here. As he likes to say, “Even after 50 years, investing remains both my vocation and my avocation.” As the bluegrass music drifts down the hallway from the boom box in his office, we are lucky that Steve is just not a retirement kind of guy.
Steve continues to be a very actively involved partner—contributing to asset allocation disciplines; writing commentary; acting in an Advisory role to the portfolio management team; continuing his role on the Funds’ Board of Directors; and managing some private accounts and his family foundation assets.
Steve’s longstanding reputation and process are the backbone of the Leuthold Funds. All of us at Leuthold continue to be steadfastly focused on managing the Funds with that same diligence and care.
The 2010-2011 fiscal year started out strong, with impressive market gains through December 2010 securing a big victory for the bulls, both domestically and globally. With double-digit performance gains across every size and style index, this served to change the tone of the market from conservative and overly pessimistic to more widespread optimism by early 2011. The global bull market turned two years old in March 2011, and despite a range of bad news between January and March, including higher oil prices, Middle East unrest, the catastrophes in Japan, and the European Sovereign debt crisis, the stock market did not break stride. Throughout this, both our domestic and global Major Trend Index analyses remained bullish, and we were anticipating the potential for additional global market gains as 2011 progressed.
The market remained strong through April, but as soft economic numbers hit the tape, a sell-off began in May and continued into June. Fears about the impact of the tsunami in Japan morphed into an economic slowdown at home, which was exacerbated by more European debt issues. Despite all the headwinds, our market analysis remained with a positive bias, and a powerful rally in the final four days of June erased moderate market losses suffered during May and the first half of June. With our market analysis still positive on balance, we viewed the May-June decline as an overdue bull market correction. We did not – at the time –suspect that the spring highs in the stock market would turn out to be the final highs of the cyclical bull market.
However, the market reversed back to a downtrend in July, and by early August, our Major Trend disciplines turned decisively negative. This change in outlook prompted a shift in our asset allocation portfolios to a defensive stance before the worst of the bear market hit. Despite this timely defensive move, our remaining long equity holdings performed considerably worse than the benchmark indexes. Had our equities merely been able to match their respective market benchmarks, our tactical asset allocation Funds’ downside protection during those months would have been excellent.
| | The Leuthold Funds - 2011 Annual Report | 1 |
Why did our equities suffer such a disproportionate decline? From a technical perspective, market strength in 2011 had been fairly uniform across key sub-sectors, and we would normally expect internal market performance to become more disparate, or “fractured” before stocks made their final bull market highs. These dynamics did not materialize leading up to the conclusion of this bull market. The lack of these more customary “warning” signals resulted in most of our Funds’ long stock exposure being ill-positioned to navigate the volatile market decline commencing in August. The decline caught us with stock exposure heavily weighted toward cyclicals, materials, and energy; which are not traditionally defensive areas to seek shelter during a market decline.
The last three months of the fiscal year saw a cascade of global risk events that brought down all markets around the world. The worsening sovereign credit crisis in Europe, loss of confidence due to the U.S. debt ceiling debate, S&P downgrade of U.S. Treasuries, and the fear of a global recession, all contributed to a global risk-off trade. As a result, both volatility and cross-asset correlation shot up and economically sensitive industries and higher beta small/mid cap stocks were hit much harder.
For the fiscal year ended September 30, 2011, all eight of the Leuthold Funds had negative results, with six underperforming relative to their benchmarks, and two outperforming on a relative basis. The net losses in our Funds over the last twelve months are almost entirely the result of the market collapse during the last three months of the fiscal year, which saw a -13.87% loss in the S&P 500, and the DJIA decline of -11.49%. Broader market indexes and global markets experienced even steeper losses, as illustrated by the Russell 2000 decline of -21.87%, and the MSCI ACWI (All Country World Index) -17.33% loss.
Looking ahead, we believe the major market risk for the remainder of 2011 is the refocus on the U.S. deficit dilemma and our political system that may once again demonstrate it is incapable of taking meaningful action. If some meaningful deficit reductions are implemented, the U.S. stock market could run to new highs or better by year-end. We are less worried over the potential for accelerating U.S. inflation than we were six months ago, thanks to recent declines in commodity prices which have been as large, or even larger than, the fall in stock prices. The immediate danger of the Eurozone crisis now seems to be behind us and the fear of a new recession in late 2011-early 2012 is no longer a primary psychological stock market negative. The consensus currently believes the economic expansion, although modest, will continue and more economists are saying 2012 might be a better year than 2011, with unemployment even coming down a few notches.
Regardless of the consensus, the economists, and even our own expectations and predictions, it is our disciplines that drive our investment strategies. With countless forces affecting market action both in the short term and over the long term, we think it is most prudent to remain flexible and make adjustments along the way. The last three months of the fiscal year was a particularly challenging period for most of our strategies, but this is a very short time to measure, and we remain confident in the processes involved. Within each of our strategies we attempt to be poised to add value and find opportunities in all market conditions, and doing so requires a level of portfolio dexterity that is atypical in most mutual fund organizations. We believe this autonomy affords us the opportunity to produce market-beating returns over the long term.
| 2 | The Leuthold Funds - 2011 Annual Report | |
FUND OVERVIEWS
Leuthold Core Investment Fund (re-opened to all investors on May 16, 2011)
This Fund began trading on November 20, 1995. The strategy is flexible and value-oriented. The Leuthold Core Investment Fund adjusts asset class exposure based on underlying market dynamics and trends in order to attempt to avoid undue risk and take advantage of areas that appear poised to outperform. Assets are actively allocated between stocks, bonds, money market instruments, foreign securities, and other alternative investments. The Fund may also hedge equity exposure and fixed income exposure through short-selling strategies when our disciplines indicate potential market vulnerabilities. While at times individual portfolio allocations may appear unconventional, they are intended to assemble as complementing positions in an effort to carry out the Fund’s guiding principle: capital appreciation over the long-term, attained through relatively risk averse, prudent investment selection.
● | Leuthold Core Investment Fund uses the Leuthold Select Industries strategy as the primary vehicle for its U.S.-traded stock exposure. |
| Investment Guidelines: 30%-70% equity exposure and 30%-70% fixed income exposure. Under extreme market conditions, there may be a departure from these guidelines. Equity exposure is determined by our Major Trend Index which was designed to attempt to identify major (longer-term) market trends. This proprietary Leuthold index has been formally calculated on a weekly basis for 40+ years, and is currently composed of over 190 individual factors. |
Leuthold Asset Allocation Fund
This Fund began trading on May 24, 2006, as the successor to the then-closed Leuthold Core Investment Fund. The strategy and objective of this Fund are identical to those of the Leuthold Core Investment Fund in terms of guiding disciplines, flexibility, asset class exposure, and risk aversion. The difference between the two portfolios is in the stock selection approach employed for the primary U.S.-traded stock exposure.
| Leuthold Asset Allocation Fund currently uses a multi-strategy approach for its U.S.-traded stock exposure. This multi-strategy approach employs a combination of the Leuthold Select Equities and Leuthold Undervalued & Unloved methodologies. |
Leuthold Global Fund
This asset allocation strategy was introduced on April 30, 2008, and can be considered the “global” equivalent of the Leuthold Core Investment Fund. The strategy and objective of this Fund are analogous to that of the Leuthold Core Investment Fund in terms of guiding disciplines, flexibility, asset class exposure, and risk aversion. The Leuthold Global Fund invests in U.S. and foreign-traded stocks, bonds, money market instruments, and alternative investments. When market conditions are deemed unfavorable, the Fund may also sell short certain securities in order to hedge exposure to a particular asset class. The key distinction is that the Leuthold Global Fund intends to invest at least 40% of assets in foreign-traded securities, including stocks, bonds, and other asset classes.
| | The Leuthold Funds - 2011 Annual Report | 3 |
| Leuthold Global Fund uses the Leuthold Global Industries strategy as the primary vehicle for its stock exposure. |
| Investment Guidelines: 30%-70% equity exposure and 30%-70% fixed income exposure. Under extreme market conditions, there may be a departure from these guidelines. Equity exposure is determined by our Global Major Trend Index which was designed to attempt to identify major (longer-term) market trends on a global basis. This proprietary Leuthold index is composed of around 100 individual factors. |
Leuthold Select Industries Fund (re-opened to all investors on May 16, 2011)
This Fund began trading on June 19, 2000, and unlike our asset allocation strategies, it is mandated to remain 100% invested in stocks at all times. This attribute results in the potential for considerably higher volatility, higher risk, and the probability that investors will lose money when the stock market declines. The Leuthold Select Industries Fund strategy is a top-down approach, based on industry group selection and rotation, and sector concentrations. Driven by a quantitative evaluation of around 120 equity-industry groups, it attempts to detect collective strength and emerging leadership potential, while exposing areas that appear vulnerable and should be avoided.
| The elements of industry group rotation and sector concentrations result in this Fund’s potential for higher volatility; it is potentially more risky while offering potentially more reward. |
Leuthold Global Industries Fund
This Fund became available on May 17, 2010. The Leuthold Global Industries Fund invests in common stocks and other equity securities from around the world, based on a disciplined, unemotional, and quantitative approach to concentrated equity group investments. The strategy employs an industry group selection/rotation approach based on the methodology of our Leuthold Select Industries strategy; however, under normal conditions at least 40% of the Leuthold Global Industries Fund’s assets will be invested in securities from non-U.S. markets.
| As with the Leuthold Select Industries Fund, the elements of industry group rotation and sector concentrations result in the potential for higher volatility in the Leuthold Global Industries Fund; it is potentially more risky while offering potentially more reward. |
Leuthold Global Clean Technology Fund
This Fund became available on July 22, 2009, and unlike our other equity strategies, this Fund employs fundamental stock-selection. The Fund allocates its investments globally, in companies that endeavor to reduce humans’ impact on the environment through energy efficient and “clean” technologies, innovations, and solutions. A confluence of factors will help increase the demand for products from firms focused on technologies that clean, preserve, and/or maximize the earth’s resources, making these firms excellent long-term investments. In brief, noteworthy dynamics include: political influence, higher fossil fuel prices, growing world population, changing energy source preferences, commodity price volatility, and significant and growing markets.
| 4 | The Leuthold Funds - 2011 Annual Report | |
The Fund invests primarily across four clean technology sectors: Alternative Energy, Resource Conservation, Clean Water, and Clean Environment. The universe of stocks maintained for security selection is further organized among over 30 different “sub-industries”. This helps identify specific clean technology industries showing signs of unusual strength or weakness, and may be used as a basis for establishing overweight and underweight industry exposures in the Fund’s portfolio.
| The nature of this strategy combined with the inherently smaller capitalization of the eligible stock universe results in a high level of volatility in performance. Investors should have a very long term outlook when employing this Fund. |
Leuthold Hedged Equity Fund
This Fund began trading on July 22, 2009, and employs a combination of our short-selling strategy and our domestic industry-group selection/rotation approach of the Leuthold Select Industries strategy. The Leuthold Hedged Equity Fund pursues its investment objective by establishing long and short positions in common stocks. This is an unleveraged Fund which seeks to maintain approximately equal weightings of gross long exposure and gross short exposure, but its objective is to produce absolute returns.
Grizzly Short Fund
Introduced on June 19, 2000, this unleveraged, actively managed Fund is 100% short individual stocks. (Short-selling strategies are aimed at profiting when stock prices decline.) Policy mandates the Grizzly Short Fund target 100% exposure in stocks sold short at all times, even when the stock market is in a rising trend, and regardless of whether our firm is bullish toward stocks.
| The Grizzly Short Fund typically maintains approximately equal-weighted short positions in around 60-90 individual stocks, initially selected by a multi-factor quantitative discipline. Each position is monitored daily and subject to a set of short covering disciplines. |
| Shareholders should anticipate they will most likely lose money investing in this Fund when stock prices are in a rising trend. |
The Grizzly Short Fund is a tool for sophisticated users. Traders, experienced investors, and speculators who anticipate the market may decline will employ the Grizzly Short Fund to tactically regulate stock market risk. It is also used in varying degrees with other multi-faceted portfolio strategies. This is not a Fund for buy and hold investors.
| | The Leuthold Funds - 2011 Annual Report | 5 |
ANNUAL PERFORMANCE REVIEW
Leuthold Core Investment Fund (re-opened to all investors on May 16, 2011)
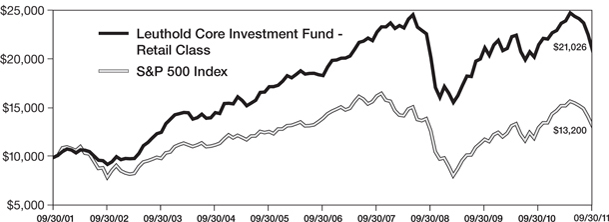
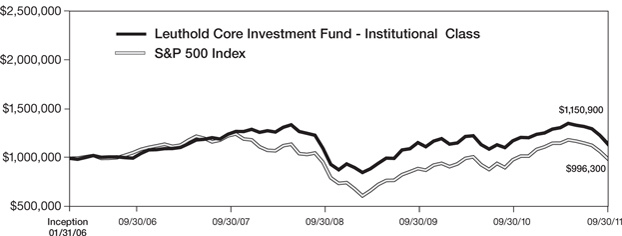
This is our firm’s flagship asset allocation strategy, with $1.01 billion of assets under management. For the fiscal year ended September 30, 2011, the Leuthold Core Investment Fund (retail share class) posted a total return loss of -2.61%, underperforming the S&P 500’s total return gain of +1.14% over the same time frame.
From the beginning of the fiscal year, October 1, 2010, through late July 2011, the Fund maintained a bullish stance with an average 62% net allocation to stocks. In early August 2011, our market analysis turned decisively negative and equity exposure was thus significantly reduced, initially targeting 45%, with further reductions taking net exposure down to 31% by the end of September. This was accomplished through a combination of reducing U.S. stock positions, lowering Emerging Market equity exposure, and initiating an equity hedge. This lowered exposure was well-timed, as the S&P 500 lost -12.08% total return from August 1 through September 30, while our equity hedge produced a strong +17.30% total return gain. However, more than offsetting this gain was the Core Fund’s U.S.-traded stock exposure, which produced a -19.51% total return loss during those two months. Hence, despite the Fund’s timely move to a defensive stance in early August, the success of the equity hedge was obscured by the outsized losses in the Fund’s U.S.-traded stocks. One of our Fund’s objectives is to outperform the S&P 500 with our long stock exposure, therefore when our stocks underperform when we are in a defensive mode, it is especially disappointing as it reduces the net effectiveness of the equity hedge.
For full details regarding the allocations affecting the Leuthold Core Investment Fund’s U.S.-traded long stock exposure, please refer to the performance discussion of the Leuthold Select Industries Fund on subsequent pages.
The Leuthold Core Investment Fund’s Emerging Market Equities exposure maintained an overweight position most of the year, at 14.5% on average. In contrast with last year, this allocation was a large performance drag, turning in a loss of over -19.5%. The majority of this loss was experienced in August and September; hence the effect on overall performance was not nearly as damaging as it might have been, because we had significantly reduced exposure in early August as part of our shift to become more defensive. As of the end of September, the Emerging Market Equities exposure is 8%, much closer to our long-term average position of about 5%. Worth mentioning is the gradual phasing-out, during the last twelve months, of our exposure attained via Emerging Market ETFs and open-end funds. Global markets continue to develop, becoming more accessible. In addition, we have built out our global trading capabilities allowing us to establish direct exposure to Emerging Markets; hence our holdings are now composed of individual stocks. We believe this offers an excellent opportunity to better identify and target specific market segments. Currently, due to strong conviction about the long term consumer-driven story, we have been overweighting consumer related sectors in Emerging Markets. At present, the majority of this exposure is through Chinese companies, but there is also exposure to South Korea, Thailand, Indonesia, Taiwan, Singapore, Hong Kong, Malaysia, and the Philippines.
Our Fund’s normal guideline minimum for Fixed Income is 30% of assets. However, as we’ve noted for a number of years, we see very few opportunities in the fixed income market so we’ve continued to maintain a much lower-than-normal minimum exposure. Including a Fixed Income Hedge employed for eight months during the fiscal year ended September 30, 2011, we had an average of just 5.75% of net fixed income exposure.
| 6 | The Leuthold Funds - 2011 Annual Report | |
The constant fixed income holdings for the last twelve months were Brazilian Bonds and Quality Corporate Bonds. High Yield Floating Rate Bonds were introduced in January, followed by Emerging Market Bonds in April, and Australian Bonds in July. Of these, only the Quality Corporate Bonds (3% average holding) and Australian Bonds (1% holding) produced net gains, +3% and +6% total returns, respectively. Prior to 2011, our Brazilian Bond holding had a multi-year run of returns near +30%, but the opportunity has run its course. Results over the last twelve months were a muted mix of gains and losses, and in September the holding lost over -21%. This was a 4% portfolio allocation and ended the year with a total return loss of nearly -6%. High Yield Floating Rate Bonds (2% holding) lost about -1% total return, and the Emerging Market Bonds (1% holding) were down -7% total return for the fiscal year ended September 30, 2011. The Fixed Income Hedge was also a portfolio negative, with a total return loss of nearly -4%.
Originally purchased in early 2009, we maintained the allocation to a diversified portfolio of REITs until early August 2011, when it was sold to fund the equity hedge. This position posted a -4% total return loss for the 11 months held during the fiscal year.
Alternatives: On average, we held a 5% combined allocation to physical Gold and Silver during the last twelve months. This position, which was initiated in April 2009, was established due to our concern regarding the potential risk of very dangerous long-term inflation as physical gold and silver offer some defense. While it is just a small allocation, it has been the portfolio standout. On the heels of a +31% gain in the 2009-2010 fiscal year, this physical metals allocation produced a total return gain of over +35% for the fiscal year ended September 30, 2011.
In summary, there were occurrences when our long stock exposure via the Select Industries strategy did not perform in a complementary manner, and this was the key portfolio component which detracted from performance. While we are always disappointed to report negative results, the differential between the Core Fund’s fiscal year total return loss of -2.61%, versus the S&P 500’s modest total return gain of +1.14%, is a relatively low hurdle to attempt to make up for in the new fiscal year. Overall, we believe the past year underscores the power of our asset allocation strategy’s flexibility to adjust exposure to risk. In particular, the latitude to be able to initiate relevant portfolio defense via the equity hedge from August through September was tremendously additive and demonstrates the effectiveness of our asset allocation strategy’s underlying principle: attempting to minimize risk in declining – or uncertain - market environments.
| The longer-term results of the Fund make it evident the strategy goals are being achieved. For the 10-year time frame ended September 30, 2011, the Leuthold Core Investment Fund has a cumulative total return gain of +110.26% (+7.71% annualized), compared to the S&P 500’s +32.00% cumulative total return gain (+2.82% annualized). |
| We will adhere to the disciplined market analysis that has driven our long-term performance. As market conditions change, you can expect the Fund to adapt exposures attempting to take part in gains of rising markets and/or take measures to minimize risk when our disciplines indicate conditions warrant a defensive position. |
| | The Leuthold Funds - 2011 Annual Report | 7 |
Leuthold Asset Allocation Fund
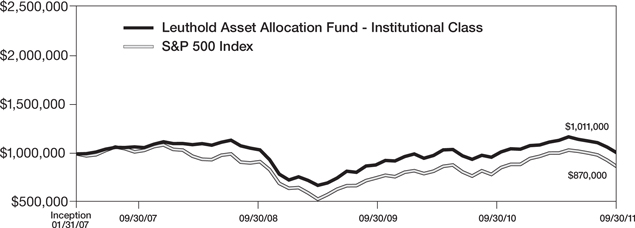
This Fund has assets under management of $993 million. For the fiscal year ended September 30, 2011, the Leuthold Asset Allocation Fund (retail share class) generated a total return loss of -1.34%, underperforming the S&P 500’s total return gain of +1.14% over the same time frame.
From the beginning of the fiscal year, October 1, 2010, through late July 2011, the Fund maintained a bullish stance with an average 62% net allocation to stocks. In early August 2011, our market analysis turned decisively negative and equity exposure was thus significantly reduced, initially targeting 45%, with further reductions taking net exposure down to 31% by the end of September. This was accomplished through a combination of reducing U.S. stock positions, lowering Emerging Market equity exposure, and initiating an equity hedge. This lowered exposure was well-timed, as the S&P 500 lost -12.08% total return from August 1 through September 30, while our equity hedge produced a strong +17.30% total return gain. Almost counterbalancing this gain was the Asset Allocation Fund’s U.S.-traded long stock exposure, which produced a -14.76% total return loss during those two months, losing more than the S&P 500. Hence, despite the Fund’s timely move to a defensive stance in early August, the success of the equity hedge was obscured by the outsized losses in the Fund’s long stock exposure. One of our Fund’s objectives is to outperform the S&P 500 with our long stock exposure; therefore, when our stocks underperform when we are in a defensive mode, it is especially disappointing as it reduces the net effectiveness of the equity hedge.
For its U.S.-traded equity exposure, this Fund has used a multi-strategy approach. Since inception, this multi-strategy approach has employed a combination of the Leuthold Select Equities and Leuthold Undervalued & Unloved strategies. Both are bottom-up, quantitative methodologies and each generally contributes a different type of stock market exposure. Individually these two strategies are quite different, but when used in tandem, they allow us to construct an equity portfolio with overall characteristics suitable for an asset allocation approach, and afford us the flexibility to adjust the mix to align with our market outlook. For the fiscal year ended September 30, 2011, the combined allocation to the Leuthold Select Equities strategy and the Leuthold Undervalued & Unloved strategy contributed a total return loss of -3.35%.
This U.S.-traded equity exposure via Select Equities/Undervalued & Unloved underperformed the S&P 500 during six of the last twelve months, and matched or slightly outperformed in the other six months. While there was no extreme divergence in any particular month, the months of underperformance overwhelmed the results, as the majority of those months lagged in the range of 1% to over 2%, whereas the months of outperformance typically added less than one-half percent more than the S&P 500’s gain.
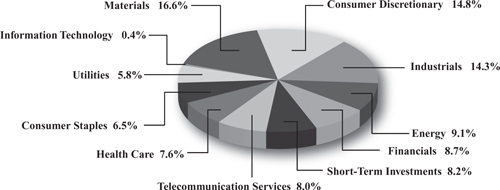
For the fiscal year ended September 30, 2011, there were only three broad sectors that contributed overall net gains in this combined Select Equities/Undervalued & Unloved stock allocation: Consumer Discretionary, Telecommunication Services, and Utilities. The Consumer Discretionary sector had the biggest contribution to return, which included additive investments in a broad range of groups including: Apparel Retail, Footwear, Apparel Accessories/Luxury Goods, Home Furnishings, and Auto Parts/Equipment. The Telecommunication Services sector had positive results from the Integrated Telecom and Wireless Telecom Services groups. The best Utilities sector results were primarily attributed to investments in Electric Utilities stocks. Other significant positive group contributors came from a range of other sectors: Integrated Oil & Gas (Energy sector); Tobacco (Consumer Staples sector); and Electronic Components and Electronic Manufacturing Services (Information Technology Sector).
| 8 | The Leuthold Funds - 2011 Annual Report | |
Sector investments which detracted the most from performance were Materials, Industrials, Information Technology, and Financials. Within the Materials sector, the worst group investments included Diversified Metals & Mining, Aluminum, and Steel. The Industrials sector group detracting the most was Industrial Machinery. Performance detractors from the Information Technology sector included Technology Distributors, Semiconductor Equipment, and Semiconductors. Financials groups which were the most negative contributors included Regional Banks and Diversified Financial Services. There were a handful of other group investments from miscellaneous sectors that also were performance detractors: Pharmaceuticals (Health Care sector); and Oil & Gas Drilling and Oil & Gas Refining (Energy sector).
Exposure to foreign stocks within the Select Equities/Undervalued & Unloved mix has remained steady over the course of the year. There was an average 16% exposure to foreign stocks, with just under 2% of that coming from Emerging Market equities.
Aside from the U.S.-traded Select Equities/Undervalued & Unloved stock selection strategy, the Leuthold Asset Allocation Fund otherwise follows the very same investment mandates, asset mix shifts, and asset class investment vehicles as the Leuthold Core Investment Fund. To minimize repetition, for the performance review of all the other asset classes held by this Fund during the last 12 months: Emerging Market Equities, Fixed Income, REITs, and Alternatives (Gold and Silver), please refer to the preceding discussion of the Leuthold Core Investment Fund performance details.
| The Leuthold Asset Allocation Fund now has a five year record which we believe reflects favorably that the objective is being achieved, especially considering the gamut of events that occurred during this time: bull and bear markets, financial/liquidity crises, bailouts, housing bust, recession, recovery, and multiple “QE” endeavors. For the five year time frame ended September 30, 2011, the Leuthold Asset Allocation Fund has a cumulative total return gain of +8.84% (+1.71% annualized), compared to the S&P 500’s -5.76% cumulative total return loss (-1.18% annualized). |
| We will adhere to the disciplined market analysis that has driven our long-term performance. As market conditions change, you can expect the Fund to adapt exposures attempting to take part in gains of rising markets and/or take measures to minimize risk when our disciplines indicate conditions warrant a defensive position. |
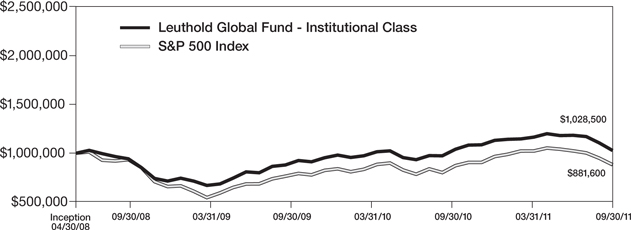
Leuthold Global Fund
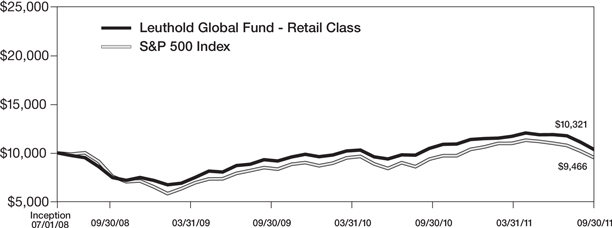
This Fund has assets under management of $445 million. It offers investors a global alternative to our domestically focused tactical asset allocation strategies of the Leuthold Core Investment Fund and the Leuthold Asset Allocation Fund. For the fiscal year ended September 30, 2011, the Leuthold Global Fund (retail share class) produced a total return loss of -1.33%, outperforming the -5.54% total return loss in the MSCI ACWI (All Country World Index) and the -2.60% total return loss of the Lipper Global Flexible Portfolio Funds Index.
From the beginning of the fiscal year, October 1, 2010, through late July 2011, the Fund maintained a bullish stance with an average 62% net allocation to stocks. In early August 2011, as with our domestic market analysis, our global market analysis turned decisively negative and equity exposure was thus significantly reduced, initially targeting 50%, with further reductions taking net exposure down to 32% by the end of September. This was accomplished through a combination of reducing global stock positions and employing an equity hedge. This lowered exposure was well-timed, with the MSCI ACWI
| | The Leuthold Funds - 2011 Annual Report | 9 |
losing -15.99% total return from August 1 through September 30, while our global equity hedge position produced a +15.77% total return gain. However, similar to the experience of our domestic asset allocation Funds, the Leuthold Global Fund’s long stock exposure performed poorly. This global stock exposure produced a -21.68% total return loss during those two months, more than offsetting the shelter provided by the gain of the equity hedge. Hence, despite the Fund’s timely move to a defensive stance in early August, the success of the equity hedge was obscured by the outsized losses in the Fund’s long stock exposure. One of the Fund’s objectives is to outperform the MSCI ACWI with our long stock exposure; therefore, when our stocks underperform when we are defensively positioned, it is especially disappointing as it reduces the net effectiveness of the equity hedge.
For full details regarding the allocations affecting the Leuthold Global Fund’s long stock exposure, please refer to the performance discussion of the Leuthold Global Industries Fund on subsequent pages.
The Leuthold Global Fund normally has a guideline minimum level of 30% invested in Fixed Income; however, as with last year the Fund remained far below the normal minimum for the entire fiscal year, with an average allocation of just 10%. As we noted in our commentary for the Leuthold Core/Asset Allocation Funds, there is very little that is attractive to us on a risk/reward basis in the fixed income markets, be it domestic fixed income or foreign fixed income.
We began the fiscal year with allocations to Global Government Bonds (average 3% of assets), Global High Yield Bonds (average 3% of assets), Global Corporate Bond Funds (average 3% of assets), Treasury Inflation Protected Securities (average 2% of assets), and a package of foreign Convertible Bonds (average 1% of assets). In June, a new 1% holding was established in U.S. Municipal Bonds. With the exception of Global Government Bonds, each of these fixed income subsets contributed solid positive performance during the year, with results ranging from +2.5% to +6% total return. Global Government Bonds had relatively flat results, +0.42% total return for the twelve months ended September 30, 2011. As a means to offset the risk of rising interest rates, the Fund also employed a Fixed Income Hedge – shorting U.S. Treasury Bonds - on and off during the fiscal year. The hedge was employed from October 2010 – January 2011, and produced positive net results. It was not successful the second time around, turning in losses after being re-deployed in late May and held through fiscal year-end. The allocation ranged from 1.5% to 3% of assets, and the result of the combined holding periods was a net total return loss, of about -3.8% for the fiscal year ended September 30, 2011.
The Leuthold Global Fund had an allocation to REITs, specifically targeting exposure to mortgage REITs and global real estate. This 4% allocation contributed a strong total return gain of +15.50% for the holding period between October 1, 2010, and early August 2011. The position was eliminated in early August as our outlook became defensive, and the proceeds were used to increase the equity hedge.
Alternatives: This physical Gold and Silver holding was initiated in 2009, and over the last twelve months, on average, we maintained a 5% combined allocation. With the U.S. and other foreign governments pumping money into the global economy, we made this allocation due to our concerns about the long-term inflation implications related to the excess liquidity. While it is just a small allocation, it has been the portfolio standout. On the heels of a +32% gain in the 2009-2010 fiscal year, this physical metals allocation produced a total return gain of nearly +35% for the fiscal year ended September 30, 2011.
| 10 | The Leuthold Funds - 2011 Annual Report | |
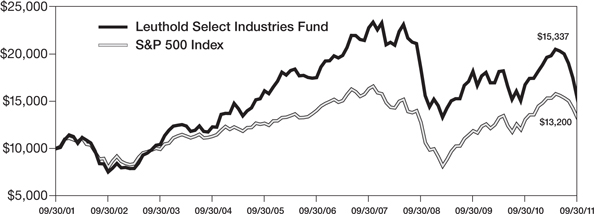
Leuthold Select Industries Fund (re-opened to all investors May 16, 2011)
This all-equity Fund, with total assets under management of $16 million, had a very disappointing total return loss of -8.60% for the fiscal year ended September 30, 2011, compared to a +1.14% total return gain for the S&P 500.
This year’s substantial underperformance is primarily attributable to the last three months of the fiscal year ended September 30, 2011. During this three month period, the Leuthold Select Industries Fund had a total return loss of -23.51%, versus the S&P 500 total return loss of -13.87%. The third quarter of 2011 saw a cascade of global risk events, and as the market veered sharply south, this Select Industries equity portfolio was ill-positioned to absorb the impact, with large concentrations in Energy, Consumer Discretionary, and Materials stocks – not areas associated with a defensive stance. Additionally, our quantitative equity strategy does best in periods when there is a strong distinction between winners and losers among equity groups and themes. The changes in the market took place so rapidly that the 2011 bear market offered virtually no place to hide.
There were quite a few changes in the portfolio sector exposure as the year progressed, which is another indication of a trendless market and lack of leadership. Again, this is an environment where the group selection strategy does not thrive. The 2010-2011 fiscal year began with the heaviest exposure to Health Care and Information Technology. The third heaviest sector weight traded off between Consumer Discretionary and Consumer Staples until April, when Consumer Staples faded and Energy and Materials exposure was boosted. The Financials sector exposure was also being boosted as Information Technology was being significantly reduced by late July. Health Care maintained one of the top two heaviest weights during the entire twelve month period, and ended the year at a sizeable 46% of assets, followed by Materials, Energy, Consumer Discretionary, and Financials. As of September 30, 2011, there was little to no exposure in Information Technology, Consumer Staples, Industrials, Telecommunications and Utilities.
The best performance from the sector level was provided by the heavy Information Technology exposure held between October 2010 and April 2011. This was followed by outperformance from our Health Care sector stocks, and to a lesser degree, Consumer Staples and Industrials sector exposure. The largest losses by far came from the Fund’s Materials sector exposure, which wasn’t even a significant portfolio weight until July. The Financials and Energy sectors also contributed large portfolio losses.
From an industry group perspective, for the full fiscal year, the Leuthold Select Industries Fund’s most beneficial exposure came from group investments in Semiconductors and Electronic Components (Information Technology sector); Managed Health Care and Pharmaceuticals (Health Care sector); and Hypermarkets & Super Centers (Consumer Staples sector).
The least productive industry group investments in the Fund for the year ended September 30, 2011, were from those allocations which were the biggest detractors (as noted above) from a sector level: Oil & Gas Drilling (Energy sector); Steel, Aluminum, and Fertilizers & Ag Chemicals (Materials sector); and Diversified Financial Services and Diversified Capital Markets (Financials sector).
Exposure to foreign stocks in the Leuthold Select Industries Fund is now at 17%, versus an average of 25% last fiscal year. Within this foreign exposure, Developed Market stock exposure remained relatively consistent at around a 15% allocation while there has been a migration away from Emerging Market stocks, now at 3% exposure versus 10% in October 2010.
| | The Leuthold Funds - 2011 Annual Report | 11 |
With the exception of the Health Care sector holdings in Managed Health Care and Pharmaceuticals, current portfolio group holdings bear little resemblance to the holdings a year ago. This is unusual as the strategy intends to uncover longer-term industry group trends. (It is more typical for the portfolio to have at least one-half of its positions being held a year or longer at any given time.)
In summary, the rapidly changing conditions beginning in the third quarter of 2011 put us at a great disadvantage considering our lack of defensive allocations. Since the market lows of 2009, there has been an extremely high level of performance correlation with no regard for size or quality of stocks, making it additionally difficult to navigate and gain traction with this strategy. We expect to see a reversion of the currently high cross-asset correlations to a lower level, which should benefit the process employed in this Fund’s industry group approach. While this strategy is not ideal for all market conditions, we believe over the longer term it is more typical than not for the market to be driven by macro-theme dynamics, allowing this Fund to uncover more persistent areas of strength. Our longer term results illustrate how the Leuthold Select Industries Fund was designed to take advantage of those trends.
| Since inception on June 19, 2000, through September 30, 2011, the Leuthold Select Industries Fund has produced a +52.76% cumulative total return gain (+3.83% annualized) versus a -6.05% cumulative total return loss for the S&P 500 (-0.55% annualized). |
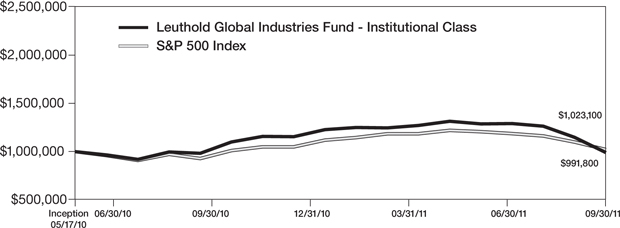
Leuthold Global Industries Fund
This all-equity Fund, with total assets under management of $20 million, had a disappointing total return loss of -10.23% (retail share class) for the fiscal year ended September 30, 2011, compared to the -5.54% total return loss of the MSCI ACWI (All Country World Index).
This is a relatively new Fund, launched on May 17, 2010; however, this Fund’s strategy is an extension of our domestic industry group selection/rotation approach which was established in the late 1990s and known as our Select Industries strategy. This global version of our disciplined, unemotional and quantitative approach employs many of the same factors as our domestic group selection strategy; it attempts to uncover those industry groups that appear most attractive at the global level. This Fund will normally invest at least 40% of its assets in equity securities from international markets.
Within the Leuthold Global Industries Fund, foreign-traded stocks composed 66% and U.S.-traded stocks composed 34%, on average, during the 2010-2011 fiscal year ended September 30, 2011. Of the foreign-traded securities, typically 77% has been invested in Developed Markets over the last twelve months, versus 23% Emerging Market stock exposure. In general, the largest foreign market country concentrations that were consistent throughout the year were spread among Japan, Germany, South Korea, Hong Kong, and Taiwan. Sweden and France also each had a relatively steady presence as heavier weighted allocations. From a performance stance, the most positive contributors at the country level came from investments in Mexico, South Korea, Taiwan, and the Philippines. The biggest detractors from performance at the country level included investments in the U.S., Hong Kong, Sweden, Germany, and Japan.
| 12 | The Leuthold Funds - 2011 Annual Report | |
While the country exposures may be of interest, equity exposure is dictated by the industry groups (not countries) that appear most attractive according to our quantitative disciplines. The Leuthold Global Industries Fund employs a top-down industry group approach for its equity selection. We believe that industry group leadership on a global basis will generate superior returns over the more traditional approach of “country” or “regional” concentrations, as the global economy has become increasingly interdependent.
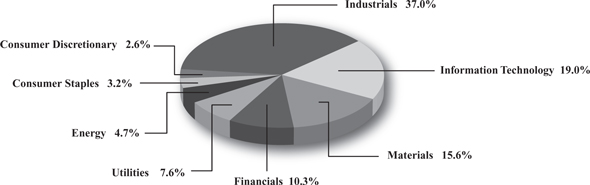
As with our domestic Leuthold Select Industries Fund, the Leuthold Global Industries Fund’s underperformance is primarily attributable to the last three months of the fiscal year ended September 30, 2011. During this three month period, the Leuthold Global Industries Fund had a total return loss of -23.34%, versus the MSCI ACWI total return loss of -17.33%. Our Leuthold Global Industries Fund had too many cyclical, non-dollar, emerging bets on the table and as correlations surged to all-time highs, those positions were severely punished. This Global Industries equity portfolio was positioned with its largest concentrations in Materials, Consumer Discretionary and Industrials stocks – very unfavorable areas during a market plunge. Additionally, our quantitative equity strategy does best in periods when there is a strong distinction between winners and losers among equity groups and themes. The changes in the market took place so rapidly that the 2011 bear market offered virtually no place to hide, neither domestically nor globally.
During the fiscal year ended September 30, 2011, the areas of strength among our global equity exposure primarily came from the broad sectors of Financials, Telecommunication Services, and to a much lesser degree, Utilities. At the global industry group level, these sectors were represented by Consumer Finance (Financials sector); Developed Wireless Telecom Services (Telecommunication Services sector); and Water Utilities (Utilities sector).
There was much more impact on portfolio results from the sectors contributing overall negative results. The largest negative contributors were: Information Technology, Materials, Energy, Industrials, and Consumer Discretionary. The specific industry group investments that produced the biggest losses included: Industrial Machinery and Airlines (Industrials sector); Semiconductor Equipment (Information Technology sector); Auto Components and Automobiles (Consumer Discretionary sector); Integrated Oil & Gas (Energy sector); and Fertilizers/Agricultural Chemicals and Diversified Chemicals/Industrial Gases (Materials sector).
As markets topped-out in late April/early May, the warning flags that typically wave as market tops are formed were simply not present. These flags have historically offered enough lead time for our disciplines to incorporate the trend change, allowing for some advance portfolio repositioning to a more defensive slant, as market tops are normally a “process”, not an “event.” We felt that our valuation bias would help us in such an environment, but this proved false over this limited window. This approach to global industry investing is not managed for the short term, however, and it was introduced during an unprecedented period of high correlation, which has persisted through this year. Looking ahead, our Leuthold Global Industries Fund contains companies with cheaper valuations and better growth prospects than the market as a whole, and we believe the disciplines will prevail over time.
| | The Leuthold Funds - 2011 Annual Report | 13 |
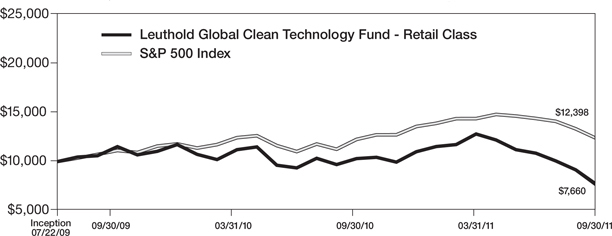
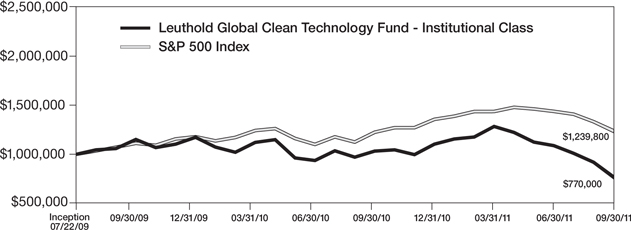
Leuthold Global Clean Technology Fund
The Leuthold Global Clean Technology Fund has $16 million in assets under management. For the fiscal year ended September 30, 2011, the Fund (retail share class) had a -25.63% total return loss, versus a total return loss of -39.66% in the Ardour Composite Global Alternative Energy Index, and a total return loss of -5.54% in the MSCI ACWI (All Country World Index).
The Fund began the year with strong results, as a significant portfolio overweight to the Resource Conservation sector and a large overweight to the Alternative Energy sector drove the Fund’s performance, turning in a +24.37% total return for the first six months through March 31, 2011. In particular, during this time frame, investments in solar, water, and emission-control companies were especially productive. The extension of tax credits and cash grants in the U.S. for renewable energy projects and cleaner fossil fuels additionally benefited a number of portfolio positions, boosting our returns considerably.
The Fund’s overall performance for the fiscal year ended September 30, 2011, was the result of a six month string of losses from April through September, where this Fund experienced a big -40.20% total return loss. During that time the Fund was heavily overweight in stocks from the Clean Environment sector, and moderately overweight in Alternative Energy and Resource Conservation. Significant contributors to this performance were losses related to investment in a wind turbine stock and our exposure to solar stocks, which took a big hit following Germany’s and Italy’s reductions in incentives for new solar installations. Positions in economically sensitive stocks, such as filtration and emissions control companies, were particularly poor performers as investors’ fears of a double-dip recession were inflamed by the downward revision of domestic economic data. Furthermore, investments in equipment manufacturers to the renewable sector underperformed, dragging the Fund’s results lower.
During the last three months of the fiscal year ended September 30, 2011, the Leuthold Global Clean Technology Fund was also generally affected by the decline in the overall stock market, and in particular, investors’ risk-aversion to smaller capitalization securities.
There were two major changes in the Fund’s sector exposure during the fiscal year. Exposure to the Clean Environment sector increased from 10% in October 2010 to 33% of portfolio assets at the end of September 2011. The Alternative Energy sector experienced the reverse action, with 50% exposure in October 2010 being reduced down to 30% as of September 30, 2011. The other three sectors experienced moderate to negligible change in portfolio exposure, with the Resource Conservation sector exposure being lowered to 14% during the year, down from 20%; Clean Water sector exposure was reduced from 12% in October 2010 to 10% by September 2011; and the Diversified sector, which will normally have very minimal exposure, ended the year with 3% of assets, down from 10% in October 2010.
The largest non-U.S. exposures during the year within the Fund were: China, Canada, Germany, Spain, Brazil, Taiwan, Japan, Switzerland, and France. Other, smaller concentrations among foreign countries were: Singapore, Denmark, Austria, Belgium, and Hong Kong. The U.S.-traded stock exposure during fiscal year 2010-2011 was 47% on average, with foreign country investments averaging about 53% of portfolio assets. (The Fund intends to invest at least 40% of assets in foreign-traded securities.)
While the Fund experienced a large loss for the 2010-2011 fiscal year (-25.63% total return), when weighed against the Ardour Composite Global Alternative Energy Index (-39.66% total return), which is the most comparable benchmark, our results are
| 14 | The Leuthold Funds - 2011 Annual Report | |
clearly superior, with over a 1400 basis point advantage. We appreciate that investors don’t take pleasure in realizing this level of losses; however, this theme is very long term oriented. We manage the Fund for long-term total return as the sector is likely to benefit from a multi-decade, cyclical upswing in demand for goods and services. As this past year’s experience demonstrates, results will be very volatile due to the inherent nature of the strategy and small capitalization of stocks in this fledgling industry.
Our approach is to identify and invest in best-in-class, profitable growth companies expected to increase revenues by about 20% per annum. Our focus remains on identifying cash-generating businesses with excellent revenue and profit growth outlooks. Though harder to find these days, they exist and we are selectively making investments that we believe will be productive over the longer term. We attempt to acquire shares when we deem them to be undervalued. We prefer to hold shares in companies for extended periods of time, though we will reduce or eliminate positions we deem overvalued. In short, we view this opportunity akin to a marathon, not a sprint, and we invest the Fund’s capital accordingly.
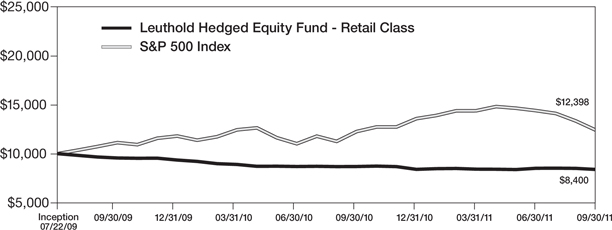
Leuthold Hedged Equity Fund
The Leuthold Hedged Equity Fund has $6 million in assets under management. For the fiscal year ended September 30, 2011, the Fund (retail share class) had a total return loss of -3.34%, versus the S&P 500 total return gain of +1.14%. This Fund is managed with equal allocations to both long and short equities, but its objective is to produce positive net performance. To do so, we require enough relative outperformance on one or both sides in order to yield a positive result. This objective has yet to be achieved, as we are still digging out of a relative performance hole since the Fund was introduced in July 2009. Over the last fiscal year, both the long-stock exposure and the short-stock exposure employed in this Fund had net losses.
For the Fund’s long-stock investments, the Leuthold Hedged Equity Fund employs the group selection and rotation approach of the Leuthold Select Industries Fund, which had a total return loss of -8.60% for the fiscal year ended September 30, 2011. On the short-side, the Fund’s exposure was attained through the investment strategy of the Grizzly Short Fund, and this strategy produced a total return loss of -2.06% for the fiscal year.
To minimize repetition, the performance review of key performance drivers for each of these equity strategies are presented in the discussions covering the Leuthold Select Industries Fund and the Grizzly Short Fund.
Overall performance since inception remains far below our expectations, based on how the two underlying component strategies have performed, historically. In general, market conditions since the Fund’s inception have been unusual. The stock market has been in a period where leadership at the industry group level has been short-lived, accompanied by fast-rotation trends. These conditions are not conducive to our long-side, industry group selection approach, which attempts to uncover longer-term leadership trends. Additionally, since the market lows of 2009, there has been an extremely high level of correlation among stocks, with no regard for size or quality, making it additionally difficult for our short-selling strategy.
Historically, both the short-stock and long-stock selection strategies employed in this Fund have shown the potential to flourish and/or serve to balance each other in most market environments, and we are confident performance will bear this out given a longer time frame.
| | The Leuthold Funds - 2011 Annual Report | 15 |
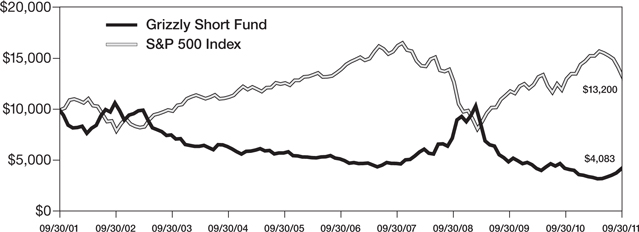
Grizzly Short Fund
This Fund is 100% short individual stocks, with assets under management of about $263 million. For the fiscal year ended September 30, 2011, the Grizzly Short Fund produced a -2.06% total return loss. This compares unfavorably to the S&P Mid Cap Index, which had -1.28% total return loss (short-selling that index would have produced over a +1% gain for the fiscal year). The Grizzly Short Fund also underperformed the S&P 500’s +1.14% total return gain, as shorting the S&P 500 would have produced a smaller loss (about -1%) than the Grizzly Short Fund produced.
For the October 2010 through April 2011 period of the fiscal year, short selling was not a winning strategy, as the market was still running in bull market mode. However, during that time, December 2010 was the only month of significant underperformance as a strong year-end rally continued to promote stocks of every size and style, regardless of quality. For the October 2010 through April 2011 period, the Fund had a total return loss of -24.76% versus the S&P Mid Cap Index total return gain of +27.49%.
The bull market topped out in late April/early May 2011, and the Grizzly Short Fund produced gains in each of the next five months, through September 2011. For the last five months of the fiscal year, the Grizzly Short Fund solidly outperformed with a total return gain of +30.16% versus the S&P Mid Cap Index -22.57% total return loss (short-selling the S&P Mid Cap Index would have produced a lagging +22% gain).
The Grizzly Short Fund has extremely high turnover, and sector concentrations and industry group exposure have the potential to fluctuate considerably throughout the year. This is a highly disciplined methodology, however. As opposed to a market capitalization weighted index, our Fund is not predisposed to the risk of performance being heavily influenced from a small number of individual stocks, because the Grizzly Short Fund positions are similarly weighted across the portfolio. There are policies in place that trigger specific short-covering action, such as capturing gains and stop-loss tactics. Additionally, there are limitations on how much of the portfolio can be concentrated within a particular sector or sub-industry group therein.
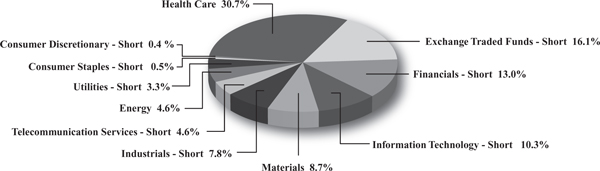
At the sector level, the Grizzly Short Fund’s performance was clearly influenced by heavy concentrations, during the entire year, in Consumer Discretionary, Information Technology, and Financials sectors. During June, the Industrials weight was increased and this sector also had a significant positive influence for full-year results. Industry groups from these sectors that most contributed to positive results included: Building Products and Airlines (Industrials sector); Investment Banking/Brokerage and Regional Banks (Financials sector); Electronic Components and Semiconductors (Information Technology sector); and Hotels/Resorts/Cruise Lines, Movies & Entertainment, and Homebuilders (Consumer Discretionary sector). There was a miscellaneous stock from Oil & Gas Services (Energy sector), and a particular Steel stock (Materials sector) included among the significant positive contributors.
The biggest overall detractors from performance from a sector perspective were Health Care, Consumer Staples, Materials, and Energy. Industry group investments within these sectors included Packaged Foods/Meats and Food Retail (Consumer Staples sector); Steel and Paper Packaging (Materials sector); Oil & Gas Equipment and Oil & Gas Storage/Transportation (Energy sector); and Biotechnology and Pharmaceuticals (Health Care sector). The Information Technology sector was also represented among the industry group detractors, and these included stocks from Application Software and Internet Software & Services.
| 16 | The Leuthold Funds - 2011 Annual Report | |
When our market analysis indicates a bullish environment for stocks, we expect the Fund may still uncover selective opportunities to profit, as there will be vulnerable areas of the stock market regardless of the underlying trend. However, in a decisively rising market environment, investors should expect the Grizzly Short Fund to produce net losses. During those periods, the Fund will aim to add value by losing less than an index short. When the market trend is decisively negative, the Grizzly Short Fund should produce net gains, and historically, our actively managed strategy has been able to add value versus an index short in this environment as well.
The Grizzly Short Fund’s year-by-year results are volatile, and while the advantage for employing a short-selling strategy in down-market cycles is clear (as evidenced by results of 2007-2008, and the recent May-September 2011 period), the tremendous risk of short-selling in rising market conditions should also be very apparent considering the Fund’s losses during the bull market period of 2009- early 2011. Yet, for those experienced with short-selling, there are viable uses for this strategy in all market conditions.
Investors who are not experienced in short-selling and adjusting market risk should consider the Leuthold Core Investment Fund, Leuthold Asset Allocation Fund, or Leuthold Global Fund. These three Funds have the flexibility built into their disciplines to overlay our short-selling strategies and hedge against market declines when the stock market is viewed as overvalued and vulnerable to a downside correction.
IN CLOSING
Our current U.S. market analysis, via our domestic Major Trend Index, has recently moved back up into positive territory – which, based on the 40+ years history of this work, would normally indicate to us that the stock market has transitioned into a decisively rising trend. However, based on a variety of historical measures we look to as a means of confirming impending transitions, we believe this may instead be an interim bear market rally. There are still major hurdles facing the stock market; most imminently the European crisis, but the U.S. is also struggling with its own deficit issues, and the specter of a global recession is still lurking. Nevertheless, our quantitative market analysis drives our process, and we will abide by the disciplines directing us to increase equity exposure. Because of the many hurdles still present, we are taking a cautiously bullish stance, and will be limiting our increased equity exposure to around 55% for the time being (up from 31% equity exposure as of fiscal year-end September 30, 2011). If our instincts that this may be a bear market rally prove correct, we will again begin building up more defense when our quantitative analysis exhibits enough weakness to point us to the exit as market conditions deteriorate. Over its long history, more often than not our Major Trend Index discipline has been successful in its guidance to adjust our asset allocation equity exposure through the changing market cycles.
We like to remind shareholders that our firm is majority employee-owned and independent; and we are proud to mention that employee-directed investment in Leuthold Funds is at an impressive level. We think this demonstrates the judicious character of the team, as we are firm believers that in view of the volatile and unpredictable nature of the stock market, Leuthold Funds has the vehicles to provide diversification and shelter for one’s long-term, serious money.
| | The Leuthold Funds - 2011 Annual Report | 17 |
We thank you for your support, and welcome you to contact us if you have any questions.
| Sincerely, | | |
| | | |
| | |
| Doug Ramsey, CFA, CMT | | |
| CIO & Co-Portfolio Manager | | |
| | | |
| | |
| Andy Engel, CFA | James Floyd, CFA | Matt Paschke, CFA |
| Co-Portfolio Manager | Co-Portfolio Manager | Co-Portfolio Manager |
| | | |
| | |
| Greg Swenson, CFA | Chun Wang, CFA | David Kurzman |
| Co-Portfolio Manager | Co-Portfolio Manager | Co-Portfolio Manager |
| 18 | The Leuthold Funds - 2011 Annual Report | |
Expense Example – September 30, 2011 (Unaudited)
As a shareholder of the Funds, you incur two types of costs: (1) transaction costs, including reinvested dividends, or other distributions; redemption fees; and exchange fees; and (2) ongoing costs, including management fees; distribution and/or service fees; and other Fund expenses. This example is intended to help you understand your ongoing costs (in dollars) of investing in the Funds and to compare costs with the ongoing costs of investing in other mutual funds.
The Example is based on an investment of $1,000 invested at the beginning of the period and held the entire period (April 1, 2011 – September 30, 2011).
Actual Expenses
The first line of the following table provides information about actual account values and actual expenses. Although the Funds charge no sales load (the Leuthold Core Investment Fund, Leuthold Asset Allocation Fund, Leuthold Global Fund, Leuthold Global Industries Fund, and Leuthold Hedged Equity Fund charge a 2% redemption fee for redemptions made within five business days after a purchase and the Leuthold Global Clean Technology Fund charges a 2% redemption fee for redemptions made within 30 days after a purchase), you will be assessed fees for outgoing wire transfers, returned checks, or stop payment orders at prevailing rates charged by U.S. Bancorp Fund Services, LLC, the Funds’ transfer agent. If you request a redemption be made by wire transfer, currently a $15.00 fee is charged by the Funds’ transfer agent. To the extent that the Funds invest in shares of other investment companies as part of its investment strategy, you will indirectly bear your proportionate share of any fees and expenses charged by the underlying funds in which a Fund invests in addition to the expenses of the Fund. Actual expenses of the underlying funds are expected to vary by fund. These expenses are not included in the following example. The example includes, but is not limited to, management fees, shareholder servicing fees, fund accounting, custody, and transfer agent fees. However, the following example does not include portfolio trading commissions and related expenses, and extraordinary expenses as determined under generally accepted accounting principles. You may use the information in this line, together with the amount you invested, to estimate the expenses that you paid over the period. Simply divide your account value by $1,000 (for example, an $8,600 account value divided by $1,000 = 8.6), then multiply the result by the number in the first line under the heading entitled “Expenses Paid During Period” to estimate the expenses you paid on your account during this period.
Hypothetical Example for Comparison Purposes
The second line of the following table provides information about hypothetical account values and hypothetical expenses based on the Funds’ actual expense ratios and an assumed rate of return of 5% per year before expenses, which is not the Funds’ actual return. The hypothetical account values and expenses may not be used to estimate the actual ending account balance or expenses you paid for the period. You may use this information to compare the ongoing costs of investing in the Funds and other funds. To do so, compare this 5% hypothetical example with the 5% hypothetical examples that appear in the shareholder reports of the other funds.
Please note that the expenses shown in the table are meant to highlight your ongoing costs only and do not reflect any transactional costs, such as redemption fees or exchange fees. Therefore, the second line of the table is useful in comparing ongoing costs only, and will not help you determine the relative costs of owning different funds. In addition, if these transactional costs were included, your costs would have been higher.
| | The Leuthold Funds - 2011 Annual Report | 19 |
Expense Example Tables (Unaudited)
Leuthold Core Investment Fund - Retail Class
| | | Beginning | | | Ending | | | Expenses Paid | |
| | | Account Value | | | Account Value | | | During Period* | |
| | | April 1, 2011 | | | September 30, 2011 | | | April 1, 2011 - September 30, 2011 | |
| Actual** | | $ | 1,000.00 | | | $ | 874.60 | | | $ | 6.02 | |
| Hypothetical (5% return before expenses)*** | | | 1,000.00 | | | | 1,018.65 | | | | 6.48 | |
| * | Expenses are equal to the Fund’s annualized expense ratio of 1.28%, multiplied by the average account value over the period, multiplied by 183/365 to reflect the one-half year period. |
| ** | Excluding dividends and interest on short positions, your actual cost of investment in the Fund would be $5.36 and the Fund’s annualized expense ratio would be 1.14%. |
| *** | Excluding dividends and interest on short positions, your hypothetical cost of investment in the Fund would be $5.77 and the Fund’s annualized expense ratio would be 1.14%. |
Leuthold Core Investment Fund - Institutional Class
| | | Beginning | | | Ending | | | Expenses Paid | |
| | | Account Value | | | Account Value | | | During Period* | |
| | | April 1, 2011 | | | September 30, 2011 | | | April 1, 2011 - September 30, 2011 | |
| Actual** | | $ | 1,000.00 | | | $ | 875.20 | | | $ | 5.45 | |
| Hypothetical (5% return before expenses)*** | | | 1,000.00 | | | | 1,019.25 | | | | 5.87 | |
| * | Expenses are equal to the Fund’s annualized expense ratio of 1.16%, multiplied by the average account value over the period, multiplied by 183/365 to reflect the one-half year period. |
| ** | Excluding dividends and interest on short positions, your actual cost of investment in the Fund would be $4.79 and the Fund’s annualized expense ratio would be 1.02%. |
| *** | Excluding dividends and interest on short positions, your hypothetical cost of investment in the Fund would be $5.16 and the Fund’s annualized expense ratio would be 1.02%. |
Leuthold Asset Allocation Fund - Retail Class
| | | Beginning | | | Ending | | | Expenses Paid | |
| | | Account Value | | | Account Value | | | During Period* | |
| | | April 1, 2011 | | | September 30, 2011 | | | April 1, 2011 - September 30, 2011 | |
| Actual** | | $ | 1,000.00 | | | $ | 886.00 | | | $ | 6.90 | |
| Hypothetical (5% return before expenses)*** | | | 1,000.00 | | | | 1,017.75 | | | | 7.38 | |
| * | Expenses are equal to the Fund’s annualized expense ratio of 1.46%, multiplied by the average account value over the period, multiplied by 183/365 to reflect the one-half year period. |
| ** | Excluding dividends and interest on short positions, your actual cost of investment in the Fund would be $6.24 and the Fund’s annualized expense ratio would be 1.32%. |
| *** | Excluding dividends and interest on short positions, your hypothetical cost of investment in the Fund would be $6.68 and the Fund’s annualized expense ratio would be 1.32%. |
| 20 | The Leuthold Funds - 2011 Annual Report | |
Expense Example Tables (Unaudited)
Leuthold Asset Allocation Fund - Institutional Class
| | | Beginning | | | Ending | | | Expenses Paid | |
| | | Account Value | | | Account Value | | | During Period* | |
| | | April 1, 2011 | | | September 30, 2011 | | | April 1, 2011 - September 30, 2011 | |
| Actual** | | $ | 1,000.00 | | | $ | 887.60 | | | $ | 5.87 | |
| Hypothetical (5% return before expenses)*** | | | 1,000.00 | | | | 1018.85 | | | | 6.28 | |
| * | Expenses are equal to the Fund’s annualized expense ratio of 1.24%, multiplied by the average account value over the period, multiplied by 183/365 to reflect the one-half year period. |
| ** | Excluding dividends and interest on short positions, your actual cost of investment in the Fund would be $5.21 and the Fund’s annualized expense ratio would be 1.10%. |
| *** | Excluding dividends and interest on short positions, your hypothetical cost of investment in the Fund would be $5.57 and the Fund’s annualized expense ratio would be 1.10%. |
Leuthold Global Fund - Retail Class
| | | Beginning | | | Ending | | | Expenses Paid | |
| | | Account Value | | | Account Value | | | During Period* | |
| | | April 1, 2011 | | | September 30, 2011 | | | April 1, 2011 - September 30, 2011 | |
| Actual** | | $ | 1,000.00 | | | $ | 882.00 | | | $ | 7.88 | |
| Hypothetical (5% return before expenses)*** | | | 1,000.00 | | | | 1,016.70 | | | | 8.44 | |
| * | Expenses are equal to the Fund’s annualized expense ratio of 1.67%, multiplied by the average account value over the period, multiplied by 183/365 to reflect the one-half year period. |
| ** | Excluding dividends and interest on short positions, your actual cost of investment in the Fund would be $6.98 and the Fund’s annualized expense ratio would be 1.48%. |
| *** | Excluding dividends and interest on short positions, your hypothetical cost of investment in the Fund would be $7.49 and the Fund’s annualized expense ratio would be 1.48%. |
Leuthold Global Fund - Institutional Class
| | | Beginning | | | Ending | | | Expenses Paid | |
| | | Account Value | | | Account Value | | | During Period* | |
| | | April 1, 2011 | | | September 30, 2011 | | | April 1, 2011 - September 30, 2011 | |
| Actual** | | $ | 1,000.00 | | | $ | 882.80 | | | $ | 7.13 | |
| Hypothetical (5% return before expenses)*** | | | 1,000.00 | | | | 1,017.50 | | | | 7.64 | |
| * | Expenses are equal to the Fund’s annualized expense ratio of 1.51%, multiplied by the average account value over the period, multiplied by 183/365 to reflect the one-half year period. |
| ** | Excluding dividends and interest on short positions, your actual cost of investment in the Fund would be $6.23 and the Fund’s annualized expense ratio would be 1.32%. |
| *** | Excluding dividends and interest on short positions, your hypothetical cost of investment in the Fund would be $6.68 and the Fund’s annualized expense ratio would be 1.32%. |
| | The Leuthold Funds - 2011 Annual Report | 21 |
Expense Example Tables (Unaudited)
Leuthold Select Industries Fund
| | | Beginning | | | Ending | | | Expenses Paid | |
| | | Account Value | | | Account Value | | | During Period* | |
| | | April 1, 2011 | | | September 30, 2011 | | | April 1, 2011 - September 30, 2011 | |
| Actual | | $ | 1,000.00 | | | $ | 772.60 | | | $ | 6.22 | |
| Hypothetical (5% return before expenses) | | | 1,000.00 | | | | 1,018.05 | | | | 7.08 | |
| * | Expenses are equal to the Fund’s annualized expense ratio of 1.40%, multiplied by the average account value over the period, multiplied by 183/365 to reflect the one-half year period. |
Leuthold Global Industries Fund - Retail Class
| | | Beginning | | | Ending | | | Expenses Paid | |
| | | Account Value | | | Account Value | | | During Period* | |
| | | April 1, 2011 | | | September 30, 2011 | | | April 1, 2011 - September 30, 2011 | |
| Actual | | $ | 1,000.00 | | | $ | 778.00 | | | $ | 9.27 | |
| Hypothetical (5% return before expenses) | | | 1,000.00 | | | | 1,014.64 | | | | 10.50 | |
| * | Expenses are equal to the Fund's annualized expense ratio of 2.08%, multiplied by the average account value over the period, multiplied by 183/365 to reflect the one-half year period. |
Leuthold Global Industries Fund - Institutional Class
| | | Beginning | | | Ending | | | Expenses Paid | |
| | | Account Value | | | Account Value | | | During Period | |
| | | April 1, 2011 | | | September 30, 2011 | | | April 1, 2011 - September 30, 2011 | |
| Actual | | $ | 1,000.00 | | | $ | 779.10 | | | $ | 8.03 | |
| Hypothetical (5% return before expenses) | | | 1,000.00 | | | | 1,016.04 | | | | 9.10 | |
| * | Expenses are equal to the Fund's annualized expense ratio of 1.80%, multiplied by the average account value over the period, multiplied by 183/365 to reflect the one-half year period. |
Leuthold Global Clean Technology Fund - Retail Class
| | | Beginning | | | Ending | | | Expenses Paid | |
| | | Account Value | | | Account Value | | | During Period* | |
| | | April 1, 2011 | | | September 30, 2011 | | | April 1, 2011 - September 30, 2011 | |
| Actual | | $ | 1,000.00 | | | $ | 598.00 | | | $ | 7.85 | |
| Hypothetical (5% return before expenses) | | | 1,000.00 | | | | 1,015.24 | | | | 9.90 | |
| * | Expenses are equal to the Fund’s annualized expense ratio of 1.96%, multiplied by the average account value over the period, multiplied by 183/365 to reflect the one-half year period. |
| 22 | The Leuthold Funds - 2011 Annual Report | |
Expense Example Tables (Unaudited)
Leuthold Global Clean Technology Fund - Institutional Class
| | | Beginning | | | Ending | | | Expenses Paid | |
| | | Account Value | | | Account Value | | | During Period | |
| | | April 1, 2011 | | | September 30, 2011 | | | April 1, 2011 - September 30, 2011 | |
| Actual | | $ | 1,000.00 | | | $ | 599.20 | | | $ | 6.37 | |
| Hypothetical (5% return before expenses) | | | 1,000.00 | | | | 1,017.10 | | | | 8.04 | |
| * | Expenses are equal to the Fund's annualized expense ratio of 1.59%, multiplied by the average account value over the period, multiplied by 183/365 to reflect the one-half year period. |
Leuthold Hedged Equity Fund - Retail Class
| | | Beginning | | | Ending | | | Expenses Paid | |
| | | Account Value | | | Account Value | | | During Period* | |
| | | April 1, 2011 | | | September 30, 2011 | | | April 1, 2011 - September 30, 2011 | |
Actual** | | $ | 1,000.00 | | | $ | 997.60 | | | $ | 15.22 | |
Hypothetical (5% return before expenses)*** | | | 1,000.00 | | | | 1,009.83 | | | | 15.32 | |
| * | Expenses are equal to the Fund’s annualized expense ratio of 3.04%, multiplied by the average account value over the period, multiplied by 183/365 to reflect the one-half year period. |
| ** | Excluding dividends and interest on short positions, your actual cost of investment in the Fund would be $11.27 and the Fund’s annualized expense ratio would be 2.25%. |
| *** | Excluding dividends and interest on short positions, your hypothetical cost of investment in the Fund would be $11.36 and the Fund’s annualized expense ratio would be 2.25%. |
Leuthold Hedged Equity Fund - Institutional Class
| | | Beginning | | | Ending | | | Expenses Paid | |
| | | Account Value | | | Account Value | | | During Period* | |
| | | April 1, 2011 | | | September 30, 2011 | | | April 1, 2011 - September 30, 2011 | |
Actual** | | $ | 1,000.00 | | | $ | 998.80 | | | $ | 13.43 | |
Hypothetical (5% return before expenses)*** | | | 1,000.00 | | | | 1,011.63 | | | | 13.51 | |
| * | Expenses are equal to the Fund’s annualized expense ratio of 2.68%, multiplied by the average account value over the period, multiplied by 183/365 to reflect the one-half year period. |
| ** | Excluding dividends and interest on short positions, your actual cost of investment in the Fund would be $9.67 and the Fund’s annualized expense ratio would be 1.93%. |
| *** | Excluding dividends and interest on short positions, your hypothetical cost of investment in the Fund would be $9.75 and the Fund’s annualized expense ratio would be 1.93%. |
Grizzly Short Fund
| | | Beginning | | | Ending | | | Expenses Paid | |
| | | Account Value | | | Account Value | | | During Period* | |
| | | April 1, 2011 | | | September 30, 2011 | | | April 1, 2011 - September 30, 2011 | |
Actual** | | $ | 1,000.00 | | | $ | 1,249.20 | | | $ | 18.61 | |
Hypothetical (5% return before expenses)*** | | | 1,000.00 | | | | 1,008.52 | | | | 16.62 | |
| * | Expenses are equal to the Fund’s annualized expense ratio of 3.30%, multiplied by the average account value over the period, multiplied by 183/365 to reflect the one-half year period. |
| ** | Excluding dividends and interest on short positions, your actual cost of investment in the Fund would be $8.68 and the Fund’s annualized expense ratio would be 1.54%. |
| *** | Excluding dividends and interest on short positions, your hypothetical cost of investment in the Fund would be $7.79 and the Fund’s annualized expense ratio would be 1.54%. |
| | The Leuthold Funds - 2011 Annual Report | 23 |
(Unaudited)
Leuthold Core Investment Fund
Allocation of Portfolio Holdings
September 30, 2011
Leuthold Asset Allocation Fund
Allocation of Portfolio Holdings
September 30, 2011
| 24 | The Leuthold Funds - 2011 Annual Report | |
(Unaudited)
Leuthold Global Fund
Allocation of Portfolio Holdings
September 30, 2011
Leuthold Select Industries Fund
Allocation of Portfolio Holdings
September 30, 2011*
*Excludes short-term investments
| | The Leuthold Funds - 2011 Annual Report | 25 |
(Unaudited)
Leuthold Global Industries Fund
Allocation of Portfolio Holdings
September 30, 2011
Leuthold Global Clean Technology Fund
Allocation of Portfolio Holdings
September 30, 2011*
*Excludes short-term investments
| 26 | The Leuthold Funds - 2011 Annual Report | |
(Unaudited)
Leuthold Hedged Equity Fund
Allocation of Portfolio Holdings (Net Exposure)
September 30, 2011*
Grizzly Short Fund
Allocation of Portfolio Holdings
September 30, 2011*
*Excludes short-term investments
| | The Leuthold Funds - 2011 Annual Report | 27 |
| Leuthold Core Investment Fund (Unaudited) | | | |
| Components of Portfolio Holdings | | Fair Value | |
| U.S. Traded Equity Securities | | $ | 429,660,529 | |
| Short-Term Investments | | | 186,192,878 | |
| U.S. Traded Equity Securities - Short | | | 180,572,172 | |
| Non-U.S. Traded Equity Securities | | | 67,842,656 | |
| Precious Metals | | | 46,095,804 | |
| Corporate Bonds | | | 40,224,781 | |
| Corporate Bond Funds | | | 34,816,257 | |
| Brazilian Bonds | | | 28,746,178 | |
| Australian Bonds | | | 13,669,411 | |
| Emerging Country Investments | | | 10,693,025 | |
| Total: | | $ | 1,038,513,691 | |
| | | | | |
| Leuthold Asset Allocation Fund (Unaudited) | | | | |
| Components of Portfolio Holdings | | Fair Value | |
| U.S. Traded Equity Securities | | $ | 432,417,526 | |
| U.S. Traded Equity Securities - Short | | | 175,657,067 | |
| Short-Term Investments | | | 175,214,742 | |
| Non-U.S. Traded Equity Securities | | | 65,882,536 | |
| Precious Metals | | | 45,301,366 | |
| Corporate Bonds | | | 39,522,984 | |
| Corporate Bond Funds | | | 32,403,576 | |
| Brazilian Bonds | | | 28,121,260 | |
| Australian Bonds | | | 13,455,827 | |
| Emerging Country Investments | | | 10,431,451 | |
| Total: | | $ | 1,018,408,335 | |
| | | | | |
| Leuthold Global Fund (Unaudited) | | | | |
| Components of Portfolio Holdings | | Fair Value | |
| Short-Term Investments | | $ | 114,355,854 | |
| Non-U.S. Traded Equity Securities | | | 108,013,204 | |
| U.S. Traded Equity Securities | | | 97,138,824 | |
| U.S. Traded Equity Securities - Short | | | 38,994,577 | |
| Precious Metals | | | 20,119,309 | |
| Corporate Bonds | | | 17,506,686 | |
| Corporate Bond Funds | | | 16,032,536 | |
| Emerging Country Investments - Short | | | 11,390,701 | |
| Non-U.S. Traded Equity Securities - Short | | | 10,371,040 | |
| Australian Bonds | | | 9,685,917 | |
| High Yield Bond Funds | | | 8,097,096 | |
| U.S. Treasury Obligations | | | 5,592,385 | |
| Brazilian Bonds | | | 3,718,880 | |
| Emerging Country Investments | | | 2,300,476 | |
| Total: | | $ | 463,317,485 | |
| | | | | |
| Leuthold Select Industries Fund (Unaudited) | | | | |
| Components of Portfolio Holdings* | | Fair Value | |
| Health Care | | $ | 7,351,189 | |
| Materials | | | 2,746,211 | |
| Consumer Discretionary | | | 2,090,341 | |
| Energy | | | 1,668,301 | |
| Financials | | | 1,452,679 | |
| Information Technology | | | 726,361 | |
| Industrials | | | 108,200 | |
| Total: | | $ | 16,143,282 | |
| | | | | |
| Leuthold Global Industries Fund (Unaudited) | | | | |
| Components of Portfolio Holdings | | Fair Value | |
| Materials | | $ | 3,666,300 | |
| Consumer Discretionary | | | 3,272,824 | |
| Industrials | | | 3,150,953 | |
| Energy | | | 2,021,602 | |
| Financials | | | 1,912,483 | |
| Short-Term Investments | | | 1,801,941 | |
| Telecommunication Services | | | 1,767,581 | |
| Health Care | | | 1,687,948 | |
| Consumer Staples | | | 1,443,547 | |
| Utilities | | | 1,287,652 | |
| Information Technology | | | 97,315 | |
| Total: | | $ | 22,110,146 | |
| | | | | |
| Leuthold Global Clean Technology Fund | | | | |
| (Unaudited) | | | | |
| Components of Portfolio Holdings* | | Fair Value | |
| Industrials | | $ | 5,400,161 | |
| Information Technology | | | 2,762,349 | |
| Materials | | | 2,278,917 | |
| Financials | | | 1,505,866 | |
| Utilities | | | 1,109,206 | |
| Energy | | | 690,509 | |
| Consumer Staples | | | 464,201 | |
| Consumer Discretionary | | | 377,978 | |
| Total: | | $ | 14,589,187 | |
*Excludes short-term investments
| 28 | The Leuthold Funds - 2011 Annual Report | |
| Leuthold Hedged Equity Fund (Unaudited) | | | |
Components of Portfolio Holdings* | | Fair Value | |
| Long | | | |
| Health Care | | $ | 1,237,430 | |
| Materials | | | 459,522 | |
| Consumer Discretionary | | | 346,208 | |
| Energy | | | 279,267 | |
| Financials | | | 240,648 | |
| Information Technology | | | 121,429 | |
| Industrials | | | 17,884 | |
| | | $ | 2,702,388 | |
| Short | | | | |
| Financials | | | 692,369 | |
| Exchange Traded Funds | | | 559,891 | |
| Information Technology | | | 480,429 | |
| Consumer Discretionary | | | 359,377 | |
| Industrials | | | 291,144 | |
| Health Care | | | 170,560 | |
| Telecommunication Services | | | 161,868 | |
| Materials | | | 158,407 | |
| Energy | | | 117,705 | |
| Utilities | | | 114,287 | |
| Consumer Staples | | | 17,338 | |
| | | $ | 3,123,375 | |
| Total: | | $ | 5,825,763 | |
| | | | | |
| Grizzly Short Fund (Unaudited) | | | | |
| Components of Portfolio Holdings* | | Fair Value | |
| Financials | | $ | 53,839,928 | |
| Exchange Traded Funds | | | 46,814,072 | |
| Information Technology | | | 37,331,076 | |
| Consumer Discretionary | | | 27,813,061 | |
| Industrials | | | 22,399,793 | |
| Health Care | | | 13,207,763 | |
| Telecommunication Services | | | 12,581,215 | |
| Materials | | | 11,864,763 | |
| Energy | | | 9,111,877 | |
| Utilities | | | 8,881,410 | |
| Consumer Staples | | | 1,337,172 | |
| Total: | | $ | 245,182,130 | |
The Global Industry Classification Standard (GICS®) was developed by and/or is the exclusive property of MSCI, Inc. and Standard & Poor Financial Services LLC (“S&P”). GICS is a service mark of MSCI and S&P and has been licensed for use by U.S. Bancorp Fund Services, LLC.
*Excludes short-term investments
| | The Leuthold Funds - 2011 Annual Report | 29 |
| Leuthold Core Investment Fund – Retail Class |
Average Annual Rate of Return For Periods Ended
September 30, 2011
| | | 1 Year | | | 3 Year | | | 5 Year | | | 10 Year | |
| Leuthold Core Investment Fund - Retail Class | | | (2.61 | )% | | | 1.24 | % | | | 2.69 | % | | | 7.71 | % |
| Lipper Flexible Fund Index | | | (0.22 | )% | | | 3.95 | % | | | 1.97 | % | | | 4.44 | % |
| S&P 500 Index | | | 1.14 | % | | | 1.23 | % | | | (1.18 | )% | | | 2.82 | % |
A $10,000 Investment in the Leuthold Core Investment Fund – Retail Class
The Lipper Flexible Fund Index is composed of funds that allocate investments across various asset classes with a focus on total return, as defined by Lipper.
The S&P 500 Index is an unmanaged capitalization-weighted index of 500 stocks designed to measure performance of the broad domestic economy through changes in the aggregate market value of the 500 stocks which represent all major industries.
This chart assumes an initial gross investment of $10,000 made on 9/30/01. Returns shown include the reinvestment of all dividends. The Fund’s past performance is not necessarily an indication of its future performance. It may perform better or worse in the future. The graph and the table do not reflect the deduction of taxes that a shareholder would pay on Fund distributions or the redemption of shares.
| 30 | The Leuthold Funds - 2011 Annual Report | |
| Leuthold Core Investment Fund – Institutional Class |
Average Annual Rate of Return For Periods Ended
September 30, 2011
| | | 1 Year | | | 3 Year | | | 5 Year | | | Since Inception | |
Leuthold Core Investment Fund - Institutional Class | | | (2.49 | )% | | | 1.38 | % | | | 2.82 | % | | | 2.51 | % |
| Lipper Flexible Fund Index | | | (0.22 | )% | | | 3.95 | % | | | 1.97 | % | | | 2.28 | % |
| S&P 500 Index | | | 1.14 | % | | | 1.23 | % | | | (1.18 | )% | | | (0.07 | )% |
A $1,000,000 Investment in the Leuthold Core Investment Fund – Institutional Class
The Lipper Flexible Fund Index is composed of funds that allocate investments across various asset classes with a focus on total return, as defined by Lipper.
The S&P 500 Index is an unmanaged capitalization-weighted index of 500 stocks designed to measure performance of the broad domestic economy through changes in the aggregate market value of the 500 stocks which represent all major industries.
This chart assumes an initial gross investment of $1,000,000 made on 1/31/06 (commencement of operations). Returns shown include the reinvestment of all dividends. The Fund’s past performance is not necessarily an indication of its future performance. It may perform better or worse in the future. The graph and the table do not reflect the deduction of taxes that a shareholder would pay on Fund distributions or the redemption of shares.
| | The Leuthold Funds - 2011 Annual Report | 31 |
| Leuthold Asset Allocation Fund - Retail Class |
Average Annual Rate of Return For Periods Ended
September 30, 2011
| | | 1 Year | | | 3 Year | | | 5 Year | | | Since Inception | |
| Leuthold Asset Allocation Fund - Retail Class | | | (1.34 | )% | | | 2.12 | % | | | 1.71 | % | | | 1.08 | % |
| Lipper Flexible Fund Index | | | (0.22 | )% | | | 3.95 | % | | | 1.97 | % | | | 2.58 | % |
| S&P 500 Index | | | 1.14 | % | | | 1.23 | % | | | (1.18 | )% | | | 0.13 | % |
A $10,000 Investment in the Leuthold Asset Allocation Fund – Retail Class
The Lipper Flexible Fund Index is composed of funds that allocate investments across various asset classes with a focus on total return, as defined by Lipper.
The S&P 500 Index is an unmanaged capitalization-weighted index of 500 stocks designed to measure performance of the broad domestic economy through changes in the aggregate market value of the 500 stocks which represent all major industries.
This chart assumes an initial gross investment of $10,000 made on 5/24/06 (commencement of operations). Returns shown include the reinvestment of all dividends. The Fund’s past performance is not necessarily an indication of its future performance. It may perform better or worse in the future. The graph and the table do not reflect the deduction of taxes that a shareholder would pay on Fund distributions or the redemption of shares.
| 32 | The Leuthold Funds - 2011 Annual Report | |
| Leuthold Asset Allocation Fund - Institutional Class |
Average Annual Rate of Return For Periods Ended
September 30, 2011
| | | 1 Year | | | 3 Year | | | 5 Year | | | Since Inception | |
| | | | | | | | | | | | | |
Leuthold Asset Allocation Fund - Institutional Class | | | (0.95 | )% | | | 2.42 | % | | | n/a | | | | 0.24 | % |
| Lipper Flexible Fund Index | | | (0.22 | )% | | | 3.95 | % | | | 1.97 | % | | | 0.59 | % |
| S&P 500 Index | | | 1.14 | % | | | 1.23 | % | | | (1.18 | )% | | | (2.94 | )% |
A $1,000,000 Investment in the Leuthold Asset Allocation Fund – Institutional Class
The Lipper Flexible Fund Index is composed of funds that allocate investments across various asset classes with a focus on total return, as defined by Lipper.
The S&P 500 Index is an unmanaged capitalization-weighted index of 500 stocks designed to measure performance of the broad domestic economy through changes in the aggregate market value of the 500 stocks which represent all major industries.
This chart assumes an initial gross investment of $1,000,000 made on 1/31/07 (commencement of operations). Returns shown include the reinvestment of all dividends. The Fund’s past performance is not necessarily an indication of its future performance. It may perform better or worse in the future. The graph and the table do not reflect the deduction of taxes that a shareholder would pay on Fund distributions or the redemption of shares.
| | The Leuthold Funds - 2011 Annual Report | 33 |
| Leuthold Global Fund - Retail Class |
Average Annual Rate of Return For Periods Ended
September 30, 2011
| | | 1 Year | | | 3 Year | | | 5 Year | | | Since Inception | |
| Leuthold Global Fund - Retail Class | | | (1.33 | )% | | | 6.29 | % | | | n/a | | | | 0.98 | % |
Lipper Global Flexible Portfolio Funds Index | | | (2.60 | )% | | | 1.97 | % | | | (0.11 | )% | | | (1.98 | )% |
| MSCI ACWI | | | (5.54 | )% | | | 1.14 | % | | | (1.07 | )% | | | (4.18 | )% |
| S&P 500 Index | | | 1.14 | % | | | 1.23 | % | | | (1.18 | )% | | | (1.67 | )% |
A $10,000 Investment in the Leuthold Global Fund – Retail Class
The Lipper Global Flexible Portfolio Funds Index is an equally weighted representation of the largest funds in the Lipper Global Flexible Portfolio Funds category. These funds allocate their investments across various asset classes, including both domestic and foreign stocks, bonds, and money market instruments, with a focus on total return.
The MSCI ACWI (All Country World Index) is a free float-adjusted market capitalization weighted index that is designed to measure the equity market performance of developed and emerging markets. As of May 30, 2011, the MSCI ACWI consisted of 45 country indices comprising 24 developed and 21 emerging market country indices. The developed market country indices included are: Australia, Austria, Belgium, Canada, Denmark, Finland, France, Germany, Greece, Hong Kong, Ireland, Israel, Italy, Japan, Netherlands, New Zealand, Norway, Portugal, Singapore, Spain, Sweden, Switzerland, the United Kingdom, and the United States. The emerging market country indices included are: Brazil, Chile, China, Colombia, Czech Republic, Egypt, Hungary, India, Indonesia, Korea, Malaysia, Mexico, Morocco, Peru, Philippines, Poland, Russia, South Africa, Taiwan, Thailand, and Turkey.
The S&P 500 Index is an unmanaged capitalization-weighted index of 500 stocks designed to measure performance of the broad domestic economy through changes in the aggregate market value of the 500 stocks which represent all major industries.
This chart assumes an initial gross investment of $10,000 made on 7/1/08 (commencement of operations). Returns shown include the reinvestment of all dividends. The Fund’s past performance is not necessarily an indication of its future performance. It may perform better or worse in the future. The graph and the table do not reflect the deduction of taxes that a shareholder would pay on Fund distributions or the redemption of shares.
| 34 | The Leuthold Funds - 2011 Annual Report | |
| Leuthold Global Fund - Institutional Class |
Average Annual Rate of Return For Periods Ended
September 30, 2011
| | | 1 Year | | | 3 Year | | | 5 Year | | | Since Inception | |
| | | | | | | | | | | | | |
| Leuthold Global Fund - Institutional Class | | | (1.11 | )% | | | 6.52 | % | | | n/a | | | | 0.83 | % |
| Lipper Global Flexible Portfolio | | | | | | | | | | | | | | | | |
| Funds Index | | | (2.60 | )% | | | 1.97 | % | | | (0.11 | )% | | | (3.27 | )% |
| MSCI ACWI | | | (5.54 | )% | | | 1.14 | % | | | (1.07 | )% | | | (6.10 | )% |
| S&P 500 Index | | | 1.14 | % | | | 1.23 | % | | | (1.18 | )% | | | (3.62 | )% |
A $1,000,000 Investment in the Leuthold Global Fund - Institutional Class
The Lipper Global Flexible Portfolio Funds Index is an equally weighted representation of the largest funds in the Lipper Global Flexible Portfolio Funds category. These funds allocate their investments across various asset classes, including both domestic and foreign stocks, bonds, and money market instruments, with a focus on total return.
The MSCI ACWI (All Country World Index) is a free float-adjusted market capitalization weighted index that is designed to measure the equity market performance of developed and emerging markets. As of May 30, 2011, the MSCI ACWI consisted of 45 country indices comprising 24 developed and 21 emerging market country indices. The developed market country indices included are: Australia, Austria, Belgium, Canada, Denmark, Finland, France, Germany, Greece, Hong Kong, Ireland, Israel, Italy, Japan, Netherlands, New Zealand, Norway, Portugal, Singapore, Spain, Sweden, Switzerland, the United Kingdom, and the United States. The emerging market country indices included are: Brazil, Chile, China, Colombia, Czech Republic, Egypt, Hungary, India, Indonesia, Korea, Malaysia, Mexico, Morocco, Peru, Philippines, Poland, Russia, South Africa, Taiwan, Thailand, and Turkey.
The S&P 500 Index is an unmanaged capitalization-weighted index of 500 stocks designed to measure performance of the broad domestic economy through changes in the aggregate market value of the 500 stocks which represent all major industries.
This chart assumes an initial gross investment of $1,000,000 made on 4/30/08 (commencement of operations). Returns shown include the reinvestment of all dividends. The Fund’s past performance is not necessarily an indication of its future performance. It may perform better or worse in the future. The graph and the table do not reflect the deduction of taxes that a shareholder would pay on Fund distributions or the redemption of shares.
| | The Leuthold Funds - 2011 Annual Report | 35 |
| Leuthold Select Industries Fund |
Average Annual Rate of Return For Periods Ended
September 30, 2011
| | | 1 Year | | | 3 Year | | | 5 Year | | | 10 Year | |
| | | | | | | | | | | | | |
| Leuthold Select Industries Fund | | | (8.60 | )% | | | (6.06 | )% | | | (2.64 | )% | | | 4.37 | % |
| Russell 2000 Index | | | (3.53 | )% | | | (0.37 | )% | | | (1.02 | )% | | | 6.12 | % |
| S&P 500 Index | | | 1.14 | % | | | 1.23 | % | | | (1.18 | )% | | | 2.82 | % |
A $10,000 Investment in the Leuthold Select Industries Fund
The Russell 2000 Index is comprised of approximately 2000 of the smallest companies in the Russell 3000 Index, representing approximately 10% of the Russell 3000 total market capitalization.
The S&P 500 Index is an unmanaged capitalization-weighted index of 500 stocks designed to measure performance of the broad domestic economy through changes in the aggregate market value of the 500 stocks which represent all major industries.
This chart assumes an initial gross investment of $10,000 made on 9/30/01. Returns shown include the reinvestment of all dividends. The Fund’s past performance is not necessarily an indication of its future performance. It may perform better or worse in the future. The graph and the table do not reflect the deduction of taxes that a shareholder would pay on Fund distributions or the redemption of shares.
| 36 | The Leuthold Funds - 2011 Annual Report | |
| Leuthold Global Industries Fund - Retail Class |
Average Annual Rate of Return For Periods Ended
September 30, 2011
| | | 1 Year | | | 3 Year | | | 5 Year | | | Since Inception | |
| | | | | | | | | | | | | |
| Leuthold Global Industries Fund - | | | | | | | | | | | | |
| Retail Class | | | (10.23 | )% | | | n/a | | | | n/a | | | | (0.84 | )% |
| MSCI ACWI | | | (5.54 | )% | | | 1.14 | % | | | (1.07 | )% | | | 1.34 | % |
| S&P 500 Index | | | 1.14 | % | | | 1.23 | % | | | (1.18 | )% | | | 1.68 | % |
A $10,000 Investment in the Leuthold Global Industries Fund - Retail Class
The MSCI ACWI (All Country World Index) is a free float-adjusted market capitalization weighted index that is designed to measure the equity market performance of developed and emerging markets. As of May 30, 2011, the MSCI ACWI consisted of 45 country indices comprising 24 developed and 21 emerging market country indices. The developed market country indices included are: Australia, Austria, Belgium, Canada, Denmark, Finland, France, Germany, Greece, Hong Kong, Ireland, Israel, Italy, Japan, Netherlands, New Zealand, Norway, Portugal, Singapore, Spain, Sweden, Switzerland, the United Kingdom, and the United States. The emerging market country indices included are: Brazil, Chile, China, Colombia, Czech Republic, Egypt, Hungary, India, Indonesia, Korea, Malaysia, Mexico, Morocco, Peru, Philippines, Poland, Russia, South Africa, Taiwan, Thailand, and Turkey.
The S&P 500 Index is an unmanaged capitalization-weighted index of 500 stocks designed to measure performance of the broad domestic economy through changes in the aggregate market value of the 500 stocks which represent all major industries.
This chart assumes an initial gross investment of $10,000 made on 5/17/10 (commencement of operations). Returns shown include the reinvestment of all dividends. The Fund’s past performance is not necessarily an indication of its future performance. It may perform better or worse in the future. The graph and the table do not reflect the deduction of taxes that a shareholder would pay on Fund distributions or the redemption of shares.
| | The Leuthold Funds - 2011 Annual Report | 37 |
| Leuthold Global Industries Fund - Institutional Class |
Average Annual Rate of Return For Periods Ended
September 30, 2011
| | | 1 Year | | | 3 Year | | | 5 Year | | | Since Inception | |
| | | | | | | | | | | | | |
| Leuthold Global Industries Fund - | | | | | | | | | | | | |
| Institutional Class | | | (9.92 | )% | | | n/a | | | | n/a | | | | (0.60 | )% |
| MSCI ACWI | | | (5.54 | )% | | | 1.14 | % | | | (1.07 | )% | | | 1.34 | % |
| S&P 500 Index | | | 1.14 | % | | | 1.23 | % | | | (1.18 | )% | | | 1.68 | % |
A $1,000,000 Investment in the Leuthold Global Industries Fund - Institutional Class
The MSCI ACWI (All Country World Index) is a free float-adjusted market capitalization weighted index that is designed to measure the equity market performance of developed and emerging markets. As of May 30, 2011, the MSCI ACWI consisted of 45 country indices comprising 24 developed and 21 emerging market country indices. The developed market country indices included are: Australia, Austria, Belgium, Canada, Denmark, Finland, France, Germany, Greece, Hong Kong, Ireland, Israel, Italy, Japan, Netherlands, New Zealand, Norway, Portugal, Singapore, Spain, Sweden, Switzerland, the United Kingdom, and the United States. The emerging market country indices included are: Brazil, Chile, China, Colombia, Czech Republic, Egypt, Hungary, India, Indonesia, Korea, Malaysia, Mexico, Morocco, Peru, Philippines, Poland, Russia, South Africa, Taiwan, Thailand, and Turkey.
The S&P 500 Index is an unmanaged capitalization-weighted index of 500 stocks designed to measure performance of the broad domestic economy through changes in the aggregate market value of the 500 stocks which represent all major industries.
This chart assumes an initial gross investment of $1,000,000 made on 5/17/10 (commencement of operations). Returns shown include the reinvestment of all dividends. The Fund’s past performance is not necessarily an indication of its future performance. It may perform better or worse in the future. The graph and the table do not reflect the deduction of taxes that a shareholder would pay on Fund distributions or the redemption of shares.
| 38 | The Leuthold Funds - 2011 Annual Report | |
| Leuthold Global Clean Technology Fund - Retail Class |
Average Annual Rate of Return For Periods Ended
September 30, 2011
| | | 1 Year | | | 3 Year | | | 5 Year | | | Since Inception | |
| | | | | | | | | | | | | |
| Leuthold Global Clean Technology Fund - | | | | | | | | | | | | |
| Retail Class | | | (25.63 | )% | | | n/a | | | | n/a | | | | (11.45 | )% |
| Ardour Composite Global Alternative | | | | | | | | | | | | | | | | |
| Energy Index | | | (39.66 | )% | | | (27.55 | )% | | | (13.15 | )% | | | (24.36 | )% |
| S&P 500 Index | | | 1.14 | % | | | 1.23 | % | | | (1.18 | )% | | | 10.30 | % |
A $10,000 Investment in the Leuthold Global Clean Technology Fund - Retail Class
The Ardour Composite Global Alternative Energy Index is a capitalization weighted, float adjusted equity index designed to serve as an equity benchmark for globally traded stocks which are principally engaged in the field of alternative energy technologies, including renewable energy, alternative fuels, and related enabling technologies. The index is published by S-Network Global Indexes, LLC.
The S&P 500 Index is an unmanaged capitalization-weighted index of 500 stocks designed to measure performance of the broad domestic economy through changes in the aggregate market value of the 500 stocks which represent all major industries.
This chart assumes an initial gross investment of $10,000 made on 7/22/09 (commencement of operations). Returns shown include the reinvestment of all dividends. The Fund’s past performance is not necessarily an indication of its future performance. It may perform better or worse in the future. The graph and the table do not reflect the deduction of taxes that a shareholder would pay on Fund distributions or the redemption of shares.
| | The Leuthold Funds - 2011 Annual Report | 39 |
| Leuthold Global Clean Technology Fund - Institutional Class |
Average Annual Rate of Return For Periods Ended
September 30, 2011
| | | 1 Year | | | 3 Year | | | 5 Year | | | Since Inception | |
| | | | | | | | | | | | | |
| Leuthold Global Clean Technology Fund - | | | | | | | | | | | | |
| Institutional Class | | | (25.46 | )% | | | n/a | | | | n/a | | | | (11.24 | )% |
| Ardour Composite Global Alternative | | | | | | | | | | | | | | | | |
| Energy Index | | | (39.66 | )% | | | (27.55 | )% | | | (13.15 | )% | | | (24.36 | )% |
| S&P 500 Index | | | 1.14 | % | | | 1.23 | % | | | (1.18 | )% | | | 10.30 | % |
A $1,000,000 Investment in the Leuthold Global Clean Technology Fund - Institutional Class
The Ardour Composite Global Alternative Energy Index is a capitalization weighted, float adjusted equity index designed to serve as an equity benchmark for globally traded stocks which are principally engaged in the field of alternative energy technologies, including renewable energy, alternative fuels, and related enabling technologies. The index is published by S-Network Global Indexes, LLC.
The S&P 500 Index is an unmanaged capitalization-weighted index of 500 stocks designed to measure performance of the broad domestic economy through changes in the aggregate market value of the 500 stocks which represent all major industries.
This chart assumes an initial gross investment of $1,000,000 made on 7/22/09 (commencement of operations). Returns shown include the reinvestment of all dividends. The Fund’s past performance is not necessarily an indication of its future performance. It may perform better or worse in the future. The graph and the table do not reflect the deduction of taxes that a shareholder would pay on Fund distributions or the redemption of shares.
| 40 | The Leuthold Funds - 2011 Annual Report | |
| Leuthold Hedged Equity Fund - Retail Class |
Average Annual Rate of Return For Periods Ended
September 30, 2011
| | | 1 Year | | | 3 Year | | | 5 Year | | | Since Inception | |
| | | | | | | | | | | | | |
| Leuthold Hedged Equities Fund- | | | | | | | | | | | | |
| Retail Class | | | (3.34 | )% | | | n/a | | | | n/a | | | | (7.65 | )% |
| Citigroup 90-Day Treasury Bills Index | | | 0.11 | % | | | 0.20 | % | | | 1.62 | % | | | 0.12 | % |
| S&P 500 Index | | | 1.14 | % | | | 1.23 | % | | | (1.18 | )% | | | 10.30 | % |
A $10,000 Investment in the Leuthold Hedged Equity Fund - Retail Class
The Citigroup 90-Day Treasury Bills Index is an unmanaged index representing monthly return equivalents of yield averages of the last 3 month Treasury Bill issues.
The S&P 500 Index is an unmanaged capitalization-weighted index of 500 stocks designed to measure performance of the broad domestic economy through changes in the aggregate market value of the 500 stocks which represent all major industries.
This chart assumes an initial gross investment of $10,000 made on 7/22/09 (commencement of operations). Returns shown include the reinvestment of all dividends. The Fund’s past performance is not necessarily an indication of its future performance. It may perform better or worse in the future. The graph and the table do not reflect the deduction of taxes that a shareholder would pay on Fund distributions or the redemption of shares.
| | The Leuthold Funds - 2011 Annual Report | 41 |
| Leuthold Hedged Equity Fund - Institutional Class |
Average Annual Rate of Return For Periods Ended
September 30, 2011
| | | 1 Year | | | 3 Year | | | 5 Year | | | Since Inception | |
| | | | | | | | | | | | | |
| Leuthold Hedged Equities Fund - | | | | | | | | | | | | |
| Institutional Class | | | (3.11 | )% | | | n/a | | | | n/a | | | | (7.55 | )% |
| Citigroup 90-Day Treasury Bills Index | | | 0.11 | % | | | 0.20 | % | | | 1.62 | % | | | 0.12 | % |
| S&P 500 Index | | | 1.14 | % | | | 1.23 | % | | | (1.18 | )% | | | 10.30 | % |
A $1,000,000 Investment in the Leuthold Hedged Equity Fund - Institutional Class
The Citigroup 90-Day Treasury Bills Index is an unmanaged index representing monthly return equivalents of yield averages of the last 3 month Treasury Bill issues.
The S&P 500 Index is an unmanaged capitalization-weighted index of 500 stocks designed to measure performance of the broad domestic economy through changes in the aggregate market value of the 500 stocks which represent all major industries.
This chart assumes an initial gross investment of $1,000,000 made on 7/22/09 (commencement of operations). Returns shown include the reinvestment of all dividends. The Fund’s past performance is not necessarily an indication of its future performance. It may perform better or worse in the future. The graph and the table do not reflect the deduction of taxes that a shareholder would pay on Fund distributions or the redemption of shares.
| 42 | The Leuthold Funds - 2011 Annual Report | |
Average Annual Rate of Return For Periods Ended
September 30, 2011
| | | 1 Year | | | 3 Year | | | 5 Year | | | 10 Year | |
| | | | | | | | | | | | | |
| Grizzly Short Fund | | | (2.06 | )% | | | (16.94 | )% | | | (4.32 | )% | | | (8.57 | )% |
| S&P MidCap 400 Index | | | (1.28 | )% | | | 4.05 | % | | | 2.20 | % | | | 7.50 | % |
| S&P 500 Index | | | 1.14 | % | | | 1.23 | % | | | (1.18 | )% | | | 2.82 | % |
A $10,000 Investment in the Grizzly Short Fund
The S&P MidCap 400 Index is a capitalization-weighted index which measures the performance of the mid-range sector of the U.S. stock market. The index was developed with a base level of 100 as of December 31, 1990.
The S&P 500 Index is an unmanaged capitalization-weighted index of 500 stocks designed to measure performance of the broad domestic economy through changes in the aggregate market value of the 500 stocks which represent all major industries.
This chart assumes an initial gross investment of $10,000 made on 9/30/01. Returns shown include the reinvestment of all dividends. The Fund’s past performance is not necessarily an indication of its future performance. It may perform better or worse in the future. The graph and the table do not reflect the deduction of taxes that a shareholder would pay on Fund distributions or the redemption of shares.
| | The Leuthold Funds - 2011 Annual Report | 43 |
Statements of Assets and Liabilities
September 30, 2011
| | | Leuthold | | | Leuthold | | | | | | | |
| | | Core | | | Asset | | | Leuthold | | | Leuthold | |
| | | Investment | | | Allocation | | | Global | | | Select | |
| | | Fund | | | Fund | | | Fund | | | Industries | |
| | | (Consolidated) | | | (Consolidated) | | | (Consolidated) | | | Fund | |
| | | | | | | | | | | | | |
| ASSETS: | | | | | | | | | | | | |
| Investments, at cost | | $ | 865,650,738 | | | $ | 805,463,041 | | | $ | 414,366,216 | | | $ | 18,014,009 | |
| | | | | | | | | | | | | | | | | |
| Investments, at fair value | | $ | 857,941,519 | | | $ | 842,751,268 | | | $ | 402,561,167 | | | $ | 16,295,196 | |
| Cash | | | 46,694 | | | | 45,552 | | | | 34,331 | | | | — | |
| Receivable for Fund shares sold | | | 514,204 | | | | 1,146,652 | | | | 287,978 | | | | 18,023 | |
| Receivable for investments sold | | | 3,357,782 | | | | — | | | | — | | | | 135,698 | |
| Collateral at broker for securities sold short | | | 331,252,901 | | | | 325,922,914 | | | | 103,015,790 | | | | — | |
| Interest receivable | | | 1,530,932 | | | | 1,501,168 | | | | 486,227 | | | | — | |
| Dividends receivable | | | 354,789 | | | | 792,825 | | | | 641,006 | | | | 13,950 | |
| Other assets | | | 29,902 | | | | 49,294 | | | | 19,176 | | | | 11,616 | |
| Total Assets | | | 1,195,028,723 | | | | 1,172,209,673 | | | | 507,045,675 | | | | 16,474,483 | |
| | | | | | | | | | | | | | | | | |
| LIABILITIES: | | | | | | | | | | | | | | | | |
| Securities sold short, at fair value (proceeds $201,295,003, $195,812,764, $70,549,715 and $0, respectively) | | | 180,572,172 | | | | 175,657,067 | | | | 60,756,318 | | | | — | |
| Interest payable on securities sold short | | | 60,480 | | | | 59,047 | | | | 29,754 | | | | — | |
| Payable for investments purchased | | | 3,430,372 | | | | — | | | | 347,884 | | | | 129,392 | |
| Payable for Fund shares redeemed | | | 1,024,421 | | | | 1,508,356 | | | | 470,081 | | | | 15,156 | |
| Payable to Adviser | | | 782,448 | | | | 763,747 | | | | 418,119 | | | | 16,478 | |
| Payable to Custodian | | | 49,121 | | | | 44,742 | | | | 36,795 | | | | 48 | |
| Dividends payable on securities sold short | | | 214,218 | | | | 208,387 | | | | 56,466 | | | | –– | |
| Distribution (Rule 12b-1) fees payable | | | — | | | | 400,644 | | | | 58,725 | | | | 577 | |
| Shareholder servicing fees payable | | | 172,162 | | | | — | | | | — | | | | 4,762 | |
| Accrued expenses and other liabilities | | | 272,764 | | | | 475,800 | | | | 131,739 | | | | 29,535 | |
| Total Liabilities | | | 186,578,158 | | | | 179,117,790 | | | | 62,305,881 | | | | 195,948 | |
| NET ASSETS | | $ | 1,008,450,565 | | | $ | 993,091,883 | | | $ | 444,739,794 | | | $ | 16,278,535 | |
| 44 | The Leuthold Funds - 2011 Annual Report | See Notes to the Financial Statements. |
Statements of Assets and Liabilities (continued)
September 30, 2011
| | | Leuthold | | | Leuthold | | | | | | | |
| | | Core | | | Asset | | | Leuthold | | | Leuthold | |
| | | Investment | | | Allocation | | | Global | | | Select | |
| | | Fund | | | Fund | | | Fund | | | Industries | |
| | | (Consolidated) | | | (Consolidated) | | | (Consolidated) | | | Fund | |
| | | | | | | | | | | | | |
| NET ASSETS CONSIST OF: | | | | | | | | | | | | |
| Capital stock | | $ | 1,003,400,830 | | | $ | 1,331,353,127 | | | $ | 445,658,408 | | | $ | 23,136,977 | |
| Accumulated net investment income (loss) | | | 16,992,082 | | | | 15,526,681 | | | | 1,851,244 | | | | –– | |
| Accumulated net realized gain (loss) on investments | | | (24,836,131 | ) | | | (411,113,970 | ) | | | (723,918 | ) | | | (5,139,620 | ) |
| Net unrealized appreciation (depreciation) on investments and short positions | | | 12,893,784 | | | | 57,326,045 | | | | (2,045,940 | ) | | | (1,718,822 | ) |
| Total Net Assets | | $ | 1,008,450,565 | | | $ | 993,091,883 | | | $ | 444,739,794 | | | $ | 16,278,535 | |
| | | | | | | | | | | | | | | | | |
| Retail Class Shares | | | | | | | | | | | | | | | | |
| Net assets | | $ | 660,933,063 | | | $ | 606,985,298 | | | $ | 152,292,208 | | | $ | 16,278,535 | |
| Shares outstanding (1,000,000,000 shares of $0.0001 par value authorized) | | | 42,631,683 | | | | 62,437,823 | | | | 16,000,314 | | | | 1,510,697 | |
| Net Asset Value, Redemption | | | | | | | | | | | | | | | | |
Price and Offering Price Per Share | | $ | 15.50 | * | | $ | 9.72 | * | | $ | 9.52 | * | | $ | 10.78 | |
| | | | | | | | | | | | | | | | | |
| Institutional Class Shares | | | | | | | | | | | | | | | | |
| Net assets | | $ | 347,517,502 | | | $ | 386,106,585 | | | $ | 292,447,586 | | | | n/a | |
| Shares outstanding (1,000,000,000 shares of $0.0001 par value authorized) | | | 22,423,654 | | | | 39,561,752 | | | | 30,656,975 | | | | n/a | |
| Net Asset Value, Redemption | | | | | | | | | | | | | | | | |
Price and Offering Price Per Share | | $ | 15.50 | * | | $ | 9.76 | * | | $ | 9.54 | * | | | n/a | |
* Redemption price may differ from NAV if redemption fee is applied.
See Notes to the Financial Statements. | The Leuthold Funds - 2011 Annual Report | 45 |
Statements of Assets and Liabilities (continued)
September 30, 2011
| | | Leuthold | | | Leuthold | | | Leuthold | | | | |
| | | Global | | | Global Clean | | | Hedged | | | Grizzly | |
| | | Industries | | | Technology | | | Equity | | | Short | |
| | | Fund | | | Fund | | | Fund | | | Fund | |
| | | | | | | | | | | | | |
| ASSETS: | | | | | | | | | | | | |
| Investments, at cost | | $ | 24,772,460 | | | $ | 19,270,261 | | | $ | 3,111,471 | | | $ | 23,198,003 | |
| | | | | | | | | | | | | | | | | |
| Investments, at fair value | | $ | 22,110,146 | | | $ | 15,246,586 | | | $ | 2,785,010 | | | $ | 23,198,003 | |
| Cash | | | — | | | | — | | | | — | | | | 31 | |
| Receivable for Fund shares sold | | | 15,000 | | | | 14,320 | | | | 464 | | | | 21,693,693 | |
| Receivable for investments sold | | | — | | | | 910,192 | | | | 17,247 | | | | 21,374,934 | |
| Collateral at brokers for securities sold short | | | — | | | | — | | | | 6,462,928 | | | | 442,991,072 | |
| Interest receivable | | | 4 | | | | — | | | | — | | | | 201 | |
| Dividends receivable | | | 61,339 | | | | 39,257 | | | | 2,180 | | | | –– | |
| Other assets | | | 15,913 | | | | 11,490 | | | | 12,367 | | | | 14,339 | |
| Total Assets | | | 22,202,402 | | | | 16,221,845 | | | | 9,280,196 | | | | 509,272,273 | |
| | | | | | | | | | | | | | | | | |
| LIABILITIES: | | | | | | | | | | | | | | | | |
| Securities sold short, at fair value (proceeds $0, $0, $3,722,856, and $276,153,766, respectively) | | | — | | | | –– | | | | 3,123,375 | | | | 245,182,130 | |
| Interest payable on securities sold short | | | — | | | | — | | | | 973 | | | | 60,524 | |
| Payable for investments purchased | | | 1,378,318 | | | | — | | | | 22,212 | | | | — | |
| Payable for Fund shares redeemed | | | 477,997 | | | | 23,328 | | | | 29,280 | | | | 85,505 | |
| Payable to Adviser | | | 22,071 | | | | 14,792 | | | | 15,414 | | | | 210,779 | |
| Payable to Custodian | | | 10,240 | | | | 6,446 | | | | — | | | | 113 | |
| Dividends payable on securities sold short | | | — | | | | –– | | | | 2,543 | | | | 187,473 | |
| Distribution (Rule 12b-1) fees payable | | | 3,430 | | | | 10,062 | | | | 7,286 | | | | — | |
| Shareholder servicing fees payable | | | — | | | | –– | | | | –– | | | | 25,024 | |
| Accrued expenses and other liabilities | | | 28,356 | | | | 29,413 | | | | 24,940 | | | | 72,642 | |
| Total Liabilities | | | 1,920,412 | | | | 84,041 | | | | 3,226,023 | | | | 245,824,190 | |
| NET ASSETS | | $ | 20,281,990 | | | $ | 16,137,804 | | | $ | 6,054,173 | | | $ | 263,448,083 | |
| 46 | The Leuthold Funds - 2011 Annual Report | See Notes to the Financial Statements. |
Statements of Assets and Liabilities (continued)
September 30, 2011
| | | Leuthold | | | Leuthold | | | Leuthold | | | | |
| | | Global | | | Global Clean | | | Hedged | | | Grizzly | |
| | | Industries | | | Technology | | | Equity | | | Short | |
| | | Fund | | | Fund | | | Fund | | | Fund | |
| | | | | | | | | | | | | |
| NET ASSETS CONSIST OF: | | | | | | | | | | | | |
| Capital stock | | $ | 24,013,542 | | | $ | 23,388,915 | | | $ | 6,568,646 | | | $ | 304,998,938 | |
| Accumulated net investment income (loss) | | | (26,563 | ) | | | –– | | | | –– | | | | –– | |
| Accumulated net realized gain (loss) on investments | | | (1,040,841 | ) | | | (3,227,154 | ) | | | (787,493 | ) | | | (72,522,491 | ) |
| Net unrealized appreciation (depreciation) on investments and short positions | | | (2,664,148 | ) | | | (4,023,957 | ) | | | 273,020 | | | | 30,971,636 | |
| Total Net Assets | | $ | 20,281,990 | | | $ | 16,137,804 | | | $ | 6,054,173 | | | $ | 263,448,083 | |
| | | | | | | | | | | | | | | | | |
| Retail Class Shares | | | | | | | | | | | | | | | | |
| Net assets | | $ | 5,377,373 | | | $ | 8,026,453 | | | $ | 4,882,593 | | | $ | 263,448,083 | |
Shares outstanding (1,000,000,000 shares of $0.0001 par value authorized) | | | 550,130 | | | | 1,047,596 | | | | 581,489 | | | | 16,326,662 | |
| Net Asset Value, Redemption | | | | | | | | | | | | | | | | |
Price and Offering Price Per Share | | $ | 9.77 | * | | $ | 7.66 | * | | $ | 8.40 | * | | $ | 16.14 | |
| | | | | | | | | | | | | | | | | |
| Institutional Class Shares | | | | | | | | | | | | | | | | |
| Net assets | | $ | 14,904,617 | | | $ | 8,111,351 | | | $ | 1,171,580 | | | | n/a | |
Shares outstanding (1,000,000,000 shares of $0.0001 par value authorized) | | | 1,525,195 | | | | 1,053,274 | | | | 139,129 | | | | n/a | |
| Net Asset Value, Redemption | | | | | | | | | | | | | | | | |
Price and Offering Price Per Share | | $ | 9.77 | * | | $ | 7.70 | * | | $ | 8.42 | * | | | n/a | |
* Redemption price may differ from NAV if redemption fee is applied.
See Notes to the Financial Statements. | The Leuthold Funds - 2011 Annual Report | 47 |
Statements of Operations
For the Year Ended September 30, 2011
| | | Leuthold | | | Leuthold | | | | | | | |
| | | Core | | | Asset | | | Leuthold | | | Leuthold | |
| | | Investment | | | Allocation | | | Global | | | Select | |
| | | Fund | | | Fund | | | Fund | | | Industries | |
| | | (Consolidated) | | | (Consolidated) | | | (Consolidated) | | | Fund | |
| | | | | | | | | | | | | |
| INVESTMENT INCOME: | | | | | | | | | | | | |
| Dividend income (net of foreign taxes withheld of $381,851, $410,824, $730,509, and $6,567, respectively) | | $ | 16,873,235 | | | $ | 20,532,013 | | | $ | 9,494,125 | | | $ | 358,006 | |
| Interest income | | | 4,937,366 | | | | 4,743,796 | | | | 835,334 | | | | 72 | |
| Total investment income | | | 21,810,601 | | | | 25,275,809 | | | | 10,329,459 | | | | 358,078 | |
| | | | | | | | | | | | | | | | | |
| EXPENSES: | | | | | | | | | | | | | | | | |
| Investment advisory fees (Note 3) | | | 10,992,682 | | | | 10,606,272 | | | | 4,754,427 | | | | 308,911 | |
| Administration fees | | | 474,481 | | | | 420,796 | | | | 142,802 | | | | 10,791 | |
| Transfer agent fees | | | 252,010 | | | | 1,103,506 | | | | 222,991 | | | | 10,198 | |
| Legal fees | | | 18,056 | | | | 20,115 | | | | 10,237 | | | | 481 | |
| Audit fees | | | 59,222 | | | | 59,216 | | | | 33,921 | | | | 26,418 | |
| Fund accounting fees | | | 112,774 | | | | 109,735 | | | | 54,968 | | | | 6,062 | |
| Custody fees | | | 290,827 | | | | 258,897 | | | | 204,130 | | | | 10,273 | |
| Shareholder servicing fees - | | | | | | | | | | | | | | | | |
| Retail Class | | | 925,379 | | | | — | | | | — | | | | 27,049 | |
| Registration fees | | | 49,376 | | | | 75,497 | | | | 45,885 | | | | 20,033 | |
| Reports to shareholders | | | 159,235 | | | | 195,268 | | | | 36,511 | | | | 5,920 | |
| Directors’ fees | | | 66,235 | | | | 63,604 | | | | 19,398 | | | | 1,731 | |
| Distribution (Rule 12b-1) fees - | | | | | | | | | | | | | | | | |
| Retail Class (Note 4) | | | — | | | | 1,666,357 | | | | 222,972 | | | | –– | |
| Other | | | 59,085 | | | | 50,165 | | | | 13,785 | | | | 3,392 | |
| Total expenses before dividends and | | | | | | | | | | | | | | | | |
| interest on short positions | | | 13,459,362 | | | | 14,629,428 | | | | 5,762,027 | | | | 431,259 | |
| Dividends and interest on short positions | | | 1,243,308 | | | | 1,200,146 | | | | 753,815 | | | | –– | |
| (Reimbursement) or recovery from Adviser | | | –– | | | | –– | | | | –– | | | | — | |
| Total expenses | | | 14,702,670 | | | | 15,829,574 | | | | 6,515,842 | | | | 431,259 | |
| NET INVESTMENT INCOME (LOSS) | | $ | 7,107,931 | | | $ | 9,446,235 | | | $ | 3,813,617 | | | $ | (73,181 | ) |
| 48 | The Leuthold Funds - 2011 Annual Report | See Notes to the Financial Statements. |
Statements of Operations (continued)
For the Year Ended September 30, 2011
| | | Leuthold | | | Leuthold | | | | | | | |
| | | Core | | | Asset | | | Leuthold | | | Leuthold | |
| | | Investment | | | Allocation | | | Global | | | Select | |
| | | Fund | | | Fund | | | Fund | | | Industries | |
| | | (Consolidated) | | | (Consolidated) | | | (Consolidated) | | | Fund | |
| | | | | | | | | | | | | |
| REALIZED AND UNREALIZED GAIN (LOSS) ON INVESTMENTS, INVESTMENT COMPANIES, SHORT POSITIONS, FOREIGN CURRENCY, AND FOREIGN CURRENCY TRANSLATION: | | | | | | | | | | | | |
| Net realized gain (loss) on: | | | | | | | | | | | | |
| Investments | | $ | 94,890,247 | | | $ | 102,889,228 | | | $ | 4,951,666 | | | $ | 3,704,579 | |
| Investment companies | | | 45,324,544 | | | | 25,467,995 | | | | 466,717 | | | | — | |
| Realized gain distributions received from investment companies | | | 6,426 | | | | 6,187 | | | | 34,000 | | | | — | |
| Short positions | | | (12,213,646 | ) | | | (11,655,495 | ) | | | (4,622,873 | ) | | | –– | |
| Foreign currency and foreign currency translation | | | 151,106 | | | | 838,498 | | | | (157,274 | ) | | | 21 | |
| Net unrealized appreciation (depreciation) during the period on: | | | | | | | | | | | | | | | | |
| Investments | | | (123,887,562 | ) | | | (126,519,925 | ) | | | (35,767,356 | ) | | | (3,531,987 | ) |
| Investment companies | | | (47,561,064 | ) | | | (26,673,621 | ) | | | (2,398,302 | ) | | | –– | |
| Short positions | | | 29,392,305 | | | | 28,237,948 | | | | 11,907,174 | | | | –– | |
| Foreign currency and foreign currency translation | | | (160,329 | ) | | | (155,514 | ) | | | (56,769 | ) | | | (48 | ) |
| Net realized and unrealized gain (loss) on investments, investment companies, short positions, foreign currency, and foreign currency translation | | | (14,057,973 | ) | | | (7,564,699 | ) | | | (25,643,017 | ) | | | 172,565 | |
| NET INCREASE (DECREASE) IN NET ASSETS RESULTING FROM OPERATIONS | | $ | (6,950,042 | ) | | $ | 1,881,536 | | | $ | (21,829,400 | ) | | $ | 99,384 | |
See Notes to the Financial Statements. | The Leuthold Funds - 2011 Annual Report | 49 |
Statements of Operations (continued)
For the Year Ended September 30, 2011
| | | Leuthold | | | Leuthold | | | Leuthold | | | | |
| | | Global | | | Global Clean | | | Hedged | | | Grizzly | |
| | | Industries | | | Technology | | | Equity | | | Short | |
| | | Fund | | | Fund | | | Fund | | | Fund | |
| | | | | | | | | | | | | |
| INVESTMENT INCOME: | | | | | | | | | | | | |
| Dividend income (net of foreign taxes withheld of $73,361, $19,087, $751, and $0, respectively) | | $ | 626,108 | | | $ | 209,503 | | | $ | 41,482 | | | $ | –– | |
| Interest income | | | 68 | | | | 904 | | | | 21 | | | | 2,227 | |
| Total investment income | | | 626,176 | | | | 210,407 | | | | 41,503 | | | | 2,227 | |
| | | | | | | | | | | | | | | | | |
| EXPENSES: | | | | | | | | | | | | | | | | |
| Investment advisory fees (Note 3) | | | 245,187 | | | | 262,675 | | | | 85,212 | | | | 1,611,902 | |
| Administration fees | | | 9,524 | | | | 9,857 | | | | 2,507 | | | | 50,063 | |
| Transfer agent fees | | | 10,796 | | | | 23,693 | | | | 8,386 | | | | 61,502 | |
| Legal fees | | | 13,722 | | | | 447 | | | | 133 | | | | 1,771 | |
| Audit fees | | | 21,020 | | | | 22,599 | | | | 23,219 | | | | 36,623 | |
| Fund accounting fees | | | 15,505 | | | | 7,070 | | | | 6,944 | | | | 14,316 | |
| Custody fees | | | 56,162 | | | | 27,342 | | | | 7,200 | | | | 641 | |
| Shareholder servicing fees - | | | | | | | | | | | | | | | | |
| Retail Class | | | –– | | | | — | | | | — | | | | 119,457 | |
| Registration fees | | | 41,497 | | | | 57,744 | | | | 53,851 | | | | 43,656 | |
| Reports to shareholders | | | 2,690 | | | | 3,917 | | | | 1,350 | | | | 25,222 | |
| Directors’ fees | | | 1,159 | | | | 1,422 | | | | 353 | | | | 7,249 | |
| Distribution (Rule 12b-1) fees - | | | | | | | | | | | | | | | | |
| Retail Class (Note 4) | | | 15,450 | | | | 31,242 | | | | 15,023 | | | | –– | |
| Other | | | 1,712 | | | | 4,088 | | | | 3,345 | | | | 6,621 | |
| Total expenses before dividends and interest on short positions | | | 434,424 | | | | 452,096 | | | | 207,523 | | | | 1,979,023 | |
| Dividends and interest on short positions | | | –– | | | | –– | | | | 48,275 | | | | 1,902,621 | |
| (Reimbursement) or recovery from Adviser | | | 19,172 | | | | –– | | | | (57,551 | ) | | | — | |
| Total expenses | | | 453,596 | | | | 452,096 | | | | 198,247 | | | | 3,881,644 | |
NET INVESTMENT INCOME (LOSS) | | $ | 172,580 | | | $ | (241,689 | ) | | $ | (156,744 | ) | | $ | (3,879,417 | ) |
| 50 | The Leuthold Funds - 2011 Annual Report | See Notes to the Financial Statements. |
| The Leuthold Funds |
| Statements of Operations (continued) |
| For the Year Ended September 30, 2011 |
| | | Leuthold | | | Leuthold | | | Leuthold | | | | |
| | | Global | | | Global Clean | | | Hedged | | | Grizzly | |
| | | Industries | | | Technology | | | Equity | | | Short | |
| | | Fund | | | Fund | | | Fund | | | Fund | |
| REALIZED AND UNREALIZED GAIN (LOSS) ON INVESTMENTS, INVESTMENT COMPANIES, SHORT POSITIONS, FOREIGN CURRENCY, AND FOREIGN CURRENCY TRANSLATION: | | | | | | | | | | | | |
| Net realized gain (loss) on: | | | | | | | | | | | | |
| Investments | | $ | (1,038,578 | ) | | $ | (2,515,763 | ) | | $ | 280,460 | | | $ | — | |
| Investment companies | | | 2,605 | | | | — | | | | 2,677 | | | | — | |
| Realized gain distributions received from investment companies | | | 2 | | | | –– | | | | — | | | | 146 | |
| Short positions | | | –– | | | | –– | | | | (464,764 | ) | | | (31,942,139 | ) |
| Foreign currency and foreign currency translation | | | (44,297 | ) | | | 85,577 | | | | 18 | | | | 515 | |
| Net unrealized appreciation (depreciation) during the period on: | | | | | | | | | | | | | | | | |
| Investments | | | (3,805,827 | ) | | | (3,101,868 | ) | | | (481,448 | ) | | | –– | |
| Investment companies | | | (27,881 | ) | | | — | | | | — | | | | –– | |
| Short positions | | | — | | | | — | | | | 651,059 | | | | 37,629,806 | |
| Foreign currency and foreign currency translation | | | (3,122 | ) | | | (568 | ) | | | –– | | | | –– | |
| Net realized and unrealized gain (loss) on investments, investment companies, short positions, foreign currency, and foreign currency translation | | | (4,917,098 | ) | | | (5,532,622 | ) | | | (11,998 | ) | | | 5,688,328 | |
| NET INCREASE (DECREASE) IN NET ASSETS RESULTING FROM OPERATIONS | | $ | (4,744,518 | ) | | $ | (5,774,311 | ) | | $ | (168,742 | ) | | $ | 1,808,911 | |
| See Notes to the Financial Statements. | The Leuthold Funds - 2011 Annual Report | 51 |
| Leuthold Core Investment Fund |
| Statements of Changes in Net Assets (Consolidated) |
| | | Year Ended | | | Year Ended | |
| | | September 30, 2011 | | | September 30, 2010 | |
| OPERATIONS: | | | | | | |
| Net investment income | | $ | 7,107,931 | | | $ | 12,524,280 | |
| Net realized gain on investments, investment companies, short positions, foreign currency, and foreign currency translation | | | 128,158,677 | | | | 24,723,910 | |
| Net unrealized depreciation on investments, investment companies, short positions, foreign currency, and foreign currency translation | | | (142,216,650 | ) | | | (21,639,383 | ) |
| Net increase (decrease) in net assets from operations | | | (6,950,042 | ) | | | 15,608,807 | |
| | | | | | | | | |
| DISTRIBUTIONS TO SHAREHOLDERS: | | | | | | | | |
| From net investment income - Retail Class | | | (3,081,175 | ) | | | — | |
| From net investment income - Institutional Class | | | (2,050,771 | ) | | | — | |
| From net realized gains - Retail Class | | | — | | | | — | |
| From net realized gains - Institutional Class | | | — | | | | — | |
| Return of capital - Retail Class | | | — | | | | (3,094,952 | ) |
| Return of capital - Institutional Class | | | — | | | | (1,931,051 | ) |
| Total distributions | | | (5,131,946 | ) | | | (5,026,003 | ) |
| | | | | | | | | |
| CAPITAL SHARE TRANSACTIONS: | | | | | | | | |
| Proceeds from shares sold - Retail Class | | | 91,440,164 | | | | 168,897,014 | |
| Proceeds from shares sold - Institutional Class | | | 53,074,051 | | | | 99,255,481 | |
| Proceeds from shares issued to holders in reinvestment of dividends - Retail Class | | | 2,906,808 | | | | 2,919,440 | |
Proceeds from shares issued to holders in reinvestment of dividends - Institutional Class | | | 1,918,404 | | | | 1,892,170 | |
| Cost of shares redeemed - Retail Class * | | | (283,073,874 | ) | | | (265,074,961 | ) |
| Cost of shares redeemed - Institutional Class ** | | | (156,096,354 | ) | | | (114,132,958 | ) |
| Net decrease in net assets from capital share transactions | | | (289,830,801 | ) | | | (106,243,814 | ) |
| | | | | | | | | |
| TOTAL DECREASE IN NET ASSETS: | | | (301,912,789 | ) | | | (95,661,010 | ) |
| NET ASSETS | | | | | | | | |
| Beginning of year | | | 1,310,363,354 | | | | 1,406,024,364 | |
| End of year (including accumulated net investment income (loss) of $16,992,082 and $(1,873,912), respectively) | | $ | 1,008,450,565 | | | $ | 1,310,363,354 | |
| | | | | | | | | |
| CHANGES IN SHARES OUTSTANDING: | | | | | | | | |
| Shares sold -Retail Class | | | 5,338,404 | | | | 10,525,894 | |
| Shares sold - Institutional Class | | | 3,146,529 | | | | 6,192,321 | |
| Shares issued to holders in reinvestment of dividends - Retail Class | | | 171,204 | | | | 177,366 | |
| Shares issued to holders in reinvestment of dividends -Institutional Class | | | 113,197 | | | | 115,026 | |
| Shares redeemed - Retail Class | | | (16,595,763 | ) | | | (16,787,529 | ) |
| Shares redeemed - Institutional Class | | | (9,101,904 | ) | | | (7,305,189 | ) |
| Net decrease in shares outstanding | | | (16,928,333 | ) | | | (7,082,111 | ) |
| | | | | | | | | |
| * Net of redemption fees of (Retail Class): | | $ | 1,366 | | | $ | 18,328 | |
| ** Net of redemption fees of (Institutional Class): | | $ | 28,224 | | | $ | 2 | |
| 52 | The Leuthold Funds - 2011 Annual Report | See Notes to the Financial Statements. |
| Leuthold Asset Allocation Fund |
| Statements of Changes in Net Assets (Consolidated) |
| | | Year Ended | | | Year Ended | |
| | | September 30, 2011 | | | September 30, 2010 | |
| OPERATIONS: | | | | | | |
| Net investment income | | $ | 9,446,235 | | | $ | 15,846,137 | |
| Net realized gain on investments, investment companies, short positions, foreign currency, and foreign currency translation | | | 117,546,413 | | | | 64,565,842 | |
| Net unrealized appreciation (depreciation) on investments, investment companies, short positions, foreign currency, and foreign currency translation | | | (125,111,112 | ) | | | 24,673,607 | |
| Net increase in net assets from operations | | | 1,881,536 | | | | 105,085,586 | |
| | | | | | | | | |
| DISTRIBUTIONS TO SHAREHOLDERS: | | | | | | | | |
| From net investment income - Retail Class | | | (4,321,330 | ) | | | (1,213,277 | ) |
| From net investment income - Institutional Class | | | (3,180,752 | ) | | | (549,204 | ) |
| From net realized gains - Retail Class | | | — | | | | — | |
| From net realized gains - Institutional Class | | | — | | | | — | |
| Return of capital - Retail Class | | | — | | | | (4,032,554 | ) |
| Return of capital - Institutional Class | | | — | | | | (1,825,382 | ) |
| Total distributions | | | (7,502,082 | ) | | | (7,620,417 | ) |
| | | | | | | | | |
| CAPITAL SHARE TRANSACTIONS: | | | | | | | | |
| Proceeds from shares sold - Retail Class | | | 165,626,458 | | | | 269,449,836 | |
| Proceeds from shares sold - Institutional Class | | | 129,757,090 | | | | 132,879,950 | |
| Proceeds from shares issued to holders in reinvestment of dividends - Retail Class | | | 3,892,104 | | | | 4,771,756 | |
| Proceeds from shares issued to holders in reinvestment of dividends - Institutional Class | | | 2,990,024 | | | | 2,142,582 | |
| Cost of shares redeemed - Retail Class * | | | (407,864,634 | ) | | | (347,429,796 | ) |
| Cost of shares redeemed - Institutional Class ** | | | (132,510,447 | ) | | | (121,529,433 | ) |
| Net decrease in net assets from capital share transactions | | | (238,109,405 | ) | | | (59,715,105 | ) |
| | | | | | | | | |
| | | | | | | | | |
| TOTAL INCREASE (DECREASE) IN NET ASSETS: | | | (243,729,951 | ) | | | 37,750,064 | |
| NET ASSETS | | | | | | | | |
| Beginning of year | | | 1,236,821,834 | | | | 1,199,071,770 | |
| End of year (including accumulated net investment income of $15,526,681 and $320,103, respectively) | | $ | 993,091,883 | | | $ | 1,236,821,834 | |
| | | | | | | | | |
| CHANGES IN SHARES OUTSTANDING: | | | | | | | | |
| Shares sold -Retail Class | | | 15,651,134 | | | | 27,769,493 | |
| Shares sold - Institutional Class | | | 12,144,533 | | | | 13,668,262 | |
| Shares issued to holders in reinvestment of dividends - Retail Class | | | 374,930 | | | | 478,205 | |
| Shares issued to holders in reinvestment of dividends -Institutional Class | | | 287,495 | | | | 214,388 | |
| Shares redeemed - Retail Class | | | (38,689,099 | ) | | | (36,248,252 | ) |
| Shares redeemed - Institutional Class | | | (12,469,491 | ) | | | (12,596,014 | ) |
| Net decrease in shares outstanding | | | (22,700,498 | ) | | | (6,713,918 | ) |
| | | | | | | | | |
| * Net of redemption fees of (Retail Class): | | $ | 4,091 | | | $ | 4,001 | |
| ** Net of redemption fees of (Institutional Class): | | $ | 7 | | | $ | — | |
| See Notes to the Financial Statements. | The Leuthold Funds - 2011 Annual Report | 53 |
| Leuthold Global Fund |
| Statements of Changes in Net Assets (Consolidated) |
| | | Year Ended | | | Year Ended | |
| | | September 30, 2011 | | | September 30, 2010 | |
| OPERATIONS: | | | | | | |
| Net investment income | | $ | 3,813,617 | | | $ | 2,069,446 | |
| Net realized gain on investments, investment companies, short positions, foreign currency, and foreign currency translation | | | 672,236 | | | | 19,514,817 | |
| Net unrealized appreciation (depreciation) on investments, investment companies, short positions, foreign currency, and foreign currency translation | | | (26,315,253 | ) | | | 5,097,126 | |
| Net increase (decrease) in net assets from operations | | | (21,829,400 | ) | | | 26,681,389 | |
| | | | | | | | | |
| DISTRIBUTIONS TO SHAREHOLDERS: | | | | | | | | |
| From net investment income - Retail Class | | | (841,488 | ) | | | (201,150 | ) |
| From net investment income - Institutional Class | | | (2,412,402 | ) | | | (423,478 | ) |
| From net realized gains - Retail Class | | | (5,218,636 | ) | | | — | |
| From net realized gains - Institutional Class | | | (9,824,159 | ) | | | — | |
| Total distributions | | | (18,296,685 | ) | | | (624,628 | ) |
| | | | | | | | | |
| CAPITAL SHARE TRANSACTIONS: | | | | | | | | |
| Proceeds from shares sold - Retail Class | | | 109,872,463 | | | | 84,051,580 | |
| Proceeds from shares sold - Institutional Class | | | 157,499,873 | | | | 77,405,797 | |
| Proceeds from shares issued to holders in reinvestment of dividends - Retail Class | | | 4,061,793 | | | | 125,999 | |
| Proceeds from shares issued to holders in reinvestment of dividends - Institutional Class | | | 10,572,414 | | | | 362,170 | |
| Cost of shares redeemed - Retail Class* | | | (46,673,365 | ) | | | (51,419,965 | ) |
| Cost of shares redeemed - Institutional Class** | | | (40,113,619 | ) | | | (26,707,262 | ) |
| Net increase in net assets from capital share transactions | | | 195,219,559 | | | | 83,818,319 | |
| | | | | | | | | |
| TOTAL INCREASE IN NET ASSETS: | | | 155,093,474 | | | | 109,875,080 | |
| NET ASSETS | | | | | | | | |
| Beginning of year | | | 289,646,320 | | | | 179,771,240 | |
| End of year (including accumulated net investment income of $1,851,244 and $2,218, respectively) | | $ | 444,739,794 | | | $ | 289,646,320 | |
| | | | | | | | | |
| CHANGES IN SHARES OUTSTANDING: | | | | | | | | |
| Shares sold -Retail Class | | | 10,329,104 | | | | 8,754,373 | |
| Shares sold - Institutional Class | | | 14,738,195 | | | | 8,056,701 | |
| Shares issued to holders in reinvestment of dividends - Retail Class | | | 395,426 | | | | 12,879 | |
| Shares issued to holders in reinvestment of dividends -Institutional Class | | | 1,024,489 | | | | 36,911 | |
| Shares redeemed - Retail Class | | | (4,441,240 | ) | | | (5,455,495 | ) |
| Shares redeemed - Institutional Class | | | (3,796,602 | ) | | | (2,793,589 | ) |
| Net increase in shares outstanding | | | 18,249,372 | | | | 8,611,780 | |
| | | | | | | | | |
| * Net of redemption fees of (Retail Class): | | $ | 3,180 | | | $ | 17,562 | |
| ** Net of redemption fees of (Institutional Class): | | $ | 656 | | | $ | — | |
| 54 | The Leuthold Funds - 2011 Annual Report | See Notes to the Financial Statements. |
| Leuthold Select Industries Fund |
| Statements of Changes in Net Assets |
| | | Year Ended | | | Year Ended | |
| | | September 30, 2011 | | | September 30, 2010 | |
| OPERATIONS: | | | | | | |
| Net investment income (loss) | | $ | (73,181 | ) | | $ | 110,459 | |
| Net realized gain on investments, foreign currency, and foreign currency translation | | | 3,704,600 | | | | 187,472 | |
| Net unrealized depreciation on investments, investment companies, foreign currency, and foreign currency translation | | | (3,532,035 | ) | | | (4,391,386 | ) |
| Net increase (decrease) in net assets from operations | | | 99,384 | | | | (4,093,455 | ) |
| | | | | | | | | |
| DISTRIBUTIONS TO SHAREHOLDERS: | | | | | | | | |
| From net investment income | | | (45,146 | ) | | | (87,441 | ) |
| From net realized gains | | | — | | | | — | |
| Total distributions | | | (45,146 | ) | | | (87,441 | ) |
| | | | | | | | | |
| CAPITAL SHARE TRANSACTIONS: | | | | | | | | |
| Proceeds from shares sold | | | 1,688,661 | | | | 12,399,177 | |
| Proceeds from shares sold in connection with the acquisition of Leuthold Select Equities Fund - (Note 1) | | | — | | | | 8,835,263 | |
| Proceeds from shares issued to holders in reinvestment of dividends | | | 39,403 | | | | 60,336 | |
| Cost of shares redeemed | | | (24,592,254 | ) | | | (25,568,753 | ) |
| Net decrease in net assets from capital share transactions | | | (22,864,190 | ) | | | (4,273,977 | ) |
| | | | | | | | | |
| TOTAL DECREASE IN NET ASSETS: | | | (22,809,952 | ) | | | (8,454,873 | ) |
| NET ASSETS | | | | | | | | |
| Beginning of year | | | 39,088,487 | | | | 47,543,360 | |
| End of year (including accumulated net investment income (loss) of $0 and $22,725, respectively) | | $ | 16,278,535 | | | $ | 39,088,487 | |
| | | | | | | | | |
| CHANGES IN SHARES OUTSTANDING: | | | | | | | | |
| Shares sold | | | 131,238 | | | | 980,357 | |
| Shares sold in connection with the acquisition of Leuthold Select Equities Fund | | | — | | | | 731,396 | |
| Shares issued to holders in reinvestment of dividends | | | 3,080 | | | | 5,305 | |
| Shares redeemed | | | (1,936,088 | ) | | | (2,112,955 | ) |
| Net decrease in shares outstanding | | | (1,801,770 | ) | | | (395,897 | ) |
| See Notes to the Financial Statements. | The Leuthold Funds - 2011 Annual Report | 55 |
| Leuthold Global Industries Fund |
| Statement of Changes in Net Assets |
| | | | | | Period from | |
| | | | | | May 17, 2010* | |
| | | Year Ended | | | through | |
| | | September 30, 2011 | | | September 30, 2010 | |
| | | | | | | �� |
| OPERATIONS: | | | | | | |
| Net investment income | | $ | 172,580 | | | $ | 5,734 | |
| Net realized gain (loss) on investments, investment companies, foreign currency, and foreign currency translation | | | (1,080,268 | ) | | | 70,563 | |
| Net unrealized appreciation (depreciation) on investments, investment companies, foreign currency, and foreign currency translation | | | (3,836,830 | ) | | | 1,172,682 | |
| Net increase (decrease) in net assets from operations | | | (4,744,518 | ) | | | 1,248,979 | |
| | | | | | | | | |
| DISTRIBUTIONS TO SHAREHOLDERS: | | | | | | | | |
| From net investment income - Retail Class | | | (28,834 | ) | | | — | |
| From net investment income - Institutional Class | | | (130,716 | ) | | | — | |
| From net realized gains - Retail Class | | | (45,735 | ) | | | — | |
| From net realized gains - Institutional Class | | | (30,728 | ) | | | — | |
| Total distributions | | | (236,013 | ) | | | — | |
| | | | | | | | | |
| CAPITAL SHARE TRANSACTIONS: | | | | | | | | |
| Proceeds from shares sold - Retail Class | | | 2,926,049 | | | | 5,128,852 | |
| Proceeds from shares sold - Institutional Class | | | 25,175,738 | | | | 3,342,433 | |
| Proceeds from shares issued to holders in reinvestment of dividends - Retail Class | | | 12,928 | | | | — | |
| Proceeds from shares issued to holders in reinvestment of dividends - Institutional Class | | | 158,397 | | | | — | |
| Cost of shares redeemed - Retail Class ** | | | (3,025,963 | ) | | | — | |
| Cost of shares redeemed - Institutional Class *** | | | (9,704,892 | ) | | | — | |
| Net increase in net assets from capital share transactions | | | 15,542,257 | | | | 8,471,285 | |
| | | | | | | | | |
| TOTAL INCREASE IN NET ASSETS: | | | 10,561,726 | | | | 9,720,264 | |
| NET ASSETS | | | | | | | | |
| Beginning of period | | | 9,720,264 | | | | — | |
| End of period (including accumulated net investment income (loss) of $(26,563) and $2,032, respectively) | | $ | 20,281,990 | | | $ | 9,720,264 | |
| | | | | | | | | |
| CHANGES IN SHARES OUTSTANDING: | | | | | | | | |
| Shares sold -Retail Class | | | 269,387 | | | | 531,349 | |
| Shares sold - Institutional Class | | | 2,007,864 | | | | 351,371 | |
| Shares issued to holders in reinvestment of dividends - Retail Class | | | 1,093 | | | | — | |
| Shares issued to holders in reinvestment of dividends -Institutional Class | | | 13,457 | | | | — | |
| Shares redeemed - Retail Class | | | (251,699 | ) | | | — | |
| Shares redeemed - Institutional Class | | | (847,497 | ) | | | — | |
| Net increase in shares outstanding | | | 1,192,605 | | | | 882,720 | |
| | | | | | | | | |
| * Commencement of Fund Operations | | | | | | | | |
| ** Net of redemption fees of (Retail Class): | | $ | 38 | | | $ | — | |
| *** Net of redemption fees of (Institutional Class): | | $ | — | | | $ | — | |
| 56 | The Leuthold Funds - 2011 Annual Report | See Notes to the Financial Statements. |
| Leuthold Global Clean Technology Fund |
| Statements of Changes in Net Assets |
| | | Year Ended | | | Year Ended | |
| | | September 30, 2011 | | | September 30, 2010 | |
| OPERATIONS: | | | | | | |
| | | | | | | |
| Net investment loss | | $ | (241,689 | ) | | $ | (253,652 | ) |
| Net realized loss on investments, investment companies, foreign currency, and foreign currency translation | | | (2,430,186 | ) | | | (689,320 | ) |
| Net unrealized depreciation on investments, investment companies, foreign currency, and foreign currency translation | | | (3,102,436 | ) | | | (1,887,137 | ) |
| Net decrease in net assets from operations | | | (5,774,311 | ) | | | (2,830,109 | ) |
| | | | | | | | | |
| DISTRIBUTIONS TO SHAREHOLDERS: | | | | | | | | |
| From net investment income - Retail Class | | | — | | | | — | |
| From net investment income - Institutional Class | | | — | | | | — | |
| From net realized gains - Retail Class | | | — | | | | — | |
| From net realized gains - Institutional Class | | | — | | | | — | |
| Total distributions | | | — | | | | — | |
| | | | | | | | | |
| CAPITAL SHARE TRANSACTIONS: | | | | | | | | |
| Proceeds from shares sold - Retail Class | | | 6,824,754 | | | | 14,727,315 | |
| Proceeds from shares sold - Institutional Class | | | 1,225,845 | | | | 11,645,942 | |
| Proceeds from shares issued to holders in reinvestment of dividends - Retail Class | | | — | | | | — | |
| Proceeds from shares issued to holders in reinvestment of dividends - Institutional Class | | | — | | | | — | |
| Cost of shares redeemed - Retail Class * | | | (7,573,809 | ) | | | (4,027,376 | ) |
| Cost of shares redeemed - Institutional Class ** | | | (5,950,651 | ) | | | (758,976 | ) |
| Net increase (decrease) in net assets from capital share transactions | | | (5,473,861 | ) | | | 21,586,905 | |
| | | | | | | | | |
| TOTAL INCREASE (DECREASE) IN NET ASSETS: | | | (11,248,172 | ) | | | 18,756,796 | |
| NET ASSETS | | | | | | | | |
| Beginning of year | | | 27,385,976 | | | | 8,629,180 | |
| End of year (including accumulated net investment income (loss) of $0 and $(1,375), respectively) | | $ | 16,137,804 | | | $ | 27,385,976 | |
| | | | | | | | | |
| CHANGES IN SHARES OUTSTANDING: | | | | | | | | |
| Shares sold -Retail Class | | | 603,918 | | | | 1,354,745 | |
| Shares sold - Institutional Class | | | 112,308 | | | | 1,011,088 | |
| Shares issued to holders in reinvestment of dividends - Retail Class | | | — | | | | — | |
| Shares issued to holders in reinvestment of dividends -Institutional Class | | | — | | | | — | |
| Shares redeemed - Retail Class | | | (713,831 | ) | | | (385,687 | ) |
| Shares redeemed - Institutional Class | | | (555,473 | ) | | | (75,494 | ) |
| Net increase (decrease) in shares outstanding | | | (553,078 | ) | | | 1,904,652 | |
| | | | | | | | | |
| * Net of redemption fees of (Retail Class): | | $ | 146 | | | $ | 767 | |
| ** Net of redemption fees of (Institutional Class): | | $ | 11 | | | $ | — | |
| See Notes to the Financial Statements. | The Leuthold Funds - 2011 Annual Report | 57 |
| Leuthold Hedged Equity Fund |
| Statements of Changes in Net Assets |
| | | Year Ended | | | Year Ended | |
| | | September 30, 2011 | | | September 30, 2010 | |
| OPERATIONS: | | | | | | |
| Net investment loss | | $ | (156,744 | ) | | $ | (101,211 | ) |
| Net realized loss on investments, investment companies, short positions, foreign currency, and foreign currency translation | | | (181,609 | ) | | | (551,085 | ) |
| Net unrealized appreciation on investments, investment companies, and short positions | | | 169,611 | | | | 79,270 | |
| Net decrease in net assets from operations | | | (168,742 | ) | | | (573,026 | ) |
| | | | | | | | | |
| DISTRIBUTIONS TO SHAREHOLDERS: | | | | | | | | |
| From net investment income - Retail Class | | | — | | | | — | |
| From net investment income - Institutional Class | | | — | | | | — | |
| From net realized gains - Retail Class | | | — | | | | — | |
| From net realized gains - Institutional Class | | | — | | | | — | |
| Total distributions | | | — | | | | — | |
| | | | | | | | | |
| CAPITAL SHARE TRANSACTIONS: | | | | | | | | |
| Proceeds from shares sold - Retail Class | | | 5,487,575 | | | | 8,141,275 | |
| Proceeds from shares sold - Institutional Class | | | 1,178,045 | | | | 653,583 | |
| Proceeds from shares issued to holders in reinvestment of dividends - Retail Class | | | — | | | | — | |
| Proceeds from shares issued to holders in reinvestment of dividends - Institutional Class | | | — | | | | — | |
| Cost of shares redeemed - Retail Class * | | | (4,975,894 | ) | | | (3,735,782 | ) |
| Cost of shares redeemed - Institutional Class ** | | | (56,299 | ) | | | (2,006,364 | ) |
| Net increase in net assets from capital share transactions | | | 1,633,427 | | | | 3,052,712 | |
| | | | | | | | | |
| TOTAL INCREASE IN NET ASSETS: | | | 1,464,685 | | | | 2,479,686 | |
| NET ASSETS | | | | | | | | |
| Beginning of year | | | 4,589,488 | | | | 2,109,802 | |
| End of year (including accumulated net investment income (loss) of $0 and $(24), respectively) | | $ | 6,054,173 | | | $ | 4,589,488 | |
| | | | | | | | | |
| CHANGES IN SHARES OUTSTANDING: | | | | | | | | |
| Shares sold -Retail Class | | | 645,192 | | | | 885,085 | |
| Shares sold - Institutional Class | | | 138,227 | | | | 68,347 | |
| Shares issued to holders in reinvestment of dividends - Retail Class | | | — | | | | — | |
| Shares issued to holders in reinvestment of dividends -Institutional Class | | | — | | | | — | |
| Shares redeemed - Retail Class | | | (584,512 | ) | | | (426,389 | ) |
| Shares redeemed - Institutional Class | | | (6,680 | ) | | | (219,245 | ) |
| Net increase in shares outstanding | | | 192,227 | | | | 307,798 | |
| | | | | | | | | |
| * Net of redemption fees of (Retail Class): | | $ | 3 | | | $ | 106 | |
| ** Net of redemption fees of (Institutional Class): | | $ | — | | | $ | — | |
| 58 | The Leuthold Funds - 2011 Annual Report | See Notes to the Financial Statements. |
| Grizzly Short Fund |
| Statements of Changes in Net Assets |
| | | Year Ended | | | Year Ended | |
| | | September 30, 2011 | | | September 30, 2010 | |
| OPERATIONS: | | | | | | |
| Net investment loss | | $ | (3,879,417 | ) | | $ | (3,599,148 | ) |
| Net realized loss on investment companies, short positions, foreign currency, and foreign currency translation | | | (31,941,478 | ) | | | (20,017,576 | ) |
| Net unrealized appreciation (depreciation) on investments and short positions | | | 37,629,806 | | | | (911,386 | ) |
| Net increase (decrease) in net assets from operations | | | 1,808,911 | | | | (24,528,110 | ) |
| | | | | | | | | |
| DISTRIBUTIONS TO SHAREHOLDERS: | | | | | | | | |
| From net investment income | | | — | | | | — | |
| From net realized gains | | | — | | | | — | |
| Total distributions | | | — | | | | — | |
| | | | | | | | | |
| CAPITAL SHARE TRANSACTIONS: | | | | | | | | |
| Proceeds from shares sold | | | 298,354,919 | | | | 320,755,091 | |
| Proceeds from shares issued to holders in reinvestment of dividends | | | — | | | | — | |
| Cost of shares redeemed | | | (233,267,989 | ) | | | (185,918,997 | ) |
| Net increase in net assets from capital share transactions | | | 65,086,930 | | | | 134,836,094 | |
| | | | | | | | | |
| TOTAL INCREASE IN NET ASSETS: | | | 66,895,841 | | | | 110,307,984 | |
| NET ASSETS | | | | | | | | |
| Beginning of year | | | 196,552,242 | | | | 86,244,258 | |
| End of year (including accumulated net investment income (loss) of $0 and $(39), respectively) | | $ | 263,448,083 | | | $ | 196,552,242 | |
| | | | | | | | | |
| CHANGES IN SHARES OUTSTANDING: | | | | | | | | |
| Shares sold | | | 16,037,579 | | | | 72,220,440 | |
| Shares issued to holders in reinvestment of dividends | | | — | | | | — | |
| Shares redeemed | | | (47,368,866 | ) | | | (42,727,644 | ) |
| Net increase (decrease) in shares outstanding | | | (31,331,287 | ) | | | 29,492,796 | |
| See Notes to the Financial Statements. | The Leuthold Funds - 2011 Annual Report | 59 |
| Leuthold Core Investment Fund - Retail |
| Financial Highlights |
| | | Year Ended | | | Year Ended | | | Year Ended | | | | | | | |
| | | September 30, | | | September 30, | | | September 30, | | | Year Ended | | | Year Ended | |
| | | 2011 | | | 2010 | | | 2009 | | | September 30, | | | September 30, | |
| | | (Consolidated) | | | (Consolidated) | | | (Consolidated) | | | 2008 | | | 2007 | |
| | | | | | | | | | | | | | | | |
Per Share Data (1): | | | | | | | | | | | | | | | |
| Net asset value, beginning of year | | $ | 15.99 | | | $ | 15.79 | | | $ | 15.20 | | | $ | 21.18 | | | $ | 17.45 | |
| Income (loss) from investment operations: | | | | | | | | | | | | | | | | | | | | |
| Net investment income | | | 0.09 | (3) | | | 0.14 | (2) | | | 0.28 | (2) | | | 0.26 | (3) | | | 0.39 | (3) |
| Net realized and unrealized gains (losses) on investments and short positions | | | (0.51 | ) | | | 0.11 | | | | 0.45 | | | | (2.18 | ) | | | 3.81 | |
| Total from investment operations | | | (0.42 | ) | | | 0.25 | | | | 0.73 | | | | (1.92 | ) | | | 4.20 | |
| | | | | | | | | | | | | | | | | | | | | |
| Less distributions: | | | | | | | | | | | | | | | | | | | | |
| From net investment income | | | (0.07 | ) | | | — | | | | (0.13 | ) | | | (0.31 | ) | | | (0.38 | ) |
| From net realized gains | | | — | | | | — | | | | — | | | | (3.75 | ) | | | (0.09 | ) |
| Return of capital | | | — | | | | (0.05 | ) | | | (0.01 | ) | | | — | | | | — | |
Redemption fees(4) | | | 0.00 | | | | 0.00 | | | | 0.00 | | | | 0.00 | | | | 0.00 | |
| Total distributions | | | (0.07 | ) | | | (0.05 | ) | | | (0.14 | ) | | | (4.06 | ) | | | (0.47 | ) |
| Net asset value, end of year | | $ | 15.50 | | | $ | 15.99 | | | $ | 15.79 | | | $ | 15.20 | | | $ | 21.18 | |
| | | | | | | | | | | | | | | | | | | | | |
| Total return | | | (2.61 | )% | | | 1.53 | % | | | 4.95 | % | | | (11.48 | )% | | | 24.32 | % |
| | | | | | | | | | | | | | | | | | | | | |
| Supplemental data and ratios: | | | | | | | | | | | | | | | | | | | | |
| Net assets, end of year | | $ | 660,933,063 | | | $ | 858,708,522 | | | $ | 944,341,607 | | | $ | 1,103,832,039 | | | $ | 1,574,861,576 | |
Ratio of expenses to average net assets(5): | | | 1.24 | % | | | 1.37 | % | | | 1.15 | % | | | 1.28 | % | | | 1.15 | % |
Ratio of net investment income to average net assets (6): | | | 0.54 | % | | | 0.85 | % | | | 2.14 | % | | | 1.51 | % | | | 1.96 | % |
Portfolio turnover rate (7) | | | 83.15 | % | | | 100.36 | % | | | 116.70 | % | | | 238.34 | % | | | 144.17 | % |
| (1) | For a share outstanding throughout the period. Rounded to the nearest cent. |
| (2) | Net investment income per share is calculated based on average shares outstanding. |
| (3) | Net investment income per share is calculated using ending balances prior to consideration of adjustments for permanent book and tax differences. |
| (4) | Amount represents less than $0.005 per share. |
| (5) | The ratio of expenses to average net assets includes dividends and interest on short positions. The expense ratios excluding dividends and interest on short positions were 1.14% for the year ended September 30, 2011, 1.12% for the period ended September 30, 2010, 1.14% for the year ended September 30, 2009, 1.11% for the year ended September 30, 2008, and 1.08% for the year ended September 30, 2007. |
| (6) | The net investment income ratios include dividends and interest on short positions. |
| (7) | The portfolio turnover rate excludes purchases and sales of short positions as the Adviser does not intend to hold the short positions for more than one year. |
| 60 | The Leuthold Funds - 2011 Annual Report | See Notes to the Financial Statements. |
| Leuthold Core Investment Fund - Institutional |
| Financial Highlights |
| | | Year Ended | | | Year Ended | | | Year Ended | | | | | | | |
| | | September 30, | | | September 30, | | | September 30, | | | Year Ended | | | Year Ended | |
| | | 2011 | | | 2010 | | | 2009 | | | September 30, | | | September 30, | |
| | | (Consolidated) | | | (Consolidated) | | | (Consolidated) | | | 2008 | | | 2007 | |
| | | | | | | | | | | | | | | | |
Per Share Data (1): | | | | | | | | | | | | | | | |
| Net asset value, beginning of year | | $ | 15.98 | | | $ | 15.78 | | | $ | 15.19 | | | $ | 21.17 | | | $ | 17.43 | |
| Income (loss) from investment operations: | | | | | | | | | | | | | | | | | | | | |
| Net investment income | | | 0.11 | (3) | | | 0.15 | (2) | | | 0.30 | (3) | | | 0.28 | (3) | | | 0.40 | (3) |
| Net realized and unrealized gains (losses) on investments and short positions | | | (0.50 | ) | | | 0.11 | | | | 0.45 | | | | (2.19 | ) | | | 3.83 | |
| Total from investment operations | | | (0.39 | ) | | | 0.26 | | | | 0.75 | | | | (1.91 | ) | | | 4.23 | |
| | | | | | | | | | | | | | | | | | | | | |
| Less distributions: | | | | | | | | | | | | | | | | | | | | |
| From net investment income | | | (0.09 | ) | | | — | | | | (0.15 | ) | | | (0.32 | ) | | | (0.40 | ) |
| From net realized gains | | | — | | | | — | | | | — | | | | (3.75 | ) | | | (0.09 | ) |
| Return of capital | | | — | | | | (0.06 | ) | | | (0.01 | ) | | | — | | | | — | |
| Redemption fees | | | 0.00 | (4) | | | 0.00 | (4) | | | 0.00 | (4) | | | — | | | | — | |
| Total distributions | | | (0.09 | ) | | | (0.06 | ) | | | (0.16 | ) | | | (4.07 | ) | | | (0.49 | ) |
| Net asset value, end of year | | $ | 15.50 | | | $ | 15.98 | | | $ | 15.78 | | | $ | 15.19 | | | $ | 21.17 | |
| | | | | | | | | | | | | | | | | | | | | |
| Total return | | | (2.49 | )% | | | 1.64 | % | | | 5.14 | % | | | (11.46 | )% | | | 24.53 | % |
| | | | | | | | | | | | | | | | | | | | | |
| Supplemental data and ratios: | | | | | | | | | | | | | | | | | | | | |
| Net assets, end of year | | $ | 347,517,502 | | | $ | 451,654,832 | | | $ | 461,682,757 | | | $ | 317,733,525 | | | $ | 203,412,179 | |
Ratio of expenses to average net assets (5): | | | 1.13 | % | | | 1.27 | % | | | 1.03 | % | | | 1.18 | % | | | 1.05 | % |
Ratio of net investment income to average net assets (6): | | | 0.66 | % | | | 0.95 | % | | | 2.25 | % | | | 1.61 | % | | | 2.06 | % |
Portfolio turnover rate (7) | | | 83.15 | % | | | 100.36 | % | | | 116.70 | % | | | 238.34 | % | | | 144.17 | % |
| (1) | For a share outstanding throughout the period. Rounded to the nearest cent. |
| (2) | Net investment income per share is calculated based on average shares outstanding. |
| (3) | Net investment income per share is calculated using ending balances prior to consideration of adjustments for permanent book and tax differences. |
| (4) | Amount represents less than $0.005 per share. |
| (5) | The ratio of expenses to average net assets includes dividends and interest on short positions. The expense ratios excluding dividends and interest on short positions were 1.03% for the year ended September 30, 2011, 1.02% for the year ended September 30, 2010, 1.02% for the year ended September 30, 2009, 1.01% for the year ended September 30, 2008, and 0.98% for the year ended September 30, 2007. |
| (6) | The net investment income ratios include dividends and interest on short positions. |
| (7) | The portfolio turnover rate excludes purchases and sales of short positions as the Adviser does not intend to hold the short positions for more than one year. |
| See Notes to the Financial Statements. | The Leuthold Funds - 2011 Annual Report | 61 |
| Leuthold Asset Allocation Fund - Retail |
| Financial Highlights |
| | | Year Ended | | | Year Ended | | | Year Ended | | | | | | | |
| | | September 30, | | | September 30, | | | September 30, | | | Year Ended | | | Year Ended | |
| | | 2011 | | | 2010 | | | 2009 | | | September 30, | | | September 30, | |
| | | (Consolidated) | | | (Consolidated) | | | (Consolidated) | | | 2008 | | | 2007 | |
| | | | | | | | | | | | | | | | |
Per Share Data (1): | | | | | | | | | | | | | | | |
| Net asset value, beginning of year | | $ | 9.91 | | | $ | 9.12 | | | $ | 9.45 | | | $ | 11.43 | | | $ | 9.73 | |
| Income (loss) from investment operations: | | | | | | | | | | | | | | | | | | | | |
| Net investment income | | | 0.07 | (3) | | | 0.11 | (2) | | | 0.21 | (3) | | | 0.20 | (3) | | | 0.16 | (3) |
| Net realized and unrealized gains (losses) on investments and short positions | | | (0.20 | ) | | | 0.74 | | | | (0.35 | ) | | | (1.80 | ) | | | 1.72 | |
| Total from investment operations | | | (0.13 | ) | | | 0.85 | | | | (0.14 | ) | | | (1.60 | ) | | | 1.88 | |
| | | | | | | | | | | | | | | | | | | | | |
| Less distributions: | | | | | | | | | | | | | | | | | | | | |
| From net investment income | | | (0.06 | ) | | | (0.02 | ) | | | (0.19 | ) | | | (0.20 | ) | | | (0.18 | ) |
| From net realized gains | | | — | | | | — | | | | — | | | | (0.18 | ) | | | — | |
| Return of capital | | | — | | | | (0.04 | ) | | | — | | | | — | | | | — | |
Redemption fees (4) | | | 0.00 | | | | 0.00 | | | | 0.00 | | | | 0.00 | | | | 0.00 | |
| Total distributions | | | (0.06 | ) | | | (0.06 | ) | | | (0.19 | ) | | | (0.38 | ) | | | (0.18 | ) |
| Net asset value, end of year | | $ | 9.72 | | | $ | 9.91 | | | $ | 9.12 | | | $ | 9.45 | | | $ | 11.43 | |
| | | | | | | | | | | | | | | | | | | | | |
| Total return | | | (1.34 | )% | | | 9.26 | % | | | (1.20 | )% | | | (14.45 | )% | | | 19.46 | % |
| | | | | | | | | | | | | | | | | | | | | |
| Supplemental data and ratios: | | | | | | | | | | | | | | | | | | | | |
| Net assets, end of year | | $ | 606,985,298 | | | $ | 843,525,684 | | | $ | 849,399,319 | | | $ | 1,205,840,473 | | | $ | 566,453,346 | |
Ratio of expenses to average net assets (5): | | | 1.42 | % | | | 1.57 | % | | | 1.34 | % | | | 1.34 | % | | | 1.43 | % |
Ratio of net investment income to average net assets (6): | | | 0.72 | % | | | 1.17 | % | | | 2.60 | % | | | 1.99 | % | | | 1.97 | % |
Portfolio turnover rate (7) | | | 105.62 | % | | | 100.64 | % | | | 147.01 | % | | | 197.96 | % | | | 196.15 | % |
| (1) | For a share outstanding throughout the period. Rounded to the nearest cent. |
| (2) | Net investment income per share is calculated based on average shares outstanding. |
| (3) | Net investment income per share is calculated using ending balances prior to consideration of adjustments for permanent book and tax differences. |
| (4) | Amount represents less than $0.005 per share. |
| (5) | The ratio of expenses to average net assets includes dividends and interest on short positions. The expense ratios excluding dividends and interest on short positions were 1.32% for the year ended September 30, 2011, 1.32% for the year ended September 30, 2010, 1.32% for the year ended September 30, 2009, 1.23% for the year ended September 30, 2008, and 1.32% for the year ended September 30, 2007. |
| (6) | The net investment income ratios include dividends and interest on short positions. |
| (7) | The portfolio turnover rate excludes purchases and sales of short positions as the Adviser does not intend to hold the short positions for more than one year. |
| 62 | The Leuthold Funds - 2011 Annual Report | See Notes to the Financial Statements. |
| Leuthold Asset Allocation Fund - Institutional |
| Financial Highlights |
| | | | | | | | | | | | | | | Period from | |
| | | Year Ended | | | Year Ended | | | Year Ended | | | | | | January 31,2007(1) | |
| | | September 30, | | | September 30, | | | September 30, | | | Year Ended | | | through | |
| | | 2011 | | | 2010 | | | 2009 | | | September 30, | | | September 30, | |
| | | (Consolidated) | | | (Consolidated) | | | (Consolidated) | | | 2008 | | | 2007 | |
| | | | | | | | | | | | | | | | |
Per Share Data (2): | | | | | | | | | | | | | | | |
| Net asset value, beginning of period | | $ | 9.93 | | | $ | 9.13 | | | $ | 9.45 | | | $ | 11.44 | | | $ | 10.53 | |
| Income (loss) from investment operations: | | | | | | | | | | | | | | | | | | | | |
| Net investment income | | | 0.10 | (4) | | | 0.13 | (3) | | | 0.23 | (4) | | | 0.21 | (4) | | | 0.12 | (4) |
| Net realized and unrealized gains (losses) on investments and short positions | | | (0.19 | ) | | | 0.73 | | | | (0.34 | ) | | | (1.81 | ) | | | 0.92 | |
| Total from investment operations | | | (0.09 | ) | | | 0.86 | | | | (0.11 | ) | | | (1.60 | ) | | | 1.04 | |
| | | | | | | | | | | | | | | | | | | | | |
| Less distributions: | | | | | | | | | | | | | | | | | | | | |
| From net investment income | | | (0.08 | ) | | | (0.02 | ) | | | (0.21 | ) | | | (0.21 | ) | | | (0.13 | ) |
| From net realized gains | | | — | | | | — | | | | — | | | | (0.18 | ) | | | — | |
| Return of capital | | | — | | | | (0.04 | ) | | | — | | | | — | | | | — | |
| Redemption fees | | | 0.00 | (5) | | | — | | | | 0.00 | (5) | | | 0.00 | (5) | | | 0.00 | (5) |
| Total distributions | | | (0.08 | ) | | | (0.06 | ) | | | (0.21 | ) | | | (0.39 | ) | | | (0.13 | ) |
| Net asset value, end of period | | $ | 9.76 | | | $ | 9.93 | | | $ | 9.13 | | | $ | 9.45 | | | $ | 11.44 | |
| | | | | | | | | | | | | | | | | | | | | |
| Total return | | | (0.95 | )% | | | 9.41 | % | | | (0.85 | )% | | | (14.42 | )% | | | 9.95 | % |
| | | | | | | | | | | | | | | | | | | | | |
| Supplemental data and ratios: | | | | | | | | | | | | | | | | | | | | |
| Net assets, end of period | | $ | 386,106,585 | | | $ | 393,296,150 | | | $ | 349,672,451 | | | $ | 683,852,979 | | | $ | 189,777,479 | |
Ratio of expenses to average net assets (6): | | | 1.20 | % | | | 1.36 | % | | | 1.11 | % | | | 1.21 | % | | | 1.22 | %(7) |
Ratio of net investment income to average net assets (8): | | | 0.94 | % | | | 1.38 | % | | | 2.82 | % | | | 2.12 | % | | | 2.11 | %(7) |
Portfolio turnover rate (9) | | | 105.62 | % | | | 100.64 | % | | | 147.01 | % | | | 197.96 | % | | | 196.15 | % |
| (1) | Commencement of share class operations. |
| (2) | For a share outstanding throughout the period. Rounded to the nearest cent. |
| (3) | Net investment income per share is calculated based on average shares outstanding. |
| (4) | Net investment income per share is calculated using ending balances prior to consideration of adjustments for permanent book and tax differences. |
| (5) | Amount represents less than $0.005 per share. |
| (6) | The ratio of expenses to average net assets includes dividends and interest on short positions. The expense ratios excluding dividends and interest on short positions were 1.10% for the year ended September 30, 2011, 1.11% for the year ended September 30, 2010, 1.10% for the year ended September 30, 2009, 1.09% for the year ended September 30, 2008, and 1.08% for the period ended September 30, 2007. |
| (8) | The net investment income ratios include dividends and interest on short positions. |
| (9) | The portfolio turnover rate excludes purchases and sales of short positions as the Adviser does not intend to hold the short positions for more than one year. |
| See Notes to the Financial Statements. | The Leuthold Funds - 2011 Annual Report | 63 |
| Leuthold Global Fund - Retail |
| Financial Highlights |
| | | Year Ended | | | Year Ended | | | Year Ended | | | Period from | |
| | | September 30, | | | September 30, | | | September 30, | | | July 1, 2008 (1) | |
| | | 2011 | | | 2010 | | | 2009 | | | through | |
| | | (Consolidated) | | | (Consolidated) | | | (Consolidated) | | | September 30, 2008 | |
Per Share Data (2): | | | | | | | | | | | | |
| Net asset value, beginning of period | | $ | 10.18 | | | $ | 9.07 | | | $ | 8.51 | | | $ | 10.00 | |
| Income (loss) from investment operations: | | | | | | | | | | | | | | | | |
| Net investment income | | | 0.08 | (4) | | | 0.07 | (3) | | | 0.09 | (4) | | | 0.03 | (4) |
| Net realized and unrealized gains (losses) on investments and short positions | | | (0.17 | ) | | | 1.06 | | | | 0.59 | | | | (1.52 | ) |
| Total from investment operations | | | (0.09 | ) | | | 1.13 | | | | 0.68 | | | | (1.49 | ) |
| | | | | | | | | | | | | | | | | |
| Less distributions: | | | | | | | | | | | | | | | | |
| From net investment income | | | (0.07 | ) | | | (0.02 | ) | | | (0.12 | ) | | | — | |
| From net realized gains | | | (0.50 | ) | | | — | | | | — | | | | — | |
Redemption fees (5) | | | 0.00 | | | | 0.00 | | | | 0.00 | | | | 0.00 | |
| Total distributions | | | (0.57 | ) | | | (0.02 | ) | | | (0.12 | ) | | | — | |
| Net asset value, end of period | | $ | 9.52 | | | $ | 10.18 | | | $ | 9.07 | | | $ | 8.51 | |
| | | | | | | | | | | | | | | | | |
| Total return | | | (1.33 | )% | | | 12.39 | % | | | 8.28 | % | | | (14.04 | )% |
| | | | | | | | | | | | | | | | | |
| Supplemental data and ratios: | | | | | | | | | | | | | | | | |
| Net assets, end of period | | $ | 152,292,208 | | | $ | 98,906,854 | | | $ | 58,120,794 | | | $ | 19,940,804 | |
Ratio of expenses to average net assets (6): | | | 1.74 | % | | | 1.93 | % | | | 1.82 | % | | | 1.83 | %(7) |
Ratio of net investment income to average net assets (8): | | | 0.83 | % | | | 0.78 | % | | | 1.56 | % | | | 2.01 | %(7) |
Portfolio turnover rate (9) | | | 123.51 | % | | | 140.87 | % | | | 152.90 | % | | | 62.34 | % |
| (1) | Commencement of share class operations. |
| (2) | For a share outstanding throughout the period. Rounded to the nearest cent. |
| (3) | Net investment income per share is calculated based on average shares outstanding. |
| (4) | Net investment income per share is calculated using ending balances prior to consideration of adjustments for permanent book and tax differences. |
| (5) | Amount represents less than $0.005 per share. |
| (6) | The ratio of expenses to average net assets includes dividends and interest on short positions. The expense ratios excluding dividends and interest on short positions were 1.55% for the year ended September 30, 2011, 1.65% for the year ended Septemeber 30, 2010, 1.77% for the year ended September 30, 2009, and 1.83% for the period ended September 30, 2008. |
| (8) | The net investment income ratios include dividends and interest on short positions. |
| (9) | The portfolio turnover rate excludes purchases and sales of short positions as the Adviser does not intend to hold the short positions for more than one year. |
| 64 | The Leuthold Funds - 2011 Annual Report | See Notes to the Financial Statements. |
| Leuthold Global Fund - Institutional |
| Financial Highlights |
| | | Year Ended | | | Year Ended | | | Year Ended | | | Period from | |
| | | September 30, | | | September 30, | | | September 30, | | | April 30, 2008 (1) | |
| | | 2011 | | | 2010 | | | 2009 | | | through | |
| | | (Consolidated) | | | (Consolidated) | | | (Consolidated) | | | September 30, 2008 | |
Per Share Data (2): | | | | | | | | | | | | |
| Net asset value, beginning of period | | $ | 10.20 | | | $ | 9.08 | | | $ | 8.51 | | | $ | 10.00 | |
| Income (loss) from investment operations: | | | | | | | | | | | | | | | | |
| Net investment income | | | 0.10 | (4) | | | 0.09 | (3) | | | 0.11 | (4) | | | 0.04 | (4) |
| Net realized and unrealized gains (losses) on investments and short positions | | | (0.17 | ) | | | 1.06 | | | | 0.59 | | | | (1.53 | ) |
| Total from investment operations | | | (0.07 | ) | | | 1.15 | | | | 0.70 | | | | (1.49 | ) |
| | | | | | | | | | | | | | | | |
| Less distributions: | | | | | | | | | | | | | | | | |
| From net investment income | | | (0.09 | ) | | | (0.03 | ) | | | (0.13 | ) | | | — | |
| From net realized gains | | | (0.50 | ) | | | — | | | | — | | | | — | |
| Redemption fees | | | 0.00 | (5) | | | — | | | | — | | | | — | |
| Total distributions | | | (0.59 | ) | | | (0.03 | ) | | | (0.13 | ) | | | — | |
| Net asset value, end of period | | $ | 9.54 | | | $ | 10.20 | | | $ | 9.08 | | | $ | 8.51 | |
| | | | | | | | | | | | | | | | | |
| Total return | | | (1.11 | )% | | | 12.52 | % | | | 8.63 | % | | | (14.90 | )% |
| | | | | | | | | | | | | | | | | |
| Supplemental data and ratios: | | | | | | | | | | | | | | | | |
| Net assets, end of year | | $ | 292,447,586 | | | $ | 190,739,466 | | | $ | 121,650,446 | | | $ | 51,045,894 | |
Ratio of expenses to average net assets (6): | | | 1.57 | % | | | 1.75 | % | | | 1.57 | % | | | 1.61 | %(7) |
Ratio of net investment income to average net assets (8): | | | 1.01 | % | | | 0.97 | % | | | 1.80 | % | | | 2.20 | %(7) |
Portfolio turnover rate (9) | | | 123.51 | % | | | 140.87 | % | | | 152.90 | % | | | 62.34 | % |
| (1) | Commencement of share class operations. |
| (2) | For a share outstanding throughout the period. Rounded to the nearest cent. |
| (3) | Net investment income per share is calculated based on average shares outstanding. |
| (4) | Net investment income per share is calculated using ending balances prior to consideration of adjustments for permanent book and tax differences. |
| (5) | Amount represents less than $0.005 per share. |
| (6) | The ratio of expenses to average net assets includes dividends and interest on short positions. The expense ratios excluding dividends and interest on short positions were 1.38% for the year ended September 30, 2011, 1.47% for the year ended September 30, 2010, 1.53% for the year ended September 30, 2009, and 1.60% for the period ended September 30, 2008. |
| (8) | The net investment income ratios include dividends and interest on short positions. |
| (9) | The portfolio turnover rate excludes purchases and sales of short positions as the Adviser does not intend to hold the short positions for more than one year. |
| See Notes to the Financial Statements. | The Leuthold Funds - 2011 Annual Report | 65 |
| Leuthold Select Industries Fund |
| Financial Highlights |
| | | Year Ended | | | Year Ended | | | Year Ended | | | Year Ended | | | Year Ended | |
| | | September 30, | | | September 30, | | | September 30, | | | September 30, | | | September 30, | |
| | | 2011 | | | 2010 | | | 2009 | | | 2008 | | | 2007 | |
Per Share Data (1): | | | | | | | | | | | | | | | |
| Net asset value, beginning of year | | $ | 11.80 | | | $ | 12.82 | | | $ | 13.03 | | | $ | 21.94 | | | $ | 17.25 | |
| Income (loss) from investment operations: | | | | | | | | | | | | | | | | | | | | |
| Net investment income (loss) | | | (0.05 | ) (3) | | | 0.03 | (2) | | | (0.04 | ) (3) | | | (0.04 | ) (3) | | | 0.13 | (3) |
| Net realized and unrealized gains (losses) on investments | | | (0.95 | ) | | | (1.03 | ) | | | (0.17 | ) | | | (3.15 | ) | | | 4.98 | |
| Total from investment operations | | | (1.00 | ) | | | (1.00 | ) | | | (0.21 | ) | | | (3.19 | ) | | | 5.11 | |
| | | | | | | | | | | | | | | | | | | | | |
| Less distributions: | | | | | | | | | | | | | | | | | | | | |
| From net investment income | | | (0.02 | ) | | | (0.02 | ) | | | — | | | | (0.06 | ) | | | (0.12 | ) |
| From net realized gains | | | — | | | | — | | | | — | | | | (5.63 | ) | | | (0.30 | ) |
| Return of capital | | | — | | | | — | | | | — | | | | (0.03 | ) | | | — | |
| Total distributions | | | (0.02 | ) | | | (0.02 | ) | | | — | | | | (5.72 | ) | | | (0.42 | ) |
| Net asset value, end of year | | $ | 10.78 | | | $ | 11.80 | | | $ | 12.82 | | | $ | 13.03 | | | $ | 21.94 | |
| | | | | | | | | | | | | | | | | | | | | |
| Total return | | | (8.60 | )% | | | (7.76 | )% | | | (1.69 | )% | | | (18.90 | )% | | | 30.12 | % |
| | | | | | | | | | | | | | | | | | | | | |
| Supplemental data and ratios: | | | | | | | | | | | | | | | | | | | | |
| Net assets, end of year | | $ | 16,278,535 | | | $ | 39,088,487 | | | $ | 47,543,360 | | | $ | 42,632,379 | | | $ | 74,020,005 | |
| Ratio of expenses to average net assets: | | | 1.40 | % | | | 1.30 | % | | | 1.38 | % | | | 1.30 | % | | | 1.29 | % |
| Ratio of net investment income (loss) to average net assets: | | | (0.24 | )% | | | 0.24 | % | | | (0.38 | )% | | | (0.11 | )% | | | 0.61 | % |
| Portfolio turnover rate | | | 109.26 | % | | | 178.24 | % | | | 164.20 | % | | | 139.89 | % | | | 132.08 | % |
| (1) | For a share outstanding throughout the period. Rounded to the nearest cent. |
| (2) | Net investment income per share is calculated based on average shares outstanding. |
| (3) | Net investment income (loss) per share is calculated using ending balances prior to consideration of adjustments for permanent book and tax differences. |
| 66 | The Leuthold Funds - 2011 Annual Report | See Notes to the Financial Statements. |
| Leuthold Global Industries Fund - Retail |
| Financial Highlights |
| | | | | | Period from | |
| | | | | | May 17, 2010 (1) | |
| | | Year Ended | | | through | |
| | | September 30, 2011 | | | September 30, 2010 | |
Per Share Data (2): | | | | | | |
| Net asset value, beginning of period | | $ | 11.01 | | | $ | 10.00 | |
| Income (loss) from investment operations: | | | | | | | | |
Net investment income (3) | | | 0.06 | | | | 0.00 | (4) |
| Net realized and unrealized gains (losses) on investments | | | (1.16 | ) | | | 1.01 | |
| Total from investment operations | | | (1.10 | ) | | | 1.01 | |
| | | | | | | | | |
| Less distributions: | | | | | | | | |
| From net investment income | | | (0.06 | ) | | | — | |
| From net realized gains | | | (0.08 | ) | | | — | |
| Redemption fees | | | 0.00 | (4) | | | — | |
| Total distributions | | | (0.14 | ) | | | — | |
| Net asset value, end of period | | $ | 9.77 | | | $ | 11.01 | |
| | | | | | | | | |
| Total return | | | (10.23 | )% | | | 10.10 | % |
| | | | | | | | | |
| Supplemental data and ratios: | | | | | | | | |
| Net assets, end of period | | $ | 5,377,373 | | | $ | 5,850,019 | |
| Ratio of expenses to average net assets: | | | | | | | | |
| Before expense reimbursement or recovery | | | 1.96 | % | | | 4.42 | %(5) |
| After expense reimbursement or recovery | | | 2.04 | % | | | 1.96 | %(5) |
| Ratio of net investment income to average net assets: | | | | | | | | |
| Before expense reimbursement or recovery | | | 0.60 | % | | | (2.29 | )%(5) |
| After expense reimbursement or recovery | | | 0.52 | % | | | 0.17 | %(5) |
| Portfolio turnover rate | | | 179.57 | % | | | 112.58 | % |
| (1) | Commencement of share class operations. |
| (2) | For a share outstanding throughout the period. Rounded to the nearest cent. |
| (3) | Net investment loss per share is calculated using ending balances prior to consideration of adjustments for permanent book and tax differences. |
| (4) | Amount represents less than $0.005 per share. |
| See Notes to the Financial Statements. | The Leuthold Funds - 2011 Annual Report | 67 |
| Leuthold Global Industries Fund - Institutional |
| Financial Highlights |
| | | | | | Period from | |
| | | | | | May 17, 2010 (1) | |
| | | Year Ended | | | through | |
| | | September 30, 2011 | | | September 30, 2010 | |
Per Share Data (2): | | | | | | |
| Net asset value, beginning of period | | $ | 11.01 | | | $ | 10.00 | |
| Income (loss) from investment operations: | | | | | | | | |
Net investment income(3) | | | 0.09 | | | | 0.01 | |
| Net realized and unrealized gains (losses) on investments | | | (1.15 | ) | | | 1.00 | |
| Total from investment operations | | | (1.06 | ) | | | 1.01 | |
| | | | | | | | | |
| Less distributions: | | | | | | | | |
| From net investment income | | | (0.10 | ) | | | — | |
| From net realized gains | | | (0.08 | ) | | | — | |
| Total distributions | | | (0.18 | ) | | | — | |
| Net asset value, end of period | | $ | 9.77 | | | $ | 11.01 | |
| | | | | | | | | |
| Total return | | | (9.92 | )% | | | 10.10 | % |
| | | | | | | | | |
| Supplemental data and ratios: | | | | | | | | |
| Net assets, end of period | | $ | 14,904,617 | | | $ | 3,870,245 | |
| Ratio of expenses to average net assets: | | | | | | | | |
| Before expense reimbursement or recovery | | | 1.71 | % | | | 4.17 | %(4) |
| After expense reimbursement or recovery | | | 1.79 | % | | | 1.71 | %(4) |
| Ratio of net investment income to average net assets: | | | | | | | | |
| Before expense reimbursement or recovery | | | 0.85 | % | | | (2.04 | )%(4) |
| After expense reimbursement or recovery | | | 0.77 | % | | | 0.42 | %(4) |
| Portfolio turnover rate | | | 179.57 | % | | | 112.58 | % |
| (1) | Commencement of share class operations. |
| (2) | For a share outstanding throughout the period. Rounded to the nearest cent. |
| (3) | Net investment income per share is calculated using ending balances prior to consideration of adjustments for permanent book and tax differences. |
| 68 | The Leuthold Funds - 2011 Annual Report | See Notes to the Financial Statements. |
| Leuthold Global Clean Technology Fund - Retail |
| Financial Highlights |
| | | | | | | | | Period from | |
| | | | | | | | | July 22, 2009 (1) | |
| | | Year Ended | | | Year Ended | | | through | |
| | | September 30, 2011 | | | September 30, 2010 | | | September 30, 2009 | |
Per Share Data (2): | | | | | | | | | |
| Net asset value, beginning of period | | $ | 10.30 | | | $ | 11.52 | | | $ | 10.00 | |
| Income (loss) from investment operations: | | | | | | | | | | | | |
Net investment loss (3) | | | (0.12 | ) | | | (0.14 | ) | | | (0.01 | ) |
| Net realized and unrealized gains (losses) on investments | | | (2.52 | ) | | | (1.08 | ) | | | 1.53 | |
| Total from investment operations | | | (2.64 | ) | | | (1.22 | ) | | | 1.52 | |
| | | | | | | | | | | | | |
| Less distributions: | | | | | | | | | | | | |
| From net investment income | | | — | | | | — | | | | — | |
| From net realized gains | | | — | | | | — | | | | — | |
Redemption fees (4) | | | 0.00 | | | | 0.00 | | | | 0.00 | |
| Total distributions | | | — | | | | — | | | | — | |
| Net asset value, end of period | | $ | 7.66 | | | $ | 10.30 | | | $ | 11.52 | |
| | | | | | | | | | | | | |
| Total return | | | (25.63 | )% | | | (10.59 | )% | | | 15.20 | % |
| | | | | | | | | | | | | |
| Supplemental data and ratios: | | | | | | | | | | | | |
| Net assets, end of period | | $ | 8,026,453 | | | $ | 11,926,464 | | | $ | 2,170,237 | |
| Ratio of expenses to average net assets: | | | | | | | | | | | | |
| Before expense reimbursement or recovery | | | 1.85 | % | | | 1.75 | % | | | 3.67 | %(5) |
| After expense reimbursement or recovery | | | 1.85 | % | | | 1.84 | % | | | 2.07 | %(5) |
| Ratio of net investment loss to average net assets: | | | | | | | | | | | | |
| Before expense reimbursement or recovery | | | (1.05 | )% | | | (1.23 | )% | | | (3.35 | )%(5) |
| After expense reimbursement or recovery | | | (1.05 | )% | | | (1.32 | )% | | | (1.75 | )%(5) |
| Portfolio turnover rate | | | 113.07 | % | | | 62.17 | % | | | 22.50 | % |
| (1) | Commencement of share class operations. |
| (2) | For a share outstanding throughout the period. Rounded to the nearest cent. |
| (3) | Net investment loss per share is calculated using ending balances prior to consideration of adjustments for permanent book and tax differences. |
| (4) | Amount represents less than $0.005 per share. |
| See Notes to the Financial Statements. | The Leuthold Funds - 2011 Annual Report | 69 |
| Leuthold Global Clean Technology Fund - Institutional |
| Financial Highlights |
| | | | | | | | | Period from | |
| | | | | | | | | July 22, 2009 (1) | |
| | | Year Ended | | | Year Ended | | | through | |
| | | September 30, 2011 | | | September 30, 2010 | | | September 30, 2009 | |
Per Share Data (2): | | | | | | | | | |
| Net asset value, beginning of period | | $ | 10.33 | | | $ | 11.52 | | | $ | 10.00 | |
| Income (loss) from investment operations: | | | | | | | | | | | | |
Net investment loss(3) | | | (0.11 | ) | | | (0.11 | ) | | | (0.03 | ) |
| Net realized and unrealized gains (losses) on investments | | | (2.52 | ) | | | (1.08 | ) | | | 1.55 | |
| Total from investment operations | | | (2.63 | ) | | | (1.19 | ) | | | 1.52 | |
| | | | | | | | | | | | | |
| Less distributions: | | | | | | | | | | | | |
| From net investment income | | | — | | | | — | | | | — | |
| From net realized gains | | | — | | | | — | | | | — | |
| Redemption fees | | | 0.00 | (4) | | | — | | | | — | |
| Total distributions | | | — | | | | — | | | | | |
| Net asset value, end of period | | $ | 7.70 | | | $ | 10.33 | | | $ | 11.52 | |
| | | | | | | | | | | | | |
| Total return | | | (25.46 | )% | | | (10.33 | )% | | | 15.20 | % |
| | | | | | | | | | | | | |
| Supplemental data and ratios: | | | | | | | | | | | | |
| Net assets, end of period | | $ | 8,111,351 | | | $ | 15,459,512 | | | $ | 6,458,943 | |
| Ratio of expenses to average net assets: | | | | | | | | | | | | |
| Before expense reimbursement or recovery | | | 1.60 | % | | | 1.51 | % | | | 3.42 | %(5) |
| After expense reimbursement or recovery | | | 1.60 | % | | | 1.60 | % | | | 1.82 | %(5) |
| Ratio of net investment income to average net assets: | | �� | | | | | | | | | | |
| Before expense reimbursement or recovery | | | (0.80 | )% | | | (0.99 | )% | | | (3.11 | )%(5) |
| After expense reimbursement or recovery | | | (0.80 | )% | | | (1.08 | )% | | | (1.51 | )%(5) |
| Portfolio turnover rate | | | 113.07 | % | | | 62.17 | % | | | 22.50 | % |
| (1) | Commencement of share class operations. |
| (2) | For a share outstanding throughout the period. Rounded to the nearest cent. |
| (3) | Net investment loss per share is calculated using ending balances prior to consideration of adjustments for permanent book and tax differences. |
| (4) | Amount represents less than $0.005 per share. |
| 70 | The Leuthold Funds - 2011 Annual Report | See Notes to the Financial Statements. |
| Leuthold Hedged Equity Fund - Retail |
| Financial Highlights |
| | | | | | | | | Period from | |
| | | | | | | | | July 22, 2009 (1) | |
| | | Year Ended | | | Year Ended | | | through | |
| | | September 30, 2011 | | | September 30, 2010 | | | September 30, 2009 | |
Per Share Data (2): | | | | | | | | | |
| Net asset value, beginning of period | | $ | 8.69 | | | $ | 9.56 | | | $ | 10.00 | |
| Loss from investment operations: | | | | | | | | | | | | |
| Net investment loss | | | (0.20 | ) (3) | | | (0.18 | ) (3) | | | (0.02 | ) (4) |
| Net realized and unrealized losses on investments and short positions | | | (0.09 | ) | | | (0.69 | ) | | | (0.42 | ) |
| Total from investment operations | | | (0.29 | ) | | | (0.87 | ) | | | (0.44 | ) |
| | | | | | | | | | | | | |
| Less distributions: | | | | | | | | | | | | |
| From net investment income | | | — | | | | — | | | | — | |
| From net realized gains | | | — | | | | — | | | | — | |
Redemption fees (5) | | | 0.00 | | | | 0.00 | | | | 0.00 | |
| Total distributions | | | — | | | | — | | | | — | |
| Net asset value, end of period | | $ | 8.40 | | | $ | 8.69 | | | $ | 9.56 | |
| | | | | | | | | | | | | |
| Total return | | | (3.34 | )% | | | (9.10 | )% | | | (4.40 | )% |
| | | | | | | | | | | | | |
| Supplemental data and ratios: | | | | | | | | | | | | |
| Net assets, end of period | | $ | 4,882,593 | | | $ | 4,523,612 | | | $ | 593,636 | |
| Ratio of expenses to average net assets: | | | | | | | | | | | | |
Before expense reimbursement (6) | | | 3.78 | % | | | 3.53 | % | | | 17.77 | %(7) |
After expense reimbursement (6) | | | 2.94 | % | | | 2.80 | % | | | 2.69 | %(7) |
| Ratio of net investment loss to average net assets: | | | | | | | | | | | | |
Before expense reimbursement (8) | | | (3.17 | )% | | | (2.77 | )% | | | (17.27 | )%(7) |
After expense reimbursement (8) | | | (2.33 | )% | | | (2.04 | )% | | | (2.19 | )%(7) |
Portfolio turnover rate (9) | | | 159.06 | % | | | 260.05 | % | | | 34.06 | % |
| (1) | Commencement of share class operations. |
| (2) | For a share outstanding throughout the period. Rounded to the nearest cent. |
| (3) | Net investment loss per share is calculated based on average shares outstanding. |
| (4) | Net investment loss per share is calculated using ending balances prior to consideration of adjustments for permanent book and tax differences. |
| (5) | Amount represents less than $0.005 per share. |
| (6) | The ratio of expenses to average net assets includes dividends and interest on short positions. The before expense reimbursement and after expense reimbursement ratios excluding dividends and interest on short positions were 3.07% and 2.23%, respectively, for the year ended September 30, 2011, 2.97% and 2.24%, respectively, for the year ended September 30, 2010, and 17.47% and 2.37%, respectively, for the period ended September 30, 2009. |
| (8) | The net investment loss ratios include dividends and interest on short positions. |
| (9) | The portfolio turnover rate excludes purchases and sales of short positions as the Adviser does not intend to hold the short positions for more than one year. |
| See Notes to the Financial Statements. | The Leuthold Funds - 2011 Annual Report | 71 |
| Leuthold Hedged Equity Fund - Institutional |
Financial Highlights
| | | | | | | | | Period from | |
| | | | | | | | | July 22, 2009 (1) | |
| | | Year Ended | | | Year Ended | | | through | |
| | | September 30, 2011 | | | September 30, 2010 | | | September 30, 2009 | |
| | | | | | | | | | |
Per Share Data (2): | | | | | | | | | |
| Net asset value, beginning of period | | $ | 8.69 | | | $ | 9.57 | | | $ | 10.00 | |
| Loss from investment operations: | | | | | | | | | | | | |
| Net investment loss | | | (0.18 | )(3) | | | (0.17 | )(3) | | | (0.01 | )(4) |
| Net realized and unrealized losses on investments and short positions | | | (0.09 | ) | | | (0.71 | ) | | | (0.42 | ) |
| Total from investment operations | | | (0.27 | ) | | | (0.88 | ) | | | (0.43 | ) |
| | | | | | | | | | | | | |
| Less distributions: | | | | | | | | | | | | |
| From net investment income | | | — | | | | — | | | | — | |
| From net realized gains | | | — | | | | — | | | | — | |
| Total distributions | | | — | | | | — | | | | — | |
| Net asset value, end of period | | $ | 8.42 | | | $ | 8.69 | | | $ | 9.57 | |
| | | | | | | | | | | | | |
| Total return | | | (3.11 | )% | | | (9.20 | )% | | | (4.30 | )% |
| | | | | | | | | | | | | |
| Supplemental data and ratios: | | | | | | | | | | | | |
| Net assets, end of period | | $ | 1,171,580 | | | $ | 65,876 | | | $ | 1,516,166 | |
| Ratio of expenses to average net assets: | | | | | | | | | | | | |
Before expense reimbursement (5) | | | 3.53 | % | | | 3.28 | % | | | 17.53 | %(6) |
After expense reimbursement (5) | | | 2.69 | % | | | 2.55 | % | | | 2.44 | %(6) |
| Ratio of net investment loss to average net assets: | | | | | | | | | | | | |
Before expense reimbursement (7) | | | (2.92 | )% | | | (2.52 | )% | | | (17.04 | )%(6) |
After expense reimbursement (7) | | | (2.08 | )% | | | (1.79 | )% | | | (1.95 | )%(6) |
Portfolio turnover rate (8) | | | 159.06 | % | | | 260.05 | % | | | 34.06 | % |
| (1) | Commencement of share class operations. |
| (2) | For a share outstanding throughout the period. Rounded to the nearest cent. |
| (3) | Net investment loss per share is calculated based on average shares outstanding. |
| (4) | Net investment loss per share is calculated using ending balances prior to consideration of adjustments for permanent book and tax differences. |
| (5) | The ratio of expenses to average net assets includes dividends and interest on short positions. The before expense reimbursement and after expense reimbursement ratios excluding dividends and interest on short positions were 2.82% and 1.98%, respectively, for the year ended September 30, 2011, 2.72% and 1.99%, respectively, for the year ended September 30, 2010, and 17.22% and 2.15%, respectively, for the period ended September 30, 2009. |
| (7) | The net investment loss ratios include dividends and interest on short positions. |
| (8) | The portfolio turnover rate excludes purchases and sales of short positions as the Adviser does not intend to hold the short positions for more than one year. |
| 72 | The Leuthold Funds - 2011 Annual Report | See Notes to the Financial Statements. |
Financial Highlights
| | | Year Ended | | | Year Ended | | | Year Ended | | | Year Ended | | | Year Ended | |
| | | September 30, | | | September 30, | | | September 30, | | | September 30, | | | September 30, | |
| | | 2011 | | | 2010(1) | | | 2009(1) | | | 2008(1) | | | 2007(1) | |
| | | | | | | | | | | | | | | | |
Per Share Data (2): | | | | | | | | | | | | | | | |
| Net asset value, beginning of year | | $ | 16.48 | | | $ | 19.00 | | | $ | 29.28 | | | $ | 19.52 | | | $ | 22.76 | |
| Income (loss) from investment operations: | | | | | | | | | | | | | | | | | | | | |
| Net investment income (loss) | | | (0.43 | )(3) | | | (0.48 | )(3) | | | (0.88 | )(4) | | | 0.48 | (4) | | | 1.24 | (4) |
| Net realized and unrealized gains (losses) on investments and short positions | | | 0.09 | | | | (2.04 | ) | | | (7.88 | ) | | | 9.76 | | | | (3.24 | ) |
| Total from investment operations | | | (0.34 | ) | | | (2.52 | ) | | | (8.76 | ) | | | 10.24 | | | | (2.00 | ) |
| | | | | | | | | | | | | | | | | | | | | |
| Less distributions: | | | | | | | | | | | | | | | | | | | | |
| From net investment income | | | — | | | | — | | | | (0.04 | ) | | | (0.48 | ) | | | (1.24 | ) |
| From net realized gains | | | — | | | | — | | | | (0.76 | ) | | | — | | | | — | |
| Return of capital | | | — | | | | — | | | | (0.72 | ) | | | — | | | | — | |
| Total distributions | | | — | | | | — | | | | (1.52 | ) | | | (0.48 | ) | | | (1.24 | ) |
| Net asset value, end of year | | $ | 16.14 | | | $ | 16.48 | | | $ | 19.00 | | | $ | 29.28 | | | $ | 19.52 | |
| | | | | | | | | | | | | | | | | | | | | |
| Total return | | | (2.06 | )% | | | (13.26 | )% | | | (32.54 | )% | | | 53.43 | % | | | (8.82 | )% |
| | | | | | | | | | | | | | | | | | | | | |
| Supplemental data and ratios: | | | | | | | | | | | | | | | | | | | | |
| Net assets, end of year | | $ | 263,448,083 | | | $ | 196,552,242 | | | $ | 86,244,258 | | | $ | 135,738,825 | | | $ | 76,664,501 | |
Ratio of expenses to average net assets(5): | | | 3.01 | % | | | 2.72 | % | | | 3.53 | % | | | 3.21 | % | | | 2.86 | % |
Ratio of net investment income to average net assets(6): | | | (3.01 | )% | | | (2.71 | )% | | | (2.83 | )% | | | 2.01 | % | | | 6.40 | % |
Portfolio turnover rate (7) | | | 0.00 | % | | | 0.00 | % | | | 0.00 | % | | | 0.00 | % | | | 0.00 | % |
| (1) | Per share data adjusted for 1:4 reverse split completed as of May 20, 2011. |
| (2) | For a share outstanding throughout the period. Rounded to the nearest cent. |
| (3) | Net investment loss per share is calculated based on average shares outstanding. |
| (4) | Net investment income (loss) per share is calculated using ending balances prior to consideration of adjustments for permanent book and tax differences. |
| (5) | The ratio of expenses to average net assets includes dividends and interest on short positions. The expense ratios excluding dividends and interest on short positions were 1.53% for the year ended September 30, 2011, 1.49% for the year ended September 30, 2010, 1.47% for the year ended September 30, 2009, 1.50% for the year ended September 30, 2008, and 1.61% for the year ended September 30, 2007. |
| (6) | The net investment income (loss) ratios include dividends and interest on short positions. |
| (7) | The portfolio turnover rate excludes purchases and sales of short positions as the Adviser does not intend to hold the short positions for more than one year. |
See Notes to the Financial Statements. | The Leuthold Funds - 2011 Annual Report | 73 |
| Leuthold Core Investment Fund |
Consolidated Schedule of Investments
September 30, 2011
| | | Shares | | | Fair Value | |
| | | | | | | |
| COMMON STOCKS - 49.15% | | | | | | |
| Auto Components - 0.03% | | | | | | |
| Minth Group, Ltd. (b) | | | 338,000 | | | $ | 309,901 | |
| Beverages - 0.07% | | | | | | | | |
| Tsingtao Brewery Co., Ltd. (b) | | | 120,000 | | | | 664,920 | |
| Biotechnology - 2.77% | | | | | | | | |
| Alexion Pharmaceuticals, Inc. (a) | | | 51,022 | | | | 3,268,469 | |
| Amgen, Inc. (a) | | | 61,174 | | | | 3,361,511 | |
| Biogen Idec, Inc. (a) | | | 35,836 | | | | 3,338,124 | |
| BioMarin Pharmaceutical, Inc. (a) | | | 87,269 | | | | 2,781,263 | |
| Celgene Corp. (a) | | | 60,974 | | | | 3,775,510 | |
| Cepheid, Inc. (a) | | | 79,363 | | | | 3,081,665 | |
| Gilead Sciences, Inc. (a) | | | 86,763 | | | | 3,366,405 | |
| Pharmasset, Inc. (a) | | | 38,876 | | | | 3,202,216 | |
| Sino Biopharmaceutical (b) | | | 368,000 | | | | 105,381 | |
| United Therapeutics Corp. (a) | | | 43,078 | | | | 1,614,994 | |
| | | | | | | | 27,895,538 | |
| Capital Markets - 1.43% | | | | | | | | |
| Credit Suisse Group AG - ADR | | | 200,079 | | | | 5,250,073 | |
| Deutsche Bank AG (b) | | | 143,133 | | | | 4,953,833 | |
| UBS AG (a)(b) | | | 370,402 | | | | 4,233,695 | |
| | | | | | | | 14,437,601 | |
| Chemicals - 3.49% | | | | | | | | |
| Agrium, Inc. (b) | | | 46,685 | | | | 3,112,022 | |
| American Vanguard Corp. | | | 79,005 | | | | 881,696 | |
| CF Industries Holdings, Inc. | | | 32,833 | | | | 4,051,264 | |
| China BlueChemical, Ltd. (b) | | | 3,784,000 | | | | 2,925,197 | |
| Monsanto Co. | | | 79,518 | | | | 4,774,261 | |
| Mosaic Co. | | | 110,813 | | | | 5,426,513 | |
| Potash Corp. of Saskatchewan, Inc. (b) | | | 131,334 | | | | 5,676,255 | |
| Scotts Miracle-Gro Co. - Class A | | | 65,154 | | | | 2,905,868 | |
| Sociedad Quimica y Minera de Chile SA - ADR | | | 56,432 | | | | 2,698,014 | |
| Terra Nitrogen Co. LP | | | 18,982 | | | | 2,741,760 | |
| | | | | | | | 35,192,850 | |
| Construction Materials - 0.08% | | | | | | | | |
| Semen Gresik Persero Tbk PT (b) | | | 893,000 | | | | 843,220 | |
| Distributors - 0.21% | | | | | | | | |
| Jardine Cycle & Carriage, Ltd. (b) | | | 66,000 | | | | 2,118,419 | |
| Diversified Consumer Services - 0.12% | | | | | | | | |
New Oriental Education & Technology Group - ADR (a) | | | 51,620 | | | | 1,185,711 | |
| Diversified Financial Services - 2.25% | | | | | | | | |
| Bank of America Corp. | | | 644,356 | | | | 3,943,459 | |
| Citigroup, Inc. | | | 222,139 | | | | 5,691,201 | |
| ING Groep N.V. - ADR (a) | | | 811,088 | | | | 5,718,171 | |
| JPMorgan Chase & Co. | | | 243,686 | | | | 7,339,822 | |
| | | | | | | | 22,692,653 | |
| Electronic Equipment, Instruments & Components - 1.84% | | | | | | | | |
| Avnet, Inc. (a) | | | 105,683 | | | | 2,756,213 | |
Flextronics International, Ltd. (a)(b) | | | 148,263 | | | | 834,721 | |
| IPG Photonics Corp. (a) | | | 49,250 | | | | 2,139,420 | |
| Jabil Circuit, Inc. | | | 281,136 | | | | 5,001,409 | |
| Molex, Inc. | | | 53,354 | | | | 1,086,821 | |
| SYNNEX Corp. (a) | | | 44,633 | | | | 1,169,385 | |
| TE Connectivity, Ltd. (b) | | | 77,466 | | | | 2,179,893 | |
| Tech Data Corp. (a) | | | 44,633 | | | | 1,929,484 | |
| TTM Technologies, Inc. (a) | | | 154,420 | | | | 1,468,534 | |
| | | | | | | | 18,565,880 | |
| Energy Equipment & Services - 4.23% | | | | | | | | |
| Atwood Oceanics, Inc. (a) | | | 135,438 | | | | 4,653,650 | |
| Ensco PLC - ADR | | | 154,420 | | | | 6,243,200 | |
| Helmerich & Payne, Inc. | | | 154,420 | | | | 6,269,452 | |
| Noble Corp. (b) | | | 160,576 | | | | 4,712,906 | |
| Patterson-UTI Energy, Inc. | | | 311,917 | | | | 5,408,641 | |
| Precision Drilling Corp. (a)(b) | | | 325,256 | | | | 2,696,372 | |
| Rowan Companies, Inc. (a) | | | 194,948 | | | | 5,885,480 | |
| Seadrill, Ltd. (b) | | | 137,490 | | | | 3,785,100 | |
| Transocean, Ltd. (b) | | | 62,589 | | | | 2,987,999 | |
| | | | | | | | 42,642,800 | |
| 74 | The Leuthold Funds - 2011 Annual Report | See Notes to the Financial Statements. |
| Leuthold Core Investment Fund |
Consolidated Schedule of Investments (continued)
September 30, 2011
| | | Shares | | | Fair Value | |
| | | | | | | |
| Food & Staples Retailing - 0.27% | | | | | | |
| CP ALL PCL (b) | | | 1,756,100 | | | $ | 2,711,687 | |
| Food Products - 0.44% | | | | | | | | |
Golden Agri-Resources, Ltd. (b) | | | 8,276,000 | | | | 3,891,536 | |
Uni-President China Holdings, Ltd. (b) | | | 1,017,000 | | | | 555,031 | |
| | | | | | | | 4,446,567 | |
| Health Care Equipment & Supplies - 0.49% | | | | | | | | |
Mindray Medical International, Ltd. - ADR | | | 100,753 | | | | 2,378,778 | |
Shandong Weigao Group Medical Polymer Co., Ltd. (b) | | | 1,204,000 | | | | 1,354,373 | |
| Supermax Corp. Bhd (b) | | | 865,250 | | | | 693,826 | |
| Top Glove Corp. Bhd (b) | | | 427,200 | | | | 549,974 | |
| | | | | | | | 4,976,951 | |
| Health Care Providers & Services - 9.77% | | | | | | | | |
| Aetna, Inc. | | | 330,386 | | | | 12,009,531 | |
| AMERIGROUP Corp. (a) | | | 206,471 | | | | 8,054,434 | |
| CIGNA Corp. | | | 268,504 | | | | 11,261,058 | |
| Coventry Health Care, Inc. (a) | | | 395,403 | | | | 11,391,560 | |
| Healthspring, Inc. (a) | | | 266,896 | | | | 9,731,028 | |
| Humana, Inc. | | | 183,020 | | | | 13,311,045 | |
| Magellan Health Services, Inc. (a) | | | 121,073 | | | | 5,847,826 | |
| Shanghai Pharmaceuticals Holding Co., Ltd. (a)(b) | | | 619,000 | | | | 1,348,106 | |
| Sinopharm Group Co., Ltd. (b) | | | 341,600 | | | | 910,214 | |
| UnitedHealth Group, Inc. | | | 295,311 | | | | 13,619,743 | |
| WellPoint, Inc. | | | 169,297 | | | | 11,051,708 | |
| | | | | | | | 98,536,253 | |
| Hotels, Restaurants & Leisure - 0.18% | | | | | | | | |
| Gourmet Master Co., Ltd. (b) | | | 260,400 | | | | 1,815,751 | |
| Household Durables - 0.16% | | | | | | | | |
| Woongjin Coway Co., Ltd. (b) | | | 50,170 | | | | 1,635,353 | |
| Internet & Catalog Retail - 0.13% | | | | | | | | |
| GS Home Shopping, Inc. (b) | | | 14,876 | | | | 1,351,158 | |
| Internet Software & Services - 0.92% | | | | | | | | |
| Baidu, Inc. - ADR (a) | | | 56,531 | | | | 6,043,729 | |
| Daum Communications Corp. (b) | | | 10,871 | | | | 1,323,290 | |
| Netease.com, Inc. - ADR (a) | | | 25,900 | | | | 988,344 | |
| Tencent Holdings, Ltd. (b) | | | 42,200 | | | | 889,801 | |
| | | | | | | | 9,245,164 | |
| Leisure Equipment & Products - 0.43% | | | | | | | | |
| Polaris Industries, Inc. | | | 86,188 | | | | 4,306,814 | |
| Machinery - 1.37% | | | | | | | | |
| Cummins, Inc. | | | 33,859 | | | | 2,764,926 | |
| United Tractors Tbk PT (b) | | | 2,361,500 | | | | 5,910,467 | |
| Weichai Power Co., Ltd. (b) | | | 1,115,000 | | | | 5,133,003 | |
| | | | | | | | 13,808,396 | |
| Media - 0.77% | | | | | | | | |
| BEC World PCL (b) | | | 2,242,200 | | | | 2,650,824 | |
| Cheil Worldwide, Inc. (b) | | | 126,700 | | | | 2,005,819 | |
| Focus Media Holding, Ltd. - ADR (a) | | | 41,470 | | | | 696,281 | |
| Global Mediacom Tbk PT (b) | | | 3,618,000 | | | | 337,516 | |
| Lopez Holdings Corp. (b) | | | 1,836,700 | | | | 184,825 | |
| MCOT PCL (b) | | | 312,600 | | | | 274,034 | |
| Media Nusantara Citra Tbk PT (b) | | | 11,256,000 | | | | 1,306,157 | |
| Media Prima Bhd (b) | | | 238,300 | | | | 164,216 | |
| Star Publications Malaysia Bhd (b) | | | 95,899 | | | | 94,622 | |
| | | | | | | | 7,714,294 | |
See Notes to the Financial Statements. | The Leuthold Funds - 2011 Annual Report | 75 |
| Leuthold Core Investment Fund |
Consolidated Schedule of Investments (continued)
September 30, 2011
| | | Shares | | | Fair Value | |
| | | | | | | |
| Metals & Mining - 3.74% | | | | | | |
| Alcoa, Inc. | | | 682,833 | | | $ | 6,534,712 | |
| Allegheny Technologies, Inc. | | | 61,563 | | | | 2,277,215 | |
Aluminum Corp. of China, Ltd. - ADR | | | 122,612 | | | | 1,280,069 | |
| Century Aluminum Co. (a) | | | 166,732 | | | | 1,490,584 | |
| Cliffs Natural Resources, Inc. | | | 77,466 | | | | 3,963,935 | |
| Kaiser Aluminum Corp. | | | 63,615 | | | | 2,816,872 | |
| Noranda Aluminum Holding Corp. (a) | | | 144,159 | | | | 1,203,728 | |
| POSCO - ADR | | | 43,291 | | | | 3,290,549 | |
| Reliance Steel & Aluminum Co. | | | 74,901 | | | | 2,547,383 | |
| Schnitzer Steel Industries Inc. - Class A | | | 50,276 | | | | 1,850,157 | |
| Steel Dynamics, Inc. | | | 199,566 | | | | 1,979,695 | |
| Vale SA - ADR | | | 302,683 | | | | 6,901,172 | |
| Worthington Industries, Inc. | | | 115,943 | | | | 1,619,724 | |
| | | | | | | | 37,755,795 | |
| Multiline Retail - 4.45% | | | | | | | | |
| Dillard's, Inc. - Class A | | | 192,383 | | | | 8,364,813 | |
| Golden Eagle Retail Group, Ltd. (b) | | | 1,270,000 | | | | 2,609,343 | |
| JC Penney Co., Inc. | | | 218,034 | | | | 5,838,951 | |
| Kohl's Corp. | | | 172,888 | | | | 8,488,801 | |
| Macy's, Inc. | | | 369,889 | | | | 9,735,479 | |
| New World Department Store China, Ltd. (b) | | | 946,000 | | | | 529,645 | |
| Nordstrom, Inc. | | | 183,149 | | | | 8,366,246 | |
| Parkson Holdings Bhd (b) | | | 503,182 | | | | 895,246 | |
| | | | | | | | 44,828,524 | |
| Oil, Gas & Consumable Fuels – 0.48% | | | | | | | | |
| Banpu PCL (b) | | | 285,200 | | | | 4,807,618 | |
| Personal Products – 0.24% | | | | | | | | |
| Amorepacific Corp. (b) | | | 2,446 | | | | 2,441,744 | |
| Pharmaceuticals - 6.68% | | | | | | | | |
| AstraZeneca PLC - ADR | | | 94,396 | | | | 4,187,407 | |
| Bristol-Myers Squibb Co. | | | 171,862 | | | | 5,393,030 | |
| Celltrion, Inc. (b) | | | 30,248 | | | | 1,133,610 | |
| China Pharmaceutical Group, Ltd. (b) | | | 920,000 | | | | 224,465 | |
| China Shineway Pharmaceutical Group, Ltd. (b) | | | 422,000 | | | | 522,393 | |
| Eli Lilly & Co. | | | 126,716 | | | | 4,684,690 | |
| Endo Pharmaceuticals Holdings, Inc. (a) | | | 106,709 | | | | 2,986,785 | |
| Forest Laboratories, Inc. (a) | | | 173,401 | | | | 5,339,017 | |
| Jazz Pharmaceuticals, Inc. (a) | | | 88,753 | | | | 3,685,024 | |
| Johnson & Johnson | | | 81,571 | | | | 5,196,888 | |
| Kalbe Farma Tbk PT (b) | | | 801,500 | | | | 296,345 | |
| Medicines Co. (a) | | | 92,344 | | | | 1,374,079 | |
| Medicis Pharmaceutical Corp. - Class A | | | 88,753 | | | | 3,237,709 | |
| Merck & Co., Inc. | | | 132,360 | | | | 4,329,496 | |
| Novartis AG - ADR | | | 87,214 | | | | 4,863,925 | |
| Pfizer, Inc. | | | 259,589 | | | | 4,589,533 | |
| Questcor Pharmaceuticals, Inc. (a) | | | 49,250 | | | | 1,342,555 | |
| Shire PLC - ADR | | | 48,737 | | | | 4,577,866 | |
| Tong Ren Tang Technologies Co., Ltd. (b) | | | 405,000 | | | | 379,652 | |
| United Laboratories International Holdings, Ltd. (b) | | | 814,000 | | | | 626,122 | |
| Viropharma, Inc. (a) | | | 115,430 | | | | 2,085,820 | |
| Watson Pharmaceuticals, Inc. (a) | | | 92,344 | | | | 6,302,478 | |
| | | | | | | | 67,358,889 | |
| 76 | The Leuthold Funds - 2011 Annual Report | See Notes to the Financial Statements. |
| Leuthold Core Investment Fund |
Consolidated Schedule of Investments (continued)
September 30, 2011
| | | Shares | | | Fair Value | |
Semiconductors & Semiconductor Equipment - 0.36% | | | | | | |
Taiwan Semiconductor Manufacturing Co., Ltd. - ADR | | | 175,200 | | | $ | 2,002,536 | |
| United Microelectronics Corp. - ADR | | | 871,700 | | | | 1,664,947 | |
| | | | | | | | 3,667,483 | |
| Specialty Retail - 0.53% | | | | | | | | |
| Best Buy Co., Inc. | | | 161,602 | | | | 3,765,327 | |
| DSW, Inc. - Class A | | | 34,886 | | | | 1,611,035 | |
| | | | | | | | 5,376,362 | |
| Textiles, Apparel & Luxury Goods - 0.54% | | | | | | | | |
| 361 Degrees International, Ltd. (b) | | | 1,469,000 | | | | 701,734 | |
| Fossil, Inc. (a) | | | 36,425 | | | | 2,952,610 | |
| Pou Chen Corp. (b) | | | 2,535,000 | | | | 1,838,343 | |
| | | | | | | | 5,492,687 | |
| Transportation Infrastructure - 0.44% | | | | | | | | |
| Jasa Marga PT (b) | | | 4,795,000 | | | | 2,168,387 | |
| Zhejiang Expressway Co., Ltd. (b) | | | 3,670,000 | | | | 2,238,552 | |
| | | | | | | | 4,406,939 | |
| Water Utilities - 0.17% | | | | | | | | |
| Guangdong Investment, Ltd. (b) | | | 2,660,000 | | | | 1,663,482 | |
| Wireless Telecommunication Services - 0.07% | | | | | | | | |
| Globe Telecom, Inc. (b) | | | 34,830 | | | | 707,354 | |
TOTAL COMMON STOCKS (Cost $530,723,802) | | | | | | $ | 495,604,758 | |
| | | | | | | | | |
| PREFERRED STOCKS - 0.19% | | | | | | | | |
| Metals & Mining - 0.19% | | | | | | | | |
| Gerdau SA - ADR | | | 266,259 | | | $ | 1,898,427 | |
TOTAL PREFERRED STOCKS (Cost $2,684,370) | | | | | | $ | 1,898,427 | |
| | | | | | | | | |
| INVESTMENT COMPANIES - 4.51% | | | | | | | | |
| Exchange Traded Funds - 4.51% | | | | | | | | |
iShares Barclays Intermediate Credit Bond Fund | | | 112,637 | | | $ | 12,040,895 | |
iShares iBoxx Investment Grade Corporate Bond Fund | | | 202,736 | | | | 22,775,362 | |
WisdomTree Emerging Markets Local Debt Fund | | | 222,262 | | | | 10,693,025 | |
| TOTAL INVESTMENT COMPANIES | | | | | | | | |
| (Cost $45,474,905) | | | | | | $ | 45,509,282 | |
| | | | | | | | | |
| | | Troy Ounces | | | Fair Value | |
| PRECIOUS METALS - 4.57% | | | | | | | | |
| Gold Bullion (a) | | | 23,828 | | | $ | 38,656,164 | |
| Silver (a) | | | 247,000 | | | | 7,439,640 | |
| TOTAL PRECIOUS METALS | | | | | | | | |
| (Cost $24,514,868) | | | | | | $ | 46,095,804 | |
| | | | | | | | | |
| | | Principal | | | | | |
| | | Amount | | | Fair Value | |
| CORPORATE BONDS - 3.99% | | | | | | | | |
| Beverages - 0.21% | | | | | | | | |
| Dr. Pepper Snapple Group, Inc. | | | | | | | | |
| 2.900%, 01/15/2016 | | $ | 2,036,000 | | | $ | 2,102,437 | |
| Chemicals - 0.21% | | | | | | | | |
| Dow Chemical Co. | | | | | | | | |
| 7.600%, 05/15/2014 | | | 1,823,000 | | | | 2,070,512 | |
| Diversified Financial Services - 0.21% | | | | | | | | |
| Export-Import Bank of Korea | | | | | | | | |
| 8.125%, 01/21/2014 (b) | | | 1,880,000 | | | | 2,098,447 | |
| Diversified Telecommunication Services - 0.42% | | | | | | | | |
| AT&T, Inc. | | | | | | | | |
| 5.100%, 09/15/2014 | | | 2,368,000 | | | | 2,600,542 | |
| Cellco Partnership / Verizon | | | | | | | | |
| Wireless Capital LLC | | | | | | | | |
| 5.550%, 02/01/2014 | | | 1,450,000 | | | | 1,586,361 | |
| | | | | | | | 4,186,903 | |
See Notes to the Financial Statements. | The Leuthold Funds - 2011 Annual Report | 77 |
| Leuthold Core Investment Fund |
Consolidated Schedule of Investments (continued)
September 30, 2011
| | | | | Principal | | | | |
| | | | | Amount | | | Fair Value | |
| Electric Utilities - 0.36% | | | | | | | | |
| Duke Energy Corp. | | | | | | | | |
| 3.950%, 09/15/2014 | | | | $ | 1,470,000 | | | $ | 1,561,622 | |
| Exelon Corp. | | | | | | | | | | |
| 4.900%, 06/15/2015 | | | | | 1,932,000 | | | | 2,091,181 | |
| | | | | | | | | | 3,652,803 | |
| Industrial Conglomerates - 0.26% | | | | | | | | | | |
| General Electric Co. | | | | | | | | | | |
| 5.250%, 12/06/2017 | | | | | 2,355,000 | | | | 2,616,556 | |
| Media - 0.46% | | | | | | | | | | |
| DIRECTV Holdings LLC / | | | | | | | | | | |
| DIRECTV Financing Co., Inc. | | | | | | | | | | |
| 7.625%, 05/15/2016 | | | | | 1,946,000 | | | | 2,091,950 | |
| Time Warner Cable, Inc. | | | | | | | | | | |
| 8.250%, 04/01/2019 | | | | | 2,028,000 | | | | 2,539,512 | |
| | | | | | | | | | 4,631,462 | |
| Metals & Mining - 0.61% | | | | | | | | | | |
| Freeport-McMoRan Copper & Gold, Inc. | | | | | | | | | | |
| 8.375%, 04/01/2017 | | | | | 1,918,000 | | | | 2,057,055 | |
| Nabors Industries, Inc. | | | | | | | | | | |
| 9.250%, 01/15/2019 | | | | | 1,629,000 | | | | 2,060,709 | |
| Teck Resources, Ltd. | | | | | | | | | | |
| 10.750%, 05/15/2019 (b) | | | | | 1,677,000 | | | | 2,083,673 | |
| | | | | | | | | | 6,201,437 | |
| Oil, Gas & Consumable Fuels - 0.53% | | | | | | | | | | |
| Anadarko Petroleum Corp. | | | | | | | | | | |
| 5.950%, 09/15/2016 | | | | | 1,856,000 | | | | 2,030,091 | |
| Enterprise Products Operating LP | | | | | | | | | | |
| 5.600%, 10/15/2014 | | | | | 1,200,000 | | | | 1,313,402 | |
| Petrobras International Finance Co. | | | | | | | | | | |
| 6.125%, 10/06/2016 (b) | | | | | 1,861,000 | | | | 2,019,185 | |
| | | | | | | | | | 5,362,678 | |
| Pharmaceuticals - 0.15% | | | | | | | | | | |
| Hospira, Inc. | | | | | | | | | | |
| 6.050%, 03/30/2017 | | | | | 1,336,000 | | | | 1,540,850 | |
Semiconductors & Semiconductor Equipment - 0.15% | | | | | | | | | | |
| KLA-Tencor Corp. | | | | | | | | | | |
| 6.900%, 05/01/2018 | | | | | 1,351,000 | | | | 1,543,718 | |
| Tobacco - 0.21% | | | | | | | | | | |
| Altria Group, Inc. | | | | | | | | | | |
| 9.700%, 11/10/2018 | | | | | 1,589,000 | | | | 2,105,729 | |
| Wireless Telecommunications Services - 0.21% | | | | | | | | | | |
| Rogers Communications, Inc. | | | | | | | | | | |
| 6.375%, 03/01/2014 (b) | | | | | 1,902,000 | | | | 2,111,249 | |
| TOTAL CORPORATE BONDS | | | | | | | | | | |
| (Cost $40,828,938) | | | | | | | | $ | 40,224,781 | |
| | | | | | | | | | | |
| FOREIGN GOVERNMENT BONDS - 4.21% | | | | | | | | | | |
| Commonwealth of Australia (b) | | | | | | | | | | |
| | AUD | | | 12,800,000 | | | $ | 13,669,411 | |
| Republic of Brazil (b) | | | | | | | | | | |
| | BRL | | | 46,000,000 | | | | 28,746,178 | |
| TOTAL FOREIGN GOVERNMENT BONDS | | | | | | | | | | |
| (Cost $35,230,977) | | | | | | | | $ | 42,415,589 | |
| 78 | The Leuthold Funds - 2011 Annual Report | See Notes to the Financial Statements. |
| Leuthold Core Investment Fund |
Consolidated Schedule of Investments (continued)
September 30, 2011
| | | Shares | | | Fair Value | |
| SHORT-TERM INVESTMENTS - 18.46% | | | | | | |
| Money Market Funds - 18.46% | | | | | | |
Fidelity Institutional Money Market Fund - Government Portfolio 0.01% (c) | | | 186,192,878 | | | $ | 186,192,878 | |
| TOTAL SHORT-TERM INVESTMENTS | | | | | | | | |
| (Cost $186,192,878) | | | | | | $ | 186,192,878 | |
| | | | | | | | | |
| Total Investments | | | | | | | | |
| (Cost $865,650,738) - 85.08% | | | | | | $ | 857,941,519 | |
Other Assets in Excess of Liabilities - 14.92% (d) | | | | | | | 150,509,046 | |
| TOTAL NET ASSETS - 100.00% | | | | | | $ | 1,008,450,565 | |
Percentages are stated as a percent of net assets.
ADR American Depository Receipt
AUDAustralian Dollar
BRL Brazilian Real
| (a) | Non-income producing security. |
| (b) | Foreign issued security. |
| (c) | The rate quoted is the annualized seven-day yield as of September 30, 2011. |
| (d) | All or a portion of the assets have been committed as collateral for open securities sold short. |
The Global Industry Classification Standard (GICS®) was developed by and/or is the exclusive property of MSCI, Inc. and Standard & Poor Financial Services LLC ("S&P"). GICS is a service mark of MSCI and S&P and has been licensed for use by U.S. Bancorp Fund Services, LLC.
See Notes to the Financial Statements. | The Leuthold Funds - 2011 Annual Report | 79 |
| Leuthold Core Investment Fund |
Consolidated Schedule of Securities Sold Short - (a)
September 30, 2011
| | | Shares | | | Fair Value | |
| COMMON STOCKS - 12.02% | | | | | | |
| Aerospace & Defense - 0.06% | | | | | | |
| DigitalGlobe, Inc. | | | 28,110 | | | $ | 546,177 | |
| Airlines - 0.39% | | | | | | | | |
| Delta Air Lines, Inc. | | | 217,517 | | | | 1,631,377 | |
| United Continental Holdings, Inc. | | | 117,126 | | | | 2,269,902 | |
| | | | | | | | 3,901,279 | |
| Biotechnology - 0.14% | | | | | | | | |
| Onyx Pharmaceuticals, Inc. | | | 46,400 | | | | 1,392,464 | |
| Building Products - 0.39% | | | | | | | | |
| Lennox International, Inc. | | | 32,726 | | | | 843,676 | |
| Masco Corp. | | | 144,283 | | | | 1,027,295 | |
| Simpson Manufacturing Co., Inc. | | | 47,481 | | | | 1,183,701 | |
| USG Corp. | | | 135,568 | | | | 912,373 | |
| | | | | | | | 3,967,045 | |
| Capital Markets - 0.53% | | | | | | | | |
| Greenhill & Co., Inc. | | | 21,408 | | | | 612,055 | |
| Jefferies Group, Inc. | | | 87,244 | | | | 1,082,698 | |
| Knight Capital Group, Inc. - Class A | | | 106,967 | | | | 1,300,719 | |
| Morgan Stanley | | | 98,865 | | | | 1,334,677 | |
| Stifel Financial Corp. | | | 38,102 | | | | 1,011,989 | |
| | | | | | | | 5,342,138 | |
| Commercial Banks - 0.60% | | | | | | | | |
| Hancock Holding Co. | | | 48,280 | | | | 1,292,939 | |
| HDFC Bank, Ltd. - ADR | | | 64,837 | | | | 1,889,999 | |
| Iberiabank Corp. | | | 14,253 | | | | 670,746 | |
| International Bancshares Corp. | | | 41,589 | | | | 546,895 | |
| TCF Financial Corp. | | | 125,208 | | | | 1,146,905 | |
| Wintrust Financial Corp. | | | 20,546 | | | | 530,292 | |
| | | | | | | | 6,077,776 | |
| Commercial Services & Supplies - 0.06% | | | | | | | | |
| Geo Group, Inc. | | | 34,248 | | | | 635,643 | |
| Communications Equipment - 0.05% | | | | | | | | |
| Viasat, Inc. | | | 14,755 | | | | 491,489 | |
| Construction & Engineering - 0.30% | | | | | | | | |
| Quanta Services, Inc | | | 98,472 | | | | 1,850,289 | |
| The Shaw Group, Inc. | | | 52,464 | | | | 1,140,567 | |
| | | | | | | | 2,990,856 | |
| Construction Materials - 0.53% | | | | | | | | |
| Eagle Materials, Inc. | | | 24,207 | | | | 403,047 | |
| Martin Marietta Materials, Inc. | | | 32,024 | | | | 2,024,557 | |
| Texas Industries, Inc. | | | 34,641 | | | | 1,099,505 | |
| Vulcan Materials Co. | | | 66,867 | | | | 1,842,855 | |
| | | | | | | | 5,369,964 | |
| Diversified Telecommunication Services - 0.30% | | | | | | | | |
| CenturyLink, Inc. | | | 58,362 | | | | 1,932,950 | |
| TW Telecom, Inc. | | | 67,710 | | | | 1,118,569 | |
| | | | | | | | 3,051,519 | |
| Electric Utilities - 0.06% | | | | | | | | |
| Korea Electric Power Corp. - ADR | | | 71,835 | | | | 610,597 | |
| Electronic Equipment, Instruments & Components - 0.19% | | | | | | | | |
| Universal Display Corp | | | 39,335 | | | | 1,885,720 | |
| Food Products - 0.08% | | | | | | | | |
| Sanderson Farms, Inc. | | | 16,000 | | | | 760,000 | |
| Gas Utilities - 0.07% | | | | | | | | |
| WGL Holdings, Inc. | | | 17,880 | | | | 698,572 | |
| Health Care Equipment & Supplies - 0.42% | | | | | | | | |
| Align Technology, Inc. | | | 33,966 | | | | 515,264 | |
| HeartWare International, Inc. | | | 8,985 | | | | 578,724 | |
| Intuitive Surgical, Inc. | | | 6,473 | | | | 2,357,984 | |
| NxStage Medical, Inc. | | | 38,643 | | | | 806,093 | |
| | | | | | | | 4,258,065 | |
| 80 | The Leuthold Funds - 2011 Annual Report | See Notes to the Financial Statements. |
| Leuthold Core Investment Fund |
Consolidated Schedule of Securities Sold Short - (a) (continued)
September 30, 2011
| | | Shares | | | Fair Value | |
| Health Care Technology - 0.22% | | | | | | |
| Allscripts Healthcare Solutions, Inc. | | | 123,157 | | | $ | 2,219,289 | |
| Hotels, Restaurants & Leisure - 0.43% | | | | | | | | |
| Ctrip.com International, Ltd. - ADR | | | 55,440 | | | | 1,782,951 | |
| Gaylord Entertainment Co. | | | 48,258 | | | | 933,310 | |
| Home Inns & Hotels Management, Inc. - ADR | | | 49,003 | | | | 1,262,807 | |
| Orient-Express Hotels Ltd. - Class A (b) | | | 54,699 | | | | 377,970 | |
| | | | | | | | 4,357,038 | |
| Household Durables - 0.95% | | | | | | | | |
| D.R. Horton, Inc. | | | 167,655 | | | | 1,515,601 | |
| Lennar Corp. - Class A | | | 107,924 | | | | 1,461,291 | |
| MDC Holdings, Inc. | | | 78,488 | | | | 1,329,587 | |
| NVR, Inc. | | | 2,701 | | | | 1,631,350 | |
| Pulte Group, Inc. | | | 291,046 | | | | 1,149,632 | |
| Sony Corp. - ADR | | | 80,206 | | | | 1,523,914 | |
| Toll Brothers, Inc. | | | 65,992 | | | | 952,264 | |
| | | | | | | | 9,563,639 | |
| Independent Power Producers & Energy Traders - 0.17% | | | | | | | | |
| Calpine Corp. | | | 123,219 | | | | 1,734,924 | |
| Industrial Conglomerates - 0.19% | | | | | | | | |
| Koninklijke Philips Electronics N.V. - NYS | | | 105,806 | | | | 1,898,160 | |
| Insurance - 0.86% | | | | | | | | |
| Aspen Insurance Holdings Ltd. (b) | | | 33,725 | | | | 777,024 | |
| First American Financial Corp. | | | 44,682 | | | | 571,930 | |
| Markel Corp. | | | 2,115 | | | | 755,330 | |
| Old Republic International Corp. | | | 177,525 | | | | 1,583,523 | |
| PartnerRe, Ltd. (b) | | | 32,873 | | | | 1,718,272 | |
| Platinum Underwriters Holdings, Ltd. (b) | | | 19,051 | | | | 585,818 | |
| RenaissanceRe Holdings, Ltd. (b) | | | 31,817 | | | | 2,029,924 | |
| Validus Holdings Ltd. (b) | | | 26,812 | | | | 668,155 | |
| | | | | | | | 8,689,976 | |
| Internet Software & Services - 0.59% | | | | | | | | |
| Digital River, Inc. | | | 21,089 | | | | 437,175 | |
| Equinix, Inc. | | | 25,677 | | | | 2,280,888 | |
| VeriSign, Inc. | | | 80,641 | | | | 2,307,139 | |
| WebMD Health Corp. | | | 29,853 | | | | 900,068 | |
| | | | | | | | 5,925,270 | |
| Media - 0.37% | | | | | | | | |
| Lamar Advertising Co. - Class A | | | 27,943 | | | | 475,869 | |
| New York Times Co. - Class A | | | 260,628 | | | | 1,514,249 | |
| Regal Entertainment Group - Class A | | | 151,703 | | | | 1,780,993 | |
| | | | | | | | 3,771,111 | |
| Metals & Mining - 0.17% | | | | | | | | |
| Ivanhoe Mines, Ltd. (b) | | | 125,515 | | | | 1,719,556 | |
| Multi-Utilities - 0.21% | | | | | | | | |
| Integrys Energy Group, Inc. | | | 43,097 | | | | 2,095,376 | |
| Oil, Gas & Consumable Fuels - 0.59% | | | | | | | | |
| EOG Resources, Inc. | | | 18,560 | | | | 1,317,946 | |
| Inergy LP | | | 35,132 | | | | 879,003 | |
| InterOil Corp. (b) | | | 31,523 | | | | 1,535,801 | |
| McMoRan Exploration Co. | | | 120,592 | | | | 1,197,478 | |
| Teekay Corp. (b) | | | 46,155 | | | | 1,043,564 | |
| | | | | | | | 5,973,792 | |
See Notes to the Financial Statements. | The Leuthold Funds - 2011 Annual Report | 81 |
| Leuthold Core Investment Fund |
Consolidated Schedule of Securities Sold Short - (a) (continued)
September 30, 2011
| | | Shares | | | Fair Value | |
| Real Estate Investment Trusts (REITs) - 1.16% | | | | | | |
| Boston Properties, Inc. | | | 23,699 | | | $ | 2,111,581 | |
| Brandywine Realty Trust | | | 170,454 | | | | 1,365,336 | |
| Corporate Office Properties Trust | | | 57,546 | | | | 1,253,352 | |
| Digital Realty Trust, Inc. | | | 36,065 | | | | 1,989,345 | |
| HCP, Inc. | | | 55,312 | | | | 1,939,239 | |
| Healthcare Realty Trust, Inc. | | | 59,535 | | | | 1,003,165 | |
| Ventas, Inc. | | | 41,143 | | | | 2,032,464 | |
| | | | | | | | 11,694,482 | |
| Semiconductors & Semiconductor Equipment - 0.80% | | | | | | | | |
| Cree, Inc. | | | 79,254 | | | | 2,059,019 | |
| PMC - Sierra, Inc. | | | 269,736 | | | | 1,613,021 | |
| Power Integrations, Inc. | | | 22,699 | | | | 694,817 | |
| Rambus, Inc | | | 155,484 | | | | 2,176,776 | |
| Silicon Laboratories, Inc. | | | 46,008 | | | | 1,541,728 | |
| | | | | | | | 8,085,361 | |
| Software - 0.57% | | | | | | | | |
| Concur Technologies, Inc. | | | 25,312 | | | | 942,113 | |
| Salesforce.com, Inc. | | | 16,931 | | | | 1,934,875 | |
| SuccessFactors, Inc. | | | 94,667 | | | | 2,176,394 | |
| Taleo Corp. - Class A | | | 27,187 | | | | 699,249 | |
| | | | | | | | 5,752,631 | |
| Thrifts & Mortgage Finance - 0.17% | | | | | | | | |
| New York Community Bancorp, Inc. | | | 140,453 | | | | 1,671,391 | |
| Wireless Telecommunication Services - 0.40% | | | | | | | | |
| American Tower Corp. - Class A | | | 39,275 | | | | 2,112,995 | |
| Crown Castle International Corp. | | | 47,743 | | | | 1,941,708 | |
| | | | | | | | 4,054,703 | |
| TOTAL COMMON STOCKS | | | | | | | | |
| (Proceeds $137,037,951) | | | | | | $ | 121,186,003 | |
| | | | | | | | | |
| INVESTMENT COMPANIES - 5.89% | | | | | | | | |
| Exchange Traded Funds - 5.89% | | | | | | | | |
| iShares Russell 2000 Index Fund | | | 160,000 | | | $ | 10,280,000 | |
| Powershares QQQ Trust Series 1 | | | 236,000 | | | | 12,394,720 | |
| SPDR Dow Jones Industrial Average ETF Trust | | | 87,931 | | | | 9,576,565 | |
| SPDR S&P 500 ETF Trust | | | 239,771 | | | | 27,134,884 | |
| TOTAL INVESTMENT COMPANIES | | | | | | | | |
| (Proceeds $64,257,052) | | | | | | $ | 59,386,169 | |
| TOTAL SECURITIES SOLD SHORT | | | | | | | | |
| (Proceeds $201,295,003) - 17.91% | | | | | | $ | 180,572,172 | |
Percentages are stated as a percent of net assets.
ADR American Depository Receipt
NYS New York Registered Shares
| (a) | All securities sold short are non-income producing. |
| (b) | Foreign issued security. |
The Global Industry Classification Standard (GICS®) was developed by and/or is the exclusive property of MSCI, Inc. and Standard & Poor Financial Services LLC ("S&P"). GICS is a service mark of MSCI and S&P and has been licensed for use by U.S. Bancorp Fund Services, LLC.
| 82 | The Leuthold Funds - 2011 Annual Report | See Notes to the Financial Statements. |
| Leuthold Asset Allocation Fund |
Consolidated Schedule of Investments
September 30, 2011
| | | Shares | | | Fair Value | |
| COMMON STOCKS - 50.18% | | | | | | |
| Auto Components - 0.65% | | | | | | |
| Autoliv, Inc. (b) | | | 46,348 | | | $ | 2,247,878 | |
| Cooper Tire & Rubber Co. | | | 215,061 | | | | 2,342,014 | |
| Minth Group, Ltd. (b) | | | 332,000 | | | | 304,400 | |
| TRW Automotive Holdings Corp. (a) | | | 47,104 | | | | 1,541,714 | |
| | | | | | | | 6,436,006 | |
| Beverages - 0.89% | | | | | | | | |
| Molson Coors Brewing Co. - Class B | | | 207,356 | | | | 8,213,371 | |
| Tsingtao Brewery Co., Ltd. (b) | | | 118,000 | | | | 653,838 | |
| | | | | | | | 8,867,209 | |
| Biotechnology - 0.01% | | | | | | | | |
| Sino Biopharmaceutical (b) | | | 356,000 | | | | 101,944 | |
| Chemicals - 1.63% | | | | | | | | |
| Agrium, Inc. (b) | | | 46,856 | | | | 3,123,421 | |
| Cabot Corp. | | | 127,182 | | | | 3,151,570 | |
| CF Industries Holdings, Inc. | | | 35,204 | | | | 4,343,821 | |
| China BlueChemical, Ltd. (b) | | | 3,718,000 | | | | 2,874,176 | |
| Kronos Worldwide, Inc. | | | 43,634 | | | | 701,635 | |
| Westlake Chemical Corp. | | | 59,252 | | | | 2,031,159 | |
| | | | | | | | 16,225,782 | |
| Commercial Banks - 1.06% | | | | | | | | |
| Canadian Imperial Bank of Commerce (b) | | | 48,145 | | | | 3,361,484 | |
| M&T Bank Corp. | | | 32,036 | | | | 2,239,316 | |
| PNC Financial Services Group, Inc. | | | 101,895 | | | | 4,910,320 | |
| | | | | | | | 10,511,120 | |
| Commercial Services & Supplies - 0.18% | | | | | | | | |
| Deluxe Corp. | | | 95,448 | | | | 1,775,333 | |
| Communications Equipment Manufacturing - 0.24% | | | | | | |
| Cisco Systems, Inc. | | | 150,933 | | | | 2,337,952 | |
| Computers & Peripherals - 0.42% | | | | | | | | |
| Seagate Technology PLC (b) | | | 401,969 | | | | 4,132,241 | |
| Construction Materials - 0.07% | | | | | | | | |
| Semen Gresik Persero Tbk PT (b) | | | 778,000 | | | | 734,630 | |
| Consumer Finance - 0.86% | | | | | | | | |
| Discover Financial Services | | | 199,078 | | | | 4,566,850 | |
| Ezcorp, Inc. - Class A (a) | | | 139,445 | | | | 3,979,760 | |
| | | | | | | | 8,546,610 | |
| Distributors - 0.20% | | | | | | | | |
| Jardine Cycle & Carriage, Ltd. (b) 62,000 | | | | | | | 1,990,030 | |
| Diversified Consumer Services - 0.38% | | | | | | | | |
| DeVry, Inc. | | | 71,648 | | | | 2,648,110 | |
| New Oriental Education & Technology Group - ADR (a) | | | 50,724 | | | | 1,165,130 | |
| | | | | | | | 3,813,240 | |
| Diversified Telecommunication Services - 1.54% | | | | | | | | |
| AT&T Inc. | | | 251,680 | | | | 7,177,913 | |
| Verizon Communications, Inc. | | | 221,366 | | | | 8,146,269 | |
| | | | | | | | 15,324,182 | |
| Electric Utilities - 1.88% | | | | | | | | |
| Edison International | | | 228,753 | | | | 8,749,802 | |
| PPL Corp. | | | 346,187 | | | | 9,880,177 | |
| | | | | | | | 18,629,979 | |
| Electronic Equipment, Instruments & Components - 1.54% | | | | | | | | |
| Arrow Electronics, Inc. (a) | | | 253,008 | | | | 7,028,562 | |
| Avnet, Inc. (a) | | | 144,288 | | | | 3,763,031 | |
| Jabil Circuit, Inc. | | | 252,628 | | | | 4,494,252 | |
| | | | | | | | 15,285,845 | |
See Notes to the Financial Statements. | The Leuthold Funds - 2011 Annual Report | 83 |
| Leuthold Asset Allocation Fund |
| Consolidated Schedule of Investments (continued) |
| September 30, 2011 |
| | | Shares | | | Fair Value | |
| Energy Equipment & Services - 0.68% | | | | | | |
| Ensco PLC - ADR | | | 48,400 | | | $ | 1,956,812 | |
| RPC, Inc. | | | 116,273 | | | | 1,897,575 | |
| Seadrill, Ltd. (b) | | | 105,716 | | | | 2,910,362 | |
| | | | | | | | 6,764,749 | |
| Food & Staples Retailing - 0.55% | | | | | | | | |
| CP ALL PCL (b) | | | 1,630,300 | | | | 2,517,433 | |
| Walgreen Co. | | | 90,490 | | | | 2,976,216 | |
| | | | | | | | 5,493,649 | |
| Food Products - 2.28% | | | | | | | | |
| Archer-Daniels-Midland Co. | | | 83,044 | | | | 2,060,322 | |
| ConAgra Foods, Inc. | | | 386,690 | | | | 9,365,632 | |
| Darling International, Inc. (a) | | | 293,039 | | | | 3,689,361 | |
| Golden Agri-Resources, Ltd. (b) | | | 8,227,000 | | | | 3,868,495 | |
| Smithfield Foods, Inc. (a) | | | 159,907 | | | | 3,118,187 | |
| Uni-President China Holdings, Ltd. (b) | | | 1,008,000 | | | | 550,119 | |
| | | | | | | | 22,652,116 | |
| Health Care Equipment & Supplies - 0.84% | | | | | | | | |
| Baxter International, Inc. | | | 62,723 | | | | 3,521,269 | |
| Mindray Medical International, Ltd. - ADR | | | 98,898 | | | | 2,334,982 | |
| Shandong Weigao Group Medical Polymer Co., Ltd. (b) | | | 1,168,000 | | | | 1,313,876 | |
| Supermax Corp. Bhd (b) | | | 803,250 | | | | 644,110 | |
| Top Glove Corp. Bhd (b) | | | 396,600 | | | | 510,580 | |
| | | | | | | | 8,324,817 | |
| Health Care Providers & Services - 4.55% | | | | | | | | |
| Aetna, Inc. | | | 267,937 | | | | 9,739,510 | |
| AMERIGROUP Corp. (a) | | | 83,300 | | | | 3,249,533 | |
| AmerisourceBergen Corp. | | | 112,059 | | | | 4,176,439 | |
| Healthspring, Inc. (a) | | | 166,105 | | | | 6,056,188 | |
| Humana, Inc. | | | 93,465 | | | | 6,797,709 | |
| Shanghai Pharmaceuticals Holding Co., Ltd. (a)(b) | | | 599,400 | | | | 1,305,420 | |
| Sinopharm Group Co., Ltd. (b) | | | 331,200 | | | | 882,503 | |
| UnitedHealth Group, Inc. | | | 146,219 | | | | 6,743,620 | |
| WellPoint, Inc. | | | 96,036 | | | | 6,269,230 | |
| | | | | | | | 45,220,152 | |
| Hotels, Restaurants & Leisure - 0.18% | | | | | | | | |
| Gourmet Master Co., Ltd. (b) | | | 258,300 | | | | 1,801,108 | |
| | | | | | | | | |
| Household Durables - 0.15% | | | | | | | | |
| Woongjin Coway Co., Ltd. (b) | | | 46,570 | | | | 1,518,007 | |
| | | | | | | | | |
| Industrial Conglomerates - 0.50% | | | | | | | | |
| 3M Co. | | | 40,503 | | | | 2,907,710 | |
| General Electric Co. | | | 133,227 | | | | 2,030,380 | |
| | | | | | | | 4,938,090 | |
| Insurance - 1.18% | | | | | | | | |
| ACE, Ltd. (b) | | | 82,025 | | | | 4,970,715 | |
| Chubb Corp. | | | 39,739 | | | | 2,383,943 | |
| Travelers Companies, Inc. | | | 88,903 | | | | 4,332,243 | |
| | | | | | | | 11,686,901 | |
| Internet & Catalog Retail - 0.14% | | | | | | | | |
| GS Home Shopping, Inc. (b) | | | 14,788 | | | | 1,343,165 | |
| | | | | | | | | |
| Internet Software & Services - 0.92% | | | | | | | | |
| Baidu, Inc. - ADR (a) | | | 56,194 | | | | 6,007,701 | |
| Daum Communications Corp. (b) | | | 10,528 | | | | 1,281,537 | |
| Netease.com, Inc. - ADR (a) | | | 25,100 | | | | 957,816 | |
| Tencent Holdings, Ltd. (b) | | | 41,500 | | | | 875,042 | |
| | | | | | | | 9,122,096 | |
| 84 | The Leuthold Funds - 2011 Annual Report | See Notes to the Financial Statements. |
| Leuthold Asset Allocation Fund |
| Consolidated Schedule of Investments (continued) |
| September 30, 2011 |
| | | Shares | | | Fair Value | |
| IT Services - 0.14% | | | | | | |
| CACI International Inc. - Class A (a) | | | 28,798 | | | $ | 1,438,172 | |
| | | | | | | | | |
| Machinery - 3.02% | | | | | | | | |
| AGCO Corp. (a) | | | 96,192 | | | | 3,325,357 | |
| Caterpillar, Inc. | | | 26,747 | | | | 1,974,999 | |
| Eaton Corp. | | | 124,422 | | | | 4,416,981 | |
| Joy Global, Inc. | | | 39,915 | | | | 2,489,898 | |
| Parker Hannifin Corp. | | | 54,294 | | | | 3,427,580 | |
| Timken Co. | | | 105,861 | | | | 3,474,358 | |
| United Tractors Tbk PT (b) | | | 2,320,500 | | | | 5,807,850 | |
| Weichai Power Co., Ltd. (b) | | | 1,108,000 | | | | 5,100,778 | |
| | | | | | | | 30,017,801 | |
| Media - 1.52% | | | | | | | | |
| BEC World PCL (b) | | | 1,953,100 | | | | 2,309,037 | |
| Cheil Worldwide, Inc. (b) | | | 117,625 | | | | 1,862,150 | |
| DIRECTV - Class A (a) | | | 112,803 | | | | 4,765,927 | |
| DISH Network Corp. - Class A (a) | | | 125,942 | | | | 3,156,107 | |
| Focus Media Holding, Ltd. - ADR (a) | | | 40,160 | | | | 674,286 | |
| Global Mediacom Tbk PT (b) | | | 3,504,000 | | | | 326,881 | |
| Lopez Holdings Corp. (b) | | | 1,778,200 | | | | 178,938 | |
| MCOT PCL (b) | | | 302,700 | | | | 265,356 | |
| Media Nusantara Citra Tbk PT (b) | | | 10,901,000 | | | | 1,264,962 | |
| Media Prima Bhd (b) | | | 230,800 | | | | 159,048 | |
| Star Publications Malaysia Bhd (b) | | | 92,901 | | | | 91,664 | |
| | | | | | | | 15,054,356 | |
| Metals & Mining - 1.13% | | | | | | | | |
| Alcoa, Inc. | | | 239,504 | | | | 2,292,053 | |
| Cliffs Natural Resources, Inc. | | | 53,550 | | | | 2,740,154 | |
| Freeport-McMoRan Copper & Gold, Inc. | | | 73,879 | | | | 2,249,616 | |
| POSCO - ADR | | | 22,630 | | | | 1,720,106 | |
| Rio Tinto PLC - ADR | | | 49,336 | | | | 2,174,731 | |
| | | | | | | | 11,176,660 | |
| Multiline Retail - 1.01% | | | | | | | | |
| Dillard's, Inc. - Class A | | | 62,475 | | | | 2,716,413 | |
| Golden Eagle Retail Group, Ltd. (b) | | | 1,248,000 | | | | 2,564,142 | |
| Macy's, Inc. | | | 127,926 | | | | 3,367,012 | |
| New World Department Store China, Ltd. (b) | | | 930,000 | | | | 520,687 | |
| Parkson Holdings Bhd (b) | | | 467,125 | | | | 831,095 | |
| | | | | | | | 9,999,349 | |
| Multi-Utilities - 0.60% | | | | | | | | |
| Alliant Energy Corp. | | | 153,097 | | | | 5,921,792 | |
| | | | | | | | | |
| Oil, Gas & Consumable Fuels - 5.30% | | | | | | | | |
| Banpu PCL (b) | | | 283,500 | | | | 4,778,961 | |
| Chevron Corp. | | | 149,861 | | | | 13,865,140 | |
| ConocoPhillips | | | 142,669 | | | | 9,033,801 | |
| Exxon Mobil Corp. | | | 89,158 | | | | 6,475,545 | |
| HollyFrontier Corp. | | | 70,409 | | | | 1,846,124 | |
| PetroChina Co., Ltd. - ADR | | | 26,775 | | | | 3,226,120 | |
| Royal Dutch Shell PLC - ADR | | | 69,417 | | | | 4,270,534 | |
| Sasol, Ltd. - ADR | | | 23,800 | | | | 966,280 | |
| Valero Energy Corp. | | | 139,082 | | | | 2,472,878 | |
| W&T Offshore, Inc. | | | 213,953 | | | | 2,943,993 | |
| Western Refining, Inc. (a) | | | 223,622 | | | | 2,786,330 | |
| | | | | | | | 52,665,706 | |
| Personal Products - 0.60% | | | | | | | | |
| Amorepacific Corp. (b) | | | 2,432 | | | | 2,427,768 | |
| Herbalife, Ltd. (b) | | | 65,946 | | | | 3,534,706 | |
| | | | | | | | 5,962,474 | |
See Notes to the Financial Statements. | The Leuthold Funds - 2011 Annual Report | 85 |
| Leuthold Asset Allocation Fund |
| Consolidated Schedule of Investments (continued) |
| September 30, 2011 |
| | | Shares | | | Fair Value | |
| Pharmaceuticals - 4.95% | | | | | | |
| AstraZeneca PLC - ADR | | | 59,863 | | | $ | 2,655,522 | |
| Celltrion, Inc. (b) | | | 29,294 | | | | 1,097,857 | |
| China Pharmaceutical Group, Ltd. (b) | | | 904,000 | | | | 220,561 | |
| China Shineway Pharmaceutical Group, Ltd. (b) | | | 408,000 | | | | 505,062 | |
| Eli Lilly & Co. | | | 219,583 | | | | 8,117,983 | |
| Forest Laboratories, Inc. (a) | | | 106,605 | | | | 3,282,368 | |
| Jazz Pharmaceuticals, Inc. (a) | | | 96,936 | | | | 4,024,783 | |
| Johnson & Johnson | | | 146,728 | | | | 9,348,041 | |
| Kalbe Farma Tbk PT (b) | | | 776,500 | | | | 287,102 | |
| Merck & Co., Inc. | | | 143,162 | | | | 4,682,829 | |
| Novo Nordisk A/S - ADR | | | 43,138 | | | | 4,293,094 | |
| Pfizer, Inc. | | | 246,585 | | | | 4,359,623 | |
| Shire PLC - ADR | | | 56,029 | | | | 5,262,804 | |
| Tong Ren Tang Technologies Co., Ltd. (b) | | | 392,000 | | | | 367,465 | |
| United Laboratories International Holdings, Ltd. (b) | | | 788,000 | | | | 606,123 | |
| | | | | | | | 49,111,217 | |
| Semiconductors & Semiconductor Equipment - 3.13% | | | | | | | | |
| Applied Materials, Inc. | | | 408,039 | | | | 4,223,204 | |
| ASML Holding NV - ADR | | | 98,175 | | | | 3,390,964 | |
| Brooks Automation, Inc. (a) | | | 278,805 | | | | 2,272,261 | |
| Fairchild Semiconductor International, Inc. (a) | | | 273,453 | | | | 2,953,292 | |
| GT Advanced Technologies, Inc. (a) | | | 198,086 | | | | 1,390,564 | |
| Intel Corp. | | | 183,211 | | | | 3,907,891 | |
| Novellus Systems, Inc. (a) | | | 142,305 | | | | 3,879,234 | |
| Taiwan Semiconductor Manufacturing Co., Ltd. - ADR | | | 174,200 | | | | 1,991,106 | |
| Texas Instruments, Inc. | | | 203,050 | | | | 5,411,282 | |
| United Microelectronics Corp. - ADR | | | 866,500 | | | | 1,655,015 | |
| | | | | | | | 31,074,813 | |
| Software - 0.38% | | | | | | | | |
| Check Point Software Technologies, Ltd. (a)(b) | | | 71,152 | | | | 3,753,980 | |
| | | | | | | | | |
| Specialty Retail - 0.98% | | | | | | | | |
| Foot Locker, Inc. | | | 167,592 | | | | 3,366,923 | |
| Limited Brands, Inc. | | | 87,884 | | | | 3,384,413 | |
| Signet Jewelers, Ltd. (a)(b) | | | 89,250 | | | | 3,016,650 | |
| | | | | | | | 9,767,986 | |
| Textiles, Apparel & Luxury Goods - 0.25% | | | | | | | | |
| 361 Degrees International, Ltd. (b) | | | 1,443,000 | | | | 689,314 | |
| Pou Chen Corp. (b) | | | 2,520,000 | | | | 1,827,465 | |
| | | | | | | | 2,516,779 | |
| Tobacco - 2.40% | | | | | | | | |
| British American Tobacco PLC - ADR | | | 63,467 | | | | 5,377,559 | |
| Lorillard, Inc. | | | 29,006 | | | | 3,210,964 | |
| Philip Morris International, Inc. | | | 76,359 | | | | 4,763,275 | |
| Reynolds American, Inc. | | | 278,682 | | | | 10,445,001 | |
| | | | | | | | 23,796,799 | |
| Transportation Infrastructure - 0.44% | | | | | | | | |
| Jasa Marga PT (b) | | | 4,766,500 | | | | 2,155,499 | |
| Zhejiang Expressway Co., Ltd. (b) | | | 3,606,000 | | | | 2,199,515 | |
| | | | | | | | 4,355,014 | |
| Water Utilities - 0.16% | | | | | | | | |
| Guangdong Investment, Ltd. (b) | | | 2,576,000 | | | | 1,610,951 | |
| | | | | | | | | |
| Wireless Telecommunication Services - 0.65% | | | | | | | | |
| Globe Telecom, Inc. (b) | | | 37,220 | | | | 755,892 | |
| Vodafone Group PLC - ADR | | | 223,913 | | | | 5,743,368 | |
| | | | | | | | 6,499,260 | |
| TOTAL COMMON STOCKS | | | | | | | | |
| (Cost $490,922,752) | | | | | | $ | 498,300,062 | |
| 86 | The Leuthold Funds - 2011 Annual Report | See Notes to the Financial Statements. |
| Leuthold Asset Allocation Fund |
| Consolidated Schedule of Investments (continued) |
| September 30, 2011 |
| | | Shares | | | Fair Value | |
| | | | | | | |
| INVESTMENT COMPANIES - 4.31% | | | | | | |
| Exchange Traded Funds - 4.31% | | | | | | |
| iShares Barclays Intermediate Credit Bond Fund | | | 105,525 | | | $ | 11,280,623 | |
| iShares iBoxx Investment Grade Corporate Bond Fund | | | 188,027 | | | | 21,122,953 | |
| WisdomTree Emerging Markets Local Debt Fund | | | 216,825 | | | | 10,431,451 | |
TOTAL INVESTMENT COMPANIES (Cost $42,855,556) | | | | | | $ | 42,835,027 | |
| | | | | | | | | |
| | | Troy Ounces | | | Fair Value | |
| | | | | | | | | |
| PRECIOUS METALS - 4.56% | | | | | | | | |
| Gold Bullion (a) | | | 23,394 | | | $ | 37,952,086 | |
| Silver (a) | | | 244,000 | | | | 7,349,280 | |
TOTAL PRECIOUS METALS (Cost $24,006,584) | | | | | | $ | 45,301,366 | |
| | | | | | | | | |
| | | Principal | | | | | |
| | | Amount | | | Fair Value | |
| | | | | | | | | |
| CORPORATE BONDS - 3.98% | | | | | | | | |
| Beverages - 0.21% | | | | | | | | |
Dr. Pepper Snapple Group, Inc. 2.900%, 01/15/2016 | | $ | 2,001,000 | | | $ | 2,066,295 | |
| Chemicals - 0.21% | | | | | | | | |
Dow Chemical Co. 7.600%, 05/15/2014 | | | 1,791,000 | | | | 2,034,168 | |
| Diversified Financial Services - 0.21% | | | | | | | | |
Export-Import Bank of Korea 8.125%, 01/21/2014 (b) | | | 1,847,000 | | | | 2,061,612 | |
| | | | | | | | | |
| Diversified Telecommunication Services - 0.41% | | | | | | | | |
| AT&T, Inc. | | | | | | | | |
| 5.100%, 09/15/2014 | | | 2,327,000 | | | | 2,555,516 | |
Cellco Partnership / Verizon Wireless Capital LLC 5.550%, 02/01/2014 | | | 1,425,000 | | | | 1,559,010 | |
| | | | | | | | 4,114,526 | |
| Electric Utilities - 0.36% | | | | | | | | |
| Duke Energy Corp. | | | | | | | | |
| 3.950%, 09/15/2014 | | | 1,444,000 | | | | 1,534,002 | |
| Exelon Corp. | | | | | | | | |
| 4.900%, 06/15/2015 | | | 1,899,000 | | | | 2,055,462 | |
| | | | | | | | 3,589,464 | |
| Industrial Conglomerates - 0.26% | | | | | | | | |
| General Electric Co. | | | | | | | | |
| 5.250%, 12/06/2017 | | | 2,314,000 | | | | 2,571,002 | |
| | | | | | | | | |
| Media - 0.46% | | | | | | | | |
| DIRECTV Holdings LLC / DIRECTV Financing Co., Inc. | | | | | | | | |
| 7.625%, 05/15/2016 | | | 1,912,000 | | | | 2,055,400 | |
| Time Warner Cable, Inc. | | | | | | | | |
| 8.250%, 04/01/2019 | | | 1,992,000 | | | | 2,494,432 | |
| | | | | | | | 4,549,832 | |
| Metals & Mining - 0.61% | | | | | | | | |
| Freeport-McMoRan Copper & Gold, Inc. | | | | | | | | |
| 8.375%, 04/01/2017 | | | 1,884,000 | | | | 2,020,590 | |
| Nabors Industries, Inc. | | | | | | | | |
| 9.250%, 01/15/2019 | | | 1,600,000 | | | | 2,024,024 | |
| Teck Resources, Ltd. | | | | | | | | |
| 10.750%, 05/15/2019 (b) | | | 1,648,000 | | | | 2,047,640 | |
| | | | | | | | 6,092,254 | |
See Notes to the Financial Statements. | The Leuthold Funds - 2011 Annual Report | 87 |
| Leuthold Asset Allocation Fund |
| Consolidated Schedule of Investments (continued) |
| September 30, 2011 |
| | | Principal | | | | |
| | | Amount | | | Fair Value | |
| | | | | | | |
| Oil, Gas & Consumable Fuels - 0.53% | | | | | | |
| Anadarko Petroleum Corp. | | | | | | |
| 5.950%, 09/15/2016 | | $ | 1,823,000 | | | $ | 1,993,995 | |
| Enterprise Products Operating LP | | | | | | | | |
| 5.600%, 10/15/2014 | | | 1,180,000 | | | | 1,291,512 | |
| Petrobras International Finance Co. | | | | | | | | |
| 6.125%, 10/06/2016 (b) | | | 1,829,000 | | | | 1,984,465 | |
| | | | | | | | 5,269,972 | |
| Pharmaceuticals - 0.15% | | | | | | | | |
| Hospira, Inc. | | | | | | | | |
| 6.050%, 03/30/2017 | | | 1,313,000 | | | | 1,514,324 | |
| | | | | | | | | |
| Semiconductors & Semiconductor | | | | | | | | |
| Equipment - 0.15% | | | | | | | | |
| KLA-Tencor Corp. | | | | | | | | |
| 6.900%, 05/01/2018 | | | 1,327,000 | | | | 1,516,294 | |
| | | | | | | | | |
| Tobacco - 0.21% | | | | | | | | |
| Altria Group, Inc. | | | | | | | | |
| 9.700%, 11/10/2018 | | | 1,561,000 | | | | 2,068,623 | |
| | | | | | | | | |
| Wireless Telecommunications Services - 0.21% | | | | | | | | |
| Rogers Communications, Inc. | | | | | | | | |
| 6.375%, 03/01/2014 (b) | | | 1,869,000 | | | | 2,074,618 | |
| | | | | | | | | |
| TOTAL CORPORATE BONDS | | | | | | | | |
| (Cost $40,116,575) | | | | | | $ | 39,522,984 | |
| | | | | | | | | |
| FOREIGN GOVERNMENT BONDS - 4.19% | | | | | | | | |
| | | | | | | | | |
| Commonwealth of Australia (b) | | | | | | | | |
| 6.000%, 02/15/2017 | | | | | | | | |
| | | AUD | 12,600,000 | | | $ | 13,455,827 | |
| Republic of Brazil (b) | | | | | | | | |
| 12.500%, 01/05/2022 | | | | | | | | |
| | | BRL | 45,000,000 | | | | 28,121,260 | |
| TOTAL FOREIGN GOVERNMENT BONDS | | | | | | | | |
| (Cost $32,346,832) | | | | | | $ | 41,577,087 | |
| | | | | | | | | |
| | | Shares | | | Fair Value | |
| SHORT-TERM INVESTMENTS - 17.64% | | | | | | | | |
| Money Market Funds - 17.64% | | | | | | | | |
| Fidelity Institutional Money | | | | | | | | |
| Market Fund - Government Portfolio 0.01% (c) | | | 175,214,742 | | | $ | 175,214,742 | |
| | | | | | | | | |
| TOTAL SHORT-TERM INVESTMENTS | | | | | | | | |
| (Cost $175,214,742) | | | | | | $ | 175,214,742 | |
| | | | | | | | | |
| Total Investments | | | | | | | | |
| (Cost $805,463,041) - 84.86% | | | | | | $ | 842,751,268 | |
| | | | | | | | | |
Other Assets in Excess of Liabilities - 15.14% (d) | | | | | | | 150,340,615 | |
| TOTAL NET ASSETS - 100.00% | | | | | | $ | 993,091,883 | |
Percentages are stated as a percent of net assets.
ADRAmerican Depository Receipt
| (a) | Non-income producing security. |
| (b) | Foreign issued security. |
| (c) | The rate quoted is the annualized seven-day yield as of September 30, 2011. |
| (d) | All or a portion of the assets have been committed as collateral for open securities sold short. |
The Global Industry Classification Standard (GICS®) was developed by and/or is the exclusive property of MSCI, Inc. and Standard & Poor Financial Services LLC ("S&P"). GICS is a service mark of MSCI and S&P and has been licensed for use by U.S. Bancorp Fund Services, LLC. .
| 88 | The Leuthold Funds - 2011 Annual Report | See Notes to the Financial Statements. |
| Leuthold Asset Allocation Fund |
| Consolidated Schedule of Securities Sold Short - (a) |
| September 30, 2011 |
| | | Shares | | | Fair Value | |
| | | | | | | |
| COMMON STOCKS - 11.88% | | | | | | |
| Aerospace & Defense - 0.05% | | | | | | |
| DigitalGlobe, Inc. | | | 27,331 | | | $ | 531,041 | |
| | | | | | | | | |
| Airlines - 0.38% | | | | | | | | |
| Delta Air Lines, Inc. | | | 211,489 | | | | 1,586,167 | |
| United Continental Holdings, Inc. | | | 113,855 | | | | 2,206,510 | |
| | | | | | | | 3,792,677 | |
| Biotechnology - 0.14% | | | | | | | | |
| Onyx Pharmaceuticals, Inc. | | | 45,114 | | | | 1,353,871 | |
| | | | | | | | | |
| Building Products - 0.39% | | | | | | | | |
| Lennox International, Inc. | | | 31,819 | | | | 820,294 | |
| Masco Corp. | | | 140,284 | | | | 998,822 | |
| Simpson Manufacturing Co., Inc. | | | 46,165 | | | | 1,150,893 | |
| USG Corp. | | | 131,811 | | | | 887,088 | |
| | | | | | | | 3,857,097 | |
| Capital Markets - 0.52% | | | | | | | | |
| Greenhill & Co., Inc. | | | 20,815 | | | | 595,101 | |
| Jefferies Group, Inc. | | | 84,808 | | | | 1,052,467 | |
| Knight Capital Group, Inc. - | | | | | | | | |
| Class A | | | 104,002 | | | | 1,264,664 | |
| Morgan Stanley | | | 96,125 | | | | 1,297,688 | |
| Stifel Financial Corp. | | | 37,046 | | | | 983,942 | |
| | | | | | | | 5,193,862 | |
| Commercial Banks - 0.60% | | | | | | | | |
| Hancock Holding Co. | | | 46,932 | | | | 1,256,839 | |
| HDFC Bank, Ltd. – ADR | | | 63,065 | | | | 1,838,345 | |
| Iberiabank Corp. | | | 13,864 | | | | 652,440 | |
| International Bancshares Corp. | | | 40,436 | | | | 531,733 | |
| TCF Financial Corp. | | | 121,737 | | | | 1,115,111 | |
| Wintrust Financial Corp. | | | 19,973 | | | | 515,503 | |
| | | | | | | | 5,909,971 | |
| Commercial Services & Supplies - 0.06% | | | | | | | | |
| Geo Group, Inc. | | | 33,291 | | | | 617,881 | |
| | | | | | | | | |
| Communications Equipment - 0.05% | | | | | | | | |
| Viasat, Inc. | | | 14,346 | | | | 477,865 | |
| Construction & Engineering - 0.29% | | | | | | | | |
| Quanta Services, Inc. | | | 95,743 | | | | 1,799,011 | |
| The Shaw Group, Inc. | | | 51,010 | | | | 1,108,957 | |
| | | | | | | | 2,907,968 | |
| Construction Materials - 0.53% | | | | | | | | |
| Eagle Materials, Inc. | | | 23,536 | | | | 391,875 | |
| Martin Marietta Materials, Inc. | | | 31,129 | | | | 1,967,975 | |
| Texas Industries, Inc. | | | 33,681 | | | | 1,069,035 | |
| Vulcan Materials Co. | | | 65,834 | | | | 1,814,385 | |
| | | | | | | | 5,243,270 | |
| Diversified Telecommunication Services - 0.30% | | | | | | | | |
| CenturyLink, Inc. | | | 56,732 | | | | 1,878,964 | |
| TW Telecom, Inc. | | | 65,834 | | | | 1,087,578 | |
| | | | | | | | 2,966,542 | |
| Electric Utilities - 0.06% | | | | | | | | |
| Korea Electric Power Corp. - ADR | | | 69,844 | | | | 593,674 | |
| | | | | | | | | |
| Electronic Equipment, Instruments & Components - 0.18% | | | | | | | | |
| Universal Display Corp. | | | 38,237 | | | | 1,833,082 | |
| | | | | | | | | |
| Food Products - 0.07% | | | | | | | | |
| Sanderson Farms, Inc. | | | 15,554 | | | | 38,815 | |
| | | | | | | | | |
| Gas Utilities - 0.07% | | | | | | | | |
| WGL Holdings, Inc. | | | 17,380 | | | | 679,037 | |
| | | | | | | | | |
| Health Care Equipment & Supplies - 0.42% | | | | | | | | |
| Align Technology, Inc. | | | 33,017 | | | | 500,868 | |
| HeartWare International, Inc. | | | 8,736 | | | | 562,686 | |
| Intuitive Surgical, Inc. | | | 6,357 | | | | 2,315,728 | |
| NxStage Medical, Inc. | | | 37,564 | | | | 783,585 | |
| | | | | | | | 4,162,867 | |
See Notes to the Financial Statements. | The Leuthold Funds - 2011 Annual Report | 89 |
| Leuthold Asset Allocation Fund |
| Consolidated Schedule of Securities Sold Short - (a) (continued) |
| September 30, 2011 |
| | | Shares | | | Fair Value | |
| Health Care Technology - 0.22% | | | | | | |
| Allscripts Healthcare Solutions, Inc. | | | 119,718 | | | $ | 2,157,318 | |
| | | | | | | | | |
| Hotels, Restaurants & Leisure - 0.43% | | | | | | | | |
| Ctrip.com International, Ltd. - ADR | | | 53,920 | | | | 1,734,067 | |
| Gaylord Entertainment Co. | | | 46,921 | | | | 907,452 | |
| Home Inns & Hotels Management, Inc. - ADR | | | 47,645 | | | | 1,227,812 | |
| Orient-Express Hotels Ltd. - Class A (b) | | | 53,183 | | | | 367,494 | |
| | | | | | | | 4,236,825 | |
| Household Durables - 0.94% | | | | | | | | |
| D.R. Horton, Inc. | | | 163,009 | | | | 1,473,601 | |
| Lennar Corp. - Class A | | | 104,933 | | | | 1,420,793 | |
| MDC Holdings, Inc. | | | 76,313 | | | | 1,292,742 | |
| NVR, Inc. | | | 2,626 | | | | 1,586,052 | |
| Pulte Group, Inc. | | | 282,980 | | | | 1,117,771 | |
| Sony Corp. - ADR | | | 77,984 | | | | 1,481,696 | |
| Toll Brothers, Inc. | | | 64,163 | | | | 925,872 | |
| | | | | | | | 9,298,527 | |
| Independent Power Producers & Energy Traders - 0.17% | | | | | | | | |
| Calpine Corp. | | | 119,804 | | | | 1,686,840 | |
| | | | | | | | | |
| Industrial Conglomerates - 0.19% | | | | | | | | |
| Koninklijke Philips Electronics N.V. - NYS | | | 103,957 | | | | 1,864,989 | |
| | | | | | | | | |
| Insurance - 0.85% | | | | | | | | |
| Aspen Insurance Holdings Ltd. (b) | | | 33,263 | | | | 766,380 | |
| First American Financial Corp. | | | 43,444 | | | | 556,083 | |
| Markel Corp. | | | 2,080 | | | | 742,830 | |
| Old Republic International Corp. | | | 172,604 | | | | 1,539,628 | |
| PartnerRe, Ltd. (b) | | | 31,962 | | | | 1,670,654 | |
| Platinum Underwriters Holdings, Ltd. (b) | | | 18,523 | | | | 569,582 | |
| RenaissanceRe Holdings, Ltd. (b) | | | 30,936 | | | | 1,973,717 | |
| Validus Holdings Ltd. (b) | | | 26,064 | | | | 649,515 | |
| | | | | | | | 8,468,389 | |
| Internet Software & Services - 0.58% | | | | | | | | |
| Digital River, Inc. | | | 20,504 | | | | 425,048 | |
| Equinix, Inc. | | | 25,224 | | | | 2,240,648 | |
| VeriSign, Inc. | | | 76,705 | | | | 2,194,530 | |
| WebMD Health Corp. | | | 29,026 | | | | 875,134 | |
| | | | | | | | 5,735,360 | |
| Media - 0.37% | | | | | | | | |
| Lamar Advertising Co. - Class A | | | 27,163 | | | | 462,586 | |
| New York Times Co. - Class A | | | 253,405 | | | | 1,472,283 | |
| Regal Entertainment Group - Class A | | | 148,297 | | | | 1,741,007 | |
| | | | | | | | 3,675,876 | |
| Metals & Mining - 0.17% | | | | | | | | |
| Ivanhoe Mines, Ltd. (b) | | | 122,010 | | | | 1,671,537 | |
| | | | | | | | | |
| Multi-Utilities - 0.21% | | | | | | | | |
| Integrys Energy Group, Inc. | | | 41,894 | | | | 2,036,886 | |
| 90 | The Leuthold Funds - 2011 Annual Report | See Notes to the Financial Statements. |
| Leuthold Asset Allocation Fund |
| Consolidated Schedule of Securities Sold Short - (a) (continued) |
| September 30, 2011 |
| | | Shares | | | Fair Value | |
| Oil, Gas & Consumable Fuels - 0.58% | | | | | | |
| EOG Resources, Inc. | | | 18,046 | | | $ | 1,281,447 | |
| Inergy LP | | | 34,158 | | | | 854,633 | |
| InterOil Corp. (b) | | | 30,649 | | | | 1,493,219 | |
| McMoRan Exploration Co. | | | 117,250 | | | | 1,164,293 | |
| Teekay Corp. (b) | | | 44,876 | | | | 1,014,646 | |
| | | | | | | | 5,808,238 | |
| Real Estate Investment Trusts (REITs) - 1.15% | | | | | | | | |
| Boston Properties, Inc. | | | 23,283 | | | | 2,074,515 | |
| Brandywine Realty Trust | | | 165,730 | | | | 1,327,497 | |
| Corporate Office Properties Trust | | | 55,951 | | | | 1,218,613 | |
| Digital Realty Trust, Inc. | | | 35,065 | | | | 1,934,185 | |
| HCP, Inc. | | | 53,779 | | | | 1,885,492 | |
| Healthcare Realty Trust, Inc. | | | 57,885 | | | | 975,362 | |
| Ventas, Inc. | | | 39,994 | | | | 1,975,704 | |
| | | | | | | | 11,391,368 | |
Semiconductors & Semiconductor Equipment - 0.79% | | | | | | | | |
| Cree, Inc. | | | 77,992 | | | | 2,026,232 | |
| PMC - Sierra, Inc. | | | 262,260 | | | | 1,568,315 | |
| Power Integrations, Inc. | | | 22,079 | | | | 675,838 | |
| Rambus, Inc. | | | 151,142 | | | | 2,115,988 | |
| Silicon Laboratories, Inc. | | | 44,733 | | | | 1,499,003 | |
| | | | | | | | 7,885,376 | |
| Software - 0.56% | | | | | | | | |
| Concur Technologies, Inc. | | | 24,610 | | | | 915,984 | |
| Salesforce.com, Inc. | | | 16,458 | | | | 1,880,820 | |
| SuccessFactors, Inc. | | | 92,024 | | | | 2,115,632 | |
| Taleo Corp. - Class A | | | 26,428 | | | | 679,728 | |
| | | | | | | | 5,592,164 | |
| Thrifts & Mortgage Finance - 0.16% | | | | | | | | |
| New York Community Bancorp, Inc. | | | 136,561 | | | | 1,625,076 | |
| | | | | | | | | |
| Wireless Telecommunication Services - 0.40% | | | | | | | | |
| American Tower Corp. - Class A | | | 38,178 | | | | 2,053,976 | |
| Crown Castle International Corp. | | | 46,410 | | | | 1,887,495 | |
| | | | | | | | 3,941,471 | |
| TOTAL COMMON STOCKS | | | | | | | | |
| (Proceeds $133,356,533) | | | | | | $ | 117,935,760 | |
| | | | | | | | | |
| INVESTMENT COMPANIES - 5.81% | | | | | | | | |
| Exchange Traded Funds - 5.81% | | | | | | | | |
| iShares Russell 2000 Index Fund | | | 155,600 | | | $ | 9,997,300 | |
| Powershares QQQ Trust Series 1 | | | 229,000 | | | | 12,027,080 | |
| SPDR Dow Jones Industrial Average ETF Trust | | | 85,476 | | | | 9,309,191 | |
| SPDR S&P 500 ETF Trust | | | 233,169 | | | | 26,387,736 | |
| | | | | | | | | |
| TOTAL INVESTMENT COMPANIES | | | | | | | | |
| (Proceeds $62,456,231) | | | | | | $ | 57,721,307 | |
| | | | | | | | | |
| TOTAL SECURITIES SOLD SHORT | | | | | | | | |
| (Proceeds $195,812,764) - 17.69% | | | | | | $ | 175,657,067 | |
Percentages are stated as a percent of net assets.
ADR American Depository Receipt
NYS New York Registered Shares
| (a) | All securities sold short are non-income producing. |
| (b) | Foreign issued security. |
The Global Industry Classification Standard (GICS®) was developed by and/or is the exclusive property of MSCI, Inc. and Standard & Poor Financial Services LLC ("S&P"). GICS is a service mark of MSCI and S&P and has been licensed for use by U.S. Bancorp Fund Services, LLC.
See Notes to the Financial Statements. | The Leuthold Funds - 2011 Annual Report | 91 |
Consolidated Schedule of Investments
September 30, 2011
| | | Shares | | | Fair Value | |
| COMMON STOCKS - 46.13% | | | | | | |
| Auto Components - 3.85% | | | | | | |
| Autoliv, Inc. (b) | | | 36,679 | | | $ | 1,778,932 | |
| Cheng Shin Rubber Industry Co., Ltd. (b) | | | 724,000 | | | | 1,522,835 | |
| Johnson Controls, Inc. | | | 69,763 | | | | 1,839,650 | |
| Kenda Rubber Industrial Co., Ltd. (b) | | | 1,967,062 | | | | 2,136,497 | |
| Lear Corp. | | | 56,467 | | | | 2,422,434 | |
| Leoni AG (b) | | | 25,104 | | | | 815,768 | |
| Minth Group, Ltd. (b) | | | 1,656,000 | | | | 1,518,330 | |
| Plastic Omnium SA (b) | | | 118,573 | | | | 2,867,382 | |
| TRW Automotive Holdings Corp. (a) | | | 67,266 | | | | 2,201,616 | |
| | | | | | | | 17,103,444 | |
| Automobiles - 1.41% | | | | | | | | |
| Hyundai Motor Co. (b) | | | 12,882 | | | | 2,307,289 | |
| Thor Industries, Inc. | | | 71,793 | | | | 1,590,215 | |
| Volkswagen AG (b) | | | 19,167 | | | | 2,393,018 | |
| | | | | | | | 6,290,522 | |
| Chemicals - 8.35% | | | | | | | | |
| Agrium, Inc. (b) | | | 20,900 | | | | 1,393,194 | |
| Arkema SA (b) | | | 28,738 | | | | 1,694,072 | |
| Ashland, Inc. | | | 44,504 | | | | 1,964,406 | |
| Bagfas Bandirma Gubre Fabrik (b) | | | 12,553 | | | | 1,144,928 | |
| Cabot Corp. | | | 66,956 | | | | 1,659,170 | |
| CF Industries Holdings, Inc. | | | 13,592 | | | | 1,677,117 | |
| China Petrochemical Development Corp. (b) | | | 2,389,700 | | | | 2,591,619 | |
| The Dow Chemical Co. | | | 41,710 | | | | 936,807 | |
| El du Pont de Nemours & Co. | | | 24,586 | | | | 982,702 | |
| Fuchs Petrolub AG (b) | | | 49,121 | | | | 2,045,694 | |
| Gubre Fabrikalari TAS (a)(b) | | | 98,991 | | | | 649,855 | |
| Hanwha Chemical Corp. (b) | | | 40,220 | | | | 885,963 | |
| Hanwha Corp. (b) | | | 27,121 | | | | 778,142 | |
| Hyosung Corp. (b) | | | 16,193 | | | | 762,881 | |
| Israel Corp., Ltd. (b) | | | 1,309 | | | | 881,926 | |
| K+S AG (b) | | | 17,874 | | | | 947,807 | |
| Mitsubishi Chemical Holdings Corp. (b) | | | 207,000 | | | | 1,419,720 | |
| Mosaic Co. | | | 33,719 | | | | 1,651,219 | |
| Olin Corp. | | | 117,862 | | | | 2,122,695 | |
| Scotts Miracle-Gro Co. - Class A | | | 24,121 | | | | 1,075,797 | |
| Sinopec Shanghai Petrochemical Co., Ltd. (b) | | | 2,794,000 | | | | 1,008,185 | |
| Solutia, Inc. (a) | | | 57,101 | | | | 733,748 | |
| Taekwang Industrial Co., Ltd. (b) | | | 1,565 | | | | 1,610,101 | |
| Taiwan Prosperity Chemical Corp. (b) | | | 310,000 | | | | 902,280 | |
| USI Corp. (b) | | | 2,126,900 | | | | 2,093,749 | |
| Westlake Chemical Corp. | | | 49,884 | | | | 1,710,023 | |
| Yara International ASA (b) | | | 46,800 | | | | 1,814,565 | |
| | | | | | | | 37,138,365 | |
| Consumer Finance - 3.79% | | | | | | | | |
| Capital One Financial Corp. | | | 57,864 | | | | 2,293,150 | |
| Cash America International, Inc. | | | 55,678 | | | | 2,848,487 | |
| Credit Acceptance Corp. (a) | | | 40,055 | | | | 2,577,940 | |
| DFC Global Corp. (a) | | | 46,292 | | | | 1,011,480 | |
| Discover Financial Services | | | 146,095 | | | | 3,351,419 | |
| Ezcorp, Inc. - Class A (a) | | | 33,634 | | | | 959,914 | |
| International Personal Finance PLC (b) | | | 300,740 | | | | 1,047,223 | |
| Provident Financial PLC (b) | | | 68,728 | | | | 1,076,035 | |
| Samsung Card Co. (b) | | | 46,832 | | | | 1,685,563 | |
| | | | | | | | 16,851,211 | |
| 92 | The Leuthold Funds - 2011 Annual Report | See Notes to the Financial Statements. |
Consolidated Schedule of Investments (continued)
September 30, 2011
| | | Shares | | | Fair Value | |
| Food Products - 3.35% | | | | | | |
| Archer-Daniels-Midland Co. | | | 84,649 | | | $ | 2,100,142 | |
| Bunge, Ltd. | | | 36,498 | | | | 2,127,468 | |
| Charoen Pokphand Indonesia Tbk PT (b) | | | 11,659,500 | | | | 3,183,481 | |
| Golden Agri-Resources, Ltd. (b) | | | 4,747,000 | | | | 2,232,132 | |
| GrainCorp, Ltd. (b) | | | 310,828 | | | | 2,165,672 | |
| Perusahaan Perkebunan London Sumatra Indonesia Tbk PT (b) | | | 9,486,500 | | | | 2,212,437 | |
| Tradewinds Malaysia Bhd (b) | | | 369,900 | | | | 900,273 | |
| | | | | | | | 14,921,605 | |
| Health Care Providers & Services - 3.75% | | | | | | | | |
| Aetna, Inc. | | | 56,582 | | | | 2,056,756 | |
| AMERIGROUP Corp. (a) | | | 23,396 | | | | 912,678 | |
| CIGNA Corp. | | | 48,192 | | | | 2,021,172 | |
| Coventry Health Care, Inc. (a) | | | 68,167 | | | | 1,963,891 | |
| Health Net, Inc. (a) | | | 48,410 | | | | 1,147,801 | |
| Healthspring, Inc. (a) | | | 29,954 | | | | 1,092,123 | |
| Humana, Inc. | | | 14,938 | | | | 1,086,441 | |
| Magellan Health Services, Inc. (a) | | | 23,254 | | | | 1,123,168 | |
| UnitedHealth Group, Inc. | | | 23,927 | | | | 1,103,513 | |
| WellCare Health Plans, Inc. (a) | | | 50,998 | | | | 1,936,904 | |
| WellPoint, Inc. | | | 34,206 | | | | 2,232,968 | |
| | | | | | | | 16,677,415 | |
| Insurance - 0.51% | | | | | | | | |
| Montpelier Re Holdings, Ltd. (b) | | | 128,506 | | | | 2,271,986 | |
| Machinery - 2.86% | | | | | | | | |
| Eaton Corp. | | | 39,705 | | | | 1,409,528 | |
| Ebara Corp. (b) | | | 246,000 | | | | 988,720 | |
| Fuji Machine Manufacturing Co., Ltd. (b) | | | 51,700 | | | | 928,361 | |
| Melrose PLC (b) | | | 194,958 | | | | 884,694 | |
| Mueller Industries, Inc. | | | 68,224 | | | | 2,632,764 | |
| Singamas Container Holdings, Ltd. (b) | | | 2,794,000 | | | | 470,008 | |
| SKF AB (b) | | | 68,793 | | | | 1,312,425 | |
| Snap-on, Inc. | | | 21,211 | | | | 941,768 | |
| Timken Co. | | | 48,979 | | | | 1,607,491 | |
| Trelleborg AB - Class B (b) | | | 239,048 | | | | 1,564,307 | |
| | | | | | | | 12,740,066 | |
| Media - 2.18% | | | | | | | | |
| Cinemark Holdings, Inc. | | | 141,129 | | | | 2,664,516 | |
| Daiichikosho Co., Ltd. (b) | | | 175,900 | | | | 3,484,704 | |
| ProSiebenSat.1 Media AG (b) | | | 143,560 | | | | 2,559,965 | |
| TV Azteca SAB de CV (b) | | | 1,824,901 | | | | 971,108 | |
| | | | | | | | 9,680,293 | |
| Oil, Gas & Consumable Fuels - 4.58% | | | | | | | | |
| Chevron Corp. | | | 25,763 | | | | 2,383,593 | |
| China Petroleum & Chemical Corp. - ADR | | | 27,613 | | | | 2,645,325 | |
| ConocoPhillips | | | 38,826 | | | | 2,458,462 | |
| Hess Corp. | | | 29,915 | | | | 1,569,341 | |
| Polskie Gornictwo Naftowe i Gazownictwo SA (b) | | | 1,036,339 | | | | 1,267,205 | |
| PTT PCL (b) | | | 116,400 | | | | 973,589 | |
| Repsol YPF SA (b) | | | 74,703 | | | | 1,999,660 | |
| Royal Dutch Shell PLC - ADR | | | 38,593 | | | | 2,374,241 | |
| Sasol, Ltd. - ADR | | | 23,642 | | | | 959,865 | |
| Statoil ASA - ADR | | | 104,489 | | | | 2,251,738 | |
| Suncor Energy, Inc. (b) | | | 57,670 | | | | 1,467,125 | |
| | | | | | | | 20,350,144 | |
| See Notes to the Financial Statements. | The Leuthold Funds - 2011 Annual Report | 93 |
Consolidated Schedule of Investments (continued)
September 30, 2011
| | | Shares | | | Fair Value | |
| Paper & Forest Products - 0.11% | | | | | | |
| China Forestry Holdings Co., Ltd. (b)(e)(f) | | | 2,484,000 | | | $ | 472,086 | |
| Semiconductors & Semiconductor | | | | | | | | |
| Equipment - 0.22% | | | | | | | | |
| ASM Pacific Technology, Ltd. (b) | | | 98,300 | | | | 971,968 | |
| Trading Companies & Distributors - 4.22% | | | | | | | | |
| Applied Industrial Technologies, Inc. | | | 70,474 | | | | 1,914,074 | |
| BayWa AG (b) | | | 55,109 | | | | 2,164,018 | |
| Hanwa Co., Ltd. (b) | | | 621,000 | | | | 2,834,072 | |
| JFE Shoji Holdings, Inc. (b) | | | 557,842 | | | | 2,487,977 | |
| LG International Corp. (b) | | | 34,270 | | | | 1,279,980 | |
| Nagase & Co., Ltd. (b) | | | 207,000 | | | | 2,584,481 | |
| Seven Group Holdings, Ltd. (b) | | | 132,748 | | | | 1,021,257 | |
| Toyota Tsusho Corp. (b) | | | 148,700 | | | | 2,585,332 | |
| WESCO International, Inc. (a) | | | 56,351 | | | | 1,890,576 | |
| | | | | | | | 18,761,767 | |
| Water Utilities - 2.95% | | | | | | | | |
| American Water Works Co., Inc. | | | 71,379 | | | | 2,154,218 | |
| Beijing Enterprises Water Group, Ltd. (a)(b) | | | 4,914,000 | | | | 896,048 | |
Cia de Saneamento Basico do Estado de Sao Paulo (b) | | | 77,600 | | | | 1,805,198 | |
| Cia de Saneamento de Minas Gerais-COPASA (b) | | | 127,730 | | | | 2,001,290 | |
| Guangdong Investment, Ltd. (b) | | | 5,206,000 | | | | 3,255,672 | |
| Hyflux, Ltd. (b) | | | 1,002,000 | | | | 1,141,509 | |
| Severn Trent PLC (b) | | | 77,691 | | | | 1,866,949 | |
| | | | | | | | 13,120,884 | |
| Wireless Telecommunication Services - 4.00% | | | | | | | | |
| China Mobile, Ltd. (b) | | | 220,000 | | | | 2,178,134 | |
| Freenet AG (b) | | | 97,311 | | | | 1,147,665 | |
| KDDI Corp. (b) | | | 291 | | | | 2,022,248 | |
| M1, Ltd. (b) | | | 673,000 | | | | 1,265,831 | |
| MetroPCS Communications, Inc. (a) | | | 105,782 | | | | 921,361 | |
| Mobistar SA (b) | | | 17,654 | | | | 1,015,848 | |
| Rogers Communications, Inc. - Class B (b) | | | 30,308 | | | | 1,037,454 | |
| Softbank Corp. (b) | | | 34,900 | | | | 1,037,091 | |
| Telephone & Data Systems, Inc. | | | 46,948 | | | | 997,645 | |
| Tim Participacoes SA - ADR | | | 82,176 | | | | 1,936,067 | |
Total Access Communication PCL (b) | | | 909,100 | | | | 2,164,176 | |
| Vodacom Group, Ltd. (b) | | | 185,577 | | | | 2,076,752 | |
| | | | | | | | 17,800,272 | |
TOTAL COMMON STOCKS
(Cost $222,912,988) | | | | | | $ | 205,152,028 | |
| | | | | | | | | |
| INVESTMENT COMPANIES - 5.94% | | | | | | | | |
| | | | | | | | | |
| Exchange Traded Funds - 5.94% | | | | | | | | |
| iShares Barclays Intermediate Credit Bond Fund | | | 118,940 | | | $ | 12,714,686 | |
| iShares iBoxx Investment Grade Corporate Bond Fund | | | 29,534 | | | | 3,317,850 | |
| iShares JPMorgan USD Emerging Markets Bond Fund | | | 25,299 | | | | 2,667,273 | |
| PowerShares Build America Bond Portfolio | | | 95,819 | | | | 2,761,504 | |
| PowerShares Emerging Markets Sovereign Debt Portfolio | | | 102,078 | | | | 2,668,319 | |
| WisdomTree Emerging Markets Local Debt Fund | | | 47,817 | | | | 2,300,476 | |
TOTAL INVESTMENT COMPANIES
(Cost $26,144,305) | | | | | | $ | 26,430,108 | |
| 94 | The Leuthold Funds - 2011 Annual Report | See Notes to the Financial Statements. |
Consolidated Schedule of Investments (continued)
September 30, 2011
| | | Troy Ounces | | | Fair Value | |
| PRECIOUS METALS - 4.52% | | | | | | |
| Gold Bullion (a) | | | 10,378 | | | $ | 16,836,229 | |
| Silver (a) | | | 109,000 | | | | 3,283,080 | |
TOTAL PRECIOUS METALS
(Cost $13,949,548) | | | | | | $ | 20,119,309 | |
| | | | | | | | | |
| | | Principal | | | | | |
| | | Amount | | | Fair Value | |
| | | | | | | | | |
| CORPORATE BONDS - 3.94% | | | | | | | | |
| Beverages - 0.21% | | | | | | | | |
Dr. Pepper Snapple Group, Inc.
2.900%, 01/15/2016 | | $ | 886,000 | | | $ | 914,911 | |
| Chemicals - 0.20% | | | | | | | | |
Dow Chemical Co.
7.600%, 05/15/2014 | | | 793,000 | | | | 900,667 | |
| Diversified Financial Services - 0.20% | | | | | | | | |
Export-Import Bank of Korea
8.125%, 01/21/2014 (b) | | | 818,000 | | | | 913,048 | |
| Diversified Telecommunication Services - 0.41% | | | | | | | | |
AT&T, Inc.
5.100%, 09/15/2014 | | | 1,031,000 | | | | 1,132,246 | |
Cellco Partnership / Verizon Wireless Capital LLC
5.550%, 02/01/2014 | | | 631,000 | | | | 690,340 | |
| | | | | | | | 1,822,586 | |
| Electric Utilities - 0.36% | | | | | | | | |
Duke Energy Corp.
3.950%, 09/15/2014 | | | 640,000 | | | | 679,890 | |
Exelon Corp.
4.900%, 06/15/2015 | | | 841,000 | | | | 910,292 | |
| | | | | | | | 1,590,182 | |
| Industrial Conglomerates - 0.26% | | | | | | | | |
General Electric Co.
5.250%, 12/06/2017 | | | 1,025,000 | | | | 1,138,841 | |
| Media - 0.45% | | | | | | | | |
DIRECTV Holdings LLC / DIRECTV Financing Co., Inc.
7.625%, 05/15/2016 | | | 847,000 | | | | 910,525 | |
Time Warner Cable, Inc.
8.250%, 04/01/2019 | | | 883,000 | | | | 1,105,715 | |
| | | | | | | | 2,016,240 | |
| Metals & Mining - 0.61% | | | | | | | | |
Freeport-McMoRan Copper & Gold, Inc.
8.375%, 04/01/2017 | | | 834,000 | | | | 894,465 | |
Nabors Industries, Inc.
9.250%, 01/15/2019 | | | 709,000 | | | | 896,896 | |
Teck Resources, Ltd.
10.750%, 05/15/2019 (b) | | | 730,000 | | | | 907,025 | |
| | | | | | | | 2,698,386 | |
| Oil, Gas & Consumable Fuels - 0.52% | | | | | | | | |
Anadarko Petroleum Corp.
5.950%, 09/15/2016 | | | 808,000 | | | | 883,790 | |
Enterprise Products Operating LP
5.600%, 10/15/2014 | | | 523,000 | | | | 572,424 | |
Petrobras International Finance Co.
6.125%, 10/06/2016 (b) | | | 810,000 | | | | 878,850 | |
| | | | | | | | 2,335,064 | |
| Pharmaceuticals - 0.15% | | | | | | | | |
Hospira, Inc.
6.050%, 03/30/2017 | | | 581,000 | | | | 670,085 | |
| Semiconductors & Semiconductor Equipment - 0.15% | | | | | | | | |
KLA-Tencor Corp.
6.900%, 05/01/2018 | | | 588,000 | | | | 671,877 | |
| Tobacco - 0.21% | | | | | | | | |
Altria Group, Inc.
9.700%, 11/10/2018 | | | 691,000 | | | | 915,707 | |
| See Notes to the Financial Statements. | The Leuthold Funds - 2011 Annual Report | 95 |
Consolidated Schedule of Investments (continued)
September 30, 2011
| | | | Principal | | | | |
| | | | Amount | | | Fair Value | |
| | | | | | | | |
| Wireless Telecommunications Services - 0.21% | | | | | | | |
Rogers Communications, Inc.
6.375%, 03/01/2014 (b) | | | $ | 828,000 | | | $ | 919,092 | |
TOTAL CORPORATE BONDS
(Cost $17,769,622) | | | | | | | $ | 17,506,686 | |
| | | | | | | | | | |
| UNITED STATES TREASURY | | | | | | | | | |
| OBLIGATIONS - 1.26% | | | | | | | | | |
| United States Treasury Inflation Indexed | | | | | | | | | |
| Bonds - 1.26% | | | | | | | | | |
| 1.250%, 04/15/2014 | | | $ | 5,337,600 | | | $ | 5,592,385 | |
TOTAL UNITED STATES TREASURY OBLIGATIONS
(Cost $5,481,367) | | | | | | | $ | 5,592,385 | |
| | | | | | | | | | |
| FOREIGN GOVERNMENT BONDS - 3.02% | | | | | | | | | |
Commonwealth of Australia (b) 6.000%, 02/15/2017 | AUD | | | 5,000,000 | | | $ | 5,339,614 | |
| 5.939%, 08/20/2020 | AUD | | | 2,522,625 | | | | 4,346,303 | |
Republic of Brazil (b)
12.500%, 01/05/2022 | BRL | | | 5,951,000 | | | | 3,718,880 | |
TOTAL FOREIGN GOVERNMENT BONDS
(Cost $13,752,532) | | | | | | $ | 13,404,797 | |
| | | Shares | | | Fair Value | |
| SHORT-TERM INVESTMENTS - 25.71% | | | | | | |
| Money Market Funds - 25.71% | | | | | | |
| Fidelity Institutional Money Market Fund - Government Portfolio 0.01% (c) | | | 114,355,854 | | | $ | 114,355,854 | |
TOTAL SHORT-TERM INVESTMENTS
(Cost $114,355,854) | | | | | | $ | 114,355,854 | |
| | | | | | | | | |
Total Investments
(Cost $414,366,216) - 90.52% | | | | | | $ | 402,561,167 | |
| Other Assets in Excess of Liabilities - 9.48% (d) | | | | | | | 42,178,627 | |
| TOTAL NET ASSETS - 100.00% | | | | | | $ | 444,739,794 | |
Percentages are stated as a percent of net assets.
ADR American Depository Receipt
| (a) | Non-income producing security. |
| (b) | Foreign issued security. |
| (c) | The rate quoted is the annualized seven-day yield as of September 30, 2011. |
| (d) | All or a portion of the assets have been committed as collateral for open securities sold short. |
| (e) | Illiquid Security. The fair value of these securities total $472,086, which represent 0.11% of total net assets. |
| (f) | The security is currently being fair valued in accordance with procedures established by the Board of Directors of Leuthold Funds due to a halt in trading of the security on January 26, 2011. |
The Global Industry Classification Standard (GICS®) was developed by and/or is the exclusive property of MSCI, Inc. and Standard & Poor Financial Services LLC ("S&P"). GICS is a service mark of MSCI and S&P and has been licensed for use by U.S. Bancorp Fund Services, LLC.
| 96 | The Leuthold Funds - 2011 Annual Report | See Notes to the Financial Statements. |
Consolidated Schedule of Investments (continued)
September 30, 2011
| | | | | | Percentage | |
| | | Fair | | | of Total | |
| | | Value | | | Investments | |
| | | | | | | |
| CURRENCY EXPOSURE | | | | | | |
| September 30, 2011 | | | | | | |
| Australian Dollar | | $ | 12,872,845 | | | | 3.20 | % |
| Brazilian Real | | | 7,525,369 | | | | 1.87 | |
| British Pound | | | 4,874,901 | | | | 1.21 | |
| Canadian Dollar | | | 1,037,454 | | | | 0.26 | |
| Euro | | | 19,650,898 | | | | 4.88 | |
| Hong Kong Dollar | | | 10,770,429 | | | | 2.68 | |
| Indonesian Rupiah | | | 5,395,919 | | | | 1.34 | |
| Israel Shekel | | | 881,926 | | | | 0.22 | |
| Japanese Yen | | | 20,372,707 | | | | 5.06 | |
| Malaysian Ringgit | | | 900,273 | | | | 0.22 | |
| Mexican Peso | | | 971,109 | | | | 0.24 | |
| New Taiwan Dollar | | | 9,246,981 | | | | 2.30 | |
| New Turkish Lira | | | 1,794,782 | | | | 0.45 | |
| Norwegian Krone | | | 1,814,565 | | | | 0.45 | |
| Polish Zloty | | | 1,267,205 | | | | 0.31 | |
| Singapore Dollar | | | 4,639,472 | | | | 1.15 | |
| South African Rand | | | 2,076,752 | | | | 0.52 | |
| South Korea Won | | | 9,309,918 | | | | 2.31 | |
| Swedish Krona | | | 2,876,731 | | | | 0.71 | |
| Thai Baht | | | 3,137,764 | | | | 0.78 | |
| US Dollar | | | 261,023,858 | | | | 64.84 | |
| | | | 382,441,858 | | | | 95.00 | % |
| Precious Metals | | | 20,119,309 | | | | 5.00 | % |
| Total Investments | | $ | 402,561,167 | | | | 100.00 | % |
| | | | | | | | | |
| PORTFOLIO DIVERSIFICATION | | | | | | | | |
| September 30, 2011 | | | | | | | | |
| Australia | | $ | 12,872,846 | | | | 3.20 | % |
| Belgium | | | 1,015,848 | | | | 0.25 | |
| Bermuda | | | 2,271,986 | | | | 0.56 | |
| Brazil | | | 10,340,285 | | | | 2.57 | |
| Britain | | | 4,874,901 | | | | 1.21 | |
| Canada | | | 4,804,798 | | | | 1.19 | |
| China | | | 5,643,926 | | | | 1.40 | |
| France | | | 4,561,454 | | | | 1.13 | |
| Germany | | | 12,073,935 | | | | 3.00 | |
| Hong Kong | | | 7,771,830 | | | | 1.93 | |
| Indonesia | | | 5,395,918 | | | | 1.34 | |
| Israel | | | 881,926 | | | | 0.22 | |
| Japan | | | 20,372,706 | | | | 5.06 | |
| Malaysia | | | 900,273 | | | | 0.22 | |
| Mexico | | | 971,108 | | | | 0.24 | |
| Netherlands | | | 2,374,241 | | | | 0.59 | |
| Norway | | | 4,066,303 | | | | 1.01 | |
| Poland | | | 1,267,205 | | | | 0.32 | |
| Singapore | | | 4,639,472 | | | | 1.15 | |
| South Africa | | | 3,036,617 | | | | 0.75 | |
| South Korea | | | 10,222,966 | | | | 2.54 | |
| Spain | | | 1,999,660 | | | | 0.50 | |
| Sweden | | | 4,655,664 | | | | 1.16 | |
| Taiwan | | | 9,246,980 | | | | 2.30 | |
| Thailand | | | 3,137,765 | | | | 0.78 | |
| Turkey | | | 1,794,783 | | | | 0.45 | |
| United States | | | 241,246,462 | | | | 59.93 | |
| | | | 382,441,858 | | | | 95.00 | % |
| Precious Metals | | | 20,119,309 | | | | 5.00 | % |
| Total Investments | | $ | 402,561,167 | | | | 100.00 | % |
| See Notes to the Financial Statements. | The Leuthold Funds - 2011 Annual Report | 97 |
Consolidated Schedule of Securities Sold Short - (a)
September 30, 2011
| | | Shares | | | Fair Value | |
| COMMON STOCKS - 4.60% | | | | | | |
| Airlines - 0.06% | | | | | | |
| Turk Hava Yollari (b) | | | 174,204 | | | $ | 254,969 | |
| Biotechnology - 0.03% | | | | | | | | |
| Basilea Pharmaceutica (b) | | | 1,708 | | | | 73,303 | |
| Zeltia SA (b) | | | 33,322 | | | | 68,750 | |
| | | | | | | | 142,053 | |
| Capital Markets - 0.42% | | | | | | | | |
| The Charles Schwab Corp. | | | 14,569 | | | | 164,193 | |
| Close Brothers Group PLC (b) | | | 24,924 | | | | 256,908 | |
| Greenhill & Co., Inc. | | | 3,741 | | | | 106,955 | |
| ICAP PLC (b) | | | 30,703 | | | | 197,451 | |
| kabu.com Securities Co., Ltd. (b) | | | 74,600 | | | | 209,882 | |
| Knight Capital Group, Inc. - Class A | | | 22,691 | | | | 275,922 | |
| Matsui Securities Co., Ltd. (b) | | | 62,600 | | | | 286,501 | |
| Monex Group, Inc. (b) | | | 813 | | | | 127,858 | |
| Tullett Prebon PLC (b) | | | 47,930 | | | | 253,451 | |
| | | | | | | | 1,879,121 | |
| Commercial Banks - 0.63% | | | | | | | | |
| Banco Santander Chile - ADR | | | 1,352 | | | | 99,345 | |
| Bank of Kyoto, Ltd. (b) | | | 41,000 | | | | 368,378 | |
| BB&T Corp. | | | 6,908 | | | | 147,348 | |
| China Merchants Bank Co., Ltd. (b) | | | 51,000 | | | | 78,457 | |
| Commonwealth Bank of Australia (b) | | | 2,338 | | | | 103,056 | |
| Deutsche Postbank AG (b) | | | 9,716 | | | | 268,150 | |
| Grupo Financiero Inbursa SA (b) | | | 50,800 | | | | 84,945 | |
| Hancock Holding Co. | | | 5,145 | | | | 137,783 | |
| Hang Seng Bank, Ltd. (b) | | | 8,100 | | | | 95,537 | |
| HDFC Bank, Ltd. - ADR | | | 11,941 | | | | 348,080 | |
| Hiroshima Bank, Ltd. (b) | | | 41,000 | | | | 204,654 | |
| ICICI Bank Ltd. - ADR | | | 2,664 | | | | 92,494 | |
| Investors Bancorp, Inc. | | | 13,535 | | | | 170,947 | |
| KB Financial Group, Inc. - ADR | | | 2,481 | | | | 81,278 | |
| Standard Chartered PLC (b) | | | 4,890 | | | | 98,140 | |
| Turkiye Garanti Bankasi AS (b) | | | 67,019 | | | | 261,094 | |
| Valley National Bancorp | | | 13,276 | | | | 140,593 | |
| | | | | | | | 2,780,279 | |
| Communications Equipment - 0.36% | | | | | | | | |
| Acme Packet, Inc. | | | 6,678 | | | | 284,416 | |
| Aruba Networks, Inc. | | | 16,072 | | | | 336,066 | |
Hitachi Kokusai Electric, Inc. (b) | | | 42,000 | | | | 272,812 | |
| Polycom, Inc. | | | 13,295 | | | | 244,229 | |
| VTech Holdings Ltd (b) | | | 25,200 | | | | 236,066 | |
| Wi-Lan, Inc. (b) | | | 40,403 | | | | 236,349 | |
| | | | | | | | 1,609,938 | |
| Computers & Peripherals - 0.06% | | | | | | | | |
| Imagination Technologies Group PLC (b) | | | 40,028 | | | | 261,664 | |
| Construction & Engineering - 0.06% | | | | | | | | |
| Trevi Finanziaria Industriale SpA (b) | | | 26,270 | | | | 270,827 | |
Electronic Equipment, Instruments & Components - 0.39% | | | | | | | | |
| Anritsu Corp. (b) | | | 26,000 | | | | 290,911 | |
| DataTec, Ltd. (b) | | | 21,513 | | | | 101,297 | |
| Hexagon AB - Class B (b) | | | 17,595 | | | | 231,562 | |
| Hirose Electric Co., Ltd. (b) | | | 2,400 | | | | 225,282 | |
| Keyence Corp. (b) | | | 1,000 | | | | 277,454 | |
| Trimble Navigation, Ltd. | | | 6,751 | | | | 226,496 | |
| Universal Display Corp. | | | 8,225 | | | | 394,307 | |
| | | | | | | | 1,747,309 | |
| 98 | The Leuthold Funds - 2011 Annual Report | See Notes to the Financial Statements. |
Consolidated Schedule of Securities Sold Short - (a) (continued)
September 30, 2011
| | | Shares | | | Fair Value | |
| Health Care Equipment & Supplies - 0.14% | | | | | | |
| Align Technology, Inc. | | | 14,121 | | | $ | 214,216 | |
| Edwards Lifesciences Corp. | | | 2,969 | | | | 211,630 | |
| HeartWare International, Inc. | | | 2,958 | | | | 190,525 | |
| | | | | | | | 616,371 | |
| Hotels, Restaurants & Leisure - 0.12% | | | | | | | | |
| Domino's Pizza UK & IRL PLC (b) | | | 33,916 | | | | 235,620 | |
| Oriental Land Co., Ltd. (b) | | | 2,700 | | | | 289,498 | |
| | | | | | | | 525,118 | |
| Household Durables - 0.06% | | | | | | | | |
| D.R. Horton, Inc. | | | 28,598 | | | | 258,526 | |
| Independent Power Producers & Energy Traders - 0.04% | | | | | | | | |
| The AES Corp. | | | 20,160 | | | | 196,762 | |
| Insurance - 0.18% | | | | | | | | |
| Arthur J. Gallagher & Co. | | | 10,021 | | | | 263,552 | |
| RenaissanceRe Holdings, Ltd. (b) | | | 4,262 | | | | 271,916 | |
| St James's Place PLC (b) | | | 56,241 | | | | 271,965 | |
| | | | | | | | 807,433 | |
| Machinery - 0.06% | | | | | | | | |
| KUKA AG (b) | | | 14,580 | | | | 263,409 | |
| Media - 0.25% | | | | | | | | |
| Axel Springer AG (b) | | | 2,790 | | | | 96,905 | |
| Informa PLC (b) | | | 20,707 | | | | 105,784 | |
| John Wiley & Sons, Inc. - Class A | | | 5,307 | | | | 235,737 | |
| Lagardere SCA (b) | | | 3,580 | | | | 88,803 | |
| Morningstar, Inc. | | | 4,473 | | | | 252,456 | |
| Rightmove PLC (b) | | | 7,525 | | | | 140,345 | |
| Thomson Reuters Corp. | | | 7,127 | | | | 193,155 | |
| | | | | | | | 1,113,185 | |
| Metals & Mining - 0.17% | | | | | | | | |
| Dowa Holdings Co., Ltd. (b) | | | 48,000 | | | | 270,712 | |
| Independence Group NL (b) | | | 55,776 | | | | 233,169 | |
| Nucor Corp. | | | 7,289 | | | | 230,624 | |
| | | | | | | | 734,505 | |
| Office Electronics - 0.05% | | | | | | | | |
| Canon, Inc. (b) | | | 3,000 | | | | 138,078 | |
| Ricoh Co., Ltd. (b) | | | 10,000 | | | | 84,792 | |
| | | | | | | | 222,870 | |
| Personal Products - 0.09% | | | | | | | | |
| Beiersdorf AG (b) | | | 4,372 | | | | 235,027 | |
| Shiseido Co., Ltd. (b) | | | 8,000 | | | | 156,308 | |
| | | | | | | | 391,335 | |
| Professional Services - 0.41% | | | | | | | | |
Acacia Research - Acacia Technologies | | | 7,287 | | | | 262,259 | |
| Bureau Veritas (b) | | | 3,546 | | | | 257,300 | |
| CoStar Group, Inc. | | | 5,810 | | | | 301,946 | |
| IHS, Inc. - Class A | | | 3,732 | | | | 279,191 | |
| Intertek Group PLC (b) | | | 8,808 | | | | 254,789 | |
| RPX Corp. | | | 10,918 | | | | 226,112 | |
| SGS SA (b) | | | 155 | | | | 237,698 | |
| | | | | | | | 1,819,295 | |
| Real Estate Management & Development - 0.06% | | | | | | | | |
| Hang Lung Properties, Ltd. (b) | | | 89,000 | | | | 267,432 | |
| Semiconductors & Semiconductor Equipment - 0.05% | | | | | | | | |
| Cavium, Inc. | | | 8,250 | | | | 222,832 | |
| See Notes to the Financial Statements. | The Leuthold Funds - 2011 Annual Report | 99 |
Consolidated Schedule of Securities Sold Short - (a) (continued)
September 30, 2011
| | | Shares | | | Fair Value | |
| Software - 0.55% | | | | | | |
| Aspen Technology, Inc. | | | 16,414 | | | $ | 250,642 | |
| Aveva Group PLC (b) | | | 13,349 | | | | 292,888 | |
| Concur Technologies, Inc. | | | 7,265 | | | | 270,403 | |
| Dassault Systemes SA (b) | | | 4,514 | | | | 321,915 | |
| QLIK Technologies, Inc. | | | 6,964 | | | | 150,840 | |
| RealPage, Inc. | | | 5,910 | | | | 120,859 | |
| Red Hat, Inc. | | | 3,753 | | | | 158,602 | |
| Salesforce.com, Inc. | | | 2,178 | | | | 248,902 | |
| SuccessFactors, Inc. | | | 5,407 | | | | 124,307 | |
| Synchronoss Technologies, Inc. | | | 10,833 | | | | 269,850 | |
| Ultimate Software Group, Inc. | | | 5,539 | | | | 258,782 | |
| | | | | | | | 2,467,990 | |
| Thrifts & Mortgage Finance - 0.36% | | | | | | | | |
| Astoria Financial Corp. | | | 22,387 | | | | 172,156 | |
| Capitol Federal Financial, Inc. | | | 23,576 | | | | 248,962 | |
| First Niagara Financial Group, Inc. | | | 18,859 | | | | 172,560 | |
| Home Capital Group, Inc. (b) | | | 5,762 | | | | 239,740 | |
| Northwest Bancshares, Inc. | | | 22,349 | | | | 266,177 | |
| People's United Financial, Inc. | | | 25,854 | | | | 294,736 | |
| TFS Financial Corp. | | | 28,212 | | | | 229,363 | |
| | | | | | | | 1,623,694 | |
TOTAL COMMON STOCKS
(Proceeds $22,949,707) | | | | | | $ | 20,476,917 | |
| | | | | | | | | |
| INVESTMENT COMPANIES - 9.06% | | | | | | | | |
| Exchange Traded Funds - 9.06% | | | | | | | | |
| iShares MSCI EAFE Index Fund | | | 322,369 | | | $ | 15,393,120 | |
| iShares MSCI Emerging Markets Index Fund | | | 324,799 | | | | 11,390,701 | |
| iShares Russell 2000 Index Fund | | | 176,414 | | | | 11,334,599 | |
| SPDR S&P 500 ETF Trust | | | 19,095 | | | | 2,160,981 | |
| | | | | | | | | |
TOTAL INVESTMENT COMPANIES
(Proceeds $47,600,008) | | | | | | $ | 40,279,401 | |
| | | | | | | | | |
TOTAL SECURITIES SOLD SHORT
(Proceeds $70,549,715) - 13.66% | | | | | | $ | 60,756,318 | |
Percentages are stated as a percent of net assets.
ADR American Depository Receipt
| (a) | All securities sold short are non-income producing. |
| (b) | Foreign issued security. |
The Global Industry Classification Standard (GICS®) was developed by and/or is the exclusive property of MSCI, Inc. and Standard & Poor Financial Services LLC ("S&P"). GICS is a service mark of MSCI and S&P and has been licensed for use by U.S. Bancorp Fund Services, LLC.
| 100 | The Leuthold Funds - 2011 Annual Report | See Notes to the Financial Statements. |
Consolidated Schedule of Securities Sold Short - (a) (continued)
September 30, 2011
| | | | | | Percentage | |
| | | Fair | | | of Total | |
| | | Value | | | Investments | |
| CURRENCY EXPOSURE | | | | | | |
| September 30, 2011 | | | | | | |
| Australian Dollar | | $ | 336,225 | | | | 0.55 | % |
| British Pound | | | 2,369,005 | | | | 3.90 | |
| Canadian Dollar | | | 669,244 | | | | 1.10 | |
| Euro | | | 1,871,086 | | | | 3.08 | |
| Hong Kong Dollar | | | 677,492 | | | | 1.12 | |
| Japanese Yen | | | 3,203,120 | | | | 5.27 | |
| Mexican Peso | | | 84,945 | | | | 0.14 | |
| New Turkish Lira | | | 516,063 | | | | 0.85 | |
| South African Rand | | | 101,297 | | | | 0.17 | |
| Swedish Krona | | | 231,562 | | | | 0.38 | |
| Swiss Franc | | | 311,001 | | | | 0.51 | |
| US Dollar | | | 50,385,278 | | | | 82.93 | |
| Total Investments | | $ | 60,756,318 | | | | 100.00 | % |
| | | | | | | | | |
| PORTFOLIO DIVERSIFICATION | | | | | | | | |
| September 30, 2011 | | | | | | | | |
| Australia | | $ | 336,225 | | | | 0.55 | % |
| Bermuda | | | 271,916 | | | | 0.45 | |
| Britain | | | 2,263,221 | | | | 3.73 | |
| Canada | | | 476,089 | | | | 0.78 | |
| Chile | | | 99,345 | | | | 0.16 | |
| China | | | 78,457 | | | | 0.13 | |
| France | | | 668,018 | | | | 1.10 | |
| Germany | | | 863,491 | | | | 1.42 | |
| Hong Kong | | | 599,035 | | | | 0.99 | |
| India | | | 440,574 | | | | 0.73 | |
| Italy | | | 270,827 | | | | 0.45 | |
| Japan | | | 3,203,120 | | | | 5.27 | |
| Mexico | | | 84,945 | | | | 0.14 | |
| South Africa | | | 101,297 | | | | 0.17 | |
| South Korea | | | 81,278 | | | | 0.13 | |
| Spain | | | 68,750 | | | | 0.11 | |
| Sweden | | | 231,562 | | | | 0.38 | |
| Switzerland | | | 416,785 | | | | 0.69 | |
| Turkey | | | 516,063 | | | | 0.85 | |
| United States | | | 49,685,320 | | | | 81.77 | |
| Total Investments | | $ | 60,756,318 | | | | 100.00 | % |
| See Notes to the Financial Statements. | The Leuthold Funds - 2011 Annual Report | 101 |
| Leuthold Select Industries Fund |
Schedule of Investments
September 30, 2011
| | | Shares | | | Fair Value | |
| COMMON STOCKS - 98.71% | | | | | | |
| Biotechnology - 6.70% | | | | | | |
| Alexion Pharmaceuticals, Inc. (a) | | | 2,010 | | | $ | 128,761 | |
| Amgen, Inc. (a) | | | 2,409 | | | | 132,375 | |
| Biogen Idec, Inc. (a) | | | 1,411 | | | | 131,435 | |
| BioMarin Pharmaceutical, Inc. (a) | | | 3,324 | | | | 105,936 | |
| Celgene Corp. (a) | | | 2,410 | | | | 149,227 | |
| Cepheid, Inc. (a) | | | 3,057 | | | | 118,703 | |
| Gilead Sciences, Inc. (a) | | | 3,417 | | | | 132,580 | |
| Pharmasset, Inc. (a) | | | 1,525 | | | | 125,614 | |
| United Therapeutics Corp. (a) | | | 1,750 | | | | 65,607 | |
| | | | | | | | 1,090,238 | |
| Capital Markets - 3.47% | | | | | | | | |
| Credit Suisse Group AG - ADR | | | 7,828 | | | | 205,407 | |
| Deutsche Bank AG (b) | | | 5,600 | | | | 193,816 | |
| UBS AG (a)(b) | | | 14,491 | | | | 165,632 | |
| | | | | | | | 564,855 | |
| Chemicals - 7.76% | | | | | | | | |
| Agrium, Inc. (b) | | | 1,826 | | | | 121,721 | |
| American Vanguard Corp. | | | 3,091 | | | | 34,496 | |
| CF Industries Holdings, Inc. | | | 1,285 | | | | 158,556 | |
| Monsanto Co. | | | 3,111 | | | | 186,784 | |
| Mosaic Co. | | | 4,335 | | | | 212,285 | |
| Potash Corp. of Saskatchewan,Inc. (b) | | | 5,138 | | | | 222,064 | |
| Scotts Miracle-Gro Co. - Class A | | | 2,549 | | | | 113,685 | |
| Sociedad Quimica y Minera de Chile SA - ADR | | | 2,208 | | | | 105,565 | |
| Terra Nitrogen Co. LP | | | 743 | | | | 107,319 | |
| | | | | | | | 1,262,475 | |
| Diversified Financial Services - 5.45% | | | | | | | | |
| Bank of America Corp. | | | 25,209 | | | | 154,279 | |
| Citigroup, Inc. | | | 8,691 | | | | 222,663 | |
| ING Groep N.V. - ADR (a) | | | 31,733 | | | | 223,718 | |
| JPMorgan Chase & Co. | | | 9,534 | | | | 287,164 | |
| | | | | | | | 887,824 | |
| Electronic Equipment, Instruments & Components - 4.46% | | | | | | | | |
| Avnet, Inc. (a) | | | 4,135 | | | | 107,841 | |
| Flextronics International, Ltd. (a)(b) | | | 5,801 | | | | 32,660 | |
| IPG Photonics Corp. (a) | | | 1,927 | | | | 83,709 | |
| Jabil Circuit, Inc. | | | 10,999 | | | | 195,672 | |
| Molex, Inc. | | | 2,087 | | | | 42,512 | |
| SYNNEX Corp. (a) | | | 1,746 | | | | 45,745 | |
| TE Connectivity, Ltd. (b) | | | 3,031 | | | | 85,292 | |
| Tech Data Corp. (a) | | | 1,746 | | | | 75,480 | |
| TTM Technologies, Inc. (a) | | | 6,041 | | | | 57,450 | |
| | | | | | | | 726,361 | |
| Energy Equipment & Services - 10.25% | | | | | | | | |
| Atwood Oceanics, Inc. (a) | | | 5,299 | | | | 182,074 | |
| Ensco PLC - ADR | | | 6,041 | | | | 244,238 | |
| Helmerich & Payne, Inc. | | | 6,041 | | | | 245,264 | |
| Noble Corp. (b) | | | 6,282 | | | | 184,377 | |
| Patterson-UTI Energy, Inc. | | | 12,203 | | | | 211,600 | |
| Precision Drilling Corp. (a)(b) | | | 12,725 | | | | 105,490 | |
| Rowan Companies, Inc. (a) | | | 7,627 | | | | 230,259 | |
| Seadrill, Ltd. (b) | | | 5,379 | | | | 148,084 | |
| Transocean, Ltd. (b) | | | 2,449 | | | | 116,915 | |
| | | | | | | | 1,668,301 | |
| Health Care Providers & Services - 23.04% | | | | | | | | |
| Aetna, Inc. | | | 12,926 | | | | 469,860 | |
| AMERIGROUP Corp. (a) | | | 8,092 | | | | 315,669 | |
| CIGNA Corp. | | | 10,388 | | | | 435,673 | |
| Coventry Health Care, Inc. (a) | | | 15,235 | | | | 438,920 | |
| Healthspring, Inc. (a) | | | 10,578 | | | | 385,674 | |
| Humana, Inc. | | | 7,081 | | | | 515,001 | |
| Magellan Health Services, Inc. (a) | | | 4,737 | | | | 228,797 | |
| UnitedHealth Group, Inc. | | | 11,453 | | | | 528,212 | |
| WellPoint, Inc. | | | 6,623 | | | | 432,350 | |
| | | | | | | | 3,750,156 | |
| 102 | The Leuthold Funds - 2011 Annual Report | See Notes to the Financial Statements. |
| Leuthold Select Industries Fund |
Schedule of Investments (continued)
September 30, 2011
| | | Shares | | | Fair Value | |
| Leisure Equipment & Products - 1.04% | | | | | | |
| Polaris Industries, Inc. | | | 3,372 | | | $ | 168,499 | |
| Machinery - 0.66% | | | | | | | | |
| Cummins, Inc. | | | 1,325 | | | | 108,200 | |
| Metals & Mining - 8.66% | | | | | | | | |
| Alcoa, Inc. | | | 26,715 | | | | 255,662 | |
| Allegheny Technologies, Inc. | | | 2,409 | | | | 89,109 | |
| Aluminum Corp. of China, Ltd. - ADR | | | 4,797 | | | | 50,081 | |
| Century Aluminum Co. (a) | | | 6,523 | | | | 58,316 | |
| Cliffs Natural Resources, Inc. | | | 3,031 | | | | 155,096 | |
| Kaiser Aluminum Corp. | | | 2,489 | | | | 110,213 | |
| Noranda Aluminum Holding Corp. (a) | | | 5,640 | | | | 47,094 | |
| POSCO - ADR | | | 803 | | | | 61,036 | |
| Reliance Steel & Aluminum Co. | | | 2,930 | | | | 99,649 | |
| Schnitzer Steel Industries Inc.- Class A | | | 1,967 | | | | 72,386 | |
| Steel Dynamics, Inc. | | | 7,808 | | | | 77,455 | |
| Vale SA - ADR | | | 11,842 | | | | 269,998 | |
| Worthington Industries, Inc. | | | 4,536 | | | | 63,368 | |
| | | | | | | | 1,409,463 | |
| Multiline Retail - 9.80% | | | | | | | | |
| Dillard’s, Inc. - Class A | | | 7,527 | | | | 327,274 | |
| JC Penney Co., Inc. | | | 8,530 | | | | 228,433 | |
| Kohl’s Corp. | | | 6,764 | | | | 332,113 | |
| Macy’s, Inc. | | | 14,471 | | | | 380,877 | |
| Nordstrom, Inc. | | | 7,165 | | | | 327,297 | |
| | | | | | | | 1,595,994 | |
| Pharmaceuticals - 15.42% | | | | | | | | |
| AstraZeneca PLC - ADR | | | 3,693 | | | | 163,822 | |
| Bristol-Myers Squibb Co. | | | 6,724 | | | | 210,999 | |
| Eli Lilly & Co. | | | 4,958 | | | | 183,297 | |
| Endo Pharmaceuticals Holdings, Inc. (a) | | | 4,175 | | | | 116,858 | |
| Forest Laboratories, Inc. (a) | | | 6,784 | | | | 208,879 | |
| Jazz Pharmaceuticals, Inc. (a) | | | 3,472 | | | | 144,158 | |
| Johnson & Johnson | | | 3,191 | | | | 203,299 | |
| Medicines Co. (a) | | | 3,613 | | | | 53,761 | |
| Medicis Pharmaceutical Corp. - Class A | | | 3,472 | | | | 126,659 | |
| Merck & Co., Inc. | | | 5,178 | | | | 169,372 | |
| Novartis AG - ADR | | | 3,412 | | | | 190,287 | |
| Pfizer, Inc. | | | 10,156 | | | | 179,558 | |
| Questcor Pharmaceuticals, Inc. (a) | | | 1,927 | | | | 52,530 | |
| Shire PLC - ADR | | | 1,907 | | | | 179,125 | |
| Viropharma, Inc. (a) | | | 4,516 | | | | 81,604 | |
| Watson Pharmaceuticals, Inc. (a) | | | 3,613 | | | | 246,587 | |
| | | | | | | | 2,510,795 | |
| Specialty Retail - 1.29% | | | | | | | | |
| Best Buy Co., Inc. | | | 6,322 | | | | 147,302 | |
| DSW, Inc. - Class A | | | 1,365 | | | | 63,036 | |
| | | | | | | | 210,338 | |
| Textiles, Apparel & Luxury Goods - 0.71% | | | | | | | | |
| Fossil, Inc. (a) | | | 1,425 | | | | 115,510 | |
TOTAL COMMON STOCKS
(Cost $17,758,402) | | | | | | $ | 16,069,009 | |
| | | | | | | | | |
| PREFERRED STOCKS - 0.46% | | | | | | | | |
| Metals & Mining - 0.46% | | | | | | | | |
| Gerdau SA - ADR | | | 10,417 | | | $ | 74,273 | |
TOTAL PREFERRED STOCKS
(Cost $103,693) | | | | | | $ | 74,273 | |
| See Notes to the Financial Statements. | The Leuthold Funds - 2011 Annual Report | 103 |
| Leuthold Select Industries Fund |
Schedule of Investments (continued)
September 30, 2011
| | | Shares | | | Fair Value | |
| SHORT-TERM INVESTMENTS - 0.93% | | | | | | |
| Money Market Funds - 0.93% | | | | | | |
| Fidelity Institutional Money Market Fund - Government Portfolio 0.01% (c) | | | 151,914 | | | $ | 151,914 | |
TOTAL SHORT-TERM INVESTMENTS
(Cost $151,914) | | | | | | $ | 151,914 | |
| | | | | | | | | |
Total Investments
(Cost $18,014,009) - 100.10% | | | | | | $ | 16,295,196 | |
| Liabilities in Excess of Other Assets - (0.10)% | | | | | | | (16,661 | ) |
| TOTAL NET ASSETS - 100.00% | | | | | | $ | 16,278,535 | |
Percentages are stated as a percent of net assets.
| ADR | American Depository Receipt |
| (a) | Non-income producing security. |
| (b) | Foreign issued security. |
| (c) | The rate quoted is the annualized seven-day yield as of September 30, 2011. |
The Global Industry Classification Standard (GICS®) was developed by and/or is the exclusive property of MSCI, Inc. and Standard & Poor Financial Services LLC ("S&P"). GICS is a service mark of MSCI and S&P and has been licensed for use by U.S. Bancorp Fund Services, LLC.
| 104 | The Leuthold Funds - 2011 Annual Report | See Notes to the Financial Statements. |
| Leuthold Global Industries Fund |
Schedule of Investments
September 30, 2011
| | | Shares | | | Fair Value | |
| COMMON STOCKS - 100.13% | | | | | | |
| Auto Components - 8.34% | | | | | | |
| Autoliv, Inc. (b) | | | 3,678 | | | $ | 178,383 | |
| Cheng Shin Rubber Industry Co., Ltd. (b) | | | 68,261 | | | | 143,578 | |
| Johnson Controls, Inc. | | | 6,996 | | | | 184,484 | |
| Kenda Rubber Industrial Co., Ltd. (b) | | | 184,959 | | | | 200,891 | |
| Lear Corp. | | | 5,663 | | | | 242,943 | |
| Leoni AG (b) | | | 2,518 | | | | 81,824 | |
| Minth Group, Ltd. (b) | | | 165,659 | | | | 151,887 | |
| Plastic Omnium SA (b) | | | 11,891 | | | | 287,553 | |
| TRW Automotive Holdings Corp. (a) | | | 6,746 | | | | 220,797 | |
| | | | | | | | 1,692,340 | |
| Automobiles - 3.04% | | | | | | | | |
| Hyundai Motor Co. (b) | | | 1,209 | | | | 216,543 | |
| Thor Industries, Inc. | | | 7,200 | | | | 159,480 | |
| Volkswagen AG (b) | | | 1,922 | | | | 239,964 | |
| | | | | | | | 615,987 | |
| Chemicals - 17.97% | | | | | | | | |
| Agrium, Inc. (b) | | | 2,096 | | | | 139,719 | |
| Arkema SA (b) | | | 2,882 | | | | 169,891 | |
| Ashland, Inc. | | | 4,463 | | | | 196,997 | |
| Bagfas Bandirma Gubre Fabrik (b) | | | 1,195 | | | | 108,993 | |
| Cabot Corp. | | | 6,715 | | | | 166,398 | |
| CF Industries Holdings, Inc. | | | 1,346 | | | | 166,083 | |
| China Petrochemical Development Corp. (b) | | | 223,932 | | | | 242,854 | |
| The Dow Chemical Co. | | | 4,183 | | | | 93,950 | |
| El du Pont de Nemours & Co. | | | 2,466 | | | | 98,566 | |
| Fuchs Petrolub AG (b) | | | 4,926 | | | | 205,148 | |
| Gubre Fabrikalari TAS (a)(b) | | | 9,043 | | | | 59,365 | |
| Hanwha Chemical Corp. (b) | | | 3,770 | | | | 83,045 | |
| Hanwha Corp. (b) | | | 2,544 | | | | 72,991 | |
| Hyosung Corp. (b) | | | 1,519 | | | | 71,563 | |
| Israel Corp., Ltd. (b) | | | 124 | | | | 83,544 | |
| K+S AG (b) | | | 1,792 | | | | 95,025 | |
| Mitsubishi Chemical Holdings Corp. (b) | | | 20,957 | | | | 143,735 | |
| Mosaic Co. | | | 3,406 | | | | 166,792 | |
| Olin Corp. | | | 11,820 | | | | 212,878 | |
| Scotts Miracle-Gro Co. - Class A | | | 2,419 | | | | 107,888 | |
| Sinopec Shanghai Petrochemical Co., Ltd. (b) | | | 280,674 | | | | 101,277 | |
| Solutia, Inc. (a) | | | 5,726 | | | | 73,579 | |
| Taekwang Industrial Co., Ltd. (b) | | | 147 | | | | 151,236 | |
| Taiwan Prosperity Chemical Corp. (b) | | | 29,186 | | | | 84,948 | |
| USI Corp. (b) | | | 199,098 | | | | 195,994 | |
| Westlake Chemical Corp. | | | 5,003 | | | | 171,503 | |
| Yara International ASA (b) | | | 4,650 | | | | 180,293 | |
| | | | | | | | 3,644,255 | |
| Consumer Finance - 8.31% | | | | | | | | |
| Capital One Financial Corp. | | | 5,803 | | | | 229,973 | |
| Cash America International, Inc. | | | 5,584 | | | | 285,677 | |
| Credit Acceptance Corp. (a) | | | 4,017 | | | | 258,534 | |
| DFC Global Corp. (a) | | | 4,774 | | | | 104,312 | |
| Discover Financial Services | | | 14,651 | | | | 336,094 | |
| Ezcorp, Inc. - Class A (a) | | | 3,468 | | | | 98,977 | |
| International Personal Finance PLC (b) | | | 30,160 | | | | 105,022 | |
| Provident Financial PLC (b) | | | 6,892 | | | | 107,904 | |
| Samsung Card Co. (b) | | | 4,394 | | | | 158,147 | |
| | | | | | | | 1,684,640 | |
| Food Products - 7.12% | | | | | | | | |
| Archer-Daniels-Midland Co. | | | 8,489 | | | | 210,612 | |
| Bunge, Ltd. | | | 3,660 | | | | 213,341 | |
| Charoen Pokphand Indonesia Tbk PT (b) | | | 1,067,674 | | | | 291,515 | |
| Golden Agri-Resources, Ltd. (b) | | | 476,052 | | | | 223,849 | |
| GrainCorp, Ltd. (b) | | | 31,171 | | | | 217,182 | |
| See Notes to the Financial Statements. | The Leuthold Funds - 2011 Annual Report | 105 |
| Leuthold Global Industries Fund |
Schedule of Investments (continued)
September 30, 2011
| | | Shares | | | Fair Value | |
| Food Products - 7.12% (continued) | | | | | | |
| Perusahaan Perkebunan London Sumatra Indonesia Tbk PT (b) | | | 868,372 | | | $ | 202,521 | |
| Tradewinds Malaysia Bhd (b) | | | 34,730 | | | | 84,527 | |
| | | | | | | | 1,443,547 | |
| Health Care Providers & Services - 8.32% | | | | | | | | |
| Aetna, Inc. | | | 5,715 | | | | 207,740 | |
| AMERIGROUP Corp. (a) | | | 2,346 | | | | 91,517 | |
| CIGNA Corp. | | | 4,958 | | | | 207,938 | |
| Coventry Health Care, Inc. (a) | | | 6,960 | | | | 200,518 | |
| Health Net, Inc. (a) | | | 4,855 | | | | 115,112 | |
| Healthspring, Inc. (a) | | | 3,004 | | | | 109,526 | |
| Humana, Inc. | | | 1,498 | | | | 108,949 | |
| Magellan Health Services, Inc. (a) | | | 2,332 | | | | 112,636 | |
| UnitedHealth Group, Inc. | | | 2,399 | | | | 110,642 | |
| WellCare Health Plans, Inc. (a) | | | 5,152 | | | | 195,673 | |
| WellPoint, Inc. | | | 3,488 | | | | 227,697 | |
| | | | | | | | 1,687,948 | |
| Insurance - 1.12% | | | | | | | | |
| Montpelier Re Holdings, Ltd. (b) | | | 12,887 | | | | 227,842 | |
| Machinery - 6.30% | | | | | | | | |
| Eaton Corp. | | | 3,982 | | | | 141,361 | |
| Ebara Corp. (b) | | | 24,856 | | | | 99,901 | |
| Fuji Machine Manufacturing Co., Ltd. (b) | | | 5,200 | | | | 93,375 | |
| Melrose PLC (b) | | | 19,551 | | | | 88,720 | |
| Mueller Industries, Inc. | | | 6,842 | | | | 264,033 | |
| Singamas Container Holdings, Ltd. (b) | | | 280,674 | | | | 47,214 | |
| SKF AB (b) | | | 6,899 | | | | 131,618 | |
| Snap-on, Inc. | | | 2,127 | | | | 94,439 | |
| Timken Co. | | | 4,912 | | | | 161,212 | |
| Trelleborg AB - Class B (b) | | | 23,973 | | | | 156,877 | |
| | | | | | | | 1,278,750 | |
| Media - 4.76% | | | | | | | | |
| Cinemark Holdings, Inc. | | | 14,153 | | | | 267,209 | |
| Daiichikosho Co., Ltd. (b) | | | 17,639 | | | | 349,441 | |
| ProSiebenSat.1 Media AG (b) | | | 14,397 | | | | 256,728 | |
| TV Azteca SAB de CV (b) | | | 171,231 | | | | 91,119 | |
| | | | | | | | 964,497 | |
| Oil, Gas & Consumable Fuels - 9.97% | | | | | | | | |
| Chevron Corp. | | | 2,584 | | | | 239,072 | |
| China Petroleum & Chemical Corp. - ADR | | | 2,769 | | | | 265,270 | |
| ConocoPhillips | | | 3,894 | | | | 246,568 | |
| Hess Corp. | | | 3,000 | | | | 157,380 | |
| Polskie Gornictwo Naftowe i Gazownictwo SA (b) | | | 94,886 | | | | 116,024 | |
| PTT PCL (b) | | | 10,695 | | | | 89,455 | |
| Repsol YPF SA (b) | | | 7,492 | | | | 200,547 | |
| Royal Dutch Shell PLC - ADR | | | 3,870 | | | | 238,082 | |
| Sasol, Ltd. - ADR | | | 2,371 | | | | 96,263 | |
| Statoil ASA - ADR | | | 10,479 | | | | 225,822 | |
| Suncor Energy, Inc. (b) | | | 5,783 | | | | 147,119 | |
| | | | | | | | 2,021,602 | |
| Paper & Forest Products - 0.11% | | | | | | | | |
| China Forestry Holdings Co., Ltd. (b)(d)(e) | | | 116,000 | | | | 22,046 | |
| Semiconductors & Semiconductor Equipment - 0.48% | | | | | | | | |
| ASM Pacific Technology, Ltd. (b) | | | 9,842 | | | | 97,315 | |
| 106 | The Leuthold Funds - 2011 Annual Report | See Notes to the Financial Statements. |
| Leuthold Global Industries Fund |
| Schedule of Investments (continued) |
| September 30, 2011 |
| | | Shares | | | Fair Value | |
| | | | | | | |
| Trading Companies & Distributors - 9.23% | | | | | | |
Applied Industrial Technologies, Inc. | | | 7,067 | | | $ | 191,940 | |
| BayWa AG (b) | | | 5,527 | | | | 217,034 | |
| Hanwa Co., Ltd. (b) | | | 62,372 | | | | 284,648 | |
| JFE Shoji Holdings, Inc. (b) | | | 56,273 | | | | 250,978 | |
| LG International Corp. (b) | | | 3,215 | | | | 120,080 | |
| Nagase & Co., Ltd. (b) | | | 20,457 | | | | 255,414 | |
| Seven Group Holdings, Ltd. (b) | | | 13,313 | | | | 102,420 | |
| Toyota Tsusho Corp. (b) | | | 14,960 | | | | 260,098 | |
| WESCO International, Inc. (a) | | | 5,651 | | | | 189,591 | |
| | | | | | | | 1,872,203 | |
| Water Utilities - 6.35% | | | | | | | | |
| American Water Works Co., Inc. | | | 7,158 | | | | 216,028 | |
| Beijing Enterprises Water | | | | | | | | |
| Group, Ltd. (a)(b) | | | 493,112 | | | | 89,915 | |
| Cia de Saneamento Basico do | | | | | | | | |
| Estado de Sao Paulo (b) | | | 7,296 | | | | 169,726 | |
| Cia de Saneamento de Minas | | | | | | | | |
| Gerais-COPASA (b) | | | 11,983 | | | | 187,751 | |
| Guangdong Investment, Ltd. (b) | | | 515,501 | | | | 322,380 | |
| Hyflux, Ltd. (b) | | | 100,621 | | | | 114,631 | |
| Severn Trent PLC (b) | | | 7,791 | | | | 187,221 | |
| | | | | | | | 1,287,652 | |
| Wireless Telecommunication Services - 8.71% | | | | | | | | |
| China Mobile, Ltd. (b) | | | 22,000 | | | | 217,813 | |
| Freenet AG (b) | | | 9,759 | | | | 115,096 | |
| KDDI Corp. (b) | | | 30 | | | | 208,479 | |
| M1, Ltd. (b) | | | 67,236 | | | | 126,463 | |
MetroPCS Communications, Inc. (a) | | | 10,608 | | | | 92,396 | |
| Mobistar SA (b) | | | 1,770 | | | | 101,850 | |
Rogers Communications, Inc. - Class B (b) | | | 2,884 | | | | 98,720 | |
| Softbank Corp. (b) | | | 3,500 | | | | 104,006 | |
| Telephone & Data Systems, Inc. | | | 4,708 | | | | 100,045 | |
| Tim Participacoes SA - ADR | | | 8,454 | | | | 199,176 | |
Total Access Communication PCL (b) | | | 86,500 | | | | 205,919 | |
| Vodacom Group, Ltd. (b) | | | 17,659 | | | | 197,618 | |
| | | | | | | | 1,767,581 | |
| TOTAL COMMON STOCKS | | | | | | | | |
| (Cost $22,970,519) | | | | | | $ | 20,308,205 | |
| | | | | | | | |
| SHORT-TERM INVESTMENTS - 8.88% | | | | | | | | |
| Money Market Funds - 8.88% | | | | | | | | |
| Fidelity Institutional Money Market | | | | | | | | |
| Fund - Government Portfolio | | | | | | | | |
| 0.01% (c) | | | 1,801,941 | | | $ | 1,801,941 | |
| TOTAL SHORT-TERM INVESTMENTS | | | | | | | | |
| (Cost $1,801,941) | | | | | | $ | 1,801,941 | |
| | | | | | | | | |
| Total Investments | | | | | | | | |
| (Cost $24,772,460) - 109.01% | | | | | | $ | 22,110,146 | |
| Liabilities in Excess of | | | | | | | | |
| Other Assets - (9.01)% | | | | | | | (1,828,156 | ) |
| TOTAL NET ASSETS - 100.00% | | | | | | $ | 20,281,990 | |
Percentages are stated as a percent of net assets.
ADR American Depository Receipt
| (a) | Non-income producing security. |
| (b) | Foreign issued security. |
| (c) | The rate quoted is the annualized seven-day yield as of September 30, 2011. |
| (d) | Illiquid security. The market value of these securities total $22,046, which represent 0.11% of total net assets. |
| (e) | The security is currently being fair valued in accordance with procedures established by the Board of Directors of Leuthold Funds due to a halt in trading of the security on January 26, 2011. |
The Global Industry Classification Standard (GICS®) was developed by and/or is the exclusive property of MSCI, Inc. and Standard & Poor Financial Services LLC ("S&P"). GICS is a service mark of MSCI and S&P and has been licensed for use by U.S. Bancorp Fund Services, LLC.
| See Notes to the Financial Statements. | The Leuthold Funds - 2011 Annual Report | 107 |
| Leuthold Global Industries Fund |
| Schedule of Investments (continued) |
| September 30, 2011 |
| | | | | | Percentage | |
| | | Fair | | | of Total | |
| | | Value | | | Investments | |
| | | | | | | |
| CURRENCY EXPOSURE | | | | | | |
| September 30, 2011 | | | | | | |
| Australian Dollar | | $ | 319,601 | | | | 1.45 | % |
| Brazilian Real | | | 357,477 | | | | 1.62 | |
| British Pound | | | 488,867 | | | | 2.21 | |
| Canadian Dollar | | | 98,720 | | | | 0.45 | |
| Euro | | | 1,970,658 | | | | 8.91 | |
| Hong Kong Dollar | | | 1,049,849 | | | | 4.75 | |
| Indonesian Rupiah | | | 494,037 | | | | 2.23 | |
| Israel Shekel | | | 83,544 | | | | 0.38 | |
| Japanese Yen | | | 2,050,075 | | | | 9.27 | |
| Malaysian Ringgit | | | 84,527 | | | | 0.38 | |
| Mexican Peso | | | 91,119 | | | | 0.41 | |
| New Taiwan Dollar | | | 868,265 | | | | 3.93 | |
| New Turkish Lira | | | 168,358 | | | | 0.76 | |
| Norwegian Krone | | | 180,293 | | | | 0.82 | |
| Polish Zloty | | | 116,024 | | | | 0.52 | |
| Singapore Dollar | | | 464,942 | | | | 2.10 | |
| South African Rand | | | 197,618 | | | | 0.89 | |
| South Korea Won | | | 873,606 | | | | 3.95 | |
| Swedish Krona | | | 288,495 | | | | 1.31 | |
| Thai Baht | | | 295,374 | | | | 1.34 | |
| US Dollar | | | 11,568,697 | | | | 52.32 | |
| Total Investments | | $ | 22,110,146 | | | | 100.00 | % |
| | | | | | | | | |
| PORTFOLIO DIVERSIFICATION | | | | | | | | |
| September 30, 2011 | | | | | | | | |
| Australia | | $ | 319,602 | | | | 1.45 | % |
| Belgium | | | 101,850 | | | | 0.46 | |
| Bermuda | | | 227,842 | | | | 1.03 | |
| Brazil | | | 556,653 | | | | 2.52 | |
| Britain | | | 488,867 | | | | 2.21 | |
| Canada | | | 385,558 | | | | 1.74 | |
| China | | | 540,480 | | | | 2.44 | |
| France | | | 457,444 | | | | 2.07 | |
| Germany | | | 1,210,819 | | | | 5.48 | |
| Hong Kong | | | 774,637 | | | | 3.50 | |
| Indonesia | | | 494,036 | | | | 2.23 | |
| Israel | | | 83,544 | | | | 0.38 | |
| Japan | | | 2,050,075 | | | | 9.27 | |
| Malaysia | | | 84,527 | | | | 0.38 | |
| Mexico | | | 91,119 | | | | 0.41 | |
| Netherlands | | | 238,082 | | | | 1.08 | |
| Norway | | | 406,115 | | | | 1.84 | |
| Poland | | | 116,024 | | | | 0.53 | |
| Singapore | | | 464,943 | | | | 2.10 | |
| South Africa | | | 293,881 | | | | 1.33 | |
| South Korea | | | 873,605 | | | | 3.95 | |
| Spain | | | 200,547 | | | | 0.91 | |
| Sweden | | | 466,878 | | | | 2.11 | |
| Taiwan | | | 868,265 | | | | 3.93 | |
| Thailand | | | 295,374 | | | | 1.34 | |
| Turkey | | | 168,358 | | | | 0.76 | |
| United States | | | 9,851,021 | | | | 44.55 | |
| Total Investments | | $ | 22,110,146 | | | | 100.00 | % |
| 108 | The Leuthold Funds - 2011 Annual Report | See Notes to the Financial Statements. |
| Leuthold Global Clean Technology Fund |
| Schedule of Investments |
| September 30, 2011 |
| | | Shares | | | Fair Value | |
| | | | | | | |
| COMMON STOCKS - 87.18% | | | | | | |
| Aerospace & Defense - 3.13% | | | | | | |
| ITT Corp. | | | 12,038 | | | $ | 505,596 | |
| Auto Components - 2.34% | | | | | | | | |
| Tenneco, Inc. (a) | | | 14,759 | | | | 377,978 | |
| Building Products - 2.39% | | | | | | | | |
| Ameresco, Inc. - Class A (a) | | | 37,909 | | | | 385,155 | |
| Capital Markets - 2.85% | | | | | | | | |
Uranium Participation Corp. (a)(b) | | | 85,059 | | | | 460,239 | |
| Chemicals - 14.12% | | | | | | | | |
| ADA-ES, Inc. (a) | | | 29,596 | | | | 453,115 | |
| Cereplast, Inc. (a) | | | 153,443 | | | | 435,778 | |
| CF Industries Holdings, Inc. | | | 2,959 | | | | 365,111 | |
| LSB Industries, Inc. (a) | | | 15,208 | | | | 436,013 | |
| OM Group, Inc. (a) | | | 9,342 | | | | 242,612 | |
| Umicore SA (b) | | | 9,411 | | | | 346,288 | |
| | | | | | | | 2,278,917 | |
| Commercial Services & Supplies - 2.90% | | | | | | | | |
| Clean Harbors, Inc. (a) | | | 2,068 | | | | 106,088 | |
| Newalta Corp. (b) | | | 32,632 | | | | 360,917 | |
| | | | | | | | 467,005 | |
| Computers & Peripherals - 3.31% | | | | | | | | |
| Intevac, Inc. (a) | | | 76,454 | | | | 534,414 | |
| | | | | | | | | |
| Construction & Engineering - 3.89% | | | | | | | | |
| Abengoa SA (b) | | | 6,246 | | | | 133,972 | |
Insituform Technologies, Inc. - Class A (a) | | | 36,382 | | | | 421,304 | |
| Layne Christensen Co. (a) | | | 3,150 | | | | 72,765 | |
| | | | | | | | 628,041 | |
| Electrical Equipment - 5.65% | | | | | | | | |
| Areva SA (a)(b) | | | 7,030 | | | | 223,452 | |
| Ecotality, Inc. (a) | | | 97,179 | | | | 181,725 | |
| Roper Industries, Inc. | | | 6,724 | | | | 463,351 | |
| Vestas Wind System A/S (a)(b) | | | 2,615 | | | | 42,748 | |
| | | | | | | | 911,276 | |
| Electronic Equipment, Instruments | | | | | | | | |
| & Components - 8.42% | | | | | | | | |
| 5N Plus, Inc. (a)(b) | | | 63,586 | | | | 445,387 | |
| Horiba, Ltd. (b) | | | 16,100 | | | | 494,084 | |
| Kemet Corp. (a) | | | 51,463 | | | | 367,961 | |
| LPKF Laser & Electronics AG (b) | | | 4,051 | | | | 50,528 | |
| | | | | | | | 1,357,960 | |
| Food Products - 2.88% | | | | | | | | |
| Cosan, Ltd. - Class A (b) | | | 49,018 | | | | 464,200 | |
| | | | | | | | | |
Independent Power Producers & Energy Traders - 0.50% | | | | | | | | |
| U.S. Geothermal, Inc. (a) | | | 176,467 | | | | 81,175 | |
| | | | | | | | | |
| Internet Software & Services - 6.48% | | | | | | | | |
| World Energy Solutions, Inc. (a) | | | 349,708 | | | | 1,045,627 | |
| | | | | | | | | |
| Machinery - 15.51% | | | | | | | | |
| CLARCOR, Inc. | | | 12,099 | | | | 500,657 | |
| Donaldson Co., Inc. | | | 4,974 | | | | 272,575 | |
| ESCO Technologies, Inc. | | | 17,630 | | | | 449,565 | |
| KSB AG (b) | | | 653 | | | | 433,053 | |
| Kurita Water Industries, Ltd. (b) | | | 10,100 | | | | 285,859 | |
| Pall Corp. | | | 12,048 | | | | 510,835 | |
| Pentair, Inc. | | | 1,579 | | | | 50,544 | |
| | | | | | | | 2,503,088 | |
| Multi-Utilities - 0.94% | | | | | | | | |
| Suez Environnement Co. (b) | | | 10,802 | | | | 151,232 | |
| See Notes to the Financial Statements. | The Leuthold Funds - 2011 Annual Report | 109 |
| Leuthold Global Clean Technology Fund |
| Schedule of Investments (continued) |
| September 30, 2011 |
| | | Shares | | | Fair Value | |
| | | | | | | |
| Oil, Gas & Consumable Fuels - 4.28% | | | | | | |
| Green Plains Renewable Energy, | | | | | | |
| Inc. (a) | | | 45,758 | | | $ | 426,922 | |
| Rentech, Inc. (a) | | | 337,845 | | | | 263,587 | |
| | | | | | | | 690,509 | |
| Semiconductors & Semiconductor | | | | | | | | |
| Equipment - 5.39% | | | | | | | | |
| Epistar Corp. (b) | | | 100,000 | | | | 177,522 | |
| GT Advanced Technologies, | | | | | | | | |
| Inc. (a) | | | 49,037 | | | | 344,240 | |
| SMA Solar Technology AG (b) | | | 690 | | | | 36,395 | |
| Taiwan Surface Mounting | | | | | | | | |
| Technology Co., Ltd. (b) | | | 151,800 | | | | 311,819 | |
| | | | | | | | 869,976 | |
| Water Utilities - 2.20% | | | | | | | | |
| Hyflux, Ltd. (b) | | | 312,000 | | | | 355,440 | |
| TOTAL COMMON STOCKS | | | | | | | | |
| (Cost $18,023,085) | | | | | | $ | 14,067,828 | |
| | | | | | | | | |
| PREFERRED STOCKS - 3.23% | | | | | | | | |
| Electric Utilities - 3.23% | | | | | | | | |
| Cia Energetica de Minas | | | | | | | | |
| Gerais - ADR | | | 35,132 | | | $ | 521,359 | |
| TOTAL PREFERRED STOCKS | | | | | | | | |
| (Cost $589,777) | | | | | | $ | 521,359 | |
| | | Number of | | | | |
| | | Warrants | | | Fair Value | |
| | | | | | | |
| WARRANTS - 0.0% | | | | | | |
| Cereplast, Inc. | | | | | | |
| Expiration: December 10, 2015, | | | | | | |
| Exercise Price: $4.44 (a) | | | 107,000 | | | $ | –– | |
| TOTAL WARRANTS (Cost $0) | | | | | | $ | –– | |
| | | Shares | | | Fair Value | |
| | | | | | | |
| SHORT-TERM INVESTMENTS - 4.07% | | | | | | |
| Money Market Funds - 4.07% | | | | | | |
| Fidelity Institutional Money Market | | | | | | |
| Fund - Government Portfolio | | | | | | |
| 0.01% (c) | | | 657,399 | | | $ | 657,399 | |
| TOTAL SHORT-TERM INVESTMENTS | | | | | | | | |
| (Cost $657,399) | | | | | | $ | 657,399 | |
| | | | | | | | | |
| Total Investments | | | | | | | | |
| (Cost $19,270,261) - 94.48% | | | | | | $ | 15,246,586 | |
| Other Assets in Excess of | | | | | | | | |
| Liabilities - 5.52% | | | | | | | 891,218 | |
| TOTAL NET ASSETS - 100.00% | | | | | | $ | 16,137,804 | |
Percentages are stated as a percent of net assets.
ADR American Depository Receipt
| (a) | Non-income producing security. |
| (b) | Foreign issued security. |
| (c) | The rate quoted is the annualized seven-day yield as of September 30, 2011. |
The Global Industry Classification Standard (GICS®) was developed by and/or is the exclusive property of MSCI, Inc. and Standard & Poor Financial Services LLC ("S&P"). GICS is a service mark of MSCI and S&P and has been licensed for use by U.S. Bancorp Fund Services, LLC.
| 110 | The Leuthold Funds - 2011 Annual Report | See Notes to the Financial Statements. |
| Leuthold Global Clean Technology Fund |
| Schedule of Investments (continued) |
| September 30, 2011 |
| | | | | | Percentage | |
| | | Fair | | | of Total | |
| | | Value | | | Investments | |
| | | | | | | |
| CURRENCY EXPOSURE | | | | | | |
| September 30, 2011 | | | | | | |
| Canadian Dollar | | $ | 1,266,544 | | | | 8.31 | % |
| Danish Kroner | | | 42,748 | | | | 0.28 | |
| Euro | | | 1,374,920 | | | | 9.02 | |
| Japanese Yen | | | 779,943 | | | | 5.11 | |
| New Taiwan Dollar | | | 489,342 | | | | 3.21 | |
| Singapore Dollar | | | 355,440 | | | | 2.33 | |
| US Dollar | | | 10,937,649 | | | | 71.74 | |
| Total Investments | | $ | 15,246,586 | | | | 100.00 | % |
| | | | | | | | | |
| PORTFOLIO DIVERSIFICATION | | | | | | | | |
| September 30, 2011 | | | | | | | | |
| Belgium | | $ | 346,288 | | | | 2.27 | % |
| Brazil | | | 985,559 | | | | 6.46 | |
| Canada | | | 1,266,543 | | | | 8.31 | |
| Denmark | | | 42,748 | | | | 0.28 | |
| France | | | 374,684 | | | | 2.46 | |
| Germany | | | 519,976 | | | | 3.41 | |
| Japan | | | 779,943 | | | | 5.12 | |
| Singapore | | | 355,440 | | | | 2.33 | |
| Spain | | | 133,972 | | | | 0.88 | |
| Taiwan | | | 489,341 | | | | 3.21 | |
| United States | | | 9,952,092 | | | | 65.27 | |
| Total Investments | | $ | 15,246,586 | | | | 100.00 | % |
| See Notes to the Financial Statements. | The Leuthold Funds - 2011 Annual Report | 111 |
| Leuthold Hedged Equity Fund |
| Schedule of Investments |
| September 30, 2011 |
| | | Shares | | | Fair Value | |
| | | | | | | |
| COMMON STOCKS - 44.44% | | | | | | |
| Biotechnology - 3.09% | | | | | | |
| Alexion Pharmaceuticals, Inc. (a) | | | 345 | | | $ | 22,101 | |
| Amgen, Inc. (a) | | | 413 | | | | 22,694 | |
| Biogen Idec, Inc. (a) | | | 242 | | | | 22,542 | |
| BioMarin Pharmaceutical, Inc. (a) | | | 570 | | | | 18,166 | |
| Celgene Corp. (a) | | | 413 | | | | 25,573 | |
| Cepheid, Inc. (a) | | | 525 | | | | 20,386 | |
| Gilead Sciences, Inc. (a) | | | 586 | | | | 22,737 | |
| Pharmasset, Inc. (a) | | | 262 | | | | 21,581 | |
| United Therapeutics Corp. (a) | | | 300 | | | | 11,247 | |
| | | | | | | | 187,027 | |
| Capital Markets - 1.55% | | | | | | | | |
| Credit Suisse Group AG - ADR | | | 1,297 | | | | 34,033 | |
| Deutsche Bank AG (b) | | | 928 | | | | 32,118 | |
| UBS AG (a)(b) | | | 2,400 | | | | 27,432 | |
| | | | | | | | 93,583 | |
| Chemicals - 3.50% | | | | | | | | |
| Agrium, Inc. (b) | | | 303 | | | | 20,198 | |
| American Vanguard Corp. | | | 528 | | | | 5,893 | |
| CF Industries Holdings, Inc. | | | 221 | | | | 27,269 | |
| Monsanto Co. | | | 530 | | | | 31,821 | |
| Mosaic Co. | | | 718 | | | | 35,160 | |
| Potash Corp. of Saskatchewan, | | | | | | | | |
| Inc. (b) | | | 851 | | | | 36,780 | |
| Scotts Miracle-Gro Co. - Class A | | | 422 | | | | 18,821 | |
| Sociedad Quimica y Minera | | | | | | | | |
| de Chile SA - ADR | | | 366 | | | | 17,499 | |
| Terra Nitrogen Co. LP | | | 127 | | | | 18,344 | |
| | | | | | | | 211,785 | |
| Diversified Financial Services - 2.43% | | | | | | | | |
| Bank of America Corp. | | | 4,176 | | | | 25,557 | |
| Citigroup, Inc. | | | 1,440 | | | | 36,893 | |
| ING Groep N.V. - ADR (a) | | | 5,256 | | | | 37,055 | |
| JPMorgan Chase & Co. | | | 1,579 | | | | 47,559 | |
| | | | | | | | 147,064 | |
| Electronic Equipment, Instruments | | | | | | | | |
| & Components - 2.01% | | | | | | | | |
| Avnet, Inc. (a) | | | 685 | | | | 17,865 | |
| Flextronics International, | | | | | | | | |
| Ltd. (a)(b) | | | 990 | | | | 5,574 | |
| IPG Photonics Corp. (a) | | | 319 | | | | 13,857 | |
| Jabil Circuit, Inc. | | | 1,822 | | | | 32,413 | |
| Molex, Inc. | | | 358 | | | | 7,292 | |
| SYNNEX Corp. (a) | | | 289 | | | | 7,572 | |
| TE Connectivity, Ltd. (b) | | | 518 | | | | 14,577 | |
| Tech Data Corp. (a) | | | 289 | | | | 12,493 | |
| TTM Technologies, Inc. (a) | | | 1,029 | | | | 9,786 | |
| | | | | | | | 121,429 | |
| Energy Equipment & Services - 4.61% | | | | | | | | |
| Atwood Oceanics, Inc. (a) | | | 878 | | | | 30,168 | |
| Ensco PLC - ADR | | | 1,031 | | | | 41,683 | |
| Helmerich & Payne, Inc. | | | 1,001 | | | | 40,641 | |
| Noble Corp. (b) | | | 1,041 | | | | 30,553 | |
| Patterson-UTI Energy, Inc. | | | 2,081 | | | | 36,085 | |
| Precision Drilling Corp. (a)(b) | | | 2,108 | | | | 17,475 | |
| Rowan Companies, Inc. (a) | | | 1,263 | | | | 38,130 | |
| Seadrill, Ltd. (b) | | | 891 | | | | 24,529 | |
| Transocean, Ltd. (b) | | | 419 | | | | 20,003 | |
| | | | | | | | 279,267 | |
| Health Care Providers & Services - 10.48% | | | | | | | | |
| Aetna, Inc. | | | 2,141 | | | | 77,825 | |
| AMERIGROUP Corp. (a) | | | 1,389 | | | | 54,185 | |
| CIGNA Corp. | | | 1,783 | | | | 74,779 | |
| Coventry Health Care, Inc. (a) | | | 2,614 | | | | 75,309 | |
| Healthspring, Inc. (a) | | | 1,752 | | | | 63,878 | |
| Humana, Inc. | | | 1,215 | | | | 88,367 | |
| Magellan Health Services, Inc. (a) | | | 785 | | | | 37,916 | |
| UnitedHealth Group, Inc. | | | 1,965 | | | | 90,626 | |
| WellPoint, Inc. | | | 1,097 | | | | 71,612 | |
| | | | | | | | 634,497 | |
| 112 | The Leuthold Funds - 2011 Annual Report | See Notes to the Financial Statements. |
| Leuthold Hedged Equity Fund |
| Schedule of Investments (continued) |
| September 30, 2011 |
| | | Shares | | | Fair Value | |
| | | | | | | |
| Leisure Equipment & Products - 0.46% | | | | | | |
| Polaris Industries, Inc. | | | 558 | | | $ | 27,883 | |
| | | | | | | | | |
| Machinery - 0.29% | | | | | | | | |
| Cummins, Inc. | | | 219 | | | | 17,884 | |
| | | | | | | | | |
| Metals & Mining - 3.89% | | | | | | | | |
| Alcoa, Inc. | | | 4,555 | | | | 43,591 | |
| Allegheny Technologies, Inc. | | | 399 | | | | 14,759 | |
| Aluminum Corp. of China, | | | | | | | | |
| Ltd. - ADR | | | 795 | | | | 8,300 | |
| Century Aluminum Co. (a) | | | 1,112 | | | | 9,941 | |
| Cliffs Natural Resources, Inc. | | | 502 | | | | 25,687 | |
| Kaiser Aluminum Corp. | | | 423 | | | | 18,730 | |
| Noranda Aluminum Holding | | | | | | | | |
| Corp. (a) | | | 934 | | | | 7,799 | |
| POSCO - ADR | | | 133 | | | | 10,109 | |
| Reliance Steel & Aluminum Co. | | | 485 | | | | 16,495 | |
| Schnitzer Steel Industries | | | | | | | | |
| Inc. - Class A | | | 326 | | | | 11,997 | |
| Steel Dynamics, Inc. | | | 1,293 | | | | 12,827 | |
| Vale SA - ADR | | | 1,961 | | | | 44,711 | |
| Worthington Industries, Inc. | | | 751 | | | | 10,492 | |
| | | | | | | | 235,438 | |
| Multiline Retail - 4.37% | | | | | | | | |
| Dillard's, Inc. - Class A | | | 1,247 | | | | 54,220 | |
| JC Penney Co., Inc. | | | 1,413 | | | | 37,840 | |
| Kohl's Corp. | | | 1,120 | | | | 54,992 | |
| Macy's, Inc. | | | 2,397 | | | | 63,089 | |
| Nordstrom, Inc. | | | 1,187 | | | | 54,222 | |
| | | | | | | | 264,363 | |
| Pharmaceuticals - 6.87% | | | | | | | | |
| AstraZeneca PLC - ADR | | | 612 | | | | 27,148 | |
| Bristol-Myers Squibb Co. | | | 1,114 | | | | 34,957 | |
| Eli Lilly & Co. | | | 821 | | | | 30,353 | |
| Endo Pharmaceuticals Holdings, | | | | | | | | |
| Inc. (a) | | | 692 | | | | 19,369 | |
| Forest Laboratories, Inc. (a) | | | 1,124 | | | | 34,608 | |
| Jazz Pharmaceuticals, Inc. (a) | | | 575 | | | | 23,874 | |
| Johnson & Johnson | | | 529 | | | | 33,703 | |
| Medicines Co. (a) | | | 598 | | | | 8,898 | |
| Medicis Pharmaceutical Corp. - | | | | | | | | |
| Class A | | | 575 | | | | 20,976 | |
| Merck & Co., Inc. | | | 858 | | | | 28,065 | |
| Novartis AG - ADR | | | 565 | | | | 31,510 | |
| Pfizer, Inc. | | | 1,682 | | | | 29,738 | |
| Questcor Pharmaceuticals, | | | | | | | | |
| Inc. (a) | | | 319 | | | | 8,696 | |
| Shire PLC - ADR | | | 316 | | | | 29,682 | |
| Viropharma, Inc. (a) | | | 748 | | | | 13,516 | |
| Watson Pharmaceuticals, Inc. (a) | | | 598 | | | | 40,814 | |
| | | | | | | | 415,907 | |
| Specialty Retail - 0.57% | | | | | | | | |
| Best Buy Co., Inc. | | | 1,047 | | | | 24,395 | |
| DSW, Inc. - Class A | | | 226 | | | | 10,437 | |
| | | | | | | | 34,832 | |
| Textiles, Apparel & Luxury Goods - 0.32% | | | | | | | | |
| Fossil, Inc. (a) | | | 236 | | | | 19,130 | |
| TOTAL COMMON STOCKS | | | | | | | | |
| (Cost $3,012,028) | | | | | | $ | 2,690,089 | |
| See Notes to the Financial Statements. | The Leuthold Funds - 2011 Annual Report | 113 |
| Leuthold Hedged Equity Fund |
| Schedule of Investments (continued) |
| September 30, 2011 |
| | | Shares | | | Fair Value | |
| | | | | | | |
| PREFERRED STOCKS - 0.20% | | | | | | |
| Metals & Mining - 0.20% | | | | | | |
| Gerdau SA - ADR | | | 1,725 | | | $ | 12,299 | |
| TOTAL PREFERRED STOCKS | | | | | | | | |
| (Cost $16,821) | | | | | | $ | 12,299 | |
| | | | | | | | | |
| SHORT-TERM INVESTMENTS - 1.36% | | | | | | | | |
| Money Market Funds - 1.36% | | | | | | | | |
| Fidelity Institutional Money Market | | | | | | | | |
| Fund - Government Portfolio | | | | | | | | |
| 0.01% (c) | | | 82,622 | | | $ | 82,622 | |
| TOTAL SHORT-TERM INVESTMENTS | | | | | | | | |
| (Cost $82,622) | | | | | | $ | 82,622 | |
| | | | | | | | | |
| Total Investments | | | | | | | | |
| (Cost $3,111,471) - 46.00% | | | | | | $ | 2,785,010 | |
| Other Assets in Excess of | | | | | | | | |
| Liabilities - 54.00% (d) | | | | | | | 3,269,163 | |
| TOTAL NET ASSETS - 100.00% | | | | | | $ | 6,054,173 | |
Percentages are stated as a percent of net assets.
ADR American Depository Receipt
| (a) | Non-income producing security. |
| (b) | Foreign issued security. |
| (c) | The rate quoted is the annualized seven-day yield as of September 30, 2011. |
| (d) | All or a portion of the assets have been committed as collateral for open securities sold short. |
The Global Industry Classification Standard (GICS®) was developed by and/or is the exclusive property of MSCI, Inc. and Standard & Poor Financial Services LLC ("S&P"). GICS is a service mark of MSCI and S&P and has been licensed for use by U.S. Bancorp Fund Services, LLC.
| 114 | The Leuthold Funds - 2011 Annual Report | See Notes to the Financial Statements. |
| Leuthold Hedged Equity Fund |
| Schedule of Securities Sold Short - (a) |
| September 30, 2011 |
| | | Shares | | | Fair Value | |
| | | | | | | |
| COMMON STOCKS - 42.34% | | | | | | |
| Aerospace & Defense - 0.18% | | | | | | |
| DigitalGlobe, Inc. | | | 554 | | | $ | 10,764 | |
| | | | | | | | | |
| Airlines - 1.43% | | | | | | | | |
| Delta Air Lines, Inc. | | | 4,286 | | | | 32,145 | |
| United Continental Holdings, Inc. | | | 2,800 | | | | 54,264 | |
| | | | | | | | 86,409 | |
| Biotechnology - 0.45% | | | | | | | | |
| Onyx Pharmaceuticals, Inc. | | | 914 | | | | 27,429 | |
| | | | | | | | | |
| Building Products - 1.29% | | | | | | | | |
| Lennox International, Inc. | | | 645 | | | | 16,628 | |
| Masco Corp. | | | 2,843 | | | | 20,242 | |
| Simpson Manufacturing Co., Inc. | | | 936 | | | | 23,335 | |
| USG Corp. | | | 2,671 | | | | 17,976 | |
| | | | | | | | 78,181 | |
| Capital Markets - 1.82% | | | | | | | | |
| Greenhill & Co., Inc. | | | 422 | | | | 12,065 | |
| Jefferies Group, Inc. | | | 2,089 | | | | 25,924 | |
| Knight Capital Group, Inc. - | | | | | | | | |
| Class A | | | 2,108 | | | | 25,633 | |
| Morgan Stanley | | | 1,948 | | | | 26,298 | |
| Stifel Financial Corp. | | | 751 | | | | 19,947 | |
| | | | | | | | 109,867 | |
| Commercial Banks - 2.24% | | | | | | | | |
| Hancock Holding Co. | | | 1,156 | | | | 30,958 | |
| HDFC Bank, Ltd. - ADR | | | 1,511 | | | | 44,045 | |
| Iberiabank Corp. | | | 333 | | | | 15,671 | |
| International Bancshares Corp. | | | 820 | | | | 10,783 | |
| TCF Financial Corp. | | | 2,467 | | | | 22,598 | |
| Wintrust Financial Corp. | | | 447 | | | | 11,537 | |
| | | | | | | | 135,592 | |
| Commercial Services & Supplies - 0.25% | | | | | | | | |
| Geo Group, Inc. | | | 820 | | | | 15,219 | |
| | | | | | | | | |
| Communications Equipment - 0.16% | | | | | | | | |
| Viasat, Inc. | | | 291 | | | | 9,693 | |
| | | | | | | | | |
| Construction & Engineering - 0.97% | | | | | | | | |
| Quanta Services, Inc. | | | 1,940 | | | | 36,453 | |
| The Shaw Group, Inc. | | | 1,034 | | | | 22,479 | |
| | | | | | | | 58,932 | |
| Construction Materials - 1.92% | | | | | | | | |
| Eagle Materials, Inc. | | | 477 | | | | 7,942 | |
| Martin Marietta Materials, Inc. | | | 767 | | | | 48,490 | |
| Texas Industries, Inc. | | | 683 | | | | 21,678 | |
| Vulcan Materials Co. | | | 1,374 | | | | 37,867 | |
| | | | | | | | 115,977 | |
| Diversified Telecommunication Services - 1.08% | | | | | | | | |
| CenturyLink, Inc. | | | 1,311 | | | | 43,420 | |
| TW Telecom, Inc. | | | 1,334 | | | | 22,038 | |
| | | | | | | | 65,458 | |
| Electric Utilities - 0.20% | | | | | | | | |
| Korea Electric Power Corp. - ADR | | | 1,416 | | | | 12,036 | |
| | | | | | | | | |
| Electronic Equipment, Instruments | | | | | | | | |
| & Components - 0.77% | | | | | | | | |
| Universal Display Corp. | | | 968 | | | | 46,406 | |
| | | | | | | | | |
| Food Products - 0.29% | | | | | | | | |
| Sanderson Farms, Inc. | | | 365 | | | | 17,338 | |
| | | | | | | | | |
| Gas Utilities - 0.28% | | | | | | | | |
| WGL Holdings, Inc. | | | 428 | | | | 16,722 | |
| | | | | | | | | |
| Health Care Equipment & Supplies - 1.49% | | | | | | | | |
| Align Technology, Inc. | | | 746 | | | | 11,317 | |
| HeartWare International, Inc. | | | 177 | | | | 11,401 | |
| Intuitive Surgical, Inc. | | | 132 | | | | 48,085 | |
| NxStage Medical, Inc. | | | 925 | | | | 19,295 | |
| | | | | | | | 90,098 | |
| See Notes to the Financial Statements. | The Leuthold Funds - 2011 Annual Report | 115 |
| Leuthold Hedged Equity Fund |
| Schedule of Securities Sold Short - (a) (continued) |
| September 30, 2011 |
| | | Shares | | | Fair Value | |
| | | | | | | |
| Health Care Technology - 0.88% | | | | | | |
| Allscripts Healthcare Solutions, | | | | | | |
| Inc. | | | 2,943 | | | $ | 53,033 | |
| | | | | | | | | |
| Hotels, Restaurants & Leisure - 1.58% | | | | | | | | |
| Ctrip.com International, Ltd. - | | | | | | | | |
| ADR | | | 1,296 | | | | 41,679 | |
| Gaylord Entertainment Co. | | | 1,140 | | | | 22,048 | |
| Home Inns & Hotels Management, | | | | | | | | |
| Inc. - ADR | | | 966 | | | | 24,894 | |
| Orient-Express Hotels Ltd. - | | | | | | | | |
| Class A (b) | | | 1,078 | | | | 7,449 | |
| | | | | | | | 96,070 | |
| Household Durables - 3.11% | | | | | | | | |
| D.R. Horton, Inc. | | | 3,304 | | | | 29,868 | |
| Lennar Corp. - Class A | | | 2,127 | | | | 28,800 | |
| MDC Holdings, Inc. | | | 1,547 | | | | 26,206 | |
| NVR, Inc. | | | 53 | | | | 32,011 | |
| Pulte Group, Inc. | | | 5,735 | | | | 22,653 | |
| Sony Corp. - ADR | | | 1,580 | | | | 30,020 | |
| Toll Brothers, Inc. | | | 1,300 | | | | 18,759 | |
| | | | | | | | 188,317 | |
| Independent Power Producers & | | | | | | | | |
| Energy Traders - 0.56% | | | | | | | | |
| Calpine Corp. | | | 2,428 | | | | 34,186 | |
| | | | | | | | | |
| Industrial Conglomerates - 0.69% | | | | | | | | |
| Koninklijke Philips Electronics | | | | | | | | |
| N.V. - NYS | | | 2,321 | | | | 41,639 | |
| | | | | | | | | |
| Insurance - 2.87% | | | | | | | | |
| Aspen Insurance Holdings Ltd. (b) | | | 669 | | | | 15,414 | |
| First American Financial Corp. | | | 880 | | | | 11,264 | |
| Markel Corp. | | | 42 | | | | 14,999 | |
| Old Republic International Corp. | | | 3,498 | | | | 31,202 | |
| PartnerRe, Ltd. (b) | | | 648 | | | | 33,871 | |
| Platinum Underwriters Holdings, | | | | | | | | |
| Ltd. (b) | | | 375 | | | | 11,531 | |
| RenaissanceRe Holdings, Ltd. (b) | | | 627 | | | | 40,003 | |
| Validus Holdings Ltd. (b) | | | 616 | | | | 15,351 | |
| | | | | | | | 173,635 | |
| Internet Software & Services - 1.96% | | | | | | | | |
| Digital River, Inc. | | | 416 | | | | 8,624 | |
| Equinix, Inc. | | | 526 | | | | 46,724 | |
| VeriSign, Inc. | | | 1,603 | | | | 45,862 | |
| WebMD Health Corp. | | | 588 | | | | 17,728 | |
| | | | | | | | 118,938 | |
| Media - 1.24% | | | | | | | | |
| Lamar Advertising Co. - Class A | | | 610 | | | | 10,389 | |
| New York Times Co. - Class A | | | 5,136 | | | | 29,840 | |
| Regal Entertainment Group - | | | | | | | | |
| Class A | | | 2,961 | | | | 34,762 | |
| | | | | | | | 74,991 | |
| Metals & Mining - 0.70% | | | | | | | | |
| Ivanhoe Mines, Ltd. (b) | | | 3,097 | | | | 42,429 | |
| | | | | | | | | |
| Multi-Utilities - 0.85% | | | | | | | | |
| Integrys Energy Group, Inc. | | | 1,056 | | | | 51,343 | |
| | | | | | | | | |
| Oil, Gas & Consumable Fuels - 1.94% | | | | | | | | |
| EOG Resources, Inc. | | | 366 | | | | 25,990 | |
| Inergy LP | | | 692 | | | | 17,314 | |
| InterOil Corp. (b) | | | 621 | | | | 30,255 | |
| McMoRan Exploration Co. | | | 2,376 | | | | 23,594 | |
| Teekay Corp. (b) | | | 909 | | | | 20,552 | |
| | | | | | | | 117,705 | |
| 116 | The Leuthold Funds - 2011 Annual Report | See Notes to the Financial Statements. |
| Leuthold Hedged Equity Fund |
| Schedule of Securities Sold Short - (a) (continued) |
| September 30, 2011 |
| | | Shares | | | Fair Value | |
| | | | | | | |
| Real Estate Investment Trusts (REITs) - 3.97% | | | | | | |
| Boston Properties, Inc. | | | 515 | | | $ | 45,886 | |
| Brandywine Realty Trust | | | 3,359 | | | | 26,906 | |
| Corporate Office Properties Trust | | | 1,134 | | | | 24,698 | |
| Digital Realty Trust, Inc. | | | 711 | | | | 39,219 | |
| HCP, Inc. | | | 1,090 | | | | 38,215 | |
| Healthcare Realty Trust, Inc. | | | 1,173 | | | | 19,765 | |
| Ventas, Inc. | | | 924 | | | | 45,646 | |
| | | | | | | | 240,335 | |
| | | | | | | | | |
| Semiconductors & Semiconductor | | | | | | | | |
| Equipment - 2.87% | | | | | | | | |
| Cree, Inc. | | | 1,635 | | | | 42,477 | |
| PMC - Sierra, Inc. | | | 5,315 | | | | 31,784 | |
| Power Integrations, Inc. | | | 528 | | | | 16,162 | |
| Rambus, Inc. | | | 3,799 | | | | 53,186 | |
| Silicon Laboratories, Inc. | | | 907 | | | | 30,394 | |
| | | | | | | | 174,003 | |
| | | | | | | | | |
| Software - 2.17% | | | | | | | | |
| Concur Technologies, Inc. | | | 499 | | | | 18,573 | |
| Salesforce.com, Inc. | | | 405 | | | | 46,283 | |
| SuccessFactors, Inc. | | | 2,178 | | | | 50,072 | |
| Taleo Corp. - Class A | | | 640 | | | | 16,461 | |
| | | | | | | | 131,389 | |
| | | | | | | | | |
| Thrifts & Mortgage Finance - 0.54% | | | | | | | | |
| New York Community Bancorp, Inc. | | | 2,768 | | | | 32,939 | |
| | | | | | | | | |
| Wireless Telecommunication Services - 1.59% | | | | | | | | |
| American Tower Corp. - Class A | | | 965 | | | | 51,917 | |
| Crown Castle International Corp. | | | 1,094 | | | | 44,493 | |
| | | | | | | | 96,410 | |
| | | | | | | | | |
| TOTAL COMMON STOCKS | | | | | | | | |
| (Proceeds $3,137,349) | | | | | | $ | 2,563,483 | |
| | | | | | | | | |
| INVESTMENT COMPANIES - 9.25% | | | | | | | | |
| Exchange Traded Funds - 9.25% | | | | | | | | |
| SPDR Dow Jones Industrial | | | | | | | | |
| Average ETF Trust | | | 2,116 | | | $ | 230,454 | |
| SPDR S&P 500 ETF Trust | | | 2,911 | | | | 329,438 | |
| TOTAL INVESTMENT COMPANIES | | | | | | | | |
| (Proceeds $585,507) | | | | | | $ | 559,892 | |
| | | | | | | | | |
| TOTAL SECURITIES SOLD SHORT | | | | | | | | |
| (Proceeds $3,722,856) - 51.59% | | | | | | $ | 3,123,375 | |
Percentages are stated as a percent of net assets.
ADRAmerican Depository Receipt
NYS New York Registered Shares
| (a) | All securities sold short are non-income producing |
| (b) | Foreign issued security. |
The Global Industry Classification Standard (GICS®) was developed by and/or is the exclusive property of MSCI, Inc. and Standard & Poor Financial Services LLC ("S&P"). GICS is a service mark of MSCI and S&P and has been licensed for use by U.S. Bancorp Fund Services, LLC.
| See Notes to the Financial Statements. | The Leuthold Funds - 2011 Annual Report | 117 |
| Grizzly Short Fund |
| Schedule of Investments |
| September 30, 2011 |
| | | Shares | | | Fair Value | |
| | | | | | | |
| SHORT-TERM INVESTMENTS - 8.81% | | | | | | |
| Money Market Funds - 8.81% | | | | | | |
Fidelity Institutional Money Market Fund - Government Portfolio 0.01% (c) | | | 23,198,003 | | | $ | 23,198,003 | |
| TOTAL SHORT-TERM INVESTMENTS | | | | | | | | |
| (Cost $23,198,003) | | | | | | $ | 23,198,003 | |
| | | | | | | | | |
| Total Investments | | | | | | | | |
| (Cost $ 23,198,003) - 8.81% | | | | | | $ | 23,198,003 | |
| | | | | | | | | |
| Other Assets in Excess of | | | | | | | | |
| Liabilities - 91.19% (d) | | | | | | | 240,250,080 | |
| TOTAL NET ASSETS - 100.00% | | | | | | $ | 263,448,083 | |
Percentages are stated as a percent of net assets
| (a) | Non-income producing security. |
| (b) | Foreign issued security. |
| (c) | The rate quoted is the annualized seven-day yield as of September 30, 2011 |
| (d) | All or a portion of the assets have been committed as collateral for open securities sold short. |
The Global Industry Classification Standard (GICS®) was developed by and/or is the exclusive property of MSCI, Inc. and Standard & Poor Financial Services LLC ("S&P"). GICS is a service mark of MSCI and S&P and has been licensed for use by U.S. Bancorp Fund Services, LLC.
| 118 | The Leuthold Funds - 2011 Annual Report | See Notes to the Financial Statements. |
| Grizzly Short Fund |
| Schedule of Securities Sold Short - (a) |
| September 30, 2011 |
| | | Shares | | | Fair Value | |
| | | | | | | |
| COMMON STOCKS - 75.30% | | | | | | |
| | | | | | | |
| Aerospace & Defense - 0.32% | | | | | | |
| DigitalGlobe, Inc. | | | 42,892 | | | $ | 833,392 | |
| | | | | | | | | |
| Airlines - 2.55% | | | | | | | | |
| Delta Air Lines, Inc. | | | 333,075 | | | | 2,498,063 | |
| United Continental Holdings, Inc. | | | 217,811 | | | | 4,221,177 | |
| | | | | | | | 6,719,240 | |
| | | | | | | | | |
| Biotechnology - 0.81% | | | | | | | | |
| Onyx Pharmaceuticals, Inc. | | | 71,042 | | | | 2,131,970 | |
| | | | | | | | | |
| Building Products - 2.30% | | | | | | | | |
| Lennox International, Inc. | | | 50,262 | | | | 1,295,754 | |
| Masco Corp. | | | 220,498 | | | | 1,569,946 | |
| Simpson Manufacturing Co., Inc. | | | 72,373 | | | | 1,804,259 | |
| USG Corp. | | | 207,753 | | | | 1,398,178 | |
| | | | | | | | 6,068,137 | |
| | | | | | | | | |
| Capital Markets - 3.24% | | | | | | | | |
| Greenhill & Co., Inc. | | | 32,834 | | | | 938,724 | |
| Jefferies Group, Inc. | | | 162,174 | | | | 2,012,579 | |
| Knight Capital Group, Inc. - Class A | | | 163,531 | | | | 1,988,537 | |
| Morgan Stanley | | | 151,451 | | | | 2,044,589 | |
| Stifel Financial Corp. | | | 58,298 | | | | 1,548,395 | |
| | | | | | | | 8,532,824 | |
| | | | | | | | | |
| Commercial Banks - 4.00% | | | | | | | | |
| Hancock Holding Co. | | | 89,801 | | | | 2,404,871 | |
| HDFC Bank, Ltd. - ADR | | | 117,287 | | | | 3,418,916 | |
| Iberiabank Corp. | | | 26,129 | | | | 1,229,631 | |
| International Bancshares Corp. | | | 63,672 | | | | 837,287 | |
| TCF Financial Corp. | | | 191,656 | | | | 1,755,569 | |
| Wintrust Financial Corp. | | | 34,856 | | | | 899,633 | |
| | | | | | | | 10,545,907 | |
| | | | | | | | | |
| Commercial Services & Supplies - 0.45% | | | | | | | | |
| Geo Group, Inc. | | | 63,672 | | | | 1,181,752 | |
| | | | | | | | | |
| Communications Equipment - 0.29% | | | | | | | | |
| Viasat, Inc. | | | 22,777 | | | | 758,702 | |
| | | | | | | | | |
| Construction & Engineering - 1.66% | | | | | | | | |
| Quanta Services, Inc. | | | 150,786 | | | | 2,833,269 | |
| The Shaw Group, Inc. | | | 70,377 | | | | 1,529,996 | |
| | | | | | | | 4,363,265 | |
| | | | | | | | |
| Construction Materials - 3.25% | | | | | | | | |
| Eagle Materials, Inc. | | | 36,852 | | | | 613,586 | |
| Martin Marietta Materials, Inc. | | | 59,654 | | | | 3,771,326 | |
| Texas Industries, Inc. | | | 39,351 | | | | 1,249,001 | |
| Vulcan Materials Co. | | | 106,564 | | | | 2,936,904 | |
| | | | | | | | 8,570,817 | |
| | | | | | | | | |
| Diversified Telecommunication Services - 1.93% | | | | | | | | |
| CenturyLink, Inc. | | | 101,855 | | | | 3,373,438 | |
| TW Telecom, Inc. | | | 103,876 | | | | 1,716,031 | |
| | | | | | | | 5,089,469 | |
| | | | | | | | | |
| Electric Utilities - 0.35% | | | | | | | | |
| Korea Electric Power Corp. - ADR | | | 109,916 | | | | 934,286 | |
| | | | | | | | | |
| Electronic Equipment, Instruments | | | | | | | | |
| & Components - 1.37% | | | | | | | | |
| Universal Display Corp. | | | 75,137 | | | | 3,602,068 | |
| | | | | | | | | |
| Food Products - 0.51% | | | | | | | | |
| Sanderson Farms, Inc. | | | 28,151 | | | | 1,337,173 | |
| | | | | | | | | |
| Gas Utilities - 0.50% | | | | | | | | |
| WGL Holdings, Inc. | | | 33,499 | | | | 1,308,806 | |
| | | | | | | | | |
| Health Care Equipment & Supplies - 2.64% | | | | | | | | |
| Align Technology, Inc. | | | 58,298 | | | | 884,380 | |
| HeartWare International, Inc. | | | 14,075 | | | | 906,571 | |
| Intuitive Surgical, Inc. | | | 10,058 | | | | 3,663,928 | |
| NxStage Medical, Inc. | | | 71,708 | | | | 1,495,829 | |
| | | | | | | | 6,950,708 | |
| See Notes to the Financial Statements. | The Leuthold Funds - 2011 Annual Report | 119 |
| Grizzly Short Fund |
Schedule of Securities Sold Short - (a) (continued) September 30, 2011 |
| | | Shares | | | Fair Value | |
| | | | | | | |
| Health Care Technology - 1.56% | | | | | | |
| Allscripts Healthcare Solutions, Inc. | | | 228,917 | | | $ | 4,125,084 | |
| | | | | | | | | |
| Hotels, Restaurants & Leisure - 2.82% | | | | | | | | |
| Ctrip.com International, Ltd. - ADR | | | 99,551 | | | | 3,201,560 | |
| Gaylord Entertainment Co. | | | 88,470 | | | | 1,711,010 | |
| Home Inns & Hotels Management, Inc. - ADR | | | 75,060 | | | | 1,934,296 | |
| Orient-Express Hotels Ltd. - Class A (b) | | | 83,761 | | | | 578,789 | |
| | | | | | | | 7,425,655 | |
| | | | | | | | | |
| Household Durables - 5.53% | | | | | | | | |
| D.R. Horton, Inc. | | | 256,684 | | | | 2,320,424 | |
| Lennar Corp. - Class A | | | 164,861 | | | | 2,232,218 | |
| MDC Holdings, Inc. | | | 119,948 | | | | 2,031,919 | |
| NVR, Inc. | | | 4,018 | | | | 2,426,792 | |
Pulte Group, Inc. | | | 445,653 | | | | 1,760,329 | |
| Sony Corp. - ADR | | | 122,635 | | | | 2,330,065 | |
| Toll Brothers, Inc. | | | 101,189 | | | | 1,460,157 | |
| | | | | | | | 14,561,904 | |
| | | | | | | | | |
| Independent Power Producers & | | | | | | | | |
| Energy Traders - 1.01% | | | | | | | | |
| Calpine Corp. | | | 188,329 | | | | 2,651,672 | |
| | | | | | | | | |
| Industrial Conglomerates - 1.23% | | | | | | | | |
| Koninklijke Philips Electronics N.V. - NYS | | | 180,268 | | | | 3,234,008 | |
| | | | | | | | | |
| Insurance - 5.14% | | | | | | | | |
| Aspen Insurance Holdings Ltd. (b) | | | 52,284 | | | $ | 1,204,623 | |
| First American Financial Corp. | | | 68,355 | | | | 874,944 | |
| Markel Corp. | | | 3,353 | | | | 1,197,457 | |
| Old Republic International Corp. | | | 271,425 | | | | 2,421,111 | |
| PartnerRe, Ltd. (b) | | | 50,262 | | | | 2,627,195 | |
| Platinum Underwriters Holdings, Ltd. (b) | | | 29,482 | | | | 906,571 | |
| RenaissanceRe Holdings, Ltd. (b) | | | 48,931 | | | | 3,121,798 | |
| Validus Holdings Ltd. (b) | | | 47,959 | | | | 1,195,138 | |
| | | | | | | | 13,548,837 | |
| | | | | | | | | |
| Internet Software & Services - 3.51% | | | | | | | | |
| Digital River, Inc. | | | 32,169 | | | | 666,863 | |
| Equinix, Inc. | | | 40,870 | | | | 3,630,482 | |
| VeriSign, Inc. | | | 124,657 | | | | 3,566,437 | |
| WebMD Health Corp. | | | 45,579 | | | | 1,374,207 | |
| | | | | | | | 9,237,989 | |
| | | | | | | | | |
| Media - 2.21% | | | | | | | | |
| Lamar Advertising Co. - Class A | | | 47,575 | | | | 810,202 | |
| New York Times Co. - Class A | | | 398,743 | | | | 2,316,697 | |
| Regal Entertainment Group - Class A | | | 229,864 | | | | 2,698,603 | |
| | | | | | | | 5,825,502 | |
| | | | | | | | | |
| Metals & Mining - 1.25% | | | | | | | | |
| Ivanhoe Mines, Ltd. (b) | | | 240,434 | | | | 3,293,946 | |
| | | | | | | | | |
| Multi-Utilities - 1.51% | | | | | | | | |
| Integrys Energy Group, Inc. | | | 81,996 | | | | 3,986,645 | |
| 120 | The Leuthold Funds - 2011 Annual Report | See Notes to the Financial Statements. |
| Grizzly Short Fund |
| Schedule of Securities Sold Short - (a) (continued) |
| September 30, 2011 |
| | | Shares | | | Fair Value | |
| | | | | | | |
| Oil, Gas & Consumable Fuels - 3.46% | | | | | | |
| EOG Resources, Inc. | | | 28,151 | | | $ | 1,999,003 | |
| Inergy LP | | | 53,615 | | | | 1,341,447 | |
| InterOil Corp. (b) | | | 48,240 | | | | 2,350,253 | |
| McMoRan Exploration Co. | | | 184,285 | | | | 1,829,950 | |
| Teekay Corp. (b) | | | 70,377 | | | | 1,591,224 | |
| | | | | | | | 9,111,877 | |
| | | | | | | | |
| Real Estate Investment Trusts (REITs) - 7.08% | | | | | | | | |
| Boston Properties, Inc. | | | 40,204 | | | | 3,582,177 | |
| Brandywine Realty Trust | | | 260,702 | | | | 2,088,223 | |
| Corporate Office Properties Trust | | | 87,805 | | | | 1,912,393 | |
| Digital Realty Trust, Inc. | | | 54,945 | | | | 3,030,766 | |
| HCP, Inc. | | | 84,452 | | | | 2,960,887 | |
| Healthcare Realty Trust, Inc. | | | 91,132 | | | | 1,535,574 | |
| Ventas, Inc. | | | 71,708 | | | | 3,542,375 | |
| | | | | | | | 18,652,395 | |
| | | | | | | | | |
Semiconductors & Semiconductor Equipment - 5.13% | | | | | | | | |
| Cree, Inc. | | | 127,344 | | | | 3,308,397 | |
| PMC - Sierra, Inc. | | | 412,819 | | | | 2,468,658 | |
| Power Integrations, Inc. | | | 40,870 | | | | 1,251,031 | |
| Rambus, Inc. | | | 294,944 | | | | 4,129,216 | |
| Silicon Laboratories, Inc. | | | 70,377 | | | | 2,358,333 | |
| | | | | | | | 13,515,635 | |
| | | | | | | | | |
| Software - 3.88% | | | | | | | | |
| Concur Technologies, Inc. | | | 38,874 | | | | 1,446,890 | |
| Salesforce.com, Inc. | | | 31,478 | | | | 3,597,306 | |
| SuccessFactors, Inc. | | | 169,417 | | | | 3,894,897 | |
| Taleo Corp. - Class A | | | 49,673 | | | | 1,277,589 | |
| | | | | | | | 10,216,682 | |
| | | | | | | | | |
| Thrifts & Mortgage Finance - 0.97% | | | | | | | | |
| New York Community Bancorp, Inc. | | | 215,123 | | | | 2,559,964 | |
| | | | | | | | | |
| Wireless Telecommunication Services - 2.84% | | | | | | | | |
| American Tower Corp. - Class A | | | 74,907 | | | | 4,029,998 | |
| Crown Castle International Corp. | | | 85,118 | | | | 3,461,749 | |
| | | | | | | | 7,491,747 | |
| | | | | | | | |
| TOTAL COMMON STOCKS | | | | | | | | |
| (Proceeds $227,308,298) | | | | | | $ | 198,368,058 | |
| | | | | | | | | |
| INVESTMENT COMPANIES - 17.77% | | | | | | | | |
| Exchange Traded Funds - 17.77% | | | | | | | | |
| iShares Russell 2000 Index Fund | | | 39,721 | | | $ | 2,552,074 | |
| SPDR Dow Jones Industrial | | | | | | | | |
| Average ETF Trust | | | 171,596 | | | | 18,688,520 | |
| SPDR S&P 500 ETF Trust | | | 225,974 | | | | 25,573,478 | |
| TOTAL INVESTMENT COMPANIES | | | | | | | | |
| (Proceeds $48,845,468) | | | | | | $ | 46,814,072 | |
| | | | | | | | | |
| TOTAL SECURITIES SOLD SHORT | | | | | | | | |
| (Proceeds $276,153,766) - 93.07% | | | | | | $ | 245,182,130 | |
Percentages are stated as a percent of net assets.
ADR American Depository Receipt
NYS New York Registered Shares
| (a) | All securities sold short are non-income producing. |
| (b) | Foreign issued security. |
The Global Industry Classification Standard (GICS®) was developed by and/or is the exclusive property of MSCI, Inc. and Standard & Poor Financial Services LLC ("S&P"). GICS is a service mark of MSCI and S&P and has been licensed for use by U.S. Bancorp Fund Services, LLC.
| See Notes to the Financial Statements. | The Leuthold Funds - 2011 Annual Report | 121 |
| The Leuthold Funds |
| Notes to the Financial Statements |
| 1. | ORGANIZATION AND SIGNIFICANT ACCOUNTING POLICIES |
Leuthold Funds, Inc. (the “Company”) was incorporated on August 30, 1995, as a Maryland Corporation and is registered with the Securities and Exchange Commission as an open-end management investment company under the Investment Company Act of 1940, as amended. The Company consists of eight series (the “Funds”): Leuthold Core Investment Fund, Leuthold Asset Allocation Fund, Leuthold Global Fund, Leuthold Select Industries Fund, Leuthold Global Industries Fund, Leuthold Global Clean Technology Fund, Leuthold Hedged Equity Fund, and Grizzly Short Fund. The investment objective of the Leuthold Core Investment Fund is to seek total return consistent with prudent investment risk over the long-term. The Leuthold Core Investment Fund commenced operations on November 20, 1995. Effective January 31, 2006, the Leuthold Core Investment Fund issued a class of Institutional Shares, which are not subject to the shareholder servicing fee of up to 0.25% that the Retail Shares are subject to, as described in the Funds’ prospectus. The investment objective of the Leuthold Asset Allocation Fund is to seek total return consistent with prudent investment risk over the long-term. The Leuthold Asset Allocation Fund commenced operations on May 24, 2006. Effective January 31, 2007, the Leuthold Asset Allocation Fund added a class of Institutional Shares, which is not subject to the 0.25% 12b-1 fee that the Retail Shares are subject to, as discussed in the Funds’ prospectus. The Leuthold Global Fund seeks long-term capital appreciation and dividend income. The Leuthold Global Fund commenced operations on April 30, 2008, issuing a class of Institutional Shares and adding a new class of Retail Shares effective July 1, 2008, which are subject to a 0.25% 12b-1 fee that the Institutional Shares are not subject to. The investment objective of the Leuthold Select Industries Fund is capital appreciation. The Leuthold Select Industries Fund commenced operations on June 19, 2000. The Leuthold Global Industries Fund seeks long-term capital appreciation and dividend income. The Leuthold Global Industries Fund commenced operations on May 17, 2010, issuing classes of Retail and Institutional Shares where the Fund’s Retail Shares are subject to a 0.25% 12b-1 fee to which the Institutional Shares are not subject. The Leuthold Global Clean Technology Fund seeks capital appreciation and long-term growth. The Leuthold Global Clean Technology Fund commenced operations on July 22, 2009, issuing classes of Retail and Institutional Shares where the Fund’s Retail Shares are subject to a 0.25% 12b-1 fee to which the Institutional Shares are not subject. The Leuthold Hedged Equity Fund seeks capital appreciation and income (or “total return”).The Leuthold Hedged Equity Fund commenced operations on July 22, 2009, issuing classes of Retail and Institutional Shares where the Fund’s Retail Shares are subject to a 0.25% 12b-1 fee to which the Institutional Shares are not subject. The investment objective of the Grizzly Short Fund is capital appreciation, and the Fund commenced operations on June 19, 2000. All classes of shares in a Fund have identical voting, dividend, liquidation, and other rights, and the same terms and conditions, except that certain fees and expenses, including distribution and shareholder servicing fees, may differ among classes. Each class has exclusive voting rights on any matters relating to that class’s servicing or distribution arrangements.
As of the close of business on February 19, 2010, pursuant to an Agreement and Plan of Reorganization previously approved by the Funds’ Board of Directors, all of the assets, subject to the liabilities, of the Leuthold Select Equities Fund, were transferred to the Leuthold Select Industries Fund in exchange for a corresponding class of shares of the Leuthold Select Industries Fund of equal value. The purpose of the transaction was to combine two funds with comparable investment objectives and strategies. The exchange ratio was 0.58. The net asset value of the Leuthold Select Industries Fund shares on the close of business February 19, 2010, after the reorganization was $12.08, and a total of 731,396 shares were issued to shareholders of the Leuthold Select Equities Fund in the exchange. The exchange was a tax-free event to Leuthold Select Equities Fund shareholders. For financial reporting purposes, assets received and shares issued by the Leuthold Select Industries Fund were recorded at fair value; however the cost basis of investments received from Leuthold Select Equities Fund was carried forward to align ongoing reporting of the Leuthold Select Industries Fund’s realized and unrealized gains and losses with amounts distributable to shareholders for tax purposes.
| 122 | The Leuthold Funds - 2011 Annual Report |
The components of net assets immediately before the acquisition were as follows:
| | | | | | | | | | | | | | | | |
| | | | | | | | | Accumulated | | | | | | | |
| | | | | | Accumulated | | | net realized | | | Net | | | | |
| | | Capital | | | net investment | | | loss on | | | Unrealized | | | Net | |
| | | Stock | | | loss | | | investments | | | Appreciation | | | Assets | |
| Leuthold Select Industries Fund | | $ | 48,758,704 | | | $ | (195,240 | ) | | $ | (5,366,210 | ) | | $ | 1,384,566 | | | $ | 44,581,820 | |
| Leuthold Select Equities Fund | | | 19,346,377 | | | | (63,506 | ) | | | (10,447,608 | )* | | | –– | | | | 8,835,263 | |
| Total | | $ | 68,105,081 | | | $ | (258,746 | ) | | $ | (15,813,818 | ) | | $ | 1,384,566 | | | $ | 53,417,083 | |
* Due to rules under section 381 and 382 of the internal revenue code, the combined Fund will only be able to utilize $1,641,117 of these losses and the losses will be limited to $215,625 each year over the next seven years. The combined Fund may not utilize the remaining $8,806,491.
Assuming the acquisition of Leuthold Select Equities Fund had been completed on October 1, 2009, the combined Funds’ pro forma results in the Statement of Operations during the period ended September 30, 2010 were as follows:
| Net investment income (loss) | | $ | 82,178 | * |
| Net realized and unrealized gain (loss) on investment | | | (3,852,836 | )** |
| Net increase (decrease) in net assets resulting from operations | | $ | (3,770,658 | ) |
* $110,459 as reported in the Leuthold Select Industries Fund Statement of Operations, plus $(28,281) Leuthold Select Equities Fund pre-merger.
** $(4,203,914) as reported in the Leuthold Select Industries Fund Statement of Operations plus $351,078 Leuthold Select Equities Fund pre-merger.
Because the combined Funds have been managed as a single integrated Fund since the acquisition was completed, it is not practicable to separate the amounts of revenue and earnings of the Leuthold Select Equities Fund that have been included in the Leuthold Select Industries Fund’s Statement of Operations since February 19, 2010.
During the year ended September 30, 2011, shares of the Grizzly Short Fund were adjusted to reflect a reverse stock split. The effect of the reverse stock split was to reduce the number of shares outstanding while maintaining the Fund’s and each shareholder’s aggregate net asset value. A summary of the reverse stock split is as follows:
| | | | | | | | | | | | Shares | | | Shares | |
| | | | | | Net Asset | | | Net Asset | | | Outstanding | | | Outstanding | |
| | | | | | Value Before | | | Value After | | | Before | | | After | |
| | Date | | Rate | | Reverse Split | | | Reverse Split | | | Reverse Split | | | Reverse Split | |
| Grizzly Short Fund | 5/23/2011 | | 1:4 | | $ | 3.18 | | | $ | 12.72 | | | | 35,124,485 | | | | 8,781,121 | |
| The Leuthold Funds - 2011 Annual Report | 123 |
The following is a summary of significant accounting policies consistently followed by the Funds.
a) Investment Valuation – Securities listed on a national securities exchange are valued at the last sale price on the day the valuation is made, and securities that are traded on the NASDAQ Global Market, NASDAQ Global Select Market or the NASDAQ Capital Market are valued at the Nasdaq Official Closing Price. Price information on listed stocks is taken from the exchange where the security is primarily traded. Securities, including securities sold short, which are listed on an exchange but which are not traded on the valuation date are valued at the mean between the bid and the asked prices. Unlisted securities for which market quotations are readily available are valued at the latest quoted bid price or, if available, at prices provided by an independent pricing service. Securities sold short which are not listed on an exchange but for which market quotations are readily available are valued at the average of the current bid and asked prices. Debt securities are valued at bid prices provided by an independent pricing service that may use a matrix pricing method or other analytical pricing model. Physical metals are valued at prices provided by an independent pricing service. Other assets, including certain investments in open-end investment companies, and securities for which no quotations are readily available are valued at fair value as determined in good faith by the Board of Directors and the Funds’ Fair Value Pricing Committee. Short-term instruments (those with remaining maturities of 60 days or less) are valued at amortized cost, which approximates market value. Exchange traded options are valued at the last reported sale price on an exchange on which the option is traded. If no sales are reported on a particular day, the mean between the highest bid and lowest asked quotations at the close of the exchanges is used. Non-exchange traded options also will be valued at the mean between the last bid and asked quotations. For options where market quotations are not readily available, fair value shall be determined. The Funds may invest in foreign securities. Trading in foreign securities may be completed at times that vary from the closing of the New York Stock Exchange. The Funds’ policy is to value the foreign securities at the latest closing price on the exchange on which they are traded immediately prior to the closing of the New York Stock Exchange. Foreign securities quoted in foreign currencies are translated into U.S. dollars at current rates. Occasionally, events that affect these values and exchange rates may occur between the times at which they are determined and the closing of the New York Stock Exchange. If these events materially affect the value of portfolio securities, then these securities may be valued at their value as determined in good faith by the Funds’ Board of Directors. Some of the factors which may be considered by the Board of Directors and the Funds’ Fair Value Pricing Committee in determining fair value are fundamental analytical data relating to the investment, the nature and duration of any restrictions on disposition, trading in similar securities of the same issuer or comparable companies, information from broker dealers, and an evaluation of the forces that influence the market in which the securities are purchased and sold. The use of fair value pricing by a Fund may cause the net asset value of its shares to differ significantly from the net asset value that would be calculated without regard to such considerations. Each of the Funds may invest in metals such as aluminum, copper, zinc, lead, nickel, tin, silver, palladium and other industrial and precious metals. Metals not traded on an exchange are valued at the mid-point between the closing bid and asked prices as obtained from a commonly used reputable pricing source.
| 124 | The Leuthold Funds - 2011 Annual Report |
The Funds have adopted fair valuation accounting standards which establish a definition of fair value and set out a hierarchy for measuring fair value. These standards require additional disclosures about the various inputs and valuation techniques used to develop the measurements of fair value and a discussion of changes in valuation techniques and related inputs during the period. These inputs are summarized in the following three levels:
| | Level 1 - | Quoted prices in active markets for identical securities |
| | Level 2 - | Other significant observable inputs (including quoted prices for similar securities, interest rates, prepayment speeds, credit risk, etc.). |
| | Level 3 - | Significant unobservable inputs (including the Funds’ own assumptions in determining the fair value of investments). |
The inputs or methodology used for valuing securities are not an indication of the risk associated with investing in those securities. The following is a summary of the inputs used to value the Funds’ net assets as of September 30, 2011:
| Leuthold Core Investment Fund | |
| Investments at Fair Value | | Level 1 | | | Level 2 | | | Level 3 | | | Total | |
| Common Stocks | | $ | 485,434,629 | | | $ | 10,170,129 | | | $ | –– | | | $ | 495,604,758 | |
| Preferred Stocks | | | 1,898,427 | | | | –– | | | | –– | | | | 1,898,427 | |
| Exchange Traded Funds | | | 45,509,282 | | | | –– | | | | –– | | | | 45,509,282 | |
| Precious Metals | | | –– | | | | 46,095,804 | | | | –– | | | | 46,095,804 | |
| Corporate Bonds | | | –– | | | | 40,224,781 | | | | –– | | | | 40,224,781 | |
| Foreign Government Bonds | | | –– | | | | 42,415,589 | | | | –– | | | | 42,415,589 | |
| Money Market Funds | | | 186,192,878 | | | | –– | | | | –– | | | | 186,192,878 | |
| Total Investments in Securities | | $ | 719,035,216 | | | $ | 138,906,303 | | | $ | –– | | | $ | 857,941,519 | |
| Securities Sold Short at Fair Value | | Level 1 | | | Level 2 | | | Level 3 | | | Total | |
| Common Stocks - Short | | $ | 121,186,003 | | | $ | –– | | | $ | –– | | | $ | 121,186,003 | |
| Exchange Traded Funds - Short | | | 59,386,169 | | | | –– | | | | –– | | | | 59,386,169 | |
| Total Securities Sold Short | | $ | 180,572,172 | | | $ | –– | | | $ | –– | | | $ | 180,572,172 | |
The Fund did not invest in any Level 3 securities or have transfers into or out of Level 1 or Level 2 securities during the period. The basis for recognizing and valuing transfers is as of the end of the period in which transfers occur.
| The Leuthold Funds - 2011 Annual Report | 125 |
| Leuthold Asset Allocation Fund | |
| Investments at Fair Value | | Level 1 | | | Level 2 | | | Level 3 | | | Total | |
| Common Stocks | | $ | 488,694,631 | | | $ | 9,605,431 | | | $ | –– | | | $ | 498,300,062 | |
| Exchange Traded Funds | | | 42,835,027 | | | | –– | | | | –– | | | | 42,835,027 | |
| Precious Metals | | | –– | | | | 45,301,366 | | | | –– | | | | 45,301,366 | |
| Corporate Bonds | | | –– | | | | 39,522,984 | | | | –– | | | | 39,522,984 | |
| Foreign Government Bonds | | | –– | | | | 41,577,087 | | | | –– | | | | 41,577,087 | |
| Money Market Funds | | | 175,214,742 | | | | –– | | | | –– | | | | 175,214,742 | |
| Total Investments in Securities | | $ | 706,744,400 | | | $ | 136,006,868 | | | $ | –– | | | $ | 842,751,268 | |
| Securities Sold Short at Fair Value | | Level 1 | | | Level 2 | | | Level 3 | | | Total | |
| Common Stocks - Short | | $ | 117,935,760 | | | $ | –– | | | $ | –– | | | $ | 117,935,760 | |
| Exchange Traded Funds - Short | | | 57,721,307 | | | | –– | | | | –– | | | | 57,721,307 | |
| Total Securities Sold Short | | $ | 175,657,067 | | | $ | –– | | | $ | –– | | | $ | 175,657,067 | |
The Fund did not invest in any Level 3 securities or have transfers into or out of Level 1 or Level 2 securities during the period. The basis for recognizing and valuing transfers is as of the end of the period in which transfers occur.
| Leuthold Global Fund | |
| Investments at Fair Value | | Level 1 | | | Level 2 | | | Level 3 | | | Total | |
| Common Stocks | | $ | 203,706,353 | | | $ | 973,589 | | | $ | 472,086 | | | $ | 205,152,028 | |
| Exchange Traded Funds | | | 26,430,108 | | | | –– | | | | –– | | | | 26,430,108 | |
| Precious Metals | | | –– | | | | 20,119,309 | | | | –– | | | | 20,119,309 | |
| Corporate Bonds | | | –– | | | | 17,506,686 | | | | –– | | | | 17,506,686 | |
| United States Treasury Obligations | | | –– | | | | 5,592,385 | | | | –– | | | | 5,592,385 | |
| Foreign Government Bonds | | | –– | | | | 13,404,797 | | | | –– | | | | 13,404,797 | |
| Money Market Funds | | | 114,355,854 | | | | –– | | | | –– | | | | 114,355,854 | |
| Total Investments in Securities | | $ | 344,492,315 | | | $ | 57,596,766 | | | $ | 472,086 | | | $ | 402,561,167 | |
| Securities Sold Short at Fair Value | | Level 1 | | | Level 2 | | | Level 3 | | | Total | |
| Common Stocks - Short | | $ | 20,476,917 | | | $ | –– | | | $ | –– | | | $ | 20,476,917 | |
| Exchange Traded Funds - Short | | | 40,279,401 | | | | –– | | | | –– | | | | 40,279,401 | |
| Total Securities Sold Short | | $ | 60,756,318 | | | $ | –– | | | $ | –– | | | $ | 60,756,318 | |
The following is a reconciliation of Level 3 assets for which significant unobservable inputs were used to determine fair value:
| | | Investments | |
| | | in Securities | |
| | | at Fair Value | |
| Balance as of September 30, 2010 | | $ | –– | |
| Accrued discounts/premiums | | | –– | |
| Realized gain (loss) | | | –– | |
| Change in unrealized appreciation (depreciation) | | | –– | |
| Purchases | | | –– | |
| Sales | | | –– | |
| Transfer in and/or out of Level 3 | | | 472,086 | |
| Balance as of September 30, 2011 | | $ | 472,086 | |
| | | | | |
| Change in unrealized appreciation (depreciation) during | | | | |
| the period for Level 3 investments held at September 30, 2011: | | $ | –– | |
The security transferred into Level 3 as the security is fair valued by the Board of Directors due to a halt in trading of the security on January 26, 2011. The basis for recognizing and valuing transfers is as of the end of the period in which transfers occur.
| 126 | The Leuthold Funds - 2011 Annual Report |
| Leuthold Select Industries Fund | |
| Investments at Fair Value | | Level 1 | | | Level 2 | | | Level 3 | | | Total | |
| Common Stocks | | $ | 16,069,009 | | | $ | –– | | | $ | –– | | | $ | 16,069,009 | |
| Preferred Stocks | | | 74,273 | | | | –– | | | | –– | | | | 74,273 | |
| Money Market Funds | | | 151,914 | | | | –– | | | | –– | | | | 151,914 | |
| Total Investments in Securities | | $ | 16,295,196 | | | $ | –– | | | $ | –– | | | $ | 16,295,196 | |
The Fund did not invest in any Level 3 securities or have transfers into or out of Level 1 or Level 2 securities during the period. The basis for recognizing and valuing transfers is as of the end of the period in which transfers occur.
| Leuthold Global Industries Fund | |
| Investments at Fair Value | | Level 1 | | | Level 2 | | | Level 3 | | | Total | |
| Common Stocks | | $ | 20,196,704 | | | $ | 89,455 | | | $ | 22,046 | | | $ | 20,308,205 | |
| Money Market Funds | | | 1,801,941 | | | | –– | | | | –– | | | | 1,801,941 | |
| Total Investments in Securities | | $ | 21,998,645 | | | $ | 89,455 | | | $ | 22,046 | | | $ | 22,110,146 | |
The following is a reconciliation of Level 3 assets for which significant unobservable inputs were used to determine fair value:
| | | Investments in Securities at Fair Value | |
| Balance as of September 30, 2010 | | $ | –– | |
| Accrued discounts/premiums | | | –– | |
| Realized gain (loss) | | | –– | |
| Change in unrealized appreciation (depreciation) | | | –– | |
| Purchases | | | –– | |
| Sales | | | –– | |
| Transfer in and/or out of Level 3 | | | 22,046 | |
| Balance as of September 30, 2011 | | $ | 22,046 | |
| | | | | |
Change in unrealized appreciation (depreciation) during the period for Level 3 investments held at September 30, 2011: | | $ | –– | |
The security transferred into Level 3 as the security is fair valued by the Board of Directors due to a halt in trading of the security on January 26, 2011. The basis for recognizing and valuing transfers is as of the end of the period in which transfers occur.
| Leuthold Global Clean Technology Fund | |
| Investments at Fair Value | | Level 1 | | | Level 2 | | | Level 3 | | | Total | |
| Common Stocks | | $ | 14,067,828 | | | $ | –– | | | $ | –– | | | $ | 14,067,828 | |
| Preferred Stocks | | | 521,359 | | | | –– | | | | –– | | | | 521,359 | |
| Warrants | | | –– | | | | 0 | * | | | –– | | | | –– | |
| Money Market Funds | | | 657,399 | | | | –– | | | | –– | | | | 657,399 | |
| Total Investments in Securities | | $ | 15,246,586 | | | $ | –– | | | $ | –– | | | $ | 15,246,586 | |
The Fund did not invest in any Level 3 securities during the period. The basis for recognizing and valuing transfers is as of the end of the period in which transfers occur.
* Warrants valued at $0 at September 30, 2011.
| The Leuthold Funds - 2011 Annual Report | 127 |
| Leuthold Hedged Equity Fund | |
| Investments at Fair Value | | Level 1 | | | Level 2 | | | Level 3 | | | Total | |
| Common Stocks | | $ | 2,690,089 | | | $ | –– | | | $ | –– | | | $ | 2,690,089 | |
| Preferred Stocks | | | 12,299 | | | | –– | | | | –– | | | | 12,299 | |
| Money Market Funds | | | 82,622 | | | | –– | | | | –– | | | | 82,622 | |
| Total Investments in Securities | | $ | 2,785,010 | | | $ | –– | | | $ | –– | | | $ | 2,785,010 | |
| | | | | | | | | | | | | | | | | |
| Securities Sold Short at Fair Value | | Level 1 | | | Level 2 | | | Level 3 | | | Total | |
| Common Stocks - Short | | $ | 2,563,483 | | | $ | –– | | | $ | –– | | | $ | 2,563,483 | |
| Exchange Traded Funds - Short | | | 559,892 | | | | –– | | | | –– | | | | 559,892 | |
| Total Securities Sold Short | | $ | 3,123,375 | | | $ | –– | | | $ | –– | | | $ | 3,123,375 | |
The Fund did not invest in any Level 3 securities or have transfers into or out of Level 1 or Level 2 securities during the period. The basis for recognizing and valuing transfers is as of the end of the period in which transfers occur.
| Grizzly Short Fund | |
| Investments at Fair Value | | Level 1 | | | Level 2 | | | Level 3 | | | Total | |
| Money Market Funds | | $ | 23,198,003 | | | $ | –– | | | $ | –– | | | $ | 23,198,003 | |
| Total Investments in Securities | | $ | 23,198,003 | | | $ | –– | | | $ | –– | | | $ | 23,198,003 | |
| | | | | | | | | | | | | | | | | |
| Securities Sold Short at Fair Value | | Level 1 | | | Level 2 | | | Level 3 | | | Total | |
| Common Stocks - Short | | $ | 198,368,058 | | | $ | –– | | | $ | –– | | | $ | 198,368,058 | |
| Exchange Traded Funds - Short | | | 46,814,072 | | | | –– | | | | –– | | | | 46,814,072 | |
| Total Securities Sold Short | | $ | 245,182,130 | | | $ | –– | | | $ | –– | | | $ | 245,182,130 | |
The Fund did not invest in any Level 3 securities or have transfers into or out of Level 1 or Level 2 securities during the period. The basis for recognizing and valuing transfers is as of the end of the period in which transfers occur.
For further information regarding security characteristics, see the Schedules of Investments.
In May 2011, the Financial Accounting Standards Board (“FASB”) issued Accounting Standards Update (“ASU”) No. 2011-04 “Amendments to Achieve Common Fair Value Measurement and Disclosure Requirements” in Generally Accepted Accounting Principles (“GAAP”) and the International Financial Reporting Standards “IFRS”. ASU No. 2011-04 amends FASB Accounting Standards Codification (“ASC”) Topic 820, Fair Value Measurements and Disclosures to establish common requirements for measuring fair value and disclosing information about fair value measurements in accordance with GAAP and IFRS. ASU 2011-04 is effective for fiscal years beginning after December 15, 2011 and for interim periods within those fiscal years. Management is currently evaluating the impact of these amendments.
| 128 | The Leuthold Funds - 2011 Annual Report |
| b) | Federal Income Taxes – Provision for federal income taxes or excise taxes has not been made since the Funds have elected to be taxed as “regulated investment companies” and intend to distribute substantially all taxable income to shareholders and otherwise comply with the provisions of the Internal Revenue Code applicable to regulated investment companies.Distributions from net realized gains for book purposes may include short-term capital gains which are included as ordinary income to shareholders for tax purposes. The Funds also designate as distributions of long-term gains, to the extent necessary to fully distribute such capital gains, earnings and profits distributed to shareholders on the redemption of shares. The tax character of distributions paid during the fiscal years ended September 30, 2011 and 2010 was as follows: |
| Year Ended September 30, 2011 | |
| | | Leuthold | | | Leuthold | | | | | | Leuthold | | | Leuthold | | | Leuthold | | | Leuthold | | | | |
| | | Core | | | Asset | | | Leuthold | | | Select | | | Global | | | Global Clean | | | Hedged | | | Grizzly | |
| | | Investment | | | Allocation | | | Global | | | Industries | | | Industries | | | Technology | | | Equity | | | Short | |
| | | Fund | | | Fund | | | Fund | | | Fund | | | Fund | | | Fund | | | Fund | | | Fund | |
| | | | | | | | | | | | | | | | | | | | | | | | | |
| Distributions paid from: | | | | | | | | | | | | | | | | | | | | | | | | |
| | | | | | | | | | | | | | | | | | | | | | | | | |
| Ordinary Income | | $ | 5,131,946 | | | $ | 7,502,082 | | | $ | 11,346,023 | | | $ | 45,146 | | | $ | 236,013 | | | $ | –– | | | $ | –– | | | $ | –– | |
| Long Term Capital Gain | | | –– | | | | –– | | | | 6,950,662 | | | | –– | | | | –– | | | | –– | | | | –– | | | | –– | |
| Return of Capital | | | –– | | | | –– | | | | –– | | | | –– | | | | –– | | | | –– | | | | –– | | | | –– | |
| | | | | | | | | | | | | | | | | | | | | | | | | | | | | | | | | |
| Total Distributions Paid | | $ | 5,131,946 | | | $ | 7,502,082 | | | $ | 18,296,685 | | | $ | 45,146 | | | $ | 236,013 | | | $ | –– | | | $ | –– | | | $ | –– | |
| Year Ended September 30, 2010 | |
| | | Leuthold | | | Leuthold | | | | | | Leuthold | | | Leuthold | | | Leuthold | | | Leuthold | | | | |
| | | Core | | | Asset | | | Leuthold | | | Select | | | Global | | | Global Clean | | | Hedged | | | Grizzly | |
| | | Investment | | | Allocation | | | Global | | | Industries | | | Industries | | | Technology | | | Equity | | | Short | |
| | | Fund | | | Fund | | | Fund | | | Fund | | | Fund | | | Fund | | | Fund | | | Fund | |
| | | | | | | | | | | | | | | | | | | | | | | | | |
| Distributions paid from: | | | | | | | | | | | | | | | | | | | | | | | | |
| | | | | | | | | | | | | | | | | | | | | | | | | |
| Ordinary Income | | $ | –– | | | $ | 1,762,481 | | | $ | 624,628 | | | $ | 87,441 | | | $ | –– | | | $ | –– | | | $ | –– | | | $ | –– | |
| Long Term Capital Gain | | | –– | | | | –– | | | | –– | | | | –– | | | | –– | | | | –– | | | | –– | | | | –– | |
| Return of Capital | | | 5,026,003 | | | | 5,857,936 | | | | –– | | | | –– | | | | –– | | | | –– | | | | –– | | | | –– | |
| | | | | | | | | | | | | | | | | | | | | | | | | | | | | | | | | |
| Total Distributions Paid | | $ | 5,026,003 | | | $ | 7,620,417 | | | $ | 624,628 | | | $ | 87,441 | | | $ | –– | | | $ | –– | | | $ | –– | | | $ | –– | |
At September 30, 2011, the components of accumulated earnings (deficit) on a tax basis were as follows:
| | | Leuthold | | | Leuthold | | | | | | Leuthold | | | Leuthold | | | Leuthold | | | Leuthold | | | | |
| | | Core | | | Asset | | | Leuthold | | | Select | | | Global | | | Global Clean | | | Hedged | | | Grizzly | |
| | | Investment | | | Allocation | | | Global | | | Industries | | | Industries | | | Technology | | | Equity | | | Short | |
| | | Fund | | | Fund | | | Fund | | | Fund | | | Fund | | | Fund | | | Fund | | | Fund | |
| Undistributed ordinary income | | $ | 16,992,082 | | | $ | 15,526,681 | | | $ | 1,853,877 | | | $ | –– | | | $ | 18,020 | | | $ | –– | | | $ | –– | | | $ | –– | |
| Undistributed long-term gains | | | –– | | | | –– | | | | 3,045,442 | | | | –– | | | | –– | | | | –– | | | | –– | | | | –– | |
| Distributable earnings | | | 16,992,082 | | | | 15,526,681 | | | | 4,899,319 | | | | –– | | | | 18,020 | | | | –– | | | | –– | | | | –– | |
Capital loss carryover and post-October losses | | | (22,593,066 | ) | | | (408,900,037 | ) | | | –– | | | | (5,056,202 | ) | | | (851,791 | ) | | | (3,227,154 | ) | | | (698,509 | ) | | | (68,863,526 | ) |
| Other accumulated gains (losses) | | | 19,005,369 | | | | 18,485,509 | | | | 9,014,025 | | | | –– | | | | –– | | | | –– | | | | 555,121 | | | | 27,312,671 | |
| Unrealized appreciation (depreciation) | | | (8,354,650 | ) | | | 36,626,603 | | | | (14,831,958 | ) | | | (1,802,240 | ) | | | (2,897,781 | ) | | | (4,023,957 | ) | | | (371,085 | ) | | | –– | |
| Total accumulated gain (loss) | | $ | 5,049,735 | | | $ | (338,261,244 | ) | | $ | (918,614 | ) | | $ | (6,858,442 | ) | | $ | (3,731,552 | ) | | $ | (7,251,111 | ) | | $ | (514,473 | ) | | $ | (41,550,855 | ) |
| The Leuthold Funds - 2011 Annual Report | 129 |
Net investment income and realized gains and losses for federal income tax purposes may differ from that reported on the financial statements because of permanent book-to-tax differences. U.S. GAAP requires that permanent differences between financial reporting and tax reporting be reclassified between various components of net assets. These differences are primarily due to net operating losses, and differences from REIT adjustments and foreign currency gain and loss.
Additionally, U.S. Generally Accepted Accounting Principles require that certain components of net assets relating to permanent differences be reclassified between financial and tax reporting. These reclassifications have no effect on net assets or net asset value per share. For the year ended September 30, 2011, the following table shows the reclassifications made:
| | | Undistributed | | | Accumulated | | | | |
| | | Net Investment | | | Net Realized | | | Paid In | |
| | | Income/(Loss) | | | Gain/(Loss) | | | Capital | |
| | | | | | | | | | |
| Leuthold Core Investment Fund | | $ | 16,890,009 | | | $ | (16,517,041 | ) | | $ | (372,968 | ) |
| Leuthold Asset Allocation Fund | | | 13,262,425 | | | | (12,521,595 | ) | | | (740,830 | ) |
| Leuthold Global Fund | | | 1,289,298 | | | | (1,289,298 | ) | | | –– | |
| Leuthold Select Industries Fund | | | 95,602 | | | | (20 | ) | | | (95,582 | ) |
| Leuthold Global Industries Fund | | | (41,625 | ) | | | 41,625 | | | | –– | |
| Leuthold Global Clean Technology Fund | | | 243,064 | | | | (85,577 | ) | | | (157,487 | ) |
| Leuthold Hedged Equity Fund | | | 156,768 | | | | (1,025 | ) | | | (155,743 | ) |
| Grizzly Short Fund | | | 3,879,456 | | | | (73,609 | ) | | | (3,805,847 | ) |
The Funds intend to utilize provisions of the federal income tax laws which allow the Funds to carry realized capital losses forward for eight years following the year of loss and offset such losses against any future realized capital gains. At September 30, 2011, the Funds had the following capital loss carryforwards available for federal income tax purposes:
| | | Leuthold | | | Leuthold | | | | | | Leuthold | | | Leuthold | | | Leuthold | | | Leuthold | | | | |
| | | Core | | | Asset | | | Leuthold | | | Select | | | Global | | | Global Clean | | | Hedged | | | Grizzly | |
| | | Investment | | | Allocation | | | Global | | | Industries | | | Industries | | | Technology | | | Equity | | | Short | |
| | | Fund | | | Fund | | | Fund | | | Fund | | | Fund | | | Fund | | | Fund | | | Fund | |
| Expires 09/30/17 | | $ | –– | | | $ | (66,840,379 | ) | | $ | –– | | | $ | (1,293,754 | )* | | $ | –– | | | $ | –– | | | $ | –– | | | $ | –– | |
| Expires 09/30/18 | | | (22,593,066 | ) | | | (342,059,658 | ) | | | –– | | | | (3,762,448 | ) | | | –– | | | | (17,387 | ) | | | (48,852 | ) | | | (18,663,090 | ) |
| Expires 09/30/19 | | | –– | | | | –– | | | | –– | | | | –– | | | | (17,340 | ) | | | (1,413,543 | ) | | | (498,485 | ) | | | (25,380,935 | ) |
*Capital loss carryforward transferred in from merger, subject to annual limitations.
The Leuthold Global Industries Fund, Leuthold Global Clean Technology Fund, Leuthold Hedged Equity Fund, and Grizzly Short Fund intend to defer and treat $834,451, $1,796,224, $151,172, and $24,819,501, respectively, of post-October losses incurred during the fiscal year ended September 30, 2011 as arising in the fiscal year ending September 30, 2012.
As of September 30, 2011, the Funds did not have any tax positions that did not meet the “more likely-than-not” threshold of being sustained by the applicable tax authority. Generally, tax authorities can examine all the tax returns filed for the last three years.
The Funds recognize interest and penalties, if any, related to unrecognized tax benefits as income tax expense in the Statement of Operations. During the period, the Funds did not incur any interest or penalties.
| 130 | The Leuthold Funds - 2011 Annual Report |
On December 22, 2010, the Regulated Investment Company Modernization Act of 2010 (the “Act”) was enacted, which changed various technical rules governing the tax treatment of regulated investment companies. The changes are generally effective for taxable years beginning after the date of enactment. One of the more prominent changes addresses capital loss carryforwards. Under the Act, each Fund will be permitted to carry forward capital losses incurred in taxable years beginning after the date of enactment for an unlimited period. However, any losses incurred during those future taxable years will be required to be utilized prior to the losses incurred in pre-enactment taxable years, which carry an expiration date. As a result of this ordering rule, pre-enactment capital loss carryforwards may be more likely to expire unused. Additionally, post-enactment capital loss carryforwards will retain their character as either short-term or long-term capital losses rather than being considered all short-term as permitted under previous regulation.
| c) | Distributions to Shareholders – Dividends from net investment income, if any, are declared and paid quarterly. Distributions of net realized capital gains, if any, are declared and paid at least annually. |
| d) | Use of Estimates – The preparation of financial statements in conformity with U.S. GAAP requires management to make estimates and assumptions that affect the reported amounts of assets and liabilities and disclosure of contingent assets and liabilities at the date of the financial statements and the reported amounts of revenues and expenses during the reporting period. Actual results could differ from those estimates. |
| e) | Basis for Consolidation for the Leuthold Core Investment Fund, Leuthold Asset Allocation Fund, and Leuthold Global Fund –The Leuthold Core Investment Fund, Leuthold Asset Allocation Fund, and Leuthold Global Fund may invest up to 25% of their total assets in their Subsidiary, Leuthold Core, Ltd., Leuthold Asset Allocation, Ltd., and Leuthold Global, Ltd. (the “Subsidiaries”), respectively. The Subsidiaries, which are organized under the laws of the Cayman Islands, are wholly owned and controlled by the Leuthold Core Investment Fund, Leuthold Asset Allocation Fund, and Leuthold Global Fund, respectively, and are therefore consolidated in the respective Funds’ financial statements herein. All intercompany balances, revenues, and expenses have been eliminated in consolidation. The Subsidiaries act as investment vehicles in order to enter into certain investments for the Leuthold Core Investment Fund, Leuthold Asset Allocation Fund, and Leuthold Global Fund consistent with the investment objectives and policies specified in the Prospectus and Statement of Additional Information. |
| f) | Short Positions – For financial statement purposes, an amount equal to the required amount of collateral to be segregated for short positions is included in the Statements of Assets and Liabilities as an asset. The amount of the securities sold short, shown as a liability, is subsequently marked-to-market to reflect the current value of the short position. Subsequent fluctuations in the market prices of securities sold, but not yet purchased, may require purchasing the securities at prices which could differ from the amount reflected in the Statements of Assets and Liabilities. The Funds are liable for any dividends or interest payable on securities while those securities are in a short position. As collateral for their short positions, the Funds are required under the Investment Company Act of 1940 to maintain segregated assets consisting of cash, cash equivalents, or liquid securities. These segregated assets are valued consistent with Note 1a above. The amount of segregated assets is required to be adjusted daily to reflect changes in the market value of the securities sold short. Leuthold Core Investment Fund, Leuthold Asset Allocation Fund, Leuthold Global Fund, Leuthold Hedged Equity Fund and Grizzly Short Fund’s receivable from broker for securities sold short is with two major security dealers. |
| The Leuthold Funds - 2011 Annual Report | 131 |
| g) | Other – Investment and shareholder transactions are recorded on the trade date. The Funds determine the gain or loss realized from the investment transactions by comparing the original cost of the security lot sold with the net sales proceeds. Dividend income is recognized on the ex-dividend date or as soon as information is available to the Funds, and interest income is recognized on an accrual basis. Discounts and premiums on bonds are amortized using the yield to maturity method over the life of the respective bond. For financial reporting purposes, the Funds isolate changes in the exchange rate of investment securities from the fluctuations arising from changes in the market prices of securities for realized gains and losses. |
| h) | Expenses – Expenses that directly relate to one of the Funds are charged directly to that Fund. Other operating expenses of the Funds, such as Directors fees and expenses, insurance expense, and legal fees are allocated between the eight Funds based on the relative net asset value of the individual Funds. |
| i) | Counterparty risk – Counterparty risk may arise as the result of the failure of a counterparty to a securities contract to comply with the terms of the contract. Potential counterparty risk is measured by the credit worthiness of the counterparty and additional risk may arise from unanticipated events affecting the value of the underlying security. |
| j) | Subsequent Events – The Funds have evaluated subsequent events through the date of issuance of the Funds’ financial statements. This evaluation did not result in any subsequent events that necessitated recognition or disclosure. |
| 2. | INVESTMENT TRANSACTIONS |
Purchases and sales of investment securities, other than short-term investments and short sales, for the year ended September 30, 2011 are summarized below.
| | | Leuthold | | | Leuthold | | | | | | Leuthold | | | Leuthold | | | Leuthold | | | Leuthold | |
| | | Core | | | Asset | | | Leuthold | | | Select | | | Global | | | Global Clean | | | Hedged | |
| | | Investment | | | Allocation | | | Global | | | Industries | | | Industries | | | Technology | | | Equity | |
| | | Fund | | | Fund | | | Fund | | | Fund | | | Fund | | | Fund | | | Fund | |
| Purchases | | $ | 835,546,609 | | | $ | 1,027,916,969 | | | $ | 494,689,270 | | | $ | 33,026,234 | | | $ | 57,988,106 | | | $ | 28,467,784 | | | $ | 5,645,834 | |
| Sales | | | 1,194,316,585 | | | | 1,333,310,416 | | | | 413,908,290 | | | | 55,624,081 | | | | 41,970,156 | | | | 34,875,267 | | | | 5,178,617 | |
At September 30, 2011, gross unrealized appreciation and depreciation of investments and cost of investments (excluding short positions) for tax purposes were as follows:
| | | Leuthold | | | Leuthold | | | | | | Leuthold | | | Leuthold | | | Leuthold | | | Leuthold | | | | |
| | | Core | | | Asset | | | Leuthold | | | Select | | | Global | | | Global Clean | | | Hedged | | | Grizzly | |
| | | Investment | | | Allocation | | | Global | | | Industries | | | Industries | | | Technology | | | Equity | | | Short | |
| | | Fund | | | Fund | | | Fund* | | | Fund | | | Fund | | | Fund | | | Fund | | | Fund | |
| Tax Cost of Investments | | $ | 866,176,341 | | | $ | 806,006,786 | | | $ | 417,358,837 | | | $ | 18,097,427 | | | $ | 25,006,093 | | | $ | 19,270,261 | | | $ | 3,156,095 | | | $ | 23,198,003 | |
| Gross Unrealized Appreciation | | $ | 90,689,856 | | | $ | 91,375,132 | | | $ | 21,040,152 | | | $ | 1,470,414 | | | $ | 857,572 | | | $ | 677,095 | | | $ | 222,072 | | | $ | 2,401,700 | |
| Gross Unrealized Depreciation | | | (99,044,506 | ) | | | (54,748,529 | ) | | | (35,872,110 | ) | | | (3,272,654 | ) | | | (3,755,353 | ) | | | (4,701,052 | ) | | | (593,157 | ) | | | (2,401,700 | ) |
| Net unrealized appreciation (depreciation) | | $ | (8,354,650 | ) | | $ | 36,626,603 | | | $ | (14,831,958 | ) | | $ | (1,802,240 | ) | | $ | (2,897,781 | ) | | $ | (4,023,957 | ) | | $ | (371,085 | ) | | $ | –– | |
The differences between book and tax basis of unrealized appreciation (depreciation) are primarily attributable to the tax deferral of losses on wash sales.
| 132 | The Leuthold Funds - 2011 Annual Report |
| 3. | INVESTMENT ADVISORY AND OTHER AGREEMENTS |
The Funds have entered into an Investment Advisory Agreement (“advisory agreement”) with Leuthold Weeden Capital Management (“Investment Adviser”).Pursuant to its advisory agreement with the Funds, the Investment Adviser is entitled to receive a fee, calculated daily as applied to each Fund’s daily net assets and payable monthly, at annual rates of:
| Leuthold | | | Leuthold | | | | | | Leuthold | | | Leuthold | | | Leuthold | | | Leuthold | | | | |
| Core | | | Asset | | | Leuthold | | | Select | | | Global | | | Global Clean | | | Hedged | | | Grizzly | |
| Investment | | | Allocation | | | Global | | | Industries | | | Industries | | | Technology | | | Equity | | | Short | |
| Fund | | | Fund | | | Fund* | | | Fund | | | Fund | | | Fund | | | Fund | | | Fund | |
| | 0.90 | % | | | 0.90 | % | | | 1.10 | % | | | 1.00 | % | | | 1.00 | % | | | 1.00 | % | | | 1.25 | % | | | 1.25 | % |
* The Investment Adviser contractually decreased the Advisory fee from 1.25% to 1.10% as of May 16, 2011.
The Investment Adviser has agreed to waive its advisory fee and/or reimburse the Funds’ other expenses, including organization expenses, to the extent necessary to ensure that the Funds’ total operating expenses (exclusive of interest, taxes, brokerage commissions, dividends and interest on short positions, and other costs incurred in connection with the purchase or sale of portfolio securities, and extraordinary items) do not exceed the following rates, based on each Fund’s average daily net assets:
| Leuthold | | | Leuthold | | | | | | Leuthold | | | Leuthold | | | Leuthold | | | Leuthold | | | | |
| Core | | | Asset | | | Leuthold | | | Select | | | Global | | | Global Clean | | | Hedged | | | Grizzly | |
| Investment | | | Allocation | | | Global | | | Industries | | | Industries | | | Technology | | | Equity | | | Short | |
| Fund | | | Fund | | | Fund | | | Fund | | | Fund | | | Fund | | | Fund | | | Fund | |
| | 1.25 | % | | | 1.50 | % | | | 1.85 | % | | | 1.60 | % | | | 1.85 | % | | | 1.85 | % | | | 2.20 | % | | | 2.50 | % |
Any waiver or reimbursement is subject to later adjustments to allow the Investment Adviser to recoup amounts previously waived or reimbursed to the extent actual fees and expenses for a fiscal period are less than each Fund’s expense limitation, provided, however, that the Investment Adviser shall only be entitled to recoup such amounts for a period of three years from the date such amount was waived or reimbursed. Amounts subject to future recoupment as of September 30, 2011 are as follows:
| Leuthold Global Industries Fund | | Leuthold Hedged Equity Fund | |
| Year of Expiration | | Recoverable Amount | | Year of Expiration | | Recoverable Amount | |
| 9/30/2013 | | $ | 31,506 | | 9/30/2012 | | $ | 26,633 | |
| | | | | | 9/30/2013 | | | 37,088 | |
| | | | | | 9/30/2014 | | | 57,551 | |
U.S. Bancorp Fund Services, LLC serves as transfer agent, administrator, and accounting services agent for the Funds. U.S. Bank, N.A. serves as custodian for the Funds. For the year ended September 30, 2011, the Leuthold Core Investment Fund, Leuthold Asset Allocation Fund, Leuthold Global Fund, Leuthold Select Industries Fund, Leuthold Global Industries, Leuthold Global Clean Technology Fund, Leuthold Hedged Equity Fund, and Grizzly Short Fund paid Weeden & Co., L.P., an affiliate of the Adviser, $698,977, $117,979, $87,216, $34,379, $9,237, $35,063, $3,779, and $0, respectively, for brokerage commissions.
| The Leuthold Funds - 2011 Annual Report | 133 |
Each of the Leuthold Asset Allocation Fund – Retail Class, Leuthold Global Fund – Retail Class, Leuthold Global Industries Fund, Leuthold Global Clean Technology Fund – Retail Class and Leuthold Hedged Equity Fund – Retail Class has adopted a distribution plan pursuant to Rule 12b-1 under the Investment Company Act, whereby Rafferty Capital Markets, LLC serves as distributor. This plan allows each Fund to use up to 0.25% of its average daily net assets to pay sales, distribution, and other fees for the sale of its shares and for services provided to investors. Each Fund may pay all or a portion of this fee to any securities dealer, financial institution, or any other person who renders personal service to the Funds’ shareholders, assists in the maintenance of the Funds’ shareholder accounts, or who renders assistance in distributing or promoting the sale of shares of the Fund pursuant to a written agreement approved by the Board of Directors. To the extent such fee is not paid to such persons, each of the Funds may use the fee for its expenses of distribution of its shares, including, but not limited to, payment by the Fund of the cost of preparing, printing, and distributing Prospectuses and Statements of Additional Information to prospective investors and of implementing and operating the Plan.
The Funds enter into contracts that contain a variety of indemnifications. The Funds’ maximum exposure under these arrangements is unknown. However, the Funds have not had prior claims or losses pursuant to these contracts and expect the risk of loss to be remote.
Each Fund may invest up to 15% of net assets in securities for which there is no readily available market (“illiquid securities”). The 15% limitation includes securities whose disposition would be subject to legal restrictions (“restricted securities”). Illiquid and restricted securities often have a market value lower than the market price of unrestricted securities of the same issuer and are not readily marketable without some time delay. This could result in a Fund being unable to realize a favorable price upon disposition of such securities and in some cases might make disposition of such securities at the time desired by the Fund impossible.
| 7. | LENDING PORTFOLIO SECURITIES |
The Funds may lend portfolio securities constituting up to 30% of total assets to unaffiliated broker dealers, banks, or other recognized institutional borrowers of securities, provided that the borrower at all times maintains cash, U.S. government securities or equivalent collateral or provides an irrevocable letter of credit in favor of the Fund equal in value to at least 100% of the value of the securities loaned. The Funds did not lend any portfolio securities during the reporting period, and will not enter into any securities lending arrangements in the future without the prior approval of the Board of Directors.
| 134 | The Leuthold Funds - 2011 Annual Report |
REPORT OF INDEPENDENT REGISTERED PUBLIC ACCOUNTING FIRM
To the Shareholders and Board of Directors
Leuthold Funds, Inc.
We have audited the accompanying statements of assets and liabilities, including the schedules of investments and securities sold short (as applicable), of Leuthold Funds, Inc. (consisting of Leuthold Core Investment Fund (consolidated), Leuthold Asset Allocation Fund (consolidated), Leuthold Global Fund (consolidated), Leuthold Select Industries Fund, Leuthold Global Industries Fund, Leuthold Global Clean Technology Fund, Leuthold Hedged Equity Fund, and Grizzly Short Fund) (the “Funds”) as of September 30, 2011, and the related statements of operations, changes in net assets and the financial highlights for each of the periods indicated therein. These financial statements and financial highlights are the responsibility of the Funds’management.Our responsibility is to express an opinion on these financial statements and financial highlights based on our audits.
We conducted our audits in accordance with the standards of the Public Company Accounting Oversight Board (United States). Those standards require that we plan and perform the audits to obtain reasonable assurance about whether the financial statements and financial highlights are free of material misstatement. We were not engaged to perform an audit of the Funds’ internal control over financial reporting. Our audits included consideration of internal control over financial reporting as a basis for designing audit procedures that are appropriate in the circumstances, but not for the purpose of expressing an opinion on the effectiveness of the Funds’ internal control over financial reporting. Accordingly, we express no such opinion. An audit includes examining, on a test basis, evidence supporting the amounts and disclosures in the financial statements and financial highlights, assessing the accounting principles used and significant estimates made by management, and evaluating the overall financial statement presentation. Our procedures included confirmation of securities owned and securities sold short (as applicable) as of September 30, 2011, by correspondence with the custodian and brokers.We believe that our audits provide a reasonable basis for our opinion.
In our opinion, the financial statements and financial highlights referred to above present fairly, in all material respects, the financial position of each of the respective funds constituting Leuthold Funds, Inc. at September 30, 2011, the results of their operations, changes in their net assets and the financial highlights for each of the periods indicated therein, in conformity with U.S. generally accepted accounting principles.
Minneapolis, Minnesota
November 18, 2011
| | The Leuthold Funds - 2011 Annual Report | 135 |
ADDITIONAL INFORMATION (Unaudited)
SHAREHOLDER NOTIFICATION OF FEDERAL TAX STATUS (Unaudited)
The percentage of dividend income distributed for the year ended September 30, 2011, which is designated as qualified dividend income under the Jobs and Growth Tax Relief Reconciliation Act of 2003, is as follows: Leuthold Core Investment Fund 52.65%, Leuthold Asset Allocation Fund 67.21%, Leuthold Global Fund 59.62%, Leuthold Select Industries Fund 100.00%, and Leuthold Global Industries Fund 65.25%.
The percentage of dividend income distributed for the year ended September 30, 2011, designated as qualified dividends received deduction available to corporate shareholders, is as follows: Leuthold Core Investment Fund 31.90%, Leuthold Asset Allocation Fund 48.18%, Leuthold Global Fund 32.60%, Leuthold Select Industries Fund 100.00%, and Leuthold Global Industries Fund 35.10%.
The Leuthold Core Investment Fund, Leuthold Asset Allocation Fund, Leuthold Global Fund, Leuthold Select Industries Fund, and Leuthold Global Industries Fund designated 1.11%, 0.27%, 1.00%, 0.05%, and 0.01%, respectively, of their ordinary distributions paid as qualified interest related dividends under the Internal Revenue Code Section 871(k)(1)(C) for the year ended September 30, 2011. The Leuthold Global Fund and Leuthold Global Industries Fund designated 71.41% and 32.39%, respectively, of their ordinary distributions paid as short-term capital gain distributions under Internal Revenue Section 871(k)(2)(C) for the year ended September 30, 2011.
For the year ended September 30, 2011, the Leuthold Global Industries Fund earned foreign source income and paid foreign taxes which it intends to pass through to its shareholders pursuant to Section 853 of the Internal Revenue Code as follows:
| | | Foreign Source | | | Taxes | |
| | | Income Earned | | | Paid | |
| Australia | | $ | 2,136 | | | $ | 320 | |
| Belgium | | | 9,619 | | | | 1,443 | |
| Bermuda | | | 13,250 | | | | — | |
| Brazil | | | 18,923 | | | | 1,724 | |
| Canada | | | 5,730 | | | | 860 | |
| China | | | 12,087 | | | | 1,212 | |
| Denmark | | | 7,637 | | | | 1,146 | |
| Finland | | | 8,049 | | | | 1,207 | |
| France | | | 25,478 | | | | 3,574 | |
| Germany | | | 88,283 | | | | 13,243 | |
| Hong Kong | | | 62,796 | | | | 991 | |
| Indonesia | | | 7,845 | | | | 1,354 | |
| Israel | | | 9,170 | | | | 1,873 | |
| Japan | | | 83,603 | | | | 5,857 | |
| Malaysia | | | 5,222 | | | | — | |
| 136 | The Leuthold Funds - 2011 Annual Report | |
SHAREHOLDER NOTIFICATION OF FEDERAL TAX STATUS (Unaudited) (continued)
| | | Foreign Source | | | Taxes | |
| | | Income Earned | | | Paid | |
| Marshall Islands | | | 2,956 | | | | — | |
| Mexico | | | 8,675 | | | | — | |
| Netherlands | | | 15,329 | | | | 2,299 | |
| Norway | | | 15,262 | | | | 2,296 | |
| Poland | | | 5,480 | | | | 822 | |
| Portugal | | | 2,731 | | | | 410 | |
| Republic of Korea | | | 8,130 | | | | 1,341 | |
| Singapore | | | 17,101 | | | | — | |
| South Africa | | | 3,270 | | | | — | |
| Spain | | | 6,976 | | | | 1,047 | |
| Sweden | | | 20,933 | | | | 3,140 | |
| Taiwan | | | 54,671 | | | | 17,151 | |
| Thailand | | | 9,656 | | | | 746 | |
| Turkey | | | 35,762 | | | | 4,842 | |
| United Kingdom | | | 21,719 | | | | 2,220 | |
| United States | | | 119,114 | | | | — | |
| | | | | | | | | |
| | | $ | 707,593 | | | $ | 71,118 | |
| | The Leuthold Funds - 2011 Annual Report | 137 |
The Leuthold Funds
ADDITIONAL DISCLOSURE REGARDING FUND DIRECTORS AND OFFICERS (UNAUDITED)
Independent Directors
| | | | | | | | | # of | | | |
| | | | | | | | | Portfolios in | | Other | |
| | | Position(s) | | Term of Office | | | | Fund Complex | | Directorships | |
| Name, Year of Birth, | | Held with | | and Length of | | Principal Occupation(s) | | Overseen By | | Held by | |
| and Address | | the Company | | Time Served | | During Past Five Years | | Director | | Director | |
| Lawrence L. Horsch (1934) | | Chairman | | Indefinite Term, | | Chairman, Eagle Management & | | 8 | | None | |
| c/o Leuthold Weeden | | and Director | | Director since | | Financial Corp., a management | | | | | |
| Capital Management | | | | 1995 | | consulting firm | | | | | |
| 33 South Sixth Street | | | | | | | | | | | |
| Suite 4600 | | | | | | | | | | | |
| Minneapolis, MN 55402 | | | | | | | | | | | |
| | | | | | | | | | | | |
| | | | | | | | | | | | |
| | | | | | | | | | | | |
| Paul M. Kelnberger (1943) | | Director and | | Indefinite Term, | | Consultant to Johnson, | | 8 | | None | |
| c/o Leuthold Weeden | | Chair of | | Director since | | West & Co., PLC | | | | | |
| Capital Management | | Audit | | 1995 | | | | | | | |
| 33 South Sixth Street | | Committee | | | | | | | | | |
| Suite 4600 | | | | | | | | | | | |
| Minneapolis, MN 55402 | | | | | | | | | | | |
| | | | | | | | | | | | |
| | | | | | | | | | | | |
| | | | | | | | | | | | |
| Addison L. Piper (1946) | | Director and | | Indefinite Term, | | Retired Chairman and Chief | | 8 | | Piper Jaffray | |
| c/o Leuthold Weeden | | Chair of | | Director since | | Executive Officer of Piper Jaffray | | | | Companies | |
| Capital Management | | Nominating | | 2009 | | Companies, Served as Vice Chairman | | | | and | |
| 33 South Sixth Street | | Committee | | | | of Piper Jaffray Companies from | | | | Renaissance | |
| Suite 4600 | | | | | | 2003 to 2006. | | | | Learning, Inc. | |
| Minneapolis, MN 55402 | | | | | | | | | | | |
| | | | | | | | | | | | |
| Interested Directors (and Officers) | | | | | | | |
| | | | | | | | | | | | |
| Steven C. Leuthold (1937) | | Director | | Indefinite Term, | | Managing member of Leuthold | | 8 | | None | |
| 33 South Sixth Street | | | | Director since 1995 | | Weeden Capital Management | | | | | |
| Suite 4600 | | | | | | (the “Adviser”). Prior to October 2011, | | | |
| Minneapolis, MN 55402 | | | | | | served as Chief Investment Officer | | | | | |
| | | | | | | of the Adviser. | | | | | |
| | | | | | | | | | | | |
| John C. Mueller (1968) | | Director | | Indefinite Term, | | Co-Chief Executive Officer | | 8 | | None | |
| 33 South Sixth Street | | | | Director since 2009 | | of The Leuthold Group since 2005. | | | | | |
| Suite 4600 | | | | | | Involved in Sales and Marketing for | | | | | |
| Minneapolis, MN 55402 | | President | | One year term, | | The Leuthold Group since 2001. | | | | | |
| | | | | President since 2011 | | | | | | | |
| 138 | The Leuthold Funds - 2011 Annual Report | |
The Leuthold Funds
| | | | | | | | | # of | | | |
| | | | | | | | | Portfolios in | | Other | |
| | | Position(s) | | Term of Office | | | | Fund Complex | | Directorships | |
| Name, Year of Birth, | | Held with | | and Length of | | Principal Occupation | | Overseen By | | Held by | |
| and Address | | the Company | | Time Served | | During Past Five Years | | Director | | Director | |
Edward C. Favreau (1952) 33 South Sixth Street Suite 4600 Minneapolis, MN 55402 | | Vice President | | One Year Term, Vice President since 1999 | | Manager of Marketing and Sales of the Adviser since 1999. Prior to joining the Adviser, he was Vice President and Sales Manager of U.S. Bancorp Investments, Inc. | | N/A | | N/A | |
| | | | | | | | | | | | |
Roger A. Peters (1960) 33 South Sixth Street Suite 4600 Minneapolis, MN 55402 | | Vice President and Chief Compliance Officer and Anti-Money Laundering Officer | | One Year Term, Chief Compliance Officer since 2006 and Vice President since 2007 and Anti-Money Laundering Officer since 2011 | | Chief Compliance Officer of the Adviser since 2005. Prior to joining the Adviser, he was Vice President, Commercial Product Management of U.S. Bank from 2003-2005. | | N/A | | N/A | |
| | | | | | | | | | | | |
Holly J. Weiss (1968) 33 South Sixth Street Suite 4600 Minneapolis, MN 55402 | | Secretary and Treasurer | | One Year Term, Secretary and Treasurer since 2009 | | Chief Financial Officer of the Adviser since 2011 and Controller of the Adviser from 2008 to 2011. Prior to joining the Adviser, she was Controller of Churchill Capital Mezzanine Finance from 2001-2008. | | N/A | | N/A | |
| | | | | | | | | | | | |
Glenn R. Larson (1965) 33 South Sixth Street Suite 4600 Minneapolis, MN 55402 | | Assistant Secretary | | One Year Term, Assistant Secretary since 2006 | | Compliance Officer of the Adviser since 2005. Prior to joining the Adviser, he was a Compliance Representative of U.S. Bancorp Investment Services, Inc. from 2003 until 2005. | | N/A | | N/A | |
The Statement of Additional Information includes additional information about the Funds’ Directors and is available free of charge upon request by calling the Funds toll free at (800) 273-6886.
Information regarding the method the Funds use to vote proxies relating to portfolio securities is available without charge upon request by calling toll-free at (800) 273-6886 or by accessing the Funds’ website at www.leutholdfunds.com. Information regarding how the Funds voted proxies relating to portfolio securities during the most recent twelve-month period ended June 30 is available without charge upon request by calling toll-free at (800) 273-6886 or on the SEC’s website at www.sec.gov.
| | The Leuthold Funds - 2011 Annual Report | 139 |
The Leuthold Funds
Investment Adviser:
Leuthold Weeden Capital
Management, Minnesota
Administrator, Transfer Agent,
Dividend Paying Agent,
Shareholder Servicing Agent:
U.S. Bancorp Fund Services, LLC, Wisconsin
Custodian:
U.S. Bank, N.A., Wisconsin
Counsel:
Foley & Lardner, LLP, Wisconsin
Independent Registered
Public Accounting Firm:
Ernst &Young LLP, Minnesota
The Funds are required to file their complete schedules of portfolio holdings with the SEC for their first and third fiscal quarters on Form N-Q. Once filed, the Fund’s Form N-Q is available without charge, upon request on the SEC’s website (http://www.sec.gov) and may be available by calling 1-800-273-6886. You can also obtain copies of Form N-Q by (i) visiting the SEC’s Public Reference Room in Washington, DC (information on the operation of the Public Reference Room may be obtained by calling 1-800-SEC-0330); (ii) sending your request and a duplicating fee to the SEC’s Public Reference Room, Washington, DC 20549-0102; or (iii) sending your request electronically to publicinfosec.gov.
This report is authorized for distribution only when preceded or accompanied by a current prospectus.
Item 2. Code of Ethics.
The registrant has adopted a code of ethics that applies to the registrant’s principal executive officer and principal financial officer. The registrant has not made any amendments to its code of ethics during the period covered by this report. The registrant has not granted any waivers from any provisions of the code of ethics during the period covered by this report. A copy of the registrant’s Code of Ethics is filed herewith.
Item 3. Audit Committee Financial Expert.
The registrant’s board of directors has determined that there is at least one audit committee financial expert serving on its audit committee. Paul Kelnberger is the “audit committee financial expert” and is considered to be “independent” as each term is defined in Item 3 of Form N-CSR.
Item 4. Principal Accountant Fees and Services.
The registrant has engaged its principal accountant to perform audit services, audit-related services, tax services and other services during the past two fiscal years. “Audit services” refer to performing an audit of the registrant's annual financial statements or services that are normally provided by the accountant in connection with statutory and regulatory filings or engagements for those fiscal years. “Audit-related services” refer to the assurance and related services by the principal accountant that are reasonably related to the performance of the audit. “Tax services” refer to professional services rendered by the principal accountant for tax compliance, tax advice, and tax planning. No “other services” were provided by the principal accountant. The following table details the aggregate fees billed or expected to be billed for each of the last two fiscal years for audit fees, audit-related fees, tax fees and other fees by the principal accountant.
The audit committee has adopted pre-approval policies and procedures that require the audit committee to pre-approve all audit and non-audit services of the registrant, including services provided to any entity affiliated with the registrant.
The percentage of fees billed by Ernst & Young, LLP applicable to non-audit services pursuant to waiver of pre-approval requirement were as follows:
All of the principal accountant’s hours spent on auditing the registrant’s financial statements were attributed to work performed by full-time permanent employees of the principal accountant. (If more than 50 percent of the accountant’s hours were spent to audit the registrant's financial statements for the most recent fiscal year, state how many hours were attributed to work performed by persons other than the principal accountant's full-time, permanent employees.)
The following table indicates the non-audit fees billed or expected to be billed by the registrant’s accountant for services to the registrant and to the registrant’s investment adviser (and any other controlling entity, etc.—not sub-adviser) for the last two years. The audit committee of the board of directors has considered whether the provision of non-audit services that were rendered to the registrant's investment adviser is compatible with maintaining the principal accountant's independence and has concluded that the provision of such non-audit services by the accountant has not compromised the accountant’s independence.
Item 5. Audit Committee of Listed Registrants.
Not applicable to registrants who are not listed issuers (as defined in Rule 10A-3 under the Securities Exchange Act of 1934).
Item 6. Investments.
Schedule of Investments is included as part of the report to shareholders filed under Item 1 of this Form.
Item 7. Disclosure of Proxy Voting Policies and Procedures for Closed-End Management Investment Companies.
Not applicable to open-end investment companies.
Item 8. Portfolio Managers of Closed-End Management Investment Companies.
Not applicable to open-end investment companies.
Item 9. Purchases of Equity Securities by Closed-End Management Investment Company and Affiliated Purchasers.
Not applicable to open-end investment companies.
Item 10. Submission of Matters to a Vote of Security Holders.
Not Applicable.
Item 11. Controls and Procedures.
Item 12. Exhibits.
Pursuant to the requirements of the Securities Exchange Act of 1934 and the Investment Company Act of 1940, the registrant has duly caused this report to be signed on its behalf by the undersigned, thereunto duly authorized.
Pursuant to the requirements of the Securities Exchange Act of 1934 and the Investment Company Act of 1940, this report has been signed below by the following persons on behalf of the registrant and in the capacities and on the dates indicated.
* Print the name and title of each signing officer under his or her signature.