UNITED STATES
SECURITIES AND EXCHANGE COMMISSION
Washington, D.C. 20549
FORM N-CSR
CERTIFIED SHAREHOLDER REPORT OF REGISTERED
MANAGEMENT INVESTMENT COMPANIES
Investment Company Act file number 811-09094
| | Leuthold Funds, Inc. | |
| (Exact name of registrant as specified in charter) |
| | 33 S. Sixth Street, Suite 4600, Minneapolis, MN 55402 | |
| (Address of principal executive offices) (Zip code) |
| | Leuthold Weeden Capital Management | |
| | 33 S. Sixth Street, Suite 4600, Minneapolis, MN 55402 | |
| (Name and address of agent for service) |
| | 612-332-9141 | |
| Registrant’s telephone number, including area code |
Date of fiscal year end: September 30, 2012
Date of reporting period: September 30, 2012
Item 1. Reports to Stockholders.
Annual Report
September 30, 2012
The Leuthold Funds
Leuthold Core Investment Fund
Leuthold Asset Allocation Fund
Leuthold Global Fund
Leuthold Select Industries Fund
Leuthold Global Industries Fund
Leuthold Global Clean Technology Fund
Grizzly Short Fund
| The Leuthold Funds |
| Table of Contents |
| Letter to Shareholders | | 1 |
| | | |
| Expense Examples | | 16 |
| | | |
| Allocation of Portfolio Holdings | | 20 |
| | | |
| Components of Portfolio Holdings | | 24 |
| | | |
| Investment Graphs | | 26 |
| | | |
| Statements of Assets and Liabilities | | 38 |
| | | |
| Statements of Operations | | 42 |
| | | |
| Statements of Changes in Net Assets | | 46 |
| | | |
| Financial Highlights | | 53 |
| | | |
| Schedule of Investments | | |
| | | |
| Leuthold Core Investment Fund | | 65 |
| | | |
| Leuthold Asset Allocation Fund | | 75 |
| | | |
| Leuthold Global Fund | | 86 |
| | | |
| Leuthold Select Industries Fund | | 95 |
| | | |
| Leuthold Global Industries Fund | | 98 |
| | | |
| Leuthold Global Clean Technology Fund | | 103 |
| | | |
| Grizzly Short Fund | | 106 |
| | | |
| Notes to the Financial Statements | | 110 |
| | | |
| Report of Independent Registered Public Accounting Firm | | 122 |
| | | |
| Additional Information | | 123 |
| | | |
| Directors and Officers | | 124 |
Dear Fellow Shareholders:
One year ago, stock markets around the world made a bear market bottom in the early days of October, and spent the last three months of the year recouping losses suffered during the summer of 2011. U.S. markets were the primary beneficiaries during that time, with gains ranging from 12-16%. Global market action was strangely disparate, with foreign developed markets turning in a much less robust gain of under 4% for the last three months of 2011. Stocks continued to rally across the board through the first quarter of 2012, benefitting U.S. Small Caps, Mid Caps, and Large Caps alike, with gains of between 12-14%; foreign developed markets also kept relatively close pace in the first quarter, up 11%. The best part of the year’s performance was achieved in these first six months of the fiscal year, with the S&P 500 up 25.89%, the S&P MidCap 400 up 28.23%, and the small cap Russell 2000 Index up 29.83% from October 2011 through March 2012. Foreign developed markets trailed with a 15% gain during that six month time frame.
U.S. and global markets moved down in April and May, surrendering some of the year’s earlier gains. Domestic stocks saw moderate losses ranging from between -6% to -8%, while foreign developed markets were hit especially hard, -13% in those two months. The remaining four months of the fiscal year were positive, with U.S. market gains of between 7% (Mid Cap stocks) to 11% (Small and Large Caps) during that time, while foreign developed markets outperformed (+15%) during the June-September period.
The summer rally pushed the S&P 500 to new bull market highs in September. While foreign markets also rallied, no major global or foreign stock market composite was able to better the highs they recorded back in April. Through September 2012, the S&P 500 is now up a remarkable 30% from last year’s October 4th low, yet this rally surely ranks among the least enjoyed and least exploited gain of that magnitude in history. Neither the average U.S. stock, nor many professionally managed portfolios, have kept pace with these gains. Overseas stocks have fared even worse.
We have generally referred to the 3 1/2-year-old bull market as a global one, but the U.S. did the heavy-lifting over all but the first six months of the bull market dating back to March 2009. The MSCI World “Ex USA” Index is down -1.3% in the last three years through September 2012, and the MSCI Emerging Markets Index is up only 9.7% over the same period. Such U.S. stock market dominance would have been hard to envision in the world of three years ago, when boundless opportunities in emerging markets – versus a sclerotic, “New Normal” United States – were taken for granted.
The past three years have been difficult for equity managers relying heavily on quantitative tools, and we are no exception. All six of our quantitatively-driven strategies have underperformed their benchmarks during this time. It is not unusual for “quant” managers to lag their benchmarks during the first year or so of a new bull market, but the effect has lasted much longer than we’ve traditionally experienced.
The stock market low of 2009 was a rare event attended by nearly apocalyptic investor psychology and 80-year extremes in market action. One might have expected the rebound from this extreme to be just as unprecedented, and in many ways it has been. But our models rely on consistent and repetitive patterns that are a necessary by-product of a capitalistic system – repetitive patterns that are probably ultimately tied to hard-wired biases in human behavior. No approach can be expected to outperform in all environments, and tinkering excessively with models that have stood the test of time is typically counterproductive. We know the historical market biases will eventually re-assert themselves, and accordingly, we are sticking with the core of our quantitative investment disciplines.
We now wonder whether the preference for U.S. assets (and “safe” assets in general) has swung too far. The S&P 500 normalized Price/Earnings ratio is more than six points above the comparable non-U.S. measure (20.2x versus 13.8x), and we have run out of superlatives/profanities to describe the overvaluation of U.S. bonds. We doubt the hoarding of all things American will prove the best strategy for the next three years. In the meantime, our disciplines have us tactically bullish on stocks globally – with the emphasis on “global.”
|
The Leuthold Funds - 2012 Annual Report | 1 |
The summer’s stock market upswing drove the S&P 500 beyond the “typical” or “median” experience for a cyclical bull market, based on analysis back to 1932. From its low on March 9, 2009, through the most recent high on September 14, 2012, the S&P 500 has risen 116% (price only) over a period of 43 months, while the medians for previous bull markets are +90%, and 42 months, respectively. Our most reliable valuation measures today trade at levels we’d label as “mildly” overvalued. Valuations are far from levels that mandate an immediate run for cover, but they are not cheap. While our market analysis has correctly remained on the bullish side since late October 2011, weakening readings of late suggest that defensive portfolio moves might be required in coming months. The U.S. bull market is mature and we are on higher alert for signs of an impending breakdown; we think the odds are better than even that 2013 will see a cyclical top.
Despite these benchmark comparisons and statistics, and regardless of our expectations and predictions, it is our disciplines that drive our investment strategies. The increasingly interdependent relationships of global markets and economies have created seemingly limitless and unpredictable dynamics that can affect market action, both in the short term and over the long term. Having disciplines removes the emotions and eliminates the potential for responding to headlines in an imprudent manner; they offer a balanced means for weighing information through more contemplative risk/reward analysis. We will remain flexible with our asset allocation strategies and abide by the disciplines to change course throughout the year, as necessary.
FUND OVERVIEWS
Leuthold Core Investment Fund
This Fund began trading on November 20, 1995. The strategy is flexible and value-oriented. The Leuthold Core Investment Fund adjusts asset class exposure depending on market conditions and the economic environment, with the objective of identifying areas that appear poised to outperform while attempting to avoid undue risk. Assets are allocated between stocks, bonds, money market instruments, foreign securities, and other alternative investments. The Fund may hedge equity exposure and fixed income exposure through short-selling strategies when our disciplines indicate potential market vulnerabilities. While at times individual portfolio positions may appear unconventional, they are intended to integrate as complementing allocations in an effort to carry out the Fund’s guiding principle: capital appreciation over the long-term, attained through relatively risk averse, prudent investment selection.
| ● | Leuthold Core Investment Fund uses the Leuthold Select Industries strategy as the primary vehicle for directing its U.S.-traded stock exposure. |
| Investment Guidelines: 30%-70% equity exposure and 30%-70% fixed income exposure. Under extreme market conditions, there may be a departure from these guidelines. |
Leuthold Asset Allocation Fund
This Fund began trading on May 24, 2006. The strategy and objective of this Fund are the same as those of the Leuthold Core Investment Fund in terms of guiding disciplines, flexibility, asset class exposure, and risk aversion. This Fund uses other strategies, however, to obtain its targeted U.S.-traded stock exposure.
|
| 2 | The Leuthold Funds - 2012 Annual Report |
| ● | Leuthold Asset Allocation Fund uses a combination of two quantitative, stock screening methodologies for its U.S.-traded stock selection. These are proprietary disciplines of the adviser, referred to as: 1) Leuthold Select Equities, and; 2) Leuthold Undervalued & Unloved. |
| ● | Effective December 3, 2012, changes will begin to be implemented within the investment strategy of the Leuthold Asset Allocation Fund in order to reflect a more broadly diversified product (greater variety of asset class exposures), with more formal risk controls. Going forward, these changes will clearly differentiate it from the Leuthold Core Investment Fund investment strategy. Please see the Supplement to the Prospectus dated November 5, 2012, for more details. |
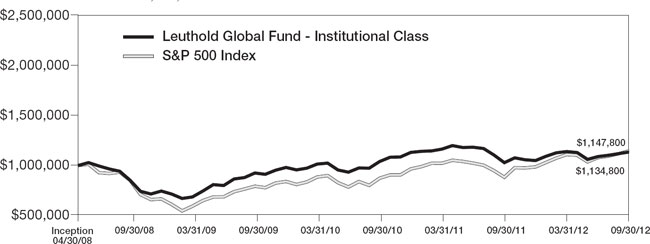
Leuthold Global Fund
This asset allocation strategy was introduced on April 30, 2008, and can be considered the “global” equivalent of our flagship Leuthold Core Investment Fund. The strategy and objective of this Fund are analogous to that of the Leuthold Core Investment Fund in terms of guiding disciplines, flexibility, asset class exposure, and risk aversion; however, this global version requires a minimum level of investment in foreign-traded securities. The Leuthold Global Fund invests in U.S. and foreign-traded stocks, bonds, money market instruments, and alternative investments; when market conditions are deemed unfavorable, the Fund may sell short certain securities in order to hedge exposure to a particular asset class. The Leuthold Global Fund intends to invest at least 40% of assets in foreign-traded securities, be it stocks, bonds, and/or other asset classes.
| ● | Leuthold Global Fund uses the Leuthold Global Industries strategy as the primary vehicle for directing its investments in global stock markets. |
| ● | Investment Guidelines: 30%-70% equity exposure and 30%-70% fixed income exposure. Under extreme market conditions, there may be a departure from these guidelines. |
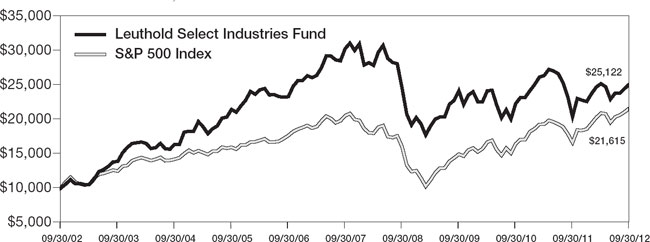
Leuthold Select Industries Fund
This Fund began trading on June 19, 2000, and unlike our asset allocation strategies, it will maintain 100% long exposure in stocks regardless of market conditions. This attribute results in the potential for considerably higher volatility, higher risk, and the probability that investors will lose money when the stock market declines. The Leuthold Select Industries Fund strategy is a top-down approach, based on industry group selection and rotation, and sector concentrations. Driven by extensive quantitative analysis, the strategy attempts to identify collective areas of strength and emerging leadership opportunities.
| ● | The elements of industry group rotation and sector concentrations result in the potential for higher volatility; it is potentially more risky while offering potentially more reward. |
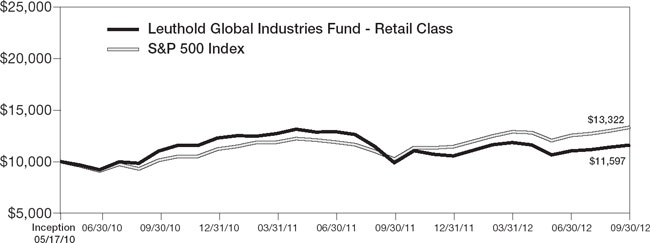
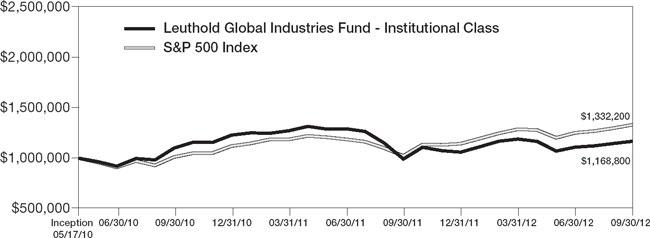
Leuthold Global Industries Fund
This is a relatively new Fund, launched on May 17, 2010; however, this Fund’s strategy is an extension of our domestic industry group selection/rotation approach which was established in the late 1990s as our Select Industries strategy, described above. This global version of our disciplined, quantitative approach to concentrated equity group investing employs many of the same factors as our domestic group selection strategy. The intent is to identify those industry groups that appear most attractive at the global level. This Fund will normally invest at least 40% of its assets in equity securities traded in foreign markets.
|
The Leuthold Funds - 2012 Annual Report | 3 |
| ● | The elements of industry group rotation and sector concentrations result in the potential for higher volatility. It is potentially more risky while offering potentially more reward. |
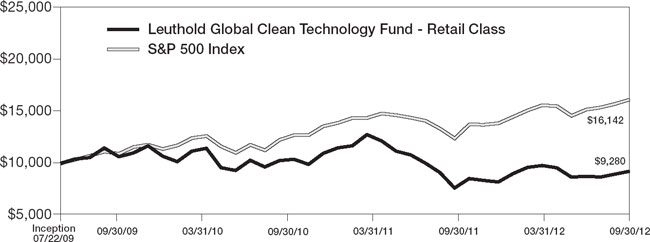
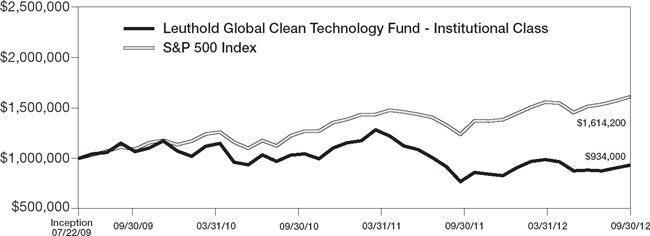
Leuthold Global Clean Technology Fund
This Fund became available on July 22, 2009, and unlike our other equity strategies, this Fund employs fundamental stock-selection. The Fund allocates its investments globally, in companies that endeavor to reduce the negative effects on the environment that may come about as by-products of society and modern technology. This is achieved through energy efficient and “clean” technologies, innovations, and solutions. A confluence of factors will help increase the demand for products from firms focused on technologies that clean, preserve, and/or maximize the earth’s resources, making these firms intriguing long-term investment opportunities. In brief, noteworthy dynamics benefitting these efforts include: political pressure for new/improved resources, higher fossil fuel prices, growing world population, changing energy source preferences, commodity price volatility, increasingly scarce resources, and significant and growing markets.
The Fund invests primarily across four clean technology sectors: Alternative Energy, Resource Conservation, Clean Water, and Clean Environment. The universe of stocks maintained for security selection is further organized among over 30 different sub-industries. This helps identify specific clean technology industries showing signs of unusual strength or weakness, and may be used as a basis for establishing overweight and underweight industry exposures.
| ● | The nature of this strategy combined with the inherently smaller capitalization of the eligible stock universe results in a high level of volatility in performance. |
| ● | On November 12, 2012, the Fund’s Board of Directors approved the closing and liquidation of the Leuthold Global Clean Technology Fund. Shareholders were sent notification with a letter of instruction outlining the course of action. Please see the Supplement to the Prospectus dated November 12, 2012 for more details. |
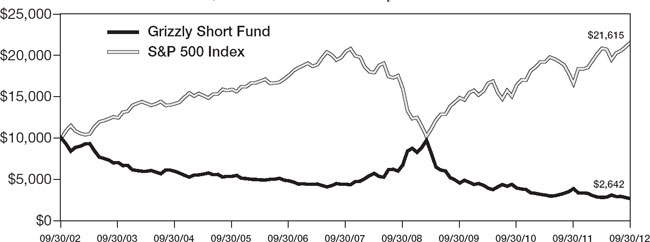
Grizzly Short Fund
Introduced on June 19, 2000, this unleveraged, actively managed Fund is 100% short individual stocks. (The intent of short-selling stocks is to profit when stock prices decline.) Policy mandates the Grizzly Short Fund target 100% exposure in stocks sold short at all times, even when the stock market is in a rising trend.
| ● | The Grizzly Short Fund typically maintains approximately equal-weighted short positions in around 60-90 individual stocks, initially selected by a multi-factor quantitative discipline. Each position is monitored daily and subject to a set of short covering disciplines. |
| ● | Shareholders should anticipate they will most likely lose money investing in this Fund when stock prices are rising. |
The Grizzly Short Fund is a tool for stock market sophisticates, traders, advisors, and experienced investors to employ, as a means to tactically moderate stock market risk, when they anticipate the market may decline. It is also used in varying degrees with other multi-faceted portfolio strategies. This is not a Fund for buy and hold investors.
|
| 4 | The Leuthold Funds - 2012 Annual Report |
ANNUAL PERFORMANCE REVIEW
Leuthold Core Investment Fund
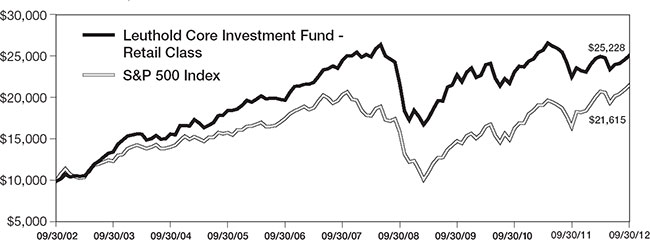
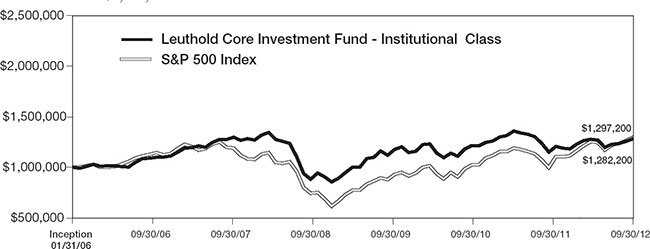
This is our firm’s flagship asset allocation strategy, with $791 million of assets under management. For the fiscal year ended September 30, 2012, the Leuthold Core Investment Fund (retail share class) posted a total return gain of 11.34%. During the same time frame, the S&P 500 had a total return gain of 30.20%.
The fiscal year commenced in October 2011 with the portfolio positioned near its maximum defensive level of just 31% net equity exposure. Our market analysis improved to a cautiously positive outlook for stocks by the end of October and equity exposure was increased to 50-55%. In late December, our indicators strengthened further and equity exposure was increased to near 60%. We were fairly bullish the remainder of the year with average equity exposure of 62% from January through September 2012.
The Fund’s near maximum defensive posture in October 2011 was inopportune and created an immediate 6% performance disadvantage in the first month of the fiscal year, as the S&P 500 rallied with an 11% gain that month, versus the Fund’s 4.84% gain. Additionally contributing to the year’s underperformance was the Fund’s lower average exposure to stocks. Even when in fully bullish mode, the Fund’s upside limit to stocks is 70%; hence, during market advances it is unlikely that the aggregate portfolio will be able to compete head to head with a 100% invested benchmark. It is, however, our intention that the long stock exposure in the Fund will outperform the S&P 500, and this was not accomplished over the last twelve months.
There were four months in which the Fund’s U.S. equity exposure outperformed the S&P 500, by an average of 0.8%, but these advantage months were more than offset by seven months in which the U.S. equities lagged the S&P 500 by an average of 1% (there was one month of even performance). Adding to the equity underperformance were two months in which the Emerging Market Equities position trailed the S&P 500 by a considerable margin of between 5%-6% each of those months.
For specifics related to the Leuthold Core Investment Fund’s U.S.-traded stock investments during the last twelve months, see the performance discussion of the Leuthold Select Industries Fund on subsequent pages.
The Leuthold Core Investment Fund held an average of 7.7% of assets in Emerging Market Equities over the last twelve months, just slightly above the normal base target of 5%. This was quite the reverse of fiscal year 2011, when there was an oversized position of 15% of assets. For the fiscal year ended September 30th, the Emerging Market Equities produced a solid 13% gain, a welcome turnaround from the prior year’s double digit loss, but trailing the S&P 500 by about 17 percentage points.
For the majority of the last twelve months, the characteristics of this Emerging Market Equities exposure were the same as last year, with all investments focused in Asia, the majority of which consisted of individual stocks of Chinese companies. A new approach was implemented at the end of August in order to attain a more comprehensive exposure to all accessible emerging markets, thereby diversifying the risk outside of Asia and increasing the potential for uncovering opportunities. Although the largest regional exposure still comes from the Pacific Rim, as of the end of September 2012, the portfolio includes investments from South America, Eastern Europe, Africa, and North America. The largest country exposure is now Brazil; followed by China, South Korea, South Africa, Hong Kong, Thailand, Indonesia, and Russia. There is also exposure to Singapore, Turkey, Poland, Taiwan, Malaysia, Mexico, Philippines, Chile, and Hungary.
|
| The Leuthold Funds - 2012 Annual Report | 5 |
Our asset allocation strategy’s normal guideline minimum for Fixed Income is 30% of assets. Prior to the last twelve months, we had been maintaining a drastically lower exposure with an average of just 5.75% in 2011 and 9% in 2010, due to the inherent risk of rising rates. The Federal Reserve has been holding interest rates at excessively low levels for an unprecedented period of time and it is inevitable that rates will rise from these artificially low levels. However, our attempt to avoid the risk by minimizing exposure here has been a losing proposition. By primarily avoiding this asset class, we’ve passed up some rather robust gains, particularly with U.S. Treasuries in 2011. To address this portfolio deficiency and bulk up the Fund’s income generating assets, last December an initiative was launched to increase fixed income exposure back up toward the normal minimum level. This was achieved by evaluating the landscape for tactical, prudent income opportunities through the use of a multi-factor risk aversion analysis tool. This has been a gradual process, but by the end of the fiscal year, the Fund’s fixed income exposure had been boosted to about 24%.
During the year, fixed income holdings included Quality Corporate Bonds (8.2% average position); Aggregate Bond Funds composed of corporate debt, developed market sovereign debt, and mortgage backed securities (6.7% average position); and Emerging Market Sovereign Debt (2.3% average position). An allocation to High Yield Bonds was initiated in February (1.5% average position). Although it was one of the smaller allocations, the Emerging Market Sovereign Debt was by far the best performer, with a 22% gain. The other fixed income allocations also had solid gains, with the Aggregate Bond Funds up 4.4%, High Yield Bonds up 5.2%, and Quality Corporate Bonds up 9%.
The Leuthold Core Investment Fund had an average allocation of 4.9% to the Real Estate asset class during the 2012 fiscal year. Established in November of 2011, there was an emphasis on Retail and Residential segments, but there was also exposure to the Industrial, Health Care, and Office segments. The real estate exposure was attained through a package of REITs, versus physical real estate, as REITs allow for greater transparency, efficient portfolio rebalancing, ease of diversification through specialty subsets of properties, and liquidity of the stock market, all the while offering performance dynamics akin to physical real estate values. Real Estate was one of the best performing asset classes for the year, with the Fund’s holdings gaining over 17% for the eleven month holding period.
We held an average allocation of 4.4% in Precious Metals during the 2012 fiscal year, obtained via holdings in physical Gold and Silver. The physical Gold was held for the full year, while the Silver portion of the allocation was eliminated in March. The combined allocation performed very well, contributing an 11% gain to the portfolio for the twelve months ended September 30th. This position was initiated in April 2009 as a means to incorporate some defense against the longer-term risk of inflation and debasement of the dollar. We believe these concerns are still valid and expect this holding to be maintained for the foreseeable future.
While it was a very strong year for the S&P 500, the average stock, and most professional managers, did not participate in the rally to the same degree as exemplified by the major market indexes. Although our asset allocation strategy was not alone in its underperformance, the extent of the underperformance over the last twelve months was much more than that with which we are comfortable. We are, however, encouraged that our U.S. stock selection strategy has been showing relative improvement over the last six months, as volatility has moderated and highly correlated action has been unwinding. These developments are heartening, as our stock selection strategy is one of the underlying drivers behind the Fund’s potential to outperform over the long term. We anticipate that if the market continues its migration back to a more historically normal level of stability and correlation relationships, there will be opportunities to recoup the shorter-term performance disadvantage experienced of late.
|
| 6 | The Leuthold Funds - 2012 Annual Report |
Leuthold Asset Allocation Fund
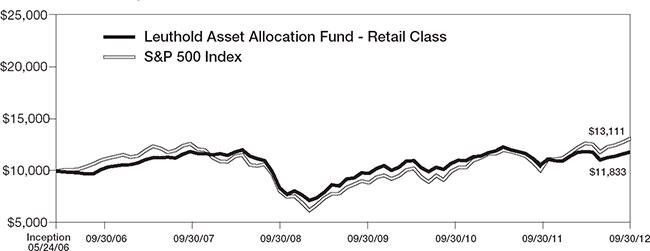
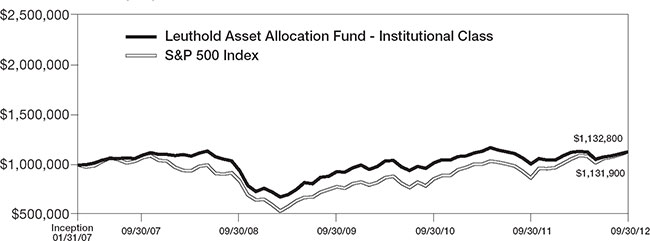
This Fund has assets under management of $627 million. For the fiscal year ended September 30, 2012, the Leuthold Asset Allocation Fund (retail share class) generated a total return gain of 11.73%, underperforming the S&P 500’s total return gain of 30.20% over the same time frame.
The fiscal year commenced in October 2011 with the portfolio positioned near its maximum defensive level of just 31% net equity exposure. Our market analysis improved to a cautiously positive outlook for stocks by the end of October and equity exposure was increased to 50-55%. In late December, our indicators strengthened further and equity exposure was increased to near 60%. We were fairly bullish the remainder of the year with average equity exposure of 62% from January through September 2012.
The Fund’s near maximum defensive posture in October 2011 was inopportune and created an immediate 5.6% performance disadvantage in the first month of the fiscal year, as the S&P 500 rallied with an 11% gain that month, versus the Fund’s 5.35% gain. Additionally contributing to the year’s underperformance was the Fund’s lower average exposure to stocks. Even when in fully bullish mode, the Fund’s upside limit to stocks is 70%; hence, during market advances it is unlikely that the aggregate portfolio will be able to compete head to head with a 100% invested benchmark. It is, however, our intention that the long stock exposure in the Fund will outperform the S&P 500, and this was not accomplished over the last twelve months.
There were four months in which the Fund’s U.S. equity exposure outperformed the S&P 500, by an average of 1.4%, but these advantage months were more than offset by the other eight months in which the U.S. equity exposure lagged the S&P 500 by an average of 1%. Adding to the equity underperformance were two months in which the Emerging Market Equities position trailed the S&P 500 by a considerable margin of between 5%-6% each of those months.
For its U.S.-traded equity exposure, the Fund has been using a multi-strategy approach, employing a combination of the Leuthold Select Equities and Leuthold Undervalued & Unloved strategies. Both are bottom-up, quantitative methodologies and each generally contributes a different type of stock market exposure. When used in tandem, they allow us to construct an equity portfolio with overall characteristics suitable for an asset allocation approach, and afford us the flexibility to adjust the mix to align with our market outlook. For the fiscal year ended September 30, 2012, the combined allocation to this stock mix contributed a total return gain of 26.31%, about 4% behind the S&P 500 gain of 30.20%.
Within this U.S. equity exposure, all of the broad sector concentrations had net gains for the year, and the largest sector concentrations produced the best performance. The Information Technology and Health Care sectors each carried between an 18%-19% average portfolio weight during the year, and had the most positive contributions to return, with gains of 36% and 30%, respectively. Within these two sectors, the most profitable industry group exposures included Pharmaceuticals, Managed Health Care, Computer & Storage Peripherals, Biotechnology, Semiconductor Equipment, and Data Processing/Outsourced Services. The next best performing sector concentrations were Financials and Energy, followed by Consumer Staples and Industrials. Industry group exposures with the most positive results from these sectors included: Oil & Gas Refining/Marketing, Tobacco, Integrated Oil & Gas, Consumer Finance, Regional Banks, Industrial Machinery, and Construction/Farm/Heavy Trucks. Two other industry group investments that produced strong results were Fertilizers & Agricultural Chemicals (Materials sector); and Apparel Retail (Consumer Discretionary sector).
|
| The Leuthold Funds - 2012 Annual Report | 7 |
The Utilities and Telecommunications sector concentrations contributed the least to this equity allocation’s performance, yet still provided solid total returns of over 13%. From an industry group perspective, the Fund experienced losses in group investments from a range of sectors, but the Consumer Discretionary sector investments were most heavily represented among the losers. These group investments included: Home Furnishings, Apparel Accessories & Luxury Goods, Automotive Retail, and Education Services. Rounding out the list of the biggest detractors to performance were losses from industry group investments in Coal & Consumable Fuels (Energy sector), Personal Products (Consumer Staples sector), and Multi-line Insurance (Financials sector).
Investments in domestic stocks held in a relatively steady range throughout the year, at an average of 84%. The foreign domiciled market exposure included in this U.S.-traded equity mix composed an average of 14% in Developed Markets and 2% in Emerging Markets. This composition is comparable to prior years.
The Leuthold Asset Allocation Fund follows the same investment mandates and asset mix shifts as the Leuthold Core Investment Fund. Therefore, aside from the U.S.-traded equities, the Fund holds the very same investments as the Leuthold Core Investment Fund; hence, for the annual review of the Fund’s Emerging Market Equities, Fixed Income, REITs, and Alternatives (Gold and Silver), refer to the performance details outlined in the preceding section for the Leuthold Core Investment Fund.
Leuthold Global Fund
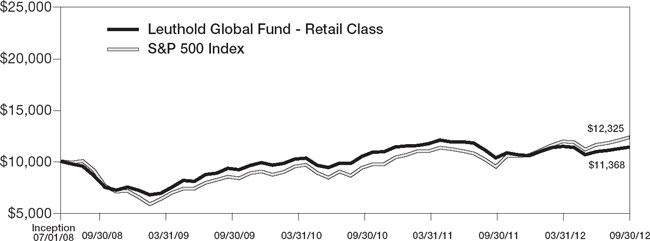
This Fund has assets under management of $387 million. It offers investors a global alternative to our proprietary tactical asset allocation disciplines. For the fiscal year ended September 30, 2012, the Leuthold Global Fund (retail share class) produced a total return gain of 10.14%, underperforming the total return gain of 21.67% in the MSCI ACWI (All Country World Index).
As with our domestic asset allocation funds, the fiscal year commenced in October 2011 with the Leuthold Global Fund positioned with just 32% net equity exposure, near its maximum defensive level. In the second half of October, our global market analysis improved to reflect a cautiously positive outlook for stocks and the Fund’s equity exposure was increased to a more neutral range of 50-55%, where it stayed through the end of 2011. During January our market indicators strengthened further and net equity exposure was increased to 60%. This more optimistic stance was upheld for the rest of the year, and average equity exposure was 62% from January through September 2012.
The Fund’s near maximum defensive posture in October 2011 was inopportune and created an immediate 6% performance disadvantage in the first month of the fiscal year, as the MSCI ACWI rallied by nearly +11% that month, versus the Fund’s 4.73% gain. Additionally contributing to the year’s underperformance was the Fund’s lower average exposure to stocks. Even when in fully bullish mode, the Fund’s upside limit to stocks is 70%; hence, during market advances it is unlikely that the aggregate portfolio will be able to compete head to head with a 100% invested benchmark. It is, however, our intention that the long stock exposure in the Fund will outperform the MSCI ACWI, and this was not accomplished over the last twelve months.
There were five months in which the Fund’s global equities outperformed the MSCI ACWI, by an average of just 0.6%; this slim margin was not enough to offset six months in which the equities lagged the MSCI ACWI by an average of 0.8% (there was one month in which performance matched the MSCI ACWI). In January and February, two of the strongest months of the year for the MSCI ACWI, the Fund’s equities held up fairly well, but there were outsized losses experienced in each of those months by the portfolio’s residual equity hedge. This hedge position resulted in the Fund lagging the fully invested MSCI ACWI by nearly 2% in each of those months.
The Leuthold Global Fund employs the strategy of the Leuthold Global Industries Fund for directing its long stock exposure. Please see that section for the performance details of the global equities.
|
| 8 | The Leuthold Funds - 2012 Annual Report |
The Fund’s normal guideline minimum for Fixed Income is 30% of assets, and prior to the last twelve months, we had been maintaining a drastically lower exposure of just 10% in 2011 and 2010, due to the inherent risk of rising rates. The Federal Reserve has been holding interest rates at excessively low levels for an unprecedented period of time, and it is inevitable that rates will rise from these artificially low levels. However, our attempt to avoid the risk by minimizing exposure here has been a losing proposition, as we’ve passed up some rather robust gains, particularly with U.S. Treasuries during fiscal year 2011. To address this portfolio deficiency and bulk up the Fund’s income generating assets, last December an initiative was launched to increase fixed income exposure back up toward the normal minimum level. This was achieved by evaluating the landscape for tactical, prudent income opportunities through the use of a multi-factor risk aversion analysis tool. This has been a gradual process, but by the end of the fiscal year, the Fund’s fixed income exposure had been boosted to 25%.
For the full year, the fixed income holdings included Quality Corporate Bonds (7.6% average weight), Developed Market Sovereign Debt (5.7% average weight), Emerging Market Sovereign Debt (2.4% average weight), Municipal Bonds (1.5% average weight), and Treasury Inflation Protection (TIP) Securities (1.5% average weight). An allocation to High Yield Bonds was initiated in February (1.6% average weight). The Emerging Market Sovereign Debt allocation was the best performer, with a +14% total return. The other positions also had solid gains: Municipal Bonds were up 8.4%, Corporate Bonds were up 6.3%, High Yield Bonds up 5.2%, Developed Market Sovereign Debt up 4.5%, and TIPS up 3.3%.
The Leuthold Global Fund had an average allocation of 5.0% to the Real Estate asset class during the 2012 fiscal year. Established in November of 2011, there was an emphasis on the Retail and Residential segments, but there was also exposure to the Diversified, Health Care, and Office segments. The real estate exposure was attained through a package of REITs, versus physical real estate, as REITs allow for greater transparency, efficient portfolio rebalancing, ease of diversification through specialty subsets of properties, and liquidity of the stock market, all the while offering performance dynamics akin to physical real estate values. Real Estate was one of the best performing asset classes for the year, with the holdings in the Leuthold Global Fund gaining about 15% for the eleven month holding period during the 2012 fiscal year ended September 30th.
There was an average allocation of 4.5% in Precious Metals during the 2012 fiscal year, obtained via holdings in physical Gold and Silver. The physical Gold was held for the full year, while the Silver portion of the allocation was eliminated in early March. The combined allocation performed very well, contributing a 15.5% gain to the portfolio for the twelve months ended September 30th. With the U.S. and other foreign governments pumping money into the global economy, we made this allocation back in early 2009 due to our concerns about the long-term inflation implications related to the excess liquidity and debasement of the dollar. We believe these concerns are still valid and expect this holding to be maintained for the foreseeable future.
Leuthold Select Industries Fund
This all-equity Fund, with total assets under management of $13.5 million, had a solid total return gain of 23.34% for the fiscal year ended September 30, 2012; however, this strong performance trailed the benchmark by nearly 7%, as the S&P 500 turned in an exceptional 30.20% total return gain over the same time frame.
The Leuthold Select Industries Fund was a perennial laggard versus the S&P 500 during the last twelve months, underperforming in eight of the months by an average of 1%. There was only one month of convincing outperformance, which occurred in October 2011, as the Fund gained over 2% more than the S&P 500. In two of the months this strategy was +0.5% additive against the S&P 500 and there was one month of relatively flat results. Our quantitative group selection approach does best in periods when there is a strong distinction between winners and losers among equity groups and themes. The last twelve months continued to be a challenge in this sense, as risk-on/risk-off market dynamics are not favorable conditions for the stock market to establish the trends and equity leadership themes that this strategy thrives on.
|
| The Leuthold Funds - 2012 Annual Report | 9 |
There were considerable changes in portfolio sector and group concentrations as the year progressed. This was due to a concerted effort to broaden exposure, when possible, to attempt to moderate the negative effects that cross-asset correlations and volatility were having on our industry group approach. This was accomplished by spreading out exposure more evenly across sectors, as well as increasing the number of industry group investments.
In addition to widening our exposures to accommodate a more diversified collection of industry group investments, we have been gradually increasing the market capitalization of new purchases, as we expect that Large Cap stocks are poised for a period of leadership. Despite these efforts, the Fund still has a Mid/Small Cap bias due to certain industry group exposures and the residual effect of the past Mid/Small Cap leadership cycle, so we were not able to fully capitalize on Large Cap stock outperformance during the last six months.
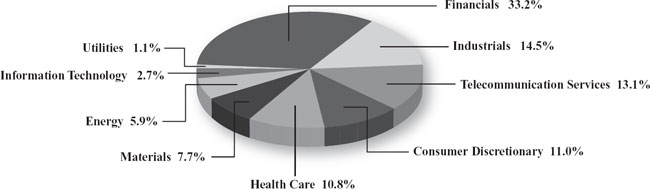
The fiscal year began with a substantial overweight concentration of 46% in the Health Care sector, with the Materials sector weight a distant second at 17% of assets. The next heaviest sector weights were Consumer Discretionary (13%), Energy (10%), and Financials (9%). These were followed by Information Technology (4%) and Industrials (1%). There was no exposure to Consumer Staples, Telecommunications, or Utilities. By year end, sector exposure was built out as follows: Financials (24%), Health Care (17%), Information Technology (15%), Industrials (15%), Consumer Discretionary (13%), Materials (7%), Energy (6%), and Consumer Staples (3%). Both Telecom and Utilities continued to be de-emphasized, with no exposure to these sectors. Individual industry group investments expanded from ten groups in October 2011, to 15 groups as of September 30, 2012.
The leading contributor to the Fund’s positive performance from the broad sector level was provided by the heavy-weight Health Care sector, which, as noted above, was pared back from a 46% portfolio weight, to 17% by year end (this is still overweight relative to the S&P 500 Health Care weight of 12%). Financials, Consumer Discretionary, and Energy sector investments were the next biggest contributors to the Fund’s return, followed by Materials and Consumer Staples.
From an industry group perspective, the Leuthold Select Industries Fund’s most beneficial exposure during the year came from group investments in Managed Health Care, Pharmaceuticals, Oil & Gas Refining/Marketing, Fertilizers & Agricultural Chemicals, Department Stores, Oil & Gas Drilling, Diversified Financial Services, and Tobacco.
The least productive broad sector exposures came from investments in Industrials and Information Technology. From an industry group perspective, performance detractors came from a range of sectors; these groups included Computer Storage & Peripherals, Construction/Farm Machinery/Heavy Trucks, Integrated Oil & Gas, Computer Hardware, Office Electronics, Trading Companies & Distributors, Commodity Chemicals, and Homefurnishing Retail.
Exposure to foreign-domiciled stocks in the Leuthold Select Industries Fund has primarily been on a downtrend this year, having begun the year at 17%, and declining to a low of 8% by June before increasing some to end the year at 13%. Within this foreign exposure, Developed Market stocks composed an average of 10%, with Emerging Market stock exposure at about a 3% average allocation.
Since the market lows of 2009, there has been an extremely high level of performance correlation with no regard for size or quality of stocks, making it difficult to navigate and gain traction with this strategy. We expect to see a reversion of the high cross-asset correlations to a lower level, which should benefit the process employed in this Fund’s industry group approach. While this strategy is not ideal for all market conditions, we believe over the longer term it is more typical than not for the market to be driven by macro-theme dynamics, allowing this Fund to uncover more persistent areas of strength.
|
| 10 | The Leuthold Funds - 2012 Annual Report |
Leuthold Global Industries Fund
This all-equity Fund, with total assets under management of $7.9 million, had a strong total return gain of 17.33% (retail share class) for the fiscal year ended September 30, 2012. Its benchmark comparator, the MSCI ACWI (All Country World Index) had total return gain of 21.67% over that time frame.
The Leuthold Global Industries Fund trailed the MSCI ACWI in six of the last twelve months, by about 1% on average; it outperformed in three months by 0.9%; and was about even with the benchmark in three of the months. While it is our goal to outperform the index, our quantitative group selection approach does best in periods when there is a strong distinction between winners and losers among equity groups and themes. The last twelve months continued to be a challenge in this sense, as risk-on/risk-off market dynamics are not favorable conditions for the market to establish the trends and equity leadership themes upon which this strategy thrives.
U.S. stock exposure within the Fund rose from 40% last October to a high of 53% from March through May, before declining back down to 48% by fiscal year end. The MSCI ACWI had a steady average exposure of 45% to U.S. stocks. Of the foreign-traded securities in the Leuthold Global Industries Fund, typically 83% was invested in Developed Markets over the last twelve months, versus 17% in Emerging Market stocks.
Equity exposure in this Fund is dictated by the industry groups that appear most attractive according to our quantitative disciplines; we do not direct investments based on attempting to identify opportunities specific to countries or regions. We believe that industry group leadership on a global basis will generate superior returns over the more traditional approach of “country” or “regional” concentrations, as the global economy has become increasingly interdependent.
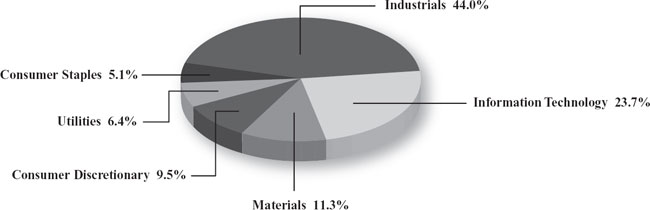
During the fiscal year ended September 30, 2012, all broad sector exposures, with the exception of Information Technology, had a positive contribution to return. Sectors with the most significant overall contribution to return were Financials, Health Care, Consumer Discretionary, and Industrials. Compared to the MSCI ACWI sector exposures, the Fund had generous overweight positions in Health Care, Telecommunications, and Utilities, and results from these allocations were particularly value-added versus the benchmark’s corresponding results. At the global industry group level, the best results came from the Fund’s investments in stocks from Consumer Finance, Integrated Oil & Gas, Water Utilities, Automotive Components, Managed Health Care, and Agricultural Products.
As noted above, the only sector exposure detracting from performance, compared to the benchmark, was Information Technology. This was the second best performing sector in the MSCI ACWI; however, our disciplines led us to have a significant underweight here, resulting in a large performance differential. Our Energy and Consumer Staples sector exposures were also underweight versus the index, so while still additive to the Fund’s performance, the results were not as value added compared to the MSCI ACWI’s corresponding sector results. The specific industry groups that detracted most from performance included investments in stocks from Computers & Peripherals, Paper & Forest Products, Developed Diversified Telecom Services, and Multi-line Insurance.
The Fund had investments in 35 different countries during the year, with an average of 27 country investments in any given month. The country exposures are the by-product of the companies that make up the industry groups purchased in the Fund; they are not purely intentional choices. As a point of interest, however, foreign market allocations that were consistently larger weights throughout the year included Japan, United Kingdom, Hong Kong, Germany, Taiwan, and Brazil. Australia and China also each had a relatively steady presence as heavier weighted allocations. From a performance stance, the most positive contributors at the country level came from investments in the U.S., Brazil, Thailand, Germany, Sweden, and South Africa. With the exception of the U.S. and Germany, each of these allocations was also more value-added to performance than corresponding MSCI ACWI results from investments in these countries. The biggest detractors from performance at the country level included investments in China, Japan, Spain, and Belgium.
|
| The Leuthold Funds - 2012 Annual Report | 11 |
The Leuthold Global Industries Fund became available during an unprecedented period of high correlation and market volatility, which has persisted since the Fund’s inception in May 2010. These dynamics are counterproductive to the objective of finding groups that demonstrate the likelihood of establishing and maintaining leadership for a period of time. Over the last twelve months, however, our model has been showing consistent improvement and it appears the markets may be slowly returning to a more classic environment where identifiable trends and well-defined industry leadership are characteristic to the marketplace.
Leuthold Global Clean Technology Fund
The Leuthold Global Clean Technology Fund has $8.7 million in assets under management. For the fiscal year ended September 30, 2012, the Fund (retail share class) had a total return gain of 21.15% compared to a total return loss of -10.78% in the Ardour Composite Global Alternative Energy Index. The MSCI ACWI (All Country World Index) produced a total return gain of 21.67% during that time.
The Fund’s strong performance for the full year was secured during the first six months, from October 2011 through March 2012, when it produced a total return gain of 28.33%. With the exception of the Alternative Energy sector which had a small 1% loss in the fourth quarter of 2011, all sector returns were otherwise very solid during that six month period, and particularly robust from January through March.
The most noteworthy contributors to the Fund’s gain during the first six months were investments in renewable & non-renewable power producers, energy and water conservation stocks, pollution control businesses, filtration & emissions control companies, energy efficiency, recycled building materials, and clean water subsectors. There was a small exposure to photovoltaics in the fourth quarter of 2011 that was a minor drag, and holdings in battery manufacturers and filtration companies were small detractors from performance during the January through March period. Acknowledging that many of the positions had risen in value very quickly during that six month time frame, in March the portfolio began to be repositioned to reflect a somewhat more defensive approach, in anticipation of a potential pullback in ensuing months.
The April through June period did indeed experience a correction, resulting in a -10.58% total return loss for the Fund. Efforts to become more defensive helped to minimize the extent of the losses, but the inherently smaller market capitalization of the portfolio still hampered results. Specific areas of portfolio weakness during this time came from holdings in energy efficiency, raw and recycled materials, and emission control companies. There was some value added from investments in battery manufacturers, water-related companies, and instrumentation firms.
The Fund gained back 5.57% total return during the last three months of the fiscal year ended September 30, 2012. Benefiting the portfolio were holdings in energy efficiency, biofuel stocks, and process manufacturing companies; while exposure to hydroelectric companies and waste treatment corporations detracted from results during that three month period.
Throughout the year, the Fund was consistently overweight in stocks from the Clean Environment sector (33% average weight). Exposure to the Resource Conservation and Clean Water sectors increased throughout the year, both overweight holdings compared to the universe, at average weights of 22% and 15%, respectively. The Alternative Energy sector was an underweight holding compared to the investable universe; however, while its portfolio exposure was on a downtrend most of the year, on average it composed the second heaviest weight (23%) relative to the Fund’s other exposures, ranging from a high of 30% in October 2011 down to a low of 17% in late June 2012. For the full year, the Clean Water sector was the clear winner, with a gain of 26%; this was followed by the Resource Conservation gain of 10%, and the Clean Environment gain of 9%. The Alternative Energy sector trailed with a loss of -7%.
|
| 12 | The Leuthold Funds - 2012 Annual Report |
The largest non-U.S. exposures within the Fund during the year were: Brazil, Japan, Switzerland, Germany, Canada, and Belgium. Smaller concentrations among foreign countries came from the United Kingdom, France, Spain, Taiwan, Singapore, Netherlands, and Denmark. The U.S.-traded stock exposure during the fiscal year was 63% on average, with foreign country investments averaging about 37% of portfolio assets.
Comparing this year’s gain of 21.15% with last year’s loss of -25.63% demonstrates the inherent volatility of stocks in this industry. Over the short term, performance can be influenced by a range of diverse factors including political, regulatory, commodity prices, population growth, and technological advances or failures, to name a few. This is a multi-decade venture expected to benefit from a cyclical upswing in demand for goods, services, and increasingly scarce resources.
Grizzly Short Fund
This Fund is 100% short individual stocks, with assets under management of about $136 million. For the fiscal year ended September 30, 2012, the Grizzly Short Fund produced a -31.47% total return loss. This compares to the S&P MidCap 400 Index, which had a total return gain of 28.54% (short-selling that index would have produced a loss of around -28%); the S&P 500 had a total return gain of 30.20% for the fiscal year. The Grizzly Short Fund lagged the inverse of each of these benchmarks by a relatively small margin, but it is our objective for the Fund to outperform – in this case by losing less than the inverse of the benchmark’s gain – hence, this Fund was not value-added over the last twelve months when measured against these yardsticks.
The market maintained a surprisingly forceful recovery during the last twelve months, making short-selling a losing enterprise. The S&P MidCap 400 Index produced concrete gains in seven months, and about flat performance in four months, leaving just one really good month to profit from short-selling. In May, the S&P MidCap 400 was down -6.48%, while the Grizzly Short Fund outperformed with a 9.24% gain. As a prelude to May’s gain, the Fund had a small 1% gain in April; with a 0.3% gain in July offering the only other respite from the year’s losses. The remaining nine months of the year the Grizzly Short Fund lost money, with seven of those months experiencing substantial underperformance – lagging the S&P MidCap 400 benchmark by 2% on average.
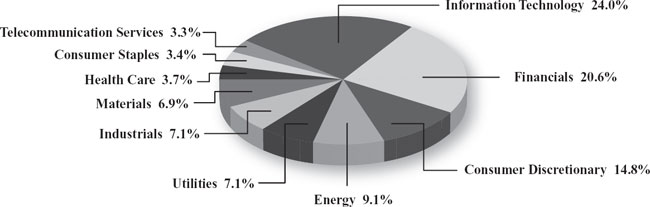
At the broad sector level, the Grizzly Short Fund’s full year performance was clearly influenced by heavy concentrations in Information Technology, Consumer Discretionary, and Financials. Information Technology was the heaviest sector exposure all year, with an average weight of 23%. The Consumer Discretionary weight declined steadily all year, but at 17% on average it was the second heaviest weight overall. The Financials sector exposure had no clear trend as its weight fluctuated up and down, with an average weight of 13% for the year. These three largest sector weights had the biggest contribution to the Fund’s losses. Industrials, Materials, and Health Care sector exposures were the next most significant contributors to the Fund’s negative return.
From an industry group perspective, the largest detractors from performance were: Communications Equipment, Life Sciences Tools & Services, Construction & Engineering, Building Products, Construction Materials, Health Care Facilities, Alternative Carriers, Cable & Satellite, Semiconductors, Forest Products, Investment Banking & Brokerage, and Internet Retail.
|
| The Leuthold Funds - 2012 Annual Report | 13 |
While none of the Fund’s broad sector exposures had a net positive contribution to return, Consumer Staples, Energy, Utilities, and Telecommunications sector exposure contributed the least to the Fund’s losses, primarily because these were undersized portfolio weights. As far as value-added positions (investments which helped to offset the Fund’s losses), specific industry group investments that contributed the most in this respect were: Thrifts & Mortgage Finance, Systems Software, Restaurants, Consumer Electronics, Electronic Components, Coal & Consumable Fuels, Internet Software & Services, IT Consulting & Services, and Integrated Oil & Gas.
The Grizzly Short Fund has extremely high turnover, and sector concentrations and industry group exposure have the potential to fluctuate considerably throughout the year. This is a highly disciplined methodology, however. As opposed to a market capitalization weighted index, the Fund is not predisposed to the risk of performance being heavily influenced from a handful of stocks with an oversized percentage of assets, because the Grizzly Short Fund positions are similarly weighted across the portfolio. There are policies in place that trigger specific short-covering action, such as capturing gains and stop-loss tactics. Additionally, there are limitations on how much of the portfolio can be concentrated within a particular sector or sub-industry group therein.
In a decisively rising market environment such as the last twelve months, investors should expect the Grizzly Short Fund to produce net losses. During those periods, the Fund will aim to add value by losing less than an index short, as there will be vulnerable areas of the stock market regardless of the underlying trend. With the recent year’s unusually high level of cross-asset correlations, the low quality stocks have moved in tandem with the high quality stocks, making our short-selling strategy difficult to outperform versus the benchmark indexes.
Investors who are not experienced in short-selling and adjusting market risk should consider the Leuthold Core Investment Fund, Leuthold Asset Allocation Fund, or Leuthold Global Fund. These three Funds have the flexibility built into their disciplines to overlay our short-selling strategies and hedge against market declines when the stock market is viewed as overvalued and vulnerable to a downside correction.
IN CLOSING
Last year in this shareholder letter we wrote that we believed the market rally being experienced at that time was likely an interim rally in a new cyclical bear market. We could not have been more wrong! Rather, the S&P 500 proceeded to amass a gain of over 30% during the subsequent twelve months. As noted earlier, with another year under its belt, the bull market is now over 43 months old, having lasted longer than the average cyclical bull market, based on data back to 1932, and gaining nearly 30% more than the median bull market gain (as of September 2012). Our current U.S. market analysis is only mildly bullish and it is inevitable the market will transition either into a clear downtrend at some point or maintain in a trading range; such is the nature of the stock market. It is our opinion this is very likely to occur during 2013.
When the markets do move into correction mode or a trading zone, be it 2013 or later, there will still be opportunities to add value within the Leuthold Fund strategies. In times of market declines, our asset allocation funds have the flexibility to reduce and/or hedge equity exposure, minimizing the risk of losses compared to a fully invested benchmark. There will typically still be areas of stock leadership and themes to profit from during market weakness, and this is where our long stock strategies aim to create an advantage – by identifying values, and avoiding areas with higher vulnerabilities. Clearly, our 100% short-selling strategy should be the biggest beneficiary of a market decline, but its objective is to add value over an index short. This actively managed short-selling methodology aims to achieve that edge over an index short through its strict set of disciplines which allow for a higher level of scrutiny and selectivity in identifying stocks which appear most susceptible to decline.
|
| 14 | The Leuthold Funds - 2012 Annual Report |
Regardless of market direction, our quantitative processes continually monitor an extensive range of market data, and the attractiveness of investments are reassessed and adjusted as these measures dictate. We believe all of our strategies have the potential to add value in any market environment.
Our firm is majority employee-owned and independent. We believe that the high level of employee-directed investments in Leuthold Funds exemplifies the dedication to the firm’s success and the motivation to produce steady, market-beating performance over the long term. Every member of the Leuthold team recognizes the importance of our shareholders; we work hard every day to meet or exceed client expectations. The interests of shareholders are at the top of our list.
We welcome you to contact us if you have any questions. Thank you for your support.
Sincerely,
| | | | | |
| | | | |
| Doug Ramsey, CFA, CMT | | | | |
| CIO & Co-Portfolio Manager | | | | |
| | | | | |
| | | | |
| Matt Paschke, CFA | | Chun Wang, CFA, PRM | | Eric Weigel |
| Co-Portfolio Manager | | Co-Portfolio Manager | | Co-Portfolio Manager |
| | | | | |
| | | | |
| Greg Swenson, CFA | | David Kurzman | | |
| Co-Portfolio Manager | | Co-Portfolio Manager | | |
|
| The Leuthold Funds - 2012 Annual Report | 15 |
Expense Example – September 30, 2012 (Unaudited)
As a shareholder of the Funds, you incur two types of costs: (1) transaction costs, including reinvested dividends, or other distributions; redemption fees; and exchange fees; and (2) ongoing costs, including management fees; distribution and/or service fees; and other Fund expenses. This example is intended to help you understand your ongoing costs (in dollars) of investing in the Funds and to compare costs with the ongoing costs of investing in other mutual funds.
The Example is based on an investment of $1,000 invested at the beginning of the period and held the entire period (April 1, 2012 – September 30, 2012).
Actual Expenses
The first line of the following table provides information about actual account values and actual expenses. Although the Funds charge no sales load (the Leuthold Core Investment Fund, Leuthold Asset Allocation Fund, Leuthold Global Fund, and Leuthold Global Industries Fund charge a 2% redemption fee for redemptions made within five business days after a purchase and the Leuthold Global Clean Technology Fund charges a 2% redemption fee for redemptions made within 30 days after a purchase), you will be assessed fees for outgoing wire transfers, returned checks, or stop payment orders at prevailing rates charged by U.S. Bancorp Fund Services, LLC, the Funds’ transfer agent. If you request a redemption be made by wire transfer, currently a $15.00 fee is charged by the Funds’ transfer agent. To the extent that the Funds invest in shares of other investment companies as part of its investment strategy, you will indirectly bear your proportionate share of any fees and expenses charged by the underlying funds in which a Fund invests in addition to the expenses of the Fund. Actual expenses of the underlying funds are expected to vary by fund. These expenses are not included in the following example. The example includes, but is not limited to, management fees, shareholder servicing fees, fund accounting, custody, and transfer agent fees. However, the following example does not include portfolio trading commissions and related expenses, and extraordinary expenses as determined under generally accepted accounting principles. You may use the information in this line, together with the amount you invested, to estimate the expenses that you paid over the period. Simply divide your account value by $1,000 (for example, an $8,600 account value divided by $1,000 = 8.6), then multiply the result by the number in the first line under the heading entitled “Expenses Paid During Period” to estimate the expenses you paid on your account during this period.
Hypothetical Example for Comparison Purposes
The second line of the following table provides information about hypothetical account values and hypothetical expenses based on the Funds’ actual expense ratios and an assumed rate of return of 5% per year before expenses, which is not the Funds’ actual return. The hypothetical account values and expenses may not be used to estimate the actual ending account balance or expenses you paid for the period. You may use this information to compare the ongoing costs of investing in the Funds and other funds. To do so, compare this 5% hypothetical example with the 5% hypothetical examples that appear in the shareholder reports of the other funds.
Please note that the expenses shown in the table are meant to highlight your ongoing costs only and do not reflect any transactional costs, such as redemption fees or exchange fees. Therefore, the second line of the table is useful in comparing ongoing costs only, and will not help you determine the relative costs of owning different funds. In addition, if these transactional costs were included, your costs would have been higher.
|
| 16 | The Leuthold Funds - 2012 Annual Report |
| The Leuthold Funds |
| Expense Example Tables (Unaudited) |
Leuthold Core Investment Fund - Retail Class
| | | | | | | | | | | | | | |
| | | Beginning Account Value April 1, 2012 | | Ending Account Value September 30, 2012 | | Expenses Paid During Period* April 1, 2012 - September 30, 2012 | |
| Actual** | | $ | 1,000.00 | | | $ | 1,002.70 | | | $ | 5.86 | | |
| Hypothetical (5% return before expenses)*** | | | 1,000.00 | | | | 1,019.15 | | | | 5.91 | | |
* Expenses are equal to the Fund’s annualized expense ratio of 1.17%, multiplied by the average account value over the period, multiplied by 183/366 to reflect the one-half year period.
** Excluding dividends and interest on short positions, your actual cost of investment in the Fund would be $5.76 and the Fund’s annualized expense ratio would be 1.15%.
*** Excluding dividends and interest on short positions, your hypothetical cost of investment in the Fund would be $5.81 and the Fund’s annualized expense ratio would be 1.15%.
Leuthold Core Investment Fund - Institutional Class
| | | | | | | | | | | | | | |
| | | Beginning Account Value April 1, 2012 | | Ending Account Value September 30, 2012 | | Expenses Paid During Period* April 1, 2012 - September 30, 2012 | |
| Actual** | | $ | 1,000.00 | | | $ | 1,003.20 | | | $ | 5.36 | | |
| Hypothetical (5% return before expenses)*** | | | 1,000.00 | | | | 1,019.65 | | | | 5.40 | | |
* Expenses are equal to the Fund’s annualized expense ratio of 1.07%, multiplied by the average account value over the period, multiplied by 183/366 to reflect the one-half year period.
** Excluding dividends and interest on short positions, your actual cost of investment in the Fund would be $5.21 and the Fund’s annualized expense ratio would be 1.04%.
*** Excluding dividends and interest on short positions, your hypothetical cost of investment in the Fund would be $5.25 and the Fund’s annualized expense ratio would be 1.04%.
Leuthold Asset Allocation Fund - Retail Class
| | | | | | | | | | | | | | |
| | | Beginning Account Value April 1, 2012 | | Ending Account Value September 30, 2012 | | Expenses Paid During Period* April 1, 2012 - September 30, 2012 | |
| Actual** | | $ | 1,000.00 | | | $ | 994.70 | | | $ | 6.93 | | |
| Hypothetical (5% return before expenses)*** | | | 1,000.00 | | | | 1,018.05 | | | | 7.01 | | |
* Expenses are equal to the Fund’s annualized expense ratio of 1.39%, multiplied by the average account value over the period, multiplied by 183/366 to reflect the one-half year period.
** Excluding dividends and interest on short positions, your actual cost of investment in the Fund would be $6.78 and the Fund’s annualized expense ratio would be 1.36%.
*** Excluding dividends and interest on short positions, your hypothetical cost of investment in the Fund would be $6.86 and the Fund’s annualized expense ratio would be 1.36%.
Leuthold Asset Allocation Fund - Institutional Class
| | | | | | | | | | | | | | |
| | | Beginning Account Value April 1, 2012 | | Ending Account Value September 30, 2012 | | Expenses Paid During Period* April 1, 2012 - September 30, 2012 | |
| Actual** | | $ | 1,000.00 | | | $ | 995.10 | | | $ | 5.79 | | |
| Hypothetical (5% return before expenses)*** | | | 1,000.00 | | | | 1,019.20 | | | | 5.86 | | |
* Expenses are equal to the Fund’s annualized expense ratio of 1.16%, multiplied by the average account value over the period, multiplied by 183/366 to reflect the one-half year period.
** Excluding dividends and interest on short positions, your actual cost of investment in the Fund would be $5.69 and the Fund’s annualized expense ratio would be 1.14%.
*** Excluding dividends and interest on short positions, your hypothetical cost of investment in the Fund would be $5.75 and the Fund’s annualized expense ratio would be 1.14%.
|
| The Leuthold Funds - 2012 Annual Report | 17 |
| The Leuthold Funds |
| Expense Example Tables (Unaudited) |
Leuthold Global Fund - Retail Class
| | | | | | | | | | | | | | |
| | | Beginning Account Value April 1, 2012 | | Ending Account Value September 30, 2012 | | Expenses Paid During Period* April 1, 2012 - September 30, 2012 | |
| Actual** | | $ | 1,000.00 | | | $ | 994.20 | | | $ | 7.58 | | |
| Hypothetical (5% return before expenses)*** | | | 1,000.00 | | | | 1,017.40 | | | | 7.67 | | |
* Expenses are equal to the Fund’s annualized expense ratio of 1.52%, multiplied by the average account value over the period, multiplied by 183/366 to reflect the one-half year period.
** Excluding dividends and interest on short positions, your actual cost of investment in the Fund would be $7.53 and the Fund’s annualized expense ratio would be 1.51%.
*** Excluding dividends and interest on short positions, your hypothetical cost of investment in the Fund would be $7.62 and the Fund’s annualized expense ratio would be 1.51%.
Leuthold Global Fund - Institutional Class
| | | | | | | | | | | | | | |
| | | Beginning Account Value April 1, 2012 | | Ending Account Value September 30, 2012 | | Expenses Paid During Period* April 1, 2012 - September 30, 2012 | |
| Actual** | | $ | 1,000.00 | | | $ | 995.00 | | | $ | 6.48 | | |
| Hypothetical (5% return before expenses)*** | | | 1,000.00 | | | | 1,018.50 | | | | 6.56 | | |
* Expenses are equal to the Fund’s annualized expense ratio of 1.30%, multiplied by the average account value over the period, multiplied by 183/366 to reflect the one-half year period.
** Excluding dividends and interest on short positions, your actual cost of investment in the Fund would be $6.48 and the Fund’s annualized expense ratio would be 1.30%.
*** Excluding dividends and interest on short positions, your hypothetical cost of investment in the Fund would be $6.56 and the Fund’s annualized expense ratio would be 1.30%.
Leuthold Select Industries Fund
| | | | | | | | | | | | | | |
| | | Beginning Account Value April 1, 2012 | | Ending Account Value September 30, 2012 | | Expenses Paid During Period* April 1, 2012 - September 30, 2012 | |
| Actual | | $ | 1,000.00 | | | $ | 997.60 | | | $ | 7.99 | | |
| Hypothetical (5% return before expenses) | | | 1,000.00 | | | | 1,017.00 | | | | 8.07 | | |
* Expenses are equal to the Fund’s annualized expense ratio of 1.60%, multiplied by the average account value over the period, multiplied by 183/366 to reflect the one-half year period.
Leuthold Global Industries Fund - Retail Class
| | | | | | | | | | | | | | |
| | | Beginning Account Value April 1, 2012 | | Ending Account Value September 30, 2012 | | Expenses Paid During Period* April 1, 2012 - September 30, 2012 | |
| Actual | | $ | 1,000.00 | | | $ | 979.50 | | | $ | 9.85 | | |
| Hypothetical (5% return before expenses) | | | 1,000.00 | | | | 1,015.05 | | | | 10.02 | | |
* Expenses are equal to the Fund’s annualized expense ratio of 1.99%, multiplied by the average account value over the period, multiplied by 183/366 to reflect the one-half year period.
|
| 18 | The Leuthold Funds - 2012 Annual Report |
| The Leuthold Funds |
| Expense Example Tables (Unaudited) |
Leuthold Global Industries Fund - Institutional Class
| | | | | | | | | | | | | | |
| | | Beginning Account Value April 1, 2012 | | Ending Account Value September 30, 2012 | | Expenses Paid During Period* April 1, 2012 - September 30, 2012 | |
| Actual | | $ | 1,000.00 | | | $ | 982.10 | | | $ | 8.47 | | |
| Hypothetical (5% return before expenses) | | | 1,000.00 | | | | 1,016.45 | | | | 8.62 | | |
* Expenses are equal to the Fund’s annualized expense ratio of 1.71%, multiplied by the average account value over the period, multiplied by 183/366 to reflect the one-half year period.
Leuthold Global Clean Technology Fund - Retail Class
| | | | | | | | | | | | | | |
| | | Beginning Account Value April 1, 2012 | | Ending Account Value September 30, 2012 | | Expenses Paid During Period* April 1, 2012 - September 30, 2012 | |
| Actual | | $ | 1,000.00 | | | $ | 944.00 | | | $ | 9.38 | | |
| Hypothetical (5% return before expenses) | | | 1,000.00 | | | | 1,015.35 | | | | 9.72 | | |
* Expenses are equal to the Fund’s annualized expense ratio of 1.93%, multiplied by the average account value over the period, multiplied by 183/366 to reflect the one-half year period.
Leuthold Global Clean Technology Fund - Institutional Class
| | | | | | | | | | | | | | |
| | | Beginning Account Value April 1, 2012 | | Ending Account Value September 30, 2012 | | Expenses Paid During Period* April 1, 2012 - September 30, 2012 | |
| Actual | | $ | 1,000.00 | | | $ | 944.40 | | | $ | 8.22 | | |
| Hypothetical (5% return before expenses) | | | 1,000.00 | | | | 1,016.55 | | | | 8.52 | | |
* Expenses are equal to the Fund’s annualized expense ratio of 1.69%, multiplied by the average account value over the period, multiplied by 183/366 to reflect the one-half year period.
Grizzly Short Fund
| | | | | | | | | | | | | | |
| | | Beginning Account Value April 1, 2012 | | Ending Account Value September 30, 2012 | | Expenses Paid During Period* April 1, 2012 - September 30, 2012 | |
Actual** | | $ | 1,000.00 | | | $ | 946.90 | | | $ | 15.28 | | |
Hypothetical (5% return before expenses)*** | | | 1,000.00 | | | | 1,009.30 | | | | 15.77 | | |
* Expenses are equal to the Fund’s annualized expense ratio of 3.14%, multiplied by the average account value over the period, multiplied by 183/366 to reflect the one-half year period.
** Excluding dividends and interest on short positions, your actual cost of investment in the Fund would be $7.50 and the Fund’s annualized expense ratio would be 1.54%.
*** Excluding dividends and interest on short positions, your hypothetical cost of investment in the Fund would be $7.74 and the Fund’s annualized expense ratio would be 1.54%.
|
| The Leuthold Funds - 2012 Annual Report | 19 |
| The Leuthold Funds |
| (Unaudited) |
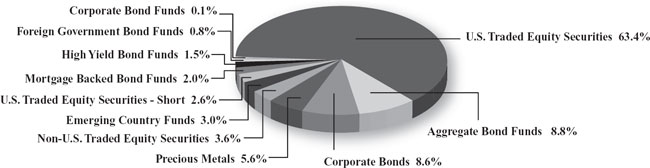
Leuthold Core Investment Fund
Allocation of Portfolio Holdings
September 30, 2012*
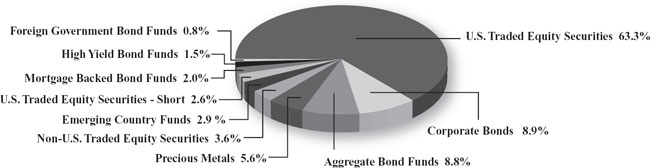
Leuthold Asset Allocation Fund
Allocation of Portfolio Holdings
September 30, 2012*
*Excludes short-term investments
|
| 20 | The Leuthold Funds - 2012 Annual Report |
| The Leuthold Funds |
| (Unaudited) |
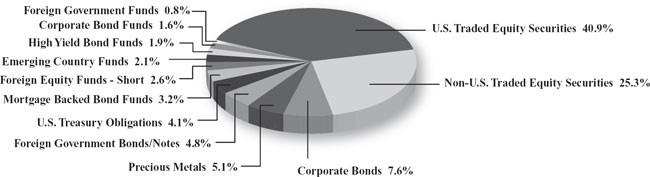
Leuthold Global Fund
Allocation of Portfolio Holdings
September 30, 2012*
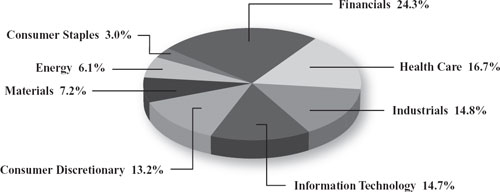
Leuthold Select Industries Fund
Allocation of Portfolio Holdings
September 30, 2012*
*Excludes short-term investments
|
| The Leuthold Funds - 2012 Annual Report | 21 |
| The Leuthold Funds |
| (Unaudited) |
Leuthold Global Industries Fund
Allocation of Portfolio Holdings
September 30, 2012*
Leuthold Global Clean Technology Fund
Allocation of Portfolio Holdings
September 30, 2012*
*Excludes short-term investments
|
| 22 | The Leuthold Funds - 2012 Annual Report |
| The Leuthold Funds |
| (Unaudited) |
Grizzly Short Fund
Allocation of Portfolio Holdings
September 30, 2012*
*Excludes short-term investments
|
| The Leuthold Funds - 2012 Annual Report | 23 |
| | | | | |
| Leuthold Core Investment Fund (Unaudited) |
| Components of Portfolio Holdings* | | Fair Value | |
| U.S. Traded Equity Securities | | $ | 484,829,767 | |
| Aggregate Bond Funds | | | 67,477,763 | |
| Corporate Bonds | | | 65,830,749 | |
| Precious Metals | | | 43,019,237 | |
| Non-U.S. Traded Equity Securities | | | 27,429,932 | |
| Emerging Country Funds | | | 22,584,519 | |
| U.S. Traded Equity Securities - Short | | | 19,627,038 | |
| Mortgage Backed Bond Funds | | | 15,174,113 | |
| High Yield Bond Funds | | | 11,806,115 | |
| Foreign Government Bond Funds | | | 6,368,148 | |
| Corporate Bond Funds | | | 1,053,798 | |
| Total: | | $ | 765,201,179 | |
| | | | | |
| Leuthold Asset Allocation Fund (Unaudited) | | | | |
| Components of Portfolio Holdings* | | Fair Value | |
| U.S. Traded Equity Securities | | $ | 387,126,194 | |
| Corporate Bonds | | | 54,104,986 | |
| Aggregate Bond Funds | | | 53,986,204 | |
| Precious Metals | | | 34,254,042 | |
| Non-U.S. Traded Equity Securities | | | 21,883,061 | |
| Emerging Country Funds | | | 18,001,294 | |
| U.S. Traded Equity Securities - Short | | | 15,744,312 | |
| Mortgage Backed Bond Funds | | | 12,102,132 | |
| High Yield Bond Funds | | | 9,375,830 | |
| Foreign Government Bond Funds | | | 5,062,857 | |
| Total: | | $ | 611,640,912 | |
| | | | | |
| Leuthold Global Fund (Unaudited) | | | | |
| Components of Portfolio Holdings* | | Fair Value | |
| U.S. Traded Equity Securities | | $ | 152,235,117 | |
| Non-U.S. Traded Equity Securities | | | 94,031,854 | |
| Corporate Bonds | | | 28,087,646 | |
| Precious Metals | | | 18,785,720 | |
| Foreign Government Bonds/Notes | | | 18,014,662 | |
| U.S. Treasury Obligations | | | 15,406,791 | |
| Mortgage Backed Bond Funds | | | 11,834,909 | |
| Foreign Equity Funds - Short | | | 9,497,176 | |
| Emerging Country Funds | | | 7,961,427 | |
| High Yield Bond Funds | | | 6,902,242 | |
| Corporate Bond Funds | | | 6,101,278 | |
| Foreign Government Funds | | | 3,055,649 | |
| Total: | | $ | 371,914,471 | |
| | | | | |
| Leuthold Select Industries Fund (Unaudited) | | | | |
| Components of Portfolio Holdings* | | Fair Value | |
| Financials | | $ | 3,280,350 | |
| Health Care | | | 2,245,352 | |
| Industrials | | | 1,996,371 | |
| Information Technology | | | 1,981,390 | |
| Consumer Discretionary | | | 1,785,496 | |
| Materials | | | 966,444 | |
| Energy | | | 825,740 | |
| Consumer Staples | | | 407,772 | |
| Total: | | $ | 13,488,915 | |
| | | | | |
| Leuthold Global Industries Fund (Unaudited) | | | | |
| Components of Portfolio Holdings* | | Fair Value | |
| Financials | | $ | 2,592,621 | |
| Industrials | | | 1,135,359 | |
| Telecommunication Services | | | 1,023,425 | |
| Consumer Discretionary | | | 857,294 | |
| Health Care | | | 843,988 | |
| Materials | | | 606,840 | |
| Energy | | | 461,355 | |
| Information Technology | | | 211,331 | |
| Utilities | | | 85,288 | |
| Total: | | $ | 7,817,501 | |
| | | | | |
| Leuthold Global Clean Technology Fund (Unaudited) | | | | |
| Components of Portfolio Holdings* | | | Fair Value | |
| Industrials | | $ | 3,669,815 | |
| Information Technology | | | 1,981,925 | |
| Materials | | | 945,214 | |
| Consumer Discretionary | | | 795,043 | |
| Utilities | | | 530,400 | |
| Consumer Staples | | | 427,094 | |
| Total: | | $ | 8,349,491 | |
*Excludes short-term investments
|
| 24 | The Leuthold Funds - 2012 Annual Report |
| Grizzly Short Fund (Unaudited) | | | | |
| Components of Portfolio Holdings* | | Fair Value | |
| Information Technology | | $ | 31,109,886 | |
| Financials | | | 26,682,263 | |
| Consumer Discretionary | | | 19,167,112 | |
| Energy | | | 11,759,755 | |
| Utilities | | | 9,231,803 | |
| Industrials | | | 9,181,481 | |
| Materials | | | 9,004,846 | |
| Health Care | | | 4,778,536 | |
| Consumer Staples | | | 4,468,868 | |
| Telecommunication Services | | | 4,221,152 | |
| Total: | | $ | 129,605,702 | |
The Global Industry Classification Standard (GICS®) was developed by and/or is the exclusive property of MSCI, Inc. and Standard & Poor’s Financial Services LLC (“S&P”). GICS is a service mark of MSCI and S&P and has been licensed for use by U.S. Bancorp Fund Services, LLC.
*Excludes short-term investments
|
| The Leuthold Funds - 2012 Annual Report | 25 |
| |
| Leuthold Core Investment Fund - Retail Class |
| (Unaudited) |
Average Annual Rate of Return For Periods Ended
September 30, 2012
| | | | | | | | | | | | | | | | | | | | | | |
| | | 1 Year | | 3 Year | | 5 Year | | 10 Year | |
| Leuthold Core Investment Fund - Retail Class | | | | 11.34 | % | | | | 3.26 | % | | | | 0.45 | % | | | | 9.70 | % | |
| Lipper Flexible Fund Index | | | | 18.63 | % | | | | 9.00 | % | | | | 2.36 | % | | | | 7.74 | % | |
| S&P 500 Index | | | | 30.20 | % | | | | 13.20 | % | | | | 1.05 | % | | | | 8.01 | % | |
A $10,000 Investment in the Leuthold Core Investment Fund – Retail Class
The Lipper Flexible Fund Index is composed of funds that allocate investments across various asset classes with a focus on total return, as defined by Lipper.
The S&P 500 Index is an unmanaged capitalization-weighted index of 500 stocks designed to measure performance of the broad domestic economy through changes in the aggregate market value of the 500 stocks which represent all major industries.
This chart assumes an initial gross investment of $10,000 made on 9/30/02. Returns shown include the reinvestment of all dividends. The Fund’s past performance is not necessarily an indication of its future performance. It may perform better or worse in the future. The graph and the table do not reflect the deduction of taxes that a shareholder would pay on Fund distributions or the redemption of shares.
|
| 26 | The Leuthold Funds - 2012 Annual Report |
| |
| Leuthold Core Investment Fund - Institutional Class |
| (Unaudited) |
Average Annual Rate of Return For Periods Ended
September 30, 2012
| | | | | | | | | | | | | | | | | | | | | | |
| | | 1 Year | | 3 Year | | 5 Year | | Since Inception | |
| Leuthold Core Investment Fund - Institutional Class | | | | 11.40 | % | | | | 3.36 | % | | | | 0.55 | % | | | | 3.80 | % | |
| Lipper Flexible Fund Index | | | | 18.63 | % | | | | 9.00 | % | | | | 2.36 | % | | | | 4.58 | % | |
| S&P 500 Index | | | | 30.20 | % | | | | 13.20 | % | | | | 1.05 | % | | | | 3.98 | % | |
A $1,000,000 Investment in the Leuthold Core Investment Fund – Institutional Class
The Lipper Flexible Fund Index is composed of funds that allocate investments across various asset classes with a focus on total return, as defined by Lipper.
The S&P 500 Index is an unmanaged capitalization-weighted index of 500 stocks designed to measure performance of the broad domestic economy through changes in the aggregate market value of the 500 stocks which represent all major industries.
This chart assumes an initial gross investment of $1,000,000 made on 1/31/06 (commencement of operations). Returns shown include the reinvestment of all dividends. The Fund’s past performance is not necessarily an indication of its future performance. It may perform better or worse in the future. The graph and the table do not reflect the deduction of taxes that a shareholder would pay on Fund distributions or the redemption of shares.
|
| The Leuthold Funds - 2012 Annual Report | 27 |
| |
| Leuthold Asset Allocation Fund - Retail Class |
| (Unaudited) |
Average Annual Rate of Return For Periods Ended
September 30, 2012
| | | | | | | | | | | | | | | | | | | | | | |
| | | 1 Year | | 3 Year | | 5 Year | | Since Inception | |
| Leuthold Asset Allocation Fund - Retail Class | | | | 11.73 | % | | | | 6.40 | % | | | | 0.36 | % | | | | 2.68 | % | |
| Lipper Flexible Fund Index | | | | 18.63 | % | | | | 9.00 | % | | | | 2.36 | % | | | | 4.96 | % | |
| S&P 500 Index | | | | 30.20 | % | | | | 13.20 | % | | | | 1.05 | % | | | | 4.35 | % | |
A $10,000 Investment in the Leuthold Asset Allocation Fund – Retail Class
The Lipper Flexible Fund Index is composed of funds that allocate investments across various asset classes with a focus on total return, as defined by Lipper.
The S&P 500 Index is an unmanaged capitalization-weighted index of 500 stocks designed to measure performance of the broad domestic economy through changes in the aggregate market value of the 500 stocks which represent all major industries.
This chart assumes an initial gross investment of $10,000 made on 5/24/06 (commencement of operations). Returns shown include the reinvestment of all dividends. The Fund’s past performance is not necessarily an indication of its future performance. It may perform better or worse in the future. The graph and the table do not reflect the deduction of taxes that a shareholder would pay on Fund distributions or the redemption of shares.
|
| 28 | The Leuthold Funds - 2012 Annual Report |
| |
| Leuthold Asset Allocation Fund - Institutional Class |
| (Unaudited) |
Average Annual Rate of Return For Periods Ended
September 30, 2012
| | | | | | | | | | | | | | | | | | | | | | |
| | | 1 Year | | 3 Year | | 5 Year | | Since Inception | |
| Leuthold Asset Allocation Fund - Institutional Class | | | | 11.96 | % | | | | 6.66 | % | | | | 0.58 | % | | | | 2.21 | % | |
| Lipper Flexible Fund Index | | | | 18.63 | % | | | | 9.00 | % | | | | 2.36 | % | | | | 3.56 | % | |
| S&P 500 Index | | | | 30.20 | % | | | | 13.20 | % | | | | 1.05 | % | | | | 2.23 | % | |
A $1,000,000 Investment in the Leuthold Asset Allocation Fund – Institutional Class
The Lipper Flexible Fund Index is composed of funds that allocate investments across various asset classes with a focus on total return, as defined by Lipper.
The S&P 500 Index is an unmanaged capitalization-weighted index of 500 stocks designed to measure performance of the broad domestic economy through changes in the aggregate market value of the 500 stocks which represent all major industries.
This chart assumes an initial gross investment of $1,000,000 made on 1/31/07 (commencement of operations). Returns shown include the reinvestment of all dividends. The Fund’s past performance is not necessarily an indication of its future performance. It may perform better or worse in the future. The graph and the table do not reflect the deduction of taxes that a shareholder would pay on Fund distributions or the redemption of shares.
|
| The Leuthold Funds - 2012 Annual Report | |
| |
| Leuthold Global Fund - Retail Class |
| (Unaudited) |
Average Annual Rate of Return For Periods Ended
September 30, 2012
| | | | | | | | | | | | | | | | | | |
| | | 1 Year | | 3 Year | | 5 Year | | Since Inception | |
| Leuthold Global Fund - Retail Class | | | 10.14 | % | | | 6.89 | % | | | n/a | | | | 3.06 | % | |
Lipper Global Flexible Portfolio Funds Index | | | 14.40 | % | | | 6.60 | % | | | (0.17 | %) | | | 1.66 | % | |
| MSCI ACWI | | | 21.67 | % | | | 7.78 | % | | | (1.54 | %) | | | 1.36 | % | |
| S&P 500 Index | | | 30.20 | % | | | 13.20 | % | | | 1.05 | % | | | 5.04 | % | |
A $10,000 Investment in the Leuthold Global Fund - Retail Class
The Lipper Global Flexible Portfolio Funds Index is an equally weighted representation of the largest funds in the Lipper Global Flexible Portfolio Funds category. These funds allocate their investments across various asset classes, including both domestic and foreign stocks, bonds, and money market instruments, with a focus on total return.
The MSCI ACWI (All Country World Index) is a free float-adjusted market capitalization weighted index that is designed to measure the equity market performance of developed and emerging markets. As of May 30, 2011, the MSCI ACWI consisted of 45 country indices comprising 24 developed and 21 emerging market country indices. The developed market country indices included are: Australia, Austria, Belgium, Canada, Denmark, Finland, France, Germany, Greece, Hong Kong, Ireland, Israel, Italy, Japan, Netherlands, New Zealand, Norway, Portugal, Singapore, Spain, Sweden, Switzerland, the United Kingdom, and the United States. The emerging market country indices included are: Brazil, Chile, China, Colombia, Czech Republic, Egypt, Hungary, India, Indonesia, Korea, Malaysia, Mexico, Morocco, Peru, Philippines, Poland, Russia, South Africa, Taiwan, Thailand, and Turkey.
The S&P 500 Index is an unmanaged capitalization-weighted index of 500 stocks designed to measure performance of the broad domestic economy through changes in the aggregate market value of the 500 stocks which represent all major industries.
This chart assumes an initial gross investment of $10,000 made on 7/1/08 (commencement of operations). Returns shown include the reinvestment of all dividends. The Fund’s past performance is not necessarily an indication of its future performance. It may perform better or worse in the future. The graph and the table do not reflect the deduction of taxes that a shareholder would pay on Fund distributions or the redemption of shares.
|
| 30 | The Leuthold Funds - 2012 Annual Report |
| Leuthold Global Fund - Institutional Class |
| (Unaudited) |
Average Annual Rate of Return For Periods Ended
September 30, 2012
| | | | | | | | | | | | | | | | | | |
| | | 1 Year | | 3 Year | | 5 Year | | Since Inception | |
| Leuthold Global Fund - Institutional Class | | | 10.34 | % | | | 7.07 | % | | | n/a | | | | 2.90 | % | |
Lipper Global Flexible Portfolio Funds Index | | | 14.40 | % | | | 6.60 | % | | | (0.17 | %) | | | 0.47 | % | |
| MSCI ACWI | | | 21.67 | % | | | 7.78 | % | | | (1.54 | %) | | | (0.43 | %) | |
| S&P 500 Index | | | 30.20 | % | | | 13.20 | % | | | 1.05 | % | | | 3.17 | % | |
A $1,000,000 Investment in the Leuthold Global Fund - Institutional Class
The Lipper Global Flexible Portfolio Funds Index is an equally weighted representation of the largest funds in the Lipper Global Flexible Portfolio Funds category. These funds allocate their investments across various asset classes, including both domestic and foreign stocks, bonds, and money market instruments, with a focus on total return.
The MSCI ACWI (All Country World Index) is a free float-adjusted market capitalization weighted index that is designed to measure the equity market performance of developed and emerging markets. As of May 30, 2011, the MSCI ACWI consisted of 45 country indices comprising 24 developed and 21 emerging market country indices. The developed market country indices included are: Australia, Austria, Belgium, Canada, Denmark, Finland, France, Germany, Greece, Hong Kong, Ireland, Israel, Italy, Japan, Netherlands, New Zealand, Norway, Portugal, Singapore, Spain, Sweden, Switzerland, the United Kingdom, and the United States. The emerging market country indices included are: Brazil, Chile, China, Colombia, Czech Republic, Egypt, Hungary, India, Indonesia, Korea, Malaysia, Mexico, Morocco, Peru, Philippines, Poland, Russia, South Africa, Taiwan, Thailand, and Turkey.
The S&P 500 Index is an unmanaged capitalization-weighted index of 500 stocks designed to measure performance of the broad domestic economy through changes in the aggregate market value of the 500 stocks which represent all major industries.
This chart assumes an initial gross investment of $1,000,000 made on 4/30/08 (commencement of operations). Returns shown include the reinvestment of all dividends. The Fund’s past performance is not necessarily an indication of its future performance. It may perform better or worse in the future. The graph and the table do not reflect the deduction of taxes that a shareholder would pay on Fund distributions or the redemption of shares.
|
| The Leuthold Funds - 2012 Annual Report | 31 |
| Leuthold Select Industries Fund |
| (Unaudited) |
Average Annual Rate of Return For Periods Ended
September 30, 2012
| | | | | | | | | | | | | | | | | | |
| | | 1 Year | | 3 Year | | 5 Year | | 10 Year | |
| Leuthold Select Industries Fund | | | 23.34 | % | | | 1.31 | % | | | (3.68 | %) | | | 9.65 | % | |
| Russell 2000 Index | | | 31.91 | % | | | 12.99 | % | | | 2.21 | % | | | 10.17 | % | |
| S&P 500 Index | | | 30.20 | % | | | 13.20 | % | | | 1.05 | % | | | 8.01 | % | |
A $10,000 Investment in the Leuthold Select Industries Fund
The Russell 2000 Index is comprised of approximately 2000 of the smallest companies in the Russell 3000 Index, representing approximately 10% of the Russell 3000 total market capitalization.
The S&P 500 Index is an unmanaged capitalization-weighted index of 500 stocks designed to measure performance of the broad domestic economy through changes in the aggregate market value of the 500 stocks which represent all major industries.
This chart assumes an initial gross investment of $10,000 made on 9/30/02. Returns shown include the reinvestment of all dividends. The Fund’s past performance is not necessarily an indication of its future performance. It may perform better or worse in the future. The graph and the table do not reflect the deduction of taxes that a shareholder would pay on Fund distributions or the redemption of shares.
|
| 32 | The Leuthold Funds - 2012 Annual Report |
| |
| Leuthold Global Industries Fund - Retail Class |
| (Unaudited) |
Average Annual Rate of Return For Periods Ended
September 30, 2012
| | | | | | | | | | | | | | | | | | |
| | | 1 Year | | 3 Year | | 5 Year | | Since Inception | |
Leuthold Global Industries Fund - Retail Class | | | 17.33 | % | | | n/a | | | | n/a | | | | 6.44 | % | |
| MSCI ACWI | | | 21.67 | % | | | 7.78 | % | | | (1.54 | %) | | | 9.46 | % | |
| S&P 500 Index | | | 30.20 | % | | | 13.20 | % | | | 1.05 | % | | | 12.85 | % | |
A $10,000 Investment in the Leuthold Global Industries Fund - Retail Class
The MSCI ACWI (All Country World Index) is a free float-adjusted market capitalization weighted index that is designed to measure the equity market performance of developed and emerging markets. As of May 30, 2011, the MSCI ACWI consisted of 45 country indices comprising 24 developed and 21 emerging market country indices. The developed market country indices included are: Australia, Austria, Belgium, Canada, Denmark, Finland, France, Germany, Greece, Hong Kong, Ireland, Israel, Italy, Japan, Netherlands, New Zealand, Norway, Portugal, Singapore, Spain, Sweden, Switzerland, the United Kingdom, and the United States. The emerging market country indices included are: Brazil, Chile, China, Colombia, Czech Republic, Egypt, Hungary, India, Indonesia, Korea, Malaysia, Mexico, Morocco, Peru, Philippines, Poland, Russia, South Africa, Taiwan, Thailand, and Turkey.
The S&P 500 Index is an unmanaged capitalization-weighted index of 500 stocks designed to measure performance of the broad domestic economy through changes in the aggregate market value of the 500 stocks which represent all major industries.
This chart assumes an initial gross investment of $10,000 made on 5/17/10 (commencement of operations). Returns shown include the reinvestment of all dividends. The Fund’s past performance is not necessarily an indication of its future performance. It may perform better or worse in the future. The graph and the table do not reflect the deduction of taxes that a shareholder would pay on Fund distributions or the redemption of shares.
|
| The Leuthold Funds - 2012 Annual Report | 33 |
| Leuthold Global Industries Fund - Institutional Class |
| (Unaudited) |
Average Annual Rate of Return For Periods Ended
September 30, 2012
| | | | | | | | | | | | | | | | | | |
| | | 1 Year | | 3 Year | | 5 Year | | Since Inception | |
Leuthold Global Industries Fund - Institutional Class | | | 17.84 | % | | | n/a | | | | n/a | | | | 6.80 | % | |
| MSCI ACWI | | | 21.67 | % | | | 7.78 | % | | | (1.54 | %) | | | 9.46 | % | |
| S&P 500 Index | | | 30.20 | % | | | 13.20 | % | | | 1.05 | % | | | 12.85 | % | |
A $1,000,000 Investment in the Leuthold Global Industries Fund - Institutional Class
The MSCI ACWI (All Country World Index) is a free float-adjusted market capitalization weighted index that is designed to measure the equity market performance of developed and emerging markets. As of May 30, 2011, the MSCI ACWI consisted of 45 country indices comprising 24 developed and 21 emerging market country indices. The developed market country indices included are: Australia, Austria, Belgium, Canada, Denmark, Finland, France, Germany, Greece, Hong Kong, Ireland, Israel, Italy, Japan, Netherlands, New Zealand, Norway, Portugal, Singapore, Spain, Sweden, Switzerland, the United Kingdom, and the United States. The emerging market country indices included are: Brazil, Chile, China, Colombia, Czech Republic, Egypt, Hungary, India, Indonesia, Korea, Malaysia, Mexico, Morocco, Peru, Philippines, Poland, Russia, South Africa, Taiwan, Thailand, and Turkey.
The S&P 500 Index is an unmanaged capitalization-weighted index of 500 stocks designed to measure performance of the broad domestic economy through changes in the aggregate market value of the 500 stocks which represent all major industries.
This chart assumes an initial gross investment of $1,000,000 made on 5/17/10 (commencement of operations). Returns shown include the reinvestment of all dividends. The Fund’s past performance is not necessarily an indication of its future performance. It may perform better or worse in the future. The graph and the table do not reflect the deduction of taxes that a shareholder would pay on Fund distributions or the redemption of shares.
|
| 34 | The Leuthold Funds - 2012 Annual Report |
| Leuthold Global Clean Technology Fund - Retail Class |
| (Unaudited) |
Average Annual Rate of Return For Periods Ended
September 30, 2012
| | | | | | | | | | | | | | | | | | |
| | | 1 Year | | 3 Year | | 5 Year | | Since Inception | |
Leuthold Global Clean Technology Fund - Retail Class | | | 21.15 | % | | | (6.95 | %) | | | n/a | | | | (2.31 | %) | |
Ardour Composite Global Alternative Energy Index | | | (10.78 | %) | | | (23.37 | %) | | | (23.66 | %) | | | (20.35 | %) | |
| S&P 500 Index | | | 30.20 | % | | | 13.20 | % | | | 1.05 | % | | | 16.19 | % | |
A $10,000 Investment in the Leuthold Global Clean Technology Fund - Retail Class
The Ardour Composite Global Alternative Energy Index is a capitalization weighted, float adjusted equity index designed to serve as an equity benchmark for globally traded stocks which are principally engaged in the field of alternative energy technologies, including renewable energy, alternative fuels, and related enabling technologies. The index is published by S-Network Global Indexes, LLC.
The S&P 500 Index is an unmanaged capitalization-weighted index of 500 stocks designed to measure performance of the broad domestic economy through changes in the aggregate market value of the 500 stocks which represent all major industries.
This chart assumes an initial gross investment of $10,000 made on 7/22/09 (commencement of operations). Returns shown include the reinvestment of all dividends. The Fund’s past performance is not necessarily an indication of its future performance. It may perform better or worse in the future. The graph and the table do not reflect the deduction of taxes that a shareholder would pay on Fund distributions or the redemption of shares.
|
| The Leuthold Funds - 2012 Annual Report | 35 |
| Leuthold Global Clean Technology Fund - Institutional Class |
| (Unaudited) |
Average Annual Rate of Return For Periods Ended
September 30, 2012
| | | | | | | | | | | | | | | | | | |
| | | 1 Year | | 3 Year | | 5 Year | | Since Inception | |
Leuthold Global Clean Technology Fund - Institutional Class | | | 21.30 | % | | | (6.75 | %) | | | n/a | | | | (2.12 | %) | |
Ardour Composite Global Alternative Energy Index | | | (10.78 | %) | | | (23.37 | %) | | | (23.66 | %) | | | (20.35 | %) | |
| S&P 500 Index | | | 30.20 | % | | | 13.20 | % | | | 1.05 | % | | | 16.19 | % | |
The Ardour Composite Global Alternative Energy Index is a capitalization weighted, float adjusted equity index designed to serve as an equity benchmark for globally traded stocks which are principally engaged in the field of alternative energy technologies, including renewable energy, alternative fuels, and related enabling technologies. The index is published by S-Network Global Indexes, LLC.
The S&P 500 Index is an unmanaged capitalization-weighted index of 500 stocks designed to measure performance of the broad domestic economy through changes in the aggregate market value of the 500 stocks which represent all major industries.
This chart assumes an initial gross investment of $1,000,000 made on 7/22/09 (commencement of operations). Returns shown include the reinvestment of all dividends. The Fund’s past performance is not necessarily an indication of its future performance. It may perform better or worse in the future. The graph and the table do not reflect the deduction of taxes that a shareholder would pay on Fund distributions or the redemption of shares.
|
| 36 | The Leuthold Funds - 2012 Annual Report |
| Grizzly Short Fund |
| (Unaudited) |
Average Annual Rate of Return For Periods Ended
September 30, 2012
| | | | | | | | | | | | | | | | | | |
| | | 1 Year | | 3 Year | | 5 Year | | 10 Year | |
| Grizzly Short Fund | | | (31.47 | %) | | | (16.50 | %) | | | (9.64 | %) | | | (12.46 | %) | |
| S&P MidCap 400 Index | | | 28.54 | % | | | 14.33 | % | | | 3.83 | % | | | 10.77 | % | |
| S&P 500 Index | | | 30.20 | % | | | 13.20 | % | | | 1.05 | % | | | 8.01 | % | |
A $10,000 Investment in the Grizzly Short Fund
The S&P MidCap 400 Index is a capitalization-weighted index which measures the performance of the mid-range sector of the U.S. stock market. The index was developed with a base level of 100 as of December 31, 1990.
The S&P 500 Index is an unmanaged capitalization-weighted index of 500 stocks designed to measure performance of the broad domestic economy through changes in the aggregate market value of the 500 stocks which represent all major industries.
This chart assumes an initial gross investment of $10,000 made on 9/30/02. Returns shown include the reinvestment of all dividends. The Fund’s past performance is not necessarily an indication of its future performance. It may perform better or worse in the future. The graph and the table do not reflect the deduction of taxes that a shareholder would pay on Fund distributions or the redemption of shares.
|
The Leuthold Funds - 2012 Annual Report | 37 |
| The Leuthold Funds |
| Statements of Assets and Liabilities |
| September 30, 2012 |
| | | Leuthold Core Investment Fund (Consolidated) | | | Leuthold Asset Allocation Fund (Consolidated) | | | Leuthold Global Fund (Consolidated) | | | Leuthold Select Industries Fund | |
| ASSETS: | | | | | | | | | | | | |
| Investments, at cost | | $ | 676,405,902 | | | $ | 531,407,395 | | | $ | 343,750,526 | | | $ | 12,022,152 | |
| | | | | | | | | | | | | | | | | |
| Investments, at fair value | | $ | 757,444,111 | | | $ | 600,775,503 | | | $ | 375,684,629 | | | $ | 13,511,668 | |
| Cash | | | 30,019 | | | | 87,275 | | | | 3,905,357 | | | | 416 | |
| Receivable for Fund shares sold | | | 307,855 | | | | 126,406 | | | | 1,823,300 | | | | — | |
| Receivable for investments sold | | | 19,293,640 | | | | 11,773,069 | | | | 6,621,884 | | | | 185,268 | |
| Collateral at broker for securities sold short | | | 39,796,251 | | | | 31,581,510 | | | | 18,697,219 | | | | — | |
| Interest receivable | | | 953,686 | | | | 784,742 | | | | 633,310 | | | | 1 | |
| Dividends receivable | | | 782,449 | | | | 585,441 | | | | 449,917 | | | | 18,471 | |
| Other assets | | | 22,870 | | | | 22,492 | | | | 10,875 | | | | 10,802 | |
| Total Assets | | | 818,630,881 | | | | 645,736,438 | | | | 407,826,491 | | | | 13,726,626 | |
| | | | | | | | | | | | | | | | | |
| LIABILITIES: | | | | | | | | | | | | | | | | |
| | | | | | | | | | | | | | | | | |
| Securities sold short, at fair value (proceeds $19,310,588, $15,490,463, $9,738,455, and $0, respectively) | | | 19,627,038 | | | | 15,744,312 | | | | 9,497,176 | | | | — | |
| Interest payable on securities sold short | | | 14,139 | | | | 11,373 | | | | 1,609 | | | | — | |
| Payable for investments purchased | | | 5,356,094 | | | | 252,484 | | | | 10,339,542 | | | | 147,377 | |
| Payable for Fund shares redeemed | | | 1,029,561 | | | | 1,316,820 | | | | 392,720 | | | | 61,424 | |
| Payable to Adviser | | | 598,764 | | | | 476,026 | | | | 353,146 | | | | 13,168 | |
| Payable to Custodian | | | 77,284 | | | | 87,945 | | | | 60,599 | | | | 9,747 | |
| Dividends payable on securities sold short | | | — | | | | — | | | | — | | | | — | |
| Distribution (Rule 12b-1) fees payable | | | — | | | | 375,325 | | | | 76,753 | | | | 402 | |
| Shareholder servicing fees payable | | | 141,150 | | | | — | | | | — | | | | 2,729 | |
| Accrued expenses and other liablities | | | 454,739 | | | | 588,565 | | | | 263,287 | | | | 33,352 | |
| Total Liabilities | | | 27,298,769 | | | | 18,852,850 | | | | 20,984,832 | | | | 268,199 | |
| NET ASSETS | | $ | 791,332,112 | | | $ | 626,883,588 | | | $ | 386,841,659 | | | $ | 13,458,427 | |
|
| 38 | The Leuthold Funds - 2012 Annual Report | See Notes to the Financial Statements. |
| |
| The Leuthold Funds |
| Statements of Assets and Liabilities (continued) |
| September 30, 2012 |
| | | Leuthold Core Investment Fund (Consolidated) | | | Leuthold Asset Allocation Fund (Consolidated) | | | Leuthold Global Fund (Consolidated) | | | Leuthold Select Industries Fund | |
| NET ASSETS CONSIST OF: | | | | | | | | | | | | |
| Capital stock | | $ | 712,938,619 | | | $ | 899,047,683 | | | $ | 356,837,477 | | | $ | 16,982,904 | |
| Accumulated net investment income (loss) | | | 5,683,952 | | | | 8,246,872 | | | | 833,163 | | | | 7,803 | |
| Accumulated net realized gain (loss) on investments | | | (8,012,293 | ) | | | (349,525,582 | ) | | | (3,004,346 | ) | | | (5,021,783 | ) |
| Net unrealized appreciation (depreciation) on investments and short positions | | | 80,721,834 | | | | 69,114,615 | | | | 32,175,365 | | | | 1,489,503 | |
| Total Net Assets | | $ | 791,332,112 | | | $ | 626,883,588 | | | $ | 386,841,659 | | | $ | 13,458,427 | |
| | | | | | | | | | | | | | | | | |
| Retail Class Shares | | | | | | | | | | | | | | | | |
| Net assets | | $ | 527,760,001 | | | $ | 359,697,107 | | | $ | 120,450,807 | | | $ | 13,458,427 | |
| Shares outstanding (1,000,000,000 shares of $0.0001 par value authorized) | | | 31,455,318 | | | | 34,251,681 | | | | 11,757,480 | | | | 1,014,868 | |
| Net Asset Value, Redemption Price and Offering Price Per Share | | $ | 16.78 | * | | $ | 10.50 | * | | $ | 10.24 | * | | $ | 13.26 | |
| | | | | | | | | | | | | | | | | |
| Institutional Class Shares | | | | | | | | | | | | | | | | |
| Net assets | | $ | 263,572,111 | | | $ | 267,186,481 | | | $ | 266,390,852 | | | | n/a | |
| Shares outstanding (1,000,000,000 shares of $0.0001 par value authorized) | | | 15,716,635 | | | | 25,346,679 | | | | 25,939,066 | | | | n/a | |
| Net Asset Value, Redemption Price and Offering Price Per Share | | $ | 16.77 | * | | $ | 10.54 | * | | $ | 10.27 | * | | | n/a | |
* Redemption price may differ from NAV if redemption fee is applied.
|
| See Notes to the Financial Statements. | The Leuthold Funds - 2012 Annual Report | 39 |
| |
| The Leuthold Funds |
| Statements of Assets and Liabilities (continued) |
| September 30, 2012 |
| | | Leuthold Global Industries Fund | | | Leuthold Global Clean Technology Fund | | | Grizzly Short Fund | |
| ASSETS: | | | | | | | | | |
| Investments, at cost | | $ | 7,273,853 | | | $ | 7,747,849 | | | $ | 5,461,654 | |
| | | | | | | | | | | | | |
| Investments, at fair value | | $ | 7,946,919 | | | $ | 8,591,246 | | | $ | 5,461,654 | |
| Cash | | | 140,097 | | | | 277 | | | | — | |
| Receivable for Fund shares sold | | | — | | | | — | | | | 257,446 | |
| Receivable for investments sold | | | 233,563 | | | | 93,504 | | | | 4,191,001 | |
| Collateral at broker for securities sold short | | | — | | | | — | | | | 256,486,352 | |
| Interest receivable | | | 1 | | | | 2 | | | | 64 | |
| Dividends receivable | | | 19,838 | | | | 17,270 | | | | — | |
| Other assets | | | 13,160 | | | | 14,532 | | | | 21,749 | |
| Total Assets | | | 8,353,578 | | | | 8,716,831 | | | | 266,418,266 | |
| | | | | | | | | | | | | |
| LIABILITIES: | | | | | | | | | | | | |
| Securities sold short, at fair value (proceeds $0, $0, and $128,740,486, respectively) | | | — | | | | — | | | | 129,605,702 | |
| Interest payable on securities sold short | | | — | | | | — | | | | 37,990 | |
| Payable for investments purchased | | | 357,696 | | | | — | | | | — | |
| Payable for Fund shares redeemed | | | — | | | | 1,450 | | | | 24,879 | |
| Payable to Adviser | | | 3,433 | | | | 1,839 | | | | 159,026 | |
| Payable to Custodian | | | 16,740 | | | | 9,308 | | | | 390 | |
| Dividends payable on securities sold short | | | — | | | | — | | | | 100,467 | |
| Distribution (Rule 12b-1) fees payable | | | 3,210 | | | | 8,137 | | | | — | |
| Shareholder servicing fees payable | | | — | | | | — | | | | 47,759 | |
| Accrued expenses and other liablities | | | 37,887 | | | | 31,511 | | | | 156,044 | |
| Total Liabilities | | | 418,966 | | | | 52,245 | | | | 130,132,257 | |
| NET ASSETS | | $ | 7,934,612 | | | $ | 8,664,586 | | | $ | 136,286,009 | |
|
| The Leuthold Funds - 2012 Annual Report | See Notes to the Financial Statements. |
| |
| The Leuthold Funds |
| Statements of Assets and Liabilities (continued) |
| September 30, 2012 |
| | | Leuthold Global Industries Fund | | | Leuthold Global Clean Technology Fund | | | Grizzly Short Fund | |
| NET ASSETS CONSIST OF: | | | | | | | | | |
| Capital stock | | $ | 9,492,297 | | | $ | 13,587,346 | | | $ | 263,791,629 | |
| Accumulated net investment income (loss) | | | (17,087 | ) | | | (53,816 | ) | | | (3,874,894 | ) |
| Accumulated net realized gain (loss) on investments | | | (2,212,663 | ) | | | (5,712,260 | ) | | | (122,765,493 | ) |
| Net unrealized appreciation (depreciation) on investments and short positions | | | 672,065 | | | | 843,316 | | | | (865,233 | ) |
| Total Net Assets | | $ | 7,934,612 | | | $ | 8,664,586 | | | $ | 136,286,009 | |
| | | | | | | | | | | | | |
| Retail Class Shares | | | | | | | | | | | | |
| Net assets | | $ | 3,782,099 | | | $ | 7,477,204 | | | $ | 136,286,009 | |
| Shares outstanding (1,000,000,000 shares of $0.0001 par value authorized) | | | 330,624 | | | | 805,923 | | | | 12,323,800 | |
| Net Asset Value, Redemption Price and Offering Price Per Share | | $ | 11.44 | * | | $ | 9.28 | * | | $ | 11.06 | |
| | | | | | | | | | | | | |
| Institutional Class Shares | | | | | | | | | | | | |
| Net assets | | $ | 4,152,513 | | | $ | 1,187,382 | | | | n/a | |
| Shares outstanding (1,000,000,000 shares of $0.0001 par value authorized) | | | 361,678 | | | | 127,127 | | | | n/a | |
| Net Asset Value, Redemption Price and Offering Price Per Share | | $ | 11.48 | * | | $ | 9.34 | * | | | n/a | |
* Redemption price may differ from NAV if redemption fee is applied.
|
| See Notes to the Financial Statements. | The Leuthold Funds - 2012 Annual Report | 41 |
| |
| The Leuthold Funds |
| Statements of Operations |
| For the Year Ended September 30, 2012 |
| | | Leuthold Core Investment Fund (Consolidated) | | | Leuthold Asset Allocation Fund (Consolidated) | | | Leuthold Global Fund (Consolidated) | | | Leuthold Select Industries Fund | |
| INVESTMENT INCOME: | | | | | | | | | | | | |
| Dividend income (net of foreign taxes withheld of $326,214, $371, 238, $348,123, and $4,444, respectively) | | $ | 15,741,342 | | | $ | 16,695,255 | | | $ | 8,045,857 | | | $ | 276,726 | |
| Interest income | | | 1,958,173 | | | | 1,807,774 | | | | 1,040,758 | | | | 12 | |
| Total investment income | | | 17,699,515 | | | | 18,503,029 | | | | 9,086,615 | | | | 276,738 | |
| | | | | | | | | | | | | | | | | |
| EXPENSES: | | | | | | | | | | | | | | | | |
| Investment advisory fees (Note 3) | | | 8,624,402 | | | | 7,546,509 | | | | 4,707,124 | | | | 152,051 | |
| Administration fees | | | 349,604 | | | | 306,520 | | | | 156,834 | | | | 5,107 | |
| Transfer agent fees | | | 256,037 | | | | 799,954 | | | | 304,218 | | | | 7,952 | |
| Legal fees | | | 26,210 | | | | 24,967 | | | | 13,038 | | | | 347 | |
| Audit and tax fees | | | 57,799 | | | | 56,082 | | | | 30,725 | | | | 22,120 | |
| Fund accounting fees | | | 105,165 | | | | 94,788 | | | | 60,973 | | | | 6,125 | |
| Custody fees | | | 173,453 | | | | 185,660 | | | | 135,934 | | | | 23,351 | |
| Shareholder servicing fees-Retail Class | | | 658,387 | | | | — | | | | — | | | | 11,306 | |
| Registration fees | | | 53,036 | | | | 80,464 | | | | 63,867 | | | | 26,027 | |
| Report to shareholders | | | 150,228 | | | | 184,051 | | | | 70,685 | | | | 3,865 | |
| Directors’ fees | | | 66,354 | | | | 59,451 | | | | 29,158 | | | | 1,075 | |
Distribution (Rule 12b-1) fees-Retail Class (Note 4) | | | — | | | | 1,089,575 | | | | 290,886 | | | | — | |
| Other | | | 41,743 | | | | 39,527 | | | | 17,022 | | | | 906 | |
| Total expenses before dividends and interest on short positions | | | 10,562,418 | | | | 10,467,548 | | | | 5,880,464 | | | | 260,232 | |
| Dividends and interest on short positions | | | 759,589 | | | | 702,639 | | | | 249,787 | | | | — | |
| (Reimbursement) or recovery from Adviser (Note 3) | | | — | | | | — | | | | — | | | | (16,951 | ) |
| Total expenses | | | 11,322,007 | | | | 11,170,187 | | | | 6,130,251 | | | | 243,281 | |
| NET INVESTMENT INCOME (LOSS) | | $ | 6,377,508 | | | $ | 7,332,842 | | | $ | 2,956,364 | | | $ | 33,457 | |
|
| 42 | The Leuthold Funds - 2012 Annual Report | See Notes to the Financial Statements. |
| |
| The Leuthold Funds |
| Statements of Operations (continued) |
| For the Year Ended September 30, 2012 |
| | | Leuthold Core Investment Fund (Consolidated) | | | Leuthold Asset Allocation Fund (Consolidated) | | | Leuthold Global Fund (Consolidated) | | | Leuthold Select Industries Fund | |
| REALIZED AND UNREALIZED GAIN (LOSS) ON INVESTMENTS, INVESTMENT COMPANIES, SHORT POSITIONS, FOREIGN CURRENCY, AND FOREIGN CURRENCY TRANSLATION: | | | | | | | | | | | | |
| | | | | | | | | | | | | |
| Net realized gain (loss) on: | | | | | | | | | | | | |
| Investments | | $ | 34,856,901 | | | $ | 81,870,239 | | | $ | 2,351,222 | | | $ | 118,039 | |
| Investment companies | | | (2,394,164 | ) | | | (1,633,882 | ) | | | 442,191 | | | | — | |
| Realized gain distributions received from investment companies | | | 153,373 | | | | 134,723 | | | | 6,831 | | | | — | |
| Short positions | | | (9,152,089 | ) | | | (8,530,405 | ) | | | 1,330,765 | | | | — | |
| Foreign currency and foreign currency translation | | | 3,560,362 | | | | 4,573,415 | | | | (113,573 | ) | | | 6 | |
| Net unrealized appreciation (depreciation) during the period on: | | | | | | | | | | | | | | | | |
| Investments | | | 86,068,096 | | | | 29,970,155 | | | | 42,488,501 | | | | 3,208,329 | |
| Investment companies | | | 2,679,334 | | | | 2,109,727 | | | | 1,250,650 | | | | — | |
| Short positions | | | (21,039,281 | ) | | | (20,409,545 | ) | | | (9,552,118 | ) | | | — | |
| Foreign currency and foreign currency translation | | | 119,901 | | | | 118,233 | | | | 34,272 | | | | (4 | ) |
| Net realized and unrealized gain (loss) on investments, investment companies, short positions, foreign currency, and foreign currency translation | | | 94,852,433 | | | | 88,202,660 | | | | 38,238,741 | | | | 3,326,370 | |
| NET INCREASE (DECREASE) IN NET ASSETS RESULTING FROM OPERATIONS | | $ | 101,229,941 | | | $ | 95,535,502 | | | $ | 41,195,105 | | | $ | 3,359,827 | |
|
| See Notes to the Financial Statements. | The Leuthold Funds - 2012 Annual Report | 43 |
| |
| The Leuthold Funds |
| Statements of Operations (continued) |
| For the Year Ended September 30, 2012 |
| | | Leuthold Global Industries Fund | | | Leuthold Global Clean Technology Fund | | | Grizzly Short Fund | |
| INVESTMENT INCOME: | | | | | | | | | |
| Dividend income (net of foreign taxes withheld of $11,967, $7,299, and $0, respectively) | | $ | 230,578 | | | $ | 146,584 | | | $ | — | |
| Interest income | | | 11 | | | | 55 | | | | 1,569 | |
| Total investment income | | | 230,589 | | | | 146,639 | | | | 1,569 | |
| | | | | | | | | | | | | |
| EXPENSES: | | | | | | | | | | | | |
| Investment advisory fees (Note 3) | | | 111,299 | | | | 116,247 | | | | 2,485,442 | |
| Administration fees | | | 3,396 | | | | 4,104 | | | | 76,127 | |
| Transfer agent fees | | | 11,348 | | | | 13,955 | | | | 104,364 | |
| Legal fees | | | 303 | | | | 135 | | | | 4,809 | |
| Audit and tax fees | | | 18,879 | | | | 19,516 | | | | 32,270 | |
| Fund accounting fees | | | 13,675 | | | | 3,463 | | | | 22,314 | |
| Custody fees | | | 53,465 | | | | 18,954 | | | | 903 | |
| Shareholder servicing fees-Retail Class | | | — | | | | — | | | | 190,859 | |
| Registration fees | | | 35,997 | | | | 28,854 | | | | 52,120 | |
| Report to shareholders | | | 2,190 | | | | 3,880 | | | | 35,286 | |
| Directors’ fees | | | 876 | | | | 857 | | | | 13,393 | |
| Distribution (Rule 12b-1) fees-Retail Class (Note 4) | | | 11,478 | | | | 18,996 | | | | — | |
| Other | | | 1,733 | | | | 1,592 | | | | 9,670 | |
| Total expenses before dividends and interest on short positions | | | 264,639 | | | | 230,553 | | | | 3,027,557 | |
| Dividends and interest on short positions | | | — | | | | — | | | | 3,118,134 | |
| (Reimbursement) or recovery from Adviser (Note 3) | | | (58,737 | ) | | | (15,497 | ) | | | — | |
| Total expenses | | | 205,902 | | | | 215,056 | | | | 6,145,691 | |
| NET INVESTMENT INCOME (LOSS) | | $ | 24,687 | | �� | $ | (68,417 | ) | | $ | (6,144,122 | ) |
|
| 44 | The Leuthold Funds - 2012 Annual Report | See Notes to the Financial Statements. |
| |
| The Leuthold Funds |
| Statements of Operations (continued) |
| For the Year Ended September 30, 2012 |
| | | Leuthold Global Industries Fund | | | Leuthold Global Clean Technology Fund | | | Grizzly Short Fund | |
| REALIZED AND UNREALIZED GAIN (LOSS) ON INVESTMENTS, INVESTMENT COMPANIES, SHORT POSITIONS, FOREIGN CURRENCY, AND FOREIGN CURRENCY TRANSLATION: | | | | | | | | | |
| | | | | | | | | | |
| Net realized gain (loss) on: | | | | | | | | | |
| Investments | | $ | (1,171,382 | ) | | $ | (2,498,491 | ) | | $ | — | |
| Investment companies | | | — | | | | — | | | | — | |
| Realized gain distributions received from investment companies | | | — | | | | — | | | | — | |
| Short positions | | | — | | | | — | | | | (50,048,056 | ) |
| Foreign currency and foreign currency translation | | | (6,890 | ) | | | (2,637 | ) | | | 373 | |
| Net unrealized appreciation (depreciation) during the period on: | | | | | | | | | | | | |
| Investments | | | 3,335,380 | | | | 4,867,072 | | | | — | |
| Investment companies | | | — | | | | — | | | | — | |
| Short positions | | | — | | | | — | | | | (31,836,852 | ) |
| Foreign currency and foreign currency translation | | | 833 | | | | 201 | | | | (17 | ) |
| Net realized and unrealized gain (loss) on investments, short positions, foreign currency, and foreign currency translation | | | 2,157,941 | | | | 2,366,145 | | | | (81,884,552 | ) |
| NET INCREASE (DECREASE) IN NET ASSETS RESULTING FROM OPERATIONS | | $ | 2,182,628 | | | $ | 2,297,728 | | | $ | (88,028,674 | ) |
|
| See Notes to the Financial Statements. | The Leuthold Funds - 2012 Annual Report | 45 |
| Leuthold Core Investment Fund |
| Statements of Changes in Net Assets (Consolidated) |
| | | Year Ended September 30, 2012 | | | Year Ended September 30, 2011 | |
| OPERATIONS: | | | | | | |
| Net investment income | | $ | 6,377,508 | | | $ | 7,107,931 | |
| Net realized gain on investments, investment companies, short positions, foreign currency, and foreign currency translation | | | 27,024,383 | | | | 128,158,677 | |
| Net unrealized appreciation (depreciation) on investments, investment companies, short positions, foreign currency, and foreign currency translation | | | 67,828,050 | | | | (142,216,650 | ) |
| Net increase (decrease) in net assets from operations | | | 101,229,941 | | | | (6,950,042 | ) |
| | | | | | | | | |
| DISTRIBUTIONS TO SHAREHOLDERS: | | | | | | | | |
| From net investment income - Retail Class | | | (17,620,148 | ) | | | (3,081,175 | ) |
| From net investment income - Institutional Class | | | (10,266,042 | ) | | | (2,050,771 | ) |
| From net realized gains - Retail Class | | | — | | | | — | |
| From net realized gains - Institutional Class | | | — | | | | — | |
| Total distributions | | | (27,886,190 | ) | | | (5,131,946 | ) |
| | | | | | | | | |
| CAPITAL SHARE TRANSACTIONS: | | | | | | | | |
| Proceeds from shares sold - Retail Class | | | 70,403,726 | | | | 91,440,164 | |
| Proceeds from shares sold - Institutional Class | | | 55,408,295 | | | | 53,074,051 | |
| Proceeds from shares issued to holders in reinvestment of dividends - Retail Class | | | 16,330,521 | | | | 2,906,808 | |
| Proceeds from shares issued to holders in reinvestment of dividends - Institutional Class | | | 9,619,985 | | | | 1,918,404 | |
| Cost of shares redeemed - Retail Class* | | | (267,568,264 | ) | | | (283,073,874 | ) |
| Cost of shares redeemed - Institutional Class** | | | (174,656,467 | ) | | | (156,096,354 | ) |
| Net decrease in net assets from capital share transactions | | | (290,462,204 | ) | | | (289,830,801 | ) |
| | | | | | | | | |
| TOTAL DECREASE IN NET ASSETS: | | | (217,118,453 | ) | | | (301,912,789 | ) |
| NET ASSETS | | | | | | | | |
| Beginning of year | | | 1,008,450,565 | | | | 1,310,363,354 | |
| End of year (including accumulated net investment income of $5,683,952 and $16,992,082, respectively) | | $ | 791,332,112 | | | $ | 1,008,450,565 | |
| | | | | | | | | |
| CHANGES IN SHARES OUTSTANDING: | | | | | | | | |
| Shares sold - Retail Class | | | 4,337,297 | | | | 5,338,404 | |
| Shares sold - Institutional Class | | | 3,445,401 | | | | 3,146,529 | |
| Shares issued to holders in reinvestment of dividends - Retail Class | | | 1,022,237 | | | | 171,204 | |
| Shares issued to holders in reinvestment of dividends - Institutional Class | | | 601,871 | | | | 113,197 | |
| Shares redeemed - Retail Class | | | (16,535,899 | ) | | | (16,595,763 | ) |
| Shares redeemed - Institutional Class | | | (10,754,291 | ) | | | (9,101,904 | ) |
| Net decrease in shares outstanding | | | (17,883,384 | ) | | | (16,928,333 | ) |
| | | | | | | | | |
| * Net of redemption fees of (Retail Class): | | $ | 96 | | | $ | 1,366 | |
| ** Net of redemption fees of (Institutional Class): | | $ | 139 | | | $ | 28,224 | |
|
| 46 | The Leuthold Funds - 2012 Annual Report | See Notes to the Financial Statements. |
| Leuthold Asset Allocation Fund |
| Statements of Changes in Net Assets (Consolidated) |
| | | Year Ended September 30, 2012 | | | Year Ended September 30, 2011 | |
| OPERATIONS: | | | | | | |
| Net investment income | | $ | 7,332,842 | | | $ | 9,446,235 | |
| Net realized gain on investments, investment companies, short positions, foreign currency, and foreign currency translation | | | 76,414,090 | | | | 117,546,413 | |
| Net unrealized appreciation (depreciation) on investments, investment companies, short positions, foreign currency, and foreign currency translation | | | 11,788,570 | | | | (125,111,112 | ) |
| Net increase in net assets from operations | | | 95,535,502 | | | | 1,881,536 | |
| | | | | | | | | |
| DISTRIBUTIONS TO SHAREHOLDERS: | | | | | | | | |
| From net investment income - Retail Class | | | (17,167,035 | ) | | | (4,321,330 | ) |
| From net investment income - Institutional Class | | | (12,272,080 | ) | | | (3,180,752 | ) |
| From net realized gains - Retail Class | | | — | | | | — | |
| From net realized gains - Institutional Class | | | — | | | | — | |
| Total distributions | | | (29,439,115 | ) | | | (7,502,082 | ) |
| | | | | | | | | |
| CAPITAL SHARE TRANSACTIONS: | | | | | | | | |
| Proceeds from shares sold - Retail Class | | | 52,411,631 | | | | 165,626,458 | |
| Proceeds from shares sold - Institutional Class | | | 48,368,810 | | | | 129,757,090 | |
| Proceeds from shares issued to holders in reinvestment of dividends - Retail Class | | | 15,107,383 | | | | 3,892,104 | |
| Proceeds from shares issued to holders in reinvestment of dividends - Institutional Class | | | 11,515,740 | | | | 2,990,024 | |
| Cost of shares redeemed - Retail Class* | | | (354,441,167 | ) | | | (407,864,634 | ) |
| Cost of shares redeemed - Institutional Class** | | | (205,267,079 | ) | | | (132,510,447 | ) |
| Net decrease in net assets from capital share transactions | | | (432,304,682 | ) | | | (238,109,405 | ) |
| | | | | | | | | |
| TOTAL DECREASE IN NET ASSETS: | | | (366,208,295 | ) | | | (243,729,951 | ) |
| NET ASSETS | | | | | | | | |
| Beginning of year | | | 993,091,883 | | | | 1,236,821,834 | |
| End of year (including accumulated net investment income of $8,246,872 and $15,526,681, respectively) | | $ | 626,883,588 | | | $ | 993,091,883 | |
| | | | | | | | | |
| CHANGES IN SHARES OUTSTANDING: | | | | | | | | |
| Shares sold - Retail Class | | | 5,112,849 | | | | 15,651,134 | |
| Shares sold - Institutional Class | | | 4,731,096 | | | | 12,144,533 | |
| Shares issued to holders in reinvestment of dividends - Retail Class | | | 1,492,344 | | | | 374,930 | |
| Shares issued to holders in reinvestment of dividends - Institutional Class | | | 1,130,495 | | | | 287,495 | |
| Shares redeemed - Retail Class | | | (34,791,335 | ) | | | (38,689,099 | ) |
| Shares redeemed - Institutional Class | | | (20,076,664 | ) | | | (12,469,491 | ) |
| Net decrease in shares outstanding | | | (42,401,215 | ) | | | (22,700,498 | ) |
| | | | | | | | | |
| * Net of redemption fees of (Retail Class): | | $ | 803 | | | $ | 4,091 | |
| ** Net of redemption fees of (Institutional Class): | | $ | — | | | $ | 7 | |
|
| See Notes to the Financial Statements. | The Leuthold Funds - 2012 Annual Report | 47 |
| Leuthold Global Fund |
| Statements of Changes in Net Assets (Consolidated) |
| | | Year Ended September 30, 2012 | | | Year Ended September 30, 2011 | |
| OPERATIONS: | | | | | | |
| Net investment income | | $ | 2,956,364 | | | $ | 3,813,617 | |
| Net realized gain on investments, investment companies, short positions, foreign currency, and foreign currency translation | | | 4,017,436 | | | | 672,236 | |
| Net unrealized appreciation (depreciation) on investments, investment companies, short positions, foreign currency, and foreign currency translation | | | 34,221,305 | | | | (26,315,253 | ) |
| Net increase (decrease) in net assets from operations | | | 41,195,105 | | | | (21,829,400 | ) |
| | | | | | | | | |
| DISTRIBUTIONS TO SHAREHOLDERS: | | | | | | | | |
| From net investment income - Retail Class | | | (1,693,659 | ) | | | (841,488 | ) |
| From net investment income - Institutional Class | | | (3,991,623 | ) | | | (2,412,402 | ) |
| From net realized gains - Retail Class | | | (1,600,165 | ) | | | (5,218,636 | ) |
| From net realized gains - Institutional Class | | | (2,986,860 | ) | | | (9,824,159 | ) |
| Total distributions | | | (10,272,307 | ) | | | (18,296,685 | ) |
| | | | | | | | | |
| CAPITAL SHARE TRANSACTIONS: | | | | | | | | |
| Proceeds from shares sold - Retail Class | | | 38,817,784 | | | | 109,872,463 | |
| Proceeds from shares sold - Institutional Class | | | 42,023,979 | | | | 157,499,873 | |
| Proceeds from shares issued to holders in reinvestment of dividends - Retail Class | | | 2,512,501 | | | | 4,061,793 | |
| Proceeds from shares issued to holders in reinvestment of dividends - Institutional Class | | | 6,030,728 | | | | 10,572,414 | |
| Cost of shares redeemed - Retail Class* | | | (83,069,375 | ) | | | (46,673,365 | ) |
| Cost of shares redeemed - Institutional Class** | | | (95,136,550 | ) | | | (40,113,619 | ) |
| Net increase (decrease) in net assets from capital share transactions | | | (88,820,933 | ) | | | 195,219,559 | |
| | | | | | | | | |
| TOTAL INCREASE (DECREASE) IN NET ASSETS: | | | (57,898,135 | ) | | | 155,093,474 | |
| NET ASSETS | | | | | | | | |
| Beginning of year | | | 444,739,794 | | | | 289,646,320 | |
| End of year (including accumulated net investment income of $833,163 and $1,851,244, respectively) | | $ | 386,841,659 | | | $ | 444,739,794 | |
| | | | | | | | | |
| CHANGES IN SHARES OUTSTANDING: | | | | | | | | |
| Shares sold - Retail Class | | | 3,945,983 | | | | 10,329,104 | |
| Shares sold - Institutional Class | | | 4,228,765 | | | | 14,738,195 | |
| Shares issued to holders in reinvestment of dividends - Retail Class | | | 261,893 | | | | 395,426 | |
| Shares issued to holders in reinvestment of dividends - Institutional Class | | | 625,025 | | | | 1,024,489 | |
| Shares redeemed - Retail Class | | | (8,450,710 | ) | | | (4,441,240 | ) |
| Shares redeemed - Institutional Class | | | (9,571,699 | ) | | | (3,796,602 | ) |
| Net increase (decrease) in shares outstanding | | | (8,960,743 | ) | | | 18,249,372 | |
| | | | | | | | | |
| * Net of redemption fees of (Retail Class): | | $ | 2,558 | | | $ | 3,180 | |
| ** Net of redemption fees of (Institutional Class): | | $ | — | | | $ | 656 | |
|
| 48 | The Leuthold Funds - 2012 Annual Report | See Notes to the Financial Statements. |
| Leuthold Select Industries Fund |
| Statements of Changes in Net Assets |
| | | Year Ended September 30, 2012 | | | Year Ended September 30, 2011 | |
| OPERATIONS: | | | | | | |
| Net investment income (loss) | | $ | 33,457 | | | $ | (73,181 | ) |
| Net realized gain on investments, foreign currency, and foreign currency translation | | | 118,045 | | | | 3,704,600 | |
| Net unrealized appreciation (depreciation) on investments, foreign currency, and foreign currency translation | | | 3,208,325 | | | | (3,532,035 | ) |
| Net increase in net assets from operations | | | 3,359,827 | | | | 99,384 | |
| | | | | | | | | |
| DISTRIBUTIONS TO SHAREHOLDERS: | | | | | | | | |
| From net investment income | | | (25,862 | ) | | | (45,146 | ) |
| From net realized gains | | | — | | | | — | |
| Total distributions | | | (25,862 | ) | | | (45,146 | ) |
| | | | | | | | | |
| CAPITAL SHARE TRANSACTIONS: | | | | | | | | |
| Proceeds from shares sold | | | 542,710 | | | | 1,688,661 | |
| Proceeds from shares issued to holders in reinvestment of dividends | | | 21,471 | | | | 39,403 | |
| Cost of shares redeemed | | | (6,718,254 | ) | | | (24,592,254 | ) |
| Net decrease in net assets from capital share transactions | | | (6,154,073 | ) | | | (22,864,190 | ) |
| | | | | | | | | |
| TOTAL DECREASE IN NET ASSETS: | | | (2,820,108 | ) | | | (22,809,952 | ) |
| NET ASSETS | | | | | | | | |
| Beginning of year | | | 16,278,535 | | | | 39,088,487 | |
| End of year (including accumulated net investment income of $7,803 and $0, respectively) | | $ | 13,458,427 | | | $ | 16,278,535 | |
| | | | | | | | | |
| CHANGES IN SHARES OUTSTANDING: | | | | | | | | |
| Shares sold | | | 43,940 | | | | 131,238 | |
| Shares issued to holders in reinvestment of dividends | | | 1,675 | | | | 3,080 | |
| Shares redeemed | | | (541,444 | ) | | | (1,936,088 | ) |
| Net decrease in shares outstanding | | | (495,829 | ) | | | (1,801,770 | ) |
|
| See Notes to the Financial Statements. | The Leuthold Funds - 2012 Annual Report | 49 |
| Leuthold Global Industries Fund |
| Statement of Changes in Net Assets |
| | | Year Ended September 30, 2012 | | | Year Ended September 30, 2011 | |
| OPERATIONS: | | | | | | |
| Net investment income | | $ | 24,687 | | | $ | 172,580 | |
| Net realized loss on investments, investment companies, foreign currency, and foreign currency translation | | | (1,178,272 | ) | | | (1,080,268 | ) |
| Net unrealized appreciation (depreciation) on investments, investment companies, foreign currency, and foreign currency translation | | | 3,336,213 | | | | (3,836,830 | ) |
| Net increase (decrease) in net assets from operations | | | 2,182,628 | | | | (4,744,518 | ) |
| | | | | | | | | |
| DISTRIBUTIONS TO SHAREHOLDERS: | | | | | | | | |
| From net investment income - Retail Class | | | (11,008 | ) | | | (28,834 | ) |
| From net investment income - Institutional Class | | | (7,012 | ) | | | (130,716 | ) |
| From net realized gains - Retail Class | | | — | | | | (45,735 | ) |
| From net realized gains - Institutional Class | | | — | | | | (30,728 | ) |
| Total distributions | | | (18,020 | ) | | | (236,013 | ) |
| | | | | | | | | |
| CAPITAL SHARE TRANSACTIONS: | | | | | | | | |
| Proceeds from shares sold - Retail Class | | | 290,757 | | | | 2,926,049 | |
| Proceeds from shares sold - Institutional Class | | | 333,333 | | | | 25,175,738 | |
| Proceeds from shares issued to holders in reinvestment of dividends - Retail Class | | | 1,464 | | | | 12,928 | |
| Proceeds from shares issued to holders in reinvestment of dividends - Institutional Class | | | 7,012 | | | | 158,397 | |
| Cost of shares redeemed - Retail Class* | | | (2,743,118 | ) | | | (3,025,963 | ) |
| Cost of shares redeemed - Institutional Class** | | | (12,401,434 | ) | | | (9,704,892 | ) |
| Net increase (decrease) from capital share transactions | | | (14,511,986 | ) | | | 15,542,257 | |
| | | | | | | | | |
| TOTAL INCREASE (DECREASE) IN NET ASSETS: | | | (12,347,378 | ) | | | 10,561,726 | |
| NET ASSETS | | | | | | | | |
| Beginning of year | | | 20,281,990 | | | | 9,720,264 | |
| End of year (including accumulated net investment loss of $(17,087) and $(26,563), respectively) | | $ | 7,934,612 | | | $ | 20,281,990 | |
| | | | | | | | | |
| CHANGES IN SHARES OUTSTANDING: | | | | | | | | |
| Shares sold - Retail Class | | | 27,418 | | | | 269,387 | |
| Shares sold - Institutional Class | | | 30,553 | | | | 2,007,864 | |
| Shares issued to holders in reinvestment of dividends - Retail Class | | | 141 | | | | 1,093 | |
| Shares issued to holders in reinvestment of dividends - Institutional Class | | | 674 | | | | 13,457 | |
| Shares redeemed - Retail Class | | | (247,065 | ) | | | (251,699 | ) |
| Shares redeemed - Institutional Class | | | (1,194,744 | ) | | | (847,497 | ) |
| Net increase (decrease) in shares outstanding | | | (1,383,023 | ) | | | 1,192,605 | |
| | | | | | | | | |
| * Net of redemption fees of (Retail Class): | | $ | — | | | $ | 38 | |
| ** Net of redemption fees of (Institutional Class): | | $ | — | | | $ | — | |
|
| 50 | The Leuthold Funds - 2012 Annual Report | See Notes to the Financial Statements. |
| Leuthold Global Clean Technology Fund |
| Statements of Changes in Net Assets |
| | | Year Ended September 30, 2012 | | | Year Ended September 30, 2011 | |
| OPERATIONS: | | | | | | |
| Net investment loss | | $ | (68,417 | ) | | $ | (241,689 | ) |
| Net realized loss on investments, foreign currency, and foreign currency translation | | | (2,501,128 | ) | | | (2,430,186 | ) |
| Net unrealized appreciation (depreciation) on investments, foreign currency, and foreign currency translation | | | 4,867,273 | | | | (3,102,436 | ) |
| Net increase (decrease) in net assets from operations | | | 2,297,728 | | | | (5,774,311 | ) |
| | | | | | | | | |
| DISTRIBUTIONS TO SHAREHOLDERS: | | | | | | | | |
| From net investment income - Retail Class | | | — | | | | — | |
| From net investment income - Institutional Class | | | — | | | | — | |
| From net realized gains - Retail Class | | | — | | | | — | |
| From net realized gains - Institutional Class | | | — | | | | — | |
| Total distributions | | | — | | | | — | |
| | | | | | | | | |
| CAPITAL SHARE TRANSACTIONS: | | | | | | | | |
| Proceeds from shares sold - Retail Class | | | 2,616,056 | | | | 6,824,754 | |
| Proceeds from shares sold - Institutional Class | | | 26,291 | | | | 1,225,845 | |
| Proceeds from shares issued to holders in reinvestment of dividends - Retail Class | | | — | | | | — | |
| Proceeds from shares issued to holders in reinvestment of dividends - Institutional Class | | | — | | | | — | |
| Cost of shares redeemed - Retail Class* | | | (4,536,562 | ) | | | (7,573,809 | ) |
| Cost of shares redeemed - Institutional Class** | | | (7,876,731 | ) | | | (5,950,651 | ) |
| Net decrease in net assets from capital share transactions | | | (9,770,946 | ) | | | (5,473,861 | ) |
| | | | | | | | | |
| TOTAL DECREASE IN NET ASSETS: | | | (7,473,218 | ) | | | (11,248,172 | ) |
| NET ASSETS | | | | | | | | |
| Beginning of year | | | 16,137,804 | | | | 27,385,976 | |
| End of year (including accumulated net investment loss of $(53,816) and $0, respectively) | | $ | 8,664,586 | | | $ | 16,137,804 | |
| | | | | | | | | |
| CHANGES IN SHARES OUTSTANDING: | | | | | | | | |
| Shares sold - Retail Class | | | 287,491 | | | | 603,918 | |
| Shares sold - Institutional Class | | | 2,774 | | | | 112,308 | |
| Shares issued to holders in reinvestment of dividends - Retail Class | | | — | | | | — | |
| Shares issued to holders in reinvestment of dividends - Institutional Class | | | — | | | | — | |
| Shares redeemed - Retail Class | | | (529,164 | ) | | | (713,831 | ) |
| Shares redeemed - Institutional Class | | | (928,921 | ) | | | (555,473 | ) |
| Net decrease in shares outstanding | | | (1,167,820 | ) | | | (553,078 | ) |
| | | | | | | | | |
| *Net of redemption fees of (Retail Class): | | $ | 482 | | | $ | 146 | |
| **Net of redemption fees of (Institutional Class): | | $ | — | | | $ | 11 | |
|
| See Notes to the Financial Statements. | The Leuthold Funds - 2012 Annual Report | 51 |
| Grizzly Short Fund |
| Statements of Changes in Net Assets |
| | | Year Ended September 30, 2012 | | | Year Ended September 30, 2011 | |
| OPERATIONS: | | | | | | |
| Net investment loss | | $ | (6,144,122 | ) | | $ | (3,879,417 | ) |
| Net realized loss on investment companies, short positions, foreign currency, and foreign currency translation | | | (50,047,683 | ) | | | (31,941,478 | ) |
| Net unrealized appreciation (depreciation) on short positions, foreign currency, and foreign currency translation | | | (31,836,869 | ) | | | 37,629,806 | |
| Net increase (decrease) in net assets from operations | | | (88,028,674 | ) | | | 1,808,911 | |
| | | | | | | | | |
| DISTRIBUTIONS TO SHAREHOLDERS: | | | | | | | | |
| From net investment income | | | — | | | | — | |
| From net realized gains | | | — | | | | — | |
| Total distributions | | | — | | | | — | |
| | | | | | | | | |
| CAPITAL SHARE TRANSACTIONS: | | | | | | | | |
| Proceeds from shares sold | | | 293,170,610 | | | | 298,354,919 | |
| Proceeds from shares issued to holders in reinvestment of dividends | | | — | | | | — | |
| Cost of shares redeemed | | | (332,304,010 | ) | | | (233,267,989 | ) |
| Net increase (decrease) in net assets from capital share transactions | | | (39,133,400 | ) | | | 65,086,930 | |
| | | | | | | | | |
| TOTAL INCREASE (DECREASE) IN NET ASSETS: | | | (127,162,074 | ) | | | 66,895,841 | |
| NET ASSETS | | | | | | | | |
| Beginning of year | | | 263,448,083 | | | | 196,552,242 | |
| End of year (including accumulated net investment loss of $(3,874,894) and $0, respectively) | | $ | 136,286,009 | | | $ | 263,448,083 | |
| | | | | | | | | |
| CHANGES IN SHARES OUTSTANDING: | | | | | | | | |
| Shares sold | | | 22,016,553 | | | | 16,037,579 | |
| Shares issued to holders in reinvestment of dividends | | | — | | | | — | |
| Shares redeemed | | | (26,019,415 | ) | | | (47,368,866 | ) |
| Net decrease in shares outstanding | | | (4,002,862 | ) | | | (31,331,287 | ) |
|
| 52 | The Leuthold Funds - 2012 Annual Report | See Notes to the Financial Statements. |
| Leuthold Core Investment Fund - Retail |
| Financial Highlights |
| | | Year Ended September 30, 2012 (Consolidated) | | | Year Ended September 30, 2011 (Consolidated) | | | Year Ended September 30, 2010 (Consolidated) | | | Year Ended September 30, 2009 (Consolidated) | | | Year Ended September 30, 2008 | |
| | | | | | | | | | | | | | | | | | | | | |
Per Share Data (1): | | | | | | | | | | | | | | | | | | | | |
| Net asset value, beginning of year | | $ | 15.50 | | | $ | 15.99 | | | $ | 15.79 | | | $ | 15.20 | | | $ | 21.18 | |
| Income (loss) from investment operations: | | | | | | | | | | | | | | | | | | | | |
| Net investment income | | | 0.11 | (2) | | | 0.09 | (3) | | | 0.14 | (2) | | | 0.28 | (2) | | | 0.26 | (3) |
| Net realized and unrealized gains (losses) on investments and short positions | | | 1.62 | | | | (0.51 | ) | | | 0.11 | | | | 0.45 | | | | (2.18 | ) |
| Total from investment operations | | | 1.73 | | | | (0.42 | ) | | | 0.25 | | | | 0.73 | | | | (1.92 | ) |
| | | | | | | | | | | | | | | | | | | | | |
| Less distributions: | | | | | | | | | | | | | | | | | | | | |
| From net investment income | | | (0.45 | ) | | | (0.07 | ) | | | –– | | | | (0.13 | ) | | | (0.31 | ) |
| From net realized gains | | | –– | | | | –– | | | | –– | | | | –– | | | | (3.75 | ) |
| From return of capital | | | –– | | | | –– | | | | (0.05 | ) | | | (0.01 | ) | | | –– | |
Redemption fees(4) | | | 0.00 | | | | 0.00 | | | | 0.00 | | | | 0.00 | | | | 0.00 | |
| Total distributions | | | (0.45 | ) | | | (0.07 | ) | | | (0.05 | ) | | | (0.14 | ) | | | (4.06 | ) |
| Net asset value, end of year | | $ | 16.78 | | | $ | 15.50 | | | $ | 15.99 | | | $ | 15.79 | | | $ | 15.20 | |
| | | | | | | | | | | | | | | | | | | | | |
| Total Return | | | 11.34 | % | | | (2.61 | %) | | | 1.53 | % | | | 4.95 | % | | | (11.48 | %) |
| | | | | | | | | | | | | | | | | | | | | |
| Supplemental data and ratios: | | | | | | | | | | | | | | | | | | | | |
| Net assets, end of year | | $ | 527,760,001 | | | $ | 660,993,063 | | | $ | 858,708,522 | | | $ | 944,341,607 | | | $ | 1,103,832,039 | |
Ratio of expenses to average net assets(5) | | | 1.22 | % | | | 1.24 | % | | | 1.37 | % | | | 1.15 | % | | | 1.28 | % |
Ratio of net investment income to average net assets(6) | | | 0.69 | % | | | 0.54 | % | | | 0.85 | % | | | 2.14 | % | | | 1.51 | % |
Portfolio turnover rate (7) | | | 149.17 | % | | | 83.15 | % | | | 100.36 | % | | | 116.70 | % | | | 238.34 | % |
| (1) | For a share outstanding throughout the period. Rounded to the nearest cent. |
| (2) | Net investment income per share is calculated based on average shares outstanding. |
| (3) | Net investment income per share is calculated using ending balances prior to consideration of adjustments for permanent book and tax differences. |
| (4) | Amount represents less than $0.005 per share. |
| (5) | The ratio of expenses to average net assets includes dividends and interest on short positions. The expense ratios excluding dividends and interest on short positions were 1.14% for the year ended September 30, 2012, 1.14% for the year ended September 30, 2011, 1.12% for the year ended September 30, 2010, 1.14% for the year ended September 30, 2009, and 1.11% for the year ended September 30, 2008. |
| (6) | The net investment income ratios include dividends and interest on short positions. |
| (7) | The portfolio turnover rate excludes purchases and sales of short positions as the Adviser does not intend to hold the short positions for more than one year. |
|
See Notes to the Financial Statements. | The Leuthold Funds - 2012 Annual Report | 53 |
| Leuthold Core Investment Fund - Institutional |
| Financial Highlights |
| | | Year Ended September 30, 2012 (Consolidated) | | | Year Ended September 30, 2011 (Consolidated) | | | Year Ended September 30, 2010 (Consolidated) | | | Year Ended September 30, 2009 (Consolidated) | | | Year Ended September 30, 2008 | |
| | | | | | | | | | | | | | | | | | | | | |
Per Share Data (1): | | | | | | | | | | | | | | | | | | | | |
| Net asset value, beginning of year | | $ | 15.50 | | | $ | 15.98 | | | $ | 15.78 | | | $ | 15.19 | | | $ | 21.17 | |
| Income (loss) from investment operations: | | | | | | | | | | | | | | | | | | | | |
| Net investment income | | | 0.12 | (2) | | | 0.11 | (3) | | | 0.15 | (2) | | | 0.30 | (3) | | | 0.28 | (3) |
| Net realized and unrealized gains (losses) on investments and short positions | | | 1.62 | | | | (0.50 | ) | | | 0.11 | | | | 0.45 | | | | (2.19 | ) |
| Total from investment operations | | | 1.74 | | | | (0.39 | ) | | | 0.26 | | | | 0.75 | | | | (1.91 | ) |
| | | | | | | | | | | | | | | | | | | | | |
| Less distributions: | | | | | | | | | | | | | | | | | | | | |
| From net investment income | | | (0.47 | ) | | | (0.09 | ) | | | –– | | | | (0.15 | ) | | | (0.32 | ) |
| From net realized gains | | | –– | | | | –– | | | | –– | | | | –– | | | | (3.75 | ) |
| Return of capital | | | –– | | | | –– | | | | (0.06 | ) | | | (0.01 | ) | | | –– | |
| Redemption fees | | | 0.00 | (4) | | | 0.00 | (4) | | | 0.00 | (4) | | | 0.00 | (4) | | | –– | |
| Total distributions | | | (0.47 | ) | | | (0.09 | ) | | | (0.06 | ) | | | (0.16 | ) | | | (4.07 | ) |
| Net asset value, end of year | | $ | 16.77 | | | $ | 15.50 | | | $ | 15.98 | | | $ | 15.78 | | | $ | 15.19 | |
| | | | | | | | | | | | | | | | | | | | | |
| Total Return | | | 11.40 | % | | | (2.49 | %) | | | 1.64 | % | | | 5.14 | % | | | (11.46 | %) |
| | | | | | | | | | | | | | | | | | | | | |
| Supplemental data and ratios: | | | | | | | | | | | | | | | | | | | | |
| Net assets, end of year | | $ | 263,572,111 | | | $ | 347,517,502 | | | $ | 451,654,832 | | | $ | 461,682,757 | | | $ | 317,733,525 | |
Ratio of expenses to average net assets(5) | | | 1.11 | % | | | 1.13 | % | | | 1.27 | % | | | 1.03 | % | | | 1.18 | % |
Ratio of net investment income to average net assets(6) | | | 0.80 | % | | | 0.66 | % | | | 0.95 | % | | | 2.25 | % | | | 1.61 | % |
Portfolio turnover rate (7) | | | 149.17 | % | | | 83.15 | % | | | 100.36 | % | | | 116.70 | % | | | 238.34 | % |
| (1) | For a share outstanding throughout the period. Rounded to the nearest cent. |
| (2) | Net investment income per share is calculated based on average shares outstanding. |
| (3) | Net investment income per share is calculated using ending balances prior to consideration of adjustments for permanent book and tax differences. |
| (4) | Amount represents less than $0.005 per share. |
| (5) | The ratio of expenses to average net assets includes dividends and interest on short positions. The expense ratios excluding dividends and interest on short positions were 1.03% for the year ended September 30, 2012, 1.03% for the year ended September 30, 2011, 1.02% for the year ended September 30, 2010, 1.02% for the year ended September 30, 2009, and 1.01% for the year ended September 30, 2008. |
| (6) | The net investment income ratios include dividends and interest on short positions. |
| (7) | The portfolio turnover rate excludes purchases and sales of short positions as the Adviser does not intend to hold the short positions for more than one year. |
|
| 54 | The Leuthold Funds - 2012 Annual Report | See Notes to the Financial Statements. |
| Leuthold Asset Allocation Fund - Retail |
| Financial Highlights |
| | | Year Ended September 30, 2012 (Consolidated) | | | Year Ended September 30, 2011 (Consolidated) | | | Year Ended September 30, 2010 (Consolidated) | | | Year Ended September 30, 2009 (Consolidated) | | | Year Ended September 30, 2008 | |
| | | | | | | | | | | | | | | | | | | | | |
Per Share Data (1): | | | | | | | | | | | | | | | | | | | | |
| Net asset value, beginning of year | | $ | 9.72 | | | $ | 9.91 | | | $ | 9.12 | | | $ | 9.45 | | | $ | 11.43 | |
| Income (loss) from investment operations: | | | | | | | | | | | | | | | | | | | | |
| Net investment income | | | 0.09 | (2) | | | 0.07 | (3) | | | 0.11 | (2) | | | 0.21 | (3) | | | 0.20 | (3) |
| Net realized and unrealized gains (losses) on investments and short positions | | | 1.03 | | | | (0.20 | ) | | | 0.74 | | | | (0.35 | ) | | | (1.80 | ) |
| Total from investment operations | | | 1.12 | | | | (0.13 | ) | | | 0.85 | | | | (0.14 | ) | | | (1.60 | ) |
| | | | | | | | | | | | | | | | | | | | | |
| Less distributions: | | | | | | | | | | | | | | | | | | | | |
| From net investment income | | | (0.34 | ) | | | (0.06 | ) | | | (0.02 | ) | | | (0.19 | ) | | | (0.20 | ) |
| From net realized gains | | | –– | | | | –– | | | | –– | | | | –– | | | | (0.18 | ) |
| Return of capital | | | –– | | | | –– | | | | (0.04 | ) | | | –– | | | | –– | |
Redemption fees(4) | | | 0.00 | | | | 0.00 | | | | 0.00 | | | | 0.00 | | | | 0.00 | |
| Total distributions | | | (0.34 | ) | | | (0.06 | ) | | | (0.06 | ) | | | (0.19 | ) | | | (0.38 | ) |
| Net asset value, end of year | | $ | 10.50 | | | $ | 9.72 | | | $ | 9.91 | | | $ | 9.12 | | | $ | 9.45 | |
| | | | | | | | | | | | | | | | | | | | | |
| Total Return | | | 11.73 | % | | | (1.34 | %) | | | 9.26 | % | | | (1.20 | %) | | | (14.45 | %) |
| | | | | | | | | | | | | | | | | | | | | |
| Supplemental data and ratios: | | | | | | | | | | | | | | | | | | | | |
| Net assets, end of year | | $ | 359,697,107 | | | $ | 606,985,298 | | | $ | 843,525,684 | | | $ | 849,399,319 | | | $ | 1,205,840,473 | |
Ratio of expenses to average net assets(5) | | | 1.42 | % | | | 1.42 | % | | | 1.57 | % | | | 1.34 | % | | | 1.34 | % |
Ratio of net investment income to average net assets(6) | | | 0.84 | % | | | 0.72 | % | | | 1.17 | % | | | 2.60 | % | | | 1.99 | % |
Portfolio turnover rate (7) | | | 133.11 | % | | | 105.62 | % | | | 100.64 | % | | | 147.01 | % | | | 197.96 | % |
| (1) | For a share outstanding throughout the period. Rounded to the nearest cent. |
| (2) | Net investment income per share is calculated based on average shares outstanding. |
| (3) | Net investment income per share is calculated using ending balances prior to consideration of adjustments for permanent book and tax differences. |
| (4) | Amount represents less than $0.005 per share. |
| (5) | The ratio of expenses to average net assets includes dividends and interest on short positions. The expense ratios excluding dividends and interest on short positions were 1.34% for the year ended September 30, 2012, 1.32% for the year ended September 30, 2011, 1.32% for the year ended September 30, 2010, 1.32% for the year ended September 30, 2009, and 1.23% for the year ended September 30, 2008. |
| (6) | The net investment income ratios include dividends and interest on short positions. |
| (7) | The portfolio turnover rate excludes purchases and sales of short positions as the Adviser does not intend to hold the short positions for more than one year. |
|
See Notes to the Financial Statements. | The Leuthold Funds - 2012 Annual Report | 55 |
| Leuthold Asset Allocation Fund - Institutional |
| Financial Highlights |
| | | Year Ended September 30, 2012 (Consolidated) | | | Year Ended September 30, 2011 (Consolidated) | | | Year Ended September 30, 2010 (Consolidated) | | | Year Ended September 30, 2009 (Consolidated) | | | Year Ended September 30, 2008 | |
| | | | | | | | | | | | | | | | | | | | | |
Per Share Data (1): | | | | | | | | | | | | | | | | | | | | |
| Net asset value, beginning of year | | $ | 9.76 | | | $ | 9.93 | | | $ | 9.13 | | | $ | 9.45 | | | $ | 11.44 | |
| Income (loss) from investment operations: | | | | | | | | | | | | | | | | | | | | |
| Net investment income | | | 0.10 | (2) | | | 0.10 | (3) | | | 0.13 | (2) | | | 0.23 | (3) | | | 0.21 | (3) |
| Net realized and unrealized gains (losses) on investments and short positions | | | 1.05 | | | | (0.19 | ) | | | 0.73 | | | | (0.34 | ) | | | (1.81 | ) |
| Total from investment operations | | | 1.15 | | | | (0.09 | ) | | | 0.86 | | | | (0.11 | ) | | | (1.60 | ) |
| | | | | | | | | | | | | | | | | | | | | |
| Less distributions: | | | | | | | | | | | | | | | | | | | | |
| From net investment income | | | (0.37 | ) | | | (0.08 | ) | | | (0.02 | ) | | | (0.21 | ) | | | (0.21 | ) |
| From net realized gains | | | –– | | | | –– | | | | –– | | | | –– | | | | (0.18 | ) |
| Return of capital | | | –– | | | | –– | | | | (0.04 | ) | | | –– | | | | –– | |
| Redemption fees | | | –– | | | | 0.00 | (4) | | | –– | | | | 0.00 | (4) | | | 0.00 | (4) |
| Total distributions | | | (0.37 | ) | | | (0.08 | ) | | | (0.06 | ) | | | (0.21 | ) | | | (0.39 | ) |
| Net asset value, end of year | | $ | 10.54 | | | $ | 9.76 | | | $ | 9.93 | | | $ | 9.13 | | | $ | 9.45 | |
| | | | | | | | | | | | | | | | | | | | | |
| Total Return | | | 11.96 | % | | | (0.95 | %) | | | 9.41 | % | | | (0.85 | %) | | | (14.42 | %) |
| | | | | | | | | | | | | | | | | | | | | |
| Supplemental data and ratios: | | | | | | | | | | | | | | | | | | | | |
| Net assets, end of year | | $ | 267,186,481 | | | $ | 386,106,585 | | | $ | 393,296,150 | | | $ | 349,672,451 | | | $ | 683,852,979 | |
Ratio of expenses to average net assets(5) | | | 1.20 | % | | | 1.20 | % | | | 1.36 | % | | | 1.11 | % | | | 1.21 | % |
Ratio of net investment income to average net assets(6) | | | 1.06 | % | | | 0.94 | % | | | 1.38 | % | | | 2.82 | % | | | 2.12 | % |
Portfolio turnover rate (7) | | | 133.11 | % | | | 105.62 | % | | | 100.64 | % | | | 147.01 | % | | | 197.96 | % |
| (1) | For a share outstanding throughout the period. Rounded to the nearest cent. |
| (2) | Net investment income per share is calculated based on average shares outstanding. |
| (3) | Net investment income per share is calculated using ending balances prior to consideration of adjustments for permanent book and tax differences. |
| (4) | Amount represents less than $0.005 per share. |
| (5) | The ratio of expenses to average net assets includes dividends and interest on short positions. The expense ratios excluding dividends and interest on short positions were 1.12% for the year ended September 30, 2012, 1.10% for the year ended September 30, 2011, 1.11% for the year ended September 30, 2010, 1.10% for the year ended September 30, 2009, and 1.09% for the year ended September 30, 2008. |
| (6) | The net investment income ratios include dividends and interest on short positions. |
| (7) | The portfolio turnover rate excludes purchases and sales of short positions as the Adviser does not intend to hold the short positions for more than one year. |
|
| 56 | The Leuthold Funds - 2012 Annual Report | See Notes to the Financial Statements. |
| Leuthold Global Fund - Retail |
| Financial Highlights |
| | | Year Ended September 30, 2012 (Consolidated) | | | Year Ended September 30, 2011 (Consolidated) | | | Year Ended September 30, 2010 (Consolidated) | | | Year Ended September 30, 2009 (Consolidated) | | | Period from July 1, 2008(1) through September 30, 2008 | |
| | | | | | | | | | | | | | | | | | | | | |
Per Share Data (2): | | | | | | | | | | | | | | | | | | | | |
| Net asset value, beginning of period | | $ | 9.52 | | | $ | 10.18 | | | $ | 9.07 | | | $ | 8.51 | | | $ | 10.00 | |
| Income (loss) from investment operations: | | | | | | | | | | | | | | | | | | | | |
| Net investment income | | | 0.05 | (4) | | | 0.08 | (4) | | | 0.07 | (3) | | | 0.09 | (4) | | | 0.03 | (4) |
| Net realized and unrealized gains (losses) on investments and short positions | | | 0.89 | | | | (0.17 | ) | | | 1.06 | | | | 0.59 | | | | (1.52 | ) |
| Total from investment operations | | | 0.94 | | | | (0.09 | ) | | | 1.13 | | | | 0.68 | | | | (1.49 | ) |
| | | | | | | | | | | | | | | | | | | | | |
| Less distributions: | | | | | | | | | | | | | | | | | | | | |
| From net investment income | | | (0.12 | ) | | | (0.07 | ) | | | (0.02 | ) | | | (0.12 | ) | | | –– | |
| From net realized gains | | | (0.10 | ) | | | (0.50 | ) | | | –– | | | | –– | | | | –– | |
Redemption fees(5) | | | 0.00 | | | | 0.00 | | | | 0.00 | | | | 0.00 | | | | 0.00 | |
| Total distributions | | | (0.22 | ) | | | (0.57 | ) | | | (0.02 | ) | | | (0.12 | ) | | | –– | |
| | | | | | | | | | | | | | | | | | | | | |
| Net asset value, end of period | | $ | 10.24 | | | $ | 9.52 | | | $ | 10.18 | | | $ | 9.07 | | | $ | 8.51 | |
| | | | | | | | | | | | | | | | | | | | | |
| Total Return | | | 10.14 | % | | | (1.33 | %) | | | 12.39 | % | | | 8.28 | % | | | (14.04 | %) |
| | | | | | | | | | | | | | | | | | | | | |
| Supplemental data and ratios: | | | | | | | | | | | | | | | | | | | | |
| Net assets, end of period | | $ | 120,450,807 | | | $ | 152,292,208 | | | $ | 98,906,854 | | | $ | 58,120,794 | | | $ | 19,940,804 | |
Ratio of expenses to average net assets(6) | | | 1.57 | % | | | 1.74 | % | | | 1.93 | % | | | 1.82 | % | | | 1.83 | %(7) |
Ratio of net investment income to average net assets(8) | | | 0.60 | % | | | 0.83 | % | | | 0.78 | % | | | 1.56 | % | | | 2.01 | %(7) |
Portfolio turnover rate (9) | | | 127.41 | % | | | 123.51 | % | | | 140.87 | % | | | 152.90 | % | | | 62.34 | % |
| (1) | Commencement of share class operations. |
| (2) | For a share outstanding throughout the period. Rounded to the nearest cent. |
| (3) | Net investment income per share is calculated based on average shares outstanding. |
| (4) | Net investment income per share is calculated using ending balances prior to consideration of adjustments for permanent book and tax differences. |
| (5) | Amount represents less than $0.005 per share. |
| (6) | The ratio of expenses to average net assets includes dividends and interest on short positions. The expense ratios excluding dividends and interest on short positions were 1.51% for the year ended September 30, 2012, 1.55% for the year ended September 30, 2011, 1.65% for the year ended September 30, 2010, 1.77% for the year ended September 30, 2009, and 1.83% for the period ended September 30, 2008. |
| (7) | Annualized. |
| (8) | The net investment income ratios include dividends and interest on short positions. |
| (9) | The portfolio turnover rate excludes purchases and sales of short positions as the Adviser does not intend to hold the short positions for more than one year. |
|
See Notes to the Financial Statements. | The Leuthold Funds - 2012 Annual Report | 57 |
| Leuthold Global Fund - Institutional |
| Financial Highlights |
| | | Year Ended September 30, 2012 (Consolidated) | | | Year Ended September 30, 2011 (Consolidated) | | | Year Ended September 30, 2010 (Consolidated) | | | Year Ended September 30, 2009 (Consolidated) | | | Period from April 30, 2008(1) through September 30, 2008 | |
| | | | | | | | | | | | | | | | | | | | | |
Per Share Data (2): | | | | | | | | | | | | | | | | | | | | |
| Net asset value, beginning of period | | $ | 9.54 | | | $ | 10.20 | | | $ | 9.08 | | | $ | 8.51 | | | $ | 10.00 | |
| Income (loss) from investment operations: | | | | | | | | | | | | | | | | | | | | |
| Net investment income | | | 0.09 | (4) | | | 0.10 | (4) | | | 0.09 | (3) | | | 0.11 | (4) | | | 0.04 | (4) |
| Net realized and unrealized gains (losses) on investments and short positions | | | 0.88 | | | | (0.17 | ) | | | 1.06 | | | | 0.59 | | | | (1.53 | ) |
| Total from investment operations | | | 0.97 | | | | (0.07 | ) | | | 1.15 | | | | 0.70 | | | | (1.49 | ) |
| | | | | | | | | | | | | | | | | | | | | |
| Less distributions: | | | | | | | | | | | | | | | | | | | | |
| From net investment income | | | (0.14 | ) | | | (0.09 | ) | | | (0.03 | ) | | | (0.13 | ) | | | –– | |
| From net realized gains | | | (0.10 | ) | | | (0.50 | ) | | | –– | | | | –– | | | | –– | |
| Redemption fees | | | –– | | | | 0.00 | (5) | | | –– | | | | –– | | | | –– | |
| Total distributions | | | (0.24 | ) | | | (0.59 | ) | | | (0.03 | ) | | | (0.13 | ) | | | –– | |
| Net asset value, end of period | | $ | 10.27 | | | $ | 9.54 | | | $ | 10.20 | | | $ | 9.08 | | | $ | 8.51 | |
| | | | | | | | | | | | | | | | | | | | | |
| Total Return | | | 10.34 | % | | | (1.11 | %) | | | 12.52 | % | | | 8.63 | % | | | (14.90 | %) |
| | | | | | | | | | | | | | | | | | | | | |
| Supplemental data and ratios: | | | | | | | | | | | | | | | | | | | | |
| Net assets, end of period | | $ | 266,390,852 | | | $ | 292,447,586 | | | $ | 190,739,466 | | | $ | 121,650,446 | | | $ | 51,045,894 | |
Ratio of expenses to average net assets(6) | | | 1.36 | % | | | 1.57 | % | | | 1.75 | % | | | 1.57 | % | | | 1.61 | %(7) |
Ratio of net investment income to average net assets(8) | | | 0.81 | % | | | 1.01 | % | | | 0.97 | % | | | 1.80 | % | | | 2.20 | %(7) |
Portfolio turnover rate (9) | | | 127.41 | % | | | 123.51 | % | | | 140.87 | % | | | 152.90 | % | | | 62.34 | % |
| (1) | Commencement of share class operations. |
| (2) | For a share outstanding throughout the period. Rounded to the nearest cent. |
| (3) | Net investment income per share is calculated based on average shares outstanding. |
| (4) | Net investment income per share is calculated using ending balances prior to consideration of adjustments for permanent book and tax differences. |
| (5) | Amount represents less than $0.005 per share. |
| (6) | The ratio of expense to average net assets includes dividends and interest on short positions. The expense ratios excluding dividends and interest on short positions were 1.31% for the year ended September 30, 2012, 1.38% for the year ended September 30, 2011, 1.47% for the year ended September 30, 2010, 1.53% for the year ended September 30, 2009, and 1.60% for the period ended September 30, 2008. |
| (7) | Annualized. |
| (8) | The net investment income ratios include dividends and interest on short positions. |
| (9) | The portfolio turnover rate excludes purchases and sales of short positions as the Adviser does not intend to hold the short positions for more than one year. |
|
| 58 | The Leuthold Funds - 2012 Annual Report | See Notes to the Financial Statements. |
| Leuthold Select Industries Fund |
| Financial Highlights |
| | | Year Ended September 30, 2012 | | | Year Ended September 30, 2011 | | | Year Ended September 30, 2010 | | | Year Ended September 30, 2009 | | | Year Ended September 30, 2008 | |
Per Share Data (1): | | | | | | | | | | | | | | | | | | | | |
| Net asset value, beginning of year | | $ | 10.78 | | | $ | 11.80 | | | $ | 12.82 | | | $ | 13.03 | | | $ | 21.94 | |
| Income (loss) from investment operations: | | | | | | | | | | | | | | | | | | | | |
| Net investment income (loss) | | | 0.03 | (3) | | | (0.05 | )(2) | | | 0.03 | (3) | | | (0.04 | )(2) | | | (0.04 | )(2) |
| Net realized and unrealized gains (losses) on investments | | | 2.47 | | | | (0.95 | ) | | | (1.03 | ) | | | (0.17 | ) | | | (3.15 | ) |
| Total from investment operations | | | 2.50 | | | | (1.00 | ) | | | (1.00 | ) | | | (0.21 | ) | | | (3.19 | ) |
| | | | | | | | | | | | | | | | | | | | | |
| Less distributions: | | | | | | | | | | | | | | | | | | | | |
| From net investment income | | | (0.02 | ) | | | (0.02 | ) | | | (0.02 | ) | | | –– | | | | (0.06 | ) |
| From net realized gains | | | –– | | | | –– | | | | –– | | | | –– | | | | (5.63 | ) |
| Return of capital | | | –– | | | | –– | | | | –– | | | | –– | | | | (0.03 | ) |
| Total distributions | | | (0.02 | ) | | | (0.02 | ) | | | (0.02 | ) | | | –– | | | | (5.72 | ) |
| Net asset value, end of year | | $ | 13.26 | | | $ | 10.78 | | | $ | 11.80 | | | $ | 12.82 | | | $ | 13.03 | |
| | | | | | | | | | | | | | | | | | | | | |
| Total Return | | | 23.34 | % | | | (8.60 | %) | | | (7.76 | %) | | | (1.69 | %) | | | (18.90 | %) |
| | | | | | | | | | | | | | | | | | | | | |
| Supplemental data and ratios: | | | | | | | | | | | | | | | | | | | | |
| Net assets, end of year | | $ | 13,458,427 | | | $ | 16,278,535 | | | $ | 39,088,487 | | | $ | 47,543,360 | | | $ | 42,632,379 | |
| Ratio of expenses to average net assets: | | | | | | | | | | | | | | | | | | | | |
| Before expense reimbursement or recovery | | | 1.71 | % | | | 1.40 | % | | | 1.30 | % | | | 1.38 | % | | | 1.30 | % |
| After expense reimbursement or recovery | | | 1.60 | % | | | 1.40 | % | | | 1.30 | % | | | 1.38 | % | | | 1.30 | % |
| Ratio of net investment income (loss) to average net assets: | | | | | | | | | | | | | | | | | | | | |
| Before expense reimbursement or recovery | | | 0.11 | % | | | (0.24 | %) | | | 0.24 | % | | | (0.38 | %) | | | (0.11 | %) |
| After expense reimbursement or recovery | | | 0.22 | % | | | (0.24 | %) | | | 0.24 | % | | | (0.38 | %) | | | (0.11 | %) |
| Portfolio Turnover | | | 139.61 | % | | | 109.26 | % | | | 178.24 | % | | | 164.20 | % | | | 139.89 | % |
| (1) | For a share outstanding throughout the period. Rounded to the nearest cent. |
| (2) | Net investment loss per share is calculated using ending balances prior to consideration of adjustments for permanent book and tax differences. |
| (3) | Net investment income per share is calculated based on average shares outstanding. |
|
See Notes to the Financial Statements. | The Leuthold Funds - 2012 Annual Report | 59 |
| Leuthold Global Industries Fund - Retail |
| Financial Highlights |
| | | Year Ended September 30, 2012 | | | Year Ended September 30, 2011 | | | Period from May 17, 2010 (1) through September 30, 2010 | |
| | | | | | | | | | | | | |
Per Share Data (2): | | | | | | | | | | | | |
| Net asset value, beginning of period | | $ | 9.77 | | | $ | 11.01 | | | $ | 10.00 | |
| Income (loss) from investment operations: | | | | | | | | | | | | |
Net investment income (3) | | | 0.01 | | | | 0.06 | | | | 0.00 | (4) |
| Net realized and unrealized gains (losses) on investments | | | 1.68 | | | | (1.16 | ) | | | 1.01 | |
| Total from investment operations | | | 1.69 | | | | (1.10 | ) | | | 1.01 | |
| | | | | | | | | | | | | |
| Less distributions: | | | | | | | | | | | | |
| From net investment income | | | (0.02 | ) | | | (0.06 | ) | | | — | |
| From net realized gains | | | — | | | | (0.08 | ) | | | — | |
| Redemption fees | | | — | | | | 0.00 | (4) | | | — | |
| Total distributions | | | (0.02 | ) | | | (0.14 | ) | | | — | |
| Net asset value, end of period | | $ | 11.44 | | | $ | 9.77 | | | $ | 11.01 | |
| | | | | | | | | | | | | |
| Total return | | | 17.33 | % | | | (10.23 | %) | | | 10.10 | % |
| | | | | | | | | | | | | |
| Supplemental data and ratios: | | | | | | | | | | | | |
| Net assets, end of period | | $ | 3,782,099 | | | $ | 5,377,373 | | | $ | 5,850,019 | |
| Ratio of expenses to average net assets: | | | | | | | | | | | | |
| Before expense reimbursement or recovery | | | 2.52 | % | | | 1.96 | % | | | 4.42 | %(5) |
| After expense reimbursement or recovery | | | 2.00 | % | | | 2.04 | % | | | 1.96 | %(5) |
| Ratio of net investment income to average net assets: | | | | | | | | | | | | |
| Before expense reimbursement or recovery | | | (0.45 | %) | | | 0.60 | % | | | (2.29 | %)(5) |
| After expense reimbursement or recovery | | | 0.07 | % | | | 0.52 | % | | | 0.17 | %(5) |
| Portfolio turnover rate | | | 117.30 | % | | | 179.57 | % | | | 112.58 | % |
| (1) | Commencement of share class operations. |
| (2) | For a share outstanding throughout the period. Rounded to the nearest cent. |
| (3) | Net investment income per share is calculated using ending balances prior to consideration of adjustments for permanent book and tax differences. |
| (4) | Amount represents less than $0.005 per share. |
| (5) | Annualized. |
|
| 60 | The Leuthold Funds - 2012 Annual Report | See Notes to the Financial Statements. |
| Leuthold Global Industries Fund - Institutional |
| Financial Highlights |
| | | Year Ended September 30, 2012 | | | Year Ended September 30, 2011 | | | Period from May 17, 2010 (1) through September 30, 2010 | |
Per Share Data (2): | | | | | | | | | |
| Net asset value, beginning of period | | $ | 9.77 | | | $ | 11.01 | | | $ | 10.00 | |
| | | | | | | | | | | | | |
| Income (loss) from investment operations: | | | | | | | | | | | | |
Net investment income (3) | | | 0.06 | | | | 0.09 | | | | 0.01 | |
| Net realized and unrealized gains (losses) on investments | | | 1.67 | | | | (1.15 | ) | | | 1.00 | |
| Total from investment operations | | | 1.73 | | | | (1.06 | ) | | | 1.01 | |
| | | | | | | | | | | | | |
| Less distributions: | | | | | | | | | | | | |
| From net investment income | | | (0.02 | ) | | | (0.10 | ) | | | — | |
| From net realized gains | | | — | | | | (0.08 | ) | | | — | |
| Total distributions | | | (0.02 | ) | | | (0.18 | ) | | | — | |
| Net asset value, end of period | | $ | 11.48 | | | $ | 9.77 | | | $ | 11.01 | |
| | | | | | | | | | | | | |
| Total return | | | 17.84 | % | | | (9.92 | %) | | | 10.10 | % |
| | | | | | | | | | | | | |
| Supplemental data and ratios: | | | | | | | | | | | | |
| Net assets, end of period | | $ | 4,152,513 | | | $ | 14,904,617 | | | $ | 3,870,245 | |
| Ratio of expenses to average net assets: | | | | | | | | | | | | |
| Before expense reimbursement or recovery | | | 2.27 | % | | | 1.71 | % | | | 4.17 | %(4) |
| After expense reimbursement or recovery | | | 1.75 | % | | | 1.79 | % | | | 1.71 | %(4) |
| Ratio of net investment income to average net assets: | | | | | | | | | | | | |
| Before expense reimbursement or recovery | | | (0.20 | %) | | | 0.85 | % | | | (2.04 | %)(4) |
| After expense reimbursement or recovery | | | 0.32 | % | | | 0.77 | % | | | 0.42 | %(4) |
| Portfolio turnover rate | | | 117.30 | % | | | 179.57 | % | | | 112.58 | % |
| (1) | Commencement of share class operations. |
| (2) | For a share outstanding throughout the period. Rounded to the nearest cent. |
| (3) | Net investment income per share is calculated using ending balances prior to consideration of adjustments for permanent book and tax differences. |
| (4) | Annualized. |
|
| See Notes to the Financial Statements. | The Leuthold Funds - 2012 Annual Report | 61 |
| Leuthold Global Clean Technology Fund - Retail |
| Financial Highlights |
| | | Year Ended September 30, 2012 | | | Year Ended September 30, 2011 | | | Year Ended September 30, 2010 | | | Period from July 22, 2009 (1) through September 30, 2009 | |
Per Share Data (2): | | | | | | | | | | | | | | | | |
| Net asset value, beginning of period | | $ | 7.66 | | | $ | 10.30 | | | $ | 11.52 | | | $ | 10.00 | |
| Income (loss) from investment operations: | | | | | | | | | | | | | | | | |
| Net investment loss | | | (0.06 | )(3) | | | (0.12 | )(4) | | | (0.14 | )(4) | | | (0.01 | )(4) |
| Net realized and unrealized gains (losses) on investments | | | 1.68 | | | | (2.52 | ) | | | (1.08 | ) | | | 1.53 | |
| Total from investment operations | | | 1.62 | | | | (2.64 | ) | | | (1.22 | ) | | | 1.52 | |
| | | | | | | | | | | | | | | | | |
| Less distributions: | | | | | | | | | | | | | | | | |
| From net investment income | | | — | | | | — | | | | — | | | | — | |
| From net realized gains | | | — | | | | — | | | | — | | | | — | |
Redemption fees(5) | | | 0.00 | | | | 0.00 | | | | 0.00 | | | | 0.00 | |
| Total distributions | | | — | | | | — | | | | — | | | | — | |
| Net asset value, end of period | | $ | 9.28 | | | $ | 7.66 | | | $ | 10.30 | | | $ | 11.52 | |
| | | | | | | | | | | | | | | | | |
| Total return | | | 21.15 | % | | | (25.63 | %) | | | (10.59 | %) | | | 15.20 | % |
| | | | | | | | | | | | | | | | | |
| Supplemental data and ratios: | | | | | | | | | | | | | | | | |
| Net assets, end of period | | $ | 7,477,204 | | | $ | 8,026,453 | | | $ | 11,926,464 | | | $ | 2,170,237 | |
| Ratio of expenses to average net assets: | | | | | | | | | | | | | | | | |
| Before expense reimbursement or recovery | | | 2.06 | % | | | 1.85 | % | | | 1.75 | % | | | 3.67 | %(6) |
| After expense reimbursement or recovery | | | 1.93 | % | | | 1.85 | % | | | 1.84 | % | | | 2.07 | %(6) |
| Ratio of net investment loss to average net assets: | | | | | | | | | | | | | | | | |
| Before expense reimbursement or recovery | | | (0.80 | %) | | | (1.05 | %) | | | (1.23 | %) | | | (3.35 | %)(6) |
| After expense reimbursement or recovery | | | (0.67 | %) | | | (1.05 | %) | | | (1.32 | %) | | | (1.75 | %)(6) |
| Portfolio turnover rate | | | 121.30 | % | | | 113.07 | % | | | 62.17 | % | | | 22.50 | % |
| (1) | Commencement of share class operations. |
| (2) | For a share outstanding throughout the period. Rounded to the nearest cent. |
| (3) | Net investment loss per share is calculated based on average shares outstanding. |
| (4) | Net investment loss per share is calculated using ending balances prior to consideration of adjustments for permanent book and tax differences. |
| (5) | Amount represents less than $0.005 per share. |
| (6) | Annualized. |
|
| 62 | The Leuthold Funds - 2012 Annual Report | See Notes to the Financial Statements. |
| Leuthold Global Clean Technology Fund - Institutional |
| Financial Highlights |
| | | Year Ended September 30, 2012 | | | Year Ended September 30, 2011 | | | Year Ended September 30, 2010 | | | Period from July 22, 2009 (1) through September 30, 2009 | |
Per Share Data (2): | | | | | | | | | | | | | | | | |
| Net asset value, beginning of period | | $ | 7.70 | | | $ | 10.33 | | | $ | 11.52 | | | $ | 10.00 | |
| | | | | | | | | | | | | | | | | |
| Income (loss) from investment operations: | | | | | | | | | | | | | | | | |
| Net investment loss | | | (0.04 | )(3) | | | (0.11 | )(4) | | | (0.11 | )(4) | | | (0.03 | )(4) |
| Net realized and unrealized gains (losses) on investments | | | 1.68 | | | | (2.52 | ) | | | (1.08 | ) | | | 1.55 | |
| Total from investment operations | | | 1.64 | | | | (2.63 | ) | | | (1.19 | ) | | | 1.52 | |
| | | | | | | | | | | | | | | | | |
| Less distributions: | | | | | | | | | | | | | | | | |
| From net investment income | | | — | | | | — | | | | — | | | | — | |
| From net realized gains | | | — | | | | — | | | | — | | | | — | |
| Redemption fees | | | — | | | | 0.00 | | | | — | | | | — | |
| Total distributions | | | — | | | | — | | | | — | | | | — | |
| Net asset value, end of period | | $ | 9.34 | | | $ | 7.70 | | | $ | 10.33 | | | $ | 11.52 | |
| | | | | | | | | | | | | | | | | |
| Total return | | | 21.30 | % | | | (25.46 | %) | | | (10.33 | %) | | | 15.20 | % |
| | | | | | | | | | | | | | | | | |
| Supplemental data and ratios: | | | | | | | | | | | | | | | | |
| Net assets, end of period | | $ | 1,187,382 | | | $ | 8,111,351 | | | $ | 15,459,512 | | | $ | 6,458,943 | |
| Ratio of expenses to average net assets: | | | | | | | | | | | | | | | | |
| Before expense reimbursement or recovery | | | 1.82 | % | | | 1.60 | % | | | 1.51 | % | | | 3.42 | %(6) |
| After expense reimbursement or recovery | | | 1.69 | % | | | 1.60 | % | | | 1.60 | % | | | 1.82 | %(6) |
| Ratio of net investment loss to average net assets: | | | | | | | | | | | | | | | | |
| Before expense reimbursement or recovery | | | (0.56 | %) | | | (0.80 | %) | | | (0.99 | %) | | | (3.11 | %)(6) |
| After expense reimbursement or recovery | | | (0.43 | %) | | | (0.80 | %) | | | (1.08 | %) | | | (1.51 | %)(6) |
| Portfolio turnover rate | | | 121.30 | % | | | 113.07 | % | | | 62.17 | % | | | 22.50 | % |
| (1) | Commencement of share class operations. |
| (2) | For a share outstanding throughout the period. Rounded to the nearest cent. |
| (3) | Net investment loss per share is calculated based on average shares outstanding. |
| (4) | Net investment loss per share is calculated using ending balances prior to consideration of adjustments for permanent book and tax differences. |
| (5) | Amount represents less than $0.005 per share. |
| (6) | Annualized. |
|
| See Notes to the Financial Statements. | The Leuthold Funds - 2012 Annual Report | 63 |
| Grizzly Short Fund |
| Financial Highlights |
| | | Year Ended September 30, 2012 | | | Year Ended September 30, 2011 | | | Year Ended September 30, 2010(1) | | | Year Ended September 30, 2009(1) | | | Year Ended September 30, 2008(1) | |
Per Share Data (2): | | | | | | | | | | | | | | | | | | | | |
| Net asset value, beginning of year | | $ | 16.14 | | | $ | 16.48 | | | $ | 19.00 | | | $ | 29.28 | | | $ | 19.52 | |
| | | | | | | | | | | | | | | | | | | | | |
| Income (loss) from investment operations: | | | | | | | | | | | | | | | | | | | | |
| Net investment income (loss) | | | (0.40 | )(3) | | | (0.43 | )(3) | | | (0.48 | )(3) | | | (0.88 | )(4) | | | 0.48 | (4) |
| Net realized and unrealized gains (losses) on investments and short positions | | | (4.68 | ) | | | 0.09 | | | | (2.04 | ) | | | (7.88 | ) | | | 9.76 | |
| Total from investment operations | | | (5.08 | ) | | | (0.34 | ) | | | (2.52 | ) | | | (8.76 | ) | | | 10.24 | |
| | | | | | | | | | | | | | | | | | | | | |
| Less distributions: | | | | | | | | | | | | | | | | | | | | |
| From net investment income | | | — | | | | — | | | | — | | | | (0.04 | ) | | | (0.48 | ) |
| From net realized gains | | | — | | | | — | | | | — | | | | (0.76 | ) | | | — | |
| Return of capital | | | — | | | | — | | | | — | | | | (0.72 | ) | | | — | |
| Total distributions | | | — | | | | — | | | | — | | | | (1.52 | ) | | | (0.48 | ) |
| Net asset value, end of year | | $ | 11.06 | | | $ | 16.14 | | | $ | 16.48 | | | $ | 19.00 | | | $ | 29.28 | |
| | | | | | | | | | | | | | | | | | | | | |
| Total return | | | (31.47 | %) | | | (2.06 | %) | | | (13.26 | %) | | | (32.54 | %) | | | 53.43 | % |
| | | | | | | | | | | | | | | | | | | | | |
| Supplemental data and ratios: | | | | | | | | | | | | | | | | | | | | |
| Net assets, end of year | | $ | 136,286,009 | | | $ | 263,488,083 | | | $ | 196,552,242 | | | $ | 86,244,258 | | | $ | 135,738,825 | |
Ratio of expenses to average net assets(5): | | | 3.09 | % | | | 3.01 | % | | | 2.72 | % | | | 3.53 | % | | | 3.21 | % |
Ratio of net investment income (loss) to average net assets(6): | | | (3.09 | %) | | | (3.01 | %) | | | (2.71 | %) | | | (2.83 | %) | | | 2.01 | % |
Portfolio turnover rate (7) | | | 0.00 | % | | | 0.00 | % | | | 0.00 | % | | | 0.00 | % | | | 0.00 | % |
| (1) | Per share data adjusted for 1:4 reverse split completed as of May 20, 2011. |
| (2) | For a share outstanding throughout the period. Rounded to the nearest cent. |
| (3) | Net investment loss per share is calculated based on average shares outstanding. |
| (4) | Net investment income (loss) per share is calculated using ending balances prior to consideration of adjustments for permanent book and tax differences. |
| (5) | The ratio of expenses to average net assets includes dividends and interest on short positions. The expense ratios excluding dividends and interest on short positions were 1.52% for the year ended September 30, 2012, 1.53% for the year ended September 30, 2011, 1.49% for the year ended September 30, 2010, 1.47% for the year ended September 30, 2009, and 1.50% for the year ended September 30, 2008. |
| (6) | The net investment income (loss) ratios include dividends and interest on short positions. |
| (7) | The portfolio turnover rate excludes purchases and sales of short positions as the Adviser does not intend to hold the short positions for more than one year. |
|
| 64 | The Leuthold Funds - 2012 Annual Report | See Notes to the Financial Statements. |
Leuthold Core Investment Fund |
Consolidated Schedule of Investments |
| September 30, 2012 |
| | | Shares | | | Fair Value | |
| | | | | | | |
| COMMON STOCKS - 64.56% | | | | | | |
| Aerospace & Defense - 0.07% | | | | | | |
| Aselsan Elektronik Sanayi Ve Ticaret AS (b) | | | 66,088 | | | $ | 238,929 | |
| Embraer SA - ADR | | | 11,103 | | | | 295,562 | |
| | | | | | | | 534,491 | |
| | | | | | | | | |
| Airlines - 0.02% | | | | | | | | |
| AirAsia Bhd (b) | | | 144,000 | | | | 141,980 | |
| | | | | | | | | |
| Auto Components - 0.02% | | | | | | | | |
| Halla Climate Control Corp. (b) | | | 7,450 | | | | 153,573 | |
| | | | | | | | | |
| Automobiles - 0.08% | | | | | | | | |
| Dongfeng Motor Group Co., Ltd. (b) | | | 104,000 | | | | 120,852 | |
| Hyundai Motor Co. (b) | | | 1,215 | | | | 274,052 | |
| Tofas Turk Otomobil Fabrikasi AS (b) | | | 47,379 | | | | 239,648 | |
| | | | | | | | 634,552 | |
| | | | | | | | | |
| Beverages - 0.03% | | | | | | | | |
| Tsingtao Brewery Co., Ltd. (b) | | | 48,000 | | | | 263,852 | |
| | | | | | | | | |
| Biotechnology - 0.64% | | | | | | | | |
| Alexion Pharmaceuticals, Inc. (a) | | | 44,432 | | | | 5,083,021 | |
| | | | | | | | | |
| Building Products - 0.01% | | | | | | | | |
| China Liansu Group Holdings, Ltd. (b) | | | 149,000 | | | | 77,069 | |
| | | | | | | | | |
| Capital Markets - 0.04% | | | | | | | | |
| CETIP SA - Mercados Organizados (b) | | | 23,200 | | | | 303,611 | |
| | | | | | | | | |
| Chemicals - 4.07% | | | | | | | | |
| Aeci, Ltd. (b) | | | 6,574 | | | | 64,642 | |
| Agrium, Inc. (b) | | | 55,222 | | | | 5,713,268 | |
| CF Industries Holdings, Inc. | | | 26,024 | | | | 5,783,574 | |
| China BlueChemical, Ltd. (b) | | | 254,000 | | | | 149,785 | |
| China Lumena New Materials Corp. (b) | | | 558,000 | | | | 97,094 | |
| China Petrochemical Development Corp. (b) | | | 219,000 | | | | 184,715 | |
| | | | | | | | | |
| | | Shares | | | Fair Value | |
| | | | | | | | | |
| Chemicals - 4.07% (continued) | | | | | | | | |
| Gubre Fabrikalari TAS (a)(b) | | | 26,347 | | | $ | 186,293 | |
| Huntsman Corp. | | | 316,734 | | | | 4,728,839 | |
| Monsanto Co. | | | 110,444 | | | | 10,052,613 | |
| Mosaic Co. | | | 90,768 | | | | 5,229,145 | |
| | | | | | | | 32,189,968 | |
| | | | | | | | | |
| Commercial Banks - 8.18% | | | | | | | | |
| Banco Bilbao Vizcaya Argentaria SA - ADR | | | 180,900 | | | | 1,401,975 | |
| Banco Santander SA - ADR | | | 301,501 | | | | 2,249,197 | |
| Bangkok Bank PCL (b) | | | 97,600 | | | | 613,569 | |
| Bank of China, Ltd. (b) | | | 1,586,000 | | | | 600,347 | |
| BB&T Corp. | | | 137,738 | | | | 4,567,392 | |
| Chemical Financial Corp. | | | 37,450 | | | | 906,290 | |
| Citizens Republic Bancorp, Inc. (a) | | | 86,959 | | | | 1,682,657 | |
| Credicorp, Ltd. (b) | | | 36,180 | | | | 4,532,630 | |
| DBS Group Holdings, Ltd. (b) | | | 51,000 | | | | 595,693 | |
| East West Bancorp, Inc. | | | 97,750 | | | | 2,064,480 | |
| Fifth Third Bancorp | | | 306,578 | | | | 4,755,025 | |
| First Financial Bancorp | | | 77,438 | | | | 1,309,477 | |
| First Republic Bank | | | 67,282 | | | | 2,318,538 | |
| HSBC Holdings PLC - ADR | | | 98,384 | | | | 4,570,921 | |
| Huntington Bancshares, Inc. | | | 580,151 | | | | 4,003,042 | |
| International Bancshares Corp. | | | 61,570 | | | | 1,172,908 | |
| KeyCorp | | | 396,711 | | | | 3,467,254 | |
| Old National Bancorp | | | 138,373 | | | | 1,883,256 | |
| PacWest Bancorp | | | 55,857 | | | | 1,305,378 | |
| PNC Financial Services Group, Inc. | | | 66,013 | | | | 4,165,420 | |
| Sberbank of Russia (b) | | | 34,566 | | | | 407,299 | |
| Security Bank Corp. (b) | | | 46,130 | | | | 181,053 | |
| Sumitomo Mitsui Financial Group, Inc. - ADR | | | 210,098 | | | | 1,298,406 | |
| Susquehanna Bancshares, Inc. | | | 132,026 | | | | 1,380,992 | |
| Turkiye Vakiflar Bankasi Tao (b) | | | 103,187 | | | | 223,076 | |
| Umpqua Holdings Corp. | | | 98,384 | | | | 1,268,170 | |
| Webster Financial Corp. | | | 98,384 | | | | 2,331,701 | |
| Wells Fargo & Co. | | | 274,974 | | | | 9,494,852 | |
| | | | | | | | 64,750,998 | |
|
| See Notes to the Financial Statements. | The Leuthold Funds - 2012 Annual Report | 65 |
| Leuthold Core Investment Fund |
| Consolidated Schedule of Investments (continued) |
| September 30, 2012 |
| | | Shares | | | Fair Value | |
| | | | | | | |
| COMMON STOCKS - 64.56% (continued) | | | | | | |
| Commercial Services & Supplies - 0.02% | | | | | | |
| Valid Solucoes e Servicos de Seguranca em Meios de Pagamento e Identificacao SA (b) | | | 8,700 | | | $ | 160,503 | |
| | | | | | | | | |
| Computers & Peripherals - 1.98% | | | | | | | | |
| Apple, Inc. | | | 21,581 | | | | 14,400,138 | |
| JCY International Bhd (b) | | | 193,400 | | | | 49,252 | |
| Lenovo Group, Ltd. (b) | | | 700,000 | | | | 577,080 | |
| Lite-On Technology Corp. (b) | | | 184,000 | | | | 236,995 | |
| Pegatron Corp. (b) | | | 307,000 | | | | 397,757 | |
| | | | | | | | 15,661,222 | |
| | | | | | | | | |
| Construction & Engineering - 0.01% | | | | | | | | |
| Tekfen Holding AS (b) | | | 25,720 | | | | 93,310 | |
| | | | | | | | | |
| Construction Materials - 0.07% | | | | | | | | |
| China Shanshui Cement Group, Ltd. (b) | | | 274,000 | | | | 176,903 | |
| Indocement Tunggal Prakarsa Tbk PT (b) | | | 61,000 | | | | 129,247 | |
| Semen Gresik Persero Tbk PT (b) | | | 148,000 | | | | 222,847 | |
| | | | | | | | 528,997 | |
| | | | | | | | | |
| Consumer Finance - 3.26% | | | | | | | | |
| American Express Co. | | | 54,587 | | | | 3,103,817 | |
| Capital One Financial Corp. | | | 128,852 | | | | 7,345,852 | |
| Discover Financial Services | | | 203,116 | | | | 8,069,799 | |
| Ezcorp, Inc. - Class A (a) | | | 92,672 | | | | 2,124,969 | |
| First Cash Financial Services, Inc. (a) | | | 45,701 | | | | 2,102,703 | |
| SLM Corp. | | | 193,595 | | | | 3,043,313 | |
| | | | | | | | 25,790,453 | |
| | | | | | | | | |
| | | Shares | | | Fair Value | |
| | | | | | | | | |
| | | | | | | | | |
| Distributors - 0.07% | | | | | | | | |
| Dogus Otomotiv Servis ve Ticaret AS (a)(b) | | | 19,213 | | | $ | 64,884 | |
| Imperial Holdings, Ltd. (b) | | | 9,488 | | | | 213,460 | |
| Jardine Cycle & Carriage, Ltd. (b) | | | 4,000 | | | | 156,135 | |
| Li & Fung, Ltd. (b) | | | 94,000 | | | | 144,953 | |
| | | | | | | | 579,432 | |
| | | | | | | | | |
| Diversified Financial Services - 0.01% | | | | | | | | |
| African Bank Investments, Ltd. (b) | | | 24,053 | | | | 95,702 | |
| | | | | | | | | |
| Diversified Telecommunication Services - 0.08% | | | | | | | | |
| China Telecom Corp., Ltd. - ADR | | | 3,324 | | | | 192,692 | |
| Hutchison Telecommunications Hong Kong Holdings, Ltd. (b) | | | 172,000 | | | | 75,901 | |
| Rostelecom OJSC - ADR | | | 8,836 | | | | 224,366 | |
| Telekomunikasi Indonesia Persero Tbk PT - ADR | | | 4,669 | | | | 181,764 | |
| | | | | | | | 674,723 | |
| | | | | | | | | |
| Electric Utilities - 0.07% | | | | | | | | |
| PGE SA (b) | | | 46,140 | | | | 266,445 | |
| Tauron Polska Energia SA (b) | | | 189,613 | | | | 289,828 | |
| | | | | | | | 556,273 | |
| | | | | | | | | |
| Electronic Equipment, Instruments & Components - 0.10% | | | | | | | | |
| Digital China Holdings, Ltd. (b) | | | 233,000 | | | | 369,769 | |
| E Ink Holdings, Inc. (b) | | | 360,000 | | | | 390,809 | |
| | | | | | | | 760,578 | |
| | | | | | | | | |
| Food & Staples Retailing - 1.74% | | | | | | | | |
| BIM Birlesik Magazalar AS (b) | | | 5,149 | | | | 214,819 | |
| CVS Caremark Corp. | | | 137,738 | | | | 6,669,274 | |
| Grupo Comercial Chedraui SA de CV (b) | | | 26,200 | | | | 66,763 | |
| Spar Group, Ltd. (b) | | | 15,206 | | | | 233,793 | |
| Walgreen Co. | | | 180,266 | | | | 6,568,893 | |
| | | | | | | | 13,753,542 | |
|
| 66 | The Leuthold Funds - 2012 Annual Report | See Notes to the Financial Statements. |
| Leuthold Core Investment Fund |
Consolidated Schedule of Investments (continued) September 30, 2012 |
| | | Shares | | | Fair Value | |
| | | | | | | |
| COMMON STOCKS - 64.56% (continued) | | | | | | |
| Food Products - 0.26% | | | | | | |
| AVI, Ltd. (b) | | | 32,620 | | | $ | 233,928 | |
| Cosan, Ltd. - Class A (a)(b) | | | 21,325 | | | | 338,214 | |
| Golden Agri-Resources, Ltd. (b) | | | 504,000 | | | | 269,429 | |
| Kulim Malaysia Bhd (b) | | | 137,700 | | | | 221,535 | |
| Lotte Samkang Co., Ltd. (b) | | | 530 | | | | 271,753 | |
| Perusahaan Perkebunan London Sumatra Indonesia Tbk PT (b) | | | 772,500 | | | | 196,685 | |
| Thai Union Frozen Products PCL (b) | | | 59,900 | | | | 142,329 | |
| Tongaat Hulett, Ltd. (b) | | | 21,170 | | | | 355,462 | |
| | | | | | | | 2,029,335 | |
| | | | | | | | | |
| Gas Utilities - 0.02% | | | | | | | | |
| Perusahaan Gas Negara Persero Tbk PT (b) | | | 291,500 | | | | 125,288 | |
| | | | | | | | | |
| Health Care Equipment & Supplies - 0.05% | | | | | | | | |
| Biosensors International Group, Ltd. (a)(b) | | | 126,000 | | | | 124,896 | |
| Mindray Medical International, Ltd. - ADR | | | 3,579 | | | | 120,290 | |
| Supermax Corp. Bhd (b) | | | 179,400 | | | | 120,777 | |
| | | | | | | | 365,963 | |
| | | | | | | | | |
| Health Care Providers & Services - 2.11% | | | | | | | | |
| Bangkok Dusit Medical Services PCL (b) | | | 40,600 | | | | 141,704 | |
| Humana, Inc. | | | 54,587 | | | | 3,829,278 | |
| KPJ Healthcare Bhd (b) | | | 62,100 | | | | 123,646 | |
| Life Healthcare Group Holdings, Ltd. (b) | | | 83,961 | | | | 320,768 | |
| UnitedHealth Group, Inc. | | | 123,139 | | | | 6,823,132 | |
| WellCare Health Plans, Inc. (a) | | | 29,833 | | | | 1,687,056 | |
| WellPoint, Inc. | | | 65,378 | | | | 3,792,578 | |
| | | | | | | | 16,718,162 | |
| | | | | | | | | |
| | | Shares | | | Fair Value | |
| | | | | | | | | |
| Hotels, Restaurants & Leisure - 1.17% | | | | | | | | |
| Carnival Corp. | | | 121,235 | | | $ | 4,417,803 | |
| Genting Bhd (b) | | | 71,600 | | | | 203,512 | |
| Starwood Hotels & Resorts Worldwide, Inc. | | | 80,612 | | | | 4,672,272 | |
| | | | | | | | 9,293,587 | |
| | | | | | | | | |
| Household Durables - 0.30% | | | | | | | | |
| Even Construtora e Incorporadora SA (b) | | | 56,800 | | | | 219,103 | |
| Ez Tec Empreendimentos e Participacoes SA (b) | | | 26,100 | | | | 325,727 | |
| Haier Electronics Group Co., Ltd. (a)(b) | | | 133,000 | | | | 153,419 | |
| NACCO Industries, Inc. - Class A | | | 13,329 | | | | 1,671,590 | |
| | | | | | | | 2,369,839 | |
| | | | | | | | | |
| Independent Power Producers & Energy Traders - 0.01% | | | | | | | | |
| First Gen Corp. (a)(b) | | | 148,000 | | | | 70,895 | |
| | | | | | | | | |
| Industrial Conglomerates - 0.04% | | | | | | | | |
| Bidvest Group, Ltd. (b) | | | 8,760 | | | | 216,709 | |
| Sigdo Koppers SA (b) | | | 40,797 | | | | 99,251 | |
| | | | | | | | 315,960 | |
| | | | | | | | | |
| Insurance - 2.68% | | | | | | | | |
| ACE, Ltd. (b) | | | 55,857 | | | | 4,222,789 | |
| Allied World Assurance Co. Holdings AG (b) | | | 26,659 | | | | 2,059,408 | |
| Allstate Corp. | | | 123,139 | | | | 4,877,536 | |
| Brasil Insurance Participacoes e Administracao SA (b) | | | 7,000 | | | | 66,090 | |
| Chubb Corp. | | | 57,126 | | | | 4,357,571 | |
| Fidelity National Financial, Inc. - Class A | | | 106,636 | | | | 2,280,944 | |
| LIG Insurance Co., Ltd. (b) | | | 18,170 | | | | 422,191 | |
|
| See Notes to the Financial Statements. | The Leuthold Funds - 2012 Annual Report | 67 |
| Leuthold Core Investment Fund |
| Consolidated Schedule of Investments (continued) |
| September 30, 2012 |
| | | Shares | | | Fair Value | |
| | | | | | | |
| COMMON STOCKS - 64.56% (continued) | | | | | | |
| | | | | | | |
| Insurance - 2.68% (continued) | | | | | | |
| PICC Property & Casualty Co., Ltd. (a)(b) | | | 546,000 | | | $ | 665,246 | |
| Sanlam, Ltd. (b) | | | 78,738 | | | | 355,790 | |
| W.R. Berkley Corp. | | | 51,414 | | | | 1,927,511 | |
| | | | | | | | 21,235,076 | |
| | | | | | | | | |
| Internet Software & Services - 0.15% | | | | | | | | |
| Daum Communications Corp. (b) | | | 4,013 | | | | 408,463 | |
| NetEase, Inc. - ADR (a) | | | 6,989 | | | | 392,362 | |
| Sohu.com, Inc. (a)(b) | | | 9,780 | | | | 411,640 | |
| | | | | | | | 1,212,465 | |
| | | | | | | | | |
| IT Services - 6.20% | | | | | | | | |
| Accenture PLC - Class A (b) | | | 35,545 | | | | 2,489,216 | |
| Alliance Data Systems Corp. (a) | | | 15,868 | | | | 2,252,462 | |
| Amdocs, Ltd. (a) | | | 67,917 | | | | 2,240,582 | |
| Cielo SA (b) | | | 14,900 | | | | 371,462 | |
| Cognizant Technology Solutions Corp. - Class A (a) | | | 33,641 | | | | 2,352,179 | |
| Convergys Corp. | | | 125,043 | | | | 1,959,424 | |
| DST Systems, Inc. | | | 34,276 | | | | 1,938,650 | |
| Fiserv, Inc. (a) | | | 41,893 | | | | 3,101,339 | |
| Gartner, Inc. (a) | | | 43,797 | | | | 2,018,604 | |
| Global Payments, Inc. | | | 46,336 | | | | 1,938,235 | |
| International Business Machines Corp. | | | 33,006 | | | | 6,847,095 | |
| Jack Henry & Associates, Inc. | | | 63,474 | | | | 2,405,664 | |
| Mastercard, Inc. - Class A | | | 10,791 | | | | 4,871,921 | |
| Sapient Corp. (a) | | | 220,254 | | | | 2,347,908 | |
| Teradata Corp. (a) | | | 27,928 | | | | 2,106,050 | |
| Total System Services, Inc. | | | 82,516 | | | | 1,955,629 | |
| Visa, Inc. - Class A | | | 39,354 | | | | 5,284,455 | |
| Western Union Co. | | | 140,277 | | | | 2,555,847 | |
| | | | | | | | 49,036,722 | |
| | | Shares | | | Fair Value | |
| | | | | | | |
| Life Sciences Tools & Services - 0.02% | | | | | | |
| WuXi PharmaTech Cayman, Inc. - ADR (a) | | | 8,652 | | | $ | 129,174 | |
| | | | | | | | | |
| Machinery - 3.72% | | | | | | | | |
| AGCO Corp. (a) | | | 57,761 | | | | 2,742,492 | |
| Caterpillar, Inc. | | | 55,222 | | | | 4,751,301 | |
| CNH Global NV (a)(b) | | | 47,605 | | | | 1,845,646 | |
| Cummins, Inc. | | | 59,665 | | | | 5,501,710 | |
| Deere & Co. | | | 56,492 | | | | 4,660,025 | |
| Oshkosh Corp. (a) | | | 101,558 | | | | 2,785,736 | |
| Sauer-Danfoss, Inc. | | | 27,928 | | | | 1,122,985 | |
| Toro Co. | | | 67,282 | | | | 2,676,478 | |
| WABCO Holdings, Inc. | | | 58,396 | | | | 3,367,697 | |
| | | | | | | | 29,454,070 | |
| | | | | | | | | |
| Media - 0.09% | | | | | | | | |
| Cheil Worldwide, Inc. (b) | | | 9,494 | | | | 201,345 | |
| Cyfrowy Polsat SA (a)(b) | | | 28,003 | | | | 128,288 | |
| Global Mediacom Tbk PT (b) | | | 825,500 | | | | 176,500 | |
| Media Nusantara Citra Tbk PT (b) | | | 660,500 | | | | 178,931 | |
| | | | | | | | 685,064 | |
| | | | | | | | | |
| Metals & Mining - 0.19% | | | | | | | | |
| Grupo Mexico SAB de CV (b) | | | 150,000 | | | | 495,737 | |
| Jastrzebska Spolka Weglowa SA (b) | | | 9,815 | | | | 280,310 | |
| Jiangxi Copper Co., Ltd. (b) | | | 68,000 | | | | 170,703 | |
| KGHM Polska Miedz SA (b) | | | 7,187 | | | | 342,877 | |
| POSCO - ADR | | | 2,765 | | | | 225,458 | |
| | | | | | | | 1,515,085 | |
| | | | | | | | | |
| Multiline Retail - 2.39% | | | | | | | | |
| Big Lots, Inc. (a) | | | 78,708 | | | | 2,328,183 | |
| Dollar General Corp. (a) | | | 69,821 | | | | 3,598,574 | |
| Dollar Tree, Inc. (a) | | | 87,594 | | | | 4,228,600 | |
| Family Dollar Stores, Inc. | | | 40,623 | | | | 2,693,305 | |
| Target Corp. | | | 95,211 | | | | 6,043,042 | |
| | | | | | | | 18,891,704 | |
|
| 68 | The Leuthold Funds - 2012 Annual Report | See Notes to the Financial Statements. |
| Leuthold Core Investment Fund |
| Consolidated Schedule of Investments (continued) |
| September 30, 2012 |
| | | Shares | | | Fair Value | |
| | | | | | | |
| COMMON STOCKS - 64.56% (continued) | | | | | | |
| | | | | | | |
| Multi-Utilities - 0.01% | | | | | | |
| YTL Corp. Bhd (b) | | | 151,100 | | | $ | 84,732 | |
| | | | | | | | | |
| Office Electronics - 0.16% | | | | | | | | |
| Zebra Technologies Corp. - Class A (a) | | | 34,911 | | | | 1,310,559 | |
| | | | | | | | | |
| Oil, Gas & Consumable Fuels - 3.87% | | | | | | | | |
| Bangchak Petroleum PCL (b) | | | 249,800 | | | | 197,674 | |
| Banpu PCL (b) | | | 23,950 | | | | 304,279 | |
| Chevron Corp. | | | 34,911 | | | | 4,069,226 | |
| China Petroleum & Chemical Corp. - ADR | | | 5,362 | | | | 495,556 | |
| CNOOC, Ltd. - ADR | | | 1,669 | | | | 338,356 | |
| CVR Energy, Inc. (a) | | | 64,109 | | | | 2,356,006 | |
| Delek US Holdings, Inc. | | | 103,462 | | | | 2,637,246 | |
| Exxon Mobil Corp. | | | 54,587 | | | | 4,991,981 | |
| Gazprom OAO - ADR (a) | | | 27,935 | | | | 281,526 | |
| HollyFrontier Corp. | | | 66,647 | | | | 2,750,522 | |
| Indo Tambangraya Megah Tbk PT (b) | | | 46,500 | | | | 204,008 | |
| Lukoil OAO - ADR | | | 6,959 | | | | 430,130 | |
| Marathon Petroleum Corp. | | | 46,336 | | | | 2,529,482 | |
| PTT PCL (b) | | | 32,300 | | | | 344,516 | |
| Sasol, Ltd. - ADR | | | 8,178 | | | | 364,575 | |
| SK Innovation Co., Ltd. (b) | | | 3,459 | | | | 519,737 | |
| Tesoro Corp. (a) | | | 81,881 | | | | 3,430,814 | |
| Valero Energy Corp. | | | 87,594 | | | | 2,774,978 | |
| Western Refining, Inc. | | | 62,204 | | | | 1,628,501 | |
| | | | | | | | 30,649,113 | |
| Personal Products - 0.04% | | | | | | | | |
| AMOREPACIFIC Group (b) | | | 721 | | | | 319,817 | |
| | | | | | | | | |
| | | Shares | | | Fair Value | |
| | | | | | | |
| Pharmaceuticals - 6.73% | | | | | | |
| Allergan, Inc. | | | 38,084 | | | $ | 3,487,733 | |
| Aspen Pharmacare Holdings, Ltd. (b) | | | 12,584 | | | | 216,546 | |
| Bristol-Myers Squibb Co. | | | 148,529 | | | | 5,012,854 | |
| Eli Lilly & Co. | | | 109,175 | | | | 5,175,987 | |
| Jazz Pharmaceuticals PLC (a)(b) | | | 59,031 | | | | 3,365,357 | |
| Kalbe Farma Tbk PT (b) | | | 266,000 | | | | 130,194 | |
| Merck & Co., Inc. | | | 114,253 | | | | 5,152,810 | |
| Mylan, Inc. (a) | | | 183,439 | | | | 4,475,911 | |
| Novartis AG - ADR | | | 45,066 | | | | 2,760,743 | |
| Novo Nordisk A/S - ADR | | | 20,948 | | | | 3,305,804 | |
| Pfizer, Inc. | | | 315,465 | | | | 7,839,305 | |
| Richter Gedeon Nyrt (b) | | | 464 | | | | 81,218 | |
| Sino Biopharmaceutical (b) | | | 332,000 | | | | 121,925 | |
| ViroPharma, Inc. (a) | | | 99,654 | | | | 3,011,544 | |
| Warner Chilcott PLC - Class A (b) | | | 312,926 | | | | 4,224,501 | |
| Watson Pharmaceuticals, Inc. (a) | | | 57,126 | | | | 4,864,850 | |
| | | | | | | | 53,227,282 | |
| | | | | | | | | |
| Real Estate Investment Trusts (REITs) - 4.60% | | | | | | | | |
| American Campus Communities, Inc. | | | 75,873 | | | | 3,329,307 | |
| Apartment Investment & Management Co. - Class A | | | 164,774 | | | | 4,282,476 | |
| BioMed Realty Trust, Inc. | | | 124,156 | | | | 2,324,201 | |
| Equity One, Inc. | | | 134,119 | | | | 2,824,546 | |
| HCP, Inc. | | | 117,258 | | | | 5,215,636 | |
| Home Properties, Inc. | | | 52,881 | | | | 3,240,019 | |
| Liberty Property Trust | | | 95,033 | | | | 3,443,996 | |
| Mack-Cali Realty Corp. | | | 84,303 | | | | 2,242,460 | |
| Realty Income Corp. | | | 67,443 | | | | 2,757,744 | |
| Regency Centers Corp. | | | 78,938 | | | | 3,846,649 | |
| Weingarten Realty Investors | | | 104,229 | | | | 2,929,877 | |
| | | | | | | | 36,436,911 | |
|
| See Notes to the Financial Statements. | The Leuthold Funds - 2012 Annual Report | 69 |
| Leuthold Core Investment Fund |
| Consolidated Schedule of Investments (continued) |
| September 30, 2012 |
| | | Shares | | | Fair Value | |
| | | | | | | |
| COMMON STOCKS - 64.56% (continued) | | | | | | |
| | | | | | | |
| Real Estate Management & Development - 0.28% | | | | | | |
| Alam Sutera Realty Tbk PT (b) | | | 3,475,000 | | | $ | 178,913 | |
| Aliansce Shopping Centers SA (b) | | | 31,000 | | | | 336,722 | |
| BR Properties SA (b) | | | 25,100 | | | | 326,247 | |
| Bumi Serpong Damai PT (b) | | | 3,186,000 | | | | 374,251 | |
| Franshion Properties China, Ltd. (b) | | | 556,000 | | | | 169,116 | |
| Megaworld Corp. (b) | | | 6,467,000 | | | | 344,289 | |
| Multiplan Empreendimentos Imobiliarios SA (b) | | | 11,300 | | | | 332,214 | |
| UOL Group, Ltd. (b) | | | 38,000 | | | | 176,888 | |
| | | | | | | | 2,238,640 | |
| | | | | | | | | |
| Road & Rail - 4.33% | | | | | | | | |
| Canadian National Railway Co. (b) | | | 55,222 | | | | 4,872,237 | |
| Canadian Pacific Railway, Ltd. (b) | | | 55,222 | | | | 4,577,352 | |
| ComfortDelGro Corp., Ltd. (b) | | | 168,000 | | | | 234,355 | |
| CSX Corp. | | | 228,506 | | | | 4,741,499 | |
| Genesee & Wyoming, Inc. - Class A (a) | | | 33,641 | | | | 2,249,237 | |
| Kansas City Southern | | | 43,162 | | | | 3,270,816 | |
| Norfolk Southern Corp. | | | 101,558 | | | | 6,462,136 | |
| Union Pacific Corp. | | | 66,013 | | | | 7,835,743 | |
| | | | | | | | 34,243,375 | |
| | | | | | | | | |
| | | | | | | | | |
| Semiconductors & Semiconductor Equipment - 0.14% | | | | | | | | |
| Samsung Electronics Co., Ltd. (b) | | | 584 | | | | 703,777 | |
| Spreadtrum Communications, Inc. - ADR | | | 20,026 | | | | 411,735 | |
| | | | | | | | 1,115,512 | |
| | | | | | | |
| | | Shares | | | Fair Value | |
| | | | | | | |
| Software - 0.04% | | | | | | |
| Totvs SA (b) | | | 14,800 | | | $ | 306,549 | |
| | | | | | | | | |
| Specialty Retail - 3.64% | | | | | | | | |
| Aaron’s, Inc. | | | 74,899 | | | | 2,082,941 | |
| Bed Bath & Beyond, Inc. (a) | | | 73,630 | | | | 4,638,690 | |
| The Home Depot, Inc. | | | 196,769 | | | | 11,878,945 | |
| Lowe’s Cos, Inc. | | | 151,702 | | | | 4,587,468 | |
| Pier 1 Imports, Inc. | | | 179,631 | | | | 3,366,285 | |
| Williams-Sonoma, Inc. | | | 51,414 | | | | 2,260,674 | |
| | | | | | | | 28,815,003 | |
| | | | | | | | | |
| Textiles, Apparel & Luxury Goods - 0.02% | | | | | | | | |
| LG Fashion Corp. (b) | | | 2,830 | | | | 78,764 | |
| Shenzhou International Group Holdings, Ltd. (b) | | | 52,000 | | | | 88,818 | |
| | | | | | | | 167,582 | |
| | | | | | | | | |
| Thrifts & Mortgage Finance - 0.02% | | | | | | | | |
| Malaysia Building Society (b) | | | 167,200 | | | | 131,421 | |
| | | | | | | | | |
| Trading Companies & Distributors - 0.29% | | | | | | | | |
| Applied Industrial Technologies, Inc. | | | 55,222 | | | | 2,287,847 | |
| | | | | | | | | |
| Transportation Infrastructure - 0.06% | | | | | | | | |
| Airports of Thailand PCL (b) | | | 105,600 | | | | 272,257 | |
| Obrascon Huarte Lain Brasil SA (b) | | | 22,800 | | | | 207,728 | |
| | | | | | | | 479,985 | |
| | | | | | | | | |
| Water Utilities - 0.05% | | | | | | | | |
| Cia de Saneamento Basico do Estado de Sao Paulo - ADR | | | 3,283 | | | | 266,612 | |
| Guangdong Investment, Ltd. (b) | | | 124,000 | | | | 97,956 | |
| | | | | | | | 364,568 | |
|
| 70 | The Leuthold Funds - 2012 Annual Report | See Notes to the Financial Statements. |
| Leuthold Core Investment Fund |
| Consolidated Schedule of Investments (continued) |
| September 30, 2012 |
| | | Shares | | | Fair Value | |
| | | | | | | |
| COMMON STOCKS - 64.56% (continued) | | | | | | |
| | | | | | | |
| Wireless Telecommunication Services - 0.31% | | | | | | |
| Advanced Info Service PCL (b) | | | 28,200 | | | $ | 195,839 | |
| America Movil SAB de CV - ADR | | | 17,109 | | | | 435,253 | |
| China Mobile, Ltd. - ADR | | | 4,887 | | | | 270,544 | |
| ENTEL Chile SA (b) | | | 14,755 | | | | 307,483 | |
| Mobile Telesystems OJSC - ADR | | | 21,865 | | | | 383,075 | |
| MTN Group, Ltd. (b) | | | 11,802 | | | | 227,839 | |
| Tim Participacoes SA - ADR | | | 20,254 | | | | 389,282 | |
| Turkcell Iletisim Hizmetleri AS - ADR (a) | | | 16,029 | | | | 242,679 | |
| | | | | | | | 2,451,994 | |
| | | | | | | | | |
| TOTAL COMMON STOCKS (Cost $454,217,991) | | | | | | $ | 510,867,129 | |
| | | | | | | | | |
| PREFERRED STOCKS - 0.17% | | | | | | | | |
| | | | | | | | | |
| Commercial Banks - 0.02% | | | | | | | | |
| Itau Unibanco Holding SA - ADR | | | 10,100 | | | $ | 154,328 | |
| | | | | | | | | |
| Containers & Packaging - 0.04% | | | | | | | | |
| Klabin SA (b) | | | 63,600 | | | | 331,608 | |
| | | | | | | | | |
| Electric Utilities - 0.02% | | | | | | | | |
| Cia Energetica de Minais Gerais (b) | | | 14,600 | | | | 177,166 | |
| | | | | | | | | |
| Food & Staples Retailing - 0.04% | | | | | | | | |
| Cia Brasileira de Distribuicao Grupo Pao de Acucar - ADR | | | 6,771 | | | | 305,440 | |
| | | | | | | | | |
| Metals & Mining - 0.05% | | | | | | | | |
| Vale SA - ADR | | | 24,400 | | | | 424,028 | |
| | | | | | | | | |
| TOTAL PREFERRED STOCKS (Cost $1,450,476) | | | | | | $ | 1,392,570 | |
| | | Shares | | | Fair Value | |
| | | | | | | |
| INVESTMENT COMPANIES - 15.73% | | | | | | |
| | | | | | | |
| Exchange Traded Funds - 15.73% | | | | | | |
| iShares Barclays Aggregate Bond Fund | | | 291,979 | | | $ | 32,833,038 | |
| iShares Barclays MBS Bond Fund | | | 139,008 | | | | 15,174,113 | |
| iShares iBoxx $ High Yield Corporate Bond Fund | | | 85,055 | | | | 7,856,530 | |
| iShares iBoxx Investment Grade Corporate Bond Fund | | | 8,654 | | | | 1,053,798 | |
| iShares JPMorgan USD Emerging Markets Bond Fund | | | 101,558 | | | | 12,314,923 | |
| iShares MSCI Emerging Markets Index Fund | | | 154,615 | | | | 6,388,692 | |
| PowerShares Emerging Markets Sovereign Debt Portfolio | | | 126,455 | | | | 3,880,904 | |
| PowerShares Senior Loan Portfolio | | | 79,000 | | | | 1,971,050 | |
| SPDR Barclays Capital International Treasury Bond ETF | | | 103,463 | | | | 6,368,148 | |
| SPDR Barclays Capital Short Term High Yield Bond ETF | | | 65,000 | | | | 1,978,535 | |
| Vanguard Total Bond Market ETF | | | 406,867 | | | | 34,644,725 | |
| | | | | | | | | |
| TOTAL INVESTMENT COMPANIES (Cost $121,750,746) | | | | | | $ | 124,464,456 | |
| | | | | | | | | |
| | | Troy Ounces | | | Fair Value | |
| | | | | | | | | |
| PRECIOUS METALS - 5.44% | | | | | | | | |
| Gold Bullion (a) | | | 24,228 | | | $ | 43,019,237 | |
| | | | | | | | | |
| TOTAL PRECIOUS METALS (Cost $23,405,738) | | | | | | $ | 43,019,237 | |
|
| See Notes to the Financial Statements. | The Leuthold Funds - 2012 Annual Report | 71 |
| Leuthold Core Investment Fund |
| Consolidated Schedule of Investments (continued) |
| September 30, 2012 |
| | | Principal Amount | | | Fair Value | |
| | | | | | | |
| CORPORATE BONDS - 8.32% | | | | | | |
| | | | | | | |
| Beverages - 0.27% | | | | | | |
Dr. Pepper Snapple Group, Inc.
2.900%, 01/15/2016 | | $ | 2,036,000 | | | $ | 2,156,417 | |
| | | | | | | | | |
| Biotechnology - 0.21% | | | | | | | | |
Amgen, Inc.
4.100%, 06/15/2021 | | | 1,538,000 | | | | 1,674,393 | |
| | | | | | | | | |
| Capital Markets - 0.70% | | | | | | | | |
Goldman Sachs Group, Inc.
6.150%, 04/01/2018 | | | 2,540,000 | | | | 2,964,635 | |
Morgan Stanley
5.300%, 03/01/2013 | | | 2,530,000 | | | | 2,574,538 | |
| | | | | | | | 5,539,173 | |
| | | | | | | | | |
| Chemicals - 0.25% | | | | | | | | |
Dow Chemical Co.
7.600%, 05/15/2014 | | | 1,823,000 | | | | 2,014,194 | |
| | | | | | | | | |
| Computers & Peripherals - 0.31% | | | | | | | | |
Hewlett-Packard Co.
4.750%, 06/02/2014 | | | 2,300,000 | | | | 2,424,681 | |
| | | | | | | | | |
| Consumer Finance - 0.43% | | | | | | | | |
Capital One Financial Corp.
7.375%, 05/23/2014 | | | 1,502,000 | | | | 1,653,079 | |
SLM Corp.
6.250%, 01/25/2016 | | | 1,577,000 | | | | 1,711,045 | |
| | | | | | | | 3,364,124 | |
| | | | | | | | | |
| Diversified Financial Services - 1.13% | | | | | | | | |
Citigroup, Inc.
5.500%, 04/11/2013 | | | 2,540,000 | | | | 2,602,146 | |
Export-Import Bank of Korea
8.125%, 01/21/2014 (b) | | | 1,880,000 | | | | 2,046,352 | |
Ford Motor Credit Co., LLC
3.000%, 06/12/2017 | | | 1,655,000 | | | | 1,684,611 | |
JPMorgan Chase & Co.
3.150%, 07/05/2016 | | | 2,500,000 | | | | 2,644,223 | |
| | | | | | | | 8,977,332 | |
| | | | | | | | | |
| | | Principal Amount | | | Fair Value | |
| | | | | | | | | |
| Diversified Telecommunication Services - 0.52% | | | | | | | | |
AT&T, Inc.
5.100%, 09/15/2014 | | $ | 2,368,000 | | | $ | 2,574,750 | |
Cellco Partnership / Verizon
Wireless Capital LLC
5.550%, 02/01/2014 | | | 1,450,000 | | | | 1,542,367 | |
| | | | | | | | 4,117,117 | |
| | | | | | | | | |
| Electric Utilities - 0.68% | | | | | | | | |
Duke Energy Corp.
3.950%, 09/15/2014 | | | 1,470,000 | | | | 1,558,232 | |
Exelon Corp.
4.900%, 06/15/2015 | | | 1,932,000 | | | | 2,123,598 | |
Oncor Electric Delivery Co. LLC
6.800%, 09/01/2018 | | | 1,377,000 | | | | 1,699,433 | |
| | | | | | | | 5,381,263 | |
| | | | | | | | | |
| Health Care Providers & Services - 0.21% | | | | | | | | |
Coventry Health Care, Inc.
5.950%, 03/15/2017 | | | 1,449,000 | | | | 1,692,054 | |
| | | | | | | | | |
| Industrial Conglomerates - 0.35% | | | | | | | | |
General Electric Co.
5.250%, 12/06/2017 | | | 2,355,000 | | | | 2,786,396 | |
| | | | | | | | | |
| Insurance - 0.22% | | | | | | | | |
Genworth Financial, Inc.
6.515%, 05/22/2018 | | | 1,681,000 | | | | 1,710,977 | |
| | | | | | | | | |
| Internet & Catalog Retail - 0.33% | | | | | | | | |
Expedia, Inc.
7.456%, 08/15/2018 | | | 2,200,000 | | | | 2,602,519 | |
| | | | | | | | | |
| Media - 0.34% | | | | | | | | |
Time Warner Cable, Inc.
8.250%, 04/01/2019 | | | 2,028,000 | | | | 2,722,026 | |
| | | | | | | | | |
| Metals & Mining - 0.27% | | | | | | | | |
Nabors Industries, Inc.
9.250%, 01/15/2019 | | | 1,629,000 | | | | 2,131,905 | |
|
| 72 | The Leuthold Funds - 2012 Annual Report | See Notes to the Financial Statements. |
| Leuthold Core Investment Fund |
Consolidated Schedule of Investments (continued) September 30, 2012 |
| | | Principal
Amount | | | Fair Value | |
| | | | | | | |
| CORPORATE BONDS - 8.32% (continued) | | | | | | |
| | | | | | | |
| Oil, Gas & Consumable Fuels - 0.91% | | | | | | |
Anadarko Petroleum Corp.
5.950%, 09/15/2016 | | $ | 1,856,000 | | | $ | 2,150,544 | |
Enterprise Products Operating, LLC
5.600%, 10/15/2014 | | | 1,200,000 | | | | 1,311,083 | |
Petrobras International Finance Co.
6.125%, 10/06/2016 (b) | | | 1,861,000 | | | | 2,108,267 | |
Petrohawk Energy Corp.
7.250%, 08/15/2018 | | | 1,458,000 | | | | 1,656,409 | |
| | | | | | | | 7,226,303 | |
| | | | | | | | | |
| Pharmaceuticals - 0.20% | | | | | | | | |
Hospira, Inc.
6.050%, 03/30/2017 | | | 1,336,000 | | | | 1,544,806 | |
| | | | | | | | | |
| Real Estate Investment Trusts (REITs) - 0.21% | | | | | | | | |
Vornado Realty LP
4.250%, 04/01/2015 | | | 1,575,000 | | | | 1,664,438 | |
| | | | | | | | | |
| Semiconductors & Semiconductor Equipment - 0.21% | | | | | | | | |
KLA-Tencor Corp.
6.900%, 05/01/2018 | | | 1,351,000 | | | | 1,630,358 | |
| | | | | | | | | |
| Software - 0.21% | | | | | | | | |
BMC Software, Inc.
7.250%, 06/01/2018 | | | 1,368,000 | | | | 1,647,846 | |
| | | | | | | | | |
| Tobacco - 0.10% | | | | | | | | |
Altria Group, Inc.
9.700%, 11/10/2018 | | | 537,000 | | | | 769,146 | |
| | | | | | | | | |
| Wireless Telecommunication Services - 0.26% | | | | | | | | |
Rogers Communications, Inc.
6.375%, 03/01/2014 (b) | | | 1,902,000 | | | | 2,053,281 | |
TOTAL CORPORATE BONDS
(Cost $63,706,489) | | | | | | $ | 65,830,749 | |
| | | | | | | | | |
| | | Shares | | | Fair Value | |
| | | | | | | | | |
| RIGHTS - 0.00% | | | | | | | | |
| | | | | | | | | |
| Multi-Utilities - 0.00% | | | | | | | | |
| YTL Corp. Bhd (a)(b) | | | 10,073 | | | $ | — | |
| | | | | | | | | |
TOTAL RIGHTS
(Cost $4,492) | | | | | | $ | — | |
| | | | | | | | | |
| SHORT-TERM INVESTMENTS - 1.50% | | | | | | | | |
| Money Market Funds - 1.50% | | | | | | | | |
Fidelity Institutional Money Market
Fund - Government Portfolio 0.01% (c) | | | 11,869,970 | | | $ | 11,869,970 | |
TOTAL SHORT-TERM INVESTMENTS
(Cost $11,869,970) | | | | | | $ | 11,869,970 | |
| | | | | | | | | |
| Total Investments (Cost $676,405,902) - 95.72% | | | | | | $ | 757,444,111 | |
| | | | | | | | | |
| Other Assets in Excess of Liabilities - 4.28% (d) | | | | | | | 33,888,001 | |
| TOTAL NET ASSETS - 100.00% | | | | | | $ | 791,332,112 | |
| Percentages are stated as a percent of net assets. |
| ADR American Depository Receipt |
| (a) | Non-income producing security. |
| (b) | Foreign issued security. |
| (c) | The rate quoted is the annualized seven-day yield as of September 30, 2012. |
| (d) | All or a portion of the assets have been committed as collateral for open securities sold short. |
The Global Industry Classification Standard (GICS®) was developed by and/or is the exclusive property of MSCI, Inc. and Standard & Poor’s Financial Services LLC (“S&P”). GICS is a service mark of MSCI and S&P and has been licensed for use by U.S. Bancorp Fund Services, LLC.
|
| See Notes to the Financial Statements. | The Leuthold Funds - 2012 Annual Report | 73 |
| Leuthold Core Investment Fund |
| Consolidated Schedule of Securities Sold Short - (a) |
| September 30, 2012 |
| | | Shares | | | Fair Value | |
| | | | | | | |
| INVESTMENT COMPANIES - 2.48% | | | | | | |
| Exchange Traded Funds - 2.48% | | | | | | |
| iShares Russell 2000 Index Fund | | | 235,167 | | | $ | 19,627,038 | |
TOTAL INVESTMENT COMPANIES
(Proceeds $19,310,588) | | | | | | $ | 19,627,038 | |
| | | | | | | | | |
TOTAL SECURITIES SOLD SHORT
(Proceeds $19,310,588) - 2.48% | | | | | | $ | 19,627,038 | |
| Percentages are stated as a percent of net assets. |
| (a) | All securities sold short are non-income producing. |
The Global Industry Classification Standard (GICS®) was developed by and/or is the exclusive property of MSCI, Inc. and Standard & Poor’s Financial Services LLC (“S&P”). GICS is a service mark of MSCI and S&P and has been licensed for use by U.S. Bancorp Fund Services, LLC.
|
| 74 | The Leuthold Funds - 2012 Annual Report | See Notes to the Financial Statements. |
| Leuthold Asset Allocation Fund |
| Consolidated Schedule of Investments |
| September 30, 2012 |
| | | Shares | | | Fair Value | |
| | | | | | | |
| COMMON STOCKS - 65.07% | | | | | | |
| | | | | | | |
| Aerospace & Defense - 0.75% | | | | | | |
| Aselsan Elektronik Sanayi Ve Ticaret AS (b) | | | 52,656 | | | $ | 190,368 | |
| Embraer SA - ADR | | | 8,846 | | | | 235,481 | |
| L-3 Communications Holdings, Inc. | | | 30,995 | | | | 2,222,651 | |
| Raytheon Co. | | | 35,763 | | | | 2,044,213 | |
| | | | | | | | 4,692,713 | |
| | | | | | | | | |
| Airlines - 0.54% | | | | | | | | |
| AirAsia Bhd (b) | | | 114,700 | | | | 113,091 | |
| Southwest Airlines Co. | | | 190,142 | | | | 1,667,545 | |
| U.S. Airways Group, Inc. (a) | | | 151,398 | | | | 1,583,623 | |
| | | | | | | | 3,364,259 | |
| | | | | | | | | |
| Auto Components - 0.74% | | | | | | | | |
| Autoliv, Inc. (b) | | | 29,803 | | | | 1,846,892 | |
| Cooper Tire & Rubber Co. | | | 138,881 | | | | 2,663,738 | |
| Halla Climate Control Corp. (b) | | | 5,940 | | | | 122,446 | |
| | | | | | | | 4,633,076 | |
| | | | | | | | | |
| Automobiles - 0.31% | | | | | | | | |
| Dongfeng Motor Group Co., Ltd. (b) | | | 82,000 | | | | 95,287 | |
| Harley-Davidson, Inc. | | | 33,379 | | | | 1,414,268 | |
| Hyundai Motor Co. (b) | | | 968 | | | | 218,339 | |
| Tofas Turk Otomobil Fabrikasi AS (b) | | | 37,749 | | | | 190,939 | |
| | | | | | | | 1,918,833 | |
| | | | | | | | | |
| Beverages - 1.10% | | | | | | | | |
| Anheuser-Busch InBev NV - ADR | | | 36,955 | | | | 3,174,804 | |
| Molson Coors Brewing Co. - Class B | | | 78,083 | | | | 3,517,639 | |
| Tsingtao Brewery Co., Ltd. (b) | | | 38,000 | | | | 208,883 | |
| | | | | | | | 6,901,326 | |
| | | Shares | | | Fair Value | |
| | | | | | | |
| Biotechnology - 1.79% | | | | | | |
| Ariad Pharmaceuticals, Inc. (a) | | | 46,492 | | | $ | 1,126,269 | |
| Biogen Idec, Inc. (a) | | | 29,207 | | | | 4,358,560 | |
| Celgene Corp. (a) | | | 46,492 | | | | 3,551,989 | |
| PDL BioPharma, Inc. | | | 172,856 | | | | 1,329,263 | |
| Vertex Pharmaceuticals, Inc. (a) | | | 14,901 | | | | 833,711 | |
| | | | | | | | 11,199,792 | |
| | | | | | | | | |
| Building Products - 0.01% | | | | | | | | |
| China Liansu Group Holdings, Ltd. (b) | | | 118,000 | | | | 61,034 | |
| | | | | | | | | |
| Capital Markets - 1.28% | | | | | | | | |
| Ameriprise Financial, Inc. | | | 33,379 | | | | 1,892,255 | |
| Bank of New York Mellon Corp. | | | 78,083 | | | | 1,766,237 | |
| CETIP SA - Mercados Organizados (b) | | | 18,500 | | | | 242,104 | |
| Goldman Sachs Group, Inc. | | | 12,517 | | | | 1,422,933 | |
| Janus Capital Group, Inc. | | | 184,181 | | | | 1,738,669 | |
| KKR & Co. LP | | | 63,182 | | | | 954,680 | |
| | | | | | | | 8,016,878 | |
| | | | | | | | | |
| Chemicals - 2.25% | | | | | | | | |
| Aeci, Ltd. (b) | | | 5,237 | | | | 51,495 | |
| Agrium, Inc. (b) | | | 45,300 | | | | 4,686,738 | |
| CF Industries Holdings, Inc. | | | 16,094 | | | | 3,576,731 | |
| China BlueChemical, Ltd. (b) | | | 202,000 | | | | 119,121 | |
| China Lumena New Materials Corp. (b) | | | 444,000 | | | | 77,258 | |
| China Petrochemical Development Corp. (b) | | | 174,000 | | | | 146,760 | |
| FMC Corp. | | | 35,763 | | | | 1,980,555 | |
| Gubre Fabrikalari TAS (a)(b) | | | 20,992 | | | | 148,429 | |
| Huntsman Corp. | | | 143,053 | | | | 2,135,781 | |
| NewMarket Corp. | | | 4,768 | | | | 1,175,217 | |
| | | | | | | | 14,098,085 | |
|
| See Notes to the Financial Statements. | The Leuthold Funds - 2012 Annual Report | 75 |
| Leuthold Asset Allocation Fund |
| Consolidated Schedule of Investments (continued) |
| September 30, 2012 |
| | | Shares | | | Fair Value | |
| | | | | | | |
| COMMON STOCKS - 65.07% (continued) | | | | | | |
| | | | | | | |
| Commercial Banks - 5.07% | | | | | | |
| Bangkok Bank PCL (b) | | | 77,800 | | | $ | 489,095 | |
| Bank of China, Ltd. (b) | | | 1,264,000 | | | | 478,460 | |
| BB&T Corp. | | | 110,270 | | | | 3,656,553 | |
| Canadian Imperial Bank of Commerce (b) | | | 30,995 | | | | 2,423,499 | |
| DBS Group Holdings, Ltd. (b) | | | 41,000 | | | | 478,890 | |
| Fifth Third Bancorp | | | 178,221 | | | | 2,764,208 | |
| Huntington Bancshares, Inc. | | | 541,219 | | | | 3,734,411 | |
| KeyCorp | | | 320,678 | | | | 2,802,726 | |
| M&T Bank Corp. | | | 26,823 | | | | 2,552,477 | |
| PNC Financial Services Group, Inc. | | | 28,015 | | | | 1,767,746 | |
| Sberbank of Russia (b) | | | 27,540 | | | | 324,510 | |
| Security Bank Corp. (b) | | | 36,750 | | | | 144,238 | |
| SunTrust Banks, Inc. | | | 100,733 | | | | 2,847,722 | |
| Turkiye Vakiflar Bankasi Tao (b) | | | 82,215 | | | | 177,738 | |
| Wells Fargo & Co. | | | 206,236 | | | | 7,121,329 | |
| | | | | | | | 31,763,602 | |
| | | | | | | | | |
| Commercial Services & Supplies - 0.16% | | | | | | | | |
| Avery Dennison Corp. | | | 28,015 | | | | 891,437 | |
| Valid Solucoes e Servicos de Seguranca em Meios de Pagamento e Identificacao SA (b) | | | 7,000 | | | | 129,141 | |
| | | | | | | | 1,020,578 | |
| | | | | | | | | |
| Communications Equipment - 0.30% | | | | | | | | |
| Cisco Systems, Inc. | | | 98,349 | | | | 1,877,482 | |
| | | | | | | | | |
| Computers & Peripherals - 3.00% | | | | | | | | |
| Apple, Inc. | | | 7,153 | | | | 4,772,911 | |
| Diebold, Inc. | | | 22,650 | | | | 763,532 | |
| Hewlett-Packard Co. | | | 72,123 | | | | 1,230,418 | |
| JCY International Bhd (b) | | | 154,100 | | | | 39,243 | |
| Lenovo Group, Ltd. (b) | | | 558,000 | | | | 460,016 | |
| Lite-On Technology Corp. (b) | | | 147,000 | | | | 189,338 | |
| | | Shares | | | Fair Value | |
| | | | | | | |
| Computers & Peripherals - 3.00% (continued) | | | | | | |
| Pegatron Corp. (b) | | | 245,000 | | | $ | 317,428 | |
| SanDisk Corp. (a) | | | 61,990 | | | | 2,692,226 | |
| Seagate Technology PLC (b) | | | 269,418 | | | | 8,351,958 | |
| | | | | | | | 18,817,070 | |
| | | | | | | | | |
| Construction & Engineering - 0.20% | | | | | | | | |
| KBR, Inc. | | | 40,532 | | | | 1,208,664 | |
| Tekfen Holding AS (b) | | | 20,492 | | | | 74,343 | |
| | | | | | | | 1,283,007 | |
| | | | | | | | | |
| Construction Materials - 0.07% | | | | | | | | |
| China Shanshui Cement Group, Ltd. (b) | | | 218,000 | | | | 140,747 | |
| Indocement Tunggal Prakarsa Tbk PT (b) | | | 48,500 | | | | 102,762 | |
| Semen Gresik Persero Tbk PT (b) | | | 118,000 | | | | 177,676 | |
| | | | | | | | 421,185 | |
| | | | | | | | | |
| Consumer Finance - 0.77% | | | | | | | | |
| Discover Financial Services | | | 120,999 | | | | 4,807,290 | |
| | | | | | | | | |
| Distributors - 0.07% | | | | | | | | |
| Dogus Otomotiv Servis ve Ticaret AS (a)(b) | | | 15,308 | | | | 51,697 | |
| Imperial Holdings, Ltd. (b) | | | 7,560 | | | | 170,084 | |
| Jardine Cycle & Carriage, Ltd. (b) | | | 3,000 | | | | 117,101 | |
| Li & Fung, Ltd. (b) | | | 76,000 | | | | 117,196 | |
| | | | | | | | 456,078 | |
| | | | | | | | | |
| Diversified Financial Services - 0.20% | | | | | | | | |
| African Bank Investments, Ltd. (b) | | | 19,164 | | | | 76,249 | |
| CME Group, Inc. | | | 20,862 | | | | 1,195,393 | |
| | | | | | | | 1,271,642 | |
|
| 76 | The Leuthold Funds - 2012 Annual Report | See Notes to the Financial Statements. |
| Leuthold Asset Allocation Fund |
| Consolidated Schedule of Investments (continued) |
| September 30, 2012 |
| | | Shares | | | Fair Value | |
| | | | | | | |
| COMMON STOCKS - 65.07% (continued) | | | | | | |
| | | | | | | |
| Diversified Telecommunication Services - 0.94% | | | | | | |
| China Telecom Corp., Ltd. - ADR | | | 2,648 | | | $ | 153,504 | |
| Hutchison Telecommunications Hong Kong Holdings, Ltd. (b) | | | 138,000 | | | | 60,897 | |
| Rostelecom OJSC - ADR | | | 7,040 | | | | 178,762 | |
| Telekomunikasi Indonesia Persero Tbk PT - ADR | | | 3,720 | | | | 144,820 | |
| Verizon Communications, Inc. | | | 117,423 | | | | 5,350,966 | |
| | | | | | | | 5,888,949 | |
| | | | | | | | | |
| Electric Utilities - 0.62% | | | | | | | | |
| PGE SA (b) | | | 36,762 | | | | 212,290 | |
| PPL Corp. | | | 118,019 | | | | 3,428,452 | |
| Tauron Polska Energia SA (b) | | | 151,074 | | | | 230,920 | |
| | | | | | | | 3,871,662 | |
| | | | | | | | | |
| Electrical Equipment - 0.19% | | | | | | | | |
| Babcock & Wilcox Co. (a) | | | 47,088 | | | | 1,199,331 | |
| | | | | | | | | |
| Electronic Equipment, Instruments & Components - 0.52% | | | | | | | | |
| Corning, Inc. | | | 200,275 | | | | 2,633,616 | |
| Digital China Holdings, Ltd. (b) | | | 186,000 | | | | 295,180 | |
| E Ink Holdings, Inc. (b) | | | 287,000 | | | | 311,562 | |
| | | | | | | | 3,240,358 | |
| | | | | | | | | |
| Energy Equipment & Services - 0.88% | | | | | | | | |
| Ensco PLC - Class (b) | | | 32,187 | | | | 1,756,123 | |
| Helix Energy Solutions Group, Inc. (a) | | | 30,399 | | | | 555,390 | |
| Seadrill, Ltd. (b) | | | 47,088 | | | | 1,846,791 | |
| Transocean, Ltd. (b) | | | 29,803 | | | | 1,337,856 | |
| | | | | | | | 5,496,160 | |
| | | Shares | | | Fair Value | |
| | | | | | | |
| Food & Staples Retailing - 1.28% | | | | | | |
| BIM Birlesik Magazalar AS (b) | | | 4,102 | | | $ | 171,137 | |
| CVS Caremark Corp. | | | 75,103 | | | | 3,636,487 | |
| Grupo Comercial Chedraui SA de CV (b) | | | 20,900 | | | | 53,258 | |
| Spar Group, Ltd. (b) | | | 12,115 | | | | 186,269 | |
| Wal-Mart Stores, Inc. | | | 53,645 | | | | 3,959,001 | |
| | | | | | | | 8,006,152 | |
| | | | | | | | | |
| Food Products - 1.18% | | | | | | | | |
| Archer-Daniels-Midland Co. | | | 82,852 | | | | 2,251,918 | |
| AVI, Ltd. (b) | | | 25,990 | | | | 186,382 | |
| Bunge, Ltd. | | | 26,226 | | | | 1,758,453 | |
| ConAgra Foods, Inc. | | | 64,970 | | | | 1,792,522 | |
| Cosan, Ltd. - Class A (a)(b) | | | 16,991 | | | | 269,477 | |
| Golden Agri-Resources, Ltd. (b) | | | 401,000 | | | | 214,367 | |
| Kulim Malaysia Bhd (b) | | | 109,700 | | | | 176,488 | |
| Lotte Samkang Co., Ltd. (b) | | | 423 | | | | 216,890 | |
| Perusahaan Perkebunan London Sumatra Indonesia Tbk PT (b) | | | 615,500 | | | | 156,711 | |
| Thai Union Frozen Products PCL (b) | | | 47,700 | | | | 113,341 | |
| Tongaat Hulett, Ltd. (b) | | | 16,867 | | | | 283,211 | |
| | | | | | | | 7,419,760 | |
| | | | | | | | | |
| Gas Utilities - 0.02% | | | | | | | | |
| Perusahaan Gas Negara Persero Tbk PT (b) | | | 232,000 | | | | 99,715 | |
| | | | | | | | | |
| Health Care Equipment & Supplies - 1.15% | | | | | | | | |
Biosensors International Group, Ltd. (a)(b) | | | 100,000 | | | | 99,124 | |
| C.R. Bard, Inc. | | | 18,478 | | | | 1,933,723 | |
| Medtronic, Inc. | | | 66,758 | | | | 2,878,605 | |
| Mindray Medical International, Ltd. - ADR | | | 2,852 | | | | 95,856 | |
| Supermax Corp. Bhd (b) | | | 142,900 | | | | 96,204 | |
| Zimmer Holdings, Inc. | | | 31,591 | | | | 2,136,183 | |
| | | | | | | | 7,239,695 | |
|
| See Notes to the Financial Statements. | The Leuthold Funds - 2012 Annual Report | 77 |
| Leuthold Asset Allocation Fund |
| Consolidated Schedule of Investments (continued) |
| September 30, 2012 |
| | | Shares | | | Fair Value | |
| | | | | | | |
| COMMON STOCKS - 65.07% (continued) | | | | | | |
| | | | | | | |
| Health Care Providers & Services - 3.33% | | | | | | |
| Aetna, Inc. | | | 60,202 | | | $ | 2,383,999 | |
| Bangkok Dusit Medical Services PCL (b) | | | 32,400 | | | | 113,084 | |
| Community Health Systems, Inc. (a) | | | 85,236 | | | | 2,483,777 | |
| DaVita, Inc. (a) | | | 18,492 | | | | 1,915,956 | |
| HCA Holdings, Inc. | | | 129,940 | | | | 4,320,505 | |
| KPJ Healthcare Bhd (b) | | | 49,500 | | | | 98,558 | |
| Life Healthcare Group Holdings, Ltd. (b) | | | 66,896 | | | | 255,572 | |
| Omnicare, Inc. | | | 77,487 | | | | 2,632,234 | |
| UnitedHealth Group, Inc. | | | 32,783 | | | | 1,816,506 | |
| WellCare Health Plans, Inc. (a) | | | 35,167 | | | | 1,988,694 | |
| WellPoint, Inc. | | | 48,877 | | | | 2,835,355 | |
| | | | | | | | 20,844,240 | |
| | | | | | | | | |
| Hotels, Restaurants & Leisure - 0.03% | | | | | | | | |
| Genting Bhd (b) | | | 57,000 | | | | 162,014 | |
| | | | | | | | | |
| Household Durables - 0.09% | | | | | | | | |
| Even Construtora e Incorporadora SA (b) | | | 45,300 | | | | 174,742 | |
| Ez Tec Empreendimentos e Participacoes SA (b) | | | 20,800 | | | | 259,583 | |
| Haier Electronics Group Co., Ltd. (a)(b) | | | 106,000 | | | | 122,275 | |
| | | | | | | | 556,600 | |
| | | | | | | | | |
| Independent Power Producers & Energy Traders - 0.36% | | | | | | | | |
| AES Corp. (a) | | | 203,255 | | | | 2,229,707 | |
| First Gen Corp. (a)(b) | | | 117,900 | | | | 56,477 | |
| | | | | | | | 2,286,184 | |
| | | Shares | | | Fair Value | |
| | | | | | | |
| Industrial Conglomerates - 0.87% | | | | | | |
| Bidvest Group, Ltd. (b) | | | 6,980 | | | $ | 172,674 | |
| General Electric Co. | | | 175,241 | | | | 3,979,723 | |
| Siemens AG - ADR | | | 12,517 | | | | 1,253,578 | |
| Sigdo Koppers SA (b) | | | 32,505 | | | | 79,078 | |
| | | | | | | | 5,485,053 | |
| | | | | | | | | |
| Insurance - 1.98% | | | | | | | | |
| ACE, Ltd. (b) | | | 35,167 | | | | 2,658,625 | |
| Brasil Insurance Participacoes e Administracao SA (b) | | | 5,500 | | | | 51,928 | |
| Everest Re Group, Ltd. (b) | | | 17,882 | | | | 1,912,659 | |
| LIG Insurance Co., Ltd. (b) | | | 14,480 | | | | 336,452 | |
| PICC Property & Casualty Co., Ltd. (a)(b) | | | 436,000 | | | | 531,222 | |
| Protective Life Corp. | | | 42,916 | | | | 1,124,829 | |
| Prudential Financial, Inc. | | | 25,034 | | | | 1,364,603 | |
| Sanlam, Ltd. (b) | | | 62,734 | | | | 283,473 | |
| Sun Life Financial, Inc. (b) | | | 141,861 | | | | 3,295,431 | |
| Validus Holdings, Ltd. (b) | | | 25,630 | | | | 869,113 | |
| | | | | | | | 12,428,335 | |
| | | | | | | | | |
| Internet Software & Services - 0.35% | | | | | | | | |
| Daum Communications Corp. (b) | | | 3,544 | | | | 360,726 | |
| NetEase, Inc. - ADR (a) | | | 5,569 | | | | 312,644 | |
| Sohu.com, Inc. (a)(b) | | | 7,792 | | | | 327,965 | |
| Yahoo!, Inc. (a) | | | 75,699 | | | | 1,209,291 | |
| | | | | | | | 2,210,626 | |
| | | | | | | | | |
| IT Services - 3.15% | | | | | | | | |
| Amdocs, Ltd. (a) | | | 175,241 | | | | 5,781,201 | |
| Cielo SA (b) | | | 11,800 | | | | 294,178 | |
| International Business Machines Corp. | | | 17,882 | | | | 3,709,621 | |
| Lender Processing Services, Inc. | | | 63,778 | | | | 1,778,768 | |
| Mastercard, Inc. - Class A | | | 9,537 | | | | 4,305,765 | |
| NeuStar, Inc. - Class A (a) | | | 20,266 | | | | 811,248 | |
| Visa, Inc. - Class A | | | 22,650 | | | | 3,041,442 | |
| | | | | | | | 19,722,223 | |
|
| 78 | The Leuthold Funds - 2012 Annual Report | See Notes to the Financial Statements. |
| Leuthold Asset Allocation Fund |
| Consolidated Schedule of Investments (continued) |
| September 30, 2012 |
| | | Shares | | | Fair Value | |
| | | | | | | |
| COMMON STOCKS - 65.07% (continued) | | | | | | |
| | | | | | | |
| Leisure Equipment & Products - 0.37% | | | | | | |
| Hasbro, Inc. | | | 60,798 | | | $ | 2,320,660 | |
| | | | | | | | | |
| Life Sciences Tools & Services - 0.32% | | | | | | | | |
| Life Technologies Corp. (a) | | | 39,340 | | | | 1,922,939 | |
| WuXi PharmaTech Cayman, Inc. - ADR (a) | | | 6,894 | | | | 102,928 | |
| | | | | | | | 2,025,867 | |
| Machinery - 1.78% | | | | | | | | |
| Cummins, Inc. | | | 28,015 | | | | 2,583,263 | |
| Eaton Corp. | | | 72,719 | | | | 3,436,700 | |
| Oshkosh Corp. (a) | | | 57,221 | | | | 1,569,572 | |
| Timken Co. | | | 44,108 | | | | 1,639,053 | |
| Valmont Industries, Inc. | | | 14,901 | | | | 1,959,482 | |
| | | | | | | | 11,188,070 | |
| Media - 0.09% | | | | | | | | |
| Cheil Worldwide, Inc. (b) | | | 7,565 | | | | 160,435 | |
| Cyfrowy Polsat SA (a)(b) | | | 22,311 | | | | 102,212 | |
| Global Mediacom Tbk PT (b) | | | 658,000 | | | | 140,687 | |
| Media Nusantara Citra Tbk PT (b) | | | 526,500 | | | | 142,630 | |
| | | | | | | | 545,964 | |
| Metals & Mining - 0.93% | | | | | | | | |
| Alcoa, Inc. | | | 241,999 | | | | 2,141,691 | |
| Grupo Mexico SAB de CV (b) | | | 119,500 | | | | 394,937 | |
| Jastrzebska Spolka Weglowa SA (b) | | | 7,820 | | | | 223,335 | |
| Jiangxi Copper Co., Ltd. (b) | | | 54,000 | | | | 135,558 | |
| KGHM Polska Miedz SA (b) | | | 5,726 | | | | 273,176 | |
| POSCO - ADR | | | 2,203 | | | | 179,633 | |
| Reliance Steel & Aluminum Co. | | | 47,684 | | | | 2,496,257 | |
| | | | | | | | 5,844,587 | |
| | | Shares | | | Fair Value | |
| | | | | | | |
| Multiline Retail - 0.69% | | | | | | |
| Kohl’s Corp. | | | 35,167 | | | $ | 1,801,254 | |
| Target Corp. | | | 39,340 | | | | 2,496,910 | |
| | | | | | | | 4,298,164 | |
| Multi-Utilities - 0.70% | | | | | | | | |
| Alliant Energy Corp. | | | 100,137 | | | | 4,344,944 | |
| YTL Corp. Bhd (b) | | | 120,400 | | | | 67,516 | |
| | | | | | | | 4,412,460 | |
| Office Electronics - 0.09% | | | | | | | | |
| Canon, Inc. - ADR | | | 16,690 | | | | 534,247 | |
| | | | | | | | | |
| Oil, Gas & Consumable Fuels - 5.17% | | | | | | | | |
| Bangchak Petroleum PCL (b) | | | 199,000 | | | | 157,474 | |
| Banpu PCL (b) | | | 19,050 | | | | 242,026 | |
| Chevron Corp. | | | 69,142 | | | | 8,059,191 | |
| China Petroleum & Chemical Corp. - ADR | | | 4,272 | | | | 394,818 | |
| CNOOC, Ltd. - ADR | | | 1,330 | | | | 269,631 | |
| ConocoPhillips | | | 68,546 | | | | 3,919,460 | |
| Devon Energy Corp. | | | 39,936 | | | | 2,416,128 | |
| Encana Corp. (b) | | | 122,192 | | | | 2,678,449 | |
| Exxon Mobil Corp. | | | 39,936 | | | | 3,652,147 | |
| Gazprom OAO - ADR (a) | | | 22,257 | | | | 224,303 | |
| Indo Tambangraya Megah Tbk PT (b) | | | 37,000 | | | | 162,329 | |
| Lukoil OAO - ADR | | | 5,545 | | | | 342,732 | |
| Peabody Energy Corp. | | | 22,054 | | | | 491,584 | |
| Petroleo Brasileiro SA - ADR | | | 39,936 | | | | 916,132 | |
| Phillips 66 | | | 33,975 | | | | 1,575,421 | |
| PTT PCL (b) | | | 25,700 | | | | 274,119 | |
| Royal Dutch Shell PLC - ADR | | | 48,281 | | | | 3,351,184 | |
| Sasol, Ltd. - ADR | | | 22,610 | | | | 1,007,954 | |
| SK Innovation Co., Ltd. (b) | | | 2,756 | | | | 414,107 | |
| Statoil ASA - ADR | | | 72,123 | | | | 1,860,052 | |
| | | | | | | | 32,409,241 | |
|
| See Notes to the Financial Statements. | The Leuthold Funds - 2012 Annual Report | 79 |
| Leuthold Asset Allocation Fund |
| Consolidated Schedule of Investments (continued) |
| September 30, 2012 |
| | | Shares | | | Fair Value | |
| | | | | | | |
| COMMON STOCKS - 65.07% (continued) | | | | | | |
| | | | | | | |
| Personal Products - 0.39% | | | | | | |
| AMOREPACIFIC Group (b) | | | 575 | | | $ | 255,055 | |
| Avon Products, Inc. | | | 135,901 | | | | 2,167,621 | |
| | | | | | | | 2,422,676 | |
| Pharmaceuticals - 4.24% | | | | | | | | |
| Aspen Pharmacare Holdings, Ltd. (b) | | | 10,026 | | | | 172,528 | |
| Eli Lilly & Co. | | | 105,502 | | | | 5,001,850 | |
| GlaxoSmithKline PLC - ADR | | | 39,340 | | | | 1,819,082 | |
| Kalbe Farma Tbk PT (b) | | | 212,500 | | | | 104,008 | |
| Merck & Co., Inc. | | | 178,817 | | | | 8,064,647 | |
| Nektar Therapeutics (a) | | | 94,177 | | | | 1,005,810 | |
| Pfizer, Inc. | | | 160,339 | | | | 3,984,424 | |
| Questcor Pharmaceuticals, Inc. (a) | | | 59,606 | | | | 1,102,711 | |
| Richter Gedeon Nyrt (b) | | | 369 | | | | 64,589 | |
| Shire PLC - ADR | | | 26,823 | | | | 2,379,200 | |
| Sino Biopharmaceutical (b) | | | 264,000 | | | | 96,952 | |
| Teva Pharmaceutical Industries, Ltd. - ADR | | | 67,950 | | | | 2,813,810 | |
| | | | | | | | 26,609,611 | |
| Professional Services - 0.12% | | | | | | | | |
| Manpower, Inc. | | | 20,266 | | | | 745,789 | |
| | | | | | | | | |
| Real Estate Investment Trusts (REITs) - 4.64% | | | | | | | | |
| American Campus Communities, Inc. | | | 60,557 | | | | 2,657,241 | |
| Apartment Investment & Management Co. - Class A | | | 131,513 | | | | 3,418,023 | |
| BioMed Realty Trust, Inc. | | | 99,094 | | | | 1,855,039 | |
| Equity One, Inc. | | | 107,046 | | | | 2,254,389 | |
| HCP, Inc. | | | 93,589 | | | | 4,162,839 | |
| Home Properties, Inc. | | | 42,207 | | | | 2,586,023 | |
| Liberty Property Trust | | | 75,850 | | | | 2,748,804 | |
| Mack-Cali Realty Corp. | | | 67,286 | | | | 1,789,807 | |
| | | Shares | | | Fair Value | |
| | | | | | | |
Real Estate Investment Trusts (REITs) - 4.64% (continued) | | | | | | |
| Realty Income Corp. | | | 53,829 | | | $ | 2,201,068 | |
| Regency Centers Corp. | | | 63,004 | | | | 3,070,185 | |
| Weingarten Realty Investors | | | 83,190 | | | | 2,338,471 | |
| | | | | | | | 29,081,889 | |
Real Estate Management & Development - 0.73% | | | | | | | | |
| Alam Sutera Realty Tbk PT (b) | | | 2,768,500 | | | | 142,538 | |
Aliansce Shopping Centers SA (b) | | | 24,700 | | | | 268,292 | |
| Altisource Portfolio Solutions SA (a)(b) | | | 19,670 | | | | 1,696,538 | |
| BR Properties SA (b) | | | 20,000 | | | | 259,958 | |
| Bumi Serpong Damai PT (b) | | | 2,538,500 | | | | 298,191 | |
| Franshion Properties China, Ltd. (b) | | | 444,000 | | | | 135,050 | |
| Megaworld Corp. (b) | | | 5,153,000 | | | | 274,334 | |
| Multiplan Empreendimentos Imobiliarios SA (b) | | | 9,000 | | | | 264,595 | |
| The St. Joe Co. (a) | | | 57,221 | | | | 1,115,809 | |
| UOL Group, Ltd. (b) | | | 30,000 | | | | 139,648 | |
| | | | | | | | 4,594,953 | |
| Road & Rail - 1.04% | | | | | | | | |
| Canadian Pacific Railway, Ltd. (b) | | | 23,246 | | | | 1,926,861 | |
| ComfortDelGro Corp., Ltd. (b) | | | 134,000 | | | | 186,926 | |
| Kansas City Southern | | | 22,650 | | | | 1,716,417 | |
| Old Dominion Freight Line, Inc. (a) | | | 88,216 | | | | 2,660,594 | |
| | | | | | | | 6,490,798 | |
|
| 80 | The Leuthold Funds - 2012 Annual Report | See Notes to the Financial Statements. |
| Leuthold Asset Allocation Fund |
| Consolidated Schedule of Investments (continued) |
| September 30, 2012 |
| | | Shares | | | Fair Value | |
| | | | | | | |
| COMMON STOCKS - 65.07% (continued) | | | | | | |
| | | | | | | |
Semiconductors & Semiconductor Equipment - 0.97% | | | | | | |
| Applied Materials, Inc. | | | 193,122 | | | $ | 2,156,207 | |
| Intel Corp. | | | 64,374 | | | | 1,460,002 | |
| Samsung Electronics Co., Ltd. (b) | | | 465 | | | | 560,371 | |
| Spreadtrum Communications, Inc. - ADR | | | 15,956 | | | | 328,056 | |
| TriQuint Semiconductor, Inc. (a) | | | 317,102 | | | | 1,601,365 | |
| | | | | | | | 6,106,001 | |
| Software - 1.72% | | | | | | | | |
| Activision Blizzard, Inc. | | | 142,457 | | | | 1,606,915 | |
| CA, Inc. | | | 51,261 | | | | 1,320,740 | |
| Electronic Arts, Inc. (a) | | | 86,428 | | | | 1,096,771 | |
| Microsoft Corp. | | | 218,753 | | | | 6,514,464 | |
| Totvs SA (b) | | | 11,800 | | | | 244,411 | |
| | | | | | | | 10,783,301 | |
| Specialty Retail - 2.65% | | | | | | | | |
| Advance Auto Parts, Inc. | | | 22,650 | | | | 1,550,166 | |
| Foot Locker, Inc. | | | 114,443 | | | | 4,062,726 | |
| The Home Depot, Inc. | | | 65,566 | | | | 3,958,219 | |
| Lowe’s Cos, Inc. | | | 60,798 | | | | 1,838,532 | |
| O’Reilly Automotive, Inc. (a) | | | 23,246 | | | | 1,943,831 | |
| Staples, Inc. | | | 84,044 | | | | 968,187 | |
| TJX Cos, Inc. | | | 50,665 | | | | 2,269,285 | |
| | | | | | | | 16,590,946 | |
| Textiles, Apparel & Luxury Goods - 0.02% | | | | | | | | |
| LG Fashion Corp. (b) | | | 2,260 | | | | 62,899 | |
| Shenzhou International Group Holdings, Ltd. (b) | | | 41,000 | | | | 70,030 | |
| | | | | | | | 132,929 | |
| | | Shares | | | Fair Value | |
| | | | | | | |
| Thrifts & Mortgage Finance - 0.32% | | | | | | |
| Malaysia Building Society (b) | | | 133,200 | | | $ | 104,697 | |
| New York Community Bancorp, Inc. | | | 135,901 | | | | 1,924,358 | |
| | | | | | | | 2,029,055 | |
| Tobacco - 0.87% | | | | | | | | |
| Philip Morris International, Inc. | | | 32,187 | | | | 2,894,899 | |
| Reynolds American, Inc. | | | 59,606 | | | | 2,583,324 | |
| | | | | | | | 5,478,223 | |
| Trading Companies & Distributors - 0.19% | | | | | | | | |
| WESCO International, Inc. (a) | | | 20,862 | | | | 1,193,306 | |
| | | | | | | | | |
| Transportation Infrastructure - 0.06% | | | | | | | | |
| Airports of Thailand PCL (b) | | | 84,100 | | | | 216,826 | |
| Obrascon Huarte Lain Brasil SA (b) | | | 18,100 | | | | 164,906 | |
| | | | | | | | 381,732 | |
| Water Utilities - 0.20% | | | | | | | | |
Cia de Saneamento Basico do Estado de Sao Paulo - ADR | | | 14,537 | | | | 1,180,550 | |
| Guangdong Investment, Ltd. (b) | | | 98,000 | | | | 77,417 | |
| | | | | | | | 1,257,967 | |
| Wireless Telecommunication Services - 1.22% | | | | | | | | |
| Advanced Info Service PCL (b) | | | 22,500 | | | | 156,254 | |
| America Movil SAB de CV - ADR | | | 13,632 | | | | 346,798 | |
| China Mobile, Ltd. - ADR | | | 35,485 | | | | 1,964,450 | |
| ENTEL Chile SA (b) | | | 11,756 | | | | 244,986 | |
| Mobile Telesystems OJSC - ADR | | | 17,421 | | | | 305,216 | |
| MTN Group, Ltd. (b) | | | 9,403 | | | | 181,526 | |
| NII Holdings, Inc. (a) | | | 82,256 | | | | 645,710 | |
| Tim Participacoes SA - ADR | | | 16,137 | | | | 310,153 | |
| Turkcell Iletisim Hizmetleri AS - ADR (a) | | | 12,771 | | | | 193,353 | |
| Vodafone Group PLC - ADR | | | 116,231 | | | | 3,312,002 | |
| | | | | | | | 7,660,448 | |
| | | | | | | | | |
TOTAL COMMON STOCKS
(Cost $358,213,813) | | | | | | $ | 407,899,871 | |
|
| See Notes to the Financial Statements. | The Leuthold Funds - 2012 Annual Report | 81 |
| Leuthold Asset Allocation Fund |
| Consolidated Schedule of Investments (continued) |
| September 30, 2012 |
| | | Shares | | | Fair Value | |
| | | | | | | |
| PREFERRED STOCKS - 0.18% | | | | | | |
| Commercial Banks - 0.02% | | | | | | |
| Itau Unibanco Holding SA - ADR | | | 8,100 | | | $ | 123,768 | |
| | | | | | | | | |
| Containers & Packaging - 0.04% | | | | | | | | |
| Klabin SA (b) | | | 50,700 | | | | 264,348 | |
| | | | | | | | | |
| Electric Utilities - 0.02% | | | | | | | | |
| Cia Energetica de Minas Gerais (b) | | | 11,600 | | | | 140,762 | |
| | | | | | | | | |
| Food & Staples Retailing - 0.04% | | | | | | | | |
| Cia Brasileira de Distribuicao Grupo Pao de Acucar - ADR | | | 5,395 | | | | 243,368 | |
| | | | | | | | | |
| Metals & Mining - 0.06% | | | | | | | | |
| Vale SA - ADR | | | 19,400 | | | | 337,138 | |
TOTAL PREFERRED STOCKS (Cost $1,155,261) | | | | | | $ | 1,109,384 | |
| | | | | | | | | |
| | | Principal Amount | | | Fair Value | |
| | | | | | | | | |
| INVESTMENT COMPANIES - 15.72% | | | | | | | | |
| Exchange Traded Funds - 15.72% | | | | | | | | |
| iShares Barclays Aggregate Bond Fund | | | 233,654 | | | $ | 26,274,392 | |
| iShares Barclays MBS Bond Fund | | | 110,866 | | | | 12,102,132 | |
| iShares iBoxx $ High Yield Corporate Bond Fund | | | 67,950 | | | | 6,276,541 | |
| iShares JPMorgan USD Emerging Markets Bond Fund | | | 81,064 | | | | 9,829,821 | |
| iShares MSCI Emerging Markets Index Fund | | | 123,385 | | | | 5,098,268 | |
| PowerShares Emerging Markets Sovereign Debt Portfolio | | | 100,137 | | | | 3,073,205 | |
| PowerShares Senior Loan Portfolio | | | 62,000 | | | | 1,546,900 | |
| SPDR Barclays Capital International Treasury Bond ETF | | | 82,256 | | | | 5,062,857 | |
| SPDR Barclays Capital Short Term High Yield Bond ETF | | | 51,000 | | | | 1,552,389 | |
| Vanguard Total Bond Market ETF | | | 325,447 | | | | 27,711,812 | |
TOTAL INVESTMENT COMPANIES
(Cost $96,439,120) | | | | | | $ | 98,528,317 | |
| | | Troy Ounces | | | Fair Value | |
| | | | | | | |
| PRECIOUS METALS - 5.46% | | | | | | |
| Gold Bullion (a) | | | 19,292 | | | $ | 34,254,042 | |
TOTAL PRECIOUS METALS
(Cost $18,356,479) | | | | | | $ | 34,254,042 | |
|
| 82 | The Leuthold Funds - 2012 Annual Report | See Notes to the Financial Statements. |
| Leuthold Asset Allocation Fund |
| Consolidated Schedule of Investments (continued) |
| September 30, 2012 |
| | | | | | | |
| | | Principal Amount | | | Fair Value | |
| | | | | | | |
| CORPORATE BONDS - 8.63% | | | | | | |
| Beverages - 0.28% | | | | | | |
| Dr. Pepper Snapple Group, Inc. 2.900%, 01/15/2016 | | $ | 1,679,000 | | | $ | 1,778,303 | |
| | | | | | | | | |
| Biotechnology - 0.22% | | | | | | | | |
| Amgen, Inc. 4.100%, 06/15/2021 | | | 1,269,000 | | | | 1,381,537 | |
| | | | | | | | | |
| Capital Markets - 0.73% | | | | | | | | |
| Goldman Sachs Group, Inc. 6.150%, 04/01/2018 | | | 2,095,000 | | | | 2,445,240 | |
| Morgan Stanley 5.300%, 03/01/2013 | | | 2,087,000 | | | | 2,123,740 | |
| | | | | | | | 4,568,980 | |
| Chemicals - 0.27% | | | | | | | | |
| Dow Chemical Co. 7.600%, 05/15/2014 | | | 1,504,000 | | | | 1,661,738 | |
| | | | | | | | | |
| Computers & Peripherals - 0.30% | | | | | | | | |
| Hewlett-Packard Co. 4.750%, 06/02/2014 | | | 1,800,000 | | | | 1,897,576 | |
| | | | | | | | | |
| Consumer Finance - 0.44% | | | | | | | | |
| Capital One Financial Corp. 7.375%, 05/23/2014 | | | 1,239,000 | | | | 1,363,625 | |
| SLM Corp. 6.250%, 01/25/2016 | | | 1,301,000 | | | | 1,411,585 | |
| | | | | | | | 2,775,210 | |
| Diversified Financial Services - 1.18% | | | | | | | | |
| Citigroup, Inc. 5.500%, 04/11/2013 | | | 2,095,000 | | | | 2,146,258 | |
| Export-Import Bank of Korea 8.125%, 01/21/2014 (b) | | | 1,551,000 | | | | 1,688,240 | |
| Ford Motor Credit Co., LLC 3.000%, 06/12/2017 | | | 1,365,000 | | | | 1,389,423 | |
| JPMorgan Chase & Co. 3.150%, 07/05/2016 | | | 2,062,000 | | | | 2,180,955 | |
| | | | | | | | 7,404,876 | |
| | | | | | | | | |
| | | Principal Amount | | | Fair Value | |
| | | | | | | | | |
| Diversified Telecommunication Services - 0.54% | | | | | | | | |
| AT&T, Inc. 5.100%, 09/15/2014 | | $ | 1,953,000 | | | $ | 2,123,516 | |
| Cellco Partnership / Verizon Wireless Capital LLC 5.550%, 02/01/2014 | | | 1,196,000 | | | | 1,272,186 | |
| | | | | | | | 3,395,702 | |
| Electric Utilities - 0.71% | | | | | | | | |
| Duke Energy Corp. 3.950%, 09/15/2014 | | | 1,213,000 | | | | 1,285,807 | |
| Exelon Corp. 4.900%, 06/15/2015 | | | 1,594,000 | | | | 1,752,079 | |
| Oncor Electric Delivery Co. LLC 6.800%, 09/01/2018 | | | 1,136,000 | | | | 1,402,001 | |
| | | | | | | | 4,439,887 | |
| Health Care Providers & Services - 0.22% | | | | | | | | |
| Coventry Health Care, Inc. 5.950%, 03/15/2017 | | | 1,195,000 | | | | 1,395,448 | |
| | | | | | | | | |
| Industrial Conglomerates - 0.37% | | | | | | | | |
| General Electric Co. 5.250%, 12/06/2017 | | | 1,942,000 | | | | 2,297,741 | |
| | | | | | | | | |
| Insurance - 0.23% | | | | | | | | |
| Genworth Financial, Inc. | | | | | | | | |
| 6.515%, 05/22/2018 | | | 1,387,000 | | | | 1,411,734 | |
| | | | | | | | | |
| Internet & Catalog Retail - 0.32% | | | | | | | | |
| Expedia, Inc. 7.456%, 08/15/2018 | | | 1,700,000 | | | | 2,011,037 | |
| | | | | | | | | |
| Media - 0.36% | | | | | | | | |
| Time Warner Cable, Inc. 8.250%, 04/01/2019 | | | 1,673,000 | | | | 2,245,537 | |
| | | | | | | | | |
| Metals & Mining - 0.28% | | | | | | | | |
| Nabors Industries, Inc. 9.250%, 01/15/2019 | | | 1,344,000 | | | | 1,758,920 | |
|
| See Notes to the Financial Statements. | The Leuthold Funds - 2012 Annual Report | 83 |
| Leuthold Asset Allocation Fund |
| Consolidated Schedule of Investments (continued) |
| September 30, 2012 |
| | | Shares | | | Fair Value | |
| | | | | | | |
| CORPORATE BONDS - 8.63% (continued) | | | | | | |
| Oil, Gas & Consumable Fuels - 0.95% | | | | | | |
| Anadarko Petroleum Corp. 5.950%, 09/15/2016 | | $ | 1,531,000 | | | $ | 1,773,967 | |
| Enterprise Products Operating, LLC 5.600%, 10/15/2014 | | | 990,000 | | | | 1,081,643 | |
| Petrobras International Finance Co. 6.125%, 10/06/2016 (b) | | | 1,535,000 | | | | 1,738,952 | |
| Petrohawk Energy Corp. 7.250%, 08/15/2018 | | | 1,203,000 | | | | 1,366,708 | |
| | | | | | | | 5,961,270 | |
| Pharmaceuticals - 0.20% | | | | | | | | |
| Hospira, Inc. 6.050%, 03/30/2017 | | | 1,102,000 | | | | 1,274,234 | |
| | | | | | | | | |
| Real Estate Investment Trusts (REITs) - 0.22% | | | | | | | | |
| Vornado Realty LP 4.250%, 04/01/2015 | | | 1,299,000 | | | | 1,372,765 | |
| | | | | | | | | |
| Semiconductors & Semiconductor Equipment - 0.21% | | | | | | | | |
| KLA-Tencor Corp. 6.900%, 05/01/2018 | | | 1,115,000 | | | | 1,345,559 | |
| | | | | | | | | |
| Software - 0.22% | | | | | | | | |
| BMC Software, Inc. 7.250%, 06/01/2018 | | | 1,129,000 | | | | 1,359,955 | |
| | | | | | | | | |
| Tobacco - 0.11% | | | | | | | | |
| Altria Group, Inc. 9.700%, 11/10/2018 | | | 470,000 | | | | 673,182 | |
| | | | | | | | | |
| Wireless Telecommunication Services - 0.27% | | | | | | | | |
| Rogers Communications, Inc. 6.375%, 03/01/2014 (b) | | | 1,569,000 | | | | 1,693,795 | |
| | | | | | | | | |
TOTAL CORPORATE BONDS
(Cost $52,360,239) | | | | | | $ | 54,104,986 | |
| | | | | | | | | |
| | | Shares | | | Fair Value | |
| | | | | | | | | |
| RIGHTS - 0.00% | | | | | | | | |
| Multi-Utilities - 0.00% | | | | | | | | |
| YTL Corp. Bhd (a)(b) | | | 8,027 | | | $ | — | |
TOTAL RIGHTS
(Cost $3,580) | | | | | | $ | — | |
| | | | | | | | | |
| SHORT-TERM INVESTMENTS - 0.78% | | | | | | | | |
| Money Market Funds - 0.78% | | | | | | | | |
| Fidelity Institutional Money Market Fund - Government Portfolio 0.01% (c) | | | 4,878,903 | | | $ | 4,878,903 | |
TOTAL SHORT-TERM INVESTMENTS
(Cost $4,878,903) | | | | | | $ | 4,878,903 | |
| | | | | | | | | |
Total Investments (Cost $531,407,395) - 95.84% | | | | | | $ | 600,775,503 | |
| | | | | | | | | |
| Other Assets in Excess of Liabilities - 4.16% (d) | | | | | | | 26,108,085 | |
| | | | | | | | | |
| TOTAL NET ASSETS - 100.00% | | | | | | $ | 626,883,588 | |
| |
| Percentages are stated as a percent of net assets. |
| ADR American Depository Receipt |
| (a) Non-income producing security. |
| (b) Foreign issued security. |
| (c) The rate quoted is the annualized seven-day yield as of September 30, 2012. |
| (d) All or a portion of the assets have been committed as collateral for open securities sold short. |
The Global Industry Classification Standard (GICS®) was developed by and/or is the exclusive property of MSCI, Inc. and Standard & Poor’s Financial Services LLC (“S&P”). GICS is a service mark of MSCI and S&P and has been licensed for use by U.S. Bancorp Fund Services, LLC.
|
| 84 | The Leuthold Funds - 2012 Annual Report | See Notes to the Financial Statements. |
| Leuthold Asset Allocation Fund |
| Consolidated Schedule of Securities Sold Short - (a) |
| September 30, 2012 |
| | | Shares | | | Fair Value | |
| | | | | | | |
| INVESTMENT COMPANIES - 2.51% | | | | | | |
| Exchange Traded Funds - 2.51% | | | | | | |
| iShares Russell 2000 Index Fund | | | 188,645 | | | $ | 15,744,312 | |
TOTAL INVESTMENT COMPANIES
(Proceeds $15,490,463) | | | | | | $ | 15,744,312 | |
| | | | | | | | | |
TOTAL SECURITIES SOLD SHORT
(Proceeds $15,490,463) - 2.51% | | | | | | $ | 15,744,312 | |
| Percentages are stated as a percent of net assets. |
| (a) All securities sold short are non-income producing. |
The Global Industry Classification Standard (GICS®) was developed by and/or is the exclusive property of MSCI, Inc. and Standard & Poor’s Financial Services LLC (“S&P”). GICS is a service mark of MSCI and S&P and has been licensed for use by U.S. Bancorp Fund Services, LLC.
|
| See Notes to the Financial Statements. | The Leuthold Funds - 2012 Annual Report | 85 |
| Leuthold Global Fund |
| Consolidated Schedule of Investments |
| September 30, 2012 |
| | | Shares | | | Fair Value | |
| | | | | | | |
| COMMON STOCKS - 62.90% | | | | | | |
| Airlines - 2.68% | | | | | | |
| Alaska Air Group, Inc. (a) | | | 31,070 | | | $ | 1,089,314 | |
| China Eastern Airlines Corp., Ltd. (a)(b) | | | 1,618,000 | | | | 490,270 | |
| China Southern Airlines Co., Ltd. (a)(b) | | | 1,144,000 | | | | 500,290 | |
| Copa Holdings SA - Class A (b) | | | 14,517 | | | | 1,179,797 | |
| easyJet PLC (b) | | | 128,674 | | | | 1,209,347 | |
| JetBlue Airways Corp. (a) | | | 206,363 | | | | 988,479 | |
| Ryanair Holdings PLC - ADR (a) | | | 38,154 | | | | 1,230,466 | |
| Southwest Airlines Co. | | | 125,243 | | | | 1,098,381 | |
| U.S. Airways Group, Inc. (a) | | | 89,320 | | | | 934,287 | |
| United Continental Holdings, Inc. (a) | | | 52,393 | | | | 1,021,664 | |
| Westjet Airlines, Ltd. (b) | | | 36,095 | | | | 640,685 | |
| | | | | | | | 10,382,980 | |
| Auto Components - 4.59% | | | | | | | | |
| Brembo SpA (b) | | | 54,992 | | | | 555,810 | |
| Cie Generale des Etablissements Michelin (b) | | | 30,172 | | | | 2,362,519 | |
| Continental AG (a)(b) | | | 22,846 | | | | 2,240,611 | |
| Cooper Tire & Rubber Co. | | | 56,584 | | | | 1,085,281 | |
| Dana Holding Corp. | | | 81,792 | | | | 1,006,042 | |
| Faurecia (b) | | | 59,134 | | | | 978,115 | |
| GKN PLC (b) | | | 327,711 | | | | 1,139,459 | |
| Leoni AG (b) | | | 29,783 | | | | 1,115,109 | |
| Magna International, Inc. (b) | | | 38,787 | | | | 1,677,926 | |
| Plastic Omnium SA (b) | | | 21,328 | | | | 530,719 | |
| Showa Corp. (a)(b) | | | 128,400 | | | | 1,131,502 | |
| Sumitomo Rubber Industries, Ltd. (b) | | | 91,100 | | | | 1,083,409 | |
| Tianneng Power International, Ltd. (b) | | | 970,000 | | | | 587,092 | |
| TRW Automotive Holdings Corp. (a) | | | 51,730 | | | | 2,261,118 | |
| | | | | | | | 17,754,712 | |
| | | | | | | | | |
| | | Shares | | | Fair Value | |
| | | | | | | | | |
| Chemicals - 4.59% | | | | | | | | |
| Agrium, Inc. (b) | | | 23,540 | | | $ | 2,435,448 | |
| CF Industries Holdings, Inc. | | | 11,128 | | | | 2,473,087 | |
| Chr. Hansen Holding A/S (b) | | | 66,380 | | | | 1,994,770 | |
| Dongyue Group (b) | | | 1,966,000 | | | | 865,932 | |
| Innophos Holdings, Inc. | | | 21,141 | | | | 1,025,127 | |
| Mosaic Co. | | | 40,190 | | | | 2,315,346 | |
| Nippon Shokubai Co., Ltd. (b) | | | 126,000 | | | | 1,409,200 | |
| Rockwood Holdings, Inc. | | | 39,117 | | | | 1,822,852 | |
| Yara International ASA (b) | | | 46,650 | | | | 2,342,466 | |
| Zeon Corp. (b) | | | 153,000 | | | | 1,063,827 | |
| | | | | | | | 17,748,055 | |
| Commercial Banks - 6.69% | | | | | | | | |
| Bank of the Ozarks, Inc. | | | 39,493 | | | | 1,361,324 | |
| BB&T Corp. | | | 104,032 | | | | 3,449,701 | |
| Fifth Third Bancorp | | | 256,413 | | | | 3,976,966 | |
| First Citizens BancShares, Inc. - Class A | | | 3,191 | | | | 519,814 | |
| Fulton Financial Corp. | | | 119,270 | | | | 1,176,002 | |
| Hachijuni Bank, Ltd. (b) | | | 81,000 | | | | 449,090 | |
| Huntington Bancshares, Inc. | | | 542,097 | | | | 3,740,469 | |
| International Bancshares Corp. | | | 30,220 | | | | 575,691 | |
| KeyCorp | | | 420,801 | | | | 3,677,801 | |
| Laurentian Bank of Canada (b) | | | 11,432 | | | | 538,168 | |
| National Penn Bancshares, Inc. | | | 122,844 | | | | 1,119,109 | |
| PNC Financial Services Group, Inc. | | | 46,731 | | | | 2,948,726 | |
| San-In Godo Bank, Ltd. (b) | | | 68,000 | | | | 495,167 | |
| Webster Financial Corp. | | | 77,383 | | | | 1,833,977 | |
| | | | | | | | 25,862,005 | |
| Computers & Peripherals - 1.20% | | | | | | | | |
| Apple, Inc. | | | 3,347 | | | | 2,233,319 | |
| Gemalto NV (b) | | | 27,305 | | | | 2,401,448 | |
| | | | | | | | 4,634,767 | |
|
| 86 | The Leuthold Funds - 2012 Annual Report | See Notes to the Financial Statements. |
| Leuthold Global Fund |
Consolidated Schedule of Investments (continued) September 30, 2012 |
| | | Shares | | | Fair Value | |
| | | | | | | |
| COMMON STOCKS - 62.90% (continued) | | | | | | |
| | | | | | | |
| Consumer Finance - 4.74% | | | | | | |
| Capital One Financial Corp. | | | 53,243 | | | $ | 3,035,384 | |
| Cash America International, Inc. | | | 51,207 | | | | 1,975,054 | |
| Credit Acceptance Corp. (a) | | | 36,858 | | | | 3,151,728 | |
| Credit Saison Co., Ltd. (b) | | | 85,100 | | | | 2,056,001 | |
| Discover Financial Services | | | 134,363 | | | | 5,338,242 | |
| International Personal Finance PLC (b) | | | 281,361 | | | | 1,364,525 | |
| Provident Financial PLC (b) | | | 64,288 | | | | 1,426,785 | |
| | | | | | | | 18,347,719 | |
| | | | | | | | | |
| Diversified Telecommunication Services - 4.46% | | | | | | | | |
| Asia Pacific Telecom Co., Ltd. (a)(b) | | | 1,900,000 | | | | 1,133,641 | |
| BT Group PLC (b) | | | 450,413 | | | | 1,679,029 | |
| Elisa OYJ (b) | | | 25,996 | | | | 588,275 | |
| France Telecom SA - ADR | | | 90,664 | | | | 1,107,914 | |
| Jasmine International PCL (b) | | | 20,083,300 | | | | 2,525,562 | |
| Manitoba Telecom Services, Inc. (b) | | | 34,266 | | | | 1,176,358 | |
| Telecom Corp. of New Zealand, Ltd. (b) | | | 595,145 | | | | 1,171,735 | |
| Telefonica SA - ADR | | | 118,477 | | | | 1,573,375 | |
| Telekom Malaysia Bhd (b) | | | 588,500 | | | | 1,190,059 | |
| Telekomunikasi Indonesia Persero Tbk PT - ADR | | | 29,207 | | | | 1,137,028 | |
| Telstra Corp., Ltd. (b) | | | 424,445 | | | | 1,720,699 | |
| Time dotCom Bhd (b) | | | 536,200 | | | | 542,458 | |
| Verizon Communications, Inc. | | | 37,345 | | | | 1,701,812 | |
| | | | | | | | 17,247,945 | |
| | | | | | | | | |
| Health Care Providers & Services - 5.51% | | | | | | | | |
| Bangkok Dusit Medical Services PCL (b) | | | 723,100 | | | | 2,523,800 | |
| Community Health Systems, Inc. (a) | | | 88,093 | | | | 2,567,030 | |
| HCA Holdings, Inc. | | | 79,544 | | | | 2,644,838 | |
| | | Shares | | | Fair Value | |
| | | | | | | |
| Health Care Providers & Services - 5.51% (continued) | | | | | | |
| Health Management Associates, Inc. - Class A (a) | | | 158,991 | | | $ | 1,333,935 | |
| KPJ Healthcare Bhd (b) | | | 592,500 | | | | 1,179,711 | |
| Life Healthcare Group Holdings, Ltd. (b) | | | 298,012 | | | | 1,138,537 | |
| LifePoint Hospitals, Inc. (a) | | | 57,176 | | | | 2,445,989 | |
| Netcare, Ltd. (b) | | | 1,134,830 | | | | 2,436,604 | |
| Ramsay Health Care, Ltd. (b) | | | 48,279 | | | | 1,200,180 | |
| Select Medical Holdings Corp. (a) | | | 114,157 | | | | 1,281,983 | |
| Universal Health Services, Inc. - Class B | | | 55,851 | | | | 2,554,066 | |
| | | | | | | | 21,306,673 | |
| | | | | | | | | |
| Insurance - 8.22% | | | | | | | | |
| Allianz SE (b) | | | 18,637 | | | | 2,222,714 | |
| Alterra Capital Holdings, Ltd. (b) | | | 47,052 | | | | 1,126,425 | |
| American International Group, Inc. (a) | | | 68,005 | | | | 2,229,884 | |
| Arch Capital Group, Ltd. (a)(b) | | | 28,881 | | | | 1,203,760 | |
| Assurant, Inc. | | | 31,397 | | | | 1,171,108 | |
| Endurance Specialty Holdings, Ltd. (b) | | | 30,903 | | | | 1,189,766 | |
| Everest Re Group, Ltd. (b) | | | 21,420 | | | | 2,291,083 | |
| Genworth Financial, Inc. - Class A (a) | | | 211,663 | | | | 1,106,998 | |
| Gjensidige Forsikring ASA (b) | | | 83,125 | | | | 1,154,903 | |
| Hannover Rueckversicherung AG (a)(b) | | | 37,652 | | | | 2,409,418 | |
| Muenchener Rueckversicherungs AG (b) | | | 15,870 | | | | 2,481,472 | |
| PartnerRe, Ltd. (b) | | | 29,801 | | | | 2,213,618 | |
| Powszechny Zaklad Ubezpieczen SA (b) | | | 10,341 | | | | 1,163,227 | |
| Reinsurance Group of America, Inc. | | | 40,400 | | | | 2,337,948 | |
|
| See Notes to the Financial Statements. | The Leuthold Funds - 2012 Annual Report | 87 |
| |
| Leuthold Global Fund |
| Consolidated Schedule of Investments (continued) |
| September 30, 2012 |
| | | Shares | | | Fair Value | |
| | | | | | | |
| COMMON STOCKS - 62.90% (continued) | | | | | | |
| | | | | | | |
| Insurance - 8.22% (continued) | | | | | | |
| SCOR SE (b) | | | 89,808 | | | $ | 2,314,928 | |
| Swiss Re AG (b) | | | 35,937 | | | | 2,312,323 | |
| Validus Holdings, Ltd. (b) | | | 67,677 | | | | 2,294,927 | |
| Vienna Insurance Group AG Wiener Versicherung Gruppe (b) | | | 13,510 | | | | 573,677 | |
| | | | | | | | 31,798,179 | |
| | | | | | | | | |
| Leisure Equipment & Products - 1.81% | | | | | | | | |
| Hasbro, Inc. | | | 40,330 | | | | 1,539,396 | |
| Mattel, Inc. | | | 53,634 | | | | 1,902,934 | |
| Merida Industry Co., Ltd. (b) | | | 296,700 | | | | 1,087,429 | |
| Nikon Corp. (b) | | | 46,000 | | | | 1,264,875 | |
| Tamron Co., Ltd. (b) | | | 39,000 | | | | 1,190,730 | |
| | | | | | | | 6,985,364 | |
| | | | | | | | | |
| Office Electronics - 0.40% | | | | | | | | |
| Xerox Corp. | | | 210,616 | | | | 1,545,921 | |
| | | | | | | | | |
| Oil, Gas & Consumable Fuels - 3.36% | | | | | | | | |
| BP PLC - ADR | | | 48,014 | | | | 2,033,873 | |
| Chevron Corp. | | | 16,191 | | | | 1,887,223 | |
| China Petroleum & Chemical Corp. - ADR | | | 15,410 | | | | 1,424,192 | |
| Polskie Gornictwo Naftowe i Gazownictwo SA (b) | | | 1,078,912 | | | | 1,371,428 | |
| PTT PCL (b) | | | 114,400 | | | | 1,220,204 | |
| Royal Dutch Shell PLC - ADR | | | 24,488 | | | | 1,699,712 | |
| Statoil ASA - ADR | | | 62,991 | | | | 1,624,538 | |
| Suncor Energy, Inc. (b) | | | 53,048 | | | | 1,742,627 | |
| | | | | | | | 13,003,797 | |
| | | | | | | | | |
| Paper & Forest Products - 0.01% | | | | | | | | |
| China Forestry Holdings Co., Ltd. (a)(b)(d)(e) | | | 2,484,000 | | | | 48,052 | |
| | | Shares | | | Fair Value | |
| | | | | | | |
| Pharmaceuticals - 0.94% | | | | | | |
| Abbott Laboratories | | | 17,376 | | | $ | 1,191,299 | |
| Eli Lilly & Co. | | | 51,793 | | | | 2,455,506 | |
| | | | | | | | 3,646,805 | |
| | | | | | | | | |
| Real Estate Investment Trusts (REITs) - 4.86% | | | | | | | | |
| American Campus Communities, Inc. | | | 39,179 | | | | 1,719,175 | |
| Apartment Investment & Management Co. - Class A | | | 85,087 | | | | 2,211,411 | |
| BioMed Realty Trust, Inc. | | | 64,112 | | | | 1,200,177 | |
| Equity One, Inc. | | | 69,257 | | | | 1,458,552 | |
| HCP, Inc. | | | 60,550 | | | | 2,693,264 | |
| Home Properties, Inc. | | | 27,307 | | | | 1,673,100 | |
| Liberty Property Trust | | | 49,073 | | | | 1,778,406 | |
| Mack-Cali Realty Corp. | | | 43,533 | | | | 1,157,978 | |
| Realty Income Corp. | | | 34,826 | | | | 1,424,035 | |
| Regency Centers Corp. | | | 40,762 | | | | 1,986,332 | |
| Weingarten Realty Investors | | | 53,822 | | | | 1,512,936 | |
| | | | | | | | 18,815,366 | |
| | | | | | | | | |
| Road & Rail - 3.96% | | | | | | | | |
| Amerco, Inc. | | | 7,865 | | | | 836,521 | |
| ComfortDelGro Corp., Ltd. (b) | | | 572,000 | | | | 797,921 | |
| CSX Corp. | | | 72,516 | | | | 1,504,707 | |
| DSV A/S (b) | | | 51,026 | | | | 1,145,520 | |
| Firstgroup PLC (b) | | | 198,972 | | | | 771,268 | |
| Go-Ahead Group PLC (b) | | | 24,335 | | | | 516,636 | |
| Guangshen Railway Co., Ltd. (b) | | | 1,200,000 | | | | 387,227 | |
| Hitachi Transport System, Ltd. (b) | | | 29,300 | | | | 490,966 | |
| MTR Corp., Ltd. (b) | | | 314,000 | | | | 1,187,053 | |
| Nippon Express Co., Ltd. (b) | | | 251,000 | | | | 950,725 | |
| Norfolk Southern Corp. | | | 26,134 | | | | 1,662,906 | |
| Ryder System, Inc. | | | 20,081 | | | | 784,364 | |
| Sankyu, Inc. (b) | | | 139,000 | | | | 524,743 | |
|
| 88 | The Leuthold Funds - 2012 Annual Report | See Notes to the Financial Statements. |
| Leuthold Global Fund |
| Consolidated Schedule of Investments (continued) |
| September 30, 2012 |
| | | Shares | | | Fair Value | |
| | | | | | | |
| COMMON STOCKS - 62.90% (continued) | | | | | | |
| | | | | | | |
| Road & Rail - 3.96% (continued) | | | | | | |
| Seino Holdings Co., Ltd. (b) | | | 94,000 | | | $ | 595,104 | |
| Stagecoach Group PLC (b) | | | 162,756 | | | | 738,930 | |
| Tokyu Corp. (b) | | | 209,000 | | | | 998,344 | |
| TransForce, Inc. (b) | | | 28,101 | | | | 497,363 | |
| Werner Enterprises, Inc. | | | 42,840 | | | | 915,491 | |
| | | | | | | | 15,305,789 | |
| | | | | | | | | |
| Trading Companies & Distributors - 1.90% | | | | | | | | |
| Applied Industrial Technologies, Inc. | | | 64,790 | | | | 2,684,250 | |
| Travis Perkins PLC (b) | | | 101,132 | | | | 1,704,509 | |
| WESCO International, Inc. (a) | | | 51,835 | | | | 2,964,962 | |
| | | | | | | | 7,353,721 | |
| | | | | | | | | |
| Water Utilities - 0.67% | | | | | | | | |
| Cia de Saneamento Basico do Estado de Sao Paulo (b) | | | 63,300 | | | | 2,575,714 | |
| | | | | | | | | |
| Wireless Telecommunication Services - 2.31% | | | | | | | | |
| Axiata Group Bhd (b) | | | 1,338,400 | | | | 2,842,065 | |
| MTN Group, Ltd. (b) | | | 131,672 | | | | 2,541,945 | |
| Tim Participacoes SA - ADR | | | 41,111 | | | | 790,153 | |
| Total Access Communication PCL (b) | | | 923,700 | | | | 2,771,477 | |
| | | | | | | | 8,945,640 | |
TOTAL COMMON STOCKS
(Cost $221,290,238) | | | | | | $ | 243,309,204 | |
| | | | | | | | | |
| PREFERRED STOCKS - 0.76% | | | | | | | | |
| | | | | | | | | |
| Diversified Telecommunication Services - 0.76% | | | | | | | | |
| Oi SA - ADR | | | 305,035 | | | $ | 1,226,241 | |
| Telefonica Brasil SA - ADR | | | 79,647 | | | | 1,731,526 | |
TOTAL PREFERRED STOCKS
(Cost $2,865,946) | | | | | | $ | 2,957,767 | |
| | | Shares | | | Fair Value | |
| | | | | | | |
| INVESTMENT COMPANIES - 9.27% | | | | | | |
| | | | | | | |
| Exchange Traded Funds - 9.27% | | | | | | |
| iShares Barclays MBS Bond Fund | | | 108,418 | | | $ | 11,834,909 | |
| iShares iBoxx $ High Yield Corporate Bond Fund | | | 54,389 | | | | 5,023,912 | |
| iShares JPMorgan USD Emerging Markets Bond Fund | | | 30,805 | | | | 3,735,414 | |
| PowerShares Build America Bond Portfolio | | | 202,970 | | | | 6,101,278 | |
| PowerShares Emerging Markets Sovereign Debt Portfolio | | | 137,700 | | | | 4,226,013 | |
| PowerShares Senior Loan Portfolio | | | 37,881 | | | | 945,131 | |
| SPDR Barclays Capital International Treasury Bond ETF | | | 49,645 | | | | 3,055,649 | |
| SPDR Barclays Capital Short Term High Yield Bond ETF | | | 30,658 | | | | 933,199 | |
TOTAL INVESTMENT COMPANIES
(Cost $34,319,054) | | | | | | $ | 35,855,505 | |
| | | Troy Ounces | | | Fair Value | |
| | | | | | | |
| PRECIOUS METALS - 4.86% | | | | | | |
| Gold Bullion (a) | | | 10,580 | | | $ | 18,785,720 | |
TOTAL PRECIOUS METALS
(Cost $12,371,574) | | | | | | $ | 18,785,720 | |
|
| See Notes to the Financial Statements. | The Leuthold Funds - 2012 Annual Report | 89 |
| Leuthold Global Fund |
| Consolidated Schedule of Investments (continued) |
| September 30, 2012 |
| | | Principal Amount | | | Fair Value | |
| | | | | | | |
| CORPORATE BONDS - 7.26% | | | | | | |
| | | | | | | |
| Beverages - 0.24% | | | | | | |
| Dr. Pepper Snapple Group, Inc. 2.900%, 01/15/2016 | | $ | 886,000 | | | $ | 938,402 | |
| | | | | | | | | |
| Biotechnology - 0.21% | | | | | | | | |
| Amgen, Inc. 4.100%, 06/15/2021 | | | 731,000 | | | | 795,826 | |
| | | | | | | | | |
| Capital Markets - 0.30% | | | | | | | | |
| Morgan Stanley 5.300%, 03/01/2013 | | | 1,120,000 | | | | 1,139,716 | |
| | | | | | | | | |
| Chemicals - 0.23% | | | | | | | | |
| Dow Chemical Co. 7.600%, 05/15/2014 | | | 793,000 | | | | 876,169 | |
| | | | | | | | | |
| Computers & Peripherals - 0.27% | | | | | | | | |
| Hewlett-Packard Co. 4.750%, 06/02/2014 | | $ | 1,000,000 | | | | 1,054,209 | |
| | | | | | | | | |
| Consumer Finance - 0.41% | | | | | | | | |
| Capital One Financial Corp. 7.375%, 05/23/2014 | | | 713,000 | | | | 784,717 | |
| SLM Corp. 6.250%, 01/25/2016 | | | 749,000 | | | | 812,665 | |
| | | | | | | | 1,597,382 | |
| | | | | | | | | |
| Diversified Financial Services - 1.04% | | | | | | | | |
| Citigroup, Inc. 5.500%, 04/11/2013 | | | 1,100,000 | | | | 1,126,914 | |
| Export-Import Bank of Korea 8.125%, 01/21/2014 (b) | | | 818,000 | | | | 890,381 | |
| Ford Motor Credit Co., LLC 3.000%, 06/12/2017 | | | 786,000 | | | | 800,063 | |
| JPMorgan Chase & Co. 3.150%, 07/05/2016 | | | 1,120,000 | | | | 1,184,612 | |
| | | | | | | | 4,001,970 | |
| | | Principal Amount | | | Fair Value | |
| | | | | | | |
| Diversified Telecommunication Services - 0.46% | | | | | | |
| AT&T, Inc. 5.100%, 09/15/2014 | | | 1,031,000 | | | $ | 1,121,017 | |
| Cellco Partnership / Verizon Wireless Capital LLC 5.550%, 02/01/2014 | | | 631,000 | | | | 671,195 | |
| | | | | | | | 1,792,212 | |
| | | | | | | | | |
| Electric Utilities - 0.62% | | | | | | | | |
| Duke Energy Corp. 3.950%, 09/15/2014 | | | 640,000 | | | | 678,414 | |
| Exelon Corp. 4.900%, 06/15/2015 | | | 841,000 | | | | 924,403 | |
| Oncor Electric Delivery Co. LLC 6.800%, 09/01/2018 | | | 654,000 | | | | 807,138 | |
| | | | | | | | 2,409,955 | |
| | | | | | | | | |
| Health Care Providers & Services - 0.21% | | | | | | | | |
| Coventry Health Care, Inc. 5.950%, 03/15/2017 | | $ | 689,000 | | | | 804,572 | |
| | | | | | | | | |
| Industrial Conglomerates - 0.31% | | | | | | | | |
| General Electric Co. 5.250%, 12/06/2017 | | | 1,025,000 | | | | 1,212,763 | |
| | | | | | | | | |
| Insurance - 0.21% | | | | | | | | |
| Genworth Financial, Inc. 6.515%, 05/22/2018 | | | 799,000 | | | | 813,249 | |
| | | | | | | | | |
| Internet & Catalog Retail - 0.30% | | | | | | | | |
| Expedia, Inc. 7.456%, 08/15/2018 | | | 970,000 | | | | 1,147,474 | |
| | | | | | | | | |
| Media - 0.31% | | | | | | | | |
| Time Warner Cable, Inc. 8.250%, 04/01/2019 | | | 883,000 | | | | 1,185,182 | |
| | | | | | | | | |
| Metals & Mining - 0.24% | | | | | | | | |
| Nabors Industries, Inc. 9.250%, 01/15/2019 | | | 709,000 | | | | 927,882 | |
|
| 90 | The Leuthold Funds - 2012 Annual Report | See Notes to the Financial Statements. |
| Leuthold Global Fund |
| Consolidated Schedule of Investments (continued) |
| September 30, 2012 |
| | | Principal Amount | | | Fair Value | |
| | | | | | | |
| CORPORATE BONDS - 7.26% (continued) | | | | | | |
| Oil, Gas & Consumable Fuels - 0.83% | | | | | | |
| Anadarko Petroleum Corp. 5.950%, 09/15/2016 | | | 808,000 | | | $ | 936,228 | |
| Enterprise Products Operating, LLC 5.600%, 10/15/2014 | | | 523,000 | | | | 571,414 | |
| Petrobras International Finance Co. 6.125%, 10/06/2016 (b) | | | 810,000 | | | | 917,623 | |
| Petrohawk Energy Corp. 7.250%, 08/15/2018 | | | 692,000 | | | | 786,169 | |
| | | | | | | | 3,211,434 | |
| Pharmaceuticals - 0.17% | | | | | | | | |
| Hospira, Inc. 6.050%, 03/30/2017 | | | 581,000 | | | | 671,806 | |
| | | | | | | | | |
| Real Estate Investment Trusts (REITs) - 0.20% | | | | | | | | |
| Vornado Realty LP 4.250%, 04/01/2015 | | | 745,000 | | | | 787,306 | |
| | | | | | | | | |
| Semiconductors & Semiconductor Equipment - 0.18% | | | | | | | | |
| KLA-Tencor Corp. 6.900%, 05/01/2018 | | $ | 588,000 | | | | 709,586 | |
| | | | | | | | | |
| Software - 0.20% | | | | | | | | |
| BMC Software, Inc. 7.250%, 06/01/2018 | | | 650,000 | | | | 782,968 | |
| | | | | | | | | |
| Tobacco - 0.09% | | | | | | | | |
| Altria Group, Inc. 9.700%, 11/10/2018 | | | 233,000 | | | | 333,726 | |
| | | | | | | | | |
| Wireless Telecommunication Services - 0.23% | | | | | | | | |
| Rogers Communications, Inc. 6.375%, 03/01/2014 (b) | | | 828,000 | | | | 893,857 | |
TOTAL CORPORATE BONDS
(Cost $27,300,565) | | | | | | | 28,087,646 | |
| | | Principal Amount | | Fair Value | |
| UNITED STATES TREASURY OBLIGATIONS - 3.98% | | | | | | | |
| United States Treasury Inflation Indexed Bonds - 1.11% | | | | | | | |
| 1.375%, 01/15/2020 | | $ | 3,602,164 | | $ | 4,309,932 | |
| | | | | | | | |
| United States Treasury Notes - 2.87% | | | | | | | |
| 1.375%, 11/30/2015 | | | 10,750,000 | | | 11,096,859 | |
| | | | | | | | |
TOTAL UNITED STATES TREASURY OBLIGATIONS
(Cost $15,261,352) | | | | | $ | 15,406,791 | |
| | | | | | | | |
| FOREIGN GOVERNMENT BONDS/NOTES - 4.66% | | | | | | | |
| Canadian Government 2.500%, 06/01/2015 (b) | | | | | | | |
| | CAD | | 3,250,000 | | $ | 3,426,963 | |
| Canadian Government Real Real Return TIPS 4.250%, 12/01/2021 (b) | | | | | | | |
| | CAD | | 2,925,000 | | | 4,239,599 | |
| New Zealand Government 6.000%, 12/15/2017 (b) | | | | | | | |
| | NZD | | 3,800,000 | | | 3,623,788 | |
| Norwegian Government 4.250%, 05/19/2017 (b) | | | | | | | |
| | NOK | | 17,000,000 | | | 3,330,800 | |
| United Kingdom Treasury Notes 1.750%, 01/22/2017 (b) | | | | | | | |
| | GBP | | 2,000,000 | | | 3,393,512 | |
TOTAL FOREIGN GOVERNMENT BONDS/NOTES
(Cost $17,074,463) | | | | | $ | 18,014,662 | |
|
| See Notes to the Financial Statements. | The Leuthold Funds - 2012 Annual Report | 91 |
| Leuthold Global Fund |
| Consolidated Schedule of Investments (continued) |
| September 30, 2012 |
| | | Shares | | | Fair Value | |
| SHORT-TERM INVESTMENTS - 3.43% | | | | | | |
| Money Market Funds - 3.43% | | | | | | |
| Fidelity Institutional Money Market Fund - Government Portfolio 0.01% (c) | | | 13,267,334 | | | $ | 13,267,334 | |
TOTAL SHORT-TERM INVESTMENTS
(Cost $13,267,334) | | | | | | $ | 13,267,334 | |
| | | | | | | | | |
Total Investments
(Cost $343,750,526) - 97.12% | | | | | | $ | 375,684,629 | |
| Other Assets in Excess of Liabilities - 2.88% (f) | | | | | | | 11,157,030 | |
| TOTAL NET ASSETS - 100.00% | | | | | | $ | 386,841,659 | |
| Percentages are stated as a percent of net assets. |
| ADR American Depository Receipt |
| CAD Canadian Dollar |
| GBP British Pound |
| NZD New Zealand Dollar |
| NOK Norwegian Krone |
| (a) | Non-income producing security. |
| (b) | Foreign issued security. |
| (c) | The rate quoted is the annualized seven-day yield as of September 30, 2012. |
| (d) | Illiquid Security. The fair value of these securities total $48,052 which represent 0.01% of total net assets. |
| (e) | The security is currently being fair valued in accordance with procedures established by the Board of Directors of the Leuthold Funds due to a halt in trading of the security on January 26, 2011. |
| (f) | All or a portion of the assets have been committed as collateral for open securities sold short. |
The Global Industry Classification Standard (GICS®) was developed by and/or is the exclusive property of MSCI, Inc. and Standard & Poor’s Financial Services LLC (“S&P”). GICS is a service mark of MSCI and S&P and has been licensed for use by U.S. Bancorp Fund Services, LLC.
|
| 92 | The Leuthold Funds - 2012 Annual Report | See Notes to the Financial Statements. |
| Leuthold Global Fund |
| Consolidated Schedule of Investments (continued) |
| September 30, 2012 |
| | | Fair Value | | | Percentage
of Total
Investments |
| CURRENCY EXPOSURE September 30, 2012 | | | | | | | | |
| Australian Dollar | | $ | 2,920,879 | | | | 0.78 | % |
| Brazilian Real | | | 2,575,714 | | | | 0.69 | |
| British Pound | | | 13,943,999 | | | | 3.71 | |
| Canadian Dollar | | | 10,519,136 | | | | 2.80 | |
| Danish Kroner | | | 3,140,290 | | | | 0.84 | |
| Euro | | | 20,774,814 | | | | 5.53 | |
| Hong Kong Dollar | | | 4,065,917 | | | | 1.08 | |
| Japanese Yen | | | 13,703,683 | | | | 3.65 | |
| Malaysian Ringgit | | | 5,754,293 | | | | 1.53 | |
| New Taiwan Dollar | | | 2,221,070 | | | | 0.59 | |
| New Zealand Dollar | | | 4,795,523 | | | | 1.28 | |
| Norwegian Krone | | | 6,828,169 | | | | 1.82 | |
| Polish Zloty | | | 2,534,655 | | | | 0.67 | |
| Singapore Dollar | | | 797,921 | | | | 0.21 | |
| South African Rand | | | 6,117,086 | | | | 1.63 | |
| Swiss Franc | | | 2,312,323 | | | | 0.61 | |
| Thai Baht | | | 9,041,043 | | | | 2.41 | |
| US Dollar | | | 244,852,394 | | | | 65.17 | |
| | | | 356,898,909 | | | | 95.00 | % |
| Precious Metals | | | 18,785,720 | | | | 5.00 | % |
| Total Investments | | $ | 375,684,629 | | | | 100.00 | % |
| | | Fair Value | | | Percentage of Total Investments |
| PORTFOLIO DIVERSIFICATION September 30, 2012 | | | | | | |
| Australia | | $ | 2,920,879 | | | | 0.78 | % |
| Austria | | | 573,677 | | | | 0.15 | |
| Bermuda | | | 10,319,579 | | | | 2.75 | |
| Brazil | | | 6,323,634 | | | | 1.68 | |
| Britain | | | 15,977,873 | | | | 4.25 | |
| Canada | | | 17,268,994 | | | | 4.60 | |
| Cayman Islands | | | 917,623 | | | | 0.24 | |
| China | | | 3,715,963 | | | | 0.99 | |
| Denmark | | | 3,140,290 | | | | 0.84 | |
| Finland | | | 588,275 | | | | 0.16 | |
| France | | | 7,294,195 | | | | 1.94 | |
| Germany | | | 10,469,324 | | | | 2.79 | |
| Hong Kong | | | 1,774,145 | | | | 0.47 | |
| Indonesia | | | 1,137,028 | | | | 0.30 | |
| Ireland | | | 1,230,466 | | | | 0.33 | |
| Italy | | | 555,810 | | | | 0.15 | |
| Japan | | | 13,703,683 | | | | 3.65 | |
| Malaysia | | | 5,754,293 | | | | 1.53 | |
| Netherlands | | | 4,101,160 | | | | 1.09 | |
| New Zealand | | | 4,795,523 | | | | 1.28 | |
| Norway | | | 8,452,707 | | | | 2.25 | |
| Panama | | | 1,179,797 | | | | 0.31 | |
| Poland | | | 2,534,655 | | | | 0.67 | |
| Singapore | | | 797,921 | | | | 0.21 | |
| South Africa | | | 6,117,086 | | | | 1.63 | |
| South Korea | | | 890,381 | | | | 0.24 | |
| Spain | | | 1,573,375 | | | | 0.42 | |
| Switzerland | | | 2,312,323 | | | | 0.61 | |
| Taiwan | | | 2,221,070 | | | | 0.59 | |
| Thailand | | | 9,041,043 | | | | 2.41 | |
| United States | | | 209,216,137 | | | | 55.69 | |
| | | | 356,898,909 | | | | 95.00 | % |
| Precious Metals | | | 18,785,720 | | | | 5.00 | % |
| Total Investments | | $ | 375,684,629 | | | | 100.00 | % |
|
| See Notes to the Financial Statements. | The Leuthold Funds - 2012 Annual Report | 93 |
| Leuthold Global Fund |
| Consolidated Schedule of Securities Sold Short - (a) |
| September 30, 2012 |
| | | Shares | | | Fair Value | |
| INVESTMENT COMPANIES - 2.46% | | | |
| Exchange Traded Funds - 2.46% | | | | |
| iShares MSCI EAFE | | | | | | |
| Index Fund | | | 179,192 | | | $ | 9,497,176 | |
| TOTAL INVESTMENT COMPANIES | | | | | |
| (Proceeds $9,738,455) | | | | | | $ | 9,497,176 | |
| | | | | | | | | |
| TOTAL SECURITIES SOLD SHORT | | | | |
| (Proceeds $9,738,455) - 2.46% | | | $ | 9,497,176 | |
| Percentages are stated as a percent of net assets. |
| (a) All securities sold short are non-income producing. |
The Global Industry Classification Standard (GICS®) was developed by and/or is the exclusive property of MSCI, Inc. and Standard & Poor’s Financial Services LLC (“S&P”). GICS is a service mark of MSCI and S&P and has been licensed for use by U.S. Bancorp Fund Services, LLC.
|
| 94 | The Leuthold Funds - 2012 Annual Report | See Notes to the Financial Statements. |
| Leuthold Select Industries Fund |
| Schedule of Investments |
| September 30, 2012 |
| | | Shares | | | Fair Value | |
| | | | | | | |
| COMMON STOCKS - 100.23% | | | | | | |
| Biotechnology - 1.15% | | | | | | |
| Alexion Pharmaceuticals, Inc. (a) | | | 1,353 | | | $ | 154,783 | |
| | | | | | | | | |
| Chemicals - 7.18% | | | | | | | | |
| Agrium, Inc. (b) | | | 1,697 | | | | 175,572 | |
| CF Industries Holdings, Inc. | | | 803 | | | | 178,459 | |
| Huntsman Corp. | | | 9,701 | | | | 144,836 | |
| Monsanto Co. | | | 3,356 | | | | 305,463 | |
| Mosaic Co. | | | 2,814 | | | | 162,114 | |
| | | | | | | | 966,444 | |
| Commercial Banks - 14.06% | | | | | | | | |
Banco Bilbao Vizcaya Argentaria SA - ADR | | | 5,201 | | | | 40,308 | |
| Banco Santander SA - ADR | | | 8,955 | | | | 66,804 | |
| BB&T Corp. | | | 4,221 | | | | 139,968 | |
| Chemical Financial Corp. | | | 1,166 | | | | 28,217 | |
| Citizens Republic Bancorp, Inc. (a) | | | 2,640 | | | | 51,084 | |
| Credicorp, Ltd. (b) | | | 1,118 | | | | 140,063 | |
| East West Bancorp, Inc. | | | 2,988 | | | | 63,107 | |
| Fifth Third Bancorp | | | 9,460 | | | | 146,725 | |
| First Financial Bancorp | | | 2,345 | | | | 39,654 | |
| First Republic Bank | | | 2,050 | | | | 70,643 | |
| HSBC Holdings PLC - ADR | | | 3,058 | | | | 142,075 | |
| Huntington Bancshares, Inc. | | | 17,834 | | | | 123,055 | |
| International Bancshares Corp. | | | 1,876 | | | | 35,738 | |
| KeyCorp | | | 12,260 | | | | 107,152 | |
| Old National Bancorp | | | 4,127 | | | | 56,168 | |
| PacWest Bancorp | | | 1,688 | | | | 39,449 | |
| PNC Financial Services Group, Inc. | | | 2,023 | | | | 127,651 | |
| Sumitomo Mitsui Financial Group, Inc. - ADR | | | 6,496 | | | | 40,145 | |
| Susquehanna Bancshares, Inc. | | | 4,006 | | | | 41,903 | |
| Umpqua Holdings Corp. | | | 2,975 | | | | 38,348 | |
| Webster Financial Corp. | | | 3,015 | | | | 71,455 | |
| Wells Fargo & Co. | | | 8,197 | | | | 283,042 | |
| | | | | | | | 1,892,754 | |
| | | Shares | | | Fair Value | |
| | | | | | | |
| Computers & Peripherals - 3.32% | | | | | | |
| Apple, Inc. | | | 670 | | | $ | 447,064 | |
| | | | | | | | | |
| Consumer Finance - 5.82% | | | | | | | | |
| American Express Co. | | | 1,661 | | | | 94,444 | |
| Capital One Financial Corp. | | | 3,926 | | | | 223,821 | |
| Discover Financial Services | | | 6,150 | | | | 244,340 | |
| Ezcorp, Inc. - Class A (a) | | | 2,774 | | | | 63,608 | |
| First Cash Financial Services, Inc. (a) | | | 1,380 | | | | 63,494 | |
| SLM Corp. | | | 5,922 | | | | 93,094 | |
| | | | | | | | 782,801 | |
| Food & Staples Retailing - 3.03% | | | | | | | | |
| CVS Caremark Corp. | | | 4,247 | | | | 205,640 | |
| Walgreen Co. | | | 5,547 | | | | 202,132 | |
| | | | | | | | 407,772 | |
| Health Care Providers & Services - 3.62% | | | | | | | | |
| Humana, Inc. | | | 1,635 | | | | 114,695 | |
| UnitedHealth Group, Inc. | | | 3,738 | | | | 207,122 | |
| WellCare Health Plans, Inc. (a) | | | 898 | | | | 50,782 | |
| WellPoint, Inc. | | | 1,983 | | | | 115,034 | |
| | | | | | | | 487,633 | |
| Hotels, Restaurants & Leisure - 2.07% | | | | | | | | |
| Carnival Corp. | | | 3,698 | | | | 134,755 | |
| Starwood Hotels & Resorts Worldwide, Inc. | | | 2,479 | | | | 143,683 | |
| | | | | | | | 278,438 | |
| Household Durables - 0.38% | | | | | | | | |
| NACCO Industries, Inc. - Class A | | | 402 | | | | 50,415 | |
|
| See Notes to the Financial Statements. | The Leuthold Funds - 2012 Annual Report | 95 |
| Leuthold Select Industries Fund |
| Schedule of Investments (continued) |
| September 30, 2012 |
| | | Shares | | | Fair Value | |
| | | | | | | |
| COMMON STOCKS - 100.23% (continued) | | | | | | |
| Insurance - 4.49% | | | | | | |
| ACE, Ltd. (b) | | | 1,715 | | | $ | 129,654 | |
| Allied World Assurance Co. Holdings AG (b) | | | 817 | | | | 63,113 | |
| Allstate Corp. | | | 3,765 | | | | 149,132 | |
| Chubb Corp. | | | 1,728 | | | | 131,812 | |
| Fidelity National Financial, Inc. - Class A | | | 3,310 | | | | 70,801 | |
| WR Berkley Corp. | | | 1,608 | | | | 60,284 | |
| | | | | | | | 604,796 | |
| | | | | | | | | |
| IT Services - 11.11% | | | | | | | | |
| Accenture PLC - Class A (b) | | | 1,114 | | | | 78,013 | |
| Alliance Data Systems Corp. (a) | | | 482 | | | | 68,420 | |
| Amdocs, Ltd. (a) | | | 2,119 | | | | 69,906 | |
| Cognizant Technology Solutions Corp. - Class A (a) | | | 1,053 | | | | 73,626 | |
| Convergys Corp. | | | 3,779 | | | | 59,217 | |
| DST Systems, Inc. | | | 1,032 | | | | 58,370 | |
| Fiserv, Inc. (a) | | | 1,260 | | | | 93,278 | |
| Gartner, Inc. (a) | | | 1,371 | | | | 63,189 | |
| Global Payments, Inc. | | | 1,394 | | | | 58,311 | |
| International Business Machines Corp. | | | 1,030 | | | | 213,674 | |
| Jack Henry & Associates, Inc. | | | 1,916 | | | | 72,616 | |
| Mastercard, Inc. - Class A | | | 335 | | | | 151,246 | |
| Sapient Corp. (a) | | | 6,762 | | | | 72,083 | |
| Teradata Corp. (a) | | | 882 | | | | 66,512 | |
| Total System Services, Inc. | | | 2,492 | | | | 59,060 | |
| Visa, Inc. - Class A | | | 1,193 | | | | 160,196 | |
| Western Union Co. | | | 4,247 | | | | 77,380 | |
| | | | | | | | 1,495,097 | |
| | | Shares | | | Fair Value | |
| | | | | | | |
| Machinery - 6.64% | | | | | | |
| AGCO Corp. (a) | | | 1,742 | | | $ | 82,710 | |
| Caterpillar, Inc. | | | 1,675 | | | | 144,117 | |
| CNH Global NV (a)(b) | | | 1,434 | | | | 55,596 | |
| Cummins, Inc. | | | 1,836 | | | | 169,298 | |
| Deere & Co. | | | 1,715 | | | | 141,470 | |
| Oshkosh Corp. (a) | | | 3,109 | | | | 85,280 | |
| Sauer-Danfoss, Inc. | | | 831 | | | | 33,414 | |
| Toro Co. | | | 2,010 | | | | 79,958 | |
| WABCO Holdings, Inc. | | | 1,755 | | | | 101,211 | |
| | | | | | | | 893,054 | |
| | | | | | | | | |
| Multiline Retail - 4.26% | | | | | | | | |
| Big Lots, Inc. (a) | | | 2,385 | | | | 70,548 | |
| Dollar General Corp. (a) | | | 2,104 | | | | 108,440 | |
| Dollar Tree, Inc. (a) | | | 2,653 | | | �� | 128,074 | |
| Family Dollar Stores, Inc. | | | 1,233 | | | | 81,748 | |
| Target Corp. | | | 2,908 | | | | 184,571 | |
| | | | | | | | 573,381 | |
| | | | | | | | | |
| Office Electronics - 0.29% | | | | | | | | |
| Zebra Technologies Corp. - Class A (a) | | | 1,045 | | | | 39,229 | |
| | | | | | | | | |
| Oil, Gas & Consumable Fuels - 6.14% | | | | | | | | |
| Chevron Corp. | | | 1,059 | | | | 123,437 | |
| CVR Energy, Inc. (a) | | | 1,943 | | | | 71,405 | |
| Delek US Holdings, Inc. | | | 3,135 | | | | 79,911 | |
| Exxon Mobil Corp. | | | 1,688 | | | | 154,368 | |
| HollyFrontier Corp. | | | 2,023 | | | | 83,489 | |
| Marathon Petroleum Corp. | | | 1,394 | | | | 76,098 | |
| Tesoro Corp. (a) | | | 2,479 | | | | 103,870 | |
| Valero Energy Corp. | | | 2,653 | | | | 84,047 | |
| Western Refining, Inc. | | | 1,876 | | | | 49,114 | |
| | | | | | | | 825,739 | |
|
| 96 | The Leuthold Funds - 2012 Annual Report | See Notes to the Financial Statements. |
| Leuthold Select Industries Fund |
| Schedule of Investments (continued) |
| September 30, 2012 |
| | | Shares | | | Fair Value | |
| | | | | | | |
| COMMON STOCKS - 100.23% (continued) | | | | | | |
| Pharmaceuticals - 11.91% | | | | | | |
| Allergan, Inc. | | | 1,184 | | | $ | 108,431 | |
| Bristol-Myers Squibb Co. | | | 4,489 | | | | 151,504 | |
| Eli Lilly & Co. | | | 3,310 | | | | 156,927 | |
| Jazz Pharmaceuticals PLC (a)(b) | | | 1,769 | | | | 100,851 | |
| Merck & Co., Inc. | | | 3,457 | | | | 155,911 | |
| Mylan, Inc. (a) | | | 5,695 | | | | 138,958 | |
| Novartis AG - ADR | | | 1,340 | | | | 82,088 | |
| Novo Nordisk A/S - ADR | | | 642 | | | | 101,314 | |
| Pfizer, Inc. | | | 9,554 | | | | 237,417 | |
| ViroPharma, Inc. (a) | | | 3,015 | | | | 91,113 | |
| Warner Chilcott PLC - Class A (b) | | | 9,635 | | | | 130,072 | |
| Watson Pharmaceuticals, Inc. (a) | | | 1,742 | | | | 148,349 | |
| | | | | | | | 1,602,935 | |
| | | | | | | | | |
| Road & Rail - 7.68% | | | | | | | | |
| Canadian National Railway Co. (b) | | | 1,674 | | | | 147,697 | |
| Canadian Pacific Railway, Ltd. (b) | | | 1,715 | | | | 142,157 | |
| CSX Corp. | | | 6,914 | | | | 143,466 | |
| Genesee & Wyoming, Inc. - Class A (a) | | | 1,018 | | | | 68,063 | |
| Kansas City Southern | | | 1,300 | | | | 98,514 | |
| Norfolk Southern Corp. | | | 3,063 | | | | 194,899 | |
| Union Pacific Corp. | | | 2,010 | | | | 238,587 | |
| | | | | | | | 1,033,383 | |
| | | | | | | | | |
| Specialty Retail - 6.56% | | | | | | | | |
Aaron’s, Inc. | | | 2,345 | | | | 65,214 | |
| Bed Bath & Beyond, Inc. (a) | | | 2,275 | | | | 143,325 | |
| The Home Depot, Inc. | | | 6,015 | | | | 363,126 | |
Lowe’s Cos, Inc. | | | 4,636 | | | | 140,193 | |
| Pier 1 Imports, Inc. | | | 5,505 | | | | 103,164 | |
| Williams-Sonoma, Inc. | | | 1,552 | | | | 68,241 | |
| | | | | | | | 883,263 | |
| | | Shares | | | Fair Value | |
| | | | | | | |
| Trading Companies & Distributors - 0.52% | | | | | | |
| Applied Industrial Technologies, Inc. | | | 1,688 | | | $ | 69,934 | |
TOTAL COMMON STOCKS
(Cost $11,999,399) | | | | | | $ | 13,488,915 | |
| | | | | | | | | |
| SHORT-TERM INVESTMENTS - 0.17% | | | | | | | | |
| Money Market Funds - 0.17% | | | | | | | | |
| Fidelity Institutional Money Market Fund - Government Portfolio 0.01% (c) | | | 22,753 | | | $ | 22,753 | |
TOTAL SHORT-TERM INVESTMENTS
(Cost $22,753) | | | | | | $ | 22,753 | |
| | | | | | | | | |
Total Investments
(Cost $12,022,152) - 100.40% | | | | | | $ | 13,511,668 | |
| | | | | | | | | |
| Liabilities in Excess of Other Assets - (0.40)% | | | | | | | (53,241 | ) |
| | | | | | | | | |
| TOTAL NET ASSETS - 100.00% | | | | | | $ | 13,458,427 | |
| Percentages are stated as a percent of net assets. |
| ADR American Depository Receipt |
| (a) | Non-income producing security. |
| (b) | Foreign issued security. |
| (c) | The rate quoted is the annualized seven-day yield as of September 30, 2012. |
The Global Industry Classification Standard (GICS®) was developed by and/or is the exclusive property of MSCI, Inc. and Standard & Poor’s Financial Services LLC (“S&P”). GICS is a service mark of MSCI and S&P and has been licensed for use by U.S. Bancorp Fund Services, LLC.
|
| See Notes to the Financial Statements. | The Leuthold Funds - 2012 Annual Report | 97 |
| Leuthold Global Industries Fund |
| Schedule of Investments |
| September 30, 2012 |
| | | Shares | | | Fair Value | |
| | | | | | | |
| COMMON STOCKS - 97.28% | | | | | | |
| Airlines - 4.49% | | | | | | |
| Alaska Air Group, Inc. (a) | | | 1,061 | | | $ | 37,199 | |
| China Eastern Airlines Corp., Ltd. (a)(b) | | | 56,000 | | | | 16,969 | |
| China Southern Airlines Co., Ltd. (a)(b) | | | 40,000 | | | | 17,493 | |
| Copa Holdings SA - Class A (b) | | | 496 | | | | 40,310 | |
| easyJet PLC (b) | | | 4,517 | | | | 42,453 | |
| JetBlue Airways Corp. (a) | | | 7,044 | | | | 33,741 | |
| Ryanair Holdings PLC - ADR (a) | | | 1,302 | | | | 41,989 | |
| Southwest Airlines Co. | | | 4,275 | | | | 37,492 | |
| U.S. Airways Group, Inc. (a) | | | 3,049 | | | | 31,892 | |
| United Continental Holdings, Inc. (a) | | | 1,788 | | | | 34,866 | |
| Westjet Airlines, Ltd. (b) | | | 1,222 | | | | 21,690 | |
| | | | | | | | 356,094 | |
| | | | | | | | | |
| Auto Components - 7.74% | | | | | | | | |
| Brembo SpA (b) | | | 1,894 | | | | 19,143 | |
| Cie Generale des Etablissements Michelin (b) | | | 1,036 | | | | 81,121 | |
| Continental AG (a)(b) | | | 784 | | | | 76,890 | |
| Cooper Tire & Rubber Co. | | | 1,906 | | | | 36,557 | |
| Dana Holding Corp. | | | 2,730 | | | | 33,579 | |
| Faurecia (b) | | | 2,074 | | | | 34,305 | |
| GKN PLC (b) | | | 11,492 | | | | 39,958 | |
| Leoni AG (b) | | | 1,044 | | | | 39,089 | |
| Magna International, Inc. (b) | | | 1,330 | | | | 57,536 | |
| Plastic Omnium SA (b) | | | 734 | | | | 18,265 | |
| Showa Corp. (a)(b) | | | 4,500 | | | | 39,655 | |
| Sumitomo Rubber Industries, Ltd. (b) | | | 3,200 | | | | 38,056 | |
| Tianneng Power International, Ltd. (b) | | | 34,000 | | | | 20,578 | |
| TRW Automotive Holdings Corp. (a) | | | 1,812 | | | | 79,203 | |
| | | | | | | | 613,935 | |
| | | Shares | | | Fair Value | |
| | | | | | | |
| Chemicals - 7.62% | | | | | | |
| Agrium, Inc. (b) | | | 803 | | | $ | 83,078 | |
| CF Industries Holdings, Inc. | | | 380 | | | | 84,451 | |
| Chr. Hansen Holding A/S (b) | | | 2,363 | | | | 71,010 | |
| Dongyue Group (b) | | | 68,000 | | | | 29,951 | |
| Innophos Holdings, Inc. | | | 722 | | | | 35,010 | |
| Mosaic Co. | | | 1,372 | | | | 79,041 | |
| Nippon Shokubai Co., Ltd. (b) | | | 4,000 | | | | 44,736 | |
| Rockwood Holdings, Inc. | | | 1,335 | | | | 62,211 | |
| Yara International ASA (b) | | | 1,600 | | | | 80,342 | |
| Zeon Corp. (b) | | | 5,000 | | | | 34,766 | |
| | | | | | | | 604,596 | |
| | | | | | | | | |
| Commercial Banks - 11.12% | | | | | | | | |
| Bank of the Ozarks, Inc. | | | 1,348 | | | | 46,466 | |
| BB&T Corp. | | | 3,551 | | | | 117,751 | |
| Fifth Third Bancorp | | | 8,752 | | | | 135,743 | |
| First Citizens BancShares, Inc. - Class A | | | 110 | | | | 17,919 | |
| Fulton Financial Corp. | | | 4,098 | | | | 40,406 | |
| Hachijuni Bank, Ltd. (b) | | | 3,000 | | | | 16,633 | |
| Huntington Bancshares, Inc. | | | 18,504 | | | | 127,678 | |
| International Bancshares Corp. | | | 1,031 | | | | 19,640 | |
| KeyCorp | | | 14,363 | | | | 125,533 | |
| Laurentian Bank of Canada (b) | | | 394 | | | | 18,548 | |
| National Penn Bancshares, Inc. | | | 4,193 | | | | 38,198 | |
| PNC Financial Services Group, Inc. | | | 1,595 | | | | 100,644 | |
| San-In Godo Bank, Ltd. (b) | | | 2,000 | | | | 14,564 | |
| Webster Financial Corp. | | | 2,641 | | | | 62,592 | |
| | | | | | | | 882,315 | |
| | | | | | | | | |
| Computers & Peripherals - 2.00% | | | | | | | | |
| Apple, Inc. | | | 114 | | | | 76,068 | |
| Gemalto NV (b) | | | 938 | | | | 82,496 | |
| | | | | | | | 158,564 | |
|
| 98 | The Leuthold Funds - 2012 Annual Report | See Notes to the Financial Statements. |
| Leuthold Global Industries Fund |
| Schedule of Investments (continued) |
| September 30, 2012 |
| | | Shares | | | Fair Value | |
| | | | | | | |
| COMMON STOCKS - 97.28% (continued) | | | | | | |
| Consumer Finance - 7.91% | | | | | | |
| Capital One Financial Corp. | | | 1,817 | | | $ | 103,587 | |
| Cash America International, Inc. | | | 1,748 | | | | 67,420 | |
| Credit Acceptance Corp. (a) | | | 1,258 | | | | 107,572 | |
| Credit Saison Co., Ltd. (b) | | | 2,900 | | | | 70,064 | |
| Discover Financial Services | | | 4,586 | | | | 182,202 | |
| International Personal Finance PLC (b) | | | 9,750 | | | | 47,285 | |
| Provident Financial PLC (b) | | | 2,228 | | | | 49,447 | |
| | | | | | | | 627,577 | |
| | | | | | | | | |
| Diversified Telecommunication Services - 7.56% | | | | | | | | |
| Asia Pacific Telecom Co., | | | | | | | | |
| Ltd. (a)(b) | | | 67,000 | | | | 39,976 | |
| BT Group PLC (b) | | | 15,864 | | | | 59,137 | |
| Elisa OYJ (b) | | | 895 | | | | 20,253 | |
| France Telecom SA - ADR | | | 3,122 | | | | 38,151 | |
| Jasmine International PCL (b) | | | 692,400 | | | | 87,072 | |
| Manitoba Telecom Services, Inc. (b) | | | 1,180 | | | | 40,510 | |
| Telecom Corp. of New Zealand, Ltd. (b) | | | 20,495 | | | | 40,351 | |
| Telefonica SA - ADR | | | 4,173 | | | | 55,418 | |
| Telekom Malaysia Bhd (b) | | | 20,600 | | | | 41,657 | |
| Telekomunikasi Indonesia Persero Tbk PT - ADR | | | 981 | | | | 38,190 | |
| Telstra Corp., Ltd. (b) | | | 14,948 | | | | 60,599 | |
| Time dotCom Bhd (b) | | | 18,200 | | | | 18,412 | |
| Verizon Communications, Inc. | | | 1,315 | | | | 59,925 | |
| | | | | | | | 599,651 | |
| | | Shares | | | Fair Value | |
| | | | | | | |
| Health Care Providers & Services - 9.07% | | | | | | |
| Bangkok Dusit Medical | | | | | | |
| Services PCL (b) | | | 24,200 | | | $ | 84,464 | |
| Community Health Systems, Inc. (a) | | | 3,007 | | | | 87,624 | |
| HCA Holdings, Inc. | | | 2,715 | | | | 90,274 | |
| Health Management Associates, Inc. - Class A (a) | | | 5,427 | | | | 45,533 | |
| KPJ Healthcare Bhd (b) | | | 19,000 | | | | 37,830 | |
| Life Healthcare Group Holdings, Ltd. (b) | | | 9,739 | | | | 37,207 | |
| LifePoint Hospitals, Inc. (a) | | | 1,952 | | | | 83,507 | |
| Netcare, Ltd. (b) | | | 38,631 | | | | 82,945 | |
| Ramsay Health Care, Ltd. (b) | | | 1,577 | | | | 39,203 | |
| Select Medical Holdings Corp. (a) | | | 3,897 | | | | 43,763 | |
| Universal Health Services, Inc. - Class B | | | 1,906 | | | | 87,161 | |
| | | | | | | | 719,511 | |
| | | | | | | | | |
| Insurance - 13.65% | | | | | | | | |
| Allianz SE (b) | | | 653 | | | | 77,879 | |
| Alterra Capital Holdings, Ltd. (b) | | | 1,606 | | | | 38,448 | |
| American International Group, Inc. (a) | | | 2,382 | | | | 78,106 | |
| Arch Capital Group, Ltd. (a)(b) | | | 986 | | | | 41,096 | |
| Assurant, Inc. | | | 1,081 | | | | 40,321 | |
| Endurance Specialty Holdings, Ltd. (b) | | | 1,055 | | | | 40,618 | |
| Everest Re Group, Ltd. (b) | | | 731 | | | | 78,188 | |
| Genworth Financial, Inc. - Class A (a) | | | 7,289 | | | | 38,121 | |
| Gjensidige Forsikring ASA (b) | | | 2,863 | | | | 39,777 | |
| Hannover Rueckversicherung AG (a)(b) | | | 1,244 | | | | 79,606 | |
| Muenchener Rueckversicherungs AG (b) | | | 534 | | | | 83,498 | |
|
| See Notes to the Financial Statements. | The Leuthold Funds - 2012 Annual Report | 99 |
| Leuthold Global Industries Fund |
| Schedule of Investments (continued) |
| September 30, 2012 |
| | | Shares | | | Fair Value | |
| | | | | | | |
| COMMON STOCKS - 97.28% (continued) | | | | | | |
| Insurance - 13.65% (continued) | | | | | | |
| PartnerRe, Ltd. (b) | | | 1,017 | | | $ | 75,543 | |
| Powszechny Zaklad Ubezpieczen SA (b) | | | 356 | | | | 40,045 | |
| Reinsurance Group of America, Inc. | | | 1,379 | | | | 79,803 | |
| SCOR SE (b) | | | 3,026 | | | | 77,999 | |
| Swiss Re AG (b) | | | 1,175 | | | | 75,604 | |
| Validus Holdings, Ltd. (b) | | | 2,310 | | | | 78,332 | |
| Vienna Insurance Group AG Wiener Versicherung Gruppe (b) | | | 465 | | | | 19,745 | |
| | | | | | | | 1,082,729 | |
| | | | | | | | | |
| Leisure Equipment & Products - 3.07% | | | | | | | | |
| Hasbro, Inc. | | | 1,377 | | | | 52,560 | |
| Mattel, Inc. | | | 1,831 | | | | 64,964 | |
| Merida Industry Co., Ltd. (b) | | | 11,500 | | | | 42,148 | |
| Nikon Corp. (b) | | | 1,600 | | | | 43,996 | |
| Tamron Co., Ltd. (b) | | | 1,300 | | | | 39,691 | |
| | | | | | | | 243,359 | |
| | | | | | | | | |
| Office Electronics - 0.66% | | | | | | | | |
| Xerox Corp. | | | 7,189 | | | | 52,767 | |
| | | | | | | | | |
| Oil, Gas & Consumable Fuels - 5.81% | | | | | | | | |
| BP PLC - ADR | | | 1,639 | | | | 69,428 | |
| Chevron Corp. | | | 553 | | | | 64,458 | |
| China Petroleum & Chemical Corp. - ADR | | | 526 | | | | 48,613 | |
| Polskie Gornictwo Naftowe i Gazownictwo SA (b) | | | 43,027 | | | | 54,693 | |
| PTT PCL (b) | | | 4,800 | | | | 51,197 | |
| Royal Dutch Shell PLC - ADR | | | 836 | | | | 58,027 | |
| Statoil ASA - ADR | | | 2,150 | | | | 55,448 | |
| Suncor Energy, Inc. (b) | | | 1,811 | | | | 59,491 | |
| | | | | | | | 461,355 | |
| | | Shares | | | Fair Value | |
| | | | | | | |
| Paper & Forest Products - 0.03% | | | | | | |
| China Forestry Holdings Co., Ltd. (a)(b)(d)(e) | | | 116,000 | | | $ | 2,244 | |
| | | | | | | | | |
| Pharmaceuticals - 1.57% | | | | | | | | |
| Abbott Laboratories | | | 593 | | | | 40,656 | |
| Eli Lilly & Co. | | | 1,768 | | | | 83,821 | |
| | | | | | | | 124,477 | |
| | | | | | | | | |
| Road & Rail - 6.65% | | | | | | | | |
| Amerco, Inc. | | | 268 | | | | 28,504 | |
| ComfortDelGro Corp., Ltd. (b) | | | 20,000 | | | | 27,899 | |
| CSX Corp. | | | 2,475 | | | | 51,356 | |
| DSV A/S (b) | | | 1,817 | | | | 40,791 | |
| Firstgroup PLC (b) | | | 6,895 | | | | 26,727 | |
| Go-Ahead Group PLC (b) | | | 843 | | | | 17,897 | |
| Guangshen Railway Co., Ltd. (b) | | | 42,000 | | | | 13,553 | |
| Hitachi Transport System, Ltd. (b) | | | 1,000 | | | | 16,757 | |
| MTR Corp., Ltd. (b) | | | 11,000 | | | | 41,585 | |
| Nippon Express Co., Ltd. (b) | | | 9,000 | | | | 34,090 | |
| Norfolk Southern Corp. | | | 892 | | | | 56,758 | |
| Ryder System, Inc. | | | 685 | | | | 26,756 | |
| Sankyu, Inc. (b) | | | 5,000 | | | | 18,876 | |
| Seino Holdings Co., Ltd. (b) | | | 3,000 | | | | 18,993 | |
| Stagecoach Group PLC (b) | | | 5,640 | | | | 25,606 | |
| Tokyu Corp. (b) | | | 7,000 | | | | 33,437 | |
| TransForce, Inc. (b) | | | 965 | | | | 17,080 | |
| Werner Enterprises, Inc. | | | 1,462 | | | | 31,243 | |
| | | | | | | | 527,908 | |
| | | | | | | | | |
| Trading Companies & Distributors - 3.17% | | | | | | | | |
| Applied Industrial Technologies, Inc. | | | 2,211 | | | | 91,602 | |
| Travis Perkins PLC (b) | | | 3,475 | | | | 58,568 | |
| WESCO International, Inc. (a) | | | 1,769 | | | | 101,187 | |
| | | | | | | | 251,357 | |
|
| 100 | The Leuthold Funds - 2012 Annual Report | See Notes to the Financial Statements. |
| Leuthold Global Industries Fund |
| Schedule of Investments (continued) |
| September 30, 2012 |
| | | Shares | | | Fair Value | |
| | | | | | | |
| COMMON STOCKS - 97.28% (continued) | | | | | | |
| Water Utilities - 1.07% | | | | | | |
| Cia de Saneamento Basico do Estado de Sao Paulo (b) | | | 2,096 | | | $ | 85,288 | |
| | | | | | | | | |
| Wireless Telecommunication Services - 4.09% | | | | | | | | |
| Axiata Group Bhd (b) | | | 44,900 | | | | 95,344 | |
| MTN Group, Ltd. (b) | | | 4,430 | | | | 85,522 | |
| Tim Participacoes SA - ADR | | | 1,403 | | | | 26,965 | |
| Total Access Communication PCL (b) | | | 38,800 | | | | 116,416 | |
| | | | | | | | 324,247 | |
TOTAL COMMON STOCKS
(Cost $7,048,000) | | | | | | $ | 7,717,974 | |
| | | | | | | | | |
| PREFERRED STOCKS - 1.25% | | | | | | | | |
| Diversified Telecommunication Services - 1.25% | | | | | | | | |
| Oi SA - ADR | | | 10,270 | | | $ | 41,285 | |
| Telefonica Brasil SA - ADR | | | 2,679 | | | | 58,242 | |
TOTAL PREFERRED STOCKS
(Cost $96,435) | | | | | | $ | 99,527 | |
| | | | | | | | | |
| SHORT-TERM INVESTMENTS - 1.63% | | | | | | | | |
| Money Market Funds - 1.63% | | | | | | | | |
| Fidelity Institutional Money Market Fund - Government Portfolio 0.01% (c) | | | 129,418 | | | $ | 129,418 | |
TOTAL SHORT-TERM INVESTMENTS
(Cost $129,418) | | | | | | $ | 129,418 | |
| | | Shares | | | Fair Value | |
| | | | | | | |
Total Investments
(Cost $7,273,853) - 100.16% | | | | | | $ | 7,946,919 | |
| | | | | | | | | |
| Liabilities in Excess of Other Assets - (0.16)% | | | | | | | (12,307 | ) |
| | | | | | | | | |
| TOTAL NET ASSETS - 100.00% | | | | | | $ | 7,934,612 | |
| Percentages are stated as a percent of net assets. |
| ADR American Depository Receipt |
| (a) | Non-income producing security. |
| (b) | Foreign issued security. |
| (c) | The rate quoted is the annualized seven-day yield as of September 30, 2012. |
| (d) | Illiquid Security. The fair value of these securities total $2,244 which represent 0.03% of total net assets. |
| (e) | The security is currently being fair valued in accordance with procedures established by the Board of Directors of the Leuthold Funds due to a halt in trading of the security on January 26, 2011. |
The Global Industry Classification Standard (GICS®) was developed by and/or is the exclusive property of MSCI, Inc. and Standard & Poor’s Financial Services LLC (“S&P”). GICS is a service mark of MSCI and S&P and has been licensed for use by U.S. Bancorp Fund Services, LLC.
|
| See Notes to the Financial Statements. | The Leuthold Funds - 2012 Annual Report | 101 |
| Leuthold Global Industries Fund |
| Schedule of Investments (continued) |
| September 30, 2012 |
| | | | | Percentage | |
| | | Fair | | of Total | |
| | | Value | | Investments | |
| CURRENCY EXPOSURE | | | | | | | |
| September 30, 2012 | | | | | | | |
| Australian Dollar | | $ | 99,802 | | 1.26 | % | |
| Brazilian Real | | | 85,288 | | 1.07 | | |
| British Pound | | | 367,079 | | 4.62 | | |
| Canadian Dollar | | | 97,828 | | 1.23 | | |
| Danish Kroner | | | 111,801 | | 1.40 | | |
| Euro | | | 710,289 | | 8.94 | | |
| Hong Kong Dollar | | | 142,372 | | 1.79 | | |
| Japanese Yen | | | 464,314 | | 5.84 | | |
| Malaysian Ringgit | | | 193,243 | | 2.43 | | |
| New Taiwan Dollar | | | 82,124 | | 1.03 | | |
| New Zealand Dollar | | | 40,351 | | 0.51 | | |
| Norwegian Krone | | | 120,119 | | 1.51 | | |
| Polish Zloty | | | 94,738 | | 1.19 | | |
| Singapore Dollar | | | 27,899 | | 0.35 | | |
| South African Rand | | | 205,674 | | 2.59 | | |
| Swiss Franc | | | 75,604 | | 0.95 | | |
| Thai Baht | | | 339,149 | | 4.27 | | |
| US Dollar | | | 4,689,245 | | 59.02 | | |
| Total Investments | | $ | 7,946,919 | | 100.00 | % | |
| | | | | | | | |
| | | | | Percentage | |
| | | Fair | | of Total | |
| | | Value | | Investments | |
| PORTFOLIO DIVERSIFICATION | | | | | | | |
| September 30, 2012 | | | | | | | |
| Australia | | $ | 99,802 | | 1.26 | % | |
| Austria | | | 19,745 | | 0.25 | | |
| Bermuda | | | 352,225 | | 4.43 | | |
| Brazil | | | 211,780 | | 2.67 | | |
| Britain | | | 294,958 | | 3.72 | | |
| Canada | | | 297,933 | | 3.75 | | |
| China | | | 128,823 | | 1.62 | | |
| Denmark | | | 111,801 | | 1.40 | | |
| Finland | | | 20,253 | | 0.26 | | |
| France | | | 249,841 | | 3.14 | | |
| Germany | | | 356,962 | | 4.49 | | |
| Hong Kong | | | 62,163 | | 0.78 | | |
| Indonesia | | | 38,190 | | 0.48 | | |
| Ireland | | | 41,989 | | 0.53 | | |
| Italy | | | 19,143 | | 0.24 | | |
| Japan | | | 464,314 | | 5.84 | | |
| Malaysia | | | 193,243 | | 2.43 | | |
| Netherlands | | | 140,523 | | 1.77 | | |
| New Zealand | | | 40,351 | | 0.51 | | |
| Norway | | | 175,567 | | 2.21 | | |
| Panama | | | 40,310 | | 0.51 | | |
| Poland | | | 94,738 | | 1.19 | | |
| Singapore | | | 27,899 | | 0.35 | | |
| South Africa | | | 205,674 | | 2.59 | | |
| Spain | | | 55,418 | | 0.70 | | |
| Switzerland | | | 75,604 | | 0.95 | | |
| Taiwan | | | 42,148 | | 0.53 | | |
| Taiwan, Province of China | | | 39,976 | | 0.50 | | |
| Thailand | | | 339,149 | | 4.27 | | |
| United Kingdom | | | 141,548 | | 1.78 | | |
| United States | | | 3,564,849 | | 44.85 | | |
| Total Investments | | $ | 7,946,919 | | 100.00 | % | |
|
| 102 | The Leuthold Funds - 2012 Annual Report | See Notes to the Financial Statements. |
| Leuthold Global Clean Technology Fund |
| Schedule of Investments |
| September 30, 2012 |
| | | Shares | | Fair Value | |
| COMMON STOCKS - 95.34% | | | | | | | |
| | | | | | | | |
| Auto Components - 9.18% | | | | | | | |
| Gentherm, Inc. (a) | | | 28,742 | | $ | 357,551 | |
| Johnson Controls, Inc. | | | 5,986 | | | 164,016 | |
| Tenneco, Inc. (a) | | | 9,767 | | | 273,476 | |
| | | | | | | 795,043 | |
| | | | | | | | |
| Building Products - 0.46% | | | | | | | |
| Ameresco, Inc. - Class A (a) | | | 3,375 | | | 39,859 | |
| | | | | | | | |
| Chemicals - 5.41% | | | | | | | |
| ADA-ES, Inc. (a) | | | 19,846 | | | 468,564 | |
| | | | | | | | |
| Commercial Services & Supplies - 7.50% | | | | | | | |
| Clean Harbors, Inc. (a) | | | 7,154 | | | 349,473 | |
| Newalta Corp. (b) | | | 20,417 | | | 300,097 | |
| | | | | | | 649,570 | |
| | | | | | | | |
| Construction & Engineering - 2.86% | | | | | | | |
| Chicago Bridge & Iron Co. NV (b) | | | 6,517 | | | 248,233 | |
| | | | | | | | |
| Electrical Equipment - 8.31% | | | | | | | |
| 2G energy AG (a)(b) | | | 3,906 | | | 179,522 | |
| ABB, Ltd. - ADR | | | 10,653 | | | 199,211 | |
| Polypore International, Inc. (a) | | | 8,428 | | | 297,930 | |
| Roper Industries, Inc. | | | 394 | | | 43,297 | |
| | | | | | | 719,960 | |
| | | | | | | | |
| Electronic Equipment, Instruments & Components - 13.76% | | | | | | | |
| 5N Plus, Inc. (a)(b) | | | 144,366 | | | 312,785 | |
| Dialight PLC (b) | | | 16,034 | | | 311,224 | |
| Horiba, Ltd. (b) | | | 8,500 | | | 250,575 | |
| LPKF Laser & Electronics AG (b) | | | 14,977 | | | 318,017 | |
| | | | | | | 1,192,601 | |
| | | | | | | | |
| Food Products - 4.93% | | | | | | | |
| Cosan, Ltd. - Class A (a)(b) | | | 26,929 | | | 427,094 | |
| | | | | | | | |
| | | Shares | | Fair Value | |
| Internet Software & Services - 6.15% | | | | | | | |
| World Energy Solutions, Inc. (a) | | | 127,094 | | $ | 532,524 | |
| | | | | | | | |
| Machinery - 23.22% | | | | | | | |
| Chart Industries, Inc. (a) | | | 1,676 | | | 123,773 | |
| CLARCOR, Inc. | | | 6,269 | | | 279,785 | |
| Donaldson Co., Inc. | | | 4,523 | | | 156,993 | |
| ESCO Technologies, Inc. | | | 7,243 | | | 281,391 | |
| ITT Corp. | | | 5,507 | | | 110,966 | |
| Kurita Water Industries, Ltd. (b) | | | 7,600 | | | 168,029 | |
| Pall Corp. | | | 3,794 | | | 240,881 | |
| Pentair, Ltd. (b) | | | 8,210 | | | 365,427 | |
| Xylem, Inc. | | | 11,330 | | | 284,949 | |
| | | | | | | 2,012,194 | |
| | | | | | | | |
| Metals & Mining - 5.50% | | | | | | | |
| Horsehead Holding Corp. (a) | | | 30,884 | | | 288,456 | |
| Umicore SA (b) | | | 3,595 | | | 188,194 | |
| | | | | | | 476,650 | |
| | | | | | | | |
| Software - 2.96% | | | | | | | |
| PSI AG Gesellschaft Fuer Produkte und Systeme der Informations technologie (b) | | | 12,196 | | | 256,800 | |
| | | | | | | | |
| Water Utilities - 5.10% | | | | | | | |
| American Water Works Co., Inc. | | | 6,770 | | | 250,896 | |
| Aqua America, Inc. | | | 5,772 | | | 142,915 | |
| Cia de Saneamento Basico do Estado de Sao Paulo - ADR | | | 592 | | | 48,076 | |
| | | | | | | 441,887 | |
TOTAL COMMON STOCKS
(Cost $7,413,803) | | | | | $ | 8,260,979 | |
|
| See Notes to the Financial Statements. | The Leuthold Funds - 2012 Annual Report | 103 |
| Leuthold Global Clean Technology Fund |
| Schedule of Investments (continued) |
| September 30, 2012 |
| | | Shares | | Fair Value | |
| PREFERRED STOCKS - 1.02% | | | | | | | |
| | | | | | | | |
| Electric Utilities - 1.02% | | | | | | | |
| Cia Energetica de Minas Gerais - ADR | | | 7,303 | | $ | 88,512 | |
| TOTAL PREFERRED STOCKS | | | | | | | |
| (Cost $92,291) | | | | | $ | 88,512 | |
| | | | | | | | |
| | | Number of | | | | |
| | | Warrants | | Fair Value | |
| WARRANTS - 0.0% | | | | | | | |
| Cereplast, Inc. | | | | | | | |
| Expiration: December 10, 2015, Exercise Price: $4.44 (a) | | | 107,000 | | $ | — | |
| TOTAL WARRANTS | | | | | | | |
| (Cost $0) | | | | | $ | — | |
| | | | | | | | |
| | | Shares | | Fair Value | |
| SHORT-TERM INVESTMENTS - 2.79% | | | | | | | |
| | | | | | | | |
| Money Market Funds - 2.79% | | | | | | | |
| Fidelity Institutional Money Market Fund - Government Portfolio 0.01% (c) | | | 241,755 | | $ | 241,755 | |
| TOTAL SHORT-TERM INVESTMENTS | | | | | | | |
| (Cost $241,755) | | | | | $ | 241,755 | |
| Total Investments | | | | | | | |
| (Cost $7,747,849) - 99.15% | | | | | $ | 8,591,246 | |
| Other Assets in Excess of Liabilities - 0.85% | | | | | | 73,340 | |
| TOTAL NET ASSETS - 100.00% | | | | | $ | 8,664,586 | |
Percentages are stated as a percent of net assets.
ADR American Depository Receipt
(a) Non-income producing security.
(b) Foreign issued security.
(c) The rate quoted is the annualized seven-day yield as of September 30, 2012.
The Global Industry Classification Standard (GICS®) was developed by and/or is the exclusive property of MSCI, Inc. and Standard & Poor’s Financial Services LLC (“S&P”). GICS is a service mark of MSCI and S&P and has been licensed for use by U.S. Bancorp Fund Services, LLC.
|
| 104 | The Leuthold Funds - 2012 Annual Report | See Notes to the Financial Statements. |
| Leuthold Global Clean Technology Fund |
| Schedule of Investments (continued) |
| September 30, 2012 |
| | | | | Percentage | |
| | | Fair | | of Total | |
| | | Value | | Investments | |
| CURRENCY EXPOSURE | | | | | | | |
| September 30, 2012 | | | | | | | |
| British Pound | | $ | 311,224 | | 3.62 | % | |
| Canadian Dollar | | | 612,882 | | 7.14 | | |
| Euro | | | 942,532 | | 10.97 | | |
| Japanese Yen | | | 418,604 | | 4.87 | | |
| US Dollar | | | 6,306,004 | | 73.40 | | |
| Total Investments | | $ | 8,591,246 | | 100.00 | % | |
| | | | | | | | |
| | | | | Percentage | |
| | | Fair | | of Total | |
| | | Value | | Investments | |
| PORTFOLIO DIVERSIFICATION | | | | | | | |
| September 30, 2012 | | | | | | | |
| Belgium | | $ | 188,194 | | 2.19 | % | |
| Brazil | | | 563,682 | | 6.56 | | |
| Britain | | | 311,224 | | 3.62 | | |
| Canada | | | 612,882 | | 7.14 | | |
| Germany | | | 754,339 | | 8.78 | | |
| Japan | | | 418,604 | | 4.87 | | |
| Netherlands | | | 248,233 | | 2.89 | | |
| Switzerland | | | 564,638 | | 6.57 | | |
| United States | | | 4,929,450 | | 57.38 | | |
| Total Investments | | $ | 8,591,246 | | 100.00 | % | |
|
| See Notes to the Financial Statements. | The Leuthold Funds - 2012 Annual Report | 105 |
| Grizzly Short Fund |
| Schedule of Investments |
| September 30, 2012 |
| | | Shares | | Fair Value | |
| SHORT-TERM INVESTMENTS - 4.01% | | | | | | | |
| | | | | | | | |
| Money Market Funds - 4.01% | | | | | | | |
| Fidelity Institutional Money Market Fund - Government Portfolio 0.01% (a) | | | 5,461,654 | | $ | 5,461,654 | |
| TOTAL SHORT-TERM INVESTMENTS | | | | | | | |
| (Cost $5,461,654) | | | | | $ | 5,461,654 | |
| | | | | | | | |
| Total Investments | | | | | | | |
| (Cost $5,461,654) - 4.01% | | | | | $ | 5,461,654 | |
| Other Assets in Excess of Liabilities - 95.99% (b) | | | | | | 130,824,355 | |
| TOTAL NET ASSETS - 100.00% | | | | | $ | 136,286,009 | |
Percentages are stated as a percent of net assets.
(a) The rate quoted is the annualized seven-day yield as of September 30, 2012.
(b) All or a portion of the assets have been committed as collateral for open securities sold short.
The Global Industry Classification Standard (GICS®) was developed by and/or is the exclusive property of MSCI, Inc. and Standard & Poor’s Financial Services LLC (“S&P”). GICS is a service mark of MSCI and S&P and has been licensed for use by U.S. Bancorp Fund Services, LLC.
|
| 106 | The Leuthold Funds - 2012 Annual Report | See Notes to the Financial Statements. |
| Grizzly Short Fund |
| Schedule of Securities Sold Short - (a) |
| September 30, 2012 |
| | | Shares | | Fair Value | |
| COMMON STOCKS - 84.37% | | | | | | | |
| | | | | | | | |
| Air Freight & Logistics - 1.66% | | | | | | | |
| Expeditors International of Washington, Inc. | | | 62,096 | | $ | 2,257,811 | |
| | | | | | | | |
| Building Products - 1.45% | | | | | | | |
Fortune Brands Home & Security, Inc. | | | 72,972 | | | 1,970,974 | |
| | | | | | | | |
| Capital Markets - 4.44% | | | | | | | |
| Credit Suisse Group AG - ADR | | | 84,959 | | | 1,796,883 | |
| Jefferies Group, Inc. | | | 149,920 | | | 2,052,405 | |
| Lazard, Ltd. - Class A (b) | | | 75,252 | | | 2,199,616 | |
| | | | | | | 6,048,904 | |
| | | | | | | | |
| Chemicals - 1.35% | | | | | | | |
| Ashland, Inc. | | | 25,786 | | | 1,846,278 | |
| | | | | | | | |
| Communications Equipment - 4.69% | | | | | | | |
| Acme Packet, Inc. | | | 73,264 | | | 1,252,814 | |
| Aruba Networks, Inc. | | | 104,605 | | | 2,352,043 | |
| EchoStar Corp. - Class A | | | 27,189 | | | 779,237 | |
| JDS Uniphase Corp. | | | 112,966 | | | 1,399,084 | |
| ViaSat, Inc. | | | 16,197 | | | 605,444 | |
| | | | | | | 6,388,622 | |
| | | | | | | | |
| Computers & Peripherals - 1.21% | | | | | | | |
| NetApp, Inc. | | | 49,993 | | | 1,643,770 | |
| | | | | | | | |
| Construction Materials - 1.23% | | | | | | | |
| Vulcan Materials Co. | | | 35,551 | | | 1,681,562 | |
| | | | | | | | |
| Containers & Packaging - 1.22% | | | | | | | |
| Sealed Air Corp. | | | 107,178 | | | 1,656,972 | |
| | | | | | | | |
| Diversified Consumer Services - 1.35% | | | | | | | |
| Sotheby’s | | | 58,296 | | | 1,836,324 | |
| | | | | | | | |
| Diversified Telecommunication Services - 1.67% | | | | | | | |
| Level 3 Communications, Inc. | | | 99,226 | | | 2,279,221 | |
| | | | | | | | |
| | | Shares | | Fair Value | |
| Electric Utilities - 0.75% | | | | | | | |
Korea Electric Power Corp. - ADR | | | 82,035 | | $ | 1,018,875 | |
| | | | | | | | |
| Electrical Equipment - 0.46% | | | | | | | |
| II-VI, Inc. | | | 33,153 | | | 630,570 | |
| | | | | | | | |
| Electronic Equipment, Instruments & Components - 1.89% | | | | | | | |
| IPG Photonics Corp. | | | 32,452 | | | 1,859,500 | |
| National Instruments Corp. | | | 28,359 | | | 713,796 | |
| | | | | | | 2,573,296 | |
| | | | | | | | |
| Energy Equipment & Services - 1.86% | | | | | | | |
| Gulfmark Offshore, Inc. - Class A | | | 19,588 | | | 647,188 | |
| McDermott International, Inc. | | | 154,364 | | | 1,886,328 | |
| | | | | | | 2,533,516 | |
| | | | | | | | |
| Food Products - 3.28% | | | | | | | |
| BRF - Brasil Foods SA - ADR | | | 130,683 | | | 2,260,816 | |
| Kellogg Co. | | | 42,742 | | | 2,208,052 | |
| | | | | | | 4,468,868 | |
| | | | | | | | |
| Gas Utilities - 2.32% | | | | | | | |
| AGL Resources, Inc. | | | 36,194 | | | 1,480,696 | |
| Piedmont Natural Gas Co., Inc. | | | 26,487 | | | 860,298 | |
| South Jersey Industries, Inc. | | | 15,612 | | | 826,343 | |
| | | | | | | 3,167,337 | |
| | | | | | | | |
| Health Care Equipment & Supplies - 1.81% | | | | | | | |
| Alere, Inc. | | | 32,685 | | | 637,031 | |
| Haemonetics Corp. | | | 10,583 | | | 848,756 | |
| HeartWare International, Inc. | | | 10,349 | | | 977,877 | |
| | | | | | | 2,463,664 | |
| | | | | | | | |
| Health Care Providers & Services - 1.70% | | | | | | | |
| Brookdale Senior Living, Inc. | | | 99,693 | | | 2,314,871 | |
|
| See Notes to the Financial Statements. | The Leuthold Funds - 2012 Annual Report | 107 |
| Grizzly Short Fund |
| Schedule of Securities Sold Short - (a) (continued) |
| September 30, 2012 |
| | | Shares | | Fair Value | |
| COMMON STOCKS - 84.37% (continued) | | | | | | | |
| | | | | | | | |
| Hotels, Restaurants & Leisure - 4.99% | | | | | | | |
| BJ’s Restaurants, Inc. | | | 17,775 | | $ | 806,096 | |
| Chipotle Mexican Grill, Inc. | | | 6,023 | | | 1,912,543 | |
| Marriott Vacations Worldwide Corp | | | 49,642 | | | 1,788,105 | |
| MGM Resorts International | | | 213,478 | | | 2,294,889 | |
| | | | | | | 6,801,633 | |
| | | | | | | | |
| Independent Power Producers & Energy Traders - 3.70% | | | | | | | |
| Atlantic Power Corp. | | | 51,689 | | | 773,267 | |
| Calpine Corp. | | | 133,373 | | | 2,307,353 | |
| NRG Energy, Inc. | | | 91,864 | | | 1,964,971 | |
| | | | | | | 5,045,591 | |
| | | | | | | | |
| Internet & Catalog Retail - 1.15% | | | | | | | |
| Amazon.com, Inc. | | | 6,139 | | | 1,561,270 | |
| | | | | | | | |
| Internet Software & Services - 2.90% | | | | | | | |
| Facebook, Inc. - Class A | | | 98,466 | | | 2,131,789 | |
| SINA Corp. (b) | | | 28,242 | | | 1,826,692 | |
| | | | | | | 3,958,481 | |
| | | | | | | | |
| IT Services - 0.65% | | | | | | | |
| ServiceSource International, Inc. | | | 85,894 | | | 881,272 | |
| | | | | | | | |
| Machinery - 3.17% | | | | | | | |
| Colfax Corp. | | | 65,195 | | | 2,390,701 | |
| SPX Corp. | | | 29,528 | | | 1,931,426 | |
| | | | | | | 4,322,127 | |
| | | | | | | | |
| Media - 3.25% | | | | | | | |
| Liberty Global, Inc. - Class A | | | 34,498 | | | 2,095,754 | |
| Lions Gate Entertainment Corp. | | | 152,668 | | | 2,331,240 | |
| | | | | | | 4,426,994 | |
| | | | | | | | |
| | | Shares | | Fair Value | |
| Metals & Mining - 2.80% | | | | | | | |
| Compass Minerals International, | | | | | | | |
| Inc. | | | 29,236 | | $ | 2,180,713 | |
| Silver Standard Resources, Inc. (b) | | | 56,951 | | | 912,925 | |
| Turquoise Hill Resources, Ltd. (b) | | | 85,660 | | | 726,397 | |
| | | | | | | 3,820,035 | |
| | | | | | | | |
| Multiline Retail - 0.86% | | | | | | | |
| JC Penney Co., Inc. | | | 48,180 | | | 1,170,292 | |
| | | | | | | | |
| Oil, Gas & Consumable Fuels - 6.77% | | | | | | | |
| Anadarko Petroleum Corp. | | | 17,191 | | | 1,201,995 | |
| Arch Coal, Inc. | | | 75,954 | | | 480,789 | |
| Bill Barrett Corp. | | | 33,738 | | | 835,690 | |
| CONSOL Energy, Inc. | | | 61,570 | | | 1,850,178 | |
| Forest Oil Corp. | | | 143,021 | | | 1,208,527 | |
| SandRidge Energy, Inc. | | | 172,081 | | | 1,199,405 | |
| Southwestern Energy Co. | | | 36,252 | | | 1,260,845 | |
| Ultra Petroleum Corp. | | | 54,086 | | | 1,188,810 | |
| | | | | | | 9,226,239 | |
| | | | | | | | |
| Real Estate Investment Trusts (REITs) - 4.41% | | | | | | | |
| Corporate Office Properties Trust | | | 54,576 | | | 1,308,187 | |
| Piedmont Office Realty Trust, Inc. - Class A | | | 43,269 | | | 750,285 | |
| SL Green Realty Corp. | | | 23,915 | | | 1,914,874 | |
| Vornado Realty Trust | | | 25,143 | | | 2,037,840 | |
| | | | | | | 6,011,186 | |
| | | | | | | | |
| Semiconductors & Semiconductor Equipment - 5.96% | | | | | | | |
| Cavium, Inc. | | | 65,488 | | | 2,182,715 | |
| Freescale Semiconductor, Ltd. | | | 78,351 | | | 745,118 | |
| Hittite Microwave Corp. | | | 14,442 | | | 801,098 | |
| Micron Technology, Inc. | | | 356,557 | | | 2,133,993 | |
| Microsemi Corp. | | | 34,498 | | | 692,375 | |
| NXP Semiconductor N.V. (b) | | | 62,915 | | | 1,573,504 | |
| | | | | | | 8,128,803 | |
|
| 108 | The Leuthold Funds - 2012 Annual Report | See Notes to the Financial Statements. |
| Grizzly Short Fund |
| Schedule of Securities Sold Short - (a) (continued) |
| September 30, 2012 |
| | | Shares | | Fair Value | |
| COMMON STOCKS - 84.37% (continued) | | | | | | | |
| | | | | | | | |
| Software - 5.53% | | | | | | | |
| Comverse Technology, Inc. | | | 117,235 | | $ | 720,995 | |
| Guidewire Software, Inc. | | | 29,762 | | | 924,110 | |
| MicroStrategy, Inc. | | | 13,916 | | | 1,865,718 | |
| RealPage, Inc. | | | 38,474 | | | 869,513 | |
| Solera Holdings, Inc. | | | 38,533 | | | 1,690,443 | |
| Take-Two Interactive Software, Inc. | | | 59,991 | | | 625,706 | |
| TiVo, Inc. | | | 80,456 | | | 839,156 | |
| | | | | | | 7,535,641 | |
| | | | | | | | |
| Specialty Retail - 2.47% | | | | | | | |
Abercrombie & Fitch Co. - Class A | | | 58,471 | | | 1,983,336 | |
| Five Below, Inc. | | | 35,498 | | | 1,387,262 | |
| | | | | | | 3,370,598 | |
| | | | | | | | |
| Wireless Telecommunication Services - 1.42% | | | | | | | |
| Sprint Nextel Corp. | | | 351,799 | | | 1,941,931 | |
| TOTAL COMMON STOCKS | | | | | | | |
| (Proceeds $114,448,452) | | | | | $ | 114,983,528 | |
| | | | | | | | |
| | | Shares | | Fair Value | |
| INVESTMENT COMPANIES - 10.73% | | | | | | | |
| | | | | | | | |
| Exchange Traded Funds - 10.73% | | | | | | | |
| SPDR Dow Jones Industrial Average ETF Trust | | | 109,080 | | $ | 14,622,174 | |
| TOTAL INVESTMENT COMPANIES | | | | | | | |
| (Proceeds $14,292,034) | | | | | $ | 14,622,174 | |
| | | | | | | | |
| TOTAL SECURITIES SOLD SHORT | | | | | | | |
| (Proceeds $128,740,486) - 95.10% | | | | | $ | 129,605,702 | |
Percentages are stated as a percent of net assets.
ADR American Depository Receipt
(a) All securities sold short are non-income producing.
(b) Foreign issued security.
The Global Industry Classification Standard (GICS®) was developed by and/or is the exclusive property of MSCI, Inc. and Standard & Poor’s Financial Services LLC (“S&P”). GICS is a service mark of MSCI and S&P and has been licensed for use by U.S. Bancorp Fund Services, LLC.
|
| See Notes to the Financial Statements. | The Leuthold Funds - 2012 Annual Report | 109 |
| The Leuthold Funds |
| Notes to the Financial Statements |
| 1. | ORGANIZATIONAND SIGNIFICANT ACCOUNTING POLICIES |
| | Leuthold Funds, Inc. (the “Company”) was incorporated on August 30, 1995, as a Maryland Corporation and is registered with the Securities and Exchange Commission as an open-end management investment company under the Investment Company Act of 1940, as amended. The Company consists of seven series (the “Funds”) as follows: |
| | | | | | | |
| Fund | | Investment Objective | | Inception – Retail Share Class | | Inception – Institutional Share Class |
| Leuthold Core Investment Fund | | Seeks total return consistent with prudent investment risk over the long-term | | 11/20/1995 | | 1/31/2006 |
| Leuthold Asset Allocation Fund | | Seeks total return consistent with prudent investment risk over the long-term | | 5/24/2006 | | 1/31/2007 |
| Leuthold Global Fund | | Seeks long-term capital appreciation and dividend income | | 7/1/2008 | | 4/30/2008 |
| Leuthold Select Industries Fund | | Capital appreciation | | 6/19/2000 | | n/a |
| Leuthold Global Industries Fund | | Seeks long-term capital appreciation and dividend income | | 5/17/2010 | | 5/17/2010 |
| Leuthold Global Clean Technology Fund | | Seeks capital appreciation and long-term growth | | 7/22/2009 | | 7/22/2009 |
| Grizzly Short Fund | | Capital appreciation | | 6/19/2000 | | n/a |
| | All classes of shares in a Fund have identical voting, dividend, liquidation, and other rights, and the same terms and conditions, except that certain fees and expenses, including distribution and shareholder servicing fees, may differ among classes. Each class has exclusive voting rights on any matters relating to that class’s servicing or distribution arrangements. |
| | |
| | The following is a summary of significant accounting policies consistently followed by the Funds. |
| | |
| a) | Investment Valuation – Securities listed on a national securities exchange are valued at the last sale price on the day the valuation is made, and securities that are traded on the NASDAQ Global Market, NASDAQ Global Select Market or the NASDAQ Capital Market are valued at the NASDAQ Official Closing Price. Price information on listed stocks is taken from the exchange where the security is primarily traded. Securities, including securities sold short, which are listed on an exchange but which are not traded on the valuation date are valued at the mean between the bid and the asked prices. Unlisted securities for which market quotations are readily available are valued at the latest quoted bid price or, if unavailable, at prices provided by an independent pricing service. Securities sold short which are not listed on an exchange but for which market quotations are readily available are valued at the average of the current bid and asked prices. Debt securities are valued at bid prices provided by an independent pricing service that may use a matrix pricing method or other analytical pricing model. Other assets, including certain investments in open-end investment companies, and securities for which no quotations are readily available are valued at fair value as determined in good faith by the Board of Directors and the Funds’ Fair Value Pricing Committee. Short-term instruments (those with remaining maturities of 60 days or less) are valued at amortized cost, which approximates market value. Exchange traded options are valued at the last reported sale price on an exchange on which the option is traded. If no sales are reported on a particular day, the mean between the highest bid and lowest asked quotations at the close of the exchanges is used. Non-exchange traded options also will be valued at the mean between the last bid and asked quotations. For options where market quotations are not readily available, fair value shall be determined. |
|
| 110 | The Leuthold Funds - 2012 Annual Report | |
| | The Funds may invest in foreign securities. Trading in foreign securities may be completed at times that vary from the closing of the New York Stock Exchange. The Board has approved the use of their independent pricing provider’s proprietary fair value pricing model to assist in determining current valuation for foreign securities traded in markets that close prior to the New York Stock Exchange. Foreign securities quoted in foreign currencies are translated into U.S. dollars at current rates. Occasionally, events that affect these values and exchange rates may occur between the times at which they are determined and the closing of the New York Stock Exchange. If these events materially affect the value of portfolio securities, then these securities may be valued as determined in good faith by the Funds’ Board of Directors. Some of the factors which may be considered by the Board of Directors and the Funds’ Fair Value Pricing Committee in determining fair value are fundamental analytical data relating to the investment, the nature and duration of any restrictions on disposition, trading in similar securities of the same issuer or comparable companies, information from broker dealers, and an evaluation of the forces that influence the market in which the securities are purchased and sold. The use of fair value pricing by a Fund may cause the net asset value of its shares to differ significantly from the net asset value that would be calculated without regard to such considerations. |
| | | |
| | Physical metals are valued at prices provided by an independent pricing service. The Leuthold Core Investment Fund, the Leuthold Asset Allocation Fund, the Leuthold Global Fund, the Leuthold Global Industries Fund, and the Leuthold Global Clean Technology Fund may invest in metals such as aluminum, copper, zinc, lead, nickel, tin, silver, palladium and other industrial and precious metals. Metals not traded on an exchange are valued at the mid-point between the closing bid and asked prices as obtained from a commonly used reputable pricing source. |
| | | |
| b) | Fair Valuation Measurements – The Funds have adopted fair valuation accounting standards which establish a definition of fair value and set out a hierarchy for measuring fair value. These standards require additional disclosures about the various inputs and valuation techniques used to develop the measurements of fair value and a discussion of changes in valuation techniques and related inputs during the period. These inputs are summarized in the following three levels: |
| | | |
| | Level 1 - | Quoted prices in active markets for identical securities. |
| | | |
| | Level 2 - | Other significant observable inputs (including quoted prices for similar securities, interest rates, prepayment speeds, credit risk, etc.). |
| | | |
| | Level 3 - | Significant unobservable inputs (including the Funds’ own assumptions in determining the fair value of investments). |
|
| | The Leuthold Funds - 2012 Annual Report | 111 |
| | The inputs or methodology used for valuing securities are not an indication of the risk associated with investing in those securities. The following is a summary of the inputs used to value the Funds’ net assets as of September 30, 2012: |
| Leuthold Core Investment Fund | |
| Investments at Fair Value | | Level 1 | | Level 2 | | Level 3 | | Total | |
| Common Stocks | | $ | 489,339,389 | | $ | 21,527,740 | | $ | — | | $ | 510,867,129 | |
| Preferred Stocks | | | 1,392,570 | | | — | | | — | | | 1,392,570 | |
| Exchange Traded Funds | | | 124,464,456 | | | — | | | — | | | 124,464,456 | |
| Precious Metals | | | — | | | 43,019,237 | | | — | | | 43,019,237 | |
| Corporate Bonds | | | — | | | 65,830,749 | | | — | | | 65,830,749 | |
| Rights | | | — | | | 0 | * | | — | | | 0 | |
| Money Market Funds | | | 11,869,970 | | | — | | | — | | | 11,869,970 | |
| Total Investments in Securities | | $ | 627,066,385 | | $ | 130,377,726 | | $ | — | | $ | 757,444,111 | |
| | | | | | | | | | | | | | |
| Securities Sold Short at Fair Value | | | Level 1 | | | Level 2 | | | Level 3 | | | Total | |
| Exchange Traded Funds - Short | | $ | 19,627,038 | | $ | — | | $ | — | | $ | 19,627,038 | |
| Total Securities Sold Short | | $ | 19,627,038 | | $ | — | | $ | — | | $ | 19,627,038 | |
| | The basis for recognizing and valuing transfers is as of the end of the period in which transfers occur. There were transfers from Level 1 to Level 2 of common stocks in the amount of $2,498,139 during the year ended September 30, 2012. The transfers were due to the adjustment of fair value of certain securities due to developments that occurred between the time of the close of the foreign markets on which they trade and the close of regular session trading on the NYSE. The Fund did not invest in any Level 3 securities during the period. |
| | |
| | * Rights valued at $0 at September 30, 2012. |
| Leuthold Asset Allocation Fund | |
| Investments at Fair Value | | Level 1 | | Level 2 | | Level 3 | | Total | |
| Common Stocks | | $ | 390,716,942 | | $ | 17,182,929 | | $ | — | | $ | 407,899,871 | |
| Preferred Stocks | | | 1,109,384 | | | — | | | — | | | 1,109,384 | |
| Exchange Traded Funds | | | 98,528,317 | | | — | | | — | | | 98,528,317 | |
| Precious Metals | | | — | | | 34,254,042 | | | — | | | 34,254,042 | |
| Corporate Bonds | | | — | | | 54,104,986 | | | — | | | 54,104,986 | |
| Rights | | | — | | | 0 | * | | — | | | 0 | |
| Money Market Funds | | | 4,878,903 | | | — | | | — | | | 4,878,903 | |
| Total Investments in Securities | | $ | 495,233,546 | | $ | 105,541,957 | | $ | — | | $ | 600,775,503 | |
| | | | | | | | | | | | | | |
| Securities Sold Short at Fair Value | | | Level 1 | | | Level 2 | | | Level 3 | | | Total | |
| Exchange Traded Funds - Short | | $ | 15,744,312 | | $ | — | | $ | — | | $ | 15,744,312 | |
| Total Securities Sold Short | | $ | 15,744,312 | | $ | — | | $ | — | | $ | 15,744,312 | |
| | The basis for recognizing and valuing transfers is as of the end of the period in which transfers occur. There were transfers from Level 1 to Level 2 of common stocks in the amount of $2,016,207 during the year ended September 30, 2012. The transfers were due to the adjustment of fair value of certain securities due to developments that occurred between the time of the close of the foreign markets on which they trade and the close of regular session trading on the NYSE. The Fund did not invest in any Level 3 securities during the period. |
| | |
| | * Rights valued at $0 at September 30, 2012. |
|
| 112 | The Leuthold Funds - 2012 Annual Report | |
| Leuthold Global Fund | |
| Investments at Fair Value | | Level 1 | | Level 2 | | Level 3 | | Total | |
| Common Stocks | | $ | 155,839,281 | | $ | 87,421,871 | | $ | 48,052 | | $ | 243,309,204 | |
| Preferred Stocks | | | 2,957,767 | | | — | | | — | | | 2,957,767 | |
| Exchange Traded Funds | | | 35,855,505 | | | — | | | — | | | 35,855,505 | |
| Precious Metals | | | — | | | 18,785,720 | | | — | | | 18,785,720 | |
| Corporate Bonds | | | — | | | 28,087,646 | | | — | | | 28,087,646 | |
| United States Treasury Obligations | | | — | | | 15,406,791 | | | — | | | 15,406,791 | |
| Foreign Government Bonds/Notes | | | — | | | 18,014,662 | | | — | | | 18,014,662 | |
| Money Market Funds | | | 13,267,334 | | | — | | | — | | | 13,267,334 | |
| Total Investments in Securities | | $ | 207,919,887 | | $ | 167,716,690 | | $ | 48,052 | | $ | 375,684,629 | |
| | | | | | | | | | | | | | |
| Securities Sold Short at Fair Value | | | Level 1 | | | Level 2 | | | Level 3 | | | Total | |
| Exchange Traded Funds - Short | | $ | 9,497,176 | | $ | — | | $ | — | | $ | 9,497,176 | |
| Total Securities Sold Short | | $ | 9,497,176 | | $ | — | | $ | — | | $ | 9,497,176 | |
| | The basis for recognizing and valuing transfers is as of the end of the period in which transfers occur. There were transfers from Level 1 to Level 2 of common stocks in the amount of $8,151,032 during the year ended September 30, 2012. The transfers were due to the adjustment of fair value of certain securities due to developments that occurred between the time of the close of the foreign markets on which they trade and the close of regular session trading on the NYSE. |
| | |
| | The following is a reconciliation of Level 3 assets for which significant unobservable inputs were used to determine fair value: |
| | | | Investments in Securities at Fair Value | |
| | Balance as of September 30, 2011 | | $ | 472,086 | |
| | Accrued discounts/premiums | | | — | |
| | Realized gain (loss) | | | — | |
| | Change in unrealized appreciation (depreciation) | | | (424,034 | ) |
| | Purchases | | | — | |
| | Sales | | | — | |
| | Transfer in and/or out of Level 3 | | | — | |
| | Balance as of September 30, 2012 | | $ | 48,052 | |
| | | | | | |
| | Change in unrealized appreciation (depreciation) during the period ended for Level 3 investments held at September 30, 2012: | | $ | (424,034 | ) |
| | The security is classified as a Level 3 security due to a halt in trading of the security on January 26, 2011. The security is valued at fair value as determined in good faith by the Directors. The Adviser submits a report to the Directors setting forth the factors considered in determining the price. The significant unobservable input used in the fair valuation of this security is a discount of 95% from the last traded price of HKD 2.95. Significant changes in the discount rate may result in a change in fair value measurement. During the period the discount ranged from 50% to 95%. |
| Leuthold Select Industries Fund | |
| Investments at Fair Value | | Level 1 | | Level 2 | | Level 3 | | Total | |
| Common Stocks | | $ | 13,488,915 | | $ | — | | $ | — | | $ | 13,488,915 | |
| Money Market Funds | | | 22,753 | | | — | | | — | | | 22,753 | |
| Total Investments in Securities | | $ | 13,511,668 | | $ | — | | $ | — | | $ | 13,511,668 | |
| | The Fund did not invest in any Level 3 securities or have transfers into or out of Level 1 or Level 2 securities during the period. The basis for recognizing and valuing transfers is as of the end of the period in which transfers occur. |
|
| | The Leuthold Funds - 2012 Annual Report | 113 |
| Leuthold Global Industries Fund | |
| Investments at Fair Value | | Level 1 | | Level 2 | | Level 3 | | Total | |
| Common Stocks | | $ | 4,683,392 | | $ | 3,032,338 | | $ | 2,244 | | $ | 7,717,974 | |
| Preferred Stocks | | | 99,527 | | | — | | | — | | | 99,527 | |
| Money Market Funds | | | 129,418 | | | — | | | — | | | 129,418 | |
| Total Investments in Securities | | $ | 4,912,337 | | $ | 3,032,338 | | $ | 2,244 | | $ | 7,946,919 | |
| | The basis for recognizing and valuing transfers is as of the end of the period in which transfers occur. There were transfers from Level 1 to Level 2 of common stocks in the amount of $289,121 during the year ended September 30, 2012. The transfers were due to the adjustment of fair value of certain securities due to developments that occurred between the time of the close of the foreign markets on which they trade and the close of regular session trading on the NYSE. |
| | |
| | The following is a reconciliation of Level 3 assets for which significant unobservable inputs were used to determine fair value: |
| | | | | | |
| | | | Investments in Securities at Fair Value | |
| | Balance as of September 30, 2011 | | $ | 22,046 | |
| | Accrued discounts/premiums | | | — | |
| | Realized gain (loss) | | | — | |
| | Change in unrealized appreciation (depreciation) | | | (19,802 | ) |
| | Purchases | | | — | |
| | Sales | | | — | |
| | Transfer in and/or out of Level 3 | | | — | |
| | Balance as of September 30, 2012 | | $ | 2,244 | |
| | | | | | |
| | Change in unrealized appreciation (depreciation) during the period ended for Level 3 investments held at September 30, 2012: | | $ | (19,802 | ) |
| | The security is classified as a Level 3 security due to a halt in trading of the security on January 26, 2011. The security is valued at fair value as determined in good faith by the Directors. The Adviser submits a report to the Directors setting forth the factors considered in determining the price. The significant unobservable input used in the fair valuation of this security is a discount of 95% from the last traded price of HKD 2.95. Significant changes in the discount rate may result in a change in fair value measurement. During the period the discount ranged from 50% to 95%. |
| Leuthold Global Clean Technology Fund | |
| Investments at Fair Value | | Level 1 | | Level 2 | | Level 3 | | Total | |
| Common Stocks | | $ | 6,588,618 | | $ | 1,672,361 | | $ | — | | $ | 8,260,979 | |
| Preferred Stocks | | | 88,512 | | | — | | | — | | | 88,512 | |
| Warrants | | | — | | | 0 | * | | — | | | 0 | |
| Money Market Funds | | | 241,755 | | | — | | | — | | | 241,755 | |
| Total Investments in Securities | | $ | 6,918,885 | | $ | 1,672,361 | | $ | — | | $ | 8,591,246 | |
| | The basis for recognizing and valuing transfers is as of the end of the period in which transfers occur. There were transfers from Level 1 to Level 2 of common stocks in the amount of $924,815 during the year ended September 30, 2012. The transfers were due to the adjustment of fair value of certain securities due to developments that occurred between the time of the close of the foreign markets on which they trade and the close of regular session trading on the NYSE. The Fund did not invest in any Level 3 securities during the period. |
| | |
| | * Warrants valued at $0 at September 30, 2012. |
|
| 114 | The Leuthold Funds - 2012 Annual Report | |
| Grizzly Short Fund | |
| Investments at Fair Value | | Level 1 | | | Level 2 | | | Level 3 | | | Total | |
| Money Market Funds | | $ | 5,461,654 | | | $ | — | | | $ | — | | | $ | 5,461,654 | |
| Total Investments in Securities | | $ | 5,461,654 | | | $ | — | | | $ | — | | | $ | 5,461,654 | |
| Securities Sold Short at Fair Value | | Level 1 | | | Level 2 | | | Level 3 | | | Total | |
| Common Stocks - Short | | $ | 114,983,528 | | | $ | — | | | $ | — | | | $ | 114,983,528 | |
| Exchange Traded Funds - Short | | | 14,622,174 | | | | — | | | | — | | | | 14,622,174 | |
| Total Securities Sold Short | | $ | 129,605,702 | | | $ | — | | | $ | — | | | $ | 129,605,702 | |
| | |
| | The Fund did not invest in any Level 3 securities or have transfers into or out of Level 1 or Level 2 securities during the period. The basis for recognizing and valuing transfers is as of the end of the period in which transfers occur. |
| | |
| | For further information regarding security characteristics, see the Schedules of Investments. |
| | |
| c) | Federal Income Taxes – Provision for federal income taxes or excise taxes has not been made since the Funds have elected to be taxed as “regulated investment companies” and intend to distribute substantially all taxable income to shareholders and otherwise comply with the provisions of the Internal Revenue Code applicable to regulated investment companies. Distributions from net realized gains for book purposes may include short-term capital gains which are included as ordinary income to shareholders for tax purposes. The Funds also designate as distributions of long-term gains, to the extent necessary to fully distribute such capital gains, earnings and profits distributed to shareholders on the redemption of shares. The tax character of distributions paid during the fiscal years ended September 30, 2012 and 2011 was as follows: |
| Year Ended September 30, 2012 | |
| | | Leuthold Core Investment Fund | | | Leuthold Asset Allocation Fund | | | Leuthold Global Fund | | | Leuthold Select Industries Fund | | | Leuthold Global Industries Fund | | | Leuthold Global Clean Technology Fund | | | Grizzly Short Fund | |
| Distributions paid from: | | | | | | | | | | | | | | | | | | | | | |
| | | | | | | | | | | | | | | | | | | | | | |
| Ordinary Income | | $ | 27,886,190 | | | $ | 29,439,115 | | | $ | 5,685,282 | | | $ | 25,862 | | | $ | 18,020 | | | $ | — | | | $ | — | |
| Long Term Capital Gain | | | — | | | | — | | | | 4,587,025 | | | | — | | | | — | | | | — | | | | — | |
| Return of Capital | | | — | | | | — | | | | — | | | | — | | | | — | | | | — | | | | — | |
| Total Distribution Paid | | $ | 27,886,190 | | | $ | 29,439,115 | | | $ | 10,272,307 | | | $ | 25,862 | | | $ | 18,020 | | | | — | | | | — | |
| Year Ended September 30, 2011 | |
| | | Leuthold Core Investment Fund | | | Leuthold Asset Allocation Fund | | | Leuthold Global Fund | | | Leuthold Select Industries Fund | | | Leuthold Global Industries Fund | | | Leuthold Global Clean Technology Fund | | | Grizzly Short Fund | |
| Distributions paid from: | | | | | | | | | | | | | | | | | | | | | |
| | | | | | | | | | | | | | | | | | | | | | |
| Ordinary Income | | $ | 5,131,946 | | | $ | 7,502,082 | | | $ | 11,346,023 | | | $ | 45,146 | | | $ | 236,013 | | | $ | — | | | $ | — | |
| Long Term Capital Gain | | | — | | | | — | | | | 6,950,662 | | | | — | | | | — | | | | — | | | | — | |
| Return of Capital | | | — | | | | — | | | | — | | | | — | | | | — | | | | — | | | | — | |
| Total Distributions Paid | | $ | 5,131,946 | | | $ | 7,502,082 | | | $ | 18,296,685 | | | $ | 45,146 | | | $ | 236,013 | | | $ | — | | | $ | — | |
|
| | The Leuthold Funds - 2012 Annual Report | 115 |
At September 30, 2012, the components of accumulated earnings (deficit) on a tax basis were as follows:
| | | | | | | | | | | | | | | | | | | | | | |
| | | Leuthold Core Investment Fund | | | Leuthold Asset Allocation Fund | | | Leuthold Global Fund | | | Leuthold Select Industries Fund | | | Leuthold Global Industries Fund | | | Leuthold Global Clean Technology Fund | | | Grizzly Short Fund | |
| Undistributed ordinary income | | $ | 5,683,952 | | | $ | 8,246,872 | | | $ | 1,237,305 | | | $ | 7,803 | | | $ | — | | | $ | — | | | $ | — | |
| Undistributed long-term gains | | | — | | | | — | | | | — | | | | — | | | | — | | | | — | | | | — | |
| Distributable earnings | | | 5,683,952 | | | | 8,246,872 | | | | 1,237,305 | | | | 7,803 | | | | — | | | | — | | | | — | |
| | | | | | | | | | | | | | | | | | | | | | | | | | | | | |
| Capital loss carryover and post-October losses | | | (7,742,724 | ) | | | (347,663,871 | ) | | | (2,601,550 | ) | | | (5,015,081 | ) | | | (2,188,086 | ) | | | (5,632,764 | ) | | | (124,071,973 | ) |
| Other accumulated gains (losses) | | | (316,450 | ) | | | (411,362 | ) | | | 241,279 | | | | — | | | | — | | | | — | | | | (3,433,630 | ) |
| Unrealized appreciation (depreciation) | | | 80,768,715 | | | | 67,664,266 | | | | 31,127,148 | | | | 1,482,801 | | | | 630,401 | | | | 710,004 | | | | (17 | ) |
| Total accumulated gain (loss) | | $ | 78,393,493 | | | $ | (272,164,095 | ) | | $ | 30,004,182 | | | $ | (3,524,477 | ) | | $ | (1,557,685 | ) | | $ | (4,922,760 | ) | | $ | (127,505,620 | ) |
Net investment income and realized gains and losses for federal income tax purposes may differ from that reported on the financial statements because of permanent book-to-tax differences. U.S. GAAP requires that permanent differences between financial reporting and tax reporting be reclassified between various components of net assets. These differences are primarily due to net operating losses, and differences from REIT adjustments and foreign currency gain and loss.
Additionally, U.S. GAAP requires that certain components of net assets relating to permanent differences be reclassified between financial and tax reporting. These reclassifications have no effect on net assets or net asset value per share. For the year ended September 30, 2012, the following table shows the reclassifications made:
| | | | | | | | | | |
| | | Undistributed Net Investment Income/(Loss) | | | Accumulated Net Realized Gain/(Loss) | | | Paid In Capital | |
| | | | | | | | | | |
| Leuthold Core Investment Fund | | $ | 10,200,552 | | | $ | (10,200,545 | ) | | $ | (7 | ) |
| Leuthold Asset Allocation Fund | | | 14,826,464 | | | | (14,825,702 | ) | | | (762 | ) |
| Leuthold Global Fund | | | 1,710,837 | | | | (1,710,839 | ) | | | 2 | |
| Leuthold Select Industries Fund | | | 208 | | | | (208 | ) | | | — | |
| Leuthold Global Industries Fund | | | 2,809 | | | | 6,450 | | | | (9,259 | ) |
| Leuthold Global Clean Technology Fund | | | 14,601 | | | | 16,022 | | | | (30,623 | ) |
| Grizzly Short Fund | | | 2,269,228 | | | | (195,319 | ) | | | (2,073,909 | ) |
Under current law, the Funds may carry forward net capital losses indefinitely to use to offset capital gains realized in future years. Previous law limited the carry forward of capital losses to the eight tax years following the year the capital loss was realized. If a Fund has capital losses that are subject to current law and also has capital losses subject to prior law, the losses realized under current law will be utilized to offset capital gains before any of the losses governed by prior law can be used. As a result of these ordering rules, capital losses realized under previous law may be more likely to expire unused. Capital losses realized under current law will carry forward retaining their classification as long-term or short-term losses, whereas under prior law all capital losses were carried forward as short-term capital losses.
|
| 116 | The Leuthold Funds - 2012 Annual Report | |
| | | Leuthold Core Investment Fund | | | Leuthold Asset Allocation Fund | | | Leuthold Global Fund | | | Leuthold Select Industries Fund | | | Leuthold Global Industries Fund | | | Leuthold Global Clean Technology Fund | | | Grizzly Short Fund | |
| Expires 09/30/17 | | $ | — | | | $ | — | | | $ | — | | | $ | (1,078,129 | )* | | $ | — | | | $ | — | | | $ | — | |
| Expires 09/30/18 | | | — | | | | (334,348,407 | ) | | | — | | | | (3,118,819 | ) | | | — | | | | (17,387 | ) | | | (18,663,090 | ) |
| Expires 09/30/19 | | | — | | | | — | | | | — | | | | — | | | | (17,340 | ) | | | (1,413,543 | ) | | | (25,380,935 | ) |
| Unlimited Short-Term | | | — | | | | — | | | | — | | | | — | | | | (514,900 | ) | | | (2,737,687 | ) | | | (21,657,328 | ) |
| Unlimited Long-Term | | | — | | | | — | | | | — | | | | — | | | | — | | | | (64,687 | ) | | | — | |
| | | | | | | | | | | | | | | | | | | | | | | | | | | | | |
| *Capital loss carryforward transferred in from merger, subject to annual limitations. | |
| | The Leuthold Core Investment Fund, Leuthold Asset Allocation Fund, Leuthold Global Fund, Leuthold Select Industries Fund, Leuthold Global Industries Fund, Leuthold Global Clean Technology Fund and Grizzly Short Fund intend to defer and treat $7,742,724, $13,315,464, $2,601,550, $818,133, $1,655,846, $1,399,460, and $58,370,620, respectively, of late year losses incurred during the fiscal year ended September 30, 2012 as arising in the fiscal year ending September 30, 2013. |
| | |
| | As of September 30, 2012, the Funds did not have any tax positions that did not meet the “more likely-than-not” threshold of being sustained by the applicable tax authority. Generally, tax authorities can examine all the tax returns filed for the last three years. |
| | |
| | The Funds recognize interest and penalties, if any, related to unrecognized tax benefits as income tax expense in the Statement of Operations. During the period, the Funds did not incur any interest or penalties. |
| | |
| d) | Distributions to Shareholders – Dividends from net investment income, if any, are declared and paid quarterly. Distributions of net realized capital gains, if any, are declared and paid at least annually. |
| | |
| e) | Use of Estimates – The preparation of financial statements in conformity with U.S. GAAP requires management to make estimates and assumptions that affect the reported amounts of assets and liabilities and disclosure of contingent assets and liabilities at the date of the financial statements and the reported amounts of revenues and expenses during the reporting period. Actual results could differ from those estimates. |
| | |
| f) | Basis for Consolidation for the Leuthold Core Investment Fund, Leuthold Asset Allocation Fund, and Leuthold Global Fund – The Leuthold Core Investment Fund, Leuthold Asset Allocation Fund, and Leuthold Global Fund may invest up to 25% of their total assets in their Subsidiary, Leuthold Core, Ltd., Leuthold Asset Allocation, Ltd., and Leuthold Global, Ltd. (the “Subsidiaries”), respectively. The Subsidiaries, which are organized under the laws of the Cayman Islands, are wholly owned and controlled by the Leuthold Core Investment Fund, Leuthold Asset Allocation Fund, and Leuthold Global Fund, respectively, and are therefore consolidated in the respective Funds’ financial statements herein. All intercompany balances, revenues, and expenses have been eliminated in consolidation. The Subsidiaries act as investment vehicles in order to enter into certain investments for the Leuthold Core Investment Fund, Leuthold Asset Allocation Fund, and Leuthold Global Fund consistent with the investment objectives and policies specified in the Prospectus and Statement of Additional Information. |
|
| | The Leuthold Funds - 2012 Annual Report | 117 |
| g) | Short Positions – For financial statement purposes, an amount equal to the required amount of collateral to be segregated for short positions is included in the Statements of Assets and Liabilities as an asset. The amount of the securities sold short, shown as a liability, is subsequently marked-to-market to reflect the current value of the short position. Subsequent fluctuations in the market prices of securities sold short may require purchasing the securities at prices which could differ from the amount reflected in the Statements of Assets and Liabilities. The Funds are liable for any dividends or interest payable on securities while those securities are in a short position. As collateral for their short positions, the Funds are required under the Investment Company Act of 1940 to maintain segregated assets consisting of cash, cash equivalents, or liquid securities. These segregated assets are valued consistent with Note 1a above. The amount of segregated assets is required to be adjusted daily to reflect changes in the market value of the securities sold short. Leuthold Core Investment Fund, Leuthold Asset Allocation Fund, Leuthold Global Fund, and Grizzly Short Fund’s receivable from broker for securities sold short is with two major security dealers. |
| | |
| h) | Other – Investment and shareholder transactions are recorded on the trade date. The Funds determine the gain or loss realized from the investment transactions by comparing the original cost of the security lot sold with the net sales proceeds. Dividend income is recognized on the ex-dividend date or as soon as information is available to the Funds, and interest income is recognized on an accrual basis. Discounts and premiums on bonds are amortized using the yield to maturity method over the life of the respective bond. For financial reporting purposes, the Funds isolate changes in the exchange rate of investment securities from the fluctuations arising from changes in the market prices of securities for realized gains and losses. |
| | |
| i) | Expenses – Expenses that directly relate to one of the Funds are charged directly to that Fund. Other operating expenses of the Funds, such as Directors fees and expenses, insurance expense, and legal fees are allocated between the seven Funds based on the relative net asset value of the individual Funds. |
| | |
| j) | Counterparty risk – Counterparty risk may arise as the result of the failure of a counterparty to a securities contract to comply with the terms of the contract. Potential counterparty risk is measured by the credit worthiness of the counterparty and additional risk may arise from unanticipated events affecting the value of the underlying security. |
| | |
| k) | Subsequent Events – The Funds have evaluated subsequent events through the date of issuance of the Funds’ financial statements. At a meeting of the Board of Directors of the Funds held on November 12, 2012, the Board voted to close the Leuthold Global Clean Technology Fund (the “Fund”) to new investments, effective November 12, 2012, (other than reinvestment of dividends and distributions), and adopted a plan to terminate and liquidate the Fund on or before December 24, 2012 (the “Liquidation Date”). Management determined that there were no other events that impacted the Funds’ Financial Statements. |
|
| 118 | The Leuthold Funds - 2012 Annual Report | |
| 2. | INVESTMENT TRANSACTIONS |
| | Purchases and sales of investment securities, other than short-term investments and short sales, for the year ended September 30, 2012 are summarized below. |
| | | | | | | | | | | | | | | | | | | | |
| | | Leuthold Core Investment Fund | | Leuthold Asset Allocation Fund | | Leuthold Global Fund | | Leuthold Select Industries Fund | | Leuthold Global Industries Fund | | Leuthold Global Clean Technology Fund | |
| Purchases | | $ | 1,241,087,990 | | $ | 977,183,580 | | $ | 514,497,528 | | $ | 21,072,237 | | $ | 13,071,299 | | $ | 13,394,309 | |
| Sales | | | 1,289,832,006 | | | 1,163,984,822 | | | 485,673,052 | | | 27,044,746 | | | 27,725,359 | | | 22,002,586 | |
| | At September 30, 2012, gross unrealized appreciation and depreciation of investments and cost of investments (excluding short positions) for tax purposes were as follows: |
| | | Leuthold Core Investment Fund | | Leuthold Asset Allocation Fund | | Leuthold Global Fund | | Leuthold Select Industries Fund | | Leuthold Global Industries Fund | | Leuthold Global Clean Technology Fund | | Grizzly Short Fund | |
| Tax cost of investments | | $ | 676,675,471 | | $ | 533,111,593 | | $ | 344,557,464 | | $ | 12,028,854 | | $ | 7,315,517 | | $ | 7,881,161 | | $ | 5,461,654 | |
| | | | | | | | | | | | | | | | | | | | | | | |
| Gross unrealized appreciation | | $ | 88,701,134 | | $ | 77,809,165 | | $ | 36,516,834 | | $ | 1,694,384 | | $ | 821,555 | | $ | 992,425 | | $ | 5,436,680 | |
| Gross unrealized depreciation | | | (7,932,419 | ) | | (10,144,899 | ) | | (5,389,686 | ) | | (211,583 | ) | | (191,154 | ) | | (282,421 | ) | | (5,436,697 | ) |
| Net unrealized appreciation (depreciation) | | $ | 80,768,715 | | $ | 67,664,266 | | $ | 31,127,148 | | $ | 1,482,801 | | $ | 630,401 | | $ | 710,004 | | $ | (17 | ) |
| | |
| | The differences between book and tax basis of unrealized appreciation (depreciation) are primarily attributable to the tax deferral of losses on wash sales. |
| | |
| 3. | INVESTMENT ADVISORY AND OTHER AGREEMENTS |
| | The Funds have entered into an Investment Advisory Agreement (“advisory agreement”) with Leuthold Weeden Capital Management (“Investment Adviser”). Pursuant to its advisory agreement with the Funds, the Investment Adviser is entitled to receive a fee, calculated daily as applied to each Fund’s daily net assets and payable monthly, at annual rates of: |
Leuthold Core Investment Fund | | Leuthold Asset Allocation Fund | | Leuthold Global Fund | | Leuthold Select Industries Fund | | Leuthold Global Industries Fund | | Leuthold Global Clean Technology Fund | | Grizzly Short Fund |
| 0.90% | | 0.90% | | 1.10% | | 1.00% | | 1.00% | | 1.00% | | 1.25% |
| | The Investment Adviser has agreed to waive its advisory fee and/or reimburse the Funds’ other expenses, including organization expenses, to the extent necessary to ensure that the Funds’ total operating expenses (exclusive of interest, taxes, brokerage commissions, dividends and interest on short positions, and other costs incurred in connection with the purchase or sale of portfolio securities, and extraordinary items) do not exceed the following rates, based on each Fund’s average daily net assets: |
|
| | The Leuthold Funds - 2012 Annual Report | 119 |
Leuthold Core Investment Fund | | Leuthold Asset Allocation Fund | | Leuthold Global Fund | | Leuthold Select Industries Fund | | Leuthold Global Industries Fund | | Leuthold Global Clean Technology Fund | | Grizzly Short Fund |
| 1.25% | | 1.50% | | 1.85% | | 1.60% | | 1.85% | | 1.85% | | 2.50% |
| | Any waiver or reimbursement is subject to later adjustments to allow the Investment Adviser to recoup amounts previously waived or reimbursed to the extent actual fees and expenses for a fiscal period are less than each Fund’s expense limitation, provided, however, that the Investment Adviser shall only be entitled to recoup such amounts for a period of three years from the date such amount was waived or reimbursed. Amounts subject to future recoupment as of September 30, 2012 are as follows: |
| | Leuthold Select Industries Fund | | Leuthold Global Industries Fund | |
| | Year of Expiration | | Recoverable Amount | | Year of Expiration | | Recoverable Amount | |
| | 9/30/2015 | | $16,951 | | 9/30/2013 | | $31,506 | |
| | | | | | 9/30/2015 | | 58,737 | |
| | Leuthold Global Clean Technology Fund |
| | Year of Expiration | | Recoverable Amount |
| | 9/30/2015 | | $15,497 |
| | |
| | U.S. Bancorp Fund Services, LLC serves as transfer agent, administrator, and accounting services agent for the Funds. U.S. Bank, N.A. serves as custodian for the Funds. For the year ended September 30, 2012, the Leuthold Core Investment Fund, Leuthold Asset Allocation Fund, Leuthold Global Fund, Leuthold Select Industries Fund, Leuthold Global Industries Fund, Leuthold Global Clean Technology Fund, and Grizzly Short Fund paid Weeden & Co., L.P., an affiliate of the Adviser, $645,259, $255,744, $36,227, $15,258, $1,235, $9,798, and $53,840, respectively, for brokerage commissions. |
| | |
| 4. | DISTRIBUTION PLAN |
| | Each of the Leuthold Asset Allocation Fund – Retail Class, Leuthold Global Fund – Retail Class, Leuthold Global Industries Fund – Retail Class, and Leuthold Global Clean Technology Fund – Retail Class has adopted a distribution plan pursuant to Rule 12b-1 under the Investment Company Act, whereby Rafferty Capital Markets, LLC serves as distributor. This plan allows each Fund to use up to 0.25% of its average daily net assets to pay sales, distribution, and other fees for the sale of its shares and for services provided to investors. Each Fund may pay all or a portion of this fee to any securities dealer, financial institution, or any other person who renders personal service to the Funds’ shareholders, assists in the maintenance of the Funds’ shareholder accounts, or who renders assistance in distributing or promoting the sale of shares of the Fund pursuant to a written agreement approved by the Board of Directors. To the extent such fee is not paid to such persons, each of the Funds may use the fee for its expenses of distribution of its shares, including, but not limited to, payment by the Fund of the cost of preparing, printing, and distributing Prospectuses and Statements of Additional Information to prospective investors and of implementing and operating the Plan. |
|
| 120 | The Leuthold Funds - 2012 Annual Report | |
| 5. | INDEMNIFICATIONS |
| | The Funds enter into contracts that contain a variety of indemnifications. The Funds’ maximum exposure under these arrangements is unknown. However, the Funds have not had prior claims or losses pursuant to these contracts and expect the risk of loss to be remote. |
| | |
| 6. | ILLIQUID SECURITIES |
| | Each Fund may invest up to 15% of net assets in securities for which there is no readily available market (“illiquid securities”). The 15% limitation includes securities whose disposition would be subject to legal restrictions (“restricted securities”). Illiquid and restricted securities often have a market value lower than the market price of unrestricted securities of the same issuer and are not readily marketable without some time delay. This could result in a Fund being unable to realize a favorable price upon disposition of such securities and in some cases might make disposition of such securities at the time desired by the Fund impossible. |
| | |
| 7. | LENDING PORTFOLIO SECURITIES |
| | The Funds may lend portfolio securities constituting up to 30% of total assets to unaffiliated broker dealers, banks, or other recognized institutional borrowers of securities, provided that the borrower at all times maintains cash, U.S. government securities or equivalent collateral or provides an irrevocable letter of credit in favor of the Fund equal in value to at least 100% of the value of the securities loaned. The Funds did not lend any portfolio securities during the reporting period, and will not enter into any securities lending arrangements in the future without the prior approval of the Board of Directors. |
|
| | The Leuthold Funds - 2012 Annual Report | 121 |
REPORT OF INDEPENDENT REGISTERED PUBLIC ACCOUNTING FIRM
| | |
| | To the Shareholders and Board of Directors |
| | Leuthold Funds, Inc. |
| | |
| | We have audited the accompanying statements of assets and liabilities, including the schedules of investments and securities sold short (as applicable), of Leuthold Funds, Inc. (consisting of Leuthold Core Investment Fund (consolidated), Leuthold Asset Allocation Fund (consolidated), Leuthold Global Fund (consolidated), Leuthold Select Industries Fund, Leuthold Global Industries Fund, Leuthold Global Clean Technology Fund, and Grizzly Short Fund) (the “Funds”) as of September 30, 2012, and the related statements of operations for the year then ended, changes in net assets for the two years in the period then ended, and the financial highlights for each of the periods indicated therein. These financial statements and financial highlights are the responsibility of the Funds’management. Our responsibility is to express an opinion on these financial statements and financial highlights based on our audits. |
| | |
| | We conducted our audits in accordance with the standards of the Public Company Accounting Oversight Board (United States). Those standards require that we plan and perform the audits to obtain reasonable assurance about whether the financial statements and financial highlights are free of material misstatement. We were not engaged to perform an audit of the Funds’ internal control over financial reporting. Our audits included consideration of internal control over financial reporting as a basis for designing audit procedures that are appropriate in the circumstances, but not for the purpose of expressing an opinion on the effectiveness of the Funds’ internal control over financial reporting. Accordingly, we express no such opinion. An audit includes examining, on a test basis, evidence supporting the amounts and disclosures in the financial statements and financial highlights, assessing the accounting principles used and significant estimates made by management, and evaluating the overall financial statement presentation. Our procedures included confirmation of securities owned and securities sold short (as applicable) as of September 30, 2012, by correspondence with the custodian and brokers. We believe that our audits provide a reasonable basis for our opinion. |
| | |
| | In our opinion, the financial statements and financial highlights referred to above present fairly, in all material respects, the financial position of each of the respective funds constituting Leuthold Funds, Inc. at September 30, 2012, the results of their operations for the year then ended, changes in their net assets for the two years in the period then ended, and the financial highlights for each of the periods indicated therein, in conformity with U.S. generally accepted accounting principles. |

Minneapolis, Minnesota
November 21, 2012
|
| 122 | The Leuthold Funds - 2012 Annual Report | |
ADDITIONAL INFORMATION (Unaudited)
SHAREHOLDER NOTIFICATION OF FEDERAL TAX STATUS (Unaudited)
| | |
| | The percentage of dividend income distributed for the year ended September 30, 2012, which is designated as qualified dividend income under the Jobs and Growth Tax Relief Reconciliation Act of 2003, is as follows: Leuthold Core Investment Fund 59.24%, Leuthold Asset Allocation Fund 63.94%, Leuthold Global Fund 100%, Leuthold Select Industries Fund 100.00%, and Leuthold Global Industries Fund 100%. |
| | |
| | The percentage of dividend income distributed for the year ended September 30, 2012, designated as qualified dividends received deduction available to corporate shareholders, is as follows: Leuthold Core Investment Fund 42.50%, Leuthold Asset Allocation Fund 46.10%, Leuthold Global Fund 47.50%, Leuthold Select Industries Fund 100.00%, and Leuthold Global Industries Fund 53.00%. |
| | |
| | The Leuthold Core Investment Fund, Leuthold Asset Allocation Fund, Leuthold Global Fund, and Leuthold Global Industries Fund designated 4.79%, 3.80%, 9.81%, and 0.01%, respectively, of their ordinary distributions paid as qualified interest related dividends under the Internal Revenue Code Section 871(k)(1)(C) for the year ended September 30, 2012. |
|
| | The Leuthold Funds - 2012 Annual Report | 123 |
ADDITIONAL DISCLOSURE REGARDING FUND DIRECTORS AND OFFICERS (UNAUDITED)
Independent Directors
| | | | | | | | | | | |
Name, Year of Birth, and Address | | Position(s) Held with the Company | | Term of Office and Length of Time Served | | Principal Occupation(s) During Past Five Years | | # of Portfolios in Fund Complex Overseen By Director | | Other Directorships Held by Director |
Lawrence L. Horsch (1934) c/o Leuthold Weeden Capital Management 33 South Sixth Street Suite 4600 Minneapolis, MN 55402 | | Chairman and Director | | Indefinite Term, Director since 1995 | | Chairman, Eagle Management & Financial Corp., a management consulting firm | | 7 | | None |
| | | | | | | | | | | |
Paul M. Kelnberger (1943) c/o Leuthold Weeden Capital Management 33 South Sixth Street Suite 4600 Minneapolis, MN 55402 | | Director and Chair of Audit Committee | | Indefinite Term, Director since 1995 | | Consultant to Johnson, West & Co., PLC | | 7 | | None |
| | | | | | | | | | | |
Addison L. Piper (1946) c/o Leuthold Weeden Capital Management 33 South Sixth Street Suite 4600 Minneapolis, MN 55402 | | Director and Chair of Nominating Committee | | Indefinite Term, Director since 2009 | | Retired Chairman and Chief Executive Officer of Piper Jaffray Companies, Served as Vice Chairman of Piper Jaffray Companies from 2003 to 2006. | | 7 | | Piper Jaffray Companies |
| | | | | | | | | | | |
| Interested Directors (and Officers) | | | | | | | | |
| | | | | | | | | | | |
Steven C. Leuthold (1937) 33 South Sixth Street Suite 4600 Minneapolis, MN 55402 | | Director | | Indefinite Term, Director since 1995 | | Managing member of Leuthold Weeden Capital Management (the “Adviser”). Prior to October 2011, served as Chief Investment Officer of the Adviser. | | 7 | | None |
| | | | | | | | | | | |
John C. Mueller (1968) 33 South Sixth Street Suite 4600 Minneapolis, MN 55402 | | Director President | | Indefinite Term, Director since 2009 One year term, President since 2011 | | Co-Chief Executive Officer of The Leuthold Group since 2005. Involved in Sales and Marketing for The Leuthold Group since 2001. | | 7 | | None |
|
| 124 | The Leuthold Funds - 2012 Annual Report |
Name, Year of Birth, and Address | | Position(s) Held with the Company | | Term of Office and Length of Time Served | | Principal Occupation During Past Five Years | | # of Portfolios in Fund Complex Overseen By Director | | Other Directorships Held by Director |
Edward C. Favreau (1952) 33 South Sixth Street Suite 4600 Minneapolis, MN 55402 | | Vice President | | One Year Term, Vice President since 1999 | | Manager of Marketing and Sales of the Adviser since 1999. Prior to joining the Adviser, he was Vice President and Sales Manager of U.S. Bancorp Investments, Inc. | | N/A | | N/A |
| | | | | | | | | | | |
Roger A. Peters (1960) 33 South Sixth Street Suite 4600 Minneapolis, MN 55402 | | Vice President and Chief Compliance Officer and Anti-Money Laundering Officer | | One Year Term, Chief Compliance Officer since 2006 and Vice President since 2007 and Anti-Money Laundering Officer since 2011 | | Chief Compliance Officer of the Adviser since 2005. Prior to joining the Adviser, he was Vice President, Commercial Product Management of U.S. Bank from 2003-2005. | | N/A | | N/A |
| | | | | | | | | | | |
Holly J. Weiss (1968) 33 South Sixth Street Suite 4600 Minneapolis, MN 55402 | | Secretary and Treasurer | | One Year Term, Secretary and Treasurer since 2009 | | Chief Financial Officer of the Adviser since 2011 and Controller of the Adviser from 2008 to 2011. Prior to joining the Adviser, she was Controller of Churchill Capital Mezzanine Finance from 2001-2008. | | N/A | | N/A |
| | | | | | | | | | | |
Glenn R. Larson (1965) 33 South Sixth Street Suite 4600 Minneapolis, MN 55402 | | Assistant Secretary | | One Year Term, Assistant Secretary since 2006 | | Compliance Officer of the Adviser since 2005. Prior to joining the Adviser, he was a Compliance Representative of U.S. Bancorp Investment Services, Inc. from 2003 until 2005. | | N/A | | N/A |
The Statement of Additional Information includes additional information about the Funds’ Directors and is available free of charge upon request by calling the Funds toll free at (800) 273-6886.
Information regarding the method the Funds use to vote proxies relating to portfolio securities is available without charge upon request by calling toll-free at (800) 273-6886 or by accessing the Funds’ website at www.leutholdfunds.com. Information regarding how the Funds voted proxies relating to portfolio securities during the most recent twelve-month period ended June 30 is available without charge upon request by calling toll-free at (800) 273-6886 or on the SEC’s website at www.sec.gov.
|
| The Leuthold Funds - 2012 Annual Report | 125 |
The Leuthold Funds
| |
| Investment Adviser: |
| Leuthold Weeden Capital |
| Management, Minnesota |
| |
Administrator, Transfer Agent, Dividend Paying Agent, Shareholder Servicing Agent: |
| U.S. Bancorp Fund Services, LLC, |
| Wisconsin |
| |
| Custodian: |
| U.S. Bank, N.A., Wisconsin |
| |
| Counsel: |
| Foley & Lardner, LLP, Wisconsin |
| |
Independent Registered Public Accounting Firm: |
| Ernst & Young LLP, Minnesota |
The Funds are required to file their complete schedules of portfolio holdings with the SEC for their first and third fiscal quarters on Form N-Q. Once filed, the Fund’s Form N-Q is available without charge, upon request on the SEC’s website (http://www.sec.gov) and may be available by calling 1-800-273-6886. You can also obtain copies of Form N-Q by (i) visiting the SEC’s Public Reference Room in Washington, DC (information on the operation of the Public Reference Room may be obtained by calling 1-800-SEC-0330); (ii) sending your request and a duplicating fee to the SEC’s Public Reference Room, Washington, DC 20549-0102; or (iii) sending your request electronically to publicinfosec.gov.
This report is authorized for distribution only when preceded or accompanied by a current prospectus.
Item 2. Code of Ethics.
The registrant has adopted a code of ethics that applies to the registrant’s principal executive officer and principal financial officer. The registrant has not made any amendments to its code of ethics during the period covered by this report. The registrant has not granted any waivers from any provisions of the code of ethics during the period covered by this report. A copy of the registrant’s Code of Ethics is filed herewith.
Item 3. Audit Committee Financial Expert.
The registrant’s board of directors has determined that there is at least one audit committee financial expert serving on its audit committee. Paul Kelnberger is the “audit committee financial expert” and is considered to be “independent” as each term is defined in Item 3 of Form N-CSR.
Item 4. Principal Accountant Fees and Services.
The registrant has engaged its principal accountant to perform audit services, audit-related services, tax services and other services during the past two fiscal years. “Audit services” refer to performing an audit of the registrant's annual financial statements or services that are normally provided by the accountant in connection with statutory and regulatory filings or engagements for those fiscal years. “Audit-related services” refer to the assurance and related services by the principal accountant that are reasonably related to the performance of the audit. “Tax services” refer to professional services rendered by the principal accountant for tax compliance, tax advice, and tax planning. No “other services” were provided by the principal accountant. The following table details the aggregate fees billed or expected to be billed for each of the last two fiscal years for audit fees, audit-related fees, tax fees and other fees by the principal accountant.
| | | FYE 9/30/2012 | | | FYE 9/30/2011 | |
| Audit Fees | | $ | 221,100 | | | $ | 229,100 | |
| Audit-Related Fees | | $ | 0 | | | $ | 0 | |
| Tax Fees | | $ | 18,920 | | | $ | 20,880 | |
| All Other Fees | | $ | 0 | | | $ | 0 | |
The audit committee has adopted pre-approval policies and procedures that require the audit committee to pre-approve all audit and non-audit services of the registrant, including services provided to any entity affiliated with the registrant.
The percentage of fees billed by Ernst & Young, LLP applicable to non-audit services pursuant to waiver of pre-approval requirement were as follows:
| | | FYE 9/30/2012 | | | FYE 9/30/2011 | |
| Audit-Related Fees | | | 0 | % | | | 0 | % |
| Tax Fees | | | 0 | % | | | 0 | % |
| All Other Fees | | | 0 | % | | | 0 | % |
All of the principal accountant’s hours spent on auditing the registrant’s financial statements were attributed to work performed by full-time permanent employees of the principal accountant. (If more than 50 percent of the accountant’s hours were spent to audit the registrant's financial statements for the most recent fiscal year, state how many hours were attributed to work performed by persons other than the principal accountant's full-time, permanent employees.)
The following table indicates the non-audit fees billed or expected to be billed by the registrant’s accountant for services to the registrant and to the registrant’s investment adviser (and any other controlling entity, etc.—not sub-adviser) for the last two years. The audit committee of the board of directors has considered whether the provision of non-audit services that were rendered to the registrant's investment adviser is compatible with maintaining the principal accountant's independence and has concluded that the provision of such non-audit services by the accountant has not compromised the accountant’s independence.
| Non-Audit Related Fees | | FYE 9/30/2012 | | | FYE 9/30/2011 | |
| Registrant | | $ | 0 | | | $ | 0 | |
| Registrant’s Investment Adviser | | $ | 0 | | | $ | 0 | |
Item 5. Audit Committee of Listed Registrants.
Not applicable to registrants who are not listed issuers (as defined in Rule 10A-3 under the Securities Exchange Act of 1934).
Item 6. Investments.
Schedule of Investments is included as part of the report to shareholders filed under Item 1 of this Form.
Item 7. Disclosure of Proxy Voting Policies and Procedures for Closed-End Management Investment Companies.
Not applicable to open-end investment companies.
Item 8. Portfolio Managers of Closed-End Management Investment Companies.
Not applicable to open-end investment companies.
Item 9. Purchases of Equity Securities by Closed-End Management Investment Company and Affiliated Purchasers.
Not applicable to open-end investment companies.
Item 10. Submission of Matters to a Vote of Security Holders.
Not Applicable.
Item 11. Controls and Procedures.
| (a) | The Registrant’s President and Treasurer have reviewed the Registrant's disclosure controls and procedures (as defined in Rule 30a-3(c) under the Investment Company Act of 1940 (the “Act”)) as of a date within 90 days of the filing of this report, as required by Rule 30a-3(b) under the Act and Rules 13a-15(b) or 15d-15(b) under the Securities Exchange Act of 1934. Based on their review, such officers have concluded that the disclosure controls and procedures are effective in ensuring that information required to be disclosed in this report is appropriately recorded, processed, summarized and reported and made known to them by others within the Registrant and by the Registrant’s service provider. |
| (b) | There were no changes in the Registrant's internal control over financial reporting (as defined in Rule 30a-3(d) under the Act) that occurred during the second fiscal quarter of the period covered by this report that has materially affected, or is reasonably likely to materially affect, the Registrant's internal control over financial reporting. |
Item 12. Exhibits.
| (a) | (1) Any code of ethics or amendment thereto, that is subject of the disclosure required by Item 2, to the extent that the registrant intends to satisfy Item 2 requirements through filing an exhibit. Incorporated by reference to previous Form N-CSR filing, filed December 8, 2008. |
(2) A separate certification for each principal executive and principal financial officer pursuant to Section 302 of the Sarbanes-Oxley Act of 2002. Filed herewith.
(3) Any written solicitation to purchase securities under Rule 23c-1 under the Act sent or given during the period covered by the report by or on behalf of the registrant to 10 or more persons. Not applicable to open-end investment companies.
| (b) | Certifications pursuant to Section 906 of the Sarbanes-Oxley Act of 2002. Furnished herewith. |
SIGNATURES
Pursuant to the requirements of the Securities Exchange Act of 1934 and the Investment Company Act of 1940, the registrant has duly caused this report to be signed on its behalf by the undersigned, thereunto duly authorized.
| | (Registrant) | Leuthold Funds, Inc. | |
| | By (Signature and Title)* | /s/ John Mueller | |
| | | John Mueller, President | |
Pursuant to the requirements of the Securities Exchange Act of 1934 and the Investment Company Act of 1940, this report has been signed below by the following persons on behalf of the registrant and in the capacities and on the dates indicated.
| | By (Signature and Title)* )* | /s/ John Mueller | |
| | | John Mueller, President | |
| | By (Signature and Title)* | /s/ Holly Weiss | |
| | | Holly Weiss, Treasurer | |
* Print the name and title of each signing officer under his or her signature.