Washington, D.C. 20549
Leuthold Funds, Inc.
33 S. Sixth Street, Suite 4600, Minneapolis, MN 55402
33 S. Sixth Street, Suite 4600, Minneapolis, MN 55402
Item 1. Reports to Stockholders.
Annual Report
September 30, 2014
The Leuthold Funds
Leuthold Core Investment Fund
Retail Class Shares LCORX
Institutional Class Shares LCRIX
Leuthold Global Fund
Retail Class Shares GLBLX
Institutional Class Shares GLBIX
Leuthold Select Industries Fund LSLTX
Leuthold Global Industries Fund
Retail Class Shares LGINX
Institutional Class Shares LGIIX
Grizzly Short Fund GRZZX
| The Leuthold Funds |
| Table of Contents |
| Letter to Shareholders | | 1 |
| | | |
| Expense Examples | | 14 |
| | | |
| Allocation of Portfolio Holdings | | 17 |
| | | |
| Components of Portfolio Holdings | | 20 |
| | | |
| Investment Graphs | | 21 |
| | | |
| Statements of Assets and Liabilities | | 30 |
| | | |
| Statements of Operations | | 34 |
| | | |
| Statements of Changes in Net Assets | | 38 |
| | | |
| Financial Highlights | | 43 |
| | | |
| Schedule of Investments | | |
| | | |
| Leuthold Core Investment Fund | | 51 |
| | | |
| Leuthold Global Fund | | 63 |
| | | |
| Leuthold Select Industries Fund | | 73 |
| | | |
| Leuthold Global Industries Fund | | 77 |
| | | |
| Grizzly Short Fund | | 82 |
| | | |
| Notes to the Financial Statements | | 87 |
| | | |
| Report of Independent Registered Public Accounting Firm | | 102 |
| | | |
| Additional Information | | 103 |
| | | |
| Directors and Officers | | 104 |
Dear Fellow Shareholders:
It’s often said that the best bull markets surprise even the bulls, and the current one has certainly done that. Five years ago, when this bull market commenced, we didn’t even consider that the NASDAQ could possibly reach 5000 during the advance; on September 2, 2014, it closed within 8% of that target. Another milestone – the inflation-adjusted S&P 500 peak, recorded in March 2000, looms just 3.3% above its September 30, 2014, close. (At its September 18th high, it was just 1.3% short of that milestone.)
Our disciplined, quantitative market analysis kept us in harmony with the market advance for the majority of the last twelve months. In July our indicators began to deteriorate, a signal to us that a near-term setback was at hand. The combination of less Fed liquidity, elevated sentiment readings, and internally divergent stock market action all pointed to elevated risks.
While we expected a near-term correction, persistent strength in most stock market breadth measures in early September made it difficult to argue that a final bull market high was imminent. The NYSE Daily Advance/Decline Line joined the S&P 500 in record high territory on September 5th, and historically, such a “breadth confirmation” suggests a final bull market high is not likely for three to four more months, at a minimum. Hence, chances were good that any market decline would be measured in weeks (not months) and contained within the parameters of either a shallow (under 7%) or intermediate (7-12%) correction, before commencing to new – (and final?) – highs for this bull market cycle.
In the ensuing weeks, the S&P 500, propped up by mega cap stocks, experienced a loss of 1.4% for the month of September 2014, the close of our fiscal year. Our worry, however, is the weakness of Mid Cap, and especially Small Cap stocks. The trivial loss for the S&P 500 in September disguised the plight of the “average stock” performance, and that of smaller cap indices, which ranged from losses of between 4.6% (S&P 400 MidCap) to 6.1% (Russell 2000). Most active managers, including us, tend to be under-exposed to mega cap stocks and therefore experienced equity losses in September along the lines of the “average stock.”
There has also been pronounced underperformance in equal-weighted measures in relation to capweighted ones, all across the capitalization spectrum – a reason the indexes have recently become so difficult for managers to beat. While Mid and Small Cap equal-weighted averages have shown a weakening trend throughout 2014, the underperformance of the equal-weighted S&P 500 is a newer development. All three equal-weighted measures experienced a free-fall in September. Yet, bull markets can persist for an extended time in the face of Small Cap underperformance. (Does 1995-1999 ring a bell?)
In the end, neither the duration nor the extent of a cyclical bull move can be projected in advance. We will continue to focus our analyses on current conditions, such as valuations, Fed policy, inflation pressures, investor sentiment, and stock market action itself. These disciplines helped us stay aboard a bull that far exceeded our expectations, and currently they are indicating we may be poised for a healthy near-term correction. Nonetheless, while the signs are not as robust as earlier in the year, the five-plus-year-old upswing likely has a little more life left.
During the fiscal year ended September 30, 2014, the Leuthold Core Investment Fund performance surpassed the return of its peer average as measured by the Lipper Flexible Portfolio Funds Index. The Leuthold Global Fund had solid results, but not
| The Leuthold Funds - 2014 Annual Report | 1 |
as strong as the Leuthold Core Investment Fund; foreign markets have trailed the U.S. stock market over the past year. Predictably, when compared to all-equity benchmarks in a strong year for stocks, both Funds trailed. As with last year, the performance gap between these tactical asset allocation funds versus all-equity benchmarks is explained by the Prospectus mandate which caps the Funds’ upper limit on stock market exposure at 70%. By the same token, the Funds’ maximum exposure threshold, and the flexibility to tactically lower equity exposure further, reduces downside risk during market declines. This allows the occasion for the Funds to make up the ground they lost against all-equity benchmarks during the stronger market advances. Considering the advanced age (5+ years) of the bull market, and some of the greatest bull market gains in history, the “catch up” phase for these tactical strategies is getting closer.
Both the Leuthold Select Industries Fund and the Leuthold Global Industries Fund (long-only equities) were strong performers for the first nine months of the fiscal year, each leading their benchmark comparators by between 400 – 700 basis points through June. Their results reflected the perpetuation of strong group leadership trends that were established in the prior fiscal year. The last three months of the year posed more of a challenge, especially September, when the “average stock” suffered a serious breakdown. During that time, the Leuthold Select Industries Fund and the Leuthold Global Industries Fund forfeited their performance advantage against their mega cap benchmarks, the S&P 500 and MSCI All Country World Index, respectively, each ending the year with performance about on par comparatively. Versus their Lipper peer fund index benchmarks, during the last three months of the fiscal year, Leuthold Select Industries and Leuthold Global Industries Funds also lost some of their performance edge, but overall preserved their leadership positions over those peer fund indices for the full twelve months ended September 30th.
The Grizzly Short Fund had mixed performance against its benchmarks for the 2013-2014 fiscal year. Its most comparable benchmark based on market capitalization is the inverse of the S&P 400 MidCap Index, which outperformed by losing 2.4% less than the Grizzly Short Fund. However, when compared to its peer fund group, the Lipper Dedicated Short Bias Funds Index, the Grizzly Short Fund outperformed by 1,023 basis points, and the Fund also outdid the mega cap S&P 500 (inverse benchmark) by over 550 basis points. These variable fiscal year comparisons of the Grizzly Short Fund results against several benchmarks illustrate how severely and suddenly the market’s seemingly uniform strength broke down. Especially in September, as noted earlier, the Small Cap, Mid Cap, and average stock experienced a free-fall while the mega cap S&P 500 survived relatively unscathed. The Grizzly Short Fund results compared so much more favorably against the S&P 500 than the S&P 400 MidCap because those short-selling the mega cap index had much less opportunity to profit from declining prices compared to those, like the Grizzly Short Fund, with smaller capitalization characteristics.
Following, we review the results of each Leuthold Fund strategy in depth, and present the fine points of portfolio performance drivers – good and bad – for the fiscal year ended September 30, 2014.
| 2 | The Leuthold Funds - 2014 Annual Report |
FUND OVERVIEWS
Leuthold Core Investment Fund
Opened on November 20, 1995, this is our firm’s flagship tactical asset allocation strategy, with $846 million of assets under management. The strategy is flexible, with exposure to asset class investments routinely adjusted to suit the environment; these adjustments are determined by the ongoing study of market conditions and economic factors. The objective is to identify areas of value that appear poised for strong performance while attempting to avoid excessive risk. Assets are allocated between stocks, bonds, foreign securities, alternative investments, and money market instruments. The Fund may employ hedging techniques for tactical purposes, to take advantage of pricing excesses, or for major defensive moves against a particular asset class. The Fund’s objective is capital appreciation and income over the long-term, attained through relatively risk averse, prudent investment selection. When the stock market is in a strong uptrend, the Leuthold Core Investment Fund’s diversified portfolio will unlikely match returns of a fully invested equity portfolio. However, over a full market cycle, it is our goal to outperform the stock market.
| | | |
| | ● | Leuthold Core Investment Fund uses the Leuthold Select Industries strategy as the primary vehicle for its U.S.-traded stock market exposure. |
| | | |
| | ● | Investment Guidelines: 30%-70% equity exposure; 30%-70% fixed income exposure. There is no foreign investment minimum criterion. Certain market conditions may prompt a departure from these guidelines. |
| | | |
| | ● | Effective on November 8, 2013, the Leuthold Core Investment Fund acquired the assets and liabilities of the Leuthold Asset Allocation Fund. The investment adviser recommended the acquisition because of the similarities of the two Funds’ investment objectives, investment strategies, risks, and portfolios. In addition, the acquisition provides the potential to achieve economies of scale due to the larger combined asset base and shared costs. |
Leuthold Global Fund
Opened on April 30, 2008, with current assets under management of $362 million, this tactical asset allocation strategy is the “global” equivalent of our flagship Leuthold Core Investment Fund. The strategy and objective of this Fund are analogous to that of the Leuthold Core Investment Fund in terms of guiding disciplines, flexibility, asset class exposure, and risk aversion; however, this global version intends to maintain at least 40% of assets in foreign-traded securities. The Leuthold Global Fund invests in U.S. and foreign-traded stocks, bonds, alternative investments, and money market instruments. The Fund may employ hedging techniques for tactical purposes, to take advantage of pricing excesses, or for major defensive moves against a particular asset class.
| | | |
| | ● | Leuthold Global Fund uses the Leuthold Global Industries strategy as the primary vehicle for its global stock market investments. |
| | | |
| | ● | Investment Guidelines: 30%-70% equity exposure; 30%-70% fixed income exposure; 40% minimum in foreign-traded securities. Certain market conditions may prompt a departure from these guidelines. |
| The Leuthold Funds - 2014 Annual Report | 3 |
Leuthold Select Industries Fund
This Fund opened on June 19, 2000, and has total assets under management of $15 million. It maintains 100% long exposure in domestically traded stocks, regardless of market conditions. This attribute results in the potential for considerably higher volatility, higher risk, and the probability that investors will lose money when the stock market declines. The Leuthold Select Industries Fund employs a top-down approach, based on industry group rotation, and sector concentrations. Driven by extensive quantitative analysis, the strategy attempts to identify collective areas of strength and emerging leadership opportunities.
| | | |
| | ● | This strategy contains more risk as it is more aggressive and thereby offers the potential to achieve larger gains in market upswings, or deeper losses in market corrections. |
Leuthold Global Industries Fund
Launched on May 17, 2010, this Fund has total assets under management of $28 million. It is an extension of our domestic approach to equity industry group rotation. The intent of this equity strategy is to identify collective areas of strength and emerging leadership opportunities at the global level. This Fund will normally invest at least 40% of its assets in equity securities traded in foreign markets.
| | | |
| | ● | This strategy contains more risk as it is more aggressive and thereby offers the potential to achieve larger gains in market upswings, or deeper losses in market corrections. Foreign investment carries additional risks. |
Grizzly Short Fund
Opened June 19, 2000, this is an unleveraged, actively managed Fund that is 100% invested in stocks sold short, intended to profit when stock prices decline. The Fund has assets under management of $72 million. Policy mandates the Grizzly Short Fund target 100% exposure in stocks sold short at all times, even when the stock market is in a rising trend.
| | | |
| | ● | The Grizzly Short Fund typically maintains approximately equal-weighted short positions in roughly 60-90 individual stocks, initially selected by a multi-factor quantitative discipline. Each position is monitored daily and subject to a set of short covering disciplines. |
| | | |
| | ● | Shareholders should anticipate they would most likely lose money investing in this Fund when stock prices are rising. |
This is not a Fund for buy and hold investors. The Grizzly Short Fund is a tool for experienced investors, traders, and advisors to employ as a means of tactically moderating risk from stock price fluctuations. It is also used in varying degrees with other multi-faceted portfolio strategies.
| 4 | The Leuthold Funds - 2014 Annual Report |
ANNUAL PERFORMANCE REVIEW
Leuthold Core Investment Fund
The Fund maintained a bullish posture from October 2013 through July 2014, with average net equity exposure of 63%, a heavier level than the prior fiscal year. Throughout July, however, our market analysis reversed course, and by early August a “neutral” reading was triggered; it was the first neutral reading in over a year. This weaker pattern of scores resulted in a more cautious stance toward stocks, and net equity exposure was thus reduced to 56% for August and September.
For the fiscal year ended September 30, 2014, the Leuthold Core Investment Fund posted a total return gain of 11.49% (retail share class), soundly outperforming the 9.63% total return gain of the Lipper Flexible Portfolio Funds Index. The all-equity S&P 500 benchmark had a total return gain of 19.73% for the year.
Over the course of a full market cycle the goal is to outperform the S&P 500; however, during strong intra-cycle market advances (like the last twelve months), we don’t expect the Fund will be able to match the returns of a fully-invested equity index. On the other hand, like the Leuthold Core Investment Fund, the Lipper Flexible Portfolio Funds Index is composed of funds that allocate investments across several asset classes. Because of that similitude, it is a reasonable benchmark to use as a performance gauge with the Leuthold Core Investment Fund throughout the course of market cycles. Over the last twelve months, when evaluated against the more comparable Lipper Flexible Portfolio Funds Index, the Leuthold Core Investment Fund exceeded its peers’ average results.
Among the Fund’s sub-asset class exposures is our Leuthold Select Industries equity allocation (U.S.- traded long stocks), and we do endeavor to surpass, over the long-term, the results of the S&P 500 within that allocation. For the twelve months ended September 30, 2014, Leuthold Select Industries performed very well, nearly matching the return of the S&P 500. For performance specifics related to the Fund’s U.S.-traded stock investments, see the performance discussion of the Leuthold Select Industries Fund on subsequent pages.
The Fund maintained an Equity Hedge in varying degrees, even though we were positive toward stocks the majority of the year. This position served different functions at different times: 1) hold net equities at/below the 70% maximum threshold when market gains propped up exposure; and, 2) lessen the impact of losses amidst volatility and mid-cycle market corrections. From October through July, the hedge was a relatively negligible 5% position, on average. When our market analysis declined to neutral in early August, the hedge was boosted to a 10% allocation and provided some shelter when the market corrected in September. The holding delivered a cumulative 13.8% net loss during the year, yet because of the allocation’s relatively insignificant size, the effect on Fund performance overall was immaterial.
Emerging Market (EM) Equities continued their long tenure in the portfolio (14+ years), averaging 4% of portfolio assets – in the vicinity of last year’s average holding of 5% (our normal long-term base target). For the fiscal year ended September 30, 2014, these EM equities outperformed with a 6.90% gain versus the MSCI Emerging Market Index gain of 4.66%.
| | | |
| | ● | Within the EM equity allocation, the portfolio’s highest concentration continued to be in the Pacific Rim (ex-Japan), at nearly 70% weight. This was followed by Europe (13%), Latin America (8%), Africa/MidEast (7%), and North America (1%). The largest change occurred with the exposure to Latin America, which dropped from a 16% weight one year ago — 10% less than the benchmark weight of 18%. Countries with positive contributions to return of at least 1% during the fiscal year were South Korea, China, India, and Hong Kong. Countries that detracted from performance by at least 1% were Russia and Brazil. |
| The Leuthold Funds - 2014 Annual Report | 5 |
| | ● | From a sector view, Information Technology was the largest weight in the EM exposure, up from being the second largest weight twelve months ago. It was also by far the most positive sector contributor to the Fund’s EM return, providing over 3% to results. Financials and Consumer Discretionary were the next biggest sector weights in the EM allocation. The biggest change among the sector exposure was a 4% reduction in the Telecommunications weight, which dropped it from the fourth heaviest portfolio weight one year ago, to the third smallest EM weight now. EM stocks from Consumer Discretionary, Consumer Staples, and Health Care each provided over 1% to the allocation’s return, while EM stocks from Materials, Energy, and Industrials had negative contributions to return. |
For the Fund’s Fixed Income selection, we employ a top-down tactical asset allocation framework, using a multi-factor model to first evaluate “risk” and determine whether to favor low risk assets (Developed Market government securities), or higher risk assets (credit). For low risk vehicles, a multi-factor model is used to select between nominal and inflation-linked government securities, whereas the high-risk allocation applies a two-factor model (Momentum and Yield) to assess relative attractiveness among the five credit classes.
| | | |
| | ● | In this interest rate environment we do not believe potential rewards outweigh the substantial risks in Fixed Income, so our exposure has been lower than our guideline minimum target of 30%. Over the last twelve months we maintained an average level of 21% in this asset class, similar to the prior two fiscal years; we view the overall allocation as a potential shock absorber to unexpected equity jolts. |
| | | |
| | ● | To diversify risk, Fixed Income investments were apportioned over a range of security types, including government securities and credit. The largest single allocation was Developed Sovereign Debt at a 12.8% average portfolio weight. This was followed by Quality Corporate Bonds (3.7%), MBS Bond Funds (3.0%), Municipal Bonds (0.7%), and High Yield Bonds (0.5%). The small remaining position in Emerging Sovereign Debt (0.4% average weight) was sold out of the portfolio by March. With the exception of Developed Sovereign Debt (small 0.6% loss), all holdings had cumulative gains for the fiscal year. |
Our physical Gold allocation had dwindled to a 2.5% weight by October 2013, and was completely sold-off in December, as we believed the gold play had run its course. This position lost 8% during the final three-month holding period, but its minuscule weight resulted in negligible adverse impact on overall Fund results.
Leuthold Global Fund
This is the global variation of the Leuthold Core Investment Fund, and it thereby follows the same macro analysis of stock market risk. Due to this, one should expect that the two Funds will make parallel moves when it comes to major defensive or offensive market strategy adjustments. As with the Leuthold Core Investment Fund, from October 2013 through July 2014, the Leuthold Global Fund maintained a bullish posture with average net equity exposure of 63%, a heavier level than the prior fiscal year. Throughout July, however, our market analysis reversed course, and by early August a “neutral” reading was triggered; it was the first neutral reading in over a year. This weaker pattern of scores resulted in a more cautious stance toward stocks, and net equity exposure was thus reduced to 56% for August and September.
For the fiscal year ended September 30, 2014, the Leuthold Global Fund posted a total return gain of 7.68% (retail share class), lagging the 11.89% total return gain of the all-equity MSCI All Country World Index (ACWI). Because the MSCI ACWI is 100%
| 6 | The Leuthold Funds - 2014 Annual Report |
invested in equities, we don’t consider the Fund’s 4% performance lag as disappointing, especially in light of the Fund’s further reduced equity exposure the last few months of the fiscal year.
In contrast to the all-equity MSCI ACWI, the Leuthold Global Fund strategy requires investments to be allocated across a variety of asset classes, with maximum exposure to the stock market capped at 70%. Therefore, while over the course of a full market cycle the objective is to outperform the MSCI ACWI, this all-equity benchmark is not an ideal measure for appraising the Leuthold Global Fund’s intra-cycle results. During strong intra-cycle market advances (like the last twelve months), we don’t expect the Fund will be able to match the returns of a fully invested equity index. In prior years we also used the Lipper Global Flexible Funds Index as comparator because it was a better representation of peer group, flexible asset allocation performance throughout the course of a market cycle. Lipper eliminated this classification in August; hence, for now we do not have a suitable replacement to present true ‘like for like’ performance comparisons.
The Leuthold Global Fund’s long stock exposure, on the other hand, does endeavor to exceed the results of the MSCI ACWI throughout market cycles. In the latest fiscal year ended September 30, 2014, performance of the Fund’s global equities was solid, matching the return of the MSCI ACWI. For fiscal year performance details related to the global equity allocation employed here, see the discussion of the Leuthold Global Industries Fund on subsequent pages.
The Fund maintained an Equity Hedge in varying degrees even though we were positive toward stocks the majority of the year. This position served a few different functions: 1) hold net equities at/below the 70% maximum threshold when market gains propped up exposure; 2) lessen the impact of losses amidst volatility and mid-cycle market corrections; and, 3) preserve a minor foothold in foreign stocks sold short as this process can be more complex and inefficient to initiate when trading on foreign exchanges. From October through July, the hedge was a relatively negligible 4% position, on average. When our market analysis declined to neutral in early August, the hedge was boosted to a 10% allocation and provided some shelter when the market corrected in September. The holding delivered a cumulative net loss of 10.6% during the year, yet because of the allocation’s relatively insignificant size, the effect on Fund performance overall was immaterial.
For the Fund’s Fixed Income selection, we employ a top-down tactical asset allocation framework, using a multi-factor model to first evaluate “risk” and determine whether to favor low risk assets (Developed Market government securities), or higher risk assets (credit). For low risk vehicles, a multi-factor model is used to select between nominal and inflation-linked government securities, whereas the high-risk allocation applies a two-factor model (Momentum and Yield) to assess relative attractiveness among the five credit classes.
| | | |
| | ● | In this interest rate environment we do not believe potential rewards outweigh the substantial risks in Fixed Income, so our exposure has been lower than our guideline minimum target of 30%. Over the last twelve months we maintained an average level of 22% in this asset class, similar to the prior two fiscal years; we view the overall allocation as a potential shock absorber to unexpected equity jolts. |
| | | |
| | ● | To diversify risk, Fixed Income investments were apportioned over a range of security types, including government securities and credit. The largest single allocation was Developed Sovereign Debt at a 12.3% average portfolio weight. This was followed by Quality Corporate Bonds (4.4%), MBS Bond Funds (3.5%), High Yield Bonds (0.7%), and Municipal Bonds (0.5%). The small remaining position in Emerging Sovereign Debt (0.1% average weight) was sold out of the portfolio by March. With the exception of Developed Sovereign Debt (small 0.6% loss), all holdings had cumulative gains for the fiscal year. |
| The Leuthold Funds - 2014 Annual Report | 7 |
Our physical Gold allocation had dwindled to a 2.2% weight by October 2013, and was completely sold-off in December, as we believed the gold play had run its course. This position lost 8% during the final three-month holding period, but its minuscule weight resulted in negligible adverse impact on overall Fund results.
Leuthold Select Industries Fund
This all-equity Fund had a competitive total return gain of 19.02% for the fiscal year ended September 30, 2014, outperforming the 15.37% total return gain of the Lipper Multi-Cap Core Funds Index and about matching the S&P 500’s 19.73% total return gain.
Other than a short lapse in May, our industry group model sustained its traction of the prior year uninterrupted from October 2013 through June 2014. During those months, the Fund outperformed the S&P 500 by nearly 500 basis points and it was ahead of the Lipper Multi-Cap Core Funds Index by nearly 700 basis points. That leadership cushion was important during the final three months, especially in September, as volatility jumped and risk-off mentality spread across stocks. Medium-term trends abruptly disappeared, posing a challenge to the Leuthold Select Industries Fund. From July through September, the Fund lost 460 and 263 basis points more than the S&P 500 and Lipper Multi-Cap Core Funds Index, respectively.
Three of the four heaviest broad sector concentrations at the beginning of the fiscal year are still among the top four. This includes Information Technology, Industrials, and Consumer Discretionary. That stability of corresponding exposure over the course of twelve months underscores the firmness of leadership trends present in the market. This is an elemental characteristic or the long-term success of Select Industries; the impressive outperformance during the first nine months illustrates the edge the Fund can gain from the strategy’s ability to identify trends early on. Equally, the underperformance of the last three months shows how the removal of trends can be a disadvantage.
Our holdings in Industrials, Information Technology, and Health Care were the most significant positive contributors to return. Each allocation outperformed its respective S&P 500 sector, which indicates our selection of investments within each was superior to owning the S&P 500 sector. The same can be said of our Consumer Staples and Consumer Discretionary holdings, as each was a positive contributor to return and outperformed the corresponding S&P 500 sector. Our Financials holdings added solid performance but did not outperform the S&P 500 Financials sector. Just two sector allocations had negative contributions to performance, Utilities and Energy, which, when combined, provided a 1% loss.
The most notable changes among sector exposure were in the Financials and Energy sectors. Financials declined to a 5% weight versus 18% a year ago, while Energy rose to a 12% weight versus a zero weight at the beginning of the fiscal year. Market exposure broadened further during the year with the addition of small weights to the Materials and Utilities sectors, both of which were at zero exposure a year ago. Telecommunication Services is the sole sector that remains at a zero weight.
At the industry level, few groups were subtractive to performance. Consequently, the Fund’s most favorable exposures were a diversified lot as far as sector affiliation. Five of the most positive contributors were reprises from last year, indicating that the disciplines effectively identified particularly strong and prolonged leadership trends with these groups: Airlines, Data Processing & Outsourced Services, Drug Retail, Automotive Retail, and Managed Health Care. Other groups with large positive contributions to return were Health Care Distributors, Technology Hardware & Storage, Aerospace & Defense, and Multi-Line Insurance.
| 8 | The Leuthold Funds - 2014 Annual Report |
Those industry group holdings with minor subtractive contributions to return included Integrated Oil & Gas, Water Utilities, Oil & Gas Refining, and Advertising. With the exception of Advertising, these group detractors aligned with the performance detractors at the sector-level (Energy and Utilities).
For the first nine months of the fiscal year, foreign-domiciled stocks (traded on U.S. exchanges, i.e. via ADR/ADS) comprised about 8% of the portfolio, with Developed Markets capturing 99% of that exposure. These ratios underwent a relatively noteworthy change in late June, as foreign-domiciled stocks expanded to a 14% weight. Additionally, within that foreign market exposure, Developed Market stocks decreased to a 95% weight and Emerging Market stocks increased to 5%. This illustrates how just one group allocation can have a conspicuous effect on portfolio attributes, as these foreign weight changes were triggered by the new purchase of an Energy sector group, Integrated Oil & Gas, of which 80% of the component stocks are from non-U.S. companies, and have a particularly strong Emerging Market presence.
Leuthold Global Industries Fund
This all-equity Fund had a solid total return gain of 11.78% (retail share class) for the fiscal year ended September 30, 2014. The Lipper Global Multi-Cap Value Index lagged the Fund with a total return gain of 9.47%, and the MSCI All Country World Index (ACWI) returned slightly more, 11.89% total return.
As with our domestic equity strategy, our global industry group model upheld its performance leadership for the first nine months of the fiscal year. During those months, the Fund outperformed the S&P 500 by over 400 basis points and it led the Lipper Global Multi-Cap Value Index by about 500 basis points. That leadership cushion was important during the final three months, especially in September, as volatility jumped and risk-off mentality spread across stocks. Medium-term trends abruptly disappeared, posing a challenge to this Global Industries strategy. From July through September, the Fund lost 699 and 207 basis points more than the MSCI ACWI and Lipper Global Multi-Cap Value Index, respectively.
The Fund’s U.S. stock exposure ended the year at a weight of 45%, the lower end of its twelve-month range. During the year it fluctuated by 11%, reaching a high point of 55% by the end of December before migrating down to a low of 44% in May. The MSCI ACWI stayed in a much narrower range, with 46-47% directed to U.S. stocks from September through July; it then trended a small degree higher, to about 49% by September 30th. The Fund’s Developed Market and Emerging Market exposures also drifted much more than did those of the MSCI ACWI. Of the foreign-traded securities in the Global Industries Fund, Developed Market exposure ranged from 92% down to 78%, and Emerging Market stocks spanned from 8% to 22%, differentials of 14% for each subset. Rather than random fluctuation, there was a distinct trend as the year progressed toward higher exposure in Emerging Markets and a lowered weight in Developed Markets. These variations demonstrate the Fund’s dynamic approach (versus the MSCI benchmark) to actively shift allocations as the quantitative disciplines identify value and potential opportunities, based on changing conditions in the marketplace.
As noted, the levels of Developed and EM exposure are not deliberate choices. Rather, they are guided solely by the results of the quantitative scoring of the equity groups and stocks within groups. This Fund’s investments are determined by: 1) selecting the industry groups that appear most attractive according to our quantitative disciplines; and, 2) investing in the highest rated stocks from those groups. Our global selection approach does not consider, or target, specific countries of domicile or regions of the world as do most global investment tactics. We believe that building investments in concentrations of industries, which may mutually benefit from the interdependent global economy, will generate superior returns over the traditional approach of focusing on location.
| The Leuthold Funds - 2014 Annual Report | 9 |
During the fiscal year, five broad sector exposures were responsible for the bulk of the Fund’s gain. Information Technology, Industrials, and Financials had the biggest effect, followed by Consumer Discretionary and Health Care. The Fund’s Info Tech and Consumer Discretionary positions were about double the weight of their corresponding MSCI ACWI sector weights, while the other three sector weights were about in line comparatively. At the global industry group level, the best results came from the Fund’s allocations to equity investments in Computers & Peripherals, Airlines (repeat from 2013), Managed Health Care, Semiconductors, Auto Components (repeat from 2013), Multi-Line Insurance (repeat from 2013), and Road & Rail. Note the three group investments that carried over (repeats) from last year and continued to outperform. This indicates that the disciplines effectively identified particularly strong and prolonged leadership trends with these groups.
Sector allocations that subtracted from performance were Energy, Materials, and Consumer Staples. Each of these performed considerably worse than its equivalent MSCI ACWI sector, indicating poor selection of industry group investments and/or stock positions within those related industry groups. The specific industry group investments with the most negative contributions to return were Oil & Gas Exploration, Integrated Oil & Gas, Casinos & Gaming, Steel, Automobiles, Oil & Gas Refining, and Paper & Forest Products.
During the year, the Fund had investments in 31 countries outside the U.S., with an average of 27 country investments in any given month. Developed Market allocations that carried the heaviest weights all year (outside of the U.S.) were Japan, Germany, France, Canada, United Kingdom, Switzerland, and Hong Kong. During the front half of the year, Sweden was also a heavier weighted country, but that exposure incrementally decreased during the second half. In the latter half of the year, new allocations to Italy, Australia, and Spain grew to become some of the larger positions by fiscal year-end.
| | | |
| | ● | Of the Emerging Market exposures, the biggest weights all year were investments in Taiwan, South Korea, and Poland. The number of different EM country investments began to expand quite rapidly in early 2014, reaching 16 countries by June, compared to an average of eight from October through January. Countries with larger positions from this expanded, second half EM exposure included Brazil, Czech Republic, Malaysia, and Thailand. China and India were full year holdings, but neither held a material weight until the last few months of the fiscal year. |
| | | |
| | ● | Performance-wise, U.S. investments provided the most positive contribution to return. This was followed by investments in Germany, Taiwan, Japan, and Brazil. Each was an overweight position compared to the equivalent MSCI ACWI country exposure; our holdings associated with these countries were more value-added as they outperformed the corresponding MSCI ACWI country allocations. This tells us our group and/or stock selection within groups was high-quality. On the downside, South Korea, one of the heaviest weights in our EM exposure for the full year, was the largest country detractor to performance, contributing a loss of 80 basis points. Hong Kong investments produced the next most significant country level loss, subtracting 25 basis points from return. |
Again, our global equity selection is unusual because the country-specific exposures are not intentional. Rather, they are the by-product of the quantitative approach used to gain exposure to the attractively-rated global industry groups. The traditional approach is to target the “locations” that appear to have upside potential, and then select stocks within that country or region that may benefit from its merits. We believe our non-traditional approach is able to cast a more expansive net to capture a higher quality collection of global opportunities, rather than limit our choices based on locality.
| 10 | The Leuthold Funds - 2014 Annual Report |
Grizzly Short Fund
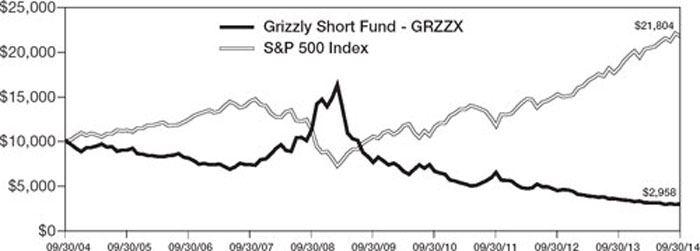
This Fund is 100% short individual stocks, and is intended to profit when stock prices decline. For the fiscal year ended September 30, 2014, the Grizzly Short Fund produced a total return loss of 14.20%, appreciably better (+1,023 basis points) than the Lipper Dedicated Short Bias Funds Index total return loss of 24.43%. The Grizzly Short Fund results trailed the benchmark S&P MidCap 400 Index, which had total return gain of 11.82% (measured against the inverse performance, the Grizzly Short Fund was 238 basis points worse). Compared to the S&P 500 (19.73% total return), the Fund was 553 basis points better than the corresponding inverse of this index.
Bearing in mind that the median market capitalization of the Grizzly Short Fund is about $2.5 billion, compared with that of the S&P MidCap 400 Index ($3.6 billion), and the S&P 500 ($17.1 billion), the Grizzly Short Fund is more comparable to the S&P MidCap 400. Hence, the Grizzly Short Fund was not value-added over the last twelve months when compared to the index that most resembles the Fund’s typical stock positions, but it was value-added over its Large Cap counterpart.
Despite all broad sector exposures in the S&P 500 producing strong gains over the last twelve months, the Grizzly Short Fund still had two portfolio sector concentrations which produced positive contributions to its return. The Fund’s quantitative analysis was effective in identifying collections of stocks from the Consumer Staples and Industrials sectors which were vulnerable to decline in the face of strong market gains. These combined positions helped to offset Fund losses by 173 basis points.
Health Care holdings were relatively neutral performers, while Utilities and Telecommunications allocations were each subtractive by less than 100 basis points – these three sector weights were small allocations of about 4% each. (Frequently, the sectors and stocks we avoid are just as important as the ones we target.)
As is predictable in a market advance, the heaviest sector weight in the short portfolio, Information Technology, produced the largest negative contribution to return. This was followed by portfolio losses from stocks in the Financials and Materials sectors. Consumer Discretionary and Energy sector holdings each detracted by just over 100 basis points.
Dissecting by industry groups, there were constructive exposures which helped to offset the Fund’s losses, and thereby played a role in the Fund’s outperformance versus the S&P 500. The leading positive contributors included Packaged Foods & Meats, Electrical Components, Homefurnishing Retail, Research & Consulting Services, Coal & Consumable Fuels, Commercial Services, Airlines, Aerospace & Defense, and Silver. Of these groups, over half are constituents of the two sectors which generated gains, as noted earlier: Industrials and Consumer Staples.
There was no consistent sector theme among the industry group detractors. Those subtracting the most from results included Communications Equipment, Oil & Gas Storage/Transport, Steel, Semiconductors, Internet Software & Services, Specialized REITs, Environmental & Facilities Services, Homebuilding, and Regional Banks.
The Grizzly Short Fund is a highly disciplined methodology, with portfolio positions monitored on a daily basis. High turnover is characteristic; sector concentrations and industry group exposures have the potential to fluctuate considerably throughout the year. As opposed to a market capitalization weighted index, such as the S&P MidCap 400 or the S&P 500, the Grizzly Short Fund positions are similarly weighted across the portfolio. Due to this, the Fund is not subject to the shortcomings of having a small selection of oversized positions driving results. Additional features of the strategy include policies that trigger specific short-covering action, such as capturing gains and stop-loss tactics, and weighting limitations on sector and sub-industry group concentrations.
| The Leuthold Funds - 2014 Annual Report | 11 |
When the stock market is in a clearly rising trend, investors should expect the Grizzly Short Fund to lose money. Under those circumstances, the Fund’s goal is to add value over an index short by losing less. This past year the Fund’s objective was met when compared to the S&P 500 benchmark, but it fell short versus the S&P 400 MidCap Index.
Investors who are not experienced in short-selling and adjusting portfolios for changing risk profiles should consider one of our tactical asset allocation funds: the Leuthold Core Investment Fund or the Leuthold Global Fund. Those two Funds have the ability to implement this exact short-selling strategy to reduce risk when the stock market is viewed as overvalued and appears susceptible to a downside correction.
IN CLOSING
At this time our stock market analysis is bordering on a neutral/negative near-term outlook toward stocks. We would not be surprised to see a peak-to-trough correction in global stocks of 12-15%, with considerably larger losses in Small Caps and Emerging Market equities. However, the duration or extent of a market correction (or a rebound, for that matter) is an unknown factor, and there’s certainly the chance that any decline will fall short of our expectation.
Investor sentiment had been fairly restrained since the beginning of the bull market back in March 2009, but the big gains of 2013 seemed to finally drive away the last of any lingering memories from the 2008 debacle. In fact, in March of this year, our proprietary composite reading of investor sentiment shot up to the most optimistic reading in its 36-year history, sending a strong negative signal from a contrarian point of view.
While damage to any capitalization-weighted stock market measure has so far been limited, the DJIA, Russell 2000, and MSCI All Country World Index have broken below major trend-lines drawn off their 2009 bear market lows. Similar trend breaks in mid-2011 led immediately to a 19.4% decline in the S&P 500, along with much larger losses in Small Caps, cyclical stocks, and almost all foreign markets. Today, the breakdowns are occurring in the context of: 1) one of the longer cyclical bull markets on record (67 months through September); 2) elevated levels of investor confidence; 3) valuation readings above all but the “bubble era” market tops; 4) multiple “tapers” in the monthly level of Fed bond buying; and, 5) a severe breakdown in internal stock market participation (Small Cap and the “average stock” performance versus Mega Caps).
Still, the combination of elevated stock market valuations (especially in the U.S.) and inflated investor expectations can persist for extended periods…the market advance throughout the Technology mania provides the most memorable historical example. Inflated sentiment and valuation readings generally don’t become dangerous until stock market “liquidity” (or Federal Reserve policy accommodation) begins to contract. We believe the succession of Fed “tapers” in the monthly level of Quantitative Easing (QE) throughout 2014 has finally triggered such a liquidity contraction. In other words, this unusual form of Fed “tightening” has been underway for several months—even though the Fed isn’t expected to increase its benchmark Federal Funds Rate above the zero level until mid-2015 at the earliest.
Regardless of market direction, our quantitative processes continually monitor an extensive range of market data; asset class and equity group attractiveness are reassessed and adjusted on an ongoing basis. We anticipate increasingly difficult conditions in the coming year, especially with long equities, and we will embrace the challenge of finding routes to prosper in each of our strategies. Our goal is to add value over the long-term.
| 12 | The Leuthold Funds - 2014 Annual Report |
Your comments and questions are always welcome. We appreciate your interest and support of the Leuthold Fund strategies.
Sincerely,
| | | |
 | | |
| | | |
| Doug Ramsey, CFA, CMT | | |
| CIO & Co-Portfolio Manager | | |
| | | |
 |  |  |
| | | |
| Matt Paschke, CFA | Chun Wang, CFA, PRM | Greg Swenson, CFA |
| Co-Portfolio Manager | Co-Portfolio Manager | Co-Portfolio Manager |
| The Leuthold Funds - 2014 Annual Report | 13 |
Expense Example – September 30, 2014 (Unaudited)
As a shareholder of the Funds, you incur two types of costs: (1) transaction costs, including reinvested dividends, or other distributions; redemption fees; and exchange fees; and (2) ongoing costs, including management fees; distribution and/or service fees; and other Fund expenses. This example is intended to help you understand your ongoing costs (in dollars) of investing in the Funds and to compare costs with the ongoing costs of investing in other mutual funds.
The Example is based on an investment of $1,000 invested at the beginning of the period and held the entire period (April 1, 2014 – September 30, 2014).
Actual Expenses
The first line of the following table provides information about actual account values and actual expenses. Although the Funds charge no sales load (the Leuthold Core Investment Fund, Leuthold Global Fund and Leuthold Global Industries Fund charge a 2% redemption fee for redemptions made within five business days after a purchase), you will be assessed fees for outgoing wire transfers, returned checks, or stop payment orders at prevailing rates charged by U.S. Bancorp Fund Services, LLC, the Funds’ transfer agent. If you request a redemption be made by wire transfer, currently a $15.00 fee is charged by the Funds’ transfer agent. To the extent that the Funds invest in shares of other investment companies as part of its investment strategy, you will indirectly bear your proportionate share of any fees and expenses charged by the underlying funds in which a Fund invests in addition to the expenses of the Fund. Actual expenses of the underlying funds are expected to vary by fund. These expenses are not included in the following example. The example includes, but is not limited to, management fees, shareholder servicing fees, fund accounting, custody, and transfer agent fees. However, the following example does not include portfolio trading commissions and related expenses, and extraordinary expenses as determined under generally accepted accounting principles. You may use the information in this line, together with the amount you invested, to estimate the expenses that you paid over the period. Simply divide your account value by $1,000 (for example, an $8,600 account value divided by $1,000 = 8.6), then multiply the result by the number in the first line under the heading entitled “Expenses Paid During Period” to estimate the expenses you paid on your account during this period.
Hypothetical Example for Comparison Purposes
The second line of the following table provides information about hypothetical account values and hypothetical expenses based on the Funds’ actual expense ratios and an assumed rate of return of 5% per year before expenses, which is not the Funds’ actual return. The hypothetical account values and expenses may not be used to estimate the actual ending account balance or expenses you paid for the period. You may use this information to compare the ongoing costs of investing in the Funds and other funds. To do so, compare this 5% hypothetical example with the 5% hypothetical examples that appear in the shareholder reports of the other funds.
Please note that the expenses shown in the table are meant to highlight your ongoing costs only and do not reflect any transactional costs, such as redemption fees or exchange fees. Therefore, the second line of the table is useful in comparing ongoing costs only, and will not help you determine the relative costs of owning different funds. In addition, if these transactional costs were included, your costs would have been higher.
| 14 | The Leuthold Funds - 2014 Annual Report |
| The Leuthold Funds |
| Expense Example Tables (Unaudited) |
Leuthold Core Investment Fund - Retail Class - LCORX
| | | | | | | | | | | |
| | | Beginning Account Value April 1, 2014 | | Ending Account Value September 30, 2014 | | Expenses Paid During Period* April 1, 2014 - September 30, 2014 | |
| Actual** | | $1,000.00 | | | $1,003.30 | | | $ 6.48 | | |
| Hypothetical (5% return before expenses)*** | | 1,000.00 | | | 1,018.60 | | | 6.53 | | |
| | |
| * | Expenses are equal to the Fund’s annualized expense ratio of 1.29%, multiplied by the average account value over the period, multiplied by 183/365 to reflect the one-half year period. |
| ** | Excluding dividends and interest on short positions, your actual cost of investment in the Fund would be $5.78 and the Fund’s annualized expense ratio would be 1.15%. |
| *** | Excluding dividends and interest on short positions, your hypothetical cost of investment in the Fund would be $5.82 and the Fund’s annualized expense ratio would be 1.15%. |
Leuthold Core Investment Fund - Institutional Class - LCRIX
| | | | | | | | | | | |
| | | Beginning Account Value April 1, 2014 | | Ending Account Value September 30, 2014 | | Expenses Paid During Period* April 1, 2014 - September 30, 2014 | |
| Actual** | | $1,000.00 | | | $1,004.30 | | | $ 5.98 | | |
| Hypothetical (5% return before expenses)*** | | 1,000.00 | | | 1,019.10 | | | 6.02 | | |
| | |
| * | Expenses are equal to the Fund’s annualized expense ratio of 1.19%, multiplied by the average account value over the period, multiplied by 183/365 to reflect the one-half year period. |
| ** | Excluding dividends and interest on short positions, your actual cost of investment in the Fund would be $5.33 and the Fund’s annualized expense ratio would be 1.06%. |
| *** | Excluding dividends and interest on short positions, your hypothetical cost of investment in the Fund would be $5.37 and the Fund’s annualized expense ratio would be 1.06%. |
Leuthold Global Fund - Retail Class - GLBLX
| | | | | | | | | | | |
| | | Beginning Account Value April 1, 2014 | | Ending Account Value September 30, 2014 | | Expenses Paid During Period* April 1, 2014 - September 30, 2014 | |
| Actual** | | $1,000.00 | | | $ 993.20 | | | $ 8.29 | | |
| Hypothetical (5% return before expenses)*** | | 1,000.00 | | | 1,016.75 | | | 8.39 | | |
| | |
| * | Expenses are equal to the Fund’s annualized expense ratio of 1.66%, multiplied by the average account value over the period, multiplied by 183/365 to reflect the one-half year period. |
| ** | Excluding dividends and interest on short positions, your actual cost of investment in the Fund would be $7.59 and the Fund’s annualized expense ratio would be 1.52%. |
| *** | Excluding dividends and interest on short positions, your hypothetical cost of investment in the Fund would be $7.68 and the Fund’s annualized expense ratio would be 1.52%. |
Leuthold Global Fund - Institutional Class - GLBIX
| | | | | | | | | | | |
| | | Beginning Account Value April 1, 2014 | | Ending Account Value September 30, 2014 | | Expenses Paid During Period* April 1, 2014 - September 30, 2014 | |
| Actual** | | $1,000.00 | | | $ 994.30 | | | $ 7.35 | | |
| Hypothetical (5% return before expenses)*** | | 1,000.00 | | | 1,017.70 | | | 7.44 | | |
| | |
| * | Expenses are equal to the Fund’s annualized expense ratio of 1.47%, multiplied by the average account value over the period, multiplied by 183/365 to reflect the one-half year period. |
| ** | Excluding dividends and interest on short positions, your actual cost of investment in the Fund would be $6.65 and the Fund’s annualized expense ratio would be 1.33%. |
| *** | Excluding dividends and interest on short positions, your hypothetical cost of investment in the Fund would be $6.73 and the Fund’s annualized expense ratio would be 1.33%. |
| | |
| The Leuthold Funds - 2014 Annual Report | 15 |
| The Leuthold Funds |
| Expense Example Tables (Unaudited) |
Leuthold Select Industries Fund - LSLTX
| | | | | | | | | | | |
| | | Beginning Account Value April 1, 2014 | | Ending Account Value September 30, 2014 | | Expenses Paid During Period* April 1, 2014 - September 30, 2014 | |
| Actual | | $1,000.00 | | | $1,006.00 | | | $ 7.84 | | |
| Hypothetical (5% return before expenses) | | 1,000.00 | | | 1,017.25 | | | 7.89 | | |
| | |
| * | Expenses are equal to the Fund’s annualized expense ratio of 1.56%, multiplied by the average account value over the period, multiplied by 183/365 to reflect the one-half year period. |
Leuthold Global Industries Fund - Retail Class - LGINX
| | | | | | | | | | | |
| | | Beginning Account Value April 1, 2014 | | Ending Account Value September 30, 2014 | | Expenses Paid During Period* April 1, 2014 - September 30, 2014 | |
| Actual | | $1,000.00 | | | $ 990.80 | | | $ 8.43 | | |
| Hypothetical (5% return before expenses) | | 1,000.00 | | | 1,016.59 | | | 8.54 | | |
| | |
| * | Expenses are equal to the Fund’s annualized expense ratio of 1.69%, multiplied by the average account value over the period, multiplied by 183/365 to reflect the one-half year period. |
Leuthold Global Industries Fund - Institutional Class - LGIIX
| | | | | | | | | | | |
| | | Beginning | | Ending | | Expenses Paid | |
| | | Account Value | | Account Value | | During Period* | |
| | | April 1, 2014 | | September 30, 2014 | | April 1, 2014 - September 30, 2014 | |
| Actual | | $1,000.00 | | | $ 992.30 | | | $ 7.19 | | |
| Hypothetical (5% return before expenses) | | 1,000.00 | | | 1,017.85 | | | 7.28 | | |
| | |
| * | Expenses are equal to the Fund’s annualized expense ratio of 1.44%, multiplied by the average account value over the period, multiplied by 183/365 to reflect the one-half year period. |
Grizzly Short Fund - GRZZX
| | | | | | | | | | | |
| | | Beginning | | Ending | | Expenses Paid | |
| | | Account Value | | Account Value | | During Period* | |
| | | April 1, 2014 | | September 30, 2014 | | April 1, 2014 - September 30, 2014 | |
Actual** | | $1,000.00 | | | $ 960.90 | | | $ 15.44 | | |
Hypothetical (5% return before expenses)*** | | 1,000.00 | | | 1,009.32 | | | 15.82 | | |
| | |
| * | Expenses are equal to the Fund’s annualized expense ratio of 3.14%, multiplied by the average account value over the period, multiplied by 183/365 to reflect the one-half year period. |
| ** | Excluding dividends and interest on short positions, your actual cost of investment in the Fund would be $7.62 and the Fund’s annualized expense ratio would be 1.55%. |
| *** | Excluding dividends and interest on short positions, your hypothetical cost of investment in the Fund would be $7.81 and the Fund’s annualized expense ratio would be 1.55%. |
| | |
| 16 | The Leuthold Funds - 2014 Annual Report |
| The Leuthold Funds |
| (Unaudited) |
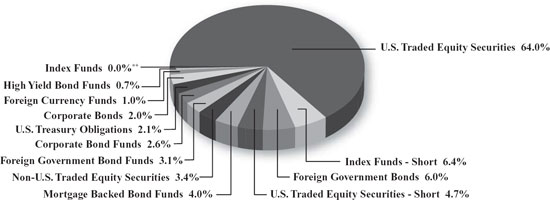
Leuthold Core Investment Fund
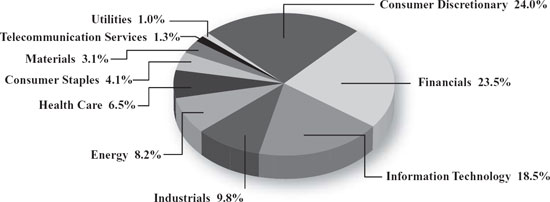
Allocation of Portfolio Holdings
September 30, 2014*
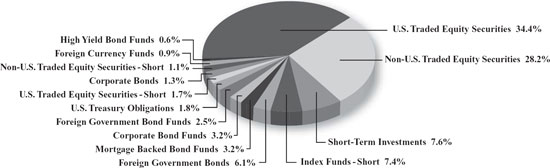
Leuthold Global Fund
Allocation of Portfolio Holdings
September 30, 2014
| * | Excludes short-term investments less than 5% of net assets. |
| ** | Amount is less than 0.05%. |
| The Leuthold Funds - 2014 Annual Report | 17 |
| The Leuthold Funds |
| (Unaudited) |
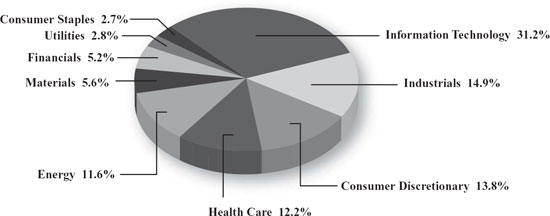
Leuthold Select Industries Fund
Allocation of Portfolio Holdings
September 30, 2014*
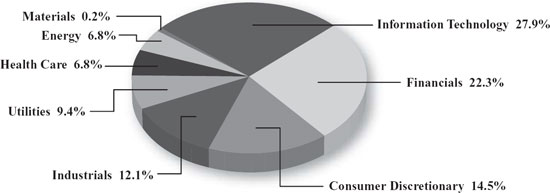
Leuthold Global Industries Fund
Allocation of Portfolio Holdings
September 30, 2014
| | * Excludes short-term investments less than 5% of net assets. |
| 18 | The Leuthold Funds - 2014 Annual Report |
| The Leuthold Funds |
| (Unaudited) |
Grizzly Short Fund
Allocation of Portfolio Holdings
September 30, 2014*
| *Excludes short-term investments less than 5% of net assets. | | |
| | The Leuthold Funds - 2014 Annual Report | 19 |
| Leuthold Core Investment Fund (Unaudited) | |
| Components of Portfolio Holdings* | | Fair Value | |
| U.S. Traded Equity Securities | | $ | 532,210,468 | |
| Index Funds - Short | | | 53,169,884 | |
| Foreign Government Bonds | | | 51,026,320 | |
| U.S. Traded Equity Securities - Short | | | 39,108,074 | |
| Mortgage Backed Bond Funds | | | 32,970,928 | |
| Non-U.S. Traded Equity Securities | | | 28,051,939 | |
| Foreign Government Bond Funds | | | 25,582,367 | |
| Corporate Bond Funds | | | 21,652,720 | |
| U.S. Treasury Obligations | | | 17,390,649 | |
| Corporate Bonds | | | 16,390,474 | |
| Foreign Currency Funds | | | 7,964,206 | |
| High Yield Bond Funds | | | 5,882,940 | |
| Index Funds | | | 237,975 | |
| Total: | | $ | 831,638,944 | |
| | | | | |
| Leuthold Global Fund (Unaudited) | | | | |
| Components of Portfolio Holdings | | Fair Value | |
| U.S. Traded Equity Securities | | $ | 127,698,925 | |
| Non-U.S. Traded Equity Securities | | | 104,881,297 | |
| Short-Term Investments | | | 28,089,171 | |
| Index Funds - Short | | | 27,335,689 | |
| Foreign Government Bonds | | | 22,685,885 | |
| Mortgage Backed Bond Funds | | | 12,071,558 | |
| Corporate Bond Funds | | | 11,868,149 | |
| Foreign Government Bond Funds | | | 9,202,959 | |
| U.S. Treasury Obligations | | | 6,618,023 | |
| U.S. Traded Equity Securities - Short | | | 6,320,865 | |
| Corporate Bonds | | | 4,929,325 | |
| Non-U.S. Traded Equity Securities - Short | | | 4,153,446 | |
| Foreign Currency Funds | | | 3,195,379 | |
| High Yield Bond Funds | | | 2,104,353 | |
| Total: | | $ | 371,155,024 | |
The Global Industry Classification Standard (GICS®) was developed by and/or is the exclusive property of MSCI, Inc. and Standard & Poor’s Financial Services LLC (“S&P”). GICS is a service mark of MSCI, Inc. and S&P and has been licensed for use by U.S. Bancorp Fund Services, LLC.
| Leuthold Select Industries Fund (Unaudited) | |
| Components of Portfolio Holdings* | | Fair Value | |
| Information Technology | | $ | 4,662,521 | |
| Industrials | | | 2,225,879 | |
| Consumer Discretionary | | | 2,058,293 | |
| Health Care | | | 1,827,715 | |
| Energy | | | 1,722,226 | |
| Materials | | | 833,582 | |
| Financials | | | 777,286 | |
| Utilities | | | 413,851 | |
| Consumer Staples | | | 404,238 | |
| Total: | | $ | 14,925,591 | |
| | | | | |
| Leuthold Global Industries Fund (Unaudited) | |
| Components of Portfolio Holdings | | Fair Value | |
| Information Technology | | $ | 7,800,799 | |
| Financials | | | 6,246,831 | |
| Consumer Discretionary | | | 4,062,453 | |
| Industrials | | | 3,376,736 | |
| Utilities | | | 2,624,451 | |
| Health Care | | | 1,915,156 | |
| Energy | | | 1,889,159 | |
| Materials | | | 65,176 | |
| Total: | | $ | 27,980,761 | |
| | | | | |
| Grizzly Short Fund (Unaudited) | | | | |
| Components of Portfolio Holdings* | | Fair Value | |
| Consumer Discretionary | | $ | 16,292,924 | |
| Financials | | | 15,974,814 | |
| Information Technology | | | 12,550,359 | |
| Industrials | | | 6,640,305 | |
| Energy | | | 5,559,709 | |
| Health Care | | | 4,404,034 | |
| Consumer Staples | | | 2,783,304 | |
| Materials | | | 2,072,706 | |
| Telecommunication Services | | | 885,032 | |
| Utilities | | | 705,648 | |
| Total: | | $ | 67,868,835 | |
| | *Excludes short-term investments less than 5% of net assets. |
| 20 | The Leuthold Funds - 2014 Annual Report |
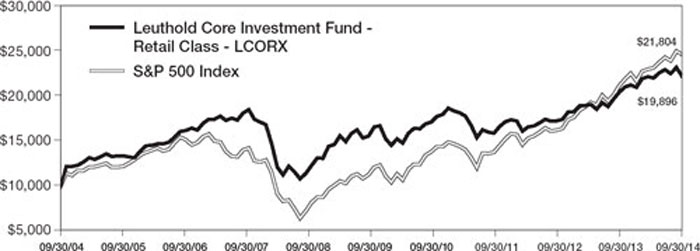
| Leuthold Core Investment Fund - Retail Class - LCORX |
| (Unaudited) |
Average Annual Rate of Return For Periods Ended
September 30, 2014
| | | 1 Year | | 3 Year | | 5 Year | | 10 Year |
Leuthold Core Investment Fund - Retail Class - LCORX | | 11.49% | | | 11.38% | | | 6.44% | | | 7.12% | |
| Lipper Flexible Portfolio Fund Index | | 9.63% | | | 13.14% | | | 9.59% | | | 6.89% | |
| S&P 500 Index | | 19.73% | | | 22.99% | | | 15.70% | | | 8.11% | |
A $10,000 Investment in the Leuthold Core Investment Fund – Retail Class - LCORX
The Lipper Flexible Portfolio Funds Index is composed of funds that allocate investments across various asset classes with a focus on total return, as defined by Lipper.
The S&P 500 Index is an unmanaged capitalization-weighted index of 500 stocks designed to measure performance of the broad domestic economy through changes in the aggregate market value of the 500 stocks which represent all major industries.
This chart assumes an initial gross investment of $10,000 made on 9/30/04. Returns shown include the reinvestment of all dividends. The Fund’s past performance is not necessarily an indication of its future performance. It may perform better or worse in the future. The graph and the table do not reflect the deduction of taxes that a shareholder would pay on Fund distributions or the redemption of shares.
| | |
| The Leuthold Funds - 2014 Annual Report | 21 |
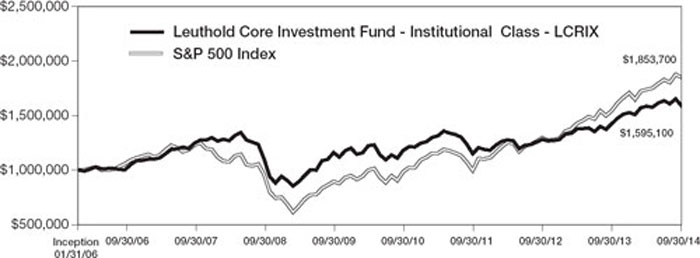
| Leuthold Core Investment Fund - Institutional Class - LCRIX |
| (Unaudited) |
Average Annual Rate of Return For Periods Ended
September 30, 2014
| | | | | | | | | | | | | |
| | | 1 Year | | 3 Year | | 5 Year | | Since Inception |
Leuthold Core Investment Fund - Institutional Class - LCRIX | | 11.66% | | | 11.49% | | | 6.55% | | | 5.54% | |
| Lipper Flexible Portfolio Fund Index | | 9.63% | | | 13.14% | | | 9.59% | | | 5.92% | |
| S&P 500 Index | | 19.73% | | | 22.99% | | | 15.70% | | | 7.38% | |
A $1,000,000 Investment in the Leuthold Core Investment Fund – Institutional Class - LCRIX
The Lipper Flexible Portfolio Funds Index is composed of funds that allocate investments across various asset classes with a focus on total return, as defined by Lipper.
The S&P 500 Index is an unmanaged capitalization-weighted index of 500 stocks designed to measure performance of the broad domestic economy through changes in the aggregate market value of the 500 stocks which represent all major industries.
This chart assumes an initial gross investment of $1,000,000 made on 1/31/06 (commencement of operations). Returns shown include the reinvestment of all dividends. The Fund’s past performance is not necessarily an indication of its future performance. It may perform better or worse in the future. The graph and the table do not reflect the deduction of taxes that a shareholder would pay on Fund distributions or the redemption of shares.
| | |
| 22 | The Leuthold Funds - 2014 Annual Report |
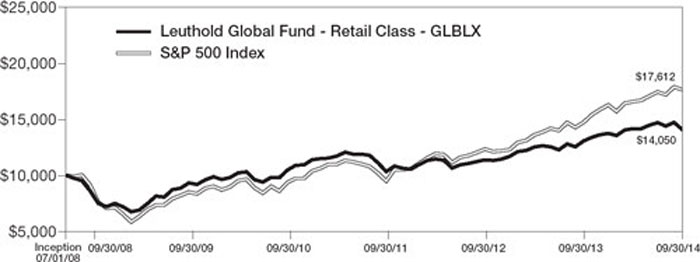
| Leuthold Global Fund - Retail Class - GLBLX |
| (Unaudited) |
Average Annual Rate of Return For Periods Ended
September 30, 2014
| | | | | | | | | | | | | |
| | | 1 Year | | 3 Year | | 5 Year | | Since Inception |
Leuthold Global Fund - Retail Class - GLBLX | | 7.68% | | | 10.83% | | | 8.58% | | | 5.59% | |
| MSCI ACWI | | 11.89% | | | 17.24% | | | 10.65% | | | 5.57% | |
| Barclays Global Aggregate Index | | 1.19% | | | 1.16% | | | 2.69% | | | 3.61% | |
| S&P 500 Index | | 19.73% | | | 22.99% | | | 15.70% | | | 9.48% | |
A $10,000 Investment in the Leuthold Global Fund - Retail Class - GLBLX
The MSCI ACWI (All Country World Index) is a free float-adjusted market capitalization weighted index that is designed to measure the equity market performance of developed and emerging markets. As of June 2, 2014, the MSCI ACWI consisted of 46 country indices comprising 23 developed and 23 emerging market country indices. The developed market country indices included are: Australia, Austria, Belgium, Canada, Denmark, Finland, France, Germany, Hong Kong, Ireland, Israel, Italy, Japan, Netherlands, New Zealand, Norway, Portugal, Singapore, Spain, Sweden, Switzerland, the United Kingdom, and the United States. The emerging market country indices included are: Brazil, Chile, China, Colombia, Czech Republic, Egypt, Greece, Hungary, India, Indonesia, Korea, Malaysia, Mexico, Peru, Philippines, Poland, Qatar, Russia, South Africa, Taiwan, Thailand, Turkey, and United Arab Emirates.
The Barclays Global Aggregate Index provides a broad-based measure of the global investment grade fixed-rate debt markets. It is comprised of the U.S. Aggregate, Pan-European Aggregate, and the Asian-Pacific Aggregate Indices. It also includes a wide range of standard and customized sub-indices by liquidity constraint, sector, quality, and maturity.
The S&P 500 Index is an unmanaged capitalization-weighted index of 500 stocks designed to measure performance of the broad domestic economy through changes in the aggregate market value of the 500 stocks which represent all major industries.
This chart assumes an initial gross investment of $10,000 made on 7/1/08 (commencement of operations). Returns shown include the reinvestment of all dividends. The Fund’s past performance is not necessarily an indication of its future performance. It may perform better or worse in the future. The graph and the table do not reflect the deduction of taxes that a shareholder would pay on Fund distributions or the redemption of shares.
| | |
| The Leuthold Funds - 2014 Annual Report | 23 |
| Leuthold Global Fund - Institutional Class - GLBIX |
| (Unaudited) |
Average Annual Rate of Return For Periods Ended
September 30, 2014
| | | | | | | | | | | | | |
| | | 1 Year | | 3 Year | | 5 Year | | Since Inception |
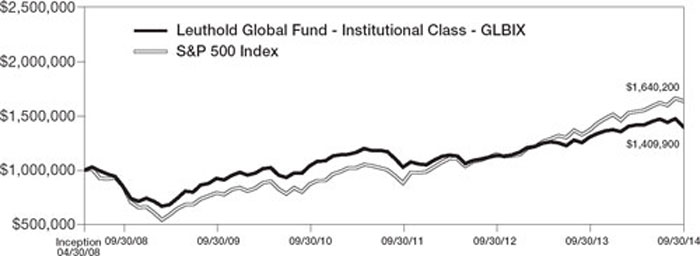
Leuthold Global Fund - Institutional Class - GLBIX | | 7.95% | | | 11.08% | | | 8.81% | | | 5.50% | |
| MSCI ACWI | | 11.89% | | | 17.24% | | | 10.65% | | | 4.17% | |
| Barclays Global Aggregate Index | | 1.19% | | | 1.16% | | | 2.69% | | | 3.32% | |
| S&P 500 Index | | 19.73% | | | 22.99% | | | 15.70% | | | 8.01% | |
A $1,000,000 Investment in the Leuthold Global Fund - Institutional Class - GLBIX
The MSCI ACWI (All Country World Index) is a free float-adjusted market capitalization weighted index that is designed to measure the equity market performance of developed and emerging markets. As of June 2, 2014, the MSCI ACWI consisted of 46 country indices comprising 23 developed and 23 emerging market country indices. The developed market country indices included are: Australia, Austria, Belgium, Canada, Denmark, Finland, France, Germany, Hong Kong, Ireland, Israel, Italy, Japan, Netherlands, New Zealand, Norway, Portugal, Singapore, Spain, Sweden, Switzerland, the United Kingdom, and the United States. The emerging market country indices included are: Brazil, Chile, China, Colombia, Czech Republic, Egypt, Greece, Hungary, India, Indonesia, Korea, Malaysia, Mexico, Peru, Philippines, Poland, Qatar, Russia, South Africa, Taiwan, Thailand, Turkey, and United Arab Emirates.
The Barclays Global Aggregate Index provides a broad-based measure of the global investment grade fixed-rate debt markets. It is comprised of the U.S. Aggregate, Pan-European Aggregate, and the Asian-Pacific Aggregate Indices. It also includes a wide range of standard and customized sub-indices by liquidity constraint, sector, quality, and maturity.
The S&P 500 Index is an unmanaged capitalization-weighted index of 500 stocks designed to measure performance of the broad domestic economy through changes in the aggregate market value of the 500 stocks which represent all major industries.
This chart assumes an initial gross investment of $1,000,000 made on 4/30/08 (commencement of operations). Returns shown include the reinvestment of all dividends. The Fund’s past performance is not necessarily an indication of its future performance. It may perform better or worse in the future. The graph and the table do not reflect the deduction of taxes that a shareholder would pay on Fund distributions or the redemption of shares.
| | |
| 24 | The Leuthold Funds - 2014 Annual Report |
| Leuthold Select Industries Fund - LSLTX |
| (Unaudited) |
Average Annual Rate of Return For Periods Ended
September 30, 2014
| | | | | | | | | | | | | |
| | | 1 Year | | 3 Year | | 5 Year | | 10 Year |
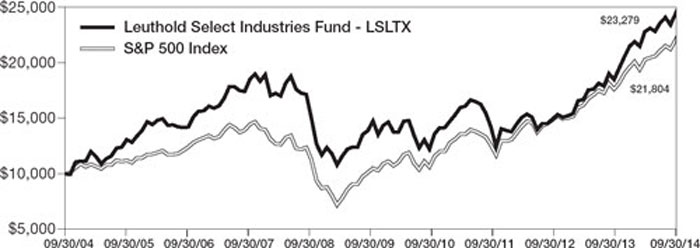
| Leuthold Select Industries Fund - LSLTX | | 19.02% | | | 23.16% | | | 9.51% | | | 8.82% | |
| Russell 2000 Index | | 3.93% | | | 21.26% | | | 14.29% | | | 8.19% | |
| Lipper Multi-Cap Core Funds Index | | 15.37% | | | 21.46% | | | 14.25% | | | 8.09% | |
| S&P 500 Index | | 19.73% | | | 22.99% | | | 15.70% | | | 8.11% | |
A $10,000 Investment in the Leuthold Select Industries Fund - LSLTX
The Russell 2000 Index is comprised of approximately 2000 of the smallest companies in the Russell 3000 Index, representing approximately 10% of the Russell 3000 total market capitalization.
The Lipper Multi-Cap Core Funds Index is an average of funds that invest in a variety of market capitalization ranges without concentrating 75% of their equity assets in any one market capitalization range over an extended period of time. Multi-cap funds typically have between 25% and 75% of their assets invested in companies with market capitalizations (on a three-year weighted basis) above 300% of the dollar-weighted median market capitalization of the middle 1,000 securities of the S&P SuperComposite 1500 Index. These funds typically have an average price-to-earnings ratio, price-to-book ratio, and three-year sales-per-share growth value, compared to the S&P SuperComposite 1500 Index.
The S&P 500 Index is an unmanaged capitalization-weighted index of 500 stocks designed to measure performance of the broad domestic economy through changes in the aggregate market value of the 500 stocks which represent all major industries.
This chart assumes an initial gross investment of $10,000 made on 9/30/04. Returns shown include the reinvestment of all dividends. The Fund’s past performance is not necessarily an indication of its future performance. It may perform better or worse in the future. The graph and the table do not reflect the deduction of taxes that a shareholder would pay on Fund distributions or the redemption of shares.
| | |
| The Leuthold Funds - 2014 Annual Report | 25 |
| Leuthold Global Industries Fund - Retail Class - LGINX |
| (Unaudited) |
Average Annual Rate of Return For Periods Ended
September 30, 2014
| | | | | | | | | | | | | |
| | | 1 Year | | 3 Year | | 5 Year | | Since Inception |
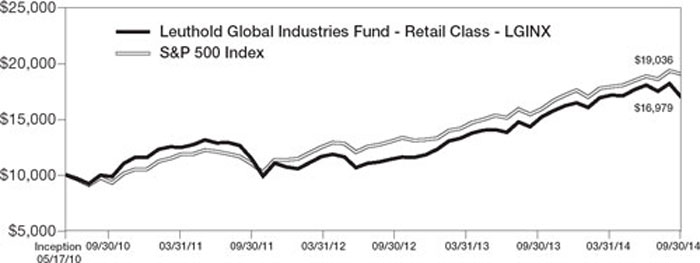
Leuthold Global Industries Fund - Retail Class - LGINX | | 11.78% | | | 19.76% | | | n/a | | | 12.87% | |
| MSCI ACWI | | 11.89% | | | 17.24% | | | 10.65 | % | | 12.00% | |
| Lipper Global Multi-Cap Value Index | | 9.47% | | | 17.13% | | | n/a | | | 12.07% | |
| S&P 500 Index | | 19.73% | | | 22.99% | | | 15.70 | % | | 15.86% | |
A $10,000 Investment in the Leuthold Global Industries Fund - Retail Class - LGINX
The MSCI ACWI (All Country World Index) is a free float-adjusted market capitalization weighted index that is designed to measure the equity market performance of developed and emerging markets. As of June 2, 2014, the MSCI ACWI consisted of 46 country indices comprising 23 developed and 23 emerging market country indices. The developed market country indices included are: Australia, Austria, Belgium, Canada, Denmark, Finland, France, Germany, Hong Kong, Ireland, Israel, Italy, Japan, Netherlands, New Zealand, Norway, Portugal, Singapore, Spain, Sweden, Switzerland, the United Kingdom, and the United States. The emerging market country indices included are: Brazil, Chile, China, Colombia, Czech Republic, Egypt, Greece, Hungary, India, Indonesia, Korea, Malaysia, Mexico, Peru, Philippines, Poland, Qatar, Russia, South Africa, Taiwan, Thailand, Turkey, and United Arab Emirates.
The Lipper Global Multi-Cap Value Index is an index that measures investment in a variety of market capitalization ranges without concentrating 75% of their equity assets in any one market capitalization range over an extended period of time. Typically this index has 25% to 75% of their assets invested in companies both inside and outside of the U.S. with market capitalizations (on a three-year weighted basis) above 400% of the 75th market capitalization percentile of the S&P/Citigroup World Broad Market Index.
The S&P 500 Index is an unmanaged capitalization-weighted index of 500 stocks designed to measure performance of the broad domestic economy through changes in the aggregate market value of the 500 stocks which represent all major industries.
This chart assumes an initial gross investment of $10,000 made on 5/17/10 (commencement of operations). Returns shown include the reinvestment of all dividends. The Fund’s past performance is not necessarily an indication of its future performance. It may perform better or worse in the future. The graph and the table do not reflect the deduction of taxes that a shareholder would pay on Fund distributions or the redemption of shares.
| | |
| 26 | The Leuthold Funds - 2014 Annual Report |
| Leuthold Global Industries Fund - Institutional Class - LGIIX |
| (Unaudited) |
Average Annual Rate of Return For Periods Ended
September 30, 2014
| | | | | | | | | | | | | |
| | | 1 Year | | 3 Year | | 5 Year | | Since Inception |
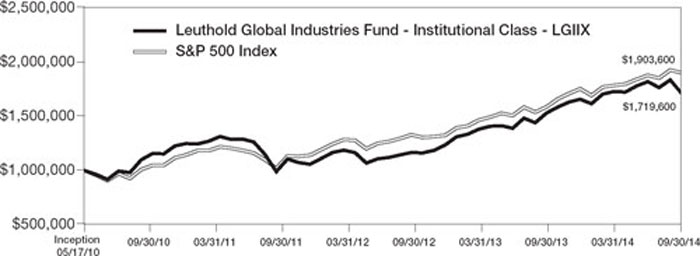
Leuthold Global Industries Fund - Institutional Class - LGIIX | | 12.16% | | | 20.13% | | | n/a | | | 13.20% | |
| MSCI ACWI | | 11.89% | | | 17.24% | | | 10.65 | % | | 12.00% | |
| Lipper Global Multi-Cap Value Index | | 9.47% | | | 17.13% | | | n/a | | | 12.07% | |
| S&P 500 Index | | 19.73% | | | 22.99% | | | 15.70 | % | | 15.86% | |
A $1,000,000 Investment in the Leuthold Global Industries Fund - Institutional Class - LGIIX
The MSCI ACWI (All Country World Index) is a free float-adjusted market capitalization weighted index that is designed to measure the equity market performance of developed and emerging markets. As of June 2, 2014, the MSCI ACWI consisted of 46 country indices comprising 23 developed and 23 emerging market country indices. The developed market country indices included are: Australia, Austria, Belgium, Canada, Denmark, Finland, France, Germany, Hong Kong, Ireland, Israel, Italy, Japan, Netherlands, New Zealand, Norway, Portugal, Singapore, Spain, Sweden, Switzerland, the United Kingdom, and the United States. The emerging market country indices included are: Brazil, Chile, China, Colombia, Czech Republic, Egypt, Greece, Hungary, India, Indonesia, Korea, Malaysia, Mexico, Peru, Philippines, Poland, Qatar, Russia, South Africa, Taiwan, Thailand, Turkey, and United Arab Emirates.
The Lipper Global Multi-Cap Value Index is an index that measures investment in a variety of market capitalization ranges without concentrating 75% of their equity assets in any one market capitalization range over an extended period of time. Typically this index has 25% to 75% of their assets invested in companies both inside and outside of the U.S. with market capitalizations (on a three-year weighted basis) above 400% of the 75th market capitalization percentile of the S&P/Citigroup World Broad Market Index.
The S&P 500 Index is an unmanaged capitalization-weighted index of 500 stocks designed to measure performance of the broad domestic economy through changes in the aggregate market value of the 500 stocks which represent all major industries.
This chart assumes an initial gross investment of $1,000,000 made on 5/17/10 (commencement of operations). Returns shown include the reinvestment of all dividends. The Fund’s past performance is not necessarily an indication of its future performance. It may perform better or worse in the future. The graph and the table do not reflect the deduction of taxes that a shareholder would pay on Fund distributions or the redemption of shares.
| | |
| The Leuthold Funds - 2014 Annual Report | 27 |
| Grizzly Short Fund - GRZZX |
| (Unaudited) |
Average Annual Rate of Return For Periods Ended
September 30, 2014
| | | | | | | | | | | | | |
| | | 1 Year | | 3 Year | | 5 Year | | 10 Year |
| Grizzly Short Fund - GRZZX | | (14.20 | %) | | (22.99 | %) | | (17.25 | %) | | (11.47 | %) |
| Lipper Dedicated Short Bias Funds Index | | (24.43 | %) | | (29.53 | %) | | (23.34 | %) | | (14.46 | %) |
| S&P MidCap 400 Index | | 11.82 | % | | 22.43 | % | | 16.37 | % | | 10.29 | % |
| S&P 500 Index | | 19.73 | % | | 22.99 | % | | 15.70 | % | | 8.11 | % |
A $10,000 Investment in the Grizzly Short Fund - GRZZX
The Lipper Dedicated Short Bias Funds Index is an equally weighted representation of funds in the Lipper Dedicated Short Bias category. These funds employ a hedge fund strategy that maintains a new short exposure to the market through a combination of short and long positions. A dedicated short bias investment strategy attempts to capture profits when the market declines, by holding investments that are overall biased to the short side.
The S&P MidCap 400 Index is a capitalization-weighted index which measures the performance of the mid-range sector of the U.S. stock market. The index was developed with a base level of 100 as of December 31, 1990.
The S&P 500 Index is an unmanaged capitalization-weighted index of 500 stocks designed to measure performance of the broad domestic economy through changes in the aggregate market value of the 500 stocks which represent all major industries.
This chart assumes an initial gross investment of $10,000 made on 9/30/04. Returns shown include the reinvestment of all dividends. The Fund’s past performance is not necessarily an indication of its future performance. It may perform better or worse in the future. The graph and the table do not reflect the deduction of taxes that a shareholder would pay on Fund distributions or the redemption of shares.
| | |
| 28 | The Leuthold Funds - 2014 Annual Report |
| | |
| The Leuthold Funds - 2014 Annual Report | 29 |
| The Leuthold Funds |
| Statements of Assets and Liabilities |
| September 30, 2014 |
| | | Leuthold Core Investment Fund (Consolidated) | | | Leuthold Global Fund (Consolidated) | | | Leuthold Select Industries Fund | |
| ASSETS: | | | | | | | | | |
| Investments, at cost | | | | | | | | | |
| Unaffiliated Securities | | $ | 658,399,847 | | | $ | 300,955,408 | | | $ | 12,548,015 | |
| Affiliated Securities | | | 8,599,014 | | | | — | | | | — | |
| Total Investments, at cost | | | 666,998,861 | | | | 300,955,408 | | | | 12,548,015 | |
| Investments, at fair value | | | | | | | | | | | | |
| Unaffiliated Securities | | | 757,256,288 | | | | 333,345,025 | | | | 14,997,615 | |
| Affiliated Securities | | | 7,964,206 | | | | — | | | | — | |
| Total Investments, at fair value | | | 765,220,494 | | | | 333,345,025 | | | | 14,997,615 | |
| Cash | | | — | | | | 104,335 | | | | 517 | |
Foreign currency
(cost $4,545, $106,815, and $0, respectively) | | | 4,553 | | | | 106,819 | | | | — | |
| Receivable for Fund shares sold | | | 549,049 | | | | 508,556 | | | | — | |
| Receivable for investments sold | | | 2,610,409 | | | | — | | | | — | |
| Collateral at broker for securities sold short | | | 172,509,019 | | | | 65,704,946 | | | | — | |
| Interest receivable | | | 858,338 | | | | 351,598 | | | | 2 | |
| Dividends receivable | | | 424,641 | | | | 845,912 | | | | 9,125 | |
| Other assets | | | 57,332 | | | | 13,886 | | | | 10,854 | |
| Total Assets | | | 942,233,835 | | | | 400,981,077 | | | | 15,018,113 | |
| | | | | | | | | | | | | |
| LIABILITIES: | | | | | | | | | | | | |
Securities sold short, at fair value
(proceeds $94,768,954, $38,413,995, and $0, respectively) | | | 92,277,958 | | | | 37,810,000 | | | | — | |
| Payable for investments purchased | | | 2,442,215 | | | | — | | | | — | |
| Payable for Fund shares redeemed | | | 391,529 | | | | 76,330 | | | | — | |
| Payable to Adviser | | | 645,787 | | | | 335,500 | | | | 6,485 | |
| Payable to Custodian | | | 34,557 | | | | 20,353 | | | | 2,151 | |
| Payable to Directors | | | 31,384 | | | | 12,967 | | | | 573 | |
| Dividends payable on securities sold short | | | 156,971 | | | | 63,739 | | | | — | |
| Distribution (Rule 12b-1) fees payable | | | 36,294 | | | | 39,153 | | | | — | |
| Shareholder servicing fees payable | | | 61,745 | | | | — | | | | 1,530 | |
| Accrued expenses and other liabilities | | | 349,183 | | | | 169,351 | | | | 29,923 | |
| Total Liabilities | | | 96,427,623 | | | | 38,527,393 | | | | 40,662 | |
| NET ASSETS | | $ | 845,806,212 | | | $ | 362,453,684 | | | $ | 14,977,451 | |
| 30 | The Leuthold Funds - 2014 Annual Report | See Notes to the Financial Statements. |
| The Leuthold Funds |
| Statements of Assets and Liabilities (continued) |
| September 30, 2014 |
| | | Leuthold | | | | | | | |
| | | Core | | | Leuthold | | | Leuthold | |
| | | Investment | | | Global | | | Select | |
| | | Fund | | | Fund | | | Industries | |
| | | (Consolidated) | | | (Consolidated) | | | Fund | |
| | | | | | | | | | |
| NET ASSETS CONSIST OF: | | | | | | | | | |
| Capital stock | | $ | 725,481,389 | | | $ | 297,140,719 | | | $ | 14,007,628 | |
| Accumulated net investment income (loss) | | | 1,207,272 | | | | 1,013,299 | | | | (38,812 | ) |
| Accumulated net realized gain (loss) | | | 18,428,485 | | | | 31,359,252 | | | | (1,440,965 | ) |
| Net unrealized appreciation on investments | | | 100,689,066 | | | | 32,940,414 | | | | 2,449,600 | |
| Total Net Assets | | $ | 845,806,212 | | | $ | 362,453,684 | | | $ | 14,977,451 | |
| | | | | | | | | | | | | |
| Retail Class Shares | | | | | | | | | | | | |
| | $ | 569,237,299 | | | $ | 130,838,148 | | | $ | 14,977,451 | |
Shares outstanding
(1,000,000,000 shares of $0.0001 par value authorized) | | | 30,190,431 | | | | 11,585,850 | | | | 748,204 | |
| Net Asset Value, Redemption Price and Offering Price Per Share | | $ | 18.85 | * | | $ | 11.29 | * | | $ | 20.02 | |
| | | | | | | | | | | | | |
| Institutional Class Shares | | | | | | | | | | | | |
| | $ | 276,568,913 | | | $ | 231,615,536 | | | | n/a | |
Shares outstanding
(1,000,000,000 shares of $0.0001 par value authorized) | | | 14,675,523 | | | | 20,431,495 | | | | n/a | |
| Net Asset Value, Redemption Price and Offering Price Per Share | | $ | 18.85 | * | | $ | 11.34 | * | | | n/a | |
* Redemption price may differ from NAV if redemption fee is applied.
| See Notes to the Financial Statements. | The Leuthold Funds - 2014 Annual Report | 31 |
| The Leuthold Funds |
| Statements of Assets and Liabilities (continued) |
| September 30, 2014 |
| | | Leuthold | | | | |
| | | Global | | | Grizzly | |
| | | Industries | | | Short | |
| | | Fund | | | Fund | |
| | | | | | | |
| ASSETS: | | | | | | |
| Investments, at cost | | | | | | |
| Unaffiliated Securities | | $ | 25,374,331 | | | $ | 1,183,717 | |
| Affiliated Securities | | | — | | | | — | |
| Total investments, at cost | | | 25,374,331 | | | | 1,183,717 | |
| Investments, at fair value | | | | | | | | |
| Unaffiliated Securities | | | 27,980,761 | | | | 1,183,717 | |
| Affiliated Securities | | | — | | | | — | |
| Total investments, at fair value | | | 27,980,761 | | | | 1,183,717 | |
| Cash | | | — | | | | 1 | |
Foreign currency
(cost $4,933 and $0, respectively) | | | 4,938 | | | | — | |
| Receivable for Fund shares sold | | | 48,969 | | | | 2,065,225 | |
| Receivable for investments sold | | | 189,681 | | | | 4,267,100 | |
| Collateral at broker for securities sold short | | | — | | | | 137,144,887 | |
| Interest receivable | | | 2 | | | | 11 | |
| Dividends receivable | | | 92,174 | | | | — | |
| Other assets | | | 15,592 | | | | 19,381 | |
| Total Assets | | | 28,332,117 | | | | 144,680,322 | |
| | | | | | | | | |
| LIABILITIES: | | | | | | | | |
Securities sold short, at fair value
(proceeds $0 and $71,625,736, respectively) | | | — | | | | 67,868,835 | |
| Payable for investments purchased | | | — | | | | 4,120,503 | |
| Payable for Fund shares redeemed | | | 17,634 | | | | 330,508 | |
| Payable to Adviser | | | 7,923 | | | | 72,523 | |
| Payable to Custodian | | | 53,302 | | | | 89 | |
| Payable to Directors | | | 1,152 | | | | 2,424 | |
| Dividends payable on securities sold short | | | — | | | | 48,486 | |
| Distribution (Rule 12b-1) fees payable | | | 5,084 | | | | — | |
| Shareholder servicing fees payable | | | — | | | | 7,040 | |
| Accrued expenses and other liabilities | | | 41,966 | | | | 47,707 | |
| Total Liabilities | | | 127,061 | | | | 72,498,115 | |
| NET ASSETS | | $ | 28,205,056 | | | $ | 72,182,207 | |
| 32 | The Leuthold Funds - 2014 Annual Report | See Notes to the Financial Statements. |
| The Leuthold Funds |
| Statements of Assets and Liabilities (continued) |
| September 30, 2014 |
| | | Leuthold | | | | |
| | | Global | | | Grizzly | |
| | | Industries | | | Short | |
| | | Fund | | | Fund | |
| | | | | | | |
| NET ASSETS CONSIST OF: | | | | | | |
| Capital stock | | $ | 25,270,585 | | | $ | 229,966,376 | |
| Accumulated net investment income (loss) | | | 43,270 | | | | (1,626,796 | ) |
| Accumulated net realized gain (loss) on investments | | | 288,986 | | | | (159,914,274 | ) |
| Net unrealized appreciation on investments and short positions | | | 2,602,215 | | | | 3,756,901 | |
| Total Net Assets | | $ | 28,205,056 | | | $ | 72,182,207 | |
| | | | | | | | | |
| Retail Class Shares | | | | | | | | |
| | $ | 11,351,746 | | | $ | 72,182,207 | |
Shares outstanding
(1,000,000,000 shares of $0.0001 par value authorized) | | | 686,137 | | | | 9,797,920 | |
| Net Asset Value, Redemption Price and Offering Price Per Share | | $ | 16.54 | * | | $ | 7.37 | |
| | | | | | | | | |
| Institutional Class Shares | | | | | | | | |
| | $ | 16,853,310 | | | | n/a | |
Shares outstanding
(1,000,000,000 shares of $0.0001 par value authorized) | | | 1,013,706 | | | | n/a | |
| Net Asset Value, Redemption Price and Offering Price Per Share | | $ | 16.63 | * | | | n/a | |
* Redemption price may differ from NAV if redemption fee is applied.
| See Notes to the Financial Statements. | The Leuthold Funds - 2014 Annual Report | 33 |
| The Leuthold Funds |
| Statements of Operations |
| For the Year Ended September 30, 2014 |
| | | Leuthold | | | | | | | |
| | | Core | | | Leuthold | | | Leuthold | |
| | | Investment | | | Global | | | Select | |
| | | Fund | | | Fund | | | Industries | |
| | | (Consolidated) | | | (Consolidated) | | | Fund | |
| | | | | | | | | | |
| INVESTMENT INCOME: | | | | | | | | | |
| Dividend income (net of foreign taxes withheld of $178,303, $497,183, and $0, respectively) | | $ | 9,012,562 | | | $ | 5,963,354 | | | $ | 170,909 | |
| Interest income | | | 1,821,171 | | | | 815,507 | | | | 27 | |
| Total investment income | | | 10,833,733 | | | | 6,778,861 | | | | 170,936 | |
| | | | | | | | | | | | | |
| EXPENSES: | | | | | | | | | | | | |
| Investment advisory fees (Note 3) | | | 7,407,913 | | | | 3,932,206 | | | | 138,347 | |
| Administration fees | | | 359,430 | | | | 147,768 | | | | 6,263 | |
| Transfer agent fees | | | 231,902 | | | | 242,646 | | | | 6,516 | |
| Legal fees | | | 42,003 | | | | 22,508 | | | | 468 | |
| Audit fees | | | 71,072 | | | | 72,657 | | | | 24,420 | |
| Fund accounting fees | | | 124,592 | | | | 67,764 | | | | 5,847 | |
| Custody fees | | | 137,802 | | | | 113,216 | | | | 11,254 | |
| Shareholder servicing fees - Retail Class | | | 546,005 | | | | — | | | | 12,422 | |
| Registration fees | | | 37,932 | | | | 46,508 | | | | 20,885 | |
| Report to shareholders | | | 81,368 | | | | 26,189 | | | | 1,985 | |
| Directors’ fees | | | 117,240 | | | | 50,807 | | | | 2,056 | |
Distribution (Rule 12b-1) fees - Retail Class (Note 4) | | | — | | | | 261,929 | | | | — | |
| Other | | | 64,583 | | | | 31,284 | | | | 1,412 | |
| Total expenses before dividends and interest on short positions | | | 9,221,842 | | | | 5,015,482 | | | | 231,875 | |
| Dividends and interest on short positions | | | 1,005,752 | | | | 401,062 | | | | — | |
| Reimbursement from Adviser (Note 3) | | | — | | | | — | | | | (13,531 | ) |
| Total expenses | | | 10,227,594 | | | | 5,416,544 | | | | 218,344 | |
| NET INVESTMENT INCOME (LOSS) | | $ | 606,139 | | | $ | 1,362,317 | | | $ | (47,408 | ) |
| 34 | The Leuthold Funds - 2014 Annual Report | See Notes to the Financial Statements. |
| The Leuthold Funds |
| Statements of Operations (continued) |
| For the Year Ended September 30, 2014 |
| | | Leuthold | | | | | | | |
| | | Core | | | Leuthold | | | Leuthold | |
| | | Investment | | | Global | | | Select | |
| | | Fund | | | Fund | | | Industries | |
| | | (Consolidated) | | | (Consolidated) | | | Fund | |
| REALIZED AND UNREALIZED GAIN (LOSS) ON INVESTMENTS, INVESTMENT COMPANIES, SHORT POSITIONS, AND FOREIGN CURRENCY AND FOREIGN CURRENCY TRANSLATION: | | | | | | | | | |
| Net realized gain (loss) on: | | | | | | | | | |
| Affiliated Issuers | | $ | (878,403 | ) | | $ | — | | | $ | — | |
| Unaffiliated Issuers | | | 87,396,518 | | | | 38,145,816 | | | | 1,549,083 | |
| Investment companies | | | (620,880 | ) | | | (479,917 | ) | | | — | |
| Realized gain distributions received from investment companies | | | 8,387 | | | | 6,495 | | | | — | |
| Short positions | | | (7,804,344 | ) | | | (2,078,447 | ) | | | — | |
| Foreign currency and foreign currency translation | | | 54,542 | | | | 364,923 | | | | (31 | ) |
| Net unrealized appreciation (depreciation) during the period on: | | | | | | | | | | | | |
| Affiliated Issuers | | | (439,361 | ) | | | (150,257 | ) | | | — | |
| Unaffiliated Issuers | | | 20,887,799 | | | | 14,591,819 | | | | 529,718 | |
| Investment companies | | | 241,881 | | | | 35,563 | | | | — | |
| Short positions | | | 2,185,189 | | | | 279,658 | | | | — | |
| Foreign currency and foreign currency translation | | | (3,630,005 | ) | | | (25,244,779 | ) | | | — | |
| Net realized and unrealized gain on investments, investment companies, short positions, and foreign currency and foreign currency translation | | | 97,401,323 | | | | 25,470,874 | | | | 2,078,770 | |
| NET INCREASE IN NET ASSETS RESULTING FROM OPERATIONS | | $ | 98,007,462 | | | $ | 26,833,191 | | | $ | 2,031,362 | |
| See Notes to the Financial Statements. | The Leuthold Funds - 2014 Annual Report | 35 |
| The Leuthold Funds |
| Statements of Operations (continued) |
| For the Year Ended September 30, 2014 |
| | | Leuthold | | | | |
| | | Global | | | Grizzly | |
| | | Industries | | | Short | |
| | | Fund | | | Fund | |
| | | | | | | |
| INVESTMENT INCOME: | | | | | | |
| Dividend income (net of foreign taxes withheld of $57,337 and $0, respectively) | | $ | 600,314 | | | $ | — | |
| Interest income | | | 44 | | | | 661 | |
| Total investment income | | | 600,358 | | | | 661 | |
| | | | | | | | | |
| EXPENSES: | | | | | | | | |
| Investment advisory fees (Note 3) | | | 268,795 | | | | 854,544 | |
| Administration fees | | | 15,097 | | | | 30,055 | |
| Transfer agent fees | | | 33,758 | | | | 31,105 | |
| Legal fees | | | 887 | | | | 2,576 | |
| Audit fees | | | 22,819 | | | | 8,708 | |
| Fund accounting fees | | | 17,989 | | | | 11,496 | |
| Custody fees | | | 83,287 | | | | 512 | |
| Shareholder servicing fees - Retail Class | | | — | | | | 59,818 | |
| Registration fees | | | 32,020 | | | | 45,134 | |
| Report to shareholders | | | 3,998 | | | | 10,949 | |
| Directors’ fees | | | 4,141 | | | | 9,828 | |
Distribution (Rule 12b-1) fees - Retail Class (Note 4) | | | 23,236 | | | | — | |
| Other | | | 2,591 | | | | 6,488 | |
| Total expenses before dividends and interest on short positions | | | 508,618 | | | | 1,071,213 | |
| Dividends and interest on short positions | | | — | | | | 1,218,838 | |
| Reimbursement from Adviser (Note 3) | | | (89,378 | ) | | | — | |
| Total expenses | | | 419,240 | | | | 2,290,051 | |
| NET INVESTMENT INCOME (LOSS) | | $ | 181,118 | | | $ | (2,289,390 | ) |
| 36 | The Leuthold Funds - 2014 Annual Report | See Notes to the Financial Statements. |
| The Leuthold Funds |
| Statements of Operations (continued) |
| For the Year Ended September 30, 2014 |
| | | Leuthold | | | | |
| | | Global | | | Grizzly | |
| | | Industries | | | Short | |
| | | Fund | | | Fund | |
| REALIZED AND UNREALIZED GAIN (LOSS) ON INVESTMENTS, INVESTMENT COMPANIES, SHORT POSITIONS, AND FOREIGN CURRENCY AND FOREIGN CURRENCY TRANSLATION: | | | | | | |
| Net realized gain (loss) on: | | | | | | |
| Unaffiliated Issuers | | $ | 1,332,925 | | | $ | — | |
| Investment companies | | | (11,597 | ) | | | — | |
| Short positions | | | — | | | | (10,545,730 | ) |
| Foreign currency and foreign currency translation | | | (5,844 | ) | | | 11 | |
| Net unrealized appreciation (depreciation) during the period on: | | | | | | | | |
| Unaffiliated Issuers | | | 4,541,471 | | | | — | |
| Short positions | | | — | | | | 2,110,822 | |
| Foreign currency and foreign currency translation | | | (3,748,129 | ) | | | 8 | |
| Net realized and unrealized gain (loss) on investments, investment companies, short positions, and foreign currency and foreign currency translation | | | 2,108,826 | | | | (8,434,889 | ) |
| NET INCREASE (DECREASE) IN NET ASSETS RESULTING FROM OPERATIONS | | $ | 2,289,944 | | | $ | (10,724,279 | ) |
| See Notes to the Financial Statements. | The Leuthold Funds - 2014 Annual Report | 37 |
| Leuthold Core Investment Fund |
| Statements of Changes in Net Assets (Consolidated) |
| | | Year Ended
September 30, 2014 | | Year Ended
September 30, 2013 | |
| OPERATIONS: | | | | | | | | | |
| Net investment income | | | $ | 606,139 | | | | $ | 3,544,463 | | |
Net realized gain on investments, investment companies, short positions, and foreign currency and foreign currency translation | | | | 78,155,820 | | | | | 67,006,642 | | |
Net unrealized appreciation on investments, investment companies, short positions, and foreign currency and foreign currency translation | | | | 19,245,503 | | | | | 721,729 | | |
| Net increase in net assets from operations | | | | 98,007,462 | | | | | 71,272,834 | | |
| | | | | | | | | | | | |
| DISTRIBUTIONS TO SHAREHOLDERS: | | | | | | | | | | | |
| From net investment income - Retail Class | | | | (6,851,465 | ) | | | | (6,240,190 | ) | |
| From net investment income - Institutional Class | | | | (3,018,397 | ) | | | | (3,087,211 | ) | |
| From net realized gain - Retail Class | | | | (38,977,891 | ) | | | | (3,272,588 | ) | |
| From net realized gain - Institutional Class | | | | (16,784,889 | ) | | | | (1,577,499 | ) | |
| Total distributions | | | | (65,632,642 | ) | | | | (14,177,488 | ) | |
| | | | | | | | | | | |
| CAPITAL SHARE TRANSACTIONS: | | | | | | | | | | | |
| Proceeds from shares sold - Retail Class | | | | 86,391,117 | | | | | 49,789,000 | | |
| Proceeds from shares sold - Institutional Class | | | | 69,205,107 | | | | | 30,970,032 | | |
Proceeds from shares sold in connection with the acquisition of Leuthold Asset Allocation Fund - Retail Class | | | | 182,519,930 | | | | | — | | |
Proceeds from shares sold in connection with the acquisition of Leuthold Asset Allocation Fund - Institutional Class | | | | 49,759,635 | | | | | — | | |
Proceeds from shares issued to holders in reinvestment of dividends - Retail Class | | | | 42,023,848 | | | | | 8,877,918 | | |
Proceeds from shares issued to holders in reinvestment of dividends - Institutional Class | | | | 19,411,870 | | | | | 4,522,253 | | |
| Cost of shares redeemed - Retail Class* | | | | (192,000,052 | ) | | | | (215,964,484 | ) | |
| Cost of shares redeemed - Institutional Class** | | | | (49,424,848 | ) | | | | (121,077,392 | ) | |
| Net increase (decrease) in net assets from capital share transactions | | | | 207,886,607 | | | | | (242,882,673 | ) | |
| | | | | | | | | | | | |
| TOTAL INCREASE (DECREASE) IN NET ASSETS: | | | | 240,261,427 | | | | | (185,787,327 | ) | |
| NET ASSETS | | | | | | | | | | | |
| Beginning of year | | | | 605,544,785 | | | | | 791,332,112 | | |
End of year (including accumulated net investment income of $1,207,272 and $13,460,491, respectively) | | | $ | 845,806,212 | | | | $ | 605,544,785 | | |
| | | | | | | | | | | | |
| CHANGES IN SHARES OUTSTANDING: | | | | | | | | | | | |
| Shares sold - Retail Class | | | | 6,101,049 | | | | | 2,850,613 | | |
| Shares sold - Institutional Class | | | | 2,862,061 | | | | | 1,802,270 | | |
Shares sold in connection with the acquisition of Leuthold Asset Allocation Fund - Retail Class | | | | 9,682,755 | | | | | — | | |
Shares sold in connection with the acquisition of Leuthold Asset Allocation Fund - Institutional Class | | | | 2,641,170 | | | | | — | | |
| Shares issued to holders in reinvestment of dividends - Retail Class | | | | 2,289,986 | | | | | 519,467 | | |
| Shares issued to holders in reinvestment of dividends - Institutional Class | | | | 1,057,511 | | | | | 264,692 | | |
| Shares redeemed - Retail Class | | | | (10,242,962 | ) | | | | (12,465,795 | ) | |
| Shares redeemed - Institutional Class | | | | (2,632,232 | ) | | | | (7,036,584 | ) | |
| Net increase (decrease) in shares outstanding | | | | 11,759,338 | | | | | (14,065,337 | ) | |
| | | | | | | | | | | | |
| *Net of redemption fees of (Retail Class): | | | $ | 145 | | | | $ | 565 | | |
| **Net of redemption fees of (Institutional Class): | | | $ | — | | | | $ | — | | |
| 38 | The Leuthold Funds - 2014 Annual Report | See Notes to the Financial Statements. |
|
Statements of Changes in Net Assets (Consolidated) |
| | | Year Ended
September 30, 2014 | | Year Ended
September 30, 2013 | |
| OPERATIONS: | | | | | | | | | | | |
| Net investment income | | | $ | 1,362,317 | | | | $ | 2,654,175 | | |
Net realized gain on investments, investment companies, short positions, and foreign currency and foreign currency translation | | | | 35,958,870 | | | | | 36,654,801 | | |
Net unrealized appreciation (depreciation) on investments, investment companies, short positions, and foreign currency and foreign currency translation | | | | (10,487,996 | ) | | | | 11,253,045 | | |
| Net increase in net assets from operations | | | | 26,833,191 | | | | | 50,562,021 | | |
| | | | | | | | | | | | |
| DISTRIBUTIONS TO SHAREHOLDERS: | | | | | | | | | | | |
| From net investment income - Retail Class | | | | (929,028 | ) | | | | (894,989 | ) | |
| From net investment income - Institutional Class | | | | (2,174,903 | ) | | | | (2,194,670 | ) | |
| From net realized gain - Retail Class | | | | (12,130,685 | ) | | | | (221,460 | ) | |
| From net realized gain - Institutional Class | | | | (23,092,085 | ) | | | | (448,609 | ) | |
| Total distributions | | | | (38,326,701 | ) | | | | (3,759,728 | ) | |
| | | | | | | | | | | | |
| CAPITAL SHARE TRANSACTIONS: | | | | | | | | | | | |
| Proceeds from shares sold - Retail Class | | | | 28,178,583 | | | | | 29,869,334 | | |
| Proceeds from shares sold - Institutional Class | | | | 65,598,450 | | | | | 35,454,813 | | |
Proceeds from shares issued to holders in reinvestment of dividends - Retail Class | | | | 11,165,016 | | | | | 948,383 | | |
Proceeds from shares issued to holders in reinvestment of dividends - Institutional Class | | | | 22,343,076 | | | | | 2,196,722 | | |
| Cost of shares redeemed - Retail Class* | | | | (31,081,448 | ) | | | | (40,216,497 | ) | |
| Cost of shares redeemed - Institutional Class** | | | | (87,950,876 | ) | | | | (96,202,314 | ) | |
| Net increase (decrease) in net assets from capital share transactions | | | | 8,252,801 | | | | | (67,949,559 | ) | |
| | | | | | | | | | | | |
| TOTAL DECREASE IN NET ASSETS: | | | | (3,240,709 | ) | | | | (21,147,266 | ) | |
| NET ASSETS | | | | | | | | | | | |
| Beginning of year | | | | 365,694,393 | | | | | 386,841,659 | | |
End of year (including accumulated net investment income of $1,013,299 and $884,698, respectively) | | | $ | 362,453,684 | | | | $ | 365,694,393 | | |
| | | | | | | | | | | | |
| CHANGES IN SHARES OUTSTANDING: | | | | | | | | | | | |
| Shares sold - Retail Class | | | | 2,455,643 | | | | | 2,733,961 | | |
| Shares sold - Institutional Class | | | | 5,739,189 | | | | | 3,227,726 | | |
| Shares issued to holders in reinvestment of dividends - Retail Class | | | | 1,008,593 | | | | | 90,141 | | |
| Shares issued to holders in reinvestment of dividends - Institutional Class | | | | 2,009,032 | | | | | 208,265 | | |
| Shares redeemed - Retail Class | | | | (2,728,305 | ) | | | | (3,731,663 | ) | |
| Shares redeemed - Institutional Class | | | | (7,785,815 | ) | | | | (8,905,968 | ) | |
| Net decrease in shares outstanding | | | | 698,337 | | | | | (6,377,538 | ) | |
| | | | | | | | | | | | |
| *Net of redemption fees of (Retail Class): | | | $ | 8 | | | | $ | 17 | | |
| **Net of redemption fees of (Institutional Class): | | | $ | — | | | | $ | 545 | | |
See Notes to the Financial Statements. | The Leuthold Funds - 2014 Annual Report | 39 |
Leuthold Select Industries Fund |
Statements of Changes in Net Assets |
| | | Year Ended
September 30, 2014 | | Year Ended
September 30, 2013 | |
| OPERATIONS: | | | | | | | | | |
| Net investment income (loss) | | | $ | (47,408 | ) | | | $ | 22,859 | | |
| Net realized gain on investments and foreign currency and foreign currency translation | | | | 1,549,052 | | | | | 2,028,574 | | |
| Net unrealized appreciation on investments and foreign currency and foreign currency translation | | | | 529,718 | | | | | 430,379 | | |
| Net increase in net assets from operations | | | | 2,031,362 | | | | | 2,481,812 | | |
| | | | | | | | | | | | |
| DISTRIBUTIONS TO SHAREHOLDERS: | | | | | | | | | | | |
| From net investment income | | | | — | | | | | (33,785 | ) | |
| From net realized gain | | | | — | | | | | — | | |
| Total distributions | | | | — | | | | | (33,785 | ) | |
| | | | | | | | | | | | |
| CAPITAL SHARE TRANSACTIONS: | | | | | | | | | | | |
| Proceeds from shares sold | | | | 6,087,355 | | | | | 4,327,938 | | |
| Proceeds from shares issued to holders in reinvestment of dividends | | | | — | | | | | 32,398 | | |
| Cost of shares redeemed | | | | (2,946,797 | ) | | | | (10,461,259 | ) | |
Net increase (decrease) in net assets from capital share transactions | | | | 3,140,558 | | | | | (6,100,923 | ) | |
| | | | | | | | | | | | |
| TOTAL INCREASE (DECREASE) IN NET ASSETS: | | | | 5,171,920 | | | | | (3,652,896 | ) | |
| NET ASSETS | | | | | | | | | | | |
| Beginning of year | | | | 9,805,531 | | | | | 13,458,427 | | |
| End of year (including accumulated net investment income (loss) of $(38,812) and $0, respectively) | | | $ | 14,977,451 | | | | $ | 9,805,531 | | |
| | | | | | | | | | | | |
| CHANGES IN SHARES OUTSTANDING: | | | | | | | | | | | |
| Shares sold | | | | 316,747 | | | | | 284,592 | | |
| Shares issued to holders in reinvestment of dividends | | | | — | | | | | 2,354 | | |
| Shares redeemed | | | | (151,433 | ) | | | | (718,924 | ) | |
| Net increase (decrease) in shares outstanding | | | | 165,314 | | | | | (431,978 | ) | |
| 40 | The Leuthold Funds - 2014 Annual Report | See Notes to the Financial Statements. |
Leuthold Global Industries Fund |
Statement of Changes in Net Assets |
| | | Year Ended September 30, 2014 | | Year Ended September 30, 2013 | |
| OPERATIONS: | | | | | | | | | | | |
| Net investment income | | | $ | 181,118 | | | | $ | 86,470 | | |
| Net realized gain on investments, investment companies, and foreign currency, and foreign currency translation | | | | 1,315,484 | | | | | 1,261,818 | | |
| Net unrealized appreciation on investments and foreign currency and foreign currency translation | | | | 793,342 | | | | | 1,136,808 | | |
| Net increase in net assets from operations | | | | 2,289,944 | | | | | 2,485,096 | | |
| | | | | | | | | | | | |
| DISTRIBUTIONS TO SHAREHOLDERS: | | | | | | | | | | | |
| From net investment income - Retail Class | | | | (58,291 | ) | | | | (25,886 | ) | |
| From net investment income - Institutional Class | | | | (155,355 | ) | | | | (43,352 | ) | |
| From net realized gain - Retail Class | | | | — | | | | | — | | |
| From net realized gain - Institutional Class | | | | — | | | | | — | | |
| Total distributions | | | | (213,646 | ) | | | | (69,238 | ) | |
| | | | | | | | | | | | |
| CAPITAL SHARE TRANSACTIONS: | | | | | | | | | | | |
| Proceeds from shares sold - Retail Class | | | | 18,250,930 | | | | | 1,493,503 | | |
| Proceeds from shares sold - Institutional Class | | | | 9,601,034 | | | | | 6,982,171 | | |
| Proceeds from shares issued to holders in reinvestment of dividends - Retail Class | | | | 35,569 | | | | | 6,185 | | |
| Proceeds from shares issued to holders in reinvestment of dividends - Institutional Class | | | | 119,677 | | | | | 26,996 | | |
| Cost of shares redeemed - Retail Class* | | | | (12,209,693 | ) | | | | (1,594,609 | ) | |
| Cost of shares redeemed - Institutional Class** | | | | (4,171,907 | ) | | | | (2,761,568 | ) | |
| Net increase in net assets from capital share transactions | | | | 11,625,610 | | | | | 4,152,678 | | |
| | | | | | | | | | | | |
| TOTAL INCREASE IN NET ASSETS: | | | | 13,701,908 | | | | | 6,568,536 | | |
| NET ASSETS | | | | | | | | | | | |
| Beginning of year | | | | 14,503,148 | | | | | 7,934,612 | | |
| End of year (including accumulated net investment income of $43,270 and $31,220 respectively) | | | $ | 28,205,056 | | | | $ | 14,503,148 | | |
| | | | | | | | | | | | |
| CHANGES IN SHARES OUTSTANDING: | | | | | | | | | | | |
| Shares sold - Retail Class | | | | 1,121,305 | | | | | 115,457 | | |
| Shares sold - Institutional Class | | | | 604,894 | | | | | 486,301 | | |
| Shares issued to holders in reinvestment of dividends - Retail Class | | | | 2,058 | | | | | 464 | | |
| Shares issued to holders in reinvestment of dividends - Institutional Class | | | | 7,073 | | | | | 2,039 | | |
| Shares redeemed - Retail Class | | | | (759,511 | ) | | | | (124,261 | ) | |
| Shares redeemed - Institutional Class | | | | (247,417 | ) | | | | (200,862 | ) | |
| Net increase in shares outstanding | | | | 728,402 | | | | | 279,138 | | |
| | | | | | | | | | | | |
| *Net of redemption fees of (Retail Class): | | | $ | 1,430 | | | | $ | 38 | | |
| **Net of redemption fees of (Institutional Class): | | | $ | — | | | | $ | 346 | | |
| See Notes to the Financial Statements. | The Leuthold Funds - 2014 Annual Report | 41 |
|
Statements of Changes in Net Assets |
| | | Year Ended September 30, 2014 | | Year Ended
September 30, 2013 | |
| OPERATIONS: | | | | | | | | | | | |
| Net investment loss | | | $ | (2,289,390 | ) | | | $ | (3,527,731 | ) | |
| Net realized loss on short positions and foreign currency and foreign currency translation | | | | (10,545,719 | ) | | | | (26,479,080 | ) | |
| Net unrealized appreciation on short positions and foreign currency and foreign currency translation | | | | 2,110,830 | | | | | 2,511,304 | | |
| Net decrease in net assets from operations | | | | (10,724,279 | ) | | | | (27,495,507 | ) | |
| | | | | | | | | | | | |
| DISTRIBUTIONS TO SHAREHOLDERS: | | | | | | | | | | | |
| From net investment income | | | | — | | | | | — | | |
| From net realized gain | | | | — | | | | | — | | |
| Total distributions | | | | — | | | | | — | | |
| | | | | | | | | | | | |
| CAPITAL SHARE TRANSACTIONS: | | | | | | | | | | | |
| Proceeds from shares sold | | | | 62,151,591 | | | | | 134,718,165 | | |
| Cost of shares redeemed | | | | (74,159,907 | ) | | | | (148,593,865 | ) | |
| Net decrease in net assets from capital share transactions | | | | (12,008,316 | ) | | | | (13,875,700 | ) | |
| | | | | | | | | | | | |
| TOTAL DECREASE IN NET ASSETS: | | | | (22,732,595 | ) | | | | (41,371,207 | ) | |
| NET ASSETS | | | | | | | | | | | |
| Beginning of year | | | | 94,914,802 | | | | | 136,286,009 | | |
| End of year (including accumulated net investment loss of $(1,626,796) and $(2,056,487), respectively) | | | $ | 72,182,207 | | | | $ | 94,914,802 | | |
| | | | | | | | | | | | |
| CHANGES IN SHARES OUTSTANDING: | | | | | | | | | | | |
| Shares sold | | | | 7,960,339 | | | | | 14,065,201 | | |
| Shares issued to holders in reinvestment of dividends | | | | — | | | | | — | | |
| Shares redeemed | | | | (9,220,444 | ) | | | | (15,330,976 | ) | |
| Net decrease in shares outstanding | | | | (1,260,105 | ) | | | | (1,265,775 | ) | |
| 42 | The Leuthold Funds - 2014 Annual Report | See Notes to the Financial Statements. |
| Leuthold Core Investment Fund - Retail - LCORX |
| Financial Highlights |
| | | | | | | | | | | | | | | | | | | | | |
| | | Year Ended
September 30, 2014 (Consolidated) | | | Year Ended September 30, 2013 (Consolidated) | | | Year Ended September 30, 2012 (Consolidated) | | | Year Ended September 30, 2011 (Consolidated) | | | Year Ended September 30, 2010 (Consolidated) | |
| | | | | | | | | | | | | | | | | | | | | |
Per Share Data(1): | | | | | | | | | | | | | | | | | | | | |
| Net asset value, beginning of year | | $ | 18.29 | | | $ | 16.78 | | | $ | 15.50 | | | $ | 15.99 | | | $ | 15.79 | |
| Income (loss) from investment operations: | | | | | | | | | | | | | | | | | | | | |
| Net investment income | | | 0.01 | (2) | | | 0.09 | (2) | | | 0.11 | (2) | | | 0.09 | (3) | | | 0.14 | (2) |
| Net realized and unrealized gains (losses) on investments and short positions | | | 2.02 | | | | 1.78 | | | | 1.62 | | | | (0.51 | ) | | | 0.11 | |
| Total from investment operations | | | 2.03 | | | | 1.87 | | | | 1.73 | | | | (0.42 | ) | | | 0.25 | |
| | | | | | | | | | | | | | | | | | | | | |
| Less distributions: | | | | | | | | | | | | | | | | | | | | |
| From net investment income | | | (0.21 | ) | | | (0.23 | ) | | | (0.16 | ) | | | (0.02 | ) | | | — | |
| From net realized gains | | | (1.26 | ) | | | (0.13 | ) | | | (0.29 | ) | | | (0.05 | ) | | | — | |
| From return of capital | | | — | | | | — | | | | — | | | | — | | | | (0.05 | ) |
Redemption fees(4) | | | 0.00 | | | | 0.00 | | | | 0.00 | | | | 0.00 | | | | 0.00 | |
| Total distributions | | | (1.47 | ) | | | (0.36 | ) | | | (0.45 | ) | | | (0.07 | ) | | | (0.05 | ) |
| Net asset value, end of year | | $ | 18.85 | | | $ | 18.29 | | | $ | 16.78 | | | $ | 15.50 | | | $ | 15.99 | |
| | | | | | | | | | | | | | | | | | | | | |
| Total Return | | | 11.49 | % | | | 11.29 | % | | | 11.34 | % | | | (2.61 | %) | | | 1.53 | % |
| | | | | | | | | | | | | | | | | | | | | |
| Supplemental data and ratios: | | | | | | | | | | | | | | | | | | | | |
| Net assets, end of year | | $ | 569,237,299 | | | $ | 409,043,691 | | | $ | 527,760,001 | | | $ | 660,993,063 | | | $ | 858,708,522 | |
Ratio of expenses to average net assets(5) | | | 1.28 | % | | | 1.28 | % | | | 1.22 | % | | | 1.24 | % | | | 1.37 | % |
Ratio of net investment income to average net assets(6) | | | 0.04 | % | | | 0.49 | % | | | 0.69 | % | | | 0.54 | % | | | 0.85 | % |
Portfolio turnover rate(7) | | | 80.65 | % | | | 105.28 | % | | | 149.17 | % | | | 83.15 | % | | | 100.36 | % |
(1) For a share outstanding throughout the period. Rounded to the nearest cent.
(2) Net investment income per share is calculated based on average shares outstanding.
(3) Net investment income per share is calculated using ending balances prior to consideration of adjustments for permanent book and tax differences.
(4) Amount represents less than $0.005 per share.
(5) The ratio of expenses to average net assets includes dividends and interest on short positions. The expense ratios excluding dividends and interest on short positions were 1.15% for the year ended September 30, 2014, 1.16% for the year ended September 30, 2013, 1.14% for the year ended September 30, 2012, 1.14% for the year ended September 30, 2011, and 1.12% for the year ended September 30, 2010.
(6) The net investment income ratios include dividends and interest on short positions.
(7) The portfolio turnover rate excludes purchases and sales of short positions as the Adviser does not intend to hold the short positions for more than one year.
| | | |
| See Notes to the Financial Statements. | The Leuthold Funds - 2014 Annual Report | 43 |
Leuthold Core Investment Fund - Institutional - LCRIX |
|
| | | | | | | | | | | | | | | | | | | | | |
| | | Year Ended
September 30,
2014
(Consolidated) | | | Year Ended
September 30,
2013
(Consolidated) | | | Year Ended
September 30,
2012
(Consolidated) | | | Year Ended
September 30,
2011
(Consolidated) | | | Year Ended
September 30,
2010
(Consolidated) | |
| | | | | | | | | | | | | | | | | |
Per Share Data(1): | | | | | | | | | | | | | | | | |
| Net asset value, beginning of year | | $ | 18.28 | | | $ | 16.77 | | | $ | 15.50 | | | $ | 15.98 | | | $ | 15.78 | |
| Income (loss) from investment operations: | | | | | | | | | | | | | | | | | | | | |
| Net investment income | | | 0.03 | (2) | | | 0.11 | (2) | | | 0.12 | (2) | | | 0.11 | (3) | | | 0.15 | (2) |
| Net realized and unrealized gains (losses) on investments and short positions | | | 2.03 | | | | 1.78 | | | | 1.62 | | | | (0.50 | ) | | | 0.11 | |
| Total from investment operations | | | 2.06 | | | | 1.89 | | | | 1.74 | | | | (0.39 | ) | | | 0.26 | |
| | | | | | | | | | | | | | | | | | | | | |
| Less distributions: | | | | | | | | | | | | | | | | | | | | |
| From net investment income | | | (0.23 | ) | | | (0.25 | ) | | | (0.18 | ) | | | (0.04 | ) | | | — | |
| From net realized gains | | | (1.26 | ) | | | (0.13 | ) | | | (0.29 | ) | | | (0.05 | ) | | | — | |
| From return of capital | | | — | | | | — | | | | — | | | | — | | | | (0.06 | ) |
| Redemption fees | | | — | | | | — | | | | 0.00 | (4) | | | 0.00 | (4) | | | 0.00 | (4) |
| Total distributions | | | (1.49 | ) | | | (0.38 | ) | | | (0.47 | ) | | | (0.09 | ) | | | (0.06 | ) |
| Net asset value, end of year | | $ | 18.85 | | | $ | 18.28 | | | $ | 16.77 | | | $ | 15.50 | | | $ | 15.98 | |
| | | | | | | | | | | | | | | | | | | | | |
| Total Return | | | 11.66 | % | | | 11.42 | % | | | 11.40 | % | | | (2.49 | %) | | | 1.64 | % |
| | | | | | | | | | | | | | | | | | | | | |
| Supplemental data and ratios: | | | | | | | | | | | | | | | | | | | | |
| Net assets, end of year | | $ | 276,568,913 | | | $ | 196,501,094 | | | $ | 263,572,111 | | | $ | 347,517,502 | | | $ | 451,654,832 | |
Ratio of expenses to average net assets(5) | | | 1.18 | % | | | 1.17 | % | | | 1.11 | % | | | 1.13 | % | | | 1.27 | % |
Ratio of net investment income to average net assets(6) | | | 0.14 | % | | | 0.60 | % | | | 0.80 | % | | | 0.66 | % | | | 0.95 | % |
Portfolio turnover rate(7) | | | 80.65 | % | | | 105.28 | % | | | 149.17 | % | | | 83.15 | % | | | 100.36 | % |
(1) For a share outstanding throughout the period. Rounded to the nearest cent.
(2) Net investment income per share is calculated based on average shares outstanding.
(3) Net investment income per share is calculated using ending balances prior to consideration of adjustments for permanent book and tax differences.
(4) Amount represents less than $0.005 per share.
(5) The ratio of expenses to average net assets includes dividends and interest on short positions. The expense ratios excluding dividends and interest on short positions were 1.06% for the year ended September 30, 2014, 1.06% for the year ended September 30, 2013, 1.03% for the year ended September 30, 2012, 1.03% for the year ended September 30, 2011, and 1.02% for the year ended September 30, 2010.
(6) The net investment income ratios include dividends and interest on short positions.
(7) The portfolio turnover rate excludes purchases and sales of short positions as the Adviser does not intend to hold the short positions for more than one year.
| 44 | The Leuthold Funds - 2014 Annual Report | See Notes to the Financial Statements. |
Leuthold Global Fund - Retail - GLBLX |
|
| | | | | | | | | | | | | | | | | | | | | |
| | | Year Ended
September 30,
2014
(Consolidated) | | | Year Ended
September 30,
2013
(Consolidated) | | | Year Ended
September 30,
2012
(Consolidated) | | | Year Ended
September 30,
2011
(Consolidated) | | | Year Ended
September 30,
2010
(Consolidated) | |
| | | | | | | | | | | | | | | | |
Per Share Data(1): | | | | | | | | | | | | | | | |
| Net asset value, beginning of year | | $ | 11.65 | | | $ | 10.24 | | | $ | 9.52 | | | $ | 10.18 | | | $ | 9.07 | |
| Income (loss) from investment operations: | | | | | | | | | | | | | | | | | | | | |
| Net investment income | | | 0.03 | (2) | | | 0.07 | (2) | | | 0.05 | (3) | | | 0.08 | (3) | | | 0.07 | (2) |
| Net realized and unrealized gains (losses) on investments and short positions | | | 0.83 | | | | 1.44 | | | | 0.89 | | | | (0.17 | ) | | | 1.06 | |
| Total from investment operations | | | 0.86 | | | | 1.51 | | | | 0.94 | | | | (0.09 | ) | | | 1.13 | |
| | | | | | | | | | | | | | | | | | | | | |
| Less distributions: | | | | | | | | | | | | | | | | | | | | |
| From net investment income | | | (0.08 | ) | | | (0.08 | ) | | | (0.07 | ) | | | (0.05 | ) | | | (0.02 | ) |
| From net realized gains | | | (1.14 | ) | | | (0.02 | ) | | | (0.15 | ) | | | (0.52 | ) | | | — | |
Redemption fees(4) | | | 0.00 | | | | 0.00 | | | | 0.00 | | | | 0.00 | | | | 0.00 | |
| Total distributions | | | (1.22 | ) | | | (0.10 | ) | | | (0.22 | ) | | | (0.57 | ) | | | (0.02 | ) |
| Net asset value, end of year | | $ | 11.29 | | | $ | 11.65 | | | $ | 10.24 | | | $ | 9.52 | | | $ | 10.18 | |
| | | | | | | | | | | | | | | | | | | | | |
| Total Return | | | 7.68 | % | | | 14.78 | % | | | 10.14 | % | | | (1.33 | %) | | | 12.39 | % |
| | | | | | | | | | | | | | | | | | | | | |
| Supplemental data and ratios: | | | | | | | | | | | | | | | | | | | | |
| Net assets, end of year | | $ | 130,838,148 | | | $ | 126,418,514 | | | $ | 120,450,807 | | | $ | 152,292,208 | | | $ | 98,906,854 | |
Ratio of expenses to average net assets(5) | | | 1.65 | % | | | 1.63 | % | | | 1.57 | % | | | 1.74 | % | | | 1.93 | % |
Ratio of net investment income to average net assets(6) | | | 0.25 | % | | | 0.61 | % | | | 0.60 | % | | | 0.83 | % | | | 0.78 | % |
Portfolio turnover rate(7) | | | 71.63 | % | | | 101.03 | % | | | 127.41 | % | | | 123.51 | % | | | 140.87 | % |
(1) For a share outstanding throughout the period. Rounded to the nearest cent.
(2) Net investment income per share is calculated based on average shares outstanding.
(3) Net investment income per share is calculated using ending balances prior to consideration of adjustments for permanent book and tax differences.
(4) Amount represents less than $0.005 per share.
(5) The ratio of expenses to average net assets includes dividends and interest on short positions. The expense ratios excluding dividends and interest on short positions were 1.53% for the year ended September 30, 2014, 1.51% for the year ended September 30, 2013, 1.51% for the year ended September 30, 2012, 1.55% for the year ended September 30, 2011, and 1.65% for the year ended September 30, 2010.
(6) The net investment income ratios include dividends and interest on short positions.
(7) The portfolio turnover rate excludes purchases and sales of short positions as the Adviser does not intend to hold the short positions for more than one year.
| See Notes to the Financial Statements. | The Leuthold Funds - 2014 Annual Report | 45 |
Leuthold Global Fund - Institutional - GLBIX |
|
| | | | | | | | | | | | | | | | | | | | | |
| | | Year Ended
September 30,
2014
(Consolidated) | | | Year Ended
September 30, 2013
(Consolidated) | | | Year Ended
September 30,
2012
(Consolidated) | | | Year Ended
September 30,
2011
(Consolidated) | | | Year Ended
September 30,
2010
(Consolidated) | |
| | | | | | | | | | | | | | | | |
Per Share Data(1): | | | | | | | | | | | | | | | |
| Net asset value, beginning of year | | $ | 11.69 | | | $ | 10.27 | | | $ | 9.54 | | | $ | 10.20 | | | $ | 9.08 | |
| Income (loss) from investment operations: | | | | | | | | | | | | | | | | | | | | |
| Net investment income | | | 0.05 | (2) | | | 0.09 | (2) | | | 0.09 | (3) | | | 0.10 | (3) | | | 0.09 | (2) |
| Net realized and unrealized gains (losses) on investments and short positions | | | 0.84 | | | | 1.45 | | | | 0.88 | | | | (0.17 | ) | | | 1.06 | |
| Total from investment operations | | | 0.89 | | | | 1.54 | | | | 0.97 | | | | (0.07 | ) | | | 1.15 | |
| | | | | | | | | | | | | | | | | | | | | |
| Less distributions: | | | | | | | | | | | | | | | | | | | | |
| From net investment income | | | (0.10 | ) | | | (0.10 | ) | | | (0.09 | ) | | | (0.07 | ) | | | (0.03 | ) |
| From net realized gains | | | (1.14 | ) | | | (0.02 | ) | | | (0.15 | ) | | | (0.52 | ) | | | — | |
| Redemption fees | | | — | | | | 0.00 | (4) | | | — | | | | 0.00 | (4) | | | — | |
| Total distributions | | | (1.24 | ) | | | (0.12 | ) | | | (0.24 | ) | | | (0.59 | ) | | | (0.03 | ) |
| Net asset value, end of year | | $ | 11.34 | | | $ | 11.69 | | | $ | 10.27 | | | $ | 9.54 | | | $ | 10.20 | |
| | | | | | | | | | | | | | | | | | | | | |
| Total Return | | | 7.95 | % | | | 15.08 | % | | | 10.34 | % | | | (1.11 | %) | | | 12.52 | % |
| | | | | | | | | | | | | | | | | | | | | |
| Supplemental data and ratios: | | | | | | | | | | | | | | | | | | | | |
| Net assets, end of year | | $ | 231,615,536 | | | $ | 239,275,879 | | | $ | 266,390,852 | | | $ | 292,447,586 | | | $ | 190,739,466 | |
Ratio of expenses to average net assets(5) | | | 1.44 | % | | | 1.44 | % | | | 1.36 | % | | | 1.57 | % | | | 1.75 | % |
Ratio of net investment income to average net assets(6) | | | 0.45 | % | | | 0.80 | % | | | 0.81 | % | | | 1.01 | % | | | 0.97 | % |
Portfolio turnover rate(7) | | | 71.63 | % | | | 101.03 | % | | | 127.41 | % | | | 123.51 | % | | | 140.87 | % |
(1) For a share outstanding throughout the period. Rounded to the nearest cent.
(2) Net investment income per share is calculated based on average shares outstanding.
(3) Net investment income per share is calculated using ending balances prior to consideration of adjustments for permanent book and tax differences.
(4) Amount represents less than $0.005 per share.
(5) The ratio of expenses to average net assets includes dividends and interest on short positions. The expense ratios excluding dividends and interest on short positions were 1.33% for the year ended September 30, 2014, 1.32% for the year ended September 30, 2013, 1.31% for the year ended September 30, 2012, 1.38% for the year ended September 30, 2011, and 1.47% for the year ended September 30, 2010.
(6) The net investment income ratios include dividends and interest on short positions.
(7) The portfolio turnover rate excludes purchases and sales of short positions as the Adviser does not intend to hold the short positions for more than one year.
| 46 | The Leuthold Funds - 2014 Annual Report | See Notes to the Financial Statements. |
| Leuthold Select Industries Fund - LSLTX |
| Financial Highlights |
| | | | | | | | | | | | | | | | | | | | | |
| | | Year Ended | | | Year Ended | | | Year Ended | | | Year Ended | | | Year Ended | |
| | | September 30, | | | September 30, | | | September 30, | | | September 30, | | | September 30, | |
| | | 2014 | | | 2013 | | | 2012 | | | 2011 | | | 2010 | |
| | | | | | | | | | | | | | | | |
Per Share Data(1): | | | | | | | | | | | | | | | |
| Net asset value, beginning of year | | $ | 16.82 | | | $ | 13.26 | | | $ | 10.78 | | | $ | 11.80 | | | $ | 12.82 | |
| Income (loss) from investment operations: | | | | | | | | | | | | | | | | | | | | |
| Net investment income (loss) | | | (0.07 | )(2) | | | 0.03 | (3) | | | 0.03 | (3) | | | (0.05 | )(2) | | | 0.03 | (3) |
| Net realized and unrealized gains (losses) on investments and short positions | | | 3.27 | | | | 3.58 | | | | 2.47 | | | | (0.95 | ) | | | (1.03 | ) |
| Total from investment operations | | | 3.20 | | | | 3.61 | | | | 2.50 | | | | (1.00 | ) | | | (1.00 | ) |
| | | | | | | | | | | | | | | | | | | | | |
| Less distributions: | | | | | | | | | | | | | | | | | | | | |
| From net investment income | | | –– | | | | (0.05 | ) | | | (0.02 | ) | | | (0.02 | ) | | | (0.02 | ) |
| Total distributions | | | –– | | | | (0.05 | ) | | | (0.02 | ) | | | (0.02 | ) | | | (0.02 | ) |
| Net asset value, end of year | | $ | 20.02 | | | $ | 16.82 | | | $ | 13.26 | | | $ | 10.78 | | | $ | 11.80 | |
| | | | | | | | | | | | | | | | | | | | | |
| Total Return | | | 19.02 | % | | | 27.26 | % | | | 23.34 | % | | | (8.60 | %) | | | (7.76 | %) |
| | | | | | | | | | | | | | | | | | | | | |
| Supplemental data and ratios: | | | | | | | | | | | | | | | | | | | | |
| Net assets, end of year | | $ | 14,977,451 | | | $ | 9,805,531 | | | $ | 13,458,427 | | | $ | 16,278,535 | | | $ | 39,088,487 | |
| Ratio of expenses to average net assets: | | | | | | | | | | | | | | | | | | | | |
| Before expense reimbursement or recovery | | | 1.68 | % | | | 1.80 | % | | | 1.71 | % | | | 1.40 | % | | | 1.30 | % |
| After expense reimbursement or recovery | | | 1.58 | % | | | 1.60 | % | | | 1.60 | % | | | 1.40 | % | | | 1.30 | % |
| Ratio of net investment income (loss) to average net assets: | | | | | | | | | | | | | | | | | | | | |
| Before expense reimbursement or recovery | | | (0.44 | %) | | | 0.00 | % | | | 0.11 | % | | | (0.24 | %) | | | 0.24 | % |
| After expense reimbursement or recovery | | | (0.34 | %) | | | 0.20 | % | | | 0.22 | % | | | (0.24 | %) | | | 0.24 | % |
| Portfolio Turnover | | | 66.79 | % | | | 136.34 | % | | | 139.61 | % | | | 109.26 | % | | | 178.24 | % |
| (1) | For a share outstanding throughout the period. Rounded to the nearest cent. |
| (2) | Net investment loss per share is calculated using ending balances prior to consideration of adjustments for permanent book and tax differences. |
| (3) | Net investment income per share is calculated based on average shares outstanding. |
| See Notes to the Financial Statements. | The Leuthold Funds - 2014 Annual Report | 47 |
Leuthold Global Industries Fund - Retail - LGINX |
| Financial Highlights |
| | | | | | | | | | | | | | | | | | | | | |
| | | | | | | | | | | | | | | Period from | |
| | | | | | | | | | | | | | | May 17, 2010(1) | |
| | | Year Ended | | | Year Ended | | | Year Ended | | | Year Ended | | | through | |
| | | September 30, | | | September 30, | | | September 30, | | | September 30, | | | September 30, | |
| | | 2014 | | | 2013 | | | 2012 | | | 2011 | | | 2010 | |
| | | | | | | | | | | | | | | | |
Per Share Data(2): | | | | | | | | | | | | | | | |
| Net asset value, beginning of period | | $ | 14.89 | | | $ | 11.44 | | | $ | 9.77 | | | $ | 11.01 | | | $ | 10.00 | |
| Income (loss) from investment operations: | | | | | | | | | | | | | | | | | | | | |
| Net investment income | | | 0.08 | (3) | | | 0.10 | (3) | | | 0.01 | (4) | | | 0.06 | (4) | | | 0.00 | (4)(5) |
| Net realized and unrealized gains (losses) on investments and short positions | | | 1.68 | | | | 3.43 | | | | 1.68 | | | | (1.16 | ) | | | 1.01 | |
| Total from investment operations | | | 1.76 | | | | 3.53 | | | | 1.69 | | | | (1.10 | ) | | | 1.01 | |
| | | | | | | | | | | | | | | | | | | | | |
| Less distributions: | | | | | | | | | | | | | | | | | | | | |
| From net investment income | | | (0.11 | ) | | | (0.08 | ) | | | (0.02 | ) | | | (0.06 | ) | | | –– | |
| From net realized gains | | | –– | | | | –– | | | | –– | | | | (0.08 | ) | | | –– | |
| Redemption fees | | | 0.00 | (5) | | | 0.00 | (5) | | | –– | | | | 0.00 | (5) | | | –– | |
| Total distributions | | | (0.11 | ) | | | (0.08 | ) | | | (0.02 | ) | | | (0.14 | ) | | | –– | |
| Net asset value, end of period | | $ | 16.54 | | | $ | 14.89 | | | $ | 11.44 | | | $ | 9.77 | | | $ | 11.01 | |
| | | | | | | | | | | | | | | | | | | | | |
| Total Return | | | 11.78 | % | | | 30.98 | % | | | 17.33 | % | | | (10.23 | %) | | | 10.10 | % |
| | | | | | | | | | | | | | | | | | | | | |
| Supplemental data and ratios: | | | | | | | | | | | | | | | | | | | | |
| Net assets, end of period | | $ | 11,351,746 | | | $ | 4,797,409 | | | $ | 3,782,099 | | | $ | 5,377,373 | | | $ | 5,850,019 | |
| Ratio of expenses to average net assets: | | | | | | | | | | | | | | | | | | | | |
| Before expense reimbursement or recovery | | | 2.06 | % | | | 2.70 | % | | | 2.52 | % | | | 1.96 | % | | | 4.42 | %(6) |
| After expense reimbursement or recovery | | | 1.72 | % | | | 1.96 | % | | | 2.00 | % | | | 2.04 | % | | | 1.96 | %(6) |
| Ratio of net investment income to average net assets: | | | | | | | | | | | | | | | | | | | | |
| Before expense reimbursement or recovery | | | 0.18 | % | | | 0.01 | % | | | (0.45 | %) | | | 0.60 | % | | | (2.29 | %)(6) |
| After expense reimbursement or recovery | | | 0.52 | % | | | 0.75 | % | | | 0.07 | % | | | 0.52 | % | | | 0.17 | %(6) |
| Portfolio Turnover | | | 107.17 | % | | | 142.87 | % | | | 117.30 | % | | | 179.57 | % | | | 112.58 | % |
| (1) | Commencement of share class operations. |
| (2) | For a share outstanding throughout the period. Rounded to the nearest cent. |
| (3) | Net investment income per share is calculated based on average shares outstanding. |
| (4) | Net investment income per share is calculated using ending balances prior to consideration of adjustments for permanent book and tax differences. |
| (5) | Amount represents less than $0.005 per share. |
| (6) | Annualized. |
| 48 | The Leuthold Funds - 2014 Annual Report | See Notes to the Financial Statements. |
Leuthold Global Industries Fund - Institutional - LGIIX |
| Financial Highlights |
| | | | | | | | | | | | | | | | |
| | | | | | | | | | | | | | | Period from | |
| | | | | | | | | | | | | | | May 17, 2010(1) | |
| | | Year Ended | | | Year Ended | | | Year Ended | | | Year Ended | | | through | |
| | | September 30, | | | September 30, | | | September 30, | | | September 30, | | | September 30, | |
| | | 2014 | | | 2013 | | | 2012 | | | 2011 | | | 2010 | |
| | | | | | | | | | | | | | | | |
Per Share Data(2): | | | | | | | | | | | | | | | |
| Net asset value, beginning of period | | $ | 14.95 | | | $ | 11.48 | | | $ | 9.77 | | | $ | 11.01 | | | $ | 10.00 | |
| Income (loss) from investment operations: | | | | | | | | | | | | | | | | | | | | |
| Net investment income | | | 0.13 | (3) | | | 0.13 | (3) | | | 0.06 | (4) | | | 0.09 | (4) | | | 0.01 | (4) |
| Net realized and unrealized gains (losses) on investments and short positions | | | 1.69 | | | | 3.45 | | | | 1.67 | | | | (1.15 | ) | | | 1.00 | |
| Total from investment operations | | | 1.82 | | | | 3.58 | | | | 1.73 | | | | (1.06 | ) | | | 1.01 | |
| | | | | | | | | | | | | | | | | | | | | |
| Less distributions: | | | | | | | | | | | | | | | | | | | | |
| From net investment income | | | (0.14 | ) | | | (0.11 | ) | | | (0.02 | ) | | | (0.10 | ) | | | –– | |
| From net realized gains | | | –– | | | | –– | | | | –– | | | | (0.08 | ) | | | –– | |
| Redemption fees | | | –– | | | | 0.00 | (5) | | | –– | | | | –– | | | | –– | |
| Total distributions | | | (0.14 | ) | | | (0.11 | ) | | | (0.02 | ) | | | (0.18 | ) | | | –– | |
| Net asset value, end of period | | $ | 16.63 | | | $ | 14.95 | | | $ | 11.48 | | | $ | 9.77 | | | $ | 11.01 | |
| | | | | | | | | | | | | | | | | | | | | |
| Total Return | | | 12.16 | % | | | 31.17 | % | | | 17.84 | % | | | (9.92 | %) | | | 10.10 | % |
| | | | | | | | | | | | | | | | | | | | | |
| Supplemental data and ratios: | | | | | | | | | | | | | | | | | | | | |
| Net assets, end of period | | $ | 16,853,310 | | | $ | 9,705,739 | | | $ | 4,152,513 | | | $ | 14,904,617 | | | $ | 3,870,245 | |
| Ratio of expenses to average net assets: | | | | | | | | | | | | | | | | | | | | |
| Before expense reimbursement or recovery | | | 1.81 | % | | | 2.45 | % | | | 2.27 | % | | | 1.71 | % | | | 4.17 | %(6) |
| After expense reimbursement or recovery | | | 1.47 | % | | | 1.71 | % | | | 1.75 | % | | | 1.79 | % | | | 1.71 | %(6) |
| Ratio of net investment income to average net assets: | | | | | | | | | | | | | | | | | | | | |
| Before expense reimbursement or recovery | | | 0.43 | % | | | 0.26 | % | | | (0.20 | %) | | | 0.85 | % | | | (2.04 | %)(6) |
| After expense reimbursement or recovery | | | 0.77 | % | | | 1.00 | % | | | 0.32 | % | | | 0.77 | % | | | 0.42 | %(6) |
| Portfolio Turnover | | | 107.17 | % | | | 142.87 | % | | | 117.30 | % | | | 179.57 | % | | | 112.58 | % |
| (1) | Commencement of share class operations. |
| (2) | For a share outstanding throughout the period. Rounded to the nearest cent. |
| (3) | Net investment income per share is calculated based on average shares outstanding. |
| (4) | Net investment income per share is calculated using ending balances prior to consideration of adjustments for permanent book and tax differences. |
| (5) | Amount represents less than $0.005 per share. |
| (6) | Annualized. |
| See Notes to the Financial Statements. | The Leuthold Funds - 2014 Annual Report | 49 |
Grizzly Short Fund - GRZZX |
| Financial Highlights |
| | | Year Ended | | | Year Ended | | | Year Ended | | | Year Ended | | | Year Ended | |
| | | September 30, | | | September 30, | | | September 30, | | | September 30, | | | September 30, | |
| | | 2014 | | | 2013 | | | 2012 | | | 2011 | | | 2010(1) | |
| | | | | | | | | | | | | | | | |
Per Share Data(2): | | | | | | | | | | | | | | | |
| Net asset value, beginning of year | | $ | 8.58 | | | $ | 11.06 | | | $ | 16.14 | | | $ | 16.48 | | | $ | 19.00 | |
| Income (loss) from investment operations: | | | | | | | | | | | | | | | | | | | | |
| Net investment loss | | | (0.26 | )(4) | | | (0.34 | )(3) | | | (0.40 | )(3) | | | (0.43 | )(3) | | | (0.48 | )(3) |
| Net realized and unrealized gains (losses) on investments and short positions | | | (0.95 | ) | | | (2.14 | ) | | | (4.68 | ) | | | 0.09 | | | | (2.04 | ) |
| Total from investment operations | | | (1.21 | ) | | | (2.48 | ) | | | (5.08 | ) | | | (0.34 | ) | | | (2.52 | ) |
| | | | | | | | | | | | | | | | | | | | | |
| Less distributions: | | | | | | | | | | | | | | | | | | | | |
| From net investment income | | | –– | | | | –– | | | | –– | | | | –– | | | | –– | |
| From net realized gains | | | –– | | | | –– | | | | –– | | | | –– | | | | –– | |
| From return of capital | | | –– | | | | –– | | | | –– | | | | –– | | | | –– | |
| Total distributions | | | –– | | | | –– | | | | –– | | | | –– | | | | –– | |
| Net asset value, end of year | | $ | 7.37 | | | $ | 8.58 | | | $ | 11.06 | | | $ | 16.14 | | | $ | 16.48 | |
| | | | | | | | | | | | | | | | | | | | | |
| Total Return | | | (14.20 | %) | | | (22.33 | %) | | | (31.47 | %) | | | (2.06 | %) | | | (13.26 | %) |
| | | | | | | | | | | | | | | | | | | | | |
| Supplemental data and ratios: | | | | | | | | | | | | | | | | | | | | |
| Net assets, end of year | | $ | 72,182,207 | | | $ | 94,914,802 | | | $ | 136,286,009 | | | $ | 263,488,083 | | | $ | 196,552,242 | |
Ratio of expenses to average net assets(5) | | | 3.35 | % | | | 3.43 | % | | | 3.09 | % | | | 3.01 | % | | | 2.72 | % |
Ratio of net investment loss to average net assets(6) | | | (3.35 | %) | | | (3.42 | %) | | | (3.09 | %) | | | (3.01 | %) | | | (2.71 | %) |
Portfolio turnover rate(7) | | | 0.00 | % | | | 0.00 | % | | | 0.00 | % | | | 0.00 | % | | | 0.00 | % |
| (1) | Per share data adjusted for 1:4 reverse split completed as of May 20, 2011. |
| (2) | For a share outstanding throughout the period. Rounded to the nearest cent. |
| (3) | Net investment loss per share is calculated based on average shares outstanding. |
| (4) | Net investment loss per share is calculated using ending balances prior to consideration of adjustments for permanent book and tax differences. |
| (5) | The ratio of expenses to average net assets includes dividends and interest on short positions. The expense ratios excluding dividends and interest on short positions were 1.57% for the year ended September 30, 2014, 1.54% for the year ended September 30, 2013, 1.52% for the year ended September 30, 2012, 1.53% for the year ended September 30, 2011, and 1.49% for the year ended September 30, 2010. |
| (6) | The net investment loss ratios include dividends and interest on short positions. |
| (7) | The portfolio turnover rate excludes purchases and sales of short positions as the Adviser does not intend to hold the short positions for more than one year. |
| 50 | The Leuthold Funds - 2014 Annual Report | See Notes to the Financial Statements. |
| Leuthold Core Investment Fund |
| Consolidated Schedule of Investments |
| September 30, 2014 |
| | | Shares | | | Fair Value | |
| COMMON STOCKS - 65.97% | | | | |
| | | | | | | |
| Aerospace & Defense - 4.07% | | | | |
| AAR Corp. | | | 67,517 | | | $ | 1,630,535 | |
| Alliant Techsystems, Inc. | | | 25,815 | | | | 3,295,027 | |
| Boeing Co. | | | 32,434 | | | | 4,131,443 | |
| Exelis, Inc. | | | 167,468 | | | | 2,769,921 | |
L-3 Communications Holdings, Inc. | | | 27,139 | | | | 3,227,370 | |
| Lockheed Martin Corp. | | | 30,449 | | | | 5,565,468 | |
| Moog, Inc. - Class A (a) | | | 24,491 | | | | 1,675,184 | |
| Northrop Grumman Corp. | | | 40,378 | | | | 5,320,205 | |
| Raytheon Co. | | | 43,687 | | | | 4,439,473 | |
| Triumph Group, Inc. | | | 33,758 | | | | 2,195,958 | |
| Vectrus, Inc. (a) | | | 9,304 | | | | 181,703 | |
| | | | | | | | 34,432,287 | |
| | | | | | | | | |
| Air Freight & Logistics - 0.03% | | | | | | | | |
| Hyundai Glovis Co., Ltd. (b) | | | 963 | | | | 293,623 | |
| | | | | | | | | |
| Airlines - 5.28% | | | | | | | | |
| Air China, Ltd. (b) | | | 220,000 | | | | 139,047 | |
| Alaska Air Group, Inc. | | | 147,610 | | | | 6,426,939 | |
| American Airlines Group, Inc. | | | 186,002 | | | | 6,599,351 | |
| Copa Holdings SA - Class A (b) | | | 36,406 | | | | 3,906,000 | |
| Delta Air Lines, Inc. | | | 213,803 | | | | 7,728,978 | |
| Hawaiian Holdings, Inc. (a) | | | 354,793 | | | | 4,771,966 | |
| JetBlue Airways Corp. (a) | | | 438,858 | | | | 4,660,672 | |
| Southwest Airlines Co. | | | 301,177 | | | | 10,170,747 | |
| Turk Hava Yollari (a)(b) | | | 85,000 | | | | 241,668 | |
| | | | | | | | 44,645,368 | |
| | | | | | |
| Auto Components - 0.22% | | | | | |
APM Automotive Holdings Bhd (b) | | | 51,700 | | | | 92,589 | |
| Autometal SA (b) | | | 29,500 | | | | 233,204 | |
| Mando Corp. (b)(e) | | | 1,200 | | | | 155,793 | |
Halla Visteon Climate Control Corp. (b) | | | 6,240 | | | | 302,237 | |
| Hyundai Mobis Co., Ltd. (b) | | | 1,237 | | | | 301,149 | |
Kenda Rubber Industrial Co., Ltd. (b) | | | 85,601 | | | | 170,029 | |
| Minth Group, Ltd. (b) | | | 80,000 | | | | 154,497 | |
Pyeong Hwa Automotive Co., Ltd. (b) | | | 7,139 | | | | 142,201 | |
| Sungwoo Hitech Co., Ltd. (b) | | | 21,109 | | | | 341,851 | |
| | | | | | | | 1,893,550 | |
| | | | | | | | | |
| Automobiles - 0.12% | | | | | | | | |
| Hyundai Motor Co. (b) | | | 1,017 | | | | 183,236 | |
| Tata Motors, Ltd. - ADR | | | 18,106 | | | | 791,413 | |
| | | | | | | | 974,649 | |
| | | | | | | | | |
| Banks - 0.39% | | | | | | | | |
Bank Negara Indonesia Persero Tbk PT (b) | | | 377,000 | | | | 170,358 | |
| Bank of China, Ltd. (b) | | | 1,328,000 | | | | 594,924 | |
China CITIC Bank Corp., Ltd. (b) | | | 304,000 | | | | 184,177 | |
| Corpbanca SA (b) | | | 16,500,000 | | | | 210,741 | |
CTBC Financial Holding Co., Ltd. (b) | | | 250,953 | | | | 168,552 | |
| DBS Group Holdings, Ltd. (b) | | | 43,000 | | | | 620,169 | |
| ICICI Bank Ltd. - ADR | | | 2,600 | | | | 127,660 | |
| Industrial Bank of Korea (b) | | | 11,600 | | | | 174,907 | |
| Kasikornbank PLC - NVDR | | | 24,300 | | | | 175,756 | |
King’s Town Bank Co., Ltd. (b) | | | 157,000 | | | | 173,648 | |
| Sberbank of Russia - ADR | | | 28,936 | | | | 227,548 | |
Taishin Financial Holding Co., Ltd. (b) | | | 246,251 | | | | 115,253 | |
| Taiwan Business Bank (a)(b) | | | 566,000 | | | | 166,978 | |
Turkiye Sinai Kalkinma Bankasi AS (b) | | | 200,000 | | | | 168,557 | |
| | | | | | | | 3,279,228 | |
| See Notes to the Financial Statements. | The Leuthold Funds - 2014 Annual Report | 51 |
| Leuthold Core Investment Fund |
| Consolidated Schedule of Investments (continued) |
| September 30, 2014 |
| | | Shares | | | Fair Value | |
| COMMON STOCKS - 65.97% (continued) | |
| | | | | | | |
| Building Products - 0.02% | | | | | | |
China Lesso Group Holdings, Ltd. (b) | | | 327,446 | | | $ | 163,001 | |
| | | | | | | | | |
| Chemicals - 3.36% | | | | | | | | |
| Aeci, Ltd. (b) | | | 5,503 | | | | 58,395 | |
| Axiall Corp. | | | 58,912 | | | | 2,109,639 | |
| Cabot Corp. | | | 95,979 | | | | 4,872,854 | |
| China BlueChemical, Ltd. (b) | | | 212,000 | | | | 91,957 | |
| China General Plastics Corp. (b) | | | 301,600 | | | | 115,650 | |
China Lumena New Materials Corp. (a)(b)(e)(g) | | | 838,000 | | | | 134,903 | |
| Kukdo Chemical Co., Ltd. (b) | | | 1,780 | | | | 79,756 | |
LyondellBasell Industries NV - Class A | | | 72,812 | | | | 7,911,752 | |
| Methanex Corp. (b) | | | 86,051 | | | | 5,748,207 | |
| Soda Sanayii AS (b) | | | 157,394 | | | | 262,383 | |
| Westlake Chemical Corp. | | | 80,755 | | | | 6,992,575 | |
| | | | | | | | 28,378,071 | |
| | | | | | | | | |
| Construction & Engineering - 0.02% | | | | |
Wilson Bayly Holmes-Ovcon, Ltd. (b) | | | 16,647 | | | | 206,034 | |
| | | | | | | | | |
| Construction Materials - 0.01% | | | | | |
China Shanshui Cement Group, Ltd. (b) | | | 230,000 | | | | 82,123 | |
| | | | | | | | | |
| Consumer Finance - 3.24% | | | | | |
| Capital One Financial Corp. | | | 105,246 | | | | 8,590,178 | |
| Discover Financial Services | | | 143,638 | | | | 9,248,851 | |
| Navient Corp. | | | 269,405 | | | | 4,771,162 | |
Portfolio Recovery Associates, Inc. (a) | | | 47,659 | | | | 2,489,230 | |
| SLM Corp. | | | 269,405 | | | | 2,306,107 | |
| | | | | | | | 27,405,528 | |
| | | | | |
| Containers & Packaging - 0.03% | | | | |
| CPMC Holdings, Ltd. (b) | | | 141,000 | | | | 112,725 | |
| Kian JOO CAN Factory Bhd (b) | | | 180,700 | | | | 164,148 | |
| | | | | | | | 276,873 | |
| | | | | | | | | |
| Distributors - 0.03% | | | | | | | | |
Xinhua Winshare Publishing and Media Co., Ltd. (b) | | | 315,000 | | | | 277,887 | |
| | | | | | | | | |
| Diversified Financial Services - 0.03% | | | | |
Fubon Financial Holding Co., Ltd. (b) | | | 170,000 | | | | 260,501 | |
| | | | | | | | | |
| Diversified Telecommunication Services - 0.06% | |
China Communications Services Corp., Ltd. (b) | | | 358,000 | | | | 166,401 | |
China Telecom Corp., Ltd. - ADR | | | 2,782 | | | | 170,898 | |
Telekomunikasi Indonesia Persero Tbk PT - ADR | | | 2,745 | | | | 132,035 | |
| | | | | | | | 469,334 | |
| | | | | | | | | |
| Electric Utilities - 0.09% | | | | | | | | |
| Light SA (b) | | | 23,000 | | | | 197,324 | |
| PGE SA (b) | | | 38,625 | | | | 244,022 | |
Reliance Infrastructure, Ltd. - GDR | | | 3,300 | | | | 91,740 | |
| Tauron Polska Energia SA (b) | | | 158,729 | | | | 256,817 | |
| | | | | | | | 789,903 | |
| | | | | | |
| Electrical Equipment - 0.01% | | | | | |
| Boer Power Holdings, Ltd. (b) | | | 81,000 | | | | 110,288 | |
| 52 | The Leuthold Funds - 2014 Annual Report | See Notes to the Financial Statements. |
| Leuthold Core Investment Fund |
| Consolidated Schedule of Investments (continued) |
| September 30, 2014 |
| | | Shares | | | Fair Value | |
| COMMON STOCKS - 65.97% (continued) | |
| | | | | |
Electronic Equipment, Instruments & Components - 4.65% | | | | |
| Arrow Electronics, Inc. (a) | | | 95,318 | | | $ | 5,275,851 | |
| Avnet, Inc. | | | 111,204 | | | | 4,614,966 | |
| Benchmark Electronics, Inc. (a) | | | 99,951 | | | | 2,219,912 | |
| Chin-Poon Industrial Co., Ltd. (b) | | | 151,000 | | | | 250,987 | |
| Flextronics International, Ltd. (a) | | | 397,157 | | | | 4,098,660 | |
| Ingram Micro, Inc. - Class A (a) | | | 146,948 | | | | 3,792,728 | |
| Insight Enterprises, Inc. (a) | | | 110,542 | | | | 2,501,565 | |
| Jabil Circuit, Inc. | | | 191,959 | | | | 3,871,813 | |
| Jahwa Electronics Co., Ltd. (b) | | | 7,960 | | | | 91,512 | |
| Sanmina Corp. (a) | | | 133,709 | | | | 2,789,170 | |
| SYNNEX Corp. (a) | | | 56,926 | | | | 3,679,127 | |
| Taiwan Union Technology Corp. (b) | | | 145,000 | | | | 133,154 | |
| TE Connectivity, Ltd. (b) | | | 106,570 | | | | 5,892,255 | |
| Wasion Group Holdings, Ltd. (b) | | | 158,000 | | | | 145,310 | |
| | | | | | | | 39,357,010 | |
| | | | | | | | | |
| Energy Equipment & Services - 0.04% | | | | |
| China Oilfield Services, Ltd. (b) | | | 62,000 | | | | 163,351 | |
| Dayang Enterprise Holdings Bhd (b) | | | 138,000 | | | | 142,965 | |
| | | | | | | | 306,316 | |
| | | | | | | | | |
| Food & Staples Retailing - 1.73% | | | | | |
| CVS Health Corp. | | | 179,382 | | | | 14,277,013 | |
| Magnit OJSC - GDR | | | 6,078 | | | | 349,607 | |
| | | | | | | | 14,626,620 | |
| | | | | | | | | |
| Food Products - 0.03% | | | | | | | | |
| Lotte Food Co., Ltd. (b) | | | 397 | | | | 286,792 | |
| | | | | | | |
| Gas Utilities - 0.01% | | | | | | |
| Gail India, Ltd. - GDR | | | 2,900 | | | | 125,106 | |
| | | | | | | | | |
| Health Care Equipment & Supplies - 0.03% | |
| i-SENS, Inc. (a)(b) | | | 1,829 | | | | 98,438 | |
| Kossan Rubber Industries (b) | | | 144,100 | | | | 194,634 | |
| | | | | | | | 293,072 | |
| | | | | | | | | |
| Health Care Providers & Services - 7.71% | |
| Aetna, Inc. | | | 75,460 | | | | 6,112,260 | |
| Cigna Corp. | | | 43,025 | | | | 3,901,937 | |
| Ensign Group, Inc. | | | 39,525 | | | | 1,375,470 | |
| Hanger, Inc. (a) | | | 66,855 | | | | 1,371,865 | |
| HCA Holdings, Inc. (a) | | | 125,464 | | | | 8,847,721 | |
| Humana, Inc. | | | 41,701 | | | | 5,433,223 | |
| Kindred Healthcare, Inc. | | | 66,826 | | | | 1,296,424 | |
| LifePoint Hospitals, Inc. (a) | | | 56,127 | | | | 3,883,427 | |
| Magellan Health, Inc. (a) | | | 50,306 | | | | 2,753,247 | |
| Mediclinic International, Ltd. (b) | | | 36,599 | | | | 298,092 | |
| Qualicorp SA (a)(b) | | | 18,500 | | | | 183,054 | |
| Select Medical Holdings Corp. | | | 101,275 | | | | 1,218,338 | |
| Shanghai Pharmaceuticals Holding Co., Ltd. (b) | | | 173,200 | | | | 423,361 | |
| UnitedHealth Group, Inc. | | | 93,994 | | | | 8,106,983 | |
| Universal Health Services, Inc. - Class B | | | 49,645 | | | | 5,187,903 | |
| VCA, Inc. (a) | | | 103,482 | | | | 4,069,947 | |
| WellCare Health Plans, Inc. (a) | | | 40,378 | | | | 2,436,409 | |
| WellPoint, Inc. | | | 69,502 | | | | 8,313,829 | |
| | | | | | | | 65,213,490 | |
| | | | | | | | | |
| Hotels, Restaurants & Leisure - 0.02% | | | | |
| REXLot Holdings, Ltd. (b) | | | 1,406,000 | | | | 142,301 | |
| See Notes to the Financial Statements. | The Leuthold Funds - 2014 Annual Report | 53 |
| Leuthold Core Investment Fund |
| Consolidated Schedule of Investments (continued) |
| September 30, 2014 |
| | | Shares | | | Fair Value | |
| COMMON STOCKS - 65.97% (continued) | |
| | |
| Household Durables - 0.18% | |
| Direcional Engenharia SA (b) | | | 21,600 | | | $ | 87,185 | |
| Even Construtora e Incorporadora SA (b) | | | 81,000 | | | | 179,687 | |
| Ez Tec Empreendimentos e Participacoes SA (b) | | | 11,400 | | | | 97,944 | |
| Haier Electronics Group Co., Ltd. (b) | | | 112,000 | | | | 293,716 | |
| Lentex SA (b) | | | 69,000 | | | | 170,908 | |
| Man Wah Holdings, Ltd. (b) | | | 115,200 | | | | 169,143 | |
| Steinhoff International Holdings, Ltd. (b) | | | 116,895 | | | | 559,840 | |
| | | | | | | | 1,558,423 | |
| | | | | | | | | |
| Insurance - 0.12% | | | | | | | | |
| PICC Property & Casualty Co., Ltd. (b) | | | 508,000 | | | | 901,106 | |
| Porto Seguro SA (b) | | | 12,500 | | | | 145,542 | |
| | | | | | | | 1,046,648 | |
| | | | | | | | | |
| Internet Software & Services - 0.11% | | | | | | | | |
| Tencent Holdings, Ltd. (b) | | | 62,000 | | | | 922,650 | |
| | | | | | | | | |
| IT Services - 5.22% | | | | | | | | |
| Accenture PLC - Class A (b) | | | 39,054 | | | | 3,175,871 | |
| Amdocs, Ltd. | | | 52,954 | | | | 2,429,529 | |
| Cognizant Technology Solutions Corp. - Class A (a) | | | 52,954 | | | | 2,370,751 | |
| Comp SA (a)(b) | | | 4,800 | | | | 92,794 | |
| Computer Sciences Corp. | | | 68,840 | | | | 4,209,566 | |
| Convergys Corp. | | | 95,979 | | | | 1,710,346 | |
| DST Systems, Inc. | | | 37,730 | | | | 3,166,302 | |
| Fiserv, Inc. (a) | | | 63,545 | | | | 4,107,231 | |
| Global Payments, Inc. | | | 35,082 | | | | 2,451,530 | |
| International Business Machines Corp. | | | 25,815 | | | | 4,900,461 | |
| Korea Info & Comm (a)(b) | | | 29,000 | | | | 295,224 | |
| MasterCard, Inc. - Class A | | | 70,164 | | | | 5,186,523 | |
| Nice Information & Telecommunication, Inc. (b) | | | 12,600 | | | | 322,392 | |
| Sapient Corp. (a) | | | 170,115 | | | | 2,381,610 | |
| Travelsky Technology, Ltd. (b) | | | 208,000 | | | | 223,982 | |
| Visa, Inc. - Class A | | | 25,153 | | | | 5,366,896 | |
| Western Union Co. | | | 107,232 | | | | 1,720,001 | |
| | | | | | | | 44,111,009 | |
| | | | | | | | | |
| Machinery - 0.03% | | | | | | | | |
| Hy-Lok Corp. (b) | | | 6,750 | | | | 217,491 | |
| | | | | | | | | |
| Media - 0.03% | | | | | | | | |
| Cyfrowy Polsat SA (b) | | | 26,500 | | | | 221,036 | |
| | | | | | | | | |
| Metals & Mining - 0.08% | | | | | | | | |
| Eregli Demir ve Celik Fabrikalari TAS (b) | | | 152,000 | | | | 282,324 | |
| Hindalco Industries, Ltd. - GDR | | | 46,000 | | | | 115,892 | |
| Kumba Iron Ore, Ltd. (b) | | | 6,684 | | | | 157,410 | |
| Sesa Sterlite, Ltd. - ADR | | | 6,600 | | | | 113,916 | |
| | | | | | | | 669,542 | |
| | | | | | | | | |
| Multiline Retail - 3.23% | | | | | | | | |
Dillard’s, Inc. - Class A | | | 58,892 | | | | 6,418,050 | |
Kohl’s Corp. | | | 128,898 | | | | 7,866,645 | |
Macy’s, Inc. | | | 128,944 | | | | 7,501,962 | |
| Nordstrom, Inc. | | | 81,417 | | | | 5,566,480 | |
| | | | | | | | 27,353,137 | |
| | | | | | | | | |
| Oil, Gas & Consumable Fuels - 7.50% | | | | | |
| BP PLC - ADR | | | 52,292 | | | | 2,298,233 | |
| Chevron Corp. | | | 21,182 | | | | 2,527,436 | |
China Petroleum & Chemical Corp. - ADR | | | 59,091 | | | | 5,162,190 | |
| CNOOC, Ltd. - ADR | | | 1,398 | | | | 241,211 | |
| CVR Energy, Inc. | | | 52,292 | | | | 2,339,021 | |
| Gazprom Neft OAO - ADR | | | 7,000 | | | | 133,995 | |
| 54 | The Leuthold Funds - 2014 Annual Report | See Notes to the Financial Statements. |
| Leuthold Core Investment Fund |
| Consolidated Schedule of Investments (continued) |
| September 30, 2014 |
| | | Shares | | | Fair Value | |
| COMMON STOCKS - 65.97% (continued) | |
| | |
| Oil, Gas & Consumable Fuels - 7.50% (continued) | |
| Gazprom OAO - ADR | | | 18,000 | | | $ | 126,239 | |
| Green Plains, Inc. | | | 75,460 | | | | 2,821,449 | |
| Hess Corp. | | | 50,306 | | | | 4,744,862 | |
| HollyFrontier Corp. | | | 50,306 | | | | 2,197,366 | |
| Lukoil OAO - ADR | | | 7,318 | | | | 372,789 | |
| Marathon Petroleum Corp. | | | 50,968 | | | | 4,315,461 | |
| PBF Energy, Inc. - Class A | | | 70,826 | | | | 1,699,824 | |
| PetroChina Co., Ltd. - ADR | | | 21,844 | | | | 2,807,172 | |
| Petroleo Brasileiro SA - ADR | | | 185,340 | | | | 2,629,975 | |
| Phillips 66 | | | 56,264 | | | | 4,574,826 | |
| Polskie Gornictwo Naftowe i Gazownictwo SA (b) | | | 134,185 | | | | 204,857 | |
PTT Exploration & Production PCL - NVDR | | | 30,300 | | | | 149,265 | |
| PTT PCL - NVDR | | | 18,800 | | | | 208,473 | |
REX American Resources Corp. (a) | | | 23,167 | | | | 1,688,411 | |
| Rosneft OAO - GDR | | | 40,827 | | | | 237,824 | |
| Sasol, Ltd. - ADR | | | 88,624 | | | | 4,829,122 | |
| Statoil ASA - ADR | | | 159,525 | | | | 4,332,699 | |
| Suncor Energy, Inc. (b) | | | 117,823 | | | | 4,259,301 | |
| Total SA - ADR | | | 37,730 | | | | 2,431,698 | |
| Valero Energy Corp. | | | 82,741 | | | | 3,828,426 | |
| Western Refining, Inc. | | | 53,616 | | | | 2,251,336 | |
| | | | | | | | 63,413,461 | |
| | | | | | | | | |
| Paper & Forest Products - 0.03% | | | | | |
| Fibria Celulose SA - ADR (a) | | | 25,433 | | | | 279,763 | |
| | | | | | | | | |
| Personal Products - 0.11% | | | | | | | | |
| AMOREPACIFIC Group (b) | | | 865 | | | | 958,242 | |
| | | | | | | |
| Pharmaceuticals - 0.16% | | | | | | |
| Aspen Pharmacare Holdings, Ltd. (b) | | | 17,302 | | | | 515,160 | |
Dr. Reddy’s Laboratories, Ltd. - ADR | | | 9,378 | | | | 492,814 | |
| Guangzhou Baiyunshan Pharmaceutical Holdings Co., Ltd. (b) | | | 54,000 | | | | 184,739 | |
| Richter Gedeon Nyrt (b) | | | 8,266 | | | | 129,086 | |
| | | | | | | | 1,321,799 | |
| | | | | | | | | �� |
| Real Estate Management & Development - 0.24% | |
| Bumi Serpong Damai TBK PT (b) | | | 1,959,300 | | | | 248,179 | |
| China South City Holdings, Ltd. (b) | | | 564,000 | | | | 260,533 | |
| CIFI Holdings Group Co., Ltd. (b) | | | 1,216,000 | | | | 227,022 | |
| Franshion Properties China, Ltd. (b) | | | 466,000 | | | | 113,336 | |
K Wah International Holdings, Ltd. (b) | | | 347,000 | | | | 193,543 | |
New World Development Co., Ltd. (b) | | | 164,000 | | | | 191,051 | |
| Shimao Property Holdings, Ltd. (b) | | | 84,500 | | | | 170,692 | |
| Sunway Bhd (b) | | | 205,900 | | | | 215,886 | |
| Vista Land & Lifescapes, Inc. (b) | | | 1,600,000 | | | | 219,924 | |
| Wing Tai Holdings, Ltd. (b) | | | 120,000 | | | | 165,871 | |
| | | | | | | | 2,006,037 | |
| | | | | | | | | |
| Road & Rail - 0.02% | | | | | | | | |
| PKP Cargo SA (b) | | | 6,000 | | | | 143,811 | |
| See Notes to the Financial Statements. | The Leuthold Funds - 2014 Annual Report | 55 |
| Leuthold Core Investment Fund |
| Consolidated Schedule of Investments (continued) |
| September 30, 2014 |
| | | Shares | | | Fair Value | |
| COMMON STOCKS - 65.97% (continued) | |
| | | | | | | |
Semiconductors & Semiconductor Equipment - 4.33% | | | | | | |
| Advanced Semiconductor Engineering, Inc. - ADR | | | 197,187 | | | $ | 1,165,375 | |
ChipMOS TECHNOLOGIES Bermuda, Ltd. (b) | | | 47,659 | | | | 1,078,047 | |
| Cirrus Logic, Inc. (a) | | | 124,442 | | | | 2,594,616 | |
| First Solar, Inc. (a) | | | 39,054 | | | | 2,570,144 | |
| Integrated Device Technology, Inc. | | | 181,368 | | | | 2,892,820 | |
Integrated Silicon Solution, Inc. | | | 39,054 | | | | 536,602 | |
| Intel Corp. | | | 88,036 | | | | 3,065,413 | |
| Lattice Semiconductor Corp. (a) | | | 147,610 | | | | 1,107,075 | |
| Lumens Co., Ltd. (a)(b) | | | 14,700 | | | | 98,830 | |
| Magnachip Semiconductor Corp. (a)(b) | | | 61,559 | | | | 720,240 | |
| Marvell Technology Group, Ltd. (b) | | | 188,649 | | | | 2,542,989 | |
| MediaTek, Inc. (b) | | | 15,000 | | | | 222,146 | |
| Micron Technology, Inc. (a) | | | 117,823 | | | | 4,036,616 | |
| NVIDIA Corp. | | | 146,948 | | | | 2,711,191 | |
| ON Semiconductor Corp. (a) | | | 240,280 | | | | 2,148,103 | |
| Silicon Image, Inc. (a) | | | 110,542 | | | | 557,132 | |
| Silicon Motion Technology Corp. - ADR | | | 60,897 | | | | 1,640,565 | |
| Siliconware Precision Industries Co. - ADR | | | 147,610 | | | | 1,006,700 | |
| SK Hynix, Inc. (a)(b) | | | 5,100 | | | | 225,731 | |
| Taiwan Semiconductor Co., Ltd. (b) | | | 151,000 | | | | 182,954 | |
| Taiwan Semiconductor Manufacturing Co., Ltd. - ADR | | | 138,957 | | | | 2,804,152 | |
| Vanguard International Semiconductor Corp. (b) | | | 183,000 | | | | 267,256 | |
| Xilinx, Inc. | | | 57,588 | | | | 2,438,852 | |
| | | | | | | | 36,613,549 | |
| | | | | | | |
| Software - 0.93% | | | | | | |
| Microsoft Corp. | | | 168,792 | | | | 7,825,197 | |
| | | | | | | | | |
| Specialty Retail - 5.34% | | | | | | | | |
| Advance Auto Parts, Inc. | | | 44,349 | | | | 5,778,675 | |
| Asbury Automotive Group, Inc. (a) | | | 106,570 | | | | 6,865,239 | |
| AutoNation, Inc. (a) | | | 76,122 | | | | 3,829,698 | |
| AutoZone, Inc. (a) | | | 9,929 | | | | 5,060,414 | |
| CarMax, Inc. (a) | | | 91,346 | | | | 4,243,022 | |
| Group 1 Automotive, Inc. | | | 42,363 | | | | 3,080,214 | |
| Lithia Motors, Inc. - Class A | | | 93,994 | | | | 7,114,406 | |
O’Reilly Automotive, Inc. (a) | | | 34,420 | | | | 5,175,391 | |
| Penske Automotive Group, Inc. | | | 97,965 | | | | 3,976,399 | |
| | | | | | | | 45,123,458 | |
| | | | | | | | | |
Technology Hardware, Storage & Peripherals - 5.04% | | | | | | | | |
| Apple, Inc. | | | 68,840 | | | | 6,935,630 | |
| Bematech SA (b) | | | 23,300 | | | | 77,579 | |
| Catcher Technology Co., Ltd. (b) | | | 25,000 | | | | 231,544 | |
| Hewlett-Packard Co. | | | 160,848 | | | | 5,705,279 | |
| Lenovo Group, Ltd. (b) | | | 832,000 | | | | 1,239,259 | |
| Lexmark International, Inc. - Class A | | | 144,300 | | | | 6,132,750 | |
| Pegatron Corp. (b) | | | 290,000 | | | | 533,074 | |
| QLogic Corp. (a) | | | 206,521 | | | | 1,891,732 | |
| Samsung Electronics Co., Ltd. (b) | | | 853 | | | | 955,366 | |
| SanDisk Corp. | | | 71,488 | | | | 7,002,250 | |
| Seagate Technology PLC (b) | | | 95,979 | | | | 5,496,717 | |
| Western Digital Corp. | | | 66,193 | | | | 6,441,903 | |
| | | | | | | | 42,643,083 | |
| | | | | | | | | |
| Textiles, Apparel & Luxury Goods - 0.03% | |
| Shenzhou International Group Holdings, Ltd. (b) | | | 73,000 | | | | 234,701 | |
| 56 | The Leuthold Funds - 2014 Annual Report | See Notes to the Financial Statements. |
| Leuthold Core Investment Fund |
| Consolidated Schedule of Investments (continued) |
| September 30, 2014 |
| | | Shares | | | Fair Value | |
| COMMON STOCKS - 65.97% (continued) | |
| | |
| Trading Companies & Distributors - 0.02% | |
| Barloworld, Ltd. (b) | | | 17,400 | | | $ | 142,502 | |
| | | | | | | | | |
| Transportation Infrastructure - 0.07% | | | | |
| Arteris SA (b) | | | 21,442 | | | | 137,530 | |
Shenzhen International Holdings, Ltd. (b) | | | 124,000 | | | | 169,063 | |
| TAV Havalimanlari Holding AS (b) | | | 19,000 | | | | 152,549 | |
| Wilson Sons, Ltd. (b) | | | 10,400 | | | | 139,361 | |
| | | | | | | | 598,503 | |
| | | | | | | | | |
| Water Utilities - 1.73% | | | | | | | | |
| American States Water Co. | | | 43,687 | | | | 1,328,959 | |
| American Water Works Co., Inc. | | | 111,866 | | | | 5,395,297 | |
| Aqua America, Inc. | | | 106,570 | | | | 2,507,592 | |
| California Water Service Group | | | 60,235 | | | | 1,351,673 | |
| Cia de Saneamento Basico do Estado de Sao Paulo - ADR | | | 501,741 | | | | 4,069,120 | |
| | | | | | | | 14,652,641 | |
| | | | | | | | | |
| Wireless Telecommunication Services - 0.19% | |
| China Mobile, Ltd. - ADR | | | 6,930 | | | | 407,138 | |
| Mobile Telesystems OJSC - ADR | | | 18,304 | | | | 273,462 | |
| MTN Group, Ltd. (b) | | | 9,880 | | | | 208,302 | |
| SK Telecom Co., Ltd. - ADR | | | 8,361 | | | | 253,673 | |
| Tim Participacoes SA - ADR | | | 12,073 | | | | 316,313 | |
| Turkcell Iletisim Hizmetleri AS - ADR (a) | | | 10,258 | | | | 134,790 | |
| | | | | | | | 1,593,678 | |
TOTAL COMMON STOCKS(Cost $458,772,058) | | | | | | $ | 557,939,316 | |
| | |
| PREFERRED STOCKS - 0.27% | |
| | | | | | | |
| Banks - 0.01% | | | | | | |
| Itau Unibanco Holding SA - ADR | | | 9,796 | | | $ | 135,968 | |
| | | | | | | | | |
| Chemicals - 0.23% | | | | | | | | |
| Braskem SA - ADR | | | 147,300 | | | | 1,939,941 | |
| | | | | | | | | |
| Food & Staples Retailing - 0.03% | |
| Cia Brasileira de Distribuicao Grupo Pao de Acucar - ADR | | | 5,668 | | | | 247,182 | |
TOTAL PREFERRED STOCKS
(Cost $2,271,754) | | | | | | $ | 2,323,091 | |
| | | | | | | | | |
| INVESTMENT COMPANIES - 11.15% | |
| | | | | | | | | |
| Exchange Traded Funds - 11.15% | |
| CurrencyShares Japanese Yen Trust (d) | | | 89,687 | | | $ | 7,964,206 | |
| iShares CMBS ETF | | | 20,199 | | | | 1,036,853 | |
| iShares Floating Rate Bond ETF | | | 192,223 | | | | 9,770,695 | |
| iShares Global Ex USD High Yield Corporate Bond ETF | | | 31,643 | | | | 1,691,334 | |
| iShares iBoxx $ Investment Grade Corporate Bond Fund ETF | | | 27,441 | | | | 3,244,075 | |
| iShares MBS ETF | | | 256,640 | | | | 27,745,350 | |
| iShares MSCI India Small-Cap ETF | | | 7,500 | | | | 237,975 | |
| PIMCO 0-5 Year High Yield Corporate Bond Index Exchange-Traded Fund | | | 40,440 | | | | 4,191,606 | |
| PowerShares Build America Bond Portfolio | | | 225,551 | | | | 6,687,587 | |
| PowerShares International Corporate Bond Portfolio | | | 33,368 | | | | 969,674 | |
| SPDR Barclays International Corporate Bond ETF | | | 27,664 | | | | 980,689 | |
| SPDR Barclays International Treasury Bond ETF | | | 414,879 | | | | 23,801,608 | |
| See Notes to the Financial Statements. | The Leuthold Funds - 2014 Annual Report | 57 |
| Leuthold Core Investment Fund |
| Consolidated Schedule of Investments (continued) |
| September 30, 2014 |
| | | Shares | | | Fair Value | |
INVESTMENT COMPANIES - 11.15% (continued) | |
| | |
| Exchange Traded Funds - 11.15% (continued) | |
SPDR Barclays Short-Term International Treasury Bond ETF | | | 52,283 | | | $ | 1,780,759 | |
| Vanguard Mortgage-Backed Securities ETF | | | 79,679 | | | | 4,188,725 | |
TOTAL INVESTMENT COMPANIES
(Cost $95,562,751) | | | | | | $ | 94,291,136 | |
| | | | | | | | | |
| | | Principal | | | | | |
| | | Amount | | | Fair Value | |
| CORPORATE BONDS - 1.94% | | | | | |
| | | | | | | | | |
| Biotechnology - 0.18% | | | | | | | | |
| Amgen, Inc. | | | | | | | | |
| 4.100%, 06/15/2021 | | $ | 1,417,000 | | | $ | 1,507,118 | |
| | | | | | | | | |
| Capital Markets - 0.58% | | | | | |
| Goldman Sachs Group, Inc. | | | | | | | | |
| 6.150%, 04/01/2018 | | | 4,326,000 | | | | 4,877,825 | |
| | | | | | | | | |
| Health Care Providers & Services - 0.32% | |
| Coventry Health Care, Inc. | | | | | | | | |
| 5.950%, 03/15/2017 | | | 2,469,000 | | | | 2,733,630 | |
| | | | | | | | | |
| Industrial Conglomerates - 0.53% | | | | | |
| General Electric Co. | | | | | | | | |
| 5.250%, 12/06/2017 | | | 4,012,000 | | | | 4,451,117 | |
| | | | | | | | | |
| Oil, Gas & Consumable Fuels - 0.24% | | | | |
| Enterprise Products Operating, LLC | | | | | | | | |
| 5.600%, 10/15/2014 | | | 2,044,000 | | | | 2,047,863 | |
| | | | | | | | | |
| Tobacco - 0.09% | | | | | | | | |
| Altria Group, Inc. | | | | | | | | |
| 9.700%, 11/10/2018 | | | 600,000 | | | | 772,921 | |
TOTAL CORPORATE BONDS
(Cost $15,617,981) | | | | | | $ | 16,390,474 | |
| | | | | |
UNITED STATES TREASURY OBLIGATIONS - 2.05% | | | | |
| | | | |
| United States Treasury Notes - 2.05% | | | |
| 2.500%, 04/30/2015 | | | $ | 6,540,000 | | | $ | 6,632,737 | |
| 2.125%, 08/31/2020 | | | | 5,646,000 | | | | 5,675,992 | |
| 5.250%, 11/15/2028 | | | | 3,950,000 | | | | 5,081,920 | |
TOTAL UNITED STATES TREASURY
OBLIGATIONS (Cost $17,278,283) | | | $ | 17,390,649 | |
| | | | | | | | | | |
| FOREIGN GOVERNMENT BONDS - 6.03% | |
| | |
| Bank Nederlands Gemeenten NV | | | | | | | | | |
| 1.850%, 11/07/2016 (b) | | | | | | | | | |
| | JPY | | | 410,000,000 | | | $ | 3,888,329 | |
| Commonwealth of Australia | | | | | | | | | |
| 2.750%, 10/21/2019 (b) | | | | | | | | | |
| | AUD | | | 5,820,000 | | | | 5,034,498 | |
| Development Bank of Japan | | | | | | | | | |
| 1.750%, 03/17/2017 (b) | | | | | | | | | |
| | JPY | | | 410,000,000 | | | | 3,887,630 | |
| Federal Republic of Germany | | | | | | | | | |
| 3.500%, 07/04/2019 (b) | | | | | | | | | |
| | EUR | | | 7,820,000 | | | | 11,470,874 | |
| Government of France | | | | | | | | | |
| 3.500%, 04/25/2020 (b) | | | | | | | | | |
| | EUR | | | 2,600,000 | | | | 3,843,296 | |
| Government of Uinted Kingdom | | | | | | | | | |
| 3.750%, 09/07/2020 (b) | | | | | | | | | |
| | GBP | | | 2,950,000 | | | | 5,270,306 | |
| Kingdom of Spain | | | | | | | | | |
| 4.000%, 04/30/2020 (b) | | | | | | | | | |
| | EUR | | | 4,110,000 | | | | 6,006,239 | |
| Province of Manitoba Canada | | | | | | | | | |
| 1.750%, 05/30/2019 (b) | | | | | | | | | |
| | USD | | | 3,800,000 | | | | 3,765,090 | |
| 58 | The Leuthold Funds - 2014 Annual Report | See Notes to the Financial Statements. |
| Leuthold Core Investment Fund |
| Consolidated Schedule of Investments (continued) |
| September 30, 2014 |
| | | | Principal | | | | |
| | | | Amount | | | Fair Value | |
| FOREIGN GOVERNMENT BONDS - 6.03% (continued) | |
| | |
| Republic of Italy | | | | | | | | | |
| 4.500%, 03/01/2019 (b) | | | | | | | | | |
| | EUR | | | 2,190,000 | | | $ | 3,196,610 | |
| 4.250%, 09/01/2019 (b) | | | | | | | | | |
| | EUR | | | 3,200,000 | | | | 4,663,448 | |
| | | | | | | | | 7,860,058 | |
TOTAL FOREIGN GOVERNMENT BONDS
(Cost $51,636,526) | | | | | | | $ | 51,026,320 | |
| | | Shares | | | Fair Value | |
| | | | | | | |
| SHORT-TERM INVESTMENTS - 3.06% | |
| | | | | |
| Money Market Funds - 3.06% | | | | |
Fidelity Institutional Money Market Funds - Government Portfolio, 0.01% (c) | | | 25,859,508 | | | $ | 25,859,508 | |
TOTAL SHORT-TERM INVESTMENTS
(Cost $25,859,508) | | | | | | $ | 25,859,508 | |
| | | | | | | | | |
Total Investments
(Cost $666,998,861) - 90.47% | | | | | | $ | 765,220,494 | |
Other Assets in Excess of Liabilities - 9.53% (f) | | | | | | | 80,585,718 | |
| TOTAL NET ASSETS - 100.00% | | | | | | $ | 845,806,212 | |
| Percentages are stated as a percent of net assets. |
| ADR | American Depositary Receipt |
| AUD | Australian Dollar |
| EUR | Euro |
| GBP | British Pound |
| GDR | Global Depositary Receipt |
| JPY | Japanese Yen |
| NVDR | Non-Voting Depositary Receipt |
| USD | U.S. Dollar |
| (a) | Non-income producing security. |
| (b) | Foreign issued security. |
| (c) | The rate quoted is the annualized seven-day yield as of September 30, 2014. |
| (d) | Affiliated security (See Note 2). |
| (e) | The security is currently being fair valued in accordance with procedures established by the Board of Directors of Leuthold Funds, Inc. due to a lack of market activity and observable inputs. |
| (f) | All or a portion of the assets have been committed as collateral for open securities sold short. |
| (g) | Illiquid security. The fair value of this security is $134,903 which represents 0.02% of total net assets. |
The Global Industry Classification Standard (GICS®) was developed by and/or is the exclusive property of MSCI, Inc. and Standard & Poor’s Financial Services LLC (“S&P”). GICS® is a service mark of MSCI, Inc. and S&P and has been licensed for use by U.S. Bancorp Fund Services, LLC.
| See Notes to the Financial Statements. | The Leuthold Funds - 2014 Annual Report | 59 |
| Leuthold Core Investment Fund |
| Consolidated Schedule of Securities Sold Short - (a) |
| September 30, 2014 |
| | | Shares | | | Fair Value | |
| COMMON STOCKS - 4.62% | | | | |
| | | | | | | |
| Aerospace & Defense - 0.05% | | | | |
| DigitalGlobe, Inc. | | | 15,695 | | | $ | 447,307 | |
| | | | | | | | | |
| Air Freight & Logistics - 0.02% | | | | | |
| UTi Worldwide, Inc. | | | 13,817 | | | | 146,875 | |
| | | | | | | | | |
| Airlines - 0.04% | | | | | | | | |
| Latam Airlines Group SA - ADR | | | 28,590 | | | | 325,068 | |
| | | | | | | | | |
| Banks - 0.08% | | | | | | | | |
| First Horizon National Corp. | | | 52,143 | | | | 640,316 | |
| | | | | | | | | |
| Capital Markets - 0.21% | | | | | | | | |
| Credit Suisse Group AG - ADR | | | 24,004 | | | | 663,471 | |
| Deutsche Bank AG (b) | | | 18,890 | | | | 658,505 | |
| Greenhill & Co., Inc. | | | 9,586 | | | | 445,653 | |
| | | | | | | | 1,767,629 | |
| | | | | | | | | |
| Chemicals - 0.08% | | | | | | | | |
| Balchem Corp. | | | 4,001 | | | | 226,337 | |
| Chemtura Corp. | | | 8,795 | | | | 205,187 | |
| Intrepid Potash, Inc. | | | 13,696 | | | | 211,603 | |
| | | | | | | | 643,127 | |
| | | | | | | | | |
| Commercial Services & Supplies - 0.11% | |
| Healthcare Services Group, Inc. | | | 7,364 | | | | 210,684 | |
| Waste Management, Inc. | | | 15,774 | | | | 749,738 | |
| | | | | | | | 960,422 | |
| | | | | | | | | |
| Communications Equipment - 0.11% | | | | |
| Aruba Networks, Inc. | | | 33,606 | | | | 725,218 | |
| ViaSat, Inc. | | | 3,828 | | | | 210,999 | |
| | | | | | | | 936,217 | |
| | | | | | | | | |
| Construction & Engineering - 0.05% | | | | |
| MasTec, Inc. | | | 14,097 | | | | 431,650 | |
| | | | | | | | | |
| Diversified Consumer Services - 0.07% | | | | |
| Sotheby’s | | �� | 15,748 | | | | 562,519 | |
| | | | | | | | | |
| Diversified Financial Services - 0.17% | | | | |
| CME Group, Inc. | | | 9,107 | | | | 728,150 | |
| Intercontinental Exchange, Inc. | | | 3,469 | | | | 676,629 | |
| | | | | | | | 1,404,779 | |
| | | | | | | | | |
| Electrical Equipment - 0.02% | | | | | |
| Polypore International, Inc. | | | 5,010 | | | | 194,939 | |
| | | | | | | | | |
| Electronic Equipment, Instruments & Components - 0.05% | | | | | | | | |
| Itron, Inc. | | | 11,557 | | | | 454,306 | |
| | | | | | | | | |
| | | | | | | | | |
| Energy Equipment & Services - 0.06% | | | | |
| McDermott International, Inc. | | | 94,805 | | | | 542,285 | |
| | | | | | | | | |
| Food Products - 0.12% | | | | | | | | |
| Darling Ingredients, Inc. | | | 33,710 | | | | 617,567 | |
| Post Holdings, Inc. | | | 12,630 | | | | 419,064 | |
| | | | | | | | 1,036,631 | |
| | | | | | | | | |
| Gas Utilities - 0.03% | | | | | | | | |
| WGL Holdings, Inc. | | | 5,036 | | | | 212,116 | |
| | | | | | | | | |
| Health Care Equipment & Supplies - 0.20% | |
| HeartWare International, Inc. | | | 4,766 | | | | 369,985 | |
| Insulet Corp. | | | 11,649 | | | | 429,266 | |
| Spectranetics Corp. | | | 24,699 | | | | 656,252 | |
| Wright Medical Group, Inc. | | | 6,935 | | | | 210,130 | |
| | | | | | | | 1,665,633 | |
| | | | | | | | | |
| Health Care Technology - 0.12% | | | | | |
| Allscripts Healthcare Solutions, Inc. | | | 27,634 | | | | 370,710 | |
| Medidata Solutions, Inc. | | | 14,655 | | | | 649,070 | |
| | | | | | | | 1,019,780 | |
| | | |
| 60 | The Leuthold Funds - 2014 Annual Report | See Notes to the Financial Statements. |
| Leuthold Core Investment Fund |
| Consolidated Schedule of Securities Sold Short - (a) (continued) |
| September 30, 2014 |
| | | Shares | | | Fair Value | |
| COMMON STOCKS - 4.62% (continued) | |
| | |
| Hotels, Restaurants & Leisure - 0.32% | | | |
| Bob Evans Farms, Inc. | | | 9,186 | | | $ | 434,865 | |
| Boyd Gaming Corp. | | | 17,794 | | | | 180,787 | |
| Darden Restaurants, Inc. | | | 13,025 | | | | 670,267 | |
| Dunkin’ Brands Group, Inc. | | | 13,832 | | | | 619,950 | |
| Pinnacle Entertainment, Inc. | | | 18,419 | | | | 462,133 | |
| Scientific Games Corp. - Class A | | | 34,380 | | | | 370,273 | |
| | | | | | | | 2,738,275 | |
| | | | | | | | | |
| Household Durables - 0.08% | | | | | |
| Sony Corp. - ADR | | | 39,412 | | | | 710,992 | |
| | | | | | | | | |
| Independent Power and Renewable Electricity Producers - 0.03% | | | | | |
| Pattern Energy Group, Inc. | | | 7,237 | | | | 223,768 | |
| | | | | | | | | |
| Insurance - 0.05% | | | | | | | | |
| Willis Group Holdings PLC (b) | | | 10,580 | | | | 438,012 | |
| | | | | | | | | |
| Internet & Catalog Retail - 0.23% | | | | | |
| Amazon.com, Inc. | | | 1,944 | | | | 626,824 | |
| Groupon, Inc. | | | 97,987 | | | | 654,553 | |
| HomeAway, Inc. | | | 18,476 | | | | 655,898 | |
| | | | | | | | 1,937,275 | |
| | | | | | | | | |
| Internet Software & Services - 0.27% | | | | |
| Cornerstone OnDemand, Inc. | | | 15,114 | | | | 520,073 | |
| CoStar Group, Inc. | | | 4,247 | | | | 660,578 | |
| Cvent, Inc. | | | 11,032 | | | | 279,882 | |
| LinkedIn Corp. - Class A | | | 3,123 | | | | 648,928 | |
| Shutterstock, Inc. | | | 3,012 | | | | 214,996 | |
| | | | | | | | 2,324,457 | |
| | | | | | | | | |
| IT Services - 0.03% | | | | | | | | |
| Cardtronics, Inc. | | | 6,169 | | | | 217,149 | |
| | | | | | | | | |
| Machinery - 0.13% | | | | | | | | |
| Navistar International Corp. | | | 16,574 | | | | 545,450 | |
| Proto Labs, Inc. | | | 7,980 | | | | 550,620 | |
| | | | | | | | 1,096,070 | |
| | | | | | | | | |
| Media - 0.17% | | | | | | | | |
| DreamWorks Animation SKG, Inc. - Class A | | | 29,528 | | | | 805,228 | |
| Liberty Global PLC - Class A (b) | | | 14,405 | | | | 612,789 | |
| | | | | | | | 1,418,017 | |
| | | | | | | | | |
| Oil, Gas & Consumable Fuels - 0.32% | | | | |
| Alpha Natural Resources, Inc. | | | 96,053 | | | | 238,211 | |
| Antero Resources Corp. | | | 11,583 | | | | 635,791 | |
| Genesis Energy LP | | | 4,041 | | | | 212,718 | |
| PDC Energy, Inc. | | | 11,158 | | | | 561,136 | |
| Talisman Energy, Inc. (b) | | | 58,766 | | | | 508,326 | |
| WPX Energy, Inc. | | | 24,681 | | | | 593,825 | |
| | | | | | | | 2,750,007 | |
| | | | | | | | | |
| Paper & Forest Products - 0.07% | | | | | |
| Louisiana-Pacific Corp. | | | 46,464 | | | | 631,446 | |
| | | | | | | | | |
| Personal Products - 0.07% | | | | | | | | |
| Avon Products, Inc. | | | 44,392 | | | | 559,339 | |
| | | | | | | | | |
| Professional Services - 0.04% | | | | | |
| Advisory Board Co. | | | 6,810 | | | | 317,278 | |
| | | | | | | | | |
| Real Estate Investment Trusts (REITs) - 0.38% | |
| CBL & Associates Properties, Inc. | | | 36,459 | | | | 652,616 | |
| Crown Castle International Corp. | | | 8,803 | | | | 708,906 | |
| Liberty Property Trust | | | 11,683 | | | | 388,576 | |
| Mack-Cali Realty Corp. | | | 10,210 | | | | 195,113 | |
| National Retail Properties, Inc. | | | 18,863 | | | | 652,094 | |
| Plum Creek Timber Co, Inc. | | | 15,261 | | | | 595,332 | |
| | | | | | | | 3,192,637 | |
| | |
| See Notes to the Financial Statements. | The Leuthold Funds - 2014 Annual Report | 61 |
| Leuthold Core Investment Fund |
| Consolidated Schedule of Securities Sold Short - (a) (continued) |
| September 30, 2014 |
| | | Shares | | | Fair Value | |
| COMMON STOCKS - 4.62% (continued) | |
| | | | | | | |
| Real Estate Management & Development - 0.03% | | | | | | |
| Alexander & Baldwin, Inc. | | | 5,892 | | | $ | 211,935 | |
| | | | | | | | | |
| Software - 0.43% | | | | | | | | |
| Advent Software, Inc. | | | 7,709 | | | | 243,296 | |
| Guidewire Software, Inc. | | | 10,234 | | | | 453,776 | |
| NetSuite, Inc. | | | 7,730 | | | | 692,144 | |
| Proofpoint, Inc. | | | 5,893 | | | | 218,866 | |
| RealPage, Inc. | | | 10,384 | | | | 160,952 | |
| Salesforce.com, Inc. | | | 11,480 | | | | 660,444 | |
| ServiceNow, Inc. | | | 10,907 | | | | 641,114 | |
| Workday, Inc. - Class A | | | 7,248 | | | | 597,960 | |
| | | | | | | | 3,668,552 | |
| | | | | | | | | |
| Specialty Retail - 0.30% | | | | | | | | |
Abercrombie & Fitch Co. - Class A | | | 16,739 | | | | 608,295 | |
| Cabela’s, Inc. | | | 10,131 | | | | 596,716 | |
| Five Below, Inc. | | | 17,614 | | | | 697,691 | |
| Office Depot, Inc. | | | 129,842 | | | | 667,388 | |
| | | | | | | | 2,570,090 | |
| | | | | | | | | |
| Thrifts & Mortgage Finance - 0.02% | | | | |
| Capitol Federal Financial, Inc. | | | 17,244 | | | | 203,824 | |
| | | | | | | | | |
| Wireless Telecommunication Services - 0.06% | |
| Sprint Corp. | | | 80,024 | | | | 507,352 | |
TOTAL COMMON STOCKS
(Proceeds $41,420,609) | | | | | | $ | 39,108,074 | |
| | | | | | | | | |
| INVESTMENT COMPANIES - 6.29% | | | | |
| | | | | | | | | |
| Exchange Traded Funds - 6.29% | | | | | |
| iShares Russell 2000 ETF | | | 75,700 | | | $ | 8,277,795 | |
| SPDR S&P 500 ETF Trust | | | 145,344 | | | | 28,635,675 | |
| Vanguard Small-Cap ETF | | | 146,944 | | | | 16,256,414 | |
TOTAL INVESTMENT COMPANIES
(Proceeds $53,348,345) | | | | | | $ | 53,169,884 | |
| | | | | | |
TOTAL SECURITIES SOLD SHORT
(Proceeds $94,768,954) - 10.91% | | | $ | 92,277,958 | |
Percentages are stated as a percent of net assets.
ADR American Depositary Receipt
(a) Non-income producing security.
(b) Foreign issued security.
The Global Industry Classification Standard (GICS®) was developed by and/or is the exclusive property of MSCI, Inc. and Standard & Poor’s Financial Services LLC (“S&P”). GICS® is a service mark of MSCI, Inc. and S&P and has been licensed for use by U.S. Bancorp Fund Services, LLC.
| | | |
| 62 | The Leuthold Funds - 2014 Annual Report | See Notes to the Financial Statements. |
| Leuthold Global Fund |
| Consolidated Schedule of Investments |
| September 30, 2014 |
| | | Shares | | | Fair Value | |
| COMMON STOCKS - 62.94% | | | | |
| | | | | | | |
| Airlines - 3.35% | | | | | | |
| Alaska Air Group, Inc. | | | 42,394 | | | $ | 1,845,835 | |
| American Airlines Group, Inc. | | | 66,131 | | | | 2,346,328 | |
| Copa Holdings SA - Class A (b) | | | 7,936 | | | | 851,453 | |
| Delta Air Lines, Inc. | | | 112,558 | | | | 4,068,972 | |
| JetBlue Airways Corp. (a) | | | 284,326 | | | | 3,019,542 | |
| | | | | | | | 12,132,130 | |
| | | | | | | | | |
| Auto Components - 5.15% | | | | | | | | |
| Brembo SpA (b) | | | 36,940 | | | | 1,206,781 | |
| Calsonic Kansei Corp. (b) | | | 232,000 | | | | 1,262,134 | |
| Cie Generale des Etablissements Michelin (b) | | | 20,199 | | | | 1,902,569 | |
| Continental AG (b) | | | 9,918 | | | | 1,878,749 | |
| GKN PLC (b) | | | 222,244 | | | | 1,144,458 | |
| Lear Corp. | | | 22,810 | | | | 1,971,012 | |
| Leoni AG (b) | | | 20,199 | | | | 1,096,348 | |
| Magna International, Inc. (b) | | | 26,663 | | | | 2,530,585 | |
| Pirelli & C. SpA (b) | | | 89,955 | | | | 1,240,401 | |
| Plastic Omnium SA (b) | | | 42,966 | | | | 1,025,922 | |
| Showa Corp. (b) | | | 87,300 | | | | 956,180 | |
| Sumitomo Rubber Industries, Ltd. (b) | | | 62,000 | | | | 881,955 | |
| Visteon Corp. (a) | | | 15,967 | | | | 1,552,791 | |
| | | | | | | | 18,649,885 | |
| | | | | | | | | |
| Automobiles - 2.35% | | | | | | | | |
| Daihatsu Motor Co., Ltd. (b) | | | 26,000 | | | | 412,579 | |
| Ford Motor Co. | | | 107,575 | | | | 1,591,034 | |
| Geely Automobile Holdings, Ltd. (b) | | | 960,000 | | | | 401,487 | |
| Hyundai Motor Co. (b) | | | 5,362 | | | | 966,089 | |
| Kia Motors Corp. (b) | | | 21,310 | | | | 1,082,315 | |
| Nissan Motor Co., Ltd. (b) | | | 109,200 | | | | 1,057,073 | |
| Tata Motors, Ltd. - ADR | | | 32,250 | | | | 1,409,647 | |
| Thor Industries, Inc. | | | 12,569 | | | | 647,304 | |
| Volkswagen AG (b) | | | 4,620 | | | | 954,590 | |
| | | | | | | | 8,522,118 | |
| | | | | | | | | |
| Banks - 3.74% | | | | | | | | |
| AMMB Holdings Bhd (b) | | | 632,700 | | | | 1,324,621 | |
| Banco do Brasil SA (b) | | | 107,400 | | | | 1,117,109 | |
| Bank Negara Indonesia Persero Tbk PT (b) | | | 3,178,500 | | | | 1,436,290 | |
| China CITIC Bank Corp., Ltd. (b) | | | 2,037,000 | | | | 1,234,106 | |
| Grupo Financiero Santander Mexico SAB de CV - Class B - ADR | | | 118,629 | | | | 1,605,051 | |
| Krung Thai Bank PCL - NVDR | | | 2,438,000 | | | | 1,777,209 | |
| Powszechna Kasa Oszczednosci Bank Polski SA (b) | | | 124,973 | | | | 1,492,745 | |
| State Bank of India - GDR | | | 14,938 | | | | 1,175,903 | |
| Thanachart Capital PCL - NVDR | | | 642,400 | | | | 736,073 | |
| Turkiye Is Bankasi (b) | | | 743,700 | | | | 1,652,703 | |
| | | | | | | | 13,551,810 | |
| | | | | | | | | |
| Electric Utilities - 2.80% | | | | | | | | |
| CEZ AS (b) | | | 84,064 | | | | 2,555,635 | |
| EDP - Energias do Brasil SA (b) | | | 251,600 | | | | 1,020,688 | |
| Enersis SA - ADR | | | 74,297 | | | | 1,172,407 | |
| Light SA (b) | | | 140,000 | | | | 1,201,103 | |
| Manila Electric Co. (b) | | | 117,180 | | | | 663,392 | |
| PGE SA (b) | | | 186,409 | | | | 1,177,679 | |
| Tauron Polska Energia SA (b) | | | 709,123 | | | | 1,147,333 | |
| Tenaga Nasional Bhd (b) | | | 318,100 | | | | 1,201,221 | |
| | | | | | | | 10,139,458 | |
| | | |
| See Notes to the Financial Statements. | The Leuthold Funds - 2014 Annual Report | 63 |
| Leuthold Global Fund |
| Consolidated Schedule of Investments (continued) |
| September 30, 2014 |
| | | Shares | | | Fair Value | |
| COMMON STOCKS - 62.94% (continued) | |
| | | | | |
Electronic Equipment, Instruments & Components - 4.99% | | | | | | |
| Arrow Electronics, Inc. (a) | | | 29,089 | | | $ | 1,610,076 | |
| Avnet, Inc. | | | 34,215 | | | | 1,419,922 | |
| Benchmark Electronics, Inc. (a) | | | 48,791 | | | | 1,083,648 | |
| Celestica, Inc. (a)(b) | | | 119,718 | | | | 1,215,137 | |
| Daeduck GDS Co., Ltd. (b) | | | 39,300 | | | | 450,198 | |
| Delta Electronics Thailand PCL - NVDR | | | 441,900 | | | | 842,850 | |
| Hexagon AB - Class B (b) | | | 49,315 | | | | 1,559,361 | |
| Hon Hai Precision Industry Co., Ltd. (b) | | | 742,560 | | | | 2,338,870 | |
| Jabil Circuit, Inc. | | | 60,000 | | | | 1,210,200 | |
| Oki Electric Industry Co., Ltd. (b) | | | 493,000 | | | | 1,153,599 | |
| Plexus Corp. (a) | | | 28,214 | | | | 1,041,943 | |
| Sanmina Corp. (a) | | | 70,022 | | | | 1,460,659 | |
| SYNNEX Corp. (a) | | | 22,525 | | | | 1,455,791 | |
| Tech Data Corp. (a) | | | 21,372 | | | | 1,257,956 | |
| | | | | | | | 18,100,210 | |
| | | | | | | | | |
| Gas Utilities - 2.13% | | | | | | | | |
| AGL Resources, Inc. | | | 23,685 | | | | 1,215,988 | |
| Atmos Energy Corp. | | | 24,584 | | | | 1,172,657 | |
| Gas Natural SDG SA (b) | | | 40,789 | | | | 1,199,884 | |
| New Jersey Resource Corp. | | | 22,599 | | | | 1,141,475 | |
| Tokyo Gas Co., Ltd. (b) | | | 211,000 | | | | 1,185,636 | |
| Towngas China Co., Ltd. (b) | | | 529,000 | | | | 566,673 | |
| UGI Corp. | | | 36,186 | | | | 1,233,581 | |
| | | | | | | | 7,715,894 | |
| | | | | | | | | |
| Health Care Providers & Services - 4.49% | |
| Aetna, Inc. | | | 26,839 | | | | 2,173,959 | |
| Centene Corp. (a) | | | 21,153 | | | | 1,749,565 | |
| Health Net, Inc. (a) | | | 41,328 | | | | 1,905,634 | |
| Humana, Inc. | | | 18,255 | | | | 2,378,444 | |
| Magellan Health, Inc. (a) | | | 20,736 | | | | 1,134,881 | |
| Rhoen-Klinikum AG (b) | | | 39,792 | | | | 1,204,412 | |
| UnitedHealth Group, Inc. | | | 25,137 | | | | 2,168,066 | |
| WellCare Health Plans, Inc. (a) | | | 18,156 | | | | 1,095,533 | |
| WellPoint, Inc. | | | 20,626 | | | | 2,467,282 | |
| | | | | | | | 16,277,776 | |
| | | | | | | | | |
| Household Durables - 1.44% | | | | | |
| Alpine Electronics Inc. (b) | | | 46,000 | | | | 759,529 | |
| Helen of Troy, Ltd. (a)(b) | | | 24,907 | | | | 1,308,116 | |
| Pioneer Corp. (b) | | | 262,600 | | | | 721,961 | |
| Whirlpool Corp. | | | 16,645 | | | | 2,424,344 | |
| | | | | | | | 5,213,950 | |
| | | | | | | | | |
| Insurance - 7.62% | | | | | | | | |
| American International | | | | | | | | |
| Group, Inc. | | | 47,146 | | | | 2,546,827 | |
| Assurant, Inc. | | | 21,405 | | | | 1,376,342 | |
| Baloise Holding AG (b) | | | 16,086 | | | | 2,056,297 | |
| Everest Re Group, Ltd. (b) | | | 14,621 | | | | 2,368,748 | |
| Genworth Financial, Inc. - Class A (a) | | | 144,304 | | | | 1,890,382 | |
| Gjensidige Forsikring ASA (b) | | | 55,838 | | | | 1,181,117 | |
| Helvetia Holding AG (b) | | | 2,301 | | | | 1,114,207 | |
| Kemper Corp. | | | 23,482 | | | | 801,910 | |
| Liberty Holdings, Ltd. (b) | | | 66,816 | | | | 729,011 | |
| Mapfre SA (b) | | | 553,639 | | | | 1,956,760 | |
| Muenchener Rueckversicherungs AG (b) | | | 10,672 | | | | 2,105,251 | |
| PartnerRe, Ltd. (b) | | | 20,340 | | | | 2,235,163 | |
| Porto Seguro SA (b) | | | 73,300 | | | | 853,457 | |
| | | |
| 64 | The Leuthold Funds - 2014 Annual Report | See Notes to the Financial Statements. |
| Leuthold Global Fund |
| Consolidated Schedule of Investments (continued) |
| September 30, 2014 |
| | | Shares | | | Fair Value | |
| COMMON STOCKS - 62.94% (continued) | |
| | | | | | | |
| Insurance - 7.62% (continued) | | | | |
| SCOR SE (b) | | | 60,414 | | | $ | 1,886,910 | |
| Swiss Re AG (b) | | | 24,173 | | | | 1,923,744 | |
| Talanx AG (b) | | | 28,434 | | | | 944,443 | |
| Unum Group | | | 48,178 | | | | 1,656,360 | |
| | | | | | | | 27,626,929 | |
| | | | | | | | | |
| Oil, Gas & Consumable Fuels - 4.29% | | | | | |
| AWE, Ltd. (a)(b) | | | 628,978 | | | | 1,009,057 | |
| BP PLC - ADR | | | 37,922 | | | | 1,666,672 | |
| Chevron Corp. | | | 14,382 | | | | 1,716,060 | |
| China Petroleum & Chemical Corp. - ADR | | | 17,200 | | | | 1,502,592 | |
| Hess Corp. | | | 16,410 | | | | 1,547,791 | |
| Husky Energy, Inc. (b) | | | 61,036 | | | | 1,675,295 | |
| Imperial Oil, Ltd. (b) | | | 36,069 | | | | 1,703,178 | |
| Statoil ASA - ADR | | | 64,966 | | | | 1,764,477 | |
| Suncor Energy, Inc. (b) | | | 46,302 | | | | 1,673,817 | |
| Valero Energy Corp. | | | 28,176 | | | | 1,303,704 | |
| | | | | | | | 15,562,643 | |
| | | | | | | | | |
| Paper & Forest Products - 0.16% | | | | | |
| China Forestry Holdings Co., Ltd. (a)(b)(d)(e) | | | 2,484,000 | | | | 47,986 | |
| Resolute Forest Products, Inc. (a)(b) | | | 34,325 | | | | 536,843 | |
| | | | | | | | 584,829 | |
| | | | | | | | | |
Real Estate Management & Development - 2.59% | | | | | | | | |
| AP Thailand PCL - NVDR | | | 2,057,100 | | | | 456,012 | |
| Brookfield Property Partners LP | | | 40,214 | | | | 847,309 | |
| Daiwa House Industry Co., Ltd. (b) | | | 67,100 | | | | 1,205,446 | |
| Deutsche Euroshop AG (b) | | | 10,735 | | | | 463,846 | |
| Jones Lang LaSalle, Inc. | | | 9,540 | | | | 1,205,284 | |
| Keppel Land, Ltd. (b) | | | 269,000 | | | | 737,519 | |
| Kerry Properties, Ltd. (b) | | | 214,500 | | | | 719,108 | |
| Megaworld Corp. (b) | | | 4,758,000 | | | | 532,625 | |
| Pruksa Real Estate PCL - NVDR | | | 571,100 | | | | 601,983 | |
| Realogy Holdings Corp. (a) | | | 18,999 | | | | 706,763 | |
| Soho China, Ltd. (b) | | | 614,000 | | | | 444,124 | |
| The St. Joe Co., Ltd. (a) | | | 47,700 | | | | 950,661 | |
| Takara Leben Co., Ltd. (b) | | | 141,600 | | | | 527,033 | |
| | | | | | | | 9,397,713 | |
| | | | | | | | | |
| Road & Rail - 4.49% | | | | | | | | |
| AMERCO | | | 5,360 | | | | 1,403,731 | |
| Canadian National Railway Co. (b) | | | 23,029 | | | | 1,634,926 | |
| Central Japan Railway Co. (b) | | | 12,800 | | | | 1,726,576 | |
| Con-way, Inc. | | | 28,760 | | | | 1,366,100 | |
| Keisei Electric Railway Co., Ltd. (b) | | | 98,000 | | | | 983,949 | |
| Norfolk Southern Corp. | | | 15,274 | | | | 1,704,578 | |
| Ryder System, Inc. | | | 15,829 | | | | 1,424,135 | |
| Sankyu, Inc. (b) | | | 138,000 | | | | 737,513 | |
| Seino Holdings Co., Ltd. (b) | | | 90,000 | | | | 721,467 | |
| Union Pacific Corp. | | | 20,220 | | | | 2,192,252 | |
| Werner Enterprises, Inc. | | | 38,164 | | | | 961,733 | |
| West Japan Railway Co. (b) | | | 31,400 | | | | 1,405,240 | |
| | | | | | | | 16,262,200 | |
| | | |
| See Notes to the Financial Statements. | The Leuthold Funds - 2014 Annual Report | 65 |
| Leuthold Global Fund |
| Consolidated Schedule of Investments (continued) |
| September 30, 2014 |
| | | Shares | | | Fair Value | |
| COMMON STOCKS - 62.94% (continued) | |
| | | | | | | |
| Semiconductors & Semiconductor Equipment - 4.86% | | | | | | |
| A-DATA Technology Co., Ltd. (b) | | | 281,040 | | | $ | 585,469 | |
| Advanced Semiconductor Engineering, Inc. - ADR | | | 197,059 | | | | 1,164,619 | |
| ChipMOS TECHNOLOGIES Bermuda, Ltd. (b) | | | 33,251 | | | | 752,138 | |
| Cirrus Logic, Inc. (a) | | | 39,451 | | | | 822,553 | |
| CSR PLC (b) | | | 68,754 | | | | 842,860 | |
| First Solar, Inc. (a) | | | 20,648 | | | | 1,358,845 | |
| Iljin Display Co., Ltd. (b) | | | 35,110 | | | | 270,765 | |
| Intel Corp. | | | 82,448 | | | | 2,870,839 | |
| Magnachip Semiconductor Corp. (a)(b) | | | 36,191 | | | | 423,435 | |
| Marvell Technology Group, Ltd. (b) | | | 109,566 | | | | 1,476,950 | |
| NVIDIA Corp. | | | 100,341 | | | | 1,851,291 | |
| Radiant Opto-Electronics Corp. (b) | | | 126,050 | | | | 498,610 | |
| Realtek Semiconductor Corp. (b) | | | 203,320 | | | | 722,014 | |
| Shindengen Electric Manufacturing Co., Ltd. (b) | | | 114,000 | | | | 778,147 | |
| Sigurd Microelectronics Corp. (b) | | | 515,000 | | | | 517,008 | |
| Silicon Works Co., Ltd. (b) | | | 32,078 | | | | 698,644 | |
| Skyworks Solutions, Inc. | | | 34,095 | | | | 1,979,215 | |
| | | | | | | | 17,613,402 | |
| | | | | | | | | |
| Technology Hardware, Storage & Peripherals - 8.15% | | | | | | | | |
| Apple, Inc. | | | 29,659 | | | | 2,988,144 | |
| Asustek Computer, Inc. (b) | | | 148,000 | | | | 1,412,272 | |
| Eizo Corp. (b) | | | 65,300 | | | | 1,505,996 | |
| FUJIFILM Holdings Corp. (b) | | | 88,200 | | | | 2,710,130 | |
| Hewlett-Packard Co. | | | 53,546 | | | | 1,899,277 | |
| Lenovo Group, Ltd. (b) | | | 1,188,000 | | | | 1,769,518 | |
| Lexmark International, Inc. - Class A | | | 30,747 | | | | 1,306,748 | |
| NCR Corp. (a) | | | 67,399 | | | | 2,251,801 | |
| Pegatron Corp. (b) | | | 952,000 | | | | 1,749,954 | |
| Ricoh Co., Ltd. (b) | | | 202,000 | | | | 2,170,150 | |
| Samsung Electronics Co., Ltd. (b) | | | 1,458 | | | | 1,632,971 | |
| SanDisk Corp. | | | 32,260 | | | | 3,159,867 | |
| Seiko Epson Corp. (b) | | | 59,400 | | | | 2,862,066 | |
| Western Digital Corp. | | | 21,822 | | | | 2,123,717 | |
| | | | | | | | 29,542,611 | |
| | | | | | | | | |
| Water Utilities - 0.34% | | | | | | | | |
| Guangdong Investment, Ltd. (b) | | | 1,046,000 | | | | 1,222,765 | |
TOTAL COMMON STOCKS
(Cost $195,810,412) | | | | | | $ | 228,116,323 | |
| | | | | | | | | |
| PREFERRED STOCKS - 1.23% | | | | | | | | |
| | | | | | | | | |
| Automobiles - 0.40% | | | | | | | | |
| Porsche Automobile Holding SE (b) | | | 18,330 | | | $ | 1,462,241 | |
| | | | | | | | | |
| Banks - 0.20% | | | | | | | | |
| Banco do Estado do Rio Grande do Sul SA (b) | | | 120,700 | | | | 722,400 | |
| | | |
| 66 | The Leuthold Funds - 2014 Annual Report | See Notes to the Financial Statements. |
| Leuthold Global Fund |
| Consolidated Schedule of Investments (continued) |
| September 30, 2014 |
| | | Shares | | | Fair Value | |
| PREFERRED STOCKS - 1.23% (continued) | |
| | | | | | | |
| Electric Utilities - 0.63% | | | | | | |
| Cia Energetica de Minas Gerais - ADR | | | 169,581 | | | $ | 1,056,490 | |
| Companhia Paranaense de Energia - ADR | | | 89,449 | | | | 1,222,768 | |
| | | | | | | | 2,279,258 | |
TOTAL PREFERRED STOCKS
(Cost $3,870,260) | | | | | | $ | 4,463,899 | |
| | | | | | | | | |
| INVESTMENT COMPANIES - 10.61% | |
| | | | | | |
| Exchange Traded Funds - 10.61% | | | | | |
| CurrencyShares Japanese Yen Trust | | | 35,984 | | | $ | 3,195,379 | |
| iShares CMBS ETF | | | 13,500 | | | | 692,981 | |
| iShares Floating Rate Bond ETF | | | 86,280 | | | | 4,385,612 | |
| iShares Global ex USD High Yield Corporate Bond ETF | | | 13,422 | | | | 717,413 | |
| iShares iBoxx $ Investment Grade Corporate Bond Fund ETF | | | 31,145 | | | | 3,681,962 | |
| iShares Intermediate Credit Bond ETF | | | 9,148 | | | | 999,968 | |
| iShares MBS ETF | | | 105,250 | | | | 11,378,577 | |
| PIMCO 0-5 Year High Yield Corporate Bond Index Exchange-Traded Fund | | | 13,381 | | | | 1,386,941 | |
| PowerShares Build America Bond Portfolio | | | 56,300 | | | | 1,669,295 | |
| PowerShares International Corporate Bond Portfolio | | | 36,500 | | | | 1,060,690 | |
| SPDR Barclays International Corporate Bond ETF | | | 30,200 | | | | 1,070,590 | |
| SPDR Barclays International Treasury Bond ETF | | | 96,352 | | | | 5,527,714 | |
| SPDR Barclays Short-Term International Treasury Bond ETF | | | 78,546 | | | | 2,675,277 | |
TOTAL INVESTMENT COMPANIES
(Cost $38,780,595) | | | | | | $ | 38,442,399 | |
| | | | | | | | | |
| | | Principal Amount | | | Fair Value | |
| CORPORATE BONDS - 1.35% | | | | | |
| | | | | | | | | |
| Banks - 0.32% | | | | | | | | |
| JPMorgan Chase & Co. | | | | | | | | |
| 3.150%, 07/05/2016 | | $ | 1,120,000 | | | $ | 1,159,150 | |
| | | | | | | | | |
| Biotechnology - 0.21% | | | | | | | | |
| Amgen, Inc. | | | | | | | | |
| 4.100%, 06/15/2021 | | | 731,000 | | | | 777,490 | |
| | | | | | | | | |
| Industrial Conglomerates - 0.31% | | | | | |
| General Electric Co. | | | | | | | | |
| 5.250%, 12/06/2017 | | | 1,025,000 | | | | 1,137,187 | |
| | | | | | | | | |
| Internet & Catalog Retail - 0.31% | | | | | |
| Expedia, Inc. | | | | | | | | |
| 7.456%, 08/15/2018 | | | 970,000 | | | | 1,134,415 | |
| | | | | | | | | |
| Oil, Gas & Consumable Fuels - 0.15% | | | | |
| Enterprise Products Operating, LLC | | | | | |
| 5.600%, 10/15/2014 | | | 523,000 | | | | 523,988 | |
| | | | | | | | | |
| Tobacco - 0.05% | | | | | | | | |
| Altria Group, Inc. | | | | | | | | |
| 9.700%, 11/10/2018 | | | 153,000 | | | | 197,095 | |
TOTAL CORPORATE BONDS
(Cost $4,668,221) | | | | | | $ | 4,929,325 | |
| | | | | | | | | |
| UNITED STATES TREASURY OBLIGATIONS - 1.83% | | | | | |
| | | | | | | | | |
| United States Treasury Notes - 1.83% | | | | |
| 2.500%, 04/30/2015 | | $ | 1,520,000 | | | $ | 1,541,554 | |
| 2.125%, 08/31/2020 | | | 3,130,000 | | | | 3,146,626 | |
| 5.250%, 11/15/2028 | | | 1,500,000 | | | | 1,929,843 | |
TOTAL UNITED STATES TREASURY OBLIGATIONS
(Cost $6,553,903) | | | | | | $ | 6,618,023 | |
| | | |
| See Notes to the Financial Statements. | The Leuthold Funds - 2014 Annual Report | 67 |
| Leuthold Global Fund |
| Consolidated Schedule of Investments (continued) |
| September 30, 2014 |
| | | | Principal Amount | | | Fair Value | |
| FOREIGN GOVERNMENT BONDS - 6.26% | |
| | | | | |
| Bank Nederlands Gemeenten NV | | | | |
| 1.850%, 11/07/2016 (b) | | | | | | |
| | JPY | | | 170,000,000 | | | $ | 1,612,234 | |
| Commonwealth of Australia | | | | | | | | | |
| 2.750%, 10/21/2019 (b) | | | | | | | | | |
| | AUD | | | 2,460,000 | | | | 2,127,984 | |
| Development Bank of Japan | | | | | | | | | |
| 1.750%, 03/17/2017 (b) | | | | | | | | | |
| | JPY | | | 160,000,000 | | | | 1,517,124 | |
| Federal Republic of Germany | | | | | | | | | |
| 4.250%, 07/04/2018 (b) | | | | | | | | | |
| | EUR | | | 1,630,000 | | | | 2,388,290 | |
| 3.500%, 07/04/2019 (b) | | | | | | | | | |
| | EUR | | | 1,630,000 | | | | 2,390,988 | |
| | | | | | | | | 4,779,278 | |
| Government of France | | | | | | | | | |
| 3.750%, 04/25/2021 (b) | | | | | | | | | |
| | EUR | | | 2,370,000 | | | | 3,600,515 | |
| Government of United Kingdom | | | | | | | | | |
| 3.750%, 09/07/2020 (b) | | | | | | | | | |
| | GBP | | | 1,570,000 | | | | 2,804,875 | |
| Kingdom of Spain | | | | | | | | | |
| 4.300%, 10/31/2019 (b) | | | | | | | | | |
| | EUR | | | 1,290,000 | | | | 1,901,004 | |
| Province of Manitoba Canada | | | | | | | | | |
| 1.300%, 04/03/2017 (b) | | | | | | | | | |
| | USD | | | 2,100,000 | | | | 2,114,687 | |
| Republic of Italy | | | | | | | | | |
| 4.500%, 08/01/2018 (b) | | | | | | | | | |
| | EUR | | | 1,550,000 | | | | 2,228,184 | |
TOTAL FOREIGN GOVERNMENT BONDS
(Cost $23,182,846) | | | | | | | $ | 22,685,885 | |
| | | Shares | | | Fair Value | |
| SHORT-TERM INVESTMENTS - 7.75% | | | | | | |
| | | | | | | |
| Money Market Funds - 7.75% | | | | |
| Fidelity Institutional Money Market Funds - Government Portfolio, 0.01% (c) | | | 28,089,171 | | | $ | 28,089,171 | |
TOTAL SHORT-TERM INVESTMENTS
(Cost $28,089,171) | | | | | | $ | 28,089,171 | |
| | | | | | | | | |
Total Investments
(Cost $300,955,408) - 91.97% | | | $ | 333,345,025 | |
| Other Assets in Excess of Liabilities - 8.03%(f) | | | | | | | 29,108,659 | |
| TOTAL NET ASSETS - 100.00% | | | | | $ | 362,453,684 | |
Percentages are stated as a percent of net assets.
| ADR | American Depositary Receipt |
| AUD | Australian Dollar |
| EUR | Euro |
| GBP | British Pound |
| GDR | Global Depositary Receipt |
| JPY | Japanese Yen |
| USD | U.S. Dollar |
| NVDR | Non-Voting Depositary Receipt |
| (a) | Non-income producing security. |
| (b) | Foreign issued security. |
| (c) | The rate quoted is the annualized seven-day yield as of September 30, 2014. |
| (d) | Illiquid Security. The fair value of this security is $47,986 which represents 0.01% of total net assets. |
| (e) | The security is currently being fair valued in accordance with procedures established by the Board of Directors of the Leuthold Funds due to a halt in trading of the security on January 26, 2011. |
| (f) | All or a portion of the assets have been committed as collateral for open securities sold short. |
The Global Industry Classification Standard (GICS®) was developed by and/or is the exclusive property of MSCI, Inc. and Standard & Poor’s Financial Services LLC (“S&P”). GICS® is a service mark of MSCI, Inc. and S&P and has been licensed for use by U.S. Bancorp Fund Services, LLC.
| | | |
| 68 | The Leuthold Funds - 2014 Annual Report | See Notes to the Financial Statements. |
| Leuthold Global Fund |
| Consolidated Schedule of Investments (continued) |
| September 30, 2014 |
| | | | | | Percentage | |
| | | Fair | | | of Total | |
| | | Value | | | Investments | |
| CURRENCY EXPOSURE | | | | | | |
| September 30, 2014 | | | | | | |
| Australian Dollar | | $ | 3,137,041 | | | | 0.94 | % |
| Brazilian Real | | | 4,914,757 | | | | 1.47 | |
| British Pound | | | 4,792,194 | | | | 1.44 | |
| Canadian Dollar | | | 3,310,221 | | | | 0.99 | |
| Czech Koruna | | | 2,555,635 | | | | 0.77 | |
| Euro | | | 33,038,088 | | | | 9.91 | |
| Hong Kong Dollar | | | 6,405,768 | | | | 1.92 | |
| Indonesian Rupiah | | | 1,436,290 | | | | 0.43 | |
| Japanese Yen | | | 28,853,716 | | | | 8.66 | |
| Malaysian Ringgit | | | 2,525,842 | | | | 0.76 | |
| New Taiwan Dollar | | | 7,824,197 | | | | 2.35 | |
| New Turkish Lira | | | 1,652,703 | | | | 0.50 | |
| Norwegian Krone | | | 1,181,118 | | | | 0.35 | |
| Philippine Peso | | | 1,196,017 | | | | 0.36 | |
| Polish Zloty | | | 3,817,756 | | | | 1.14 | |
| Singapore Dollar | | | 737,519 | | | | 0.22 | |
| South African Rand | | | 729,011 | | | | 0.22 | |
| South Korea Won | | | 5,100,981 | | | | 1.53 | |
| Swedish Krona | | | 1,559,361 | | | | 0.47 | |
| Swiss Franc | | | 5,094,248 | | | | 1.53 | |
| Thai Baht | | | 4,414,129 | | | | 1.32 | |
| US Dollar | | | 209,068,433 | | | | 62.72 | |
| Total Investments | | $ | 333,345,025 | | | | 100.00 | % |
| | | | | | Percentage | |
| | | Fair | | | of Total | |
| | | Value | | | Investments | |
| PORTFOLIO DIVERSIFICATION | | | | |
| September 30, 2014 | | | | | | |
| Australia | | $ | 3,137,041 | | | | 0.94 | % |
| Brazil | | | 7,194,015 | | | | 2.16 | |
| Canada | | | 13,084,468 | | | | 3.93 | |
| Chile | | | 1,172,407 | | | | 0.35 | |
| China | | | 5,399,813 | | | | 1.62 | |
| Czech Republic | | | 2,555,635 | | | | 0.77 | |
| France | | | 8,415,916 | | | | 2.52 | |
| Germany | | | 14,889,158 | | | | 4.47 | |
| Hong Kong | | | 2,508,546 | | | | 0.75 | |
| India | | | 2,585,550 | | | | 0.78 | |
| Indonesia | | | 1,436,290 | | | | 0.43 | |
| Italy | | | 4,675,366 | | | | 1.40 | |
| Japan | | | 27,241,483 | | | | 8.17 | |
| Malaysia | | | 2,525,842 | | | | 0.76 | |
| Mexico | | | 1,605,051 | | | | 0.48 | |
| Netherlands | | | 1,612,234 | | | | 0.48 | |
| Norway | | | 2,945,594 | | | | 0.88 | |
| Panama | | | 851,453 | | | | 0.26 | |
| Philippines | | | 1,196,017 | | | | 0.36 | |
| Poland | | | 3,817,756 | | | | 1.14 | |
| Singapore | | | 737,519 | | | | 0.22 | |
| South Africa | | | 729,011 | | | | 0.22 | |
| South Korea | | | 5,524,417 | | | | 1.66 | |
| Spain | | | 5,057,648 | | | | 1.52 | |
| Sweden | | | 1,559,361 | | | | 0.47 | |
| Switzerland | | | 5,094,248 | | | | 1.53 | |
| Taiwan | | | 9,740,954 | | | | 2.92 | |
| Thailand | | | 4,414,129 | | | | 1.32 | |
| Turkey | | | 1,652,703 | | | | 0.50 | |
| United Kingdom | | | 6,458,865 | | | | 1.94 | |
| United States | | | 183,526,535 | | | | 55.05 | |
| Total Investments | | $ | 333,345,025 | | | | 100.00 | % |
| | | |
| See Notes to the Financial Statements. | The Leuthold Funds - 2014 Annual Report | 69 |
| Leuthold Global Fund |
| Consolidated Schedule of Securities Sold Short - (a) |
| September 30, 2014 |
| | | Shares | | | Fair Value | |
| COMMON STOCKS - 2.89% | | | | |
| | | | | | | |
| Aerospace & Defense - 0.07% | | | | |
| Bae Systems (b) | | | 16,294 | | | $ | 124,024 | |
| TransDigm Group, Inc. | | | 658 | | | | 121,289 | |
| | | | | | | | 245,313 | |
| | | | | | | | | |
| Air Freight & Logistics - 0.03% | | | | | |
| XPO Logistics, Inc. | | | 2,919 | | | | 109,959 | |
| | | | | | | | | |
| Banks - 0.06% | | | | | | | | |
| Home BancShares, Inc. | | | 3,617 | | | | 106,376 | |
| Investors Bancorp, Inc. | | | 12,084 | | | | 122,411 | |
| | | | | | | | 228,787 | |
| | | | | | | | | |
| Capital Markets - 0.24% | | | | | | | | |
| Charles Schwab Corp. | | | 5,266 | | | | 154,768 | |
| Deutsche Bank AG (b) | | | 2,871 | | | | 100,083 | |
| Greenhill & Co., Inc. | | | 2,463 | | | | 114,505 | |
| ICAP PLC (b) | | | 19,000 | | | | 118,823 | |
| kabu.com Securities Co., Ltd. (b) | | | 24,000 | | | | 117,373 | |
| Matsui Securities Co., Ltd. (b) | | | 13,100 | | | | 122,186 | |
| UBS AG (b) | | | 7,123 | | | | 123,726 | |
| | | | | | | | 851,464 | |
| | | | | | | | | |
| Chemicals - 0.03% | | | | | | | | |
| Mexichem SAB de CV (b) | | | 29,000 | | | | 120,746 | |
| | | | | | | | | |
| Commercial Services & Supplies - 0.11% | |
| Covanta Holding Corp. | | | 6,343 | | | | 134,599 | |
| Healthcare Services Group, Inc. | | | 4,184 | | | | 119,704 | |
| Waste Management, Inc. | | | 2,985 | | | | 141,877 | |
| | | | | | | | 396,180 | |
| | | | | | | | | |
| Construction & Engineering - 0.10% | | | | |
| China State Construction International Holdings, Ltd. (b) | | | 74,000 | | | | 110,011 | |
| Chiyoda Corp. (b) | | | 10,000 | | | | 110,585 | |
| SNC Lavalin Group, Inc. (b) | | | 2,923 | | | | 134,595 | |
| | | | | | | | 355,191 | |
| | | | | | | | | |
| Food & Staples Retailing - 0.13% | | | | | |
| Booker Group PLC (b) | | | 48,000 | | | | 94,791 | |
| Empire Co., Ltd. - Class A (b) | | | 1,750 | | | | 121,708 | |
| George Weston, Ltd. (b) | | | 1,499 | | | | 118,132 | |
| Loblaw Companies Ltd. (b) | | | 2,446 | | | | 122,415 | |
| | | | | | | | 457,046 | |
| | | | | | | | | |
| Food Products - 0.24% | | | | | | | | |
| B&G Foods, Inc. | | | 4,006 | | | | 110,365 | |
| BRF SA - ADR | | | 4,680 | | | | 111,337 | |
| China Mengniu Dairy Co., Ltd. (b) | | | 29,000 | | | | 119,338 | |
| Darling Ingredients, Inc. | | | 6,161 | | | | 112,869 | |
| Grupo Bimbo SAB de CV (b) | | | 43,300 | | | | 125,543 | |
| Post Holdings, Inc. | | | 2,783 | | | | 92,340 | |
| WhiteWave Foods Co. | | | 3,194 | | | | 116,038 | |
| Yakult Honsha Co., Ltd. (b) | | | 1,900 | | | | 99,792 | |
| | | | | | | | 887,622 | |
| | | | | | | | | |
| Health Care Equipment & Supplies - 0.20% | |
| Abaxis, Inc. | | | 2,172 | | | | 110,142 | |
| ABIOMED, Inc. | | | 4,883 | | | | 121,245 | |
| Endologix, Inc. | | | 7,802 | | | | 82,701 | |
| HeartWare International, Inc. | | | 1,432 | | | | 111,166 | |
| Shandong Weigao Group Medical Polymer Co., Ltd. (b) | | | 132,000 | | | | 130,207 | |
| Tornier NV (b) | | | 6,873 | | | | 164,265 | |
| | | | | | | | 719,726 | |
| | | | | | | | | |
| Health Care Technology - 0.03% | | | | | |
| M3, Inc. (b) | | | 7,300 | | | | 117,065 | |
| | | | | | | | | |
| Hotels, Restaurants & Leisure - 0.16% | | | | |
| Domino’s Pizza Group PLC (b) | | | 13,554 | | | | 124,651 | |
| Fiesta Restaurant Group, Inc. | | | 2,653 | | | | 131,801 | |
| McDonald’s Holding Co. Japan, Ltd. (b) | | | 4,600 | | | | 113,753 | |
| Pinnacle Entertainment, Inc. | | | 4,376 | | | | 109,794 | |
| Popeyes Louisiana Kitchen, Inc. | | | 2,691 | | | | 108,986 | |
| | | | | | | | 588,985 | |
| | | |
| 70 | The Leuthold Funds - 2014 Annual Report | See Notes to the Financial Statements. |
| Leuthold Global Fund |
| Consolidated Schedule of Securities Sold Short - (a) (continued) |
| September 30, 2014 |
| | | Shares | | | Fair Value | |
| COMMON STOCKS - 2.89% (continued) | |
| | | | | | | |
| Industrial Conglomerates - 0.04% | | | | |
| Beijing Enterprises Holdings, Ltd. (b) | | | 17,500 | | | $ | 150,141 | |
| | | | | | | | | |
| Internet & Catalog Retail - 0.10% | | | | | |
| Amazon.com, Inc. | | | 380 | | | | 122,527 | |
| HomeAway, Inc. | | | 3,628 | | | | 128,794 | |
| TripAdvisor, Inc. | | | 1,382 | | | | 126,343 | |
| | | | | | | | 377,664 | |
| | | | | | | | | |
| Internet Software & Services - 0.10% | | | | | |
| Cornerstone OnDemand, Inc. | | | 2,627 | | | | 90,395 | |
| LinkedIn Corp. - Class A | | | 720 | | | | 149,609 | |
| Shutterstock, Inc. | | | 1,547 | | | | 110,425 | |
| | | | | | | | 350,429 | |
| | | | | | | | | |
| Leisure Products - 0.08% | | | | | | | | |
| Sankyo Co., Ltd. (b) | | | 3,000 | | | | 107,514 | |
| Shimano, Inc. (b) | | | 1,400 | | | | 170,301 | |
| | | | | | | | 277,815 | |
| | | | | | | | | |
| Life Sciences Tools & Services - 0.04% | | | | | |
| MorphoSys AG (b) | | | 1,435 | | | | 140,002 | |
| | | | | | | | | |
| Machinery - 0.04% | | | | | | | | |
| MAN SE (b) | | | 1,339 | | | | 150,683 | |
| | | | | | | | | |
| Media - 0.20% | | | | | | | | |
| Loral Space & Communications, Inc. | | | 1,664 | | | | 119,492 | |
| Mediaset Espana Comunicacion SA (b) | | | 10,576 | | | | 131,254 | |
| Morningstar, Inc. | | | 1,757 | | | | 119,300 | |
Sinclair Broadcast Group, Inc. - Class A | | | 4,096 | | | | 106,865 | |
| Sirius XM Holdings, Inc. | | | 37,143 | | | | 129,629 | |
| Thomson Reuters Corp. | | | 3,355 | | | | 122,156 | |
| | | | | | | | 728,696 | |
| | | | | | | | | |
| Paper & Forest Products - 0.06% | | | | | |
| Louisiana-Pacific Corp. | | | 7,790 | | | | 105,866 | |
| Stora Enso Oyj (b) | | | 13,633 | | | | 113,108 | |
| | | | | | | | 218,974 | |
| | | | | | | | | |
| Personal Products - 0.10% | | | | | | | | |
| Coty, Inc. - Class A | | | 6,571 | | | | 108,750 | |
| Euglena Co., Ltd. (b) | | | 8,900 | | | | 111,203 | |
| Hengan International Group Co., Ltd. (b) | | | 13,800 | | | | 135,762 | |
| | | | | | | | 355,715 | |
| | | | | | | | | |
| Pharmaceuticals - 0.03% | | | | | | | | |
| Salix Pharmaceuticals, Ltd. | | | 728 | | | | 113,743 | |
| | | | | | | | | |
| Professional Services - 0.18% | | | | | |
| Advisory Board Co. | | | 2,138 | | | | 99,609 | |
| Bureau Veritas SA (b) | | | 4,629 | | | | 102,306 | |
| Corporate Executive Board Co. | | | 1,802 | | | | 108,246 | |
| IHS, Inc. - Class A | | | 925 | | | | 115,801 | |
| Nihon M&A Center, Inc. (b) | | | 3,900 | | | | 113,142 | |
| Wageworks, Inc. | | | 2,502 | | | | 113,916 | |
| | | | | | | | 653,020 | |
| | | | | | | | | |
| Software - 0.21% | | | | | | | | |
| Guidewire Software, Inc. | | | 2,940 | | | | 130,359 | |
| NetSuite, Inc. | | | 1,407 | | | | 125,983 | |
| Salesforce.com, Inc. | | | 2,230 | | | | 128,292 | |
| ServiceNow, Inc. | | | 2,329 | | | | 136,899 | |
| Solera Holdings, Inc. | | | 1,935 | | | | 109,056 | |
| Tableau Software, Inc. - Class A | | | 1,889 | | | | 137,236 | |
| | | | | | | | 767,825 | |
| | | |
| See Notes to the Financial Statements. | The Leuthold Funds - 2014 Annual Report | 71 |
| Leuthold Global Fund |
| Consolidated Schedule of Securities Sold Short - (a) (continued) |
| September 30, 2014 |
| | | Shares | | | Fair Value | |
| COMMON STOCKS - 2.89% (continued) | |
| | | | | | | |
| Specialty Retail - 0.17% | | | | | | |
| Fast Retailing Co., Ltd. (b) | | | 400 | | | $ | 134,037 | |
| L’Occitane International (b) | | | 47,000 | | | | 107,640 | |
| Restoration Hardware Holdings, Inc. | | | 1,349 | | | | 107,313 | |
| Tiffany & Co. | | | 1,328 | | | | 127,900 | |
Ulta Salon Cosmetics & Fragrance, Inc. | | | 1,274 | | | | 150,548 | |
| | | | | | | | 627,438 | |
| | | | | | | | | |
| Textiles, Apparel & Luxury Goods - 0.07% | |
| Asics Corp. (b) | | | 5,800 | | | | 130,811 | |
| China Dongxiang Group Co., Ltd. (b) | | | 585,000 | | | | 109,804 | |
| | | | | | | | 240,615 | |
| | | | | | | | | |
| Thrifts & Mortgage Finance - 0.07% | | | | | |
| Bofi Holding, Inc. | | | 1,676 | | | | 121,862 | |
| TFS Financial Corp. | | | 8,492 | | | | 121,605 | |
| | | | | | | | 243,467 | |
TOTAL COMMON STOCKS
(Proceeds $10,560,470) | | | | | | $ | 10,474,311 | |
| | | | | | | | | |
| INVESTMENT COMPANIES - 7.54% | | | | |
| | | | | | | | | |
| Exchange Traded Funds - 7.54% | | | | | |
| iShares MSCI EAFE ETF | | | 60,008 | | | $ | 3,847,713 | |
| iShares MSCI Emerging Markets ETF | | | 48,660 | | | | 2,022,310 | |
| iShares MSCI South Korea Capped ETF | | | 3,051 | | | | 184,616 | |
| iShares Russell 2000 ETF | | | 97,050 | | | | 10,612,417 | |
| SPDR S&P 500 ETF Trust | | | 54,150 | | | | 10,668,633 | |
TOTAL INVESTMENT COMPANIES
(Proceeds $27,853,525) | | | | | | $ | 27,335,689 | |
TOTAL SECURITIES SOLD SHORT
(Proceeds $38,413,995) - 10.43% | | | $ | 37,810,000 | |
Percentages are stated as a percent of net assets.
ADR American Depositary Receipt
(a) Non-income producing security.
(b) Foreign issued security.
The Global Industry Classification Standard (GICS®) was developed by and/or is the exclusive property of MSCI, Inc. and Standard & Poor’s Financial Services LLC (“S&P”). GICS® is a service mark of MSCI, Inc. and S&P and has been licensed for use by U.S. Bancorp Fund Services, LLC.
| | | |
| 72 | The Leuthold Funds - 2014 Annual Report | See Notes to the Financial Statements. |
| Leuthold Select Industries Fund |
| Schedule of Investments |
| September 30, 2014 |
| | | Shares | | | Fair Value | |
| COMMON STOCKS - 99.32% | | | | |
| | | | | | | |
| Aerospace & Defense - 6.49% | | | | |
| AAR Corp. | | | 1,857 | | | $ | 44,846 | |
| Alliant Techsystems, Inc. | | | 726 | | | | 92,667 | |
| Boeing Co. | | | 918 | | | | 116,935 | |
| Exelis, Inc. | | | 4,738 | | | | 78,366 | |
| L-3 Communications Holdings, Inc. | | | 768 | | | | 91,331 | |
| Lockheed Martin Corp. | | | 854 | | | | 156,094 | |
| Moog, Inc. - Class A (a) | | | 683 | | | | 46,717 | |
| Northrop Grumman Corp. | | | 1,152 | | | | 151,787 | |
| Raytheon Co. | | | 1,238 | | | | 125,806 | |
| Triumph Group, Inc. | | | 960 | | | | 62,448 | |
| Vectrus, Inc. (a) | | | 263 | | | | 5,141 | |
| | | | | | | | 972,138 | |
| | | | | | | | | |
| Airlines - 8.37% | | | | | | | | |
| Alaska Air Group, Inc. | | | 4,183 | | | | 182,128 | |
| American Airlines Group, Inc. | | | 5,271 | | | | 187,015 | |
| Copa Holdings SA - Class A (b) | | | 1,024 | | | | 109,865 | |
| Delta Air Lines, Inc. | | | 6,061 | | | | 219,105 | |
| Hawaiian Holdings, Inc. (a) | | | 10,052 | | | | 135,199 | |
| JetBlue Airways Corp. (a) | | | 12,442 | | | | 132,134 | |
| Southwest Airlines Co. | | | 8,537 | | | | 288,295 | |
| | | | | | | | 1,253,741 | |
| | | | | | | | | |
| Chemicals - 5.23% | | | | | | | | |
| Axiall Corp. | | | 1,665 | | | | 59,624 | |
| Cabot Corp. | | | 2,732 | | | | 138,704 | |
| LyondellBasell Industries NV - Class A | | | 2,070 | | | | 224,926 | |
| Methanex Corp. (b) | | | 2,433 | | | | 162,524 | |
| Westlake Chemical Corp. | | | 2,284 | | | | 197,771 | |
| | | | | | | | 783,549 | |
| | | | | | | |
| Consumer Finance - 5.19% | | | | | | |
| Capital One Financial Corp. | | | 2,988 | | | | 243,881 | |
| Discover Financial Services | | | 4,076 | | | | 262,454 | |
| Navient Corp. | | | 7,640 | | | | 135,304 | |
| Portfolio Recovery Associates, Inc. (a) | | | 1,345 | | | | 70,249 | |
| SLM Corp. | | | 7,640 | | | | 65,398 | |
| | | | | | | | 777,286 | |
| | | | | | | | | |
Electronic Equipment, Instruments & Components - 7.34% | | | | | | | | |
| Arrow Electronics, Inc. (a) | | | 2,710 | | | | 149,998 | |
| Avnet, Inc. | | | 3,159 | | | | 131,099 | |
| Benchmark Electronics, Inc. (a) | | | 2,838 | | | | 63,032 | |
| Flextronics International, Ltd. (a) | | | 11,269 | | | | 116,296 | |
| Ingram Micro, Inc. - Class A (a) | | | 4,162 | | | | 107,421 | |
| Insight Enterprises, Inc. (a) | | | 3,137 | | | | 70,990 | |
| Jabil Circuit, Inc. | | | 5,442 | | | | 109,765 | |
| Sanmina Corp. (a) | | | 3,799 | | | | 79,247 | |
| SYNNEX Corp. (a) | | | 1,622 | | | | 104,830 | |
| TE Connectivity, Ltd. (b) | | | 3,009 | | | | 166,368 | |
| | | | | | | | 1,099,046 | |
| | | | | | | | | |
| Food & Staples Retailing - 2.70% | | | | | |
| CVS Health Corp. | | | 5,079 | | | | 404,238 | |
| | | | | | | | | |
| Health Care Providers & Services - 12.20% | |
| Aetna, Inc. | | | 2,134 | | | | 172,854 | |
| CIGNA Corp. | | | 1,216 | | | | 110,279 | |
| Ensign Group, Inc. | | | 1,115 | | | | 38,802 | |
| Hanger, Inc. (a) | | | 1,900 | | | | 38,988 | |
| HCA Holdings, Inc. (a) | | | 3,586 | | | | 252,885 | |
| Humana, Inc. | | | 1,174 | | | | 152,960 | |
| Kindred Healthcare, Inc. | | | 1,885 | | | | 36,569 | |
| LifePoint Hospitals, Inc. (a) | | | 1,596 | | | | 110,427 | |
| Magellan Health, Inc. (a) | | | 1,430 | | | | 78,264 | |
| Select Medical Holdings Corp. | | | 2,861 | | | | 34,418 | |
| See Notes to the Financial Statements. | The Leuthold Funds - 2014 Annual Report | 73 |
| Leuthold Select Industries Fund |
| Schedule of Investments (continued) |
| September 30, 2014 |
| | | Shares | | | Fair Value | |
| COMMON STOCKS - 99.32% (continued) | |
| | | | | | | |
Health Care Providers & Services - 12.20% (continued) | | | | | | |
| UnitedHealth Group, Inc. | | | 2,668 | | | $ | 230,115 | |
| Universal Health Services, Inc. - Class B | | | 1,423 | | | | 148,704 | |
| VCA, Inc. (a) | | | 2,973 | | | | 116,928 | |
| WellCare Health Plans, Inc. (a) | | | 1,152 | | | | 69,512 | |
| WellPoint, Inc. | | | 1,973 | | | | 236,010 | |
| | | | | | | | 1,827,715 | |
| | | | | | | | | |
| IT Services - 8.14% | | | | | | | | |
| Accenture PLC - Class A (b) | | | 1,110 | | | | 90,265 | |
| Amdocs, Ltd. | | | 1,494 | | | | 68,545 | |
| Cognizant Technology Solutions Corp. - Class A (a) | | | 1,494 | | | | 66,886 | |
| Computer Sciences Corp. | | | 1,942 | | | | 118,753 | |
| Convergys Corp. | | | 2,710 | | | | 48,292 | |
| DST Systems, Inc. | | | 1,067 | | | | 89,543 | |
| Fiserv, Inc. (a) | | | 1,793 | | | | 115,891 | |
| Global Payments, Inc. | | | 1,003 | | | | 70,090 | |
| International Business Machines Corp. | | | 726 | | | | 137,817 | |
| MasterCard, Inc. - Class A | | | 1,985 | | | | 146,731 | |
| Sapient Corp. (a) | | | 4,823 | | | | 67,522 | |
| Visa, Inc. - Class A | | | 704 | | | | 150,212 | |
| Western Union Co. | | | 3,052 | | | | 48,954 | |
| | | | | | | | 1,219,501 | |
| | | | | | | | | |
| Multiline Retail - 5.22% | | | | | | | | |
| Dillard’s, Inc. - Class A | | | 1,682 | | | | 183,304 | |
| Kohl’s Corp. | | | 3,690 | | | | 225,201 | |
| Macy’s, Inc. | | | 3,666 | | | | 213,288 | |
| Nordstrom, Inc. | | | 2,347 | | | | 160,464 | |
| | | | | | | | 782,257 | |
| | | | | |
| Oil, Gas & Consumable Fuels - 11.50% | | | | |
| BP PLC - ADR | | | 1,473 | | | | 64,738 | |
| Chevron Corp. | | | 598 | | | | 71,353 | |
| China Petroleum & Chemical Corp. - ADR | | | 1,473 | | | | 128,681 | |
| CVR Energy, Inc. | | | 1,473 | | | | 65,887 | |
| Green Plains, Inc. | | | 2,134 | | | | 79,790 | |
| Hess Corp. | | | 1,409 | | | | 132,897 | |
| HollyFrontier Corp. | | | 1,430 | | | | 62,462 | |
| Marathon Petroleum Corp. | | | 1,451 | | | | 122,856 | |
| PBF Energy, Inc. - Class A | | | 2,006 | | | | 48,144 | |
| PetroChina Co., Ltd. - ADR | | | 619 | | | | 79,548 | |
| Petroleo Brasileiro SA - ADR | | | 5,250 | | | | 74,498 | |
| Phillips 66 | | | 1,601 | | | | 130,177 | |
| REX American Resources Corp. (a) | | | 662 | | | | 48,247 | |
| Sasol, Ltd. - ADR | | | 2,326 | | | | 126,744 | |
| Statoil ASA - ADR | | | 4,567 | | | | 124,040 | |
| Suncor Energy, Inc. (b) | | | 3,351 | | | | 121,139 | |
| Total SA - ADR | | | 1,067 | | | | 68,768 | |
| Valero Energy Corp. | | | 2,348 | | | | 108,642 | |
| Western Refining, Inc. | | | 1,515 | | | | 63,615 | |
| | | | | | | | 1,722,226 | |
| | | | | | | | | |
Semiconductors & Semiconductor Equipment - 6.68% | | | | | | | | |
Advanced Semiconductor Engineering, Inc. - ADR | | | 4,759 | | | | 28,126 | |
| ChipMOS TECHNOLOGIES Bermuda, Ltd. (b) | | | 1,302 | | | | 29,451 | |
| Cirrus Logic, Inc. (a) | | | 3,585 | | | | 74,747 | |
| First Solar, Inc. (a) | | | 1,110 | | | | 73,049 | |
| Integrated Device Technology, Inc. | | | 5,143 | | | | 82,031 | |
| Integrated Silicon Solution, Inc. | | | 1,067 | | | | 14,661 | |
| Intel Corp. | | | 2,497 | | | | 86,945 | |
| Lattice Semiconductor Corp. (a) | | | 4,400 | | | | 33,000 | |
| 74 | The Leuthold Funds - 2014 Annual Report | See Notes to the Financial Statements. |
| Leuthold Select Industries Fund |
| Schedule of Investments (continued) |
| September 30, 2014 |
| | | Shares | | | Fair Value | |
| COMMON STOCKS - 99.32% (continued) | |
| | | | | | | |
Semiconductors & Semiconductor Equipment - 6.68% (continued) | | | | |
| Magnachip Semiconductor Corp. (a)(b) | | | 1,686 | | | $ | 19,726 | |
| Marvell Technology Group, Ltd. (b) | | | 5,357 | | | | 72,212 | |
| Micron Technology, Inc. (a) | | | 3,329 | | | | 114,052 | |
| NVIDIA Corp. | | | 4,162 | | | | 76,789 | |
| ON Semiconductor Corp. (a) | | | 6,787 | | | | 60,676 | |
| Silicon Image, Inc. (a) | | | 3,052 | | | | 15,382 | |
| Silicon Motion Technology Corp. - ADR | | | 1,665 | | | | 44,855 | |
| Siliconware Precision Industries Co. - ADR | | | 4,412 | | | | 30,090 | |
| Taiwan Semiconductor Manufacturing Co., Ltd. - ADR | | | 3,692 | | | | 74,505 | |
| Xilinx, Inc. | | | 1,643 | | | | 69,581 | |
| | | | | | | | 999,878 | |
| | | | | | | | | |
| Software - 1.48% | | | | | | | | |
| Microsoft Corp. | | | 4,781 | | | | 221,647 | |
| | | | | | | | | |
| Specialty Retail - 8.52% | | | | | | | | |
| Advance Auto Parts, Inc. | | | 1,259 | | | | 164,048 | |
| Asbury Automotive Group, Inc. (a) | | | 3,009 | | | | 193,840 | |
| AutoNation, Inc. (a) | | | 2,156 | | | | 108,468 | |
| AutoZone, Inc. (a) | | | 276 | | | | 140,666 | |
| CarMax, Inc. (a) | | | 2,582 | | | | 119,934 | |
| Group 1 Automotive, Inc. | | | 1,195 | | | | 86,888 | |
| Lithia Motors, Inc. - Class A | | | 2,668 | | | | 201,941 | |
| O’Reilly Automotive, Inc. (a) | | | 982 | | | | 147,654 | |
| Penske Automotive Group, Inc. | | | 2,774 | | | | 112,597 | |
| | | | | | | | 1,276,036 | |
| | | | | |
Technology Hardware, Storage & Peripherals - 7.50% | | | | |
| Apple, Inc. | | | 1,935 | | | | 194,951 | |
| Hewlett-Packard Co. | | | 4,567 | | | | 161,991 | |
| Lexmark International, Inc. - Class A | | | 4,098 | | | | 174,165 | |
| QLogic Corp. (a) | | | 5,848 | | | | 53,568 | |
| SanDisk Corp. | | | 2,027 | | | | 198,545 | |
| Seagate Technology PLC (b) | | | 2,732 | | | | 156,462 | |
| Western Digital Corp. | | | 1,878 | | | | 182,767 | |
| | | | | | | | 1,122,449 | |
| | | | | | | | | |
| Water Utilities - 2.76% | | | | | | | | |
| American States Water Co. | | | 1,195 | | | | 36,352 | |
| American Water Works Co., Inc. | | | 3,180 | | | | 153,371 | |
| Aqua America, Inc. | | | 3,031 | | | | 71,319 | |
| California Water Service Group | | | 1,665 | | | | 37,363 | |
| Cia de Saneamento Basico do Estado de Sao Paulo - ADR | | | 14,235 | | | | 115,446 | |
| | | | | | | | 413,851 | |
| | | | | | | | | |
TOTAL COMMON STOCKS
(Cost $12,427,542) | | | | | | $ | 14,875,558 | |
| | | | | | | | | |
| PREFERRED STOCKS - 0.33% | | | | | |
| | | | | | | | | |
| Chemicals - 0.33% | | | | | | | | |
| Braskem SA - ADR | | | 3,799 | | | $ | 50,033 | |
TOTAL PREFERRED STOCKS
(Cost $48,449) | | | | | | $ | 50,033 | |
| See Notes to the Financial Statements. | The Leuthold Funds - 2014 Annual Report | 75 |
| Leuthold Select Industries Fund | |
Schedule of Investments (continued)
September 30, 2014 | |
| | |
| | | Shares | | | Fair Value | |
| SHORT-TERM INVESTMENTS - 0.48% | |
| | | | | | | |
| Money Market Funds - 0.48% | | | | |
| Fidelity Institutional Money Market Funds - Government Portfolio, 0.01% (c) | | | 72,024 | | | $ | 72,024 | |
TOTAL SHORT-TERM INVESTMENTS
(Cost $72,024) | | | | | | $ | 72,024 | |
| | | | | | | | | |
Total Investments
(Cost $12,548,015) - 100.13% | | | $ | 14,997,615 | |
| Liabilities in Excess of Other Assets - (0.13)% | | | | | | | (20,164 | ) |
| TOTAL NET ASSETS - 100.00% | | | $ | 14,977,451 | |
Percentages are stated as a percent of net assets.
ADR American Depositary Receipt
(a) Non-income producing security.
(b) Foreign issued security.
(c) The rate quoted is the annualized seven-day yield as of September 30, 2014.
The Global Industry Classification Standard (GICS®) was developed by and/or is the exclusive property of MSCI, Inc. and Standard & Poor’s Financial Services LLC (“S&P”). GICS® is a service mark of MSCI, Inc. and S&P and has been licensed for use by U.S. Bancorp Fund Services, LLC.
| 76 | The Leuthold Funds - 2014 Annual Report | See Notes to the Financial Statements. |
| Leuthold Global Industries Fund |
| Schedule of Investments |
| September 30, 2014 |
| | | Shares | | | Fair Value | |
| COMMON STOCKS - 97.25% | | | | |
| | | | | | | |
| Airlines - 5.04% | | | | | | |
| Alaska Air Group, Inc. | | | 4,970 | | | $ | 216,394 | |
| American Airlines Group, Inc. | | | 7,732 | | | | 274,331 | |
| Copa Holdings SA - Class A (b) | | | 929 | | | | 99,673 | |
| Delta Air Lines, Inc. | | | 13,192 | | | | 476,891 | |
| JetBlue Airways Corp. (a) | | | 33,326 | | | | 353,922 | |
| | | | | | | | 1,421,211 | |
| | | | | | | | | |
| Auto Components - 7.91% | | | | | | | | |
| Brembo SpA (b) | | | 4,449 | | | | 145,343 | |
| Calsonic Kansei Corp. (b) | | | 28,000 | | | | 152,327 | |
| Cie Generale des Etablissements Michelin (b) | | | 2,433 | | | | 229,167 | |
| Continental AG (b) | | | 1,175 | | | | 222,578 | |
| GKN PLC (b) | | | 26,767 | | | | 137,838 | |
| Lear Corp. | | | 2,674 | | | | 231,060 | |
| Leoni AG (b) | | | 2,433 | | | | 132,057 | |
| Magna International, Inc. (b) | | | 3,125 | | | | 296,594 | |
| Pirelli & C. SpA (b) | | | 11,031 | | | | 152,108 | |
| Plastic Omnium SA (b) | | | 5,175 | | | | 123,566 | |
| Showa Corp. (b) | | | 10,500 | | | | 115,005 | |
| Sumitomo Rubber Industries, Ltd. (b) | | | 7,500 | | | | 106,688 | |
| Visteon Corp. (a) | | | 1,933 | | | | 187,984 | |
| | | | | | | | 2,232,315 | |
| | | | | | | | | |
| Automobiles - 3.65% | | | | | | | | |
| Daihatsu Motor Co., Ltd. (b) | | | 3,000 | | | | 47,605 | |
| Ford Motor Co. | | | 12,609 | | | | 186,487 | |
| Geely Automobile Holdings, Ltd. (b) | | | 115,000 | | | | 48,095 | |
| Hyundai Motor Co. (b) | | | 695 | | | | 125,220 | |
| Kia Motors Corp. (b) | | | 2,762 | | | | 140,279 | |
| Nissan Motor Co., Ltd. (b) | | | 13,100 | | | | 126,810 | |
| Tata Motors, Ltd. - ADR | | | 3,781 | | | | 165,268 | |
| Thor Industries, Inc. | | | 1,473 | | | | 75,860 | |
| Volkswagen AG (b) | | | 556 | | | | 114,881 | |
| | | | | | | | 1,030,505 | |
| | | | | | | |
| Banks - 5.98% | | | | | | |
| AMMB Holdings Bhd (b) | | | 82,600 | | | | 172,931 | |
| Banco Do Brasil SA (b) | | | 14,100 | | | | 146,660 | |
| Bank Negara Indonesia Persero Tbk PT (b) | | | 415,300 | | | | 187,664 | |
| China CITIC Bank Corp., Ltd. (b) | | | 252,000 | | | | 152,673 | |
| Grupo Financiero Santander Mexico SBA de CV - Class B - ADR | | | 14,219 | | | | 192,383 | |
| Krung Thai Bank PCL - NVDR | | | 296,600 | | | | 216,210 | |
| Powszechna Kasa Oszczednosci Bank Polski SA (b) | | | 15,248 | | | | 182,130 | |
| State Bank of India - GDR | | | 1,807 | | | | 142,245 | |
| Thanachart Capital PCL - NVDR | | | 79,900 | | | | 91,551 | |
| Turkiye Is Bankasi (b) | | | 90,735 | | | | 201,638 | |
| | | | | | | | 1,686,085 | |
| | | | | | | | | |
| Electric Utilities - 4.50% | | | | | | | | |
| CEZ AS (b) | | | 10,196 | | | | 309,969 | |
| EDP - Energias do Brasil SA (b) | | | 33,400 | | | | 135,497 | |
| Enersis SA - ADR | | | 8,948 | | | | 141,199 | |
| Light SA (b) | | | 18,600 | | | | 159,575 | |
| Manila Electric Co. (b) | | | 14,910 | | | | 84,410 | |
| PGE SA (b) | | | 22,610 | | | | 142,844 | |
| Tauron Polska Energia SA (b) | | | 86,012 | | | | 139,164 | |
| Tenaga Nasional Bhd (b) | | | 41,800 | | | | 157,847 | |
| | | | | | | | 1,270,505 | |
| | | | | | | | | |
Electronic Equipment, Instruments & Components - 7.65% | | | | | |
| Arrow Electronics, Inc. (a) | | | 3,409 | | | | 188,688 | |
| Avnet, Inc. | | | 4,010 | | | | 166,415 | |
| Benchmark Electronics, Inc. (a) | | | 5,846 | | | | 129,840 | |
| Celestica, Inc. (a)(b) | | | 14,344 | | | | 145,592 | |
| Daeduck GDS Co., Ltd. (b) | | | 5,090 | | | | 58,308 | |
| See Notes to the Financial Statements. | The Leuthold Funds - 2014 Annual Report | 77 |
| Leuthold Global Industries Fund |
| Schedule of Investments (continued) |
| September 30, 2014 |
| | | Shares | | | Fair Value | |
| COMMON STOCKS - 97.25% (continued) | |
| | | | | | | |
Electronic Equipment, Instruments & Components - 7.65% (continued) | | | | |
| Delta Electronics Thailand PCL - NVDR | | | 53,200 | | | $ | 101,470 | |
| Hexagon AB - Class B (b) | | | 5,939 | | | | 187,794 | |
| Hon Hai Precision Industry Co., Ltd. (b) | | | 89,488 | | | | 281,864 | |
| Jabil Circuit, Inc. | | | 7,033 | | | | 141,856 | |
| Oki Electric Industry Co., Ltd. (b) | | | 60,000 | | | | 140,397 | |
| Plexus Corp. (a) | | | 3,381 | | | | 124,860 | |
| Sanmina Corp. (a) | | | 8,207 | | | | 171,198 | |
| SYNNEX Corp. (a) | | | 2,641 | | | | 170,688 | |
| Tech Data Corp. (a) | | | 2,504 | | | | 147,385 | |
| | | | | | | | 2,156,355 | |
| | | | | | | | | |
| Gas Utilities - 3.30% | | | | | | | | |
| AGL Resources, Inc. | | | 2,849 | | | | 146,268 | |
| Atmos Energy Corp. | | | 2,958 | | | | 141,097 | |
| Gas Natural SDG SA (b) | | | 4,971 | | | | 146,231 | |
| New Jersey Resource Corp. | | | 2,699 | | | | 136,326 | |
| Tokyo Gas Co., Ltd. (b) | | | 25,000 | | | | 140,478 | |
| Towngas China Co., Ltd. (b) | | | 66,000 | | | | 70,700 | |
| UGI Corp. | | | 4,354 | | | | 148,428 | |
| | | | | | | | 929,528 | |
| | | | | | | | | |
| Health Care Providers & Services - 6.79% | |
| Aetna, Inc. | | | 3,144 | | | | 254,664 | |
| Centene Corp. (a) | | | 2,477 | | | | 204,873 | |
| Health Net, Inc. (a) | | | 4,923 | | | | 227,000 | |
| Humana, Inc. | | | 2,138 | | | | 278,560 | |
| Magellan Health, Inc. (a) | | | 2,429 | | | | 132,939 | |
| Rhoen-Klinikum AG (b) | | | 4,814 | | | | 145,709 | |
| UnitedHealth Group, Inc. | | | 2,945 | | | | 254,006 | |
| WellCare Health Plans, Inc. (a) | | | 2,128 | | | | 128,403 | |
| WellPoint, Inc. | | | 2,416 | | | | 289,002 | |
| | | | | | | | 1,915,156 | |
| | | | | | | | | |
| Household Durables - 2.21% | | | | | | | | |
| Alpine Electronics, Inc. (b) | | | 5,600 | | | | 92,464 | |
| Helen of Troy, Ltd. (a)(b) | | | 2,919 | | | | 153,306 | |
| Pioneer Corp. (b) | | | 31,700 | | | | 87,152 | |
| Whirlpool Corp. | | | 1,995 | | | | 290,572 | |
| | | | | | | | 623,494 | |
| | | | | | | | | |
| Insurance - 11.72% | | | | | | | | |
| American International Group, Inc. | | | 5,526 | | | | 298,515 | |
| Assurant, Inc. | | | 2,509 | | | | 161,329 | |
| Baloise Holding AG (b) | | | 1,937 | | | | 247,610 | |
| Everest Re Group, Ltd. (b) | | | 1,713 | | | | 277,523 | |
| Genworth Financial, Inc. - Class A (a) | | | 16,914 | | | | 221,573 | |
| Gjensidige Forsikring ASA (b) | | | 6,725 | | | | 142,251 | |
| Helvetia Holding AG (b) | | | 281 | | | | 136,068 | |
| Kemper Corp. | | | 2,856 | | | | 97,532 | |
| Liberty Holdings, Ltd. (b) | | | 8,047 | | | | 87,799 | |
| Mapfre SA (b) | | | 67,547 | | | | 238,735 | |
| Muenchener Rueckversicherungs AG (b) | | | 1,285 | | | | 253,490 | |
| PartnerRe, Ltd. (b) | | | 2,384 | | | | 261,978 | |
| Porto Seguro SA (b) | | | 9,700 | | | | 112,941 | |
| SCOR SE (b) | | | 7,276 | | | | 227,251 | |
| Swiss Re AG (b) | | | 2,911 | | | | 231,664 | |
| Talanx AG (b) | | | 3,425 | | | | 113,762 | |
| Unum Group | | | 5,647 | | | | 194,144 | |
| | | | | | | | 3,304,165 | |
| 78 | The Leuthold Funds - 2014 Annual Report | See Notes to the Financial Statements. |
| Leuthold Global Industries Fund |
| Schedule of Investments (continued) |
| September 30, 2014 |
| | | Shares | | | Fair Value | |
| COMMON STOCKS - 97.25% (continued) | |
| | | | | | | |
| Oil, Gas & Consumable Fuels - 6.70% | | | | |
| AWE, Ltd. (a)(b) | | | 77,201 | | | $ | 123,852 | |
| BP PLC - ADR | | | 4,609 | | | | 202,566 | |
| Chevron Corp. | | | 1,749 | | | | 208,691 | |
| China Petroleum & Chemical Corp. - ADR | | | 2,065 | | | | 180,398 | |
| Hess Corp. | | | 1,971 | | | | 185,905 | |
| Husky Energy, Inc. (b) | | | 7,515 | | | | 206,269 | |
| Imperial Oil Ltd (b) | | | 4,384 | | | | 207,012 | |
| Statoil ASA - ADR | | | 7,897 | | | | 214,483 | |
| Suncor Energy, Inc. (b) | | | 5,628 | | | | 203,452 | |
| Valero Energy Corp. | | | 3,383 | | | | 156,531 | |
| | | | | | | | 1,889,159 | |
| | | | | | | | | |
| | | | | | | | | |
| Paper & Forest Products - 0.23% | | | | | |
| China Forestry Holdings Co., Ltd. (a)(b)(c)(d) | | | 116,000 | | | | 2,241 | |
| Resolute Forest Products, Inc. (a)(b) | | | 4,024 | | | | 62,935 | |
| | | | | | | | 65,176 | |
| | | | | | | | | |
| Real Estate Management & Development - 4.11% | | | | | | | | |
| AP Thailand PCL - NVDR | | | 264,200 | | | | 58,567 | |
| Brookfield Property Partners LP | | | 4,841 | | | | 102,000 | |
| Daiwa House Industry Co., Ltd. (b) | | | 8,000 | | | | 143,719 | |
| Deutsche Euroshop AG (b) | | | 1,379 | | | | 59,585 | |
| Jones Lang Lasalle, Inc. | | | 1,143 | | | | 144,407 | |
| Keppel Land, Ltd. (b) | | | 34,000 | | | | 93,218 | |
| Kerry Properties, Ltd. (b) | | | 27,000 | | | | 90,517 | |
| Megaworld Corp. (b) | | | 611,000 | | | | 68,397 | |
| Pruksa Real Estate PCL - NVDR | | | 74,500 | | | | 78,529 | |
| Realogy Holdings Corp. (a) | | | 2,254 | | | | 83,849 | |
| Soho China, Ltd. (b) | | | 79,000 | | | | 57,143 | |
| The St. Joe Co., Ltd. (a) | | | 5,804 | | | | 115,674 | |
| Takara Leben Co., Ltd. (b) | | | 17,200 | | | | 64,018 | |
| | | | | | | | 1,159,623 | |
| | | | | | | | | |
| Road & Rail - 6.93% | | | | | | | | |
| AMERCO | | | 652 | | | | 170,752 | |
| Canadian National Railway Co. (b) | | | 2,925 | | | | 207,658 | |
| Central Japan Railway Co. (b) | | | 1,500 | | | | 202,333 | |
| Con-way, Inc. | | | 3,499 | | | | 166,203 | |
| Keisei Electric Railway Co., Ltd. (b) | | | 12,000 | | | | 120,484 | |
| Norfolk Southern Corp. | | | 1,838 | | | | 205,121 | |
| Ryder System, Inc. | | | 1,926 | | | | 173,282 | |
| Sankyu, Inc. (b) | | | 16,000 | | | | 85,509 | |
| Seino Holdings Co., Ltd. (b) | | | 10,000 | | | | 80,163 | |
| Union Pacific Corp. | | | 2,370 | | | | 256,955 | |
| Werner Enterprises, Inc. | | | 4,643 | | | | 117,004 | |
| West Japan Railway Co. (b) | | | 3,800 | | | | 170,061 | |
| | | | | | | | 1,955,525 | |
| | | | | | | | | |
Semiconductors & Semiconductor Equipment - 7.43% | | | | | | | | |
| A-DATA Technology Co., Ltd. (b) | | | 34,249 | | | | 71,348 | |
| Advanced Semiconductor Engineering, Inc. - ADR | | | 23,097 | | | | 136,503 | |
| ChipMOS TECHNOLOGIES Bermuda, Ltd. (b) | | | 3,944 | | | | 89,213 | |
| Cirrus Logic, Inc. (a) | | | 4,624 | | | | 96,410 | |
| CSR PLC (b) | | | 8,281 | | | | 101,517 | |
| First Solar, Inc. (a) | | | 2,420 | | | | 159,260 | |
| Iljin Display Co., Ltd. (b) | | | 4,550 | | | | 35,089 | |
| Intel Corp. | | | 9,664 | | | | 336,501 | |
| Magnachip Semiconductor Corp. (a)(b) | | | 4,242 | | | | 49,631 | |
| Marvell Technology Group, Ltd. (b) | | | 13,156 | | | | 177,343 | |
| See Notes to the Financial Statements. | The Leuthold Funds - 2014 Annual Report | 79 |
| Leuthold Global Industries Fund |
| Schedule of Investments (continued) |
| September 30, 2014 |
| | | Shares | | | Fair Value | |
| COMMON STOCKS - 97.25% (continued) | |
| | | | | | | |
Semiconductors & Semiconductor Equipment - 7.43% (continued) | | | | |
| NVIDIA Corp. | | | 11,760 | | | $ | 216,972 | |
| Radiant Opto-Electronics Corp. (b) | | | 15,210 | | | | 60,166 | |
| Realtek Semiconductor Corp. (b) | | | 24,100 | | | | 85,582 | |
| Shindengen Electric Manufacturing Co., Ltd. (b) | | | 14,000 | | | | 95,562 | |
| Sigurd Microelectronics Corp. (b) | | | 62,000 | | | | 62,242 | |
| Silicon Works Co., Ltd. (b) | | | 4,147 | | | | 90,320 | |
| Skyworks Solutions, Inc. | | | 3,996 | | | | 231,968 | |
| | | | | | | | 2,095,627 | |
| | | | | | | | | |
| Technology Hardware, Storage & Peripherals - 12.58% | | | | | |
| Apple, Inc. | | | 3,474 | | | | 350,005 | |
| Asustek Computer, Inc. (b) | | | 18,000 | | | | 171,763 | |
| Eizo Corp. (b) | | | 8,000 | | | | 184,502 | |
| FUJIFILM Holdings Corp. (b) | | | 10,600 | | | | 325,707 | |
| Hewlett-Packard Co. | | | 6,276 | | | | 222,610 | |
| Lenovo Group, Ltd. (b) | | | 144,000 | | | | 214,487 | |
| Lexmark International, Inc. - Class A | | | 3,604 | | | | 153,170 | |
| NCR Corp. (a) | | | 8,118 | | | | 271,222 | |
| Pegatron Corp. (b) | | | 115,000 | | | | 211,391 | |
| Ricoh Co., Ltd. (b) | | | 24,000 | | | | 257,840 | |
| Samsung Electronics Co., Ltd. (b) | | | 189 | | | | 211,681 | |
| SanDisk Corp. | | | 3,866 | | | | 378,675 | |
| Seiko Epson Corp. (b) | | | 7,200 | | | | 346,917 | |
| Western Digital Corp. | | | 2,557 | | | | 248,847 | |
| | | | | | | | 3,548,817 | |
| | | | | | | | | |
| Water Utilities - 0.52% | | | | | | | | |
| Guangdong Investment, Ltd. (b) | | | 126,000 | | | | 147,293 | |
TOTAL COMMON STOCKS
(Cost $24,868,972) | | | | | | $ | 27,430,539 | |
| | | | | | | |
| PREFERRED STOCKS - 1.95% | | | | |
| | | | | | | |
| Automobiles - 0.63% | | | | | | |
| Porsche Automobile Holding SE (b) | | | 2,208 | | | $ | 176,139 | |
| | | | | | | | | |
| Banks - 0.34% | | | | | | | | |
| Banco do Estado do Rio Grande do Sul SA (b) | | | 16,200 | | | | 96,958 | |
| | | | | | | | | |
| Electric Utilities - 0.98% | | | | | | | | |
| Cia Energetica de Minas Gerais - ADR | | | 20,618 | | | | 128,450 | |
| Companhia Paranaense de Energia - ADR | | | 10,876 | | | | 148,675 | |
| | | | | | | | 277,125 | |
| | | | | | | | | |
TOTAL PREFERRED STOCKS
(Cost $505,359) | | | | | | $ | 550,222 | |
| | | | | | | | | |
Total Investments
(Cost $25,374,331) - 99.20% | | | $ | 27,980,761 | |
| Other Assets in Excess of Liabilities - 0.80% | | | | | | | 224,295 | |
| TOTAL NET ASSETS - 100.00% | | | $ | 28,205,056 | |
Percentages are stated as a percent of net assets.
ADR American Depositary Receipt
GDR Global Depositary Receipt
NVDR Non-Voting Depositary Receipt
(a) Non-income producing security.
(b) Foreign issued security.
(c) Illiquid Security. The fair value of these securities total $2,241 which represents 0.01% of total net assets.
(d) The security is currently being fair valued in accordance with procedures established by the Board of Directors of the Leuthold Funds due to a halt in trading of the security on January 26, 2011.
The Global Industry Classification Standard (GICS®) was developed by and/or is the exclusive property of MSCI, Inc. and Standard & Poor’s Financial Services LLC (“S&P”). GICS® is a service mark of MSCI, Inc. and S&P and has been licensed for use by U.S. Bancorp Fund Services, LLC.
| 80 | The Leuthold Funds - 2014 Annual Report | See Notes to the Financial Statements. |
| Leuthold Global Industries Fund |
| Schedule of Investments (continued) |
| September 30, 2014 |
| | | | | | Percentage | |
| | | Fair | | | of Total | |
| | | Value | | | Investments | |
| CURRENCY EXPOSURE | | | | | | |
| September 30, 2014 | | | | | | |
| Australian Dollar | | $ | 123,852 | | | | 0.44 | % |
| Brazilian Real | | | 651,630 | | | | 2.33 | |
| British Pound | | | 239,356 | | | | 0.86 | |
| Canadian Dollar | | | 413,927 | | | | 1.48 | |
| Czech Koruna | | | 309,969 | | | | 1.11 | |
| Euro | | | 2,480,603 | | | | 8.87 | |
| Hong Kong Dollar | | | 783,149 | | | | 2.80 | |
| Indonesian Rupiah | | | 187,664 | | | | 0.67 | |
| Japanese Yen | | | 3,085,741 | | | | 11.02 | |
| Malaysian Ringgit | | | 330,778 | | | | 1.18 | |
| New Taiwan Dollar | | | 944,355 | | | | 3.37 | |
| New Turkish Lira | | | 201,638 | | | | 0.72 | |
| Norwegian Krone | | | 142,251 | | | | 0.51 | |
| Philippine Peso | | | 152,807 | | | | 0.55 | |
| Polish Zloty | | | 464,138 | | | | 1.66 | |
| Singapore Dollar | | | 93,218 | | | | 0.33 | |
| South African Rand | | | 87,799 | | | | 0.31 | |
| South Korea Won | | | 660,898 | | | | 2.36 | |
| Swedish Krona | | | 187,794 | | | | 0.67 | |
| Swiss Franc | | | 615,342 | | | | 2.20 | |
| Thai Baht | | | 546,327 | | | | 1.95 | |
| US Dollar | | | 15,277,524 | | | | 54.61 | |
| Total Investments | | $ | 27,980,760 | | | | 100.00 | % |
| | | | | | Percentage | |
| | | Fair | | | of Total | |
| | | Value | | | Investments | |
| PORTFOLIO DIVERSIFICATION | | | | |
| September 30, 2014 | | | | | | |
| Australia | | $ | 123,852 | | | | 0.44 | % |
| Brazil | | | 928,756 | | | | 3.32 | |
| Canada | | | 1,329,512 | | | | 4.75 | |
| Chile | | | 141,199 | | | | 0.51 | |
| China | | | 655,037 | | | | 2.34 | |
| Czech Republic | | | 309,969 | | | | 1.11 | |
| France | | | 579,984 | | | | 2.07 | |
| Germany | | | 1,218,201 | | | | 4.36 | |
| Hong Kong | | | 308,510 | | | | 1.10 | |
| India | | | 307,513 | | | | 1.10 | |
| Indonesia | | | 187,664 | | | | 0.67 | |
| Italy | | | 297,451 | | | | 1.06 | |
| Japan | | | 3,085,741 | | | | 11.03 | |
| Malaysia | | | 330,778 | | | | 1.18 | |
| Mexico | | | 192,383 | | | | 0.69 | |
| Norway | | | 356,734 | | | | 1.28 | |
| Panama | | | 99,673 | | | | 0.36 | |
| Philippines | | | 152,807 | | | | 0.55 | |
| Poland | | | 464,138 | | | | 1.66 | |
| Singapore | | | 93,218 | | | | 0.33 | |
| South Africa | | | 87,799 | | | | 0.31 | |
| South Korea | | | 710,528 | | | | 2.54 | |
| Spain | | | 384,966 | | | | 1.37 | |
| Sweden | | | 187,794 | | | | 0.67 | |
| Switzerland | | | 615,342 | | | | 2.20 | |
| Taiwan | | | 1,170,072 | | | | 4.18 | |
| Thailand | | | 546,327 | | | | 1.95 | |
| Turkey | | | 201,638 | | | | 0.72 | |
| United Kingdom | | | 441,921 | | | | 1.58 | |
| United States | | | 12,471,253 | | | | 44.57 | |
| Total Investments | | $ | 27,980,760 | | | | 100.00 | % |
| See Notes to the Financial Statements. | The Leuthold Funds - 2014 Annual Report | 81 |
| Grizzly Short Fund |
Schedule of Investments September 30, 2014 |
| | | | | | | | | |
| | | Shares | | | Fair Value | |
| SHORT-TERM INVESTMENTS - 1.64% | | | | | | |
| | | | | | | |
| Money Market Funds - 1.64% | | | | | | |
| Fidelity Institutional Money Market Funds - Government Portfolio, 0.01% (a) | | | 1,183,717 | | | $ | 1,183,717 | |
TOTAL SHORT-TERM INVESTMENTS
(Cost $1,183,717) | | | | | | $ | 1,183,717 | |
| | | | | | | | | |
Total Investments
(Cost $1,183,717) - 1.64% | | | | | | $ | 1,183,717 | |
| Other Assets in Excess of Liabilities - 98.36% (b) | | | | | | | 70,998,490 | |
| TOTAL NET ASSETS - 100.00% | | | | | | $ | 72,182,207 | |
| Percentages are stated as a percent of net assets. |
| (a) | The rate quoted is the annualized seven-day yield as of September 30, 2014. |
| (b) | All or a portion of the assets have been committed as collateral for open securities sold short. |
The Global Industry Classification Standard (GICS®) was developed by and/or is the exclusive property of MSCI, Inc. and Standard & Poor’s Financial Services LLC (“S&P”). GICS® is a service mark of MSCI, Inc. and S&P and has been licensed for use by U.S. Bancorp Fund Services, LLC.
| 82 | The Leuthold Funds - 2014 Annual Report | See Notes to the Financial Statements. |
|
Schedule of Securities Sold Short - (a) |
| | | | | | | | | |
| | | Shares | | | Fair Value | |
| COMMON STOCKS - 90.16% | | | | | | |
| | | | | | | |
| Aerospace & Defense - 1.10% | | | | | | |
| DigitalGlobe, Inc. | | | 27,937 | | | $ | 796,205 | |
| | | | | | | | | |
| Air Freight & Logistics - 0.37% | | | | | | | | |
| UTi Worldwide, Inc. | | | 25,369 | | | | 269,673 | |
| | | | | | | | | |
| Airlines - 0.80% | | | | | | | | |
Latam Airlines Group SA - ADR | | | 50,782 | | | | 577,391 | |
| | | | | | | | | |
| Banks - 1.51% | | | | | | | | |
| First Horizon National Corp. | | | 88,503 | | | | 1,086,817 | |
| | | | | | | | | |
| Capital Markets - 3.92% | | | | | | | | |
| Credit Suisse Group AG - ADR | | | 38,075 | | | | 1,052,393 | |
| Deutsche Bank AG (b) | | | 29,929 | | | | 1,043,325 | |
| Greenhill & Co., Inc. | | | 15,850 | | | | 736,866 | |
| | | | | | | | 2,832,584 | |
| | | | | | | | | |
| Chemicals - 1.44% | | | | | | | | |
| Balchem Corp. | | | 6,331 | | | | 358,145 | |
| Chemtura Corp. | | | 13,946 | | | | 325,360 | |
| Intrepid Potash, Inc. | | | 23,244 | | | | 359,120 | |
| | | | | | | | 1,042,625 | |
| | | | | | | | | |
| Commercial Services & Supplies - 2.31% | | | | | | | | |
| Healthcare Services Group, Inc. | | | 12,839 | | | | 367,324 | |
| Waste Management, Inc. | | | 27,361 | | | | 1,300,468 | |
| | | | | | | | 1,667,792 | |
| | | | | | | | | |
| Communications Equipment - 2.20% | | | | | | | | |
| Aruba Networks, Inc. | | | 58,043 | | | | 1,252,568 | |
| ViaSat, Inc. | | | 6,110 | | | | 336,783 | |
| | | | | | | | 1,589,351 | |
| | | | | | | | | |
| Construction & Engineering - 0.98% | | | | | | | | |
| MasTec, Inc. | | | 23,044 | | | | 705,607 | |
| | | | | | | | | |
| Diversified Consumer Services - 1.26% | | | | | | | | |
| Sotheby’s | | | 25,457 | | | | 909,324 | |
| | | | | | | | | |
| Diversified Financial Services - 3.13% | | | | | | | | |
| CME Group, Inc. | | | 14,655 | | | | 1,171,740 | |
| Intercontinental Exchange, Inc. | | | 5,578 | | | | 1,087,989 | |
| | | | | | | | 2,259,729 | |
| | | | | | | | | |
| Electrical Equipment - 0.43% | | | | | | | | |
| Polypore International, Inc. | | | 7,925 | | | | 308,362 | |
| | | | | | | | | |
Electronic Equipment, Instruments & Components - 1.09% | | | | | | | | |
| Itron, Inc. | | | 19,967 | | | | 784,903 | |
| | | | | | | | | |
| Energy Equipment & Services - 1.30% | | | | | | | | |
| McDermott International, Inc. | | | 163,768 | | | | 936,753 | |
| | | | | | | | | |
| Food Products - 2.50% | | | | | | | | |
| Darling Ingredients, Inc. | | | 58,176 | | | | 1,065,784 | |
| Post Holdings, Inc. | | | 22,358 | | | | 741,839 | |
| | | | | | | | 1,807,623 | |
| | | | | | | | | |
| Gas Utilities - 0.47% | | | | | | | | |
| WGL Holdings, Inc. | | | 8,102 | | | | 341,256 | |
| | | | | | | | | |
| Health Care Equipment & Supplies - 3.81% | | | | | | | | |
| HeartWare International, Inc. | | | 8,235 | | | | 639,283 | |
| Insulet Corp. | | | 19,042 | | | | 701,698 | |
| Spectranetics Corp. | | | 40,422 | | | | 1,074,013 | |
| Wright Medical Group, Inc. | | | 11,068 | | | | 335,360 | |
| | | | | | | | 2,750,354 | |
| | | | | | | | | |
| Health Care Technology - 2.29% | | | | | | | | |
Allscripts Healthcare Solutions, Inc. | | | 45,071 | | | | 604,627 | |
| Medidata Solutions, Inc. | | | 23,686 | | | | 1,049,053 | |
| | | | | | | | 1,653,680 | |
| See Notes to the Financial Statements. | The Leuthold Funds - 2014 Annual Report | 83 |
|
Schedule of Securities Sold Short - (a) (continued) |
| | | | | | | | | |
| | | Shares | | | Fair Value | |
| COMMON STOCKS - 90.16% (continued) | | | | | | |
| | | | | | | |
| Hotels, Restaurants & Leisure - 6.10% | | | | | | |
| Bob Evans Farms, Inc. | | | 15,009 | | | $ | 710,526 | |
| Boyd Gaming Corp. | | | 28,379 | | | | 288,330 | |
| Darden Restaurants, Inc. | | | 21,211 | | | | 1,091,518 | |
| Dunkin’ Brands Group, Inc. | | | 22,063 | | | | 988,864 | |
| Pinnacle Entertainment, Inc. | | | 29,752 | | | | 746,478 | |
| Scientific Games Corp. - Class A | | | 53,615 | | | | 577,434 | |
| | | | | | | | 4,403,150 | |
| | | | | | | | | |
| Household Durables - 1.61% | | | | | | | | |
| Sony Corp. - ADR | | | 64,285 | | | | 1,159,701 | |
| | | | | | | | | |
Independent Power and Renewable Electricity Producers - 0.51% | | | | | | | | |
| Pattern Energy Group, Inc. | | | 11,785 | | | | 364,392 | |
| | | | | | | | | |
| Insurance - 0.99% | | | | | | | | |
| Willis Group Holdings PLC (b) | | | 17,294 | | | | 715,972 | |
| | | | | | | | | |
| Internet & Catalog Retail - 4.30% | | | | | | | | |
| Amazon.com, Inc. | | | 3,099 | | | | 999,242 | |
| Groupon, Inc. | | | 154,515 | | | | 1,032,160 | |
| HomeAway, Inc. | | | 30,239 | | | | 1,073,484 | |
| | | | | | | | 3,104,886 | |
| | | | | | | | | |
| Internet Software & Services - 5.28% | | | | | | | | |
| Cornerstone OnDemand, Inc. | | | 24,793 | | | | 853,127 | |
| CoStar Group, Inc. | | | 6,915 | | | | 1,075,559 | |
| Cvent, Inc. | | | 18,684 | | | | 474,013 | |
| LinkedIn Corp. - Class A | | | 5,105 | | | | 1,060,768 | |
| Shutterstock, Inc. | | | 4,905 | | | | 350,119 | |
| | | | | | | | 3,813,586 | |
| | | | | | | | | |
| IT Services - 0.48% | | | | | | | | |
| Cardtronics, Inc. | | | 9,917 | | | | 349,078 | |
| | | | | | | | | |
| Machinery - 2.46% | | | | | | | | |
| Navistar International Corp. | | | 26,299 | | | | 865,500 | |
| Proto Labs, Inc. | | | 13,149 | | | | 907,281 | |
| | | | | | | | 1,772,781 | |
| | | | | | | | | |
| Media - 3.24% | | | | | | | | |
DreamWorks Animation SKG, Inc. - Class A | | | 47,683 | | | | 1,300,316 | |
| Liberty Global PLC - Class A (b) | | | 24,395 | | | | 1,037,763 | |
| | | | | | | | 2,338,079 | |
| | | | | | | | | |
| Oil, Gas & Consumable Fuels - 6.40% | | | | | | | | |
| Alpha Natural Resources, Inc. | | | 176,785 | | | | 438,427 | |
| Antero Resources Corp. | | | 19,082 | | | | 1,047,411 | |
| Genesis Energy LP | | | 6,862 | | | | 361,216 | |
| PDC Energy, Inc. | | | 18,019 | | | | 906,175 | |
| Talisman Energy, Inc. (b) | | | 105,814 | | | | 915,291 | |
| WPX Energy, Inc. | | | 39,669 | | | | 954,436 | |
| | | | | | | | 4,622,956 | |
| | | | | | | | | |
| Paper & Forest Products - 1.43% | | | | | | | | |
| Louisiana-Pacific Corp. | | | 75,797 | | | | 1,030,081 | |
| | | | | | | | | |
| Personal Products - 1.35% | | | | | | | | |
| Avon Products, Inc. | | | 77,435 | | | | 975,681 | |
| | | | | | | | | |
| Professional Services - 0.75% | | | | | | | | |
| Advisory Board Co. | | | 11,644 | | | | 542,494 | |
| | | | | | | | | |
| Real Estate Investment Trusts (REITs) - 7.72% | | | | | | | | |
| CBL & Associates Properties, Inc. | | | 63,002 | | | | 1,127,736 | |
| Crown Castle International Corp. | | | 16,248 | | | | 1,308,451 | |
| Liberty Property Trust | | | 20,189 | | | | 671,486 | |
| Mack-Cali Realty Corp. | | | 16,780 | | | | 320,666 | |
| National Retail Properties, Inc. | | | 32,143 | | | | 1,111,184 | |
| Plum Creek Timber Co., Inc. | | | 26,387 | | | | 1,029,357 | |
| | | | | | | | 5,568,880 | |
| 84 | The Leuthold Funds - 2014 Annual Report | See Notes to the Financial Statements. |
|
Schedule of Securities Sold Short - (a) (continued) |
| | | | | | | | | |
| | | Shares | | | Fair Value | |
| COMMON STOCKS - 90.16% (continued) | | | | | | |
| | | | | | | |
Real Estate Management & Development - 0.51% | | | | | | |
| Alexander & Baldwin, Inc. | | | 10,183 | | | $ | 366,283 | |
| | | | | | | | | |
| Software - 8.33% | | | | | | | | |
| Advent Software, Inc. | | | 13,326 | | | | 420,569 | |
| Guidewire Software, Inc. | | | 16,824 | | | | 745,976 | |
| NetSuite, Inc. | | | 12,707 | | | | 1,137,785 | |
| Proofpoint, Inc. | | | 9,652 | | | | 358,475 | |
| RealPage, Inc. | | | 17,665 | | | | 273,807 | |
| Salesforce.com, Inc. | | | 18,766 | | | | 1,079,608 | |
| ServiceNow, Inc. | | | 17,760 | | | | 1,043,933 | |
| Workday, Inc. - Class A | | | 11,555 | | | | 953,288 | |
| | | | | | | | 6,013,441 | |
| | | | | | | | | |
| Specialty Retail - 6.07% | | | | | | | | |
| Abercrombie & Fitch Co. - Class A | | | 27,538 | | | | 1,000,731 | |
| Cabelas, Inc. | | | 17,621 | | | | 1,037,877 | |
| Five Below, Inc. | | | 29,973 | | | | 1,187,230 | |
| Office Depot, Inc. | | | 224,114 | | | | 1,151,946 | |
| | | | | | | | 4,377,784 | |
| | | | | | | | | |
| Thrifts & Mortgage Finance - 0.49% | | | | | | | | |
| Capitol Federal Financial, Inc. | | | 29,929 | | | | 353,761 | |
| | | | | | | | | |
| Wireless Telecommunication Services - 1.23% | | | | | | | | |
| Sprint Corp. | | | 139,595 | | | | 885,032 | |
TOTAL COMMON STOCKS
(Proceeds $68,914,941) | | | | | | $ | 65,078,047 | |
| | | | | | | | | |
| INVESTMENT COMPANIES - 3.86% | | | | | | | | |
| | | | | | | | | |
| Exchange Traded Funds - 3.86% | | | | | | | | |
| SPDR S&P 500 ETF Trust | | | 14,165 | | | $ | 2,790,788 | |
TOTAL INVESTMENT COMPANIES
(Proceeds $2,710,795) | | | | | | $ | 2,790,788 | |
| | | | | | | | | |
TOTAL SECURITIES SOLD SHORT
(Proceeds $71,625,736) - 94.02% | | | | | | $ | 67,868,835 | |
| Percentages are stated as a percent of net assets. |
| ADR American Depositary Receipt |
| (a) | Non-income producing security. |
| (b) | Foreign issued security. |
The Global Industry Classification Standard (GICS®) was developed by and/or is the exclusive property of MSCI, Inc. and Standard & Poor’s Financial Services LLC (“S&P”). GICS® is a service mark of MSCI, Inc. and S&P and has been licensed for use by U.S. Bancorp Fund Services, LLC.
| See Notes to the Financial Statements. | The Leuthold Funds - 2014 Annual Report | 85 |
| 86 | The Leuthold Funds - 2014 Annual Report | |
| The Leuthold Funds |
| Notes to the Financial Statements |
| 1. ORGANIZATION AND SIGNIFICANT ACCOUNTING POLICIES |
Leuthold Funds, Inc. (the “Company”) was incorporated on August 30, 1995, as a Maryland Corporation and is registered with the Securities and Exchange Commission as an open-end management investment company under the Investment Company Act of 1940, as amended. The Company consists of five series (the “Funds”):
| | | | | Inception – | | Inception – |
| | | | | Retail | | Institutional |
| Fund | | Investment Objective | | Share Class | | Share Class |
| Leuthold Core Investment Fund | | Seeks total return consistent with prudent investment risk over the long-term | | 11/20/1995 | | 1/31/2006 |
| | | | | | | |
| Leuthold Global Fund | | Seeks total return consistent with prudent investment risk over the long-term | | 7/1/2008 | | 4/30/2008 |
| | | | | | | |
| Leuthold Select Industries Fund | | Capital appreciation | | 6/19/2000 | | n/a |
| | | | | | | |
| Leuthold Global Industries Fund | | Seeks capital appreciation and dividend income | | 5/17/2010 | | 5/17/2010 |
| | | | | | | |
| Grizzly Short Fund | | Capital appreciation | | 6/19/2000 | | n/a |
| | | | | | | |
All classes of shares in a Fund have identical voting, dividend, liquidation, and other rights, and the same terms and conditions, except that certain fees and expenses, including distribution and shareholder servicing fees, may differ among classes. Each class has exclusive voting rights on any matters relating to that class’s servicing or distribution arrangements.
As of the close of business on November 7, 2013, pursuant to an Agreement and Plan of Reorganization previously approved by the Funds’ Board of Directors, all of the assets, subject to the liabilities, of the Leuthold Asset Allocation Fund, were transferred to the Leuthold Core Investment Fund in exchange for a corresponding class of shares of the Leuthold Core Investment Fund of equal value. The purpose of the transaction was to combine two Funds with comparable investment objectives and strategies. The exchange ratio for shareholders of the Retail Class and Institutional Class was 0.58 and 0.59, respectively. The net asset value of the Leuthold Core Investment Fund – Retail Class and Leuthold Core Investment Fund – Institutional Class shares on the close of business November 7, 2013, after the reorganization, was $18.85 and $18.84, respectively, and a total of 9,682,755 shares of Leuthold Core Investment Fund – Retail Class and 2,641,170 of Leuthold Core Investment Fund – Institutional Class were issued to shareholders of the Leuthold Asset Allocation Fund in the exchange. The exchange was a tax-free event to Leuthold Asset Allocation Fund shareholders. For financial reporting purposes, assets received and shares issued by the Leuthold Core Investment Fund were recorded at fair value; however the cost basis of investments received from the Leuthold Asset Allocation Fund was carried forward to align ongoing reporting of the Leuthold Core Investment Fund’s realized and unrealized gains and losses with amounts distributable to shareholders for tax purposes.
| | |
| The Leuthold Funds - 2014 Annual Report | 87 |
The components of net assets immediately before the acquisition were as follows:
| | | | | | | | | Accumulated | | | | | | | |
| | | | | | Accumulated | | | net realized | | | Net | | | | |
| | | | | | net investment | | | gain/(loss) | | | Unrealized | | | | |
| | | Capital Stock | | | income /(loss) | | | on investments | | | Appreciation | | | Net Assets | |
| Leuthold Core Investment Fund | | $ | 454,023,967 | | | $ | (4,092,312 | ) | | $ | 67,821,018 | | | $ | 90,023,735 | | | $ | 607,776,408 | |
| Leuthold Asset Allocation Fund | | | 489,133,392 | | | | (6,898,358 | ) | | | (263,538,929 | )* | | | 13,583,460 | | | | 232,279,565 | |
| Total | | $ | 943,157,359 | | | $ | (10,990,670 | ) | | $ | (195,717,911 | ) | | $ | 103,607,195 | | | $ | 840,055,973 | |
* Due to rules under section 382 of the Internal Revenue Code, the combined Fund will only be able to utilize up to $47,062,326 of these losses and the losses will be limited to $8,129,785 each year ($17,598,977 in the first short year) over the next four years. The combined Fund cannot utilize the remaining $216,476,603.
Assuming the acquisition of Leuthold Asset Allocation Fund had been completed on October 1, 2013, the combined Funds’ pro forma results in the Statement of Operations during the period ended September 30, 2014 were as follows:
| Net investment income (loss) | | $ | (1,957,781 | )* |
| Net realized and unrealized gain (loss) on investment | | $ | 129,412,063 | ** |
| Net increase (decrease) in net assets resulting from operations | | $ | 127,454,282 | |
* $606,139 as reported in the Leuthold Core Investment Fund Statement of Operations, plus $(2,563,920) Leuthold Asset Allocation Fund pre-merger.
** $97,401,323 as reported in the Leuthold Core Investment Fund Statement of Operations plus $32,010,740 Leuthold Asset Allocation Fund pre-merger.
Because the combined Funds have been managed as a single integrated Fund since the acquisition was completed, it is not practicable to separate the amounts of revenue and earnings of the Leuthold Asset Allocation Fund that have been included in the Leuthold Core Investment Fund’s Statement of Operations since November 7, 2013.
The following is a summary of significant accounting policies consistently followed by the Funds.
a) Investment Valuation – Securities listed on a national securities exchange are valued at the last sale price on the day the valuation is made, and securities that are traded on the NASDAQ Global Market, NASDAQ Global Select Market or the NASDAQ Capital Market are valued at the NASDAQ Official Closing Price. Price information on listed stocks is taken from the exchange where the security is primarily traded. Securities, including securities sold short, which are listed on an exchange but which are not traded on the valuation date are generally valued at the mean between the bid and the asked prices. Unlisted securities for which market quotations are readily available are valued at the latest quoted bid price or, if unavailable, at prices provided by an independent pricing service. Securities sold short which are not listed on an exchange but for which market quotations are readily available are generally valued at the average of the current bid and asked prices. Debt securities are valued at bid prices provided by an independent pricing service that may use a matrix pricing method or other analytical pricing model. Other assets, including certain investments in open-end investment companies, and securities for which no quotations are readily available are valued at fair value as determined in good faith by the Board of Directors and the Funds’ Fair Value Pricing Committee. Short-term instruments (those with remaining maturities of 60
| | |
| 88 | The Leuthold Funds - 2014 Annual Report |
days or less) are valued at amortized cost, which approximates market value. Amortized cost will not be used if its use would be inappropriate due to credit or other impairment of the issuer. Exchange traded options are valued at the last reported sale price on an exchange on which the option is traded. If no sales are reported on a particular day, the mean between the highest bid and lowest asked quotations at the close of the exchanges is used. Non-exchange traded options also will be valued at the mean between the last bid and asked quotations. For options where market quotations are not readily available, fair value shall be determined.
The Funds may invest in foreign securities. Trading in foreign securities may be completed at times that vary from the closing of the New York Stock Exchange. The Board has approved the use of their independent pricing provider’s proprietary fair value pricing model to assist in determining current valuation for foreign securities traded in markets that close prior to the New York Stock Exchange. Foreign securities quoted in foreign currencies are translated into U.S. dollars at current rates. Occasionally, events that affect these values and exchange rates may occur between the times at which they are determined and the closing of the New York Stock Exchange (NYSE). If these events materially affect the value of portfolio securities, then these securities may be valued as determined in good faith by the Funds’ Board of Directors. Some of the factors which may be considered by the Board of Directors and the Funds’ Fair Value Pricing Committee in determining fair value are fundamental analytical data relating to the investment, the nature and duration of any restrictions on disposition, trading in similar securities of the same issuer or comparable companies, information from broker dealers, and an evaluation of the forces that influence the market in which the securities are purchased and sold. The use of fair value pricing by a Fund may cause the net asset value of its shares to differ significantly from the net asset value that would be calculated without regard to such considerations.
Physical metals are valued at prices provided by an independent pricing service. The Leuthold Core Investment Fund, the Leuthold Global Fund, and the Leuthold Global Industries Fund may invest in metals such as aluminum, copper, zinc, lead, nickel, tin, silver, palladium, and other industrial and precious metals. Metals not traded on an exchange are valued at the mid-point between the closing bid and asked prices as obtained from a commonly used reputable pricing source. As of September 30, 2014, none of the Funds held physical metals.
b) Fair Valuation Measurements – The Funds have adopted fair valuation accounting standards which establish a definition of fair value and set out a hierarchy for measuring fair value. These standards require additional disclosures about the various inputs and valuation techniques used to develop the measurements of fair value and a discussion of changes in valuation techniques and related inputs during the period. These inputs are summarized in the following three levels:
Level 1 - Quoted prices in active markets for identical securities.
Level 2 - Other significant observable inputs (including quoted prices for similar securities, interest rates, prepayment speeds, credit risk, etc.).
Level 3 - Significant unobservable inputs (including the Funds’ own assumptions in determining the fair value of investments).
The inputs or methodology used for valuing securities are not an indication of the risk associated with investing in those securities. The following is a summary of the inputs used to value the Funds’ net assets as of September 30, 2014:
| The Leuthold Funds - 2014 Annual Report | 89 |
Leuthold Core Investment Fund | |
| Investments at Fair Value | | Level 1 | | | Level 2 | | | Level 3 | | | Total | |
| Common Stocks | | | | | | | | | | | | |
| Aerospace & Defense | | $ | 34,432,287 | | | $ | –– | | | $ | –– | | | $ | 34,432,287 | |
| Air Freight & Logistics | | | –– | | | | 293,623 | | | | –– | | | | 293,623 | |
| Airlines | | | 44,264,653 | | | | 380,715 | | | | –– | | | | 44,645,368 | |
| Auto Components | | | 233,204 | | | | 1,504,553 | | | | 155,793 | | | | 1,893,550 | |
| Automobiles | | | 791,413 | | | | 183,236 | | | | –– | | | | 974,649 | |
| Banks | | | 338,401 | | | | 2,940,827 | | | | –– | | | | 3,279,228 | |
| Building Products | | | –– | | | | 163,001 | | | | –– | | | | 163,001 | |
| Chemicals | | | 27,635,027 | | | | 608,141 | | | | 134,903 | | | | 28,378,071 | |
| Construction & Engineering | | | –– | | | | 206,034 | | | | –– | | | | 206,034 | |
| Construction Materials | | | –– | | | | 82,123 | | | | –– | | | | 82,123 | |
| Consumer Finance | | | 27,405,528 | | | | –– | | | | –– | | | | 27,405,528 | |
| Containers & Packaging | | | 164,148 | | | | 112,725 | | | | –– | | | | 276,873 | |
| Distributors | | | 277,887 | | | | –– | | | | –– | | | | 277,887 | |
| Diversified Financial Services | | | –– | | | | 260,501 | | | | –– | | | | 260,501 | |
| Diversified Telecommunication Services | | | 302,933 | | | | 166,401 | | | | –– | | | | 469,334 | |
| Electric Utilities | | | 289,064 | | | | 500,839 | | | | –– | | | | 789,903 | |
| Electrical Equipment | | | –– | | | | 110,288 | | | | –– | | | | 110,288 | |
Electronic Equipment, Instruments & Components | | | 38,736,047 | | | | 620,963 | | | | –– | | | | 39,357,010 | |
| Energy Equipment & Services | | | –– | | | | 306,316 | | | | –– | | | | 306,316 | |
| Food & Staples Retailing | | | 14,277,013 | | | | 349,607 | | | | –– | | | | 14,626,620 | |
| Food Products | | | –– | | | | 286,792 | | | | –– | | | | 286,792 | |
| Gas Utilities | | | 125,106 | | | | –– | | | | –– | | | | 125,106 | |
| Health Care Equipment & Supplies | | | –– | | | | 293,072 | | | | –– | | | | 293,072 | |
| Health Care Providers & Services | | | 64,915,398 | | | | 298,092 | | | | –– | | | | 65,213,490 | |
| Hotels, Restaurants & Leisure | | | –– | | | | 142,301 | | | | –– | | | | 142,301 | |
| Household Durables | | | 535,724 | | | | 1,022,699 | | | | –– | | | | 1,558,423 | |
| Insurance | | | 145,542 | | | | 901,106 | | | | –– | | | | 1,046,648 | |
| Internet Software & Services | | | –– | | | | 922,650 | | | | –– | | | | 922,650 | |
| IT Services | | | 43,269,411 | | | | 841,598 | | | | –– | | | | 44,111,009 | |
| Machinery | | | –– | | | | 217,491 | | | | –– | | | | 217,491 | |
| Media | | | –– | | | | 221,036 | | | | –– | | | | 221,036 | |
| Metals & Mining | | | 113,916 | | | | 555,626 | | | | –– | | | | 669,542 | |
| Multiline Retail | | | 27,353,137 | | | | –– | | | | –– | | | | 27,353,137 | |
| Oil, Gas & Consumable Fuels | | | 61,980,019 | | | | 1,433,442 | | | | –– | | | | 63,413,461 | |
| Paper & Forest Products | | | 279,763 | | | | –– | | | | –– | | | | 279,763 | |
| Personal Products | | | 958,242 | | | | –– | | | | –– | | | | 958,242 | |
| Pharmaceuticals | | | 492,814 | | | | 828,985 | | | | –– | | | | 1,321,799 | |
| Real Estate Management & Development | | | –– | | | | 2,006,037 | | | | –– | | | | 2,006,037 | |
| Road & Rail | | | –– | | | | 143,811 | | | | –– | | | | 143,811 | |
Semiconductors & Semiconductor Equipment | | | 35,616,632 | | | | 996,917 | | | | –– | | | | 36,613,549 | |
| Software | | | 7,825,197 | | | | –– | | | | –– | | | | 7,825,197 | |
| Specialty Retail | | | 45,123,458 | | | | –– | | | | –– | | | | 45,123,458 | |
| Technology Hardware, Storage & Peripherals | | | 39,683,840 | | | | 2,959,243 | | | | –– | | | | 42,643,083 | |
| Textiles, Apparel & Luxury Goods | | | –– | | | | 234,701 | | | | –– | | | | 234,701 | |
| Trading Companies & Distributors | | | –– | | | | 142,502 | | | | –– | | | | 142,502 | |
| Transportation Infrastructure | | | 276,891 | | | | 321,612 | | | | –– | | | | 598,503 | |
| Water Utilities | | | 14,652,641 | | | | –– | | | | –– | | | | 14,652,641 | |
| Wireless Telecommunication Services | | | 1,385,376 | | | | 208,302 | | | | –– | | | | 1,593,678 | |
| Total Common Stocks | | | 533,880,712 | | | | 23,767,908 | | | | 290,696 | | | | 557,939,316 | |
| 90 | The Leuthold Funds - 2014 Annual Report |
Leuthold Core Investment Fund (continued) | |
| Investments at Fair Value | | Level 1 | | | Level 2 | | | Level 3 | | | Total | |
| Preferred Stocks | | $ | 2,323,091 | | | $ | –– | | | $ | –– | | | $ | 2,323,091 | |
| Exchange Traded Funds | | | 94,291,136 | | | | –– | | | | –– | | | | 94,291,136 | |
| Corporate Bonds | | | –– | | | | 16,390,474 | | | | –– | | | | 16,390,474 | |
| United States Treasury Obligations | | | –– | | | | 17,390,649 | | | | –– | | | | 17,390,649 | |
| Foreign Government Bonds | | | –– | | | | 51,026,320 | | | | –– | | | | 51,026,320 | |
| Money Market Funds | | | 25,859,508 | | | | –– | | | | –– | | | | 25,859,508 | |
| Total Investments in Securities | | $ | 656,354,447 | | | $ | 108,575,351 | | | $ | 290,696 | | | $ | 765,220,494 | |
| Securities Sold Short at Fair Value | | Level 1 | | | Level 2 | | | Level 3 | | | Total | |
| Common Stocks | | $ | 39,108,074 | | | $ | –– | | | $ | –– | | | $ | 39,108,074 | |
| Exchange Traded Funds | | | 53,169,884 | | | | –– | | | | –– | | | | 53,169,884 | |
| Total Securities Sold Short | | $ | 92,277,958 | | | $ | –– | | | $ | –– | | | $ | 92,277,958 | |
The basis for recognizing and valuing transfers is as of the end of the period in which transfers occur. The following is a summary of transfers for the year ended September 30, 2014:
| | | Level 1 | | | Level 2 | | | Level 3 | |
| Transfers into: | | $ | 1,659,490 | | | $ | 206,034 | | | $ | 134,903 | |
| Transfers out of: | | | (206,034 | ) | | | (1,794,393 | ) | | | –– | |
| Net transfers into and/or out of: | | $ | 1,453,456 | | | $ | (1,588,359 | ) | | $ | 134,903 | |
The transfers were due to the adjustment of fair value of certain securities due to developments that occurred between the time of the close of the foreign markets on which they trade and the close of regular session trading on the NYSE.
The following is a reconciliation of Level 3 assets for which significant unobservable inputs were used to determine fair value:
| | | Investment in | |
| | | Securities at | |
| | | Fair Value | |
| Balance as of September 30, 2013 | | $ | 0 | |
| Accrued discounts/premiums | | | –– | |
| Realized gain (loss) | | | –– | |
| Change in unrealized appreciation (depreciation) | | | –– | |
| Purchases | | | 155,793 | (1) |
| Sales | | | –– | |
| Transfer in and/or out of Level 3 | | | 134,903 | (2) |
| Balance as of September 30, 2014 | | $ | 290,696 | |
Change in unrealized appreciation (depreciation) during the period ended for Level 3 investments held at September 30, 2014: | | $ | –– | |
(1) This security (Mando Corp.) is classified as a Level 3 security due to a halt in trading on August 29, 2014 as a result of a pending corporate reorganization resulting in the creation of two separate corporations. This security is valued at the last traded price of 137,000 KRW.
(2) This security (China Lumena New Materials Corp.) is classified as a Level 3 security due to a halt in trading on March 25, 2014, and the security is valued at the last traded price of 1.25 HKD.
| The Leuthold Funds - 2014 Annual Report | 91 |
| Leuthold Global Fund | |
| Investments at Fair Value | | Level 1 | | | Level 2 | | | Level 3 | | | Total | |
| Common Stocks | | | | | | | | | | | | |
| Airlines | | $ | 12,132,130 | | | $ | –– | | | $ | –– | | | $ | 12,132,130 | |
| Auto Components | | | 6,054,388 | | | | 12,595,497 | | | | –– | | | | 18,649,885 | |
| Automobiles | | | 3,647,985 | | | | 4,874,133 | | | | –– | | | | 8,522,118 | |
| Banks | | | 2,722,160 | | | | 10,829,650 | | | | –– | | | | 13,551,810 | |
| Electric Utilities | | | 3,394,198 | | | | 6,745,260 | | | | –– | | | | 10,139,458 | |
Electronic Equipment, Instruments & Components | | | 11,755,332 | | | | 6,344,878 | | | | –– | | | | 18,100,210 | |
| Gas Utilities | | | 4,763,701 | | | | 2,952,193 | | | | –– | | | | 7,715,894 | |
| Health Care Providers & Services | | | 15,073,364 | | | | 1,204,412 | | | | –– | | | | 16,277,776 | |
| Household Durables | | | 3,732,460 | | | | 1,481,490 | | | | –– | | | | 5,213,950 | |
| Insurance | | | 14,910,306 | | | | 12,716,623 | | | | –– | | | | 27,626,929 | |
| Oil, Gas & Consumable Fuels | | | 14,553,586 | | | | 1,009,057 | | | | –– | | | | 15,562,643 | |
| Paper & Forest Products | | | 536,843 | | | | –– | | | | 47,986 | | | | 584,829 | |
| Real Estate Management & Development | | | 3,710,017 | | | | 5,687,696 | | | | –– | | | | 9,397,713 | |
| Road & Rail | | | 10,687,455 | | | | 5,574,745 | | | | –– | | | | 16,262,200 | |
| Semiconductors & Semiconductor Equipment | | | 12,699,885 | | | | 4,913,517 | | | | –– | | | | 17,613,402 | |
| Technology Hardware, Storage & Peripherals | | | 13,729,554 | | | | 15,813,057 | | | | –– | | | | 29,542,611 | |
| Water Utilities | | | –– | | | | 1,222,765 | | | | –– | | | | 1,222,765 | |
| Total Common Stocks | | | 134,103,364 | | | | 93,964,973 | | | | 47,986 | | | | 228,116,323 | |
| Preferred Stocks | | | | | | | | | | | | | | | | |
| | | –– | | | | 1,462,241 | | | | –– | | | | 1,462,241 | |
| Banks | | | 722,400 | | | | –– | | | | –– | | | | 722,400 | |
| Electric Utilities | | | 2,279,258 | | | | –– | | | | –– | | | | 2,279,258 | |
| Total Preferred Stocks | | | 3,001,658 | | | | 1,462,241 | | | | –– | | | | 4,463,899 | |
| Exchange Traded Funds | | | 38,442,399 | | | | –– | | | | –– | | | | 38,442,399 | |
| Corporate Bonds | | | –– | | | | 4,929,325 | | | | –– | | | | 4,929,325 | |
| United States Treasury Obligations | | | –– | | | | 6,618,023 | | | | –– | | | | 6,618,023 | |
| Foreign Government Bonds | | | –– | | | | 22,685,885 | | | | –– | | | | 22,685,885 | |
| Money Market Funds | | | 28,089,171 | | | | –– | | | | –– | | | | 28,089,171 | |
| Total Investments in Securities | | $ | 203,636,592 | | | $ | 129,660,447 | | | $ | 47,986 | | | $ | 333,345,025 | |
| Securities Sold Short at Fair Value | | Level 1 | | | Level 2 | | | Level 3 | | | Total | |
| Common Stocks | | | | | | | | | | | | | | | | |
| Aerospace & Defense | | $ | 121,289 | | | $ | 124,024 | | | $ | –– | | | $ | 245,313 | |
| Air Freight & Logistics | | | 109,959 | | | | –– | | | | –– | | | | 109,959 | |
| Banks | | | 228,787 | | | | –– | | | | –– | | | | 228,787 | |
| Capital Markets | | | 493,082 | | | | 358,382 | | | | –– | | | | 851,464 | |
| Chemicals | | | 120,746 | | | | –– | | | | –– | | | | 120,746 | |
| Commercial Services & Supplies | | | 396,180 | | | | –– | | | | –– | | | | 396,180 | |
| Construction & Engineering | | | 134,595 | | | | 220,596 | | | | –– | | | | 355,191 | |
| Food & Staples Retailing | | | 362,255 | | | | 94,791 | | | | –– | | | | 457,046 | |
| Food Products | | | 668,492 | | | | 219,130 | | | | –– | | | | 887,622 | |
| Health Care Equipment & Supplies | | | 589,519 | | | | 130,207 | | | | –– | | | | 719,726 | |
| Health Care Technology | | | –– | | | | 117,065 | | | | –– | | | | 117,065 | |
| Hotels, Restaurants & Leisure | | | 350,581 | | | | 238,404 | | | | –– | | | | 588,985 | |
| Industrial Conglomerates | | | –– | | | | 150,141 | | | | –– | | | | 150,141 | |
| Internet & Catalog Retail | | | 377,664 | | | | –– | | | | –– | | | | 377,664 | |
| Internet Software & Services | | | 350,429 | | | | –– | | | | –– | | | | 350,429 | |
| Leisure Products | | | –– | | | | 277,815 | | | | –– | | | | 277,815 | |
| 92 | The Leuthold Funds - 2014 Annual Report |
| Leuthold Global Fund (continued) | |
| Securities Sold Short at Fair Value | | Level 1 | | | Level 2 | | | Level 3 | | | Total | |
| Common Stocks (continued) | | | | | | | | | | | | |
| Life Sciences Tools & Services | | $ | –– | | | $ | 140,002 | | | $ | –– | | | $ | 140,002 | |
| Machinery | | | –– | | | | 150,683 | | | | –– | | | | 150,683 | |
| Media | | | 597,442 | | | | 131,254 | | | | –– | | | | 728,696 | |
| Paper & Forest Products | | | 105,866 | | | | 113,108 | | | | –– | | | | 218,974 | |
| Personal Products | | | 108,750 | | | | 246,965 | | | | –– | | | | 355,715 | |
| Pharmaceuticals | | | 113,743 | | | | –– | | | | –– | | | | 113,743 | |
| Professional Services | | | 437,572 | | | | 215,448 | | | | –– | | | | 653,020 | |
| Software | | | 767,825 | | | | –– | | | | –– | | | | 767,825 | |
| Specialty Retail | | | 385,761 | | | | 241,677 | | | | –– | | | | 627,438 | |
| Textiles, Apparel & Luxury Goods | | | –– | | | | 240,615 | | | | –– | | | | 240,615 | |
| Thrifts & Mortgage Finance | | | 243,467 | | | | –– | | | | –– | | | | 243,467 | |
| Total Common Stocks | | | 7,064,004 | | | | 3,410,307 | | | | –– | | | | 10,474,311 | |
| Exchange Traded Funds | | | 27,335,689 | | | | –– | | | | –– | | | | 27,335,689 | |
| Total Securities Sold Short | | $ | 34,399,693 | | | $ | 3,410,307 | | | $ | –– | | | $ | 37,810,000 | |
The basis for recognizing and valuing transfers is as of the end of the period in which transfers occur. There were transfers into Level 1 and out of Level 2 in the amount of $1,181,117 for the year ended September 30, 2014.
The following is a reconciliation of Level 3 assets for which significant unobservable inputs were used to determine fair value:
| | | Investments in | |
| | | Securities at | |
| | | | |
| Balance as of September 30, 2013 | | $ | 48,041 | |
| Accrued discounts/premiums | | | –– | |
| Realized gain (loss) | | | –– | |
| Change in unrealized appreciation (depreciation) | | | (55 | )* |
| Purchases | | | –– | |
| Sales | | | –– | |
| Transfers into and/or out of Level 3 | | | –– | |
| Balance as of September 30, 2014 | | $ | 47,986 | (1) |
Change in unrealized appreciation (depreciation) during the period ended for Level 3 investments held at September 30, 2014: | | $ | (55 | )* |
| | * | Unrealized depreciation is due to a change in foreign currency exchange rate. |
| | | |
| | (1) | This security (China Forestry Holdings Co., Ltd.) is classified as a Level 3 security due to a halt in trading of the security on January 26, 2011. The security is valued at fair value as determined in good faith by the Directors. Leuthold Weeden Capital Management (the “Adviser”) submits a report to the Directors setting forth the factors considered in determining the price. The significant unobservable input used in the fair valuation of this security is a discount of 95% from the last traded price of HKD 2.95. Significant changes in the discount rate may result in a change in fair value measurement. During the entire period the discount rate was 95%. |
| The Leuthold Funds - 2014 Annual Report | 93 |
| | | | | | | | | | | | | | | |
| Leuthold Select Industries Fund | |
| Investments at Fair Value | | Level 1 | | | Level 2 | | | Level 3 | | | Total | |
| Common Stocks | | $ | 14,875,558 | | | $ | –– | | | $ | –– | | | $ | 14,875,558 | |
| Preferred Stocks | | | 50,033 | | | | –– | | | | –– | | | | 50,033 | |
| Money Market Funds | | | 72,024 | | | | –– | | | | –– | | | | 72,024 | |
| Total Investments in Securities | | $ | 14,997,615 | | | $ | –– | | | $ | –– | | | $ | 14,997,615 | |
| | The Fund did not invest in any Level 3 securities or have transfers into or out of Level 1 or Level 2 securities during the period. The basis for recognizing and valuing transfers is as of the end of the period in which transfers occur. |
| | | | | | | | | | | | | | | | | |
| Leuthold Global Industries Fund | |
| Investments at Fair Value | | Level 1 | | | Level 2 | | | Level 3 | | | Total | |
| Common Stocks | | | | | | | | | | | | |
| Airlines | | $ | 1,421,211 | | | $ | –– | | | $ | –– | | | $ | 1,421,211 | |
| Auto Components | | | 715,638 | | | | 1,516,677 | | | | –– | | | | 2,232,315 | |
| Automobiles | | | 427,615 | | | | 602,890 | | | | –– | | | | 1,030,505 | |
| Banks | | | 339,043 | | | | 1,347,042 | | | | –– | | | | 1,686,085 | |
| Electric Utilities | | | 436,271 | | | | 834,234 | | | | –– | | | | 1,270,505 | |
| Electronic Equipment, Instruments & Components | | | 1,386,522 | | | | 769,833 | | | | –– | | | | 2,156,355 | |
| Gas Utilities | | | 572,119 | | | | 357,409 | | | | –– | | | | 929,528 | |
| Health Care Providers & Services | | | 1,769,447 | | | | 145,709 | | | | –– | | | | 1,915,156 | |
| Household Durables | | | 443,878 | | | | 179,616 | | | | –– | | | | 623,494 | |
| Insurance | | | 1,767,786 | | | | 1,536,379 | | | | –– | | | | 3,304,165 | |
| Oil, Gas & Consumable Fuels | | | 1,765,307 | | | | 123,852 | | | | –– | | | | 1,889,159 | |
| Paper & Forest Products | | | 62,935 | | | | –– | | | | 2,241 | | | | 65,176 | |
| Real Estate Management & Development | | | 445,930 | | | | 713,693 | | | | –– | | | | 1,159,623 | |
| Road & Rail | | | 1,296,975 | | | | 658,550 | | | | –– | | | | 1,955,525 | |
| Semiconductors & Semiconductor Equipment | | | 1,493,801 | | | | 601,826 | | | | –– | | | | 2,095,627 | |
| Technology Hardware, Storage & Peripherals | | | 1,624,529 | | | | 1,924,288 | | | | –– | | | | 3,548,817 | |
| Water Utilities | | | –– | | | | 147,293 | | | | –– | | | | 147,293 | |
| Total Common Stocks | | | 15,969,007 | | | | 11,459,291 | | | | 2,241 | | | | 27,430,539 | |
| Preferred Stocks | | | | | | | | | | | | | | | | |
| Automobiles | | | –– | | | | 176,139 | | | | –– | | | | 176,139 | |
| Banks | | | 96,958 | | | | –– | | | | –– | | | | 96,958 | |
| Electric Utilities | | | 277,125 | | | | –– | | | | –– | | | | 277,125 | |
| Total Preferred Stocks | | | 374,083 | | | | 176,139 | | | | – | | | | 550,222 | |
| Total Investments in Securities | | $ | 16,343,090 | | | $ | 11,635,430 | | | $ | 2,241 | | | $ | 27,980,761 | |
| | |
| | The basis for recognizing and valuing transfers is as of the end of the period in which transfers occur. There were transfers into Level 1 and out of Level 2 in the amount of $142,251 for the year ended September 30, 2014. |
| | |
| | The transfers were due to the adjustment of fair value of certain securities due to developments that occurred between the time of the close of the foreign markets on which they trade and the close of regular session trading on the NYSE. |
| | |
| | The following is a reconciliation of Level 3 assets for which significant unobservable inputs were used to determine fair value: |
| | |
| 94 | The Leuthold Funds - 2014 Annual Report |
| | | | | | |
| | | Investments in | | |
| | | Securities | | |
| | | at Fair Value | | |
| Balance as of September 30, 2013 | | $ | 2,243 | | |
| Accrued discounts/premiums | | | –– | | |
| Realized gain (loss) | | | –– | | |
| Change in unrealized appreciation (depreciation) | | | (2) | * | |
| Purchases | | | –– | | |
| Sales | | | –– | | |
| Transfers into and/or out of Level 3 | | | –– | | |
| Balance as of September 30, 2014 | | $ | 2,241 | (1) | |
| Change in unrealized appreciation (depreciation) during the period ended for Level 3 investments held at September 30, 2014: | | $ | (2) | | |
| | * | Unrealized depreciation is due to a change in foreign currency exchange rate. |
| | | |
| | (1) | This security (China Forestry Holdings Co., Ltd.) is classified as a Level 3 security due to a halt in trading of the security on January 26, 2011. The security is valued at fair value as determined in good faith by the Directors. The Adviser submits a report to the Directors setting forth the factors considered in determining the price. The significant unobservable input used in the fair valuation of the security is a discount of 95% from the last traded price of HKD 2.95. Significant changes in the discount rate may result in a change in fair value measurement. During the entire period the discount rate was 95%. |
| | | | | | | | | | |
| Grizzly Short Fund | |
| Investments at Fair Value | | Level 1 | | | Level 2 | | | Level 3 | | | Total | |
| Money Market Funds | | $ | 1,183,717 | | | $ | –– | | | $ | –– | | | $ | 1,183,717 | |
| Total Investments in Securities | | $ | 1,183,717 | | | $ | –– | | | $ | –– | | | $ | 1,183,717 | |
| | | | | | | | | | | | | | | | | |
| Securities Sold Short at Fair Value | | Level 1 | | | Level 2 | | | Level 3 | | | Total | |
| Common Stocks | | $ | 65,078,047 | | | $ | –– | | | $ | –– | | | $ | 65,078,047 | |
| Exchange Traded Funds | | | 2,790,788 | | | | –– | | | | –– | | | | 2,790,788 | |
| Total Securities Sold Short | | $ | 67,868,835 | | | $ | –– | | | $ | –– | | | $ | 67,868,835 | |
| | The Fund did not invest in any Level 3 securities or have transfers into or out of Level 1 or Level 2 securities during the period. The basis for recognizing and valuing transfers is as of the end of the period in which transfers occur. |
| | |
| | For further information regarding security characteristics, see the Schedules of Investments. |
| | |
| c) | Federal Income Taxes – Provision for federal income taxes or excise taxes has not been made since the Funds have elected to be taxed as “regulated investment companies” and intend to distribute substantially all taxable income to shareholders and otherwise comply with the provisions of the Internal Revenue Code applicable to regulated investment companies. Distributions from net realized gains for book purposes may include short-term capital gains which are included as ordinary income to shareholders for tax purposes. The Funds also designate as distributions of long-term gains, to the extent necessary to fully distribute such capital gains, earnings and profits distributed to shareholders on the redemption of shares. The tax character of distributions paid during the fiscal years ended September 30, 2014 and 2013 was as follows: |
| | |
| The Leuthold Funds - 2014 Annual Report | 95 |
| | | | | | | | | | | | |
| Year Ended September 30, 2014 | |
| | | | | | | | | | | | | | | | |
| | | Leuthold | | | | | | Leuthold | | | Leuthold | | | | |
| | | Core | | | Leuthold | | | Select | | | Global | | | Grizzly | |
| | | Investment | | | Global | | | Industries | | | Industries | | | Short | |
| | | Fund | | | Fund | | | Fund | | | Fund | | | Fund | |
| Distributions paid from: | | | | | | | | | | | | | | | |
| Ordinary Income | | $ | 24,526,872 | | | $ | 18,066,758 | | | $ | –– | | | $ | 213,646 | | | $ | –– | |
| Long Term Capital Gain | | | 41,105,770 | | | | 20,259,943 | | | | –– | | | | –– | | | | –– | |
Return of Capital | | | –– | | | | –– | | | | –– | | | | –– | | | | –– | |
| Total Distribution Paid | | $ | 65,632,642 | | | $ | 38,326,701 | | | $ | –– | | | $ | 213,646 | | | $ | –– | |
| | | | | | | | | | | | | | | | | | | | | |
| Year Ended September 30, 2013 | |
| | | | | | | | | | | | | | | | | | | | | |
| | | Leuthold | | | | | | | Leuthold | | | Leuthold | | | | | |
| | | Core | | | Leuthold | | | Select | | | Global | | | Grizzly | |
| | | Investment | | | Global | | | Industries | | | Industries | | | Short | |
| | | Fund | | | Fund | | | Fund | | | Fund | | | Fund | |
| Distributions paid from: | | | | | | | | | | | | | | | | | | | | |
| Ordinary Income | | $ | 14,177,488 | | | $ | 3,759,728 | | | $ | 33,785 | | | $ | 69,238 | | | $ | –– | |
| Long Term Capital Gain | | | –– | | | | –– | | | | –– | | | | –– | | | | –– | |
Return of Capital | | | –– | | | | –– | | | | –– | | | | –– | | | | –– | |
| Total Distribution Paid | | $ | 14,177,488 | | | $ | 3,759,728 | | | $ | 33,785 | | | $ | 69,238 | | | $ | –– | |
| | At September 30, 2014, the components of accumulated earnings (deficit) on a tax basis were as follows: |
| | | | | | | | | | | | | | | | |
| | | Leuthold | | | | | | Leuthold | | | Leuthold | | | | |
| | | Core | | | Leuthold | | | Select | | | Global | | | Grizzly | |
| | | Investment | | | Global | | | Industries | | | Industries | | | Short | |
| | | Fund | | | Fund | | | Fund | | | Fund | | | Fund | |
| Undistributed Ordinary Income | | $ | 15,386,590 | | | $ | 6,958,022 | | | $ | –– | | | $ | 43,270 | | | $ | –– | |
| Undistributed long-term gains | | | 34,728,908 | | | | 25,689,775 | | | | –– | | | | 380,557 | | | | –– | |
| Distributable earnings | | | 50,115,498 | | | | 32,647,797 | | | | –– | | | | 423,827 | | | | –– | |
| Capital loss carryover and late-year losses | | | (29,463,349 | ) | | | –– | | | | (1,450,099 | ) | | | –– | | | | (161,134,891 | ) |
| Other accumulated gains | | | 2,200,406 | | | | 448,628 | | | | –– | | | | –– | | | | 3,350,722 | |
| Unrealized appreciation | | | 97,472,268 | | | | 32,216,540 | | | | 2,419,922 | | | | 2,510,644 | | | | –– | |
| Total accumulated earnings (deficit) | | $ | 120,324,823 | | | $ | 65,312,965 | | | $ | 969,823 | | | $ | 2,934,471 | | | $ | (157,784,169 | ) |
| | Net investment income and realized gains and losses for federal income tax purposes may differ from that reported on the financial statements because of permanent book-to-tax differences. U.S. GAAP requires that permanent differences between financial reporting and tax reporting be reclassified between various components of net assets. These differences are primarily due to net operating losses, and differences from REIT adjustments and foreign currency gain and loss. |
| | |
| | Additionally, U.S. GAAP requires that certain components of net assets relating to permanent differences be reclassified between financial and tax reporting. These reclassifications have no effect on net assets or net asset value per share. For the year ended September 30, 2014, the following table shows the reclassifications made: |
| | |
| 96 | The Leuthold Funds - 2014 Annual Report |
| | | | | | | | | | | |
| | | Undistributed | | | Accumulated | | | | | |
| | | Net Investment | | | Net Realized | | | Paid In | | |
| | | Income/(Loss) | | | Gain/(Loss) | | | Capital | | |
| | | | | | | | | | | |
| Leuthold Core Investment Fund | | $ | (2,989,496 | ) | | $ | (44,574,521 | ) | | $ | 47,564,017 | | |
| Leuthold Global Fund | | | 1,870,215 | | | | (1,870,216 | ) | | | 1 | | |
| Leuthold Select Industries Fund | | | 8,596 | | | | 3,173 | | | | (11,769 | ) | |
| Leuthold Global Industries Fund | | | 44,578 | | | | (44,578 | ) | | | –– | | |
| Grizzly Short Fund | | | 2,719,081 | | | | (18,431 | ) | | | (2,700,650 | ) | |
| | Under current law, the Funds may carry forward net capital losses indefinitely to use to offset capital gains realized in future years. Previous law limited the carry forward of capital losses to the eight tax years following the year the capital loss was realized. If a Fund has capital losses that are subject to current law and also has capital losses subject to prior law, the losses realized under current law will be utilized to offset capital gains before any of the losses governed by prior law can be used. As a result of these ordering rules, capital losses realized under previous law may be more likely to expire unused. Capital losses realized under current law will carry forward retaining their classification as long-term or short-term losses, whereas under prior law all capital losses were carried forward as short-term capital losses. |
| | | Leuthold | | | | | | Leuthold | | | Leuthold | | | | |
| | | Core | | | Leuthold | | | Select | | | Global | | | Grizzly | |
| | | Investment | | | Global | | | Industries | | | Industries | | | Short | |
| | | Fund | | | Fund | | | Fund | | | Fund | | | Fund | |
| | | | | | | | | | | | | | | | | | | | | |
| Expires 09/30/17 | | $ | (29,463,349 | )* | | $ | –– | | | $ | (646,879 | )* | | $ | –– | | | $ | –– | |
| Expires 09/30/18 | | | –– | | | | –– | | | | (764,408 | ) | | | –– | | | | (18,663,090 | ) |
| Expires 09/30/19 | | | –– | | | | –– | | | | –– | | | | –– | | | | (25,380,935 | ) |
| Unlimited Short-Term | | | –– | | | | –– | | | | –– | | | | –– | | | | (105,532,771 | ) |
| | * Capital loss carryforward transferred in from merger, subject to annual limitations. |
| | |
| | The Grizzly Short Fund and Leuthold Select Industries Fund intend to defer and treat $11,558,095 and $38,812, respectively, of qualified late-year losses incurred during the fiscal year ended September 30, 2014 as arising in the fiscal year ending September 30, 2015. |
| | |
| | As of September 30, 2014, the Funds had no tax positions that did not meet the “more likely-than-not” threshold of being sustained by the applicable tax authority. Generally, tax authorities can examine all the tax returns filed for the last three years. |
| | |
| | The Funds recognize interest and penalties, if any, related to unrecognized tax benefits as income tax expense in the Statements of Operations. During the period, the Funds did not incur any interest or penalties. |
| | |
| d) | Distributions to Shareholders – Dividends from net investment income, if any, are declared and paid quarterly. Distributions of net realized capital gains, if any, are declared and paid at least annually. |
| | |
| e) | Use of Estimates – The preparation of financial statements in conformity with U.S. GAAP requires management to make estimates and assumptions that affect the reported amounts of assets and liabilities and disclosure of contingent assets and liabilities at the date of the financial statements and the reported amounts of revenues and expenses during the reporting period. Actual results could differ from those estimates. |
| | |
| The Leuthold Funds - 2014 Annual Report | 97 |
| | |
| f) | Basis for Consolidation for the Leuthold Core Investment Fund and Leuthold Global Fund –The Leuthold Core Investment Fund and Leuthold Global Fund may invest up to 25% of their total assets in their Subsidiary, Leuthold Core, Ltd. and Leuthold Global, Ltd. (the “Subsidiaries”), respectively. The Subsidiaries, which are organized under the laws of the Cayman Islands, are wholly owned and controlled by the Leuthold Core Investment Fund and Leuthold Global Fund, respectively, and are therefore consolidated in the respective Funds’ financial statements herein. All intercompany balances, revenues, and expenses have been eliminated in consolidation. The Subsidiaries act as investment vehicles in order to enter into certain investments for the Leuthold Core Investment Fund and Leuthold Global Fund consistent with the investment objectives and policies specified in the Prospectus and Statement of Additional Information. As of September 30, 2014, no assets were held in the Subsidiaries. |
| | |
| g) | Short Positions – For financial statement purposes, an amount equal to the required amount of collateral to be segregated for short positions is included in the Statements of Assets and Liabilities as an asset. The amount of the securities sold short, shown as a liability, is subsequently marked-to-market to reflect the current value of the short position. Subsequent fluctuations in the market prices of securities sold short may require purchasing the securities at prices which could differ from the amount reflected in the Statements of Assets and Liabilities. The Funds are liable for any dividends or interest payable on securities while those securities are in a short position. As collateral for their short positions, the Funds are required under the Investment Company Act of 1940 to maintain segregated assets consisting of cash, cash equivalents, or liquid securities. These segregated assets are valued consistent with Note 1a above. The amount of segregated assets is required to be adjusted daily to reflect changes in the market value of the securities sold short. Grizzly Short Fund’s receivable from broker for securities sold short is with two major security dealers. |
| | |
| h) | Other – Investment and shareholder transactions are recorded on the trade date. The Funds determine the gain or loss realized from the investment transactions by comparing the original cost of the security lot sold with the net sales proceeds. Dividend income is recognized on the ex-dividend date or as soon as information is available to the Funds, and interest income is recognized on an accrual basis. Discounts and premiums on bonds are amortized using the yield to maturity method over the life of the respective bond. For financial reporting purposes, the Funds isolate changes in the exchange rate of investment securities from the fluctuations arising from changes in the market prices of securities for realized gains and losses. |
| | |
| i) | Expenses – Expenses that directly relate to one of the Funds are charged directly to that Fund. Other operating expenses of the Funds, such as Directors fees and expenses, insurance expense, and legal fees are allocated between the five Funds based on the relative net asset value of the individual Funds. |
| | |
| j) | Counterparty risk – Counterparty risk may arise as the result of the failure of a counterparty to a securities contract to comply with the terms of the contract. Potential counterparty risk is measured by the credit worthiness of the counterparty and additional risk may arise from unanticipated events affecting the value of the underlying security. |
| | |
| k) | Subsequent Events – The Funds have evaluated subsequent events through the date of issuance of the Funds’ financial statements. This evaluation did not result in any subsequent events that necessitated recognition or disclosure. |
| | |
| 98 | The Leuthold Funds - 2014 Annual Report |
| 2. | INVESTMENT TRANSACTIONS |
| | Purchases and sales of investment securities, other than short-term investments and short sales, for the year ended September 30, 2014 are summarized below. |
| | | | | | | | | | | | | |
| | | Leuthold | | | | | | Leuthold | | | Leuthold | |
| | | Core | | | Leuthold | | | Select | | | Global | |
| | | Investment | | | Global | | | Industries | | | Industries | |
| | | Fund | | | Fund | | | Fund | | | Fund | |
| Purchases | | $ | 672,575,589 | | | $ | 225,371,133 | | | $ | 12,234,434 | | | $ | 39,522,538 | |
| Sales | | | 586,448,022 | | | | 276,254,991 | | | | 9,040,522 | | | | 27,660,996 | |
| | There were no purchases or sales of investment securities presented for the Grizzly Short Fund because this Fund invests only in securities sold short. |
| | |
| | At September 30, 2014, gross unrealized appreciation and depreciation of investments and cost of investments (excluding short positions) for tax purposes were as follows: |
| | | Leuthold | | | | | | Leuthold | | | Leuthold | | | | |
| | | Core | | | Leuthold | | | Select | | | Global | | | Grizzly | |
| | | Investment | | | Global | | | Industries | | | Industries | | | Short | |
| | | Fund | | | Fund | | | Fund | | | Fund | | | Fund | |
Tax cost of investments | | $ | 667,724,663 | | | $ | 301,075,287 | | | $ | 12,577,693 | | | $ | 25,465,902 | | | $ | 1,183,717 | |
| Gross unrealized appreciation | | | 118,696,224 | | | | 42,501,750 | | | | 2,864,335 | | | | 3,623,902 | | | | 1,519,058 | |
| Gross unrealized depreciation | | | (21,223,956 | ) | | | (10,285,210 | ) | | | (444,413 | ) | | | (1,113,258 | ) | | | (1,519,058 | ) |
| Net unrealized appreciation | | $ | 97,472,268 | | | $ | 32,216,540 | | | $ | 2,419,922 | | | $ | 2,510,644 | | | | –– | |
| | The differences between book and tax basis of unrealized appreciation (depreciation) are primarily attributable to the tax deferral of losses on wash sales. |
| | |
| | The Core Investment Fund and the Global Fund owned 5% or more of the voting securities of the following companies during the year ended September 30, 2014. As a result, these companies are deemed to be affiliates of the Core Investment Fund and the Global Fund as defined by the 1940 Act. Transactions during the period in these securities of affiliated companies were as follows: |
| Leuthold Core Investment Fund |
| | | Share Activity | | | | | | | |
| | | Balance | | | | | | | | | Balance | | | Dividend | | | Fair Value at | |
| Security Name | | 09/30/13 | | | Purchases | | | Sales | | | 09/30/14 | | | Income | | | 09/30/14 | |
| CurrencyShares Japanese Yen Trust | | | 160,155 | | | | 87,000 | | | | 157,468 | | | | 89,687 | | | $ | –– | | | $ | 7,964,206 | |
| | | | | | | | | | | | | | | | | | | $ | –– | | | $ | 7,964,206 | |
| | | | | | | | | | | | | | | | | | | | | | | | | |
| Leuthold Global Fund |
| | | Share Activity | | | | | | | | | |
| | | Balance | | | | | | | | | | | Balance | | | Dividend | | | Fair Value at | |
| Security Name | | 09/30/13 | | | Purchases | | | Sales | | | 09/30/14 | | | Income | | | 09/30/14 | |
CurrencyShares Japanese Yen Trust(1) | | | 95,068 | | | | 19,300 | | | | 78,384 | | | | 35,984 | | | $ | –– | | | $ | 3,195,379 | |
| | | | | | | | | | | | | | | | | | | $ | –– | | | $ | 3,195,379 | |
| | (1) Issuer was not an affiliate as of September 30, 2014 due to sales during the year. |
| | |
| The Leuthold Funds - 2014 Annual Report | 99 |
| 3. | INVESTMENT ADVISORY AND OTHER AGREEMENTS |
| | Each of the Funds has entered into an Investment Advisory Agreement (“advisory agreement”) with the Adviser. Pursuant to its advisory agreements with the Funds, the Adviser is entitled to receive a fee, calculated daily as applied to each Fund’s daily net assets and payable monthly, at annual rates of: |
| Leuthold | | | | Leuthold | | Leuthold | | |
| Core | | Leuthold | | Select | | Global | | Grizzly |
| Investment | | Global | | Industries | | Industries | | Short |
| Fund | | Fund | | Fund | | Fund | | Fund |
| 0.90% | | 1.10% | | 1.00% | | 1.00% | | 1.25% |
| | The Adviser has agreed to waive its advisory fee and/or reimburse the Funds’ other expenses, including organization expenses, to the extent necessary to ensure that the Funds’ total operating expenses (exclusive of interest, taxes, brokerage commissions, dividends and interest on short positions, and other costs incurred in connection with the purchase or sale of portfolio securities, and extraordinary items) do not exceed the following rates, based on each Fund’s average daily net assets: |
| | | | | | | Leuthold | | Leuthold | | |
| | | | | | | Global | | Global | | |
| Leuthold | | | | Leuthold | | Industries | | Industries | | |
| Core | | Leuthold | | Select | | Fund | | Fund | | Grizzly |
| Investment | | Global | | Industries | | Retail | | Institutional | | Short |
| Fund | | Fund | | Fund | | Class | | Class | | Fund |
| 1.25% | | 1.85% | | 1.50%(1) | | 1.50%(2) | | 1.25%(2) | | 2.50% |
| | (1) Effective August 11, 2014, the Adviser has contractually agreed to reduce the expense limitation for the Leuthold Select Industries Fund from 1.60% to 1.50%. |
| | (2) Effective August 11, 2014, the Adviser has contractually agreed to reduce the expense limitation for the Leuthold Global Industries Fund from 1.60% at the total Fund level to 1.50% for the Retail Class and 1.25% for the Institutional Class. |
| | |
| | Any waiver or reimbursement is subject to later adjustments to allow the Adviser to recoup amounts previously waived or reimbursed to the extent actual fees and expenses for a fiscal period are less than each Fund’s expense limitation, provided, however, that the Adviser shall only be entitled to recoup such amounts for a period of three years from the date such amount was waived or reimbursed. Amounts subject to future recoupment as of September 30, 2014 are as follows: |
| Leuthold Select Industries Fund | | Leuthold Global Industries Fund |
| Year of Expiration | | Recoverable Amount | | Year of Expiration | | Recoverable Amount |
| 9/30/2015 | | $ | 16,951 | | | 9/30/2015 | | $ | 58,737 | |
| 9/30/2016 | | | 22,934 | | | 9/30/2016 | | | 71,564 | |
| 9/30/2017 | | | 13,531 | | | 9/30/2017 | | | 89,378 | |
| | U.S. Bancorp Fund Services, LLC serves as transfer agent, administrator, and accounting services agent for the Funds. U.S. Bank, N.A. serves as custodian for the Funds. For the year ended September 30, 2014, the Leuthold Core Investment Fund, Leuthold Global Fund, Leuthold Select Industries Fund, Leuthold Global Industries, and Grizzly Short Fund paid Weeden & Co., L.P., an affiliate of the Adviser, $205,599, $18,731, $4,166, $1,244, and $33,603, respectively, for brokerage commissions. |
| | |
| 100 | The Leuthold Funds - 2014 Annual Report |
| 4. | DISTRIBUTION PLAN |
| | The Leuthold Global Fund �� Retail Class and Leuthold Global Industries Fund – Retail Class has adopted a distribution plan pursuant to Rule 12b-1 under the Investment Company Act, whereby Rafferty Capital Markets, LLC serves as distributor. This plan allows each Fund to use up to 0.25% of its average daily net assets to pay sales, distribution, and other fees for the sale of its shares and for services provided to investors. Each Fund may pay all or a portion of this fee to any securities dealer, financial institution, or any other person who renders personal service to the Funds’ shareholders, assists in the maintenance of the Funds’ shareholder accounts, or who renders assistance in distributing or promoting the sale of shares of the Fund pursuant to a written agreement approved by the Board of Directors. To the extent such fee is not paid to such persons, each of the Funds may use the fee for its expenses of distribution of its shares, including, but not limited to, payment by the Fund of the cost of preparing, printing, and distributing Prospectuses and Statements of Additional Information to prospective investors and of implementing and operating the Plan. |
| | |
| 5. | INDEMNIFICATIONS |
| | The Funds enter into contracts that contain a variety of indemnifications. The Funds’ maximum exposure under these arrangements is unknown. However, the Funds have not had prior claims or losses pursuant to these contracts and expect the risk of loss to be remote. |
| | |
| 6. | ILLIQUID SECURITIES |
| | Each Fund may invest up to 15% of net assets in securities for which there is no readily available market (“illiquid securities”). The 15% limitation includes securities whose disposition would be subject to legal restrictions (“restricted securities”). Illiquid and restricted securities often have a market value lower than the market price of unrestricted securities of the same issuer and are not readily marketable without some time delay. This could result in a Fund being unable to realize a favorable price upon disposition of such securities and in some cases might make disposition of such securities at the time desired by the Fund impossible. |
| | |
| 7. | LENDING PORTFOLIO SECURITIES |
| | The Funds may lend portfolio securities constituting up to 30% of total assets to unaffiliated broker dealers, banks, or other recognized institutional borrowers of securities, provided that the borrower at all times maintains cash, U.S. government securities or equivalent collateral or provides an irrevocable letter of credit in favor of the Fund equal in value to at least 100% of the value of the securities loaned. The Funds did not lend any portfolio securities during the reporting period, and will not enter into any securities lending arrangements in the future without the prior approval of the Board of Directors. |
| The Leuthold Funds - 2014 Annual Report | 101 |
REPORT OF INDEPENDENT REGISTERED PUBLIC ACCOUNTING FIRM
| | |
| | To the Shareholders and Board of Directors Leuthold Funds, Inc. |
| | |
| | We have audited the accompanying statements of assets and liabilities, including the schedules of investments and securities sold short (as applicable), of Leuthold Funds, Inc., comprising Leuthold Core Investment Fund (consolidated), Leuthold Global Fund (consolidated), Leuthold Select Industries Fund, Leuthold Global Industries Fund, and Grizzly Short Fund (collectively, the Funds), as of September 30, 2014, and the related statements of operations for the year then ended, the statements of changes in net assets for each of the two years in the period then ended, and the financial highlights for each of the periods indicated therein. These financial statements and financial highlights are the responsibility of the Funds’ management. Our responsibility is to express an opinion on these financial statements and financial highlights based on our audits. |
| | |
| | We conducted our audits in accordance with the standards of the Public Company Accounting Oversight Board (United States). Those standards require that we plan and perform the audit to obtain reasonable assurance about whether the financial statements and financial highlights are free of material misstatement. We were not engaged to perform an audit of the Funds’ internal control over financial reporting. Our audits included consideration of internal control over financial reporting as a basis for designing audit procedures that are appropriate in the circumstances, but not for the purpose of expressing an opinion on the effectiveness of the Funds’ internal control over financial reporting. Accordingly, we express no such opinion. An audit also includes examining, on a test basis, evidence supporting the amounts and disclosures in the financial statements and financial highlights, assessing the accounting principles used and significant estimates made by management, and evaluating the overall financial statement presentation. Our procedures included confirmation of securities owned as of September 30, 2014, by correspondence with the custodian and brokers. We believe that our audits provide a reasonable basis for our opinion. |
| | |
| | In our opinion, the financial statements and financial highlights referred to above present fairly, in all material respects, the financial position of each of the respective Funds constituting Leuthold Funds, Inc. at September 30, 2014, the results of their operations for the year then ended, the changes in their net assets for each of the two years in the period then ended, and the financial highlights for each of the periods indicated therein, in conformity with U.S. generally accepted accounting principles. |
| | |  |
| | Minneapolis, Minnesota | |
| | November 26, 2014 | |
| 102 | The Leuthold Funds - 2014 Annual Report |
ADDITIONAL INFORMATION (Unaudited)
SHAREHOLDER NOTIFICATION OF FEDERAL TAX STATUS (Unaudited)
| | |
| | The percentage of dividend income distributed for the year ended September 30, 2014, which is designated as qualified dividend income under the Jobs and Growth Tax Relief Reconciliation Act of 2003, is as follows: Leuthold Core Investment Fund 28.08%, Leuthold Global Fund 34.12%, and Leuthold Global Industries Fund 100.00%. |
| | |
| | The percentage of dividend income distributed for the year ended September 30, 2014, designated as qualified dividends received deduction available to corporate shareholders, is as follows: Leuthold Core Investment Fund 21.04%, Leuthold Global Fund 7.20%, and Leuthold Global Industries Fund 45.50%. |
| | |
| | The Leuthold Core Investment Fund and Leuthold Global Fund designated 6.22% and 4.96%, respectively, of their ordinary distributions paid as qualified interest related dividends under the Internal Revenue Code Section 871(k)(1)(C) for the year ended September 30, 2014. The Leuthold Core Investment Fund and Leuthold Global Fund designated 20.97% and 76.25%, respectively, of their ordinary distributions paid as short-term capital gain distributions under Internal Revenue Section 871 (k)(2)(C) for the year ended September 30, 2014. |
| | |
| | The Leuthold Global Industries Fund has elected to pass through certain foreign taxes to its shareholders under Internal Revenue Code Section 853. These taxes total $52,505 for the year ended September 30, 2014. Additional information will be provided with the Fund’s Forms 1099 for the 2014 tax year. |
| The Leuthold Funds - 2014 Annual Report | 103 |
ADDITIONAL DISCLOSURE REGARDING FUND DIRECTORS AND OFFICERS (UNAUDITED)
Independent Directors
| | | | | | | | | | | |
Name, Year of Birth, and Address | | Position(s) Held with the Company | | Term of Office and Length of Time Served | | Principal Occupation(s) During Past Five Years | | # of Portfolios in Fund Complex Overseen By Director | | Other
Directorships
Held by Director |
Lawrence L. Horsch (1934) c/o Leuthold Weeden Capital Management 33 South Sixth Street Suite 4600 Minneapolis, MN 55402 | | Chairman and Director | | Indefinite Term, Director since 1995 | | Chairman, Eagle Management & Financial Corp., a management consulting firm | | 5 | | None |
| | | | | | | | | | | |
Paul M. Kelnberger (1943) c/o Leuthold Weeden Capital Management 33 South Sixth Street Suite 4600 Minneapolis, MN 55402 | | Director and Chair of Audit Committee | | Indefinite Term, Director since 1995 | | Consultant to Johnson, West & Co., PLC | | 5 | | None |
| | | | | | | | | | | |
Addison L. Piper (1946) c/o Leuthold Weeden Capital Management 33 South Sixth Street Suite 4600 Minneapolis, MN 55402 | | Director and Chair of Nominating Committee | | Indefinite Term, Director since 2009 | | Retired Chairman and Chief Executive Officer of Piper Jaffray Companies. | | 5 | | Piper Jaffray Companies |
| | | | | | | | | | | |
| Interested Directors (and Officers) | | | | | | | |
| | | | | | | | | | | |
John C. Mueller (1968) 33 South Sixth Street Suite 4600 | | Director | | Indefinite Term, Director since 2009 | | Co-Chief Executive Officer of The Leuthold Group since 2005. Involved in Sales and Marketing for | | 5 | | None |
| Minneapolis, MN 55402 | | President | | One year term, President since 2011 | | The Leuthold Group since 2001. | | | | |
| 104 | The Leuthold Funds - 2014 Annual Report |
Name, Year of Birth, and Address | | Position(s) Held with the Company | | Term of Office and Length of Time Served | | Principal Occupation During Past Five Years | | # of Portfolios in Fund Complex Overseen By Director | | Other
Directorships
Held by
Director |
Holly J. Weiss (1968) 33 South Sixth Street Suite 4600 Minneapolis, MN 55402 | | Secretary and Treasurer | | One Year Term, Secretary and Treasurer since 2009 | | Chief Financial Officer of the Adviser since 2011 and Controller of the Adviser from 2008 to 2011. Prior to joining the Adviser, she was Controller of Churchill Capital Mezzanine Finance from 2001-2008. | | N/A | | N/A |
| | | | | | | | | | | |
Roger A. Peters (1960) 33 South Sixth Street Suite 4600 Minneapolis, MN 55402 | | Vice President and Chief Compliance Officer and Anti-Money Laundering Officer | | One Year Term, Chief Compliance Officer since 2006 and Vice President since 2007 and Anti-Money Laundering Officer since 2011 | | Chief Compliance Officer of the Adviser since 2005. | | N/A | | N/A |
| | | | | | | | | | | |
Glenn R. Larson (1965) 33 South Sixth Street Suite 4600 Minneapolis, MN 55402 | | Assistant Secretary | | One Year Term, Assistant Secretary since 2006 | | Compliance Officer of the Adviser since 2005. | | N/A | | N/A |
The Statement of Additional Information includes additional information about the Funds’ Directors and is available free of charge upon request by calling the Funds toll free at (800) 273-6886.
Information regarding the method the Funds use to vote proxies relating to portfolio securities is available without charge upon request by calling toll-free at (800) 273-6886 or by accessing the Funds’ website at www.leutholdfunds.com. Information regarding how the Funds voted proxies relating to portfolio securities during the most recent twelve-month period ended June 30 is available without charge upon request by calling toll-free at (800) 273-6886 or on the SEC’s website at www.sec.gov.
| The Leuthold Funds - 2014 Annual Report | 105 |

| The Leuthold Funds |
| | | |
| | Investment Adviser: | |
| | Leuthold Weeden Capital Management, | |
| | Minneapolis, Minnesota | |
| | | |
| | Administrator, Transfer Agent, | |
| | Dividend Paying Agent, | |
| | Shareholder Servicing Agent: | |
| | U.S. Bancorp Fund Services, LLC, | |
| | Milwaukee, Wisconsin | |
| | | |
| | Custodian: | |
| | U.S. Bank, N.A., | |
| | Milwaukee, Wisconsin | |
| | | |
| | Counsel: | |
| | Foley & Lardner, LLP, | |
| | Milwaukee, Wisconsin | |
| | | |
| | Independent Registered | |
| | Public Accounting Firm: | |
| | Ernst &Young LLP, | |
| | Minneapolis, Minnesota | |
| | | |
| | The Funds are required to file their complete schedules of portfolio holdings with the SEC for their first and third fiscal quarters on Form N-Q. Once filed, the Fund’s Form N-Q is available without charge, upon request on the SEC’s website (http://www.sec.gov) and may be available by calling 1-800-273-6886. You can also obtain copies of Form N-Q by (i) visiting the SEC’s Public Reference Room in Washington, DC (information on the operation of the Public Reference Room may be obtained by calling 1-800-SEC-0330); (ii) sending your request and a duplicating fee to the SEC’s Public Reference Room, Washington, DC 20549-0102; or (iii) sending your request electronically to publicinfosec.gov. | |
| | | |
| | This report is authorized for distribution only when preceded or accompanied by a current prospectus. | |
Item 2. Code of Ethics.
The registrant has adopted a code of ethics that applies to the registrant’s principal executive officer and principal financial officer. The registrant has made an amendment to its code of ethics during the period covered by this report. The registrant has not granted any waivers from any provisions of the code of ethics during the period covered by this report. A copy of the registrant’s Code of Ethics is filed herewith.
Item 3. Audit Committee Financial Expert.
The registrant’s board of directors has determined that there is at least one audit committee financial expert serving on its audit committee. Paul Kelnberger is the “audit committee financial expert” and is considered to be “independent” as each term is defined in Item 3 of Form N-CSR.
Item 4. Principal Accountant Fees and Services.
The registrant has engaged its principal accountant to perform audit services, audit-related services, tax services and other services during the past two fiscal years. “Audit services” refer to performing an audit of the registrant's annual financial statements or services that are normally provided by the accountant in connection with statutory and regulatory filings or engagements for those fiscal years. “Audit-related services” refer to the assurance and related services by the principal accountant that are reasonably related to the performance of the audit. “Tax services” refer to professional services rendered by the principal accountant for tax compliance, tax advice, and tax planning. No “other services” were provided by the principal accountant. The following table details the aggregate fees billed or expected to be billed for each of the last two fiscal years for audit fees, audit-related fees, tax fees and other fees by the principal accountant.
The audit committee has adopted pre-approval policies and procedures that require the audit committee to pre-approve all audit and non-audit services of the registrant, including services provided to any entity affiliated with the registrant.
The percentage of fees billed by Ernst & Young, LLP applicable to non-audit services pursuant to waiver of pre-approval requirement were as follows:
All of the principal accountant’s hours spent on auditing the registrant’s financial statements were attributed to work performed by full-time permanent employees of the principal accountant. (If more than 50 percent of the accountant’s hours were spent to audit the registrant's financial statements for the most recent fiscal year, state how many hours were attributed to work performed by persons other than the principal accountant's full-time, permanent employees.)
The following table indicates the non-audit fees billed or expected to be billed by the registrant’s accountant for services to the registrant and to the registrant’s investment adviser (and any other controlling entity, etc.—not sub-adviser) for the last two years. The audit committee of the board of directors has considered whether the provision of non-audit services that were rendered to the registrant's investment adviser is compatible with maintaining the principal accountant's independence and has concluded that the provision of such non-audit services by the accountant has not compromised the accountant’s independence.
Item 5. Audit Committee of Listed Registrants.
Not applicable to registrants who are not listed issuers (as defined in Rule 10A-3 under the Securities Exchange Act of 1934).
Item 6. Investments.
Schedule of Investments is included as part of the report to shareholders filed under Item 1 of this Form.
Item 7. Disclosure of Proxy Voting Policies and Procedures for Closed-End Management Investment Companies.
Not applicable to open-end investment companies.
Item 8. Portfolio Managers of Closed-End Management Investment Companies.
Not applicable to open-end investment companies.
Item 9. Purchases of Equity Securities by Closed-End Management Investment Company and Affiliated Purchasers.
Not applicable to open-end investment companies.
Item 10. Submission of Matters to a Vote of Security Holders.
Not Applicable.
Item 11. Controls and Procedures.
Item 12. Exhibits.
Pursuant to the requirements of the Securities Exchange Act of 1934 and the Investment Company Act of 1940, the registrant has duly caused this report to be signed on its behalf by the undersigned, thereunto duly authorized.
Pursuant to the requirements of the Securities Exchange Act of 1934 and the Investment Company Act of 1940, this report has been signed below by the following persons on behalf of the registrant and in the capacities and on the dates indicated.
* Print the name and title of each signing officer under his or her signature.