Annual Report
September 30, 2017
The Leuthold Funds
Leuthold Core Investment Fund
Retail Class Shares LCORX
Institutional Class Shares LCRIX
Leuthold Global Fund
Retail Class Shares GLBLX
Institutional Class Shares GLBIX
Leuthold Select Industries Fund LSLTX
Leuthold Global Industries Fund
Retail Class Shares LGINX
Institutional Class Shares LGIIX
Grizzly Short Fund GRZZX
The Leuthold Funds
Table of Contents
| 1 |
| | |
| 12 |
| | |
| 15 |
| | |
| 18 |
| | |
| 26 |
| | |
| 30 |
| | |
| 34 |
| | |
| 39 |
| | |
| Schedules of Investments and Securities Sold Short | |
| | |
| 47 |
| | |
| 59 |
| | |
| 68 |
| | |
| 72 |
| | |
| 77 |
| | |
| 81 |
| | |
| 96 |
| | |
| 97 |
| | |
| 98 |
The Leuthold Funds
Dear Fellow Shareholders:
One year ago, after months of buildup, the U.S. presidential election was a market-moving event. The commonly accepted wisdom, and feared for months in advance, was that a Trump win would crater the market. To the contrary, the Trump victory ignited a rally that was led by U.S. cyclicals; the smaller the market cap the better. Along with higher stock prices, bond yields jumped and the dollar surged in anticipation of Trump’s new policies.
Confidence likewise surged in the weeks following the presidential election, and 2017 commenced with fairly uniform intensity across all capitalization tiers and most equity sectors. Interest-sensitive groups—like Banks, Brokerage, and Insurers—also strengthened on a relative basis as bond yields climbed, suggesting that interest rates hadn’t moved up enough to provide serious competition for stocks.
Driven by an increase in consumer and business sentiment, global equities soared; international stocks, especially Emerging Markets, performed even better than U.S. stocks. The most impressive part may be that this happened in the face of the now-uncertain future of the Trump administration policies that boosted stocks at the end of 2016. While most of the attention was focused on Washington D.C. and Trump Twitter, the rest of the world was showing higher economic growth than expected.
Despite disappointments in fiscal policy and macro-economic data, the “Goldilocks” environment persevered. Global economic expansion broadened further, while inflation remained muted. Interest rates were well-contained despite multiple central banks embarking on the tightening path. A weaker dollar helped international stocks and loosened U.S. financial conditions. Our economic and market analyses together supported above-average exposure to equities, and our tactical portfolios were positioned this year with an average 65% in stocks—near the upper end of the strategy parameters.
The Leuthold Funds’ domestic and global long-equity strategies and tactical portfolios flourished in the environment of the last twelve months. The late phase of a bull market generally features well-defined trends in industry group leadership; this is an environment that’s ideal for our quantitative approach. Our equity portfolios were well ahead of their benchmarks for the year, with the models correctly capturing big moves in several sectors, while sidestepping underperformers. Despite the upward trajectory for risk assets, our short-only strategy also did not disappoint; it outperformed its peer fund category by a very wide margin, and convincingly surpassed the inverse comparators of the broad market indexes.
From a purely technical point of view, if a bear market is born in the near future, it would have to be considered the result of some sort of “immaculate conception.” New S&P 500 highs have been confirmed by all of the other benchmarks considered ‘critically needed’ to sustain the bull, and a secondary set of indexes that we consider less critical—but still ‘nice to have’ —has also been making new highs in virtual lockstep with the blue chips. There remain leaders and laggards, but that’s very different from saying there are major internal divergences.
While it doesn’t rule out the possibility of a short-term setback, this remarkable level of bullish “agreement” across the U.S. market stacks the odds heavily against an imminent cyclical top. Notwithstanding the higher risk, ever-pricier stock market valuations, it is evident that the bull market is beckoning for even more elevated levels before giving up the ghost.
Herein, we examine investment allocations and portfolio characteristics that materially influenced the performance of each Leuthold Fund strategy during the fiscal year ended September 30, 2017.
The Leuthold Funds - 2017 Annual Report | 1 |
ANNUAL PERFORMANCE REVIEW
Leuthold Core Investment Fund
Our market disciplines maintained a generally positive stance toward stocks for the fiscal year ended September 30, 2017; equity exposure was held in the upper bounds of the parameters, at 65% on average. Elevated stock valuations—the product of an eight and a half year old bull market—prompted us to stop short of the Fund’s 70% maximum level for equities that would normally accompany our bullish outlook.
For the fiscal year, the Leuthold Core Investment Fund posted a strong +14.31% total return (retail share class). This was markedly better than the Morningstar Tactical Allocation peer group +9.31% total return. Versus the fully-invested S&P 500 +18.61% total return, the Fund trailed by a spread of about 4%. Bearing in mind the Fund’s stock exposure is curbed at a level about one-third lower, we are very pleased with its relatively small performance deficit to the fully-invested benchmark.
The best performing portfolio component was U.S.-traded long stocks; the allocation, via the Leuthold Select Industries strategy, outdid both its peer-group average and the S&P 500. This is a turnaround from 2015-16 when the allocation substantially trailed both comparators. The year’s outperformance in this allocation is attributable almost entirely to its overweight sector positions in Information Technology and Industrials. More performance details related to this equity exposure can be found under the Leuthold Select Industries section.
U.S.-traded stock exposure is accompanied by the Fund’s long-time position in globally traded Emerging Market (EM) equities. This is an important diversification segment among global market opportunities. Having integrated it as a distinct equity subset twenty years ago, the Leuthold Core Investment Fund’s management team recognized the theme’s significance earlier than most.
The Fund held 6.2% on average in EM stocks during the fiscal year—almost double that of the prior year. The larger position was rewarded, as EM stocks maintained a steady track of recovery. Improving on the 2015-16 FY result of nearly +15%, this position’s last twelve months’ cumulative total return was +23%, nearly on par with the MSCI Emerging Market (EM) Index +25% total return. On a stand-alone return basis, this was the Fund’s number one performer; however, contribution to the Fund’s overall return translated to just +1.32% after factoring in its relatively minor share of portfolio assets.
| ● | China and South Korea were the Fund’s two most additive EM exposures with a joint contribution of +9.97%; this, however, trailed the benchmark’s respective exposure results (+11.47%). An overweight Hong Kong holding was an advantage over the benchmark’s exposure as it provided a meaningfully larger contribution, +3.02% versus +0.82%, respectively. Other heavyweight country allocations outperforming in the Fund, versus corresponding MSCI EM positions, included Poland, Greece, Chile, Thailand, and Turkey. |
| ● | Indian stocks, in general, had relatively strong results during the year but the Fund was underweight here. Moreover, based on the Fund’s particular holdings, India was its largest country detractor, providing a small loss. This indicates that while the country allocation was well-chosen, the Fund’s Indian stock selection was poor. Equity selection was likewise inferior with the Fund’s positions in Hungary, Mexico, and the Philippines; these contributed small losses to the Fund versus net gains of the respective MSCI EM holdings. The only other small country detractor to performance was the Fund’s Singapore holding. |
2 | The Leuthold Funds - 2017 Annual Report |
Due to the deterioration of a variety of Attitudinal measures we monitor, in late July the Fund incorporated a small equity hedge to position more defensively in the near-term. The hedge was value-added in August as Small and Mid Caps suffered losses, while Large Caps were flat. As the market rebounded in September, the hedge lost money, more than offsetting its prior month’s gain. The position’s overall net loss for the FY had negligible impact, as the brief holding period did not pull enough weight to make a difference. Overall, the hedge equated to an average 6% weight during the roughly two-month holding period.
Fixed income is determined by a top-down tactical allocation framework. A multi-factor model is employed to first evaluate “risk”and assess whether lower-risk vehicles, such as Developed Market government securities, or higher-risk vehicles (credits) should be favored. The lower-risk category includes nominal and inflation-linked government securities, whereas the higher-risk segment contains vehicles across a range of credit classes.
The Fund remained underweight fixed income through the year, and held very short duration. Multiple central banks have embarked on a tightening path, the Federal Reserve has lifted the Funds rate four times thus far, the Fed is also expected to soon begin contracting its expansive balance sheet, and yields are anticipated to continue on an upward trend. Considering the substantial risk, we don’t see any reason to be aggressive in this space. Over the last twelve months, fixed income was held at an average 22% of assets—a little higher than the 19% average during FY 2015-16. The position has been slowly creeping toward the Fund’s normal guideline minimum of 30%, but there is still a sizable gap to close. At present, the overall allocation is viewed as a shock absorber to potentially negative surprises in the equity market.
As a means of diversification, fixed income assets were distributed across a range of securities with varying risk profiles, including government securities and credits. Similar to the last two years, Developed Market Sovereign Debt was the largest subclass at 12% average weight. Quality Corporate Bonds, MBS Bond Funds, and Emerging Market Sovereign Debt were also full-year allocations with FY average weights of 4%, 2%, and 2%, respectively. Municipal Bonds and High Yield Bonds were sold before year end (partial-year average weights were each less than 1%). Collectively, the small gains and losses from these assorted fixed income components provided a relatively inconsequential net loss of seven basis points.
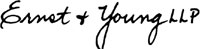
Leuthold Global Fund
This tactical allocation fund is the global counterpart of the Leuthold Core Investment Fund. In our quant work, U.S. and foreign stock market risk is evaluated by a single macro-analysis tool. Accordingly, major defensive (or offensive) asset allocation modifications described in this section will echo those of the Leuthold Core Investment Fund; investment vehicles, allocation weights, and performance may vary.
Our market disciplines maintained a generally positive stance toward stocks for the fiscal year ended September 30, 2017; equity exposure was held in the upper bounds of the parameters, at 65% on average. Elevated stock valuations—the product of an eight and a half year old bull market—prompted us to stop short of the Fund’s 70% maximum level for equities that would normally accompany our bullish outlook.
For the fiscal year, the Leuthold Global Fund produced a solid +12.02% total return (retail-share class), besting the Morningstar World Allocation average +8.36% total return. Versus the fully-invested MSCI All Country World Index (ACWI) +19.29% total return, the Fund trailed by a 7.3% spread. The Fund’s return computes to 62% of the gain in the MSCI ACWI, which is effectively explained by the percentage difference between the Fund’s lower average long stock exposure (65%) versus the index’s 100% stock portfolio.
The Leuthold Funds - 2017 Annual Report | 3 |
The best performing portfolio component was the Fund’s long stock exposure; the allocation, via the Leuthold Global Industries strategy, outdid both its peer-group average and the MSCI ACWI. This was a turnaround from 2015-16 when, despite strong returns for global equities, the Fund’s stocks substantially trailed its benchmark comparators. The last twelve months’ outperformance in this allocation is primarily attributable to its overweight positions in the Materials, Financials, and Industrials sectors. Additional performance details related to this holding are included in the Leuthold Global Industries section.
Due to the deterioration of a variety of Attitudinal measures we monitor, in late July the Fund incorporated an equity hedge to position more defensively for the near-term. The hedge was value-added in August as U.S. Small and Mid Caps suffered losses, while global Large Caps were relatively flat. As the market rebounded in September, the hedge lost money, more than offsetting its prior month’s gain. The position’s overall net loss for the FY had negligible impact, as the brief holding period did not pull enough weight to make a difference. Overall, the hedge equated to an average 6% weight during the roughly two-month holding period.
Fixed income is determined by a top-down tactical allocation framework. A multi-factor model is employed to first evaluate “risk” and assess whether lower-risk vehicles, such as Developed Market government securities, or higher-risk vehicles (credits) should be favored. The lower-risk category includes nominal and inflation-linked government securities, whereas the higher-risk segment contains vehicles across a range of credit classes.
Versus the normal guideline minimum, the Fund was underweight fixed income through the year, and held very short duration. Multiple central banks have embarked on a tightening path, the Federal Reserve has lifted the Funds rate four times thus far, the Fed is also expected to soon begin contracting its expansive balance sheet, and yields are anticipated to continue on an upward trend. Considering the substantial risk, we don’t see any reason to be aggressive in this space. Over the last twelve months, fixed income was held at an average 25% of assets—a little higher than the 24% average of 2015-16. This is still below the normal guideline minimum of 30%, but following a four-year string of 20% exposure levels (prior to late-2015), there has been progress toward closing the gap. The overall allocation continues to be viewed as a shock absorber to potentially negative surprises in the equity market.
As a means of diversification, fixed income assets were distributed across a range of securities with varying risk profiles, including government securities and credits. Similar to the last two years, Developed Market Sovereign Debt was the largest subclass at 14% average weight. Quality Corporate Bonds, MBS Bond Funds, and Emerging Market Sovereign Debt were also full-year allocations with FY average weights of 5%, 3%, and 3%, respectively. Municipal Bonds and High Yield Bonds were sold before year end (partial-year average weights were 0.6% and 1.2%, respectively). Collectively, the small gains and losses from these assorted fixed income components resulted in a relatively inconsequential net loss of two basis points.
Leuthold Select Industries Fund
This fully-invested portfolio composed of U.S.-traded stocks had a strong total return of +22.93% for the fiscal year ended September 30, 2017. The Fund outperformed its peer category, Morningstar Mid Cap Blend by a significant margin (+15.75% total return), and was value-added over the S&P 500 (+18.61% total return).
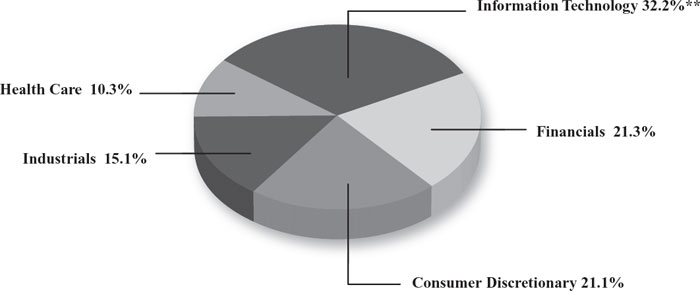
Three of the Fund’s heaviest equity-sector concentrations during the previous three fiscal years remained among the top four largest weights, on average, for the fourth year running: Information Technology, Consumer Discretionary, and Industrials. Financials replaced Health Care to round out the latest year’s top four weights; Health Care had consistent exposure, though it was held below market weight. There was a particularly large concentration of assets constrained to three of the Fund’s
4 | The Leuthold Funds - 2017 Annual Report |
heaviest-weighted sectors: Information Technology, Industrials, and Financials, which together comprised an average 71% portfolio weight. Alternatively, Materials and Utilities sector exposures were virtually nonexistent (average FY weights of 1.43% and 1.16%, respectively), and there was zero exposure to four major market sectors: Energy, Telecom, Consumer Staples, and Real Estate.
The Fund’s most additive industry group concentrations came from the Information Technology sector. Semiconductor Equipment was particularly strong, with three times better results than the next best IT group holdings: Electronic Manufacturing Services and Home Entertainment Software. The Industrials sector exposure was the second best concentration; the portfolio’s industry leaders from that sector were Aerospace & Defense, Airlines, Trading Companies & Distributors, and Railroads. The Financials, Health Care, and Consumer Discretionary leading portfolio industries were Banks, Managed Health Care, and Auto Parts & Equipment. Fund investments among these five sectors made up 97% of the year’s assets, on average; four of these sector concentrations combined to contribute a spread of 8% more to return than that of the corresponding sectors within the S&P 500.
None of the Fund’s sector concentrations contributed a loss to overall return. At the industry group level, there was only a handful among the Fund’s holdings which contributed losses. Combined, these results offset the overall FY gain by less than 1%. The largest portfolio group detractors were positions in Advertising, Homefurnishing Retail, and Semiconductors.
This portfolio construction of disproportionate sector weights versus the S&P 500 exemplifies the ‘concentrated assets’ approach intended to set the Fund strategy apart and add alpha. The quantitative methodology aims to identify themes that are in position to expand their market leadership and/or uphold existing positions of strength. More often than not, this is a very effective tactic.
The Fund’s fiscal year average weight of 10% to foreign-domiciled stocks (ADR/ADS traded on U.S. exchanges) had minimal fluctuation from one month to the next. Roughly 40% of this foreign exposure was in Emerging Markets (EM), unlike the prior two fiscal years when foreign exposure was almost exclusively from stocks of Developed Markets (DM). This year’s EM-based exposure primarily came from holdings via the Emerging Diversified Banks group. Concentrations in either DM or EM stocks are mostly arbitrary, the result of: 1) the composition of the groups identified as quantitatively attractive; and, 2) valuation appeal based on the quantitative stock selection model. Some industries are inclined to have a stronger presence in Developed Markets versus Emerging Markets, and vice versa.
The Fund had over two-thirds of assets exposed to just three of the eleven broad market sectors during the year, and these were the S&P 500’s top three performing sectors. Essentially absent from the Fund’s investments were four broad market sectors that equate to about 21% of the S&P 500 composition, but this deficiency had no relative adverse consequences on Fund performance. Over the long run, the Fund strategy has proven the advantage of centering on the themes it determines to be exhibiting the strongest leadership momentum, versus that of quasi-mirroring the exposures of the S&P 500 or other benchmark. As with all actively-managed styles, there will be market environments when the Fund’s approach does not prevail and Fund performance will disappoint.
The Fund’s sector heavyweights have been generally consistent since 2013, and relative to both the S&P 500 and its peer group comparator, the Leuthold Select Industries Fund has outperformed in four of the five fiscal years since that time. This additive relative performance reinforces the Fund’s methodology that longer-term equity leadership trends largely exist, and sticking with those themes, as long as the disciplines continue to assert the presence of underlying strength, can be rewarding.
The Leuthold Funds - 2017 Annual Report | 5 |
Leuthold Global Industries Fund
As stocks rallied worldwide, this globally-focused equity portfolio followed suit with a competitive total return of +20.90% for the fiscal year ended September 30, 2017 (retail-share class). The Fund outdid both the Morningstar World Large Stock average and the MSCI All Country World Index (ACWI) total returns of +17.68% and +19.29%, respectively.
The Fund’s overall FY outperformance masks three consecutive months of dreadfully lagging results from March-May, the result of temporarily disadvantageous positions in the Materials and Industrials sectors. That downside reversal dissolved the Fund’s previously extra-strong performance advantage; over that March-May period, the Fund relinquished nearly 400 basis points versus the MSCI ACWI, and nearly 500 basis points versus the Morningstar World Large Stock average. A crucial rebound for the Fund in June allowed it to recover an average of nearly 130 basis points against each benchmark, and it proceeded to lead in the remaining four months to claw back another 180 basis points on average, ending the fiscal year with a small performance edge.
The Fund’s last twelve months’ allotment to Developed Market (DM) countries was consistently in the 79% range. U.S.-traded stocks were the largest DM share (average 41%); this concentration hovered within a small spread of less than seven basis points, up or down, all year. In comparison, the 90% DM exposure of the MSCI ACWI held U.S. stocks at a higher level of 51%. Emerging Market (EM) holdings in the Fund, at 21% on average, were about twice the weight of the MSCI ACWI’s customary 10% allocation; however, despite EM stocks experiencing a powerful upswing all year, the Fund’s much heavier EM position didn’t likewise benefit to the same degree from its specific positions. The Fund’s combined contribution to return from its EM exposure amounted to just 68% of the gain contributed by the respective exposure of the MSCI EM benchmark’s smaller allocations.
At the broad sector level, only three exposures detracted from performance during the fiscal year (Telecom, Utilities, Real Estate), albeit the combined tally had minimal impact amounting to just under -1.25%. Meanwhile, the corresponding sector exposures in the MSCI ACWI were additive by 1.84%. On the up side, overweight allocations to Materials, Financials, Industrials, and Consumer Discretionary were the Fund’s leading sector contributors to return (+21% combined); these were also more additive to return than the MSCI ACWI counterparts, which provided a collective +11%. Information Technology, Energy, and Health Care exposures in the Fund added to gains, but to a lesser degree, and none of the three kept up with the benchmark’s corresponding sector gains.
From an industry group perspective, most of those providing the largest positive contributions to Fund return were constituents of the top sector contributors. From the Materials sector, strong contributors were Commodity Chemicals, Paper & Forest Products, and Steel. The top Financials groups included Emerging Diversified Banks, Diversified Financial Services, and Life & Health Insurance. Among the portfolio’s largest gainers from Industrials were Airlines and Trading Companies & Distributors, while the Fund’s Consumer Discretionary sector’s biggest contributors were Auto Components and Automobiles. Electronic Equipment & Instruments, from the Information Technology sector, rounds out the list of the most significant group outperformers. All of these group concentrations also outperformed the related MSCI ACWI positions by a considerable margin. Industries detracting the most from Fund performance were Real Estate Management & Development, Data Processing & Outsourced Services, Emerging Electric Utilities, Emerging Diversified Telecom Services, and Advertising.
Most foreign-focused funds concentrate on specific countries or regions. Segmenting the marketplace into specialized subsets, to limit the scope of expertise required, is a long-established approach used to manage the vast global universe of potential
6 | The Leuthold Funds - 2017 Annual Report |
investments. Alternatively, the Leuthold Global Industries Fund methodology allows it to incorporate all investable global equities in its universe of potential investments. For the most part, the Fund’s exposures to specific countries and regions of the world are not deliberately targeted. The goal of the Leuthold Global Industries Fund is to build concentrated investments in attractive industries, regardless of country-origin, and modify such exposure as opportunities evolve. We believe our country-impartial tactic will generate superior returns in the long run, as the Fund is not dependent on selecting from a compartmentalized group of stocks that may revolve in and out of favor, or be subject to the cyclical occurrences of regional or country-specific political and economic ups and downs. The entire investable global universe is at the Fund’s disposal, which we view as a distinct advantage. We summarize details of the meaningful exposures herein to assess how the Fund was geographically diversified—or specialized, however inadvertent.
On the whole, the Fund incorporated investments among 33 countries outside the U.S. during the fiscal year. U.S. stocks were the most additive to both the Fund and the benchmark return. Outside the U.S., the Fund’s relatively larger DM country exposure (and average weight) included Japan (10%), U.K. (6%), Hong Kong (3%), Germany (3%), Canada (3%), France (3%), and Australia (3%). Overweight Fund positions to Japan and Hong Kong (relative to the MSCI ACWI), resulted in far superior results than those country exposures of the benchmark. A relative overweight position in Finland was not a Fund advantage, however, as it severely lagged the return of the minuscule exposure of that held by the MSCI ACWI. This indicates that the country allocation, itself, wasn’t a relative detractor; rather, it was the Fund’s industry group/stock investments within Finland that were substandard. Underweight allocations to Switzerland and the Netherlands had opposite results. The Fund’s Swiss holdings (made up of miscellaneous sector exposures) trailed the benchmark, while the Fund’s Dutch allocation, primarily composed of Financials stocks, significantly outperformed the heavier country allocation of the MSCI ACWI. The Fund’s outperformance in the Netherland’s allocation suggests the Fund’s choice of industries/stocks was higher quality.
The Fund’s biggest EM country weights were South Korea (4%), Taiwan (3%), China (3%), Brazil (3%), and South Africa (2%). Versus the MSCI ACWI, the Fund’s materially heavier exposure to Thailand, Brazil, Malaysia, and South Korea paid off, contributing significantly more to return than corresponding MSCI ACWI exposure to those countries; however, relative overweight exposure to South Africa and Taiwan did not outperform the benchmark’s smaller allocations, which tells us the Fund’s group/stock selection was substandard versus the benchmark, not necessarily the country allocation, itself.
With no targeted-weight prerequisites, the Fund freely migrates across the spectrum of countries, a dynamic approach in contrast to the essentially static construction of the MSCI ACWI. Unlike the benchmark, this flexibility enables the Fund to change focus and/or fluidly shift portfolio characteristics if there are red flags to avoid certain industries, or to incorporate other concentrations when the quantitative disciplines draw attention to newly appealing investment themes.
With regards to the potential risk of currency fluctuations, the Leuthold Global Industries Fund does not implement special practices to circumvent the possibility of adverse influences. While some funds employ currency hedging programs, they are costly, and there is no assurance that such campaigns will be additive to performance. The Leuthold Global Industries Fund does, however, attempt to identify and capitalize on broad FX-market trends through a U.S. dollar-based relative strength component which is incorporated in the model. In recent years, U.S. dollar strength had been a headwind for a global equity portfolio that does not hedge currency exposure, like ours, but this year a weaker U.S. dollar added some tailwind. The effects of U.S. dollar strength/weakness should balance out over time.
In summary, our global-investment process is distinctive in that the quantitative analysis employed aims to identify attractive industries. The Fund attempts to profit from those themes by accumulating applicable exposure through reasonably-priced
The Leuthold Funds - 2017 Annual Report | 7 |
stocks which may be trading on any viable global stock exchange. Conventional global investment styles aim to assemble expertise in subclasses of equities, typically based on commonalities such as locale, and thereby have both less diversification and much smaller stock universes from which to pick. We believe the borderless approach of the Leuthold Global Industries Fund has an advantage over the traditional country-focused style.
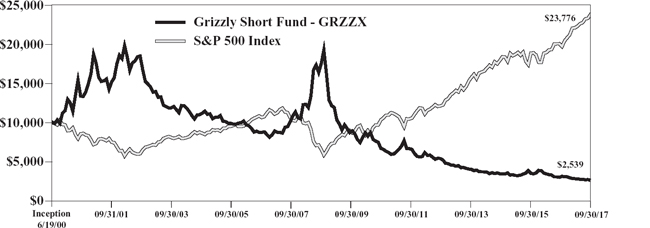
Grizzly Short Fund
This Fund is 100% short individual stocks; the goal is to profit when stock prices decline. For the fiscal year ended September 30, 2017, the Grizzly Short Fund produced a -12.97% total return; this is nearly two times better than its peer group average, the Morningstar Bear Market fund category, which returned -25.44%. The Fund also improved on the inverse results of both the S&P MidCap 400 and S&P 500 total returns of +17.52% and +18.61%, respectively. (Compared to inverse results of these two market indexes, the Grizzly Short Fund exceeded each by an average of 500 basis points).
In the past we’ve noted that a large performance difference between the Fund and a benchmark can be attributable to disproportionate market capitalization. With the Grizzly Short Fund more closely tracking the cap size of the S&P MidCap, historically performance between the two has been quite narrow, a reflection that the MidCap index serves as a more equitable comparator than the three-times larger S&P 500. Over the last two years, the extraordinarily broad nature of bull market breadth appears to have, at least temporarily, suspended this size trait as a performance factor.
Most of the Grizzly Short Fund’s sector allocations detracted from performance. Information Technology and Financials, both underweight versus the S&P 500, were the largest contributors to the twelve-month loss (-6% combined). Within the Financials exposure, the Fund’s investments amassed much deeper losses than the inverse S&P 500 holdings, but due to the Fund’s significantly lower overall exposure (average 6% weight versus S&P 500 14% weight), the downside effect was muted. The opposite occurred with the Information Technology exposure; the benchmark accumulated bigger losses among its Information Technology positions, hence the Fund’s selection of investments within the sector was superior (by losing less). These sectors’ collective contribution to Fund return being less negative than that of the associated S&P 500 sectors explains the bulk of the Grizzly Short Fund’s overall fiscal year relative outperformance. Among other sector exposure, Consumer Discretionary, Materials, Industrials, Telecom, and Health Care each tacked on -1.2% on average to the year’s loss. Energy, Real Estate, Utilities, and Consumer Staples positions were relatively flat. Among these, additional boosts to the Fund’s FY relative outperformance came from Consumer Staples, Utilities, Health Care, and Industrials sector holdings, which were additive (by losing 2% less) compared to the inverse S&P 500 sector allocations.
Out of the 235 stock positions that were held at one time or another over the course of the year, 65 had a positive contribution to Fund return and delivered a solid offset to the losing positions (+1,011 basis points). Those industry groups detracting the most were components of the Fund’s two biggest sector detractors: Financials’ Regional Banks and Investment Banking/ Brokerage groups, and the Information Technology groups of Internet Software & Services and Application Software. Pharmaceuticals and Health Care Equipment groups combined for the Fund’s largest group losers in its Health Care sector exposure.
Single industry group concentrations that provided the best returns (offsetting losses) were Apparel Accessories & Luxury Goods (Consumer Discretionary sector), Packaged Foods & Meats (Consumer Staples), and Biotechnology (Health Care). Within the Energy sector, the combined holdings of Oil & Gas Exploration and Oil & Gas Equipment also served to contribute a gain.
8 | The Leuthold Funds - 2017 Annual Report |
Typically, having well-defined sector overweights and/or underweights can be either a meaningful advantage or disadvantage with the Grizzly Short Fund. With the exception of Energy, this past year’s sector weighting divergences in the Fund (versus the S&P 500) were not very extensive. Energy’s huge underweight did serve the Fund well, as did the less pronounced Health Care underweight. None of the other tilts were particularly significant size-wise, or notable performance-wise. This comparatively low level of disproportionate sector weight versus the S&P 500 is likely the result of the deep-seated market breadth which developed this year, evidenced by the remarkable level of bullish agreement across capitalization tiers, sectors, styles, and factors.
The Grizzly Short Fund is an extremely disciplined methodology, with stock positions monitored on a daily basis. High turnover is characteristic; sector concentrations and industry-group compositions have the potential to fluctuate considerably, unlike the S&P 500 sector/group weights. Safeguards in the Fund include specific gain/loss constraints that trigger short-covering action to lock-in gains and/or stop losses, and sector and sub-industry group concentrations employ weighting restrictions as a means to avoid the vulnerability of being overexposed to a specific area. As opposed to a market-capitalization weighted index, such as the S&P 500, the Grizzly Short Fund stock positions are similarly weighted across the portfolio. It’s unlikely that a relatively small number of stocks could have an enormous effect on Fund performance, as can occur in a cap-weighted index, such as the YTD bias of six big Tech stocks (Alphabet, Microsoft, Amazon, Netflix, Facebook, and Apple) on the S&P 500, which are exclusively responsible for 24% of the index’s +16% return through late October.
The year’s seemingly unstoppable procession of new equity market highs tells us that the bull market is in an extended topping process, which is a challenging environment for short-sellers. Broadly rising stock prices lead to negative returns for the Grizzly Short Fund, yet, the Fund was value-added with solid outperformance versus the inverse of both the S&P 500 and S&P MidCap 400, and it was sharply ahead of its Morningstar peer group of bear market funds. Ultimately, market breadth will begin to deteriorate in advance of the final bull market peak, a condition which should greatly benefit the Grizzly Short Fund. Such a transition, however, does not appear to be imminent. For now, the Fund is positioned to pick out market laggards and take advantage of downside weakness, which is inevitable even as the market advances further and stock valuations get stretched to even higher highs.
Investors who are not experienced in short-selling and who do not monitor for changing risk profiles should consider one of our tactical asset allocation funds: the Leuthold Core Investment Fund or the Leuthold Global Fund. These diversified Funds have the latitude to implement this short-selling strategy within their portfolio allocations to hedge downside equity risk when the stock market is viewed as overvalued and vulnerable to a correction.
Year Of The G.O.A.T.?
The stock market began October with a surge into the S&P 500 target zone of 2,550-2,600 that we established at the beginning of 2017, and it did so with the backing of much broader leadership than we had expected at the onset of the year. Blue chip stocks (both domestic and international) have been the biggest winners—which fits the historical tendency for those stocks to perform well in the late stages of a cyclical bull market. But, Mid and Small Caps managed to match the blue chips’ gains over the last three months after lagging during the first half of 2017.
The newest bull market highs recorded in late October were some of the broadest we’ve observed throughout the entire eight and a half year bull market, extending beyond the capitalization tier subsets to include traditional leading groups like Transportation stocks, Banks, and Utilities, along with various cyclical industries that have also tended to roll over prior to the
The Leuthold Funds - 2017 Annual Report | 9 |
final bull market peak. From the perspective of pure price action, the latest market highs look nothing like those observed at the last several bull market peaks. In each of those instances, the market had suffered significant “internal” damage by the time the S&P 500 and Dow Jones Industrial Average made their final highs; secondary stocks and various bellwether industry groups usually underperform for many months in advance.
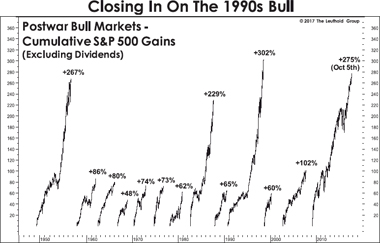
Based solely on the market’s favorable momentum, breadth, and leadership trends, we expect stocks to be trading at even higher levels in the next three to six months. But these bullish “technical” considerations have been partly offset by deterioration in our Intrinsic Value measures. The current 20-month bull market rally commenced from valuation levels that were already fairly lofty, and the breadth of the upside move—while bullish from a technical point of view—has resulted in a market that is now more broadly overvalued than even that of the late 1990s’ market mania.
Valuations are not the stock market’s only challenge. With the U.S. unemployment rate recently falling to the 4.2% level, we must consider the likelihood that this cycle’s best news on inflation and corporate profitability may already be behind us. In fact, several of our economic measures have reached thresholds where they’ve historically proven “too hot” for both the stock and bond markets. Our leading inflation indicators continue to trend slowly upward, and the Federal Reserve will soon announce the details of its plan to begin to shrink the $4.5 trillion balance sheet it built up during the years of Quantitative Easing. It’s difficult to imagine that even a small liquidation of the Fed’s massive bond holdings will be pulled-off without some stock market hitch.
In this cycle, the Fed has been notorious for “moving the goalposts,” regarding which economic conditions are required for rate hikes. That, in turn, requires us to move our goalpost by 100 S&P 500 points, to a 2017 year-end zone of 2,650-2,700. If the S&P 500 notches a close above 2,717, this bull market will become the Greatest (postwar) cyclical bull Of All Time—eclipsing even the 1990-1998 gain of 302%. It’s already been a good year for the G.O.A.T., with Tom Brady, Roger Federer, and Floyd Mayweather all cementing their claims. With the S&P 500 less than 7% away from the requisite threshold, why not?
10 | The Leuthold Funds - 2017 Annual Report |
Thank you for your interest and support of the Leuthold Funds. We welcome your comments and questions.
Sincerely,
Doug Ramsey, CFA, CMT
CIO & Co-Portfolio Manager
| | |
| Chun Wang, CFA, PRM | Jun Zhu, CFA | Greg Swenson, CFA |
| Co-Portfolio Manager | Co-Portfolio Manager | Co-Portfolio Manager |
Kristen Perleberg, CFA
Co-Portfolio Manager
The Leuthold Funds - 2017 Annual Report | 11 |
The Leuthold Funds
Expense Examples – September 30, 2017 (Unaudited)
As a shareholder of the Funds, you incur two types of costs: (1) transaction costs, including reinvested dividends, or other distributions; redemption fees; and exchange fees; and (2) ongoing costs, including management fees; distribution and/or service fees; and other Fund expenses. This example is intended to help you understand your ongoing costs (in dollars) of investing in the Funds and to compare costs with the ongoing costs of investing in other mutual funds.
The Example is based on an investment of $1,000 invested at the beginning of the period and held the entire period (April 1, 2017 – September 30, 2017).
Actual Expenses
The first line of the following table provides information about actual account values and actual expenses. Although the Funds charge no sales load (the Leuthold Core Investment Fund, Leuthold Global Fund, and Leuthold Global Industries Fund charge a 2% redemption fee for redemptions made within five business days after a purchase), you will be assessed fees for outgoing wire transfers, returned checks, or stop payment orders at prevailing rates charged by U.S. Bancorp Fund Services, LLC, the Funds’ transfer agent. If you request a redemption be made by wire transfer, currently a $15.00 fee is charged by the Funds’ transfer agent. To the extent that the Funds invest in shares of other investment companies as part of its investment strategy, you will indirectly bear your proportionate share of any fees and expenses charged by the underlying funds in which a Fund invests in addition to the expenses of the Fund. Actual expenses of the underlying funds are expected to vary by fund. These expenses are not included in the following examples. The examples include, but are not limited to, management fees, shareholder servicing fees, fund accounting, custody, and transfer agent fees. However, the following examples do not include portfolio trading commissions and related expenses, and extraordinary expenses as determined under generally accepted accounting principles. You may use the information in this line, together with the amount you invested, to estimate the expenses that you paid over the period. Simply divide your account value by $1,000 (for example, an $8,600 account value divided by $1,000 = 8.6), then multiply the result by the number in the first line under the heading entitled “Expenses Paid During Period” to estimate the expenses you paid on your account during this period.
Hypothetical Examples for Comparison Purposes
The second line of the following tables provide information about hypothetical account values and hypothetical expenses based on the Funds’actual expense ratios and an assumed rate of return of 5% per year before expenses, which is not the Funds’ actual return. The hypothetical account values and expenses may not be used to estimate the actual ending account balance or expenses you paid for the period. You may use this information to compare the ongoing costs of investing in the Funds and other funds. To do so, compare this 5% hypothetical example with the 5% hypothetical examples that appear in the shareholder reports of the other funds.
Please note that the expenses shown in the tables are meant to highlight your ongoing costs only and do not reflect any transactional costs, such as redemption fees or exchange fees. Therefore, the second line of the tables is useful in comparing ongoing costs only, and will not help you determine the relative costs of owning different funds. In addition, if these transactional costs were included, your costs would have been higher.
12 | The Leuthold Funds - 2017 Annual Report |
The Leuthold Funds
Expense Example Tables (Unaudited)
Leuthold Core Investment Fund - Retail Class - LCORX
| | | Beginning
Account Value
April 1, 2017 | | | Ending
Account Value
September 30, 2017 | | | Expenses Paid
During Period*
April 1, 2017 - September 30, 2017 | |
| Actual** | | $ | 1,000.00 | | | | $ | 1,082.40 | | | | $ | 6.42 | | |
| Hypothetical (5% return before expenses)*** | | | 1,000.00 | | | | | 1,018.90 | | | | | 6.23 | | |
* Expenses are equal to the Fund’s annualized expense ratio of 1.23%, multiplied by the average account value over the period, multiplied by 183/365 to reflect the one-half year period.
** Excluding dividends and interest on securities sold short, your actual cost of investment in the Fund would be $6.16 and the Fund’s annualized expense ratio would be 1.18%.
*** Excluding dividends and interest on securities sold short, your hypothetical cost of investment in the Fund would be $5.97 and the Fund’s annualized expense ratio would be 1.18%.
Leuthold Core Investment Fund - Institutional Class - LCRIX
| | | Beginning
Account Value
April 1, 2017 | | | Ending
Account Value
September 30, 2017 | | | Expenses Paid
During Period*
April 1, 2017 - September 30, 2017 | |
| Actual** | | $ | 1,000.00 | | | | $ | 1,083.10 | | | | $ | 5.90 | | |
| Hypothetical (5% return before expenses)*** | | | 1,000.00 | | | | | 1,019.40 | | | | | 5.72 | | |
* Expenses are equal to the Fund’s annualized expense ratio of 1.13%, multiplied by the average account value over the period, multiplied by 183/365 to reflect the one-half year period.
** Excluding dividends and interest on securities sold short, your actual cost of investment in the Fund would be $5.64 and the Fund’s annualized expense ratio would be 1.08%.
*** Excluding dividends and interest on securities sold short, your hypothetical cost of investment in the Fund would be $5.47 and the Fund’s annualized expense ratio would be 1.08%.
Leuthold Global Fund - Retail Class - GLBLX
| | | Beginning
Account Value
April 1, 2017 | | | Ending
Account Value
September 30, 2017 | | | Expenses Paid
During Period*
April 1, 2017 - September 30, 2017 | |
| Actual** | | $ | 1,000.00 | | | | $ | 1,069.10 | | | | $ | 7.26 | | |
| Hypothetical (5% return before expenses)*** | | | 1,000.00 | | | | | 1,018.05 | | | | | 7.08 | | |
* Expenses are equal to the Fund’s annualized expense ratio of 1.40%, multiplied by the average account value over the period, multiplied by 183/365 to reflect the one-half year period.
** Excluding dividends and interest on securities sold short, your actual cost of investment in the Fund would be $7.21 and the Fund’s annualized expense ratio would be 1.39%.
*** Excluding dividends and interest on securities sold short, your hypothetical cost of investment in the Fund would be $7.03 and the Fund’s annualized expense ratio would be 1.39%.
Leuthold Global Fund - Institutional Class - GLBIX
| | | Beginning
Account Value April 1, 2017 | | | Ending
Account Value
September 30, 2017 | | | Expenses Paid
During Period*
April 1, 2017 - September 30, 2017 | |
| Actual** | | $ | 1,000.00 | | | | $ | 1,070.20 | | | | $ | 6.49 | | |
| Hypothetical (5% return before expenses)*** | | | 1,000.00 | | | | | 1,018.80 | | | | | 6.33 | | |
* Expenses are equal to the Fund’s annualized expense ratio of 1.25%, multiplied by the average account value over the period, multiplied by 183/365 to reflect the one-half year period.
** Excluding dividends and interest on securities sold short, your actual cost of investment in the Fund would be $6.44 and the Fund’s annualized expense ratio would be 1.24%.
*** Excluding dividends and interest on securities sold short, your hypothetical cost of investment in the Fund would be $6.28 and the Fund’s annualized expense ratio would be 1.24%.
| The Leuthold Funds - 2017 Annual Report | 13 |
The Leuthold Funds
Expense Example Tables (Unaudited) (continued)
Leuthold Select Industries Fund - Retail Class - LSLTX
| | | Beginning
Account Value April 1, 2017 | | | Ending
Account Value
September 30, 2017 | | | Expenses Paid
During Period*
April 1, 2017 - September 30, 2017 | |
| Actual | | $ | 1,000.00 | | | | $ | 1,111.50 | | | | $ | 7.94 | | |
| Hypothetical (5% return before expenses) | | | 1,000.00 | | | | | 1,017.55 | | | | | 7.59 | | |
* Expenses are equal to the Fund’s annualized expense ratio of 1.50%, multiplied by the average account value over the period, multiplied by 183/365 to reflect the one-half year period.
Leuthold Global Industries Fund - Retail Class - LGINX
| | | Beginning
Account Value April 1, 2017 | | | Ending
Account Value
September 30, 2017 | | | Expenses Paid
During Period*
April 1, 2017 - September 30, 2017 | |
| Actual | | $ | 1,000.00 | | | | $ | 1,097.50 | | | | $ | 7.89 | | |
| Hypothetical (5% return before expenses) | | | 1,000.00 | | | | | 1,017.55 | | | | | 7.59 | | |
* Expenses are equal to the Fund’s annualized expense ratio of 1.50%, multiplied by the average account value over the period, multiplied by 183/365 to reflect the one-half year period.
Leuthold Global Industries Fund - Institutional Class - LGIIX
| | | Beginning
Account Value April 1, 2017 | | | Ending
Account Value
September 30, 2017 | | | Expenses Paid
During Period*
April 1, 2017 - September 30, 2017 | |
| Actual | | $ | 1,000.00 | | | | $ | 1,098.90 | | | | $ | 6.58 | | |
| Hypothetical (5% return before expenses) | | | 1,000.00 | | | | | 1,018.80 | | | | | 6.33 | | |
* Expenses are equal to the Fund’s annualized expense ratio of 1.25%, multiplied by the average account value over the period, multiplied by 183/365 to reflect the one-half year period.
Grizzly Short Fund - GRZZX
| | | Beginning
Account Value
April 1, 2017 | | | Ending
Account Value
September 30, 2017 | | | Expenses Paid
During Period*
April 1, 2017 - September 30, 2017 | |
Actual** | | $ | 1,000.00 | | | | $ | 925.90 | | | | $ | 13.18 | | |
Hypothetical (5% return before expenses)*** | | | 1,000.00 | | | | | 1,011.38 | | | | | 13.77 | | |
* Expenses are equal to the Fund’s annualized expense ratio of 2.73%, multiplied by the average account value over the period, multiplied by 183/365 to reflect the one-half year period.
** Excluding dividends and interest on securities sold short, your actual cost of investment in the Fund would be $7.48 and the Fund’s annualized expense ratio would be 1.55%.
*** Excluding dividends and interest on securities sold short, your hypothetical cost of investment in the Fund would be $7.84 and the Fund’s annualized expense ratio would be 1.55%.
| 14 | The Leuthold Funds - 2017 Annual Report |
The Leuthold Funds
(Unaudited)
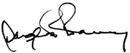
Leuthold Core Investment Fund
Allocation of Portfolio Holdings
September 30, 2017
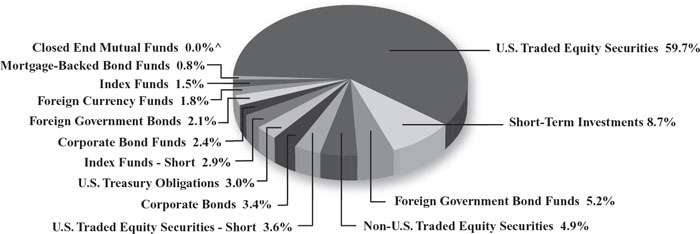
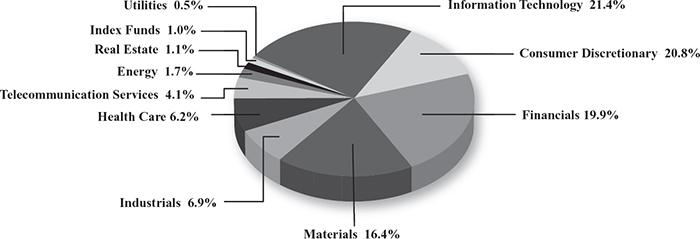
Leuthold Global Fund
Allocation of Portfolio Holdings
September 30, 2017
^ Amount is less than 0.05%.
The Leuthold Funds - 2017 Annual Report | 15 |
The Leuthold Funds
(Unaudited)
Leuthold Select Industries Fund
Allocation of Portfolio Holdings
September 30, 2017*
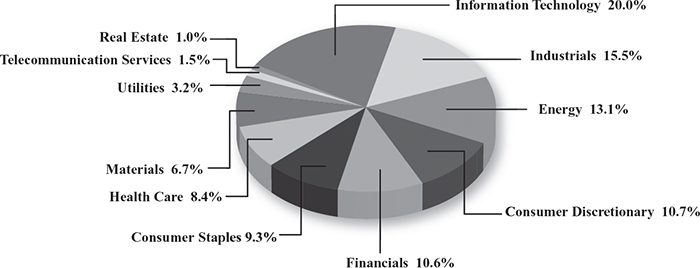
Leuthold Global Industries Fund
Allocation of Portfolio Holdings
September 30, 2017*
* Excludes short-term investments less than 5% of net assets.
** For presentation purposes, the Fund has grouped some of the industry classifications. For purposes of categorizing securities for compliance with Section 8(b)(1) of the Investment Company Act of 1940, the Fund uses more specific industry classifications.
16 | The Leuthold Funds - 2017 Annual Report |
The Leuthold Funds
(Unaudited)
Grizzly Short Fund
Allocation of Securities Sold Short
September 30, 2017
The Leuthold Funds - 2017 Annual Report | 17 |
| Leuthold Core Investment Fund - Retail Class - LCORX |
(Unaudited)
Average Annual Rate of Return For Periods Ended
September 30, 2017
| | | 1 Year | | 3 Year | | 5 Year | | 10 Year | | Since
Inception |
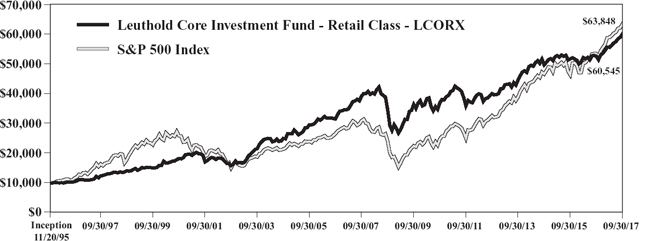
| Leuthold Core Investment Fund - Retail Class - LCORX | | 14.31% | | 6.56% | | 8.47% | | 4.38% | | 8.59% |
| Lipper Flexible Portfolio Fund Index | | 12.17% | | 5.43% | | 7.43% | | 4.86% | | 6.52% |
| S&P 500 Index | | 18.61% | | 10.81% | | 14.22% | | 7.44% | | 8.85% |
| Morningstar Tactical Allocation Index | | 9.31% | | 3.38% | | 4.89% | | 3.34% | | 5.12% |
| Bloomberg Barclays Global Aggregate Index | | (1.26)% | | 1.30% | | 0.48% | | 3.31% | | 4.61% |
A $10,000 investment in the Leuthold Core Investment Fund – Retail Class - LCORX
The Lipper Flexible Portfolio Funds Index is composed of funds that allocate investments across various asset classes with a focus on total return, as defined by Lipper.
The S&P 500 Index is an unmanaged capitalization-weighted index of 500 stocks designed to measure performance of the broad domestic economy through changes in the aggregate market value of the 500 stocks, which represent all major industries.
The Morningstar Tactical Allocation Index is comprised of funds that incorporate a tactical asset allocation strategy which is the process by which the asset of a fund is changed on a short-term basis to take advantage of perceived differences in relative values of the various asset classes.
The Bloomberg Barclays Global Aggregate Index provides a broad-based measure of the global investment grade fixed-rate debt markets. It is comprised of the U.S. Aggregate, Pan-European Aggregate, the Asian-Pacific Aggregate Indices, and the Canadian Aggregate Indices. It also includes a wide range of standard and customized sub-indices by liquidity constraint, sector, quality, and maturity.
This chart assumes an initial gross investment of $10,000 made on September 30, 2007. Returns shown include the reinvestment of all dividends. The Fund’s past performance is not necessarily an indication of its future performance. It may perform better or worse in the future. The graph and the table do not reflect the deduction of taxes that a shareholder would pay on Fund distributions or the redemption of shares.
18 | The Leuthold Funds - 2017 Annual Report |
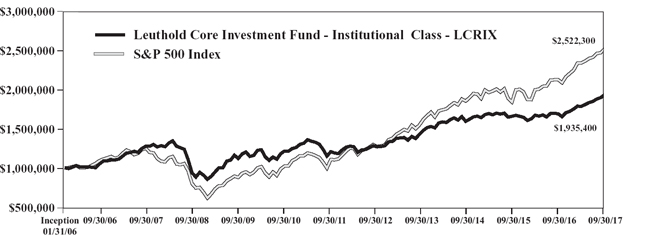
Leuthold Core Investment Fund - Institutional Class - LCRIX
(Unaudited)
Average Annual Rate of Return For Periods Ended
September 30, 2017
| | | | | | | | | | | |
| | | 1 Year | | 3 Year | | 5 Year | | 10 Year | | Since
Inception |
| Leuthold Core Investment Fund - Institutional Class - LCRIX | | 14.43% | | 6.66% | | 8.58% | | 4.49% | | 5.82% |
| Lipper Flexible Portfolio Fund Index | | 12.17% | | 5.43% | | 7.43% | | 4.86% | | 5.79% |
| S&P 500 Index | | 18.61% | | 10.81% | | 14.22% | | 7.44% | | 8.26% |
| Morningstar Tactical Allocation Index | | 9.31% | | 3.38% | | 4.89% | | 3.34% | | 3.47% |
| Bloomberg Barclays Global Aggregate Index | | (1.26)% | | 1.30% | | 0.48% | | 3.31% | | 3.81% |
A $1,000,000 investment in the Leuthold Core Investment Fund – Institutional Class - LCRIX
The Lipper Flexible Portfolio Funds Index is composed of funds that allocate investments across various asset classes with a focus on total return, as defined by Lipper.
The S&P 500 Index is an unmanaged capitalization-weighted index of 500 stocks designed to measure performance of the broad domestic economy through changes in the aggregate market value of the 500 stocks, which represent all major industries.
The Morningstar Tactical Allocation Index is comprised of funds that incorporate a tactical asset allocation strategy which is the process by which the asset of a fund is changed on a short-term basis to take advantage of perceived differences in relative values of the various asset classes.
The Bloomberg Barclays Global Aggregate Index provides a broad-based measure of the global investment grade fixed-rate debt markets. It is comprised of the U.S. Aggregate, Pan-European Aggregate, the Asian-Pacific Aggregate Indices, and the Canadian Aggregate Indices. It also includes a wide range of standard and customized sub-indices by liquidity constraint, sector, quality, and maturity.
This chart assumes an initial gross investment of $1,000,000 made on September 30, 2007. Returns shown include the reinvestment of all dividends. The Fund’s past performance is not necessarily an indication of its future performance. It may perform better or worse in the future. The graph and the table do not reflect the deduction of taxes that a shareholder would pay on Fund distributions or the redemption of shares.
The Leuthold Funds - 2017 Annual Report | 19 |
Leuthold Global Fund - Retail Class - GLBLX
(Unaudited)
Average Annual Rate of Return For Periods Ended
September 30, 2017
| | | 1 Year | | 3 Year | | 5 Year | | Since
Inception | |
| Leuthold Global Fund - Retail Class - GLBLX | | 12.02% | | 4.01% | | 6.82% | | 5.08% | |
| MSCI ACWI | | 19.29% | | 8.02% | | 10.79% | | 6.36% | |
| Bloomberg Barclays Global Aggregate Index | | (1.26)% | | 1.30% | | 0.48% | | 2.86% | |
| S&P 500 Index | | 18.61% | | 10.81% | | 14.22% | | 9.91% | |
A $10,000 investment in the Leuthold Global Fund - Retail Class - GLBLX
The MSCI ACWI (All Country World Index) is a free float-adjusted market capitalization weighted index that is designed to measure the equity market performance of developed and emerging markets. The MSCI ACWI consists of 47 country indices comprising 23 developed and 24 emerging market country indices. The developed market country indices included are: Australia, Austria, Belgium, Canada, Denmark, Finland, France, Germany, Hong Kong, Ireland, Israel, Italy, Japan, Netherlands, New Zealand, Norway, Portugal, Singapore, Spain, Sweden, Switzerland, the United Kingdom, and the United States. The emerging market country indices included are: Brazil, Chile, China, Colombia, Czech Republic, Egypt, Greece, Hungary, India, Indonesia, Korea, Malaysia, Mexico, Pakistan, Peru, Philippines, Poland, Qatar, Russia, South Africa, Taiwan, Thailand, Turkey, and United Arab Emirates.
The Bloomberg Barclays Global Aggregate Index provides a broad-based measure of the global investment grade fixed-rate debt markets. It is comprised of the U.S. Aggregate, Pan-European Aggregate, the Asian-Pacific Aggregate Indices, and the Canadian Aggregate Indices. It also includes a wide range of standard and customized sub-indices by liquidity constraint, sector, quality, and maturity.
The S&P 500 Index is an unmanaged capitalization-weighted index of 500 stocks designed to measure performance of the broad domestic economy through changes in the aggregate market value of the 500 stocks, which represent all major industries.
This chart assumes an initial gross investment of $10,000 made on July 1, 2008 (commencement of operations). Returns shown include the reinvestment of all dividends. The Fund’s past performance is not necessarily an indication of its future performance. It may perform better or worse in the future. The graph and the table do not reflect the deduction of taxes that a shareholder would pay on Fund distributions or the redemption of shares.
20 | The Leuthold Funds - 2017 Annual Report |
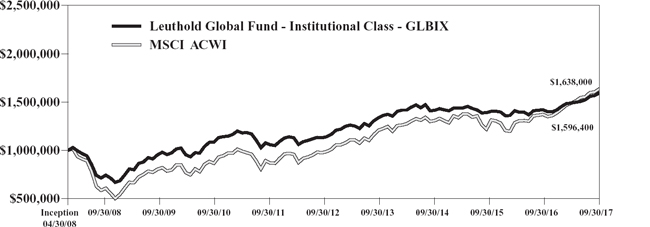
Leuthold Global Fund - Institutional Class - GLBIX
(Unaudited)
Average Annual Rate of Return For Periods Ended
September 30, 2017
| | | | | | | | | | |
| | | 1 Year | | 3 Year | | 5 Year | | Since
Inception | |
| Leuthold Global Fund - Institutional Class - GLBIX | | 12.28% | | 4.23% | | 7.06% | | 5.09% | |
| MSCI ACWI | | 19.29% | | 8.02% | | 10.79% | | 5.38% | |
| Bloomberg Barclays Global Aggregate Index | | (1.26)% | | 1.30% | | 0.48% | | 2.68% | |
| S&P 500 Index | | 18.61% | | 10.81% | | 14.22% | | 8.90% | |
A $1,000,000 investment in the Leuthold Global Fund - Institutional Class - GLBIX
The MSCI ACWI (All Country World Index) is a free float-adjusted market capitalization weighted index that is designed to measure the equity market performance of developed and emerging markets. The MSCI ACWI consists of 47 country indices comprising 23 developed and 24 emerging market country indices. The developed market country indices included are: Australia, Austria, Belgium, Canada, Denmark, Finland, France, Germany, Hong Kong, Ireland, Israel, Italy, Japan, Netherlands, New Zealand, Norway, Portugal, Singapore, Spain, Sweden, Switzerland, the United Kingdom, and the United States. The emerging market country indices included are: Brazil, Chile, China, Colombia, Czech Republic, Egypt, Greece, Hungary, India, Indonesia, Korea, Malaysia, Mexico, Pakistan, Peru, Philippines, Poland, Qatar, Russia, South Africa, Taiwan, Thailand, Turkey, and United Arab Emirates.
The Bloomberg Barclays Global Aggregate Index provides a broad-based measure of the global investment grade fixed-rate debt markets. It is comprised of the U.S. Aggregate, Pan-European Aggregate, the Asian-Pacific Aggregate Indices, and the Canadian Aggregate Indices. It also includes a wide range of standard and customized sub-indices by liquidity constraint, sector, quality, and maturity.
The S&P 500 Index is an unmanaged capitalization-weighted index of 500 stocks designed to measure performance of the broad domestic economy through changes in the aggregate market value of the 500 stocks, which represent all major industries.
This chart assumes an initial gross investment of $1,000,000 made onApril 30, 2008 (commencement of operations). Returns shown include the reinvestment of all dividends. The Fund’s past performance is not necessarily an indication of its future performance. It may perform better or worse in the future. The graph and the table do not reflect the deduction of taxes that a shareholder would pay on Fund distributions or the redemption of shares.
The Leuthold Funds - 2017 Annual Report | 21 |
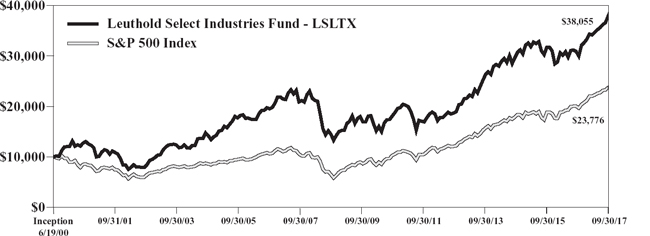
Leuthold Select Industries Fund - LSLTX
(Unaudited)
Average Annual Rate of Return For Periods Ended
September 30, 2017
| | | 1 Year | | 3 Year | | 5 Year | | 10 Year | | Since
Inception |
| Leuthold Select Industries Fund - LSLTX | | 22.93% | | 10.07% | | 15.10% | | 5.29% | | 8.04% |
| Russell 2000 Index | | 20.74% | | 12.18% | | 13.79% | | 7.85% | | 7.68% |
| Lipper Multi-Cap Core Funds Index | | 17.81% | | 9.46% | | 13.25% | | 6.67% | | 5.40% |
| S&P 500 Index | | 18.61% | | 10.81% | | 14.22% | | 7.44% | | 5.14% |
A $10,000 investment in the Leuthold Select Industries Fund - LSLTX
The Russell 2000 Index is comprised of approximately 2000 of the smallest companies in the Russell 3000 Index, representing approximately 10% of the Russell 3000 total market capitalization.
The Lipper Multi-Cap Core Funds Index is an average of funds that invest in a variety of market capitalization ranges without concentrating 75% of their equity assets in any one market capitalization range over an extended period of time. Multi-cap funds typically have between 25% and 75% of their assets invested in companies with market capitalizations (on a three-year weighted basis) above 300% of the dollar-weighted median market capitalization of the middle 1,000 securities of the S&P SuperComposite 1500 Index. These funds typically have an average price-to-earnings ratio, price-to-book ratio, and three-year sales-per-share growth value, compared to the S&P SuperComposite 1500 Index.
The S&P 500 Index is an unmanaged capitalization-weighted index of 500 stocks designed to measure performance of the broad domestic economy through changes in the aggregate market value of the 500 stocks, which represent all major industries.
This chart assumes an initial gross investment of $10,000 made on September 30, 2007. Returns shown include the reinvestment of all dividends. The Fund’s past performance is not necessarily an indication of its future performance. It may perform better or worse in the future. The graph and the table do not reflect the deduction of taxes that a shareholder would pay on Fund distributions or the redemption of shares.
22 | The Leuthold Funds - 2017 Annual Report |
Leuthold Global Industries Fund - Retail Class - LGINX
(Unaudited)
Average Annual Rate of Return For Periods Ended
September 30, 2017
| | | 1 Year | | 3 Year | | 5 Year | | Since Inception | |
| Leuthold Global Industries Fund - Retail Class - LGINX | | 20.90% | | 6.72% | | 12.22% | | 10.33% | |
| MSCI ACWI | | 19.29% | | 8.02% | | 10.79% | | 10.36% | |
| Lipper Global Multi-Cap Value Index | | 18.12% | | 6.00% | | 10.21% | | 9.56% | |
| S&P 500 Index | | 18.61% | | 10.81% | | 14.22% | | 13.78% | |
A $10,000 investment in the Leuthold Global Industries Fund - Retail Class - LGINX
The MSCI ACWI (All Country World Index) is a free float-adjusted market capitalization weighted index that is designed to measure the equity market performance of developed and emerging markets. The MSCI ACWI consists of 47 country indices comprising 23 developed and 24 emerging market country indices. The developed market country indices included are: Australia, Austria, Belgium, Canada, Denmark, Finland, France, Germany, Hong Kong, Ireland, Israel, Italy, Japan, Netherlands, New Zealand, Norway, Portugal, Singapore, Spain, Sweden, Switzerland, the United Kingdom, and the United States. The emerging market country indices included are: Brazil, Chile, China, Colombia, Czech Republic, Egypt, Greece, Hungary, India, Indonesia, Korea, Malaysia, Mexico, Pakistan, Peru, Philippines, Poland, Qatar, Russia, South Africa, Taiwan, Thailand, Turkey, and United Arab Emirates.
The Lipper Global Multi-Cap Value Index is an index that measures investment in a variety of market capitalization ranges without concentrating 75% of their equity assets in any one market capitalization range over an extended period of time. Typically this index has 25% to 75% of their assets invested in companies both inside and outside of the U.S. with market capitalizations (on a three-year weighted basis) above 400% of the 75th market capitalization percentile of the S&P/Citigroup World Broad Market Index.
The S&P 500 Index is an unmanaged capitalization-weighted index of 500 stocks designed to measure performance of the broad domestic economy through changes in the aggregate market value of the 500 stocks, which represent all major industries.
This chart assumes an initial gross investment of $10,000 made on May 17, 2010 (commencement of operations). Returns shown include the reinvestment of all dividends. The Fund’s past performance is not necessarily an indication of its future performance. It may perform better or worse in the future. The graph and the table do not reflect the deduction of taxes that a shareholder would pay on Fund distributions or the redemption of shares.
The Leuthold Funds - 2017 Annual Report | 23 |
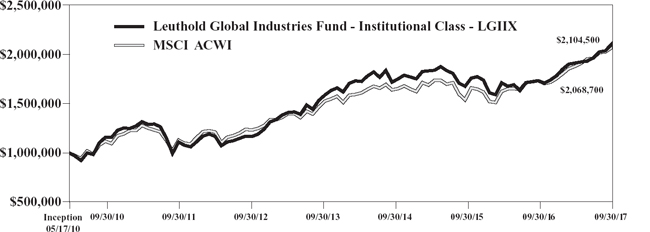
Leuthold Global Industries Fund - Institutional Class - LGIIX
(Unaudited)
Average Annual Rate of Return For Periods Ended
September 30, 2017
| | | 1 Year | | 3 Year | | 5 Year | | Since Inception | |
| Leuthold Global Industries Fund - Institutional Class - LGIIX | | 21.25% | | 6.96% | | 12.48% | | 10.62% | |
| MSCI ACWI | | 19.29% | | 8.02% | | 10.79% | | 10.36% | |
| Lipper Global Multi-Cap Value Index | | 18.12% | | 6.00% | | 10.21% | | 9.56% | |
| S&P 500 Index | | 18.61% | | 10.81% | | 14.22% | | 13.78% | |
A $1,000,000 investment in the Leuthold Global Industries Fund - Institutional Class - LGIIX
The MSCI ACWI (All Country World Index) is a free float-adjusted market capitalization weighted index that is designed to measure the equity market performance of developed and emerging markets. The MSCI ACWI consists of 47 country indices comprising 23 developed and 24 emerging market country indices. The developed market country indices included are: Australia, Austria, Belgium, Canada, Denmark, Finland, France, Germany, Hong Kong, Ireland, Israel, Italy, Japan, Netherlands, New Zealand, Norway, Portugal, Singapore, Spain, Sweden, Switzerland, the United Kingdom, and the United States. The emerging market country indices included are: Brazil, Chile, China, Colombia, Czech Republic, Egypt, Greece, Hungary, India, Indonesia, Korea, Malaysia, Mexico, Pakistan, Peru, Philippines, Poland, Qatar, Russia, South Africa, Taiwan, Thailand, Turkey, and United Arab Emirates.
The Lipper Global Multi-Cap Value Index is an index that measures investment in a variety of market capitalization ranges without concentrating 75% of their equity assets in any one market capitalization range over an extended period of time. Typically this index has 25% to 75% of their assets invested in companies both inside and outside of the U.S. with market capitalizations (on a three-year weighted basis) above 400% of the 75th market capitalization percentile of the S&P/Citigroup World Broad Market Index.
The S&P 500 Index is an unmanaged capitalization-weighted index of 500 stocks designed to measure performance of the broad domestic economy through changes in the aggregate market value of the 500 stocks, which represent all major industries.
This chart assumes an initial gross investment of $1,000,000 made on May 17, 2010 (commencement of operations). Returns shown include the reinvestment of all dividends. The Fund’s past performance is not necessarily an indication of its future performance. It may perform better or worse in the future. The graph and the table do not reflect the deduction of taxes that a shareholder would pay on Fund distributions or the redemption of shares.
24 | The Leuthold Funds - 2017 Annual Report |
Grizzly Short Fund - GRZZX
(Unaudited)
Average Annual Rate of Return For Periods Ended
September 30, 2017
| | | | | | | | | | | Since |
| | | 1 Year | | 3 Year | | 5 Year | | 10 Year | | Inception |
| Grizzly Short Fund - GRZZX | | (12.97)% | | (10.02)% | | (13.45)% | | (11.57)% | | (7.63)% |
| Lipper Dedicated Short Bias | | (22.48)% | | (18.02)% | | (21.60)% | | (17.14)% | | n/a* |
| S&P MidCap 400 Index | | 17.52% | | 11.18% | | 14.43% | | 9.00% | | 9.13% |
| S&P 500 Index | | 18.61% | | 10.81% | | 14.22% | | 7.44% | | 5.14% |
A $10,000 investment in the Grizzly Short Fund - GRZZX
The Lipper Dedicated Short Bias Funds Index is an equally weighted representation of funds in the Lipper Dedicated Short Bias category. These funds employ a hedge fund strategy that maintains a net short exposure to the market through a combination of short and long positions. A dedicated short bias investment strategy attempts to capture profits when the market declines, by holding investments that are overall biased to the short side.
The S&P MidCap 400 Index is a capitalization-weighted index, which measures the performance of the mid-range sector of the U.S. stock market. The index was developed with a base level of 100 as of December 31, 1990.
The S&P 500 Index is an unmanaged capitalization-weighted index of 500 stocks designed to measure performance of the broad domestic economy through changes in the aggregate market value of the 500 stocks, which represent all major industries.
This chart assumes an initial gross investment of $10,000 made on September 30, 2007. Returns shown include the reinvestment of all dividends. The Fund’s past performance is not necessarily an indication of its future performance. It may perform better or worse in the future. The graph and the table do not reflect the deduction of taxes that a shareholder would pay on Fund distributions or the redemption of shares.
*Index was introduced in July 2003.
The Leuthold Funds - 2017 Annual Report | 25 |
| Statements of Assets and Liabilities |
| September 30, 2017 |
| | | Leuthold | | | | | | | |
| | | Core | | | Leuthold | | | Leuthold | |
| | | Investment | | | Global | | | Select | |
| | Fund | | | Fund | | | Industries | |
| | | (Consolidated) | | | (Consolidated) | | | Fund | |
| ASSETS: | | | | | | | | | |
| Investments, at cost | | | | | | | | | | | | |
| Unaffiliated Securities | | $ | 721,834,912 | * | | $ | 99,819,875 | * | | $ | 11,061,393 | |
| Affiliated Securities | | | 15,975,666 | | | | — | | | | — | |
| Total Investments, at cost | | | 737,810,578 | | | | 99,819,875 | | | | 11,061,393 | |
| | | | | | | | | | | | | |
| Investments, at fair value | | | | | | | | | | | | |
| Unaffiliated Securities | | | 894,501,308 | | | | 111,768,382 | | | | 15,067,352 | |
| Affiliated Securities | | | 16,031,974 | | | | — | | | | — | |
| Total Investments, at fair value | | | 910,533,282 | | | | 111,768,382 | | | | 15,067,352 | |
| Cash | | | 16,002 | | | | 554 | | | | 410 | |
Foreign currency
(cost $12,052, $19,280, and $0, respectively) | | | 12,081 | | | | 19,334 | | | | — | |
| Receivable for Fund shares sold | | | 591,848 | | | | 45,119 | | | | 16,170 | |
| Collateral at broker for securities sold short | | | 60,784,141 | | | | 7,581,152 | | | | — | |
| Tri-party collateral held at custodian | | | 11,500,001 | | | | 1,500,001 | | | | — | |
| Interest receivable | | | 885,906 | | | | 133,962 | | | | 122 | |
| Dividends receivable | | | 307,157 | | | | 515,857 | | | | 6,910 | |
| Securities lending income receivable | | | 18,255 | | | | 6,053 | | | | — | |
| Other assets | | | 48,771 | | | | 8,300 | | | | 9,770 | |
| Total Assets | | | 984,697,444 | | | | 121,578,714 | | | | 15,100,734 | |
| | | | | | | | | | | | | |
| LIABILITIES: | | | | | | | | | | | | |
Securities sold short, at fair value
(proceeds $57,151,617, $7,186,012, and $0, respectively) | | | 57,964,906 | | | | 7,343,769 | | | | — | |
| Collateral received for securities loaned | | | 74,692,474 | | | | 11,234,557 | | | | — | |
| Payable for investments purchased | | | 295,602 | | | | 23,329 | | | | — | |
| Payable for Fund shares redeemed | | | 202,593 | | | | 36,411 | | | | 4,002 | |
| Payable to Adviser | | | 622,527 | | | | 75,785 | | | | 4,506 | |
| Payable to Custodian | | | 43,646 | | | | 17,880 | | | | 3,185 | |
| Payable to Directors | | | 37,783 | | | | 4,969 | | | | 638 | |
| Dividends payable on securities sold short | | | 146,222 | | | | 1,657 | | | | — | |
| Distribution (Rule 12b-1) fees payable | | | 7,361 | | | | 39,294 | | | | 89 | |
| Shareholder servicing fees payable | | | 45,404 | | | | — | | | | 1,090 | |
| Accrued expenses and other liabilities | | | 587,656 | | | | 146,779 | | | | 41,358 | |
| Total Liabilities | | | 134,646,174 | | | | 18,924,430 | | | | 54,868 | |
| NET ASSETS | | $ | 850,051,270 | | | $ | 102,654,284 | | | $ | 15,045,866 | |
| * Includes loaned securities with market value of: | | $ | 73,267,883 | | | $ | 10,977,352 | | | | n/a | |
| 26 The Leuthold Funds - 2017 Annual Report | See Notes to the Financial Statements. |
| Statements of Assets and Liabilities (continued) |
| September 30, 2017 |
| | | Leuthold | | | | | | | |
| | | Core | | | Leuthold | | | Leuthold | |
| | | Investment | | | Global | | | Select | |
| | | Fund | | | Fund | | | Industries | |
| | | (Consolidated) | | | (Consolidated) | | | Fund | |
| NET ASSETS CONSIST OF: | | | | | | | | | | | | |
| Capital stock | | $ | 651,333,761 | | | $ | 82,985,897 | | | $ | 10,531,563 | |
| Accumulated net investment income (loss) | | | 1,613 | | | | 19,636 | | | | (14,651 | ) |
| Accumulated net realized gain on investments and securities sold short | | | 26,800,898 | | | | 7,887,159 | | | | 522,995 | |
| Net unrealized appreciation on investments and securities sold short | | | 171,914,998 | | | | 11,761,592 | | | | 4,005,959 | |
| Total Net Assets | | $ | 850,051,270 | | | $ | 102,654,284 | | | $ | 15,045,866 | |
| | | | | | | | | | | | | |
| Retail Class Shares | | | | | | | | | | | | |
| Net assets | | $ | 464,660,913 | | | $ | 24,040,140 | | | $ | 15,045,866 | |
Shares outstanding
(1,000,000,000 shares of $0.0001 par value authorized) | | | 22,620,201 | | | | 2,391,758 | | | | 571,652 | |
| Net Asset Value, Redemption Price, and Offering Price Per Share | | $ | 20.54 | ** | | $ | 10.05 | ** | | $ | 26.32 | |
| | | | | | | | | | | | | |
| Institutional Class Shares | | | | | | | | | | | | |
| Net assets | | $ | 385,390,357 | | | $ | 78,614,144 | | | | n/a | |
Shares outstanding
(1,000,000,000 shares of $0.0001 par value authorized) | | | 18,742,933 | | | | 7,739,606 | | | | n/a | |
| Net Asset Value, Redemption Price, and Offering Price Per Share | | $ | 20.56 | ** | | $ | 10.16 | ** | | | n/a | |
** Redemption price may differ from NAV if redemption fee is applied.
| See Notes to the Financial Statements. | The Leuthold Funds - 2017 Annual Report 27 |
| Statements of Assets and Liabilities (continued) |
| September 30, 2017 |
| | | Leuthold | | | | |
| | | Global | | | Grizzly | |
| | | Industries | | | Short | |
| | | Fund | | | Fund | |
| ASSETS: | | | | | | |
| Investments, at cost | | $ | 9,113,432 | | | $ | 174,298,921 | |
| | | | | | | | | |
| Investments, at fair value | | | 10,941,410 | | | | 174,298,921 | |
| Cash | | | 86 | | | | — | |
| Foreign currency (cost $894 and $0, respectively) | | | 895 | | | | — | |
| Receivable for Fund shares sold | | | 2,764 | | | | 289,841 | |
| Collateral at broker for securities sold short | | | — | | | | 203,800,965 | |
| Tri-party collateral held at custodian | | | — | | | | 31,500,001 | |
| Interest receivable | | | 75 | | | | 131,617 | |
| Dividends receivable | | | 40,440 | | | | — | |
| Other assets | | | 13,731 | | | | 144,689 | |
| Total Assets | | | 10,999,401 | | | | 410,166,034 | |
| | | | | | | | | |
| LIABILITIES: | | | | | | | | |
Securities sold short, at fair value
(proceeds $0 and $203,032,353, respectively) | | | — | | | | 201,864,691 | |
| Payable for investments purchased | | | — | | | | 1,836,463 | |
| Payable for Fund shares redeemed | | | — | | | | 234,530 | |
| Payable to Adviser | | | 7,575 | | | | 215,749 | |
| Payable to Custodian | | | 7,651 | | | | 2,394 | |
| Payable to Directors | | | 467 | | | | 8,643 | |
| Dividends payable on securities sold short | | | — | | | | 131,686 | |
| Distribution (Rule 12b-1) fees payable | | | 2,596 | | | | — | |
| Shareholder servicing fees payable | | | — | | | | 24,002 | |
| Accrued expenses and other liablities | | | 47,679 | | | | 149,603 | |
| Total Liabilities | | | 65,968 | | | | 204,467,761 | |
| NET ASSETS | | $ | 10,933,433 | | | $ | 205,698,273 | |
| 28 | The Leuthold Funds - 2017 Annual Report | See Notes to the Financial Statements. |
| Statements of Assets and Liabilities (continued) |
| September 30, 2017 |
| | | Leuthold | | | | |
| | | Global | | | Grizzly | |
| | | Industries | | | Short | |
| | | Fund | | | Fund | |
| | | | | | | |
| NET ASSETS CONSIST OF: | | | | | | | | |
| Capital stock | | $ | 8,255,800 | | | $ | 439,690,227 | |
| Accumulated net investment income (loss) | | | 84,921 | | | | (2,164,686 | ) |
| Accumulated net realized gain (loss) on investments and securities sold short | | | 765,485 | | | | (232,994,930 | ) |
| Net unrealized appreciation on investments and securities sold short | | | 1,827,227 | | | | 1,167,662 | |
| Total Net Assets | | $ | 10,933,433 | | | $ | 205,698,273 | |
| | | | | | | | | |
| Retail Class Shares | | | | | | | | |
| Net assets | | $ | 1,952,884 | | | $ | 205,698,273 | |
Shares outstanding
(1,000,000,000 shares of $0.0001 par value authorized) | | | 107,703 | | | | 38,270,690 | |
| Net Asset Value, Redemption Price, and Offering Price Per Share | | | $18.13 | ** | | | $5.37 | |
| | | | | | | | | |
| Institutional Class Shares | | | | | | | | |
| Net assets | | $ | 8,980,549 | | | | n/a | |
Shares outstanding
(1,000,000,000 shares of $0.0001 par value authorized) | | | 492,858 | | | | n/a | |
| Net Asset Value, Redemption Price, and Offering Price Per Share | | | $18.22 | ** | | | n/a | |
**Redemption price may differ from NAV if redemption fee is applied.
| See Notes to the Financial Statements. | The Leuthold Funds - 2017 Annual Report | 29 |
| Statements of Operations |
| For the Year Ended September 30, 2017 |
| | | Leuthold | | | | | | | |
| | | Core | | | Leuthold | | | Leuthold | |
| | | Investment | | | Global | | | Select | |
| | | Fund | | | Fund | | | Industries | |
| | | (Consolidated) | | | (Consolidated) | | | Fund | |
| INVESTMENT INCOME: | | | | | | | | | | | | |
| Dividend income (net of foreign taxes withheld of $264,368, $132,572, and $2,837, respectively) | | $ | 9,577,804 | | | $ | 1,930,896 | | | $ | 190,026 | |
| Interest income | | | 2,278,806 | | | | 364,448 | | | | 641 | |
| Income from securities lending, net | | | 18,255 | | | | 6,053 | | | | — | |
| Total investment income | | | 11,874,865 | | | | 2,301,397 | | | | 190,667 | |
| | | | | | | | | | | | | |
| EXPENSES: | | | | | | | | | | | | |
| Investment advisory fees (Note 3) | | | 7,583,576 | | | | 1,168,724 | | | | 134,806 | |
| Administration fees | | | 343,794 | | | | 51,117 | | | | 7,384 | |
| Transfer agent fees | | | 399,452 | | | | 93,556 | | | | 6,845 | |
| Legal fees | | | 42,336 | | | | 11,455 | | | | 558 | |
| Audit fees | | | 90,728 | | | | 66,441 | | | | 32,036 | |
| Fund accounting fees | | | 142,527 | | | | 32,899 | | | | 6,921 | |
| Custody fees | | | 162,422 | | | | 108,004 | | | | 11,415 | |
| Shareholder servicing fees - Retail Class | | | 523,903 | | | | — | | | | 12,101 | |
| Registration fees | | | 47,025 | | | | 39,093 | | | | 24,791 | |
| Report to shareholders | | | 104,097 | | | | 11,037 | | | | 2,419 | |
| Directors’ fees | | | 147,995 | | | | 18,929 | | | | 2,421 | |
| Distribution (Rule 12b-1) fees - Retail Class (Note 4) | | | — | | | | 66,582 | | | | — | |
| Other | | | 51,347 | | | | 10,963 | | | | 1,415 | |
| Total expenses before dividends and interest on securities sold short and reimbursement from Adviser | | | 9,639,202 | | | | 1,678,800 | | | | 243,112 | |
| Dividends and interest on securities sold short | | | 193,488 | | | | 4,617 | | | | — | |
| Reimbursement from Adviser (Note 3) | | | — | | | | — | | | | (40,903 | ) |
| Total expenses | | | 9,832,690 | | | | 1,683,417 | | | | 202,209 | |
| NET INVESTMENT INCOME (LOSS) | | $ | 2,042,175 | | | $ | 617,980 | | | $ | (11,542 | ) |
| 30 | The Leuthold Funds - 2017 Annual Report | See Notes to the Financial Statements. |
The Leuthold Funds
Statements of Operations (continued)
For the Year Ended September 30, 2017
| | Leuthold | | | | | | | |
| | Core | | | Leuthold | | | Leuthold | |
| | Investment | | | Global | | | Select | |
| | Fund | | | Fund | | | Industries | |
| | (Consolidated) | | | (Consolidated) | | | Fund | |
| | | | | | | | | | | | | |
| REALIZED AND UNREALIZED GAIN ON INVESTMENTS, INVESTMENT COMPANIES, SECURITIES SOLD SHORT, AND FOREIGN CURRENCY AND FOREIGN CURRENCY TRANSLATION: | | | | | | | | | | | | |
| Net realized gain (loss) on: | | | | | | | | | | | | |
| Unaffiliated investments | | $ | 36,427,786 | | | $ | 9,403,984 | | | $ | 1,184,365 | |
| Affiliated investments | | | (23,965 | ) | | | — | | | | — | |
| Investment companies | | | (195,525 | ) | | | (109,316 | ) | | | — | |
| Realized gain distributions from investment companies | | | 37,194 | | | | 9,585 | | | | — | |
| Securities sold short | | | (644,108 | ) | | | (126,928 | ) | | | — | |
| Foreign currency and foreign currency translation | | | (925,265 | ) | | | (320,423 | ) | | | 48 | |
| Net unrealized appreciation (depreciation) during the period on: | | | | | | | | | | | | |
| Unaffiliated investments | | | 73,033,785 | | | | 223,309 | | | | 1,625,084 | |
| Affiliated investments | | | 39,668 | | | | — | | | | — | |
| Investment companies | | | (674,763 | ) | | | (318,567 | ) | | | — | |
| Securities sold short | | | (813,289 | ) | | | (157,757 | ) | | | — | |
| Foreign currency and foreign currency translation | | | 2,898,044 | | | | 2,529,994 | | | | — | |
| Net realized and unrealized gain on investments, investment companies, securities sold short, and foreign currency and foreign currency translation | | | 109,159,562 | | | | 11,133,881 | | | | 2,809,497 | |
| NET INCREASE IN NET ASSETS RESULTING FROM OPERATIONS | | $ | 111,201,737 | | | $ | 11,751,861 | | | $ | 2,797,955 | |
| See Notes to the Financial Statements. | The Leuthold Funds - 2017 Annual Report | 31 |
| Statements of Operations (continued) |
| For the Year Ended September 30, 2017 |
| | | Leuthold | | | | |
| | | Global | | | Grizzly | |
| | | Industries | | | Short | |
| | | Fund | | | Fund | |
| | | | | |
| INVESTMENT INCOME: | | | | | | | | |
| Dividend income (net of foreign taxes withheld of $18,278 and $0, respectively) | | $ | 234,926 | | | $ | 3,444 | |
| Interest income | | | 627 | | | | 1,612,001 | |
| Total investment income | | | 235,553 | | | | 1,615,445 | |
| | | | | | | | | |
| EXPENSES: | | | | | | | | |
| Investment advisory fees (Note 3) | | | 105,615 | | | | 2,371,188 | |
| Administration fees | | | 8,264 | | | | 69,557 | |
| Transfer agent fees | | | 11,912 | | | | 80,575 | |
| Legal fees | | | 3,478 | | | | 9,290 | |
| Audit fees | | | 31,581 | | | | 31,581 | |
| Fund accounting fees | | | 16,780 | | | | 26,541 | |
| Custody fees | | | 37,913 | | | | 8,779 | |
| Shareholder servicing fees - Retail Class | | | — | | | | 192,106 | |
| Registration fees | | | 33,803 | | | | 63,738 | |
| Report to shareholders | | | 1,003 | | | | 23,225 | |
| Directors’ fees | | | 1,812 | | | | 29,844 | |
| Distribution (Rule 12b-1) fees - Retail Class (Note 4) | | | 4,546 | | | | — | |
| Other | | | 1,972 | | | | 12,169 | |
| Total expenses before dividends and interest on securities sold short and reimbursement from Adviser | | | 258,679 | | | | 2,918,593 | |
| Dividends and interest on securities sold short | | | — | | | | 2,074,331 | |
| Reimbursement from Adviser (Note 3) | | | (122,114 | ) | | | — | |
| Total expenses | | | 136,565 | | | | 4,992,924 | |
| NET INVESTMENT INCOME (LOSS) | | $ | 98,988 | | | $ | (3,377,479 | ) |
| 32 | The Leuthold Funds - 2017 Annual Report | See Notes to the Financial Statements. |
| Statements of Operations (continued) |
| For the Year Ended September 30, 2017 |
| | | Leuthold | | | | |
| | | Global | | | Grizzly | |
| | | Industries | | | Short | |
| | | Fund | | | Fund | |
| | | | | |
| REALIZED AND UNREALIZED GAIN (LOSS) ON INVESTMENTS, INVESTMENT COMPANIES, SECURITIES SOLD SHORT, AND FOREIGN CURRENCY AND FOREIGN CURRENCY TRANSLATION: | | | | | | | | |
| Net realized gain (loss) on: | | | | | | | | |
| Investments | | $ | 943,647 | | | $ | — | |
| Investment companies | | | 16,473 | | | | — | |
| Securities sold short | | | — | | | | (28,568,699 | ) |
| Foreign currency and foreign currency translation | | | (4,569 | ) | | | 13 | |
| Net unrealized appreciation (depreciation) during the period on: | | | | | | | | |
| Investments | | | 676,887 | | | | — | |
| Investment companies | | | 12,268 | | | | — | |
| Securities sold short | | | — | | | | 4,861,675 | |
| Foreign currency and foreign currency translation | | | 256,461 | | | | (8 | ) |
| Net realized and unrealized gain (loss) on investments, investment companies, securities sold short, foreign currency, and foreign currency translation | | | 1,901,167 | | | | (23,707,019 | ) |
| NET INCREASE (DECREASE) IN NET ASSETS RESULTING FROM OPERATIONS | | $ | 2,000,155 | | | $ | (27,084,498 | ) |
| See Notes to the Financial Statements. | The Leuthold Funds - 2017 Annual Report | 33 |
Leuthold Core Investment Fund
Statements of Changes in Net Assets (Consolidated)
| | | Year Ended
September 30, 2017 | | Year Ended
September 30, 2016 |
| OPERATIONS: | | | | | | |
| Net investment income (loss) | | | $ | 2,042,175 | | | | $ | (320,937 | ) |
| Net realized gain on investments, investment companies, securities sold short, and foreign currency and foreign currency translation | | | | 34,676,117 | | | | | 30,250,183 | |
| Net unrealized appreciation (depreciation) on investments, investment companies, securities sold short, and foreign currency foreign currency translation | | | | 74,483,445 | | | | | (12,519,445 | ) |
| Net increase in net assets from operations | | | | 111,201,737 | | | | | 17,409,801 | |
| | | | | | | | | | | |
| DISTRIBUTIONS TO SHAREHOLDERS: | | | | | | | | | | |
| From net investment income - Retail Class | | | | (244,990 | ) | | | | — | |
| From net investment income - Institutional Class | | | | (609,095 | ) | | | | — | |
| From net realized gain - Retail Class | | | | (2,313,962 | ) | | | | (21,888,252 | ) |
| From net realized gain - Institutional Class | | | | (1,509,877 | ) | | | | (11,929,481 | ) |
| Total distributions | | | | (4,677,924 | ) | | | | (33,817,733 | ) |
| | | | | | | | | | | |
| CAPITAL SHARE TRANSACTIONS: | | | | | | | | | | |
| Proceeds from shares sold - Retail Class | | | | 47,009,722 | | | | | 146,481,681 | |
| Proceeds from shares sold - Institutional Class | | | | 74,784,361 | | | | | 154,167,792 | |
| Proceeds from shares issued to holders in reinvestment of dividends - Retail Class | | | | 2,441,849 | | | | | 20,756,438 | |
| Proceeds from shares issued to holders in reinvestment of dividends - Institutional Class | | | | 1,831,572 | | | | | 9,925,183 | |
| Cost of shares redeemed - Retail Class* | | | | (171,719,259 | ) | | | | (194,753,275 | ) |
| Cost of shares redeemed - Institutional Class** | | | | (114,514,807 | ) | | | | (74,750,814 | ) |
| Net increase (decrease) in net assets from capital share transactions | | | | (160,166,562 | ) | | | | 61,827,005 | |
| | | | | | | | | | | |
| TOTAL INCREASE (DECREASE) IN NET ASSETS: | | | | (53,642,749 | ) | | | | 45,419,073 | |
| NET ASSETS | | | | | | | | | | |
| Beginning of year | | | | 903,694,019 | | | | | 858,274,946 | |
| End of year (including accumulated net investment income (loss) of $1,613 and $(471,749), respectively) | | | $ | 850,051,270 | | | | $ | 903,694,019 | |
| | | | | | | | | | | |
| CHANGES IN SHARES OUTSTANDING: | | | | | | | | | | |
| Shares sold - Retail Class | | | | 2,470,375 | | | | | 8,190,260 | |
| Shares sold - Institutional Class | | | | 3,863,613 | | | | | 8,670,133 | |
| Shares issued to holders in reinvestment of dividends - Retail Class | | | | 134,342 | | | | | 1,170,696 | |
| Shares issued to holders in reinvestment of dividends - Institutional Class | | | | 99,015 | | | | | 559,796 | |
| Shares redeemed - Retail Class | | | | (9,045,976 | ) | | | | (10,924,985 | ) |
| Shares redeemed - Institutional Class | | | | (6,185,014 | ) | | | | (4,194,560 | ) |
| Net increase (decrease) in shares outstanding | | | | (8,663,645 | ) | | | | 3,471,340 | |
| * Net of redemption fees of (Retail Class): | | | $ | 440 | | | | $ | 974 | |
| ** Net of redemption fees of (Institutional Class): | | | $ | 105 | | | | $ | 580 | |
| 34 | The Leuthold Funds - 2017 Annual Report | See Notes to the Financial Statements. |
Leuthold Global Fund
Statements of Changes in Net Assets (Consolidated)
| | | Year Ended
September 30, 2017 | | Year Ended
September 30, 2016 |
| OPERATIONS: | | | | |
| Net investment income | | $ | 617,980 | | | $ | 28,306 | |
| Net realized gain on investments, investment companies, securities sold short, and foreign currency and foreign currency translation | | | 8,856,902 | | | | 16,342,097 | |
| Net unrealized appreciation (depreciation) on investments, investment companies, securities sold short, and foreign currency and foreign currency translation | | | 2,276,979 | | | | (13,346,292 | ) |
| Net increase in net assets from operations | | | 11,751,861 | | | | 3,024,111 | |
| | | | | | | | | |
| DISTRIBUTIONS TO SHAREHOLDERS: | | | | | | | | |
| From net investment income - Retail Class | | | — | | | | — | |
| From net investment income - Institutional Class | | | (115,269 | ) | | | — | |
| From net realized gain - Retail Class | | | (3,355,947 | ) | | | (3,376,271 | ) |
| From net realized gain - Institutional Class | | | (8,317,368 | ) | | | (7,894,959 | ) |
| Total distributions | | | (11,788,584 | ) | | | (11,271,230 | ) |
| | | | | | | | | |
| CAPITAL SHARE TRANSACTIONS: | | | | | | | | |
| Proceeds from shares sold - Retail Class | | | 4,096,510 | | | | 11,179,273 | |
| Proceeds from shares sold - Institutional Class | | | 8,483,230 | | | | 21,291,279 | |
| Proceeds from shares issued to holders in reinvestment of dividends - Retail Class | | | 2,988,956 | | | | 3,127,382 | |
| Proceeds from shares issued to holders in reinvestment of dividends - Institutional Class | | | 7,307,081 | | | | 6,958,006 | |
| Cost of shares redeemed - Retail Class* | | | (60,927,741 | ) | | | (28,796,025 | ) |
| Cost of shares redeemed - Institutional Class** | | | (41,921,745 | ) | | | (136,372,209 | ) |
| Net decrease in net assets from capital share transactions | | | (79,973,709 | ) | | | (122,612,294 | ) |
| | | | | | | | | |
| TOTAL DECREASE IN NET ASSETS: | | | (80,010,432 | ) | | | (130,859,413 | ) |
| NET ASSETS | | | | | | | | |
| Beginning of year | | | 182,664,716 | | | | 313,524,129 | |
| End of year (including accumulated net investment income (loss) of $19,636 and $(286,740), respectively) | | $ | 102,654,284 | | | $ | 182,664,716 | |
| | | | | | | | | |
| CHANGES IN SHARES OUTSTANDING: | | | | | | | | |
| Shares sold - Retail Class | | | 439,767 | | | | 1,173,955 | |
| Shares sold - Institutional Class | | | 895,830 | | | | 2,166,720 | |
| Shares issued to holders in reinvestment of dividends - Retail Class | | | 341,205 | | | | 319,773 | |
| Shares issued to holders in reinvestment of dividends - Institutional Class | | | 824,956 | | | | 706,397 | |
| Shares redeemed - Retail Class | | | (6,375,412 | ) | | | (2,978,066 | ) |
| Shares redeemed - Institutional Class | | | (4,426,522 | ) | | | (14,065,895 | ) |
| Net decrease in shares outstanding | | | (8,300,176 | ) | | | (12,677,116 | ) |
| | | | | | | | | |
| * Net of redemption fees of (Retail Class): | | $ | 289 | | | $ | 80 | |
| ** Net of redemption fees of (Institutional Class): | | $ | 2,022 | | | $ | 332 | |
| See Notes to the Financial Statements. | The Leuthold Funds - 2017 Annual Report | 35 |
Leuthold Select Industries Fund
Statements of Changes in Net Assets
| | | | | |
| | | Year Ended
September 30, 2017 | | Year Ended
September 30, 2016 |
| OPERATIONS: | | | | |
| Net investment income (loss) | | $ | (11,542 | ) | | $ | 3,082 | |
| Net realized gain on investments | | | 1,184,413 | | | | 342,100 | |
| Net unrealized appreciation (depreciation) on investments | | | 1,625,084 | | | | (136,672 | ) |
| Net increase in net assets from operations | | | 2,797,955 | | | | 208,510 | |
| | | | | | | | | |
| DISTRIBUTIONS TO SHAREHOLDERS: | | | | | | | | |
| From net investment income | | | — | | | | (5,500 | ) |
| From net realized gain | | | — | | | | (168,405 | ) |
| Return of capital | | | — | | | | (14,196 | ) |
| Total distributions | | | — | | | | (188,101 | ) |
| | | | | | | | | |
| CAPITAL SHARE TRANSACTIONS: | | | | | | | | |
| Proceeds from shares sold | | | 3,207,231 | | | | 3,320,362 | |
| Proceeds from shares issued to holders in reinvestment of dividends | | | — | | | | 179,407 | |
| Cost of shares redeemed | | | (3,590,211 | ) | | | (3,513,432 | ) |
| Net decrease in net assets from capital share transactions | | | (382,980 | ) | | | (13,663 | ) |
| | | | | | | | | |
| TOTAL INCREASE IN NET ASSETS: | | | 2,414,975 | | | | 6,746 | |
| NET ASSETS | | | | | | | | |
| Beginning of year | | | 12,630,891 | | | | 12,624,145 | |
| End of year (including accumulated net investment loss of $(14,651) and $(12,282), respectively) | | $ | 15,045,866 | | | $ | 12,630,891 | |
| | | | | | | | | |
| CHANGES IN SHARES OUTSTANDING: | | | | | | | | |
| Shares sold | | | 134,033 | | | | 153,554 | |
| Shares issued to holders in reinvestment of dividends | | | — | | | | 8,230 | |
| Shares redeemed | | | (152,339 | ) | | | (165,408 | ) |
| Net decrease in shares outstanding | | | (18,306 | ) | | | (3,624 | ) |
| 36 | The Leuthold Funds - 2017 Annual Report | See Notes to the Financial Statements. |
| Leuthold Global Industries Fund |
| Statements of Changes in Net Assets |
| | | Year Ended
September 30, 2017 | | Year Ended
September 30, 2016 |
| OPERATIONS: | | | | |
| Net investment income | | $ | 98,988 | | | $ | 142,038 | |
| Net realized gain on investments, investment companies, and foreign currency and foreign currency translation | | | 955,551 | | | | 890,915 | |
| Net unrealized appreciation (depreciation) on investments, investment companies and foreign currency and foreign currency translation | | | 945,616 | | | | (697,425 | ) |
| Net increase in net assets from operations | | | 2,000,155 | | | | 335,528 | |
| | | | | | | | | |
| DISTRIBUTIONS TO SHAREHOLDERS: | | | | | | | | |
| From net investment income - Retail Class | | | (7,947 | ) | | | (14,390 | ) |
| From net investment income - Institutional Class | | | (57,055 | ) | | | (86,040 | ) |
| From net realized gain - Retail Class | | | (66,243 | ) | | | (178,645 | ) |
| From net realized gain - Institutional Class | | | (332,198 | ) | | | (459,259 | ) |
| Total distributions | | | (463,443 | ) | | | (738,334 | ) |
| | | | | | | | | |
| CAPITAL SHARE TRANSACTIONS: | | | | | | | | |
| Proceeds from shares sold - Retail Class | | | 131,335 | | | | 192,819 | |
| Proceeds from shares sold - Institutional Class | | | 1,183,211 | | | | 1,135,550 | |
| Proceeds from shares issued to holders in reinvestment of dividends - Retail Class | | | 72,780 | | | | 94,645 | |
| Proceeds from shares issued to holders in reinvestment of dividends - Institutional Class | | | 374,587 | | | | 526,731 | |
| Cost of shares redeemed - Retail Class | | | (357,409 | ) | | | (3,211,663 | ) |
| Cost of shares redeemed - Institutional Class | | | (3,643,282 | ) | | | (5,988,415 | ) |
| Net decrease in net assets from capital share transactions | | | (2,238,778 | ) | | | (7,250,333 | ) |
| | | | | | | | | |
| TOTAL DECREASE IN NET ASSETS: | | | (702,066 | ) | | | (7,653,139 | ) |
| NET ASSETS | | | | | | | | |
| Beginning of year | | | 11,635,499 | | | | 19,288,638 | |
| End of year (including accumulated net investment income of $84,921 and $44,728, respectively) | | $ | 10,933,433 | | | $ | 11,635,499 | |
| | | | | | | | | |
| CHANGES IN SHARES OUTSTANDING: | | | | | | | | |
| Shares sold - Retail Class | | | 8,038 | | | | 12,597 | |
| Shares sold - Institutional Class | | | 72,895 | | | | 73,605 | |
| Shares issued to holders in reinvestment of dividends - Retail Class | | | 4,869 | | | | 5,919 | |
| Shares issued to holders in reinvestment of dividends - Institutional Class | | | 24,828 | | | | 32,914 | |
| Shares redeemed - Retail Class | | | (22,437 | ) | | | (219,631 | ) |
| Shares redeemed - Institutional Class | | | (229,142 | ) | | | (384,166 | ) |
| Net decrease in shares outstanding | | | (140,949 | ) | | | (478,762 | ) |
| See Notes to the Financial Statements. | The Leuthold Funds - 2017 Annual Report | 37 |
| Statements of Changes in Net Assets |
| | | Year Ended
September 30, 2017 | | Year Ended
September 30, 2016 |
| OPERATIONS: | | | | |
| Net investment loss | | $ | (3,377,479 | ) | | $ | (6,831,127 | ) |
| Net realized loss on securities sold short and foreign currency and foreign currency translation | | | (28,568,686 | ) | | | (41,559,059 | ) |
| Net unrealized appreciation (depreciation) on securities sold short and foreign currency and foreign currency translation | | | 4,861,667 | | | | (31,216,977 | ) |
| Net decrease in net assets from operations | | | (27,084,498 | ) | | | (79,607,163 | ) |
| | | | | | | | | |
| DISTRIBUTIONS TO SHAREHOLDERS: | | | | | | | | |
| From net investment income | | | — | | | | — | |
| From net realized gain | | | — | | | | — | |
| Total distributions | | | — | | | | — | |
| | | | | | | | | |
| CAPITAL SHARE TRANSACTIONS: | | | | | | | | |
| Proceeds from shares sold | | | 224,754,923 | | | | 400,472,363 | |
| Cost of shares redeemed | | | (170,183,996 | ) | | | (408,496,540 | ) |
| Net increase (decrease) in net assets from capital share transactions | | | 54,570,927 | | | | (8,024,177 | ) |
| | | | | | | | | |
| TOTAL INCREASE (DECREASE) IN NET ASSETS: | | | 27,486,429 | | | | (87,631,340 | ) |
| NET ASSETS | | | | | | | | |
| Beginning of year | | | 178,211,844 | | | | 265,843,184 | |
| End of year (including accumulated net investment loss of $(2,164,686) and $(4,870,403), respectively) | | $ | 205,698,273 | | | $ | 178,211,844 | |
| | | | | | | | | |
| CHANGES IN SHARES OUTSTANDING: | | | | | | | | |
| Shares sold | | | 37,475,246 | | | | 53,022,634 | |
| Shares redeemed | | | (28,097,409 | ) | | | (57,419,840 | ) |
| Net increase (decrease) in shares outstanding | | | 9,377,837 | | | | (4,397,206 | ) |
| 38 | The Leuthold Funds - 2017 Annual Report | See Notes to the Financial Statements. |
Leuthold Core Investment Fund - Retail - LCORX
Fi
nancial Highlights (Consolidated)
| | | Year Ended | | Year Ended | | Year Ended | | Year Ended | | Year Ended |
| | | September 30, | | September 30, | | September 30, | | September 30, | | September 30, |
| | | 2017 | | 2016 | | 2015 | | 2014 | | 2013 |
| | | (Consolidated) | | (Consolidated) | | (Consolidated) | | (Consolidated) | | (Consolidated) |
| | | | | | | | | | | | | | | | |
Per Share Data(1): | | | | | | | | | | | | | | | |
| Net asset value, beginning of year | | $ | 18.06 | | | $ | 18.44 | | | $ | 18.85 | | | $ | 18.29 | | | $ | 16.78 | |
| Income (loss) from investment operations: | | | | | | | | | | | | | | | | | | | | |
Net investment income (loss) (2) | | | 0.04 | | | | (0.01 | ) | | | (0.01 | ) | | | 0.01 | | | | 0.09 | |
| Net realized and unrealized gain on investments and securities sold short | | | 2.53 | | | | 0.32 | | | | 0.76 | | | | 2.02 | | | | 1.78 | |
| Total from investment operations | | | 2.57 | | | | 0.31 | | | | 0.75 | | | | 2.03 | | | | 1.87 | |
| | | | | | | | | | | | | | | | | | | | | |
| Less distributions: | | | | | | | | | | | | | | | | | | | | |
| From net investment income | | | (0.01 | ) | | — | | | | (0.03 | ) | | | (0.21 | ) | | | (0.23 | ) |
| From net realized gain | | | (0.08 | ) | | | (0.69 | ) | | | (1.13 | ) | | | (1.26 | ) | | | (0.13 | ) |
Redemption fees(3) | | | 0.00 | | | | 0.00 | | | | 0.00 | | | | 0.00 | | | | 0.00 | |
| Total distributions | | | (0.09 | ) | | | (0.69 | ) | | | (1.16 | ) | | | (1.47 | ) | | | (0.36 | ) |
| Net asset value, end of year | | $ | 20.54 | | | $ | 18.06 | | | $ | 18.44 | | | $ | 18.85 | | | $ | 18.29 | |
| | | | | | | | | | | | | | | | | | | | | |
| Total Return | | | 14.31 | % | | | 1.76 | % | | | 4.03 | % | | | 11.49 | % | | | 11.29 | % |
| | | | | | | | | | | | | | | | | | | | | |
| Supplemental data and ratios: | | | | | | | | | | | | | | | | | | | | |
| Net assets, end of year | | $ | 464,660,913 | | | $ | 524,731,192 | | | $ | 564,608,599 | | | $ | 569,237,299 | | | $ | 409,043,691 | |
Ratio of expenses to average net assets (4) | | | 1.21 | % | | | 1.29 | % | | | 1.30 | % | | | 1.28 | % | | | 1.28 | % |
Ratio of net investment income (loss) to average net assets (5) | | | 0.20 | % | | | (0.08 | )% | | | (0.05 | )% | | | 0.04 | % | | | 0.49 | % |
Portfolio turnover rate (6) | | | 52.36 | % | | | 109.32 | % | | | 78.96 | % | | | 80.65 | % | | | 105.28 | % |
| (1) | For a share outstanding throughout the period. Rounded to the nearest cent. |
| (2) | Net investment income (loss) per share is calculated based on average shares outstanding. |
| (3) | Amount represents less than $0.005 per share. |
| (4) | The ratio of expenses to average net assets includes dividends and interest on securities sold short. The expense ratios excluding dividends and interest on securities sold short were 1.19% for the year ended September 30, 2017, 1.17% for the year ended September 30, 2016, 1.16% for the year ended September 30, 2015, 1.15% for the year ended September 30, 2014, and 1.16% for the year ended September 30, 2013. |
| (5) | The net investment income ratios include dividends and interest on securities sold short. |
| (6) | The portfolio turnover rate excludes purchases and sales of securities sold short. |
| See Notes to the Financial Statements. | The Leuthold Funds - 2017 Annual Report | 39 |
Leuthold Core Investment Fund - Institutional - LCRIX
Financial Highlights (Consolidated)
| | | Year Ended | | Year Ended | | Year Ended | | Year Ended | | Year Ended |
| | | September 30, | | September 30, | | September 30, | | September 30, | | September 30, |
| | | 2017 | | 2016 | | 2015 | | 2014 | | 2013 |
| | | (Consolidated) | | (Consolidated) | | (Consolidated) | | (Consolidated) | | (Consolidated) |
| | | | | | | | | | | | | | | | |
Per Share Data(1): | | | | | | | | | | | | | | | |
| Net asset value, beginning of year | | $ | 18.08 | | | $ | 18.43 | | | $ | 18.85 | | | $ | 18.28 | | | $ | 16.77 | |
| Income from investment operations: | | | | | | | | | | | | | | | | | | | | |
Net investment income (2) | | | 0.06 | | | | 0.01 | | | | 0.01 | | | | 0.03 | | | | 0.11 | |
| Net realized and unrealized gain on investments and securities sold short | | | 2.53 | | | | 0.33 | | | | 0.74 | | | | 2.03 | | | | 1.78 | |
| Total from investment operations | | | 2.59 | | | | 0.34 | | | | 0.75 | | | | 2.06 | | | | 1.89 | |
| | | | | | | | | | | | | | | | | | | | | |
| Less distributions: | | | | | | | | | | | | | | | | | | | | |
| From net investment income | | | (0.03 | ) | | — | | | | (0.04 | ) | | | (0.23 | ) | | | (0.25 | ) |
| From net realized gain | | | (0.08 | ) | | | (0.69 | ) | | | (1.13 | ) | | | (1.26 | ) | | | (0.13 | ) |
| Redemption fees | | | 0.00 | (3) | | | 0.00 | (3) | | | 0.00 | (3) | | | — | | | | — | |
| Total distributions | | | (0.11 | ) | | | (0.69 | ) | | | (1.17 | ) | | | (1.49 | ) | | | (0.38 | ) |
| Net asset value, end of year | | $ | 20.56 | | | $ | 18.08 | | | $ | 18.43 | | | $ | 18.85 | | | $ | 18.28 | |
| | | | | | | | | | | | | | | | | | | | | |
| Total Return | | | 14.43 | % | | | 1.93 | % | | | 4.03 | % | | | 11.66 | % | | | 11.42 | % |
| | | | | | | | | | | | | | | | | | | | | |
| Supplemental data and ratios: | | | | | | | | | | | | | | | | | | | | |
| Net assets, end of year | | $ | 385,390,357 | | | $ | 378,962,827 | | | $ | 293,666,347 | | | $ | 276,568,913 | | | $ | 196,501,094 | |
Ratio of expenses to average net assets (4) | | | 1.10 | % | | | 1.17 | % | | | 1.20 | % | | | 1.18 | % | | | 1.17 | % |
Ratio of net investment income to average net assets (5) | | | 0.30 | % | | | 0.04 | % | | | 0.05 | % | | | 0.14 | % | | | 0.60 | % |
Portfolio turnover rate (6) | | | 52.36 | % | | | 109.32 | % | | | 78.96 | % | | | 80.65 | % | | | 105.28 | % |
| (1) | For a share outstanding throughout the period. Rounded to the nearest cent. |
| (2) | Net investment income per share is calculated based on average shares outstanding. |
| (3) | Amount represents less than $0.005 per share. |
| (4) | The ratio of expenses to average net assets includes dividends and interest on securities sold short. The expense ratios excluding dividends and interest on securities sold short were 1.08% for the year ended September 30, 2017, 1.05% for the year ended September 30, 2016, 1.06% for the year ended September 30, 2015, 1.06% for the year ended September 30, 2014, and 1.06% for the year ended September 30, 2013. |
| (5) | The net investment income ratios include dividends and interest on securities sold short. |
| (6) | The portfolio turnover rate excludes purchases and sales of securities sold short. |
| 40 | The Leuthold Funds - 2017 Annual Report | See Notes to the Financial Statements. |
Leuthold Global Fund - Retail - GLBLX
Financial Highlights (Consolidated)
| | | Year Ended | | Year Ended | | Year Ended | | Year Ended | | Year Ended |
| | | September 30, | | September 30, | | September 30, | | September 30, | | September 30, |
| | | 2017 | | 2016 | | 2015 | | 2014 | | 2013 |
| | | (Consolidated) | | (Consolidated) | | (Consolidated) | | (Consolidated) | | (Consolidated) |
| | | | | | | | | | | | | | | | |
Per Share Data(1): | | | | | | | | | | | | | | | |
| Net asset value, beginning of year | | $ | 9.86 | | | $ | 10.03 | | | $ | 11.29 | | | $ | 11.65 | | | $ | 10.24 | |
| Income (loss) from investment operations: | | | | | | | | | | | | | | | | | | | | |
Net investment income (loss) (2) | | | 0.04 | | | | (0.01 | ) | | | (0.03 | ) | | | 0.03 | | | | 0.07 | |
| Net realized and unrealized gain (loss) on investments and securities sold short | | | 1.02 | | | | 0.21 | | | | (0.11 | ) | | | 0.83 | | | | 1.44 | |
| Total from investment operations | | | 1.06 | | | | 0.20 | | | | (0.14 | ) | | | 0.86 | | | | 1.51 | |
| | | | | | | | | | | | | | | | | | | | | |
| Less distributions: | | | | | | | | | | | | | | | | | | | | |
| From net investment income | | | — | | | | — | | | | (0.03 | ) | | | (0.08 | ) | | | (0.08 | ) |
| From net realized gain | | | (0.87 | ) | | | (0.37 | ) | | | (1.09 | ) | | | (1.14 | ) | | | (0.02 | ) |
Redemption fees(3) | | | 0.00 | | | | 0.00 | | | | 0.00 | | | | 0.00 | | | | 0.00 | |
| Total distributions | | | (0.87 | ) | | | (0.37 | ) | | | (1.12 | ) | | | (1.22 | ) | | | (0.10 | ) |
| Net asset value, end of year | | $ | 10.05 | | | $ | 9.86 | | | $ | 10.03 | | | $ | 11.29 | | | $ | 11.65 | |
| | | | | | | | | | | | | | | | | | | | | |
| Total Return | | | 12.02 | % | | | 1.89 | % | | | (1.41 | )% | | | 7.68 | % | | | 14.78 | % |
| | | | | | | | | | | | | | | | | | | | | |
| Supplemental data and ratios: | | | | | | | | | | | | | | | | | | | | |
| Net assets, end of year | | $ | 24,040,140 | | | $ | 78,743,516 | | | $ | 95,026,857 | | | $ | 130,838,148 | | | $ | 126,418,514 | |
Ratio of expenses to average net assets (4) | | | 1.56 | % | | | 1.82 | % | | | 1.71 | % | | | 1.65 | % | | | 1.63 | % |
Ratio of net investment income (loss) to average net assets (5) | | | 0.38 | % | | | (0.15 | )% | | | (0.29 | )% | | | 0.25 | % | | | 0.61 | % |
Portfolio turnover rate (6) | | | 63.13 | % | | | 102.93 | % | | | 78.37 | % | | | 71.63 | % | | | 101.03 | % |
| (1) | For a share outstanding throughout the period. Rounded to the nearest cent. |
| (2) | Net investment income (loss) per share is calculated based on average shares outstanding. |
| (3) | Amount represents less than $0.005 per share. |
| (4) | The ratio of expenses to average net assets includes dividends and interest on securities sold short. The expense ratios excluding dividends and interest on securities sold short were 1.56% for the year ended September 30, 2017, 1.61% for the year ended September 30, 2016, 1.54% for the year ended September 30, 2015, 1.53% for the year ended September 30, 2014, and 1.51% for the year ended September 30, 2013. |
| (5) | The net investment income ratios include dividends and interest on securities sold short. |
| (6) | The portfolio turnover rate excludes purchases and sales of securities sold short. |
| See Notes to the Financial Statements. | The Leuthold Funds - 2017 Annual Report | 41 |
Leuthold Global Fund - Institutional - GLBIX
Financial Highlights (Consolidated)
| | | Year Ended | | Year Ended | | Year Ended | | Year Ended | | Year Ended |
| | | September 30, | | September 30, | | September 30, | | September 30, | | September 30, |
| | | 2017 | | 2016 | | 2015 | | 2014 | | 2013 |
| | | (Consolidated) | | (Consolidated) | | (Consolidated) | | (Consolidated) | | (Consolidated) |
| | | | | | | | | | | | | | | | |
Per Share Data(1): | | | | | | | | | | | | | | | |
| Net asset value, beginning of year | | $ | 9.95 | | | $ | 10.10 | | | $ | 11.34 | | | $ | 11.69 | | | $ | 10.27 | |
| Income (loss) from investment operations: | | | | | | | | | | | | | | | | | | | | |
Net investment income (loss) (2) | | | 0.06 | | | | 0.01 | | | | (0.01 | ) | | | 0.05 | | | | 0.09 | |
| Net realized and unrealized gain (loss) on investments and securities sold short | | | 1.03 | | | | 0.21 | | | | (0.11 | ) | | | 0.84 | | | | 1.45 | |
| Total from investment operations | | | 1.09 | | | | 0.22 | | | | (0.12 | ) | | | 0.89 | | | | 1.54 | |
| | | | | | | | | | | | | | | | | | | | | |
| Less distributions: | | | | | | | | | | | | | | | | | | | | |
| From net investment income | | | (0.01 | ) | | | — | | | | (0.03 | ) | | | (0.10 | ) | | | (0.10 | ) |
| From net realized gain | | | (0.87 | ) | | | (0.37 | ) | | | (1.09 | ) | | | (1.14 | ) | | | (0.02 | ) |
| Redemption fees | | | 0.00 | (3) | | | 0.00 | (3) | | | 0.00 | (3) | | | — | | | | 0.00 | (3) |
| Total distributions | | | (0.88 | ) | | | (0.37 | ) | | | (1.12 | ) | | | (1.24 | ) | | | (0.12 | ) |
| Net asset value, end of year | | $ | 10.16 | | | $ | 9.95 | | | $ | 10.10 | | | $ | 11.34 | | | $ | 11.69 | |
| | | | | | | | | | | | | | | | | | | | | |
| Total Return | | | 12.28 | % | | | 2.18 | % | | | (1.30 | )% | | | 7.95 | % | | | 15.08 | % |
| | | | | | | | | | | | | | | | | | | | | |
| Supplemental data and ratios: | | | | | | | | | | | | | | | | | | | | |
| Net assets, end of year | | $ | 78,614,144 | | | $ | 103,921,200 | | | $ | 218,497,272 | | | $ | 231,615,536 | | | $ | 239,275,879 | |
Ratio of expenses to average net assets (4) | | | 1.36 | % | | | 1.57 | % | | | 1.50 | % | | | 1.44 | % | | | 1.44 | % |
Ratio of net investment income (loss) to average net assets (5) | | | 0.58 | % | | | 0.10 | % | | | (0.09 | )% | | | 0.45 | % | | | 0.80 | % |
Portfolio turnover rate (6) | | | 63.13 | % | | | 102.93 | % | | | 78.37 | % | | | 71.63 | % | | | 101.03 | % |
| (1) | For a share outstanding throughout the period. Rounded to the nearest cent. |
| (2) | Net investment income (loss) per share is calculated based on average shares outstanding. |
| (3) | Amount represents less than $0.005 per share. |
| (4) | The ratio of expenses to average net assets includes dividends and interest on securities sold short. The expense ratios excluding dividends and interest on securities sold short were 1.36% for the year ended September 30, 2017, 1.36% for the year ended September 30, 2016, 1.33% for the year ended September 30, 2015, 1.33% for the year ended September 30, 2014, and 1.32% for the year ended September 30, 2013. |
| (5) | The net investment income ratios include dividends and interest on securities sold short. |
| (6) | The portfolio turnover rate excludes purchases and sales of securities sold short. |
| 42 | The Leuthold Funds - 2017 Annual Report | See Notes to the Financial Statements. |
Leuthold Select Industries Fund - LSLTX
Financial Highlights
| | | Year Ended | | Year Ended | | Year Ended | | Year Ended | | Year Ended |
| | | September 30, | | September 30, | | September 30, | | September 30, | | September 30, |
| | | 2017 | | 2016 | | 2015 | | 2014 | | 2013 |
| | | | | | | | | | | | | | | | |
Per Share Data(1): | | | | | | | | | | | | | | | |
| Net asset value, beginning of year | | $ | 21.41 | | | $ | 21.27 | | | $ | 20.02 | | | $ | 16.82 | | | $ | 13.26 | |
| Income (loss) from investment operations: | | | | | | | | | | | | | | | | | | | | |
| Net investment income (loss) | | | (0.02 | )(2) | | | (0.00 | )(2) | | | (0.03 | )(2) | | | (0.07 | )(2) | | | 0.03 | (3) |
| Net realized and unrealized gain on investments | | | 4.93 | | | | 0.45 | | | | 1.28 | | | | 3.27 | | | | 3.58 | |
| Total from investment operations | | | 4.91 | | | | 0.45 | | | | 1.25 | | | | 3.20 | | | | 3.61 | |
| | | | | | | | | | | | | | | | | | | | | |
| Less distributions: | | | | | | | | | | | | | | | | | | | | |
| From net investment income | | | — | | | | (0.03 | ) | | | — | | | | — | | | | (0.05 | ) |
| From net realized gain | | | — | | | | (0.28 | ) | | | — | | | | — | | | | — | |
| Total distributions | | | — | | | | (0.31 | ) | | | — | | | | — | | | | (0.05 | ) |
| Net asset value, end of year | | $ | 26.32 | | | $ | 21.41 | | | $ | 21.27 | | | $ | 20.02 | | | $ | 16.82 | |
| | | | | | | | | | | | | | | | | | | | | |
| Total Return | | | 22.93 | % | | | 2.09 | % | | | 6.24 | % | | | 19.02 | % | | | 27.26 | % |
| | | | | | | | | | | | | | | | | | | | | |
| Supplemental data and ratios: | | | | | | | | | | | | | | | | | | | | |
| Net assets, end of year | | $ | 15,045,866 | | | $ | 12,630,891 | | | $ | 12,624,145 | | | $ | 14,977,451 | | | $ | 9,805,531 | |
| Ratio of expenses to average net assets: | | | | | | | | | | | | | | | | | | | | |
| Before expense reimbursement or recovery | | | 1.80 | % | | | 1.72 | % | | | 1.73 | % | | | 1.68 | % | | | 1.80 | % |
| After expense reimbursement or recovery | | | 1.50 | % | | | 1.50 | % | | | 1.50 | % | | | 1.58 | % | | | 1.60 | % |
| Ratio of net investment income (loss) to average net assets: | | | | | | | | | | | | | | | | | | | | |
| Before expense reimbursement or recovery | | | (0.39 | )% | | | (0.20 | )% | | | (0.35 | )% | | | (0.44 | )% | | | 0.00 | % |
| After expense reimbursement or recovery | | | (0.09 | )% | | | 0.02 | % | | | (0.12 | )% | | | (0.34 | )% | | | 0.20 | % |
| Portfolio turnover rate | | | 62.72 | % | | | 118.26 | % | | | 77.42 | % | | | 66.79 | % | | | 136.34 | % |
| (1) | For a share outstanding throughout the period. Rounded to the nearest cent. |
| (2) | Net invesment loss per share is calculated using ending balances prior to consideration of adjustments for permanent book and tax differences. |
| (3) | Net investment income per share is calculated based on average shares outstanding. |
| See Notes to the Financial Statements. | The Leuthold Funds - 2017 Annual Report | 43 |
Leuthold Global Industries Fund - Retail - LGINX
Financial Highlights
| | | Year Ended | | Year Ended | | Year Ended | | Year Ended | | Year Ended |
| | | September 30, | | September 30, | | September 30, | | September 30, | | September 30, |
| | | 2017 | | 2016 | | 2015 | | 2014 | | 2013 |
Per Share Data(1): | | | | | | | | | | | | | | | |
| Net asset value, beginning of year | | $ | 15.64 | | | $ | 15.76 | | | $ | 16.54 | | | $ | 14.89 | | | $ | 11.44 | |
| Income (loss) from investment operations: | | | | | | | | | | | | | | | | | | | | |
Net investment income (2) | | | 0.12 | | | | 0.12 | | | | 0.04 | | | | 0.08 | | | | 0.10 | |
| Net realized and unrealized gain (loss) on investments | | | 3.01 | | | | 0.41 | | | | (0.46 | ) | | | 1.68 | | | | 3.43 | |
| Total from investment operations | | | 3.13 | | | | 0.53 | | | | (0.42 | ) | | | 1.76 | | | | 3.53 | |
| | | | | | | | | | | | | | | | | | | | | |
| Less distributions: | | | | | | | | | | | | | | | | | | | | |
| From net investment income | | | (0.07 | ) | | | (0.07 | ) | | | (0.05 | ) | | | (0.11 | ) | | | (0.08 | ) |
| From net realized gain | | | (0.57 | ) | | | (0.58 | ) | | | (0.31 | ) | | | — | | | | — | |
| Redemption fees | | | — | | | | — | | | | 0.00 | (3) | | | 0.00 | (3) | | | 0.00 | (3) |
| Total distributions | | | (0.64 | ) | | | (0.65 | ) | | | (0.36 | ) | | | (0.11 | ) | | | (0.08 | ) |
| Net asset value, end of year | | $ | 18.13 | | | $ | 15.64 | | | $ | 15.76 | | | $ | 16.54 | | | $ | 14.89 | |
| | | | | | | | | | | | | | | | | | | | | |
| Total Return | | | 20.90 | % | | | 3.24 | % | | | (2.61 | )% | | | 11.78 | % | | | 30.98 | % |
| | | | | | | | | | | | | | | | | | | | | |
| Supplemental data and ratios: | | | | | | | | | | | | | | | | | | | | |
| Net assets, end of year | | $ | 1,952,884 | | | $ | 1,833,241 | | | $ | 5,015,722 | | | $ | 11,351,746 | | | $ | 4,797,409 | |
| Ratio of expenses to average net assets: | | | | | | | | | | | | | | | | | | | | |
| Before expense reimbursement or recovery | | | 2.66 | % | | | 2.35 | % | | | 2.04 | % | | | 2.06 | % | | | 2.70 | % |
| After expense reimbursement or recovery | | | 1.50 | % | | | 1.50 | % | | | 1.50 | % | | | 1.72 | % | | | 1.96 | % |
| Ratio of net investment income to average net assets: | | | | | | | | | | | | | | | | | | | | |
| Before expense reimbursement or recovery | | | (0.43 | )% | | | (0.10 | )% | | | (0.29 | )% | | | 0.18 | % | | | 0.01 | % |
| After expense reimbursement or recovery | | | 0.73 | | | | 0.75 | % | | | 0.24 | % | | | 0.52 | % | | | 0.75 | % |
| Portfolio turnover rate | | | 87.41 | % | | | 110.53 | % | | | 95.84 | % | | | 107.17 | % | | | 142.87 | % |
| (1) | For a share outstanding throughout the period. Rounded to the nearest cent. |
| (2) | Net investment income per share is calculated based on average shares outstanding. |
| (3) | Amount represents less than $0.005 per share. |
| 44 | The Leuthold Funds - 2017 Annual Report | See Notes to the Financial Statements. |
Leuthold Global Industries Fund - Institutional - LGIIX
Financial Highlights
| | | Year Ended | | Year Ended | | Year Ended | | Year Ended | | Year Ended |
| | | September 30, | | September 30, | | September 30, | | September 30, | | September 30, |
| | | 2017 | | 2016 | | 2015 | | 2014 | | 2013 |
Per Share Data(1): | | | | | | | | | | | | | | | |
| Net asset value, beginning of year | | $ | 15.70 | | | $ | 15.82 | | | $ | 16.63 | | | $ | 14.95 | | | $ | 11.48 | |
| Income (loss) from investment operations: | | | | | | | | | | | | | | | | | | | | |
Net investment income (2) | | | 0.16 | | | | 0.15 | | | | 0.08 | | | | 0.13 | | | | 0.13 | |
| Net realized and unrealized gain (loss) on investments | | | 3.03 | | | | 0.43 | | | | (0.48 | ) | | | 1.69 | | | | 3.45 | |
| Total from investment operations | | | 3.19 | | | | 0.58 | | | | (0.40 | ) | | | 1.82 | | | | 3.58 | |
| | | | | | | | | | | | | | | | | | | | | |
| Less distributions: | | | | | | | | | | | | | | | | | | | | |
| From net investment income | | | (0.10 | ) | | | (0.12 | ) | | | (0.10 | ) | | | (0.14 | ) | | | (0.11 | ) |
| From net realized gain | | | (0.57 | ) | | | (0.58 | ) | | | (0.31 | ) | | | — | | | | — | |
| Redemption fees | | | — | | | | — | | | | 0.00 | (3) | | | — | | | | 0.00 | (3) |
| Total distributions | | | (0.67 | ) | | | (0.70 | ) | | | (0.41 | ) | | | (0.14 | ) | | | (0.11 | ) |
| Net asset value, end of year | | $ | 18.22 | | | $ | 15.70 | | | $ | 15.82 | | | $ | 16.63 | | | $ | 14.95 | |
| | | | | | | | | | | | | | | | | | | | | |
| Total Return | | | 21.25 | % | | | 3.47 | % | | | (2.44 | )% | | | 12.16 | % | | | 31.17 | % |
| | | | | | | | | | | | | | | | | | | | | |
| Supplemental data and ratios: | | | | | | | | | | | | | | | | | | | | |
| Net assets, end of year | | $ | 8,980,549 | | | $ | 9,802,258 | | | $ | 14,272,916 | | | $ | 16,853,310 | | | $ | 9,705,739 | |
| Ratio of expenses to average net assets: | | | | | | | | | | | | | | | | | | | | |
| Before expense reimbursement or recovery | | | 2.41 | % | | | 2.10 | % | | | 1.79 | % | | | 1.81 | % | | | 2.45 | % |
| After expense reimbursement or recovery | | | 1.25 | % | | | 1.25 | % | | | 1.25 | % | | | 1.47 | % | | | 1.71 | % |
| Ratio of net investment income to average net assets: | | | | | | | | | | | | | | | | | | | | |
| Before expense reimbursement or recovery | | | (0.18 | )% | | | 0.15 | % | | | (0.05 | )% | | | 0.43 | % | | | 0.26 | % |
| After expense reimbursement or recovery | | | 0.98 | % | | | 1.00 | % | | | 0.49 | % | | | 0.77 | % | | | 1.00 | % |
| Portfolio turnover rate | | | 87.41 | % | | | 110.53 | % | | | 95.84 | % | | | 107.17 | % | | | 142.87 | % |
| (1) | For a share outstanding throughout the period. Rounded to the nearest cent. |
| (2) | Net investment income per share is calculated based on average shares outstanding. |
| (3) | Amount represents less than $0.005 per share. |
| See Notes to the Financial Statements. | The Leuthold Funds - 2017 Annual Report | 45 |
Grizzly Short Fund - GRZZX
Financial Highlights
| | | Year Ended | | Year Ended | | Year Ended | | Year Ended | | Year Ended |
| | | September 30, | | September 30, | | September 30, | | September 30, | | September 30, |
| | | 2017 | | 2016 | | 2015 | | 2014 | | 2013 |
Per Share Data(1): | | | | | | | | | | | | | | | |
| Net asset value, beginning of year | | $ | 6.17 | | | $ | 7.99 | | | $ | 7.37 | | | $ | 8.58 | | | $ | 11.06 | |
| Income (loss) from investment operations: | | | | | | | | | | | | | | | | | | | | |
| Net investment loss | | | (0.10 | )(2) | | | (0.18 | )(2) | | | (0.20 | )(2) | | | (0.26 | )(3) | | | (0.34 | )(2) |
| Net realized and unrealized gain (loss) on investments and securities sold short | | | (0.70 | ) | | | (1.64 | ) | | | 0.82 | | | | (0.95 | ) | | | (2.14 | ) |
| Total from investment operations | | | (0.80 | ) | | | (1.82 | ) | | | 0.62 | | | | (1.21 | ) | | | (2.48 | ) |
| | | | | | | | | | | | | | | | | | | | | |
| Less distributions: | | | | | | | | | | | | | | | | | | | | |
| From net investment income | | | — | | | | — | | | | — | | | | — | | | | — | |
| From net realized gain | | | — | | | | — | | | | — | | | | — | | | | — | |
| From return of capital | | | — | | | | — | | | | — | | | | — | | | | — | |
| Total distributions | | | — | | | | — | | | | — | | | | — | | | | — | |
| Net asset value, end of year | | $ | 5.37 | | | $ | 6.17 | | | $ | 7.99 | | | $ | 7.37 | | | $ | 8.58 | |
| | | | | | | | | | | | | | | | | | | | | |
| Total Return | | | (12.97 | )% | | | (22.78 | )% | | | 8.41 | % | | | (14.20 | )% | | | (22.33 | )% |
| | | | | | | | | | | | | | | | | | | | | |
| Supplemental data and ratios: | | | | | | | | | | | | | | | | | | | | |
| Net assets, end of year | | $ | 205,698,273 | | | $ | 178,211,844 | | | $ | 265,843,184 | | | $ | 72,182,207 | | | $ | 94,914,802 | |
Ratio of expenses to average net assets (4) | | | 2.63 | % | | | 2.65 | % | | | 2.81 | % | | | 3.35 | % | | | 3.43 | % |
Ratio of net investment loss to average net assets (5) | | | (1.78 | )% | | | (2.50 | )% | | | (2.81 | )% | | | (3.35 | )% | | | (3.42 | )% |
Portfolio turnover rate(6) | | | 0.00 | % | | | 0.00 | % | | | 0.00 | % | | | 0.00 | % | | | 0.00 | % |
| (1) | For a share outstanding throughout the period. Rounded to the nearest cent. |
| (2) | Net investment loss per share is calculated based on average shares outstanding. |
| (3) | Net investment loss per share is calculated using ending balances prior to consideration of adjustments for permanent book and tax differences. |
| (4) | The ratio of expenses to average net assets includes dividends and interest on securites sold short. The expense ratios excluding dividends and interest on securities sold short were 1.54% for the year ended September 30, 2017, 1.52% for the year ended September 30, 2016, 1.55% for the year ended September 30, 2015, 1.57% for the year ended September 30, 2014, and 1.54% for the year ended September 30, 2013. |
| (5) | The net investment income ratios include dividends and interest on securities sold short. |
| (6) | The portfolio turnover rate excludes purchases and sales of securities sold short. |
| 46 | The Leuthold Funds - 2017 Annual Report | See Notes to the Financial Statements. |
Leuthold Core Investment Fund
Consolidated Schedule of Investments
September 30, 2017
| | | Shares | | | Fair Value | |
| COMMON STOCKS - 66.76% | | | | |
| Aerospace & Defense - 3.01% | | | | |
| General Dynamics Corp. | | | 14,986 | | | $ | 3,080,822 | |
| L3 Technologies, Inc. | | | 20,209 | | | | 3,807,982 | |
| Northrop Grumman Corp. | | | 20,890 | | | | 6,010,471 | |
| Raytheon Co. | | | 32,470 | | | | 6,058,252 | |
| Spirit AeroSystems Holdings, Inc. - Class A | | | 46,775 | | | | 3,635,353 | |
| Textron, Inc. | | | 56,084 | | | | 3,021,806 | |
| | | | | | | | 25,614,686 | |
| | | | | | | | | |
| Air Freight & Logistics - 0.02% | | | | | |
| Hyundai Glovis Co., Ltd. (b) | | | 1,582 | | | | 204,764 | |
| | | | | | | | | |
| Airlines - 3.61% | | | | | | | | |
| Air China, Ltd. (b) | | | 150,000 | | | | 124,762 | |
| Alaska Air Group, Inc. | | | 42,688 | | | | 3,255,814 | |
| American Airlines Group, Inc. (h) | | | 114,213 | | | | 5,423,975 | |
| China Southern Airlines Co., Ltd. - ADR | | | 5,699 | | | | 195,875 | |
| Delta Air Lines, Inc. | | | 133,059 | | | | 6,416,105 | |
| Hawaiian Holdings, Inc. (a)(h) | | | 129,653 | | | | 4,868,470 | |
| JetBlue Airways Corp. (a)(h) | | | 133,059 | | | | 2,465,583 | |
| Southwest Airlines Co. | | | 142,368 | | | | 7,969,761 | |
| | | | | | | | 30,720,345 | |
| | | | | | | | | |
| Auto Components - 3.20% | | | | | | | | |
| American Axle & Manufacturing Holdings, Inc. (a) | | | 126,474 | | | | 2,223,413 | |
| BorgWarner, Inc. (h) | | | 92,187 | | | | 4,722,740 | |
| Chaowei Power Holdings, Ltd. (b) | | | 414,000 | | | | 240,336 | |
| Cooper Tire & Rubber Co. (h) | | | 59,490 | | | | 2,224,926 | |
| Cooper-Standard Holding, Inc. (a)(h) | | | 20,209 | | | | 2,343,638 | |
| Gentex Corp. (h) | | | 120,797 | | | | 2,391,781 | |
| Hankook Tire Co., Ltd. (b) | | | 4,031 | | | | 212,274 | |
| Lear Corp. | | | 26,793 | | | | 4,637,332 | |
| Magna International, Inc. (b) | | | 77,883 | | | | 4,157,395 | |
| Minth Group, Ltd. (b) | | | 108,000 | | | | 567,547 | |
| Nexteer Automotive Group, Ltd. | | | 277,000 | | | | 477,533 | |
| Tenneco, Inc. | | | 37,011 | | | | 2,245,457 | |
| Tianneng Power International, Ltd. (b) | | | 214,000 | | | | 221,733 | |
| Tong Yang Industry Co., Ltd. (b) | | | 147,000 | | | | 300,567 | |
| Xinyi Glass Holdings, Ltd. (b) | | | 250,000 | | | | 247,781 | |
| | | | | | | | 27,214,453 | |
| | | | | | | | | |
| Automobiles - 2.65% | | | | | | | | |
| BAIC Motor Corp., Ltd. (b) | | | 197,500 | | | | 187,696 | |
| Fiat Chrysler Automobiles NV (b) | | | 238,656 | | | | 4,274,329 | |
| Ford Motor Co. | | | 352,496 | | | | 4,219,377 | |
| Geely Automobile Holdings, Ltd. (b) | | | 116,000 | | | | 329,407 | |
| General Motors Co. | | | 106,301 | | | | 4,292,434 | |
| Great Wall Motor Co., Ltd. (b) | | | 359,500 | | | | 444,940 | |
| Honda Motor Co., Ltd. - ADR | | | 139,760 | | | | 4,131,306 | |
| Tofas Turk Otomobil Fabrikasi AS (b) | | | 31,769 | | | | 275,261 | |
| Toyota Motor Corp. - ADR | | | 34,494 | | | | 4,110,650 | |
| Yadea Group Holdings, Ltd. (b) | | | 660,000 | | | | 246,190 | |
| | | | | | | | 22,511,590 | |
| | | | | | | | | |
| Banks - 5.33% | | | | | | | | |
| Agricultural Bank of China, Ltd. (b) | | | 358,000 | | | | 161,154 | |
| Alpha Bank AE (a)(b) | | | 65,310 | | | | 129,462 | |
| Banco Macro SA - ADR (h) | | | 17,257 | | | | 2,025,109 | |
| Bank Negara Indonesia Persero Tbk PT (b) | | | 510,400 | | | | 280,657 | |
| Bank of China, Ltd. (b) | | | 2,269,000 | | | | 1,127,065 | |
| Bank Tabungan Negara Persero Tbk PT (b) | | | 2,117,700 | | | | 495,976 | |
| BB&T Corp. | | | 60,399 | | | | 2,835,129 | |
| China Construction Bank Corp. (b) | | | 198,000 | | | | 165,419 | |
| See Notes to the Financial Statements. | The Leuthold Funds - 2017 Annual Report | 47 |
Leuthold Core Investment Fund
Consolidated Schedule of Investments (continued)
September 30, 2017
| | | Shares | | | Fair Value | |
| COMMON STOCKS - 66.76% (continued) | |
| Banks - 5.33% (continued) | | | | | | |
| China Merchants Bank Co., Ltd. (b) | | | 93,000 | | | $ | 329,318 | |
| Chong Hing Bank, Ltd. (b) | | | 104,000 | | | | 212,533 | |
| Chongqing Rural Commercial Bank Co., Ltd. (b) | | | 459,000 | | | | 292,201 | |
| CIT Group, Inc. | | | 64,486 | | | | 3,163,038 | |
| Citigroup, Inc. | | | 41,098 | | | | 2,989,469 | |
| Citizens Financial Group, Inc. | | | 78,337 | | | | 2,966,622 | |
| Credicorp, Ltd. (b) | | | 13,624 | | | | 2,793,193 | |
| CTBC Financial Holding Co., Ltd. (b) | | | 260,000 | | | | 163,202 | |
| Dah Sing Financial Holdings, Ltd. (b) | | | 15,000 | | | | 102,124 | |
| DBS Group Holdings, Ltd. (b) | | | 24,000 | | | | 369,458 | |
| Fifth Third Bancorp (h) | | | 99,681 | | | | 2,789,074 | |
| First BanCorp (a)(b) | | | 223,430 | | | | 1,143,962 | |
| Grupo Financiero Galicia SA - ADR | | | 44,050 | | | | 2,270,337 | |
| Hana Financial Group, Inc. (b) | | | 12,438 | | | | 516,012 | |
| Huishang Bank Corp., Ltd. (b) | | | 340,000 | | | | 167,571 | |
| IBERIABANK Corp. | | | 28,383 | | | | 2,331,663 | |
| Kasikornbank PCL - NVDR | | | 33,200 | | | | 206,469 | |
| KB Financial Group, Inc. - ADR | | | 68,425 | | | | 3,354,878 | |
| Kiatnakin Bank PCL - NVDR | | | 83,300 | | | | 174,412 | |
| OTP Bank PLC (b) | | | 4,300 | | | | 161,430 | |
| Regions Financial Corp. | | | 190,733 | | | | 2,904,864 | |
| SunTrust Banks, Inc. | | | 48,591 | | | | 2,904,284 | |
| Taiwan Business Bank (b) | | | 897,834 | | | | 244,752 | |
| TCF Financial Corp. | | | 133,286 | | | | 2,271,193 | |
| Turkiye Is Bankasi - Class C (b) | | | 114,000 | | | | 216,914 | |
| Turkiye Sinai Kalkinma Bankasi AS (b) | | | 438,140 | | | | 170,902 | |
| Umpqua Holdings Corp. | | | 127,836 | | | | 2,494,080 | |
| Woori Bank (b) | | | 23,506 | | | | 366,970 | |
| | | | | | | | 45,290,896 | |
| | | | | | | | | |
| Biotechnology - 2.22% | | | | | | | | |
| AbbVie, Inc. | | | 66,075 | | | | 5,871,425 | |
| Amgen, Inc. | | | 24,296 | | | | 4,529,989 | |
| Biogen, Inc. (a) | | | 13,624 | | | | 4,265,947 | |
| Gilead Sciences, Inc. | | | 51,543 | | | | 4,176,014 | |
| | | | | | | | 18,843,375 | |
| | | | | | | | | |
| Building Products - 0.04% | | | | | | | | |
| IS Dongseo Co., Ltd. (b) | | | 3,440 | | | | 98,811 | |
| Trakya Cam Sanayii AS (b) | | | 207,100 | | | | 210,924 | |
| | | | | | | | 309,735 | |
| | | | | | | | | |
| Capital Markets - 3.30% | | | | | | | | |
| Ameriprise Financial, Inc. | | | 25,885 | | | | 3,844,181 | |
| Bank of New York Mellon Corp. | | | 62,896 | | | | 3,334,746 | |
| Evercore, Inc. - Class A (h) | | | 42,007 | | | | 3,371,062 | |
| Federated Investors, Inc. - Class B (h) | | | 75,158 | | | | 2,232,192 | |
| Franklin Resources, Inc. | | | 73,114 | | | | 3,254,304 | |
| Invesco, Ltd. | | | 85,376 | | | | 2,991,575 | |
| Morgan Stanley | | | 42,688 | | | | 2,056,281 | |
| State Street Corp. | | | 35,876 | | | | 3,427,593 | |
| T. Rowe Price Group, Inc. | | | 38,601 | | | | 3,499,181 | |
| | | | | | | | 28,011,115 | |
| | | | | | | | | |
| Chemicals - 0.35% | | | | | | | | |
| AECI, Ltd. (b) | | | 25,629 | | | | 192,528 | |
| China Lumena New Materials Corp. (a)(b)(d)(e) | | | 838,000 | | | | 6,437 | |
| China Sanjiang Fine Chemicals Co., Ltd. (b) | | | 466,000 | | | | 157,689 | |
| ENF Technology Co., Ltd. (b) | | | 19,630 | | | | 430,766 | |
| Fufeng Group, Ltd. (b) | | | 358,000 | | | | 245,957 | |
| Grand Pacific Petrochemical (b) | | | 425,000 | | | | 319,424 | |
| Hanwha Chemical Corp. (b) | | | 12,875 | | | | 366,325 | |
| Huchems Fine Chemical Corp. (b) | | | 8,800 | | | | 184,419 | |
| Korea Petrochemical Industry Co., Ltd. (b) | | | 1,089 | | | | 236,530 | |
| PTT Global Chemical PCL - NVDR | | | 83,500 | | | | 192,998 | |
| 48 | The Leuthold Funds - 2017 Annual Report | See Notes to the Financial Statements. |
Leuthold Core Investment Fund
Consolidated Schedule of Investments (continued)
September 30, 2017
| | | Shares | | | Fair Value | |
| Chemicals - 0.35% (continued) | | | | | | |
| SKC Co., Ltd. (b) | | | 5,501 | | | $ | 198,571 | |
| UNIPETROL (b) | | | 30,300 | | | | 468,638 | |
| | | | | | | | 3,000,282 | |
| | | | | | | | | |
| Communications Equipment - 0.07% | | | | | | | | |
| Huneed Technologies (a)(b) | | | 12,900 | | | | 118,807 | |
| Sercomm Corp. (b) | | | 42,000 | | | | 113,344 | |
| Yangtze Optical Fibre and Cable Joint Stock, Ltd. Co. (b) | | | 84,500 | | | | 323,501 | |
| | | | | | | | 555,652 | |
| | | | | | | | | |
| Construction Materials - 0.03% | | | | | | | | |
| China Resources Cement Holdings, Ltd. (b) | | | 380,000 | | | | 234,275 | |
| | | | | | | | | |
| Consumer Finance - 0.49% | | | | | | | | |
| Navient Corp. | | | 160,987 | | | | 2,418,025 | |
| World Acceptance Corp. (a)(h) | | | 21,344 | | | | 1,769,204 | |
| | | | | | | | 4,187,229 | |
| | | | | | | | | |
| Diversified Consumer Services - 0.25% | | | | | | | | |
| Adtalem Global Education, Inc. (h) | | | 53,360 | | | | 1,912,956 | |
| Kroton Educacional SA (b) | | | 32,600 | | | | 205,554 | |
| | | | | | | | 2,118,510 | |
| | | | | | | | | |
| Diversified Financial Services - 0.04% | | | | | | | | |
| Fubon Financial Holding Co., Ltd. (b) | | | 204,000 | | | | 318,805 | |
| | | | | | | | | |
| Diversified Telecommunication Services - 0.10% | | | | | | | | |
| China Communications Services Corp., Ltd. (b) | | | 486,000 | | | | 250,918 | |
| China Telecom Corp., Ltd. - ADR | | | 3,749 | | | | 191,649 | |
| CITIC Telecom International Holdings, Ltd. (b) | | | 549,000 | | | | 158,591 | |
| Telekomunikasi Indonesia Persero Tbk PT - ADR | | | 7,313 | | | | 250,836 | |
| | | | | | | | 851,994 | |
| | | | | | | | | |
| Electric Utilities - 0.02% | | | | | | | | |
| Tenaga Nasional Bhd (b) | | | 49,900 | | | | 169,327 | |
| | | | | | | | | |
| Electronic Equipment, Instruments & Components - 5.04% | | | | | | | | |
| Arrow Electronics, Inc. (a) | | | 74,477 | | | | 5,988,696 | |
| Avnet, Inc. | | | 96,048 | | | | 3,774,686 | |
| Benchmark Electronics, Inc. (a) | | | 79,245 | | | | 2,706,217 | |
| Chin-Poon Industrial Co., Ltd. (b) | | | 196,000 | | | | 376,694 | |
| Corning, Inc. | | | 67,438 | | | | 2,017,745 | |
| DataTec, Ltd. (b) | | | 31,806 | | | | 134,542 | |
| Elite Material Co., Ltd. (b) | | | 74,000 | | | | 352,407 | |
| Flex, Ltd. (a) | | | 357,624 | | | | 5,925,830 | |
| FLEXium Interconnect, Inc. (b) | | | 45,873 | | | | 176,191 | |
| Hon Hai Precision Industry Co., Ltd. (b) | | | 74,300 | | | | 258,037 | |
| Jabil, Inc. (h) | | | 245,909 | | | | 7,020,702 | |
| Jarllytec Co., Ltd. (b) | | | 74,000 | | | | 128,512 | |
| Kingboard Chemical Holdings, Ltd. (b) | | | 53,500 | | | | 284,930 | |
| Methode Electronics, Inc. | | | 60,626 | | | | 2,567,511 | |
| Plexus Corp. (a) | | | 38,601 | | | | 2,164,744 | |
| Sanmina Corp. (a) | | | 93,096 | | | | 3,458,516 | |
| Sinbon Electronics Co., Ltd. (b) | | | 63,000 | | | | 166,850 | |
| SVI PCL - NVDR | | | 929,000 | | | | 140,927 | |
| Tech Data Corp. (a) | | | 58,355 | | | | 5,184,842 | |
| | | | | | | | 42,828,579 | |
| | | | | | | | | |
| Food & Staples Retailing - 0.03% | | | | | | | | |
| Shoprite Holdings, Ltd. (b) | | | 19,060 | | | | 291,305 | |
| | | | | | | | | |
| Food Products - 0.14% | | | | | | | | |
| CJ CheilJedang Corp. (b) | | | 426 | | | | 131,906 | |
| Indofood Sukses Makmur Tbk PT (b) | | | 346,000 | | | | 216,670 | |
| Industrias Bachoco Sab de CV (b) | | | 33,200 | | | | 183,995 | |
| See Notes to the Financial Statements. | The Leuthold Funds - 2017 Annual Report | 49 |
Leuthold Core Investment Fund
Consolidated Schedule of Investments (continued)
September 30, 2017
| | | Shares | | | Fair Value | |
| COMMON STOCKS - 66.76% (continued) | | | | | | |
| Food Products - 0.14% (continued) | | | | | | |
| Sao Martinho SA (b) | | | 43,700 | | | $ | 246,154 | |
| Uni-President Enterprises Corp. (b) | | | 91,560 | | | | 191,978 | |
| WH Group, Ltd. (b) | | | 230,500 | | | | 245,483 | |
| | | | | | | | 1,216,186 | |
| | | | | | | | | |
| Health Care Providers & Services - 4.25% | |
| Aetna, Inc. | | | 42,915 | | | | 6,823,914 | |
| Anthem, Inc. | | | 32,016 | | | | 6,079,198 | |
| Centene Corp. (a) | | | 62,215 | | | | 6,020,546 | |
| Cigna Corp. (h) | | | 24,750 | | | | 4,626,765 | |
| Humana, Inc. | | | 19,300 | | | | 4,702,059 | |
| Qualicorp SA (b) | | | 29,100 | | | | 344,736 | |
| UnitedHealth Group, Inc. | | | 38,374 | | | | 7,515,548 | |
| | | | | | | | 36,112,766 | |
| | | | | | | | | |
| Hotels, Restaurants & Leisure - 3.11% | | | | | | | | |
| Carnival Corp. | | | 101,043 | | | | 6,524,347 | |
| ILG, Inc. (h) | | | 123,522 | | | | 3,301,743 | |
| Marriott Vacations Worldwide Corp. | | | 24,523 | | | | 3,053,849 | |
| Norwegian Cruise Line Holdings, Ltd. (a)(h) | | | 55,857 | | | | 3,019,071 | |
| Royal Caribbean Cruises, Ltd. | | | 45,867 | | | | 5,437,074 | |
| Wyndham Worldwide Corp. | | | 48,364 | | | | 5,098,049 | |
| | | | | | | | 26,434,133 | |
| | | | | | | | | |
| Household Durables - 3.75% | | | | | | | | |
| Arcelik AS (b) | | | 34,711 | | | | 221,372 | |
| CalAtlantic Group, Inc. (h) | | | 96,502 | | | | 3,534,868 | |
| D.R. Horton, Inc. | | | 182,331 | | | | 7,280,477 | |
| Haier Electronics Group Co., Ltd. (b) | | | 78,000 | | | | 190,913 | |
| Lentex SA (b) | | | 78,742 | | | | 176,948 | |
| M/I Homes, Inc. (a) | | | 68,346 | | | | 1,826,889 | |
| MDC Holdings, Inc. (h) | | | 71,525 | | | | 2,375,345 | |
| Meritage Homes Corp. (a) | | | 59,945 | | | | 2,661,558 | |
| PulteGroup, Inc. | | | 212,304 | | | | 5,802,268 | |
| Taiwan Sakura Corp. (b) | | | 169,000 | | | | 213,946 | |
| Taylor Morrison Home Corp. - Class A (a) | | | 102,632 | | | | 2,263,036 | |
| Toll Brothers, Inc. (h) | | | 128,972 | | | | 5,348,469 | |
| | | | | | | | 31,896,089 | |
| | | | | | | | | |
| Independent Power & Renewable Electricity Producers - 0.05% | | | | | |
| Huaneng Renewables Corp., Ltd. (b) | | | 904,000 | | | | 299,651 | |
| SPCG PCL - NVDR | | | 266,400 | | | | 163,064 | |
| | | | | | | | 462,715 | |
| | | | | | | | | |
| Industrial Conglomerates - 0.03% | | | | | |
| Turkiye Sise ve Cam Fabrikalari AS (b) | | | 229,811 | | | | 264,450 | |
| | | | | | | | | |
| Insurance - 4.15% | | | | | | | | |
| Aflac, Inc. (h) | | | 49,046 | | | | 3,991,854 | |
| Cathay Financial Holding Co., Ltd. (b) | | | 236,000 | | | | 376,090 | |
| China Life Insurance Co., Ltd. (b) | | | 105,370 | | | | 99,369 | |
| China Taiping Insurance Holdings Co., Ltd. (b) | | | 58,000 | | | | 156,069 | |
| CNO Financial Group, Inc. | | | 113,077 | | | | 2,639,217 | |
| Dhipaya Insurance PCL - NVDR | | | 124,000 | | | | 170,105 | |
| Hanwha General Insurance Co., Ltd. (b) | | | 32,377 | | | | 227,402 | |
| Hanwha Life Insurance Co., Ltd. (b) | | | 38,600 | | | | 231,227 | |
| Korean Reinsurance Co. (b) | | | 13,329 | | | | 132,207 | |
| Lincoln National Corp. | | | 50,181 | | | | 3,687,300 | |
| Manulife Financial Corp. (b)(h) | | | 180,969 | | | | 3,671,861 | |
| MetLife, Inc. (h) | | | 59,263 | | | | 3,078,713 | |
| 50 | The Leuthold Funds - 2017 Annual Report | See Notes to the Financial Statements. |
Leuthold Core Investment Fund
Consolidated Schedule of Investments (continued)
September 30, 2017
| | | Shares | | | Fair Value | |
| COMMON STOCKS - 66.76% (continued) | | | | | | |
| Insurance - 4.15% (continued) | | | | | | |
| PICC Property & Casualty Co., Ltd. (b) | | | 482,000 | | | $ | 855,022 | |
| Ping An Insurance Group Co. of China, Ltd. (b) | | | 73,000 | | | | 563,882 | |
| Principal Financial Group, Inc. | | | 57,447 | | | | 3,696,140 | |
| Prudential Financial, Inc. | | | 44,050 | | | | 4,683,396 | |
| Qualitas Controladora SAB de CV (b) | | | 150,000 | | | | 246,458 | |
| Sanlam, Ltd. (b) | | | 33,674 | | | | 168,229 | |
| Shinkong Insurance Co., Ltd. (b) | | | 194,000 | | | | 168,970 | |
| Sun Life Financial, Inc. (b) | | | 57,220 | | | | 2,278,501 | |
| Unum Group | | | 76,066 | | | | 3,889,255 | |
| Wiz Solucoes e Corretagem de Seguros SA (b) | | | 42,400 | | | | 233,075 | |
| | | | | | | | 35,244,342 | |
| | | | | | | | | |
| Internet Software & Services - 0.57% | | | | | | | | |
| Alibaba Group Holding, Ltd. - ADR (a)(h) | | | 12,949 | | | | 2,236,422 | |
| NetEase, Inc. - ADR | | | 1,420 | | | | 374,610 | |
| Tencent Holdings, Ltd. (b) | | | 50,500 | | | | 2,207,895 | |
| | | | | | | | 4,818,927 | |
| | | | | | | | | |
| IT Services - 5.97% | | | | | | | | |
| Accenture PLC - Class A (b) | | | 44,958 | | | | 6,072,477 | |
| Amdocs, Ltd. | | | 38,828 | | | | 2,497,417 | |
| CACI International, Inc. - Class A (a)(h) | | | 17,030 | | | | 2,373,130 | |
| CGI Group, Inc. - Class A (a)(b) | | | 36,330 | | | | 1,884,437 | |
| Chinasoft International, Ltd. (b) | | | 654,000 | | | | 364,192 | |
| Cognizant Technology Solutions Corp. - Class A | | | 38,601 | | | | 2,800,117 | |
| Convergys Corp. | | | 70,617 | | | | 1,828,274 | |
| DST Systems, Inc. | | | 55,403 | | | | 3,040,517 | |
| Fiserv, Inc. (a) | | | 47,002 | | | | 6,061,378 | |
| International Business Machines Corp. | | | 34,059 | | | | 4,941,280 | |
| MasterCard, Inc. - Class A | | | 51,543 | | | | 7,277,872 | |
| Science Applications International Corp. | | | 35,195 | | | | 2,352,786 | |
| Visa, Inc. - Class A (h) | | | 73,114 | | | | 7,694,517 | |
| Western Union Co. (h) | | | 79,472 | | | | 1,525,862 | |
| | | | | | | | 50,714,256 | |
| | | | | | | | | |
| Metals & Mining - 0.16% | | | | | | | | |
| Ann Joo Resources Bhd (b) | | | 447,700 | | | | 376,672 | |
| Boryszew SA (a)(b) | | | 57,100 | | | | 156,561 | |
| Chung Hung Steel Corp. (a)(b) | | | 329,000 | | | | 114,751 | |
| Eregli Demir ve Celik Fabrikalari TAS (b) | | | 107,022 | | | | 232,234 | |
| Jastrzebska Spolka Weglowa SA (a)(b) | | | 6,615 | | | | 175,047 | |
| Thai Metal Trade PCL - NVDR | | | 648,500 | | | | 303,526 | |
| | | | | | | | 1,358,791 | |
| | | | | | | | | |
| Multiline Retail - 0.43% | | | | | | | | |
| Target Corp. | | | 61,265 | | | | 3,615,248 | |
| | | | | | | | | |
| Oil, Gas & Consumable Fuels - 0.29% | | | | | | | | |
| Grupa Lotos SA (b) | | | 12,988 | | | | 212,758 | |
| GS Holdings Corp. (b) | | | 4,194 | | | | 240,890 | |
| Hellenic Petroleum SA (b) | | | 20,483 | | | | 174,698 | |
| Motor Oil Hellas Corinth Refineries SA (b) | | | 8,500 | | | | 203,452 | |
| NewOcean Energy Holdings, Ltd. (b) | | | 366,000 | | | | 99,942 | |
| Polski Koncern Naftowy ORLEN SA (b) | | | 13,329 | | | | 444,741 | |
| Polskie Gornictwo Naftowe i Gazownictwo SA (b) | | | 180,799 | | | | 336,642 | |
| SK Innovation Co., Ltd. (b) | | | 1,349 | | | | 235,123 | |
| Thai Oil PCL - NVDR | | | 115,000 | | | | 319,201 | |
| Tupras Turkiye Petrol Rafinerileri AS (b) | | | 6,130 | | | | 209,194 | |
| | | | | | | | 2,476,641 | |
| See Notes to the Financial Statements. | The Leuthold Funds - 2017 Annual Report | 51 |
Leuthold Core Investment Fund
Consolidated Schedule of Investments (continued)
September 30, 2017
| | | Shares | | | Fair Value | |
| COMMON STOCKS - 66.76% (continued) | | | | | | |
| Paper & Forest Products - 0.12% | | | | | | |
| Alkim Alkali Kimya AS (b) | | | 31,800 | | | $ | 203,372 | |
| Lee & Man Paper Manufacturing, Ltd. (b) | | | 350,000 | | | | 450,340 | |
| Nine Dragons Paper Holdings, Ltd. (b) | | | 113,000 | | | | 223,633 | |
| Sappi, Ltd. (b) | | | 22,519 | | | | 153,371 | |
| | | | | | | | 1,030,716 | |
| | | | | | | | | |
| Pharmaceuticals - 0.11% | | | | | | | | |
| China Pharmaceutical Group, Ltd. (b) | | | 262,000 | | | | 440,317 | |
| Guangzhou Baiyunshan Pharmaceutical Holdings Co., Ltd. (b) | | | 56,000 | | | | 146,532 | |
| Sino Biopharmaceutical, Ltd. (b) | | | 344,000 | | | | 364,446 | |
| | | | | | | | 951,295 | |
| | | | | | | | | |
| Professional Services - 0.32% | | | | | | | | |
| ManpowerGroup, Inc. (h) | | | 23,160 | | | | 2,728,711 | |
| | | | | | | | | |
| Real Estate Investment Trusts (REITs) - 0.02% | | | | | | | | |
| Proligis Propery Mexico SA de CV (b) | | | 90,400 | | | | 178,814 | |
| | | | | | | | | |
| Real Estate Management & Development - 0.20% | | | | | | | | |
| China Aoyuan Property Group, Ltd. (b) | | | 330,000 | | | | 185,052 | |
| China Resources Land, Ltd. (b) | | | 72,000 | | | | 221,379 | |
| Gemdale Properties & Investment Corp., Ltd. (b) | | | 2,200,000 | | | | 248,955 | |
| K Wah International Holdings, Ltd. (b) | | | 301,000 | | | | 181,682 | |
| Kerry Properties, Ltd. (b) | | | 54,500 | | | | 226,369 | |
| Logan Property Holdings Co., Ltd. (b) | | | 160,000 | | | | 165,513 | |
| Sena Development PCL - NVDR | | | 1,484,800 | | | | 170,991 | |
| Yanlord Land Group, Ltd. (b) | | | 237,000 | | | | 323,770 | |
| | | | | | | | 1,723,711 | |
| | | | | | | | | |
| Road & Rail - 2.56% | | | | | | | | |
| Canadian National Railway Co. (b) | | | 43,369 | | | | 3,593,121 | |
| CSX Corp. | | | 93,323 | | | | 5,063,706 | |
| Genesee & Wyoming, Inc. - Class A (a) | | | 29,972 | | | | 2,218,228 | |
| Kansas City Southern | | | 31,335 | | | | 3,405,488 | |
| Norfolk Southern Corp. | | | 30,199 | | | | 3,993,516 | |
| Union Pacific Corp. | | | 29,745 | | | | 3,449,528 | |
| | | | | | | | 21,723,587 | |
| | | | | | | | | |
| Semiconductors & Semiconductor Equipment - 7.59% | | | | | | | | |
| Applied Materials, Inc. | | | 220,251 | | | | 11,472,875 | |
| APS Holdings Corp. (a)(b) | | | 9,200 | | | | 78,940 | |
| Chen Full International Co., Ltd. (b) | | | 85,000 | | | | 124,646 | |
| Cirrus Logic, Inc. (a) | | | 29,745 | | | | 1,586,003 | |
| Dongbu HiTek Co., Ltd. (a)(b) | | | 14,872 | | | | 199,457 | |
| Hua Hong Semiconductor, Ltd. (b) | | | 208,000 | | | | 282,565 | |
| Intel Corp. (h) | | | 68,800 | | | | 2,619,904 | |
| King Yuan Electronics Co., Ltd. (b) | | | 358,600 | | | | 352,514 | |
| KLA-Tencor Corp. | | | 32,924 | | | | 3,489,944 | |
| Kulicke & Soffa Industries, Inc. (a)(b)(h) | | | 89,463 | | | | 1,929,717 | |
| Lam Research Corp. (h) | | | 74,250 | | | | 13,739,220 | |
| MKS Instruments, Inc. | | | 61,307 | | | | 5,790,446 | |
| PSK, Inc. (b) | | | 11,472 | | | | 239,033 | |
| QUALCOMM, Inc. | | | 33,151 | | | | 1,718,548 | |
| 52 | The Leuthold Funds - 2017 Annual Report | See Notes to the Financial Statements. |
Leuthold Core Investment Fund
Consolidated Schedule of Investments (continued)
September 30, 2017
| | | Shares | | | Fair Value | |
| COMMON STOCKS - 66.76% (continued) | | | | | | |
| Semiconductors & Semiconductor Equipment - 7.59% (continued) | | | | | | |
| Samsung Electronics Co., Ltd. (b) | | | 1,076 | | | $ | 2,421,241 | |
| Silicon Works Co., Ltd. (b) | | | 4,968 | | | | 192,172 | |
| SK Hynix, Inc. (b) | | | 7,657 | | | | 558,427 | |
| SolarEdge Technologies, Inc. (a)(b) | | | 125,112 | | | | 3,571,948 | |
| Taiwan Semiconductor Co., Ltd. (b) | | | 202,000 | | | | 364,548 | |
| Taiwan Semiconductor Manufacturing Co., Ltd. - ADR | | | 87,054 | | | | 3,268,878 | |
| Tera Semicon Co., Ltd. (b) | | | 5,500 | | | | 144,467 | |
| Teradyne, Inc. (h) | | | 266,572 | | | | 9,940,470 | |
| Unisem M Bhd (b) | | | 315,000 | | | | 281,614 | |
| Wonik Holdings Co., Ltd. (a)(b) | | | 28,009 | | | | 185,614 | |
| | | | | | | | 64,553,191 | |
| | | | | | | | | |
| Software - 2.51% | | | | | | | | |
| Activision Blizzard, Inc. | | | 169,162 | | | | 10,912,640 | |
| Electronic Arts, Inc. (a) | | | 88,327 | | | | 10,427,886 | |
| | | | | | | | 21,340,526 | |
| | | | | | | | | |
| Specialty Retail - 0.28% | | | | | | | | |
| Bed, Bath & Beyond, Inc. (h) | | | 59,263 | | | | 1,390,903 | |
| FF Group (a)(b) | | | 18,414 | | | | 400,946 | |
| Super Group, Ltd. (a)(b) | | | 119,207 | | | | 379,284 | |
| Zhongsheng Group Holdings, Ltd. (b) | | | 86,000 | | | | 186,810 | |
| | | | | | | | 2,357,943 | |
| | | | | | | | | |
| Technology Hardware, Storage & Peripherals - 0.14% | | | | | | | | |
| Catcher Technology Co., Ltd. (b) | | | 34,000 | | | | 318,047 | |
| Pegatron Corp. (b) | | | 346,000 | | | | 900,922 | |
| | | | | | | | 1,218,969 | |
| | | | | | | | | |
| Tobacco - 0.03% | | | | | | | | |
| Philip Morris CR AS (b) | | | 287 | | | | 216,201 | |
| | | | | | | | | |
| Transportation Infrastructure - 0.10% | | | | | | | | |
| Celebi Hava Servisi AS (b) | | | 22,698 | | | | 212,248 | |
| TAV Havalimanlari Holding AS (b) | | | 44,000 | | | | 218,039 | |
| Wilson Sons, Ltd. - BDR | | | 33,300 | | | | 446,853 | |
| | | | | | | | 877,140 | |
| | | | | | | | | |
| Water Utilities - 0.05% | | | | | | | | |
| Cia de Saneamento Basico do Estado de Sao Paulo - ADR | | | 27,223 | | | | 284,752 | |
| Cia de Saneamento de Minas Gerais-COPASA (b) | | | 10,600 | | | | 143,346 | |
| | | | | | | | 428,098 | |
| | | | | | | | | |
| Wireless Telecommunication Services - 0.03% | | | | | | | | |
| China Mobile, Ltd. - ADR | | | 4,947 | | | | 250,170 | |
TOTAL COMMON STOCKS
(Cost $400,806,894) | | | | | | $ | 567,470,533 | |
| | | | | | | | | |
| PREFERRED STOCKS - 1.18% | | | | | | | | |
| Banks - 1.06% | | | | | | | | |
| Banco Bradesco SA - ADR (h) | | | 300,655 | | | $ | 3,328,251 | |
| Bancolombia SA - ADR | | | 55,403 | | | | 2,536,903 | |
| Itau Unibanco Holding SA - ADR | | | 228,728 | | | | 3,133,574 | |
| | | | | | | | 8,998,728 | |
| | | | | | | | | |
| Chemicals - 0.05% | | | | | | | | |
| Braskem SA - ADR | | | 16,435 | | | | 439,472 | |
| | | | | | | | | |
| Paper & Forest Products - 0.02% | | | | | | | | |
| Suzano Papel e Celulose SA - Class A (b) | | | 33,400 | | | | 194,042 | |
| | | | | | | | | |
| Textiles, Apparel & Luxury Goods - 0.03% | | | | | | | | |
| Alpargatas SA (b) | | | 54,000 | | | | 271,095 | |
| | | | | | | | | |
| Water Utilities - 0.02% | | | | | | | | |
| Cia de Saneamento do Parana (b) | | | 45,000 | | | | 152,740 | |
TOTAL PREFERRED STOCKS
(Cost $7,791,621) | | | | | | $ | 10,056,077 | |
| See Notes to the Financial Statements. | The Leuthold Funds - 2017 Annual Report | 53 |
Leuthold Core Investment Fund
Consolidated Schedule of Investments (continued)September 30, 2017
| | | Shares | | | Fair Value | |
| INVESTMENT COMPANIES - 12.28% | | | | | | |
| Exchange-Traded Funds - 12.28% | | | | | | |
| Central and Eastern Europe Fund, Inc. | | | 6,456 | | | $ | 159,463 | |
| CurrencyShares Japanese Yen Trust (a)(f) | | | 187,794 | | | | 16,031,974 | |
| Global X MSCI Pakistan ETF | | | 23,381 | | | | 339,492 | |
| iShares Floating Rate Bond ETF (h) | | | 415,650 | | | | 21,173,211 | |
| iShares International Treasury Bond ETF (h) | | | 314,000 | | | | 15,464,500 | |
| iShares JP Morgan USD Emerging Markets Bond ETF (h) | | | 35,104 | | | | 4,086,808 | |
| iShares MBS ETF | | | 44,902 | | | | 4,809,004 | |
| iShares MSCI India Small-Cap ETF (h) | | | 19,778 | | | | 904,052 | |
| iShares MSCI Russia Capped ETF | | | 57,395 | | | | 1,930,194 | |
| iShares MSCI UAE Capped ETF | | | 28,931 | | | | 502,242 | |
| Morgan Stanley China A Share Fund, Inc. | | | 11,400 | | | | 272,004 | |
| SPDR Bloomberg Barclays International Treasury Bond ETF | | | 1,050,795 | | | | 29,516,831 | |
| SPDR Bloomberg Barclays Short-Term International Treasury Bond ETF (h) | | | 52,283 | | | | 1,672,010 | |
| VanEck Vectors Russia ETF | | | 35,810 | | | | 798,205 | |
| Vanguard Mortgage-Backed Securities ETF | | | 127,679 | | | | 6,738,898 | |
TOTAL INVESTMENT COMPANIES
(Cost $101,985,949) | | | | | | $ | 104,398,888 | |
| | | Principal
Amount | | | Fair Value | |
| CORPORATE BONDS - 3.55% | | | | | | |
| Banks - 1.15% | | | | | | |
JPMorgan Chase & Co.
1.500%, 01/27/2025 | | $ | 4,600,000 | | | $ | 5,632,703 | |
Wells Fargo & Co.
1.125%, 10/29/2021 | | | 3,430,000 | | | | 4,182,346 | |
| | | | | | | | 9,815,049 | |
| | | | | | | | | |
| Biotechnology - 0.39% | | | | | | | | |
AbbVie, Inc.
2.850%, 05/14/2023 | | | 3,260,000 | | | | 3,285,378 | |
| | | | | | | | | |
| Diversified Telecommunication Services - 0.55% | | | | | | | | |
AT&T, Inc.
3.400%, 05/15/2025 | | | 4,700,000 | | | | 4,636,084 | |
| | | | | | | | | |
| Food Products - 0.50% | | | | | | | | |
Kraft Heinz Foods Co.
3.950%, 07/15/2025 | | | 4,150,000 | | | | 4,274,342 | |
| | | | | | | | | |
| Internet Software & Services - 0.41% | | | | | | | | |
Alibaba Group Holding, Ltd.
2.500%, 11/28/2019 (b) | | | 3,480,000 | | | $ | 3,508,463 | |
| | | | | | | | | |
| Software - 0.55% | | | | | | | | |
Oracle Corp.
2.950%, 05/15/2025 | | | 4,620,000 | | | | 4,658,767 | |
TOTAL CORPORATE BONDS
(Cost $29,109,113) | | | | | | $ | 30,178,083 | |
| | | | | | | | | |
| UNITED STATES TREASURY OBLIGATIONS - 3.20% | | | | | | | | |
| | | | | | | | | |
| United States Treasury Notes - 3.20% | | | | | | | | |
| 2.125%, 05/15/2025 | | $ | 27,346,000 | | | $ | 27,168,678 | |
TOTAL UNITED STATES TREASURY OBLIGATIONS
(Cost $27,230,449) | | | | | | $ | 27,168,678 | |
| 54 | The Leuthold Funds - 2017 Annual Report | See Notes to the Financial Statements. |
Leuthold Core Investment Fund
Consolidated Schedule of Investments (continued)
September 30, 2017
| | | Principal
Amount | | | Fair Value | |
| FOREIGN GOVERNMENT BONDS - 2.26% | | | | | | |
Argentina Republic Government International Bond
6.250%, 04/22/2019 (b) | | $ | 4,300,000 | | | $ | 4,525,750 | |
Government of the United Kingdom
2.250%, 09/07/2023 (b) | | GBP | 3,750,000 | | | | 5,413,594 | |
Indonesia Government International Bond
5.875%, 03/13/2020 (b)(g) | | $ | 2,260,000 | | | | 2,457,811 | |
Korea International Bond
7.125%, 04/16/2019 (b) | | $ | 2,250,000 | | | | 2,419,650 | |
Poland Government International Bond
6.375%, 07/15/2019 (b) | | $ | 2,000,000 | | | | 2,159,760 | |
Turkey Government International Bond
7.500%, 11/07/2019 (b) | | $ | 2,010,000 | | | | 2,189,895 | |
TOTAL FOREIGN GOVERNMENT BONDS
(Cost $18,792,734) | | | | | | $ | 19,166,460 | |
| | | Shares | | | Fair Value | |
| RIGHTS - 0.00% | | | | | | | | |
| Insurance - 0.00% | | | | | | | | |
| Hanwa General Insurance Co. (a)(b) | | | 7,422 | | | $ | 5,314 | |
TOTAL RIGHTS
(Cost $4,569) | | | | | | $ | 5,314 | |
| | | | | | | | | |
| SHORT-TERM INVESTMENTS - 9.10% | | | | | | | | |
| Money Market Funds - 9.10% | | | | | | | | |
| Fidelity Institutional Money Market Funds - Government Portfolio - Class I, 0.908% (c)(i) | | | 77,396,775 | | | $ | 77,396,775 | |
TOTAL SHORT-TERM INVESTMENTS
(Cost $77,396,775) | | | | | | $ | 77,396,775 | |
| | | | | | | | | |
| INVESTMENTS PURCHASED AS SECURITIES LENDING COLLATERAL - 8.79% | | | | | | | | |
| Mount Vernon Liquid Assets Portfolio, LLC, 1.320% (c) | | | 74,692,474 | | | $ | 74,692,474 | |
TOTAL INVESTMENTS PURCHASED AS SECURITIES LENDING COLLATERAL
(Cost 74,692,474) | | | | | | $ | 74,692,474 | |
| | | | | | | | | |
Total Investments
(Cost $737,810,578) - 107.12% | | | | | | $ | 910,533,282 | |
| Liabilities in Excess of Other Assets - (7.12)% | | | | | | | (60,482,012 | ) |
| TOTAL NET ASSETS - 100.00% | | | | | | $ | 850,051,270 | |
Percentages are stated as a percent of net assets.
| ADR | American Depositary Receipt |
| BDR | Brazilian Depositary Receipt |
| NVDR | Non-Voting Depositary Receipt |
| (a) | Non-income producing security. |
| (b) | Foreign issued security. |
| (c) | The rate quoted is the annualized seven-day yield as of September 30, 2017. |
| (d) | Illiquid security. At September 30, 2017, the fair value of these securities total $11,751, which represents an amount that rounds to 0.00% of total net assets. |
| (e) | This security is currently being fair valued in accordance with procedures established by the Board of Directors of Leuthold Funds, Inc. |
| (f) | Affiliated security (Note 2). At September 30, 2017, the market value of this security totals $16,031,974, which represents 1.89% of total net assets. |
| (g) | Restricted security as defined in Rule 144(a) under the Securities Act of 1933. Resale to the public may require registration or may extend only to qualified institutional buyers. At September 30, 2017, the market value of these securities total $2,457,811, which represents 0.29% of total net assets. |
| (h) | This security or a portion of this security was out on loan as of September 30, 2017. Total loaned securities had a value of $73,267,883 or 8.62% of total net assets. The remaining contractual maturity of all of the securities lending transactions is overnight and continuous. See Note 7. |
| (i) | All or a portion of the assets have been committed as collateral for open securites sold short. |
The Global Industry Classification Standard (GICS®) was developed by and/or is the exclusive property of MSCI, Inc. and Standard & Poor’s Financial Services LLC (“S&P”). GICS® is a service mark of MSCI, Inc. and S&P and has been licensed for use by U.S. Bancorp Fund Services, LLC.
| See Notes to the Financial Statements. | The Leuthold Funds - 2017 Annual Report | 55 |
Leuthold Core Investment Fund
Consolidated Schedule of Securities Sold Short - (a)
September 30, 2017
| | | Shares | | | Fair Value | |
| COMMON STOCKS - 3.82% | | | | | | |
| Banks - 0.17% | | | | | | |
| First Republic Bank | | | 5,166 | | | $ | 539,640 | |
| Investors Bancorp, Inc. | | | 12,976 | | | | 176,993 | |
| MB Financial, Inc. | | | 3,973 | | | | 178,864 | |
| People’s United Financial, Inc. | | | 29,169 | | | | 529,126 | |
| | | | | | | | 1,424,623 | |
| | | | | | | | | |
| Beverages - 0.12% | | | | | | | | |
| Anheuser-Busch InBev SA/NV - ADR | | | 4,532 | | | | 540,668 | |
| Monster Beverage Corp. | | | 9,382 | | | | 518,355 | |
| | | | | | | | 1,059,023 | |
| | | | | | | | | |
| Building Products - 0.06% | | | | | | | | |
| Johnson Controls International PLC | | | 12,255 | | | | 493,754 | |
| | | | | | | | | |
| Capital Markets - 0.09% | | | | | | | | |
| FactSet Research Systems, Inc. | | | 3,110 | | | | 560,142 | |
| Interactive Brokers Group, Inc. - Class A | | | 3,845 | | | | 173,179 | |
| | | | | | | | 733,321 | |
| | | | | | | | | |
| Chemicals - 0.09% | | | | | | | | |
| Ashland Global Holdings, Inc. | | | 8,569 | | | | 560,327 | |
| GCP Applied Technologies, Inc. | | | 6,290 | | | | 193,103 | |
| | | | | | | | 753,430 | |
| | | | | | | | | |
| Commercial Services & Supplies - 0.11% | | | | | | | | |
| Cintas Corp. | | | 3,774 | | | | 544,513 | |
| Clean Harbors, Inc. | | | 2,899 | | | | 164,373 | |
| Ritchie Bros Auctioneers, Inc. (b) | | | 5,719 | | | | 180,835 | |
| | | | | | | | 889,721 | |
| | | | | | | | | |
| Communications Equipment - 0.03% | | | | | |
| ViaSat, Inc. | | | 4,322 | | | | 277,991 | |
| | | | | | | | | |
| Construction Materials - 0.06% | | | | | | | | |
| Vulcan Materials Co. | | | 4,306 | | | | 514,998 | |
| | | | | | | | | |
| Containers & Packaging - 0.07% | | | | | | | | |
| Ball Corp. | | | 13,757 | | | | 568,164 | |
| | | | | | | | | |
| Diversified Telecommunication Services - 0.06% | |
| Zayo Group Holdings, Inc. | | | 14,414 | | | | 496,130 | |
| | | | | | | | | |
| Electrical Equipment - 0.10% | | | | | | | | |
| Acuity Brands, Inc. | | | 2,267 | | | | 388,292 | |
| Emerson Electric Co. | | | 7,820 | | | | 491,409 | |
| | | | | | | | 879,701 | |
| | | | | | | | | |
| Energy Equipment & Services - 0.23% | | | | | | | | |
| Core Laboratories NV (b) | | | 4,533 | | | | 447,407 | |
| Dril-Quip, Inc. | | | 10,436 | | | | 460,749 | |
| Halliburton Co. | | | 10,990 | | | | 505,870 | |
| Schlumberger, Ltd. (b) | | | 7,195 | | | | 501,923 | |
| | | | | | | | 1,915,949 | |
| | | | | | | | | |
| Food Products - 0.23% | | | | | | | | |
| BRF SA - ADR | | | 11,944 | | | | 172,113 | |
| Conagra Brands, Inc. | | | 13,283 | | | | 448,169 | |
| Hormel Foods Corp. | | | 15,195 | | | | 488,367 | |
| Kellogg Co. | | | 7,248 | | | | 452,058 | |
| TreeHouse Foods, Inc. | | | 6,114 | | | | 414,101 | |
| | | | | | | | 1,974,808 | |
| | | | | | | | | |
| Health Care Equipment & Supplies - 0.23% | | | | | | | | |
| Abbott Laboratories | | | 10,368 | | | | 553,236 | |
| ABIOMED, Inc. | | | 3,103 | | | | 523,166 | |
| ICU Medical, Inc. | | | 1,022 | | | | 189,939 | |
| Insulet Corp. | | | 3,400 | | | | 187,272 | |
| Nevro Corp. | | | 3,953 | | | | 359,249 | |
| Penumbra, Inc. | | | 1,858 | | | | 167,777 | |
| | | | | | | | 1,980,639 | |
| 56 | The Leuthold Funds - 2017 Annual Report | See Notes to the Financial Statements. |
Leuthold Core Investment Fund
Consolidated Schedule of Securities Sold Short - (a) (continued)
September 30, 2017
| | | Shares | | | Fair Value | |
| COMMON STOCKS - 3.82% (continued) | |
| Hotels, Restaurants & Leisure - 0.12% | | | | |
| Hilton Worldwide Holdings, Inc. | | | 7,987 | | | $ | 554,697 | |
| Starbucks Corp. | | | 7,906 | | | | 424,632 | |
| | | | | | | | 979,329 | |
| | | | | | | | | |
| Industrial Conglomerates - 0.06% | | | | | |
| 3M Co. | | | 2,516 | | | | 528,108 | |
| | | | | | | | | |
| Insurance - 0.13% | | | | | | | | |
| Markel Corp. | | | 553 | | | | 590,593 | |
| Willis Towers Watson PLC (b) | | | 3,488 | | | | 537,954 | |
| | | | | | | | 1,128,547 | |
| | | | | | | | | |
| Internet & Direct Marketing Retail - 0.15% | |
| Amazon.com, Inc. | | | 530 | | | | 509,516 | |
| Ctrip.com International, Ltd. - ADR | | | 9,883 | | | | 521,229 | |
| TripAdvisor, Inc. | | | 6,589 | | | | 267,052 | |
| | | | | | | | 1,297,797 | |
| | | | | | | | | |
| Internet Software & Services - 0.02% | | | | | |
| Cornerstone OnDemand, Inc. | | | 5,093 | | | | 206,827 | |
| | | | | | | | | |
| Life Sciences Tools & Services - 0.06% | | | | | |
| Illumina, Inc. | | | 2,682 | | | | 534,254 | |
| | | | | | | | | |
| Machinery - 0.12% | | | | | | | | |
| Flowserve Corp. | | | 10,226 | | | | 435,525 | |
| Wabtec Corp. | | | 7,168 | | | | 542,976 | |
| | | | | | | | 978,501 | |
| | | | | | | | | |
| Media - 0.12% | | | | | | | | |
| Grupo Televisa SAB - ADR | | | 18,804 | | | | 463,895 | |
| IMAX Corp. (b) | | | 16,762 | | | | 379,659 | |
| News Corp. - Class A | | | 13,047 | | | | 173,003 | |
| | | | | | | | 1,016,557 | |
| | | | | | | | | |
| Metals & Mining - 0.04% | | | | | | | | |
| Franco-Nevada Corp. (b) | | | 4,421 | | | | 342,539 | |
| | | | | | | | | |
| Multi-Utilities - 0.06% | | | | | | | | |
| Dominion Energy, Inc. | | | 6,601 | | | | 507,815 | |
| | | | | | | | | |
| Oil, Gas & Consumable Fuels - 0.27% | | | | | |
| Apache Corp. | | | 10,147 | | | | 464,733 | |
| Hess Corp. | | | 9,013 | | | | 422,620 | |
| Occidental Petroleum Corp. | | | 8,144 | | | | 522,926 | |
| PDC Energy, Inc. | | | 7,233 | | | | 354,634 | |
| RSP Permian, Inc. | | | 16,131 | | | | 557,971 | |
| | | | | | | | 2,322,884 | |
| | | | | | | | | |
| Pharmaceuticals - 0.02% | | | | | | | | |
| Nektar Therapeutics | | | 7,928 | | | | 190,272 | |
| | | | | | | | | |
| Professional Services - 0.15% | | | | | |
| Nielsen Holdings PLC (b) | | | 13,256 | | | | 549,461 | |
| Verisk Analytics, Inc. | | | 6,589 | | | | 548,139 | |
| WageWorks, Inc. | | | 2,937 | | | | 178,276 | |
| | | | | | | | 1,275,876 | |
| | | | | | | | | |
| Real Estate Investment Trusts (REITs) - 0.04% | |
| Acadia Realty Trust | | | 5,903 | | | | 168,944 | |
| Education Realty Trust, Inc. | | | 4,296 | | | | 154,355 | |
| | | | | | | | 323,299 | |
| | | | | | | | | |
| Real Estate Management & Development - 0.02% | | | | | | | | |
| Kennedy-Wilson Holdings, Inc. | | | 8,540 | | | | 158,417 | |
| | | | | | | | | |
| Semiconductors & Semiconductor Equipment - 0.16% | | | | | | | | |
| Ambarella, Inc. | | | 6,418 | | | | 314,546 | |
| Cavium, Inc. | | | 7,753 | | | | 511,233 | |
| Inphi Corp. | | | 13,226 | | | | 524,940 | |
| | | | | | | | 1,350,719 | |
See Notes to the Financial Statements. | The Leuthold Funds - 2017 Annual Report | 57 |
Leuthold Core Investment Fund
Consolidated Schedule of Securities Sold Short - (a) (continued)
September 30, 2017
| | | Shares | | | Fair Value | |
| COMMON STOCKS - 3.82% (continued) | |
| Software - 0.53% | | | | | | |
| CommVault Systems, Inc. | | | 2,805 | | | $ | 170,544 | |
| Guidewire Software, Inc. | | | 7,748 | | | | 603,259 | |
| Salesforce.com, Inc. | | | 5,587 | | | | 521,938 | |
| Splunk, Inc. | | | 8,665 | | | | 575,616 | |
| Symantec Corp. | | | 16,366 | | | | 536,968 | |
| Tableau Software, Inc. - Class A | | | 7,985 | | | | 597,997 | |
| Ultimate Software Group, Inc. | | | 2,425 | | | | 459,780 | |
| Workday, Inc. - Class A | | | 4,955 | | | | 522,207 | |
| Zendesk, Inc. | | | 18,396 | | | | 535,508 | |
| | | | | | | | 4,523,817 | |
| | | | | | | | | |
| Specialty Retail - 0.02% | | | | | | | | |
| Monro, Inc. | | | 3,084 | | | | 172,858 | |
| | | | | | | | | |
| Technology Hardware, Storage & Peripherals - 0.02% | | | | | | | | |
| Diebold Nixdorf, Inc. | | | 6,378 | | | | 145,737 | |
| | | | | | | | | |
| Water Utilities - 0.06% | | | | | | | | |
| American Water Works Co., Inc. | | | 6,668 | | | | 539,508 | |
TOTAL COMMON STOCKS (Proceeds $32,120,624) | | | | | | $ | 32,485,913 | |
| | | | | | | | | |
| INVESTMENT COMPANIES - 3.00% | | | | | |
| | | | | | | | | |
| Exchange-Traded Funds - 3.00% | | | | | |
| SPDR S&P 500 ETF Trust | | | 101,417 | | | $ | 25,478,993 | |
TOTAL INVESTMENT COMPANIES (Proceeds $25,030,993) | | | | | | $ | 25,478,993 | |
| | | | | | | | | |
TOTAL SECURITIES SOLD SHORT (Proceeds $57,151,617) - 6.82% | | | $ | 57,964,906 | |
Percentages are stated as a percent of net assets.
ADR American Depositary Receipt
(a) Non-income producing security.
(b) Foreign issued security.
The Global Industry Classification Standard (GICS®) was developed by and/or is the exclusive property of MSCI, Inc. and Standard & Poor’s Financial Services LLC (“S&P”). GICS® is a service mark of MSCI, Inc. and S&P and has been licensed for use by U.S. Bancorp Fund Services, LLC.
| 58 | The Leuthold Funds - 2017 Annual Report | See Notes to the Financial Statements. |
Consolidated Schedule of Investments
September 30, 2017
| | | Shares | | | Fair Value | |
| COMMON STOCKS - 68.82% | | | | |
| Airlines - 4.49% | | | | | | |
| Air Canada (a)(b) | | | 30,445 | | | $ | 640,254 | |
| AirAsia Bhd (b) | | | 561,700 | | | | 459,368 | |
| Delta Air Lines, Inc. | | | 14,762 | | | | 711,824 | |
| Deutsche Lufthansa AG (b) | | | 26,928 | | | | 748,833 | |
| Hawaiian Holdings, Inc. (a)(g) | | | 5,770 | | | | 216,664 | |
| International Consolidated Airlines Group SA (b) | | | 53,284 | | | | 423,677 | |
| JetBlue Airways Corp. (a)(g) | | | 24,615 | | | | 456,116 | |
| SkyWest, Inc. | | | 8,601 | | | | 377,584 | |
| United Continental Holdings, Inc. (a) | | | 9,372 | | | | 570,567 | |
| | | | | | | | 4,604,887 | |
| | | | | | | | | |
| Auto Components - 4.78% | | | | | | | | |
| Brembo SpA (b) | | | 23,601 | | | | 399,498 | |
| Cheng Shin Rubber Industry Co., Ltd. (b) | | | 137,000 | | | | 274,490 | |
| Cie Plastic Omnium SA (b) | | | 10,854 | | | | 464,309 | |
| Cooper Tire & Rubber Co. (g) | | | 8,976 | | | | 335,702 | |
| Cooper-Standard Holding, Inc. (a)(g) | | | 2,818 | | | | 326,803 | |
| Faurecia (b) | | | 7,372 | | | | 511,584 | |
| Goodyear Tire & Rubber Co. | | | 16,052 | | | | 533,729 | |
| Lear Corp. | | | 5,680 | | | | 983,094 | |
| Magna International, Inc. (b) | | | 13,278 | | | | 708,780 | |
| Tong Yang Industry Co., Ltd. (b) | | | 183,000 | | | | 374,176 | |
| | | | | | | | 4,912,165 | |
| | | | | | | | | |
| Automobiles - 4.63% | | | | | | | | |
| Fiat Chrysler Automobiles NV (b) | | | 45,623 | | | | 817,108 | |
| Ford Motor Co. | | | 61,030 | | | | 730,529 | |
| Geely Automobile Holdings, Ltd. (b) | | | 245,000 | | | | 695,730 | |
| General Motors Co. | | | 21,934 | | | | 885,695 | |
| Great Wall Motor Co., Ltd. (b) | | | 251,500 | | | | 311,273 | |
| Kia Motors Corp. (b) | | | 5,380 | | | | 148,847 | |
| Nissan Motor Co., Ltd. (b) | | | 27,600 | | | | 273,423 | |
| Renault SA (b) | | | 3,444 | | | | 338,397 | |
| Tata Motors, Ltd. - ADR (a) | | | 17,613 | | | | 550,758 | |
| | | | | | | | 4,751,760 | |
| | | | | | | | | |
| Banks - 5.65% | | | | | | | | |
| Banco do Brasil SA (b) | | | 45,600 | | | | 503,203 | |
| Banco Santander SA - ADR | | | 51,306 | | | | 356,064 | |
| Bank of America Corp. | | | 20,541 | | | | 520,509 | |
| Barclays Africa Group, Ltd. (b) | | | 25,873 | | | | 265,559 | |
| CIMB Group Holdings Bhd (b) | | | 270,900 | | | | 404,694 | |
| Credicorp, Ltd. (b) | | | 1,900 | | | | 389,538 | |
| Grupo Financiero Banorte SAB de CV (b) | | | 53,000 | | | | 364,888 | |
| Hana Financial Group, Inc. (b) | | | 11,132 | | | | 461,831 | |
| Krung Thai Bank PCL - NVDR | | | 599,100 | | | | 338,159 | |
| Nedbank Group, Ltd. (b) | | | 21,314 | | | | 318,916 | |
| Nordea Bank AB (b) | | | 26,850 | | | | 364,548 | |
| Taishin Financial Holding Co., Ltd. (b) | | | 807,542 | | | | 347,989 | |
| TMB Bank PCL - NVDR | | | 4,506,800 | | | | 340,917 | |
| Turkiye Is Bankasi - Class C (b) | | | 166,215 | | | | 316,266 | |
| Woori Bank (b) | | | 32,490 | | | | 507,227 | |
| | | | | | | | 5,800,308 | |
| | | | | | | | | |
| Capital Markets - 3.31% | | | | | | | | |
| BGC Partners, Inc. - Class A | | | 29,975 | | | | 433,738 | |
| China Everbright, Ltd. (b) | | | 158,000 | | | | 364,878 | |
| China Galaxy Securities Co., Ltd. (b) | | | 485,000 | | | | 427,378 | |
| Close Brothers Group PLC (b) | | | 17,542 | | | | 346,888 | |
| Goldman Sachs Group, Inc. | | | 2,687 | | | | 637,330 | |
| Lazard, Ltd. - Class A (b) | | | 10,867 | | | | 491,406 | |
| Morgan Stanley | | | 14,478 | | | | 697,405 | |
| | | | | | | | 3,399,023 | |
| See Notes to the Financial Statements. | The Leuthold Funds - 2017 Annual Report | 59 |
Leuthold Global Fund
Consolidated Schedule of Investments (continued)
September 30, 2017
| | | | | | | |
| | | Shares | | | Fair Value | |
| COMMON STOCKS - 68.82% (continued) | |
| Chemicals - 4.29% | | | | | | |
| Denka Co., Ltd. (b) | | | 22,400 | | | $ | 738,827 | |
| Hyosung Corp. (b) | | | 2,815 | | | | 358,732 | |
| Lotte Chemical Corp. (b) | | | 2,299 | | | | 761,197 | |
| LyondellBasell Industries NV - Class A (b) | | | 9,572 | | | | 948,106 | |
| Tosoh Corp. (b) | | | 52,000 | | | | 1,173,752 | |
| Trinseo SA (b) | | | 6,377 | | | | 427,897 | |
| | | | | | | | 4,408,511 | |
| | | | | | | | | |
| Electronic Equipment, Instruments & Components - 4.91% | | | | | | | | |
| Arrow Electronics, Inc. (a) | | | 5,374 | | | | 432,123 | |
| Avnet, Inc. | | | 8,585 | | | | 337,391 | |
| Corning, Inc. | | | 15,670 | | | | 468,846 | |
| Hexagon AB - Class B (b) | | | 8,722 | | | | 432,682 | |
| Hon Hai Precision Industry Co., Ltd. (b) | | | 147,800 | | | | 513,296 | |
| Innolux Corp. (b) | | | 1,129,000 | | | | 528,468 | |
| Jabil, Inc. (g) | | | 16,987 | | | | 484,979 | |
| Kingboard Chemical Holdings, Ltd. (b) | | | 120,500 | | | | 641,758 | |
| Sanmina Corp. (a) | | | 13,480 | | | | 500,782 | |
| TDK Corp. (b) | | | 4,600 | | | | 312,584 | |
| Tech Data Corp. (a) | | | 4,411 | | | | 391,917 | |
| | | | | | | | 5,044,826 | |
| | | | | | | | | |
| Health Care Providers & Services - 4.28% | |
| Anthem, Inc. | | | 4,322 | | | | 820,661 | |
| Centene Corp. (a) | | | 11,783 | | | | 1,140,241 | |
| Humana, Inc. | | | 3,335 | | | | 812,506 | |
| Magellan Health, Inc. (a) | | | 6,555 | | | | 565,696 | |
| Odontoprev SA (b) | | | 109,000 | | | | 526,562 | |
| Qualicorp SA (b) | | | 45,000 | | | | 533,098 | |
| | | | | | | | 4,398,764 | |
| | | | | |
| Household Durables - 5.07% | | | | |
| Barratt Developments PLC (b) | | | 61,793 | | | | 509,061 | |
| Bellway PLC (b) | | | 12,958 | | | | 573,200 | |
| CalAtlantic Group, Inc. (g) | | | 13,847 | | | | 507,216 | |
| Haseko Corp. (b) | | | 41,800 | | | | 557,795 | |
| MDC Holdings, Inc. (g) | | | 14,366 | | | | 477,095 | |
| Meritage Homes Corp. (a)(g) | | | 11,594 | | | | 514,773 | |
| PulteGroup, Inc. (g) | | | 21,152 | | | | 578,084 | |
| Redrow PLC (b) | | | 65,641 | | | | 521,156 | |
| Taylor Morrison Home Corp. - Class A (a) | | | 20,874 | | | | 460,272 | |
| TRI Pointe Group, Inc. (a)(g) | | | 36,461 | | | | 503,526 | |
| | | | | | | | 5,202,178 | |
| | | | | | | | | |
| Independent Power & Renewable Electricity Producers - 0.34% | | | | | |
| Electric Power Development Co., Ltd. (b) | | | 13,900 | | | | 349,179 | |
| | | | | | | | | |
| Insurance - 4.27% | | | | | | | | |
| CNO Financial Group, Inc. (g) | | | 16,254 | | | | 379,368 | |
| Dai-ichi Life Holdings, Inc. (b) | | | 29,000 | | | | 520,190 | |
| Legal & General Group PLC (b) | | | 101,747 | | | | 354,636 | |
| Lincoln National Corp. | | | 4,892 | | | | 359,464 | |
| Medibank Pvt, Ltd. (b) | | | 185,211 | | | | 424,945 | |
| Old Mutual PLC (b) | | | 125,225 | | | | 326,208 | |
| Phoenix Group Holdings (b) | | | 34,687 | | | | 351,576 | |
| Ping An Insurance Group Co. of China, Ltd. (b) | | | 84,500 | | | | 652,713 | |
| Prudential Financial, Inc. | | | 4,428 | | | | 470,785 | |
| Unum Group | | | 10,619 | | | | 542,950 | |
| | | | | | | | 4,382,835 | |
| | | | | | | | | |
| Internet Software & Services - 1.85% | | | | | |
| Akamai Technologies, Inc. (a) | | | 7,615 | | | | 371,003 | |
| Alphabet, Inc. - Class A (a) | | | 579 | | | | 563,784 | |
| eBay, Inc. (a) | | | 16,506 | | | | 634,820 | |
| j2 Global, Inc. (g) | | | 4,441 | | | | 328,101 | |
| | | | | | | | 1,897,708 | |
| 60 | The Leuthold Funds - 2017 Annual Report | See Notes to the Financial Statements. |
Leuthold Global Fund
Consolidated Schedule of Investments (continued)
September 30, 2017
| | | | | | | |
| | | Shares | | | Fair Value | |
| COMMON STOCKS - 68.82% (continued) | |
| Metals & Mining - 2.39% | | | | | | |
| APERAM SA (b) | | | 7,779 | | | $ | 407,659 | |
| BlueScope Steel, Ltd. (b) | | | 67,833 | | | | 585,976 | |
| Ferrexpo PLC (b) | | | 114,016 | | | | 446,732 | |
| Reliance Steel & Aluminum Co. (g) | | | 3,556 | | | | 270,861 | |
| Voestalpine AG (b) | | | 8,626 | | | | 439,885 | |
| Worthington Industries, Inc. | | | 6,560 | | | | 301,760 | |
| | | | | | | | 2,452,873 | |
| | | | | | | | | |
| Oil, Gas & Consumable Fuels - 1.14% | | | | | |
| Adaro Energy Tbk PT (b) | | | 2,542,200 | | | | 345,092 | |
| Exxaro Resources, Ltd. (b) | | | 42,409 | | | | 386,176 | |
| Whitehaven Coal, Ltd. (b) | | | 151,943 | | | | 440,526 | |
| | | | | | | | 1,171,794 | |
| | | | | | | | | |
| Paper & Forest Products - 4.44% | | | | | |
| China Forestry Holdings Co., Ltd. (a)(b)(d)(e) | | | 2,484,000 | | | | 47,698 | |
| Domtar Corp. | | | 9,222 | | | | 400,143 | |
| Fibria Celulose SA - ADR | | | 25,036 | | | | 338,987 | |
| Lee & Man Paper Manufacturing, Ltd. (b) | | | 353,000 | | | | 454,200 | |
| Louisiana-Pacific Corp. (a) | | | 22,910 | | | | 620,403 | |
| Norbord, Inc. (b) | | | 10,220 | | | | 389,142 | |
| Sappi, Ltd. (b) | | | 86,597 | | | | 589,789 | |
| Stora Enso OYJ (b) | | | 45,904 | | | | 649,316 | |
| UPM-Kymmene OYJ (b) | | | 12,073 | | | | 327,552 | |
| West Fraser Timber Co., Ltd. (b) | | | 12,846 | | | | 741,264 | |
| | | | | | | | 4,558,494 | |
| | | | | | | | | |
| Real Estate Management & Development - 1.44% | |
| Daiwa House Industry Co., Ltd. (b) | | | 10,100 | | | | 348,880 | |
| Hongkong Land Holdings, Ltd (b) | | | 62,300 | | | | 449,224 | |
| Realogy Holdings Corp. (g) | | | 10,179 | | | | 335,398 | |
| Vonovia SE (b) | | | 8,101 | | | | 345,001 | |
| | | | | | | | 1,478,503 | |
| | | | | | | |
| Semiconductors & Semiconductor Equipment - 8.28% | | | | | | |
| A-DATA Technology Co., Ltd. (b) | | | 120,000 | | | | 327,118 | |
| Amkor Technology, Inc. (a)(g) | | | 51,259 | | | | 540,782 | |
| Applied Materials, Inc. | | | 11,102 | | | | 578,303 | |
| ASM International NV (b) | | | 9,274 | | | | 586,471 | |
| Cirrus Logic, Inc. (a) | | | 6,120 | | | | 326,318 | |
| Dialog Semiconductor PLC (a)(b) | | | 8,410 | | | | 372,190 | |
| Dongbu HiTek Co., Ltd. (a)(b) | | | 26,253 | | | | 352,095 | |
| Jusung Engineering Co., Ltd. (a)(b) | | | 43,229 | | | | 538,435 | |
| KLA-Tencor Corp. | | | 3,411 | | | | 361,566 | |
| Kulicke & Soffa Industries, Inc. (a)(b)(g) | | | 18,359 | | | | 396,004 | |
| Lam Research Corp. (g) | | | 3,217 | | | | 595,274 | |
| Micron Technology, Inc. (a) | | | 23,159 | | | | 910,843 | |
| ON Semiconductor Corp. (a)(g) | | | 27,238 | | | | 503,086 | |
| Sanken Electric Co., Ltd. (b) | | | 67,000 | | | | 369,212 | |
| SCREEN Holdings Co., Ltd. (b) | | | 5,500 | | | | 382,058 | |
| STMicroelectronics NV - ADR (g) | | | 24,236 | | | | 470,663 | |
| Tokyo Seimitsu Co., Ltd. (b) | | | 11,800 | | | | 418,744 | |
| Ulvac, Inc. (b) | | | 7,400 | | | | 466,363 | |
| | | | | | | | 8,495,525 | |
| | | | | | | | | |
| Transportation Infrastructure - 0.34% | | | | | |
| Zhejiang Expressway Co., Ltd. (b) | | | 278,000 | | | | 346,305 | |
| | | | | | | | | |
| Wireless Telecommunication Services - 2.92% | |
| China Mobile, Ltd. - ADR | | | 9,676 | | | | 489,315 | |
| Freenet AG (b) | | | 13,702 | | | | 458,557 | |
| KDDI Corp. (b) | | | 33,900 | | | | 893,603 | |
| Softbank Group Corp. (b) | | | 14,200 | | | | 1,151,568 | |
| | | | | | | | 2,993,043 | |
| | | | | | | | | |
TOTAL COMMON STOCKS
(Cost $59,320,314) | | | | | | $ | 70,648,681 | |
| See Notes to the Financial Statements. | The Leuthold Funds - 2017 Annual Report | 61 |
Leuthold Global Fund
Consolidated Schedule of Investments (continued)
September 30, 2017
| | | | | | | |
| | | Shares | | | Fair Value | |
| PREFERRED STOCKS - 0.31% | | | | |
| Paper & Forest Products - 0.31% | | | | |
| Suzano Papel e Celulose SA - Class A (b) | | | 54,900 | | | $ | 318,949 | |
TOTAL PREFERRED STOCKS
(Cost $249,771) | | | | | | $ | 318,949 | |
| | | | | | | | | |
| INVESTMENT COMPANIES - 11.37% | |
| Exchange-Traded Funds - 11.37% | | | | | |
| CurrencyShares Japanese Yen Trust (a)(g) | | | 24,360 | | | $ | 2,079,613 | |
| iShares Floating Rate Bond ETF (g) | | | 40,787 | | | | 2,077,690 | |
| iShares International Treasury Bond ETF (g) | | | 32,620 | | | | 1,606,535 | |
| iShares JP Morgan USD Emerging Markets Bond ETF (g) | | | 6,698 | | | | 779,781 | |
| iShares MBS ETF | | | 9,805 | | | | 1,050,116 | |
| SPDR Bloomberg Barclays International Treasury Bond ETF | | | 127,061 | | | | 3,569,143 | |
| SPDR Bloomberg Barclays Short-Term International Treasury Bond ETF | | | 16,007 | | | | 511,904 | |
TOTAL INVESTMENT COMPANIES
(Cost $11,383,428) | | | | | | $ | 11,674,782 | |
| | | Principal
Amount | | | Fair Value | |
| CORPORATE BONDS - 3.70% | | | | |
| Banks - 1.41% | | | | | | |
JPMorgan Chase & Co.
1.500%, 01/27/2025 | | $ | 470,000 | | | $ | 575,515 | |
Wells Fargo & Co.
1.125%, 10/29/2021 | | | 720,000 | | | | 877,927 | |
| | | | | | | | 1,453,442 | |
| | | | | | | | | |
| Biotechnology - 0.72% | | | | | | | | |
AbbVie, Inc.
2.850%, 05/14/2023 | | | 730,000 | | | | 735,683 | |
| | | | | | | | | |
| Diversified Telecommunication Services - 1.57% | |
AT&T, Inc.
3.400%, 05/15/2025 | | | 1,630,000 | | | | 1,607,834 | |
TOTAL CORPORATE BONDS
(Cost $3,644,398) | | | | | | $ | 3,796,959 | |
| | | | | | | | | |
| UNITED STATES TREASURY OBLIGATIONS - 3.43% | | | | | | | | |
| United States Treasury Notes - 3.43% | | | | | |
| 2.125%, 05/15/2025 | | $ | 3,545,000 | | | $ | 3,522,013 | |
TOTAL UNITED STATES TREASURY OBLIGATIONS
(Cost $3,478,541) | | | | | | $ | 3,522,013 | |
| 62 | The Leuthold Funds - 2017 Annual Report | See Notes to the Financial Statements. |
Leuthold Global Fund
Consolidated Schedule of Investments (continued)
September 30, 2017
| | | Principal Amount | | | Fair Value | |
| FOREIGN GOVERNMENT BONDS - 3.30% | | | | | | | | |
Argentina Republic Government International Bond
6.250%, 04/22/2019 (b) | | $ | 725,000 | | | $ | 763,062 | |
Government of the United Kingdom
2.250%, 09/07/2023 (b) | | GBP | 630,000 | | | | 909,484 | |
Indonesia Government International Bond
5.875%, 03/13/2020 (b)(f) | | $ | 290,000 | | | | 315,383 | |
Korea International Bond
7.125%, 04/16/2019 (b) | | $ | 400,000 | | | | 430,160 | |
Poland Government International Bond
6.375%, 07/15/2019 (b) | | $ | 406,000 | | | | 438,431 | |
Turkey Government International Bond
7.500%, 11/07/2019 (b) | | $ | 490,000 | | | | 533,855 | |
TOTAL FOREIGN GOVERNMENT BONDS
(Cost $3,326,800) | | | | | | $ | 3,390,375 | |
| | | Shares | | | Fair Value | |
| SHORT-TERM INVESTMENTS - 7.00% | | | | | | |
| Money Market Funds - 7.00% | | | | | | |
Fidelity Institutional Money Market
Funds - Government Portfolio
- Class I, 0.908% (c)(h) | | | 7,182,066 | | | $ | 7,182,066 | |
TOTAL SHORT-TERM INVESTMENTS
(Cost $7,182,066) | | | | | | $ | 7,182,066 | |
| | | | | | | | | |
| INVESTMENTS PURCHASED AS SECURITIES LENDING COLLATERAL - 10.95% | | | | | | | | |
Mount Vernon Liquid Assets Portfolio, LLC, 1.320% (c) 11,234,557 | | | | | | $ | 11,234,557 | |
TOTAL INVESTMENTS PURCHASED AS SECURITIES LENDING COLLATERAL
(Cost 11,234,557) | | | | | | $ | 11,234,557 | |
Total Investments
(Cost $99,819,875) - 108.88% | | $ | 111,768,382 | |
Liabilities in Excess of
Other Assets - (8.88)% (h) | | | (9,114,098 | ) |
| TOTAL NET ASSETS - 100.00% | | $ | 102,654,284 | |
Percentages are stated as a percent of net assets.
| ADR | American Depositary Receipt |
| NVDR | Non-Voting Depositary Receipt |
| (a) | Non-income producing security. |
| (b) | Foreign issued security. |
| (c) | The rate quoted is the annualized seven-day yield as of September 30, 2017. |
| (d) | Illiquid security. At September 30, 2017, the fair value of these securites total $47,698, which represents 0.05% of total net assets. |
| (e) | The security is currently being fair valued in accordance with procedures established by the Board of Directros of Leuthold Funds, Inc. |
| (f) | Restricted security as defined in Rule 144(a) under the Securities Act of 1933. Resale to the public may require registration or may extend only to qualified institutional buyers. At September 30, 2017, the market value of these securities total $315,383, which represents 0.31% of total net assets. |
| (g) | This security or a portion of this security was out on loan as of September 30, 2017. Total loaned securities had a value of $10,977,352 or 10.69% of total net assets. The remaining contractual maturity of all of the securities lending transactions is overnight and continuous. See Note 7. |
| (h) | All or a portion of the assets have been committed as collateral for open securites sold short. |
The Global Industry Classification Standard (GICS®) was developed by and/or is the exclusive property of MSCI, Inc. and Standard & Poor’s Financial Services LLC (“S&P”). GICS® is a service mark of MSCI, Inc. and S&P and has been licensed for use by U.S. Bancorp Fund Services, LLC.
| See Notes to the Financial Statements. | The Leuthold Funds - 2017 Annual Report | 63 |
Leuthold Global Fund
Consolidated Schedule of Investments (continued)
September 30, 2017
| | | Fair Value | | | Percentage of Total Investments |
| CURRENCY EXPOSURE | | | | | | | |
| Australian Dollar | | $ | 1,451,447 | | | | 1.30 | % | |
| Brazilian Real | | | 1,881,812 | | | | 1.68 | | |
| British Pound | | | 4,762,618 | | | | 4.26 | | |
| Canadian Dollar | | | 1,770,660 | | | | 1.58 | | |
| Euro | | | 7,502,694 | | | | 6.71 | | |
| Hong Kong Dollar | | | 3,941,933 | | | | 3.53 | | |
| Indonesian Rupiah | | | 345,092 | | | | 0.31 | | |
| Japanese Yen | | | 7,956,178 | | | | 7.12 | | |
| Malaysian Ringgit | | | 864,062 | | | | 0.77 | | |
| Mexican Peso | | | 364,888 | | | | 0.33 | | |
| New Taiwan Dollar | | | 2,365,537 | | | | 2.12 | | |
| South African Rand | | | 1,560,440 | | | | 1.40 | | |
| South Korea Won | | | 3,128,364 | | | | 2.80 | | |
| Swedish Krona | | | 797,230 | | | | 0.71 | | |
| Thai Baht | | | 679,076 | | | | 0.61 | | |
| Turkish Lira | | | 316,266 | | | | 0.28 | | |
| US Dollar | | | 72,080,085 | | | | 64.49 | | |
| Total Investments | | $ | 111,768,382 | | | | 100.00 | % | |
| | | Fair Value | | | Percentage of Total Investments |
| PORTFOLIO DIVERSIFICATION | | | | | | | |
| Argentina | | $ | 763,062 | | | | 0.68 | % | |
| Australia | | | 1,451,447 | | | | 1.30 | | |
| Austria | | | 439,885 | | | | 0.39 | | |
| Bermuda | | | 491,406 | | | | 0.44 | | |
| Brazil | | | 2,220,799 | | | | 1.99 | | |
| Canada | | | 2,479,440 | | | | 2.22 | | |
| China | | | 2,481,097 | | | | 2.22 | | |
| Finland | | | 976,868 | | | | 0.87 | | |
| France | | | 1,314,290 | | | | 1.18 | | |
| Germany | | | 1,552,391 | | | | 1.39 | | |
| Hong Kong | | | 2,399,375 | | | | 2.15 | | |
| India | | | 550,758 | | | | 0.49 | | |
| Indonesia | | | 660,475 | | | | 0.59 | | |
| Italy | | | 399,498 | | | | 0.36 | | |
| Japan | | | 7,956,178 | | | | 7.12 | | |
| Jersey | | | 351,576 | | | | 0.31 | | |
| Luxembourg | | | 407,659 | | | | 0.37 | | |
| Malaysia | | | 864,062 | | | | 0.77 | | |
| Mexico | | | 364,888 | | | | 0.33 | | |
| Netherlands | | | 586,471 | | | | 0.52 | | |
| Peru | | | 389,538 | | | | 0.35 | | |
| Poland | | | 438,431 | | | | 0.39 | | |
| Singapore | | | 396,004 | | | | 0.35 | | |
| South Africa | | | 1,560,440 | | | | 1.40 | | |
| South Korea | | | 3,558,524 | | | | 3.18 | | |
| Spain | | | 356,064 | | | | 0.32 | | |
| Sweden | | | 797,230 | | | | 0.71 | | |
| Switzerland | | | 917,395 | | | | 0.82 | | |
| Taiwan | | | 2,365,537 | | | | 2.12 | | |
| Thailand | | | 679,076 | | | | 0.61 | | |
| Turkey | | | 850,121 | | | | 0.76 | | |
| United Kingdom | | | 5,153,608 | | | | 4.61 | | |
| United States | | | 65,594,789 | | | | 58.69 | | |
| Total Investments | | $ | 111,768,382 | | | | 100.00 | % | |
| 64 | The Leuthold Funds - 2017 Annual Report | See Notes to the Financial Statements. |
Leuthold Global Fund
Schedule of Securities Sold Short - (a)
September 30, 2017
| | | Shares | | | Fair Value | |
| COMMON STOCKS - 2.50% | | | | | | |
| Banks - 0.11% | | | | | | |
| First Republic Bank | | | 407 | | | $ | 42,515 | |
| Investors Bancorp, Inc. | | | 1,024 | | | | 13,968 | |
| MB Financial, Inc. | | | 313 | | | | 14,091 | |
| People’s United Financial, Inc. | | | 2,301 | | | | 41,740 | |
| | | | | | | | 112,314 | |
| | | | | | | | | |
| Beverages - 0.08% | | | | | | | | |
| Anheuser-Busch InBev SA/NV - ADR | | | 358 | | | | 42,709 | |
| Monster Beverage Corp. | | | 740 | | | | 40,885 | |
| | | | | | | | 83,594 | |
| | | | | | | | | |
| Building Products - 0.04% | | | | | | | | |
| Johnson Controls International PLC | | | 967 | | | | 38,960 | |
| | | | | | | | | |
| Capital Markets - 0.06% | | | | | | | | |
| FactSet Research Systems, Inc. | | | 245 | | | | 44,127 | |
| Interactive Brokers Group, Inc. - Class A | | | 303 | | | | 13,647 | |
| | | | | | | | 57,774 | |
| | | | | | | | | |
| Chemicals - 0.06% | | | | | | | | |
| Ashland Global Holdings, Inc. | | | 676 | | | | 44,204 | |
| GCP Applied Technologies, Inc. | | | 496 | | | | 15,227 | |
| | | | | | | | 59,431 | |
| | | | | | | | | |
| Commercial Services & Supplies - 0.07% | | | | | | | | |
| Cintas Corp. | | | 298 | | | | 42,995 | |
| Clean Harbors, Inc. | | | 229 | | | | 12,984 | |
| Ritchie Bros Auctioneers, Inc. (b) | | | 451 | | | | 14,261 | |
| | | | | | | | 70,240 | |
| | | | | | | | | |
| Communications Equipment - 0.02% | | | | | | | | |
| ViaSat, Inc. | | | 341 | | | | 21,933 | |
| | | | | | | | | |
| Construction Materials - 0.04% | | | | | | | | |
| Vulcan Materials Co. | | | 340 | | | | 40,664 | |
| | | | | | | | | |
| Containers & Packaging - 0.04% | | | | | |
| Ball Corp. | | | 1,085 | | | | 44,810 | |
| Diversified Telecommunication Services - 0.04% | | | | | | |
| Zayo Group Holdings, Inc. | | | 1,137 | | | | 39,136 | |
| | | | | | | | | |
| Electrical Equipment - 0.07% | | | | | | | | |
| Acuity Brands, Inc. | | | 179 | | | | 30,659 | |
| Emerson Electric Co. | | | 617 | | | | 38,772 | |
| | | | | | | | 69,431 | |
| | | | | | | | | |
| Energy Equipment & Services - 0.15% | | | | | | | | |
| Core Laboratories NV (b) | | | 358 | | | | 35,335 | |
| Dril-Quip, Inc. | | | 823 | | | | 36,335 | |
| Halliburton Co. | | | 867 | | | | 39,908 | |
| Schlumberger, Ltd. (b) | | | 567 | | | | 39,554 | |
| | | | | | | | 151,132 | |
| | | | | | | | | |
| Food Products - 0.15% | | | | | | | | |
| BRF SA - ADR | | | 942 | | | | 13,574 | |
| Conagra Brands, Inc. | | | 1,048 | | | | 35,359 | |
| Hormel Foods Corp. | | | 1,199 | | | | 38,536 | |
| Kellogg Co. | | | 572 | | | | 35,676 | |
| TreeHouse Foods, Inc. | | | 482 | | | | 32,646 | |
| | | | | | | | 155,791 | |
| | | | | | | | | |
| Health Care Equipment & Supplies - 0.15% | | | | | | | | |
| Abbott Laboratories | | | 818 | | | | 43,648 | |
| ABIOMED, Inc. | | | 245 | | | | 41,307 | |
| ICU Medical, Inc. | | | 81 | | | | 15,054 | |
| Insulet Corp. | | | 268 | | | | 14,761 | |
| Nevro Corp. | | | 312 | | | | 28,355 | |
| Penumbra, Inc. | | | 147 | | | | 13,274 | |
| | | | | | | | 156,399 | |
| | | | | | | | | |
| Hotels, Restaurants & Leisure - 0.08% | | | | | | | | |
| Hilton Worldwide Holdings, Inc. | | | 630 | | | | 43,754 | |
| Starbucks Corp. | | | 624 | | | | 33,515 | |
| | | | | | | | 77,269 | |
| Industrial Conglomerates - 0.04% | | | | | | | | |
| 3M Co. | | | 198 | | | | 41,560 | |
| See Notes to the Financial Statements. | The Leuthold Funds - 2017 Annual Report | 65 |
Leuthold Global Fund
Schedule of Securities Sold Short - (a) (continued)
September 30, 2017
| | | Shares | | | Fair Value | |
| COMMON STOCKS - 2.50% (continued) | | | | | | |
| Insurance - 0.09% | | | | | | |
| Markel Corp. | | | 44 | | | $ | 46,991 | |
| Willis Towers Watson PLC (b) | | | 275 | | | | 42,413 | |
| | | | | | | | 89,404 | |
| | | | | | | | | |
| Internet & Direct Marketing Retail - 0.10% | | | | | | | | |
| Amazon.com, Inc. | | | 42 | | | | 40,377 | |
| Ctrip.com International, Ltd. - ADR | | | 779 | | | | 41,084 | |
| TripAdvisor, Inc. | | | 520 | | | | 21,076 | |
| | | | | | | | 102,537 | |
| | | | | | | | | |
| Internet Software & Services - 0.02% | | | | | | | | |
| Cornerstone OnDemand, Inc. | | | 402 | | | | 16,325 | |
| | | | | | | | | |
| Life Sciences Tools & Services - 0.04% | | | | | | | | |
| Illumina, Inc. | | | 212 | | | | 42,230 | |
| | | | | | | | | |
| Machinery - 0.07% | | | | | | | | |
| Flowserve Corp. | | | 807 | | | | 34,370 | |
| Wabtec Corp. | | | 565 | | | | 42,799 | |
| | | | | | | | 77,169 | |
| | | | | | | | | |
| Media - 0.08% | | | | | | | | |
| Grupo Televisa SAB - ADR | | | 1,484 | | | | 36,610 | |
| IMAX Corp. (b) | | | 1,322 | | | | 29,943 | |
| News Corp. - Class A | | | 1,029 | | | | 13,645 | |
| | | | | | | | 80,198 | |
| | | | | | | | | |
| Metals & Mining - 0.03% | | | | | | | | |
| Franco-Nevada Corp. (b) | | | 349 | | | | 27,041 | |
| | | | | | | | | |
| Multi-Utilities - 0.04% | | | | | | | | |
| Dominion Energy, Inc. | | | 521 | | | | 40,081 | |
| | | | | | | | | |
| Oil, Gas & Consumable Fuels - 0.18% | | | | | | | | |
| Apache Corp. | | | 800 | | | | 36,640 | |
| Hess Corp. | | | 711 | | | | 33,339 | |
| Occidental Petroleum Corp. | | | 642 | | | | 41,223 | |
| PDC Energy, Inc. | | | 571 | | | | 27,996 | |
| RSP Permian, Inc. | | | 1,273 | | | | 44,033 | |
| | | | | | | | 183,231 | |
| | | | | | | | | |
| Pharmaceuticals - 0.01% | | | | | | | | |
| Nektar Therapeutics | | | 626 | | | | 15,024 | |
| | | | | | | | | |
| Professional Services - 0.10% | | | | | | | | |
| Nielsen Holdings PLC (b) | | | 1,046 | | | | 43,357 | |
| Verisk Analytics, Inc. | | | 520 | | | | 43,259 | |
| WageWorks, Inc. | | | 232 | | | | 14,082 | |
| | | | | | | | 100,698 | |
| | | | | | | | | |
| Real Estate Investment Trusts (REITs) - 0.02% | | | | | | | | |
| Acadia Realty Trust | | | 466 | | | | 13,337 | |
| Education Realty Trust, Inc. | | | 339 | | | | 12,180 | |
| | | | | | | | 25,517 | |
| | | | | | | | | |
| Real Estate Management & Development - 0.01% | | | | | | | | |
| Kennedy-Wilson Holdings, Inc. | | | 674 | | | | 12,503 | |
| | | | | | | | | |
| Semiconductors & Semiconductor | | | | | | | | |
| Equipment - 0.10% | | | | | | | | |
| Ambarella, Inc. | | | 506 | | | | 24,799 | |
| Cavium, Inc. | | | 612 | | | | 40,355 | |
| Inphi Corp. | | | 1,044 | | | | 41,437 | |
| | | | | | | | 106,591 | |
| | | | | | | | | |
| Software - 0.35% | | | | | | | | |
| CommVault Systems, Inc. | | | 221 | | | | 13,437 | |
| Guidewire Software, Inc. | | | 611 | | | | 47,572 | |
| Salesforce.com, Inc. | | | 441 | | | | 41,198 | |
| Splunk, Inc. | | | 684 | | | | 45,438 | |
| Symantec Corp. | | | 1,291 | | | | 42,358 | |
| Tableau Software, Inc. - Class A | | | 630 | | | | 47,181 | |
| Ultimate Software Group, Inc. | | | 191 | | | | 36,214 | |
| Workday, Inc. - Class A | | | 391 | | | | 41,207 | |
| Zendesk, Inc. | | | 1,451 | | | | 42,239 | |
| | | | | | | | 356,844 | |
| | | | | | | | | |
| Specialty Retail - 0.01% | | | | | | | | |
| Monro, Inc. | | | 243 | | | | 13,620 | |
| 66 | The Leuthold Funds - 2017 Annual Report | See Notes to the Financial Statements. |
Leuthold Global Fund
Schedule of Securities Sold Short - (a) (continued)
September 30, 2017
| | | Shares | | | Fair Value | |
| COMMON STOCKS - 2.50% (continued) | | | | | | |
| Technology Hardware, Storage & Peripherals - 0.01% | | | | | | |
| Diebold Nixdorf, Inc. | | | 503 | | | $ | 11,494 | |
| | | | | | | | | |
| Water Utilities - 0.04% | | | | | | | | |
| American Water Works Co., Inc. | | | 526 | | | | 42,559 | |
TOTAL COMMON STOCKS
(Proceeds $2,534,666) | | | | | | $ | 2,563,504 | |
| | | | | | | | | |
| INVESTMENT COMPANIES - 4.65% | | | | | | | | |
| Exchange-Traded Funds - 4.65% | | | | | | | | |
| iShares MSCI ACWI ETF | | | 29,891 | | | $ | 2,057,099 | |
| iShares MSCI EAFE ETF | | | 31,824 | | | | 2,179,307 | |
| iShares MSCI Emerging Markets ETF | | | 12,137 | | | | 543,859 | |
TOTAL INVESTMENT COMPANIES
(Proceeds $4,651,346) | | | | | | $ | 4,780,265 | |
| | | | | | | | | |
TOTAL SECURITIES SOLD SHORT
(Proceeds $7,186,012) - 7.15% | | | | | | $ | 7,343,769 | |
Percentages are stated as a percent of net assets.
ADR American Depositary Receipt
(a) Non-income producing security.
(b) Foreign issued security.
The Global Industry Classification Standard (GICS®) was developed by and/or is the exclusive property of MSCI, Inc. and Standard & Poor’s Financial Services LLC (“S&P”). GICS® is a service mark of MSCI, Inc. and S&P and has been licensed for use by U.S. Bancorp Fund Services, LLC.
| See Notes to the Financial Statements. | The Leuthold Funds - 2017 Annual Report | 67 |
Leuthold Select Industries Fund
Schedule of Investments
September 30, 2017
| | | Shares | | | Fair Value | |
| COMMON STOCKS - 95.85% | | | | | | |
| Aerospace & Defense - 4.67% | | | | | | |
| General Dynamics Corp. | | | 410 | | | $ | 84,288 | |
| L3 Technologies, Inc. | | | 552 | | | | 104,013 | |
| Northrop Grumman Corp. | | | 580 | | | | 166,878 | |
| Raytheon Co. | | | 887 | | | | 165,496 | |
| Spirit AeroSystems Holdings, Inc. - Class A | | | 1,275 | | | | 99,093 | |
| Textron, Inc. | | | 1,527 | | | | 82,275 | |
| | | | | | | | 702,043 | |
| | | | | | | | | |
| Airlines - 5.50% | | | | | | | | |
| Alaska Air Group, Inc. | | | 1,163 | | | | 88,702 | |
| American Airlines Group, Inc. | | | 3,114 | | | | 147,884 | |
| Delta Air Lines, Inc. | | | 3,625 | | | | 174,797 | |
| Hawaiian Holdings, Inc. (a) | | | 3,531 | | | | 132,589 | |
| JetBlue Airways Corp. (a) | | | 3,624 | | | | 67,153 | |
| Southwest Airlines Co. | | | 3,877 | | | | 217,034 | |
| | | | | | | | 828,159 | |
| | | | | | | | | |
| Auto Components - 4.66% | | | | | | | | |
| American Axle & Manufacturing Holdings, Inc. (a) | | | 3,553 | | | | 62,462 | |
| BorgWarner, Inc. | | | 2,592 | | | | 132,788 | |
| Cooper Tire & Rubber Co. | | | 1,668 | | | | 62,383 | |
| Cooper-Standard Holding, Inc. (a) | | | 569 | | | | 65,987 | |
| Gentex Corp. | | | 3,396 | | | | 67,241 | |
| Lear Corp. | | | 751 | | | | 129,983 | |
| Magna International, Inc. (b) | | | 2,191 | | | | 116,956 | |
| Tenneco, Inc. | | | 1,042 | | | | 63,218 | |
| | | | | | | | 701,018 | |
| | | | | | | | | |
| Automobiles - 3.92% | | | | | | | | |
| Fiat Chrysler Automobiles NV (b) | | | 6,692 | | | | 119,854 | |
| Ford Motor Co. | | | 9,885 | | | | 118,323 | |
| General Motors Co. | | | 2,981 | | | | 120,373 | |
| Honda Motor Co., Ltd. - ADR | | | 3,919 | | | | 115,846 | |
| Toyota Motor Corp. - ADR | | | 967 | | | | 115,237 | |
| | | | | | | | 589,633 | |
| | | | | | | | | |
| Banks - 7.23% | | | | | | | | |
| Banco Macro SA - ADR | | | 482 | | | | 56,563 | |
| BB&T Corp. | | | 1,692 | | | | 79,422 | |
| CIT Group, Inc. | | | 1,791 | | | | 87,849 | |
| Citigroup, Inc. | | | 1,139 | | | | 82,851 | |
| Citizens Financial Group, Inc. | | | 2,197 | | | | 83,200 | |
| Credicorp, Ltd. (b) | | | 382 | | | | 78,318 | |
| Fifth Third Bancorp | | | 2,838 | | | | 79,407 | |
| First BanCorp (a)(b) | | | 6,261 | | | | 32,056 | |
| Grupo Financiero Galicia SA - ADR | | | 1,225 | | | | 63,136 | |
| IBERIABANK Corp. | | | 797 | | | | 65,474 | |
| KB Financial Group, Inc. - ADR | | | 1,701 | | | | 83,400 | |
| Regions Financial Corp. | | | 5,348 | | | | 81,450 | |
| SunTrust Banks, Inc. | | | 1,364 | | | | 81,526 | |
| TCF Financial Corp. | | | 3,721 | | | | 63,406 | |
| Umpqua Holdings Corp. | | | 3,582 | | | | 69,885 | |
| | | | | | | | 1,087,943 | |
| | | | | | | | | |
| Biotechnology - 3.53% | | | | | | | | |
| AbbVie, Inc. | | | 1,859 | | | | 165,190 | |
| Amgen, Inc. | | | 684 | | | | 127,532 | |
| Biogen, Inc. (a) | | | 384 | | | | 120,238 | |
| Gilead Sciences, Inc. | | | 1,449 | | | | 117,398 | |
| | | | | | | | 530,358 | |
| | | | | | | | | |
| Capital Markets - 5.20% | | | | | | | | |
| Ameriprise Financial, Inc. | | | 721 | | | | 107,076 | |
| Bank of New York Mellon Corp. | | | 1,755 | | | | 93,050 | |
| Evercore, Inc. - Class A | | | 1,172 | | | | 94,053 | |
| Federated Investors, Inc. - Class B | | | 2,120 | | | | 62,964 | |
| Franklin Resources, Inc. | | | 2,037 | | | | 90,667 | |
| Invesco, Ltd. | | | 2,376 | | | | 83,255 | |
| Morgan Stanley | | | 1,208 | | | | 58,189 | |
| State Street Corp. | | | 1,002 | | | | 95,731 | |
| T. Rowe Price Group, Inc. | | | 1,077 | | | | 97,630 | |
| | | | | | | | 782,615 | |
| 68 | The Leuthold Funds - 2017 Annual Report | See Notes to the Financial Statements. |
Leuthold Select Industries Fund
Schedule of Investments (continued)
September 30, 2017
| | | Shares | | | Fair Value | |
| COMMON STOCKS - 95.85% (continued) | | | | | | |
| Consumer Finance - 0.79% | | | | | | |
| Navient Corp. | | | 4,582 | | | $ | 68,821 | |
| World Acceptance Corp. (a) | | | 612 | | | | 50,729 | |
| | | | | | | | 119,550 | |
| | | | | | | | | |
| Diversified Consumer Services - 0.35% | | | | | | | | |
| Adtalem Global Education, Inc. | | | 1,480 | | | | 53,058 | |
| | | | | | | | | |
| Electronic Equipment, Instruments & Components - 7.46% | | | | | | | | |
| Arrow Electronics, Inc. (a) | | | 2,030 | | | | 163,232 | |
| Avnet, Inc. | | | 2,614 | | | | 102,730 | |
| Benchmark Electronics, Inc. (a) | | | 2,160 | | | | 73,764 | |
| Corning, Inc. | | | 1,914 | | | | 57,267 | |
| Flex, Ltd. (a) | | | 9,945 | | | | 164,789 | |
| Jabil, Inc. | | | 6,836 | | | | 195,168 | |
| Methode Electronics, Inc. | | | 1,654 | | | | 70,047 | |
| Plexus Corp. (a) | | | 1,054 | | | | 59,108 | |
| Sanmina Corp. (a) | | | 2,572 | | | | 95,550 | |
| Tech Data Corp. (a) | | | 1,587 | | | | 141,005 | |
| | | | | | | | 1,122,660 | |
| | | | | | | | | |
| Health Care Providers & Services - 6.47% | | | | | | | | |
| Aetna, Inc. | | | 1,169 | | | | 185,883 | |
| Anthem, Inc. | | | 869 | | | | 165,006 | |
| Centene Corp. (a) | | | 1,695 | | | | 164,025 | |
| Cigna Corp. | | | 674 | | | | 125,997 | |
| Humana, Inc. | | | 525 | | | | 127,906 | |
| UnitedHealth Group, Inc. | | | 1,048 | | | | 205,251 | |
| | | | | | | | 974,068 | |
| | | | | | | | | |
| Hotels, Restaurants & Leisure - 4.92% | | | | | | | | |
| Carnival Corp. | | | 2,811 | | | | 181,506 | |
| ILG, Inc. | | | 3,424 | | | | 91,524 | |
| Marriott Vacations Worldwide Corp. | | | 677 | | | | 84,307 | |
| Norwegian Cruise Line Holdings, Ltd. (a) | | | 1,549 | | | | 83,724 | |
| Royal Caribbean Cruises, Ltd. | | | 1,310 | | | | 155,287 | |
| Wyndham Worldwide Corp. | | | 1,369 | | | | 144,306 | |
| | | | | | | | 740,654 | |
| | | | | | | | | |
| Household Durables - 5.75% | | | | | | | | |
| CalAtlantic Group, Inc. | | | 2,645 | | | | 96,886 | |
| D.R. Horton, Inc. | | | 5,086 | | | | 203,084 | |
| M/I Homes, Inc. (a) | | | 1,905 | | | | 50,921 | |
| MDC Holdings, Inc. | | | 1,999 | | | | 66,387 | |
| Meritage Homes Corp. (a) | | | 1,670 | | | | 74,148 | |
| PulteGroup, Inc. | | | 5,927 | | | | 161,985 | |
| Taylor Morrison Home Corp. - Class A (a) | | | 2,865 | | | | 63,173 | |
| Toll Brothers, Inc. | | | 3,598 | | | | 149,209 | |
| | | | | | | | 865,793 | |
| | | | | | | | | |
| Insurance - 5.94% | | | | | | | | |
| Aflac, Inc. | | | 1,388 | | | | 112,969 | |
| CNO Financial Group, Inc. | | | 3,240 | | | | 75,621 | |
| Lincoln National Corp. | | | 1,423 | | | | 104,562 | |
| Manulife Financial Corp. (b) | | | 5,121 | | | | 103,905 | |
| MetLife, Inc. | | | 1,679 | | | | 87,224 | |
| Principal Financial Group, Inc. | | | 1,629 | | | | 104,810 | |
| Prudential Financial, Inc. | | | 1,222 | | | | 129,923 | |
| Sun Life Financial, Inc. (b) | | | 1,640 | | | | 65,305 | |
| Unum Group | | | 2,152 | | | | 110,032 | |
| | | | | | | | 894,351 | |
| See Notes to the Financial Statements. | The Leuthold Funds - 2017 Annual Report | 69 |
Leuthold Select Industries Fund
Schedule of Investments (continued)
September 30, 2017
| | | Shares | | | Fair Value | |
| COMMON STOCKS - 95.85% (continued) | | | | | | |
| IT Services - 9.12% | | | | | | |
| Accenture PLC - Class A (b) | | | 1,223 | | | $ | 165,191 | |
| Amdocs, Ltd. | | | 1,057 | | | | 67,986 | |
| CACI International, Inc. - Class A (a) | | | 464 | | | | 64,659 | |
| CGI Group, Inc. - Class A (a)(b) | | | 990 | | | | 51,351 | |
| Cognizant Technology Solutions Corp. - Class A | | | 1,050 | | | | 76,167 | |
| Convergys Corp. | | | 1,924 | | | | 49,812 | |
| DST Systems, Inc. | | | 1,515 | | | | 83,143 | |
| Fiserv, Inc. (a) | | | 1,282 | | | | 165,327 | |
| International Business Machines Corp. | | | 928 | | | | 134,634 | |
| MasterCard, Inc. - Class A | | | 1,405 | | | | 198,386 | |
| Science Applications International Corp. | | | 959 | | | | 64,109 | |
| Visa, Inc. - Class A | | | 1,991 | | | | 209,533 | |
| Western Union Co. | | | 2,163 | | | | 41,530 | |
| | | | | | | | 1,371,828 | |
| | | | | | | | | |
| Multiline Retail - 0.67% | | | | | | | | |
| Target Corp. | | | 1,720 | | | | 101,497 | |
| | | | | | | | | |
| Professional Services - 0.51% | | | | | | | | |
| ManpowerGroup, Inc. | | | 646 | | | �� | 76,112 | |
| | | | | | | | | |
| Road & Rail - 4.09% | | | | | | | | |
| Canadian National Railway Co. (b) | | | 1,230 | | | | 101,906 | |
| CSX Corp. | | | 2,641 | | | | 143,301 | |
| Genesee & Wyoming, Inc. - Class A (a) | | | 844 | | | | 62,464 | |
| Kansas City Southern | | | 886 | | | | 96,290 | |
| Norfolk Southern Corp. | | | 858 | | | | 113,462 | |
| Union Pacific Corp. | | | 843 | | | | 97,763 | |
| | | | | | | | 615,186 | |
| | | | | | | | | |
| Semiconductors & Semiconductor Equipment - 10.94% | | | | | | | | |
| Applied Materials, Inc. | | | 6,162 | | | | 320,979 | |
| Cirrus Logic, Inc. (a) | | | 829 | | | | 44,202 | |
| Intel Corp. | | | 1,907 | | | | 72,619 | |
| KLA-Tencor Corp. | | | 921 | | | | 97,626 | |
| Kulicke & Soffa Industries, Inc. (a)(b) | | | 2,495 | | | | 53,817 | |
| Lam Research Corp. | | | 2,078 | | | | 384,513 | |
| MKS Instruments, Inc. | | | 1,698 | | | | 160,376 | |
| QUALCOMM, Inc. | | | 934 | | | | 48,419 | |
| SolarEdge Technologies, Inc. (a)(b) | | | 3,463 | | | | 98,869 | |
| Taiwan Semiconductor Manufacturing Co., Ltd. - ADR | | | 2,301 | | | | 86,402 | |
| Teradyne, Inc. | | | 7,459 | | | | 278,146 | |
| | | | | | | | 1,645,968 | |
| | | | | | | | | |
| Software - 3.87% | | | | | | | | |
| Activision Blizzard, Inc. | | | 4,611 | | | | 297,456 | |
| Electronic Arts, Inc. (a) | | | 2,406 | | | | 284,052 | |
| | | | | | | | 581,508 | |
| | | | | | | | | |
| Specialty Retail - 0.26% | | | | | | | | |
| Bed, Bath & Beyond, Inc. | | | 1,649 | | | | 38,702 | |
TOTAL COMMON STOCKS
(Cost $10,463,410) | | | | | | $ | 14,422,704 | |
| | | | | | | | | |
| PREFERRED STOCKS - 1.56% | | | | | | | | |
| Banks - 1.56% | | | | | | | | |
| Banco Bradesco SA - ADR | | | 7,351 | | | $ | 81,376 | |
| Bancolombia SA - ADR | | | 1,555 | | | | 71,203 | |
| Itau Unibanco Holding SA - ADR | | | 5,980 | | | | 81,926 | |
TOTAL PREFERRED STOCKS
(Cost $187,840) | | | | | | $ | 234,505 | |
| 70 | The Leuthold Funds - 2017 Annual Report | See Notes to the Financial Statements. |
Leuthold Select Industries Fund
Schedule of Investments (continued)
September 30, 2017
| | | | Shares | | Fair Value | |
| SHORT-TERM INVESTMENTS - 2.73% | | | | | | |
| Money Market Funds - 2.73% | | | | | | |
| Fidelity Institutional Money Market Funds - Government Portfolio - Class I, 0.908% (c) | | | 410,143 | | $ | 410,143 | |
TOTAL SHORT-TERM INVESTMENTS
(Cost $410,143) | | | | | $ | 410,143 | |
| | | | | | | | |
Total Investments
(Cost $11,061,393) - 100.14% | | | | | $ | 15,067,352 | |
| Liabilities in Excess of Other Assets - (0.14)% | | | | | | (21,486 | ) |
| TOTAL NET ASSETS - 100.00% | | | | | $ | 15,045,866 | |
Percentages are stated as a percent of net assets.
ADR American Depositary Receipt
| (a) | Non-income producing security. |
| (b) | Foreign issued security. |
| (c) | The rate quoted is the annualized seven-day yield as of September 30, 2017. |
The Global Industry Classification Standard (GICS®) was developed by and/or is the exclusive property of MSCI, Inc. and Standard & Poor’s Financial Services LLC (“S&P”). GICS® is a service mark of MSCI, Inc. and S&P and has been licensed for use by U.S. Bancorp Fund Services, LLC.
| See Notes to the Financial Statements. | The Leuthold Funds - 2017 Annual Report | 71 |
Leuthold Global Industries Fund
Schedule of Investments
September 30, 2017
| | | Shares | | | Fair Value | |
| COMMON STOCKS - 97.99% | | | | | | |
| Airlines - 6.38% | | | | | | |
| Air Canada (a)(b) | | | 4,734 | | | $ | 99,555 | |
| AirAsia Bhd (b) | | | 87,300 | | | | 71,396 | |
| Delta Air Lines, Inc. | | | 2,212 | | | | 106,663 | |
| Deutsche Lufthansa AG (b) | | | 4,042 | | | | 112,403 | |
| Hawaiian Holdings, Inc. (a) | | | 897 | | | | 33,682 | |
| International Consolidated Airlines Group SA (b) | | | 7,862 | | | | 62,513 | |
| JetBlue Airways Corp. (a) | | | 3,689 | | | | 68,357 | |
| SkyWest, Inc. | | | 1,337 | | | | 58,694 | |
| United Continental Holdings, Inc. (a) | | | 1,391 | | | | 84,684 | |
| | | | | | | | 697,947 | |
| | | | | | | | | |
| Auto Components - 6.71% | | | | | | | | |
| Brembo SpA (b) | | | 3,535 | | | | 59,838 | |
| Cheng Shin Rubber Industry Co., Ltd. (b) | | | 20,000 | | | | 40,072 | |
| Cie Plastic Omnium SA (b) | | | 1,627 | | | | 69,599 | |
| Cooper Tire & Rubber Co. | | | 1,345 | | | | 50,303 | |
| Cooper-Standard Holding, Inc. (a) | | | 422 | | | | 48,939 | |
| Faurecia (b) | | | 1,105 | | | | 76,682 | |
| Goodyear Tire & Rubber Co. | | | 2,406 | | | | 80,000 | |
| Lear Corp. | | | 851 | | | | 147,291 | |
| Magna International, Inc. (b) | | | 1,990 | | | | 106,226 | |
| Tong Yang Industry Co., Ltd. (b) | | | 27,000 | | | | 55,206 | |
| | | | | | | | 734,156 | |
| | | | | | | | | |
| Automobiles - 6.58% | | | | | | | | |
| Fiat Chrysler Automobiles NV (b) | | | 6,849 | | | | 122,666 | |
| Ford Motor Co. | | | 9,490 | | | | 113,595 | |
| Geely Automobile Holdings, Ltd. (b) | | | 35,000 | | | | 99,390 | |
| General Motors Co. | | | 3,411 | | | | 137,736 | |
| Great Wall Motor Co., Ltd. (b) | | | 37,500 | | | | 46,412 | |
| Kia Motors Corp. (b) | | | 802 | | | | 22,189 | |
| Nissan Motor Co., Ltd. (b) | | | 4,100 | | | | 40,617 | |
| Renault SA (b) | | | 516 | | | | 50,700 | |
| Tata Motors, Ltd. - ADR (a) | | | 2,739 | | | | 85,649 | |
| | | | | | | | 718,954 | |
| | | | | | | | | |
| Banks - 8.08% | | | | | | | | |
| Banco do Brasil SA (b) | | | 6,800 | | | | 75,039 | |
| Banco Santander SA - ADR | | | 7,981 | | | | 55,388 | |
| Bank of America Corp. | | | 3,259 | | | | 82,583 | |
| Barclays Africa Group, Ltd. (b) | | | 4,023 | | | | 41,292 | |
| CIMB Group Holdings Bhd (b) | | | 40,600 | | | | 60,652 | |
| Credicorp, Ltd. (b) | | | 295 | | | | 60,481 | |
| Grupo Financiero Banorte SAB de CV (b) | | | 7,900 | | | | 54,389 | |
| Hana Financial Group, Inc. (b) | | | 1,731 | | | | 71,813 | |
| Krung Thai Bank PCL - NVDR | | | 89,800 | | | | 50,687 | |
| Nedbank Group, Ltd. (b) | | | 3,194 | | | | 47,791 | |
| Nordea Bank AB (b) | | | 4,177 | | | | 56,712 | |
| Taishin Financial Holding Co., Ltd. (b) | | | 120,757 | | | | 52,037 | |
| TMB Bank PCL - NVDR | | | 675,400 | | | | 51,091 | |
| Turkiye Is Bankasi - Class C (b) | | | 25,123 | | | | 47,803 | |
| Woori Bank (b) | | | 4,869 | | | | 76,014 | |
| | | | | | | | 883,772 | |
| | | | | | | | | |
| Capital Markets - 4.70% | | | | | | | | |
| BGC Partners, Inc. - Class A | | | 4,492 | | | | 64,999 | |
| China Everbright, Ltd. (b) | | | 24,000 | | | | 55,425 | |
| China Galaxy Securities Co., Ltd. (b) | | | 72,500 | | | | 63,887 | |
| Close Brothers Group PLC (b) | | | 2,629 | | | | 51,988 | |
| Goldman Sachs Group, Inc. | | | 418 | | | | 99,145 | |
| Lazard, Ltd. - Class A (b) | | | 1,629 | | | | 73,663 | |
| Morgan Stanley | | | 2,170 | | | | 104,529 | |
| | | | | | | | 513,636 | |
| 72 | The Leuthold Funds - 2017 Annual Report | See Notes to the Financial Statements. |
Leuthold Global Industries Fund
Schedule of Investments (continued)
September 30, 2017
| | | Shares | | | Fair Value | |
| COMMON STOCKS - 97.99% (continued) | | | | | | |
| Chemicals - 6.10% | | | | | | |
| Denka Co., Ltd. (b) | | | 3,400 | | | $ | 112,143 | |
| Hyosung Corp. (b) | | | 422 | | | | 53,778 | |
| Lotte Chemical Corp. (b) | | | 344 | | | | 113,898 | |
| LyondellBasell Industries NV - Class A (b) | | | 1,434 | | | | 142,038 | |
| Tosoh Corp. (b) | | | 8,000 | | | | 180,577 | |
| Trinseo SA (b) | | | 956 | | | | 64,148 | |
| | | | | | | | 666,582 | |
| | | | | | | | | |
| Electronic Equipment, Instruments & Components - 6.90% | | | | | | | | |
| Arrow Electronics, Inc. (a) | | | 805 | | | | 64,730 | |
| Avnet, Inc. | | | 1,287 | | | | 50,579 | |
| Corning, Inc. | | | 2,348 | | | | 70,252 | |
| Hexagon AB - Class B (b) | | | 1,307 | | | | 64,838 | |
| Hon Hai Precision Industry Co., Ltd. (b) | | | 21,600 | | | | 75,015 | |
| Innolux Corp. (b) | | | 169,000 | | | | 79,107 | |
| Jabil, Inc. | | | 2,546 | | | | 72,688 | |
| Kingboard Chemical Holdings, Ltd. (b) | | | 18,000 | | | | 95,864 | |
| Sanmina Corp. (a) | | | 2,020 | | | | 75,043 | |
| TDK Corp. (b) | | | 700 | | | | 47,567 | |
| Tech Data Corp. (a) | | | 661 | | | | 58,730 | |
| | | | | | | | 754,413 | |
| | | | | | | | | |
| Health Care Providers & Services - 6.19% | | | | | | | | |
| Anthem, Inc. | | | 664 | | | | 126,080 | |
| Centene Corp. (a) | | | 1,822 | | | | 176,315 | |
| Humana, Inc. | | | 513 | | | | 124,982 | |
| Magellan Health, Inc. (a) | | | 1,004 | | | | 86,645 | |
| Odontoprev SA (b) | | | 16,700 | | | | 80,675 | |
| Qualicorp SA (b) | | | 6,900 | | | | 81,742 | |
| | | | | | | | 676,439 | |
| | | | | | | | | |
| Household Durables - 7.34% | | | | | | | | |
| Barratt Developments PLC (b) | | | 9,603 | | | | 79,111 | |
| Bellway PLC (b) | | | 2,014 | | | | 89,090 | |
| CalAtlantic Group, Inc. | | | 2,152 | | | | 78,828 | |
| Haseko Corp. (b) | | | 6,500 | | | | 86,738 | |
| MDC Holdings, Inc. | | | 2,233 | | | | 74,158 | |
| Meritage Homes Corp. (a) | | | 1,802 | | | | 80,009 | |
| PulteGroup, Inc. | | | 3,175 | | | | 86,773 | |
| Redrow PLC (b) | | | 10,201 | | | | 80,991 | |
| Taylor Morrison Home Corp. - Class A (a) | | | 3,133 | | | | 69,082 | |
| TRI Pointe Group, Inc. (a) | | | 5,666 | | | | 78,247 | |
| | | | | | | | 803,027 | |
| | | | | | | | | |
| Independent Power & Renewable Electricity Producers - 0.48% | | | | | | | | |
| Electric Power Development Co., Ltd. (b) | | | 2,100 | | | | 52,754 | |
| | | | | | | | | |
| Insurance - 6.03% | | | | | | | | |
| CNO Financial Group, Inc. | | | 2,436 | | | | 56,856 | |
| Dai-ichi Life Holdings, Inc. (b) | | | 4,500 | | | | 80,719 | |
| Legal & General Group PLC (b) | | | 15,248 | | | | 53,147 | |
| Lincoln National Corp. | | | 717 | | | | 52,685 | |
| Medibank Pvt, Ltd. (b) | | | 27,757 | | | | 63,685 | |
| Old Mutual PLC (b) | | | 18,767 | | | | 48,888 | |
| Phoenix Group Holdings (b) | | | 5,198 | | | | 52,685 | |
| Ping An Insurance Group Co. of China, Ltd. (b) | | | 12,500 | | | | 96,555 | |
| Prudential Financial, Inc. | | | 664 | | | | 70,597 | |
| Unum Group | | | 1,633 | | | | 83,495 | |
| | | | | | | | 659,312 | |
| | | | | | | | | |
| Internet Software & Services - 2.60% | | | | | | | | |
| Akamai Technologies, Inc. (a) | | | 1,141 | | | | 55,589 | |
| Alphabet, Inc. - Class A (a) | | | 87 | | | | 84,714 | |
| eBay, Inc. (a) | | | 2,474 | | | | 95,150 | |
| j2 Global, Inc. | | | 666 | | | | 49,204 | |
| | | | | | | | 284,657 | |
| See Notes to the Financial Statements. | The Leuthold Funds - 2017 Annual Report | 73 |
Leuthold Global Industries Fund
Schedule of Investments (continued)
September 30, 2017
| | | Shares | | | Fair Value | |
| COMMON STOCKS - 97.99% (continued) | | | | | | |
| Metals & Mining - 3.38% | | | | | | |
| APERAM SA (b) | | | 1,166 | | | $ | 61,104 | |
| BlueScope Steel, Ltd. (b) | | | 10,166 | | | | 87,819 | |
| Ferrexpo PLC (b) | | | 17,528 | | | | 68,677 | |
| Reliance Steel & Aluminum Co. | | | 533 | | | | 40,599 | |
| Voestalpine AG (b) | | | 1,293 | | | | 65,937 | |
| Worthington Industries, Inc. | | | 983 | | | | 45,218 | |
| | | | | | | | 369,354 | |
| | | | | | | | | |
| Oil, Gas & Consumable Fuels - 1.65% | | | | | | | | |
| Adaro Energy Tbk PT (b) | | | 390,800 | | | | 53,049 | |
| Exxaro Resources, Ltd. (b) | | | 6,520 | | | | 59,371 | |
| Whitehaven Coal, Ltd. (b) | | | 23,358 | | | | 67,722 | |
| | | | | | | | 180,142 | |
| | | | | | | | | |
| Paper & Forest Products - 6.40% | | | | | | | | |
| China Forestry Holdings Co., Ltd. (a)(b)(d)(e) | | | 116,000 | | | | 2,227 | |
| Domtar Corp. | | | 1,434 | | | | 62,221 | |
| Fibria Celulose SA - ADR | | | 3,893 | | | | 52,711 | |
| Lee & Man Paper Manufacturing, Ltd. (b) | | | 55,000 | | | | 70,768 | |
| Louisiana-Pacific Corp. (a) | | | 3,522 | | | | 95,376 | |
| Norbord, Inc. (b) | | | 1,589 | | | | 60,504 | |
| Sappi, Ltd. (b) | | | 13,312 | | | | 90,664 | |
| Stora Enso OYJ (b) | | | 7,057 | | | | 99,822 | |
| UPM-Kymmene OYJ (b) | | | 1,877 | | | | 50,925 | |
| West Fraser Timber Co., Ltd. (b) | | | 1,975 | | | | 113,965 | |
| | | | | | | | 699,183 | |
| | | | | | | | | |
| Real Estate Management & Development - 2.11% | | | | | | | | |
| Daiwa House Industry Co., Ltd. (b) | | | 1,600 | | | | 55,268 | |
| Hongkong Land Holdings, Ltd. (b) | | | 9,700 | | | | 69,944 | |
| Realogy Holdings Corp. | | | 1,583 | | | | 52,160 | |
| Vonovia SE (b) | | | 1,260 | | | | 53,660 | |
| | | | | | | | 231,032 | |
| | | | | | | | | |
| Semiconductors & Semiconductor Equipment - 11.77% | | | | | | | | |
| A-DATA Technology Co., Ltd. (b) | | | 18,000 | | | | 49,068 | |
| Amkor Technology, Inc. (a) | | | 7,630 | | | | 80,497 | |
| Applied Materials, Inc. | | | 1,667 | | | | 86,834 | |
| ASM International NV (b) | | | 1,398 | | | | 88,407 | |
| Cirrus Logic, Inc. (a) | | | 952 | | | | 50,761 | |
| Dialog Semiconductor PLC (a)(b) | | | 1,308 | | | | 57,886 | |
| Dongbu HiTek Co., Ltd. (a)(b) | | | 4,084 | | | | 54,773 | |
| Jusung Engineering Co., Ltd. (a)(b) | | | 6,445 | | | | 80,275 | |
| KLA-Tencor Corp. | | | 500 | | | | 53,000 | |
| Kulicke & Soffa Industries, Inc. (a)(b) | | | 2,737 | | | | 59,037 | |
| Lam Research Corp. | | | 483 | | | | 89,374 | |
| Micron Technology, Inc. (a) | | | 3,560 | | | | 140,015 | |
| ON Semiconductor Corp. (a) | | | 4,291 | | | | 79,255 | |
| Sanken Electric Co., Ltd. (b) | | | 10,000 | | | | 55,106 | |
| SCREEN Holdings Co., Ltd. (b) | | | 800 | | | | 55,572 | |
| STMicroelectronics NV - ADR | | | 3,818 | | | | 74,146 | |
| Tokyo Seimitsu Co., Ltd. (b) | | | 1,800 | | | | 63,876 | |
| Ulvac, Inc. (b) | | | 1,100 | | | | 69,324 | |
| | | | | | | | 1,287,206 | |
| | | | | | | | | |
| Transportation Infrastructure - 0.50% | | | | | | | | |
| Zhejiang Expressway Co., Ltd. (b) | | | 44,000 | | | | 54,811 | |
| | | | | | | | | |
| Wireless Telecommunication Services - 4.09% | | | | | | | | |
| China Mobile, Ltd. - ADR | | | 1,450 | | | | 73,326 | |
| Freenet AG (b) | | | 2,053 | | | | 68,707 | |
| KDDI Corp. (b) | | | 5,100 | | | | 134,436 | |
| Softbank Group Corp. (b) | | | 2,100 | | | | 170,302 | |
| | | | | | | | 446,771 | |
TOTAL COMMON STOCKS
(Cost $8,909,149) | | | | | | $ | 10,714,148 | |
| 74 | The Leuthold Funds - 2017 Annual Report | See Notes to the Financial Statements. |
Leuthold Global Industries Fund
Schedule of Investments (continued)
September 30, 2017
| | | | Shares | | | Fair Value | |
| PREFERRED STOCKS - 0.45% | | | | |
| Paper & Forest Products - 0.45% | | | | |
| Suzano Papel e Celulose SA - Class A (b) | | | 8,500 | | | $ | 49,382 | |
TOTAL PREFERRED STOCKS
(Cost $38,671) | | | | | | $ | 49,382 | |
| | | | | | | | | |
| INVESTMENT COMPANIES - 0.97% | |
| | | | | | | | | |
| Exchange-Traded Funds - 0.97% | | | | | | | | |
| iShares Core MSCI EAFE ETF | | | 657 | | | $ | 42,160 | |
| iShares Core MSCI Emerging Markets ETF | | | 406 | | | | 21,932 | |
| SPDR S&P 500 ETF Trust | | | 167 | | | | 41,955 | |
TOTAL INVESTMENT COMPANIES
(Cost $93,779) | | | | | | $ | 106,047 | |
| | | | | | | | | |
| SHORT-TERM INVESTMENTS - 0.66% | | | | | | | | |
| | | | | | | | | |
| Money Market Funds - 0.66% | | | | | | | | |
| Fidelity Institutional Money Market Funds - Government Portfolio - Class I, 0.908% (c) | | | 71,833 | | | $ | 71,833 | |
TOTAL SHORT-TERM INVESTMENTS
(Cost $71,833) | | | | | | $ | 71,833 | |
| | | | | | | | | |
Total Investments
(Cost $9,113,432) - 100.07% | | | | | | $ | 10,941,410 | |
| Liabilities in Excess of Other Assets - (0.07)% | | | | | | | (7,977 | ) |
| TOTAL NET ASSETS - 100.00% | | | | | | $ | 10,933,433 | |
Percentages are stated as a percent of net assets.
| ADR | American Depositary Receipt |
| NVDR | Non-Voting Depositary Receipt |
| (a) | Non-income producing security. |
| (b) | Foreign issued security. |
| (c) | The rate quoted is the annualized seven-day yield as of September 30, 2017. |
| (d) | Illiquid security. The fair value of these securities total $2,227 which represents 0.02% of total net assets. |
| (e) | The security is currently being fair valued in accordance with procedures established by the Board of Directors of Leuthold Funds, Inc. |
The Global Industry Classification Standard (GICS®) was developed by and/or is the exclusive property of MSCI, Inc. and Standard & Poor’s Financial Services LLC (“S&P”). GICS® is a service mark of MSCI, Inc. and S&P and has been licensed for use by U.S. Bancorp Fund Services, LLC.
| See Notes to the Financial Statements. | The Leuthold Funds - 2017 Annual Report | 75 |
Leuthold Global Industries Fund
Schedule of Investments (continued)
September 30, 2017
| | | | | | | | |
| | | Fair Value | | | Percentage
of Total
Investments |
| CURRENCY EXPOSURE | | | | | | | |
| Australian Dollar | | $ | 219,225 | | | | 2.00 | % | |
| Brazilian Real | | | 286,838 | | | | 2.62 | | |
| British Pound | | | 587,090 | | | | 5.37 | | |
| Canadian Dollar | | | 274,024 | | | | 2.50 | | |
| Euro | | | 915,671 | | | | 8.37 | | |
| Hong Kong Dollar | | | 585,338 | | | | 5.35 | | |
| Indonesian Rupiah | | | 53,049 | | | | 0.48 | | |
| Japanese Yen | | | 1,204,999 | | | | 11.01 | | |
| Malaysian Ringgit | | | 132,048 | | | | 1.21 | | |
| Mexican Peso | | | 54,389 | | | | 0.50 | | |
| New Taiwan Dollar | | | 350,504 | | | | 3.20 | | |
| South African Rand | | | 239,118 | | | | 2.19 | | |
| South Korea Won | | | 472,741 | | | | 4.32 | | |
| Swedish Krona | | | 121,550 | | | | 1.11 | | |
| Thai Baht | | | 101,778 | | | | 0.93 | | |
| Turkish Lira | | | 47,803 | | | | 0.44 | | |
| US Dollar | | | 5,295,245 | | | | 48.40 | | |
| Total Investments | | $ | 10,941,410 | | | | 100.00 | % | |
| | | Fair Value | | | Percentage
of Total
Investments |
| PORTFOLIO DIVERSIFICATION | | | | | | |
| Australia | | $ | 219,225 | | | | 2.00 | % | |
| Austria | | | 65,937 | | | | 0.60 | | |
| Bermuda | | | 73,663 | | | | 0.67 | | |
| Brazil | | | 339,549 | | | | 3.10 | | |
| Canada | | | 380,250 | | | | 3.47 | | |
| China | | | 363,281 | | | | 3.32 | | |
| Finland | | | 150,747 | | | | 1.38 | | |
| France | | | 196,982 | | | | 1.80 | | |
| Germany | | | 234,770 | | | | 2.15 | | |
| Hong Kong | | | 365,327 | | | | 3.34 | | |
| India | | | 85,649 | | | | 0.78 | | |
| Indonesia | | | 53,049 | | | | 0.48 | | |
| Italy | | | 59,838 | | | | 0.55 | | |
| Japan | | | 1,204,999 | | | | 11.01 | | |
| Jersey | | | 52,685 | | | | 0.48 | | |
| Luxembourg | | | 61,104 | | | | 0.56 | | |
| Malaysia | | | 132,048 | | | | 1.21 | | |
| Mexico | | | 54,389 | | | | 0.50 | | |
| Netherlands | | | 88,407 | | | | 0.81 | | |
| Peru | | | 60,481 | | | | 0.55 | | |
| Singapore | | | 59,037 | | | | 0.54 | | |
| South Africa | | | 239,118 | | | | 2.19 | | |
| South Korea | | | 472,741 | | | | 4.32 | | |
| Spain | | | 55,388 | | | | 0.51 | | |
| Sweden | | | 121,550 | | | | 1.11 | | |
| Switzerland | | | 142,823 | | | | 1.31 | | |
| Taiwan | | | 350,504 | | | | 3.20 | | |
| Thailand | | | 101,778 | | | | 0.93 | | |
| Turkey | | | 47,803 | | | | 0.44 | | |
| United Kingdom | | | 646,280 | | | | 5.91 | | |
| United States | | | 4,462,008 | | | | 40.78 | | |
| Total Investments | | $ | 10,941,410 | | | | 100.00 | % | |
| 76 | The Leuthold Funds - 2017 Annual Report | See Notes to the Financial Statements. |
Schedule of Investments
September 30, 2017
| | | Shares | | | Fair Value | |
| SHORT-TERM INVESTMENTS - 84.74% | |
| Money Market Funds - 84.74% | | | | |
Fidelity Institutional Money Market Funds - Government Portfolio - Class I, 0.908% (a)(b) | | | 174,298,921 | | | $ | 174,298,921 | |
TOTAL SHORT-TERM INVESTMENTS
(Cost $174,298,921) | | | | | | $ | 174,298,921 | |
| | | | | | | | | |
Total Investments
(Cost $174,298,921) - 84.74% | | | $ | 174,298,921 | |
| Other Assets in Excess of Liabilities - 15.26% (b) | | | | 31,399,352 | |
| TOTAL NET ASSETS - 100.00% | | | $ | 205,698,273 | |
Percentages are stated as a percent of net assets.
| (a) | The rate quoted is the annualized seven-day yield as of September 30, 2017. |
| (b) | All or a portion of the assets have been committed as collateral for open securities sold short. |
The Global Industry Classification Standard (GICS®) was developed by and/or is the exclusive property of MSCI, Inc. and Standard & Poor’s Financial Services LLC (“S&P”). GICS® is a service mark of MSCI, Inc. and S&P and has been licensed for use by U.S. Bancorp Fund Services, LLC.
| See Notes to the Financial Statements. | The Leuthold Funds - 2017 Annual Report | 77 |
Grizzly Short Fund
Schedule of Securities Sold Short - (a)
September 30, 2017
| | | | | | | |
| | | Shares | | | Fair Value | |
| COMMON STOCKS - 98.14% | | | | |
| Banks - 4.31% | | | | | | |
| First Republic Bank | | | 32,093 | | | $ | 3,352,435 | |
| Investors Bancorp, Inc. | | | 80,723 | | | | 1,101,062 | |
| MB Financial, Inc. | | | 24,957 | | | | 1,123,564 | |
| People’s United Financial, Inc. | | | 181,094 | | | | 3,285,045 | |
| | | | | | | | 8,862,106 | |
| | | | | | | | | |
| Beverages - 3.20% | | | | | | | | |
| Anheuser-Busch InBev SA/NV - ADR | | | 28,163 | | | | 3,359,846 | |
| Monster Beverage Corp. | | | 58,291 | | | | 3,220,578 | |
| | | | | | | | 6,580,424 | |
| | | | | | | | | |
| Building Products - 1.49% | | | | | | | | |
| Johnson Controls International PLC | | | 76,138 | | | | 3,067,600 | |
| | | | | | | | | |
| Capital Markets - 2.22% | | | | | | | | |
| FactSet Research Systems, Inc. | | | 19,321 | | | | 3,479,905 | |
Interactive Brokers Group, Inc. - Class A | | | 24,150 | | | | 1,087,716 | |
| | | | | | | | 4,567,621 | |
| | | | | | | | | |
| Chemicals - 2.27% | | | | | | | | |
| Ashland Global Holdings, Inc. | | | 53,215 | | | | 3,479,729 | |
| GCP Applied Technologies, Inc. | | | 38,970 | | | | 1,196,379 | |
| | | | | | | | 4,676,108 | |
| | | | | | | | | |
| Commercial Services & Supplies - 2.68% | |
| Cintas Corp. | | | 23,415 | | | | 3,378,316 | |
| Clean Harbors, Inc. | | | 18,011 | | | | 1,021,224 | |
| Ritchie Bros Auctioneers, Inc. (b) | | | 35,531 | | | | 1,123,490 | |
| | | | | | | | 5,523,030 | |
| | | | | | | | | |
| Communications Equipment - 0.84% | | | | | |
| ViaSat, Inc. | | | 26,853 | | | | 1,727,185 | |
| | | | | | | | | |
| Construction Materials - 1.57% | | | | | |
| Vulcan Materials Co. | | | 27,043 | | | | 3,234,343 | |
| | | | | | | | | |
| Containers & Packaging - 1.72% | | | | | |
| Ball Corp. | | | 85,471 | | | | 3,529,952 | |
| | | | | | | | | |
| Diversified Telecommunication Services - 1.50% | |
| Zayo Group Holdings, Inc. | | | 89,731 | | | | 3,088,541 | |
| | | | | | | | | |
| Electrical Equipment - 2.66% | | | | | |
| Acuity Brands, Inc. | | | 14,081 | | | | 2,411,794 | |
| Emerson Electric Co. | | | 48,681 | | | | 3,059,114 | |
| | | | | | | | 5,470,908 | |
| | | | | | | | | |
| Energy Equipment & Services - 5.79% | | | | | |
| Core Laboratories NV (b) | | | 28,163 | | | | 2,779,688 | |
| Dril-Quip, Inc. | | | 64,840 | | | | 2,862,686 | |
| Halliburton Co. | | | 68,279 | | | | 3,142,882 | |
| Schlumberger, Ltd. (b) | | | 44,701 | | | | 3,118,342 | |
| | | | | | | | 11,903,598 | |
| | | | | | | | | |
| Food Products - 5.97% | | | | | | | | |
| BRF SA - ADR | | | 74,337 | | | | 1,071,196 | |
| ConAgra Brands, Inc. | | | 82,524 | | | | 2,784,360 | |
| Hormel Foods Corp. | | | 94,477 | | | | 3,036,491 | |
| Kellogg Co. | | | 45,028 | | | | 2,808,396 | |
| TreeHouse Foods, Inc. | | | 37,987 | | | | 2,572,860 | |
| | | | | | | | 12,273,303 | |
| | | | | | | | | |
| Health Care Equipment & Supplies - 6.00% | |
| Abbott Laboratories | | | 64,513 | | | | 3,442,414 | |
| ABIOMED, Inc. | | | 19,316 | | | | 3,256,677 | |
| ICU Medical, Inc. | | | 6,386 | | | | 1,186,838 | |
| Insulet Corp. | | | 21,122 | | | | 1,163,400 | |
| Nevro Corp. | | | 24,561 | | | | 2,232,104 | |
| Penumbra, Inc. | | | 11,669 | | | | 1,053,711 | |
| | | | | | | | 12,335,144 | |
| | | | | | | | | |
| Hotels, Restaurants & Leisure - 2.96% | | | | | |
| Hilton Worldwide Holdings, Inc. | | | 49,613 | | | | 3,445,623 | |
| Starbucks Corp. | | | 49,121 | | | | 2,638,289 | |
| | | | | | | | 6,083,912 | |
| 78 | The Leuthold Funds - 2017 Annual Report | See Notes to the Financial Statements. |
Grizzly Short Fund
Schedule of Securities Sold Short - (a) (continued)
September 30, 2017
| | | Shares | | | Fair Value | |
| COMMON STOCKS - 98.14% (continued) | |
| Industrial Conglomerates - 1.59% | | | | |
| 3M Co. | | | 15,555 | | | $ | 3,264,994 | |
| | | | | | | | | |
| Insurance - 3.41% | | | | | | | | |
| Markel Corp. | | | 3,439 | | | | 3,672,783 | |
| Willis Towers Watson PLC (b) | | | 21,613 | | | | 3,333,373 | |
| | | | | | | | 7,006,156 | |
| | | | | | | | | |
| Internet & Direct Marketing Retail - 3.91% | |
| Amazon.com, Inc. | | | 3,275 | | | | 3,148,421 | |
Ctrip.com International, Ltd. - ADR | | | 61,402 | | | | 3,238,341 | |
| TripAdvisor, Inc. | | | 40,935 | | | | 1,659,096 | |
| | | | | | | | 8,045,858 | |
| | | | | | | | | |
| Internet Software & Services - 0.62% | | | | | |
| Cornerstone OnDemand, Inc. | | | 31,601 | | | | 1,283,317 | |
| | | | | | | | | |
| Life Sciences Tools & Services - 1.62% | | | | | |
| Illumina, Inc. | | | 16,701 | | | | 3,326,839 | |
| | | | | | | | | |
| Machinery - 2.96% | | | | | | | | |
| Flowserve Corp. | | | 63,530 | | | | 2,705,742 | |
| Wabtec Corp. | | | 44,537 | | | | 3,373,678 | |
| | | | | | | | 6,079,420 | |
| | | | | | | | | |
| Media - 3.07% | | | | | | | | |
| Grupo Televisa SAB - ADR | | | 116,745 | | | | 2,880,099 | |
| IMAX Corp. (b) | | | 104,138 | | | | 2,358,726 | |
| News Corp. - Class A | | | 80,887 | | | | 1,072,561 | |
| | | | | | | | 6,311,386 | |
| | | | | | | | | |
| Metals & Mining - 1.03% | | | | | | | | |
| Franco-Nevada Corp. (b) | | | 27,344 | | | | 2,118,613 | |
| | | | | | | | | |
| Multi-Utilities - 1.53% | | | | | | | | |
| Dominion Energy, Inc. | | | 40,935 | | | | 3,149,130 | |
| | | | | | | | | |
| Oil, Gas & Consumable Fuels - 7.01% | | | | | |
| Apache Corp. | | | 63,039 | | | | 2,887,186 | |
| Hess Corp. | | | 55,998 | | | | 2,625,746 | |
| Occidental Petroleum Corp. | | | 50,595 | | | | 3,248,705 | |
| PDC Energy, Inc. | | | 44,864 | | | | 2,199,682 | |
| RSP Permian, Inc. | | | 100,208 | | | | 3,466,195 | |
| | | | | | | | 14,427,514 | |
| | | | | | | | | |
| Pharmaceuticals - 0.57% | | | | | | | | |
| Nektar Therapeutics | | | 49,285 | | | | 1,182,840 | |
| | | | | | | | | |
| Professional Services - 3.85% | | | | | |
| Nielsen Holdings PLC (b) | | | 82,360 | | | | 3,413,822 | |
| Verisk Analytics, Inc. | | | 40,935 | | | | 3,405,383 | |
| WageWorks, Inc. | | | 18,175 | | | | 1,103,222 | |
| | | | | | | | 7,922,427 | |
| | | | | | | | | |
| Real Estate Investment Trusts (REITs) - 0.98% | |
| Acadia Realty Trust | | | 36,677 | | | | 1,049,695 | |
| Education Realty Trust, Inc. | | | 26,689 | | | | 958,936 | |
| | | | | | | | 2,008,631 | |
| | | | | | | | | |
Real Estate Management & Development - 0.48% | | | | | | | | |
| Kennedy-Wilson Holdings, Inc. | | | 53,051 | | | | 984,096 | |
| | | | | | | | | |
| Semiconductors & Semiconductor Equipment - 4.08% | | | | | | | | |
| Ambarella, Inc. | | | 39,788 | | | | 1,950,010 | |
| Cavium, Inc. | | | 48,264 | | | | 3,182,528 | |
| Inphi Corp. | | | 82,197 | | | | 3,262,399 | |
| | | | | | | | 8,394,937 | |
| See Notes to the Financial Statements. | The Leuthold Funds - 2017 Annual Report | 79 |
Grizzly Short Fund
Schedule of Securities Sold Short - (a) (continued)
September 30, 2017
| | | | | | | |
| | | Shares | | | Fair Value | |
| COMMON STOCKS - 98.14% (continued) | |
| Software - 13.66% | | | | | | |
| CommVault Systems, Inc. | | | 17,356 | | | $ | 1,055,245 | |
Guidewire Software, Inc. | | | 48,139 | | | | 3,748,103 | |
| Salesforce.com, Inc. | | | 34,713 | | | | 3,242,888 | |
| Splunk, Inc. | | | 53,870 | | | | 3,578,584 | |
| Symantec Corp. | | | 101,681 | | | | 3,336,154 | |
| Tableau Software, Inc. - Class A | | | 49,613 | | | | 3,715,518 | |
| Ultimate Software Group, Inc. | | | 15,064 | | | | 2,856,134 | |
| Workday, Inc. - Class A | | | 30,783 | | | | 3,244,220 | |
| Zendesk, Inc. | | | 114,289 | | | | 3,326,953 | |
| | | | | | | | 28,103,799 | |
| | | | | | | | | |
| Specialty Retail - 0.52% | | | | | | | | |
| Monro, Inc. | | | 19,157 | | | | 1,073,750 | |
| | | | | | | | | |
Technology Hardware, Storage & Peripherals - 0.44% | | | | | | | | |
| Diebold Nixdorf, Inc. | | | 39,625 | | | | 905,431 | |
| | | | | | | | | |
| Water Utilities - 1.63% | | | | | | | | |
| American Water Works Co., Inc. | | | 41,426 | | | | 3,351,778 | |
TOTAL COMMON STOCKS
(Proceeds $203,032,353) | | | | | | $ | 201,864,691 | |
| | |
TOTAL SECURITIES SOLD SHORT (Proceeds $203,032,353) - 98.14% | | | $ | 201,864,691 | |
Percentages are stated as a percent of net assets.
| ADR | American Depositary Receipt |
| (a) | Non-income producing security. |
| (b) | Foreign issued security. |
The Global Industry Classification Standard (GICS®) was developed by and/or is the exclusive property of MSCI, Inc. and Standard & Poor’s Financial services LLC (“S&P”). GICS® is a service mark of MSCI, Inc. and S&P and has been licensed for use by U.S. Bancorp Fund Services, LLC.
| 80 | The Leuthold Funds - 2017 Annual Report | See Notes to the Financial Statements. |
The Leuthold Funds
N
otes to the Financial Statements
| 1. | ORGANIZATIONAND SIGNIFICANT ACCOUNTING POLICIES |
| | Leuthold Funds, Inc. (the “Company”) was incorporated on August 30, 1995, as a Maryland Corporation and is registered with the Securities and Exchange Commission as an open-end management investment company under the Investment Company Act of 1940, as amended. In addition, the Funds are considered investment companies under, and follow the accounting and reporting guidance in, Accounting Standards Codification Topic 946 – Investment Companies. Leuthold Weeden Capital Management is the investment adviser (the“Adviser”). The Company consists of five series (each series a “Fund” and collectively the“Funds”): |
| | Fund | Investment Objective | Inception –
Retail
Share Class | Inception –
Institutional
Share Class |
| | Leuthold Core Investment Fund | Seeks total return consistent with prudent investment risk over the long-term | 11/20/1995 | 1/31/2006 |
| | Leuthold Global Fund | Seeks total return consistent with prudent investment risk over the long-term | 7/1/2008 | 4/30/2008 |
| | Leuthold Select Industries Fund | Capital appreciation | 6/19/2000 | n/a |
| | Leuthold Global Industries Fund | Seeks capital appreciation and dividend income | 5/17/2010 | 5/17/2010 |
| | Grizzly Short Fund | Capital appreciation | 6/19/2000 | n/a |
| | All classes of shares in a Fund have identical voting, dividend, liquidation, and other rights, and the same terms and conditions, except that certain fess and expenses, including distribution and shareholder servicing fees, may differ among classes. Each class has exclusive voting rights on any matters relating to that class’s servicing or distribution arrangements. |
| | |
| | The following is a summary of significant accounting policies consistently followed by the Funds. |
| | |
| a) Investment Valuation – Securities listed on a national securities exchange (other than The NASDAQ OMX Group, Inc., referred to as“NASDAQ”) are valued at the last sale price on the day the valuation is made. Securities that are traded on NASDAQ under one of its three listing tiers, NASDAQ Global Market, NASDAQ Global Select Market, and NASDAQ Capital Market, are valued at the NASDAQ Official Closing Price. Price information on listed stocks is taken from the exchange where the security is primarily traded. Securities, including securities sold short, which are listed on an exchange but which are not traded on the valuation date are generally valued at the mean between the bid and the asked prices. Unlisted securities for which market quotations are readily available are valued at the latest quoted bid price or, if unavailable, at prices provided by an independent pricing service. Securities sold short which are not listed on an exchange but for which market quotations are readily available are generally valued at the average of the current bid and asked prices. Debt securities are valued at bid prices provided by an independent pricing service that may use a matrix pricing method or other analytical pricing model. Exchange-traded options are valued at the last reported sale price priced on the primary exchange on which the option is traded. If no sales are reported on a particular day, the mean between the highest bid and lowest asked quotations at the close of the exchanges is used. Non-exchange-traded options are valued at the mean between the last bid and asked quotations. For options where market quotations are not readily available, fair value shall be determined. Shares of open-end investment companies (other than shares of an exchange-traded fund traded on domestic securities exchanges or on NASDAQ) are valued at one of the following prices (as determined by the Adviser): (a) the net |
| The Leuthold Funds - 2017 Annual Report | 81 |
The Leuthold Funds
| | asset value announced by such open-end investment company following the close of business on the day a Fund’s net asset value is to be calculated; (b) the net asset value announced by such open-end investment company following the close of business on the business day immediately preceding the day a Fund’s net asset value is to be calculated; or (c) a value determined by the Adviser by adding to, or subtracting from, the net asset value announced by such open-end investment company following the close of business on the business day immediately preceding the day a Fund’s net asset value is to be calculated, an amount equal to the Adviser’s estimate of the effect of changes in the market prices for the types of securities held by such investment company. Other assets, including securities for which no quotations are readily available, are valued at fair value as determined in good faith by the Board of Directors (“Directors”) pursuant to the Funds’ “Pricing and Valuation Guidelines.” |
| | |
| | The Funds may invest in foreign securities. (Foreign securities may be priced at the closing price reported on the foreign exchange on which they are principally traded.) Trading in foreign securities may be completed at times that vary from the closing of the New York Stock Exchange (“NYSE”). The Directors have approved the use of their independent pricing provider’s proprietary fair value pricing model to assist in determining current valuation for foreign securities traded in markets that close prior to the NYSE. Foreign securities quoted in foreign currencies are translated into U.S. dollars at current exchange rates. Occasionally, events that affect these values and exchange rates may occur between the times at which they are determined and the closing of the NYSE. If these events materially affect the value of portfolio securities, then these securities may be valued as determined in good faith by the Directors. Some of the factors which may be considered by the Directors and the Funds’ Fair Value Pricing Committee in determining fair value are fundamental analytical data relating to the investment, the nature and duration of any restrictions on disposition, trading in similar securities of the same issuer or comparable companies, information from broker-dealers, and an evaluation of the forces that influence the market in which the securities are purchased and sold. The use of fair value pricing by a Fund may cause the net asset value of its shares to differ significantly from the net asset value that would be calculated without regard to such considerations. |
| | |
| | Physical metals are valued at prices provided by an independent pricing service. The Leuthold Core Investment Fund, the Leuthold Global Fund, and the Leuthold Global Industries Fund may invest in metals such as aluminum, copper, zinc, lead, nickel, tin, silver, palladium, and other industrial and precious metals. Metals not traded on an exchange are valued at the mean between the closing bid and asked prices as obtained from a reputable pricing source. As of September 30, 2017, none of the Funds held physical metals. |
| | |
| b) | Fair Valuation Measurements – The Funds have adopted fair valuation accounting standards, which establish a definition of fair value and set out a hierarchy for measuring fair value. These standards require additional disclosures about the various inputs and valuation techniques used to develop the measurements of fair value and a discussion of changes in valuation techniques and related inputs during the period. These inputs are summarized in the following three levels: |
| | |
| | Level 1 - Quoted prices in active markets for identical securities. |
| | |
| | Level 2 - Other significant observable inputs (including quoted prices for similar securities, interest rates, prepayment speeds, credit risk, etc.). |
| | |
| | Level 3 - Significant unobservable inputs (including the Funds’ own assumptions in determining the fair value of investments). |
| | |
| | The inputs or methodology used for valuing securities are not an indication of the risk associated with investing in those securities. |
| 82 | The Leuthold Funds - 2017 Annual Report |
The Leuthold Funds
| | The following is a summary of the inputs used to value the Funds’ investments and securities sold short as of September 30, 2017: |
Leuthold Core Investment Fund
| | Investments at Fair Value | | Level 1 | | Level 2 | | Level 3 | | Total |
| | Common Stocks | | | | | | | | | | | | |
| | Aerospace & Defense | | $ | 25,614,686 | | | $ | — | | | $ | — | | | $ | 25,614,686 | |
| | Air Freight & Logistics | | | — | | | | 204,764 | | | | — | | | | 204,764 | |
| | Airlines | | | 30,595,583 | | | | 124,762 | | | | — | | | | 30,720,345 | |
| | Auto Components | | | 24,946,682 | | | | 2,267,771 | | | | — | | | | 27,214,453 | |
| | Automobiles | | | 21,028,096 | | | | 1,483,494 | | | | — | | | | 22,511,590 | |
| | Banks | | | 39,404,466 | | | | 5,886,430 | | | | — | | | | 45,290,896 | |
| | Biotechnology | | | 18,843,375 | | | | — | | | | — | | | | 18,843,375 | |
| | Building Products | | | — | | | | 309,735 | | | | — | | | | 309,735 | |
| | Capital Markets | | | 28,011,115 | | | | — | | | | — | | | | 28,011,115 | |
| | Chemicals | | | 468,638 | | | | 2,525,207 | | | | 6,437 | | | | 3,000,282 | |
| | Communications Equipment | | | — | | | | 555,652 | | | | — | | | | 555,652 | |
| | Construction Materials | | | — | | | | 234,275 | | | | — | | | | 234,275 | |
| | Consumer Finance | | | 4,187,229 | | | | — | | | | — | | | | 4,187,229 | |
| | Diversified Consumer Services | | | 2,118,510 | | | | — | | | | — | | | | 2,118,510 | |
| | Diversified Financial Services | | | — | | | | 318,805 | | | | — | | | | 318,805 | |
| | Diversified Telecommunication Services | | | 442,485 | | | | 409,509 | | | | — | | | | 851,994 | |
| | Electric Utilities | | | — | | | | 169,327 | | | | — | | | | 169,327 | |
| | Electronic Equipment, Instruments & Components | | | 40,944,031 | | | | 1,884,548 | | | | — | | | | 42,828,579 | |
| | Food & Staples Retailing | | | — | | | | 291,305 | | | | — | | | | 291,305 | |
| | Food Products | | | 430,149 | | | | 786,037 | | | | — | | | | 1,216,186 | |
| | Health Care Providers & Services | | | 36,112,766 | | | | — | | | | — | | | | 36,112,766 | |
| | Hotels, Restaurants & Leisure | | | 26,434,133 | | | | — | | | | — | | | | 26,434,133 | |
| | Household Durables | | | 31,269,858 | | | | 626,231 | | | | — | | | | 31,896,089 | |
| | Independent Power & Renewable Electricity Producers | | | — | | | | 462,715 | | | | — | | | | 462,715 | |
| | Industrial Conglomerates | | | — | | | | 264,450 | | | | — | | | | 264,450 | |
| | Insurance | | | 32,265,875 | | | | 2,978,467 | | | | — | | | | 35,244,342 | |
| | Internet Software & Services | | | 2,611,032 | | | | 2,207,895 | | | | — | | | | 4,818,927 | |
| | IT Services | | | 50,350,064 | | | | 364,192 | | | | — | | | | 50,714,256 | |
| | Metals & Mining | | | — | | | | 1,358,791 | | | | — | | | | 1,358,791 | |
| | Multiline Retail | | | 3,615,248 | | | | — | | | | — | | | | 3,615,248 | |
| | Oil, Gas & Consumable Fuels | | | — | | | | 2,476,641 | | | | — | | | | 2,476,641 | |
| | Paper & Forest Products | | | — | | | | 1,030,716 | | | | — | | | | 1,030,716 | |
| | Pharmaceuticals | | | — | | | | 951,295 | | | | — | | | | 951,295 | |
| | Professional Services | | | 2,728,711 | | | | — | | | | — | | | | 2,728,711 | |
| | Real Estate Investment Trusts (REITs) | | | 178,814 | | | | — | | | | — | | | | 178,814 | |
| | Real Estate Management & Development | | | — | | | | 1,723,711 | | | | — | | | | 1,723,711 | |
| | Road & Rail | | | 21,723,587 | | | | — | | | | — | | | | 21,723,587 | |
| | Semiconductors & Semiconductor Equipment | | | 59,127,953 | | | | 5,425,238 | | | | — | | | | 64,553,191 | |
| | Software | | | 21,340,526 | | | | — | | | | — | | | | 21,340,526 | |
| | Specialty Retail | | | 1,390,903 | | | | 967,040 | | | | — | | | | 2,357,943 | |
| | Technology Hardware, Storage & Peripherals | | | — | | | | 1,218,969 | | | | — | | | | 1,218,969 | |
| | Tobacco | | | 216,201 | | | | — | | | | — | | | | 216,201 | |
| | Transportation Infrastructure | | | 446,853 | | | | 430,287 | | | | — | | | | 877,140 | |
| | Water Utilities | | | 428,098 | | | | — | | | | — | | | | 428,098 | |
| | Wireless Telecommunication Services | | | 250,170 | | | | — | | | | — | | | | 250,170 | |
| | Total Common Stocks | | | 527,525,837 | | | | 39,938,259 | | | | 6,437 | | | | 567,470,533 | |
| The Leuthold Funds - 2017 Annual Report | 83 |
The Leuthold Funds
Leuthold Core Investment Fund (continued)
| | Investments at Fair Value | | Level 1 | | Level 2 | | Level 3 | | Total |
| | Preferred Stocks | | $ | 10,056,077 | | | $ | — | | | $ | — | | | $ | 10,056,077 | |
| | Exchange-Traded Funds | | | 104,398,888 | | | | — | | | | — | | | | 104,398,888 | |
| | Corporate Bonds | | | — | | | | 30,178,083 | | | | — | | | | 30,178,083 | |
| | United States Treasury Obligation | | | — | | | | 27,168,678 | | | | — | | | | 27,168,678 | |
| | Foreign Government Bonds | | | — | | | | 19,166,460 | | | | — | | | | 19,166,460 | |
| | Rights | | | — | | | | 5,314 | | | | — | | | | 5,314 | |
| | Money Market Funds | | | 77,396,775 | | | | — | | | | — | | | | 77,396,775 | |
| | Investments Purchased as Securites Lending Collateral* | | | — | | | | — | | | | — | | | | 74,692,474 | |
| | Total Investments in Securities | | $ | 719,377,577 | | | $ | 116,456,794 | | | $ | 6,437 | | | $ | 910,533,282 | |
| | * Certain investments that are measured at fair value using the net asset value per share (or its equivalent) practical expedient have not been categorized in the fair value hierarchy. The fair value amounts presented in the table are intended to permit reconciliation of the fair value hierarchy to the amounts presented in the Schedule of Investments. |
| | Securities Sold Short at Fair Value | | Level 1 | | Level 2 | | Level 3 | | Total |
| | Common Stocks | | $ | 32,485,913 | | | $ | — | | | $ | — | | | $ | 32,485,913 | |
| | Exchange-Traded Funds | | | 25,478,993 | | | | — | | | | — | | | | 25,478,993 | |
| | Total Securities Sold Short | | $ | 57,964,906 | | | $ | — | | | $ | — | | | $ | 57,964,906 | |
| | The basis for recognizing and valuing transfers is as of the end of the period in which transfers occur. The following is a summary of transfers for the year ended September 30, 2017: |
| | | | Level 1 | | Level 2 | | Level 3 | |
| | Transfers into: | | $ | — | | | $ | 548,611 | | | $ | — | | |
| | Transfers out of: | | | (548,611 | ) | | | — | | | | — | | |
| | Net Transfers into and/or out of: | | $ | (548,611 | ) | | $ | 548,611 | | | $ | — | | |
| | The transfers were due to the adjustment of fair value of certain securities due to developments that occurred between the time of the close of the foreign markets on which they trade and the close of regular session trading on the NYSE. The following is a reconciliation of Level 3 investments for which significant unobservable inputs were used to determine fair value: |
| | Leuthold Core Investment Fund | | | | | | Investment in
Securities at
Fair Value | | | |
| | Balance as of September 30, 2016 | | | | | | $ | 6,482 | | | | |
| | Accrued discounts/premiums | | | | | | | — | | | | |
| | Realized gain (loss) | | | | | | | — | | | | |
| | Change in unrealized depreciation | | | | | | | (45 | )* | | | |
| | Purchases | | | | | | | — | | | | |
| | Sales | | | | | | | — | | | | |
| | Transfer into and/or out of Level 3 | | | | | | | — | | | | |
| | Balance as of September 30, 2017 | | | | | | $ | 6,437 | (1) | | | |
| | Change in net unrealized depreciation during the period for Level 3 investments held at September 30, 2017: | | | | | | $ | (45 | ) | | | |
| | * Unrealized depreciation is due to a change in foreign currency exchange rate. (1) The security (China Forestry Holdings Co., Ltd.) is classified as a Level 3 security due to a halt in trading of the security on January 26, 2011. The security is valued at fair value as determined in good faith by the Directors. The Adviser submits a report to the Directors setting forth the factors considered in determining the price. The significant unobservable input used in the fair valuation of this security is a discount of 95% from the last traded price of Hong Kong Dollar 2.95. Significant changes in the discount rate may result in a change in fair value measurement. For the duration of the period the discount was 95%. |
| 84 | The Leuthold Funds - 2017 Annual Report |
The Leuthold Funds
| | Leuthold Global Fund |
| | Investments at Fair Value | | Level 1 | | Level 2 | | Level 3 | | Total |
| | Common Stocks | | | | | | | | | | | | |
| | Airlines | | $ | 2,973,009 | | | $ | 1,631,878 | | | $ | — | | | $ | 4,604,887 | |
| | Auto Components | | | 2,888,108 | | | | 2,024,057 | | | | — | | | | 4,912,165 | |
| | Automobiles | | | 2,984,090 | | | | 1,767,670 | | | | — | | | | 4,751,760 | |
| | Banks | | | 2,134,202 | | | | 3,666,106 | | | | — | | | | 5,800,308 | |
| | Capital Markets | | | 2,259,879 | | | | 1,139,144 | | | | — | | | | 3,399,023 | |
| | Chemicals | | | 1,376,003 | | | | 3,032,508 | | | | — | | | | 4,408,511 | |
| | Electronic Equipment, Instruments & Components | | | 2,616,038 | | | | 2,428,788 | | | | — | | | | 5,044,826 | |
| | Health Care Providers & Services | | | 4,398,764 | | | | — | | | | — | | | | 4,398,764 | |
| | Household Durables | | | 3,562,122 | | | | 1,640,056 | | | | — | | | | 5,202,178 | |
| | Independent Power & Renewable Electricity Producers | | | — | | | | 349,179 | | | | — | | | | 349,179 | |
| | Insurance | | | 1,752,567 | | | | 2,630,268 | | | | — | | | | 4,382,835 | |
| | Internet Software & Services | | | 1,897,708 | | | | — | | | | — | | | | 1,897,708 | |
| | Metals & Mining | | | 1,019,353 | | | | 1,433,520 | | | | — | | | | 2,452,873 | |
| | Oil, Gas & Consumable Fuels | | | — | | | | 1,171,794 | | | | — | | | | 1,171,794 | |
| | Paper & Forest Products | | | 2,489,939 | | | | 2,020,857 | | | | 47,698 | | | | 4,558,494 | |
| | Real Estate Management & Development | | | 335,398 | | | | 1,143,105 | | | | — | | | | 1,478,503 | |
| | Semiconductors & Semiconductor Equipment | | | 4,682,839 | | | | 3,812,686 | | | | — | | | | 8,495,525 | |
| | Transportation Infrastructure | | | — | | | | 346,305 | | | | — | | | | 346,305 | |
| | Wireless Telecommunication Services | | | 489,315 | | | | 2,503,728 | | | | — | | | | 2,993,043 | |
| | Total Common Stocks | | | 37,859,334 | | | | 32,741,649 | | | | 47,698 | | | | 70,648,681 | |
| | Preferred Stocks | | | 318,949 | | | | — | | | | — | | | | 318,949 | |
| | Exchange-Traded Funds | | | 11,674,782 | | | | — | | | | — | | | | 11,674,782 | |
| | Corporate Bonds | | | — | | | | 3,796,959 | | | | — | | | | 3,796,959 | |
| | United States Treasury Obligation | | | — | | | | 3,522,013 | | | | — | | | | 3,522,013 | |
| | Foreign Government Bonds | | | — | | | | 3,390,375 | | | | — | | | | 3,390,375 | |
| | Money Market Funds | | | 7,182,066 | | | | — | | | | — | | | | 7,182,066 | |
| | Investments Purchased as Securites Lending Collateral* | | | — | | | | — | | | | — | | | | 11,234,557 | |
| | Total Investments in Securities | | $ | 57,035,131 | | | $ | 43,450,996 | | | $ | 47,698 | | | $ | 111,768,382 | |
| * | Certain investments that are measured at fair value using the net asset value per share (or its equivalent) practical expedient have not been categorized in the fair value hierarchy. The fair value amounts presented in the table are intended to permit reconciliation of the fair value hierarchy to the amounts presented in the Schedule of Investments. |
| | Securities Sold Short at Fair Value | | Level 1 | | Level 2 | | Level 3 | | Total |
| | Common Stocks | | $ | 2,563,504 | | | $ | — | | | $ | — | | | $ | 2,563,504 | |
| | Exchange-Traded Funds | | | 4,780,265 | | | | — | | | | — | | | | 4,780,265 | |
| | Total Securities Sold Short | | $ | 7,343,769 | | | $ | — | | | $ | — | | | $ | 7,343,769 | |
| The Leuthold Funds - 2017 Annual Report | 85 |
The Leuthold Funds
The basis for recognizing and valuing transfers is as of the end of the period in which transfers occur. The following is summary of transfers for the year ended September 30, 2017:
| | | | Level 1 | | Level 2 | | Level 3 |
| | Transfers into: | | $ | 521,156 | | | $ | — | | | $ | — | |
| | Transfers out of: | | | — | | | | (521,156 | ) | | | — | |
| | Net Transfers into and/or out of: | | $ | 521,156 | | | $ | (521,156 | ) | | $ | — | |
The transfers were due to the adjustment of fair value of certain securities due to developments that occurred between the time of the close of the foreign markets on which they trade and the close of regular session trading on the NYSE.
The following is a reconciliation of Level 3 investments for which significant unobservable inputs were used to determine fair value:
| | | | | | | | | | | | Investment in | | | | |
| | | | | | | | | | | | Securities at | | | | |
| | Leuthold Global Fund | | | | | | | | | | Fair Value | | | | |
| | Balance as of September 30, 2016 | | | | | | | | | | $ | 48,038 | | | | | |
| | Accrued discounts/premiums | | | | | | | | | | | — | | | | | |
| | Realized gain (loss) | | | | | | | | | | | — | | | | | |
| | Change in unrealized appreciation (depreciation) | | | | | | | | | | | (340 | )* | | | | |
| | Purchases | | | | | | �� | | | | | — | | | | | |
| | Sales | | | | | | | | | | | — | | | | | |
| | Transfer into and/or out of Level 3 | | | | | | | | | | | — | | | | | |
| | Balance as of September 30, 2017 | | | | | | | | | | $ | 47,698 | (1) | | | | |
| | | | | | | | | | | | | | | | | | |
| | Change in net unrealized appreciation (depreciation) during the period for Level 3 investments held at September 30, 2017: | | | $ | (340 | ) | | | | |
| * | Unrealized appreciation is due to a change in foreign currency exchange rate. |
| (1) | The security (China Forestry Holdings Co., Ltd.) is classified as a Level 3 security due to a halt in trading of the security on January 26, 2011. The security is valued at fair value as determined in good faith by the Directors. The Adviser submits a report to the Directors setting forth the factors considered in determining the price. The significant unobservable input used in the fair valuation of this security is a discount of 95% from the last traded price of Hong Kong Dollar 2.95 2.95. Significant changes in the discount rate may result in a change in fair value measurement. For the duration of the period the discount was 95%. |
| | Leuthold Select Industries Fund |
| | Investments at Fair Value | | Level 1 | | Level 2 | | Level 3 | | Total |
| | Common Stocks | | $ | 14,422,704 | | | $ | — | | | $ | — | | | $ | 14,422,704 | |
| | Preferred Stocks | | | 234,505 | | | | — | | | | — | | | | 234,505 | |
| | Money Market Funds | | | 410,143 | | | | — | | | | — | | | | 410,143 | |
| | Total Investments in Securities | | $ | 15,067,352 | | | $ | — | | | $ | — | | | $ | 15,067,352 | |
The Fund did not invest in any Level 3 securities or have any transfers into or out of Level 1 or Level 2 during the period. The basis for recognizing and valuing transfers is as of the end of the period in which transfers occur.
| 86 | The Leuthold Funds - 2017 Annual Report |
The Leuthold Funds
Leuthold Global Industries Fund
| | Investments at Fair Value | | Level 1 | | Level 2 | | Level 3 | | Total |
| | Common Stocks | | | | | | | | | | | | |
| | Airlines | | $ | 451,635 | | | $ | 246,312 | | | $ | — | | | $ | 697,947 | |
| | Auto Components | | | 432,759 | | | | 301,397 | | | | — | | | | 734,156 | |
| | Automobiles | | | 459,646 | | | | 259,308 | | | | — | | | | 718,954 | |
| | Banks | | | 327,880 | | | | 555,892 | | | | — | | | | 883,772 | |
| | Capital Markets | | | 342,336 | | | | 171,300 | | | | — | | | | 513,636 | |
| | Chemicals | | | 206,186 | | | | 460,396 | | | | — | | | | 666,582 | |
| | Electronic Equipment, Instruments & Components | | | 392,022 | | | | 362,391 | | | | — | | | | 754,413 | |
| | Health Care Providers & Services | | | 676,439 | | | | — | | | | — | | | | 676,439 | |
| | Household Durables | | | 548,088 | | | | 254,939 | | | | — | | | | 803,027 | |
| | Independent Power & Renewable Electricity Producers | | | — | | | | 52,754 | | | | — | | | | 52,754 | |
| | Insurance | | | 263,633 | | | | 395,679 | | | | — | | | | 659,312 | |
| | Internet Software & Services | | | 284,657 | | | | — | | | | — | | | | 284,657 | |
| | Metals & Mining | | | 154,494 | | | | 214,860 | | | | — | | | | 369,354 | |
| | Oil, Gas & Consumable Fuels | | | — | | | | 180,142 | | | | — | | | | 180,142 | |
| | Paper & Forest Products | | | 384,777 | | | | 312,179 | | | | 2,227 | | | | 699,183 | |
| | Real Estate Management & Development | | | 52,160 | | | | 178,872 | | | | — | | | | 231,032 | |
| | Semiconductors & Semiconductor Equipment | | | 712,919 | | | | 574,287 | | | | — | | | | 1,287,206 | |
| | Transportation Infrastructure | | | — | | | | 54,811 | | | | — | | | | 54,811 | |
| | Wireless Telecommunication Services | | | 73,326 | | | | 373,445 | | | | — | | | | 446,771 | |
| | Total Common Stocks | | | 5,762,957 | | | | 4,948,964 | | | | 2,227 | | | | 10,714,148 | |
| | Preferred Stocks | | | 49,382 | | | | — | | | | — | | | | 49,382 | |
| | Exchange-Traded Funds | | | 106,047 | | | | — | | | | — | | | | 106,047 | |
| | Money Market Funds | | | 71,833 | | | | — | | | | — | | | | 71,833 | |
| | Total Investments in Securities | | $ | 5,990,219 | | | $ | 4,948,964 | | | $ | 2,227 | | | $ | 10,941,410 | |
| | The basis for recognizing and valuing transfers is as of the end of the period in which transfers occur. The following is a summary of transfers for the year ended September 30, 2017: |
| | | | Level 1 | | Level 2 | | Level 3 | | | | |
| | Transfers into: | | $ | 80,991 | | | $ | — | | | $ | — | | | | | |
| | Transfers out of: | | | — | | | | (80,991 | ) | | | — | | | | | |
| | Net Transfers into and/or out of: | | $ | 80,991 | | | $ | (80,991 | ) | | $ | — | | | | | |
| | The transfers were due to the adjustment of fair value of certain securities due to developments that occurred between the time of the close of the foreign markets on which they trade and the close of regular session trading on the NYSE. |
| The Leuthold Funds - 2017 Annual Report | 87 |
The Leuthold Funds
| | The following is a reconciliation of Level 3 investments for which significant unobservable inputs were used to determine fair value: |
| | Leuthold Global Industries Fund | | | | | | Investment in
Securities at
Fair Value | | | |
| | Balance as of September 30, 2016 | | | | | | $ | 2,243 | | | | |
| | Accrued discounts/premiums | | | | | | | — | | | | |
| | Realized gain (loss) | | | | | | | — | | | | |
| | Change in unrealized depreciation | | | | | | | (16 | )* | | | |
| | Purchases | | | | | | | — | | | | |
| | Sales | | | | | | | — | | | | |
| | Transfer into and/or out of Level 3 | | | | | | | — | | | | |
| | Balance as of September 30, 2017 | | | | | | $ | 2,227 | (1) | | | |
| | Change in net unrealized depreciation during the period for Level 3 investments held at September 30, 2017: | | $ | (16 | ) | | | |
| | * Unrealized depreciation is due to a change in foreign currency exchange rate. |
| | |
| | (1) The security (China Forestry Holdings Co., Ltd.) is classified as a Level 3 security due to a halt in trading of the security on January 26, 2011. The security is valued at fair value as determined in good faith by the Directors. The Adviser submits a report to the Directors setting forth the factors considered in determining the price. The significant unobservable input used in the fair valuation of this security is a discount of 95% from the last traded price of Hong Kong Dollar 2.95. Significant changes in the discount rate may result in a change in fair value measurement. For the duration of the period the discount was 95%. |
Grizzly Short Fund
| | Investments at Fair Value | | Level 1 | | Level 2 | | Level 3 | | Total |
| | Money Market Funds | | $ | 174,298,921 | | | $ | — | | | $ | — | | | $ | 174,298,921 | |
| | Total Investments in Securities | | $ | 174,298,921 | | | $ | — | | | $ | — | | | $ | 174,298,921 | |
| | | | | | | | | | | | | | | | | | |
| | Securities Sold Short at Fair Value | | Level 1 | | Level 2 | | Level 3 | | Total |
| | Common Stocks | | $ | 201,864,691 | | | $ | — | | | $ | — | | | $ | 201,864,691 | |
| | Total Securities Sold Short | | $ | 201,864,691 | | | $ | — | | | $ | — | | | $ | 201,864,691 | |
| | The Fund did not invest in any Level 3 securities or have any transfers into or out of Level 1 or Level 2 during the period. The basis for recognizing and valuing transfers is as of the end of the period in which transfers occur. |
| | |
| | For further information regarding security characteristics, see the Schedules of Investments and Securities Sold Short. |
| | |
| c) | Federal Income Taxes – Provision for federal income taxes or excise taxes has not been made since the Funds have elected to be taxed as “regulated investment companies” and intend to distribute substantially all taxable income to shareholders and otherwise comply with the provisions of the Internal Revenue Code applicable to regulated investment companies. Distributions from net realized gains for book purposes may include short-term capital gains, which are included as ordinary income to shareholders for tax purposes. The Funds also designate as distributions of long-term gains, to the extent necessary to fully distribute such capital gains, earnings and profits distributed to shareholders on the redemption of shares. |
| 88 | The Leuthold Funds - 2017 Annual Report |
The Leuthold Funds
| | The tax character of distributions paid during the fiscal years ended September 30, 2017 and 2016 was as follows: |
| | Year Ended September 30, 2017 |
| | | | Leuthold Core Investment Fund | | Leuthold Global Fund | | Leuthold Select Industries Fund | | Leuthold Global Industries Fund | | Grizzly Short Fund |
| | Distributions paid from: | | | | | | | | | | | | | | | | | | | | |
| | Ordinary Income | | | $ | 854,085 | | | | $ | 395,482 | | | | $ | — | | | | $ | 154,354 | | | | $ | — | |
| | Long-Term Capital Gain* | | | | 3,823,839 | | | | | 11,393,102 | | | | | — | | | | | 309,089 | | | | | — | |
| | Return of Capital | | | | — | | | | | — | | | | | — | | | | | — | | | | | — | |
| | Total accumulated earnings | | | $ | 4,677,924 | | | | $ | 11,788,584 | | | | $ | — | | | | $ | 463,443 | | | | $ | — | |
| | Year Ended September 30, 2016 |
| | | | Leuthold Fund | | Leuthold Global Fund | | Leuthold Select Industries Fund | | Leuthold Global Industries Fund | | Grizzly Short Fund |
| | Distributions paid from: | | | | | | | | | | | | | | | | | | | | |
| | Ordinary Income | | | $ | — | | | | $ | — | | | | $ | 5,500 | | | | $ | 100,430 | | | | $ | — | |
| | Long Term Capital Gain* | | | | 33,817,733 | | | | | 11,271,230 | | | | | 168,405 | | | | | 637,904 | | | | | — | |
| | Return of Capital | | | | — | | | | | — | | | | | 14,196 | | | | | — | | | | | — | |
| | Total Distribution Paid | | | $ | 33,817,733 | | | | $ | 11,271,230 | | | | $ | 188,101 | | | | $ | 738,334 | | | | $ | — | |
| | * | The funds designate these distributions as long-term capital gain dividends per IRC Sec. 852(b)(3)(C) in the 20-percent group (which may be taxed at a 20-percent rate, a 15-percent rate or 0-percent rate, depending on the shareholder’s taxable income). |
| | At September 30, 2017, the components of accumulated earnings (deficit) on a tax basis were as follows: |
| | | | Leuthold Core Investment Fund | | Leuthold Global Fund | | Leuthold Select Industries Fund | | Leuthold Global Industries Fund | | Grizzly Short Fund |
| | Undistributed Ordinary Income | | | $ | 1,613 | | | | $ | 3,185,192 | | | | $ | — | | | | $ | 433,308 | | | | $ | — | |
| | Undistributed long-term gains | | | | 26,947,568 | | | | | 5,034,661 | | | | | 552,698 | | | | | 440,582 | | | | | — | |
| | Distributable earnings | | | | 26,949,181 | | | | | 8,219,853 | | | | | 552,698 | | | | | 873,890 | | | | | — | |
| | Capital loss carryover and late-year losses | | | | — | | | | | — | | | | | (14,651 | ) | | | | — | | | | | (234,764,694 | ) |
| | Other accumulated gains (losses) | | | | 5,554 | | | | | (29,212 | ) | | | | — | | | | | (752 | ) | | | | — | |
| | Unrealized appreciation | | | | 171,762,774 | | | | | 11,477,746 | | | | | 3,976,256 | | | | | 1,804,495 | | | | | 772,740 | |
| | Total accumulated earnings (deficit) | | | $ | 198,717,509 | | | | $ | 19,668,387 | | | | $ | 4,514,303 | | | | $ | 2,677,633 | | | | $ | (233,991,954 | ) |
| | Net investment income and realized gains and losses for federal income tax purposes may differ from that reported on the financial statements because of permanent book-to-tax differences. U.S. Generally Accepted Accounting Principles (“U.S. GAAP”) requires that permanent differences between financial reporting and tax reporting be reclassified between various components of net assets. These differences are primarily due to partnership adjustments and securities sold short. |
| The Leuthold Funds - 2017 Annual Report | 89 |
The Leuthold Funds
| | Additionally, U.S. GAAP requires that certain components of net assets relating to permanent differences be reclassified between financial and tax reporting. These reclassifications have no effect on net assets or net asset value per share. For the year ended September 30, 2017, the following table shows the reclassifications made: |
| | | | Undistributed Net Investment Income/(Loss) | | Accumulated Net Realized Gain/(Loss) | | Paid In Capital |
| | Leuthold Core Investment Fund | | $ | (714,728 | ) | | $ | 3,305,801 | | | $ | (2,591,073 | ) |
| | Leuthold Global Fund | | | (196,335 | ) | | | 189,332 | | | | 7,003 | |
| | Leuthold Select Industries Fund | | | 9,173 | | | | (48 | ) | | | (9,125 | ) |
| | Leuthold Global Industries Fund | | | 6,207 | | | | (5,685 | ) | | | (522 | ) |
| | Grizzly Short Fund | | | 6,083,196 | | | | (74,420 | ) | | | (6,008,776 | ) |
| | Under current law, the Funds may carry forward net capital losses indefinitely to use to offset capital gains realized in future years. Previous law limited the carry forward of capital losses to the eight tax years following the year the capital loss was realized. If a Fund has capital losses that are subject to current law and also has capital losses subject to prior law, the losses realized under current law will be utilized to offset capital gains before any of the losses governed by prior law can be used. As a result of these ordering rules, capital losses realized under previous law may be more likely to expire unused. Capital losses realized under current law will carry forward retaining their classification as long-term or short-term losses, whereas under prior law all capital losses were carried forward as short-term capital losses. |
| | | | Leuthold Core Investment Fund | | Leuthold Global Fund | | Leuthold Select Industries Fund | | Leuthold Global Industries Fund | | Grizzly Short Fund |
| | Expires 09/30/18 | | | — | | | | — | | | | — | | | | — | | | | (18,663,090 | ) |
| | Expires 09/30/19 | | | — | | | | — | | | | — | | | | — | | | | (25,380,935 | ) |
| | Unlimited Short-Term | | | — | | | | — | | | | — | | | | — | | | | (188,555,983 | ) |
| | The Leuthold Select Industries Fund and Grizzly Short Fund intend to defer and treat $14,651 and $2,164,686, respectively, of qualified late-year ordinary losses incurred during the fiscal year ended September 30, 2017 as arising on the first day of the fiscal year ending September 30, 2018. As of September 30, 2017, the Funds had no tax positions that did not meet the “more likely-than-not” threshold of being sustained by the applicable tax authority. Generally, tax authorities can examine all the tax returns filed for the last three years. The Funds recognize interest and penalties, if any, related to unrecognized tax benefits as income tax expense in the Statements of Operations. During the year ended September 30, 2017, the Funds did not incur any interest or penalties. |
| 90 | The Leuthold Funds - 2017 Annual Report |
The Leuthold Funds
| d) | Distributions to Shareholders – Dividends from net investment income, if any, are declared and paid quarterly. Distributions of net realized capital gains, if any, are declared and paid at least annually. |
| | |
| e) | Use of Estimates – The preparation of financial statements in conformity with U.S. GAAP requires management to make estimates and assumptions that affect the reported amounts of assets and liabilities and disclosure of contingent assets and liabilities at the date of the financial statements and the reported amounts of revenues and expenses during the reporting period. Actual results could differ from those estimates. |
| | |
| f) | Basis for Consolidation for the Leuthold Core Investment Fund and Leuthold Global Fund – The Leuthold Core Investment Fund and Leuthold Global Fund may invest up to 25% of their total assets in their subsidiaries, Leuthold Core, Ltd. and Leuthold Global, Ltd. (the “Subsidiaries”), respectively. The Subsidiaries, which are organized under the laws of the Cayman Islands, are wholly owned and controlled by the Leuthold Core Investment Fund and Leuthold Global Fund, respectively, and are therefore consolidated in the respective Funds’ financial statements herein. All intercompany balances, revenues, and expenses have been eliminated in consolidation. The Subsidiaries act as investment vehicles in order to enter into certain investments for the Leuthold Core Investment Fund and Leuthold Global Fund consistent with the investment objectives and policies specified in the Prospectus and Statement of Additional Information. As of the year ended September 30, 2017, no assets were held in the Subsidiaries. |
| | |
| g) | Securities Sold Short – For financial statement purposes, an amount equal to the required amount of collateral to be segregated for securities sold short is included in the Statements of Assets and Liabilities as an asset. The amount of the securities sold short, shown as a liability, is subsequently marked-to-market to reflect the current value of the securities sold short. Subsequent fluctuations in the market prices of securities sold short may require purchasing the securities at prices which could differ from the amount reflected in the Statements of Assets and Liabilities. The Funds are liable for any dividends or interest payable on securities sold short. As collateral for their securities sold short, the Funds are required under the 1940 Act to maintain segregated assets consisting of cash, cash equivalents, or liquid securities. These segregated assets are valued consistent with Note 1a. The amount of segregated assets is required to be adjusted daily to reflect changes in the fair value of the securities sold short. The Leuthold Core Investment Fund, Leuthold Global Fund, and Grizzly Short Fund’s collateral at broker for securities sold short is with one major security dealer. |
| | |
| h) | Other – Investment and shareholder transactions are recorded on the trade date. The Funds determine the gain or loss realized from the investment transactions by comparing the original cost of the security lot sold with the net sales proceeds. The Funds utilize an identified lot approach to transactions. Dividend income is recognized on the ex-dividend date or as soon as information is available to the Funds, and interest income is recognized on an accrual basis. Discounts and premiums on bonds are amortized using the yield to maturity method over the life of the respective bond. For financial reporting purposes, the Funds isolate changes in the exchange rate of investment securities from the fluctuations arising from changes in the market prices of securities for realized gains and losses. |
| | |
| i) | Expenses – Expenses that directly relate to one of the Funds are charged directly to that Fund. Other operating expenses of the Funds, such as Directors’ fees and expenses, insurance expense, and legal fees are allocated between the Funds based on the relative net asset value of the individual Funds. |
| The Leuthold Funds - 2017 Annual Report | 91 |
The Leuthold Funds
| j) | Counterparty Risk – Counterparty risk may arise as the result of the failure of a counterparty to a securities contract to comply with the terms of the contract. Potential counterparty risk is measured by the creditworthiness of the counterparty and additional risk may arise from unanticipated events affecting the value of the underlying security. |
| | |
| k) | Recent Accounting Pronouncements – In October 2016, the SEC adopted new rules and amended existing rules (together, “final rules”) intended to modernize the reporting and disclosure of information by registered investment companies. In part, the final rules amend Regulation S-X and require standardized, enhanced disclosure about derivatives in investment company financial statements, as well as other amendments. The compliance date for the amendments to Regulation S-X was August 1, 2017. Management concluded that the final rules do not have a material impact on the Funds’ financial statements and disclosures. |
| | |
| l) | Subsequent Events – The Funds have evaluated subsequent events through the date of issuance of the Funds’ financial statements. This evaluation did not result in any subsequent events that necessitated recognition or disclosure. |
| 2. | INVESTMENT TRANSACTIONS |
| | Purchases and sales of investment securities, other than short-term investments and securities sold short, for the year ended September 30, 2017 are summarized below: |
| | | Leuthold
Core
Investment
Fund | | Leuthold
Global
Fund | | Leuthold
Select
Industries
Fund | | Leuthold
Global
Industries
Fund |
| | Purchases | | $ | 384,847,690 | | | $ | 69,167,671 | | | $ | 8,418,073 | | | $ | 9,114,049 | |
| | Sales | | | 487,387,394 | | | | 152,267,864 | | | | 9,011,415 | | | | 11,770,886 | |
| | | | | | | | | | | | | | | | | | |
| | There were no purchases or sales of investment securities in the Grizzly Short Fund because this Fund invests only in securities sold short. At September 30, 2017, gross unrealized appreciation and depreciation of investments and cost of investments (including securities sold short) for tax purposes were as follows: |
| | | Leuthold
Core
Investment
Fund | | Leuthold
Global
Fund | | Leuthold
Select
Industries
Fund | | Leuthold
Global
Industries
Fund | | Grizzly
Short
Fund |
| | Tax cost of investments | | $ | 680,817,683 | | | $ | 92,966,201 | | | $ | 11,091,096 | | | $ | 9,137,810 | | | $ | (28,338,510 | ) |
| | Gross unrealized appreciation | | | 179,694,909 | | | | 14,046,700 | | | | 4,115,168 | | | | 2,013,753 | | | | 8,298,917 | |
| | Gross unrealized depreciation | | | (7,932,135 | ) | | | (2,568,954 | ) | | | (138,912 | ) | | | (209,258 | ) | | | (7,526,177 | ) |
| | Net unrealized appreciation | | $ | 171,762,774 | | | $ | 11,477,746 | | | $ | 3,976,256 | | | $ | 1,804,495 | | | $ | 772,740 | |
| | | | | | | | | | | | | | | | | | | | | | |
| | The differences between book and tax basis of unrealized appreciation (depreciation) are primarily attributable to the tax deferral of losses on wash sales and passive foreign investment company transactions. |
| 92 | The Leuthold Funds - 2017 Annual Report |
The Leuthold Funds
The Leuthold Core Investment Fund owned 5% or more of the voting securities of the following companies during the year ended September 30, 2017. As a result, these companies are deemed to be affiliates of the Leuthold Core Investment Fund as defined by the 1940 Act. Transactions during the period in these securities of affiliated companies were as follows:
| | Leuthold Core Investment Fund | |
| | Share Activity | |
| Security Name | Balance
09/30/16 | Purchases | Sales | Balance
09/30/17 | Dividend
Income | Fair Value
at 09/30/17 | | Change in
Unrealized
Appreciation | |
| | Currency Shares Japanese Yen Trust | 49,899 | 177,579 | 39,684 | 187,794 | $ | .— | $ | 16,031,974 | $ | 56,308 | |
| 3. | INVESTMENT ADVISORY AND OTHER AGREEMENTS | |
| | Each of the Funds has entered into an Investment Advisory Agreement (“advisory agreement”) with the Adviser. Pursuant to its advisory agreement with the Funds, the Adviser is entitled to receive a fee, calculated daily as applied to each Fund’s average daily net assets and payable monthly, at annual rates of: |
Leuthold
Core
Investment
Fund | | Leuthold
Global
Fund | | Leuthold
Select
Industries
Fund | | Leuthold
Global
Industries
Fund | | Grizzly
Short
Fund |
| 0.90% | | 0.90%* | | 1.00% | | 1.00% | | 1.25% |
* The Leuthold Global Fund reduced its contractual advisory fee from 1.10% to 0.90% effective February 13, 2017.
The Adviser has agreed to waive its advisory fee and/or reimburse the Funds’ other expenses, to the extent necessary to ensure that the Funds’ total operating expenses (exclusive of interest, taxes, brokerage commissions, dividends and interest on securities sold short, and extraordinary items) do not exceed the following rates, based on each Fund’s average daily net assets:
Leuthold
Core
Investment
Fund | | Leuthold
Global
Fund | | Leuthold
Select
Industries
Fund | | Leuthold
Global
Industries
Fund
Retail
Class | | Leuthold
Global
Industries
Fund
Institutional
Class | | Grizzly
Short
Fund |
| 1.25% | | 1.85% | | 1.50% | | 1.50% | | 1.25% | | 2.50% |
Any waiver or reimbursement is subject to later adjustments to allow the Adviser to recoup amounts previously waived or reimbursed to the extent actual fees and expenses for a fiscal period are less than each Fund’s expense limitation, provided, however, that the Adviser shall only be entitled to recoup such amounts for a period of three fiscal years from the date such amount was waived or reimbursed.
| The Leuthold Funds - 2017 Annual Report | 93 |
The Leuthold Funds
Amounts subject to future recoupment as of September 30, 2017 are as follows:
| Leuthold Select Industries Fund | | Leuthold Global Industries Fund |
| Year of Expiration | | Recoverable Amount | | Year of Expiration | | Recoverable Amount |
| 9/30/2018 | | $ | 31,187 | | | 9/30/2018 | | $ | 128,120 | |
| 9/30/2019 | | | 29,664 | | | 9/30/2019 | | | 127,058 | |
| 9/30/2020 | | | 40,903 | | | 9/30/2020 | | | 122,114 | |
U.S. Bancorp Fund Services, LLC serves as transfer agent, administrator, and accounting services agent for the Funds. U.S. Bank, N.A. serves as custodian for the Funds.
| 4. | DISTRIBUTION PLAN The Leuthold Global Fund – Retail Class and Leuthold Global Industries Fund – Retail Class have adopted a distribution plan pursuant to Rule 12b-1 under the 1940 Act, whereby Rafferty Capital Markets, LLC serves as distributor. This plan allows each Fund to use up to 0.25% of its average daily net assets to pay sales, distribution, and other fees for the sale of its shares and for services provided to investors. Each Fund may pay all or a portion of this fee to any securities dealer, financial institution, or any other person who renders personal service to the Funds’ shareholders, assists in the maintenance of the Funds’ shareholder accounts, or who renders assistance in distributing or promoting the sale of shares of the Fund pursuant to a written agreement approved by the Directors. To the extent such fee is not paid to such persons, each of the Funds may use the fee for its expenses of distribution of its shares, including, but not limited to, payment by the Fund of the cost of preparing, printing, and distributing Prospectuses and Statements of Additional Information to prospective investors and of implementing and operating the plan. |
| 5. | INDEMNIFICATIONS The Funds enter into contracts that contain a variety of indemnifications. The Funds’ maximum exposure under these arrangements is unknown. However, the Funds have not had prior claims or losses pursuant to these contracts and expect the risk of loss to be remote |
| 6. | ILLIQUID SECURITIES Each Fund may invest up to 15% of its net assets in securities for which there is no readily available market (“illiquid securities”). The 15% limitation includes securities whose disposition would be subject to legal restrictions (“restricted securities”). Illiquid and restricted securities often have a market value lower than the market price of unrestricted securities of the same issuer and are not readily marketable without some time delay. This could result in a Fund being unable to realize a favorable price upon disposition of such securities and in some cases might make disposition of such securities at the time desired by the Fund impossible. |
94 | The Leuthold Funds - 2017 Annual Report |
The Leuthold Funds
7. LENDING PORTFOLIO SECURITIES
The Funds may lend portfolio securities constituting up to 30% of total assets to unaffiliated broker-dealers, banks, or other recognized institutional borrowers of securities, provided that the borrower at all times maintains cash, U.S. government securities, or equivalent collateral or provides an irrevocable letter of credit in favor of the Funds equal in value to at least 100% of the value of the securities loaned. During the time portfolio securities are on loan, the borrower pays the lending Fund an amount equivalent to any dividends or interest paid on such securities, and the Fund may receive an agreed-upon amount of interest income from the borrower who delivered equivalent collateral or provided a letter of credit. Loans are subject to termination at the option of the lending Fund or the borrower. The lending Fund may pay reasonable administrative and custodial fees in connection with a loan of portfolio securities and may pay a negotiated portion of the interest earned on the cash or equivalent collateral to the borrower or placing broker. The lending Fund does not have the right to vote securities on loan, but could terminate the loan and regain the right to vote if that were considered important with respect to the investment.
The primary risk in securities lending is a default by the borrower during a sharp rise in price of the borrowed security resulting in a deficiency in the collateral posted by the borrower. The Funds will seek to minimize this risk by requiring that the value of the securities loaned be computed each day and additional collateral be furnished each day if required.
As of September 30, 2017, the market value of the securities on loan and payable on collateral received for securities lending were as follows:
| | Market Value of
Securities on Loan | | Payable on
Collateral Received | |
| Leuthold Core Investment Fund | | $ | 73,267,883 | | $ | 74,692,474 | |
| Leuthold Global Fund | | | 10,977,352 | | | 11,234,557 | |
The Leuthold Funds - 2017 Annual Report | 95 |
The Leuthold Funds
REPORT OF INDEPENDENT REGISTERED PUBLIC ACCOUNTING FIRM
To the Shareholders and Board of Directors
Leuthold Funds, Inc.
We have audited the accompanying statements of assets and liabilities, including the schedules of investments and securities sold short (as applicable), of Leuthold Funds, Inc., comprising Leuthold Core Investment Fund (consolidated), Leuthold Global Fund (consolidated), Leuthold Select Industries Fund, Leuthold Global Industries Fund, and Grizzly Short Fund (collectively, the Funds), as of September 30, 2017, and the related statements of operations for the year then ended, the statements of changes in net assets for each of the two years in the period then ended, and the financial highlights for each of the five years in the period then ended. These financial statements and financial highlights are the responsibility of the Funds’ management. Our responsibility is to express an opinion on these financial statements and financial highlights based on our audits.
We conducted our audits in accordance with the standards of the Public Company Accounting Oversight Board (United States). Those standards require that we plan and perform the audit to obtain reasonable assurance about whether the financial statements and financial highlights are free of material misstatement. We were not engaged to perform an audit of the Funds’ internal control over financial reporting. Our audits included consideration of internal control over financial reporting as a basis for designing audit procedures that are appropriate in the circumstances, but not for the purpose of expressing an opinion on the effectiveness of the Funds’ internal control over financial reporting. Accordingly, we express no such opinion. An audit also includes examining, on a test basis, evidence supporting the amounts and disclosures in the financial statements and financial highlights, assessing the accounting principles used and significant estimates made by management, and evaluating the overall financial statement presentation. Our procedures included confirmation of securities owned as of September 30, 2017, by correspondence with the custodian and brokers or by other appropriate auditing procedures where replies from brokers were not received. We believe that our audits provide a reasonable basis for our opinion.
In our opinion, the financial statements and financial highlights referred to above present fairly, in all material respects, the financial position of each of the respective Funds constituting Leuthold Funds, Inc. at September 30, 2017, the results of their operations for the year then ended, the changes in their net assets for each of the two years in the period then ended, and the financial highlights for each of the five years in the period then ended, in conformity with U.S. generally accepted accounting principles.
Minneapolis, Minnesota
November 22, 2017
| 96 | The Leuthold Funds - 2017 Annual Report |
The Leuthold Funds
ADDITIONAL INFORMATION (Unaudited)
SHAREHOLDER NOTIFICATION OF FEDERAL TAX STATUS (Unaudited)
The percentage of dividend income distributed for the year ended September 30, 2017, which is designated as qualified dividend income under the Jobs and Growth Tax Relief Reconciliation Act of 2003, is as follows: Leuthold Core Investment Fund 100.00%, Leuthold Global Fund 42.68%, and Leuthold Global Industries Fund 57.22%.
The percentage of dividend income distributed for the year ended September 30, 2017, designated as qualified dividends received deduction available to corporate shareholders, is as follows: Leuthold Core Investment Fund 100.00%, Leuthold Global Fund 15.19%, and Leuthold Global Industries Fund 28.38%.
The Leuthold Global Industries Fund designated 0.07% of its ordinary distributions paid as qualified interest related dividends under the Internal Revenue Code Section 871(k)(1)(C) for the year ended September 30, 2017. The Leuthold Global Fund and Leuthold Global Industries Fund designated 70.85% and 57.89%, respectively, of their ordinary distributions paid as short-term capital gain distributions under Internal Revenue Section 871(k)(2)(C) for the year ended September 30, 2017.
| The Leuthold Funds - 2017 Annual Report | 97 |
The Leuthold Funds
ADDITIONAL DISCLOSURE REGARDING FUND DIRECTORS AND OFFICERS (UNAUDITED)
Independent Directors
Name, Year of Birth,
and Address | | Position(s)
Held with
the Company | | Term of Office
and Length of
Time Served | | Principal Occupation(s)
During Past Five Years | | # of Portfolios in Fund Complex Overseen By Director | | Other Directorships Held by Director |
| | | | | | | | | | | |
Lawrence L. Horsch (1934)
c/o Leuthold Weeden
Capital Management
33 South Sixth Street
Suite 4600
Minneapolis, MN 55402 | | Chairman and Director | | Indefinite, Director since1995 | | Chairman, Eagle Management & Financial Corp., a management consulting firm | | 5 | | None |
| | | | | | | | | | | |
Paul M. Kelnberger (1943)
c/o Leuthold Weeden
Capital Management
33 South Sixth Street
Suite 4600
Minneapolis, MN 55402 | | Director and Chair of Audit Committee | | Indefinite, Director since1995 | | Retired Partner of Johnson, West & Co., PLC (currently Boeckermann, Grafstrom & Mayer, LLC) Certified Public Accountants | | 5 | | None |
| | | | | | | | | | | |
Addison L. Piper (1946)
c/o Leuthold Weeden
Capital Management
33 South Sixth Street
Suite 4600
Minneapolis, MN 55402 | | Director and Chair of Nominating Committee | | Indefinite, Director since 2009 | | Retired Chairman and Chief Executive Officer of Piper Jaffray Companies and PREDEX. | | 5 | | Piper Jaffray Companies and PREDEX |
| 98 | The Leuthold Funds - 2017 Annual Report |
The Leuthold Funds
ADDITIONAL DISCLOSURE REGARDING FUND DIRECTORS AND OFFICERS (UNAUDITED)
Interested Directors (and Officers)
Name, Year of Birth,
and Address | | Position(s)
Held with
the Company | | Term of Office
and Length of
Time Served | | Principal Occupation
During Past Five Years | | # of
Portfolios in
Fund Complex
Overseen By
Director | | Other
Directorships
Held by
Director |
| | | | | | | | | | | |
John C. Mueller (1968)
33 South Sixth Street
Suite 4600 | | Director | | Indefinite, Director since 2009 | | Co-Chief Executive Officer of The Leuthold Group since 2005. Involved in Sales and Marketing for | | 5 | | None |
| Minneapolis, MN 55402 | | President | | One year term, President since 2011 | | The Leuthold Group since 2001. | | | | |
| | | | | | | | | | | |
Holly J. Weiss (1968)
33 South Sixth Street
Suite 4600
Minneapolis, MN 55402 | | Secretary and Treasurer | | One Year Term, Secretary and Treasurer since 2009 | | Chief Financial Officer of the Adviser since 2011 and Controller of the Adviser from 2008 to 2011. | | N/A | | N/A |
| | | | | | | | | | | |
Roger A. Peters (1960)
33 South Sixth Street
Suite 4600
Minneapolis, MN 55402 | | Vice President and Chief Compliance Officer and Anti-Money Laundering Officer | | One Year Term, Chief Compliance Officer since 2006 and Vice President since 2007 and Anti-Money Laundering Officer since 2011 | | Chief Compliance Officer of the Adviser since 2005. | | N/A | | N/A |
| | | | | | | | | | | |
Glenn R. Larson (1965)
33 South Sixth Street
Suite 4600
Minneapolis, MN 55402 | | Assistant Secretary | | One Year Term, Assistant Secretary since 2006 | | Compliance Officer of the Adviser since 2005. | | N/A | | N/A |
The Statement of Additional Information includes additional information about the Funds’ Directors and is available free of charge upon request by calling the Funds toll free at (800) 273-6886.
Information regarding the method the Funds use to vote proxies relating to portfolio securities is available without charge upon request by calling toll-free at (800) 273-6886 or by accessing the Funds’ website at www.leutholdfunds.com. Information regarding how the Funds voted proxies relating to portfolio securities during the most recent twelve-month period ended June 30 is available without charge upon request by calling toll-free at (800) 273-6886 or on the SEC’s website at www.sec.gov.
| The Leuthold Funds - 2017 Annual Report | 99 |
| | The Leuthold Funds | |
| | | |
| | Investment Adviser: | |
| | Leuthold Weeden Capital Management, | |
| | Minneapolis, Minnesota | |
| | | |
| | Administrator, Transfer Agent, | |
| | Fund Accountant, | |
| | Shareholder Servicing Agent: | |
| | U.S. Bancorp Fund Services, LLC, | |
| | Milwaukee, Wisconsin | |
| | | |
| | Custodian: | |
| | U.S. Bank, N.A., | |
| | Milwaukee, Wisconsin | |
| | | |
| | Counsel: | |
| | Foley & Lardner, LLP, | |
| | Milwaukee, Wisconsin | |
| | | |
| | Independent Registered | |
| | Public Accounting Firm: | |
| | Ernst & Young LLP, | |
| | Minneapolis, Minnesota | |
| | | |
| | The Funds are required to file their complete schedules of portfolio holdings with the SEC for their first and third fiscal quarters on Form N-Q. Once filed, the Fund’s Form N-Q is available without charge, upon request on the SEC’s website (http://www.sec.gov) and may be available by calling 1-800-273-6886. You can also obtain copies of Form N-Q by (i) visiting the SEC’s Public Reference Room in Washington, DC (information on the operation of the Public Reference Room may be obtained by calling 1-800-SEC-0330); (ii) sending your request and a duplicating fee to the SEC’s Public Reference Room, Washington, DC 20549-0102; or (iii) sending your request electronically to publicinfosec.gov. | |
| | | |
| | This report is authorized for distribution only when preceded or accompanied by a current prospectus. | |
The registrant has adopted a code of ethics that applies to the registrant’s principal executive officer and principal financial officer. The registrant has not made any amendments to its code of ethics during the period covered by this report. The registrant has not granted any waivers from any provisions of the code of ethics during the period covered by this report. A copy of the registrant’s Code of Ethics is filed herewith.
The registrant’s board of directors has determined that there is at least one audit committee financial expert serving on its audit committee. Paul Kelnberger is the “audit committee financial expert” and is considered to be “independent” as each term is defined in Item 3 of Form N-CSR.
The registrant has engaged its principal accountant to perform audit services, audit-related services, tax services and other services during the past two fiscal years. “Audit services” refer to performing an audit of the registrant's annual financial statements or services that are normally provided by the accountant in connection with statutory and regulatory filings or engagements for those fiscal years. “Audit-related services” refer to the assurance and related services by the principal accountant that are reasonably related to the performance of the audit. “Tax services” refer to professional services rendered by the principal accountant for tax compliance, tax advice, and tax planning. No “other services” were provided by the principal accountant. The following table details the aggregate fees billed or expected to be billed for each of the last two fiscal years for audit fees, audit-related fees, tax fees and other fees by the principal accountant.
The audit committee has adopted pre-approval policies and procedures that require the audit committee to pre-approve all audit and non-audit services of the registrant, including services provided to any entity affiliated with the registrant.
The percentage of fees billed by Ernst & Young, LLP applicable to non-audit services pursuant to waiver of pre-approval requirement were as follows:
All of the principal accountant’s hours spent on auditing the registrant’s financial statements were attributed to work performed by full-time permanent employees of the principal accountant. (If more than 50 percent of the accountant’s hours were spent to audit the registrant's financial statements for the most recent fiscal year, state how many hours were attributed to work performed by persons other than the principal accountant's full-time, permanent employees.)
The following table indicates the non-audit fees billed or expected to be billed by the registrant’s accountant for services to the registrant and to the registrant’s investment adviser (and any other controlling entity, etc.—not sub-adviser) for the last two years. The audit committee of the board of directors has considered whether the provision of non-audit services that were rendered to the registrant's investment adviser is compatible with maintaining the principal accountant's independence and has concluded that the provision of such non-audit services by the accountant has not compromised the accountant’s independence.
Not applicable to registrants who are not listed issuers (as defined in Rule 10A-3 under the Securities Exchange Act of 1934).
Schedule of Investments is included as part of the report to shareholders filed under Item 1 of this Form.
Not applicable to open-end investment companies.
Not applicable to open-end investment companies.
Not applicable to open-end investment companies.
Not Applicable.
Pursuant to the requirements of the Securities Exchange Act of 1934 and the Investment Company Act of 1940, the registrant has duly caused this report to be signed on its behalf by the undersigned, thereunto duly authorized.
Pursuant to the requirements of the Securities Exchange Act of 1934 and the Investment Company Act of 1940, this report has been signed below by the following persons on behalf of the registrant and in the capacities and on the dates indicated.
* Print the name and title of each signing officer under his or her signature.