Annual Report
September 30, 2019

LEUTHOLD FUNDS
| Leuthold Core Investment Fund | Leuthold Global Fund |
| Retail Class Shares LCORX | Retail Class Shares GLBLX |
| Institutional Class Shares LCRIX | Institutional Class Shares GLBIX |
| | |
| Leuthold Select Industries Fund | Grizzly Short Fund |
| LSLTX | GRZZX |
Beginning on January 1, 2021, as permitted by regulations adopted by the U.S. Securities and Exchange Commission, paper copies of the Funds’ annual and semi-annual shareholder reports will no longer be sent by mail, unless you specifically request paper copies of the reports. Instead, the reports will be made available on the Funds’ website https://funds.leutholdgroup.com, and you will be notified by mail each time a report is posted and provided with a website link to access the report.
If you already elected to receive shareholder reports electronically, you will not be affected by this change and you need not take any action. You may elect to receive shareholder reports and other communications from the Funds electronically anytime by contacting your financial intermediary (such as a broker-dealer or a bank) or, if you are a direct investor, by calling 1-800-273-6886, sending an e-mail request to publicinfo@sec.gov, or by enrolling at https://funds.leutholdgroup.com.
You may elect to receive all future reports in paper free of charge. If you invest through a financial intermediary, you can contact your financial intermediary to request that you continue to receive paper copies of your shareholder reports. If you invest directly with the Funds, you can call 1-800-273-6886 or send an email request to publicinfo@sec.gov to let the Funds know you wish to continue receiving paper copies of your shareholder reports. Your election to receive reports in paper will apply to all Funds held in your account if you invest through your financial intermediary or all Funds held with the fund complex if you invest directly with the Funds.
The Securities and Exchange Commission has not approved or disapproved these securities or determined if this semi-annual report is accurate or complete. Any representation to the contrary is a criminal offense. An investment in the Funds is not a deposit of a bank and is not insured or guaranteed by the Federal Deposit Insurance Corporation or any other government agency.
Inside Cover - blank

The Leuthold Funds
Dear Fellow Shareholders:
One year ago, cyclical conditions seemed to be as strong as ever, with analysts and financial journalists, alike, endorsing the stock market like a stock analyst with a “BUY” recommendation. Contrary to that pervasive optimism, our market analysis was suggesting a cautious posture. The divergent picture supplied by our indicators reminded us of a peculiar “SELL” recommendation we came across nearly 30 years ago. The internal memo cited confusingly incompatible reasons for endorsing a “sell”: booming new orders, a record backlog, recent increases in selling prices, and a big dividend hike to boot. The rationale for “selling” instead read like reasons for a “Strong BUY” recommendation. At closer look, that cryptic sell memo’s summary statement explained, “Business conditions are so good that they’re unlikely to show material improvement in the year ahead.” Within a few weeks, the subject stock of that memo made a cyclical (and, in retrospect, “terminal”) price high and the company subsequently failed.
Reminiscent of the counsel from that 30-year-old sell memo’s summary explanation, were business conditions and optimism also “too good” in October 2018? It seems so. Our cautionary stance turned out to be warranted; the S&P 500 fell to within 0.1% of correction territory last October and proceeded to decline until breaching that threshold the day after Thanksgiving. A fast and furious six-day 6% rally ensued, followed by a two-day collapse in early December that was deep enough to challenge the November low. Global central bank liquidity was eroding with the U.S. economy operating beyond full employment and with domestic valuations still historically rich. When Christmas Eve arrived—not with snowfall but with a single-day market freefall of 3%—Leuthold tactical accounts were defensively aligned with 30% net equities. The December 24th decline was the worst-ever recorded for the last trading day before Christmas. Amidst that day’s decline, our tactical accounts took the opportunity to cover a portion of the equity hedge at the lows, lifting exposure back up to 37% from 30%.
That late-2018 stock market setback was the fifteenth S&P 500 decline of 19% or more since WWII, and trader sentiment took a sharp blow. But long-term optimism among consumers and investors was deeply embedded, and stocks bounced 16.2% from the Christmas Eve low through early February 2019. Market breadth accompanying that rally was compelling. The consensus view—with a Powell Put in the back pocket—was that a run toward new highs for U.S. stocks was likely. The strong rebound was persuasive enough that we allowed tactical Funds’ net equity allocations to drift up alongside the market, to around 45%. Our market analysis then officially improved from negative to neutral, so net equities were actively increased to over 50% by April.
Despite the impressive rebound, our quantitative stock market model never improved beyond its neutral zone. The cyclical negatives continued to pile up and, combined with a nudge from May’s technical action, the model moved back down to negative territory at the end of May. Tactical Funds’ net equity exposure was reduced to 45% in response, and it remained at that level through fiscal year end.
U.S. equity valuations are very high, global business cycle indicators continue to erode, and long-term technical non-confirmations remain in place. The chart shows that most equities are not sharing the same experience of the large caps, reflected by the inability of these indices to follow suit with the S&P 500’s repeated attempts to challenge prior highs. However, long-term non-confirmations can persist for many months with no ill effects. One concession for the bulls is that sentiment has stayed remarkably restrained in the face of the market’s stubborn rise. The gradual loss of enthusiasm, though, during the final phase of a bull market likely reflects the underperformance of broadly diversified equity portfolios. Mid caps, small caps, and foreign stocks usually fail to keep up with the blue-chip averages in the later stages of the cycle.
| The Leuthold Funds - 2019 Annual Report | 1 |

Through September 30th, it has now been 20 months since global stocks peaked on January 26th, 2018. Those lucky enough to have been invested solely in the S&P 500 and held on for the volatile ride from that point forward, would have a return of +3.6% to show for it. Those who prudently sought to “de-worsify” away from expensive U.S. large caps have paid a heavy price. Returns for mid, small, and micro-cap stocks are at -3%, -3%, and -12%, respectively, since the January 2018 top; EAFE and Emerging Market index results are -14% and -21%, respectively.
The silver lining is that the global bear market, in terms of length, is well advanced. Among many value-oriented, cyclical, non-U.S., and/or small cap stocks, it is quite well advanced based on price as well. Two-tiered markets like the current one eventually present active managers with career-making opportunities, as experienced by those who resisted the overvalued mega caps in early 2000. In that unusual case, the best day to sell the S&P 500 (March 24th, 2000) turned out to be an outstanding day to buy everything else that had been out of favor up to that time.
This year’s rebound closely tracks the 1998-99 rally, and leadership has become just as dangerously concentrated. We don’t expect an identical buying opportunity as 2000, but one never knows. Following the March 2000 stock market peak, the economy expanded for eleven more months while large cap growth investors racked up large losses—losses of which undoubtedly contributed to the onset of the 2001 recession. A similar economic sequence is likely to play out in 2020 if U.S. large caps break down in coming months.
The last decade has been incredible for the S&P 500—but that’s partly because the index was oversold almost half the time in the prior decade (2000-2009). The 2009-2019 experience has been truly passively driven, “set it and forget it” for investment success. The upcoming ten years are likely to be much more challenging; however, we expect this will present the conditions for active managers to add great value and demonstrate the benefits of having flexibility to adjust asset exposures and shift between the range of equity styles as needed.
| 2 | The Leuthold Funds - 2019 Annual Report |
ANNUAL PERFORMANCE REVIEW
Tactical Asset Allocation—Domestic & Global
The Leuthold Core Investment Fund and Leuthold Global Fund began the fiscal year with a cautious stance toward the stock market. Net equity exposure for each averaged about 40% during the fourth quarter of 2018, thus both Funds fared well versus their respective 100% equity benchmarks as the market sold off in December. As a response to the December plunge, the Fed capitulated and eased off its policy guidance for “measured tightening,” emphasizing that it would be patient with future rate decisions. The market rallied and our quantitative work began to improve due to strong momentum across price indices and breadth measures. By April, these factors had driven our stance up to a neutral posture toward stocks and the net equity positions were lifted to the 54% range. This was short-lived, as technical gauges and economic trends deteriorated, pushing our indicators back to a negative outlook in June. Net equities were cut back to 45% and remained there through fiscal year end.
For the twelve months through September, the Leuthold Core Investment Fund posted a +1.21% total return (retail share class). Its peer group, Morningstar Tactical Allocation, trailed the Leuthold Core Investment Fund with a total return of -0.32%. The fully invested S&P 500 benchmark produced a +4.25% total return.
The Leuthold Global Fund had a -3.97% total return for the fiscal year (retail share class), lagging its peer-fund category, the Morningstar World Allocation average (+1.50% total return) by nearly 550 basis points. Compared to the fully invested MSCI All Country World Index (ACWI) +1.38% total return, the Leuthold Global Fund underperformed by a similar spread.
Underperformance disparities versus each Fund’s fully invested benchmark are partially linked to long stock allocations being confined at much lower levels during the strong rallies of the last twelve months. Further widening of the performance gaps was directly related to long equity results.
Tactical Long Equity Exposure
The monthly-average long stock position during the fiscal year was 56% for both Leuthold tactical Funds. Mirroring U.S. stocks’ dominance over foreign stocks, there was a conspicuous difference between the two Funds’ equity results; the Leuthold Core Investment Fund’s U.S.-traded stocks returned +1.13%, in contrast to the more globally concentrated Leuthold Global Fund’s equity performance of -7.26%. The Leuthold Core Investment Fund’s long equity segment was behind its benchmark’s corresponding allotment by 300 basis points, and the Leuthold Global Fund’s long stock holdings lagged by an appreciably higher spread of about 860 basis points. In June, the Leuthold Core Investment Fund added a small allocation to emerging market equities, but it was not value-added through fiscal year end (-3.15%). Specifics of tactical Funds’ long stock performance will follow under “Long Equity Exposure—Domestic & Global.”
Tactical Equity Hedge
With the market freefall into the Christmas Eve low, both Funds benefited from their defensive postures. The hedge added nearly 3% to the Leuthold Core Investment Fund in the last three months of 2018, and it boosted the Leuthold Global Fund by 2%. With the ensuing stock market recovery in 2019, the equity hedge experienced gains in only two other months, May and August. For the full fiscal year, with a monthly average weight of 11-12%, the equity hedge had net negative performance, but it did not detract from either Funds’ results because the gains from earlier in the year nullified the losses.
| The Leuthold Funds - 2019 Annual Report | 3 |
Tactical Fixed Income
The Funds were underweight fixed income all year, with a 21% average weight (normal minimum is 30%). Duration was kept at the short end of the scale compared to the benchmark. Assets were spread across securities with varying risk profiles and exposures. Developed Market Sovereign Debt was the largest subclass at a 13% average weight; Quality Corporate Bonds and Emerging Market Sovereign Debt were also full-year components with small positions of 4% and 1-1.5%, respectively. MBS Bond Funds were acquired in January at an average monthly holding of 1%, while a persistent lack of inflation triggered the July sale of the 1-1.5% allocation to TIPs. All the fixed income subsets had net gains, but the bearing on performance was immaterial because of the relatively insignificant weights in relation to net returns.
We look forward to raising our fixed income stake when interest rates progress enough to create more attractive opportunities.
Commodities
This 3% portfolio share was initiated in May of 2018, due to expectations that inflation pressures were heating up while interest rates and commodities’ prices appeared to be on the upswing. The focus initially included economic exposure to a mixed basket of heavily traded commodities from the sectors of energy, industrial metals, precious metals, and agriculture. With the Fed putting the brakes on normalizing interest rates in early 2019, inflation fears diminished. That, along with the continuation of a broad-based global manufacturing sector slowdown and a weaker dollar, the cyclical case for industrial metals was no longer justifiable, so that segment of the investment was deactivated in mid-2019. The sale proceeds were added to the gold portion, which offers defense, diversification, and it benefits from a softening dollar. The Funds’ commodities allocation, overall, returned 5% for the fiscal year but it did not have a measurable effect on performance.
Long Equity Exposure—Domestic & Global
Leuthold Select Industries (SI) Fund and Leuthold Global Industries (GI) Strategy are fully invested stock portfolios. Both use the firm’s decades’ old group-based investment model—a top-down methodology which, firstly, identifies industry groups that appear poised to become market leaders in the given environment, and next, invests in a selection of representative stocks that are highly attractive using a disciplined value-oriented process. Leuthold SI Fund is the domestic version and employs U.S.-traded securities. The Leuthold GI Strategy targets at least 40% of assets in stocks traded on global exchanges outside the United States.
For the fiscal year ended September 30, 2019, the Leuthold SI Fund had a total return of -0.19%; it outperformed its peer category, Morningstar Mid Cap Blend (-1.45% total return), but lagged the relative resiliency of the S&P 500 (+4.25% total return). The Leuthold GI strategy produced an -8.52% total return (Global Industries, L.P., net performance), which trailed both the MSCI ACWI and the Morningstar World Large Stock peer category (+1.38% and +0.87% total returns, respectively).
Equity Sector And Industry Group Drivers
The Funds’ equity rotation-driven approach will often result in lopsided weights among broad sectors and industry groups versus the benchmarks. The quantitative methodology intends to find themes that appear intact to expand market leadership and/or uphold existing strength; it attempts to avoid industries that may be on the cusp of a downturn because of the market backdrop or other economic dynamics. Concentrating holdings among the highest rated industries, per our model, has proven successful in providing alpha over the long term.
| 4 | The Leuthold Funds - 2019 Annual Report |
Communication Services, Information Technology (IT), and Consumer Staples were the top three sectors that drove the U.S. stock market higher over the last twelve months; Communication Services and IT were also two of the best sector performers in the SI Fund. The IT weight in the SI Fund was about the same as that of the benchmark, at 21%, although IT group/stock selection within the Fund was far better, adding over 250 basis points over the index IT results. The SI Fund’s Communication Services average position during the year (7%) was underweight the benchmark by about 200 basis points and, while it was additive to Fund performance, having a smaller share prompted the underperformance when compared to the benchmark’s corresponding sector results. Industry group concentrations that boosted SI Fund performance from these two sectors were: Semiconductor Equipment, Data Processing/Outsourced Services, Integrated Telecom, Cable & Satellite, and Communications Equipment.
The market sectors of Consumer Discretionary, Financials, and Industrials were also strong performers for the SI Fund, each of which outpaced the benchmark’s sector returns. Among these, the SI Fund’s weight in Consumer Discretionary (22% average) and Industrials (17%) were nearly double those of the index, while it had about half (6%) of the benchmark’s Financials weight. These sectors’ outperformance in the SI Fund was attributable to a wide range of industry positions; the leading groups were: General Merchandise Stores, Homebuilding, Environmental & Facilities Services, Consumer Finance, Automotive Retail, Railroads, and Airlines.
As has been the case throughout this ten-plus-year bull market, global stocks were weak over the last twelve months in comparison to U.S. large caps. Global equity sector performance was led by Consumer Staples, Information Technology, Utilities, and Real Estate. Of those, Consumer Staples was a small positive contributor to GI Strategy return, but it was only a 1.5% average weight during the year. Utilities and Real Estate were not represented in the GI Strategy at all; hence, there was no benefit from the upside of those global sectors as reflected by the benchmark. IT was held at an overweight in the GI Strategy (23% versus the benchmark’s 15%), but industry/stock allocation was ineffective, as despite the big emphasis, its contribution to GI Strategy performance trailed the benchmark by 71 basis points. Semiconductor Equipment and Data Processing/Outsourced Services were two IT holdings in the GI Strategy that did outperform.
Consumer Discretionary and Financials were the best performing sectors in the GI Strategy and, in spite of being underweight, each outperformed the corresponding benchmark sector. This indicates that the GI Strategy’s industry selection within those sectors was especially productive. Outperforming groups related to these sectors were: Homebuilding, Consumer Finance, and Property & Casualty Insurance. Communication Services (14% average weight) and Industrials (4%) were the other small net-additive sector contributors to the GI Strategy return.
Domestically, unfavorable results came from the Health Care and Energy sectors and, among global sectors, these were also the biggest detractors, in addition to Materials. Lingering policy risks within the U.S. Health Care industry increasingly rattled investor confidence and we can point to the SI Fund’s overexposure to that sector as the key dynamic that led to its disappointing underperformance. Health Care was an average weight of 21% in the SI Fund versus the benchmark’s 15% weight and, although the position was actively reduced from 26% last October, to an underweight 12% as of fiscal year end, it was costly. The Fund experienced a loss of over 580 basis points compared to the benchmark’s 60 basis point offset from Health Care. Within the GI Strategy, Health Care was also overweight the index by the same degree as the SI Fund and it assembled a loss of 200 basis points versus the benchmark’s minimal 27 basis point downside. The SI Fund benefited from having zero Energy investments during the year, while its benchmark yielded a 130 basis point loss with its related interest. The GI Strategy, on the other hand, had an Energy overweight (12% versus the benchmark’s 6%). This impaired the GI Strategy by nearly 400 basis points against the MSCI ACWI loss of 100 basis points. The other net detractor for the GI Strategy, Materials (6% weight, on par with the benchmark), triggered a 350 basis point loss relative to the 20 basis point decline affiliated with the MSCI ACWI.
| The Leuthold Funds - 2019 Annual Report | 5 |
At the industry group level, detractors aligned with the poor sector results specific to the SI Fund included Health Care Services, Biotechnology, and Drug Retail. Managed Health Care and Health Care Facilities were letdowns for both SI and GI portfolios. GI Strategy group losses associated with Energy and Materials were plentiful. The largest involved Oil & Gas Refining, Oil & Gas Exploration, Paper & Forest Products, Diversified/Precious Metals, Integrated Oil & Gas, Steel, Commodity Chemicals, and Coal.
Global/Foreign Exposure Attribution
With the SI Fund and, to a larger extent the GI portfolio, concentrations in developed market and emerging market stocks are essentially arbitrary, the result of: 1) the composition of groups identified as quantitatively attractive; and, 2) valuation appeal based on the quantitative stock-selection model. Some industries are inclined to have a stronger presence in developed markets versus emerging markets, and the other way around.
The domestically traded Leuthold SI Fund can, at times, have a significant level of foreign stocks, which is obtained through ADR/ADS securities traded on U.S. exchanges. The degree thereof has the potential to materially affect SI Fund performance, both on an absolute basis and relative to the S&P 500. For the full fiscal year, there was an average foreign weight of 7% in the SI Fund. This broke down to 53% in developed markets (ex-U.S.) and 47% in emerging markets. As illustrated by the twelve-month MSCI ACWI Ex-USA and the MSCI EM index returns of -1.23% and -2.02%, respectively, through September 30th, the SI Fund’s foreign-domiciled stocks were a hindrance to the portfolio’s overall underperformance gap.
The Leuthold GI Strategy aims to have a minimum of 40% in foreign-traded stocks; however, specific countries or regions are not openly targeted. The quantitative approach builds the portfolio by selecting stocks across the globe that appear to best characterize the industry concentrations of which the disciplines identify as having the most attractive growth potential. During the last twelve months, on average, U.S. stocks comprised 54% of portfolio assets; developed market stocks (ex-U.S.) incorporated 33% of assets, and emerging market stocks consisted of a 13% weight. Over the fiscal year, there was little fluctuation between the three segments’ portfolio weights.
The configuration of sector/industry investments in the GI Strategy’s U.S. position was detractive to performance for the fiscal year. Alternatively, the 53% portion of its benchmark (MSCI ACWI) that is dedicated to U.S. stocks returned solid results, over 350 basis points above that of the GI Strategy. As far as GI Strategy country exposure, a handful were additive. Taiwan, Ireland, Thailand, and Denmark had profitable results; allocation weights ranged in size from 0.3% to 1.7% and each outperformed the corresponding segment of the MSCI ACWI.
The largest country detractors for the GI Strategy were Japan, Australia, United Kingdom, South Korea, Finland, and the United States. All had losses and underperformed the benchmark’s associated allocations, again indicating that the Fund’s selection of industries/stocks within these countries was not constructive. Based on the disciplines that determined industry groups in which to invest, there were 33 countries that the GI Strategy was exposed to at some point during the year.
Concerning global currency movements, the Leuthold GI Strategy does not proactively make adjustments for the effects of fluctuation. While some global investment approaches do use currency-hedging practices, they are expensive and are not guaranteed to be value-added. The GI Strategy incorporates a U.S. dollar-based relative strength component among its quantitative inputs; this aims to distinguish broad FX-market trends of which to potentially capitalize. Currency movement was generally not a big driver of portfolio performance during the last twelve months. The U.S. dollar was moderately higher over this time, up about 4%. The GI Strategy has been equal-to-overweight the dollar, which contributed about 20 basis points to the portfolio’s relative performance. During the prior fiscal year, strength in the U.S. dollar created a headwind for our global equity strategy. In the end, the forces behind U.S. dollar strength/weakness largely balance out over time, just as the last two years’ experience illustrates.
| 6 | The Leuthold Funds - 2019 Annual Report |
Short-Only Domestic Equity
The Grizzly Short Fund is 100% short individual stocks. The goal is to profit when stock prices fall. This is an actively managed and quantitative methodology that identifies mid/large cap stocks which appear to be overvalued and vulnerable to a price decline. These are companies with ample liquidity and are not thought to be at risk of going out of business.
For the fiscal year ended September 30, 2019, the Grizzly Short Fund produced a -7.62% total return, trailing the average total return of -5.46% of its peer group, the Lipper Dedicated Short Bias category. The Grizzly Short Fund also fell behind the inverse results of the S&P MidCap 400 (-2.49% total return) and the inverse S&P 500 (+4.25% total return).
The Grizzly Short Fund often has well-defined sector/group overweights and/or underweights due to the disciplines that may detect common frailties among stocks across the same industry (which results in an overweight within the Fund); industries exhibiting collective stock market strength will either be underweight or have zero allocation in the portfolio. Because the S&P 500 maintains a static allotment to sectors/industries, regardless of shifting market leadership, we expect any Grizzly Short Fund/S&P 500 sector deviations to ultimately result in a meaningful advantage for the Fund. Outsized sector/group positions in the Fund may also be a drawback during times of short-term leadership collisions or erratic market reversals.
Short-Equity Sector And Industry Group Drivers
Nine of the eleven broad sectors incorporated in the Grizzly Short Fund’s portfolio detracted from performance. The worst came from Consumer Discretionary exposure on both an absolute and relative basis; its average portfolio weight was about the same as the benchmark (14%), yet it trailed that corresponding position by 275 basis points. The Fund’s Information Technology investment was similarly detractive; despite being underweight the benchmark allocation (23% versus 26%, respectively), its result was 44 basis points worse and was subtractive by 300 basis points on the whole. Among these sectors, stocks sold short that were the most damaging to return were from the industries of: Internet & Direct Marketing Retail, Restaurants, Semiconductors, and Electronic Manufacturing Services.
The sectors of Health Care (11% weight) and Materials (7%) each detracted by 1.6% on average, while Financials (8%) and Industrials (14%) contributed 1% apiece to the year’s decline. All underperformed the benchmark’s associated sector results, with divergences ranging from -15 to -200 basis points. Group concentrations from these sectors with the most sizable effect on the Fund’s fiscal year loss included Health Care Equipment, Health Care Supplies, Gold Miners, Thrifts & Mortgage Finance, and Research/Consulting Services.
Sector losses from Utilities (2% average weight), Real Estate (2%), and Communication Services (1%) combined to detract over 120 basis points from the Grizzly Short Fund’s fiscal year return; each was underweight the benchmark. There were not any specific industries that had a particularly large influence from these areas, as losses were spread out across miscellaneous stock investments. On a relative basis, Utilities and Real Estate did outperform by losing less than the benchmark’s related shares.
| The Leuthold Funds - 2019 Annual Report | 7 |
The Energy sector (8% weight) was the sole winner for the Grizzly Short Fund over the last twelve months; it was an overweight compared to the benchmark (5%) and it outperformed by over 300 basis points. Each of the Energy group investments throughout the year had net positive contributions to return. The most successful was Oil & Gas Equipment/Services, followed by Oil & Gas Exploration/Production. The Consumer Staples sector did not have an impact on the year’s results, and it was underweight at a 5% share. In comparison, the benchmark’s 7% weight earned a loss of over 100 basis points.
As noted, unlike the static S&P 500 sector/group weights, sector concentrations and industry group compositions have the potential to fluctuate considerably in the Grizzly Short Fund. Due to that, sector and sub-industry group concentrations utilize weighting controls to avoid the vulnerability of overexposure to a limited range. There are disciplined measures incorporated that will initiate short-covering action to: 1) lock in a partial gain; or, 2) rein in a loss. In addition, the Fund’s individual stocks are similarly weighted across the portfolio. It is therefore unlikely that a select few stocks could have an overwhelming effect on performance, as is the case in a cap-weighted index like the S&P 500. Stocks in the portfolio are closely monitored on an intra-day basis and investors should expect high turnover.
It was a volatile twelve months for the stock market and the Grizzly Short Fund experienced the same performance roundtrips (up and down) on an inverse basis. Current economic uncertainty continues to weigh on the minds of investors, and the Grizzly Short Fund is situated to capitalize on impending market weakness. In the meantime, as the bull market seems to be tracing out a market top, investors should expect it to be difficult for a short-selling strategy. However, the increasingly narrow market breadth offers opportunities for the Grizzly Short Fund. Frontpage emphasis on “new market highs” disguises the level of weakness among stocks not represented by the blue-chip index headliners.
“The Broader The Top, The Deeper The Drop.” … Anonymous
On October 4th, the average global stock (measured by the equal-weighted MSCI ACWI) closed down 15.5% from its January 2018 peak, while the “ex-U.S.” version of that index is near bear territory, with a loss of 19.8%. The Value Line Arithmetic Composite—probably the best proxy for the average domestic stock portfolio—still trades about 10% below its August 2018 peak. And, it has been more than 20 months since the NYSE Composite printed a new bull market high. These numbers, buried on the back page, support our less-fashionable opinion that the action of the last 20+ months represents a drawn-out cyclical topping process. Despite record earnings, record profit margins, and an historic U-turn in Fed policy, the most weatherproof equity benchmark in the world—the S&P 500—has gained less than 4% since global stocks topped-out in January 2018.
Valuations and the economic backdrop call for extreme caution. Technically, though, the hardiness of U.S. blue chips has prevented our market analysis from suffering a serious collapse deep into the negative zone. Our tactical Funds are positioned with net equities of 45% in early October 2019, and the allotment to overvalued mega caps is especially light.
Looking forward, we think the U.S. market will eventually revisit (and probably undercut) last December’s lows. Although, a two-tiered market like the last 20 months can produce some surprising opportunities, just like the late 1990s’ two-tiered market. We’ll look to our disciplines and analysis tools to direct changes within our equity concentrations and to adjust tactical Funds’ net equity levels as needed; however, tactical equity levels will likely remain below average until valuations see a significant reset.
| 8 | The Leuthold Funds - 2019 Annual Report |
Whether the next year brings more record stock market highs, more volatility, or a bear market and a recession, Leuthold long stock portfolios have the means to navigate and do relatively well throughout. All strategies experience shortcomings and headwinds with certain market dynamics, but overall, our equity group rotation has historically guided the portfolios to concentrations of leadership in all types of markets. In unproductive conditions there will continue to be profitable themes; the goal is that our technical analyses will expose opportunities of which our portfolios can take advantage and result in outperformance against the benchmarks—and sometimes that means “losing less.” Within our tactical Funds, being effective at both preserving and growing shareholder principal entails the tall task of minimizing losses on the downside. Our quantitative disciplines and our hedging capability render our approach better equipped than most of our peers during difficult stock market environments.
This has been an unprecedented bull market, both in terms of duration and return. Currently there are many red flags, including stretched corporate balance sheets with extreme leverage, and cyclically high profitability; we believe that a very challenging phase is imminent. The timing of the ultimate U.S. market peak is the X-factor. Admittedly, we’ve been anticipating the manifestation of this for some time. Luckily, unlike most firms, our strategies are not required to follow rigid mandates and align portfolios to comply with a narrow set of stock characteristics. The flexibility built into Leuthold Funds’ investment strategies offers the latitude to adapt as market leadership and the economic environment develop through their natural cycles. We will always manage the Funds with shareholders’ interests at heart. Being shareholders, ourselves, we can assure you that we strive to obtain the best possible outcomes under the given circumstances.
We welcome you to contact us at any time if you have questions or would like to give us feedback.
Sincerely,
 | | | | |
| Doug Ramsey, CFA, CMT | | | | |
| CIO & Co-Portfolio Manager | | | | |
| | | | | |
| | | | | |
 | |  | |  |
| Chun Wang, CFA, PRM | | Scott Opsal, CFA | | Jun Zhu, CFA, CAIA |
| Co-Portfolio Manager | | Co-Portfolio Manager | | Co-Portfolio Manager |
| | | | | |
| | | | | |
 | |  | | |
| Greg Swenson, CFA | | Kristen Perleberg, CFA | | |
| Co-Portfolio Manager | | Co-Portfolio Manager | | |
| The Leuthold Funds - 2019 Annual Report | 9 |
| 10 | The Leuthold Funds - 2019 Annual Report |
The Leuthold Funds
Expense Examples – September 30, 2019 (Unaudited)
As a shareholder of the Funds, you incur two types of costs: (1) transaction costs, including redemption fees and exchange fees; and (2) ongoing costs, including management fees; distribution and/or service fees; and other Fund expenses. This example is intended to help you understand your ongoing costs (in dollars) of investing in the Funds and to compare costs with the ongoing costs of investing in other mutual funds.
The Example is based on an investment of $1,000 invested at the beginning of the period and held the entire period (April 1, 2019 – September 30, 2019).
Actual Expenses
The first line of the following tables provides information about actual account values and actual expenses. Although the Funds charge no sales load (the Leuthold Core Investment Fund and Leuthold Global Fund charge a 2% redemption fee for redemptions made within five business days after a purchase), you will be assessed fees for outgoing wire transfers, returned checks, or stop payment orders at prevailing rates charged by U.S. Bancorp Fund Services, LLC, the Funds’ transfer agent. If you request a redemption be made by wire transfer, currently a $15.00 fee is charged by the Funds’ transfer agent. To the extent that the Funds invest in shares of other investment companies as part of its investment strategy, you will indirectly bear your proportionate share of any fees and expenses charged by the underlying funds in which a Fund invests in addition to the expenses of the Fund. Actual expenses of the underlying funds are expected to vary by fund. These expenses are not included in the following examples. The examples include, but are not limited to, management fees, shareholder servicing fees, fund accounting, custody, and transfer agent fees. However, the following examples do not include portfolio trading commissions and related expenses, and extraordinary expenses as determined under generally accepted accounting principles. You may use the information in this line, together with the amount you invested, to estimate the expenses that you paid over the period. Simply divide your account value by $1,000 (for example, an $8,600 account value divided by $1,000 = 8.6), then multiply the result by the number in the first line under the heading entitled “Expenses Paid During Period” to estimate the expenses you paid on your account during this period.
Hypothetical Examples for Comparison Purposes
The second line of the following tables provides information about hypothetical account values and hypothetical expenses based on the Funds’ actual expense ratios and an assumed rate of return of 5% per year before expenses, which is not the Funds’ actual return. The hypothetical account values and expenses may not be used to estimate the actual ending account balance or expenses you paid for the period. You may use this information to compare the ongoing costs of investing in the Funds and other funds. To do so, compare this 5% hypothetical example with the 5% hypothetical examples that appear in the shareholder reports of the other funds.
Please note that the expenses shown in the tables are meant to highlight your ongoing costs only and do not reflect any transactional costs, such as redemption fees or exchange fees. Therefore, the second line of the tables is useful in comparing ongoing costs only and will not help you determine the relative costs of owning different funds. In addition, if these transactional costs were included, your costs would have been higher.
| The Leuthold Funds - 2019 Annual Report | 11 |
The Leuthold Funds
Expense Example Tables (Unaudited)
Leuthold Core Investment Fund - Retail Class - LCORX
| | | Beginning
Account Value
April 1, 2019 | | Ending
Account Value
September 30, 2019 | | Expenses Paid
During Period*
April 1, 2019 - September 30, 2019 |
| Actual** | | $1,000.00 | | $1,036.10 | | $ 6.58 |
| Hypothetical (5% return before expenses)*** | | 1,000.00 | | 1,018.60 | | 6.53 |
* | Expenses are equal to the Fund’s annualized expense ratio of 1.29%, multiplied by the average account value over the period, multiplied by 183/365 to reflect the one-half year period. |
** | Excluding dividends and interest on securities sold short, your actual cost of investment in the Fund would be $6.13 and the Fund’s annualized expense ratio would be 1.20%. |
*** | Excluding dividends and interest on securities sold short, your hypothetical cost of investment in the Fund would be $6.07 and the Fund’s annualized expense ratio would be 1.20%. |
Leuthold Core Investment Fund - Institutional Class - LCRIX
| | | Beginning
Account Value
April 1, 2019 | | Ending
Account Value
September 30, 2019 | | Expenses Paid
During Period*
April 1, 2019 - September 30, 2019 |
| Actual** | | $1,000.00 | | $1,037.10 | | $ 6.08 |
| Hypothetical (5% return before expenses)*** | | 1,000.00 | | 1,019.10 | | 6.02 |
* | Expenses are equal to the Fund’s annualized expense ratio of 1.19%, multiplied by the average account value over the period, multiplied by 183/365 to reflect the one-half year period. |
** | Excluding dividends and interest on securities sold short, your actual cost of investment in the Fund would be $5.62 and the Fund’s annualized expense ratio would be 1.10%. |
*** | Excluding dividends and interest on securities sold short, your hypothetical cost of investment in the Fund would be $5.57 and the Fund’s annualized expense ratio would be 1.10%. |
Leuthold Global Fund - Retail Class - GLBLX
| | | Beginning
Account Value
April 1, 2019 | | Ending
Account Value
September 30, 2019 | | Expenses Paid
During Period*
April 1, 2019 - September 30, 2019 |
| Actual** | | $1,000.00 | | $1,006.50 | | $ 9.46 |
| Hypothetical (5% return before expenses)*** | | 1,000.00 | | 1,015.64 | | 9.50 |
* | Expenses are equal to the Fund’s annualized expense ratio of 1.88%, multiplied by the average account value over the period, multiplied by 183/365 to reflect the one-half year period. |
** | Excluding dividends and interest on securities sold short, your actual cost of investment in the Fund would be $8.25 and the Fund’s annualized expense ratio would be 1.64%. |
*** | Excluding dividends and interest on securities sold short, your hypothetical cost of investment in the Fund would be $8.29 and the Fund’s annualized expense ratio would be 1.64%. |
Leuthold Global Fund - Institutional Class - GLBIX
| | | Beginning
Account Value
April 1, 2019 | | Ending
Account Value
September 30, 2019 | | Expenses Paid
During Period*
April 1, 2019 - September 30, 2019 |
| Actual** | | $1,000.00 | | $1,007.80 | | $ 8.20 |
| Hypothetical (5% return before expenses)*** | | 1,000.00 | | 1,016.90 | | 8.24 |
* | Expenses are equal to the Fund’s annualized expense ratio of 1.63%, multiplied by the average account value over the period, multiplied by 183/365 to reflect the one-half year period. |
** | Excluding dividends and interest on securities sold short, your actual cost of investment in the Fund would be $7.00 and the Fund’s annualized expense ratio would be 1.39%. |
*** | Excluding dividends and interest on securities sold short, your hypothetical cost of investment in the Fund would be $7.03 and the Fund’s annualized expense ratio would be 1.39%. |
| 12 | The Leuthold Funds - 2019 Annual Report |
The Leuthold Funds
Expense Example Tables (Unaudited) (continued)
Leuthold Select Industries Fund - Retail Class - LSLTX
| | | Beginning
Account Value
April 1, 2019 | | Ending
Account Value
September 30, 2019 | | Expenses Paid
During Period*
April 1, 2019 - September 30, 2019 |
| Actual | | $1,000.00 | | $1,056.10 | | $7.73 |
| Hypothetical (5% return before expenses) | | 1,000.00 | | 1,017.55 | | 7.59 |
* | Expenses are equal to the Fund’s annualized expense ratio of 1.50%, multiplied by the average account value over the period, multiplied by 183/365 to reflect the one-half period. |
Grizzly Short Fund - Retail Class - GRZZX
| | | Beginning
Account Value
April 1, 2019 | | Ending
Account Value
September 30, 2019 | | Expenses Paid
During Period*
April 1, 2019 - September 30, 2019 |
| Actual** | | $1,000.00 | | $ 978.10 | | $ 11.65 |
| Hypothetical (5% return before expenses)*** | | 1,000.00 | | 1,013.29 | | 11.86 |
* | Expenses are equal to the Fund’s annualized expense ratio of 2.35%, multiplied by the average account value over the period, multiplied by 183/365 to reflect the one-half period. |
** | Excluding dividends and interest on securities sold short, your actual cost of investment in the Fund would be $7.88 and the Fund’s annualized expense ratio would be 1.59%. |
*** | Excluding dividends and interest on securities sold short, your hypothetical cost of investment in the Fund would be $8.04 and the Fund’s annualized expense ratio would be 1.59%. |
| The Leuthold Funds - 2019 Annual Report | 13 |
The Leuthold Funds
(Unaudited)
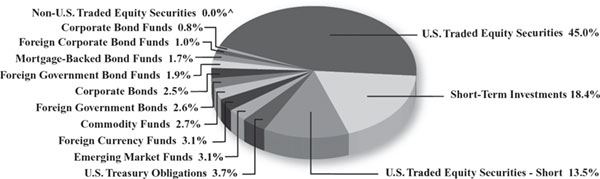
Leuthold Core Investment Fund
Allocation of Portfolio Holdings
September 30, 2019
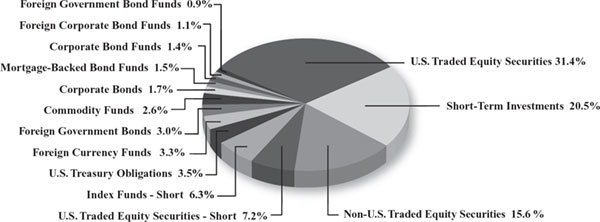
Leuthold Global Fund
Allocation of Portfolio Holdings
September 30, 2019
^ | Amount is less than 0.05%. |
Reflected as a percent of absolute value of investments and securities sold short.
| 14 | The Leuthold Funds - 2019 Annual Report |
The Leuthold Funds
(Unaudited)
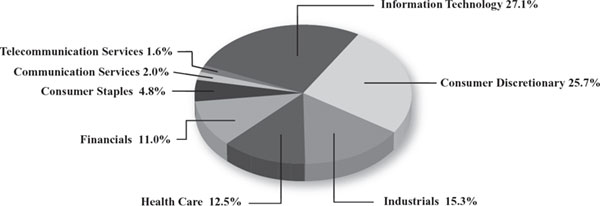
Leuthold Select Industries Fund
Allocation of Portfolio Holdings
September 30, 2019*
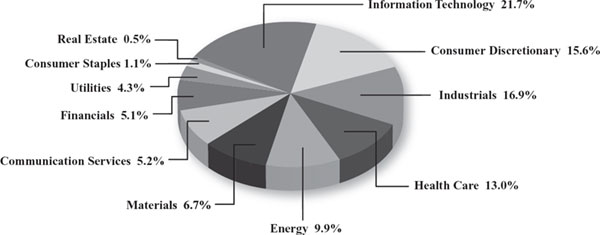
Grizzly Short Fund
Allocation of Securities Sold Short
September 30, 2019
* | Excludes short-term investments less than 5% of net assets. |
Reflected as a percent of absolute value of investments and securities sold short.
| The Leuthold Funds - 2019 Annual Report | 15 |
Leuthold Core Investment Fund - Retail Class - LCORX
(Unaudited)
Average Annual Rate of Return For Periods Ended
September 30, 2019
| | | 1 Year | | 3 Year | | 5 Year | | 10 Year | | Since
Inception |
| Leuthold Core Investment Fund - Retail Class - LCORX | | 1.21% | | 6.09% | | 4.80% | | 5.62% | | 8.04% |
| Lipper Flexible Portfolio Fund Index | | 3.68% | | 7.18% | | 5.17% | | 7.36% | | 6.37% |
| S&P 500 Index | | 4.25% | | 13.39% | | 10.84% | | 13.24% | | 9.02% |
| Morningstar Tactical Allocation Index | | (0.32)% | | 4.55% | | 2.71% | | 4.51% | | 4.97% |
| Bloomberg Barclays Global Aggregate Index | | 7.60% | | 1.59% | | 1.99% | | 2.34% | | n/a |
A $10,000 investment in the Leuthold Core Investment Fund – Retail Class - LCORX

The Lipper Flexible Portfolio Funds Index is composed of funds that allocate investments across various asset classes with a focus on total return, as defined by Lipper.
The S&P 500 Index is an unmanaged capitalization-weighted index of 500 stocks designed to measure performance of the broad domestic economy through changes in the aggregate market value of the 500 stocks, which represent all major industries.
The Morningstar Tactical Allocation Index is comprised of funds that incorporate a tactical asset allocation strategy which is the process by which the asset of a fund is changed on a short-term basis to take advantage of perceived differences in relative values of the various asset classes.
The Bloomberg Barclays Global Agregate Index provides a broad-based measure of the global investment grade fixed-rate debt markets. It is comprised of the U.S. Aggregate, Pan-European Aggregate, the Asian-Pacific Aggregate Indices, and the Canadian Aggregate Indices. It also includes a wide range of standard and customized sub-indices by liquidity constraint, sector, quality, and maturity.
Index figures do not take any expenses, fees, or taxes into account, but mutual fund returns do. The indices are used herein for comparative purposes in accordance with the U.S Securities and Exchange Commission regulations.
This chart assumes an initial gross investment of $10,000 made on November 20,1995 (commencement of operations). Returns shown include the reinvestment of all dividends. The Fund’s past performance is not necessarily an indication of its future performance. It may perform better or worse in the future. The graph and the table do not reflect the deduction of taxes that a shareholder would pay on Fund distributions or the redemption of shares.
| 16 | The Leuthold Funds - 2019 Annual Report |
Leuthold Core Investment Fund - Institutional Class - LCRIX
(Unaudited)
Average Annual Rate of Return For Periods Ended
September 30, 2019
| | | 1 Year | | 3 Year | | 5 Year | | 10 Year | | Since
Inception |
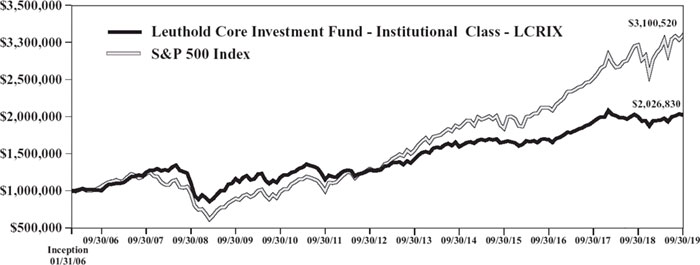
| Leuthold Core Investment Fund - Institutional Class - LCRIX | | 1.33% | | 6.22% | | 4.91% | | 5.73% | | 5.31% |
| Lipper Flexible Portfolio Fund Index | | 3.68% | | 7.18% | | 5.17% | | 7.36% | | 5.64% |
| S&P 500 Index | | 4.25% | | 13.39% | | 10.84% | | 13.24% | | 8.63% |
| Morningstar Tactical Allocation Index | | (0.32)% | | 4.55% | | 2.71% | | 4.51% | | 3.26% |
| Bloomberg Barclays Global Aggregate Index | | 7.60% | | 1.59% | | 1.99% | | 2.34% | | 3.71% |
A $1,000,000 investment in the Leuthold Core Investment Fund – Institutional Class - LCRIX
The Lipper Flexible Portfolio Funds Index is composed of funds that allocate investments across various asset classes with a focus on total return, as defined by Lipper.
The S&P 500 Index is an unmanaged capitalization-weighted index of 500 stocks designed to measure performance of the broad domestic economy through changes in the aggregate market value of the 500 stocks, which represent all major industries.
The Morningstar Tactical Allocation Index is comprised of funds that incorporate a tactical asset allocation strategy which is the process by which the asset of a fund is changed on a short-term basis to take advantage of perceived differences in relative values of the various asset classes.
The Bloomberg Barclays Global Aggregate Index provides a broad-based measure of the global investment grade fixed-rate debt markets. It is comprised of the U.S. Aggregate, Pan-European Aggregate, the Asian-Pacific Aggregate Indices, and the Canadian Aggregate Indices. It also includes a wide range of standard and customized sub-indices by liquidity constraint, sector, quality, and maturity.
Index figures do not take any expenses, fees, or taxes into account, but mutual fund returns do. The indices are used herein for comparative purposes in accordance with the U.S Securities and Exchange Commission regulations.
This chart assumes an initial gross investment of $1,000,000 made on January 31, 2006 (commencement of operations). Returns shown include the reinvestment of all dividends. The Fund’s past performance is not necessarily an indication of its future performance. It may perform better or worse in the future. The graph and the table do not reflect the deduction of taxes that a shareholder would pay on Fund distributions or the redemption of shares.
| The Leuthold Funds - 2019 Annual Report | 17 |
Leuthold Global Fund - Retail Class - GLBLX
(Unaudited)
Average Annual Rate of Return For Periods Ended
September 30, 2019
| | | 1 Year | | 3 Year | | 5 Year | | 10 Year | | Since
Inception |
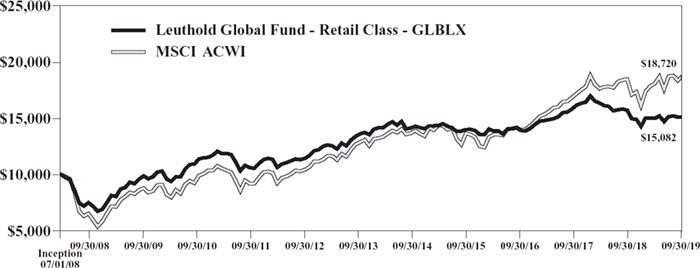
| Leuthold Global Fund - Retail Class - GLBLX | | (3.97)% | | 2.24% | | 1.43% | | 4.94% | | 3.72% |
| MSCI ACWI | | 1.38% | | 9.71% | | 6.65% | | 8.35% | | 5.73% |
| Bloomberg Barclays Global Aggregate Index | | 7.60% | | 1.59% | | 1.99% | | 2.34% | | 2.89% |
| S&P 500 Index | | 4.25% | | 13.39% | | 10.84% | | 13.24% | | 10.08% |
A $10,000 investment in the Leuthold Global Fund - Retail Class - GLBLX
The MSCI ACWI (All Country World Index) captures large- and mid-cap representation across 23 Developed Market (DM) and 26 Emerging Market (EM) countries.
The Bloomberg Barclays Global Aggregate Index provides a broad-based measure of the global investment grade fixed-rate debt markets. It is comprised of the U.S. Aggregate, Pan-European Aggregate, the Asian-Pacific Aggregate Indices, and the Canadian Aggregate Indices. It also includes a wide range of standard and customized sub-indices by liquidity constraint, sector, quality, and maturity.
The S&P 500 Index is an unmanaged capitalization-weighted index of 500 stocks designed to measure performance of the broad domestic economy through changes in the aggregate market value of the 500 stocks, which represent all major industries.
Index figures do not take any expenses, fees, or taxes into account, but mutual fund returns do. The indices are used herein for comparative purposes in accordance with the U.S Securities and Exchange Commission regulations.
This chart assumes an initial gross investment of $10,000 made on July 1, 2008 (commencement of operations). Returns shown include the reinvestment of all dividends. The Fund��s past performance is not necessarily an indication of its future performance. It may perform better or worse in the future. The graph and the table do not reflect the deduction of taxes that a shareholder would pay on Fund distributions or the redemption of shares.
| 18 | The Leuthold Funds - 2019 Annual Report |
Leuthold Global Fund - Institutional Class - GLBIX
(Unaudited)
Average Annual Rate of Return For Periods Ended
September 30, 2019
| | | 1 Year | | 3 Year | | 5 Year | | 10 Year | | Since
Inception |
| Leuthold Global Fund - Institutional Class - GLBIX | | (3.70)% | | 2.49% | | 1.66% | | 5.17% | | 3.80% |
| MSCI ACWI | | 1.38% | | 9.71% | | 6.65% | | 8.35% | | 4.92% |
| Bloomberg Barclays Global Aggregate Index | | 7.60% | | 1.59% | | 1.99% | | 2.34% | | 2.74% |
| S&P 500 Index | | 4.25% | | 13.39% | | 10.84% | | 13.24% | | 9.24% |
A $1,000,000 investment in the Leuthold Global Fund - Institutional Class - GLBIX

The MSCI ACWI (All Country World Index) captures large- and mid-cap representation across 23 Developed Market (DM) and 26 Emerging Market (EM) countries.
The Bloomberg Barclays Global Aggregate Index provides a broad-based measure of the global investment grade fixed-rate debt markets. It is comprised of the U.S. Aggregate, Pan-European Aggregate, the Asian-Pacific Aggregate Indices, and the Canadian Aggregate Indices. It also includes a wide range of standard and customized sub-indices by liquidity constraint, sector, quality, and maturity.
The S&P 500 Index is an unmanaged capitalization-weighted index of 500 stocks designed to measure performance of the broad domestic economy through changes in the aggregate market value of the 500 stocks, which represent all major industries.
Index figures do not take any expenses, fees, or taxes into account, but mutual fund returns do. The indices are used herein for comparative purposes in accordance with the U.S Securities and Exchange Commission regulations.
This chart assumes an initial gross investment of $1,000,000 made on April 30, 2008 (commencement of operations). Returns shown include the reinvestment of all dividends. The Fund’s past performance is not necessarily an indication of its future performance. It may perform better or worse in the future. The graph and the table do not reflect the deduction of taxes that a shareholder would pay on Fund distributions or the redemption of shares.
| The Leuthold Funds - 2019 Annual Report | 19 |
Leuthold Select Industries Fund - LSLTX
(Unaudited)
Average Annual Rate of Return For Periods Ended September 30, 2019
| | | 1 Year | | 3 Year | | 5 Year | | 10 Year | | Since
Inception |
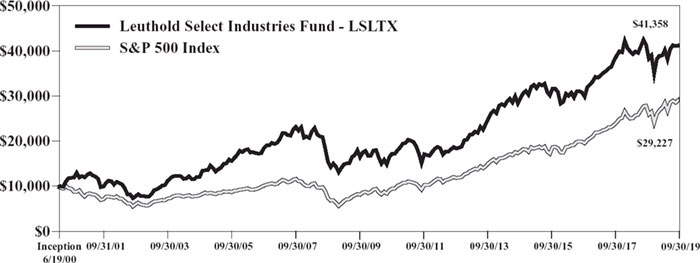
| Leuthold Select Industries Fund - LSLTX | | (0.19)% | | 10.14% | | 7.70% | | 8.60% | | 7.64% |
| Russell 2000 Index | | (8.89)% | | 8.23% | | 8.19% | | 11.19% | | 7.13% |
| S&P 600 Index | | (9.34)% | | 9.33% | | 9.89% | | 13.02% | | 9.34% |
| Lipper Multi-Cap Core Funds Index | | 0.98% | | 11.09% | | 8.82% | | 11.50% | | 5.54% |
| S&P 500 Index | | 4.25% | | 13.39% | | 10.84% | | 13.24% | | 5.72% |
A $10,000 investment in the Leuthold Select Industries Fund - LSLTX
The Russell 2000 Index is comprised of approximately 2000 of the smallest companies in the Russell 3000 Index, representing approximately 10% of the Russell 3000 total market capitalization.
The S&P 600 Index is an index of small-cap stocks which tracks a broad range of small-sized companies that meet specific liquidity and stability requirements. This is determined by specific metrics such as public float, market capitalization, and financial viability among a few other factors. Market capitalization, for instance, must fall between $450 million and $2.1 billion to ensure individual assets do not overlap with the larger S&P 500 or mid-cap S&P 400 indexes.
The Lipper Multi-Cap Core Funds Index is an average of funds that invest in a variety of market capitalization ranges without concentrating 75% of their equity assets in any one market capitalization range over an extended period of time. Multi-cap funds typically have between 25% and 75% of their assets invested in companies with market capitalizations (on a three-year weighted basis) above 300% of the dollar-weighted median market capitalization of the middle 1,000 securities of the S&P SuperComposite 1500 Index. These funds typically have an average price-to-earnings ratio, price-to-book ratio, and three-year sales-per-share growth value, compared to the S&P SuperComposite 1500 Index.
The S&P 500 Index is an unmanaged capitalization-weighted index of 500 stocks designed to measure performance of the broad domestic economy through changes in the aggregate market value of the 500 stocks, which represent all major industries.
Index figures do not take any expenses, fees, or taxes into account, but mutual fund returns do. The indices are used herein for comparative purposes in accordance with the U.S Securities and Exchange Commission regulations.
This chart assumes an initial gross investment of $10,000 made on June 19, 2000 (commencement of operations). Returns shown include the reinvestment of all dividends. The Fund’s past performance is not necessarily an indication of its future performance. It may perform better or worse in the future. The graph and the table do not reflect the deduction of taxes that a shareholder would pay on Fund distributions or the redemption of shares.
| 20 | The Leuthold Funds - 2019 Annual Report |
Grizzly Short Fund - GRZZX
(Unaudited)
Average Annual Rate of Return For Periods Ended September 30, 2019
| | | 1 Year | | 3 Year | | 5 Year | | 10 Year | | Since
Inception |
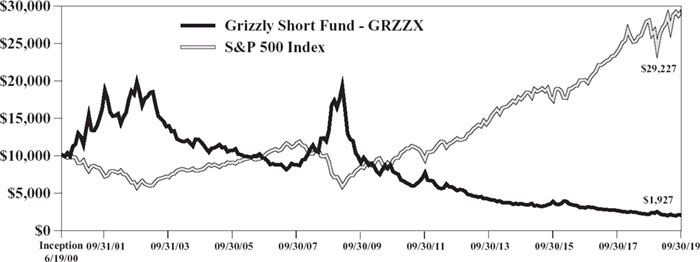
| Grizzly Short Fund - GRZZX | | (7.62)% | | (12.90)% | | (11.17)% | | (14.27)% | | (8.18)% |
| Lipper Dedicated Short Bias Fund Index | | (5.46)% | | (15.63)% | | (15.65)% | | (19.55)% | | n/a* |
| S&P MidCap 400 Index | | (2.49)% | | 9.38% | | 8.88% | | 12.56% | | 8.75% |
| S&P 500 Index | | 4.25% | | 13.39% | | 10.84% | | 13.24% | | 5.72% |
A $10,000 investment in the Grizzly Short Fund - GRZZX
The Lipper Dedicated Short Bias Funds Index is an equally weighted representation of funds in the Lipper Dedicated Short Bias category. These funds employ a hedge fund strategy that maintains a net short exposure to the market through a combination of short and long positions. A dedicated short bias investment strategy attempts to capture profits when the market declines, by holding investments that are overall biased to the short side.
The S&P MidCap 400 Index is a capitalization-weighted index, which measures the performance of the mid-range sector of the U.S. stock market. The index was developed with a base level of 100 as of December 31, 1990.
The S&P 500 Index is an unmanaged capitalization-weighted index of 500 stocks designed to measure performance of the broad domestic economy through changes in the aggregate market value of the 500 stocks, which represent all major industries.
Index figures do not take any expenses, fees, or taxes into account, but mutual fund returns do. The indices are used herein for comparative purposes in accordance with the U.S Securities and Exchange Commission regulations.
This chart assumes an initial gross investment of $10,000 made on June 19, 2000 (commencement of operations). Returns shown include the reinvestment of all dividends. The Fund’s past performance is not necessarily an indication of its future performance. It may perform better or worse in the future. The graph and the table do not reflect the deduction of taxes that a shareholder would pay on Fund distributions or the redemption of shares.
* Index was introduced in July 2003.
| The Leuthold Funds - 2019 Annual Report | 21 |
The Leuthold Funds
Statements of Assets and Liabilities
September 30, 2019
| | | Leuthold
Core
Investment
Fund | | | Leuthold
Global
Fund | |
| ASSETS: | | | | | | | | |
| Investments, at cost | | | | | | | | |
| Unaffiliated Securities | | $ | 546,019,393 | * | | $ | 57,241,163 | * |
| Affiliated Securities | | | 19,045,784 | | | | — | |
| Total Investments, at cost | | | 565,065,177 | | | | 57,241,163 | |
| | | | | | | | | |
| Investments, at fair value | | | | | | | | |
| Unaffiliated Securities | | | 635,040,452 | | | | 58,418,713 | |
| Affiliated Securities | | | 19,614,081 | | | | — | |
| Total Investments, at fair value | | | 654,654,533 | | | | 58,418,713 | |
| Foreign currency (cost $10,484 and $164,963, respectively) | | | 10,480 | | | | 164,963 | |
| Receivable for Fund shares sold | | | 904,018 | | | | 5,583 | |
| Receivable for investments sold | | | 13,744,944 | | | | 2,840,527 | |
| Collateral at broker for securities sold short | | | 95,067,095 | | | | 8,322,758 | |
| Tri-party collateral held at custodian | | | 20,000,001 | | | | 1,500,001 | |
| Interest receivable | | | 559,893 | | | | 47,043 | |
| Dividends receivable | | | 144,193 | | | | 203,039 | |
| Securities lending income receivable | | | 38,428 | | | | 3,035 | |
| Other assets | | | 175,071 | | | | 23,786 | |
| Total Assets | | | 785,298,656 | | | | 71,529,448 | |
| | | | | | | | | |
| LIABILITIES: | | | | | | | | |
| Securities sold short, at fair value (proceeds $96,429,317 and $8,313,816, respectively) | | | 91,932,355 | | | | 8,129,436 | |
| Collateral received for securities loaned | | | 58,159,492 | | | | 7,331,745 | |
| Payable for investments purchased | | | 12,590,401 | | | | 2,734,193 | |
| Payable for Fund shares redeemed | | | 3,377,277 | | | | — | |
| Payable to Adviser | | | 475,233 | | | | 39,978 | |
| Payable to Custodian | | | 15,330 | | | | 11,513 | |
| Payable to Directors | | | 34,910 | | | | 2,999 | |
| Dividends payable on securities sold short | | | 46,113 | | | | 1,909 | |
| Distribution (Rule 12b-1) fees payable | | | 7,361 | | | | 19,902 | |
| Shareholder servicing fees payable | | | 54,335 | | | | — | |
| Accrued expenses and other liabilities | | | 331,540 | | | | 95,365 | |
| Total Liabilities | | | 167,024,347 | | | | 18,367,040 | |
| NET ASSETS | | $ | 618,274,309 | | | $ | 53,162,408 | |
| | | | | | | | | |
| * Includes loaned securities with market value of: | | $ | 57,032,547 | | | $ | 7,193,841 | |
| 22 | The Leuthold Funds - 2019 Annual Report | See Notes to the Financial Statements. |
The Leuthold Funds
Statements of Assets and Liabilities (continued)
September 30, 2019
| | | Leuthold
Core
Investment
Fund | | | Leuthold
Global
Fund | |
| NET ASSETS CONSIST OF: | | | | | | | | |
| Capital stock | | $ | 514,675,079 | | | $ | 53,383,579 | |
| Total distributable earnings | | | 103,599,230 | | | | (221,171 | ) |
| Total Net Assets | | $ | 618,274,309 | | | $ | 53,162,408 | |
| | | | | | | | | |
| Retail Class Shares | | | | | | | | |
| Net assets | | $ | 316,887,197 | | | $ | 7,485,394 | |
| Shares outstanding (1,000,000,000 shares of $0.0001 par value authorized) | | | 16,878,500 | | | | 924,892 | |
| Net Asset Value, Redemption Price, and Offering Price Per Share | | $ | 18.77 | ** | | $ | 8.09 | ** |
| | | | | | | | | |
| Institutional Class Shares | | | | | | | | |
| Net assets | | $ | 301,387,112 | | | $ | 45,677,014 | |
| Shares outstanding (1,000,000,000 shares of $0.0001 par value authorized) | | | 16,024,823 | | | | 5,562,748 | |
| Net Asset Value, Redemption Price, and Offering Price Per Share | | $ | 18.81 | ** | | $ | 8.21 | ** |
** Redemption price may differ from NAV if redemption fee is applied.
| See Notes to the Financial Statements. | The Leuthold Funds - 2019 Annual Report | 23 |
The Leuthold Funds
Statements of Assets and Liabilities (continued)
September 30, 2019
| | | Leuthold
Select
Industries
Fund | | | Grizzly
Short
Fund | |
| ASSETS: | | | | | | | | |
| Investments, at cost | | $ | 8,991,668 | | | $ | 70,599,843 | |
| | | | | | | | | |
| Investments, at fair value | | | 11,808,278 | | | | 70,599,843 | |
| Foreign currency (cost $333 and $0, respectively) | | | 333 | | | | — | |
| Receivable for Fund shares sold | | | — | | | | 41,087 | |
| Receivable for investments sold | | | — | | | | 4,188,090 | |
| Collateral at broker for securities sold short | | | — | | | | 93,047,892 | |
| Tri-party collateral held at custodian | | | — | | | | 18,000,001 | |
| Interest receivable | | | 90 | | | | 120,598 | |
| Dividends receivable | | | 4,370 | | | | — | |
| Other assets | | | 26,678 | | | | 136,141 | |
| Total Assets | | | 11,839,749 | | | | 186,133,652 | |
| | | | | | | | | |
| LIABILITIES: | | | | | | | | |
| Securities sold short, at fair value (proceeds $0 and $97,324,483, respectively) | | | — | | | | 90,328,624 | |
| Payable for investments purchased | | | — | | | | 3,163,910 | |
| Payable for Fund shares redeemed | | | 1,074 | | | | 177,592 | |
| Payable to Adviser | | | 13,334 | | | | 94,762 | |
| Payable to Custodian | | | 1,841 | | | | 1,715 | |
| Payable to Directors | | | 653 | | | | 5,088 | |
| Dividends payable on securities sold short | | | — | | | | 43,719 | |
| Shareholder servicing fees payable | | | 2,244 | | | | 14,917 | |
| Accrued expenses and other liablities | | | 36,719 | | | | 65,239 | |
| Total Liabilities | | | 55,865 | | | | 93,895,566 | |
| NET ASSETS | | $ | 11,783,884 | | | $ | 92,238,086 | |
| 24 | The Leuthold Funds - 2019 Annual Report | See Notes to the Financial Statements. |
The Leuthold Funds
Statements of Assets and Liabilities (continued)
September 30, 2019
| | | Leuthold
Select
Industries
Fund | | | Grizzly
Short
Fund | |
| NET ASSETS CONSIST OF: | | | | | | | | |
| Capital stock | | $ | 8,906,886 | | | $ | 322,148,551 | |
| Total distributable earnings | | | 2,876,998 | | | | (229,910,465 | ) |
| Total Net Assets | | $ | 11,783,884 | | | $ | 92,238,086 | |
| | | | | | | | | |
| Retail Class Shares | | | | | | | | |
| Net assets | | $ | 11,783,884 | | | $ | 92,238,086 | |
| Shares outstanding (1,000,000,000 shares of $0.0001 par value authorized) | | | 470,948 | | | | 5,712,018 | |
| Net Asset Value, Redemption Price, and Offering Price Per Share | | $ | 25.02 | | | $ | 16.15 | |
| See Notes to the Financial Statements. | The Leuthold Funds - 2019 Annual Report | 25 |
The Leuthold Funds
Statements of Operations
For the Year Ended September 30, 2019
| | | Leuthold
Core
Investment
Fund | | | Leuthold
Global
Fund | |
| INVESTMENT INCOME: | | | | | | | | |
| Dividend income (net of foreign taxes withheld of $13,734 and $50,757, respectively) | | $ | 6,338,839 | | | $ | 858,590 | |
| Interest income | | | 6,009,802 | | | | 557,354 | |
| Income from securities lending, net | | | 307,317 | | | | 47,845 | |
| Total investment income | | | 12,655,958 | | | | 1,463,789 | |
| | | | | | | | | |
| EXPENSES: | | | | | | | | |
| Investment advisory fees (Note 3) | | | 6,334,568 | | | | 611,718 | |
| Administration fees | | | 349,774 | | | | 49,999 | |
| Transfer agent fees (Note 5) | | | 371,921 | | | | 63,787 | |
| Legal fees | | | 26,144 | | | | 5,483 | |
| Audit fees | | | 89,560 | | | | 64,260 | |
| Fund accounting fees | | | 132,492 | | | | 21,734 | |
| Custody fees | | | 55,915 | | | | 51,784 | |
| Shareholder servicing fees - Retail Class (Note 5) | | | 344,903 | | | | — | |
| Registration fees | | | 62,666 | | | | 35,542 | |
| Report to shareholders | | | 88,833 | | | | 7,989 | |
| Directors’ fees | | | 154,173 | | | | 14,757 | |
| Distribution (Rule 12b-1) fees - Retail Class (Note 4) | | | — | | | | 25,346 | |
| Other | | | 55,499 | | | | 6,965 | |
| Total expenses before dividends and interest on securities sold short | | | 8,066,448 | | | | 959,364 | |
| Dividends and interest on securities sold short | | | 879,847 | | | | 177,412 | |
| Total expenses | | | 8,946,295 | | | | 1,136,776 | |
| NET INVESTMENT INCOME | | $ | 3,709,663 | | | $ | 327,013 | |
| 26 | The Leuthold Funds - 2019 Annual Report | See Notes to the Financial Statements. |
The Leuthold Funds
Statements of Operations (continued)
For the Year Ended September 30, 2019
| | | Leuthold
Core
Investment
Fund | | | Leuthold
Global
Fund | |
| REALIZED AND UNREALIZED GAIN (LOSS) ON INVESTMENTS, INVESTMENT COMPANIES, SECURITIES SOLD SHORT, AND FOREIGN CURRENCY AND FOREIGN CURRENCY TRANSLATION: | | | | | | | | |
| Net realized gain (loss) on: | | | | | | | | |
| Investments | | $ | 20,902,154 | | | $ | (1,668,846 | ) |
| Investment companies | | | (3,484,692 | ) | | | (112,450 | ) |
| Realized gain distributions received from investment companies | | | 219,720 | | | | — | |
| Securities sold short | | | 186,123 | | | | 441,852 | |
| Foreign currency and foreign currency translation | | | 130,233 | | | | 43,616 | |
| Net unrealized appreciation (depreciation) during the year on: | | | | | | | | |
| Investments | | | (24,726,380 | ) | | | (2,889,560 | ) |
| Investment companies | | | 5,611,887 | | | | 419,709 | |
| Securities sold short | | | 2,560,305 | | | | (83,437 | ) |
| Foreign currency and foreign currency translation | | | (1,751,541 | ) | | | (231,915 | ) |
| Net realized and unrealized loss on investments, investment companies, securities sold short, and foreign currency and foreign currency translation | | | (352,191 | ) | | | (4,081,031 | ) |
| NET INCREASE (DECREASE) IN NET ASSETS | | | | | | | | |
| RESULTING FROM OPERATIONS | | $ | 3,357,472 | | | $ | (3,754,018 | ) |
| See Notes to the Financial Statements. | The Leuthold Funds - 2019 Annual Report | 27 |
The Leuthold Funds
Statements of Operations (continued)
For the Year Ended September 30, 2019
| | | Leuthold
Select
Industries
Fund | | | Grizzly
Short
Fund | |
| INVESTMENT INCOME: | | | | | | | | |
| Dividend income (net of foreign taxes withheld of $465 and $0, respectively) | | $ | 179,502 | | | $ | 8,912 | |
| Interest income | | | 2,638 | | | | 3,646,896 | |
| Total investment income | | | 182,140 | | | | 3,655,808 | |
| | | | | | | | | |
| EXPENSES: | | | | | | | | |
| Investment advisory fees (Note 3) | | | 131,926 | | | | 1,236,441 | |
| Administration fees | | | 20,939 | | | | 58,785 | |
| Transfer agent fees (Note 5) | | | 9,923 | | | | 54,489 | |
| Legal fees | | | 512 | | | | 2,791 | |
| Audit fees | | | 28,184 | | | | 28,260 | |
| Fund accounting fees | | | 5,598 | | | | 19,453 | |
| Custody fees | | | 5,477 | | | | 7,278 | |
| Shareholder servicing fees - Retail Class (Note 5) | | | 14,034 | | | | 87,789 | |
| Registration fees | | | 9,283 | | | | 39,324 | |
| Report to shareholders | | | 2,353 | | | | 14,279 | |
| Directors’ fees | | | 2,808 | | | | 22,148 | |
| Other | | | 2,065 | | | | 9,259 | |
| Total expenses before dividends and interest on securities sold short and reimbursement from Adviser | | | 233,102 | | | | 1,580,296 | |
| Dividends and interest on securities sold short | | | — | | | | 1,004,931 | |
| Reimbursement from Adviser (Note 3) | | | (35,213 | ) | | | — | |
| Total expenses | | | 197,889 | | | | 2,585,227 | |
| NET INVESTMENT INCOME (LOSS) | | $ | (15,749 | ) | | $ | 1,070,581 | |
| 28 | The Leuthold Funds - 2019 Annual Report | See Notes to the Financial Statements. |
The Leuthold Funds
Statements of Operations (continued)
For the Year Ended September 30, 2019
| | | Leuthold
Select
Industries
Fund | | | Grizzly
Short
Fund | |
| REALIZED AND UNREALIZED GAIN (LOSS) ON INVESTMENTS, INVESTMENT COMPANIES, SECURITIES SOLD SHORT, AND FOREIGN CURRENCY AND FOREIGN CURRENCY TRANSLATION: | | | | | | | | |
| Net realized gain (loss) on: | | | | | | | | |
| Investments | | $ | 405,578 | | | $ | — | |
| Investment companies | | | 7,920 | | | | — | |
| Securities sold short | | | — | | | | (12,327,226 | ) |
| Foreign currency and foreign currency translation | | | 2 | | | | — | |
| Net unrealized appreciation (depreciation) during the year on: | | | | | | | | |
| Investments | | | (946,731 | ) | | | — | |
| Securities sold short | | | — | | | | 3,713,595 | |
| Foreign currency and foreign currency translation | | | (3 | ) | | | — | |
| Net realized and unrealized loss on investments, investment companies, securities sold short, and foreign currency and foreign currency translation | | | (533,234 | ) | | | (8,613,631 | ) |
| NET DECREASE IN NET ASSETS | | | | | | | | |
| RESULTING FROM OPERATIONS | | $ | (548,983 | ) | | $ | (7,543,050 | ) |
| See Notes to the Financial Statements. | The Leuthold Funds - 2019 Annual Report | 29 |
Leuthold Core Investment Fund
Statements of Changes in Net Assets
| | | Year Ended
September 30, 2019 | | | Year Ended
September 30, 2018 | |
| OPERATIONS: | | | | | | | | |
| Net investment income | | $ | 3,709,663 | | | $ | 2,708,840 | |
| Net realized gain on investments, investment companies, securities sold short, and foreign currency and foreign currency translation | | �� | 17,953,538 | | | | 84,625,374 | |
| Net unrealized depreciation on investments, investment companies, securities sold short, and foreign currency and foreign currency translation | | | (18,305,729 | ) | | | (59,527,356 | ) |
| Net increase in net assets from operations | | | 3,357,472 | | | | 27,806,858 | |
| | | | | | | | | |
| DISTRIBUTIONS TO SHAREHOLDERS: | | | | | | | | |
| Distributions - Retail Class | | | (36,279,698 | ) | | | (15,722,617 | ) |
| Distributions - Institutional Class | | | (39,291,618 | ) | | | (13,500,115 | ) |
| Total distributions | | | (75,571,316 | ) | | | (29,222,732 | ) |
| | | | | | | | | |
| CAPITAL SHARE TRANSACTIONS: | | | | | | | | |
| Proceeds from shares sold - Retail Class | | | 23,071,159 | | | | 49,574,688 | |
| Proceeds from shares sold - Institutional Class | | | 99,334,788 | | | | 99,394,031 | |
| Proceeds from shares issued to holders in reinvestment of dividends - Retail Class | | | 34,048,341 | | | | 14,973,202 | |
| Proceeds from shares issued to holders in reinvestment of dividends - Institutional Class | | | 35,405,269 | | | | 11,741,082 | |
| Cost of shares redeemed - Retail Class* | | | (108,678,134 | ) | | | (125,626,684 | ) |
| Cost of shares redeemed - Institutional Class** | | | (229,952,506 | ) | | | (61,432,479 | ) |
| Net decrease in net assets from capital share transactions | | | (146,771,083 | ) | | | (11,376,160 | ) |
| | | | | | | | | |
| TOTAL DECREASE IN NET ASSETS: | | | (218,984,927 | ) | | | (12,792,034 | ) |
| NET ASSETS | | | | | | | | |
| Beginning of year | | | 837,259,236 | | | | 850,051,270 | |
| End of year | | $ | 618,274,309 | | | $ | 837,259,236 | |
| | | | | | | | | |
| | | | | | | | | |
| CHANGES IN SHARES OUTSTANDING: | | | | | | | | |
| Shares sold - Retail Class | | | 1,246,916 | | | | 2,391,128 | |
| Shares sold - Institutional Class | | | 5,471,510 | | | | 4,806,861 | |
| Shares issued to holders in reinvestment of dividends - Retail Class | | | 1,878,824 | | | | 734,892 | |
| Shares issued to holders in reinvestment of dividends - Institutional Class | | | 1,950,355 | | | | 575,096 | |
| Shares redeemed - Retail Class | | | (5,911,248 | ) | | | (6,082,213 | ) |
| Shares redeemed - Institutional Class | | | (12,549,398 | ) | | | (2,972,534 | ) |
| Net decrease in shares outstanding | | | (7,913,041 | ) | | | (546,770 | ) |
| | | | | | | | | |
| * Net of redemption fees of (Retail Class): | | $ | 132 | | | $ | 299 | |
| ** Net of redemption fees of (Institutional Class): | | $ | 142 | | | $ | 262 | |
| 30 | The Leuthold Funds - 2019 Annual Report | See Notes to the Financial Statements. |
Leuthold Global Fund
Statements of Changes in Net Assets
| | | Year Ended
September 30, 2019 | | | Year Ended
September 30, 2018 | |
| OPERATIONS: | | | | | | | | |
| Net investment income | | $ | 327,013 | | | $ | 456,785 | |
| Net realized gain (loss) on investments, investment companies, securities sold short, and foreign currency and foreign currency translation | | | (1,295,828 | ) | | | 7,014,480 | |
| Net unrealized depreciation on investments, investment companies, securities sold short, and foreign currency and foreign currency translation | | | (2,785,203 | ) | | | (7,628,313 | ) |
| Net decrease in net assets from operations | | | (3,754,018 | ) | | | (157,048 | ) |
| | | | | | | | | |
| DISTRIBUTIONS TO SHAREHOLDERS: | | | | | | | | |
| Distributions - Retail Class | | | (898,152 | ) | | | (2,138,468 | ) |
| Distributions - Institutional Class | | | (4,756,056 | ) | | | (6,753,470 | ) |
| Total distributions | | | (5,654,208 | ) | | | (8,891,938 | ) |
| | | | | | | | | |
| CAPITAL SHARE TRANSACTIONS: | | | | | | | | |
| Proceeds from shares sold - Retail Class | | | 2,174,839 | | | | 2,028,207 | |
| Proceeds from shares sold - Institutional Class | | | 20,930,190 | | | | 15,052,597 | |
| Proceeds from shares issued to holders in reinvestment of dividends - Retail Class | | | 861,148 | | | | 2,063,968 | |
| Proceeds from shares issued to holders in reinvestment of dividends - Institutional Class | | | 4,460,742 | | | | 6,015,022 | |
| Cost of shares redeemed - Retail Class* | | | (12,393,873 | ) | | | (7,608,038 | ) |
| Cost of shares redeemed - Institutional Class** | | | (36,213,570 | ) | | | (28,405,896 | ) |
| Net decrease in net assets from capital share transactions | | | (20,180,524 | ) | | | (10,854,140 | ) |
| | | | | | | | | |
| TOTAL DECREASE IN NET ASSETS: | | | (29,588,750 | ) | | | (19,903,126 | ) |
| NET ASSETS | | | | | | | | |
| Beginning of year | | | 82,751,158 | | | | 102,654,284 | |
| End of year | | $ | 53,162,408 | | | $ | 82,751,158 | |
| | | | | | | | | |
| CHANGES IN SHARES OUTSTANDING: | | | | | | | | |
| Shares sold - Retail Class | | | 276,540 | | | | 211,107 | |
| Shares sold - Institutional Class | | | 2,534,279 | | | | 1,553,258 | |
| Shares issued to holders in reinvestment of dividends - Retail Class | | | 107,218 | | | | 219,621 | |
| Shares issued to holders in reinvestment of dividends - Institutional Class | | | 547,843 | | | | 632,740 | |
| Shares redeemed - Retail Class | | | (1,473,489 | ) | | | (807,863 | ) |
| Shares redeemed - Institutional Class | | | (4,492,387 | ) | | | (2,952,591 | ) |
| Net decrease in shares outstanding | | | (2,499,996 | ) | | | (1,143,728 | ) |
| | | | | | | | | |
| * Net of redemption fees of (Retail Class): | | $ | 62 | | | $ | 205 | |
| ** Net of redemption fees of (Institutional Class): | | $ | 259 | | | $ | 2 | |
| See Notes to the Financial Statements. | The Leuthold Funds - 2019 Annual Report | 31 |
Leuthold Select Industries Fund
Statements of Changes in Net Assets
| | | Year Ended
September 30, 2019 | | | Year Ended
September 30, 2018 | |
| OPERATIONS: | | | | | | | | |
| Net investment loss | | $ | (15,749 | ) | | $ | (3,769 | ) |
| Net realized gain on investments | | | 413,500 | | | | 1,713,403 | |
| Net unrealized depreciation on investments | | | (946,734 | ) | | | (242,614 | ) |
| Net increase (decrease) in net assets from operations | | | (548,983 | ) | | | 1,467,020 | |
| | | | | | | | | |
| DISTRIBUTIONS TO SHAREHOLDERS: | | | | | | | | |
| Distributions - Retail Class | | | (1,295,440 | ) | | | (741,441 | ) |
| Total distributions | | | (1,295,440 | ) | | | (741,441 | ) |
| | | | | | | | | |
| CAPITAL SHARE TRANSACTIONS: | | | | | | | | |
| Proceeds from shares sold | | | 1,366,497 | | | | 11,024,392 | |
| Proceeds from shares issued to holders in reinvestment of dividends | | | 1,242,103 | | | | 712,871 | |
| Cost of shares redeemed | | | (7,092,225 | ) | | | (9,396,776 | ) |
| Net increase (decrease) in net assets from capital share transactions | | | (4,483,625 | ) | | | 2,340,487 | |
| | | | | | | | | |
| TOTAL INCREASE (DECREASE) IN NET ASSETS: | | | (6,328,048 | ) | | | 3,066,066 | |
| NET ASSETS | | | | | | | | |
| Beginning of year | | | 18,111,932 | | | | 15,045,866 | |
| End of year | | $ | 11,783,884 | | | $ | 18,111,932 | |
| | | | | | | | | |
| CHANGES IN SHARES OUTSTANDING: | | | | | | | | |
| Shares sold | | | 55,582 | | | | 412,330 | |
| Shares issued to holders in reinvestment of dividends | | | 52,833 | | | | 27,474 | |
| Shares redeemed | | | (300,598 | ) | | | (348,325 | ) |
| Net increase (decrease) in shares outstanding | | | (192,183 | ) | | | 91,479 | |
| 32 | The Leuthold Funds - 2019 Annual Report | See Notes to the Financial Statements. |
Grizzly Short Fund
Statements of Changes in Net Assets
| | | Year Ended
September 30, 2019 | | | Year Ended
September 30, 2018 | |
| OPERATIONS: | | | | | | | | |
| Net investment gain (loss) | | $ | 1,070,581 | | | $ | (894,109 | ) |
| Net realized loss on securities sold short and foreign currency and foreign currency translation | | | (12,327,226 | ) | | | (35,514,168 | ) |
| Net unrealized appreciation on securities sold short and foreign currency and foreign currency translation | | | 3,713,595 | | | | 2,114,602 | |
| Net decrease in net assets from operations | | | (7,543,050 | ) | | | (34,293,675 | ) |
| | | | | | | | | |
| DISTRIBUTIONS TO SHAREHOLDERS: | | | | | | | | |
| Distributions - Retail Class | | | (838,199 | ) | | | — | |
| Total distributions | | | (838,199 | ) | | | — | |
| | | | | | | | | |
| CAPITAL SHARE TRANSACTIONS: | | | | | | | | |
| Proceeds from shares sold | | | 100,269,875 | | | | 136,445,760 | |
| Proceeds from shares issued to holders in reinvestment of dividends | | | 735,046 | | | | — | |
| Cost of shares redeemed | | | (99,334,343 | ) | | | (208,901,601 | ) |
| Net increase (decrease) in net assets from capital share transactions | | | 1,670,578 | | | | (72,455,841 | ) |
| | | | | | | | | |
| TOTAL DECREASE IN NET ASSETS: | | | (6,710,671 | ) | | | (106,749,516 | ) |
| NET ASSETS | | | | | | | | |
| Beginning of year | | | 98,948,757 | | | | 205,698,273 | |
| End of year | | $ | 92,238,086 | | | $ | 98,948,757 | |
| | | | | | | | | |
| CHANGES IN SHARES OUTSTANDING: | | | | | | | | |
| Shares sold | | | 5,600,448 | | | | 24,912,796 | |
| Shares issued to holders in reinvestment of dividends | | | 46,438 | | | | — | |
| Shares redeemed | | | (5,541,094 | ) | | | (57,577,260 | ) |
| Net increase (decrease) in shares outstanding | | | 105,792 | | | | (32,664,464 | ) |
| See Notes to the Financial Statements. | The Leuthold Funds - 2019 Annual Report | 33 |
| 34 | The Leuthold Funds - 2019 Annual Report | See Notes to the Financial Statements. |
Leuthold Core Investment Fund - Retail - LCORX
Financial Highlights
| | | Year Ended
September 30,
2019 | | Year Ended
September 30,
2018
(Consolidated) | | Year Ended
September 30,
2017
(Consolidated) | | Year Ended
September 30,
2016
(Consolidated) | | Year Ended
September 30,
2015
(Consolidated) |
| Per Share Data (1): | | | | | | | | | | | | | | | | | | | | |
| Net asset value, beginning of year | | $ | 20.50 | | | $ | 20.54 | | | $ | 18.06 | | | $ | 18.44 | | | $ | 18.85 | |
| Income (loss) from investment operations: | | | | | | | | | | | | | | | | | | | | |
| Net investment income (loss) (2) | | | 0.09 | | | | 0.05 | | | | 0.04 | | | | (0.01 | ) | | | (0.01 | ) |
| Net realized and unrealized gain | | | | | | | | | | | | | | | | | | | | |
| on investments and securities sold short | | | 0.08 | | | | 0.61 | | | | 2.53 | | | | 0.32 | | | | 0.76 | |
| Total from investment operations | | | 0.17 | | | | 0.66 | | | | 2.57 | | | | 0.31 | | | | 0.75 | |
| | | | | | | | | | | | | | | | | | | | | |
| Less distributions: | | | | | | | | | | | | | | | | | | | | |
| From net investment income | | | (0.07 | ) | | | (0.05 | ) | | | (0.01 | ) | | | — | | | | (0.03 | ) |
| From net realized gain | | | (1.83 | ) | | | (0.65 | ) | | | (0.08 | ) | | | (0.69 | ) | | | (1.13 | ) |
| Redemption fees (3) | | | 0.00 | | | | 0.00 | | | | 0.00 | | | | 0.00 | | | | 0.00 | |
| Total distributions | | | (1.90 | ) | | | (0.70 | ) | | | (0.09 | ) | | | (0.69 | ) | | | (1.16 | ) |
| Net asset value, end of year | | $ | 18.77 | | | $ | 20.50 | | | $ | 20.54 | | | $ | 18.06 | | | $ | 18.44 | |
| | | | | | | | | | | | | | | | | | | | | |
| Total Return | | | 1.21 | % | | | 3.23 | % | | | 14.31 | % | | | 1.76 | % | | | 4.03 | % |
| | | | | | | | | | | | | | | | | | | | | |
| Supplemental data and ratios: | | | | | | | | | | | | | | | | | | | | |
| Net assets, end of year | | $ | 316,887,197 | | | $ | 403,095,456 | | | $ | 464,660,913 | | | $ | 524,731,192 | | | $ | 564,608,599 | |
| Ratio of expenses to average net assets (4) | | | 1.32 | % | | | 1.38 | % | | | 1.21 | % | | | 1.29 | % | | | 1.30 | % |
| Ratio of net investment income (loss) to average net assets (5) | | | 0.48 | % | | | 0.26 | % | | | 0.20 | % | | | (0.08 | )% | | | (0.05 | )% |
| Portfolio turnover rate (6) | | | 66.68 | % | | | 79.00 | % | | | 52.36 | % | | | 109.32 | % | | | 78.96 | % |
| (1) | For a share outstanding throughout the period. Rounded to the nearest cent. |
| (2) | Net investment income (loss) per share is calculated based on average shares outstanding. |
| (3) | Amount represents less than $0.005 per share. |
| (4) | The ratio of expenses to average net assets includes dividends and interest on securities sold short. The expense ratios excluding dividends and interest on securities sold short were 1.20% for the year ended September 30, 2019, 1.19% for the year ended September 30, 2018, 1.19% for the year ended September 30, 2017, 1.17% for the year ended September 30, 2016, and 1.16% for the year ended September 30, 2015. |
| (5) | The net investment income ratios include dividends and interest on securities sold short. |
| (6) | The portfolio turnover rate excludes purchases and sales of securities sold short. |
| See Notes to the Financial Statements. | The Leuthold Funds - 2019 Annual Report | 35 |
Leuthold Core Investment Fund - Institutional - LCRIX
Financial Highlights
| | | Year Ended
September 30,
2019 | | Year Ended
September 30,
2018
(Consolidated) | | Year Ended
September 30,
2017
(Consolidated) | | Year Ended
September 30,
2016
(Consolidated) | | Year Ended
September 30,
2015
(Consolidated) |
| Per Share Data (1): | | | | | | | | | | | | | | | | | | | | |
| Net asset value, beginning of year | | $ | 20.53 | | | $ | 20.56 | | | $ | 18.08 | | | $ | 18.43 | | | $ | 18.85 | |
| Income from investment operations: | | | | | | | | | | | | | | | | | | | | |
| Net investment income (2) | | | 0.11 | | | | 0.08 | | | | 0.06 | | | | 0.01 | | | | 0.01 | |
| Net realized and unrealized gain on investments | | | | | | | | | | | | | | | | | | | | |
| and securities sold short | | | 0.09 | | | | 0.60 | | | | 2.53 | | | | 0.33 | | | | 0.74 | |
| Total from investment operations | | | 0.20 | | | | 0.68 | | | | 2.59 | | | | 0.34 | | | | 0.75 | |
| | | | | | | | | | | | | | | | | | | | | |
| Less distributions: | | | | | | | | | | | | | | | | | | | | |
| From net investment income | | | (0.09 | ) | | | (0.06 | ) | | | (0.03 | ) | | | — | | | | (0.04 | ) |
| From net realized gain | | | (1.83 | ) | | | (0.65 | ) | | | (0.08 | ) | | | (0.69 | ) | | | (1.13 | ) |
| Redemption fees (3) | | | 0.00 | | | | 0.00 | | | | 0.00 | | | | 0.00 | | | | 0.00 | |
| Total distributions | | | (1.92 | ) | | | (0.71 | ) | | | (0.11 | ) | | | (0.69 | ) | | | (1.17 | ) |
| Net asset value, end of year | | $ | 18.81 | | | $ | 20.53 | | | $ | 20.56 | | | $ | 18.08 | | | $ | 18.43 | |
| | | | | | | | | | | | | | | | | | | | | |
| Total Return | | | 1.33 | % | | | 3.35 | % | | | 14.43 | % | | | 1.93 | % | | | 4.03 | % |
| | | | | | | | | | | | | | | | | | | | | |
| Supplemental data and ratios: | | | | | | | | | | | | | | | | | | | | |
| Net assets, end of year | | $ | 301,387,112 | | | $ | 434,163,780 | | | $ | 385,390,357 | | | $ | 378,962,827 | | | $ | 293,666,347 | |
| Ratio of expenses to average net assets (4) | | | 1.22 | % | | | 1.27 | % | | | 1.10 | % | | | 1.17 | % | | | 1.20 | % |
| Ratio of net investment income to average net assets (5) | | | 0.58 | % | | | 0.37 | % | | | 0.30 | % | | | 0.04 | % | | | 0.05 | % |
| Portfolio turnover rate (6) | | | 66.68 | % | | | 79.00 | % | | | 52.36 | % | | | 109.32 | % | | | 78.96 | % |
| (1) | For a share outstanding throughout the period. Rounded to the nearest cent. |
| (2) | Net investment income per share is calculated based on average shares outstanding. (3) Amount represents less than $0.005 per share. |
(3)
| Amount represents less than $0.005 per share.
|
| (4) | The ratio of expenses to average net assets includes dividends and interest on securities sold short. The expense ratios excluding dividends and interest on securities sold short were 1.10% for the year ended September 30, 2019, 1.08% for the year ended September 30, 2018, 1.08% for the year ended September 30, 2017, 1.05% for the year ended September 30, 2016, and 1.06% for the year ended September 30, 2015. |
| (5) | The net investment income ratios include dividends and interest on securities sold short. |
| (6) | The portfolio turnover rate excludes purchases and sales of securities sold short. |
| 36 | The Leuthold Funds - 2019 Annual Report | See Notes to the Financial Statements. |
Leuthold Global Fund - Retail - GLBLX
Financial Highlights
| | | Year Ended
September 30,
2019 | | Year Ended
September 30,
2018
(Consolidated) | | Year Ended
September 30,
2017
(Consolidated) | | Year Ended
September 30,
2016
(Consolidated) | | Year Ended
September 30,
2015
(Consolidated) |
| Per Share Data (1): | | | | | | | | | | | | | | | | | | | | |
| Net asset value, beginning of year | | $ | 9.11 | | | $ | 10.05 | | | $ | 9.86 | | | $ | 10.03 | | | $ | 11.29 | |
| Income (loss) from investment operations: | | | | | | | | | | | | | | | | | | | | |
| Net investment income (loss) (2) | | | 0.02 | | | | 0.03 | | | | 0.04 | | | | (0.01 | ) | | | (0.03 | ) |
| Net realized and unrealized gain (loss) | | | | | | | | | | | | | | | | | | | | |
| on investments and securities sold short | | | (0.39 | ) | | | (0.07 | ) | | | 1.02 | | | | 0.21 | | | | (0.11 | ) |
| Total from investment operations | | | (0.37 | ) | | | (0.04 | ) | | | 1.06 | | | | 0.20 | | | | (0.14 | ) |
| | | | | | | | | | | | | | | | | | | | | |
| Less distributions: | | | | | | | | | | | | | | | | | | | | |
| From net investment income | | | (0.01 | ) | | | (0.02 | ) | | | — | | | | — | | | | (0.03 | ) |
| From net realized gain | | | (0.64 | ) | | | (0.88 | ) | | | (0.87 | ) | | | (0.37 | ) | | | (1.09 | ) |
| Redemption fees (3) | | | 0.00 | | | | 0.00 | | | | 0.00 | | | | 0.00 | | | | 0.00 | |
| Total distributions | | | (0.65 | ) | | | (0.90 | ) | | | (0.87 | ) | | | (0.37 | ) | | | (1.12 | ) |
| Net asset value, end of year | | $ | 8.09 | | | $ | 9.11 | | | $ | 10.05 | | | $ | 9.86 | | | $ | 10.03 | |
| | | | | | | | | | | | | | | | | | | | | |
| Total Return | | | (3.97 | )% | | | (0.67 | )% | | | 12.02 | % | | | 1.89 | % | | | (1.41 | )% |
| | | | | | | | | | | | | | | | | | | | | |
| Supplemental data and ratios: | | | | | | | | | | | | | | | | | | | | |
| Net assets, end of year | | $ | 7,485,394 | | | $ | 18,362,218 | | | $ | 24,040,140 | | | $ | 78,743,516 | | | $ | 95,026,857 | |
| Ratio of expenses to average net assets (4) | | | 1.88 | % | | | 1.75 | % | | | 1.56 | % | | | 1.82 | % | | | 1.71 | % |
| Ratio of net investment income (loss) | | | | | | | | | | | | | | | | | | | | |
| to average net assets (5) | | | 0.27 | % | | | 0.28 | % | | | 0.38 | % | | | (0.15 | )% | | | (0.29 | )% |
| Portfolio turnover rate (6) | | | 93.77 | % | | | 79.09 | % | | | 63.13 | % | | | 102.93 | % | | | 78.37 | % |
| (1) | For a share outstanding throughout the period. Rounded to the nearest cent. |
| (2) | Net investment income (loss) per share is calculated based on average shares outstanding. |
| (3) | Amount represents less than $0.005 per share. |
| (4) | The ratio of expenses to average net assets includes dividends and interest on securities sold short. The expense ratios excluding dividends and interest on securities sold short were 1.62% for the year ended September 30, 2019, 1.54% for the year ended September 30, 2018, 1.56% for the year ended September 30, 2017, 1.61% for the year ended September 30, 2016, and 1.54% for the year ended September 30, 2015. |
| (5) | The net investment income ratios include dividends and interest on securities sold short. |
| (6) | The portfolio turnover rate excludes purchases and sales of securities sold short. |
| See Notes to the Financial Statements. | The Leuthold Funds - 2019 Annual Report | 37 |
Leuthold Global Fund - Institutional - GLBIX
Financial Highlights
| | | Year Ended
September 30,
2019 | | Year Ended
September 30,
2018
(Consolidated) | | Year Ended
September 30,
2017
(Consolidated) | | Year Ended
September 30,
2016
(Consolidated) | | Year Ended
September 30,
2015
(Consolidated) |
| Per Share Data (1): | | | | | | | | | | | | | | | | | | | | |
| Net asset value, beginning of year | | $ | 9.23 | | | $ | 10.16 | | | $ | 9.95 | | | $ | 10.10 | | | $ | 11.34 | |
| Income (loss) from investment operations: | | | | | | | | | | | | | | | | | | | | |
| Net investment income (loss) (2) | | | 0.04 | | | | 0.05 | | | | 0.06 | | | | 0.01 | | | | (0.01 | ) |
| Net realized and unrealized gain (loss) | | | | | | | | | | | | | | | | | | | | |
| on investments and securities sold short | | | (0.39 | ) | | | (0.07 | ) | | | 1.03 | | | | 0.21 | | | | (0.11 | ) |
| Total from investment operations | | | (0.35 | ) | | | (0.02 | ) | | | 1.09 | | | | 0.22 | | | | (0.12 | ) |
| | | | | | | | | | | | | | | | | | | | | |
| Less distributions: | | | | | | | | | | | | | | | | | | | | |
| From net investment income | | | (0.03 | ) | | | (0.03 | ) | | | (0.01 | ) | | | — | | | | (0.03 | ) |
| From net realized gain | | | (0.64 | ) | | | (0.88 | ) | | | (0.87 | ) | | | (0.37 | ) | | | (1.09 | ) |
| Redemption fees (3) | | | 0.00 | | | | 0.00 | | | | 0.00 | | | | 0.00 | | | | 0.00 | |
| Total distributions | | | (0.67 | ) | | | (0.91 | ) | | | (0.88 | ) | | | (0.37 | ) | | | (1.12 | ) |
| Net asset value, end of year | | $ | 8.21 | | | $ | 9.23 | | | $ | 10.16 | | | $ | 9.95 | | | $ | 10.10 | |
| | | | | | | | | | | | | | | | | | | | | |
| Total Return | | | (3.70 | )% | | | (0.43 | )% | | | 12.28 | % | | | 2.18 | % | | | (1.30 | )% |
| | | | | | | | | | | | | | | | | | | | | |
| Supplemental data and ratios: | | | | | | | | | | | | | | | | | | | | |
| Net assets, end of year | | $ | 45,677,014 | | | $ | 64,388,940 | | | $ | 78,614,144 | | | $ | 103,921,200 | | | $ | 218,497,272 | |
| Ratio of expenses to average net assets (4) | | | 1.63 | % | | | 1.50 | % | | | 1.36 | % | | | 1.57 | % | | | 1.50 | % |
| Ratio of net investment income (loss) to average net assets (5) | | | 0.52 | % | | | 0.53 | % | | | 0.58 | % | | | 0.10 | % | | | (0.09 | )% |
| Portfolio turnover rate (6) | | | 93.77 | % | | | 79.09 | % | | | 63.13 | % | | | 102.93 | % | | | 78.37 | % |
| (1) | For a share outstanding throughout the period. Rounded to the nearest cent. |
| (2) | Net investment income (loss) per share is calculated based on average shares outstanding.
|
| (3) | Amount represents less than $0.005 per share. |
| (4) | The ratio of expenses to average net assets includes dividends and interest on securities sold short. The expense ratios excluding dividends and interest on securities sold short were 1.37% for the year ended September 30, 2019, 1.29% for the year ended September 30, 2018, 1.36% for the year ended September 30, 2017, 1.36% for the year ended September 30, 2016, and 1.33% for the year ended September 30, 2015. |
| (5) | The net investment income ratios include dividends and interest on securities sold short. |
| (6) | The portfolio turnover rate excludes purchases and sales of securities sold short. |
| 38 | The Leuthold Funds - 2019 Annual Report | See Notes to the Financial Statements. |
Leuthold Select Industries Fund - LSLTX
Financial Highlights
| | | Year Ended
September 30,
2019 | | Year Ended
September 30,
2018 | | Year Ended
September 30,
2017 | | Year Ended
September 30,
2016 | | Year Ended
September 30,
2015 |
| Per Share Data (1): | | | | | | | | | | | | | | | | | | | | |
| Net asset value, beginning of year | | $ | 27.31 | | | $ | 26.32 | | | $ | 21.41 | | | $ | 21.27 | | | $ | 20.02 | |
| Income (loss) from investment operations: | | | | | | | | | | | | | | | | | | | | |
| Net investment income (loss) (2) | | | (0.03 | ) | | | (0.01 | ) | | | (0.02 | ) | | | 0.00 | (3) | | | (0.03 | ) |
| Net realized and unrealized gain on investments | | | (0.16 | ) | | | 2.28 | | | | 4.93 | | | | 0.45 | | | | 1.28 | |
| Total from investment operations | | | (0.19 | ) | | | 2.27 | | | | 4.91 | | | | 0.45 | | | | 1.25 | |
| | | | | | | | | | | | | | | | | | | | | |
| Less distributions: | | | | | | | | | | | | | | | | | | | | |
| From net investment income | | | — | | | | (0.01 | ) | | | — | | | | (0.03 | ) | | | — | |
| From net realized gain | | | (2.10 | ) | | | (1.27 | ) | | | — | | | | (0.28 | ) | | | — | |
| Total distributions | | | (2.10 | ) | | | (1.28 | ) | | | — | | | | (0.31 | ) | | | — | |
| Net asset value, end of year | | $ | 25.02 | | | $ | 27.31 | | | $ | 26.32 | | | $ | 21.41 | | | $ | 21.27 | |
| | | | | | | | | | | | | | | | | | | | | |
| Total Return | | | (0.19 | )% | | | 8.89 | % | | | 22.93 | % | | | 2.09 | % | | | 6.24 | % |
| | | | | | | | | | | | | | | | | | | | | |
| Supplemental data and ratios: | | | | | | | | | | | | | | | | | | | | |
| Net assets, end of year | | $ | 11,783,884 | | | $ | 18,111,932 | | | $ | 15,045,866 | | | $ | 12,630,891 | | | $ | 12,624,145 | |
| Ratio of expenses to average net assets: | | | | | | | | | | | | | | | | | | | | |
| Before expense reimbursement or recovery | | | 1.77 | % | | | 1.65 | % | | | 1.80 | % | | | 1.72 | % | | | 1.73 | % |
| After expense reimbursement or recovery | | | 1.50 | % | | | 1.50 | % | | | 1.50 | % | | | 1.50 | % | | | 1.50 | % |
| Ratio of net investment income to average net assets: | | | | | | | | | | | | | | | | | | | | |
| Before expense reimbursement or recovery | | | (0.39 | )% | | | (0.17 | )% | | | (0.39 | )% | | | (0.20 | )% | | | (0.35 | )% |
| After expense reimbursement or recovery | | | (0.12 | )% | | | (0.02 | )% | | | (0.09 | )% | | | 0.02 | % | | | (0.12 | )% |
| Portfolio turnover rate | | | 72.87 | % | | | 104.00 | % | | | 62.72 | % | | | 118.26 | % | | | 77.42 | % |
| (1) | For a share outstanding throughout the period. Rounded to the nearest cent. |
| (2) | Net investment income (loss) per share is calculated based on average shares outstanding. |
| (3) | Amount represents less than $0.005 per share. |
| See Notes to the Financial Statements. | The Leuthold Funds - 2019 Annual Report | 39 |
Grizzly Short Fund - GRZZX
Financial Highlights
| | | Year Ended
September 30,
2019 | | Year Ended
September 30,
2018 | | Year Ended
September 30,
2017 (1) | | Year Ended
September 30,
2016 (1) | | Year Ended
September 30,
2015 (1) |
| Per Share Data (2): | | | | | | | | | | | | | | | | | | | | |
| Net asset value, beginning of year | | $ | 17.65 | | | $ | 21.48 | | | $ | 24.68 | | | $ | 31.96 | | | $ | 29.48 | |
| Income (loss) from investment operations: | | | | | | | | | | | | | | | | | | | | |
| Net investment income (loss) (3) | | | 0.19 | | | | (0.03 | ) | | | (0.40 | ) | | | (0.72 | ) | | | (0.80 | ) |
| Net realized and unrealized gain (loss) | | | | | | | | | | | | | | | | | | | | |
| on investments and securities sold short | | | (1.54 | ) | | | (3.80 | ) | | | (2.80 | ) | | | (6.56 | ) | | | 3.28 | |
| Total from investment operations | | | (1.35 | ) | | | (3.83 | ) | | | (3.20 | ) | | | (7.28 | ) | | | 2.48 | |
| | | | | | | | | | | | | | | | | | | | | |
| Less distributions: | | | | | | | | | | | | | | | | | | | | |
| From net investment income | | | (0.15 | ) | | | — | | | | — | | | | — | | | | — | |
| From net realized gain | | | — | | | | — | | | | — | �� | | | — | | | | — | |
| Total distributions | | | (0.15 | ) | | | — | | | | — | | | | — | | | | — | |
| Net asset value, end of year | | $ | 16.15 | | | $ | 17.65 | | | $ | 21.48 | | | $ | 24.68 | | | $ | 31.96 | |
| | | | | | | | | | | | | | | | | | | | | |
| Total Return | | | (7.62 | )% | | | (17.83 | )% | | | (12.97 | )% | | | (22.78 | )% | | | 8.41 | % |
| | | | | | | | | | | | | | | | | | | | | |
| Supplemental data and ratios: | | | | | | | | | | | | | | | | | | | | |
| Net assets, end of year | | $ | 92,238,086 | | | $ | 98,948,757 | | | $ | 205,698,273 | | | $ | 178,211,844 | | | $ | 265,843,184 | |
| Ratio of expenses to average net assets (4) | | | 2.61 | % | | | 2.64 | % | | | 2.63 | % | | | 2.65 | % | | | 2.81 | % |
| Ratio of net investment income (loss) to average net assets (5) | | | 1.08 | % | | | (0.54 | )% | | | (1.78 | )% | | | (2.50 | )% | | | (2.81 | )% |
| Portfolio turnover rate (6) | | | 0.00 | % | | | 0.00 | % | | | 0.00 | % | | | 0.00 | % | | | 0.00 | % |
| (1) | Per share data adjusted for 1:4 reverse split completed as of May 18, 2018. |
| (2) | For a share outstanding throughout the period. Rounded to the nearest cent. |
| (3) | Net investment income (loss) per share is calculated based on average shares outstanding. |
| (4) | The ratio of expenses to average net assets includes dividends and interest on securites sold short. The expense ratios excluding dividends and interest on securities sold short were 1.60% for the year ended September 30, 2019, 1.53% for the year ended September 30, 2018, 1.54% for the year ended September 30, 2017, 1.52% for the year ended September 30, 2016, and 1.55% for the year ended September 30, 2015. |
| (5) | The net investment income (loss) ratios include dividends and interest on securities sold short. |
| (6) | The portfolio turnover rate excludes purchases and sales of securities sold short. |
| 40 | The Leuthold Funds - 2019 Annual Report | See Notes to the Financial Statements. |
Leuthold Core Investment Fund
Schedule of Investments
September 30, 2019
| | | Shares | | Fair Value |
| COMMON STOCKS - 55.72% | | | | | | | | |
| Airlines - 0.88% | | | | | | | | |
| Delta Air Lines, Inc. (f) | | | 47,977 | | | $ | 2,763,475 | |
| United Airlines Holdings, Inc. (a)(f) | | | 29,947 | | | | 2,647,614 | |
| | | | | | | | 5,411,089 | |
| Biotechnology - 2.38% | | | | | | | | |
| Alexion Pharmaceuticals, Inc. (a) | | | 35,037 | | | | 3,431,524 | |
| Amgen, Inc. | | | 24,119 | | | | 4,667,268 | |
| Celgene Corp. (a) | | | 21,480 | | | | 2,132,964 | |
| Gilead Sciences, Inc. | | | 70,695 | | | | 4,480,649 | |
| | | | | | | | 14,712,405 | |
| Capital Markets - 2.32% | | | | | | | | |
| FactSet Research Systems, Inc. (f) | | | 6,742 | | | | 1,638,104 | |
| Intercontinental Exchange, Inc. (f) | | | 31,985 | | | | 2,951,256 | |
| Moody’s Corp. | | | 13,954 | | | | 2,858,198 | |
| MSCI, Inc. | | | 8,623 | | | | 1,877,658 | |
| Nasdaq, Inc. | | | 21,010 | | | | 2,087,343 | |
| S&P Global, Inc. | | | 11,916 | | | | 2,919,182 | |
| | | | | | | | 14,331,741 | |
| Chemicals - 0.00% (i) | | | | | | | | |
| China Lumena New Materials Corp. (a)(b)(d)(e) | | | 838,000 | | | | 6,415 | |
| | | | | | | | | |
| Commercial Services & Supplies - 2.15% | | | | | | | | |
| Republic Services, Inc. | | | 57,071 | | | | 4,939,495 | |
| Tetra Tech, Inc. | | | 35,121 | | | | 3,047,098 | |
| Waste Management, Inc. | | | 46,253 | | | | 5,319,095 | |
| | | | | | | | 13,305,688 | |
| | | Shares | | Fair Value |
| | | | | |
| Consumer Finance - 2.75% | | | | | | | | |
| Ally Financial, Inc. | | | 90,938 | | | $ | 3,015,504 | |
| Capital One Financial Corp. | | | 50,329 | | | | 4,578,932 | |
| OneMain Holdings, Inc. | | | 39,354 | | | | 1,443,505 | |
| Santander Consumer USA Holdings, Inc. (f) | | | 83,725 | | | | 2,135,825 | |
| Synchrony Financial | | | 121,355 | | | | 4,136,992 | |
| World Acceptance Corp. (a) | | | 13,013 | | | | 1,659,288 | |
| | | | | | | | 16,970,046 | |
| Diversified Telecommunication Services - 1.95% | | | | | | | | |
| AT&T, Inc. | | | 179,680 | | | | 6,799,091 | |
| Verizon Communications, Inc. | | | 87,488 | | | | 5,280,776 | |
| | | | | | | | 12,079,867 | |
| Entertainment - 2.49% | | | | | | | | |
| Activision Blizzard, Inc. | | | 96,580 | | | | 5,111,014 | |
| Electronic Arts, Inc. (a) | | | 53,636 | | | | 5,246,673 | |
| The Walt Disney Co. | | | 38,570 | | | | 5,026,442 | |
| | | | | | | | 15,384,129 | |
| Food & Staples Retailing - 2.66% | | | | | | | | |
| Costco Wholesale Corp. | | | 31,044 | | | | 8,944,087 | |
| Walmart, Inc. | | | 63,343 | | | | 7,517,547 | |
| | | | | | | | 16,461,634 | |
| Health Care Providers & Services - 4.66% | | | | | | | | |
| Anthem, Inc. | | | 10,662 | | | | 2,559,946 | |
| Centene Corp. (a) | | | 90,624 | | | | 3,920,394 | |
| Encompass Health Corp. | | | 57,228 | | | | 3,621,388 | |
| HCA Healthcare, Inc. | | | 48,448 | | | | 5,834,108 | |
| Humana, Inc. (f) | | | 14,895 | | | | 3,808,205 | |
| UnitedHealth Group, Inc. | | | 26,341 | | | | 5,724,426 | |
| Universal Health Services, Inc. - Class B | | | 22,264 | | | | 3,311,770 | |
| | | | | | | | 28,780,237 | |
| See Notes to the Financial Statements. | The Leuthold Funds - 2019 Annual Report | 41 |
Leuthold Core Investment Fund
Schedule of Investments (continued)
September 30, 2019
| | | Shares | | Fair Value |
| COMMON STOCKS - 55.72% (continued) | | | | | | | | |
| Hotels, Restaurants & Leisure - 2.24% | | | | | | | | |
| Cracker Barrel Old Country Store, Inc. (f) | | | 9,407 | | | $ | 1,530,048 | |
| Darden Restaurants, Inc. (f) | | | 21,794 | | | | 2,576,487 | |
| McDonald’s Corp. | | | 11,446 | | | | 2,457,571 | |
| Starbucks Corp. (f) | | | 26,811 | | | | 2,370,629 | |
| The Wendy’s Co. | | | 91,878 | | | | 1,835,722 | |
| Yum! Brands, Inc. | | | 27,281 | | | | 3,094,484 | |
| | | | | | | | 13,864,941 | |
| Household Durables - 3.18% | | | | | | | | |
| D.R. Horton, Inc. | | | 83,725 | | | | 4,413,145 | |
| KB Home | | | 61,775 | | | | 2,100,350 | |
| Lennar Corp. - Class A | | | 50,172 | | | | 2,802,106 | |
| Meritage Homes Corp. (a) | | | 35,905 | | | | 2,525,917 | |
| PulteGroup, Inc. | | | 127,626 | | | | 4,664,730 | |
| Toll Brothers, Inc. | | | 77,140 | | | | 3,166,597 | |
| | | | | | | | 19,672,845 | |
| Insurance - 0.71% | | | | | | | | |
| MetLife, Inc. | | | 92,819 | | | | 4,377,344 | |
| | | | | | | | | |
| Interactive Media & Services - 2.25% | | | | | | | | |
| Alphabet, Inc. - Class A (a) | | | 6,585 | | | | 8,041,207 | |
| Facebook, Inc. - Class A (a) | | | 19,755 | | | | 3,517,970 | |
| IAC/InterActiveCorp (a) | | | 10,818 | | | | 2,358,000 | |
| | | | | | | | 13,917,177 | |
| Internet & Direct Marketing Retail - 3.14% | | | | | | | | |
| Amazon.com, Inc. (a) | | | 3,920 | | | | 6,804,767 | |
| Booking Holdings, Inc. (a) | | | 2,352 | | | | 4,616,059 | |
| eBay, Inc. | | | 85,450 | | | | 3,330,841 | |
| Etsy, Inc. (a) | | | 38,256 | | | | 2,161,464 | |
| Expedia Group, Inc. - Class A | | | 18,815 | | | | 2,528,924 | |
| | | | | | | | 19,442,055 | |
| | | Shares | | Fair Value |
| | | | | |
| IT Services - 5.11% | | | | | | | | |
| Fiserv, Inc. (a) | | | 55,190 | | | $ | 5,717,132 | |
| FleetCor Technologies, Inc. (a) | | | 12,543 | | | | 3,597,082 | |
| Genpact, Ltd. | | | 44,058 | | | | 1,707,247 | |
| Mastercard, Inc. - Class A | | | 30,260 | | | | 8,217,708 | |
| MAXIMUS, Inc. | | | 37,786 | | | | 2,919,346 | |
| Visa, Inc. - Class A (f) | | | 42,960 | | | | 7,389,550 | |
| The Western Union Co. (f) | | | 87,645 | | | | 2,030,735 | |
| | | | | | | | 31,578,800 | |
| Media - 0.99% | | | | | | | | |
| Comcast Corp. - Class A | | | 86,234 | | | | 3,887,429 | |
| Nexstar Media Group, Inc. (f) | | | 21,794 | | | | 2,229,744 | |
| | | | | | | | 6,117,173 | |
| Multiline Retail - 3.65% | | | | | | | | |
| Dollar General Corp. | | | 49,232 | | | | 7,824,934 | |
| Dollar Tree, Inc. (a)(f) | | | 43,744 | | | | 4,993,815 | |
| Target Corp. | | | 91,408 | | | | 9,772,429 | |
| | | | | | | | 22,591,178 | |
| Professional Services - 2.19% | | | | | | | | |
| ASGN, Inc. (a)(f) | | | 50,486 | | | | 3,173,550 | |
| Insperity, Inc. | | | 38,413 | | | | 3,788,290 | |
| Robert Half International, Inc. | | | 58,325 | | | | 3,246,370 | |
| TriNet Group, Inc. (a) | | | 53,622 | | | | 3,334,752 | |
| | | |
| | | | 13,542,962 | |
| Road & Rail - 3.28% | | | | | | | | |
| Canadian National Railway Co. (b) | | | 28,379 | | | | 2,550,137 | |
| Canadian Pacific Railway, Ltd. (b) | | | 16,463 | | | | 3,662,359 | |
| Genesee & Wyoming, Inc. - Class A (a) | | | 30,260 | | | | 3,344,032 | |
| Kansas City Southern | | | 27,908 | | | | 3,712,043 | |
| Norfolk Southern Corp. | | | 19,912 | | | | 3,577,390 | |
| Union Pacific Corp. | | | 21,010 | | | | 3,403,200 | |
| | | | | | | | 20,249,161 | |
| 42 | The Leuthold Funds - 2019 Annual Report | See Notes to the Financial Statements. |
Leuthold Core Investment Fund
Schedule of Investments (continued)
September 30, 2019
| | | Shares | | Fair Value |
| COMMON STOCKS - 55.72% (continued) | | | | | | | | |
| Semiconductors & Semiconductor | | | | | | | | |
| Equipment - 4.13% | | | | | | | | |
| Applied Materials, Inc. | | | 96,895 | | | $ | 4,835,060 | |
| KLA Corp. | | | 19,755 | | | | 3,149,935 | |
| Kulicke & Soffa Industries, Inc. (b) | | | 53,622 | | | | 1,259,044 | |
| Lam Research Corp. | | | 34,964 | | | | 8,080,530 | |
| MKS Instruments, Inc. | | | 36,689 | | | | 3,385,661 | |
| SolarEdge Technologies, Inc. (a)(b)(f) | | | 57,855 | | | | 4,843,621 | |
| | | | | | | | 25,553,851 | |
| Software - 1.45% | | | | | | | | |
| Microsoft Corp. | | | 64,440 | | | | 8,959,093 | |
| | | | | | | | | |
| Specialty Retail - 0.88% | | | | | | | | |
| AutoZone, Inc. (a) | | | 2,979 | | | | 3,231,083 | |
| Group 1 Automotive, Inc. (f) | | | 23,989 | | | | 2,214,425 | |
| | | | | | | | 5,445,508 | |
| Thrifts & Mortgage Finance - 0.28% | | | | | | | | |
| Radian Group, Inc. | | | 75,886 | | | | 1,733,236 | |
| TOTAL COMMON STOCKS | | | | | | | | |
| (Cost $260,642,811) | | | | | | $ | 344,488,575 | |
| | | | | | | | | |
| INVESTMENT COMPANIES - 17.36% | | | | | | | | |
| Exchange Traded Funds - 17.36% | | | | | | | | |
| Global X MSCI Greece ETF (f) | | | 286,296 | | | $ | 2,671,142 | |
| Invesco CurrencyShares Euro Currency Trust (a)(f) | | | 34,111 | | | | 3,532,535 | |
| Invesco CurrencyShares Japanese Yen Trust (a)(f)(h) | | | 223,014 | | | | 19,614,081 | |
| iShares China Large-Cap ETF | | | 234,682 | | | | 9,340,344 | |
| iShares Intermediate-Term Corporate Bond ETF (f) | | | 100,004 | | | | 5,792,232 | |
| | | Shares | | Fair Value |
| | | | | |
| Exchange Traded Funds - 17.36% (continued) | | | | | | | | |
| iShares International Treasury Bond ETF (f) | | | 289,900 | | | $ | 14,631,253 | |
| iShares JP Morgan USD Emerging Markets Bond ETF | | | 66,763 | | | | 7,567,586 | |
| iShares MBS ETF | | | 121,040 | | | | 13,108,632 | |
| iShares MSCI Peru ETF | | | 47,037 | | | | 1,649,117 | |
| iShares MSCI South Korea ETF | | | 72,750 | | | | 4,098,735 | |
| iShares MSCI Turkey ETF (f) | | | 105,832 | | | | 2,827,831 | |
| SPDR Gold Shares (a) | | | 143,305 | | | | 19,900,765 | |
| VanEck Vectors Russia ETF | | | 113,672 | | | | 2,592,858 | |
| TOTAL INVESTMENT COMPANIES | | | | | | | | |
| (Cost $102,806,168) | | | | | | $ | 107,327,111 | |
| | | Principal
Amount | | Fair Value |
| | | | | |
| CORPORATE BONDS - 2.98% | | | | | | | | |
| Banks - 0.87% | | | | | | | | |
| JPMorgan Chase & Co. | | | | | | | | |
| 1.500%, 01/27/2025 | | $ | 4,600,000 | | | $ | 5,357,132 | |
| | | | | | | | | |
| Food Products - 0.70% | | | | | | | | |
| Kraft Heinz Foods Co. | | | | | | | | |
| 3.950%, 07/15/2025 | | | 4,150,000 | | | | 4,343,900 | |
| | | | | | | | | |
| Software - 0.77% | | | | | | | | |
| Oracle Corp. | | | | | | | | |
| 2.950%, 05/15/2025 | | | 4,620,000 | | | | 4,793,105 | |
| | | | | | | | | |
| Technology Hardware, Storage & Peripherals - 0.64% | | | | | | | | |
| Apple, Inc. | | | | | | | | |
| 1.000%, 11/10/2022 | | | 3,500,000 | | | | 3,959,329 | |
| TOTAL CORPORATE BONDS | | | | | | | | |
| (Cost $18,140,806) | | | | | | $ | 18,453,466 | |
| See Notes to the Financial Statements. | The Leuthold Funds - 2019 Annual Report | 43 |
Leuthold Core Investment Fund
Schedule of Investments (continued)
September 30, 2019
| | | Principal
Amount | | Fair Value |
| UNITED STATES TREASURY | | | | | | | | |
| OBLIGATIONS - 4.49% | | | | | | | | |
| | | | | | | | | |
| United States Treasury Notes - 4.49% | | | | | | | | |
| 2.500%, 12/31/2020 | | $ | 27,530,000 | | | $ | 27,766,586 | |
| TOTAL UNITED STATES TREASURY OBLIGATIONS (Cost $27,759,821) | | | | | | $ | 27,766,586 | |
| FOREIGN GOVERNMENT BONDS - 3.14% | | | | | | | | |
| Canadian Government Bond 2.250%, 06/01/2025 (b) | | | | | | | | |
| CAD | | | 5,400,000 | | | $ | 4,265,260 | |
| French Republic Government Bond OAT 1.250%, 05/25/2034 (b) | | | | | | | | |
| | | | | | | | | |
| EUR | | | 7,930,000 | | | | 10,225,825 | |
| Government of the United Kingdom 2.250%, 09/07/2023 (b) | | | | | | | | |
| | | | | | | | | |
| GBP | | | 3,750,000 | | | | 4,964,812 | |
| OTAL FOREIGN GOVERNMENT BONDS (Cost $18,552,673) | | | | | | $ | 19,455,897 | |
| | | Shares | | Fair Value |
| SHORT-TERM INVESTMENTS - 12.78% | | | | | | | | |
| | | | | | | | | |
| Money Market Funds - 12.78% | | | | | | | | |
| Fidelity Institutional Money Market Funds - Government Portfolio - Class I, 1.860% (c)(g) | | | 79,003,405 | | | $ | 79,003,405 | |
| TOTAL SHORT-TERM INVESTMENTS | | | | | | | | |
| (Cost $79,003,405) | | | | | | $ | 79,003,405 | |
| | | Shares | | Fair Value |
| INVESTMENTS PURCHASED AS | | | | | | | | |
| SECURITIES LENDING COLLATERAL - 9.41% | | | | | | | | |
| Mount Vernon Liquid Assets Portfolio, LLC, 2.110% (c) | | | 58,159,493 | | | $ | 58,159,493 | |
| TOTAL INVESTMENTS PURCHASED AS SECURITIES LENDING COLLATERAL | | | | | | | | |
| (Cost $58,159,493) | | | | | | $ | 58,159,493 | |
| | | | | | | | | |
| Total Investments | | | | | | | | |
| (Cost $565,065,177) - 105.88% | | | | | | $ | 654,654,533 | |
| Liabilities in Excess of Other Assets - (g) (5.88)% | | | | | | | (36,380,224 | ) |
| TOTAL NET ASSETS - 100.00% | | | | | | $ | 618,274,309 | |
Percentages are stated as a percent of net assets.
CAD Canadian Dollar
EUR Euro
GBP British Pound
| (a) | Non-income producing security. |
| (b) | Foreign issued security. |
| (c) | The rate quoted is the annualized seven-day yield as of September 30, 2019. |
| (d) | Illiquid security. The fair value of these securities total $6,415 which represents an amount that rounds to 0.00% of total net assets. |
| (e) | This security is currently being fair valued in accordance with procedures established by the Board of Directors of Leuthold Funds, Inc. and is deemed a Level 3 security as it is valued usinig significant unobservable inputs. |
| (f) | This security or a portion of this security was out on loan as of September 30, 2019. Total loaned securities had a value of $57,032,547 or 9.22% of net assets. The remaining contractual maturity of all of the securities lending transactions is overnight and continuous. See Note 8. |
| (g) | All or a portion of the assets have been committed as collateral for open securites sold short. |
| (h) | Affiliated security. At September 30, 2019, the market value of this security totals $19,614,081, which represents 3.17% of total net assets. |
| (i) | Rounds to less than 0.005%. |
The Global Industry Classification Standard (GICS®) was developed by and/or is the exclusive property of MSCI, Inc. and Standard & Poor’s Financial Services LLC (“S&P”). GICS® is a service mark of MSCI, Inc. and S&P and has been licensed for use by U.S. Bancorp Fund Services, LLC.
| 44 | The Leuthold Funds - 2019 Annual Report | See Notes to the Financial Statements. |
Leuthold Core Investment Fund
Schedule of Securities Sold Short - (a)
September 30, 2019
| | | Shares | | Fair Value |
| COMMON STOCKS - 14.38% | | | | | | | | |
| Aerospace & Defense - 0.27% | | | | | | | | |
| AeroVironment, Inc. | | | 7,070 | | | $ | 378,669 | |
| Axon Enterprise, Inc. | | | 22,542 | | | | 1,279,935 | |
| | | | | | | | 1,658,604 | |
| Air Freight & Logistics - 0.21% | | | | | | | | |
| FedEx Corp. | | | 8,914 | | | | 1,297,611 | |
| | | | | | | | | |
| Auto Components - 0.14% | | | | | | | | |
| Dorman Products, Inc. | | | 5,901 | | | | 469,365 | |
| Veoneer, Inc. (b) | | | 26,742 | | | | 400,863 | |
| | | | | | | | 870,228 | |
| Automobiles - 0.49% | | | | | | | | |
| Tesla, Inc. | | | 6,660 | | | | 1,604,194 | |
| Thor Industries, Inc. | | | 24,888 | | | | 1,409,657 | |
| | | | | | | | 3,013,851 | |
| Banks - 0.48% | | | | | | | | |
| CenterState Bank Corp. | | | 21,927 | | | | 525,919 | |
| Commerce Bancshares, Inc. | | | 18,033 | | | | 1,093,702 | |
| First Republic Bank | | | 13,832 | | | | 1,337,554 | |
| | | | | | | | 2,957,175 | |
| Capital Markets - 0.28% | | | | | | | | |
| The Charles Schwab Corp. | | | 33,812 | | | | 1,414,356 | |
| Virtu Financial, Inc. - Class A | | | 18,955 | | | | 310,104 | |
| | | | | | | | 1,724,460 | |
| Chemicals - 0.79% | | | | | | | | |
| Ashland Global Holdings, Inc. | | | 18,238 | | | | 1,405,238 | |
| Balchem Corp. | | | 4,861 | | | | 482,163 | |
| DuPont de Nemours, Inc. | | | 22,439 | | | | 1,600,125 | |
| The Mosaic Co. | | | 69,167 | | | | 1,417,923 | |
| | | | | | | | 4,905,449 | |
| | | Shares | | Fair Value |
| | | | | |
| Commercial Services & Supplies - 0.46% | | | | | | | | |
| Rollins, Inc. | | | 36,066 | | | $ | 1,228,769 | |
| Stericycle, Inc. | | | 31,558 | | | | 1,607,249 | |
| | | | | | | | 2,836,018 | |
| Communications Equipment - 0.15% | | | | | | | | |
| Lumentum Holdings, Inc. | | | 16,906 | | | | 905,485 | |
| | | | | | | | | |
| Construction & Engineering - 0.08% | | | | | | | | |
| Granite Construction, Inc. | | | 14,454 | | | | 464,407 | |
| | | | | | | | | |
| Electronic Equipment, Instruments & Components - 0.42% | | | | | | | | |
| Cognex Corp. | | | 27,255 | | | | 1,339,038 | |
| IPG Photonics Corp. | | | 9,324 | | | | 1,264,335 | |
| | | | | | | | 2,603,373 | |
| Energy Equipment & Services - 0.56% | | | | | | | | |
| Core Laboratories NV (b) | | | 23,464 | | | | 1,093,892 | |
| Halliburton Co. | | | 35,349 | | | | 666,329 | |
| National Oilwell Varco, Inc. | | | 34,632 | | | | 734,198 | |
| Schlumberger, Ltd. | | | 27,972 | | | | 955,803 | |
| | | | | | | | 3,450,222 | |
| Entertainment - 0.39% | | | | | | | | |
| Netflix, Inc. | | | 3,689 | | | | 987,250 | |
| World Wrestling Entertainment, Inc. - Class A | | | 20,082 | | | | 1,428,834 | |
| | | | | | | | 2,416,084 | |
| Food Products - 0.08% | | | | | | | | |
| Cal-Maine Foods, Inc. | | | 12,090 | | | | 483,056 | |
| | | | | | | | | |
| Gas Utilities - 0.37% | | | | | | | | |
| Northwest Natural Holding Co. | | | 6,455 | | | | 460,500 | |
| South Jersey Industries, Inc. | | | 14,754 | | | | 485,554 | |
| UGI Corp. | | | 26,947 | | | | 1,354,626 | |
| | | | | | | | 2,300,680 | |
| See Notes to the Financial Statements. | The Leuthold Funds - 2019 Annual Report | 45 |
Leuthold Core Investment Fund
Schedule of Securities Sold Short - (a) (continued)
September 30, 2019
| | | Shares | | Fair Value |
| COMMON STOCKS - 14.38% (continued) | | | | | | | | |
| Health Care Equipment & Supplies - 1.19% | | | | | | | | |
| ABIOMED, Inc. | | | 5,430 | | | $ | 965,943 | |
| Avanos Medical, Inc. | | | 13,832 | | | | 518,147 | |
| Becton Dickinson and Co. | | | 6,148 | | | | 1,555,198 | |
| DexCom, Inc. | | | 9,734 | | | | 1,452,702 | |
| Intuitive Surgical, Inc. | | | 2,664 | | | | 1,438,374 | |
| iRhythm Technologies, Inc. | | | 11,892 | | | | 881,316 | |
| Quidel Corp. | | | 8,504 | | | | 521,720 | |
| | | | | | | | 7,333,400 | |
| Health Care Technology - 0.08% | | | | | | | | |
| Tabula Rasa HealthCare, Inc. | | | 8,504 | | | | 467,210 | |
| | | | | | | | | |
| Hotels, Restaurants & Leisure - 0.79% | | | | | | | | |
| Bloomin’ Brands, Inc. | | | 51,538 | | | | 975,614 | |
| Boyd Gaming Corp. | | | 61,067 | | | | 1,462,555 | |
| Eldorado Resorts, Inc. | | | 33,491 | | | | 1,335,286 | |
| The Stars Group, Inc. (b) | | | 74,387 | | | | 1,114,317 | |
| | | | | | | | 4,887,772 | |
| Household Durables - 0.21% | | | | | | | | |
| iRobot Corp. | | | 21,517 | | | | 1,326,953 | |
| | | | | | | | | |
| Household Products - 0.08% | | | | | | | | |
| Spectrum Brands Holdings, Inc. | | | 9,631 | | | | 507,746 | |
| | | | | | | | | |
| Industrial Conglomerates - 0.22% | | | | | | | | |
| General Electric Co. | | | 152,360 | | | | 1,362,098 | |
| | | | | | | | | |
| Interactive Media & Services - 0.28% | | | | | | | | |
| CarGurus, Inc. - Class A | | | 25,001 | | | | 773,781 | |
| Zillow Group, Inc. - Class C | | | 31,251 | | | | 931,905 | |
| | | | | | | | 1,705,686 | |
| Internet & Direct Marketing Retail - 0.21% | | | | | | | | |
| GrubHub, Inc. | | | 23,361 | | | | 1,313,122 | |
| | | Shares | | Fair Value |
| | | | | |
| IT Services - 0.45% | | | | | | | | |
| GoDaddy, Inc. - Class A | | | 19,468 | | | $ | 1,284,499 | |
| Square, Inc. - Class A | | | 24,522 | | | | 1,519,138 | |
| | | | | | | | 2,803,637 | |
| Life Sciences Tools & Services - 0.23% | | | | | | | | |
| Illumina, Inc. | | | 4,629 | | | | 1,408,234 | |
| | | | | | | | | |
| Machinery - 0.67% | | | | | | | | |
| Colfax Corp. | | | 50,093 | | | | 1,455,703 | |
| The Toro Co. | | | 18,238 | | | | 1,336,845 | |
| Xylem, Inc. | | | 17,214 | | | | 1,370,579 | |
| | | | | | | | 4,163,127 | |
| Metals & Mining - 0.20% | | | | | | | | |
| Alcoa Corp. | | | 60,657 | | | | 1,217,386 | |
| | | | | | | | | |
| Oil, Gas & Consumable Fuels - 0.91% | | | | | | | | |
| Concho Resources, Inc. | | | 13,218 | | | | 897,502 | |
| Kosmos Energy, Ltd. | | | 147,237 | | | | 918,759 | |
| Murphy Oil Corp. | | | 62,242 | | | | 1,376,170 | |
| Noble Energy, Inc. | | | 68,239 | | | | 1,532,648 | |
| PDC Energy, Inc. | | | 32,993 | | | | 915,556 | |
| | | | | | | | 5,640,635 | |
| Pharmaceuticals - 0.44% | | | | | | | | |
| Elanco Animal Health, Inc. | | | 51,280 | | | | 1,363,535 | |
| Teva Pharmaceutical Industries, Ltd. - ADR | | | 199,800 | | | | 1,374,624 | |
| | | | | | | | 2,738,159 | |
| Real Estate Management & Development - 0.07% | | | | | | | | |
| Redfin Corp. | | | 26,333 | | | | 443,448 | |
| | | | | | | | | |
| Road & Rail - 0.23% | | | | | | | | |
| JB Hunt Transport Services, Inc. | | | 12,820 | | | | 1,418,533 | |
| 46 | The Leuthold Funds - 2019 Annual Report | See Notes to the Financial Statements. |
Leuthold Core Investment Fund
Schedule of Securities Sold Short - (a) (continued)
September 30, 2019
| | | Shares | | Fair Value |
| COMMON STOCKS - 14.38% (continued) | | | | | | | | |
| Semiconductors & Semiconductor Equipment - 0.45% | | | | | | | | |
| Advanced Micro Devices, Inc. | | | 49,855 | | | $ | 1,445,296 | |
| NVIDIA Corp. | | | 7,582 | | | | 1,319,799 | |
| | | | | | | | 2,765,095 | |
| Software - 1.04% | | | | | | | | |
| Dropbox, Inc. - Class A | | | 63,936 | | | | 1,289,589 | |
| Nutanix, Inc. - Class A | | | 35,042 | | | | 919,853 | |
| Palo Alto Networks, Inc. | | | 6,762 | | | | 1,378,298 | |
| salesforce.com, Inc. | | | 9,734 | | | | 1,444,915 | |
| Splunk, Inc. | | | 11,886 | | | | 1,400,884 | |
| | | | | | | | 6,433,539 | |
| Specialty Retail - 0.29% | | | | | | | | |
| National Vision Holdings, Inc. | | | 17,931 | | | | 431,599 | |
| Tiffany & Co. | | | 14,857 | | | | 1,376,204 | |
| | | | | | | | 1,807,803 | |
| Technology Hardware, Storage & Peripherals - 0.29% | | | | | | | | |
| 3D Systems Corp. | | | 51,436 | | | | 419,204 | |
| Pure Storage, Inc. | | | 79,612 | | | | 1,348,627 | |
| | | | | | | | 1,767,831 | |
| Textiles, Apparel & Luxury Goods - 0.23% | | | | | | | | |
| Canada Goose Holdings, Inc. (b) | | | 32,685 | | | | 1,437,159 | |
| | | | | | | | | |
| Trading Companies & Distributors - 0.38% | | | | | | | | |
| SiteOne Landscape Supply, Inc. | | | 13,013 | | | | 963,222 | |
| Univar Solutions, Inc. | | | 66,926 | | | | 1,389,384 | |
| | | | | | | | 2,352,606 | |
| Water Utilities - 0.27% | | | | | | | | |
| Aqua America, Inc. | | | 37,808 | | | | 1,694,933 | |
| TOTAL COMMON STOCKS | | | | | | | | |
| (Proceeds $93,381,420) | | | | | | $ | 88,882,815 | |
| | | Shares | | Fair Value |
| | | | | |
| INVESTMENT COMPANIES - 0.49% | | | | | | | | |
| | | | | | | | | |
| Exchange Traded Funds - 0.49% | | | | | | | | |
| SPDR Dow Jones Industrial Average ETF Trust | | | 11,329 | | | $ | 3,049,540 | |
| TOTAL INVESTMENT COMPANIES | | | | | | | | |
| (Proceeds $3,047,897) | | | | | | $ | 3,049,540 | |
| | | | | | | | | |
| TOTAL SECURITIES SOLD SHORT | | | | | | | | |
| (Proceeds $96,429,317) - 14.87% | | | | | | $ | 91,932,355 | |
Percentages are stated as a percent of net assets.
ADR American Depositary Receipt
(a) Non-income producing security.
(b) Foreign issued security.
The Global Industry Classification Standard (GICS®) was developed by and/or is the exclusive property of MSCI, Inc. and Standard & Poor’s Financial Services LLC (“S&P”). GICS® is a service mark of MSCI, Inc. and S&P and has been licensed for use by U.S. Bancorp Fund Services, LLC.
| See Notes to the Financial Statements. | The Leuthold Funds - 2019 Annual Report | 47 |
Leuthold Global Fund
Schedule of Investments September 30, 2019
| | | Shares | | Fair Value |
| COMMON STOCKS - 60.45% | | | | | | | | |
| | | | | | | | | |
| Banks - 2.42% | | | | | | | | |
| Banco do Brasil SA (b) | | | 12,100 | | | $ | 132,796 | |
| Bank Mandiri Persero Tbk PT (b) | | | 304,400 | | | | 149,721 | |
| China CITIC Bank Corp., Ltd. - H Shares (b) | | | 235,000 | | | | 125,293 | |
| CTBC Financial Holding Co., Ltd. (b) | | | 204,000 | | | | 135,413 | |
| Grupo Financiero Banorte SAB de CV (b) | | | 25,800 | | | | 139,054 | |
| Nedbank Group, Ltd. (b) | | | 7,586 | | | | 113,670 | |
| RHB Bank Bhd (b) | | | 97,900 | | | | 131,895 | |
| Taishin Financial Holding Co., Ltd. (b) | | | 273,573 | | | | 122,090 | |
| Thanachart Capital PCL - NVDR | | | 72,400 | | | | 134,982 | |
| Turkiye Halk Bankasi AS (b) | | | 85,318 | | | | 98,955 | |
| | | | | | | | 1,283,869 | |
| Beverages - 0.79% | | | | | | | | |
| PepsiCo, Inc. (f) | | | 3,059 | | | | 419,389 | |
| Building Products - 2.46% | | | | | | | | |
| American Woodmark Corp. (a) | | | 1,848 | | | | 164,306 | |
| Assa Abloy AB - Class B (b) | | | 8,600 | | | | 191,188 | |
| Builders FirstSource, Inc. (a) | | | 8,060 | | | | 165,834 | |
| Kingspan Group PLC (b) | | | 3,833 | | | | 187,165 | |
| Masco Corp. | | | 5,479 | | | | 228,365 | |
| Owens Corning | | | 3,323 | | | | 210,014 | |
| Universal Forest Products, Inc. | | | 4,022 | | | | 160,397 | |
| | | | | | | | 1,307,269 | |
| | | Shares | | Fair Value |
| | | | | |
| Capital Markets - 4.17% | | | | | | | | |
| Evercore, Inc. - Class A | | | 2,380 | | | $ | 190,638 | |
| The Goldman Sachs Group, Inc. | | | 2,270 | | | | 470,412 | |
| Haitong Securities Co., Ltd. - H Shares (b) | | | 183,200 | | | | 192,143 | |
| LPL Financial Holdings, Inc. | | | 3,096 | | | | 253,562 | |
| Meritz Securities Co., Ltd. (b) | | | 38,950 | | | | 164,193 | |
| Morgan Stanley | | | 11,122 | | | | 474,576 | |
| Raymond James Financial, Inc. | | | 3,021 | | | | 249,112 | |
| Stifel Financial Corp. | | | 3,892 | | | | 223,323 | |
| | | | | | | | 2,217,959 | |
| Construction Materials - 0.76% | | | | | | | | |
| China National Building Material | | | | | | | | |
| Co., Ltd. - H Shares (b) | | | 178,000 | | | | 159,654 | |
| CRH PLC - ADR | | | 7,127 | | | | 244,884 | |
| | | | | | | | 404,538 | |
| Consumer Finance - 4.26% | | | | | | | | |
| Ally Financial, Inc. | | | 10,644 | | | | 352,955 | |
| Capital One Financial Corp. (f) | | | 4,745 | | | | 431,700 | |
| Encore Capital Group, Inc. (a)(f) | | | 4,783 | | | | 159,393 | |
| Hitachi Capital Corp. (b) | | | 6,200 | | | | 126,538 | |
| Krungthai Card PCL - NVDR | | | 161,500 | | | | 225,952 | |
| Nelnet, Inc. - Class A | | | 3,152 | | | | 200,467 | |
| Santander Consumer USA Holdings, Inc. (f) | | | 13,822 | | | | 352,599 | |
| Synchrony Financial | | | 12,169 | | | | 414,841 | |
| | | | | | | | 2,264,445 | |
| Entertainment - 2.93% | | | | | | | | |
| Activision Blizzard, Inc. | | | 6,388 | | | | 338,053 | |
| Electronic Arts, Inc. (a) | | | 3,327 | | | | 325,447 | |
| Konami Holdings Corp. (b) | | | 5,500 | | | | 266,440 | |
| NetEase, Inc. - ADR | | | 1,236 | | | | 328,999 | |
| Nintendo Co., Ltd. (b) | | | 800 | | | | 297,997 | |
| | | | | | | | 1,556,936 | |
| 48 | The Leuthold Funds - 2019 Annual Report | See Notes to the Financial Statements. |
| Schedule of Investments (continued) |
| September 30, 2019 |
| | | Shares | | | Fair Value | |
| COMMON STOCKS - 60.45% (continued) |
| |
| Food & Staples Retailing - 4.22% | | | | | | | | |
| Alimentation Couche-Tard, Inc. - Class B (b) | | | 10,414 | | | $ | 319,137 | |
| Koninklijke Ahold Delhaize NV (b) | | | 12,864 | | | | 321,699 | |
| The Kroger Co. | | | 9,324 | | | | 240,373 | |
| Seven & i Holdings Co., Ltd. (b) | | | 8,300 | | | | 318,100 | |
| US Foods Holding Corp. (a) | | | 5,816 | | | | 239,038 | |
| Walgreens Boots Alliance, Inc. | | | 5,962 | | | | 329,758 | |
| Walmart, Inc. | | | 4,017 | | | | 476,737 | |
| | | | | | | | 2,244,842 | |
| Gas Utilities - 0.25% | | | | | | | | |
| Enagas SA (b) | | | 5,816 | | | | 134,446 | |
| Hotels, Restaurants & Leisure - 3.52% | | | | | | | | |
| Aramark | | | 6,021 | | | | 262,395 | |
| Cracker Barrel Old Country Store, Inc. (f) | | | 959 | | | | 155,982 | |
| Darden Restaurants, Inc. (f) | | | 2,006 | | | | 237,149 | |
| McDonald’s Corp. | | | 1,429 | | | | 306,821 | |
| Starbucks Corp. (f) | | | 3,272 | | | | 289,310 | |
| The Wendy’s Co. | | | 7,547 | | | | 150,789 | |
| Yum China Holdings, Inc. (b)(f) | | | 5,260 | | | | 238,962 | |
| Yum! Brands, Inc. | | | 2,035 | | | | 230,830 | |
| | | | | | | | 1,872,238 | |
| Household Durables - 3.84% | | | | | | | | |
| Barratt Developments PLC (b) | | | 30,268 | | | | 240,951 | |
| Haseko Corp. (b) | | | 20,500 | | | | 239,752 | |
| Lennar Corp. - Class A (f) | | | 6,001 | | | | 335,156 | |
| Meritage Homes Corp. (a) | | | 5,679 | | | | 399,518 | |
| Redrow PLC (b) | | | 30,621 | | | | 232,549 | |
| Toll Brothers, Inc. | | | 7,924 | | | | 325,280 | |
| TRI Pointe Group, Inc. (a)(f) | | | 17,859 | | | | 268,599 | |
| | | | | | | | 2,041,805 | |
| | | Shares | | | Fair Value | |
| | | | | | | |
| Insurance - 7.07% | | | | | | | | |
| The Allstate Corp. | | | 3,245 | | | $ | 352,666 | |
| Arch Capital Group, Ltd. (a)(b) | | | 5,624 | | | | 236,095 | |
| Dai-ichi Life Holdings, Inc. (b) | | | 14,100 | | | | 214,361 | |
| Fidelity National Financial, Inc. | | | 4,867 | | | | 216,143 | |
| First American Financial Corp. | | | 3,487 | | | | 205,768 | |
| Legal & General Group PLC (b) | | | 75,573 | | | | 230,672 | |
| Lincoln National Corp. | | | 2,402 | | | | 144,889 | |
| Medibank Pvt, Ltd. (b) | | | 90,164 | | | | 207,064 | |
| MetLife, Inc. | | | 9,268 | | | | 437,079 | |
| MS&AD Insurance Group Holdings, Inc. (b) | | | 6,200 | | | | 201,526 | |
| Old Mutual, Ltd. (b) | | | 61,038 | | | | 78,000 | |
| Old Republic International Corp. | | | 8,559 | | | | 201,736 | |
| Ping An Insurance Group Co of China, Ltd. - H Shares (b) | | | 41,500 | | | | 476,989 | |
| The Progressive Corp. (f) | | | 2,409 | | | | 186,095 | |
| Prudential Financial, Inc. | | | 2,159 | | | | 194,202 | |
| RSA Insurance Group PLC (b) | | | 26,975 | | | | 176,985 | |
| | | | | | | | 3,760,270 | |
| Interactive Media & Services - 2.67% | | | | | | | | |
| Alphabet, Inc. - Class A (a) | | | 458 | | | | 559,282 | |
| Auto Trader Group PLC (b) | | | 24,511 | | | | 153,626 | |
| Baidu, Inc. - Class A - ADR (a) | | | 1,360 | | | | 139,754 | |
| Facebook, Inc. - Class A (a) | | | 999 | | | | 177,902 | |
| IAC/InterActiveCorp (a)(f) | | | 1,052 | | | | 229,304 | |
| Yandex NV - Class A (a)(b)(f) | | | 4,585 | | | | 160,521 | |
| | | | | | | | 1,420,389 | |
| Internet & Direct Marketing Retail - 0.90% | | | | | | | | |
| eBay, Inc. | | | 6,170 | | | | 240,507 | |
| Rakuten, Inc. (b) | | | 24,100 | | | | 238,893 | |
| | | | | | | | 479,400 | |
| See Notes to the Financial Statements. | The Leuthold Funds - 2019 Annual Report | 49 |
| Schedule of Investments (continued) |
| September 30, 2019 |
| | | Shares | | | Fair Value | |
| COMMON STOCKS - 60.45% (continued) | | | | | | | | |
| | | | | | | | | |
| IT Services - 7.30% | | | | | | | | |
| Accenture PLC - Class A (b) | | | 2,138 | | | $ | 411,244 | |
| Bechtle AG (b) | | | 1,958 | | | | 199,278 | |
| CACI International, Inc. (a) | | | 1,420 | | | | 328,389 | |
| Computershare, Ltd. (b) | | | 12,919 | | | | 141,228 | |
| CSG Systems International, Inc. (f) | | | 4,182 | | | | 216,126 | |
| DXC Technology Co. | | | 4,061 | | | | 119,800 | |
| Fiserv, Inc. (a)(f) | | | 3,077 | | | | 318,746 | |
| FleetCor Technologies, Inc. (a) | | | 1,218 | | | | 349,298 | |
| Genpact, Ltd. | | | 8,867 | | | | 343,596 | |
| ManTech International Corp. - Class A | | | 3,022 | | | | 215,801 | |
| MAXIMUS, Inc. | | | 2,805 | | | | 216,714 | |
| NET One Systems Co., Ltd. (b) | | | 15,500 | | | | 420,494 | |
| NS Solutions Corp. (b) | | | 6,700 | | | | 219,906 | |
| TIS, Inc. (b) | | | 3,600 | | | | 208,002 | |
| Wipro, Ltd. - ADR | | | 46,955 | | | | 171,386 | |
| | | | | | | | 3,880,008 | |
| Life Sciences Tools & Services - 3.83% | | | | | | | | |
| Bio-Rad Laboratories, Inc. - Class A (a) | | | 826 | | | | 274,843 | |
| Eurofins Scientific SE (b) | | | 533 | | | | 247,866 | |
| Gerresheimer AG (b) | | | 3,394 | | | | 243,350 | |
| IQVIA Holdings, Inc. (a) | | | 2,702 | | | | 403,625 | |
| Medpace Holdings, Inc. (a) | | | 4,218 | | | | 354,481 | |
| Siegfried Holding AG (b) | | | 634 | | | | 249,511 | |
| Syneos Health, Inc. (a) | | | 4,896 | | | | 260,516 | |
| | | | | | | | 2,034,192 | |
| | | Shares | | | Fair Value | |
| | | | | | | |
| Oil, Gas & Consumable Fuels - 2.85% | | | | | | | | |
| Energy Transfer LP | | | 16,065 | | | $ | 210,130 | |
| Enterprise Products Partners LP | | | 8,811 | | | | 251,818 | |
| Keyera Corp. (b) | | | 7,584 | | | | 184,155 | |
| Magellan Midstream Partners LP | | | 2,822 | | | | 187,014 | |
| Phillips 66 Partners LP | | | 3,295 | | | | 186,563 | |
| Plains All American Pipeline LP | | | 9,826 | | | | 203,889 | |
| TC Energy Corp. (b) | | | 5,626 | | | | 291,371 | |
| | | | | | | | 1,514,940 | |
| Paper & Forest Products - 0.09% | | | | | | | | |
| China Forestry Holdings Co., Ltd. (a)(b)(d)(e) | | | 2,484,000 | | | | 47,539 | |
| | | | | | | | | |
| Semiconductors & Semiconductor Equipment - 5.83% | | | | | | | | |
| Applied Materials, Inc. | | | 5,445 | | | | 271,705 | |
| ASM International NV (b) | | | 2,143 | | | | 197,161 | |
| Diodes, Inc. (a) | | | 4,031 | | | | 161,845 | |
| Globalwafers Co., Ltd. (b) | | | 16,000 | | | | 161,365 | |
| Intel Corp. | | | 7,962 | | | | 410,282 | |
| Lam Research Corp. | | | 1,577 | | | | 364,460 | |
| MKS Instruments, Inc. | | | 1,895 | | | | 174,871 | |
| ON Semiconductor Corp. (a)(f) | | | 7,589 | | | | 145,785 | |
| SCREEN Holdings Co., Ltd. (b) | | | 2,700 | | | | 160,815 | |
| Sino-American Silicon Products, Inc. (b) | | | 69,000 | | | | 182,305 | |
| SK Hynix, Inc. (b) | | | 3,821 | | | | 262,427 | |
| Skyworks Solutions, Inc. | | | 2,900 | | | | 229,825 | |
| SUMCO Corp. (b) | | | 16,600 | | | | 226,137 | |
| UniTest, Inc. (b) | | | 12,763 | | | | 149,871 | |
| | | | | | | | 3,098,854 | |
| Thrifts & Mortgage Finance - 0.29% | | | | | | | | |
| Radian Group, Inc. | | | 6,780 | | | | 154,855 | |
TOTAL COMMON STOCKS
(Cost $31,436,675) | | | | | | $ | 32,138,183 | |
| 50 | The Leuthold Funds - 2019 Annual Report | See Notes to the Financial Statements. |
| Schedule of Investments (continued) |
| September 30, 2019 |
| | | Shares | | | Fair Value | |
| INVESTMENT COMPANIES - 13.59% |
| | | | | | | | | |
| Exchange Traded Funds - 13.59% | | | | | | | | |
| Invesco CurrencyShares Euro Currency Trust (a)(f) | | | 5,297 | | | $ | 548,557 | |
| Invesco CurrencyShares Japanese Yen Trust (a)(f) | | | 19,121 | | | | 1,681,692 | |
| iShares Intermediate-Term Corporate Bond ETF (f) | | | 15,683 | | | | 908,359 | |
| iShares International Treasury Bond ETF (f) | | | 11,909 | | | | 601,047 | |
| iShares JP Morgan USD Emerging Markets Bond ETF | | | 6,615 | | | | 749,810 | |
| iShares MBS ETF | | | 9,220 | | | | 998,526 | |
| SPDR Gold Shares (a) | | | 12,496 | | | | 1,735,320 | |
TOTAL INVESTMENT COMPANIES
(Cost $6,898,498) | | | | | | $ | 7,223,311 | |
| | | Principal
Amount | | | Fair Value | |
| CORPORATE BONDS - 2.19% | | | | | | | | |
| | | | | | | | | |
| Banks - 1.03% | | | | | | | | |
| JPMorgan Chase & Co. | | | | | | | | |
| 1.500%, 01/27/2025 | | $ | 470,000 | | | $ | 547,359 | |
| Diversified Telecommunication Services - 1.16% | | | | | | | | |
| AT&T, Inc. | | | | | | | | |
| 3.400%, 05/15/2025 | | | 590,000 | | | | 615,574 | |
TOTAL CORPORATE BONDS
(Cost $1,099,907) | | | | | | $ | 1,162,933 | |
| | | | | | | | | |
| UNITED STATES TREASURY OBLIGATIONS - 4.33% | | | | | | | | |
| | | | | | | | | |
| United States Treasury Notes - 4.33% | | | | | | | | |
| 2.500%, 12/31/2020 | | $ | 2,280,000 | | | $ | 2,299,594 | |
| | | | | | | | | |
| TOTAL UNITED STATES TREASURY OBLIGATIONS (Cost $2,302,064) | | | | | | $ | 2,299,594 | |
| FOREIGN GOVERNMENT BONDS - 3.70% | | | | | | | | |
Canadian Government Bond
2.250%, 06/01/2025 (b) | | | | | | | | |
| CAD | | | 610,000 | | | $ | 481,816 | |
French Republic Government Bond OAT
1.250%, 05/25/2034 (b) | | | | | | | | |
| EUR | | | 802,000 | | | | 1,034,188 | |
Government of the United Kingdom
2.250%, 09/07/2023 (b) | | | | | | | | |
| GBP | | | 340,000 | | | | 450,143 | |
TOTAL FOREIGN GOVERNMENT BONDS
(Cost $1,875,474) | | | | | | $ | 1,966,147 | |
| See Notes to the Financial Statements. | The Leuthold Funds - 2019 Annual Report | 51 |
| Schedule of Investments (continued) |
| September 30, 2019 |
| | | Shares | | | Fair Value | |
| SHORT-TERM INVESTMENTS - 11.84% |
| |
| Money Market Funds - 11.84% | | | |
| Fidelity Institutional Money Market Funds - Government Portfolio - Class I, 1.860% (c)(g) | | | 6,296,800 | | | $ | 6,296,800 | |
TOTAL SHORT-TERM INVESTMENTS
(Cost $6,296,800) | | | | | | $ | 6,296,800 | |
| | | | | | | | | |
| INVESTMENTS PURCHASED AS SECURITIES LENDING COLLATERAL - 13.79% | | | | | | | | |
| Mount Vernon Liquid Assets Portfolio, LLC, 2.110% (c) | | | 7,331,745 | | | $ | 7,331,745 | |
| TOTAL INVESTMENTS PURCHASED AS SECURITIES LENDING COLLATERAL (Cost $7,331,745) | | | | | | $ | 7,331,745 | |
| | | | | | | | | |
Total Investments
(Cost $57,241,163) - 109.89% | | | | | | $ | 58,418,713 | |
| Liabilities in Excess of Other Assets - (g) (9.89)% | | | | | | | (5,256,305 | ) |
| TOTAL NET ASSETS - 100.00% | | | | | | $ | 53,162,408 | |
Percentages are stated as a percent of net assets.
| ADR | American Depositary Receipt |
| CAD | Canadian Dollar |
| EUR | Euro |
| GBP | British Pound |
| NVDR | Non-Voting Depositary Receipt |
| (a) | Non-income producing security. |
| (b) | Foreign issued security. |
| (c) | The rate quoted is the annualized seven-day yield as of September 30, 2019. |
| (d) | Illiquid security. The fair value of these securities total $47,539 which represents 0.09% of total net assets. |
| (e) | This security is currently being fair valued in accordance with procedures established by the Board of Directors of Leuthold Funds, Inc. and is deemed a Level 3 security as it is valued using significant unobservable inputs. |
| (f) | This security or a portion of this security was out on loan as of September 30, 2019. Total loaned securities had a value of $7,193,841 or 13.53% of net assets. The remaining contractual maturity of all of the securities lending transactions is overnight and continuous. See Note 8. |
| (g) | All or a portion of the assets have been committed as collateral for open securities sold short. |
The Global Industry Classification Standard (GICS®) was developed by and/or is the exclusive property of MSCI, Inc. and Standard & Poor’s Financial Services LLC (“S&P”). GICS® is a service mark of MSCI, Inc. and S&P and has been licensed for use by U.S. Bancorp Fund Services, LLC.
| 52 | The Leuthold Funds - 2019 Annual Report | See Notes to the Financial Statements. |
| Schedule of Investments (continued) |
| September 30, 2019 |
| | | Fair
Value | | | Percentage
of Total
Investments | |
| CURRENCY EXPOSURE | | | | | | | | |
| Australian Dollar | | $ | 348,292 | | | | 0.59 | % |
| Brazilian Real | | | 132,796 | | | | 0.23 | |
| British Pound | | | 1,562,926 | | | | 2.67 | |
| Canadian Dollar | | | 985,108 | | | | 1.68 | |
| Euro | | | 3,112,512 | | | | 5.33 | |
| Hong Kong Dollar | | | 1,001,618 | | | | 1.71 | |
| Indonesian Rupiah | | | 149,721 | | | | 0.26 | |
| Japanese Yen | | | 3,138,961 | | | | 5.37 | |
| Malaysian Ringgit | | | 131,895 | | | | 0.23 | |
| Mexican Peso | | | 139,054 | | | | 0.24 | |
| South African Rand | | | 113,670 | | | | 0.19 | |
| South Korean Won | | | 576,491 | | | | 0.99 | |
| Swedish Krona | | | 191,188 | | | | 0.33 | |
| Swiss Franc | | | 249,511 | | | | 0.43 | |
| Taiwan New Dollar | | | 601,173 | | | | 1.03 | |
| Thai Baht | | | 360,934 | | | | 0.62 | |
| Turkish Lira | | | 98,955 | | | | 0.17 | |
| US Dollar | | | 45,523,908 | | | | 77.93 | |
| Total Investments | | $ | 58,418,713 | | | | 100.00 | % |
| | | Fair
Value | | | Percentage
of Total
Investments | |
| GEOGRAPHIC DIVERSIFICATION | | | | | | | | |
| Australia | | $ | 348,292 | | | | 0.59 | % |
| Bermuda | | | 236,095 | | | | 0.40 | |
| Brazil | | | 132,796 | | | | 0.23 | |
| Canada | | | 1,276,479 | | | | 2.18 | |
| China | | | 1,709,333 | | | | 2.93 | |
| France | | | 1,034,188 | | | | 1.77 | |
| Germany | | | 442,628 | | | | 0.76 | |
| India | | | 171,386 | | | | 0.29 | |
| Indonesia | | | 149,721 | | | | 0.26 | |
| Ireland | | | 843,293 | | | | 1.44 | |
| Japan | | | 3,138,961 | | | | 5.37 | |
| Luxembourg | | | 247,866 | | | | 0.42 | |
| Malaysia | | | 131,895 | | | | 0.23 | |
| Mexico | | | 139,054 | | | | 0.24 | |
| Netherlands | | | 518,860 | | | | 0.89 | |
| Russia | | | 160,521 | | | | 0.27 | |
| South Africa | | | 191,670 | | | | 0.33 | |
| South Korea | | | 576,491 | | | | 0.99 | |
| Spain | | | 134,446 | | | | 0.23 | |
| Sweden | | | 191,188 | | | | 0.33 | |
| Switzerland | | | 249,511 | | | | 0.43 | |
| Taiwan | | | 601,173 | | | | 1.03 | |
| Thailand | | | 360,934 | | | | 0.62 | |
| Turkey | | | 98,955 | | | | 0.17 | |
| United Kingdom | | | 1,484,926 | | | | 2.54 | |
| United States | | | 43,848,051 | | | | 75.06 | |
| Total Investments | | $ | 58,418,713 | | | | 100.00 | % |
| See Notes to the Financial Statements. | The Leuthold Funds - 2019 Annual Report | 53 |
| Schedule of Securities Sold Short - (a) |
| September 30, 2019 |
| | | Shares | | | Fair Value | |
| COMMON STOCKS - 7.42% | | | |
| | | | |
| Aerospace & Defense - 0.13% | | | | | | | | |
| AeroVironment, Inc. | | | 305 | | | $ | 16,336 | |
| Axon Enterprise, Inc. | | | 969 | | | | 55,020 | |
| | | | | | | | 71,356 | |
| Air Freight & Logistics - 0.10% | | | | | | | | |
| FedEx Corp. | | | 383 | | | | 55,753 | |
| | | | | | | | | |
| Auto Components - 0.07% | | | | | | | | |
| Dorman Products, Inc. | | | 254 | | | | 20,203 | |
| Veoneer, Inc. (b) | | | 1,149 | | | | 17,224 | |
| | | | | | | | 37,427 | |
| Automobiles - 0.24% | | | | | | | | |
| Tesla, Inc. | | | 284 | | | | 68,407 | |
| Thor Industries, Inc. | | | 1,069 | | | | 60,548 | |
| | | | | | | | 128,955 | |
| Banks - 0.24% | | | | | | | | |
| CenterState Bank Corp. | | | 942 | | | | 22,594 | |
| Commerce Bancshares, Inc. | | | 772 | | | | 46,822 | |
| First Republic Bank | | | 595 | | | | 57,536 | |
| | | | | | | | 126,952 | |
| Capital Markets - 0.14% | | | | | | | | |
| The Charles Schwab Corp. | | | 1,453 | | | | 60,779 | |
| Virtu Financial, Inc. - Class A | | | 815 | | | | 13,333 | |
| | | | | | | | 74,112 | |
| Chemicals - 0.40% | | | | | | | | |
| Ashland Global Holdings, Inc. | | | 784 | | | | 60,407 | |
| Balchem Corp. | | | 209 | | | | 20,731 | |
| DuPont de Nemours, Inc. | | | 965 | | | | 68,814 | |
| The Mosaic Co. | | | 2,972 | | | | 60,926 | |
| | | | | | | | 210,878 | |
| | | Shares | | | Fair Value | |
| | | | | | | |
| Commercial Services & Supplies - 0.23% | | | | | | | | |
| Rollins, Inc. | | | 1,550 | | | $ | 52,809 | |
| Stericycle, Inc. | | | 1,356 | | | | 69,061 | |
| | | | | | | | 121,870 | |
| Communications Equipment - 0.07% | | | | | | | | |
| Lumentum Holdings, Inc. | | | 727 | | | | 38,938 | |
| | | | | | | | | |
| Construction & Engineering - 0.04% | | | | | | | | |
| Granite Construction, Inc. | | | 621 | | | | 19,953 | |
| Diversified Telecommunication Services - 0.13% | | | | | | | | |
| Intelsat SA (b) | | | 3,026 | | | | 68,993 | |
| | | | | | | | | |
| Electronic Equipment, Instruments & Components - 0.21% | | | | | | | | |
| Cognex Corp. | | | 1,169 | | | | 57,433 | |
| IPG Photonics Corp. | | | 401 | | | | 54,376 | |
| | | | | | | | 111,809 | |
| Energy Equipment & Services - 0.28% | | | | | | | | |
| Core Laboratories NV (b) | | | 1,009 | | | | 47,040 | |
| Halliburton Co. | | | 1,519 | | | | 28,633 | |
| National Oilwell Varco, Inc. | | | 1,489 | | | | 31,567 | |
| Schlumberger, Ltd. | | | 1,202 | | | | 41,072 | |
| | | | | | | | 148,312 | |
| Entertainment - 0.19% | | | | | | | | |
| Netflix, Inc. | | | 159 | | | | 42,552 | |
| World Wrestling Entertainment, Inc. - Class A | | | 861 | | | | 61,260 | |
| | | | | | | | 103,812 | |
| Food Products - 0.04% | | | | | | | | |
| Cal-Maine Foods, Inc. | | | 520 | | | | 20,777 | |
| | | | | | | | | |
| Gas Utilities - 0.19% | | | | | | | | |
| Northwest Natural Holding Co. | | | 277 | | | | 19,761 | |
| South Jersey Industries, Inc. | | | 634 | | | | 20,865 | |
| UGI Corp. | | | 1,158 | | | | 58,213 | |
| | | | | | | | 98,839 | |
| 54 | The Leuthold Funds - 2019 Annual Report | See Notes to the Financial Statements. |
| Schedule of Securities Sold Short - (a) (continued) |
| September 30, 2019 |
| | | Shares | | | Fair Value | |
| COMMON STOCKS - 7.42% (continued) |
| |
| Health Care Equipment & Supplies - 0.59% | | | | | | | | |
| ABIOMED, Inc. | | | 233 | | | $ | 41,448 | |
| Avanos Medical, Inc. | | | 595 | | | | 22,289 | |
| Becton Dickinson and Co. | | | 264 | | | | 66,782 | |
| DexCom, Inc. | | | 418 | | | | 62,382 | |
| Intuitive Surgical, Inc. | | | 115 | | | | 62,092 | |
| iRhythm Technologies, Inc. | | | 511 | | | | 37,870 | |
| Quidel Corp. | | | 363 | | | | 22,270 | |
| | | | | | | | 315,133 | |
| Health Care Technology - 0.04% | | | | | | | | |
| Tabula Rasa HealthCare, Inc. | | | 366 | | | | 20,108 | |
| | | | | | | | | |
| Hotels, Restaurants & Leisure - 0.39% | | | | | | | | |
| Bloomin’ Brands, Inc. | | | 2,215 | | | | 41,930 | |
| Boyd Gaming Corp. | | | 2,625 | | | | 62,869 | |
| Eldorado Resorts, Inc. | | | 1,439 | | | | 57,373 | |
| The Stars Group, Inc. (b) | | | 3,197 | | | | 47,891 | |
| | | | | | | | 210,063 | |
| Household Durables - 0.11% | | | | | | | | |
| iRobot Corp. | | | 925 | | | | 57,045 | |
| | | | | | | | | |
| Household Products - 0.04% | | | | | | | | |
| Spectrum Brands Holdings, Inc. | | | 412 | | | | 21,721 | |
| | | | | | | | | |
| Industrial Conglomerates - 0.11% | | | | | | | | |
| General Electric Co. | | | 6,549 | | | | 58,548 | |
| | | | | | | | | |
| Interactive Media & Services - 0.14% | | | | | | | | |
| CarGurus, Inc. - Class A | | | 1,075 | | | | 33,271 | |
| Zillow Group, Inc. - Class C | | | 1,343 | | | | 40,048 | |
| | | | | | | | 73,319 | |
| Internet & Direct Marketing Retail - 0.11% | | | | | | | | |
| GrubHub, Inc. | | | 1,004 | | | | 56,435 |
|
| | | Shares | | | Fair Value | |
| | | | | | | |
| IT Services - 0.23% | | | | | | | | |
| GoDaddy, Inc. - Class A | | | 837 | | | $ | 55,225 | |
| Square, Inc. - Class A | | | 1,054 | | | | 65,295 | |
| | | | | | | | 120,520 | |
| Life Sciences Tools & Services - 0.11% | | | | | | | | |
| Illumina, Inc. | | | 199 | | | | 60,540 | |
| | | | | | | | | |
| Machinery - 0.34% | | | | | | | | |
| Colfax Corp. | | | 2,152 | | | | 62,537 | |
| The Toro Co. | | | 785 | | | | 57,540 | |
| Xylem, Inc. | | | 740 | | | | 58,919 | |
| | | | | | | | 178,996 | |
| Metals & Mining - 0.10% | | | | | | | | |
| Alcoa Corp. | | | 2,607 | | | | 52,322 | |
| | | | | | | | | |
| Oil, Gas & Consumable Fuels - 0.45% | | | | | | | | |
| Concho Resources, Inc. | | | 568 | | | | 38,567 | |
| Kosmos Energy, Ltd. | | | 6,329 | | | | 39,493 | |
| Murphy Oil Corp. | | | 2,674 | | | | 59,122 | |
| Noble Energy, Inc. | | | 2,933 | | | | 65,875 | |
| PDC Energy, Inc. | | | 1,414 | | | | 39,239 | |
| | | | | | | | 242,296 | |
| Pharmaceuticals - 0.22% | | | | | | | | |
| Elanco Animal Health, Inc. | | | 2,203 | | | | 58,578 | |
| Teva Pharmaceutical Industries, Ltd. - ADR | | | 8,588 | | | | 59,085 | |
| | | | | | | | 117,663 | |
| Real Estate Management & Development - 0.04% | | | | | | | | |
| Redfin Corp. | | | 1,132 | | | | 19,063 | |
| | | | | | | | | |
| Road & Rail - 0.11% | | | | | | | | |
| JB Hunt Transport Services, Inc. | | | 551 | | | | 60,968 | |
| See Notes to the Financial Statements. | The Leuthold Funds - 2019 Annual Report | 55 |
Leuthold Global Fund
Schedule of Securities Sold Short - (a) (continued)
September 30, 2019
| | | Shares | | | Fair Value | |
| COMMON STOCKS - 7.42% (continued) | | | | | | | | |
| | | | | | | | |
| Semiconductors & Semiconductor Equipment - 0.22% | | | | | | | | |
| Advanced Micro Devices, Inc. | | | 2,142 | | | $ | 62,096 | |
| NVIDIA Corp. | | | 326 | | | | 56,747 | |
| | | | | | | | 118,843 | |
| Software - 0.63% | | | | | | | | |
| DocuSign, Inc. | | | 931 | | | | 57,648 | |
| Dropbox, Inc. - Class A | | | 2,748 | | | | 55,427 | |
| Nutanix, Inc. - Class A | | | 1,506 | | | | 39,532 | |
| Palo Alto Networks, Inc. | | | 291 | | | | 59,315 | |
| salesforce.com, Inc. | | | 416 | | | | 61,751 | |
| Splunk, Inc. | | | 511 | | | | 60,226 | |
| | | | | | | | 333,899 | |
| Specialty Retail - 0.15% | | | | | | | | |
| National Vision Holdings, Inc. | | | 771 | | | | 18,558 | |
| Tiffany & Co. | | | 639 | | | | 59,190 | |
| | | | | | | | 77,748 | |
| Technology Hardware, Storage & Peripherals - 0.14% | | | | | | | | |
| 3D Systems Corp. | | | 2,211 | | | | 18,019 | |
| Pure Storage, Inc. | | | 3,422 | | | | 57,969 | |
| | | | | | | | 75,988 | |
| Textiles, Apparel & Luxury Goods - 0.12% | | | | | | | | |
| Canada Goose Holdings, Inc. (b) | | | 1,405 | | | | 61,778 | |
| Trading Companies & Distributors - 0.19% | | | | | | | | |
| SiteOne Landscape Supply, Inc. | | | 558 | | | | 41,303 | |
| Univar Solutions, Inc. | | | 2,876 | | | | 59,706 | |
| | | | | | | | 101,009 | |
| | | Shares | | | Fair Value | |
| | | | | | | |
| Water Utilities - 0.14% | | | | | | | | |
| Aqua America, Inc. | | | 1,625 | | | $ | 72,849 | |
TOTAL COMMON STOCKS
(Proceeds $4,099,279) | | | | | | $ | 3,945,590 | |
| | | | | | | | | |
| INVESTMENT COMPANIES - 7.87% | | | | | | | | |
| Exchange Traded Funds - 7.87% | | | | | | | | |
| iShares MSCI ACWI ETF | | | 26,663 | | | $ | 1,966,396 | |
| iShares MSCI EAFE ETF | | | 27,177 | | | | 1,772,212 | |
| iShares MSCI Emerging Markets ETF | | | 10,894 | | | | 445,238 | |
TOTAL INVESTMENT COMPANIES
(Proceeds $4,214,537) | | | | | | $ | 4,183,846 | |
TOTAL SECURITIES SOLD SHORT
(Proceeds $8,313,816) - 15.29% | | | | | | $ | 8,129,436 | |
Percentages are stated as a percent of net assets.
ADR American Depositary Receipt
(a) Non-income producing security.
(b) Foreign issued security.
The Global Industry Classification Standard (GICS®) was developed by and/or is the exclusive property of MSCI, Inc. and Standard & Poor’s Financial Services LLC (“S&P”). GICS® is a service mark of MSCI, Inc. and S&P and has been licensed for use by U.S. Bancorp Fund Services, LLC.
| 56 | The Leuthold Funds - 2019 Annual Report | See Notes to the Financial Statements. |
Leuthold Select Industries Fund
Schedule of Investments
September 30, 2019
| | | Shares | | | Fair Value | |
| COMMON STOCKS - 99.08% | | | | | | | | |
| | | | | | | | | |
| Airlines - 1.60% | | | | | | | | |
| Delta Air Lines, Inc. | | | 1,669 | | | $ | 96,134 | |
| United Airlines Holdings, Inc. (a) | | | 1,041 | | | | 92,035 | |
| | | | | | | | 188,169 | |
| Biotechnology - 4.27% | | | | | | | | |
| Alexion Pharmaceuticals, Inc. (a) | | | 1,188 | | | | 116,353 | |
| Amgen, Inc. | | | 832 | | | | 161,000 | |
| Celgene Corp. (a) | | | 734 | | | | 72,886 | |
| Gilead Sciences, Inc. | | | 2,409 | | | | 152,683 | |
| | | | | | | | 502,922 | |
| Capital Markets - 4.19% | | | | | | | | |
| FactSet Research Systems, Inc. | | | 233 | | | | 56,612 | |
| Intercontinental Exchange, Inc. | | | 1,099 | | | | 101,405 | |
| Moody’s Corp. | | | 479 | | | | 98,113 | |
| MSCI, Inc. | | | 296 | | | | 64,454 | |
| Nasdaq, Inc. | | | 726 | | | | 72,128 | |
| S&P Global, Inc. | | | 411 | | | | 100,687 | |
| | | | | | | | 493,399 | |
| Commercial Services & Supplies - 3.86% | | | | | | | | |
| Republic Services, Inc. | | | 1,946 | | | | 168,426 | |
| Tetra Tech, Inc. | | | 1,217 | | | | 105,587 | |
| Waste Management, Inc. | | | 1,576 | | | | 181,240 | |
| | | | | | | | 455,253 | |
| Consumer Finance - 4.91% | | | | | | | | |
| Ally Financial, Inc. | | | 3,106 | | | | 102,995 | |
| Capital One Financial Corp. | | | 1,742 | | | | 158,487 | |
| OneMain Holdings, Inc. | | | 1,338 | | | | 49,078 | |
| Santander Consumer USA Holdings, Inc. | | | 2,803 | | | | 71,505 | |
| Synchrony Financial | | | 4,137 | | | | 141,030 | |
| World Acceptance Corp. (a) | | | 439 | | | | 55,977 | |
| | | | | | | | 579,072 | |
| | | Shares | | | Fair Value | |
| | | | | | | |
| Diversified Telecommunication Services - 3.54% | | | | | | | | |
| AT&T, Inc. | | | 6,185 | | | $ | 234,040 | |
| Verizon Communications, Inc. | | | 3,030 | | | | 182,891 | |
| | | | | | | | 416,931 | |
| Entertainment - 4.50% | | | | | | | | |
| Activision Blizzard, Inc. | | | 3,315 | | | | 175,430 | |
| Electronic Arts, Inc. (a) | | | 1,841 | | | | 180,086 | |
| The Walt Disney Co. | | | 1,340 | | | | 174,629 | |
| | | | | | | | 530,145 | |
| Food & Staples Retailing - 4.79% | | | | | | | | |
| Costco Wholesale Corp. | | | 1,063 | | | | 306,261 | |
| Walmart, Inc. | | | 2,178 | | | | 258,485 | |
| | | | | | | | 564,746 | |
| Health Care Providers & Services - 8.15% | | | | | | | | |
| Anthem, Inc. | | | 344 | | | | 82,594 | |
| Centene Corp. (a) | | | 3,009 | | | | 130,169 | |
| Encompass Health Corp. | | | 1,927 | | | | 121,941 | |
| HCA Healthcare, Inc. | | | 1,627 | | | | 195,923 | |
| Humana, Inc. | | | 494 | | | | 126,301 | |
| UnitedHealth Group, Inc. | | | 884 | | | | 192,111 | |
| Universal Health Services, Inc. - Class B | | | 750 | | | | 111,563 | |
| | | | | | | | 960,602 | |
| Hotels, Restaurants & Leisure - 4.03% | | | | | | | | |
| Cracker Barrel Old Country Store, Inc. | | | 325 | | | | 52,861 | |
| Darden Restaurants, Inc. | | | 742 | | | | 87,719 | |
| McDonald’s Corp. | | | 394 | | | | 84,596 | |
| Starbucks Corp. | | | 926 | | | | 81,877 | |
| The Wendy’s Co. | | | 3,163 | | | | 63,197 | |
| Yum! Brands, Inc. | | | 927 | | | | 105,149 | |
| | | | | | | | 475,399 | |
| See Notes to the Financial Statements. | The Leuthold Funds - 2019 Annual Report | 57 |
Leuthold Select Industries Fund
Schedule of Investments (continued)
September 30, 2019
| | | Shares | | | Fair Value | |
| COMMON STOCKS - 99.08% (continued) | | | | | | | | |
| | | | | | | | | |
| Household Durables - 5.58% | | | | | | | | |
| D.R. Horton, Inc. | | | 2,806 | | | $ | 147,904 | |
| KB Home | | | 2,084 | | | | 70,856 | |
| Lennar Corp. - Class A | | | 1,678 | | | | 93,716 | |
| Meritage Homes Corp. (a) | | | 1,197 | | | | 84,209 | |
| PulteGroup, Inc. | | | 4,249 | | | | 155,301 | |
| Toll Brothers, Inc. | | | 2,579 | | | | 105,868 | |
| | | | | | | | 657,854 | |
| Insurance - 1.26% | | | | | | | | |
| MetLife, Inc. | | | 3,160 | | | | 149,026 | |
| Interactive Media & Services - 4.09% | | | | | | | | |
| Alphabet, Inc. - Class A (a) | | | 228 | | | | 278,420 | |
| Facebook, Inc. - Class A (a) | | | 678 | | | | 120,738 | |
| IAC/InterActiveCorp (a) | | | 379 | | | | 82,611 | |
| | | | | | | | 481,769 | |
| Internet & Direct Marketing Retail - 5.65% | | | | | | | | |
| Amazon.com, Inc. (a) | | | 136 | | | | 236,084 | |
| Booking Holdings, Inc. (a) | | | 78 | | | | 153,084 | |
| eBay, Inc. | | | 2,939 | | | | 114,562 | |
| Etsy, Inc. (a) | | | 1,317 | | | | 74,410 | |
| Expedia Group, Inc. - Class A | | | 649 | | | | 87,232 | |
| | | | | | | | 665,372 | |
| IT Services - 8.98% | | | | | | | | |
| Fiserv, Inc. (a) | | | 1,839 | | | | 190,502 | |
| FleetCor Technologies, Inc. (a) | | | 430 | | | | 123,316 | |
| Genpact, Ltd. | | | 1,503 | | | | 58,241 | |
| Mastercard, Inc. - Class A | | | 1,007 | | | | 273,471 | |
| MAXIMUS, Inc. | | | 1,293 | | | | 99,897 | |
| Visa, Inc. - Class A | | | 1,428 | | | | 245,630 | |
| The Western Union Co. | | | 2,910 | | | | 67,425 | |
| | | | | | | | 1,058,482 | |
| | | Shares | | | Fair Value | |
| | | | | | | |
| Media - 1.80% | | | | | | | | |
| Comcast Corp. - Class A | | | 3,001 | | | $ | 135,285 | |
| Nexstar Media Group, Inc. | | | 747 | | | | 76,426 | |
| | | | | | | | 211,711 | |
| Multiline Retail - 6.38% | | | | | | | | |
| Dollar General Corp. | | | 1,637 | | | | 260,185 | |
| Dollar Tree, Inc. (a) | | | 1,458 | | | | 166,445 | |
| Target Corp. | | | 3,039 | | | | 324,899 | |
| | | | | | | | 751,529 | |
| Professional Services - 3.86% | | | | | | | | |
| ASGN, Inc. (a) | | | 1,670 | | | | 104,976 | |
| Insperity, Inc. | | | 1,309 | | | | 129,093 | |
| Robert Half International, Inc. | | | 1,954 | | | | 108,760 | |
| TriNet Group, Inc. (a) | | | 1,793 | | | | 111,507 | |
| | | | | | | | 454,336 | |
| Road & Rail - 5.81% | | | | | | | | |
| Canadian National Railway Co. (b) | | | 954 | | | | 85,726 | |
| Canadian Pacific Railway, Ltd. (b) | | | 555 | | | | 123,465 | |
| Genesee & Wyoming, Inc. - Class A (a) | | | 1,019 | | | | 112,610 | |
| Kansas City Southern | | | 947 | | | | 125,960 | |
| Norfolk Southern Corp. | | | 674 | | | | 121,091 | |
| Union Pacific Corp. | | | 717 | | | | 116,140 | |
| | | | | | | | 684,992 | |
| Semiconductors & Semiconductor Equipment - 7.19% | | | | | | | | |
| Applied Materials, Inc. | | | 3,204 | | | | 159,880 | |
| KLA Corp. | | | 660 | | | | 105,237 | |
| Kulicke & Soffa Industries, Inc. (b) | | | 1,789 | | | | 42,006 | |
| Lam Research Corp. | | | 1,165 | | | | 269,243 | |
| MKS Instruments, Inc. | | | 1,217 | | | | 112,305 | |
| SolarEdge Technologies, Inc. (a)(b) | | | 1,895 | | | | 158,649 | |
| | | | | | | | 847,320 | |
| 58 | The Leuthold Funds - 2019 Annual Report | See Notes to the Financial Statements. |
Leuthold Select Industries Fund
Schedule of Investments (continued)
September 30, 2019
| | | Shares | | | Fair Value | |
| COMMON STOCKS - 99.08% (continued) | | | | | | | | |
| | | | | | | | | |
| Software - 2.60% | | | | | | | | |
| Microsoft Corp. | | | 2,201 | | | $ | 306,005 | |
| Specialty Retail - 1.54% | | | | | | | | |
| AutoZone, Inc. (a) | | | 99 | | | | 107,377 | |
| Group 1 Automotive, Inc. | | | 805 | | | | 74,310 | |
| | | | | | | | 181,687 | |
| Thrifts & Mortgage Finance - 0.50% | | | | | | | | |
| Radian Group, Inc. | | | 2,557 | | | | 58,402 | |
TOTAL COMMON STOCKS
(Cost $8,858,513) | | | | | | $ | 11,675,123 | |
| | | | | | | | | |
| SHORT-TERM INVESTMENTS - 1.13% | | | | | | | | |
| | | | | | | | | |
| Money Market Funds - 1.13% | | | | | | | | |
| Fidelity Institutional Money Market Funds - Government Portfolio - Class I, 1.860% (c) | | | 133,155 | | | $ | 133,155 | |
TOTAL SHORT-TERM INVESTMENTS
(Cost $133,155) | | | | | | $ | 133,155 | |
| | | | | | | | | |
| | | | | | | | | |
Total Investments
(Cost $8,991,668) - 100.21% | | | | | | $ | 11,808,278 | |
| Liabilities in Excess of Other Assets - (0.21)% | | | | | | | (24,394 | ) |
| TOTAL NET ASSETS - 100.00% | | | | | | $ | 11,783,884 | |
Percentages are stated as a percent of net assets.
(a) Non-income producing security.
(b) Foreign issued security.
(c) The rate quoted is the annualized seven-day yield as of September 30, 2019.
The Global Industry Classification Standard (GICS®) was developed by and/or is the exclusive property of MSCI, Inc. and Standard & Poor’s Financial Services LLC (“S&P”). GICS® is a service mark of MSCI, Inc. and S&P and has been licensed for use by U.S. Bancorp Fund Services, LLC.
| See Notes to the Financial Statements. | The Leuthold Funds - 2019 Annual Report | 59 |
Grizzly Short Fund
Schedule of Investments
September 30, 2019
| | | Shares | | | Fair Value | |
| SHORT-TERM INVESTMENTS - 76.54% | | | |
| | | | | | | | | |
| Money Market Funds - 76.54% | | | | | | | | |
| Fidelity Institutional Money Market Funds - Government Portfolio - Class I, 1.860% (a)(b) | | | 70,599,843 | | | $ | 70,599,843 | |
TOTAL SHORT-TERM INVESTMENTS
(Cost $70,599,843) | | | | | | $ | 70,599,843 | |
Total Investments
(Cost $70,599,843) - 76.54% | | | | | | $ | 70,599,843 | |
| Other Assets in Excess of Liabilities - (b) 23.46% | | | | | | | 21,638,24 | |
| TOTAL NET ASSETS - 100.00% | | | | | | $ | 92,238,086 | |
Percentages are stated as a percent of net assets.
(a) The rate quoted is the annualized seven-day yield as of September 30, 2019.
(b) All or a portion of the assets have been committed as collateral for open securities sold short.
The Global Industry Classification Standard (GICS®) was developed by and/or is the exclusive property of MSCI, Inc. and Standard & Poor’s Financial Services LLC (“S&P”). GICS® is a service mark of MSCI, Inc. and S&P and has been licensed for use by U.S. Bancorp Fund Services, LLC.
| 60 | The Leuthold Funds - 2019 Annual Report | See Notes to the Financial Statements. |
Grizzly Short Fund
Schedule of Securities Sold Short - (a)
September 30, 2019
| | | Shares | | | Fair Value | |
| COMMON STOCKS - 97.93% | | | | | | | | |
| | | | | | | | | |
| Aerospace & Defense - 1.77% | | | | | | | | |
| AeroVironment, Inc. | | | 6,959 | | | $ | 372,724 | |
| Axon Enterprise, Inc. | | | 22,199 | | | | 1,260,459 | |
| | | | | | | | 1,633,183 | |
| Air Freight & Logistics - 1.39% | | | | | | | | |
| FedEx Corp. | | | 8,779 | | | | 1,277,959 | |
| Auto Components - 0.93% | | | | | | | | |
| Dorman Products, Inc. | | | 5,789 | | | | 460,457 | |
| Veoneer, Inc. (b) | | | 26,336 | | | | 394,777 | |
| | | | | | | | 855,234 | |
| Automobiles - 3.21% | | | | | | | | |
| Tesla, Inc. | | | 6,572 | | | | 1,582,997 | |
| Thor Industries, Inc. | | | 24,381 | | | | 1,380,940 | |
| | | | | | | | 2,963,937 | |
| Banks - 3.16% | | | | | | | | |
| CenterState Bank Corp. | | | 21,593 | | | | 517,908 | |
| Commerce Bancshares, Inc. | | | 17,738 | | | | 1,075,810 | |
| First Republic Bank | | | 13,622 | | | | 1,317,247 | |
| | | | | | | | 2,910,965 | |
| Capital Markets - 1.84% | | | | | | | | |
| The Charles Schwab Corp. | | | 33,298 | | | | 1,392,855 | |
| Virtu Financial, Inc. - Class A | | | 18,667 | | | | 305,392 | |
| | | | | | | | 1,698,247 | |
| Chemicals - 5.23% | | | | | | | | |
| Ashland Global Holdings, Inc. | | | 17,961 | | | | 1,383,895 | |
| Balchem Corp. | | | 4,768 | | | | 472,938 | |
| DuPont de Nemours, Inc. | | | 22,098 | | | | 1,575,808 | |
| The Mosaic Co. | | | 67,835 | | | | 1,390,618 | |
| | | | | | | | 4,823,259 | |
| | | Shares | | | Fair Value | |
| Commercial Services & Supplies - 3.03% | | | | | | | | |
| Rollins, Inc. | | | 35,518 | | | $ | 1,210,098 | |
| Stericycle, Inc. | | | 31,078 | | | | 1,582,803 | |
| | | | | | | | 2,792,901 | |
| Communications Equipment - 0.97% | | | | | | | | |
| Lumentum Holdings, Inc. | | | 16,649 | | | | 891,720 | |
| Construction & Engineering - 0.49% | | | | | | | | |
| Granite Construction, Inc. | | | 14,177 | | | | 455,507 | |
| Diversified Telecommunication Services - 1.71% | | | | | | | | |
| Intelsat SA (b) | | | 69,320 | | | | 1,580,496 | |
| Electronic Equipment, Instruments & Components - 2.76% | | | | | | | | |
| Cognex Corp. | | | 26,633 | | | | 1,308,480 | |
| IPG Photonics Corp. | | | 9,127 | | | | 1,237,621 | |
| | | | | | | | 2,546,101 | |
| Energy Equipment & Services - 3.68% | | | | | | | | |
| Core Laboratories NV (b) | | | 23,107 | | | | 1,077,248 | |
| Halliburton Co. | | | 34,811 | | | | 656,188 | |
| National Oilwell Varco, Inc. | | | 34,105 | | | | 723,026 | |
| Schlumberger, Ltd. | | | 27,546 | | | | 941,247 | |
| | | | | | | | 3,397,709 | |
| Entertainment - 2.58% | | | | | | | | |
| Netflix, Inc. | | | 3,632 | | | | 971,996 | |
| World Wrestling Entertainment, Inc. - Class A | | | 19,788 | | | | 1,407,916 | |
| | | | | | | | 2,379,912 | |
| Food Products - 0.52% | | | | | | | | |
| Cal-Maine Foods, Inc. | | | 11,906 | | | | 475,704 | |
| Gas Utilities - 2.45% | | | | | | | | |
| Northwest Natural Holding Co. | | | 6,357 | | | | 453,509 | |
| South Jersey Industries, Inc. | | | 14,530 | | | | 478,182 | |
| UGI Corp. | | | 26,379 | | | | 1,326,072 | |
| | | | | | | | 2,257,763 | |
| See Notes to the Financial Statements. | The Leuthold Funds - 2019 Annual Report | 61 |
Grizzly Short Fund
Schedule of Securities Sold Short - (a)
September 30, 2019
| | | Shares | | | Fair Value | |
| COMMON STOCKS - 97.93% (continued) | | | | | | | | |
| | | | | | | | | |
| Health Care Equipment & Supplies - 7.82% | | | | | | | | |
| ABIOMED, Inc. | | | 5,348 | | | $ | 951,356 | |
| Avanos Medical, Inc. | | | 13,622 | | | | 510,280 | |
| Becton Dickinson and Co. | | | 6,054 | | | | 1,531,420 | |
| DexCom, Inc. | | | 9,586 | | | | 1,430,615 | |
| Intuitive Surgical, Inc. | | | 2,623 | | | | 1,416,236 | |
| iRhythm Technologies, Inc. | | | 11,666 | | | | 864,567 | |
| Quidel Corp. | | | 8,333 | | | | 511,230 | |
| | | | | | | | 7,215,704 | |
| Health Care Technology - 0.50% | | | | | | | | |
| Tabula Rasa HealthCare, Inc. | | | 8,375 | | | | 460,123 | |
| Hotels, Restaurants & Leisure - 5.21% | | | | | | | | |
| Bloomin’ Brands, Inc. | | | 50,754 | | | | 960,773 | |
| Boyd Gaming Corp. | | | 60,138 | | | | 1,440,305 | |
| Eldorado Resorts, Inc. | | | 32,850 | | | | 1,309,730 | |
| The Stars Group, Inc. (b) | | | 73,255 | | | | 1,097,360 | |
| | | | | | | | 4,808,168 | |
| Household Durables - 1.42% | | | | | | | | |
| iRobot Corp. | | | 21,190 | | | | 1,306,787 | |
| Household Products - 0.54% | | | | | | | | |
| Spectrum Brands Holdings, Inc. | | | 9,477 | | | | 499,627 | |
| Industrial Conglomerates - 1.45% | | | | | | | | |
| General Electric Co. | | | 150,042 | | | | 1,341,375 | |
| Interactive Media & Services - 1.82% | | | | | | | | |
| CarGurus, Inc. - Class A | | | 24,620 | | | | 761,989 | |
| Zillow Group, Inc. - Class C | | | 30,775 | | | | 917,711 | |
| | | | | | | | 1,679,700 | |
| Internet & Direct Marketing Retail - 1.40% | | | | | | | | |
| GrubHub, Inc. | | | 23,006 | | | | 1,293,167 | |
| | | Shares | | | Fair Value | |
| IT Services - 2.99% | | | | | | | | |
| GoDaddy, Inc. - Class A | | | 19,171 | | | $ | 1,264,903 | |
| Square, Inc. - Class A | | | 24,056 | | | | 1,490,269 | |
| | | | | | | | 2,755,172 | |
| Life Sciences Tools & Services - 1.50% | | | | | | | | |
| Illumina, Inc. | | | 4,541 | | | | 1,381,463 | |
| Machinery - 4.43% | | | | | | | | |
| Colfax Corp. | | | 49,140 | | | | 1,428,009 | |
| The Toro Co. | | | 17,881 | | | | 1,310,677 | |
| Xylem, Inc. | | | 16,952 | | | | 1,349,718 | |
| | | | | | | | 4,088,404 | |
| Metals & Mining - 1.30% | | | | | | | | |
| Alcoa Corp. | | | 59,734 | | | | 1,198,861 | |
| Oil, Gas & Consumable Fuels - 6.02% | | | | | | | | |
| Concho Resources, Inc. | | | 13,016 | | | | 883,786 | |
| Kosmos Energy, Ltd. | | | 144,997 | | | | 904,781 | |
| Murphy Oil Corp. | | | 61,046 | | | | 1,349,727 | |
| Noble Energy, Inc. | | | 67,201 | | | | 1,509,335 | |
| PDC Energy, Inc. | | | 32,501 | | | | 901,903 | |
| | | | | | | | 5,549,532 | |
| Pharmaceuticals - 2.92% | | | | | | | | |
| Elanco Animal Health, Inc. | | | 50,492 | | | | 1,342,582 | |
| Teva Pharmaceutical Industries, Ltd. - ADR | | | 196,760 | | | | 1,353,709 | |
| | | | | | | | 2,696,291 | |
| Real Estate Management & Development - 0.47% | | | | | | | | |
| Redfin Corp. | | | 25,932 | | | | 436,695 | |
| Road & Rail - 1.51% | | | | | | | | |
| JB Hunt Transport Services, Inc. | | | 12,559 | | | | 1,389,653 | |
| 62 | The Leuthold Funds - 2019 Annual Report | See Notes to the Financial Statements. |
Grizzly Short Fund
Schedule of Securities Sold Short - (a)
September 30, 2019
| | | Shares | | | Fair Value | |
| COMMON STOCKS - 97.93% (continued) | | | | | | | | |
| | | | | | | | | |
| Semiconductors & Semiconductor Equipment - 2.94% | | | | | | | | |
| Advanced Micro Devices, Inc. | | | 48,839 | | | $ | 1,415,842 | |
| NVIDIA Corp. | | | 7,467 | | | | 1,299,781 | |
| | | | | | | | 2,715,623 | |
| Software - 8.29% | | | | | | | | |
| DocuSign, Inc. | | | 21,260 | | | | 1,316,419 | |
| Dropbox, Inc. - Class A | | | 62,963 | | | | 1,269,964 | |
| Nutanix, Inc. - Class A | | | 34,509 | | | | 905,861 | |
| Palo Alto Networks, Inc. | | | 6,660 | | | | 1,357,508 | |
| salesforce.com, Inc. | | | 9,560 | | | | 1,419,087 | |
| Splunk, Inc. | | | 11,705 | | | | 1,379,551 | |
| | | | | | | | 7,648,390 | |
| Specialty Retail - 1.93% | | | | | | | | |
| National Vision Holdings, Inc. | | | 17,658 | | | | 425,028 | |
| Tiffany & Co. | | | 14,631 | | | | 1,355,270 | |
| | | | | | | | 1,780,298 | |
| Technology Hardware, Storage & Peripherals - 1.89% | | | | | | | | |
| 3D Systems Corp. | | | 50,653 | | | | 412,822 | |
| Pure Storage, Inc. | | | 78,401 | | | | 1,328,113 | |
| | | | | | | | 1,740,935 | |
| Textiles, Apparel & Luxury Goods - 1.54% | | | | | | | | |
| Canada Goose Holdings, Inc. (b) | | | 32,188 | | | | 1,415,306 | |
| Trading Companies & Distributors - 2.51% | | | | | | | | |
| SiteOne Landscape Supply, Inc. | | | 12,901 | | | | 954,932 | |
| Univar Solutions, Inc. | | | 65,639 | | | | 1,362,666 | |
| | | | | | | | 2,317,598 | |
| | | Shares | | | Fair Value | |
| Water Utilities - 1.81% | | | | | | | | |
| Aqua America, Inc. | | | 37,233 | | | $ | 1,669,155 | |
TOTAL COMMON STOCKS
(Proceeds $97,324,484) | | | | | | $ | 90,328,624 | |
| | | | | | | | | |
TOTAL SECURITIES SOLD SHORT
(Proceeds $97,324,484) - 97.93% | | | | | | $ | 90,328,624 | |
Percentages are stated as a percent of net assets.
ADR American Depositary Receipt
(a) Non-income producing security.
(b) Foreign issued security.
The Global Industry Classification Standard (GICS®) was developed by and/or is the exclusive property of MSCI, Inc. and Standard & Poor’s Financial Services LLC (“S&P”). GICS® is a service mark of MSCI, Inc. and S&P and has been licensed for use by U.S. Bancorp Fund Services, LLC.
| See Notes to the Financial Statements. | The Leuthold Funds - 2019 Annual Report | 63 |
| 64 | The Leuthold Funds - 2019 Annual Report |
The Leuthold Funds
Notes to the Financial Statements
| 1. | ORGANIZATION AND SIGNIFICANTACCOUNTING POLICIES |
Leuthold Funds, Inc. (the “Company”) was incorporated on August 30, 1995, as a Maryland Corporation and is registered with the Securities and Exchange Commission as an open-end management investment company under the Investment Company Act of 1940, as amended. In addition, the Funds are considered investment companies under, and follow the accounting and reporting guidance in, Accounting Standards Codification Topic 946 – Investment Companies. The Leuthold Group, LLC, doing business as Leuthold Weeden Capital Management, is the investment adviser (the “Adviser”). The Company consists of four series (each series a “Fund” and, collectively, the “Funds”):
| Fund | Investment Objective | Inception –
Retail
Share Class | Inception –
Institutional
Share Class |
| Leuthold Core Investment Fund | Seeks total return consistent with prudent | | |
| | investment risk over the long term | 11/20/1995 | 1/31/2006 |
| Leuthold Global Fund | Seeks total return consistent with prudent | 7/1/2008 | 4/30/2008 |
| | investment risk over the long term | | |
| Leuthold Select Industries Fund | Capital appreciation | 6/19/2000 | n/a |
| Grizzly Short Fund | Capital appreciation | 6/19/2000 | n/a |
All classes of shares in a Fund have identical voting, dividend, liquidation, and other rights, and the same terms and conditions, except that certain fees and expenses, including distribution and shareholder servicing fees, may differ among classes. Each class has exclusive voting rights on any matters relating to that class’s servicing or distribution arrangements.
The following is a summary of significant accounting policies consistently followed by the Funds.
| a) | Investment Valuation – Securities listed on a national securities exchange (other than The NASDAQ OMX Group, Inc., referred to as “NASDAQ”) are valued at the last sale price on the day the valuation is made. Securities that are traded on NASDAQ under one of its three listing tiers, NASDAQ Global Market, NASDAQ Global Select Market, and NASDAQ Capital Market, are valued at the NASDAQ Official Closing Price. Price information on listed stocks is taken from the exchange where the security is primarily traded. Securities, including securities sold short, which are listed on an exchange, but which are not traded on the valuation date are generally valued at the mean between the bid and the asked prices. Unlisted securities for which market quotations are readily available are valued at the latest quoted bid price or, if unavailable, at prices provided by an independent pricing service. Securities sold short which are not listed on an exchange but for which market quotations are readily available are generally valued at the average of the current bid and asked prices. Debt securities are valued at bid prices provided by an independent pricing service that may use a matrix pricing method or other analytical pricing model. Exchange-traded options are valued at the last reported sale price priced on the primary exchange on which the option is traded. If no sales are reported on a particular day, the mean between the highest bid and lowest asked quotations at the close of the exchanges is used. Non-exchange traded options are valued at the mean between the last bid and asked quotations. For options where market quotations are not readily available, fair value shall be determined. Shares of open-end investment companies (other than shares of an exchange-traded fund traded on domestic securities exchanges or on NASDAQ) are valued at one of the following prices as determined by the Adviser: (a) the net asset value announced by such open-end investment company following the close of business on the business day a Fund’s net asset value is to be calculated; (b) the net asset value announced by such open-end investment company following the close of business on the business day immediately preceding the day a Fund’s net asset value is to be calculated; or (c) a value determined by the Adviser by adding to, or subtracting from, the net asset value announced by such open-end investment company following the close of business on the business day immediately preceding the day a Fund’s net asset value is to be calculated, an amount equal to the Adviser’s estimate of the effect of changes in the market prices for the types of securities held by such investment company. Other assets, including securities for which no quotations are readily available, are valued at fair value as determined in good faith by the Board of Directors (“Directors”) pursuant to the Funds’ “Pricing and Valuation Guidelines.” |
| The Leuthold Funds - 2019 Annual Report | 65 |
The Leuthold Funds
The Funds may invest in foreign securities. Foreign securities may be priced at the closing price reported on the foreign exchange on which they are principally traded. Trading in foreign securities may be completed at times that vary from the closing of the New York Stock Exchange (“NYSE”). The Directors have approved the use of their independent pricing provider’s proprietary fair value pricing model to assist in determining current valuation for foreign securities traded in markets that close prior to the NYSE. Foreign securities quoted in foreign currencies are translated into U.S. dollars at current exchange rates. Occasionally, events that affect these values and exchange rates may occur between the times at which they are determined and the closing of the NYSE. If these events materially affect the value of portfolio securities, then these securities may be valued as determined in good faith by the Directors. Some of the factors which may be considered by the Directors and the Funds’ Fair Value Pricing Committee in determining fair value are fundamental analytical data relating to the investment, the nature and duration of any restrictions on disposition, trading in similar securities of the same issuer or comparable companies, information from broker-dealers, and an evaluation of the forces that influence the market in which the securities are purchased and sold. The use of fair value pricing by a Fund may cause the net asset value of its shares to differ significantly from the net asset value that would be calculated without regard to such considerations.
| b) | Fair Valuation Measurements –The Funds have adopted fair valuation accounting standards, which establish a definition of fair value and set out a hierarchy for measuring fair value. These standards require additional disclosures about the various inputs and valuation techniques used to develop the measurements of fair value and a discussion of changes in valuation techniques and related inputs during the period. These inputs are summarized in the following three levels: |
Level 1 - Quoted prices in active markets for identical securities.
Level 2 - Other significant observable inputs (including quoted prices for similar securities, interest rates, prepayment speeds, credit risk, etc.).
Level 3 - Significant unobservable inputs (including the Funds’ own assumptions in determining the fair value of investments).
The inputs or methodology used for valuing securities are not an indication of the risk associated with investing in those securities.
| 66 | The Leuthold Funds - 2019 Annual Report |
The Leuthold Funds
The following is a summary of the inputs used to value the Funds’ investments and securities sold short as of September 30, 2019:
| Leuthold Core Investment Fund |
| Investments at Fair Value | | | Level 1 | | | | Level 2 | | | | Level 3 | | | | Total | |
| Common Stocks | | | | | | | | | | | | | | | | |
| Airlines | | $ | 5,411,089 | | | $ | — | | | $ | — | | | $ | 5,411,089 | |
| Biotechnology | | | 14,712,405 | | | | — | | | | — | | | | 14,712,405 | |
| Capital Markets | | | 14,331,741 | | | | — | | | | — | | | | 14,331,741 | |
| Chemicals | | | — | | | | — | | | | 6,415 | | | | 6,415 | |
| Commercial Services & Supplies | | | 13,305,688 | | | | — | | | | — | | | | 13,305,688 | |
| Consumer Finance | | | 16,970,046 | | | | — | | | | — | | | | 16,970,046 | |
| Diversified Telecommunication Services | | | 12,079,867 | | | | — | | | | — | | | | 12,079,867 | |
| Entertainment | | | 15,384,129 | | | | — | | | | — | | | | 15,384,129 | |
| Food & Staples Retailing | | | 16,461,634 | | | | — | | | | — | | | | 16,461,634 | |
| Health Care Providers & Services | | | 28,780,237 | | | | — | | | | — | | | | 28,780,237 | |
| Hotels, Restaurants & Leisure | | | 13,864,941 | | | | — | | | | — | | | | 13,864,941 | |
| Household Durables | | | 19,672,845 | | | | — | | | | — | | | | 19,672,845 | |
| Insurance | | | 4,377,344 | | | | — | | | | — | | | | 4,377,344 | |
| Interactive Media & Services | | | 13,917,177 | | | | — | | | | — | | | | 13,917,177 | |
| Internet & Direct Marketing Retail | | | 19,442,055 | | | | — | | | | — | | | | 19,442,055 | |
| IT Services | | | 31,578,800 | | | | — | | | | — | | | | 31,578,800 | |
| Media | | | 6,117,173 | | | | — | | | | — | | | | 6,117,173 | |
| Multiline Retail | | | 22,591,178 | | | | — | | | | — | | | | 22,591,178 | |
| Professional Services | | | 13,542,962 | | | | — | | | | — | | | | 13,542,962 | |
| Road & Rail | | | 20,249,161 | | | | — | | | | — | | | | 20,249,161 | |
| Semiconductors & Semiconductor Equipment | | | 25,553,851 | | | | — | | | | — | | | | 25,553,851 | |
| Software | | | 8,959,093 | | | | — | | | | — | | | | 8,959,093 | |
| Specialty Retail | | | 5,445,508 | | | | — | | | | — | | | | 5,445,508 | |
| Thrifts & Mortgage Finance | | | 1,733,236 | | | | — | | | | — | | | | 1,733,236 | |
| Total Common Stocks | | $ | 344,482,160 | | | $ | — | | | $ | 6,415 | | | $ | 344,488,575 | |
| Exchange Traded Funds | | | 107,327,111 | | | | — | | | | — | | | | 107,327,111 | |
| Corporate Bonds | | | — | | | | 18,453,466 | | | | — | | | | 18,453,466 | |
| United States Treasury Obligations | | | — | | | | 27,766,586 | | | | — | | | | 27,766,586 | |
| Foreign Government Bonds | | | — | | | | 19,455,897 | | | | — | | | | 19,455,897 | |
| Money Market Funds | | | 79,003,405 | | | | — | | | | — | | | | 79,003,405 | |
| Investments Purchased as Securities Lending Collateral* | | | — | | | | — | | | | — | | | | 58,159,493 | |
| Total Investments in Securities | | $ | 530,812,676 | | | $ | 65,675,949 | | | $ | 6,415 | | | $ | 654,654,533 | |
| * | Certain investments that are measured at fair value using the net asset value per share (or its equivalent) practical expedient have not been categorized in the fair value hierarchy. The fair value amounts presented in the table are intended to permit reconciliation of the fair value hierarchy to the amounts presented in the Schedule of Investments. |
| Securities Sold Short at Fair Value | | Level 1 | | Level 2 | | Level 3 | | Total |
| Common Stocks | | $ | 88,882,815 | | | $ | — | | | $ | — | | | $ | 88,882,815 | |
| Exchange Traded Funds | | | 3,049,540 | | | | — | | | | — | | | | 3,049,540 | |
| Total Securities Sold Short | | $ | 91,932,355 | | | $ | — | | | $ | — | | | $ | 91,932,355 | |
| The Leuthold Funds - 2019 Annual Report | 67 |
The Leuthold Funds
The following is a reconciliation of Level 3 investments for which significant unobservable inputs were used to determine fair value:
| Leuthold Core Investment Fund | | Investment in
Securities at
Fair Value |
| Balance as of September 30, 2018 | | $ | 6,423 | |
| Accrued discounts/premiums | | | — | |
| Realized gain (loss) | | | — | |
| Change in unrealized depreciation | | | (8 | )* |
| Purchases | | | — | |
| Sales | | | — | |
| Transfer into and/or out of Level 3 | | | — | |
| Balance as of September 30, 2019 | | $ | 6,415 | (1) |
| Change in net unrealized depreciation during | | | | |
| the period for Level 3 investments held at September 30, 2019: | | $ | (8 | ) |
| * | Unrealized depreciation is due to a change in foreign currency exchange rate. |
| (1) | The security (China Lumena New Materials Corp.) is classified as a Level 3 security due to a halt in trading of the security on March 25, 2014. The security is valued at fair value as determined in good faith by the Directors. The Adviser submits a report to the Directors setting forth the factors considered in determining the price. The significant unobservable input used in the fair valuation of this security is a discount of 95% from the last traded price of Hong Kong Dollar 1.25. Significant changes in the discount rate may result in a change in fair value measurement. For the duration of the period, the discount was 95%. |
| Leuthold Global Fund |
| Investments at Fair Value | | Level 1 | | Level 2 | | Level 3 | | Total |
| Common Stocks | | | | | | | | | | | | | | | | |
| Banks | | $ | 271,850 | | | $ | 1,012,019 | | | $ | — | | | $ | 1,283,869 | |
| Beverages | | | 419,389 | | | | — | | | | — | | | | 419,389 | |
| Building Products | | | 1,116,081 | | | | 191,188 | | | | — | | | | 1,307,269 | |
| Capital Markets | | | 1,861,623 | | | | 356,336 | | | | — | | | | 2,217,959 | |
| Construction Materials | | | 244,884 | | | | 159,654 | | | | — | | | | 404,538 | |
| Consumer Finance | | | 1,911,955 | | | | 352,490 | | | | — | | | | 2,264,445 | |
| Entertainment | | | 992,499 | | | | 564,437 | | | | — | | | | 1,556,936 | |
| Food & Staples Retailing | | | 1,605,043 | | | | 639,799 | | | | — | | | | 2,244,842 | |
| Gas Utilities | | | — | | | | 134,446 | | | | — | | | | 134,446 | |
| Hotels, Restaurants & Leisure | | | 1,872,238 | | | | — | | | | — | | | | 1,872,238 | |
| Household Durables | | | 1,328,553 | | | | 713,252 | | | | — | | | | 2,041,805 | |
| Insurance | | | 2,174,673 | | | | 1,585,597 | | | | — | | | | 3,760,270 | |
| Interactive Media & Services | | | 1,266,763 | | | | 153,626 | | | | — | | | | 1,420,389 | |
| Internet & Direct Marketing Retail | | | 240,507 | | | | 238,893 | | | | — | | | | 479,400 | |
| IT Services | | | 2,691,100 | | | | 1,188,908 | | | | — | | | | 3,880,008 | |
| Life Sciences Tools & Services | | | 1,293,465 | | | | 740,727 | | | | — | | | | 2,034,192 | |
| Oil, Gas & Consumable Fuels | | | 1,514,940 | | | | — | | | | — | | | | 1,514,940 | |
| Paper & Forest Products | | | — | | | | — | | | | 47,539 | | | | 47,539 | |
| Semiconductors & Semiconductor Equipment | | | 1,758,773 | | | | 1,340,081 | | | | — | | | | 3,098,854 | |
| Thrifts & Mortgage Finance | | | 154,855 | | | | — | | | | — | | | | 154,855 | |
| Total Common Stocks | | | 22,719,191 | | | | 9,371,453 | | | | 47,539 | | | | 32,138,183 | |
| Exchange Traded Funds | | | 7,223,311 | | | | — | | | | — | | | | 7,223,311 | |
| Corporate Bonds | | | — | | | | 1,162,933 | | | | — | | | | 1,162,933 | |
| United States Treasury Obligations | | | — | | | | 2,299,594 | | | | — | | | | 2,299,594 | |
| Foreign Government Bonds | | | — | | | | 1,966,147 | | | | — | | | | 1,966,147 | |
| Money Market Funds | | | 6,296,800 | | | | — | | | | — | | | | 6,296,800 | |
| Investments Purchased as Securities Lending Collateral* | | | — | | | | — | | | | — | | | | 7,331,745 | |
| Total Investments in Securities | | $ | 36,239,302 | | | $ | 14,800,127 | | | $ | 47,539 | | | $ | 58,418,713 | |
| * | Certain investments that are measured at fair value using the net asset value per share (or its equivalent) practical expedient have not been categorized in the fair value hierarchy. The fair value amounts presented in the table are intended to permit reconciliation of the fair value hierarchy to the amounts presented in the Schedule of Investments. |
| 68 | The Leuthold Funds - 2019 Annual Report |
The Leuthold Funds
| Securities Sold Short at Fair Value | | Level 1 | | Level 2 | | Level 3 | | Total |
| Common Stocks | | $ | 3,945,590 | | | $ | — | | | $ | — | | | $ | 3,945,590 | |
| Exchange-Traded Funds | | | 4,183,846 | | | | — | | | | — | | | | 4,183,846 | |
| Total Securities Sold Short | | $ | 8,129,436 | | | $ | — | | | $ | — | | | $ | 8,129,436 | |
The following is a reconciliation of Level 3 investments for which significant unobservable inputs were used to determine fair value:
| Leuthold Global Investment Fund | | Investment in
Securities at
Fair Value |
| | | |
| Balance as of September 30, 2018 | | $ | 47,596 | |
| Accrued discounts/premiums | | | — | |
| Realized gain (loss) | | | — | |
| Change in unrealized depreciation | | | (57 | )* |
| Purchases | | | — | |
| Sales | | | — | |
| Transfer into and/or out of Level 3 | | | — | |
| Balance as of September 30, 2019 | | $ | 47,539 | (1) |
| Change in net unrealized depreciation during the period for Level 3 investments held at September 30, 2019: | | $ | (57 | ) |
| | * | Unrealized depreciation is due to a change in foreign currency exchange rate. |
| (1) | The security (China Forestry Holdings Co., Ltd.) is classified as a Level 3 security due to a halt in trading of the security on January 26, 2011. The security is valued at fair value as determined in good faith by the Directors. The Adviser submits a report to the Directors setting forth the factors considered in determining the price. The significant unobservable input used in the fair valuation of this security is a discount of 95% from the last traded price of Hong Kong Dollar 2.95. Significant changes in the discount rate may result in a change in fair value measurement. For the duration of the period the discount was 95%. |
| Leuthold Select Industries Fund |
| Investments at Fair Value | | Level 1 | | Level 2 | | Level 3 | | Total |
| Common Stocks | | $ | 11,675,123 | | | $ | — | | | $ | — | | | $ | 11,675,123 | |
| Money Market Funds | | | 133,155 | | | | — | | | | — | | | | 133,155 | |
| Total Investments in Securities | | $ | 11,808,278 | | | $ | — | | | $ | — | | | $ | 11,808,278 | |
The Fund did not invest in any Level 3 securities during the period.
| Grizzly Short Fund |
| Investments at Fair Value | | Level 1 | | Level 2 | | Level 3 | | Total |
| Money Market Funds | | $ | 70,599,843 | | | $ | — | | | $ | — | | | $ | 70,599,843 | |
| Total Investments in Securities | | $ | 70,599,843 | | | $ | — | | | $ | — | | | $ | 70,599,843 | |
| Securities Sold Short at Fair Value | | Level 1 | | Level 2 | | Level 3 | | Total |
| Common Stocks | | $ | 90,328,624 | | | $ | — | | | $ | — | | | $ | 90,328,624 | |
| Total Securities Sold Short | | $ | 90,328,624 | | | $ | — | | | $ | — | | | $ | 90,328,624 | |
The Fund did not invest in any Level 3 securities during the period.
For further information regarding security characteristics, see the Schedules of Investments and Securities Sold Short.
| The Leuthold Funds - 2019 Annual Report | 69 |
The Leuthold Funds
| c) | Federal Income Taxes – Provision for federal income taxes or excise taxes has not been made since the Funds have elected to be taxed as “regulated investment companies” and intend to distribute substantially all taxable income to shareholders and otherwise comply with the provisions of the Internal Revenue Code applicable to regulated investment companies. Distributions from net realized gains for book purposes may include short-term capital gains, which are included as ordinary income to shareholders for tax purposes. The Funds also designate as distributions of long-term gains, to the extent necessary to fully distribute such capital gains, earnings and profits distributed to shareholders on the redemption of shares. |
The tax character of distributions paid during the fiscal years ended September 30, 2019 and 2018 was as follows:
| Year Ended September 30, 2019 |
| | | Leuthold
Core
Investment
Fund | |
Leuthold
Global
Fund | | Leuthold Select
Industries
Fund | | Grizzly
Short
Fund |
| Distributions paid from: | | | | | | | | | | | | | | | | |
| Ordinary income | | $ | 2,916,524 | | | $ | 198,337 | | | $ | — | | | $ | 838,199 | |
| Long-term capital gain* | | | 72,654,792 | | | | 5,455,871 | | | | 1,295,440 | | | | — | |
| Total distributions paid | | $ | 75,571,316 | | | $ | 5,654,208 | | | $ | 1,295,440 | | | $ | 838,199 | |
| Year Ended September 30, 2018 |
| | | Leuthold
Core
Investment
Fund | |
Leuthold
Global
Fund | | Leuthold Select
Industries
Fund | | Grizzly
Short
Fund |
| Distributions paid from: | | | | | | | | | | | | | | | | |
| Ordinary income | | $ | 2,274,796 | | | $ | 3,573,894 | | | $ | 5,625 | | | $ | — | |
| Long-term capital gain* | | | 26,947,936 | | | | 5,318,043 | | | | 735,816 | | | | — | |
| Total distributions paid | | $ | 29,222,732 | | | $ | 8,891,937 | | | $ | 741,441 | | | $ | — | |
| * | The funds designate these distributions as long-term capital gain dividends per IRC Sec. 852(b)(3)(C) in the 20-percent group (which may be taxed at a 20-percent rate, a 15-percent rate or 0-percent rate, depending on the shareholder’s taxable income). |
At September 30, 2019, the components of accumulated earnings (deficit) on a tax basis were as follows:
| | | Leuthold
Core
Investment
Fund | |
Leuthold
Global
Fund | | Leuthold Select
Industries
Fund | | Grizzly
Short
Fund |
| Undistributed ordinary income | | $ | 494,580 | | | $ | 82,739 | | | $ | — | | | $ | 52,038 | |
| Undistributed long-term gains | | | 8,866,887 | | | | — | | | | 88,381 | | | | — | |
| Distributable earnings | | | 9,361,467 | | | | 82,739 | | | | 88,381 | | | | 52,038 | |
| Capital loss carryover and late-year losses | | | — | | | | (1,534,826 | ) | | | (10,192 | ) | | | (236,828,465 | ) |
| Other accumulated gains (losses) | | | (4,409 | ) | | | (13,854 | ) | | | 1 | | | | (1 | ) |
| Unrealized appreciation | | | 94,242,172 | | | | 1,244,770 | | | | 2,798,808 | | | | 6,865,963 | |
| Total accumulated earnings (deficit) | | $ | 103,599,230 | | | $ | (221,171 | ) | | $ | 2,876,998 | | | $ | (229,910,465 | ) |
| 70 | The Leuthold Funds - 2019 Annual Report |
The Leuthold Funds
Net investment income and realized gains and losses for federal income tax purposes may differ from that reported on the financial statements because of permanent book-to-tax differences. U.S. Generally Accepted Accounting Principles (“U.S. GAAP”) requires that permanent differences between financial reporting and tax reporting be reclassified between various components of net assets. These differences are primarily due to partnership adjustments, securities sold short, earnings and profits distributed to shareholders on the redemption of shares, net operating losses, and expiration of capital losses.
Additionally, U.S. GAAP requires that certain components of net assets relating to permanent differences be reclassified between financial and tax reporting. These reclassifications have no effect on net assets or net asset value per share. For the year ended September 30, 2019, the following table shows the reclassifications made:
| | | Distributable
Earnings | | Paid In
Capital |
| Leuthold Core Investment Fund | | $ | (8,700,938 | ) | | $ | 8,700,938 | |
| Leuthold Global Fund | | | 141 | | | | (141 | ) |
| Leuthold Select Industries Fund | | | (111,385 | ) | | | 111,385 | |
| Grizzly Short Fund | | | 25,380,935 | | | | (25,380,935 | ) |
Under current law, the Funds may carry forward net capital losses indefinitely to use to offset capital gains realized in future years. Previous law limited the carry forward of capital losses to the eight tax years following the year the capital loss was realized. If a Fund has capital losses that are subject to current law and also has capital losses subject to prior law, the losses realized under current law will be utilized to offset capital gains before any of the losses governed by prior law can be used. As a result of these ordering rules, capital losses realized under previous law may be more likely to expire unused. Capital losses realized under current law will carry forward retaining their classification as long-term or short-term losses, whereas under prior law all capital losses were carried forward as short-term capital losses.
| | | Leuthold
Core
Investment
Fund | |
Leuthold
Global
Fund | | Leuthold Select
Industries
Fund | | Grizzly
Short
Fund |
| Unlimited Short-Term | | $ | — | | | $ | (1,534,826 | ) | | $ | — | | | $ | (236,828,465 | ) |
Grizzly Short Fund had $25,380,935 of capital losses expire on Septermber 30, 2019.
The Leuthold Select Industries Fund intends to defer and treat $10,192 of qualified late-year losses incurred during the fiscal year ended September 30, 2019 as arising on the first day of the fiscal year ending September 30, 2020.
As of September 30, 2019, the Funds had no tax positions that did not meet the “more likely-than-not” threshold of being sustained by the applicable tax authority. Generally, tax authorities can examine all the tax returns filed for the last three years. The Funds recognize interest and penalties, if any, related to unrecognized tax benefits as income tax expense in the Statements of Operations. During the year ended September 30, 2019, the Funds did not incur any interest or penalties.
| d) | Distributions to Shareholders – Dividends from net investment income, if any, are declared and paid quarterly. Distributions of net realized capital gains, if any, are declared and paid at least annually. |
| The Leuthold Funds - 2019 Annual Report | 71 |
The Leuthold Funds
| e) | Use of Estimates – The preparation of financial statements in conformity with U.S. GAAP requires management to make estimates and assumptions that affect the reported amounts of assets and liabilities and disclosure of contingent assets and liabilities at the date of the financial statements and the reported amounts of revenues and expenses during the reporting period. Actual results could differ from those estimates. |
| f) | Basis for Consolidation for the Leuthold Core Investment Fund and Leuthold Global Fund – Leuthold Core, Ltd. and Leuthold Global, Ltd. (the “Subsidiaries”) acted as investment vehicles in order to enter into certain investments for the Leuthold Core Investment Fund and Leuthold Global Fund, respectively. The Subsidiaries were liquidated in May 2018. |
| g) | Securities Sold Short – For financial statement purposes, an amount equal to the required amount of collateral to be segregated for securities sold short is included in the Statements of Assets and Liabilities as an asset. The amount of the securities sold short, shown as a liability, is subsequently marked-to-market to reflect the current value of the securities sold short. Subsequent fluctuations in the market prices of securities sold short may require purchasing the securities at prices which could differ from the amount reflected in the Statements of Assets and Liabilities. The Funds are liable for any dividends or interest payable on securities sold short. As collateral for their securities sold short, the Funds are required under the 1940 Act to maintain segregated assets consisting of cash, cash equivalents, or liquid securities. These segregated assets are valued consistent with Note 1a. The amount of segregated assets is required to be adjusted daily to reflect changes in the fair value of the securities sold short. The Leuthold Core Investment Fund, Leuthold Global Fund, and Grizzly Short Fund’s collateral at broker for securities sold short is with one major securities dealer. |
With regard to the cash collateral that is posted with counterparties, the Funds have established a collateral account for each respective counterparty with its custodian (the “Account”) and have entered into a tri-party agreement with the custodian and the respective counterparty regarding the transfer of assets to and from the Account.
The Adviser reviews each Account on a daily basis to ensure that the Account does not maintain a material amount of cash collateral in excess of what is required by the applicable counterparty (the amount of collateral required by such counterparty is subject to change and generally not known until the next business day, which necessitates the maintenance of a minimum amount of excess cash collateral). In the event that the excess cash collateral in an Account is equal to or in excess of the greater of $250,000 or 1% of the total assets of the applicable Fund calculated at each month end, then the applicable Fund, pursuant to the tri-party agreement, will instruct the custodian to sweep such excess cash collateral into the Fund’s interest bearing account with the custodian. The amount of collateral held related to this tri-party agreement is included in the Statement of Assets and Liabilities as an asset.
| h) | Other – Investment and shareholder transactions are recorded on the trade date. The Funds determine the gain or loss realized from the investment transactions by comparing the original cost of the security lot sold with the net sales proceeds. The Funds utilize an identified lot approach to transactions. Dividend income is recognized on the ex-dividend date or as soon as information is available to the Funds, and interest income is recognized on an accrual basis. Discounts and premiums on bonds are amortized using the yield to maturity method over the life of the respective bond. For financial reporting purposes, the Funds isolate changes in the exchange rate of investment securities from the fluctuations arising from changes in the market prices of securities for realized gains and losses. |
| 72 | The Leuthold Funds - 2019 Annual Report |
The Leuthold Funds
| i) | Expenses – Expenses that directly relate to one of the Funds are charged directly to that Fund. Other operating expenses of the Funds, such as Directors’ fees and expenses, insurance expense, and legal fees are allocated between the Funds based on the relative net asset value of the individual Funds. |
| j) | Counterparty Risk – Counterparty risk may arise as the result of the failure of a counterparty to a securities contract to comply with the terms of the contract. Potential counterparty risk is measured by the creditworthiness of the counterparty and additional risk may arise from unanticipated events affecting the value of the underlying security. |
| k) | Recent Accounting Pronouncements – In March 2017, the Financial Accounting Standards Board (FASB) issued Accounting Standards Update (ASU) No. 2017-08, Receivable-Nonrefundable Fees and Other Costs (Subtopic 310-20): Premium Amortization on Purchased Callable Debt Securities. The amendments in ASU No. 2017-08 shorten the amortization period for certain callable debt securities, held at a premium, to be amortized to the earliest call date. ASU No. 2017-08 does not require an accounting change for securities held at a discount, which continues to be amortized to maturity. ASU No. 2017-08 is effective for fiscal years and interim periods within those fiscal years beginning after December 15, 2018. Management is currently evaluating the impact, if any, of applying this provision. |
In August 2018, the FASB issued ASU No. 2018-13, Fair Value Measurement (Topic 820): Disclosure Framework-Changes to the Disclosure Requirements for Fair Value Measurement, which changes the fair value measurement disclosure requirements of Topic 820. The amendments in ASU No. 2018-13 are the result of a broader disclosure project called FASB Concept Statement, Conceptual Framework for Financial Reporting-Chapter 8: Notes to Financial Statements. The objective and primary focus of the project are to improve the effectiveness of disclosures in the notes to the financial statements by facilitating clear communication of the information required by GAAP that is most important to users of the financial statements. ASU No. 2018-13 is effective for all entities for fiscal years beginning after December 15, 2019, including interim periods therein. Early adoption is permitted for any eliminated or modified disclosures upon issuance of ASU No. 2018-13. Management has chosen to early adopt the eliminated or modified disclosures for the year ended September 30, 2019.
| l) | Subsequent Events – The Funds have evaluated subsequent events through the date of issuance of the Funds’ financial statements. This evaluation did not result in any subsequent events that necessitated recognition or disclosure. |
| The Leuthold Funds - 2019 Annual Report | 73 |
The Leuthold Funds
| 2. | INVESTMENT TRANSACTIONS |
Purchases and sales of investment securities, other than short-term investments and securities sold short, for the year ended September 30, 2019 are summarized below.
| | | | Leuthold
Core
Investment
Fund | | | Leuthold
Global
Fund | | | Leuthold
Select
Industries
Fund | |
| Purchases | | | $ | 376,480,382 | | | $ | 51,644,176 | | | $ | 9,702,260 | |
| Sales | | | | 525,477,882 | | | | 68,963,588 | | | | 15,217,394 | |
There were no purchases or sales of investment securities in the Grizzly Short Fund because this Fund invests only in securities sold short.
At September 30, 2019, gross unrealized appreciation and depreciation of investments and securities sold short and cost of investments and cost of securities sold short for tax purposes were as follows:
| | | Leuthold
Core
Investment
Fund | | | Leuthold
Global
Fund | | | Leuthold
Select
Industries
Fund | | | Grizzly
Short
Fund | |
| Tax cost of Investments | | $ | 468,490,490 | | | $ | 49,209,470 | | | $ | 9,009,470 | | | $ | (26,594,744 | ) |
| Unrealized Appreciation | | | 100,665,735 | | | | 3,610,620 | | | | 2,934,363 | | | | 8,931,361 | |
| Unrealized Depreciation | | | (6,423,563 | ) | | | (2,365,850 | ) | | | (135,555 | ) | | | (2,065,398 | ) |
| Net unrealized appreciation | | $ | 94,242,172 | | | $ | 1,244,770 | | | $ | 2,798,808 | | | $ | 6,865,963 | |
The differences between book and tax basis of unrealized appreciation (depreciation) are primarily attributable to the tax deferral of losses on wash sales and passive foreign investment company transactions.
The Leuthold Core Investment Fund owned 5% or more of the voting securities of the following companies during the year ended September 30, 2019. As a result, these companies are deemed to be affiliates of the Leuthold Core Investment Fund as defined by the 1940 Act. Transactions during the period in these securities of affiliated companies were as follows:
| Leuthold Core Investment Fund |
| Security Name | Share
Balance
09/30/19 | Fair Value
at 09/30/18 | Purchases | Sales | Realized
Gain (Loss) | Change in
Unrealized
Appreciation | Fair Value
at 09/30/19 | Dividend
Income |
| Invesco Currency Shares Japanese Yen Trust | 223,014 | $24,151,976 | $ | — | $(5,440,782) | $(235,283) | $1,138,170 | $19,614,081 | $ | — |
| 74 | The Leuthold Funds - 2019 Annual Report |
The Leuthold Funds
| 3. | INVESTMENT ADVISORY AND OTHER AGREEMENTS |
Each of the Funds has entered into an Investment Advisory Agreement (“advisory agreement”) with the Adviser. Pursuant to its advisory agreement with the Funds, the Adviser is entitled to receive a fee, calculated daily as applied to each Fund’s average daily net assets and payable monthly, at annual rates of:
Leuthold
Core
Investment
Fund | | Leuthold
Global
Fund | | Leuthold
Select
Industries Fund | | Grizzly
Short
Fund |
| 0.90% | | 0.90% | | 1.00% | | 1.25% |
The Adviser has agreed to waive its advisory fee and/or reimburse the Funds’ other expenses, to the extent necessary to ensure that the Funds’ total operating expenses (exclusive of interest, taxes, brokerage commissions, dividends and interest on securities sold short, and extraordinary items) do not exceed the following rates, based on each Fund’s average daily net assets:
Leuthold
Core
Investment
Fund | | Leuthold
Global
Fund | | Leuthold
Select
Industries
Fund | | Grizzly
Short
Fund |
| 1.25% | | 1.85% | | 1.50% | | 2.50% |
Any waiver or reimbursement is subject to later adjustments to allow the Adviser to recoup amounts previously waived or reimbursed to the extent actual fees and expenses for a fiscal period are less than each Fund’s expense limitation, provided, however, that the recoupment period for the Adviser is limited to three years from the time the expenses were waived or incurred and is limited to the lesser of (1) the expense cap in effect at the time of the waiver, and (2) the expense cap in effect at the time of recapture.
Amounts subject to future recoupment as of September 30, 2019 are as follows:
| Leuthold Select Industries Fund |
| Year of Expiration | | Recoverable Amount |
| 9/30/2020 | | $ 40,903 |
| 9/30/2021 | | 28,151 |
| 9/30/2022 | | 35,213 |
U.S. Bancorp Fund Services, LLC (“Fund Services”), doing business as U.S. Bank Global Fund Services, serves as transfer agent, administrator, and accounting services agent for the Funds. U.S. Bank, N.A. serves as custodian for the Funds.
| The Leuthold Funds - 2019 Annual Report | 75 |
The Leuthold Funds
The Leuthold Global Fund – Retail Class has adopted a distribution plan pursuant to Rule 12b-1 under the 1940 Act, whereby Rafferty Capital Markets, LLC serves as distributor. This plan allows the Fund to use up to 0.25% of its average daily net assets to pay sales, distribution, and other fees for the sale of its shares and for services provided to investors. The Fund may pay all or a portion of this fee to any securities dealer, financial institution, or any other person who renders personal service to the Fund’s shareholders, assists in the maintenance of the Fund’s shareholder accounts, or who renders assistance in distributing or promoting the sale of shares of the Fund pursuant to a written agreement approved by the Directors. To the extent such fee is not paid to such persons, the Fund may use the fee for its expenses of distribution of its shares, including, but not limited to, payment by the Fund of the cost of preparing, printing, and distributing Prospectuses and Statements of Additional Information to prospective investors and of implementing and operating the plan.
| 5. | SUB-TRANSFER AGENT & SHAREHOLDER SERVICING FEE PLANS |
The Funds are permitted to pay sub-transfer agent fees for various platform agreement not to exceed 0.15% of the Funds’ average daily net assets. In addition, the Retail Class shares of the Leuthold Core Investment Fund, Leuthold Select Industries Fund, and Grizzly Short Fund have adopted a Shareholder Servicing Fee Plan not to exceed 0.15% of these Funds’ Retail Class shares average daily net assets. These fees are used to finance certain activities related to servicing and maintaining shareholder accounts. Sub-transfer agent and shareholder servicing fees incurred by the Funds are disclosed in the Statements of Operations.
The Funds enter into contracts that contain a variety of indemnifications. The Funds’ maximum exposure under these arrangements is unknown. However, the Funds have not had prior claims or losses pursuant to these contracts and expect the risk of loss to be remote.
Each Fund may invest up to 15% of net assets in illiquid investments. An “illiquid investment” is any investment that a Fund reasonably expects cannot be sold or disposed of in current market conditions in seven calendar days or less without the sale or disposition significantly changing the market value of the investment. A Fund will take into account relevant market, trading, and investment specific considerations when determining whether an investment is an illiquid investment. The illiquidity status of an investment is generally evaluated monthly. The 15% limitation may include securities whose disposition would be subject to legal restrictions (“restricted securities”). Restricted securities often have a market value lower than the market price of unrestricted securities of the same issuer and are not readily marketable without some time delay. This could result in a Fund being unable to realize a favorable price upon disposition of restricted securities and in some cases might make disposition of such securities at the time desired by the Fund impossible.
| 76 | The Leuthold Funds - 2019 Annual Report |
The Leuthold Funds
| 8. | LENDING PORTFOLIO SECURITIES |
The Funds may lend portfolio securities constituting up to 30% of total assets to unaffiliated broker dealers, banks, or other recognized institutional borrowers of securities, provided that the borrower at all times maintains cash, U.S. government securities, or equivalent collateral or provides an irrevocable letter of credit in favor of the Funds equal in value to at least 100% of the value of the securities loaned. During the time portfolio securities are on loan, the borrower pays the lending Fund an amount equivalent to any dividends or interest paid on such securities, and the Fund may receive an agreed-upon amount of interest income from the borrower who delivered equivalent collateral or provided a letter of credit. Loans are subject to termination at the option of the lending Fund or the borrower. The lending Fund may pay reasonable administrative and custodial fees in connection with a loan of portfolio securities and may pay a negotiated portion of the interest earned on the cash or equivalent collateral to the borrower or placing broker. The lending Fund does not have the right to vote securities on loan but could terminate the loan and regain the right to vote if that were considered important with respect to the investment.
The primary risk in securities lending is a default by the borrower during a sharp rise in price of the borrowed security resulting in a deficiency in the collateral posted by the borrower. The Funds will seek to minimize this risk by requiring that the value of the securities loaned will be computed each day and additional collateral be furnished each day if required.
As of September 30, 2019, the market value of the securities on loan and payable on collateral received for securities lending were as follows:
| | | Market Value of
Securities on Loan | | | Payable on
Collateral Received | |
| Leuthold Core Investment Fund | | $ | 57,032,547 | | | $ | 58,159,492 | |
| Leuthold Global Fund | | | 7,193,841 | | | | 7,331,745 | |
| The Leuthold Funds - 2019 Annual Report | 77 |
The Leuthold Funds
REPORT OF INDEPENDENT REGISTERED PUBLIC ACCOUNTING FIRM
To the Shareholders and Board of Directors
Leuthold Funds, Inc.
Opinion on the Financial Statements
We have audited the accompanying statements of assets and liabilities, including the schedules of investments and securities sold short (as applicable), of Leuthold Funds, Inc., comprising Leuthold Core Investment Fund, Leuthold Global Fund, Leuthold Select Industries Fund, and Grizzly Short Fund (collectively, the “Funds”), including the schedules of investments, as of September 30, 2019, and the related statements of operations for the year then ended, the statements of changes in net assets for each of the two years in the period then ended, the financial highlights for each of the five years in the period then ended, and the related notes (collectively referred to as the “financial statements”). In our opinion, the financial statements present fairly, in all material respects, the financial position of the Funds at September 30, 2019, the results of their operations for the year then ended, the changes in their net assets for each of the two years in the period then ended and the financial highlights for each of the five years in the period then ended, in conformity with U.S. generally accepted accounting principles.
Basis for Opinion
These financial statements are the responsibility of the Funds’ management. Our responsibility is to express an opinion on each of the Funds’ financial statements and financial highlights based on our audits. We are a public accounting firm registered with the Public Company Accounting Oversight Board (United States) (“PCAOB”) and are required to be independent with respect to the Funds in accordance with the U.S. federal securities laws and the applicable rules and regulations of the Securities and Exchange Commission and the PCAOB.
We conducted our audits in accordance with the standards of the PCAOB. Those standards require that we plan and perform the audit to obtain reasonable assurance about whether the financial statements are free of material misstatement, whether due to error or fraud. The Funds are not required to have, nor were we engaged to perform, an audit of the Funds’ internal control over financial reporting. As part of our audits we are required to obtain an understanding of internal control over financial reporting but not for the purpose of expressing an opinion on the effectiveness of the Funds’ internal control over financial reporting. Accordingly, we express no such opinion.
Our audits include performing procedures to assess the risks of material misstatement of the financial statements, whether due to error or fraud, and performing procedures that respond to those risks. Such procedures include examining, on a test basis, evidence regarding the amounts and disclosures in the financial statements. Our procedures included confirmation of securities owned as of September 30, 2019, by correspondence with the custodians. Our audits also included evaluating the accounting principles used and significant estimates made by management, as well as evaluating the overall presentation of the financial statements. We believe that our audits provide a reasonable basis for our opinion.
| | |  |
| We have served as the Funds’ auditor since 2002. | | |
| | | |
| Minneapolis, Minnesota | | |
| November 26, 2019 | | |
| 78 | The Leuthold Funds - 2019 Annual Report |
The Leuthold Funds
ADDITIONAL INFORMATION (Unaudited)
SHAREHOLDER NOTIFICATION OF FEDERAL TAX STATUS (Unaudited)
The percentage of dividend income distributed for the year ended September 30, 2019, which is designated as qualified dividend income under the Jobs and Growth Tax Relief Reconciliation Act of 2003, is as follows: Leuthold Core Investment Fund 100.00%, Leuthold Global Fund 100.00%, and Leuthold Select Industries Fund 0.00%.
The percentage of dividend income distributed for the year ended September 30, 2019, designated as qualified dividends received deduction available to corporate shareholders, is as follows: Leuthold Core Investment Fund 100.00%, Leuthold Global Fund 84.36%, and Leuthold Select Industries Fund 0.00%.
The Leuthold Core Investment Fund, Leuthold Global Fund, and Leuthold Select Industries Fund designated 31.94%, 25.15%, and 50.31%, respectively, of their ordinary distributions paid as qualified interest related dividends under the Internal Revenue Code Section 871(k)(1)(C) for the year ended September 30, 2019.
| The Leuthold Funds - 2019 Annual Report | 79 |
The Leuthold Funds
ADDITIONAL DISCLOSURE REGARDING FUND DIRECTORS AND OFFICERS (UNAUDITED)
Independent Directors
Name, Year of Birth,
and Address | | Position(s)
Held with
the Company | | Term of Office
and Length of
Time Served | | Principal Occupation(s)
During Past Five Years | | # of
Portfolios in
Fund Complex
Overseen By Director | | Other
Directorships
Held by
Director |
| | | | | | | | | | | |
Lawrence L. Horsch (1934)
c/o Leuthold Weeden
Capital Management
150 South Fifth Street
Suite 1700
Minneapolis, MN 55402 | | Chairman and Director | | Indefinite, Director since 1995 | | Chairman, Eagle Management & Financial Corp., a management consulting firm | | 4 | | Somero Enterprises and Pioneer Sales Group |
| | | | | | | | | | | |
Steven R. Schroll (1957)
c/o Leuthold Weeden
Capital Management
150 South Fifth Street
Suite 1700
Minneapolis, MN 55402 | | Director and Chair of Nominating Committee | | Indefinite, Director since 2019 | | Retired. Served as Senior Equity Portfolio Manager at Ameriprise Financial (Columbia Management) from 2002 to 2018 | | 4 | | None |
| | | | | | | | | | | |
Addison L. Piper (1946)
c/o Leuthold Weeden
Capital Management
150 South Fifth Street
Suite 1700
Minneapolis, MN 55402 | | Director and Chair of Audit Committee | | Indefinite, Director since 2009 | | Retired Chairman and Chief Executive Officer of Piper Jaffray Companies and PREDEX. | | 4 | | Piper Jaffray Companies and PREDEX |
| 80 | The Leuthold Funds - 2019 Annual Report |
The Leuthold Funds
ADDITIONAL DISCLOSURE REGARDING FUND DIRECTORS AND OFFICERS (UNAUDITED)
Interested Persons
Name, Year of Birth,
and Address | | Position(s)
Held with
the Company | | Term of Office
and Length of
Time Served | | Principal Occupation
During Past Five Years | | # of
Portfolios in
Fund Complex
Overseen By
Director | | Other
Directorships
Held by
Director |
| | | | | | | | | | | |
John C. Mueller (1968)
150 South Fifth Street
Suite 1700
Minneapolis, MN 55402 | | Director President | | Indefinite, Director since 2009 One year term, President since 2011 | | Co-Chief Executive Officer of The Leuthold Group since 2005. Involved in Sales and Marketing for The Leuthold Group since 2001. | | 4 | | None |
| | | | | | | | | | | |
Holly J. Weiss (1968)
150 South Fifth Street
Suite 1700
Minneapolis, MN 55402 | | Secretary and Treasurer | | One Year Term, Secretary and Treasurer since 2009 | | Chief Financial Officer of the Adviser since 2011 and Controller of the Adviser from 2008 to 2011. | | N/A | | N/A |
| | | | | | | | | | | |
Roger A. Peters (1960)
150 South Fifth Street
Suite 1700
Minneapolis, MN 55402 | | Vice President and Chief Compliance Officer and Anti-Money Laundering Officer | | One Year Term, Chief Compliance Officer since 2006 and Vice President since 2007 and Anti-Money Laundering Officer since 2011 | | Chief Compliance Officer of the Adviser since 2005. | | N/A | | N/A |
Glenn R. Larson (1965)
150 South Fifth Street
Suite 1700
Minneapolis, MN 55402 | | Assistant Secretary | | One Year Term, Assistant Secretary since 2006 | | Compliance Officer of the Adviser since 2005. | | N/A | | N/A |
The Statement of Additional Information includes additional information about the Funds’ Directors and is available free of charge upon request by calling the Funds toll free at (800) 273-6886.
Information regarding the method the Funds use to vote proxies relating to portfolio securities is available without charge upon request by calling toll-free at (800) 273-6886 or by accessing the Funds’ website at https://funds.leutholdgroup.com. Information regarding how the Funds voted proxies relating to portfolio securities during the most recent twelve-month period ended June 30 is available without charge upon request by calling toll-free at (800) 273-6886 or on the SEC’s website at www.sec.gov.
| The Leuthold Funds - 2019 Annual Report | 81 |
| 82 | The Leuthold Funds - 2019 Annual Report |
Inside Back Cover - blank
| | Investment Adviser: | |
| | The Leuthold Group, LLC, doing business as Leuthold Weeden Capital Management, Minneapolis, Minnesota | |
| | |
| | |
| | Administrator, Transfer Agent, | |
| | Fund Accountant, | |
| | Shareholder Servicing Agent: | |
| | U.S. Bancorp Fund Services, LLC,
Milwaukee, Wisconsin | |
| | |
| | | |
| | Custodian: | |
| | U.S. Bank, N.A.,
Milwaukee, Wisconsin | |
| | |
| | | |
| | Counsel: | |
| | Foley & Lardner, LLP,
Milwaukee, Wisconsin | |
| | |
| | | |
| | Independent Registered | |
| | Public Accounting Firm: | |
| | Ernst & Young LLP,
Minneapolis, Minnesota | |
| | |
| | | |
| | The Funds are required to file their complete schedules of portfolio holdings with the SEC for their first and third fiscal quarters on Form N-PORT. Once filed, the Fund’s Form N-PORT is available without charge, upon request on the SEC’s website (http://www.sec.gov) and may be available by calling 1-800-273-6886. You can also obtain copies of Form N-PORT by (i) visiting the SEC’s Public Reference Room in Washington, DC (information on the operation of the Public Reference Room may be obtained by calling 1-800-SEC-0330); (ii) sending your request and a duplicating fee to the SEC’s Public Reference Room, Washington, DC 20549-0102; or (iii) sending your request electronically to publicinfosec.gov. | |
| | |
| | |
| | |
| | |
| | |
| | |
| | |
| | |
| | |
| | |
| | |
| | |
| | |
| | |
| | |
| | This report is authorized for distribution only when preceded or accompanied by a current prospectus. | |