Annual Report
September 30, 2020

LEUTHOLD FUNDS
| Leuthold Core Investment Fund | Leuthold Select Industries Fund |
| Retail Class Shares LCORX | LSLTX |
| Institutional Class Shares LCRIX | |
| | Grizzly Short Fund |
| | GRZZX |
| Leuthold Global Fund | |
| Retail Class Shares GLBLX | Leuthold Core ETF |
| Institutional Class Shares GLBIX | LCR |
Beginning on January 1, 2021, as permitted by regulations adopted by the U.S. Securities and Exchange Commission, paper copies of the Funds’ annual and semi-annual shareholder reports will no longer be sent by mail, unless you specifically request paper copies of the reports. Instead, the reports will be made available on the Funds’ website https://funds.leutholdgroup.com, and you will be notified by mail each time a report is posted and provided with a website link to access the report.
If you already elected to receive shareholder reports electronically, you will not be affected by this change and you need not take any action. You may elect to receive shareholder reports and other communications from the Funds electronically anytime by contacting your financial intermediary (such as a broker-dealer or a bank) or, if you are a direct mutual fund investor, by calling 1-800-273-6886, sending an e-mail request to publicinfo@sec.gov, or by enrolling at https://funds.leutholdgroup.com. For the Core ETF, call 1-800-306-8817 or send an e-mail request to publicinfo@sec.gov.
You may elect to receive all future reports in paper free of charge. If you invest through a financial intermediary, you may contact your financial intermediary to request that you continue to receive paper copies of your shareholder reports. If you invest directly with the Mutual Funds, you may call 1-800-273-6886 or send an email request to publicinfo@sec.gov to let the Funds know you wish to continue receiving paper copies of your shareholder reports. For the Core ETF, call 1-800-306-8817 or send an e-mail request to publicinfo@sec.gov. Your election to receive reports in paper will apply to all Mutual Funds held in your account if you invest through your financial intermediary or all Mutual Funds held with the fund complex if you invest directly with the Funds.
The Securities and Exchange Commission has not approved or disapproved these securities or determined if this annual report is accurate or complete. Any representation to the contrary is a criminal offense. An investment in the Funds is not a deposit of a bank and is not insured or guaranteed by the Federal Deposit Insurance Corporation or any other government agency.
Inside Cover - blank
Leuthold Funds
Table of Contents

Leuthold Funds
Dear Leuthold Fund Shareholders:
The year 2020 has been delivering an “unprecedented” number of “firsts.” The magnitude of which is so pronounced that the word “unprecedented” no longer seems to have a precedent. A word for such extraordinarily unparalleled circumstances had previously been rarely applicable for describing day to day events; here in 2020, “unprecedented” has been exhausted to the point that it has effectively become as mundane as the word “unique.” We are all too well acquainted with the seemingly immeasurable “firsts” that have touched our lives at every level during the last nine months. Pandemic, shortages, full employment-to-unemployment extremes, global economic shutdown, shelter-in-place, deserted offices and cities, distance and hybrid learning, traditions prohibited, celebrations restricted—even stock market action has produced some “firsts”—and this list does not scratch the surface.
These extraordinary “firsts” are being experienced collectively by humankind worldwide—another “first.” Amongst the challenges, sadness, loss, and madness, individuals around the globe are confronting these “firsts” together, and we are finding solutions, compromising, adapting, sharing, inventing, researching, and getting creative. There is a bright light amid the world’s turmoil, unknowns, and negativity. The resiliency and brilliance of mankind are awe-inspiring and will prevail. The “good” being done is not publicized enough (not a “first”), and we need to hear more of it. Stay safe, and remember to look for the “good stuff.”
The Last Twelve Months’ Market Action
The stock market rallied in the last three months of 2019, leaving the S&P 500’s principal median-valuation ratios in the top decile of the 30-year history and above the level of the September 2018 market high. By January 2020, we believed a market “melt-up” had already occurred. From a long-term technical perspective (and possibly an economic and psychological stance, too), we observed that 2020 appeared to be a “better” candidate for a cyclical top than 2018.
In the 24 months leading up to January, big gyrations framed the type of long-term divergences that accompanied major tops like 1972 and 2000. We noted that if the stock market peaked in the first half of 2020, these non-confirmations would be remembered as ridiculously obvious omens of a stock market top.
Early February saw a new extreme in optimism by retail-oriented equity-option traders relative to the institutional players. We wrote, “From a pure sentiment perspective, this might be the worst market-entry point we’ve seen in the last 20 years.” Practically on cue, in late February, the stock market dropped. The lengthiest bull market in history was snuffed-out as stock index losses convincingly passed the -20% threshold that defines a bear market. In 27 historic trading days, the DJIA collapsed 37%, and the S&P 500 experienced a 23-day, 34% peak-to-trough plunge. The extent of these losses is in the range of the median bear market decline of the last 120 years, but they far exceeded the post-WWII bear-market median loss of -27%.
W.D. Gann, a legendary trader and market analyst, argued that it was much more likely—than suggested by chance alone—for the market to have a meaningful trend-reversal on an anniversary of a historically-significant inflection point. Consistent with that theory, the 2020 bear-market low of March 23rd registered one-day short of the 20th anniversary of the S&P 500’s Y2K peak.
Following this year’s low, the stock market rebounded in what we believed was a typical “bear market rally.” In late August, the relentless stock market recovery surpassed its previous record-price peak of February, and we were proven wrong. Technically, a new “bull market” was in process. Through September 30th, the S&P 500 had rallied nearly 52% from the 2020 low of the shortest bear market in history.
| Leuthold Funds - 2020 Annual Report | 1 |
Since March, there has been an incredible amount of Fed liquidity dumped into the markets, and we respect the mostly bullish message of the stock-market tape. However, today, valuations for large caps (and growth stocks in particular) are so high that any remaining upside in the blue-chip averages is severely limited. The most heavily weighted S&P 500 measures that we monitor show historical percentile readings in the mid-to-upper 90s. Valuations for the median S&P 500 stock are also at those levels. Meanwhile, mid and small caps are in the vicinity of their long-term medians or even below. These pockets of cheaper valuations are attractive opportunities to realign away from the increasing madness that characterizes the large cap growth space.
In the years ahead, the “composition” of a tactical asset allocator’s stock portfolio may be more critical than the overall “level” of exposure. That was the case during the 2000-2002 bear market and during much of the bull market that followed. We think the massive valuation premium on large cap growth stocks is extremely vulnerable if the cyclical recovery continues to trace out anything close to the typical path. When the upturn falters or even aborts, large cap growth premiums will likely persist—but we expect that will be at market levels 30-40% below today. Value, mid cap, and small cap stocks would also be susceptible in a double-dip scenario, but we doubt their relative valuations can compress much further. Putting on our rose-tinted glasses (which had accumulated a filthy layer of dust), recent sentiment measures have been slower to rebound than stock prices—a contrarian “positive.”
From now ‘til eternity, bullish market pundits will contend that the global spread of the coronavirus “triggered” the 2020 bear market and global recession. Although the pandemic was undoubtedly the ultimate catalyst, cracks had been developing in the stock market for over a year leading up to the February peak.
There were pre-existing warning signs from bonds, cyclical stocks, and especially corporate credit. Spreads on low-grade corporate bonds began to widen in early 2018 and then failed to “confirm” the stock market’s huge 2019 gain. The yield curve initially inverted in March 2019, and the timing of the recession’s arrival—March 2020—was right in line with that indicator’s typical twelve-month lead time.
Last September’s overnight repo-market intervention by the Fed signaled corporate liquidity had deteriorated badly. The Fed’s move to “re-liquefy” initiated a rally that was narrow enough to thrash most active managers; but, it was somehow “broad” enough to prop up the NYSE Advance/Decline line until three weeks before the February high—which left most of the technical crowd heavily exposed when the 2020 bear market commenced.
The media narrative will be impossible to alter, but the reality is: The coronavirus was simply the kid in the crowd who shouted, “The Emperor has no clothes on!”
| 2 | Leuthold Funds - 2020 Annual Report |
ANNUAL PERFORMANCE REVIEW
TACTICAL ASSET ALLOCATION—DOMESTIC & GLOBAL MUTUAL FUNDS
The Leuthold Core Investment Fund and Leuthold Global Fund began the 2019-2020 fiscal year with a neutral outlook for the stock market. That stance was reflected by the 51% average net equity allocation for the fourth quarter of 2019. In January, bullish forecasts abounded despite the pervasiveness of extended valuations for market-cap-weighted and median measures. The S&P 500 closed February 19th at a record high for the bull market that began eleven years ago. Within a few days of that mark, our quantitative analysis—which guides the tactical portfolios’ level of stock exposure—tumbled to a deeply negative reading; we reduced net equity exposure down to 42%. The S&P 500 tallied losses for the next seven consecutive trading days (February 20th through month-end), culminating in a loss of 13%. The S&P 500 bounced nearly 6% by March 4th, but that was followed by a tumultuous period of one-day swings—alternating between 3-11% losses and 5-12% gains. From the February 19th market top to the March 23rd closing low, the S&P 500 and MSCI All Country World Index (ACWI) each booked a loss of 34%. By comparison, the Leuthold Core Investment Fund and Leuthold Global Fund losses for the same period were about 41% less, at -19.5% and -20.5%, respectively. By March 31st, both the S&P 500 and MSCI ACWI had rebounded 15% while the Leuthold Core and Global Funds had recovered about 8%.
Although we believed that a cyclical bear market was underway, April valuations had vastly improved over the prior two months’ downswing. We lowered the Funds’ equity hedge to reflect this development. Stocks went on a full-scale upsurge in April; the two benchmarks had gains ranging between 11-13% for the month, and our tactical funds—with average net equity exposure of just 46%—moved up 6%. Stocks enjoyed substantial gains over the next four months, but valuations on U.S. large caps had already moved back into the danger zone as early as June. The overall equity environment seemed precarious, and Leuthold tactical funds maintained a relatively cautious stance for the rest of the fiscal year (47% average net equity exposure).
The debate as to whether the upswing since March was a bear-market rally or a “brand new” bull market was resolved in late August when key market indices reached closing-day price levels above the prior records of February. During September, the S&P 500 made another new high before reversing course; it closed the month down nearly 4%, while the MSCI ACWI gave back over 3%. Even with the setback, S&P 500 valuations (market-cap-weighted and median measures) ended September at historically high percentile readings, while small to mid-cap valuations sat near, or below, their median levels.
For the twelve months through September, the Leuthold Core Investment Fund’s retail share class posted a +6.72% total return. The gain is 354 basis points (bps) better than its peer group, Morningstar Tactical Allocation (+3.18% total return). The fully invested S&P 500 benchmark produced a +15.15% total return. The S&P 500 and the Leuthold Core Investment Fund’s performance gap is primarily due to the Fund’s average net equity exposure being 56% lower throughout the fiscal year.
The retail share class of Leuthold Global Fund ended September with a one-year total return of +2.56%. That is a wide-margin better than its peer-fund category, the Morningstar World Allocation average (+0.34% total return). The fully invested MSCI ACWI had a fiscal year total return of +10.44%. The big variance with the MSCI ACWI is due to the Fund’s 44% lower net equity exposure combined with underperformance among its global equities.
Tactical Funds’ Long Equity Exposure
Traditional stock investments made up 59% of both Funds’ average monthly equity allocation (long stock exposure). U.S. large-cap growth stock returns dwarfed those of nearly everything else. The MSCI ACWI (+10.44%) held a relatively distant second place to the S&P 500’s 15.15% gain, but no index came remotely close to the NASDAQ’s +41% return. The Leuthold Core Investment Fund’s U.S.-traded stocks returned +13.23%, and its Emerging Market (EM) equity holding produced +45.23%.
| Leuthold Funds - 2020 Annual Report | 3 |
The Leuthold Global Fund’s stock holdings were up 5.68%. Versus the benchmarks, Leuthold Core Investment Fund’s domestic stocks trailed the S&P 500 by 192 bps, while its EM stocks far exceeded the MSCI Emerging Market index by a whopping 5,577 bps. The Leuthold Global Fund’s equities lagged the MSCI ACWI by 476 bps. See specific equity performance drivers in the section, “Long Equity Exposure—Domestic & Global.”
Emerging Market Equities—Core Investment Fund
We earmarked EM equities for a portion of the Leuthold Core Investment Fund’s long-stock exposure; the average monthly weight was close to 3%. It was additive by nearly 80 bps. This allocation provided a small counterbalance when U.S. stocks plunged from late February through late March—losses generated in these holdings were minimal compared to the domestic long stock exposure. Despite massive underperformance since their January 2018 peak, the valuation case for EM stocks is not a slam dunk. A U.S. dollar decline may trigger a reversal in fortunes for EM equities. Considering their huge valuation discount, we anticipate some ample opportunities ahead to add exposure to this space.
Tactical Funds’ Equity Hedge
The Funds began the fiscal year with a 14% hedge against long stock investments; this was trimmed to 9% in the last quarter of 2019. Our stock market analysis gradually deteriorated at the front end of 2020, prompting boosts to the equity hedge in January and late February. These moves repositioned the portfolios quite defensively just before the bull market disintegrated with a -34% S&P 500 nosedive over a brief period of 23 trading days, which officially ended the bull market that began in 2009. Between January and March 31st, the hedge offset stock losses by nearly 4%. This holding detracted from performance as the stock market recovered from April through August, but it delivered close to a 50 bps lift with September’s stock market slump. The position’s weight moved within a tight range all year; the monthly average was 11%. The allocation had a net loss for the twelve months, offsetting portfolio gains by -250 bps in Leuthold Core Fund and -180 bps in the Leuthold Global Fund.
Tactical Funds’ Fixed Income
Fixed income markets continue to be devoid of compelling opportunities; however, this segment played its traditional role as a downside buffer through the February-March stock market collapse. The Funds’ fixed income allocation was 20-21% during the fiscal year. Due to unappealing risk/reward prospects, our bond holdings’ duration was at the short end of the scale compared to the benchmark. Fixed income investments were diversified to encompass differing risk profiles. Developed Market Sovereign Debt retained the heaviest weight (12%), followed by Quality Corporate Bonds (5%), and MBS Bond funds (2%). We sold Emerging Market Sovereign Debt in May (1.8% allocation), and, in August, High Yield Bonds were introduced as a 1.5% position. Marginal gains were achieved by DM Sovereign Debt, Corporates, and MBS Bonds, translating to about +95 bps. Combined, EM Sovereign Debt and High Yield Bonds shaved off about -25 bps.
Our long-time policy for fixed income exposure is a minimum level of 30%; however, the allocation has been about 10% below that threshold for many years. The risk of rising yields is pervasive, and the stakes are higher with long-term bonds—which is why we’re opting for short duration. Despite the challenging environment and scarcity of “income,” bonds still play a constructive role on a smaller scale. In time, this asset class’ circumstances will reverse course, and more attractive prospects will be available to enhance the Funds’ yield profiles.
| 4 | Leuthold Funds - 2020 Annual Report |
Gold
This position inched from 3% in October 2019 up to 4% by late June. In July, it was tactically increased to 5%. Gold offers defense, diversification, and it profits from a softening dollar. The last twelve months’ gain was nearly +28%; it added about 100 bps to the Funds’ annual results. While gold should continue to benefit from the Fed’s aggressive stimulus, we do not expect to add at current prices.
LEUTHOLD CORE ETF
The ETF version of the Leuthold Core Investment portfolio became available for investment on January 6, 2020. This product simulates the same asset allocation and tactical adjustments to produce the equivalent performance for investors who want to invest in our Core Fund’s “best ideas” but prefer the features of an ETF vehicle. The Core ETF builds its stock market exposure with equity sector and industry ETFs of third parties that match the targeted stock market allocations traditionally obtained via individual stocks in the related Core strategy products. Corresponding fixed income, alternatives, and other potential positions, such as asset class hedges (when applicable), are also acquired through ETFs with parallel concentrations to the desired exposures.
The Leuthold Core ETF had a +6.52% NAV total return (+6.64% market total return) for the fiscal year’s inception-to-date period of January 6, 2020, through September 30, 2020. This gain bested the benchmark S&P 500’s +5.42% total return over that timeframe, which is impressive, given that the Core ETF’s average net stock market exposure was 48% lower.
ETF Portfolio: Overall Performance Drivers
Among the traditional equity allocation (56% average long stock exposure), the Leuthold Core ETF held its largest weight in the diversified Technology sector; this concentration was also the primary source of the overall Core ETF gain, inception-to-date. The Core ETF’s position in IT (26%) was similar to that of the S&P 500’s, and its contribution to return was a solid 800 bps, but it trailed the S&P 500’s respective +1,100 bps. The Core ETF’s diversified Tech sector holding was augmented with a Semiconductor-focused security, which boosted the portfolio’s gain by another 100 bps.
Positions representing the Communication Services and Consumer Discretionary sectors (overweights) were the next best performers, each adding 190 bps. Supplementary concentrations at the group level from Consumer Discretionary included Home Construction (80 bps additive), Homebuilders (+8 bps), and Retail (+3 bps). There were no underlying industry-specific investments associated with the Communication Services sector.
The Core ETF’s Health Care sector exposure was not a robust contributor to return; the sizeably underweight allocation curbed its upside prospects. Complementing the broad HC sector was an investment that targeted Biotechnology (a solid performer, +120 bps), along with HC Providers and Pharmaceuticals, which had relatively flat results.
The Financials sector was a noteworthy performance detractor resulting in almost -600 bps. Luckily a sub-position to the Brokerage industry group had a minimal negative impact. The broad Consumer Staples sector had flat results; there was no other exposure to underlying Staples industries.
Traditional long stocks were hedged throughout the inception-to-date period with a security that signified a monthly average weight of 11%. This component (incorporated within the portfolio’s equity arm) provided inverse stock market exposure for defense against equity declines. The allocation was constructive during the bear market downswing earlier in the year. Following the ensuing stock market rally from the March 23rd bear market low, measured through September 30th, the equity hedge was subtractive (-250 bps) from overall return.
| Leuthold Funds - 2020 Annual Report | 5 |
The Core ETF’s fixed income (average 20% of assets) did its conventional job as a downside buffer through the February-March stock market collapse. The securities were diversified across Developed Market Sovereign Debt (largest holding, at 12%), Quality Corporate Bond exposure (5%), and an MBS Bond allocation (2%). In May, Emerging Market Sovereign Debt was eliminated (near a 2% allocation), and, in August, High Yield Bonds were activated at a weight close to 1.5%. DM Sovereign Debt, Corporates, and MBS Bonds achieved marginal gains (combined for +90 bps); together, EM Sovereign Debt and High Yield Bonds detracted by -25 bps.
Gold was the dedicated “alternatives” allocation, which presented defense and diversification. The holding was a substantial value add on an absolute basis. In relation to its small portfolio weight (4% average), this component added a modest 100 bps.
In summary, the equity hedge had a relatively big negative offset to portfolio gains following the March 23rd stock market low, and the Core ETF would have profited from a higher level of equity exposure. Nevertheless, after breaking down performance attribution from underlying headline asset-class components, the equity portfolio’s Financials position was most damaging. Absent the broad Financials sector investment, the Leuthold Core ETF’s already outstanding relative results (with less than 50% net equities) would have been even more exceptional versus the 100% invested S&P 500.
LEUTHOLD SELECT INDUSTRIES AND LEUTHOLD GLOBAL INDUSTRIES
Long Equity Exposure—Domestic & Global Strategies
Leuthold Select Industries (SI) Fund and Leuthold Global Industries (GI) strategy are fully invested in the stock market. The “industry” emphasis was borne from Steve Leuthold’s pioneering concept, 50 years ago, that industry group rotation and sector concentrations may provide attractive results versus a portfolio of stocks with no macroeconomic commonalities or shared performance drivers.
This top-down methodology aims to identify industry groups that, as an aggregate, are showing strength or appear likely to be leaders based on global trends and the economic setting. The momentum factor primarily guides industry group attractiveness. Valuation considerations drive stock selection. The equity universe for the SI Fund is composed of liquid, domestically traded securities. The Leuthold GI stock universe contains roughly 5,000 stocks traded on global exchanges, and it targets at least 40% of assets in non-U.S. equities.
For the fiscal year ended September 30th, 2020, the Leuthold SI Fund had a total return of +11.28%; this was an enormous lead of 1,179 bps over its peer-fund category, Morningstar Mid Cap Blend (-0.51% total return). Compared to the S&P 600 SmallCap benchmark, SI’s performance was 1,957 bps better. As with most actively managed equity funds, SI trailed the large-cap growth dominated S&P 500 total return of +15.15%. The Leuthold GI strategy (Global Industries, L.P., net performance) produced a total return of +3.78%, which was worse than either the MSCI ACWI or the Morningstar World Large Stock category (+10.44% and +10.77% total returns, respectively).
Equity Sector/Industry Group Drivers
(Relative performance and portfolio overweight/underweight comparisons refer to the corresponding sector/group exposures of each strategy’s respective benchmark.)
The strategies’ equity rotation approach can result in large underweights or overweights compared to their respective benchmarks. We invest in industry groups that manifest leadership and appear likely to continue that role looking forward, given our longer-term investment outlook. Per our model, investing in the highest-rated industries has proven successful in providing alpha over time.
| 6 | Leuthold Funds - 2020 Annual Report |
The Information Technology (IT) sector propelled the fiscal year gains of the S&P 500 and MSCI ACWI. The IT sector was also Leuthold SI’s best performing broad sector and Leuthold GI’s second-best, but its relative portfolio contributions were lower by 33% and 46%. SI had a similar IT weight as the benchmark, and GI held a small overweight.
From a relative stance, robust results also came from overweight exposures to Communication Services and Health Care. In contrast, although the Consumer Discretionary allocation in SI (overweight) and GI (underweight) was favorable, each trailed its benchmark on an absolute and relative basis.
The two strategies had poor overall results and relative underperformance from their holdings in the Financials and Industrials sectors. SI Fund was overweight in each allocation, and the GI strategy was overweight Financials, but underweight Industrials.
One of our key performance measurements is looking at what we call the “total effect” of attribution. This evaluates investments based on the combined success of “group” selection and the underlying “stocks chosen” to represent the industry. Based on this total effect gauge, the domestic and global portfolios had some commonalities. Both had highly constructive results with overweight positions in Semiconductor Equipment, Interactive Home Entertainment, and Homebuilding. The SI Fund additionally benefited from the total effect of exposure to Financial Exchanges/Data and Managed Health Care; both were overweight versus the benchmark.
Adverse “total effect” results varied between the two strategies. Each had poor outcomes with group concentrations and the stock selection from Consumer Finance (overweight) and Internet/Catalog Retail (underweight). Within the SI Fund, other large detractors included Technology Hardware/Storage and Semiconductors (underweights), along with Human Resources/Employment Services (overweight). The GI strategy suffered additional downside from its combined effect of group/stock selection in its Software (underweight), Regional Banks (benchmark weight), and overweights in Life/Health Insurance and Data Processing/Outsourced Services. Among these, the most unfavorable from a “strategy conviction” perspective was Internet/Catalog Retail (SI and GI), Software (GI), Technology Hardware/Storage (SI), and Semiconductors (SI). Even though these groups were substantially underweight, they were the worst relative performers.
The S&P 500 and MSCI ACWI bore losses from sector holdings in Utilities, Real Estate, and Energy. These allocations pared-back each index’s annual gain by close to 300 bps. Leuthold SI had a relative advantage as it had zero exposure to those three sectors, and the GI strategy benefited as well, with no Real Estate position and virtually no Utilities (0.03% average weight) or Energy (0.29% weight).
Over the last twelve months, there have been numerous parallels between SI and GI portfolio allocations and the respective performance outcomes, yet many factors can inversely influence U.S. and non-U.S. industries. Among them are leadership and political structure, financial health, climates, and geography in general. Eurasia’s contiguous boundaries make a natural setting for regional transcontinental-industry economics to ebb and flow alike. North American industries’ physical detachment and distance from global peers often results in a different set of nuances impacting their business-cycle growth and leadership trends. These distinctions lead to the possibility that our internal group models may score an industry as “Attractive” for investment in one of the strategies but not in the other. Performance between a domestic group and its foreign counterpart may also be at odds.
| Leuthold Funds - 2020 Annual Report | 7 |
Examples of this behavior were evident over the last twelve months in the SI and GI portfolios. An overweight exposure to the domestic Biotechnology group in SI was additive by over 150 bps. At the same time, GI had a minimal weight in Biotech—represented by global stocks, which resulted in a loss. The same occurred with SI industry allocations to Data Processing, Health Care Services, Life/Health Insurance, and Managed Health Care; these generated solid gains. The global versions of the same groups either detracted or added little, comparatively, to GI performance. Likewise, GI group investments in Construction Materials, Life Sciences, Semiconductors, and Thrifts/Mortgage Finance were materially additive versus the SI Fund’s allocations to the same groups of the domestic variety.
Global/Foreign Equity Exposure
Leuthold SI and GI strategies do not have guidelines specifying the amount to invest in developed market (DM) or emerging market (EM) stock concentrations. These characteristics are a function of the quantitative process, which generates the list of groups eligible for investment. Some industries may be more prevalent in developed markets versus emerging markets, and the other way around.
The SI Fund obtains foreign stock exposure from ADR/ADS securities traded on U.S. exchanges. At times, this has materially affected performance, both on an absolute basis and relative to the S&P 500. For the fiscal year, DM foreign stocks made up a 6% quarterly average weight among SI assets, and there were no EM stocks among portfolio investments. The best performance comparison is against the MSCI ACWI ex-USA, which had a lackluster 3% gain over the last twelve months. Based on those results, and considering the SI Fund’s small concentration, foreign holdings did not have much bearing on performance at all but provided a bit of diversification.
Leuthold GI methodology builds the portfolio by selecting stocks across the globe that best characterize the chosen industry allocations. U.S. stocks encompassed most of the assets, with 56% on average during the last year. Of the 44% in foreign securities, DM stocks (ex-U.S.) incorporated 32% of assets, and EM held 12%.
GI’s U.S. stocks had a small additive contribution of about +2%, which paled compared to the MSCI ACWI U.S.-exposure’s +10% (virtually its entire twelve-month gain). These results indicate that the MSCI ACWI is heavily biased to richly priced large cap U.S.-growth stocks. In contrast, our approach leans toward stocks with more attractive valuations. Securities in the Leuthold GI portfolio are more evenly weighted as well; this differs greatly from the top-heavy indexes that have been powered in recent years by a small number of the mega-cap stocks.
GI exposures in other countries that provided outstanding performance (absolute and relative) were industry investments in Germany, Netherlands, Denmark, Ireland, Luxembourg, Hong Kong, and Canada. These positions combined for relative outperformance of 380 bps. Results like this indicate that GI’s selection of industries/stocks within those countries was superior to the index’s investments. The portfolio’s group concentrations affiliated with the U.K. had a negative outcome, both absolutely and relatively.
Among the EM industry investments in the GI strategy, those from China and Taiwan supplied the most upside. However, the relative effect of China was lower by over 50 bps. GI had poor results from exposure to Thailand, Indonesia, Mexico, and Brazil. These detractors were minimal allocations, and the losses ranged from -30 to -46 bps. In summary, the GI strategy had exposure to the economic landscapes of 26 different nations.
| 8 | Leuthold Funds - 2020 Annual Report |
We do not adjust for global currency fluctuation in the Leuthold GI strategy. These hedging practices are expensive and don’t guarantee against losses. Instead, the GI model incorporates a U.S. dollar-based relative strength component to identify potentially attractive, broad FX-market opportunities. Specific to the last twelve months, currency movement had a negligible performance impact on a relative basis. The portfolio was roughly equal-weight exposure to U.S. stocks and diversified well across the rest of the world—a combination that typically results in minimal currency impact.
GRIZZLY SHORT FUND
Short-Only Equity Exposure
The Grizzly Short Fund is 100% short individual stocks. Investors use this tactic for various functions: a means to potentially profit when stock prices decline, used in tandem with other investment styles to gain diversification, and managing capital gains exposure, among others. The Grizzly Short Fund is an actively managed, quantitative methodology used to identify mid/large cap stocks that look overvalued and vulnerable to a price decline. These are generally healthy companies with ample liquidity, not the type expected to be at risk of failing.
For the fiscal year ended September 30th, 2020, the Grizzly Short Fund produced a -32.96% total return. The result was somewhat worse than the -29.90% total return of the Morningstar “Bear Market” category. The S&P 500 had a total return of +15.15%. At face value, the gap between the Grizzly Short Fund’s loss and the “inverse” of the S&P 500 (-15.15%) looks unusually large. However, an index’s reverse performance is not an ideal comparator. A proxy that mirrors the inverse S&P 500 and trades in real-time exposes the true investment consequences of cash flows, volatility, and the effect of tracking assets in daily percentage terms. Over the last year, an investable vehicle that matched the exact reverse, daily percent return of the S&P 5001 produced an annual total return of nearly -22%—almost 700 bps worse than what’s implied by the S&P 500’s inverse performance.
One would have had better results with short selling the mid cap space than either the Grizzly Short Fund or the S&P 500 inverse proxy. An investable security that mirrored the holdings of the S&P 400 MidCap2, on an inverse basis, had a -12% one-year total return. In contrast, the S&P 400 MidCap Index’s inverse performance would reflect a +2.16% total return—a very misleading point of reference.
There can be extended periods in which the Grizzly Short Fund has conspicuous overweights or underweights to particular sectors. These sector deviations between Grizzly/S&P 500 allocations are generally advantageous for the Fund; this flexibility allows the movement in and out of market segments as their attractiveness changes. On the other hand, the S&P 500’s sector concentrations do not dramatically change unless there has been a prolonged period of extreme results that alter market cap characteristics. For a market index, that is a gradual process. Having outsized or undersized sector/group positions in the Fund can also be a drawback when there is an abrupt market reversal or when industry news creates short-term day-to-day swings against the strategy.
1 ProShares Short S&P500 (SH)
2 ProShares Short MidCap400 (MYY)
| Leuthold Funds - 2020 Annual Report | 9 |
Short Equity Exposure: Sectors And Industry Group Drivers
(Relative performance and Fund overweight/underweight references relate to the S&P 500’s corresponding sector/group exposures.)
Eight of the eleven broad sectors incorporated in the Grizzly Short Fund’s portfolio detracted from performance. Among the worst absolute performers, the Fund and S&P 500 had three in common: Information Technology, Consumer Discretionary, and Health Care. IT holdings were the most subtractive for each, but the Fund had considerably less exposure—which improved its relative results by over 260 bps. The Fund’s Consumer Discretionary overweight was relatively more detractive by almost 400 bps, while its underweight to Health Care trailed the benchmark by nearly 220 bps. There was a big overweight to Industrials that led to another negative performance discrepancy; on a relative basis, the Fund’s positions were more subtractive by about 450 bps.
Much of these sectors’ terrible relative performance reflects exposure to industries that are unmistakably beneficiaries of the “pandemic culture.” This turmoil has been continuously evolving since the shelter-in-place closure and distance-learning directive, not to mention the healthcare-related implications of COVID-19 itself. The Fund’s varied exposure to pandemic beneficiaries within the IT, Consumer Discretionary, and Health Care sectors included Application Software, Internet Services/Infrastructure, Semiconductors, Data Processing/Outsourced Services, Casinos/Gaming (online channels), Health Care Equipment/Supplies, and Pharmaceuticals.
Less obvious is the pandemic stimulated windfall to the Industrials sector. This segment contains an extensive spectrum of specialties and resources that provide solutions and products playing to multiple end-markets. One of the Fund’s key exposures involved securities from the Industrials Machinery group; this space features a seemingly boundless range of capabilities that have the potential to profit from the COVID-19 effect. Among them are sterilization/sanitation products, medical equipment, air quality treatment, consumer electronics, printing solutions, transportation, tools, packaging, and construction machinery.
Communication Services, Consumer Staples, and Financials detracted from the Grizzly Short Fund’s return by similar amounts (-120 bps to -170 bps), while the benchmark’s concentrations provided downside from -10 bps to -253 bps. The Fund’s Financials’ allocation was about one-half the S&P 500’s weight, but it underperformed by over 100 bps, indicating unconstructive industry selection in the Fund’s underlying group holdings. Conversely, Communication Services (underweight by about one-half) contributed better relative results of over 80 bps.
The poor performance from short selling in these three sectors is attributable to more pandemic repercussions. Among these were Communication Services’ Interactive Home Entertainment and Interactive Media & Services groups. Consumer Staples had small losses from several positions, but the Packaged Foods/Meats and Personal Products industries generated most of the downside from that space. Financials sector losses were the result of Property/Casualty Insurance and Regional Banks stocks.
The Energy sector (overweight) and the Utilities sector contributed gains; both had relative outperformance, adding a combined 225 bps above that of the index. The oil industry’s prolonged supply/demand imbalance has chipped away at Energy’s clout for years, and it now represents the smallest sector weight in the S&P 500. The spread of coronavirus added fuel to the fire as worldwide oil demand plummeted even more. The Fund’s exposure to this sector helped to scale back losses elsewhere. The Fund’s industry positions had net gains from Integrated Oil & Gas, O&G Equipment/Services, O&G Exploration/Production, and O&G Storage/Transportation.
10 Leuthold Funds - 2020 Annual Report
The Fund’s Real Estate allocation was underweight by 1.5%, but it was relatively additive by a small amount; the index’s exposure had a loss. This sector was impaired almost immediately from the aftermath of the “stay-at-home” decree, which abruptly became the new business-as-usual “normal.” Groups that aided the Funds’ results were REITS from Developers, Office, Residential, and Services subsets. (Curiously, considering the impact of the pandemic shutdown, Retail and Hotel/Resort REIT positions slightly detracted from performance.)
Grizzly Short Fund sector/industry group allocations may be far removed from the benchmark, both in terms of percent exposure and the underlying industries characterizing the respective sectors. The Fund has policies to manage position weights at both levels to avoid the potential for a particular concentration having too much influence due to expanding in size relative to the other stock/group investments. Procedures include short covering to lock in a portion of a gain or scale back a losing position. Also, the Fund’s stocks are weighted similarly across the portfolio. Therefore, it is unlikely that a select few stocks could have an overwhelming effect on long-term performance, as is the case with the cap-weighted S&P 500. Portfolio holdings are monitored closely on an intra-day basis, and investors should expect high turnover.
THE “HIGHEST” MARKET “LOW” EVER
Today, the worry is not about the “risk of loss,” it’s the Fear Of Missing Out on gains. The investing public has a case of FOMO as contagious as that leading up to Y2K. The infection strain of 2020 involves single stocks that dwarf entire equity sectors. Several years ago, we were amazed when Apple’s market cap surpassed the S&P 600 SmallCap Index as a whole. Two months ago, it eclipsed the entire market value of the S&P 400 MidCap Index! With five giant companies now comprising nearly 25% of the S&P 500, institutional equity managers have a new definition for the present-day FOMO contagion: Fear Of MegaCap Outperformance.
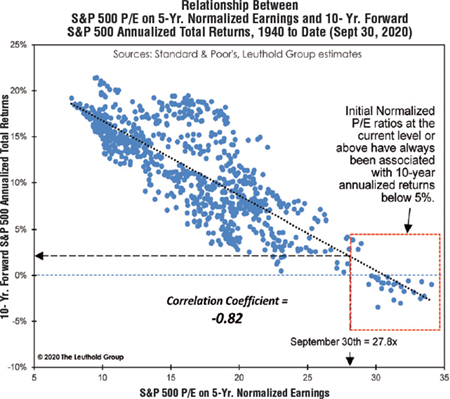
Valuations at the March 23rd stock market low were the highest ever experienced at a bear market bottom. Since that time, the S&P 500 has gained what may seem to be a “jaw-dropping” 51.75% (through September 30th). The size of that gain is not a rarity. The six-month rallies from the bear market lows of 1932, 1938, 1982, and 2009 had similar returns ranging from +44-53%. What is extraordinary about this new bull market is that it has propelled many large caps to valuation levels realized only four other times in history: 1999, 2000, 2019, and pre-pandemic 2020. Measured at the bull market’s six-month anniversary on September 23rd, the S&P 500 price to earnings (P/E) ratio, based on five-year normalized earnings per share (EPS), was 26.9x—30% higher than the six-month mark of previous bull markets. Similarly, back in 2009, equity markets rallied sharply from the March low, but by the end of 2009, the S&P 500 valuation was still 30% below its price-high P/E level.
Many sophisticated investors claim that high valuations are warranted, given the environment of near-zero rates. Interest rate levels have no sway in our performance-forecasting measures. When valuation readings are as high as they are today, the stock market has never produced an annualized gain of +5% or higher in the next ten-year period (see scatterplot).
Leuthold Funds - 2020 Annual Report 11
The present-day market mania hasn’t quite matched the extremes of 2000 on a valuation basis. But, in some ways, we think psychology is even more dangerous than 20 years ago. At the height of the Technology Bubble, the “objects” of investment-infatuation were excessively overvalued businesses. Today, there is an underlying faith that the Fed and Treasury bureaucrats will keep both good and bad companies afloat (and richly priced). We can’t unearth a single historical analog that merits such confidence.
Meanwhile, the yield for a traditional 60/40 U.S.-balanced portfolio (60% S&P 500/40% 10-Yr. Treasury Bond) plummeted to a tiny 1.37% in August—exactly one-third its 120-year average yield of 4.11%. Income has historically accounted for a bit more than half of the 60/40 annualized total return of +8%. For retirees and conservative investors, this is a major dilemma. With the time-honored 60/40 performance prospects now incredibly compromised, Leuthold tactical portfolios’ flexible asset-allocation strategy is even more compelling as an alternative to the now seemingly obsolete “balanced” methodology.
There are times when our tactical “weight of the evidence” approach is perceived as “blinding us” to new realities of the marketplace. The late-1990s era was challenging for our tactical asset allocation. We “didn’t get” the new economy. Instead, we had confidence in the guidance of our valuation measures that had offered practical direction for decades. The aughts turned out to be a terrific decade for our disciplines—one that more than paid off for that late-1990s’ intransigence. In 2019 and 2020, our regard for time-tested valuation tools resulted in our tactical portfolios being underexposed to stocks (like in the late 1990s) during a pair of tremendous rallies (though the more defensive stance cushioned losses during two significant declines). The current day critique is that we don’t appreciate today’s policymakers’ “brilliance” and their miraculous ability to pivot just when stocks (and the economy) need it most.
Indeed, a “weight of the evidence” approach has shortcomings when the market temporarily obsesses over a single phenomenon—like the dot-coms in 1999 and “liquidity” today. Others who employ multi-factor techniques have lately thrown up their hands, reluctant to fight the wall of money now descending on Wall Street.
Our tactical funds’ goals are to preserve shareholder capital and grow assets without taking on disproportionate risk. Our quantitative approach removes subjectivity, we have the latitude to participate in new opportunities as they materialize, and we can hedge exposures when needed. We believe these features combine for an asset allocation system that is better equipped than its peers to navigate the market as the underlying cycles develop and the appeal of investment prospects rotates.
Our stock portfolio methodologies are as disciplined as our tactical asset allocation process. Some market dynamics are more constructive for our techniques, and some are less productive. Over the long term, our approach has successfully identified groups of stocks that can profit or add value under the given stock market setting, be it positive or negative. The goal is to find the most attractive leadership areas and selectively obtain exposure to a concentrated number of themes rather than capture the broad stock market’s performance. This is what separates us from most other managers.
Looking forward, we believe the market will experience a three- to four-year period where headline indexes like the S&P 500, DJIA, and NASDAQ will be more inclined to move sideways, with minimal upside progress. This should provide plentiful occasions for active managers, like us, who can focus on industry groups and themes that had previously been neglected and who have the clearance to invest across all stock market styles and sizes.
12 Leuthold Funds - 2020 Annual Report
We are thankful for your support as shareholders, and we value your confidence in us to manage your assets. As co-shareholders, we guarantee you that we have a firm conviction in our investment practices, and we will always make every effort to realize the best results possible.
We welcome you to contact us at any time if you have questions or would like to give us feedback.
Sincerely,

Doug Ramsey, CFA, CMT
CIO & Co-Portfolio Manager
 | |  | |  |
| Chun Wang, CFA, PRM | | Scott Opsal, CFA | | Jun Zhu, CFA, CAIA |
| Co-Portfolio Manager | | Co-Portfolio Manager | | Co-Portfolio Manager |
| | | | | |
 | |  | | |
| Greg Swenson, CFA | | Kristen Perleberg, CFA | | |
| Co-Portfolio Manager | | Co-Portfolio Manager | | |
Leuthold Funds - 2020 Annual Report 13
Leuthold Funds
(Unaudited)
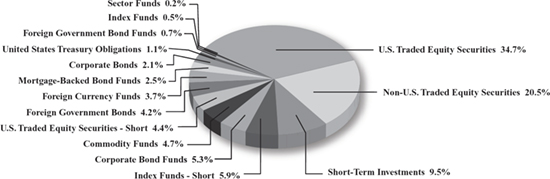
Leuthold Core Investment Fund
Allocation of Portfolio Holdings
September 30, 2020

Leuthold Global Fund
Allocation of Portfolio Holdings
September 30, 2020
| ^ | Amount is less than 0.05%. |
Reflected as a percent of absolute value of investments and securities sold short.
14 Leuthold Funds - 2020 Annual Report
Leuthold Funds
(Unaudited)
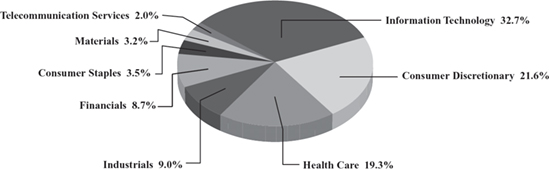
Leuthold Select Industries Fund
Allocation of Portfolio Holdings
September 30, 2020*
Grizzly Short Fund
Allocation of Securities Sold Short
September 30, 2020
| * | Excludes short-term investments less than 5% of net assets. |
Reflected as a percent of absolute value of investments and securities sold short.
Leuthold Funds - 2020 Annual Report 15
Leuthold Funds
(Unaudited)
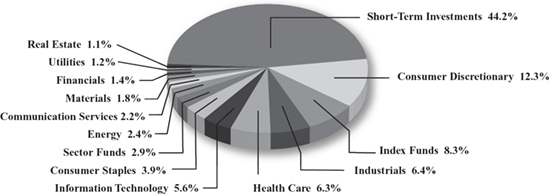
Leuthold Core ETF
Allocation of Portfolio Holdings
September 30, 2020

16 Leuthold Funds - 2020 Annual Report
Leuthold Core Investment Fund - Retail Class - LCORX
(Unaudited)
Average Annual Rate of Return For Periods Ended
September 30, 2020
| | | 1 Year | | 3 Year | | 5 Year | | 10 Year | | Since
Inception |
| Leuthold Core Investment Fund - Retail Class - LCORX | | 6.72% | | 3.69% | | 5.34% | | 6.14% | | 7.98% |
| S&P 500 Index | | 15.15% | | 12.28% | | 14.15% | | 13.74% | | 9.26% |
| Morningstar Tactical Allocation Index | | 3.18% | | 2.72% | | 4.53% | | 3.89% | | 4.90% |
| Bloomberg Barclays Global Aggregate Index | | 6.24% | | 4.10% | | 3.92% | | 2.36% | | n/a |
A $10,000 investment in the Leuthold Core Investment Fund – Retail Class - LCORX

The S&P 500 Index is an unmanaged capitalization-weighted index of 500 stocks designed to measure performance of the broad domestic economy through changes in the aggregate market value of the 500 stocks, which represent all major industries.
The Morningstar Tactical Allocation Index is comprised of funds that incorporate a tactical asset allocation strategy which is the process by which the asset of a fund is changed on a short-term basis to take advantage of perceived differences in relative values of the various asset classes.
The Bloomberg Barclays Global Aggregate Index provides a broad-based measure of the global investment grade fixed-rate debt markets. It is comprised of the U.S. Aggregate, Pan-European Aggregate, the Asian-Pacific Aggregate, and the Canadian Aggregate Indices. It also includes a wide range of standard and customized sub-indices by liquidity constraint, sector, quality, and maturity.
Index figures do not take any expenses, fees, or taxes into account, but mutual fund returns do. The indices are used herein for comparative purposes in accordance with the U.S Securities and Exchange Commission regulations.
This chart assumes an initial gross investment of $10,000 made on November 20, 1995 (commencement of operations). Returns shown include the reinvestment of all dividends. The Fund’s past performance is not necessarily an indication of its future performance. It may perform better or worse in the future. The graph and the table do not reflect the deduction of taxes that a shareholder would pay on Fund distributions or the redemption of shares.
Leuthold Funds - 2020 Annual Report 17
Leuthold Core Investment Fund - Institutional Class - LCRIX
(Unaudited)
Average Annual Rate of Return For Periods Ended
September 30, 2020
| | | 1 Year | | 3 Year | | 5 Year | | 10 Year | | Since
Inception |
| Leuthold Core Investment Fund - Institutional Class - LCRIX | | 6.76% | | 3.79% | | 5.45% | | 6.25% | | 5.41% |
| S&P 500 Index | | 15.15% | | 12.28% | | 14.15% | | 13.74% | | 9.07% |
| Morningstar Tactical Allocation Index | | 3.18% | | 2.72% | | 4.53% | | 3.89% | | 3.25% |
| Bloomberg Barclays Global Aggregate Index | | 6.24% | | 4.10% | | 3.92% | | 2.36% | | 3.87% |
A $1,000,000 investment in the Leuthold Core Investment Fund – Institutional Class - LCRIX

The S&P 500 Index is an unmanaged capitalization-weighted index of 500 stocks designed to measure performance of the broad domestic economy through changes in the aggregate market value of the 500 stocks, which represent all major industries.
The Morningstar Tactical Allocation Index is comprised of funds that incorporate a tactical asset allocation strategy which is the process by which the asset of a fund is changed on a short-term basis to take advantage of perceived differences in relative values of the various asset classes.
The Bloomberg Barclays Global Aggregate Index provides a broad-based measure of the global investment grade fixed-rate debt markets. It is comprised of the U.S. Aggregate, Pan-European Aggregate, the Asian-Pacific Aggregate, and the Canadian Aggregate Indices. It also includes a wide range of standard and customized sub-indices by liquidity constraint, sector, quality, and maturity.
Index figures do not take any expenses, fees, or taxes into account, but mutual fund returns do. The indices are used herein for comparative purposes in accordance with the U.S Securities and Exchange Commission regulations.
This chart assumes an initial gross investment of $1,000,000 made on January 31, 2006 (commencement of operations). Returns shown include the reinvestment of all dividends. The Fund’s past performance is not necessarily an indication of its future performance. It may perform better or worse in the future. The graph and the table do not reflect the deduction of taxes that a shareholder would pay on Fund distributions or the redemption of shares.
18 Leuthold Funds - 2020 Annual Report
Leuthold Global Fund - Retail Class - GLBLX
(Unaudited)
Average Annual Rate of Return For Periods Ended
September 30, 2020
| | | 1 Year | | 3 Year | | 5 Year | | 10 Year | | Since
Inception |
| Leuthold Global Fund - Retail Class - GLBLX | | 2.56% | | (0.73)% | | 2.23% | | 3.99% | | 3.63% |
| MSCI ACWI | | 10.44% | | 7.12% | | 10.30% | | 8.55% | | 6.11% |
| Bloomberg Barclays Global Aggregate Index | | 6.24% | | 4.10% | | 3.92% | | 2.36% | | 3.16% |
| S&P 500 Index | | 15.15% | | 12.28% | | 14.15% | | 13.74% | | 10.49% |
A $10,000 investment in the Leuthold Global Fund - Retail Class - GLBLX
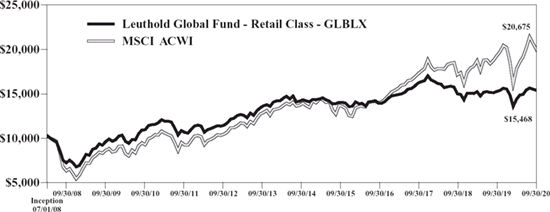
The MSCI ACWI (All Country World Index) captures large- and mid-cap representation across 23 Developed Market (DM) and 26 Emerging Market (EM) countries.
The Bloomberg Barclays Global Aggregate Index provides a broad-based measure of the global investment grade fixed-rate debt markets. It is comprised of the U.S. Aggregate, Pan-European Aggregate, the Asian-Pacific Aggregate, and the Canadian Aggregate Indices. It also includes a wide range of standard and customized sub-indices by liquidity constraint, sector, quality, and maturity.
The S&P 500 Index is an unmanaged capitalization-weighted index of 500 stocks designed to measure performance of the broad domestic economy through changes in the aggregate market value of the 500 stocks, which represent all major industries.
Index figures do not take any expenses, fees, or taxes into account, but mutual fund returns do. The indices are used herein for comparative purposes in accordance with the U.S Securities and Exchange Commission regulations.
This chart assumes an initial gross investment of $10,000 made on July 1, 2008 (commencement of operations). Returns shown include the reinvestment of all dividends. The Fund’s past performance is not necessarily an indication of its future performance. It may perform better or worse in the future. The graph and the table do not reflect the deduction of taxes that a shareholder would pay on Fund distributions or the redemption of shares.
Leuthold Funds - 2020 Annual Report 19
Leuthold Global Fund - Institutional Class - GLBIX
(Unaudited)
Average Annual Rate of Return For Periods Ended
September 30, 2020
| | | 1 Year | | 3 Year | | 5 Year | | 10 Year | | Since
Inception |
| Leuthold Global Fund - Institutional Class - GLBIX | | 2.79% | | (0.48)% | | 2.49% | | 4.23% | | 3.72% |
| MSCI ACWI | | 10.44% | | 7.12% | | 10.30% | | 8.55% | | 5.36% |
| Bloomberg Barclays Global Aggregate Index | | 6.24% | | 4.10% | | 3.92% | | 2.36% | | 3.02% |
| S&P 500 Index | | 15.15% | | 12.28% | | 14.15% | | 13.74% | | 9.70% |
A $1,000,000 investment in the Leuthold Global Fund - Institutional Class - GLBIX
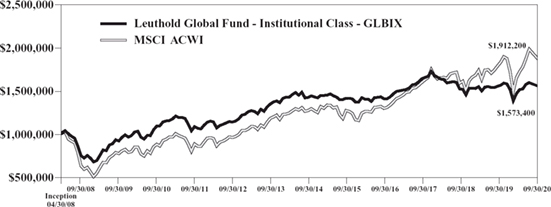
The MSCI ACWI (All Country World Index) captures large- and mid-cap representation across 23 Developed Market (DM) and 26 Emerging Market (EM) countries.
The Bloomberg Barclays Global Aggregate Index provides a broad-based measure of the global investment grade fixed-rate debt markets. It is comprised of the U.S. Aggregate, Pan-European Aggregate, the Asian-Pacific Aggregate, and the Canadian Aggregate Indices. It also includes a wide range of standard and customized sub-indices by liquidity constraint, sector, quality, and maturity.
The S&P 500 Index is an unmanaged capitalization-weighted index of 500 stocks designed to measure performance of the broad domestic economy through changes in the aggregate market value of the 500 stocks, which represent all major industries.
Index figures do not take any expenses, fees, or taxes into account, but mutual fund returns do. The indices are used herein for comparative purposes in accordance with the U.S Securities and Exchange Commission regulations.
This chart assumes an initial gross investment of $1,000,000 made on April 30, 2008 (commencement of operations). Returns shown include the reinvestment of all dividends. The Fund’s past performance is not necessarily an indication of its future performance. It may perform better or worse in the future. The graph and the table do not reflect the deduction of taxes that a shareholder would pay on Fund distributions or the redemption of shares.
20 Leuthold Funds - 2020 Annual Report
Leuthold Select Industries Fund - LSLTX
(Unaudited)
Average Annual Rate of Return For Periods Ended
September 30, 2020
| | | 1 Year | | 3 Year | | 5 Year | | 10 Year | | Since
Inception |
| Leuthold Select Industries Fund - LSLTX | | 11.28% | | 6.54% | | 8.70% | | 10.66% | | 7.82% |
| S&P 600 Index | | (8.29)% | | (0.33)% | | 7.20% | | 10.57% | | 8.40% |
| S&P 500 Index | | 15.15% | | 12.28% | | 14.15% | | 13.74% | | 6.17% |
A $10,000 investment in the Leuthold Select Industries Fund - LSLTX

The S&P 600 Index is an index of small-cap stocks which tracks a broad range of small-sized companies that meet specific liquidity and stability requirements. This is determined by specific metrics such as public float, market capitalization, and financial viability among a few other factors. Market capitalization, for instance, must fall between $450 million and $2.1 billion to ensure individual assets do not overlap with the larger S&P 500 or mid-cap S&P 400 indexes.
The S&P 500 Index is an unmanaged capitalization-weighted index of 500 stocks designed to measure performance of the broad domestic economy through changes in the aggregate market value of the 500 stocks, which represent all major industries.
Index figures do not take any expenses, fees, or taxes into account, but mutual fund returns do. The indices are used herein for comparative purposes in accordance with the U.S Securities and Exchange Commission regulations.
This chart assumes an initial gross investment of $10,000 made on June 19, 2000 (commencement of operations). Returns shown include the reinvestment of all dividends. The Fund’s past performance is not necessarily an indication of its future performance. It may perform better or worse in the future. The graph and the table do not reflect the deduction of taxes that a shareholder would pay on Fund distributions or the redemption of shares.
Leuthold Funds - 2020 Annual Report 21
Grizzly Short Fund - GRZZX
(Unaudited)
Average Annual Rate of Return For Periods Ended
September 30, 2020
| | | 1 Year | | 3 Year | | 5 Year | | 10 Year | | Since
Inception |
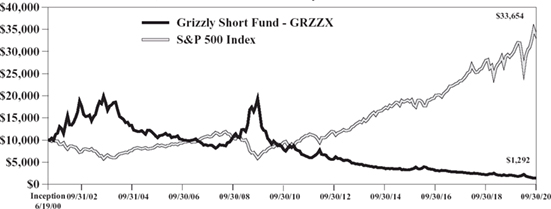
| Grizzly Short Fund - GRZZX | | (32.96)% | | (20.16)% | | (19.31)% | | (16.45)% | | (9.60)% |
| S&P MidCap 400 Index | | (2.16)% | | 2.90% | | 8.11% | | 10.49% | | 8.18% |
| S&P 500 Index | | 15.15% | | 12.28% | | 14.15% | | 13.74% | | 6.17% |
A $10,000 investment in the Grizzly Short Fund - GRZZX
The S&P MidCap 400 Index is a capitalization-weighted index, which measures the performance of the mid-range sector of the U.S. stock market. The index was developed with a base level of 100 as of December 31, 1990.
The S&P 500 Index is an unmanaged capitalization-weighted index of 500 stocks designed to measure performance of the broad domestic economy through changes in the aggregate market value of the 500 stocks, which represent all major industries.
Index figures do not take any expenses, fees, or taxes into account, but mutual fund returns do. The indices are used herein for comparative purposes in accordance with the U.S Securities and Exchange Commission regulations.
This chart assumes an initial gross investment of $10,000 made on June 19, 2000 (commencement of operations). Returns shown include the reinvestment of all dividends. The Fund’s past performance is not necessarily an indication of its future performance. It may perform better or worse in the future. The graph and the table do not reflect the deduction of taxes that a shareholder would pay on Fund distributions or the redemption of shares.
22 Leuthold Funds - 2020 Annual Report
Leuthold Core ETF - LCR
(Unaudited)
Average Annual Rate of Return For Periods Ended
September 30, 2020
| | | 3 Month | | 6 Month | | Since
Inception* |
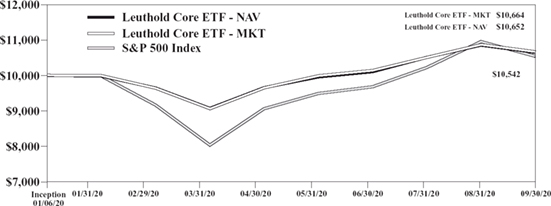
| Leuthold Core ETF - LCR - NAV | | 5.45% | | 17.46% | | 6.52% |
| Leuthold Core ETF - LCR - Market (“MKT”) | | 5.21% | | 17.76% | | 6.64% |
| S&P 500 Index | | 8.93% | | 31.31% | | 5.42% |
| Morningstar Tactical Allocation Index | | 5.06% | | 15.10% | | n/a |
| Bloomberg Barclays Global Aggregate Index | | 2.66% | | 6.07% | | 5.37% |
* Fund commenced operations on January 6, 2020. Information presented is for the period January 6, 2020 through September 30, 2020.
A $10,000 investment in the Leuthold Core ETF - LCR
The S&P 500 Index is an unmanaged capitalization-weighted index of 500 stocks designed to measure performance of the broad domestic economy through changes in the aggregate market value of the 500 stocks, which represent all major industries.
The Morningstar Tactical Allocation Index is comprised of funds that incorporate a tactical asset allocation strategy which is the process by which the asset of a fund is changed on a short-term basis to take advantage of perceived differences in relative values of the various asset classes.
The Bloomberg Barclays Global Aggregate Index provides a broad-based measure of the global investment grade fixed-rate debt markets. It is comprised of the U.S. Aggregate, Pan-European Aggregate, the Asian-Pacific Aggregate, and the Canadian Aggregate Indices. It also includes a wide range of standard and customized sub-indices by liquidity constraint, sector, quality, and maturity.
Index figures do not take any expenses, fees, or taxes into account, but ETF returns do. The indices are used herein for comparative purposes in accordance with the U.S Securities and Exchange Commission regulations.
This chart assumes an initial gross investment of $10,000 made on January 6, 2020 (commencement of operations). Returns shown include the reinvestment of all dividends. The Fund’s past performance is not necessarily an indication of its future performance. It may perform better or worse in the future. The graph and the table do not reflect the deduction of taxes that a shareholder would pay on Fund distributions or the redemption of shares.
Leuthold Funds - 2020 Annual Report 23
24 Leuthold Funds - 2020 Annual Report
Leuthold Core Investment Fund
Schedule of Investments
September 30, 2020
| | | Shares | | | Fair Value | |
| COMMON STOCKS - 59.39% | | | |
| | | | |
| Air Freight & Logistics - 0.29% | | | | | | | | |
| Atlas Air Worldwide Holdings, Inc. (a) | | | 26,112 | | | $ | 1,590,221 | |
| Biotechnology - 4.19% | | | | | | | | |
| AbbVie, Inc. | | | 34,641 | | | | 3,034,205 | |
| Alexion Pharmaceuticals, Inc. (a) | | | 29,041 | | | | 3,323,162 | |
| Amgen, Inc. | | | 20,055 | | | | 5,097,179 | |
| Biogen, Inc. (a) | | | 10,418 | | | | 2,955,378 | |
| Gilead Sciences, Inc. | | | 58,733 | | | | 3,711,338 | |
| Regeneron Pharmaceuticals, Inc. (a) | | | 8,465 | | | | 4,738,538 | |
| | | | | | | | 22,859,800 | |
| Building Products - 1.99% | | | | | | | | |
| Builders FirstSource, Inc. (a) | | | 70,844 | | | | 2,310,931 | |
| Carrier Global Corp. | | | 79,391 | | | | 2,424,601 | |
| Masco Corp. | | | 27,307 | | | | 1,505,435 | |
| Masonite International Corp. (a) | | | 12,732 | | | | 1,252,829 | |
| Owens Corning | | | 23,182 | | | | 1,595,153 | |
| UFP Industries, Inc. | | | 30,604 | | | | 1,729,432 | |
| | | | | | | | 10,818,381 | |
| Capital Markets - 5.16% | | | | | | | | |
| Evercore, Inc. - Class A | | | 35,683 | | | | 2,335,809 | |
| The Goldman Sachs Group, Inc. | | | 17,581 | | | | 3,533,254 | |
| Moody's Corp. | | | 11,590 | | | | 3,359,362 | |
| Morgan Stanley | | | 60,817 | | | | 2,940,502 | |
| MSCI, Inc. | | | 7,163 | | | | 2,555,615 | |
| Nasdaq, Inc. | | | 17,451 | | | | 2,141,412 | |
| Raymond James Financial, Inc. | | | 34,250 | | | | 2,492,030 | |
| S&P Global, Inc. | | | 9,897 | | | | 3,568,858 | |
| Stifel Financial Corp. | | | 44,147 | | | | 2,232,072 | |
| UBS Group AG (b) | | | 265,666 | | | | 2,962,176 | |
| | | | | | | | 28,121,090 | |
| | | Shares | | | Fair Value | |
| | | | | | | |
| Chemicals - 0.00% (h) | | | | | | | | |
| China Lumena New Materials Corp. (a)(b)(d)(e) | | | 20,950 | | | $ | 6,488 | |
| Construction & Engineering - 0.29% | | | | | | | | |
| MasTec, Inc. (a) | | | 37,668 | | | | 1,589,590 | |
| Distributors - 0.33% | | | | | | | | |
| LKQ Corp. (a) | | | 64,593 | | | | 1,791,164 | |
| Diversified Telecommunication Services - 0.79% | | | | | | | | |
| Verizon Communications, Inc. | | | 72,667 | | | | 4,322,960 | |
| Electronic Equipment, Instruments & Components - 1.40% | | | | | | | | |
| Insight Enterprises, Inc. (a) | | | 37,636 | | | | 2,129,445 | |
| SYNNEX Corp. | | | 39,459 | | | | 5,526,627 | |
| | | | | | | | 7,656,072 | |
| Entertainment - 3.01% | | | | | | | | |
| Activision Blizzard, Inc. | | | 80,221 | | | | 6,493,890 | |
| Electronic Arts, Inc. (a) | | | 44,538 | | | | 5,808,201 | |
| Take-Two Interactive Software, Inc. (a) | | | 24,874 | | | | 4,109,682 | |
| | | | | | | | 16,411,773 | |
| Food & Staples Retailing - 1.67% | | | | | | | | |
| Costco Wholesale Corp. | | | 13,283 | | | | 4,715,465 | |
| Walmart, Inc. | | | 31,515 | | | | 4,409,264 | |
| | | | | | | | 9,124,729 | |
| Health Care Providers & Services - 7.32% | | | | | | | | |
| Anthem, Inc. | | | 8,856 | | | | 2,378,633 | |
| Centene Corp. (a) | | | 75,272 | | | | 4,390,616 | |
| Cigna Corp. | | | 12,111 | | | | 2,051,725 | |
| CVS Health Corp. | | | 36,073 | | | | 2,106,663 | |
| Encompass Health Corp. | | | 47,533 | | | | 3,088,694 | |
| Fresenius Medical Care AG & Co. KGaA - ADR | | | 43,496 | | | | 1,847,710 | |
| See Notes to the Financial Statements. | Leuthold Funds - 2020 Annual Report | 25 |
Leuthold Core Investment Fund
Schedule of Investments (continued)
September 30, 2020
| | | Shares | | | Fair Value | |
| COMMON STOCKS - 59.39% (continued) |
| |
| Health Care Providers & Services - 7.32% (continued) | | | | | | | | |
| HCA Healthcare, Inc. | | | 40,241 | | | $ | 5,017,248 | |
| Humana, Inc. | | | 12,372 | | | | 5,120,647 | |
| Laboratory Corp. of America Holdings (a) | | | 10,288 | | | | 1,936,922 | |
| Premier, Inc. | | | 40,371 | | | | 1,325,380 | |
| Quest Diagnostics, Inc. | | | 15,758 | | | | 1,804,133 | |
| UnitedHealth Group, Inc. | | | 21,878 | | | | 6,820,904 | |
| Universal Health Services, Inc. - Class B | | | 18,492 | | | | 1,979,014 | |
| | | | | | | | 39,868,289 | |
| Household Durables - 5.34% | | | | | | | | |
| D.R. Horton, Inc. | | | 69,542 | | | | 5,259,461 | |
| KB Home | | | 51,310 | | | | 1,969,791 | |
| La-Z-Boy, Inc. | | | 50,154 | | | | 1,586,371 | |
| Lennar Corp. - Class A | | | 41,673 | | | | 3,403,851 | |
| Meritage Homes Corp. (a) | | | 29,822 | | | | 3,292,051 | |
| Mohawk Industries, Inc. (a) | | | 17,369 | | | | 1,695,041 | |
| PulteGroup, Inc. | | | 106,006 | | | | 4,907,018 | |
| Sony Corp. - ADR | | | 19,931 | | | | 1,529,704 | |
| Toll Brothers, Inc. | | | 64,072 | | | | 3,117,743 | |
| Whirlpool Corp. | | | 12,762 | | | | 2,346,804 | |
| | | | | | | | 29,107,835 | |
| Interactive Media & Services - 2.26% | | | | | | | | |
| Alphabet, Inc. - Class A (a) | | | 5,470 | | | | 8,016,832 | |
| Facebook, Inc. - Class A (a) | | | 16,409 | | | | 4,297,517 | |
| | | | | | | | 12,314,349 | |
| IT Services - 3.26% | | | | | | | | |
| Akamai Technologies, Inc. (a) | | | 19,404 | | | | 2,144,918 | |
| Mastercard, Inc. - Class A | | | 25,134 | | | | 8,499,565 | |
| Visa, Inc. - Class A | | | 35,683 | | | | 7,135,529 | |
| | | | | | | | 17,780,012 | |
| | | Shares | | | Fair Value | |
| | | | | | | |
| Life Sciences Tools & Services - 0.33% | | | | | | | | |
| Medpace Holdings, Inc. (a) | | | 16,018 | | | $ | 1,790,011 | |
| Media - 0.61% | | | | | | | | |
| Comcast Corp. - Class A | | | 71,626 | | | | 3,313,419 | |
| Metals & Mining - 1.88% | | | | | | | | |
| Agnico Eagle Mines, Ltd. (b) | | | 17,451 | | | | 1,389,274 | |
| B2Gold Corp. (b) | | | 197,166 | | | | 1,285,523 | |
| Barrick Gold Corp. (b) | | | 91,030 | | | | 2,558,853 | |
| Kinross Gold Corp. (a)(b) | | | 148,460 | | | | 1,309,417 | |
| Newmont Corp. | | | 38,678 | | | | 2,454,119 | |
| Yamana Gold, Inc. (b) | | | 216,960 | | | | 1,232,333 | |
| | | | | | | | 10,229,519 | |
| Multiline Retail - 4.38% | | | | | | | | |
| Dollar General Corp. | | | 40,892 | | | | 8,571,781 | |
| Dollar Tree, Inc. (a) | | | 36,334 | | | | 3,318,747 | |
| Target Corp. | | | 75,923 | | | | 11,951,799 | |
| | | | | | | | 23,842,327 | |
| Professional Services - 1.34% | | | | | | | | |
| ASGN, Inc. (a) | | | 41,934 | | | | 2,665,325 | |
| Insperity, Inc. | | | 31,906 | | | | 2,089,524 | |
| Robert Half International, Inc. | | | 48,445 | | | | 2,564,678 | |
| | | | | | | | 7,319,527 | |
| Semiconductors & Semiconductor Equipment - 5.61% | | | | | | | | |
| Applied Materials, Inc. | | | 80,481 | | | | 4,784,595 | |
| KLA Corp. | | | 16,409 | | | | 3,179,080 | |
| Lam Research Corp. | | | 29,041 | | | | 9,634,352 | |
| MKS Instruments, Inc. | | | 30,473 | | | | 3,328,566 | |
| SolarEdge Technologies, Inc. (a)(b) | | | 40,555 | | | | 9,666,284 | |
| | | | | | | | 30,592,877 | |
| 26 | Leuthold Funds - 2020 Annual Report | See Notes to the Financial Statements. |
Leuthold Core Investment Fund
Schedule of Investments (continued)
September 30, 2020
| | | Shares | | | Fair Value | |
| COMMON STOCKS - 59.39% (continued) |
| |
| Software - 2.90% | | | | | | | | |
| Adobe, Inc. (a) | | | 9,246 | | | $ | 4,534,516 | |
| Microsoft Corp. | | | 53,524 | | | | 11,257,703 | |
| | | | | | | | 15,792,219 | |
| Specialty Retail - 2.28% | | | | | | | | |
| AutoNation, Inc. (a) | | | 28,336 | | | | 1,499,824 | |
| Best Buy Co., Inc. | | | 20,316 | | | | 2,260,968 | |
| The Home Depot, Inc. | | | 9,071 | | | | 2,519,107 | |
| The Michaels Companies, Inc. (a) | | | 147,747 | | | | 1,426,497 | |
| Penske Automotive Group, Inc. | | | 34,120 | | | | 1,626,159 | |
| Rent-A-Center, Inc | | | 45,059 | | | | 1,346,814 | |
| Williams-Sonoma, Inc. | | | 19,013 | | | | 1,719,536 | |
| | | | | | | | 12,398,905 | |
| Technology Hardware, Storage & Peripherals - 0.99% | | | | | | | | |
| Apple, Inc. | | | 46,360 | | | | 5,368,951 | |
| Trading Companies & Distributors - 1.42% |
| BMC Stock Holdings, Inc. (a) | | | 41,934 | | | | 1,796,033 | |
| HD Supply Holdings, Inc. (a) | | | 48,445 | | | | 1,997,872 | |
| Triton International, Ltd. (b) | | | 32,297 | | | | 1,313,519 | |
| United Rentals, Inc. (a) | | | 14,976 | | | | 2,613,312 | |
| | | | | | | | 7,720,736 | |
| Wireless Telecommunication Services - 0.35% |
| T-Mobile US, Inc. (a) | | | 16,799 | | | | 1,921,134 | |
| TOTAL COMMON STOCKS | | | | | | | | |
| (Cost $213,914,213) | | | | | | $ | 323,652,378 | |
| | | Shares | | | Fair Value | |
| | | | | | | |
| INVESTMENT COMPANIES - 18.85% |
| |
| Exchange Traded Funds - 18.85% | | | | | | | | |
| Invesco CurrencyShares Japanese Yen Trust (a)(g) | | | 194,533 | | | $ | 17,434,047 | |
| iShares Core MSCI Emerging Markets ETF | | | 244,439 | | | | 12,906,379 | |
| iShares Floating Rate Bond ETF | | | 107,920 | | | | 5,473,702 | |
| iShares Gold Trust (a) | | | 370,369 | | | | 6,662,939 | |
| iShares International Treasury Bond ETF | | | 218,724 | | | | 11,563,938 | |
| iShares MBS ETF | | | 121,040 | | | | 13,362,816 | |
| iShares 5-10 Year Investment Grade Corporate Bond ETF | | | 100,004 | | | | 6,081,243 | |
| SPDR Bloomberg Barclays High Yield Bond ETF | | | 25,893 | | | | 2,699,863 | |
| SPDR Bloomberg Barclays Short Term High Yield Bond ETF | | | 210,607 | | | | 5,448,403 | |
| SPDR Gold Shares (a) | | | 119,029 | | | | 21,082,417 | |
| TOTAL INVESTMENT COMPANIES (Cost $88,873,443) | | | | | | $ | 102,715,747 | |
| | | Principal
Amount | | | Fair Value | |
| CORPORATE BONDS - 3.26% | | | | | | | | |
| | | | | | | | | |
| Banks - 1.05% | | | | | | | | |
| JPMorgan Chase & Co. | | | | | | | | |
| 1.500%, 01/27/2025 | | $ | 4,600,000 | | | $ | 5,704,516 | |
| Food Products - 0.52% | | | | | | | | |
| Kraft Heinz Foods Co. | | | | | | | | |
| 3.950%, 07/15/2025 | | | 2,598,000 | | | | 2,818,955 | |
| Software - 0.92% | | | | | | | | |
| Oracle Corp. | | | | | | | | |
| 2.950%, 05/15/2025 | | | 4,620,000 | | | | 5,031,607 | |
| See Notes to the Financial Statements. | Leuthold Funds - 2020 Annual Report | 27 |
Leuthold Core Investment Fund
Schedule of Investments (continued)
September 30, 2020
| | | Principal
Amount | | | Fair Value | |
| CORPORATE BONDS - 3.26% (continued) |
| |
| Technology Hardware, Storage & Peripherals - 0.77% | | | | | | | | |
| Apple, Inc. | | | | | | | | |
| 1.000%, 11/10/2022 | | $ | 3,500,000 | | | $ | 4,210,833 | |
| TOTAL CORPORATE BONDS | | | | | | | | |
| (Cost $16,520,885) | | | | | | $ | 17,765,911 | |
| | | | | | | | | |
| UNITED STATES TREASURY OBLIGATIONS - 1.00% | | | | | | | | |
| | | | | | | | | |
| United States Treasury Notes - 1.00% | | | | | | | | |
| 0.625%, 08/15/2030 | | $ | 5,490,000 | | | $ | 5,462,550 | |
| TOTAL UNITED STATES TREASURY OBLIGATIONS (Cost $5,467,697) | | | | | | $ | 5,462,550 | |
| | | | | | | | | |
| FOREIGN GOVERNMENT BONDS - 3.23% | | | | | | | | |
Canadian Government Bond
2.250%, 06/01/2025 (b) | | | | | | | | |
| CAD | | | 8,100,000 | | | $ | 6,619,486 | |
French Republic Government Bond OAT
1.250%, 05/25/2034 (b) | | | | | | | | |
| EUR | | | 7,930,000 | | | | 10,985,390 | |
| TOTAL FOREIGN GOVERNMENT BONDS | | | | | | | | |
| (Cost $15,823,962) | | | | | | $ | 17,604,876 | |
| | | Shares | | | Fair Value | |
| SHORT-TERM INVESTMENTS - 11.28% |
| |
| Money Market Funds - 11.28% | | | |
| Fidelity Institutional Money Market Funds - Government Portfolio - Class I, 0.010% (c)(f) | | | 61,455,619 | | | $ | 61,455,619 | |
| TOTAL SHORT-TERM INVESTMENTS | | | | | | | | |
| (Cost $61,455,619) | | | | | | $ | 61,455,619 | |
| | | | | | | | | |
| Total Investments | | | | | | | | |
| (Cost $402,055,819) - 97.01% | | | | | | $ | 528,657,081 | |
| Other Assets in Excess of Liabilities - 2.99% | | | | | | | 16,294,906 | |
| TOTAL NET ASSETS - 100.00% | | | | | | $ | 544,951,987 | |
Percentages are stated as a percent of net assets.
ADR American Depositary Receipt
CAD Canadian Dollar
EUR Euro
| (a) | Non-income producing security. |
| (b) | Foreign issued security. |
| (c) | The rate quoted is the annualized seven-day effective yield as of September 30, 2020. |
| (d) | Illiquid security. The fair value of this security totals $6,488, which represents an amount that rounds to 0.00% of total net assets. |
| (e) | This security is currently being fair valued in accordance with procedures established by the Board of Directors of Leuthold Funds, Inc. and is deemed a Level 3 security as it is valued usinig significant unobservable inputs. |
| (f) | All or a portion of the assets have been committed as collateral for open securites sold short. |
| (g) | Affiliated security. At September 30, 2020, the market value of this security totals $17,434,047, which represents 3.20% of total net assets. |
| (h) | Rounds to less than 0.005%. |
The Global Industry Classification Standard (GICS®) was developed by and/or is the exclusive property of MSCI, Inc. and Standard & Poor’s Financial Services LLC (“S&P”). GICS® is a service mark of MSCI, Inc. and S&P and has been licensed for use by U.S. Bancorp Fund Services, LLC.
| 28 | Leuthold Funds - 2020 Annual Report | See Notes to the Financial Statements. |
Leuthold Core Investment Fund
Schedule of Securities Sold Short - (a)
September 30, 2020
| | | Shares | | | Fair Value | |
| COMMON STOCKS - 5.03% | | | |
| | | | |
| Aerospace & Defense - 0.32% | | | | | | | | |
| The Boeing Co. | | | 2,739 | | | $ | 452,647 | |
| Cubic Corp. | | | 4,288 | | | | 249,433 | |
| HEICO Corp. | | | 4,008 | | | | 419,477 | |
| TransDigm Group, Inc. | | | 1,292 | | | | 613,855 | |
| | | | | | | | 1,735,412 | |
| Airlines - 0.10% | | | | | | | | |
| Delta Air Lines, Inc. | | | 17,860 | | | | 546,159 | |
| Auto Components - 0.07% | | | | | | | | |
| Autoliv, Inc. (b) | | | 5,457 | | | | 397,706 | |
| Beverages - 0.10% | | | | | | | | |
| The Coca-Cola Co. | | | 10,808 | | | | 533,591 | |
| Biotechnology - 0.11% | | | | | | | | |
| Exact Sciences Corp. | | | 5,993 | | | | 610,986 | |
| Capital Markets - 0.04% | | | | | | | | |
| Moelis & Co. - Class A | | | 5,447 | | | | 191,408 | |
| Chemicals - 0.20% | | | | | | | | |
| DuPont de Nemours, Inc. | | | 9,841 | | | | 545,979 | |
| Livent Corp. | | | 22,978 | | | | 206,112 | |
| Sociedad Quimica y Minera de Chile SA - ADR | | | 10,945 | | | | 354,837 | |
| | | | | | | | 1,106,928 | |
| Commercial Services & Supplies - 0.03% |
| US Ecology, Inc. | | | 4,684 | | | | 153,026 | |
| Communications Equipment - 0.03% | | | | | | | | |
| ViaSat, Inc. | | | 4,736 | | | | 162,871 | |
| Construction & Engineering - 0.07% | | | | | | | | |
| WillScot Mobile Mini Holdings Corp. | | | 21,470 | | | | 358,120 | |
| | | Shares | | | Fair Value | |
| | | | | | | |
| Energy Equipment & Services - 0.09% | | | | | | | | |
| Dril-Quip, Inc. | | | 5,262 | | | $ | 130,287 | |
| Halliburton Co. | | | 31,978 | | | | 385,335 | |
| | | | | | | | 515,622 | |
| Entertainment - 0.25% | | | | | | | | |
| Cinemark Holdings, Inc. | | | 12,895 | | | | 128,950 | |
| Live Nation Entertainment, Inc. | | | 10,281 | | | | 553,940 | |
| Madison Square Garden Sports Corp. - Class A | | | 1,271 | | | | 191,260 | |
| The Walt Disney Co. | | | 4,062 | | | | 504,013 | |
| | | | | | | | 1,378,163 | |
| Food & Staples Retailing - 0.17% | | | | | | | | |
| Performance Food Group Co. | | | 9,937 | | | | 344,019 | |
| Sysco Corp. | | | 8,936 | | | | 555,998 | |
| | | | | | | | 900,017 | |
| Food Products - 0.08% | | | | | | | | |
| Beyond Meat, Inc. | | | 2,583 | | | | 428,933 | |
| Gas Utilities - 0.03% | | | | | | | | |
| New Jersey Resources Corp. | | | 6,193 | | | | 167,335 | |
| Health Care Equipment & Supplies - 0.49% | | | | | | | | |
| Becton Dickinson and Co. | | | 2,148 | | | | 499,796 | |
| Boston Scientific Corp. | | | 12,095 | | | | 462,150 | |
| The Cooper Companies, Inc. | | | 1,598 | | | | 538,718 | |
| Glaukos Corp. | | | 6,588 | | | | 326,238 | |
| Mesa Laboratories, Inc. | | | 1,055 | | | | 268,772 | |
| Stryker Corp. | | | 2,776 | | | | 578,435 | |
| | | | | | | | 2,674,109 | |
| See Notes to the Financial Statements. | Leuthold Funds - 2020 Annual Report | 29 |
Leuthold Core Investment Fund
Schedule of Securities Sold Short - (a) (continued)
September 30, 2020
| | | Shares | | | Fair Value | |
| COMMON STOCKS - 5.03% (continued) |
| |
| Hotels, Restaurants & Leisure - 0.68% | | | | | | | | |
| Aramark | | | 12,090 | | | $ | 319,780 | |
| Choice Hotels International, Inc. | | | 3,456 | | | | 297,078 | |
| Churchill Downs, Inc. | | | 2,034 | | | | 333,210 | |
| MGM Resorts International | | | 16,655 | | | | 362,246 | |
| Norwegian Cruise Line Holdings, Ltd. | | | 20,173 | | | | 345,160 | |
| Planet Fitness, Inc. - Class A | | | 5,905 | | | | 363,866 | |
| Restaurant Brands International, Inc. (b) | | | 9,203 | | | | 529,265 | |
| Shake Shack, Inc. - Class A | | | 2,989 | | | | 192,731 | |
| Starbucks Corp. | | | 7,412 | | | | 636,839 | |
| Vail Resorts, Inc. | | | 1,545 | | | | 330,584 | |
| | | | | | | | 3,710,759 | |
| Insurance - 0.12% | | | | | | | | |
| American Financial Group, Inc. | | | 6,314 | | | | 422,912 | |
| Erie Indemnity Co. - Class A | | | 1,179 | | | | 247,920 | |
| | | | | | | | 670,832 | |
| Internet & Direct Marketing Retail - 0.04% | | | | | | | | |
| The RealReal, Inc. | | | 16,468 | | | | 238,292 | |
| IT Services - 0.20% | | | | | | | | |
| Broadridge Financial Solutions, Inc. | | | 4,566 | | | | 602,712 | |
| Fidelity National Information Services, Inc. | | | 3,291 | | | | 484,468 | |
| | | | | | | | 1,087,180 | |
| Machinery - 0.11% | | | | | | | | |
| Ingersoll Rand, Inc. | | | 17,056 | | | | 607,194 | |
| Multiline Retail - 0.03% | | | | | | | | |
| Kohl's Corp. | | | 8,154 | | | | 151,094 | |
| Multi-Utilities - 0.10% | | | | | | | | |
| NiSource, Inc. | | | 24,752 | | | | 544,544 | |
| | | Shares | | | Fair Value | |
| | | | | | | |
| Oil, Gas & Consumable Fuels - 0.18% | | | | | | | | |
| Hess Corp. | | | 11,749 | | | $ | 480,887 | |
| Occidental Petroleum Corp. | | | 35,386 | | | | 354,214 | |
| PDC Energy, Inc. | | | 11,743 | | | | 145,554 | |
| | | | | | | | 980,655 | |
| Personal Products - 0.09% | | | | | | | | |
| The Estee Lauder Companies, Inc. - Class A | | | 2,332 | | | | 508,959 | |
| Pharmaceuticals - 0.11% | | | | | | | | |
| Elanco Animal Health, Inc. | | | 21,442 | | | | 598,875 | |
| Real Estate Investment Trusts (REITs) - 0.09% | | | | | | | | |
| Park Hotels & Resorts, Inc. | | | 18,106 | | | | 180,879 | |
| VEREIT, Inc. | | | 48,514 | | | | 315,341 | |
| | | | | | | | 496,220 | |
| Real Estate Management &Development - 0.03% | | | | | | | | |
| The Howard Hughes Corp. | | | 2,933 | | | | 168,941 | |
| Road & Rail - 0.10% | | | | | | | | |
| Lyft, Inc. - Class A | | | 19,348 | | | | 533,037 | |
| Semiconductors & Semiconductor Equipment - 0.07% | | | | | | | | |
| Universal Display Corp. | | | 2,051 | | | | 370,698 | |
| Software - 0.25% | | | | | | | | |
| 8x8, Inc. | | | 11,887 | | | | 184,843 | |
| Anaplan, Inc. | | | 6,036 | | | | 377,733 | |
| Medallia, Inc. | | | 12,349 | | | | 338,609 | |
| PROS Holdings, Inc. | | | 4,898 | | | | 156,442 | |
| Q2 Holdings, Inc. | | | 3,391 | | | | 309,463 | |
| | | | | | | | 1,367,090 | |
| 30 | Leuthold Funds - 2020 Annual Report | See Notes to the Financial Statements. |
Leuthold Core Investment Fund
Schedule of Securities Sold Short - (a) (continued)
September 30, 2020
| | | Shares | | | Fair Value | |
| COMMON STOCKS - 5.03% (continued) |
| |
| Specialty Retail - 0.27% | | | | | | | | |
| Five Below, Inc. | | | 2,917 | | | $ | 370,459 | |
| The Gap, Inc. | | | 28,941 | | | | 492,865 | |
| Ross Stores, Inc. | | | 6,475 | | | | 604,247 | |
| | | | | | | | 1,467,571 | |
| Technology Hardware, Storage & Peripherals - 0.09% | | | | | | | | |
| Western Digital Corp. | | | 13,059 | | | | 477,306 | |
| Textiles, Apparel & Luxury Goods - 0.29% |
| Canada Goose Holdings, Inc. (b) | | | 7,345 | | | | 236,289 | |
| Gildan Activewear, Inc. (b) | | | 11,463 | | | | 225,477 | |
| Lululemon Athletica, Inc. (b) | | | 1,570 | | | | 517,111 | |
| VF Corp. | | | 8,777 | | | | 616,584 | |
| | | | | | | | 1,595,461 | |
| TOTAL COMMON STOCKS | | | | | | | | |
| (Proceeds $26,764,490) | | | | | | $ | 27,435,094 | |
| | | | | | | | | |
| INVESTMENT COMPANIES - 5.58% | | | | | | | | |
| | | | | | | | | |
| Exchange Traded Funds - 5.58% | | | | | | | | |
| Energy Select Sector SPDR Fund | | | 19,173 | | | $ | 574,231 | |
| Financial Select Sector SPDR Fund | | | 27,415 | | | | 659,879 | |
| Invesco QQQ Trust Series 1 | | | 7,999 | | | | 2,222,442 | |
| iShares S&P 100 ETF | | | 14,195 | | | | 2,210,588 | |
| SPDR S&P 500 ETF Trust | | | 70,333 | | | | 23,553,818 | |
| SPDR S&P Bank ETF | | | 22,219 | | | | 654,350 | |
| Utilities Select Sector SPDR Fund | | | 8,916 | | | | 529,432 | |
| TOTAL INVESTMENT COMPANIES | | | | | | | | |
| (Cost $27,480,877) | | | | | | $ | 30,404,740 | |
| | | | | | | | | |
| TOTAL SECURITIES SOLD SHORT | | | | | | | | |
| (Proceeds $54,245,367) - 10.61% | | | | | | $ | 57,839,834 | |
Percentages are stated as a percent of net assets.
ADR American Depositary Receipt
| (a) | Non-income producing security. |
| (b) | Foreign issued security. |
The Global Industry Classification Standard (GICS®) was developed by and/or is the exclusive property of MSCI, Inc. and Standard & Poor’s Financial Services LLC (“S&P”). GICS® is a service mark of MSCI, Inc. and S&P and has been licensed for use by U.S. Bancorp Fund Services, LLC.
| See Notes to the Financial Statements. | Leuthold Funds - 2020 Annual Report | 31 |
Leuthold Global Fund
Schedule of Investments
September 30, 2020
| | | Shares | | | Fair Value | |
| COMMON STOCKS - 60.21% | | | | | | | | |
| | | | | | | | | |
| Capital Markets - 3.81% | | | | | | | | |
| Evercore, Inc. - Class A | | | 1,123 | | | $ | 73,512 | |
| The Goldman Sachs Group, Inc. | | | 1,083 | | | | 217,651 | |
| Haitong Securities Co., Ltd. - H Shares (a)(b) | | | 86,800 | | | | 74,229 | |
| LPL Financial Holdings, Inc. | | | 1,461 | | | | 112,015 | |
| Meritz Securities Co., Ltd. (b) | | | 18,375 | | | | 50,922 | |
| Morgan Stanley | | | 5,306 | | | | 256,545 | |
| Raymond James Financial, Inc. | | | 1,425 | | | | 103,683 | |
| Stifel Financial Corp. | | | 1,836 | | | | 92,828 | |
| | | | | | | | 981,385 | |
| Communications Equipment - 0.59% | | | | | | | | |
| Ciena Corp. (a) | | | 1,459 | | | | 57,908 | |
| Juniper Networks, Inc. | | | 4,401 | | | | 94,621 | |
| | | | | | | | 152,529 | |
| Construction Materials - 3.21% | | | | | | | | |
| Asia Cement Corp. (b) | | | 53,000 | | | | 76,365 | |
| Buzzi Unicem SpA (b) | | | 3,165 | | | | 73,535 | |
| China National Building Material Co., Ltd. - H Shares (b) | | | 84,000 | | | | 107,053 | |
| China Resources Cement Holdings, Ltd. (b) | | | 58,000 | | | | 79,736 | |
| CRH PLC - ADR | | | 3,362 | | | | 121,335 | |
| HeidelbergCement AG (b) | | | 1,574 | | | | 96,181 | |
| LafargeHolcim, Ltd. (b) | | | 2,326 | | | | 105,879 | |
| Martin Marietta Materials, Inc. | | | 429 | | | | 100,969 | |
| Taiheiyo Cement Corp. (b) | | | 2,600 | | | | 66,387 | |
| | | | | | | | 827,440 | |
| | | Shares | | | Fair Value | |
| Entertainment - 4.44% | | | | | | |
| Activision Blizzard, Inc. | | | 3,002 | | | $ | 243,012 | |
| Electronic Arts, Inc. (a) | | | 1,563 | | | | 203,831 | |
| Konami Holdings Corp. (b) | | | 2,600 | | | | 112,472 | |
| NetEase, Inc. - ADR | | | 581 | | | | 264,163 | |
| Nexon Co., Ltd. (b) | | | 3,800 | | | | 94,786 | |
| Nintendo Co., Ltd. (b) | | | 400 | | | | 226,677 | |
| | | | | | | | 1,144,941 | |
| Food & Staples Retailing - 3.95% | | | | | | | | |
| Alimentation Couche-Tard, Inc. - Class B (b) | | | 4,913 | | | | 171,091 | |
| Koninklijke Ahold Delhaize NV (b) | | | 6,069 | | | | 179,388 | |
| The Kroger Co. | | | 4,399 | | | | 149,170 | |
| Seven & i Holdings Co., Ltd. (b) | | | 3,900 | | | | 121,173 | |
| Wal-Mart de Mexico SAB de CV (b) | | | 53,900 | | | | 128,976 | |
| Walmart, Inc. | | | 1,917 | | | | 268,208 | |
| | | | | | | | 1,018,006 | |
| Health Care Providers & Services - 6.30% | | | | | | | | |
| Anthem, Inc. | | | 832 | | | | 223,467 | |
| Centene Corp. (a) | | | 2,272 | | | | 132,526 | |
| Cigna Corp. | | | 512 | | | | 86,738 | |
| CVS Health Corp. | | | 1,898 | | | | 110,843 | |
| Fresenius SE & Co KGaA (b) | | | 2,202 | | | | 100,135 | |
| Henry Schein, Inc. (a) | | | 1,371 | | | | 80,587 | |
| Humana, Inc. | | | 563 | | | | 233,020 | |
| Laboratory Corp. of America Holdings (a) | | | 694 | | | | 130,659 | |
| McKesson Corp. | | | 789 | | | | 117,506 | |
| Medipal Holdings Corp. (b) | | | 3,300 | | | | 66,173 | |
| Molina Healthcare, Inc. (a) | | | 663 | | | | 121,355 | |
| Quest Diagnostics, Inc. | | | 1,132 | | | | 129,603 | |
| Sonic Healthcare, Ltd. (b) | | | 3,873 | | | | 91,973 | |
| | | | | | | | 1,624,585 | |
| 32 | Leuthold Funds - 2020 Annual Report | See Notes to the Financial Statements. |
Leuthold Global Fund
Schedule of Investments (continued)
September 30, 2020
| | | Shares | | | Fair Value | |
| COMMON STOCKS - 60.21% (continued) | | | | | | | | |
| | | | | | | | | |
| Household Durables - 5.33% | | | | | | | | |
| Barratt Developments PLC (b) | | | 13,990 | | | $ | 85,797 | |
| Haier Electronics Group Co., Ltd. (b) | | | 22,000 | | | | 79,982 | |
| Haseko Corp. (b) | | | 9,500 | | | | 125,134 | |
| KB Home | | | 4,254 | | | | 163,311 | |
| Lennar Corp. - Class A | | | 2,773 | | | | 226,499 | |
| Meritage Homes Corp. (a) | | | 2,624 | | | | 289,663 | |
| Redrow PLC (b) | | | 14,153 | | | | 73,639 | |
| Toll Brothers, Inc. | | | 3,738 | | | | 181,891 | |
| TRI Pointe Group, Inc. (a) | | | 8,253 | | | | 149,709 | |
| | | | | | | | 1,375,625 | |
| Insurance - 1.31% | | | | | | | | |
| Legal & General Group PLC (b) | | | 34,931 | | | | 85,213 | |
| Medibank Pvt, Ltd. (b) | | | 41,675 | | | | 75,198 | |
| MetLife, Inc. | | | 4,283 | | | | 159,199 | |
| Old Mutual, Ltd. (b) | | | 28,212 | | | | 17,314 | |
| | | | | | | | 336,924 | |
| Interactive Media & Services - 3.40% | | | | | | | | |
| Alphabet, Inc. - Class A (a) | | | 211 | | | | 309,241 | |
| Auto Trader Group PLC (b) | | | 11,330 | | | | 82,261 | |
| Facebook, Inc. - Class A (a) | | | 864 | | | | 226,282 | |
| Twitter, Inc. (a) | | | 2,718 | | | | 120,951 | |
| Yandex NV - Class A (a)(b) | | | 2,119 | | | | 138,265 | |
| | | | | | | | 877,000 | |
| | | Shares | | | Fair Value | |
| IT Services - 4.07% | | | | | | | | |
| Accenture PLC - Class A (b) | | | 988 | | | $ | 223,278 | |
| Atos SE (b) | | | 1,313 | | | | 105,508 | |
| Bechtle AG (b) | | | 905 | | | | 183,122 | |
| CACI International, Inc. (a) | | | 656 | | | | 139,833 | |
| ManTech International Corp. - Class A | | | 1,397 | | | | 96,226 | |
| NS Solutions Corp. (b) | | | 3,100 | | | | 95,520 | |
| TIS, Inc. (b) | | | 4,900 | | | | 104,076 | |
| Wipro, Ltd. - ADR | | | 21,699 | | | | 101,985 | |
| | | | | | | | 1,049,548 | |
| Life Sciences Tools & Services - 3.12% | | | | | | | | |
| Charles River Laboratories International, Inc. (a) | | | 603 | | | | 136,549 | |
| Eurofins Scientific SE (b) | | | 136 | | | | 107,735 | |
| Gerresheimer AG (b) | | | 914 | | | | 102,243 | |
| Medpace Holdings, Inc. (a) | | | 969 | | | | 108,286 | |
| PRA Health Sciences, Inc. (a) | | | 928 | | | | 94,136 | |
| Siegfried Holding AG (b) | | | 139 | | | | 95,063 | |
| Syneos Health, Inc. (a) | | | 1,684 | | | | 89,522 | |
| Waters Corp. (a) | | | 368 | | | | 72,010 | |
| | | | | | | | 805,544 | |
| Metals & Mining - 3.54% | | | | | | | | |
| Anglo American PLC (b) | | | 4,640 | | | | 112,259 | |
| BHP Group, Ltd. - ADR | | | 3,632 | | | | 187,811 | |
| Boliden AB (b) | | | 2,739 | | | | 81,268 | |
| Grupo Mexico SAB de CV (b) | | | 45,000 | | | | 114,538 | |
| KAZ Minerals PLC (b) | | | 10,661 | | | | 72,085 | |
| Korea Zinc Co., Ltd. (b) | | | 229 | | | | 73,908 | |
| Rio Tinto PLC - ADR | | | 3,157 | | | | 190,651 | |
| Sumitomo Metal Mining Co., Ltd. (b) | | | 2,600 | | | | 80,637 | |
| | | | | | | | 913,157 | |
| See Notes to the Financial Statements. | Leuthold Funds - 2020 Annual Report | 33 |
Leuthold Global Fund
Schedule of Investments (continued)
September 30, 2020
| | | Shares | | | Fair Value | |
| COMMON STOCKS - 60.21% (continued) | | | | | | | | |
| | | | | | | | | |
| Paper & Forest Products - 0.19% | | | | | | | | |
| China Forestry Holdings Co., Ltd. (a)(b)(d)(e) | | | 2,484,000 | | | $ | 48,077 | |
| Pharmaceuticals - 3.99% | | | | | | | | |
| Bristol-Myers Squibb Co. | | | 2,815 | | | | 169,716 | |
| GlaxoSmithKline PLC - ADR | | | 4,395 | | | | 165,428 | |
| Merck & Co., Inc. | | | 1,850 | | | | 153,458 | |
| Novartis AG - ADR | | | 2,201 | | | | 191,399 | |
| Novo Nordisk A/S - Class B - ADR | | | 2,844 | | | | 197,459 | |
| Pfizer, Inc. | | | 4,162 | | | | 152,745 | |
| | | | | | | | 1,030,205 | |
| Semiconductors & Semiconductor Equipment - 7.39% | | | | | | | | |
| Applied Materials, Inc. | | | 2,516 | | | | 149,576 | |
| ASM International NV (b) | | | 991 | | | | 142,054 | |
| Diodes, Inc. (a) | | | 1,865 | | | | 105,279 | |
| Globalwafers Co., Ltd. (b) | | | 8,000 | | | | 107,042 | |
| Intel Corp. | | | 3,683 | | | | 190,706 | |
| Lam Research Corp. | | | 729 | | | | 241,846 | |
| Marvell Technology Group, Ltd. | | | 3,799 | | | | 150,820 | |
| SCREEN Holdings Co., Ltd. (b) | | | 1,200 | | | | 64,060 | |
| Sino-American Silicon Products, Inc. (b) | | | 32,000 | | | | 107,801 | |
| SK Hynix, Inc. (b) | | | 1,768 | | | | 126,735 | |
| Skyworks Solutions, Inc. | | | 1,342 | | | | 195,261 | |
| SUMCO Corp. (b) | | | 7,700 | | | | 108,640 | |
| Taiwan Surface Mounting Technology Corp. (b) | | | 24,000 | | | | 86,965 | |
| UniTest, Inc. (b) | | | 5,899 | | | | 127,607 | |
| | | | | | | | 1,904,392 | |
| | | Shares | | | Fair Value | |
| Software - 2.65% | | | | | | |
| Fuji Soft, Inc. (b) | | | 1,600 | | | $ | 82,505 | |
| Netcompany Group A/S (a)(b) | | | 1,154 | | | | 95,708 | |
| Nuance Communications, Inc. (a) | | | 3,312 | | | | 109,925 | |
| Open Text Corp. (b) | | | 2,053 | | | | 86,719 | |
| SAP SE - ADR | | | 928 | | | | 144,592 | |
| SS&C Technologies Holdings, Inc. | | | 1,208 | | | | 73,108 | |
| Trend Micro, Inc. (b) | | | 1,500 | | | | 91,408 | |
| | | | | | | | 683,965 | |
| Specialty Retail - 0.30% | | | | | | | | |
| Penske Automotive Group, Inc. | | | 1,638 | | | | 78,067 | |
| Trading Companies & Distributors - 2.62% | | | | | | | | |
| Air Lease Corp. | | | 2,093 | | | | 61,576 | |
| GMS, Inc. (a) | | | 3,002 | | | | 72,348 | |
| Indutrade AB (b) | | | 2,914 | | | | 155,984 | |
| ITOCHU Corp. (b) | | | 4,300 | | | | 110,105 | |
| Mitsui & Co., Ltd. (b) | | | 5,300 | | | | 91,069 | |
| Triton International, Ltd. (b) | | | 2,568 | | | | 104,441 | |
| WESCO International, Inc. (a) | | | 1,797 | | | | 79,104 | |
| | | | | | | | 674,627 | |
| TOTAL COMMON STOCKS | | | | | | | | |
| (Cost $14,306,441) | | | | | | $ | 15,526,017 | |
| | | | | | | | | |
| INVESTMENT COMPANIES - 17.89% | | | | | | | | |
| | | | | | | | | |
| Exchange Traded Funds - 17.89% | | | | | | | | |
| Invesco CurrencyShares Japanese Yen Trust (a) | | | 11,391 | | | $ | 1,020,861 | |
| iShares Floating Rate Bond ETF | | | 5,022 | | | | 254,716 | |
| iShares Gold Trust (a) | | | 17,034 | | | | 306,442 | |
| iShares International Treasury Bond ETF | | | 3,376 | | | | 178,489 | |
| iShares MBS ETF | | | 6,215 | | | | 686,136 | |
| iShares 5-10 Year Investment Grade Corporate Bond ETF | | | 13,461 | | | | 818,563 | |
| 34 | Leuthold Funds - 2020 Annual Report | See Notes to the Financial Statements. |
Leuthold Global Fund
Schedule of Investments (continued)
September 30, 2020
| | | Shares | | | Fair Value | |
| INVESTMENT COMPANIES - 17.89% (continued) | | | | | | | | |
| | | | | | | | | |
| Exchange Traded Funds - 17.89% (continued) | | | | | | | | |
| SPDR Bloomberg Barclays High Yield Bond ETF | | | 1,215 | | | $ | 126,688 | |
| SPDR Bloomberg Barclays Short Term High Yield Bond ETF | | | 9,801 | | | | 253,552 | |
| SPDR Gold Shares (a) | | | 5,474 | | | | 969,555 | |
| TOTAL INVESTMENT COMPANIES | | | | | | | | |
| (Cost $4,131,939) | | | | | | $ | 4,615,002 | |
| | | Principal
Amount | | | Fair Value | |
| CORPORATE BONDS - 2.26% | | | | | | | | |
| | | | | | | | | |
| Banks - 2.26% | | | | | | | | |
JPMorgan Chase & Co.
1.500%, 01/27/2025 | | $ | 470,000 | | | $ | 582,853 | |
| TOTAL CORPORATE BONDS | | | | | | | | |
| (Cost $518,795) | | | | | | $ | 582,853 | |
| | | | | | | | | |
| UNITED STATES TREASURY OBLIGATIONS - 1.16% | | | | | | | | |
| | | | | | | | | |
| United States Treasury Notes - 1.16% | | | | | | | | |
| 0.625%, 08/15/2030 | | $ | 300,000 | | | $ | 298,500 | |
| TOTAL UNITED STATES TREASURY OBLIGATIONS (Cost $298,781) | | | | | | $ | 298,500 | |
| | | | | | | | | |
| FOREIGN GOVERNMENT BONDS - 4.48% | | | | | | | | |
Canadian Government Bond
2.250%, 06/01/2025 (b) | | | | | | | | |
| CAD | | | 610,000 | | | $ | 498,504 | |
French Republic Government Bond OAT
1.250%, 05/25/2034 (b) | | | | | | | | |
| EUR | | | 474,000 | | | | 656,630 | |
| TOTAL FOREIGN GOVERNMENT BONDS | | | | | | | | |
| (Cost $1,042,289) | | | | | | $ | 1,155,134 | |
| | | Shares | | | Fair Value | |
| SHORT-TERM INVESTMENTS - 10.05% | | | | | | | | |
| | | | | | | | | |
| Money Market Funds - 10.05% | | | | | | | | |
| Fidelity Institutional Money Market Funds - Government Portfolio - Class I, 0.010% (c)(f) | | | 2,590,700 | | | $ | 2,590,700 | |
| TOTAL SHORT-TERM INVESTMENTS | | | | | | | | |
| (Cost $2,590,700) | | | | | | $ | 2,590,700 | |
| | | | | | | | | |
| Total Investments | | | | | | | | |
| (Cost $22,888,945) - 96.05% | | | | | | $ | 24,768,206 | |
| Other Assets in Excess of Liabilities - 3.95% | | | | | | | 1,018,771 | |
| TOTAL NET ASSETS - 100.00% | | | | | | $ | 25,786,977 | |
Percentages are stated as a percent of net assets.
ADR American Depositary Receipt
CAD Canadian Dollar
EUR Euro
| (a) | Non-income producing security. |
| (b) | Foreign issued security. |
| (c) | The rate quoted is the annualized seven-day effective yield as of September 30, 2020. |
| (d) | Illiquid security. The fair value of these securities total $48,077 which represents 0.19% of total net assets. |
| (e) | This security is currently being fair valued in accordance with procedures established by the Board of Directors of Leuthold Funds, Inc. and is deemed a Level 3 security as it is valued using significant unobservable inputs. |
| (f) | All or a portion of the assets have been committed as collateral for open securities sold short. |
The Global Industry Classification Standard (GICS®) was developed by and/or is the exclusive property of MSCI, Inc. and Standard & Poor’s Financial Services LLC (“S&P”). GICS® is a service mark of MSCI, Inc. and S&P and has been licensed for use by U.S. Bancorp Fund Services, LLC.
| See Notes to the Financial Statements. | Leuthold Funds - 2020 Annual Report | 35 |
Leuthold Global Fund
Schedule of Investments (continued)
September 30, 2020
| | | Fair
Value | | | Percentage
of Total
Investments | |
| CURRENCY EXPOSURE | | | | | | | | |
| Australian Dollar | | $ | 167,171 | | | | 0.68 | % |
| British Pound | | | 528,568 | | | | 2.13 | |
| Canadian Dollar | | | 669,595 | | | | 2.70 | |
| Danish Krone | | | 95,708 | | | | 0.39 | |
| Euro | | | 2,329,384 | | | | 9.41 | |
| Hong Kong Dollar | | | 389,077 | | | | 1.57 | |
| Japanese Yen | | | 1,640,822 | | | | 6.62 | |
| Mexican Peso | | | 243,514 | | | | 0.98 | |
| South Korean Won | | | 379,172 | | | | 1.53 | |
| Swedish Krona | | | 237,252 | | | | 0.96 | |
| Swiss Franc | | | 200,942 | | | | 0.81 | |
| Taiwan New Dollar | | | 378,173 | | | | 1.53 | |
| US Dollar | | | 17,508,828 | | | | 70.69 | |
| Total Investments | | $ | 24,768,206 | | | | 100.00 | % |
| | | Fair
Value | | | Percentage
of Total
Investments | |
| PORTFOLIO DIVERSIFICATION | | | | | | | | |
| Australia | | $ | 354,982 | | | | 1.43 | % |
| Bermuda | | | 104,441 | | | | 0.42 | |
| Canada | | | 756,314 | | | | 3.05 | |
| China | | | 493,522 | | | | 1.99 | |
| Denmark | | | 293,167 | | | | 1.18 | |
| France | | | 762,138 | | | | 3.08 | |
| Germany | | | 626,273 | | | | 2.53 | |
| Hong Kong | | | 159,718 | | | | 0.65 | |
| India | | | 101,985 | | | | 0.41 | |
| Ireland | | | 344,613 | | | | 1.39 | |
| Italy | | | 73,535 | | | | 0.30 | |
| Japan | | | 1,640,822 | | | | 6.62 | |
| Luxembourg | | | 107,735 | | | | 0.44 | |
| Mexico | | | 243,514 | | | | 0.98 | |
| Netherlands | | | 321,442 | | | | 1.30 | |
| Russia | | | 138,265 | | | | 0.56 | |
| South Africa | | | 17,314 | | | | 0.07 | |
| South Korea | | | 379,172 | | | | 1.53 | |
| Sweden | | | 237,252 | | | | 0.96 | |
| Switzerland | | | 392,341 | | | | 1.58 | |
| Taiwan | | | 378,173 | | | | 1.53 | |
| United Kingdom | | | 867,333 | | | | 3.50 | |
| United States | | | 15,974,155 | | | | 64.50 | |
| Total Investments | | $ | 24,768,206 | | | | 100.00 | % |
| 36 | Leuthold Funds - 2020 Annual Report | See Notes to the Financial Statements. |
Leuthold Global Fund
Schedule of Securities Sold Short - (a)
September 30, 2020
| | | Shares | | | Fair Value | |
| COMMON STOCKS - 2.94% | | | | | | | | |
| | | | | | | | | |
| Aerospace & Defense - 0.19% | | | | | | | | |
| The Boeing Co. | | | 76 | | | $ | 12,560 | |
| Cubic Corp. | | | 118 | | | | 6,864 | |
| HEICO Corp. | | | 111 | | | | 11,617 | |
| TransDigm Group, Inc. | | | 36 | | | | 17,104 | |
| | | | | | | | 48,145 | |
| Airlines - 0.06% | | | | | | | | |
| Delta Air Lines, Inc. | | | 493 | | | | 15,076 | |
| Auto Components - 0.04% | | | | | | | | |
| Autoliv, Inc. (b) | | | 151 | | | | 11,005 | |
| Beverages - 0.06% | | | | | | | | |
| The Coca-Cola Co. | | | 298 | | | | 14,712 | |
| Biotechnology - 0.06% | | | | | | | | |
| Exact Sciences Corp. | | | 165 | | | | 16,822 | |
| Capital Markets - 0.02% | | | | | | | | |
| Moelis & Co. - Class A | | | 150 | | | | 5,271 | |
| Chemicals - 0.12% | | | | | | | | |
| DuPont de Nemours, Inc. | | | 272 | | | | 15,090 | |
| Livent Corp. | | | 634 | | | | 5,687 | |
| Sociedad Quimica y Minera de Chile SA - ADR | | | 302 | | | | 9,791 | |
| | | | | | | | 30,568 | |
| Commercial Services & Supplies - 0.02% | | | | | | | | |
| US Ecology, Inc. | | | 129 | | | | 4,214 | |
| Communications Equipment - 0.02% | | | | | | | | |
| ViaSat, Inc. | | | 130 | | | | 4,471 | |
| Construction & Engineering - 0.04% | | | | | | | | |
| WillScot Mobile Mini Holdings Corp. | | | 592 | | | | 9,875 | |
| | | Shares | | | Fair Value | |
| Energy Equipment & Services - 0.05% | | | | | | | | |
| Dril-Quip, Inc. | | | 145 | | | $ | 3,590 | |
| Halliburton Co. | | | 882 | | | | 10,628 | |
| | | | | | | | 14,218 | |
| | | | | | | | | |
| Entertainment - 0.15% | | | | | | | | |
| Cinemark Holdings, Inc. | | | 356 | | | | 3,560 | |
| Live Nation Entertainment, Inc. | | | 284 | | | | 15,302 | |
| Madison Square Garden Sports Corp. - Class A | | | 35 | | | | 5,267 | |
| The Walt Disney Co. | | | 112 | | | | 13,897 | |
| | | | | | | | 38,026 | |
| Food & Staples Retailing - 0.10% | | | | | | | | |
| Performance Food Group Co. | | | 274 | | | | 9,486 | |
| Sysco Corp. | | | 247 | | | | 15,368 | |
| | | | | | | | 24,854 | |
| Food Products - 0.04% | | | | | | | | |
| Beyond Meat, Inc. | | | 71 | | | | 11,790 | |
| Gas Utilities - 0.02% | | | | | | | | |
| New Jersey Resources Corp. | | | 170 | | | | 4,593 | |
| Health Care Equipment & Supplies - 0.29% | | | | | | | | |
| Becton Dickinson and Co. | | | 59 | | | | 13,728 | |
| Boston Scientific Corp. | | | 334 | | | | 12,762 | |
| The Cooper Companies, Inc. | | | 44 | | | | 14,833 | |
| Glaukos Corp. | | | 181 | | | | 8,963 | |
| Mesa Laboratories, Inc. | | | 29 | | | | 7,388 | |
| Stryker Corp. | | | 77 | | | | 16,045 | |
| | | | | | | | 73,719 | |
| See Notes to the Financial Statements. | Leuthold Funds - 2020 Annual Report | 37 |
Leuthold Global Fund
Schedule of Securities Sold Short - (a) (continued)
September 30, 2020
| | | Shares | | | Fair Value | |
| COMMON STOCKS - 2.94% (continued) | | | | | | | | |
| | | | | | | | | |
| Hotels, Restaurants & Leisure - 0.40% | | | | | | | | |
| Aramark | | | 334 | | | $ | 8,834 | |
| Choice Hotels International, Inc. | | | 95 | | | | 8,166 | |
| Churchill Downs, Inc. | | | 56 | | | | 9,174 | |
| MGM Resorts International | | | 460 | | | | 10,005 | |
| Norwegian Cruise Line Holdings, Ltd. | | | 557 | | | | 9,530 | |
| Planet Fitness, Inc. - Class A | | | 163 | | | | 10,044 | |
| Restaurant Brands International, Inc. (b) | | | 254 | | | | 14,608 | |
| Shake Shack, Inc. - Class A | | | 82 | | | | 5,287 | |
| Starbucks Corp. | | | 205 | | | | 17,614 | |
| Vail Resorts, Inc. | | | 43 | | | | 9,201 | |
| | | | | | | | 102,463 | |
| Insurance - 0.07% | | | | | | | | |
| American Financial Group, Inc. | | | 174 | | | | 11,655 | |
| Erie Indemnity Co. - Class A | | | 32 | | | | 6,729 | |
| | | | | | | | 18,384 | |
| Internet & Direct Marketing Retail - 0.02% | | | | | | | | |
| The RealReal, Inc. | | | 454 | | | | 6,569 | |
| IT Services - 0.12% | | | | | | | | |
| Broadridge Financial Solutions, Inc. | | | 126 | | | | 16,632 | |
| Fidelity National Information Services, Inc. | | | 91 | | | | 13,396 | |
| | | | | | | | 30,028 | |
| Machinery - 0.06% | | | | | | | | |
| Ingersoll Rand, Inc. | | | 469 | | | | 16,696 | |
| Multiline Retail - 0.02% | | | | | | | | |
| Kohl's Corp. | | | 225 | | | | 4,169 | |
| Multi-Utilities - 0.06% | | | | | | | | |
| NiSource, Inc. | | | 683 | | | | 15,026 | |
| | | Shares | | | Fair Value | |
| Oil, Gas & Consumable Fuels - 0.10% | | | | | | | | |
| Hess Corp. | | | 324 | | | $ | 13,261 | |
| Occidental Petroleum Corp. | | | 973 | | | | 9,740 | |
| PDC Energy, Inc. | | | 323 | | | | 4,004 | |
| | | | | | | | 27,005 | |
| Personal Products - 0.05% | | | | | | | | |
| The Estee Lauder Companies, Inc. - Class A | | | 64 | | | | 13,968 | |
| Pharmaceuticals - 0.06% | | | | | | | | |
| Elanco Animal Health, Inc. | | | 587 | | | | 16,395 | |
| Real Estate Investment Trusts (REITs) - 0.05% | | | | | | | | |
| Park Hotels & Resorts, Inc. | | | 500 | | | | 4,995 | |
| VEREIT, Inc. | | | 1,339 | | | | 8,703 | |
| | | | | | | | 13,698 | |
| Real Estate Management & Development - 0.02% | | | | | | | | |
| The Howard Hughes Corp. | | | 81 | | | | 4,666 | |
| Road & Rail - 0.06% | | | | | | | | |
| Lyft, Inc. - Class A | | | 532 | | | | 14,657 | |
| Semiconductors & Semiconductor Equipment - 0.04% | | | | | | | | |
| Universal Display Corp. | | | 57 | | | | 10,302 | |
| Software - 0.15% | | | | | | | | |
| 8x8, Inc. | | | 326 | | | | 5,069 | |
| Anaplan, Inc. | | | 167 | | | | 10,451 | |
| Medallia, Inc. | | | 341 | | | | 9,350 | |
| PROS Holdings, Inc. | | | 135 | | | | 4,312 | |
| Q2 Holdings, Inc. | | | 94 | | | | 8,579 | |
| | | | | | | | 37,761 | |
| 38 | Leuthold Funds - 2020 Annual Report | See Notes to the Financial Statements. |
Leuthold Global Fund
Schedule of Securities Sold Short - (a) (continued)
September 30, 2020
| | | Shares | | | Fair Value | |
| COMMON STOCKS - 2.94% (continued) | | | | | | | | |
| | | | | | | | | |
| Specialty Retail - 0.16% | | | | | | | | |
| Five Below, Inc. | | | 80 | | | $ | 10,160 | |
| The Gap, Inc. | | | 799 | | | | 13,607 | |
| Ross Stores, Inc. | | | 178 | | | | 16,611 | |
| | | | | | | | 40,378 | |
| Technology Hardware, Storage & Peripherals - 0.05% | | | | | | | | |
| Western Digital Corp. | | | 360 | | | | 13,158 | |
| Textiles, Apparel & Luxury Goods - 0.17% | | | | | | | | |
| Canada Goose Holdings, Inc. (b) | | | 203 | | | | 6,531 | |
| Gildan Activewear, Inc. (b) | | | 315 | | | | 6,196 | |
| Lululemon Athletica, Inc. (b) | | | 43 | | | | 14,163 | |
| VF Corp. | | | 240 | | | | 16,860 | |
| | | | | | | | 43,750 | |
| TOTAL COMMON STOCKS | | | | | | | | |
| (Proceeds $737,606) | | | | | | $ | 756,432 | |
| | | | | | | | | |
| INVESTMENT COMPANIES - 6.95% | | | | | | | | |
| | | | | | | | | |
| Exchange Traded Funds - 6.95% | | | | | | | | |
| Energy Select Sector SPDR Fund | | | 529 | | | $ | 15,843 | |
| Financial Select Sector SPDR Fund | | | 757 | | | | 18,221 | |
| Invesco QQQ Trust Series 1 | | | 221 | | | | 61,403 | |
| iShares MSCI ACWI ETF | | | 9,836 | | | | 786,093 | |
| iShares MSCI EAFE ETF | | | 10,049 | | | | 639,619 | |
| iShares MSCI Emerging Markets ETF | | | 4,040 | | | | 178,124 | |
| iShares S&P 100 ETF | | | 392 | | | | 61,046 | |
| SPDR S&P Bank ETF | | | 613 | | | | 18,053 | |
| Utilities Select Sector SPDR Fund | | | 246 | | | | 14,608 | |
| TOTAL INVESTMENT COMPANIES | | | | | | | | |
| (Proceeds $1,857,489) | | | | | | $ | 1,793,010 | |
| | | Shares | | Fair Value | |
| | | | | | | | |
| TOTAL SECURITIES SOLD SHORT | | | | | | | |
| (Proceeds $2,595,095) - 9.89% | | | | | $ | 2,549,442 | |
Percentages are stated as a percent of net assets.
| (a) | Non-income producing security. |
| (b) | Foreign issued security. |
The Global Industry Classification Standard (GICS®) was developed by and/or is the exclusive property of MSCI, Inc. and Standard & Poor’s Financial Services LLC (“S&P”). GICS® is a service mark of MSCI, Inc. and S&P and has been licensed for use by U.S. Bancorp Fund Services, LLC.
| See Notes to the Financial Statements. | Leuthold Funds - 2020 Annual Report | 39 |
Leuthold Select Industries Fund
Schedule of Investments
September 30, 2020
| | | Shares | | | Fair Value | |
| COMMON STOCKS - 100.12% | | | | | | | | |
| | | | | | | | | |
| Air Freight & Logistics - 0.50% | | | | | | | | |
| Atlas Air Worldwide Holdings, Inc. (a) | | | 709 | | | $ | 43,178 | |
| Biotechnology - 7.12% | | | | | | | | |
| AbbVie, Inc. | | | 940 | | | | 82,334 | |
| Alexion Pharmaceuticals, Inc. (a) | | | 783 | | | | 89,599 | |
| Amgen, Inc. | | | 548 | | | | 139,280 | |
| Biogen, Inc. (a) | | | 280 | | | | 79,430 | |
| Gilead Sciences, Inc. | | | 1,588 | | | | 100,346 | |
| Regeneron Pharmaceuticals, Inc. (a) | | | 227 | | | | 127,070 | |
| | | | | | | | 618,059 | |
| Building Products - 3.36% | | | | | | | | |
| Builders FirstSource, Inc. (a) | | | 1,883 | | | | 61,423 | |
| Carrier Global Corp. | | | 2,148 | | | | 65,600 | |
| Masco Corp. | | | 747 | | | | 41,182 | |
| Masonite International Corp. (a) | | | 337 | | | | 33,161 | |
| Owens Corning | | | 634 | | | | 43,626 | |
| UFP Industries, Inc. | | | 817 | | | | 46,169 | |
| | | | | | | | 291,161 | |
| Capital Markets - 8.74% | | | | | | | | |
| Evercore, Inc. - Class A | | | 958 | | | | 62,711 | |
| The Goldman Sachs Group, Inc. | | | 469 | | | | 94,255 | |
| Moody's Corp. | | | 315 | | | | 91,303 | |
| Morgan Stanley | | | 1,643 | | | | 79,439 | |
| MSCI, Inc. | | | 195 | | | | 69,572 | |
| Nasdaq, Inc. | | | 478 | | | | 58,655 | |
| Raymond James Financial, Inc. | | | 908 | | | | 66,066 | |
| S&P Global, Inc. | | | 271 | | | | 97,722 | |
| Stifel Financial Corp. | | | 1,182 | | | | 59,762 | |
| UBS Group AG (b) | | | 7,086 | | | | 79,009 | |
| | | | | | | | 758,494 | |
| | | Shares | | | Fair Value | |
| | | | | | | |
| Construction & Engineering - 0.50% | | | | | | | | |
| MasTec, Inc. (a) | | | 1,023 | | | $ | 43,171 | |
| Distributors - 0.55% | | | | | | | | |
| LKQ Corp. (a) | | | 1,712 | | | | 47,474 | |
| Diversified Telecommunication Services - 1.37% | | | | | | | | |
| Verizon Communications, Inc. | | | 1,997 | | | | 118,802 | |
| Electronic Equipment, Instruments & Components - 2.38% | | | | | | | | |
| Insight Enterprises, Inc. (a) | | | 993 | | | | 56,184 | |
| SYNNEX Corp. | | | 1,072 | | | | 150,144 | |
| | | | | | | | 206,328 | |
| Entertainment - 5.13% | | | | | | | | |
| Activision Blizzard, Inc. | | | 2,184 | | | | 176,795 | |
| Electronic Arts, Inc. (a) | | | 1,213 | | | | 158,187 | |
| Take-Two Interactive Software, Inc. (a) | | | 667 | | | | 110,202 | |
| | | | | | | | 445,184 | |
| Food & Staples Retailing - 2.86% | | | | | | | | |
| Costco Wholesale Corp. | | | 361 | | | | 128,155 | |
| Walmart, Inc. | | | 855 | | | | 119,623 | |
| | | | | | | | 247,778 | |
| Health Care Providers & Services - 12.33% | | | | | | | | |
| Anthem, Inc. | | | 227 | | | | 60,970 | |
| Centene Corp. (a) | | | 1,983 | | | | 115,668 | |
| Cigna Corp. | | | 337 | | | | 57,091 | |
| CVS Health Corp. | | | 1,003 | | | | 58,575 | |
| Encompass Health Corp. | | | 1,270 | | | | 82,525 | |
| Fresenius Medical Care AG & Co. KGaA - ADR | | | 1,207 | | | | 51,273 | |
| HCA Healthcare, Inc. | | | 1,072 | | | | 133,657 | |
| Humana, Inc. | | | 326 | | | | 134,928 | |
| Laboratory Corp. of America Holdings (a) | | | 284 | | | | 53,469 | |
| 40 | Leuthold Funds - 2020 Annual Report | See Notes to the Financial Statements. |
Leuthold Select Industries Fund
Schedule of Investments (continued)
September 30, 2020
| | | Shares | | | Fair Value | |
| COMMON STOCKS - 100.12% (continued) | | | | | | | | |
| | | | | | | | | |
| Health Care Providers & Services - 12.33% (continued) | | | | | | | | |
| Premier, Inc. | | | 1,127 | | | $ | 36,999 | |
| Quest Diagnostics, Inc. | | | 438 | | | | 50,147 | |
| UnitedHealth Group, Inc. | | | 583 | | | | 181,762 | |
| Universal Health Services, Inc. - Class B | | | 495 | | | | 52,975 | |
| | | | | | | | 1,070,039 | |
| Household Durables - 8.96% | | | | | | | | |
| D.R. Horton, Inc. | | | 1,849 | | | | 139,840 | |
| KB Home | | | 1,374 | | | | 52,748 | |
| La-Z-Boy, Inc. | | | 1,362 | | | | 43,080 | |
| Lennar Corp. - Class A | | | 1,106 | | | | 90,338 | |
| Meritage Homes Corp. (a) | | | 789 | | | | 87,098 | |
| Mohawk Industries, Inc. (a) | | | 475 | | | | 46,355 | |
| PulteGroup, Inc. | | | 2,800 | | | | 129,612 | |
| Sony Corp. - ADR | | | 541 | | | | 41,522 | |
| Toll Brothers, Inc. | | | 1,700 | | | | 82,722 | |
| Whirlpool Corp. | | | 350 | | | | 64,361 | |
| | | | | | | | 777,676 | |
| Interactive Media & Services - 3.88% | | | | | | | | |
| Alphabet, Inc. - Class A (a) | | | 150 | | | | 219,840 | |
| Facebook, Inc. - Class A (a) | | | 447 | | | | 117,069 | |
| | | | | | | | 336,909 | |
| IT Services - 5.43% | | | | | | | | |
| Akamai Technologies, Inc. (a) | | | 527 | | | | 58,254 | |
| Mastercard, Inc. - Class A | | | 664 | | | | 224,545 | |
| Visa, Inc. - Class A | | | 941 | | | | 188,172 | |
| | | | | | | | 470,971 | |
| Life Sciences Tools & Services - 0.56% | | | | | | | | |
| Medpace Holdings, Inc. (a) | | | 436 | | | | 48,723 | |
| | | Shares | | | Fair Value | |
| | | | | | | |
| Media - 1.05% | | | | | | | | |
| Comcast Corp. - Class A | | | 1,977 | | | $ | 91,456 | |
| Metals & Mining - 3.18% | | | | | | | | |
| Agnico Eagle Mines, Ltd. (b) | | | 466 | | | | 37,098 | |
| B2Gold Corp. (b) | | | 5,282 | | | | 34,439 | |
| Barrick Gold Corp. (b) | | | 2,488 | | | | 69,938 | |
| Kinross Gold Corp. (a)(b) | | | 3,979 | | | | 35,095 | |
| Newmont Corp. | | | 1,048 | | | | 66,495 | |
| Yamana Gold, Inc. (b) | | | 5,812 | | | | 33,012 | |
| | | | | | | | 276,077 | |
| Multiline Retail - 7.25% | | | | | | | | |
| Dollar General Corp. | | | 1,079 | | | | 226,180 | |
| Dollar Tree, Inc. (a) | | | 961 | | | | 87,778 | |
| Target Corp. | | | 2,003 | | | | 315,312 | |
| | | | | | | | 629,270 | |
| Professional Services - 2.24% | | | | | | | | |
| ASGN, Inc. (a) | | | 1,100 | | | | 69,916 | |
| Insperity, Inc. | | | 862 | | | | 56,452 | |
| Robert Half International, Inc. | | | 1,288 | | | | 68,187 | |
| | | | | | | | 194,555 | |
| Semiconductors & Semiconductor Equipment - 9.23% | | | | | | | | |
| Applied Materials, Inc. | | | 2,111 | | | | 125,499 | |
| KLA Corp. | | | 435 | | | | 84,277 | |
| Lam Research Corp. | | | 768 | | | | 254,784 | |
| MKS Instruments, Inc. | | | 802 | | | | 87,602 | |
| SolarEdge Technologies, Inc. (a)(b) | | | 1,043 | | | | 248,599 | |
| | | | | | | | 800,761 | |
| Software - 4.95% | | | | | | | | |
| Adobe, Inc. (a) | | | 254 | | | | 124,569 | |
| Microsoft Corp. | | | 1,451 | | | | 305,189 | |
| | | | | | | | 429,758 | |
| See Notes to the Financial Statements. | Leuthold Funds - 2020 Annual Report | 41 |
Leuthold Select Industries Fund
Schedule of Investments (continued)
September 30, 2020
| | | Shares | | | Fair Value | |
| COMMON STOCKS - 100.12% (continued) | | | | | | | | |
| | | | | | | | | |
| Specialty Retail - 3.86% | | | | | | | | |
| AutoNation, Inc. (a) | | | 776 | | | $ | 41,074 | |
| Best Buy Co., Inc. | | | 558 | | | | 62,100 | |
| The Home Depot, Inc. | | | 245 | | | | 68,039 | |
| The Michaels Companies, Inc. (a) | | | 4,011 | | | | 38,726 | |
| Penske Automotive Group, Inc. | | | 910 | | | | 43,371 | |
| Rent-A-Center, Inc. | | | 1,207 | | | | 36,077 | |
| Williams-Sonoma, Inc. | | | 508 | | | | 45,943 | |
| | | | | | | | 335,330 | |
| Technology Hardware, Storage & Peripherals - 1.70% | | | | | | | | |
| Apple, Inc. | | | 1,270 | | | | 147,079 | |
| Trading Companies & Distributors - 2.39% | | | | | | | | |
| BMC Stock Holdings, Inc. (a) | | | 1,128 | | | | 48,312 | |
| HD Supply Holdings, Inc. (a) | | | 1,284 | | | | 52,952 | |
| Triton International, Ltd. (b) | | | 869 | | | | 35,342 | |
| United Rentals, Inc. (a) | | | 403 | | | | 70,324 | |
| | | | | | | | 206,930 | |
| Wireless Telecommunication Services - 0.60% | | | | | | | | |
| T-Mobile US, Inc. (a) | | | 458 | | | | 52,377 | |
| TOTAL COMMON STOCKS | | | | | | | | |
| (Cost $5,718,428) | | | | | | $ | 8,687,540 | |
| | | Shares | | | Fair Value | |
| | | | | | | |
| SHORT-TERM INVESTMENTS - 0.39% | | | | | | | | |
| | | | | | | | | |
| Money Market Funds - 0.39% | | | | | | | | |
| Fidelity Institutional Money Market Funds - Government Portfolio - Class I, 0.010% (c) | | | 34,165 | | | $ | 34,165 | |
| TOTAL SHORT-TERM INVESTMENTS | | | | | | | | |
| (Cost $34,165) | | | | | | $ | 34,165 | |
| | | | | | | | | |
| Total Investments | | | | | | | | |
| (Cost $5,752,593) - 100.51% | | | | | | $ | 8,721,705 | |
| Liabilities in Excess of Other Assets - (0.51)% | | | | | | | (44,697 | ) |
| TOTAL NET ASSETS - 100.00% | | | | | | $ | 8,677,008 | |
Percentages are stated as a percent of net assets.
ADR American Depositary Receipt
| (a) | Non-income producing security. |
| (b) | Foreign issued security. |
| (c) | The rate quoted is the annualized seven-day effective yield as of September 30, 2020. |
The Global Industry Classification Standard (GICS®) was developed by and/or is the exclusive property of MSCI, Inc. and Standard & Poor’s Financial Services LLC (“S&P”). GICS® is a service mark of MSCI, Inc. and S&P and has been licensed for use by U.S. Bancorp Fund Services, LLC.
| 42 | Leuthold Funds - 2020 Annual Report | See Notes to the Financial Statements. |
Grizzly Short Fund
Schedule of Investments
September 30, 2020
| | | Shares | | | Fair Value | |
| SHORT-TERM INVESTMENTS - 79.64% | | | | | | | | |
| | | | | | | | | |
| Money Market Funds - 79.64% | | | | | | | | |
| Fidelity Institutional Money Market Funds - Government Portfolio - Class I, 0.010% (a)(b) | | | 98,064,864 | | | $ | 98,064,864 | |
| TOTAL SHORT-TERM INVESTMENTS | | | | | | | | |
| (Cost $98,064,864) | | | | | | $ | 98,064,864 | |
| | | | | | | | | |
| Total Investments | | | | | | | | |
| (Cost $98,064,864) - 79.64% | | | | | | $ | 98,064,864 | |
| Other Assets in Excess of Liabilities - (b) 20.36% | | | | | | | 25,074,653 | |
| TOTAL NET ASSETS - 100.00% | | | | | | $ | 123,139,517 | |
Percentages are stated as a percent of net assets.
| (a) | The rate quoted is the annualized seven-day yield as of September 30, 2020. |
| (b) | All or a portion of the assets have been committed as collateral for open securities sold short. |
The Global Industry Classification Standard (GICS®) was developed by and/or is the exclusive property of MSCI, Inc. and Standard & Poor’s Financial Services LLC (“S&P”). GICS® is a service mark of MSCI, Inc. and S&P and has been licensed for use by U.S. Bancorp Fund Services, LLC.
| See Notes to the Financial Statements. | Leuthold Funds - 2020 Annual Report | 43 |
Grizzly Short Fund
Schedule of Securities Sold Short - (a)
September 30, 2020
| | | Shares | | | Fair Value | |
| COMMON STOCKS - 80.29% | | | |
| | | | |
| Aerospace & Defense - 5.08% | | | | | | | | |
| The Boeing Co. | | | 10,018 | | | $ | 1,655,575 | |
| Cubic Corp. | | | 15,427 | | | | 897,388 | |
| HEICO Corp. | | | 14,426 | | | | 1,509,825 | |
| TransDigm Group, Inc. | | | 4,608 | | | | 2,189,353 | |
| | | | | | | | 6,252,141 | |
| Airlines - 1.60% | | | | | | | | |
| Delta Air Lines, Inc. | | | 64,515 | | | | 1,972,869 | |
| Auto Components - 1.16% | | | | | | | | |
| Autoliv, Inc. (b) | | | 19,635 | | | | 1,430,999 | |
| Beverages - 1.56% | | | | | | | | |
| The Coca-Cola Co. | | | 38,943 | | | | 1,922,616 | |
| Biotechnology - 1.77% | | | | | | | | |
| Exact Sciences Corp. | | | 21,438 | | | | 2,185,604 | |
| Capital Markets - 0.56% | | | | | | | | |
| Moelis & Co. - Class A | | | 19,635 | | | | 689,974 | |
| Chemicals - 3.24% | | | | | | | | |
| DuPont de Nemours, Inc. | | | 35,463 | | | | 1,967,487 | |
| Livent Corp. | | | 82,547 | | | | 740,447 | |
| Sociedad Quimica y Minera de Chile SA - ADR | | | 39,470 | | | | 1,279,617 | |
| | | | | | | | 3,987,551 | |
| Commercial Services & Supplies - 0.45% | | | | | | | | |
| US Ecology, Inc. | | | 16,830 | | | | 549,836 | |
| Communications Equipment - 0.48% | | | | | | | | |
| ViaSat, Inc. | | | 17,030 | | | | 585,662 | |
| Construction & Engineering - 1.05% | | | | | | | | |
| WillScot Mobile Mini Holdings Corp. | | | 77,359 | | | | 1,290,348 | |
| | | Shares | | | Fair Value | |
| Energy Equipment & Services - 1.51% | | | | | | | | |
| Dril-Quip, Inc. | | | 18,834 | | | $ | 466,330 | |
| Halliburton Co. | | | 115,205 | | | | 1,388,220 | |
| | | | | | | | 1,854,550 | |
| Entertainment - 4.04% | | | | | | | | |
| Cinemark Holdings, Inc. | | | 46,483 | | | | 464,830 | |
| Live Nation Entertainment, Inc. | | | 37,066 | | | | 1,997,116 | |
| Madison Square Garden Sports Corp. - Class A | | | 4,608 | | | | 693,412 | |
| The Walt Disney Co. | | | 14,626 | | | | 1,814,794 | |
| | | | | | | | 4,970,152 | |
| Food & Staples Retailing - 2.64% | | | | | | | | |
| Performance Food Group Co. | | | 35,803 | | | | 1,239,500 | |
| Sysco Corp. | | | 32,257 | | | | 2,007,030 | |
| | | | | | | | 3,246,530 | |
| Food Products - 1.24% | | | | | | | | |
| Beyond Meat, Inc. | | | 9,216 | | | | 1,530,409 | |
| Gas Utilities - 0.49% | | | | | | | | |
| New Jersey Resources Corp. | | | 22,440 | | | | 606,329 | |
| Health Care Equipment & Supplies - 7.84% | | | | | | | | |
| Becton Dickinson and Co. | | | 7,814 | | | | 1,818,161 | |
| Boston Scientific Corp. | | | 43,477 | | | | 1,661,256 | |
| The Cooper Companies, Inc. | | | 5,757 | | | | 1,940,800 | |
| Glaukos Corp. | | | 23,842 | | | | 1,180,656 | |
| Mesa Laboratories, Inc. | | | 3,807 | | | | 969,871 | |
| Stryker Corp. | | | 10,018 | | | | 2,087,451 | |
| | | | | | | | 9,658,195 | |
| Hotels, Restaurants & Leisure - 10.87% | | | | | | | | |
| Aramark | | | 43,477 | | | | 1,149,967 | |
| Choice Hotels International, Inc. | | | 12,422 | | | | 1,067,795 | |
| Churchill Downs, Inc. | | | 7,413 | | | | 1,214,398 | |
| MGM Resorts International | | | 60,009 | | | | 1,305,196 | |
| Norwegian Cruise Line Holdings, Ltd. | | | 72,529 | | | | 1,240,971 | |
| 44 | Leuthold Funds - 2020 Annual Report | See Notes to the Financial Statements. |
Grizzly Short Fund
Schedule of Securities Sold Short - (a) (continued)
September 30, 2020
| | | Shares | | | Fair Value | |
| COMMON STOCKS - 80.29% (continued) |
| |
| Hotels, Restaurants & Leisure - 10.87% (continued) | | | | | | | | |
| Planet Fitness, Inc. - Class A | | | 21,305 | | | $ | 1,312,814 | |
| Restaurant Brands International, Inc. (b) | | | 33,202 | | | | 1,909,447 | |
| Shake Shack, Inc. - Class A | | | 10,819 | | | | 697,609 | |
| Starbucks Corp. | | | 26,647 | | | | 2,289,510 | |
| Vail Resorts, Inc. | | | 5,610 | | | | 1,200,372 | |
| | | | | | | | 13,388,079 | |
| Insurance - 1.95% | | | | | | | | |
| American Financial Group, Inc. | | | 22,640 | | | | 1,516,427 | |
| Erie Indemnity Co. - Class A | | | 4,207 | | | | 884,648 | |
| | | | | | | | 2,401,075 | |
| Internet & Direct Marketing Retail - 0.70% | | | | | | | | |
| The RealReal, Inc. | | | 59,306 | | | | 858,158 | |
| IT Services - 3.17% | | | | | | | | |
| Broadridge Financial Solutions, Inc. | | | 16,429 | | | | 2,168,628 | |
| Fidelity National Information Services, Inc. | | | 11,821 | | | | 1,740,169 | |
| | | | | | | | 3,908,797 | |
| Machinery - 1.78% | | | | | | | | |
| Ingersoll Rand, Inc. | | | 61,509 | | | | 2,189,720 | |
| Multiline Retail - 0.44% | | | | | | | | |
| Kohl's Corp. | | | 29,252 | | | | 542,040 | |
| Multi-Utilities - 1.59% | | | | | | | | |
| NiSource, Inc. | | | 89,159 | | | | 1,961,498 | |
| Oil, Gas & Consumable Fuels - 2.88% | | | | | | | | |
| Hess Corp. | | | 42,676 | | | | 1,746,729 | |
| Occidental Petroleum Corp. | | | 127,627 | | | | 1,277,546 | |
| PDC Energy, Inc. | | | 42,275 | | | | 523,999 | |
| | | | | | | | 3,548,274 | |
| | | Shares | | | Fair Value | |
| Personal Products - 1.49% | | | | | | | | |
| The Estee Lauder Companies, Inc. - Class A | | | 8,415 | | | $ | 1,836,574 | |
| Pharmaceuticals - 1.75% | | | | | | | | |
| Elanco Animal Health, Inc. | | | 77,338 | | | | 2,160,050 | |
| Real Estate Investment Trusts (REITs) - 1.45% | | | | | | | | |
| Park Hotels & Resorts, Inc. | | | 65,206 | | | | 651,408 | |
| VEREIT, Inc. | | | 174,711 | | | | 1,135,622 | |
| | | | | | | | 1,787,030 | |
| Real Estate Management & Development - 0.50% | | | | | | | | |
| The Howard Hughes Corp. | | | 10,619 | | | | 611,654 | |
| Road & Rail - 1.56% | | | | | | | | |
| Lyft, Inc. - Class A | | | 69,724 | | | | 1,920,896 | |
| Semiconductors & Semiconductor Equipment - 1.09% | | | | | | | | |
| Universal Display Corp. | | | 7,413 | | | | 1,339,826 | |
| Software - 4.02% | | | | | | | | |
| 8x8, Inc. | | | 42,876 | | | | 666,722 | |
| Anaplan, Inc. | | | 22,039 | | | | 1,379,200 | |
| Medallia, Inc. | | | 44,479 | | | | 1,219,614 | |
| PROS Holdings, Inc. | | | 17,832 | | | | 569,554 | |
| Q2 Holdings, Inc. | | | 12,222 | | | | 1,115,380 | |
| | | | | | | | 4,950,470 | |
| Specialty Retail - 4.29% | | | | | | | | |
| Five Below, Inc. | | | 10,419 | | | | 1,323,213 | |
| The Gap, Inc. | | | 104,185 | | | | 1,774,271 | |
| Ross Stores, Inc. | | | 23,442 | | | | 2,187,607 | |
| | | | | | | | 5,285,091 | |
| Technology Hardware, Storage & Peripherals - 1.39% | | | | | | | | |
| Western Digital Corp. | | | 46,883 | | | | 1,713,574 | |
| See Notes to the Financial Statements. | Leuthold Funds - 2020 Annual Report | 45 |
Grizzly Short Fund
Schedule of Securities Sold Short - (a) (continued)
September 30, 2020
| | | Shares | | | Fair Value | |
| COMMON STOCKS - 80.29% (continued) |
| |
| Textiles, Apparel & Luxury Goods - 4.66% | | | | | | | | |
| Canada Goose Holdings, Inc. (b) | | | 26,447 | | | $ | 850,800 | |
| Gildan Activewear, Inc. (b) | | | 41,273 | | | | 811,840 | |
| Lululemon Athletica, Inc. (b) | | | 5,610 | | | | 1,847,766 | |
| VF Corp. | | | 31,656 | | | | 2,223,834 | |
| | | | | | | | 5,734,240 | |
| TOTAL COMMON STOCKS | | | | | | | | |
| (Proceeds $96,370,737) | | | | | | $ | 98,870,811 | |
| | | | | | | | | |
| INVESTMENT COMPANIES - 20.07% | | | | | | | | |
| | | | | | | | | |
| Exchange Traded Funds - 20.07% | | | | | | | | |
| Energy Select Sector SPDR Fund | | | 68,923 | | | $ | 2,064,244 | |
| Financial Select Sector SPDR Fund | | | 98,776 | | | | 2,377,538 | |
| Invesco QQQ Trust Series 1 | | | 29,059 | | | | 8,073,752 | |
| iShares S&P 100 ETF | | | 50,779 | | | | 7,907,814 | |
| SPDR S&P Bank ETF | | | 80,944 | | | | 2,383,801 | |
| Utilities Select Sector SPDR Fund | | | 32,167 | | | | 1,910,076 | |
| TOTAL INVESTMENT COMPANIES | | | | | | | | |
| (Proceeds $25,152,684) | | | | | | $ | 24,717,225 | |
| | | | | | | | | |
| TOTAL SECURITIES SOLD SHORT | | | | | | | | |
| (Proceeds $121,523,421) - 100.36% | | | | | | $ | 123,588,036 | |
Percentages are stated as a percent of net assets.
ADR American Depositary Receipt
| (a) | Non-income producing security. |
| (b) | Foreign issued security. |
The Global Industry Classification Standard (GICS®) was developed by and/or is the exclusive property of MSCI, Inc. and Standard & Poor’s Financial Services LLC (“S&P”). GICS® is a service mark of MSCI, Inc. and S&P and has been licensed for use by U.S. Bancorp Fund Services, LLC.
| 46 | Leuthold Funds - 2020 Annual Report | See Notes to the Financial Statements. |
Leuthold Core ETF
Schedule of Investments
September 30, 2020
| | | Shares | | | Fair Value | |
| INVESTMENT COMPANIES - 94.92% | | | |
| | | | |
| Exchange Traded Funds - 94.92% | | | | | | | | |
| Communication Services Select Sector SPDR Fund | | | 17,223 | | | $ | 1,023,046 | |
| Consumer Discretionary Select Sector SPDR Fund | | | 4,832 | | | | 710,207 | |
| Direxion Shares ETF Trust - Direxion Daily S&P 500 Bear 1x Shares | | | 56,400 | | | | 1,173,683 | |
| Fidelity MSCI Consumer Staples Index ETF | | | 17,946 | | | | 684,819 | |
| Health Care Select Sector SPDR Fund | | | 3,011 | | | | 317,600 | |
| Invesco CurrencyShares British Pound Sterling Trust (a) | | | 306 | | | | 38,198 | |
| Invesco CurrencyShares Euro Currency Trust (a) | | | 2,006 | | | | 221,402 | |
| Invesco CurrencyShares JapaneseYen Trust (a) | | | 2,006 | | | | 179,778 | |
| iShares 7-10Year Treasury Bond ETF | | | 1,030 | | | | 125,475 | |
| iShares Core MSCI Emerging Markets ETF | | | 5,100 | | | | 269,280 | |
| iShares Floating Rate Bond ETF | | | 2,250 | | | | 114,120 | |
| iShares Gold Trust (a) | | | 31,610 | | | | 568,664 | |
| iShares iBoxx $ Investment Grade Corporate Bond ETF | | | 773 | | | | 104,131 | |
| iShares MBS ETF | | | 2,262 | | | | 249,725 | |
| iShares MSCI Global Gold Miners ETF | | | 5,069 | | | | 165,554 | |
| iShares Nasdaq Biotechnology ETF | | | 3,011 | | | | 407,720 | |
| iShares 5-10 Year Investment Grade Corporate Bond ETF | | | 3,100 | | | | 188,511 | |
| iShares U.S. Broker-Dealers & Securities Exchanges ETF | | | 4,307 | | | | 267,087 | |
| iShares U.S. Healthcare Providers ETF | | | 2,963 | | | | 597,993 | |
| iShares U.S. Home Construction ETF | | | 6,071 | | | | 343,922 | |
| | | Shares | | | Fair Value | |
| SPDR Bloomberg Barclays High Yield Bond ETF | | | 529 | | | $ | 55,159 | |
| SPDR Bloomberg Barclays International Corporate Bond ETF | | | 4,638 | | | | 165,066 | |
| SPDR Bloomberg Barclays International Treasury Bond ETF | | | 17,158 | | | | 509,078 | |
| SPDR Bloomberg Barclays Short Term High Yield Bond ETF | | | 4,391 | | | | 113,595 | |
| SPDR S&P Homebuilders ETF | | | 2,560 | | | | 137,933 | |
| SPDR S&P Retail ETF | | | 1,871 | | | | 92,914 | |
| SPDR S&P Semiconductor ETF | | | 1,280 | | | | 160,934 | |
| Technology Select Sector SPDR Fund | | | 15,058 | | | | 1,757,268 | |
| TOTAL INVESTMENT COMPANIES | | | | | | | | |
| (Cost $10,077,700) | | | | | | $ | 10,742,862 | |
| | | | | | | | | |
| SHORT-TERM INVESTMENTS - 5.25% | | | | | | | | |
| | | | | | | | | |
| Money Market Funds - 5.25% | | | | | | | | |
| Fidelity Institutional Money Market Funds - Government Portfolio - Class I, 0.010% (b) | | | 593,695 | | | $ | 593,695 | |
| TOTAL SHORT-TERM INVESTMENTS | | | | | | | | |
| (Cost $593,695) | | | | | | $ | 593,695 | |
| | | | | | | | | |
| Total Investments | | | | | | | | |
| (Cost $10,671,395) - 100.17% | | | | | | $ | 11,336,557 | |
| Liabilities in Excess of Other Assets - (0.17)% | | | | | | | (19,167 | ) |
| TOTAL NET ASSETS - 100.00% | | | | | | $ | 11,317,390 | |
Percentages are stated as a percent of net assets.
| (a) | Non-income producing security. |
| (b) | The rate quoted is the annualized seven-day effective yield as of September 30, 2020. |
The Global Industry Classification Standard (GICS®) was developed by and/or is the exclusive property of MSCI, Inc. and Standard & Poor’s Financial Services LLC (“S&P”). GICS® is a service mark of MSCI, Inc. and S&P and has been licensed for use by U.S. Bancorp Fund Services, LLC.
| See Notes to the Financial Statements. | Leuthold Funds - 2020 Annual Report | 47 |
Leuthold Funds
Statements of Assets and Liabilities
September 30, 2020
| | | Leuthold
Core
Investment
Fund | | | Leuthold
Global
Fund | |
| ASSETS: | | | | | | |
| Investments, at cost | | | | | | | | |
| Unaffiliated Securities | | $ | 385,494,855 | | | $ | 22,888,945 | |
| Affiliated Securities | | | 16,560,964 | | | | — | |
| Total Investments, at cost | | | 402,055,819 | | | | 22,888,945 | |
| | | | | | | | | |
| Investments, at fair value | | | | | | | | |
| Unaffiliated Securities | | | 511,223,034 | | | | 24,768,206 | |
| Affiliated Securities | | | 17,434,047 | | | | — | |
| Total Investments, at fair value | | | 528,657,081 | | | | 24,768,206 | |
| Cash | | | — | | | | 775 | |
| Foreign currency (cost $0 and $18,489, respectively) | | | — | | | | 19,457 | |
| Receivable for Fund shares sold | | | 275,753 | | | | 2,645 | |
| Receivable for investments sold | | | 1,402,352 | | | | 38,701 | |
| Collateral at broker for securities sold short | | | 66,106,009 | | | | 2,979,032 | |
| Tri-party collateral held at custodian | | | 10,000,001 | | | | 600,001 | |
| Interest receivable | | | 257,520 | | | | 12,441 | |
| Dividends receivable | | | 102,677 | | | | 73,132 | |
| Other assets | | | 12,730 | | | | 14,195 | |
| Total Assets | | | 606,814,123 | | | | 28,508,585 | |
| | | | | | | | | |
| LIABILITIES: | | | | | | | | |
| Securities sold short, at fair value (proceeds $54,245,367 and $2,595,095, respectively) | | | 57,839,834 | | | | 2,549,442 | |
| Payable for investments purchased | | | 2,798,383 | | | | 76,956 | |
| Payable for Fund shares redeemed | | | 415,197 | | | | 660 | |
| Payable to Adviser | | | 400,985 | | | | 16,612 | |
| Payable to Custodian | | | 7,925 | | | | 6,792 | |
| Payable to Directors | | | 33,314 | | | | 1,561 | |
| Dividends payable on securities sold short | | | 104,562 | | | | 354 | |
| Distribution (Rule 12b-1) fees payable | | | — | | | | 16,850 | |
| Shareholder servicing fees payable | | | 22,785 | | | | — | |
| Accrued expenses and other liabilities | | | 239,151 | | | | 52,381 | |
| Total Liabilities | | | 61,862,136 | | | | 2,721,608 | |
| NET ASSETS | | $ | 544,951,987 | | | $ | 25,786,977 | |
| 48 | Leuthold Funds - 2020 Annual Report | See Notes to the Financial Statements. |
Leuthold Funds
Statements of Assets and Liabilities (continued)
September 30, 2020
| | | Leuthold
Core
Investment
Fund | | | Leuthold
Global
Fund | |
| NET ASSETS CONSIST OF: | | | | | | | | |
| Capital stock | | $ | 421,791,637 | | | $ | 25,754,274 | |
| Total distributable earnings | | | 123,160,350 | | | | 32,703 | |
| Total Net Assets | | $ | 544,951,987 | | | $ | 25,786,977 | |
| | | | | | | | | |
| Retail Class Shares | | | | | | | | |
| Net assets | | $ | 276,018,345 | | | $ | 4,690,110 | |
| Shares outstanding (1,000,000,000 shares of $0.0001 par value authorized) | | | 14,014,384 | | | | 568,861 | |
| Net Asset Value, Redemption Price, and Offering Price Per Share | | $ | 19.70 | * | | $ | 8.24 | * |
| | | | | | | | | |
| Institutional Class Shares | | | | | | | | |
| Net assets | | $ | 268,933,642 | | | $ | 21,096,867 | |
| Shares outstanding (1,000,000,000 shares of $0.0001 par value authorized) | | | 13,625,759 | | | | 2,518,332 | |
| Net Asset Value, Redemption Price, and Offering Price Per Share | | $ | 19.74 | * | | $ | 8.38 | * |
* Redemption price may differ from NAV if redemption fee is applied.
| See Notes to the Financial Statements. | Leuthold Funds - 2020 Annual Report | 49 |
Leuthold Funds
Statements of Assets and Liabilities (continued)
September 30, 2020
| | | Leuthold
Select
Industries
Fund | | | Grizzly
Short
Fund | | | Leuthold
Core
ETF | |
| ASSETS: | | | | | | | | | |
| Investments, at cost | | $ | 5,752,593 | | | $ | 98,064,864 | | | $ | 10,671,395 | |
| | | | | | | | | | | | | |
| Investments, at fair value | | | 8,721,705 | | | | 98,064,864 | | | | 11,336,557 | |
| Receivable for Fund shares sold | | | — | | | | 678,283 | | | | — | |
| Receivable for investments sold | | | — | | | | 5,059,421 | | | | — | |
| Collateral at broker for securities sold short | | | — | | | | 136,005,602 | | | | — | |
| Tri-party collateral held at custodian | | | — | | | | 22,000,001 | | | | — | |
| Dividends receivable | | | 2,731 | | | | 741 | | | | 9 | |
| Receivable from Advisor | | | — | | | | — | | | | 4,800 | |
| Other assets | | | 14,483 | | | | 4,574 | | | | 12,769 | |
| Total Assets | | | 8,738,919 | | | | 261,813,486 | | | | 11,354,135 | |
| | | | | | | | | | | | | |
| LIABILITIES: | | | | | | | | | | | | |
| Securities sold short, at fair value | | | | | | | | | | | | |
| (proceeds $0, $121,523,421, and $0, respectively) | | | — | | | | 123,588,036 | | | | — | |
| Payable for investments purchased | | | — | | | | 10,133,967 | | | | — | |
| Payable for Fund shares redeemed | | | 12,025 | | | | 4,684,605 | | | | — | |
| Payable to Adviser | | | 3,680 | | | | 125,401 | | | | — | |
| Payable to Custodian | | | 1,371 | | | | 4,696 | | | | 363 | |
| Payable to Directors | | | 602 | | | | 7,634 | | | | 602 | |
| Dividends payable on securities sold short | | | — | | | | 36,023 | | | | — | |
| Shareholder servicing fees payable | | | 693 | | | | 9,410 | | | | — | |
| Accrued expenses and other liabilities | | | 43,540 | | | | 84,197 | | | | 35,780 | |
| Total Liabilities | | | 61,911 | | | | 138,673,969 | | | | 36,745 | |
| NET ASSETS | | $ | 8,677,008 | | | $ | 123,139,517 | | | $ | 11,317,390 | |
| | | | | | | | | | | | | |
| 50 | Leuthold Funds - 2020 Annual Report | See Notes to the Financial Statements. |
Leuthold Funds
Statements of Assets and Liabilities (continued)
September 30, 2020
| | | Leuthold
Select
Industries
Fund | | | Grizzly
Short
Fund | | | Leuthold
Core
ETF | |
| NET ASSETS CONSIST OF: | | | | | | | | | | | | |
| Capital stock | | $ | 5,299,153 | | | $ | 440,094,986 | | | $ | 10,731,155 | |
| Total distributable earnings | | | 3,377,855 | | | | (316,955,469 | ) | | | 586,235 | |
| Total Net Assets | | $ | 8,677,008 | | | $ | 123,139,517 | | | $ | 11,317,390 | |
| | | | | | | | | | | | | |
| Retail Class Shares | | | | | | | | | | | | |
| Net assets | | $ | 8,677,008 | | | $ | 123,139,517 | | | $ | 11,317,390 | |
| Shares outstanding (1,000,000,000 shares of $0.0001 par value authorized) | | | 320,607 | | | | 11,382,375 | | | | 425,000 | |
| Net Asset Value, Redemption Price, and Offering Price Per Share | | $ | 27.06 | | | $ | 10.82 | | | $ | 26.63 | |
| See Notes to the Financial Statements. | Leuthold Funds - 2020 Annual Report | 51 |
Leuthold Funds
Statements of Operations
For the Year Ended September 30, 2020
| | | Leuthold | | | | |
| | | Core | | | Leuthold | |
| | | Investment | | | Global | |
| | | Fund | | | Fund | |
| INVESTMENT INCOME: | | | | | | | | |
| Dividend income (net of foreign taxes withheld of $28,594 and $46,490, respectively) | | $ | 6,269,892 | | | $ | 533,977 | |
| Interest income | | | 1,221,354 | | | | 61,737 | |
| Income from securities lending, net | | | 132,881 | | | | 9,297 | |
| Total investment income | | | 7,624,127 | | | | 605,011 | |
| | | | | | | | | |
| EXPENSES: | | | | | | | | |
| Investment advisory fees (Note 3) | | | 5,083,981 | | | | 285,816 | |
| Administration fees | | | 273,694 | | | | 30,612 | |
| Transfer agent fees (Note 5) | | | 257,846 | | | | 58,025 | |
| Legal fees | | | 45,178 | | | | 5,811 | |
| Audit fees | | | 128,670 | | | | 5,970 | |
| Fund accounting fees | | | 103,553 | | | | 13,986 | |
| Custody fees | | | 54,698 | | | | 32,782 | |
| Shareholder servicing fees - Retail Class (Note 5) | | | 255,801 | | | | — | |
| Registration fees | | | 54,051 | | | | 37,515 | |
| Report to shareholders | | | 72,150 | | | | 3,744 | |
| Directors’ fees | | | 158,285 | | | | 8,315 | |
| Distribution (Rule 12b-1) fees - Retail Class (Note 4) | | | — | | | | 10,782 | |
| Other | | | 60,503 | | | | 5,709 | |
| Total expenses before dividends and interest on securities sold short and reimbursement from Adviser | | | 6,548,410 | | | | 499,067 | |
| Dividends and interest on securities sold short | | | 791,567 | | | | 63,419 | |
| Reimbursement from Adviser (Note 3) | | | — | | | | (13,060 | ) |
| Total expenses | | | 7,339,977 | | | | 549,426 | |
| NET INVESTMENT INCOME | | $ | 284,150 | | | $ | 55,585 | |
| 52 | Leuthold Funds - 2020 Annual Report | See Notes to the Financial Statements. |
Leuthold Funds
Statements of Operations (continued)
For the Year Ended September 30, 2020
| | | Leuthold | | | | |
| | | Core | | | Leuthold | |
| | | Investment | | | Global | |
| | | Fund | | | Fund | |
| REALIZED AND UNREALIZED GAIN (LOSS) ON INVESTMENTS, INVESTMENT COMPANIES, SECURITIES SOLD SHORT, AND FOREIGN CURRENCY AND FOREIGN CURRENCY TRANSLATION: | | | | | | | | |
| Net realized gain (loss) on: | | | | | | | | |
| Unaffiliated investments | | $ | 6,866,960 | | | $ | 39,629 | |
| Affiliated investments | | | 16,036 | | | | — | |
| Investment companies | | | 49,939 | | | | 118,003 | |
| Realized gain distributions received from investment companies | | | 1,450 | | | | — | |
| Securities sold short | | | (2,954,541 | ) | | | (273,785 | ) |
| Foreign currency and foreign currency translation | | | (2,848 | ) | | | (3,051 | ) |
| Net unrealized appreciation (depreciation) during the period on: | | | | | | | | |
| Unaffiliated investments | | | 25,918,955 | | | | 158,806 | |
| Affiliated investments | | | 304,785 | | | | — | |
| Investment companies | | | 9,321,361 | | | | 158,250 | |
| Securities sold short | | | (8,091,429 | ) | | | (138,726 | ) |
| Foreign currency and foreign currency translation | | | 1,475,931 | | | | 397,942 | |
| Net realized and unrealized gain on investments, investment companies, securities sold short, and foreign currency and foreign currency translation | | | 32,906,599 | | | | 457,068 | |
| NET INCREASE IN NET ASSETS RESULTING FROM OPERATIONS | | $ | 33,190,749 | | | $ | 512,653 | |
| See Notes to the Financial Statements. | Leuthold Funds - 2020 Annual Report | 53 |
Leuthold Funds
Statements of Operations (continued)
For the Year Ended September 30, 2020
| | | Leuthold | | | | | | | |
| | | Select | | | Grizzly | | | Leuthold | |
| | | Industries | | | Short | | | Core | |
| | | Fund | | | Fund | | | ETF* | |
| INVESTMENT INCOME: | | | | | | | | | | | | |
| Dividend income (net of foreign taxes withheld of $447, $0, and $0, respectively) | | $ | 128,579 | | | $ | 517,801 | | | $ | 47,630 | |
| Interest income | | | 6 | | | | 222,395 | | | | 21 | |
| Income from securities lending, net | | | — | | | | 11 | | | | — | |
| Total investment income | | | 128,585 | | | | 740,207 | | | | 47,651 | |
| | | | | | | | | | | | | |
| EXPENSES: | | | | | | | | | | | | |
| Investment advisory fees (Note 3) | | | 95,610 | | | | 1,529,785 | | | | 22,006 | |
| Administration fees | | | 17,707 | | | | 76,269 | | | | 34,904 | |
| Transfer agent fees (Note 5) | | | 33,252 | | | | 77,476 | | | | 9,893 | |
| Legal fees | | | 842 | | | | 8,464 | | | | 44,098 | |
| Audit fees | | | 39,370 | | | | 39,370 | | | | 18,520 | |
| Fund accounting fees | | | 4,508 | | | | 26,392 | | | | 8,053 | |
| Custody fees | | | 15,400 | | | | 10,273 | | | | 1,678 | |
| Shareholder servicing fees - Retail Class (Note 5) | | | 8,785 | | | | 91,491 | | | | — | |
| Registration fees | | | 40,986 | | | | 35,238 | | | | — | |
| Report to shareholders | | | 1,363 | | | | 22,480 | | | | 1,039 | |
| Directors’ fees | | | 2,668 | | | | 34,673 | | | | 1,322 | |
| Other | | | 2,118 | | | | 8,564 | | | | 4,120 | |
Total expenses before dividends and interest on securities sold short and
reimbursement from Adviser | | | 262,609 | | | | 1,960,475 | | | | 145,633 | |
| Dividends and interest on securities sold short | | | — | | | | 1,514,579 | | | | — | |
| Reimbursement from Adviser (Note 3) | | | (119,193 | ) | | | — | | | | (117,025 | ) |
| Total expenses | | | 143,416 | | | | 3,475,054 | | | | 28,608 | |
| NET INVESTMENT INCOME (LOSS) | | $ | (14,831 | ) | | $ | (2,734,847 | ) | | $ | 19,043 | |
* Fund commenced operations on January 6, 2020. Information presented is for the period January 6, 2020 through September 30, 2020.
| 54 | Leuthold Funds - 2020 Annual Report | See Notes to the Financial Statements. |
Leuthold Funds
Statements of Operations (continued)
For the Year Ended September 30, 2020
| | | Leuthold | | | | | | | |
| | | Select | | | Grizzly | | | Leuthold | |
| | | Industries | | | Short | | | Core | |
| | | Fund | | | Fund | | | ETF* | |
| REALIZED AND UNREALIZED GAIN (LOSS) ON INVESTMENTS, INVESTMENT COMPANIES, SECURITIES SOLD SHORT, FOREIGN CURRENCY AND FOREIGN CURRENCY TRANSLATION, AND FUTURES CONTRACTS: | | | | | | | | | | | | |
| Net realized gain (loss) on: | | | | | | | | | | | | |
| Investments | | $ | 859,275 | | | $ | — | | | $ | — | |
| Investment companies | | | — | | | | — | | | | (25,250 | ) |
| Securities sold short | | | — | | | | (75,197,723 | ) | | | — | |
| Foreign currency and foreign currency translation | | | 4 | | | | 78 | | | | — | |
| Futures contracts | | | — | | | | — | | | | (87,290 | ) |
| Net unrealized appreciation (depreciation) during the period on: | | | | | | | | | | | | |
| Investments | | | 152,501 | | | | — | | | | — | |
| Investment companies | | | — | | | | — | | | | 665,162 | |
| Securities sold short | | | — | | | | (9,060,474 | ) | | | — | |
| Net realized and unrealized gain (loss) on investments, investment companies, securities sold short, foreign currency and foreign currency translation, and futures contracts | | | 1,011,780 | | | | (84,258,119 | ) | | | 552,622 | |
| NET INCREASE (DECREASE) IN NET ASSETS RESULTING FROM OPERATIONS | | $ | 996,949 | | | $ | (86,992,966 | ) | | $ | 571,665 | |
* Fund commenced operations on January 6, 2020. Information presented is for the period January 6, 2020 through September 30, 2020.
| See Notes to the Financial Statements. | Leuthold Funds - 2020 Annual Report | 55 |
Leuthold Core Investment Fund
Statements of Changes in Net Assets
| | | Year Ended
September 30, 2020 | | | Year Ended
September 30, 2019 | |
| OPERATIONS: | | | | | | |
| Net investment income | | $ | 284,150 | | | $ | 3,709,663 | |
| Net realized gain on investments, investment companies, securities sold short, and foreign currency and foreign currency translation | | | 3,976,996 | | | | 17,953,538 | |
| Net unrealized appreciation (depreciation) on investments, investment companies, securities sold short, and foreign currency and foreign currency translation | | | 28,929,603 | | | | (18,305,729 | ) |
| Net increase in net assets from operations | | | 33,190,749 | | | | 3,357,472 | |
| | | | | | | | | |
| DISTRIBUTIONS TO SHAREHOLDERS: | | | | | | | | |
| Distributions - Retail Class | | | (5,114,896 | ) | | | (36,279,698 | ) |
| Distributions - Institutional Class | | | (5,125,299 | ) | | | (39,291,618 | ) |
| Total distributions | | | (10,240,195 | ) | | | (75,571,316 | ) |
| | | | | | | | | |
| CAPITAL SHARE TRANSACTIONS: | | | | | | | | |
| Proceeds from shares sold - Retail Class | | | 22,568,562 | | | | 23,071,159 | |
| Proceeds from shares sold - Institutional Class | | | 63,625,590 | | | | 99,334,788 | |
| Proceeds from shares issued to holders in reinvestment of dividends - Retail Class | | | 4,812,373 | | | | 34,048,341 | |
| Proceeds from shares issued to holders in reinvestment of dividends - Institutional Class | | | 4,564,710 | | | | 35,405,269 | |
| Cost of shares redeemed - Retail Class* | | | (80,719,938 | ) | | | (108,678,134 | ) |
| Cost of shares redeemed - Institutional Class** | | | (111,124,173 | ) | | | (229,952,506 | ) |
| Net decrease in net assets from capital share transactions | | | (96,272,876 | ) | | | (146,771,083 | ) |
| | | | | | | | | |
| TOTAL DECREASE IN NET ASSETS: | | | (73,322,322 | ) | | | (218,984,927 | ) |
| NET ASSETS | | | | | | | | |
| Beginning of year | | | 618,274,309 | | | | 837,259,236 | |
| End of year | | $ | 544,951,987 | | | $ | 618,274,309 | |
| | | | | | | | | |
| CHANGES IN SHARES OUTSTANDING: | | | | | | | | |
| Shares sold - Retail Class | | | 1,213,798 | | | | 1,246,916 | |
| Shares sold - Institutional Class | | | 3,414,384 | | | | 5,471,510 | |
| Shares issued to holders in reinvestment of dividends - Retail Class | | | 258,592 | | | | 1,878,824 | |
| Shares issued to holders in reinvestment of dividends - Institutional Class | | | 245,386 | | | | 1,950,355 | |
| Shares redeemed - Retail Class | | | (4,336,506 | ) | | | (5,911,248 | ) |
| Shares redeemed - Institutional Class | | | (6,058,834 | ) | | | (12,549,398 | ) |
| Net decrease in shares outstanding | | | (5,263,180 | ) | | | (7,913,041 | ) |
| | | | | | | | | |
| * Net of redemption fees of (Retail Class): | | $ | 1,712 | | | $ | 132 | |
| ** Net of redemption fees of (Institutional Class): | | $ | 2,754 | | | $ | 142 | |
| 56 | Leuthold Funds - 2020 Annual Report | See Notes to the Financial Statements. |
Leuthold Global Fund
Statements of Changes in Net Assets
| | | Year Ended
September 30, 2020 | | | Year Ended
September 30, 2019 | |
| OPERATIONS: | | | | | | |
| Net investment income | | $ | 55,585 | | | $ | 327,013 | |
| Net realized loss on investments, investment companies, securities sold short, and foreign currency and foreign currency translation | | | (119,204 | ) | | | (1,295,828 | ) |
| Net unrealized appreciation (depreciation) on investments, investment companies, securities sold short, and foreign currency and foreign currency translation | | | 576,272 | | | | (2,785,203 | ) |
| Net increase (decrease) in net assets from operations | | | 512,653 | | | | (3,754,018 | ) |
| | | | | | | | | |
| DISTRIBUTIONS TO SHAREHOLDERS: | | | | | | | | |
| Distributions - Retail Class | | | (53,171 | ) | | | (898,152 | ) |
| Distributions - Institutional Class | | | (205,817 | ) | | | (4,756,056 | ) |
| Total distributions | | | (258,988 | ) | | | (5,654,208 | ) |
| | | | | | | | | |
| CAPITAL SHARE TRANSACTIONS: | | | | | | | | |
| Proceeds from shares sold - Retail Class | | | 1,315,364 | | | | 2,174,839 | |
| Proceeds from shares sold - Institutional Class | | | 2,575,923 | | | | 20,930,190 | |
| Proceeds from shares issued to holders in reinvestment of dividends - Retail Class | | | 51,854 | | | | 861,148 | |
| Proceeds from shares issued to holders in reinvestment of dividends - Institutional Class | | | 175,787 | | | | 4,460,742 | |
| Cost of shares redeemed - Retail Class* | | | (4,141,527 | ) | | | (12,393,873 | ) |
| Cost of shares redeemed - Institutional Class** | | | (27,606,497 | ) | | | (36,213,570 | ) |
| Net decrease in net assets from capital share transactions | | | (27,629,096 | ) | | | (20,180,524 | ) |
| | | | | | | | | |
| TOTAL DECREASE IN NET ASSETS: | | | (27,375,431 | ) | | | (29,588,750 | ) |
| NET ASSETS | | | | | | | | |
| Beginning of year | | | 53,162,408 | | | | 82,751,158 | |
| End of year | | $ | 25,786,977 | | | $ | 53,162,408 | |
| | | | | | | | | |
| CHANGES IN SHARES OUTSTANDING: | | | | | | | | |
| Shares sold - Retail Class | | | 159,784 | | | | 276,540 | |
| Shares sold - Institutional Class | | | 311,163 | | | | 2,534,279 | |
| Shares issued to holders in reinvestment of dividends - Retail Class | | | 6,270 | | | | 107,218 | |
| Shares issued to holders in reinvestment of dividends - Institutional Class | | | 20,952 | | | | 547,843 | |
| Shares redeemed - Retail Class | | | (522,085 | ) | | | (1,473,489 | ) |
| Shares redeemed - Institutional Class | | | (3,376,531 | ) | | | (4,492,387 | ) |
| Net decrease in shares outstanding | | | (3,400,447 | ) | | | (2,499,996 | ) |
| | | | | | | | | |
| * Net of redemption fees of (Retail Class): | | $ | — | | | $ | 62 | |
| ** Net of redemption fees of (Institutional Class): | | $ | 4 | | | $ | 259 | |
| See Notes to the Financial Statements. | Leuthold Funds - 2020 Annual Report | 57 |
Leuthold Select Industries Fund
Statements of Changes in Net Assets
| | | Year Ended
September 30, 2020 | | | Year Ended
September 30, 2019 | |
| OPERATIONS: | | | | | | |
| Net investment loss | | $ | (14,831 | ) | | $ | (15,749 | ) |
| Net realized gain on investments and foreign currency and foreign currency translation | | | 859,279 | | | | 413,500 | |
| Net unrealized appreciation (depreciation) on investments | | | 152,501 | | | | (946,734 | ) |
| Net increase (decrease) in net assets from operations | | | 996,949 | | | | (548,983 | ) |
| | | | | | | | | |
| DISTRIBUTIONS TO SHAREHOLDERS: | | | | | | | | |
| Distributions - Retail Class | | | (328,244 | ) | | | (1,295,440 | ) |
| Total distributions | | | (328,244 | ) | | | (1,295,440 | ) |
| | | | | | | | | |
| CAPITAL SHARE TRANSACTIONS: | | | | | | | | |
| Proceeds from shares sold | | | 1,399,080 | | | | 1,366,497 | |
| Proceeds from shares issued to holders in reinvestment of dividends | | | 307,570 | | | | 1,242,103 | |
| Cost of shares redeemed | | | (5,482,231 | ) | | | (7,092,225 | ) |
| Net decrease in net assets from capital share transactions | | | (3,775,581 | ) | | | (4,483,625 | ) |
| | | | | | | | | |
| TOTAL DECREASE IN NET ASSETS: | | | (3,106,876 | ) | | | (6,328,048 | ) |
| NET ASSETS | | | | | | | | |
| Beginning of year | | | 11,783,884 | | | | 18,111,932 | |
| End of year | | $ | 8,677,008 | | | $ | 11,783,884 | |
| | | | | | | | | |
| CHANGES IN SHARES OUTSTANDING: | | | | | | | | |
| Shares sold | | | 61,824 | | | | 55,582 | |
| Shares issued to holders in reinvestment of dividends | | | 12,220 | | | | 52,833 | |
| Shares redeemed | | | (224,385 | ) | | | (300,598 | ) |
| Net decrease in shares outstanding | | | (150,341 | ) | | | (192,183 | ) |
| 58 | Leuthold Funds - 2020 Annual Report | See Notes to the Financial Statements. |
Grizzly Short Fund
Statements of Changes in Net Assets
| | | Year Ended
September 30, 2020 | | | Year Ended
September 30, 2019 | |
| OPERATIONS: | | | | | | |
| Net investment gain (loss) | | $ | (2,734,847 | ) | | $ | 1,070,581 | |
| Net realized loss on securities sold short and foreign currency and foreign currency translation | | | (75,197,645 | ) | | | (12,327,226 | ) |
| Net unrealized appreciation (depreciation) on securities sold short | | | (9,060,474 | ) | | | 3,713,595 | |
| Net decrease in net assets from operations | | | (86,992,966 | ) | | | (7,543,050 | ) |
| | | | | | | | | |
| DISTRIBUTIONS TO SHAREHOLDERS: | | | | | | | | |
| Distributions - Retail Class | | | (52,038 | ) | | | (838,199 | ) |
| Total distributions | | | (52,038 | ) | | | (838,199 | ) |
| | | | | | | | | |
| CAPITAL SHARE TRANSACTIONS: | | | | | | | | |
| Proceeds from shares sold | | | 414,198,829 | | | | 100,269,875 | |
| Proceeds from shares issued to holders in reinvestment of dividends | | | 44,541 | | | | 735,046 | |
| Cost of shares redeemed | | | (296,296,935 | ) | | | (99,334,343 | ) |
| Net increase in net assets from capital share transactions | | | 117,946,435 | | | | 1,670,578 | |
| | | | | | | | | |
| TOTAL INCREASE (DECREASE) IN NET ASSETS: | | | 30,901,431 | | | | (6,710,671 | ) |
| NET ASSETS | | | | | | | | |
| Beginning of year | | | 92,238,086 | | | | 98,948,757 | |
| End of year | | $ | 123,139,517 | | | $ | 92,238,086 | |
| | | | | | | | | |
| CHANGES IN SHARES OUTSTANDING: | | | | | | | | |
| Shares sold | | | 26,268,586 | | | | 5,600,448 | |
| Shares issued to holders in reinvestment of dividends | | | 3,121 | | | | 46,438 | |
| Shares redeemed | | | (20,601,350 | ) | | | (5,541,094 | ) |
| Net increase in shares outstanding | | | 5,670,357 | | | | 105,792 | |
| See Notes to the Financial Statements. | Leuthold Funds - 2020 Annual Report | 59 |
Leuthold Core ETF
Statements of Changes in Net Assets
| | | Year Ended
September 30, 2020* | |
| OPERATIONS: | | | |
| Net investment gain | | $ | 19,043 | |
| Net realized loss on investment companies and futures contracts | | | (112,540 | ) |
| Net unrealized appreciation on investment companies | | | 665,162 | |
| Net increase in net assets from operations | | | 571,665 | |
| | | | | |
| DISTRIBUTIONS TO SHAREHOLDERS: | | | | |
| Distributions - Retail Class | | | — | |
| Total distributions | | | — | |
| | | | | |
| CAPITAL SHARE TRANSACTIONS: | | | | |
| Proceeds from shares sold | | | 11,319,330 | |
| Proceeds from shares issued to holders in reinvestment of dividends | | | — | |
| Cost of shares redeemed | | | (573,605 | ) |
| Net increase in net assets from capital share transactions | | | 10,745,725 | |
| | | | | |
| TOTAL INCREASE IN NET ASSETS: | | | 11,317,390 | |
| NET ASSETS | | | | |
| Beginning of period | | | — | |
| End of period | | $ | 11,317,390 | |
| | | | | |
| CHANGES IN SHARES OUTSTANDING: | | | | |
| Shares sold | | | 450,001 | |
| Shares issued to holders in reinvestment of dividends | | | — | |
| Shares redeemed | | | (25,001 | ) |
| Net increase in shares outstanding | | | 425,000 | |
* The Fund commenced operations on January 6, 2020. The information presented is for the period January 6, 2020 through September 30, 2020.
| 60 | Leuthold Funds - 2020 Annual Report | See Notes to the Financial Statements. |
Leuthold Funds
Notes to the Financial Statements
| 1. | ORGANIZATION AND SIGNIFICANT ACCOUNTING POLICIES |
Leuthold Funds, Inc. (the “Company”) was incorporated on August 30, 1995, as a Maryland Corporation and is registered with the Securities and Exchange Commission as an open-end management investment company under the Investment Company Act of 1940, as amended (the “1940 Act”). In addition, the Funds are considered investment companies under, and follow the accounting and reporting guidance in, Financial Accounting Standards Board Accounting Standards Codification Topic 946 – Investment Companies. The Leuthold Group, LLC, doing business as Leuthold Weeden Capital Management, is the investment adviser (the “Adviser”). The Company consists of five series (each series a “Fund” and, collectively, the “Funds”):
| Fund | Investment Objective | Inception – Retail Share Class | Inception – Institutional
Share Class |
| Leuthold Core Investment Fund | Seeks total return consistent with prudent investment risk over the long term | 11/20/1995 | 1/31/2006 |
| Leuthold Global Fund | Seeks total return consistent with prudent investment risk over the long term | 07/01/2008 | 4/30/2008 |
| Leuthold Select Industries Fund | Capital appreciation | 06/19/2000 | n/a |
| Grizzly Short Fund | Capital appreciation | 06/19/2000 | n/a |
| Leuthold Core ETF | Capital appreciation and income | 01/06/2020 | n/a |
| | | | |
All classes of shares in a Fund have identical voting, dividend, liquidation, and other rights, and the same terms and conditions, except that certain fees and expenses, including distribution and shareholder servicing fees, may differ among classes. Each class has exclusive voting rights on any matters relating to that class’s servicing or distribution arrangements.
The following is a summary of significant accounting policies consistently followed by the Funds.
| a) | Investment Valuation – Securities listed on a national securities exchange (other than The NASDAQ OMX Group, Inc., referred to as “NASDAQ”) are valued at the last sale price on the day the valuation is made. Securities that are traded on NASDAQ under one of its three listing tiers, NASDAQ Global Market, NASDAQ Global Select Market, and NASDAQ Capital Market, are valued at the NASDAQ Official Closing Price. Price information on listed stocks is taken from the exchange where the security is primarily traded. Securities, including securities sold short, which are listed on an exchange, but which are not traded on the valuation date are generally valued at the mean between the bid and the asked prices. Unlisted securities for which market quotations are readily available are valued at the latest quoted bid price or, if unavailable, at prices provided by an independent pricing service. Securities sold short which are not listed on an exchange but for which market quotations are readily available are generally valued at the average of the current bid and asked prices. Debt securities are valued at bid prices provided by an independent pricing service that may use a matrix pricing method or other analytical pricing model. Exchange-traded options are valued at the last reported sale price priced on the primary exchange on which the option is traded. If no sales are reported on a particular day, the mean between the highest bid and lowest asked quotations at the close of the exchanges is used. Non-exchange traded options are valued at the mean between the last bid and asked quotations. For options where market quotations are not readily available, fair value shall be determined. Shares of open-end investment companies (other than shares of an exchange-traded fund traded on domestic securities exchanges or on NASDAQ) are valued at one of the following prices as determined by the Adviser: (a) the net asset value announced by such open-end investment company following the close of business on the business day a Fund’s net asset value is to be calculated; (b) the net asset value announced by such open-end investment company following the close of business on the business day immediately preceding the day a Fund’s net asset value is to be calculated; or (c) a value determined by the Adviser by adding to, or subtracting from, the net asset value announced by such open-end investment company following the close of business on the business day immediately preceding the day a Fund’s net asset value is to be calculated, an amount equal to the Adviser’s estimate of the effect of changes in the market prices for the types of securities held by such investment company. Other assets, including securities for which no quotations are readily available, are valued at fair value as determined in good faith by the Board of Directors (“Directors”) pursuant to the Funds’ “Pricing and Valuation Guidelines.” |
| Leuthold Funds - 2020 Annual Report | 61 |
Leuthold Funds
The Funds may invest in foreign securities. Foreign securities may be priced at the closing price reported on the foreign exchange on which they are principally traded. Trading in foreign securities may be completed at times that vary from the closing of the New York Stock Exchange (“NYSE”). The Directors have approved the use of their independent pricing provider’s proprietary fair value pricing model to assist in determining current valuation for foreign securities traded in markets that close prior to the NYSE. Foreign securities quoted in foreign currencies are translated into U.S. dollars at current exchange rates. Occasionally, events that affect these values and exchange rates may occur between the times at which they are determined and the closing of the NYSE. If these events materially affect the value of portfolio securities, then these securities may be valued as determined in good faith by the Directors. Some of the factors which may be considered by the Directors and the Funds’ Fair Value Pricing Committee in determining fair value are fundamental analytical data relating to the investment, the nature and duration of any restrictions on disposition, trading in similar securities of the same issuer or comparable companies, information from broker-dealers, and an evaluation of the forces that influence the market in which the securities are purchased and sold. The use of fair value pricing by a Fund may cause the net asset value of its shares to differ significantly from the net asset value that would be calculated without regard to such considerations.
| b) | Fair Valuation Measurements –The Funds have adopted fair valuation accounting standards, which establish a definition of fair value and set out a hierarchy for measuring fair value. These standards require additional disclosures about the various inputs and valuation techniques used to develop the measurements of fair value and a discussion of changes in valuation techniques and related inputs during the period. These inputs are summarized in the following three levels: |
Level 1 - Quoted prices in active markets for identical securities.
Level 2 - Other significant observable inputs (including quoted prices for similar securities, interest rates, prepayment speeds, credit risk, etc.).
Level 3 - Significant unobservable inputs (including the Funds’ own assumptions in determining the fair value of investments).
The inputs or methodology used for valuing securities are not an indication of the risk associated with investing in those securities.
| 62 | Leuthold Funds - 2020 Annual Report |
Leuthold Funds
The following is a summary of the inputs used to value the Funds’ investments and securities sold short as of September 30, 2020:
| Leuthold Core Investment Fund |
| Investments at Fair Value | | | Level 1 | | | | Level 2 | | | | Level 3 | | | | Total | |
| Common Stocks | | | | | | | | | | | | | | | | |
| Air Freight & Logistics | | $ | 1,590,221 | | | $ | — | | | $ | — | | | $ | 1,590,221 | |
| Biotechnology | | | 22,859,800 | | | | — | | | | — | | | | 22,859,800 | |
| Building Products | | | 10,818,381 | | | | — | | | | — | | | | 10,818,381 | |
| Capital Markets | | | 28,121,090 | | | | — | | | | — | | | | 28,121,090 | |
| Chemicals | | | — | | | | — | | | | 6,488 | | | | 6,488 | |
| Construction & Engineering | | | 1,589,590 | | | | — | | | | — | | | | 1,589,590 | |
| Distributors | | | 1,791,164 | | | | — | | | | — | | | | 1,791,164 | |
| Diversified Telecommunication Services | | | 4,322,960 | | | | — | | | | — | | | | 4,322,960 | |
| Electronic Equipment, Instruments & Components | | | 7,656,072 | | | | — | | | | — | | | | 7,656,072 | |
| Entertainment | | | 16,411,773 | | | | — | | | | — | | | | 16,411,773 | |
| Food & Staples Retailing | | | 9,124,729 | | | | — | | | | — | | | | 9,124,729 | |
| Health Care Providers & Services | | | 39,868,289 | | | | — | | | | — | | | | 39,868,289 | |
| Household Durables | | | 29,107,835 | | | | — | | | | — | | | | 29,107,835 | |
| Interactive Media & Services | | | 12,314,349 | | | | — | | | | — | | | | 12,314,349 | |
| IT Services | | | 17,780,012 | | | | — | | | | — | | | | 17,780,012 | |
| Life Sciences Tools & Services | | | 1,790,011 | | | | — | | | | — | | | | 1,790,011 | |
| Media | | | 3,313,419 | | | | — | | | | — | | | | 3,313,419 | |
| Metals & Mining | | | 10,229,519 | | | | — | | | | — | | | | 10,229,519 | |
| Multiline Retail | | | 23,842,327 | | | | — | | | | — | | | | 23,842,327 | |
| Professional Services | | | 7,319,527 | | | | — | | | | — | | | | 7,319,527 | |
| Semiconductors & Semiconductor Equipment | | | 30,592,877 | | | | — | | | | — | | | | 30,592,877 | |
| Software | | | 15,792,219 | | | | — | | | | — | | | | 15,792,219 | |
| Specialty Retail | | | 12,398,905 | | | | — | | | | — | | | | 12,398,905 | |
| Technology Hardware, Storage & Peripherals | | | 5,368,951 | | | | — | | | | — | | | | 5,368,951 | |
| Trading Companies & Distributors | | | 7,720,736 | | | | — | | | | — | | | | 7,720,736 | |
| Wireless Telecommunication Services | | | 1,921,134 | | | | — | | | | — | | | | 1,921,134 | |
| Total Common Stocks | | $ | 323,645,890 | | | $ | — | | | $ | 6,488 | | | $ | 323,652,378 | |
| Exchange Traded Funds | | | 102,715,747 | | | | — | | | | — | | | | 102,715,747 | |
| Corporate Bonds | | | — | | | | 17,765,911 | | | | — | | | | 17,765,911 | |
| United States Treasury Obligations | | | — | | | | 5,462,550 | | | | — | | | | 5,462,550 | |
| Foreign Government Bonds | | | — | | | | 17,604,876 | | | | — | | | | 17,604,876 | |
| Money Market Funds | | | 61,455,619 | | | | — | | | | — | | | | 61,455,619 | |
| Total Investments in Securities | | $ | 487,817,256 | | | $ | 40,833,337 | | | $ | 6,488 | | | $ | 528,657,081 | |
| Securities Sold Short at Fair Value | | Level 1 | | | Level 2 | | | Level 3 | | | Total | |
| Common Stocks | | $ | 27,435,094 | | | $ | — | | | $ | — | | | $ | 27,435,094 | |
| Exchange Traded Funds | | | 30,404,740 | | | | — | | | | — | | | | 30,404,740 | |
| Total Securities Sold Short | | $ | 57,839,834 | | | $ | — | | | $ | — | | | $ | 57,839,834 | |
| Leuthold Funds - 2020 Annual Report | 63 |
Leuthold Funds
The following is a reconciliation of Level 3 investments for which significant unobservable inputs were used to determine fair value:
| Leuthold Core Investment Fund | | Investment in
Securities at
Fair Value | |
| Balance as of September 30, 2019 | | $ | 6,415 | |
| Accrued discounts/premiums | | | — | |
| Realized gain (loss) | | | — | |
| Change in unrealized appreciation | | | 73 | * |
| Purchases | | | — | |
| Sales | | | — | |
| Transfer into and/or out of Level 3 | | | — | |
| Balance as of September 30, 2020 | | $ | 6,488 | (1) |
Change in net unrealized appreciation during
the period for Level 3 investments held at September 30, 2020: | | $ | 73 | |
| * | Unrealized appreciation is due to a change in foreign currency exchange rate. |
| (1) | The security (China Lumena New Materials Corp.) is classified as a Level 3 security due to a halt in trading of the security on March 25, 2014. The security is valued at fair value as determined in good faith by the Directors. The Adviser submits a report to the Directors setting forth the factors considered in determining the price. The significant unobservable input used in the fair valuation of this security is a discount of 95% from the last traded price of Hong Kong Dollar 1.25. Significant changes in the discount rate may result in a change in fair value measurement. For the duration of the period, the discount was 95%. The security underwent a 1:40 reverse split on February 18, 2020, resulting in a fair value price of Hong Kong Dollar 2.40. |
| Leuthold Global Fund |
| Investments at Fair Value | | Level 1 | | | Level 2 | | | Level 3 | | | Total | |
| Common Stocks | | | | | | | | | | | | | | | | |
| Capital Markets | | $ | 856,234 | | | $ | 125,151 | | | $ | — | | | $ | 981,385 | |
| Communications Equipment | | | 152,529 | | | | — | | | | — | | | | 152,529 | |
| Construction Materials | | | 222,304 | | | | 605,136 | | | | — | | | | 827,440 | |
| Entertainment | | | 711,006 | | | | 433,935 | | | | — | | | | 1,144,941 | |
| Food & Staples Retailing | | | 717,445 | | | | 300,561 | | | | — | | | | 1,018,006 | |
| Health Care Providers & Services | | | 1,366,304 | | | | 258,281 | | | | — | | | | 1,624,585 | |
| Household Durables | | | 1,011,073 | | | | 364,552 | | | | — | | | | 1,375,625 | |
| Insurance | | | 159,199 | | | | 177,725 | | | | — | | | | 336,924 | |
| Interactive Media & Services | | | 794,739 | | | | 82,261 | | | | — | | | | 877,000 | |
| IT Services | | | 561,322 | | | | 488,226 | | | | — | | | | 1,049,548 | |
| Life Sciences Tools & Services | | | 500,503 | | | | 305,041 | | | | — | | | | 805,544 | |
| Metals & Mining | | | 493,000 | | | | 420,157 | | | | — | | | | 913,157 | |
| Paper & Forest Products | | | — | | | | — | | | | 48,077 | | | | 48,077 | |
| Pharmaceuticals | | | 1,030,205 | | | | — | | | | — | | | | 1,030,205 | |
| Semiconductors & Semiconductor Equipment | | | 1,033,488 | | | | 870,904 | | | | — | | | | 1,904,392 | |
| Software | | | 414,344 | | | | 269,621 | | | | — | | | | 683,965 | |
| Specialty Retail | | | 78,067 | | | | — | | | | — | | | | 78,067 | |
| Trading Companies & Distributors | | | 317,469 | | | | 357,158 | | | | — | | | | 674,627 | |
| Total Common Stocks | | $ | 10,419,231 | | | $ | 5,058,709 | | | $ | 48,077 | | | $ | 15,526,017 | |
| Exchange Traded Funds | | | 4,615,002 | | | | — | | | | — | | | | 4,615,002 | |
| Corporate Bonds | | | — | | | | 582,853 | | | | — | | | | 582,853 | |
| United States Treasury Obligations | | | — | | | | 298,500 | | | | — | | | | 298,500 | |
| Foreign Government Bonds | | | — | | | | 1,155,134 | | | | — | | | | 1,155,134 | |
| Money Market Funds | | | 2,590,700 | | | | — | | | | — | | | | 2,590,700 | |
| Total Investments in Securities | | $ | 17,624,933 | | | $ | 7,095,196 | | | $ | 48,077 | | | $ | 24,768,206 | |
| 64 | Leuthold Funds - 2020 Annual Report |
Leuthold Funds
| Leuthold Global Fund (continued) |
| Securities Sold Short at Fair Value | | | Level 1 | | | | Level 2 | | | | Level 3 | | | | Total | |
| Common Stocks | | $ | 756,432 | | | $ | — | | | $ | — | | | $ | 756,432 | |
| Exchange-Traded Funds | | | 1,793,010 | | | | — | | | | — | | | | 1,793,010 | |
| Total Securities Sold Short | | $ | 2,549,442 | | | $ | — | | | $ | — | | | $ | 2,549,442 | |
The following is a reconciliation of Level 3 investments for which significant unobservable inputs were used to determine fair value:
| Leuthold Global Investment Fund | | Investment in
Securities at
Fair Value | |
| Balance as of September 30, 2019 | | $ | 47,539 | |
| Accrued discounts/premiums | | | — | |
| Realized gain (loss) | | | — | |
| Change in unrealized appreciation | | | 538 | * |
| Purchases | | | — | |
| Sales | | | — | |
| Transfer into and/or out of Level 3 | | | — | |
| Balance as of September 30, 2020 | | $ | 48,077 | (1) |
Change in net unrealized appreciation during
the period for Level 3 investments held at September 30, 2020: | | $ | 538 | |
| * | Unrealized appreciation is due to a change in foreign currency exchange rate. |
| (1) | The security (China Forestry Holdings Co., Ltd.) is classified as a Level 3 security due to a halt in trading of the security on January 26, 2011. The security is valued at fair value as determined in good faith by the Directors. The Adviser submits a report to the Directors setting forth the factors considered in determining the price. The significant unobservable input used in the fair valuation of this security is a discount of 95% from the last traded price of Hong Kong Dollar 2.95. Significant changes in the discount rate may result in a change in fair value measurement. For the duration of the period the discount was 95%. |
| Leuthold Select Industries Fund |
| Investments at Fair Value | | | Level 1 | | | | Level 2 | | | | Level 3 | | | | Total | |
| Common Stocks | | $ | 8,687,540 | | | $ | — | | | $ | — | | | $ | 8,687,540 | |
| Money Market Funds | | | 34,165 | | | | — | | | | — | | | | 34,165 | |
| Total Investments in Securities | | $ | 8,721,705 | | | $ | — | | | $ | — | | | $ | 8,721,705 | |
The Fund did not invest in any Level 3 securities during the period.
| Grizzly Short Fund |
| Investments at Fair Value | | Level 1 | | | Level 2 | | | Level 3 | | | Total | |
| Money Market Funds | | $ | 98,064,864 | | | $ | — | | | $ | — | | | $ | 98,064,864 | |
| Total Investments in Securities | | $ | 98,064,864 | | | $ | — | | | $ | — | | | $ | 98,064,864 | |
| Securities Sold Short at Fair Value | | Level 1 | | | Level 2 | | | Level 3 | | | Total | |
| Common Stocks | | $ | 98,870,811 | | | $ | — | | | $ | — | | | $ | 98,870,811 | |
| Exchange Traded Funds | | | 24,717,225 | | | | — | | | | — | | | | 24,717,225 | |
| Total Securities Sold Short | | $ | 123,588,036 | | | $ | — | | | $ | — | | | $ | 123,588,036 | |
The Fund did not invest in any Level 3 securities during the period.
| Leuthold Funds - 2020 Annual Report | 65 |
Leuthold Funds
| Leuthold Core ETF |
| Investments at Fair Value | | Level 1 | | | Level 2 | | | Level 3 | | | Total | |
| Exchange Traded Funds | | $ | 10,742,862 | | | $ | — | | | $ | — | | | $ | 10,742,862 | |
| Money Market Funds | | | 593,695 | | | | — | | | | — | | | | 593,695 | |
| Total Investments in Securities | | $ | 11,336,557 | | | $ | — | | | $ | — | | | $ | 11,336,557 | |
The Fund did not invest in any Level 3 securities during the period.
The Leuthold Core ETF has provided additional disclosures below regarding derivatives and hedging activity intending to improve financial reporting by enabling investors to understand how and why the Fund uses futures contracts (a type of derivative), how they are accounted for and how they affect an entity’s results of operations and financial position. The Fund may use derivatives for risk management purposes or as part of its investment strategies. Derivatives are financial contracts whose values depend on, or are derived from, the value of an underlying asset, reference rate, or index. The Fund may use derivatives to earn income and enhance returns, to hedge or adjust the risk profile of its portfolio, to replace more traditional direct investments, and to obtain exposure to otherwise inaccessible markets.
The average notional amount for futures contracts is based on the monthly notional amounts. The notional amount for futures contracts represents the U.S. dollar value of the contract as of the day of opening the transaction or latest contract reset date. The Leuthold Core ETF’s average notional value of futures contracts outstanding during the period ended September 30, 2020, was $503,735. The following tables show the effects of derivative instruments on the financial statements. As of September 30, 2020, the Leuthold Core ETF did not hold any futures contracts.
Statements of Operations
The effect of derivative instruments on the Statements of Operations for the period ended September 30, 2020:
| Instrument | | Location of Gain (Loss) on Derivatives Recognized in Income | | Realized Gain (Loss) on Derivatives | | | Change in Unrealized Appreciation (Depreciation) on Derivatives | |
| Equity Index Contracts - Futures | | Net Realized and Net Unrealized Gain (Loss) on Futures Contracts | | $ | (87,290 | ) | | $ | — | |
The Leuthold Core Investment Fund, Leuthold Global Fund, Leuthold Select Industries Fund, and Grizzly Short Fund did not have derivatives activity during the year ended September 30, 2020.
For further information regarding security characteristics, see the Schedules of Investments and and Schedules of Securities Sold Short.
| c) | Federal Income Taxes – Provision for federal income taxes or excise taxes has not been made since the Funds have elected to be taxed as “regulated investment companies” and intend to distribute substantially all taxable income to shareholders and otherwise comply with the provisions of the Internal Revenue Code applicable to regulated investment companies. Distributions from net realized gains for book purposes may include short-term capital gains, which are included as ordinary income to shareholders for tax purposes. The Funds also designate as distributions of long-term gains, to the extent necessary to fully distribute such capital gains, earnings and profits distributed to shareholders on the redemption of shares. |
| 66 | Leuthold Funds - 2020 Annual Report |
Leuthold Funds
The tax character of distributions paid during the fiscal years ended September 30, 2020 and 2019 was as follows:
| Year Ended September 30, 2020 |
| | | Leuthold | | | | | | | Leuthold | | | | | | | |
| | | Core | | | Leuthold | | | Select | | | Grizzly | | | Leuthold | |
| | | Investment | | | Global | | | Industries | | | Short | | | Core | |
| | | Fund | | | Fund | | | Fund | | | Fund | | | ETF | |
| Distributions paid from: | | | | | | | | | | | | | | | | | | | | |
| Ordinary income | | $ | 771,119 | | | $ | 258,988 | | | $ | — | | | $ | 52,038 | | | $ | — | |
| Long-term capital gain* | | | 9,469,076 | | | | — | | | | 328,244 | | | | — | | | | — | |
| Total distributions paid | | $ | 10,240,195 | | | $ | 258,988 | | | $ | 328,244 | | | $ | 52,038 | | | $ | — | |
| Year Ended September 30, 2019 | |
| | | Leuthold | | | | | | Leuthold | | | | |
| | | Core | | | Leuthold | | | Select | | | Grizzly | |
| | | Investment | | | Global | | | Industries | | | Short | |
| | | Fund | | | Fund | | | Fund | | | Fund | |
| Distributions paid from: | | | | | | | | | | | | | | | | |
| Ordinary income | | $ | 2,916,524 | | | $ | 198,337 | | | $ | — | | | $ | 838,199 | |
| Long-term capital gain* | | | 72,654,792 | | | | 5,455,871 | | | | 1,295,440 | | | | — | |
| Total distributions paid | | $ | 75,571,316 | | | $ | 5,654,208 | | | $ | 1,295,440 | | | $ | 838,199 | |
| * | The funds designate these distributions as long-term capital gain dividends per IRC Sec. 852(b)(3)(C) in the 20-percent group (which may be taxed at a 20-percent rate, a 15-percent rate or 0-percent rate, depending on the shareholder’s taxable income). |
At September 30, 2020, the components of accumulated earnings (deficit) on a tax basis were as follows:
| | | Leuthold | | | | | | Leuthold | | | | | | | |
| | | Core | | | Leuthold | | | Select | | | Grizzly | | | Leuthold | |
| | | Investment | | | Global | | | Industries | | | Short | | | Core | |
| | | Fund | | | Fund | | | Fund | | | Fund | | | ETF | |
| Undistributed ordinary income | | $ | — | | | $ | 58,805 | | | $ | — | | | $ | — | | | $ | 67,683 | |
| Undistributed long-term gains | | | 678,676 | | | | — | | | | 440,286 | | | | — | | | | — | |
| Distributable earnings | | | 678,676 | | | | 58,805 | | | | 440,286 | | | | — | | | | 67,683 | |
| Capital loss carryover and late-year losses | | | — | | | | (1,878,791 | ) | | | (8,921 | ) | | | (310,537,706 | ) | | | (138,087 | ) |
| Other accumulated gains (losses) | | | (730,220 | ) | | | (20,058 | ) | | | — | | | | (2,361,084 | ) | | | — | |
| Unrealized appreciation (depreciation) | | | 123,211,894 | | | | 1,872,747 | | | | 2,946,490 | | | | (4,056,679 | ) | | | 656,639 | |
| Total accumulated earnings (deficit) | | $ | 123,160,350 | | | $ | 32,703 | | | $ | 3,377,855 | | | $ | (316,955,469 | ) | | $ | 586,235 | |
Net investment income and realized gains and losses for federal income tax purposes may differ from that reported on the financial statements because of permanent book-to-tax differences. U.S. Generally Accepted Accounting Principles (“U.S. GAAP”) requires that permanent differences between financial reporting and tax reporting be reclassified between various components of net assets. These differences are primarily due to partnership adjustments, securities sold short, earnings and profits distributed to shareholders on the redemption of shares, net operating losses, realized gain on redemptions in kind, and expiration of capital losses.
| Leuthold Funds - 2020 Annual Report | 67 |
Leuthold Funds
Additionally, U.S. GAAP requires that certain components of net assets relating to permanent differences be reclassified between financial and tax reporting. These reclassifications have no effect on net assets or net asset value per share. For the year ended September 30, 2020, the following table shows the reclassifications made:
| | | Distributable | | | Paid In | |
| | | Earnings | | | Capital | |
| Leuthold Core Investment Fund | | $ | (3,389,434 | ) | | $ | 3,389,434 | |
| Leuthold Global Fund | | | 209 | | | | (209 | ) |
| Leuthold Select Industries Fund | | | (167,848 | ) | | | 167,848 | |
| Grizzly Short Fund | | | — | | | | — | |
| Leuthold Core ETF | | | 14,570 | | | | (14,570 | ) |
Under current law, the Funds may carry forward net capital losses indefinitely to use to offset capital gains realized in future years. Capital losses realized will carry forward retaining their classification as long-term or short-term losses.
| | | Leuthold | | | | | | Leuthold | | | | | | | |
| | | Core | | | Leuthold | | | Select | | | Grizzly | | | Leuthold | |
| | | Investment | | | Global | | | Industries | | | Short | | | Core | |
| | | Fund | | | Fund | | | Fund | | | Fund | | | ETF | |
| Unlimited Short-Term | | $ | — | | | $ | (1,878,791 | ) | | $ | — | | | $ | (308,444,597 | ) | | $ | (85,714 | ) |
| Unlimited Long-Term | | | — | | | | — | | | | — | | | | — | | | | (52,373 | ) |
The Leuthold Select Industries Fund and Grizzly Short Fund intend to defer and treat $8,921 and $2,093,109, respectively, of qualified late year ordinary losses incurred during the fiscal year ended September 30, 2020 as arising on the first day of the fiscal year ending September 30, 2021.
As of September 30, 2020, the Funds had no tax positions that did not meet the “more-likely-than-not” threshold of being sustained by the applicable tax authority. Generally, tax authorities can examine all the tax returns filed for the last three years. The Funds recognize interest and penalties, if any, related to unrecognized tax benefits as income tax expense in the Statements of Operations. During the year ended September 30, 2020, the Funds did not incur any interest or penalties.
| d) | Distributions to Shareholders – Dividends from net investment income, if any, are declared and paid quarterly for the Leuthold Core Investment Fund, Leuthold Global Fund, Leuthold Select Industries Fund, and Grizzly Short Fund, and are declared and paid annually for the Leuthold Core ETF. Distributions of net realized capital gains, if any, are declared and paid at least annually. |
| e) | Use of Estimates – The preparation of financial statements in conformity with U.S. GAAP requires management to make estimates and assumptions that affect the reported amounts of assets and liabilities and disclosure of contingent assets and liabilities at the date of the financial statements and the reported amounts of revenues and expenses during the reporting period. Actual results could differ from those estimates. |
| 68 | Leuthold Funds - 2020 Annual Report |
Leuthold Funds
| f) | Basis for Consolidation for the Leuthold Core Investment Fund and Leuthold Global Fund – Leuthold Core, Ltd. and Leuthold Global, Ltd. (the “Subsidiaries”) previously acted as investment vehicles in order to enter into certain investments for the Leuthold Core Investment Fund and Leuthold Global Fund, respectively. The Subsidiaries were liquidated in May 2018 and, therefore, the financial statements of these Funds are no longer consolidated. |
| g) | Securities Sold Short – For financial statement purposes, an amount equal to the required amount of collateral to be segregated for securities sold short is included in the Statements of Assets and Liabilities as an asset. The amount of the securities sold short, shown as a liability, is subsequently marked-to-market to reflect the current value of the securities sold short. Subsequent fluctuations in the market prices of securities sold short may require purchasing the securities at prices which could differ from the amount reflected in the Statements of Assets and Liabilities. The Funds are liable for any dividends or interest payable on securities sold short. As collateral for their securities sold short, the Funds are required under the 1940 Act to maintain segregated assets consisting of cash, cash equivalents, or liquid securities. These segregated assets are valued consistent with Note 1a. The amount of segregated assets is required to be adjusted daily to reflect changes in the fair value of the securities sold short. The Leuthold Core Investment Fund, Leuthold Global Fund, and Grizzly Short Fund’s collateral at broker for securities sold short is with one major international security dealer. |
With regard to the cash collateral that is posted with counterparties, the Funds have established a collateral account for each respective counterparty with its custodian (the “Account”) and have entered into a tri-party agreement with the custodian and the respective counterparty regarding the transfer of assets to and from the Account.
The Adviser reviews each Account on a daily basis to ensure that the Account does not maintain a material amount of cash collateral in excess of what is required by the applicable counterparty (the amount of collateral required by such counterparty is subject to change and generally not known until the next business day, which necessitates the maintenance of a minimum amount of excess cash collateral). In the event that the excess cash collateral in an Account is equal to or in excess of the greater of $250,000 or 3% of the total assets of the applicable Fund calculated at each month end, then the applicable Fund, pursuant to the tri-party agreement, will instruct the custodian to sweep such excess cash collateral into the Fund’s interest bearing account with the custodian. The amount of collateral held related to this tri-party agreement is included in the Statement of Assets and Liabilities as an asset.
| h) | Other – Investment and shareholder transactions are recorded on the trade date. The Funds determine the gain or loss realized from the investment transactions by comparing the original cost of the security lot sold with the net sales proceeds. The Funds utilize an identified lot approach to transactions. Dividend income is recognized on the ex-dividend date or as soon as information is available to the Funds, and interest income is recognized on an accrual basis. Discounts and premiums on bonds are amortized using the yield to maturity method over the life of the respective bond. For financial reporting purposes, the Funds isolate changes in the exchange rate of investment securities from the fluctuations arising from changes in the market prices of securities for realized gains and losses. |
| i) | Expenses – Expenses that directly relate to one of the Funds are charged to that Fund. Other operating expenses of the Funds, such as Directors’ fees and expenses, insurance expense, and legal fees are allocated between the Funds based on the relative net asset value of the individual Funds. |
| Leuthold Funds - 2020 Annual Report | 69 |
Leuthold Funds
| j) | Counterparty Risk – Counterparty risk may arise as the result of the failure of a counterparty to a securities contract to comply with the terms of the contract. Potential counterparty risk is measured by the creditworthiness of the counterparty and additional risk may arise from unanticipated events affecting the value of the underlying security. |
| k) | Managed Futures Strategy/Commodities Risk (Leuthold Core ETF only) – The Fund may invest in underlying investments that principally invest in the commodities markets through investment in managed futures programs. Such investments may subject an underlying investment to greater volatility than investments in traditional securities. Commodities are real assets such as oil, agriculture, livestock, industrial metals, and precious metals such as gold or silver. Prices of commodities and related contracts may fluctuate significantly over short periods for a variety of reasons, including weather and natural disasters; pandemics and other global health emergencies; governmental, agricultural, trade, fiscal, monetary, and exchange control programs and policies; acts of terrorism; tariffs; and U.S. and international economic, political, military and regulatory developments. The demand and supply of these commodities may also fluctuate widely based on such factors as interest rates, investors’ expectations with respect to the rate of inflation, currency exchange rates, the production and cost levels of the producers and/or forward selling by such producers, global or regional political, economic, or financial events, purchases and sales by central banks, and trading activities by hedge funds and other commodity funds. Commodity underlying investments may use derivatives, such as futures, options, and swaps, which expose them to further risks, including counterparty risk (i.e., the risk that the institution on the other side of the trade will default). |
| l) | Shares May Trade at Prices Other Than NAV (Leuthold Core ETF only) – As with all exchange traded funds (“ETFs”), shares may be bought and sold in the secondary market at market prices. Although it is expected that the market price of shares will approximate the Fund’s net asset value (“NAV”), there may be times when the market price of shares is more than the NAV intra-day (premium) or less than the NAV intra-day (discount) due to supply and demand of shares or during periods of market volatility. This risk is heightened in times of market volatility, periods of steep market declines, and periods when there is limited trading activity for shares in the secondary market, in which case such premiums or discounts may be significant. |
| m) | Authorized Participants, Market Makers and Liquidity Providers Concentration Risk (Leuthold Core ETF only) –The Fund has a limited number of financial institutions that may act as authorized participants (“APs”). In addition, there may be a limited number of market makers and/or liquidity providers in the marketplace. To the extent either of the following events occur, shares may trade at a material discount to NAV and possibly face delisting: (i) APs exit the business or otherwise become unable to process creation and/or redemption orders and no other APs step forward to perform these services, or (ii) market makers and/or liquidity providers exit the business or significantly reduce their business activities and no other entities step forward to perform their functions. |
| n) | Recently Issued Accounting Pronouncements – In August 2018, the FASB issued ASU No. 2018-13, Fair Value Measurement (Topic 820): Disclosure Framework-Changes to the Disclosure Requirements for Fair Value Measurement, which changes the fair value measurement disclosure requirements of Topic 820. The amendments in ASU No. 2018-13 are the result of a broader disclosure project called FASB Concept Statement, Conceptual Framework for Financial Reporting-Chapter 8: Notes to Financial Statements. The objective and primary focus of the project are to improve the effectiveness of disclosures in the notes to the financial statements by facilitating clear communication of the information required by GAAP that is most important to users of the financial statements. ASU No. 2018-13 is effective for all entities for fiscal years beginning after December 15, 2019, including interim periods therein. Early adoption is permitted for any eliminated or modified disclosures upon issuance of ASU No. 2018-13. Management has chosen to early adopt the revised disclosures for the fiscal period ended September 30, 2020. |
| 70 | Leuthold Funds - 2020 Annual Report |
Leuthold Funds
| o) | Subsequent Events – In preparing these financial statements, the Funds have evaluated events and transactions for potential recognition or disclosure through the date the financial statements were issued. The global outbreak of coronavirus disease 2019 (“COVID-19”) has disrupted global economic markets and adversely affected individual companies and investment products. The prolonged economic impact of COVID-19 is uncertain. The operation and financial performance of the issuers of securities in which the Funds invest depends on future developments, including the duration and spread of the outbreak, and such uncertainty may in turn impact the value of the Funds’ investments. |
| 2. | INVESTMENT TRANSACTIONS |
Purchases and sales of investment securities, other than short-term investments and securities sold short, for the year ended September 30, 2020 are summarized below.
| | | Leuthold | | | | | | Leuthold | | | | |
| | | Core | | | Leuthold | | | Select | | | Leuthold | |
| | | Investment | | | Global | | | Industries | | | Core | |
| | | Fund | | | Fund | | | Fund | | | ETF | |
| Purchases | | $ | 271,210,658 | | | $ | 14,346,754 | | | $ | 7,058,607 | | | $ | 12,656,203 | |
| Sales | | | 364,150,455 | | | | 37,803,049 | | | | 11,021,940 | | | | 2,553,252 | |
There were no purchases or sales of investment securities in the Grizzly Short Fund because this Fund invests only in securities sold short.
At September 30, 2020, gross unrealized appreciation and depreciation of investments and securities sold short and cost of investments and cost of securities sold short for tax purposes were as follows:
| | | Leuthold | | | | | | Leuthold | | | | | | | |
| | | Core | | | Leuthold | | | Select | | | Grizzly | | | Leuthold | |
| | | Investment | | | Global | | | Industries | | | Short | | | Core | |
| | | Fund | | | Fund | | | Fund | | | Fund | | | ETF | |
| Tax cost of investments | | $ | 401,855,441 | | | $ | 22,940,546 | | | $ | 5,775,215 | | | $ | 98,064,864 | | | $ | 10,679,918 | |
| Unrealized appreciation | | | 134,039,712 | | | | 3,658,912 | | | | 3,009,900 | | | | — | | | | 713,700 | |
| Unrealized depreciation | | | (7,233,351 | ) | | | (1,832,786 | ) | | | (63,410 | ) | | | — | | | | (57,061 | ) |
| Net unrealized appreciation (depreciation) | | $ | 126,806,361 | | | $ | 1,826,126 | | | $ | 2,946,490 | | | $ | — | | | $ | 656,639 | |
The differences between book and tax basis of unrealized appreciation (depreciation) are primarily attributable to the tax deferral of losses on wash sales and passive foreign investment company transactions.
| Leuthold Funds - 2020 Annual Report | 71 |
Leuthold Funds
The Leuthold Core Investment Fund owned 5% or more of the voting securities of the following companies during the year ended September 30, 2020. As a result, these companies are deemed to be affiliates of the Leuthold Core Investment Fund as defined by the 1940 Act. Transactions during the period in these securities of affiliated companies were as follows:
| Leuthold Core Investment Fund | |
| Security Name | | Share Balance 09/30/20 | | | Fair Value at 09/30/19 | | | Purchases | | | Sales | | | Realized Gain (Loss) | | | Change in Unrealized Appreciation | | | Fair Value at 09/30/20 | | | Dividend Income | |
| Invesco Currency Shares Japanese Yen Trust | | | 194,533 | | | $ | 19,614,081 | | | $ | — | | | $ | (2,500,855 | ) | | $ | 16,036 | | | $ | 304,785 | | | $ | 17,434,047 | | | $ | — | |
| 3. | INVESTMENT ADVISORY AND OTHER AGREEMENTS |
Each of the Funds has entered into an Investment Advisory Agreement (“advisory agreement”) with the Adviser. Pursuant to its advisory agreement with the Funds, the Adviser is entitled to receive a fee, calculated daily as applied to each Fund’s average daily net assets and payable monthly, at annual rates of:
| Leuthold | | | | Leuthold | | | | |
| Core | | Leuthold | | Select | | Grizzly | | Leuthold |
| Investment | | Global | | Industries | | Short | | Core |
| Fund | | Fund | | Fund | | Fund | | ETF |
| 0.90% | | 0.90% | | 1.00% | | 1.25% | | 0.50% |
The Adviser has agreed to waive its advisory fee and/or reimburse the Funds’ other expenses, to the extent necessary to ensure that the Funds’ total operating expenses (exclusive of interest, taxes, brokerage commissions, dividends and interest on securities sold short, and extraordinary items) do not exceed the following rates, based on each Fund’s average daily net assets:
| Leuthold | | | | Leuthold | | | | |
| Core | | Leuthold | | Select | | Grizzly | | Leuthold |
| Investment | | Global | | Industries | | Short | | Core |
| Fund | | Fund | | Fund | | Fund | | ETF |
| 1.25% | | 1.85% | | 1.50% | | 2.50% | | 0.65% |
Any waiver or reimbursement is subject to later adjustments to allow the Adviser to recoup amounts previously waived or reimbursed to the extent actual fees and expenses for a fiscal period are less than each Fund’s expense limitation, provided, however, that the recoupment period for the Adviser is limited to three years from the time the expenses were waived or incurred and is limited to the lesser of (1) the expense cap in effect at the time of the waiver, and (2) the expense cap in effect at the time of recapture.
| 72 | Leuthold Funds - 2020 Annual Report |
Leuthold Funds
Amounts subject to future recoupment as of September 30, 2020 are as follows:
| Leuthold Global Fund |
| Year of Expiration | | Recoverable Amount |
| 9/30/2023 | | $ 13,060 |
| | | |
| Leuthold Select Industries Fund |
| Year of Expiration | | Recoverable Amount |
| 9/30/2021 | | $ 28,151 |
| 9/30/2022 | | 39,650 |
| 9/30/2023 | | 119,193 |
| | | |
| Leuthold Core ETF |
| Year of Expiration | | Recoverable Amount |
| 9/30/2023 | | $ 117,025 |
U.S. Bancorp Fund Services, LLC (“Fund Services”), doing business as U.S. Bank Global Fund Services, serves as transfer agent, administrator, and accounting services agent for the Funds. U.S. Bank, N.A. serves as custodian for the Funds.
The Leuthold Global Fund – Retail Class has adopted a distribution plan pursuant to Rule 12b-1 under the 1940 Act, whereby Rafferty Capital Markets, LLC serves as distributor. This plan allows the Fund to use up to 0.25% of its average daily net assets to pay sales, distribution, and other fees for the sale of its shares and for services provided to investors. The Fund may pay all or a portion of this fee to any securities dealer, financial institution, or any other person who renders personal service to the Fund’s shareholders, assists in the maintenance of the Fund’s shareholder accounts, or who renders assistance in distributing or promoting the sale of shares of the Fund pursuant to a written agreement approved by the Directors. To the extent such fee is not paid to such persons, the Fund may use the fee for its expenses of distribution of its shares, including, but not limited to, payment by the Fund of the cost of preparing, printing, and distributing Prospectuses and Statements of Additional Information to prospective investors and of implementing and operating the plan.
| 5. | SUB-TRANSFER AGENT AND SHAREHOLDER SERVICING FEE PLANS |
The Funds are permitted to pay sub-transfer agent fees for various platform agreement not to exceed 0.15% of the Funds’ average daily net assets. In addition, the Retail Class shares of the Leuthold Core Investment Fund, Leuthold Select Industries Fund, and Grizzly Short Fund have adopted a Shareholder Servicing Fee Plan not to exceed 0.15% of these Funds’ Retail Class shares average daily net assets. These fees are used to finance certain activities related to servicing and maintaining shareholder accounts. Sub-transfer agent and shareholder servicing fees incurred by the Funds are disclosed in the Statements of Operations.
| Leuthold Funds - 2020 Annual Report | 73 |
Leuthold Funds
The Funds enter into contracts that contain a variety of indemnifications. The Funds’ maximum exposure under these arrangements is unknown. However, the Funds have not had prior claims or losses pursuant to these contracts and expect the risk of loss to be remote.
Each Fund may invest up to 15% of net assets in illiquid investments. An “illiquid investment” is any investment that a Fund reasonably expects cannot be sold or disposed of in current market conditions in seven calendar days or less without the sale or disposition significantly changing the market value of the investment. A Fund will take into account relevant market, trading, and investment specific consideration when determining whether an investment is an illiquid investment. The illiquidity status of an investment is generally evaluated monthly. The 15% limitation may include securities whose disposition would be subject to legal restrictions (“restricted securities”). Restricted securities often have a market value lower than the market price of unrestricted securities of the same issuer and are not readily marketable without some time delay. This could result in a Fund being unable to realize a favorable price upon disposition of restricted securities and in some cases might make disposition of such securities at the time desired by the Fund impossible.
| 8. | LENDING PORTFOLIO SECURITIES |
The Funds may lend portfolio securities constituting up to 30% of total assets to unaffiliated broker dealers, banks, or other recognized institutional borrowers of securities, provided that the borrower at all times maintains cash, U.S. government securities or equivalent collateral or provides an irrevocable letter of credit in favor of the Funds equal in value to at least 100% of the value of the securities loaned. During the time portfolio securities are on loan, the borrower pays the lending Fund an amount equivalent to any dividends or interest paid on such securities, and the Fund may receive an agreed-upon amount of interest income from the borrower who delivered equivalent collateral or provided a letter of credit. Loans are subject to termination at the option of the lending Fund or the borrower. The lending Fund may pay reasonable administrative and custodial fees in connection with a loan of portfolio securities and may pay a negotiated portion of the interest earned on the cash or equivalent collateral to the borrower or placing broker. The lending Fund does not have the right to vote securities on loan but could terminate the loan and regain the right to vote if that were considered important with respect to the investment.
The primary risk in securities lending is a default by the borrower during a sharp rise in price of the borrowed security resulting in a deficiency in the collateral posted by the borrower. The Funds will seek to minimize this risk by requiring that the value of the securities loaned will be computed each day and additional collateral be furnished each day if required.
The Funds engaged in securities lending during the fiscal year ended September 30, 2020 but were not engaged in securities lending as of September 30, 2020.
| 74 | Leuthold Funds - 2020 Annual Report |
Leuthold Core Investment Fund - Retail - LCORX
Financial Highlights
| | | Year Ended
September 30,
2020 | | | Year Ended
September 30,
2019 | | | Year Ended
September 30,
2018
(Consolidated) | | | Year Ended
September 30,
2017
(Consolidated) | | | Year Ended
September 30,
2016
(Consolidated) | |
| Per Share Data(1): | | | | | | | | | | | | | | | |
| Net asset value, beginning of year | | $ | 18.77 | | | $ | 20.50 | | | $ | 20.54 | | | $ | 18.06 | | | $ | 18.44 | |
| Income (loss) from investment operations: | | | | | | | | | | | | | | | | | | | | |
| Net investment income (loss)(2) | | | 0.00 | (3) | | | 0.09 | | | | 0.05 | | | | 0.04 | | | | (0.01 | ) |
| Net realized and unrealized gain on investments and securities sold short | | | 1.24 | | | | 0.08 | | | | 0.61 | | | | 2.53 | | | | 0.32 | |
| Total from investment operations | | | 1.24 | | | | 0.17 | | | | 0.66 | | | | 2.57 | | | | 0.31 | |
| | | | | | | | | | | | | | | | | | | | | |
| Less distributions: | | | | | | | | | | | | | | | | | | | | |
| From net investment income | | | (0.04 | ) | | | (0.07 | ) | | | (0.05 | ) | | | (0.01 | ) | | | — | |
| From net realized gain | | | (0.27 | ) | | | (1.83 | ) | | | (0.65 | ) | | | (0.08 | ) | | | (0.69 | ) |
| Redemption fees(3) | | | 0.00 | | | | 0.00 | | | | 0.00 | | | | 0.00 | | | | 0.00 | |
| Total distributions | | | (0.31 | ) | | | (1.90 | ) | | | (0.70 | ) | | | (0.09 | ) | | | (0.69 | ) |
| Net asset value, end of year | | $ | 19.70 | | | $ | 18.77 | | | $ | 20.50 | | | $ | 20.54 | | | $ | 18.06 | |
| | | | | | | | | | | | | | | | | | | | | |
| Total Return | | | 6.72 | % | | | 1.21 | % | | | 3.23 | % | | | 14.31 | % | | | 1.76 | % |
| | | | | | | | | | | | | | | | | | | | | |
| Supplemental data and ratios: | | | | | | | | | | | | | | | | | | | | |
| Net assets, end of year | | $ | 276,018,345 | | | $ | 316,887,197 | | | $ | 403,095,456 | | | $ | 464,660,913 | | | $ | 524,731,192 | |
| Ratio of expenses to average net assets(4) | | | 1.34 | % | | | 1.32 | % | | | 1.38 | % | | | 1.21 | % | | | 1.29 | % |
| Ratio of net investment income (loss) to average net assets(5) | | | 0.00 | % | | | 0.48 | % | | | 0.26 | % | | | 0.20 | % | | | (0.08 | )% |
| Portfolio turnover rate(6) | | | 60.08 | % | | | 66.68 | % | | | 79.00 | % | | | 52.36 | % | | | 109.32 | % |
| (1) | For a share outstanding throughout the period. Rounded to the nearest cent. |
| (2) | Net investment income (loss) per share is calculated based on average shares outstanding. |
| (3) | Amount represents less than $0.005 per share. |
| (4) | The ratio of expenses to average net assets includes dividends and interest on securities sold short. The expense ratios excluding dividends and interest on securities sold short were 1.20% for the year ended September 30, 2020, 1.20% for the year ended September 30, 2019, 1.19% for the year ended September 30, 2018, 1.19% for the year ended September 30, 2017, and 1.17% for the year ended September 30, 2016. |
| (5) | The net investment income ratios include dividends and interest on securities sold short. |
| (6) | The portfolio turnover rate excludes purchases and sales of securities sold short. |
| See Notes to the Financial Statements. | Leuthold Funds - 2020 Annual Report | 75 |
Leuthold Core Investment Fund - Institutional - LCRIX
Financial Highlights
| | | Year Ended
September 30,
2020 | | | Year Ended
September 30,
2019 | | | Year Ended
September 30,
2018
(Consolidated) | | | Year Ended
September 30,
2017
(Consolidated) | | | Year Ended
September 30,
2016
(Consolidated) | |
| Per Share Data(1): | | | | | | | | | | | | | | | |
| Net asset value, beginning of year | | $ | 18.81 | | | $ | 20.53 | | | $ | 20.56 | | | $ | 18.08 | | | $ | 18.43 | |
| Income from investment operations: | | | | | | | | | | | | | | | | | | | | |
| Net investment income(2) | | | 0.02 | | | | 0.11 | | | | 0.08 | | | | 0.06 | | | | 0.01 | |
| Net realized and unrealized gain on investments and securities sold short | | | 1.23 | | | | 0.09 | | | | 0.60 | | | | 2.53 | | | | 0.33 | |
| Total from investment operations | | | 1.25 | | | | 0.20 | | | | 0.68 | | | | 2.59 | | | | 0.34 | |
| | | | | | | | | | | | | | | | | | | | | |
| Less distributions: | | | | | | | | | | | | | | | | | | | | |
| From net investment income | | | (0.05 | ) | | | (0.09 | ) | | | (0.06 | ) | | | (0.03 | ) | | | — | |
| From net realized gain | | | (0.27 | ) | | | (1.83 | ) | | | (0.65 | ) | | | (0.08 | ) | | | (0.69 | ) |
| Redemption fees(3) | | | 0.00 | | | | 0.00 | | | | 0.00 | | | | 0.00 | | | | 0.00 | |
| Total distributions | | | (0.32 | ) | | | (1.92 | ) | | | (0.71 | ) | | | (0.11 | ) | | | (0.69 | ) |
| Net asset value, end of year | | $ | 19.74 | | | $ | 18.81 | | | $ | 20.53 | | | $ | 20.56 | | | $ | 18.08 | |
| | | | | | | | | | | | | | | | | | | | | |
| Total Return | | | 6.76 | % | | | 1.33 | % | | | 3.35 | % | | | 14.43 | % | | | 1.93 | % |
| | | | | | | | | | | | | | | | | | | | | |
| Supplemental data and ratios: | | | | | | | | | | | | | | | | | | | | |
| Net assets, end of year | | $ | 268,933,642 | | | $ | 301,387,112 | | | $ | 434,163,780 | | | $ | 385,390,357 | | | $ | 378,962,827 | |
| Ratio of expenses to average net assets(4) | | | 1.25 | % | | | 1.22 | % | | | 1.27 | % | | | 1.10 | % | | | 1.17 | % |
| Ratio of net investment income to average net assets(5) | | | 0.10 | % | | | 0.58 | % | | | 0.37 | % | | | 0.30 | % | | | 0.04 | % |
| Portfolio turnover rate(6) | | | 60.08 | % | | | 66.68 | % | | | 79.00 | % | | | 52.36 | % | | | 109.32 | % |
| (1) | For a share outstanding throughout the period. Rounded to the nearest cent. |
| (2) | Net investment income per share is calculated based on average shares outstanding. |
| (3) | Amount represents less than $0.005 per share. |
| (4) | The ratio of expenses to average net assets includes dividends and interest on securities sold short. The expense ratios excluding dividends and interest on securities sold short were 1.11% for the year ended September 30, 2020, 1.10% for the year ended September 30, 2019, 1.08% for the year ended September 30, 2018, 1.08% for the year ended September 30, 2017, and 1.05% for the year ended September 30, 2016. |
| (5) | The net investment income ratios include dividends and interest on securities sold short. |
| (6) | The portfolio turnover rate excludes purchases and sales of securities sold short. |
| 76 | Leuthold Funds - 2020 Annual Report | See Notes to the Financial Statements. |
Leuthold Global Fund - Retail - GLBLX
Financial Highlights
| | | Year Ended
September 30,
2020 | | | Year Ended
September 30,
2019 | | | Year Ended
September 30,
2018
(Consolidated) | | | Year Ended
September 30,
2017
(Consolidated) | | | Year Ended
September 30,
2016
(Consolidated) | |
| Per Share Data(1): | | | | | | | | | | | | | | | |
| Net asset value, beginning of year | | $ | 8.09 | | | $ | 9.11 | | | $ | 10.05 | | | $ | 9.86 | | | $ | 10.03 | |
| Income (loss) from investment operations: | | | | | | | | | | | | | | | | | | | | |
| Net investment income (loss)(2) | | | 0.00 | (3) | | | 0.02 | | | | 0.03 | | | | 0.04 | | | | (0.01 | ) |
| Net realized and unrealized gain (loss) on investments and securities sold short | | | 0.21 | | | | (0.39 | ) | | | (0.07 | ) | | | 1.02 | | | | 0.21 | |
| Total from investment operations | | | 0.21 | | | | (0.37 | ) | | | (0.04 | ) | | | 1.06 | | | | 0.20 | |
| | | | | | | | | | | | | | | | | | | | | |
| Less distributions: | | | | | | | | | | | | | | | | | | | | |
| From net investment income | | | (0.06 | ) | | | (0.01 | ) | | | (0.02 | ) | | | — | | | | — | |
| From net realized gain | | | — | | | | (0.64 | ) | | | (0.88 | ) | | | (0.87 | ) | | | (0.37 | ) |
| Redemption fees | | | — | | | | 0.00 | (3) | | | 0.00 | (3) | | | 0.00 | (3) | | | 0.00 | (3) |
| Total distributions | | | (0.06 | ) | | | (0.65 | ) | | | (0.90 | ) | | | (0.87 | ) | | | (0.37 | ) |
| Net asset value, end of year | | $ | 8.24 | | | $ | 8.09 | | | $ | 9.11 | | | $ | 10.05 | | | $ | 9.86 | |
| | | | | | | | | | | | | | | | | | | | | |
| Total Return | | | 2.56 | % | | | (3.97 | )% | | | (0.67 | )% | | | 12.02 | % | | | 1.89 | % |
| | | | | | | | | | | | | | | | | | | | | |
| Supplemental data and ratios: | | | | | | | | | | | | | | | | | | | | |
| Net assets, end of year | | $ | 4,690,110 | | | $ | 7,485,394 | | | $ | 18,362,218 | | | $ | 24,040,140 | | | $ | 78,743,516 | |
| Ratio of expenses to average net assets(4) | | | | | | | | | | | | | | | | | | | | |
| Before expense reimbursement or recovery | | | 1.94 | % | | | 1.88 | % | | | 1.75 | % | | | 1.56 | % | | | 1.82 | % |
| After expense reimbursement or recovery | | | 1.91 | % | | | 1.88 | % | | | 1.75 | % | | | 1.56 | % | | | 1.82 | % |
| Ratio of net investment income (loss) to average net assets(5) | | | | | | | | | | | | | | | | | | | | |
| Before expense reimbursement or recovery | | | (0.03 | %) | | | 0.27 | % | | | 0.28 | % | | | 0.38 | % | | | (0.15 | %) |
| After expense reimbursement or recovery | | | 0.01 | % | | | 0.27 | % | | | 0.28 | % | | | 0.38 | % | | | (0.15 | %) |
| Portfolio turnover rate(6) | | | 55.31 | % | | | 93.77 | % | | | 79.09 | % | | | 63.13 | % | | | 102.93 | % |
| (1) | For a share outstanding throughout the period. Rounded to the nearest cent. |
| (2) | Net investment income (loss) per share is calculated based on average shares outstanding. |
| (3) | Amount represents less than $0.005 per share. |
| (4) | The ratio of expenses to average net assets includes dividends and interest on securities sold short. The expense ratios excluding dividends and interest on securities sold short before and after expense reimbursement and recorvery were 1.74% and 1.69% for the year ended September 30, 2020, 1.62% and 1.62% for the year ended September 30, 2019, 1.54% and 1.54% for the year ended September 30, 2018, 1.56% and 1.56% for the year ended September 30, 2017, and 1.61% and 1.61% for the year ended September 30, 2016, respectively. |
| (5) | The net investment income (loss) ratios include dividends and interest on securities sold short. |
| (6) | The portfolio turnover rate excludes purchases and sales of securities sold short. |
| See Notes to the Financial Statements. | Leuthold Funds - 2020 Annual Report | 77 |
Leuthold Global Fund - Institutional - GLBIX
Financial Highlights
| | | Year Ended
September 30,
2020 | | | Year Ended
September 30,
2019 | | | Year Ended
September 30,
2018
(Consolidated) | | | Year Ended
September 30,
2017
(Consolidated) | | | Year Ended
September 30,
2016
(Consolidated) | |
| Per Share Data(1): | | | | | | | | | | | | | | | |
| Net asset value, beginning of year | | $ | 8.21 | | | $ | 9.23 | | | $ | 10.16 | | | $ | 9.95 | | | $ | 10.10 | |
| Income (loss) from investment operations: | | | | | | | | | | | | | | | | | | | | |
| Net investment income(2) | | | 0.02 | | | | 0.04 | | | | 0.05 | | | | 0.06 | | | | 0.01 | |
| Net realized and unrealized gain (loss) on investments and securities sold short | | | 0.21 | | | | (0.39 | ) | | | (0.07 | ) | | | 1.03 | | | | 0.21 | |
| Total from investment operations | | | 0.23 | | | | (0.35 | ) | | | (0.02 | ) | | | 1.09 | | | | 0.22 | |
| | | | | | | | | | | | | | | | | | | | | |
| Less distributions: | | | | | | | | | | | | | | | | | | | | |
| From net investment income | | | (0.06 | ) | | | (0.03 | ) | | | (0.03 | ) | | | (0.01 | ) | | | — | |
| From net realized gain | | | — | | | | (0.64 | ) | | | (0.88 | ) | | | (0.87 | ) | | | (0.37 | ) |
| Redemption fees(3) | | | 0.00 | | | | 0.00 | | | | 0.00 | | | | 0.00 | | | | 0.00 | |
| Total distributions | | | (0.06 | ) | | | (0.67 | ) | | | (0.91 | ) | | | (0.88 | ) | | | (0.37 | ) |
| Net asset value, end of year | | $ | 8.38 | | | $ | 8.21 | | | $ | 9.23 | | | $ | 10.16 | | | $ | 9.95 | |
| | | | | | | | | | | | | | | | | | | | | |
| Total Return | | | 2.79 | % | | | (3.70 | )% | | | (0.43 | )% | | | 12.28 | % | | | 2.18 | % |
| | | | | | | | | | | | | | | | | | | | | |
| Supplemental data and ratios: | | | | | | | | | | | | | | | | | | | | |
| Net assets, end of year | | $ | 21,096,867 | | | $ | 45,677,014 | | | $ | 64,388,940 | | | $ | 78,614,144 | | | $ | 103,921,200 | |
| Ratio of expenses to average net assets(4) | | | | | | | | | | | | | | | | | | | | |
| Before expense reimbursement or recovery | | | 1.73 | % | | | 1.63 | % | | | 1.50 | % | | | 1.36 | % | | | 1.57 | % |
| After expense reimbursement or recovery | | | 1.69 | % | | | 1.63 | % | | | 1.50 | % | | | 1.36 | % | | | 1.57 | % |
| Ratio of net investment income to average net assets(5) | | | | | | | | | | | | | | | | | | | | |
| Before expense reimbursement or recovery | | | 0.17 | % | | | 0.52 | % | | | 0.53 | % | | | 0.58 | % | | | 0.10 | % |
| After expense reimbursement or recovery | | | 0.21 | % | | | 0.52 | % | | | 0.53 | % | | | 0.58 | % | | | 0.10 | % |
| Portfolio turnover rate(6) | | | 55.31 | % | | | 93.77 | % | | | 79.09 | % | | | 63.13 | % | | | 102.93 | % |
| (1) | For a share outstanding throughout the period. Rounded to the nearest cent. |
| (2) | Net investment income per share is calculated based on average shares outstanding. |
| (3) | Amount represents less than $0.005 per share. |
| (4) | The ratio of expenses to average net assets includes dividends and interest on securities sold short. The expense ratios excluding dividends and interest on securities sold short before and after expense reimbursement and recovery were 1.53% and 1.49% for the year ended September 30, 2020, 1.37% and 1.37% for the year ended September 30, 2019, 1.29% and 1.29% for the year ended September 30, 2018, 1.36% and 1.36% for the year ended September 30, 2017, and 1.36% and 1.36% for the year ended September 30, 2016, respectively. |
| (5) | The net investment income ratios include dividends and interest on securities sold short. |
| (6) | The portfolio turnover rate excludes purchases and sales of securities sold short. |
| 78 | Leuthold Funds - 2020 Annual Report | See Notes to the Financial Statements. |
Leuthold Select Industries Fund - LSLTX
Financial Highlights
| | | Year Ended
September 30,
2020 | | | Year Ended
September 30,
2019 | | | Year Ended
September 30,
2018 | | | Year Ended
September 30,
2017 | | | Year Ended
September 30,
2016 | |
| Per Share Data(1): | | | | | | | | | | | | | | | |
| Net asset value, beginning of year | | $ | 25.02 | | | $ | 27.31 | | | $ | 26.32 | | | $ | 21.41 | | | $ | 21.27 | |
| Income (loss) from investment operations: | | | | | | | | | | | | | | | | | | | | |
| Net investment income (loss)(2) | | | (0.04 | ) | | | (0.03 | ) | | | (0.01 | ) | | | (0.02 | ) | | | 0.00 | (3) |
| Net realized and unrealized gain (loss) on investments | | | 2.81 | | | | (0.16 | ) | | | 2.28 | | | | 4.93 | | | | 0.45 | |
| Total from investment operations | | | 2.77 | | | | (0.19 | ) | | | 2.27 | | | | 4.91 | | | | 0.45 | |
| | | | | | | | | | | | | | | | | | | | | |
| Less distributions: | | | | | | | | | | | | | | | | | | | | |
| From net investment income | | | — | | | | — | | | | (0.01 | ) | | | — | | | | (0.03 | ) |
| From net realized gain | | | (0.73 | ) | | | (2.10 | ) | | | (1.27 | ) | | | — | | | | (0.28 | ) |
| Total distributions | | | (0.73 | ) | | | (2.10 | ) | | | (1.28 | ) | | | — | | | | (0.31 | ) |
| Net asset value, end of year | | $ | 27.06 | | | $ | 25.02 | | | $ | 27.31 | | | $ | 26.32 | | | $ | 21.41 | |
| | | | | | | | | | | | | | | | | | | | | |
| Total Return | | | 11.28 | % | | | (0.19 | )% | | | 8.89 | % | | | 22.93 | % | | | 2.09 | % |
| | | | | | | | | | | | | | | | | | | | | |
| Supplemental data and ratios: | | | | | | | | | | | | | | | | | | | | |
| Net assets, end of year | | $ | 8,677,008 | | | $ | 11,783,884 | | | $ | 18,111,932 | | | $ | 15,045,866 | | | $ | 12,630,891 | |
| Ratio of expenses to average net assets: | | | | | | | | | | | | | | | | | | | | |
| Before expense reimbursement or recovery | | | 2.75 | % | | | 1.77 | % | | | 1.65 | % | | | 1.80 | % | | | 1.72 | % |
| After expense reimbursement or recovery | | | 1.50 | % | | | 1.50 | % | | | 1.50 | % | | | 1.50 | % | | | 1.50 | % |
| Ratio of net investment income to average net assets: | | | | | | | | | | | | | | | | | | | | |
| Before expense reimbursement or recovery | | | (1.40 | )% | | | (0.39 | )% | | | (0.17 | )% | | | (0.39 | )% | | | (0.20 | )% |
| After expense reimbursement or recovery | | | (0.16 | )% | | | (0.12 | )% | | | (0.02 | )% | | | (0.09 | )% | | | 0.02 | % |
| Portfolio turnover rate | | | 73.99 | % | | | 72.87 | % | | | 104.00 | % | | | 62.72 | % | | | 118.26 | % |
| (1) | For a share outstanding throughout the period. Rounded to the nearest cent. |
| (2) | Net investment income (loss) per share is calculated based on average shares outstanding. |
| (3) | Amount represents less than $0.005 per share. |
| See Notes to the Financial Statements. | Leuthold Funds - 2020 Annual Report | 79 |
Grizzly Short Fund - GRZZX
Financial Highlights
| | | Year Ended
September 30,
2020 | | | Year Ended
September 30,
2019 | | | Year Ended
September 30,
2018 | | | Year Ended
September 30,
2017(1) | | | Year Ended
September 30,
2016(1) | |
| Per Share Data(2): | | | | | | | | | | | | | | | |
| Net asset value, beginning of year | | $ | 16.15 | | | $ | 17.65 | | | $ | 21.48 | | | $ | 24.68 | | | $ | 31.96 | |
| Income (loss) from investment operations: | | | | | | | | | | | | | | | | | | | | |
| Net investment income (loss)(3) | | | (0.31 | ) | | | 0.19 | | | | (0.03 | ) | | | (0.40 | ) | | | (0.72 | ) |
| Net realized and unrealized loss on investments and securities sold short | | | (5.01 | ) | | | (1.54 | ) | | | (3.80 | ) | | | (2.80 | ) | | | (6.56 | ) |
| Total from investment operations | | | (5.32 | ) | | | (1.35 | ) | | | (3.83 | ) | | | (3.20 | ) | | | (7.28 | ) |
| | | | | | | | | | | | | | | | | | | | | |
| Less distributions: | | | | | | | | | | | | | | | | | | | | |
| From net investment income | | | (0.01 | ) | | | (0.15 | ) | | | — | | | | — | | | | — | |
| From net realized gain | | | — | | | | — | | | | — | | | | — | | | | — | |
| Total distributions | | | (0.01 | ) | | | (0.15 | ) | | | — | | | | — | | | | — | |
| Net asset value, end of year | | $ | 10.82 | | | $ | 16.15 | | | $ | 17.65 | | | $ | 21.48 | | | $ | 24.68 | |
| | | | | | | | | | | | | | | | | | | | | |
| Total Return | | | (32.96 | )% | | | (7.62 | )% | | | (17.83 | )% | | | (12.97 | )% | | | (22.78 | )% |
| | | | | | | | | | | | | | | | | | | | | |
| Supplemental data and ratios: | | | | | | | | | | | | | | | | | | | | |
| Net assets, end of year | | $ | 123,139,517 | | | $ | 92,238,086 | | | $ | 98,948,757 | | | $ | 205,698,273 | | | $ | 178,211,844 | |
| Ratio of expenses to average net assets(4) | | | 2.84 | % | | | 2.61 | % | | | 2.64 | % | | | 2.63 | % | | | 2.65 | % |
| Ratio of net investment income (loss) to average net assets(5) | | | (2.23 | )% | | | 1.08 | % | | | (0.54 | )% | | | (1.78 | )% | | | (2.50 | )% |
| Portfolio turnover rate(6) | | | 0.00 | % | | | 0.00 | % | | | 0.00 | % | | | 0.00 | % | | | 0.00 | % |
| (1) | Per share data adjusted for 1:4 reverse split completed as of May 18, 2018. |
| (2) | For a share outstanding throughout the period. Rounded to the nearest cent. |
| (3) | Net investment income (loss) per share is calculated based on average shares outstanding. |
| (4) | The ratio of expenses to average net assets includes dividends and interest on securites sold short. The expense ratios excluding dividends and interest on securities sold short were 1.24% for the year ended September 30, 2020, 1.60% for the year ended September 30, 2019, 1.53% for the year ended September 30, 2018, 1.54% for the year ended September 30, 2017, and 1.52% for the year ended September 30, 2016. |
| (5) | The net investment income (loss) ratios include dividends and interest on securities sold short. |
| (6) | The portfolio turnover rate excludes purchases and sales of securities sold short. |
| 80 | Leuthold Funds - 2020 Annual Report | See Notes to the Financial Statements. |
Leuthold Core ETF - LCR
Financial Highlights
| | | Year Ended
September 30,
2020(1) | |
| Per Share Data(2): | | | |
| Net asset value, beginning of period | | $ | 25.00 | |
| Income from investment operations: | | | | |
| Net investment income(3) | | | 0.08 | |
| Net realized and unrealized gain on investments and futures contracts | | | 1.55 | |
| Total from investment operations | | | 1.63 | |
| | | | | |
| Less distributions: | | | | |
| From net investment income | | | — | |
| From net realized gain | | | — | |
| Total distributions | | | — | |
| Net asset value, end of period | | $ | 26.63 | |
| | | | | |
| Total Return | | | 6.52 | % |
| | | | | |
| Supplemental data and ratios: | | | | |
| Net assets, end of period | | $ | 11,317,390 | |
| Ratio of expenses to average net assets(4) | | | | |
| Before expense reimbursement or recovery | | | 2.43 | % |
| After expense reimbursement or recovery | | | 0.48 | % |
| Ratio of net investment income (loss) to average net assets(4) | | | | |
| Before expense reimbursement or recovery | | | (1.64 | )% |
| After expense reimbursement or recovery | | | 0.32 | % |
| Portfolio turnover rate | | | 47.53 | % |
| (1) | Fund commenced operations on January 6, 2020. Information presented is for the period January 6, 2020 through September 30, 2020. Information presented is not annualized, unless otherwise noted. |
| (2) | For a share outstanding throughout the period. Rounded to the nearest cent. |
| (3) | Net investment income per share is calculated based on average shares outstanding. |
| See Notes to the Financial Statements. | Leuthold Funds - 2020 Annual Report | 81 |
| 82 | Leuthold Funds - 2020 Annual Report | |
Leuthold Funds
Expense Examples – September 30, 2020 (Unaudited)
As a shareholder of the Funds, you incur two types of costs: (1) transaction costs, including redemption fees and exchange fees; and (2) ongoing costs, including management fees; distribution and/or service fees; and other Fund expenses. This example is intended to help you understand your ongoing costs (in dollars) of investing in the Funds and to compare costs with the ongoing costs of investing in other mutual funds.
The Examples are based on an investment of $1,000 invested at the beginning of the period and held the entire period (April 1, 2020 - September 30, 2020).
Actual Expenses
The first line of the following tables provides information about actual account values and actual expenses. Although the Funds charge no sales load (the Leuthold Core Investment Fund and Leuthold Global Fund charge a 2% redemption fee for redemptions made within five business days after a purchase), you will be assessed fees for outgoing wire transfers, returned checks, or stop payment orders at prevailing rates charged by U.S. Bancorp Fund Services, LLC, the Funds’ transfer agent. If you request a redemption be made by wire transfer, currently a $15.00 fee is charged by the Funds’ transfer agent. To the extent that the Funds invest in shares of other investment companies as part of its investment strategy, you will indirectly bear your proportionate share of any fees and expenses charged by the underlying funds in which a Fund invests in addition to the expenses of the Fund. Actual expenses of the underlying funds are expected to vary by fund. These expenses are not included in the following examples. The examples include, but are not limited to, management fees, shareholder servicing fees, fund accounting, custody, and transfer agent fees. However, the following examples do not include portfolio trading commissions and related expenses, and extraordinary expenses as determined under generally accepted accounting principles. You may use the information in this line, together with the amount you invested, to estimate the expenses that you paid over the period. Simply divide your account value by $1,000 (for example, an $8,600 account value divided by $1,000 = 8.6), then multiply the result by the number in the first line under the heading entitled “Expenses Paid During Period” to estimate the expenses you paid on your account during this period.
Hypothetical Examples for Comparison Purposes
The second line of the following tables provides information about hypothetical account values and hypothetical expenses based on the Funds’ actual expense ratios and an assumed rate of return of 5% per year before expenses, which is not the Funds’ actual return. The hypothetical account values and expenses may not be used to estimate the actual ending account balance or expenses you paid for the period. You may use this information to compare the ongoing costs of investing in the Funds and other funds. To do so, compare this 5% hypothetical example with the 5% hypothetical examples that appear in the shareholder reports of the other funds.
Please note that the expenses shown in the tables are meant to highlight your ongoing costs only and do not reflect any transactional costs, such as redemption fees or exchange fees. Therefore, the second line of the tables is useful in comparing ongoing costs only and will not help you determine the relative costs of owning different funds. In addition, if these transactional costs were included, your costs would have been higher.
| Leuthold Funds - 2020 Annual Report | 83 |
Leuthold Funds
Expense Example Tables (Unaudited)
Leuthold Core Investment Fund - Retail Class - LCORX
| | | Beginning Account Value April 1, 2020 | | | Ending Account Value September 30, 2020 | | | Expenses Paid During Period* April 1, 2020 - September 30, 2020 | |
| Actual** | | $ | 1,000.00 | | | $ | 1,160.20 | | | $ | 7.24 | |
| Hypothetical (5% return before expenses)*** | | | 1,000.00 | | | | 1,018.30 | | | | 6.76 | |
| * | Expenses are equal to the Fund’s annualized expense ratio of 1.34%, multiplied by the average account value over the period, multiplied by 183/366 to reflect the one-half year period. |
| ** | Excluding dividends and interest on securities sold short, your actual cost of investment in the Fund would be $6.43 and the Fund’s annualized expense ratio would be 1.19%. |
| *** | Excluding dividends and interest on securities sold short, your hypothetical cost of investment in the Fund would be $6.01 and the Fund’s annualized expense ratio would be 1.19%. |
Leuthold Core Investment Fund - Institutional Class - LCRIX
| | | Beginning Account Value April 1, 2020 | | | Ending Account Value September 30, 2020 | | | Expenses Paid During Period*
April 1, 2020 - September 30, 2020 | |
| Actual** | | $ | 1,000.00 | | | $ | 1,160.50 | | | $ | 6.81 | |
| Hypothetical (5% return before expenses)*** | | | 1,000.00 | | | | 1,018.70 | | | | 6.36 | |
| * | Expenses are equal to the Fund’s annualized expense ratio of 1.26%, multiplied by the average account value over the period, multiplied by 183/366 to reflect the one-half year period. |
| ** | Excluding dividends and interest on securities sold short, your actual cost of investment in the Fund would be $6.00 and the Fund’s annualized expense ratio would be 1.11%. |
| *** | Excluding dividends and interest on securities sold short, your hypothetical cost of investment in the Fund would be $5.60 and the Fund’s annualized expense ratio would be 1.11%. |
Leuthold Global Fund - Retail Class - GLBLX
| | | Beginning Account Value April 1, 2020 | | | Ending Account Value September 30, 2020 | | | Expenses Paid During Period* April 1, 2020 - September 30, 2020 | |
| Actual** | | $ | 1,000.00 | | | $ | 1,142.90 | | | $ | 10.66 | |
| Hypothetical (5% return before expenses)*** | | | 1,000.00 | | | | 1,015.05 | | | | 10.02 | |
| * | Expenses are equal to the Fund’s annualized expense ratio of 1.99%, multiplied by the average account value over the period, multiplied by 183/366 to reflect the one-half year period. |
| ** | Excluding dividends and interest on securities sold short, your actual cost of investment in the Fund would be $9.86 and the Fund’s annualized expense ratio would be 1.84%. |
| *** | Excluding dividends and interest on securities sold short, your hypothetical cost of investment in the Fund would be $9.27 and the Fund’s annualized expense ratio would be 1.84%. |
Leuthold Global Fund - Institutional Class - GLBIX
| | | Beginning Account Value April 1, 2020 | | | Ending Account Value September 30, 2020 | | | Expenses Paid During Period* April 1, 2020 - September 30, 2020 | |
| Actual** | | $ | 1,000.00 | | | $ | 1,143.20 | | | $ | 9.81 | |
| Hypothetical (5% return before expenses)*** | | | 1,000.00 | | | | 1,015.85 | | | | 9.22 | |
| * | Expenses are equal to the Fund’s annualized expense ratio of 1.83%, multiplied by the average account value over the period, multiplied by 183/366 to reflect the one-half year period. |
| ** | Excluding dividends and interest on securities sold short, your actual cost of investment in the Fund would be $9.16 and the Fund’s annualized expense ratio would be 1.71%. |
| *** | Excluding dividends and interest on securities sold short, your hypothetical cost of investment in the Fund would be $8.62 and the Fund’s annualized expense ratio would be 1.71%. |
| 84 | Leuthold Funds - 2020 Annual Report |
Leuthold Funds
Expense Example Tables (Unaudited) (continued)
Leuthold Select Industries Fund - Retail Class - LSLTX
| | | Beginning Account Value April 1, 2020 | | | Ending Account Value September 30, 2020 | | | Expenses Paid During Period* April 1, 2020 - September 30, 2020 | |
| Actual | | $ | 1,000.00 | | | $ | 1,370.10 | | | $ | 8.89 | |
| Hypothetical (5% return before expenses) | | | 1,000.00 | | | | 1,017.50 | | | | 7.57 | |
| * | Expenses are equal to the Fund’s annualized expense ratio of 1.50%, multiplied by the average account value over the period, multiplied by 183/366 to reflect the one-half year period. |
Grizzly Short Fund - Retail Class - GRZZX
| | | Beginning Account Value April 1, 2020 | | | Ending Account Value September 30, 2020 | | | Expenses Paid During Period* April 1, 2020 - September 30, 2020 | |
| Actual** | | $ | 1,000.00 | | | $ | 606.50 | | | $ | 10.64 | |
| Hypothetical (5% return before expenses)*** | | | 1,000.00 | | | | 1,011.75 | | | | 13.33 | |
| * | Expenses are equal to the Fund’s annualized expense ratio of 2.65%, multiplied by the average account value over the period, multiplied by 183/366 to reflect the one-half year period. |
| ** | Excluding dividends and interest on securities sold short, your actual cost of investment in the Fund would be $6.47 and the Fund’s annualized expense ratio would be 1.61%. |
| *** | Excluding dividends and interest on securities sold short, your hypothetical cost of investment in the Fund would be $8.12 and the Fund’s annualized expense ratio would be 1.61%. |
Leuthold Core ETF - LCR
| | | Beginning Account Value April 1, 2020 | | | Ending Account Value September 30, 2020 | | | Expenses Paid During Period* April 1, 2020 - September 30, 2020 | |
| Actual | | $ | 1,000.00 | | | $ | 1,174.60 | | | $ | 3.53 | |
| Hypothetical (5% return before expenses) | | | 1,000.00 | | | | 1,021.75 | | | | 3.29 | |
| * | Expenses are equal to the Fund’s annualized expense ratio of 0.65%, multiplied by the average account value over the period, multiplied by 183/366 to reflect the one-half year period. |
| Leuthold Funds - 2020 Annual Report | 85 |
Leuthold Funds
LIQUIDITY RISK MANAGEMENT PROGRAM DISCLOSURE (Unaudited)
On May 11, 2020, the Directors of Leuthold Funds, Inc. reviewed and considered a written report prepared by the program administrator of the Funds’ Liquidity Risk Management Program (the “Program”), the Funds’ Liquidity Risk Management Committee (the “Program Administrator”), which addressed the operation of the Program and assessed the Program’s adequacy and effectiveness of implementation for the most recent annual period (the “Review Period”). In considering the report, the Directors noted that the Program Administrator has determined that the Funds primarily hold, and continue to hold, assets that are highly liquid investments, and thus may rely on the exclusion from the requirements to determine and review a highly liquid investment minimum and to adopt shortfall policies and procedures. They then confirmed with the Program Administrator that no material changes were made to the Program, and reviewed all of the material features of the Program to ensure that they understand how the Program is designed to assess and manage the risk that the Funds could not meet requests to redeem shares issued by the Funds without significant dilution of remaining investors in the Funds. The Directors noted that the Program Administrator concluded that in all market conditions and under all Fund-specific stresses to date, the Funds have been able to meet redemption needs without significant dilution to the Funds’ remaining investors during the Review Period. Following the Directors’ review and discussion, they determined that they believe the disclosures in the report, taken as a whole, provide the information necessary for the Directors to effectively assess the Program and its implementation during the Review Period, and that they are comfortable with the report’s conclusion that the Program is reasonably designed to assess and manage the Funds’ liquidity risk and complies with the requirements of Rule 22e-4, and that the Program has operated as intended during the Review Period.
| 86 | Leuthold Funds - 2020 Annual Report |
Leuthold Funds
REPORT OF INDEPENDENT REGISTERED PUBLIC ACCOUNTING FIRM
To the Shareholders and Board of Directors
Leuthold Funds, Inc.
Opinion on the Financial Statements
We have audited the accompanying statements of assets and liabilities of Leuthold Funds, Inc., comprising Leuthold Core Investment Fund, Leuthold Global Fund, Leuthold Select Industries Fund, Grizzly Short Fund and Leuthold Core ETF (collectively, the “Funds”), including the schedules of investments and securities sold short (as applicable), as of September 30, 2020, and the related statements of operations, changes in net assets and the financial highlights for each of periods indicated in the table below and the related notes (collectively referred to as the “financial statements”). In our opinion, the financial statements present fairly, in all material respects, the financial position of each of the Funds at September 30, 2020, the results of their operations, changes in net assets and the financial highlights for each of the periods indicated in the table below, in conformity with U.S. generally accepted accounting principles.
| The Funds comprising Leuthold Funds, Inc. | Statement of Operations | Statement of Changes in Net Assets | Financial Highlights |
Leuthold Core Investment Fund Leuthold Global Fund Leuthold Select Industries Fund Grizzly Short Fund | For the year ended
September 30, 2020 | For each of the two years in the period ended
September 30, 2020 | For each of the five years in the period ended
September 30, 2020 |
| Leuthold Core ETF | For the period from January 6, 2020 (commencement of operations) to
September 30, 2020 |
Basis for Opinion
These financial statements are the responsibility of the Funds’ management. Our responsibility is to express an opinion on each of the Funds’ financial statements and financial highlights based on our audits. We are a public accounting firm registered with the Public Company Accounting Oversight Board (United States) (“PCAOB”) and are required to be independent with respect to the Funds in accordance with the U.S. federal securities laws and the applicable rules and regulations of the Securities and Exchange Commission and the PCAOB.
We conducted our audits in accordance with the standards of the PCAOB. Those standards require that we plan and perform the audit to obtain reasonable assurance about whether the financial statements are free of material misstatement, whether due to error or fraud. The Funds are not required to have, nor were we engaged to perform, an audit of the Funds’ internal control over financial reporting. As part of our audits we are required to obtain an understanding of internal control over financial reporting but not for the purpose of expressing an opinion on the effectiveness of the Funds’ internal control over financial reporting. Accordingly, we express no such opinion.
| Leuthold Funds - 2020 Annual Report | 87 |
Leuthold Funds
Our audits include performing procedures to assess the risks of material misstatement of the financial statements, whether due to error or fraud, and performing procedures that respond to those risks. Such procedures include examining, on a test basis, evidence regarding the amounts and disclosures in the financial statements. Our procedures included confirmation of securities owned as of September 30, 2020, by correspondence with the custodians and brokers. Our audits also included evaluating the accounting principles used and significant estimates made by management, as well as evaluating the overall presentation of the financial statements. We believe that our audits provide a reasonable basis for our opinion.

We have served as the Funds’ auditor since 2002.
Minneapolis, Minnesota
November 24, 2020
| 88 | Leuthold Funds - 2020 Annual Report |
Leuthold Funds
ADDITIONAL INFORMATION (Unaudited)
SHAREHOLDER NOTIFICATION OF FEDERAL TAX STATUS (Unaudited)
The percentage of dividend income distributed for the period ended September 30, 2020, which is designated as qualified dividend income under the Jobs and Growth Tax Relief Reconciliation Act of 2003, is as follows: Leuthold Core Investment Fund 100.00%, Leuthold Global Fund 100.00%, and Leuthold Select Industries Fund 0.00%.
The percentage of dividend income distributed for the period ended September 30, 2020, designated as qualified dividends received deduction available to corporate shareholders, is as follows: Leuthold Core Investment Fund 100.00%, Leuthold Global Fund 87.06%, and Leuthold Select Industries Fund 0.00%.
The Leuthold Core Investment Fund, Leuthold Global Fund, Grizzly Short Fund, and Leuthold Select Industries Fund designated 23.78%, 22.61%, 50.31%, and 0.00%, respectively, of their ordinary distributions paid as qualified interest related dividends under the Internal Revenue Code Section 871(k)(1)(C) for the period ended September 30, 2020.
| Leuthold Funds - 2020 Annual Report | 89 |
Leuthold Funds
ADDITIONAL DISCLOSURE REGARDING FUND DIRECTORS AND OFFICERS (UNAUDITED)
Independent Directors
Name, Year of Birth, and Address | | Position(s) Held with the Company | | Term of Office and Length of Time Served | | Principal Occupation(s) During Past Five Years | | # of Portfolios in Fund Complex Overseen By Director | | Other Directorships Held by Director |
| | | | | | | | | | | |
Lawrence L. Horsch (1934)
c/o Leuthold Weeden
Capital Management
150 South Fifth Street
Suite 1700
Minneapolis, MN 55402 | | Chairman and Director | | Indefinite, Director since 1995 | | Chairman, Eagle Management & Financial Corp., a management consulting firm. | | 5 | | Somero Enterprises and Pioneer Sales Group |
| | | | | | | | | | | |
Steven R. Schroll (1957)
c/o Leuthold Weeden
Capital Management
150 South Fifth Street
Suite 1700
Minneapolis, MN 55402 | | Director and Chair of Nominating Committee | | Indefinite, Director since 2019 | | Retired. Served as Senior Equity Portfolio Manager at Ameriprise Financial (Columbia Management) from 2002 to 2018. | | 5 | | None |
| | | | | | | | | | | |
Addison L. Piper (1946)
c/o Leuthold Weeden
Capital Management
150 South Fifth Street
Suite 1700
Minneapolis, MN 55402 | | Director and Chair of Audit Committee | | Indefinite, Director since 2009 | | Retired Chairman and Chief Executive Officer of Piper Jaffray Companies and PREDEX. | | 5 | | Piper Sandler Companies and PREDEX |
| 90 | Leuthold Funds - 2020 Annual Report |
Leuthold Funds
ADDITIONAL DISCLOSURE REGARDING FUND DIRECTORS AND OFFICERS (UNAUDITED)
Interested Persons
Name, Year of Birth, and Address | | Position(s) Held with the Company | | Term of Office and Length of Time Served | | Principal Occupation During Past Five Years | | # of Portfolios in Fund Complex Overseen By Director | | Other Directorships Held by Director |
| | | | | | | | | | | |
John C. Mueller (1968) 150 South Fifth Street Suite 1700 Minneapolis, MN 55402 | | Director President | | Indefinite, Director
since 2009 One year term, President since 2011 | | Co-Chief Executive Officer of The Leuthold Group since 2005. Involved in Sales and Marketing for The Leuthold Group since 2001. | | 5 | | None |
| | | | | | | | | | | |
Holly J. Weiss (1968) 150 South Fifth Street Suite 1700 Minneapolis, MN 55402 | | Secretary and Treasurer | | One Year Term, Secretary and Treasurer since 2009 | | Chief Financial Officer of the Adviser since 2011 and Controller of the Adviser from 2008 to 2011. | | N/A | | N/A |
| | | | | | | | | | | |
Roger A. Peters (1960) 150 South Fifth Street Suite 1700 Minneapolis, MN 55402 | | Vice President and Chief Compliance Officer and Anti-Money Laundering Officer | | One Year Term, Chief Compliance Officer since 2006 and Vice President since 2007 and Anti-Money Laundering Officer since 2011 | | Chief Compliance Officer of the Adviser since 2005. | | N/A | | N/A |
| | | | | | | | | | | |
Glenn R. Larson (1965) 150 South Fifth Street Suite 1700 Minneapolis, MN 55402 | | Assistant Secretary | | One Year Term, Assistant Secretary since 2006 | | Compliance Officer of the Adviser since 2005. | | N/A | | N/A |
The Statement of Additional Information includes additional information about the Funds’ Directors and is available free of charge upon request by calling the Funds toll free at (800) 273-6886 for the Mutual Funds and (800) 306-8817 for the Core ETF.
Information regarding the policies and procedures the Funds use to determine how to vote proxies relating to portfolio securities is available without charge on the SEC's website at http://www.sec.gov, upon request by calling toll-free (800) 273-6886 for the Mutual Funds and (800) 306-8817 for the Core ETF, or by accessing the Funds’ website at https://funds.leutholdgroup.com. Information regarding how the Funds voted proxies relating to portfolio securities during the most recent twelve-month period ended June 30 is available without charge upon request by calling toll-free (800) 273-6886 for the Mutual Funds and (800) 306-8817 for the Core ETF or on the SEC’s website at http://www.sec.gov.
| Leuthold Funds - 2020 Annual Report | 91 |
| 92 | Leuthold Funds - 2020 Annual Report |
| Leuthold Funds - 2020 Annual Report | 93 |
| 94 | Leuthold Funds - 2020 Annual Report |
Inside Back Cover - blank
| | Leuthold Funds Investment Adviser: The Leuthold Group, LLC, doing business as Leuthold Weeden Capital Management, Minneapolis, Minnesota Administrator, Transfer Agent, Fund Accountant, Shareholder Servicing Agent: U.S. Bancorp Fund Services, LLC,
Milwaukee, Wisconsin Custodian: U.S. Bank, N.A.,
Milwaukee, Wisconsin Counsel: Foley & Lardner, LLP,
Milwaukee, Wisconsin Independent Registered Public Accounting Firm: Ernst & Young LLP,
Minneapolis, Minnesota The Funds are required to file their complete schedules of portfolio holdings with the SEC for their first and third fiscal quarters as an exhibit to their reports on Form N-PORT. Once filed, the Fund’s Form N-PORT is available without charge on the SEC’s website (http://www.sec.gov) and is available upon request by calling 1-800-273-6886. This report is authorized for distribution only when preceded or accompanied by a current prospectus. | |
The registrant has adopted a code of ethics that applies to the registrant’s principal executive officer and principal financial officer. The registrant has not made any amendments to its code of ethics during the period covered by this report. The registrant has not granted any waivers from any provisions of the code of ethics during the period covered by this report. A copy of the registrant’s Code of Ethics is filed herewith.
The registrant’s board of directors has determined that there is at least one audit committee financial expert serving on its audit committee. Addison Piper is the “audit committee financial expert” and is considered to be “independent” as each term is defined in Item 3 of Form N-CSR.
The registrant has engaged its principal accountant to perform audit services, audit-related services, tax services and other services during the past two fiscal years. “Audit services” refer to performing an audit of the registrant's annual financial statements or services that are normally provided by the accountant in connection with statutory and regulatory filings or engagements for those fiscal years. “Audit-related services” refer to the assurance and related services by the principal accountant that are reasonably related to the performance of the audit. “Tax services” refer to professional services rendered by the principal accountant for tax compliance, tax advice, and tax planning. No “other services” were provided by the principal accountant. The following table details the aggregate fees billed or expected to be billed for each of the last two fiscal years for audit fees, audit-related fees, tax fees and other fees by the principal accountant.
The audit committee has adopted pre-approval policies and procedures that require the audit committee to pre-approve all audit and non-audit services of the registrant, including services provided to any entity affiliated with the registrant.
The percentage of fees billed by Ernst & Young, LLP applicable to non-audit services pursuant to waiver of pre-approval requirement were as follows:
All of the principal accountant’s hours spent on auditing the registrant’s financial statements were attributed to work performed by full-time permanent employees of the principal accountant. (If more than 50 percent of the accountant’s hours were spent to audit the registrant's financial statements for the most recent fiscal year, state how many hours were attributed to work performed by persons other than the principal accountant's full-time, permanent employees.)
The following table indicates the non-audit fees billed or expected to be billed by the registrant’s accountant for services to the registrant and to the registrant’s investment adviser (and any other controlling entity, etc.—not sub-adviser) for the last two years. The audit committee of the board of directors has considered whether the provision of non-audit services that were rendered to the registrant's investment adviser is compatible with maintaining the principal accountant's independence and has concluded that the provision of such non-audit services by the accountant has not compromised the accountant’s independence.
Not applicable to registrants who are not listed issuers (as defined in Rule 10A-3 under the Securities Exchange Act of 1934).
Schedule of Investments is included as part of the report to shareholders filed under Item 1 of this Form.
Not applicable to open-end investment companies.
Not applicable to open-end investment companies.
Not applicable to open-end investment companies.
Not Applicable.
Not applicable to open-end investment companies.
Pursuant to the requirements of the Securities Exchange Act of 1934 and the Investment Company Act of 1940, the registrant has duly caused this report to be signed on its behalf by the undersigned, thereunto duly authorized.
John Mueller, President/Principal Executive Officer
Pursuant to the requirements of the Securities Exchange Act of 1934 and the Investment Company Act of 1940, this report has been signed below by the following persons on behalf of the registrant and in the capacities and on the dates indicated.
John Mueller, President/Principal Executive Officer
Holly Weiss, Treasurer/Principal Financial Officer
* Print the name and title of each signing officer under his or her signature.