Washington, D.C. 20549
Leuthold Funds, Inc.
33 S. Sixth Street, Suite 4600, Minneapolis, MN 55402
Steven C. Leuthold
33 S. Sixth Street, Suite 4600, Minneapolis, MN 55402
Item 1. Reports to Stockholders.
September 30, 2010
The Leuthold Funds
Leuthold Core Investment Fund
Leuthold Asset Allocation Fund
Leuthold Global Fund
Leuthold Select Industries Fund
Leuthold Global Industries Fund
Leuthold Undervalued & Unloved Fund
Leuthold Global Clean Technology Fund
Leuthold Hedged Equity Fund
Grizzly Short Fund
| Letter to Shareholders | 1 |
| Expense Examples | 19 |
| Allocation of Portfolio Holdings | 25 |
| Components of Portfolio Holdings | 28 |
| Investment Graphs | 30 |
| Statements of Assets and Liabilities | 45 |
| Statements of Operations | 49 |
| Statements of Changes in Net Assets | 53 |
| Financial Highlights | 62 |
| Schedule of Investments | |
Leuthold Core Investment Fund | 77 |
Leuthold Asset Allocation Fund | 85 |
Leuthold Global Fund | 94 |
Leuthold Select Industries Fund | 103 |
Leuthold Global Industries Fund | 106 |
Leuthold Undervalued & Unloved Fund | 110 |
Leuthold Global Clean Technology Fund | 112 |
Leuthold Hedged Equity Fund | 115 |
Grizzly Short Fund | 121 |
| Notes to the Financial Statements | 125 |
| Report of Independent Registered Public Accounting Firm | 138 |
| Directors and Officers | 140 |
This page is intentionally left blank
Please do not print this text
Dear Fellow Shareholders:
The last 12-month period has been a challenging investment environment. During the fiscal year ended September 30, 2010, Leuthold Funds had mixed results; with three of our Funds solidly outperforming, two Funds about matching their respective benchmarks, and four Funds underperforming in varying degrees. Overall, we had a comparatively favorable showing for the fiscal year ended September 30, 2010. Leuthold Fund strategies are primarily long-term methodologies, and these shorter-term results should be viewed as a part of the process of building a successful long-term record. We believe that most of our shareholders understand this, as Leuthold Fund client investments over the last 12 months have held steady, while broad domestic equity mutual funds, overall, have experienced net outflows. Your support is of the utmost importance to us. We sincerely appreciate your continued commitment to Leuthold Funds.
One year ago we had a very positive, intermediate term outlook for the stock market, and anticipated we were likely in the second half of the cyclical bull market which began in mid-March 2009. We expected the bull market to prolong into at least the first half of 2010. As it turned out, by the end of March 2010 the market had gained about 75% over the preceding 13-month period. While this sounds substantial, this seemingly huge market rise only served to restore the market to the levels first achieved 12 years ago. Based on the still reasonable market valuations, and the lack of broad-based support, among other factors, we believed the market still had solid upside.
In April of 2010, it appeared that Main Street investors finally became enthusiastic toward the rising stock market, but this enthusiasm was short-lived, as a market high reached on April 23rd gave way to a steep, painful correction. This correction stretched through June and settled at lows on July 2nd, producing an S&P 500 peak-to-trough decline of -16%. This will stand as the deepest intermediate market correction in 30 years. Our stock market analysis turned “cautious” in early July, but we expected this reading would likely be reversed back to positive in the weeks ahead. Yet, in response to this cautionary reading, asset allocation portfolio equity exposure was trimmed down to a 50% level – a level we view as “neutral” – and a more prudent stance while we awaited either: 1) confirmatio n that a more defensive outlook was, in fact, suitable for market conditions, or 2) that a reversal of the signal back to a positive stance was forthcoming.
Our expectations for a reversal back to positive were met in late-September. In spite of the reduced equity exposure during what was a relatively strong rebound (July-September), performance in our asset allocation portfolios was not significantly affected by this temporary neutral equity stance. All three asset allocation portfolios posted healthy gains during this period.
| • | The 2010 action of our quantitative market analysis is similar to that of 2006, which had us reducing equity exposure in the summer…and buying new highs in September. As with this past year, the defensive adjustment back then did not produce a significant drag on performance, and the bull market at that time would go on to last another 13 months. |
| • | Because a primary objective of our asset allocation strategies is to attempt to minimize losses when market conditions appear uncertain, our disciplined market analysis is designed to alert us to potentially uncertain or negative conditions. Tactical asset allocation is a messy, humbling, and sometimes lonely endeavor. But, those are not good reasons to not attempt it. By and large, we believe our disciplines have functioned very well to aid us in achieving our intended asset allocation goals. |
The Leuthold Funds - 2010 Annual Report 1
Now, as we begin the new fiscal year for Leuthold Funds, we are back where we started 12 months ago, officially back aboard the “bull”, with both our domestic and global Major Trend Index analyses firmly positive toward the stock market.
Looking forward, we believe this ongoing cyclical bull market will carry into 2011. Emerging market indexes should move to new all-time highs before it is over, and the U.S. and most developed country markets will also move substantially higher. Additionally, the U.S. economy is slowly improving as unemployment claims edge lower and small business employment improves. With the economic trough occurring about 18 months ago, a median-duration expansion would put the current cyclical expansion peak in the second half of 2012.
As reflected by our asset allocation portfolios’ low fixed income exposure, we continue to believe that buying U.S. bonds at current levels will be a loser’s game over the next two years. It is only a matter of time before interest rates rise. Many investors are not aware that one can lose money with fixed income investments.
As with last year, we maintain the opinion that we will be experiencing a series of cyclical bull and bear markets over the next three to five years. We believe this will be the necessary base-building to the next secular bull market, perhaps commencing in the years of 2015 - 2016. This pattern would correspond to the typical market action expected when recovering from the very low multiples (bottom quartile of valuations) seen at the March 2009 market lows.
Regardless of our expectations and predictions, we believe it is more important to trust the strategy disciplines. We will always remain flexible with our asset allocation portfolios, and we will change course as necessary, if (when) the disciplines direct us to make adjustments due to changing market conditions.
FUND OVERVIEWS
Leuthold Core Investment Fund (soft-closed; available only to existing shareholders)
This Fund began trading on November 20, 1995. The strategy is flexible, value-oriented, and risk-averse. The Leuthold Core Investment Fund adjusts asset class exposure based on underlying market dynamics and trends, in order to attempt to avoid undue risk, and take advantage of areas that appear poised to outperform. Assets are actively allocated between stocks, bonds, money market instruments, foreign securities, and other alternative investments. The Fund may also hedge equity exposure and fixed income exposure through short-selling strategies when our disciplines indicate potential market vulnerabilities. While at times individual portfolio allocations may appear unconventional, they are intended to assemble as complementing positions in an effort to carry out the Fund’s guiding principle: capital appreciation over the long-te rm, attained through relatively risk averse, prudent investment selection.
| • | Through September 30, 2010, Lipper rankings placed this Fund’s ten-year performance in the top 9% of funds included within their “Flexible Portfolio Funds” category which contained 44 funds over that time frame. For the five-year period ended September 30, 2010, Lipper ranks this Fund’s performance among the top 20% out of the 82 funds in this same category. |
2 The Leuthold Funds - 2010 Annual Report
| • | Leuthold Core Investment Fund uses the Leuthold Select Industries equity selection as the primary vehicle for its U.S.-traded equity component. |
| • | Investment Guidelines: 30%-70% equity exposure and 30%-70% fixed income exposure. Under extreme market conditions, there may be a departure from these guidelines. Equity exposure is determined by our Major Trend Index which was designed to attempt to identify major (longer-term) market trends. This proprietary Leuthold index has been formally calculated on a weekly basis for 40+ years, and is currently composed of over 190 individual factors. |
Leuthold Asset Allocation Fund
This successor to the soft-closed Leuthold Core Investment Fund began trading on May 24, 2006. The strategy and objective of this Fund are identical to those of the Leuthold Core Investment Fund in terms of guiding disciplines, flexibility, asset class exposure, and risk aversion. The difference between the two portfolios is in the stock selection approach employed for the primary U.S.-traded equity allocation.
| • | The Leuthold Asset Allocation Fund currently uses a multi-strategy approach for domestic equity selection. This multi-strategy approach employs a combination of the Leuthold Select Equities and Leuthold Undervalued & Unloved strategies. |
Leuthold Global Fund
This asset allocation strategy was introduced on April 30, 2008, and can be considered the “global” equivalent of the Leuthold Core Investment Fund. The strategy and objective of this Fund are analogous to that of the Leuthold Core Investment Fund in terms of guiding disciplines, flexibility, asset class exposure, and risk aversion. The primary difference is the Leuthold Global Fund intends to invest at least 40% of assets in foreign-traded securities, including stocks, bonds, and other asset classes.
| • | The Leuthold Global Fund uses a top-down industry group approach for its equity selection. This allows us to construct a global equity portfolio based on industry group leadership trends rather than the traditional country-focused strategies typically employed by other global fund managers. We believe a focus on industry overweights and underweights, rather than countries or regions, increases the likelihood of generating superior returns as the global economy becomes increasingly interdependent. |
| • | The Leuthold Global Fund invests in U.S. and foreign-traded stocks, bonds, money market instruments, and alternative investments. When market conditions are deemed unfavorable, the Fund may also sell short certain securities in order to hedge exposure to a particular asset class. |
| • | Investment Guidelines: 30%-70% equity exposure and 30%-70% fixed income exposure. Under extreme market conditions, there may be a departure from these guidelines. Equity exposure is determined by our Global Major Trend Index which was designed to attempt to identify major (longer-term) market trends on a global basis. This proprietary Leuthold index is composed of around 110 individual factors. |
The Leuthold Funds - 2010 Annual Report 3
Leuthold Select Industries Fund (soft-closed; available only to existing shareholders)
This Fund began trading on June 19, 2000, and unlike our asset allocation strategies, it is mandated to remain 100% invested in stocks at all times. This attribute results in the potential for considerably higher volatility, higher risk, and the probability that investors will lose money when the stock market declines. The Leuthold Select Industries Fund strategy is a top-down approach, based on industry group selection and rotation, and sector concentrations. Driven by a quantitative evaluation of over 150 equity-industry groups, it attempts to detect collective strength and emerging leadership potential, while exposing areas that appear vulnerable and should be avoided.
| • | Through September 30, 2010, Lipperranked this Fund’s ten-year performance in the top 32% of funds included within their “Multi-Cap Growth” category which contained 254 funds over that time frame. |
| • | The elements of industry group rotation and sector concentrations result in this Fund’s potential for higher volatility; it is potentially more risky while offering potentially more reward. |
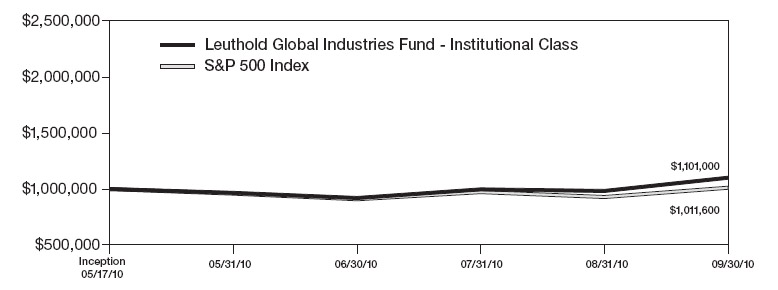
NEW Leuthold Global Industries Fund
This Fund became available on May 17, 2010. The Leuthold Global Industries Fund invests in common stocks and other equity securities from around the world, based on a disciplined, unemotional, and quantitative approach to concentrated equity group investments. The strategy employs an industry group selection/rotation approach based on the methodology of our Leuthold Select Industries strategy; however, under normal conditions at least 40% of the Leuthold Global Industries Fund’s assets will be invested in securities from non-U.S. markets.
Leuthold Undervalued & Unloved Fund
This actively managed Fund, which became available on November 14, 2006, employs a “value” stock screening methodology developed by The Leuthold Group in the mid-1970s. The strategy attempts to identify stocks with low expectations built into the price – stocks which appear undervalued and/or overlooked by Wall Street.
| • | Prior to becoming available as a mutual fund, this Undervalued & Unloved stock selection approach was actively employed as an investment theme within the Leuthold Select Industries Fund’s group framework. |
| • | This Fund was closed to investors as of end of day November 8, 2010. It will be liquidated on December 20, 2010. |
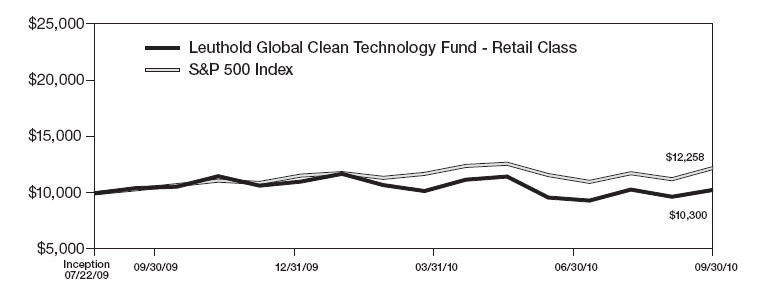
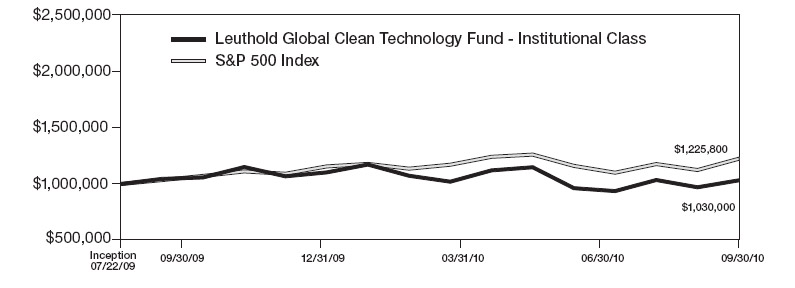
Leuthold Global Clean Technology Fund
This Fund became available on July 22, 2009, and unlike our other equity strategies, this Fund employs fundamental stock selection. The Fund allocates its investments globally, in companies that endeavor to reduce humans’ impact on the environment through energy efficient and “clean” technologies, innovations, and solutions. A confluence of factors will help increase the demand for products from firms focused on technologies that clean, preserve, and/or maximize the earth’s resources, making these firms excellent long-term investments. In brief, noteworthy dynamics include: political influence, higher fossil fuel prices, growing world population, changing energy source preferences, c ommodity price volatility, and significant and growing markets.
4 The Leuthold Funds - 2010 Annual Report
The Fund invests primarily across four clean technology sectors: Alternative Energy, Resource Conservation, Clean Water, and Clean Environment. The universe of stocks maintained for security selection is further organized among over 30 different “sub-industries”. This helps identify specific clean technology industries showing signs of unusual strength or weakness, and may be used as a basis for establishing overweight and underweight industry exposures in the Fund’s portfolio.
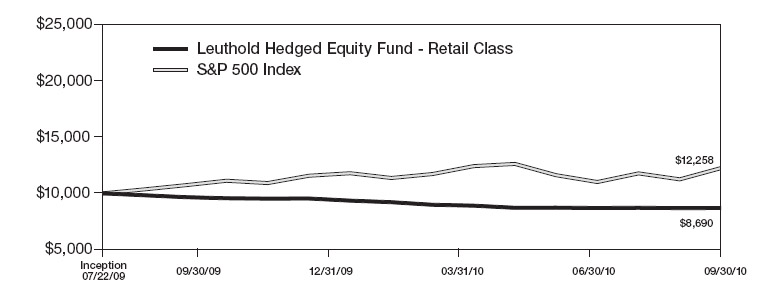
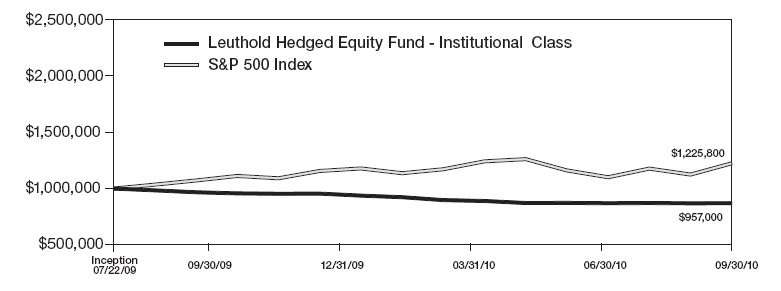
Leuthold Hedged Equity Fund
This Fund began trading on July 22, 2009, and employs a combination of our short-selling strategy and our domestic industry group selection/rotation approach. The Leuthold Hedged Equity Fund pursues its investment objective by establishing long and short positions in common stocks. This is an unleveraged Fund which seeks to maintain approximately equal weightings of gross long exposure and gross short exposure, but its objective is to produce positive net performance.
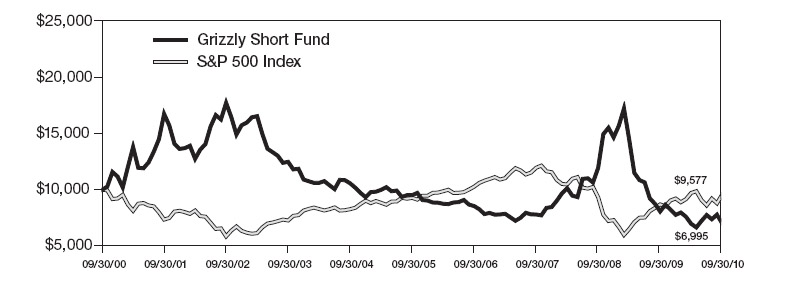
Grizzly Short Fund
Introduced on June 19, 2000, this unleveraged, actively managed Fund is 100% short individual stocks. (Short-selling strategies are aimed at profiting when stock prices decline.) Policy mandates the Grizzly Short Fund target 100% exposure in stocks sold short at all times, even when the stock market is in a rising trend; and regardless of whether our firm is bullish toward stocks.
| • | The Grizzly Short Fund typically maintains approximately equal-weighted short positions in about 60-70 individual stocks, initially selected by a multi-factor quantitative discipline. Each position is monitored daily and subject to a set of short covering disciplines. |
| • | Shareholders should anticipate they will most likely lose money investing in this Fund when stock prices are in a rising trend. |
The Grizzly Short Fund is a tool for sophisticated users. Traders, experienced investors, and speculators who anticipate the market may decline will employ the Grizzly Short Fund to tactically regulate stock market risk. It is also used in varying degrees with other multi-faceted portfolio strategies. This is not a Fund for buy and hold investors!
ANNUAL PERFORMANCE REVIEW
Herein we examine the performance dynamics, both the good and the bad, of each of the Leuthold Funds for the fiscal year ended September 30, 2010. For a number of our Leuthold Funds, performance for the fiscal year was influenced by two separate periods within this 12-month time frame: 1) The first phase was the continuation of the powerful bull market recovery between September 30, 2009, through a high on April 23, 2010, and 2) the second phase, which included a swift and steep -16% market correction between May and July 2nd, and the ensuing extension of the bull market between July and September 2010. In the performance discussions below, we make note of those Funds with performance dynamics being influenced by those two market phases.
The Leuthold Funds - 2010 Annual Report 5
Leuthold Core Investment Fund (soft-closed; available only to existing shareholders)
This is our firm’s flagship asset allocation strategy, with current assets of about $1.3 billion. For the fiscal year ended September 30th, 2010, the Core Fund (retail share class) posted a total return gain of +1.53%, significantly underperforming the S&P 500’s total return gain of +10.16% over the same time frame.
The Core Fund’s net allocation to stocks was in bullish mode between October 2009 and June 2010, then turned “cautious” from early July 2010 through late-September 2010. This cautious reading resulted in the Core Fund reducing net equity exposure to a neutral stance of 50% in early July. The lowered equity exposure was accomplished via an equity hedge, as we often do when making tactical shifts.
While the market rebounded in the July through September period, our lower equity exposure made it difficult to fully keep pace with the broad equity market. However, it was the Core Fund’s U.S.-traded equity allocation, the Leuthold Select Industries strategy, which was the root of the Core Investment Fund’s underperformance this last fiscal year. The Leuthold Select Industries equities in the Fund averaged about 46% of assets during the fiscal year ended September 30, 2010, and this strategy turned in a total return loss of -7.76% during this time frame, versus the S&P 500 total return gain of +10.16%. This equity underperformance can be directly correlated to the first nine months of the fiscal year (Oct. 2009 – June 2010). Since July 2010, the results have been much improved, in that the Select Industries equities have performed on par with the S&P 500.To us, this improvement since July is a strong indication that the more typical rotation of U.S. stock market leadership is becoming discernable; and that is a condition in which the Select Industries equity strategy thrives. We are encouraged by this turnaround over the last three months and believe this equity allocation is positioned to benefit from these more conventional market qualities in coming months. For the full details regarding Leuthold Select Industries equity strategy’s results for the fiscal year, please see the performance discussion of the Leuthold Select Industries Fund.
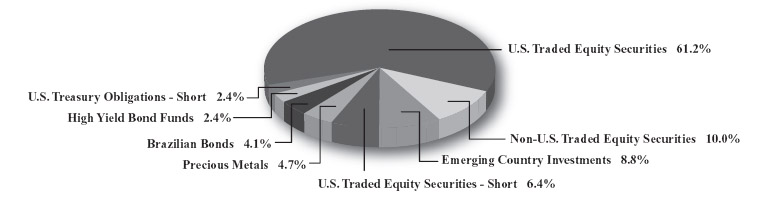
On the positive side, the Leuthold Core Investment Fund’s Emerging Market Equities exposure turned in a nearly +25% gain for the fiscal year ended September 30, 2010. As with last year, exposure here remained a significant overweight in this asset allocation strategy – on average around 18% of assets throughout the year. This emerging market equity exposure is composed of a basket of Asian-traded stocks, primarily Chinese companies, as well as emerging market open-end funds, and emerging market ETFs.
Our Fund’s normal guideline minimum for Fixed Income is 30% of assets. However, as has been the case for a number of years, our comparative analysis this last year continued to indicate that attractive fixed income opportunities on a risk-reward basis were very limited, which led us to maintain a much lower than normal minimum exposure. During the full fiscal year ended September 30, 2010, we had an average of just 9% of portfolio assets allocated to fixed income. This was carried out through relatively low allocations to select fixed income vehicles, as well as a Fixed Income Hedge, which served to additionally lower the Fund’s overall net fixed income exposure.
During the year, the Leuthold Core Investment Fund’s fixed income exposure was composed of High Yield bond funds, Brazilian bonds, and Quality Corporate bonds. We attained additional “income” through a package of REITs, as well as a short-lived investment in a package of common stocks with high dividend yields, which we dubbed, “Better Than Bonds”.
6 The Leuthold Funds - 2010 Annual Report
The Brazilian bonds and the REITs were the only allocations within our fixed income exposure that were held for the full fiscal year. These were also our best performing allocations, with the Brazilian bonds up nearly +27% and the REITs returning about +31% for the 12 months ended September 30, 2010. Due to their high correlation to the stock market, the High Yield bond funds were eliminated as the market correction escalated in May 2010. Despite the correction, during our partial year holding period the High Yield bond funds’ performance was additive, up over +4%. The Quality Corporate bonds were also a partial-year holding (purchased in June); and this small allocation (2% of assets) was a performance additive, up nearly +7% though September 30, 2010.
The remaining fixed income “proxy”, Better Than Bonds, proved to be “worse than bonds” from a performance perspective during its short 4-month holding period. This makeshift fixed income holding generated a total return loss of nearly -5%. Ironically, the Fixed Income Hedge, which was designed to offset risk of loss from our traditional fixed income investments, was the allocation providing the worst performance in the Fund for the fiscal year ended September 30, 2010. This allocation was down nearly -13%.
Despite the strong gains for most of our Fixed Income holdings, this exposure did not appreciably benefit the portfolio due to the very small allocations that we maintained. In general, bond yields remained at extremely low levels throughout the year, thereby generating strong gains for traditional bond market securities. Our portfolio’s lack of material bond market exposure prohibited the Fund from participating in this opportunity.
Although we missed opportunities in fixed income this past fiscal year, we remain extremely concerned about the coming prospects. The secular bull market in bonds, which began in the early 1980s, is ending. Our timing with reduced exposure in the Fund may be considered premature in hindsight, but we’d prefer to err on the side of caution. All of our bond analysis risk-reward studies point to impending risk. Rising interest rates are inevitable, and investors will lose money. We believe it is just a matter of time.
Alternatives: During the prior fiscal year - in early April 2009 - a small starter position in physical Gold was established, followed by an allocation to physical Silver. Combined, this physical precious metals position began the 2009-2010 fiscal year as 3% of portfolio assets. This holding was established due to our concern regarding the potential for very dangerous long-term inflation risk. The U.S. risk of monetary debasement inflation (10% - 20%) is now the highest we’ve ever seen, and the physical gold and silver offer some defense. In a sense, one could view this as an insurance policy, which, if we’re lucky we may never need to collect on. This holding was increased to 4% in September 2010, and it is anticipated to continue to be tactically increased during the coming 2010-2011 fiscal year. While it is a small portfolio allocation, it has been a big frontrunner, from a performance stance. For the fiscal year ended September 30, 2010, this physical metals allocation has produced a total return gain of over +31%.
In summary, while we are disappointed that the Leuthold Core Investment Fund’s U.S.-traded stock exposure’s lagging performance earlier in the year led to overall Core Investment Fund underperformance for the full year, remember that the Fund’s objectives, which include long-term capital appreciation and minimization of risk, are directed by very long-standing principles and disciplines. A year’s underperformance in one of the Fund’s key strategy allocations will not cause us to question the underlying methodology of the Fund as a whole.
The Leuthold Funds - 2010 Annual Report 7
| • | We believe our longer-term results testify to our success in achieving the strategy goals. For the 10-year period ended September 30, 2010, the Leuthold Core Investment Fund has a cumulative total return gain of +102.59% (+7.32% annualized), compared to the S&P 500’s -4.20% cumulative total return loss (-0.43% annualized). |
| • | We will adhere to the disciplined market analysis that drives our long-term performance. As market conditions change, you can expect the Fund to adapt exposures to attempt to best take advantage of rising markets and/or take measures to minimize risk when our disciplines indicate conditions warrant a defensive position. |
Leuthold Asset Allocation Fund
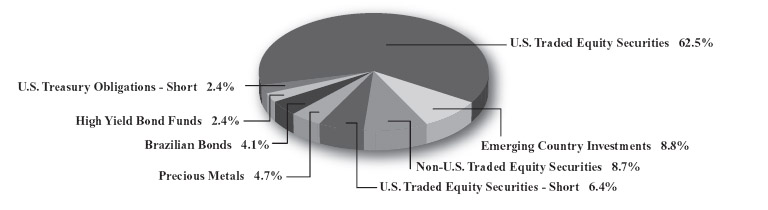
This is the successor Fund to the soft-closed Leuthold Core Investment Fund, with current assets of about $1.2 billion. For the fiscal year ended September 30, 2010, the Leuthold Asset Allocation Fund (retail share class) generated a total return gain of +9.26%, a little shy of the S&P 500’s total return gain of +10.16% over the same time frame.
As with the Leuthold Core Investment Fund, the Asset Allocation Fund’s net allocation to stocks was in bullish mode between October 2009 and June 2010; then turned “cautious” from early July 2010 through late-September 2010. This cautious reading resulted in the Asset Allocation Fund reducing net equity exposure to a neutral stance of 50% in early July. The lowered equity exposure was accomplished via an equity hedge, as we often do when making tactical shifts.
The Leuthold Asset Allocation Fund did have improved results over the Leuthold Core Investment Fund because its U.S.-traded equity selection, which is different than the Core Fund’s, did not have the same leadership challenges, and in fact, had a relatively strong, competitive return for the full fiscal year ended September 30, 2010.
For its U.S.-traded equity exposure, this Fund has used a multi-strategy approach. Since inception, this multi-strategy approach has employed a combination of the Leuthold Select Equities and Leuthold Undervalued & Unloved strategies. Both are bottom-up, quantitative methodologies and each generally contributes a different type of stock market exposure. Individually these two strategies are quite different, but when used in tandem, they allow us to construct an equity portfolio with overall characteristics suitable for an asset allocation approach, and afford us the flexibility to adjust the mix to align with our market outlook. For the fiscal year ended September 30, 2010, the combined allocations of the Leuthold Select Equities strategy and the Leuthold Undervalued & Unloved strategy contributed a total return gain of about + 9%.
The entire gain for this Fund’s U.S.-traded equity allocation can be attributed to the “pre-correction” period: September 30, 2009 through April 23, 2010. During this time frame, this position was up over +18% total return. The biggest contributors during this portion of the year were from the Industrials sector, Consumer Discretionary sector, and the Materials sector. From an industry group perspective, the most additive areas were: Construction & Farm Machinery and Industrial Conglomerates (Industrials sector); Personal Products (Consumer Staples sector); Department Stores and Apparel Retail (Consumer Discretionary sector); Managed Health Care (Health Care sector); and Diversified Metals & Mining, Specialty Chemicals, and Steel (Materials sector). No broad sector exposure contributed net losses ov er this time frame.
8 The Leuthold Funds - 2010 Annual Report
During the correction/post-correction time frame, April 23rd through fiscal year end, September 30th, this combined U.S.-traded equity exposure of the Select Equities and Undervalued & Unloved strategies gave back almost half (-8%) of the pre-correction gains. The hardest hit exposures were from the same broad sectors that contributed the pre-correction gains (Industrials, Consumer Discretionary, and Materials), with the addition of stocks from the Information Technology sector. Some of the industry groups contributing the largest losses during this portion of the year were: Computer Storage & Peripherals and Semiconductors (Information Technology sector); Department Stores, Apparel Retail, Footwear, and Apparel Accessories/Luxury Goods (Consumer Discretionary sector); Industrial Conglomerates (Industrials sector); and Hea lth Care Services (Health Care sector). Within this stock mix, there were only three broad sectors that contributed overall net gains, to a small degree, during this portion of the year: Health Care sector, Consumer Staples sector, and the Utilities sector.
Although the Leuthold Asset Allocation Fund uses a different U.S.-traded stock selection strategy, it otherwise follows the very same asset allocation directives, allocations, and asset class investment vehicles as the Leuthold Core Investment Fund. Hence, for the performance review of all the other asset classes held by this Fund during the last 12 months, aside from the U.S.-traded equities, please refer to the preceding discussion of the Leuthold Core Investment Fund performance details.
Leuthold Global Fund
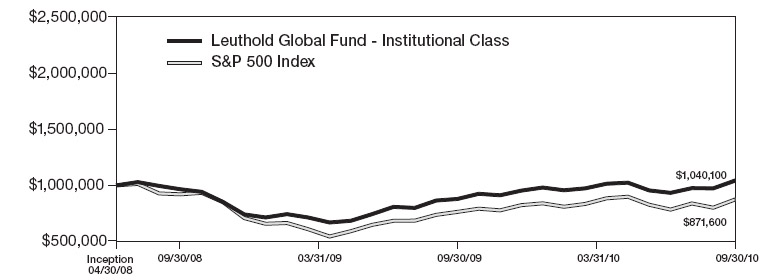
This Fund began trading on April 30, 2008, and assets under management are now nearly $300 million. This Fund offers investors a global alternative to our domestically focused tactical asset allocation strategies of the Leuthold Core Investment Fund and the Leuthold Asset Allocation Fund.
For the fiscal year ended September 30, 2010, the Leuthold Global Fund has outperformed its benchmark by a healthy margin. The Leuthold Global Fund (retail share class) produced a total return gain of +12.39% for the 12 months ended September 30, 2010, compared to the total return gain of +8.95% in the MSCI All Country World Index. Over the same time frame, the S&P 500 had a total return gain of +10.16%.
As suggested by performance, there were few detractors from the Leuthold Global Fund’s results over the last 12 months. Net equity exposure during the year ranged from highs of 69%-70% (October 2009 – December 2009) down to a neutral zone around 50% (July – mid-September). The foreign-traded stocks composed 59% and U.S.-traded stocks composed 41%, on average, of the equity allocation during the 2009-2010 fiscal year ended September 30, 2010. Within the foreign-traded securities, the largest country concentrations were spread between the United Kingdom, South Korea, Taiwan, Brazil, Sweden, and Japan. Other foreign countries boasting heavy weights in this equity portfolio this past year included Canada, Mexico, Norway, Hong Kong, China, and Australia.
While the country allocations are worthy of note from a curiosity standpoint, equity exposure is dictated by the industry groups (not countries) that appear most attractive according to our quantitative disciplines. The Leuthold Global Fund employs a top-down industry group approach for its equity selection. We believe that industry group leadership on a global basis will generate superior returns over the more traditional approach of “country” or “regional” concentrations, as the global economy has become increasingly interdependent.
The Leuthold Funds - 2010 Annual Report 9
Over the last fiscal year ended September 30, 2010, the areas of strength among our global equity exposure primarily came from the broad sectors of: Consumer Discretionary, Materials, and to a lesser degree, Information Technology. Breaking this down to the global industry group level, the biggest outperformers included Commodity Chemicals (Materials sector); Media, Automobiles, Auto Components, and Internet & Catalog Retail (Consumer Discretionary sector); Industrial Conglomerates (Industrials sector); Food & Staples Retailing (Consumer Staples sector); and Internet Software & Services (Information Technology sector).
The only broad sector contributing overall negative results to the equity portfolio was Telecommunication Services. From that sector, the specific industry group investments producing negative contributions included Emerging Diversified Telecom Services, Developed Diversified Telecom Services, and Developed Wireless Telecom Services. While there were no other overall negative contributors at the broad sector level, other industry group investments which were performance detractors included: Aerospace & Defense, Electronic Equipment, and Professional Services (Industrials sector); Energy Equipment & Services (Energy sector); Reinsurance and Diversified Banks (Financials sector); and Paper/Forest Products (Materials sector).
| • | As with our domestic asset allocation strategies, our quantitative analysis on the global stock market outlook (Global Major Trend Index) turned “cautious” in early July 2010, and this discipline required us to reduce net equity exposure – which was achieved by establishing an equity hedge (short-selling stocks). This equity hedge, which lowered equity exposure down to a “neutral” stance of 50%, was employed from July through mid/late-September. All in all, despite the market’s relatively strong rebound during this time frame, this lowered equity exposure did not have a material impact on the Fund’s performance during the July through September period. |
The Leuthold Global Fund normally has a guideline minimum level of 30% invested in Fixed Income; however, as with last year the Fund remained far below the normal minimum for the entire fiscal year, with an average allocation of just 10%. As we noted in our commentary for the Leuthold Core/Asset Allocation Funds, it continues to be extremely difficult to find anything attractive on a risk/reward basis in the fixed income markets, be it domestic fixed income or foreign fixed income.
We began the fiscal year with allocations to Global High Yield bonds (average 4.5% of assets); Global Government bonds (average 4.5% of assets); Miscellaneous Global bond funds (average 3% of assets); and a package of domestic and foreign Convertible bonds (average 1.5% of assets). In March, a small 2% allocation was invested in Treasury Inflation Protection bonds (TIPs). Each of these Fixed Income subsets contributed positive performance to overall Fund results during the year. As a means to offset the risk of rising interest rates, the Fund also invested in a Fixed Income Hedge, consisting of U.S. Treasury bonds (average 4% of assets). However, rates held steady or moved lower during the year, so this Fixed Income Hedge was a performance detractor to the Fund’s net fixed income results.
As with our other asset allocation Funds, our low fixed income exposure caused this Fund to largely miss out on the last year’s gains achieved by traditional fixed income vehicles. Yet, all of our bond analysis risk-reward studies point to impending risk. Rising interest rates are inevitable, and investors will lose money. It is just a matter of time. We believe it is more important to continue to attempt to minimize the risk of loss that we see on the horizon.
10 The Leuthold Funds - 2010 Annual Report
Alternatives: During the prior fiscal year (2008-2009), a 1% starter position in physical Gold was established, and subsequently increased to 2%. During the 2009-2010 fiscal year we added physical Silver to the mix, and the overall position was increased to about 3% of assets. With the U.S. and other foreign governments pumping money into the global economy, we made this allocation due to our concerns about the long-term inflation implications related to the excess liquidity. This Gold and Silver investment, while small, was a strong performance contributor to the Fund’s results, having produced a +32% total return gain for the fiscal year ended September 30, 2010.
Leuthold Select Industries Fund (soft-closed; available only to existing shareholders)
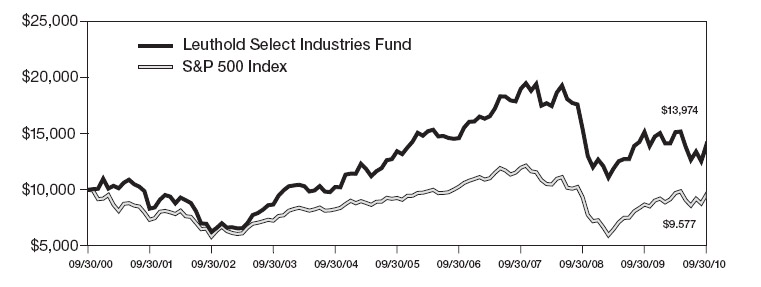
This all-equity Fund, with total assets under management of $39 million, had a very disappointing total return loss of -7.76% for the fiscal year ended September 30, 2010, compared to a +10.16% total return gain for the S&P 500.
| • | This underperformance can be directly correlated to the first nine months of the fiscal year (Oct. 2009 – June 2010). Since July 2010, the results have been much improved, in that the Select Industries equities have performed on par with the S&P 500. To us, this improvement since July is a strong indication that the more typical rotation of U.S. stock market leadership is becoming discernable; and that is a condition in which the Select Industries Fund thrives. We are encouraged by this turnaround over the last three months and believe this Fund is positioned to benefit from these more conventional market qualities in coming months. |
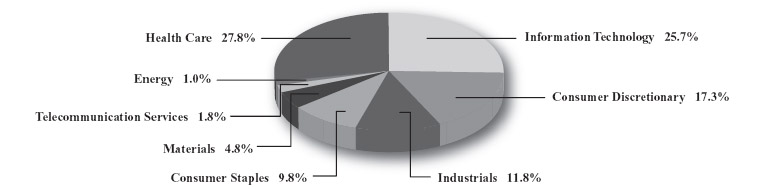
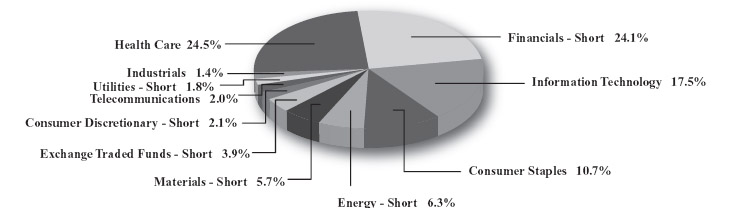
Back in October 2009, as we began the 2009-2010 fiscal year, the Leuthold Select Industries Fund was heavily exposed to three market sectors: Information Technology, Financials, and Health Care. The combined weight of these sectors made up 63% of portfolio assets, with Information Technology, specifically, representing a significant overweight in the Fund (28%), compared to the Info Tech sector weighting of 19% in the S&P 500.
As the year progressed, the Fund’s exposure to the Info Tech sector fluctuated between 19% and 32%, a relatively consistent presence throughout the year. At fiscal year end, exposure here is now at 26%. The Health Care exposure dropped to as low as 10% by mid-year, but was recently boosted significantly to end the year with a 28% portfolio weighting – now the largest exposure as we begin the new fiscal year. In contrast, the Financial sector exposure steadily declined all year, and there has been little to no exposure to this sector over the last 5 months. It was the Consumer Discretionary sector which replaced the Financials as the 3rd heaviest portfolio exposure by February 2010 and it remains among the top three heaviest portfolio wei ghts as of September 30, 2010. Other noteworthy sector weight changes included reduced exposure in Telecommunication Services and Utilities, each now between 0-1% weights versus 7%-8% a year ago; and the Consumer Staples sector rose from zero weight a year ago, to a 10% weight now. There was little change to the portfolio exposure in Industrials, Materials, and Energy, now 12%, 5%, and 1% weights, respectively.
From an industry group perspective, for the full fiscal year, the Leuthold Select Industries Fund’s most beneficial exposure came from group investments in Paper Products (Materials sector); Managed Health Care and Pharmaceuticals (Health Care sector); and Systems Software and Semiconductors (Information Technology sector).
Just as there were no driving trends among U.S. market leadership during much of the last 12 months, there was no theme among the Select Industries Fund’s performance detractors during the fiscal year. The least productive industry group investments in the Fund for the year ended September 30, 2010 were: Airlines (Industrials sector); Independent Power Producers (Utilities sector); Biotechnology (Health Care sector); Consumer Electronics (Consumer Discretionary sector); and Integrated Telecommunication Services (Telecommunication sector).
The Leuthold Funds - 2010 Annual Report 11
As with last year, there remains a relatively high exposure to foreign stocks in the Leuthold Select Industries Fund, now at 25%, versus 31% last year and just 9% two years ago.
The current portfolio group holdings bear no resemblance to the holdings a year ago, despite Information Technology and Health Care remaining as the largest sector weights. This is unusual as the strategy intends to uncover longer-term industry group trends. (It is more typical for the portfolio to have at least one-half of its positions being held a year or longer at any given time.)
In summary, the biggest contributor to the Fund’s performance struggle over the last year has been the lack of group leadership driving the U.S. stock market rebound. Rather, the U.S. stock market has been in a period where leadership at the industry group level has been fleeting, accompanied by a fast-churning, stock picker’s environment. This condition has occurred at times in the past and will happen again. Therefore, we are not questioning our general strategy approach as no stock selection method will be ideal for all market conditions. It is helpful to look at our longer-term performance record as a reminder that the industry group concentration strategy we employ has been a successful approach to generating market beating returns more often than it has not.
| • | Since inception on June 19, 2000, through September 30, 2010, the Leuthold Select Industries Fund has produced a cumulative total return gain of +67.13% (+5.12% annualized) versus a cumulative total return loss of -7.11% for the S&P 500 (-0.72% annualized). |
Historically, the “fast rotation” trends experienced in 2009-2010, which are unfavorable to our strategy, tend to be transitory in nature, and eventually give way to a more macro-themed stock market environment. As noted above, this Fund’s performance since July has been competitive with the S&P 500. We are encouraged that this improvement is an indication that the market is getting back in synch with its more traditional style of exposing longer-term trends of strength and weakness to constructively guide our industry group approach as we enter the 2010-2011 fiscal year.
Leuthold Global Industries Fund
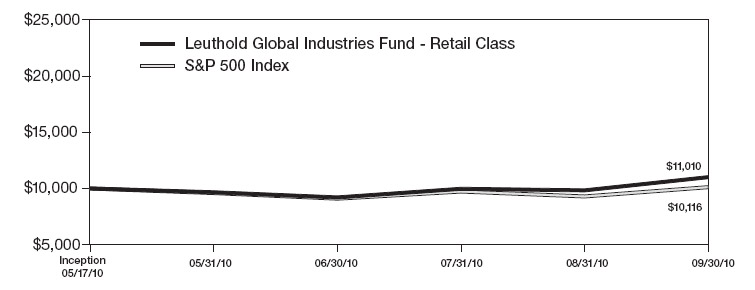
This is our newest Fund, which opened on May 17, 2010. However, this Fund’s strategy is not new-found; rather, it is an extension of our domestic industry group selection/rotation approach which was established in the late 1990s and known as our Select Industries strategy. This global version of our disciplined, unemotional, and quantitative approach employs many of the same factors as our domestic group selection strategy, as it attempts to uncover those industry groups that appear most attractive at the global level. This Fund will normally invest at least 40% of its assets in equity securities from international markets.
As of the fiscal year ended September 30, 2010, the Leuthold Global Industries Fund has $10 million in assets under management. Since this Fund began trading on May 17th, it does not have a full year of performance to discuss in this annual review. However, thus far it has performed extremely well. Since inception on May 17, 2010 through September 30, 2010, the Fund has a total return gain of +10.10% versus the MSCI All Country World Index total return gain of +7.82% and the S&P 500 total return gain of just +1.16%.
12 The Leuthold Funds - 2010 Annual Report
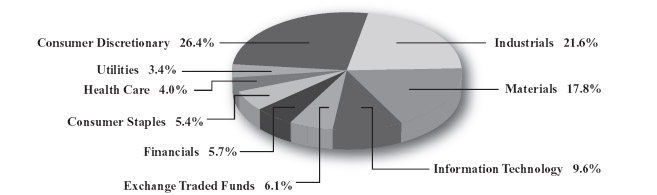
During this short inception-to-date time frame, the Fund’s investments in every sector except Health Care and Energy contributed positive performance; most particularly, the Materials sector, Consumer Discretionary sector, and the Consumer Staples sector. From an industry group perspective, the most valued-added investments came from: Commodity Chemicals, Food & Staples Retail, Auto Components, Automobiles, and Industrial Conglomerates. Industry group investments detracting the most from performance included: Energy Equipment & Services, Aerospace & Defense, and Health Care Services & Technology.
Leuthold Undervalued & Unloved Fund
The Leuthold Undervalued & Unloved Fund, launched on November 14, 2006, has $8 million in assets under management. During the 12 months ended September 30, 2010, the Fund outperformed its benchmarks with a total return gain of +10.88% compared to the +9.15% total return gain for the Russell 3000 Value index and the +8.90% total return gain in the Russell 1000 Value index. Over the same time frame, the S&P 500 turned in a total return gain of +10.16%, slightly lagging the Undervalued & Unloved Fund.
Twelve months ago the Fund began this fiscal year with the somewhat unorthodox appearance of having a “growth” and “cyclical” bias, as Information Technology sector stocks composed the heaviest portfolio weight, while the more conventionally “value” oriented sectors of Utilities, Consumer Staples, and Health Care composed minuscule portfolio exposure. This is because the market meltdown from 2008 to early-2009 had stocks beaten down to extreme valuation lows not seen since 1982. Traditional “growth” and “cyclical” stocks were selling at cheap “value” stock earnings multiples. This allowed “value” style portfolio managers the rare opportunity to buy beaten down blue-chip growth stocks at discount prices.
Information Technology composed a relatively heavy portfolio weight until near the end of the second quarter of 2010. This coincided with when the more traditional value sectors began to reclaim their status as the “heavy-weights” in the portfolio. The more traditional “value” configuration now consists of heavy exposure to: Consumer Staples, Financials, Health Care, Energy, and Utilities.
Not surprisingly, the additive performance contributors leading up to the year’s market high on April 23rd were less-traditional portfolio exposures in Industrials, Materials, Consumer Discretionary, and Financials stocks. Following the April 23rd peak, the traditional value sectors held sway, with Consumer Staples, Health Care, and Utilities stocks contributing the most, on an additive basis from April 23rd through fiscal year end, September 30, 2010. Despite its relatively heavy weight for most of the year, the Information Technology sector exposure was a performance detractor when measuring the full year’s results. In fact, the Info Tech sector was the only area that turned in an overall negative contribution to return for the 12 months ended Se ptember 30th.
From an equity industry group standpoint, the top contributors to performance for the full year were stocks from: Construction & Farm Machinery (Industrials sector); Tobacco (Consumer Staples sector); Specialized REITs (Financials sector); and Pharmaceuticals (Health Care sector). Considering this, the more value-oriented sector exposure was obviously most beneficial to the full year results – likely because these areas offered some defensive characteristics during the steep (-16%) market correction between early May and July 2nd.
The Leuthold Funds - 2010 Annual Report 13
There were no equity groups that contributed substantial losses to the full year’s performance. The handful of portfolio equity groups which detracted from performance for the full year were a mixed bag: Technology Distributors and Computer Hardware (Info Tech sector); Department Stores (Consumer Discretionary sector); Industrial Conglomerates (Industrials sector); and Managed Health Care (Health Care sector).
Despite the Leuthold Undervalued & Unloved Fund’s favorable fiscal year performance, we have been unable to attract sufficient assets into the Fund. As such, we closed the Fund to new investment after November 8, 2010, and will liquidate the Fund on December 20, 2010.
Leuthold Global Clean Technology Fund
The Leuthold Global Clean Technology Fund opened just over a year ago, and has $27 million in assets under management. For the fiscal year ended September 30, 2010, the Fund had a disappointing total return loss of -10.59% (retail share class), versus a total return loss of -16.43% in the Ardour Global Alternative Energy Index, and a total return gain of +8.95% in the MSCI All Country World Index.
The Fund’s overall net losses for the fiscal year were primarily the result of a significant portfolio overweight to the Alternative Energy sector, which composed an average of 48% of assets for the fiscal year. This Alternative Energy sector in particular had a debilitating performance year, with most of its sub-groups contributing negative performance results. The most significant group detractors to performance within this sector included: Wind Turbines/Wind Power, Turbines/Flywheel/Energy Transmission, Solar/Photovoltaic Cells, Uranium Mining, Hydro Electricity, Diversified Renewable Power Generation, and Nuclear Energy Equipment/Services. Additional contributors to portfolio losses came from sub-industry groups of the Resource Conservation sect or (Batteries/Energy Storage Systems, and Water Conservation Systems) and the Clean Environment sector (Environmental Services and Clean Transportation).
Somewhat offsetting portfolio losses were net gains from a range of sub-industry groups from a variety of the Clean Technology universe sectors. Among the best performing groups were: Clean Agriculture and Pollution/Emissions Controls (Clean Environment sector); Renewable/Conventional Power Generation and Biofuels/Ethanol/Cellulosic (Alternative Energy sector); Water Infrastructure and Water Utilities (Clean Water sector); and Efficient Lighting/LEDs (Resource Conservation sector).
The largest non-U.S. exposures during the year within the Leuthold Global Clean Technology Fund included: Germany, China, Spain, Canada, and Switzerland. Other sizeable concentrations among foreign countries were: Denmark, France, Taiwan, Austria, Japan, and Belgium. U.S.-traded stock exposure during fiscal year 2009-2010 was 47% on average, with foreign country investments averaging about 53% of portfolio assets. (Under normal circumstances, the Fund intends to invest at least 40% of assets in foreign-traded securities.)
While the Leuthold Global Clean Technology Fund’s first full fiscal year resulted in disappointing performance, we consider this time frame to be too short to use as a guide for future expectations. We manage the Fund for long-term total return as the sector is likely to benefit from a multi-decade, cyclical upswing in demand for goods and services. Our approach is to identify and invest in Best-in-Class, profitable growth companies expected to increase revenues by about 20% per annum. We attempt to acquire shares when we deem them to be undervalued. We prefer to hold shares in companies for extended periods of time, though we will reduce or eliminate positions we dee m overvalued. In short, we view this opportunity akin to a marathon, not a sprint, and we invest the Fund’s capital accordingly.
14 The Leuthold Funds - 2010 Annual Report
We are confident our approach to investing in “Best-In-Class” Clean Technology companies will generate above-average returns for investors in the Leuthold Global Clean Technology Fund over the long haul.
Leuthold Hedged Equity Fund
The Leuthold Hedged Equity Fund opened a little over a year ago, and currently contains $5 million in assets under management. For the fiscal year ended September 30, 2010, the Fund had a total return loss of -9.10%, versus the S&P 500 total return gain of +10.16%. This Fund is managed with equal allocations to both long and short equities, but its objective is to produce positive net performance. To do so, we require enough relative outperformance on one or both sides in order to yield a positive result, and, disappointingly, this has not occurred over the last year. Both our long-stock exposure and the short-stock exposure employed in this Fund lost money during the fiscal year ended September 30, 2010.
For the Fund’s long-stock investments, the Leuthold Hedged Equity Fund employed the group selection and rotation approach of the Leuthold Select Industries Fund, which had a total return loss of -7.76% for the fiscal year ended September 30, 2010. On the short-side, the Fund’s exposure was attained through the investment strategy of the Grizzly Short Fund, and this strategy produced a total return loss of -13.26% for the 12 months ended September 30, 2010. Specifics on the key performance drivers for each of these equity strategies are presented in the discussions covering the Leuthold Selec t Industries Fund and the Grizzly Short Fund.
Overall performance is falling far below our expectations, based on how the two underlying component strategies have performed, historically. In general, market conditions since the Fund’s inception have been unusual. The stock market has been in a period where leadership at the industry group level has been short-lived, accompanied by fast-rotation trends. These conditions are not conducive to our long-side, industry group selection approach, which attempts to uncover longer-term leadership trends. Additionally, the market theme for over a year has been that weak, lower-quality stocks have been driving market upside. In this environment, our approach to short-selling can prove to be extremely challenging as the intent is to profit from lower- quality stocks declining in price.
Historically, both the short-stock and long-stock selection strategies employed in this Fund have shown the potential to flourish and/or serve to balance each other in most market environments, and we are confident performance will bear this out given a longer time frame.
Grizzly Short Fund
The Grizzly Short Fund lost ground again this year as the market continued its rebound from the March 9, 2009, low. As investors should expect, a strategy designed to profit in down market conditions is unlikely to prosper when the market is in recovery mode.
The Leuthold Funds - 2010 Annual Report 15
For the fiscal year ended September 30, 2010, the Grizzly Short Fund produced a total return loss of -13.26%, which compares relatively favorably with the +17.78% total return gain of the S&P Mid Cap 400 Index. The Grizzly Short Fund underperformed, however, when compared to the S&P 500’s total return gain of +10.16%, as shorting the S&P 500 would have produced a smaller loss than the Grizzly Short Fund produced. As of September 30, 2010, the Grizzly Short Fund contained $196 million in assets under management.
Shorting was very difficult in the first half of the 2009-2010 fiscal year. In many respects the bull market increased momentum as almost all major indices hit new highs, market breadth accelerated, and volatility continued to decline. That trend completely reversed at the end of April when a steep correction began. Subsequently, May and June were two of the best months for the Grizzly Short Fund this last year. Previous to this interim correction, low-quality stocks had been driving the market rebound; but as of May, all of a sudden quality mattered again, and investors were looking to sell risky assets and hold on to companies that could turn a profit. This type of environment almost always bodes well for our short-selling strategy, and this tendency continu ed through the last three months of the fiscal year, benefiting the Grizzly Short Fund with competitive relative performance results.
The Grizzly Short Fund has extremely high turnover, and sector concentrations and industry group exposure can fluctuate from day to day. The individual stock positions are similarly weighted across the portfolio, and there are limitations on how much of the portfolio can be concentrated within a particular sector or sub-industry group therein.
These features, combined with the Fund’s quantitative methodology, make it impractical to attribute specific performance dynamics to isolated short positions. Sector concentrations and stock market themes are more effective for discussing the portfolio dynamics when reviewing Grizzly Short Fund performance drivers. Following are the concentrations and themes that were among the most significant contributors to the Fund’s performance, compared to index shorts, over the fiscal year ended September 30, 2010.
The Grizzly Short Fund’s past year’s performance was clearly influenced by the pre-correction period and the correction/ post-correction period. During the pre-correction phase, September 30, 2009 through April 23, 2010, the Grizzly Short Fund had no positive contributors to its performance, based on its broad sector exposure. The biggest losses came from the Fund’s sector exposure to: Consumer Discretionary, Financials, Information Technology, Industrials, and Energy. In contrast, during the correction/post-correction phase following the market high on April 23, 2010 through September 30, 2010, nine of the ten broad sector weights in the Grizzly Short Fund were positive contributors to performance, with the best perform ance being contributed by: Financials, Information Technology, Energy, and Consumer Discretionary (all sectors that had contributed the worst results during the pre-correction phase).
There were no consistent themes among equity industry group performers. Those contributing the most to positive performance results for the Grizzly Short Fund during the fiscal year were Semiconductor Equipment, Investment Banking/Brokerage, and Home Entertainment Software. On the negative side, the biggest detractors to performance based on the Grizzly Short Fund’s exposure during the year were: Application Software, Airlines, and Hotels/Resorts & Cruise Lines.
16 The Leuthold Funds - 2010 Annual Report
Additional Comments Related to the Grizzly Short Fund
Our most recent market analysis leaves us firmly “bullish” in our outlook for the stock market going forward through the end of 2010 and likely the first part of 2011. We would therefore expect the Grizzly Short Fund to continue to produce net losses during this time. However, as demonstrated since the steep correction in May through early July, the market has begun paying closer attention to quality rather than beta. This transition benefited our short-selling approach over the last five months, and we expect it will allow the Fund to uncover opportunities to profit going forward, as there will be vulnerable areas of the stock market regardless of the underlying trend.
Investors who are not experienced in short-selling and adjusting market risk should consider the Leuthold Asset Allocation Fund or Leuthold Global Fund. These two Funds have the flexibility built into their disciplines to overlay our short-selling strategies and hedge against market declines when the stock market is viewed as overvalued and vulnerable to a downside correction.
The Grizzly Short Fund’s year-by-year results are volatile, and while the advantage for employing a short-selling strategy during down-market years is clear (as evidenced by results of 2007-2008), the tremendous risk of short-selling in rising market conditions should also now be very apparent considering the more recent results during the bull market which commenced after the March 9, 2009, market lows. There are viable uses for this strategy in all market conditions. For those less experienced, however, please note that one should expect to lose money when employing this Fund during rising market conditions.
IN CLOSING
We believe this is still a cyclical bull market, and the steep -16% decline from the April 23rd high to the early July low was an abnormally deep bull market correction, not the first leg down in a new cyclical bear market. The huge advance from the March 2009 low through the April 2010 high was probably too far too fast. In May of 2010, what first appeared to be a normal 6%-8% bull market correction was hit by a bad news tornado, financial fears in Europe, and the ecological disaster in the Gulf.
The result was a correction “overshoot” causing buyers (both institutional and individual) to freeze, letting the high frequency traders play ping pong with the market averages. This is why we choose to rely on quantitative disciplines to direct our asset allocation decisions. We are confident that the disciplines of our numbers will continue to be more reliable than our gut feelings and market opinions. Our firm’s Major Trend Index discipline has a 40+ year history, and more often than not it has prudently and successfully guided us through the changing market cycles.
All of our strategies employ quantitative disciplines, and we will continue to abide by these respective disciplines to guide the course of each strategy in the months and years ahead. These quantitative systems allow us to identify opportunities, uncover apparent weakness, and attempt to protect assets as the investment environment progresses through the various phases of market cycles. Regardless of whether it is one of our asset allocation strategies, or one of our 100% equity investments, these tools were designed to remove emotions, severely restrict judgments, and diminish the potential for personal bias to come into play with portfolio decisions.
The Leuthold Funds - 2010 Annual Report 17
We like to remind shareholders that our firm is majority employee-owned and independent; and we are always proud to note that employee-directed investments in Leuthold Funds is at an impressive level. With over 16,000 mutual fund choices in the U.S., we believe that our combined employee and outside shareholders’ commitment to Leuthold Funds reflects a loyalty and confidence that is uncommon in the investment management business today.
Thank you for sharing our conviction in Leuthold Funds.
Sincerely,
18 The Leuthold Funds - 2010 Annual Report
Expense Example – September 30, 2010 (Unaudited)
As a shareholder of the Funds, you incur two types of costs: (1) transaction costs, including reinvested dividends, or other distributions; redemption fees; and exchange fees; and (2) ongoing costs, including management fees; distribution and/or service fees; and other Fund expenses. This example is intended to help you understand your ongoing costs (in dollars) of investing in the Funds and to compare costs with the ongoing costs of investing in other mutual funds.
The Example is based on an investment of $1,000 invested at the beginning of the period and held the entire period (April 1, 2010 – September 30, 2010).
Actual Expenses
The first line of the following table provides information about actual account values and actual expenses. Although the Funds charge no sales load (the Leuthold Core Investment Fund, Leuthold Asset Allocation Fund, Leuthold Global Fund, Leuthold Global Industries Fund, Leuthold Undervalued & Unloved Fund, and Leuthold Hedged Equity Fund charge a 2% redemption fee for redemptions made within five business days after a purchase and the Leuthold Global Clean Technology Fund charges a 2% redemption fee for redemptions made within 30 days after a purchase), you will be assessed fees for outgoing wire transfers, returned checks, or stop payment orders at prevailing rates charged by U.S. Bancorp Fund Services, LLC, the Funds’ transfer agent. If you re quest a redemption be made by wire transfer, currently a $15.00 fee is charged by the Funds’ transfer agent. To the extent that the Funds invest in shares of other investment companies as part of its investment strategy, you will indirectly bear your proportionate share of any fees and expenses charged by the underlying funds in which a Fund invests in addition to the expenses of the Fund. Actual expenses of the underlying funds are expected to vary by fund. These expenses are not included in the following example. The example includes, but is not limited to, management fees, shareholder servicing fees, fund accounting, custody, and transfer agent fees. However, the following example does not include portfolio trading commissions and related expenses, interest expense, and extraordinary expenses as determined under generally accepted accounting principles. You may use the information in this line, together with the amount you invested, to estimate the expense s that you paid over the period. Simply divide your account value by $1,000 (for example, an $8,600 account value divided by $1,000 = 8.6), then multiply the result by the number in the first line under the heading entitled “Expenses Paid During Period” to estimate the expenses you paid on your account during this period.
Hypothetical Example for Comparison Purposes
The second line of the following table provides information about hypothetical account values and hypothetical expenses based on the Funds’ actual expense ratios and an assumed rate of return of 5% per year before expenses, which is not the Funds’ actual return. The hypothetical account values and expenses may not be used to estimate the actual ending account balance or expenses you paid for the period. You may use this information to compare the ongoing costs of investing in the Funds and other funds. To do so, compare this 5% hypothetical example with the 5% hypothetical examples that appear in the shareholder reports of the other funds.
Please note that the expenses shown in the table are meant to highlight your ongoing costs only and do not reflect any transactional costs, such as redemption fees or exchange fees. Therefore, the second line of the table is useful in comparing ongoing costs only, and will not help you determine the relative costs of owning different funds. In addition, if these transactional costs were included, your costs would have been higher.
The Leuthold Funds - 2010 Annual Report 19Expense Example Tables (Unaudited)
Leuthold Core Investment Fund - Retail Class
| | | Beginning | | | Ending | | | Expenses Paid |
| | | Account Value | | | Account Value | | | During Period* |
| | | April 1, 2010 | | | September 30, 2010 | | | April 1, 2010 - September 30, 2010 |
| | | | | | | | | | |
| Actual** | | $ | 1,000.00 | | | $ | 963.20 | | | $ | 7.14 | |
| Hypothetical (5% return before expenses)*** | | | 1,000.00 | | | | 1,017.80 | | | | 7.33 | |
| * | Expenses are equal to the Fund’s annualized expense ratio of 1.45%, multiplied by the average account value over the period, multiplied by 183/365 to reflect the one-half year period. |
| ** | Excluding dividends and interest on short positions, your actual cost of investment in the Fund would be $5.46 and the Fund’s annualized expense ratio would be 1.11%. |
| *** | Excluding dividends and interest on short positions, your hypothetical cost of investment in the Fund would be $5.62 and the Fund’s annualized expense ratio would be 1.11%. |
Leuthold Core Investment Fund - Institutional Class
| | | Beginning | | | Ending | | | Expenses Paid |
| | | Account Value | | | Account Value | | | During Period* |
| | | April 1, 2010 | | | September 30, 2010 | | | April 1, 2010 - September 30, 2010 |
| | | | | | | | | | |
| Actual** | | $ | 1,000.00 | | | $ | 963.80 | | | $ | 6.60 | |
| Hypothetical (5% return before expenses)*** | | | 1,000.00 | | | | 1,018.35 | | | | 6.78 | |
| * | Expenses are equal to the Fund’s annualized expense ratio of 1.34%, multiplied by the average account value over the period, multiplied by 183/365 to reflect the one-half year period. |
| ** | Excluding dividends and interest on short positions, your actual cost of investment in the Fund would be $4.97 and the Fund’s annualized expense ratio would be 1.01%. |
| *** | Excluding dividends and interest on short positions, your hypothetical cost of investment in the Fund would be $5.11 and the Fund’s annualized expense ratio would be 1.01%. |
Leuthold Asset Allocation Fund - Retail Class
| | | Beginning | | | Ending | | | Expenses Paid |
| | | Account Value | | | Account Value | | | During Period* |
| | | April 1, 2010 | | | September 30, 2010 | | | April 1, 2010 - September 30, 2010 |
| | | | | | | | | | |
| Actual** | | $ | 1,000.00 | | | $ | 979.20 | | | $ | 8.14 | |
| Hypothetical (5% return before expenses)*** | | | 1,000.00 | | | | 1,016.85 | | | | 8.29 | |
| * | Expenses are equal to the Fund’s annualized expense ratio of 1.64%, multiplied by the average account value over the period, multiplied by 183/365 to reflect the one-half year period. |
| ** | Excluding dividends and interest on short positions, your actual cost of investment in the Fund would be $6.55 and the Fund’s annualized expense ratio would be 1.32%. |
| *** | Excluding dividends and interest on short positions, your hypothetical cost of investment in the Fund would be $6.68 and the Fund’s annualized expense ratio would be 1.32%. |
20 The Leuthold Funds - 2010 Annual Report
Expense Example Tables (Unaudited)
Leuthold Asset Allocation Fund - Institutional Class
| | | Beginning | | | Ending | | | Expenses Paid |
| | | Account Value | | | Account Value | | | During Period* |
| | | April 1, 2010 | | | September 30, 2010 | | | April 1, 2010 - September 30, 2010 |
| | | | | | | | | | |
| Actual** | | $ | 1,000.00 | | | $ | 980.30 | | | $ | 7.05 | |
| Hypothetical (5% return before expenses)*** | | | 1,000.00 | | | | 1,017.95 | | | | 7.18 | |
| * | Expenses are equal to the Fund’s annualized expense ratio of 1.42%, multiplied by the average account value over the period, multiplied by 183/365 to reflect the one-half year period. |
| ** | Excluding dividends and interest on short positions, your actual cost of investment in the Fund would be $5.46 and the Fund’s annualized expense ratio would be 1.10%. |
| *** | Excluding dividends and interest on short positions, your hypothetical cost of investment in the Fund would be $5.57 and the Fund’s annualized expense ratio would be 1.10%. |
Leuthold Global Fund - Retail Class
| | | Beginning | | | Ending | | | Expenses Paid |
| | | Account Value | | | Account Value | | | During Period* |
| | | April 1, 2010 | | | September 30, 2010 | | | April 1, 2010 - September 30, 2010 |
| | | | | | | | | | |
| Actual** | | $ | 1,000.00 | | | $ | 1,025.20 | | | $ | 10.00 | |
| Hypothetical (5% return before expenses)*** | | | 1,000.00 | | | | 1,015.19 | | | | 9.95 | |
| * | Expenses are equal to the Fund’s annualized expense ratio of 1.97%, multiplied by the average account value over the period, multiplied by 183/365 to reflect the one-half year period. |
| ** | Excluding dividends and interest on short positions, your actual cost of investment in the Fund would be $8.43 and the Fund’s annualized expense ratio would be 1.74%. |
| *** | Excluding dividends and interest on short positions, your hypothetical cost of investment in the Fund would be $8.39 and the Fund’s annualized expense ratio would be 1.74%. |
Leuthold Global Fund - Institutional Class
| | | Beginning | | | Ending | | | Expenses Paid |
| | | Account Value | | | Account Value | | | During Period* |
| | | April 1, 2010 | | | September 30, 2010 | | | April 1, 2010 - September 30, 2010 |
| | | | | | | | | | |
| Actual** | | $ | 1,000.00 | | | $ | 1,025.10 | | | $ | 9.24 | |
| Hypothetical (5% return before expenses)*** | | | 1,000.00 | | | | 1,015.94 | | | | 9.20 | |
| * | Expenses are equal to the Fund’s annualized expense ratio of 1.82%, multiplied by the average account value over the period, multiplied by 183/365 to reflect the one-half year period. |
| ** | Excluding dividends and interest on short positions, your actual cost of investment in the Fund would be $7.97 and the Fund’s annualized expense ratio would be 1.57%. |
| *** | Excluding dividends and interest on short positions, your hypothetical cost of investment in the Fund would be $7.94 and the Fund’s annualized expense ratio would be 1.57%. |
The Leuthold Funds - 2010 Annual Report 21
Expense Example Tables (Unaudited)
Leuthold Select Industries Fund
| | | Beginning | | | Ending | | | Expenses Paid |
| | | Account Value | | | Account Value | | | During Period* |
| | | April 1, 2010 | | | September 30, 2010 | | | April 1, 2010 - September 30, 2010 |
| | | | | | | | | | |
| Actual | | $ | 1,000.00 | | | $ | 923.10 | | | $ | 6.17 | |
| Hypothetical (5% return before expenses) | | | 1,000.00 | | | | 1,018.65 | | | | 6.48 | |
| * | Expenses are equal to the Fund’s annualized expense ratio of 1.28%, multiplied by the average account value over the period, multiplied by 183/365 to reflect the one-half year period. |
Leuthold Global Industries Fund - Retail Class
| | | Beginning | | | Ending | | | Expenses Paid |
| | | Account Value | | | Account Value | | | During Period* |
| | | April 1, 2010 | | | September 30, 2010 | | | April 1, 2010 - September 30, 2010 |
| | | | | | | | | | |
| Actual | | $ | 1,000.00 | | | $ | 1,101.00 | | | $ | 7.67 | * |
| Hypothetical (5% return before expenses) | | | 1,000.00 | | | | 1,008.80 | | | | 9.87 | ** |
| * | Expenses are equal to the Fund’s annualized expense ratio of 1.96%, multiplied by the average account value over the period, multiplied by 136/365 (to reflect the period from May 17, 2010 to September 30, 2010, the Fund’s commencement of operations date to the end of the period) to reflect the Fund’s actual expenses. |
| ** | Expenses are equal to the Fund’s annualized expense ratio of 1.96%, multiplied by the average account value over the period, multiplied by 183/365 to reflect the one-half year period. |
Leuthold Global Industries Fund - Institutional Class
| | | Beginning | | | Ending | | | Expenses Paid |
| | | Account Value | | | Account Value | | | During Period* |
| | | April 1, 2010 | | | September 30, 2010 | | | April 1, 2010 - September 30, 2010 |
| | | | | | | | | | |
| Actual | | $ | 1,000.00 | | | $ | 1,101.00 | | | $ | 6.69 | * |
| Hypothetical (5% return before expenses) | | | 1,000.00 | | | | 1,010.06 | | | | 8.62 | ** |
| * | Expenses are equal to the Fund’s annualized expense ratio of 1.71%, multiplied by the average account value over the period, multiplied by 136/365 (to reflect the period from May 17, 2010 to September 30, 2010, the Fund’s commencement of operations date to the end of the period) to reflect the Fund’s actual expenses. |
| ** | Expenses are equal to the Fund’s annualized expense ratio of 1.71%, multiplied by the average account value over the period, multiplied by 183/365 to reflect the one-half year period. |
22 The Leuthold Funds - 2010 Annual Report
Expense Example Tables (Unaudited)
Leuthold Undervalued & Unloved Fund
| | | Beginning | | | Ending | | | Expenses Paid |
| | | Account Value | | | Account Value | | | During Period* |
| | | April 1, 2010 | | | September 30, 2010 | | | April 1, 2010 - September 30, 2010 |
| | | | | | | | | | |
| Actual | | $ | 1,000.00 | | | $ | 969.30 | | | $ | 7.41 | |
| Hypothetical (5% return before expenses) | | | 1,000.00 | | | | 1,017.55 | | | | 7.59 | |
| * | Expenses are equal to the Fund’s annualized expense ratio of 1.50%, multiplied by the average account value over the period, multiplied by 183/365 to reflect the one-half year period. |
Leuthold Global Clean Technology Fund - Retail Class
| | | Beginning | | | Ending | | | Expenses Paid |
| | | Account Value | | | Account Value | | | During Period* |
| | | April 1, 2010 | | | September 30, 2010 | | | April 1, 2010 - September 30, 2010 |
| | | | | | | | | | |
| Actual | | $ | 1,000.00 | | | $ | 918.80 | | | $ | 8.85 | |
| Hypothetical (5% return before expenses) | | | 1,000.00 | | | | 1,015.84 | | | | 9.30 | |
| * | Expenses are equal to the Fund’s annualized expense ratio of 1.84%, multiplied by the average account value over the period, multiplied by 183/365 to reflect the one-half year period. |
Leuthold Global Clean Technology Fund - Institutional Class
| | | Beginning | | | Ending | | | Expenses Paid |
| | | Account Value | | | Account Value | | | During Period* |
| | | April 1, 2010 | | | September 30, 2010 | | | April 1, 2010 - September 30, 2010 |
| | | | | | | | | | |
| Actual | | $ | 1,000.00 | | | $ | 920.70 | | | $ | 7.32 | |
| Hypothetical (5% return before expenses) | | | 1,000.00 | | | | 1,017.45 | | | | 7.69 | |
| * | Expenses are equal to the Fund's annualized expense ratio of 1.52%, multiplied by the average account value over the period, multiplied by 183/365 to reflect the one-half year period. |
The Leuthold Funds - 2010 Annual Report 23
Expense Example Tables (Unaudited)
Leuthold Hedged Equity Fund - Retail Class
| | | Beginning | | | Ending | | | Expenses Paid |
| | | Account Value | | | Account Value | | | During Period* |
| | | April 1, 2010 | | | September 30, 2010 | | | April 1, 2010 - September 30, 2010 |
| | | | | | | | | | |
| Actual** | | $ | 1,000.00 | | | $ | 976.40 | | | $ | 14.07 | |
| Hypothetical (5% return before expenses)*** | | | 1,000.00 | | | | 1,010.83 | | | | 14.32 | |
| * | Expenses are equal to the Fund’s annualized expense ratio of 2.84%, multiplied by the average account value over the period, multiplied by 183/365 to reflect the one-half year period. |
| ** | Excluding dividends and interest on short positions, your actual cost of investment in the Fund would be $10.95 and the Fund’s annualized expense ratio would be 2.21%. |
| *** | Excluding dividends and interest on short positions, your hypothetical cost of investment in the Fund would be $11.16 and the Fund’s annualized expense ratio would be 2.21%. |
Leuthold Hedged Equity Fund - Institutional Class
| | | Beginning | | | Ending | | | Expenses Paid |
| | | Account Value | | | Account Value | | | During Period* |
| | | April 1, 2010 | | | September 30, 2010 | | | April 1, 2010 - September 30, 2010 |
| | | | | | | | | | |
| Actual** | | $ | 1,000.00 | | | $ | 977.50 | | | $ | 21.37 | |
| Hypothetical (5% return before expenses)*** | | | 1,000.00 | | | | 1,003.46 | | | | 21.65 | |
| * | Expenses are equal to the Fund’s annualized expense ratio of 4.31%, multiplied by the average account value over the period, multiplied by 183/365 to reflect the one-half year period. |
| ** | Excluding dividends and interest on short positions, your actual cost of investment in the Fund would be $7.39 and the Fund’s annualized expense ratio would be 1.49%. |
| *** | Excluding dividends and interest on short positions, your hypothetical cost of investment in the Fund would be $7.54 and the Fund’s annualized expense ratio would be 1.49%. |
| | | Beginning | | | Ending | | | Expenses Paid |
| | | Account Value | | | Account Value | | | During Period* |
| | | April 1, 2010 | | | September 30, 2010 | | | April 1, 2010 - September 30, 2010 |
| | | | | | | | | | |
| Actual** | | $ | 1,000.00 | | | $ | 1,004.90 | | | $ | 14.27 | |
| Hypothetical (5% return before expenses)*** | | | 1,000.00 | | | | 1,010.83 | | | | 14.32 | |
| * | Expenses are equal to the Fund’s annualized expense ratio of 2.84%, multiplied by the average account value over the period, multiplied by 183/365 to reflect the one-half year period. |
| ** | Excluding dividends and interest on short positions, your actual cost of investment in the Fund would be $7.24 and the Fund’s annualized expense ratio would be 1.44%. |
| *** | Excluding dividends and interest on short positions, your hypothetical cost of investment in the Fund would be $7.28 and the Fund’s annualized expense ratio would be 1.44%. |
24 The Leuthold Funds - 2010 Annual Report
(Unaudited)
Leuthold Core Investment Fund
Allocation of Portfolio Holdings • September 30, 2010*
Leuthold Asset Allocation Fund
Allocation of Portfolio Holdings • September 30, 2010*
Leuthold Global Fund
Allocation of Portfolio Holdings • September 30, 2010

*Excludes short-term investments
The Leuthold Funds - 2010 Annual Report 25
(Unaudited)
Leuthold Select Industries Fund
Allocation of Portfolio Holdings • September 30, 2010*
Leuthold Global Industries Fund
Allocation of Portfolio Holdings • September 30, 2010*
Leuthold Undervalued & Unloved Fund
Allocation of Portfolio Holdings • September 30, 2010*
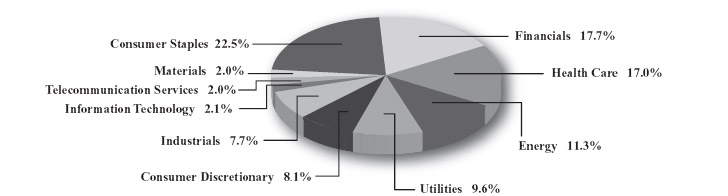
*Excludes short-term investments
26 The Leuthold Funds - 2010 Annual Report(Unaudited)
Leuthold Global Clean Technology Fund
Allocation of Portfolio Holdings • September 30, 2010*
Leuthold Hedged Equity Fund
Allocation of Portfolio Holdings (Net Exposure) • September 30, 2010*
Grizzly Short Fund
Allocation of Portfolio Holdings • September 30, 2010*
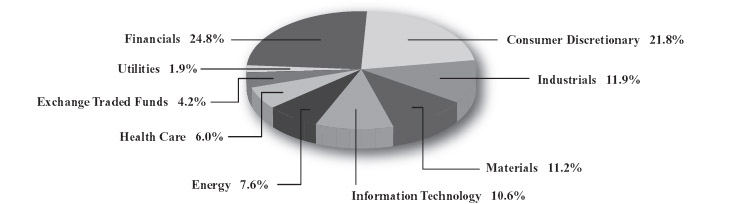
*Excludes short-term investments
The Leuthold Funds - 2010 Annual Report 27
| Leuthold Core Investment Fund (Unaudited) | | | |
| Components of Portfolio Holdings* | | Fair Value | |
| | | | |
| U.S. Traded Equity Securities | | $ | 711,404,759 | |
| Non-U.S. Traded Equity Securities | | | 117,108,112 | |
| Emerging Country Investments | | | 103,173,063 | |
| U.S. Traded Equity Securities - Short | | | 74,647,340 | |
| Precious Metals | | | 55,208,787 | |
| Brazilian Bonds | | | 48,247,570 | |
| High Yield Bond Funds | | | 28,548,327 | |
| U.S.Treasury Obligations - Short | | | 28,306,185 | |
| Total: | | $ | 1,166,644,143 | |
| | | | | |
| | | | | |
| | | | | |
| Leuthold Asset Allocation Fund (Unaudited) | | | | |
| Components of Portfolio Holdings* | | Fair Value | |
| | | | | |
| U.S. Traded Equity Securities | | $ | 686,240,810 | |
| Emerging Country Investments | | | 96,261,898 | |
| Non-U.S. Traded Equity Securities | | | 95,531,782 | |
| U.S. Traded Equity Securities - Short | | | 69,744,365 | |
| Precious Metals | | | 51,625,567 | |
| Brazilian Bonds | | | 44,911,846 | |
| High Yield Bond Funds | | | 26,587,798 | |
| U.S.Treasury Obligations - Short | | | 26,190,075 | |
| Total: | | $ | 1,097,094,141 | |
| | | | | |
| | | | | |
| | | | | |
| Leuthold Global Fund (Unaudited) | | | | |
| Components of Portfolio Holdings | | Fair Value | |
| | | | | |
| Non-U.S. Traded Equity Securities | | $ | 123,607,723 | |
| U.S. Traded Equity Securities | | | 73,720,400 | |
| Short-Term Investments | | | 39,566,046 | |
| High Yield Bond Funds | | | 22,161,842 | |
| Precious Metals | | | 11,151,970 | |
| Non-U.S. Traded Equity | | | | |
| Securities - Short | | | 9,075,060 | |
| U.S. Traded Equity Securities - Short | | | 7,820,210 | |
| Foreign Government Bonds | | | 7,190,935 | |
| U.S. Treasury Obligations | | | 5,419,098 | |
| U.S. Treasury Obligations - Short | | | 4,853,741 | |
| Total: | | $ | 304,567,025 | |
| | | | | |
| Leuthold Select Industries Fund (Unaudited) | | | |
| Components of Portfolio Holdings* | | Fair Value | |
| | | | |
| Health Care | | $ | 10,713,565 | |
| Information Technology | | | 9,923,682 | |
| Consumer Discretionary | | | 6,693,157 | |
| Industrials | | | 4,564,485 | |
| Consumer Staples | | | 3,771,571 | |
| Materials | | | 1,860,450 | |
| Telecommunication Services | | | 687,850 | |
| Energy | | | 383,905 | |
| Total: | | $ | 38,598,665 | |
| | | | | |
| | | | | |
| Leuthold Global Industries Fund (Unaudited) | | | | |
| Components of Portfolio Holdings* | | Fair Value | |
| | | | | |
| Consumer Discretionary | | $ | 2,414,662 | |
| Industrials | | | 1,976,423 | |
| Materials | | | 1,626,018 | |
| Information Technology | | | 880,461 | |
| Exchange Traded Funds | | | 562,271 | |
| Financials | | | 521,349 | |
| Consumer Staples | | | 499,072 | |
| Health Care | | | 369,005 | |
| Utilities | | | 310,190 | |
| Total: | | $ | 9,159,451 | |
| | | | | |
| | | | | |
| Leuthold Undervalued & Unloved Fund | | | | |
| (Unaudited) | | | | |
| Components of Portfolio Holdings* | | Fair Value | |
| | | | | |
| Consumer Staples | | $ | 1,748,178 | |
| Financials | | | 1,387,143 | |
| Health Care | | | 1,331,250 | |
| Energy | | | 886,446 | |
| Utilities | | | 747,977 | |
| Consumer Discretionary | | | 636,945 | |
| Industrials | | | 604,496 | |
| Information Technology | | | 163,069 | |
| Telecommunication Services | | | 159,210 | |
| Materials | | | 154,443 | |
| Total: | | $ | 7,819,157 | |
| | | | | |
*Excludes short-term investments
28 The Leuthold Funds - 2010 Annual Report| Leuthold Global Clean Technology Fund | | | |
| (Unaudited) | | | |
| Components of Portfolio Holdings* | | Fair Value | |
| Industrials | | $ | 13,228,167 | |
| Information Technology | | | 7,930,678 | |
| Materials | | | 3,136,212 | |
| Utilities | | | 1,724,700 | |
| Consumer Discretionary | | | 742,600 | |
| Energy | | | 92,105 | |
| Total: | | $ | 26,854,462 | |
| | | | | |
| | | | | |
| Leuthold Hedged Equity Fund (Unaudited) | | | | |
Components of Portfolio Holdings* | | Fair Value | |
| | | | | |
| Long | | | | |
| Health Care | | $ | 678,347 | |
| Information Technology | | | 620,765 | |
| Consumer Discretionary | | | 419,385 | |
| Industrials | | | 289,599 | |
| Consumer Staples | | | 239,785 | |
| Materials | | | 118,329 | |
| Telecommunications | | | 43,731 | |
| Energy | | | 24,430 | |
| | | | 2,434,371 | |
| | | | | |
| Short | | | | |
| Financials | | | 537,936 | |
| Consumer Discretionary | | | 466,348 | |
| Industrials | | | 258,615 | |
| Materials | | | 245,930 | |
| Information Technology | | | 229,738 | |
| Energy | | | 165,317 | |
| Health Care | | | 129,822 | |
| Exchange Traded Funds - Short | | | 88,078 | |
| Utilities | | | 40,683 | |
| | | $ | 2,162,467 | |
| Total: | | $ | 4,596,838 | |
| | | | | |
| Grizzly Short Fund (Unaudited) | | | |
| Components of Portfolio Holdings* | | Fair Value | |
| Financials | | $ | 48,049,487 | |
| Consumer Discretionary | | | 42,159,695 | |
| Industrials | | | 23,095,600 | |
| Materials | | | 21,760,800 | |
| Information Technology | | | 20,589,029 | |
| Energy | | | 14,629,972 | |
| Health Care | | | 11,534,324 | |
| Exchange Traded Funds | | | 8,101,127 | |
| Utilities | | | 3,600,275 | |
| Total: | | $ | 193,520,309 | |
| | | | | |
The Global Industry Classification Standard (GICS®) was developed by and/or is the exclusive property of MSCI, Inc. and Standard & Poor Financial Services LLC (“S&P”). GICS is a service mark of MSCI and S&P and has been licensed for use by U.S. Bancorp Fund Services, LLC.
*Excludes short-term investments
The Leuthold Funds - 2010 Annual Report 29
Leuthold Core Investment Fund – Retail Class
Average Annual Rate of Return For Periods Ended
September 30, 2010
| | 1 Year | | 3 Year | | 5 Year | | 10 Year |
| Leuthold Core Investment Fund - Retail Class | 1.53% | | (1.93%) | | 4.57% | | 7.32% |
| Lipper Flexible Fund Index | 9.41% | | (1.72%) | | 3.68% | | 2.59% |
| S&P 500 Index | 10.16% | | (7.16%) | | 0.64% | | (0.43%) |
A $10,000 Investment in the Leuthold Core Investment Fund – Retail Class
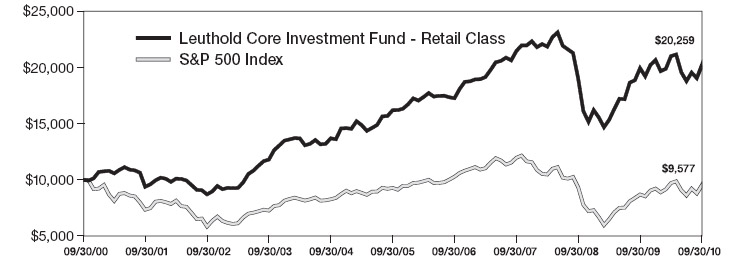
The Lipper Flexible Fund Index is composed of funds that allocate investments across various asset classes with a focus on total return, as defined by Lipper.
The S&P 500 Index is an unmanaged capitalization-weighted index of 500 stocks designed to measure performance of the broad domestic economy through changes in the aggregate market value of the 500 stocks which represent all major industries.
This chart assumes an initial gross investment of $10,000 made on 9/30/00. Returns shown include the reinvestment of all dividends. The Fund��s past performance is not necessarily an indication of its future performance. It may perform better or worse in the future. The graph and the table do not reflect the deduction of taxes that a shareholder would pay on Fund distributions or the redemption of shares.
30 The Leuthold Funds - 2010 Annual ReportLeuthold Core Investment Fund – Institutional Class
Average Annual Rate of Return For Periods Ended
September 30, 2010
| | 1 Year | | 3 Year | | 5 Year | | Since Inception |
Leuthold Core Investment Fund - Institutional Class | 1.64% | | (1.82%) | | n/a | | 3.62% |
| Lipper Flexible Fund Index | 9.41% | | (1.72%) | | 3.68% | | 2.82% |
| S&P 500 Index | 10.16% | | (7.16%) | | 0.64% | | (0.32%) |
A $1,000,000 Investment in the Leuthold Core Investment Fund – Institutional Class
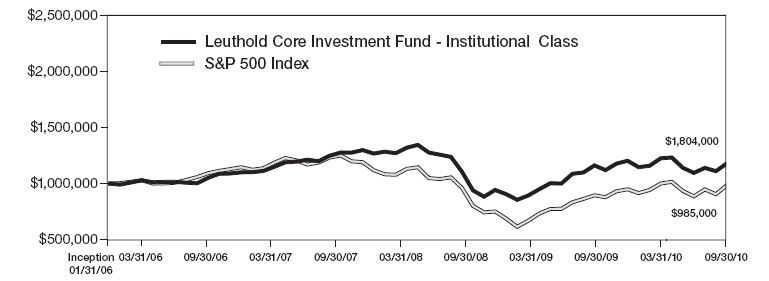
The Lipper Flexible Fund Index is composed of funds that allocate investments across various asset classes with a focus on total return, as defined by Lipper.
The S&P 500 Index is an unmanaged capitalization-weighted index of 500 stocks designed to measure performance of the broad domestic economy through changes in the aggregate market value of the 500 stocks which represent all major industries.
This chart assumes an initial gross investment of $1,000,000 made on 1/31/06 (commencement of operations). Returns shown include the reinvestment of all dividends. The Fund’s past performance is not necessarily an indication of its future performance. It may perform better or worse in the future. The graph and the table do not reflect the deduction of taxes that a shareholder would pay on Fund distributions or the redemption of shares.
The Leuthold Funds - 2010 Annual Report 31
Leuthold Asset Allocation Fund - Retail Class
Average Annual Rate of Return For Periods Ended
September 30, 2010
| | 1 Year | | 3 Year | | 5 Year | | Since Inception |
| Leuthold Asset Allocation Fund - Retail Class | 9.26% | | (2.62%) | | n/a | | 1.64% |
| Lipper Flexible Fund Index | 9.41% | | (1.72%) | | 3.68% | | 3.24% |
| S&P 500 Index | 10.16% | | (7.16%) | | 0.64% | | (0.10%) |
A $10,000 Investment in the Leuthold Asset Allocation Fund – Retail Class
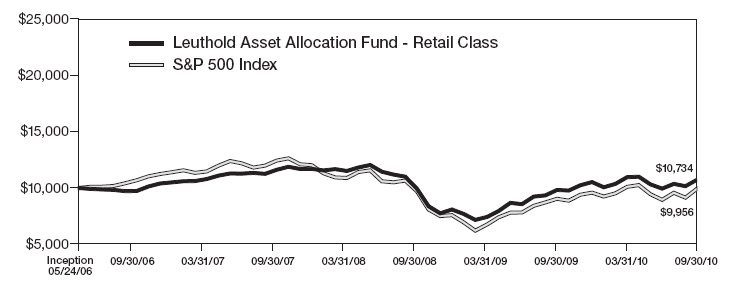
The Lipper Flexible Fund Index is composed of funds that allocate investments across various asset classes with a focus on total return, as defined by Lipper.
The S&P 500 Index is an unmanaged capitalization-weighted index of 500 stocks designed to measure performance of the broad domestic economy through changes in the aggregate market value of the 500 stocks which represent all major industries.
This chart assumes an initial gross investment of $10,000 made on 5/24/06 (commencement of operations). Returns shown include the reinvestment of all dividends. The Fund’s past performance is not necessarily an indication of its future performance. It may perform better or worse in the future. The graph and the table do not reflect the deduction of taxes that a shareholder would pay on Fund distributions or the redemption of shares.
32 The Leuthold Funds - 2010 Annual ReportLeuthold Asset Allocation Fund - Institutional Class
Average Annual Rate of Return For Periods Ended
September 30, 2010
| | 1 Year | | 3 Year | | 5 Year | | Since Inception |
Leuthold Asset Allocation Fund - Institutional Class | 9.41% | | (2.45%) | | n/a | | 0.56% |
| Lipper Flexible Fund Index | 9.41% | | (1.72%) | | 3.68% | | 0.81% |
| S&P 500 Index | 10.16% | | (7.16%) | | 0.64% | | (4.03%) |
A $1,000,000 Investment in the Leuthold Asset Allocation Fund – Institutional Class
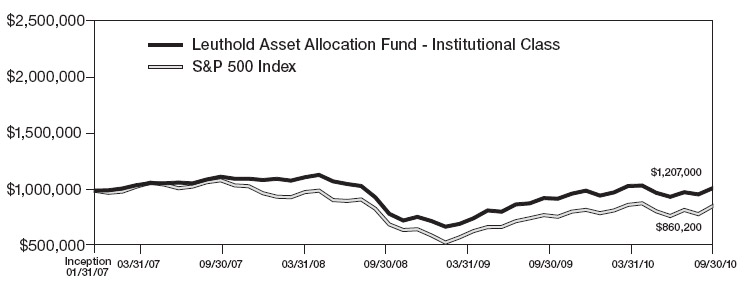
The Lipper Flexible Fund Index is composed of funds that allocate investments across various asset classes with a focus on total return, as defined by Lipper.
The S&P 500 Index is an unmanaged capitalization-weighted index of 500 stocks designed to measure performance of the broad domestic economy through changes in the aggregate market value of the 500 stocks which represent all major industries.
This chart assumes an initial gross investment of $1,000,000 made on 1/31/07 (commencement of operations). Returns shown include the reinvestment of all dividends. The Fund’s past performance is not necessarily an indication of its future performance. It may perform better or worse in the future. The graph and the table do not reflect the deduction of taxes that a shareholder would pay on Fund distributions or the redemption of shares.
The Leuthold Funds - 2010 Annual Report 33
Leuthold Global Fund - Retail Class
Average Annual Rate of Return For Periods Ended
September 30, 2010
| | 1 Year | | 3 Year | | 5 Year | | Since Inception |
Leuthold Global Fund - Retail Class | 12.39% | | n/a | | n/a | | 2.02% |
| MSCI All Country World Index | 8.95% | | (6.97%) | | 2.93% | | (3.56%) |
| S&P 500 Index | 10.16% | | (7.16%) | | 0.64% | | (2.90%) |
A $10,000 Investment in the Leuthold Global Fund - Retail Class
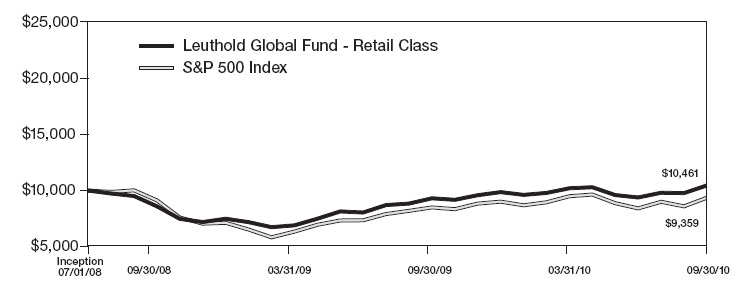
The MSCI ACWI (All Country World Index) is a free float-adjusted market capitalization weighted index that is designed to measure the equity market performance of developed and emerging markets. As of May 27, 2010, the MSCI ACWI consisted of 45 country indices comprising 24 developed and 21 emerging market country indices. The developed market country indices included are: Australia, Austria, Belgium, Canada, Denmark, Finland, France, Germany, Greece, Hong Kong, Ireland, Israel, Italy, Japan, Netherlands, New Zealand, Norway, Portugal, Singapore, Spain, Sweden, Switzerland, the United Kingdom, and the United States. The emerging market country indices included are: Brazil, Chile, China, Colombia, Czech Republic, Egypt, Hungary, India, Indonesia, Korea, Malaysia, Mexico, Morocco, Peru, Philippines, Poland, Russia, South Africa, Taiwan, Thailand, and Turkey.
The S&P 500 Index is an unmanaged capitalization-weighted index of 500 stocks designed to measure performance of the broad domestic economy through changes in the aggregate market value of the 500 stocks which represent all major industries. This chart assumes an initial gross investment of $10,000 made on 7/1/08 (commencement of operations). Returns shown include the reinvestment of all dividends. The Fund’s past performance is not necessarily an indication of its future performance. It may perform better or worse in the future. The graph and the table do not reflect the deduction of taxes that a shareholder would pay on Fund distributions or the redemption of shares.
34 The Leuthold Funds - 2010 Annual ReportLeuthold Global Fund - Institutional Class
Average Annual Rate of Return For Periods Ended
September 30, 2010
| | 1 Year | | 3 Year | | 5 Year | | Since Inception |
Leuthold Global Fund - Institutional Class | 12.52% | | n/a | | n/a | | 1.64% |
| MSCI All Country World Index | 8.95% | | (6.97%) | | 2.93% | | 6.33% |
| S&P 500 Index | 10.16% | | (7.16%) | | 0.64% | | (5.52%) |
A $1,000,000 Investment in the Leuthold Global Fund - Institutional Class
The MSCI ACWI (All Country World Index) is a free float-adjusted market capitalization weighted index that is designed to measure the equity market performance of developed and emerging markets. As of May 27, 2010, the MSCI ACWI consisted of 45 country indices comprising 24 developed and 21 emerging market country indices. The developed market country indices included are: Australia, Austria, Belgium, Canada, Denmark, Finland, France, Germany, Greece, Hong Kong, Ireland, Israel, Italy, Japan, Netherlands, New Zealand, Norway, Portugal, Singapore, Spain, Sweden, Switzerland, the United Kingdom, and the United States. The emerging market country indices included are: Brazil, Chile, China, Colombia, Czech Republic, Egypt, Hungary, India, Indonesia, Korea, Malaysia, Mexico, Morocco, Peru, Philippines, Poland, Russia, South Africa, Taiwan, Thailand, and Turkey.
The S&P 500 Index is an unmanaged capitalization-weighted index of 500 stocks designed to measure performance of the broad domestic economy through changes in the aggregate market value of the 500 stocks which represent all major industries. This chart assumes an initial gross investment of $1,000,000 made on 4/30/08 (commencement of operations). Returns shown include the reinvestment of all dividends. The Fund’s past performance is not necessarily an indication of its future performance. It may perform better or worse in the future. The graph and the table do not reflect the deduction of taxes that a shareholder would pay on Fund distributions or the redemption of shares.
The Leuthold Funds - 2010 Annual Report 35
Leuthold Select Industries Fund
Average Annual Rate of Return For Periods Ended
September 30, 2010
| | 1 Year | | 3 Year | | 5 Year | | 10 Year |
Leuthold Select Industries Fund | (7.76%) | | (9.73%) | | 0.79% | | 3.40% |
| Russell 2000 Index | 13.35% | | (4.29%) | | 1.60% | | 4.00% |
| S&P 500 Index | 10.16% | | (7.16%) | | 0.64% | | (0.43%) |
A $10,000 Investment in the Leuthold Select Industries Fund
The Russell 2000 Index is comprised of the smallest 2000 companies in the Russell 3000 Index, representing approximately 8% of the Russell 3000 total market capitalization.
The S&P 500 Index is an unmanaged capitalization-weighted index of 500 stocks designed to measure performance of the broad domestic economy through changes in the aggregate market value of the 500 stocks which represent all major industries.
This chart assumes an initial gross investment of $10,000 made on 9/30/00. Returns shown include the reinvestment of all dividends. The Fund’s past performance is not necessarily an indication of its future performance. It may perform better or worse in the future. The graph and the table do not reflect the deduction of taxes that a shareholder would pay on Fund distributions or the redemption of shares.
36 The Leuthold Funds - 2010 Annual ReportLeuthold Global Industries Fund - Retail Class
Average Annual Rate of Return For Periods Ended
September 30, 2010
| | 1 Year | | 3 Year | | 5 Year | | Since Inception(1) |
Leuthold Global Industries Fund - Retail Class | n/a | | n/a | | n/a | | 10.10% |
| MSCI All Country World Index | 8.95% | | (6.97%) | | 2.93% | | 7.82% |
| S&P 500 Index | 10.16% | | (7.16%) | | 0.64% | | 1.16% |
A $10,000 Investment in the Leuthold Global Industries Fund - Retail Class
The MSCI ACWI (All Country World Index) is a free float-adjusted market capitalization weighted index that is designed to measure the equity market performance of developed and emerging markets. As of May 27, 2010, the MSCI ACWI consisted of 45 country indices comprising 24 developed and 21 emerging market country indices. The developed market country indices included are: Australia, Austria, Belgium, Canada, Denmark, Finland, France, Germany, Greece, Hong Kong, Ireland, Israel, Italy, Japan, Netherlands, New Zealand, Norway, Portugal, Singapore, Spain, Sweden, Switzerland, the United Kingdom, and the United States. The emerging market country indices included are: Brazil, Chile, China, Colombia, Czech Republic, Egypt, Hungary, India, Indonesia, Korea, Malaysia, Mexico, Morocco, Peru, Philippines, Poland, Russia, South Africa, Taiwan, Thailand, and Turkey.
The S&P 500 Index is an unmanaged capitalization-weighted index of 500 stocks designed to measure performance of the broad domestic economy through changes in the aggregate market value of the 500 stocks which represent all major industries. This chart assumes an initial gross investment of $10,000 made on 5/17/10 (commencement of operations). Returns shown include the reinvestment of all dividends. The Fund’s past performance is not necessarily an indication of its future performance. It may perform better or worse in the future. The graph and the table do not reflect the deduction of taxes that a shareholder would pay on Fund distributions or the redemption of shares.
The Leuthold Funds - 2010 Annual Report 37
Leuthold Global Industries Fund - Institutional Class
Average Annual Rate of Return For Periods Ended
September 30, 2010
| | 1 Year | | 3 Year | | 5 Year | | Since Inception(1) |
Leuthold Global Industries Fund - Institutional Class | n/a | | n/a | | n/a | | 10.10% |
| MSCI All Country World Index | 8.95% | | (6.97%) | | 2.93% | | 7.82% |
| S&P 500 Index | 10.16% | | (7.16%) | | 0.64% | | 1.16% |
A $1,000,000 Investment in the Leuthold Global Industries Fund - Institutional Class
The MSCI ACWI (All Country World Index) is a free float-adjusted market capitalization weighted index that is designed to measure the equity market performance of developed and emerging markets. As of May 27, 2010, the MSCI ACWI consisted of 45 country indices comprising 24 developed and 21 emerging market country indices. The developed market country indices included are: Australia, Austria, Belgium, Canada, Denmark, Finland, France, Germany, Greece, Hong Kong, Ireland, Israel, Italy, Japan, Netherlands, New Zealand, Norway, Portugal, Singapore, Spain, Sweden, Switzerland, the United Kingdom, and the United States. The emerging market country indices included are: Brazil, Chile, China, Colombia, Czech Republic, Egypt, Hungary, India, Indonesia, Korea, Malaysia, Mexico, Morocco, Peru, Philippines, Poland, Ru ssia, South Africa, Taiwan, Thailand, and Turkey.
The S&P 500 Index is an unmanaged capitalization-weighted index of 500 stocks designed to measure performance of the broad domestic economy through changes in the aggregate market value of the 500 stocks which represent all major industries. This chart assumes an initial gross investment of $1,000,000 made on 5/17/10 (commencement of operations). Returns shown include the reinvestment of all dividends. The Fund’s past performance is not necessarily an indication of its future performance. It may perform better or worse in the future. The graph and the table do not reflect the deduction of taxes that a shareholder would pay on Fund distributions or the redemption of shares.
38 The Leuthold Funds - 2010 Annual ReportLeuthold Undervalued & Unloved Funds
Average Annual Rate of Return For Periods Ended
September 30, 2010
| | 1 Year | | 3 Year | | 5 Year | | Since Inception |
Leuthold Undervalued & Unloved Fund | 10.88% | | (5.95%) | | n/a | | (4.08%) |
| 8.15% | | (9.04%) | | (0.39%) | | (5.11%) |
| S&P 500 Index | 10.16% | | (7.16%) | | 0.64% | | (2.93%) |
A $10,000 Investment in the Leuthold Undervalued & Unloved Fund
The Russell 3000 Value Index measures the performance of those Russell 3000 Index companies with lower price-to-book ratios and lower forecasted growth values.
The S&P 500 Index is an unmanaged capitalization-weighted index of 500 stocks designed to measure performance of the broad domestic economy through changes in the aggregate market value of the 500 stocks which represent all major industries.
This chart assumes an initial gross investment of $10,000 made on 11/14/06 (commencement of operations). Returns shown include the reinvestment of all dividends. The Fund’s past performance is not necessarily an indication of its future performance. It may perform better or worse in the future. The graph and the table do not reflect the deduction of taxes that a shareholder would pay on Fund distributions or the redemption of shares.
The Leuthold Funds - 2010 Annual Report 39
Leuthold Global Clean Technology Fund - Retail Class
Average Annual Rate of Return For Periods Ended
September 30, 2010
| | 1 Year | | 3 Year | | 5 Year | | Since Inception |
Leuthold Global Clean Technology Fund - Retail Class | (10.59%) | | n/a | | n/a | | 2.51% |
Ardour Global Alternative Energy Index | (16.43%) | | (51.83%) | | (15.60%) | | (10.13%) |
| S&P 500 Index | 10.16% | | (7.16%) | | 0.64% | | 18.63% |
A $10,000 Investment in the Leuthold Global Clean Technology Fund - Retail Class
The Ardour Global Alternative Energy Index is a pure-play equity index designed to serve as a benchmark for publicly traded companies which are principally engaged in the field of alternative energy technologies, including renewable energy, alternative fuels, and related enabling technologies. The index is published by S-Network Global Indexes LLC.
The S&P 500 Index is an unmanaged capitalization-weighted index of 500 stocks designed to measure performance of the broad domestic economy through changes in the aggregate market value of the 500 stocks which represent all major industries.
This chart assumes an initial gross investment of $10,000 made on 7/22/09 (commencement of operations). Returns shown include the reinvestment of all dividends. The Fund’s past performance is not necessarily an indication of its future performance. It may perform better or worse in the future. The graph and the table do not reflect the deduction of taxes that a shareholder would pay on Fund distributions or the redemption of shares.
40 The Leuthold Funds - 2010 Annual ReportLeuthold Global Clean Technology Fund - Institutional Class
Average Annual Rate of Return For Periods Ended
September 30, 2010
| | 1 Year | | 3 Year | | 5 Year | | Since Inception |
Leuthold Global Clean Technology Fund - Institutional Class | (10.33%) | | n/a | | n/a | | 2.76% |
Ardour Global Alternative Energy Index | (16.43%) | | (51.83%) | | (15.60%) | | (10.13%) |
| S&P 500 Index | 10.16% | | (7.16%) | | 0.64% | | 18.63% |
A $1,000,000 Investment in the Leuthold Global Clean Technology Fund - Institutional Class
The Ardour Global Alternative Energy Index is a pure-play equity index designed to serve as a benchmark for publicly traded companies which are principally engaged in the field of alternative energy technologies, including renewable energy, alternative fuels, and related enabling technologies. The index is published by S-Network Global Indexes LLC.
The S&P 500 Index is an unmanaged capitalization-weighted index of 500 stocks designed to measure performance of the broad domestic economy through changes in the aggregate market value of the 500 stocks which represent all major industries.
This chart assumes an initial gross investment of $1,000,000 made on 7/22/09 (commencement of operations). Returns shown include the reinvestment of all dividends. The Fund’s past performance is not necessarily an indication of its future performance. It may perform better or worse in the future. The graph and the table do not reflect the deduction of taxes that a shareholder would pay on Fund distributions or the redemption of shares.
The Leuthold Funds - 2010 Annual Report 41
Leuthold Hedged Equity Fund - Retail Class
Average Annual Rate of Return For Periods Ended
September 30, 2010
| | 1 Year | | 3 Year | | 5 Year | | Since Inception |
Leuthold Hedged Equity Fund - Retail Class | (9.10%) | | n/a | | n/a | | (11.11%) |
| 13.35% | | (4.29%) | | 1.60% | | 24.55% |
| S&P 500 Index | 10.16% | | (7.16%) | | 0.64% | | 18.63% |
A $10,000 Investment in the Leuthold Hedged Equity Fund - Retail Class
The Russell 2000 Index is comprised of the smallest 2000 companies in the Russell 3000 Index, representing approximately 8% of the Russell 3000 total market capitalization.
The S&P 500 Index is an unmanaged capitalization-weighted index of 500 stocks designed to measure performance of the broad domestic economy through changes in the aggregate market value of the 500 stocks which represent all major industries.
This chart assumes an initial gross investment of $10,000 made on 7/22/09 (commencement of operations). Returns shown include the reinvestment of all dividends. The Fund’s past performance is not necessarily an indication of its future performance. It may perform better or worse in the future. The graph and the table do not reflect the deduction of taxes that a shareholder would pay on Fund distributions or the redemption of shares.
42 The Leuthold Funds - 2010 Annual ReportLeuthold Hedged Equity Fund - Institutional Clas s
Average Annual Rate of Return For Periods Ended
September 30, 2010
| | 1 Year | | 3 Year | | 5 Year | | Since Inception |
Leuthold Hedged Equity Fund - Institutional Class | (9.20%) | | n/a | | n/a | | (11.11%) |
| 13.35% | | (4.29%) | | 1.60% | | 24.55% |
| S&P 500 Index | 10.16% | | (7.16%) | | 0.64% | | 18.63% |
A $1,000,000 Investment in the Leuthold Hedged Equity Fund - Institutional Class
The Russell 2000 Index is comprised of the smallest 2000 companies in the Russell 3000 Index, representing approximately 8% of the Russell 3000 total market capitalization.
The S&P 500 Index is an unmanaged capitalization-weighted index of 500 stocks designed to measure performance of the broad domestic economy through changes in the aggregate market value of the 500 stocks which represent all major industries.
This chart assumes an initial gross investment of $1,000,000 made on 7/22/09 (commencement of operations). Returns shown include the reinvestment of all dividends. The Fund’s past performance is not necessarily an indication of its future performance. It may perform better or worse in the future. The graph and the table do not reflect the deduction of taxes that a shareholder would pay on Fund distributions or the redemption of shares.
The Leuthold Funds - 2010 Annual Report 43Average Annual Rate of Return For Periods Ended
September 30, 2010
| | 1 Year | | 3 Year | | 5 Year | | 10 Year |
| (13.26%) | | (3.53%) | | (5.98%) | | (3.51%) |
| 17.78% | | (1.67%) | | 3.77% | | 5.40% |
| S&P 500 Index | 10.16% | | (7.16%) | | 0.64% | | (0.43%) |
A $10,000 Investment in the Grizzly Short Fund
Standard and Poor’s MidCap 400 Index is a capitalization-weighted index which measures the performance of the mid-range sector of the U.S. stock market. The index was developed with a base level of 100 as of December 31, 1990.
The S&P 500 Index is an unmanaged capitalization-weighted index of 500 stocks designed to measure performance of the broad domestic economy through changes in the aggregate market value of the 500 stocks which represent all major industries.
This chart assumes an initial gross investment of $10,000 made on 9/30/00. Returns shown include the reinvestment of all dividends. The Fund’s past performance is not necessarily an indication of its future performance. It may perform better or worse in the future. The graph and the table do not reflect the deduction of taxes that a shareholder would pay on Fund distributions or the redemption of shares.
44 The Leuthold Funds - 2010 Annual Report Statements of Assets and Liabilities
September 30, 2010
| | | Leuthold | | | Leuthold | | | | | | | | | | |
| | | Core | | | Asset | | | Leuthold | | | Leuthold | | | Leuthold | |
| | | Investment | | | Allocation | | | Global | | | Select | | | Global | |
| | | Fund | | | Fund | | | Fund | | | Industries | | | Industries | |
| | | (Consolidated) | | | (Consolidated) | | | (Consolidated) | | | Fund | | | Fund | |
| | | | | | | | | | | | | | | | |
| ASSETS: | | | | | | | | | | | | | | | |
| Investments, at cost | | $ | 942,892,324 | | | $ | 847,975,359 | | | $ | 256,454,081 | | | $ | 38,199,322 | | | $ | 8,506,413 | |
| | | | | | | | | | | | | | | | | | | | | |
| | | | | | | | | | | | | | | | | | | | | |
| | | | | | | | | | | | | | | | | | | | | |
| Investments, at fair value | | $ | 1,106,631,730 | | | $ | 1,038,457,132 | | | $ | 282,818,014 | | | $ | 40,012,496 | | | $ | 9,677,807 | |
| Cash | | | — | | | | 15,563 | | | | — | | | | — | | | | — | |
| Foreign currency (cost $0, $1, $10,694, | | | | | | | | | | | | | | | | | | | | |
$0, and $5,958, respectively) | | | — | | | | 1 | | | | 10,944 | | | | — | | | | 6,091 | |
| Receivable for Fund shares sold | | | 835,228 | | | | 1,370,637 | | | | 958,510 | | | | — | | | | — | |
| Receivable for investments sold | | | 7,077,401 | | | | 6,232,778 | | | | 11,771,816 | | | | 141,724 | | | | 95,728 | |
| Collateral at broker for | | | | | | | | | | | | | | | | | | | | |
securities sold short | | | 401,306,064 | | | | 372,835,125 | | | | 31,824,815 | | | | — | | | | — | |
| Interest receivable | | | 1,176,312 | | | | 1,094,927 | | | | 185,461 | | | | 31 | | | | 12 | |
| Dividends receivable | | | 855,358 | | | | 1,489,024 | | �� | | 585,200 | | | | 37,191 | | | | 17,078 | |
| Receivable from Adviser | | | — | | | | — | | | | — | | | | –– | | | | 16,011 | |
| Other assets | | | 32,697 | | | | 36,805 | | | | 10,769 | | | | 10,518 | | | | 2,910 | |
| | | | | | | | | | | | | | | | | | | | | |
| Total Assets | | | 1,517,914,790 | | | | 1,421,531,992 | | | | 328,165,529 | | | | 40,201,960 | | | | 9,815,637 | |
| | | | | | | | | | | | | | | | | | | | | |
| | | | | | | | | | | | | | | | | | | | | |
| | | | | | | | | | | | | | | | | | | | | |
| LIABILITIES: | | | | | | | | | | | | | | | | | | | | |
| Bank overdraft | | | — | | | | — | | | | 1,908,817 | | | | — | | | | — | |
| Securities sold short, at fair value | | | | | | | | | | | | | | | | | | | | |
(proceeds $94,284,051, $87,852,189, | | | | | | | | | | | | | | | | | | | | |
$19,635,234, $0, and $0, respectively) | | | 102,953,525 | | | | 95,934,440 | | | | 21,749,011 | | | | — | | | | — | |
| Interest payable on securities sold short | | | 222,795 | | | | 207,247 | | | | 71,670 | | | | — | | | | — | |
| Payable for investments purchased | | | 100,187,297 | | | | 85,245,746 | | | | 14,243,389 | | | | 1,002,243 | | | | 47,963 | |
| Payable for Fund shares redeemed | | | 2,231,663 | | | | 1,017,910 | | | | 67,446 | | | | 42,478 | | | | — | |
| Payable to Adviser | | | 962,934 | | | | 908,507 | | | | 280,351 | | | | 31,208 | | | | — | |
| Payable to Custodian | | | 43,071 | | | | 51,274 | | | | 17,093 | | | | 1,985 | | | | 3,999 | |
| Dividends payable on securities sold short | | | 448,020 | | | | 418,373 | | | | 37,298 | | | | –– | | | | — | |
| Distribution (Rule 12b-1) fees payable | | | — | | | | 366,135 | | | | 34,703 | | | | 1,296 | | | | 1,958 | |
| Shareholder servicing fees payable | | | 160,712 | | | | — | | | | –– | | | | 5,124 | | | | –– | |
| Accrued expenses and other liabilities | | | 341,419 | | | | 560,526 | | | | 109,431 | | | | 29,139 | | | | 41,453 | |
| | | | | | | | | | | | | | | | | | | | | |
| Total Liabilities | | | 207,551,436 | | | | 184,710,158 | | | | 38,519,209 | | | | 1,113,473 | | | | 95,373 | |
| | | | | | | | | | | | | | | | | | | | | |
| NET ASSETS | | $ | 1,310,363,354 | | | $ | 1,236,821,834 | | | $ | 289,646,320 | | | $ | 39,088,487 | | | $ | 9,720,264 | |
| | | | | | | | | | | | | | | | | | | | | |
See Notes to the Finacial Statements The Leuthold Funds - 2010 Annual Report 45
Statements of Assets and Liabilities (continued)
September 30, 2010
| | | Leuthold | | | Leuthold | | | | | | | | | | |
| | | Core | | | Asset | | | Leuthold | | | Leuthold | | | Leuthold | |
| | | Investment | | | Allocation | | | Global | | | Select | | | Global | |
| | | Fund | | | Fund | | | Fund | | | Industries | | | Industries | |
| | | (Consolidated) | | | (Consolidated) | | | (Consolidated) | | | Fund | | | Fund | |
| | | | | | | | | | | | | | | | |
| NET ASSETS CONSIST OF: | | | | | | | | | | | | | | | |
| Capital stock | | $ | 1,293,604,599 | | | $ | 1,570,203,362 | | | $ | 250,438,850 | | | $ | 46,096,749 | | | $ | 8,471,285 | |
| Accumulated net investment | | | | | | | | | | | | | | | | | | | | |
income (loss) | | | (1,873,912 | ) | | | 320,103 | | | | 2,218 | | | | 22,725 | | | | 2,032 | |
| Accumulated net realized gain | | | | | | | | | | | | | | | | | | | | |
(loss) on investments | | | (136,477,767 | ) | | | (516,138,788 | ) | | | 14,935,939 | | | | (8,844,200 | ) | | | 74,265 | |
| Net unrealized appreciation (depreciation) | | | | | | | | | | | | | | | | | | | | |
on investments and short positions | | | 155,110,434 | | | | 182,437,157 | | | | 24,269,313 | | | | 1,813,213 | | | | 1,172,682 | |
| | | | | | | | | | | | | | | | | | | | | |
| Total Net Assets | | $ | 1,310,363,354 | | | $ | 1,236,821,834 | | | $ | 289,646,320 | | | $ | 39,088,487 | | | $ | 9,720,264 | |
| | | | | | | | | | | | | | | | | | | | | |
| | | | | | | | | | | | | | | | | | | | | |
| Retail Class Shares | | | | | | | | | | | | | | | | | | | | |
Net assets | | $ | 858,708,522 | | | $ | 843,525,684 | | | $ | 98,906,854 | | | $ | 39,088,487 | | | $ | 5,850,019 | |
Shares outstanding | | | | | | | | | | | | | | | | | | | | |
(1,000,000,000 shares of | | | | | | | | | | | | | | | | | | | | |
$0.0001 par value authorized) | | | 53,717,838 | | | | 85,100,858 | | | | 9,717,024 | | | | 3,312,467 | | | | 531,349 | |
Net Asset Value, Redemption | | | | | | | | | | | | | | | | | | | | |
Price and Offering Price | | | | | | | | | | | | | | | | | | | | |
Per Share | | $ | 15.99 | * | | $ | 9.91 | * | | $ | 10.18 | * | | $ | 11.80 | | | $ | 11.01 | * |
| | | | | | | | | | | | | | | | | | | | | |
| | | | | | | | | | | | | | | | | | | | | |
| | | | | | | | | | | | | | | | | | | | | |
| | | | | | | | | | | | | | | | | | | | | |
| Institutional Class Shares | | | | | | | | | | | | | | | | | | | | |
Net assets | | $ | 451,654,832 | | | $ | 393,296,150 | | | $ | 190,739,466 | | | | n/a | | | $ | 3,870,245 | |
Shares outstanding | | | | | | | | | | | | | | | | | | | | |
(1,000,000,000 shares of | | | | | | | | | | | | | | | | | | | | |
$0.0001 par value authorized) | | | 28,265,832 | | | | 39,599,215 | | | | 18,690,893 | | | | n/a | | | | 351,371 | |
Net Asset Value, Redemption | | | | | | | | | | | | | | | | | | | | |
Price and Offering Price | | | | | | | | | | | | | | | | | | | | |
Per Share | | $ | 15.98 | * | | $ | 9.93 | * | | $ | 10.20 | * | | | n/a | | | $ | 11.01 | * |
| | | | | | | | | | | | | | | | | | | | | |
46 The Leuthold Funds - 2010 Annual Report & #160; See Notes to the Finacial StatementsThe Leuthold Funds
Statements of Assets and Liabilities (continued)
September 30, 2010
| | | Leuthold | | | Leuthold | | | Leuthold | | | | |
| | | Undervalued | | | Global Clean | | | Hedged | | | Grizzly | |
| | | & Unloved | | | Technology | | | Equity | | | Short | |
| | | Fund | | | Fund | | | Fund | | | Fund | |
| | | | | | | | | | | | | |
| ASSETS: | | | | | | | | | | | | |
| Investments, at cost | | $ | 6,812,701 | | | $ | 29,315,181 | | | $ | 2,355,600 | | | $ | 11,326,967 | |
| | | | | | | | | | | | | | | | | |
| | | | | | | | | | | | | | | | | |
| Investments, at fair value | | $ | 7,991,619 | | | $ | 28,393,374 | | | $ | 2,510,587 | | | $ | 11,326,967 | |
| Cash | | | 406 | | | | — | | | | — | | | | — | |
| Foreign currency (cost $0, $0, | | | | | | | | | | | | | | | | |
$0, and $0, respectively) | | | — | | | | — | | | | — | | | | — | |
| Receivable for Fund shares sold | | | — | | | | 47,847 | | | | 75 | | | | 443,632 | |
| Receivable for investments sold | | | — | | | | — | | | | 9,017 | | | | — | |
| Collateral at brokers for | | | | | | | | | | | | | | | | |
securities sold short | | | — | | | | — | | | | 4,329,759 | | | | 386,769,119 | |
| Interest receivable | | | 3 | | | | 38 | | | | 5 | | | | 594 | |
| Dividends receivable | | | 25,224 | | | | 3,855 | | | | 1,577 | | | | –– | |
| Receivable from Adviser | | | — | | | | –– | | | | — | | | | — | |
| Other assets | | | 14,471 | | | | 37,398 | | | | 32,137 | | | | 23,938 | |
| | | | | | | | | | | | | | | | | |
| Total Assets | | | 8,031,723 | | | | 28,482,512 | | | | 6,883,157 | | | | 398,564,250 | |
| | | | | | | | | | | | | | | | | |
| | | | | | | | | | | | | | | | | |
| LIABILITIES: | | | | | | | | | | | | | | | | |
| Bank overdraft | | | — | | | | 335,342 | | | | — | | | | — | |
| Securities sold short, at fair value | | | | | | | | | | | | | | | | |
(proceeds $0, $0, $2,110,889, | | | | | | | | | | | | | | | | |
and $186,862,139, respectively) | | | — | | | | –– | | | | 2,162,467 | | | | 193,520,309 | |
| Interest payable on securities sold short | | | — | | | | — | | | | — | | | | — | |
| Payable for investments purchased | | | — | | | | 648,689 | | | | 84,387 | | | | 7,954,439 | |
| Payable for Fund shares redeemed | | | 335 | | | | 54,371 | | | | 22,517 | | | | 81,184 | |
| Payable to Adviser | | | 8,833 | | | | 21,956 | | | | 666 | | | | 209,706 | |
| Payable to Custodian | | | 643 | | | | 4,374 | | | | 2,165 | | | | 149 | |
| Interest payable on securities sold short | | | — | | | | –– | | | | 268 | | | | 24,762 | |
| Dividends payable on securities sold short | | | — | | | | –– | | | | 967 | | | | 119,287 | |
| Distribution (Rule 12b-1) fees payable | | | 5,768 | | | | 6,512 | | | | 2,005 | | | | — | |
| Shareholder servicing fees payable | | | — | | | | –– | | | | — | | | | 27,322 | |
| Accrued expenses and other liabilities | | | 20,291 | | | | 25,292 | | | | 18,227 | | | | 74,850 | |
| | | | | | | | | | | | | | | | | |
| Total Liabilities | | | 35,870 | | | | 1,096,536 | | | | 2,293,669 | | | | 202,012,008 | |
| | | | | | | | | | | | | | | | | |
| | | | | | | | | | | | | | | | | |
| NET ASSETS | | $ | 7,995,853 | | | $ | 27,385,976 | | | $ | 4,589,488 | | | $ | 196,552,242 | |
| | | | | | | | | | | | | | | | | |
See Notes to the Finacial Statements The Leuthold Funds - 2010 Annual Report 47
Statements of Assets and Liabilities (continued)
September 30, 2010
| | | Leuthold | | | Leuthold | | | Leuthold | | | | |
| | | Undervalued | | | Global Clean | | | Hedged | | | Grizzly | |
| | | & Unloved | | | Technology | | | Equity | | | Short | |
| | | Fund | | | Fund | | | Fund | | | Fund | |
| | | | | | | | | | | | | |
| NET ASSETS CONSIST OF: | | | | | | | | | | | | |
Capital stock | | $ | 14,921,133 | | | $ | 29,020,263 | | | $ | 5,090,962 | | | $ | 243,717,855 | |
Accumulated net investment income (loss) | | | 27,283 | | | | (1,375 | ) | | | (24 | ) | | | (39 | ) |
Accumulated net realized gain (loss) | | | | | | | | | | | | | | | | |
on investments | | | (8,131,487 | ) | | | (711,391 | ) | | | (604,859 | ) | | | (40,507,404 | ) |
Net unrealized appreciation | | | | | | | | | | | | | | | | |
(depreciation) on investments | | | | | | | | | | | | | | | | |
and short positions | | | 1,178,924 | | | | (921,521 | ) | | | 103,409 | | | | (6,658,170 | ) |
| | | | | | | | | | | | | | | | | |
| Total Net Assets | | $ | 7,995,853 | | | $ | 27,385,976 | | | $ | 4,589,488 | | | $ | 196,552,242 | |
| | | | | | | | | | | | | | | | | |
| | | | | | | | | | | | | | | | | |
| | | | | | | | | | | | | | | | | |
| | | | | | | | | | | | | | | | | |
| Retail Class Shares | | | | | | | | | | | | | | | | |
Net assets | | $ | 7,995,853 | | | $ | 11,926,464 | | | $ | 4,523,612 | | | $ | 196,552,242 | |
Shares outstanding | | | | | | | | | | | | | | | | |
(1,000,000,000 shares of | | | | | | | | | | | | | | | | |
$0.0001 par value authorized) | | | 987,026 | | | | 1,157,509 | | | | 520,809 | | | | 47,657,949 | |
Net Asset Value, Redemption | | | | | | | | | | | | | | | | |
Price and Offering Price | | | | | | | | | | | | | | | | |
Per Share | | $ | 8.10 | * | | $ | 10.30 | * | | $ | 8.69 | * | | $ | 4.12 | |
| | | | | | | | | | | | | | | | | |
| | | | | | | | | | | | | | | | | |
| | | | | | | | | | | | | | | | | |
| | | | | | | | | | | | | | | | | |
| Institutional Class Shares | | | | | | | | | | | | | | | | |
Net assets | | | n/a | | | | 15,459,512 | | | | 65,876 | | | | n/a | |
Shares outstanding | | | | | | | | | | | | | | | | |
(1,000,000,000 shares of | | | | | | | | | | | | | | | | |
$0.0001 par value authorized) | | | n/a | | | | 1,496,439 | | | | 7,582 | | | | n/a | |
| Net Asset Value, Redemption | | | | | | | | | | | | | | | | |
Price and Offering Price | | | | | | | | | | | | | | | | |
Per Share | | | n/a | | | $ | 10.33 | * | | $ | 8.69 | * | | | n/a | |
| | | | | | | | | | | | | | | | | |
48 The Leuthold Funds - 2010 Annual Report & #160; See Notes to the Finacial StatementsThe Leuthold Funds
Statements of Operations
For the Year Ended September 30, 2010
| | | Leuthold | | | Leuthold | | | | | | | | | | |
| | | Core | | | Asset | | | Leuthold | | | Leuthold | | | Leuthold | |
| | | Investment | | | Allocation | | | Global | | | Select | | | Global | |
| | | Fund | | | Fund | | | Fund | | | Industries | | | Industries | |
| | | (Consolidated) | | | (Consolidated) | | | (Consolidated) | | | Fund | | | Fund* | |
| | | | | | | | | | | | | | | | |
| INVESTMENT INCOME: | | | | | | | | | | | | | | | |
Dividend income (net of | | | | | | | | | | | | | | | |
foreign taxes withheld | | | | | | | | | | | | | | | |
of $715,240, $491,878, | | | | | | | | | | | | | | | |
| $295,277, $39,253, and | | | | | | | | | | | | | | | |
| $3,993, respectively) | | $ | 23,095,355 | | | $ | 26,955,505 | | | $ | 5,559,657 | | | $ | 719,440 | | | $ | 43,843 | |
Interest income | | | 8,346,109 | | | | 8,189,516 | | | | 674,753 | | | | 334 | | | | 60 | |
| | | | | | | | | | | | | | | | | | | | | |
| Total investment income | | | 31,441,464 | | | | 35,145,021 | | | | 6,234,410 | | | | 719,774 | | | | 43,903 | |
| | | | | | | | | | | | | | | | | | | | | |
| | | | | | | | | | | | | | | | | | | | | |
| | | | | | | | | | | | | | | | | | | | | |
| | | | | | | | | | | | | | | | | | | | | |
| | | | | | | | | | | | | | | | | | | | | |
| EXPENSES: | | | | | | | | | | | | | | | | | | | | |
Investment advisory fees (Note 3) | | | 12,747,088 | | | | 11,549,115 | | | | 2,869,424 | | | | 468,721 | | | | 20,602 | |
Administration fees | | | 469,221 | | | | 458,118 | | | | 81,273 | | | | 17,957 | | | | 540 | |
Transfer agent fees | | | 266,599 | | | | 1,353,133 | | | | 126,758 | | | | 13,986 | | | | 629 | |
Legal fees | | | 51,383 | | | | 30,061 | | | | 16,752 | | | | 389 | | | | 8,110 | |
Audit fees | | | 54,112 | | | | 54,354 | | | | 28,133 | | | | 20,214 | | | | 15,000 | |
Fund accounting fees | | | 128,979 | | | | 117,079 | | | | 37,220 | | | | 7,589 | | | | 4,484 | |
Custody fees | | | 317,552 | | | | 354,008 | | | | 103,192 | | | | 12,857 | | | | 19,509 | |
Shareholder servicing fees - | | | | | | | | | | | | | | | | | | | | |
Retail Class | | | 967,184 | | | | — | | | | — | | | | 36,922 | | | | –– | |
Registration fees | | | 61,089 | | | | 88,601 | | | | 67,345 | | | | 19,931 | | | | 16,088 | |
Reports to shareholders | | | 138,285 | | | | 165,225 | | | | 20,233 | | | | 5,505 | | | | 422 | |
Directors’ fees | | | 76,259 | | | | 69,284 | | | | 11,589 | | | | 2,600 | | | | 88 | |
Distribution (Rule 12b-1) fees - | | | | | | | | | | | | | | | | | | | | |
(Note 4) | | | –– | | | | 1,820,130 | | | | 146,255 | | | | –– | | | | 2,982 | |
Other | | | 64,969 | | | | 49,863 | | | | 6,756 | | | | 2,644 | | | | 393 | |
| | | | | | | | | | | | | | | | | | | | | |
Total expenses before dividends and | | | | | | | | | | | | | | | | | | | | |
interest on short positions | | | 15,342,720 | | | | 16,108,971 | | | | 3,514,930 | | | | 609,315 | | | | 88,847 | |
Dividends and interest on | | | | | | | | | | | | | | | | | | | | |
short positions | | | 3,574,464 | | | | 3,189,913 | | | | 650,034 | | | | –– | | | | — | |
(Reimbursement) or recovery | | | | | | | | | | | | | | | | | | | | |
from Adviser | | | — | | | | — | | | | –– | | | | — | | | | (50,678 | ) |
| | | | | | | | | | | | | | | | | | | | | |
Total expenses | | | 18,917,184 | | | | 19,298,884 | | | | 4,164,964 | | | | 609,315 | | | | 38,169 | |
| | | | | | | | | | | | | | | | | | | | | |
| NET INVESTMENT INCOME | | | | | | | | | | | | | | | | | | | | |
(LOSS) | | $ | 12,524,280 | | | $ | 15,846,137 | | | $ | 2,069,446 | | | $ | 110,459 | | | $ | 5,734 | |
| | | | | | | | | | | | | | | | | | | | | |
*Period from May 17, 2010 (commencement of operations) through September 30, 2010.
See Notes to the Finacial Statements The Leuthold Funds - 2010 Annual Report 49
The Leuthold Funds
Statements of Operations
For the Year Ended September 30, 2010
| | | Leuthold | | | Leuthold | | | | | | | | | | |
| | | Core | | | Asset | | | Leuthold | | | Leuthold | | | Leuthold | |
| | | Investment | | | Allocation | | | Global | | | Select | | | Global | |
| | | Fund | | | Fund | | | Fund | | | Industries | | | Industries | |
| | | (Consolidated) | | | (Consolidated) | | | (Consolidated) | | | Fund | | | Fund* | |
| | | | | | | | | | | | | | | | |
| REALIZED AND UNREALIZED | | | | | | | | | | | | | | | |
GAIN (LOSS) ON INVESTMENTS, | | | | | | | | | | | | | | | |
INVESTMENT COMPANIES, | | | | | | | | | | | | | | | |
SHORT POSITIONS, FOREIGN | | | | | | | | | | | | | | | |
CURRENCY, AND FOREIGN | | | | | | | | | | | | | | | |
CURRENCY TRANSLATION: | | | | | | | | | | | | | | | |
Net realized gain (loss) on: | | | | | | | | | | | | | | | |
Investments | | $ | 13,250,868 | | | $ | 48,969,430 | | | $ | 19,800,804 | | | $ | 236,366 | | | $ | 29,787 | |
Investment companies | | | 25,701,324 | | | | 28,990,057 | | | | 1,873,560 | | | | (48,599 | ) | | | 44,477 | |
Realized gain distributions | | | | | | | | | | | | | | | | | | | | |
received from investment | | | | | | | | | | | | | | | | | | | | |
companies | | | 193,853 | | | | 44,210 | | | | — | | | | — | | | | –– | |
Short positions | | | (14,484,422 | ) | | | (13,511,742 | ) | | | (2,092,339 | ) | | | –– | | | | –– | |
Foreign currency and foreign | | | | | | | | | | | | | | | | | | | | |
currency translation | | | 62,287 | | | | 73,887 | | | | (67,208 | ) | | | (295 | ) | | | (3,701 | ) |
Net unrealized appreciation | | | | | | | | | | | | | | | | | | | | |
(depreciation) during the period on: | | | | | | | | | | | | | | | | | | | | |
Investments | | | (15,020,018 | ) | | | 37,185,464 | | | | 7,059,821 | | | | (4,420,708 | ) | | | 1,143,513 | |
Investment companies | | | 2,118,780 | | | | (4,352,256 | ) | | | (140,031 | ) | | | 29,328 | | | | 27,881 | |
Short positions | | | (8,669,474 | ) | | | (8,082,251 | ) | | | (1,835,438 | ) | | | –– | | | | –– | |
Foreign currency and foreign | | | | | | | | | | | | | | | | | | | | |
currency translation | | | (68,671 | ) | | | (77,350 | ) | | | 12,774 | | | | (6 | ) | | | 1,288 | |
| | | | | | | | | | | | | | | | | | | | | |
Net realized and unrealized | | | | | | | | | | | | | | | | | | | | |
gain (loss) on investments, | | | | | | | | | | | | | | | | | | | | |
investment companies, short | | | | | | | | | | | | | | | | | | | | |
positions, foreign currency, | | | | | | | | | | | | | | | | | | | | |
and foreign currency translation | | | 3,084,527 | | | | 89,239,450 | | | | 24,611,943 | | | | (4,203,914 | ) | | | 1,243,245 | |
| | | | | | | | | | | | | | | | | | | | | |
| NET INCREASE (DECREASE) | | | | | | | | | | | | | | | | | | | | |
IN NET ASSETS RESULTING | | | | | | | | | | | | | | | | | | | | |
FROM OPERATIONS | | $ | 15,608,807 | | | $ | 105,085,586 | | | $ | 26,681,389 | | | $ | (4,093,455 | ) | | $ | 1,248,979 | |
| | | | | | | | | | | | | | | | | | | | | |
*Period from May 17, 2010 (commencement of operations) through September 30, 2010.
50 The Leuthold Funds - 2010 Annual Report & #160; See Notes to the Finacial StatementsThe Leuthold Funds
Statements of Operations
For the Year Ended September 30, 2010
| | | Leuthold | | | Leuthold | | | Leuthold | | | | |
| | | Undervalued | | | Global Clean | | | Hedged | | | Grizzly | |
| | | & Unloved | | | Technology | | | Equity | | | Short | |
| | | Fund | | | Fund | | | Fund | | | Fund | |
| | | | | | | | | | | | | |
| INVESTMENT INCOME: | | | | | | | | | | | | |
Dividend income (net of | | | | | | | | | | | | |
foreign taxes withheld | | | | | | | | | | | | |
of $7,614, $12,788, $2,086, | | | | | | | | | | | | |
and $0, respectively) | | $ | 264,875 | | | $ | 112,666 | | | $ | 38,602 | | | $ | –– | |
Interest income | | | 76 | | | | 267 | | | | 56 | | | | 26,797 | |
| | | | | | | | | | | | | | | | | |
| Total investment income | | | 264,951 | | | | 112,933 | | | | 38,658 | | | | 26,797 | |
| | | | | | | | | | | | | | | | | |
| | | | | | | | | | | | | | | | | |
| | | | | | | | | | | | | | | | | |
| | | | | | | | | | | | | | | | | |
| | | | | | | | | | | | | | | | | |
| EXPENSES: | | | | | | | | | | | | | | | | |
Investment advisory fees (Note 3) | | | 70,875 | | | | 216,404 | | | | 63,259 | | | | 1,662,671 | |
Administration fees | | | 2,814 | | | | 7,522 | | | | 1,825 | | | | 38,080 | |
Transfer agent fees | | | 12,882 | | | | 15,887 | | | | 8,293 | | | | 51,154 | |
Legal fees | | | 219 | | | | 3,447 | | | | 116 | | | | 3,618 | |
Audit fees | | | 17,900 | | | | 16,002 | | | | 16,002 | | | | 30,652 | |
Fund accounting fees | | | 3,206 | | | | 6,946 | | | | 6,250 | | | | 11,554 | |
Custody fees | | | 3,608 | | | | 31,567 | | | | 17,069 | | | | 1,241 | |
Shareholder servicing fees - | | | | | | | | | | | | | | | | |
Retail Class | | | –– | | | | — | | | | — | | | | 102,334 | |
Registration fees | | | 19,284 | | | | 24,816 | | | | 23,883 | | | | 47,850 | |
Reports to shareholders | | | 2,334 | | | | 2,700 | | | | 616 | | | | 24,364 | |
Directors’ fees | | | 550 | | | | 973 | | | | 249 | | | | 6,891 | |
Distribution (Rule 12b-1) fees - | | | | | | | | | | | | | | | | |
(Note 4) | | | 23,615 | | | | 19,333 | | | | 10,807 | | | | –– | |
Other | | | 493 | | | | 359 | | | | 105 | | | | 4,229 | |
| | | | | | | | | | | | | | | | | |
Total expenses before dividends and | | | | | | | | | | | | | | | | |
interest on short positions | | | 157,780 | | | | 345,956 | | | | 148,474 | | | | 1,984,638 | |
Dividends and interest on | | | | | | | | | | | | | | | | |
short positions | | | –– | | | | –– | | | | 28,483 | | | | 1,641,307 | |
(Reimbursement) or recovery | | | | | | | | | | | | | | | | |
from Adviser | | | (15,985 | ) | | | 20,629 | | | | (37,088 | ) | | | — | |
| | | | | | | | | | | | | | | | | |
Total expenses | | | 141,795 | | | | 366,585 | | | | 139,869 | | | | 3,625,945 | |
| | | | | | | | | | | | | | | | | |
| NET INVESTMENT INCOME (LOSS) | | $ | 123,156 | | | $ | (253,652 | ) | | $ | (101,211 | ) | | $ | (3,599,148 | ) |
| | | | | | | | | | | | | | | | | |
See Notes to the Finacial Statements The Leuthold Funds - 2010 Annual Report 51
The Leuthold Funds
Statements of Operations
For the Year Ended September 30, 2010
| | | Leuthold | | | Leuthold | | | Leuthold | | | | |
| | | Undervalued | | | Global Clean | | | Hedged | | | Grizzly | |
| | | & Unloved | | | Technology | | | Equity | | | Short | |
| | | Fund | | | Fund | | | Fund | | | Fund | |
| | | | | | | | | | | | | |
| REALIZED AND UNREALIZED | | | | | | | | | | | | |
GAIN (LOSS) ON INVESTMENTS, | | | | | | | | | | | | |
INVESTMENT COMPANIES, | | | | | | | | | | | | |
SHORT POSITIONS, FOREIGN | | | | | | | | | | | | |
CURRENCY, AND FOREIGN | | | | | | | | | | | | |
CURRENCY TRANSLATION: | | | | | | | | | | | | |
Net realized gain (loss) on: | | | | | | | | | | | | |
Investments | | $ | 1,922,896 | | | $ | (674,509 | ) | | $ | (291,100 | ) | | $ | –– | |
Investment companies | | | 7 | | | | (12,213 | ) | | | (1,483 | ) | | | — | |
Realized gain distributions | | | | | | | | | | | | | | | | |
received from investment | | | | | | | | | | | | | | | | |
companies | | | –– | | | | –– | | | | — | | | | — | |
Short positions | | | –– | | | | –– | | | | (258,478 | ) | | | (20,017,537 | ) |
Foreign currency and foreign | | | | | | | | | | | | | | | | |
currency translation | | | (135 | ) | | | (2,598 | ) | | | (24 | ) | | | (39 | ) |
Net unrealized appreciation | | | | | | | | | | | | | | | | |
(depreciation) during the period on: | | | | | | | | | | | | | | | | |
Investments | | | (1,110,286 | ) | | | (1,889,322 | ) | | | 100,460 | | | | (1,788 | ) |
Investment companies | | | 878 | | | | 1,926 | | | | (202 | ) | | | –– | |
Short positions | | | — | | | | — | | | | (20,988 | ) | | | (909,598 | ) |
Foreign currency and foreign | | | | | | | | | | | | | | | | |
currency translation | | | 6 | | | | 259 | | | | –– | | | | –– | |
| | | | | | | | | | | | | | | | | |
Net realized and unrealized | | | | | | | | | | | | | | | | |
gain (loss) on investments, | | | | | | | | | | | | | | | | |
investment companies, short | | | | | | | | | | | | | | | | |
positions, foreign currency, | | | | | | | | | | | | | | | | |
and foreign currency translation | | | 813,366 | | | | (2,576,457 | ) | | | (471,815 | ) | | | (20,928,962 | ) |
| | | | | | | | | | | | | | | | | |
| NET INCREASE (DECREASE) | | | | | | | | | | | | | | | | |
IN NET ASSETS RESULTING | | | | | | | | | | | | | | | | |
FROM OPERATIONS | | $ | 936,522 | | | $ | (2,830,109 | ) | | $ | (573,026 | ) | | $ | (24,528,110 | ) |
| | | | | | | | | | | | | | | | | |
52 The Leuthold Funds - 2010 Annual Report & #160; See Notes to the Finacial Statements
Leuthold Core Investment Fund
Statements of Changes in Net Assets (Consolidated)
| | | Year Ended | | | Year Ended | |
| | | September 30, 2010 | | | September 30, 2009 | |
| | | | | | | |
| OPERATIONS: | | | | | | |
Net investment income | | $ | 12,524,280 | | | $ | 23,798,151 | |
Net realized gain (loss) on investments, investment companies, | | | | | | | | |
short positions, foreign currency, and foreign currency translation | | | 24,723,910 | | | | (200,965,261 | ) |
Net unrealized appreciation (depreciation) on investments, | | | | | | | | |
investment companies, short positions, foreign currency, and | | | | | | | | |
foreign currency translation | | | (21,639,383 | ) | | | 208,378,879 | |
Net increase in net assets from operations | | | 15,608,807 | | | | 31,211,769 | |
| | | | | | | | | |
| DISTRIBUTIONS TO SHAREHOLDERS: | | | | | | | | |
From net investment income - Retail Class | | | — | | | | (8,208,970 | ) |
From net investment income - Institutional Class | | | — | | | | (2,984,376 | ) |
From net realized gains - Retail Class | | | — | | | | — | |
From net realized gains - Institutional Class | | | — | | | | — | |
Return of capital - Retail Class | | | (3,094,952 | ) | | | (416,061 | ) |
Return of capital - Institutional Class | | | (1,931,051 | ) | | | (145,055 | ) |
Total distributions | | | (5,026,003 | ) | | | (11,754,462 | ) |
| | | | | | | | | |
| CAPITAL SHARE TRANSACTIONS: | | | | | | | | |
Proceeds from shares sold - Retail Class | | | 168,897,014 | | | | 186,115,028 | |
Proceeds from shares sold - Institutional Class | | | 99,255,481 | | | | 214,116,385 | |
Proceeds from shares issued to holders in | | | | | | | | |
reinvestment of dividends - Retail Class | | | 2,919,440 | | | | 8,084,798 | |
Proceeds from shares issued to holders in | | | | | | | | |
reinvestment of dividends - Institutional Class | | | 1,892,170 | | | | 3,068,737 | |
Cost of shares redeemed - Retail Class * | | | (265,074,961 | ) | | | (351,579,721 | ) |
Cost of shares redeemed - Institutional Class ** | | | (114,132,958 | ) | | | (94,803,734 | ) |
Net decrease in net assets from capital share transactions | | | (106,243,814 | ) | | | (34,998,507 | ) |
| | | | | | | | | |
| TOTAL DECREASE IN NET ASSETS: | | | (95,661,010 | ) | | | (15,541,200 | ) |
| NET ASSETS | | | | | | | | |
Beginning of year | | | 1,406,024,364 | | | | 1,421,565,564 | |
End of year (including accumulated net investment | | | | | | | | |
loss of $(1,873,912) and $(34,281,751), respectively) | | $ | 1,310,363,354 | | | $ | 1,406,024,364 | |
| | | | | | | | | |
| CHANGES IN SHARES OUTSTANDING: | | | | | | | | |
Shares sold -Retail Class | | | 10,525,894 | | | | 14,017,941 | |
Shares sold - Institutional Class | | | 6,192,321 | | | | 15,601,976 | |
Shares issued to holders in reinvestment of dividends - Retail Class | | | 177,366 | | | | 626,061 | |
Shares issued to holders in reinvestment of dividends -Institutional Class | | | 115,026 | | | | 235,615 | |
Shares redeemed - Retail Class | | | (16,787,529 | ) | | | (27,452,158 | ) |
Shares redeemed - Institutional Class | | | (7,305,189 | ) | | | (7,495,664 | ) |
Net decrease in shares outstanding | | | (7,082,111 | ) | | | (4,466,229 | ) |
| | | | | | | | | |
| * Net of redemption fees of (Retail Class): | | $ | 18,328 | | | $ | 6,888 | |
| ** Net of redemption fees of (Institutional Class): | | $ | 2 | | | $ | 23 | |
| | | | | | | | | |
See Notes to the Finacial Statements The Leuthold Funds - 2010 Annual Report 53
Leuthold Asset Allocation Fund
Statements of Changes in Net Assets (Consolidated)
| | | Year Ended | | | Year Ended | |
| | | September 30, 2010 | | | September 30, 2009 | |
| | | | | | | |
| OPERATIONS: | | | | | | |
Net investment income | | $ | 15,846,137 | | | $ | 34,211,335 | |
Net realized gain (loss) on investments, investment companies, short positions, | | | | | | | | |
foreign currency, and foreign currency translation | | | 64,565,842 | | | | (531,584,342 | ) |
Net unrealized appreciation on investments, investment companies, | | | | | | | | |
short positions, foreign currency, and foreign currency translation | | | 24,673,607 | | | | 350,145,636 | |
Net increase(decrease) in net assets from operations | | | 105,085,586 | | | | (147,227,371 | ) |
| | | | | | | | | |
| DISTRIBUTIONS TO SHAREHOLDERS: | | | | | | | | |
From net investment income - Retail Class | | | (1,213,277 | ) | | | (19,928,664 | ) |
From net investment income - Institutional Class | | | (549,204 | ) | | | (11,467,158 | ) |
From net realized gains - Retail Class | | | — | | | | — | |
From net realized gains - Institutional Class | | | — | | | | — | |
Return of Capital - Retail Class | | | (4,032,554 | ) | | | — | |
Return of Capital - Institutional Class | | | (1,825,382 | ) | | | — | |
Total distributions | | | (7,620,417 | ) | | | (31,395,822 | ) |
| | | | | | | | | |
| CAPITAL SHARE TRANSACTIONS: | | | | | | | | |
Proceeds from shares sold - Retail Class | | | 269,449,836 | | | | 419,552,436 | |
Proceeds from shares sold - Institutional Class | | | 132,879,950 | | | | 164,837,640 | |
Proceeds from shares issued to holders in | | | | | | | | |
reinvestment of dividends - Retail Class | | | 4,771,756 | | | | 18,315,706 | |
Proceeds from shares issued to holders in | | | | | | | | |
reinvestment of dividends - Institutional Class | | | 2,142,582 | | | | 10,526,794 | |
Cost of shares redeemed - Retail Class * | | | (347,429,796 | ) | | | (690,837,491 | ) |
Cost of shares redeemed - Institutional Class ** | | | (121,529,433 | ) | | | (434,393,574 | ) |
Net decrease in net assets from capital share transactions | | | (59,715,105 | ) | | | (511,998,489 | ) |
| | | | | | | | | |
| TOTAL INCREASE (DECREASE) IN NET ASSETS: | | | 37,750,064 | | | | (690,621,682 | ) |
| NET ASSETS | | | | | | | | |
Beginning of year | | | 1,199,071,770 | | | | 1,889,693,452 | |
End of year (including accumulated net investment | | | | | | | | |
income (loss) of $320,103 and $66,592,857, respectively) | | $ | 1,236,821,834 | | | $ | 1,199,071,770 | |
| | | | | | | | | |
| CHANGES IN SHARES OUTSTANDING: | | | | | | | | |
Shares sold -Retail Class | | | 27,769,493 | | | | 54,606,678 | |
Shares sold - Institutional Class | | | 13,668,262 | | | | 21,536,485 | |
Shares issued to holders in reinvestment of dividends - Retail Class | | | 478,205 | | | | 2,311,462 | |
Shares issued to holders in reinvestment of dividends -Institutional Class | | | 214,388 | | | | 1,338,483 | |
Shares redeemed - Retail Class | | | (36,248,252 | ) | | | (91,475,621 | ) |
Shares redeemed - Institutional Class | | | (12,596,014 | ) | | | (56,924,983 | ) |
| | | | | | | | | |
Net decrease in shares outstanding | | | (6,713,918 | ) | | | (68,607,496 | ) |
| | | | | | | | | |
| * Net of redemption fees of (Retail Class): | | $ | 4,001 | | | $ | 51,462 | |
| ** Net of redemption fees of (Institutional Class): | | $ | — | | | $ | 8,310 | |
| | | | | | | | | |
54 The Leuthold Funds - 2010 Annual Report & #160; See Notes to the Finacial Statements
Statements of Changes in Net Assets (Consolidated)
| | | Year Ended | | | Year Ended | |
| | | September 30, 2010 | | | September 30, 2009 | |
| | | | | | | |
| OPERATIONS: | | | | | | |
Net investment income | | $ | 2,069,446 | | | $ | 1,960,117 | |
Net realized gain (loss) on investments, investment companies, short positions, | | | | | | | | |
foreign currency, and foreign currency translation | | | 19,514,817 | | | | (5,476,356 | ) |
Net unrealized appreciation on investments, investment companies, | | | | | | | | |
short positions, foreign currency, and foreign currency translation | | | 5,097,126 | | | | 27,140,242 | |
Net increase in net assets from operations | | | 26,681,389 | | | | 23,624,003 | |
| | | | | | | | | |
| DISTRIBUTIONS TO SHAREHOLDERS: | | | | | | | | |
From net investment income - Retail Class | | | (201,150 | ) | | | (618,634 | ) |
From net investment income - Institutional Class | | | (423,478 | ) | | | (1,433,819 | ) |
From net realized gains - Retail Class | | | — | | | | — | |
From net realized gains - Institutional Class | | | — | | | | — | |
Total distributions | | | (624,628 | ) | | | (2,052,453 | ) |
| | | | | | | | | |
| | | | | | | | | |
| CAPITAL SHARE TRANSACTIONS: | | | | | | | | |
Proceeds from shares sold - Retail Class | | | 84,051,580 | | | | 59,189,888 | |
Proceeds from shares sold - Institutional Class | | | 77,405,797 | | | | 82,792,698 | |
Proceeds from shares issued to holders in | | | | | | | | |
reinvestment of dividends - Retail Class | | | 125,999 | | | | 392,293 | |
Proceeds from shares issued to holders in | | | | | | | | |
reinvestment of dividends - Institutional Class | | | 362,170 | | | | 1,235,122 | |
Cost of shares redeemed - Retail Class* | | | (51,419,965 | ) | | | (29,844,638 | ) |
Cost of shares redeemed - Institutional Class** | | | (26,707,262 | ) | | | (26,552,371 | ) |
Net increase in net assets from capital share transactions | | | 83,818,319 | | | | 87,212,992 | |
| | | | | | | | | |
| | | | | | | | | |
| TOTAL INCREASE IN NET ASSETS: | | | 109,875,080 | | | | 108,784,542 | |
| NET ASSETS | | | | | | | | |
Beginning of year | | | 179,771,240 | | | | 70,986,698 | |
End of year (including accumulated net investment | | | | | | | | |
income (loss) of $2,218 and ($828,157), respectively) | | $ | 289,646,320 | | | $ | 179,771,240 | |
| | | | | | | | | |
| CHANGES IN SHARES OUTSTANDING: | | | | | | | | |
Shares sold -Retail Class | | | 8,754,373 | | | | 7,928,026 | |
Shares sold - Institutional Class | | | 8,056,701 | | | | 10,792,892 | |
Shares issued to holders in reinvestment of dividends - Retail Class | | | 12,879 | | | | 49,459 | |
Shares issued to holders in reinvestment of dividends -Institutional Class | | | 36,911 | | | | 156,565 | |
Shares redeemed - Retail Class | | | (5,455,495 | ) | | | (3,916,540 | ) |
Shares redeemed - Institutional Class | | | (2,793,589 | ) | | | (3,555,197 | ) |
Net increase in shares outstanding | | | 8,611,780 | | | | 11,455,205 | |
| | | | | | | | | |
| * Net of redemption fees of (Retail Class): | | $ | 17,562 | | | $ | 618 | |
| ** Net of redemption fees of (Institutional Class): | | $ | — | | | $ | — | |
| | | | | | | | | |
See Notes to the Finacial Statements The Leuthold Funds - 2010 Annual Report 55
Leuthold Select Industries Fund
Statements of Changes in Net Assets
| | | Year Ended | | | Year Ended | |
| | | September 30, 2010 | | | September 30, 2009 | |
| | | | | | | |
| OPERATIONS: | | | | | | |
| Net investment income (loss) | | $ | 110,459 | | | $ | (128,880 | ) |
| Net realized gain (loss) on investments, foreign currency, and | | | | | | | | |
| foreign currency translation | | | 187,472 | | | | (6,387,544 | ) |
| Net unrealized appreciation (depreciation) on investments, | | | | | | | | |
| investment companies, foreign currency, and foreign | | | | | | | | |
| currency translation | | | (4,391,386 | ) | | | 6,128,336 | |
| | | | | | | | | |
| Net decrease in net assets from operations | | | (4,093,455 | ) | | | (388,088 | ) |
| | | | | | | | | |
| | | | | | | | | |
| DISTRIBUTIONS TO SHAREHOLDERS: | | | | | | | | |
| From net investment income | | | (87,441 | ) | | | — | |
| From net realized gains | | | — | | | | — | |
| Return of capital | | | — | | | | — | |
| Total distributions | | | (87,441 | ) | | | — | |
| | | | | | | | | |
| | | | | | | | | |
| CAPITAL SHARE TRANSACTIONS: | | | | | | | | |
| Proceeds from shares sold | | | 12,399,177 | | | | 20,965,333 | |
| Proceeds from shares sold in connection with the acquisition | | | | | | | | |
| of Leuthold Select Equities Fund - (Note 1) | | | 8,835,263 | | | | — | |
| Proceeds from shares issued to holders in | | | | | | | | |
| reinvestment of dividends | | | 60,336 | | | | — | |
| Cost of shares redeemed | | | (25,568,753 | ) | | | (15,666,264 | ) |
| Net increase (decrease) in net assets from capital share transactions | | | (4,273,977 | ) | | | 5,299,069 | |
| | | | | | | | | |
| | | | | | | | | |
| | | | | | | | | |
| TOTAL INCREASE (DECREASE) IN NET ASSETS: | | | (8,454,873 | ) | | | 4,910,981 | |
| NET ASSETS | | | | | | | | |
| Beginning of year | | | 47,543,360 | | | | 42,632,379 | |
| End of year (including accumulated net investment | | | | | | | | |
| income (loss) of $22,725 and $0, respectively) | | $ | 39,088,487 | | | $ | 47,543,360 | |
| | | | | | | | | |
| | | | | | | | | |
| CHANGES IN SHARES OUTSTANDING: | | | | | | | | |
| Shares sold | | | 980,357 | | | | 1,915,831 | |
| Shares sold in connection with the acquisition of | | | | | | | | |
| Leuthold Select Equities Fund | | | 731,396 | | | | — | |
| Shares issued to holders in reinvestment of dividends | | | 5,305 | | | | — | |
| Shares redeemed | | | (2,112,955 | ) | | | (1,478,826 | ) |
| Net increase (decrease) in shares outstanding | | | (395,897 | ) | | | 437,005 | |
| | | | | | | | | |
56 The Leuthold Funds - 2010 Annual Report & #160; See Notes to the Finacial Statements
Leuthold Global Industries Fund
Statements of Changes in Net Assets
| | | Period from | |
| | | May 17, 2010* | |
| | | through | |
| | | September 30, 2010 | |
| | | | |
| OPERATIONS: | | | |
| Net investment income | | $ | 5,734 | |
| Net realized gain on investments, investment companies, foreign currency, | | | | |
| and foreign currency translation | | | 70,563 | |
| Net unrealized appreciation on investments, investment companies, | | | | |
| foreign currency, and foreign currency translation | | | 1,172,682 | |
| Net increase in net assets from operations | | | 1,248,979 | |
| | | | | |
| | | | | |
| DISTRIBUTIONS TO SHAREHOLDERS: | | | | |
| From net investment income - Retail Class | | | — | |
| From net investment income - Institutional Class | | | — | |
| From net realized gains - Retail Class | | | — | |
| From net realized gains - Institutional Class | | | — | |
| Total distributions | | | — | |
| | | | | |
| | | | | |
| CAPITAL SHARE TRANSACTIONS: | | | | |
| Proceeds from shares sold - Retail Class | | | 5,128,852 | |
| Proceeds from shares sold - Institutional Class | | | 3,342,433 | |
| Proceeds from shares issued to holders in reinvestment of dividends - Retail Class | | | — | |
| Proceeds from shares issued to holders in reinvestment of dividends - Institutional Class | | | — | |
| Cost of shares redeemed - Retail Class | | | — | |
| Cost of shares redeemed - Institutional Class | | | — | |
| Net increase in net assets from capital share transactions | | | 8,471,285 | |
| | | | | |
| | | | | |
| TOTAL INCREASE IN NET ASSETS: | | | 9,720,264 | |
| NET ASSETS | | | | |
| Beginning of period | | | — | |
| End of period (including accumulated net investment | | | | |
| income of $2,032) | | $ | 9,720,264 | |
| | | | | |
| | | | | |
| CHANGES IN SHARES OUTSTANDING: | | | | |
| Shares sold -Retail Class | | | 531,349 | |
| Shares sold - Institutional Class | | | 351,371 | |
| Shares issued to holders in reinvestment of dividends - Retail Class | | | — | |
| Shares issued to holders in reinvestment of dividends -Institutional Class | | | — | |
| Shares redeemed - Retail Class | | | — | |
| Shares redeemed - Institutional Class | | | — | |
| Net increase in shares outstanding | | | 882,720 | |
| | | | | |
*Commencement of Fund Operations
See Notes to the Finacial Statements The Leuthold Funds - 2010 Annual Report 57
Leuthold Undervalued & Unloved Fund
Statements of Changes in Net Assets
| | | Year Ended | | | Year Ended | |
| | | September 30, 2010 | | | September 30, 2009 | |
| | | | | | | |
| OPERATIONS: | | | | | | |
| Net investment income | | $ | 123,156 | | | $ | 153,678 | |
| Net realized gain (loss) on investments and investment companies | | | 1,922,768 | | | | (6,586,377 | ) |
| Net unrealized appreciation (depreciation) on investments, investment | | | | | | | | |
| companies, foreign currency, and foreign currency translation | | | (1,109,402 | ) | | | 3,090,356 | |
| Net increase (decrease) in net assets from operations | | | 936,522 | | | | (3,342,343 | ) |
| | | | | | | | | |
| | | | | | | | | |
| DISTRIBUTIONS TO SHAREHOLDERS: | | | | | | | | |
| From net investment income | | | (99,971 | ) | | | (205,927 | ) |
| Total distributions | | | (99,971 | ) | | | (205,927 | ) |
| | | | | | | | | |
| | | | | | | | | |
| CAPITAL SHARE TRANSACTIONS: | | | | | | | | |
| Proceeds from shares sold | | | 1,953,091 | | | | 4,763,891 | |
| Proceeds from shares issued to holders in | | | | | | | | |
| reinvestment of dividends | | | 96,463 | | | | 200,336 | |
| Cost of shares redeemed* | | | (6,603,547 | ) | | | (9,904,032 | ) |
| Net decrease in net assets from capital share transactions | | | (4,553,993 | ) | | | (4,939,805 | ) |
| | | | | | | | | |
| | | | | | | | | |
| TOTAL DECREASE IN NET ASSETS: | | | (3,717,442 | ) | | | (8,488,075 | ) |
| NET ASSETS | | | | | | | | |
| Beginning of year | | | 11,713,295 | | | | 20,201,370 | |
| End of year (including accumulated net investment | | | | | | | | |
| income of $27,283 and $6,320, respectively) | | $ | 7,995,853 | | | $ | 11,713,295 | |
| | | | | | | | | |
| | | | | | | | | |
| CHANGES IN SHARES OUTSTANDING: | | | | | | | | |
| Shares sold | | | 246,739 | | | | 792,527 | |
| Shares issued to holders in reinvestment of dividends | | | 12,269 | | | | 32,493 | |
| Shares redeemed | | | (857,460 | ) | | | (1,712,155 | ) |
| Net decrease in shares outstanding | | | (598,452 | ) | | | (887,135 | ) |
| | | | | | | | | |
| | | | | | | | | |
| * Net of redemption fees of: | | $ | 1,794 | | | $ | 18 | |
58 The Leuthold Funds - 2010 Annual Report & #160; See Notes to the Finacial Statements
Leuthold Global Clean Technology Fund
Statements of Changes in Net Assets
| | | | | | Period from | |
| | | | | | July 22, 2009* | |
| | | Year Ended | | | through | |
| | | September 30, 2010 | | | September 30, 2009 | |
| | | | | | | |
| OPERATIONS: | | | | | | |
| | | | | | | |
| Net investment loss | | $ | (253,652 | ) | | $ | (19,736 | ) |
| Net realized loss on investments, investment companies, foreign currency, | | | | | | | | |
| and foreign currency translation | | | (689,320 | ) | | | (24,676 | ) |
| Net unrealized appreciation (depreciation) on investments, investment companies, | | | | | | | | |
| foreign currency, and foreign currency translation | | | (1,887,137 | ) | | | 965,616 | |
| Net increase (decrease) in net assets from operations | | | (2,830,109 | ) | | | 921,204 | |
| | | | | | | | | |
| | | | | | | | | |
| DISTRIBUTIONS TO SHAREHOLDERS: | | | | | | | | |
| From net investment income - Retail Class | | | — | | | | — | |
| From net investment income - Institutional Class | | | — | | | | — | |
| From net realized gains - Retail Class | | | — | | | | — | |
| From net realized gains - Institutional Class | | | — | | | | — | |
| Total distributions | | | — | | | | — | |
| | | | | | | | | |
| | | | | | | | | |
| CAPITAL SHARE TRANSACTIONS: | | | | | | | | |
| Proceeds from shares sold - Retail Class | | | 14,727,315 | | | | 2,068,856 | |
| Proceeds from shares sold - Institutional Class | | | 11,645,942 | | | | 5,641,064 | |
| Proceeds from shares issued to holders in | | | | | | | | |
| reinvestment of dividends - Retail Class | | | — | | | | — | |
| Proceeds from shares issued to holders in | | | | | | | | |
| reinvestment of dividends - Institutional Class | | | — | | | | — | |
| Cost of shares redeemed - Retail Class ** | | | (4,027,376 | ) | | | (1,944 | ) |
| Cost of shares redeemed - Institutional Class *** | | | (758,976 | ) | | | — | |
| Net increase in net assets from capital share transactions | | | 21,586,905 | | | | 7,707,976 | |
| | | | | | | | | |
| | | | | | | | | |
| TOTAL INCREASE IN NET ASSETS: | | | 18,756,796 | | | | 8,629,180 | |
| NET ASSETS | | | | | | | | |
| Beginning of period | | | 8,629,180 | | | | — | |
| End of period (including accumulated net investment | | | | | | | | |
| loss of $(1,375) and $(8) respectively) | | $ | 27,385,976 | | | $ | 8,629,180 | |
| | | | | | | | | |
| | | | | | | | | |
| CHANGES IN SHARES OUTSTANDING: | | | | | | | | |
| Shares sold -Retail Class | | | 1,354,745 | | | | 188,638 | |
| Shares sold - Institutional Class | | | 1,011,088 | | | | 560,845 | |
| Shares issued to holders in reinvestment of dividends - Retail Class | | | — | | | | — | |
| Shares issued to holders in reinvestment of dividends -Institutional Class | | | — | | | | — | |
| Shares redeemed - Retail Class | | | (385,687 | ) | | | (187 | ) |
| Shares redeemed - Institutional Class | | | (75,494 | ) | | | — | |
| Net increase in shares outstanding | | | 1,904,652 | | | | 749,296 | |
| | | | | | | | | |
| | | | | | | | | |
| *Commencement of operations | | | | | | | | |
| ** Net of redemption fees of (Retail Class): | | $ | 767 | | | $ | 40 | |
See Notes to the Finacial Statements The Leuthold Funds - 2010 Annual Report 59
Leuthold Hedged Equity Fund
Statements of Changes in Net Assets
| | | | | | Period from | |
| | | | | | July 22, 2009* | |
| | | Year Ended | | | through | |
| | | September 30, 2010 | | | September 30, 2009 | |
| | | | | | | |
| OPERATIONS: | | | | | | |
| Net investment loss | | $ | (101,211 | ) | | $ | (3,569 | ) |
| Net realized loss on investments, investment companies, and short positions | | | (551,085 | ) | | | (52,568 | ) |
| Net unrealized appreciation on investments, | | | | | | | | |
| investment companies, and short positions | | | 79,270 | | | | 24,139 | |
| Net decrease in net assets from operations | | | (573,026 | ) | | | (31,998 | ) |
| | | | | | | | | |
| | | | | | | | | |
| DISTRIBUTIONS TO SHAREHOLDERS: | | | | | | | | |
| From net investment income - Retail Class | | | — | | | | — | |
| From net investment income - Institutional Class | | | — | | | | — | |
| From net realized gains - Retail Class | | | — | | | | — | |
| From net realized gains - Institutional Class | | | — | | | | — | |
| Total distributions | | | — | | | | — | |
| | | | | | | | | |
| | | | | | | | | |
| CAPITAL SHARE TRANSACTIONS: | | | | | | | | |
| Proceeds from shares sold - Retail Class | | | 8,141,275 | | | | 602,225 | |
| Proceeds from shares sold - Institutional Class | | | 653,583 | | | | 1,540,555 | |
| Proceeds from shares issued to holders in | | | | | | | | |
| reinvestment of dividends - Retail Class | | | — | | | | — | |
| Proceeds from shares issued to holders in | | | | | | | | |
| reinvestment of dividends - Institutional Class | | | — | | | | — | |
| Cost of shares redeemed - Retail Class ** | | | (3,735,782 | ) | | | (980 | ) |
| Cost of shares redeemed - Institutional Class *** | | | (2,006,364 | ) | | | — | |
| Net increase in net assets from capital share transactions | | | 3,052,712 | | | | 2,141,800 | |
| | | | | | | | | |
| | | | | | | | | |
| TOTAL INCREASE IN NET ASSETS: | | | 2,479,686 | | | | 2,109,802 | |
| NET ASSETS | | | | | | | | |
| Beginning of period | | | 2,109,802 | | | | — | |
| End of period (including accumulated net investment | | | | | | | | |
| income (loss) of $(24) and $0 respectively) | | $ | 4,589,488 | | | $ | 2,109,802 | |
| | | | | | | | | |
| | | | | | | | | |
| | | | | | | | | |
| CHANGES IN SHARES OUTSTANDING: | | | | | | | | |
| Shares sold - Retail Class | | | 885,085 | | | | 62,217 | |
| Shares sold - Institutional Class | | | 68,347 | | | | 158,480 | |
| Shares issued to holders in reinvestment of dividends - Retail Class | | | — | | | | — | |
| Shares issued to holders in reinvestment of dividends -Institutional Class | | | — | | | | — | |
| Shares redeemed - Retail Class | | | (426,389 | ) | | | (104 | ) |
| Shares redeemed - Institutional Class | | | (219,245 | ) | | | — | |
| Net increase in shares outstanding | | | 307,798 | | | | 220,593 | |
| | | | | | | | | |
| | | | | | | | | |
| * Commencement of operations. | | | | | | | | |
| ** Net of redemption fees of (Retail Class): | | $ | 106 | | | $ | 20 | |
| *** Net of redemption fees of (Institutional Class): | | $ | — | | | $ | — | |
60 The Leuthold Funds - 2010 Annual Report & #160; See Notes to the Finacial Statements
Statements of Changes in Net Assets
| | | Year Ended | | | Year Ended | |
| | | September 30, 2010 | | | September 30, 2009 | |
| | | | | | | |
| OPERATIONS: | | | | | | |
| Net investment loss | | $ | (3,599,148 | ) | | $ | (3,973,183 | ) |
| Net realized loss on short positions, foreign currency, and | | | | | | | | |
| foreign currency translation | | | (20,017,576 | ) | | | (6,599,614 | ) |
| Net unrealized depreciation on investments, short positions, | | | | | | | | |
| foreign currency, and foreign currency translation | | | (911,386 | ) | | | (18,304,900 | ) |
| Net decrease in net assets from operations | | | (24,528,110 | ) | | | (28,877,697 | ) |
| | | | | | | | | |
| | | | | | | | | |
| DISTRIBUTIONS TO SHAREHOLDERS: | | | | | | | | |
| From net investment income | | | — | | | | (154,600 | ) |
| From net realized gains | | | — | | | | (3,170,228 | ) |
| Return of capital | | | — | | | | (3,189,306 | ) |
| Total distributions | | | — | | | | (6,514,134 | ) |
| | | | | | | | | |
| | | | | | | | | |
| CAPITAL SHARE TRANSACTIONS: | | | | | | | | |
| Proceeds from shares sold | | | 320,755,091 | | | | 474,152,943 | |
| Proceeds from shares issued to holders in | | | | | | | | |
| reinvestment of dividends | | | — | | | | 5,766,504 | |
| Cost of shares redeemed | | | (185,918,997 | ) | | | (494,022,183 | ) |
| Net increase (decrease) in net assets from capital share transactions | | | 134,836,094 | | | | (14,102,736 | ) |
| | | | | | | | | |
| | | | | | | | | |
| | | | | | | | | |
| TOTAL INCREASE (DECREASE) IN NET ASSETS: | | | 110,307,984 | | | | (49,494,567 | ) |
| NET ASSETS | | | | | | | | |
| Beginning of year | | | 86,244,258 | | | | 135,738,825 | |
| End of year (including accumulated net investment | | | | | | | | |
| income (loss) of $(39) and $0, respectively) | | $ | 196,552,242 | | | $ | 86,244,258 | |
| | | | | | | | | |
| | | | | | | | | |
| CHANGES IN SHARES OUTSTANDING: | | | | | | | | |
| Shares sold | | | 72,220,440 | | | | 57,292,490 | |
| Shares issued to holders in reinvestment of dividends | | | — | | | | 621,569 | |
| Shares redeemed | | | (42,727,644 | ) | | | (58,293,264 | ) |
| Net increase (decrease) in shares outstanding | | | 29,492,796 | | | | (379,205 | ) |
| | | | | | | | | |
See Notes to the Finacial Statements The Leuthold Funds - 2010 Annual Report 61
Leuthold Core Investment Fund - Retail
Financial Highlights
| | | Year Ended | | | Year Ended | | | | | | | | | | |
| | | September 30, | | | September 30, | | | Year Ended | | | Year Ended | | | Year Ended | |
| | | 2010 | | | 2009 | | | September 30, | | | September 30, | | | September 30, | |
| | | (Consolidated) | | | (Consolidated) | | | 2008 | | | 2007 | | | 2006 | |
| | | | | | | | | | | | | | | | |
| | | | | | | | | | | | | | | | |
Per Share Data (1): | | | | | | | | | | | | | | | |
| Net asset value, beginning of year | | $ | 15.79 | | | $ | 15.20 | | | $ | 21.18 | | | $ | 17.45 | | | $ | 17.50 | |
| Income (loss) from investment operations: | | | | | | | | | | | | | | | | | | | | |
| Net investment income | | | 0.14 | (2) | | | 0.28 | (2) | | | 0.26 | (3) | | | 0.39 | (3) | | | 0.43 | (3) |
| Net realized and unrealized gains (losses) | | | | | | | | | | | | | | | | | | | | |
| on investments and short positions | | | 0.11 | | | | 0.45 | | | | (2.18 | ) | | | 3.81 | | | | 0.68 | |
| Total from investment operations | | | 0.25 | | | | 0.73 | | | | (1.92 | ) | | | 4.20 | | | | 1.11 | |
| | | | | | | | | | | | | | | | | | | | | |
| | | | | | | | | | | | | | | | | | | | | |
| Less distributions: | | | | | | | | | | | | | | | | | | | | |
| From net investment income | | | — | | | | (0.13 | ) | | | (0.31 | ) | | | (0.38 | ) | | | (0.42 | ) |
| From net realized gains | | | — | | | | — | | | | (3.75 | ) | | | (0.09 | ) | | | (0.74 | ) |
| Return of capital | | | (0.05 | ) | | | (0.01 | ) | | | — | | | | — | | | | — | |
Redemption fees(4) | | | 0.00 | | | | 0.00 | | | | 0.00 | | | | 0.00 | | | | 0.00 | |
| Total distributions | | | (0.05 | ) | | | (0.14 | ) | | | (4.06 | ) | | | (0.47 | ) | | | (1.16 | ) |
| Net asset value, end of period | | $ | 15.99 | | | $ | 15.79 | | | $ | 15.20 | | | $ | 21.18 | | | $ | 17.45 | |
| | | | | | | | | | | | | | | | | | | | | |
| | | | | | | | | | | | | | | | | | | | | |
| Total return | | | 1.53 | % | | | 4.95 | % | | | (11.48 | %) | | | 24.32 | % | | | 6.64 | % |
| | | | | | | | | | | | | | | | | | | | | |
| Supplemental data and ratios: | | | | | | | | | | | | | | | | | | | | |
| Net assets, end of period | | $ | 858,708,522 | | | $ | 944,341,607 | | | $ | 1,103,832,039 | | | $ | 1,574,861,576 | | | $ | 1,490,923,347 | |
| Ratio of expenses to average net assets: | | | | | | | | | | | | | | | | | | | | |
Before expense reimbursement (5) | | | 1.37 | % | | | 1.15 | % | | | 1.28 | % | | | 1.15 | % | | | 1.39 | % |
After expense reimbursement (5) | | | 1.37 | % | | | 1.15 | % | | | 1.28 | % | | | 1.15 | % | | | 1.39 | % |
| Ratio of net investment income to average net assets: | | | | | | | | | | | | | | | | | | | | |
Before expense reimbursement (6) | | | 0.85 | % | | | 2.14 | % | | | 1.51 | % | | | 1.96 | % | | | 2.51 | % |
After expense reimbursement (6) | | | 0.85 | % | | | 2.14 | % | | | 1.51 | % | | | 1.96 | % | | | 2.51 | % |
Portfolio turnover rate (7) | | | 100.36 | % | | | 116.70 | % | | | 238.34 | % | | | 144.17 | % | | | 86.40 | % |
| (1) | For a share outstanding throughout the period. Rounded to the nearest cent. |
| (2) | Net investment income per share is calculated based on average shares outstanding. |
| (3) | Net investment income per share is calculated using ending balances prior to consideration of adjustments for permanent book and tax differences. |
| (4) | Amount represents less than $0.005 per share. |
| (5) | The ratio of expenses to average net assets includes dividends and interest on short positions. The before expense reimbursement and after expense reimbursement ratios excluding dividends on short positions were 1.12% and 1.12%, respectively, for the year ended September 30, 2010, 1.14% and 1.14%, respectively, for the year ended September 30, 2009, 1.11% and 1.11%, respectively, for the year ended September 30, 2008, 1.08% and 1.08%, respectively, for the year ended September 30, 2007, and 1.08% and 1.08%, respectively, for the year ended September 30, 2006. |
| (6) | The net investment income ratios include dividends and interest on short positions. |
| (7) | The portfolio turnover rate excludes purchases and sales of short positions as the Adviser does not intend to hold the short positions for more than one year. |
62 The Leuthold Funds - 2010 Annual Report & #160; See Notes to the Finacial Statements
Leuthold Core Investment Fund - Institutional
Financial Highlights
| | | | | | | | | | | | | | | Period from | |
| | | Year Ended | | | Year Ended | | | | | | | | | January 31, 2006(1) | |
| | | September 30, | | | September 30, | | | Year Ended | | | Year Ended | | | through | |
| | | 2010 | | | 2009 | | | September 30, | | | September 30, | | | September 30, | |
| | | (Consolidated) | | | (Consolidated) | | | 2008 | | | 2007 | | | 2006 | |
| | | | | | | | | | | | | | | | |
Per Share Data (2): | | | | | | | | | | | | | | | |
| Net asset value, beginning of year | | $ | 15.78 | | | $ | 15.19 | | | $ | 21.17 | | | $ | 17.43 | | | $ | 17.74 | |
| Income (loss) from investment operations: | | | | | | | | | | | | | | | | | | | | |
| Net investment income | | | 0.15 | (3) | | | 0.30 | (4) | | | 0.28 | (4) | | | 0.40 | (4) | | | 0.30 | (4) |
| Net realized and unrealized gains (losses) | | | | | | | | | | | | | | | | | | | | |
| on investments and short positions | | | 0.11 | | | | 0.45 | | | | (2.19 | ) | | | 3.83 | | | | (0.27 | ) |
| Total from investment operations | | | 0.26 | | | | 0.75 | | | | (1.91 | ) | | | 4.23 | | | | 0.03 | |
| | | | | | | | | | | | | | | | | | | | | |
| | | | | | | | | | | | | | | | | | | | | |
| Less distributions: | | | | | | | | | | | | | | | | | | | | |
| From net investment income | | | — | | | | (0.15 | ) | | | (0.32 | ) | | | (0.40 | ) | | | (0.34 | ) |
| From net realized gains | | | — | | | | — | | | | (3.75 | ) | | | (0.09 | ) | | | — | |
| Return of capital | | | (0.06 | ) | | | (0.01 | ) | | | — | | | | — | | | | — | |
| Redemption fees | | | 0.00 | (5) | | | 0.00 | (5) | | | — | | | | — | | | | 0.00 | (5) |
| Total distributions | | | (0.06 | ) | | | (0.16 | ) | | | (4.07 | ) | | | (0.49 | ) | | | (0.34 | ) |
| Net asset value, end of period | | $ | 15.98 | | | $ | 15.78 | | | $ | 15.19 | | | $ | 21.17 | | | $ | 17.43 | |
| | | | | | | | | | | | | | | | | | | | | |
| | | | | | | | | | | | | | | | | | | | | |
| Total return | | | 1.64 | % | | | 5.14 | % | | | (11.46 | %) | | | 24.53 | % | | | 0.17 | % |
| | | | | | | | | | | | | | | | | | | | | |
| Supplemental data and ratios: | | | | | | | | | | | | | | | | | | | | |
| Net assets, end of period | | $ | 451,654,832 | | | $ | 461,682,757 | | | $ | 317,733,525 | | | $ | 203,412,179 | | | $ | 103,587,516 | |
| Ratio of expenses to average net assets: | | | | | | | | | | | | | | | | | | | | |
Before expense reimbursement (6) | | | 1.27 | % | | | 1.03 | % | | | 1.18 | % | | | 1.05 | % | | | 1.32 | %(7) |
After expense reimbursement (6) | | | 1.27 | % | | | 1.03 | % | | | 1.18 | % | | | 1.05 | % | | | 1.32 | %(7) |
| Ratio of net investment income to average net assets: | | | | | | | | | | | | | | | | | | | | |
Before expense reimbursement (7) | | | 0.95 | % | | | 2.25 | % | | | 1.61 | % | | | 2.06 | % | | | 2.83 | %(7) |
After expense reimbursement (7) | | | 0.95 | % | | | 2.25 | % | | | 1.61 | % | | | 2.06 | % | | | 2.83 | %(7) |
Portfolio turnover rate (8) | | | 100.36 | % | | | 116.70 | % | | | 238.34 | % | | | 144.17 | % | | | 86.40 | % |
| (1) | Commencement of share class operations. |
| (2) | For a share outstanding throughout the period. Rounded to the nearest cent. |
| (3) | Net investment income per share is calculated based on average shares outstanding. |
| (4) | Net investment income per share is calculated using ending balances prior to consideration of adjustments for permanent book and tax differences. |
| (5) | Amount represents less than $0.005 per share. |
| (6) | The ratio of expenses to average net assets includes dividends and interest on short positions. The before expense reimbursement and after expense reimbursement ratios excluding dividends on short positions were 1.02% and 1.02%, respectively, for the year ended September 30, 2010, 1.02% and 1.02%, respectively, for the year ended September 30, 2009, 1.01% and 1.01%, respectively, for the year ended September 30, 2008, 0.98% and 0.98%, respectively, for the year ended September 30, 2007, and 0.99% and 0.99%, respectively, for the period ended September 30, 2006. |
| (7) | The net investment income ratios include dividends and interest on short positions. |
| (8) | The portfolio turnover rate excludes purchases and sales of short positions as the Adviser does not intend to hold the short positions for more than one year. |
See Notes to the Finacial Statements The Leuthold Funds - 2010 Annual Report 63
Leuthold Asse t Allocation Fund - Retail
| | | | | | | | | | | | | | | Period from | |
| | | Year Ended | | | Year Ended | | | | | | | | | May 24, 2006(1) | |
| | | September 30, | | | September 30, | | | Year Ended | | | Year Ended | | | through | |
| | | 2010 | | | 2009 | | | September 30, | | | September 30, | | | September 30, | |
| | | (Consolidated) | | | (Consolidated) | | | 2008 | | | 2007 | | | 2006 | |
| | | | | | | | | | | | | | | | |
Per Share Data (2): | | | | | | | | | | | | | | | |
| Net asset value, beginning of year | | $ | 9.12 | | | $ | 9.45 | | | $ | 11.43 | | | $ | 9.73 | | | $ | 10.00 | |
| Income (loss) from investment operations: | | | | | | | | | | | | | | | | | | | | |
| Net investment income | | | 0.11 | (3) | | | 0.21 | (4) | | | 0.20 | (4) | | | 0.16 | (4) | | | 0.03 | (4) |
| Net realized and unrealized gains (losses) | | | | | | | | | | | | | | | | | | | | |
| on investments and short positions | | | 0.74 | | | | (0.35 | ) | | | (1.80 | ) | | | 1.72 | | | | (0.30 | ) |
| Total from investment operations | | | 0.85 | | | | (0.14 | ) | | | (1.60 | ) | | | 1.88 | | | | (0.27 | ) |
| | | | | | | | | | | | | | | | | | | | | |
| | | | | | | | | | | | | | | | | | | | | |
| Less distributions: | | | | | | | | | | | | | | | | | | | | |
| From net investment income | | | (0.02 | ) | | | (0.19 | ) | | | (0.20 | ) | | | (0.18 | ) | | | — | |
| From net realized gains | | | — | | | | — | | | | (0.18 | ) | | | — | | | | — | |
| Return of capital | | | (0.04 | ) | | | — | | | | — | | | | — | | | | — | |
| Redemption fees | | | 0.00 | (5) | | | 0.00 | (5) | | | 0.00 | (5) | | | 0.00 | (5) | | | — | |
| Total distributions | | | (0.06 | ) | | | (0.19 | ) | | | (0.38 | ) | | | (0.18 | ) | | | — | |
| Net asset value, end of period | | $ | 9.91 | | | $ | 9.12 | | | $ | 9.45 | | | $ | 11.43 | | | $ | 9.73 | |
| | | | | | | | | | | | | | | | | | | | | |
| | | | | | | | | | | | | | | | | | | | | |
| Total return | | | 9.26 | % | | | (1.20 | %) | | | (14.45 | %) | | | 19.46 | % | | | (2.70 | %) |
| | | | | | | | | | | | | | | | | | | | | |
| Supplemental data and ratios: | | | | | | | | | | | | | | | | | | | | |
| Net assets, end of period | | $ | 843,525,684 | | | $ | 849,399,319 | | | $ | 1,205,840,473 | | | $ | 566,453,346 | | | $ | 77,573,030 | |
| Ratio of expenses to average net assets: | | | | | | | | | | | | | | | | | | | | |
Before expense reimbursement (6) | | | 1.57 | % | | | 1.34 | % | | | 1.34 | % | | | 1.43 | % | | | 1.78 | %(7) |
After expense reimbursement (6) | | | 1.57 | % | | | 1.34 | % | | | 1.34 | % | | | 1.43 | % | | | 1.73 | %(7) |
| Ratio of net investment income to average net assets: | | | | | | | | | | | | | | | | | | | | |
Before expense reimbursement (8) | | | 1.17 | % | | | 2.60 | % | | | 1.99 | % | | | 1.97 | % | | | 2.71 | %(7) |
After expense reimbursement (8) | | | 1.17 | % | | | 2.60 | % | | | 1.99 | % | | | 1.97 | % | | | 2.76 | %(7) |
Portfolio turnover rate (9) | | | 100.64 | % | | | 147.01 | % | | | 197.96 | % | | | 196.15 | % | | | 26.83 | % |
(1) | Commencement of share class operations. |
| (2) | For a share outstanding throughout the period. Rounded to the nearest cent. |
| (3) | Net investment income per share is calculated based on average shares outstanding. |
| (4) | Net investment income per share is calculated using ending balances prior to consideration of adjustments for permanent book and tax differences. |
| (5) | Amount represents less than $0.005 per share. |
| (6) | The ratio of expenses to average net assets includes dividends and interest on short positions. The before expense reimbursement and after expense reimbursement ratios excluding dividends and interest on short positions were 1.32% and 1.32% respectively for the year ended September 30, 2010, 1.32% and 1.32%, respectively, for the year ended September 30, 2009, 1.23% and 1.23%, respectively, for the year ended September 30, 2008, 1.32% and 1.32%, respectively, for the year ended September 30, 2007, and 1.55% and 1.50%, respectively, for the period ended September 30, 2006. |
| (8) | The net investment income ratios include dividends and interest on short positions. |
| (9) | The portfolio turnover rate excludes purchases and sales of short positions as the Adviser does not intend to hold the short positions for more than one year. |
64 The Leuthold Funds - 2010 Annual Report & #160; See Notes to the Finacial Statements
Leuthold Asset Allocation Fund - Institutional
Financial Highlights
| | | | | | | | | | | | Period from | |
| | | Year Ended | | | Year Ended | | | | | | January 31, 2007 (1) | |
| | | September 30, | | | September 30, | | | Year Ended | | | through | |
| | | 2010 | | | 2009 | | | September 30, | | | September 30, | |
| | | (Consolidated) | | | (Consolidated) | | | 2008 | | | 2007 | |
| | | | | | | | | | | | | |
Per Share Data (2): | | | | | | | | | | | | |
| Net asset value, beginning of year | | $ | 9.13 | | | $ | 9.45 | | | $ | 11.44 | | | $ | 10.53 | |
| | | | | | | | | | | | | | | | | |
| Income (loss) from investment operations: | | | | | | | | | | | | | | | | |
| Net investment income | | | 0.13 | (3) | | | 0.23 | (4) | | | 0.21 | (4) | | | 0.12 | (4) |
| Net realized and unrealized gains (losses) | | | | | | | | | | | | | | | | |
| on investments and short positions | | | 0.73 | | | | (0.34 | ) | | | (1.81 | ) | | | 0.92 | |
| Total from investment operations | | | 0.86 | | | | (0.11 | ) | | | (1.60 | ) | | | 1.04 | |
| | | | | | | | | | | | | | | | | |
| | | | | | | | | | | | | | | | | |
| Less distributions: | | | | | | | | | | | | | | | | |
| From net investment income | | | (0.02 | ) | | | (0.21 | ) | | | (0.21 | ) | | | (0.13 | ) |
| From net realized gains | | | — | | | | — | | | | (0.18 | ) | | | — | |
| Return of capital | | | (0.04 | ) | | | — | | | | — | | | | — | |
| Redemption fees | | | — | | | | 0.00 | (5) | | | 0.00 | (5) | | | 0.00 | (5) |
| Total distributions | | | (0.06 | ) | | | (0.21 | ) | | | (0.39 | ) | | | (0.13 | ) |
| Net asset value, end of period | | $ | 9.93 | | | $ | 9.13 | | | $ | 9.45 | | | $ | 11.44 | |
| | | | | | | | | | | | | | | | | |
| | | | | | | | | | | | | | | | | |
| Total return | | | 9.41 | % | | | (0.85 | %) | | | (14.42 | %) | | | 9.95 | % |
| | | | | | | | | | | | | | | | | |
| Supplemental data and ratios: | | | | | | | | | | | | | | | | |
| Net assets, end of period | | $ | 393,296,150 | | | $ | 349,672,451 | | | $ | 683,852,979 | | | $ | 189,777,479 | |
| Ratio of expenses to average net assets: | | | | | | | | | | | | | | | | |
Before expense reimbursement (6) | | | 1.36 | % | | | 1.11 | % | | | 1.21 | % | | | 1.22 | % (7) |
After expense reimbursement (6) | | | 1.36 | % | | | 1.11 | % | | | 1.21 | % | | | 1.22 | % (7) |
| Ratio of net investment income to average net assets: | | | | | | | | | | | | | | | | |
Before expense reimbursement (8) | | | 1.38 | % | | | 2.82 | % | | | 2.12 | % | | | 2.11 | % (7) |
After expense reimbursement (8) | | | 1.38 | % | | | 2.82 | % | | | 2.12 | % | | | 2.11 | % (7) |
Portfolio turnover rate (9) | | | 100.64 | % | | | 147.01 | % | | | 197.96 | % | | | 196.15 | % |
| (1) | Commencement of share class operations. |
| (2) | For a share outstanding throughout the period. Rounded to the nearest cent. |
| (3) | Net investment income per share is calculated based on average shares outstanding. |
| (4) | Net investment income per share is calculated using ending balances prior to consideration of adjustments for permanent book and tax differences. |
| (5) | Amount represents less than $0.005 per share. |
| (6) | The ratio of expenses to average net assets includes dividends and interest on short positions. The before expense reimbursement and after expense reimbursement ratios excluding dividends on short positions were 1.11% and 1.11%, respectively, for the year ended September 30, 2010, 1.10% and 1.10%, respectively, for the year ended September 30, 2009, 1.09% and 1.09%, respectively, for the year ended September 30, 2008, and 1.08% and 1.08%, respectively, for the period ended September 30, 2007. |
| (8) | The net investment income ratios include dividends on short positions. |
| (9) | The portfolio turnover rate excludes purchases and sales of short positions as the Adviser does not intend to hold the short positions for more than one year. |
See Notes to the Finacial Statements The Leuthold Funds - 2010 Annual Report 65
Leuthold Global Fund - Retail
Financial Highlights
| | | | | | | | | Period from | |
| | | | | | | | | July 1, | |
| | | | | | | | | 2008 (1) through | |
| | | 2010(Consolidated) | | | 2009(Consolidated) | | | September 30, 2008 | |
| | | | | | | | | | |
Per Share Data (2): | | | | | | | | | |
| Net asset value, beginning of year | | $ | 9.07 | | | $ | 8.51 | | | $ | 10.00 | |
| Income (loss) from investment operations: | | | | | | | | | | | | |
| Net investment income | | | 0.07 | (3) | | | 0.09 | (4) | | | 0.03 | (4) |
| Net realized and unrealized gains (losses) | | | | | | | | | | | | |
| on investments and short positions | | | 1.06 | | | | 0.59 | | | | (1.52 | ) |
| Total from investment operations | | | 1.13 | | | | 0.68 | | | | (1.49 | ) |
| Less distributions: | | | | | | | | | | | | |
| From net investment income | | | (0.02 | ) | | | (0.12 | ) | | | –– | |
| From net realized gains | | | — | | | | — | | | | –– | |
Redemption fees (5) | | | 0.00 | | | | 0.00 | | | | 0.00 | |
| Total distributions | | | (0.02 | ) | | | (0.12 | ) | | | –– | |
| Net asset value, end of period | | $ | 10.18 | | | $ | 9.07 | | | $ | 8.51 | |
| | | | | | | | | | | | | |
| | | | | | | | | | | | | |
| Total return | | | 12.39 | % | | | 8.28 | % | | | (14.04 | %) |
| | | | | | | | | | | | | |
| Supplemental data and ratios: | | | | | | | | | | | | |
| Net assets, end of period | | $ | 98,906,854 | | | $ | 58,120,794 | | | $ | 19,940,804 | |
| Ratio of expenses to average net assets: | | | | | | | | | | | | |
Before expense reimbursement (6) | | | 1.93 | % | | | 1.82 | % | | | 1.83 | % (7) |
After expense reimbursement (6) | | | 1.93 | % | | | 1.82 | % | | | 1.83 | % (7) |
| Ratio of net investment income to average net assets: | | | | | | | | | | | | |
Before expense reimbursement (8) | | | 0.78 | % | | | 1.56 | % | | | 2.01 | % (7) |
After expense reimbursement (8) | | | 0.78 | % | | | 1.56 | % | | | 2.01 | % (7) |
Portfolio turnover rate (9) | | | 140.87 | % | | | 152.90 | % | | | 62.34 | % |
| (1) | Commencement of share class operations. |
| (2) | For a share outstanding throughout the period. Rounded to the nearest cent. |
| (3) | Net investment income per share is calculated based on average shares outstanding. |
| (4) | Net investment income per share is calculated using ending balances prior to consideration of adjustments for permanent book and tax differences. |
| (5) | Amount represents less than $0.005 per share. |
| (6) | The ratio of expenses to average net assets includes dividends and interest on short positions. The before expense reimbursement and after expense reimbursement ratios excluding dividends on short positions were 1.65% and 1.65%, respectively, for the year ended September 30, 2010, 1.77% and 1.77%, respectively, for the year ended September 30, 2009, and 1.83% and 1.83%, respectively, for the period ended September 30, 2008. |
| (8) | The net investment income ratios include dividends on short positions. |
| (9) | The portfolio turnover rate excludes purchases and sales of short positions as the Adviser does not intend to hold the short positions for more than one year. |
66 The Leuthold Funds - 2010 Annual Report & #160; See Notes to the Finacial Statements
Leuthold Global Fund - Institutional
Financial Highlights
| | | | | | | | | Period from | |
| | | | | | | | | April 30, | |
| | | | | | | | | | |
| | | 2010(Consolidated) | | | 2009(Consolidated) | | | September 30, 2008 | |
| | | | | | | | | | |
Per Share Data (2): | | | | | | | | | |
| Net asset value, beginning of year | | $ | 9.08 | | | $ | 8.51 | | | $ | 10.00 | |
| Income (loss) from investment operations: | | | | | | | | | | | | |
| Net investment income | | | 0.09 | (3) | | | 0.11 | (4) | | | 0.04 | (4) |
| Net realized and unrealized gains (losses) | | | | | | | | | | | | |
| on investments and short positions | | | 1.06 | | | | 0.59 | | | | (1.53 | ) |
| Total from investment operations | | | 1.15 | | | | 0.70 | | | | (1.49 | ) |
| Less distributions: | | | | | | | | | | | | |
| From net investment income | | | (0.03 | ) | | | (0.13 | ) | | | –– | |
| From net realized gains | | | — | | | | — | | | | –– | |
| Total distributions | | | (0.03 | ) | | | (0.13 | ) | | | –– | |
| Net asset value, end of period | | $ | 10.20 | | | $ | 9.08 | | | $ | 8.51 | |
| | | | | | | | | | | | | |
| | | | | | | | | | | | | |
| Total return | | | 12.52 | % | | | 8.63 | % | | | (14.90 | %) |
| | | | | | | | | | | | | |
| Supplemental data and ratios: | | | | | | | | | | | | |
| Net assets, end of period | | $ | 190,739,466 | | | $ | 121,650,446 | | | $ | 51,045,894 | |
| Ratio of expenses to average net assets: | | | | | | | | | | | | |
Before expense reimbursement (5) | | | 1.75 | % | | | 1.57 | % | | | 1.61 | % (6) |
After expense reimbursement (5) | | | 1.75 | % | | | 1.57 | % | | | 1.61 | % (6) |
| Ratio of net investment income to average net assets: | | | | | | | | | | | | |
Before expense reimbursement (7) | | | 0.97 | % | | | 1.80 | % | | | 2.20 | % (6) |
After expense reimbursement (7) | | | 0.97 | % | | | 1.80 | % | | | 2.20 | % (6) |
Portfolio turnover rate (8) | | | 140.87 | % | | | 152.90 | % | | | 62.34 | % |
| (1) | Commencement of share class operations. |
| (2) | For a share outstanding throughout the period. Rounded to the nearest cent. |
| (3) | Net investment income per share is calculated based on average shares outstanding. |
| (4) | Net investment income per share is calculated using ending balances prior to consideration of adjustments for permanent book and tax differences. |
| (5) | The ratio of expenses to average net assets includes dividends and interest on short positions. The before expense reimbursement and after expense reimbursement ratios excluding dividends on short positions were 1.47% and 1.47%, respectively, for the year ended September 30, 2010, 1.53% and 1.53%, respectively, for the year ended September 30, 2009, and 1.60% and 1.60%, respectively, for the period ended September 30, 2008. |
| (7) | The net investment income ratios include dividends on short positions. |
| (8) | The portfolio turnover rate excludes purchases and sales of short positions as the Adviser does not intend to hold the short positions for more than one year. |
See Notes to the Finacial Statements The Leuthold Funds - 2010 Annual Report 67
Leuthold Select Industries Fund
Financial Highlights
| | | Year Ended | | | Year Ended | | | Year Ended | | | Year Ended | | | Year Ended | |
| | | September 30, | | | September 30, | | | September 30, | | | September 30, | | | September 30, | |
| | | 2010 | | | 2009 | | | 2008 | | | 2007 | | | 2006 | |
| | | | | | | | | | | | | | | | |
Per Share Data (1): | | | | | | | | | | | | | | | |
| Net asset value, beginning of year | | $ | 12.82 | | | $ | 13.03 | | | $ | 21.94 | | | $ | 17.25 | | | $ | 16.07 | |
| Income (loss) from investment operations: | | | | | | | | | | | | | | | | | | | | |
| Net investment income (loss) | | | 0.03 | (2) | | | (0.04 | ) (3) | | | (0.04 | ) (3) | | | 0.13 | (3) | | | 0.04 | (3) |
| Net realized and unrealized | | | | | | | | | | | | | | | | | | | | |
| gains (losses) on investments | | | | | | | | | | | | | | | | | | | | |
| and short positions | | | (1.03 | ) | | | (0.17 | ) | | | (3.15 | ) | | | 4.98 | | | | 1.34 | |
| Total from investment operations | | | (1.00 | ) | | | (0.21 | ) | | | (3.19 | ) | | | 5.11 | | | | 1.38 | |
| | | | | | | | | | | | | | | | | | | | | |
| Less distributions: | | | | | | | | | | | | | | | | | | | | |
| From net investment income | | | (0.02 | ) | | | — | | | | (0.06 | ) | | | (0.12 | ) | | | (0.03 | ) |
| From net realized gains | | | — | | | | — | | | | (5.63 | ) | | | (0.30 | ) | | | (0.17 | ) |
| Return of capital | | | — | | | | — | | | | (0.03 | ) | | | — | | | | — | |
| Total distributions | | | (0.02 | ) | | | — | | | | (5.72 | ) | | | (0.42 | ) | | | (0.20 | ) |
| Net asset value, end of period | | $ | 11.80 | | | | 12.82 | | | $ | 13.03 | | | $ | 21.94 | | | $ | 17.25 | |
| | | | | | | | | | | | | | | | | | | | | |
| | | | | | | | | | | | | | | | | | | | | |
| Total return | | | (7.76 | %) | | | (1.69 | %) | | | (18.90 | %) | | | 30.12 | % | | | 8.67 | % |
| | | | | | | | | | | | | | | | | | | | | |
| Supplemental data and ratios: | | | | | | | | | | | | | | | | | | | | |
| Net assets, end of period | | $ | 39,088,487 | | | $ | 47,543,360 | | | $ | 42,632,379 | | | $ | 74,020,005 | | | $ | 76,270,125 | |
| Ratio of expenses to average net assets: | | | | | | | | | | | | | | | | | | | | |
| Before expense recovery | | | 1.30 | % | | | 1.38 | % | | | 1.30 | % | | | 1.29 | % | | | 1.30 | % |
| After expense recovery | | | 1.30 | % | | | 1.38 | % | | | 1.30 | % | | | 1.29 | % | | | 1.32 | % |
| Ratio of net investment income | | | | | | | | | | | | | | | | | | | | |
| to average net assets: | | | | | | | | | | | | | | | | | | | | |
| Before expense recovery | | | 0.24 | % | | | (0.38 | %) | | | (0.11 | %) | | | 0.61 | % | | | 0.26 | % |
| After expense recovery | | | 0.24 | % | | | (0.38 | %) | | | (0.11 | %) | | | 0.61 | % | | | 0.24 | % |
| Portfolio turnover rate | | | 178.24 | % | | | 164.20 | % | | | 139.89 | % | | | 132.08 | % | | | 179.88 | % |
| (1) | For a share outstanding throughout the period. Rounded to the nearest cent. |
| (2) | Net investment income (loss) per share is calculated based on average shares outstanding. |
| (3) | Net investment income (loss) per share is calculated using ending balances prior to consideration of adjustments for permanent book and tax differences. |
68 The Leuthold Funds - 2010 Annual Report & #160; See Notes to the Finacial Statements
Leuthold Global Industries Fund - Retail
Financial Highlights
| | | Period from | |
| | | May 17, 2010 (1) | |
| | | through | |
| | | September 30, 2010 | |
| | | | |
Per Share Data(2): | | | |
| Net asset value, beginning of period | | $ | 10.00 | |
| | | | | |
| Income from investment operations: | | | | |
Net investment income (3)(4) | | | –– | |
| Net realized and unrealized gains | | | | |
| on investments and short positions | | | 1.01 | |
| Total from investment operations | | | 1.01 | |
| | | | | |
| Less distributions: | | | | |
| From net investment income | | | –– | |
| From net realized gains | | | –– | |
| Total distributions | | | –– | |
| Net asset value, end of period | | $ | 11.01 | |
| | | | | |
| | | | | |
| Total return | | | 10.10 | % |
| | | | | |
| Supplemental data and ratios: | | | | |
| Net assets, end of period | | $ | 5,850,019 | |
| Ratio of expenses to average net assets: | | | | |
| Before expense reimbursement | | | 4.42 | % (5) |
| After expense reimbursement | | | 1.96 | % (5) |
| Ratio of net investment income to average net assets: | | | | |
| Before expense reimbursement | | | (2.29 | %)(5) |
| After expense reimbursement | | | 0.17 | % (5) |
| Portfolio turnover rate | | | 112.58 | % |
| (1) | Commencement of share class operations. |
| (2) | For a share outstanding throughout the period. Rounded to the nearest cent. |
| (3) | Net investment income per share is calculated using ending balances prior to consideration of adjustments for permanent book and tax differences. |
| (4) | Amount represents less than $0.005 per share. |
See Notes to the Finacial Statements The Leuthold Funds - 2010 Annual Report 69
Leuthold Global Industries Fund - Institutional
Financial Highlights
| | | Period from | |
| | | May 17, 2010 (1) | |
| | | through | |
| | | September 30, 2010 | |
| | | | |
Per Share Data(2): | | | |
| Net asset value, beginning of period | | $ | 10.00 | |
| Income from investment operations: | | | | |
Net investment income (3) | | | 0.01 | |
| Net realized and unrealized gains | | | | |
| on investments and short positions | | | 1.00 | |
| Total from investment operations | | | 1.01 | |
| | | | | |
| Less distributions: | | | | |
| From net investment income | | | –– | |
| From net realized gains | | | –– | |
| Total distributions | | | –– | |
| Net asset value, end of period | | $ | 11.01 | |
| | | | | |
| Total return | | | 10.10 | % |
| | | | | |
| Supplemental data and ratios: | | | | |
| Net assets, end of period | | $ | 3,870,245 | |
| Ratio of expenses to average net assets: | | | | |
| Before expense reimbursement | | | 4.17 | % (4) |
| After expense reimbursement | | | 1.71 | % (4) |
| Ratio of net investment income to average net assets: | | | | |
| Before expense reimbursement | | | (2.04 | %)(4) |
| After expense reimbursement | | | 0.42 | % (4) |
| Portfolio turnover rate | | | 112.58 | % |
| (1) | Commencement of share class operations. |
| (2) | For a share outstanding throughout the period. Rounded to the nearest cent. |
| (3) | Net investment loss per share is calculated using ending balances prior to consideration of adjustments for permanent book and tax differences. |
70 The Leuthold Funds - 2010 Annual Report & #160; See Notes to the Finacial Statements
Leuthold Undervalued & Unloved Fund
Financial Highlights
| | | | | | | | | | | | Period from | |
| | | | | | | | | | | | November 14, 2006 (1) | |
| | | Year Ended | | | Year Ended | | | Year Ended | | | through | |
| | | | | | | | | | | | September 30, 2007 | |
| | | | | | | | | | | | | |
Per Share Data (2): | | | | | | | | | | | | |
| Net asset value, beginning of year | | $ | 7.39 | | | $ | 8.17 | | | $ | 10.12 | | | $ | 10.00 | |
| Income (loss) from investment operations: | | | | | | | | | | | | | | | | |
Net investment income (3) | | | 0.12 | | | | 0.07 | | | | 0.14 | | | | 0.11 | |
| Net realized and unrealized gains (losses) | | | | | | | | | | | | | | | | |
| on investments and short positions | | | 0.68 | | | | (0.76 | ) | | | (1.97 | ) | | | 0.12 | |
| Total from investment operations | | | 0.80 | | | | (0.69 | ) | | | (1.83 | ) | | | 0.23 | |
| | | | | | | | | | | | | | | | | |
| Less distributions: | | | | | | | | | | | | | | | | |
| From net investment income | | | (0.09 | ) | | | (0.09 | ) | | | (0.12 | ) | | | (0.11 | ) |
| Redemption fees | | | 0.00 | (4) | | | 0.00 | (4) | | | 0.00 | (4) | | | — | |
| Total distributions | | | (0.09 | ) | | | (0.09 | ) | | | (0.12 | ) | | | (0.11 | ) |
| Net asset value, end of period | | $ | 8.10 | | | $ | 7.39 | | | $ | 8.17 | | | $ | 10.12 | |
| | | | | | | | | | | | | | | | | |
| Total return | | | 10.88 | % | | | (8.25 | %) | | | (18.23 | %) | | | 2.30 | % |
| | | | | | | | | | | | | | | | | |
| Supplemental data and ratios: | | | | | | | | | | | | | | | | |
| Net assets, end of period | | $ | 7,995,853 | | | $ | 11,713,295 | | | $ | 20,201,370 | | | $ | 11,425,370 | |
| Ratio of expenses to average net assets: | | | | | | | | | | | | | | | | |
| Before expense reimbursement or recovery | | | 1.67 | % | | | 1.56 | % | | | 1.35 | % | | | 2.03 | % (5) |
| After expense reimbursement or recovery | | | 1.50 | % | | | 1.50 | % | | | 1.50 | % | | | 1.50 | % (5) |
| Ratio of net investment income to average net assets: | | | | | | | | | | | | | | | | |
| Before expense reimbursement or recovery | | | 1.13 | % | | | 1.13 | % | | | 1.79 | % | | | 1.00 | %(5) |
| After expense reimbursement or recovery | | | 1.30 | % | | | 1.19 | % | | | 1.64 | % | | | 1.53 | %(5) |
| Portfolio turnover rate | | | 124.12 | % | | | 126.70 | % | | | 110.14 | % | | | 56.25 | % |
| (1) | Commencement of operations. |
| (2) | For a share outstanding throughout the period. Rounded to the nearest cent. |
| (3) | Net investment income per share is calculated using ending balances prior to consideration of adjustments for permanent book and tax differences. |
| (4) | Amount represents less than $0.005 per share. |
See Notes to the Finacial Statements The Leuthold Funds - 2010 Annual Report 71
Leuthold Global Clean Technology Fund - Retail
Financial Highlights
| | | | | | Period from | |
| | | | | | July 22, 2009 (1) | |
| | | Year Ended | | | through | |
| | | September 30, 2010 | | | September 30, 2009 | |
| | | | | | | |
Per Share Data (2): | | | | | | |
| Net asset value, beginning of period | | $ | 11.52 | | | $ | 10.00 | |
| Income (loss) from investment operations: | | | | | | | | |
Net investment loss (3) | | | (0.14 | ) | | | (0.01 | ) |
| Net realized and unrealized gains (losses) | | | | | | | | |
| on investments and short positions | | | (1.08 | ) | | | 1.53 | |
| Total from investment operations | | | (1.22 | ) | | | 1.52 | |
| | | | | | | | | |
| Less distributions: | | | | | | | | |
| From net investment income | | | — | | | | –– | |
| From net realized gains | | | — | | | | –– | |
Redemption fees (4) | | | 0.00 | | | | 0.00 | |
| Total distributions | | | — | | | | –– | |
| Net asset value, end of period | | $ | 10.30 | | | $ | 11.52 | |
| | | | | | | | | |
| Total return | | | (10.59 | %) | | | 15.20 | % |
| | | | | | | | | |
| Supplemental data and ratios: | | | | | | | | |
| Net assets, end of period | | $ | 11,926,464 | | | $ | 2,170,237 | |
| Ratio of expenses to average net assets: | | | | | | | | |
| Before expense reimbursement or recovery | | | 1.75 | % | | | 3.67 | % (5) |
| After expense reimbursement or recovery | | | 1.84 | % | | | 2.07 | % (5) |
| Ratio of net investment income to average net assets: | | | | | | | | |
| Before expense reimbursement or recovery | | | (1.23 | %) | | | (3.35 | %)(5) |
| After expense reimbursement or recovery | | | (1.32 | %) | | | (1.75 | %)(5) |
| Portfolio turnover rate | | | 62.17 | % | | | 22.50 | % |
| (1) | Commencement of share class operations. |
| (2) | For a share outstanding throughout the period. Rounded to the nearest cent. |
| (3) | Net investment loss per share is calculated using ending balances prior to consideration of adjustments for permanent book and tax differences. |
| (4) | Amount represents less than $0.005 per share. |
72 The Leuthold Funds - 2010 Annual Report & #160; See Notes to the Finacial Statements
Leuthold Global Clean Technology Fund - Institutional
Financial Highlights
| | | | | | Period from | |
| | | | | | July 22, 2009 (1) | |
| | | Year Ended | | | through | |
| | | September 30, 2010 | | | September 30, 2009 | |
| | | | | | | |
Per Share Data (2): | | | | | | |
| Net asset value, beginning of period | | $ | 11.52 | | | $ | 10.00 | |
| Income (loss) from investment operations: | | | | | | | | |
Net investment loss (3) | | | (0.11 | ) | | | (0.03 | ) |
| Net realized and unrealized gains (losses) | | | | | | | | |
| on investments and short positions | | | (1.08 | ) | | | 1.55 | |
| Total from investment operations | | | (1.19 | ) | | | 1.52 | |
| | | | | | | | | |
| Less distributions: | | | | | | | | |
| From net investment income | | | — | | | | –– | |
| From net realized gains | | | — | | | | –– | |
| Total distributions | | | — | | | | –– | |
| Net asset value, end of period | | $ | 10.33 | | | $ | 11.52 | |
| | | | | | | | | |
| Total return | | | (10.33 | %) | | | 15.20 | % |
| | | | | | | | | |
| Supplemental data and ratios: | | | | | | | | |
| Net assets, end of period | | $ | 15,459,512 | | | $ | 6,458,943 | |
| Ratio of expenses to average net assets: | | | | | | | | |
| Before expense reimbursement | | | 1.51 | % | | | 3.42 | % (4) |
| After expense reimbursement | | | 1.60 | % | | | 1.82 | % (4) |
| Ratio of net investment income to average net assets: | | | | | | | | |
| Before expense reimbursement | | | (0.99 | %) | | | (3.11 | %)(4) |
| After expense reimbursement | | | (1.08 | %) | | | (1.51 | %)(4) |
| Portfolio turnover rate | | | 62.17 | % | | | 22.50 | % |
| (1) | Commencement of share class operations. |
| (2) | For a share outstanding throughout the period. Rounded to the nearest cent. |
| (3) | Net investment loss per share is calculated using ending balances prior to consideration of adjustments for permanent book and tax differences. |
See Notes to the Finacial Statements The Leuthold Funds - 2010 Annual Report 73
Leuthold Hedged Equity Fund - Retail
Financial Highlights
| | | | | | Period from | |
| | | | | | July 22, 2009 (1) | |
| | | Year Ended | | | through | |
| | | September 30, 2010 | | | September 30, 2009 | |
| | | | | | | |
Per Share Data (2): | | | | | | |
| Net asset value, beginning of period | | $ | 9.56 | | | $ | 10.00 | |
| Loss from investment operations: | | | | | | | | |
| Net investment loss | | | (0.18 | )(3) | | | (0.02 | )(4) |
| Net realized and unrealized losses | | | | | | | | |
| on investments and short positions | | | (0.69 | ) | | | (0.42 | ) |
| Total from investment operations | | | (0.87 | ) | �� | | (0.44 | ) |
| | | | | | | | | |
| Less distributions: | | | | | | | | |
| From net investment income | | | — | | | | –– | |
| From net realized gains | | | — | | | | –– | |
Redemption fees (5) | | | 0.00 | | | | 0.00 | |
| Total distributions | | | — | | | | –– | |
| Net asset value, end of period | | $ | 8.69 | | | $ | 9.56 | |
| | | | | | | | | |
| Total return | | | (9.10 | %) | | | (4.40 | %) |
| | | | | | | | | |
| Supplemental data and ratios: | | | | | | | | |
| Net assets, end of period | | $ | 4,523,612 | | | $ | 593,636 | |
| Ratio of expenses to average net assets: | | | | | | | | |
Before expense reimbursement (6) | | | 3.53 | % | | | 17.77 | % (7) |
After expense reimbursement (6) | | | 2.80 | % | | | 2.69 | % (7) |
| Ratio of net investment income to average net assets: | | | | | | | | |
Before expense reimbursement (8) | | | (2.77 | %) | | | (17.27 | %)(7) |
After expense reimbursement (8) | | | (2.04 | %) | | | (2.19 | %)(7) |
Portfolio turnover rate (9) | | | 260.05 | % | | | 34.06 | % |
| (1) | Commencement of share class operations. |
| (2) | For a share outstanding throughout the period. Rounded to the nearest cent. |
| (3) | Net investment loss per share is calculated based on average shares outstanding. |
| (4) | Net investment loss per share is calculated using ending balances prior to consideration of adjustments for permanent book and tax differences. |
| (5) | Amount represents less than $0.005 per share. |
| (6) | The ratio of expenses to average net assets includes dividends on short positions. The before expense reimbursement and after expense reimbursement ratios excluding dividends on short positions were 2.97% and 2.24% respectively, for the year ended September 30, 2010, and 17.47% and 2.37%, respectively, for the period ended September 30, 2009. |
| (8) | The net investment income ratios include dividends on short positions. |
| (9) | The portfolio turnover rate excludes purchases and sales of short positions as the Adviser does not intend to hold the short positions for more than one year. |
74 The Leuthold Funds - 2010 Annual Report & #160; See Notes to the Finacial Statements
Leuthold Hedged Equity Fund - Institutional
Financial Highlights
| | | | | | Period from | |
| | | | | | July 22, 2009 (1) | |
| | | Year Ended | | | through | |
| | | September 30, 2010 | | | September 30, 2009 | |
| | | | | | | |
Per Share Data (2): | | | | | | |
| Net asset value, beginning of period | | $ | 9.57 | | | $ | 10.00 | |
| Loss from investment operations: | | | | | | | | |
| Net investment loss | | | (0.17 | )(3) | | | (0.01 | )(4) |
| Net realized and unrealized losses | | | | | | | | |
| on investments and short positions | | | (0.71 | ) | | | (0.42 | ) |
| Total from investment operations | | | (0.88 | ) | | | (0.43 | ) |
| | | | | | | | | |
| Less distributions: | | | | | | | | |
| From net investment income | | | — | | | | –– | |
| From net realized gains | | | — | | | | –– | |
| Total distributions | | | — | | | | –– | |
| Net asset value, end of period | | $ | 8.69 | | | $ | 9.57 | |
| | | | | | | | | |
| Total return | | | (9.20 | %) | | | (4.30 | %) |
| | | | | | | | | |
| Supplemental data and ratios: | | | | | | | | |
| Net assets, end of period | | $ | 65,876 | | | $ | 1,516,166 | |
| Ratio of expenses to average net assets: | | | | | | | | |
Before expense reimbursement (5) | | | 3.28 | % | | | 17.53 | % (6) |
After expense reimbursement (5) | | | 2.55 | % | | | 2.44 | % (6) |
| Ratio of net investment income to average net assets: | | | | | | | | |
Before expense reimbursement (7) | | | (2.52 | %) | | | (17.04 | %)(6) |
After expense reimbursement (7) | | | (1.79 | %) | | | (1.95 | %)(6) |
Portfolio turnover rate (8) | | | 260.05 | % | | | 34.06 | % |
| (1) | Commencement of share class operations. |
| (2) | For a share outstanding throughout the period. Rounded to the nearest cent. |
| (3) | Net investment loss per share is calculated based on average shares outstanding. |
| (4) | Net investment loss per share is calculated using ending balances prior to consideration of adjustments for permanent book and tax differences. |
| (5) | The ratio of expenses to average net assets includes dividends on short positions. The before expense reimbursement and after expense reimbursement ratios excluding dividends on short positions were 2.72% and 1.99% respectively, for the year ended September 30, 2010, and 17.22% and 2.15%, respectively, for the period ended September 30, 2009. |
| (7) | The net investment income ratios include dividends on short positions. |
| (8) | The portfolio turnover rate excludes purchases and sales of short positions as the Adviser does not intend to hold the short positions for more than one year. |
See Notes to the Finacial Statements The Leuthold Funds - 2010 Annual Report 75
Financial Highlights
| | | Year Ended | | | Year Ended | | | Year Ended | | | Year Ended | | | Year Ended | |
| | | September 30, | | | September 30, | | | September 30, | | | September 30, | | | September 30, | |
| | | 2010 | | | 2009 | | | 2008 | | | 2007 | | | 2006 | |
| | | | | | | | | | | | | | | | |
Per Share Data (1): | | | | | | | | | | | | | | | |
| Net asset value, beginning of year | | $ | 4.75 | | | $ | 7.32 | | | $ | 4.88 | | | $ | 5.69 | | | $ | 6.72 | |
| Income (loss) from investment operations: | | | | | | | | | | | | | | | | | | | | |
| Net investment income (loss) | | | (0.12 | )(6) | | | (0.22 | )(2) | | | 0.12 | (2) | | | 0.31 | (2) | | | 0.36 | (2) |
| Net realized and unrealized gains (losses) | | | | | | | | | | | | | | | | | | | | |
| on investments and short positions | | | (0.51 | ) | | | (1.97 | ) | | | 2.44 | | | | (0.81 | ) | | | (1.04 | ) |
| Total from investment operations | | | (0.63 | ) | | | (2.19 | ) | | | 2.56 | | | | (0.50 | ) | | | (0.68 | ) |
| | | | | | | | | | | | | | | | | | | | | |
| Less distributions: | | | | | | | | | | | | | | | | | | | | |
| From net investment income | | | –– | | | | (0.01 | ) | | | (0.12 | ) | | | (0.31 | ) | | | (0.35 | ) |
| From net realized gains | | | –– | | | | (0.19 | ) | | | –– | | | | –– | | | | –– | |
| Return of capital | | | –– | | | | (0.18 | ) | | | –– | | | | –– | | | | –– | |
| Total distributions | | | –– | | | | (0.38 | ) | | | (0.12 | ) | | | (0.31 | ) | | | (0.35 | ) |
| Net asset value, end of period | | $ | 4.12 | | | $ | 4.75 | | | $ | 7.32 | | | $ | 4.88 | | | $ | 5.69 | |
| | | | | | | | | | | | | | | | | | | | | |
| | | | | | | | | | | | | | | | | | | | | |
| Total return | | | (13.26 | %) | | | (32.54 | %) | | | 53.43 | % | | | (8.82 | %) | | | (10.23 | %) |
| | | | | | | | | | | | | | | | | | | | | |
| Supplemental data and ratios: | | | | | | | | | | | | | | | | | | | | |
| Net assets, end of period | | $ | 196,552,242 | | | $ | 86,244,258 | | | $ | 135,738,825 | | | $ | 76,664,501 | | | $ | 48,722,993 | |
| Ratio of expenses to average net assets: | | | | | | | | | | | | | | | | | | | | |
Before expense reimbursement (3) | | | 2.72 | % | | | 3.53 | % | | | 3.21 | % | | | 2.86 | % | | | 2.93 | % |
After expense reimbursement (3) | | | 2.72 | % | | | 3.53 | % | | | 3.21 | % | | | 2.86 | % | | | 2.93 | % |
| Ratio of net investment income | | | | | | | | | | | | | | | | | | | | |
| to average net assets: | | | | | | | | | | | | | | | | | | | | |
Before expense reimbursement (4) | | | (2.71 | %) | | | (2.83 | %) | | | 2.01 | % | | | 6.40 | % | | | 5.57 | % |
After expense reimbursement (4) | | | (2.71 | %) | | | (2.83 | %) | | | 2.01 | % | | | 6.40 | % | | | 5.57 | % |
Portfolio turnover rate (5) | | | 0.00 | % | | | 0.00 | % | | | 0.00 | % | | | 0.00 | % | | | 0.00 | % |
| (1) | For a share outstanding throughout the period. Rounded to the nearest cent. |
| (2) | Net investment income per share is calculated using ending balances prior to consideration of adjustments for permanent book and tax differences. |
| (3) | The ratio of expenses to average net assets includes dividends on short positions. The before expense reimbursement and after expense reimbursement ratios excluding dividends on short positions were 1.49% and 1.49%, respectively, for the period ended September 30, 2010, 1.47% and 1.47%, respectively, for the year ended September 30, 2009, 1.50% and 1.50%, respectively, for the year ended September 30, 2008, 1.61% and 1.61%, respectively, for the year ended September 30, 2007, and 1.57% and 1.57%, respectively, for the period ended September 30, 2006. |
| (4) | The net investment income ratios include dividends on short positions. |
| (5) | The portfolio turnover rate excludes purchases and sales of short positions as the Adviser does not intend to hold the short positions for more than one year. |
| (6) | Net investment income per share is calculated based on average shares outstanding. |
76 The Leuthold Funds - 2010 Annual Report & #160; See Notes to the Finacial Statements
Leuthold Core Investment Fund
Consolidated Schedule of Investments
September 30, 2010
| | | Shares | | | Fair Value | |
| | | | | | | |
| COMMON STOCKS - 61.51% | | | | | | |
| Auto Components - 0.06% | | | | | | |
| Minth Group, Ltd. (b) | | | 380,000 | | | $ | 758,154 | |
| | | | | | | | | |
| Automobiles - 0.45% | | | | | | | | |
| BYD Co., Ltd. (b) | | | 731,200 | | | | 5,875,912 | |
| | | | | | | | | |
| Beverages - 0.70% | | | | | | | | |
| Coca-Cola Femsa SAB De | | | | | | | | |
| CV - ADR | | | 41,190 | | | | 3,221,882 | |
| Fomento Economico Mexicano | | | | | | | | |
| SAB De CV - ADR | | | 119,083 | | | | 6,041,080 | |
| | | | | | | | | |
| | | | | | | | 9,262,962 | |
| | | | | | | | | |
| Chemicals - 0.92% | | | | | | | | |
| China BlueChemical, Ltd. (b) | | | 4,268,000 | | | | 3,102,460 | |
| Sherwin Williams Co. | | | 119,083 | | | | 8,947,896 | |
| | | | | | | | 12,050,356 | |
| | | | | | | | | |
| Construction Materials - 0.08% | | | | | | | | |
| Semen Gresik Persero | | | | | | | | |
| Tbk PT (b) | | | 893,000 | | | | 990,555 | �� |
| | | | | | | | | |
| | | | | | | | | |
| Distributors - 0.15% | | | | | | | | |
| Jardine Cycle & Carriage, | | | | | | | | |
| Ltd. (b) | | | 66,000 | | | | 1,972,321 | |
| | | | | | | | | |
| | | | | | | | | |
| Diversified Consumer Services - 0.10% | | | | | | | | |
| New Oriental Education & | | | | | | | | |
| Technology Group - ADR (a) | | | 13,716 | | | | 1,338,407 | |
| | | | | | | | | |
| | | | | | | | | |
| Diversified Financial Services - 0.07% | | | | | | | | |
| Bursa Malaysia Bhd (b) | | | 380,700 | | | | 1,002,621 | |
| | | | | | | | | |
| | | | | | | | | |
| Electronic Equipment, Instruments | | | | | | | | |
| & Components - 4.76% | | | | | | | | |
| Amphenol Corp. - Class A | | | 156,567 | | | | 7,668,652 | |
| Arrow Electronics, Inc. (a) | | | 132,133 | | | | 3,531,915 | |
| Benchmark Electronics, Inc. (a) | | | 100,323 | | | | 1,645,297 | |
| Corning, Inc. | | | 486,439 | | | | 8,892,105 | |
| Dolby Laboratories, Inc. - | | | | | | | | |
| Class A (a) | | | 85,635 | | | | 4,864,924 | |
| | | Shares | | | Fair Value | |
| | | | | | | |
| Electronic Equipment, Instruments | | | | | | |
| & Components - 4.76%(continued) | | | | | | |
| | | | | | | |
| Flextronics International Ltd. | | | | | | |
| (a)(b) | | | 930,232 | | | $ | 5,618,601 | |
| LG Display Co., Ltd. - ADR | | | 193,391 | | | | 3,372,739 | |
| Molex, Inc. | | | 283,841 | | | | 5,940,792 | |
| Plexus Corp. (a) | | | 71,368 | | | | 2,094,651 | |
| Sanmina-SCI Corp. (a) | | | 335,226 | | | | 4,049,530 | |
| Tyco Electronics, Ltd. (b) | | | 323,807 | | | | 9,461,641 | |
| Vishay Intertechnology, Inc. (a) | | | 545,103 | | | | 5,276,597 | |
| | | | | | | | 62,417,444 | |
| | | | | | | | | |
| Food & Staples Retailing - 2.91% | | | | | | | | |
| BJ's Wholesale Club, Inc. (a) | | | 180,312 | | | | 7,482,948 | |
| Costco Wholesale Corp. | | | 230,688 | | | | 14,877,069 | |
| CP ALL PCL (b) | | | 1,756,100 | | | | 2,444,653 | |
| Wal-Mart Stores, Inc. | | | 248,418 | | | | 13,295,332 | |
| | | | | | | | 38,100,002 | |
| | | | | | | | | |
| Food Products - 1.06% | | | | | | | | |
| Chaoda Modern Agriculture | | | | | | | | |
| Holdings, Ltd. (b) | | | 4,097,000 | | | | 3,395,311 | |
| China Green Holdings, | | | | | | | | |
| Ltd. (b) | | | 1,824,000 | | | | 1,763,148 | |
| Golden Agri-Resources, | | | | | | | | |
| Ltd. (b) | | | 13,451,000 | | | | 5,830,028 | |
| Lotte Confectionery Co., | | | | | | | | |
| Ltd. (b) | | | 1,253 | | | | 1,469,205 | |
| Wilmar International, Ltd. (b) | | | 310,000 | | | | 1,416,699 | |
| | | | | | | | 13,874,391 | |
| | | | | | | | | |
| Health Care Equipment & Supplies - 0.67% | | | | | | | | |
| Mindray Medical International, | | | | | | | | |
| Ltd. - ADR | | | 103,360 | | | | 3,056,355 | |
| Shandong Weigao Group Medical | | | | | | | | |
| Polymer Co., Ltd. (b) | | | 1,408,000 | | | | 4,010,491 | |
| Supermax Corp. Bhd (b) | | | 865,250 | | | | 1,062,293 | |
| Top Glove Corp. Bhd (b) | | | 427,200 | | | | 709,924 | |
| | | | | | | | 8,839,063 | |
| | | | | | | | | |
See Notes to the Finacial Statements The Leuthold Funds - 2010 Annual Report 77Leuthold Core Investment Fund
Consolidated Schedule of Investments (continued)
September 30, 2010
| | | Shares | | | Fair Value | |
| | | | | | | |
| Health Care Providers & Services - 7.72% | | | | | | |
| Aetna, Inc. | | | 337,265 | | | $ | 10,660,947 | |
| AMERIGROUP Corp. (a) | | | 283,532 | | | | 12,041,604 | |
| CIGNA Corp. | | | 412,441 | | | | 14,757,139 | |
| Coventry Health Care, Inc. (a) | | | 685,696 | | | | 14,763,035 | |
| Healthspring, Inc. (a) | | | 222,322 | | | | 5,744,801 | |
| Humana, Inc. (a) | | | 193,713 | | | | 9,732,141 | |
| Magellan Health Services, Inc. (a) | | | 155,090 | | | | 7,326,452 | |
| Molina Healthcare, Inc. (a) | | | 47,715 | | | | 1,287,828 | |
| UnitedHealth Group, Inc. | | | 352,257 | | | | 12,367,743 | |
| Wellpoint, Inc. (a) | | | 220,971 | | | | 12,515,797 | |
| | | | | | | | 101,197,487 | |
| | | | | | | | | |
| | | | | | | | | |
| Hotels, Restaurants & Leisure - 0.14% | | | | | | | | |
| Ctrip.com International, Ltd. | | | | | | | | |
| - ADR (a) | | | 27,472 | | | | 1,311,788 | |
| REXLot Holdings, Ltd. (b) | | | 4,850,000 | | | | 462,569 | |
| | | | | | | | 1,774,357 | |
| | | | | | | | | |
| | | | | | | | | |
| Household Durables - 3.38% | | | | | | | | |
| Garmin, Ltd. (b) | | | 104,401 | | | | 3,168,570 | |
| LG Electronics, Inc. (b) | | | 13,989 | | | | 1,178,990 | |
| Panasonic Corp. - ADR | | | 549,695 | | | | 7,464,858 | |
| Sharp Corp. (b) | | | 907,000 | | | | 9,028,714 | |
| Sony Corp. - ADR | | | 592,424 | | | | 18,317,750 | |
| Whirlpool Corp. | | | 38,686 | | | | 3,132,019 | |
| Woongjin Coway Co., Ltd. (b) | | | 50,170 | | | | 1,953,561 | |
| | | | | | | | 44,244,462 | |
| | | | | | | | | |
| | | | | | | | | |
| Industrial Conglomerates - 5.04% | | | | | | | | |
| 3M Co. | | | 106,440 | | | | 9,229,412 | |
| Carlisle Companies, Inc. | | | 253,255 | | | | 7,584,987 | |
| General Electric Co. | | | 1,011,582 | | | | 16,438,208 | |
| Koninklijke Philips Electronics | | | | | | | | |
| N.V. - NYS | | | 323,807 | | | | 10,141,635 | |
| Siemens AG - ADR | | | 86,865 | | | | 9,155,571 | |
| Tyco International, Ltd. (b) | | | 367,444 | | | | 13,496,218 | |
| | | | | | | | 66,046,031 | |
| | | | | | | | | |
| | | Shares | | | Fair Value | |
| | | | | | | |
| | | | | | | |
| Insurance - 0.32% | | | | | | |
| China Life Insurance Co., | | | | | | |
| Ltd. (b) | | | 1,055,000 | | | $ | 4,167,596 | |
| | | | | | | | | |
| | | | | | | | | |
| Internet Software & Services - 0.76% | | | | | | | | |
| Baidu, Inc. - ADR (a) | | | 86,772 | | | | 8,904,543 | |
| Tencent Holdings, Ltd. (b) | | | 47,500 | | | | 1,038,298 | |
| | | | | | | | 9,942,841 | |
| | | | | | | | | |
| Leisure Equipment & Products - 0.31% | | | | | | | | |
| Polaris Industries, Inc. | | | 62,396 | | | | 4,061,980 | |
| | | | | | | | | |
| Machinery - 1.53% | | | | | | | | |
| Cummins, Inc. | | | 46,899 | | | | 4,248,112 | |
| United Tractors Tbk PT (b) | | | 2,664,000 | | | | 6,104,067 | |
| Weichai Power Co., Ltd. (b) | | | 917,000 | | | | 9,691,385 | |
| | | | | | | | 20,043,564 | |
| | | | | | | | | |
| | | | | | | | | |
| Marine - 0.25% | | | | | | | | |
| China Shipping Development Co., | | | | | |
| Ltd. (b) | | | 2,406,000 | | | | 3,311,841 | |
| | | | | | | | | |
| | | | | | | | | |
| Media - 1.55% | | | | | | | | |
| BEC World PCL (b) | | | 2,242,200 | | | | 2,862,776 | |
| Cheil Worldwide, Inc. (b) | | | 126,700 | | | | 1,505,622 | |
| DIRECTV - Class A (a) | | | 273,646 | | | | 11,391,883 | |
| Grupo Televisa SA - ADR | | | 243,059 | | | | 4,598,676 | |
| | | | | | | | 20,358,957 | |
| | | | | | | | | |
| | | | | | | | | |
| Multiline Retail - 0.47% | | | | | | | | |
| Golden Eagle Retail Group, | | | | | | | | |
| Ltd. (b) | | | 1,433,000 | | | | 4,063,231 | |
| New World Department Store China, | | | | | |
| Ltd. (b) | | | 1,068,000 | | | | 1,098,441 | |
| Parkson Holdings Bhd (b) | | | 498,200 | | | | 939,269 | |
| | | | | | | | 6,100,941 | |
| | | | | | | | | |
| | | | | | | | | |
| Oil, Gas & Consumable Fuels - 1.30% | | | | | | | | |
| Banpu PCL (b) | | | 462,500 | | | | 10,911,038 | |
| Occidental Petroleum Corp. | | | 78,301 | | | | 6,130,968 | |
| | | | | | | | 17,042,006 | |
| | | | | | | | | |
78 The Leuthold Funds - 2010 Annual Report & #160; See Notes to the Finacial Statements
Leuthold Core Investment Fund
Consolidated Schedule of Investments (continued)
September 30, 2010
| | | Shares | | | Fair Value | |
| | | | | | | |
| | | | | | | |
| Paper & Forest Products - 1.58% | | | | | | |
| Domtar Corp. | | | 102,584 | | | $ | 6,624,875 | |
| Fibria Celulose S.A. - ADR (a) | | | 575,023 | | | | 9,942,147 | |
| Schweitzer-Mauduit International, | | | | | | | | |
| Inc. | | | 71,368 | | | | 4,161,468 | |
| | | | | | | | 20,728,490 | |
| | | | | | | | | |
| Pharmaceuticals - 5.05% | | | | | | | | |
| Abbott Laboratories | | | 67,555 | | | | 3,529,073 | |
| Allergan, Inc. | | | 52,851 | | | | 3,516,177 | |
| AstraZeneca PLC - ADR | | | 67,255 | | | | 3,409,829 | |
| China Pharmaceutical Group, | | | | | | | | |
| Ltd. (b) 1,034,000 | | | | | | | 534,401 | |
| Endo Pharmaceuticals Holdings, | | | | | | | | |
| Inc. (a) | | | 139,066 | | | | 4,622,554 | |
| GlaxoSmithKline PLC - ADR | | | 89,690 | | | | 3,544,549 | |
| Impax Laboratories, Inc. (a) | | | 60,926 | | | | 1,206,335 | |
| Medicis Pharmaceutical Corp. - | | | | | | | | |
| Class A | | | 121,433 | | | | 3,600,488 | |
| Merck & Co., Inc. | | | 174,950 | | | | 6,439,909 | |
| Novartis AG - ADR | | | 112,561 | | | | 6,491,393 | |
| Par Pharmaceutical Companies, | | | | | | | | |
| Inc. (a) | | | 64,740 | | | | 1,882,639 | |
| Perrigo Co. | | | 62,736 | | | | 4,028,906 | |
| Pfizer, Inc. | | | 343,790 | | | | 5,902,874 | |
| Questcor Pharmaceuticals, | | | | | | | | |
| Inc. (a) | | | 166,817 | | | | 1,654,825 | |
| Shire PLC - ADR | | | 33,956 | | | | 2,284,560 | |
| Teva Pharmaceutical Industries, | | | | | | | | |
| Ltd. - ADR | | | 66,879 | | | | 3,527,867 | |
| Valeant Pharmaceuticals International, | | | | | | | | |
| Inc. (b) | | | 98,258 | | | | 2,461,363 | |
| Viropharma, Inc. (a) | | | 136,721 | | | | 2,038,510 | |
| Warner Chilcott PLC - Class A | | | | | | | | |
| (a)(b) | | | 146,856 | | | | 3,295,449 | |
| Watson Pharmaceuticals, Inc. (a) | | | 51,875 | | | | 2,194,831 | |
| | | | | | | | 66,166,532 | |
| | | | | | | | | |
| | | Shares | | | Fair Value | |
| | | | | | | |
| | | | | | | |
| Real Estate Investment Trusts (REITs) - 5.99% | | | | | | |
| CommonWealth REIT | | | 130,777 | | | $ | 3,347,891 | |
| CommonWealth REIT Escrow (a) | | | 75,000 | | | | – | |
| Entertainment Properties Trust | | | 133,551 | | | | 5,766,732 | |
| Lexington Realty Trust | | | 388,764 | | | | 2,783,550 | |
| National Retail Properties, Inc. | | | 175,954 | | | | 4,418,205 | |
| Nationwide Health Properties, | | | | | | | | |
| Inc. | | | 448,208 | | | | 17,332,204 | |
| Omega Healthcare Investors, Inc. | | | 798,928 | | | | 17,935,934 | |
| Realty Income Corp. | | | 223,510 | | | | 7,536,757 | |
| Senior Housing Properties Trust | | | 644,770 | | | | 15,152,095 | |
| Washington Real Estate | | | | | | | | |
| Investment Trust | | | 132,362 | | | | 4,199,846 | |
| | | | | | | | 78,473,214 | |
| | | | | | | | | |
| | | | | | | | | |
| Semiconductors & Semiconductor | | | | | | | | |
| Equipment - 7.40% | | | | | | | | |
| Altera Corp. | | | 440,443 | | | | 13,283,761 | |
| Analog Devices, Inc. | | | 389,874 | | | | 12,234,246 | |
| Applied Micro Circuits Corp. (a) | | | 393,952 | | | | 3,939,520 | |
| Atheros Communications, Inc. (a) | | | 243,875 | | | | 6,426,106 | |
| Broadcom Corp. - Class A | | | 220,222 | | | | 7,793,657 | |
| Cirrus Logic, Inc. (a) | | | 186,781 | | | | 3,332,173 | |
| Intel Corp. | | | 599,084 | | | | 11,520,385 | |
| LSI Corp. (a) | | | 900,462 | | | | 4,106,107 | |
| Micrel, Inc. | | | 278,132 | | | | 2,742,382 | |
| ON Semiconductor Corp. (a) | | | 818,082 | | | | 5,898,371 | |
| RF Micro Devices, Inc. (a) | | | 1,585,595 | | | | 9,735,553 | |
| Samsung Electronics Co., Ltd. - GDR | | | | | | | | |
| (Acquired 01/25/2010 through | | | | | | | | |
| 02/03/2010, Cost $13,920,256) | | | | | | | | |
| (a)(f) | | | 38,228 | | | | 13,024,845 | |
| Transcend Information, Inc. (b) | | | 414,000 | | | | 1,066,754 | |
| Volterra Semiconductor Corp. (a) | | | 83,195 | | | | 1,790,357 | |
| | | | | | | | 96,894,217 | |
| | | | | | | | | |
| Software - 0.08% | | | | | | | | |
| Longtop Financial Technologies, | | | | | | | | |
| Ltd. - ADR (a) | | | 26,892 | | | | 1,058,200 | |
| | | | | | | | | |
See Notes to the Finacial Statements The Leuthold Funds - 2010 Annual Report 79Leuthold Core Investment Fund
Consolidated Schedule of Investments (continued)
September 30, 2010
| | | Shares | | | Fair Value | |
| | | | | | | |
| | | | | | | |
| Specialty Retail - 3.34% | | | | | | |
| Best Buy, Inc. | | | 560,749 | | | $ | 22,895,382 | |
| Hhgregg, Inc. (a) | | | 109,703 | | | | 2,716,246 | |
| RadioShack Corp. | | | 142,328 | | | | 3,035,856 | |
| The Home Depot, Inc. | | | 476,739 | | | | 15,103,092 | |
| | | | | | | | 43,750,576 | |
| | | | | | | | | |
| Textiles, Apparel & Luxury Goods - 0.74% | | | | | | | | |
| 361 Degrees International, | | | | | | | | |
| Ltd. (b) | | | 1,651,000 | | | | 1,659,756 | |
| Fossil, Inc. (a) | | | 52,608 | | | | 2,829,784 | |
| Li Ning Co., Ltd. (b) | | | 1,723,000 | | | | 5,229,725 | |
| | | | | | | | 9,719,265 | |
| | | | | | | | | |
| | | | | | | | | |
| Tobacco - 0.59% | | | | | | | | |
| Phillip Morris International, | | | | | | | | |
| Inc. | | | 137,027 | | | | 7,676,252 | |
| | | | | | | | | |
| | | | | | | | | |
| Transportation Infrastructure - 0.58% | | | | | | | | |
| Grupo Aeroportuario del Sureste | | | | | | | | |
| SAB de CV - ADR | | | 24,061 | | | | 1,142,416 | |
| Jasa Marga PT (b) | | | 7,266,000 | | | | 2,605,176 | |
| Zhejiang Expressway Co., | | | | | | | | |
| Ltd. (b) | | | 4,140,000 | | | | 3,905,837 | |
| | | | | | | | 7,653,429 | |
| | | | | | | | | |
| | | | | | | | | |
| Water Utilities - 0.26% | | | | | | | | |
| Guangdong Investment, | | | | | | | | |
| Ltd. (b) | | | 6,492,000 | | | | 3,388,724 | |
| | | | | | | | | |
| | | | | | | | | |
| Wireless Telecommunication Services - 1.20% | | | | | | | | |
| America Movil SAB de CV - | | | | | | | | |
| ADR | | | 207,579 | | | | 11,070,188 | |
| China Unicom Hong Kong, | | | | | | | | |
| Ltd. (b) | | | 2,657,000 | | | | 3,890,205 | |
| Globe Telecom, Inc. (b) | | | 34,830 | | | | 706,362 | |
| | | | | | | | 15,666,755 | |
| | | | | | | | | |
| TOTAL COMMON STOCKS | | | | | | | | |
| (Cost $719,646,061) | | | | | | $ | 805,949,905 | |
| | | | | | | | | |
| | | Shares | | | Fair Value | |
| | | | | | | |
| | | | | | | |
| PREFERRED STOCKS - 0.51% | | | | | | |
| Food & Staples Retailing - 0.51% | | | | | | |
| Cia Brasileira de Distribuicao | | | | | | |
| Gupo Pao de Acucar - Class A | | | 97,342 | | | $ | 6,718,545 | |
| | | | | | | | | |
| TOTAL PREFERRED STOCKS | | | | | | | | |
| (Cost $7,022,311) | | | | | | $ | 6,718,545 | |
| | | | | | | | | |
| | | | | | | | | |
| | | | | | | | | |
| INVESTMENT COMPANIES - 10.64% | | | | | | | | |
| Exchange Traded Funds - 6.61% | | | | | | | | |
| | | | | | | | | |
| iShares iBoxx Investment Grade | | | | | | | | |
| Corporate Bond Fund | | | 252,439 | | | $ | 28,548,327 | |
| iShares MSCI Brazil Index Fund | | | 82,418 | | | | 6,340,417 | |
| iShares MSCI Emerging Markets | | | | | | | | |
| Index Fund | | | 152,785 | | | | 6,840,184 | |
| iShares MSCI Malaysia | | | | | | | | |
| Index Fund | | | 339,034 | | | | 4,658,327 | |
| iShares MSCI South Africa Fund | | | 40,815 | | | | 2,743,584 | |
| iShares MSCI South Korea | | | | | | | | |
| Index Fund | | | 142,797 | | | | 7,638,212 | |
| iShares MSCI Taiwan | | | | | | | | |
| Index Fund | | | 177,182 | | | | 2,400,816 | |
| iShares S&P Latin America 40 | | | | | | | | |
| Index Fund | | | 218,009 | | | | 11,018,175 | |
| Market Vectors - Russia ETF (d) | | | 461,466 | | | | 15,011,489 | |
| SPDR S&P Emerging Middle East | | | | | | | | |
| & Africa ETF (d) | | | 20,150 | | | | 1,427,426 | |
| | | | | | | | 86,626,957 | |
| | | | | | | | | |
80 The Leuthold Funds - 2010 Annual Report & #160; See Notes to the Finacial Statements
Leuthold Core Investment Fund
Consolidated Schedule of Investments (continued)
September 30, 2010
| | | Shares | | | Fair Value | |
| | | | | | | |
| | | | | | | |
| Mutual Funds - 4.03% | | | | | | |
| ING Russia Fund - | | | | | | |
| Class A (a)(d) | | | 217,947 | | | $ | 7,615,067 | |
| Matthews China Fund | | | 614,882 | | | | 18,046,785 | |
| Matthews India Fund | | | 378,754 | | | | 8,169,715 | |
| Matthews Korea Fund (d) | | | 844,606 | | | | 4,020,326 | |
| The Central Europe & | | | | | | | | |
| Russia Fund, Inc. | | | 44,817 | | | | 1,674,811 | |
| US Global Investors Funds - Eastern | | | | | | | | |
| European Fund (a)(d) | | | 1,335,643 | | | | 13,182,796 | |
| | | | | | | | 52,709,500 | |
| | | | | | | | | |
| TOTAL INVESTMENT COMPANIES | | | | | | | | |
| (Cost $93,079,684) | | | | | | $ | 139,336,457 | |
| | | | | | | | | |
| | | | | | | | | |
| | | | | | | | | |
| EXCHANGE TRADED NOTES - 0.63% | | | | | | | | |
| iPath MSCI India Index | | | | | | | | |
| ETN (a)(b) | | | 108,624 | | | $ | 8,229,354 | |
| | | | | | | | | |
| TOTAL EXCHANGE TRADED NOTES | | | | | | | | |
| (Cost $6,890,686) | | | | | | $ | 8,229,354 | |
| | | | | | | | | |
| | | | | | | | | |
| | | | | | | | | |
| | | Troy Ounces | | | Fair Value | |
| | | | | | | | | |
| | | | | | | | | |
| PRECIOUS METALS - 4.21% | | | | | | | | |
| Gold Bullion (a) | | | 32,028 | | | $ | 41,919,207 | |
| Silver (a) | | | 606,000 | | | | 13,289,580 | |
| | | | | | | | | |
| TOTAL PRECIOUS METALS | | | | | | | | |
| (Cost $39,753,648) | | | | | | $ | 55,208,787 | |
| | | | | | | | | |
| | | | | | | | | |
| | | | | | | | | |
| | | Principal | | | | | |
| | | Amount | | | Fair Value | |
| | | | | | | | | |
| | | | | | | | | |
| FOREIGN GOVERNMENT BONDS - 3.68% | | | | | | | | |
| Republic of Brazil (b) | | | | | | | | |
| 12.500%, 01/05/2022 | | | | | | | | |
| BRL | | | 66,505,000 | | | $ | 48,247,570 | |
| | | | | | | | | |
| TOTAL FOREIGN GOVERNMENT BONDS | | | | | | | | |
| (Cost $33,558,822) | | | | | | $ | 48,247,570 | |
| | | | | | | | | |
| | | Shares | | | Fair Value | |
| | | | | | | |
| | | | | | | |
| SHORT-TERM INVESTMENTS - 3.28% | | | | | | |
| Money Market Funds - 3.28% | | | | | | |
| Fidelity Institutional Money Market | | | | | | |
| Fund - Government Portfolio | | | | | | |
| 0.06% (c) | | | 42,941,112 | | | $ | 42,941,112 | |
| | | | | | | | | |
| TOTAL SHORT-TERM INVESTMENTS | | | | | | | | |
| (Cost $42,941,112) | | | | | | $ | 42,941,112 | |
| | | | | | | | | |
| | | | | | | | | |
| | | | | | | | | |
| | | | | | | | | |
| Total Investments | | | | | | | | |
| (Cost $942,892,324) - 84.46% | | | | | | $ | 1,106,631,730 | |
| Other Assets in Excess of | | | | | | | | |
| Liabilities - 15.54% (e) | | | | | | | 203,731,626 | |
| | | | | | | | | |
| | | | | | | | | |
| TOTAL NET ASSETS - 100.00% | | | | | | | | |
| | | | | | | $ | 1,310,363,354 | |
| | | | | | | | | |
Percentages are stated as a percent of net assets.
ADR American Depository Receipt
BRL Brazilian Real GDR Global Depository Receipt
NYS New York Registered Shares
| (a) | Non-income producing security. |
| (b) | Foreign issued security. |
| (c) | The rate quoted is the annualized seven-day yield as of September 30, 2010. |
| (d) | A portion of this security is considered illiquid. The market value of these securities total $41,257,104, which represents 3.15% of total net assets. If a fund purchases more than 1% of any class of security of a registered open-end investment company, such investment will be considered an illiquid investment. |
| (e) | All or a portion of the assets have been committed as collateral for open securities sold short. |
| (f) | Restricted security as defined in Rule 144(a) under the Securities Act of 1933. Resale to the public may require registration or may extend only to qualified institutional buyers. At September 30, 2010, the market value of these securities total $13,024,845, which represents 0.99% of total net assets. |
The Global Industry Classification Standard (GICS®) was developed by and/or is the exclusive property of MSCI, Inc. and Standard & Poor Financial Services LLC (“S&P”). GICS is a service mark of MSCI and S&P and has been licensed for use by U.S. Bancorp Fund Services, LLC.
See Notes to the Finacial Statements The Leuthold Funds - 2010 Annual Report 81Leuthold Core Investment Fund
Consolidated Schedule of Securities Sold Short
September 30, 2010
| | | Shares | | | Fair Value | |
| | | | | | | |
| | | | | | | |
| COMMON STOCKS - 5.46% | | | | | | |
| Biotechnology - 0.09% | | | | | | |
| Vertex Pharmaceuticals, Inc. | | | 35,939 | | | $ | 1,242,411 | |
| | | | | | | | | |
| | | | | | | | | |
| Building Products - 0.09% | | | | | | | | |
| Masco Corp. | | | 101,713 | | | | 1,119,860 | |
| | | | | | | | | |
| | | | | | | | | |
| Capital Markets - 0.64% | | | | | | | | |
| Blackstone Group LP | | | 73,803 | | | | 936,560 | |
| E*Trade Financial Corp. | | | 83,366 | | | | 1,212,142 | |
| Greenhill & Co., Inc. | | | 12,014 | | | | 952,950 | |
| Invesco, Ltd. (a) | | | 61,620 | | | | 1,308,193 | |
| Northern Trust Corp. | | | 25,116 | | | | 1,211,596 | |
| Stifel Financial Corp. | | | 16,633 | | | | 769,942 | |
| TD Ameritrade Holding Corp. | | | 65,718 | | | | 1,061,346 | |
| The Charles Schwab Corp. | | | 62,945 | | | | 874,935 | |
| | | | | | | | 8,327,664 | |
| | | | | | | | | |
| | | | | | | | | |
| Chemicals - 0.08% | | | | | | | | |
| Intrepid Potash, Inc. | | | 38,712 | | | | 1,009,222 | |
| | | | | | | | | |
| | | | | | | | | |
| Commercial Banks - 0.24% | | | | | | | | |
| Associated Banc-Corp. | | | 61,135 | | | | 806,371 | |
| Barclays PLC - ADR | | | 58,465 | | | | 1,102,065 | |
| First Horizon National Corp. | | | 75,655 | | | | 863,223 | |
| Westamerica Bancorporation | | | 7,607 | | | | 414,505 | |
| | | | | | | | 3,186,164 | |
| | | | | | | | | |
| | | | | | | | | |
| Commercial Services & Supplies - 0.09% | | | | | | | | |
| Covanta Holding Corp. | | | 76,705 | | | | 1,208,104 | |
| | | | | | | | | |
| | | | | | | | | |
| Construction & Engineering - 0.10% | | | | | | | | |
| Foster Wheeler AG (a) | | | 52,061 | | | | 1,273,412 | |
| | | | | | | | | |
| | | | | | | | | |
| Construction Materials - 0.09% | | | | | | | | |
| Vulcan Materials Co. | | | 31,315 | | | | 1,156,150 | |
| | | | | | | | | |
| | | | | | | | | |
| Containers & Packaging - 0.08% | | | | | | | | |
| Owens-Illinois, Inc. | | | 38,640 | | | | 1,084,238 | |
| | | | | | | | | |
| | | | | | | | | |
| Diversified Financial Services - 0.08% | | | | | | | | |
| Bank of America Corp. | | | 82,147 | | | | 1,076,947 | |
| | | | | | | | | |
| | | Shares | | | Fair Value | |
| | | | | | | |
| | | | | | | |
| Electric Utilities - 0.03% | | | | | | |
| Korea Electric Power Corp. - ADR | | | 30,000 | | | $ | 387,900 | |
| | | | | | | | | |
| | | | | | | | | |
| Energy Equipment & Services - 0.09% | | | | | | | | |
| Weatherford International, | | | | | | | | |
| Ltd. (a) | | | 65,718 | | | | 1,123,778 | |
| | | | | | | | | |
| | | | | | | | | |
| Health Care Equipment & Supplies - 0.08% | | | | | | | | |
| Alere, Inc. | | | 33,475 | | | | 1,035,382 | |
| | | | | | | | | |
| | | | | | | | | |
| Health Care Providers & Services - 0.04% | | | | | | | | |
| Brookdale Senior Living, Inc. | | | 31,602 | | | | 515,429 | |
| | | | | | | | | |
| | | | | | | | | |
| Health Care Technology - 0.04% | | | | | | | | |
| Quality Systems, Inc. | | | 7,091 | | | | 470,204 | |
| | | | | | | | | |
| | | | | | | | | |
| Hotels, Restaurants & Leisure - 0.51% | | | | | | | | |
| Bally Technologies, Inc. | | | 23,890 | | | | 834,956 | |
| Hyatt Hotels Corp. - Class A | | | 10,486 | | | | 392,072 | |
| International Game Technology | | | 76,974 | | | | 1,112,274 | |
| Marriott International, Inc. - | | | | | | | | |
| Class A | | | 31,627 | | | | 1,133,195 | |
| MGM Resorts International | | | 113,179 | | | | 1,276,659 | |
| Penn National Gaming, Inc. | | | 25,915 | | | | 767,343 | |
| Starwood Hotels & Resorts | | | | | | | | |
| Worldwide, Inc. | | | 23,094 | | | | 1,213,590 | |
| | | | | | | | 6,730,089 | |
| | | | | | | | | |
| | | | | | | | | |
| Household Durables - 0.35% | | | | | | | | |
| D.R. Horton, Inc. | | | 104,920 | | | | 1,166,710 | |
| KB Home | | | 87,275 | | | | 988,826 | |
| Pulte Group, Inc. | | | 134,950 | | | | 1,182,162 | |
| Toll Brothers, Inc. | | | 64,701 | | | | 1,230,613 | |
| | | | | | | | 4,568,311 | |
| | | | | | | | | |
| | | | | | | | | |
| Independent Power Producers & | | | | | | | | |
| Energy Traders - 0.08% | | | | | | | | |
| Calpine Corp. | | | 82,250 | | | | 1,024,013 | |
| | | | | | | | | |
| | | | | | | | | |
| Internet & Catalog Retail - 0.08% | | | | | | | | |
| Expedia, Inc. | | | 39,160 | | | | 1,104,704 | |
| | | | | | | | | |
82 The Leuthold Funds - 2010 Annual Report & #160; See Notes to the Finacial Statements
Leuthold Core Investment Fund
Consolidated Schedule of Securities Sold Short (continued)
September 30, 2010
| | | Shares | | | Fair Value | |
| | | | | | | |
| | | | | | | |
| Internet Software & Services - 0.35% | | | | | | |
| Equinix, Inc. | | | 10,474 | | | $ | 1,072,014 | |
| GSI Commerce, Inc. | | | 35,631 | | | | 880,086 | |
| IAC/InterActiveCorp | | | 49,699 | | | | 1,305,593 | |
| Rackspace Hosting, Inc. | | | 48,485 | | | | 1,259,640 | |
| | | | | | | | 4,517,333 | |
| | | | | | | | | |
| Life Sciences Tools & Services - 0.10% | | | | | | | | |
| Illumina, Inc. | | | 26,373 | | | | 1,297,551 | |
| | | | | | | | | |
| Media - 0.27% | | | | | | | | |
| DreamWorks Animation SKG, Inc. - | | | | | | | | |
| Class A | | | 37,196 | | | | 1,186,924 | |
| Lamar Advertising Co. - Class A | | | 33,064 | | | | 1,052,096 | |
| Liberty Global, Inc. - Class A | | | 41,923 | | | | 1,291,648 | |
| | | | | | | | 3,530,668 | |
| | | | | | | | | |
| | | | | | | | | |
| Metals & Mining - 0.40% | | | | | | | | |
| AK Steel Holding Corp. | | | 82,100 | | | | 1,133,801 | |
| Harmony Gold Mining Co., Ltd. - | | | | | |
| ADR | | | 123,734 | | | | 1,396,957 | |
| Royal Gold, Inc. | | | 22,796 | | | | 1,136,153 | |
| Silver Standard Resources, Inc. (a) | | | 23,457 | | | | 468,671 | |
| United States Steel Corp. | | | 24,591 | | | | 1,078,069 | |
| | | | | | | | 5,213,651 | |
| | | | | | | | | |
| | | | | | | | | |
| Oil, Gas & Consumable Fuels - 0.35% | | | | | | | | |
| Consol Energy, Inc. | | | 36,247 | | | | 1,339,689 | |
| Massey Energy Co. | | | 36,878 | | | | 1,143,956 | |
| Range Resources Corp. | | | 22,693 | | | | 865,284 | |
| Tesoro Corp. | | | 96,728 | | | | 1,292,286 | |
| | | | | | | | 4,641,215 | |
| | | | | | | | | |
| | | | | | | | | |
| Professional Services - 0.25% | | | | | | | | |
| Manpower, Inc. | | | 23,935 | | | | 1,249,407 | |
| Robert Half International, Inc. | | | 47,851 | | | | 1,244,126 | |
| Towers Watson & Co. - Class A | | | 16,294 | | | | 801,339 | |
| | | | | | | | 3,294,872 | |
| | | | | | | | | |
| | | Shares | | | Fair Value | |
| | | | | | | |
| | | | | | | |
| Real Estate Investment Trusts (REITs) - 0.21% | | | | | | |
| American Campus Communities, | | | | | | |
| Inc. | | | 36,247 | | | $ | 1,103,359 | |
| Corporate Office Properties | | | | | | | | |
| Trust SBI MD | | | 33,578 | | | | 1,252,795 | |
| EastGroup Properties, Inc. | | | 10,783 | | | | 403,068 | |
| | | | | | | | 2,759,222 | |
| | | | | | | | | |
| Real Estate Management & | | | | | | | | |
| Development - 0.12% | | | | | | | | |
| Brookfield Asset Management, Inc. - | | | | | | | | |
| Class A (a) | | | 30,676 | | | | 870,278 | |
| The St Joe Co. | | | 29,805 | | | | 741,251 | |
| | | | | | | | 1,611,529 | |
| | | | | | | | | |
| | | | | | | | | |
| Road & Rail - 0.16% | | | | | | | | |
| Con-way, Inc. | | | 28,050 | | | | 869,269 | |
| Hertz Global Holdings, Inc. | | | 113,732 | | | | 1,204,422 | |
| | | | | | | | 2,073,691 | |
| | | | | | | | | |
| | | | | | | | | |
| Semiconductors & Semiconductor | | | | | | | | |
| Equipment - 0.17% | | | | | | | | |
| MEMC Electronic Materials, | | | | | | | | |
| Inc. | | | 111,660 | | | | 1,330,987 | |
| Netlogic Microsystems, Inc. | | | 34,253 | | | | 944,698 | |
| | | | | | | | 2,275,685 | |
| | | | | | | | | |
| | | | | | | | | |
| Software - 0.09% | | | | | | | | |
| Concur Technologies, Inc. | | | 23,865 | | | | 1,179,885 | |
| | | | | | | | | |
| | | | | | | | | |
| Thrifts & Mortgage Finance - 0.11% | | | | | | | | |
| People's United Financial, Inc. | | | 83,687 | | | | 1,095,463 | |
| TFS Financial Corp. | | | 42,196 | | | | 387,781 | |
| | | | | | | | 1,483,244 | |
| | | | | | | | | |
| TOTAL COMMON STOCKS | | | | | | | | |
| (Proceeds $66,412,704) | | | | | | $ | 71,522,528 | |
| | | | | | | | | |
See Notes to the Finacial Statements The Leuthold Funds - 2010 Annual Report 83
Leuthold Core Investment Fund
Consolidated Schedule of Securities Sold Short (continued)
September 30, 2010
| | | Shares | | | Fair Value | |
| | | | | | | |
| | | | | | | |
| INVESTMENT COMPANIES - 0.24% | | | | | | |
| Exchange Traded Funds - 0.24% | | | | | | |
| SPDR Dow Jones Industrial | | | | | | |
| Average ETF Trust | | | 14,466 | | | $ | 1,561,026 | |
| SPDR S&P 500 ETF Trust | | | 13,703 | | | | 1,563,786 | |
| | | | | | | | 3,124,812 | |
| | | | | | | | | |
| TOTAL INVESTMENT COMPANIES | | | | | | | | |
| (Proceeds $3,082,136) | | | | | | $ | 3,124,812 | |
| | | | | | | | | |
| | | | | | | | | |
| | | | | | | | | |
| | | | | | | | | |
| | | Principal | | | | | |
| | | Amount | | | Fair Value | |
| | | | | | | | | |
| | | | | | | | | |
| UNITED STATES TREASURY | | | | | | | | |
| OBLIGATIONS - 2.16% | | | | | | | | |
| United States Treasury Bonds - 1.13% | | | | | | | | |
| 3.375%, 11/15/2019 | | $ | 13,783,000 | | | $ | 14,847,957 | |
| | | | | | | | | |
| | | | | | | | | |
| United States Treasury Strips - 1.03% | | | | | | | | |
| 4.61%, 05/15/2039 | | | 42,000,000 | | | | 13,458,228 | |
| | | | | | | | | |
| TOTAL UNITED STATES TREASURY OBLIGATIONS | | | | | | | | |
| (Proceeds $24,789,211) | | | | | | $ | 28,306,185 | |
| | | | | | | | | |
| | | | | | | | | |
| | | | | | | | | |
| | | | | | | | | |
| TOTAL SECURITIES SOLD SHORT | | | | | | | | |
| (Proceeds $94,284,051) - 7.86% | | | | | | $ | 102,953,525 | |
| | | | | | | | | |
| | | | | | | | | |
Percentages are stated as a percent of net assets.
ADR American Depository Receipt
| (a) | Foreign issued security. |
The Global Industry Classification Standard (GICS®) was developed by and/or is the exclusive property of MSCI, Inc. and Standard & Poor Financial Services LLC (“S&P”). GICS is a service mark of MSCI and S&P and has been licensed for use by U.S. Bancorp Fund Services, LLC.
84 The Leuthold Funds - 2010 Annual Report & #160; See Notes to the Finacial Statements
Leuthold Asset Allocation Fund
Consolidated Schedule of Investments
September 30, 2010
| | | Shares | | | Fair Value | |
| | | | | | | |
| | | | | | | |
| COMMON STOCKS - 61.87% | | | | | | |
| Auto Components - 1.01% | | | | | | |
| Autoliv, Inc. | | | 94,946 | | | $ | 6,202,822 | |
| Magna International, Inc. (b) | | | 68,577 | | | | 5,641,144 | |
| Minth Group, Ltd. (b) | | | 332,000 | | | | 662,387 | |
| | | | | | | | 12,506,353 | |
| | | | | | | | | |
| | | | | | | | | |
| Automobiles - 0.44% | | | | | | | | |
| BYD Co., Ltd. (b) | | | 681,680 | | | | 5,477,970 | |
| | | | | | | | | |
| | | | | | | | | |
| Beverages - 0.52% | | | | | | | | |
| Coca-Cola Femsa SAB De CV - | | | | | | | | |
| ADR | | | 81,382 | | | | 6,365,700 | |
| | | | | | | | | |
| | | | | | | | | |
| Biotechnology - 0.71% | | | | | | | | |
| Amgen, Inc. (a) | | | 159,779 | | | | 8,805,421 | |
| | | | | | | | | |
| | | | | | | | | |
| Chemicals - 1.77% | | | | | | | | |
| Cabot Corp. | | | 176,327 | | | | 5,742,970 | |
| China BlueChemical, Ltd. (b) | | | 3,718,000 | | | | 2,702,658 | |
| Lubrizol Corp. | | | 51,240 | | | | 5,429,903 | |
| NewMarket Corp. | | | 70,832 | | | | 8,052,182 | |
| | | | | | | | 21,927,713 | |
| | | | | | | | | |
| | | | | | | | | |
| Commercial Banks - 0.99% | | | | | | | | |
| Bank of Montreal (b) | | | 104,957 | | | | 6,061,267 | |
| Canadian Imperial Bank of | | | | | | | | |
| Commerce (b) | | | 84,421 | | | | 6,115,457 | |
| | | | | | | | 12,176,724 | |
| | | | | | | | | |
| | | | | | | | | |
| Computers & Peripherals - 1.00% | | | | | | | | |
| Lexmark International, Inc. - | | | | | | | | |
| Class A (a) | | | 165,778 | | | | 7,397,014 | |
| SanDisk Corp. (a) | | | 135,636 | | | | 4,971,060 | |
| | | | | | | | 12,368,074 | |
| | | | | | | | | |
| | | | | | | | | |
| Construction Materials - 0.07% | | | | | | | | |
| Semen Gresik Persero Tbk PT (b) | | | 778,000 | | | | 862,992 | |
| | | | | | | | | |
| | | | | | | | | |
| Containers & Packaging - 0.14% | | | | | | | | |
| Packaging Corp. of America | | | 75,205 | | | | 1,742,500 | |
| | | | | | | | | |
| | | Shares | | | Fair Value | |
| | | | | | | |
| | | | | | | |
| Distributors - 0.15% | | | | | | |
| Jardine Cycle & Carriage, Ltd. (b) | | | 62,000 | | | $ | 1,852,787 | |
| | | | | | | | | |
| | | | | | | | | |
| Diversified Consumer Services - 0.71% | | | | | | | | |
| Career Education Corp. (a) | | | 201,948 | | | | 4,335,823 | |
| Hillenbrand, Inc. | | | 147,933 | | | | 3,182,039 | |
| New Oriental Education & Technology | | | | | | | | |
| Group - ADR (a) | | | 12,681 | | | | 1,237,412 | |
| | | | | | | | 8,755,274 | |
| | | | | | | | | |
| Diversified Financial Services - 0.08% | | | | | | | | |
| Bursa Malaysia Bhd (b) | | | 353,400 | | | | 930,723 | |
| | | | | | | | | |
| | | | | | | | | |
| Diversified Telecommunication Services - 0.25% | | | | | | | | |
| Verizon Communications, Inc. | | | 96,650 | | | | 3,149,823 | |
| | | | | | | | | |
| | | | | | | | | |
| Electric Utilities - 1.18% | | | | | | | | |
| American Electric Power Co., Inc. | | | 254,741 | | | | 9,229,267 | |
| Cleco Corp. | | | 66,144 | | | | 1,959,185 | |
| Edison International | | | 49,101 | | | | 1,688,583 | |
| Pepco Holdings, Inc. | | | 92,930 | | | | 1,728,498 | |
| | | | | | | | 14,605,533 | |
| | | | | | | | | |
| | | | | | | | | |
| Electronic Equipment, Instruments & | | | | | | | | |
| Components - 2.07% | | | | | | | | |
| Arrow Electronics, Inc. (a) | | | 224,554 | | | | 6,002,328 | |
| Avnet, Inc. (a) | | | 203,455 | | | | 5,495,320 | |
| Jabil Circuit, Inc. | | | 384,303 | | | | 5,537,806 | |
| Tyco Electronics, Ltd. (b) | | | 194,412 | | | | 5,680,719 | |
| Vishay Intertechnology, Inc. (a) | | | 299,143 | | | | 2,895,704 | |
| | | | | | | | 25,611,877 | |
| | | | | | | | | |
| | | | | | | | | |
| Food & Staples Retailing - 0.18% | | | | | | | | |
| CP ALL PCL (b) | | | 1,630,300 | | | | 2,269,528 | |
| | | | | | | | | |
| | | | | | | | | |
| Food Products - 3.46% | | | | | | | | |
| Chaoda Modern Agriculture | | | | | | | | |
| Holdings, Ltd. (b) | | | 3,569,000 | | | | 2,957,741 | |
| China Green Holdings, Ltd. (b) | | | 1,590,000 | | | | 1,536,955 | |
| Corn Products International, | | | | | | | | |
| Inc. | | | 88,273 | | | | 3,310,238 | |
See Notes to the Finacial Statements The Leuthold Funds - 2010 Annual Report 85
Leuthold Asset Allocation Fund
Consolidated Schedule of Investments (continued)
September 30, 2010
| | | Shares | | | Fair Value | |
| | | | | | | |
| | | | | | | |
| Food Products - 3.46% (continued) | | | | | | |
| Golden Agri-Resources, | | | | | | |
| Ltd. (b) | | | 11,716,000 | | | $ | 5,078,032 | |
| Kraft Foods, Inc. - Class A | | | 306,613 | | | | 9,462,077 | |
| Lotte Confectionery Co., Ltd. (b) | | | 1,077 | | | | 1,262,836 | |
| Mead Johnson Nutrition Co. | | | 72,339 | | | | 4,116,812 | |
| Sara Lee Corp. | | | 656,739 | | | | 8,820,005 | |
| Tyson Foods, Inc. - Class A | | | 307,443 | | | | 4,925,237 | |
| Wilmar International, Ltd. (b) | | | 288,000 | | | | 1,316,158 | |
| | | | | | | | 42,786,091 | |
| | | | | | | | | |
| | | | | | | | | |
| Health Care Equipment & Supplies - 1.09% | | | | | | | | |
| Mindray Medical International, | | | | | | | | |
| Ltd. - ADR | | | 95,558 | | | | 2,825,650 | |
| Shandong Weigao Group Medical | | | | | | | | |
| Polymer Co., Ltd. (b) | | | 1,224,000 | | | | 3,486,393 | |
| Sirona Dental Systems, Inc. (a) | | | 152,214 | | | | 5,485,793 | |
| Supermax Corp. Bhd (b) | | | 803,250 | | | | 986,173 | |
| Top Glove Corp. Bhd (b) | | | 396,600 | | | | 659,073 | |
| | | | | | | | 13,443,082 | |
| | | | | | | | | |
| | | | | | | | | |
| Health Care Providers & Services - 2.48% | | | | | | | | |
| AMERIGROUP Corp. (a) | | | 107,002 | | | | 4,544,375 | |
| AmerisourceBergen Corp. | | | 170,299 | | | | 5,221,367 | |
| Healthspring, Inc. (a) | | | 310,457 | | | | 8,022,209 | |
| Humana, Inc. (a) | | | 147,693 | | | | 7,420,096 | |
| Lincare Holdings, Inc. | | | 218,525 | | | | 5,482,792 | |
| | | | | | | | 30,690,839 | |
| | | | | | | | | |
| | | | | | | | | |
| Hotels, Restaurants & Leisure - 0.69% | | | | | | | | |
| Cracker Barrel Old Country | | | | | | | | |
| Store, Inc. | | | 135,983 | | | | 6,902,497 | |
| Ctrip.com International, Ltd. - | | | | | | | | |
| ADR (a) | | | 25,398 | | | | 1,212,754 | |
| REXLot Holdings, Ltd. (b) | | | 4,250,000 | | | | 405,344 | |
| | | | | | | | | |
| | | | | | | | 8,520,595 | |
| | | | | | | | | |
| | | Shares | | | Fair Value | |
| | | | | | | |
| | | | | | | |
| Household Durables - 0.77% | | | | | | |
| LG Electronics, Inc. (b) | | | 12,987 | | | $ | 1,094,542 | |
| Tempur-Pedic International, | | | | | | | | |
| Inc. (a) | | | 212,497 | | | | 6,587,407 | |
| Woongjin Coway Co., Ltd. (b) | | | 46,570 | | | | 1,813,381 | |
| | | | | | | | 9,495,330 | |
| | | | | | | | | |
| Household Products - 1.24% | | | | | | | | |
| Energizer Holdings, Inc. (a) | | | 95,575 | | | | 6,425,507 | |
| Kimberly-Clark Corp. | | | 137,072 | | | | 8,916,534 | |
| | | | | | | | 15,342,041 | |
| | | | | | | | | |
| Industrial Conglomerates - 0.85% | | | | | | | | |
| 3M Co. | | | 41,674 | | | | 3,613,552 | |
| Tyco International, Ltd. (b) | | | 188,556 | | | | 6,925,662 | |
| | | | | | | | 10,539,214 | |
| | | | | | | | | |
| Insurance - 1.83% | | | | | | | | |
| ACE, Ltd. (b) | | | 53,536 | | | | 3,118,472 | |
| China Life Insurance Co., | | | | | | | | |
| Ltd. (b) | | | 919,000 | | | | 3,630,351 | |
| Chubb Corp. | | | 78,513 | | | | 4,474,456 | |
| Loews Corp. | | | 79,776 | | | | 3,023,511 | |
| Prudential Financial, Inc. | | | 99,467 | | | | 5,389,122 | |
| Travelers Companies, Inc. | | | 58,132 | | | | 3,028,677 | |
| | | | | | | | 22,664,589 | |
| | | | | | | | | |
| | | | | | | | | |
| Internet Software & Services - 0.75% | | | | | | | | |
| Baidu, Inc. - ADR (a) | | | 80,896 | | | | 8,301,547 | |
| Tencent Holdings, Ltd. (b) | | | 41,500 | | | | 907,145 | |
| | | | | | | | 9,208,692 | |
| | | | | | | | | |
| | | | | | | | | |
| Leisure Equipment & Products - 0.55% | | | | | | | | |
| Hasbro, Inc. | | | 152,214 | | | | 6,775,045 | |
| | | | | | | | | |
| | | | | | | | | |
| Machinery - 2.73% | | | | | | | | |
| Caterpillar, Inc. | | | 114,557 | | | | 9,013,345 | |
| Cummins, Inc. | | | 73,847 | | | | 6,689,061 | |
| Joy Global, Inc. | | | 61,750 | | | | 4,342,260 | |
| United Tractors Tbk PT (b) | | | 2,320,500 | | | | 5,317,000 | |
| Weichai Power Co., Ltd. (b) | | | 799,000 | | | | 8,444,293 | |
| | | | | | | | 33,805,959 | |
| | | | | | | | | |
86 The Leuthold Funds - 2010 Annual Report & #160; See Notes to the Finacial Statements
Leuthold Asset Allocation Fund
Consolidated Schedule of Investments (continued)
September 30, 2010
| | | Shares | | | Fair Value | |
| | | | | | | |
| | | | | | | |
| Marine - 0.23% | | | | | | |
| China Shipping Development Co., | | | | | | |
| Ltd. (b) | | | 2,096,000 | | | $ | 2,885,129 | |
| | | | | | | | | |
| | | | | | | | | |
| Media - 0.32% | | | | | | | | |
| BEC World PCL (b) | | | 1,953,100 | | | | 2,493,661 | |
| Cheil Worldwide, Inc. (b) | | | 117,625 | | | | 1,397,780 | |
| | | | | | | | 3,891,441 | |
| | | | | | | | | |
| | | | | | | | | |
| Metals & Mining - 1.70% | | | | | | | | |
| Cia de Minas Buenaventura SA - | | | | | | | | |
| ADR | | | 70,832 | | | | 3,200,190 | |
| Cia Siderugica Nacional SA - | | | | | | | | |
| ADR | | | 247,313 | | | | 4,370,021 | |
| Cliffs Natural Resources, Inc. | | | 49,683 | | | | 3,175,737 | |
| Freeport-McMoran Copper & | | | | | | | | |
| Gold, Inc. | | | 84,396 | | | | 7,206,574 | |
| Vale SA - ADR | | | 99,467 | | | | 3,110,333 | |
| | | | | | | | 21,062,855 | |
| | | | | | | | | |
| | | | | | | | | |
| Multiline Retail - 0.43% | | | | | | | | |
| Golden Eagle Retail Group, | | | | | | | | |
| Ltd. (b) | | | 1,248,000 | | | | 3,538,669 | |
| New World Department Store | | | | | | | | |
| China, Ltd. (b) | | | 930,000 | | | | 956,508 | |
| Parkson Holdings Bhd (b) | | | 462,500 | | | | 871,963 | |
| | | | | | | | 5,367,140 | |
| | | | | | | | | |
| | | | | | | | | |
| Multi-Utilities - 1.19% | | | | | | | | |
| Alliant Energy Corp. | | | 92,976 | | | | 3,379,678 | |
| Dominion Resources, Inc. | | | 133,105 | | | | 5,811,364 | |
| DTE Energy Co. | | | 32,742 | | | | 1,503,840 | |
| TECO Energy, Inc. | | | 232,049 | | | | 4,019,089 | |
| | | | | | | | 14,713,971 | |
| | | | | | | | | |
| | | | | | | | | |
| Oil, Gas & Consumable Fuels - 5.68% | | | | | | | | |
| Banpu PCL (b) | | | 402,900 | | | | 9,504,989 | |
| Chevron Corp. | | | 201,042 | | | | 16,294,454 | |
| Cimarex Energy Co. | | | 45,552 | | | | 3,014,631 | |
| Conocophillips | | | 271,426 | | | | 15,587,995 | |
| | | Shares | | | Fair Value | |
| | | | | | | |
| | | | | | | |
| Oil, Gas & Consumable Fuels - 5.68% (continued) | | | | | | |
| Exxon Mobil Corp. | | | 98,258 | | | $ | 6,071,362 | |
| Occidental Petroleum Corp. | | | 111,096 | | | | 8,698,817 | |
| Sunoco, Inc. | | | 152,214 | | | | 5,555,811 | |
| Williams Partners LP | | | 131,115 | | | | 5,559,276 | |
| | | | | | | | 70,287,335 | |
| | | | | | | | | |
| | | | | | | | | |
| Paper & Forest Products - 0.42% | | | | | | | | |
| Domtar Corp. | | | 79,875 | | | | 5,158,328 | |
| | | | | | | | | |
| | | | | | | | | |
| Personal Products - 0.22% | | | | | | | | |
| Herbalife, Ltd. (b) | | | 45,810 | | | | 2,764,634 | |
| | | | | | | | | |
| | | | | | | | | |
| Pharmaceuticals - 5.26% | | | | | | | | |
| Abbott Laboratories | | | 113,933 | | | | 5,951,860 | |
| Bristol-Myers Squibb Co. | | | 215,115 | | | | 5,831,768 | |
| China Pharmaceutical Group, | | | | | | | | |
| Ltd. (b) | | | 904,000 | | | | 467,214 | |
| Eli Lilly & Co. | | | 211,654 | | | | 7,731,721 | |
| Endo Pharmaceuticals Holdings, | | | | | |
| Inc. (a) | | | 52,481 | | | | 1,744,468 | |
| Johnson & Johnson | | | 51,951 | | | | 3,218,884 | |
| Medicis Pharmaceutical Corp. - | | | | | | | | |
| Class A | | | 379,398 | | | | 11,249,151 | |
| Merck & Co., Inc. | | | 87,298 | | | | 3,213,439 | |
| Novartis AG - ADR | | | 217,412 | | | | 12,538,150 | |
| Novo Nordisk A/S - ADR | | | 60,283 | | | | 5,934,258 | |
| Valeant Pharmaceuticals | | | | | | | | |
| International, Inc. (b) | | | 236,187 | | | | 5,916,472 | |
| Viropharma, Inc. (a) | | | 84,887 | | | | 1,265,665 | |
| | | | | | | | 65,063,050 | |
| | | | | | | | | |
| | | | | | | | | |
| Real Estate Investment Trusts (REITs) - 7.77% | | | | | | | | |
| CommonWealth REIT | | | 120,566 | | | | 3,086,490 | |
| CommonWealth REIT Escrow (a) | | | 25,000 | | | | – | |
| Entertainment Properties Trust | | | 123,580 | | | | 5,336,184 | |
| HCP, Inc. | | | 244,241 | | | | 8,787,791 | |
| Health Care REIT, Inc. | | | 35,775 | | | | 1,693,589 | |
| Lexington Realty Trust | | | 358,683 | | | | 2,568,170 | |
| National Retail Properties, Inc. | | | 228,840 | | | | 5,746,172 | |
See Notes to the Finacial Statements The Leuthold Funds - 2010 Annual Report 87
Leuthold Asset Allocation Fund
Consolidated Schedule of Investments (continued)
September 30, 2010
| | | Shares | | | Fair Value | |
| | | | | | | |
| | | | | | | |
| Real Estate Investment Trusts (REITs) - 7.77% | | | | | | |
| (continued) | | | | | | |
| Nationwide Health Properties, | | | | | | |
| Inc. | | | 545,507 | | | $ | 21,094,756 | |
| Omega Healthcare Investors, Inc. | | | 684,211 | | | | 15,360,537 | |
| Realty Income Corp. | | | 206,469 | | | | 6,962,135 | |
| Senior Housing Properties Trust | | | 554,602 | | | | 13,033,147 | |
| Ventas, Inc. | | | 167,014 | | | | 8,612,912 | |
| Washington Real Estate | | | | | | | | |
| Investment Trust | | | 122,073 | | | | 3,873,376 | |
| | | | | | | | 96,155,259 | |
| | | | | | | | | |
| | | | | | | | | |
| Road & Rail - 0.47% | | | | | | | | |
| Union Pacific Corp. | | | 70,832 | | | | 5,794,057 | |
| | | | | | | | | |
| | | | | | | | | |
| Semiconductors & Semiconductor | | | | | |
| Equipment - 3.07% | | | | | | | | |
| Altera Corp. | | | 220,032 | | | | 6,636,165 | |
| Intel Corp. | | | 259,216 | | | | 4,984,724 | |
| Marvell Technology Group, | | | | | | | | |
| Ltd. (a)(b) | | | 287,851 | | | | 5,040,271 | |
| Novellus Systems, Inc. (a) | | | 200,441 | | | | 5,327,722 | |
| Teradyne, Inc. (a) | | | 495,827 | | | | 5,523,513 | |
| Texas Instruments, Inc. | | | 134,428 | | | | 3,648,376 | |
| Transcend Information, Inc. (b) | | | 384,000 | | | | 989,453 | |
| Trina Solar, Ltd. - ADR (a) | | | 102,024 | | | | 3,079,084 | |
| Xilinx, Inc. | | | 104,804 | | | | 2,788,834 | |
| | | | | | | | 38,018,142 | |
| | | | | | | | | |
| | | | | | | | | |
| Software - 0.31% | | | | | | | | |
| Longtop Financial Technologies, | | | | | | | | |
| Ltd. - ADR (a) | | | 24,862 | | | | 978,320 | |
| Microsoft Corp. | | | 114,518 | | | | 2,804,546 | |
| | | | | | | | 3,782,866 | |
| | | | | | | | | |
| | | | | | | | | |
| Specialty Retail - 1.23% | | | | | | | | |
| JOS A Bank Clothiers, Inc. (a) | | | 153,861 | | | | 6,556,017 | |
| Limited Brands, Inc. | | | 321,428 | | | | 8,607,842 | |
| | | | | | | | 15,163,859 | |
| | | | | | | | | |
| | | Shares | | | Fair Value | |
| | | | | | | |
| | | | | | | |
| Textiles, Apparel & Luxury Goods - 1.72% | | | | | | |
| 361 Degrees International, | | | | | | |
| Ltd. (b) | | | 1,443,000 | | | $ | 1,450,653 | |
| Coach, Inc. | | | 155,228 | | | | 6,668,595 | |
| Deckers Outdoor Corp. (a) | | | 97,960 | | | | 4,894,082 | |
| Li Ning Co., Ltd. (b) | | | 1,501,000 | | | | 4,555,901 | |
| Skechers U.S.A., Inc. - | | | | | | | | |
| Class A (a) | | | 159,750 | | | | 3,752,527 | |
| | | | | | | | 21,321,758 | |
| | | | | | | | | |
| | | | | | | | | |
| Tobacco - 2.86% | | | | | | | | |
| Altria Group, Inc. | | | 448,994 | | | | 10,784,836 | |
| British American Tobacco | | | | | | | | |
| PLC - ADR | | | 64,732 | | | | 4,836,128 | |
| Lorillard, Inc. | | | 128,672 | | | | 10,333,648 | |
| Reynolds American, Inc. | | | 157,914 | | | | 9,378,512 | |
| | | | | | | | 35,333,124 | |
| | | | | | | | | |
| | | | | | | | | |
| Transportation Infrastructure - 0.46% | | | | | | | | |
| Jasa Marga PT (b) | | | 6,329,000 | | | | 2,269,221 | |
| Zhejiang Expressway Co., | | | | | | | | |
| Ltd. (b) | | | 3,606,000 | | | | 3,402,040 | |
| | | | | | | | 5,671,261 | |
| | | | | | | | | |
| | | | | | | | | |
| Water Utilities - 0.24% | | | | | | | | |
| Guangdong Investment | | | | | | | | |
| Ltd. (b) | | | 5,654,000 | | | | 2,951,301 | |
| | | | | | | | | |
| | | | | | | | | |
| Wireless Telecommunication Services - 0.58% | | | | | | | | |
| China Unicom Hong Kong, | | | | | | | | |
| Ltd. (b) | | | 2,314,000 | | | | 3,388,007 | |
| Globe Telecom, Inc. (b) | | | 37,220 | | | | 754,832 | |
| Vodafone Group, PLC - ADR | | | 120,455 | | | | 2,988,489 | |
| | | | | | | | 7,131,328 | |
| | | | | | | | | |
| TOTAL COMMON STOCKS | | | | | | | | |
| (Cost $635,132,631) | | | | | | $ | 765,197,307 | |
| | | | | | | | | |
88 The Leuthold Funds - 2010 Annual Report & #160; See Notes to the Finacial Statements
Leuthold Asset Allocation Fund
Consolidated Schedule of Investments (continued)
September 30, 2010
| | | Shares | | | Fair Value | |
| | | | | | | |
| | | | | | | |
| INVESTMENT COMPANIES - 10.66% | | | | | | |
| Exchange Traded Funds - 6.80% | | | | | | |
| iShares iBoxx Investment Grade | | | | | | |
| Corporate Bond Fund | | | 235,103 | | | $ | 26,587,798 | |
| iShares MSCI Brazil Index Fund | | | 76,196 | | | | 5,861,758 | |
| iShares MSCI Emerging Markets | | | | | | | | |
| Index Fund | | | 141,538 | | | | 6,336,656 | |
| iShares MSCI Malaysia | | | | | | | | |
| Index Fund | | | 351,318 | | | | 4,827,109 | |
| iShares MSCI Singapore | | | | | | | | |
| Index Fund | | | 159,361 | | | | 2,106,752 | |
| iShares MSCI South Africa | | | | | | | | |
| Index Fund | | | 39,784 | | | | 2,674,281 | |
| iShares MSCI South Korea | | | | | | | | |
| Index Fund | | | 134,468 | | | | 7,192,693 | |
| iShares MSCI Taiwan | | | | | | | | |
| Index Fund | | | 183,501 | | | | 2,486,439 | |
| iShares S&P Latin America 40 | | | | | | | | |
| Index Fund | | | 201,552 | | | | 10,186,438 | |
| Market Vectors - Russia ETF (d) | | | 426,631 | | | | 13,878,307 | |
| SPDR S&P Emerging Middle East | | | | | |
| & Africa ETF (d) | | | 27,450 | | | | 1,944,558 | |
| | | | | | | | 84,082,789 | |
| | | | | | | | | |
| | | | | | | | | |
| Mutual Funds - 3.86% | | | | | | | | |
| Apollo Investment Corporation | | | 147,386 | | | | 1,507,759 | |
| ING Russia Fund - Class A (a)(d) | | | 213,492 | | | | 7,459,403 | |
| Matthews China Fund | | | 606,999 | | | | 17,815,426 | |
| Matthews India Fund | | | 338,696 | | | | 7,305,668 | |
| The Central Europe & Russia | | | | | | | | |
| Fund, Inc. | | | 37,882 | | | | 1,415,650 | |
| US Global Investors Funds - Eastern | | | | | |
| European Fund (a)(d) | | | 1,239,125 | | | | 12,230,163 | |
| | | | | | | | 47,734,069 | |
| | | | | | | | | |
| TOTAL INVESTMENT COMPANIES | | | | | | | | |
| (Cost $105,163,766) | | | | | | $ | 131,816,858 | |
| | | Shares | | | Fair Value | |
| | | | | | | |
| | | | | | | |
| EXCHANGE TRADED NOTES - 0.61% | | | | | | |
| iPath MSCI India Index | | | | | | |
| ETN (a)(b) | | | 100,424 | | | $ | 7,608,122 | |
| | | | | | | | | |
| TOTAL EXCHANGE TRADED NOTES | | | | | | | | |
| (Cost $6,370,219) | | | | | | $ | 7,608,122 | |
| | | | | | | | | |
| | | | | | | | | |
| | | | | | | | | |
| | | | | | | | | |
| | | | | | | | | |
| | | Troy Ounces | | | Fair Value | |
| | | | | | | | | |
| | | | | | | | | |
| PRECIOUS METALS - 4.17% | | | | | | | | |
| Gold Bullion (a) | | | 29,994 | | | $ | 39,257,047 | |
| Silver (a) | | | 564,000 | | | | 12,368,520 | |
| | | | | | | | | |
| TOTAL PRECIOUS METALS | | | | | |
| (Cost $36,350,064) | | | | | | $ | 51,625,567 | |
| | | | | | | | | |
| | | | | | | | | |
| | | | | | | | | |
| | | | | | | | | |
| | | | | | | | | |
| | | Principal | | | | | |
| | | Amount | | | Fair Value | |
| | | | | | | | | |
| | | | | | | | | |
| FOREIGN GOVERNMENT BONDS - 3.63% | | | | | | | | |
| Republic of Brazil (b) | | | | | | | | |
| 12.500%, 01/05/2022 | | | | | | | | |
| BRL | | | 61,907,000 | | | $ | 44,911,846 | |
| | | | | | | | | |
| TOTAL FOREIGN GOVERNMENT BONDS | | | | | | | | |
| (Cost $27,661,247) | | | | | | $ | 44,911,846 | |
| | | | | | | | | |
See Notes to the Finacial Statements The Leuthold Funds - 2010 Annual Report 89
Leuthold Asset Allocation Fund
Consolidated Schedule of Investments (continued)
September 30, 2010
| | | Shares | | | Fair Value | |
| | | | | | | |
| | | | | | | |
| SHORT-TERM INVESTMENTS - 3.02% | | | | | | |
| Money Market Funds - 3.02% | | | | | | |
| Fidelity Institutional Money Market Fund - | | | | | | |
| Government Portfolio | | | | | | |
| 0.06% (c) | | | 37,297,432 | | | $ | 37,297,432 | |
| | | | | | | | | |
| TOTAL SHORT-TERM INVESTMENTS | | | | | | | | |
| (Cost $37,297,432) | | | | | | $ | 37,297,432 | |
| | | | | | | | | |
| | | | | | | | | |
| | | | | | | | | |
| | | | | | | | | |
| Total Investments | | | | | | | | |
| (Cost $847,975,359) - 83.96% | | | | | | | | |
| | | | | | | $ | 1,038,457,132 | |
| | | | | | | | | |
| Other Assets in Excess of | | | | | | | | |
| Liabilities - 16.04% (e) | | | | | | | 198,364,702 | |
| | | | | | | | | |
| | | | | | | | | |
| TOTAL NET ASSETS - 100.00% | | | | | | | | |
| | | | | | | $ | 1,236,821,834 | |
| | | | | | | | | |
Percentages are stated as a percent of net assets.
ADR American Depository Receipt
BRL Brazilian Real
| (a) | Non-income producing security. |
| (b) | Foreign issued security. |
| (c) | The rate quoted is the annualized seven-day yield as of September 30, 2010. |
| (d) | A portion of this security is considered illiquid. The market value of these securities total $35,512,431, which represents 2.87% of total net assets. If a fund purchases more than 1% of any class of security of a registered open-end investment company, such investment will be considered an illiquid investment. |
| (e) | All or a portion of the assets have been committed as collateral for open securities sold short. |
The Global Industry Classification Standard (GICS®) was developed by and/or is the exclusive property of MSCI, Inc. and Standard & Poor Financial Services LLC (“S&P”). GICS is a service mark of MSCI and S&P and has been licensed for use by U.S. Bancorp Fund Services, LLC.
90 The Leuthold Funds - 2010 Annual Report & #160; See Notes to the Finacial Statements Leuthold Asset Allocation Fund
Consolidated Schedule of Securities Sold Short
September 30, 2010
| | | Shares | | | Fair Value | |
| | | | | | | |
| | | | | | | |
| COMMON STOCKS - 5.40% | | | | | | |
| Biotechnology - 0.09% | | | | | | |
| Vertex Pharmaceuticals, Inc. | | | 33,426 | | | $ | 1,155,537 | |
| | | | | | | | | |
| | | | | | | | | |
| Building Products - 0.08% | | | | | | | | |
| Masco Corp. | | | 95,525 | | | | 1,051,730 | |
| | | | | | | | | |
| | | | | | | | | |
| Capital Markets - 0.63% | | | | | | | | |
| Blackstone Group LP | | | 69,313 | | | | 879,582 | |
| E*Trade Financial Corp. | | | 78,293 | | | | 1,138,380 | |
| Greenhill & Co., Inc. | | | 11,174 | | | | 886,322 | |
| Invesco, Ltd. (a) | | | 57,871 | | | | 1,228,601 | |
| Northern Trust Corp. | | | 23,588 | | | | 1,137,885 | |
| Stifel Financial Corp. | | | 15,621 | | | | 723,096 | |
| TD Ameritrade Holding Corp. | | | 61,122 | | | | 987,120 | |
| The Charles Schwab Corp. | | | 58,543 | | | | 813,748 | |
| | | | | | | | 7,794,734 | |
| | | | | | | | | |
| | | | | | | | | |
| Chemicals - 0.08% | | | | | | | | |
| Intrepid Potash, Inc. | | | 36,005 | | | | 938,651 | |
| | | | | | | | | |
| | | | | | | | | |
| Commercial Banks - 0.24% | | | | | | | | |
| Associated Banc-Corp. | | | 57,415 | | | | 757,304 | |
| Barclays PLC - ADR | | | 54,908 | | | | 1,035,016 | |
| First Horizon National Corp. | | | 70,360 | | | | 802,804 | |
| Westamerica Bancorporation | | | 7,145 | | | | 389,331 | |
| | | | | | | | 2,984,455 | |
| | | | | | | | | |
| | | | | | | | | |
| Commercial Services & Supplies - 0.09% | | | | | | | | |
| Covanta Holding Corp. | | | 71,341 | | | | 1,123,621 | |
| | | | | | | | | |
| | | | | | | | | |
| Construction & Engineering - 0.10% | | | | | | | | |
| Foster Wheeler AG (a) | | | 48,420 | | | | 1,184,353 | |
| | | | | | | | | |
| | | | | | | | | |
| Construction Materials - 0.09% | | | | | | | | |
| Vulcan Materials Co. | | | 29,410 | | | | 1,085,817 | |
| | | | | | | | | |
| | | | | | | | | |
| Containers & Packaging - 0.08% | | | | | | | | |
| Owens-Illinois, Inc. | | | 36,289 | | | | 1,018,269 | |
| | | | | | | | | |
| | | | | | | | | |
| Diversified Financial Services - 0.08% | | | | | | | | |
| Bank of America Corp. | | | 76,403 | | | $ | 1,001,643 | |
| | | | | | | | | |
| | | Shares | | | Fair Value | |
| | | | | | | |
| | | | | | | |
| Electric Utilities - 0.03% | | | | | | |
| Korea Electric Power Corp. - | | | | | | |
| ADR | | | 28,175 | | | $ | 364,303 | |
| | | | | | | | | |
| | | | | | | | | |
| Energy Equipment & Services - 0.08% | | | | | | | | |
| Weatherford International, | | | | | | | | |
| Ltd. (a) | | | 61,122 | | | | 1,045,186 | |
| | | | | | | | | |
| | | | | | | | | |
| Health Care Equipment & Supplies - 0.08% | | | | | | | | |
| Alere, Inc. | | | 31,134 | | | | 962,975 | |
| | | | | | | | | |
| | | | | | | | | |
| Health Care Providers & Services - 0.03% | | | | | | | | |
| Brookdale Senior Living, Inc. | | | 23,814 | | | | 388,406 | |
| | | | | | | | | |
| | | | | | | | | |
| Health Care Technology - 0.04% | | | | | | | | |
| Quality Systems, Inc. | | | 6,659 | | | | 441,558 | |
| | | | | | | | | |
| | | | | | | | | |
| Hotels, Restaurants & Leisure - 0.51% | | | | | | | | |
| Bally Technologies, Inc. | | | 22,436 | | | | 784,138 | |
| Hyatt Hotels Corp. - Class A | | | 9,848 | | | | 368,217 | |
| International Game Technology | | | 72,291 | | | | 1,044,605 | |
| Marriott International, Inc. - | | | | | | | | |
| Class A | | | 29,415 | | | | 1,053,940 | |
| MGM Resorts International | | | 106,293 | | | | 1,198,985 | |
| Penn National Gaming, Inc. | | | 24,338 | | | | 720,648 | |
| Starwood Hotels & Resorts | | | | | | | | |
| Worldwide, Inc. | | | 21,689 | | | | 1,139,757 | |
| | | | | | | | 6,310,290 | |
| | | | | | | | | |
| | | | | | | | | |
| Household Durables - 0.35% | | | | | | | | |
| D.R. Horton, Inc. | | | 98,537 | | | | 1,095,731 | |
| KB Home | | | 81,697 | | | | 925,627 | |
| Pulte Group, Inc. | | | 126,739 | | | | 1,110,234 | |
| Toll Brothers, Inc. | | | 60,764 | | | | 1,155,731 | |
| | | | | | | | 4,287,323 | |
| | | | | | | | | |
| | | | | | | | | |
| Independent Power Producers & | | | | | | | | |
| Energy Traders - 0.08% | | | | | | | | |
| Calpine Corp. | | | 76,498 | | | | 952,400 | |
| | | | | | | | | |
| | | | | | | | | |
| Internet & Catalog Retail - 0.08% | | | | | | | | |
| Expedia, Inc. | | | 36,777 | | | | 1,037,479 | |
| | | | | | | | | |
See Notes to the Finacial Statements ; The Leuthold Funds - 2010 Annual Report 91
Leuthold Asset Allocation Fund
Consolidated Schedule of Securities Sold Short (continued)
September 30, 2010
| | | Shares | | | Fair Value | |
| | | | | | | |
| | | | | | | |
| Internet Software & Services - 0.34% | | | | | | |
| Equinix, Inc. | | | 9,741 | | | $ | 996,991 | |
| GSI Commerce, Inc. | | | 33,140 | | | | 818,558 | |
| IAC/InterActiveCorp | | | 46,224 | | | | 1,214,305 | |
| Rackspace Hosting, Inc. | | | 45,535 | | | | 1,182,999 | |
| | | | | | | | 4,212,853 | |
| | | | | | | | | |
| | | | | | | | | |
| Life Sciences Tools & Services - 0.10% | | | | | | | | |
| Illumina, Inc. | | | 24,768 | | | | 1,218,586 | |
| | | | | | | | | |
| | | | | | | | | |
| Media - 0.27% | | | | | | | | |
| DreamWorks Animation SKG, Inc. - | | | | | | | | |
| Class A | | | 34,933 | | | | 1,114,712 | |
| Lamar Advertising Co. - Class A | | | 30,752 | | | | 978,529 | |
| Liberty Global, Inc. - Class A | | | 39,372 | | | | 1,213,051 | |
| | | | | | | | 3,306,292 | |
| | | | | | | | | |
| | | | | | | | | |
| Metals & Mining - 0.39% | | | | | | | | |
| AK Steel Holding Corp. | | | 77,117 | | | | 1,064,986 | |
| Harmony Gold Mining Co., Ltd. - | | | | | | | | |
| ADR | | | 115,081 | | | | 1,299,264 | |
| Royal Gold, Inc. | | | 21,202 | | | | 1,056,708 | |
| Silver Standard Resources, Inc. (a) 22,029 | | | | | | | 440,139 | |
| United States Steel Corp. | | | 23,095 | | | | 1,012,485 | |
| | | | | | | | 4,873,582 | |
| | | | | | | | | |
| | | | | | | | | |
| Oil, Gas & Consumable Fuels - 0.35% | | | | | | | | |
| Consol Energy, Inc. | | | 33,713 | | | | 1,246,032 | |
| Massey Energy Co. | | | 34,635 | | | | 1,074,378 | |
| Range Resources Corp. | | | 21,106 | | | | 804,772 | |
| Tesoro Corp. | | | 89,964 | | | | 1,201,919 | |
| | | | | | | | 4,327,101 | |
| | | | | | | | | |
| | | | | | | | | |
| Professional Services - 0.25% | | | | | | | | |
| Manpower, Inc. | | | 22,481 | | | | 1,173,508 | |
| Robert Half International, Inc. | | | 44,504 | | | | 1,157,104 | |
| Towers Watson & Co. - Class A | | | 15,303 | | | | 752,602 | |
| | | | | | | | 3,083,214 | |
| | | | | | | | | |
| | | Shares | | | Fair Value | |
| | | | | | | |
| | | | | | | |
| Real Estate Investment Trusts (REITs) - 0.21% | | | | | | |
| American Campus Communities, | | | | | | |
| Inc. | | | 33,713 | | | $ | 1,026,224 | |
| Corporate Office Properties Trust | | | | | | | | |
| SBI MD | | | 31,230 | | | | 1,165,191 | |
| EastGroup Properties, Inc. | | | 10,127 | | | | 378,547 | |
| | | | | | | | 2,569,962 | |
| | | | | | | | | |
| | | | | | | | | |
| Real Estate Management & Development - 0.12% | | | | | | | | |
| Brookfield Asset Management, | | | | | | | | |
| Inc. - Class A (a) | | | 28,810 | | | | 817,340 | |
| The St. Joe Co. | | | 27,991 | | | | 696,136 | |
| | | | | | | | 1,513,476 | |
| | | | | | | | | |
| | | | | | | | | |
| Road & Rail - 0.16% | | | | | | | | |
| Con-way, Inc. | | | 26,343 | | | | 816,370 | |
| Hertz Global Holdings, Inc. | | | 106,812 | | | | 1,131,139 | |
| | | | | | | | 1,947,509 | |
| | | | | | | | | |
| | | | | | | | | |
| Semiconductors & Semiconductor | | | | | | | | |
| Equipment - 0.17% | | | | | | | | |
| MEMC Electronic Materials, | | | | | | | | |
| Inc. | | | 104,867 | | | | 1,250,014 | |
| Netlogic Microsystems, Inc. | | | 32,169 | | | | 887,221 | |
| | | | | | | | 2,137,235 | |
| | | | | | | | | |
| | | | | | | | | |
| Software - 0.09% | | | | | | | | |
| Concur Technologies, Inc. | | | 22,413 | | | | 1,108,099 | |
| | | | | | | | | |
| | | | | | | | | |
| Thrifts & Mortgage Finance - 0.11% | | | | | | | | |
| People's United Financial, Inc. | | | 77,835 | | | | 1,018,860 | |
| TFS Financial Corp. | | | 39,629 | | | | 364,191 | |
| | | | | | | | 1,383,051 | |
| | | | | | | | | |
| TOTAL COMMON STOCKS | | | | | | | | |
| (Proceeds $62,031,714) | | | | | | $ | 66,809,690 | |
| | | | | | | | | |
92 The Leuthold Funds - 2010 Annual Report & #160; See Notes to the Finacial Statements Leuthold Asset Allocation Fund
Consolidated Schedule of Securities Sold Short (continued)
September 30, 2010
| | | Shares | | | Fair Value | |
| | | | | | | |
| | | | | | | |
| INVESTMENT COMPANIES - 0.24% | | | | | | |
| Exchange Traded Funds - 0.24% | | | | | | |
| SPDR Dow Jones Industrial Average | | | | | | |
| ETF Trust | | | 13,586 | | | $ | 1,466,065 | |
| SPDR S&P 500 ETF Trust | | | 12,869 | | | | 1,468,610 | |
| | | | | | | | 2,934,675 | |
| | | | | | | | | |
| TOTAL INVESTMENT COMPANIES | | | | | |
| (Proceeds $2,894,596) | | | | | | $ | 2,934,675 | |
| | | | | | | | | |
| | | | | | | | | |
| | | | | | | | | |
| | | Principal | | | | | |
| | | Amount | | | Fair Value | |
| | | | | | | | | |
| UNITED STATES TREASURY | | | | | | | | |
| OBLIGATIONS - 2.12% | | | | | | | | |
| United States Treasury Bonds - 1.12% | | | | | | | | |
| 3.375%, 11/15/2019 | | $ | 12,830,000 | | | $ | 13,821,323 | |
| | | | | | | | | |
| | | | | | | | | |
| United States Treasury Strips - 1.00% | | | | | | | | |
| 4.618%, 05/15/2039 | | | 38,600,000 | | | | 12,368,752 | |
| | | | | | | | | |
| TOTAL UNITED STATES TREASURY OBLIGATIONS | | | | | | | | |
| (Proceeds $22,925,879) | | | | | | $ | 26,190,075 | |
| | | | | | | | | |
| | | | | | | | | |
| | | | | | | | | |
| | | | | | | | | |
| TOTAL SECURITIES SOLD SHORT | | | | | | | | |
| (Proceeds $87,852,189) - 7.76% | | | | | | $ | 95,934,440 | |
| | | | | | | | | |
| | | | | | | | | |
Percentages are stated as a percent of net assets.
ADR American Depository Receipt
| (a) | Foreign issued security. |
The Global Industry Classification Standard (GICS®) was developed by and/or is the exclusive property of MSCI, Inc. and Standard & Poor Financial Services LLC (“S&P”). GICS is a service mark of MSCI and S&P and has been licensed for use by U.S. Bancorp Fund Services, LLC.
See Notes to the Finacial Statements The Leuthold Funds - 2010 Annual Report 93 Leuthold Global Fund
Consolidated Schedule of Investments
September 30, 2010
| | | Shares | | | Fair Value | |
| | | | | | | |
| | | | | | | |
| COMMON STOCKS - 68.13% | | | | | | |
| Aerospace & Defense - 0.74% | | | | | | |
| Aselsan Elektronik Sanayi Ve | | | | | | |
| Ticaret AS (b) | | | 463,316 | | | $ | 2,129,931 | |
| | | | | | | | | |
| | | | | | | | | |
| Auto Components - 4.38% | | | | | | | | |
| Autoliv, Inc. | | | 30,691 | | | | 2,005,043 | |
| Cheng Shin Rubber Industry Co., | | | | | |
| Ltd. (b) | | | 867,500 | | | | 1,910,408 | |
| Johnson Controls, Inc. | | | 58,386 | | | | 1,780,773 | |
| Lear Corp. (a) | | | 23,626 | | | | 1,864,800 | |
| Minth Group, Ltd. (b) | | | 1,392,000 | | | | 2,777,236 | |
| TRW Automotive Holdings | | | | | | | | |
| Corp. (a) | | | 56,287 | | | | 2,339,288 | |
| | | | | | | | 12,677,548 | |
| | | | | | | | | |
| | | | | | | | | |
| Automobiles - 5.53% | | | | | | | | |
| Dongfeng Motor Group Co., | | | | | | | | |
| Ltd. (b) | | | 1,368,000 | | | | 2,799,879 | |
| Ford Otomotiv Sanayi AS (b) | | | 134,937 | | | | 1,156,696 | |
| Honda Motor Co., Ltd. (b) | | | 57,800 | | | | 2,051,526 | |
| Hyundai Motor Co. (b) | | | 14,661 | | | | 1,967,229 | |
| Kia Motors Corp. (b) | | | 63,810 | | | | 2,059,380 | |
| Proton Holdings Bhd (b) | | | 1,130,000 | | | | 1,815,614 | |
| Thor Industries, Inc. | | | 60,085 | | | | 2,006,839 | |
| Tofas Turk Otomobil | | | | | | | | |
| Fabrikasi AS (b) | | | 415,675 | | | | 2,155,171 | |
| | | | | | | | 16,012,334 | |
| | | | | | | | | |
| | | | | | | | | |
| Chemicals - 6.78% | | | | | | | | |
| Ashland, Inc. | | | 17,787 | | | | 867,472 | |
| BASF SE (b) | | | 16,077 | | | | 1,013,771 | |
| Cabot Corp. | | | 29,323 | | | | 955,050 | |
| China Petrochemical | | | | | | | | |
| Development Corp. (a)(b) | | | 3,095,000 | | | | 2,209,193 | |
| Eastman Chemical Co. | | | 13,777 | | | | 1,019,498 | |
| El du Pont de Nemours & Co. | | | 20,571 | | | | 917,878 | |
| Fuchs Petrolub AG (b) | | | 19,899 | | | | 2,306,639 | |
| Fufeng Group, Ltd. (b) | | | 1,368,000 | | | | 971,494 | |
| | | Shares | | | Fair Value | |
| | | | | | | |
| | | | | | | |
| Chemicals - 6.78% (continued) | | | | | | |
| Hanwha Chem Corp. (b) | | | 85,400 | | | $ | 2,048,402 | |
| Honam Petrochemical Corp. (b) | | | 11,489 | | | | 2,141,120 | |
| Kemira OYJ (b) | | | 73,579 | | | | 1,012,095 | |
| Lanxess AG (b) | | | 19,674 | | | | 1,077,921 | |
| LCY Chemical Corp. (b) | | | 665,000 | | | | 1,236,704 | |
| Mitsubishi Chemical Holdings | | | | | | | | |
| Corp. (b) | | | 177,000 | | | | 898,994 | |
| The Dow Chemical Co. | | | 34,902 | | | | 958,409 | |
| | | | | | | | 19,634,640 | |
| | | | | | | | | |
| | | | | | | | | |
| Consumer Finance - 4.06% | | | | | | | | |
| Banco Compartamos SA | | | | | | | | |
| de CV (b) | | | 356,200 | | | | 2,268,358 | |
| Cash Amererica International, Inc. | | | 46,591 | | | | 1,630,685 | |
| Credit Accepetance Corp. (a) | | | 33,522 | | | | 2,030,092 | |
| Discover Financial Services | | | 122,269 | | | | 2,039,447 | |
| International Personal Finance | | | | | | | | |
| PLC (b) | | | 251,675 | | | | 1,066,668 | |
| Provident Financial PLC (b) | | | 57,513 | | | | 744,458 | |
| Samsung Card Co. (b) | | | 39,196 | | | | 1,973,120 | |
| | | | | | | | 11,752,828 | |
| | | | | | | | | |
| | | | | | | | | |
| Electronic Equipment, Instruments & | | | | | | | | |
| & Components - 3.09% | | | | | | | | |
| Canon Electronics, Inc. (b) | | | 36,600 | | | | 934,729 | |
| Coretronic Corp. (b) | | | 1,099,000 | | | | 1,688,523 | |
| Halma PLC (b) | | | 234,536 | | | | 1,166,085 | |
| Kingboard Chemical Holdings, | | | | | | | | |
| Ltd. (b) | | | 354,000 | | | | 1,793,075 | |
| Kingboard Laminates Holdings, | | | | | | | | |
| Ltd. (b) | | | 1,769,500 | | | | 1,797,130 | |
| LG Display Co., Ltd. - ADR | | | 90,587 | | | | 1,579,837 | |
| | | | | | | | 8,959,379 | |
| | | | | | | | | |
94 The Leuthold Funds - 2010 Annual Report & #160; See Notes to the Finacial Statements
Leuthold Global Fund
Consolidated Schedule of Investments (continued)
September 30, 2010
| | | Shares | | | Fair Value | |
| | | | | | | |
| | | | | | | |
| Food & Staples Retailing - 3.78% | | | | | | |
| Alimentation Couche Tard, Inc. - | | | | | | |
| Class B (b) | | | 93,949 | | | $ | 2,101,046 | |
| Alliance Global Group, | | | | | | | | |
| Inc. (b) | | | 8,292,300 | | | | 1,700,597 | |
| Axfood AB (b) | | | 66,124 | | | | 2,176,878 | |
| Delhaize Group SA (b) | | | 10,368 | | | | 751,939 | |
| Koninklijke Ahold NV (b) | | | 64,862 | | | | 874,329 | |
| Rallye SA (b) | | | 54,930 | | | | 2,033,086 | |
| SUPERVALU, Inc. | | | 113,010 | | | | 1,303,005 | |
| | | | | | | | 10,940,880 | |
| | | | | | | | | |
| | | | | | | | | |
| Health Care Providers & Services - 2.87% | | | | | | | | |
| Aetna, Inc. | | | 45,235 | | | | 1,429,878 | |
| Amedisys, Inc. (a) | | | 28,096 | | | | 668,685 | |
| Community Health Systems, | | | | | | | | |
| Inc. (a) | | | 65,982 | | | | 2,043,462 | |
| UnitedHealth Group, Inc. | | | 62,397 | | | | 2,190,759 | |
| WellPoint, Inc. (a) | | | 35,055 | | | | 1,985,515 | |
| | | | | | | | 8,318,299 | |
| | | | | | | | | |
| | | | | | | | | |
| Industrial Conglomerates - 5.77% | | | | | | | | |
| Alfa S.A.B. de CV - Class A (b) | | | 221,800 | | | | 1,716,085 | |
| Carlisle Companies, Inc. | | | 44,586 | | | | 1,335,350 | |
| CJ Corp. (b) | | | 22,647 | | | | 1,823,280 | |
| Discount Investment Corp. (b) | | | 35,091 | | | | 700,587 | |
| General Electric Co. | | | 92,380 | | | | 1,501,175 | |
| Hutchison Whampoa, Ltd. (b) | | | 236,000 | | | | 2,202,182 | |
| Jardine Strategic Holdings, | | | | | | | | |
| Ltd. (b) | | | 47,000 | | | | 1,259,600 | |
| Keppel Corp., Ltd. (b) | | | 295,000 | | | | 2,014,371 | |
| MMC Corp. Bhd (b) | | | 2,388,500 | | | | 2,321,186 | |
| NWS Holdings, Ltd. (b) | | | 425,000 | | | | 833,693 | |
| Reunert, Ltd. (b) | | | 113,364 | | | | 1,008,529 | |
| | | | | | | | 16,716,038 | |
| | | | | | | | | |
| | | Shares | | | Fair Value | |
| | | | | | | |
| | | | | | | |
| Media - 5.84% | | | | | | |
| Comcast Corp. - Class A | | | 108,339 | | | $ | 1,958,769 | |
| Daiichikosho Co., Ltd. (b) | | | 147,400 | | | | 2,295,400 | |
| Metropole Television SA (b) | | | 66,490 | | | | 1,563,586 | |
| Naspers, Ltd. (b) | | | 45,447 | | | | 2,222,064 | |
| ProSiebenSat.1 Media AG (b) | | | 120,146 | | | | 2,854,847 | |
| The Walt Disney Co. | | | 55,131 | | | | 1,825,387 | |
| TV Azteca SA de CV (b) | | | 3,260,200 | | | | 2,214,576 | |
| Viacom, Inc. - Class B | | | 54,966 | | | | 1,989,220 | |
| | | | | | | | 16,923,849 | |
| | | | | | | | | |
| | | | | | | | | |
| Office Electronics - 3.35% | | | | | | | | |
| Brother Industries, Ltd. (b) | | | 161,600 | | | | 1,995,802 | |
| Neopost SA (b) | | | 24,853 | | | | 1,849,559 | |
| Ricoh Co., Ltd. (b) | | | 130,000 | | | | 1,832,894 | |
| Xerox Corp. | | | 193,725 | | | | 2,005,054 | |
| Zebra Technologies Corp. (a) | | | 60,061 | | | | 2,020,452 | |
| | | | | | | | 9,703,761 | |
| | | | | �� | | | | |
| | | | | | | | | |
| Paper & Forest Products - 5.01% | | | | | | | | |
| China Forestry Holdings, | | | | | | | | |
| Ltd. (b) | | | 2,312,000 | | | | 1,013,140 | |
| Domtar Corp. | | | 24,157 | | | | 1,560,059 | |
| Holmen AB (b) | | | 69,710 | | | | 2,150,142 | |
| International Paper Co. | | | 59,625 | | | | 1,296,844 | |
| MeadWestvaco Corp. | | | 57,289 | | | | 1,396,706 | |
| Semapa-Sociedade de | | | | | | | | |
| Investimento e Gestao (b) | | | 159,778 | | | | 1,694,622 | |
| Sino-Forest Corp. (a)(b) | | | 99,100 | | | | 1,650,864 | |
| Suzano Papel e Celulose SA (b) | | | 185,775 | | | | 1,753,444 | |
| Svenska Cellulosa AB (b) | | | 131,623 | | | | 2,001,581 | |
| | | | | | | | 14,517,402 | |
| | | | | | | | | |
| | | | | | | | | |
| Real Estate Investment Trusts (REITs) - 3.59% | | | | | | | | |
| American Capital Agency Corp. | | | 96,667 | | | | 2,568,442 | |
| Annaly Capital Management, Inc. | | | 129,430 | | | | 2,277,968 | |
| Anworth Mortgage Asset Corp. | | | 389,617 | | | | 2,777,969 | |
| MFA Financial, Inc. | | | 364,787 | | | | 2,783,325 | |
| | | | | | | | 10,407,704 | |
| | | | | | | | | |
See Notes to the Finacial Statements �� The Leuthold Funds - 2010 Annual Report 95
Leuthold Global Fund
Consolidated Schedule of Investments (continued)
September 30, 2010
| | | Shares | | | Fair Value | |
| | | | | | | |
| | | | | | | |
| Road & Rail - 5.02% | | | | | | |
| Canadian Pacific Railway, | | | | | | |
| Ltd. (b) | | | 29,181 | | | $ | 1,777,998 | |
| ComfortDelgro Corp., | | | | | | | | |
| Ltd. (b) | | | 1,628,000 | | | | 1,881,652 | |
| CSX Corp. | | | 31,576 | | | | 1,746,784 | |
| Globaltrans Investment PLC - | | | | | | | | |
| GDR | | | 128,550 | | | | 1,939,819 | |
| Nippon Konpo Unyu Soko Co., | | | | | | | | |
| Ltd. (b) | | | 153,000 | | | | 1,862,099 | |
| Norfolk Southern Corp. | | | 30,101 | | | | 1,791,310 | |
| Sankyu, Inc. (b) | | | 425,000 | | | | 1,664,770 | |
| Union Pacific Corp. | | | 23,012 | | | | 1,882,382 | |
| | | | | | | | 14,546,814 | |
| | | | | | | | | |
| | | | | | | | | |
| Specialty Retail - 2.71% | | | | | | | | |
| AutoNation, Inc. (a) | | | 50,106 | | | | 1,164,965 | |
| CarMax, Inc. (a) | | | 33,369 | | | | 929,660 | |
| Collective Brands, Inc. (a) | | | 29,500 | | | | 476,130 | |
| Delek Automotive Systems, | | | | | | | | |
| Ltd. (b) | | | 77,459 | | | | 991,417 | |
| Jo-Ann Stores, Inc. (a) | | | 20,418 | | | | 909,622 | |
| K's Holdings Corp. (b) | | | 71,920 | | | | 1,654,126 | |
| WH Smith PLC (b) | | | 242,238 | | | | 1,724,563 | |
| | | | | | | | 7,850,483 | |
| | | | | | | | | |
| | | | | | | | | |
| Trading Companies & Distributors - 3.23% | | | | | | | | |
| Applied Industrial Technologies, | | | | | | | | |
| Inc. | | | 58,976 | | | | 1,804,666 | |
| BayWa AG (b) | | | 23,762 | | | | 979,259 | |
| Hanwa Co Ltd (b) | | | 248,000 | | | | 974,413 | |
| JFE Shoji Holdings, Inc. (b) | | | 461,842 | | | | 1,881,005 | |
| LG International Corp. (b) | | | 28,660 | | | | 965,178 | |
| Noble Group, Ltd. (b) | | | 1,262,000 | | | | 1,813,687 | |
| WESCO International, Inc. (a) | | | 23,767 | | | | 933,805 | |
| | | | | | | | 9,352,013 | |
| | | | | | | | | |
| | | Shares | | | Fair Value | |
| | | | | | | |
| | | | | | | |
| Water Utilities - 2.38% | | | | | | |
| American Water Works Co., Inc. | | | 59,731 | | | $ | 1,389,940 | |
| Cia de Saneamento Basico do | | | | | | | | |
| Estado de Sao Paulo (b) | | | 64,900 | | | | 1,450,278 | |
| Guangdong Investment, Ltd. (b) 2,618,000 | | | | | | | 1,366,556 | |
| Hyflux, Ltd. (b) | | | 566,000 | | | | 1,338,499 | |
| Severn Trent PLC (b) | | | 65,015 | | | | 1,338,947 | |
| | | | | | | | 6,884,220 | |
| | | | | | | | | |
| TOTAL COMMON STOCKS | | | | | | | | |
| (Cost $176,593,456) | | | | | | $ | 197,328,123 | |
| | | | | | | | | |
| | | | | | | | | |
| | | | | | | | | |
| INVESTMENT COMPANIES - 7.65% | | | | | | | | |
| Exchange Traded Funds - 6.38% | | | | | | | | |
| Advent Claymore Global Convertible | | | | | | | | |
| Securities & Income Fund | | | 226,478 | | | $ | 2,113,040 | |
| iShares Barclays Intermediate | | | | | | | | |
| Credit Bond Fund | | | 32,133 | | | | 3,482,253 | |
| iShares iBoxx $ High Yield | | | | | | | | |
| Corporate Bond Fund | | | 20,466 | | | | 1,835,595 | |
| iShares iBoxx Investment Grade | | | | | | | | |
| Corporate Bond Fund | | | 44,281 | | | | 5,007,738 | |
| iShares JPMorgan USD Emerging | | | | | | | | |
| Markets Bond Fund | | | 17,953 | | | | 1,999,067 | |
| PowerShares Emerging Markets | | | | | | | | |
| Sovereign Debt Portfolio | | | 72,500 | | | | 2,021,300 | |
| SPDR Barclays Capital High Yield | | | | | | | | |
| Bond ETF | | | 50,492 | | | | 2,020,185 | |
| | | | | | | | 18,479,178 | |
| | | | | | | | | |
| | | | | | | | | |
| Mutual Funds - 1.27% | | | | | | | | |
| RidgeWorth Seix Floating Rate | | | | | | | | |
| High Income Fund | | | 243,858 | | | | 2,143,515 | |
| Vanguard High-Yield Corporate | | | | | | | | |
| Fund | | | 270,501 | | | | 1,539,149 | |
| | | | | | | | 3,682,664 | |
| | | | | | | | | |
96 The Leuthold Funds - 2010 Annual Report & #160; See Notes to the Finacial Statements
Leuthold Global Fund
Consolidated Schedule of Investments (continued)
September 30, 2010
| | | Shares | | | Fair Value | |
| | | | | | | |
| | | | | | | |
| TOTAL INVESTMENT COMPANIES | | | | | | |
| (Cost $19,477,738) | | | | | $ | 22,161,842 | |
| | | | | | | | |
| | | | | | | | |
| | | | | | | | |
| | | Troy Ounces | | | Fair Value | |
| | | | | | | | |
| | | | | | | | |
| PRECIOUS METALS - 3.85% | | | | | | | |
| Gold Bullion (a) | | | 6,778 | | | $ | 8,871,250 | |
| Silver (a) | | | 104,000 | | | | 2,280,720 | |
| | | | | | | | | |
| TOTAL PRECIOUS METALS | | | | | | | | |
| (Cost $8,927,598) | | | | | | $ | 11,151,970 | |
| | | | | | | | | |
| | | | | | | | | |
| | | | | | | | | |
| | | | | | | | | |
| | | | | | | | | |
| | | Principal | | | | | |
| | | Amount | | | Fair Value | |
| | | | | | | | | |
| | | | | | | | | |
| UNITED STATES TREASURY | | | | | | | | |
| OBLIGATIONS - 1.87% | | | | | | | | |
| United States Treasury Inflation | | | | | | | | |
| Indexed Bonds - 1.87% | | | | | | | | |
| 1.250%, 04/15/2014 | | $ | 5,150,650 | | | $ | 5,419,098 | |
| | | | | | | | | |
| TOTAL UNITED STATES TREASURY | | | | | | | | |
| OBLIGATIONS (Cost $5,350,969) | | | | | | $ | 5,419,098 | |
| | | | | | | | | |
| | | | | | | | | |
| | | | | | | | | |
| | | | | | | | | |
| FOREIGN GOVERNMENT BONDS - 2.49% | | | | | | | | |
| Commonwealth of Australia | | | | | | | | |
| 5.750%, 06/15/2011 (b) | | | | | | | | |
| AUD | | | 2,951,000 | | | $ | 2,873,646 | |
| Republic of Brazil | | | | | | | | |
| 12.500%, 01/05/2022 (b) | | | | | | | | |
| BRL | | | 5,951,000 | | | | 4,317,289 | |
| | | | | | | | | |
| TOTAL FOREIGN GOVERNMENT BONDS | | | | | | | | |
| (Cost $6,538,274) | | | | | | $ | 7,190,935 | |
| | | | | | | | | |
| | | Shares | | | Fair Value | |
| | | | | | | |
| | | | | | | |
| SHORT-TERM INVESTMENTS - 13.66% | | | | | | |
| Money Market Funds - 13.66% | | | | | | |
| Dreyfus Government Cash Management Fund | | | | | | |
| 0.07% (c) | | | 19,721,807 | | | $ | 19,721,807 | |
| Fidelity Institutional Money Market Fund - | | | | | | | | |
| Government Portfolio | | | | | | | | |
| 0.06% (c) | | | 19,844,239 | | | | 19,844,239 | |
| | | | | | | | | |
| TOTAL SHORT-TERM INVESTMENTS | | | | | | | | |
| (Cost $39,566,046) | | | | | | $ | 39,566,046 | |
| | | | | | | | | |
| | | | | | | | | |
| | | | | | | | | |
| Total Investments | | | | | | | | |
| (Cost $256,454,081) - 97.65% | | | | | | $ | 282,818,014 | |
| | | | | | | | | |
| | | | | | | | | |
| Other Assets in Excess of | | | | | | | | |
| Liabilities - 2.35% (d) | | | | | | | 6,828,306 | |
| | | | | | | | | |
| | | | | | | | | |
| TOTAL NET ASSETS - 100.00% | | | | | | $ | 289,646,320 | |
| | | | | | | | | |
| | | | | | | | | |
Percentages are stated as a percent of net assets.
AUD Australian Dollar
BRL Brazilian Real
ADR American Depository Receipt
GDR Global Depository Receipt
| (a) | Non-income producing security. |
| (b) | Foreign issued security. |
| (c) | The rate quoted is the annualized seven-day yield as of September 30, 2010. |
| (d) | All or a portion of the assets have been committed as collateral for open securities sold short. |
The Global Industry Classification Standard (GICS®) was developed by and/or is the exclusive property of MSCI, Inc. and Standard & Poor Financial Services LLC (“S&P”). GICS is a service mark of MSCI and S&P and has been licensed for use by U.S. Bancorp Fund Services, LLC.
See Notes to the Finacial Statements The Leuthold Funds - 2010 Annual Report 97
Leuthold Global Fund
Consolidated Schedule of Investments (continued)
September 30, 2010
| | | | | | Percentage | |
| | | Fair | | | of Total | |
| | | Value | | | Investments | |
| | | | | | | |
| | | | | | | |
| CURRENCY EXPOSURE | | | | | | |
| September 30, 2010 | | | | | | |
| Australian Dollar | | $ | 2,873,646 | | | | 1.02 | % |
| Brazilian Real | | | 7,521,010 | | | | 2.66 | |
| British Pound | | | 6,040,721 | | | | 2.14 | |
| Canadian Dollar | | | 3,751,910 | | | | 1.33 | |
| Euro | | | 18,011,652 | | | | 6.37 | |
| Hong Kong Dollar | | | 15,554,385 | | | | 5.50 | |
| Israel Shekel | | | 1,692,004 | | | | 0.60 | |
| Japanese Yen | | | 18,045,758 | | | | 6.38 | |
| Malaysian Ringgit | | | 4,136,799 | | | | 1.46 | |
| Mexican Peso | | | 6,199,019 | | | | 2.19 | |
| New Taiwan Dollar | | | 7,044,828 | | | | 2.49 | |
| New Turkish Lira | | | 5,441,798 | | | | 1.92 | |
| Philippine Peso | | | 1,700,597 | | | | 0.60 | |
| Singapore Dollar | | | 7,048,209 | | | | 2.49 | |
| South African Rand | | | 3,230,593 | | | | 1.14 | |
| South Korea Won | | | 12,977,709 | | | | 4.59 | |
| Swedish Krona | | | 6,328,600 | | | | 2.24 | |
| US Dollar | | | 144,066,806 | | | | 50.94 | |
| | | | 271,666,044 | | | | 96.06 | % |
| Precious Metals | | | 11,151,970 | | | | 3.94 | % |
| Total Investments | | $ | 282,818,014 | | | | 100.00 | % |
| | | | | | | | | |
| | | | | | Percentage | |
| | | Fair | | | of Total | |
| | | Value | | | Investments | |
| | | | | | | |
| | | | | | | |
| PORTFOLIO DIVERSIFICATION | | | | | | |
| September 30, 2010 | | | | | | |
| Australia | | $ | 2,873,646 | | | | 1.02 | % |
| Belgium | | | 751,939 | | | | 0.27 | |
| Bermuda | | | 3,073,287 | | | | 1.09 | |
| Brazil | | | 7,521,010 | | | | 2.66 | |
| Canada | | | 5,529,909 | | | | 1.95 | |
| Cayman Islands | | | 1,797,130 | | | | 0.63 | |
| Finland | | | 1,012,095 | | | | 0.36 | |
| France | | | 5,446,230 | | | | 1.93 | |
| Germany | | | 8,232,437 | | | | 2.91 | |
| Hong Kong | | | 13,757,255 | | | | 4.86 | |
| Israel | | | 1,692,004 | | | | 0.60 | |
| Japan | | | 18,045,758 | | | | 6.38 | |
| Korea, Republic of | | | 14,557,546 | | | | 5.15 | |
| Malaysia | | | 4,136,799 | | | | 1.46 | |
| Mexico | | | 6,199,019 | | | | 2.19 | |
| Netherlands | | | 874,329 | | | | 0.31 | |
| Philippines | | | 1,700,597 | | | | 0.60 | |
| Portugal | | | 1,694,622 | | | | 0.60 | |
| Singapore | | | 5,234,522 | | | | 1.85 | |
| South Africa | | | 3,230,593 | | | | 1.14 | |
| Sweden | | | 6,328,600 | | | | 2.24 | |
| Taiwan, Province of China | | | 7,044,828 | | | | 2.49 | |
| Turkey | | | 5,441,798 | | | | 1.92 | |
| United Kingdom | | | 6,040,721 | | | | 2.14 | |
| United States | | | 139,449,370 | | | | 49.31 | |
| | | | 271,666,044 | | | | 96.06 | % |
| Precious Metals | | | 11,151,970 | | | | 3.94 | % |
| Total Investments | | $ | 282,818,014 | | | | 100.00 | % |
| | | | | | | | | |
98 The Leuthold Funds - 2010 Annual Report & #160; See Notes to the Finacial Statements
Leuthold Global Fund
Consolidated Schedule of Securities Sold Short
September 30, 2010
| | | Shares | | | Fair Value | |
| | | | | | | |
| | | | | | | |
| COMMON STOCKS - 5.83% | | | | | | |
| Biotechnology - 0.27% | | | | | | |
| Abraxis BioScience, Inc. | | | 1,846 | | | $ | 142,770 | |
| Amylin Pharmaceuticals, Inc. | | | 4,223 | | | | 88,050 | |
| Basilea Pharmaceutica (a) | | | 994 | | | | 61,957 | |
| Celgene Corp. | | | 2,236 | | | | 128,816 | |
| Intercell AG (a) | | | 2,839 | | | | 64,324 | |
| United Therapeutics Corp. | | | 1,738 | | | | 97,345 | |
| Vertex Pharmaceuticals, Inc. | | | 3,442 | | | | 118,990 | |
| Zeltia SA (a) | | | 19,942 | | | | 86,723 | |
| | | | | | | | 788,975 | |
| | | | | | | | | |
| | | | | | | | | |
| Capital Markets - 0.92% | | | | | | | | |
| Affiliated Managers Group, Inc. | | | 3,122 | | | | 243,547 | |
| Bank Sarasin & Cie AG (a) | | | 5,820 | | | | 225,065 | |
| CI Financial Corp. (a) | | | 12,100 | | | | 244,023 | |
| Cohen & Steers, Inc. | | | 9,439 | | | | 204,826 | |
| GMP Capital, Inc. (a) | | | 18,274 | | | | 189,684 | |
| Greenhill & Co., Inc. | | | 2,875 | | | | 228,045 | |
| Henderson Group PLC (a) | | | 114,009 | | | | 222,437 | |
| ICAP PLC (a) | | | 35,410 | | | | 240,023 | |
| kabu.com Securities Co., Ltd. (a) | | | 43,700 | | | | 166,990 | |
| Lazard, Ltd. - Class A (a) | | | 5,997 | | | | 210,375 | |
| Monex Group, Inc. (a) | | | 462 | | | | 155,513 | |
| Teton Advisors, Inc. - Class B | | | 26 | | | | – | |
| The Charles Schwab Corp. | | | 11,460 | | | | 159,294 | |
| UBS AG (a) | | | 9,476 | | | | 161,376 | |
| | | | | | | | 2,651,198 | |
| | | | | | | | | |
| | | | | | | | | |
| Chemicals - 0.42% | | | | | | | | |
| Incitec Pivot, Ltd. (a) | | | 70,150 | | | | 243,414 | |
| Intrepid Potash, Inc. | | | 7,309 | | | | 190,546 | |
| K+S AG (a) | | | 3,620 | | | | 216,719 | |
| Monsanto Co. | | | 2,696 | | | | 129,219 | |
| Sociedad Quimica y Minera de | | | | | | | | |
| Chile SA - ADR | | | 4,457 | | | | 215,006 | |
| The Mosaic Co. | | | 3,725 | | | | 218,881 | |
| | | | | | | | 1,213,785 | |
| | | | | | | | | |
| | | Shares | | | Fair Value | |
| | | | | | | |
| | | | | | | |
| Communications Equipment - 0.26% | | | | | | |
| Ciena Corp. | | | 11,845 | | | $ | 184,427 | |
| Juniper Networks, Inc. | | | 5,599 | | | | 169,929 | |
| Nokia OYJ - ADR | | | 16,890 | | | | 169,407 | |
| QUALCOMM, Inc. | | | 4,932 | | | | 222,532 | |
| | | | | | | | 746,295 | |
| | | | | | | | | |
| | | | | | | | | |
| Construction & Engineering - 0.52% | | | | | | | | |
| ACS Actividades de Construccion | | | | | | | | |
| y Servicios SA (a) | | | 3,452 | | | | 172,355 | |
| Empresas ICA S.A.B. de CV - ADR | | | 17,756 | | | | 172,588 | |
| Ferrovial SA (a) | | | 19,608 | | | | 183,345 | |
| Granite Construction, Inc. | | | 7,771 | | | | 176,713 | |
| Koninklijke BAM Groep NV (a) | | | 18,885 | | | | 122,289 | |
| Maire Tecnimont SpA (a) | | | 49,843 | | | | 198,240 | |
| Obayashi Corp. (a) | | | 53,000 | | | | 210,781 | |
| Outotec OYJ (a) | | | 6,114 | | | | 258,883 | |
| | | | | | | | 1,495,194 | |
| | | | | | | | | |
| | | | | | | | | |
| Construction Materials - 0.33% | | | | | | | | |
| Cemex S.A.B. de CV - ADR | | | 20,951 | | | | 178,084 | |
| Fletcher Building, Ltd. (a) | | | 31,385 | | | | 185,600 | |
| Imerys SA (a) | | | 3,402 | | | | 203,784 | |
| Italcementi SpA (a) | | | 23,154 | | | | 204,697 | |
| Martin Marietta Materials, Inc. | | | 2,258 | | | | 173,798 | |
| | | | | | | | 945,963 | |
| | | | | | | | | |
| | | | | | | | | |
| Diversified Telecommunication Services - 0.07% | | | | | | | | |
| Inmarsat PLC (a) | | | 18,381 | | | | 191,583 | |
| | | | | | | | | |
| | | | | | | | | |
| Health Care Equipment & Supplies - 0.33% | | | | | | | | |
| Align Technology, Inc. | | | 10,148 | | | | 198,698 | |
| Cochlear, Ltd. (a) | | | 2,728 | | | | 185,231 | |
| Edwards Lifesciences Corp. | | | 1,647 | | | | 110,432 | |
| NuVasive, Inc. | | | 3,107 | | | | 109,180 | |
| Sysmex Corp. (a) | | | 2,300 | | | | 159,523 | |
| Volcano Corp. | | | 7,393 | | | | 192,070 | |
| | | | | | | | 955,134 | |
| | | | | | | | | |
See Notes to the Finacial Statements The Leuthold Funds - 2010 Annual Report 99
Leuthold Global Fund
Consolidated Schedule of Securities Sold Short (continued)
September 30, 2010
| | | Shares | | | Fair Value | |
| | | | | | | |
| | | | | | | |
| Independent Power Producers & | | | | | | |
| Energy Traders - 0.44% | | | | | | |
| Calpine Corp. | | | 15,861 | | | $ | 197,469 | |
| Drax Group PLC (a) | | | 39,296 | | | | 236,611 | |
| Edison SpA (a) | | | 183,628 | | | | 230,680 | |
| EDP Renovaveis SA (a) | | | 35,839 | | | | 202,759 | |
| Electric Power Development | | | | | | | | |
| Co., Ltd. (a) | | | 7,200 | | | | 216,483 | |
| The AES Corp. | | | 16,639 | | | | 188,853 | |
| | | | | | | | 1,272,855 | |
| | | | | | | | | |
| | | | | | | | | |
| Internet & Catalog Retail - 0.30% | | | | | | | | |
| Amazon.com, Inc. | | | 1,077 | | | | 169,154 | |
| ASOS PLC (a) | | | 11,512 | | | | 205,255 | |
| Netflix, Inc. | | | 1,048 | | | | 169,944 | |
| priceline.com, Inc. | | | 498 | | | | 173,473 | |
| Start Today Co., Ltd. (a) | | | 61 | | | | 170,183 | |
| | | | | | | | 888,009 | |
| | | | | | | | | |
| | | | | | | | | |
| Metals & Mining - 0.35% | | | | | | | | |
| Carpenter Technology Corp. | | | 4,826 | | | | 162,684 | |
| Fortescue Metals Group, Ltd. (a) | | | 42,616 | | | | 214,602 | |
| Nippon Steel Corp. (a) | | | 36,000 | | | | 122,472 | |
| Nucor Corp. | | | 4,223 | | | | 161,319 | |
| Rautaruukki OYJ (a) | | | 9,049 | | | | 187,015 | |
| Sumitomo Metal Industries, Ltd. (a) 72,000 | | | | | | | 181,984 | |
| | | | | | | | 1,030,076 | |
| | | | | | | | | |
| | | | | | | | | |
| Oil, Gas & Consumable Fuels - 0.11% | | | | | | | | |
| Clean Energy Fuels Corp. | | | 12,241 | | | | 173,945 | |
| Saras SpA (a) | | | 71,003 | | | | 139,965 | |
| | | | | | | | 313,910 | |
| | | | | | | | | |
| | | Shares | | | Fair Value | |
| | | | | | | |
| | | | | | | |
| Professional Services - 0.48% | | | | | | |
| Adecco SA (a) | | | 3,441 | | | $ | 179,815 | |
| Hays PLC (a) | | | 96,998 | | | | 172,335 | |
| IHS, Inc. - Class A | | | 2,966 | | | | 201,688 | |
| Randstad Holdings NV (a) | | | 4,932 | | | | 224,063 | |
| Robert Half International, Inc. | | | 7,699 | | | | 200,174 | |
| Seek, Ltd. (a) | | | 32,468 | | | | 234,736 | |
| Verisk Analytics, Inc. - Class A | | | 6,991 | | | | 195,818 | |
| | | | | | | | 1,408,629 | |
| | | | | | | | | |
| | | | | | | | | |
| Real Estate Management | | | | | | | | |
| & Development - 0.67% | | | | | | | | |
| Atrium European Real Estate, | | | | | | | | |
| Ltd. (a) | | | 42,475 | | | | 236,017 | |
| Beni Stabili SpA (a) | | | 192,172 | | | | 180,504 | |
| Deutsche Euroshop AG (a) | | | 5,035 | | | | 178,429 | |
| First Capital Realty, Inc. | | | 10,290 | | | | 155,015 | |
| Goldcrest Co., Ltd. (a) | | | 9,220 | | | | 173,841 | |
| Hufvudstaden AB - Class A (a) | | | 17,055 | | | | 183,825 | |
| IVG Immobilien AG (a) | | | 30,941 | | | | 224,358 | |
| Keppel Land Ltd (a) | | | 72,000 | | | | 221,732 | |
| Sumitomo Real Estate Sales Co., | | | | | | | | |
| Ltd. (a) | | | 4,620 | | | | 209,195 | |
| The St. Joe Co. | | | 7,664 | | | | 190,604 | |
| | | | | | | | 1,953,520 | |
| | | | | | | | | |
| | | | | | | | | |
| Thrifts & Mortgage Finance - 0.36% | | | | | | | | |
| Astoria Financial Corp. | | | 12,783 | | | | 174,232 | |
| Capitol Federal Financial | | | 6,069 | | | | 149,904 | |
| First Niagara Financial | | | | | | | | |
| Group, Inc. | | | 14,654 | | | | 170,719 | |
| Northwest Bancshares, Inc. | | | 17,778 | | | | 198,936 | |
| People's United Financial, Inc. | | | 14,975 | | | | 196,023 | |
| TFS Financial Corp. | | | 16,358 | | | | 150,330 | |
| | | | | | | | 1,040,144 | |
| | | | | | | | | |
| TOTAL COMMON STOCKS | | | | | | | | |
| (Proceeds $15,273,356) | | | | | | $ | 16,895,270 | |
| | | | | | | | | |
100 The Leuthold Funds - 2010 Annual Report See Notes to the Finacial Statements
Leuthold Global Fund
Consolidated Schedule of Securities Sold Short (continued)
September 30, 2010
| | | Principal | | | | |
| | | Amount | | | Fair Value | |
| | | | | | | |
| | | | | | | |
| UNITED STATES TREASURY | | | | | | |
| OBLIGATIONS - 1.68% | | | | | | |
| United States Treasury Bonds - 1.68% | | | | | | |
| 4.250%, 05/15/2039 | | $ | 4,415,000 | | | $ | 4,853,741 | |
| | | | | | | | | |
| TOTAL UNITED STATES TREASURY OBLIGATIONS | | | | | | | | |
| (Proceeds $4,361,878) | | | | | | $ | 4,853,741 | |
| | | | | | | | | |
| | | | | | | | | |
| | | | | | | | | |
| TOTAL SECURITIES SOLD SHORT | | | | | | | | |
| (Proceeds $19,635,234 ) - 7.51% | | | | | | $ | 21,749,011 | |
| | | | | | | | | |
| | | | | | | | | |
Percentages are stated as a percent of net assets.
ADR American Depository Receipt
| (a) | Foreign issued security. |
The Global Industry Classification Standard (GICS®) was developed by and/or is the exclusive property of MSCI, Inc. and Standard & Poor Financial Services LLC (“S&P”). GICS is a service mark of MSCI and S&P and has been licensed for use by U.S. Bancorp Fund Services, LLC.
See Notes to the Finacial Statements The Leuthold Funds - 2010 Annual Report 101
Leuthold Global Fund
Consolidated Schedule of Securities Sold Short (continued)
September 30, 2010
| | | | | | Percentage | |
| | | Fair | | | of Total | |
| | | Value | | | Investments | |
| | | | | | | |
| | | | | | | |
| CURRENCY EXPOSURE | | | | | | |
| September 30, 2010 | | | | | | |
| Australian Dollar | | $ | 877,983 | | | | 4.04 | % |
| British Pound | | | 1,268,244 | | | | 5.83 | |
| Canadian Dollar | | | 588,722 | | | | 2.71 | |
| Euro | | | 3,515,150 | | | | 16.16 | |
| Japanese Yen | | | 1,766,966 | | | | 8.12 | |
| New Zealand Dollar | | | 185,600 | | | | 0.85 | |
| Singapore Dollar | | | 221,732 | | | | 1.02 | |
| Swedish Krona | | | 183,825 | | | | 0.85 | |
| Swiss Franc | | | 466,837 | | | | 2.15 | |
| US Dollar | | | 12,673,952 | | | | 58.27 | |
| Total Investments | | $ | 21,749,011 | | | | 100.00 | % |
| | | | | | | | | |
| | | | | | Percentage | |
| | | Fair | | | of Total | |
| | | Value | | | Investments | |
| | | | | | | |
| | | | | | | |
| PORTFOLIO DIVERSIFICATION | | | | | | |
| September 30, 2010 | | | | | | |
| Australia | | $ | 877,983 | | | | 4.03 | % |
| Austria | | | 64,324 | | | | 0.29 | |
| Bermuda | | | 210,375 | | | | 0.97 | |
| Canada | | | 588,722 | | | | 2.71 | |
| Chile | | | 215,006 | | | | 0.99 | |
| Finland | | | 615,304 | | | | 2.83 | |
| France | | | 203,784 | | | | 0.94 | |
| Germany | | | 619,506 | | | | 2.85 | |
| Italy | | | 954,087 | | | | 4.39 | |
| Japan | | | 1,766,966 | | | | 8.12 | |
| Jersey | | | 458,455 | | | | 2.11 | |
| Mexico | | | 350,672 | | | | 1.61 | |
| Netherlands | | | 346,351 | | | | 1.59 | |
| New Zealand | | | 185,600 | | | | 0.85 | |
| Singapore | | | 221,732 | | | | 1.02 | |
| Spain | | | 645,183 | | | | 2.97 | |
| Sweden | | | 183,825 | | | | 0.85 | |
| Switzerland | | | 628,214 | | | | 2.89 | |
| United Kingdom | | | 1,045,807 | | | | 4.81 | |
| United States | | | 11,567,115 | | | | 53.18 | |
| Total Investments | | $ | 21,749,011 | | | | 100.00 | % |
| | | | | | | | | |
102 The Leuthold Funds - 2010 Annual Report See Notes to the Finacial Statements
Leuthold Select Industries Fund
Schedule of Securities
September 30, 2010
| | | Shares | | | Fair Value | |
| | | | | | | |
| | | | | | | |
| COMMON STOCKS - 97.65% | | | | | | |
| Beverages - 1.46% | | | | | | |
| Coca-Cola Femsa SAB De CV - | | | | | | |
| ADR | | | 2,474 | | | $ | 193,516 | |
| Fomento Economico Mexicano | | | | | | | | |
| SAB De CV - ADR | | | 7,421 | | | | 376,467 | |
| | | | | | | | 569,983 | |
| | | | | | | | | |
| | | | | | | | | |
| Chemicals - 1.42% | | | | | | | | |
| Sherwin Williams Co. | | | 7,376 | | | | 554,233 | |
| | | | | | | | | |
| | | | | | | | | |
| Electronic Equipment, Instruments & | | | | | | | | |
| Components - 10.07% | | | | | | | | |
| Amphenol Corp. - Class A | | | 10,115 | | | | 495,433 | |
| Arrow Electronics, Inc. (a) | | | 7,995 | | | | 213,706 | |
| Benchmark Electronics, Inc. (a) | | | 6,140 | | | | 100,696 | |
| Corning, Inc. | | | 31,316 | | | | 572,456 | |
| Dolby Laboratories, Inc. - | | | | | | | | |
| Class A (a) | | | 5,565 | | | | 316,148 | |
| Flextronics International | | | | | | | | |
| Ltd. (a)(b) | | | 57,995 | | | | 350,290 | |
| LG Display Co. Ltd. - ADR | | | 12,279 | | | | 214,146 | |
| Molex, Inc. | | | 17,712 | | | | 370,712 | |
| Plexus Corp. (a) | | | 4,549 | | | | 133,513 | |
| Sanmina-SCI Corp. (a) | | | 21,290 | | | | 257,183 | |
| Tyco Electronics, Ltd. (b) | | | 19,744 | | | | 576,920 | |
| Vishay Intertechnology, Inc. (a) | | | 34,806 | | | | 336,922 | |
| | | | | | | | 3,938,125 | |
| | | | | | | | | |
| | | | | | | | | |
| Food & Staples Retailing - 5.89% | | | | | | | | |
| BJ's Wholesale Club, Inc. (a) | | | 11,572 | | | | 480,238 | |
| Costco Wholesale Corp. | | | 14,929 | | | | 962,771 | |
| Wal-Mart Stores, Inc. | | | 16,078 | | | | 860,495 | |
| | | | | | | | 2,303,504 | |
| | | | | | | | | |
| | | Shares | | | Fair Value | |
| | | | | | | |
| | | | | | | |
| Health Care Providers & Services - 16.68% | | | | | | |
| Aetna, Inc. | | | 21,422 | | | $ | 677,150 | |
| AMERIGROUP Corp. (a) | | | 18,746 | | | | 796,143 | |
| CIGNA Corp. | | | 25,574 | | | | 915,038 | |
| Coventry Health Care, Inc. (a) | | | 42,403 | | | | 912,936 | |
| Healthspring, Inc. (a) | | | 14,696 | | | | 379,745 | |
| Humana, Inc. (a) | | | 12,368 | | | | 621,368 | |
| Magellan Health Services, Inc. (a) | | | 10,449 | | | | 493,611 | |
| Molina Healthcare, Inc. (a) | | | 2,959 | | | | 79,863 | |
| UnitedHealth Group, Inc. | | | 23,281 | | | | 817,396 | |
| Wellpoint, Inc. (a) | | | 14,604 | | | | 827,170 | |
| | | | | | | | 6,520,420 | |
| | | | | | | | | |
| Household Durables - 6.65% | | | | | | | | |
| Garmin, Ltd. (b) | | | 6,316 | | | | 191,691 | |
| Panasonic Corp. - ADR | | | 34,762 | | | | 472,068 | |
| Sharp Corp. (b) | | | 65,000 | | | | 647,041 | |
| Sony Corp. - ADR | | | 35,203 | | | | 1,088,477 | |
| Whirlpool Corp. | | | 2,476 | | | | 200,457 | |
| | | | | | | | 2,599,734 | |
| | | | | | | | | |
| Industrial Conglomerates - 10.82% | | | | | | | | |
| 3M Co. | | | 6,670 | | | | 578,356 | |
| Carlisle Companies, Inc. | | | 15,680 | | | | 469,616 | |
| General Electric Co. | | | 67,938 | | | | 1,103,992 | |
| Koninklijke Philips Electronics | | | | | | | | |
| N.V. - NYS | | | 20,495 | | | | 641,903 | |
| Siemens AG - ADR | | | 5,521 | | | | 581,914 | |
| Tyco International, Ltd. (b) | | | 23,233 | | | | 853,348 | |
| | | | | | | | 4,229,129 | |
| | | | | | | | | |
| | | | | | | | | |
| Leisure Equipment & Products - 0.62% | | | | | | | | |
| Polaris Industries, Inc. | | | 3,710 | | | | 241,521 | |
| | | | | | | | | |
| | | | | | | | | |
| Machinery - 0.68% | | | | | | | | |
| Cummins, Inc. | | | 2,915 | | | | 264,041 | |
| | | | | | | | | |
| | | | | | | | | |
| Media - 2.42% | | | | | | | | |
| DIRECTV - Class A (a) | | | 15,945 | | | | 663,790 | |
| Grupo Televisa SA - ADR | | | 14,974 | | | | 283,308 | |
| | | | | | | | 947,098 | |
| | | | | | | | | |
See Notes to the Finacial Statements The Leuthold Funds - 2010 Annual Report 103
Leuthold Select Industries Fund
Schedule of Securities (continued)
September 30, 2010
| | | Shares | | | Fair Value | |
| | | | | | | |
| | | | | | | |
| Oil, Gas & Consumable Fuels - 0.98% | | | | | | |
| Occidental Petroleum Corp. | | | 4,903 | | | $ | 383,905 | |
| | | | | | | | | |
| | | | | | | | | |
| Paper & Forest Products - 3.34% | | | | | | | | |
| Domtar Corp. | | | 6,581 | | | | 425,001 | |
| Fibria Celulose S.A. - ADR (a) | | | 36,219 | | | | 626,226 | |
| Schweitzer-Mauduit International, | | | | | | | | |
| Inc. | | | 4,373 | | | | 254,990 | |
| | | | | | | | 1,306,217 | |
| | | | | | | | | |
| | | | | | | | | |
| Pharmaceuticals - 10.73% | | | | | | | | |
| Abbott Laboratories | | | 4,284 | | | | 223,796 | |
| Allergan, Inc. | | | 3,357 | | | | 223,341 | |
| AstraZeneca PLC - ADR | | | 4,240 | | | | 214,968 | |
| Endo Pharmaceuticals Holdings, | | | | | | | | |
| Inc. (a) | | | 8,569 | | | | 284,834 | |
| GlaxoSmithKline PLC - ADR | | | 5,698 | | | | 225,185 | |
| Impax Laboratories, Inc. (a) | | | 3,978 | | | | 78,764 | |
| Medicis Pharmaceutical Corp. - | | | | | | | | |
| Class A | | | 7,650 | | | | 226,823 | |
| Merck & Co., Inc. | | | 11,107 | | | | 408,849 | |
| Novartis AG - ADR | | | 7,478 | | | | 431,256 | |
| Par Pharmaceutical Companies, | | | | | | | | |
| Inc. (a) | | | 4,108 | | | | 119,461 | |
| Perrigo Co. | | | 4,092 | | | | 262,788 | |
| Pfizer, Inc. | | | 21,378 | | | | 367,060 | |
| Questcor Pharmaceuticals, | | | | | | | | |
| Inc. (a) | | | 10,557 | | | | 104,725 | |
| Shire PLC - ADR | | | 2,208 | | | | 148,554 | |
| Teva Pharmaceutical Industries, | | | | | | | | |
| Ltd. - ADR | | | 4,240 | | | | 223,660 | |
| Valeant Pharmaceuticals International, | | | | | | | | |
| Inc. (b) | | | 6,316 | | | | 158,216 | |
| Viropharma, Inc. (a) | | | 8,657 | | | | 129,076 | |
| Warner Chilcott PLC - | | | | | | | | |
| Class A (a)(b) | | | 9,793 | | | | 219,755 | |
| Watson Pharmaceuticals, Inc. (a) | | | 3,357 | | | | 142,035 | |
| | | | | | | | 4,193,146 | |
| | | | | | | | | |
| | | Shares | | | Fair Value | |
| | | | | | | |
| | | | | | | |
| Semiconductors & Semiconductor | | | | | | |
| Equipment - 15.32% | | | | | | |
| Altera Corp. | | | 27,429 | | | $ | 827,259 | |
| Analog Devices, Inc. | | | 24,249 | | | | 760,934 | |
| Applied Micro Circuits Corp. (a) | | | 24,382 | | | | 243,820 | |
| Atheros Communications, Inc. (a) | | | 15,150 | | | | 399,202 | |
| Broadcom Corp. - Class A | | | 13,781 | | | | 487,710 | |
| Cirrus Logic, Inc. (a) | | | 11,882 | | | | 211,975 | |
| Intel Corp. | | | 37,323 | | | | 717,721 | |
| LSI Corp. (a) | | | 55,830 | | | | 254,585 | |
| Micrel, Inc. | | | 17,315 | | | | 170,726 | |
| ON Semiconductor Corp. (a) | | | 50,972 | | | | 367,508 | |
| RF Micro Devices, Inc. (a) | | | 97,394 | | | | 597,999 | |
| Samsung Electronics Co., Ltd. - | | | | | | | | |
| GDR (Acquired 01/25/2010, | | | | | | | | |
| Cost $895,624) (a)(d) | | | 2,456 | | | | 836,795 | |
| Volterra Semiconductor Corp. (a) | | | 5,080 | | | | 109,322 | |
| | | | | | | | 5,985,556 | |
| | | | | | | | | |
| Specialty Retail - 7.01% | | | | | | | | |
| Best Buy, Inc. | | | 35,557 | | | | 1,451,792 | |
| Hhgregg, Inc. (a) | | | 6,979 | | | | 172,800 | |
| RadioShack Corp. | | | 9,011 | | | | 192,205 | |
| The Home Depot, Inc. | | | 29,019 | | | | 919,322 | |
| | | | | | | | 2,736,119 | |
| | | | | | | | | |
| | | | | | | | | |
| Textiles, Apparel & Luxury Goods - 0.43% | | | | | | | | |
| Fossil, Inc. (a) | | | 3,136 | | | | 168,685 | |
| | | | | | | | | |
| | | | | | | | | |
| Tobacco - 1.19% | | | | | | | | |
| Phillip Morris International, Inc. | | | 8,304 | | | | 465,190 | |
| | | | | | | | | |
| | | | | | | | | |
| Transportation Infrastructure - 0.18% | | | | | | | | |
| Grupo Aeroportuario del Sureste | | | | | | | | |
| SAB de CV - ADR | | | 1,502 | | | | 71,315 | |
| | | | | | | | | |
| | | | | | | | | |
| Wireless Telecommunication Services - 1.76% | | | | | | | | |
| America Movil SAB de CV - ADR | | | 12,898 | | | | 687,850 | |
| | | | | | | | | |
| | | | | | | | | |
| TOTAL COMMON STOCKS | | | | | | | | |
| (Cost $36,334,870) | | | | | | $ | 38,165,771 | |
| | | | | | | | | |
104 The Leuthold Funds - 2010 Annual Report See Notes to the Finacial Statements
Leuthold Select Industries Fund
Schedule of Securities (continued)
September 30, 2010
| | | Shares | | | Fair Value | |
| | | | | | | |
| | | | | | | |
| PREFERRED STOCKS - 1.11% | | | | | | |
| Food & Staples Retailing - 1.11% | | | | | | |
| Cia Brasileira de Distribuicao Gupo | | | | | | |
| Pao de Acucar - Class A | | | 6,272 | | | $ | 432,894 | |
| | | | | | | | | |
| TOTAL PREFERRED STOCKS | | | | | | | | |
| (Cost $450,621) | | | | | | $ | 432,894 | |
| | | | | | | | | |
| | | | | | | | | |
| | | | | | | | | |
| | | | | | | | | |
| SHORT-TERM INVESTMENTS - 3.62% | | | | | | | | |
| Money Market Funds - 3.62% | | | | | | | | |
| Fidelity Institutional Money Market Fund - | | | | | | | | |
| Government Portfolio | | | | | | | | |
| 0.06% (c) | | | 1,413,831 | | | $ | 1,413,831 | |
| | | | | | | | | |
| TOTAL SHORT-TERM INVESTMENTS | | | | | | | | |
| (Cost $1,413,831) | | | | | | $ | 1,413,831 | |
| | | | | | | | | |
| | | | | | | | | |
| | | | | | | | | |
| | | | | | | | | |
| Total Investments | | | | | | | | |
| (Cost $38,199,322) - 102.38% | | | | | | $ | 40,012,496 | |
| | | | | | | | | |
| | | | | | | | | |
| Liabilities in Excess of | | | | | | | | |
| Other Assets - (2.38)% | | | | | | | (924,009 | ) |
| | | | | | | | | |
| | | | | | | | | |
| TOTAL NET ASSETS - 100.00% | | | | | | $ | 39,088,487 | |
| | | | | | | | | |
| | | | | | | | | |
Percentages are stated as a percent of net assets.
ADR American Depository Receipt
GDR Global Depository Receipt
NYS New York Registered Shares
| (a) | Non-income producing security. |
| (b) | Foreign issued security. |
| (c) | The rate quoted is the annualized seven-day yield as of September 30, 2010. |
| (d) | Restricted security as defined in Rule 144(a) under the Securities Act of 1933. Resale to the public may require registration or may extend only to qualified institutional buyers. At September 30, 2010, the market value of these securities total $836,795, which represents 2.14% of total net assets. |
The Global Industry Classification Standard (GICS®) was developed by and/or is the exclusive property of MSCI, Inc. and Standard & Poor Financial Services LLC (“S&P”). GICS is a service mark of MSCI and S&P and has been licensed for use by U.S. Bancorp Fund Services, LLC.
See Notes to the Finacial Statements The Leuthold Funds - 2010 Annual Report 105
Leuthold Global Industries Fund
Schedule of Securities (continued)
September 30, 2010
| | | Shares | | | Fair Value | |
| | | | | | | |
| | | | | | | |
| COMMON STOCKS - 88.46% | | | | | | |
| Aerospace & Defense - 0.97% | | | | | | |
| Aselsan Elektronik Sanayi Ve | | | | | | |
| Ticaret AS (b) | | | 20,552 | | | $ | 94,481 | |
| | | | | | | | | |
| | | | | | | | | |
| Auto Components - 5.99% | | | | | | | | |
| Autoliv, Inc. | | | 1,376 | | | | 89,894 | |
| Cheng Shin Rubber Industry Co., | | | | | | | | |
| Ltd. (b) | | | 46,250 | | | | 101,852 | |
| Johnson Controls, Inc. | | | 2,617 | | | | 79,819 | |
| Lear Corp. (a) | | | 1,048 | | | | 82,719 | |
| Minth Group, Ltd. (b) | | | 62,000 | | | | 123,698 | |
| TRW Automotive Holdings | | | | | | | | |
| Corp. (a) | | | 2,497 | | | | 103,775 | |
| | | | | | | | 581,757 | |
| | | | | | | | | |
| | | | | | | | | |
| Automobiles - 7.56% | | | | | | | | |
| Dongfeng Motor Group Co., | | | | | | | | |
| Ltd. (b) | | | 60,000 | | | | 122,802 | |
| Ford Otomotiv Sanayi AS (b) | | | 5,986 | | | | 51,313 | |
| Honda Motor Co., Ltd. (b) | | | 2,600 | | | | 92,283 | |
| Hyundai Motor Co. (b) | | | 650 | | | | 87,218 | |
| Kia Motors Corp. (b) | | | 2,830 | | | | 91,334 | |
| Proton Holdings Bhd (b) | | | 59,200 | | | | 95,119 | |
| Thor Industries, Inc. | | | 2,693 | | | | 89,946 | |
| Tofas Turk Otomobil Fabrikasi | | | | | | | | |
| AS (b) | | | 20,128 | | | | 104,359 | |
| | | | | | | | 734,374 | |
| | | | | | | | | |
| | | | | | | | | |
| Chemicals - 10.10% | | | | | | | | |
| Ashland, Inc. | | | 898 | | | | 43,795 | |
| BASF SE (b) | | | 778 | | | | 49,059 | |
| Cabot Corp. | | | 1,480 | | | | 48,204 | |
| China Petrochemical Development | | | | | | | | |
| Corp. (a)(b) | | | 163,000 | | | | 116,348 | |
| Eastman Chemical Co. | | | 695 | | | | 51,430 | |
| El du Pont de Nemours & Co. | | | 1,037 | | | | 46,271 | |
| | | Shares | | | Fair Value | |
| | | | | | | |
| | | | | | | |
| Chemicals - 10.10% (continued) | | | | | | |
| Fuchs Petrolub AG (b) | | | 882 | | | $ | 102,239 | |
| Fufeng Group, Ltd. (b) | | | 66,000 | | | | 46,870 | |
| Hanwha Chem Corp. (b) | | | 4,140 | | | | 99,302 | |
| Honam Petrochemical Corp. (b) | | | 556 | | | | 103,617 | |
| Kemira OYJ (b) | | | 3,563 | | | | 49,010 | |
| Lanxess AG (b) | | | 953 | | | | 52,214 | |
| LCY Chemical Corp. (b) | | | 44,000 | | | | 81,827 | |
| Mitsubishi Chemical Holdings | | | | | | | | |
| Corp. (b) | | | 8,500 | | | | 43,172 | |
| The Dow Chemical Co. | | | 1,761 | | | | 48,357 | |
| | | | | | | | 981,715 | |
| | | | | | | | | |
| | | | | | | | | |
| Consumer Finance - 5.36% | | | | | | | | |
| Banco Compartamos SA de | | | | | | | | |
| CV (b) | | | 15,800 | | | | 100,617 | |
| Cash America International, Inc. | | | 2,067 | | | | 72,345 | |
| Credit Acceptance Corp. (b) | | | 1,487 | | | | 90,053 | |
| Discover Financial Services | | | 5,423 | | | | 90,456 | |
| International Personal Finance | | | | | | | | |
| PLC (b) | | | 11,164 | | | | 47,316 | |
| Provident Financial PLC (b) | | | 2,551 | | | | 33,021 | |
| Samsung Card Co. (b) | | | 1,739 | | | | 87,541 | |
| | | | | | | | 521,349 | |
| | | | | | | | | |
| | | | | | | | | |
| Electronic Equipment, Instruments & | | | | | | | | |
| Components - 4.23% | | | | | | | | |
| Canon Electronics, Inc. (b) | | | 1,600 | | | | 40,862 | |
| Coretronic Corp. (b) | | | 57,000 | | | | 87,576 | |
| Halma PLC (b) | | | 10,404 | | | | 51,727 | |
| Kingboard Chemical Holdings, | | | | | | | | |
| Ltd. (b) | | | 16,000 | | | | 81,044 | |
| Kingboard Laminates Holdings, | | | | | | | | |
| Ltd. (b) | | | 78,500 | | | | 79,726 | |
| LG Display Co., Ltd. - ADR | | | 4,018 | | | | 70,074 | |
| | | | | | | | 411,009 | |
| | | | | | | | | |
106 The Leuthold Funds - 2010 Annual Report See Notes to the Finacial Statements
Leuthold Global Industries Fund
Schedule of Securities (continued)
September 30, 2010
| | | Shares | | | Fair Value | |
| | | | | | | |
| | | | | | | |
| Food & Staples Retailing - 5.12% | | | | | | |
| Alimentation Couche Tard, Inc. - | | | | | | |
| Class B (b) | | | 4,167 | | | $ | 93,189 | |
| Alliance Global Group, Inc. (b) | | | 432,000 | | | | 88,595 | |
| Axfood AB (b) | | | 2,933 | | | | 96,558 | |
| Delhaize Group SA (b) | | | 460 | | | | 33,362 | |
| Koninklijke Ahold NV (b) | | | 2,877 | | | | 38,781 | |
| Rallye SA (b) | | | 2,437 | | | | 90,199 | |
| SUPERVALU, Inc. | | | 5,064 | | | | 58,388 | |
| | | | | | | | 499,072 | |
| | | | | | | | | |
| | | | | | | | | |
| Health Care Providers & Services - 3.79% | | | | | | | | |
| Aetna, Inc. | | | 2,007 | | | | 63,441 | |
| Amedisys, Inc. (a) | | | 1,246 | | | | 29,655 | |
| Community Health Systems, | | | | | | | | |
| Inc. (a) | | | 2,927 | | | | 90,649 | |
| UnitedHealth Group, Inc. | | | 2,768 | | | | 97,185 | |
| WellPoint, Inc. (a) | | | 1,555 | | | | 88,075 | |
| | | | | | | | 369,005 | |
| | | | | | | | | |
| Industrial Conglomerates - 7.76% | | | | | | | | |
| Alfa S.A.B. de CV - Class A (b) | | | 9,900 | | | | 76,597 | |
| Carlisle Companies, Inc. | | | 1,978 | | | | 59,241 | |
| CJ Corp. (b) | | | 1,235 | | | | 99,428 | |
| Discount Investment Corp. (b) | | | 1,557 | | | | 31,085 | |
| General Electric Co. | | | 4,098 | | | | 66,592 | |
| Hutchison Whampoa, Ltd. (b) | | | 10,000 | | | | 93,313 | |
| Jardine Strategic Holdings, | | | | | | | | |
| Ltd. (b) | | | 2,000 | | | | 53,600 | |
| Keppel Corp., Ltd. (b) | | | 13,000 | | | | 88,769 | |
| MMC Corp. Bhd (b) | | | 106,000 | | | | 103,013 | |
| NWS Holdings, Ltd. (b) | | | 19,000 | | | | 37,271 | |
| Reunert, Ltd. (b) | | | 5,029 | | | | 44,740 | |
| | | | | | | | 753,649 | |
| | | | | | | | | |
| Media - 7.73% | | | | | | | | |
| Comcast Corp. - Class A | | | 4,806 | | | | 86,892 | |
| Daiichikosho Co., Ltd. (b) | | | 6,500 | | | | 101,223 | |
| Metropole Television SA (b) | | | 2,949 | | | | 69,349 | |
| Naspers, Ltd. (b) | | | 2,016 | | | | 98,569 | |
| | | Shares | | | Fair Value | |
| | | | | | | |
| | | | | | | |
| Media - 7.73% (continued) | | | | | | |
| ProSiebenSat.1 Media AG (b) | | | 5,330 | | | $ | 126,650 | |
| The Walt Disney Co. | | | 2,445 | | | | 80,954 | |
| TV Azteca SA de CV (b) | | | 144,600 | | | | 98,223 | |
| Viacom, Inc. - Class B | | | 2,438 | | | | 88,231 | |
| | | | | | | | 750,091 | |
| | | | | | | | | |
| Office Electronics - 4.83% | | | | | | | | |
| Brother Industries, Ltd. (b) | | | 7,800 | | | | 96,332 | |
| Neopost SA (b) | | | 1,204 | | | | 89,602 | |
| Ricoh Co., Ltd. (b) | | | 6,000 | | | | 84,595 | |
| Xerox Corp. | | | 9,573 | | | | 99,080 | |
| Zebra Technologies Corp. (a) | | | 2,968 | | | | 99,843 | |
| | | | | | | | 469,452 | |
| | | | | | | | | |
| Paper & Forest Products - 6.63% | | | | | | | | |
| China Forestry Holdings, Ltd. (b) | | | 102,000 | | | | 44,697 | |
| Domtar Corp. | | | 1,071 | | | | 69,165 | |
| Holmen AB (b) | | | 3,092 | | | | 95,370 | |
| International Paper Co. | | | 2,645 | | | | 57,529 | |
| MeadWestvaco Corp. | | | 2,541 | | | | 61,950 | |
| Semapa-Sociedade de Investimento | | | | | | | | |
| e Gestao (b) | | | 7,088 | | | | 75,176 | |
| Sino-Forest Corp. (a)(b) | | | 4,400 | | | | 73,298 | |
| Suzano Papel e Celulose SA (b) | | | 8,300 | | | | 78,340 | |
| Svenska Cellulosa AB (b) | | | 5,838 | | | | 88,778 | |
| | | | | | | | 644,303 | |
| | | | | | | | | |
| Road & Rail - 6.70% | | | | | | | | |
| Canadian Pacific Railway, Ltd. (b) 1,295 | | | | | | | 78,904 | |
| ComfortDelgro Corp., Ltd. (b) | | | 72,000 | | | | 83,218 | |
| CSX Corp. | | | 1,401 | | | | 77,503 | |
| Globaltrans Investment PLC - | | | | | | | | |
| GDR | | | 5,700 | | | | 86,013 | |
| Nippon Konpo Unyu Soko Co., | | | | | | | | |
| Ltd. (b) | | | 7,000 | | | | 85,194 | |
| Norfolk Southern Corp. | | | 1,349 | | | | 80,279 | |
| Sankyu, Inc. (b) | | | 19,000 | | | | 74,425 | |
| Union Pacific Corp. | | | 1,031 | | | | 84,336 | |
| | | | | | | | 649,872 | |
| | | | | | | | | |
See Notes to the Finacial Statements The Leuthold Funds - 2010 Annual Report 107
Leuthold Global Industries Fund
Schedule of Securities (continued)
September 30, 2010
| | | Shares | | | Fair Value | |
| | | | | | | |
| | | | | | | |
| Specialty Retail - 3.58% | | | | | | |
| AutoNation, Inc. (a) | | | 2,222 | | | $ | 51,662 | |
| CarMax, Inc. (a) | | | 1,480 | | | | 41,233 | |
| Collective Brands, Inc. (a) | | | 1,308 | | | | 21,111 | |
| Delek Automotive Systems, Ltd. (b) | | | 3,436 | | | | 43,978 | |
| Jo-Ann Stores, Inc. (a) | | | 906 | | | | 40,362 | |
| K's Holdings Corp. (b) | | | 3,200 | | | | 73,598 | |
| WH Smith PLC (b) | | | 10,745 | | | | 76,497 | |
| | | | | | | | 348,441 | |
| | | | | | | | | |
| | | | | | | | | |
| Trading Companies & Distributors - 4.92% | | | | | | | | |
| Applied Industrial Technologies, | | | | | | | | |
| Inc. | | | 3,084 | | | | 94,370 | |
| BayWa AG (b) | | | 1,198 | | | | 49,371 | |
| Hanwa Co., Ltd. (b) | | | 12,000 | | | | 47,149 | |
| JFE Shoji Holdings, Inc. (b) | | | 24,000 | | | | 97,748 | |
| LG International Corp. (b) | | | 1,420 | | | | 47,821 | |
| Noble Group, Ltd. (b) | | | 66,000 | | | | 94,852 | |
| WESCO International, Inc. (a) | | | 1,199 | | | | 47,109 | |
| | | | | | | | 478,420 | |
| | | | | | | | | |
| | | | | | | | | |
| Water Utilities - 3.19% | | | | | | | | |
| American Water Works Co., Inc. | | | 2,677 | | | | 62,294 | |
| Cia de Saneamento Basico do Estado | | | | | | | | |
| de Sao Paulo (b) | | | 2,900 | | | | 64,804 | |
| Guangdong Investment, Ltd. (b) 118,000 | | | | | | | 61,594 | |
| Hyflux, Ltd. (b) | | | 26,000 | | | | 61,486 | |
| Severn Trent PLC (b) | | | 2,914 | | | | 60,012 | |
| | | | | | | | 310,190 | |
| | | | | | | | | |
| TOTAL COMMON STOCKS | | | | | | | | |
| (Cost $7,453,667) | | | | | | $ | 8,597,180 | |
| | | | | | | | | |
| | | | | | | | | |
| | | | | | | | | |
| INVESTMENT COMPANIES - 5.78% | | | | | | | | |
| Exchange Traded Funds - 5.78% | | | | | | | | |
| iShares MSCI EAFE Index Fund | | | 10,238 | | | $ | 562,271 | |
| | | | | | | | | |
| TOTAL INVESTMENT COMPANIES | | | | | | | | |
| (Cost $534,390) | | | | | | $ | 562,271 | |
| | | | | | | | | |
| | | Shares | | | Fair Value | |
| | | | | | | |
| | | | | | | |
| SHORT-TERM INVESTMENTS - 5.33% | | | | | | |
| Money Market Funds - 5.33% | | | | | | |
| Fidelity Institutional Money Market Fund - | | | | | | |
| Government Portfolio | | | | | | |
| 0.06% | | | 518,356 | | | $ | 518,356 | |
| | | | | | | | | |
| TOTAL SHORT-TERM INVESTMENTS | | | | | | | | |
| (Cost $518,356) | | | | | | $ | 518,356 | |
| | | | | | | | | |
| | | | | | | | | |
| | | | | | | | | |
| Total Investments | | | | | | | | |
| (Cost $8,506,413) - 99.57% | | | | | | $ | 9,677,807 | |
| | | | | | | | | |
| | | | | | | | | |
| Other Assets in Excess of | | | | | | | | |
| Liabilities - 0.43% | | | | | | | 42,457 | |
| | | | | | | | | |
| | | | | | | | | |
| TOTAL NET ASSETS - 100.00% | | | | | | $ | 9,720,264 | |
| | | | | | | | | |
| | | | | | | | | |
ADR American Depository Receipt
GDR Global Depository Receipt
| (a) | Non-income producing security. |
| (b) | Foreign issued security. |
| (c) | The rate quoted is the annualized seven-day yield as of September 30, 2010. |
The Global Industry Classification Standard (GICS®) was developed by and/or is the exclusive property of MSCI, Inc. and Standard & Poor Financial Services LLC (“S&P”). GICS is a service mark of MSCI and S&P and has been licensed for use by U.S. Bancorp Fund Services, LLC.
108 The Leuthold Funds - 2010 Annual Report See Notes to the Finacial Statements
Leuthold Global Industries Fund
Schedule of Securities (continued)
September 30, 2010
| | | | | | Percentage | |
| | | Fair | | | of Total | |
| | | Value | | | Investments | |
| | | | | | | |
| | | | | | | |
| CURRENCY EXPOSURE | | | | | | |
| September 30, 2010 | | | | | | |
| Brazilian Real | | $ | 143,144 | | | | 1.47 | % |
| British Pound | | | 268,573 | | | | 2.78 | |
| Canadian Dollar | | | 166,487 | | | | 1.72 | |
| Euro | | | 825,010 | | | | 8.52 | |
| Hong Kong Dollar | | | 691,015 | | | | 7.14 | |
| Israel Shekel | | | 75,063 | | | | 0.78 | |
| Japanese Yen | | | 836,581 | | | | 8.64 | |
| Malaysian Ringgit | | | 198,132 | | | | 2.05 | |
| Mexican Peso | | | 275,438 | | | | 2.85 | |
| New Taiwan Dollar | | | 387,603 | | | | 4.01 | |
| New Turkish Lira | | | 250,152 | | | | 2.58 | |
| Philippine Peso | | | 88,595 | | | | 0.92 | |
| Singapore Dollar | | | 328,325 | | | | 3.39 | |
| South African Rand | | | 143,309 | | | | 1.48 | |
| South Korea Won | | | 616,262 | | | | 6.37 | |
| Swedish Krona | | | 280,706 | | | | 2.90 | |
| US Dollar | | | 4,103,412 | | | | 42.40 | |
| Total Investments | | $ | 9,677,807 | | | | 100.00 | % |
| | | | | | | | | |
| | | | | | Percentage | |
| | | Fair | | | of Total | |
| | | Value | | | Investments | |
| | | | | | | |
| | | | | | | |
| PORTFOLIO DIVERSIFICATION | | | | | | |
| September 30, 2010 | | | | | | |
| Belgium | | $ | 33,362 | | | | 0.33 | % |
| Bermuda | | | 148,452 | | | | 1.53 | |
| Brazil | | | 143,144 | | | | 1.48 | |
| Canada | | | 245,391 | | | | 2.54 | |
| Cayman Islands | | | 79,726 | | | | 0.82 | |
| Finland | | | 49,010 | | | | 0.51 | |
| France | | | 249,150 | | | | 2.57 | |
| Germany | | | 379,531 | | | | 3.92 | |
| Hong Kong | | | 611,289 | | | | 6.32 | |
| Israel | | | 75,063 | | | | 0.78 | |
| Japan | | | 836,581 | | | | 8.64 | |
| Korea, Republic of | | | 686,336 | | | | 7.09 | |
| Malaysia | | | 198,132 | | | | 2.05 | |
| Mexico | | | 275,438 | | | | 2.85 | |
| Netherlands | | | 38,781 | | | | 0.40 | |
| Philippines | | | 88,595 | | | | 0.92 | |
| Portugal | | | 75,176 | | | | 0.78 | |
| Singapore | | | 233,473 | | | | 2.41 | |
| South Africa | | | 143,309 | | | | 1.48 | |
| Sweden | | | 280,706 | | | | 2.90 | |
| | | | 387,603 | | | | 4.01 | |
| Taiwan, Province of China | | | | | | | | |
| Turkey | | | 250,152 | | | | 2.58 | |
| United Kingdom | | | 268,573 | | | | 2.78 | |
| United States | | | 3,900,834 | | | | 40.31 | |
| Total Investments | | $ | 9,677,807 | | | | 100.00 | % |
| | | | | | | | | |
See Notes to the Finacial Statements The Leuthold Funds - 2010 Annual Report 109
Leuthold Undervalued & Unloved Fund
Schedule of Investments
September 30, 2010
| | | Shares | | | Fair Value | |
| | | | | | | |
| | | | | | | |
| COMMON STOCKS - 97.30% | | | | | | |
| Biotechnology - 2.80% | | | | | | |
| Amgen, Inc. (a) | | | 4,066 | | | $ | 224,077 | |
| | | | | | | | | |
| | | | | | | | | |
| Commercial Banks - 3.90% | | | | | | | | |
| Bank of Montreal (b) | | | 2,722 | | | | 157,195 | |
| Canadian Imperial Bank of | | | | | | | | |
| Commerce (b) | | | 2,133 | | | | 154,515 | |
| | | | | | | | 311,710 | |
| | | | | | | | | |
| Containers & Packaging - 0.55% | | | | | | | | |
| Packaging Corp. of America | | | 1,900 | | | | 44,023 | |
| | | | | | | | | |
| | | | | | | | | |
| Diversified Consumer Services - 1.03% | | | | | | | | |
| Hillenbrand, Inc. | | | 3,836 | | | | 82,512 | |
| | | | | | | | | |
| | | | | | | | | |
| Diversified Telecommunication Services - 1.02% | | | | | | | | |
| Verizon Communications, Inc. | | | 2,507 | | | | 81,703 | |
| | | | | | | | | |
| | | | | | | | | |
| Electric Utilities - 4.68% | | | | | | | | |
| American Electric Power Co., Inc. | | | 6,445 | | | | 233,502 | |
| Cleco Corp. | | | 1,671 | | | | 49,495 | |
| Edison International | | | 1,308 | | | | 44,982 | |
| Pepco Holdings, Inc. | | | 2,475 | | | | 46,035 | |
| | | | | | | | 374,014 | |
| | | | | | | | | |
| Food Products - 5.78% | | | | | | | | |
| Kraft Foods, Inc. - Class A | | | 7,748 | | | | 239,103 | |
| Sara Lee Corp. | | | 16,595 | | | | 222,871 | |
| | | | | | | | 461,974 | |
| | | | | | | | | |
| | | | | | | | | |
| Hotels, Restaurants & Leisure - 2.18% | | | | | | | | |
| Cracker Barrel Old Country | | | | | | | | |
| Store, Inc. | | | 3,436 | | | | 174,411 | |
| | | | | | | | | |
| Household Products - 4.88% | | | | | | | | |
| Energizer Holdings, Inc. (a) | | | 2,452 | | | | 164,848 | |
| Kimberly-Clark Corp. | | | 3,464 | | | | 225,333 | |
| | | | | | | | 390,181 | |
| | | | | | | | | |
| Industrial Conglomerates - 3.34% | | | | | | | | |
| 3M Co. | | | 1,061 | | | | 91,999 | |
| Tyco International, Ltd. (b) | | | 4,765 | | | | 175,019 | |
| | | | | | | | 267,018 | |
| | | | | | | | | |
| | | Shares | | | Fair Value | |
| | | | | | | |
| | | | | | | |
| Insurance - 4.41% | | | | | | |
| ACE, Ltd. (b) | | | 1,387 | | | $ | 80,793 | |
| Chubb Corp. | | | 2,033 | | | | 115,861 | |
| Loews Corp. | | | 2,047 | | | | 77,581 | |
| Travelers Companies, Inc. | | | 1,507 | | | | 78,515 | |
| | | | | | | | 352,750 | |
| | | | | | | | | |
| Machinery - 4.22% | | | | | | | | |
| Caterpillar, Inc. | | | 2,895 | | | | 227,779 | |
| Joy Global, Inc. | | | 1,560 | | | | 109,699 | |
| | | | | | | | | |
| | | | | | | | 337,478 | |
| | | | | | | | | |
| Metals & Mining - 1.38% | | | | | | | | |
| Cia Siderugica Nacional SA - ADR 6,249 | | | | | | | 110,420 | |
| | | | | | | | | |
| | | | | | | | | |
| Multi-Utilities - 4.67% | | | | | | | | |
| Alliant Energy Corp. | | | 2,349 | | | | 85,386 | |
| Dominion Resources, Inc. | | | 3,363 | | | | 146,829 | |
| DTE Energy Co. | | | 827 | | | | 37,984 | |
| TECO Energy, Inc. | | | 5,991 | | | | 103,764 | |
| | | | | | | | 373,963 | |
| | | | | | | | | |
| | | | | | | | | |
| Oil, Gas & Consumable Fuels - 11.09% | | | | | | | | |
| Chevron Corp. | | | 3,214 | | | | 260,495 | |
| Conocophillips | | | 4,361 | | | | 250,452 | |
| Exxon Mobil Corp. | | | 2,520 | | | | 155,711 | |
| Occidental Petroleum Corp. | | | 2,807 | | | | 219,788 | |
| | | | | | | | 886,446 | |
| | | | | | | | | |
| Pharmaceuticals - 13.85% | | | | | | | | |
| Abbott Laboratories | | | 3,018 | | | | 157,660 | |
| Bristol-Myers Squibb Co. | | | 5,436 | | | | 147,370 | |
| Eli Lilly & Co. | | | 5,348 | | | | 195,362 | |
| Endo Pharmaceuticals Holdings, | | | | | | | | |
| Inc. (a) | | | 1,360 | | | | 45,206 | |
| Johnson & Johnson | | | 1,313 | | | | 81,354 | |
| Medicis Pharmaceutical Corp. - | | | | | | | | |
| Class A | | | 3,976 | | | | 117,888 | |
| Merck & Co., Inc. | | | 2,206 | | | | 81,203 | |
| Novartis AG - ADR | | | 4,268 | | | | 246,136 | |
| Viropharma, Inc. (a) | | | 2,347 | | | | 34,994 | |
| | | | | | | | 1,107,173 | |
| | | | | | | | | |
110 The Leuthold Funds - 2010 Annual Report See Notes to the Finacial Statements
Leuthold Undervalued & Unloved Fund
Schedule of Investments (continued)
September 30, 2010
| | | Shares | | | Fair Value | |
| | | | | | | |
| | | | | | | |
| Real Estate Investment Trusts (REITs) - 8.55% | | | | | | |
| HCP, Inc. | | | 6,172 | | | $ | 222,069 | |
| Health Care REIT, Inc. | | | 904 | | | | 42,795 | |
| National Retail Properties, Inc. | | | 1,708 | | | | 42,888 | |
| Nationwide Health Properties, Inc. 4,092 | | | | | | | 158,238 | |
| Ventas, Inc. | | | 4,220 | | | | 217,625 | |
| | | | | | | | 683,615 | |
| | | | | | | | | |
| | | | | | | | | |
| Semiconductors & Semiconductor | | | | | | | | |
| Equipment - 1.15% | | | | | | | | |
| Texas Instruments, Inc. | | | 3,397 | | | | 92,195 | |
| | | | | | | | | |
| | | | | | | | | |
| Software - 0.89% | | | | | | | | |
| Microsoft Corp. | | | 2,894 | | | | 70,874 | |
| | | | | | | | | |
| | | | | | | | | |
| Specialty Retail - 4.76% | | | | | | | | |
| JOS A Bank Clothiers, Inc. (a) | | | 3,814 | | | | 162,515 | |
| Limited Brands, Inc. | | | 8,122 | | | | 217,507 | |
| | | | | | | | 380,022 | |
| | | | | | | | | |
| | | | | | | | | |
| Tobacco - 11.20% | | | | | | | | |
| Altria Group, Inc. | | | 11,402 | | | | 273,876 | |
| British American Tobacco PLC - | | | | | | | | |
| ADR | | | 1,661 | | | | 124,093 | |
| Lorillard, Inc. | | | 3,251 | | | | 261,088 | |
| Reynolds American, Inc. | | | 3,990 | | | | 236,966 | |
| | | | | | | | 896,023 | |
| | | | | | | | | |
| | | | | | | | | |
| Wireless Telecommunication Services - 0.97% | | | | | | | | |
| Vodafone Group, PLC - ADR | | | 3,124 | | | | 77,507 | |
| | | | | | | | | |
| | | | | | | | | |
| | | | | | | | | |
| TOTAL COMMON STOCKS | | | | | | | | |
| (Cost $6,602,049) | | | | | | $ | 7,780,089 | |
| | | | | | | | | |
| | | | | | | | | |
| | | | | | | | | |
| INVESTMENT COMPANIES - 0.49% | | | | | | | | |
| Mutual Funds - 0.49% | | | | | | | | |
| Apollo Investment Corporation | | | 3,819 | | | $ | 39,068 | |
| | | | | | | | | |
| TOTAL INVESTMENT COMPANIES | | | | | |
| (Cost $38,190) | | | | | | $ | 39,068 | |
| | | | | | | | | |
| | | Shares | | | Fair Value | |
| | | | | | | |
| | | | | | | |
| SHORT-TERM INVESTMENTS - 2.16% | | | | | | |
| Money Market Funds - 2.16% | | | | | | |
| Fidelity Institutional Money Market Fund - | | | | | | |
| Government Portfolio | | | | | | |
| 0.06% (c) | | | 172,462 | | | $ | 172,462 | |
| | | | | | | | | |
| TOTAL SHORT-TERM INVESTMENTS | | | | | | | | |
| (Cost $172,462) | | | | | | $ | 172,462 | |
| | | | | | | | | |
| | | | | | | | | |
| | | | | | | | | |
| Total Investments | | | | | | | | |
| (Cost $6,812,701) - 99.95% | | | | | | $ | 7,991,619 | |
| | | | | | | | | |
| | | | | | | | | |
| Other Assets in Excess of | | | | | | | | |
| Liabilities - 0.05% | | | | | | | 4,234 | |
| | | | | | | | | |
| | | | | | | | | |
| TOTAL NET ASSETS - 100.00% | | | | | | $ | 7,995,853 | |
| | | | | | | | | |
| | | | | | | | | |
Percentages are stated as a percent of net assets.
ADR American Depository Receipt
| (a) | Non-income producing security. |
| (b) | Foreign issued security. |
| (c) | The rate quoted is the annualized seven-day yield as of September 30, 2010. |
The Global Industry Classification Standard (GICS®) was developed by and/or is the exclusive property of MSCI, Inc. and Standard & Poor Financial Services LLC (“S&P”). GICS is a service mark of MSCI and S&P and has been licensed for use by U.S. Bancorp Fund Services, LLC.
See Notes to the Finacial Statements The Leuthold Funds - 2010 Annual Report 111
Leuthold Global Clean Technology Fund
Schedule of Investments
September 30, 2010
| | | Shares | | | Fair Value | |
| | | | | | | |
| | | | | | | |
| COMMON STOCKS - 97.02% | | | | | | |
| Automobiles - 2.71% | | | | | | |
| Byd Co., Ltd. (b) | | | 63,000 | | | $ | 506,267 | |
| Tesla Motors, Inc. (a) | | | 11,665 | | | | 236,333 | |
| | | | | | | | 742,600 | |
| | | | | | | | | |
| Building Products - 0.31% | | | | | | | | |
| Water-Furnace Renewable | | | | | | | | |
| Energy, Inc. (b) | | | 3,385 | | | | 85,900 | |
| | | | | | | | | |
| | | | | | | | | |
| Chemicals - 8.54% | | | | | | | | |
| ADA-ES, Inc. (a) | | | 166,189 | | | | 806,017 | |
| Cereplast, Inc. (a) | | | 214,000 | | | | 689,080 | |
| LSB Industries, Inc. (a) | | | 45,470 | | | | 844,377 | |
| | | | | | | | 2,339,474 | |
| | | | | | | | | |
| | | | | | | | | |
| Commercial Services & Supplies - 4.37% | | | | | | | | |
| BWT AG (b) | | | 12,413 | | | | 323,211 | |
| Clean Harbors, Inc. (a) | | | 1,961 | | | | 132,858 | |
| Sinomem Technology, Ltd. (b) | | | 1,951,000 | | | | 741,769 | |
| | | | | | | | 1,197,838 | |
| | | | | | | | | |
| | | | | | | | | |
| Construction & Engineering - 10.29% | | | | | | | | |
| Abengoa SA (b) | | | 29,892 | | | | 757,141 | |
| Insituform Technologies, Inc. - | | | | | | | | |
| Class A (a) | | | 35,642 | | | | 861,824 | |
| Layne Christensen Co. (a) | | | 29,881 | | | | 773,619 | |
| Quanta Services, Inc. (a) | | | 15,290 | | | | 291,733 | |
| Solar Millennium AG (a)(b) | | | 5,184 | | | | 135,017 | |
| | | | | | | | 2,819,334 | |
| | | | | | | | | |
| Construction Materials - 2.91% | | | | | | | | |
| Headwaters, Inc. (a) | | | 221,316 | | | | 796,738 | |
| | | | | | | | | |
| | | | | | | | | |
| Electrical Equipment - 8.95% | | | | | | | | |
| Advanced Battery Technologies, | | | | | | | | |
| Inc. (a) | | | 39,215 | | | | 140,782 | |
| Areva SA (b) | | | 703 | | | | 295,273 | |
| China High Speed Transmission Equipment | | | | | | | | |
| Group Co., Ltd. (b) | | | 210,000 | | | | 455,789 | |
| Nordex SE (a)(b) | | | 11,396 | | | | 104,865 | |
| | | Shares | | | Fair Value | |
| | | | | | | |
| | | | | | | |
| Electrical Equipment - 8.95%(continued) | | | | | | |
| Real Goods Solar, Inc. - | | | | | | |
| Class A (a) | | | 61,004 | | | $ | 225,105 | |
| SMA Solar Technology AG (b) | | | 4,019 | | | | 443,956 | |
| Suzlon Energy, Ltd. - GDR (a)(b) | | | 30,241 | | | | 133,060 | |
| Vestas Wind System A/S (a)(b) | | | 17,290 | | | | 651,522 | |
| | | | | | | | 2,450,352 | |
| | | | | | | | | |
| | | | | | | | | |
| Electronic Equipment, Instruments & | | | | | | | | |
| Components - 9.17% | | | | | | | | |
| 5N Plus, Inc. (a)(b) | | | 99,938 | | | | 561,417 | |
| Echelon Corp. (a) | | | 40,826 | | | | 349,062 | |
| Everlight Electronics Co., Ltd. (b) | | | 102,000 | | | | 286,984 | |
| Horiba, Ltd. (b) | | | 13,300 | | | | 324,853 | |
| Itron, Inc. (a) | | | 4,514 | | | | 276,392 | |
| Maxwell Technologies, Inc. (a) | | | 48,795 | | | | 712,895 | |
| | | | | | | | 2,511,603 | |
| | | | | | | | | |
| | | | | | | | | |
| Independent Power Producers & | | | | | | | | |
| Energy Traders - 4.53% | | | | | | | | |
| Boralex, Inc. - Class A (a)(b) | | | 39,095 | | | | 310,055 | |
| Iberdrola Renovables SA (b) | | | 180,825 | | | | 600,991 | |
| Ormat Technologies, Inc. | | | 3,719 | | | | 108,483 | |
| Plutonic Power Corp. (a)(b) | | | 104,858 | | | | 222,170 | |
| | | | | | | | 1,241,699 | |
| | | | | | | | | |
| | | | | | | | | |
| IT Services - 0.58% | | | | | | | | |
| Telvent GIT SA (a)(b) | | | 7,015 | | | | 158,679 | |
| | | | | | | | | |
| | | | | | | | | |
| Machinery - 22.19% | | | | | | | | |
| China Valves Technology, Inc. (a) | | | 115,008 | | | | 892,461 | |
| China Wind Systems, Inc. (a) | | | 176,274 | | | | 780,894 | |
| CLARCOR, Inc. | | | 10,543 | | | | 407,276 | |
| Donaldson Co., Inc. | | | 8,775 | | | | 413,566 | |
| Duoyuan Global Water, Inc. - | | | | | | | | |
| ADR (a) | | | 51,652 | | | | 673,026 | |
| Electrovaya, Inc. (a)(b) | | | 216,163 | | | | 701,705 | |
| ESCO Technologies, Inc. | | | 24,405 | | | | 811,710 | |
| Hansen Transmissions International | | | | | | | | |
| NV (a)(b) | | | 66,268 | | | | 49,552 | |
112 The Leuthold Funds - 2010 Annual Report See Notes to the Finacial Statements
Leuthold Global Clean Technology Fund
Schedule of Investments (continued)
September 30, 2010
| | | Shares | | | Fair Value | |
| | | | | | | |
| | | | | | | |
| Machinery - 22.19% (continued) | | | | | | |
| Kurita Water Industries, Ltd. (b) | | | 4,300 | | | $ | 119,347 | |
| Meyer Burger Technology | | | | | | | | |
| AG (a)(b) | | | 25,921 | | | | 817,739 | |
| Pall Corp. | | | 9,816 | | | | 408,738 | |
| | | | | | | | 6,076,014 | |
| | | | | | | | | |
| | | | | | | | | |
| Multi-Utilities - 0.73% | | | | | | | | |
| Suez Environnement Co. (b) | | | 10,802 | | | | 199,535 | |
| | | | | | | | | |
| | | | | | | | | |
| Oil, Gas & Consumable Fuels - 0.34% | | | | | | | | |
| Fersa Energias Renovables SA (b) | | | 60,324 | | | | 92,105 | |
| | | | | | | | | |
| | | | | | | | | |
| Semiconductors & Semiconductor | | | | | | | | |
| Equipment - 19.21% | | | | | | | | |
| Aixtron AG (b) | | | 12,341 | | | | 366,761 | |
| Cree, Inc. (a) | | | 2,387 | | | | 129,590 | |
| Epistar Corp. (b) | | | 129,000 | | | | 407,957 | |
| First Solar, Inc. (a) | | | 5,493 | | | | 809,394 | |
| Formosa Epitaxy, Inc. (b) | | | 207,000 | | | | 280,934 | |
| JA Solar Holdings Co., Ltd. - | | | | | | | | |
| ADR (a) | | | 33,432 | | | | 311,921 | |
| JinkoSolar Holding Co., Ltd. - | | | | | | | | |
| ADR (a) | | | 13,898 | | | | 439,316 | |
| Manz Automation AG (a)(b) | | | 7,413 | | | | 500,237 | |
| Rubicon Technology, Inc. (a) | | | 10,232 | | | | 232,164 | |
| Taiwan Surface Mounting | | | | | | | | |
| Technology Co., Ltd. (b) | | | 138,000 | | | | 307,437 | |
| Trina Solar, Ltd. - ADR (a) | | | 30,711 | | | | 926,858 | |
| Veeco Instruments, Inc. (a) | | | 7,738 | | | | 269,824 | |
| Yingli Green Energy Holding | | | | | | | | |
| Co., Ltd. - ADR (a) | | | 20,087 | | | | 278,004 | |
| | | | | | | | 5,260,397 | |
| | | | | | | | | |
| | | | | | | | | |
| Trading Companies & Distributors - 2.19% | | | | | | | | |
| Phoenix Solar AG (b) | | | 16,712 | | | | 598,729 | |
| | | | | | | | | |
| | | | | | | | | |
| | | | | | | | | |
| TOTAL COMMON STOCKS | | | | | | | | |
| (Cost $27,503,063) | | | | | | $ | 26,570,997 | |
| | | | | | | | | |
| | | Shares | | | Fair Value | |
| | | | | | | |
| | | | | | | |
| PREFERRED STOCKS - 1.04% | | | | | | |
| Electric Utilities - 1.04% | | | | | | |
| Cia Energetica de Minas Gerais - | | | | | | |
| ADR | | | 17,295 | | | $ | 283,465 | |
| | | | | | | | | |
| TOTAL PREFERRED STOCKS | | | | | | | | |
| (Cost $273,206) | | | | | | $ | 283,465 | |
| | | | | | | | | |
| | | | | | | | | |
| | | | | | | | | |
| | | | | | | | | |
| SHORT-TERM INVESTMENTS - 5.62% | | | | | | | | |
| Money Market Funds - 5.62% | | | | | | | | |
| Fidelity Institutional Money Market Fund - | | | | | | | | |
| Government Portfolio | | | | | | | | |
| 0.06% (c) | | | 1,538,912 | | | $ | 1,538,912 | |
| | | | | | | | | |
| TOTAL SHORT-TERM INVESTMENTS | | | | | | | | |
| (Cost $1,538,912) | | | | | | $ | 1,538,912 | |
| | | | | | | | | |
| | | | | | | | | |
| | | | | | | | | |
| | | | | | | | | |
| Total Investments | | | | | | | | |
| (Cost $29,315,181) - 103.68% | | | | | | $ | 28,393,374 | |
| | | | | | | | | |
| | | | | | | | | |
| Liabilities in Excess of | | | | | | | | |
| Other Assets - (3.68)% | | | | | | | (1,007,398 | ) |
| | | | | | | | | |
| | | | | | | | | |
| TOTAL NET ASSETS - 100.00% | | | | | | $ | 27,385,976 | |
| | | | | | | | | |
| | | | | | | | | |
ADR American Depository Receipt
GDR Global Depository Receipt
| (a) | Non-income producing security. |
| (b) | Foreign issued security. |
| (c) | The rate quoted is the annualized seven-day yield as of September 30, 2010. |
The Global Industry Classification Standard (GICS®) was developed by and/or is the exclusive property of MSCI, Inc. and Standard & Poor Financial Services LLC (“S&P”). GICS is a service mark of MSCI and S&P and has been licensed for use by U.S. Bancorp Fund Services, LLC.
See Notes to the Finacial Statements The Leuthold Funds - 2010 Annual Report 113
Leuthold Global Clean Technology Fund
Schedule of Investments (continued)
September 30, 2010
| | | | | | Percentage | |
| | | Fair | | | of Total | |
| | | Value | | | Investments | |
| | | | | | | |
| | | | | | | |
| CURRENCY EXPOSURE | | | | | | |
| September 30, 2010 | | | | | | |
| British Pound | | $ | 49,551 | | | | 0.18 | % |
| Canadian Dollar | | | 1,881,246 | | | | 6.63 | |
| Danish Krone | | | 651,522 | | | | 2.29 | |
| Euro | | | 4,417,822 | | | | 15.56 | |
| Hong Kong Dollar | | | 962,056 | | | | 3.39 | |
| Japanese Yen | | | 444,200 | | | | 1.56 | |
| New Taiwan Dollar | | | 1,283,312 | | | | 4.52 | |
| Singapore Dollar | | | 741,769 | | | | 2.61 | |
| Swiss Franc | | | 817,739 | | | | 2.88 | |
| US Dollar | | | 17,144,157 | | | | 60.38 | |
| Total Investments | | $ | 28,393,374 | | | | 100.00 | % |
| | | | | | | | | |
| | | | | | Percentage | |
| | | Fair | | | of Total | |
| | | Value | | | Investments | |
| | | | | | | |
| | | | | | | |
| PORTFOLIO DIVERSIFICATION | | | | | | |
| September 30, 2010 | | | | | | |
| Austria | | $ | 323,211 | | | | 1.15 | % |
| Brazil | | | 283,465 | | | | 1.00 | |
| Canada | | | 1,881,246 | | | | 6.63 | |
| Cayman Islands | | | 2,411,887 | | | | 8.49 | |
| China | | | 506,267 | | | | 1.78 | |
| Denmark | | | 651,522 | | | | 2.29 | |
| France | | | 494,808 | | | | 1.74 | |
| Germany | | | 2,149,565 | | | | 7.57 | |
| Japan | | | 444,200 | | | | 1.56 | |
| Singapore | | | 741,769 | | | | 2.61 | |
| Spain | | | 1,608,917 | | | | 5.67 | |
| Switzerland | | | 817,739 | | | | 2.88 | |
| Taiwan, Province of China | | | 1,283,312 | | | | 4.52 | |
| United Kingdom | | | 182,612 | | | | 0.64 | |
| United States | | | 13,939,828 | | | | 49.10 | |
| Virgin Islands (British) | | | 673,026 | | | | 2.37 | |
| Total Investments | | $ | 28,393,374 | | | | 100.00 | % |
| | | | | | | | | |
114 The Leuthold Funds - 2010 Annual Report �� See Notes to the Finacial Statements
Leuthold Hedged Equity Fund
Schedule of Investments
September 30, 2010
| | | Shares | | | Fair Value | |
| | | | | | | |
| | | | | | | |
| COMMON STOCKS - 52.44% | | | | | | |
| Beverages - 0.79% | | | | | | |
| Coca-Cola Femsa SAB De CV - | | | | | | |
| ADR | | | 157 | | | $ | 12,281 | |
| Fomento Economico Mexicano SAB | | | | | | | | |
| De CV - ADR | | | 472 | | | | 23,944 | |
| | | | | | | | 36,225 | |
| | | | | | | | | |
| | | | | | | | | |
| Chemicals - 0.77% | | | | | | | | |
| Sherwin Williams Co. | | | 469 | | | | 35,241 | |
| | | | | | | | | |
| | | | | | | | | |
| Electronic Equipment, Instruments & | | | | | | | | |
| Components - 5.46% | | | | | | | | |
| Amphenol Corp. - Class A | | | 643 | | | | 31,494 | |
| Arrow Electronics, Inc. (a) | | | 508 | | | | 13,579 | |
| Benchmark Electronics, Inc. (a) | | | 390 | | | | 6,396 | |
| Corning, Inc. | | | 1,992 | | | | 36,414 | |
| Dolby Laboratories, Inc. - | | | | | | | | |
| Class A (a) | | | 354 | | | | 20,111 | |
| Flextronics International | | | | | | | | |
| Ltd. (a)(b) | | | 3,688 | | | | 22,276 | |
| LG Display Co. Ltd. - ADR | | | 781 | | | | 13,621 | |
| Molex, Inc. | | | 1,126 | | | | 23,567 | |
| Plexus Corp. (a) | | | 289 | | | | 8,482 | |
| Sanmina-SCI Corp. (a) | | | 1,354 | | | | 16,356 | |
| Tyco Electronics, Ltd. (b) | | | 1,256 | | | | 36,700 | |
| Vishay Intertechnology, Inc. (a) | | | 2,213 | | | | 21,422 | |
| | | | | | | | 250,418 | |
| | | | | | | | | |
| | | | | | | | | |
| Food & Staples Retailing - 3.19% | | | | | | | | |
| BJ's Wholesale Club, Inc. (a) | | | 736 | | | | 30,544 | |
| Costco Wholesale Corp. | | | 949 | | | | 61,202 | |
| Wal-Mart Stores, Inc. | | | 1,022 | | | | 54,697 | |
| | | | | | | | 146,443 | |
| | | | | | | | | |
| | | Shares | | | Fair Value | |
| | | | | | | |
| | | | | | | |
| Health Care Providers & Services - 8.99% | | | | | | |
| Aetna, Inc. | | | 1,362 | | | $ | 43,053 | |
| AMERIGROUP Corp. (a) | | | 1,181 | | | | 50,157 | |
| CIGNA Corp. | | | 1,626 | | | | 58,178 | |
| Coventry Health Care, Inc. (a) | | | 2,697 | | | | 58,066 | |
| Healthspring, Inc. (a) | | | 926 | | | | 23,928 | |
| Humana, Inc. (a) | | | 787 | | | | 39,539 | |
| Magellan Health Services, Inc. (a) | | | 658 | | | | 31,084 | |
| Molina Healthcare, Inc. (a) | | | 188 | | | | 5,074 | |
| UnitedHealth Group, Inc. | | | 1,467 | | | | 51,506 | |
| Wellpoint, Inc. (a) | | | 920 | | | | 52,109 | |
| | | | | | | | 412,694 | |
| | | | | | | | | |
| Household Durables - 3.47% | | | | | | | | |
| Garmin, Ltd. (b) | | | 402 | | | | 12,201 | |
| Panasonic Corp. - ADR | | | 2,211 | | | | 30,025 | |
| Sharp Corp. - ADR (a) | | | 3,506 | | | | 35,025 | |
| Sony Corp. - ADR | | | 2,239 | | | | 69,229 | |
| Whirlpool Corp. | | | 156 | | | | 12,630 | |
| | | | | | | | 159,110 | |
| | | | | | | | | |
| Industrial Conglomerates - 5.85% | | | | | | | | |
| 3M Co. | | | 424 | | | | 36,765 | |
| Carlisle Companies, Inc. | | | 997 | | | | 29,860 | |
| General Electric Co. | | | 4,281 | | | | 69,566 | |
| Koninklijke Philips Electronics | | | | | | | | |
| N.V. - NYS | | | 1,303 | | | | 40,811 | |
| Siemens AG - ADR | | | 351 | | | | 36,995 | |
| Tyco International, Ltd. (b) | | | 1,478 | | | | 54,287 | |
| | | | | | | | 268,284 | |
| | | | | | | | | |
| | | | | | | | | |
| Leisure Equipment & Products - 0.33% | | | | | | | | |
| Polaris Industries, Inc. | | | 236 | | | | 15,364 | |
| | | | | | | | | |
| | | | | | | | | |
| Machinery - 0.37% | | | | | | | | |
| Cummins, Inc. | | | 185 | | | | 16,757 | |
| | | | | | | | | |
| | | | | | | | | |
| Media - 1.31% | | | | | | | | |
| DIRECTV - Class A (a) | | | 1,014 | | | | 42,213 | |
| Grupo Televisa SA - ADR | | | 952 | | | | 18,012 | |
| | | | | | | | 60,225 | |
| | | | | | | | | |
See Notes to the Finacial Statements The Leuthold Funds - 2010 Annual Report 115
Leuthold Hedged Equity Fund
Schedule of Investments (continued)
September 30, 2010
| | | Shares | | | Fair Value | |
| | | | | | | |
| | | | | | | |
| Oil, Gas & Consumable Fuels - 0.53% | | | | | | |
| Occidental Petroleum Corp. | | | 312 | | | $ | 24,430 | |
| | | | | | | | | |
| | | | | | | | | |
| Paper & Forest Products - 1.81% | | | | | | | | |
| Domtar Corp. | | | 419 | | | | 27,059 | |
| Fibria Celulose S.A. - ADR (a) | | | 2,303 | | | | 39,819 | |
| Schweitzer-Mauduit International, | | | | | | | | |
| Inc. | | | 278 | | | | 16,210 | |
| | | | | | | | 83,088 | |
| | | | | | | | | |
| | | | | | | | | |
| Pharmaceuticals - 5.79% | | | | | | | | |
| Abbott Laboratories | | | 272 | | | | 14,209 | |
| Allergan, Inc. | | | 213 | | | | 14,171 | |
| AstraZeneca PLC - ADR | | | 270 | | | | 13,689 | |
| Endo Pharmaceuticals Holdings, | | | | | | | | |
| Inc. (a) | | | 545 | | | | 18,116 | |
| GlaxoSmithKline PLC - ADR | | | 362 | | | | 14,306 | |
| Impax Laboratories, Inc. (a) | | | 251 | | | | 4,970 | |
| Medicis Pharmaceutical Corp. - | | | | | | | | |
| Class A | | | 482 | | | | 14,291 | |
| Merck & Co., Inc. | | | 700 | | | | 25,767 | |
| Novartis AG - ADR | | | 471 | | | | 27,163 | |
| Par Pharmaceutical Companies, | | | | | | | | |
| Inc. (a) | | | 261 | | | | 7,590 | |
| Perrigo Co. | | | 258 | | | | 16,569 | |
| Pfizer, Inc. | | | 1,360 | | | | 23,351 | |
| Questcor Pharmaceuticals, Inc. (a) | | | 671 | | | | 6,656 | |
| Shire PLC - ADR | | | 140 | | | | 9,419 | |
| Teva Pharmaceutical Industries, | | | | | | | | |
| Ltd. - ADR | | | 270 | | | | 14,243 | |
| Valeant Pharmaceuticals International, | | | | | | | | |
| Inc. (b) | | | 402 | | | | 10,070 | |
| Viropharma, Inc. (a) | | | 551 | | | | 8,215 | |
| Warner Chilcott PLC - | | | | | | | | |
| Class A (a)(b) | | | 617 | | | | 13,845 | |
| Watson Pharmaceuticals, Inc. (a) | | | 213 | | | | 9,012 | |
| | | | | | | | 265,652 | |
| | | | | | | | | |
| | | Shares | | | Fair Value | |
| | | | | | | |
| | | | | | | |
| Semiconductors & Semiconductor | | | | | | |
| Equipment - 8.07% | | | | | | |
| Altera Corp. | | | 1,744 | | | $ | 52,598 | |
| Analog Devices, Inc. | | | 1,542 | | | | 48,387 | |
| Applied Micro Circuits Corp. (a) | | | 1,551 | | | | 15,510 | |
| Atheros Communications, Inc. (a) | | | 963 | | | | 25,375 | |
| Broadcom Corp. - Class A | | | 876 | | | | 31,002 | |
| Cirrus Logic, Inc. (a) | | | 756 | | | | 13,487 | |
| Intel Corp. | | | 2,374 | | | | 45,652 | |
| LSI Corp. (a) | | | 3,551 | | | | 16,193 | |
| Micrel, Inc. | | | 1,101 | | | | 10,856 | |
| ON Semiconductor Corp. (a) | | | 3,242 | | | | 23,375 | |
| RF Micro Devices, Inc. (a) | | | 6,194 | | | | 38,031 | |
| Samsung Electronics Co., Ltd. - | | | | | | | | |
| GDR (Acquired 01/25/2010 | | | | | | | | |
| through 06/11/2010, | | | | | | | | |
| cost $42,612) (a)(b)(d) | | | 126 | | | | 42,930 | |
| Volterra Semiconductor Corp. (a) | | | 323 | | | | 6,951 | |
| | | | | | | | 370,347 | |
| | | | | | | | | |
| Specialty Retail - 3.79% | | | | | | | | |
| Best Buy, Inc. | | | 2,261 | | | | 92,317 | |
| Hhgregg, Inc. (a) | | | 444 | | | | 10,993 | |
| RadioShack Corp. | | | 573 | | | | 12,222 | |
| The Home Depot, Inc. | | | 1,845 | | | | 58,450 | |
| | | | | | | | 173,982 | |
| | | | | | | | | |
| | | | | | | | | |
| Textiles, Apparel & Luxury Goods - 0.23% | | | | | | | | |
| Fossil, Inc. (a) | | | 199 | | | | 10,704 | |
| | | | | | | | | |
| | | | | | | | | |
| Tobacco - 0.64% | | | | | | | | |
| Phillip Morris International, Inc. | | | 528 | | | | 29,579 | |
| | | | | | | | | |
| | | | | | | | | |
| Transportation Infrastructure - 0.10% | | | | | | | | |
| Grupo Aeroportuario del Sureste | | | | | | | | |
| SAB de CV - ADR | | | 96 | | | | 4,558 | |
| | | | | | | | | |
| | | | | | | | | |
| Wireless Telecommunication Services - 0.95% | | | | | | | | |
| America Movil SAB de CV - ADR | | | 820 | | | | 43,731 | |
| | | | | | | | | |
| | | | | | | | | |
| TOTAL COMMON STOCKS | | | | | | | | |
| (Cost $2,250,804) | | | | | | $ | 2,406,832 | |
| | | | | | | | | |
116 The Leuthold Funds - 2010 Annual Report See Notes to the Finacial Statements
Leuthold Hedged Equity Fund
Schedule of Investments (continued)
September 30, 2010
| | | Shares | | | Fair Value | |
| | | | | | | |
| | | | | | | |
| PREFERRED STOCKS - 0.60% | | | | | | |
| Food & Staples Retailing - 0.60% | | | | | | |
| Cia Brasileira de Distribuicao Gupo | | | | | | |
| Pao de Acucar - Class A | | | 399 | | | $ | 27,539 | |
| | | | | | | | | |
| TOTAL PREFERRED STOCKS | | | | | | | | |
| (Cost $28,580) | | | | | | $ | 27,539 | |
| | | | | | | | | |
| | | | | | | | | |
| | | | | | | | | |
| | | | | | | | | |
| SHORT-TERM INVESTMENTS - 1.66% | | | | | | | | |
| Money Market Funds - 1.66% | | | | | | | | |
| Fidelity Institutional Money Market Fund - | | | | | | | | |
| Government Portfolio | | | | | | | | |
| 0.06% (c) | | | 76,216 | | | $ | 76,216 | |
| | | | | | | | | |
| TOTAL SHORT-TERM INVESTMENTS | | | | | | | | |
| (Cost $76,216) | | | | | | $ | 76,216 | |
| | | | | | | | | |
| | | | | | | | | |
| | | | | | | | | |
| | | | | | | | | |
| Total Investments | | | | | | | | |
| (Cost $2,355,600) - 54.70% | | | | | | $ | 2,510,587 | |
| | | | | | | | | |
| | | | | | | | | |
| Other Assets in Excess of | | | | | | | | |
| Liabilities - 45.30% (e) | | | | | | | 2,078,901 | |
| | | | | | | | | |
| | | | | | | | | |
| TOTAL NET ASSETS - 100.00% | | | | | | $ | 4,589,488 | |
| | | | | | | | | |
| | | | | | | | | |
Percentages are stated as a percent of net assets.
ADR American Depository Receipt
GDR Global Depository Receipt
NYS New York Registered Shares
| (a) | Non-income producing security. |
| (b) | Foreign issued security. |
| (c) | The rate quoted is the annualized seven-day yield as of September 30, 2010. |
| (d) | Restricted security as defined in Rule 144(a) under the Securities Act of 1933. Resaleto the public may require registration or may extend only to qualified institutional buyers. At September 30, 2010, the market value of these securities total $42,930, which represents 0.94% of total net assets. |
| (e) | All or a portion of the assets have been committed as collateral for open securities sold short. |
The Global Industry Classification Standard (GICS®) was developed by and/or is the exclusive property of MSCI, Inc. and Standard & Poor Financial Services LLC (“S&P”). GICS is a service mark of MSCI and S&P and has been licensed for use by U.S. Bancorp Fund Services, LLC.
See Notes to the Finacial Statements The Leuthold Funds - 2010 Annual Report 117
Leuthold Hedged Equity Fund
Schedule of Securities Sold Short
September 30, 2010
| | | Shares | | | Fair Value | |
| | | | | | | |
| | | | | | | |
| COMMON STOCKS - 45.20% | | | | | | |
| Biotechnology - 0.77% | | | | | | |
| Vertex Pharmaceuticals, Inc. | | | 1,019 | | | $ | 35,227 | |
| | | | | | | | | |
| | | | | | | | | |
| Building Products - 0.71% | | | | | | | | |
| Masco Corp. | | | 2,945 | | | | 32,424 | |
| | | | | | | | | |
| | | | | | | | | |
| Capital Markets - 5.34% | | | | | | | | |
| Blackstone Group LP | | | 2,228 | | | | 28,273 | |
| E*Trade Financial Corp. | | | 2,496 | | | | 36,292 | |
| Greenhill & Co., Inc. | | | 341 | | | | 27,048 | |
| Invesco, Ltd. (a) | | | 1,846 | | | | 39,190 | |
| Northern Trust Corp. | | | 772 | | | | 37,241 | |
| Stifel Financial Corp. | | | 482 | | | | 22,312 | |
| TD Ameritrade Holding Corp. | | | 1,864 | | | | 30,104 | |
| The Charles Schwab Corp. | | | 1,785 | | | | 24,812 | |
| | | | | | | | 245,272 | |
| | | | | | | | | |
| | | | | | | | | |
| Chemicals - 0.62% | | | | | | | | |
| Intrepid Potash, Inc. | | | 1,098 | | | | 28,625 | |
| | | | | | | | | |
| | | | | | | | | |
| Commercial Banks - 2.02% | | | | | | | | |
| Associated Banc-Corp. | | | 1,773 | | | | 23,386 | |
| Barclays PLC - ADR | | | 1,693 | | | | 31,913 | |
| First Horizon National Corp. | | | 2,159 | | | | 24,636 | |
| Westamerica Bancorporation | | | 227 | | | | 12,369 | |
| | | | | | | | 92,304 | |
| | | | | | | | | |
| | | | | | | | | |
| Commercial Services & Supplies - 0.75% | | | | | | | | |
| Covanta Holding Corp. | | | 2,176 | | | | 34,272 | |
| | | | | | | | | |
| | | | | | | | | |
| Construction & Engineering - 0.79% | | | | | | | | |
| Foster Wheeler AG (a) | | | 1,477 | | | | 36,127 | |
| | | | | | | | | |
| | | | | | | | | |
| Construction Materials - 0.76% | | | | | | | | |
| Vulcan Materials Co. | | | 947 | | | | 34,963 | |
| | | | | | | | | |
| | | | | | | | | |
| Containers & Packaging - 0.68% | | | | | | | | |
| Owens-Illinois, Inc. | | | 1,110 | | | | 31,147 | |
| | | | | | | | | |
| | | | | | | | | |
| Diversified Financial Services - 0.67% | | | | | | | | |
| Bank of America Corp. | | | 2,330 | | | | 30,546 | |
| | | | | | | | | |
| | | Shares | | | Fair Value | |
| | | | | | | |
| | | | | | | |
| Electric Utilities - 0.25% | | | | | | |
| Korea Electric Power Corp. - ADR | | | 900 | | | $ | 11,637 | |
| | | | | | | | | |
| | | | | | | | | |
| Energy Equipment & Services - 0.69% | | | | | | | | |
| Weatherford International, Ltd. (a) | | | 1,864 | | | | 31,874 | |
| | | | | | | | | |
| | | | | | | | | |
| Health Care Equipment & Supplies - 0.64% | | | | | | | | |
| Alere, Inc. | | | 949 | | | | 29,353 | |
| | | | | | | | | |
| | | | | | | | | |
| Health Care Providers & Services - 0.26% | | | | | | | | |
| Brookdale Senior Living, Inc. | | | 736 | | | | 12,004 | |
| | | | | | | | | |
| | | | | | | | | |
| Health Care Technology - 0.31% | | | | | | | | |
| Quality Systems, Inc. | | | 213 | | | | 14,124 | |
| | | | | | | | | |
| | | | | | | | | |
| Hotels, Restaurants & Leisure - 4.33% | | | | | | | | |
| Bally Technologies, Inc. | | | 731 | | | | 25,548 | |
| Hyatt Hotels Corp. - Class A | | | 315 | | | | 11,778 | |
| International Game Technology | | | 2,324 | | | | 33,582 | |
| Marriott International, Inc. - | | | | | | | | |
| Class A | | | 897 | | | | 32,140 | |
| MGM Resorts International | | | 3,390 | | | | 38,238 | |
| Penn National Gaming, Inc. | | | 752 | | | | 22,267 | |
| Starwood Hotels & Resorts | | | | | | | | |
| Worldwide, Inc. | | | 669 | | | | 35,156 | |
| | | | | | | | 198,709 | |
| | | | | | | | | |
| | | | | | | | | |
| Household Durables - 2.89% | | | | | | | | |
| D.R. Horton, Inc. | | | 3,038 | | | | 33,783 | |
| KB Home | | | 2,566 | | | | 29,073 | |
| Pulte Group, Inc. | | | 3,908 | | | | 34,234 | |
| Toll Brothers, Inc. | | | 1,874 | | | | 35,643 | |
| | | | | | | | 132,733 | |
| | | | | | | | | |
| | | | | | | | | |
| Independent Power Producers & | | | | | | | | |
| Energy Traders - 0.63% | | | | | | | | |
| Calpine Corp. | | | 2,333 | | | | 29,046 | |
| | | | | | | | | |
| | | | | | | | | |
| Internet & Catalog Retail - 0.69% | | | | | | | | |
| Expedia, Inc. | | | 1,116 | | | | 31,482 | |
| | | | | | | | | |
118 The Leuthold Funds - 2010 Annual Report See Notes to the Finacial Statements
Leuthold Hedged Equity Fund
Schedule of Securities Sold Short (continued)
September 30, 2010
| | | Shares | | | Fair Value | |
| | | | | | | |
| | | | | | | |
| | | | | | | |
| Internet Software & Services - 2.80% | | | | | | |
| Equinix, Inc. | | | 297 | | | $ | 30,398 | |
| GSI Commerce, Inc. | | | 1,011 | | | | 24,972 | |
| IAC/InterActiveCorp | | | 1,410 | | | | 37,041 | |
| Rackspace Hosting, Inc. | | | 1,382 | | | | 35,904 | |
| | | | | | | | 128,315 | |
| | | | | | | | | |
| | | | | | | | | |
| Life Sciences Tools & Services - 0.85% | | | | | | | | |
| Illumina, Inc. | | | 795 | | | | 39,114 | |
| | | | | | | | | |
| | | | | | | | | |
| Media - 2.25% | | | | | | | | |
| DreamWorks Animation SKG, Inc. - | | | | | | | | |
| Class A | | | 1,066 | | | | 34,016 | |
| Lamar Advertising Co. - Class A | | | 938 | | | | 29,847 | |
| Liberty Global, Inc. - Class A | | | 1,284 | | | | 39,560 | |
| | | | | | | | 103,423 | |
| | | | | | | | | |
| | | | | | | | | |
| Metals & Mining - 3.29% | | | | | | | | |
| AK Steel Holding Corp. | | | 2,385 | | | | 32,937 | |
| Harmony Gold Mining Co., Ltd. - | | | | | | | | |
| ADR | | | 3,509 | | | | 39,617 | |
| Royal Gold, Inc. | | | 647 | | | | 32,246 | |
| Silver Standard Resources, Inc. (a) | | | 705 | | | | 14,086 | |
| United States Steel Corp. | | | 737 | | | | 32,310 | |
| | | | | | | | 151,196 | |
| | | | | | | | | |
| | | | | | | | | |
| Oil, Gas & Consumable Fuels - 2.91% | | | | | | | | |
| Consol Energy, Inc. | | | 1,028 | | | | 37,996 | |
| Massey Energy Co. | | | 1,104 | | | | 34,246 | |
| Range Resources Corp. | | | 644 | | | | 24,556 | |
| Tesoro Corp. | | | 2,743 | | | | 36,646 | |
| | | | | | | | 133,444 | |
| | | | | | | | | |
| | | | | | | | | |
| Professional Services - 2.07% | | | | | | | | |
| Manpower, Inc. | | | 696 | | | | 36,332 | |
| Robert Half International, Inc. | | | 1,357 | | | | 35,282 | |
| Towers Watson & Co. - Class A | | | 473 | | | | 23,262 | |
| | | | | | | | 94,876 | |
| | | | | | | | | |
| | | Shares | | | Fair Value | |
| | | | | | | |
| | | | | | | |
| Real Estate Investment Trusts (REITs) - 1.72% | | | | | | |
| American Campus Communities, | | | | | | |
| Inc. | | | 1,028 | | | $ | 31,292 | |
| Corporate Office Properties Trust | | | | | | | | |
| SBI MD | | | 952 | | | | 35,519 | |
| EastGroup Properties, Inc. | | | 323 | | | | 12,074 | |
| | | | | | | | 78,885 | |
| | | | | | | | | |
| | | | | | | | | |
| Real Estate Management & | | | | | | | | |
| Development - 1.05% | | | | | | | | |
| Brookfield Asset Management, Inc. - | | | | | | | | |
| Class A (a) | | | 941 | | | | 26,696 | |
| The St Joe Co. | | | 865 | | | | 21,513 | |
| | | | | | | | 48,209 | |
| | | | | | | | | |
| | | | | | | | | |
| Road & Rail - 1.32% | | | | | | | | |
| Con-way, Inc. | | | 839 | | | | 26,001 | |
| Hertz Global Holdings, Inc. | | | 3,297 | | | | 34,915 | |
| | | | | | | | 60,916 | |
| | | | | | | | | |
| | | | | | | | | |
| Semiconductors & Semiconductor | | | | | | | | |
| Equipment - 1.47% | | | | | | | | |
| MEMC Electronic Materials, Inc. | | | 3,352 | | | | 39,956 | |
| Netlogic Microsystems, Inc. | | | 990 | | | | 27,304 | |
| | | | | | | | 67,260 | |
| | | | | | | | | |
| | | | | | | | | |
| Software - 0.74% | | | | | | | | |
| Concur Technologies, Inc. | | | 691 | | | | 34,163 | |
| | | | | | | | | |
| | | | | | | | | |
| Thrifts & Mortgage Finance - 0.93% | | | | | | | | |
| People's United Financial, Inc. | | | 2,374 | | | | 31,075 | |
| TFS Financial Corp. | | | 1,267 | | | | 11,644 | |
| | | | | | | | 42,719 | |
| | | | | | | | | |
| TOTAL COMMON STOCKS | | | | | | | | |
| (Proceeds $2,024,014) | | | | | | $ | 2,074,389 | |
| | | | | | | | | |
See Notes to the Finacial Statements The Leuthold Funds - 2010 Annual Report 119
Leuthold Hedged Equity Fund
Schedule of Securities Sold Short (continued)
September 30, 2010
| | | Shares | | | Fair Value | |
| | | | | | | |
| | | | | | | |
| INVESTMENT COMPANIES - 1.92% | | | | | | |
| Exchange Traded Funds - 1.92% | | | | | | |
| SPDR Dow Jones Industrial Average | | | | | | |
| ETF Trust | | | 408 | | | $ | 44,027 | |
| SPDR S&P 500 ETF Trust | | | 386 | | | | 44,051 | |
| | | | | | | | 88,078 | |
| | | | | | | | | |
| TOTAL INVESTMENT COMPANIES | | | | | | | | |
| (Proceeds $86,875) | | | | | | $ | 88,078 | |
| | | | | | | | | |
| | | | | | | | | |
| | | | | | | | | |
| TOTAL SECURITIES SOLD SHORT | | | | | | | | |
| (Proceeds $2,110,889) - 47.12% | | | | | | $ | 2,162,467 | |
| | | | | | | | | |
| | | | | | | | | |
Percentages are stated as a percent of net assets.
ADR American Depository Receipt
| (a) | Foreign issued security. |
The Global Industry Classification Standard (GICS®) was developed by and/or is the exclusive property of MSCI, Inc. and Standard & Poor Financial Services LLC (“S&P”). GICS is a service mark of MSCI and S&P and has been licensed for use by U.S. Bancorp Fund Services, LLC.
120 The Leuthold Funds - 2010 Annual Report See Notes to the Finacial Statements
Schedule of Investments
September 30, 2010
| | | Shares | | | Fair Value | |
| | | | | | | |
| | | | | | | |
| | | | | | | |
| SHORT-TERM INVESTMENTS - 5.76% | | | | | | |
| Money Market Funds - 5.76% | | | | | | |
| Fidelity Institutional Money Market Fund - | | | | | | |
| Government Portfolio | | | | | | |
| 0.06% (a) | | | 11,326,967 | | | $ | 11,326,967 | |
| | | | | | | | | |
| TOTAL SHORT-TERM INVESTMENTS | | | | | | | | |
| (Cost $11,326,967) | | | | | | $ | 11,326,967 | |
| | | | | | | | | |
| | | | | | | | | |
| | | | | | | | | |
| | | | | | | | | |
| Total Investments | | | | | | | | |
| (Cost $11,326,967) - 5.76% | | | | | | $ | 11,326,967 | |
| | | | | | | | | |
| | | | | | | | | |
| Other Assets in Excess of | | | | | | | | |
| Liabilities - 94.24% (b) | | | | | | | 185,225,275 | |
| | | | | | | | | |
| | | | | | | | | |
| TOTAL NET ASSETS - 100.00% | | | | | | $ | 196,552,242 | |
| | | | | | | | | |
| | | | | | | | | |
Percentages are stated as a percent of net assets.
| (a) | The rate quoted is the annualized seven-day yield as of September 30, 2010. |
| (b) | All or a portion of the assets have been committed as collateral for open securities sold short. |
See Notes to the Finacial Statements The Leuthold Funds - 2010 Annual Report 121Schedule of Securities Sold Short
September 30, 2010
| | | Shares | | | Fair Value | |
| | | | | | | |
| | | | | | | |
| COMMON STOCKS - 94.34% | | | | | | |
| Biotechnology - 1.59% | | | | | | |
| Vertex Pharmaceuticals, Inc. | | | 90,214 | | | $ | 3,118,698 | |
| | | | | | | | | |
| | | | | | | | | |
| Building Products - 1.52% | | | | | | | | |
| Masco Corp. | | | 271,818 | | | | 2,992,716 | |
| | | | | | | | | |
| | | | | | | | | |
| Capital Markets - 11.09% | | | | | | | | |
| Blackstone Group LP | | | 197,183 | | | | 2,502,252 | |
| E*Trade Financial Corp. | | | 220,896 | | | | 3,211,828 | |
| Greenhill & Co., Inc. | | | 30,157 | | | | 2,392,053 | |
| Invesco, Ltd. (a) | | | 163,417 | | | | 3,469,343 | |
| Northern Trust Corp. | | | 68,305 | | | | 3,295,033 | |
| Stifel Financial Corp. | | | 44,517 | | | | 2,060,692 | |
| TD Ameritrade Holding Corp. | | | 164,963 | | | | 2,664,152 | |
| The Charles Schwab Corp. | | | 158,004 | | | | 2,196,256 | |
| | | | | | | | 21,791,609 | |
| | | | | | | | | |
| | | | | | | | | |
| Chemicals - 1.29% | | | | | | | | |
| Intrepid Potash, Inc. | | | 97,174 | | | | 2,533,326 | |
| | | | | | | | | |
| | | | | | | | | |
| Commercial Banks - 4.26% | | | | | | | | |
| Associated Banc-Corp. | | | 163,628 | | | | 2,158,253 | |
| Barclays PLC - ADR | | | 156,241 | | | | 2,945,143 | |
| First Horizon National Corp. | | | 191,017 | | | | 2,179,504 | |
| Westamerica Bancorporation | | | 20,105 | | | | 1,095,522 | |
| | | | | | | | 8,378,422 | |
| | | | | | | | | |
| | | | | | | | | |
| Commercial Services & Supplies - 1.54% | | | | | | | | |
| Covanta Holding Corp. | | | 192,543 | | | | 3,032,552 | |
| | | | | | | | | |
| | | | | | | | | |
| Construction & Engineering - 1.63% | | | | | | | | |
| Foster Wheeler AG (a) | | | 130,682 | | | | 3,196,482 | |
| | | | | | | | | |
| | | | | | | | | |
| Construction Materials - 1.57% | | | | | | | | |
| Vulcan Materials Co. | | | 83,770 | | | | 3,092,789 | |
| | | | | | | | | |
| | | | | | | | | |
| Containers & Packaging - 1.40% | | | | | | | | |
| Owens-Illinois, Inc. | | | 98,205 | | | | 2,755,632 | |
| | | | | | | | | |
| | | | | | | | | |
| Diversified Financial Services - 1.38% | | | | | | | | |
| Bank of America Corp. | | | 206,204 | | | | 2,703,334 | |
| | | | | | | | | |
| | | Shares | | | Fair Value | |
| | | | | | | |
| | | | | | | |
| Electric Utilities - 0.52% | | | | | | |
| Korea Electric Power Corp. | | | | | | |
| - ADR | | | 79,646 | | | $ | 1,029,822 | |
| | | | | | | | | |
| | | | | | | | | |
| Energy Equipment & Services - 1.43% | | | | | | | | |
| Weatherford International, | | | | | | | | |
| Ltd. (a) | | | 164,963 | | | | 2,820,867 | |
| | | | | | | | | |
| | | | | | | | | |
| Health Care Equipment & Supplies - 1.32% | | | | | | | | |
| Alere, Inc. | | | 84,028 | | | | 2,598,986 | |
| | | | | | | | | |
| | | | | | | | | |
| Health Care Providers & Services - 0.56% | | | | | | | | |
| Brookdale Senior Living, Inc. | | | 67,866 | | | | 1,106,895 | |
| | | | | | | | | |
| | | | | | | | | |
| Health Care Technology - 0.64% | | | | | | | | |
| Quality Systems, Inc. | | | 18,816 | | | | 1,247,689 | |
| | | | | | | | | |
| | | | | | | | | |
| Hotels, Restaurants & Leisure - 9.09% | | | | | | | | |
| Bally Technologies, Inc. | | | 66,653 | | | | 2,329,522 | |
| Hyatt Hotels Corp. - Class A | | | 27,838 | | | | 1,040,863 | |
| International Game Technology | | | 205,688 | | | | 2,972,192 | |
| Marriott International, Inc. - | | | | | | | | |
| Class A | | | 79,389 | | | | 2,844,508 | |
| MGM Resorts International | | | 300,027 | | | | 3,384,304 | |
| Penn National Gaming, Inc. | | | 69,360 | | | | 2,053,750 | |
| Starwood Hotels & Resorts | | | | | | | | |
| Worldwide, Inc. | | | 61,701 | | | | 3,242,387 | |
| | | | | | | | 17,867,526 | |
| | | | | | | | | |
| | | | | | | | | |
| Household Durables - 6.18% | | | | | | | | |
| D.R. Horton, Inc. | | | 280,388 | | | | 3,117,915 | |
| KB Home | | | 227,082 | | | | 2,572,839 | |
| Pulte Group, Inc. | | | 360,640 | | | | 3,159,206 | |
| Toll Brothers, Inc. | | | 172,906 | | | | 3,288,672 | |
| | | | | | | | 12,138,632 | |
| | | | | | | | | |
| | | | | | | | | |
| Independent Power Producers & | | | | | | | | |
| Energy Traders - 1.31% | | | | | | | | |
| Calpine Corp. | | | 206,462 | | | | 2,570,452 | |
| | | | | | | | | |
| | | | | | | | | |
| Internet & Catalog Retail - 1.47% | | | | | | | | |
| Expedia, Inc. | | | 102,747 | | | | 2,898,493 | |
| | | | | | | | | |
122 The Leuthold Funds - 2010 Annual Report See Notes to the Finacial StatementsSchedule of Securities Sold Short (continued)
September 30, 2010
| | | Shares | | | Fair Value | |
| | | | | | | |
| | | | | | | |
| Internet Software & Services - 5.84% | | | | | | |
| Equinix, Inc. | | | 26,291 | | | $ | 2,690,884 | |
| GSI Commerce, Inc. | | | 89,441 | | | | 2,209,193 | |
| IAC/InterActiveCorp | | | 124,753 | | | | 3,277,261 | |
| Rackspace Hosting, Inc. | | | 127,219 | | | | 3,305,150 | |
| | | | | | | | 11,482,488 | |
| | | | | | | | | |
| | | | | | | | | |
| Life Sciences Tools & Services - 1.76% | | | | | | | | |
| Illumina, Inc. | | | 70,367 | | | | 3,462,056 | |
| | | | | | | | | |
| | | | | | | | | |
| Media - 4.71% | | | | | | | | |
| DreamWorks Animation SKG, Inc. - | | | | | |
| Class A | | | 94,338 | | | | 3,010,326 | |
| Lamar Advertising Co. - Class A | | | 82,997 | | | | 2,640,965 | |
| Liberty Global, Inc. - Class A | | | 116,967 | | | | 3,603,753 | |
| | | | | | | | 9,255,044 | |
| | | | | | | | | |
| | | | | | | | | |
| Metals & Mining - 6.81% | | | | | | | | |
| AK Steel Holding Corp. | | | 211,101 | | | | 2,915,305 | |
| Harmony Gold Mining Co., Ltd. - | | | | | | | | |
| ADR | | | 310,595 | | | | 3,506,618 | |
| Royal Gold, Inc. | | | 57,222 | | | | 2,851,944 | |
| Silver Standard Resources, Inc. (a) | | | 62,377 | | | | 1,246,292 | |
| United States Steel Corp. | | | 65,212 | | | | 2,858,894 | |
| | | | | | | | 13,379,053 | |
| | | | | | | | | |
| | | | | | | | | |
| Oil, Gas & Consumable Fuels - 6.01% | | | | | | | | |
| Consol Energy, Inc. | | | 90,987 | | | | 3,362,880 | |
| Massey Energy Co. | | | 97,689 | | | | 3,030,313 | |
| Range Resources Corp. | | | 56,964 | | | | 2,172,037 | |
| Tesoro Corp. | | | 242,805 | | | | 3,243,875 | |
| | | | | | | | 11,809,105 | |
| | | | | | | | | |
| | | | | | | | | |
| Professional Services - 4.32% | | | | | | | | |
| Manpower, Inc. | | | 61,603 | | | | 3,215,677 | |
| Robert Half International, Inc. | | | 120,114 | | | | 3,122,964 | |
| Towers Watson & Co. - Class A | | | 43,611 | | | | 2,144,789 | |
| | | | | | | | 8,483,430 | |
| | | | | | | | | |
| | | Shares | | | Fair Value | |
| | | | | | | |
| | | | | | | |
| Real Estate Investment Trusts (REITs) - 3.55% | | | | | | |
| American Campus Communities, | | | | | | |
| Inc. | | | 90,987 | | | $ | 2,769,644 | |
| Corporate Office Properties Trust | | | | | | | | |
| SBI MD | | | 84,286 | | | | 3,144,711 | |
| EastGroup Properties, Inc. | | | 28,611 | | | | 1,069,479 | |
| | | | | | | | 6,983,834 | |
| | | | | | | | | |
| | | | | | | | | |
| Real Estate Management & | | | | | | | | |
| Development - 2.25% | | | | | | | | |
| Brookfield Asset Management, Inc. - | | | | | | | | |
| Class A (a) | | | 85,588 | | | | 2,428,131 | |
| The St Joe Co. | | | 79,772 | | | | 1,983,930 | |
| | | | | | | | 4,412,061 | |
| | | | | | | | | |
| | | | | | | | | |
| Road & Rail - 2.74% | | | | | | | | |
| Con-way, Inc. | | | 74,233 | | | | 2,300,481 | |
| Hertz Global Holdings, Inc. | | | 291,779 | | | | 3,089,939 | |
| | | | | | | | 5,390,420 | |
| | | | | | | | | |
| | | | | | | | | |
| Semiconductors & Semiconductor | | | | | | | | |
| Equipment - 3.03% | | | | | | | | |
| MEMC Electronic Materials, Inc. | | | 296,676 | | | | 3,536,378 | |
| Netlogic Microsystems, Inc. | | | 87,637 | | | | 2,417,028 | |
| | | | | | | | 5,953,406 | |
| | | | | | | | | |
| | | | | | | | | |
| Software - 1.61% | | | | | | | | |
| Concur Technologies, Inc. | | | 63,777 | | | | 3,153,135 | |
| | | | | | | | | |
| | | | | | | | | |
| Thrifts & Mortgage Finance - 1.92% | | | | | | | | |
| People's United Financial, Inc. | | | 210,070 | | | | 2,749,816 | |
| TFS Financial Corp. | | | 112,123 | | | | 1,030,411 | |
| | | | | | | | 3,780,227 | |
| | | | | | | | | |
| TOTAL COMMON STOCKS | | | | | | | | |
| (Proceeds $178,711,696) | | | | | | $ | 185,419,181 | |
| | | | | | | | | |
See Notes to the Finacial Statements The Leuthold Funds - 2010 Annual Report 123Schedule of Securities Sold Short (continued)
September 30, 2010
| | | Shares | | | Fair Value | |
| | | | | | | |
| | | | | | | |
| INVESTMENT COMPANIES - 4.12% | | | | | | |
| Exchange Traded Funds - 4.12% | | | | | | |
| SPDR Dow Jones Industrial Average | | | | | | |
| ETF Trust | | | 37,474 | | | $ | 4,043,819 | |
| SPDR S&P 500 ETF Trust | | | 35,553 | | | | 4,057,309 | |
| | | | | | | | 8,101,128 | |
| | | | | | | | | |
| TOTAL INVESTMENT COMPANIES | | | | | | | | |
| (Proceeds $8,150,443) | | | | | | $ | 8,101,128 | |
| | | | | | | | | |
| | | | | | | | | |
| | | | | | | | | |
| TOTAL SECURITIES SOLD SHORT | | | | | | | | |
| (Proceeds $186,862,139 ) - 98.46% | | | | | | $ | 193,520,309 | |
| | | | | | | | | |
| | | | | | | | | |
Percentages are stated as a percent of net assets.
ADR American Depository Receipt
| (a) | Foreign issued security. |
The Global Industry Classification Standard (GICS®) was developed by and/or is the exclusive property of MSCI, Inc. and Standard & Poor Financial Services LLC (“S&P”). GICS is a service mark of MSCI and S&P and has been licensed for use by U.S. Bancorp Fund Services, LLC.
124 The Leuthold Funds - 2010 Annual Report See Notes to the Finacial Statements
The Leuthold Funds
Notes to the Financial Statements
| 1. | ORGANIZATIONAND SIGNIFICANT ACCOUNTING POLICIES |
Leuthold Funds, Inc. (the “Company”) was incorporated on August 30, 1995, as a Maryland Corporation and is registered with the Securities and Exchange Commission as an open-end management investment company under the Investment Company Act of 1940, as amended. The Company consists of nine series (the “Funds”): Leuthold Core Investment Fund, Leuthold Asset Allocation Fund, Leuthold Global Fund, Leuthold Select Industries Fund, Leuthold Global Industries Fund, Leuthold Undervalued & Unloved Fund, Leuthold Global Clean Technology Fund, Leuthold Hedged Equity Fund, and Grizzly Short Fund. The investment objective of the Leuthold Core Investment Fund is to seek total return consistent with prudent investment risk over the long-term. The Leuthold Core Investment Fund commenced operations on November 20, 1995.� 0; Effective January 31, 2006, the Leuthold Core Investment Fund issued a class of Institutional Shares, which are not subject to the shareholder servicing fee of up to 0.25% that the Retail Shares are subject to, as described in the Funds’ prospectus. Effective at the close of business on March 31, 2006, the Retail Shares of the Leuthold Core Investment Fund were closed to new investors, except as stated in the Prospectus. Effective January 31, 2008, the Institutional Shares of the Leuthold Core Investment Fund were closed to new investors except as stated in the Prospectus. Effective March 2, 2009, the Leuthold Core Investment Fund was opened to existing investors. The investment objective of the Leuthold Asset Allocation Fund is to seek total return consistent with prudent investment risk over the long-term. The Leuthold Asset Allocation Fund commenced operations on May 24, 2006. Effective January 31, 2007, the Leuthold Asset Allocation Fund added a class of Institutional Shares, whi ch is not subject to the 0.25% 12b-1 fee that the Retail Shares are subject to, as discussed in the Funds’ prospectus. The Leuthold Global Fund seeks long-term capital appreciation and dividend income. The Leuthold Global Fund commenced operations on April 30, 2008, issuing a class of Institutional Shares and adding a new class of Retail Shares effective July 1, 2008, which are subject to a 0.25% 12b-1 fee that the Institutional Shares are not subject to. The investment objective of the Leuthold Select Industries Fund is capital appreciation. The Leuthold Select Industries Fund commenced operations on June 19, 2000. Effective at the close of business on March 31, 2006, the Leuthold Select Industries Fund was closed to new investors, except as stated in the Prospectus. Effective March 2, 2009, the Leuthold Select Industries Fund was opened to existing investors. The Leuthold Global Industries Fund seeks long-term capital appreciation and dividend income. The Leuthold Global Industries Fund co mmenced operations on May 17, 2010, issuing classes of Retail and Institutional Shares where the Fund’s Retail Shares are subject to a 0.25% 12b-1 fee that the Institutional Shares are not subject to. The Leuthold Undervalued & Unloved Fund seeks long-term capital appreciation and dividend income, and commenced operations on November 14, 2006. The Leuthold Global Clean Technology Fund seeks capital appreciation and long-term growth. The Leuthold Global Clean Technology Fund commenced operations on July 22, 2009, issuing classes of Retail and Institutional Shares where the Fund’s Retail Shares are subject to a 0.25% 12b-1 fee that the Institutional Shares are not subject to. The Leuthold Hedged Equity Fund seeks capital appreciation and income (or “total return”). The Leuthold Hedged Equity Fund commenced operations on July 22, 2009, issuing classes of Retail and Institutional Shares where the Fund’s Retail Shares are subject to a 0.25% 12b-1 fee that the Institutional Shares are not subject to. The investment objective of the Grizzly Short Fund is capital appreciation, and the Fund commenced operations on June 19, 2000.
&# 160; The Leuthold Funds - 2010 Annual Report 125The Leuthold Funds
As of the close of business on February 19, 2010, pursuant to an Agreement and Plan of Reorganization previously approved by the Funds’ Board of Directors, all of the assets, subject to the liabilities, of the Leuthold Select Equities Fund, were transferred to the Leuthold Select Industries Fund in exchange for a corresponding class of shares of the Leuthold Select Industries Fund of equal value. The purpose of the transaction was to combine two funds with comparable investment objectives and strategies. The exchange ratio was 0.58. The net asset value of the Leuthold Select Industries Fund shares on the close of business February 19, 2010, after the reorganization was $12.08, and a total of 731,396 shares were issued to shareholders of the Leuthold Select Equities Fund in the exchange. The exchange was a tax-free event to Leuthold Select Equities Fund shareholders. For financial reporting purposes, assets received and shares issued by the Leuthold Select Industries Fund were recorded at fair value; however, the cost basis of investments received from Leuthold Select Equities Fund was carried forward to align ongoing reporting of the Leuthold Select Industries Fund’s realized and unrealized gains and losses with amounts distributable to shareholders for tax purposes.
The components of net assets immediately before the acquisition were as follows:
| | | Capital Stock | | | | | | Accumulatednet realizedloss on investments | | | | | | Net Assets | |
| | | | | | | | | | | | | | | |
Leuthold Select Industries Fund | | $ | 48,758,704 | | | $ | (195,240 | ) | | $ | (5,366,210 | ) | | $ | 1,384,566 | | | $ | 44,581,820 | |
Leuthold Select Equities Fund | | | 19,346,377 | | | | (63,506 | ) | | | (10,447,608 | )* | | | –– | | | | 8,835,263 | |
| Total | | $ | 68,105,081 | | | $ | (258,746 | ) | | $ | (15,813,818 | ) | | $ | 1,384,566 | | | $ | 53,417,083 | |
* Due to rules under section 381 and 382 of the internal revenue code, the combined fund will only be able to utilize $1,641,117 of these losses and the losses will be limited to $215,625 each year ($131,738 in the first short year) over the next eight years. The combined fund may not utilize the remaining $8,806,491.
Assuming the acquisition of Leuthold Select Equities Fund had been completed on October 1, 2009, the combined funds’ pro forma results in the Statement of Operations during the period ended September 30, 2010 were as follows:
Net investment income (loss) | | $ | 82,178 | * |
Net realized and unrealized gain (loss) on investment | | | (3,852,836 | )** |
Net increase (decrease) in net assets resulting from operations | | $ | (3,770,658 | ) |
* $110,459 as reported in the Leuthold Select Industries Fund Statement of Operations, plus $(28,281) Leuthold Select Equities Fund pre-merger.
** $(4,203,914) as reported in the Leuthold Select Industries Fund Statement of Operations, plus $351,078 Leuthold Select Equities Fund pre-merger.
Because the combined funds have been managed as a single integrated fund since the acquisition was completed, it is not practicable to separate the amounts of revenue and earnings of the Leuthold Select Equities Fund that have been included in the Leuthold Select Industries Fund’s Statement of Operations since February 19, 2010.
126 The Leuthold Funds - 2010 Annual Report
The following is a summary of significant accounting policies consistently followed by the Funds. a) Investment Valuation – Securities listed on a national securities exchange are valued at the last sale price on the day the valuation is made, and securities that are traded on the NASDAQ Global Market, NASDAQ Global Select Market or the NASDAQ Capital Market are valued at the Nasdaq Official Closing Price. Price information on listed stocks is taken from the exchange where the security is primarily traded. Securities, including securities sold short, which are listed on an exchange but which are not traded on the valuation date are valued at the most recent bid prices. Unlisted securities for which market quotations are readily available are valued at the latest quoted bid price or, if available, at prices provided by an independent pricing service. Securities sold short which are not listed on an exchange but for which market quotations are readily available are valued at the average of the current bid and asked prices. Debt securities are valued at bid prices provided by an independent pricing service that uses a matrix pricing method or other analytical pricing model. Physical metals are valued at prices provided by an independent pricing service. Other assets, including certain investments in open-end investment companies, and securities for which no quotations are readily available are valued at fair value as determined in good faith by the Board of Directors and the Funds’ Fair Value Pricing Committee. Short-term instruments (those with remaining maturities of 60 days or less) are valued at amortized cost, which approximates market value. Exchange traded options are valued at the last reported sale price on an exchange on which the option is traded. If no sales are reported on a particular day, the mean between the highest bid and lowest asked quotations at the close of the exchanges is used. Non-exchange traded options al so will be valued at the mean between the last bid and asked quotations. For options where market quotations are not readily available, fair value shall be determined. The Funds may invest in foreign securities. Trading in foreign securities may be completed at times that vary from the closing of the New York Stock Exchange. The Funds’ policy is to value the foreign securities at the latest closing price on the exchange on which they are traded immediately prior to the closing of the New York Stock Exchange. Foreign securities quoted in foreign currencies are translated into U.S. dollars at current rates. Occasionally, events that affect these values and exchange rates may occur between the times at which they are determined and the closing of the New York Stock Exchange. If these events materially affect the value of portfolio securities, then these securities may be valued at their value as determined in good faith by the Funds’ Board of Directors. Some of the factors which may be co nsidered by the Board of Directors and the Funds’ Fair Value Pricing Committee in determining fair value are fundamental analytical data relating to the investment, the nature and duration of any restrictions on disposition, trading in similar securities of the same issuer or comparable companies, information from broker dealers, and an evaluation of the forces that influence the market in which the securities are purchased and sold. The use of fair value pricing by a Fund may cause the net asset value of its shares to differ significantly from the net asset value that would be calculated without regard to such considerations. Each of the Funds may invest in metals such as aluminum, copper, zinc, lead, nickel, tin, silver, palladium and other industrial and precious metals. Metals not traded on an exchange are valued at the mid-point between the closing bid and asked prices as obtained from a commonly used reputable pricing source.
The Funds have adopted fair valuation accounting standards which establish a definition of fair value and set out a hierarchy for measuring fair value. These standards require additional disclosures about the various inputs and valuation techniques used to develop the measurements of fair value and a discussion of changes in valuation techniques and related inputs during the period. These inputs are summarized in the following three levels:
The Leuthold Funds - 2010 Annual Report 127
The Leuthold Funds
Level 1 - Quoted prices in active markets for identical securities
Level 2 - Other significant observable inputs (including quoted prices for similar securities, interest rates, prepayment speeds, credit risk, etc.).
Level 3 - Significant unobservable inputs (including the Funds’ own assumptions in determining the fair value of investments).
The inputs or methodology used for valuing securities are not an indication of the risk associated with investing in those securities. The following is a summary of the inputs used to value the Funds’ net assets as of September 30, 2010:
| Leuthold Core Investment Fund |
| Investments at Fair Value | | Level 1 | | | Level 2 | | | Level 3 | | | Total | |
Common Stocks | | $ | 776,706,593 | | | $ | 29,243,312 | | | $ | –– | | | $ | 805,949,905 | |
Preferred Stocks | | | 6,718,545 | | | | –– | | | | –– | | | | 6,718,545 | |
Exchange Traded Funds | | | 86,626,957 | | | | –– | | | | –– | | | | 86,626,957 | |
Mutual Funds | | | 1,674,811 | | | | 51,034,689 | | | | –– | | | | 52,709,500 | |
Exchange Traded Notes | | | 8,229,354 | | | | –– | | | | –– | | | | 8,229,354 | |
Precious Metals | | | –– | | | | 55,208,787 | | | | –– | | | | 55,208,787 | |
Foreign Government Bonds | | | –– | | | | 48,247,570 | | | | –– | | | | 48,247,570 | |
Money Market Funds | | | 42,941,112 | | | | –– | | | | –– | | | | 42,941,112 | |
Total Investments in Securities | | $ | 922,897,372 | | | $ | 183,734,358 | | | $ | –– | | | $ | 1,106,631,730 | |
| | | | | | | | | | | | | |
| Securities Sold Short at Fair Value | | Level 1 | | | Level 2 | | | Level 3 | | | Total | |
Common Stocks - Short | | $ | 71,522,528 | | | $ | –– | | | $ | –– | | | $ | 71,522,528 | |
Exchange Traded Funds - Short | | | 3,124,812 | | | | –– | | | | –– | | | | 3,124,812 | |
Unites States Treasury Obligations - Short | | | –– | | | | 28,306,185 | | | | –– | | | | 28,306,185 | |
Total Securities Sold Short | | $ | 74,647,340 | | | $ | 28,306,185 | | | $ | –– | | | $ | 102,953,525 | |
The Fund did not invest in any Level 3 securities or have transfers into or out of Level 1 or Level 2 securities during the period. The basis for recognizing and valuing transfers is as of the beginning of the beginning of the period in which tranfers occur.
128 The Leuthold Funds - 2010 Annual Report
The Leuthold Funds
| Leuthold Asset Allocation Fund | |
| Investments at Fair Value | | Level 1 | | | Level 2 | | | Level 3 | | | Total | |
Common Stocks | | $ | 750,929,129 | | | $ | 14,268,178 | | | $ | –– | | | $ | 765,197,307 | |
Exchange Traded Funds | | | 84,082,789 | | | | –– | | | | –– | | | | 84,082,789 | |
Mutual Funds | | | 2,923,409 | | | | 44,810,660 | | | | –– | | | | 47,734,069 | |
Exchange Traded Notes | | | 7,608,122 | | | | –– | | | | –– | | | | 7,608,122 | |
Precious Metals | | | –– | | | | 51,625,567 | | | | –– | | | | 51,625,567 | |
Foreign Government Bonds | | | –– | | | | 44,911,846 | | | | –– | | | | 44,911,846 | |
Money Market Funds | | | 37,297,432 | | | | –– | | | | –– | | | | 37,297,432 | |
Total Investments in Securities | | $ | 882,840,881 | | | $ | 155,616,251 | | | $ | –– | | | $ | 1,038,457,132 | |
| | | | | | | | | | | | | |
| Securities Sold Short at Fair Value | | Level 1 | | | Level 2 | | | Level 3 | | | Total | |
Common Stocks - Short | | $ | 66,809,690 | | | $ | –– | | | $ | –– | | | $ | 66,809,690 | |
Exchange Traded Funds - Short | | | 2,934,675 | | | | –– | | | | –– | | | | 2,934,675 | |
Unites States Treasury Obligations - Short | | | –– | | | | 26,190,075 | | | | –– | | | | 26,190,075 | |
Total Securities Sold Short | | $ | 69,744,365 | | | $ | 26,190,075 | | | $ | –– | | | $ | 95,934,440 | |
The Fund did not invest in any Level 3 securities or have transfers into or out of Level 1 or Level 2 securities during the period. The basis for recognizing and valuing transfers is as of the beginning of the period in which tranfers occur.
| Leuthold Global Fund | |
| Investments at Fair Value | | Level 1 | | | Level 2 | | | Level 3 | | | Total | |
Common Stocks | | $ | 197,328,123 | | | $ | –– | | | $ | –– | | | $ | 197,328,123 | |
Exchange Traded Funds | | | 18,479,178 | | | | –– | | | | –– | | | | 18,479,178 | |
Mutual Funds | | | –– | | | | 3,682,664 | | | | –– | | | | 3,682,664 | |
Precious Metals | | | –– | | | | 11,151,970 | | | | –– | | | | 11,151,970 | |
United States Treasury Obligations | | | –– | | | | 5,419,098 | | | | –– | | | | 5,419,098 | |
Foreign Government Bonds | | | –– | | | | 7,190,935 | | | | –– | | | | 7,190,935 | |
Money Market Funds | | | 39,566,046 | | | | –– | | | | –– | | | | 39,566,046 | |
Total Investments in Securities | | $ | 255,373,347 | | | $ | 27,444,667 | | | $ | –– | | | $ | 282,818,014 | |
| | | | | | | | | | | | | | | | | |
| Securities Sold Short at Fair Value | | Level 1 | | | Level 2 | | | Level 3 | | | Total | |
Common Stocks - Short | | $ | 16,895,270 | | | $ | –– | | | $ | –– | | | $ | 16,895,270 | |
Unites States Treasury Obligations - Short | | | –– | | | | 4,853,741 | | | | –– | | | | 4,853,741 | |
Total Securities Sold Short | | $ | 16,895,270 | | | $ | 4,853,741 | | | $ | –– | | | $ | 21,749,011 | |
The Fund did not invest in any Level 3 securities or have transfers into or out of Level 1 or Level 2 securities during the period. The basis for recognizing and valuing transfers is as of the beginning of the period in which tranfers occur.
| Leuthold Select Industries Fund | |
| Investments at Fair Value | | Level 1 | | | Level 2 | | | Level 3 | | | Total | |
Common Stocks | | $ | 37,328,976 | | | $ | 836,795 | | | $ | –– | | | $ | 38,165,771 | |
Preferred Stocks | | | 432,894 | | | | –– | | | | –– | | | | 432,894 | |
Money Market Funds | | | 1,413,831 | | | | –– | | | | –– | | | | 1,413,831 | |
Total Investments in Securities | | $ | 39,175,701 | | | $ | 836,795 | | | $ | –– | | | $ | 40,012,496 | |
The Fund did not invest in any Level 3 securities or have transfers into or out of Level 1 or Level 2 securities during the period. The basis for recognizing and valuing transfers is as of the beginning of the period in which tranfers occur.
The Leuthold Funds - 2010 Annual Report 129
The Leuthold Funds
| Leuthold Global Industries Fund | |
| Investments at Fair Value | | Level 1 | | | Level 2 | | | Level 3 | | | Total | |
Common Stocks | | $ | 8,597,180 | | | $ | –– | | | $ | –– | | | $ | 8,597,180 | |
Exchange Traded Funds | | | 562,271 | | | | –– | | | | –– | | | | 562,271 | |
Money Market Funds | | | 518,356 | | | | –– | | | | –– | | | | 518,356 | |
Total Investments in Securities | | $ | 9,677,807 | | | $ | –– | | | $ | –– | | | $ | 9,677,807 | |
The Fund did not invest in any Level 3 securities or have transfers into or out of Level 1 or Level 2 securities during the period. The basis for recognizing and valuing transfers is as of the beginning of the period in which tranfers occur.
| Leuthold Undervalued & Unloved Fund | |
| Investments at Fair Value | | Level 1 | | | Level 2 | | | Level 3 | | | Total | |
Common Stocks | | $ | 7,780,089 | | | $ | –– | | | $ | –– | | | $ | 7,780,089 | |
Mutual Funds | | | 39,068 | | | | –– | | | | –– | | | | 39,068 | |
Money Market Funds | | | 172,462 | | | | –– | | | | –– | | | | 172,462 | |
Total Investments in Securities | | $ | 7,991,619 | | | $ | –– | | | $ | –– | | | $ | 7,991,619 | |
The Fund did not invest in any Level 3 securities or have transfers into or out of Level 1 or Level 2 securities during the period. The basis for recognizing and valuing transfers is as of the beginning of the period in which tranfers occur.
| Leuthold Global Clean Technology Fund | |
| Investments at Fair Value | | Level 1 | | | Level 2 | | | Level 3 | | | Total | |
Common Stocks | | $ | 26,570,997 | | | $ | –– | | | $ | –– | | | $ | 26,570,997 | |
Preferred Stocks | | | 283,465 | | | | –– | | | | –– | | | | 283,465 | |
Money Market Funds | | | 1,538,912 | | | | –– | | | | –– | | | | 1,538,912 | |
Total Investments in Securities | | $ | 28,393,374 | | | $ | –– | | | $ | –– | | | $ | 28,393,374 | |
The Fund did not invest in any Level 3 securities or have transfers into or out of Level 1 or Level 2 securities during the period. The basis for recognizing and valuing transfers is as of the beginning of the period in which tranfers occur.
| Leuthold Hedged Equity Fund | |
| Investments at Fair Value | | Level 1 | | | Level 2 | | | Level 3 | | | Total | |
Common Stocks | | $ | 2,363,902 | | | $ | 42,930 | | | $ | –– | | | $ | 2,406,832 | |
Preferred Stocks | | | 27,539 | | | | –– | | | | –– | | | | 27,539 | |
Money Market Funds | | | 76,216 | | | | –– | | | | –– | | | | 76,216 | |
Total Investments in Securities | | $ | 2,467,657 | | | $ | 42,930 | | | $ | –– | | | $ | 2,510,587 | |
| | | | | | | | | | | | | | | | | |
| Securities Sold Short at Fair Value | | Level 1 | | | Level 2 | | | Level 3 | | | Total | |
Common Stocks - Short | | $ | 2,074,389 | | | $ | –– | | | $ | –– | | | $ | 2,074,389 | |
Exchange Traded Funds - Short | | | 88,078 | | | | –– | | | | –– | | | | 88,078 | |
Total Securities Sold Short | | $ | 2,162,467 | | | $ | –– | | | $ | –– | | | $ | 2,162,467 | |
The Fund did not invest in any Level 3 securities or have transfers into or out of Level 1 or Level 2 securities during the period. The basis for recognizing and valuing transfers is as of the beginning of the period in which tranfers occur.
130 The Leuthold Funds - 2010 Annual Report
The Leuthold Funds
| Grizzly Short Fund | |
| Investments at Fair Value | | Level 1 | | | Level 2 | | | Level 3 | | | Total | |
Money Market Funds | | $ | 11,326,967 | | | $ | –– | | | $ | –– | | | $ | 11,326,967 | |
Total Investments in Securities | | $ | 11,326,967 | | | $ | –– | | | $ | –– | | | $ | 11,326,967 | |
| | | | | | | | | | | | | | | | | |
Securities Sold Short at Fair Value | | Level 1 | | | Level 2 | | | Level 3 | | | Total | |
Common Stocks - Short | | $ | 185,419,181 | | | $ | –– | | | $ | –– | | | $ | 185,419,181 | |
Exchange Traded Funds - Short | | | 8,101,128 | | | | –– | | | | –– | | | | 8,101,128 | |
Total Securities Sold Short | | $ | 193,520,309 | | | $ | –– | | | $ | –– | | | $ | 193,520,309 | |
The Fund did not invest in any Level 3 securities or have transfers into or out of Level 1 or Level 2 securities during the period. The basis for recognizing and valuing transfers is as of the beginning of the period in which tranfers occur.
For further information regarding security characteristics, see the Schedules of Investments.
b) | Federal Income Taxes – Provision for federal income taxes or excise taxes has not been made since the Funds have elected to be taxed as “regulated investment companies” and intend to distribute substantially all taxable income to shareholders and otherwise comply with the provisions of the Internal Revenue Code applicable to regulated investment companies. Distributions from net realized gains for book purposes may include short-term capital gains which are included as ordinary income to shareholders for tax purposes. The Funds also designate as distributions of long-term gains, to the extent necessary to fully distribute such capital gains, earnings and profits distributed to shareholders on the redemption of shares. The tax character of distributions paid during the fiscal years ended September 30, 2010 and 2009 was as follows: |
| Year Ended September 30, 2010 |
| | | Leuthold Core Investment Fund | | | Leuthold Asset Allocation Fund | | | Leuthold Global Fund | | | Leuthold Select Industries Fund | | | Leuthold Global Industries Fund | | | Leuthold Undervalued & Unloved Fund | | | Leuthold Global Clean Technology Fund | | | Leuthold Hedged Equity Fund | | | Grizzly Short Fund | |
Distributions paid from: | | | | | | | | | | | | | | | | | | | | | | | | | | | |
Ordinary Income | | $ | –– | | | $ | 1,762,481 | | | $ | 624,628 | | | $ | 87,441 | | | $ | –– | | | $ | 99,971 | | | $ | –– | | | $ | –– | | | $ | –– | |
Long Term Capital Gain | | | –– | | | | –– | | | | –– | | | | –– | | | | –– | | | | –– | | | | –– | | | | –– | | | | –– | |
Return of Capital | | | 5,026,003 | | | | 5,857,936 | | | | –– | | | | –– | | | | –– | | | | –– | | | | –– | | | | –– | | | | –– | |
Total Distributions Paid | | $ | 5,026,003 | | | $ | 7,620,417 | | | $ | 624,628 | | | $ | 87,441 | | | $ | –– | | | $ | 99,971 | | | $ | –– | | | $ | –– | | | $ | –– | |
| |
| Year Ended September 30, 2009 |
| | | Leuthold Core Investment Fund | | | Leuthold Asset Allocation Fund | | | Leuthold Global Fund | | | Leuthold Select Industries Fund | | | Leuthold Global Industries Fund | | | Leuthold Undervalued & Unloved Fund | | | Leuthold Global Clean Technology Fund | | | Leuthold Hedged Equity Fund | | | Grizzly Short Fund | |
Distributions paid from: | | | | | | | | | | | | | | | | | | | | | | | | | | | | | | | | | | | | |
Ordinary Income | | $ | 11,193,346 | | | $ | 31,395,822 | | | $ | 2,052,453 | | | $ | –– | | | $ | –– | | | $ | 205,927 | | | $ | –– | | | $ | –– | | | $ | 3,324,828 | |
Long Term Capital Gain | | | –– | | | | –– | | | | –– | | | | –– | | | | –– | | | | –– | | | | –– | | | | –– | | | | –– | |
Return of Capital | | | 561,116 | | | | –– | | | | –– | | | | –– | | | | –– | | | | –– | | | | –– | | | | –– | | | | 3,189,306 | |
Total Distributions Paid | | $ | 11,754,462 | | | $ | 31,395,822 | | | $ | 2,052,453 | | | $ | –– | | | $ | –– | | | $ | 205,927 | | | | –– | | | $ | –– | | | $ | 6,514,134 | |
The Leuthold Funds - 2010 Annual Report 131
The Leuthold Funds
At September 30, 2010, the components of accumulated earnings (deficit) on a tax basis were as follows:
| | | Leuthold Core Investment Fund | | | Leuthold Asset Allocation Fund | | | Leuthold Global Fund | | | Leuthold Select Industries Fund | | | Leuthold Global Industries Fund | | | Leuthold Undervalued & Unloved Fund | | | Leuthold Global Clean Technology Fund | | | Leuthold Hedged Equity Fund | | | Grizzly Short Fund | |
| | | | | | | | | | | | | | | | | | | | | | | | | | | | |
Undistributed ordinary | | | | | | | | | | | | | | | | | | | | | | | | | | | |
income | | $ | –– | | | $ | –– | | | $ | 8,947,969 | | | $ | 23,021 | | | $ | 110,977 | | | $ | 27,418 | | | $ | –– | | | $ | –– | | | $ | –– | |
Undistributed long-term | | | | | | | | | | | | | | | | | | | | | | | | | | | | | | | | | | | | |
gains | | | –– | | | | –– | | | | 6,905,174 | | | | –– | | | | –– | | | | –– | | | | –– | | | | –– | | | | –– | |
Distributable earnings | | | –– | | | | –– | | | | 15,853,143 | | | | 23,021 | | | | 110,977 | | | | 27,418 | | | | –– | | | | –– | | | | –– | |
Capital loss carryover and | | | | | | | | | | | | | | | | | | | | | | | | | | | | | | | | | | | | |
post-October losses | | | (130,735,366 | ) | | | (508,126,382 | ) | | | (610,938 | ) | | | (8,759,983 | ) | | | (3,702 | ) | | | (8,086,130 | ) | | | (674,538 | ) | | | (511,688 | ) | | | (37,127,807 | ) |
Other accumulated losses | | | (16,160,448 | ) | | | (15,108,387 | ) | | | (2,175,710 | ) | | | –– | | | | –– | | | | (23 | ) | | | –– | | | | (87,087 | ) | | | (10,037,806 | ) |
Unrealized appreciation | | | | | | | | | | | | | | | | | | | | | | | | | | | | | | | | | | | | |
(depreciation) | | | 163,654,569 | | | | 189,853,241 | | | | 26,140,975 | | | | 1,728,700 | | | | 1,141,704 | | | | 1,133,455 | | | | (959,749 | ) | | | 97,301 | | | | –– | |
Total accumulated | | | | | | | | | | | | | | | | | | | | | | | | | | | | | | | | | | | | |
gain (loss) | | $ | 16,758,755 | | | $ | (333,381,528 | ) | | $ | 39,207,470 | | | $ | (7,008,262 | ) | | $ | 1,248,979 | | | $ | (6,925,280 | ) | | $ | (1,634,287 | ) | | $ | (501,474 | ) | | $ | (47,165,613 | ) |
| | | | | | | | | | | | | | | | | | | | | | | | | | | | | | | | | | | | | |
Net investment income and realized gains and losses for federal income tax purposes may differ from that reported on the financial statements because of permanent book-to-tax differences. U.S. Generally Accepted Accounting Principles (“GAAP”) requires that permanent differences between financial reporting and tax reporting be reclassified between various components of net assets. These differences are primarily due to net operating losses, and differences from REIT adjustments and foreign currency gain and loss.
Additionally, U.S. Generally Accepted Accounting Principles require that certain components of net assets relating to permanent differences be reclassified between financial and tax reporting. These reclassifications have no effect on net assets or net asset value per share. For the year ended September 30, 2010, the following table shows the reclassifications made:
| | | Undistributed | | | Accumulated | | | | |
| | | Net Investment | | | Net Realized | | | Paid In | |
| | | Income/(Loss) | | | Gain/(Loss) | | | Capital | |
| | | | | | | | | | |
| | | | | | | | | | |
Leuthold Core Investment Fund | | $ | 24,909,562 | | | $ | 1,404,890 | | | $ | (26,314,452 | ) |
Leuthold Asset Allocation Fund | | | 58,687,240 | | | | 1,207,434 | | | | (59,894,674 | ) |
Leuthold Global Fund | | | (614,443 | ) | | | 616,508 | | | | (2,065 | ) |
Leuthold Select Industries Fund | | | (293 | ) | | | (1,640,822 | ) | | | 1,641,115 | |
Leuthold Global Industries Fund | | | (3,702 | ) | | | 3,702 | | | | –– | |
Leuthold Undervalued & Unloved Fund | | | (2,222 | ) | | | 2,247 | | | | (25 | ) |
Leuthold Global Clean Technology Fund | | | 252,285 | | | | 2,597 | | | | (254,882 | ) |
Leuthold Hedged Equity Fund | | | 101,187 | | | | (1,031 | ) | | | (100,156 | ) |
Grizzly Short Fund | | | 3,599,109 | | | | (86,942 | ) | | | (3,512,167 | ) |
132 The Leuthold Funds - 2010 Annual Report
The Leuthold Funds
The Funds intend to utilize provisions of the federal income tax laws which allow the Funds to carry realized capital losses forward for eight years following the year of loss and offset such losses against any future realized capital gains. At September 30, 2010, the Funds had the following capital loss carry forwards available for federal income tax purposes:
| | | Leuthold | | | Leuthold | | | | | | Leuthold | | | Leuthold | | | Leuthold | | | Leuthold | | | Leuthold | | | | |
| | | Core | | | Asset | | | Leuthold | | | Select | | | Global | | | Undervalued | | | Global Clean | | | Hedged | | | Grizzly | |
| | | Investment | | | Allocation | | | Global | | | Industries | | | Industries | | | & Unloved | | | Technology | | | Equity | | | Short | |
| | | Fund | | | Fund | | | Fund | | | Fund | | | Fund | | | Fund | | | Fund | | | Fund | | | Fund | |
Expires 09/30/16 | | $ | –– | | | $ | –– | | | $ | –– | | | $ | –– | | | $ | –– | | | $ | (256,643 | ) | | $ | –– | | | $ | –– | | | $ | –– | |
Expires 09/30/17 | | | (16,479,888 | ) | | | (164,566,149 | ) | | | –– | | | | (3,235,101 | )* | | | –– | | | | (4,388,309 | ) | | | –– | | | | –– | | | | –– | |
Expires 09/30/18 | | | (112,381,565 | ) | | | (341,989,875 | ) | | | –– | | | | (5,524,586 | ) | | | –– | | | | (3,441,043 | ) | | | (17,387 | ) | | | (48,852 | ) | | | (18,663,090 | ) |
| | | | | | | | | | | | | | | | | | | | | | | | | | | | | | | | | | | | | |
*$(1,641,117) Capital loss carry forward transferred in from Select Equities merger. | | | | | | | | | | | | | | | | | | | | | |
The Leuthold Core Investment Fund, Leuthold Asset Allocation Fund, Leuthold Global Fund, Leuthold Select Industries Fund, Leuthold Global Industries Fund, Leuthold Undervalued & Unloved Fund, Leuthold Global Clean Technology Fund, Leuthold Hedged Equity Fund and Grizzly Short Fund intend to defer and treat $1,873,913, $1,570,358, $610,938, $296, $3,702, $135, $657,151, $462,836 and $18,464,717, respectively, of post-October losses incurred during the fiscal year ended September 30, 2009 as arising in the fiscal year ended September 30, 2010.
As of September 30, 2010, the Funds did not have any tax positions that did not meet the “more-likely-than-not” threshold of being sustained by the applicable tax authority. Generally, tax authorities can examine all the tax returns filed for the last three years.
The Funds recognize interest and penalties, if any, related to unrecognized tax benefits and losses as income tax expense in the Statement of Operations. During the period, the Fund did not incur any interest or penalties.
c) | Distributions to Shareholders – Dividends from net investment income, if any, are declared and paid quarterly. Distributions of net realized capital gains, if any, are declared and paid at least annually. |
d) | Use of Estimates – The preparation of financial statements in conformity with U.S. Generally Accepted Accounting Principles (“GAAP”) requires management to make estimates and assumptions that affect the reported amounts of assets and liabilities and disclosure of contingent assets and liabilities at the date of the financial statements and the reported amounts of revenues and expenses during the reporting period. Actual results could differ from those estimates. |
e) | Basis for Consolidation for the Leuthold Core Investment Fund, Leuthold Asset Allocation Fund, and Leuthold Global Fund –The Leuthold Core Investment Fund, Leuthold Asset Allocation Fund, and Leuthold Global Fund may invest up to 25% of their total assets in their Subsidiary, Leuthold Core, Ltd., Leuthold Asset Allocation, Ltd., and Leuthold Global, Ltd. (the “Subsidiaries”), respectively. The Subsidiaries, which are organized under the laws of the Cayman Islands, are wholly owned and controlled by the Leuthold Core Investment Fund, Leuthold Asset Allocation Fund, and Leuthold Global Fund, respectively, and are therefore consolidated in the respective Funds’ financial statements herein. All intercompany balances, revenues, and expenses have been eliminated in consolidation. The Subsidiaries act as investment vehicles in order to enter into certain investments for the Leuthold Core Investment Fund, Leuthold Asset Allocation Fund, and Leuthold Global Fund cons istent with the investment objectives and policies specified in the Prospectus and Statement of Additional Information. |
The Leuthold Funds - 2010 Annual Report 133
The Leuthold Funds
f) | Short Positions – For financial statement purposes, an amount equal to the required amount of collateral to be segregated for short positions is included in the Statements of Assets and Liabilities as an asset. The amount of the securities sold short, shown as a liability, is subsequently marked-to-market to reflect the current value of the short position. Subsequent fluctuations in the market prices of securities sold, but not yet purchased, may require purchasing the securities at prices which could differ from the amount reflected in the Statements of Assets and Liabilities. The Funds are liable for any dividends or interest payable on securities while those securities are in a short position. As collateral for their short positions, the Funds are required under the Investment Company Act of 1940 to maintain segregated assets consisting of cash, cash equivalents, or liquid securities. These segregated assets are valued consistent with Note 1a above. The amount of segregated assets is required t o be adjusted daily to reflect changes in the market value of the securities sold short. Leuthold Core Investment Fund, Leuthold Asset Allocation Fund, Leuthold Global Fund, Leuthold Hedged Equity Fund, and Grizzly Short Fund’s receivable from broker for securities sold short is with two major security dealers. |
g) | Other – Investment and shareholder transactions are recorded on the trade date. The Funds determine the gain or loss realized from the investment transactions by comparing the original cost of the security lot sold with the net sales proceeds. Dividend income or expense is recognized on the ex-dividend date or as soon as information is available to the Funds, and interest income or expense is recognized on an accrual basis. Discounts and premiums on bonds are amortized using the yield to maturity method over the life of the respective bond. |
h) | Expenses – Expenses that directly relate to one of the Funds are charged directly to that Fund. Other operating expenses of the Funds, such as Directors fees and expenses, insurance expense, and legal fees are allocated between the nine Funds based on the relative net asset value of the individual Funds. |
i) | Counterparty risk – Counterparty risk may arise as the result of the failure of a counterparty to a securities contract to comply with the terms of the contract. Potential counterparty risk is measured by the credit worthiness of the counterparty and additional risk may arise from unanticipated events affecting the value of the underlying security. |
j) | Subsequent Events – The Funds have evaluated subsequent events through the date of issuance of the Funds’ financial statements. At a meeting of the Board of Directors of the Funds held on November 8, 2010, the Board voted to close the Leuthold Undervalued & Unloved Fund (the “Fund”) to new investments, effective November 8, 2010 (other than reinvestment of dividends and distributions), and adopted a plan to terminate and liquidate the Funds on or before December 20, 2010 (the “Liquidation Date”). Management determined there were no other events that impacted the Funds’ financial statements. |
134 The Leuthold Funds - 2010 Annual Report
The Leuthold Funds
| 2. | INVESTMENT TRANSACTIONS |
Purchases and sales of investment securities, other than short-term investments and short sales, for the year ended September 30, 2010 are summarized below.
| | | Leuthold | | | Leuthold | | | | | | Leuthold | | | Leuthold | | | Leuthold | | | Leuthold | | | Leuthold | |
| | | Core | | | Asset | | | Leuthold | | | Select | | | Global | | | Undervalued | | | Global Clean | | | Hedged | |
| | | Investment | | | Allocation | | | Global | | | Industries | | | Industries | | | & Unloved | | | Technology | | | Equity | |
| | | Fund | | | Fund | | | Fund | | | Fund | | | Fund | | | Fund | | | Fund | | | Fund | |
Purchases | | $ | 1,186,495,181 | | | $ | 1,089,307,598 | | | $ | 341,601,070 | | | $ | 81,684,209 | | | $ | 14,119,199 | | | $ | 11,514,447 | | | $ | 34,166,839 | | | $ | 7,823,186 | |
Sales | | | 1,435,532,808 | | | | 1,324,725,985 | | | | 275,647,021 | | | | 89,410,244 | | | | 6,211,120 | | | | 16,166,221 | | | | 12,887,099 | | | | 6,237,001 | |
At September 30, 2010, gross unrealized appreciation and depreciation of investments and cost of investments (excluding short positions) for tax purposes were as follows:
The differences between book and tax basis of unrealized appreciation (depreciation) are primarily attributable to the tax deferral of losses on wash sales.
| | | Leuthold Core Investment Fund | | | Leuthold Asset Allocation Fund | | | Leuthold Global Fund | | | Leuthold Select Industries Fund | | | Leuthold Global Industries Fund | | | Leuthold Undervalued & Unloved Fund | | | Leuthold Global Clean Technology Fund | | | Leuthold Hedged Equity Fund | | | Grizzly Short Fund | |
Tax Cost of Investments | | $ | 943,017,663 | | | $ | 848,641,526 | | | $ | 256,696,196 | | | $ | 38,283,834 | | | $ | 8,537,391 | | | $ | 6,858,170 | | | $ | 29,353,409 | | | $ | 2,413,286 | | | $ | 11,326,967 | |
Gross Unrealized | | | | | | | | | | | | | | | | | | | | | | | | | | | | | | | | | | | | |
Appreciation | | $ | 186,620,077 | | | $ | 207,271,852 | | | $ | 30,421,256 | | | $ | 2,899,620 | | | $ | 1,208,463 | | | $ | 1,196,692 | | | $ | 2,573,305 | | | $ | 267,834 | | | $ | 5,572,744 | |
Gross Unrealized | | | | | | | | | | | | | | | | | | | | | | | | | | | | | | | | | | | | |
Depreciation | | | (22,965,508 | ) | | | (17,418,611 | ) | | | (4,280,281 | ) | | | (1,170,920 | ) | | | (66,759 | ) | | | (63,237 | ) | | | (3,533,054 | ) | | | (170,533 | ) | | | (5,572,744 | ) |
Net unrealized appreciation | | | | | | | | | | | | | | | | | | | | | | | | | | | | | | | | | | | | |
(depreciation) | | $ | 163,654,569 | | | $ | 189,853,241 | | | $ | 26,140,975 | | | $ | 1,728,700 | | | $ | 1,141,704 | | | $ | 1,133,455 | | | $ | (959,749 | ) | | $ | 97,301 | | | $ | –– | |
| 3. | INVESTMENT ADVISORY AND OTHER AGREEMENTS |
The Funds have entered into an Investment Advisory Agreement (“advisory agreement”) with Leuthold Weeden Capital Management (“Investment Adviser”). Pursuant to its advisory agreement with the Funds, the Investment Adviser is entitled to receive a fee, calculated daily as applied to each Fund’s daily net assets and payable monthly, at annual rates of:
| Leuthold | | Leuthold | | | | Leuthold | | Leuthold | | Leuthold | | Leuthold | | Leuthold | | |
| Core | | Asset | | Leuthold | | Select | | Global | | Undervalued | | Global Clean | | Hedged | | Grizzly |
| Investment | | Allocation | | Global | | Industries | | Industries | | & Unloved | | Technology | | Equity | | Short |
| Fund | | Fund | | Fund | | Fund | | Fund | | Fund | | Fund | | Fund | | Fund |
0.90% | | 0.90% | | 1.25% | | 1.00% | | 1.00% | | 0.75% | | 1.00% | | 1.25% | | 1.25% |
The Investment Adviser has agreed to waive its advisory fee and/or reimburse the Funds’ other expenses, including organization expenses, to the extent necessary to ensure that the Funds’ total operating expenses (exclusive of interest, taxes, brokerage commissions, dividends and interest on short positions, and other costs incurred in connection with the purchase or sale of portfolio securities, and extraordinary items) do not exceed the following rates, based on each Fund’s average daily net assets:
The Leuthold Funds - 2010 Annual Report 135
The Leuthold Funds
| Leuthold | | Leuthold | | | | Leuthold | | Leuthold | | Leuthold | | Leuthold | | Leuthold | | |
| Core | | Asset | | Leuthold | | Select | | Global | | Undervalued | | Global Clean | | Hedged | | Grizzly |
| Investment | | Allocation | | Global | | Industries | | Industries | | & Unloved | | Technology | | Equity | | Short |
| Fund | | Fund | | Fund | | Fund | | Fund | | Fund | | Fund | | Fund | | Fund |
1.25% | | 1.50% | | 1.85% | | 1.60% | | 1.85% | | 1.50% | | 1.85% | | 2.20% | | 2.50% |
Any waiver or reimbursement is subject to later adjustments to allow the Investment Adviser to recoup amounts previously waived or reimbursed to the extent actual fees and expenses for a fiscal period are less than each Fund’s expense limitation, provided, however, that the Investment Adviser shall only be entitled to recoup such amounts for a period of three years from the date such amount was waived or reimbursed. Amounts subject to future recoupment as of September 30, 2010 are as follows:
| Leuthold Undervalued & Unloved Fund | | Leuthold Hedged Equity Fund |
| Year of Expiration | | Recoverable Amount | | Year of Expiration | | Recoverable Amount |
9/30/2011 | | $11,856 | | 9/30/2012 | | $26,633 |
9/30/2012 | | 7,171 | | 9/30/2013 | | 37,088 |
9/30/2013 | | 15,985 | | | | |
| | | | | | | |
| Leuthold Global Industries Fund | | | | |
| Year of Expiration | | Recoverable Amount | | | | |
9/30/2013 | | $ 50,678 | | | | |
U.S. Bancorp Fund Services, LLC serves as transfer agent, administrator, and accounting services agent for the Funds. U.S. Bank, N.A. serves as custodian for the Funds. For the period ended September 30, 2010, the Leuthold Core Investment Fund, Leuthold Asset Allocation Fund, Leuthold Global Fund, Leuthold Select Industries Fund, Leuthold Global Industries Fund, Leuthold Undervalued & Unloved Fund, Leuthold Global Clean Technology Fund, Leuthold Hedged Equity Fund, and Grizzly Short Fund paid Weeden & Co., L.P., an affiliate of the Adviser, $1,257,789, $204,334, $98,435, $78,943, $2,835, $1,411, $19,289, $4,136, and $0, respectively, for brokerage commissions.
Each of the Leuthold Asset Allocation Fund – Retail Class, Leuthold Global Fund – Retail Class, Leuthold Global Industries Fund – Retail Class, Leuthold Undervalued & Unloved Fund, Leuthold Global Clean Technology Fund – Retail Class, and Leuthold Hedged Equity Fund – Retail Class has adopted a distribution plan pursuant to Rule 12b-1 under the Investment Company Act, whereby Rafferty Capital Markets, LLC serves as distributor. This plan allows each Fund to use up to 0.25% of its average daily net assets to pay sales, distribution, and other fees for the sale of its shares and for services provided to investors. Each Fund may pay all or a portion of this fee to any securities dealer, financial institution, or any other person who renders personal service to the Funds’ shareholders, assists in the maintenance of the Funds’ shareholder accounts, or who renders assistance in distributing or promoting the sale of shares of the Fund pu rsuant to a written agreement approved by the Board of Directors. To the extent such fee is not paid to such persons, each of the Funds may use the fee for its expenses of distribution of its shares, including, but not limited to, payment by the Fund of the cost of preparing, printing, and distributing Prospectuses and Statements of Additional Information to prospective investors and of implementing and operating the Plan.
136 The Leuthold Funds - 2010 Annual Report
The Leuthold Funds
The Funds enter into contracts that contain a variety of indemnifications. The Funds’ maximum exposure under these arrangements is unknown. However, the Funds have not had prior claims or losses pursuant to these contracts and expect the risk of loss to be remote.
Each Fund may invest up to 15% of net assets in securities for which there is no readily available market (“illiquid securities”). The 15% limitation includes securities whose disposition would be subject to legal restrictions (“restricted securities”). Illiquid and restricted securities often have a market value lower than the market price of unrestricted securities of the same issuer and are not readily marketable without some time delay. This could result in a Fund being unable to realize a favorable price upon disposition of such securities and in some cases might make disposition of such securities at the time desired by the Fund impossible.
| 7. | LENDING PORTFOLIO SECURITIES |
The Funds may lend portfolio securities constituting up to 30% of total assets to unaffiliated broker dealers, banks, or other recognized institutional borrowers of securities, provided that the borrower at all times maintains cash, U.S. government securities or equivalent collateral or provides an irrevocable letter of credit in favor of the Fund equal in value to at least 100% of the value of the securities loaned. The Funds did not lend any portfolio securities during the reporting period, and will not enter into any securities lending arrangements in the future without the prior approval of the Board of Directors.
The Leuthold Funds - 2010 Annual Report 137
REPORT OF INDEPENDENT REGISTERED PUBLIC ACCOUNTING FIRM
To the Shareholders and Board of Directors Leuthold Funds, Inc.
We have audited the accompanying statements of assets and liabilities, including the schedules of investments and securities sold short (as applicable), of Leuthold Funds, Inc. (consisting of Leuthold Core Investment Fund (consolidated), Leuthold Asset Allocation Fund (consolidated), Leuthold Global Fund (consolidated), Leuthold Select Industries Fund, Leuthold Global Industries Fund, Leuthold Undervalued & Unloved Fund, Leuthold Global Clean Technology Fund, Leuthold Hedged Equity Fund, and Grizzly Short Fund ) (the “Funds”) as of September 30, 2010, and the related statements of operations, changes in net assets and the financial highlights for each of the periods indicated therein. These financial statements and financial highlights are the responsibility of the Funds’management.Our responsibility is to express an opinion on these financial statements and financial highlights based on our audits.
We conducted our audits in accordance with the standards of the Public Company Accounting Oversight Board (United States). Those standards require that we plan and perform the audits to obtain reasonable assurance about whether the financial statements and financial highlights are free of material misstatement. We were not engaged to perform an audit of the Funds’ internal control over financial reporting. Our audits included consideration of internal control over financial reporting as a basis for designing audit procedures that are appropriate in the circumstances, but not for the purpose of expressing an opinion on the effectiveness of the Funds’ internal control over financial reporting. Accordingly, we express no such opinion. An audit includes examining, on a test basis, evidence supporting the amounts and disclosures in the financial statements and financial highlights, assessing the accounting principles used and significant estimates made by ma nagement, and evaluating the overall financial statement presentation. Our procedures included confirmation of securities owned and securities sold short (as applicable) as of September 30, 2010, by correspondence with the custodian and brokers or by other appropriate auditing procedures where replies from brokers were not received.We believe that our audits provide a reasonable basis for our opinion.
In our opinion, the financial statements and financial highlights referred to above present fairly, in all material respects, the financial position of each of the respective funds constituting Leuthold Funds, Inc. at September 30, 2010, the results of their operations, changes in their net assets and the financial highlights for each of the periods indicated therein, in conformity with U.S. generally accepted accounting principles.
Minneapolis, Minnesota
November 24, 2010
138 The Leuthold Funds - 2010 Annual Report
ADDITIONAL INFORMATION (Unaudited)
SHAREHOLDER NOTIFICATION OF FEDERAL TAX STATUS (Unaudited)
The percentage of dividend income distributed for the year ended September 30, 2010, which is designated as qualified dividend income under the Jobs and Growth Tax Relief Reconciliation Act of 2003, is as follows: Leuthold Asset Allocation Fund 97.79%, Leuthold Global Fund 66.13%, Leuthold Select Industries Fund 100.00%, and Leuthold Undervalued & Unloved Fund 100.00%.
The percentage of dividend income distributed for the year ended September 30, 2010, designated as qualified dividends received deduction available to corporate shareholders, is as follows: Leuthold Asset Allocation Fund 83.07%, Leuthold Global Fund 38.70%, Leuthold Select Industries Fund 100.00%, and Leuthold Undervalued & Unloved Fund 100.00%.
The Leuthold Asset Allocation Fund, Leuthold Global Fund, Leuthold Select Industries Fund, and Leuthold Undervalued & Unloved Fund designated 31.06%, 7.97%, 0.05%, and 0.07%, respectively, of their ordinary distributions paid as qualified interest related dividends under the Internal Revenue Code Section 871(k)(1)(C) for the year ended September 30, 2010.
For the year ended September 30, 2010, the Leuthold Global Industries Fund earned foreign source income and paid foreign taxes which it intends to pass through to its shareholders pursuant to Section 853 of the Internal Revenue Code as follows:
| | | Foreign Source | | | Taxes | |
| | | Income Earned | | | Paid | |
| | | | | | | |
Belgium | | $ | 116 | | | $ | 17 | |
Brazil | | | 751 | | | | 113 | |
Canada | | | 1,016 | | | | 152 | |
Cayman Islands | | | 140 | | | | –– | |
France | | | 2,870 | | | | 718 | |
Germany | | | 27 | | | | 4 | |
Hong Kong | | | 4,483 | | | | –– | |
Israel | | | 1,868 | | | | 374 | |
India | | | 31 | | | | 4 | |
Japan | | | 6,575 | | | | 460 | |
Malaysia | | | 3,993 | | | | –– | |
Mexico | | | 237 | | | | –– | |
Philippines | | | 348 | | | | 104 | |
Singapore | | | 3,159 | | | | –– | |
South Africa | | | 716 | | | | –– | |
Sweden | | | 140 | | | | 21 | |
Taiwan | | | 9,464 | | | | 1,893 | |
Turkey | | | 388 | | | | 58 | |
United Kingdom | | | 1,423 | | | | –– | |
| | | | | | | | | |
| | | $ | 37,745 | | | $ | 3,918 | |
The Leuthold Funds - 2010 Annual Report 139
The Leuthold Funds
ADDITIONAL DISCLOSURE REGARDING FUND DIRECTORS AND OFFICERS (UNAUDITED)
Independent Directors
| | | | | | | | | # of | | |
| | | | | | | | | Portfolios in | | Other |
| | | Position(s) | | Term of Office | | | | Fund Complex | | Directorships |
| Name, Year of Birth, | | Held with | | and Length of | | Principal Occupation(s) | | Overseen By | | Held by |
| and Address | | the Company | | Time Served | | During Past Five Years | | Director | | Director |
Lawrence L. Horsch (1934) | | Chairman | | Indefinite Term, | | Chairman, Eagle Management & | | 9 | | None |
c/o Leuthold Weeden | | and Director | | Director since | | Financial Corp., a management | | | | |
Capital Management | | | | 1995 | | consulting firm | | | | |
33 South Sixth Street | | | | | | | | | | |
Suite 4600 | | | | | | | | | | |
Minneapolis, MN 55402 | | | | | | | | | | |
| | | | | | | | | | | |
| | | | | | | | | | | |
| | | | | | | | | | | |
Paul M. Kelnberger (1943) | | Director and | | Indefinite Term, | | Consultant to Johnson, | | 9 | | None |
332 Minnesota Street | | Chair of | | Director since | | West & Co., PLC | | | | |
Suite E1100 | | Audit | | 1995 | | | | | | |
St. Paul, MN 55101 | | Committee | | | | | | | | |
| | | | | | | | | | | |
| | | | | | | | | | | |
| | | | | | | | | | | |
Addison L. Piper (1946) | | Director | | Indefinite Term, | | Retired Chairman and Chief | | 9 | | Piper Jaffray |
c/o Leuthold Weeden | | | | Director since | | Executive Officer of Piper Jaffray | | | | Companies |
Capital Management | | | | 2009 | | Companies, Served as Vice Chairman | | | | and |
33 South Sixth Street | | | | | | of Piper Jaffray Companies from | | | | Renaissance |
Suite 4600 | | | | | | 2003 to 2006. | | | | Learning, Inc. |
Minneapolis, MN 55402 | | | | | | | | | | |
| | | | | | | | | | | |
| | | | | | | | | | | |
| | | | | | | | | | | |
| Interested Directors (and Officers) | | | | | | |
| | | | | | | | | | | |
Steven C. Leuthold (1937) | | Director | | Indefinite Term, | | Chief Investment Officer and | | 9 | | None |
33 South Sixth Street | | | | Director since 1995 | | managing member of Leuthold | | | | |
Suite 4600 | | | | | | Weeden Capital Management | | | | |
Minneapolis, MN 55402 | | President | | One year term, | | (the “Adviser”) | | | | |
| | | | | President since 1993 | | | | | | |
| | | | | | | | | | | |
| | | | | | | | | | | |
| | | | | | | | | | | |
John C. Mueller (1968) | | Director | | Indefinite Term, | | Co-Chief Executive Officer | | 9 | | None |
33 South Sixth Street | | | | Director since | | of The Leuthold Group since 2005. | | | | |
Suite 4600 | | | | 2009 | | Involved in Sales and Marketing for | | | | |
Minneapolis, MN 55402 | | | | | | The Leuthold Group since 2001. | | | | |
140 The Leuthold Funds - 2010 Annual Report
| | | | | | | | # of | | |
| | | | | | | | Portfolios in | | Other |
| | | Position(s) | | Term of Office | | | Fund Complex | | Directorships |
| Name, Year of Birth, | | Held with | | and Length of | Principal Occupation | | Overseen By | | Held by |
| and Address | | the Company | | Time Served | During Past Five Years | | Director | | Director |
Edward C. Favreau (1952) | | Vice President | | One Year Term, | Manager of Marketing and Sales | | N/A | | N/A |
33 South Sixth Street | | | | Vice President | of the Adviser since 1999. Prior | | | | |
Suite 4600 | | | | since 1999 | to joining the Adviser, he was Vice | | | | |
Minneapolis, MN 55402 | | | | | President and Sales Manager of | | | | |
| | | | | | U.S. Bancorp Investments, Inc. | | | | |
| | | | | | | | | | |
| | | | | | | | | | |
Roger A. Peters (1960) | | Vice President | | One Year Term, | Chief Compliance Officer of | | N/A | | N/A |
33 South Sixth Street | | and | | Chief Compliance | the Adviser since 2005. Prior | | | | |
Suite 4600 | | Chief Compliance | | Officer since 2006 | to joining the Adviser, he was | | | | |
Minneapolis, MN 55402 | | Officer | | and Vice President | Vice President, Commercial | | | | |
| | | | | since 2007 | Product Management of | | | | |
| | | | | | U.S. Bank from 2003-2005. | | | | |
| | | Assistant Secretary | | One Year Term, | | | | | |
| | | | | Assistant Secretary | | | | | |
| | | | | since 2006 | | | | | |
| | | | | | | | | | |
Holly J. Weiss (1968) | | Secretary and | | One Year Term, | Controller of the Adviser | | N/A | | N/A |
33 South Sixth Street | | Treasurer | | Secretary and | since 2008. Prior to joining | | | | |
Suite 4600 | | | | Treasurer | the Adviser, she was Controller | | | | |
Minneapolis, MN 55402 | | | | since 2009 | of Churchill Capital Mezzanine | | | | |
| | | | | | Finance from 2001-2008. | | | | |
| | | | | | | | | | |
| | | | | | | | | | |
Glenn R. Larson (1965) | | Assistant Secretary | | One Year Term, | Compliance Officer of the Adviser | | N/A | | N/A |
33 South Sixth Street | | | | Assistant Secretary | since 2005. Prior to joining the | | | | |
Suite 4600 | | | | since 2006 | Adviser, he was a Compliance | | | | |
Minneapolis, MN 55402 | | | | | Representative of U.S. Bancorp | | | | |
| | | | | | Investment Services, Inc. from 2003 | | | | |
| | | | | | until 2005. | | | | |
The Statement of Additional Information includes additional information about the Funds’ Directors and is available free of charge upon request by calling the Funds toll free
at (800) 273-6886.
Information regarding the method the Funds use to vote proxies relating to portfolio securities is available without charge upon request by calling toll-free at (800) 273-6886 or by accessing the Funds’ website at www.leutholdfunds.com. Information regarding how the Funds voted proxies relating to portfolio securities during the most recent twelve-month period ended June 30 is available without charge upon request by calling toll-free at (800) 273-6886 or on the SEC’s website at www.sec.gov.
The Leuthold Funds - 2010 Annual Report 141
This page is intentionally left blank
Please do not print this text
The Leuthold Funds Investment Adviser: Leuthold Weeden Capital Management, Minnesota Administrator, Transfer Agent, Dividend Paying Agent, Shareholder Servicing Agent: U.S. Bancorp Fund Services, LLC, Wisconsin Custodian: U.S. Bank, N.A., Wisconsin Counsel: Foley & Lardner, LLP, Wisconsin Independent Registered Public Accounting Firm: Ernst &Young LLP, Minnesota The Funds are required to file their complete schedules of portfolio holdings with the SEC for their first and third fiscal quarters on Form N-Q. Once filed, the Fund’s Form N-Q is available without charge, upon request on the SEC’s website (http://www.sec.gov) and may be available by calling 1-800-273-6886. You can also obtain copies of Form N-Q by (i) visiting the SEC’s Public Reference Room in Washington, DC (information on the operation of the Public Reference Room may be obtained by calling 1-800-SEC-0330); (ii) sending your request and a duplicating fee to the SEC’s Public Reference Room, Washington, DC 20549-0102; or (iii) sending your request electronically to publicinfosec.gov. This report is authorized for distribution only when preceded or accompanied by a current prospectus.
|
Item 2. Code of Ethics.
The registrant has adopted a code of ethics that applies to the registrant’s principal executive officer and principal financial officer. The registrant has not made any amendments to its code of ethics during the period covered by this report. The registrant has not granted any waivers from any provisions of the code of ethics during the period covered by this report. A copy of the registrant’s Code of Ethics is filed herewith.
Item 3. Audit Committee Financial Expert.
The registrant’s board of directors has determined that there is at least one audit committee financial expert serving on its audit committee. Paul Kelnberger is the “audit committee financial expert” and is considered to be “independent” as each term is defined in Item 3 of Form N-CSR.
Item 4. Principal Accountant Fees and Services.
The registrant has engaged its principal accountant to perform audit services, audit-related services, tax services and other services during the past two fiscal years. “Audit services” refer to performing an audit of the registrant's annual financial statements or services that are normally provided by the accountant in connection with statutory and regulatory filings or engagements for those fiscal years. “Audit-related services” refer to the assurance and related services by the principal accountant that are reasonably related to the performance of the audit. “Tax services” refer to professional services rendered by the principal accountant for tax compliance, tax advice, and tax planning. No “other services” were provided by the princip al accountant. The following table details the aggregate fees billed or expected to be billed for each of the last two fiscal years for audit fees, audit-related fees, tax fees and other fees by the principal accountant.
The audit committee has adopted pre-approval policies and procedures that require the audit committee to pre-approve all audit and non-audit services of the registrant, including services provided to any entity affiliated with the registrant.
The percentage of fees billed by Ernst & Young, LLP applicable to non-audit services pursuant to waiver of pre-approval requirement were as follows:
All of the principal accountant’s hours spent on auditing the registrant’s financial statements were attributed to work performed by full-time permanent employees of the principal accountant. (If more than 50 percent of the accountant’s hours were spent to audit the registrant's financial statements for the most recent fiscal year, state how many hours were attributed to work performed by persons other than the principal accountant's full-time, permanent employees.)
The following table indicates the non-audit fees billed or expected to be billed by the registrant’s accountant for services to the registrant and to the registrant’s investment adviser (and any other controlling entity, etc.—not sub-adviser) for the last two years. The audit committee of the board of directors has considered whether the provision of non-audit services that were rendered to the registrant's investment adviser is compatible with maintaining the principal accountant's independence and has concluded that the provision of such non-audit services by the accountant has not compromised the accountant’s independence.
Item 5. Audit Committee of Listed Registrants.
Not applicable to registrants who are not listed issuers (as defined in Rule 10A-3 under the Securities Exchange Act of 1934).
Item 6. Investments.
Schedule of Investments is included as part of the report to shareholders filed under Item 1 of this Form.
Item 7. Disclosure of Proxy Voting Policies and Procedures for Closed-End Management Investment Companies.
Not applicable to open-end investment companies.
Item 8. Portfolio Managers of Closed-End Management Investment Companies.
Not applicable to open-end investment companies.
Item 9. Purchases of Equity Securities by Closed-End Management Investment Company and Affiliated Purchasers.
Not applicable to open-end investment companies.
Item 10. Submission of Matters to a Vote of Security Holders.
Not Applicable.
Item 11. Controls and Procedures.
Item 12. Exhibits.
Pursuant to the requirements of the Securities Exchange Act of 1934 and the Investment Company Act of 1940, the registrant has duly caused this report to be signed on its behalf by the undersigned, thereunto duly authorized.
Steven C. Leuthold, President
Pursuant to the requirements of the Securities Exchange Act of 1934 and the Investment Company Act of 1940, this report has been signed below by the following persons on behalf of the registrant and in the capacities and on the dates indicated.
Steven C. Leuthold, President
* Print the name and title of each signing officer under his or her signature.