Semi-Annual Report
March 31, 2019
LEUTHOLD FUNDS
Leuthold Core Investment Fund Retail Class Shares LCORX Institutional Class Shares LCRIX Leuthold Global Fund Retail Class Shares GLBLX Institutional Class Shares GLBIX | Leuthold Select Industries Fund LSLTX Leuthold Global Industries Fund Retail Class Shares LGINX Institutional Class Shares LGIIX Grizzly Short Fund GRZZX |
Beginning on January 1, 2021, as permitted by regulations adopted by the U.S. Securities and Exchange Commission, paper copies of the Funds’ annual and semi-annual shareholder reports will no longer be sent by mail, unless you specifically request paper copies of the reports. Instead, the reports will be made available on the Funds’ website www.funds.leutholdgroup.com, and you will be notified by mail each time a report is posted and provided with a website link to access the report.
If you already elected to receive shareholder reports electronically, you will not be affected by this change and you need not take any action. You may elect to receive shareholder reports and other communications from the Funds electronically anytime by contacting your financial intermediary (such as a broker-dealer or a bank) or, if you are a direct investor, by calling 1-800-273-6886, sending an e-mail request to publicinfo@sec.gov, or by enrolling at www.funds.leutholdgroup.com.
You may elect to receive all future reports in paper free of charge. If you invest through a financial intermediary, you can contact your financial intermediary to request that you continue to receive paper copies of your shareholder reports. If you invest directly with the Funds, you can call 1-800-273-6886 or send an email request to publicinfo@sec.gov to let the Funds know you wish to continue receiving paper copies of your shareholder reports. Your election to receive reports in paper will apply to all Funds held in your account if you invest through your financial intermediary or all Funds held with the fund complex if you invest directly with the Funds.
The Securities and Exchange Commission has not approved or disapproved these securities or determined if this semi-annual report is accurate or complete. Any representation to the contrary is a criminal offense. An investment in the Funds is not a deposit of a bank and is not insured or guaranteed by the Federal Deposit Insurance Corporation or any other government agency.
Leuthold Funds
Table of Contents
| 1 |
| 4 |
| 6 |
| 10 |
| 14 |
| 19 |
| Schedules of Investments and Securities Sold Short | |
| 27 |
| 34 |
| 43 |
| 46 |
| 51 |
| 55 |
| 69 |
| 72 |
Leuthold Funds
Ex
pense Examples – March 31, 2019 (Unaudited)
As a shareholder of the Funds, you incur two types of costs: (1) transaction costs, including redemption fees and exchange fees; and (2) ongoing costs, including management fees; distribution and/or service fees; and other Fund expenses. This example is intended to help you understand your ongoing costs (in dollars) of investing in the Funds and to compare costs with the ongoing costs of investing in other mutual funds.
The Example is based on an investment of $1,000 invested at the beginning of the period and held the entire period (October 1, 2018 – March 31, 2019).
Actual Expenses
The first line of the following tables provides information about actual account values and actual expenses. Although the Funds charge no sales load (the Leuthold Core Investment Fund, Leuthold Global Fund, and Leuthold Global Industries Fund charge a 2% redemption fee for redemptions made within five business days after a purchase), you will be assessed fees for outgoing wire transfers, returned checks, or stop payment orders at prevailing rates charged by U.S. Bancorp Fund Services, LLC, the Funds’ transfer agent. If you request a redemption be made by wire transfer, currently a $15.00 fee is charged by the Funds’ transfer agent. To the extent that the Funds invest in shares of other investment companies as part of its investment strategy, you will indirectly bear your proportionate share of any fees and expenses charged by the underlying funds in which a Fund invests in addition to the expenses of the Fund. Actual expenses of the underlying funds are expected to vary by fund. These expenses are not included in the following examples. The examples include, but are not limited to, management fees, shareholder servicing fees, fund accounting, custody, and transfer agent fees. However, the following examples do not include portfolio trading commissions and related expenses, and extraordinary expenses as determined under generally accepted accounting principles. You may use the information in this line, together with the amount you invested, to estimate the expenses that you paid over the period. Simply divide your account value by $1,000 (for example, an $8,600 account value divided by $1,000 = 8.6), then multiply the result by the number in the first line under the heading entitled “Expenses Paid During Period” to estimate the expenses you paid on your account during this period.
Hypothetical Examples for Comparison Purposes
The second line of the following tables provides information about hypothetical account values and hypothetical expenses based on the Funds’ actual expense ratios and an assumed rate of return of 5% per year before expenses, which is not the Funds’ actual return. The hypothetical account values and expenses may not be used to estimate the actual ending account balance or expenses you paid for the period. You may use this information to compare the ongoing costs of investing in the Funds and other funds. To do so, compare this 5% hypothetical example with the 5% hypothetical examples that appear in the shareholder reports of the other funds.
Please note that the expenses shown in the tables are meant to highlight your ongoing costs only and do not reflect any transactional costs, such as redemption fees or exchange fees. Therefore, the second line of the tables is useful in comparing ongoing costs only and will not help you determine the relative costs of owning different funds. In addition, if these transactional costs were included, your costs would have been higher.
| See Notes to the Financial Statements. | Leuthold Funds - 2019 Semi-Annual Report | 1 |
Leuthold Funds
Expense Example Tables (Unaudited)
Leuthold Core Investment Fund - Retail Class - LCORX
| | | Beginning
Account Value
October 1, 2018 | | Ending
Account Value
March 31, 2019 | | Expenses Paid
During Period*
October 1, 2018 - March 31, 2019 |
Actual** | | $ | 1,000.00 | | | $ | 976.80 | | | $ | 6.65 | |
Hypothetical (5% return before expenses)*** | | | 1,000.00 | | | | 1,018.20 | | | | 6.79 | |
* Expenses are equal to the Fund's annualized expense ratio of 1.35%, multiplied by the average account value over the period, multiplied by 182/365 to reflect the one-half year period.
** Excluding dividends and interest on securities sold short, your actual cost of investment in the Fund would be $5.91 and the Fund's annualized expense ratio would be 1.20%.
*** Excluding dividends and interest on securities sold short, your hypothetical cost of investment in the Fund would be $6.04 and the Fund's annualized expense ratio would be 1.20%.
Leuthold Core Investment Fund - Institutional Class - LCRIX
| | | Beginning
Account Value
October 1, 2018 | | Ending
Account Value
March 31, 2019 | | Expenses Paid
During Period*
October 1, 2018 - March 31, 2019 |
Actual** | | $ | 1,000.00 | | | $ | 977.00 | | | $ | 6.16 | |
Hypothetical (5% return before expenses)*** | | | 1,000.00 | | | | 1,018.70 | | | | 6.29 | |
* Expenses are equal to the Fund's annualized expense ratio of 1.25%, multiplied by the average account value over the period, multiplied by 182/365 to reflect the one-half year period.
** Excluding dividends and interest on securities sold short, your actual cost of investment in the Fund would be $5.42 and the Fund's annualized expense ratio would be 1.10%.
*** Excluding dividends and interest on securities sold short, your hypothetical cost of investment in the Fund would be $5.54 and the Fund's annualized expense ratio would be 1.10%.
Leuthold Global Fund - Retail Class - GLBLX
| | | Beginning
Account Value
October 1, 2018 | | Ending
Account Value
March 31, 2019 | | Expenses Paid
During Period*
October 1, 2018 - March 31, 2019 |
Actual** | | $ | 1,000.00 | | | $ | 954.10 | | | $ | 9.16 | |
Hypothetical (5% return before expenses)*** | | | 1,000.00 | | | | 1,015.56 | | | | 9.45 | |
* Expenses are equal to the Fund's annualized expense ratio of 1.88%, multiplied by the average account value over the period, multiplied by 182/365 to reflect the one-half year period.
** Excluding dividends and interest on securities sold short, your actual cost of investment in the Fund would be $7.79 and the Fund's annualized expense ratio would be 1.60%.
*** Excluding dividends and interest on securities sold short, your hypothetical cost of investment in the Fund would be $8.05 and the Fund's annualized expense ratio would be 1.60%.
Leuthold Global Fund - Institutional Class - GLBIX
| | | Beginning
Account Value
October 1, 2018 | | Ending
Account Value
March 31, 2019 | | Expenses Paid
During Period*
October 1, 2018 - March 31, 2019 |
Actual** | | $ | 1,000.00 | | | $ | 955.50 | | | $ | 8.00 | |
Hypothetical (5% return before expenses)*** | | | 1,000.00 | | | | 1,016.75 | | | | 8.25 | |
* Expenses are equal to the Fund's annualized expense ratio of 1.64%, multiplied by the average account value over the period, multiplied by 182/365 to reflect the one-half year period.
** Excluding dividends and interest on securities sold short, your actual cost of investment in the Fund would be $6.63 and the Fund's annualized expense ratio would be 1.36%.
*** Excluding dividends and interest on securities sold short, your hypothetical cost of investment in the Fund would be $6.84 and the Fund's annualized expense ratio would be 1.36%.
| 2 | Leuthold Funds - 2019 Semi-Annual Report | See Notes to the Financial Statements. |
Leuthold Funds
Expense Example Tables (Unaudited) (continued)
Leuthold Select Industries Fund - LSLTX
| | | Beginning
Account Value
October 1, 2018 | | Ending
Account Value
March 31, 2019 | | Expenses Paid
During Period*
October 1, 2018 - March 31, 2019 |
| Actual | | $ | 1,000.00 | | | $ | 945.00 | | | $ | 7.27 | |
| Hypothetical (5% return before expenses) | | | 1,000.00 | | | | 1,017.45 | | | | 7.54 | |
* Expenses are equal to the Fund's annualized expense ratio of 1.50%, multiplied by the average account value over the period, multiplied by 182/365 to reflect the one-half year period.
Leuthold Global Industries Fund - Retail Class - LGINX
| | | Beginning
Account Value
October 1, 2018 | | Ending
Account Value
March 31, 2019 | | Expenses Paid
During Period*
October 1, 2018 - March 31, 2019 |
| Actual | | $ | 1,000.00 | | | $ | 913.40 | | | $ | 7.16 | |
| Hypothetical (5% return before expenses) | | | 1,000.00 | | | | 1,017.45 | | | | 7.54 | |
* Expenses are equal to the Fund's annualized expense ratio of 1.50%, multiplied by the average account value over the period, multiplied by 182/365 to reflect the one-half year period.
Leuthold Global Industries Fund - Institutional Class - LGIIX
| | | Beginning
Account Value
October 1, 2018 | | Ending
Account Value
March 31, 2019 | | Expenses Paid
During Period*
October 1, 2018 - March 31, 2019 |
| Actual | | $ | 1,000.00 | | | $ | 914.70 | | | $ | 5.97 | |
| Hypothetical (5% return before expenses) | | | 1,000.00 | | | | 1,018.70 | | | | 6.29 | |
* Expenses are equal to the Fund's annualized expense ratio of 1.25%, multiplied by the average account value over the period, multiplied by 182/365 to reflect the one-half year period.
Grizzly Short Fund - GRZZX
| | | Beginning
Account Value
October 1, 2018 | | Ending
Account Value
March 31, 2019 | | Expenses Paid
During Period*
October 1, 2018 - March 31, 2019 |
Actual** | | $ | 1,000.00 | | | $ | 944.50 | | | $ | 13.23 | |
Hypothetical (5% return before expenses)*** | | | 1,000.00 | | | | 1,011.32 | | | | 13.69 | |
* Expenses are equal to the Fund's annualized expense ratio of 2.73%, multiplied by the average account value over the period, multiplied by 182/365 to reflect the one-half year period.
** Excluding dividends and interest on securities sold short, your actual cost of investment in the Fund would be $7.81 and the Fund's annualized expense ratio would be 1.61%.
*** Excluding dividends and interest on securities sold short, your hypothetical cost of investment in the Fund would be $8.10 and the Fund's annualized expense ratio would be 1.61%.
| See Notes to the Financial Statements. | Leuthold Funds - 2019 Semi-Annual Report | 3 |
Leuthold Funds
(Unaudited)
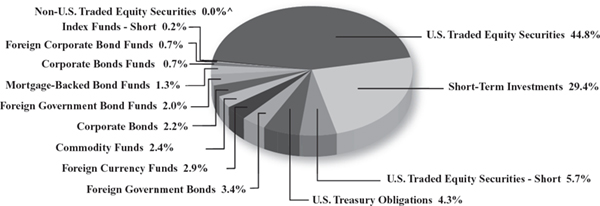
Leuthold Core Investment Fund
A
llocation of Portfolio Holdings • March 31, 2019
Leuthold Global Fund
Allocation of Portfolio Holdings • March 31, 2019
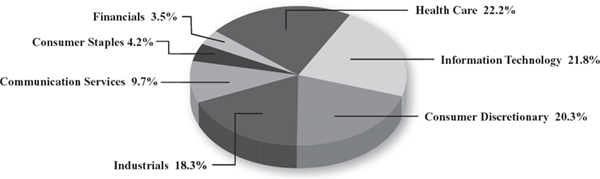
Leuthold Select Industries Fund
Allocation of Portfolio Holdings • March 31, 2019*
^ Amount is less than 0.05%.
* Excludes short-term investments less than 5% of net assets.
Reflected as a percent of absolute value of investments and securities sold short.
| 4 | Leuthold Funds - 2019 Semi-Annual Report | See Notes to the Financial Statements. |
Leuthold Funds
(Unaudited)
Leuthold Global Industries Fund
Allocation of Portfolio Holdings • March 31, 2019*
Grizzly Short Fund
Allocation of Securities Sold Short • March 31, 2019
* Excludes short-term investments less than 5% of net assets.
Reflected as a percent of absolute value of investments and securities sold short.
| See Notes to the Financial Statements. | Leuthold Funds - 2019 Semi-Annual Report | 5 |
Leuthold Funds
Statements of Assets and Liabilities
March 31, 2019 (Unaudited)
| | | Leuthold Core Investment Fund | | | Leuthold
Global
Fund | | | Leuthold Select Industries Fund | |
| ASSETS: | | | | | | | | | |
| Investments, at cost | | | | | | | | | | | | |
| Unaffiliated Securities | | $ | 708,279,488 | * | | $ | 77,525,513 | * | | $ | 10,253,011 | |
| Affiliated Securities | | | 20,482,592 | | | | — | | | | — | |
| Total Investments, at cost | | | 728,762,080 | | | | 77,525,513 | | | | 10,253,011 | |
| | | | | | | | | | | | | |
| Investments, at fair value | | | | | | | | | | | | |
| Unaffiliated Securities | | | 774,770,194 | | | | 77,925,772 | | | | 12,309,383 | |
| Affiliated Securities | | | 20,615,940 | | | | — | | | | — | |
| Total Investments, at fair value | | | 795,386,134 | | | | 77,925,772 | | | | 12,309,383 | |
| Foreign currency (cost $0, $13,335, and $0 respectively) | | | — | | | | 13,239 | | | | — | |
| Receivable for Fund shares sold | | | 444,285 | | | | 54,650 | | | | 368 | |
| Collateral at broker for securities sold short | | | 50,969,723 | | | | 5,408,416 | | | | — | |
| Tri-party collateral held at custodian | | | 9,000,001 | | | | 800,001 | | | | — | |
| Interest receivable | | | 880,529 | | | | 96,006 | | | | 217 | |
| Dividends receivable | | | 247,776 | | | | 217,466 | | | | 7,408 | |
| Securities lending income receivable | | | 16,544 | | | | 4,664 | | | | — | |
| Other assets | | | 184,107 | | | | 37,432 | | | | 13,837 | |
| Total Assets | | | 857,129,099 | | | | 84,557,646 | | | | 12,331,213 | |
| | | | | | | | | | | | | |
| LIABILITIES: | | | | | | | | | | | | |
| Securities sold short, at fair value (proceeds $49,272,128, $5,077,593, and $0 respectively) | | | 49,311,127 | | | | 4,854,127 | | | | — | |
| Collateral received for securities loaned | | | 105,428,945 | | | | 12,827,954 | | | | — | |
| Payable for Fund shares redeemed | | | 986,424 | | | | 10,614 | | | | — | |
| Payable to Adviser | | | 538,006 | | | | 53,227 | | | | 8,065 | |
| Payable to Custodian | | | 19,053 | | | | 9,209 | | | | 1,698 | |
| Payable to Directors | | | 40,803 | | | | 4,707 | | | | 805 | |
| Dividends payable on securities sold short | | | 41,180 | | | | 2,311 | | | | — | |
| Distribution (Rule 12b-1) fees payable | | | 7,361 | | | | 19,535 | | | | 88 | |
| Shareholder servicing fees payable | | | 56,428 | | | | — | | | | 1,682 | |
| Accrued expenses and other liabilities | | | 318,763 | | | | 71,588 | | | | 26,824 | |
| Total Liabilities | | | 156,748,090 | | | | 17,853,272 | | | | 39,162 | |
| NET ASSETS | | $ | 700,381,009 | | | $ | 66,704,374 | | | $ | 12,292,051 | |
| * Includes loaned securities with market value of: | | $ | 103,535,380 | | | $ | 12,580,175 | | | $ | — | |
| 6 | Leuthold Funds - 2019 Semi-Annual Report | See Notes to the Financial Statements. |
Leuthold Funds
Statements of Assets and Liabilities (continued)
March 31, 2019 (Unaudited)
| | | Leuthold Core Investment Fund | | | Leuthold
Global Fund | | | Leuthold Select
Industries Fund | |
| NET ASSETS CONSIST OF: | | | | | | | | | | | | |
| Capital stock | | $ | 610,536,515 | | | $ | 67,312,711 | | | $ | 9,983,277 | |
| Total distributable earnings | | | 89,844,494 | | | | (608,337 | ) | | | 2,308,774 | |
| Total Net Assets | | $ | 700,381,009 | | | $ | 66,704,374 | | | $ | 12,292,051 | |
| | | | | | | | | | | | | |
| Retail Class Shares | | | | | | | | | | | | |
| Net assets | | $ | 340,176,403 | | | $ | 10,186,404 | | | $ | 12,292,051 | |
| Shares outstanding (1,000,000,000 shares of $0.0001 par value authorized) | | | 18,735,090 | | | | 1,266,025 | | | | 518,927 | |
| Net Asset Value, Redemption Price, and Offering Price Per Share | | $ | 18.16 | ** | | $ | 8.05 | ** | | $ | 23.69 | |
| | | | | | | | | | | | | |
| Institutional Class Shares | | | | | | | | | | | | |
| Net assets | | $ | 360,204,606 | | | $ | 56,517,970 | | | | n/a | |
| Shares outstanding (1,000,000,000 shares of $0.0001 par value authorized) | | | 19,804,460 | | | | 6,921,295 | | | | n/a | |
| Net Asset Value, Redemption Price, and Offering Price Per Share | | $ | 18.19 | ** | | $ | 8.17 | ** | | | n/a | |
| ** | Redemption price may differ from NAV if redemption fee is applied. |
| See Notes to the Financial Statements. | Leuthold Funds - 2019 Semi-Annual Report | 7 |
Leuthold Funds
Statements of Assets and Liabilities (continued)
March 31, 2019 (Unaudited)
| | | Leuthold Global Industries Fund | | | Grizzly Short Fund | |
| ASSETS: | | | | | | |
| Investments, at cost | | $ | 7,172,613 | | | $ | 77,907,947 | |
| Investments, at fair value | | | 7,324,968 | | | | 77,907,947 | |
| Receivable for Fund shares sold | | | 3,217 | | | | 388,696 | |
| Collateral at broker for securities sold short | | | — | | | | 96,985,438 | |
| Tri-party collateral held at custodian | | | — | | | | 14,000,001 | |
| Interest receivable | | | 93 | | | | 149,367 | |
| Dividends receivable | | | 27,881 | | | | — | |
| Receivable from Advisor | | | 9,186 | | | | — | |
| Other assets | | | 28,030 | | | | 169,298 | |
| Total Assets | | | 7,393,375 | | | | 189,600,747 | |
| | | | | | | | | |
| LIABILITIES: | | | | | | | | |
| Securities sold short, at fair value (proceeds $0 and $94,102,174, respectively) | | | — | | | | 94,401,658 | |
| Payable for Fund shares redeemed | | | — | | | | 132,952 | |
| Payable to Adviser | | | — | | | | 98,504 | |
| Payable to Custodian | | | 10,515 | | | | 2,113 | |
| Payable to Directors | | | 415 | | | | 6,826 | |
| Dividends payable on securities sold short | | | — | | | | 62,394 | |
| Distribution (Rule 12b-1) fees payable | | | 858 | | | | — | |
| Shareholder servicing fees payable | | | — | | | | 17,254 | |
| Accrued expenses and other liablities | | | 26,730 | | | | 64,173 | |
| Total Liabilities | | | 38,518 | | | | 94,785,874 | |
| NET ASSETS | | $ | 7,354,857 | | | $ | 94,814,873 | |
| 8 | Leuthold Funds - 2019 Semi-Annual Report | See Notes to the Financial Statements. |
Leuthold Funds
Statements of Assets and Liabilities (continued)
March 31, 2019 (Unaudited)
| | | Leuthold
Global
Industries Fund | | | Grizzly Short Fund | |
| NET ASSETS CONSIST OF: | | | | | | | | |
| Capital stock | | $ | 7,414,750 | | | $ | 346,992,419 | |
| Total distributable earnings | | | (59,893 | ) | | | (252,177,546 | ) |
| Total Net Assets | | $ | 7,354,857 | | | $ | 94,814,873 | |
| | | | | | | | | |
| Retail Class Shares | | | | | | | | |
| Net assets | | $ | 1,192,486 | | | $ | 94,814,873 | |
| Shares outstanding (1,000,000,000 shares of $0.0001 par value authorized) | | | 88,294 | | | | 5,685,227 | |
| Net Asset Value, Redemption Price, and Offering Price Per Share | | $ | 13.51 | * | | $ | 16.68 | |
| | | | | | | | | |
| Institutional Class Shares | | | | | | | | |
| Net assets | | $ | 6,162,371 | | | | n/a | |
| Shares outstanding (1,000,000,000 shares of $0.0001 par value authorized) | | | 453,150 | | | | n/a | |
| Net Asset Value, Redemption Price, and Offering Price Per Share | | $ | 13.60 | * | | | n/a | |
| * | Redemption price may differ from NAV if redemption fee is applied. |
| See Notes to the Financial Statements. | Leuthold Funds - 2019 Semi-Annual Report | 9 |
Leuthold Funds
Statements of Operations
For the Six Months Ended March 31, 2019 (Unaudited)
| | | Leuthold Core Investment Fund | | | Leuthold Global Fund | | | Leuthold Select Industries Fund | |
| INVESTMENT INCOME: | | | | | | | | | | | | |
| Dividend income (net of foreign taxes withheld of $6,726, $23,322, and $233 respectively) | | $ | 2,981,786 | | | $ | 415,320 | | | $ | 92,257 | |
| Interest income | | | 3,394,312 | | | | 325,828 | | | | 1,669 | |
| Income from securities lending, net | | | 166,309 | | | | 28,702 | | | | — | |
| Total investment income | | | 6,542,407 | | | | 769,850 | | | | 93,926 | |
| | | | | | | | | | | | | |
| EXPENSES: | | | | | | | | | | | | |
| Investment advisory fees (Note 3) | | | 3,327,222 | | | | 337,552 | | | | 69,933 | |
| Administration fees | | | 188,527 | | | | 27,419 | | | | 11,581 | |
| Transfer agent fees (Note 5) | | | 206,066 | | | | 34,844 | | | | 4,942 | |
| Legal fees | | | 7,914 | | | | 2,259 | | | | 221 | |
| Audit fees | | | 46,328 | | | | 33,412 | | | | 15,107 | |
| Fund accounting fees | | | 71,845 | | | | 11,955 | | | | 3,108 | |
| Custody fees | | | 28,387 | | | | 29,079 | | | | 2,249 | |
| Shareholder servicing fees - Retail Class (Note 5) | | | 178,292 | | | | — | | | | 6,947 | |
| Registration fees | | | 26,273 | | | | 18,225 | | | | 8,284 | |
| Report to shareholders | | | 48,462 | | | | 4,259 | | | | 1,277 | |
| Directors’ fees | | | 74,481 | | | | 8,183 | | | | 1,414 | |
| Distribution (Rule 12b-1) fees - Retail Class (Note 4) | | | — | | | | 14,325 | | | | — | |
| Other | | | 27,151 | | | | 3,554 | | | | 1,004 | |
| Total expenses before dividends and interest on securities sold short and reimbursement from Adviser | | | 4,230,948 | | | | 525,066 | | | | 126,067 | |
| Dividends and interest on securities sold short | | | 564,507 | | | | 103,090 | | | | — | |
| Reimbursement from Adviser (Note 3) | | | — | | | | — | | | | (21,168 | ) |
| Total expenses | | | 4,795,455 | | | | 628,156 | | | | 104,899 | |
| NET INVESTMENT INCOME (LOSS) | | $ | 1,746,952 | | | $ | 141,694 | | | $ | (10,973 | ) |
| 10 | Leuthold Funds - 2019 Semi-Annual Report | See Notes to the Financial Statements. |
Leuthold Funds
Statements of Operations (continued)
For the Six Months Ended March 31, 2019 (Unaudited)
| | | Leuthold Core Investment Fund | | | Leuthold Global Fund | | | Leuthold Select Industries Fund | |
| REALIZED AND UNREALIZED GAIN (LOSS) ON INVESTMENTS, INVESTMENT COMPANIES, SECURITIES SOLD SHORT, AND FOREIGN CURRENCY AND FOREIGN CURRENCY TRANSLATION: | | | | | | | | | | | | |
| Net realized gain (loss) on: | | | | | | | | | | | | |
| Unaffiliated investments | | $ | 17,058,994 | | | $ | (1,437,314 | ) | | $ | 489,359 | |
| Affiliated investments | | | (208,066 | ) | | | — | | | | — | |
| Investment companies | | | (2,272,179 | ) | | | (207,497 | ) | | | — | |
| Realized gain distributions received from investment companies | | | — | | | | — | | | | — | |
| Securities sold short | | | 8,524,901 | | | | 703,430 | | | | — | |
| Foreign currency and foreign currency translation | | | 136,280 | | | | 27,711 | | | | (5 | ) |
| Net unrealized appreciation (depreciation) during the period on: | | | | | | | | | | | | |
| Unaffiliated investments | | | (44,541,070 | ) | | | (3,424,497 | ) | | | (1,706,971 | ) |
| Affiliated investments | | | 703,219 | | | | — | | | | — | |
| Investment companies | | | 1,112,978 | | | | 104,507 | | | | — | |
| Securities sold short | | | (1,975,657 | ) | | | (44,350 | ) | | | — | |
| Foreign currency and foreign currency translation | | | (1,106,489 | ) | | | (160,453 | ) | | | (2 | ) |
| Net realized and unrealized gain (loss) on investments, investment companies, securities sold short, and foreign currency and foreign currency translation | | | (22,567,089 | ) | | | (4,438,463 | ) | | | (1,217,619 | ) |
| NET DECREASE IN NET ASSETS RESULTING FROM OPERATIONS | | $ | (20,820,137 | ) | | $ | (4,296,769 | ) | | $ | (1,228,592 | ) |
| See Notes to the Financial Statements. | Leuthold Funds - 2019 Semi-Annual Report | 11 |
Leuthold Funds
Statements of Operations (continued)
For the Six Months Ended March 31, 2019 (Unaudited)
| | | Leuthold Global
Industries
Fund | | | Grizzly Short Fund | |
| INVESTMENT INCOME: | | | | | | | | |
| Dividend income (net of foreign taxes withheld of $4,278 and $0, respectively) | | $ | 71,023 | | | $ | 6,415 | |
| Interest income | | | 665 | | | | 1,948,429 | |
| Total investment income | | | 71,688 | | | | 1,954,844 | |
| | | | | | | | | |
| EXPENSES: | | | | | | | | |
| Investment advisory fees (Note 3) | | | 38,988 | | | | 665,789 | |
| Administration fees | | | 10,913 | | | | 32,666 | |
| Transfer agent fees (Note 5) | | | 8,370 | | | | 33,144 | |
| Legal fees | | | 1,616 | | | | 2,786 | |
| Audit fees | | | 15,184 | | | | 15,184 | |
| Fund accounting fees | | | 3,461 | | | | 10,999 | |
| Custody fees | | | 18,810 | | | | 3,973 | |
| Shareholder servicing fees - Retail Class (Note 5) | | | — | | | | 48,806 | |
| Registration fees | | | 21,463 | | | | 18,307 | |
| Report to shareholders | | | 429 | | | | 6,384 | |
| Directors’ fees | | | 726 | | | | 12,391 | |
| Distribution (Rule 12b-1) fees - Retail Class (Note 4) | | | 1,698 | | | | — | |
| Other | | | 1,129 | | | | 4,916 | |
| Total expenses before dividends and interest on securities sold short and reimbursement from Adviser | | | 122,787 | | | | 855,345 | |
| Dividends and interest on securities sold short | | | — | | | | 597,688 | |
| Reimbursement from Adviser (Note 3) | | | (72,351 | ) | | | — | |
| Total expenses | | | 50,436 | | | | 1,453,033 | |
| NET INVESTMENT INCOME | | $ | 21,252 | | | $ | 501,811 | |
| 12 | Leuthold Funds - 2019 Semi-Annual Report | See Notes to the Financial Statements. |
Leuthold Funds
Statements of Operations (continued)
For the Six Months Ended March 31, 2019 (Unaudited)
| | | Leuthold Global Industries Fund | | | Grizzly Short Fund | |
| REALIZED AND UNREALIZED GAIN (LOSS) ON INVESTMENTS, INVESTMENT COMPANIES, SECURITIES SOLD SHORT, AND FOREIGN CURRENCY AND FOREIGN CURRENCY TRANSLATION: | | | | | | | | |
| Net realized gain (loss) on: | | | | | | | | |
| Investments | | $ | (215,515 | ) | | $ | — | |
| Investment companies | | | (5,012 | ) | | | — | |
| Securities sold short | | | — | | | | (2,187,458 | ) |
| Foreign currency and foreign currency translation | | | (1,603 | ) | | | — | |
| Net unrealized appreciation (depreciation) during the period on: | | | | | | | | |
| Investments | | | (711,649 | ) | | | — | |
| Investment companies | | | (423 | ) | | | — | |
| Securities sold short | | | — | | | | (3,581,748 | ) |
| Foreign currency and foreign currency translation | | | 12,871 | | | | — | |
| Net realized and unrealized gain (loss) on investments, investment companies, securities sold short, and foreign currency and foreign currency translation | | | (921,331 | ) | | | (5,769,206 | ) |
| NET DECREASE IN NET ASSETS RESULTING FROM OPERATIONS | | $ | (900,079 | ) | | $ | (5,267,395 | ) |
| See Notes to the Financial Statements. | Leuthold Funds - 2019 Semi-Annual Report | 13 |
Leuthold Core Investment Fund
Statements of Changes in Net Assets
| | | Six Months Ended March 31, 2019 | | | Year Ended September 30, 2018 (Consolidated) | |
| | | (Unaudited) | | | | |
| OPERATIONS: | | | | | | |
| Net investment income | | $ | 1,746,952 | | | $ | 2,708,840 | |
| Net realized gain on investments, investment companies, securities sold short, and foreign currency and foreign currency translation | | | 23,239,930 | | | | 84,625,374 | |
| Net unrealized depreciation on investments, investment companies, securities sold short, and foreign currency and foreign currency translation | | | (45,807,019 | ) | | | (59,527,356 | ) |
| Net increase (decrease) in net assets from operations | | | (20,820,137 | ) | | | 27,806,858 | |
| | | | | | | | | |
| DISTRIBUTIONS TO SHAREHOLDERS: | | | | | | | | |
| Distributions - Retail Class | | | (35,495,081 | ) | | | (15,722,617 | ) |
| Distributions - Institutional Class | | | (38,354,300 | ) | | | (13,500,115 | ) |
| Total distributions | | | (73,849,381 | ) | | | (29,222,732 | ) |
| | | | | | | | | |
| CAPITAL SHARE TRANSACTIONS: | | | | | | | | |
| Proceeds from shares sold - Retail Class | | | 12,623,232 | | | | 49,574,688 | |
| Proceeds from shares sold - Institutional Class | | | 81,258,265 | | | | 99,394,031 | |
| Proceeds from shares issued to holders in reinvestment of dividends - Retail Class | | | 33,316,025 | | | | 14,973,202 | |
| Proceeds from shares issued to holders in reinvestment of dividends - Institutional Class | | | 34,566,226 | | | | 11,741,082 | |
| Cost of shares redeemed - Retail Class* | | | (63,290,392 | ) | | | (125,626,684 | ) |
| Cost of shares redeemed - Institutional Class** | | | (140,682,065 | ) | | | (61,432,479 | ) |
| Net decrease in net assets from capital share transactions | | | (42,208,709 | ) | | | (11,376,160 | ) |
| | | | | | | | | |
| TOTAL DECREASE IN NET ASSETS: | | | (136,878,227 | ) | | | (12,792,034 | ) |
| NET ASSETS | | | | | | | | |
| Beginning of period | | | 837,259,236 | | | | 850,051,270 | |
| End of period | | $ | 700,381,009 | | | $ | 837,259,236 | |
| | | | | | | | | |
| CHANGES IN SHARES OUTSTANDING: | | | | | | | | |
| Shares sold - Retail Class | | | 687,808 | | | | 2,391,128 | |
| Shares sold - Institutional Class | | | 4,495,946 | | | | 4,806,861 | |
| Shares issued to holders in reinvestment of dividends - Retail Class | | | 1,839,695 | | | | 734,892 | |
| Shares issued to holders in reinvestment of dividends - Institutional Class | | | 1,905,580 | | | | 575,096 | |
| Shares redeemed - Retail Class | | | (3,456,421 | ) | | | (6,082,213 | ) |
| Shares redeemed - Institutional Class | | | (7,749,422 | ) | | | (2,972,534 | ) |
| Net decrease in shares outstanding | | | (2,276,814 | ) | | | (546,770 | ) |
| | | | | | | | | |
| *Net of redemption fees of (Retail Class): | | $ | 130 | | | $ | 299 | |
| **Net of redemption fees of (Institutional Class): | | $ | 109 | | | $ | 262 | |
| 14 | Leuthold Funds - 2019 Semi-Annual Report | See Notes to the Financial Statements. |
Leuthold Global Fund
Statements of Changes in Net Assets
| | | Six Months Ended March 31, 2019 | | | Year Ended September 30, 2018 (Consolidated) | |
| | | (Unaudited) | | | | |
| OPERATIONS: | | | | | | |
| Net investment income | | $ | 141,694 | | | $ | 456,785 | |
| Net realized gain (loss) on investments, investment companies, securities sold short, and foreign currency and foreign currency translation | | | (913,670 | ) | | | 7,014,480 | |
| Net unrealized depreciation on investments, investment companies, securities sold short, and foreign currency and foreign currency translation | | | (3,524,793 | ) | | | (7,628,313 | ) |
| Net decrease in net assets from operations | | | (4,296,769 | ) | | | (157,048 | ) |
| | | | | | | | | |
| DISTRIBUTIONS TO SHAREHOLDERS: | | | | | | | | |
| Distributions - Retail Class | | | (885,010 | ) | | | (2,138,468 | ) |
| Distributions - Institutional Class | | | (4,613,472 | ) | | | (6,753,470 | ) |
| Total distributions | | | (5,498,482 | ) | | | (8,891,938 | ) |
| | | | | | | | | |
| CAPITAL SHARE TRANSACTIONS: | | | | | | | | |
| Proceeds from shares sold - Retail Class | | | 2,044,963 | | | | 2,028,207 | |
| Proceeds from shares sold - Institutional Class | | | 19,237,638 | | | | 15,052,597 | |
| Proceeds from shares issued to holders in reinvestment of dividends - Retail Class | | | 848,483 | | | | 2,063,968 | |
| Proceeds from shares issued to holders in reinvestment of dividends - Institutional Class | | | 4,335,168 | | | | 6,015,022 | |
| Cost of shares redeemed - Retail Class* | | | (9,479,575 | ) | | | (7,608,038 | ) |
| Cost of shares redeemed - Institutional Class** | | | (23,238,210 | ) | | | (28,405,896 | ) |
| Net decrease in net assets from capital share transactions | | | (6,251,533 | ) | | | (10,854,140 | ) |
| | | | | | | | | |
| TOTAL DECREASE IN NET ASSETS: | | | (16,046,784 | ) | | | (19,903,126 | ) |
| NET ASSETS | | | | | | | | |
| Beginning of period | | | 82,751,158 | | | | 102,654,284 | |
| End of period | | $ | 66,704,374 | | | $ | 82,751,158 | |
| | | | | | | | | |
| CHANGES IN SHARES OUTSTANDING: | | | | | | | | |
| Shares sold - Retail Class | | | 260,546 | | | | 211,107 | |
| Shares sold - Institutional Class | | | 2,326,005 | | | | 1,553,258 | |
| Shares issued to holders in reinvestment of dividends - Retail Class | | | 105,664 | | | | 219,621 | |
| Shares issued to holders in reinvestment of dividends - Institutional Class | | | 532,659 | | | | 632,740 | |
| Shares redeemed - Retail Class | | | (1,114,808 | ) | | | (807,863 | ) |
| Shares redeemed - Institutional Class | | | (2,910,382 | ) | | | (2,952,591 | ) |
| Net decrease in shares outstanding | | | (800,316 | ) | | | (1,143,728 | ) |
| | | | | | | | | |
| *Net of redemption fees of (Retail Class): | | $ | — | | | $ | 205 | |
| **Net of redemption fees of (Institutional Class): | | $ | 259 | | | $ | 2 | |
| See Notes to the Financial Statements. | Leuthold Funds - 2019 Semi-Annual Report | 15 |
Leuthold Select Industries Fund
Statements of Changes in Net Assets
| | | Six Months Ended March 31, 2019 | | | Year Ended September 30, 2018 | |
| | | (Unaudited) | | | | |
| OPERATIONS: | | | | | | |
| Net investment loss | | $ | (10,973 | ) | | $ | (3,769 | ) |
| Net realized gain on investments and foreign currency and foreign currency translation | | | 489,354 | | | | 1,713,403 | |
| Net unrealized depreciation on investments and foreign currency and foreign currency translation | | | (1,706,973 | ) | | | (242,614 | ) |
| Net increase (decrease) in net assets from operations | | | (1,228,592 | ) | | | 1,467,020 | |
| | | | | | | | | |
| DISTRIBUTIONS TO SHAREHOLDERS: | | | | | | | | |
| Distributions | | | (1,295,440 | ) | | | (741,441 | ) |
| Total distributions | | | (1,295,440 | ) | | | (741,441 | ) |
| | | | | | | | | |
| CAPITAL SHARE TRANSACTIONS: | | | | | | | | |
| Proceeds from shares sold | | | 132,932 | | | | 11,024,392 | |
| Proceeds from shares issued to holders in reinvestment of dividends | | | 1,242,103 | | | | 712,871 | |
| Cost of shares redeemed | | | (4,670,884 | ) | | | (9,396,776 | ) |
| Net increase (decrease) in net assets from capital share transactions | | | (3,295,849 | ) | | | 2,340,487 | |
| | | | | | | | | |
| TOTAL INCREASE (DECREASE) IN NET ASSETS: | | | (5,819,881 | ) | | | 3,066,066 | |
| NET ASSETS | | | | | | | | |
| Beginning of period | | | 18,111,932 | | | | 15,045,866 | |
| End of period | | $ | 12,292,051 | | | $ | 18,111,932 | |
| | | | | | | | | |
| CHANGES IN SHARES OUTSTANDING: | | | | | | | | |
| Shares sold | | | 5,466 | | | | 412,330 | |
| Shares issued to holders in reinvestment of dividends | | | 52,833 | | | | 27,474 | |
| Shares redeemed | | | (202,503 | ) | | | (348,325 | ) |
| Net increase (decrease) in shares outstanding | | | (144,204 | ) | | | 91,479 | |
| 16 | Leuthold Funds - 2019 Semi-Annual Report | See Notes to the Financial Statements. |
Leuthold Global Industries Fund
Statement of Changes in Net Assets
| | | Six Months Ended March 31, 2019 | | | Year Ended September 30, 2018 | |
| | | (Unaudited) | | | | |
| OPERATIONS: | | | | | | |
| Net investment income | | $ | 21,252 | | | $ | 96,180 | |
| Net realized gain (loss) on investments, investment companies, and foreign currency and foreign currency translation | | | (222,130 | ) | | | 1,023,906 | |
| Net unrealized depreciation on investments, investment companies, and foreign currency and foreign currency translation | | | (699,201 | ) | | | (976,355 | ) |
| Net increase (decrease) in net assets from operations | | | (900,079 | ) | | | 143,731 | |
| | | | | | | | | |
| DISTRIBUTIONS TO SHAREHOLDERS: | | | | | | | | |
| Distributions - Retail Class | | | (191,134 | ) | | | (158,928 | ) |
| Distributions - Institutional Class | | | (826,740 | ) | | | (727,913 | ) |
| Total distributions | | | (1,017,874 | ) | | | (886,841 | ) |
| | | | | | | | | |
| CAPITAL SHARE TRANSACTIONS: | | | | | | | | |
| Proceeds from shares sold - Retail Class | | | 7,590 | | | | 199,182 | |
| Proceeds from shares sold - Institutional Class | | | 61,016 | | | | 2,578,836 | |
| Proceeds from shares issued to holders in reinvestment of dividends - Retail Class | | | 186,955 | | | | 155,751 | |
| Proceeds from shares issued to holders in reinvestment of dividends - Institutional Class | | | 809,140 | | | | 706,923 | |
| Cost of shares redeemed - Retail Class* | | | (434,857 | ) | | | (375,877 | ) |
| Cost of shares redeemed - Institutional Class | | | (1,796,791 | ) | | | (3,015,381 | ) |
| Net increase (decrease) in net assets from capital share transactions | | | (1,166,947 | ) | | | 249,434 | |
| | | | | | | | | |
| TOTAL DECREASE IN NET ASSETS: | | | (3,084,900 | ) | | | (493,676 | ) |
| NET ASSETS | | | | | | | | |
| Beginning of period | | | 10,439,757 | | | | 10,933,433 | |
| End of period | | $ | 7,354,857 | | | $ | 10,439,757 | |
| | | | | | | | | |
| CHANGES IN SHARES OUTSTANDING: | | | | | | | | |
| Shares sold - Retail Class | | | 558 | | | | 11,384 | |
| Shares sold - Institutional Class | | | 4,697 | | | | 143,418 | |
| Shares issued to holders in reinvestment of dividends - Retail Class | | | 13,912 | | | | 8,884 | |
| Shares issued to holders in reinvestment of dividends - Institutional Class | | | 59,888 | | | | 40,111 | |
| Shares redeemed - Retail Class | | | (32,656 | ) | | | (21,491 | ) |
| Shares redeemed - Institutional Class | | | (119,079 | ) | | | (168,743 | ) |
| Net increase (decrease) in shares outstanding | | | (72,680 | ) | | | 13,563 | |
| | | | | | | | | |
| *Net of redemption fees of (Retail Class): | | $ | — | | | $ | 3 | |
| See Notes to the Financial Statements. | Leuthold Funds - 2019 Semi-Annual Report | 17 |
Grizzly Short Fund
Statements of Changes in Net Assets
| | | Six Months Ended March 31, 2019 | | | Year Ended
September 30, 2018 | |
| | | (Unaudited) | | | | |
| OPERATIONS: | | | | | | |
| Net investment gain (loss) | | $ | 501,811 | | | $ | (894,109 | ) |
| Net realized loss on securities sold short | | | (2,187,458 | ) | | | (35,514,168 | ) |
| Net unrealized appreciation (depreciation) on securities sold short | | | (3,581,748 | ) | | | 2,114,602 | |
| Net decrease in net assets from operations | | | (5,267,395 | ) | | | (34,293,675 | ) |
| | | | | | | | | |
| DISTRIBUTIONS TO SHAREHOLDERS: | | | | | | | | |
| Distributions | | | — | | | | — | |
| Total distributions | | | — | | | | — | |
| | | | | | | | | |
| CAPITAL SHARE TRANSACTIONS: | | | | | | | | |
| Proceeds from shares sold | | | 62,329,184 | | | | 136,445,760 | |
| Cost of shares redeemed | | | (61,195,673 | ) | | | (208,901,601 | ) |
| Net increase (decrease) in net assets from capital share transactions | | | 1,133,511 | | | | (72,455,841 | ) |
| | | | | | | | | |
| TOTAL DECREASE IN NET ASSETS: | | | (4,133,884 | ) | | | (106,749,516 | ) |
| NET ASSETS | | | | | | | | |
| Beginning of period | | | 98,948,757 | | | | 205,698,273 | |
| End of period | | $ | 94,814,873 | | | $ | 98,948,757 | |
| | | | | | | | | |
| | | | | | | | | |
| | | | | | | | | |
| CHANGES IN SHARES OUTSTANDING: | | | | | | | | |
| Shares sold | | | 3,293,053 | | | | 24,912,796 | |
| Shares redeemed | | | (3,214,052 | ) | | | (57,577,260 | ) |
| Net increase (decrease) in shares outstanding | | | 79,001 | | | | (32,664,464 | ) |
| 18 | Leuthold Funds - 2019 Semi-Annual Report | See Notes to the Financial Statements. |
Leuthold Core Investment Fund - Retail - LCORX
Financial Highlights
| | | Six Months
Ended
March 31,
2019 | | | Year Ended
September 30,
2018
(Consolidated) | | | Year Ended
September 30,
2017
(Consolidated) | | | Year Ended
September 30,
2016
(Consolidated) | | | Year Ended
September 30,
2015
(Consolidated) | | | Year Ended
September 30,
2014
(Consolidated) | |
| | | (Unaudited) | | | | | | | | | | | | | | | | |
| Per Share Data (1): | | | | | | | | | | | | | | | | | | |
| Net asset value, beginning of period | | $ | 20.50 | | | $ | 20.54 | | | $ | 18.06 | | | $ | 18.44 | | | $ | 18.85 | | | $ | 18.29 | |
| Income (loss) from investment operations: | | | | | | | | | | | | | | | | | | | | | | | | |
| Net investment income (loss)(2) | | | 0.04 | | | | 0.05 | | | | 0.04 | | | | (0.01 | ) | | | (0.01 | ) | | | 0.01 | |
| Net realized and unrealized gain (loss) on investments and securities sold short | | | (0.52 | ) | | | 0.61 | | | | 2.53 | | | | 0.32 | | | | 0.76 | | | | 2.02 | |
| Total from investment operations | | | (0.48 | ) | | | 0.66 | | | | 2.57 | | | | 0.31 | | | | 0.75 | | | | 2.03 | |
| | | | | | | | | | | | | | | | | | | | | | | | | |
| Less distributions: | | | | | | | | | | | | | | | | | | | | | | | | |
| From net investment income | | | (0.03 | ) | | | (0.05 | ) | | | (0.01 | ) | | | — | | | | (0.03 | ) | | | (0.21 | ) |
| From net realized gain | | | (1.83 | ) | | | (0.65 | ) | | | (0.08 | ) | | | (0.69 | ) | | | (1.13 | ) | | | (1.26 | ) |
| Redemption fees(3) | | | 0.00 | | | | 0.00 | | | | 0.00 | | | | 0.00 | | | | 0.00 | | | | 0.00 | |
| Total distributions | | | (1.86 | ) | | | (0.70 | ) | | | (0.09 | ) | | | (0.69 | ) | | | (1.16 | ) | | | (1.47 | ) |
| Net asset value, end of period | | $ | 18.16 | | | $ | 20.50 | | | $ | 20.54 | | | $ | 18.06 | | | $ | 18.44 | | | $ | 18.85 | |
| | | | | | | | | | | | | | | | | | | | | | | | | |
| Total Return | | | (2.32 | )% | | | 3.23 | % | | | 14.31 | % | | | 1.76 | % | | | 4.03 | % | | | 11.49 | % |
| | | | | | | | | | | | | | | | | | | | | | | | | |
| Supplemental data and ratios: | | | | | | | | | | | | | | | | | | | | | | | | |
| Net assets, end of period | | $ | 340,176,403 | | | $ | 403,095,456 | | | $ | 464,660,913 | | | $ | 524,731,192 | | | $ | 564,608,599 | | | $ | 569,237,299 | |
| Ratio of expenses to average net assets (4) | | | 1.35 | %(7) | | | 1.38 | % | | | 1.21 | % | | | 1.29 | % | | | 1.30 | % | | | 1.28 | % |
| Ratio of net investment income (loss) to average net assets (5) | | | 0.42 | %(7) | | | 0.26 | % | | | 0.20 | % | | | (0.08 | )% | | | (0.05 | )% | | | 0.04 | % |
| Portfolio turnover rate (6) | | | 26.51 | % | | | 79.00 | % | | | 52.36 | % | | | 109.32 | % | | | 78.96 | % | | | 80.65 | % |
| (1) | For a share outstanding throughout the period. Rounded to the nearest cent. |
| (2) | Net investment income (loss) per share is calculated based on average shares outstanding. |
| (3) | Amount represents less than $0.005 per share. |
| (4) | The ratio of expenses to average net assets includes dividends and interest on securities sold short. The expense ratios excluding dividends and interest on securities sold short were 1.20% for the period ended March 31, 2019, 1.19% for the year ended September 30, 2018, 1.19% for the year ended September 30, 2017, 1.17% for the year ended September 30, 2016, 1.16% for the year ended September 30, 2015, and 1.15% for the year ended September 30, 2014. |
| (5) | The net investment income ratios include dividends and interest on securities sold short. |
| (6) | The portfolio turnover rate excludes purchases and sales of securities sold short. |
| See Notes to the Financial Statements. | Leuthold Funds - 2019 Semi-Annual Report | 19 |
Leuthold Core Investment Fund - Institutional - LCRIX
Financial Highlights
| | | Six Months
Ended
March 31,
2019 | | | Year Ended
September 30,
2018
(Consolidated) | | | Year Ended
September 30,
2017
(Consolidated) | | | Year Ended
September 30,
2016
(Consolidated) | | | Year Ended
September 30,
2015
(Consolidated) | | | Year Ended
September 30,
2014
(Consolidated) | |
| | | (Unaudited) | | | | | | | | | | | | | | | | |
| Per Share Data(1): | | | | | | | | | | | | | | | | | | |
| Net asset value, beginning of period | | $ | 20.53 | | | $ | 20.56 | | | $ | 18.08 | | | $ | 18.43 | | | $ | 18.85 | | | $ | 18.28 | |
| Income from investment operations: | | | | | | | | | | | | | | | | | | | | | | | | |
| Net investment income(2) | | | 0.05 | | | | 0.08 | | | | 0.06 | | | | 0.01 | | | | 0.01 | | | | 0.03 | |
| Net realized and unrealized gain (loss) on investments and securities sold short | | | (0.53 | ) | | | 0.60 | | | | 2.53 | | | | 0.33 | | | | 0.74 | | | | 2.03 | |
| Total from investment operations | | | (0.48 | ) | | | 0.68 | | | | 2.59 | | | | 0.34 | | | | 0.75 | | | | 2.06 | |
| | | | | | | | | | | | | | | | | | | | | | | | | |
| Less distributions: | | | | | | | | | | | | | | | | | | | | | | | | |
| From net investment income | | | (0.03 | ) | | | (0.06 | ) | | | (0.03 | ) | | | — | | | | (0.04 | ) | | | (0.23 | ) |
| From net realized gain | | | (1.83 | ) | | | (0.65 | ) | | | (0.08 | ) | | | (0.69 | ) | | | (1.13 | ) | | | (1.26 | ) |
| Redemption fees | | | 0.00 | (3) | | | 0.00 | (3) | | | 0.00 | (3) | | | 0.00 | (3) | | | 0.00 | (3) | | | — | |
| Total distributions | | | (1.86 | ) | | | (0.71 | ) | | | (0.11 | ) | | | (0.69 | ) | | | (1.17 | ) | | | (1.49 | ) |
| Net asset value, end of period | | $ | 18.19 | | | $ | 20.53 | | | $ | 20.56 | | | $ | 18.08 | | | $ | 18.43 | | | $ | 18.85 | |
| | | | | | | | | | | | | | | | | | | | | | | | | |
| Total Return | | | (2.03 | )% | | | 3.35 | % | | | 14.43 | % | | | 1.93 | % | | | 4.03 | % | | | 11.66 | % |
| | | | | | | | | | | | | | | | | | | | | | | | | |
| Supplemental data and ratios: | | | | | | | | | | | | | | | | | | | | | | | | |
| Net assets, end of period | | $ | 360,204,606 | | | $ | 434,163,780 | | | $ | 385,390,357 | | | $ | 378,962,827 | | | $ | 293,666,347 | | | $ | 276,568,913 | |
| Ratio of expenses to average net assets(4) | | | 1.25 | %(7) | | | 1.27 | % | | | 1.10 | % | | | 1.17 | % | | | 1.20 | % | | | 1.18 | % |
| Ratio of net investment income to average net assets(5) | | | 0.52 | %(7) | | | 0.37 | % | | | 0.30 | % | | | 0.04 | % | | | 0.05 | % | | | 0.14 | % |
| Portfolio turnover rate (6) | | | 26.51 | % | | | 79.00 | % | | | 52.36 | % | | | 109.32 | % | | | 78.96 | % | | | 80.65 | % |
| (1) | For a share outstanding throughout the period. Rounded to the nearest cent. |
| (2) | Net investment income per share is calculated based on average shares outstanding. |
| (3) | Amount represents less than $0.005 per share. |
| (4) | The ratio of expenses to average net assets includes dividends and interest on securities sold short. The expense ratios excluding dividends and interest on securities sold short were 1.10% for the period ended March 31, 2019, 1.08% for the year ended September 30, 2018, 1.08% for the year ended September 30, 2017, 1.05% for the year ended September 30, 2016, 1.06% for the year ended September 30, 2015, and 1.06% for the year ended September 30, 2014. |
| (5) | The net investment income ratios include dividends and interest on securities sold short. |
| (6) | The portfolio turnover rate excludes purchases and sales of securities sold short. |
| 20 | Leuthold Funds - 2019 Semi-Annual Report | See Notes to the Financial Statements. |
Leuthold Global Fund - Retail - GLBLX
Financial Highlights
| | | Six Months
Ended
March 31,
2019 | | | Year Ended
September 30,
2018
(Consolidated) | | | Year Ended
September 30,
2017
(Consolidated) | | | Year Ended
September 30,
2016
(Consolidated) | | | Year Ended
September 30,
2015
(Consolidated) | | | Year Ended
September 30,
2014
(Consolidated) | |
| | | (Unaudited) | | | | | | | | | | | | | | | | |
| Per Share Data(1): | | | | | | | | | | | | | | | | | | |
| Net asset value, beginning of period | | $ | 9.11 | | | $ | 10.05 | | | $ | 9.86 | | | $ | 10.03 | | | $ | 11.29 | | | $ | 11.65 | |
| Income (loss) from investment operations: | | | | | | | | | | | | | | | | | | | | | | | | |
| Net investment income (loss)(2) | | | 0.01 | | | | 0.03 | | | | 0.04 | | | | (0.01 | ) | | | (0.03 | ) | | | 0.03 | |
| Net realized and unrealized gain (loss) on investments and securities sold short | | | (0.43 | ) | | | (0.07 | ) | | | 1.02 | | | | 0.21 | | | | (0.11 | ) | | | 0.83 | |
| Total from investment operations | | | (0.42 | ) | | | (0.04 | ) | | | 1.06 | | | | 0.20 | | | | (0.14 | ) | | | 0.86 | |
| | | | | | | | | | | | | | | | | | | | | | | | | |
| Less distributions: | | | | | | | | | | | | | | | | | | | | | | | | |
| From net investment income | | | — | | | | (0.02 | ) | | | — | | | | — | | | | (0.03 | ) | | | (0.08 | ) |
| From net realized gain | | | (0.64 | ) | | | (0.88 | ) | | | (0.87 | ) | | | (0.37 | ) | | | (1.09 | ) | | | (1.14 | ) |
| Redemption fees | | | — | | | | 0.00 | (3) | | | 0.00 | (3) | | | 0.00 | (3) | | | 0.00 | (3) | | | 0.00 | (3) |
| Total distributions | | | (0.64 | ) | | | (0.90 | ) | | | (0.87 | ) | | | (0.37 | ) | | | (1.12 | ) | | | (1.22 | ) |
| Net asset value, end of period | | $ | 8.05 | | | $ | 9.11 | | | $ | 10.05 | | | $ | 9.86 | | | $ | 10.03 | | | $ | 11.29 | |
| | | | | | | | | | | | | | | | | | | | | | | | | |
| Total Return | | | (4.59 | )% | | | (0.67 | )% | | | 12.02 | % | | | 1.89 | % | | | (1.41 | )% | | | 7.68 | % |
| | | | | | | | | | | | | | | | | | | | | | | | | |
| Supplemental data and ratios: | | | | | | | | | | | | | | | | | | | | | | | | |
| Net assets, end of period | | $ | 10,186,404 | | | $ | 18,362,218 | | | $ | 24,040,140 | | | $ | 78,743,516 | | | $ | 95,026,857 | | | $ | 130,838,148 | |
| Ratio of expenses to average net assets(4) | | | 1.88 | %(7) | | | 1.75 | % | | | 1.56 | % | | | 1.82 | % | | | 1.71 | % | | | 1.65 | % |
| Ratio of net investment income (loss) to average net assets(5) | | | 0.18 | %(7) | | | 0.28 | % | | | 0.38 | % | | | (0.15 | )% | | | (0.29 | )% | | | 0.25 | % |
| Portfolio turnover rate (6) | | | 40.42 | % | | | 79.09 | % | | | 63.13 | % | | | 102.93 | % | | | 78.37 | % | | | 71.63 | % |
| (1) | For a share outstanding throughout the period. Rounded to the nearest cent. |
| (2) | Net investment income (loss) per share is calculated based on average shares outstanding. |
| (3) | Amount represents less than $0.005 per share. |
| (4) | The ratio of expenses to average net assets includes dividends and interest on securities sold short. The expense ratios excluding dividends and interest on securities sold short were 1.60% for the period ended March 31, 2019, 1.54% for the year ended September 30, 2018, 1.56% for the year ended September 30, 2017, 1.61% for the year ended September 30, 2016, 1.54% for the year ended September 30, 2015, and 1.53% for the year ended September 30, 2014. |
| (5) | The net investment income ratios include dividends and interest on securities sold short. |
| (6) | The portfolio turnover rate excludes purchases and sales of securities sold short. |
| See Notes to the Financial Statements. | Leuthold Funds - 2019 Semi-Annual Report | 21 |
Leuthold Global Fund - Institutional - GLBIX
Financial Highlights
| | | Six Months
Ended
March 31,
2019 | | | Year Ended
September 30,
2018
(Consolidated) | | | Year Ended
September 30,
2017
(Consolidated) | | | Year Ended
September 30,
2016
(Consolidated) | | | Year Ended
September 30,
2015
(Consolidated) | | | Year Ended
September 30,
2014
(Consolidated) | |
| | | (Unaudited) | | | | | | | | | | | | | | | | |
| Per Share Data(1): | | | | | | | | | | | | | | | | | | |
| Net asset value, beginning of period | | $ | 9.23 | | | $ | 10.16 | | | $ | 9.95 | | | $ | 10.10 | | | $ | 11.34 | | | $ | 11.69 | |
| Income (loss) from investment operations: | | | | | | | | | | | | | | | | | | | | | | | | |
| Net investment income (loss)(2) | | | 0.02 | | | | 0.05 | | | | 0.06 | | | | 0.01 | | | | (0.01 | ) | | | 0.05 | |
| Net realized and unrealized gain (loss) on investments and securities sold short | | | (0.43 | ) | | | (0.07 | ) | | | 1.03 | | | | 0.21 | | | | (0.11 | ) | | | 0.84 | |
| Total from investment operations | | | (0.41 | ) | | | (0.02 | ) | | | 1.09 | | | | 0.22 | | | | (0.12 | ) | | | 0.89 | |
| | | | | | | | | | | | | | | | | | | | | | | | | |
| Less distributions: | | | | | | | | | | | | | | | | | | | | | | | | |
| From net investment income | | | (0.01 | ) | | | (0.03 | ) | | | (0.01 | ) | | | — | | | | (0.03 | ) | | | (0.10 | ) |
| From net realized gain | | | (0.64 | ) | | | (0.88 | ) | | | (0.87 | ) | | | (0.37 | ) | | | (1.09 | ) | | | (1.14 | ) |
| Redemption fees | | | 0.00 | (3) | | | 0.00 | (3) | | | 0.00 | (3) | | | 0.00 | (3) | | | 0.00 | (3) | | | — | |
| Total distributions | | | (0.65 | ) | | | (0.91 | ) | | | (0.88 | ) | | | (0.37 | ) | | | (1.12 | ) | | | (1.24 | ) |
| Net asset value, end of period | | $ | 8.17 | | | $ | 9.23 | | | $ | 10.16 | | | $ | 9.95 | | | $ | 10.10 | | | $ | 11.34 | |
| | | | | | | | | | | | | | | | | | | | | | | | | |
| Total Return | | | (4.45 | )% | | | (0.43 | )% | | | 12.28 | % | | | 2.18 | % | | | (1.30 | )% | | | 7.95 | % |
| | | | | | | | | | | | | | | | | | | | | | | | | |
| Supplemental data and ratios: | | | | | | | | | | | | | | | | | | | | | | | | |
| Net assets, end of period | | $ | 56,517,970 | | | $ | 64,388,940 | | | $ | 78,614,144 | | | $ | 103,921,200 | | | $ | 218,497,272 | | | $ | 231,615,536 | |
| Ratio of expenses to average net assets(4) | | | 1.64 | %(7) | | | 1.50 | % | | | 1.36 | % | | | 1.57 | % | | | 1.50 | % | | | 1.44 | % |
| Ratio of net investment income (loss) to average net assets(5) | | | 0.42 | %(7) | | | 0.53 | % | | | 0.58 | % | | | 0.10 | % | | | (0.09 | )% | | | 0.45 | % |
| Portfolio turnover rate (6) | | | 40.42 | % | | | 79.09 | % | | | 63.13 | % | | | 102.93 | % | | | 78.37 | % | | | 71.63 | % |
| (1) | For a share outstanding throughout the period. Rounded to the nearest cent. |
| (2) | Net investment income (loss) per share is calculated based on average shares outstanding. |
| (3) | Amount represents less than $0.005 per share. |
| (4) | The ratio of expenses to average net assets includes dividends and interest on securities sold short. The expense ratios excluding dividends and interest on securities sold short were 1.36% for the period ended March 31, 2019, 1.29% for the year ended September 30, 2018, 1.36% for the year ended September 30, 2017, 1.36% for the year ended September 30, 2016, 1.33% for the year ended September 30, 2015, and 1.33% for the year ended September 30, 2014. |
| (5) | The net investment income ratios include dividends and interest on securities sold short. |
| (6) | The portfolio turnover rate excludes purchases and sales of securities sold short. |
| 22 | Leuthold Funds - 2019 Semi-Annual Report | See Notes to the Financial Statements. |
Leuthold Select Industries Fund - LSLTX
Financial Highlights
| | | Six Months
Ended
March 31, 2019 | | | Year Ended
September 30,
2018 | | | Year Ended
September 30,
2017 | | | Year Ended
September 30,
2016 | | | Year Ended
September 30,
2015 | | | Year Ended
September 30,
2014 | |
| | | (Unaudited) | | | | | | | | | | | | | | | | |
| Per Share Data(1): | | | | | | | | | | | | | | | | | | |
| Net asset value, beginning of period | | $ | 27.31 | | | $ | 26.32 | | | $ | 21.41 | | | $ | 21.27 | | | $ | 20.02 | | | $ | 16.82 | |
| Income (loss) from investment operations: | | | | | | | | | | | | | | | | | | | | | | | | |
| Net investment income (loss)(2) | | | (0.02 | ) | | | (0.01 | ) | | | (0.02 | ) | | | 0.00 | (3) | | | (0.03 | ) | | | (0.07 | ) |
| Net realized and unrealized gain (loss) on investments | | | (1.50 | ) | | | 2.28 | | | | 4.93 | | | | 0.45 | | | | 1.28 | | | | 3.27 | |
| Total from investment operations | | | (1.52 | ) | | | 2.27 | | | | 4.91 | | | | 0.45 | | | | 1.25 | | | | 3.20 | |
| | | | | | | | | | | | | | | | | | | | | | | | | |
| Less distributions: | | | | | | | | | | | | | | | | | | | | | | | | |
| From net investment income | | | — | | | | (0.01 | ) | | | — | | | | (0.03 | ) | | | — | | | | — | |
| From net realized gain | | | (2.10 | ) | | | (1.27 | ) | | | — | | | | (0.28 | ) | | | — | | | | — | |
| Total distributions | | | (2.10 | ) | | | (1.28 | ) | | | — | | | | (0.31 | ) | | | — | | | | — | |
| Net asset value, end of period | | $ | 23.69 | | | $ | 27.31 | | | $ | 26.32 | | | $ | 21.41 | | | $ | 21.27 | | | $ | 20.02 | |
| | | | | | | | | | | | | | | | | | | | | | | | | |
| Total Return | | | (5.50 | )% | | | 8.89 | % | | | 22.93 | % | | | 2.09 | % | | | 6.24 | % | | | 19.02 | % |
| | | | | | | | | | | | | | | | | | | | | | | | | |
| Supplemental data and ratios: | | | | | | | | | | | | | | | | | | | | | | | | |
| Net assets, end of period | | $ | 12,292,051 | | | $ | 18,111,932 | | | $ | 15,045,866 | | | $ | 12,630,891 | | | $ | 12,624,145 | | | $ | 14,977,451 | |
| Ratio of expenses to average net assets: | | | | | | | | | | | | | | | | | | | | | | | | |
| Before expense reimbursement or recovery | | | 1.80 | %(4) | | | 1.65 | % | | | 1.80 | % | | | 1.72 | % | | | 1.73 | % | | | 1.68 | % |
| After expense reimbursement or recovery | | | 1.50 | %(4) | | | 1.50 | % | | | 1.50 | % | | | 1.50 | % | | | 1.50 | % | | | 1.58 | % |
| Ratio of net investment income (loss) to average net assets: | | | | | | | | | | | | | | | | | | | | | | | | |
| Before expense reimbursement or recovery | | | (0.46 | )%(4) | | | (0.17 | )% | | | (0.39 | )% | | | (0.20 | )% | | | (0.35 | )% | | | (0.44 | )% |
| After expense reimbursement or recovery | | | (0.16 | )%(4) | | | (0.02 | )% | | | (0.09 | )% | | | 0.02 | % | | | (0.12 | )% | | | (0.34 | )% |
| Portfolio turnover rate | | | 29.44 | % | | | 104.00 | % | | | 62.72 | % | | | 118.26 | % | | | 77.42 | % | | | 66.79 | % |
| (1) | For a share outstanding throughout the period. Rounded to the nearest cent. |
| (2) | Net investment income per share is calculated based on average shares outstanding. |
| (3) | Amount represents less than $0.005 per share. |
| See Notes to the Financial Statements. | Leuthold Funds - 2019 Semi-Annual Report | 23 |
Leuthold Global Industries Fund - Retail - LGINX
Financial Highlights
| | | Six Months
Ended
March 31, 2019 | | | Year Ended
September 30,
2018 | | | Year Ended
September 30,
2017 | | | Year Ended
September 30,
2016 | | | Year Ended
September 30,
2015 | | | Year Ended
September 30,
2014 | |
| | | (Unaudited) | | | | | | | | | | | | | | | | |
| Per Share Data(1): | | | | | | | | | | | | | | | | | | |
| Net asset value, beginning of period | | $ | 16.90 | | | $ | 18.13 | | | $ | 15.64 | | | $ | 15.76 | | | $ | 16.54 | | | $ | 14.89 | |
| Income (loss) from investment operations: | | | | | | | | | | | | | | | | | | | | | | | | |
| Net investment income (2) | | | 0.02 | | | | 0.12 | | | | 0.12 | | | | 0.12 | | | | 0.04 | | | | 0.08 | |
| Net realized and unrealized gain (loss) on investments | | | (1.52 | ) | | | 0.09 | | | | 3.01 | | | | 0.41 | | | | (0.46 | ) | | | 1.68 | |
| Total from investment operations | | | (1.50 | ) | | | 0.21 | | | | 3.13 | | | | 0.53 | | | | (0.42 | ) | | | 1.76 | |
| | | | | | | | | | | | | | | | | | | | | | | | | |
| Less distributions: | | | | | | | | | | | | | | | | | | | | | | | | |
| From net investment income | | | (0.13 | ) | | | (0.17 | ) | | | (0.07 | ) | | | (0.07 | ) | | | (0.05 | ) | | | (0.11 | ) |
| From net realized gain | | | (1.76 | ) | | | (1.27 | ) | | | (0.57 | ) | | | (0.58 | ) | | | (0.31 | ) | | | — | |
| Redemption fees | | | — | | | | 0.00 | (3) | | | — | | | | — | | | | 0.00 | (3) | | | 0.00 | (3) |
| Total distributions | | | (1.89 | ) | | | (1.44 | ) | | | (0.64 | ) | | | (0.65 | ) | | | (0.36 | ) | | | (0.11 | ) |
| Net asset value, end of period | | $ | 13.51 | | | $ | 16.90 | �� | | $ | 18.13 | | | $ | 15.64 | | | $ | 15.76 | | | $ | 16.54 | |
| | | | | | | | | | | | | | | | | | | | | | | | | |
| Total Return | | | (8.66 | )% | | | 0.95 | % | | | 20.90 | % | | | 3.24 | % | | | (2.61 | )% | | | 11.78 | % |
| | | | | | | | | | | | | | | | | | | | | | | | | |
| Supplemental data and ratios: | | | | | | | | | | | | | | | | | | | | | | | | |
| Net assets, end of period | | $ | 1,192,486 | | | $ | 1,798,973 | | | $ | 1,952,884 | | | $ | 1,833,241 | | | $ | 5,015,722 | | | $ | 11,351,746 | |
| Ratio of expenses to average net assets: | | | | | | | | | | | | | | | | | | | | | | | | |
| Before expense reimbursement or recovery | | | 3.36 | %(4) | | | 2.60 | % | | | 2.66 | % | | | 2.35 | % | | | 2.04 | % | | | 2.06 | % |
| After expense reimbursement or recovery | | | 1.50 | %(4) | | | 1.50 | % | | | 1.50 | % | | | 1.50 | % | | | 1.50 | % | | | 1.72 | % |
| Ratio of net investment income (loss) to average net assets: | | | | | | | | | | | | | | | | | | | | | | | | |
| Before expense reimbursement or recovery | | | (1.52 | )%(4) | | | (0.43 | )% | | | (0.43 | )% | | | (0.10 | )% | | | (0.29 | )% | | | 0.18 | % |
| After expense reimbursement or recovery | | | 0.34 | %(4) | | | 0.67 | % | | | 0.73 | % | | | 0.75 | % | | | 0.24 | % | | | 0.52 | % |
| Portfolio turnover rate | | | 44.01 | % | | | 101.26 | % | | | 87.41 | % | | | 110.53 | % | | | 95.84 | % | | | 107.17 | % |
| (1) | For a share outstanding throughout the period. Rounded to the nearest cent. |
| (2) | Net investment income per share is calculated based on average shares outstanding. |
| (3) | Amount represents less than $0.005 per share. |
| 24 | Leuthold Funds - 2019 Semi-Annual Report | See Notes to the Financial Statements. |
Leuthold Global Industries Fund - Institutional - LGIIX
Financial Highlights
| | | Six Months
Ended
March 31, 2019 | | | Year Ended
September 30,
2018 | | | Year Ended
September 30,
2017 | | | Year Ended
September 30,
2016 | | | Year Ended
September 30,
2015 | | | Year Ended
September 30,
2014 | |
| | | (Unaudited) | | | | | | | | | | | | | | | | |
| Per Share Data(1): | | | | | | | | | | | | | | | | | | |
| Net asset value, beginning of period | | $ | 17.02 | | | $ | 18.22 | | | $ | 15.70 | | | $ | 15.82 | | | $ | 16.63 | | | $ | 14.95 | |
| Income (loss) from investment operations: | | | | | | | | | | | | | | | | | | | | | | | | |
| Net investment income (2) | | | 0.04 | | | | 0.16 | | | | 0.16 | | | | 0.15 | | | | 0.08 | | | | 0.13 | |
| Net realized and unrealized gain (loss) on investments | | | (1.53 | ) | | | 0.09 | | | | 3.03 | | | | 0.43 | | | | (0.48 | ) | | | 1.69 | |
| Total from investment operations | | | (1.49 | ) | | | 0.25 | | | | 3.19 | | | | 0.58 | | | | (0.40 | ) | | | 1.82 | |
| | | | | | | | | | | | | | | | | | | | | | | | | |
| Less distributions: | | | | | | | | | | | | | | | | | | | | | | | | |
| From net investment income | | | (0.17 | ) | | | (0.18 | ) | | | (0.10 | ) | | | (0.12 | ) | | | (0.10 | ) | | | (0.14 | ) |
| From net realized gain | | | (1.76 | ) | | | (1.27 | ) | | | (0.57 | ) | | | (0.58 | ) | | | (0.31 | ) | | | — | |
| Redemption fees | | | — | | | | — | | | | — | | | | — | | | | 0.00 | (3) | | | — | |
| Total distributions | | | (1.93 | ) | | | (1.45 | ) | | | (0.67 | ) | | | (0.70 | ) | | | (0.41 | ) | | | (0.14 | ) |
| Net asset value, end of period | | $ | 13.60 | | | $ | 17.02 | | | $ | 18.22 | | | $ | 15.70 | | | $ | 15.82 | | | $ | 16.63 | |
| | | | | | | | | | | | | | | | | | | | | | | | | |
| Total Return | | | (8.53 | )% | | | 1.17 | % | | | 21.25 | % | | | 3.47 | % | | | (2.44 | )% | | | 12.16 | % |
| | | | | | | | | | | | | | | | | | | | | | | | | |
| Supplemental data and ratios: | | | | | | | | | | | | | | | | | | | | | | | | |
| Net assets, end of period | | $ | 6,162,371 | | | $ | 8,640,784 | | | $ | 8,980,549 | | | $ | 9,802,258 | | | $ | 14,272,916 | | | $ | 16,853,310 | |
| Ratio of expenses to average net assets: | | | | | | | | | | | | | | | | | | | | | | | | |
| Before expense reimbursement or recovery | | | 3.11 | %(4) | | | 2.35 | % | | | 2.41 | % | | | 2.10 | % | | | 1.79 | % | | | 1.81 | % |
| After expense reimbursement or recovery | | | 1.25 | %(4) | | | 1.25 | % | | | 1.25 | % | | | 1.25 | % | | | 1.25 | % | | | 1.47 | % |
| Ratio of net investment income (loss) to average net assets: | | | | | | | | | | | | | | | | | | | | | | | | |
| Before expense reimbursement or recovery | | | (1.27 | )% (4) | | | (0.18 | )% | | | (0.18 | )% | | | 0.15 | % | | | (0.05 | )% | | | 0.43 | % |
| After expense reimbursement or recovery | | | 0.59 | %(4) | | | 0.92 | % | | | 0.98 | % | | | 1.00 | % | | | 0.49 | % | | | 0.77 | % |
| Portfolio turnover rate | | | 44.01 | % | | | 101.26 | % | | | 87.41 | % | | | 110.53 | % | | | 95.84 | % | | | 107.17 | % |
| (1) | For a share outstanding throughout the period. Rounded to the nearest cent. |
| (2) | Net investment income per share is calculated based on average shares outstanding. |
| (3) | Amount represents less than $0.005 per share. |
| See Notes to the Financial Statements. | Leuthold Funds - 2019 Semi-Annual Report | 25 |
Grizzly Short Fund - GRZZX
Financial Highlights
| | | Six Months
Ended
March 31, 2019 | | | Year Ended
September 30,
2018 | | | Year Ended
September 30,
2017(1) | | | Year Ended
September 30,
2016(1) | | | Year Ended
September 30,
2015(1) | | | Year Ended
September 30,
2014(1) | |
| | | (Unaudited) | | | | | | | | | | | | | | | | |
| Per Share Data(2): | | | | | | | | | | | | | | | | | | |
| Net asset value, beginning of period | | $ | 17.65 | | | $ | 21.48 | | | $ | 24.68 | | | $ | 31.96 | | | $ | 29.48 | | | $ | 34.32 | |
| Income (loss) from investment operations: | | | | | | | | | | | | | | | | | | | | | | | | |
| Net investment income (loss) | | | 0.09 | (3) | | | (0.03 | )(3) | | | (0.40 | )(3) | | | (0.72 | )(3) | | | (0.80 | )(3) | | | (1.04 | )(4) |
| Net realized and unrealized gain (loss) on investments and securities sold short | | | (1.06 | ) | | | (3.80 | ) | | | (2.80 | ) | | | (6.56 | ) | | | 3.28 | | | | (3.80 | ) |
| Total from investment operations | | | (0.97 | ) | | | (3.83 | ) | | | (3.20 | ) | | | (7.28 | ) | | | 2.48 | | | | (4.84 | ) |
| | | | | | | | | | | | | | | | | | | | | | | | | |
| Less distributions: | | | | | | | | | | | | | | | | | | | | | | | | |
| From net investment income | | | — | | | | — | | | | — | | | | — | | | | — | | | | — | |
| From net realized gain | | | — | | | | — | | | | — | | | | — | | | | — | | | | — | |
| Total distributions | | | — | | | | — | | | | — | | | | — | | | | — | | | | — | |
| Net asset value, end of period | | $ | 16.68 | | | $ | 17.65 | | | $ | 21.48 | | | $ | 24.68 | | | $ | 31.96 | | | $ | 29.48 | |
| | | | | | | | | | | | | | | | | | | | | | | | | |
| Total Return | | | (5.55 | )% | | | (17.83 | )% | | | (12.97 | )% | | | (22.78 | )% | | | 8.41 | % | | | (14.20 | )% |
| | | | | | | | | | | | | | | | | | | | | | | | | |
| Supplemental data and ratios: | | | | | | | | | | | | | | | | | | | | | | | | |
| Net assets, end of period | | $ | 94,814,873 | | | $ | 98,948,757 | | | $ | 205,698,273 | | | $ | 178,211,844 | | | $ | 265,843,184 | | | $ | 72,182,207 | |
| Ratio of expenses to average net assets(5) | | | 2.73 | %(8) | | | 2.64 | % | | | 2.63 | % | | | 2.65 | % | | | 2.81 | % | | | 3.35 | % |
| Ratio of net investment income (loss) to average net assets(6) | | | 0.94 | %(8) | | | (0.54 | )% | | | (1.78 | )% | | | (2.50 | )% | | | (2.81 | )% | | | (3.35 | )% |
| Portfolio turnover rate(7) | | | 0.00 | % | | | 0.00 | % | | | 0.00 | % | | | 0.00 | % | | | 0.00 | % | | | 0.00 | % |
| (1) | Per share data adjusted for 1:4 reverse split completed as of May 18, 2018. |
| (2) | For a share outstanding throughout the period. Rounded to the nearest cent. |
| (3) | Net investment income (loss) per share is calculated based on average shares outstanding. |
| (4) | Net investment loss per share is calculated using ending balances prior to consideration of adjustments for permanent book and tax differences. |
| (5) | The ratio of expenses to average net assets includes dividends and interest on securites sold short. The expense ratios excluding dividends and interest on securities sold short were 1.61% for the period ended March 31, 2019, 1.53% for the year ended September 30, 2018, 1.54% for the year ended September 30, 2017, 1.52% for the year ended September 30, 2016, 1.55% for the year ended September 30, 2015, and 1.57% for the year ended September 30, 2014. |
| (6) | The net investment income ratios include dividends and interest on securities sold short. |
| (7) | The portfolio turnover rate excludes purchases and sales of securities sold short. |
| 26 | Leuthold Funds - 2019 Semi-Annual Report | See Notes to the Financial Statements. |
L
euthold Core Investment Fund
Schedule of InvestmentsMarch 31, 2019 (Unaudited)
| | | Shares | | | Fair Value | |
| COMMON STOCKS - 54.08% | | | | | | |
| | | | | | | |
| Airlines - 0.81% | | | | | | |
| Delta Air Lines, Inc. (f) | | | 56,269 | | | $ | 2,906,294 | |
| United Continental Holdings, Inc. (a) | | | 35,089 | | | | 2,799,400 | |
| | | | | | | | 5,705,694 | |
| Biotechnology - 2.65% | | | | | | | | |
| AbbVie, Inc. | | | 40,087 | | | | 3,230,611 | |
| Amgen, Inc. | | | 17,938 | | | | 3,407,861 | |
| Biogen, Inc. (a) | | | 10,617 | | | | 2,509,647 | |
| Celgene Corp. (a) | | | 25,077 | | | | 2,365,764 | |
| Gilead Sciences, Inc. | | | 50,886 | | | | 3,308,099 | |
| Regeneron Pharmaceuticals, Inc. (a)(f) | | | 9,152 | | | | 3,757,994 | |
| | | | | | | | 18,579,976 | |
| Chemicals - 0.00% (i) | | | | | | | | |
| China Lumena New Materials Corp. (a)(b)(d)(e) | | | 838,000 | | | | 6,405 | |
| Commercial Services & Supplies - 2.27% | | | | | | | | |
| Republic Services, Inc. (f) | | | 66,628 | | | | 5,355,559 | |
| Stericycle, Inc. (a)(f) | | | 46,127 | | | | 2,510,231 | |
| Tetra Tech, Inc. | | | 41,002 | | | | 2,443,309 | |
| Waste Management, Inc. | | | 53,998 | | | | 5,610,932 | |
| | | | | | | | 15,920,031 | |
| Consumer Finance - 1.88% | | | | | | | | |
| Ally Financial, Inc. (f) | | | 106,166 | | | | 2,918,503 | |
| Capital One Financial Corp. | | | 32,582 | | | | 2,661,624 | |
| OneMain Holdings, Inc. | | | 45,944 | | | | 1,458,722 | |
| Santander Consumer USA Holdings, Inc. (f) | | | 97,746 | | | | 2,065,373 | |
| Synchrony Financial | | | 72,486 | | | | 2,312,303 | |
| World Acceptance Corp. (a)(f) | | | 15,193 | | | | 1,779,556 | |
| | | | | | | | 13,196,081 | |
| | | Shares | | | Fair Value | |
| Entertainment - 1.18% | | | | | | |
| Viacom, Inc. - Class B | | | 116,233 | | | $ | 3,262,660 | |
| The Walt Disney Co. | | | 45,029 | | | | 4,999,570 | |
| | | |
| | | | 8,262,230 | |
| Food & Staples Retailing - 2.16% | | | | | | | | |
| Costco Wholesale Corp. | | | 32,582 | | | | 7,889,405 | |
| Walmart, Inc. | | | 73,950 | | | | 7,212,344 | |
| | | |
| | | | 15,101,749 | |
| Health Care Providers & Services - 9.41% | | | | | | | | |
| Acadia Healthcare Co., Inc. (a)(f) | | | 104,519 | | | | 3,063,452 | |
| Anthem, Inc. | | | 26,175 | | | | 7,511,701 | |
| Centene Corp. (a) | | | 105,800 | | | | 5,617,980 | |
| Cigna Corp. | | | 25,857 | | | | 4,158,323 | |
| CVS Health Corp. | | | 78,709 | | | | 4,244,776 | |
| Encompass Health Corp. | | | 66,811 | | | | 3,901,762 | |
| HCA Healthcare, Inc. | | | 56,839 | | | | 7,410,669 | |
| Humana, Inc. | | | 17,389 | | | | 4,625,474 | |
| Laboratory Corp. of America Holdings (a) | | | 23,064 | | | | 3,528,331 | |
| Quest Diagnostics, Inc. | | | 38,256 | | | | 3,439,979 | |
| Select Medical Holdings Corp. (a) | | | 142,775 | | | | 2,011,700 | |
| Tenet Healthcare Corp. (a) | | | 66,445 | | | | 1,916,274 | |
| UnitedHealth Group, Inc. | | | 30,752 | | | | 7,603,740 | |
| Universal Health Services, Inc. - Class B | | | 51,436 | | | | 6,880,594 | |
| | | |
| | | | 65,914,755 | |
| Hotels, Restaurants & Leisure - 2.62% | | | | | | | | |
| BJ's Restaurants, Inc. | | | 29,836 | | | | 1,410,646 | |
| Brinker International, Inc. (f) | | | 36,975 | | | | 1,640,950 | |
| The Cheesecake Factory, Inc. (f) | | | 37,341 | | | | 1,826,722 | |
| Cracker Barrel Old Country Store, Inc. (f) | | | 10,983 | | | | 1,774,963 | |
| Darden Restaurants, Inc. | | | 25,443 | | | | 3,090,561 | |
| Dave & Buster's Entertainment, Inc. (f) | | | 31,850 | | | | 1,588,360 | |
| See Notes to the Financial Statements. | Leuthold Funds - 2019 Semi-Annual Report | 27 |
Leuthold Core Investment Fund
Schedule of Investments (continued)March 31, 2019 (Unaudited)
| | | Shares | | | Fair Value | |
| COMMON STOCKS - 54.08% (continued) | |
| | |
| Hotels, Restaurants & Leisure - 2.62% (continued) | | | | |
| Dine Brands Global, Inc. (f) | | | 20,684 | | | $ | 1,888,242 | |
| The Wendy's Co. (f) | | | 107,264 | | | | 1,918,953 | |
| Yum! Brands, Inc. | | | 31,850 | | | | 3,178,949 | |
| | | | | | | | 18,318,346 | |
| Household Durables - 2.32% | | | | | | | | |
| D.R. Horton, Inc. | | | 97,746 | | | | 4,044,729 | |
| Lennar Corp. - Class A | | | 58,574 | | | | 2,875,398 | |
| Meritage Homes Corp. (a)(f) | | | 41,917 | | | | 1,874,109 | |
| PulteGroup, Inc. | | | 148,998 | | | | 4,165,984 | |
| Toll Brothers, Inc. | | | 90,058 | | | | 3,260,100 | |
| | | | | | | | 16,220,320 | |
| Interactive Media & Services - 2.50% | | | | | |
| Alphabet, Inc. - Class A (a) | | | 7,709 | | | | 9,072,645 | |
| Facebook, Inc. - Class A (a) | | | 23,131 | | | | 3,855,706 | |
| IAC/InterActiveCorp (a) | | | 12,771 | | | | 2,683,315 | |
| YY, Inc. - Class A - ADR (a) | | | 23,008 | | | | 1,932,902 | |
| | | | | | | | 17,544,568 | |
| IT Services - 4.95% | | | | | | | | |
| Alliance Data Systems Corp. (f) | | | 13,545 | | | | 2,370,104 | |
| Fiserv, Inc. (a)(f) | | | 64,432 | | | | 5,688,057 | |
| FleetCor Technologies, Inc. (a) | | | 14,644 | | | | 3,611,064 | |
| Genpact, Ltd. | | | 51,436 | | | | 1,809,519 | |
| MasterCard, Inc. - Class A | | | 35,328 | | | | 8,317,978 | |
| MAXIMUS, Inc. | | | 44,114 | | | | 3,131,212 | |
| Visa, Inc. - Class A (f) | | | 50,154 | | | | 7,833,553 | |
| The Western Union Co. (f) | | | 102,322 | | | | 1,889,887 | |
| | | | | | | | 34,651,374 | |
| Media - 1.49% | | | | | | | | |
| AMC Networks, Inc. - Class A (a)(f) | | | 33,314 | | | | 1,890,903 | |
| Comcast Corp. - Class A | | | 100,675 | | | | 4,024,986 | |
| Discovery, Inc. - Class A (a)(f) | | | 65,896 | | | | 1,780,510 | |
| Nexstar Media Group, Inc. - Class A (f) | | | 25,443 | | | | 2,757,258 | |
| | | | | | | | 10,453,657 | |
| | | Shares | | | Fair Value | |
| Multiline Retail - 2.97% | | | | | | |
| Dollar General Corp. | | | 57,476 | | | $ | 6,856,887 | |
| Dollar Tree, Inc. (a) | | | 51,070 | | | | 5,364,393 | |
| Target Corp. (f) | | | 106,715 | | | | 8,564,946 | |
| | | | | | | | 20,786,226 | |
| Professional Services - 2.73% | | | | | | | | |
| ASGN, Inc. (a)(f) | | | 58,940 | | | | 3,742,101 | |
| Insperity, Inc. | | | 44,846 | | | | 5,545,656 | |
| Robert Half International, Inc. (f) | | | 68,093 | | | | 4,436,940 | |
| TriNet Group, Inc. (a) | | | 62,601 | | | | 3,739,784 | |
| TrueBlue, Inc. (a) | | | 69,374 | | | | 1,640,001 | |
| | | | | | | | 19,104,482 | |
| Road & Rail - 4.04% | | | | | | | | |
| Canadian National Railway Co. (b) | | | 33,131 | | | | 2,964,562 | |
| Canadian Pacific Railway, Ltd. (b) | | | 19,220 | | | | 3,959,897 | |
| CSX Corp. (f) | | | 55,280 | | | | 4,136,049 | |
| Genesee & Wyoming, Inc. - Class A (a) | | | 35,328 | | | | 3,078,482 | |
| Kansas City Southern | | | 32,582 | | | | 3,778,860 | |
| Norfolk Southern Corp. | | | 23,247 | | | | 4,344,632 | |
| Union Pacific Corp. (f) | | | 24,528 | | | | 4,101,082 | |
| Werner Enterprises, Inc. (f) | | | 57,476 | | | | 1,962,805 | |
| | | | | | | | 28,326,369 | |
| | | | | | | | | |
| Semiconductors & Semiconductor Equipment - 3.21% | | | | | | | | |
| Applied Materials, Inc. | | | 113,122 | | | | 4,486,419 | |
| KLA-Tencor Corp. | | | 23,064 | | | | 2,754,072 | |
| Kulicke & Soffa Industries, Inc. (b) | | | 62,601 | | | | 1,384,108 | |
| Lam Research Corp. | | | 40,819 | | | | 7,307,009 | |
| MKS Instruments, Inc. (f) | | | 42,832 | | | | 3,985,518 | |
| SolarEdge Technologies, Inc. (a)(b)(f) | | | 67,544 | | | | 2,545,058 | |
| | | | | | | | 22,462,184 | |
| 28 | Leuthold Funds - 2019 Semi-Annual Report | See Notes to the Financial Statements. |
Leuthold Core Investment Fund
Schedule of Investments (continued)March 31, 2019 (Unaudited)
| | | Shares | | | Fair Value | |
| COMMON STOCKS - 54.08% (continued) | | | | | | |
| | | | | | | |
| Software - 3.72% | | | | | | |
| Check Point Software Technologies, Ltd. (a)(b) | | | 38,869 | | | $ | 4,916,540 | |
| Fortinet, Inc. (a) | | | 43,577 | | | | 3,659,160 | |
| Microsoft Corp. | | | 75,505 | | | | 8,905,060 | |
| Oracle Corp. | | | 90,669 | | | | 4,869,832 | |
| VMware, Inc. - Class A (f) | | | 20,461 | | | | 3,693,415 | |
| | | | | | | | 26,044,007 | |
| Specialty Retail - 3.17% | | | | | | | | |
| Aaron's, Inc. (f) | | | 73,218 | | | | 3,851,267 | |
| AutoZone, Inc. (a) | | | 3,478 | | | | 3,561,889 | |
| Group 1 Automotive, Inc. | | | 28,006 | | | | 1,811,988 | |
| The Home Depot, Inc. | | | 15,193 | | | | 2,915,385 | |
| Lowe's Companies, Inc. | | | 50,154 | | | | 5,490,358 | |
| Penske Automotive Group, Inc. | | | 47,409 | | | | 2,116,812 | |
| Williams-Sonoma, Inc. (f) | | | 43,287 | | | | 2,435,760 | |
| | | | | | | | 22,183,459 | |
| TOTAL COMMON STOCKS | | | | | | | | |
| (Cost $313,776,829) | | | | | | $ | 378,781,913 | |
| | | | | | | | | |
| INVESTMENT COMPANIES - 12.08% | | | | | | | | |
| | | | | | | | | |
| Exchange Traded Funds - 12.08% | | | | | | | | |
| Invesco CurrencyShares Euro Currency Trust (a)(f) | | | 34,111 | | | $ | 3,650,559 | |
| Invesco CurrencyShares Japanese Yen Trust (a)(f)(h) | | | 239,414 | | | | 20,615,940 | |
| iShares Floating Rate Bond ETF (f) | | | 120,161 | | | | 6,117,396 | |
| iShares International Treasury Bond ETF (f) | | | 347,250 | | | | 17,029,140 | |
| iShares JP Morgan USD Emerging Markets Bond ETF | | | 52,626 | | | | 5,792,018 | |
| iShares MBS ETF (f) | | | 101,832 | | | | 10,830,851 | |
| SPDR Gold Shares (a)(f) | | | 168,792 | | | | 20,594,312 | |
| TOTAL INVESTMENT COMPANIES | | | | | | | | |
| (Cost $84,608,182) | | | | | | $ | 84,630,216 | |
| | | Principal Amount | | | Fair Value | |
| CORPORATE BONDS - 2.62% | | | | |
| | | | | |
| Banks - 0.78% | | | | | | |
| JPMorgan Chase & Co. | | | | | | |
| 1.500%, 01/27/2025 | | $ | 4,600,000 | | | $ | 5,441,133 | |
| | | | | | | | | |
| Food Products - 0.60% | | | | | | | | |
| Kraft Heinz Foods Co. | | | | | | | | |
| 3.950%, 07/15/2025 | | | 4,150,000 | | | | 4,182,139 | |
| | | | | | | | | |
| Software - 0.66% | | | | | | | | |
| Oracle Corp. | | | | | | | | |
| 2.950%, 05/15/2025 | | | 4,620,000 | | | | 4,614,015 | |
| | | | | | | | | |
| Technology Hardware, Storage & Peripherals - 0.58% | | | | | | | | |
| Apple, Inc. | | | | | | | | |
| 1.000%, 11/10/2022 | | | 3,500,000 | | | | 4,079,805 | |
| TOTAL CORPORATE BONDS | | | | | | | | |
| (Cost $18,163,007) | | | | | | $ | 18,317,092 | |
| | | | | | | | | |
| UNITED STATES TREASURY OBLIGATIONS - 5.23% | | | | | | | | |
| | | | | | | | | |
| United States Treasury Inflation | | | | | |
| Index Bond - 1.38% | | | | | | | | |
| 0.125%, 07/15/2022 | | $ | 9,730,816 | | | $ | 9,678,533 | |
| United States Treasury Notes - 3.85% | | | | | |
| 2.500%, 12/31/2020 | | | 4,260,000 | | | | 4,272,813 | |
| 2.500%, 01/31/2025 | | | 13,980,000 | | | | 14,141,097 | |
| 3.500%, 02/15/2039 | | | 7,540,000 | | | | 8,543,468 | |
| | | | | | | | 26,957,378 | |
| TOTAL UNITED STATES TREASURY OBLIGATIONS (Cost $35,672,586) | | | $ | 36,635,911 | |
| See Notes to the Financial Statements. | Leuthold Funds - 2019 Semi-Annual Report | 29 |
Leuthold Core Investment Fund
Schedule of Investments (continued)March 31, 2019 (Unaudited)
| | | Principal Amount | | | Fair Value | |
| FOREIGN GOVERNMENT BONDS - 4.09% | | | | | | |
| Argentine Republic Government International Bond | | | | | | |
| 6.250%, 04/22/2019 (b) | | $ | 4,300,000 | | | $ | 4,302,150 | |
| Canadian Government Bond | | | | | | | | |
| 2.250%, 06/01/2025 (b) | | CAD
| 5,400,000
| | | | 4,203,825 | |
| French Republic Government Bond OAT | | | | | | | | |
| 1.250%, 05/25/2034 (b) | | EUR | 10,480,000
| | | | 12,655,588 | |
| Government of the United Kingdom | | | | | | | | |
| 2.250%, 09/07/2023 (b) | | GBP
| 3,750,000
| | | | 5,214,008 | |
| Korea International Bond | | | | | | | | |
| 7.125%, 04/16/2019 (b) | | $ | 2,250,000 | | | | 2,254,208 | |
| TOTAL FOREIGN GOVERNMENT BONDS | | | | | | | | |
| (Cost $28,150,253) | |
|
| | | $ | 28,629,779 | |
| | | Shares | | | Fair Value | |
| | | | | | | |
| SHORT-TERM INVESTMENTS - 20.41% | | | | | | |
| | | | | | | |
| Money Market Funds - 20.41% | | | | | | |
| Fidelity Institutional Money Market Funds - Government Portfolio - Class I, 2.300% (c)(g) | | | 142,962,278 | | | $ | 142,962,278 | |
| TOTAL SHORT-TERM INVESTMENTS | | | | | | | | |
| (Cost $142,962,278) | | | | | | $ | 142,962,278 | |
| | | | | | | | | |
| INVESTMENTS PURCHASED AS SECURITIES LENDING COLLATERAL - 15.05% | | | | | | | | |
| Mount Vernon Liquid Assets Portfolio, LLC, 2.610% (c) | | | 105,428,945 | | | $ | 105,428,945 | |
| TOTAL INVESTMENTS PURCHASED AS SECURITIES LENDING COLLATERAL | | | | | | | | |
| (Cost $105,428,945) | | | | | | $ | 105,428,945 | |
| | | Fair Value | |
| Total Investments | | | |
| (Cost $728,762,080) - 113.56% | | $ | 795,386,134 | |
| Liabilities in Excess of Other Assets - (13.56)% | | | (95,005,125 | ) |
| TOTAL NET ASSETS - 100.00% | | $ | 700,381,009 | |
Percentages are stated as a percent of net assets.
ADR American Depositary Receipt
CAD Canadian Dollar
EUR Euro
GBP British Pound
| (a) | Non-income producing security. |
| (b) | Foreign issued security. |
| (c) | The rate quoted is the annualized seven-day yield as of March 31, 2019. |
| (d) | Illiquid security. The fair value of these securities total $6,405 which represents an amount that rounds to 0.00% of total net assets. |
| (e) | This security is currently being fair valued in accordance with procedures established by the Board of Directors of Leuthold Funds, Inc. and is deemed a Level 3 security as it is valued usinig significant unobservable inputs. |
| (f) | This security or a portion of this security was out on loan as of March 31, 2019. Total loaned securities had a value of $103,535,380 or 14.78% of net assets. The remaining contractual maturity of all of the securities lending transactions is overnight and continuous. See Note 8. |
| (g) | All or a portion of the assets have been committed as collateral for open securites sold short. |
| (h) | Affiliated security. At March 31, 2019, the market value of this security totals $20,615,940, which represents 2.94% of total net assets. |
| (I) | Rounds to less than 0.005%. |
The Global Industry Classification Standard (GICS®) was developed by and/or is the exclusive property of MSCI, Inc. and Standard & Poor’s Financial Services LLC (“S&P”). GICS® is a service mark of MSCI, Inc. and S&P and has been licensed for use by U.S. Bancorp Fund Services, LLC.
| 30 | Leuthold Funds - 2019 Semi-Annual Report | See Notes to the Financial Statements. |
Leuthold Core Investment Fund
Schedule of Investments Sold Short - (a)March 31, 2019 (Unaudited)
| | | Shares | | | Fair Value | |
| COMMON STOCKS - 6.81% | | | | | | |
| | | | | | | |
| Aerospace & Defense - 0.14% | | | | | | |
| Embraer SA - ADR | | | 12,158 | | | $ | 231,124 | |
| L3 Technologies, Inc. | | | 3,793 | | | | 782,761 | |
| | | | | | | | 1,013,885 | |
| Beverages - 0.50% | | | | | | | | |
| Anheuser-Busch InBev SA/NV - ADR | | | 7,950 | | | | 667,561 | |
| Brown-Forman Corp. - Class B | | | 18,601 | | | | 981,761 | |
| Keurig Dr Pepper, Inc. | | | 27,642 | | | | 773,147 | |
| MGP Ingredients, Inc. | | | 3,325 | | | | 256,524 | |
| Monster Beverage Corp. | | | 15,224 | | | | 830,926 | |
| | | | | | | | 3,509,919 | |
| Capital Markets - 0.15% | | | | | | | | |
| SEI Investments Co. | | | 14,756 | | | | 771,001 | |
| WisdomTree Investments, Inc. | | | 34,708 | | | | 245,038 | |
| | | | | | | | 1,016,039 | |
| Chemicals - 0.18% | | | | | | | | |
| GCP Applied Technologies, Inc. | | | 8,570 | | | | 253,672 | |
| The Scotts Miracle-Gro Co. | | | 9,716 | | | | 763,483 | |
| Sensient Technologies Corp. | | | 3,728 | | | | 252,721 | |
| | | | | | | | 1,269,876 | |
| Commercial Services & Supplies - 0.21% | | | | | |
| Copart, Inc. | | | 12,626 | | | | 765,010 | |
| Healthcare Services Group, Inc. | | | 14,081 | | | | 464,532 | |
| Ritchie Bros Auctioneers, Inc. (b) | | | 7,066 | | | | 240,244 | |
| | | | | | | | 1,469,786 | |
| Construction & Engineering - 0.04% | | | | | |
| Granite Construction, Inc. | | | 5,767 | | | | 248,846 | |
| Construction Materials - 0.06% | | | | | |
| Summit Materials, Inc. - Class A | | | 27,642 | | | | 438,679 | |
| | | Shares | | | Fair Value | |
| Diversified Consumer Services - 0.23% | | | | |
| New Oriental Education & Technology Group, Inc. - ADR | | | 9,508 | | | $ | 856,576 | |
| ServiceMaster Global Holdings, Inc. | | | 16,066 | | | | 750,282 | |
| | | | | | | | 1,606,858 | |
| | | | | | | | | |
| Electronic Equipment, Instruments & Components - 0.22% | | | | | | | | |
| Cognex Corp. | | | 14,860 | | | | 755,780 | |
| IPG Photonics Corp. | | | 5,352 | | | | 812,326 | |
| | | | | | | | 1,568,106 | |
| | | | | | | | | |
| Energy Equipment & Services - 0.47% | | | | | |
| Baker Hughes, a GE Co. - Class A | | | 31,383 | | | | 869,937 | |
| Core Laboratories NV (b) | | | 11,898 | | | | 820,129 | |
| Halliburton Co. | | | 17,926 | | | | 525,232 | |
| National Oilwell Varco, Inc. | | | 17,562 | | | | 467,852 | |
| Schlumberger, Ltd. | | | 14,185 | | | | 618,040 | |
| | | | | | | | 3,301,190 | |
| Entertainment - 0.35% | | | | | | | | |
| Activision Blizzard, Inc. | | | 18,133 | | | | 825,595 | |
| Electronic Arts, Inc. | | | 7,158 | | | | 727,468 | |
| Netflix, Inc. | | | 2,494 | | | | 889,261 | |
| | | | | | | | 2,442,324 | |
| Food Products - 0.04% | | | | | | | | |
| BRF SA - ADR | | | 51,854 | | | | 301,790 | |
| Health Care Equipment & Supplies - 0.47% | |
| Align Technology, Inc. | | | 3,429 | | | | 974,968 | |
| Becton Dickinson and Co. | | | 2,962 | | | | 739,700 | |
| Insulet Corp. | | | 8,417 | | | | 800,372 | |
| Intuitive Surgical, Inc. | | | 1,351 | | | | 770,854 | |
| | | | | | | | 3,285,894 | |
| Health Care Technology - 0.10% | | | | | |
| Teladoc Health, Inc. | | | 12,782 | | | | 710,679 | |
| See Notes to the Financial Statements. | Leuthold Funds - 2019 Semi-Annual Report | 31 |
Leuthold Core Investment Fund
Schedule of Investments Sold Short - (a) (continued)March 31, 2019 (Unaudited)
| | | Shares | | | Fair Value | |
| COMMON STOCKS - 6.81% (continued) | | | | | | |
| | | | | | | |
| Hotels, Restaurants & Leisure - 0.46% | | | | |
| Boyd Gaming Corp. | | | 30,967 | | | $ | 847,257 | |
| Melco Resorts & Entertainment, Ltd. - ADR | | | 39,852 | | | | 900,257 | |
| MGM Resorts International | | | 27,278 | | | | 699,953 | |
| Vail Resorts, Inc. | | | 3,530 | | | | 767,069 | |
| | | | | | | | 3,214,536 | |
| Household Products - 0.04% | | | | | | | | |
| Spectrum Brands Holdings, Inc. | | | 4,520 | | | | 247,606 | |
| Industrial Conglomerates - 0.11% | | | | | |
| General Electric Co. | | | 77,262 | | | | 771,847 | |
| Insurance - 0.30% | | | | | | | | |
| American International Group, Inc. | | | 15,172 | | | | 653,306 | |
| Fidelity National Financial, Inc. | | | 20,333 | | | | 743,171 | |
| RenaissanceRe Holdings, Ltd. (b) | | | 5,077 | | | | 728,550 | |
| | | | | | | | 2,125,027 | |
| Interactive Media & Services - 0.08% | | | | | |
| Snap, Inc. - Class A | | | 52,790 | | | | 581,746 | |
| Internet & Direct Marketing Retail - 0.29% | |
| Alibaba Group Holding, Ltd. - ADR | | | 4,001 | | | | 729,983 | |
| GrubHub, Inc. | | | 11,847 | | | | 823,011 | |
| Shutterfly, Inc. | | | 12,088 | | | | 491,256 | |
| | | | | | | | 2,044,250 | |
| Machinery - 0.38% | | | | | | | | |
| Fortive Corp. | | | 9,404 | | | | 788,901 | |
| IDEX Corp. | | | 6,027 | | | | 914,537 | |
| Xylem, Inc. | | | 11,795 | | | | 932,277 | |
| | | | | | | | 2,635,715 | |
| Multi-Utilities - 0.11% | | | | | | | | |
| Sempra Energy | | | 6,183 | | | | 778,192 | |
| | | Shares | | | Fair Value | |
| Oil, Gas & Consumable Fuels - 0.26% | | | | |
| Concho Resources, Inc. | | | 6,703 | | | $ | 743,765 | |
| Diamondback Energy, Inc. | | | 8,157 | | | | 828,180 | |
| Jagged Peak Energy, Inc. | �� | | 24,109 | | | | 252,421 | |
| | | | | | | | 1,824,366 | |
| Pharmaceuticals - 0.08% | | | | | | | | |
| Nektar Therapeutics | | | 16,003 | | | | 537,701 | |
| Professional Services - 0.22% | | | | | | | | |
| CoStar Group, Inc. | | | 1,603 | | | | 747,671 | |
| TransUnion | | | 11,422 | | | | 763,447 | |
| | | | | | | | 1,511,118 | |
| Real Estate Investment Trusts (REITs) - 0.11% | |
| Equinix, Inc. | | | 1,767 | | | | 800,734 | |
| Real Estate Management & Development - 0.09% | |
| The Howard Hughes Corp. | | | 5,560 | | | | 611,600 | |
| Semiconductors & Semiconductor Equipment - 0.30% | | | | | | | | |
| Ambarella, Inc. | | | 14,444 | | | | 623,981 | |
| Marvell Technology Group, Ltd. | | | 38,397 | | | | 763,716 | |
| Microchip Technology, Inc. | | | 8,625 | | | | 715,530 | |
| | | | | | | | 2,103,227 | |
| Software - 0.49% | | | | | | | | |
| 2U, Inc. | | | 10,288 | | | | 728,905 | |
| Blackbaud, Inc. | | | 7,950 | | | | 633,853 | |
| Cloudera, Inc. | | | 32,318 | | | | 353,559 | |
| Instructure, Inc. | | | 8,313 | | | | 391,708 | |
| Pegasystems, Inc. | | | 9,353 | | | | 607,945 | |
| Proofpoint, Inc. | | | 6,183 | | | | 750,802 | |
| | | | | | | | 3,466,772 | |
| | | | | | | | | |
| Technology Hardware, Storage & Peripherals - 0.13% | | | | | | | | |
| Pure Storage, Inc. | | | 40,372 | | | | 879,706 | |
| 32 | Leuthold Funds - 2019 Semi-Annual Report | See Notes to the Financial Statements. |
Leuthold Core Investment Fund
Schedule of Investments Sold Short - (a) (continued)March 31, 2019 (Unaudited)
| | | Shares | | | Fair Value | |
| COMMON STOCKS - 6.81% (continued) | | | | | | |
| | | | | | | |
| Thrifts & Mortgage Finance - 0.12% | | | | | | |
| LendingTree, Inc. | | | 2,442 | | | $ | 858,509 | |
| Trading Companies & Distributors - 0.08% | | | | | | | | |
| SiteOne Landscape Supply, Inc. | | | 9,612 | | | | 549,326 | |
| TOTAL COMMON STOCKS | | | | | | | | |
| (Proceeds $47,732,297) | | | | | | $ | 47,725,849 | |
| | | | | | | | | |
| INVESTMENT COMPANIES - 0.23% | | | | | | | | |
| | | | | | | | | |
| Exchange Traded Funds - 0.23% | | | | | | | | |
| SPDR S&P 500 ETF Trust | | | 5,612 | | | $ | 1,585,278 | |
| TOTAL INVESTMENT COMPANIES | | | | | | | | |
| (Proceeds $1,539,831) | | | | | | $ | 1,585,278 | |
| | | | | | | | | |
| TOTAL SECURITIES SOLD SHORT | | | | | | | | |
| (Proceeds $49,272,128) - 7.04% | | | | | | $ | 49,311,127 | |
Percentages are stated as a percent of net assets.
ADR American Depositary Receipt
| (a) | Non-income producing security. |
| (b) | Foreign issued security. |
The Global Industry Classification Standard (GICS®) was developed by and/or is the exclusive property of MSCI, Inc. and Standard & Poor’s Financial Services LLC (“S&P”). GICS® is a service mark of MSCI, Inc. and S&P and has been licensed for use by U.S. Bancorp Fund Services, LLC.
| See Notes to the Financial Statements. | Leuthold Funds - 2019 Semi-Annual Report | 33 |
Schedule of InvestmentsMarch 31, 2019 (Unaudited)
| | | Shares | | | Fair Value | |
| COMMON STOCKS - 55.47% | | | | | | |
| | | | | | | |
| Airlines - 1.56% | | | | | | |
| Hawaiian Holdings, Inc. (f) | | | 7,463 | | | $ | 195,904 | |
| International Consolidated Airlines Group SA (b) | | | 46,366 | | | | 308,520 | |
| SkyWest, Inc. (f) | | | 4,646 | | | | 252,231 | |
| United Continental Holdings, Inc. (a) | | | 3,557 | | | | 283,777 | |
| | | | | | | | 1,040,432 | |
| Banks - 0.60% | | | | | | | | |
| Nedbank Group, Ltd. (b) | | | 8,854 | | | | 154,737 | |
| Taishin Financial Holding Co., Ltd. (b) | | | 291,000 | | | | 132,765 | |
| Turkiye Halk Bankasi AS (b) | | | 98,282 | | | | 112,968 | |
| | | | | | | | 400,470 | |
| Communications Equipment - 3.03% | | | | | |
| Arcadyan Technology Corp. (b) | | | 104,000 | | | | 315,486 | |
| Ciena Corp. (a) | | | 12,937 | | | | 483,067 | |
| Cisco Systems, Inc. (f) | | | 8,841 | | | | 477,326 | |
| CommScope Holding Co., Inc. (a) | | | 10,768 | | | | 233,989 | |
| Lumentum Holdings, Inc. (a)(f) | | | 7,295 | | | | 412,459 | |
| Taihan Fiberoptics Co., Ltd. (a)(b) | | | 27,717 | | | | 98,047 | |
| | | | | | | | 2,020,374 | |
| Consumer Finance - 2.11% | | | | | | | | |
| Ally Financial, Inc. (f) | | | 12,372 | | | | 340,106 | |
| Encore Capital Group, Inc. (a)(f) | | | 5,560 | | | | 151,399 | |
| Hitachi Capital Corp. (b) | | | 7,200 | | | | 167,211 | |
| Krungthai Card PCL - NVDR | | | 187,700 | | | | 208,926 | |
| Nelnet, Inc. - Class A | | | 3,663 | | | | 201,721 | |
| Santander Consumer USA Holdings, Inc. (f) | | | 16,066 | | | | 339,475 | |
| | | | | | | | 1,408,838 | |
| | | Shares | | | Fair Value | |
| Diversified Telecommunication Services - 0.66% | |
| China Telecom Corp., Ltd. - ADR | | | 2,739 | | | $ | 153,411 | |
| Telekomunikasi Indonesia Persero Tbk PT - ADR | | | 5,750 | | | | 157,895 | |
| Telkom SA SOC, Ltd. (b) | | | 24,815 | | | | 126,029 | |
| | | | | | | | 437,335 | |
| Electric Utilities - 0.18% | | | | | | | | |
| EDP - Energias do Brasil SA (b) | | | 28,400 | | | | 123,382 | |
| Entertainment - 0.94% | | | | | | | | |
| Viacom, Inc. - Class B | | | 9,345 | | | | 262,314 | |
| The Walt Disney Co. | | | 3,261 | | | | 362,069 | |
| | | | | | | | 624,383 | |
| Health Care Providers & Services - 6.08% | | | | | |
| Alfresa Holdings Corp. (b) | | | 15,800 | | | | 450,249 | |
| AmerisourceBergen Corp. | | | 3,665 | | | | 291,441 | |
| Anthem, Inc. | | | 2,319 | | | | 665,507 | |
| Centene Corp. (a) | | | 8,999 | | | | 477,847 | |
| Cigna Corp. | | | 3,777 | | | | 607,417 | |
| CVS Health Corp. | | | 5,977 | | | | 322,340 | |
| Laboratory Corp. of America Holdings (a)(f) | | | 2,034 | | | | 311,161 | |
| Medipal Holdings Corp. (b) | | | 17,300 | | | | 411,633 | |
| UnitedHealth Group, Inc. | | | 2,104 | | | | 520,235 | |
| | | | | | | | 4,057,830 | |
| Household Durables - 2.65% | | | | | | | | |
| Barratt Developments PLC (b) | | | 35,180 | | | | 274,804 | |
| Haseko Corp. (b) | | | 23,800 | | | | 299,970 | |
| Lennar Corp. - Class A (f) | | | 6,975 | | | | 342,403 | |
| Meritage Homes Corp. (a)(f) | | | 6,601 | | | | 295,131 | |
| Redrow PLC (b) | | | 37,372 | | | | 292,840 | |
| TRI Pointe Group, Inc. (a)(f) | | | 20,758 | | | | 262,381 | |
| | | | | | | | 1,767,529 | |
| 34 | Leuthold Funds - 2019 Semi-Annual Report | See Notes to the Financial Statements. |
Leuthold Global Fund
Schedule of Investments (continued)March 31, 2019 (Unaudited)
| | | Shares | | | Fair Value | |
| COMMON STOCKS - 55.47% (continued) | |
| | |
| Insurance - 2.68% | | | | | | |
| Dai-ichi Life Holdings, Inc. (b) | | | 16,400 | | | $ | 228,310 | |
| Legal & General Group PLC (b) | | | 87,839 | | | | 315,223 | |
| Lincoln National Corp. | | | 2,792 | | | | 163,890 | |
| Medibank Pvt, Ltd. (b) | | | 104,799 | | | | 205,707 | |
| Old Mutual, Ltd. (b) | | | 70,945 | | | | 104,366 | |
| Ping An Insurance Group Co. of China, Ltd. - H Shares (b) | | | 48,000 | | | | 540,394 | |
| Prudential Financial, Inc. | | | 2,509 | | | | 230,527 | |
| | | | | | | | 1,788,417 | |
| Interactive Media & Services - 2.54% | | | | | |
| Alphabet, Inc. - Class A (a) | | | 526 | | | | 619,044 | |
| Auto Trader Group PLC (b) | | | 28,087 | | | | 191,032 | |
| Baidu, Inc. - Class A - ADR (a) | | | 1,567 | | | | 258,320 | |
| Facebook, Inc. - Class A (a) | | | 1,145 | | | | 190,860 | |
| IAC/InterActiveCorp (a) | | | 1,211 | | | | 254,443 | |
| Yandex NV - Class A (a)(b) | | | 5,253 | | | | 180,388 | |
| | | | | | | | 1,694,087 | |
| IT Services - 6.25% | | | | | | | | |
| Accenture PLC - Class A (b)(f) | | | 2,485 | | | | 437,410 | |
| Bechtle AG (b) | | | 2,276 | | | | 211,166 | |
| CACI International, Inc. - Class A (a) | | | 1,651 | | | | 300,515 | |
| Computershare, Ltd. (b) | | | 15,016 | | | | 182,538 | |
| CSG Systems International, Inc. | | | 4,861 | | | | 205,620 | |
| DXC Technology Co. | | | 4,720 | | | | 303,543 | |
| First Data Corp. - Class A (a)(f) | | | 11,804 | | | | 310,091 | |
| FleetCor Technologies, Inc. (a)(f) | | | 1,416 | | | | 349,172 | |
| Genpact, Ltd. | | | 10,306 | | | | 362,565 | |
| ManTech International Corp. - Class A | | | 3,513 | | | | 189,772 | |
| MAXIMUS, Inc. | | | 3,261 | | | | 231,466 | |
| NET One Systems Co., Ltd. (b) | | | 18,000 | | | | 455,186 | |
| | | Shares | | | Fair Value | |
| IT Services - 6.25% (continued) | | | | | | |
| NS Solutions Corp. (b) | | | 7,800 | | | $ | 210,926 | |
| TIS, Inc. (b) | | | 4,200 | | | | 199,292 | |
| Wipro, Ltd. - ADR | | | 54,577 | | | | 217,217 | |
| | | | | | | | 4,166,479 | |
| Life Sciences Tools & Services - 3.57% | | | | | |
| Bio-Rad Laboratories, Inc. - Class A (a) | | | 961 | | | | 293,758 | |
| Cambrex Corp. (a)(f) | | | 5,976 | | | | 232,168 | |
| Eurofins Scientific SE (b) | | | 620 | | | | 256,843 | |
| Gerresheimer AG (b) | | | 3,945 | | | | 296,952 | |
| IQVIA Holdings, Inc. (a)(f) | | | 3,141 | | | | 451,833 | |
| Medpace Holdings, Inc. (a) | | | 4,903 | | | | 289,130 | |
| Siegfried Holding AG (b) | | | 737 | | | | 264,711 | |
| Syneos Health, Inc. (a)(f) | | | 5,691 | | | | 294,566 | |
| | | | | | | | 2,379,961 | |
| Media - 2.89% | | | | | | | | |
| Comcast Corp. - Class A | | | 9,899 | | | | 395,762 | |
| Fuji Media Holdings, Inc. (b) | | | 12,500 | | | | 172,671 | |
| Naspers, Ltd. (b) | | | 1,641 | | | | 382,421 | |
| Nexstar Media Group, Inc. - Class A (f) | | | 3,398 | | | | 368,241 | |
| Quebecor Inc. - Class B (b) | | | 7,870 | | | | 192,929 | |
| TEGNA, Inc. | | | 15,587 | | | | 219,777 | |
| Telenet Group Holding NV (b) | | | 4,112 | | | | 197,747 | |
| | | | | | | | 1,929,548 | |
| Metals & Mining - 1.32% | | | | | | | | |
| BlueScope Steel, Ltd. (b) | | | 38,133 | | | | 378,490 | |
| Evraz PLC (b) | | | 26,156 | | | | 211,617 | |
| Reliance Steel & Aluminum Co. | | | 2,001 | | | | 180,610 | |
| United States Steel Corp. | | | 5,552 | | | | 108,208 | |
| | | | | | | | 878,925 | |
| See Notes to the Financial Statements. | Leuthold Funds - 2019 Semi-Annual Report | 35 |
Leuthold Global Fund
Schedule of Investments (continued)March 31, 2019 (Unaudited)
| | | Shares | | | Fair Value | |
| COMMON STOCKS - 55.47% (continued) | | | | | | |
| | | | | | | |
| Oil, Gas & Consumable Fuels - 7.29% | | | | | | |
| Adaro Energy Tbk PT (b) | | | 1,443,500 | | | $ | 136,700 | |
| Cenovus Energy, Inc. (b) | | | 22,679 | | | | 196,854 | |
| Ecopetrol SA - ADR (f) | | | 11,800 | | | | 252,992 | |
| Enagas SA (b) | | | 6,760 | | | | 196,801 | |
| Energy Transfer LP | | | 18,672 | | | | 286,989 | |
| Eni SpA - ADR | | | 6,603 | | | | 232,690 | |
| Enterprise Products Partners LP | | | 10,241 | | | | 298,013 | |
| Equinor ASA - ADR (f) | | | 10,164 | | | | 223,303 | |
| Exxon Mobil Corp. | | | 4,082 | | | | 329,826 | |
| Galp Energia SGPS SA (b) | | | 10,860 | | | | 174,018 | |
| Keyera Corp. (b) | | | 8,815 | | | | 207,850 | |
| Magellan Midstream Partners LP | | | 3,281 | | | | 198,927 | |
| MOL Hungarian Oil & Gas PLC - A Series (b) | | | 18,685 | | | | 214,272 | |
| Peabody Energy Corp. | | | 7,084 | | | | 200,690 | |
| Phillips 66 Partners LP | | | 3,830 | | | | 200,500 | |
| Plains All American Pipeline LP | | | 11,399 | | | | 279,389 | |
| PTT PCL - NVDR | | | 139,400 | | | | 210,864 | |
| Repsol SA (b) | | | 13,146 | | | | 224,907 | |
| TransCanada Corp. (b) | | | 6,539 | | | | 293,863 | |
| Whitehaven Coal, Ltd. (b) | | | 86,273 | | | | 248,898 | |
| Yanzhou Coal Mining Co., Ltd. - H Shares (b) | | | 262,000 | | | | 257,820 | |
| | | | | | | | 4,866,166 | |
| Paper & Forest Products - 0.07% | | | | | | | | |
| China Forestry Holdings Co., Ltd. (a)(b)(d)(e) | | | 2,484,000 | | | | 47,465 | |
| Road & Rail - 2.86% | | | | | | | | |
| Canadian National Railway Co. (b) | | | 3,358 | | | | 300,474 | |
| Canadian Pacific Railway, Ltd. (b)(f) | | | 1,414 | | | | 291,326 | |
| Central Japan Railway Co. (b) | | | 1,200 | | | | 278,936 | |
| CSX Corp. (f) | | | 3,949 | | | | 295,464 | |
| Hitachi Transport System, Ltd. (b) | | | 6,400 | | | | 190,169 | |
| | | Shares | | | Fair Value | |
| Road & Rail - 2.86% (continued) | | | | |
| Knight-Swift Transportation Holdings, Inc. (f) | | | 5,566 | | | $ | 181,897 | |
| Ryder System, Inc. | | | 2,990 | | | | 185,350 | |
| TFI International, Inc. (b) | | | 6,332 | | | | 187,020 | |
| | | | | | | | 1,910,636 | |
| Semiconductors & Semiconductor | | | | | |
| Equipment - 4.41% | | | | | | | | |
| Applied Materials, Inc. | | | 6,329 | | | | 251,008 | |
| DB HiTek Co., Ltd. (b) | | | 15,235 | | | | 168,158 | |
| Intel Corp. | | | 7,242 | | | | 388,895 | |
| Lam Research Corp. | | | 1,834 | | | | 328,304 | |
| Micron Technology, Inc. (a) | | | 13,150 | | | | 543,490 | |
| ON Semiconductor Corp. (a)(f) | | | 16,008 | | | | 329,285 | |
| SCREEN Holdings Co., Ltd. (b) | | | 3,100 | | | | 125,403 | |
| Sino-American Silicon Products, Inc. (a)(b) | | | 80,000 | | | | 175,706 | |
| STMicroelectronics NV - NYRS | | | 14,244 | | | | 211,523 | |
| SUMCO Corp. (b) | | | 19,300 | | | | 215,893 | |
| UniTest, Inc. (b) | | | 14,835 | | | | 203,938 | |
| | | | | | | | 2,941,603 | |
| Thrifts & Mortgage Finance - 0.21% | | | | | |
| Sangsangin Co., Ltd. (a)(b) | | | 8,228 | | | | 137,130 | |
| Wireless Telecommunication Services - 3.57% | |
| China Mobile, Ltd. - ADR | | | 5,938 | | | | 302,779 | |
| KDDI Corp. (b) | | | 19,100 | | | | 411,362 | |
| Rogers Communications, Inc. - Class B (b) | | | 6,430 | | | | 345,811 | |
| SoftBank Group Corp. (b) | | | 8,100 | | | | 789,561 | |
| Telephone & Data Systems, Inc. | | | 8,054 | | | | 247,500 | |
| T-Mobile US, Inc. (a) | | | 4,121 | | | | 284,761 | |
| | | | | | | | 2,381,774 | |
| TOTAL COMMON STOCKS | | | | | | | | |
| (Cost $36,812,296) | | | | | | $ | 37,002,764 | |
| 36 | Leuthold Funds - 2019 Semi-Annual Report | See Notes to the Financial Statements. |
Leuthold Global Fund
Schedule of Investments (continued)March 31, 2019 (Unaudited)
| | | Shares | | | Fair Value | |
| PREFERRED STOCKS - 0.21% | | | | | | |
| | | | | | | |
| Diversified Telecommunication Services - 0.21% | |
| Telefonica Brasil SA - ADR | | | 11,737 | | | $ | 141,666 | |
| TOTAL PREFERRED STOCKS | | | | | | | | |
| (Cost $151,917) | | | | | | $ | 141,666 | |
| INVESTMENT COMPANIES - 11.69% | | | | | |
| | | | | | |
| Exchange Traded Funds - 11.69% | | | | | |
| Invesco CurrencyShares Euro Currency Trust (a)(f) | | | 5,297 | | | $ | 566,885 | |
| Invesco CurrencyShares Japanese Yen Trust (a)(f) | | | 21,570 | | | | 1,857,393 | |
| iShares Floating Rate Bond ETF (f) | | | 13,602 | | | | 692,478 | |
| iShares International Treasury Bond ETF (f) | | | 27,995 | | | | 1,372,875 | |
| iShares JP Morgan USD Emerging Markets Bond ETF | | | 3,940 | | | | 433,636 | |
| iShares MBS ETF (f) | | | 7,455 | | | | 792,914 | |
| SPDR Gold Shares (a)(f) | | | 17,038 | | | | 2,078,806 | |
| TOTAL INVESTMENT COMPANIES | | | | | |
| (Cost $7,785,377) | | | | | | $ | 7,794,987 | |
| | | Principal Amount | | | Fair Value | |
| CORPORATE BONDS - 1.71% | | | | | | |
| | | | | | | |
| Banks - 0.83% | | | | | | |
| JPMorgan Chase & Co. | | | | | | |
| 1.500%, 01/27/2025 | | $ | 470,000 | | | $ | 555,942 | |
| Diversified Telecommunication Services - 0.88% | | | | | | | | |
| AT&T, Inc. | | | | | | | | |
| 3.400%, 05/15/2025 | | | 590,000 | | | | 583,814 | |
| TOTAL CORPORATE BONDS | | | | | | | | |
| (Cost $1,099,898) | | | | | | $ | 1,139,756 | |
| | | | | | | | | |
| UNITED STATES TREASURY OBLIGATIONS - 5.06% | | | | | | | | |
| | | | | | | | | |
| United States Treasury Inflation Indexed Bond - 1.62% | | | | | | | | |
| 0.125%, 07/15/2022 | | $ | 1,089,107 | | | $ | 1,083,255 | |
| United States Treasury Notes - 3.44% | | | | | | | | |
| 2.500%, 01/31/2025 | | | 1,289,000 | | | | 1,303,854 | |
| 3.500%, 02/15/2039 | | | 873,000 | | | | 989,184 | |
| | | | | | | | 2,293,038 | |
TOTAL UNITED STATES TREASURY OBLIGATIONS (Cost $3,273,523) | | | | | | $ | 3,376,293 | |
| | | | | | | | | |
| FOREIGN GOVERNMENT BONDS - 5.85% | | | | | | | | |
| Argentine Republic Government International Bond | | | | | | | | |
| 6.250%, 04/22/2019 (b) | | $ | 725,000 | | | $ | 725,363 | |
| Canadian Government Bond | | | | | | | | |
| 2.250%, 06/01/2025 (b) | | CAD
| 610,000
| | | | 474,877 | |
| French Republic Government Bond OAT | | | | | | | | |
| 1.250%, 05/25/2034 (b) | | EUR | 1,180,000
| | | | 1,424,961 | |
| Government of the United Kingdom | | | | | | | | |
| 2.250%, 09/07/2023 (b) | | GBP | 630,000
| | | | 875,953 | |
| Korea International Bond | | | | | | | | |
| 7.125%, 04/16/2019 (b) | | $ | 400,000 | | | | 400,748 | |
| TOTAL FOREIGN GOVERNMENT BONDS | | | | | | | | |
| (Cost $3,834,098) | | | | | | $ | 3,901,902 | |
| See Notes to the Financial Statements. | Leuthold Funds - 2019 Semi-Annual Report | 37 |
Leuthold Global Fund
Schedule of Investments (continued)March 31, 2019 (Unaudited)
| | | Shares | | | Fair Value | |
| SHORT-TERM INVESTMENTS - 17.60% | |
| | |
| Money Market Funds - 17.60% | | | | |
| Fidelity Institutional Money Market Funds - Government Portfolio - Class I, 2.300% (c)(g) | | | 11,740,450 | | | $ | 11,740,450 | |
| TOTAL SHORT-TERM INVESTMENTS | | | | | |
| (Cost $11,740,450) | | | | | | $ | 11,740,450 | |
| | | | | | | | | |
| INVESTMENTS PURCHASED AS SECURITIES LENDING COLLATERAL - 19.23% | |
| Mount Vernon Liquid Assets Portfolio, LLC, 2.610% (c) | | | 12,827,954 | | | $ | 12,827,954 | |
| | | | | | | | | |
| TOTAL INVESTMENTS PURCHASED AS SECURITIES LENDING COLLATERAL (Cost $12,827,954) | | | $ | 12,827,954 | |
| Total Investments | | | | | | | | |
| (Cost $77,525,513) - 116.82% | | | $ | 77,925,772 | |
| | | | | | | | | |
| Liabilities in Excess of Other Assets - (16.82)% | | | | | | | (11,221,398 | ) |
| TOTAL NET ASSETS - 100.00% | | | $ | 66,704,374 | |
Percentages are stated as a percent of net assets.
ADR American Depositary Receipt
CAD Canadian Dollar
EUR Euro
GBP British Pound
NVDR Non-Voting Depositary Receipt
NYRS New York Registry Shares
| (a) | Non-income producing security. |
| (b) | Foreign issued security. |
| (c) | The rate quoted is the annualized seven-day yield as of March 31, 2019. |
| (d) | Illiquid security. The fair value of these securities total $47,465 which represents 0.07% of total net assets. |
| (e) | This security is currently being fair valued in accordance with procedures established by the Board of Directors of Leuthold Funds, Inc. and is deemed a Level 3 security as it is valued using significant unobservable inputs. |
| (f) | This security or a portion of this security was out on loan as of March 31, 2019. Total loaned securities had a value of $12,580,175 or 18.86% of net assets. The remaining contractual maturity of all of the securities lending transactions is overnight and continuous. See Note 8. |
| (g) | All or a portion of the assets have been committed as collateral for open securities sold short. |
The Global Industry Classification Standard (GICS®) was developed by and/or is the exclusive property of MSCI, Inc. and Standard & Poor’s Financial Services LLC (“S&P”). GICS® is a service mark of MSCI, Inc. and S&P and has been licensed for use by U.S. Bancorp Fund Services, LLC.
| 38 | Leuthold Funds - 2019 Semi-Annual Report | See Notes to the Financial Statements. |
Leuthold Global Fund
Schedule of Investments (continued)March 31, 2019 (Unaudited)
| | | Fair
Value | | | Percentage
of Total
Investments | |
| CURRENCY EXPOSURE | | | | | | |
| Australian Dollar | | $ | 1,015,633 | | | | 1.30 | % |
| Brazilian Real | | | 123,382 | | | | 0.16 | |
| British Pound | | | 2,574,355 | | | | 3.30 | |
| Canadian Dollar | | | 1,408,487 | | | | 1.81 | |
| Euro | | | 3,539,337 | | | | 4.54 | |
| Hong Kong Dollar | | | 845,679 | | | | 1.09 | |
| Hungarian Forint | | | 214,272 | | | | 0.28 | |
| Indonesian Rupiah | | | 136,700 | | | | 0.18 | |
| Japanese Yen | | | 4,606,772 | | | | 5.91 | |
| New Taiwan Dollar | | | 623,957 | | | | 0.80 | |
| South African Rand | | | 663,187 | | | | 0.85 | |
| South Korea Won | | | 607,273 | | | | 0.78 | |
| Swiss Franc | | | 264,710 | | | | 0.34 | |
| Thai Baht | | | 419,790 | | | | 0.54 | |
| Turkish Lira | | | 112,968 | | | | 0.14 | |
| US Dollar | | | 60,769,270 | | | | 77.98 | |
| Total Investments | | $ | 77,925,772 | | | | 100.00 | % |
| | | Fair
Value | | | Percentage
of Total
Investments | |
| PORTFOLIO DIVERSIFICATION | | | | |
| Argentina | | $ | 725,363 | | | | 0.93 | % |
| Australia | | | 1,015,633 | | | | 1.30 | |
| Belgium | | | 197,747 | | | | 0.25 | |
| Brazil | | | 265,048 | | | | 0.34 | |
| Canada | | | 2,491,004 | | | | 3.20 | |
| China | | | 1,257,410 | | | | 1.61 | |
| Colombia | | | 252,992 | | | | 0.33 | |
| France | | | 1,424,961 | | | | 1.83 | |
| Germany | | | 508,118 | | | | 0.65 | |
| Hong Kong | | | 302,779 | | | | 0.39 | |
| Hungary | | | 214,272 | | | | 0.28 | |
| India | | | 217,217 | | | | 0.28 | |
| Indonesia | | | 294,595 | | | | 0.38 | |
| Ireland | | | 437,410 | | | | 0.56 | |
| Italy | | | 232,690 | | | | 0.30 | |
| Japan | | | 4,606,772 | | | | 5.91 | |
| Luxembourg | | | 256,843 | | | | 0.33 | |
| Norway | | | 223,303 | | | | 0.29 | |
| Portugal | | | 174,018 | | | | 0.22 | |
| Russia | | | 392,005 | | | | 0.50 | |
| South Africa | | | 767,553 | | | | 0.99 | |
| South Korea | | | 1,008,021 | | | | 1.29 | |
| Spain | | | 421,708 | | | | 0.54 | |
| Switzerland | | | 476,233 | | | | 0.61 | |
| Taiwan | | | 623,957 | | | | 0.80 | |
| Thailand | | | 419,790 | | | | 0.54 | |
| Turkey | | | 112,968 | | | | 0.14 | |
| United Kingdom | | | 2,258,372 | | | | 2.90 | |
| United States | | | 56,346,990 | | | | 72.31 | |
| Total Investments | | $ | 77,925,772 | | | | 100.00 | % |
| See Notes to the Financial Statements. | Leuthold Funds - 2019 Semi-Annual Report | 39 |
Leuthold Global Fund
Schedule of Investments Sold Short - (a)March 31, 2019 (Unaudited)
| | | Shares | | | Fair Value | |
| COMMON STOCKS - 3.53% | | | | | | |
| | | | | | | |
| Aerospace & Defense - 0.07% | | | | | | |
| Embraer SA - ADR | | | 600 | | | $ | 11,406 | |
| L3 Technologies, Inc. | | | 187 | | | | 38,591 | |
| | | | | | | | 49,997 | |
| Beverages - 0.26% | | | | | | | | |
| Anheuser-Busch InBev SA/NV - ADR | | | 392 | | | | 32,916 | |
| Brown-Forman Corp. - Class B | | | 918 | | | | 48,452 | |
| Keurig Dr Pepper, Inc. | | | 1,364 | | | | 38,151 | |
| MGP Ingredients, Inc. | | | 164 | | | | 12,653 | |
| Monster Beverage Corp. | | | 751 | | | | 40,989 | |
| | | | | | | | 173,161 | |
| Capital Markets - 0.08% | | | | | | | | |
| SEI Investments Co. | | | 728 | | | | 38,038 | |
| WisdomTree Investments, Inc. | | | 1,713 | | | | 12,094 | |
| | | | | | | | 50,132 | |
| Chemicals - 0.09% | | | | | | | | |
| GCP Applied Technologies, Inc. | | | 422 | | | | 12,491 | |
| The Scotts Miracle-Gro Co. | | | 479 | | | | 37,640 | |
| Sensient Technologies Corp. | | | 184 | | | | 12,473 | |
| | | | | | | | 62,604 | |
| Commercial Services & Supplies - 0.11% | | | | | |
| Copart, Inc. | | | 623 | | | | 37,748 | |
| Healthcare Services Group, Inc. | | | 695 | | | | 22,928 | |
| Ritchie Bros Auctioneers, Inc. (b) | | | 349 | | | | 11,866 | |
| | | | | | | | 72,542 | |
| Construction & Engineering - 0.02% | | | | | |
| Granite Construction, Inc. | | | 285 | | | | 12,298 | |
| Construction Materials - 0.03% | | | | | |
| Summit Materials, Inc. - Class A | | | 1,364 | | | | 21,647 | |
| | Shares | | | Fair Value | |
| | | | | | | |
| Diversified Consumer Services - 0.12% | | | | |
| New Oriental Education & Technology Group, Inc. - ADR | | | 469 | | | $ | 42,252 | |
| ServiceMaster Global Holdings, Inc. | | | 792 | | | | 36,987 | |
| | | | | | | | 79,239 | |
| | | | | | | | | |
| Electronic Equipment, Instruments & Components - 0.12% | | | | | | | | |
| Cognex Corp. | | | 733 | | | | 37,280 | |
| IPG Photonics Corp. | | | 264 | | | | 40,070 | |
| | | | | | | | 77,350 | |
| Energy Equipment & Services - 0.24% | | | | | |
| Baker Hughes, a GE Co. - Class A | | | 1,549 | | | | 42,938 | |
| Core Laboratories NV (b) | | | 587 | | | | 40,462 | |
| Halliburton Co. | | | 885 | | | | 25,930 | |
| National Oilwell Varco, Inc. | | | 867 | | | | 23,097 | |
| Schlumberger, Ltd. | | | 700 | | | | 30,499 | |
| | | | | | | | 162,926 | |
| Entertainment - 0.18% | | | | | | | | |
| Activision Blizzard, Inc. | | | 895 | | | | 40,749 | |
| Electronic Arts, Inc. | | | 353 | | | | 35,876 | |
| Netflix, Inc. | | | 123 | | | | 43,857 | |
| | | | | | | | 120,482 | |
| Food Products - 0.02% | | | | | | | | |
| BRF SA - ADR | | | 2,559 | | | | 14,893 | |
| Health Care Equipment & Supplies - 0.24% | |
| Align Technology, Inc. | | | 169 | | | | 48,052 | |
| Becton Dickinson and Co. | | | 146 | | | | 36,460 | |
| Insulet Corp. | | | 415 | | | | 39,462 | |
| Intuitive Surgical, Inc. | | | 67 | | | | 38,229 | |
| | | | | | | | 162,203 | |
| Health Care Technology - 0.05% | | | | | | | | |
| Teladoc Health, Inc. | | | 631 | | | | 35,084 | |
| 40 | Leuthold Funds - 2019 Semi-Annual Report | See Notes to the Financial Statements. |
Leuthold Global Fund
Schedule of Investments Sold Short - (a) (continued)March 31, 2019 (Unaudited)
| | | Shares | | | Fair Value | |
| COMMON STOCKS - 3.53% (continued) | | | | | | |
| | | | | | | |
| Hotels, Restaurants & Leisure - 0.24% | | | | |
| Boyd Gaming Corp. | | | 1,528 | | | $ | 41,806 | |
| Melco Resorts & Entertainment, Ltd. - ADR | | | 1,967 | | | | 44,435 | |
| MGM Resorts International | | | 1,346 | | | | 34,538 | |
| Vail Resorts, Inc. | | | 174 | | | | 37,810 | |
| | | | | | | | 158,589 | |
| Household Products - 0.02% | | | | | | | | |
| Spectrum Brands Holdings, Inc. | | | 223 | | | | 12,216 | |
| Industrial Conglomerates - 0.06% | | | | | |
| General Electric Co. | | | 3,813 | | | | 38,092 | |
| Insurance - 0.16% | | | | | | | | |
| American International Group, Inc. | | | 749 | | | | 32,252 | |
| Fidelity National Financial, Inc. | | | 1,002 | | | | 36,623 | |
| RenaissanceRe Holdings, Ltd. (b) | | | 250 | | | | 35,875 | |
| | | | | | | | 104,750 | |
| Interactive Media & Services - 0.04% | | | | | |
| Snap, Inc. - Class A | | | 2,605 | | | | 28,707 | |
| Internet & Direct Marketing Retail - 0.15% | | | | | |
| Alibaba Group Holding, Ltd. - ADR | | | 197 | | | | 35,943 | |
| GrubHub, Inc. | | | 585 | | | | 40,640 | |
| Shutterfly, Inc. | | | 596 | | | | 24,221 | |
| | | | | | | | 100,804 | |
| Machinery - 0.19% | | | | | | | | |
| Fortive Corp. | | | 464 | | | | 38,925 | |
| IDEX Corp. | | | 297 | | | | 45,067 | |
| Xylem, Inc. | | | 582 | | | | 46,001 | |
| | | | | | | | 129,993 | |
| Multi-Utilities - 0.06% | | | | | | | | |
| Sempra Energy | | | 305 | | | | 38,387 | |
| | | Shares | | | Fair Value | |
| Oil, Gas & Consumable Fuels - 0.14% | | | | |
| Concho Resources, Inc. | | | 331 | | | $ | 36,728 | |
| Diamondback Energy, Inc. | | | 403 | | | | 40,917 | |
| Jagged Peak Energy, Inc. | | | 1,190 | | | | 12,459 | |
| | | | | | | | 90,104 | |
| Pharmaceuticals - 0.04% | | | | | | | | |
| Nektar Therapeutics | | | 790 | | | | 26,544 | |
| Professional Services - 0.11% | | | | | | | | |
| CoStar Group, Inc. | | | 79 | | | | 36,847 | |
| TransUnion | | | 563 | | | | 37,631 | |
| | | | | | | | 74,478 | |
| Real Estate Investment Trusts (REITs) - 0.06% | | | | | | | | |
| Equinix, Inc. | | | 87 | | | | 39,425 | |
| Real Estate Management & Development - 0.05% | | | | | | | | |
| The Howard Hughes Corp. | | | 274 | | | | 30,140 | |
| Semiconductors & Semiconductor Equipment - 0.16% | | | | | | | | |
| Ambarella, Inc. | | | 713 | | | | 30,802 | |
| Marvell Technology Group, Ltd. | | | 1,895 | | | | 37,691 | |
| Microchip Technology, Inc. | | | 426 | | | | 35,341 | |
| | | | | | | | 103,834 | |
| Software - 0.26% | | | | | | | | |
| 2U, Inc. | | | 508 | | | | 35,992 | |
| Blackbaud, Inc. | | | 392 | | | | 31,254 | |
| Cloudera, Inc. | | | 1,595 | | | | 17,450 | |
| Instructure, Inc. | | | 410 | | | | 19,319 | |
| Pegasystems, Inc. | | | 462 | | | | 30,030 | |
| Proofpoint, Inc. | | | 305 | | | | 37,036 | |
| | | | | | | | 171,081 | |
| See Notes to the Financial Statements. | Leuthold Funds - 2019 Semi-Annual Report | 41 |
Leuthold Global Fund
Schedule of Investments Sold Short - (a) (continued)March 31, 2019 (Unaudited)
| | | Shares | | | Fair Value | |
| COMMON STOCKS - 3.53% (continued) | | | | |
| | | | | |
| Technology Hardware, Storage & Peripherals - 0.06% | | | | | | |
| Pure Storage, Inc. | | | 1,992 | | | $ | 43,406 | |
| Thrifts & Mortgage Finance - 0.06% | | | | | |
| LendingTree, Inc. | | | 121 | | | | 42,539 | |
| Trading Companies & Distributors - 0.04% | | | | | |
| SiteOne Landscape Supply, Inc. | | | 474 | | | | 27,089 | |
| TOTAL COMMON STOCKS | | | | | | | | |
| (Proceeds $2,350,200) | | | | | | $ | 2,354,736 | |
| | | | | | | | | |
| INVESTMENT COMPANIES - 3.75% | | | | | |
| | | | | | |
| Exchange Traded Funds - 3.75% | | | | | | | | |
| iShares MSCI ACWI ETF | | | 15,486 | | | $ | 1,117,315 | |
| iShares MSCI EAFE ETF | | | 15,973 | | | | 1,036,008 | |
| iShares MSCI Emerging Markets ETF | | | 6,240 | | | | 267,821 | |
| SPDR S&P 500 ETF Trust | | | 277 | | | | 78,247 | |
| TOTAL INVESTMENT COMPANIES | | | | | | | | |
| (Proceeds $2,727,393) | | | | | | $ | 2,499,391 | |
| | | | | | | | | |
| TOTAL SECURITIES SOLD SHORT | | | | | |
| (Proceeds $5,077,593) - 7.28% | | | | | | $ | 4,854,127 | |
Percentages are stated as a percent of net assets.
ADR American Depositary Receipt
| (a) | Non-income producing security. |
| (b) | Foreign issued security. |
The Global Industry Classification Standard (GICS®) was developed by and/or is the exclusive property of MSCI, Inc. and Standard & Poor’s Financial Services LLC (“S&P”). GICS® is a service mark of MSCI, Inc. and S&P and has been licensed for use by U.S. Bancorp Fund Services, LLC.
| 42 | Leuthold Funds - 2019 Semi-Annual Report | See Notes to the Financial Statements. |
Le
uthold Select Industries Fund
Schedule of Investments
March 31, 2019 (Unaudited)
| | | Shares | | | Fair Value | |
| COMMON STOCKS - 99.10% | | | | | | |
| Airlines - 1.52% | | | | | | |
| Delta Air Lines, Inc. | | | 1,844 | | | $ | 95,242 | |
| United Continental Holdings, Inc. (a) | | | 1,150 | | | | 91,747 | |
| | | | | | | | 186,989 | |
| Biotechnology - 4.95% | | | | | | | | |
| AbbVie, Inc. | | | 1,313 | | | | 105,815 | |
| Amgen, Inc. | | | 587 | | | | 111,518 | |
| Biogen, Inc. (a) | | | 349 | | | | 82,497 | |
| Celgene Corp. (a) | | | 816 | | | | 76,981 | |
| Gilead Sciences, Inc. | | | 1,651 | | | | 107,332 | |
| Regeneron Pharmaceuticals, Inc. (a) | | | 302 | | | | 124,007 | |
| | | | | | | | 608,150 | |
| Commercial Services & Supplies - 4.23% | | | | | |
| Republic Services, Inc. | | | 2,164 | | | | 173,943 | |
| Stericycle, Inc. (a) | | | 1,543 | | | | 83,970 | |
| Tetra Tech, Inc. | | | 1,353 | | | | 80,625 | |
| Waste Management, Inc. | | | 1,752 | | | | 182,050 | |
| | | | | | | | 520,588 | |
| Consumer Finance - 3.47% | | | | | | | | |
| Ally Financial, Inc. | | | 3,454 | | | | 94,950 | |
| Capital One Financial Corp. | | | 1,066 | | | | 87,082 | |
| OneMain Holdings, Inc. | | | 1,488 | | | | 47,244 | |
| Santander Consumer USA Holdings, Inc. | | | 3,117 | | | | 65,862 | |
| Synchrony Financial | | | 2,333 | | | | 74,423 | |
| World Acceptance Corp. (a) | | | 488 | | | | 57,159 | |
| | | | | | | | 426,720 | |
| Entertainment - 2.21% | | | | | | | | |
| Viacom, Inc. - Class B | | | 3,801 | | | | 106,694 | |
| The Walt Disney Co. | | | 1,489 | | | | 165,324 | |
| | | | | | | | 272,018 | |
| | | Shares | | | Fair Value | |
| Food & Staples Retailing - 4.02% | | | | | | |
| Costco Wholesale Corp. | | | 1,064 | | | $ | 257,637 | |
| Walmart, Inc. | | | 2,422 | | | | 236,218 | |
| | | | | | | | 493,855 | |
| Health Care Providers & Services - 17.09% | | | | | | | | |
| Acadia Healthcare Co., Inc. (a) | | | 3,336 | | | | 97,778 | |
| Anthem, Inc. | | | 830 | | | | 238,193 | |
| Centene Corp. (a) | | | 3,346 | | | | 177,673 | |
| Cigna Corp. | | | 802 | | | | 128,978 | |
| CVS Health Corp. | | | 2,503 | | | | 134,987 | |
| Encompass Health Corp. | | | 2,142 | | | | 125,093 | |
| HCA Healthcare, Inc. | | | 1,807 | | | | 235,597 | |
| Humana, Inc. | | | 549 | | | | 146,034 | |
| Laboratory Corp. of America Holdings (a) | | | 745 | | | | 113,970 | |
| Quest Diagnostics, Inc. | | | 1,235 | | | | 111,051 | |
| Select Medical Holdings Corp. (a) | | | 4,539 | | | | 63,954 | |
| Tenet Healthcare Corp. (a) | | | 2,124 | | | | 61,256 | |
| UnitedHealth Group, Inc. | | | 983 | | | | 243,057 | |
| Universal Health Services, Inc. - Class B | | | 1,673 | | | | 223,797 | |
| | | | | | | | 2,101,418 | |
| Hotels, Restaurants & Leisure - 4.87% | | | | | | | | |
| BJ’s Restaurants, Inc. | | | 980 | | | | 46,335 | |
| Brinker International, Inc. | | | 1,211 | | | | 53,744 | |
| The Cheesecake Factory, Inc. | | | 1,225 | | | | 59,927 | |
| Cracker Barrel Old Country Store, Inc. | | | 361 | | | | 58,341 | |
| Darden Restaurants, Inc. | | | 825 | | | | 100,213 | |
| Dave & Buster’s Entertainment, Inc. | | | 1,044 | | | | 52,064 | |
| Dine Brands Global, Inc. | | | 678 | | | | 61,895 | |
| The Wendy’s Co. | | | 3,517 | | | | 62,919 | |
| Yum! Brands, Inc. | | | 1,031 | | | | 102,904 | |
| | | | | | | | 598,342 | |
| See Notes to the Financial Statements. | Leuthold Funds - 2019 Semi-Annual Report | 43 |
Leuthold Select Industries Fund
Schedule of Investments (continued)
March 31, 2019 (Unaudited)
| | | Shares | | | Fair Value | |
| COMMON STOCKS - 99.10% (continued) | |
| Household Durables - 4.20% | | | | | | |
| D.R. Horton, Inc. | | | 3,120 | | | $ | 129,105 | |
| Lennar Corp. - Class A | | | 1,866 | | | | 91,602 | |
| Meritage Homes Corp. (a) | | | 1,331 | | | | 59,509 | |
| PulteGroup, Inc. | | | 4,724 | | | | 132,083 | |
| Toll Brothers, Inc. | | | 2,868 | | | | 103,822 | |
| | | | | | | | 516,121 | |
| Interactive Media & Services - 4.64% | | | | | |
| Alphabet, Inc. - Class A (a) | | | 251 | | | | 295,399 | |
| Facebook, Inc. - Class A (a) | | | 749 | | | | 124,851 | |
| IAC/InterActiveCorp (a) | | | 419 | | | | 88,036 | |
| YY, Inc. - Class A - ADR (a) | | | 745 | | | | 62,588 | |
| | | | | | | | 570,874 | |
| IT Services - 9.01% | | | | | | | | |
| Alliance Data Systems Corp. | | | 444 | | | | 77,691 | |
| Fiserv, Inc. (a) | | | 2,044 | | | | 180,444 | |
| FleetCor Technologies, Inc. (a) | | | 478 | | | | 117,870 | |
| Genpact, Ltd. | | | 1,672 | | | | 58,821 | |
| MasterCard, Inc. - Class A | | | 1,120 | | | | 263,704 | |
| MAXIMUS, Inc. | | | 1,438 | | | | 102,069 | |
| Visa, Inc. - Class A | | | 1,587 | | | | 247,874 | |
| The Western Union Co. | | | 3,236 | | | | 59,769 | |
| | | | | | | | 1,108,242 | |
| Media - 2.80% | | | | | | | | |
| AMC Networks, Inc. - Class A (a) | | | 1,084 | | | | 61,528 | |
| Comcast Corp. - Class A | | | 3,336 | | | | 133,373 | |
| Discovery, Inc. - Class A (a) | | | 2,186 | | | | 59,066 | |
| Nexstar Media Group, Inc.- Class A | | | 830 | | | | 89,947 | |
| | | | | | | | 343,914 | |
| Multiline Retail - 5.36% | | | | | | | | |
| Dollar General Corp. | | | 1,820 | | | | 217,126 | |
| Dollar Tree, Inc. (a) | | | 1,621 | | | | 170,270 | |
| Target Corp. | | | 3,379 | | | | 271,198 | |
| | | | | | | | 658,594 | |
| | | Shares | | | Fair Value | |
| Professional Services - 4.97% | | | | | | |
| ASGN, Inc. (a) | | | 1,857 | | | $ | 117,901 | |
| Insperity, Inc. | | | 1,455 | | | | 179,925 | |
| Robert Half International, Inc. | | | 2,173 | | | | 141,593 | |
| TriNet Group, Inc. (a) | | | 1,993 | | | | 119,062 | |
| TrueBlue, Inc. (a) | | | 2,211 | | | | 52,268 | |
| | | | | | | | 610,749 | |
| Road & Rail - 7.43% | | | | | | | | |
| Canadian National Railway Co. (b) | | | 1,061 | | | | 94,938 | |
| Canadian Pacific Railway, Ltd. (b) | | | 617 | | | | 127,121 | |
| CSX Corp. | | | 1,775 | | | | 132,805 | |
| Genesee & Wyoming, Inc. - Class A (a) | | | 1,133 | | | | 98,730 | |
| Kansas City Southern | | | 1,053 | | | | 122,127 | |
| Norfolk Southern Corp. | | | 749 | | | | 139,981 | |
| Union Pacific Corp. | | | 797 | | | | 133,258 | |
| Werner Enterprises, Inc. | | | 1,872 | | | | 63,929 | |
| | | | | | | | 912,889 | |
| Semiconductors & Semiconductor Equipment - 5.78% | | | | | | | | |
| Applied Materials, Inc. | | | 3,562 | | | | 141,269 | |
| KLA-Tencor Corp. | | | 734 | | | | 87,647 | |
| Kulicke & Soffa Industries, Inc. (b) | | | 1,989 | | | | 43,977 | |
| Lam Research Corp. | | | 1,295 | | | | 231,818 | |
| MKS Instruments, Inc. | | | 1,353 | | | | 125,896 | |
| SolarEdge Technologies, Inc. (a)(b) | | | 2,107 | | | | 79,392 | |
| | | | | | | | 709,999 | |
| Software - 6.84% | | | | | | | | |
| Check Point Software Technologies, Ltd. (a)(b) | | | 1,260 | | | | 159,377 | |
| Fortinet, Inc. (a) | | | 1,411 | | | | 118,482 | |
| Microsoft Corp. | | | 2,432 | | | | 286,830 | |
| Oracle Corp. | | | 2,917 | | | | 156,672 | |
| VMware, Inc. - Class A | | | 662 | | | | 119,498 | |
| | | | | | | | 840,859 | |
| 44 | Leuthold Funds - 2019 Semi-Annual Report | See Notes to the Financial Statements. |
Leuthold Select Industries Fund
Schedule of Investments (continued)
March 31, 2019 (Unaudited)
| | | Shares | | | Fair Value | |
| COMMON STOCKS - 99.10% (continued) | | | | | | |
| Specialty Retail - 5.71% | | | | | | |
| Aaron’s, Inc. | | | 2,323 | | | $ | 122,190 | |
| AutoZone, Inc. (a) | | | 110 | | | | 112,653 | |
| Group 1 Automotive, Inc. | | | 895 | | | | 57,906 | |
| The Home Depot, Inc. | | | 476 | | | | 91,340 | |
| Lowe’s Companies, Inc. | | | 1,597 | | | | 174,824 | |
| Penske Automotive Group, Inc. | | | 1,505 | | | | 67,198 | |
| Williams-Sonoma, Inc. | | | 1,345 | | | | 75,683 | |
| | | | | | | | 701,794 | |
| TOTAL COMMON STOCKS | | | | | | | | |
| (Cost $10,125,743) | | | | | | $ | 12,182,115 | |
| | | | | | | | | |
| SHORT-TERM INVESTMENTS - 1.04% | | | | | | | | |
| Money Market Funds - 1.04% | | | | | | | | |
| Fidelity Institutional Money Market Funds - Government Portfolio - Class I, 2.300% (c) | | | 127,268 | | | $ | 127,268 | |
| TOTAL SHORT-TERM | | | | | | | | |
| INVESTMENTS (Cost $127,268) | | | | | | $ | 127,268 | |
| | | | | | | | | |
| Total Investments | | | | | | | | |
| (Cost $10,253,011) - 100.14% | | | | | | $ | 12,309,383 | |
| Liabilities in Excess of Other Assets - (0.14)% | | | | | | | (17,332 | ) |
| TOTAL NET ASSETS - 100.00% | | | | | | $ | 12,292,051 | |
Percentages are stated as a percent of net assets.
ADR American Depositary Receipt
| (a) | Non-income producing security. |
| (b) | Foreign issued security. |
| (c) | The rate quoted is the annualized seven-day yield as of March 31, 2019. |
The Global Industry Classification Standard (GICS®) was developed by and/or is the exclusive property of MSCI, Inc. and Standard & Poor’s Financial Services LLC (“S&P”). GICS® is a service mark of MSCI, Inc. and S&P and has been licensed for use by U.S. Bancorp Fund Services, LLC.
| See Notes to the Financial Statements. | Leuthold Funds - 2019 Semi-Annual Report | 45 |
Leuthold Global Industries Fund
Schedule of Investments
March 31, 2019 (Unaudited)
| | | Shares | | | Fair Value | |
| COMMON STOCKS - 97.22% | | | | | | |
| Airlines - 2.74% | | | | | | |
| Hawaiian Holdings, Inc. | | | 1,446 | | | $ | 37,957 | |
| International Consolidated Airlines Group SA (b) | | | 8,986 | | | | 59,793 | |
| SkyWest, Inc. | | | 901 | | | | 48,915 | |
| United Continental Holdings, Inc. (a) | | | 684 | | | | 54,570 | |
| | | | | | | | 201,235 | |
| Banks - 1.04% | | | | | | | | |
| Nedbank Group, Ltd. (b) | | | 1,672 | | | | 29,221 | |
| Taishin Financial Holding Co., Ltd. (b) | | | 56,000 | | | | 25,549 | |
| Turkiye Halk Bankasi AS (b) | | | 18,738 | | | | 21,538 | |
| | | | | | | | 76,308 | |
| Communications Equipment - 5.32% | | | | | |
| Arcadyan Technology Corp. (b) | | | 20,000 | | | | 60,670 | |
| Ciena Corp. (a) | | | 2,520 | | | | 94,097 | |
| Cisco Systems, Inc. | | | 1,704 | | | | 91,999 | |
| CommScope Holding Co., Inc. (a) | | | 2,097 | | | | 45,568 | |
| Lumentum Holdings, Inc. (a) | | | 1,416 | | | | 80,061 | |
| Taihan Fiberoptics Co., Ltd. (a)(b) | | | 5,398 | | | | 19,095 | |
| | | | | | | | 391,490 | |
| Consumer Finance - 3.73% | | | | | | | | |
| Ally Financial, Inc. | | | 2,408 | | | | 66,196 | |
| Encore Capital Group, Inc. (a) | | | 1,082 | | | | 29,463 | |
| Hitachi Capital Corp. (b) | | | 1,400 | | | | 32,513 | |
| Krungthai Card PCL - NVDR | | | 36,500 | | | | 40,628 | |
| Nelnet, Inc. - Class A | | | 713 | | | | 39,265 | |
| Santander Consumer USA Holdings, Inc. | | | 3,127 | | | | 66,073 | |
| | | | | | | | 274,138 | |
| | | Shares | | | Fair Value | |
| Diversified Telecommunication Services - 1.13% | |
| China Telecom Corp., Ltd. - ADR | | | 517 | | | $ | 28,957 | |
| Telekomunikasi Indonesia Persero Tbk PT - ADR | | | 1,086 | | | | 29,822 | |
| Telkom SA SOC, Ltd. (b) | | | 4,731 | | | | 24,027 | |
| | | | | | | | 82,806 | |
| Electric Utilities - 0.32% | | | | | | | | |
| EDP - Energias do Brasil SA (b) | | | 5,400 | | | | 23,460 | |
| | | | | | | | | |
| Entertainment - 1.65% | | | | | | | | |
| Viacom, Inc. - Class B | | | 1,816 | | | | 50,975 | |
| The Walt Disney Co. | | | 633 | | | | 70,282 | |
| | | | | | | | 121,257 | |
| Health Care Providers & Services - 10.73% | | | | | |
| Alfresa Holdings Corp. (b) | | | 3,100 | | | | 88,340 | |
| AmerisourceBergen Corp. | | | 713 | | | | 56,698 | |
| Anthem, Inc. | | | 448 | | | | 128,567 | |
| Centene Corp. (a) | | | 1,740 | | | | 92,394 | |
| Cigna Corp. | | | 734 | | | | 118,042 | |
| CVS Health Corp. | | | 1,162 | | | | 62,667 | |
| Laboratory Corp. of America Holdings (a) | | | 395 | | | | 60,427 | |
| Medipal Holdings Corp. (b) | | | 3,400 | | | | 80,899 | |
| UnitedHealth Group, Inc. | | | 408 | | | | 100,882 | |
| | | | | | | | 788,916 | |
| Household Durables - 4.66% | | | | | | | | |
| Barratt Developments PLC (b) | | | 6,835 | | | | 53,391 | |
| Haseko Corp. (b) | | | 4,600 | | | | 57,977 | |
| Lennar Corp. - Class A | | | 1,355 | | | | 66,517 | |
| Meritage Homes Corp. (a) | | | 1,282 | | | | 57,318 | |
| Redrow PLC (b) | | | 7,261 | | | | 56,896 | |
| TRI Pointe Group, Inc. (a) | | | 4,033 | | | | 50,977 | |
| | | | | | | | 343,076 | |
| 46 | Leuthold Funds - 2019 Semi-Annual Report | See Notes to the Financial Statements. |
Leuthold Global Industries Fund
Schedule of Investments (continued)
March 31, 2019 (Unaudited)
| | | Shares | | | Fair Value | |
| COMMON STOCKS - 97.22% (continued) | | | | | | |
| Insurance - 4.76% | | | | | | |
| Dai-ichi Life Holdings, Inc. (b) | | | 3,200 | | | $ | 44,548 | |
| Legal & General Group PLC (b) | | | 17,133 | | | | 61,484 | |
| Lincoln National Corp. | | | 541 | | | | 31,757 | |
| Medibank Pvt, Ltd. (b) | | | 20,487 | | | | 40,213 | |
| Old Mutual, Ltd. (b) | | | 13,852 | | | | 20,378 | |
| Ping An Insurance Group Co. of China, Ltd. - H Shares (b) | | | 9,500 | | | | 106,953 | |
| Prudential Financial, Inc. | | | 490 | | | | 45,021 | |
| | | | | | | | 350,354 | |
| Interactive Media & Services - 4.46% | | | | | |
| Alphabet, Inc. - Class A (a) | | | 102 | | | | 120,043 | |
| Auto Trader Group PLC (b) | | | 5,431 | | | | 36,939 | |
| Baidu, Inc. - Class A - ADR (a) | | | 303 | | | | 49,950 | |
| Facebook, Inc. - Class A (a) | | | 221 | | | | 36,838 | |
| IAC/InterActiveCorp (a) | | | 234 | | | | 49,166 | |
| Yandex NV - Class A (a)(b) | | | 1,016 | | | | 34,889 | |
| | | | | | | | 327,825 | |
| IT Services - 10.99% | | | | | | | | |
| Accenture PLC - Class A (b) | | | 483 | | | | 85,018 | |
| Bechtle AG (b) | | | 442 | | | | 41,009 | |
| CACI International, Inc.- Class A (a) | | | 320 | | | | 58,246 | |
| Computershare, Ltd. (b) | | | 2,921 | | | | 35,509 | |
| CSG Systems International, Inc. | | | 946 | | | | 40,016 | |
| DXC Technology Co. | | | 917 | | | | 58,972 | |
| First Data Corp. - Class A (a) | | | 2,294 | | | | 60,263 | |
| FleetCor Technologies, Inc. (a) | | | 275 | | | | 67,812 | |
| Genpact, Ltd. | | | 2,005 | | | | 70,536 | |
| ManTech International Corp. - Class A | | | 682 | | | | 36,842 | |
| MAXIMUS, Inc. | | | 632 | | | | 44,859 | |
| NET One Systems Co., Ltd. (b) | | | 3,500 | | | | 88,508 | |
| NS Solutions Corp. (b) | | | 1,500 | | | | 40,563 | |
| TIS, Inc. (b) | | | 800 | | | | 37,960 | |
| Wipro, Ltd. - ADR | | | 10,601 | | | | 42,192 | |
| | | | | | | | 808,305 | |
| | | Shares | | | Fair Value | |
| Life Sciences Tools & Services - 6.28% | | | | |
| Bio-Rad Laboratories, Inc. - Class A (a) | | | 187 | | | $ | 57,162 | |
| Cambrex Corp. (a) | | | 1,160 | | | | 45,066 | |
| Eurofins Scientific SE (b) | | | 120 | | | | 49,712 | |
| Gerresheimer AG (b) | | | 766 | | | | 57,659 | |
| IQVIA Holdings, Inc. (a) | | | 610 | | | | 87,748 | |
| Medpace Holdings, Inc. (a) | | | 952 | | | | 56,139 | |
| Siegfried Holding AG (b) | | | 143 | | | | 51,362 | |
| Syneos Health, Inc. (a) | | | 1,105 | | | | 57,195 | |
| | | | | | | | 462,043 | |
| Media - 5.09% | | | | | | | | |
| Comcast Corp. - Class A | | | 1,923 | | | | 76,881 | |
| Fuji Media Holdings, Inc. (b) | | | 2,400 | | | | 33,153 | |
| Naspers, Ltd. (b) | | | 319 | | | | 74,340 | |
| Nexstar Media Group, Inc.- Class A | | | 661 | | | | 71,633 | |
| Quebecor Inc. - Class B (b) | | | 1,529 | | | | 37,483 | |
| TEGNA, Inc. | | | 3,028 | | | | 42,695 | |
| Telenet Group Holding NV (b) | | | 799 | | | | 38,424 | |
| | | | | | | | 374,609 | |
| Metals & Mining - 2.34% | | | | | | | | |
| BlueScope Steel, Ltd. (b) | | | 7,503 | | | | 74,471 | |
| Evraz PLC (b) | | | 5,076 | | | | 41,068 | |
| Reliance Steel & Aluminum Co. | | | 393 | | | | 35,472 | |
| United States Steel Corp. | | | 1,081 | | | | 21,069 | |
| | | | | | | | 172,080 | |
| Oil, Gas & Consumable Fuels - 12.69% | | | | | |
| Adaro Energy Tbk PT (b) | | | 281,200 | | | | 26,630 | |
| Cenovus Energy, Inc. (b) | | | 4,392 | | | | 38,123 | |
| Ecopetrol SA - ADR | | | 2,285 | | | | 48,990 | |
| Enagas SA (b) | | | 1,265 | | | | 36,827 | |
| Energy Transfer LP | | | 3,543 | | | | 54,456 | |
| Eni SpA - ADR | | | 1,279 | | | | 45,072 | |
| Enterprise Products Partners LP | | | 1,943 | | | | 56,541 | |
| Equinor ASA - ADR | | | 1,968 | | | | 43,237 | |
| Exxon Mobil Corp. | | | 791 | | | | 63,913 | |
| See Notes to the Financial Statements. | Leuthold Funds - 2019 Semi-Annual Report | 47 |
Leuthold Global Industries Fund
Schedule of Investments (continued)
March 31, 2019 (Unaudited)
| | | Shares | | | Fair Value | |
| COMMON STOCKS - 97.22% (continued) | | | | |
| Oil, Gas & Consumable Fuels - 12.69% (continued) | | | | |
| Galp Energia SGPS SA (b) | | | 2,103 | | | $ | 33,698 | |
| Keyera Corp. (b) | | | 1,649 | | | | 38,882 | |
| Magellan Midstream Partners LP | | | 614 | | | | 37,227 | |
| MOL Hungarian Oil & Gas PLC - A Series (b) | | | 3,619 | | | | 41,501 | |
| Peabody Energy Corp. | | | 1,375 | | | | 38,954 | |
| Phillips 66 Partners LP | | | 717 | | | | 37,535 | |
| Plains All American Pipeline LP | | | 2,192 | | | | 53,726 | |
| PTT PCL - NVDR | | | 27,000 | | | | 40,842 | |
| Repsol SA (b) | | | 2,546 | | | | 43,558 | |
| TransCanada Corp. (b) | | | 1,241 | | | | 55,770 | |
| Whitehaven Coal, Ltd. (b) | | | 16,807 | | | | 48,488 | |
| Yanzhou Coal Mining Co., Ltd. - H Shares (b) | | | 50,000 | | | | 49,202 | |
| | | | | | | | 933,172 | |
| Paper & Forest Products - 0.03% | | | | | |
| China Forestry Holdings Co., Ltd. (a)(b)(d)(e) | | | 116,000 | | | | 2,217 | |
| Road & Rail - 4.83% | | | | | | | | |
| Canadian National Railway Co. (b) | | | 637 | | | | 56,999 | |
| Canadian Pacific Railway, Ltd. (b) | | | 272 | | | | 56,040 | |
| Central Japan Railway Co. (b) | | | 200 | | | | 46,489 | |
| CSX Corp. | | | 749 | | | | 56,040 | |
| Hitachi Transport System, Ltd. (b) | | | 1,200 | | | | 35,657 | |
| Knight-Swift Transportation Holdings, Inc. | | | 1,042 | | | | 34,053 | |
| Ryder System, Inc. | | | 560 | | | | 34,714 | |
| TFI International, Inc. (b) | | | 1,185 | | | | 35,000 | |
| | | | | | | | 354,992 | |
| | | Shares | | | Fair Value | |
| Semiconductors & Semiconductor Equipment - 7.75% | | | | | | |
| Applied Materials, Inc. | | | 1,228 | | | $ | 48,702 | |
| DB HiTek Co., Ltd. (b) | | | 2,961 | | | | 32,682 | |
| Intel Corp. | | | 1,409 | | | | 75,663 | |
| Lam Research Corp. | | | 356 | | | | 63,728 | |
| Micron Technology, Inc. (a) | | | 2,562 | | | | 105,887 | |
| ON Semiconductor Corp. (a) | | | 3,111 | | | | 63,993 | |
| SCREEN Holdings Co., Ltd. (b) | | | 600 | | | | 24,272 | |
| Sino-American Silicon Products, Inc. (a)(b) | | | 15,000 | | | | 32,945 | |
| STMicroelectronics NV - NYRS | | | 2,768 | | | | 41,105 | |
| SUMCO Corp. (b) | | | 3,700 | | | | 41,389 | |
| UniTest, Inc. (b) | | | 2,888 | | | | 39,702 | |
| | | | | | | | 570,068 | |
| Thrifts & Mortgage Finance - 0.36% | | | | | |
| Sangsangin Co., Ltd. (a)(b) | | | 1,602 | | | | 26,699 | |
| Wireless Telecommunication Services - 6.32% | |
| China Mobile, Ltd. - ADR | | | 1,153 | | | | 58,791 | |
| KDDI Corp. (b) | | | 3,700 | | | | 79,688 | |
| Rogers Communications, Inc. - Class B (b) | | | 1,252 | | | | 67,334 | |
| SoftBank Group Corp. (b) | | | 1,600 | | | | 155,963 | |
| Telephone & Data Systems, Inc. | | | 1,563 | | | | 48,031 | |
| T-Mobile US, Inc. (a) | | | 800 | | | | 55,280 | |
| | | | | | | | 465,087 | |
| TOTAL COMMON STOCKS | | | | | | | | |
| (Cost $7,000,897) | | | | | | $ | 7,150,137 | |
| | | | | | | | | |
| PREFERRED STOCKS - 0.36% | | | | | |
| Diversified Telecommunication Services - 0.36% | | | | | | | | |
| Telefonica Brasil SA - ADR | | | 2,217 | | | $ | 26,759 | |
| TOTAL PREFERRED STOCKS | | | | | | | | |
| (Cost $28,695) | | | | | | $ | 26,759 | |
| 48 | Leuthold Funds - 2019 Semi-Annual Report | See Notes to the Financial Statements. |
Leuthold Global Industries Fund
Schedule of Investments (continued)
March 31, 2019 (Unaudited)
| | | Shares | | | Fair Value | |
| INVESTMENT COMPANIES - 1.26% | | | | | | |
| Exchange Traded Funds - 1.26% | | | | | | |
| iShares Core MSCI EAFE ETF | | | 605 | | | $ | 36,766 | |
| iShares Core MSCI Emerging Markets ETF | | | 175 | | | | 9,049 | |
| SPDR S&P 500 ETF Trust | | | 167 | | | | 47,174 | |
| TOTAL INVESTMENT COMPANIES | | | | | | | | |
| (Cost $87,938) | | | | | | $ | 92,989 | |
| | | | | | | | | |
| SHORT-TERM INVESTMENTS - 0.75% | | | | | | | | |
| Money Market Funds - 0.75% | | | | | | | | |
| Fidelity Institutional Money Market Funds - Government Portfolio - Class I, 2.300% (c) | | | 55,083 | | | $ | 55,083 | |
| TOTAL SHORT-TERM INVESTMENTS | | | | | | | | |
| (Cost $55,083) | | | | | | $ | 55,083 | |
| | | | | | | | | |
| Total Investments | | | | | | | | |
| (Cost $7,172,613) - 99.59% | | | | | | $ | 7,324,968 | |
| Other Assets in Excess of Liabilities - 0.41% | | | | | | | 29,889 | |
| TOTAL NET ASSETS - 100.00% | | | | | | $ | 7,354,857 | |
Percentages are stated as a percent of net assets.
ADR American Depositary Receipt
NVDR Non-Voting Depositary Receipt
NYRS New York Registry Shares
| (a) | Non-income producing security. |
| (b) | Foreign issued security. |
| (c) | The rate quoted is the annualized seven-day yield as of March 31, 2019. (d) Illiquid security. The fair value of these securities total $2,217 which represents 0.03% of total net assets. |
| (e) | The security is currently being fair valued in accordance with procedures established by the Board of Directors of Leuthold Funds, Inc. and is deemed a Level 3 security as it is valued using significant unobservable inputs. |
The Global Industry Classification Standard (GICS®) was developed by and/or is the exclusive property of MSCI, Inc. and Standard & Poor’s Financial Services LLC (“S&P”). GICS® is a service mark of MSCI, Inc. and S&P and has been licensed for use by U.S. Bancorp Fund Services, LLC.
| See Notes to the Financial Statements. | Leuthold Funds - 2019 Semi-Annual Report | 49 |
Leuthold Global Industries Fund
Schedule of Investments (continued)
March 31, 2019 (Unaudited)
| | | Fair
Value | | | Percentage
of Total
Investments | |
| CURRENCY EXPOSURE | | | | | | |
| Australian Dollar | | $ | 198,681 | | | | 2.71 | % |
| Brazilian Real | | | 23,460 | | | | 0.32 | |
| British Pound | | | 329,947 | | | | 4.51 | |
| Canadian Dollar | | | 178,698 | | | | 2.44 | |
| Euro | | | 300,887 | | | | 4.11 | |
| Hong Kong Dollar | | | 158,372 | | | | 2.16 | |
| Hungarian Forint | | | 41,501 | | | | 0.57 | |
| Indonesian Rupiah | | | 26,630 | | | | 0.36 | |
| Japanese Yen | | | 887,919 | | | | 12.12 | |
| New Taiwan Dollar | | | 119,165 | | | | 1.63 | |
| South African Rand | | | 127,589 | | | | 1.74 | |
| South Korea Won | | | 118,178 | | | | 1.61 | |
| Swiss Franc | | | 51,362 | | | | 0.70 | |
| Thai Baht | | | 81,469 | | | | 1.11 | |
| Turkish Lira | | | 21,538 | | | | 0.30 | |
| US Dollar | | | 4,659,572 | | | | 63.61 | |
| Total Investments | | $ | 7,324,968 | | | | 100.00 | % |
| | | Fair
Value | | | Percentage
of Total
Investments | |
| PORTFOLIO DIVERSIFICATION | | | | |
| Australia | | $ | 198,681 | | | | 2.71 | % |
| Belgium | | | 38,424 | | | | 0.52 | |
| Brazil | | | 50,219 | | | | 0.69 | |
| Canada | | | 385,630 | | | | 5.26 | |
| China | | | 237,279 | | | | 3.24 | |
| Colombia | | | 48,990 | | | | 0.67 | |
| Germany | | | 98,669 | | | | 1.35 | |
| Hong Kong | | | 58,791 | | | | 0.80 | |
| Hungary | | | 41,501 | | | | 0.57 | |
| India | | | 42,192 | | | | 0.58 | |
| Indonesia | | | 56,451 | | | | 0.77 | |
| Ireland | | | 85,018 | | | | 1.15 | |
| Italy | | | 45,072 | | | | 0.62 | |
| Japan | | | 887,919 | | | | 12.12 | |
| Luxembourg | | | 49,712 | | | | 0.68 | |
| Norway | | | 43,237 | | | | 0.59 | |
| Portugal | | | 33,698 | | | | 0.46 | |
| Russia | | | 75,957 | | | | 1.04 | |
| South Africa | | | 147,966 | | | | 2.02 | |
| South Korea | | | 118,178 | | | | 1.61 | |
| Spain | | | 80,385 | | | | 1.10 | |
| Switzerland | | | 92,467 | | | | 1.26 | |
| Taiwan | | | 119,165 | | | | 1.63 | |
| Thailand | | | 81,469 | | | | 1.11 | |
| Turkey | | | 21,538 | | | | 0.30 | |
| United Kingdom | | | 268,502 | | | | 3.67 | |
| United States | | | 3,917,858 | | | | 53.48 | |
| Total Investments | | $ | 7,324,968 | | | | 100.00 | % |
| 50 | Leuthold Funds - 2019 Semi-Annual Report | See Notes to the Financial Statements. |
Grizzly Short Fund
Schedule of Investments
March 31, 2019 (Unaudited)
| | | Shares | | | Fair Value | |
| SHORT-TERM INVESTMENTS - 82.17% | | | | | | |
| Money Market Funds - 82.17% | | | | | | |
| Fidelity Institutional Money Market Funds - Government Portfolio, Class I, 2.300% (a)(b) | | | 77,907,947 | | | $ | 77,907,947 | |
| TOTAL SHORT-TERM INVESTMENTS | | | | | | | | |
| (Cost $ 77,907,947) | | | | | | $ | 77,907,947 | |
| | | | | | | | | |
| Total Investments | | | | | | | | |
| (Cost $ 77,907,947) - 82.89% | | | | | | $ | 77,907,947 | |
| Other Assets in Excess of Liabilities - 17.11% (b) | | | | | | | 16,906,926 | |
| TOTAL NET ASSETS - 100.00% | | | | | | $ | 94,814,873 | |
Percentages are stated as a percent of net assets.
| (a) | The rate quoted is the annualized seven-day yield as of March 31, 2019. |
| (b) | All or a portion of the assets have been committed as collateral for open securities sold short. |
The Global Industry Classification Standard (GICS®) was developed by and/or is the exclusive property of MSCI, Inc. and Standard & Poor’s Financial Services LLC (“S&P”). GICS® is a service mark of MSCI, Inc. and S&P and has been licensed for use by U.S. Bancorp Fund Services, LLC.
| See Notes to the Financial Statements. | Leuthold Funds - 2019 Semi-Annual Report | 51 |
Grizzly Short Fund
Schedule of Securities Sold Short - (a)
March 31, 2019 (Unaudited)
| | | Shares | | | Fair Value | |
| COMMON STOCKS - 96.36% | | | | |
| Aerospace & Defense - 2.05% | | | | | | |
| Embraer SA - ADR | | | 23,301 | | | $ | 442,952 | |
| L3 Technologies, Inc. | | | 7,269 | | | | 1,500,104 | |
| | | | | | | | 1,943,056 | |
| Beverages - 7.09% | | | | | | | | |
| Anheuser-Busch InBev SA/NV - ADR | | | 15,235 | | | | 1,279,283 | |
| Brown-Forman Corp. - Class B | | | 35,648 | | | | 1,881,501 | |
| Keurig Dr Pepper, Inc. | | | 52,974 | | | | 1,481,683 | |
| MGP Ingredients, Inc. | | | 6,373 | | | | 491,677 | |
| Monster Beverage Corp. | | | 29,176 | | | | 1,592,426 | |
| | | | | | | | 6,726,570 | |
| Capital Markets - 2.05% | | | | | | | | |
| SEI Investments Co. | | | 28,279 | | | | 1,477,578 | |
| WisdomTree Investments, Inc. | | | 66,516 | | | | 469,603 | |
| | | | | | | | 1,947,181 | |
| Chemicals - 2.57% | | | | | | | | |
| GCP Applied Technologies, Inc. | | | 16,447 | | | | 486,831 | |
| The Scotts Miracle-Gro Co. | | | 18,621 | | | | 1,463,238 | |
| Sensient Technologies Corp. | | | 7,169 | | | | 485,987 | |
| | | | | | | | 2,436,056 | |
| Commercial Services & Supplies - 2.97% | | | | | |
| Copart, Inc. | | | 24,197 | | | | 1,466,096 | |
| Healthcare Services Group, Inc. | | | 26,985 | | | | 890,235 | |
| Ritchie Bros Auctioneers, Inc. (b) | | | 13,542 | | | | 460,428 | |
| | | | | | | | 2,816,759 | |
| Construction & Engineering - 0.50% | | | | | |
| Granite Construction, Inc. | | | 11,053 | | | | 476,937 | |
| Construction Materials - 0.89% | | | | | |
| Summit Materials, Inc. - Class A | | | 52,974 | | | | 840,697 | |
| | | Shares | | | Fair Value | |
| Diversified Consumer Services - 3.25% | | | | |
| New Oriental Education & Technology Group, Inc. - ADR | | | 18,222 | | | $ | 1,641,620 | |
| ServiceMaster Global Holdings, Inc. | | | 30,827 | | | | 1,439,621 | |
| | | | | | | | 3,081,241 | |
| Electronic Equipment, Instruments & Components - 3.17% | | | | | | | | |
| Cognex Corp. | | | 28,479 | | | | 1,448,442 | |
| IPG Photonics Corp. | | | 10,256 | | | | 1,556,656 | |
| | | | | | | | 3,005,098 | |
| Energy Equipment & Services - 6.67% | | | | | |
| Baker Hughes, a GE Co. - Class A | | | 60,144 | | | | 1,667,192 | |
| Core Laboratories NV (b) | | | 22,803 | | | | 1,571,811 | |
| Halliburton Co. | | | 34,354 | | | | 1,006,572 | |
| National Oilwell Varco, Inc. | | | 33,657 | | | | 896,622 | |
| Schlumberger, Ltd. | | | 27,184 | | | | 1,184,407 | |
| | | | | | | | 6,326,604 | |
| Entertainment - 4.86% | | | | | | | | |
| Activision Blizzard, Inc. | | | 34,752 | | | | 1,582,259 | |
| Electronic Arts, Inc. | | | 12,959 | | | | 1,317,023 | |
| Netflix, Inc. | | | 4,780 | | | | 1,704,357 | |
| | | | | | | | 4,603,639 | |
| Food Products - 0.61% | | | | | | | | |
| BRF SA - ADR | | | 99,376 | | | | 578,368 | |
| Health Care Equipment & Supplies - 6.64% | |
| Align Technology, Inc. | | | 6,572 | | | | 1,868,617 | |
| Becton Dickinson and Co. | | | 5,676 | | | | 1,417,467 | |
| Insulet Corp. | | | 16,131 | | | | 1,533,897 | |
| Intuitive Surgical, Inc. | | | 2,589 | | | | 1,477,232 | |
| | | | | | | | 6,297,213 | |
| Health Care Technology - 1.44% | | | | | |
| Teladoc Health, Inc. | | | 24,496 | | | | 1,361,978 | |
| 52 | Leuthold Funds - 2019 Semi-Annual Report | See Notes to the Financial Statements. |
Grizzly Short Fund
Schedule of Securities Sold Short - (a) (continued)
March 31, 2019 (Unaudited)
| | | Shares | | | Fair Value | |
| COMMON STOCKS - 96.36% (continued) | |
| Hotels, Restaurants & Leisure - 6.50% | | | | |
| Boyd Gaming Corp. | | | 59,347 | | | $ | 1,623,734 | |
| Melco Resorts & Entertainment, Ltd. - ADR | | | 76,374 | | | | 1,725,288 | |
| MGM Resorts International | | | 52,277 | | | | 1,341,428 | |
| Vail Resorts, Inc. | | | 6,773 | | | | 1,471,773 | |
| | | | | | | | 6,162,223 | |
| Household Products - 0.50% | | | | | | | | |
| Spectrum Brands Holdings, Inc. | | | 8,663 | | | | 474,559 | |
| Industrial Conglomerates - 1.56% | | | | | |
| General Electric Co. | | | 148,069 | | | | 1,479,209 | |
| Insurance - 4.30% | | | | | | | | |
| American International Group, Inc. | | | 29,076 | | | | 1,252,013 | |
| Fidelity National Financial, Inc. | | | 39,021 | | | | 1,426,217 | |
| RenaissanceRe Holdings, Ltd. (b) | | | 9,758 | | | | 1,400,273 | |
| | | | | | | | 4,078,503 | |
| Interactive Media & Services - 1.18% | | | | | |
| Snap, Inc. - Class A | | | 101,169 | | | | 1,114,882 | |
| Internet & Direct Marketing Retail - 4.13% | | | | |
| Alibaba Group Holding, Ltd. - ADR | | | 7,667 | | | | 1,398,844 | |
| GrubHub, Inc. | | | 22,703 | | | | 1,577,177 | |
| Shutterfly, Inc. | | | 23,201 | | | | 942,889 | |
| | | | | | | | 3,918,910 | |
| Machinery - 5.33% | | | | | | | | |
| Fortive Corp. | | | 18,023 | | | | 1,511,949 | |
| IDEX Corp. | | | 11,551 | | | | 1,752,749 | |
| Xylem, Inc. | | | 22,604 | | | | 1,786,620 | |
| | | | | | | | 5,051,318 | |
| Multi-Utilities - 1.57% | | | | | | | | |
| Sempra Energy | | | 11,849 | | | | 1,491,315 | |
| | | Shares | | | Fair Value | |
| Oil, Gas & Consumable Fuels - 3.69% | | | | |
| Concho Resources, Inc. | | | 12,845 | | | $ | 1,425,281 | |
| Diamondback Energy, Inc. | | | 15,633 | | | | 1,587,219 | |
| Jagged Peak Energy, Inc. | | | 46,203 | | | | 483,745 | |
| | | | | | | | 3,496,245 | |
| Pharmaceuticals - 1.09% | | | | | | | | |
| Nektar Therapeutics | | | 30,669 | | | | 1,030,479 | |
| Professional Services - 3.06% | | | | | | | | |
| CoStar Group, Inc. | | | 3,076 | | | | 1,434,708 | |
| TransUnion | | | 21,919 | | | | 1,465,066 | |
| | | | | | | | 2,899,774 | |
| Real Estate Investment Trusts (REITs) - 1.62% | |
| Equinix, Inc. | | | 3,386 | | | | 1,534,400 | |
| Real Estate Management & Development - 1.24% | |
| The Howard Hughes Corp. | | | 10,655 | | | | 1,172,050 | |
| Semiconductors & Semiconductor Equipment - 4.25% | | | | | | | | |
| Ambarella, Inc. | | | 27,682 | | | | 1,195,862 | |
| Marvell Technology Group, Ltd. | | | 73,586 | | | | 1,463,626 | |
| Microchip Technology, Inc. | | | 16,530 | | | | 1,371,329 | |
| | | | | | | | 4,030,817 | |
| Software - 6.96% | | | | | | | | |
| 2U, Inc. | | | 19,716 | | | | 1,396,879 | |
| Blackbaud, Inc. | | | 15,235 | | | | 1,214,686 | |
| Cloudera, Inc. | | | 61,936 | | | | 677,580 | |
| Instructure, Inc. | | | 15,085 | | | | 710,805 | |
| Pegasystems, Inc. | | | 17,924 | | | | 1,165,060 | |
| Proofpoint, Inc. | | | 11,849 | | | | 1,438,824 | |
| | | | | | | | 6,603,834 | |
| Technology Hardware, Storage & Peripherals - 1.78% | | | | | | | | |
| Pure Storage, Inc. | | | 77,370 | | | | 1,685,892 | |
| See Notes to the Financial Statements. | Leuthold Funds - 2019 Semi-Annual Report | 53 |
Grizzly Short Fund
Schedule of Securities Sold Short - (a) (continued)
March 31, 2019 (Unaudited)
| | | Shares | | | Fair Value | |
| COMMON STOCKS - 96.36% (continued) | | | |
| Thrifts & Mortgage Finance - 1.73% | | | | |
| LendingTree, Inc. | | | 4,680 | | | $ | 1,645,301 | |
| Trading Companies & Distributors - 1.11% | | | | | |
| SiteOne Landscape Supply, Inc. | | | 18,421 | | | | 1,052,760 | |
| TOTAL COMMON STOCKS | | | | | | | | |
| (Proceeds $91,147,449) | | | | | | $ | 91,363,868 | |
| | | | | | | | | |
| INVESTMENT COMPANIES - 3.20% | | | | | |
| Exchange Traded Funds - 3.20% | | | | | |
| SPDR S&P 500 ETF Trust | | | 10,754 | | | $ | 3,037,790 | |
| TOTAL INVESTMENT COMPANIES | | | | | |
| (Proceeds $2,954,725) | | | | | | $ | 3,037,790 | |
| | | | | | | | | |
| TOTAL SECURITIES SOLD SHORT | | | | | |
| (Proceeds $94,102,174) - 99.56% | | | $ | 94,401,658 | |
Percentages are stated as a percent of net assets.
ADR American Depositary Receipt
(a) Non-income producing security.
(b) Foreign issued security.
The Global Industry Classification Standard (GICS®) was developed by and/or is the exclusive property of MSCI, Inc. and Standard & Poor’s Financial Services LLC (“S&P”). GICS® is a service mark of MSCI, Inc. and S&P and has been licensed for use by U.S. Bancorp Fund Services, LLC.
| 54 | Leuthold Funds - 2019 Semi-Annual Report | See Notes to the Financial Statements. |
Leuthold Funds
Notes to the Financial Statements (Unaudited)
| 1. | ORGANIZATIONAND SIGNIFICANTACCOUNTING POLICIES |
Leuthold Funds, Inc. (the “Company”) was incorporated on August 30, 1995, as a Maryland Corporation and is registered with the Securities and Exchange Commission as an open-end management investment company under the Investment Company Act of 1940, as amended. In addition, the Funds are considered investment companies under, and follow the accounting and reporting guidance in, Accounting Standards Codification Topic 946 – Investment Companies. The Leuthold Group, LLC, doing business as Leuthold Weeden Capital Management, is the investment adviser (the “Adviser”). The Company consists of five series (each series a “Fund” and collectively the “Funds”):
| Fund | | Investment Objective | | Inception –
Retail
Share Class | | Inception –
Institutional
Share Class |
| | | | | | | |
| Leuthold Core Investment Fund | | Seeks total return consistent with prudent investment risk over the long-term | | 11/20/1995 | | 1/31/2006 |
| | | | | | | |
| Leuthold Global Fund | | Seeks total return consistent with prudent investment risk over the long-term | | 7/1/2008 | | 4/30/2008 |
| | | | | | | |
| Leuthold Select Industries Fund | | Capital appreciation | | 6/19/2000 | | n/a |
| | | | | | | |
| Leuthold Global Industries Fund | | Seeks capital appreciation and dividend income | | 5/17/2010 | | 5/17/2010 |
| | | | | | | |
| Grizzly Short Fund | | Capital appreciation | | 6/19/2000 | | n/a |
| | | | | | | |
All classes of shares in a Fund have identical voting, dividend, liquidation, and other rights, and the same terms and conditions, except that certain fess and expenses, including distribution and shareholder servicing fees, may differ among classes. Each class has exclusive voting rights on any matters relating to that class’s servicing or distribution arrangements.
The following is a summary of significant accounting policies consistently followed by the Funds.
| a) | Investment Valuation – Securities listed on a national securities exchange (other than The NASDAQ OMX Group, Inc., referred to as “NASDAQ”) are valued at the last sale price on the day the valuation is made. Securities that are traded on NASDAQ under one of its three listing tiers, NASDAQ Global Market, NASDAQ Global Select Market, and NASDAQ Capital Market, are valued at the NASDAQ Official Closing Price. Price information on listed stocks is taken from the exchange where the security is primarily traded. Securities, including securities sold short, which are listed on an exchange but which are not traded on the valuation date are generally valued at the mean between the bid and the asked prices. Unlisted securities for which market quotations are readily available are valued at the latest quoted bid price or, if unavailable, at prices provided by an independent pricing service. Securities sold short which are not listed on an exchange but for which market quotations are readily available are generally valued at the average of the current bid and asked prices. Debt securities are valued at bid prices provided by an independent pricing service that may use a matrix pricing method or other analytical pricing model. Exchange-traded options are valued at the last reported sale price priced on the primary exchange on which the option is traded. If no sales are reported on a particular day, the mean between the highest bid and lowest asked quotations at the close of the exchanges is used. Non-exchange traded options are valued at the mean between the last bid and asked quotations. For options where market quotations are not readily available, fair value shall be determined. Shares of open-end investment companies (other than shares of an |
| Leuthold Funds - 2019 Semi-Annual Report | 55 |
Leuthold Funds
exchange-traded fund traded on domestic securities exchanges or on NASDAQ) are valued at one of the following prices as determined by the Adviser: (a) the net asset value announced by such open-end investment company following the close of business on the business day a Fund’s net asset value is to be calculated; (b) the net asset value announced by such open-end investment company following the close of business on the business day immediately preceding the day a Fund’s net asset value is to be calculated; or (c) a value determined by the Adviser by adding to, or subtracting from, the net asset value announced by such open-end investment company following the close of business on the business day immediately preceding the day a Fund’s net asset value is to be calculated, an amount equal to the Adviser’s estimate of the effect of changes in the market prices for the types of securities held by such investment company. Other assets, including securities for which no quotations are readily available, are valued at fair value as determined in good faith by the Board of Directors (“Directors”) pursuant to the Funds’ “Pricing and Valuation Guidelines.”
The Funds may invest in foreign securities. Foreign securities may be priced at the closing price reported on the foreign exchange on which they are principally traded. Trading in foreign securities may be completed at times that vary from the closing of the New York Stock Exchange (“NYSE”). The Directors have approved the use of their independent pricing provider’s proprietary fair value pricing model to assist in determining current valuation for foreign securities traded in markets that close prior to the NYSE. Foreign securities quoted in foreign currencies are translated into U.S. dollars at current exchange rates. Occasionally, events that affect these values and exchange rates may occur between the times at which they are determined and the closing of the NYSE. If these events materially affect the value of portfolio securities, then these securities may be valued as determined in good faith by the Directors. Some of the factors which may be considered by the Directors and the Funds’ Fair Value Pricing Committee in determining fair value are fundamental analytical data relating to the investment, the nature and duration of any restrictions on disposition, trading in similar securities of the same issuer or comparable companies, information from broker-dealers, and an evaluation of the forces that influence the market in which the securities are purchased and sold. The use of fair value pricing by a Fund may cause the net asset value of its shares to differ significantly from the net asset value that would be calculated without regard to such considerations.
| b) | Fair Valuation Measurements – The Funds have adopted fair valuation accounting standards, which establish a definition of fair value and set out a hierarchy for measuring fair value. These standards require additional disclosures about the various inputs and valuation techniques used to develop the measurements of fair value and a discussion of changes in valuation techniques and related inputs during the period. These inputs are summarized in the following three levels: |
Level 1 - Quoted prices in active markets for identical securities.
Level 2 - Other significant observable inputs (including quoted prices for similar securities, interest rates, prepayment speeds, credit risk, etc.).
Level 3 - Significant unobservable inputs (including the Funds’ own assumptions in determining the fair value of investments).
The inputs or methodology used for valuing securities are not an indication of the risk associated with investing in those securities.
| 56 | Leuthold Funds - 2019 Semi-Annual Report |
Leuthold Funds
The following is a summary of the inputs used to value the Funds’ investments and securities sold short as of March 31, 2019:
| | | | | | | | | | | | | |
| Leuthold Core Investment Fund | |
| Investments at Fair Value | | | Level 1 | | | | Level 2 | | | | Level 3 | | | | Total | |
| Common Stocks | | | | | | | | | | | | | | | | |
| Airlines | | $ | 5,705,694 | | | $ | — | | | $ | — | | | $ | 5,705,694 | |
| Biotechnology | | | 18,579,976 | | | | — | | | | — | | | | 18,579,976 | |
| Chemicals | | | — | | | | — | | | | 6,405 | | | | 6,405 | |
| Commercial Services & Supplies | | | 15,920,031 | | | | — | | | | — | | | | 15,920,031 | |
| Consumer Finance | | | 13,196,081 | | | | — | | | | — | | | | 13,196,081 | |
| Entertainment | | | 8,262,230 | | | | — | | | | — | | | | 8,262,230 | |
| Food & Staples Retailing | | | 15,101,749 | | | | — | | | | — | | | | 15,101,749 | |
| Health Care Providers & Services | | | 65,914,755 | | | | — | | | | — | | | | 65,914,755 | |
| Hotels, Restaurants & Leisure | | | 18,318,346 | | | | — | | | | — | | | | 18,318,346 | |
| Household Durables | | | 16,220,320 | | | | — | | | | — | | | | 16,220,320 | |
| Interactive Media & Services | | | 17,544,568 | | | | — | | | | — | | | | 17,544,568 | |
| IT Services | | | 34,651,374 | | | | — | | | | — | | | | 34,651,374 | |
| Media | | | 10,453,657 | | | | — | | | | — | | | | 10,453,657 | |
| Multiline Retail | | | 20,786,226 | | | | — | | | | — | | | | 20,786,226 | |
| Professional Services | | | 19,104,482 | | | | — | | | | — | | | | 19,104,482 | |
| Road & Rail | | | 28,326,369 | | | | — | | | | — | | | | 28,326,369 | |
| Semiconductors & Semiconductor Equipment | | | 22,462,184 | | | | — | | | | — | | | | 22,462,184 | |
| Software | | | 26,044,007 | | | | — | | | | — | | | | 26,044,007 | |
| Specialty Retail | | | 22,183,459 | | | | — | | | | — | | | | 22,183,459 | |
| Total Common Stocks | | | 378,775,508 | | | | — | | | | 6,405 | | | | 378,781,913 | |
| Exchange Traded Funds | | | 84,630,216 | | | | — | | | | — | | | | 84,630,216 | |
| Corporate Bonds | | | — | | | | 18,317,092 | | | | — | | | | 18,317,092 | |
| United States Treasury Obligations | | | — | | | | 36,635,911 | | | | — | | | | 36,635,911 | |
| Foreign Government Bonds | | | — | | | | 28,629,779 | | | | — | | | | 28,629,779 | |
| Money Market Funds | | | 142,962,278 | | | | — | | | | — | | | | 142,962,278 | |
| Investments Purchased as Securities Lending Collateral* | | | — | | | | — | | | | — | | | | 105,428,945 | |
| Total Investments in Securities | | $ | 606,368,002 | | | $ | 83,582,782 | | | $ | 6,405 | | | $ | 795,386,134 | |
* Certain investments that are measured at fair value using the net asset value per share (or its equivalent) practical expedient have not been categorized in the fair value hierarchy. The fair value amounts presented in the table are intended to permit reconciliation of the fair value hierarchy to the amounts presented in the Schedule of Investments.
| Securities Sold Short at Fair Value | | Level 1 | | | Level 2 | | | Level 3 | | | Total | |
| Common Stocks | | $ | 47,725,849 | | | $ | — | | | $ | — | | | $ | 47,725,849 | |
| Exchange Traded Funds | | | 1,585,278 | | | | — | | | | — | | | | 1,585,278 | |
| Total Securities Sold Short | | $ | 49,311,127 | | | $ | — | | | $ | — | | | $ | 49,311,127 | |
| Leuthold Funds - 2019 Semi-Annual Report | 57 |
Leuthold Funds
The following is a reconciliation of Level 3 investments for which significant unobservable inputs were used to determine fair value:
| | | Investments in
Securities at
Fair Value | |
| Balance as of September 30, 2018 | | $ | 6,423 | |
| Accrued discounts/premiums | | | — | |
| Realized gain (loss) | | | — | |
| Change in net unrealized depreciation | | | (18 | )* |
| Purchases | | | — | |
| Sales | | | — | |
| Transfer into and/or out of Level 3 | | | — | |
| Balance as of March 31, 2019 | | $ | 6,405 | (1) |
| | | | | |
| Change in net unrealized depreciation during the period for Level 3 investments held at March 31, 2019: | | $ | (18 | ) |
* Unrealized depreciation is due to a change in foreign currency exchange rate.
| (1) | The security (China Lumena New Materials Corp.) is classified as a Level 3 security due to a halt in trading of the security on March 25, 2014. The security is valued at fair value as determined in good faith by the Directors. The Adviser submits a report to the Directors setting forth the factors considered in determining the price. The significant unobservable input used in the fair valuation of this security is a discount of 95% from the last traded price of HKD 1.25. Significant changes in the discount rate may result in a change in fair value measurement. For the duration of the period, the discount was 95%. |
| | | | | | | | | | | | | |
| Leuthold Global Fund | |
| Investments at Fair Value | | Level 1 | | | Level 2 | | | Level 3 | | | Total | |
| Common Stocks | | | | | | | | | | | | | | | | |
| Airlines | | $ | 731,912 | | | $ | 308,520 | | | $ | — | | | $ | 1,040,432 | |
| Banks | | | — | | | | 400,470 | | | | — | | | | 400,470 | |
| Communications Equipment | | | 1,606,841 | | | | 413,533 | | | | — | | | | 2,020,374 | |
| Consumer Finance | | | 1,032,701 | | | | 376,137 | | | | — | | | | 1,408,838 | |
| Diversified Telecommunication Services | | | 311,306 | | | | 126,029 | | | | — | | | | 437,335 | |
| Electric Utilities | | | 123,382 | | | | — | | | | — | | | | 123,382 | |
| Entertainment | | | 624,383 | | | | — | | | | — | | | | 624,383 | |
| Health Care Providers & Services | | | 3,195,948 | | | | 861,882 | | | | — | | | | 4,057,830 | |
| Household Durables | | | 899,915 | | | | 867,614 | | | | — | | | | 1,767,529 | |
| Insurance | | | 394,417 | | | | 1,394,000 | | | | — | | | | 1,788,417 | |
| Interactive Media & Services | | | 1,503,055 | | | | 191,032 | | | | — | | | | 1,694,087 | |
| IT Services | | | 2,907,371 | | | | 1,259,108 | | | | — | | | | 4,166,479 | |
| Life Sciences Tools & Services | | | 1,561,455 | | | | 818,506 | | | | — | | | | 2,379,961 | |
| Media | | | 1,176,709 | | | | 752,839 | | | | — | | | | 1,929,548 | |
| Metals & Mining | | | 288,818 | | | | 590,107 | | | | — | | | | 878,925 | |
| Oil, Gas & Consumable Fuels | | | 3,201,886 | | | | 1,664,280 | | | | — | | | | 4,866,166 | |
| Paper & Forest Products | | | — | | | | — | | | | 47,465 | | | | 47,465 | |
| Road & Rail | | | 1,441,531 | | | | 469,105 | | | | — | | | | 1,910,636 | |
| Semiconductors & Semiconductor Equipment | | | 2,052,505 | | | | 889,098 | | | | — | | | | 2,941,603 | |
| Thrifts & Mortgage Finance | | | — | | | | 137,130 | | | | — | | | | 137,130 | |
| Wireless Telecommunication Services | | | 1,180,851 | | | | 1,200,923 | | | | — | | | | 2,381,774 | |
| Total Common Stocks | | | 24,234,986 | | | | 12,720,313 | | | | 47,465 | | | | 37,002,764 | |
| 58 | Leuthold Funds - 2019 Semi-Annual Report |
Leuthold Funds
| | | | | | | | | | | | | |
| Leuthold Global Fund (continued) | |
| Investments at Fair Value | | | Level 1 | | | | Level 2 | | | | Level 3 | | | | Total | |
| Preferred Stocks | | $ | 141,666 | | | $ | — | | | $ | — | | | $ | 141,666 | |
| Exchange Traded Funds | | | 7,794,987 | | | | — | | | | — | | | | 7,794,987 | |
| Corporate Bonds | | | — | | | | 1,139,756 | | | | — | | | | 1,139,756 | |
| United States Treasury Obligations | | | — | | | | 3,376,293 | | | | — | | | | 3,376,293 | |
| Foreign Government Bonds | | | — | | | | 3,901,902 | | | | — | | | | 3,901,902 | |
| Money Market Funds | | | 11,740,450 | | | | — | | | | — | | | | 11,740,450 | |
| Investments Purchased as Securities Lending Collateral* | | | — | | | | — | | | | — | | | | 12,827,954 | |
| Total Investments in Securities | | $ | 43,912,089 | | | $ | 21,138,264 | | | $ | 47,465 | | | $ | 77,925,772 | |
* Certain investments that are measured at fair value using the net asset value per share (or its equivalent) practical expedient have not been categorized in the fair value hierarchy. The fair value amounts presented in the table are intended to permit reconciliation of the fair value hierarchy to the amounts presented in the Schedule of Investments.
| Securities Sold Short at Fair Value | | Level 1 | | | Level 2 | | | Level 3 | | | Total | |
| Common Stocks | | $ | 2,354,736 | | | $ | — | | | $ | — | | | $ | 2,354,736 | |
| Exchange Traded Funds | | | 2,499,391 | | | | — | | | | — | | | | 2,499,391 | |
| Total Securities Sold Short | | $ | 4,854,127 | | | $ | — | | | $ | — | | | $ | 4,854,127 | |
The following is a reconciliation of Level 3 investments for which significant unobservable inputs were used to determine fair value:
| | | Investments in
Securities at
Fair Value | |
| Balance as of September 30, 2018 | | $ | 47,596 | |
| Accrued discounts/premiums | | | — | |
| Realized gain (loss) | | | — | |
| Change in net unrealized depreciation | | | (131 | )* |
| Purchases | | | — | |
| Sales | | | — | |
| Transfers into and/or out of Level 3 | | | — | |
| Balance as of March 31, 2019 | | $ | 47,465 | (1) |
| | | | | |
| Change in net unrealized depreciation during the period for Level 3 investments held at March 31, 2019: | | $ | (131 | ) |
* Unrealized depreciation is due to a change in foreign currency exchange rate.
| (1) | The security (China Forestry Holdings Co., Ltd.) is classified as a Level 3 security due to a halt in trading of the security on January 26, 2011. The security is valued at fair value as determined in good faith by the Directors. The Adviser submits a report to the Directors setting forth the factors considered in determining the price. The significant unobservable input used in the fair valuation of this security is a discount of 95% from the last traded price of HKD 2.95. Significant changes in the discount rate may result in a change in fair value measurement. For the duration of the period the discount was 95%. |
| Leuthold Funds - 2019 Semi-Annual Report | 59 |
Leuthold Funds
| | | | | | | | | | | | | |
| Leuthold Select Industries Fund | |
| Investments at Fair Value | | Level 1 | | | Level 2 | | | Level 3 | | | Total | |
| Common Stocks | | $ | 12,182,115 | | | $ | — | | | $ | — | | | $ | 12,182,115 | |
| Money Market Funds | | | 127,268 | | | | — | | | | — | | | | 127,268 | |
| Total Investments in Securities | | $ | 12,309,383 | | | $ | — | | | $ | — | | | $ | 12,309,383 | |
The Fund did not invest in any Level 3 securities during the period.
| | | | | | | | | | | | | |
| Leuthold Global Industries Fund | |
| Investments at Fair Value | | | Level 1 | | | | Level 2 | | | | Level 3 | | | | Total | |
| Common Stocks | | | | | | | | | | | | | | | | |
| Airlines | | $ | 141,442 | | | $ | 59,793 | | | $ | — | | | $ | 201,235 | |
| Banks | | | — | | | | 76,308 | | | | — | | | | 76,308 | |
| Communications Equipment | | | 311,725 | | | | 79,765 | | | | — | | | | 391,490 | |
| Consumer Finance | | | 200,997 | | | | 73,141 | | | | — | | | | 274,138 | |
| Diversified Telecommunication Services | | | 58,779 | | | | 24,027 | | | | — | | | | 82,806 | |
| Electric Utilities | | | 23,460 | | | | — | | | | — | | | | 23,460 | |
| Entertainment | | | 121,257 | | | | — | | | | — | | | | 121,257 | |
| Health Care Providers & Services | | | 619,677 | | | | 169,239 | | | | — | | | | 788,916 | |
| Household Durables | | | 174,812 | | | | 168,264 | | | | — | | | | 343,076 | |
| Insurance | | | 76,778 | | | | 273,576 | | | | — | | | | 350,354 | |
| Interactive Media & Services | | | 290,886 | | | | 36,939 | | | | — | | | | 327,825 | |
| IT Services | | | 564,756 | | | | 243,549 | | | | — | | | | 808,305 | |
| Life Sciences Tools & Services | | | 303,310 | | | | 158,733 | | | | — | | | | 462,043 | |
| Media | | | 228,692 | | | | 145,917 | | | | — | | | | 374,609 | |
| Metals & Mining | | | 56,541 | | | | 115,539 | | | | — | | | | 172,080 | |
| Oil, Gas & Consumable Fuels | | | 612,426 | | | | 320,746 | | | | — | | | | 933,172 | |
| Paper & Forest Products | | | — | | | | — | | | | 2,217 | | | | 2,217 | |
| Road & Rail | | | 272,846 | | | | 82,146 | | | | — | | | | 354,992 | |
| Semiconductors & Semiconductor Equipment | | | 399,078 | | | | 170,990 | | | | — | | | | 570,068 | |
| Thrifts & Mortgage Finance | | | — | | | | 26,699 | | | | — | | | | 26,699 | |
| Wireless Telecommunication Services | | | 229,436 | | | | 235,651 | | | | — | | | | 465,087 | |
| Total Common Stocks | | | 4,686,898 | | | | 2,461,022 | | | | 2,217 | | | | 7,150,137 | |
| Preferred Stock | | | 26,759 | | | | — | | | | — | | | | 26,759 | |
| Exchange Traded Funds | | | 92,989 | | | | — | | | | — | | | | 92,989 | |
| Money Market Funds | | | 55,083 | | | | — | | | | — | | | | 55,083 | |
| Total Investments in Securities | | $ | 4,861,729 | | | $ | 2,461,022 | | | $ | 2,217 | | | $ | 7,324,968 | |
| 60 | Leuthold Funds - 2019 Semi-Annual Report |
Leuthold Funds
The following is a reconciliation of Level 3 investments for which significant unobservable inputs were used to determine fair value:
| | | Investments in
Securities at
Fair Value | |
| Balance as of September 30, 2018 | | $ | 2,223 | |
| Accrued discounts/premiums | | | — | |
| Realized gain (loss) | | | — | |
| Change in net unrealized depreciation | | | (6 | )* |
| Purchases | | | — | |
| Sales | | | — | |
| Transfers into and/or out of Level 3 | | | — | |
| Balance as of March 31, 2019 | | $ | 2,217 | (1) |
| | | | | |
| Change in net unrealized depreciation during the period for Level 3 investments held at March 31, 2019: | | $ | (6 | ) |
* Unrealized depreciation is due to a change in foreign currency exchange rate.
| (1) | The security (China Forestry Holdings Co., Ltd.) is classified as a Level 3 security due to a halt in trading of the security on January 26, 2011. The security is valued at fair value as determined in good faith by the Directors. The Adviser submits a report to the Directors setting forth the factors considered in determining the price. The significant unobservable input used in the fair valuation of this security is a discount of 95% from the last traded price of HKD 2.95. Significant changes in the discount rate may result in a change in fair value measurement. For the duration of the period the discount was 95%. |
| | | | | | | | | | | | | |
| Grizzly Short Fund | |
| Investments at Fair Value | | Level 1 | | | Level 2 | | | Level 3 | | | Total | |
| Money Market Funds | | $ | 77,907,947 | | | $ | — | | | $ | — | | | $ | 77,907,947 | |
| Total Investments in Securities | | $ | 77,907,947 | | | $ | — | | | $ | — | | | $ | 77,907,947 | |
| | | | | | | | | | | | | | | | | |
| Securities Sold Short at Fair Value | | | Level 1 | | | | Level 2 | | | | Level 3 | | | | Total | |
| Common Stocks | | $ | 91,363,868 | | | $ | — | | | $ | — | | | $ | 91,363,868 | |
| Exchange Traded Funds | | | 3,037,790 | | | $ | — | | | $ | — | | | | 3,037,790 | |
| Total Securities Sold Short | | $ | 94,401,658 | | | $ | — | | | $ | — | | | $ | 94,401,658 | |
The Fund did not invest in any Level 3 securities during the period.
For further information regarding security characteristics, see the Schedules of Investments and Securities Sold Short.
| c) | Federal Income Taxes – Provision for federal income taxes or excise taxes has not been made since the Funds have elected to be taxed as “regulated investment companies” and intend to distribute substantially all taxable income to shareholders and otherwise comply with the provisions of the Internal Revenue Code applicable to regulated investment companies. Distributions from net realized gains for book purposes may include short-term capital gains, which are included as ordinary income to shareholders for tax purposes. The Funds also designate as distributions of long-term gains, to the extent necessary to fully distribute such capital gains, earnings and profits distributed to shareholders on the redemption of shares. |
| Leuthold Funds - 2019 Semi-Annual Report | 61 |
Leuthold Funds
The tax character of distributions paid during the fiscal years ended September 30, 2018 and 2017 was as follows:
| | | | | | | | | | | | | | | | |
| Year Ended September 30, 2018 | |
| | | Leuthold
Core
Investment
Fund | | |
Leuthold
Global
Fund | | | Leuthold
Select
Industries
Fund | | | Leuthold
Global
Industries
Fund | | | Grizzly
Short
Fund | |
| Distributions paid from: | | | | | | | | | | | | | | | | | | | | |
| Ordinary Income | | $ | 2,274,796 | | | $ | 3,573,894 | | | $ | 5,625 | | | $ | 436,345 | | | $ | — | |
| Long-Term Capital Gain* | | | 26,947,936 | | | | 5,318,043 | | | | 735,816 | | | | 450,496 | | | | — | |
| Return of Capital | | | — | | | | — | | | | — | | | | — | | | | — | |
| Total Distribution Paid | | $ | 29,222,732 | | | $ | 8,891,937 | | | $ | 741,441 | | | $ | 886,841 | | | $ | — | |
| | | | | | | | | | | | | | | | | | | | | |
| Year Ended September 30, 2017 | |
| | | Leuthold
Core
Investment
Fund | | |
Leuthold
Global
Fund | | | Leuthold
Select
Industries
Fund | | | Leuthold
Global
Industries
Fund | | | Grizzly
Short
Fund | |
| Distributions paid from: | | | | | | | | | | | | | | | | | | | | |
| Ordinary Income | | $ | 854,085 | | | $ | 395,482 | | | $ | — | | | $ | 154,354 | | | $ | — | |
| Long-Term Capital Gain* | | | 3,823,839 | | | | 11,393,102 | | | | — | | | | 309,089 | | | | — | |
| Return of Capital | | | — | | | | — | | | | — | | | | — | | | | — | |
| Total Distribution Paid | | $ | 4,677,924 | | | $ | 11,788,584 | | | $ | — | | | $ | 463,443 | | | $ | — | |
*The funds designate these distributions as long-term capital gain dividends per IRC Sec. 852(b)(3)(C) in the 20-percent group (which may be taxed at a 20-percent rate, a 15-percent rate or 0-percent rate, depending on the shareholder’s taxable income).
At September 30, 2018, the components of accumulated earnings (deficit) on a tax basis were as follows:
| | | Leuthold
Core
Investment
Fund | | |
Leuthold
Global
Fund | | | Leuthold
Select
Industries
Fund | | | Leuthold
Global
Industries
Fund | | | Grizzly
Short
Fund | |
| Undistributed Ordinary Income | | $ | — | | | $ | — | | | $ | — | | | $ | 115,848 | | | $ | — | |
| Undistributed long-term gains | | | 72,649,053 | | | | 5,448,398 | | | | 1,138,366 | | | | 902,020 | | | | — | |
| Distributable earnings | | | 72,649,053 | | | | 5,448,398 | | | | 1,138,366 | | | | 1,017,868 | | | | — | |
| Capital loss carryover and late-year losses | | | (332,659 | ) | | | (346,147 | ) | | | (24,117 | ) | | | — | | | | (249,962,530 | ) |
| Other accumulated gains (losses) | | | (4,392 | ) | | | (15,423 | ) | | | 2 | | | | (1,754 | ) | | | — | |
| Unrealized appreciation | | | 112,202,010 | | | | 4,100,086 | | | | 3,718,554 | | | | 841,946 | | | | 3,052,379 | |
| | | | | | | | | | | | | | | | | | | | | |
| Total accumulated earnings (deficit) | | $ | 184,514,012 | | | $ | 9,186,914 | | | $ | 4,832,805 | | | $ | 1,858,060 | | | $ | (246,910,151 | ) |
Net investment income and realized gains and losses for federal income tax purposes may differ from that reported on the financial statements because of permanent book-to-tax differences. U.S. Generally Accepted Accounting Principles (“U.S. GAAP”) requires that permanent differences between financial reporting and tax reporting be reclassified between various components of net assets. These
| 62 | Leuthold Funds - 2019 Semi-Annual Report |
Leuthold Funds
differences are primarily due to partnership adjustments, securities sold short, earnings and profits distributed to shareholders on the redemption of shares, net operating losses, and expiration of capital losses.
Additionally, U.S. GAAP requires that certain components of net assets relating to permanent differences be reclassified between financial and tax reporting. These reclassifications have no effect on net assets or net asset value per share. For the year ended September 30, 2018, the following table shows the reclassifications made:
| | | Distributable
Earnings | | | Paid
in Capital | |
| Leuthold Core Investment Fund | | $ | (12,787,623 | ) | | $ | 12,787,623 | |
| Leuthold Global Fund | | | (1,432,487 | ) | | | 1,432,487 | |
| Leuthold Select Industries Fund | | | (407,076 | ) | | | 407,076 | |
| Leuthold Global Industries Fund | | | (76,463 | ) | | | 76,463 | |
| Grizzly Short Fund | | | 21,375,478 | | | | (21,375,478 | ) |
Under current law, the Funds may carry forward net capital losses indefinitely to use to offset capital gains realized in future years. Previous law limited the carry forward of capital losses to the eight tax years following the year the capital loss was realized. If a Fund has capital losses that are subject to current law and also has capital losses subject to prior law, the losses realized under current law will be utilized to offset capital gains before any of the losses governed by prior law can be used. As a result of these ordering rules, capital losses realized under previous law may be more likely to expire unused. Capital losses realized under current law will carry forward retaining their classification as long-term or short-term losses, whereas under prior law all capital losses were carried forward as short-term capital losses.
| | | Leuthold
Core
Investment
Fund | | |
Leuthold
Global
Fund | | | Leuthold
Select
Industries
Fund | | | Leuthold
Global
Industries
Fund | | | Grizzly
Short
Fund | |
| Expires 09/30/19 | | $ | — | | | $ | — | | | $ | — | | | $ | — | | | $ | (25,380,935 | ) |
| Unlimited Short-Term | | | — | | | | — | | | | — | | | | — | | | | (224,310,627 | ) |
The Leuthold Core Investment Fund, Leuthold Global Fund, Leuthold Select Industries Fund, and Grizzly Short Fund intend to defer and treat $332,659, $346,147, $24,117, and $270,968, respectively, of qualified late-year losses incurred during the fiscal year ended September 30, 2018 as arising on the first day of the fiscal year ending September 30, 2019.
As of March 31, 2019, the Funds had no tax positions that did not meet the “more likely-than-not” threshold of being sustained by the applicable tax authority. Generally, tax authorities can examine all the tax returns filed for the last three years. The Funds recognize interest and penalties, if any, related to unrecognized tax benefits as income tax expense in the Statements of Operations. During the period ended March 31, 2019, the Funds did not incur any interest or penalties.
| d) | Distributions to Shareholders – Dividends from net investment income, if any, are declared and paid quarterly. Distributions of net realized capital gains, if any, are declared and paid at least annually. |
| e) | Use of Estimates – The preparation of financial statements in conformity with U.S. GAAP requires management to make estimates and assumptions that affect the reported amounts of assets and liabilities and disclosure of contingent assets and liabilities at the date of the financial statements and the reported amounts of revenues and expenses during the reporting period. Actual results could differ from those estimates. |
| Leuthold Funds - 2019 Semi-Annual Report | 63 |
Leuthold Funds
| f) | Basis for Consolidation for the Leuthold Core Investment Fund and Leuthold Global Fund – The Leuthold Core Investment Fund and Leuthold Global Fund may invest up to 25% of their total assets in their subsidiaries, Leuthold Core, Ltd. and Leuthold Global, Ltd. (the “Subsidiaries”), respectively. The Subsidiaries, which are organized under the laws of the Cayman Islands, are wholly owned and controlled by the Leuthold Core Investment Fund and Leuthold Global Fund, respectively, and are therefore consolidated in the respective Funds’ financial statements herein. All intercompany balances, revenues, and expenses have been eliminated in consolidation. The Subsidiaries act as investment vehicles in order to enter into certain investments for the Leuthold Core Investment Fund and Leuthold Global Fund consistent with the investment objectives and policies specified in the Prospectus and Statement of Additional Information. The Subsidiaries were liquidated in May 2018. |
| g) | Securities Sold Short – For financial statement purposes, an amount equal to the required amount of collateral to be segregated for securities sold short is included in the Statements of Assets and Liabilities as an asset. The amount of the securities sold short, shown as a liability, is subsequently marked-to-market to reflect the current value of the securities sold short. Subsequent fluctuations in the market prices of securities sold short may require purchasing the securities at prices which could differ from the amount reflected in the Statements of Assets and Liabilities. The Funds are liable for any dividends or interest payable on securities sold short. As collateral for their securities sold short, the Funds are required under the 1940 Act to maintain segregated assets consisting of cash, cash equivalents, or liquid securities. These segregated assets are valued consistent with Note 1a. The amount of segregated assets is required to be adjusted daily to reflect changes in the fair value of the securities sold short. The Leuthold Core Investment Fund, Leuthold Global Fund, and Grizzly Short Fund’s collateral at broker for securities sold short is with one major security dealer. |
With regard to the cash collateral that is posted with counterparties, the Funds will establish a collateral account for each respective counterparty with its custodian (the “Account”) and will enter into a tri-party agreement with the custodian and the respective counterparty regarding the transfer of assets to and from the Account.
The Adviser will review each Account on a daily basis to ensure that the Account does not maintain a material amount of cash collateral in excess of what is required by the applicable counterparty (the amount of collateral required by such counterparty is subject to change and generally not known until the next business day, which necessitates the maintenance of a minimum amount of excess cash collateral). In the event that the excess cash collateral in an Account is equal to or in excess of the greater of the following: $250,000 or 1% of the total assets of the applicable Fund calculated at each month end; then the applicable Fund, pursuant to the tri-party agreement, will instruct the custodian to sweep such excess cash collateral into the Fund’s interest bearing account with the custodian. The amount of collateral held related to this tri-party agreement is included in the Statement of Assets and Liabilities as an asset.
| h) | Other – Investment and shareholder transactions are recorded on the trade date. The Funds determine the gain or loss realized from the investment transactions by comparing the original cost of the security lot sold with the net sales proceeds. The Funds utilize an identified lot approach to transactions. Dividend income is recognized on the ex-dividend date or as soon as information is available to the Funds, and interest income is recognized on an accrual basis. Discounts and premiums on bonds are amortized using the yield to maturity method over the life of the respective bond. For financial reporting purposes, the Funds isolate changes in the exchange rate of investment securities from the fluctuations arising from changes in the market prices of securities for realized gains and losses. |
| 64 | Leuthold Funds - 2019 Semi-Annual Report |
Leuthold Funds
| i) | Expenses – Expenses that directly relate to one of the Funds are charged directly to that Fund. Other operating expenses of the Funds, such as Directors fees and expenses, insurance expense, and legal fees are allocated between the Funds based on the relative net asset value of the individual Funds. |
| j) | Counterparty risk – Counterparty risk may arise as the result of the failure of a counterparty to a securities contract to comply with the terms of the contract. Potential counterparty risk is measured by the creditworthiness of the counterparty and additional risk may arise from unanticipated events affecting the value of the underlying security. |
| k) | Recently Issued Accounting Pronouncements – In March 2017, the Financial Accounting Standards Board (FASB) issued Accounting Standards Update (ASU) No. 2017-08, Receivables—Nonrefundable Fees and Other Costs (Subtopic 310-20): Premium Amortization on Purchased Callable Debt Securities. The amendments in ASU No. 2017-08 shorten the amortization period for certain callable debt securities, held at a premium, to be amortized to the earliest call date. ASU No. 2017-08 does not require an accounting change for securities held at a discount; which continues to be amortized to maturity. ASU No. 2017-08 is effective for fiscal years and interim periods within those fiscal years beginning after December 15, 2018. Management is currently evaluating the impact, if any, of applying this provision. |
In August 2018, the FASB issued ASU No. 2018-13, Fair Value Measurement (Topic 820): Disclosure Framework—Changes to the Disclosure Requirements for Fair Value Measurement, which changes the fair value measurement disclosure requirements of Topic 820. The amendments in ASU No. 2018-13 are the result of a broader disclosure project called FASB Concept Statement, Conceptual Framework for Financial Reporting—Chapter 8: Notes to Financial Statements. The objective and primary focus of the project are to improve the effectiveness of disclosures in the notes to the financial statements by facilitating clear communication of the information required by GAAP that is most important to users of the financial statements. ASU No. 2018-13 is effective for all entities for fiscal years beginning after December 15, 2019, including interim periods therein. Early adoption is permitted for any eliminated or modified disclosures upon issuance of ASU No. 2018-13. Management has chosen to early adopt the eliminated or modified disclosures for the six months ended March 31, 2019.
| l) | Subsequent Events – The Funds have evaluated subsequent events through the date of issuance of the Funds’ financial statements. This evaluation did not result in any subsequent events that necessitated recognition or disclosure. |
| 2. | INVESTMENT TRANSACTIONS |
Purchases and sales of investment securities, other than short-term investments and securities sold short, for the period ended March 31, 2019 are summarized below.
| | | Leuthold
Core
Investment
Fund | | | Leuthold
Global
Fund | | | Leuthold
Select
Industries
Fund | | | Leuthold
Global
Industries
Fund | |
| Purchases | | $ | 154,715,260 | | | $ | 24,254,256 | | | $ | 4,191,657 | | | $ | 3,505,710 | |
| Sales | | | 254,786,483 | | | | 33,553,606 | | | | 8,517,101 | | | | 5,500,112 | |
There were no purchases or sales of investment securities in the Grizzly Short Fund because this Fund invests only in securities sold short.
| | Leuthold Funds - 2019 Semi-Annual Report | 65 |
Leuthold Funds
At September 30, 2018, gross unrealized appreciation and depreciation of investments and securities sold short and cost of investments and cost of securities sold short for tax purposes were as follows:
| | | Leuthold
Core
Investment
Fund | | | Leuthold
Global
Fund | | | Leuthold
Select
Industries
Fund | | | Leuthold
Global
Industries
Fund | | | Grizzly
Short
Fund | |
| Tax cost of investments | | $ | 691,063,099 | | | $ | 76,534,095 | | | $ | 14,428,918 | | | $ | 9,605,888 | | | $ | (16,161,360 | ) |
| Unrealized appreciation | | | 124,122,936 | | | | 6,552,951 | | | | 3,983,171 | | | | 1,087,857 | | | | 6,697,484 | |
| Unrealized depreciation | | | (11,920,926 | ) | | | (2,452,865 | ) | | | (264,617 | ) | | | (245,911 | ) | | | (3,645,105 | ) |
| Net unrealized appreciation | | $ | 112,202,010 | | | $ | 4,100,086 | | | $ | 3,718,554 | | | $ | 841,946 | | | $ | 3,052,379 | |
The differences between book and tax basis of unrealized appreciation (depreciation) are primarily attributable to the tax deferral of losses on wash sales and passive foreign investment company transactions.
The Leuthold Core Investment Fund owned 5% or more of the voting securities of the following companies during the period ended March 31, 2019. As a result, these companies are deemed to be affiliates of the Leuthold Core Investment Fund as defined by the 1940 Act. Transactions during the period in these securities of affiliated companies were as follows:
| | | | | | | | | | | | | | | | | | | | | | | | | |
| Leuthold Core Investment Fund | |
Security Name | | Share
Balance
03/31/19 | | | Fair Value
at
09/30/18 | | | Purchases | | | Sales | | | Realized
Gain
(loss) | | | Change in
Unrealized
Appreciation | | | Fair Value
at
03/31/19 | | | Dividend
Income | |
| Invesco CurrencyShares | | | | | | | | | | | | | | | | | | | | | | | | |
| Japanese Yen Trust | | | 239,414 | | | $ | 24,151,976 | | | $ | –– | | | $ | (4,031,189 | ) | | $ | (208,066 | ) | | $ | 703,219 | | | $ | 20,615,940 | | | $ | –– | |
| 3. | INVESTMENT ADVISORY AND OTHER AGREEMENTS |
Each of the Funds has entered into an Investment Advisory Agreement (“advisory agreement”) with the Adviser. Pursuant to its advisory agreement with the Funds, the Adviser is entitled to receive a fee, calculated daily as applied to each Fund’s average daily net assets and payable monthly, at annual rates of:
Leuthold
Core
Investment
Fund | | Leuthold
Global
Fund | | Leuthold
Select
Industries
Fund | | Leuthold
Global
Industries
Fund | | Grizzly
Short
Fund |
| 0.90% | | 0.90% | | 1.00% | | 1.00% | | 1.25% |
The Adviser has agreed to waive its advisory fee and/or reimburse the Funds’ other expenses, to the extent necessary to ensure that the Funds’ total operating expenses (exclusive of interest, taxes, brokerage commissions, dividends and interest on securities sold short, and extraordinary items) do not exceed the following rates, based on each Fund’s average daily net assets:
Leuthold
Core
Investment
Fund | | Leuthold
Global
Fund | | Leuthold
Select
Industries
Fund | | Leuthold
Global
Industries
Fund
Retail
Class | | Leuthold
Global
Industries
Fund
Institutional
Class | | Grizzly
Short
Fund |
| 1.25% | | 1.85% | | 1.50% | | 1.50% | | 1.25% | | 2.50% |
| 66 | Leuthold Funds - 2019 Semi-Annual Report | |
Leuthold Funds
Any waiver or reimbursement is subject to later adjustments to allow the Adviser to recoup amounts previously waived or reimbursed to the extent actual fees and expenses for a fiscal period are less than each Fund’s expense limitation, provided, however, that the recoupment period for the Adviser is limited to three years from the time the expenses were waived or incurred and is limited to the lesser of (1) the expense cap in effect at the time of the waiver, and (2) the expense cap in effect at the time of recapture.
Amounts subject to future recoupment as of March 31, 2019 are as follows:
| Leuthold Select Industries Fund | | Leuthold Global Industries Fund | |
| Year of Expiration | | Recoverable Amount | | | Year of Expiration | | Recoverable Amount | |
| 9/30/2019 | | $ | 14,073 | | | 9/30/2019 | | $ | 60,838 | |
| 9/30/2020 | | | 40,903 | | | 9/30/2020 | | | 122,114 | |
| 9/30/2021 | | | 28,151 | | | 9/30/2021 | | | 121,088 | |
| 3/31/2022 | | | 21,168 | | | 3/31/2022 | | | 72,351 | |
U.S. Bancorp Fund Services, LLC (“Fund Services”), doing business as U.S. Bank Global Fund Services, serves as transfer agent, administrator, and accounting services agent for the Funds. U.S. Bank, N.A. serves as custodian for the Funds.
The Leuthold Global Fund – Retail Class and Leuthold Global Industries Fund – Retail Class have adopted a distribution plan pursuant to Rule 12b-1 under the 1940 Act, whereby Rafferty Capital Markets, LLC serves as distributor. This plan allows each Fund to use up to 0.25% of its average daily net assets to pay sales, distribution, and other fees for the sale of its shares and for services provided to investors. Each Fund may pay all or a portion of this fee to any securities dealer, financial institution, or any other person who renders personal service to the Funds’ shareholders, assists in the maintenance of the Funds’ shareholder accounts, or who renders assistance in distributing or promoting the sale of shares of the Fund pursuant to a written agreement approved by the Directors. To the extent such fee is not paid to such persons, each of the Funds may use the fee for its expenses of distribution of its shares, including, but not limited to, payment by the Fund of the cost of preparing, printing, and distributing Prospectuses and Statements of Additional Information to prospective investors and of implementing and operating the plan.
| 5. | SUB-TRANSFER AGENT & SHAREHOLDER SERVICING FEE PLANS |
The Funds are permitted to pay sub-transfer agent fees for various platform agreement not to exceed 0.15% of the Funds’ average daily net assets. In addition, the Retail Class shares of the Leuthold Core Investment Fund, Leuthold Select Industries Fund, and Grizzly Short Fund have adopted a Shareholder Servicing Fee Plan not to exceed 0.15% of these Funds’ Retail Class shares average daily net assets. These fees are used to finance certain activities related to servicing and maintaining shareholder accounts. Sub-transfer agent and shareholder servicing fees incurred by the Funds are disclosed in the Statements of Operations.
The Funds enter into contracts that contain a variety of indemnifications. The Funds’ maximum exposure under these arrangements is unknown. However, the Funds have not had prior claims or losses pursuant to these contracts and expect the risk of loss to be remote.
| | Leuthold Funds - 2019 Semi-Annual Report | 67 |
Leuthold Funds
Each Fund may invest up to 15% of net assets in illiquid investments. An “illiquid investment” is any investment that a Fund reasonably expects cannot be sold or disposed of in current market conditions in seven calendar days or less without the sale or disposition significantly changing the market value of the investment. A Fund will take into account relevant market, trading, and investment specific considerations when determining whether an investment is an illiquid investment. The illiquidity status of an investment is generally evaluated monthly. The 15% limitation may include securities whose disposition would be subject to legal restrictions (“restricted securities”). Restricted securities often have a market value lower than the market price of unrestricted securities of the same issuer and are not readily marketable without some time delay. This could result in a Fund being unable to realize a favorable price upon disposition of restricted securities and in some cases might make disposition of such securities at the time desired by the Fund impossible.
| 8. | LENDING PORTFOLIO SECURITIES |
The Funds may lend portfolio securities constituting up to 30% of total assets to unaffiliated broker dealers, banks, or other recognized institutional borrowers of securities, provided that the borrower at all times maintains cash, U.S. government securities, or equivalent collateral or provides an irrevocable letter of credit in favor of the Funds equal in value to at least 100% of the value of the securities loaned. During the time portfolio securities are on loan, the borrower pays the lending Fund an amount equivalent to any dividends or interest paid on such securities, and the Fund may receive an agreed-upon amount of interest income from the borrower who delivered equivalent collateral or provided a letter of credit. Loans are subject to termination at the option of the lending Fund or the borrower. The lending Fund may pay reasonable administrative and custodial fees in connection with a loan of portfolio securities and may pay a negotiated portion of the interest earned on the cash or equivalent collateral to the borrower or placing broker. The lending Fund does not have the right to vote securities on loan, but could terminate the loan and regain the right to vote if that were considered important with respect to the investment.
The primary risk in securities lending is a default by the borrower during a sharp rise in price of the borrowed security resulting in a deficiency in the collateral posted by the borrower. The Funds will seek to minimize this risk by requiring that the value of the securities loaned will be computed each day and additional collateral be furnished each day if required.
As of March 31, 2019, the market value of the securities on loan and payable on collateral received for securities lending were as follows:
| | | Market Value of
Securities on Loan | | | Payable on
Collateral Received | |
| Leuthold Core Investment Fund | | $ | 103,535,380 | | | $ | 105,428,945 | |
| Leuthold Global Fund | | | 12,580,175 | | | | 12,827,954 | |
| 68 | Leuthold Funds - 2019 Semi-Annual Report | |
Leuthold Funds
INVESTMENT ADVISORY AGREEMENT DISCLOSURE
On November 16, 2018, the Board of Directors of Leuthold Funds, Inc. (the”Directors”) approved the continuation of the investment advisory agreements for the Leuthold Core Investment Fund, the Leuthold Global Fund, the Leuthold Select Industries Fund, the Leuthold Global Industries Fund, and the Grizzly Short Fund (collectively the “Funds,” or each, a “Fund”) with the investment adviser to the Funds, The Leuthold Group, LLC, doing business as Leuthold Weeden Capital Management (the “Adviser”). As part of the process of approving the continuation of the advisory agreements, the Directors reviewed the fiduciary duties of the Directors with respect to approving the advisory agreements and the relevant factors for the Directors to consider, and the members of the Board of Directors who are not deemed “interested persons” (as that term is defined by the Investment Company Act of 1940) of the Funds (the “Independent Directors”) met in executive session to discuss the approval of the advisory agreements.
In advance of the meeting, the Adviser sent detailed information to the Directors to assist them in their evaluation of the investment advisory agreements. This information included, but was not limited to, a memorandum from Fund counsel that summarized the legal standards applicable to the Directors’ consideration of the advisory agreements; detailed comparative information relating to the Funds’ management fees and other expenses of the Funds; information regarding fees paid by the Funds and other Fund payments; information on the Adviser’s profitability; information about brokerage commissions; detailed comparative information relating to the Funds’ performance; information about sales and redemptions of the Funds; information about the Funds’ compliance program; and other information the Directors believed was useful in evaluating the approval of advisory agreements.
All of the factors discussed by the Directors were considered as a whole, and were considered separately by the Independent Directors, meeting in executive session. The factors were viewed in their totality by the Directors, with no single factor being the principal or determinative factor in the Directors’ determination of whether to approve the continuation of the investment advisory agreements. The Directors recognized that the management and fee arrangements for the Funds are the result of years of review and discussion between the Independent Directors and the Adviser, that certain aspects of such arrangements may receive greater scrutiny in some years than in others and that the Directors’ conclusions may be based, in part, on their consideration of these same arrangements and information received during the course of the year and in prior years.
Prior to approving the continuation of the investment advisory agreements, the Directors and the Independent Directors in executive session considered, among other items:
| • | The nature and quality of the investment advisory services provided by the Adviser. |
| • | A comparison of the fees and expenses of the Funds to other similar funds. |
| • | A comparison of the fee structures of other accounts managed by the Adviser. |
| • | Whether economies of scale are recognized by the Funds. |
| • | The costs and profitability of the Funds to the Adviser. |
| • | The performance of the Funds. |
| • | The other benefits to the Adviser from serving as investment adviser to the Funds (in addition to the advisory fee). |
| | Leuthold Funds - 2019 Semi-Annual Report | 69 |
Leuthold Funds
The material considerations and determinations of the Board of Directors, including all of the Independent Directors, are as follows:
Nature and Quality of Investment Advisory Services
The Directors noted that the Adviser supervises the investment portfolios of the Funds, directing the day-to-day management of the Funds’ portfolios, including the purchase and sale of investment securities. They discussed with management the nature of the investment process employed by the portfolio managers of the Funds, which is highly research intensive. The Directors also discussed staffing at the Adviser and concluded that the Adviser is well staffed to conduct the research needed to meet the investment objectives of the Funds.
The Directors also considered the background and experience of the Adviser’s senior management and expertise of, and the amount of attention given to the Funds by investment personnel of the Adviser. In addition, the Directors considered the quality of the material service providers to the Funds, who provide administrative and distribution services on behalf of the Funds and are overseen by the Adviser, and the overall reputation and capabilities of the Adviser. Based on this review, the Directors believe that the Adviser provides high quality services to the Funds. The Directors also concluded that they were satisfied with the nature, extent, and quality of the investment advisory services provided to the Funds by the Adviser, and that the nature and extent of the services provided by the Adviser are appropriate to assure that each Fund’s operations are conducted in compliance with applicable laws, rules and regulations.
Comparative Fees and Expenses
The Directors then discussed with management the variables, in addition to the management fees, such as administrative and transaction fees that impact costs to the shareholders of the Funds. Management reviewed with the Directors the comparison of the Funds’ expense ratios to other similar funds. As part of the discussion with management, the Directors ensured that they understood and were comfortable with the criteria used by the Adviser to determine the mutual funds that make up the peer universes for purposes of the materials presented at the meeting.
The Directors compared the Funds’ proposed expense ratios to those of other comparable mutual funds, indicating that the peer groups used were in line with what the Adviser uses for their internal reporting and that the categories used to compare the Funds to their peer groups were appropriate. After review, the Directors concluded that the proposed expense ratios of the Funds were within a reasonable range of comparable mutual funds, and that the fees are reasonable.
Comparison of Fee Structures of Other Accounts
The Directors then inquired of management regarding the distinction between the services performed by the Adviser for separately managed accounts (“SMAs”) or private investment companies and those performed by the Adviser for the Funds. The Directors concluded that the services performed by the Adviser for the Funds require a higher level of service and oversight than the services performed by the Adviser for SMAs or private investment companies. Based on this determination, the Directors believe that the differential in advisory fees between the Funds and the SMAs and private investment companies are reasonable and concluded that the fee rates charged to the Funds in comparison to those charged to the Adviser’s other clients are reasonable.
Performance
The Directors reviewed the Adviser’s quality of investment management, management history, and ability to successfully market the Funds. They noted that the Funds have had periods of underperformance, and discussed with the Adviser actions that the Adviser is taking to address the underperformance of the Funds. The Directors concluded that the performance of the Funds, adjusting for risk, has been satisfactory. They also determined that the Adviser is taking sufficient steps to improve performance and that their
| 70 | Leuthold Funds - 2019 Semi-Annual Report | |
Leuthold Funds
expectation is that the Adviser’s discipline will lead to more favorable results in the long-term. Based on theses factors, the Directors concluded that renewal of the advisory agreements was in the best interest of the Funds’ shareholders.
The Directors also considered the presentation from the Adviser on the investment strategies for the Funds and reviewed the investment performance of the Funds compared with those of the Funds’ peer groups and relevant benchmarks. The Board concluded that these materials demonstrated that the performance of the Funds was satisfactory in comparison to the performance of similar funds.
Costs and Profitability
The Directors considered the costs of services provided and the profits realized by the Adviser, by reviewing reports provided by the Funds’ administrator that compared the Funds’ investment advisory fees to those of other comparable mutual funds. They also considered the Funds’ overall expense ratios compared to peer group funds and the Adviser’s proactive efforts to keep the overall expenses of the Funds lower, and they considered the resources and revenues that the Adviser has put into managing and distributing the Funds. The Directors concluded that the level of profitability realized by the Adviser from its provision of services to the Funds is reasonable, and that the overall expense ratios and investment advisory fees were fair and within the range of industry averages.
Economies of Scale
The Directors then discussed with management whether economies of scale are recognized by the Funds. They noted that as Fund assets grow, certain fixed costs are spread over the larger asset base, which may lead to some economies of scale. On the other hand, the Directors noted that many of the Funds’ expenses are subject to diseconomies of scale. For example, the intermediary service fees generally increase as the Funds’ assets grow. Given the size of the Funds the Directors determined that economies of scale were not being recognized, and they noted that the Funds have benefitted from the Adviser’s consistent efforts to keep overall expenses low. They concluded that the proposed fee schedules were reasonable.
Fall-Out Benefits
The Directors then considered other benefits to the Adviser from serving as adviser to the Funds (in addition to the advisory fee). The Directors noted that the Adviser derives ancillary benefits from its association with the Funds in the form of proprietary and third-party research products and services received from broker dealers that execute portfolio trades for the Funds. Specifically, they discussed the manner in which portfolio transactions for the Funds would be conducted, including the use of soft dollars. Based on these discussions, the Directors concluded that the research and services obtained by the Adviser would be beneficial to the Funds. The Directors determined such products and services have been used for legitimate purposes relating to the Funds by providing assistance in the investment decision-making process. The Directors further concluded that the other benefits realized by the Adviser from its relationship with the Funds were reasonable.
Conclusion
After reviewing the materials provided at the meeting, management’s presentation, as well as other information regularly provided at the Board’s quarterly meetings throughout the year regarding the quality of services provided by the Adviser, the performance of the Funds, expense information, regulatory compliance issues, trading information and related matters, and other factors deemed relevant by the Board, the Directors, including all of the Independent Directors, approved the continuation of the investment advisory agreements.
| | Leuthold Funds - 2019 Semi-Annual Report | 71 |
ADDITIONAL DISCLOSURE REGARDING FUND DIRECTORS AND OFFICERS (UNAUDITED)
Independent Directors
Name, Year of Birth,
and Address | | Position(s)
Held with
the Company | | Term of Office
and Length of
Time Served | | Principal Occupation(s)
During Past Five Years | | # of
Portfolios in
Fund Complex
Overseen By
Director | | Other
Directorships
Held by
Director |
Lawrence L. Horsch (1934) c/o Leuthold Weeden Capital Management 150 South Fifth Street Suite 1700 Minneapolis, MN 55402 | | Chairman and Director | | Indefinite, Director since 1995 | | Chairman, Eagle Management & Financial Corp., a management consulting firm | | 5 | | None |
| | | | | | | | | | | |
Paul M. Kelnberger (1943) c/o Leuthold Weeden Capital Management 150 South Fifth Street Suite 1700 Minneapolis, MN 55402 | | Director and Chair of Audit Committee | | Indefinite, Director since 1995 | | Retired Partner of Johnson, West & Co., PLC (currently Boeckermann, Grafstrom & Mayer, LLC) Certified Public Accountants | | 5 | | None |
| | | | | | | | | | | |
Addison L. Piper (1946) c/o Leuthold Weeden Capital Management 150 South Fifth Street Suite 1700 Minneapolis, MN 55402 | | Director and Chair of Nominating Committee | | Indefinite, Director since 2009 | | Retired Chairman and Chief Executive Officer of Piper Jaffray Companies and PREDEX. | | 5 | | Piper Jaffray Companies and PREDEX |
| 72 | Leuthold Funds - 2019 Semi-Annual Report |
Leuthold Funds
Interested Persons
Name, Year of Birth,
and Address | | Position(s)
Held with
the Company | | Term of Office
and Length of
Time Served | | Principal Occupation
During Past Five Years | | # of
Portfolios in
Fund Complex
Overseen By
Director | | Other
Directorships
Held by
Director |
John C. Mueller (1968) 150 South Fifth Street Suite 1700 Minneapolis, MN 55402 | | Director President | | Indefinite, Director since 2009 One year term, President since 2011 | | Co-Chief Executive Officer of The Leuthold Group since 2005. Involved in Sales and Marketing for The Leuthold Group since 2001. | | 5 | | None |
| | | | | | | | | | | |
Holly J. Weiss (1968) 150 South Fifth Street Suite 1700 Minneapolis, MN 55402 | | Secretary and Treasurer | | One Year Term, Secretary and Treasurer since 2009 | | Chief Financial Officer of the Adviser since 2011. Controller of the Adviser from 2008 to 2011. | | N/A | | N/A |
| | | | | | | | | | | |
Roger A. Peters (1960) 150 South Fifth Street Suite 1700 Minneapolis, MN 55402 | | Vice President and Chief Compliance Officer and Anti-Money Laundering Officer | | One Year Term, Chief Compliance Officer since 2006 and Vice President since 2007 and Anti-Money Laundering Officer since 2011 | | Chief Compliance Officer of the Adviser since 2005. | | N/A | | N/A |
| | | | | | | | | | | |
Glenn R. Larson (1965) 150 South Fifth Street Suite 1700 Minneapolis, MN 55402 | | Assistant Secretary | | One Year Term, Assistant Secretary since 2006 | | Compliance Officer of the Adviser since 2005. | | N/A | | N/A |
The Statement of Additional Information includes additional information about the Funds’ Directors and is available free of charge upon request by calling the Funds toll free at (800) 273-6886.
Information regarding the method the Funds use to vote proxies relating to portfolio securities is available without charge upon request by calling toll-free at (800) 273-6886 or by accessing the Funds’ website at www.leutholdfunds.com. Information regarding how the Funds voted proxies relating to portfolio securities during the most recent twelve-month period ended June 30 is available without charge upon request by calling toll-free at (800) 273-6886 or on the SEC’s website at www.sec.gov.
| Leuthold Funds - 2019 Semi-Annual Report | 73 |
| | Leuthold Funds Investment Adviser: The Leuthold Group, LLC, doing business as Leuthold Weeden Capital Management, Minneapolis, Minnesota Administrator, Transfer Agent, Fund Accountant, Shareholder Servicing Agent: U.S. Bancorp Fund Services, LLC, Milwaukee, Wisconsin Custodian: U.S. Bank, N.A., Milwaukee, Wisconsin Counsel: Foley & Lardner, LLP, Milwaukee, Wisconsin Independent Registered Public Accounting Firm: Ernst & Young LLP, Minneapolis, Minnesota The Funds are required to file their complete schedules of portfolio holdings with the SEC for their first and third fiscal quarters on Form N-Q. Once filed, the Fund’s Form N-Q is available without charge, upon request on the SEC’s website (http://www.sec.gov) and may be available by calling 1-800-273-6886. You can also obtain copies of Form N-Q by (i) visiting the SEC’s Public Reference Room in Washington, DC (information on the operation of the Public Reference Room may be obtained by calling 1-800-SEC-0330); (ii) sending your request and a duplicating fee to the SEC’s Public Reference Room, Washington, DC 20549-0102; or (iii) sending your request electronically to publicinfosec.gov. This report is authorized for distribution only when preceded or accompanied by a current prospectus. | |
Not applicable for semi-annual reports.
Not applicable for semi-annual reports.
Not applicable for semi-annual reports.
Not applicable to registrants who are not listed issuers (as defined in Rule 10A-3 under the Securities Exchange Act of 1934).
Schedule of Investments is included as part of the report to shareholders filed under Item 1 of this Form.
Not applicable to open-end investment companies.
Not applicable to open-end investment companies.
Not applicable to open-end investment companies.
Not Applicable.
Not applicable to open-end investment companies.
Pursuant to the requirements of the Securities Exchange Act of 1934 and the Investment Company Act of 1940, the registrant has duly caused this report to be signed on its behalf by the undersigned, thereunto duly authorized.
John Mueller, President/Principal Executive Officer
Pursuant to the requirements of the Securities Exchange Act of 1934 and the Investment Company Act of 1940, this report has been signed below by the following persons on behalf of the registrant and in the capacities and on the dates indicated.
John Mueller, President/Principal Executive Officer
Holly Weiss, Treasurer/Principal Financial Officer
* Print the name and title of each signing officer under his or her signature.