Semi-Annual Report
March 31, 2021

LEUTHOLD FUNDS
Leuthold Core Investment Fund
Retail Class Shares LCORX
Institutional Class Shares LCRIX
Leuthold Global Fund
Retail Class Shares GLBLX
Institutional Class Shares GLBIX
Leuthold Select Industries Fund
LSLTX
Grizzly Short Fund
GRZZX
Leuthold Core ETF
LCR
The Securities and Exchange Commission has not approved or disapproved these securities or determined if this semi-annual report is accurate or complete. Any representation to the contrary is a criminal offense. An investment in the Funds is not a deposit of a bank and is not insured or guaranteed by the Federal Deposit Insurance Corporation or any other government agency. |
Inside Cover - blank
Leuthold Funds
Table of Contents

Leuthold Funds
(Unaudited)
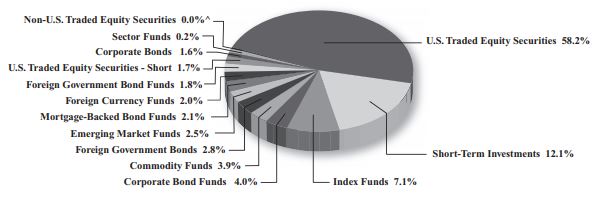
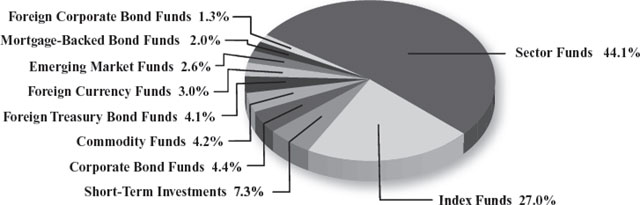
Leuthold Core Investment Fund
Allocation of Portfolio Holdings
March 31, 2021
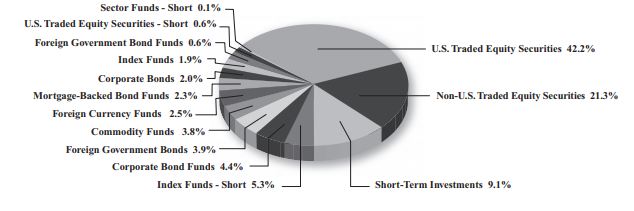
Leuthold Global Fund
Allocation of Portfolio Holdings
March 31, 2021
^ Amount is less than 0.05%. |
Reflected as a percent of absolute value of investments and securities sold short. |
|
| Leuthold Funds - 2021 Semi-Annual Report | 1 |
Leuthold Funds
(Unaudited)
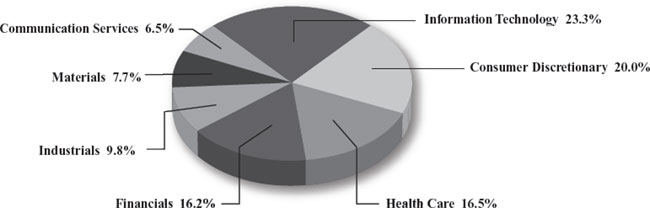
Leuthold Select Industries Fund
Allocation of Portfolio Holdings
March 31, 2021*
Grizzly Short Fund
Allocation of Securities Sold Short
March 31, 2021
* Excludes short-term investments less than 5% of net assets. |
Reflected as a percent of absolute value of investments and securities sold short. |
|
2 | Leuthold Funds - 2021 Semi-Annual Report |
Leuthold Funds
(Unaudited)
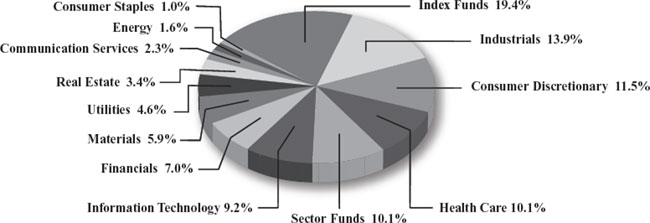
Leuthold Core ETF
Allocation of Portfolio Holdings
March 31, 2021
|
| Leuthold Funds - 2021 Semi-Annual Report | 3 |
Leuthold Core Investment Fund
Schedule of Investments
March 31, 2021 (Unaudited)
| Shares | | | Fair Value |
COMMON STOCKS - 61.52% | | | | |
Air Freight & Logistics - 0.92% | | | | |
Air Transport Services Group, Inc. (a) | 51,525 | | $ | 1,507,622 |
Atlas Air Worldwide Holdings, Inc. (a) | 32,523 | | | 1,965,690 |
Hub Group, Inc. - Class A (a) | 28,869 | | | 1,942,306 |
| | | | 5,415,618 |
Biotechnology - 2.56% | | | | |
AbbVie, Inc. | 30,696 | | | 3,321,921 |
Alexion Pharmaceuticals, Inc. (a) | 25,580 | | | 3,911,438 |
Amgen, Inc. | 17,540 | | | 4,364,127 |
Regeneron Pharmaceuticals, Inc. (a) | 7,308 | | | 3,457,707 |
| | | | 15,055,193 |
Capital Markets - 5.34% | | | | |
Credit Suisse Group AG - ADR | 191,483 | | | 2,029,720 |
Evercore, Inc. - Class A | 31,427 | | | 4,140,193 |
The Goldman Sachs Group, Inc. | 22,291 | | | 7,289,157 |
Morgan Stanley | 79,297 | | | 6,158,205 |
Raymond James Financial, Inc. | 29,965 | | | 3,672,510 |
Stifel Financial Corp. | 58,103 | | | 3,722,078 |
UBS Group AG (b) | 285,031 | | | 4,426,532 |
| | | | 31,438,395 |
Chemicals - 0.00% (h) | | | | |
China Lumena New Materials Corp. (a)(b)(d)(e) | 20,950 | | | 6,468 |
| | | | |
Construction & Engineering - 0.91% | | | | |
Comfort Systems USA, Inc. | 30,330 | | | 2,267,774 |
MasTec, Inc. (a) | 33,254 | | | 3,115,900 |
| | | | 5,383,674 |
Consumer Finance - 0.33% | | | | |
Ally Financial, Inc. | 43,034 | | | 1,945,567 |
| | | | | |
Containers & Packaging - 3.97% | | | | |
Amcor PLC (b) | 267,126 | | | 3,120,032 |
Berry Global Group, Inc. (a) | 28,138 | | | 1,727,673 |
Graphic Packaging Holding Co. | 194,406 | | | 3,530,413 |
International Paper Co. | 62,853 | | | 3,398,462 |
O-I Glass, Inc. | 99,761 | | | 1,470,477 |
Sealed Air Corp. | 67,969 | | | 3,114,340 |
Sonoco Products Co. | 52,987 | | | 3,354,077 |
Westrock Co. | 70,527 | | | 3,670,930 |
| | | | 23,386,404 |
Distributors - 0.52% | | | | |
LKQ Corp. (a) | 73,085 | | | 3,093,688 |
| | | | | |
Diversified Telecommunication Services - 0.63% | | | | |
Verizon Communications, Inc. | 63,949 | | | 3,718,634 |
| | | | | |
Electronic Equipment, Instruments & Components - 1.54% | | | | |
Arrow Electronics, Inc. (a) | 17,175 | | | 1,903,333 |
Insight Enterprises, Inc. (a) | 33,254 | | | 3,173,097 |
SYNNEX Corp. | 34,715 | | | 3,986,671 |
| | | | 9,063,101 |
Health Care Providers & Services - 7.57% | | | | |
Anthem, Inc. | 7,674 | | | 2,754,582 |
Centene Corp. (a) | 66,507 | | | 4,250,462 |
Cigna Corp. | 10,597 | | | 2,561,719 |
CVS Health Corp. | 31,792 | | | 2,391,712 |
Encompass Health Corp. | 42,024 | | | 3,441,766 |
Fresenius Medical Care AG & Co. KGaA - ADR | 38,370 | | | 1,415,086 |
HCA Healthcare, Inc. | 35,446 | | | 6,675,900 |
Humana, Inc. | 10,963 | | | 4,596,238 |
Laboratory Corp. of America Holdings (a) | 9,136 | | | 2,329,954 |
McKesson Corp. | 9,136 | | | 1,781,885 |
Premier, Inc. | 35,446 | | | 1,199,847 |
4 | Leuthold Funds - 2021 Semi-Annual Report | See Notes to the Financial Statements. |
Leuthold Core Investment Fund
Schedule of Investments (continued)
March 31, 2021 (Unaudited)
| Shares | | | Fair Value |
COMMON STOCKS - 61.52% (continued) | | | | |
Health Care Providers & Services - 7.57% | | | | |
(continued) | | | | |
Quest Diagnostics, Inc. | 13,886 | | $ | 1,782,129 |
UnitedHealth Group, Inc. | 19,368 | | | 7,206,252 |
Universal Health Services, Inc. - Class B | 16,444 | | | 2,193,465 |
| | | | 44,580,997 |
Household Durables - 5.27% | | | | |
D.R. Horton, Inc. | 61,391 | | | 5,471,166 |
KB Home | 45,313 | | | 2,108,414 |
La-Z-Boy, Inc. | 44,582 | | | 1,893,843 |
Lennar Corp. - Class A | 36,542 | | | 3,699,147 |
Meritage Homes Corp. (a) | 26,311 | | | 2,418,507 |
Mohawk Industries, Inc. (a) | 15,348 | | | 2,951,574 |
PulteGroup, Inc. | 93,914 | | | 4,924,850 |
Sony Corp. - ADR | 17,540 | | | 1,859,415 |
Toll Brothers, Inc. | 56,641 | | | 3,213,244 |
Whirlpool Corp. | 11,328 | | | 2,496,125 |
| | | | 31,036,285 |
Insurance - 3.60% | | | | |
Aflac, Inc. | 68,458 | | | 3,503,680 |
American Equity Investment Life Holding Co. | 90,602 | | | 2,856,681 |
Athene Holding, Ltd. (a)(b) | 54,091 | | | 2,726,186 |
CNO Financial Group, Inc. | 100,633 | | | 2,444,376 |
Manulife Financial Corp. (b) | 168,858 | | | 3,630,447 |
MetLife, Inc. | 57,587 | | | 3,500,714 |
Unum Group | 91,778 | | | 2,554,182 |
| | | | 21,216,266 |
Interactive Media & Services - 2.39% | | | | |
Alphabet, Inc. - Class A (a) | 4,751 | | | 9,799,032 |
Facebook, Inc. - Class A (a) | 14,617 | | | 4,305,145 |
| | | | 14,104,177 |
| | | | | |
IT Services - 2.50% | | | | |
Concentrix Corp. (a) | 34,715 | | | 5,197,530 |
Mastercard, Inc. - Class A | 14,982 | | | 5,334,341 |
Visa, Inc. - Class A | 19,733 | | | 4,178,068 |
| | | | 14,709,939 |
Media - 0.58% | | | | |
Comcast Corp. - Class A | 63,219 | | | 3,420,780 |
| | | | | |
Metals & Mining - 0.34% | | | | |
ArcelorMittal SA - NYRS | 68,284 | | | 1,991,844 |
| | | | | |
Multiline Retail - 4.13% | | | | |
Dollar General Corp. | 36,177 | | | 7,330,184 |
Dollar Tree, Inc. (a) | 32,157 | | | 3,680,690 |
Target Corp. | 67,238 | | | 13,317,831 |
| | | | 24,328,705 |
Paper & Forest Products - 0.37% | | | | |
Louisiana-Pacific Corp. | 38,909 | | | 2,157,893 |
| | | | | |
Professional Services - 2.70% | | | | |
ASGN, Inc. (a) | 36,908 | | | 3,522,500 |
Insperity, Inc. | 28,503 | | | 2,386,841 |
Korn Ferry | 38,735 | | | 2,415,902 |
ManpowerGroup, Inc. | 26,311 | | | 2,602,158 |
Robert Half International, Inc. | 43,120 | | | 3,366,378 |
TriNet Group, Inc. (a) | 20,464 | | | 1,595,373 |
| | | | 15,889,152 |
Semiconductors & Semiconductor Equipment - 6.78% | | | | |
Applied Materials, Inc. | 71,258 | | | 9,520,069 |
KLA Corp. | 14,617 | | | 4,829,457 |
Lam Research Corp. | 20,829 | | | 12,398,254 |
MKS Instruments, Inc. | 27,041 | | | 5,013,942 |
SolarEdge Technologies, Inc. (a)(b) | 28,503 | | | 8,192,902 |
| | | | 39,954,624 |
See Notes to the Financial Statements. | Leuthold Funds - 2021 Semi-Annual Report | 5 |
Leuthold Core Investment Fund
Schedule of Investments (continued)
March 31, 2021 (Unaudited)
| Shares | | | Fair Value |
COMMON STOCKS - 61.52% (continued) | | | | |
Software - 2.54% | | | | |
Adobe, Inc. (a) | 8,039 | | $ | 3,821,499 |
Microsoft Corp. | 47,140 | | | 11,114,198 |
| | | | 14,935,697 |
Specialty Retail - 2.46% | | | | |
AutoNation, Inc. (a) | 24,849 | | | 2,316,424 |
Best Buy Co., Inc. | 17,906 | | | 2,055,788 |
The Home Depot, Inc. | 8,039 | | | 2,453,905 |
Penske Automotive Group, Inc. | 29,965 | | | 2,404,392 |
Rent-A-Center, Inc. | 39,466 | | | 2,275,609 |
Williams-Sonoma, Inc. | 16,810 | | | 3,012,352 |
| | | | 14,518,470 |
Technology Hardware, Storage & Peripherals - 1.15% | | | | |
Apple, Inc. | 40,928 | | | 4,999,355 |
Dell Technologies, Inc. - Class C (a) | 20,264 | | | 1,786,272 |
| | | | 6,785,627 |
Thrifts & Mortgage Finance - 0.60% | | | | |
Flagstar Bancorp, Inc. | 42,024 | | | 1,895,282 |
PennyMac Financial Services, Inc. | 24,849 | | | 1,661,653 |
| | | | 3,556,935 |
Trading Companies & Distributors - 1.50% | | | | |
MSC Industrial Direct Co., Inc. - Class A | 14,252 | | | 1,285,388 |
Triton International, Ltd. (b) | 28,503 | | | 1,567,380 |
United Rentals, Inc. (a) | 13,155 | | | 4,332,073 |
WESCO International, Inc. (a) | 19,368 | | | 1,675,913 |
| | | | 8,860,754 |
| | | | | |
Wireless Telecommunication Services - 0.32% | | | | |
T-Mobile US, Inc. (a) | 14,982 | | | 1,877,095 |
TOTAL COMMON STOCKS | | | | |
(Cost $207,219,654) | | | $ | 362,431,982 |
| | | | |
INVESTMENT COMPANIES - 19.39% | | | | |
Exchange Traded Funds - 19.39% | | | | |
Invesco CurrencyShares Japanese Yen Trust (a)(g) | 145,298 | | $ | 12,373,578 |
iShares Core MSCI Emerging Markets ETF | 238,801 | | | 15,369,232 |
iShares Floating Rate Bond ETF | 228,111 | | | 11,583,477 |
iShares Gold Trust (a) | 361,856 | | | 5,883,778 |
iShares International Treasury Bond ETF | 218,724 | | | 11,358,337 |
iShares MBS ETF | 121,040 | | | 13,123,157 |
SPDR Bloomberg Barclays Short-Term High Yield Bond ETF | 482,378 | | | 13,183,391 |
SPDR Gold Shares (a) | 116,964 | | | 18,709,561 |
VanEck Vectors ChinaAMC China | 48,192 | | | 1,144,560 |
Vanguard Short-Term Inflation-Protected Securities ETF | 223,614 | | | 11,525,066 |
TOTAL INVESTMENT COMPANIES
(Cost $101,757,951) | | | $ | 114,254,137 |
6 | Leuthold Funds - 2021 Semi-Annual Report | See Notes to the Financial Statements. |
Leuthold Core Investment Fund
Schedule of Investments (continued)
March 31, 2021 (Unaudited)
| | Principal Amount | | | Fair Value | |
CORPORATE BONDS - 1.68% | | | | | | | | |
| | | | | | | | | |
Banks - 0.97% | | | | | | | | |
JPMorgan Chase & Co. 1.500%, 01/27/2025 | | $ | 4,600,000 | | | $ | 5,698,642 | |
| | | | | | | | |
Technology Hardware, Storage & Peripherals - 0.71% | | | | | | | | |
Apple, Inc. 1.000%, 11/10/2022 | | | 3,500,000 | | | | 4,193,080 | |
TOTAL CORPORATE BONDS (Cost $9,330,085) | | | | | | $ | 9,891,722 | |
| | | | | | | | |
FOREIGN GOVERNMENT BONDS - 2.96% | | | | | | | | |
Canadian Government Bond 2.250%, 06/01/2025 (b) | | | | | | | | |
CAD | | | 8,100,000 | | | $ | 6,833,985 | |
French Republic Government Bond OAT 1.250%, 05/25/2034 (b) | | | | | | | | |
EUR | | | 7,930,000 | | | | 10,576,371 | |
TOTAL FOREIGN GOVERNMENT BONDS (Cost $15,800,848) | | | | | | $ | 17,410,356 | |
| | Shares | | | Fair Value | |
SHORT-TERM INVESTMENTS - 12.78% | | | | | | |
Money Market Funds - 12.78% | | | | | | |
Fidelity Institutional Money Market Funds - Government Portfolio - Class I, 0.010% (c)(f) | | | 75,307,277 | | | $ | 75,307,277 | |
TOTAL SHORT-TERM INVESTMENTS (Cost $75,307,277) | | | | | | $ | 75,307,277 | |
| | | | | | | | |
Total Investments
(Cost $409,415,815) - 98.33% | | | | | | $ | 579,295,474 | |
Other Assets in Excess of Liabilities - 1.67% | | | | | | | 9,839,038 | |
TOTAL NET ASSETS - 100.00% | | | | | | $ | 589,134,512 | |
Percentages are stated as a percent of net assets.
ADR | American Depositary Receipt |
CAD | Canadian Dollar |
EUR | Euro |
NYRS | New York Registry Shares |
(a) | Non-income producing security. |
(b) | Foreign issued security. |
(c) | The rate quoted is the annualized seven-day effective yield as of March 31, 2021. |
(d) | Illiquid security. The fair value of this security totals $6,468 which represents an amount that rounds to 0.00% of total net assets. |
(e) | This security is currently being fair valued in accordance with procedures established by the Board of Directors of Leuthold Funds, Inc. and is deemed a Level 3 security as it is valued using significant unobservable inputs. |
(f) | All or a portion of the assets have been committed as collateral for open securities sold short. |
(g) | Affiliated security. At March 31, 2021, the market value of this security totals $12,373,578, which represents 2.10% of total net assets. |
(h) | Rounds to less than 0.005%. |
The Global Industry Classification Standard (GICS®) was developed by and/or is the exclusive property of MSCI, Inc. and Standard & Poor’s Financial Services LLC (“S&P”). GICS® is a service mark of MSCI, Inc. and S&P and has been licensed for use by U.S. Bancorp Fund Services, LLC.
See Notes to the Financial Statements. | Leuthold Funds - 2021 Semi-Annual Report | 7 |
Leuthold Core Investment Fund
Schedule of Investments Sold Short - (a)
March 31, 2021 (Unaudited)
| | Shares | | | Fair Value | |
COMMON STOCKS - 1.76% | | | | | | |
Aerospace & Defense - 0.12% | | | | | | | | |
The Boeing Co. | | | 1,073 | | | $ | 273,315 | |
HEICO Corp. | | | 1,353 | | | | 170,207 | |
TransDigm Group, Inc. | | | 477 | | | | 280,438 | |
| | | | | | | 723,960 | |
Airlines - 0.07% | | | | | | | | |
Alaska Air Group, Inc. | | | 2,625 | | | | 181,676 | |
Southwest Airlines Co. | | | 3,633 | | | | 221,831 | |
| | | | | | | 403,507 | |
Banks - 0.01% | | | | | | | | |
Community Bank System, Inc. | | | 1,000 | | | | 76,720 | |
| | | | | | | | | |
Capital Markets - 0.10% | | | | | | | | |
CME Group, Inc. - Class A | | | 1,237 | | | | 252,633 | |
Hamilton Lane, Inc. - Class A | | | 1,068 | | | | 94,582 | |
Intercontinental Exchange, Inc. | | | 2,061 | | | | 230,172 | |
| | | | | | | 577,387 | |
Chemicals - 0.11% | | | | | | | | |
Air Products and Chemicals, Inc. | | | 879 | | | | 247,298 | |
Ecolab, Inc. | | | 1,102 | | | | 235,905 | |
International Flavors & Fragrances,Inc. | | | 1,083 | | | | 151,198 | |
| | | | | | | 634,401 | |
Commercial Services & Supplies - 0.05% | | | | | | | | |
MSA Safety, Inc. | | | 1,140 | | | | 171,023 | |
US Ecology, Inc. | | | 2,421 | | | | 100,810 | |
| | | | | | | 271,833 | |
Diversified Consumer Services - 0.01% | | | | | | | | |
Bright Horizons Family Solutions, Inc. | | | 464 | | | | 79,553 | |
| | | | | | | | | |
Electric Utilities - 0.09% | | | | | | | | |
Edison International | | | 4,536 | | | | 265,809 | |
PG&E Corp. | | | 21,028 | | | | 246,238 | |
| | | | | | | 512,047 | |
Entertainment - 0.02% | | | | | | | | |
Madison Square Garden Sports Corp. - Class A | | | 648 | | | | 116,290 | |
| | | | | | | | | |
Food & Staples Retailing - 0.02% | | | | | | | | |
Sysco Corp. | | | 1,899 | | | | 149,527 | |
| | | | | | | | | |
Health Care Equipment & Supplies - 0.22% | | | | | | | | |
Alcon, Inc. (b) | | | 3,115 | | | | 218,611 | |
Becton Dickinson and Co. | | | 1,125 | | | | 273,544 | |
Boston Scientific Corp. | | | 6,241 | | | | 241,214 | |
The Cooper Companies, Inc. | | | 398 | | | | 152,868 | |
Insulet Corp. | | | 845 | | | | 220,477 | |
Mesa Laboratories, Inc. | | | 266 | | | | 64,771 | |
Zimmer Biomet Holdings, Inc. | | | 937 | | | | 149,995 | |
| | | | | | | 1,321,480 | |
Hotels, Restaurants & Leisure - 0.20% | | | | | | | | |
Aramark | | | 4,121 | | | | 155,691 | |
Choice Hotels International, Inc. | | | 1,773 | | | | 190,225 | |
Hilton Worldwide Holdings, Inc. | | | 1,828 | | | | 221,042 | |
Las Vegas Sands Corp. | | | 4,069 | | | | 247,233 | |
Planet Fitness, Inc. - Class A | | | 1,994 | | | | 154,136 | |
Restaurant Brands International, Inc. (b) | | | 3,521 | | | | 228,865 | |
| | | | | | | 1,197,192 | |
Industrial Conglomerates - 0.07% | | | | | | | | |
General Electric Co. | | | 11,473 | | | | 150,641 | |
Roper Technologies, Inc. | | | 604 | | | | 243,617 | |
| | | | | | | 394,258 | |
Insurance - 0.02% | | | | | | | | |
Arthur J. Gallagher & Co. | | | 1,214 | | | | 151,471 | |
8 | Leuthold Funds - 2021 Semi-Annual Report | See Notes to the Financial Statements. |
Leuthold Core Investment Fund
Schedule of Investments Sold Short - (a) (continued)
March 31, 2021 (Unaudited)
| | Shares | | | Fair Value | |
COMMON STOCKS - 1.76% (continued) | | | | | | |
IT Services - 0.08% | | | | | | | | |
Fidelity National Information Services, Inc. | | | 1,624 | | | $ | 228,351 | |
Shopify, Inc. - Class A (b) | | | 149 | | | | 164,868 | |
Switch, Inc. - Class A | | | 5,523 | | | | 89,804 | |
| | | | | | | 483,023 | |
Media - 0.04% | | | | | | | | |
Liberty Broadband Corp. - Class C | | | 1,509 | | | | 226,576 | |
| | | | | | | | | |
Metals & Mining - 0.04% | | | | | | | | |
Franco-Nevada Corp. (b) | | | 1,892 | | | | 237,049 | |
| | | | | | | | | |
Oil, Gas & Consumable Fuels - 0.04% | | | | | | | | |
Occidental Petroleum Corp. | | | 8,694 | | | | 231,434 | |
| | | | | | | | | |
Pharmaceuticals - 0.03% | | | | | | | | |
Elanco Animal Health, Inc. | | | 5,193 | | | | 152,934 | |
| | | | | | | | | |
Professional Services - 0.08% | | | | | | | | |
CoStar Group, Inc. | | | 293 | | | | 240,814 | |
Thomson Reuters Corp. (b) | | | 2,602 | | | | 227,857 | |
| | | | | | | 468,671 | |
Real Estate Investment Trusts (REITs) - 0.09% | | | | | | | | |
Sun Communities, Inc. | | | 1,013 | | | | 151,990 | |
UDR, Inc. | | | 4,577 | | | | 200,747 | |
Welltower, Inc. | | | 2,079 | | | | 148,919 | |
| | | | | | | 501,656 | |
Software - 0.15% | | | | | | | | |
Alteryx, Inc. - Class A | | | 904 | | | | 74,996 | |
Coupa Software, Inc. | | | 650 | | | | 165,412 | |
Intuit, Inc. | | | 412 | | | | 157,821 | |
PROS Holdings, Inc. | | | 2,558 | | | | 108,715 | |
RingCentral, Inc. - Class A | | | 607 | | | | 180,813 | |
Splunk, Inc. | | | 1,336 | | | | 181,001 | |
| | | | | | | 868,758 | |
| | | | | | | | | |
Specialty Retail - 0.03% | | | | | | | | |
Burlington Stores, Inc. | | | 507 | | | | 151,492 | |
| | | | | | | | | |
Textiles, Apparel & Luxury Goods - 0.04% | | | | | | | | |
VF Corp. | | | 3,342 | | | | 267,093 | |
| | | | | | | | | |
Water Utilities - 0.03% | | | | | | | | |
Essential Utilities, Inc. | | | 3,664 | | | | 163,964 | |
TOTAL COMMON STOCKS | | | | | | | | |
(Proceeds $9,583,465) | | | | | | $ | 10,362,276 | |
| | | | | | | | |
INVESTMENT COMPANIES - 5.63% | | | | | | | | |
Exchange Traded Funds - 5.63% | | | | | | | | |
Energy Select Sector SPDR Fund | | | 2,266 | | | $ | 111,170 | |
Financial Select Sector SPDR Fund | | | 14,153 | | | | 481,910 | |
Invesco QQQ Trust Series 1 | | | 3,230 | | | | 1,030,790 | |
iShares Expanded Tech-Software Sector ETF | | | 1,193 | | | | 407,314 | |
iShares Russell 1000 Growth ETF | | | 2,400 | | | | 583,296 | |
iShares S&P 100 ETF | | | 4,661 | | | | 838,188 | |
SPDR S&P 500 ETF Trust | | | 73,764 | | | | 29,234,886 | |
Utilities Select Sector SPDR Fund | | | 7,346 | | | | 470,438 | |
TOTAL INVESTMENT COMPANIES | | | |
(Proceeds $26,499,833) | | | | | | $ | 33,157,992 | |
| | | | | | | | |
TOTAL SECURITIES SOLD SHORT | | | |
(Proceeds $36,083,298) - 7.39% | $ | 43,520,268 | |
Percentages are stated as a percent of net assets.
(a) Non-income producing security.
(b) Foreign issued security.
The Global Industry Classification Standard (GICS®) was developed by and/or is the exclusive property of MSCI, Inc. and Standard & Poor’s Financial Services LLC (“S&P”). GICS® is a service mark of MSCI, Inc. and S&P and has been licensed for use by U.S. Bancorp Fund Services, LLC.
See Notes to the Financial Statements. | Leuthold Funds - 2021 Semi-Annual Report | 9 |
Leuthold Global Fund |
Schedule of Investments
March 31, 2021 (Unaudited) |
| | | Shares | | | Fair Value | |
COMMON STOCKS - 65.72% | | | | | | | |
Air Freight & Logistics - 0.85% | | | | | | | |
Atlas Air Worldwide Holdings, Inc. (a) | | | 1,607 | | $ | 97,127 | |
FedEx Corp. | | | 504 | | | 143,156 | |
| | | | | | 240,283 | |
Banks - 4.48% | | | | | | | |
Ameris Bancorp | | | 1,973 | | | 103,602 | |
Associated Banc-Corp. | | | 4,806 | | | 102,560 | |
BancorpSouth Bank | | | 2,938 | | | 95,426 | |
Bank Tabungan Negara Persero Tbk PT (b) | | | 669,200 | | | 79,401 | |
FNB Corp. | | | 8,634 | | | 109,652 | |
Investors Bancorp, Inc. | | | 7,568 | | | 111,174 | |
Mebuki Financial Group, Inc. (b) | | | 43,300 | | | 102,173 | |
People’s United Financial, Inc. | | | 8,889 | | | 159,113 | |
The PNC Financial Services Group, Inc. | | | 1,161 | | | 203,651 | |
Simmons First National Corp. | | | 3,056 | | | 90,671 | |
Valley National Bancorp | | | 8,145 | | | 111,912 | |
| | | | | | 1,269,335 | |
Capital Markets - 5.28% | | | | | | | |
Evercore, Inc. - Class A | | | 1,032 | | | 135,956 | |
The Goldman Sachs Group, Inc. | | | 995 | | | 325,365 | |
Haitong Securities Co., Ltd. - H Shares (b) | | | 79,600 | | | 73,914 | |
LPL Financial Holdings, Inc. | | | 1,342 | | | 190,779 | |
Meritz Securities Co., Ltd. (b) | | | 16,885 | | | 68,960 | |
Morgan Stanley | | | 4,876 | | | 378,670 | |
Raymond James Financial, Inc. | | | 1,310 | | | 160,553 | |
Stifel Financial Corp. | | | 2,531 | | | 162,136 | |
| | | | | | 1,496,333 | |
| | | | | | | | |
Communications Equipment - 3.85% | | | | | | | |
Ciena Corp. (a) | | | 2,208 | | | 120,822 | |
Cisco Systems, Inc. | | | 4,509 | | | 233,160 | |
Juniper Networks, Inc. | | | 4,059 | | | 102,814 | |
Lumentum Holdings, Inc. (a) | | | 1,368 | | | 124,967 | |
NETGEAR, Inc. (a) | | | 2,659 | | | 109,285 | |
Spirent Communications PLC (b) | | | 33,200 | | | 109,139 | |
Telefonaktiebolaget LM Ericsson - Class B - ADR (a) | | | 13,706 | | | 180,782 | |
Wistron NeWeb Corp. (a)(b) | | | 42,000 | | | 110,028 | |
| | | | | | 1,090,997 | |
Construction Materials - 3.27% | | | | | | | |
Asia Cement Corp. (b) | | | 49,000 | | | 82,284 | |
Buzzi Unicem SpA (b) | | | 2,905 | | | 75,458 | |
China National Building Material Co., Ltd. - H Shares (b) | | | 76,000 | | | 110,102 | |
China Resources Cement Holdings, Ltd. (b) | | | 54,000 | | | 60,913 | |
CRH PLC - ADR | | | 3,090 | | | 145,168 | |
HeidelbergCement AG (b) | | | 1,445 | | | 131,290 | |
LafargeHolcim, Ltd. (b) | | | 2,135 | | | 125,549 | |
Martin Marietta Materials, Inc. | | | 394 | | | 132,313 | |
Taiheiyo Cement Corp. (b) | | | 2,400 | | | 63,239 | |
| | | | | | 926,316 | |
Containers & Packaging - 3.22% | | | | | | | |
Berry Global Group, Inc. (a) | | | 2,860 | | | 175,604 | |
Cheng Loong Corp. (b) | | | 55,000 | | | 67,260 | |
DS Smith PLC (b) | | | 24,594 | | | 138,201 | |
O-I Glass, Inc. | | | 6,443 | | | 94,970 | |
Rengo Co., Ltd. (b) | | | 7,600 | | | 66,097 | |
Sealed Air Corp. | | | 3,469 | | | 158,950 | |
Silgan Holdings, Inc. | | | 1,770 | | | 74,393 | |
Sonoco Products Co. | | | 2,159 | | | 136,665 | |
| | | | | | 912,140 | |
10 | Leuthold Funds - 2021 Semi-Annual Report | See Notes to the Financial Statements. |
Leuthold Global Fund |
Schedule of Investments (continued)
March 31, 2021 (Unaudited) |
| | | Shares | | | Fair Value | |
COMMON STOCKS - 65.72% (continued) | | | | | | | |
Distributors - 0.34% | | | | | | | |
LKQ Corp. (a) | | | 2,309 | | $ | 97,740 | |
Health Care Providers & Services - 2.71% | | | | | | | |
Anthem, Inc. | | | 767 | | | 275,315 | |
Centene Corp. (a) | | | 2,093 | | | 133,764 | |
Humana, Inc. | | | 519 | | | 217,591 | |
Molina Healthcare, Inc. (a) | | | 610 | | | 142,593 | |
| | | | | | 769,263 | |
Household Durables - 7.80% | | | | | | | |
Barratt Developments PLC (b) | | | 12,837 | | | 132,042 | |
Electrolux AB - Class B (b) | | | 3,625 | | | 100,779 | |
Forbo Holding AG (b) | | | 30 | | | 54,456 | |
Haier Smart Home Co., Ltd. - H Class (a)(b) | | | 33,200 | | | 133,777 | |
Hanssem Co., Ltd. (b) | | | 574 | | | 59,396 | |
Haseko Corp. (b) | | | 8,700 | | | 121,688 | |
KB Home | | | 3,918 | | | 182,305 | |
La-Z-Boy, Inc. | | | 1,224 | | | 51,996 | |
Lennar Corp. - Class A | | | 2,545 | | | 257,630 | |
Meritage Homes Corp. (a) | | | 2,409 | | | 221,435 | |
Mohawk Industries, Inc. (a) | | | 579 | | | 111,347 | |
Redrow PLC (b) | | | 12,987 | | | 112,440 | |
Sony Corp. - ADR | | | 1,706 | | | 180,853 | |
TCL Electronics Holdings, Ltd. (b) | | | 58,000 | | | 45,012 | |
Toll Brothers, Inc. | | | 3,435 | | | 194,868 | |
Tri Pointe Homes, Inc. (a) | | | 7,574 | | | 154,207 | |
Whirlpool Corp. | | | 434 | | | 95,632 | |
| | | | | | 2,209,863 | |
| | | | | | | | |
Insurance - 3.04% | | | | | | | |
American Equity Investment Life Holding Co. | | | 3,331 | | | 105,026 | |
CNO Financial Group, Inc. | | | 4,306 | | | 104,593 | |
Legal & General Group PLC (b) | | | 32,052 | | | 123,065 | |
Medibank Pvt, Ltd. (b) | | | 38,240 | | | 81,508 | |
MetLife, Inc. | | | 3,931 | | | 238,966 | |
Phoenix Group Holdings PLC (b) | | | 9,073 | | | 91,729 | |
Unum Group | | | 4,171 | | | 116,079 | |
| | | | | | 860,966 | |
Interactive Media & Services - 3.52% | | | | | | | |
Alphabet, Inc. - Class A (a) | | | 194 | | | 400,129 | |
Auto Trader Group PLC (b) | | | 10,396 | | | 79,488 | |
Facebook, Inc. - Class A (a) | | | 794 | | | 233,857 | |
Twitter, Inc. (a) | | | 2,497 | | | 158,884 | |
Yandex NV - Class A (a)(b) | | | 1,945 | | | 124,597 | |
| | | | | | 996,955 | |
IT Services - 2.92% | | | | | | | |
Accenture PLC - Class A (b) | | | 907 | | | 250,559 | |
Atos SE (b) | | | 1,223 | | | 95,351 | |
Bechtle AG (b) | | | 830 | | | 155,705 | |
NS Solutions Corp. (b) | | | 2,800 | | | 89,007 | |
TIS, Inc. (b) | | | 4,600 | | | 110,129 | |
Wipro, Ltd. - ADR | | | 19,915 | | | 126,261 | |
| | | | | | 827,012 | |
Life Sciences Tools & Services - 3.39% | | | | | | | |
Charles River Laboratories International, Inc. (a) | | | 556 | | | 161,145 | |
Eurofins Scientific SE (b) | | | 1,252 | | | 119,667 | |
Gerresheimer AG (b) | | | 842 | | | 83,625 | |
Medpace Holdings, Inc. (a) | | | 893 | | | 146,497 | |
PRA Health Sciences, Inc. (a) | | | 854 | | | 130,944 | |
Siegfried Holding AG (b) | | | 128 | | | 105,473 | |
Syneos Health, Inc. (a) | | | 1,551 | | | 117,643 | |
Waters Corp. (a) | | | 339 | | | 96,334 | |
| | | | | | 961,328 | |
See Notes to the Financial Statements. | Leuthold Funds - 2021 Semi-Annual Report | 11 |
Leuthold Global Fund |
Schedule of Investments (continued)
March 31, 2021 (Unaudited) |
| | | Shares | | | Fair Value | |
COMMON STOCKS - 65.72% (continued) | | | | | | | |
Marine - 0.92% | | | | | | | |
AP Moller - Maersk A/S - Class B (b) | | | 63 | | $ | 146,256 | |
Evergreen Marine Corp Taiwan, Ltd. (a)(b) | | | 71,000 | | | 113,961 | |
| | | | | | 260,217 | |
Metals & Mining - 4.35% | | | | | | | |
Anglo American PLC (b) | | | 4,279 | | | 167,600 | |
BHP Group, Ltd. - ADR | | | 3,372 | | | 233,983 | |
Boliden AB (b) | | | 2,538 | | | 94,168 | |
Grupo Mexico SAB de CV (b) | | | 41,200 | | | 217,172 | |
KAZ Minerals PLC (b) | | | 9,803 | | | 117,143 | |
Korea Zinc Co., Ltd. (b) | | | 214 | | | 77,486 | |
Rio Tinto PLC - LN Shares - ADR | | | 2,927 | | | 227,282 | |
Sumitomo Metal Mining Co., Ltd. (b) | | | 2,300 | | | 99,671 | |
| | | | | | 1,234,505 | |
Multiline Retail - 0.75% | | | | | | | |
B&M European Value Retail SA (b) | | | 14,600 | | | 106,224 | |
Harvey Norman Holdings, Ltd. (b) | | | 24,300 | | | 106,204 | |
| | | | | | 212,428 | |
Paper & Forest Products - 0.17% | | | | | | | |
China Forestry Holdings Co., Ltd. (a)(b)(d)(e) | | | 2,484,000 | | | 47,928 | |
| | | | | | | | |
Professional Services - 0.92% | | | | | | | |
CACI International, Inc. (a) | | | 602 | | | 148,489 | |
ManTech International Corp. - Class A | | | 1,282 | | | 111,470 | |
| | | | | | 259,959 | |
| | | | | | | | |
Semiconductors & Semiconductor Equipment - 9.74% | | | | | | | |
Amkor Technology, Inc. | | | 5,631 | | | 133,511 | |
Applied Materials, Inc. | | | 2,309 | | | 308,482 | |
ASM International NV (b) | | | 909 | | | 263,560 | |
Diodes, Inc. (a) | | | 1,710 | | | 136,526 | |
Globalwafers Co., Ltd. (b) | | | 7,000 | | | 185,584 | |
Intel Corp. | | | 3,377 | | | 216,128 | |
Lam Research Corp. | | | 669 | | | 398,216 | |
Marvell Technology Group, Ltd. | | | 3,499 | | | 171,381 | |
Sino-American Silicon Products, Inc. (b) | | | 29,000 | | | 172,823 | |
SK Hynix, Inc. (b) | | | 1,621 | | | 191,378 | |
Skyworks Solutions, Inc. | | | 1,230 | | | 225,680 | |
SUMCO Corp. (b) | | | 7,000 | | | 160,421 | |
Taiwan Surface Mounting Technology Corp. (b) | | | 22,000 | | | 90,659 | |
UniTest, Inc. (b) | | | 5,413 | | | 106,583 | |
| | | | | | 2,760,932 | |
Specialty Retail - 0.44% | | | | | | | |
Penske Automotive Group, Inc. | | | 1,552 | | | 124,533 | |
Technology Hardware, Storage & Peripherals - 1.01% | | | | | | | |
HP, Inc. | | | 4,600 | | | 146,050 | |
Logitech International SA (b) | | | 1,346 | | | 140,657 | |
| | | | | | 286,707 | |
Trading Companies & Distributors - 2.75% | | | | | | | |
Air Lease Corp. | | | 1,923 | | | 94,227 | |
Indutrade AB (b) | | | 8,035 | | | 185,529 | |
ITOCHU Corp. (b) | | | 3,900 | | | 126,617 | |
Mitsui & Co., Ltd. (b) | | | 4,900 | | | 102,265 | |
Triton International, Ltd. (b) | | | 2,359 | | | 129,721 | |
WESCO International, Inc. (a) | | | 1,652 | | | 142,948 | |
| | | | | | 781,307 | |
TOTAL COMMON STOCKS (Cost $14,039,259) | | | | | $ | 18,627,047 | |
12 | Leuthold Funds - 2021 Semi-Annual Report | See Notes to the Financial Statements. |
Leuthold Global Fund |
Schedule of Investments (continued)
March 31, 2021 (Unaudited) |
| | | Shares | | | Fair Value | |
INVESTMENT COMPANIES - 16.07% | | | | | | | |
| | | | | | | | |
Exchange Traded Funds - 16.07% | | | | | | | |
Invesco CurrencyShares Japanese Yen Trust (a) | | | 8,531 | | $ | 726,500 | |
iShares Floating Rate Bond ETF | | | 11,774 | | | 597,884 | |
iShares Gold Trust (a) | | | 16,511 | | | 268,469 | |
iShares International Treasury Bond ETF | | | 3,376 | | | 175,316 | |
iShares MBS ETF | | | 6,215 | | | 673,830 | |
SPDR Bloomberg Barclays Short- Term High Yield Bond ETF | | | 25,404 | | | 694,291 | |
SPDR Gold Shares (a) | | | 5,337 | | | 853,706 | |
VanEck Vectors ChinaAMC China | | | 2,277 | | | 54,079 | |
Vanguard Short-Term Inflation- Protected Securities ETF | | | 9,933 | | | 511,947 | |
TOTAL INVESTMENT COMPANIES (Cost $4,315,993) | | | | | | 4,556,022 | |
| | | | | | | |
| | | Principal | | | | |
| | | Amount | | | Fair Value | |
| | | | | | | |
CORPORATE BONDS - 2.05% | | | | | | | |
Banks - 2.05% | | | | | | | |
JPMorgan Chase & Co. | | | | | | | |
1.500%, 01/27/2025 | | $ | 470,000 | | $ | 582,252 | |
TOTAL CORPORATE BONDS (Cost $517,809) | | | | | $ | 582,252 | |
| | | | | | | | |
FOREIGN GOVERNMENT BONDS - 4.05% | | | | | | | |
Canadian Government Bond 2.250%, 06/01/2025 (b) CAD | | | 610,000 | | $ | 514,658 | |
French Republic Government Bond OAT 1.250%, 05/25/2034 (b) EUR | | | 474,000 | | | 632,182 | |
TOTAL FOREIGN GOVERNMENT BONDS (Cost $1,042,145) | | | | | $ | 1,146,840 | |
| | | Shares | | | Fair Value | |
SHORT-TERM INVESTMENTS - 9.45% | | | | | | | |
Money Market Funds - 9.45% | | | | | | | |
Fidelity Institutional Money Market Funds - Government Portfolio - Class I, 0.010% (c)(f) | | | 2,678,724 | | $ | 2,678,724 | |
TOTAL SHORT-TERM INVESTMENTS (Cost $2,678,724) | | | | | $ | 2,678,724 | |
| | | | | | | |
Total Investments (Cost $22,593,930) - 97.34% | | | | | $ | 27,590,885 | |
Other Assets in Excess of Liabilities - 2.66% | | | | | | 752,669 | |
TOTAL NET ASSETS - 100.00% | | | | | $ | 28,343,554 | |
Percentages are stated as a percent of net assets. |
ADR | American Depositary Receipt |
CAD | Canadian Dollar |
EUR | Euro |
(a) | Non-income producing security. |
(b) | Foreign issued security. |
(c) | The rate quoted is the annualized seven-day effective yield as of March 31, 2021. |
(d) | Illiquid security. The fair value of these securities total $47,928 which represents 0.17% of total net assets. |
(e) | This security is currently being fair valued in accordance with procedures established by the Board of Directors of Leuthold Funds, Inc. and is deemed a Level 3 security as it is valued using significant unobservable inputs. |
(f) | All or a portion of the assets have been committed as collateral for open securities sold short. |
The Global Industry Classification Standard (GICS®) was developed by and/or is the exclusive property of MSCI, Inc. and Standard & Poor’s Financial Services LLC (“S&P”). GICS® is a service mark of MSCI, Inc. and S&P and has been licensed for use by U.S. Bancorp Fund Services, LLC. |
See Notes to the Financial Statements. | Leuthold Funds - 2021 Semi-Annual Report | 13 |
Leuthold Global Fund |
Schedule of Investments (continued)
March 31, 2021 (Unaudited) |
| | Fair
Value | | Percentage
of Total
Investments | |
CURRENCY EXPOSURE | | | | | | | |
Australian Dollar | | $ | 187,712 | | | 0.68 | % |
British Pound | | | 1,177,071 | | | 4.27 | |
Canadian Dollar | | | 514,658 | | | 1.86 | |
Danish Krone | | | 146,256 | | | 0.53 | |
Euro | | | 2,139,090 | | | 7.75 | |
Hong Kong Dollar | | | 471,646 | | | 1.71 | |
Indonesian Rupiah | | | 79,401 | | | 0.29 | |
Japanese Yen | | | 1,041,307 | | | 3.77 | |
Mexican Peso | | | 217,172 | | | 0.79 | |
South Korean Won | | | 503,803 | | | 1.83 | |
Swedish Krona | | | 380,476 | | | 1.38 | |
Swiss Franc | | | 285,478 | | | 1.03 | |
Taiwan New Dollar | | | 822,599 | | | 2.98 | |
US Dollar | | | 19,624,216 | | | 71.13 | |
Total Investments | | $ | 27,590,885 | | | 100.00 | % |
| | | | | | | | |
PORTFOLIO DIVERSIFICATION | | | | | | | |
Australia | | $ | 421,695 | | | 1.53 | % |
Bermuda | | | 129,721 | | | 0.47 | |
Canada | | | 514,658 | | | 1.86 | |
China | | | 365,721 | | | 1.33 | |
Denmark | | | 146,256 | | | 0.53 | |
France | | | 727,533 | | | 2.64 | |
Germany | | | 370,620 | | | 1.34 | |
Hong Kong | | | 105,925 | | | 0.38 | |
India | | | 126,261 | | | 0.46 | |
Indonesia | | | 79,401 | | | 0.29 | |
Ireland | | | 395,727 | | | 1.43 | |
Italy | | | 75,458 | | | 0.27 | |
Japan | | | 1,222,160 | | | 4.43 | |
Luxembourg | | | 119,667 | | | 0.43 | |
Mexico | | | 217,172 | | | 0.79 | |
Netherlands | | | 263,560 | | | 0.96 | |
Russia | | | 124,597 | | | 0.45 | |
South Korea | | | 503,803 | | | 1.83 | |
Sweden | | | 561,258 | | | 2.03 | |
Switzerland | | | 426,135 | | | 1.54 | |
Taiwan | | | 822,599 | | | 2.98 | |
United Kingdom | | | 1,404,353 | | | 5.09 | |
United States | | | 18,466,605 | | | 66.94 | |
Total Investments | | $ | 27,590,885 | | | 100.00 | % |
14 | Leuthold Funds - 2021 Semi-Annual Report | See Notes to the Financial Statements. |
Leuthold Global Fund |
Schedule of Investments Sold Short - (a) |
March 31, 2021 (Unaudited) |
| | | Shares | | | Fair Value | |
COMMON STOCKS - 0.60% | | | | | | | |
| | | | | | | | |
Aerospace & Defense - 0.04% | | | | | | | |
The Boeing Co. | | | 18 | | $ | 4,585 | |
HEICO Corp. | | | 22 | | | 2,768 | |
TransDigm Group, Inc. | | | 8 | | | 4,703 | |
| | | | | | 12,056 | |
Airlines - 0.02% | | | | | | | |
Alaska Air Group, Inc. | | | 43 | | | 2,976 | |
Southwest Airlines Co. | | | 60 | | | 3,664 | |
| | | | | | 6,640 | |
Banks - 0.00% (c) | | | | | | | |
Community Bank System, Inc. | | | 16 | | | 1,227 | |
| | | | | | | | |
Capital Markets - 0.03% | | | | | | | |
CME Group, Inc. - Class A | | | 20 | | | 4,085 | |
Hamilton Lane, Inc. - Class A | | | 18 | | | 1,594 | |
Intercontinental Exchange, Inc. | | | 34 | | | 3,797 | |
| | | | | | 9,476 | |
Chemicals - 0.04% | | | | | | | |
Air Products and Chemicals, Inc. | | | 14 | | | 3,939 | |
Ecolab, Inc. | | | 18 | | | 3,853 | |
International Flavors & Fragrances, Inc. | | | 18 | | | 2,513 | |
| | | | | | 10,305 | |
Commercial Services & Supplies - 0.02% | | | | | | | |
MSA Safety, Inc. | | | 19 | | | 2,850 | |
US Ecology, Inc. | | | 40 | | | 1,666 | |
| | | | | | 4,516 | |
Diversified Consumer Services - 0.00% (c) | | | | | | | |
Bright Horizons Family Solutions, Inc. 8 | | | | | | 1,371 | |
| | | | | | | | |
Electric Utilities - 0.03% | | | | | | | |
Edison International | | | 75 | | | 4,395 | |
PG&E Corp. | | | 346 | | | 4,052 | |
| | | | | | 8,447 | |
| | | | | | | | |
Entertainment - 0.01% | | | | | | | |
Madison Square Garden Sports Corp. - Class A | | | 11 | | | 1,974 | |
| | | | | | | | |
Food & Staples Retailing - 0.01% | | | | | | | |
Sysco Corp. | | | 31 | | | 2,441 | |
| | | | | | | | |
Health Care Equipment & Supplies - 0.08% | | | | | | | |
Alcon, Inc. (b) | | | 51 | | | 3,579 | |
Becton Dickinson and Co. | | | 19 | | | 4,620 | |
Boston Scientific Corp. | | | 103 | | | 3,981 | |
The Cooper Companies, Inc. | | | 7 | | | 2,689 | |
Insulet Corp. | | | 14 | | | 3,653 | |
Mesa Laboratories, Inc. | | | 4 | | | 974 | |
Zimmer Biomet Holdings, Inc. | | | 15 | | | 2,401 | |
| | | | | | 21,897 | |
Hotels, Restaurants & Leisure - 0.07% | | | | | | | |
Aramark | | | 68 | | | 2,569 | |
Choice Hotels International, Inc. | | | 29 | | | 3,111 | |
Hilton Worldwide Holdings, Inc. | | | 30 | | | 3,628 | |
Las Vegas Sands Corp. | | | 67 | | | 4,071 | |
Planet Fitness, Inc. - Class A | | | 33 | | | 2,551 | |
Restaurant Brands International, Inc. (b) | | | 58 | | | 3,770 | |
| | | | | | 19,700 | |
Industrial Conglomerates - 0.02% | | | | | | | |
General Electric Co. | | | 189 | | | 2,482 | |
Roper Technologies, Inc. | | | 10 | | | 4,033 | |
| | | | | | 6,515 | |
Insurance - 0.01% | | | | | | | |
Arthur J. Gallagher & Co. | | | 20 | | | 2,495 | |
| | | | | | | | |
IT Services - 0.03% | | | | | | | |
Fidelity National Information Services, Inc. | | | 27 | | | 3,796 | |
Shopify, Inc. - Class A (b) | | | 2 | | | 2,213 | |
Switch, Inc. - Class A | | | 91 | | | 1,480 | |
| | | | | | 7,489 | |
See Notes to the Financial Statements. | Leuthold Funds - 2021 Semi-Annual Report | 15 |
Leuthold Global Fund |
Schedule of Investments Sold Short - (a) (continued) |
March 31, 2021 (Unaudited) |
| | | Shares | | | Fair Value | |
COMMON STOCKS - 0.60% (continued) | | | | | | | |
| | | | | | | | |
Media - 0.01% | | | | | | | |
Liberty Broadband Corp. - Class C | | | 25 | | $ | 3,754 | |
| | | | | | | | |
Metals & Mining - 0.01% | | | | | | | |
Franco-Nevada Corp. (b) | | | 31 | | | 3,884 | |
| | | | | | | | |
Oil, Gas & Consumable Fuels - 0.01% | | | | | | | |
Occidental Petroleum Corp. | | | 143 | | | 3,807 | |
| | | | | | | | |
Pharmaceuticals - 0.01% | | | | | | | |
Elanco Animal Health, Inc. | | | 86 | | | 2,533 | |
| | | | | | | | |
Professional Services - 0.03% | | | | | | | |
CoStar Group, Inc. | | | 5 | | | 4,109 | |
Thomson Reuters Corp. (b) | | | 43 | | | 3,766 | |
| | | | | | 7,875 | |
Real Estate Investment Trusts (REITs) - 0.03% | | | | | | | |
Sun Communities, Inc. | | | 17 | | | 2,551 | |
UDR, Inc. | | | 75 | | | 3,290 | |
Welltower, Inc. | | | 34 | | | 2,435 | |
| | | | | | 8,276 | |
Software - 0.05% | | | | | | | |
Alteryx, Inc. - Class A | | | 15 | | | 1,244 | |
Coupa Software, Inc. | | | 11 | | | 2,799 | |
Intuit, Inc. | | | 7 | | | 2,681 | |
PROS Holdings, Inc. | | | 42 | | | 1,785 | |
RingCentral, Inc. - Class A | | | 10 | | | 2,979 | |
Splunk, Inc. | | | 22 | | | 2,981 | |
| | | | | | 14,469 | |
Specialty Retail - 0.01% | | | | | | | |
Burlington Stores, Inc. | | | 8 | | | 2,390 | |
Textiles, Apparel & Luxury Goods - 0.02% | | | | | | | |
VF Corp. | | | 55 | | | 4,396 | |
| | | | | | | |
Water Utilities - 0.01% | | | | | | | |
Essential Utilities, Inc. | | | 60 | | | 2,685 | |
TOTAL COMMON STOCKS (Proceeds $157,803) | | | | | $ | 170,618 | |
| | | | | | | |
INVESTMENT COMPANIES - 5.52% | | | | | | | |
| | | | | | | | |
Exchange Traded Funds - 5.52% | | | | | | | |
Energy Select Sector SPDR Fund | | | 37 | | $ | 1,815 | |
Financial Select Sector SPDR Fund | | | 233 | | | 7,933 | |
Invesco QQQ Trust Series 1 | | | 53 | | | 16,914 | |
iShares Expanded Tech-Software Sector ETF | | | 20 | | | 6,828 | |
iShares MSCI ACWI ETF | | | 7,675 | | | 730,276 | |
iShares MSCI EAFE ETF | | | 7,841 | | | 594,897 | |
iShares MSCI Emerging Markets ETF | | | 3,152 | | | 168,128 | |
iShares Russell 1000 Growth ETF | | | 39 | | | 9,479 | |
iShares S&P 100 ETF | | | 77 | | | 13,847 | |
SPDR S&P 500 ETF Trust | | | 19 | | | 7,530 | |
Utilities Select Sector SPDR Fund | | | 121 | | | 7,749 | |
TOTAL INVESTMENT COMPANIES (Proceeds $1,395,503) | | | | | $ | 1,565,396 | |
| | | | | | | |
TOTAL SECURITIES SOLD SHORT (Proceeds $1,553,306) - 6.12% | | | | | $ | 1,736,014 | |
Percentages are stated as a percent of net assets.
(a) Non-income producing security.
(b) Foreign issued security.
(c) Rounds to less than 0.005%.
The Global Industry Classification Standard (GICS®) was developed by and/or is the exclusive property of MSCI, Inc. and Standard & Poor’s Financial Services LLC (“S&P”). GICS® is a service mark of MSCI, Inc. and S&P and has been licensed for use by U.S. Bancorp Fund Services, LLC.
16 | Leuthold Funds - 2021 Semi-Annual Report | See Notes to the Financial Statements. |
Leuthold Select Industries Fund |
Schedule of Investments |
March 31, 2021 (Unaudited) |
| | | Shares | | | Fair Value | |
COMMON STOCKS - 99.77% | | | | | | | |
| | | | | | | | |
Air Freight & Logistics - 1.50% | | | | | | | |
Air Transport Services Group, Inc. (a) | | | 1,441 | | $ | 42,163 | |
Atlas Air Worldwide Holdings, Inc. (a) | | | 909 | | | 54,940 | |
Hub Group, Inc. - Class A (a) | | | 806 | | | 54,228 | |
| | | | | | 151,331 | |
Biotechnology - 4.21% | | | | | | | |
AbbVie, Inc. | | | 859 | | | 92,961 | |
Alexion Pharmaceuticals, Inc. (a) | | | 715 | | | 109,330 | |
Amgen, Inc. | | | 501 | | | 124,654 | |
Regeneron Pharmaceuticals, Inc. (a) | | | 207 | | | 97,940 | |
| | | | | | 424,885 | |
Capital Markets - 8.66% | | | | | | | |
Credit Suisse Group AG - ADR | | | 5,294 | | | 56,116 | |
Evercore, Inc. - Class A | | | 875 | | | 115,272 | |
The Goldman Sachs Group, Inc. | | | 618 | | | 202,086 | |
Morgan Stanley | | | 2,227 | | | 172,949 | |
Raymond James Financial, Inc. | | | 830 | | | 101,725 | |
Stifel Financial Corp. | | | 1,620 | | | 103,777 | |
UBS Group AG (b) | | | 7,939 | | | 123,293 | |
| | | | | | 875,218 | |
Construction & Engineering - 1.49% | | | | | | | |
Comfort Systems USA, Inc. | | | 847 | | | 63,330 | |
MasTec, Inc. (a) | | | 934 | | | 87,516 | |
| | | | | | 150,846 | |
Consumer Finance - 0.55% | | | | | | | |
Ally Financial, Inc. | | | 1,235 | | | 55,834 | |
| | | | | | | | |
Containers & Packaging - 6.48% | | | | | | | |
Amcor PLC (b) | | | 7,331 | | | 85,626 | |
Berry Global Group, Inc. (a) | | | 795 | | | 48,813 | |
Graphic Packaging Holding Co. | | | 5,484 | | | 99,589 | |
International Paper Co. | | | 1,739 | | | 94,028 | |
O-I Glass, Inc. | | | 2,816 | | | 41,508 | |
Sealed Air Corp. | | | 1,936 | | | 88,708 | |
Sonoco Products Co. | | | 1,480 | | | 93,684 | |
Westrock Co. | | | 1,964 | | | 102,226 | |
| | | | | | 654,182 | |
Distributors - 0.85% | | | | | | | |
LKQ Corp. (a) | | | 2,032 | | | 86,015 | |
| | | | | | | | |
Diversified Telecommunication Services - 1.05% | | | | | | | |
Verizon Communications, Inc. | | | 1,824 | | | 106,066 | |
| | | | | | | |
Electronic Equipment, Instruments & Components - 2.50% | | | | | | | |
Arrow Electronics, Inc. (a) | | | 486 | | | 53,859 | |
Insight Enterprises, Inc. (a) | | | 907 | | | 86,546 | |
SYNNEX Corp. | | | 979 | | | 112,428 | |
| | | | | | 252,833 | |
Health Care Providers & Services - 12.27% | | | | | | | |
Anthem, Inc. | | | 207 | | | 74,303 | |
Centene Corp. (a) | | | 1,812 | | | 115,805 | |
Cigna Corp. | | | 308 | | | 74,456 | |
CVS Health Corp. | | | 916 | | | 68,911 | |
Encompass Health Corp. | | | 1,160 | | | 95,004 | |
Fresenius Medical Care AG & Co. KGaA - ADR | | | 1,103 | | | 40,678 | |
HCA Healthcare, Inc. | | | 979 | | | 184,385 | |
Humana, Inc. | | | 297 | | | 124,517 | |
Laboratory Corp. of America Holdings (a) | | | 259 | | | 66,053 | |
McKesson Corp. | | | 259 | | | 50,515 | |
Premier, Inc. | | | 1,029 | | | 34,832 | |
See Notes to the Financial Statements. | Leuthold Funds - 2021 Semi-Annual Report | 17 |
Leuthold Select Industries Fund |
Schedule of Investments (continued) |
March 31, 2021 (Unaudited) |
| | | Shares | | | Fair Value | |
COMMON STOCKS - 99.77% (continued) | | | | | | | |
| | | | | | | | |
Health Care Providers & Services - 12.27% (continued) | | | | | | | |
Quest Diagnostics, Inc. | | | 400 | | $ | 51,336 | |
UnitedHealth Group, Inc. | | | 532 | | | 197,941 | |
Universal Health Services, Inc. - Class B | | | 452 | | | 60,292 | |
| | | | | | 1,239,028 | |
Household Durables - 8.50% | | | | | | | |
D.R. Horton, Inc. | | | 1,689 | | | 150,524 | |
KB Home | | | 1,255 | | | 58,395 | |
La-Z-Boy, Inc. | | | 1,244 | | | 52,845 | |
Lennar Corp. - Class A | | | 1,010 | | | 102,242 | |
Meritage Homes Corp. (a) | | | 721 | | | 66,274 | |
Mohawk Industries, Inc. (a) | | | 434 | | | 83,463 | |
PulteGroup, Inc. | | | 2,558 | | | 134,141 | |
Sony Corp. - ADR | | | 494 | | | 52,369 | |
Toll Brothers, Inc. | | | 1,553 | | | 88,102 | |
Whirlpool Corp. | | | 319 | | | 70,292 | |
| | | | | | 858,647 | |
Insurance - 5.96% | | | | | | | |
Aflac, Inc. | | | 1,937 | | | 99,136 | |
American Equity Investment Life Holding Co. | | | 2,578 | | | 81,284 | |
Athene Holding, Ltd. (a)(b) | | | 1,539 | | | 77,566 | |
CNO Financial Group, Inc. | | | 2,864 | | | 69,566 | |
Manulife Financial Corp. (b) | | | 4,778 | | | 102,727 | |
MetLife, Inc. | | | 1,629 | | | 99,027 | |
Unum Group | | | 2,612 | | | 72,692 | |
| | | | | | 601,998 | |
Interactive Media & Services - 3.99% | | | | | | | |
Alphabet, Inc. - Class A (a) | | | 137 | | | 282,565 | |
Facebook, Inc. - Class A (a) | | | 408 | | | 120,168 | |
| | | | | | 402,733 | |
| | | | | | | |
IT Services - 4.01% | | | | | | | |
Concentrix Corp. (a) | | | 979 | | | 146,576 | |
Mastercard, Inc. - Class A | | | 406 | | | 144,556 | |
Visa, Inc. - Class A | | | 538 | | | 113,911 | |
| | | | | | 405,043 | |
Media - 0.97% | | | | | | | |
Comcast Corp. - Class A | | | 1,806 | | | 97,723 | |
| | | | | | | | |
Metals & Mining - 0.56% | | | | | | | |
ArcelorMittal SA - NYRS | | | 1,929 | | | 56,269 | |
| | | | | | | | |
Multiline Retail - 6.56% | | | | | | | |
Dollar General Corp. | | | 985 | | | 199,581 | |
Dollar Tree, Inc. (a) | | | 878 | | | 100,496 | |
Target Corp. | | | 1,830 | | | 362,468 | |
| | | | | | 662,545 | |
Paper & Forest Products - 0.61% | | | | | | | |
Louisiana-Pacific Corp. | | | 1,116 | | | 61,893 | |
| | | | | | | | |
Professional Services - 4.35% | | | | | | | |
ASGN, Inc. (a) | | | 1,005 | | | 95,917 | |
Insperity, Inc. | | | 788 | | | 65,987 | |
Korn Ferry | | | 1,098 | | | 68,482 | |
ManpowerGroup, Inc. | | | 728 | | | 71,999 | |
Robert Half International, Inc. | | | 1,176 | | | 91,811 | |
TriNet Group, Inc. (a) | | | 576 | | | 44,905 | |
| | | | | | 439,101 | |
Semiconductors & Semiconductor Equipment - 10.64% | | | | | | | |
Applied Materials, Inc. | | | 1,929 | | | 257,714 | |
KLA Corp. | | | 398 | | | 131,499 | |
Lam Research Corp. | | | 566 | | | 336,906 | |
MKS Instruments, Inc. | | | 733 | | | 135,913 | |
SolarEdge Technologies, Inc. (a)(b) | | | 741 | | | 212,993 | |
| | | | | | 1,075,025 | |
18 | Leuthold Funds - 2021 Semi-Annual Report | See Notes to the Financial Statements. |
Leuthold Select Industries Fund |
Schedule of Investments (continued) |
March 31, 2021 (Unaudited) |
| | | Shares | | | Fair Value | |
COMMON STOCKS - 99.77% (continued) | | | | | | | |
| | | | | | | | |
Software - 4.18% | | | | | | | |
Adobe, Inc. (a) | | | 232 | | $ | 110,286 | |
Microsoft Corp. | | | 1,325 | | | 312,395 | |
| | | | | | 422,681 | |
Specialty Retail - 4.02% | | | | | | | |
AutoNation, Inc. (a) | | | 708 | | | 66,000 | |
Best Buy Co., Inc. | | | 509 | | | 58,438 | |
The Home Depot, Inc. | | | 224 | | | 68,376 | |
Penske Automotive Group, Inc. | | | 831 | | | 66,680 | |
Rent-A-Center Inc. | | | 1,102 | | | 63,541 | |
Williams-Sonoma, Inc. | | | 464 | | | 83,149 | |
| | | | | | 406,184 | |
Technology Hardware, Storage & Peripherals - 1.90% | | | | | | | |
Apple, Inc. | | | 1,160 | | | 141,694 | |
Dell Technologies, Inc. - Class C (a) | | | 573 | | | 50,510 | |
| | | | | | 192,204 | |
Thrifts & Mortgage Finance - 0.98% | | | | | | | |
Flagstar Bancorp, Inc. | | | 1,176 | | | 53,038 | |
PennyMac Financial Services, Inc. | | | 693 | | | 46,341 | |
| | | | | | 99,379 | |
Trading Companies & Distributors - 2.46% | | | | | | | |
MSC Industrial Direct Co., Inc. - Class A | | | 403 | | | 36,347 | |
Triton International, Ltd. (b) | | | 794 | | | 43,662 | |
United Rentals, Inc. (a) | | | 368 | | | 121,186 | |
WESCO International, Inc. (a) | | | 545 | | | 47,159 | |
| | | | | | 248,354 | |
Wireless Telecommunication Services - 0.52% | | | | | | | |
T-Mobile US, Inc. (a) | | | 418 | | | 52,371 | |
TOTAL COMMON STOCKS | | | | | | | |
(Cost $5,764,420) | | | | | $ | 10,078,388 | |
| | | | | | | |
| | | | | | | | |
SHORT-TERM INVESTMENTS - 0.38% | | | | | | | |
| | | | | | | | |
Money Market Funds - 0.38% | | | | | | | |
Fidelity Institutional Money Market Funds - Government Portfolio - Class I, 0.010% (c) | | | 37,930 | | | 37,930 | |
TOTAL SHORT-TERM INVESTMENTS | | | | | | | |
(Cost $37,930) | | | | | $ | 37,930 | |
| | | | | | | |
Total Investments (Cost $5,802,350) - 100.15% | | | | | $ | 10,116,318 | |
| | | | | | | |
Liabilities in Excess of Other Assets - (0.15)% | | | | | | (15,450 | ) |
TOTAL NET ASSETS - 100.00% | | | | | $ | 10,100,868 | |
Percentages are stated as a percent of net assets.
ADR American Depositary Receipt
NYRS New York Registry Shares
(a) Non-income producing security.
(b) Foreign issued security.
(c) The rate quoted is the annualized seven-day effective yield as of March 31, 2021.
The Global Industry Classification Standard (GICS®) was developed by and/or is the exclusive property of MSCI, Inc. and Standard & Poor’s Financial Services LLC (“S&P”). GICS® is a service mark of MSCI, Inc. and S&P and has been licensed for use by U.S. Bancorp Fund Services, LLC.
See Notes to the Financial Statements. | Leuthold Funds - 2021 Semi-Annual Report | 19 |
Grizzly Short Fund |
Schedule of Investments |
March 31, 2021 (Unaudited) |
| | | Shares | | | Fair Value | |
SHORT-TERM INVESTMENTS - 79.59% | | | | | | | |
| | | | | | | | |
Money Market Funds - 79.59% | | | | | | | |
Fidelity Institutional Money Market Funds - Government Portfolio, Class I, 0.010% (a)(b) | | | 41,423,346 | | $ | 41,423,346 | |
TOTAL SHORT-TERM INVESTMENTS | | | | | | | |
(Cost $41,423,346) | | | | | $ | 41,423,346 | |
| | | | | | | |
Total Investments (Cost $41,423,346) - 79.59% | | | | | $ | 41,423,346 | |
Other Assets in Excess of Liabilities - (b) 20.41% | | | | | | 10,620,809 | |
TOTAL NET ASSETS - 100.00% | | | | | $ | 52,044,155 | |
Percentages are stated as a percent of net assets.
(a) The rate quoted is the annualized seven-day yield as of March 31, 2021.
(b) All or a portion of the assets have been committed as collateral for open securities sold short.
The Global Industry Classification Standard (GICS®) was developed by and/or is the exclusive property of MSCI, Inc. and Standard & Poor’s Financial Services LLC (“S&P”). GICS® is a service mark of MSCI, Inc. and S&P and has been licensed for use by U.S. Bancorp Fund Services, LLC.
20 | Leuthold Funds - 2021 Semi-Annual Report | See Notes to the Financial Statements. |
Grizzly Short Fund |
Schedule of Securities Sold Short - (a) |
March 31, 2021 (Unaudited) |
| | Shares | | | Fair Value | |
COMMON STOCKS - 68.20% | | | | | | |
Aerospace & Defense - 4.74% | | | | | | | | |
The Boeing Co. | | | 3,614 | | | $ | 920,558 | |
HEICO Corp. | | | 4,663 | | | | 586,605 | |
TransDigm Group, Inc. | | | 1,632 | | | | 959,486 | |
| | | | | | | 2,466,649 | |
Airlines - 2.66% | | | | | | | | |
Alaska Air Group, Inc. | | | 8,977 | | | | 621,298 | |
Southwest Airlines Co. | | | 12,474 | | | | 761,663 | |
| | | | | | | 1,382,961 | |
Banks - 0.50% | | | | | | | | |
Community Bank System, Inc. | | | 3,381 | | | | 259,390 | |
Capital Markets - 3.76% | | | | | | | | |
CME Group, Inc. - Class A | | | 4,197 | | | | 857,153 | |
Hamilton Lane, Inc. - Class A | | | 3,614 | | | | 320,056 | |
Intercontinental Exchange, Inc. | | | 6,995 | | | | 781,202 | |
| | | | | | | 1,958,411 | |
Chemicals - 4.17% | | | | | | | | |
Air Products and Chemicals, Inc. | | | 3,031 | | | | 852,742 | |
Ecolab, Inc. | | | 3,731 | | | | 798,695 | |
International Flavors & Fragrances, Inc. | | | 3,723 | | | | 519,768 | |
| | | | | | | 2,171,205 | |
Commercial Services & Supplies - 1.77% | | | | | | | | |
MSA Safety, Inc. | | | 3,847 | | | | 577,127 | |
US Ecology, Inc. | | | 8,277 | | | | 344,654 | |
| | | | | | | 921,781 | |
Diversified Consumer Services - 0.53% | | | | | | | | |
Bright Horizons Family Solutions, Inc. | | | 1,596 | | | | 273,634 | |
Electric Utilities - 3.36% | | | | | | | | |
Edison International | | | 15,505 | | | | 908,593 | |
PG&E Corp. | | | 71,931 | | | | 842,312 | |
| | | | | | | 1,750,905 | |
| | | | | | | | | |
Entertainment - 0.76% | | | | | | | | |
Madison Square Garden Sports Corp. - Class A | | | 2,215 | | | | 397,504 | |
| | | | | | | | |
Food & Staples Retailing - 0.99% | | | | | | | | |
Sysco Corp. | | | 6,532 | | | | 514,330 | |
| | | | | | | | |
Health Care Equipment & Supplies - 8.71% | | | | | | | | |
Alcon, Inc. (b) | | | 10,609 | | | | 744,540 | |
Becton Dickinson and Co. | | | 3,847 | | | | 935,398 | |
Boston Scientific Corp. | | | 21,334 | | | | 824,559 | |
The Cooper Companies, Inc. | | | 1,370 | | | | 526,203 | |
Insulet Corp. | | | 2,915 | | | | 760,582 | |
Mesa Laboratories, Inc. | | | 933 | | | | 227,185 | |
Zimmer Biomet Holdings, Inc. | | | 3,224 | | | | 516,098 | |
| | | | | | | 4,534,565 | |
| | | | | | | | |
Hotels, Restaurants & Leisure - 7.86% | | | | | | | | |
Aramark | | | 14,106 | | | | 532,925 | |
Choice Hotels International, Inc. | | | 6,062 | | | | 650,392 | |
Hilton Worldwide Holdings, Inc. | | | 6,295 | | | | 761,191 | |
Las Vegas Sands Corp. | | | 13,873 | | | | 842,923 | |
Planet Fitness, Inc. - Class A | | | 6,762 | | | | 522,703 | |
Restaurant Brands International, Inc. (b) | | | 12,008 | | | | 780,520 | |
| | | | | | | 4,090,654 | |
| | | | | | | | |
Industrial Conglomerates - 2.62% | | | | | | | | |
General Electric Co. | | | 39,497 | | | | 518,596 | |
Roper Technologies, Inc. | | | 2,098 | | | | 846,207 | |
| | | | | | | 1,364,803 | |
| | | | | | | | |
Insurance - 1.00% | | | | | | | | |
Arthur J. Gallagher & Co. | | | 4,181 | | | | 521,663 | |
See Notes to the Financial Statements. | Leuthold Funds - 2021 Semi-Annual Report | 21 |
Grizzly Short Fund |
Schedule of Securities Sold Short - (a) (continued) |
March 31, 2021 (Unaudited) |
| | Shares | | | Fair Value | |
COMMON STOCKS - 68.20% | | | | | | |
IT Services - 3.19% | | | | | | | | |
Fidelity National Information Services, Inc. | | | 5,596 | | | $ | 786,854 | |
Shopify, Inc. - Class A (b) | | | 511 | | | | 565,421 | |
Switch, Inc. - Class A | | | 18,886 | | | | 307,086 | |
| | | | | | | 1,659,361 | |
| | | | | | | | |
Media - 1.48% | | | | | | | | |
Liberty Broadband Corp. - Class C | | | 5,130 | | | | 770,270 | |
| | | | | | | | |
Metals & Mining - 1.54% | | | | | | | | |
Franco-Nevada Corp. (b) | | | 6,412 | | | | 803,360 | |
| | | | | | | | |
Oil, Gas & Consumable Fuels - 1.52% | | | | | | | | |
Occidental Petroleum Corp. | | | 29,728 | | | | 791,359 | |
| | | | | | | | |
Pharmaceuticals - 1.00% | | | | | | | | |
Elanco Animal Health, Inc. | | | 17,720 | | | | 521,854 | |
| | | | | | | | |
Professional Services - 3.15% | | | | | | | | |
CoStar Group, Inc. | | | 1,049 | | | | 862,163 | |
Thomson Reuters Corp. (b) | | | 8,860 | | | | 775,870 | |
| | | | | | | 1,638,033 | |
Real Estate Investment Trusts (REITs) - 3.31% | | | | | | | | |
Sun Communities, Inc. | | | 3,487 | | | | 523,189 | |
UDR, Inc. | | | 15,622 | | | | 685,181 | |
Welltower, Inc. | | | 7,151 | | | | 512,226 | |
| | | | | | | 1,720,596 | |
Software - 5.74% | | | | | | | | |
Alteryx, Inc. - Class A | | | 3,148 | | | | 261,158 | |
Coupa Software, Inc. | | | 2,235 | | | | 568,763 | |
Intuit, Inc. | | | 1,417 | | | | 542,796 | |
PROS Holdings, Inc. | | | 8,744 | | | | 371,620 | |
RingCentral, Inc. - Class A | | | 2,098 | | | | 624,952 | |
Splunk, Inc. | | | 4,547 | | | | 616,028 | |
| | | | | | | 2,985,317 | |
| | | | | | | | | |
Specialty Retail - 1.00% | | | | | | | | |
Burlington Stores, Inc. | | | 1,745 | | | | 521,406 | |
| | | | | | | | |
Textiles, Apparel & Luxury Goods - 1.76% | | | | | | | | |
VF Corp. | | | 11,425 | | | | 913,086 | |
| | | | | | | | |
Water Utilities - 1.08% | | | | | | | | |
Essential Utilities, Inc. | | | 12,591 | | | | 563,447 | |
TOTAL COMMON STOCKS | | | | | | | | |
(Proceeds $33,992,790) | | | | | | $ | 35,496,544 | |
| | | | | | | | |
| | | | | | | | |
INVESTMENT COMPANIES - 28.47% | | | | | | | | |
| | | | | | | | | |
Exchange Traded Funds - 28.47% | | | | | | | | |
Energy Select Sector SPDR Fund | | | 8,044 | | | $ | 394,639 | |
Financial Select Sector SPDR Fund | | | 48,381 | | | | 1,647,373 | |
Invesco QQQ Trust Series 1 | | | 11,075 | | | | 3,534,365 | |
iShares Expanded Tech-Software Sector ETF | | | 4,080 | | | | 1,392,994 | |
iShares Russell 1000 Growth ETF | | | 8,161 | | | | 1,983,449 | |
iShares S&P 100 ETF | | | 15,972 | | | | 2,872,245 | |
SPDR S&P 500 ETF Trust | | | 3,479 | | | | 1,378,832 | |
Utilities Select Sector SPDR Fund | | | 25,182 | | | | 1,612,655 | |
TOTAL INVESTMENT COMPANIES | | | | | | | | |
(Proceeds $13,681,400) | | | | | | $ | 14,816,552 | |
| | | | | | | | |
TOTAL SECURITIES SOLD SHORT | | | | | | | | |
(Proceeds $47,674,190) - 96.67% | | | | | | $ | 50,313,096 | |
Percentages are stated as a percent of net assets.
(a) Non-income producing security.
(b) Foreign issued security.
The Global Industry Classification Standard (GICS®) was developed by and/or is the exclusive property of MSCI, Inc. and Standard & Poor’s Financial services LLC (“S&P”). GICS® is a service mark of MSCI, Inc. and S&P and has been licensed for use by U.S. Bancorp Fund Services, LLC.
22 | Leuthold Funds - 2021 Semi-Annual Report | See Notes to the Financial Statements. |
Leuthold Core ETF |
Schedule of Investments |
March 31, 2021 (Unaudited) |
| | Shares | | | Fair Value | |
INVESTMENT COMPANIES - 92.94% | | | | | | | | |
Exchange Traded Funds - 92.94% | | | | | | | | |
Communication Services Select Sector SPDR Fund | | | 16,665 | | | $ | 1,221,878 | |
Consumer Discretionary Select Sector SPDR Fund | | | 5,369 | | | | 902,368 | |
Direxion Daily S&P 500 Bear 1x Shares | | | 68,072 | | | | 1,172,200 | |
Fidelity MSCI Financials Index ETF | | | 11,462 | | | | 561,065 | |
Fidelity MSCI Materials Index ETF | | | 13,012 | | | | 575,781 | |
Invesco CurrencyShares British Pound Sterling Trust (a) | | | 380 | | | | 50,555 | |
Invesco CurrencyShares Euro Currency Trust (a) | | | 2,383 | | | | 261,820 | |
Invesco CurrencyShares Japanese Yen Trust (a) | | | 1,462 | | | | 124,504 | |
iShares Core MSCI Emerging Markets ETF | | | 5,955 | | | | 383,264 | |
iShares Floating Rate Bond ETF | | | 6,469 | | | | 328,496 | |
iShares Gold Trust (a) | | | 37,204 | | | | 604,937 | |
iShares MBS ETF | | | 2,652 | | | | 287,530 | |
iShares Nasdaq Biotechnology ETF | | | 2,160 | | | | 325,210 | |
iShares U.S. Broker-Dealers & Securities Exchanges ETF | | | 8,003 | | | | 737,556 | |
iShares U.S. Healthcare Providers ETF | | | 3,292 | | | | 828,827 | |
iShares U.S. Home Construction ETF | | | 6,736 | | | | 457,139 | |
SPDR Bloomberg Barclays International Corporate Bond ETF | | | 5,469 | | | | 195,954 | |
SPDR Bloomberg Barclays International Treasury Bond ETF | | | 20,307 | | | | 591,746 | |
SPDR Bloomberg Barclays Short-Term High Yield Bond ETF | | | 11,389 | | | | 311,261 | |
SPDR S&P Homebuilders ETF | | | 2,835 | | | | 199,499 | |
SPDR S&P Regional Banking ETF | | | 8,827 | | | | 585,583 | |
SPDR S&P Retail ETF | | | 2,076 | | | | 185,200 | |
SPDR S&P Semiconductor ETF | | | 1,417 | | | | 258,999 | |
Technology Select Sector SPDR Fund | | | 15,400 | | | | 2,045,273 | |
Vanguard Short-Term Inflation-Protected Securities ETF | | | 5,901 | | | | 304,138 | |
TOTAL INVESTMENT COMPANIES | | | | | | | | |
(Cost $11,799,694) | | | | | | $ | 13,500,783 | |
| | | | | | | | |
SHORT-TERM INVESTMENTS - 7.35% | | | | | | | | |
Money Market Funds - 7.35% | | | | | | | | |
Fidelity Institutional Money Market Funds - Government Portfolio - Class I, 0.010% (b) | | | 1,068,288 | | | $ | 1,068,288 | |
TOTAL SHORT-TERM INVESTMENTS | | | | | | | | |
(Cost $1,068,288) | | | | | | $ | 1,068,288 | |
| | | | | | | | |
Total Investments | | | | | | | | |
(Cost $12,867,982) - 100.29% | | | | | | $ | 14,569,071 | |
Liabilities in Excess of Other Assets - (0.29)% | | | | | | | (41,978 | ) |
TOTAL NET ASSETS - 100.00% | | | | | | $ | 14,527,093 | |
Percentages are stated as a percent of net assets.
(a) Non-income producing security.
(b) The rate quoted is the annualized seven-day effective yield as of March 31, 2021.
The Global Industry Classification Standard (GICS®) was developed by and/or is the exclusive property of MSCI, Inc. and Standard & Poor’s Financial services LLC (“S&P”). GICS® is a service mark of MSCI, Inc. and S&P and has been licensed for use by U.S. Bancorp Fund Services, LLC.
See Notes to the Financial Statements. | Leuthold Funds - 2021 Semi-Annual Report | 23 |
Leuthold Funds |
Statements of Assets and Liabilities
March 31, 2021 (Unaudited) |
| | Leuthold
Core
Investment
Fund | | Leuthold
Global
Fund | |
ASSETS: | | | | | | | |
Investments, at cost | | | | | | | |
Unaffiliated Securities | | $ | 397,098,201 | | $ | 22,593,930 | |
Affiliated Securities | | | 12,317,614 | | | — | |
Total Investments, at cost | | | 409,415,815 | | | 22,593,930 | |
| | | | | | | |
Investments, at fair value | | | | | | | |
Unaffiliated Securities | | | 566,921,896 | | | 27,590,885 | |
Affiliated Securities | | | 12,373,578 | | | — | |
Total Investments, at fair value | | | 579,295,474 | | | 27,590,885 | |
Cash | | | — | | | 775 | |
Foreign currency | | | | | | | |
(cost $0 and $23,742, respectively) | | | — | | | 23,013 | |
Receivable for Fund shares sold | | | 1,020,517 | | | 34,538 | |
Receivable for investments sold | | | 696,183 | | | 11,219 | |
Collateral at broker for securities sold short | | | 45,783,406 | | | 2,047,191 | |
Tri-party collateral held at custodian | | | 8,000,001 | | | 400,001 | |
Interest receivable | | | 179,601 | | | 11,673 | |
Dividends receivable | | | 121,191 | | | 76,043 | |
Other assets | | | 67,284 | | | 27,933 | |
Total Assets | | | 635,163,657 | | | 30,223,271 | |
| | | | | | | |
LIABILITIES: | | | | | | | |
Securities sold short, at fair value | | | | | | | |
(proceeds $36,083,298 and $1,553,306, respectively) | | | 43,520,268 | | | 1,736,014 | |
Payable for investments purchased | | | 1,215,569 | | | 19,763 | |
Payable for Fund shares redeemed | | | 298,609 | | | 6,266 | |
Payable to Adviser | | | 443,098 | | | 24,485 | |
Payable to Custodian | | | 23,222 | | | 16,185 | |
Payable to Directors | | | 40,815 | | | 1,900 | |
Dividends payable on securities sold short | | | 106,094 | | | 217 | |
Distribution (Rule 12b-1) fees payable | | | — | | | 15,851 | |
Shareholder servicing fees payable | | | 40,191 | | | — | |
Accrued expenses and other liabilities | | | 341,279 | | | 59,036 | |
Total Liabilities | | | 46,029,145 | | | 1,879,717 | |
NET ASSETS | | $ | 589,134,512 | | $ | 28,343,554 | |
24 | Leuthold Funds - 2021 Semi-Annual Report | See Notes to the Financial Statements. |
Leuthold Funds |
Statements of Assets and Liabilities (continued)
March 31, 2021 (Unaudited) |
| | Leuthold
Core
Investment
Fund | | Leuthold
Global
Fund | |
NET ASSETS CONSIST OF: | | | | | | | |
Capital stock | | $ | 396,971,762 | | $ | 24,605,951 | |
Total distributable earnings | | | 192,162,750 | | | 3,737,603 | |
Total Net Assets | | $ | 589,134,512 | | $ | 28,343,554 | |
| | | | | | | |
Retail Class Shares | | | | | | | |
Net assets | | $ | 285,109,545 | | $ | 5,663,580 | |
Shares outstanding (1,000,000,000 shares of $0.0001 par value authorized) | | | 12,813,804 | | | 596,322 | |
Net Asset Value, Redemption Price, and Offering Price Per Share | | | $22.25* | | | $9.50 | |
| | | | | | | |
Institutional Class Shares | | | | | | | |
Net assets | | $ | 304,024,967 | | $ | 22,679,974 | |
Shares outstanding (1,000,000,000 shares of $0.0001 par value authorized) | | | 13,628,289 | | | 2,354,709 | |
Net Asset Value, Redemption Price, and Offering Price Per Share | | | $22.31* | | | $9.63 | |
| | | | | | | |
* Redemption price may differ from NAV if redemption fee is applied. | | | | | | | |
See Notes to the Financial Statements. | Leuthold Funds - 2021 Semi-Annual Report | 25 |
Leuthold Funds |
Statements of Assets and Liabilities (continued)
March 31, 2021 (Unaudited) |
| | Leuthold
Select
Industries
Fund | | Grizzly
Short
Fund | | Leuthold
Core
ETF | |
ASSETS: | | | | | | | | | | |
Investments, at cost | | $ | 5,802,350 | | $ | 41,423,346 | | $ | 12,867,982 | |
| | | | | | | | | | |
Investments, at fair value | | | 10,116,318 | | | 41,423,346 | | | 14,569,071 | |
Receivable for Fund shares sold | | | 21,000 | | | 105,932 | | | — | |
Receivable for investments sold | | | — | | | 2,392,495 | | | — | |
Collateral at broker for securities sold short | | | — | | | 54,910,036 | | | — | |
Tri-party collateral held at custodian | | | — | | | 10,000,001 | | | — | |
Interest receivable | | | 1 | | | 349 | | | 9 | |
Dividends receivable | | | 2,937 | | | — | | | — | |
Due to Adviser | | | 52 | | | — | | | — | |
Other assets | | | 10,232 | | | 12,496 | | | 5,681 | |
Total Assets | | | 10,150,540 | | | 108,844,655 | | | 14,574,761 | |
| | | | | | | | | | |
LIABILITIES: | | | | | | | | | | |
Securities sold short, at fair value | | | | | | | | | | |
(proceeds $0, $47,674,190, and $0, respectively) | | | — | | | 50,313,096 | | | — | |
Payable for investments purchased | | | — | | | 4,156,979 | | | — | |
Payable for Fund shares redeemed | | | 8,133 | | | 127,764 | | | — | |
Payable to Adviser | | | — | | | 57,469 | | | 495 | |
Payable to Custodian | | | 2,840 | | | 2,002,357 | | | 865 | |
Payable to Directors | | | 667 | | | 4,068 | | | 1,019 | |
Dividends payable on securities sold short | | | — | | | 46,136 | | | — | |
Shareholder servicing fees payable | | | 1,834 | | | 4,157 | | | — | |
Accrued expenses and other liabilities | | | 36,198 | | | 88,474 | | | 45,289 | |
Total Liabilities | | | 49,672 | | | 56,800,500 | | | 47,668 | |
NET ASSETS | | $ | 10,100,868 | | $ | 52,044,155 | | $ | 14,527,093 | |
26 | Leuthold Funds - 2021 Semi-Annual Report | See Notes to the Financial Statements. |
Leuthold Funds |
Statements of Assets and Liabilities (continued)
March 31, 2021 (Unaudited) |
| | Leuthold
Select
Industries
Fund | | Grizzly
Short
Fund | | Leuthold
Core
ETF | |
NET ASSETS CONSIST OF: | | | | | | | | | | |
Capital stock | | $ | 5,061,764 | | $ | 401,141,562 | | $ | 12,838,090 | |
Total distributable earnings | | | 5,039,104 | | | (349,097,407 | ) | | 1,689,003 | |
Total Net Assets | | $ | 10,100,868 | | $ | 52,044,155 | | $ | 14,527,093 | |
| | | | | | | | | | |
Retail Class Shares | | | | | | | | | | |
Net assets | | $ | 10,100,868 | | $ | 52,044,155 | | $ | 14,527,093 | |
Shares outstanding | | | | | | | | | | |
(1,000,000,000 shares of $0.0001 par value authorized) | | | 313,955 | | | 6,885,089 | | | 500,000 | |
Net Asset Value, Redemption Price, and Offering Price Per Share | | | $32.17* | | | $7.56 | | | $29.05 | |
| | | | | | | | | | |
* Redemption price may differ from NAV if redemption fee is applied. |
See Notes to the Financial Statements. | Leuthold Funds - 2021 Semi-Annual Report | 27 |
Leuthold Funds
Statements of Operations
For the Six Months Ended March 31, 2021 (Unaudited)
| | | Leuthold
Core
Investment
Fund | | | Leuthold
Global
Fund | |
| INVESTMENT INCOME: | | | | | | | | |
| Dividend income | | | | | | | | |
| (net of foreign taxes withheld of $12,194 and $30,875, respectively) | | $ | 2,615,496 | | | $ | 143,529 | |
| Interest income | | | 249,457 | | | | 8,131 | |
| Total investment income | | | 2,864,953 | | | | 151,660 | |
| | | | | | | | | |
| EXPENSES: | | | | | | | | |
| Investment advisory fees (Note 3) | | | 2,535,535 | | | | 119,599 | |
| Administration fees | | | 141,816 | | | | 14,358 | |
| Transfer agent fees (Note 5) | | | 127,049 | | | | 20,297 | |
| Legal fees | | | 25,924 | | | | 2,906 | |
| Audit fees | | | 53,289 | | | | 16,540 | |
| Fund accounting fees | | | 53,202 | | | | 6,338 | |
| Custody fees | | | 27,948 | | | | 16,750 | |
| Shareholder servicing fees - Retail Class (Note 5) | | | 136,643 | | | | — | |
| Registration fees | | | 26,275 | | | | 20,099 | |
| Report to shareholders | | | 36,963 | | | | 1,695 | |
| Directors’ fees | | | 85,326 | | | | 4,024 | |
| Distribution (Rule 12b-1) fees - Retail Class (Note 4) | | | — | | | | 3,318 | |
| Other | | | 31,491 | | | | 2,438 | |
| Total expenses before dividends and interest on securities sold short and reimbursement from Adviser | | | 3,281,461 | | | | 228,362 | |
| Dividends and interest on securities sold short | | | 332,243 | | | | 20,147 | |
| Recoupment from Adviser (Note 3) | | | — | | | | 8,223 | |
| Total expenses | | | 3,613,704 | | | | 256,732 | |
| NET INVESTMENT LOSS | | $ | (748,751 | ) | | $ | (105,072 | ) |
| 28 | Leuthold Funds - 2021 Semi-Annual Report | See Notes to the Financial Statements. |
Leuthold Funds
Statements of Operations (continued)
For the Six Months Ended March 31, 2021 (Unaudited)
| | | Leuthold
Core
Investment
Fund | | | Leuthold
Global
Fund | |
| REALIZED AND UNREALIZED GAIN (LOSS) ON INVESTMENTS, INVESTMENT COMPANIES, SECURITIES SOLD SHORT, AND FOREIGN CURRENCY AND FOREIGN CURRENCY TRANSLATION: | | | | | | | | |
| Net realized gain (loss) on: | | | | | | | | |
| Unaffiliated investments | | $ | 39,680,136 | | | $ | 1,219,330 | |
| Affiliated investments | | | 172,745 | | | | — | |
| Investment companies | | | 981,161 | | | | 96,625 | |
| Realized gain distributions received from investment companies | | | 413 | | | | — | |
| Securities sold short | | | (9,842,500 | ) | | | (335,352 | ) |
| Foreign currency and foreign currency translation | | | 7,733 | | | | (109 | ) |
| Net unrealized appreciation (depreciation) during the period on: | | | | | | | | |
| Unaffiliated investments | | | 45,064,049 | | | | 3,372,229 | |
| Affiliated investments | | | (817,120 | ) | | | — | |
| Investment companies | | | (1,346,118 | ) | | | (243,034 | ) |
| Securities sold short | | | (3,842,503 | ) | | | (228,361 | ) |
| Foreign currency and foreign currency translation | | | 371,980 | | | | (12,551 | ) |
| Net realized and unrealized gain on investments, investment companies, securities sold short, and foreign currency and foreign currency translation | | | 70,429,976 | | | | 3,868,777 | |
| NET INCREASE IN NET ASSETS RESULTING FROM OPERATIONS | | $ | 69,681,225 | | | $ | 3,763,705 | |
| See Notes to the Financial Statements. | Leuthold Funds - 2021 Semi-Annual Report | 29 |
Leuthold Funds
Statements of Operations (continued)
For the Six Months Ended March 31, 2021 (Unaudited)
| | | Leuthold
Select
Industries
Fund | | | Grizzly
Short
Fund | | | Leuthold
Core
ETF | |
| INVESTMENT INCOME: | | | | | | | | | | | | |
| Dividend income | | | | | | | | | | | | |
| (net of foreign taxes withheld of $755, $0, and $0, respectively) | | $ | 53,824 | | | $ | 2,769 | | | $ | 59,507 | |
| Total investment income | | | 53,824 | | | | 2,769 | | | | 59,507 | |
| | | | | | | | | | | | | |
| EXPENSES: | | | | | | | | | | | | |
| Investment advisory fees (Note 3) | | | 47,049 | | | | 476,214 | | | | 32,325 | |
| Administration fees | | | 9,081 | | | | 22,103 | | | | 18,790 | |
| Transfer agent fees (Note 5) | | | 2,295 | | | | 33,581 | | | | 5,188 | |
| Legal fees | | | 342 | | | | 5,867 | | | | 13,508 | |
| Audit fees | | | 16,539 | | | | 16,540 | | | | 9,235 | |
| Fund accounting fees | | | 2,442 | | | | 6,923 | | | | 5,397 | |
| Custody fees | | | 2,859 | | | | 2,148 | | | | 1,156 | |
| Shareholder servicing fees - Retail Class (Note 5) | | | 5,326 | | | | 21,285 | | | | — | |
| Registration fees | | | 14,302 | | | | 31,471 | | | | — | |
| Report to shareholders | | | 765 | | | | 6,615 | | | | 59 | |
| Directors’ fees | | | 1,349 | | | | 9,470 | | | | 2,087 | |
| Other | | | 1,028 | | | | 5,223 | | | | 4,830 | |
| Total expenses before dividends and interest on securities sold short and reimbursement from Adviser | | | 103,377 | | | | 637,440 | | | | 92,575 | |
| Dividends and interest on securities sold short | | | — | | | | 485,038 | | | | — | |
| Reimbursement from Adviser (Note 3) | | | (32,804 | ) | | | — | | | | (50,552 | ) |
| Total expenses | | | 70,573 | | | | 1,122,478 | | | | 42,023 | |
| NET INVESTMENT INCOME (LOSS) | | $ | (16,749 | ) | | $ | (1,119,709 | ) | | $ | 17,484 | |
| 30 | Leuthold Funds - 2021 Semi-Annual Report | See Notes to the Financial Statements. |
Leuthold Funds
Statements of Operations (continued)
For the Six Months Ended March 31, 2021 (Unaudited)
| | | Leuthold
Select
Industries
Fund | | | Grizzly
Short
Fund | | | Leuthold
Core
ETF | |
| REALIZED AND UNREALIZED GAIN (LOSS) ON INVESTMENTS, INVESTMENT COMPANIES, SECURITIES SOLD SHORT, AND FOREIGN CURRENCY AND FOREIGN CURRENCY TRANSLATION: | | | | | | | | | | | | |
| Net realized gain (loss) on: | | | | | | | | | | | | |
| Investments | | $ | 966,696 | | | $ | — | | | $ | — | |
| Investment companies | | | — | | | | — | | | | 128,213 | |
| Securities sold short | | | — | | | | (30,447,939 | ) | | | — | |
| Net unrealized appreciation (depreciation) during the period on: | | | | | | | | | | | | |
| Investments | | | 1,344,857 | | | | — | | | | — | |
| Investment companies | | | — | | | | — | | | | 1,035,927 | |
| Securities sold short | | | — | | | | (574,290 | ) | | | — | |
| Net realized and unrealized gain (loss) on investments, investment companies, securities sold short, and foreign currency and foreign currency translation | | | 2,311,553 | | | | (31,022,229 | ) | | | 1,164,140 | |
| NET INCREASE (DECREASE) IN NET ASSETS RESULTING FROM OPERATIONS | | $ | 2,294,804 | | | $ | (32,141,938 | ) | | $ | 1,181,624 | |
| See Notes to the Financial Statements. | Leuthold Funds - 2021 Semi-Annual Report | 31 |
Leuthold Core Investment Fund
Statements of Changes in Net Assets
| | | Six Months Ended | | | Year Ended | |
| | | March 31, 2021 | | | September 30, 2020 | |
| | | (Unaudited) | | | | |
| OPERATIONS: | | | | | | |
| Net investment income (loss) | | $ | (748,751 | ) | | $ | 284,150 | |
| Net realized gain on investments, investment companies,securities sold short, and foreign currency and foreign currency translation | | | 30,999,688 | | | | 3,976,996 | |
| Net unrealized appreciation on investments, investment companies, securities sold short, and foreign currency and foreign currency translation | | | 39,430,288 | | | | 28,929,603 | |
| Net increase in net assets from operations | | | 69,681,225 | | | | 33,190,749 | |
| | | | | | | | | |
| DISTRIBUTIONS TO SHAREHOLDERS: | | | | | | | | |
| Distributions - Retail Class | | | (329,501 | ) | | | (5,114,896 | ) |
| Distributions - Institutional Class | | | (349,324 | ) | | | (5,125,299 | ) |
| Total distributions | | | (678,825 | ) | | | (10,240,195 | ) |
| | | | | | | | | |
| CAPITAL SHARE TRANSACTIONS: | | | | | | | | |
| Proceeds from shares sold - Retail Class | | | 14,976,946 | | | | 22,568,562 | |
| Proceeds from shares sold - Institutional Class | | | 26,580,168 | | | | 63,625,590 | |
| Proceeds from shares issued to holders in reinvestment of dividends - Retail Class | | | 315,155 | | | | 4,812,373 | |
| Proceeds from shares issued to holders in reinvestment of dividends - Institutional Class | | | 318,807 | | | | 4,564,710 | |
| Cost of shares redeemed - Retail Class* | | | (39,920,192 | ) | | | (80,719,938 | ) |
| Cost of shares redeemed - Institutional Class** | | | (27,090,759 | ) | | | (111,124,173 | ) |
| Net decrease in net assets from capital share transactions | | | (24,819,875 | ) | | | (96,272,876 | ) |
| | | | | | | | | |
| TOTAL INCREASE (DECREASE) IN NET ASSETS: | | | 44,182,525 | | | | (73,322,322 | ) |
| NET ASSETS | | | | | | | | |
| Beginning of period | | | 544,951,987 | | | | 618,274,309 | |
| End of period | | $ | 589,134,512 | | | $ | 544,951,987 | |
| | | | | | | | | |
| | | | | | | | | |
| CHANGES IN SHARES OUTSTANDING: | | | | | | | | |
| Shares sold - Retail Class | | | 707,227 | | | | 1,213,798 | |
| Shares sold - Institutional Class | | | 1,285,505 | | | | 3,414,384 | |
| Shares issued to holders in reinvestment of dividends - Retail Class | | | 15,502 | | | | 258,592 | |
| Shares issued to holders in reinvestment of dividends - Institutional Class | | | 15,643 | | | | 245,386 | |
| Shares redeemed - Retail Class | | | (1,923,309 | ) | | | (4,336,506 | ) |
| Shares redeemed - Institutional Class | | | (1,298,618 | ) | | | (6,058,834 | ) |
| Net decrease in shares outstanding | | | (1,198,050 | ) | | | (5,263,180 | ) |
| | | | | | | | | |
| | | | | | | | | |
| *Net of redemption fees of (Retail Class): | | $ | 251 | | | $ | 1,712 | |
| **Net of redemption fees of (Institutional Class): | | $ | 244 | | | $ | 2,754 | |
| 32 | Leuthold Funds - 2021 Semi-Annual Report | See Notes to the Financial Statements. |
Leuthold Global Fund
Statements of Changes in Net Assets
| | | Six Months Ended | | | Year Ended | |
| | | March 31, 2021 | | | September 30, 2020 | |
| | | (Unaudited) | | | | |
| OPERATIONS: | | | | | | |
| Net investment income (loss) | | $ | (105,072 | ) | | $ | 55,585 | |
| Net realized gain (loss) on investments, investment companies, securities sold short, and foreign currency and foreign currency translation | | | 980,494 | | | | (119,204 | ) |
| Net unrealized appreciation on investments, investment companies, securities sold short, and foreign currency and foreign currency translation | | | 2,888,283 | | | | 576,272 | |
| Net increase in net assets from operations | | | 3,763,705 | | | | 512,653 | |
| | | | | | | | | |
| DISTRIBUTIONS TO SHAREHOLDERS: | | | | | | | | |
| Distributions - Retail Class | | | (1,933 | ) | | | (53,171 | ) |
| Distributions - Institutional Class | | | (56,872 | ) | | | (205,817 | ) |
| Total distributions | | | (58,805 | ) | | | (258,988 | ) |
| | | | | | | | | |
| CAPITAL SHARE TRANSACTIONS: | | | | | | | | |
| Proceeds from shares sold - Retail Class | | | 971,173 | | | | 1,315,364 | |
| Proceeds from shares sold - Institutional Class | | | 231,573 | | | | 2,575,923 | |
| Proceeds from shares issued to holders in reinvestment of dividends - Retail Class | | | 1,883 | | | | 51,854 | |
| Proceeds from shares issued to holders in reinvestment of dividends - Institutional Class | | | 55,613 | | | | 175,787 | |
| Cost of shares redeemed - Retail Class* | | | (647,189 | ) | | | (4,141,527 | ) |
| Cost of shares redeemed - Institutional Class** | | | (1,761,376 | ) | | | (27,606,497 | ) |
| Net decrease in net assets from capital share transactions | | | (1,148,323 | ) | | | (27,629,096 | ) |
| | | | | | | | | |
| TOTAL INCREASE (DECREASE) IN NET ASSETS: | | | 2,556,577 | | | | (27,375,431 | ) |
| NET ASSETS | | | | | | | | |
| Beginning of period | | | 25,786,977 | | | | 53,162,408 | |
| End of period | | $ | 28,343,554 | | | $ | 25,786,977 | |
| | | | | | | | | |
| CHANGES IN SHARES OUTSTANDING: | | | | | | | | |
| Shares sold - Retail Class | | | 102,030 | | | | 159,784 | |
| Shares sold - Institutional Class | | | 26,322 | | | | 311,163 | |
| Shares issued to holders in reinvestment of dividends - Retail Class | | | 213 | | | | 6,270 | |
| Shares issued to holders in reinvestment of dividends - Institutional Class | | | 6,200 | | | | 20,952 | |
| Shares redeemed - Retail Class | | | (74,782 | ) | | | (522,085 | ) |
| Shares redeemed - Institutional Class | | | (196,145 | ) | | | (3,376,531 | ) |
| Net decrease in shares outstanding | | | (136,162 | ) | | | (3,400,447 | ) |
| | | | | | | | | |
| *Net of redemption fees of (Retail Class): | | $ | — | | | $ | — | |
| **Net of redemption fees of (Institutional Class): | | $ | 1 | | | $ | 4 | |
| See Notes to the Financial Statements. | Leuthold Funds - 2021 Semi-Annual Report | 33 |
Leuthold Select Industries Fund
Statements of Changes in Net Assets
| | | Six Months Ended | | | Year Ended | |
| | | March 31, 2021 | | | September 30, 2020 | |
| | | (Unaudited) | | | | |
| OPERATIONS: | | | | | | |
| Net investment loss | | $ | (16,749 | ) | | $ | (14,831 | ) |
| Net realized gain on investments and foreign currency and foreign currency translation | | | 966,696 | | | | 859,279 | |
| Net unrealized appreciation on investments | | | 1,344,857 | | | | 152,501 | |
| Net increase in net assets from operations | | | 2,294,804 | | | | 996,949 | |
| | | | | | | | | |
| DISTRIBUTIONS TO SHAREHOLDERS: | | | | | | | | |
| Distributions - Retail Class | | | (633,555 | ) | | | (328,244 | ) |
| Total distributions | | | (633,555 | ) | | | (328,244 | ) |
| | | | | | | | | |
| CAPITAL SHARE TRANSACTIONS: | | | | | | | | |
| Proceeds from shares sold | | | 326,515 | | | | 1,399,080 | |
| Proceeds from shares issued to holders in reinvestment of dividends | | | 606,503 | | | | 307,570 | |
| Cost of shares redeemed | | | (1,170,407 | ) | | | (5,482,231 | ) |
| Net decrease in net assets from capital share transactions | | | (237,389 | ) | | | (3,775,581 | ) |
| | | | | | | | | |
| TOTAL INCREASE (DECREASE) IN NET ASSETS: | | | 1,423,860 | | | | (3,106,876 | ) |
| NET ASSETS | | | | | | | | |
| Beginning of period | | | 8,677,008 | | | | 11,783,884 | |
| End of period | | $ | 10,100,868 | | | $ | 8,677,008 | |
| | | | | | | | | |
| | | | | | | | | |
| CHANGES IN SHARES OUTSTANDING: | | | | | | | | |
| Shares sold | | | 11,198 | | | | 61,824 | |
| Shares issued to holders in reinvestment of dividends | | | 22,405 | | | | 12,220 | |
| Shares redeemed | | | (40,255 | ) | | | (224,385 | ) |
| Net decrease in shares outstanding | | | (6,652 | ) | | | (150,341 | ) |
| 34 | Leuthold Funds - 2021 Semi-Annual Report | See Notes to the Financial Statements. |
Grizzly Short Fund
Statements of Changes in Net Assets
| | | Six Months Ended | | | Year Ended | |
| | | March 31, 2021 | | | September 30, 2020 | |
| | | (Unaudited) | | | | |
| OPERATIONS: | | | | | | |
| Net investment loss | | $ | (1,119,709 | ) | | $ | (2,734,847 | ) |
| Net realized loss on securities sold short and foreign currency and foreign currency translation | | | (30,447,939 | ) | | | (75,197,645 | ) |
| Net unrealized depreciation on securities sold short | | | (574,290 | ) | | | (9,060,474 | ) |
| Net decrease in net assets from operations | | | (32,141,938 | ) | | | (86,992,966 | ) |
| | | | | | | | | |
| DISTRIBUTIONS TO SHAREHOLDERS: | | | | | | | | |
| Distributions - Retail Class | | | — | | | | (52,038 | ) |
| Total distributions | | | — | | | | (52,038 | ) |
| | | | | | | | | |
| CAPITAL SHARE TRANSACTIONS: | | | | | | | | |
| Proceeds from shares sold | | | 79,299,501 | | | | 414,198,829 | |
| Proceeds from shares issued to holders in reinvestment of dividends | | | — | | | | 44,541 | |
| Cost of shares redeemed | | | (118,252,925 | ) | | | (296,296,935 | ) |
| Net increase (decrease) in net assets from capital share transactions | | | (38,953,424 | ) | | | 117,946,435 | |
| | | | | | | | | |
| TOTAL INCREASE (DECREASE) IN NET ASSETS: | | | (71,095,362 | ) | | | 30,901,431 | |
| NET ASSETS | | | | | | | | |
| Beginning of period | | | 123,139,517 | | | | 92,238,086 | |
| End of period | | $ | 52,044,155 | | | $ | 123,139,517 | |
| | | | | | | | | |
| | | | | | | | | |
| CHANGES IN SHARES OUTSTANDING: | | | | | | | | |
| Shares sold | | | 8,676,361 | | | | 26,268,586 | |
| Shares issued to holders in reinvestment of dividends | | | — | | | | 3,121 | |
| Shares redeemed | | | (13,173,647 | ) | | | (20,601,350 | ) |
| Net increase (decrease) in shares outstanding | | | (4,497,286 | ) | | | 5,670,357 | |
| See Notes to the Financial Statements. | Leuthold Funds - 2021 Semi-Annual Report | 35 |
Leuthold Core ETF
Statements of Changes in Net Assets
| | | Six Months Ended | | | Year Ended | |
| | | March 31, 2021 | | | September 30, 2020* | |
| | | (Unaudited) | | | | |
| OPERATIONS: | | | | | | |
| Net investment income | | $ | 17,484 | | | $ | 19,043 | |
| Net realized gain (loss) on investment companies and futures contracts | | | 128,213 | | | | (112,540 | ) |
| Net unrealized appreciation on investment companies | | | 1,035,927 | | | | 665,162 | |
| Net increase in net assets from operations | | | 1,181,624 | | | | 571,665 | |
| | | | | | | | | |
| DISTRIBUTIONS TO SHAREHOLDERS: | | | | | | | | |
| Distributions - Retail Class | | | (78,856 | ) | | | — | |
| Total distributions | | | (78,856 | ) | | | — | |
| | | | | | | | | |
| CAPITAL SHARE TRANSACTIONS: | | | | | | | | |
| Proceeds from shares sold | | | 2,794,625 | | | | 11,319,330 | |
| Proceeds from shares issued to holders in reinvestment of dividends | | | — | | | | — | |
| Cost of shares redeemed | | | (687,690 | ) | | | (573,605 | ) |
| Net increase in net assets from capital share transactions | | | 2,106,935 | | | | 10,745,725 | |
| | | | | | | | | |
| TOTAL INCREASE IN NET ASSETS: | | | 3,209,703 | | | | 11,317,390 | |
| NET ASSETS | | | | | | | | |
| Beginning of period | | | 11,317,390 | | | | — | |
| End of period | | $ | 14,527,093 | | | $ | 11,317,390 | |
| | | | | | | | | |
| | | | | | | | | |
| CHANGES IN SHARES OUTSTANDING: | | | | | | | | |
| Shares sold | | | 100,000 | | | | 450,001 | |
| Shares issued to holders in reinvestment of dividends | | | — | | | | — | |
| Shares redeemed | | | (25,000 | ) | | | (25,001 | ) |
| Net increase in shares outstanding | | | 75,000 | | | | 425,000 | |
* The Fund commenced operations on January 6, 2020. The information presented is for the period January 6, 2020 through September 30, 2020.
| 36 | Leuthold Funds - 2021 Semi-Annual Report | See Notes to the Financial Statements. |
Leuthold Funds
Notes to the Financial Statements (Unaudited)
| 1. | ORGANIZATION AND SIGNIFICANT ACCOUNTING POLICIES |
Leuthold Funds, Inc. (the “Company”) was incorporated on August 30, 1995, as a Maryland Corporation and is registered with the Securities and Exchange Commission as an open-end management investment company under the Investment Company Act of 1940, as amended (the “1940 Act”). In addition, the Funds are considered investment companies under, and follow the accounting and reporting guidance in, Accounting Standards Codification Topic 946 – Investment Companies. The Leuthold Group, LLC, doing business as Leuthold Weeden Capital Management, is the investment adviser (the “Adviser”). The Company consists of five series (each series a “Fund” and collectively the “Funds”):
| Fund | Investment Objective | Inception– Retail Share Class | Inception – Institutional Share Class |
| Leuthold Core Investment Fund | Seeks total return consistent with prudent investment risk over the long-term | 11/20/1995 | 01/31/2006 |
| | | | |
| Leuthold Global Fund | Seeks total return consistent with prudent investment risk over the long-term | 07/01/2008 | 04/30/2008 |
| | | | |
| Leuthold Select Industries Fund | Capital appreciation | 06/19/2000 | n/a |
| | | | |
| Grizzly Short Fund | Capital appreciation | 06/19/2000 | n/a |
| | | | |
| Leuthold Core ETF | Capital appreciation and income | 01/06/2020 | n/a |
All classes of shares in a Fund have identical voting, dividend, liquidation, and other rights, and the same terms and conditions, except that certain fees and expenses, including distribution and shareholder servicing fees, may differ among classes. Each class has exclusive voting rights on any matters relating to that class’s servicing or distribution arrangements.
The following is a summary of significant accounting policies consistently followed by the Funds.
| a) | Investment Valuation – Securities listed on a national securities exchange (other than The NASDAQ OMX Group, Inc., referred to as “NASDAQ”) are valued at the last sale price on the day the valuation is made. Securities that are traded on NASDAQ under one of its three listing tiers, NASDAQ Global Market, NASDAQ Global Select Market, and NASDAQ Capital Market, are valued at the NASDAQ Official Closing Price. Price information on listed stocks is taken from the exchange where the security is primarily traded. Securities, including securities sold short, which are listed on an exchange, but which are not traded on the valuation date are generally valued at the mean between the bid and the asked prices. Unlisted securities for which market quotations are readily available are valued at the latest quoted bid price or, if unavailable, at prices provided by an independent pricing service. Securities sold short which are not listed on an exchange but for which market quotations are readily available are generally valued at the average of the current bid and asked prices. Debt securities are valued at bid prices provided by an independent pricing service that may use a matrix pricing method or other analytical pricing model. Exchange-traded options are valued at the last reported sale price priced on the primary exchange on which the option is traded. If no sales are reported on a particular day, the mean between the highest bid and lowest asked quotations at the close of the exchanges is used. Non- exchange traded options are valued at the mean between the last bid and asked quotations. For options where market quotations are not readily available, fair value shall be determined. Shares of open-end investment companies (other than shares of an exchange-traded fund traded on domestic securities exchanges or on NASDAQ) are valued at one of the following prices as determined by the Adviser: (a) the net asset value announced by such open-end investment company following the close of business on the business day a Fund’s net asset value is to be calculated; (b) the net asset value announced by such open-end investment company following the close of business on the business day immediately preceding the day a Fund’s net asset value is to be calculated; or (c) a value determined by the Adviser by adding to, or subtracting from, the net asset value announced by such open-end investment company following the close of business on the business day immediately preceding the day a Fund’s net asset value is to be calculated, an amount equal to the Adviser’s estimate of the effect of changes in the market prices for the types of securities held by such investment company. Other assets, including securities for which no quotations are readily available, are valued at fair value as determined in good faith by the Board of Directors (“Directors”) pursuant to the Funds’ “Pricing and Valuation Guidelines.” |
| Leuthold Funds - 2021 Semi-Annual Report | 37 |
Leuthold Funds
The Funds may invest in foreign securities. Foreign securities may be priced at the closing price reported on the foreign exchange on which they are principally traded. Trading in foreign securities may be completed at times that vary from the closing of the New York Stock Exchange (“NYSE”). The Directors have approved the use of their independent pricing provider’s proprietary fair value pricing model to assist in determining current valuation for foreign securities traded in markets that close prior to the NYSE. Foreign securities quoted in foreign currencies are translated into U.S. dollars at current exchange rates. Occasionally, events that affect these values and exchange rates may occur between the times at which they are determined and the closing of the NYSE. If these events materially affect the value of portfolio securities, then these securities may be valued as determined in good faith by the Directors. Some of the factors which may be considered by the Directors and the Funds’ Fair Value Pricing Committee in determining fair value are fundamental analytical data relating to the investment, the nature and duration of any restrictions on disposition, trading in similar securities of the same issuer or comparable companies, information from broker- dealers, and an evaluation of the forces that influence the market in which the securities are purchased and sold. The use of fair value pricing by a Fund may cause the net asset value of its shares to differ significantly from the net asset value that would be calculated without regard to such considerations.
| b) | Fair Valuation Measurements – The Funds have adopted fair valuation accounting standards, which establish a definition of fair value and set out a hierarchy for measuring fair value. These standards require additional disclosures about the various inputs and valuation techniques used to develop the measurements of fair value and a discussion of changes in valuation techniques and related inputs during the period. These inputs are summarized in the following three levels: |
Level 1 - Quoted prices in active markets for identical securities.
Level 2 - Other significant observable inputs (including quoted prices for similar securities, interest rates, prepayment speeds, credit risk, etc.).
Level 3 - Significant unobservable inputs (including the Funds’ own assumptions in determining the fair value of investments).
The inputs or methodology used for valuing securities are not an indication of the risk associated with investing in those securities.
| 38 | Leuthold Funds - 2021 Semi-Annual Report |
Leuthold Funds
The following is a summary of the inputs used to value the Funds’ investments and securities sold short as of March 31, 2021:
| Leuthold Core Investment Fund | |
| Investments at Fair Value | | Level 1 | | | Level 2 | | | Level 3 | | | Total | |
| Common Stocks | | | | | | | | | | | | | | | | |
| Air Freight & Logistics | | $ | 5,415,618 | | | $ | — | | | $ | — | | | $ | 5,415,618 | |
| Biotechnology | | | 15,055,193 | | | | — | | | | — | | | | 15,055,193 | |
| Capital Markets | | | 31,438,395 | | | | — | | | | — | | | | 31,438,395 | |
| Chemicals | | | — | | | | — | | | | 6,468 | | | | 6,468 | |
| Construction & Engineering | | | 5,383,674 | | | | — | | | | — | | | | 5,383,674 | |
| Consumer Finance | | | 1,945,567 | | | | — | | | | — | | | | 1,945,567 | |
| Containers & Packaging | | | 23,386,404 | | | | — | | | | — | | | | 23,386,404 | |
| Distributors | | | 3,093,688 | | | | — | | | | — | | | | 3,093,688 | |
| Diversified Telecommunication Services | | | 3,718,634 | | | | — | | | | — | | | | 3,718,634 | |
| Electronic Equipment, Instruments & Components | | | 9,063,101 | | | | — | | | | — | | | | 9,063,101 | |
| Health Care Providers & Services | | | 44,580,997 | | | | — | | | | — | | | | 44,580,997 | |
| Household Durables | | | 31,036,285 | | | | — | | | | — | | | | 31,036,285 | |
| Insurance | | | 21,216,266 | | | | — | | | | — | | | | 21,216,266 | |
| Interactive Media & Services | | | 14,104,177 | | | | — | | | | — | | | | 14,104,177 | |
| IT Services | | | 14,709,939 | | | | — | | | | — | | | | 14,709,939 | |
| Media | | | 3,420,780 | | | | — | | | | — | | | | 3,420,780 | |
| Metals & Mining | | | 1,991,844 | | | | — | | | | — | | | | 1,991,844 | |
| Multiline Retail | | | 24,328,705 | | | | — | | | | — | | | | 24,328,705 | |
| Paper & Forest Products | | | 2,157,893 | | | | — | | | | — | | | | 2,157,893 | |
| Professional Services | | | 15,889,152 | | | | — | | | | — | | | | 15,889,152 | |
| Semiconductors & Semiconductor Equipment | | | 39,954,624 | | | | — | | | | — | | | | 39,954,624 | |
| Software | | | 14,935,697 | | | | — | | | | — | | | | 14,935,697 | |
| Specialty Retail | | | 14,518,470 | | | | — | | | | — | | | | 14,518,470 | |
| Technology Hardware, Storage & Peripherals | | | 6,785,627 | | | | — | | | | — | | | | 6,785,627 | |
| Thrifts & Mortgage Finance | | | 3,556,935 | | | | — | | | | — | | | | 3,556,935 | |
| Trading Companies & Distributors | | | 8,860,754 | | | | — | | | | — | | | | 8,860,754 | |
| Wireless Telecommunication Services | | | 1,877,095 | | | | — | | | | — | | | | 1,877,095 | |
| Total Common Stocks | | $ | 362,425,514 | | | $ | — | | | $ | 6,468 | | | $ | 362,431,982 | |
| Exchange Traded Funds | | | 114,254,137 | | | | — | | | | — | | | | 114,254,137 | |
| Corporate Bonds | | | — | | | | 9,891,722 | | | | — | | | | 9,891,722 | |
| Foreign Government Bonds | | | — | | | | 17,410,356 | | | | — | | | | 17,410,356 | |
| Money Market Funds | | | 75,307,277 | | | | — | | | | — | | | | 75,307,277 | |
| Total Investments in Securities | | $ | 551,986,928 | | | $ | 27,302,078 | | | $ | 6,468 | | | $ | 579,295,474 | |
| Securities Sold Short at Fair Value | | Level 1 | | | Level 2 | | | Level 3 | | | Total | |
| Common Stocks | | $ | 10,362,276 | | | $ | — | | | $ | — | | | $ | 10,362,276 | |
| Exchange Traded Funds | | | 33,157,992 | | | | — | | | | — | | | | 33,157,992 | |
| Total Securities Sold Short | | $ | 43,520,268 | | | $ | — | | | $ | — | | | $ | 43,520,268 | |
| Leuthold Funds - 2021 Semi-Annual Report | 39 |
Leuthold Funds
The following is a reconciliation of Level 3 investments for which significant unobservable inputs were used to determine fair value:
| | | Investments in Securities at Fair Value | |
| Balance as of September 30, 2020 | | $ | 6,488 | |
| Accrued discounts/premiums | | | — | |
| Realized gain (loss) | | | — | |
| Change in net unrealized depreciation | | | (20 | )* |
| Purchases | | | — | |
| Sales | | | — | |
| Transfer into and/or out of Level 3 | | | — | |
| Balance as of March 31, 2021 | | $ | 6,468 | (1) |
| Change in net unrealized depreciation during | | | | |
| the period for Level 3 investments held at March 31, 2021: | | $ | (20 | ) |
* Unrealized depreciation is due to a change in foreign currency exchange rate.
| (1) | The security (China Lumena New Materials Corp.) is classified as a Level 3 security due to a halt in trading of the security on March 25, 2014. The security is valued at fair value as determined in good faith by the Directors. The Adviser submits a report to the Directors setting forth the factors considered in determining the price. The significant unobservable input used in the fair valuation of this security is a discount of 95% from the last traded price of Hong Kong Dollar 1.25. Significant changes in the discount rate may result in a change in fair value measurement. For the duration of the period, the discount was 95%. The security underwent a 1:40 reverse split on February 18, 2020, resulting in a fair value price of Hong Kong Dollar 2.40. |
| Leuthold Global Fund | |
| Investments at Fair Value | | Level 1 | | | Level 2 | | | Level 3 | | | Total | |
| Common Stocks | | | | | | | | | | | | | | | | |
| Air Freight & Logistics | | $ | 240,283 | | | $ | — | | | $ | — | | | $ | 240,283 | |
| Banks | | | 1,087,761 | | | | 181,574 | | | | — | | | | 1,269,335 | |
| Capital Markets | | | 1,353,459 | | | | 142,874 | | | | — | | | | 1,496,333 | |
| Communications Equipment | | | 871,830 | | | | 219,167 | | | | — | | | | 1,090,997 | |
| Construction Materials | | | 277,481 | | | | 648,835 | | | | — | | | | 926,316 | |
| Containers & Packaging | | | 640,582 | | | | 271,558 | | | | — | | | | 912,140 | |
| Distributors | | | 97,740 | | | | — | | | | — | | | | 97,740 | |
| Health Care Providers & Services | | | 769,263 | | | | — | | | | — | | | | 769,263 | |
| Household Durables | | | 1,450,273 | | | | 759,590 | | | | — | | | | 2,209,863 | |
| Insurance | | | 564,664 | | | | 296,302 | | | | — | | | | 860,966 | |
| Interactive Media & Services | | | 917,467 | | | | 79,488 | | | | — | | | | 996,955 | |
| IT Services | | | 376,820 | | | | 450,192 | | | | — | | | | 827,012 | |
| Life Sciences Tools & Services | | | 652,563 | | | | 308,765 | | | | — | | | | 961,328 | |
| Marine | | | — | | | | 260,217 | | | | — | | | | 260,217 | |
| Metals & Mining | | | 678,437 | | | | 556,068 | | | | — | | | | 1,234,505 | |
| Multiline Retail | | | — | | | | 212,428 | | | | — | | | | 212,428 | |
| Paper & Forest Products | | | — | | | | — | | | | 47,928 | | | | 47,928 | |
| Professional Services | | | 259,959 | | | | — | | | | — | | | | 259,959 | |
| Semiconductors & Semiconductor Equipment | | | 1,589,924 | | | | 1,171,008 | | | | — | | | | 2,760,932 | |
| Specialty Retail | | | 124,533 | | | | — | | | | — | | | | 124,533 | |
| Technology Hardware, Storage & Peripherals | | | 286,707 | | | | — | | | | — | | | | 286,707 | |
| Trading Companies & Distributors | | | 366,896 | | | | 414,411 | | | | — | | | | 781,307 | |
| Total Common Stocks | | $ | 12,606,642 | | | $ | 5,972,477 | | | $ | 47,928 | | | $ | 18,627,047 | |
| 40 | Leuthold Funds - 2021 Semi-Annual Report |
Leuthold Funds
| Leuthold Global Fund (continued) | |
| Investments at Fair Value | | Level 1 | | | Level 2 | | | Level 3 | | | Total | |
| Exchange Traded Funds | | $ | 4,556,022 | | | $ | — | | | $ | — | | | $ | 4,556,022 | |
| Corporate Bonds | | | — | | | | 582,252 | | | | — | | | | 582,252 | |
| Foreign Government Bonds | | | — | | | | 1,146,840 | | | | — | | | | 1,146,840 | |
| Money Market Funds | | | 2,678,724 | | | | — | | | | — | | | | 2,678,724 | |
| Total Investments in Securities | | $ | 19,841,388 | | | $ | 7,701,569 | | | $ | 47,928 | | | $ | 27,590,885 | |
Securities Sold Short at Fair Value | | Level 1 | | | Level 2 | | | Level 3 | | | Total | |
| Common Stocks | | $ | 170,618 | | | $ | — | | | $ | — | | | $ | 170,618 | |
| Exchange Traded Funds | | | 1,565,396 | | | | — | | | | — | | | | 1,565,396 | |
| Total Securities Sold Short | | $ | 1,736,014 | | | $ | — | | | $ | — | | | $ | 1,736,014 | |
The following is a reconciliation of Level 3 investments for which significant unobservable inputs were used to determine fair value:
| | | Investments in Securities at Fair Value | |
| Balance as of September 30, 2020 | | $ | 48,077 | |
| Accrued discounts/premiums | | | — | |
| Realized gain (loss) | | | — | |
| Change in net unrealized depreciation | | | (149 | )* |
| Purchases | | | — | |
| Sales | | | — | |
| Transfers into and/or out of Level 3 | | | — | |
| Balance as of March 31, 2021 | | $ | 47,928 | (1) |
Change in net unrealized depreciation during the period for Level 3 investments held at March 31, 2021:
| | $ | (149 | ) |
* Unrealized depreciation is due to a change in foreign currency exchange rate.
| (1) | The security (China Forestry Holdings Co., Ltd.) is classified as a Level 3 security due to a halt in trading of the security on January 26, 2011. The security is valued at fair value as determined in good faith by the Directors. The Adviser submits a report to the Directors setting forth the factors considered in determining the price. The significant unobservable input used in the fair valuation of this security is a discount of 95% from the last traded price of Hong Kong Dollar 2.95. Significant changes in the discount rate may result in a change in fair value measurement. For the duration of the period the discount was 95%. |
| Leuthold Select Industries Fund | |
| Investments at Fair Value | | Level 1 | | | Level 2 | | | Level 3 | | | Total | |
| Common Stocks | | $ | 10,078,388 | | | $ | — | | | $ | — | | | $ | 10,078,388 | |
| Money Market Funds | | | 37,930 | | | | — | | | | — | | | | 37,930 | |
| Total Investments in Securities | | $ | 10,116,318 | | | $ | — | | | $ | — | | | $ | 10,116,318 | |
The Fund did not invest in any Level 3 securities during the period.
| Grizzly Short Fund | |
| Investments at Fair Value | | Level 1 | | | Level 2 | | | Level 3 | | | Total | |
| Money Market Funds | | $ | 41,423,346 | | | $ | — | | | $ | — | | | $ | 41,423,346 | |
| Total Investments in Securities | | $ | 41,423,346 | | | $ | — | | | $ | — | | | $ | 41,423,346 | |
| Leuthold Funds - 2021 Semi-Annual Report | 41 |
| Grizzly Short Fund (continued) |
| Securities Sold Short at Fair Value | | | Level 1 | | | | Level 2 | | | | Level 3 | | | | Total | |
| Common Stocks | | $ | 35,496,544 | | | $ | — | | | $ | — | | | $ | 35,496,544 | |
| Exchange Traded Funds | | | 14,816,552 | | | | — | | | | — | | | | 14,816,552 | |
| Total Securities Sold Short | | $ | 50,313,096 | | | $ | — | | | $ | — | | | $ | 50,313,096 | |
| | | | | | | | | | | | | | | | | |
The Fund did not invest in any Level 3 securities during the period.
| Leuthold Core ETF | |
| Investments at Fair Value | | | Level 1 | | | | Level 2 | | | | Level 3 | | | | Total | |
| Exchange Traded Funds | | $ | 13,500,783 | | | $ | — | | | $ | — | | | $ | 13,500,783 | |
| Money Market Funds | | | 1,068,288 | | | | — | | | | — | | | | 1,068,288 | |
| Total Investments in Securities | | $ | 14,569,071 | | | $ | — | | | $ | — | | | $ | 14,569,071 | |
The Fund did not invest in any Level 3 securities during the period.
For further information regarding security characteristics, see the Schedules of Investments and Schedules of Securities Sold Short.
| c) | Federal Income Taxes – Provision for federal income taxes or excise taxes has not been made since the Funds have elected to be taxed as “regulated investment companies” and intend to distribute substantially all taxable income to shareholders and otherwise comply with the provisions of the Internal Revenue Code applicable to regulated investment companies. Distributions from net realized gains for book purposes may include short-term capital gains, which are included as ordinary income to shareholders for tax purposes. The Funds also designate as distributions of long-term gains, to the extent necessary to fully distribute such capital gains, earnings and profits distributed to shareholders on the redemption of shares. |
The tax character of distributions paid during the fiscal years ended September 30, 2020 and 2019 was as follows:
| Year Ended September 30, 2020 |
| Distributions paid from: | | Leuthold
Core
Investment
Fund | | | Leuthold
Global
Fund | | | Leuthold
Select
Industries
Fund | | | Grizzly
Short
Fund | | | Leuthold
Core
ETF | |
| Ordinary income | $ | 771,119 | | $ | 258,988 | | $ | –– | | $ | 52,038 | | $ | –– | |
| Long-term capital gain* | | 9,469,076 | | | –– | | | 328,244 | | | –– | | | –– | |
| Total distributions paid | $ | 10,240,195 | | $ | 258,988 | | $ | 328,244 | | $ | 52,038 | | $ | –– | |
| Year Ended September 30, 2019 |
| | | Leuthold
Core
Investment
Fund | | | Leuthold
Global
Fund | | | Leuthold
Select
Industries
Fund | | | Grizzly
Short
Fund | |
| Distributions paid from: | | | | | | | | | | | | |
| Ordinary income | $ | 2,916,524 | | $ | 198,337 | | $ | –– | | $ | 838,199 | |
| Long-term capital gain* | | 72,654,792 | | | 5,455,871 | | | 1,295,440 | | | –– | |
| Total Distributions Paid | $ | 75,571,316 | | $ | 5,654,208 | | $ | 1,295,440 | | $ | 838,199 | |
| * | The funds designate these distributions as long-term capital gain dividends per IRC Sec. 852(b)(3)(C) in the 20-percent group (which may be taxed at a 20-percent rate, a 15-percent rate or 0-percent rate, depending on the shareholder’s taxable income). |
| 42 | Leuthold Funds - 2021 Semi-Annual Report |
At September 30, 2020, the components of accumulated earnings (deficit) on a tax basis were as follows:
| | | Leuthold
Core
Investment
Fund | | | Leuthold
Global
Fund | | | Leuthold
Select
Industries
Fund | | | Grizzly
Short
Fund | | | Leuthold
Core
ETF | |
| Undistributed ordinary income | $ | –– | | $ | 58,805 | | $ | –– | | $ | –– | | $ | 67,683 | |
| Undistributed long-term gains | | 678,676 | | | –– | | | 440,286 | | | –– | | | –– | |
| Distributable earnings | | 678,676 | | | 58,805 | | | 440,286 | | | –– | | | 67,683 | |
| Capital loss carryover and late-year losses | | –– | | | (1,878,791 | ) | | (8,921 | ) | | (310,537,706 | ) | | (138,087 | ) |
| Other accumulated gains (losses) | | (730,220 | ) | | (20,058 | ) | | –– | | | (2,361,084 | ) | | –– | |
| Unrealized appreciation (depreciation) | | 123,211,894 | | | 1,872,747 | | | 2,946,490 | | | (4,056,679 | ) | | 656,639 | |
| Total accumulated earnings (deficit) | $ | 123,160,350 | | $ | 32,703 | | $ | 3,377,855 | | $ | (316,955,469 | ) | $ | 586,235 | |
Net investment income and realized gains and losses for federal income tax purposes may differ from that reported on the financial statements because of permanent book-to-tax differences. U.S. Generally Accepted Accounting Principles (“U.S. GAAP”) requires that permanent differences between financial reporting and tax reporting be reclassified between various components of net assets. These differences are primarily due to partnership adjustments, securities sold short, earnings and profits distributed to shareholders on the redemption of shares, net operating losses, realized gain on redemptions in kind, and expiration of capital losses.
Additionally, U.S. GAAP requires that certain components of net assets relating to permanent differences be reclassified between financial and tax reporting. These reclassifications have no effect on net assets or net asset value per share. For the year ended September 30, 2020, the following table shows the reclassifications made:
| | | | Distributable
Earnings | | | Paid
in Capital | |
| Leuthold Core Investment Fund | | $ | (3,389,434 | ) | $ | 3,389,434 | |
| Leuthold Global Fund | | | 209 | | | (209 | ) |
| Leuthold Select Industries Fund | | | (167,848 | ) | | 167,848 | |
| Grizzly Short Fund | | | — | | | — | |
| Leuthold Core ETF | | | 14,570 | | | (14,570 | ) |
Under current law, the Funds may carry forward net capital losses indefinitely to use to offset capital gains realized in future years. Capital losses realized will carry forward retaining their classification as long-term or short-term losses.
| | | Leuthold
Core
Investment
Fund | | Leuthold
Global
Fund | | Leuthold
Select
Industries
Fund | | Grizzly
Short
Fund | | Leuthold
Core
ETF |
| Unlimited Short-Term | | $ | — | | | $ | (1,878,791 | ) | | $ | — | | | $ | (308,444,597 | ) | | $ | (85,714 | ) |
| Unlimited Long-Term | | | — | | | | — | | | | — | | | | — | | | | (52,373 | ) |
| Leuthold Funds - 2021 Semi-Annual Report | 43 |
The Leuthold Select Industries Fund and Grizzly Short Fund intend to defer and treat $8,921 and $2,093,109, respectively, of qualified late-year losses incurred during the fiscal year ended September 30, 2020 as arising on the first day of the fiscal year ending September 30, 2021.
As of March 31, 2021, the Funds had no tax positions that did not meet the “more likely-than-not” threshold of being sustained by the applicable tax authority. Generally, tax authorities can examine all the tax returns filed for the last three years. The Funds recognize interest and penalties, if any, related to unrecognized tax benefits as income tax expense in the Statements of Operations. During the period ended March 31, 2021, the Funds did not incur any interest or penalties.
| d) | Distributions to Shareholders – Dividends from net investment income, if any, are declared and paid quarterly for the Leuthold Core Investment Fund, Leuthold Global Fund, Leuthold Select Industries Fund, and Grizzly Short Fund, and are declared and paid annually for the Leuthold Core ETF. Distributions of net realized capital gains, if any, are declared and paid at least annually. |
| e) | Use of Estimates – The preparation of financial statements in conformity with U.S. GAAP requires management to make estimates and assumptions that affect the reported amounts of assets and liabilities and disclosure of contingent assets and liabilities at the date of the financial statements and the reported amounts of revenues and expenses during the reporting period. Actual results could differ from those estimates. |
| f) | Basis for Consolidation for the Leuthold Core Investment Fund and Leuthold Global Fund – Leuthold Core, Ltd. and Leuthold Global, Ltd (the “Subsidiaries”) previously acted as investment vehicles in order to enter into certain investments for the Leuthold Core Investment Fund and Leuthold Global Fund, respectively. The Subsidiaries were liquidated in May 2018 and, therefore, the financial statements of these Funds are no longer consolidated. |
| g) | Securities Sold Short – For financial statement purposes, an amount equal to the required amount of collateral to be segregated for securities sold short is included in the Statements of Assets and Liabilities as an asset. The amount of the securities sold short, shown as a liability, is subsequently marked-to-market to reflect the current value of the securities sold short. Subsequent fluctuations in the market prices of securities sold short may require purchasing the securities at prices which could differ from the amount reflected in the Statements of Assets and Liabilities. The Funds are liable for any dividends or interest payable on securities sold short. As collateral for their securities sold short, the Funds are required under the 1940 Act to maintain segregated assets consisting of cash, cash equivalents, or liquid securities. These segregated assets are valued consistent with Note 1a. The amount of segregated assets is required to be adjusted daily to reflect changes in the fair value of the securities sold short. The Leuthold Core Investment Fund, Leuthold Global Fund, and Grizzly Short Fund’s collateral at broker for securities sold short is with one major international security dealer. |
With regard to the cash collateral that is posted with counterparties, the Funds have established a collateral account for each respective counterparty with its custodian (the “Account”) and have entered into a tri-party agreement with the custodian and the respective counterparty regarding the transfer of assets to and from the Account.
The Adviser reviews each Account on a daily basis to ensure that the Account does not maintain a material amount of cash collateral in excess of what is required by the applicable counterparty (the amount of collateral required by such counterparty is subject to change and generally not known until the next business day, which necessitates the maintenance of a minimum amount of excess cash collateral). In the event that the excess cash collateral in an Account is equal to or in excess of the greater of the following: $250,000 or 3% of the total assets of the applicable Fund calculated at each month end; then the applicable
| 44 | Leuthold Funds - 2021 Semi-Annual Report |
Fund, pursuant to the tri-party agreement, will instruct the custodian to sweep such excess cash collateral into the Fund’s interest bearing account with the custodian. The amount of collateral held related to this tri-party agreement is included in the Statement of Assets and Liabilities as an asset.
| h) | Other – Investment and shareholder transactions are recorded on the trade date. The Funds determine the gain or loss realized from the investment transactions by comparing the original cost of the security lot sold with the net sales proceeds. The Funds utilize an identified lot approach to transactions. Dividend income is recognized on the ex-dividend date or as soon as information is available to the Funds, and interest income is recognized on an accrual basis. Discounts and premiums on bonds are amortized using the yield to maturity method over the life of the respective bond. For financial reporting purposes, the Funds isolate changes in the exchange rate of investment securities from the fluctuations arising from changes in the market prices of securities for realized gains and losses. |
| i) | Expenses – Expenses that directly relate to one of the Funds are charged directly to that Fund. Other operating expenses of the Funds, such as Directors fees and expenses, insurance expense, and legal fees are allocated between the Funds based on the relative net asset value of the individual Funds. |
| j) | Counterparty risk – Counterparty risk may arise as the result of the failure of a counterparty to a securities contract to comply with the terms of the contract. Potential counterparty risk is measured by the creditworthiness of the counterparty and additional risk may arise from unanticipated events affecting the value of the underlying security. |
| k) | Managed Futures Strategy/Commodities Risk (Leuthold Core ETF only) – The Fund may invest in underlying investments that principally invest in the commodities markets through investment in managed futures programs. Such investments may subject an underlying investment to greater volatility than investments in traditional securities. Commodities are real assets such as oil, agriculture, livestock, industrial metals, and precious metals such as gold or silver. Prices of commodities and related contracts may fluctuate significantly over short periods for a variety of reasons, including weather and natural disasters; pandemics and other global health emergencies; governmental, agricultural, trade, fiscal, monetary and exchange control programs and policies; acts of terrorism; tariffs; and U.S. and international economic, political, military and regulatory developments. The demand and supply of these commodities may also fluctuate widely based on such factors as interest rates, investors’ expectations with respect to the rate of inflation, currency exchange rates, the production and cost levels of the producers and/or forward selling by such producers, global or regional political, economic, or financial events, purchases and sales by central banks, and trading activities by hedge funds and other commodity funds. Commodity underlying investments may use derivatives, such as futures, options, and swaps, which expose them to further risks, including counterparty risk (i.e., the risk that the institution on the other side of the trade will default). |
| l) | Shares May Trade at Prices Other Than NAV (Leuthold Core ETF only) – As with all exchange traded funds (“ETFs”), shares may be bought and sold in the secondary market at market prices. Although it is expected that the market price of shares will approximate the Fund’s net asset value (“NAV”), there may be times when the market price of shares is more than the NAV intra- day (premium) or less than the NAV intra-day (discount) due to supply and demand of shares or during periods of market volatility. This risk is heightened in times of market volatility, periods of steep market declines, and periods when there is limited trading activity for shares in the secondary market, in which case such premiums or discounts may be significant. |
| Leuthold Funds - 2021 Semi-Annual Report | 45 |
| m) | Authorized Participants, Market Makers, and Liquidity Providers Concentration Risk (Leuthold Core ETF only) – The Fund has a limited number of financial institutions that may act as authorized participants (“APs”). In addition, there may be a limited number of market makers and/or liquidity providers in the marketplace. To the extent either of the following events occur, shares may trade at a material discount to NAV and possibly face delisting: (i) APs exit the business or otherwise become unable to process creation and/or redemption orders and no other APs step forward to perform these services, or (ii) market makers and/or liquidity providers exit the business or significantly reduce their business activities and no other entities step forward to perform their functions. |
| n) | Subsequent Events – In preparing these financial statements, the Funds have evaluated events and transactions for potential recognition or disclosure through the date the financial statements were issued. The global outbreak of coronavirus disease 2019 (“COVID-19”) has disrupted global economic markets and adversely affected individual companies and investment products. The prolonged economic impact of COVID-19 is uncertain. The operation and financial performance of the issuers of securities in which the Fund invests depends on future developments, including the duration and spread of the outbreak, and such uncertainty may in turn impact the value of the Fund’s investments. |
| 2. | INVESTMENT TRANSACTIONS |
Purchases and sales of investment securities, other than short-term investments and securities sold short, for the six-months ended March 31, 2021 are summarized below.
| | | Leuthold
Core
Investment
Fund | | Leuthold
Global
Fund | | Leuthold
Select
Industries
Fund | | Leuthold
Core
ETF |
| Purchases | | | $ | 105,253,026 | | | $ | 6,319,753 | | | $ | 2,182,362 | | | $ | 5,263,756 | |
| Sales | | | | 149,751,358 | | | | 8,006,291 | | | | 3,029,893 | | | | 3,669,976 | |
There were no purchases or sales of investment securities in the Grizzly Short Fund because this Fund invests only in securities sold short.
At September 30, 2020, gross unrealized appreciation and depreciation of investments and securities sold short and cost of investments and cost of securities sold short for tax purposes were as follows:
| | | Leuthold
Core
Investment
Fund | | | Leuthold
Global
Fund | | | Leuthold
Select
Industries
Fund | | | Grizzly
Short
Fund | | | Leuthold
Core
ETF | |
| Tax cost of investments | | $ | 401,855,441 | | | $ | 22,940,546 | | | $ | 5,775,215 | | | $ | 98,064,864 | | | $ | 10,679,918 | |
| Unrealized appreciation | | | 134,039,712 | | | | 3,658,912 | | | | 3,009,900 | | | | — | | | | 713,700 | |
| Unrealized depreciation | | | (7,233,351 | ) | | | (1,832,786 | ) | | | (63,410 | ) | | | — | | | | (57,061 | ) |
| Net unrealized appreciation (depreciation) | | $ | 126,806,361 | | | $ | 1,826,126 | | | $ | 2,946,490 | | | $ | — | | | $ | 656,639 | |
The differences between book and tax basis of unrealized appreciation (depreciation) are primarily attributable to the tax deferral of losses on wash sales and passive foreign investment company transactions.
| 46 | Leuthold Funds - 2021 Semi-Annual Report |
The Leuthold Core Investment Fund owned 5% or more of the voting securities of the following companies during the six- months ended March 31, 2021. As a result, these companies are deemed to be affiliates of the Leuthold Core Investment Fund as defined by the 1940 Act. Transactions during the period in these securities of affiliated companies were as follows:
| Leuthold Core Investment Fund |
| Security Name | | Share
Balance
03/31/21 | | Fair Value
at
09/30/20 | | Purchases | | Sales | | Realized
Gain
(loss) | | Change in
Unrealized
Appreciation | | Fair Value
at
03/31/21 | | Dividend
Income | |
Invesco CurrencyShares
Japanese Yen Trust | | 145,298 | | $ 17,434,047 | | $ — | | $ (4,416,095) | | $ 172,745 | | $ (817,119) | | $ 12,373,578 | | $ — | |
| | | | | | | | | | | | | | | | | | |
| 3. | INVESTMENT ADVISORY AND OTHER AGREEMENTS |
Each of the Funds has entered into an Investment Advisory Agreement (“advisory agreement”) with the Adviser. Pursuant to its advisory agreement with the Funds, the Adviser is entitled to receive a fee, calculated daily as applied to each Fund’s average daily net assets and payable monthly, at annual rates of:
Leuthold
Core
Investment
Fund | | Leuthold
Global
Fund | | Leuthold
Select
Industries
Fund | | Grizzly
Short
Fund | | Leuthold
Core
ETF |
| 0.90% | | 0.90% | | 1.00% | | 1.25% | | 0.50% |
The Adviser has agreed to waive its advisory fee and/or reimburse the Funds’ other expenses, to the extent necessary to ensure that the Funds’ total operating expenses (exclusive of interest, taxes, brokerage commissions, dividends and interest on securities sold short, and extraordinary items) do not exceed the following rates, based on each Fund’s average daily net assets:
Leuthold
Core
Investment
Fund | | Leuthold
Global
Fund | | Leuthold
Select
Industries
Fund | | Grizzly
Short
Fund | | Leuthold
Core
ETF |
| 1.25% | | 1.85% | | 1.50% | | 2.50% | | 0.65% |
Any waiver or reimbursement is subject to later adjustments to allow the Adviser to recoup amounts previously waived or reimbursed to the extent actual fees and expenses for a fiscal period are less than each Fund’s expense limitation, provided, however, that the recoupment period for the Adviser is limited to three years from the time the expenses were waived or incurred and is limited to the lesser of (1) the expense cap in effect at the time of the waiver, and (2) the expense cap in effect at the time of recapture.
| Leuthold Funds - 2021 Semi-Annual Report | 47 |
Amounts subject to future recoupment as of March 31, 2021 are as follows:
| Leuthold Global Fund | | Leuthold Select Industries Fund |
| Year of Expiration | | Recoverable Amount | | Year of Expiration | | Recoverable Amount |
| 9/30/2023 | | $ | 4,641 | | | 9/30/2021 | | $ | 18,127 | |
| 9/30/2024 | | | 196 | | | 9/30/2022 | | | 39,650 | |
| | | | | | | 9/30/2023 | | | 119,193 | |
| | | | | | | 9/30/2024 | | | 36,927 | |
| | | | | | | |
| | | | | | | |
| | | | | | | |
| Leuthold Core ETF | | | | | | |
| Year of Expiration | | Recoverable Amount | | | | | | |
| 9/30/2023 | | $ | 117,025 | | | | | | | |
| 9/30/2024 | | | 50,552 | | | | | | | |
U.S. Bancorp Fund Services, LLC (“Fund Services”), doing business as U.S. Bank Global Fund Services, serves as transfer agent, administrator, and accounting services agent for the Funds. U.S. Bank, N.A. serves as custodian for the Funds.
The Leuthold Global Fund – Retail Class has adopted a distribution plan pursuant to Rule 12b-1 under the 1940 Act, whereby Rafferty Capital Markets, LLC serves as distributor. This plan allows the Fund to use up to 0.25% of its average daily net assets to pay sales, distribution, and other fees for the sale of its shares and for services provided to investors. The Fund may pay all or a portion of this fee to any securities dealer, financial institution, or any other person who renders personal service to the Fund’s shareholders, assists in the maintenance of the Fund’s shareholder accounts, or who renders assistance in distributing or promoting the sale of shares of the Fund pursuant to a written agreement approved by the Directors. To the extent such fee is not paid to such persons, the Fund may use the fee for its expenses of distribution of its shares, including, but not limited to, payment by the Fund of the cost of preparing, printing, and distributing Prospectuses and Statements of Additional Information to prospective investors and of implementing and operating the plan.
| 5. | SUB-TRANSFER AGENT & SHAREHOLDER SERVICING FEE PLANS |
The Funds are permitted to pay sub-transfer agent fees for various platform agreement not to exceed 0.15% of the Funds’ average daily net assets. In addition, the Retail Class shares of the Leuthold Core Investment Fund, Leuthold Select Industries Fund, and Grizzly Short Fund have adopted a Shareholder Servicing Fee Plan not to exceed 0.15% of these Funds’ Retail Class shares average daily net assets. These fees are used to finance certain activities related to servicing and maintaining shareholder accounts. Sub-transfer agent and shareholder servicing fees incurred by the Funds are disclosed in the Statements of Operations.
The Funds enter into contracts that contain a variety of indemnifications. The Funds’ maximum exposure under these arrangements is unknown. However, the Funds have not had prior claims or losses pursuant to these contracts and expect the risk of loss to be remote.
| 48 | Leuthold Funds - 2021 Semi-Annual Report |
Each Fund may invest up to 15% of net assets in illiquid investments. An “illiquid investment” is any investment that a Fund reasonably expects cannot be sold or disposed of in current market conditions in seven calendar days or less without the sale or disposition significantly changing the market value of the investment. A Fund will take into account relevant market, trading, and investment specific consideration when determining whether an investment is an illiquid investment. The illiquidity status of an investment is generally evaluated monthly. The 15% limitation may include securities whose disposition would be subject to legal restrictions (“restricted securities”). Restricted securities often have a market value lower than the market price of unrestricted securities of the same issuer and are not readily marketable without some time delay. This could result in a Fund being unable to realize a favorable price upon disposition of restricted securities and in some cases might make disposition of such securities at the time desired by the Fund impossible.
| 8. | LENDING PORTFOLIO SECURITIES |
The Funds may lend portfolio securities constituting up to 30% of total assets to unaffiliated broker dealers, banks, or other recognized institutional borrowers of securities, provided that the borrower at all times maintains cash, U.S. government securities or equivalent collateral or provides an irrevocable letter of credit in favor of the Funds equal in value to at least 100% of the value of the securities loaned. During the time portfolio securities are on loan, the borrower pays the lending Fund an amount equivalent to any dividends or interest paid on such securities, and the Fund may receive an agreed-upon amount of interest income from the borrower who delivered equivalent collateral or provided a letter of credit. Loans are subject to termination at the option of the lending Fund or the borrower. The lending Fund may pay reasonable administrative and custodial fees in connection with a loan of portfolio securities and may pay a negotiated portion of the interest earned on the cash or equivalent collateral to the borrower or placing broker. The lending Fund does not have the right to vote securities on loan but could terminate the loan and regain the right to vote if that were considered important with respect to the investment.
The primary risk in securities lending is a default by the borrower during a sharp rise in price of the borrowed security resulting in a deficiency in the collateral posted by the borrower. The Funds will seek to minimize this risk by requiring that the value of the securities loaned will be computed each day and additional collateral be furnished each day if required.
During the period ended March 31, 2021, the Funds did not engage in securities lending.
| Leuthold Funds - 2021 Semi-Annual Report | 49 |
| Leuthold Core Investment Fund - Retail - LCORX |
| Financial Highlights |
| | | Six Months
Ended
March 31,
2021 | | Year Ended September 30, 2020 | | Year Ended September 30, 2019 | | Year Ended September 30, 2018 (Consolidated) | | Year Ended September 30, 2017 (Consolidated) | | Year Ended September 30, 2016 (Consolidated) |
| | | | (Unaudited) | | | | | | | | | | | | | | | | | | | | | |
| Per Share Data(1): | | | | | | | | | | | | | | | | | | | | | | | | |
| Net asset value, beginning of period | | $ | 19.70 | | | $ | 18.77 | | | $ | 20.50 | | | $ | 20.54 | | | $ | 18.06 | | | $ | 18.44 | |
| Income (loss) from investment operations: | | | | | | | | | | | | | | | | | | | | | | | | |
| Net investment income (loss)(2) | | | (0.03 | ) | | | 0.00 | (3) | | | 0.09 | | | | 0.05 | | | | 0.04 | | | | (0.01 | ) |
| Net realized and unrealized gain (loss) on investments and securities sold short | | | 2.61 | | | | 1.24 | | | | 0.08 | | | | 0.61 | | | | 2.53 | | | | 0.32 | |
| Total from investment operations | | | 2.58 | | | | 1.24 | | | | 0.17 | | | | 0.66 | | | | 2.57 | | | | 0.31 | |
| Less distributions: | | | | | | | | | | | | | | | | | | | | | | | | |
| From net investment income | | | — | | | | (0.04 | ) | | | (0.07 | ) | | | (0.05 | ) | | | (0.01 | ) | | | — | |
| From net realized gain | | | (0.03 | ) | | | (0.27 | ) | | | (1.83 | ) | | | (0.65 | ) | | | (0.08 | ) | | | (0.69 | ) |
| Redemption fees(3) | | | 0.00 | | | | 0.00 | | | | 0.00 | | | | 0.00 | | | | 0.00 | | | | 0.00 | |
| Total distributions | | | (0.03 | ) | | | (0.31 | ) | | | (1.90 | ) | | | (0.70 | ) | | | (0.09 | ) | | | (0.69 | ) |
| Net asset value, end of period | | $ | 22.25 | | | $ | 19.70 | | | $ | 18.77 | | | $ | 20.50 | | | $ | 20.54 | | | $ | 18.06 | |
| | | | | | | | | | | | | | | | | | | | | | | | | |
| Total Return | | | 13.08 | % | | | 6.72 | % | | | 1.21 | % | | | 3.23 | % | | | 14.31 | % | | | 1.76 | % |
| | | | | | | | | | | | | | | | | | | | | | | | | |
| Supplemental data and ratios: | | | | | | | | | | | | | | | | | | | | | | | | |
| Net assets, end of period | | $ | 285,109,545 | | | $ | 276,018,345 | | | $ | 316,887,197 | | | $ | 403,095,456 | | | $ | 464,660,913 | | | $ | 524,731,192 | |
| Ratio of expenses to average net assets(4) | | | 1.33 | %(7) | | | 1.34 | % | | | 1.32 | % | | | 1.38 | % | | | 1.21 | % | | | 1.29 | % |
| Ratio of net investment income (loss) to average net assets(5) | | | (0.32 | )%(7) | | | 0.00 | % | | | 0.48 | % | | | 0.26 | % | | | 0.20 | % | | | (0.08 | )% |
| Portfolio turnover rate(6) | | | 23.75 | % | | | 60.08 | % | | | 66.68 | % | | | 79.00 | % | | | 52.36 | % | | | 109.32 | % |
| (1) | For a share outstanding throughout the period. Rounded to the nearest cent. |
| (2) | Net investment income (loss) per share is calculated based on average shares outstanding. |
| (3) | Amount represents less than $0.005 per share. |
| (4) | The ratio of expenses to average net assets includes dividends and interest on securities sold short. The expense ratios excluding dividends and interest on securities sold short were 1.21% for the six months ended March 31,2021, 1.20% for the year ended September 30, 2020, 1.20% for the year ended September 30, 2019, 1.19% for the year ended September 30, 2018, 1.19% for the year ended September 30, 2017, and 1.17% for the year ended September 30, 2016. |
| (5) | The net investment income ratios include dividends and interest on securities sold short. |
| (6) | The portfolio turnover rate excludes purchases and sales of securities sold short. |
| 50 | Leuthold Funds - 2021 Semi-Annual Report |
Leuthold Core Investment Fund - Institutional - LCRIX
Financial Highlights
| | | Six Months
Ended
March 31,
2021 | | | Year Ended
September 30,
2020 | | | Year Ended
September 30,
2019 | | | Year Ended
September 30,
2018
(Consolidated) | | | Year Ended
September 30,
2017
(Consolidated) | | | Year Ended
September 30,
2016 (Consolidated) | |
| | | | (Unaudited) | | | | | | | | | | | | | | | | | | | | | |
| Per Share Data(1): | | | | | | | | | | | | | | | | | | | | | | | | |
| Net asset value, beginning of period | | $ | 19.74 | | | $ | 18.81 | | | $ | 20.53 | | | $ | 20.56 | | | $ | 18.08 | | | $ | 18.43 | |
| Income from investment operations: | | | | | | | | | | | | | | | | | | | | | | | | |
| Net investment income (loss)(2) | | | (0.02 | ) | | | 0.02 | | | | 0.11 | | | | 0.08 | | | | 0.06 | | | | 0.01 | |
| Net realized and unrealized gain on investments and securities sold short | | | 2.62 | | | | 1.23 | | | | 0.09 | | | | 0.60 | | | | 2.53 | | | | 0.33 | |
| Total from investment operations | | | 2.60 | | | | 1.25 | | | | 0.20 | | | | 0.68 | | | | 2.59 | | | | 0.34 | |
| | | | | | | | | | | | | | | | | | | | | | | | | |
| Less distributions: | | | | | | | | | | | | | | | | | | | | | | | | |
| From net investment income | | | — | | | | (0.05 | ) | | | (0.09 | ) | | | (0.06 | ) | | | (0.03 | ) | | | — | |
| From net realized gain | | | (0.03 | ) | | | (0.27 | ) | | | (1.83 | ) | | | (0.65 | ) | | | (0.08 | ) | | | (0.69 | ) |
| Redemption fees(3) | | | 0.00 | | | | 0.00 | | | | 0.00 | | | | 0.00 | | | | 0.00 | | | | 0.00 | |
| Total distributions | | | (0.03 | ) | | | (0.32 | ) | | | (1.92 | ) | | | (0.71 | ) | | | (0.11 | ) | | | (0.69 | ) |
| Net asset value, end of period | | $ | 22.31 | | | $ | 19.74 | | | $ | 18.81 | | | $ | 20.53 | | | $ | 20.56 | | | $ | 18.08 | |
| | | | | | | | | | | | | | | | | | | | | | | | | |
| Total Return | | | 13.16 | % | | | 6.76 | % | | | 1.33 | % | | | 3.35 | % | | | 14.43 | % | | | 1.93 | % |
| | | | | | | | | | | | | | | | | | | | | | | | | |
| Supplemental data and ratios: | | | | | | | | | | | | | | | | | | | | | | | | |
| Net assets, end of period | | $ | 304,024,967 | | | $ | 268,933,642 | | | $ | 301,387,112 | | | $ | 434,163,780 | | | $ | 385,390,357 | | | $ | 378,962,827 | |
| Ratio of expenses to average net assets(4) | | | 1.24 | %(7) | | | 1.25 | % | | | 1.22 | % | | | 1.27 | % | | | 1.10 | % | | | 1.17 | % |
| Ratio of net investment income (loss) to average net assets(5) | | | (0.22 | %)(7) | | | 0.10 | % | | | 0.58 | % | | | 0.37 | % | | | 0.30 | % | | | 0.04 | % |
| Portfolio turnover rate(6) | | | 23.75 | % | | | 60.08 | % | | | 66.68 | % | | | 79.00 | % | | | 52.36 | % | | | 109.32 | % |
| (1) | For a share outstanding throughout the period. Rounded to the nearest cent. |
| (2) | Net investment income (loss) per share is calculated based on average shares outstanding. |
| (3) | Amount represents less than $0.005 per share. |
| (4) | The ratio of expenses to average net assets includes dividends and interest on securities sold short. The expense ratios excluding dividends and interest on securities sold short were 1.12% for the six months ended March 31, 2021, 1.11% for the year ended September 30, 2020, 1.10% for the year ended September 30, 2019, 1.08% for the year ended September 30, 2018, 1.08% for the year ended September 30, 2017, and 1.05% for the year ended September 30, 2016. |
| (5) | The net investment income (loss) ratios include dividends and interest on securities sold short. |
| (6) | The portfolio turnover rate excludes purchases and sales of securities sold short. |
| (7) | Annualized. |
| See Notes to the Financial Statements. | Leuthold Funds - 2021 Semi-Annual Report | 51 |
Leuthold Global Fund - Retail - GLBLX
Financial Highlights
| | | Six Months
Ended
March 31,
2021 | | | Year Ended
September 30,
2020 | | | Year Ended
September 30,
2019 | | | Year Ended
September 30,
2018
(Consolidated) | | | Year Ended
September 30,
2017
(Consolidated) | | | Year Ended
September 30,
2016 (Consolidated) | |
| | | | (Unaudited) | | | | | | | | | | | | | | | | | | | | | |
| Per Share Data(1): | | | | | | | | | | | | | | | | | | | | | | | | |
| Net asset value, beginning of period | | $ | 8.24 | | | $ | 8.09 | | | $ | 9.11 | | | $ | 10.05 | | | $ | 9.86 | | | $ | 10.03 | |
| Income (loss) from investment operations: | | | | | | | | | | | | | | | | | | | | | | | | |
| Net investment income (loss)(2) | | | (0.04 | ) | | | 0.00 | (3) | | | 0.02 | | | | 0.03 | | | | 0.04 | | | | (0.01 | ) |
| Net realized and unrealized gain (loss) on investments and securities sold short | | | 1.30 | | | | 0.21 | | | | (0.39 | ) | | | (0.07 | ) | | | 1.02 | | | | 0.21 | |
| Total from investment operations | | | 1.26 | | | | 0.21 | | | | (0.37 | ) | | | (0.04 | ) | | | 1.06 | | | | 0.20 | |
| | | | | | | | | | | | | | | | | | | | | | | | | |
| Less distributions: | | | | | | | | | | | | | | | | | | | | | | | | |
| From net investment income | | | 0.00 | (3) | | | (0.06 | ) | | | (0.01 | ) | | | (0.02 | ) | | | — | | | | — | |
| From net realized gain | | | — | | | | — | | | | (0.64 | ) | | | (0.88 | ) | | | (0.87 | ) | | | (0.37 | ) |
| Redemption fees | | | — | | | | — | | | | 0.00 | (3) | | | 0.00 | (3) | | | 0.00 | (3) | | | 0.00 | (3) |
| Total distributions | | | — | | | | (0.06 | ) | | | (0.65 | ) | | | (0.90 | ) | | | (0.87 | ) | | | (0.37 | ) |
| Net asset value, end of period | | $ | 9.50 | | | $ | 8.24 | | | $ | 8.09 | | | $ | 9.11 | | | $ | 10.05 | | | $ | 9.86 | |
| | | | | | | | | | | | | | | | | | | | | | | | | |
| Total Return | | | 15.34 | % | | | 2.56 | % | | | (3.97 | )% | | | (0.67 | )% | | | 12.02 | % | | | 1.89 | % |
| | | | | | | | | | | | | | | | | | | | | | | | | |
| Supplemental data and ratios: | | | | | | | | | | | | | | | | | | | | | | | | |
| Net assets, end of period | | $ | 5,663,580 | | | $ | 4,690,110 | | | $ | 7,485,394 | | | $ | 18,362,218 | | | $ | 24,040,140 | | | $ | 78,743,516 | |
| Ratio of expenses to average net assets(4) | | | | | | | | | | | | | | | | | | | | | | | | |
| Before expense reimbursement or recovery | | | 1.99 | %(7) | | | 1.94 | % | | | 1.88 | % | | | 1.75 | % | | | 1.56 | % | | | 1.82 | % |
| After expense reimbursement or recovery | | | 2.05 | %(7) | | | 1.91 | % | | | 1.88 | % | | | 1.75 | % | | | 1.56 | % | | | 1.82 | % |
| Ratio of net investment income (loss)to average net assets(5) | | | | | | | | | | | | | | | | | | | | | | | | |
| Before expense reimbursement or recovery | | | (0.84 | )%(7) | | | (0.03 | )% | | | 0.27 | % | | | 0.28 | % | | | 0.38 | % | | | (0.15 | )% |
| After expense reimbursement or recovery | | | (0.90 | )%(7) | | | 0.01 | % | | | 0.27 | % | | | 0.28 | % | | | 0.38 | % | | | (0.15 | )% |
| Portfolio turnover rate(6) | | | 29.55 | % | | | 55.31 | % | | | 93.77 | % | | | 79.09 | % | | | 63.13 | % | | | 102.93 | % |
| (1) | For a share outstanding throughout the period. Rounded to the nearest cent. |
| (2) | Net investment income (loss) per share is calculated based on average shares outstanding. |
| (3) | Amount represents less than $0.005 per share. |
| (4) | The ratio of expenses to average net assets includes dividends and interest on securities sold short. The expense ratios excluding dividends and interest on securities sold short before and after expense reimbursement and recovery were 1.84% and 1.91% for the six months ended March 31, 2021, 1.74% and 1.69% for the year ended September 30, 2020, 1.62% and 1.62% for the year ended September 30, 2019, 1.54% and 1.54% for the year ended September 30, 2018, 1.56% and 1.56% for the year ended September 30, 2017, and 1.61% and 1.61% for the year ended September 30, 2016, respectively. |
| (5) | The net investment income (loss) ratios include dividends and interest on securities sold short. |
| (6) | The portfolio turnover rate excludes purchases and sales of securities sold short. |
| (7) | Annualized. |
| 52 | Leuthold Funds - 2021 Semi-Annual Report | See Notes to the Financial Statements. |
Leuthold Global Fund - Institutional - GLBIX
Financial Highlights
| | | Six Months Ended March 31, 2021 | | | Year Ended September 30, 2020 | | | Year Ended September 30, 2019 | | | Year Ended September 30, 2018 (Consolidated) | | | Year Ended September 30, 2017 (Consolidated) | | | Year Ended September 30, 2016 (Consolidated) | |
| | | | (Unaudited) | | | | | | | | | | | | | | | | | | | | | |
| Per Share Data(1): | | | | | | | | | | | | | | | | | | | | | | | | |
| Net asset value, beginning of period | | $ | 8.38 | | | $ | 8.21 | | | $ | 9.23 | | | $ | 10.16 | | | $ | 9.95 | | | $ | 10.10 | |
| Income (loss) from investment operations: | | | | | | | | | | | | | | | | | | | | | | | | |
| Net investment income (loss)(2) | | | (0.03 | ) | | | 0.02 | | | | 0.04 | | | | 0.05 | | | | 0.06 | | | | 0.01 | |
| Net realized and unrealized gain (loss) on investments and securities sold short | | | 1.30 | | | | 0.21 | | | | (0.39 | ) | | | (0.07 | ) | | | 1.03 | | | | 0.21 | |
| Total from investment operations | | | 1.27 | | | | 0.23 | | | | (0.35 | ) | | | (0.02 | ) | | | 1.09 | | | | 0.22 | |
| | | | | | | | | | | | | | | | | | | | | | | | | |
| Less distributions: | | | | | | | | | | | | | | | | | | | | | | | | |
| From net investment income | | | (0.02 | ) | | | (0.06 | ) | | | (0.03 | ) | | | (0.03 | ) | | | (0.01 | ) | | | — | |
| From net realized gain | | | — | | | | — | | | | (0.64 | ) | | | (0.88 | ) | | | (0.87 | ) | | | (0.37 | ) |
| Redemption fees(3) | | | 0.00 | | | | 0.00 | | | | 0.00 | | | | 0.00 | | | | 0.00 | | | | 0.00 | |
| Total distributions | | | (0.02 | ) | | | (0.06 | ) | | | (0.67 | ) | | | (0.91 | ) | | | (0.88 | ) | | | (0.37 | ) |
| Net asset value, end of period | | $ | 9.63 | | | $ | 8.38 | | | $ | 8.21 | | | $ | 9.23 | | | $ | 10.16 | | | $ | 9.95 | |
| | | | | | | | | | | | | | | | | | | | | | | | | |
| Total Return | | | 15.21 | % | | | 2.79 | % | | | (3.70 | )% | | | (0.43 | )% | | | 12.28 | % | | | 2.18 | % |
| | | | | | | | | | | | | | | | | | | | | | | | | |
| Supplemental data and ratios: | | | | | | | | | | | | | | | | | | | | | | | | |
| Net assets, end of period | | $ | 22,679,974 | | | $ | 21,096,867 | | | $ | 45,677,014 | | | $ | 64,388,940 | | | $ | 78,614,144 | | | $ | 103,921,200 | |
| Ratio of expenses to average net assets(4) | | | | | | | | | | | | | | | | | | | | | | | | |
| Before expense reimbursement or recovery | | | 1.84 | %(7) | | | 1.73 | % | | | 1.63 | % | | | 1.50 | % | | | 1.36 | % | | | 1.57 | % |
| After expense reimbursement or recovery | | | 1.91 | %(7) | | | 1.69 | % | | | 1.63 | % | | | 1.50 | % | | | 1.36 | % | | | 1.57 | % |
| Ratio of net investment income (loss) to average net assets(5) | | | | | | | | | | | | | | | | | | | | | | | | |
| Before expense reimbursement or recovery | | | (0.71 | )%(7) | | | 0.17 | % | | | 0.52 | % | | | 0.53 | % | | | 0.58 | % | | | 0.10 | % |
| After expense reimbursement or recovery | | | (0.77 | )%(7) | | | 0.21 | % | | | 0.52 | % | | | 0.53 | % | | | 0.58 | % | | | 0.10 | % |
| Portfolio turnover rate(6) | | | 29.55 | % | | | 55.31 | % | | | 93.77 | % | | | 79.09 | % | | | 63.13 | % | | | 102.93 | % |
| (1) | For a share outstanding throughout the period. Rounded to the nearest cent. |
| (2) | Net investment income (loss) per share is calculated based on average shares outstanding. |
| (3) | Amount represents less than $0.005 per share. |
| (4) | The ratio of expenses to average net assets includes dividends and interest on securities sold short. The expense ratios excluding dividends and interest on securities sold short before and after expense reimbursement and recovery were 1.69% and 1.75% for the six months ended March 31, 2021, 1.53% and 1.49% for the year ended September 30, 2020, 1.37% and 1.37% for the year ended September 30, 2019, 1.29% and 1.29% for the year ended September 30, 2018, 1.36% and 1.36% for the year ended September 30, 2017, and 1.36% and 1.36% for the year ended September 30, 2016, respectively. |
| (5) | The net investment income (loss) ratios include dividends and interest on securities sold short. |
| (6) | The portfolio turnover rate excludes purchases and sales of securities sold short. |
| (7) | Annualized. |
| See Notes to the Financial Statements. | Leuthold Funds - 2021 Semi-Annual Report | 53 |
Leuthold Select Industries Fund - LSLTX
Financial Highlights
| | | Six Months Ended March 31, 2021 | | | Year Ended September 30, 2020 | | | Year Ended September 30, 2019 | | | Year Ended September 30, 2018 (Consolidated) | | | Year Ended September 30, 2017 (Consolidated) | | | Year Ended September 30, 2016 (Consolidated) | |
| | | | (Unaudited) | | | | | | | | | | | | | | | | | | | | | |
| Per Share Data(1): | | | | | | | | | | | | | | | | | | | | | | | | |
| Net asset value, beginning of period | | $ | 27.06 | | | $ | 25.02 | | | $ | 27.31 | | | $ | 26.32 | | | $ | 21.41 | | | $ | 21.27 | |
| Income (loss) from investment operations: | | | | | | | | | | | | | | | | | | | | | | | | |
| Net investment income (loss)(2) | | | (0.05 | ) | | | (0.04 | ) | | | (0.03 | ) | | | (0.01 | ) | | | (0.02 | ) | | | 0.00 | (3) |
| Net realized and unrealized gain (loss) on investments | | | 7.12 | | | | 2.81 | | | | (0.16 | ) | | | 2.28 | | | | 4.93 | | | | 0.45 | |
| Total from investment operations | | | 7.07 | | | | (2.77 | ) | | | (0.19 | ) | | | 2.27 | | | | 4.91 | | | | 0.45 | |
| | | | | | | | | | | | | | | | | | | | | | | | | |
| Less distributions: | | | | | | | | | | | | | | | | | | | | | | | | |
| From net investment income | | | - | | | | - | | | | - | | | | (0.01 | ) | | | - | | | | (0.03 | ) |
| From net realized gain | | | (1.96 | ) | | | (0.73 | ) | | | | | | | (2.10 | ) | | | (1.27 | ) | | | (0.28 | ) |
| Total distributions | | | (1.96 | ) | | | (0.73 | ) | | | | | | | (2.10 | ) | | | (1.28 | ) | | | (0.31 | ) |
| Net asset value, end of period | | $ | 32.17 | | | $ | 27.06 | | | $ | 25.02 | | | $ | 27.31 | | | $ | 26.32 | | | $ | 21.41 | |
| | | | | | | | | | | | | | | | | | | | | | | | | |
| Total Return | | | 27.48 | % | | | 11.28 | % | | | (0.19 | )% | | | 8.89 | % | | | 22.93 | % | | | 2.09 | % |
| | | | | | | | | | | | | | | | | | | | | | | | | |
| Supplemental data and ratios: | | | | | | | | | | | | | | | | | | | | | | | | |
| Net assets, end of period | | $ | 10,100,868 | | | $ | 8,677,008 | | | $ | 11,783,884 | | | $ | 18,111,932 | | | $ | 15,045,866 | | | $ | 12,630,891 | |
| Ratio of expenses to average net assets: | | | | | | | | | | | | | | | | | | | | | | | | |
| Before expense reimbursement or recovery | | | 2.20 | %(4) | | | 2.75 | % | | | 1.77 | % | | | 1.65 | % | | | 1.80 | % | | | 1.72 | % |
| After expense reimbursement or recovery | | | 1.50 | %(4) | | | 1.50 | % | | | 1.50 | % | | | 1.50 | % | | | 1.50 | % | | | 1.50 | % |
| Ratio of net investment income (loss) to average net assets: | | | | | | | | | | | | | | | | | | | | | | | | |
| Before expense reimbursement or recovery | | | (1.05 | )%(4) | | | (1.40 | )% | | | (0.39 | )% | | | (0.17 | )% | | | (0.39 | )% | | | (0.20 | )% |
| After expense reimbursement or recovery | | | (0.36 | )%(4) | | | (0.16 | )% | | | (0.12 | )% | | | (0.02 | )% | | | (0.09 | )% | | | 0.02 | % |
| Portfolio turnover rate | | | 23.71 | % | | | 73.99 | % | | | 72.87 | % | | | 104.00 | % | | | 62.72 | % | | | 118.26 | % |
| (1) | For a share outstanding throughout the period. Rounded to the nearest cent. |
| (2) | Net investment income (loss) per share is calculated based on average shares outstanding. |
| (3) | Amount represents less than $0.005 per share. |
| (4) | Annualized. |
| 54 | Leuthold Funds - 2021 Semi-Annual Report | See Notes to the Financial Statements. |
Grizzly Short Fund - GRZZX
Financial Highlights
| | | Six Months Ended March 31, 2021 | | | Year Ended September 30, 2020 | | | Year Ended September 30, 2020 | | | Year Ended September 30, 2020 | | | Year Ended September 30, 2020 | | | Year Ended September 30, 2020 | |
| | | | (Unaudited) | | | | | | | | | | | | | | | | | | | | | |
| Per Share Data(2): | | | | | | | | | | | | | | | | | | | | | | | | |
| Net asset value, beginning of period | | $ | 10.82 | | | $ | 16.15 | | | $ | 17.65 | | | $ | 21.48 | | | $ | 24.68 | | | $ | 31.96 | |
| Income (loss) from investment operations: | | | | | | | | | | | | | | | | | | | | | | | | |
| Net investment income (loss)(3) | | | (0.13 | ) | | | (0.31 | ) | | | 0.19 | | | | (0.03 | ) | | | (0.40 | ) | | | (0.72 | ) |
| Net realized and unrealized loss on investments and securities sold short | | | (3.13 | ) | | | (5.01 | ) | | | (1.54 | ) | | | (3.80 | ) | | | (2.80 | ) | | | (6.56 | ) |
| Total from investment operations | | | (3.26 | ) | | | (5.32 | ) | | | (1.35 | ) | | | (3.83 | ) | | | (3.20 | ) | | | (7.28 | ) |
| | | | | | | | | | | | | | | | | | | | | | | | | |
| Less distributions: | | | | | | | | | | | | | | | | | | | | | | | | |
| From net investment income | | | — | | | | (0.01 | ) | | | (0.15 | ) | | | — | | | | — | | | | — | |
| From net realized gain | | | — | | | | — | | | | — | | | | — | | | | — | | | | — | |
| Total distributions | | | — | | | | (0.01 | ) | | | (0.15 | ) | | | — | | | | — | | | | — | |
| Net asset value, end of period | | $ | 7.56 | | | $ | 10.82 | | | $ | 16.15 | | | $ | 17.65 | | | $ | 21.48 | | | $ | 24.68 | |
| | | | | | | | | | | | | | | | | | | | | | | | | |
| Total Return | | | (30.13 | )% | | | (32.96 | )% | | | (7.62 | )% | | | (17.83 | )% | | | (12.97 | )% | | | (22.78 | )% |
| | | | | | | | | | | | | | | | | | | | | | | | | |
| Supplemental data and ratios: | | | | | | | | | | | | | | | | | | | | | | | | |
| Net assets, end of period | | $ | 52,044,155 | | | $ | 123,139,517 | | | $ | 92,238,086 | | | $ | 98,948,757 | | | $ | 205,698,273 | | | $ | 178,211,844 | |
| Ratio of expenses to average net assets(4) | | | 2.95 | %(7) | | | 2.84 | % | | | 2.61 | % | | | 2.64 | % | | | 2.63 | % | | | 2.65 | % |
| Ratio of net investment income (loss) to average net assets(5) | | | (2.94 | )%(7) | | | (2.23 | )% | | | 1.08 | % | | | (0.54 | )% | | | (1.78 | )% | | | (2.50 | )% |
| Portfolio turnover rate(6) | | | 0.00 | % | | | 0.00 | % | | | 0.00 | % | | | 0.00 | % | | | 0.00 | % | | | 0.00 | % |
| (1) | Per share data adjusted for 1:4 reverse split completed as of May 18, 2018. |
| (2) | For a share outstanding throughout the period. Rounded to the nearest cent. |
| (3) | Net investment income (loss) per share is calculated based on average shares outstanding. |
| (4) | The ratio of expenses to average net assets includes dividends and interest on securities sold short. The expense ratios excluding dividends and interest on securities sold short were 1.68% for the six months ended March 31, 2021, 1.24% for the year ended September 30, 2020, 1.60% for the year ended September 30, 2019, 1.53% for the year ended September 30, 2018, 1.54% for the year ended September 30, 2017, and 1.52% for the year ended September 30, 2016. |
| (5) | The net investment income (loss) ratios include dividends and interest on securities sold short. |
| (6) | The portfolio turnover rate excludes purchases and sales of securities sold short. |
| (7) | Annualized. |
| See Notes to the Financial Statements. | Leuthold Funds - 2021 Semi-Annual Report | 55 |
| Leuthold Core ETF - LCR |
| Financial Highlights |
| | | Six Months
Ended
March 31, 2021 | | Period Ended
September 30
2020(1) | |
| | | (Unaudited) | | | | |
| Per Share Data(2): | | | | | | | |
| Net asset value, beginning of period | | $ | 26.63 | | $ | 25.00 | |
| Income from investment operations: | | | | | | | |
| Net investment income(4) | | | 0.04 | | | 0.08 | |
| Net realized and unrealized gain on investments and futures contracts | | | 2.56 | | | 1.55 | |
| Total from investment operations | | | 2.60 | | | 1.63 | |
| | | | | | | | |
| Less distributions: | | | | | | | |
| From net investment income | | | (0.18 | ) | | — | |
| From net realized gain | | | — | | | — | |
| Total distributions | | | (0.18 | ) | | — | |
| Net asset value, end of period | | $ | 29.05 | | $ | 26.63 | |
| | | | | | | | |
| Total Return | | | 9.79 | % | | 6.52 | % |
| | | | | | | | |
| Supplemental data and ratios: | | | | | | | |
| Net assets, end of period | | $ | 14,527,093 | | $ | 11,317,390 | |
| Ratio of expenses to average net assets(4): | | | | | | | |
| Before expense reimbursement or recovery | | | 1.43 | % | | 3.31 | % |
| After expense reimbursement or recovery | | | 0.65 | % | | 0.65 | % |
| Ratio of net investment income (loss) to average net assets(4): | | | | | | | |
| Before expense reimbursement or recovery | | | (0.51 | )% | | (2.23 | )% |
| After expense reimbursement or recovery | | | 0.27 | % | | 0.43 | % |
| Portfolio turnover rate | | | 30.31 | % | | 47.53 | % |
| (1) | Fund commenced operations on January 6, 2020. Information presented is for the period January 6, 2020 through September 30, 2020. Information presented is not annualized unless otherwise noted. |
| (2) | For a share outstanding throughout the period. Rounded to the nearest cent. |
| (3) | Net investment income per share is calculated based on average shares outstanding. |
| (4) | Annualized. |
| 56 | Leuthold Funds - 2021 Semi-Annual Report | See Notes to the Financial Statements. |
Expense Examples – March 31, 2021 (Unaudited)
As a shareholder of the Funds, you incur two types of costs: (1) transaction costs, including redemption fees and exchange fees; and (2) ongoing costs, including management fees; distribution and/or service fees; and other Fund expenses. This example is intended to help you understand your ongoing costs (in dollars) of investing in the Funds and to compare costs with the ongoing costs of investing in other mutual funds.
The Examples are based on an investment of $1,000 invested at the beginning of the period and held the entire period (October 1, 2020 - March 31, 2021).
Actual Expenses
The first line of the following tables provides information about actual account values and actual expenses. Although the Funds charge no sales load (the Leuthold Core Investment Fund and Leuthold Global Fund charge a 2% redemption fee for redemptions made within five business days after a purchase), you will be assessed fees for outgoing wire transfers, returned checks, or stop payment orders at prevailing rates charged by U.S. Bancorp Fund Services, LLC, the Funds’ transfer agent. If you request a redemption be made by wire transfer, currently a $15.00 fee is charged by the Funds’ transfer agent. To the extent that the Funds invest in shares of other investment companies as part of its investment strategy, you will indirectly bear your proportionate share of any fees and expenses charged by the underlying funds in which a Fund invests in addition to the expenses of the Fund. Actual expenses of the underlying funds are expected to vary by fund. These expenses are not included in the following examples. The examples include, but are not limited to, management fees, shareholder servicing fees, fund accounting, custody, and transfer agent fees. However, the following examples do not include portfolio trading commissions and related expenses, and extraordinary expenses as determined under generally accepted accounting principles. You may use the information in this line, together with the amount you invested, to estimate the expenses that you paid over the period. Simply divide your account value by $1,000 (for example, an $8,600 account value divided by $1,000 = 8.6), then multiply the result by the number in the first line under the heading entitled “Expenses Paid During Period” to estimate the expenses you paid on your account during this period.
Hypothetical Examples for Comparison Purposes
The second line of the following tables provides information about hypothetical account values and hypothetical expenses based on the Funds’ actual expense ratios and an assumed rate of return of 5% per year before expenses, which is not the Funds’ actual return. The hypothetical account values and expenses may not be used to estimate the actual ending account balance or expenses you paid for the period. You may use this information to compare the ongoing costs of investing in the Funds and other funds. To do so, compare this 5% hypothetical example with the 5% hypothetical examples that appear in the shareholder reports of the other funds.
Please note that the expenses shown in the tables are meant to highlight your ongoing costs only and do not reflect any transactional costs, such as redemption fees or exchange fees. Therefore, the second line of the tables is useful in comparing ongoing costs only and will not help you determine the relative costs of owning different funds. In addition, if these transactional costs were included, your costs would have been higher.
| Leuthold Funds - 2021 Semi-Annual Report | 57 |
| Leuthold Funds |
| Expense Example Tables (Unaudited) |
| Leuthold Core Investment Fund - Retail Class - LCORX |
| | | Beginning
Account Value
October 1, 2020 | | Ending
Account Value
March 31, 2021 | | Expenses Paid
During Period
October 1, 2020 - March 31, 2021 | |
| Actual** | | $ | 1,000.00 | | $ | 1,130.80 | | $ | 7.07 | |
| Hypothetical (5% return before expenses)*** | | | 1,000.00 | | | 1,018.30 | | | 6.69 | |
| * | Expenses are equal to the Fund’s annualized expense ratio of 1.33%, multiplied by the average account value over the period, multiplied by 182/365 to reflect the one-half year period. |
| ** | Excluding dividends and interest on securities sold short, your actual cost of investment in the Fund would be $6.43 and the Fund’s annualized expense ratio would be 1.21%. |
| *** | Excluding dividends and interest on securities sold short, your hypothetical cost of investment in the Fund would be $6.09 and the Fund’s annualized expense ratio would be 1.21% |
| Leuthold Core Investment Fund - Institutional Class - LCRIX |
| | | Beginning
Account Value
October 1, 2020 | | Ending
Account Value
March 31, 2021 | | Expenses Paid
During Period
October 1, 2020 - March 31, 2021 | |
| Actual** | | $ | 1,000.00 | | $ | 1,131.60 | | $ | 6.59 | |
| Hypothetical (5% return before expenses)*** | | | 1,000.00 | | | 1,018.75 | | | 6.24 | |
| * | Expenses are equal to the Fund’s annualized expense ratio of 1.24%, multiplied by the average account value over the period, multiplied by 182/365 to reflect the one-half year period. |
| ** | Excluding dividends and interest on securities sold short, your actual cost of investment in the Fund would be $5.95 and the Fund’s annualized expense ratio would be 1.12%. |
| *** | Excluding dividends and interest on securities sold short, your hypothetical cost of investment in the Fund would be $5.64 and the Fund’s annualized expense ratio would be 1.12% |
| Leuthold Global Fund - Retail Class - GLBLX |
| | | Beginning
Account Value
October 1, 2020 | | Ending
Account Value
March 31, 2021 | | Expenses Paid
During Period
October 1, 2020 - March 31, 2021 | |
| Actual** | | $ | 1,000.00 | | $ | 1,153.40 | | $ | 11.01 | |
| Hypothetical (5% return before expenses)*** | | | 1,000.00 | | | 1,014.71 | | | 10.30 | |
| * | Expenses are equal to the Fund’s annualized expense ratio of 2.05%, multiplied by the average account value over the period, multiplied by 182/365 to reflect the one-half year period. |
| ** | Excluding dividends and interest on securities sold short, your actual cost of investment in the Fund would be $10.25 and the Fund’s annualized expense ratio would be 1.91%. |
| *** | Excluding dividends and interest on securities sold short, your hypothetical cost of investment in the Fund would be $9.60 and the Fund’s annualized expense ratio would be 1.91% |
| Leuthold Global Fund - Institutional Class - GLBIX |
| | | Beginning
Account Value
October 1, 2020 | | Ending
Account Value
March 31, 2021 | | Expenses Paid
During Period
October 1, 2020 - March 31, 2021 | |
| Actual** | | $ | 1,000.00 | | $ | 1,152.10 | | $ | 10.25 | |
| Hypothetical (5% return before expenses)*** | | | 1,000.00 | | | 1,052.41 | | | 9.60 | |
| * | Expenses are equal to the Fund’s annualized expense ratio of 1.91%, multiplied by the average account value over the period, multiplied by 182/365 to reflect the one-half year period. |
| ** | Excluding dividends and interest on securities sold short, your actual cost of investment in the Fund would be $9.39 and the Fund’s annualized expense ratio would be 1.75%. |
| *** | Excluding dividends and interest on securities sold short, your hypothetical cost of investment in the Fund would be $8.80 and the Fund’s annualized expense ratio would be 1.75%. |
| 58 | Leuthold Funds - 2021 Semi-Annual Report |
| Leuthold Funds |
| Expense Example Tables (Unaudited) (continued) |
Leuthold Select Industries Fund - LSLTX |
| | | Beginning
Account Value
October 1, 2020 | | Ending
Account Value
March 31, 2021 | | Expenses Paid
During Period
October 1, 2020 - March 31, 2021 | |
| Actual | | $ | 1,000.00 | | $ | 1,274.80 | | $ | 8.51 | |
| Hypothetical (5% return before expenses) | | | 1,000.00 | | | 1,017.50 | | | 7.54 | |
| * | Expenses are equal to the Fund’s annualized expense ratio of 1.50%, multiplied by the average account value over the period, multiplied by 182/365 to reflect the one-half year period. |
| Grizzly Short Fund - GRZZX |
| | | Beginning
Account Value
October 1, 2020 | | Ending
Account Value
March 31, 2021 | | Expenses Paid
During Period
October 1, 2020 - March 31, 2021 | |
| Actual** | | $ | 1,000.00 | | $ | 698.70 | | $ | 12.49 | |
| Hypothetical (5% return before expenses)*** | | | 1,000.00 | | | 1,010.22 | | | 14.78 | |
| * | Expenses are equal to the Fund’s annualized expense ratio of 2.95%, multiplied by the average account value over the period, multiplied by 182/365 to reflect the one-half period. |
| ** | Excluding dividends and interest on securities sold short, your actual cost of investment in the Fund would be $7.11 and the Fund’s annualized expense ratio would be 1.68%. |
| *** | Excluding dividends and interest on securities sold short, your hypothetical cost of investment in the Fund would be $8.45 and the Fund’s annualized expense ratio would be 1.68%. |
| Leuthold Core ETF - LCR |
| | | Beginning
Account Value
October 1, 2020 | | Ending
Account Value
March 31, 2021 | | Expenses Paid
During Period
October 1, 2020 - March 31, 2021 | |
| Actual | | $ | 1,000.00 | | $ | 1,097.90 | | $ | 3.40 | |
| Hypothetical (5% return before expenses) | | | 1,000.00 | | | 1,021.69 | | | 3.28 | |
| * | Expenses are equal to the Fund’s annualized expense ratio of 0.65%, multiplied by the average account value over the period, multiplied by 182/365 to reflect the one-half period. |
| Leuthold Funds - 2021 Semi-Annual Report | 59 |

| 60 | Leuthold Funds - 2021 Semi-Annual Report |
DISCLOSURE APPROVAL CONTINUATION INVESTMENT ADVISORY AGREEMENTS
On November 9, 2020, the Board of Directors of Leuthold Funds, Inc. (the “Directors”) approved the continuation of the investment advisory agreements for the Leuthold Core Investment Fund, the Grizzly Short Fund, the Leuthold Select Industries Fund, and the Leuthold Global Fund (collectively the “Funds”, or each, a “Fund”) with the investment adviser to the Funds, The Leuthold Group, LLC, doing business as Leuthold Weeden Capital Management (the “Adviser”). (The investment advisory agreement for the Leuthold Core ETF is in effect until January 2022, and was not up for continuation at this meeting.) As part of the process of approving the continuation of the advisory agreements, the Directors reviewed the fiduciary duties of the Directors with respect to approving the advisory agreements and the relevant factors for the Directors to consider, and the members of the Board of Directors who are not deemed “interested persons” (as that term is defined by the Investment Company Act of 1940) of the Funds (the “Independent Directors”) met in executive session to discuss the approval of the advisory agreements.
In advance of the meeting, the Adviser sent detailed information to the Directors to assist them in their evaluation of the investment advisory agreements. This information included, but was not limited to, a memorandum from Fund counsel that summarized the legal standards applicable to the Directors’ consideration of the advisory agreements; detailed comparative information relating to the Funds’ management fees and other expenses of the Funds; information regarding fees paid by the Funds and other Fund payments; information on the Adviser’s profitability; information about brokerage commissions; detailed comparative information relating to the Funds’ performance; information about sales and redemptions of the Funds; information about the Funds’ compliance program; and other information the Directors believed was useful in evaluating the approval of advisory agreements.
All of the factors discussed by the Directors were considered as a whole, and were considered separately by the Independent Directors, meeting in executive session. The factors were viewed in their totality by the Directors, with no single factor being the principal or determinative factor in the Directors’ determination of whether to approve the continuation of the investment advisory agreements. The Directors recognized that the management and fee arrangements for the Funds are the result of years of review and discussion between the Independent Directors and the Adviser, that certain aspects of such arrangements may receive greater scrutiny in some years than in others and that the Directors’ conclusions may be based, in part, on their consideration of these same arrangements and information received during the course of the year and in prior years.
Prior to approving the continuation of the investment advisory agreements, the Directors and the Independent Directors in executive session considered, among other items:
| • | The nature and quality of the investment advisory services provided by the Adviser, including the Adviser’s organization and operations, financial condition and stability and ownership structure; and the terms of the investment advisory agreements and how the services performed by the Adviser under the investment advisory agreements differ from those performed for other accounts managed by the Adviser. |
| • | A comparison of the fees and expenses of the Funds to other similar funds, including a comparison of the Funds’ total expenses and the total expense ratios. |
| • | A comparison of the fee structures of other accounts managed by the Adviser. |
| • | Whether economies of scale are recognized by the Funds. |
| Leuthold Funds - 2021 Semi-Annual Report | 61 |
| • | The costs and profitability of the Funds to the Adviser. |
| • | The independence, expertise, care, and conscientiousness of the Board of Directors. |
| • | Short-term and long-term investment performance of the Funds. |
| • | The other benefits to the Adviser from serving as investment adviser to the Funds (in addition to the advisory fee under the investment advisory agreements). |
The material considerations and determinations of the Board of Directors, including all of the Independent Directors, are as follows:
Nature and Quality of Investment Advisory Services
The Directors noted that the Adviser supervises the investment portfolios of the Funds, directing the day-to-day management of the Funds’ portfolios, including the purchase and sale of investment securities. The Directors then discussed with management the nature of the investment process employed by the portfolio managers of the Funds, which is highly research intensive.
Management noted that in employing its strategy, the Adviser conducts extensive quantitative research on target companies and industry groups. The Directors then discussed staffing at the Adviser and concluded that the Adviser is well staffed to conduct the research needed to meet the investment objectives of the Funds.
The Directors also considered the background and experience of the Adviser’s senior management and expertise of, and the amount of attention given to the Funds by investment personnel of the Adviser. In addition, the Directors considered the quality of the material service providers to the Funds, who provide administrative and distribution services on behalf of the Funds and are overseen by the Adviser, and the overall reputation and capabilities of the Adviser. Based on this review, the Directors believe that the Adviser provides high quality services to the Funds, and they noted that their overall confidence in the Adviser is high. The Directors also concluded that they were satisfied with the nature, extent and quality of the investment advisory services provided to the Funds by the Adviser, and that the nature and extent of the services provided by the Adviser are appropriate to assure that each Fund’s operations are conducted in compliance with applicable laws, rules and regulations.
Comparative Fees and Expenses
The Directors then discussed with management the variables, in addition to the management fees, such as administrative and transaction fees that impact costs to the shareholders of the Funds. Management reviewed with the Directors the comparison of the Funds’ expense ratios to other similar funds. As part of the discussion with management, the Directors ensured that they understood and were comfortable with the criteria used by the Adviser to determine the mutual funds that make up the peer universes for purposes of the materials.
Management discussed with the Board the Funds’ investment advisory fees and why the Funds’ fees appear higher than their peers. Management indicated that unlike some of the peers in the analyses that may employ some form of passive management into their strategies, the Adviser manages the Funds solely with an active approach. Mr. Mueller explained that at the Adviser’s size, they do not have the benefit of economies of scale that some of the larger investment advisers may experience. Additionally, Mr. Mueller discussed the Funds’ expense ratios and indicated that keeping the expense ratios as low as possible is a constant focus of the Adviser. After discussion, the Directors determined that the Funds’ advisory fees were within a reasonable range of their peers’ advisory fees, particularly in light of the Funds’ research intensive investment process.
| 62 | Leuthold Funds - 2021 Semi-Annual Report |
The Directors compared the Funds’ proposed expense ratios to those of other comparable mutual funds, indicating that the peer groups used were in line with what the Adviser uses for their internal reporting and that the categories used to compare the Funds to their peer groups were appropriate. After review, the Directors concluded that the proposed expense ratios of the Funds were within a reasonable range of comparable mutual funds, and that the fees are reasonable.
Comparison of Fee Structures of Other Accounts
The Directors then inquired of management regarding the distinction between the services performed by the Adviser for separately managed accounts (“SMAs”) or private investment companies and those performed by the Adviser for the Funds. The Adviser noted that the management of the Funds involves more comprehensive and substantive duties than the management of SMAs or private investment companies. Specifically, the Adviser noted the following:
| • | The Adviser provides tailored investment advisory services to the Funds in order to accommodate the cash flow volatility presented by the purchases and redemptions of shareholders. |
| • | With regard to the Funds, the Adviser attempts to serve the needs of thousands of accounts, ranging from direct accounts holding a few thousand dollars to the large omnibus accounts of intermediaries who in turn service thousands of large and small accounts. |
| • | The Adviser maintains a robust shareholder communication effort for the Funds to reach shareholders through direct contact, through intermediaries, or via the financial press. |
| • | The Adviser coordinates with the Funds’ Chief Compliance Officer and other service providers to ensure compliance with regulatory regimens imposed by Federal law and the Internal Revenue Code. |
| • | SMAs or private investment companies do not require the same level of services and oversight, nor do they present the same compliance risk. |
The Directors concluded that the services performed by the Adviser for the Funds require a higher level of service and oversight than the services performed by the Adviser for SMAs or private investment companies, and that the services performed by the Adviser for the Funds require a higher level of compliance resources from the Adviser. Based on this determination, the Directors believe that the differential in advisory fees between the Funds and the SMAs and private investment companies is reasonable and concluded that the fee rates charged to the Funds in comparison to those charged to the Adviser’s other clients are reasonable.
In addition to the above, the Directors discussed with management the fact that increasingly investors in the Funds invest through brokerage platforms (intermediaries), with fewer investors going directly to the Funds’ transfer agent. The Directors noted that in connection with the intermediaries, the Adviser absorbs all costs in excess of the fees paid by the Funds. As result, the cost of obtaining, retaining and servicing shareholders for the Funds is significantly higher than the costs for SMAs.
Performance
The Directors reviewed the Adviser’s quality of investment management, management history and ability to successfully market the Funds. They noted that while the Funds have had periods of underperformance, it is their expectation that the Adviser’s discipline will lead to more favorable results in the long-term. The Directors noted that the recent performance of the Funds (other than the Grizzly Short Fund) has been positive on an absolute basis and trending toward improved performance. They determined that the nature of the Grizzly Short Fund, which is designed to profit when stock prices decline, explains current underperformance, and that the Fund is operating as intended.
| Leuthold Funds - 2021 Semi-Annual Report | 63 |
The Directors noted that at each quarterly meeting, the Directors review reports comparing the investment performance of the Funds to various indices. Based on the information provided at this meeting and the information and quarterly discussions regarding the Funds’ investment performance, the Directors believe that the Adviser manages the Funds in a manner that is materially consistent with their stated investment objective and style.
The Directors also considered the presentation from the Adviser on the investment strategies for the Funds and reviewed the investment performance of the existing Funds compared with those of the existing Funds’ peer groups and relevant benchmarks. The Board concluded that the performance of the existing Funds was satisfactory in comparison to performance of similar funds.
Costs and Profitability
The Directors considered the cost of services provided and the profits realized by the Adviser, by reviewing reports provided by the Funds’ administrator that compared the Funds’ investment advisory fees to those of other comparable mutual funds. In addition, each Independent Director received and reviewed a copy of the Adviser’s audited financial statements. They also considered the Funds’ overall expense ratios compared to peer group funds and the Adviser’s proactive efforts to keep the overall expenses of the Funds lower.
The Directors discussed in detail the profitability of the Adviser as it relates to the Funds, in meetings with management of the Adviser. They also discussed the impact of the intermediary service fees on the profitability of the Adviser. The Directors also considered the resources and revenues that the Adviser has put into managing and distributing the Funds and concluded that the level of profitability realized by the Adviser from its provision of services to the Funds is reasonable, and that the overall expense ratios and investment advisory fees were fair and within a reasonable range of industry averages.
Economies of Scale
The Directors then discussed with management whether economies of scale are recognized by the Funds. They noted that as Fund assets grow, certain fixed costs are spread over the larger asset base, which may lead to some economies of scale. However, the Directors noted that many of the Funds’ expenses are subject to diseconomies of scale. For example, the intermediary service fees generally increase as the Funds’ assets grow. Given the size of the Funds and the Adviser’s efforts to keep overall expenses low, the Directors determined that the proposed fee schedules were reasonable. They determined that the Funds are not currently experiencing economies of scale given their size. The Directors determined to continue to assess the advisability of breakpoints as the Funds grow in size.
Fall-Out Benefits
The Directors then considered other benefits to the Adviser from serving as adviser to the Funds (in addition to the advisory fee). The Directors noted that the Adviser derives ancillary benefits from its association with the Funds in the form of proprietary and third-party research products and services received from broker dealers that execute portfolio trades for the Funds. Specifically, they discussed the manner in which portfolio transactions for the Funds would be conducted, including the use of soft dollars. Based on these discussions, the Directors concluded that the research and services obtained by the Adviser would be beneficial to the Funds and that Leuthold Weeden Capital Management would execute the Funds’ portfolio transactions in a manner designed to obtain best execution for the Funds. The Directors determined such products and services have been used for legitimate purposes relating to the Funds by aiding in the investment decision-making process. The Directors concluded that the other benefits realized by the Adviser from its relationship with the Funds were reasonable.
| 64 | Leuthold Funds - 2021 Semi-Annual Report |
Conclusion
After reviewing the materials and management’s presentation, as well as other information regularly provided at the Board’s quarterly meetings throughout the year regarding the quality of services provided by the Adviser, the performance of the Funds, expense information, regulatory compliance issues, trading information and related matters and other factors deemed relevant by the Board, including all of the Independent Directors, approved the continuation of the investment advisory agreements.
The Directors noted that all of the factors above were considered by the Board as a whole, and separately by the Independent Directors meeting in executive session. The factors were viewed in their totality by the Directors, with no single factor being the principal or determinative factor in the Board’s determination of whether to approve the continuation of the investment advisory agreements.
| Leuthold Funds - 2021 Semi-Annual Report | 65 |
ADDITIONAL DISCLOSURE REGARDING FUND DIRECTORS AND OFFICERS (UNAUDITED)
Independent Directors
Name, Year of Birth,
and Address | | Position(s)
Held with
the Company | | Term of Office
and Length of
Time Served | | Principal Occupation(s)
During Past Five Years | | # of
Portfolios in
Fund Complex
Overseen By
Director | | Other
Directorships
Held by
Director |
Lawrence L. Horsch (1934)
c/o Leuthold Weeden
Capital Management
150 South Fifth Street
Suite 1700
Minneapolis, MN 55402 | | Chairman and Director | | Indefinite, Director since 1995 | | Chairman, Eagle Management & Financial Corp., a management consulting firm | | 5 | | Somero Enterprises and Pioneer Sales Group |
| | | | | | | | | | | |
Steven R. Schroll (1957)
c/o Leuthold Weeden
Capital Management
150 South Fifth Street
Suite 1700
Minneapolis, MN 55402 | | Director and Chair of Nominating Committee | | Indefinite, Director since 2019 | | Retired. Served as Senior Equity Portfolio Manager at Ameriprise Financial (Columbia Management) from 2002 to 2018. | | 5 | | None |
| | | | | | | | | | | |
Addison L. Piper (1946)
c/o Leuthold Weeden
Capital Management
150 South Fifth Street
Suite 1700
Minneapolis, MN 55402 | | Director and Chair of Audit Committee | | Indefinite, Director since 2009 | | Retired Chairman and Chief Executive Officer of Piper Sandler Companies (formerly known as Piper Jaffray Companies) and PREDEX. | | 5 | | Piper Sandler (f/k/a Piper Jaffray Companies) and PREDEX |
| 66 | Leuthold Funds - 2021 Semi-Annual Report |
ADDITIONAL DISCLOSURE REGARDING FUND DIRECTORS AND OFFICERS (UNAUDITED)
Interested Persons
Name, Year of Birth,
and Address | | Position(s)
Held with
the Company | | Term of Office
and Length of
Time Served | | Principal Occupation
During Past Five Years | | # of
Portfolios in
Fund Complex
Overseen By
Director | | Other
Directorships
Held by
Director |
John C. Mueller (1968)
150 South Fifth Street
Suite 1700
Minneapolis, MN 55402 | | Director President | | Indefinite, Director since 2009 One year term, President since 2011 | | Co-Chief Executive Officer of The Leuthold Group since 2005. Involved in Sales and Marketing for The Leuthold Group since 2001. | | 5 | | None |
| | | | | | | | | | | |
Holly J. Weiss (1968)
150 South Fifth Street
Suite 1700
Minneapolis, MN 55402 | | Secretary and Treasurer | | One Year Term, Secretary and Treasurer since 2009 | | Chief Financial Officer of the Adviser since 2011. Controller of the Adviser from 2008 to 2011. | | N/A | | N/A |
| | | | | | | | | | | |
Roger A. Peters (1960)
150 South Fifth Street
Suite 1700
Minneapolis, MN 55402 | | Vice President and Chief Compliance Officer and Anti-Money Laundering Officer | | One Year Term, Chief Compliance Officer since 2006 and Vice President since 2007 and Anti-Money Laundering Officer since 2011 | | Chief Compliance Officer of the Adviser since 2005. | | N/A | | N/A |
| | | | | | | | | | | |
Glenn R. Larson (1965)
150 South Fifth Street
Suite 1700
Minneapolis, MN 55402 | | Assistant Secretary | | One Year Term, Assistant Secretary since 2006 | | Compliance Officer of the Adviser since 2005. | | N/A | | N/A |
The Statement of Additional Information includes additional information about the Funds’ Directors and is available free of charge upon request by calling the Funds toll free at (800) 273-6886 for the Mutual Funds and (800) 306-8817 for the Leuthold Core ETF.
Information regarding the policies and procedures the Funds use to determine how to vote proxies relating to portfolio securities is available without charge on the SEC’s website at http://www.sec.gov, upon request by calling toll-free (800) 273-6886 for the Mutual Funds and (800) 306-8817 for the Core ETF, or by accessing the Funds’ website at https://funds.leutholdgroup.com. Information regarding how the Funds voted proxies relating to portfolio securities during the most recent twelve-month period ended June 30 is available without charge upon request by calling toll-free (800) 273-6886 for the Mutual Funds and (800) 306-8817 for the Core ETF or on the SEC’s website at http://www.sec.gov.
| Leuthold Funds - 2021 Semi-Annual Report | 67 |

| 68 | Leuthold Funds - 2021 Semi-Annual Report |
Inside Back Cover - blank
| | Leuthold Funds | |
| | | |
| | Investment Adviser: The Leuthold Group, LLC, doing business as Leuthold Weeden Capital Management, Minneapolis, Minnesota Administrator, Transfer Agent, Fund Accountant, Shareholder Servicing Agent: U.S. Bancorp Fund Services, LLC, Milwaukee, Wisconsin Custodian: U.S. Bank, N.A., Milwaukee, Wisconsin Counsel: Foley & Lardner, LLP, Milwaukee, Wisconsin Independent Registered Public Accounting Firm: Ernst & Young LLP, Minneapolis, Minnesota The Funds are required to file their complete schedules of portfolio holdings with the SEC for their first and third fiscal quarters as an exhibit to their reports on Form N-PORT. Once filed, the Fund’s Form N-PORT is available without charge on the SEC’s website (http://www.sec.gov) and is available upon request by calling 1-800-273-6886. This report is authorized for distribution only when preceded or accompanied by a current prospectus. | |
Not applicable for semi-annual reports.
Not applicable for semi-annual reports.
Not applicable for semi-annual reports.
Not applicable to registrants who are not listed issuers (as defined in Rule 10A-3 under the Securities Exchange Act of 1934).
(a) Schedule of Investments is included as part of the report to shareholders filed under Item 1 of this Form.
(b) Not applicable.
Not applicable to open-end investment companies.
Not applicable to open-end investment companies.
Not applicable to open-end investment companies.
Not Applicable.
Not applicable to open-end investment companies.
Pursuant to the requirements of the Securities Exchange Act of 1934 and the Investment Company Act of 1940, the registrant has duly caused this report to be signed on its behalf by the undersigned, thereunto duly authorized.
John Mueller, President/Principal Executive Officer
Pursuant to the requirements of the Securities Exchange Act of 1934 and the Investment Company Act of 1940, this report has been signed below by the following persons on behalf of the registrant and in the capacities and on the dates indicated.
John Mueller, President/Principal Executive Officer
Holly Weiss, Treasurer/Principal Financial Officer
* Print the name and title of each signing officer under his or her signature.