SECURITIES AND EXCHANGE COMMISSION
Washington, D.C. 20549
FORM 6-K
Report of Foreign Private Issuer
Pursuant to Rule 13a-16 or 15d-16 of the
Securities Exchange Act of 1934
For the month of August 2007
CREDICORP LTD.
(Exact name of registrant as specified in its charter)
Clarendon House
Church Street
Hamilton HM 11 Bermuda
(Address of principal executive office)
Indicate by check mark whether the registrant files or will file annual reports under cover Form 20-F or Form 40-F.
Form 20-F x Form 40-F o
Indicate by check mark whether the registrant by furnishing the information contained in this Form is also thereby furnishing the information to the Commission pursuant to Rule 12g3-2(b) under the Securities Exchange Act of 1934.
Yes o No x
 |  CREDICORP Ltd. Reports Second Quarter 2007 Earnings Lima, Peru, August 7, 2007 - Credicorp (NYSE:BAP) announced today its unaudited results for the second quarter of 2007. These results are reported on a consolidated basis in accordance with IFRS in nominal U.S. Dollars. HIGHLIGHTS · Credicorp reported 2Q07 net earnings of US$ 87.4 million, up 10.6% QoQ and 35.6% YoY, confirming the stronger than expected business growth as a reflection of the strength of the economy and dynamic local markets. · A 14.7% QoQ increase in NII follows Credicorp’s 13% loan growth and reflects the robust growth of its banking business. · Non Financial income dropped 2.8% QoQ because of lower income from gains on the sale of securities, while fee income continued growing at an expected 2.7% for the quarter. · The strong NII resulting mainly from higher interest income from loan growth and lower interest expense improved our net margins, despite the consistent competitive pressures, leading to a recovery of Credicorp’s NIM to 5.5% for 2Q07 vs. 5.2% in the previous quarter. · Loan portfolio quality continued strengthening reaching unprecedented levels, as reflected in the low PDL/Loans ratio of only 1%, down from 1.2% for 1Q07. Net provisioning at US$ 6 million for 2Q07 reflects again the gradual normalization of net provisions required as recoveries from our portfolio of charged-off assets diminish. · Net loan growth at Credicorp’s main subsidiary BCP continued strong, reaching 13.4% QoQ, and a very solid 31% YoY, fueled by very robust growth rates achieved not only in the retail segment in general and some specific retail products especially, but also in the corporate segment, which surpassed this quarter BCP’s already strong retail growth. · Thus, BCP’s P&L numbers reflect a very healthy and dynamic banking environment with net interest income up 14.5% QoQ, resulting in Core Earnings growth of 11.7% QoQ. Such improved income combined with a proportionately lower increase in operating expenses led to a 12.9% higher 2Q07 net income for BCP which reached US$ 82 million, and translates into a solid contribution to Credicorp of US$ 79.8 million for this 2Q07. · BCP Bolivia, which is consolidated in BCP, continues its consistent growth and reports a contribution 14% higher QoQ and 67% higher YoY, reaching US$ 5.4 million for 2Q07. · ASHC’s core earnings continue expanding, though a drop in contribution was reported down to US$4.4 million for 2Q07, due to lower income from investments in securities. · PPS’s reported strong production growth; however net income volatility on gains from the sale of securities resulted in lower bottom line contribution to Credicorp of US$ 5.1 million for 2Q07 after US$ 6.6 million for 1Q07. Nevertheless, ROE for the 1H07 reached 14%, a remarkable improvement from previous years. · Finally, AFP Prima’s turnaround is proving to be a longer process than expected and a loss of US$ 1.3 million was reported for 2Q07 after its break-even result for 1Q07 of US$ 180 thousand. Nevertheless, and more importantly, results reflect a further consolidation of its position in the market. · ROAE rose to 23.7% from 22.4% QoQ; the efficiency ratio recovered further to 42.2% from 42.5% as a result mainly of the stronger income growth and recovery of NIM. |
 |
I. Credicorp Ltd.
Overview
Confirming the improvement and strong growth trend reported in the first quarter for all of Credicorp’s business segments, Credicorp closed its 2Q07 with a total net income after minority deductions of US$ 87.4 million, reflecting a 35.6% earnings growth from 2Q06 and 10.6% growth QoQ and resulting in an improved ROAE of 23.7% for the quarter.
Credicorp’s core banking business reflected a very robust business performance, with total loan growth reaching a record 12.7% QoQ, following an unusually strong performance of the corporate banking sector along with the expected strong growth of the retail segment.
Following such robust loan growth, NII also grew at an even stronger rate reaching 14.7% QoQ, reflecting a recovery of margins, as is evident in Credicorp’s NIM of 5.5% for 2Q07, up from 5.15% in 1Q07. This recovery is a reflection of interest expenses growing at a lower pace than interest income.
Fee income continued growing at a more moderate though expected 2.7% QoQ, but lower income from the sale of securities resulted in an overall drop in non-financial income of -2.8% QoQ. However, the development and the positive impact of non-financial income for Credicorp’s results is better reflected by the comparison of cumulative numbers: thus, for the 1H07 non financial income reached US$ 219 million, up 45% from US$ 151 million for 1H06. This positive development is the result of (i) focus on developing the transactional fee income to compensate for increasing competition and tightening margins, and (ii) the important contribution in fees generated by the pension fund business at Prima.
Credicorp Ltd. | Quarter | Change % | ||||||||||||||
| US$ thousands | 2Q07 | 1Q07 | 2Q06 | 2Q07/2Q06 | 2Q07/1Q07 | |||||||||||
| Net Interest income | 159,305 | 138,859 | 130,010 | 22.5 | % | 14.7 | % | |||||||||
| Total provisions, net of recoveries | (6,090 | ) | (4,418 | ) | (251 | ) | 2324.5 | % | 37.8 | % | ||||||
| Non financial income | 108,026 | 111,194 | 72,513 | 49.0 | % | -2.8 | % | |||||||||
| Insurance premiums and claims | 19,278 | 17,363 | 18,220 | 5.8 | % | 11.0 | % | |||||||||
| Operating expenses | (159,886 | ) | (149,810 | ) | (131,923 | ) | 21.2 | % | 6.7 | % | ||||||
| Translation results | 1,728 | 1,645 | 3,448 | -49.9 | % | 5.0 | % | |||||||||
| Worker's profit sharing and income taxes | (28,633 | ) | (27,924 | ) | (23,477 | ) | 22.0 | % | 2.5 | % | ||||||
Net income | 93,727 | 86,909 | 68,539 | 36.8 | % | 7.8 | % | |||||||||
| Minority Interest | 6,324 | 7,897 | 4,105 | 54.1 | % | -19.9 | % | |||||||||
Net income attributed to Credicorp | 87,403 | 79,013 | 64,434 | 35.6 | % | 10.6 | % | |||||||||
| Net income/share (US$) | 1.10 | 0.99 | 0.81 | 35.6 | % | 10.6 | % | |||||||||
Total loans | 7,031,734 | 6,239,870 | 5,501,004 | 27.8 | % | 12.7 | % | |||||||||
Deposits and Obligations | 10,152,601 | 9,336,519 | 7,922,208 | 28.2 | % | 8.7 | % | |||||||||
| Net Shareholders' Equity | 1,535,154 | 1,420,716 | 1,215,984 | 26.2 | % | 8.1 | % | |||||||||
| Net interest margin | 5.5 | % | 5.2 | % | 5.3 | % | ||||||||||
| Efficiency ratio | 42.2 | % | 42.5 | % | 41.0 | % | ||||||||||
| Return on average shareholders' equity | 23.7 | % | 22.4 | % | 21.7 | % | ||||||||||
| PDL/Total loans | 1.0 | % | 1.2 | % | 1.7 | % | ||||||||||
| Coverage ratio of PDLs | 284.4 | % | 251.4 | % | 214.2 | % | ||||||||||
| Employees | 15,007 | 14,757 | 12,525 | |||||||||||||
The insurance business is also showing important production growth. This led to Net premiums earned growth of 2.8% contributing to the overall Core Earnings growth of almost 8.5% for the quarter. However, after incurred net claims and a drop in life and health policy costs, the insurance business shows a more important growth of earnings contribution reaching an 11% QoQ income increase.
2
|
On the cost side, operating expenses start reflecting the higher personnel requirements and expansion through new branches demanded by the strong retail business growth, and increased by 6.7% QoQ. This overall operating cost is however still lower than expected as some approved investment decisions continue showing some time lag to impact our income statement. Thus the efficiency ratio for 2Q07 continued improving, though only slightly at 42.2% (from 42.5% for 1Q07).
Another positive development is the consistent improvement of portfolio quality at the same time as loan growth continues. Thus, PDL/Loans ratio improved further reaching levels hardly ever seen before in the Peruvian Banking System, reporting for 2Q07 only 1% vs. 1.2% for 1Q07. Coverage ratio evolved similarly and reached a record number at 284.4%. Total provisions net of recoveries however, start showing a reduction in recoveries in line with expectations as our book of assets for recoveries diminishes and reached US$ 6 million for 2Q07.
These developments resulted in improved ratios for the quarter, with ROAE climbing to 23.7% from 22.4% the previous quarter, and an efficiency ratio improving further to 42.2% for 2Q07 from 42.5% for 1Q07.
Credicorp - the Sum of its Parts
The success in the efforts made to recover the profitability of the individual businesses is becoming more evident when looking at Credicorp as the sum of the different contributors.
Earnings Contribution
| (US$ Thousands) | 2Q07 | 1Q07 | 2Q06 | 2Q07/2Q06 | 2Q07/1Q07 | June 07 | June 06 | June 07/ June 06 | |||||||||||||||||
| Banco de Crédito BCP(1) | 79,795 | 70,648 | 64,799 | 23 | % | 13 | % | 150,443 | 122,416 | 23 | % | ||||||||||||||
| BCB | 5,453 | 4,804 | 3,262 | 67 | % | 14 | % | 10,258 | 6,317 | 62 | % | ||||||||||||||
| Atlantic | 4,366 | 4,969 | 3,014 | 45 | % | -12 | % | 9,335 | 7,907 | 18 | % | ||||||||||||||
| PPS | 5,134 | 6,616 | 2,730 | 88 | % | -22 | % | 11,750 | 5,418 | 117 | % | ||||||||||||||
| Grupo Crédito (2) | (585 | ) | 1,202 | (2,785 | ) | -79 | % | -149 | % | 617 | (3,264 | ) | -119 | % | |||||||||||
| Prima | (1,264 | ) | 178 | (2,243 | ) | -44 | % | -812 | % | (1,086 | ) | (4,910 | ) | -78 | % | ||||||||||
| Others | 679 | 1,024 | (542 | ) | -225 | % | -34 | % | 1,703 | 1,646 | 3 | % | |||||||||||||
| Credicorp and Others (3) | (1,307 | ) | (4,422 | ) | (3,323 | ) | -61 | % | -70 | % | (5,729 | ) | (16,857 | ) | -66 | % | |||||||||
| Credicorp Ltd. | (1,539 | ) | (4,495 | ) | (3,376 | ) | -54 | % | -66 | % | (6,034 | ) | (17,114 | ) | -65 | % | |||||||||
| Otras | 232 | 73 | 53 | 338 | % | 218 | % | 305 | 257 | 19 | % | ||||||||||||||
Net income attributable to Credicorp | 87,403 | 79,013 | 64,435 | 36 | % | 11 | % | 166,416 | 115,620 | 44 | % | ||||||||||||||
(1) Includes Banco de Crédito de Bolivia.
(2) Includes Grupo Crédito, Servicorp
(3) Includes taxes on BCP´s and PPS´s dividends, and other expenses at the holding company level
In fact, BCP reported again excellent 2Q07 results, confirming its expanding earnings generation capacity reaching for 2Q07 earnings of US$ 82 million, which result in a contribution to Credicorp of US$ 79.8 million for the quarter. This puts BCP on an excellent growth track, fueled by the country’s strong economic growth and reflects an impressive 13% net earnings growth over the previous quarter and an equally excellent 35.6% ROAE for 2Q07.
BCP Bolivia, which is consolidated within BCP, reported a contribution of US$ 5.4 million for 2Q07, 14% higher QoQ and 67% higher YoY. Thus, the performance of BCP Bolivia remains unaffected by the uncertain political scenario of Bolivia, and in fact, continues growing and gaining in market share and brand positioning.
ASHC reports some drop in contribution of -12% QoQ reaching US$ 4.37 million for the 2Q07. ASHC’s business is constantly expanding as a result also of the increasing wealth generation in the country, and reported increased core earnings (+15% QoQ) excluding dividend income. However, lower gains on the sale of securities explain the quarterly drop in income contribution to Credicorp.
3
|
PPS’s improved performance since its restructuring which changed business policies, marketing policies and the whole management structure, still reflects some unstable elements related in part to risk management, but more importantly this quarter to income from the sale of securities, that affect bottom line results. Thus PPS’s contribution to Credicorp for 2Q07 drops to US$ 5.1 million from US$ 6.6 million the previous quarter as 1Q07 contribution included strong gains on securities of PV’s portfolio. It is however important to mention that the improvements reported so far at PPS have enabled it to achieve an investment grade rating by Fitch. This Insurer Financial Strength (IFS) BBB- rating was granted to Pacífico Peruano Suiza (PPS) and Pacífico Vida (PV), based on their effective restructuring, strong capitalization, conservative retention levels, recovered profitability and solid market share and franchise in Peru.
Finally, reaching break-even and maintaining a positive result has proven to need more time than expected at Prima since the strong competition resulting in high operating costs continues. Prima reported for 2Q07 a loss of US$ 1.26 million, which is mainly related to its still high operating costs. Thus, other dividend income at Grupo Crédito was not enough to fully offset this loss at Prima, but reduced Grupo Crédito’s result to only US$ -0.6 million.
Results at Credicorp Ltd. reached only US$ -1.5 million for 2Q07 given the dividend, interest and investment income which compensated in part the withholding tax provision of US$ 2.5 million per quarter and some other costs such as financing costs, minor provision for Stock Options and some administrative costs.
Altogether, the general improvements throughout the different businesses of Credicorp led to the excellent earnings reported for 2Q07 of US$ 87.4 million, and thus improved financial indicators.
4
|
II. Banco de Crédito - BCP Consolidated
Overview 2Q07
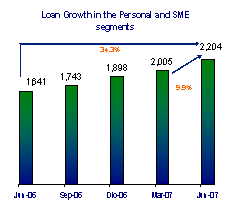
Net earnings at BCP continue surpassing expectations and reached another record level for 2Q07 with US$ 82.1 million, up 13% from US$ 72.7 million in 1Q07 and 21.9% higher than earnings of 2Q06. This superb earnings growth follows not only the implementation of a coordinated strategy focused on growth of the retail/consumer sector and expansion of our network, but also reflects the strength of the Peruvian economy which is growing at an average rate of around 8%, and is supported by a very dynamic retail sector and increased investment activity in the corporate sector. Therefore, once again the driver behind BCP’s growth was the expanded lending activity both in the commercial and consumer sectors. Noteworthy is the growth achieved by the corporate banking sector which outperformed even the dynamic retail segment with quarterly growth of 12%. An unusually strong credit demand at the corporate level which resulted from the implementation and disbursement of several important and large financing transactions with the largest local and international corporations was behind this growth. Still, strong performers continue being the Personal Loans segment, SME (PYME), and Credit Cards. Thus, total loans were up 13.3% QoQ and 30.72% YoY.
At the same time, the booming economic environment contributed as well to further growth of our proprietary investment portfolio, leading to an increase of 22% QoQ of our Investments available for sale. Altogether however, lending growth absorbed not only excess liquidity and deposit growth of 7%, but was also complemented by increased borrowings which were up over 100% from US$ 560 million in 1Q07 to US$ 1.3 billion for 2Q07.
Banco de Crédito and subsidiaries | Quarter | Change | ||||||||||||||
| US$ 000 | 2Q07 | 1Q07 | 2Q06 | 2Q07/2Q06 | 2Q07/1Q07 | |||||||||||
| Net Financial income | 141,147 | 123,289 | 114,144 | 23.7 | % | 14.5 | % | |||||||||
| Total provisions, net of recoveries | (6,885 | ) | (5,859 | ) | (1,312 | ) | 424.8 | % | 17.5 | % | ||||||
| Non financial income | 88,829 | 86,255 | 71,014 | 25.1 | % | 3.0 | % | |||||||||
| Operating expenses | (116,527 | ) | (108,218 | ) | (101,497 | ) | 14.8 | % | 7.7 | % | ||||||
| Translation results | 970 | 1,310 | 2,957 | -67.2 | % | -26.0 | % | |||||||||
| Worker´s profit sharing and income taxes | (25,470 | ) | (24,121 | ) | (17,958 | ) | 41.8 | % | 5.6 | % | ||||||
Net income | 82,064 | 72,656 | 67,348 | 21.9 | % | 12.9 | % | |||||||||
| Net income/share (US$) | 0.064 | 0.057 | 0.052 | 22.0 | % | 12.9 | % | |||||||||
| Total loans | 6,989,841 | 6,182,300 | 5,385,246 | 29.8 | % | 13.1 | % | |||||||||
| Deposits and obligations | 9,459,008 | 8,842,654 | 7,412,227 | 27.6 | % | 7.0 | % | |||||||||
| Shareholders equity | 964,164 | 881,485 | 830,259 | 16.1 | % | 9.4 | % | |||||||||
| Net financial margin | 5.5 | % | 5.2 | % | 5.3 | % | ||||||||||
| Efficiency ratio | 49.29 | % | 49.81 | % | 48.24 | % | ||||||||||
| Return on average equity | 35.57 | % | 31.50 | % | 33.77 | % | ||||||||||
| PDL/ Total loans | 0.95 | % | 1.18 | % | 1.65 | % | ||||||||||
| Coverage ratio of PDLs | 286.77 | % | 252.10 | % | 219.38 | % | ||||||||||
| BIS ratio | 10.7 | % | 11.8 | % | 10.7 | % | ||||||||||
| Branches | 250 | 246 | 228 | |||||||||||||
| ATMs | 699 | 691 | 600 | |||||||||||||
| Agentes BCP | 837 | 703 | 292 | |||||||||||||
| Employees | 11,610 | 10,934 | 9,870 | |||||||||||||
Outperforming this loan growth, NII grew 14.5% QoQ, fueled by such lending activity, other interest income from investments and interest expense growing less than interest income. In fact, interest from loans grew 10.2%, while interest from securities and investments make up for the remaining growth bringing interest income up to 12.7%. On the other hand, interest expense grows proportionately less reaching only 9.6% following further strong growth of deposit volumes as mentioned above, and the increased borrowings to support our lending activity. Thus, the stronger growth of NII resulted in an improved NIM for BCP of 5.53% vs. 5.22% the previous quarter.
5
|
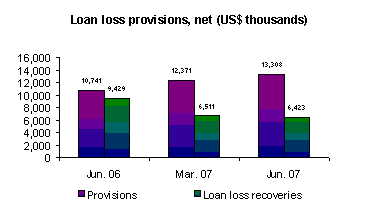
Net Provisions for 2Q07 reached US$ 6.9 million, reflecting gross provisions of US$ 13.3 million and US$ 6.4 million of recoveries vs. US$ 12.4 million of gross provisions and US$ 6.5 million of recoveries in 1Q07. This still low level of net provisions reflects the high portfolio quality and constant, though the diminishing, recoveries from charged-off assets. In fact, good economic performance and high liquidity levels in the market continue fueling improvements in portfolio quality and further drops in non-performing loans, leading to a PDL ratio of 0.95% for 2Q07 vs 1.18% for 1Q07.
Fee income and gains in foreign exchange transactions continue growing reaching a strong 7.2% and 7% respectively for the quarter. However, non financial income was up only 3% QoQ, following a correction period in the Lima Stock Exchange which generated some drops in the capital markets resulting in much lower income from the sale of securities. Still, the index of the Lima Stock Exchange (IGBVL) registered a daily average increase of 30% QoQ.
On the cost side, operating costs reflected BCP’s business expansion and was up 7.7% QoQ. This increase is perfectly in line with the announced investments in expanding our branch & sales points’ network and is expected to continue. In fact, the strongest growing costs: personnel and administrative expenses grew 11% and 13% respectively. Nevertheless, we still expect investment related expenditures to affect more our costs in the second half of the year.
Finally, the translation result for 2Q07 dropped even further to US$ 0.97 million from US$ 1.3 million in 1Q07, as the local currency stabilized further reducing its revaluation trend which generates a gain given the net Soles position in BCP’s balance sheet.
As a result of these developments, BCP’s quarterly ratios reflect additional improvements continuing this way its growth trend reaching again record levels: ROAE was 35.6%, the efficiency ratio 49.3% and portfolio quality ratios reached 0.95% delinquencies ratio and 286.8% coverage ratio.
Core Earnings
Core Revenues | Quarter | Change | ||||||||||||||
US$ 000 | 2Q07 | 1Q07 | 2Q06 | 2Q07/2Q06 | 2Q07/1Q07 | |||||||||||
| Net interest and dividend income | 141,147 | 123,289 | 114,144 | 23.7 | % | 14.5 | % | |||||||||
| Fee income, net | 66,986 | 62,470 | 55,399 | 20.9 | % | 7.2 | % | |||||||||
| Net gain on foreign exchange transactions | 12,778 | 11,937 | 11,010 | 16.1 | % | 7.0 | % | |||||||||
Core Revenues | 220,911 | 197,696 | 180,553 | 22.4 | % | 11.7 | % | |||||||||
Operating income was up 11.7% QoQ and 22.4% YoY. Despite the good growth of fee income (+7.2%) and gains from FX transactions (+7%), it is still NII the main component of core earnings, and this recorded 14.5% growth QoQ and 23.7% YoY. As mentioned before, the strong growth of NII is supported by a QoQ loan growth of 13.3%, interest income on an increased volume of trading securities and investments, and lower growth of our interest expenses, which were up by only 9.6%.
6
|
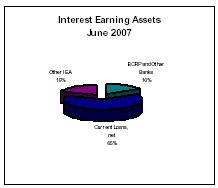
II.1 Interest Earning Assets
Growth of IEA remains strong, reaching 11.7% QoQ and 24.8% YoY
Interest Earning Assets | Quarter | Change | ||||||||||||||
| US$ 000 | 2Q07 | 1Q07 | 2Q06 | 2Q07/2Q06 | 2Q07/1Q07 | |||||||||||
| BCRP and Other Banks | 1,773,444 | 1,828,663 | 2,537,183 | -30.1 | % | -3.0 | % | |||||||||
| Interbank funds | 17,139 | 4,542 | 1,918 | 793.7 | % | 277.3 | % | |||||||||
| Trading Securities | 53,569 | 54,505 | 41,897 | 27.9 | % | -1.7 | % | |||||||||
| Available For Sale Securities | 2,001,172 | 1,641,157 | 752,476 | 165.9 | % | 21.9 | % | |||||||||
| Current Loans, net | 6,923,441 | 6,109,064 | 5,296,554 | 30.7 | % | 13.3 | % | |||||||||
Total interest earning assets | 10,768,765 | 9,637,930 | 8,630,028 | 24.8 | % | 11.7 | % | |||||||||
Robust growth of IEA of 11.7% QoQ and 24.8% YoY, follows the unusually strong growth of BCP’s total loan portfolio for 2Q07, which reached 13.3% QoQ and 30.7% YoY as a result of increased demand for credit across all banking segments; as well as an increase of investments available for sales, which were up 21.9% QoQ and 165.9% YoY. The latter is a result of the continuing high liquidity levels at BCP, which is invested in BCR Certificates of Deposits, which in turn generate attractive returns due to their tax advantages. BCR CD’s were up by 21% QoQ.
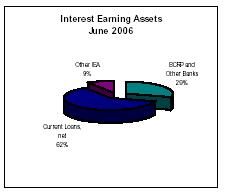
The important growth of BCP’s loan portfolio and of investments in BCRP CD’s (included in “other assets”) led to the re-composition of interest earning assets, having loans become 65% of IEA as of June 2007 vs. 62% a year ago, and other assets go from 9% to 19% as of June 2007. This assets re-composition has a positive effect on BCP’s returns since these are obviously better yielding assets than bank deposits.
Loan Portfolio
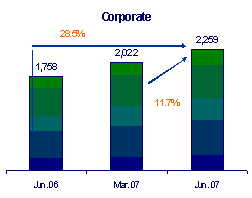
Loan portfolio, measured by average monthly balances, reached a total of US$ 6,574 million, i.e. 9.4% above the average of 1Q07 and 26.6% above the average reached in June 2006. Looking at quarter end book balances, net loan growth reported is even higher at 13.3% QoQ and 31% YoY. This extraordinarily high quarterly loan growth for 2Q07 (compared to net loan growth for 1Q07 of 5.5%) responds to very strong credit demand across the board, but especially to an unusually strong credit demand at the corporate level which resulted from the implementation and disbursement of several important and large financing transactions with the largest local and international corporations. BCP, given its very high market share of the corporate business in Peru, is obviously best positioned to benefit from the economic activity which translates into important investment activity.
Thus corporate loans reached an average monthly balance of US$ 2,259 million, reflecting this unusual quarterly growth that surpassed even our most dynamic retail sector and reached an unprecedented 11.7% QoQ and 28.5% on a yearly basis.
7
|
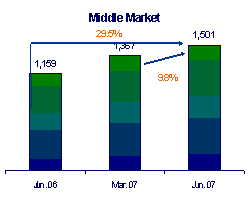
The Middle Market portfolio, which last quarter benefited from the shift of some additional portfolio from the retail segment in the month of February, has also performed strongly this quarter reaching an average monthly balance of US$ 1,501 million which reflects quarterly growth 9.8%. However, this growth calculation is still slightly distorted (overstated) given that the shift of portfolio was in the month of February. Adjusted for this distortion, quarterly growth would be 7.8%, still a very good performance but more in line with expectations for this segment.
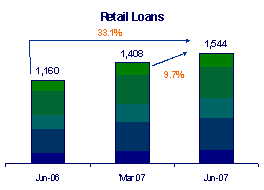
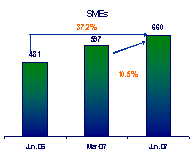
The same distortion applies to the global retail portfolio growth calculations which result slightly understated at 9.9% QoQ growth and 34% YoY. Applying the correction for the growth calculation, this improves to 11.3% QoQ growth, which reflects more realistically the dynamics that is being experienced in this market. Thus, this segment reported loan portfolio growth of 9.6% (restated) for 1Q07 and 11.3% (restated) for 2Q07, reflecting its strong dynamics. In this segment, star performers continue being Consumer lending (23.5% QoQ y 76.5% YoY), SME (10.5% QoQ and 37.2% YoY), Credit Cards (7.0% QoQ and 40.3% YoY) and Mortgages which continue growing at a more moderate though growing rate of 6.3% QoQ and 21.1% YoY.
8
|
Market Share
BCP’s market share of the financial system continues improving despite the increasing incursion of foreign players into the market and the already stronghold position it has. Thus, BCP’s market share of loans placed reached 32.0% as of June 2007 vs. 31.5% as of March 2007 and 31.2% as of June 2006.
Furthermore, market share for the corporate and middle market sectors continue revealing the solid positioning with a “share of wallet” of 49% and 47% respectively.
In the retail segment, we continue to position ourselves as an important market player expanding our share QoQ in consumer loans - up 110 bps to reach 16.6%, in mortgages BCP reached 38.3%, 90 bps higher than that of the previous quarter and SME (PYMES) - up 50 bps reaching 19.7%. BCP recovered its position in the fiercely competitive credit card business where its market share reached 18.3% - up 60 bps.
Dollarization
The de-dollarization process of BCP’s assets slowed down with respect to the 1Q07. Thus, in the 2Q07 loans in Nuevos Soles conformed 26% of total loan portfolio, 1% less than in the previous quarter. Nevertheless, the system does continue experiencing further de-dollarization of its loans, reaching as of May 2007 a high 35% of loans in Nuevos Soles and 65% in US Dollars. Furthermore, this de-dollarization process is more intense in deposits, which reported 37% (vs. 34% for 1Q07) of deposits in Nuevos Soles, evidencing an increased preference for local currency savings, fueled also by the appreciation of the local currency vis-à-vis the US Dollar.
9
|
II.2 Deposits and Mutual Funds
Deposits reported growth of 7.0% QoQ and 27.6% YoY, maintaining this way its role as main source of funding to support loan growth.
Deposits and Obligations | Quarter ended | Change | ||||||||||||||
| US$ (000) | 2Q07 | 1Q07 | 2Q06 | 2Q07/2Q06 | 2Q07/2Q06 | |||||||||||
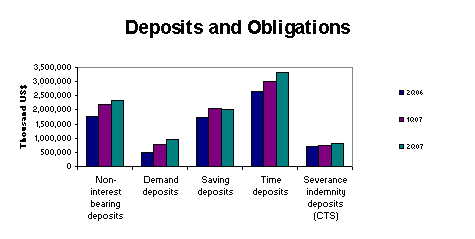
| Non-interest bearing deposits | 2,316,573 | 2,194,439 | 1,777,777 | 30.3 | % | 5.6 | % | |||||||||
| Demand deposits | 942,225 | 791,492 | 499,889 | 88.5 | % | 19.0 | % | |||||||||
| Saving deposits | 2,026,729 | 2,066,269 | 1,726,641 | 17.4 | % | -1.9 | % | |||||||||
| Time deposits | 3,317,527 | 3,021,401 | 2,664,939 | 24.5 | % | 9.8 | % | |||||||||
| Severance indemnity deposits (CTS) | 820,026 | 733,835 | 714,963 | 14.7 | % | 11.7 | % | |||||||||
| Interest payable | 35,928 | 35,219 | 28,018 | 28.2 | % | 2.0 | % | |||||||||
Total customer deposits | 9,459,008 | 8,842,654 | 7,412,227 | 27.6 | % | 7.0 | % | |||||||||
| Mutual funds in Perú | 1,776,232 | 1,432,924 | 1,065,034 | 66.8 | % | 24.0 | % | |||||||||
| Mutual funds in Bolivia | 64,833 | 60,201 | 54,811 | 18.3 | % | 7.7 | % | |||||||||
Total customer funds | 11,300,073 | 10,335,779 | 8,532,072 | 32.4 | % | 9.3 | % | |||||||||
In terms of book balances, deposits growth was 7.0% QoQ and 27.6% YoY. As mentioned before, deposits continue being the principal source of funding to support loan growth. Furthermore, such deposits continue providing the lowest cost of funds since 65% of these are mainly non- or low interest bearing. Only 35% are time deposits which bear a higher interest. In terms of source of these deposits, it is still the retail market which provides the largest share of deposits, since 51% of total deposits are generated in the retail sector, reflecting the importance of expanding our client base and increasing bank penetration not only from a loan placements point of view but also from a funding point of view.
Market Share
BCP’s market share of deposits in the financial system, reflect again BCP’s stronghold position in the market, despite the increasing competition. This reached 37.5% as of June 2007, maintaining its position from the 1Q07, but higher compared to a 36.3% as of June 2006.
BCP’s leadership is evident in most of the deposit types. Thus, of “severance payment” deposits, known as CTS, we hold 54.4% market share while our next competitor holds 19.2%. BCP’s demand deposits reached 41.3% and 43.7% market share in local and foreign currency respectively, and our savings deposits reached 33.7% and 42.5% respectively. Finally, our time deposits represented 18.6% and 38.3% market share in local and foreign currency respectively.
Mutual Funds administered through its subsidiary Credifondo, continue being a stronghold for BCP with a market share of 45.4% as of June 2007, though slightly lower than the previous quarter with 46.8%. The drop in market share is evident in spite of growth of funds administered, which reached US$ 1,776 million compared to US$ 1,432 million as of March 2007. The drop is a reflection of the competitive environment which is reflected in the YoY growth of funds administered by Credifonfo which reached 67% vs. an expansion of 90% of the market as a whole.
10
|
II.3 Net Interest Income
Interest Income grew 12.7% QoQ fueled once again by very strong loan and investments growth, while interest expense was up proportionately less by 9.6%, contributing to a recovery of NIM to 5.53%.
Net interest income | Quarter | Change | ||||||||||||||
US$ 000 | 2Q07 | 1Q07 | 2Q06 | 2Q07/2Q06 | 2Q07/1Q07 | |||||||||||
Interest income | 220,181 | 195,388 | 174,361 | 26.3 | % | 12.7 | % | |||||||||
| Interest on loans | 164,101 | 148,943 | 128,072 | 28.1 | % | 10.2 | % | |||||||||
| Interest and dividends on investments | 3,082 | 8 | 3,198 | -3.6 | % | 38425.0 | % | |||||||||
| Interest on deposits with banks | 15,497 | 16,250 | 22,686 | -31.7 | % | -4.6 | % | |||||||||
| Interest on trading securities | 32,531 | 28,545 | 14,898 | 118.4 | % | 14.0 | % | |||||||||
| Other interest income | 4,970 | 1,642 | 5,507 | -9.8 | % | 202.7 | % | |||||||||
Interest expense | (79,034 | ) | (72,099 | ) | (60,217 | ) | 31.2 | % | 9.6 | % | ||||||
| Interest on deposits | (57,927 | ) | (54,694 | ) | (40,988 | ) | 41.3 | % | 5.9 | % | ||||||
| Interest on borrowed funds | (11,220 | ) | (5,632 | ) | (10,948 | ) | 2.5 | % | 99.2 | % | ||||||
| Interest on bonds and subordinated notes | (8,165 | ) | (7,853 | ) | (6,669 | ) | 22.4 | % | 4.0 | % | ||||||
| Other interest expense | (1,722 | ) | (3,920 | ) | (1,612 | ) | 6.8 | % | -56.1 | % | ||||||
Net interest income | 141,147 | 123,289 | 114,144 | 23.7 | % | 14.5 | % | |||||||||
| Average interest earning assets | 10,203,348 | 9,444,029 | 8,557,668 | 19.2 | % | 8.0 | % | |||||||||
Net interest margin* | 5.53 | % | 5.22 | % | 5.34 | % | ||||||||||
After having grown 5.9% QoQ in 1Q07, Interest Income for 2Q07 reached a superb 12.7% QoQ growth. But it was not only the excellent loan growth, which resulted in interest income growing 10.2% QoQ, the main driver of these results, but also the important returns achieved for the growing investment portfolio.
In fact, interest on loans (+10.2%) grew more than average loan portfolio (+9.4%), despite the proportionately higher growth of less profitable corporate loans which could have resulted in a reverse effect, and despite the continuing competitive pressure on margins, reflecting an average improvement in margins. Furthermore, dividend and interest income on investments also increased strongly, contributing to the overall 12.7% quarterly growth reported. Noteworthy are the investments in BCRP CD’s which contributed with a 14% quarterly interest income growth and a US$ 3 million dividend income from an investment in BCI (Banco de Inversiones de Chile).
On the other hand, interest expense grows this quarter proportionately less than interest income increasing only 9.6% QoQ. This lower interest expense growth follows (i) an increase of interest paid on deposits of 5.91% QoQ as a result of expanded deposits’ volumes (+7%), reflecting a positive effect for BCP’s expenses, (ii) increased cost from borrowed funds which doubled from the previous quarter given the required subordinated bonds’ issues to support our capital structure, and (iii) lower “other interest expense” which benefited from an interest rate swap operation.
11
|
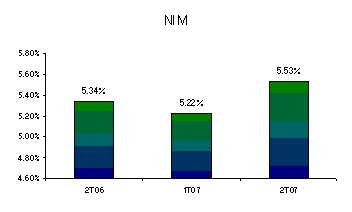
The developments reported for BCP’s interest income and interest expenses resulted in an improvement of net interest margins. Thus NIM recovers from 5.22% for 1Q07 to 5.53% for 2Q07.
II.4 Loan provisions
Provisions and recoveries continued as expected for the year, showing a further improvement of past due loans ratio, which reached an unprecedented and historically low level for BCP of 0.95%.
| Provisión for loan losses | Quarter ended | Change | ||||||||||||||
| US$ 000 | 2Q07 | 1Q07 | 2Q06 | 2Q07/ 2Q06 | 2Q07/ 1Q07 | |||||||||||
| Provisions | (13,308 | ) | (12,371 | ) | (10,741 | ) | 23.9 | % | 7.6 | % | ||||||
| Loan loss recoveries | 6,423 | 6,511 | 9,429 | -31.9 | % | -1.4 | % | |||||||||
| Total provisions, net of recoveries | (6,885 | ) | (5,859 | ) | (1,312 | ) | 424.7 | % | 17.5 | % | ||||||
| Total loans | 6,989,841 | 6,182,300 | 5,385,246 | 29.8 | % | 13.1 | % | |||||||||
| Reserve for loan losses (RLL) | 190,413 | 184,627 | 194,570 | -2.1 | % | 3.1 | % | |||||||||
| Bcp's Charge-Off amount | 9,896 | 10,507 | 12,024 | -17.7 | % | -5.8 | % | |||||||||
| Past due loans (PDL) | 66,400 | 73,237 | 88,692 | -25.1 | % | -9.3 | % | |||||||||
| PDL/Total loans | 0.95 | % | 1.18 | % | 1.65 | % | ||||||||||
| Coverage | 286.77 | % | 252.10 | % | 219.38 | % | ||||||||||
Total gross provisions for 2Q07 reached US$ 13.3 million, 7.6% higher than 1Q07. Furthermore, recoveries from previously charged-off loans totaled US$ 6.4 million and resulted in a net provision of US$ 6.9 million. In fact, BCP’s portfolio of charged-off assets continues providing recoveries, though these are diminishing and are expected to reach around US$ 25 million for the year.
This increase in provisions was generated primarily by the expanded commercial lending activity, but provisions remain at relatively low levels reflecting sustained good portfolio quality. In fact, a conservative risk policy and a general economic improvement have made it possible for BCP to reach such unprecedented and historically high portfolio quality levels, never seen before in the history of the Peruvian Banking System.
It is for this reason that despite very strong growth of the riskier Retail segment products (consumer loans, mortgages, credit cards and PYME), past-due loans ratio continued improving as delinquencies dropped 9.3% QoQ, and reached US$ 66.4 million at the end of 2Q07. Consequently, this ratio reached 0.95% by the end of 2Q07. The decreasing trend of past due loans reveals the improving liquidity and healthier financial situation of the market as a whole.
Coverage ratio also reflects this trend reaching 286.8% at the end of 2Q07 vs. 252.1% in March 2007.
12
|
II.5 Non Financial Income
During 2Q07, fee income increased 7.2% as a consequence of a growing number of transactions.
Non financial income | Quarter | Change | ||||||||||||||
| US$ 000 | 2Q07 | 1Q07 | 2Q06 | 2Q07/2Q06 | 2Q07/1Q07 | |||||||||||
| Fee income | 66,986 | 62,470 | 55,399 | 20.9 | % | 7.2 | % | |||||||||
| Net gain on foreign exchange transactions | 12,778 | 11,937 | 11,010 | 16.1 | % | 7.0 | % | |||||||||
| Net gain on sales of securities | 7,586 | 9,210 | 1,083 | 600.5 | % | -17.6 | % | |||||||||
| Other income | 1,479 | 2,638 | 3,522 | -58.0 | % | -43.9 | % | |||||||||
Total non financial income | 88,829 | 86,255 | 71,014 | 25.1 | % | 3.0 | % | |||||||||
Fee income and gains on FX-transaction, which form part of BCP’s core earnings, were up by 7.2% and 7% respectively for the quarter reflecting further increases in number of transactions and confirming our leading position in the market as a transactional bank. However, the more volatile income from gains on the sale of securities, dropped 17.6% for 2Q07 following a correction in the local capital market. Therefore, non financial income altogether reported a more moderate 3% QoQ growth.
Fee income growth reflected mainly growth in transactions related to credit cards, securities handling & administration and mortgages. Furthermore, fee income from subsidiaries and foreign operations, were noteworthy. Specifically in Credibolsa S.A.B., fee income growth was due to strong trading activity in Lima Stock Exchange during the month of May. With respect to Credifondo S.A.F.M., a 149% QoQ growth of the combined fixed income and equity funds was the main reason for the increase in fee income during 2Q07. These funds represent today 32.8% of total Credifondo's funds (16.3% as of March 2007), and translate into greater fee income, given that commissions charged on these combined fixed income and equity funds are significantly higher than other fund’s commissions.
Net gains from the sale of securities experienced a drop of 17.6% QoQ given a market correction experienced by the Lima Stock Exchange during the month of May as some investors decided to take profits and some nervousness regarding the valuations of the different instruments appeared in the market.
Average number of transactions was up from 26.8 million in 1Q07 to 28.8 million this quarter reflecting 7.7% QoQ growth.
13
|
N° of Transaction per | Quarter | Var. % | ||||||||||||||
Channel | Averag.2Q07 | Averag.1Q07 | Averag.2Q06 | 2Q07/2Q06 | 2Q07/1Q07 | |||||||||||
| Teller | 8,541,465 | 8,310,053 | 7,864,654 | 8.6 | % | 2.8 | % | |||||||||
| ATMs VíaBCP | 4,745,857 | 4,191,183 | 3,664,860 | 29.5 | % | 13.2 | % | |||||||||
| Balance Inquiries | 2,150,016 | 2,022,884 | 2,139,437 | 0.5 | % | 6.3 | % | |||||||||
| Telephone Banking | 976,654 | 943,356 | 859,989 | 13.6 | % | 3.5 | % | |||||||||
| Internet Banking VíaBCP | 6,441,179 | 5,891,783 | 4,777,407 | 34.8 | % | 9.3 | % | |||||||||
| Agente BCP | 656,986 | 497,603 | 95,444 | 588.3 | % | 32 | % | |||||||||
| Telecrédito | 2,816,308 | 2,532,613 | 2,366,886 | 19 | % | 11.2 | % | |||||||||
| Direct Debit | 283,255 | 281,029 | 243,494 | 16.3 | % | 0.8 | % | |||||||||
| P.O.S | 2,079,573 | 1,983,368 | 1,714,600 | 21.3 | % | 4.9 | % | |||||||||
| Other ATM network | 153,375 | 139,280 | 143,035 | 7.2 | % | 10.1 | % | |||||||||
Total transactions | 28,844,668 | 26,793,154 | 23,869,805 | 20.8 | % | 7.7 | % | |||||||||
The increase in number of transactions was registered mainly in ATMs (+13.2%) and Internet Banking (ViaBCP) (+9.3%), and reflects the expansion BCP is having throughout the last years in order to develop the largest operational network in the country. The completed expansion of BCP’s network as of June 2007 is in line with projections and does not yet reflect the impact of the already approved more aggressive expansion of this network planned for the next years. Thus, the number of new offices/branches, ATMs and Agentes are reported in the following chart and reveal growth in line with projections, being the most aggressive growth the one reported for Agentes of 19% QoQ.
Quarter | Change | |||||||||||||||
2Q07 | 1Q07 | 2Q06 | 2Q07/2Q06 | 2Q07/1Q07 | ||||||||||||
Branches | 250 | 246 | 228 | 10 | % | 2 | % | |||||||||
ATMs | 699 | 691 | 600 | 17 | % | 1 | % | |||||||||
Agentes BCP | 837 | 703 | 292 | 187 | % | 19 | % | |||||||||
II.6 Operating Costs and Efficiency
BCP’s efficiency ratio improved slightly to 49.29% in 2Q07 as a result of a proportionately stronger growth of income than expenses.
Operating expenses | Quarter | Change | ||||||||||||||
| US$ 000 | 2Q07 | 1Q07 | 2Q06 | 2Q07/2Q06 | 2Q07/1Q07 | |||||||||||
| Salaries and employees benefits | 56,865 | 51,302 | 44,284 | 28.4 | % | 10.8 | % | |||||||||
| Administrative, general and tax expenses | 42,631 | 37,755 | 33,942 | 25.6 | % | 12.9 | % | |||||||||
| Depreciation and amortization | 9,396 | 9,423 | 8,877 | 5.8 | % | -0.3 | % | |||||||||
| Other expenses | 7,635 | 9,738 | 14,394 | -47.0 | % | -21.6 | % | |||||||||
Total operating expenses | 116,527 | 108,218 | 101,497 | 14.8 | % | 7.7 | % | |||||||||
Efficiency Ratio | 49.29 | % | 49.81 | % | 48.24 | % | ||||||||||
Operating costs for 2Q07 were up 7.7% QoQ as personnel and administrative costs expanded in line with business growth (10.8% and 12.9% respectively).
In 2Q07, approximately 49% of operating costs were personnel expenses, and 37% general and administrative expenses. The increase in personnel costs reflects the growth in number of employees, which went up from 10,958 in March to 11,610 in June of this year, and increased sales incentives for the Commercial Division. Furthermore, provisions for profit sharing were also increased in line with higher income results.
Furthermore, general & administrative expenses and taxes, the main contributor to the quarterly costs increase, was a result mainly of higher marketing expenses (approximately 50% QoQ), which represent around 16% of general & administrative expenses and taxes. This increase results from the advertising campaigns for the consumer sector and corporate image. At the same time, increased spending in systems was reported (approximately 9% higher), mainly maintenance of hardware, ATMs and rental of hardware. Nevertheless, increased spending related to the announced larger expenditures to expand our network and systems capacity, and upgrade and expand our back-up facilities is 50% below projected numbers and is expected to impact results more heavily towards the end of the year.
14
|
Other Expenses however dropped 21.6% QoQ, since income from the sale of assets could largely offset the increased provisions for income taxes on SARs (+108% QoQ).
Finally, while operating income grew 11.7% QoQ, operating expenses (excluding “Other Expenses”) grew less at 10.6% QoQ, leading to a slight improvement of BCP’s efficiency ratio to 49.29% in 2Q07.
II.7 Shareholders’ Equity and Regulatory Capital
Shareholders' equity | Quarter | Change | ||||||||||||||
| US$ 000 | 2Q07 | 1Q07 | 2Q06 | 2Q07/2Q06 | 2Q07/1Q07 | |||||||||||
| Capital stock | 364,706 | 364,706 | 364,706 | 0.0 | % | 0.0 | % | |||||||||
| Reserves | 282,189 | 282,189 | 242,889 | 16.2 | % | 0.0 | % | |||||||||
| Unrealized Gains and Losses | 66,066 | 65,449 | 39,102 | 69.0 | % | 0.9 | % | |||||||||
| Retained Earnings | 96,484 | 96,484 | 56,337 | 71.3 | % | 0.0 | % | |||||||||
| Income for the year | 154,719 | 72,657 | 127,225 | 21.6 | % | 112.9 | % | |||||||||
Total shareholders' equity | 964,164 | 881,485 | 830,259 | 16.1 | % | 9.4 | % | |||||||||
| Return on average equity (ROAE) | 35.57 | % | 31.50 | % | 33.77 | % | ||||||||||
Total shareholders’ equity reached US$ 964 million as of June 2007, i.e. 9.4% higher QoQ, Despite this increase in shareholder’s equity, ROAE reached unprecedented levels of 35.57% for 2Q07 following the strong net earnings reported, compared to 31.5% for 1Q07 and 33.77% in 2Q06.
At the end of 2Q07, the capital adequacy ratio for BCP unconsolidated reached 10.74% (9.31 times). This ratio is lower than the system average (10.53% or 9.12 times), calculated based on the 3 largest banks in the system. Tier I capital reached 9.3% (US$656.3 million). Risk adjusted assets include US$ 324 million market risk, which requires US$ 29.4 million of equity. Total regulatory capital includes US$139 million subordinated debt.
Regulatory Capital and Capital Adequacy Ratios | Quarter ended | Change | ||||||||||||||
| US$ 000 | 2Q07 | 1Q07 | 2Q06 | 2Q07/2Q06 | 2Q07/1Q07 | |||||||||||
| Capital Stock, net | 406,101 | 404,187 | 394,762 | 2.9 | % | 0.5 | % | |||||||||
| Legal and Other capital reserves | 327,610 | 326,066 | 280,079 | 17.0 | % | 0.5 | % | |||||||||
| Generic Contingency loss reserves | 69,425 | 61,130 | 39,073 | 77.7 | % | 13.6 | % | |||||||||
| Subordinated Debt | 138,982 | 137,610 | 25,882 | 437.0 | % | 1.0 | % | |||||||||
Total | 942,119 | 928,993 | 739,795 | 27.3 | % | 1.4 | % | |||||||||
| Less: Investment in multilateral organization and banks | (148,950 | ) | (136,336 | ) | (139,069 | ) | 7.1 | % | 9.3 | % | ||||||
Total regulatory capital | 793,169 | 792,657 | 600,726 | 32.0 | % | 0.1 | % | |||||||||
| Risk-weighted assets (Credit risk) | 7,063,276 | 6,218,204 | 5,263,409 | 34.2 | % | 13.6 | % | |||||||||
Market Risk | 29,430 | 43,093 | 33,002 | -10.8 | % | -31.7 | % | |||||||||
Capital Ratios: | ||||||||||||||||
| Regulatory capital as a percentage of risk-weighted assets | 10.74 | % | 11.84 | % | 10.68 | % | ||||||||||
| Ratio of risk-weihted assets to regularoy capital | 9.31 | 8.44 | 9.37 | |||||||||||||
III. BCP Bolivia
III.1 Bolivian Financial System
In 2Q07, Bolivia reported positive macroeconomic results, maintaining the trend for the previous quarters and despite the political uncertainty which has tainted the expectations for the country. Nevertheless, during the first half of the year, inflation numbers had a sudden increase which forced president Evo Morales to call in his cabinet in order to take special measures to control the problem.
15
|
Despite this inflation hike, macroeconomic results had a positive impact in the financial system. Bank deposits recorded a 7% QoQ growth (35% YoY) reaching US$ 3,836 million as of June 2007. Total loan volume reached US$ 2,951 million, revealing an 11.3% YoY growth of the system.
III.2 Results
Net earnings for 2Q07 of BCP Bolivia reached US$ 5.5 million, 14% above earnings from 1Q07 of US$ 4.8 million and 67% above net earnings of US$ 3.3 million for 2Q06. This superb earnings growth follows mainly important growth of interest income, which increased 9% QoQ and reached a total of US$ 12.7 million, as well as a 5% QoQ growth of fee income. This way, BCP Bolivia continues the improving trend of the previous quarters, and reported ROE as of June 2007 of 29.9%, significantly higher than the 16.6% ROE for the system. Furthermore, thanks to the conservative strategy for risk management, which builds upon BCP’s experience, past due ratio dropped further to 2.7%, much better than the system (7.0%). Altogether, BCP Bolivia reports a constant and solid recovery, with financial indicators at world standards and above the Bolivian average.
As mentioned in previous quarterly reports, the focus on businesses with better margins as the Retail, Middle market and “Consolidated” segments has been determinant for BCP Bolivia’s results. The Retail segment has received strong attention, as has as well the “Consolidated” segment which comprises companies with sales below US$ 1 million p.a. In both segments some important development has been achieved as these present the best growth potential of the Bolivian market. BCP Bolivia is this way positioning itself as the bank with the best infrastructure and corporate know-how to attend these segments best.
III.3 Assets and Liabilities
Total loans as of June 2007 reached US$ 424.6 million, reflecting growth of 10.3% QoQ. BCP Bolivia holds a very diversified loan portfolio, with SME (PYME) lending outperforming the other segments as it reached 195.4% 1H07 growth with respect to 1H06. It is also noteworthy, that the retail segment conforms 43% of total loan portfolio as of June 2007. Finally, BCP Bolivia holds market shares of 15.0% and 14.5% of loans and deposits respectively, which represent the third place in the Bolivian banking system.
As mentioned before, loan portfolio quality for BCP Bolivia is superior to the system. PDL ratio was 2.7% as of June 2007. This represents a significant improvement with respect to the system, which has a 7.0% PDL ratio.
On the other hand, deposits also experienced growth of 6.0% QoQ and 36.9% YoY, as a result of increased confidence of clients and a relative stabilization of the political scenario, strong campaigns to promote savings and better deposit rates. Thus, savings deposits grew 12.2% QoQ, time deposits 5.3%, while demand deposits remained unaltered.
16
|
The following chart presents some numbers and financial indicators for BCP Bolivia:
Banco de Crédito de Bolivia | Quarter | Change % | ||||||||||||||
US$ million | 2Q07 | 1Q07 | 2Q06 | 2Q07/2Q06 | 2Q07/1Q07 | |||||||||||
| Total Loans | 424.6 | 384.8 | 360.3 | 17.8 | % | 10.3 | % | |||||||||
| Past due loans | 11.5 | 13.7 | 17.7 | -35.0 | % | -16.1 | % | |||||||||
| Loan loss reserves | -21.2 | -22.2 | -25 | -15.2 | % | -4.5 | % | |||||||||
| Total Assets | 709.1 | 672.7 | 531.9 | 33.3 | % | 5.4 | % | |||||||||
| Deposits | 566.7 | 534.5 | 414 | 36.9 | % | 6.0 | % | |||||||||
| Shareholders' net equity | 68.1 | 62.6 | 62.8 | 8.4 | % | 8.8 | % | |||||||||
| Net income | 5.5 | 4.1 | 3.3 | 66.7 | % | 34.1 | % | |||||||||
| PDL/Total loans | 2.7 | % | 3.6 | % | 4.9 | % | ||||||||||
| Coverage ratio of PDLs | 184.3 | % | 161.1 | % | 141.1 | % | ||||||||||
| ROAE | 29.9 | % | 27.6 | % | 20.7 | % | ||||||||||
| Branches | 58 | 57 | 52 | |||||||||||||
| ATMs | 143 | 143 | 134 | |||||||||||||
| Employees | 1062 | 952 | 893 | |||||||||||||
17
|
IV. Atlantic Security Holding Corporation
Net income for Atlantic Security Holding Corporation (ASHC) of US$ 4.4 million reflects growth of 44.9% YoY. Due to significant recurring dividend income that is received during the first quarter of each year, reference to QoQ variations will henceforth be made only where pertinent.
Core revenues grew by 38.6% YoY, driven by greater asset volumes, wider margins and increased commissions income. Excluding dividend income, core revenues for 2Q07 grew 16.1% with respect to 1Q07. However, net income excluding dividends fell by US$ 600 thousand QoQ due mainly to net losses from sale of securities, since operating expenses increased less than core revenues. Therefore, the income volatility that is being observed is basically related to results on investments in securities, and dividend income from the stake of Credicorp Stock held at ASHC, since ASHC’s core business continues expanding..
ASHC | Quarter | Change % | ||||||||||||||
(US$ Million) | 2Q07 | 1Q07 | 2Q06 | 2Q07 / 2Q06 | 2Q07 / 1Q07 | |||||||||||
| Net interest income | 4.8 | 4.3 | 3.3 | 44.3 | 12.2 | |||||||||||
| Dividend income | 0.1 | 19.1 | 0.2 | -49.3 | -99.4 | |||||||||||
| Fees and commissions from services | 2.3 | 2.0 | 1.7 | 36.3 | 18.9 | |||||||||||
| Net gains on foreign exchange transactions | 0.0 | 0.0 | 0.0 | 315.6 | 154.6 | |||||||||||
Core Revenues | 7.3 | 25.3 | 5.2 | 38.6 | -71.4 | |||||||||||
| Total provisions, net of recoveries | -0.8 | -0.3 | -0.2 | -424.3 | -157.1 | |||||||||||
| Net gains from sale of securities | -0.2 | 0.6 | -0.2 | -34.2 | -136.5 | |||||||||||
| Other income | 0.2 | 0.3 | 0.0 | 9,211.1 | -18.2 | |||||||||||
| Operating expenses | -2.1 | -1.9 | -1.9 | 10.1 | 10.8 | |||||||||||
Net income | 4.4 | 24.0 | 3.0 | 44.9 | -81.8 | |||||||||||
| Net income/share | 0.1 | 0.4 | 0.1 | 44.9 | -81.8 | |||||||||||
| Total loans | 107.3 | 125.4 | 118.6 | -9.5 | -14.4 | |||||||||||
| Total investments available for sale | 885.6 | 801.9 | 634.4 | 39.6 | 10.4 | |||||||||||
| Total asset | 1,606.7 | 1,432.2 | 1,337.6 | 20.1 | 12.2 | |||||||||||
| Total deposits | 1,387.0 | 1,197.8 | 1,143.1 | 21.3 | 15.8 | |||||||||||
| Shareholder's equity | 201.8 | 217.6 | 162.7 | 24.0 | -7.3 | |||||||||||
| Net interest margin | 1.37 | % | 1.34 | % | 1.15 | % | ||||||||||
| Efficiency ratio | 29.0 | % | 7.3 | % | 37.7 | % | ||||||||||
| Return on average equity * | 15.9 | % | 17.1 | % | 17.8 | % | ||||||||||
| PDL / Total loans | 0.00 | 0.00 | 0.00 | |||||||||||||
| Cover ratio | 1.2 | % | 2.0 | % | 3.0 | % | ||||||||||
| BIS ratio * | 13.4 | % | 14.1 | % | 15.5 | % | ||||||||||
| * Figures of ASB, on an accumulated basis (IH07) |
Asset growth posted 12.2% QoQ and 20.1% YoY, reflecting that the reduction in growth rates evidenced during 1Q07 has reverted, although growth is still characterized by being moderate and sustained, especially when compared to the first half of 2006. Although net interest margin did not grow as much as it did during 1Q07, it has continued to widen, closing 2Q07 with 1.37% vs 1.34% for the previous quarter; interest income has benefited from both asset growth and wider margins. This is in line with our prediction of the previous commentary, where we expected the flat yield curve scenario to remain and limit further margin widening.
Fees and commissions grew 18.9% QoQ and 36.3% YoY, results that are broadly similar to those of 1Q07. Most of the growth in this income stems from larger placement fees due to an increase in assets under management. However, as in the previous quarter, the positive performance of funds has allowed incentive fees to play an important role in the results posted for this item.
Operating expenses have grown at a lower rate than income, which translates into an improvement in the efficiency ratio from 37.7% for 2Q06 to 29.0% for 2Q07. Atlantic has been successful in managing increasingly larger levels of own and third-party assets without requiring much additional investment in infrastructure or personnel.
18
|
Interest Earning Assets
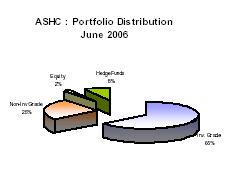
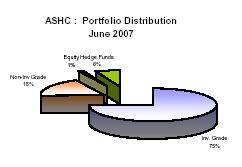
Interest earning assets reached US$ 1.477 MM, as shown in the table below. QoQ growth of 15.3% vs 2.7% for 1Q07 reveals that growth has resumed after flattening at the start of 2007. This growth is a consequence of strong deposit growth (15.8% QoQ), although it should be noted that 75% of this increase in deposits is attributed to individual large deposits whose permanence is not certain. Thus, asset growth in 2007 is expected to settle in the 5-10% range. These large deposits also explain the QoQ growth in Due from banks, as matching placements secure liquidity in case these deposits are withdrawn in the near future. Investments, however, continue to grow, replacing diminishing loan balances and capturing traditional deposit growth. The share of investment-grade securities in the investment portfolio has reached an all-time high of 75%, emphasizing ASB’s prudent investment policy of concentrating its portfolio in high credit quality, high liquidity securities.
INTEREST EARNING ASSETS* | Quarter | % Change | ||||||||||||||
(US$ Million) | 2Q07 | 1Q07 | 2Q06 | 2Q07 / 2Q06 | 2Q07 / 1Q07 | |||||||||||
| Due from banks | 531 | 402 | 506 | 5.0 | % | 31.9 | % | |||||||||
| Loans | 107 | 125 | 119 | -9.5 | % | -14.4 | % | |||||||||
| Investments | 838 | 752 | 575 | 45.9 | % | 11.4 | % | |||||||||
Total interest-earning assets | 1,477 | 1,280 | 1,199 | 23.1 | % | 15.3 | % | |||||||||
* Excludes investments in equities and mutual funds.
 |  |
19
|
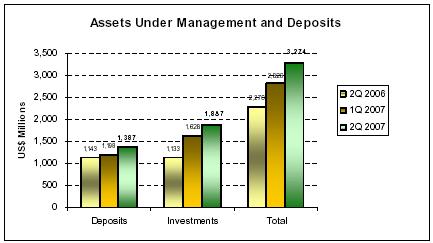
Asset Management Business
Third party managed funds include customers’ deposits, and investments such as proprietary mutual funds and securities custody. The total of these funds has grown 15.9% and 43.8% QoQ and YoY, reaching US$ 3.274 billion as of 2Q07 (US$ 2.826 billion in 1Q07). Quarterly growth in time deposits increased from 2.7% to 15.8%, but as explained before most of this growth is concentrated in a small number of large deposits. Third-party investments, which posted 15.9% QoQ growth, continued the expansive 18.3% growth of 1Q07, confirming that the management of third party funds in off-balance sheet accounts continues to command most new business. Part of this growth, however, is due to the general effect of higher asset prices between the two quarters.
20
|
V. Prima AFP
V1. Market developments
During 2Q07 competition in the Private Pension Fund System was slightly softer than in the previous quarter in terms of number of new affiliations and transfers, probably as a result of the important reduction of the sales force for the whole system. Thus, transfers dropped to 42 thousand per month from 46 thousand per month in 1Q07, while new affiliations went from 60 to 55 thousand per month for 2Q07.
Total funds under management (FuM) however did continue growing (+15.3% to US$ 19.3 billion) fueled by the performance of the Peruvian capital markets. Furthermore, appetite for investments in the Stock market continued increasing, resulting in the AFP’s fund Nr 3 -which concentrates in Stocks- increasing its share of the total FuM to 17.2% as of June 2007 (9.8% as of March 2007).
Private Pension Fund System: Main Indicators
2Q07 | 1Q07 | 4Q06 | 3Q06 | 2Q06 | ||||||||||||
Affiliates mm | 3.993 | 3.939 | 3.882 | 3.831 | 3.775 | |||||||||||
| % Change | 1.4 | % | 1.5 | % | 1.3 | % | 1.5 | % | 2.2 | % | ||||||
| Sales force (1) | 4,199 | 5,179 | 5,647 | 5,443 | 4,798 | |||||||||||
| Assets under management US$ mm | 19,334 | 16,763 | 14,391 | 12,855 | 11,385 | |||||||||||
| % Change (2) | 15.3 | % | 16.5 | % | 11.9 | % | 12.9 | % | 10.6 | % | ||||||
| Income US$ mm | 45.9 | 51.5 | 45.3 | 51.3 | 40.3 | |||||||||||
| Operating expenses US$ mm | 46.4 | 44.5 | 60.0 | 46.3 | 41.0 | |||||||||||
| Operating income US$ mm | (0.6 | ) | 7.0 | (14.7 | ) | 5.0 | (0.7 | ) | ||||||||
| Net Income US$ mm | 19.5 | 22.0 | (5.4 | ) | 13.4 | 3.5 | ||||||||||
(1) Source: SBS according to Peruvian GAAP
(2) Quarter Variation
In local Peruvian Accounting, legal reserves are included in the income statement, as opposed to the IFRS The first and third quarter include double collection
V.2 PRIMA AFP
During the 2Q07, PRIMA focused on preserving its income base taking measures to improve the efficiency of its sales force to compensate for the reduction in the numbers of sales people. In the results of its administered funds, PRIMA could sustain its leadership in terms of returns achieved for its three administered funds. In fact, 2 of its 3 funds offered the highest returns measured by an official risk adjusted rate of return. This contributed to the attractiveness of its funds which resulted in increasing the voluntary contributions affiliates can make to the funds, putting PRIMA at the top in terms of percentage of collections of the whole system.
21
|
PRIMA AFP: Main indicators
2Q07 | 1Q07 | 2Q07/1Q07 | 4Q06 | 3Q06 | 2Q06 | ||||||||||||||
| Funds under management US$ mm | 5,840 | 5,001 | 17 | % | 4,207 | 929 | 713 | ||||||||||||
| Affiliates (1) | 1,013,420 | 1,005,505 | 1 | % | 997,963 | 125,840 | 97,068 | ||||||||||||
| (1) Source: SBS. |
Commercial Results
During this quarter, Prima continued its process of reducing its sales force to rationalize and reduce its still over dimensioned operating costs. Looking to preserve its income base, the company focused on increasing its efficiency per sales person, increasing the number of new affiliation/transfers per sales person and targeting customers with higher average income.
Prima achieved these objectives during 2Q07 as the net result of its sales efforts was positive, with 96 thousand new clients vs. 82 thousand transfers away from Prima. Furthermore, the higher average income level of its new affiliations, and voluntary contributions added up to make Prima the strongest fund in terms of collections, reaching US$ 53.3 million or 38.9% of collections for the system for June 2007. This contributed to positioning Prima as Nr.2 in the market in terms of FuM reaching S/. 18,507 million of administered funds or 30.2% market share.
Investments
PRIMA maintained its leadership position in returns for its three different administered funds. In the last 12 months (June 2007 / June 2006), it reported the highest returns for all three types of funds: 25.02% for Fund Nr. 1, 55.64% for Fund Nr. 2 y 119.80% for Fund Nr. 3.
As of June and based on risk adjusted returns, PRIMA obtained the highest returns for 2 of its 3 funds. Fund Nr.1 obtained the third highest return.
Market Share-June 2007
PRIMA | ||||
| Affiliates | Number | 1,013,420 | ||
| % Share | 25.4% | |||
| Funds under management | US$ MM (as of June 07) | 5,840 | ||
| % Share. | 30.2% | |||
| Collections | US$ MM (2Q07) | 160 | ||
| % Share | 38.4% |
Financial Results
In 2Q07 PRIMA reported net losses of US$ 1.2 million. On an accumulated basis for the 1H07 the net loss was US$ 1.0 million, in line with expectations. The company generated an important level of income (US$ 12.1 million) following the good results of its commercial management, consolidating this way a higher base of income generation.
22
|
Nevertheless, the net losses are explained by the following developments:
| (1) | Sales costs related to the lay-offs in its sales force as efforts are made to reduce its operating costs. |
| (2) | Administrative expenses incurred to support the sales force and the increased flows of funds into and between funds. |
| (3) | Expenses related still to the merger as charge offs of assets continue being amortized. Thus, amortization of charge-offs and depreciation of investments in systems and premises add up to US$ 2.1 million for 2Q07 and a total of US$ 4.2 million for 1H07. |
| (4) | Financial charges for loans incurred to finance the acquisition of the PRIMA Headquarters and partially the acquisition of Unión Vida, which add up to US$ 1.02 million for 2Q07 and US$ 2.04 million for 1H07. |
Main financial indicators for PRIMA are shown below:
PRIMA AFP: Main Financial indicators (US$ m) (1)
2Q07 | 1Q07 | 1H07 | 4Q06 | 3Q06 | 2Q06 | 1Q06 | ||||||||||||||||
| Income | 12,121 | 13,657 | 25,777 | 8,923 | 8,749 | 3,117 | 2,636 | |||||||||||||||
| Operating Expenses | (13,385 | ) | (13,479 | ) | (26,864 | ) | (19,803 | ) | (13,684 | ) | (5,359 | ) | (5,303 | ) | ||||||||
| Net Income / (Loss) | (1,264 | ) | 178 | (1,086 | ) | (10,879 | ) | (4,935 | ) | (2,242 | ) | (2,667 | ) | |||||||||
| Total Assets | 239,120 | 229,159 | 239,120 | 230,560 | 183,809 | 21,486 | 21,828 | |||||||||||||||
| Total Liabilities | 112,150 | 106,055 | 112,150 | 112,079 | 58,484 | 3,237 | 3,264 | |||||||||||||||
| Net Equity | 126,971 | 123,104 | 126,971 | 118,481 | 125,325 | 18,248 | 18,563 | |||||||||||||||
(1) Information based on IFRS
23
|
VI. EL PACIFICO PERUANO SUIZA AND SUBSIDIARIES (PPS)
Results of PPS [which includes Property & Casualty (PPS), Life (PV) and Health (EPS)] for the 2Q07 continue reflecting the improving trend on a yearly basis after the implementation of its restructuring process started at the beginning of 2006. Net income after minority interests reached US$6.8 million, 43.1% higher YoY, given the improved production with Total Gross Premiums growing 22.2% YoY, as well as stronger financial income resulting from better performance of the capital markets and thus the returns on investments and gains on the sale of securities, which all compensated a slight increase of 2 percentage points in net earned loss ratio. Nevertheless, on a quarterly basis, PPS shows some volatility of its earnings, generated precisely by such extraordinary financial returns, as its net income after minorities show a 22% QoQ drop. Nevertheless, its underlying insurance business continues showing solid progress.
The improved performance of PPS for the 1H07 is better evidenced by the important recovery of market shares throughout this current year. The total market for Property & Casualty and Life generated total gross premiums for the 1H07 of US$ 586.2 million, 3.0% above the cumulated premiums for 1H06, while PPS grew its market share of these gross premiums to 30.8% as of June 30 2007 vs. 26.6% reached at the same time last year. This market share breaks down into a 34.5% market share for P&C, up from 29.2% a year ago and 25.3% for Life, also up from 23.5% as of June 2006. Including EPS market, PPS market share grew from 29.7% for the 1H06 to 33.5% during 1H07.
Furthermore, an important recognition of these positive developments at Pacífico is the recently received investment grade rating from Fitch. This Insurer Financial Strength (IFS) BBB- rating was granted to Pacífico Peruano Suiza (PPS) and Pacífico Vida (PV), based on their effective restructuring, strong capitalization, above average liquidity, conservative retention levels, strong distribution channels, recovered profitability and solid market share and franchise in Perú.
VI.1 Net Income
Net consolidated income before minority interest for 2Q07 reflect on a quarterly basis the income volatility mentioned above and resulted in a QoQ drop of 26.5% down to US$ 9.2 million, after US$ 12.5 million for 1Q07, but it also reflects the improving long term trend since this result is still 50.5% higher on a YoY comparison.
It is therefore worth mentioning, that the drop in earnings for 2Q07 is a result mainly of lower gains this 2Q07 on the sale of investments, which were extraordinarily high during the 1Q07 and responded to some profit taking as a restructuring of the investment portfolio of the Life insurance business in order to take longer positions of government bonds was implemented.
As a result, PPS’s contribution to Credicorp for 2Q07 reached US$ 5.1 million, reflecting the same QoQ drop from US$ 6.6 million, but again a significant improvement YoY from US$ 2.7 million for 2Q06. The better performers were the P&C and the Life businesses.
Underwriting results for the 2Q07 reflect a drop of 10.4% QoQ, which responds to increased operating costs from higher commissions and the impulse given to the use of less developed bank-channels (bancaseguros), which could not be offset by the lower net claims reported during this quarter. In fact, Net Earned Loss ratio dropped to 70.8% from 73% the previous quarter.
24
|
VI.2 Revenue and Operating Expenses
The growth in Total Premiums, which reached 11.5% QoQ and 22.2% YoY, is fueled mainly by growth of the P&C business, which was up 35.7% YoY, while Health grew 14% YoY and Life a moderate 5.2% YoY.
Net Premiums Earned reached a level of US$ 74.0 million, reflecting growth of 2.7% QoQ and 15.5% YoY, mainly as a result of general Premiums growth in P&C and Health. In fact, this Premiums growth was mainly reported in Fire, Automobiles, Marine Hull and Aviation. General health products also reported good growth as did also Individual Life products.
An increase in Reserves of a total of 5.6% YoY is explained mainly by the increase of reserves for P&C of US$ 2.8 million when compared to reserves a year ago, which were partly offset by a drop of US$ 1.8 million of reserves related to the Life insurance business in the same YoY comparison, as a result in the reduction in the annuity business. The stronger increase in Reserves on a quarterly basis is however a seasonal evolution, since these respond to the seasonality of its insurance contracts which lead to high reserves build-up in the months of strong production which are typically in the 2nd and 4th quarters, while reserves are reduced in the 1st and 3rd quarters.
Quarter | Change | |||||||||||||||
US$ mm | 2Q07 | 1Q07 | 2Q06 | 2Q07/2Q06 | 2Q07/1Q07 | |||||||||||
Total Gross Premium | 117.4 | 105.3 | 96.1 | 22.2 | % | 11.5 | % | |||||||||
Retained Premium | 91.4 | 82.9 | 80.5 | 13.5 | % | 10.3 | % | |||||||||
Reserve Adjustments | 17.4 | 10.9 | 16.5 | 5.5 | % | 59.6 | % | |||||||||
Net Premiums Earned | 74.0 | 72.0 | 64.0 | 15.6 | % | 2.8 | % | |||||||||
Net Earned Loss ratio (NEL) reached 70.8% this 2Q07, 2.0 percentage points below 1Q07 but 2.2 percentage points above 2Q06. NEL of 66.1% for P&C is 10.1 points above 2Q06 due to higher claims in the Medical, Technical and Fire segments. On the other hand in the Life segment, NEL drops to 68.6% from 80.3% obtained in 2Q06, basically following the reductions in reserves explained before. However, the Health segment has a negative effect on NEL since it increases 1.3% reaching 79.2% for the quarter.
Financial Income for 2Q07 reached US$ 13.2 million, up 2.6% QoQ and 8.5% YoY. These increases respond to higher dividends and interest on investments as the portfolio of administered funds expands. Extraordinary income from the sale of certain investments to re-invest in other securities is reflected in the Other Income line and thus shows a 39.1% QoQ drop.
Increases in Salaries and Employees Benefits leveled out as reflected by a drop in these costs of 1.2% QoQ. However, these are still 22.8% above 2Q06 following the increased sales efforts made since the business restructuring in 2006.
However, General Expenses and Other Operating Expenses do grow 10.2% QoQ and 27.8% YoY, responding to the increased production and larger expenses related to advertising campaigns to promote new services and products.
25
|
VI.3 Business Lines
Total contribution to BAP
(In US$, thousands)
PPS | PV | EPS | Consolidated Net Earnings at PPS | Adjustments for Consolidation and Minorities | Total Contribution to BAP | ||||||||||||||
2Q06 | 2,303 | 2,231 | 204 | 4,738 | (2,008 | ) | 2,730 | ||||||||||||
3Q06 | 2,500 | 1,740 | 1,278 | 5,519 | (933 | ) | 4,586 | ||||||||||||
4Q06 | 35,165 | 4,095 | 885 | 40,144 | (36,610 | ) | 4,534 | ||||||||||||
1Q07 | 1,883 | 6,147 | 705 | 8,735 | (2,119 | ) | 6,616 | ||||||||||||
2Q07 | 2,263 | 3,931 | 585 | 6,779 | (1,645 | ) | 5,134 | ||||||||||||
Var% 2Q07/1Q07 | 20 | % | -36 | % | -17 | % | -22 | % | N.A. | -22 | % | ||||||||
Property & Casualty (PPS)
Premiums for the P&C business grew 22.3% QoQ and 35.7% YoY following growth in almost all segments of this business. However, technical expenses and commissions were up 38.2% QoQ, due to the higher production. At the same time, reserves were increased by US$6.4 million QoQ given also the higher production. These higher expenses could not be fully offset by a drop in claims as reflected by a NEL of 66% for 2Q07 vs. 69% for 1Q07, leading to an underwriting result 6.7% below 1Q07 results. However, good financial returns helped net income reflect a 20.3% QoQ growth reaching US$ 2.3 million.
Life (PV)
Total Premiums dropped 0.6% QoQ but were up 5.2% YoY, based mainly on the Individual and Group Life products. Reserves were adjusted downwards by 15.3% YoY due to the implemented policy of reducing the involvement in the annuity business. On the other hand, financial income was up 31.8% YoY, though a QoQ 31.1% drop was reported. As mentioned before, this drop appears because some extraordinary financial income from the sale of securities during 1Q07 boosted the 1Q07 bottom line results. The sale responded to a restructuring of PV’s investment portfolio. Thus, net earnings drop 36.1% QoQ, reaching US$3.9 million, but was still 76.2% above 2Q06 results.
Health (EPS)
Premiums for the Health business grew 1.9% QoQ and 14.0% YoY. Nevertheless, NEL ratio deteriorates given a 16% increase in claims, mainly in corporate health plans, from 77.9% in 2Q06 to 79.2% for the 2Q07. Despite this fact, NEL is still within expected ranges. Underwriting results reach US$ 3.6 million, 3% below the previous quarter and 5% under the previous year, leading to net earnings of US$ 0.6 million for the 2Q07.
VI. 4 Claims
Claims for the consolidated company for 2Q07 drop 0.5% from the previous quarter, but reflect an increase of 19% YoY, reaching a total of US$ 52.4 million. As a reflection of these developments, NEL ratio, calculated over retained premiums less the reserve adjustments, reached 70.8%, showing an improvement from the 73% for 1Q07 but a deterioration vis-à-vis the 68.8% for 2Q06. This deterioration was noted mainly in P&C: mainly medical assistance and technical and fire segments, while an improvement was reported for Life given the increase in Net Premiums Earned and reduction of reserves.
VI.5 Investment Portfolio
Net financial income reported for 2Q07 was S$13.2 million, reflecting an increase of 2.6% QoQ and 8.5% YoY. This increase is explained by larger dividend income from the investments in the P&C Division and higher interest income from the growing investment portfolio of the Life Division.
26
|
The investment/securities portfolio reached US$ 778.9 million by the end of 2Q07, up from US$ 754.4 million at the end of 1Q07 and US$ 693.4 million by the end of 2Q06. Unrealized gains also increased from US$ 53.4 million for 2Q06 to US$ 87.7 million for 2Q07 due to the larger investment portfolio on PPS’s books and the improved performance of the stocks listed in the Lima Stock Market and which are part of the portfolio. It is noteworthy that from the US$ 87.7 million of unrealized gains, US$ 35.8 million correspond to the P&C portfolio and US$ 51.9 million correspond to unrealized gains on instruments that support the Life insurance business.
VI.6 Market Share
The total market for P&C and Life reported Total Gross Premiums reaching US$ 586.2 million for the 1H07, which were 3.0% larger than total premiums for 1H06. Market share of PPS and PV of this total business volume reached 30.8% this year compared to 26.6% last year, reflecting an important recovery in market positioning. In fact, P&C recaptured market share significantly, increasing its share to 34.5% for 2Q07, up from 29.2% a year ago, while the Life Division increased its market share to 25.3%, up from 23.5% as of June 2006.
The Health business sector (Empresas Prestadoras de Salud-EPS) reported Total Gross Premiums for the 1H07 of US$ 78.7 million, that is 15.6% more than the premiums reported for 1H06. Pacífico Salud (EPS) reached a 54.2% market share, 1.5 percentage points below its market share of the 1H06.
27
|
VII. ECONOMIC OUTLOOK
Economic Activity
The Peruvian economy continued showing an excellent performance during the 2Q07, with growth rates of 7.6% between January and May, led by the dynamism of the private investments and sectors associated with domestic demand, such as construction and non-primary manufacture. In the construction sector, year to date growth reaches 12.9%, in line with the dynamism of the real state projects, the productive infrastructure development and auto construction. Furthermore, the industrial non-primary sector shows growth of 12% in the same period explained by the increased production of consumption goods and intermediate goods, especially those related to construction. On the other hand, primary sectors show certain stagnation, especially the mining industry, where the lower production of gold, silver and tin could not be compensated by the expansion registered in the extraction of copper (Cerro Verde) and zynk (Cerro Lindo). In spite of this, we should highlight that during 2Q07, the official economic perspectives published by the MEF and BCR, have improved substantially and in such way that an increased dynamism is projected in the private and public sectors, which should bring growth for this year over 7 % and for the following years to about 6 %.
Gross Domestic Product and Internal Demand
(annualized percentage variation)
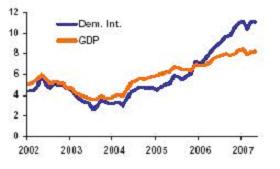
Source: INEI
External Sector
During the first five months of the year, the trade balance surplus was of US$ 2,655MM, an amount US$ 8MM lower than the surplus achieved for the same period 2006, mainly due to accelerated imports growth which surpassed the higher exports. Thus, shipments to other countries grew 16.7% in the first five months of the year reaching US$ 9,823MM, though this growth is explained by better terms of exchange (+11.7%), since a decrease of 0.7% was experienced on exported volumes. On the other hand, imports grew +24.6% in the same period, due mainly to investments in capital assets (+41.2). Finally the international reserves continued growing, closing the second quarter with US$21,528MM reserves.
Exports and Imports
(annualized percentage variation)
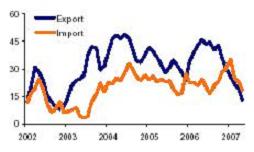
Source: BCRP
28
|
Prices and Exchange rate
To the closing of 2T07, inflation was within the range set as goal of the Central Bank BCR (2 % ± 1 %), after remaining below that range for the first five months of the year, and reached a level of +1.5% YoY. The price increases of the last months are due to specific factors related to the supply side, especially to increases in the international prices of oil and some cereals. In this context, BCR increased its reference rate to 4.75 %, as a preventive measure in view of the concerns about the growth of internal demand, which is starting to affect prices as observed in the underlying inflation. With regard to the exchange rate, it closed in June at S/. 3.168 per dollar, accumulating an appreciation of 0.88 % vis-a-vis the closing of 2006. In the latter months, the pressures to the rise of the national currency continued in such a way that the Central Bank had to support the US currency through interventions in the foreign exchange market, accumulating purchases for US$ 4,902MM.
Consumer price index (Annual percentage variation) (S/. per dollar and US$ MM) | Exchange Rate and purchases US$ BCRP | |
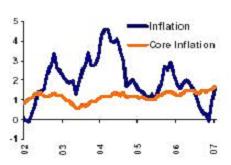 | 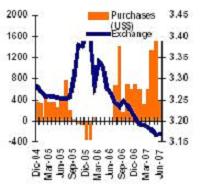 |
Source: INEI, BCR
29
|
Fiscal Aspects
During the period of January through May, tax collections increased to S/. 25,119MM. These are 16% more in real terms than tax collections in the same period of 2006. This growth is sustained principally, by increased collections of Value Added Tax (IGV, +14.3 %) and Income Tax (IR, +24.4 %), which includes income from regularizations during April. On the public spending side of the Central Government, an increase of 10.5 % up to May is observed and explained by an increase of +10.8 % in the current expenditure (17.1 %) and lower growth of public investments (+6.9 %), which should however increase more as the announced “investments shock” is implemented. Hence, the economic result of the Central Government to the closing of May reveals a surplus of S/. 7,567MM (+29.5 % YoY).
Fiscal Income of the Central Government
(Annualized, expressed in thousand of millions of Nuevos Soles)
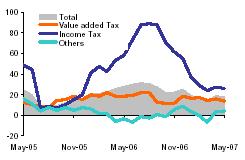
Source: Sunat
Banking System
At the closing of May 2007, total loan placements in the banking system continued to grow and reached US$17,768 MM, amount that represents an increase of +27.3% compared to the same period of 2006 and of +12.8% with respect to the closing of 2006. This result is mainly supported by the stronger credit activity in the retail segments such as consumer loans (+43.0% YoY), SME lending (+33.9% YoY) and mortgages (+19.4% YoY). Commercial credits also registered an important dynamism reaching the amount of US$ 11,422MM (+24.9% YoY). The lending dynamism came along with a further delinquencies reduction, which reached a record level of 1.62%.
Looking at the banking system’s main source of funding, deposits also continued increasing and reached US$20,394MM, which represents a growth rate of +19.1% YoY and of +7.9% for 1H07. Growth was observed in demand deposits (+30.8%) savings deposits (+15.9%) and time deposits (+15.5%).
Dollarization of the banking system continues decreasing in both loans and deposits. This way, dollar lending grew by +15.6% YoY, while soles lending grew at a more accelerated rate of +38.4%. Furthermore, dollar loans represent now 64.9% of total loan portfolio (as of May 2007), while these used to make up for 68.8% a year ago.
Dollarization of deposits also dropped from levels of 65.7% to 60.8% in the same period, which reflects an increasing preference for saving in national currency in view of the appreciation experienced by the Nuevo Sol in the last year.
Finally, interest rates continue showing a slight downward trend in the last months. This way, the TAMN (local currency lending rate) closed 2Q07 at 22.4%, below the closing level of 2Q06 (24.3%), and even below the closing rate of December 2006 (23.1%), while TAMEX (foreign currency lending rate) remained relatively stable and closed 2Q07 at 10.6%, (10.6% and 10.8% at the closing of 2Q06 and 4Q06, respectively). On the funding side, the TIPMN (local currency deposit rate) and the TIPMEX (Foreign currency deposit rate) closed this 2Q07 at 3.1% and 2.2% respectively, which are basically the same levels from December 2006.
30
|
Main Financial Indicators
2005 | 2006 | 2007 | ||||||||||||||||||||||||||||||||||||||
IQ | IIQ | IIIQ | IVQ | Year | IQ | IIQ | IIIQ | IVQ | Year | IQ | IIQ | Year (F) | ||||||||||||||||||||||||||||
| GDP (US$ MM) | 18,203 | 21,361 | 19,470 | 20,308 | 79,341 | 20,352 | 24,203 | 23,469 | 25,049 | 93,377 | 23,798 | n.d. | 103,317 | |||||||||||||||||||||||||||
| Real GDP (var. %) | 5.9 | 5.9 | 6.3 | 7.7 | 6.4 | 7.6 | 6.1 | 8.7 | 8.5 | 8.0 | 7.5 | n.d. | 7.5 | |||||||||||||||||||||||||||
| GDP per-cápita (US$) | 2,687 | 3,153 | 2,874 | 2,997 | 2,928 | 3,004 | 3,572 | 3,464 | 3,534 | 3,294 | 3,437 | n.d. | 3,690 | |||||||||||||||||||||||||||
| 28349 | 28774.235 | |||||||||||||||||||||||||||||||||||||||
| Domestic demand (var. %) | 4.1 | 4.6 | 6.1 | 7.1 | 5.5 | 10.7 | 7.2 | 10.6 | 12.5 | 10.4 | 10.4 | n.d. | 9.4 | |||||||||||||||||||||||||||
| Consumption (var. %) | 4.0 | 4.4 | 4.5 | 4.7 | 4.4 | 5.3 | 5.4 | 6.4 | 7.4 | 6.6 | 7.4 | n.d. | 6.5 | |||||||||||||||||||||||||||
| Private Investment (var. %) | 6.3 | 12.3 | 14.7 | 19.8 | 13.6 | 22.2 | 16.5 | 16.7 | 31.5 | 26.3 | 17.2 | n.d. | 19.1 | |||||||||||||||||||||||||||
| CPI (annual change, %) | 1.9 | 1.5 | 1.1 | 1.5 | 1.5 | 2.5 | 1.8 | 2.0 | 1.5 | 1.1 | 0.3 | 1.6 | 2.0 | |||||||||||||||||||||||||||
| Exchange rate, eop (S/. per US$) | 3.26 | 3.25 | 3.34 | 3.43 | 3.43 | 3.36 | 3.26 | 3.25 | 3.20 | 3.20 | 3.19 | 3.17 | 3.17 | |||||||||||||||||||||||||||
| Devaluation (annual change, %) | -5.8 | -6.3 | 0.1 | 4.5 | 4.5 | 2.9 | 0.2 | -2.8 | -6.8 | -6.8 | -5.1 | -2.8 | -0.8 | |||||||||||||||||||||||||||
| Exchange rate, average (S/. per US$) | 3.26 | 3.26 | 3.27 | 3.39 | 3.30 | 3.34 | 3.29 | 3.24 | 3.22 | 3.27 | 3.19 | 3.17 | 3.18 | |||||||||||||||||||||||||||
| Non-Financial Public Sector (% of GDP) | 2.3 | 2.7 | -0.6 | -5.3 | -0.3 | 3.9 | 5.7 | 1.4 | -2.6 | 2.1 | 4.8 | n.d. | 1.2 | |||||||||||||||||||||||||||
| Central government current revenues (% of GDP) | 15.8 | 16.2 | 15.4 | 15.4 | 15.7 | 17.8 | 18.4 | 16.6 | 16.2 | 17.3 | 17.3 | n.d. | 17.4 | |||||||||||||||||||||||||||
| Tax Income (% of GDP) | 13.9 | 14.2 | 13.1 | 13.2 | 13.6 | 15.2 | 16.3 | 14.2 | 14.0 | 14.9 | 15.0 | n.d. | 15.1 | |||||||||||||||||||||||||||
| Non Tax Income (% of GDP) | 1.9 | 2.0 | 2.2 | 2.2 | 2.1 | 2.6 | 2.1 | 2.4 | 2.1 | 2.4 | 2.3 | n.d. | 2.3 | |||||||||||||||||||||||||||
| Current expenditures (% of GDP) | 12.0 | 11.0 | 13.3 | 15.0 | 12.8 | 11.8 | 10.7 | 12.5 | 13.6 | 12.2 | 11.7 | n.d. | 12.5 | |||||||||||||||||||||||||||
| Capital expenditures (% of GDP) | 0.8 | 1.2 | 2.0 | 3.4 | 1.9 | 0.8 | 1.3 | 2.4 | 3.2 | 2.0 | 0.8 | n.d. | 3.0 | |||||||||||||||||||||||||||
| Trade Balance (US$ MM) | 1,089 | 1,059 | 1,386 | 1,726 | 5,260 | 1,245 | 2,162 | 2,828 | 2,529 | 8,853 | 1,421 | n.d. | 8,600 | |||||||||||||||||||||||||||
| Exports (US$ MM) | 3,749 | 4,063 | 4,544 | 4,980 | 17,336 | 4,631 | 5,799 | 6,503 | 6,709 | 23,750 | 5,647 | n.d. | 26,400 | |||||||||||||||||||||||||||
| Imports (US$ MM) | 2,660 | 3,004 | 3,158 | 3,254 | 12,076 | -3,386 | -3,637 | -3,675 | 4,180 | 14,897 | -4,225 | n.d. | 17,800 | |||||||||||||||||||||||||||
| Current Account Balance (US$ MM) | 143 | 142 | 380 | 440 | 1,105 | -227 | 401 | 1,199 | 957 | 2,456 | -83 | n.d. | 1,900 | |||||||||||||||||||||||||||
| Current Account Balance (% of GDP) | 0.8 | 0.7 | 2.0 | 2.2 | 1.4 | -1.1 | 1.7 | 5.1 | 3.8 | 2.6 | -0.3 | n.d. | 1.8 | |||||||||||||||||||||||||||
31
|
Company Description:
Credicorp Ltd. (NYSE: BAP) is the leading financial services holding company in Peru. It primarily operates via its four principal Subsidiaries: Banco de Credito del Peru (BCP), Atlantic Security Holding Corporation (ASHC), El Pacífico-Peruano Suiza Compañía de Seguros y Reaseguros (PPS) and Grupo Credito. Credicorp is engaged principally in commercial banking (including trade finance, corporate finance and leasing services), insurance (including commercial property, transportation and marine hull, automobile, life, health and pension fund underwriting insurance) and investment banking (including brokerage services, asset management, trust, custody and securitization services, trading and investment). BCP is the Company's primary subsidiary.
Safe Harbor for forward-looking statements:
This material includes “forward-looking statements” within the meaning of Section 21E of the Securities Exchange Act of 1934. All statement other than statements of historical information provided herein are forward-looking and may contain information about financial results, economic conditions, trends and known uncertainties.
The Company cautions readers that actual results could differ materially from those expected by the Company, depending on the outcome of certain factors, including, without limitation: (1) adverse changes in the Peruvian economy with respect to the rates of inflation, economic growth, currency devaluation, and other factors, (2) adverse changes in the Peruvian political situation, including, without limitation, the reversal of market-oriented reforms and economic recovery measures, or the failure of such measures and reforms to achieve their goals, and (3) adverse changes in the markets in which the Company operates, including increased competition, decreased demand for financial services, and other factors. Readers are cautioned not to place undue reliance on these forward-looking statements, which speak only as of the date hereof.
The Company undertakes no obligation to release publicly the result of any revisions to these forward-looking statements which may be made to reflect events or circumstances after the date hereof, including, without limitation, changes in the Company’s business strategy or planned capital expenditures, or to reflect the occurrence of unanticipated events.
32
|
CREDICORP LTD. AND SUBSIDIARIES |
CONSOLIDATED BALANCE SHEETS |
(In US$ thousands, IFRS) |
As of | June 07/ | June 07/ | ||||||||||||||
June 2007 | March 2007 | June 2006 | June 06 | March 07 | ||||||||||||
| Assets | ||||||||||||||||
Cash and due from banks | ||||||||||||||||
| Non-interest bearing | 516,676 | 544,933 | 411,860 | 25.4 | % | -5.2 | % | |||||||||
| Interest bearing | 2,041,200 | 1,950,342 | 2,845,909 | -28.3 | % | 4.7 | % | |||||||||
| Total cash and due from banks | 2,557,876 | 2,495,276 | 3,257,769 | -21.5 | % | 2.5 | % | |||||||||
Marketable securities, net | 53,569 | 61,536 | 52,463 | 2.1 | % | -12.9 | % | |||||||||
Loans | 7,031,734 | 6,239,870 | 5,501,004 | 27.8 | % | 12.7 | % | |||||||||
| Current | 6,964,320 | 6,165,394 | 5,408,449 | 28.8 | % | 13.0 | % | |||||||||
| Past Due | 67,414 | 74,477 | 92,555 | -27.2 | % | -9.5 | % | |||||||||
| Less - Reserve for possible loan losses | (191,747 | ) | (187,211 | ) | (198,228 | ) | -3.3 | % | 2.4 | % | ||||||
Loans, net | 6,839,987 | 6,052,659 | 5,302,777 | 29.0 | % | 13.0 | % | |||||||||
Investments securities available for sale | 4,686,444 | 4,029,155 | 2,418,583 | 93.8 | % | 16.3 | % | |||||||||
Reinsurance assets | 65,831 | 41,735 | 43,044 | 52.9 | % | 57.7 | % | |||||||||
Premiums and other policyholder receivables | 85,780 | 65,321 | 62,580 | 37.1 | % | 31.3 | % | |||||||||
Property, plant and equipment, net | 256,822 | 252,451 | 241,642 | 6.3 | % | 1.7 | % | |||||||||
Due from customers on acceptances | 46,331 | 31,082 | 36,173 | 28.1 | % | 49.1 | % | |||||||||
Other assets | 726,776 | 701,840 | 315,856 | 130.1 | % | 3.6 | % | |||||||||
Total Assets | 15,319,416 | 13,731,054 | 11,730,886 | 30.6 | % | 11.6 | % | |||||||||
Liabilities and shareholders' equity | ||||||||||||||||
Deposits and Obligations | ||||||||||||||||
| Non-interest bearing | 2,339,402 | 2,293,349 | 1,788,809 | 30.8 | % | 2.0 | % | |||||||||
| Interest bearing | 7,813,199 | 7,043,170 | 6,133,399 | 27.4 | % | 10.9 | % | |||||||||
| Total deposits and Obligations | 10,152,601 | 9,336,519 | 7,922,208 | 28.2 | % | 8.7 | % | |||||||||
Due to banks and correspondents | 1,685,689 | 1,019,200 | 1,116,907 | 50.9 | % | 65.4 | % | |||||||||
Acceptances outstanding | 46,331 | 31,082 | 36,173 | 28.1 | % | 49.1 | % | |||||||||
Reserves for property and casualty claims | 578,754 | 562,075 | 515,016 | 12.4 | % | 3.0 | % | |||||||||
Reserve for unearned premiums | 112,086 | 88,080 | 91,226 | 22.9 | % | 27.3 | % | |||||||||
Reinsurance payable | 25,024 | 25,856 | 14,168 | 76.6 | % | -3.2 | % | |||||||||
Bonds and subordinated debt | 504,948 | 481,521 | 409,563 | 23.3 | % | 4.9 | % | |||||||||
Other liabilities | 548,719 | 640,988 | 317,336 | 72.9 | % | -14.4 | % | |||||||||
Minority interest | 130,111 | 125,018 | 92,306 | 41.0 | % | 4.1 | % | |||||||||
Total liabilities | 13,784,262 | 12,310,338 | 10,514,903 | 31.1 | % | 12.0 | % | |||||||||
Net Shareholder's equity | 1,535,154 | 1,420,716 | 1,215,984 | 26.2 | % | 8.1 | % | |||||||||
Total liabilities and net shareholder's equity | 15,319,416 | 13,731,054 | 11,730,887 | 30.6 | % | 11.6 | % | |||||||||
Contingent Credits | 4,393,139 | 4,061,570 | 3,218,616 | 36.5 | % | 8.2 | % | |||||||||
33
|
CREDICORP LTD. AND SUBSIDIARIES | ||||||||||
QUARTERLY INCOME STATEMENT | ||||||||||
(In US$ thousands, IFRS) |
Quarter | Change | Six months | Change | ||||||||||||||||||||||
2Q07 | 1Q06 | 2Q06 | 1Q07/2Q06 | 2Q07/1Q07 | June 07 | June 06 | June 07/ June 06 | ||||||||||||||||||
Interest income and expense | |||||||||||||||||||||||||
| Interest and dividend income | 248,976 | 220,847 | 198,613 | 25.4 | % | 12.7 | % | 469,823 | 372,860 | 26.0 | % | ||||||||||||||
| Interest expense | (89,671 | ) | (81,988 | ) | (68,603 | ) | 30.7 | % | 9.4 | % | (171,659 | ) | (127,874 | ) | 34.2 | % | |||||||||
| Net interest and dividend income | 159,305 | 138,859 | 130,010 | 22.5 | % | 14.7 | % | 298,163 | 244,987 | 21.7 | % | ||||||||||||||
Provision for loan losses | (6,090 | ) | (4,418 | ) | (251 | ) | 2324.5 | % | 37.8 | % | (10,508 | ) | (3,798 | ) | 176.6 | % | |||||||||
Non financial income | |||||||||||||||||||||||||
| Fee income | 76,100 | 74,076 | 54,734 | 39.0 | % | 2.7 | % | 150,176 | 110,283 | 36.2 | % | ||||||||||||||
| Net gain on foreign exchange transactions | 12,796 | 11,956 | 11,393 | 12.3 | % | 7.0 | % | 24,751 | 21,580 | 14.7 | % | ||||||||||||||
| Net gain on sales of securities | 14,644 | 17,945 | 664 | 2104.1 | % | -18.4 | % | 32,590 | 6,241 | 422.2 | % | ||||||||||||||
| Other | 4,486 | 7,217 | 5,720 | -21.6 | % | -37.8 | % | 11,703 | 13,034 | -10.2 | % | ||||||||||||||
Total non financial Income, net | 108,026 | 111,194 | 72,513 | 49.0 | % | -2.8 | % | 219,220 | 151,138 | 20.7 | % | ||||||||||||||
Insurance premiums and claims | |||||||||||||||||||||||||
| Net premiums earned | 71,657 | 69,991 | 62,269 | 15.1 | % | 2.4 | % | 141,647 | 121,000 | 17.1 | % | ||||||||||||||
| Net claims incurred | (14,017 | ) | (13,539 | ) | (9,215 | ) | 52.1 | % | 3.5 | % | (27,556 | ) | (22,876 | ) | 20.5 | % | |||||||||
| Increase in cost for life and health policies | (38,363 | ) | (39,089 | ) | (34,834 | ) | 10.1 | % | -1.9 | % | (77,451 | ) | (69,107 | ) | 12.1 | % | |||||||||
| Total other operating income, net | 19,278 | 17,363 | 18,220 | 5.8 | % | 11.0 | % | 36,641 | 29,017 | 26.3 | % | ||||||||||||||
Operating expenses | |||||||||||||||||||||||||
| Salaries and employees benefits | (74,385 | ) | (68,978 | ) | (57,024 | ) | 30.4 | % | 30.4 | % | (143,364 | ) | (110,856 | ) | 29.3 | % | |||||||||
| Administrative, general and tax expenses | (47,981 | ) | (43,843 | ) | (37,870 | ) | 26.7 | % | 9.4 | % | (91,825 | ) | (73,820 | ) | 24.4 | % | |||||||||
| Depreciation and amortization | (12,488 | ) | (12,465 | ) | (11,116 | ) | 12.3 | % | 0.2 | % | (24,952 | ) | (22,434 | ) | 11.2 | % | |||||||||
| Other | (25,031 | ) | (24,524 | ) | (25,913 | ) | -3.4 | % | 2.1 | % | (49,555 | ) | (50,325 | ) | -1.5 | % | |||||||||
| Total operating expenses | (159,886 | ) | (149,810 | ) | (131,923 | ) | 21.2 | % | 6.7 | % | (309,695 | ) | (257,435 | ) | 20.3 | % | |||||||||
Income before translation results, workers' profit sharing and income taxes | 120,633 | 113,188 | 88,568 | 36.2 | % | 6.6 | % | 233,821 | 163,908 | 42.7 | % | ||||||||||||||
| Translation result | 1,728 | 1,645 | 3,448 | -49.9 | % | 5.0 | % | 3,373 | 8,669 | -61.1 | % | ||||||||||||||
| Workers’ profit sharing | (2,874 | ) | (3,762 | ) | (3,054 | ) | -5.9 | % | -23.6 | % | (6,636 | ) | (5,507 | ) | 20.5 | % | |||||||||
| Income taxes | (25,759 | ) | (24,162 | ) | (20,423 | ) | 26.1 | % | 6.6 | % | (49,921 | ) | (43,935 | ) | 13.6 | % | |||||||||
| Net income | 93,727 | 86,909 | 68,539 | 36.8 | % | 7.8 | % | 180,637 | 123,135 | 46.7 | % | ||||||||||||||
| Minority interest | 6,324 | 7,897 | 4,105 | 54.1 | % | -19.9 | % | 14,220 | 7,516 | 89.2 | % | ||||||||||||||
Net income attributed to Credicorp | 87,403 | 79,013 | 64,434 | 35.6 | % | 10.6 | % | 166,416 | 115,619 | 43.9 | % | ||||||||||||||
34
|
CREDICORP LTD. AND SUBSISIARIES
SELECTED FINANCIAL INDICATORS
Quarter | Six month ended | |||||||||||||||
2Q07 | 1Q07 | 2Q06 | June 07 | June 06 | ||||||||||||
Profitability | ||||||||||||||||
| Net income per common share (US$ per share)(1) | 1.10 | 0.99 | 0.81 | 2.09 | 1.45 | |||||||||||
| Net interest margin on interest earning assets (2) | 5.46 | % | 5.15 | % | 5.28 | % | 5.61 | % | 5.47 | % | ||||||
| Return on average total assets (2)(3) | 2.41 | % | 2.38 | % | 2.21 | % | 1.28 | % | 1.07 | % | ||||||
| Return on average shareholders' equity (2)(3) | 23.66 | % | 22.43 | % | 21.68 | % | 22.75 | % | 19.50 | % | ||||||
| No. of outstanding shares (millions)(4) | 79.76 | 79.76 | 79.76 | 79.76 | 79.76 | |||||||||||
Quality of loan portfolio | ||||||||||||||||
| Past due loans as a percentage of total loans | 0.96 | % | 1.19 | % | 1.68 | % | 0.96 | % | 1.68 | % | ||||||
| Reserves for loan losses as a percentage of | ||||||||||||||||
| total past due loans | 284.43 | % | 251.37 | % | 214.17 | % | 284.43 | % | 214.17 | % | ||||||
| Reserves for loan losses as a percentage of | ||||||||||||||||
| total loans | 2.73 | % | 3.77 | % | 3.60 | % | 2.73 | % | 3.60 | % | ||||||
Operating efficiency | ||||||||||||||||
| Oper. expense as a percent. of total income (5) | 42.16 | % | 42.49 | % | 41.02 | % | 42.32 | % | 41.60 | % | ||||||
| Oper. expense as a percent. of av. tot. assets(2)(3)(5) | 3.71 | % | 3.77 | % | 3.63 | % | 4.00 | % | 3.85 | % | ||||||
Average balances (millions of US$) (3) | ||||||||||||||||
| Interest earning assets | 11,668.64 | 10,783.66 | 9,856.15 | 10,630.83 | 8,963.54 | |||||||||||
| Total Assets | 14,525.24 | 13,306.29 | 11,677.23 | 12,999.10 | 10,767.61 | |||||||||||
| Net equity | 1,477.93 | 1,408.77 | 1,188.62 | 1,372.51 | 1,169.33 | |||||||||||
| (1) | Based on Net Income attributed to BAP. Number of shares outstanding of 79.8 million in all periods. |
| (2) | Ratios are annualized. |
| (3) | Averages are determined as the average of period-beginning and period-ending balances. |
| (4) | Net of treasury shares. The total number of shares was of 94.38 million. |
| (5) | Total income includes net interest income, fee income, net gain on foreign exchange transactions and net premiums earned. Operating expense does not include other expenses. |
35
|
BANCO DE CREDITO DEL PERU AND SUBSIDIARIES
CONSOLIDATED BALANCE SHEET
(In US$ thousands, IFRS)
As of | June 07/ | June 07/ | ||||||||||||||
June 07 | March 07 | June 06 | June 06 | March 07 | ||||||||||||
ASSETS | ||||||||||||||||
Cash and due from banks | 2,301,566 | 2,343,833 | 2,947,296 | -21.91 | % | -1.80 | % | |||||||||
| Cash and BCRP | 1,848,191 | 1,834,901 | 2,545,326 | -27.39 | % | 0.72 | % | |||||||||
| Deposits in other Banks | 431,090 | 500,540 | 397,164 | 8.54 | % | -13.87 | % | |||||||||
| Interbanks | 17,133 | 4,542 | 1,918 | 793.37 | % | 277.21 | % | |||||||||
| Accrued interest on cash and due from banks | 5,151 | 3,850 | 2,888 | 78.36 | % | 33.80 | % | |||||||||
Marketable securities, net | 53,569 | 54,505 | 41,897 | 27.86 | % | -1.72 | % | |||||||||
Loans | 6,989,841 | 6,182,300 | 5,385,246 | 29.80 | % | 13.06 | % | |||||||||
| Current | 6,923,441 | 6,109,064 | 5,296,554 | 30.72 | % | 13.33 | % | |||||||||
| Past Due | 66,400 | 73,237 | 88,692 | -25.13 | % | -9.33 | % | |||||||||
| Less - Reserve for possible loan losses | (190,413 | ) | (184,627 | ) | (194,570 | ) | -2.14 | % | 3.13 | % | ||||||
Loans, net | 6,799,427 | 5,997,673 | 5,190,676 | 30.99 | % | 13.37 | % | |||||||||
Investment securities available for sale | 2,858,817 | 2,344,510 | 1,074,966 | 165.94 | % | 21.94 | % | |||||||||
Property, plant and equipment, net | 197,980 | 192,113 | 194,392 | 1.85 | % | 3.05 | % | |||||||||
Due from customers acceptances | 46,220 | 30,972 | 36,173 | 27.78 | % | 49.23 | % | |||||||||
Other assets | 465,636 | 439,584 | 233,991 | 99.00 | % | 5.93 | % | |||||||||
Total Assets | 12,723,215 | 11,403,190 | 9,719,390 | 30.91 | % | 11.58 | % | |||||||||
LIABILITIES AND SHAREHOLDERS' EQUITY | ||||||||||||||||
Deposits and obligations | 9,459,008 | 8,842,654 | 7,412,227 | 27.61 | % | 6.97 | % | |||||||||
| Demand deposits | 3,258,797 | 2,985,931 | 2,277,666 | 43.08 | % | 9.14 | % | |||||||||
| Saving deposits | 2,026,729 | 2,066,269 | 1,726,641 | 17.38 | % | -1.91 | % | |||||||||
| Time deposits | 3,317,527 | 3,021,401 | 2,664,939 | 24.49 | % | 9.80 | % | |||||||||
| Severance indemnity deposits (CTS) | 820,026 | 733,835 | 714,963 | 14.69 | % | 11.75 | % | |||||||||
| Interest payable | 35,928 | 35,219 | 28,018 | 28.23 | % | 2.01 | % | |||||||||
Due to banks and correspondents | 1,301,216 | 560,691 | 732,961 | 77.53 | % | 132.07 | % | |||||||||
Bonds and subordinated debt | 537,217 | 517,313 | 426,330 | 26.01 | % | 3.85 | % | |||||||||
Acceptances outstanding | 46,220 | 30,972 | 36,173 | 27.78 | % | 49.23 | % | |||||||||
Other liabilities | 415,391 | 570,074 | 281,440 | 47.59 | % | -27.13 | % | |||||||||
Total liabilities | 11,759,051 | 10,521,705 | 8,889,131 | 32.29 | % | 11.76 | % | |||||||||
NET SHAREHOLDERS' EQUITY | 964,164 | 881,485 | 830,259 | 16.13 | % | 9.38 | % | |||||||||
| Capital stock | 364,706 | 364,706 | 364,706 | 0.00 | % | 0.00 | % | |||||||||
| Reserves | 282,189 | 282,189 | 242,889 | 16.18 | % | 0.00 | % | |||||||||
| Unrealized Gains and Losses | 66,066 | 65,449 | 39,102 | 68.96 | % | 0.94 | % | |||||||||
| Retained Earnings | 96,484 | 96,484 | 56,337 | 71.26 | % | 0.00 | % | |||||||||
| Income for the year | 154,719 | 72,657 | 127,225 | 21.61 | % | 112.95 | % | |||||||||
TOTAL LIABILITIES and NET SHAREHOLDERS' EQUITY | 12,723,215 | 11,403,190 | 9,719,390 | 30.91 | % | 11.58 | % | |||||||||
CONTINGENT CREDITS | 4,070,415 | 3,740,352 | 2,973,700 | 36.88 | % | 8.82 | % | |||||||||
36
|
BANCO DE CREDITO DEL PERU AND SUBSIDIARIES
QUARTERLY INCOME STATEMENT
(In US$ thousands, IFRS)
Three months ended | Change | Six months ended | Change June 07/ | ||||||||||||||||||||||
2Q07 | 1Q07 | 2Q06 | 2Q07/2Q06 | 2Q07/1Q07 | June 07 | June 06 | June 06 | ||||||||||||||||||
Interest income and expense | |||||||||||||||||||||||||
| Interest and dividend income | 220,180 | 195,388 | 174,360 | 26.3 | % | 12.7 | % | 415,568 | 331,645 | 25.3 | % | ||||||||||||||
| Interest expense | (79,035 | ) | (72,098 | ) | (60,218 | ) | 31.2 | % | 9.6 | % | (151,133 | ) | (112,702 | ) | 34.1 | % | |||||||||
| Net interest and dividend income | 141,146 | 123,289 | 114,143 | 23.7 | % | 14.5 | % | 264,435 | 218,943 | 20.8 | % | ||||||||||||||
Provision for loan losses | (6,885 | ) | (5,859 | ) | (1,312 | ) | 424.7 | % | 17.5 | % | (12,744 | ) | (6,151 | ) | 107.2 | % | |||||||||
Non financial income | |||||||||||||||||||||||||
| Banking services commissions | 66,986 | 62,470 | 55,399 | 20.9 | % | 7.2 | % | 129,455 | 110,707 | 16.9 | % | ||||||||||||||
| Net gain on foreign exchange transactions | 12,778 | 11,937 | 11,010 | 16.1 | % | 7.0 | % | 24,715 | 21,478 | 15.1 | % | ||||||||||||||
| Net gain on sales of securities | 7,586 | 9,210 | 1,083 | 600.3 | % | -17.6 | % | 16,796 | 404 | 4056.2 | % | ||||||||||||||
| Other | 1,479 | 2,638 | 3,522 | -58.0 | % | -44.0 | % | 4,117 | 6,859 | -40.0 | % | ||||||||||||||
| Total fees and income from services, net | 88,827 | 86,255 | 71,015 | 25.1 | % | 3.0 | % | 175,083 | 139,449 | 25.6 | % | ||||||||||||||
Operating expenses | |||||||||||||||||||||||||
| Salaries and employees benefits | (56,865 | ) | (51,302 | ) | (44,284 | ) | 28.4 | % | 10.8 | % | (108,167 | ) | (85,372 | ) | 26.7 | % | |||||||||
| Administrative expenses | (42,631 | ) | (37,755 | ) | (33,942 | ) | 25.6 | % | 12.9 | % | (80,386 | ) | (65,804 | ) | 22.2 | % | |||||||||
| Depreciation and amortization | (9,396 | ) | (9,423 | ) | (8,877 | ) | 5.8 | % | -0.3 | % | (18,819 | ) | (17,943 | ) | 4.9 | % | |||||||||
| Other | (7,635 | ) | (9,738 | ) | (14,394 | ) | -47.0 | % | -21.6 | % | (17,373 | ) | (26,779 | ) | -35.1 | % | |||||||||
| Total operating expenses | (116,527 | ) | (108,218 | ) | (101,497 | ) | 14.8 | % | 7.7 | % | (224,744 | ) | (195,898 | ) | 14.7 | % | |||||||||
Income before translation results,workers' profit sharing | |||||||||||||||||||||||||
and income taxes | 106,562 | 95,467 | 82,349 | 29.4 | % | 11.6 | % | 202,029 | 156,343 | 29.2 | % | ||||||||||||||
| Translation result | 970 | 1,310 | 2,957 | -67.2 | % | -25.9 | % | 2,280 | 7,714 | -70.4 | % | ||||||||||||||
| Workers’ profit sharing | (3,216 | ) | (3,181 | ) | (2,317 | ) | 38.8 | % | 1.1 | % | (6,397 | ) | (4,949 | ) | 29.2 | % | |||||||||
| Income taxes | (22,254 | ) | (20,940 | ) | (15,641 | ) | 42.3 | % | 6.3 | % | (43,194 | ) | (31,878 | ) | 35.5 | % | |||||||||
Net income | 82,062 | 72,657 | 67,348 | 21.8 | % | 12.9 | % | 154,719 | 127,229 | 21.6 | % | ||||||||||||||
37
|
BANCO DE CREDITO DEL PERU AND SUBSIDIARIES
SELECTED FINANCIAL INDICATORS
Three months ended | Six months ended | |||||||||||||||
2Q07 | 1Q07 | 2Q06 | June 07 | June 06 | ||||||||||||
Profitability | ||||||||||||||||
| Net income per common share (US$ per share)(1) | 0.064 | 0.057 | 0.052 | 0.120 | 0.096 | |||||||||||
| Net interest margin on interest earning assets (2) | 5.20 | % | 4.94 | % | 5.18 | % | 5.03 | % | 4.95 | % | ||||||
| Return on average total assets (2)(3) | 2.72 | % | 2.62 | % | 2.78 | % | 2.64 | % | 2.59 | % | ||||||
| Return on average shareholders' equity (2)(3) | 35.57 | % | 31.50 | % | 33.77 | % | 32.83 | % | 30.01 | % | ||||||
| No. of outstanding shares (millions) | 1,286.53 | 1,286.53 | 1,286.53 | 1,286.53 | 1,286.53 | |||||||||||
Quality of loan portfolio | ||||||||||||||||
| Past due loans as a percentage of total loans | 0.95 | % | 1.18 | % | 1.65 | % | 0.95 | % | 1.65 | % | ||||||
| Reserves for loan losses as a percentage of | ||||||||||||||||
| total past due loans | 286.77 | % | 252.10 | % | 219.38 | % | 286.77 | % | 219.38 | % | ||||||
| Reserves for loan losses as a percentage of | ||||||||||||||||
| total loans | 2.72 | % | 2.99 | % | 3.61 | % | 2.72 | % | 3.61 | % | ||||||
Operating efficiency | ||||||||||||||||
| Oper. expense as a percent. of total income (4) | 49.29 | % | 49.81 | % | 48.24 | % | 49.65 | % | 48.66 | % | ||||||
| Oper. expense as a percent. of av. tot. assets(2)(3)(4) | 3.61 | % | 3.55 | % | 3.60 | % | 3.56 | % | 3.54 | % | ||||||
Capital adequacy | ||||||||||||||||
| Total Regulatory Capital (US$Mn) | 793.2 | 792.7 | 600.7 | 793.2 | 600.7 | |||||||||||
| 'Risk-weighted assets (US$Mn) | 7,063.3 | 6,218.2 | 5,263.4 | 7,063.3 | 5,263.4 | |||||||||||
| Regulatory capital / risk-weighted assets (5) | 10.7 | % | 11.8 | % | 10.7 | % | 10.7 | % | 10.7 | % | ||||||
Average balances (millions of US$) (3) | ||||||||||||||||
| Interest earning assets | 10,866.1 | 9,975.2 | 8,817.5 | 10,484.2 | 8,703.2 | |||||||||||
| Total Assets | 12,063.2 | 11,103.2 | 9,689.5 | 11,643.2 | 9,565.3 | |||||||||||
| Net equity | 922.8 | 922.7 | 797.6 | 936.5 | 824.2 | |||||||||||
| (1) | Shares outstanding of 1,287 million is used for all periods since shares have been issued only for capitalization of profits and inflation adjustment. |
| (2) | Ratios are annualized. |
| (3) | Averages are determined as the average of period-beginning and period-ending balances. |
| (4) | Total income includes net interest income, fee income and net gain on foreign exchange transactions. Operating expense includes personnel expenses, administrative expenses and depreciation and amortization |
| (5) | Risk-weighted assets include market risk assets. |
38
|
EL PACIFICO-PERUANO SUIZA AND SUBSIDIARIAS
SELECTED FINANCIAL INDICATORS
(in millions of dollars)
Balance to and for the period of three months ending of | Change | Six months ended | Change | ||||||||||||||||||||||
2Q07 | 1Q07 | 2Q06 | 2Q07/2Q06 | 2Q07/1Q07 | June 07 | June 06 | June 07/ June 06 | ||||||||||||||||||
Results | |||||||||||||||||||||||||
| Total Gross Premiums | 117,407 | 105,298 | 96,059 | 22.22 | % | 11.50 | % | 222,705 | 189,288 | 18 | % | ||||||||||||||
| Net Primiums | 91,386 | 82,944 | 80,517 | 13.50 | % | 10.18 | % | 174,330 | 158,151 | 10 | % | ||||||||||||||
| Increase in Reserves | 17,366 | 10,894 | 16,447 | 5.59 | % | 59.41 | % | 28,260 | 33,289 | -15 | % | ||||||||||||||
| Net Premiums Earned | 74,020 | 72,050 | 64,069 | 15.53 | % | 2.74 | % | 146,070 | 124,862 | 17 | % | ||||||||||||||
| Net Claims | 52,379 | 52,628 | 44,049 | 18.91 | % | -0.47 | % | 105,007 | 91,983 | 14 | % | ||||||||||||||
| Underwriting Results | 7,885 | 8,801 | 11,819 | -33.29 | % | -10.41 | % | 16,686 | 15,828 | 5 | % | ||||||||||||||
| Financial Income | 13,221 | 12,892 | 12,188 | 8.48 | % | 2.55 | % | 26,114 | 23,996 | 9 | % | ||||||||||||||
| Other Income | 7,385 | 12,131 | 3,473 | 112.62 | % | -39.12 | % | 19,516 | 7,861 | 148 | % | ||||||||||||||
| Salaries and Employees Benefits | 9,409 | 9,519 | 7,662 | 22.79 | % | -1.16 | % | 18,927 | 14,860 | 27 | % | ||||||||||||||
| General Expenses | 5,864 | 6,208 | 4,947 | 18.53 | % | -5.54 | % | 12,072 | 10,306 | 17 | % | ||||||||||||||
| Other Operating Expenses | 17,711 | 15,182 | 13,503 | 31.17 | % | 16.66 | % | 32,893 | 26,639 | 23 | % | ||||||||||||||
| Translation Results | 242 | 320 | 414 | -41.52 | % | -24.33 | % | 563 | 758 | -26 | % | ||||||||||||||
| Income Tax | 316 | 1,353 | 3,877 | -91.86 | % | -76.67 | % | 1,669 | 3,747 | -55 | % | ||||||||||||||
| Net Income before Minority Interest | 9,190 | 12,504 | 6,106 | 50.50 | % | -26.50 | % | 21,694 | 9,942 | 118 | % | ||||||||||||||
| Minority Interest | 2,412 | 3,769 | 1,368 | 76.29 | % | -36.01 | % | 6,180 | 2,263 | 173 | % | ||||||||||||||
| Net Income after Minority Interest | 6,779 | 8,735 | 4,738 | 43.06 | % | -22.40 | % | 15,514 | 7,679 | 102 | % | ||||||||||||||
Balance(end of period) | |||||||||||||||||||||||||
| Total Assets | 1,044,462 | 990,470 | 865,934 | 20.62 | % | 5.45 | % | 1,044,462 | 865,934 | 21 | % | ||||||||||||||
| Investment on Securities and Real State | 778,850 | 754,388 | 693,431 | 12.32 | % | 3.24 | % | 778,850 | 693,431 | 12 | % | ||||||||||||||
| Technical Reserves | 691,212 | 650,968 | 606,242 | 14.02 | % | 6.18 | % | 691,212 | 606,242 | 14 | % | ||||||||||||||
| Net Equity | 212,582 | 201,777 | 178,340 | 19.20 | % | 5.36 | % | 212,582 | 178,340 | 19 | % | ||||||||||||||
Ratios | |||||||||||||||||||||||||
| Net Underwriting Results | 6.7 | % | 8.4 | % | 12.3 | % | - | - | 7.5 | % | 8.4 | % | - | ||||||||||||
| Net Earned Loss Ratio | 70.8 | % | 73.0 | % | 68.8 | % | - | - | 71.9 | % | 73.7 | % | - | ||||||||||||
| Return on Average Equity(1)(2) | 13.7 | % | 16.9 | % | 11.1 | % | - | - | 14.3 | % | 8.7 | % | - | ||||||||||||
| Return on Total Premiums | 5.8 | % | 8.3 | % | 4.9 | % | - | - | 7.0 | % | 4.1 | % | - | ||||||||||||
| Net Equity / Total Assets | 20.4 | % | 20.4 | % | 20.6 | % | - | - | 20.4 | % | 20.6 | % | - | ||||||||||||
| Increase in Technical Reserves | 19.0 | % | 13.1 | % | 20.4 | % | - | - | 16.2 | % | 21.0 | % | - | ||||||||||||
| Expenses / Net Premiums Earned | 23.9 | % | 25.2 | % | 23.0 | % | - | - | 24.5 | % | 24.7 | % | - | ||||||||||||
| Expenses / Average Assets (1)(2) | 7.1 | % | 7.5 | % | 7.1 | % | - | - | 7.2 | % | 7.4 | % | - | ||||||||||||
Combined Ratio of PPS + PS (3) | 107.8 | % | 106.5 | % | 100.4 | % | - | - | 107.1 | % | 99.8 | % | - | ||||||||||||
| Claims / Net Premiums Earned | 71.4 | % | 73.0 | % | 64.9 | % | - | - | 72.2 | % | 68.4 | % | - | ||||||||||||
| Expenses and Commissions / Net Premiums Earned | 36.3 | % | 33.5 | % | 35.6 | % | - | - | 35.0 | % | 31.4 | % | - | ||||||||||||
| (1) | Averages are determined as the average of period-beginning and period-ending balance |
| (2) | Annualized |
| (3) | Without adjustments for consolidation |
39
SIGNATURE
Pursuant to the requirements of the Securities Exchange Act of 1934, the registrant has duly caused this report to be signed on its behalf by the undersigned, thereunto duly authorized.
| CREDICORP LTD. | ||
| | | |
| Date: August 8, 2007 | By: | /s/ Guillermo Castillo |
Guillermo Castillo | ||
Authorized Representative | ||
FORWARD-LOOKING STATEMENTS
This press release may contain forward-looking statements. These statements are statements that are not historical facts, and are based on management's current view and estimates of future economic circumstances, industry conditions, company performance and financial results. The words "anticipates", "believes", "estimates", "expects", "plans" and similar expressions, as they relate to the company, are intended to identify forward-looking statements. Statements regarding the declaration or payment of dividends, the implementation of principal operating and financing strategies and capital expenditure plans, the direction of future operations and the factors or trends affecting financial condition, liquidity or results of operations are examples of forward-looking statements. Such statements reflect the current views of management and are subject to a number of risks and uncertainties. There is no guarantee that the expected events, trends or results will actually occur. The statements are based on many assumptions and factors, including general economic and market conditions, industry conditions, and operating factors. Any changes in such assumptions or factors could cause actual results to differ materially from current expectations.