SECURITIES AND EXCHANGE COMMISSION
Washington, D.C. 20549
FORM 6-K
Report of Foreign Private Issuer
Pursuant to Rule 13a-16 or 15d-16 of the
Securities Exchange Act of 1934
For the month of October 2007
CREDICORP LTD.
(Exact name of registrant as specified in its charter)
Clarendon House
Church Street
Hamilton HM 11 Bermuda
(Address of principal executive office)
Indicate by check mark whether the registrant files or will file annual reports under cover Form 20-F or Form 40-F.
Form 20-F x Form 40-F o
Indicate by check mark whether the registrant by furnishing the information contained in this Form is also thereby furnishing the information to the Commission pursuant to Rule 12g3-2(b) under the Securities Exchange Act of 1934.
Yes o No x
 | ||||
CREDICORP Ltd. Reports Third Quarter 2007 Earnings Lima, Peru, October 29, 2007 - Credicorp (NYSE:BAP) announced today its unaudited results for the third quarter of 2007. These results are reported on a consolidated basis in accordance with IFRS in nominal U.S. Dollars. We are modifying for this time our reporting procedures in light of the announcements of last Friday regarding the change in leadership at BCP and Credicorp, and presenting a report on the highlights of Credicorp results. Our customary full report will be presented as usual on November 8, 2007. HIGHLIGHTS | ||||
| · | Following the strong growth trend of the year, in 3Q07 Credicorp reported an increase of its net income by 3.3% QoQ and 75.9% YoY, totaling net earnings of US$ 90.3 million. | |||
| · | ROAE reached 23.02% for the quarter and 22.87% for the year to date. | |||
| · | Loan growth of its banking business continued strong revealing a 6.8% QoQ loan growth in both gross and net terms. | |||
| · | Interest income followed this trend with a robust 8.5% QoQ growth despite the persistent competition and pressure on rates, revealing the success of our strategy to shift our portfolio mix increasing our share of the retail business. | |||
| · | NII however, increased in less proportion and reflects the change in our funding structure and the need to complement our solid deposit base with debt. | |||
| · | An also strong fee income growth of 13.4% QoQ reveals further increases in bank transactional activity and the fee expansion at the pension fund business. Operational FX-transactional income also grows 15% QoQ, but gains from the sale of securities drop significantly following the international markets’ evolution. | |||
| · | Net interest margin reflects though a small drop from 5.5% for the previous quarter, reaching 5.2% this 3Q07. The drop follows the competitive pressures and increased funding costs, but could be contained given the better earnings structure resulting from the continuing change in loan mix. | |||
| · | Loan portfolio quality continued strengthening, reaching a PDL/Loans ratio of only 0.91%, down from 0.96% for 2Q07. Net provisioning at US$ 7.9 million for 3Q07 reflects increased gross provisions in line with loan growth but also continuing recoveries. | |||
| · | BCP’s consolidated numbers reflect a very healthy and dynamic banking environment with core revenues up 4.8% QoQ and 31.4% for the year. Such improved income combined with controlled operating expenses and an important positive translation effect given the revaluation on the Peruvian Nuevo Sol against the weak USDollar, led to a 10.6% QoQ higher net income for BCP for 3Q07 which reached US$ 90.7 million, and translates into a solid contribution to Credicorp of US$ 88.2 million for this 3Q07. | |||
| · | BCB, which is consolidated in BCP, continues its consistent growth and reports a contribution 22% higher QoQ and 91% higher YoY, reaching US$ 6.7 million for 3Q07. | |||
| · | ASHC remains a stable and growing business in line with the increasing wealth in the country and reports a remarkable contribution improvement of 42% QoQ at US$ 6.2 million. | |||
| · | PPS had a difficult quarter hit by the devastating August 15th earthquake and reported a negative contribution to Credicorp of US$ 2.96 million for 3Q07. | |||
| · | Finally, Prima AFP reflects its turn around through controlled operating costs reaching a positive contribution of US$ 1.8 million for 3Q07. | |||
| · | Credicorp performance indicators reveal these improvements with ROAE rising to 23.02% from 16.3% YoY and the efficiency ratio recovering to 40.8% from 42.2% QoQ as a result mainly of the lower operating costs in the pension fund business. | |||
I. Credicorp Ltd.
Overview
Continuing the growth trend and income improvements reported throughout the first half of the year 2007, Credicorp closed its 3Q07 with a total net income after minority deductions of US$ 90.3 million, reflecting a 75.9% earnings growth from 3Q06 and 3.3% growth QoQ, resulting in an improved ROAE of 23.02% for the quarter, and 22.9% for the year to date.
Credicorp’s core banking business reported a strong performance, with total loan growth this last quarter reaching 6.8% QoQ, fueled, as expected, by the retail segment with 12.3% QoQ loan growth in this segment.
Growth in interest income followed this robust loan growth and reached 8.5% QoQ despite the persistent competition and pressure on rates, revealing the success of our strategy to shift our portfolio mix increasing our share of the retail business.
NII however, increased in significantly less proportion (+1.1%) and reflects the change in our funding structure and the need to complement our solid deposit base with debt in order to support our accelerating loan growth. Thus, the strong loan growth was funded by a reduction of excess liquidity (-4.9% QoQ), a moderate expansion of deposits (+1.7% QoQ) and additional structured debt.
Net interest margin reflects though a small drop from 5.5% the previous quarter, but could be sustained above the 5% minimum target reaching 5.2%, despite the competitive pressures given the better earnings structure resulting from the continuing change in loan mix.
Non Financial income reported 4.6% QoQ growth. However, this number hides a strong fee income growth of 13.4% QoQ revealing further increases in bank transactional activity and the fee expansion at the pension fund business. Operational FX-transactional income also grows 15% QoQ. It is the lower gains in the sale of securities given the international markets’ evolution, lower by 65% compared to the excellent performance of the capital markets in the previous quarter, which led to an overall moderate growth of non-financial income.
Credicorp Ltd. | Quarter | Change% | ||||||||||||||
| US$ thousands | 3Q07 | 2Q07 | 3Q06 | 3Q07/ 3Q06 | 3Q07/ 2Q07 | |||||||||||
| Net Interest income | 161,055 | 159,305 | 120,667 | 33.5 | % | 1.1 | % | |||||||||
| Total provisions, net of recoveries | (7,922 | ) | (6,090 | ) | 9,795 | -180.9 | % | 30.1 | % | |||||||
| Non financial income | 112,942 | 108,026 | 85,286 | 32.4 | % | 4.6 | % | |||||||||
| Insurance premiums and claims | 9,809 | 19,278 | 19,383 | -49.4 | % | -49.1 | % | |||||||||
| Operating expenses | (163,125 | ) | (159,886 | ) | (152,042 | ) | 7.3 | % | 2.0 | % | ||||||
| Translation results | 13,811 | 1,728 | 832 | 1559.2 | % | 699.3 | % | |||||||||
| Worker's profit sharing and income taxes | (33,418 | ) | (28,633 | ) | (28,600 | ) | 16.8 | % | 16.7 | % | ||||||
Net income | 93,152 | 93,727 | 55,322 | 68.4 | % | -0.6 | % | |||||||||
| Minority Interest | 2,848 | 6,324 | 3,997 | -28.8 | % | -55.0 | % | |||||||||
Net income attributed to Credicorp | 90,304 | 87,403 | 51,324 | 75.9 | % | 3.3 | % | |||||||||
| Net income/ share (US$) | 1.13 | 1.10 | 0.64 | 75.9 | % | 3.3 | % | |||||||||
Total loans | 7,509,085 | 7,031,734 | 5,592,231 | 34.3 | % | 6.8 | % | |||||||||
Deposits and Obligations | 10,322,832 | 10,152,601 | 7,974,586 | 29.4 | % | 1.7 | % | |||||||||
| Net Shareholders' Equity | 1,603,026 | 1,535,154 | 1,296,917 | 23.6 | % | 4.4 | % | |||||||||
| Net interest margin | 5.2 | % | 5.5 | % | 4.9 | % | ||||||||||
| Efficiency ratio | 40.8 | % | 42.2 | % | 42.9 | % | ||||||||||
| Return on average shareholders' equity | 23.0 | % | 23.7 | % | 16.3 | % | ||||||||||
| PDL/ Total loans | 0.9 | % | 1.0 | % | 1.6 | % | ||||||||||
Coverage ratio of PDLs | 299.4 | % | 284.4 | % | 215.7 | % | ||||||||||
| Employees | 15,621 | 15,009 | 15,760 | |||||||||||||
2
The insurance business did have a difficult quarter. The strong 7.9 (Richter scale) earthquake that stroke the southern area of our country on August 15th, was devastating for the region and generated significant human and material losses. In such events, it is the insurance companies that carry the financial burden more than any other business. Pacífico Peruano Suiza had a share equivalent to its business market share of the insured claims in the affected region. These claims for PPS amounted to approximately US$ 44 million. Having recently applied a more conservative risk management policy, PPS had a catastrophic re-insurance policy that covered risks of this nature in excess of US$ 5 million. However, an additional US$ 1 million cost related to the damage to power lines had to be added, and PPS had to absorb these amounts, plus the policy re-instatement costs which altogether amounted to approximately US$ 8 million for the quarter.
Putting the earthquake effects apart, PPS is certainly on the right track and showing improved results. Net premiums earned for PPS remained flat QoQ as a result of some seasonality in the P&C business, but looking at the 9 months performance, PPS’s production grew 21%, 27% was the growth achieved for that same period in Life and a more moderate 7% for Health. In terms of market share, PPS continues recovering its leadership, reaching 30.5% market share for P&C and Life, 3.2% higher than a year ago, and 53.8% in the Health business.
On the cost side, the increases reflected up to date are fairly moderate given the rate of expansion of the business. Total operating costs are up by only 2% QoQ for a business which is growing at significantly higher rates and led to further improvements in Credicorp’s efficiency ratio, which dropped further to 40.77% from 42.16% QoQ. This hides a more important growth of operating expenses at BCP (up 2.8% QoQ) and specifically of personnel costs (up 4.9% QoQ), which has been partially offset by a strong reduction of operating costs at Prima AFP. Prima has been able to reduce its sales force from close to 1,000 by the end of last year to around 613 by the end of September, a significant effort which was carefully monitored to avoid negative effects in the market and on Prima’s image.
Nevertheless, total growth of operating cost for BCP was lower than expected, since income generation continues growing quicker than projected. Despite this, we still expect an increase of operating costs basically related to the important expansion of BCP’s network, which is projected to grow close to 30% until the end of 2008. This expansion brings along strong investments in new premises, systems and personnel which will certainly impact our income statement. Thus, the reported better efficiency ratio for 3Q07 may not be sustainable in the near future.
This expansion is in line with Credicorp’s strategy for its banking business and is a continuation of the growth achieved throughout the year. BCP went from 237 branches at the beginning of the year to 254 at the end of September, from 655 ATMs to 724, and from 551 Agentes BCP to 1017. This represents an expansion of our network by 38% within the year to date (9 months) or 50% on an annualized basis. Furthermore, we have increased the number of bank accounts at BCP from ca. 4.4 million to ca. 4.9 million, and of clients from ca. 2.3 million to ca. 2.5 million in this same period of time, all of these reflecting an important achievement in our effort to increase bank penetration and capture growth.
Another positive development is that this strong loan growth continues while portfolio quality remains healthy with an even improving PDL/Loans ratio which reached in 3Q07 only 0.9% vs. 1.6% for 3Q06. Total provisions net of recoveries however, reveal an increase in provisions at BCP in line with loan growth which reached US$ 17.5 million for the quarter reflecting a provisioning ratio of 12.2% of interest income or 0.2% of loan portfolio. These provisions, however, were again to a good extent offset by recoveries of US$ 8.2 million, leaving a net provision at BCP of US$ 9.2 million, which was further offset in the consolidation by reversals at Grupo Crédito, leaving US$ 7.9 million of net provisions for 3Q07 at Credicorp.
3
These developments resulted in improved ratios for the quarter, with ROAE climbing to 23.02% from 16.3% a year ago.
| (US$ Thousands) | 3Q07 | 2Q07 | 3Q06 | 3Q07/ 3Q06 | 3Q07/ 2Q07 | 3Q07 | 3Q06 | 3Q07/ 3Q06 | |||||||||||||||||
| Banco de Crédito BCP(1) | 88,227 | 79,795 | 50,840 | 74 | % | 11 | % | 238,670 | 173,256 | 38 | % | ||||||||||||||
| BCB | 6,673 | 5,453 | 3,492 | 91 | % | 22 | % | 16,931 | 9,809 | 73 | % | ||||||||||||||
| Atlantic | 6,214 | 4,366 | 3,780 | 64 | % | 42 | % | 15,549 | 11,687 | 33 | % | ||||||||||||||
| PPS | (2,960 | ) | 5,134 | 4,586 | -165 | % | -158 | % | 8,790 | 10,004 | -12 | % | |||||||||||||
| Grupo Crédito (2) | 3,803 | (585 | ) | (3,846 | ) | -199 | % | -750 | % | 4,420 | (7,110 | ) | -162 | % | |||||||||||
| Prima | 1,811 | (1,264 | ) | (4,934 | ) | -137 | % | -243 | % | 725 | (9,844 | ) | -107 | % | |||||||||||
| Others | 1,992 | 679 | 1,088 | 83 | % | 193 | % | 3,695 | 2,734 | 35 | % | ||||||||||||||
| Credicorp and Others (3) | (4,980 | ) | (1,307 | ) | (4,041 | ) | 23 | % | 281 | % | (10,709 | ) | (20,898 | ) | -49 | % | |||||||||
| Credicorp Ltd. | (5,226 | ) | (1,539 | ) | (4,325 | ) | 21 | % | 240 | % | (11,669 | ) | (21,697 | ) | -46 | % | |||||||||
| Others | 246 | 232 | - | (0.13 | ) | 6 | % | 960 | 799 | 20 | % | ||||||||||||||
Net income attributable to Credicorp | 90,304 | 87,403 | 51,319 | 76 | % | 3 | % | 256,720 | 166,939 | 54 | % | ||||||||||||||
____________________ (1) Includes Banco de Crédito de Bolivia. (2) Includes Grupo Crédito, Servicorp (3) Includes taxes on BCP's and PPS's dividends, and other expenses at the holding com pany level. |
Credicorp - the Sum of its Parts
Having experienced a devastating earthquake in the middle of the 3Q07 has been a hard test on Credicorp and its ability to respond quickly and efficiently to reinstate its operational capabilities and absorb the financial impact, especially in the insurance business.
We are very pleased to have been able to withstand such a test, and be in a position to report the excellent results we can show as a financial group.
In fact, despite this important hurdle which mobilized massive resources of the bank to recover from its effects, BCP reported excellent 3Q07 results, confirming its expanding earnings generation capacity reaching for 3Q07 earnings of US$ 90.7 million, which resulted in a contribution to Credicorp of US$ 88.2 million for the quarter. This confirms BCP’s aggressive growth track, fueled by the country’s strong economic growth and reflects an impressive 11% growth over the previous quarter and 72% over the previous year, and an equally excellent 36.1% ROAE for the quarter.
BCB, which is consolidated within BCP, reported a contribution of US$ 6.7 million for 3Q07, higher by a remarkable 22% QoQ and 91% YoY. Thus, the performance of BCB is not being negatively affected by the continuing uncertain political scenario of Bolivia, and in fact, continues growing and gaining market share and brand positioning.
ASHC reports an impressive contribution improvement of 42% QoQ reaching US$ 6.2 million for the 3Q07. ASHC’s business is constantly expanding as a result also of the increasing wealth generation in the country, and represents a stable, no-risk investment, for which its ROEA of 18% is more than satisfactory.
As explained before, PPS did have a difficult quarter. Of all the companies of the Credicorp group, it was hardest hit by the August 15th earthquake and reported a total income for the year to date 12% lower than last year reaching US$ 11.6 million. However, bottom-line numbers after minority interests for 3Q07 reached a loss of US$ 3.9 million, which in turn resulted in a negative contribution to Credicorp of US$ -2.96 million for 3Q07. Excluding the earthquake effect, PPS reported somewhat lower 3Q07 earnings than 2Q07, as several important casualties resulted in claims in both the P&C and Life businesses. Nevertheless, its performance still reflects the improving general trend at the insurance business, with results in line with the previous quarters.
4
Finally, following the cost reduction plan, by which Prima’s sales force was reduced from 1,000 to 613 within the first three quarters of the year, Prima closed the 3Q07 with a positive result of US$ 1.8 million. Furthermore, Prima has established its dominant position in the market, capturing important market shares (31.3% of AuM, 35.3% of collections and 48.2% of voluntary contributions to the funds) and is increasing its fee income by incorporating a new administration fee for voluntary funds which used to have no management charges. This performance is therefore expected to improve as the company improves its income levels, reaches further control of operating costs and works on improving its capital structure, which today [is inefficient and] hides significant profits.
Deductions in the Credicorp and others line include such normalized provision for withholding taxes of 2007 and some other costs such as financing costs, minor provision for Stock Options and some admin costs, resulting in a total of US$ 4.98 million negative charge.
The sum of the results and contributions of the different companies of the Credicorp group reached a record level in the history of Credicorp, surpassing the US$ 90 million for the first time. But more importantly, the prospects of growth and of making this level of earnings a sustainable one are very real.
It is in the midst of this aggressive growth and superb results that the important management changes announced last Friday will play a significant role. The changes, motivated by a generational succession, have as ultimate objective to become a more dynamic institution, prepared to manage its growth and to confront the strong competition in this surging market.
5
ECONOMIC OUTLOOK
Economic Activity
The Peruvian economy continued showing a positive development during 2007, with an annual growth of +7.7% between January and August, led by the dynamism of the private investments, and the sectors associated with domestic demand, such as construction and non-primary manufacture. In the construction sector, accumulated year to date growth reaches +15.8% as a result of the public infrastructure dynamism, the private productive infrastructure development and increasing auto construction.
Furthermore, the industrial non-primary sector shows growth of +12% in the same period explained by the increased production of consumption goods and intermediate goods, especially those related to construction. On the other hand, primary sectors show certain stagnation, especially the mining industry, where the lower production of gold (-22%) could not be compensated by the expansion registered in the extraction of zinc (+25.5%) and cooper (+13.7%). In spite of this, the official economic perspectives recently revised and published by the MEF and BCR, have improved, projecting a sustainable dynamic in the private sectors, which should bring growth for this year over 7 % and for the following years to about 6 %.
Gross Domestic Product and Internal Demand
(Annualized percentage variation)
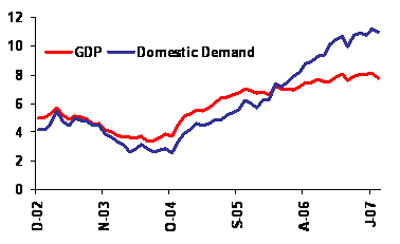 | ||
Source: INEI |
External Sector
Between January and August 2007, the trade balance surplus was of US$ 5,015MM, an amount US$ 355MM lower than the surplus achieved for the same period 2006. This is explained by annualized import growth which is already higher than exports in a context of domestic demand growing at a higher pace than economic activity. Thus, exports grew16.5% in the first eight month of the year., reaching US$ 17,286MM though this growth is explained by higher international prices of exported goods (+14.7%), since volumes increased by only 1.6% On the other hand, imports grew +29.6% in the same period, due mainly to investments in capital assets (+44.6). Finally the international reserves continued growing, closing the third quarter in US$22,827MM.
6
Exports and Imports
(Annualized percentage variation)
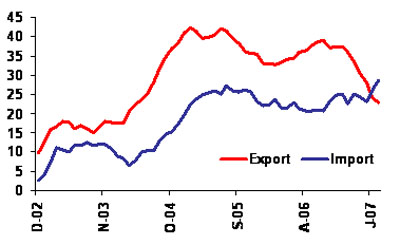
Source: BCRP
Prices and Exchange rate
To the closing of 3Q07, annualized inflation reached 2.8% within the range set as goal of the Central Bank BCR between (1% and 3%), despite to the growing trend of the last months. The price increases of the last months are due to specific factors related to the supply side, especially to the increases in the international prices of oil and some cereals. Nevertheless, there is a perception of increasing underlying inflation. In this context, BCR increased its reference rate to 50 bp. throughout the quarter, as a preventive measure to moderate the internal demand expansion which puts pressure on the referred underlying inflation. With regards to the exchange rate, it closed in September at S/. 3.085 per dollar, even thought on the fist two weeks of October the Sol appreciation lead the US Dollar to a market value of about S/. 3.02. This reflects an accumulated appreciation of the Nuevo Sol that surpassed 5.0% over the year. Due to this development the Central Bank had to support the US currency through interventions in the foreign exchange market, to reduce volatility, accumulating US$ 6,737MM on net purchases for the closed of 3Q07.
Consumer price index | Exchange Rate and purchases US$ BCRP |
(Annual percentage variation) 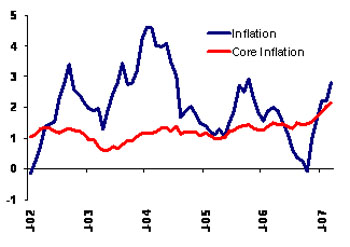 | (S/. per dollar and US$ MM) 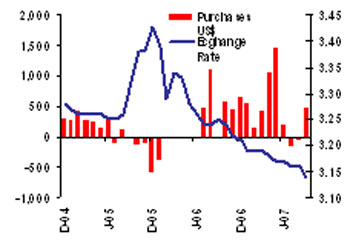 |
7
During the period of January through August May, tax collections increased to S/. 35,368MM. This figure is 15.1% more in real terms than tax collections in the same period of 2006. This growth is explained principally, by increased collections of Income Tax (IR, +21.9 %), especially from corporation (+25.1% without regularizations) and Value Added Tax (IGV, +17.3%), fueled especially in the last months by imports. On the public spending side of the Central Government, an increase of 18.2 % up to August is observed and explained by an increase of +19.3 % in the current expenditure and lower growth of public investments (+8.7%),. Hence, the economic result of the Central Government to the closing of August reveals a surplus of S/. 6,708MM, S/.644MM above the one registered on the same period in 2006.
Fiscal Income of the Central Government
(Annualized, expressed in thousand of millions of Nuevos Soles)
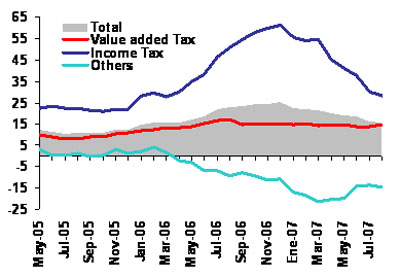 | ||
| Source: Sunat |
Banking System
At the closing of August 2007, total loan placements in the banking system continued to grow and reached US$19,496MM, amount that represents an increase of +35.63% compared to the same period of 2006 and of +23.7 with respect to the closing of 2006. This result is mainly supported by the stronger credit activity in the retail segments such as consumer loans (+55.0% YoY), though SME lending revealed also strong growth (+33.9% YoY), as did mortgages (+22.6% YoY). The lending dynamism came along with a stable and low delinquencies level of 1.6%.
Looking at the banking system’s main source of funding, deposits also continued increasing and reached US$22,263MM, which represents a growth rate of +25.6% YoY and of +17.7% for the year to date. Growth was observed in demand deposits (+33.2%) savings deposits (+17.2%) and time deposits (+27.2%).
Dollarization of the banking system continues decreasing in both loans and deposits. This way, dollar lending grew by +27.6% YoY, while soles lending grew at a more accelerated rate of +52.3%. Furthermore, dollar loans represent now 63.6% of total loan portfolio (as of August 2007), while these used to make up for 67.6% a year ago. Dollarization of deposits also dropped from levels of 63.8% to 59.0% in the same period, which reflects an increasing preference for saving in national currency in view of the appreciation experienced by the Nuevo Sol in the last year.
8
Finally, interest rates have stabilized in the last months. This way, the TAMN (local currency lending rate) closed 3Q07 at 22.5%, below the closing level of 3Q06 (23.9%), while TAMEX (foreign currency lending rate) closed 3Q07 at 10.5%, (10.6% and 10.8% at the closing of 3Q06 and 4Q06, respectively). On the funding side, the TIPMN (local currency deposit rate) and the TIPMEX (Foreign currency deposit rate) closed this 3Q07 at 3.2% and 2.2% respectively, which are basically the same levels from December 2006.
Main Financial
Indicators
2006 | 2007 | |||||||||||||||||||||||||||
IQ | 2Q | 3Q | 4Q | Year | IQ | 2Q | 3Q | Year (f) | ||||||||||||||||||||
| GDP (US$ MM) | 20,455 | 24,095 | 23,523 | 25,036 | 93,108 | 23,871 | 27,479 | n.d. | 106,586 | |||||||||||||||||||
| Real GDP (var.%) | 7.9 | 5.8 | 8.6 | 8.1 | 7.6 | 8.0 | 7.6 | n.d. | 7.5 | |||||||||||||||||||
| GDP per-cápita (US$) | 3,019 | 3,537 | 3,434 | 3,635 | 3,294 | 3,447 | 3,947 | n.d. | 3,817 | |||||||||||||||||||
| Domestic demand (var. %) | 11.1 | 7.1 | 10.3 | 12.0 | 10.1 | 10.6 | 10.2 | n.d. | 9.2 | |||||||||||||||||||
| Consumption (var. %) | 5.1 | 6.4 | 6.2 | 7.3 | 6.2 | 7.7 | 7.5 | n.d. | 7.0 | |||||||||||||||||||
| Private Investment (var. %) | 22.4 | 17.0 | 16.7 | 19.7 | 18.9 | 17.3 | 22.9 | n.d. | 19.0 | |||||||||||||||||||
| CPI (annual change, %) | 2.5 | 1.8 | 2.0 | 1.5 | 1.1 | 0.3 | 1.6 | 2.8 | 3.2 | |||||||||||||||||||
| Echange rate, eop (S/ . per US$) | 3.36 | 3.26 | 3.25 | 3.20 | 3.20 | 3.19 | 3.17 | 3.09 | 3.00 | |||||||||||||||||||
| Devaluation (annual change, % ) | 2.9 | 0.2 | -2.8 | -6.8 | -6.8 | -5.1 | -2.8 | -5.1 | -6.1 | |||||||||||||||||||
| Exchange rate , average (S/ . per US$) | 3.34 | 3.29 | 3.24 | 3.22 | 3.27 | 3.19 | 3.17 | 3.15 | 3.13 | |||||||||||||||||||
| Non- Financial Public Sector (% of GDP) | 3.9 | 5.7 | 1.5 | -2.6 | 2.1 | 4.9 | 8.2 | n.d. | 2.0 | |||||||||||||||||||
| Central govermment current revenues (% of GDP) | 17.7 | 18.5 | 16.9 | 16.2 | 17.3 | 17.3 | 20.5 | n.d. | 17.9 | |||||||||||||||||||
| Tax Income (% of GDP) | 15.1 | 16.4 | 14.2 | 14.0 | 14.9 | 14.9 | 17.7 | n.d. | 15.6 | |||||||||||||||||||
| Non Tax Income (% of GDP) | 2.6 | 2.1 | 2.7 | 2.1 | 2.4 | 2.4 | 2.8 | n.d. | 2.3 | |||||||||||||||||||
| Current expenditures (% of GDP) | 11.7 | 10.8 | 12.7 | 13.6 | 12.2 | 11.7 | 14.2 | n.d. | 12.4 | |||||||||||||||||||
| Capital Expenditures (% of GDP) | 0.8 | 1.3 | 2.4 | 3.2 | 2.0 | 0.8 | 1.4 | n.d. | 2.5 | |||||||||||||||||||
| Trade Balance (US$ MM) | 1,257 | 2,190 | 2,885 | 2,602 | 8,934 | 1,455 | 2,167 | n.d. | 8,600 | |||||||||||||||||||
| Exports (US$ MM) | 4,640 | 5,824 | 6,559 | 6,777 | 23,800 | 5,687 | 6,647 | n.d. | 26,400 | |||||||||||||||||||
| Imports (US$ MM) | -3,383 | -3,635 | -3,673 | -4,175 | -14,866 | -4,232 | -4,480 | n.d. | 17,800 | |||||||||||||||||||
| Current Account Balance (US$ MM) | -219 | 426 | 1,273 | 1,110 | 2,589 | -14 | 480.4 | n.d. | 1,900 | |||||||||||||||||||
| Current Account Balance (% of GDP) | -1.1 | 1.8 | 5.4 | 4.4 | 2.8 | -0.1 | 1.7 | n.d. | 1.8 | |||||||||||||||||||
____________________
Source: BCR, INEI, Estimations: BCP
9
Company Description:
Credicorp Ltd. (NYSE: BAP) is the leading financial services holding company in Peru. It primarily operates via its four principal Subsidiaries: Banco de Credito del Peru (BCP), Atlantic Security Holding Corporation (ASHC), El Pacífico-Peruano Suiza Compañía de Seguros y Reaseguros (PPS) and Grupo Credito. Credicorp is engaged principally in commercial banking (including trade finance, corporate finance and leasing services), insurance (including commercial property, transportation and marine hull, automobile, life, health and pension fund underwriting insurance) and investment banking (including brokerage services, asset management, trust, custody and securitization services, trading and investment). BCP is the Company's primary subsidiary.
Safe Harbor for forward-looking statements
This material includes “forward-looking statements” within the meaning of Section 21E of the Securities Exchange Act of 1934. All statement other than statements of historical information provided herein are forward-looking and may contain information about financial results, economic conditions, trends and known uncertainties.
The Company cautions readers that actual results could differ materially from those expected by the Company, depending on the outcome of certain factors, including, without limitation: (1) adverse changes in the Peruvian economy with respect to the rates of inflation, economic growth, currency devaluation, and other factors, (2) adverse changes in the Peruvian political situation, including, without limitation, the reversal of market-oriented reforms and economic recovery measures, or the failure of such measures and reforms to achieve their goals, and (3) adverse changes in the markets in which the Company operates, including increased competition, decreased demand for financial services, and other factors. Readers are cautioned not to place undue reliance on these forward-looking statements, which speak only as of the date hereof.
The Company undertakes no obligation to release publicly the result of any revisions to these forward-looking statements which may be made to reflect events or circumstances after the date hereof, including, without limitation, changes in the Company’s business strategy or planned capital expenditures, or to reflect the occurrence of unanticipated events.
10
CREDICORP LTD. AND SUBSIDIARIES
CONSOLIDATED BALANCE SHEETS
(In US$ thousands, IFRS)
As of | ||||||||||||||||
September 2007 | June 2007 | September 2006 | Sep 07/ Sep 06 | Sep 07/ June 07 | ||||||||||||
Assets | ||||||||||||||||
Cash and due from banks | ||||||||||||||||
| Non-interest bearing | 541,062 | 516,676 | 447,091 | 21.0 | % | 4.7 | % | |||||||||
| Interest bearing | 1,891,059 | 2,041,200 | 2,248,202 | -15.9 | % | -7.4 | % | |||||||||
| Total cash and due from banks | 2,432,122 | 2,557,876 | 2,695,293 | -9.8 | % | -4.9 | % | |||||||||
Marketable securities, net | 49,465 | 53,569 | 70,534 | -29.9 | % | -7.7 | % | |||||||||
Loans | 7,509,085 | 7,031,734 | 5,592,231 | 34.3 | % | 6.8 | % | |||||||||
| Current | 7,440,873 | 6,964,320 | 5,504,991 | 35.2 | % | 6.8 | % | |||||||||
| Past Due | 68,212 | 67,414 | 87,240 | -21.8 | % | 1.2 | % | |||||||||
| Less - Reserve for possible loan losses | (204,204 | ) | (191,747 | ) | (188,198 | ) | 8.5 | % | 6.5 | % | ||||||
Loans, net | 7,304,881 | 6,839,987 | 5,404,033 | 35.2 | % | 6.8 | % | |||||||||
Investments securities available for sale | 4,657,859 | 4,686,444 | 2,803,636 | 66.1 | % | -0.6 | % | |||||||||
Reinsurance assets | 91,325 | 65,831 | 37,880 | 141.1 | % | 38.7 | % | |||||||||
Premiums and other policyholder receivables | 86,779 | 85,780 | 69,835 | 24.3 | % | 1.2 | % | |||||||||
Property, plant and equipment, net | 254,820 | 256,822 | 239,705 | 6.3 | % | -0.8 | % | |||||||||
Due from customers on acceptances | 51,040 | 46,331 | 50,761 | 0.5 | % | 10.2 | % | |||||||||
Other assets | 853,365 | 726,776 | 486,987 | 75.2 | % | 17.4 | % | |||||||||
Total Assets | 15,781,656 | 15,319,416 | 11,858,664 | 33.1 | % | 3.0 | % | |||||||||
Liabilities and shareholders' equity | ||||||||||||||||
Deposits and Obligations | ||||||||||||||||
| Non-interest bearing | 2,474,260 | 2,339,402 | 1,721,411 | 43.7 | % | 5.8 | % | |||||||||
| Interest bearing | 7,848,572 | 7,813,199 | 6,253,175 | 25.5 | % | 0.5 | % | |||||||||
| Total deposits and Obligations | 10,322,832 | 10,152,601 | 7,974,586 | 29.4 | % | 1.7 | % | |||||||||
Due to banks and correspondents | 1,695,923 | 1,685,689 | 924,499 | 83.4 | % | 0.6 | % | |||||||||
Acceptances outstanding | 51,040 | 46,331 | 50,761 | 0.5 | % | 10.2 | % | |||||||||
Reserves for property and casualty claims | 638,270 | 578,754 | 528,258 | 20.8 | % | 10.3 | % | |||||||||
Reserve for unearned premiums | 118,986 | 112,086 | 90,029 | 32.2 | % | 6.2 | % | |||||||||
Reinsurance payable | 30,247 | 25,024 | 33,502 | -9.7 | % | 20.9 | % | |||||||||
Bonds and subordinated debt | 494,234 | 504,948 | 406,734 | 21.5 | % | -2.1 | % | |||||||||
Other liabilities | 693,131 | 548,719 | 445,090 | 55.7 | % | 26.3 | % | |||||||||
Minority interest | 133,968 | 130,111 | 108,288 | 23.7 | % | 3.0 | % | |||||||||
Total liabilities | 14,178,629 | 13,784,262 | 10,561,747 | 34.2 | % | 2.9 | % | |||||||||
Net Shareholder's equity | 1,603,026 | 1,535,154 | 1,296,917 | 23.6 | % | 4.4 | % | |||||||||
Total liabilities and net shareholder's equity | 15,781,656 | 15,319,416 | 11,858,664 | 33.1 | % | 3.0 | % | |||||||||
Contingent Credits | 4,702,435 | 4,393,139 | 3,555,593 | 32.3 | % | 7.0 | % | |||||||||
11
CREDICORP LTD. AND SUBSIDIARIES
QUARTERLY INCOME STATEMENT
(In US$ thousands, IFRS)
Quarter | Change | Year ended | Change | ||||||||||||||||||||||
3Q07 | 2Q07 | 3Q06 | 3Q07/3Q06 | 3Q07/2Q07 | September 07 | September 06 | Sept 07/ Sept 06 | ||||||||||||||||||
Interest income and expense | |||||||||||||||||||||||||
| Interest and dividend income | 270,182 | 248,976 | 198,339 | 36.2 | % | 8.5 | % | 740,005 | 571,199 | 29.6 | % | ||||||||||||||
| Interest expense | (109,127 | ) | (89,671 | ) | (77,672 | ) | 40.5 | % | 21.7 | % | (280,787 | ) | (205,545 | ) | 36.6 | % | |||||||||
| Net interest and dividend income | 161,055 | 159,305 | 120,667 | 33.5 | % | 1.1 | % | 459,218 | 365,653 | 25.6 | % | ||||||||||||||
Provision for loan losses | (7,922 | ) | (6,090 | ) | 9,795 | -180.9 | % | 30.1 | % | (18,430 | ) | 5,997 | -407.3 | % | |||||||||||
Non financial income | |||||||||||||||||||||||||
| Fee income | 86,270 | 76,100 | 63,935 | 34.9 | % | 13.4 | % | 236,446 | 174,218 | 35.7 | % | ||||||||||||||
| Net gain on foreign exchange transactions | 14,710 | 12,796 | 9,515 | 54.6 | % | 15.0 | % | 39,462 | 31,095 | 26.9 | % | ||||||||||||||
| Net gain on sales of securities | 5,124 | 14,644 | 6,616 | -22.6 | % | -65.0 | % | 37,714 | 12,857 | 193.3 | % | ||||||||||||||
| Other | 6,837 | 4,486 | 5,220 | 31.0 | % | 52.4 | % | 18,540 | 18,254 | 1.6 | % | ||||||||||||||
Total non financial income, net | 112,942 | 108,026 | 85,286 | 32.4 | % | 4.6 | % | 332,162 | 236,424 | 40.5 | % | ||||||||||||||
Insurance premiums and claims | |||||||||||||||||||||||||
| Net premiums earned | 74,511 | 71,657 | 65,521 | 13.7 | % | 4.0 | % | 216,159 | 186,521 | 15.9 | % | ||||||||||||||
| Net claims incurred | (19,617 | ) | (14,017 | ) | (9,553 | ) | 105.4 | % | 40.0 | % | (47,173 | ) | (32,429 | ) | 45.5 | % | |||||||||
| Increase in cost for life and health policies | (45,085 | ) | (38,363 | ) | (36,585 | ) | 23.2 | % | 17.5 | % | (122,536 | ) | (105,692 | ) | 15.9 | % | |||||||||
| Total other operating income, net | 9,809 | 19,278 | 19,383 | -49.4 | % | -49.1 | % | 46,450 | 48,400 | -4.0 | % | ||||||||||||||
Operating expenses | |||||||||||||||||||||||||
| Salaries and employees benefits | (75,649 | ) | (74,385 | ) | (61,676 | ) | 22.7 | % | 1.7 | % | (219,013 | ) | (172,532 | ) | 26.9 | % | |||||||||
| Administrative, general and tax expenses | (48,703 | ) | (47,981 | ) | (39,669 | ) | 22.8 | % | 1.5 | % | (140,528 | ) | (113,489 | ) | 23.8 | % | |||||||||
| Depreciation and amortization | (12,857 | ) | (12,488 | ) | (10,115 | ) | 27.1 | % | 3.0 | % | (37,809 | ) | (32,549 | ) | 16.2 | % | |||||||||
| Merger Expenses | - | - | (271 | ) | 100.0 | % | 100.0 | % | - | (271 | ) | -100.0 | % | ||||||||||||
| Other | (25,916 | ) | (25,031 | ) | (40,312 | ) | -35.7 | % | 3.5 | % | (75,472 | ) | (90,637 | ) | -16.7 | % | |||||||||
| Total operating expenses | (163,125 | ) | (159,886 | ) | (152,042 | ) | 7.3 | % | 2.0 | % | (472,821 | ) | (409,478 | ) | 15.5 | % | |||||||||
Income before translation results,workers' profit sharing and income taxes | 112,758 | 120,633 | 83,089 | 35.7 | % | -6.5 | % | 346,579 | 246,997 | 40.3 | % | ||||||||||||||
| Translation result | 13,811 | 1,728 | 832 | 1559.2 | % | 699.3 | % | 17,184 | 9,501 | 80.9 | % | ||||||||||||||
| Workers’ profit sharing | (4,274 | ) | (2,874 | ) | (3,216 | ) | 32.9 | % | 48.7 | % | (10,910 | ) | (8,723 | ) | 25.1 | % | |||||||||
| Income taxes | (29,144 | ) | (25,759 | ) | (25,384 | ) | 14.8 | % | 13.1 | % | (79,065 | ) | (69,319 | ) | 14.1 | % | |||||||||
| Net income | 93,152 | 93,727 | 55,322 | 68.4 | % | -0.6 | % | 273,788 | 178,456 | 53.4 | % | ||||||||||||||
| Minority interest | (2,848 | ) | (6,324 | ) | (3,997 | ) | -28.8 | % | -55.0 | % | (17,068 | ) | (11,513 | ) | 48.2 | % | |||||||||
Net income attributed to Credicorp | 90,304 | 87,403 | 51,324 | 75.9 | % | 3.3 | % | 256,720 | 166,943 | 53.8 | % | ||||||||||||||
12
CREDICORP LTD. AND SUBSISIARIES
SELECTED FINANCIAL INDICATORS
Quarter | Year ended | |||||||||||||||
3Q07 | 2Q07 | 3Q06 | September 07 | September 06 | ||||||||||||
Profitability | ||||||||||||||||
| Net income per common share (US$ per share) (1) | 1.13 | 1.10 | 0.64 | 3.22 | 2.09 | |||||||||||
| Net interest margin on interest earning assets (2) | 5.16 | % | 5.46 | % | 4.88 | % | 5.43 | % | 5.15 | % | ||||||
| Return on average total assets (2)(3) | 2.32 | % | 2.41 | % | 1.74 | % | 1.84 | % | 1.48 | % | ||||||
| Return on average shareholders' equity (2)(3) | 23.02 | % | 23.66 | % | 16.34 | % | 22.87 | % | 18.35 | % | ||||||
| No. of outstanding shares (millions) (4) | 79.76 | 79.76 | 79.76 | 79.76 | 79.76 | |||||||||||
Quality of loan portfolio | ||||||||||||||||
| Past due loans as a percentage of total loans | 0.91 | % | 0.96 | % | 1.56 | % | 0.91 | % | 1.56 | % | ||||||
| Reserves for loan losses as a percentage of total past due loans | 299.37 | % | 284.43 | % | 215.72 | % | 299.37 | % | 215.72 | % | ||||||
Reserves for loan losses as a percentage of total loans | 2.72 | % | 3.71 | % | 3.37 | % | 2.72 | % | 3.37 | % | ||||||
Operating efficiency | ||||||||||||||||
| Oper. expense as a percent. of total income (5) | 40.77 | % | 42.16 | % | 42.93 | % | 41.77 | % | 42.06 | % | ||||||
| Oper. expense as a percent. of av. tot. assets (2)(3)(5) | 3.53 | % | 3.71 | % | 3.78 | % | 3.80 | % | 3.76 | % | ||||||
Average balances (millions of US$) (3) | ||||||||||||||||
| Interest earning assets | 12,491 | 11,669 | 9,893 | 11,280 | 9,463 | |||||||||||
| Total Assets | 15,551 | 14,525 | 11,795 | 13,938 | 11,309 | |||||||||||
| Net equity | 1,569 | 1,478 | 1,256 | 1,451 | 1,200 | |||||||||||
____________________
(1) Based on Net Income attributed to BAP. Number of shares outstanding of 79.8 million in all periods.
(2) Ratios are annualized.
(3) Averages are determined as the average of period-beginning and period-ending balances.
(4) Net of treasury shares. The total number of shares was of 94.38 million.
(5) Total income includes net interest income, fee income, net gain on foreign exchange transactions and net premiums earned.
Operating expense does not include Other expenses.
13
SIGNATURE
Pursuant to the requirements of the Securities Exchange Act of 1934, the registrant has duly caused this report to be signed on its behalf by the undersigned, thereunto duly authorized.
| CREDICORP LTD. | ||
| | | |
| Date: October 30, 2007 | By: | /s/ Guillermo Castillo |
Guillermo Castillo | ||
Authorized Representative | ||