SECURITIES AND EXCHANGE COMMISSION
Washington, D.C. 20549
FORM 6-K
Report of Foreign Private Issuer
Pursuant to Rule 13a-16 or 15d-16 of the
Securities Exchange Act of 1934
For the month of August 2007
CREDICORP LTD.
(Exact name of registrant as specified in its charter)
Clarendon House
Church Street
Hamilton HM 11 Bermuda
(Address of principal executive office)
Indicate by check mark whether the registrant files or will file annual reports under cover Form 20-F or Form 40-F.
Form 20-F x Form 40-F o
Indicate by check mark whether the registrant by furnishing the information contained in this Form is also thereby furnishing the information to the Commission pursuant to Rule 12g3-2(b) under the Securities Exchange Act of 1934.
Yes o No x

CREDICORP Ltd. Reports Fourth Quarter and Year End 2007 Earnings
Lima, Peru, February 6, 2008 - Credicorp (NYSE:BAP) announced today its unaudited results for the fourth quarter of 2007. These results are reported on a consolidated basis in accordance with IFRS in nominal U.S. Dollars.
HIGHLIGHTS
 | · Credicorp reported today a further 4.1% increase in 4Q07 earnings reaching US$ 94 million, consolidating its outstanding performance with total earnings for the year 2007 of US$ 350.7 million. · Loan growth of its banking business exceeded expectations again this quarter with total net loans up 10.5% QoQ and consolidating an astounding annual growth of 40.7%. · Interest income followed this trend with a robust 20.6% QoQ growth, contributing to annual growth of 36.3% despite the persistent competition and pressure on rates, revealing the success of our strategy to shift our portfolio mix increasing our share of the retail business. · NII however, increased a more modest 27.2% during 2007 and reflects the change in our funding structure and the need to complement our solid deposit base with debt, which was evident in the 2H07. · An also strong non financial income growth of 8.1% QoQ and annual growth of 21% reveals further increases in bank transactional activity and the fee expansion at the pension fund business. · Despite the competitive pressures and increased funding costs, the impact on Net Interest Margin could be contained given the better earnings structure resulting from the continuing change in loan 5.21% improving from 2006’s NIM at 5.06%. · It is remarkable that Credicorp has reached such extraordinary loan growth while loan portfolio quality continued strengthening. PDL/Loans ratio dropped further closing the year with only 0.74%. Net provisioning of US$ 9.9 million for 4Q07 reflects increased gross provisions in line with loan growth and a gradual normalization of income from recoveries since 2006’s negative net provision line. · BCP’s consolidated numbers reflect a very healthy and dynamic banking environment with core revenues up 9.7% QoQ. Such improved income had to sustain an acceleration in operating costs due to BCP’s business expansion and year end performance related compensation & provisions, which led to higher operating costs of 26.8% for 4Q07. The higher costs were partially offset by an important positive translation effect from the revaluation on the Peruvian Nuevo Sol against the weak USDollar, leading to a softened drop in QoQ net earnings of 5% to US$ 86.2 million, and translates into a solid contribution to Credicorp of US$ 83.9 million for this 4Q07. · BCP Bolivia, which is consolidated in BCP, continues its consistent growth and reports a contribution 51% higher QoQ and 95% higher YoY, reaching an astonishing US$ 10 million contribution for 4Q07 and a total US$ 27 million for the year 2007. · ASHC remains a stable and growing business in line with the increasing wealth in the country, though 4Q07 results reflect the market turmoil and dropped its contribution to US$ 5 million (from $6.2 million in 3Q07). Nevertheless, it reports a remarkable contribution improvement of 31% for the year at US$ 20.5 million. · PPS recovered from the difficult 3Q07 hit by the devastating August 15th earthquake, but despite the strong growth and recovery of market share, total contribution to Credicorp is tainted by such event and resulted in a 35% lower contribution for the year of US$ 9.4 million. · Finally, Prima AFP reflects its turn around through controlled operating costs reaching a positive contribution of US$ 2.3 million for 4Q07 and US$ 3 million for the year 2007. · Credicorp’s annual performance indicators reveal these improvements with ROAE rising to 22.9% from 18.5% a year ago and the efficiency ratio recovering to 43% from 43.5% in 2006. |

I. Credicorp Ltd.
With 4Q07 net earnings results 4.1% stronger QoQ at US$ 94 million, Credicorp closed the year 2007 with US$ 350.7 million total net income after minority deductions, a truly outstanding result which reflects a 52.3% annual growth in earnings generation. The significant improvement in earnings is evident in the better ROAE reported of 22.9% for the year 2007.
Overview 4Q07
Credicorp’s core banking business reported a strong performance, with total loan growth this last quarter reaching 10.4% QoQ, fueled, as expected, by the consistent growth of the retail segment with 13% QoQ loan growth, and the unusually high growth in the corporate sector of around 15%.
Growth in interest income followed this robust loan growth and reached 20.6% QoQ despite the persistent competition and pressure on rates, revealing the success of our strategy to shift our portfolio mix increasing our share of the retail business.
NII however, increased this 4Q07 in significantly less proportion (+8.5%) and reflects the change in our funding structure and the need to complement our solid deposit base with debt in order to support our accelerating loan growth. Thus, the strong quarterly loan growth was funded by the expansion of deposits (+13.6%), additional international Bank debt (+37.6%), and bonds and subordinated debt (+40.2%). This is certainly a change in Credicorp’s funding structure which raised the group’s funding costs in 4Q07 and mainly during the 2H07, though deposits continue being the core funding source.
Net interest margin reflects therefore a quarterly small drop from 5.16% the previous quarter to 5.11%, which could be sustained above the 5% minimum target despite the competitive pressures given the better earnings structure resulting from the continuing change in loan mix.
Credicorp Ltd. | Quarter | Change % | ||||||||||||||
| US$ thousands | 4Q07 | 3Q07 | 4Q06 | 4Q07/4Q06 | 4Q07/3Q07 | |||||||||||
| Net Interest income | 174,756 | 161,055 | 132,873 | 31.5 | % | 8.5 | % | |||||||||
| Total provisions, net of recoveries | (9,926 | ) | (7,922 | ) | (1,754 | ) | 465.9 | % | 25.3 | % | ||||||
| Non financial income | 122,043 | 112,942 | 100,749 | 21.1 | % | 8.1 | % | |||||||||
| Insurance premiums and claims | 12,222 | 9,809 | 16,338 | -25.2 | % | 24.6 | % | |||||||||
| Operating expenses | (193,327 | ) | (163,125 | ) | (161,976 | ) | 19.4 | % | 18.5 | % | ||||||
| Tranlation results | 17,442 | 13,811 | 5,715 | 205.2 | % | 26.3 | % | |||||||||
| Worker's profit sharing and income taxes | (24,606 | ) | (33,418 | ) | (22,882 | ) | 7.5 | % | -26.4 | % | ||||||
Net income | 98,605 | 93,152 | 69,063 | 42.8 | % | 5.9 | % | |||||||||
| Minority Interest | 4,590 | 2,848 | 5,739 | -20.0 | % | 61.2 | % | |||||||||
Net income attributed to Credicorp | 94,016 | 90,304 | 63,324 | 48.5 | % | 4.1 | % | |||||||||
| Net income/share (US$) | 1.18 | 1.13 | 0.79 | 48.5 | % | 4.1 | % | |||||||||
Total loans | 8,287,667 | 7,509,085 | 5,927,101 | 39.8 | % | 10.4 | % | |||||||||
Deposits and Obligations | 11,722,242 | 10,322,832 | 8,838,991 | 32.6 | % | 13.6 | % | |||||||||
| Net Shareholders' Equity | 1,673,556 | 1,603,026 | 1,396,822 | 19.8 | % | 4.4 | % | |||||||||
| Net interest margin | 5.1 | % | 5.2 | % | 5.2 | % | ||||||||||
| Efficiency ratio | 46.2 | % | 40.8 | % | 47.3 | % | ||||||||||
| Return on average shareholders' equity | 23.0 | % | 23.0 | % | 18.8 | % | ||||||||||
| PDL/Total loans | 0.7 | % | 0.9 | % | 1.3 | % | ||||||||||
| Coverage ratio of PDLs | 346.6 | % | 299.4 | % | 247.9 | % | ||||||||||
| Employees | 14,757 | 15,002 | 11,837 | |||||||||||||
Non Financial income reported also solid growth of 8.1% QoQ growth. This growth was fueled this time by an important increase in income related to FX-transactions, which was up 51.7%, due to increased volumes of currency exchange activity resulting from the high volatility of the US currency and revaluation of the Sol.
2
The insurance business recovered from the extremely difficult 3Q, which was affected by the strong 7.8 (Richter scale) earthquake that stroke the southern area of our country on August 15th and showed a QoQ 24.6% higher insurance premiums and claims related income in Credicorp’s income statement. In fact, net premiums earned increased a strong 8.9% for the 4Q. However, two additional severe claims in the fire insurance segment also affected 4Q earnings and resulted in a reduced 4Q contribution.
It is remarkable that Credicorp has reached such extraordinary loan growth while loan portfolio quality continued strengthening. PDL/Loans ratio dropped further closing the year with only 0.74%, from 0.9% the previous quarter and 1.3% a year ago. Coverage ratio has a similar performance reaching an all time high of 346.6%. Net provisioning of US$ 9.9 million for 4Q07 reflects increased gross provisions in line with loan growth and a gradual normalization since recoveries consistently drop following a diminishing crisis-related charged-off assets portfolio and minimum additions given the improved financial market and stringent credit & risk management.
On the cost side, 4Q07 finally reflected the increase in operational costs expected from the banking business expansion underway, but were exacerbated by performance related year end compensation and retirement provisions. Salaries were up 18.4% QoQ and administrative expenses grew 36.3% reflecting as well some year end run-up in spending. A drop in other expenses mitigated the total operating costs expansion which reached a more moderate 18.5% QoQ. However, the efficiency ratio does reflect the business related increase in costs showing deterioration to 46.2% from 40.8% the previous quarter. For the year, however, Credicorp’s efficiency improved in 2007 to 43% from 43.5% in 2006.
The aggressive expansion of its banking network is in line with Credicorp’s strategy for its banking business and is a continuation of the growth achieved throughout the year. BCP went from 237 branches at the beginning of the year to 273 at the end of the year 2007, from 655 ATMs to 748, and from 551 Agentes BCP to 1,221. This represents an expansion of our network by 55% for the year. Furthermore, we have increased the number of bank accounts at BCP from ca. 4.4 million to ca. 5.1 million, and of clients from ca. 2.3 million to ca. 2.6 million in this same period of time, all of these reflecting an important achievement in our effort to increase bank penetration and capture growth.
Results for the Year 2007
The year 2007 has been with no doubt a year of growth for Credicorp in all its business segments. However, a 52.3% net income growth is by no means a sustainable growth, but rather an extraordinary growth result of some significant changes in the earnings generation structure of Credicorp. Having said this, income of US$ 350 million is certainly at a sustainable level from which we can expect to continue growing in line with future growth expectations for the Peruvian markets.
The banking business did provide the principal base of growth for Credicorp, with loans expanding at high rates as a result of a business strategy aimed at taking maximum advantage of our franchise, of our brand and of our solid reputation, and at increasing bank penetration. The results of this strategy in 2007 have been a 40% loan portfolio growth accompanied by a 36.3% interest income growth. Such strong loan growth did put pressure on funding and led us to tap somewhat more expensive sources resulting in a 52% increase in interest expense and a consequent more moderate 27.2% growth in NII for the year 2007.
3
Credicorp Ltd. | Year | Change % | ||||||||
| US$ Thousand | 2007 | 2006 | 2007/2006 | |||||||
| Net interest income | 633,974 | 498,526 | 27.2 | % | ||||||
| Commissions | 324,761 | 243,778 | 33.2 | % | ||||||
| Net gains on foreign exchange transaction | 61,778 | 41,638 | 48.4 | % | ||||||
| Net Primiums earned | 297,272 | 251,261 | 18.3 | % | ||||||
Total operating income | 1,317,785 | 1,035,202 | 27.3 | % | ||||||
| Net gains from sale of securities | 41,357 | 27,534 | 50.2 | % | ||||||
| Other income | 26,310 | 24,224 | 8.6 | % | ||||||
Total income | 1,385,451 | 1,086,960 | 27.5 | % | ||||||
| Net of recoveries | (28,356 | ) | 4,243 | -768.3 | % | |||||
| Operating expenses | (666,148 | ) | (571,454 | ) | 16.6 | % | ||||
| Total claims | (238,600 | ) | (186,522 | ) | 27.9 | % | ||||
| Translation Results | 34,627 | 15,216 | 127.6 | % | ||||||
| Workers profit sharing | (12,956 | ) | (11,051 | ) | 17.2 | % | ||||
| Income taxes | (101,624 | ) | (89,872 | ) | 13.1 | % | ||||
| Minority interest | (21,658 | ) | (17,252 | ) | 25.5 | % | ||||
Net income attributed to Credicorp | 350,736 | 230,267 | 52.3 | % | ||||||
| Net income / share (US$) | 4.40 | 2.89 | 52.3 | % | ||||||
| Total loans | 8,287,667 | 5,927,101 | 39.8 | % | ||||||
| Deposits and obligations | 11,722,242 | 8,838,991 | 32.6 | % | ||||||
| Net shareholder´s equity | 1,673,556 | 1,396,822 | 19.8 | % | ||||||
| Net interest margin | 5.2 | % | 5.1 | % | ||||||
| Efficiency ratio | 43.0 | % | 43.5 | % | ||||||
| Return on average shareholder´s equity | 22.9 | % | 18.5 | % | ||||||
| PDL / Total loans | 0.7 | % | 1.3 | % | ||||||
| Coverage ratio of PDLs | 346.6 | % | 247.9 | % | ||||||
Non-financial income has certainly two genuine high growth rates with 48% growth on gains on FX transactions (related to the increased activity due to the high volatility of the US dollar), and 50% growth in gains on sale of securities, again related to a very positive market environment which was leveled out at the end of the year by the international turmoil in the financial markets. Fee income growth of 33% is however overstated since it includes fees from the Pension Fund business, which jumped only in 2007 following the acquisition and subsequent merger of the 2nd largest pension fund company in the market.
The year 2007 was also a growth year for the insurance business with total premiums growing 25.4% for the year. Furthermore, PPS has recovered 4% of market share for the group reaching a strong 34% total market share as of November 2007. Nevertheless, the year was also strongly affected by increased casualties for the whole industry, including the strong earthquake of August last year. Thus, results consolidated into Credicorp of the insurance company PPS reveal a truly difficult year for that business. Despite net premiums earned growth of 18.3% reported in Credicorp’s income statement, the combination of tough claims from the earthquake plus additional casualties led to total claims increasing by 27.9% for the year 2007, reducing its total contribution for the year.
It is however the improved management of costs which made possible such a significantly higher growth in net earnings vis-à-vis income generation. In fact, core operating expenses, though controlled and budgeted, did increase in line with business expansion reaching 29.5% annual growth of personnel costs and 26% of administrative costs. However, other expenses, which include the costs related to the Senior Incentive Compensation Program (known as SAR), drop significantly thanks to the hedging mechanism put in place by the end of 2006 and which reduced to a minimum a significant cost element in the past given the performance of our Stock. Furthermore, in 2007 the weakness of the dollar and the fact that part of our business is also in Soles, resulted in accounting gains through the translation effect which can not be overlooked and provided an additional gain vis-à-vis 2006 which boosted our income by about US$ 19 million.
4
The growth achieved at Credicorp in 2007 is even more remarkable considering the devastating earthquake in the middle of the year which was a hard test on Credicorp and its ability to respond quickly and efficiently to reinstate its operational capabilities and absorb the financial impact, especially in the insurance business. We are very pleased to have been able to withstand such a test, and be in a position to report the excellent results we can show as a financial group for the year.
For business reasons, cost management reasons or market reasons, 2007 has been an excellent year for Credicorp, with overall improved annual ratios, which are at 22.9% ROAE, 2.3% ROAA, 43% efficiency ratio, 0.74% PDL/Total loans, 346.5% coverage ratio, 5.21% NIM and US$4.4 per share.
Credicorp - the Sum of its Parts
The contributions of the different companies that make up Credicorp are taking a different shape. No doubt BCP is and will continue being the main contributor to Credicorp, but it is also a fact that the subsidiaries are starting to become more important contributors to Credicorp’s earnings, resulting in a real sum of its parts.
| (US$ Thousands) | 4Q07 | 3Q07 | 4Q06 | 4Q07/ 4Q06 | 4Q07/ 3Q07 | Dec-07 | Dec-06 | Dec-07/ Dec-06 | |||||||||||||||||
| Banco de Crédito BCP(1) | 83,868 | 88,227 | 65,597 | 28 | % | -5 | % | 322,539 | 238,852 | 35 | % | ||||||||||||||
| BCB | 10,065 | 6,673 | 4,050 | 149 | % | 51 | % | 26,996 | 13,859 | 95 | % | ||||||||||||||
| Atlantic | 4,988 | 6,214 | 3,968 | 26 | % | -20 | % | 20,537 | 15,655 | 31 | % | ||||||||||||||
| PPS | 645 | (2,960 | ) | 4,534 | -86 | % | -122 | % | 9,435 | 14,538 | -35 | % | |||||||||||||
| Grupo Crédito (2) | 3,241 | 3,803 | (5,271 | ) | -161 | % | -15 | % | 7,661 | (12,380 | ) | -162 | % | ||||||||||||
| Prima | 2,307 | 1,811 | (10,894 | ) | -121 | % | 27 | % | 3,032 | (20,738 | ) | -115 | % | ||||||||||||
| Others | 934 | 1,992 | 5,623 | -83 | % | -53 | % | 4,629 | 8,358 | -45 | % | ||||||||||||||
| Credicorp and Others (3) | 1,273 | (4,980 | ) | (5,500 | ) | -123 | % | -126 | % | (9,436 | ) | (26,398 | ) | -64 | % | ||||||||||
| Credicorp Ltd. | 788 | (5,226 | ) | (5,855 | ) | -113 | % | -115 | % | (10,881 | ) | (27,552 | ) | -61 | % | ||||||||||
| Others | 485 | 246 | 355 | 0.37 | 97 | % | 1,445 | 1,154 | 25 | % | |||||||||||||||
Net income attributable to Credicorp | 94,015 | 90,304 | 63,328 | 48 | % | 4 | % | 350,736 | 230,267 | 52 | % | ||||||||||||||
(1) Includes Banco de Crédito de Bolivia.
(2) Includes Grupo Crédito, Servicorp
(3) Includes taxes on BCP's and PPS's dividends, and other expenses at the holding company level.
BCP’s 4Q07 contribution to Credicorp reflected the lower earnings compared to the previous quarter with US$ 83.9 million contribution for the quarter. On an annual basis, however, BCP had a 35% higher contribution to Credicorp in 2007 than in 2006, reaching a total of US$ 322.5 million. This confirms BCP’s aggressive growth track, fueled by the country’s strong economic growth and reflects an impressive 31% ROAE for the year.
BCP Bolivia, which is consolidated within BCP, reported a contribution of US$ 10 million for 4Q07, higher by a remarkable 51% QoQ and 95% YoY, and a total contribution for the year 2007 of US$ 27 million. Thus, the performance of BCP Bolivia is not being negatively affected by the continuing uncertain political scenario of Bolivia, and in fact, continues growing and gaining market share and brand positioning.
ASHC remains a stable and growing business in line with the increasing wealth in the country, though 4Q07 results reflect the market turmoil and dropped its contribution to US$ 5 million (from $6.2 million in 3Q06). Nevertheless, it reports an important contribution improvement of 31% for the year at US$ 20.5 million.
PPS recovered from the difficult 3Q07 hit by the devastating August 15th earthquake, but some additional casualties and cost adjustments led to a rather low 4Q07 contribution of US$ 0.6 million. Thus, total contribution to Credicorp is tainted by such event and reported a 35% lower contribution for the year of US$ 9.4 million.
In the pension fund business, following the cost reduction plan by which Prima’s sales force was reduced from 1,000 to 456 within the year, Prima closed the 4Q07 with a positive result of US$ 2.3 million. Furthermore, Prima has established its dominant position in the market, capturing important market shares (31.4% of AuM, 33.7% of collections and 47.2% of voluntary contributions to the funds) and increased its fee income by incorporating a new administration fee for voluntary funds which used to have no management charges. Year end results met Prima’s budget reaching US$ 3 million contribution to Credicorp.
5
Finally, at Credicorp Ltd. which consolidates income from minorities and the withholding taxes on dividends received by Credicorp from its subsidiaries which are provisioned every quarter, a partial reversion of such provisions resulted in a positive total contribution for the quarter. The adjustment responded to the decision to retain some earnings at BCP this year 2007 to strengthen its capital base and support future growth. Thus, Credicorp Ltd. represented a charge of US$ 9.4 million for 2007, significantly less than the charge of 2006 of US$ 26.4 million, which included additionally the effect of a double WHTX due to an accounting change applied that year.
II. Banco de Crédito - BCP Consolidated
Overview 4Q07
Net earnings at BCP maintained its extraordinary high level, reaching again a high US$ 86.2 million for 4Q07, though 5% below 3Q07 earnings. Nevertheless, YoY growth was still very strong at 27.3%. More importantly, income generation continued as strong as ever with loan portfolio expanding an impressive 10.4% QoQ, which led to interest income growth of 13.3% and core earnings growth of 9.7% QoQ reflecting the strength of income generation. With such strong income generation, the 5% quarterly drop in net income can only be explained by increased costs, mainly higher personnel and administrative costs which resulted from the announced aggressive business expansion, some accumulated spending towards the end of the year and a 20% higher provisioning.
Core Earnings
Core Revenues | Quarter | Change | ||||||||||||||
US$ 000 | 4Q07 | 3Q07 | 4Q06 | 4Q07/4Q06 | 4Q07/3Q07 | |||||||||||
| Net interest and dividend income | 155,565 | 142,755 | 117,723 | 32.1 | % | 9.0 | % | |||||||||
| Fee income, net | 76,708 | 75,146 | 62,079 | 23.6 | % | 2.1 | % | |||||||||
| Net gain on foreign exchange transactions | 21,497 | 13,526 | 10,853 | 98.1 | % | 58.9 | % | |||||||||
Core Revenues | 253,770 | 231,427 | 190,655 | 33.1 | % | 9.7 | % | |||||||||
Core Revenues were up 9.7% QoQ and 33.1% YoY. Though supported by growth of fee income (+2.1%) and strong gains from FX transactions (+58.9%), it is still NII the main component of core earnings, which reported a strong 9% growth QoQ and 32.1% YoY..
As indicated, total loans reflected growth of 10.4% QoQ and 40.1% YoY. Once again the driver behind BCP’s growth was the expanded lending activity both in the commercial and consumer sectors. In terms of daily average balances, loan balances were up 10.2% QoQ and 39.4% YoY
Nevertheless, the retail sector continues leading the way, with BCP’s loan book in the retail segment growing 12.9% QoQ, being the strongest performers the consumer sector with +16.3% for the quarter, SME or PYMES with +16.8% quarterly growth and credit cards with 13.9% QoQ growth. This is no doubt the result of stronger domestic demand through the increase of purchasing power in the population, as well as the further incursion in new segments by BCP, in line with its strategy to increase bank penetration. Furthermore, mortgages grew 8.3% QoQ and offer the strongest future growth potential given the low penetration of this product in the market. On the other hand, the unusual strong growth again this quarter of corporate loans of 15% QoQ confirms the increased investment activity in this sector with companies expanding its production capacity, and reflects BCP’s strong franchise which allowed it to gain another 2% market share.
6
Funding this growth has become an important challenge. To complement deposit growth, BCP successfully tapped the international markets this year and issued US$ 500 million structured securitized bonds within the 3Q07, and another Sol denominated subordinated bonds equivalent to US$ 160 million in the 4Q07. Nevertheless, deposit growth continues being the main source of funding with deposits growing a real 10.5% QoQ.
Banco de Crédito and Subsidiaries | Quarter | Change | ||||||||||||||
| US$ 000 | 4Q07 | 3Q07 | 4Q06 | 4Q07/4Q06 | 4Q07/3Q07 | |||||||||||
| Net Financial income | 155,565 | 142,755 | 117,723 | 32.1 | % | 9.0 | % | |||||||||
| Total provisions, net of recoveries | (11,089 | ) | (9,241 | ) | (3,188 | ) | 247.8 | % | 20.0 | % | ||||||
| Non financial income | 103,458 | 91,987 | 82,074 | 26.1 | % | 12.5 | % | |||||||||
| Operating expenses | (151,867 | ) | (119,814 | ) | (111,463 | ) | 36.2 | % | 26.8 | % | ||||||
| Tranlation results | 15,253 | 12,028 | 4,903 | 211.1 | % | 26.8 | % | |||||||||
| Worker's profit sharing and income taxes | (25,123 | ) | (26,981 | ) | (22,358 | ) | 12.4 | % | -6.9 | % | ||||||
Net income | 86,198 | 90,735 | 67,691 | 27.3 | % | -5.0 | % | |||||||||
| Net income/share (US$) | 0.067 | 0.071 | 0.053 | 27.4 | % | -5.0 | % | |||||||||
| Total loans | 8,224,613 | 7,450,674 | 5,871,021 | 40.1 | % | 10.4 | % | |||||||||
| Deposits and obligations | 11,249,104 | 10,263,180 | 8,356,823 | 34.6 | % | 9.6 | % | |||||||||
| Shareholders equity | 1,132,564 | 1,045,006 | 963,856 | 17.5 | % | 8.4 | % | |||||||||
| Net financial margin | 5.2 | % | 5.2 | % | 5.3 | % | ||||||||||
| Efficiency ratio | 56.9 | % | 48.3 | % | 54.5 | % | ||||||||||
| Return on average equity | 31.7 | % | 36.1 | % | 29.2 | % | ||||||||||
| PDL/Total loans | 0.7 | % | 0.9 | % | 1.3 | % | ||||||||||
| Coverage ratio of PDLs | 351.8 | % | 300.7 | % | 249.5 | % | ||||||||||
| Branches | 273 | 254 | 237 | |||||||||||||
| ATMs | 748 | 724 | 655 | |||||||||||||
| Employees | 12,667 | 12,216 | 10,771 | |||||||||||||
Interest income on loans outperformed once again loan growth of 10%, increasing by 13.3% QoQ and reflecting the better lending mix. Interest income from investments was even stronger increasing 32.5% QoQ as a result of increased liquidity to invest and better returns on CB deposits. However interest expense reflected higher funding costs through both the increased and more expensive interest on borrowed funds (up by 35.5% QoQ) and increased interest paid on deposits (up 19.9% QoQ). The latter includes however interest on deposits related to the structured bonds and which in reality reflect borrowing costs and the effect on interest expense of a change in deposit mix with interest bearing deposits increasing their proportion of total deposits.
Thanks to the strong income generation, the net effect of these changes was an almost negligible QoQ reduction of Net Interest Margin (NIM) from 5.20% to 5.17%.
Net Provisions for 4Q07 reached US$ 11.1 million, reflecting gross provisions of US$ 19.1 million and US$ 8.0 million of recoveries vs. US$ 17.5 million of gross provisions and US$ 8.2 million of recoveries in 3Q07. Recoveries continue diminishing as the crisis related charged-off portfolio is built-down and new additions are extremely low given the good credit standing in the system and improved credit & risk management. This level of provisions represents 0.2% of total loan portfolio for 4Q07. It is certainly the constant improvement of the economic performance and high liquidity in the market which allows such further improvements in portfolio quality. Thus, further drops in non-performing loans led to a PDL ratio of 0.7% for 4Q07 vs. 0.91% for 3Q07.
7
The unusually low fee income growth reported of 2.1% is however a reflection of a specific and unusual insurance income which boosted 3Q07 fee income increasing the base for comparison, and an equally unusual accounting adjustment in 4Q07 that deferred income of LC business in 4Q07. These distortions hide a healthy evolution of fee generating transactional business. Thus, average monthly transactions reached 33.3 million vs. 30.2 million the previous quarter, a proud 10.3% quarterly growth. This transactional activity is certainly also related to the growth of BCP’s network: BCP closed the year with a 55% expansion of its Agentes BCP reaching 1,221 Agentes vs. 551 by year end 2006. ATM’s went from 655 in 2006 to 748 by the end of the year, and branches totaled 273, up from 237 by year end 2006.
Gains on foreign exchange transaction, however, benefited from the volatility of the dollar and the revaluation of our local currency reaching 58.9% growth rate for the quarter.
On the cost side, operating costs is a result of BCP’s business expansion, and was up by a strong 26.8% QoQ. This increase continues in line with the announced investments in expanding our branch & sales points’ network and year end costs. In fact, this last quarter these costs experienced a “year end run-up” with programmed costs in personnel and administrative and other expenses growing in an accelerated way and reaching 25.9% and 39.4% respectively.
Personnel Costs, which account for 50% of total operating costs, were up 25.9% QoQ due to increased hiring to cover the growing needs of the expanding network, increase of the SME dedicated sales force and higher economic incentives based of performance for the retail sales force in general. Thus, total employees went from 10,771 in December 2006 to 12,667 by the end of 2007. In addition, a one time increase in provisions related to the retirement of senior officers also contributed to the increased costs for the quarter.
Administrative expenses, which account for 39% of operating costs, grew 39.4% QoQ because of higher Marketing and Systems expenses which were up 55% and 146% QoQ respectively. In both cases these were strongly related to the business expansion, more marketing support, systems growth, maintenance and back-up facilities, etc., but included as well the year end run-up of costs to meet approved budgets.
Finally, the translation result for 4Q07 was again significant due to the further weakening of the dollar in the international markets and revaluation of the Nuevo Sol from S/.3.086 in September to S/.2.996 by the end of December, and led to a strong gain of US$ 15 million vs. US$ 12 million in 3Q07 and US$ 4.9 million 4Q06, given the net Soles position in BCP’s balance sheet.
As a result of these developments, BCP’s quarterly ratios reflect this evolution maintaining its strong performance: ROAE was 31.7%, the efficiency ratio at 56.9% (vs. 48.3%) and portfolio quality ratios reached 0.7% delinquencies ratio and 351.8% coverage ratio.
8
Results for the Year 2007
BCP closed the year 2007 with superb net earnings of US$ 331.7 million, 33.9% above the previous year which totaled US$ 247.8 million.
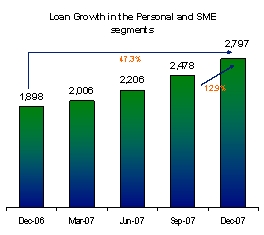
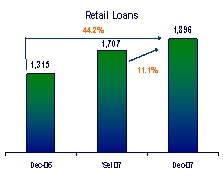
This outstanding performance is the direct result of an extraordinary growth in all business activities during 2007. Year end loan portfolio growth reached an unexpected 40.2% for the year, leading to net interest income growth of 26.8%, despite the tightening of spreads as a consequence of the continuing strong competition and increased funding costs. Such astounding total loan growth was fueled by the expected aggressive growth in year end loan balances in the retail segment of 47.7%, and the unusual and surprisingly high growth achieved in the wholesale credit business of 44.1% during 2007.
Banco de Crédito and subsidiaries | Year | Change % | ||||||||
| US$ millon | 2007 | 2006 | 2007/2006 | |||||||
| Net interest income | 562,756 | 443,728 | 26.8 | % | ||||||
| Banking services commissions | 281,310 | 232,226 | 21.1 | % | ||||||
| Net gain on foreign exchange transaction | 59,739 | 42,005 | 42.2 | % | ||||||
Total operating earnings | 903,805 | 717,959 | 25.9 | % | ||||||
| Net gain on sales of securities | 20,993 | 8,692 | 141.5 | % | ||||||
| Other income | 8,487 | 12,773 | -33.6 | % | ||||||
Total income | 933,285 | 739,424 | 26.2 | % | ||||||
| Provisions net of recoveries | (33,074 | ) | (1,948 | ) | 1597.8 | % | ||||
| Operating expenses | (496,425 | ) | (422,840 | ) | 17.4 | % | ||||
| Translation Results | 29,562 | 13,323 | 121.9 | % | ||||||
| Employee profit sharing | (11,904 | ) | (10,815 | ) | 10.1 | % | ||||
| Income taxes | (89,790 | ) | (69,388 | ) | 29.4 | % | ||||
Net income | 331,654 | 247,756 | 33.9 | % | ||||||
| Net income per share(US$) | 0.258 | 0.193 | 33.9 | % | ||||||
| Total loans | 8,224,613 | 5,871,021 | 40.1 | % | ||||||
| Deposits and obligations | 11,249,104 | 8,356,823 | 34.6 | % | ||||||
| Net Shareholder´s equity | 1,132,564 | 963,856 | 17.5 | % | ||||||
| Net interest margin | 5.24 | % | 5.17 | % | ||||||
| Efficiency Ratio | 51.29 | % | 50.51 | % | ||||||
| Return on average equity | 31.67 | % | 27.69 | % | ||||||
This business growth also fueled the increasing fee income and FX-gains since it generates significant transactional activity. Thus, fee income also grew 21.1% this year and FX transactional income was up 42.2% favored by the high volatility of the USD markets, resulting in total core earnings growth of 25.9% for the year 2007.
Even though we also reported a change in BCP’s funding structure and cost, income generation for the year was strong enough to compensate such increase in funding costs and resulted in an improvement of NIM from 5.17% for the year 2006 to 5.24% for 2007.
Operating costs on the other hand grew only 17.4% for the year, despite 4Q07’s operating costs hike. In fact, personnel costs were up 32.2% and administrative costs increased 26.8% for the year 2007. Such cost increases were heavily weighted towards the year end and reflect the business and network expansion initiated in the latter half of the year, as well as year end compensation expenses & provisions. However, other expenses, which include the costs related to the Senior Incentive Compensation Program (known as SAR), drop significantly this year thanks to the hedging mechanism put in place by the end of 2006 and which reduced to a minimum a significant cost element in the past given the performance of our Stock, reducing overall operating costs growth. Nevertheless, a real reflection on costs management is the efficiency ratio, which does deteriorate as expected and announced from 50.51% in 2006 to 51.29% for 2007.
9
Net earnings before translation results, profit sharing and taxes reflect the real business results and revealed an increase of 28.3% for the year. Nevertheless, BCP’s US dollar results had a positive impact from the currency translation given the revaluation of the Soles, which led to additional extraordinary income of US$29.6 million, higher than the effect in 2006 which resulted in additional income of US$13.3 million. Therefore, after profit sharing, which was up 10.1%, and taxes, which increased also in line with increased earnings at 29.4%, net earnings growth was an astounding 33.9%.
Finally, BCP’s ratios reflect its outstanding performance, with ROAE improving from 27.69% for 2006 to 31.67% for 2007.
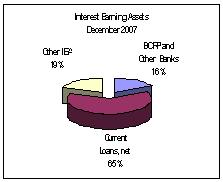
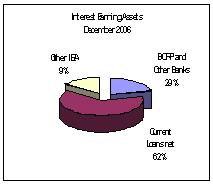
II.1 Interest Earning Assets
Growth of IEA remained strong, in line with the business expansion, reaching 15.4% QoQ and 39.4% YoY.
Interest Earning Assets | Quarter | Change | ||||||||||||||
| US$ 000 | 4Q07 | 3Q07 | 4Q06 | 4Q07/4Q06 | 4Q07/3Q07 | |||||||||||
| BCRP and Other Banks | 2,255,571 | 1,740,636 | 2,031,984 | 11.0 | % | 29.6 | % | |||||||||
| Interbank funds | 5,001 | 1,000 | 25,031 | -80.0 | % | 400.1 | % | |||||||||
| Trading Securities | 102,316 | 49,465 | 37,475 | 173.0 | % | 106.8 | % | |||||||||
| Available For Sale Securities | 2,364,084 | 1,998,309 | 1,359,805 | 73.9 | % | 18.3 | % | |||||||||
| Current Loans, net | 8,164,334 | 7,383,196 | 5,795,790 | 40.9 | % | 10.6 | % | |||||||||
Total interest earning assets | 12,891,306 | 11,172,606 | 9,250,085 | 39.4 | % | 15.4 | % | |||||||||
Growth of IEA this last quarter of 2007 results from the surprising dynamism of our economy, reaching 15.4% QoQ and 39.4% YoY. This growth follows the extraordinary expansion of BCP’s total loan portfolio for 4Q07, which reached 10.6% QoQ and 40.9% YoY as a result of increased demand for credit across all banking segments. Such loan growth revealed the need to raise funding beyond our traditional organic deposit growth, and motivated the placement of different financial instruments to increase our liquidity and have the necessary platform to continue growing. Thus, Investments available for sale, which include Central Bank CD’s, and cash deposits increased significantly reflecting the liquidity parked for future loan growth.
 |  |
Loan Portfolio
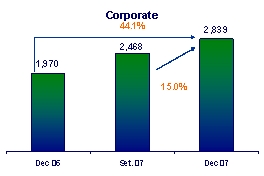
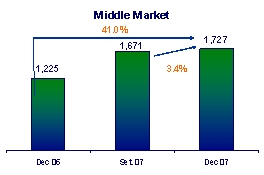
Loan portfolio continues its expanding trend reaching total net loans of US$ 8,012.6 million as of the end of the year 2007, revealing a 10.6% QoQ and 41.0% YoY growth. Measured by average monthly balances for each quarter, which give a better reflection of reality, similar growth rates are reported of 10.2% QoQ and 39.4% YoY. This loan growth is in line with the evolution and dynamism of the Peruvian economy in the last year, and especially of internal demand and private investments. In fact, strong investments aimed at expanding production capacity across almost all business sectors of the economy are behind an extraordinary loan growth in the corporate sector which reached 15% QoQ, with the Middle Market and Retail banking segments performing also at very good rates, reaching 3.4% and 12.9% QoQ growth respectively.
10
The strong corporate banking sector’s performance for 4Q07 is also evident when looking at monthly balances, with the corporate sector reaching a total average monthly balance of US$ 2,839.9 million, revealing the strongest quarterly growth for this sector in the year, and an unprecedented YoY growth of 44.1%. This is certainly a reflection of the increased investment activity, the increasing volumes of these investments in this sector, and certainly also of the dominant market share BCP holds in this segment, which allows BCP to capture and/or participate in almost every important investment and has resulted in a further consolidation of its market dominance despite the presence of aggressive international players.
The Middle Market portfolio with a total of US$ 1,727 million, though showing a significantly less flashy performance, still reached good quarterly growth numbers at 3.4% QoQ growth, but more importantly, an outstanding 41% YoY growth.
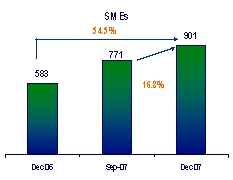
Though the corporate sector outperformed all other this 4Q07, the retail sector continues being the strong performer on a consistent way. Thus, its portfolio reached US$ 2,796.7 million in average monthly balances, reporting consistently outstanding growth of 12.9% QoQ and 47.3% YoY. Star performers within the retail segment continue being Consumer loans and SME lending, which reported 16.3% and 16.8% QoQ growth respectively and 96.6% and 54.5% YoY growth respectively, while Credit Card loans increased by 13.9% QoQ and 45.3% YoY. Mortgages reported the lowest growth rates within the retail segment, but were still extremely good at 8.3% QoQ growth and 29.7% YoY.
11
 |  |
Market Share
BCP’s market share of the financial system continues at good levels despite the strong competition, increasing incursion of foreign players into the market and the already stronghold position it has. Thus, BCP’s market share of loans placed reached 32.2% as of December 2007 which reassures its position as market leader. This is an improvement from September 2007 when a market share of 31.8% was reported.
Furthermore, market share for the corporate and middle market sectors continue revealing BCP’s solid positioning, reaching 45% and 37% respectively, based on the most recent estimates from August; though again in both cases slightly below the previous quarter.
It is however in the more attractive retail market which is the focus of BCP’s strategy, where market shares reveal some increase. Thus, market share in consumer loans were up by 30 bps reaching 17.3%. In mortgages, market share increases 70 bps to 39.7% and in the very competitive Credit Cards’ business it increases 20 bps to 18.8%. SME loans (PYMES) however drop slightly to 18.8%.
Dollarization
The de-dollarization process of BCP’s assets this 4Q07 continued with respect to the 3Q07. Thus, in the 4Q07 loans in Nuevos Soles conformed 32% of total loan portfolio, 3% more than in the previous quarter. Furthermore, the system continues experiencing further de-dollarization of its loans and deposits, reaching a high 38.2% of loans in Nuevos Soles and 61.8% in US Dollars as of December 2007. The de-dollarization process is more intense in deposits, which reported 40.6% (vs. 37.7% for Dec. 2006) of deposits in Nuevos Soles, evidencing an increased preference for local currency savings, fueled also by the appreciation of the local currency vis-à-vis the US Dollar.
12
II.2 Deposits and Mutual Funds
Deposits reported growth of 9.6% QoQ and 34.6% YoY, maintaining this way its role as main source of funding to support the strong loan growth
Deposits and Obligations | Quarter ended | Change | ||||||||||||||
| US$ (000) | 4Q07 | 3Q07 | 4Q06 | 4Q07/4Q06 | 4Q07/3Q07 | |||||||||||
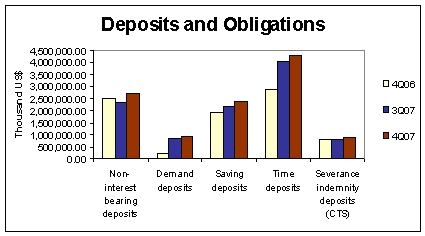
| Non-interest bearing deposits | 2,729,860 | 2,345,124 | 1,946,718 | 40.2 | % | 16.4 | % | |||||||||
| Demand deposits | 926,817 | 854,752 | 761,391 | 21.7 | % | 8.4 | % | |||||||||
| Saving deposits | 2,381,012 | 2,167,592 | 1,952,087 | 22.0 | % | 9.8 | % | |||||||||
| Time deposits | 4,268,233 | 4,067,677 | 2,885,144 | 47.9 | % | 4.9 | % | |||||||||
| Severance indemnity deposits (CTS) | 896,283 | 785,398 | 775,027 | 15.6 | % | 14.1 | % | |||||||||
| Interest payable | 46,899 | 42,637 | 36,456 | 28.6 | % | 10.0 | % | |||||||||
Total customer deposits | 11,249,104 | 10,263,180 | 8,356,823 | 34.6 | % | 9.6 | % | |||||||||
| Mutual funds in Perú | 1,955,547 | 1,884,009 | 1,233,605 | 58.5 | % | 3.8 | % | |||||||||
| Mutual funds in Bolivia | 70,919 | 65,437 | 57,550 | 23.2 | % | 8.4 | % | |||||||||
Total customer funds | 11,249,104 | 10,263,180 | 8,356,823 | 34.6 | % | 9.6 | % | |||||||||
Deposit growth for the quarter reached a strong 9.6%. This is no doubt the reflection of the strong economic growth and wealth generation, but could certainly include the effect of an increased search for secure investments in light of the uncertainties of the markets, especially the US markets. Noticeable, and of great benefit for BCP is the proportionately higher growth in low cost demand deposits.
However, it should be noted that growth in “time deposits” is overstated since it includes deposits resulting from a fund raising structure using a Credicorp subsidiary as vehicle (CCR Inc) which totaled US$500 million. The flows provided by this issue are booked as time deposits according to the transaction structure. Thus, excluding this effect, time deposits would have grown about 6.3% QoQ, while “real growth” for total deposits and obligations was approximately 10.5% QoQ
Saving deposits grew 9.8% QoQ and 22.6% YoY, while demand deposits and CTS deposits moved 14.3% and 14.1% QoQ (+35.0% and +15.6% YoY) respectively. Deposits continue being the strongest source of low cost funding since 63% of these bear none or very low interests. Furthermore, the importance of the retail segment is also evident in the funding side since approximately 48% of deposits are generated in this segment.
13
Market Share
Throughout the year, BCP’s market share of deposits in the financial system was sustained at approximately 38%. In fact, BCP’s deposits’ market share even grows from 36.9% at the end of 2006 to today’s 38.4%, reflecting again BCP’s stronghold position in the market, despite the increasing competition. These deposits are 39% in Nuevos Soles and 61% in US Dollars, reflecting an accelerated de-dollarization of the deposit portfolio resulting from the revaluation of the Soles and higher returns for soles products vis-à-vis dollar denominated saving instruments.
BCP’s leadership is evident in most of the deposit types and the slight movements in market share do not undermine this position. Thus, of “severance payment” deposits, known as CTS, we hold 53% market share while our next competitor holds 19.5%. BCP’s demand deposits reached 43.6% and 38.0% market share in local and foreign currency and our savings deposits reached 35.5% and 42.8%, respectively. Finally, our time deposits represented 22.4% and 42.8% market share in local and foreign currency respectively.
In fact, our main competitor for our deposit business is the capital market, which offers attractive returns and has gained visibility in the system. However, we are also very well positioned to capture that business. Mutual Funds administered through our subsidiary Credifondo, continue being a stronghold for BCP with a volume of US$ 1,956 million, up 3.8% QoQ and 58.5% YoY. This reflects a market share of 45.1% by the end of 2007. This growth is remarkable considering the growth of the industry with ever more personalized and tailored funds to the different need and objectives of the clients.
14
II.3 Net Interest Income
Though NII increased a strong 10.0% QoQ, the funding requirements resulting from our strong loan portfolio growth led to a shift in funding structure resulting in a slight drop in NIM to 5.17% for 4Q07 vs. 5.20% in 3Q07.
| Net interest income | Quarter | Change | ||||||||||||||
| US$ 000 | 4Q07 | 3Q07 | 4Q06 | 4Q07/4Q06 | 4Q07/3Q07 | |||||||||||
Interest income | 272,204 | 240,181 | 184,437 | 47.6 | % | 13.3 | % | |||||||||
| Interest on loans | 201,414 | 183,127 | 143,958 | 39.9 | % | 10.0 | % | |||||||||
| Interest and dividends on investments | 139 | - | 32 | 334.4 | % | 100 | ||||||||||
| Interest on deposits with banks | 17,901 | 18,985 | 16,941 | 5.7 | % | -5.7 | % | |||||||||
| Interest on trading securities | 47,069 | 35,521 | 22,136 | 112.6 | % | 32.5 | % | |||||||||
| Other interest income | 5,681 | 2,549 | 1,371 | 314.4 | % | 122.9 | % | |||||||||
Interest expense | 116,640 | 97,426 | 66,714 | 74.8 | % | 19.7 | % | |||||||||
| Interest on deposits | 83,039 | 69,241 | 50,139 | 65.6 | % | 19.9 | % | |||||||||
| Interest on borrowed funds | 14,670 | 13,515 | 6,400 | 129.2 | % | 8.5 | % | |||||||||
| Interest on bonds and subordinated notes | 11,782 | 8,698 | 7,436 | 58.4 | % | 35.5 | % | |||||||||
| Other interest expense | 7,149 | 5,972 | 2,739 | 161.0 | % | 19.7 | % | |||||||||
Net interest income | 155,565 | 142,755 | 117,723 | 32.1 | % | 9.0 | % | |||||||||
Average interest earning assets | 12,031,956 | 10,970,685 | 8,853,982 | 35.9 | % | 9.7 | % | |||||||||
Net interest margin* | 5.17 | % | 5.20 | % | 5.32 | % | ||||||||||
Interest income grew a solid 13.3% in 4Q07 following a strong 10% increase in interest on loans resulting from not only volume growth but also a further shift in portfolio structure (+12.9% retail portfolio). Further, additional income growth was reported for interest on investment portfolio, which was up 32.5%, basically resulting from the good returns achieved on BCRP CD’s.
Once again, 4Q07 reveals the need to tap on external funding sources given that organic deposit growth and excess liquidity are not enough to support the strong loan growth. Some of such increased external financing is reflected however in the deposits reported by BCP because of the structure used, and resulted in a 19.9% increase in interest on deposits, a cost which grows more than deposit volume (up 9.6%), reflecting the higher cost of such funding. Furthermore, interest on bonds and subordinated notes also increased by 35.5% given the issues placed in the market last October (USD 160 million). Thus, the general impact on interest expense was an increase of 19.7% for the quarter.
Therefore, the stronger increase in funding cost this 4Q07 was not fully offset by the re-composition of loan portfolio, but the latter could mitigate the drop in NIM. Thus, despite such solid interest income growth, net interest income growth reached a more modest 9% and resulted in a slight drop of NIM to 5.17% (vs. 5.2% for 3Q07).
15
II.4 Loan provisions
Provisions grow in line with accelerated loan growth, while recoveries remain at similar levels compared to 3Q07, leading to increased net provisions.
Provisión for loan losses | Quarter ended | Change | ||||||||||||||
| US$ 000 | 4Q07 | 3Q07 | 4Q06 | 4Q07/4Q06 | 4Q07/3Q07 | |||||||||||
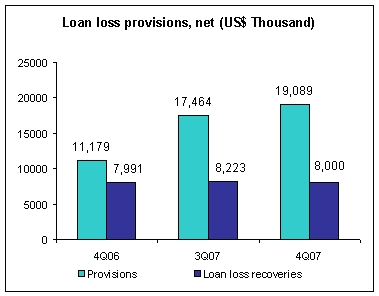
| Provisions | (19,089 | ) | (17,464 | ) | (11,179 | ) | 70.8 | % | 9.3 | % | ||||||
| Loan loss recoveries | 8,000 | 8,223 | 7,991 | 0.1 | % | -2.7 | % | |||||||||
Total provisions, net of recoveries | (11,089 | ) | (9,241 | ) | (3,188 | ) | 247.8 | % | 20.0 | % | ||||||
Total loans | 8,224,613 | 7,450,674 | 5,871,021 | 40.1 | % | 10.4 | % | |||||||||
Reserve for loan losses (RLL) | 212,060 | 202,877 | 187,689 | 13.0 | % | 4.5 | % | |||||||||
Bcp's Charge-Off amount | 12,034 | 8,274 | 12,700 | 0.95 | % | 1.45 | % | |||||||||
Past due loans (PDL) | 60,279 | 67,478 | 75,231 | -19.9 | % | -10.7 | % | |||||||||
| PDL/Total loans | 0.73 | % | 0.91 | % | 1.28 | % | ||||||||||
| Coverage | 351.80 | % | 300.65 | % | 249.48 | % | ||||||||||
Gross provisions reached US$19.1 million in 4Q07, a number 9.3% higher QoQ reflecting the accelerated growth of our loan book during this last quarter, specifically in the retail sector. Recoveries of previously charged-off loans however, have been gradually dropping given that our old crisis related portfolio of charged-off loans diminished and we’ve had significantly less new loans charged-off during the last years as our risk evaluation and risk management processes were revamped and improved. Thus, recoveries reached only US$ 8 million, a number 2.7% lower than the previous quarter. Net provisions reflect this evolution and reported US$11.1 million for the 4Q07.
Despite this increase in provisions, BCP’s past due ratio reached a new record low at 0.73% vs. 0.91% for 3Q07. These improvements, however, are not only in PDL ratios and percentages, but also in absolute terms, since past due loans dropped 10.7% to US$ 60.3 million from US$ 67.5 million, and even though our growth is concentrated in the retail products such as consumer, mortgage, credit card loans. We believe this reflects the conservative credit policy applied during the last years and obviously, also the improvements of the domestic economy.
At the same time, coverage ratios reached a new record of 351.8% for 4Q07 vs. the 300.65% from the previous quarter.
16
II.5 Non Financial Income
During 4Q07, non financial income grew 12.5% following a boost in income from FX operations.
Non financial income | Quarter | Change | ||||||||||||||
| US$ 000 | 4Q07 | 3Q07 | 4Q06 | 4Q07/4Q06 | 4Q07/3Q07 | |||||||||||
| Fee income | 76,708 | 75,146 | 62,079 | 23.6 | % | 2.1 | % | |||||||||
| Net gain on foreign exchange transactions | 21,497 | 13,526 | 10,853 | 98.1 | % | 58.9 | % | |||||||||
| Net gain on sales of securities | 2,661 | 1,537 | 5,179 | -48.6 | % | 73.1 | % | |||||||||
| Other income | 2,592 | 1,778 | 3,964 | -34.6 | % | 45.7 | % | |||||||||
Total non financial income | 103,458 | 91,987 | 82,074 | 26.1 | % | 12.5 | % | |||||||||
Fee income and gains on FX transactions, which form part of BCP’s operating income, grew 2.1% and 58.9% QoQ respectively. The low 2.1% growth of fee income hides however a distortion since on the one hand in 3Q07, this line included an extraordinary income of US$ 2.4 million from an insurance payment related to Segurimax, increasing the base for comparisons, and on the other hand a negative impact in 4Q07’s income due to an adjustment of US$-2.3 million of LC’s differed fees in 4Q07, in line with IFRS accounting. In fact, stronger fee income was generated mainly by the Corporate Finance, Consumer loans and PYME areas.
Net income on FX transactions showed a boost resulting from increased transactional activity related to the holiday season and also to a great extent to the high volatility of the dollar and revaluation of the sol which led to migration of funds from one currency to the other.
With regards to net gains on the sale of securities, this jumped 73.1% as a result of profit taking for both fixed and variable income investments, and less volatility provisions during 4Q07. The Lima Stock Exchange Index reported strong gains in October and November, which were reversed in December.
The average number of transactions grew from 30.2 million in 3Q07 to 33.3 million in 4Q07 reflecting a 10.3% QoQ growth.
Quarter | Change | |||||||||||||||
N° of Transactions per Channel | Averag. 4Q07 | Averag. 3Q07 | Averag. 4Q06 | 4Q07/ 4Q06 | 4Q07/ 3Q07 | |||||||||||
| Teller | 9,371,270 | 8,827,670 | 8,567,623 | 9.4 | % | 6.2 | % | |||||||||
| ATMSViaBCP | 5,540,733 | 4,919,609 | 4,415,629 | 25.5 | % | 12.6 | % | |||||||||
| Balance Inquiries | 2,468,491 | 2,206,366 | 2,290,454 | 7.8 | % | 11.9 | % | |||||||||
| Telephone Banking | 1,203,838 | 1,042,139 | 995,543 | 20.9 | % | 15.5 | % | |||||||||
| Internet Banking ViaBC P | 7,284,113 | 6,657,470 | 5,734,389 | 27.0 | % | 9.4 | % | |||||||||
| Agente BCP | 1,092,778 | 838,410 | 405,615 | 169.4 | % | 30.3 | % | |||||||||
| Telecrédito | 3,374,932 | 3,046,225 | 2,766,705 | 22.0 | % | 10.8 | % | |||||||||
| Direct Debit | 346,710 | 294,257 | 263,550 | 31.6 | % | 17.8 | % | |||||||||
| P.O.S. | 2,489,588 | 2,238,747 | 2,121,012 | 17.4 | % | 11.2 | % | |||||||||
| Other ATM network | 168,839 | 159,411 | 151,385 | 11.5 | % | 5.9 | % | |||||||||
| Total transactions | 33,341,293 | 30,230,305 | 27,711,905 | 20.3 | % | 10.3 | % | |||||||||
A significant increase in the number of transactions per channel was reported mainly at the Agente BCP (+30.3%), use of automatic debit (+17.8%), telephone banking (+15.5%) and ATM’s (+12.6%), all of which are also electronic channels and reflect the strategy directed at consolidating BCP’s leading position and developing the largest operational network in the country, and pushing strongly the use of more cost efficient electronic channels. The network expansion as of December, however, does not yet reflect the aggressive expansion approved for the next year. Thus, the number of access points at the end of the year reveals growth in line with projections, though a significantly stronger growth in Agentes BCP of 20% QoQ.
| Quarter | Change | |||||||||||||||
| Dec-07 | Sep-07 | Dec-06 | Dec. 07/ Dec. 06 | Dec. 07/ Sept. 07 | ||||||||||||
| Branches | 273 | 254 | 237 | 15 | % | 7 | % | |||||||||
| ATMs | 748 | 724 | 655 | 14 | % | 3 | % | |||||||||
| Agentes BCP | 1,221 | 1,017 | 551 | 122 | % | 20 | % | |||||||||
17
II.6 Operating Costs and Efficiency
BCP’s efficiency ratio deteriorated during 4Q07 reaching an already unusual 56.89% as a consequence of an acceleration of programmed spending towards the end of the year, but more importantly, larger personnel costs in anticipation of our network growth.
Operating expenses | Quarter | Change | ||||||||||||||
| US$ 000 | 4Q07 | 3Q07 | 4Q06 | 4Q07/4Q06 | 4Q07/3Q07 | |||||||||||
| Salaries and employees benefits | 75,147 | 59,669 | 52,087 | 44.3 | % | 25.9 | % | |||||||||
| Administrative, general and tax expenses | 59,234 | 42,485 | 43,176 | 37.2 | % | 39.4 | % | |||||||||
| Depreciation and amortizacion | 10,000 | 9,627 | 8,637 | 15.8 | % | 3.9 | % | |||||||||
| Other expenses | 7,485 | 8,033 | 7,563 | -1.0 | % | -6.8 | % | |||||||||
Total operating expenses | 151,867 | 119,814 | 111,463 | 36.2 | % | 26.8 | % | |||||||||
Efficiency Ratio | 56.89 | % | 48.30 | % | 54.50 | % | ||||||||||
During 4Q07, operating expenses increased significantly by 26.8% QoQ due mainly to increased expenses for salaries and administration. Higher personnel expenses, which account for 50% of all operational expenses, reflect (i) increased number of personnel hired to cover the requirements for the aggressive branch network expansion announced in October 2007, (ii) the increase in the sales force dedicated to the booming SME business, (iii) stronger economic incentives for the retail sales force based on the new salary structure with an important portion of income based on performance and target achievement, and (iv) higher provisions for voluntary bonuses (aside from legal profit sharing) and a one time provision related to the retirement of several senior management officials in 2008. In fact, employees increased from 10,771 in December 2006 to 12,667 by the end of 2007. Furthermore, there is also an important impact in costs related to the revaluation of the local currency given that BCP’s payroll is determined in Soles whereas a significant portion of its income is still in dollars, reflecting an additional increase when reporting in dollars.
General administrative expenses and taxes, which represent 39% of operating costs, increased even more reaching a 39.4% QoQ expansion mainly as a result of the important business growth and the demands of such growth on marketing and systems support. Marketing expenses were up 55% QoQ and were mainly explained by stronger image, brands and product advertising campaigns (such as the Visa/LAN credit card, the social oriented Piloto20 program, and others). System expenses grew 146% QoQ due to renewal and additional Microsoft licenses, maintenance of software, repair costs and maintenance of equipment, general support and product development and the start-up costs related to new systems processing back-up facilities. An additional element that impacted 4Q07 expenses is the common “year end expense race”, where approved and programmed expenses which lag in time are expensed in a more accelerated way towards year end.
While business related expenses increase fueled by business growth, other expenses drop 6.8% QoQ. This drop is explained by lower net provisions for stock appreciation right based on the existing hedging mechanism and by lower provisions on assets seized (-91%) and other contingencies (-43%), following improved credit and business conditions.
18
Administrative expenses | Quarter | Change | |||||||||||||||||||||||
| US$ 000 | 4Q07 | % | 3Q07 | % | 4Q06 | % | 4Q07/ 4Q06 | 4Q07/3Q07 | |||||||||||||||||
| Marketing | 12,180 | 22 | % | 7,876 | 19 | % | 9,410 | 21 | % | 29.4 | % | 54.6 | % | ||||||||||||
| Systems | 9,121 | 8 | % | 3,703 | 9 | % | 3,470 | 15 | % | 162.9 | % | 146.3 | % | ||||||||||||
| Transportation | 4,864 | 10 | % | 4,198 | 10 | % | 4,217 | 8 | % | 15.3 | % | 15.9 | % | ||||||||||||
| Maintenance | 2,319 | 4 | % | 2,045 | 5 | % | 1,842 | 4 | % | 25.9 | % | 13.4 | % | ||||||||||||
| Communications | 2,217 | 5 | % | 2,037 | 5 | % | 2,021 | 4 | % | 9.7 | % | 8.8 | % | ||||||||||||
| Consulting | 3,174 | 5 | % | 1,793 | 4 | % | 2,344 | 5 | % | 35.4 | % | 77.0 | % | ||||||||||||
| Other expenses | 16,483 | 30 | % | 13,050 | 31 | % | 13,130 | 28 | % | 25.5 | % | 26.3 | % | ||||||||||||
| Porperty taxes and others | 4,897 | 8 | % | 4,109 | 10 | % | 3,526 | 8 | % | 38.9 | % | 19.2 | % | ||||||||||||
| Other subsidiaries and elimination | 3,979 | 7 | % | 3,674 | 9 | % | 3,216 | 7 | % | 23.7 | % | 8.3 | % | ||||||||||||
Total administrative expenses | 59,234 | 100 | % | 42,485 | 100 | % | 43,176 | 100 | % | 37.2 | % | 39.4 | % | ||||||||||||
Altogether, these important increases in expenses in 4Q07 which resulted in an overall 29.2% QoQ growth of operating expenses, more than surpassed income growth of 9.7% and resulted in an important deterioration of BCP’s efficiency ratio. Thus, BCP’s efficiency ratio went from 48.3% in 3Q07 to 56.9% for 4Q07. This increase in costs, though significant for a single quarter, was no surprise since such an increase in expenses was already expected as a result of the aggressive business expansion planned and announced. In fact, these expenses are necessary to reach the business and network expansion levels at which we aim.
II.7 Shareholders’ Equity and Regulatory Capital
Shareholders' equity | Quarter | Change | ||||||||||||||
| US$ 000 | 4Q07 | 3Q07 | 4Q06 | 4Q07/4Q06 | 4Q07/3Q07 | |||||||||||
| Capital stock | 364,706 | 364,706 | 364,706 | 0.0 | % | 0.0 | % | |||||||||
| Reserves | 282,189 | 282,189 | 242,889 | 16.2 | % | 0.0 | % | |||||||||
| Unrealized Gains and Losses | 57,771 | 56,411 | 52,170 | 10.7 | % | 2.4 | % | |||||||||
| Retained Earnings | 96,245 | 96,245 | 56,335 | 70.8 | % | 0.0 | % | |||||||||
| Income for the year | 331,652 | 245,454 | 247,756 | 33.9 | % | 35.1 | % | |||||||||
Total shareholders' equity | 1,132,564 | 1,045,006 | 963,856 | 17.5 | % | 8.4 | % | |||||||||
| Return on average equity (ROAE) | 31.67 | % | 36.13 | % | 29.20 | % | ||||||||||
Total shareholders’ equity reached US$ 1,133 million as of December 2007, i.e. up 8.4% QoQ. ROAE however, dropped this quarter to 31.67%, from the extraordinary 36.13% reached in 3Q07, which is still a robust return and compares very well to 4Q06 ROAE of 29.18%, but reflects the slightly lower 4Q07 income reported by BCP.
At the end of December 2007, the capital adequacy ratio for BCP unconsolidated reached 11.8% (8.4 times), higher than 11.3% (8.8 times) for 3Q07. Therefore, this indicator outperforms the one established by the system (9.1%) and our more conservative internal ratio of 11.5%.
On the other hand, Tier I reached US$ 759.2 million. Risk adjusted assets include US$ 294 million market risk, which requires US$ 26.7 million of equity. Total regulatory capital includes US$ 295 million subordinated debt. In addition, US$ 74 million of capitalized earnings are included in the present period
Regulatory Capital and Capital Adequacy Ratios | Quarter ended | Change | ||||||||||||||
| US$ 000 | 4Q07 | 3Q07 | 4Q06 | 4Q07/4Q06 | 4Q07/3Q07 | |||||||||||
| Capital Stock, net | 429,415 | 416,892 | 402,543 | 6.7 | % | 3.0 | % | |||||||||
| Legal and Other capital reserves | 346,418 | 336,315 | 285,600 | 21.3 | % | 3.0 | % | |||||||||
| Generic Contingency loss reserves | 85,005 | 76,312 | 56,921 | 49.3 | % | 11.4 | % | |||||||||
| Subordinated Debt | 294,648 | 136,674 | 140,086 | 110.3 | % | 115.6 | % | |||||||||
| Net income capitalized | 74,019 | 71,860 | - | - | 3.0 | % | ||||||||||
Total | 1,229,505 | 1,038,054 | 885,150 | 38.9 | % | 18.4 | % | |||||||||
| Less: Investment in multilateral organization and banks | (175,762 | ) | (160,309 | ) | (154,278 | ) | 13.9 | % | 9.6 | % | ||||||
Total regulatory capital | 1,053,743 | 877,745 | 730,872 | 44.2 | % | 20.1 | % | |||||||||
| Risk-weighted assets (Credit risk) | 8,603,291 | 7,578,961 | 5,915,150 | 45.4 | % | 13.5 | % | |||||||||
Market Risk | 26,714 | 16,864 | 24,194 | 10.4 | % | 58.4 | % | |||||||||
Capital Ratios: | ||||||||||||||||
| Regulatory capital as a percentage of risk-weighted assets | 11.84 | % | 11.30 | % | 11.82 | % | ||||||||||
| Ratio of risk-weihted assets to regularoy capital | 8.44 | 8.85 | 8.46 | |||||||||||||
19
III. BCP Bolivia
Bolivian Financial System
Despite the political uncertainty that characterized the country during the last years, Bolivia registered favorable economic results, which had a positive effect on the financial system. Bank deposits reached US$ 4,236 million as of December 2007, 27% higher than the US$ 3,323 million of the previous year. Total loan volume grew 15.8% YoY, reaching US$ 3,204.1 million as of December 2007.
Continuing with the positive trend of the last months, the quality of the loan portfolio reached 5.6% as of December 2007 vs. 8.7% as of December 2006. The coverage ratio was 112.2%.
Results
In 4Q07, BCP Bolivia reached a net income of US$ 9.7 million, showing an impressive growth of +37.6% QoQ and +126.0% YoY, mainly as a result of increased interest income (+13.5% QoQ and +40.1% YoY) and fee income (+22.6% QoQ and +37.8% YoY). Net income for the year was US$ 27.0 million, 91.5% higher than that of 2006, due to an excellent performance in all financial and non-financial business lines. In addition, it is important to mention the positive effect of the appreciation of local currency (bolivianos) with respect to the US dollar, during the year.
Thus, BCP Bolivia continues with the positive trend of the last quarters, with a 35.6% ROE as of December 2007, significantly higher than the 22.2% of the system. As we mentioned in previous quarters, a conservative credit risk management strategy was maintained, with non-performing loans reaching 1.7% (2.5% in 3Q07), while coverage stood at 240.1% (181.9% in 3Q07). These figures indicate that BCP Bolivia had one of the best performances within the Bolivian banking system, which reported ratios of 5.6% and 112.2%, respectively.
On the other hand, as mentioned in previous quarterly reports, the focus on businesses with better margins as the Retail, Middle market and “Consolidated” segments has been determinant for BCP Bolivia’s results. The Retail segment has received strong attention, as has as well the “Consolidated” segment which comprises companies with sales below US$ 1 million per years. In both segments some important development has been achieved as these present the best growth potential of the Bolivian market. BCP Bolivia is in this way positioning itself as the bank with the best infrastructure and corporate know-how to attend these segments best.
Assets and Liabilities
As of December 2007, total loans reached US$ 463.8 million, revealing a 2.0% QoQ and 18.8% YoY growth. BCP Bolivia holds a much diversified loan portfolio in different business segments. During this quarter, Retail Banking revealed the highest growth (+4.9% QoQ and 19% YoY), while Corporate and Middle Market increased 1.2% QoQ, respectively (Corporate +35.5% YoY and Middle Market -2.0% YoY). Loan breakdown is mainly composed by Corporate and Retail segments which represent 41.3% and 43.2%, respectively, of total portfolio.
Within the Retail Banking segment, the SME increased 14.3% QoQ and 104.6% YoY as well as Consumer segment grew 11.2% QoQ and 46.2% YoY. In addition, it is important to mention the good performance of the mortgage segment with growth rates of +1.9% QoQ and +7.1% YoY, which represent more than 50% of the retail loan portfolio.
In terms of liabilities, BCP Bolivia showed an increased in deposits of 6.4% QoQ and 25.6% YoY, as a result of increased confidence of clients and a relative stabilization of the political scenario, strong campaigns to promote savings and better deposit rates. In addition, saving deposits grew 9.3% QoQ and 24.1% YoY, whereas time deposits slightly decreased 0.8% QoQ. Finally, BCP Bolivia holds market shares of 14.9% and 15.2% of loans and deposits, respectively, which represent the third place in the Bolivian Banking System.
Banco de Crédito de Bolivia | Quarter | Change % | ||||||||||||||
| US$ millon | 4Q07 | 3Q07 | 4Q06 | 4Q07/4Q06 | 4Q07/3Q07 | |||||||||||
| Total Loans | 463.8 | 454.5 | 390.5 | 18.8 | % | 2.0 | % | |||||||||
| Past due loans | 7.8 | 11.3 | 13.8 | -43.5 | % | -31.0 | % | |||||||||
| Loan loss reserves | (18.6 | ) | (20.6 | ) | (22.6 | ) | -17.7 | % | -9.7 | % | ||||||
| Total Assets | 821.9 | 761.3 | 653.6 | 25.8 | % | 8.0 | % | |||||||||
| Deposits | 663.9 | 623.8 | 528.5 | 25.6 | % | 6.4 | % | |||||||||
| Shareholders net equity | 85.1 | 75.4 | 70.3 | 21.1 | % | 12.9 | % | |||||||||
Net income | 9.7 | 7.0 | 4.3 | 126.0 | % | 37.6 | % | |||||||||
| PDL/Total loans | 1.7 | % | 2.5 | % | 3.6 | % | ||||||||||
| Coverage ratio of PDLs | 240.1 | % | 181.9 | % | 163.6 | % | ||||||||||
| ROAE | 35.6 | % | 31.3 | % | 21.7 | % | ||||||||||
| Branches | 61 | 58 | 57 | |||||||||||||
| ATMs | 157 | 152 | 142 | |||||||||||||
| Employees | 1441 | 1338 | 1162 | |||||||||||||
20
IV. Atlantic Security Holding Corporation
ASHC | Quarter | Change % | ||||||||||||||
(US$ Million) | 4Q 2007 | 3Q 2007 | 4Q 2006 | 4Q07 / 4Q06 | 4Q07 / 3Q07 | |||||||||||
| Net interest income | 4.9 | 4.8 | 3.9 | 26.6 | 3.2 | |||||||||||
| Dividend income | 0.2 | 0.1 | 0.2 | 6.9 | 108.4 | |||||||||||
| Fees and commissions from services | 2.2 | 2.7 | 1.7 | 32.1 | -19.2 | |||||||||||
| Net gains on foreign exchange transactions | 0.8 | 1.2 | -0.1 | 1,172.4 | -29.0 | |||||||||||
Core Revenues | 8.2 | 8.7 | 5.7 | 43.8 | -6.7 | |||||||||||
| Total provisions, net of recoveries | -3.1 | -1.1 | 0.0 | 100.0 | -168.8 | |||||||||||
| Net gains from sale of securities | 2.4 | -0.2 | 0.3 | 637.2 | 1,443.6 | |||||||||||
| Other income | 0.4 | 1.1 | 0.0 | 2,170.3 | -62.3 | |||||||||||
| Operating expenses | -2.9 | -2.3 | -2.3 | 26.9 | 25.4 | |||||||||||
Net income | 5.0 | 6.2 | 3.7 | 34.3 | -19.7 | |||||||||||
| Net income/share | 0.1 | 0.1 | 0.1 | 34.3 | -19.7 | |||||||||||
| Total loans | 130.1 | 125.5 | 131.2 | -0.8 | 3.6 | |||||||||||
| Total investments available for sale | 853.7 | 826.4 | 738.6 | 15.6 | 3.3 | |||||||||||
| Total asset | 1,615.3 | 1,486.1 | 1,379.8 | 17.1 | 8.7 | |||||||||||
| Total deposits | 1,382.9 | 1,256.8 | 1,166.1 | 18.6 | 10.0 | |||||||||||
| Shareholder's equity | 214.1 | 208.8 | 179.6 | 19.2 | 2.6 | |||||||||||
| Net interest margin | 1.34 | % | 1.38 | % | 1.25 | % | ||||||||||
| Efficiency ratio | 26.6 | % | 24.0 | % | 38.2 | % | ||||||||||
Return on average equity* | 16.5 | % | 17.0 | % | 15.7 | % | ||||||||||
| PDL / Total loans | 0.00 | 0.00 | 0.00 | |||||||||||||
| Cover ratio | 1.0 | % | 1.0 | % | 1.9 | % | ||||||||||
BIS ratio* | 14.58 | % | 14.99 | % | 15.10 | % | ||||||||||
* Figures of ASB, on an accumulated basis.
Net income for Atlantic Security Holding Corporation (ASHC) of USD 5.0 million reflects an important increase of 34.3% YoY, though also a quarterly drop of 19.7%.
Core revenues grew by 43.8% YoY driven by greater asset volumes, wider margins and increased commission income. On a QoQ basis however, core revenues presented a decrease of 6.7% mainly due to reduced fees and commissions, which were affected negatively by lower rebates and higher commissions paid to other fund managers we subcontracted during this 4Q07. In addition, net gains on foreign exchange transactions drop on a quarterly comparison since an extraordinary recognition of adjustments in the market value of structured currency products was booked in 3Q07. Reported figures for 4Q07 on foreign exchange operations are in fact a good indicator of real business results for the following quarters.
On the other hand, the positive growth trend in commission’s income that began in 3Q06 of approximately USD 350 thousand per quarter has started to slow down due to fewer new accounts for administered funds.
In 4Q07 USD 3.1 million of provisions were constituted in order to reflect the negative market environment which could worsen in the next months. Notwithstanding, asset quality remains high and shows no sign of deterioration despite current market conditions.
Net interest margin presents a decrease from 1.38% to 1.34% mainly due to an increase in average balances of deposits and lower yields achieved. As a result of the interest rates dropdown environment during this 4Q07 and the decreasing trend of spreads on Libor-Treasury rates, we expect a slight decrease in net interest margin for the following months.
Fees and commissions presents an increase of 32.1% on a YoY basis and a decrease of 19.2% on a QoQ basis, the latter being the result of reduced incentive and placement fees for products offered by the bank. We foresee that customer participation in ASB funds will remain stable and within the 2007 levels over the following months.
21
Efficiency ratio presented a slight increase from 24% reported in 3Q07 to 26.6% in 4Q07, mainly due to current provisions and the related reduction of net income. Nevertheless, this ratio compares better to 2006’s efficiency ratio.
Asset growth of 8.7% QoQ and 17.1% YoY is due to large deposits taken from customers that were placed in turn invested with correspondent banks during 4Q07. In comparison with the YoY basis asset levels are at their peak for ASHC.
Interest Earning Assets
Interest earning assets reached US$ 1.458 million, as shown in the table below. QoQ IEAs increased 8.8%, while YoY growth posted was 18.5%. As mentioned before, during 4Q07 we received several large deposits which are not likely to remain invested with us, and were invested in liquid instruments. The share of investment-grade securities in the investment portfolio remains at 75%, emphasizing ASB’s prudent investment policy of concentrating its portfolio in high credit quality, high liquidity securities.
INTEREST EARNING ASSETS* | Quarter | % Change | ||||||||||||||
(US$ Million) | 4Q07 | 3Q07 | 4Q06 | 4Q07/4Q06 | 4Q07/3Q07 | |||||||||||
| Due from banks | 548 | 452 | 430 | 27.5 | % | 21.4 | % | |||||||||
| Loans | 130 | 126 | 131 | -0.8 | % | 3.6 | % | |||||||||
| Investments | 799 | 781 | 686 | 16.6 | % | 2.4 | % | |||||||||
Total interest-earning assets | 1,478 | 1,358 | 1,247 | 18.5 | % | 8.8 | % | |||||||||
(*) Excludes investments in equities and mutual funds.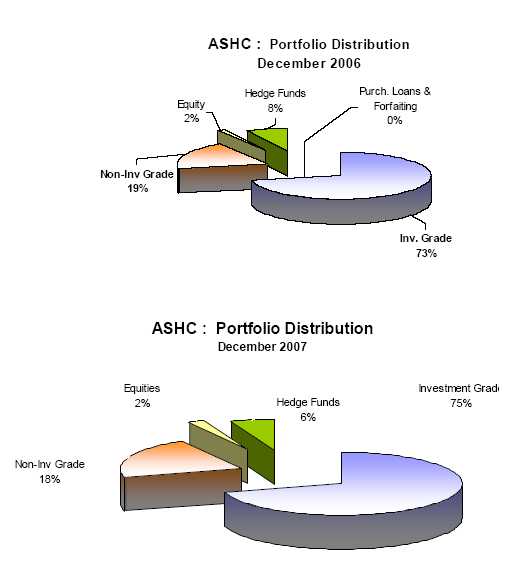
22
Asset Management Business
Third party managed funds include customers’ deposits, and investments such as proprietary mutual funds and securities custody. The total of these funds has grown 11% and 42.7% QoQ and YoY, reaching US$ 3.625 billion as of 4Q07 (US$ 3.266 billion in 3Q07). Quarterly growth was originated by specific large deposits taken and entrance of new customers to mutual funds and custody activity. As we concluded in the previous quarter, the management of third party funds in off-balance sheet accounts continues to command most new business.

23
V. PRIMA AFP
Market Developments
During 4Q07, competition in the Private Pension Fund System decreased, as a result of the continuous reduction of the sales force. Thus, the level of transfers dropped to an average of 27 thousand per month in 4Q07 from an average of 36 thousand per month in 3Q07. Reduction in sales force has not affected significantly new affiliations, reaching a level of 54 thousand, similar to the previous quarter.
In terms of funds under management (FuM), there was a reduction in the Nuevos Soles position, as a result of market contraction during the period. However local currency appreciation let to a slight growth of +0.4% for the quarter, reaching a total of US$ 20.4 billion. Market behavior affected voluntary contributions, which showed a decreasing trend.
In December 2007, the free disaffiliation law completed 4 months since its approval. Results for the first months confirm a non material effect for the Private Pension Fund System.
Financially, companies have shown a positive evolution in terms of higher earnings and lower expenses when compared to 2Q07 (we are not comparing to 3Q07 since it includes a month with double accrued earnings). However, these results were negatively affected by high legal reserves (Legal reserves are included in the Income Statement according to Peruvian GAAPs).
Private Pension Fund System: Main Indicators
| At the end of period: | 4Q07 | 3Q07 | 2Q07 | 1Q07 | |||||||||
| Affiliates (thousand) | 4,101 | 4,049 | 3,993 | 3,939 | |||||||||
| % Change (1) | 1.3 | % | 1.4 | % | 1.4 | % | 1.5 | % | |||||
| Sales force | 2,340 | 3,135 | 4,199 | 5,179 | |||||||||
| % Change (1) | -0.3 | -25.3 | % | -18.9 | % | -8.3 | % | ||||||
| Assets under management (US$ mm) | 20,371 | 20,286 | 19,334 | 16,763 | |||||||||
| % Change (1) | 0.4 | % | 4.9 | % | 15.3 | % | 16.5 | % | |||||
| Income (US$ mm) | 51.4 | 56.0 | 45.9 | 51.5 | |||||||||
| Operating Expenses (US$ mm) | 43.9 | 44.7 | 46.4 | 44.5 | |||||||||
| Operating income (US$ mm) | 7.5 | 11.3 | -0.6 | 7.0 | |||||||||
| Net Income (US$ mm) | -0.5 | 10.7 | 19.5 | 22.0 | |||||||||
Source: CONASEV, SBS:
(1) Quarter variation.
In local Peruvian accounting, legal reserves are included in the income statement as opposed to the IFRS.
There is no information for results adjusted to international financial reporting standards for the Total System.
The first and third quarter include double collection
Prima AFP
During 4Q07, Prima AFP maintained its leadership in the commercial and investment fields. In commercial terms, despite the transfers to other pension funds, Prima AFP continued raising funds as a result of its increased sales force productivity and the quality of its contributors. In addition, despite the lower level of new affiliations, the company estimates that the quality of its actual portfolio outperforms the average of the system. The company continues showing the largest market share in collections. However, a reduction of collections and of voluntary contribution balances followed the negative market developments.
In terms of its investment performance, Prima maintained its leadership in the market by positioning its funds in first or second place in terms of profitability and risk adjusted returns.
24
| PRIMA 4Q07 | System 4Q07 | % Share 4Q07 | PRIMA 3Q07 | % Share 3Q07 | ||||||||||||
| Affiliates (1) | 1,023,482 | 4,101,060 | 25.0 | % | 1,019,576 | 25.2 | % | |||||||||
| New affiliations (2) | 10,707 | 54,139 | 19.8 | % | 11,706 | 20.5 | % | |||||||||
| Funds under management US$ mm (1) | 6,403 | 20,371 | 31.4 | % | 6,347 | 31.3 | % | |||||||||
| Collections US$ mm (3) | 124 | 369 | 33.7 | % | 143 | 35.3 | % | |||||||||
| Voluntary contributions US$ mm (4) | 168 | 356 | 47.2 | % | 188 | 48.2 | % | |||||||||
(1) Source: Superintendencia de Banca y Seguros
(2) At the end of period.
(3) Accumulated to the Quarter. Include voluntary contributions
(4) Stock level at the end of period
Commercial Results
During 4Q07, Prima continued its process of reducing its sales force in order to consolidate its financial results. However, Prima’s excellent quality services and products, allowed the company to increase its income base targeting customers with higher average income.
Therefore, despite the fact that Prima had about 17 thousand new affiliations vs. 19 thousand transfers away from the company; the higher average income level of its new affiliations compensated the clients gone. This net result is evident with the funds transferred, which amounted US$ 46.4 million in this quarter, adding up to US$ 6,403 million of administered funds, which represented 31.4% market share.
Investments
Prima maintained its leadership in returns, achieving the position N°1 or N° 2 in all of its administered funds and showing consistent and solid results during the year.
Fund N°1 and Fund N°2 obtained the second highest return with 10.8% and 25.5%, respectively, for the last 12 months, while Fund N°3 was the leader in the market with a 46.4% return. Based on risk adjusted returns, Prima obtained the highest return for fund N°3 and obtained the second position in funds N°1 and 2.
On the other hand, funds under management continue its re-composition trend towards Fund N°3 from Fund N°2, though with a lower pace than previously quarters
| Dec-07 | % | Sep-07 | % | ||||||||||
| Fund 1 | 277 | 4.3 | % | 259 | 4.1 | % | |||||||
| Fund 2 | 4,154 | 64.9 | % | 4,207 | 66.3 | % | |||||||
| Fund 3 | 1,973 | 30.8 | % | 1,881 | 29.6 | % | |||||||
| Total | 6,403 | 100.0 | % | 6,347 | 100.0 | % | |||||||
Source: Superintendencia de Banca y Seguros
Financial Results
During the last quarter of 2007, the company’s income continued strong, reaching US$ 14.4 million (US$ 55 million annually). These results were similar to the previous quarter, even though the 3Q benefited from a month with double earnings. Thus, income growth was explained mainly by a larger income base and better fee structure which includes now administration charges for voluntary contributions to the funds (it used to be administered with no fees).
According to estimates based on income and administration fees for every company, during the last quarter, Prima AFP had the highest average income base of the system (31.9%).
PRIMA-AFP
25
PRIMA 4Q07 | Total System 4Q07 | PRIMA % Share | ||||||||
| Income (1) | 13.72 | 50.62 | 27.1 | % | ||||||
| Administration Fees | 1.5 | % | n.a. | |||||||
| RAM estimated base (2) | 305 | 957 | 31.9 | % | ||||||
Prima AFP estimates. in accordance to local public information, (CONASEV)
(1) Income excluding special management for collections from voluntary payments
(2) RAM: Monthly Accumulated Salary
Administration fees on voluntary contributions started in December 11th 2007, generating a new income source for the company. Even though the change in fee structure and the high volatility of the market generated a reduction in total administered funds, the positive impact on revenues provided by the change in fee structure exceeded Prima’s expectations.
During the last quarter, administrative expenses and expenses of sales personnel continue showing a downward trend. Therefore, the company showed operating expenses of US$ 9.89 million vs. US$ 11.19 million in the previous quarter.
Expenses related still to the merger as charge-off’s of assets continue being amortized. Thus, amortization and depreciation of investments in systems and properties add up to US$ 2.05 million for the period. In addition, total results include financial expenses for loans incurred to finance the acquisition of the Prima Headquarters and partially the acquisition of Union Vida, which add up to US$ 1.11 million in the fourth quarter.
Thus, following such changes in income, expenses and charges mentioned above, Prima reported net income of US$ 2.31 million for the 4Q07, while on an accumulated basis, net income was US$ 3.03 million, in line with its budget.
Total assets levels remain relatively stable reaching US$ 246.1 million, as well as liabilities (US$ 116.5 million) and equity (US$ 129.6 million). Capital Stock was reduced by capitalized losses from the periods 2005 and 2006.
PRIMA AFP: Main financial indicators (US$ Thousand)
| 4Q07 | 3Q07 | 2Q07 | 1Q07 | Total 2007 | Total 2006 | ||||||||||||||
| Income | 14,413 | 14,759 | 12,121 | 13,657 | 54,949 | 23,455 | |||||||||||||
| General Expenses | (12,105 | ) | (12,947 | ) | (13,385 | ) | (13,479 | ) | (51,916 | ) | (44,178 | ) | |||||||
| Net Income / Loss | 2,308 | 1,811 | (1,264 | ) | 178 | 3,033 | (20,723 | ) | |||||||||||
| Total Assets | 246,095 | 244,050 | 239,120 | 229,159 | 246,095 | 230,559 | |||||||||||||
| Total Liabilities | 116,485 | 114,959 | 112,150 | 106,055 | 116,485 | 112,078 | |||||||||||||
| Equity | 129,610 | 129,090 | 126,971 | 123,104 | 129,610 | 118,481 | |||||||||||||
(1) IFRS
26
VI. EL PACIFICO PERUANO SUIZA Y SUBSIDIARIAS
VI.1 PACIFICO GRUPO
Results for the quarter
Total premiums of Pacífico Grupo, which include Property & Casualty (PPS), Life (PV) and Health (EPS), amounted to US$ 129.0 million in 4Q07, representing an improvement of 11.6% QoQ and 47.3% YoY. This important growth explains the increase in reserves QoQ and YoY.
Total premiums growth was fueled by a 15.1% QoQ increase in P&C premiums, mainly in automobiles, liabilities and technical lines. Total P&C premiums were 63% higher YoY due to automobiles, technical lines and fire segments. Total premiums were also supported by the growth of Life and Health insurance premiums, which were up 41% and 26% respectively YoY.
Quarter | Change | |||||||||||||||
US$ MM | 4Q07 | 3Q07 | 4Q06 | 4Q07 / 3Q07 | 4Q07 / 4Q06 | |||||||||||
| Total Gross Premiums | 129.0 | 115.6 | 87.6 | 11.6 | % | 47.3 | % | |||||||||
| Retained Premiums | 104.2 | 91.4 | 70.7 | 14.0 | % | 47.3 | % | |||||||||
| Reserve Adjustments | 20.1 | 14.2 | 3.9 | 41.2 | % | 420.0 | % | |||||||||
| Net Premiums Earned | 84.1 | 77.1 | 66.9 | 9.0 | % | 25.8 | % | |||||||||
It is important to highlight that the re-composition of the risk portfolio favoring the retail segment which offers more retention, diversification and predictability of risk is progressing successfully. Thus, for the retail segments of Property and Casualty such as medical assistance, automobiles, personal injuries, property insurance and SOAT segments, total premiums grew 79% YoY and 39.5% on an accumulated basis.
Underwriting result for 4Q07 amounted to US$ 0.5 million, recovering from the losses of 3Q07 which resulted from the negative effect of the earthquake that stroke the southern area of our country. However, 4Q07 underwriting result was lower than that of 4Q06 due to significant and severe claims in fire and technical lines as well as an increase in life annuity claims.
Net consolidated income after minority interest reached US$ 0.8 million, representing an improvement vis-à-vis the loss of the previous quarter. Comparing results with 4Q06, it is important to remember that 4Q06 net income (US$ 40.1 million) includes an extraordinary income mainly as a result of the sale of BCP stocks for approximately US$ 40.1 million.
Results for the year 2007
Total premiums for Pacífico Grupo grew 25.4% YoY. However, results were negatively affected by the strong 7.8 Richter (8.0 Momentum) scale earthquake that stroke the southern area of our country on August 2007. As of December 2007, the Property & Casualty business (PPS) had received claims related to the earthquake for a total amount of US$ 54 million. PPS had a catastrophic reinsurance policy that covered risks of this nature, leaving an exposure of only US$ 8.1 million.
As of December 2007 total premiums reached US$ 467.2 million, US$ 94.6 million (+25%) higher than total premiums reported in 2006. This growth was led by the P&C segment, which grew 35% YoY. As a result, the group increased its market share from 30.2% as of November 2006 to 33.4% as of November 2007.
Net income for 2007 was US$ 12.4 million, US$ 53.3 million lower than that corresponding to 2006. However, as was mentioned before, a great portion of this difference was due to the extraordinary income registered during 4Q06 as a result of the sale of BCP stocks due to the change in portfolio mix. Therefore, a comparison of the contributions to Credicorp is more revealing and this dropped from US$ 14.5 million to US$ 9.4 million.
27
During 2007, life and health segments outperformed with good growth rates and profitability. However, Property & Casualty results were affected by the devastating earthquake of late August as well as the strong claims in fire, technical lines and dishonesty segments. Nevertheless, PPS has been executing with success a retail strategy to diversify its risk portfolio, transfer its risk exposure towards international re-insurance markets and reduce earnings volatility.
US$ Thousand | Adjustments for | Total | |||||||||||||||||
Net Earnings | Consolidation and Minorities | Contribution to BAP | |||||||||||||||||
Period | PPS | PV | EPS | PGA | |||||||||||||||
1Q07 | 1,883 | 6,147 | 705 | 8,735 | (2,119 | ) | 6,616 | ||||||||||||
2Q07 | 2,263 | 3,931 | 585 | 6,779 | (1,645 | ) | 5,134 | ||||||||||||
3Q07 | -6,615 | 2,108 | 598 | (3,908 | ) | 948 | (2,960 | ) | |||||||||||
4Q07 | -3,266 | 3,351 | 768 | 853 | (208 | ) | 645.0 | ||||||||||||
VI.2 PACIFICO SEGUROS GENERALES (PPS)
Total premiums in 4Q07 amounted to US$ 64.4 million, up 15.1% QoQ and 62.5% YoY. The QoQ increase was mainly due to technical lines and liabilities segment, while the YoY growth was driven by the automobile, liabilities and medical assistance segments.
During the year 2007, PPS grew at an extraordinary rate of 34.7%. Total premiums for the year reached US$ 240.4 million, US$ 61.9 million higher than 2006 premiums.
During 4Q07, net claims amounted to US$ 30.1 million revealing an improvement to 89.2% net earned loss ratio (NEL) ratio from 97.2% for the hardly hit 3Q07, but still worse in terms of claims than the 75.2% for 4Q06. Net claims for the year 2007 were US$ 102.9 million and reveal higher casualties for the year with (NEL) at 80.2% vs. 64.1% in 2006.
The strong earthquake that stroke the southern area of our country on August 2007 had a negative direct impact of US$ 8.1 million which include retained claims and additional costs for re-instatement premiums for re-insurance policy contracts. It is important to mention that in addition, the company had two important claims on fire and technical lines during the year. These three events have increased the NEL by 10 percentage points.
Technical result during the quarter reached a negative result of US$ 2.8 million vs. a negative result of US$ 5.8 for 3Q07 and a positive result of US$ 1.0 million for 4Q06. This decrease is highly related to higher claims reported during the year. Thus, technical result for the year 2007 was US$ 1.1 million, below the US$ 22.3 million reported in 2006.
Net Financial income during the 4Q07 totaled US$2.3 million vs. US$2.2 million in 3Q07 and US$1.8 million in 4Q06. On a yearly basis comparison, net financial income reached US$9.7 million, 6% higher than that obtained in 2006, given the increase in the portfolio investment of total premiums, effect that compensated the decrease in the international interest rates. On the other hand, “other income” registered US$30.4 million during 2007, 43% lower than US$53.5 million attained in 2006. The most important component that was behind this variation was the gain on sales of securities for which 2007 registered earnings of US$15.9 million, an amount lower than that obtained in 2006 when PPS registered an extraordinary gain of US$40 million for the sale of BCP stocks.
During 4Q07, PPS registered a net loss of US$ 3.2 million vs. a net loss of US$ 6.6 million in 3Q07. For the year 2007, PPS registered a net loss of US$ 5.7 million due to the negative effects of the events mentioned before that affected the NEL ratio of the company.
In terms of market share, PPS achieved 34% on November 2007, 4 percentage points higher than the 29.7% registered on November 2006.
28
Finally, consolidated net income for the group, after minority interest, reached US$ 12.4 million during 2007, 76.6% below US$ 53.3 million reached in 2006, explained in part to the extraordinary gains mentioned before.
VI.3 PACIFICO VIDA
Total premiums for the quarter amounted to US$ 39.3 million, up 6.8% QoQ and 41% YoY, driven in both cases by the growth of individual life and disability and survivor insurance. Total premiums for the year reached US$ 136.7 million, 17% higher than that attained in 2006. This growth is the result of the increase in sales force and the introduction to the market of new products, as well as the consolidation of Prima AFP in the pension fund business.
Claims in 4Q07 reached US$ 17.9 million, US$ 1 million higher than in 3Q07 and US$ 6.5 million higher than 4Q06 as a result of business expansion, which requires greater reserves. Claims for 2007 amounted to US$ 63.2 million, up 22% YoY.
Technical result of 4Q07 reached US$ 425 thousand, 40% lower than US$ 710 thousand attained in 3Q07, as a result of greater reserves and due to larger costs of sales and policy acquisitions. The technical result achieved in 4Q06 was US$2.4 million, as a consequence of lower technical reserves for life Annuities due to a decrease in its total premiums production. Finally, technical result for the year 2007 was US$ 1.5 million vis-à-vis the negative result of US$ 0.4 million in 2006. During 2007, the company benefited from the positive effect of greater extraordinary income as a result of the consolidation of Prima AFP’s client base after its merger with AFP Unión Vida and related annuity business.
Net income after minority interest reached US$ 3.3 million in 4Q07 vs. US$ 2.1 million in 3Q07 and US$ 3.9 million in 4Q06. Net income was US$ 15.5 million in 2007, 66% higher than that obtained during 2006.
The higher number in sales force and the introduction to the market of new products led to an increase in market share in the Life segment. As of November 2007, it was 26.0% vs. the 23.8% reached in December 2006.
VI.4 PACIFICO SALUD (EPS)
Total contributions for 4Q07 reached US$ 26.5 million, up 10.3% QoQ and 26.6% YoY. This growth was fueled mainly by the contributions of health programs. Total year contributions grew 17.9% reaching US$ 95.1 million, mainly as a result of health insurance contributions of US$ 80.2 million. Medical services through Asociación Médica amounted to US$ 3.7 million.
Total claims in 4Q07 reached US$ 21.8 million, vs. US$ 19.1 million in 3Q07 and US$ 16.0 million in 4Q06. The NEL ratio increase from 79.5% in 3Q07 to 82.2% in 4Q07 due to higher reserves for claims IBNR (during 4Q07, PS registered reserves for US$3.9 million) as a consequence of the growth of sales. Total claims in 2007 reached US$76.0 million, which represent a total NEL of 80.1% vs. 77.3% obtained in 2006, mainly as a consequence of a more dynamic competitive market (2 new start-up companies were created in 2007), generating a pressure to decrease prices, as well as higher technical reserves mentioned before.
Net income for the quarter reached US$ 0.8 million, slightly higher than US$ 0.6 million in 3Q07 and in line with that reached in 4Q06. Net income for the year was US$ 2.7 million, 25% lower than US$ 3.6 million registered during 2006, explained by higher personnel expenses fees expenses and higher technical reserves mentioned above. Nevertheless, this is a positive result taking into account a very tough and competitive environment.
Finally, the company maintained its leading position during the year, with a market share of 54%.
29
VII. ECONOMIC OUTLOOK
Economic Activity
The Peruvian economy accumulated an expansion of 8.4% from January to November (an estimated 8.3% for the year 2007 according to preliminary information from the Ministry of Economy), led by the dynamism of private investments, and sectors associated with domestic demand, such as construction and non-primary manufacture. Construction growth reached +15.8 reflecting the high construction activity in housing, business and industrial premises and the execution of mining and energy projects, as well as the implementation of public projects by regional governments
On the other hand, the non-primary industrial sector shows growth of +13.2% explained by the increased production of consumption and capital goods, intermediate goods though, show an important growth, especially those related to construction. On the contrary, the primary sector shows a slightly fall (-0.9%). Notwithstanding, growth perspectives for the next months are positive, explained by the dynamism of domestic demand, which might however slowdown throughout 2008 after the 25 bp increase in the BCR reference rate and increase of reserve requirements for soles and dollars, which should put pressure on lending rates.
Gross Domestic Product and Internal Demand
(Annualized percentage variation)
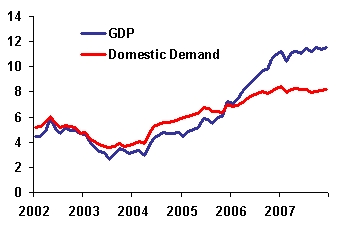
Source: INEI
External Sector
During the first eleven month of the year, the trade balance surplus was of US$ 7,241 million, an amount US$ 576million lower than the surplus achieved for the same period 2006. This is explained by 32.4% growth of imports (mainly capital goods), which surpassed by far the 17.8% growth in exports. Thus, exports reached US$ 25,033 million, with growth explained by a 14.3% increase in international prices, and only a 3.1% increase in exported volumes. Imported capital goods grew 43.7%, especially those related to agriculture and transportation, while imported intermediate goods grew 30% and consumption goods 22.4% reflecting the increases in international food prices. Thus, discounting the price impact, real import growth was only 21.4%. Finally, International reserves continue growing and closed the year with a record level of US$ 27,689 million, US$ 10,414 million above the one registered on 2006.
30
Exports and Imports
(Annualized percentage variation)
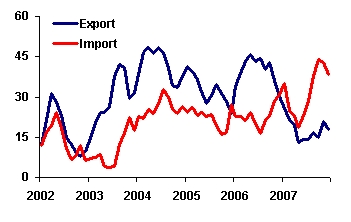
Source: BCRP
Prices and Exchange rate
At the close of 2007, annualized inflation exceeded for the first time the Central Bank’s targeted range(2% ± 1%) since the creation of such inflation target scheme (2002), with inflation remaining far below during the first month of the year, but reaching +3.9% YoY. The price increases during the last month were mainly due to increases in food international prices, which reflect not only problems of supply, but also a structural change in demand, since now agricultural commodities like sugar cane and corn are used as inputs in the preparation of bio-combustibles. In this environment, the central bank increased its reference rate during the second half of the year in 50 bp In addition, the dynamism of internal demand started to put pressure on prices rising inflation. With regards to the Exchange rate, it closed the year at S/. 2.998 Per dollar, accumulating an appreciation of 6.18% in relation to the closing of 2006. During the last months of 2007, the revaluation pressure on the domestic currency was accentuated after the cuts on interest rates in the United States, which stimulated BCR to increase its dollar purchases in order to reduce the exchange volatility, purchasing US$ 10,298 million, 2.6 times the amount of intervention in the previous year.
Consumer price index (Annual percentage variation) | Exchange Rate and purchases US$ BCRP (S/. per dollar and US$ MM) |
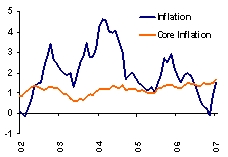 | 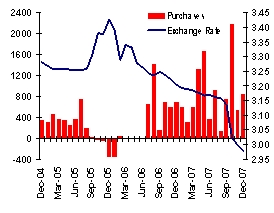 |
Source: INEI, BCR
31
Fiscal Aspects
In 2007, tax collections increased to S/. 52,548 million. That is 13.3% more in real terms than tax collections in the same period of 2006. This growth is explained principally by increased collections of Value Added Tax (IGV, +15.3%) and Income Tax (IR, +22.2%), with the latter including some regularization taxes which make up for one fifth of the total. On the public spending side of the Central Government, an increase of 14.6% up to November is observed and explained by an increase of +14.9% in current expenditure ( specially on transfers +30.9%), and lower growth of public spending (+12.2%). Hence, the economic result of the Central Government at the closing of November reveals a surplus of S/. 8,890 million (S/. 2,198 million above the one registered on the same period 2006).
Fiscal Income of the Central Government
(Annualized, expressed in thousand of millions of Nuevos Soles)
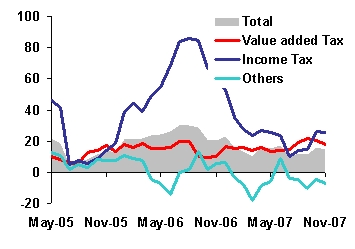
Source: Sunat
Banking System
At the closing of November 2007, total loans placed in the banking system continued the growth trend and reached US$ 21,595 million, amount that represents and increase of +41.3% compared to the same period of 2006 and of +37.5 with respect to the closing of 2006. This result is mainly supported by the stronger credit activity in the retail segments such as consumer loans (+58.7% YoY), SME lending (+40.4% YoY) and montages (+25.6% YoY). Despite the credit dynamism, delinquencies reduction continued, reaching a record low level of 1.38%.
Deposits also continued increasing and reached US$24,437 million, reflecting a 32.6% growth rate with respect to the same period of 2006, and of +29.6% with respect to the closing of 2006. Growth was observed mainly in demand deposits (+42.4% YoY), though also an import dynamism was observed in saving deposits (+35.8% YoY), and time deposits (+19.9%).
Dollarization of the banking system continues decreasing in both loans and deposits. This way dollar lending grew by +32.5% YoY, while soles lending grew at a more accelerated rate (+58.2% YoY). Furthermore, dollar loans represent now 65.8% of total loan portfolio (as of November 2006), while these used to make up for 61.7% a year ago. Dollarization of deposits also dropped from levels of 63.6% to 58.3% in the same period, which reflects an increasing preference for saving in national currency in view of the appreciation experienced by the Nuevo Sol.
32
Finally, interest rates continue showing stability in the last month, with the exception of the local currency interest rate This way TAMN closed 2007 at 22.3%, below the closing level in 2006 (23.1%), while TAMEX (foreign currency lending rate) remain steadily and closed at 10.8% in 2007. 10.9% (at the closing of 2006). On the funding side, the TIPMN (local currency deposit rate) and the TIPMEX (Foreign currency deposit rate) Closed 2007 in 3.3% and 2.5% respectively, which are slightly higher levels comparing the closing in 2006 (3.2% y 2.2%).
Main Financial Indicators
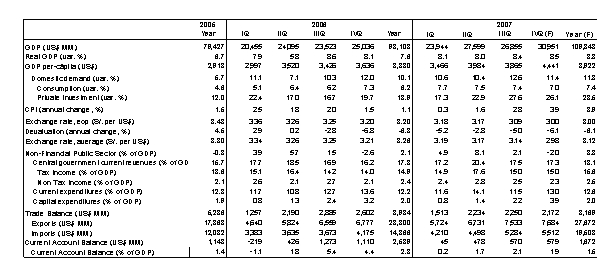
33
Company Description:
Credicorp Ltd. (NYSE: BAP) is the leading financial services holding company in Peru. It primarily operates via its four principal Subsidiaries: Banco de Credito del Peru (BCP), Atlantic Security Holding Corporation (ASHC), El Pacífico-Peruano Suiza Compañía de Seguros y Reaseguros (PPS) and Grupo Credito. Credicorp is engaged principally in commercial banking (including trade finance, corporate finance and leasing services), insurance (including commercial property, transportation and marine hull, automobile, life, health and pension fund underwriting insurance) and investment banking (including brokerage services, asset management, trust, custody and securitization services, trading and investment). BCP is the Company's primary subsidiary.
Safe Harbor for forward-looking statements:
This material includes “forward-looking statements” within the meaning of Section 21E of the Securities Exchange Act of 1934. All statement other than statements of historical information provided herein are forward-looking and may contain information about financial results, economic conditions, trends and known uncertainties.
The Company cautions readers that actual results could differ materially from those expected by the Company, depending on the outcome of certain factors, including, without limitation: (1) adverse changes in the Peruvian economy with respect to the rates of inflation, economic growth, currency devaluation, and other factors, (2) adverse changes in the Peruvian political situation, including, without limitation, the reversal of market-oriented reforms and economic recovery measures, or the failure of such measures and reforms to achieve their goals, and (3) adverse changes in the markets in which the Company operates, including increased competition, decreased demand for financial services, and other factors. Readers are cautioned not to place undue reliance on these forward-looking statements, which speak only as of the date hereof.
The Company undertakes no obligation to release publicly the result of any revisions to these forward-looking statements which may be made to reflect events or circumstances after the date hereof, including, without limitation, changes in the Company’s business strategy or planned capital expenditures, or to reflect the occurrence of unanticipated events.
34
CREDICORP LTD. AND SUBSIDIARIES | |
CONSOLIDATED BALANCE SHEETS | |
(In US$ thousands, IFRS) |
As of | Dec 06/ | Dec 07/ | ||||||||||||||
December 2007 | September 2007 | December 2006 | Dec 07 | Sep-07 | ||||||||||||
Assets | ||||||||||||||||
Cash and due from banks | ||||||||||||||||
| Non-interest bearing | 577,428 | 541,062 | 474,859 | 21.6 | % | 6.7 | % | |||||||||
| Interest bearing | 2,754,578 | 1,891,059 | 2,258,671 | 22.0 | % | 45.7 | % | |||||||||
| Total cash and due from banks | 3,332,006 | 2,432,122 | 2,733,530 | 21.9 | % | 37.0 | % | |||||||||
Marketable securities, net | 102,316 | 49,465 | 45,136 | 126.7 | % | 106.8 | % | |||||||||
Loans | 8,287,667 | 7,509,085 | 5,927,101 | 39.8 | % | 10.4 | % | |||||||||
| Current | 8,226,097 | 7,440,873 | 5,850,331 | 40.6 | % | 10.6 | % | |||||||||
| Past Due | 61,570 | 68,212 | 76,770 | -19.8 | % | -9.7 | % | |||||||||
| Less - Reserve for possible loan losses | (213,383 | ) | (204,204 | ) | (190,278 | ) | 12.1 | % | 4.5 | % | ||||||
Loans, net | 8,074,284 | 7,304,881 | 5,736,823 | 40.7 | % | 10.5 | % | |||||||||
Investments securities available for sale | 5,226,912 | 4,657,859 | 3,450,711 | 51.5 | % | 12.2 | % | |||||||||
Reinsurance assets | 116,141 | 91,325 | 35,181 | 230.1 | % | 27.2 | % | |||||||||
Premiums and other policyholder receivables | 85,495 | 86,779 | 61,279 | 39.5 | % | -1.5 | % | |||||||||
Property, plant and equipment, net | 274,935 | 254,820 | 255,478 | 7.6 | % | 7.9 | % | |||||||||
Due from customers on acceptances | 35,901 | 51,040 | 45,129 | -20.4 | % | -29.7 | % | |||||||||
Other assets | 952,518 | 853,365 | 518,263 | 83.8 | % | 11.6 | % | |||||||||
Total Assets | 18,200,508 | 15,781,656 | 12,881,529 | 41.3 | % | 15.3 | % | |||||||||
Liabilities and shareholders' equity | ||||||||||||||||
Deposits and Obligations | ||||||||||||||||
| Non-interest bearing | 3,026,358 | 2,474,260 | 1,989,564 | 52.1 | % | 22.3 | % | |||||||||
| Interest bearing | 8,695,884 | 7,848,572 | 6,849,427 | 27.0 | % | 10.8 | % | |||||||||
| Total deposits and Obligations | 11,722,242 | 10,322,832 | 8,838,991 | 32.6 | % | 13.6 | % | |||||||||
Due to banks and correspondents | 2,333,295 | 1,695,923 | 941,601 | 147.8 | % | 37.6 | % | |||||||||
Acceptances outstanding | 35,901 | 51,040 | 45,129 | -20.4 | % | -29.7 | % | |||||||||
Reserves for property and casualty claims | 688,249 | 638,270 | 545,139 | 26.3 | % | 7.8 | % | |||||||||
Reserve for unearned premiums | 127,278 | 118,986 | 83,082 | 53.2 | % | 7.0 | % | |||||||||
Reinsurance payable | 21,914 | 30,247 | 25,134 | -12.8 | % | -27.5 | % | |||||||||
Bonds and subordinated debt | 692,885 | 494,234 | 512,572 | 35.2 | % | 40.2 | % | |||||||||
Other liabilities | 765,947 | 693,131 | 356,113 | 115.1 | % | 10.5 | % | |||||||||
Minority interest | 139,241 | 133,968 | 136,946 | 1.7 | % | 3.9 | % | |||||||||
Total liabilities | 16,526,952 | 14,178,629 | 11,484,707 | 43.9 | % | 16.6 | % | |||||||||
Net Shareholder's equity | 1,673,556 | 1,603,026 | 1,396,822 | 19.8 | % | 4.4 | % | |||||||||
Total liabilities and net shareholder's equity | 18,200,508 | 15,781,656 | 12,881,529 | 41.3 | % | 15.3 | % | |||||||||
Contingent Credits | 5,035,068 | 4,702,435 | 3,499,585 | 43.9 | % | 7.1 | % | |||||||||
35
CREDICORP LTD. AND SUBSIDIARIES | |
QUARTERLY INCOME STATEMENT | |
(In US$ thousands, IFRS) |
Quarter | Change | Year ended | Change | ||||||||||||||||||||||
4Q07 | 3Q07 | 4Q06 | 4Q07/4Q06 | 4Q07/3Q07 | Dec 07 | Dec 06 | Dec 07/Dec 06 | ||||||||||||||||||
Interest income and expense | |||||||||||||||||||||||||
| Interest and dividend income | 325,969 | 270,182 | 210,805 | 54.6 | % | 20.6 | % | 1,065,974 | 782,004 | 36.3 | % | ||||||||||||||
| Interest expense | (151,213 | ) | (109,127 | ) | (77,932 | ) | 94.0 | % | 38.6 | % | (432,000 | ) | (283,478 | ) | 52.4 | % | |||||||||
| Net interest and dividend income | 174,756 | 161,055 | 132,873 | 31.5 | % | 8.5 | % | 633,974 | 498,526 | 27.2 | % | ||||||||||||||
Provision for loan losses | (9,926 | ) | (7,922 | ) | (1,754 | ) | 465.9 | % | 25.3 | % | (28,356 | ) | 4,243 | -768.3 | % | ||||||||||
Non financial income | |||||||||||||||||||||||||
| Fee income | 88,314 | 86,270 | 69,559 | 27.0 | % | 2.4 | % | 324,761 | 243,778 | 33.2 | % | ||||||||||||||
| Net gain on foreign exchange transactions | 22,316 | 14,710 | 10,543 | 111.7 | % | 51.7 | % | 61,778 | 41,638 | 48.4 | % | ||||||||||||||
| Net gain on sales of securities | 3,643 | 5,124 | 14,677 | -75.2 | % | -28.9 | % | 41,357 | 27,534 | 50.2 | % | ||||||||||||||
| Other | 7,769 | 6,837 | 5,970 | 30.1 | % | 13.6 | % | 26,310 | 24,224 | 8.6 | % | ||||||||||||||
Total non financial income, net | 122,043 | 112,942 | 100,749 | 21.1 | % | 8.1 | % | 454,205 | 337,173 | 20.7 | % | ||||||||||||||
Insurance premiums and claims | |||||||||||||||||||||||||
| Net premiums earned | 81,113 | 74,511 | 64,739 | 25.3 | % | 8.9 | % | 297,272 | 251,261 | 18.3 | % | ||||||||||||||
| Net claims incurred | (20,516 | ) | (19,617 | ) | (14,158 | ) | 44.9 | % | 4.6 | % | (67,689 | ) | (46,587 | ) | 45.3 | % | |||||||||
| Increase in cost for life and health policies | (48,374 | ) | (45,085 | ) | (34,243 | ) | 41.3 | % | 7.3 | % | (170,911 | ) | (139,935 | ) | 22.1 | % | |||||||||
| Total other operating income, net | 12,222 | 9,809 | 16,338 | -25.2 | % | 24.6 | % | 58,672 | 64,739 | -9.4 | % | ||||||||||||||
Operating expenses | |||||||||||||||||||||||||
| Salaries and employees benefits | (89,585 | ) | (75,649 | ) | (65,773 | ) | 36.2 | % | 18.4 | % | (308,597 | ) | (238,305 | ) | 29.5 | % | |||||||||
| Administrative, general and tax expenses | (66,366 | ) | (48,703 | ) | (50,726 | ) | 30.8 | % | 36.3 | % | (206,894 | ) | (164,215 | ) | 26.0 | % | |||||||||
| Depreciation and amortization | (13,363 | ) | (12,857 | ) | (14,976 | ) | -10.8 | % | 3.9 | % | (51,172 | ) | (47,525 | ) | 7.7 | % | |||||||||
| Merger Expenses | - | - | (5,584 | ) | 100.0 | % | 100.0 | % | - | (5,855 | ) | -100.0 | % | ||||||||||||
| Other | (24,012 | ) | (25,916 | ) | (24,917 | ) | -3.6 | % | -7.3 | % | (99,484 | ) | (115,554 | ) | -13.9 | % | |||||||||
| Total operating expenses | (193,327 | ) | (163,125 | ) | (161,976 | ) | 19.4 | % | 18.5 | % | (666,148 | ) | (571,454 | ) | 16.6 | % | |||||||||
Income before translation results, workers' profit sharing and income taxes | 105,768 | 112,758 | 86,230 | 22.7 | % | -6.2 | % | 452,347 | 333,226 | 35.7 | % | ||||||||||||||
| Translation result | 17,442 | 13,811 | 5,715 | 205.2 | % | 26.3 | % | 34,627 | 15,216 | 127.6 | % | ||||||||||||||
| Workers’ profit sharing | (2,046 | ) | (4,274 | ) | (2,329 | ) | -12.1 | % | -52.1 | % | (12,956 | ) | (11,051 | ) | 17.2 | % | |||||||||
| Income taxes | (22,559 | ) | (29,144 | ) | (20,553 | ) | 9.8 | % | -22.6 | % | (101,624 | ) | (89,872 | ) | 13.1 | % | |||||||||
| Net income | 98,605 | 93,152 | 69,063 | 42.8 | % | 5.9 | % | 372,393 | 247,519 | 50.5 | % | ||||||||||||||
| Minority interest | 4,590 | 2,848 | 5,739 | -20.0 | % | 61.2 | % | 21,658 | 17,252 | 25.5 | % | ||||||||||||||
Net income attributed to Credicorp | 94,016 | 90,304 | 63,324 | 48.5 | % | 4.1 | % | 350,736 | 230,267 | 52.3 | % | ||||||||||||||
36
CREDICORP LTD. AND SUBSISIARIES | |
SELECTED FINANCIAL INDICATORS |
Quarter | Year ended | |||||||||||||||
4Q07 | 3Q07 | 4Q06 | December 07 | December 06 | ||||||||||||
Profitability | ||||||||||||||||
| Net income per common share (US$ per share)(1) | 1.18 | 1.13 | 0.79 | 4.40 | 2.89 | |||||||||||
| Net interest margin on interest earning assets (2) | 5.11 | % | 5.16 | % | 5.22 | % | 5.21 | % | 5.06 | % | ||||||
| Return on average total assets (2)(3) | 2.21 | % | 2.32 | % | 2.05 | % | 2.32 | % | 1.95 | % | ||||||
| Return on average shareholders' equity (2)(3) | 22.95 | % | 23.02 | % | 18.81 | % | 22.87 | % | 18.47 | % | ||||||
| No. of outstanding shares (millions)(4) | 79.76 | 79.76 | 79.76 | 79.76 | 79.76 | |||||||||||
Quality of loan portfolio | ||||||||||||||||
| Past due loans as a percentage of total loans | 0.74 | % | 0.91 | % | 1.30 | % | 0.74 | % | 1.30 | % | ||||||
| Reserves for loan losses as a percentage of | ||||||||||||||||
| total past due loans | 346.57 | % | 299.37 | % | 247.86 | % | 346.57 | % | 247.86 | % | ||||||
| Reserves for loan losses as a percentage of | ||||||||||||||||
| total loans | 2.57 | % | 3.53 | % | 3.21 | % | 2.57 | % | 3.21 | % | ||||||
Operating efficiency | ||||||||||||||||
| Oper. expense as a percent. of total income (5) | 46.20 | % | 40.77 | % | 47.34 | % | 43.00 | % | 43.47 | % | ||||||
| Oper. expense as a percent. of av. tot. assets(2)(3)(5) | 5 3.99 | % | 3.53 | % | 4.25 | % | 3.75 | % | 3.82 | % | ||||||
Average balances (millions of US$) (3) | ||||||||||||||||
| Interest earning assets | 13,691.86 | 12,490.75 | 10,177.95 | 12,158.73 | 9,850.93 | |||||||||||
| Total Assets | 16,991.08 | 15,550.54 | 12,370.10 | 15,093.29 | 11,794.70 | |||||||||||
| Net equity | 1,638.29 | 1,569.09 | 1,346.87 | 1,523.52 | 1,241.95 | |||||||||||
(1) Based on Net Income attributed to BAP. Number of shares outstanding of 79.8 million in all periods.
(2) Ratios are annualized.
(3) Averages are determined as the average of period-beginning and period-ending balances.
(4) Net of treasury shares. The total number of shares was of 94.38 million.
(5) Total income includes net interest income, fee income, net gain on foreign exchange transactions and net premiums earned. Operating expense does not include Other expenses.
(6) For holding's financial institutions.
(7) Risk-weighted assets include market risk.
37
BANCO DE CREDITO DEL PERU AND SUBSIDIARIES | |
CONSOLIDATED BALANCE SHEET | |
(In US$ thousands, IFRS) |
As of | ||||||||||||||||
Dec-07 | Set-07 | Dec-06 | Dec07/Dec06 | Dec07/Dec06 | ||||||||||||
ASSETS | ||||||||||||||||
Cash and due from banks | 2,765,209 | 2,250,986 | 2,555,224 | 8.2 | % | 22.8 | % | |||||||||
| Cash and BCRP | 2,362,339 | 1,975,785 | 1,904,061 | 24.1 | % | 19.6 | % | |||||||||
| Deposits in other Banks | 393,042 | 269,723 | 622,993 | -36.9 | % | 45.7 | % | |||||||||
| Interbanks | 5,000 | 1,000 | 25,031 | -80.0 | % | 400.0 | % | |||||||||
| Accrued interest on cash and due from banks | 4,828 | 4,478 | 3,139 | 53.8 | % | 7.8 | % | |||||||||
Marketable securities, net | 102,316 | 49,465 | 37,475 | 173.0 | % | 106.8 | % | |||||||||
Loans | ||||||||||||||||
| Current | 8,164,334 | 7,383,196 | 5,795,790 | 40.9 | % | 10.6 | % | |||||||||
| Past Due | 60,279 | 67,478 | 75,231 | -19.9 | % | -10.7 | % | |||||||||
| Less - Reserve for possible loan losses | (212,060 | ) | (202,877 | ) | (187,689 | ) | 13.0 | % | 4.5 | % | ||||||
Loans, net | 8,012,553 | 7,247,797 | 5,683,331 | 41.0 | % | 10.6 | % | |||||||||
Investment securities available for sale | 3,377,263 | 2,854,728 | 1,942,579 | 73.9 | % | 18.3 | % | |||||||||
Property, plant and equipment, net | 217,049 | 196,567 | 197,724 | 9.8 | % | 10.4 | % | |||||||||
Due from customers acceptances | 35,822 | 50,962 | 44,984 | -20.4 | % | -29.7 | % | |||||||||
Other assets | 661,126 | 578,789 | 341,807 | 93.4 | % | 14.2 | % | |||||||||
Total Assets | 15,171,338 | 13,229,294 | 10,803,125 | 40.4 | % | 14.7 | % | |||||||||
LIABILITIES AND SHAREHOLDERS' EQUITY | ||||||||||||||||
Deposits and obligations | 11,249,104 | 10,263,180 | 8,356,823 | 34.6 | % | 9.6 | % | |||||||||
| Demand deposits | 3,656,678 | 3,199,876 | 2,708,109 | 35.0 | % | 14.3 | % | |||||||||
| Saving deposits | 2,381,012 | 2,167,592 | 1,952,087 | 22.0 | % | 9.8 | % | |||||||||
| Time deposits | 4,268,233 | 4,067,677 | 2,885,144 | 47.9 | % | 4.9 | % | |||||||||
| Severance indemnity deposits (CTS) | 896,283 | 785,398 | 775,027 | 15.6 | % | 14.1 | % | |||||||||
| Interest payable | 46,899 | 42,637 | 36,456 | 28.6 | % | 10.0 | % | |||||||||
Due to banks and correspondents | 1,459,359 | 811,398 | 495,547 | 194.5 | % | 79.9 | % | |||||||||
Bonds and subordinated debt | 721,056 | 523,298 | 532,063 | 35.5 | % | 37.8 | % | |||||||||
Acceptances outstanding | 35,822 | 50,962 | 44,984 | -20.4 | % | -29.7 | % | |||||||||
Other liabilities | 573,433 | 535,450 | 409,851 | 39.9 | % | 7.1 | % | |||||||||
Total liabilities | 14,038,774 | 12,184,288 | 9,839,268 | 42.7 | % | 15.2 | % | |||||||||
NET SHAREHOLDERS' EQUITY | 1,132,564 | 1,045,006 | 963,856 | 17.5 | % | 8.4 | % | |||||||||
| Capital stock | 364,706 | 364,706 | 364,706 | 0.0 | % | 0.0 | % | |||||||||
| Reserves | 282,189 | 282,189 | 242,889 | 16.2 | % | 0.0 | % | |||||||||
| Unrealized Gains and Losses | 57,771 | 56,411 | 52,170 | 10.7 | % | 2.4 | % | |||||||||
| Retained Earnings | 96,245 | 96,245 | 56,335 | 70.8 | % | 0.0 | % | |||||||||
| Income for the year | 331,652 | 245,454 | 247,756 | 33.9 | % | 35.1 | % | |||||||||
TOTAL LIABILITIES and NET SHAREHOLDERS' EQUITY | 15,171,338 | 13,229,294 | 10,803,125 | 40.4 | % | 14.7 | % | |||||||||
CONTINGENT CREDITS | 5,011,497 | 4,392,006 | 3,215,335 | 55.9 | % | 14.1 | % | |||||||||
38
BANCO DECREDITO DEL PERU AND SUBSIDIARIES | |
QUARTERLY INCOMESTATEMENT | |
(In US$ thousands, IFRS) |
Three months ended | Change | twelve months ended | Change | ||||||||||||||||||||||
4Q07 | 3Q07 | 4Q06 | 4Q07/ 4Q06 | 4Q07/ 3Q07 | Dec 07 | Dec 06 | Dec-07/ Dec-06 | ||||||||||||||||||
Interest income and expense | |||||||||||||||||||||||||
| Interest and dividend income | 272,204 | 240,181 | 184,437 | 47.6 | % | 13.3 | % | 927,954 | 690,911 | 34.3 | % | ||||||||||||||
| Interest expense | (116,640 | ) | (97,426 | ) | (66,714 | ) | 74.8 | % | 19.7 | % | (365,199 | ) | (247,183 | ) | 47.7 | % | |||||||||
| Net interest and dividend income | 155,565 | 142,755 | 117,723 | 32.1 | % | 9.0 | % | 562,755 | 443,729 | 26.8 | % | ||||||||||||||
Provision for loan losses | (11,089 | ) | (9,241 | ) | (3,188 | ) | 247.8 | % | 20.0 | % | (33,074 | ) | (1,948 | ) | 1598.3 | % | |||||||||
Non financial income | |||||||||||||||||||||||||
| Banking services commissions | 76,708 | 75,146 | 62,079 | 23.6 | % | 2.1 | % | 281,310 | 232,226 | 21.1 | % | ||||||||||||||
| Net gain on foreign exchange transactions | 21,497 | 13,526 | 10,853 | 98.1 | % | 58.9 | % | 59,739 | 42,005 | 42.2 | % | ||||||||||||||
| Net gain on sales of securities | 2,661 | 1,537 | 5,179 | -48.6 | % | 73.1 | % | 20,993 | 8,692 | 141.5 | % | ||||||||||||||
| Other | 2,592 | 1,778 | 3,964 | -34.6 | % | 45.8 | % | 8,487 | 12,773 | -33.6 | % | ||||||||||||||
| Total fees and income from services, net | 103,458 | 91,987 | 82,074 | 26.1 | % | 12.5 | % | 370,528 | 295,696 | 25.3 | % | ||||||||||||||
Operating expenses | |||||||||||||||||||||||||
| Salaries and employees benefits | (75,147 | ) | (59,669 | ) | (52,087 | ) | 44.3 | % | 25.9 | % | (242,983 | ) | (183,830 | ) | 32.2 | % | |||||||||
| Administrative expenses | (59,234 | ) | (42,485 | ) | (43,176 | ) | 37.2 | % | 39.4 | % | (182,105 | ) | (143,670 | ) | 26.8 | % | |||||||||
| Depreciation and amortization | (10,000 | ) | (9,627 | ) | (8,637 | ) | 15.8 | % | 3.9 | % | (38,446 | ) | (35,113 | ) | 9.5 | % | |||||||||
| Other | (7,485 | ) | (8,033 | ) | (7,563 | ) | -1.0 | % | -6.8 | % | (32,891 | ) | (60,227 | ) | -45.4 | % | |||||||||
| Total operating expenses | (151,867 | ) | (119,814 | ) | (111,463 | ) | 36.2 | % | 26.8 | % | (496,425 | ) | (422,840 | ) | 17.4 | % | |||||||||
Income before translation results,workers' profit sharing and income taxes | 96,068 | 105,687 | 85,145 | 12.8 | % | -9.1 | % | 403,784 | 314,637 | 28.3 | % | ||||||||||||||
| Translation result | 15,253 | 12,028 | 4,903 | 211.1 | % | 26.8 | % | 29,562 | 13,323 | 121.9 | % | ||||||||||||||
| Workers’ profit sharing | (1,813 | ) | (3,694 | ) | (2,620 | ) | -30.8 | % | -50.9 | % | (11,904 | ) | (10,815 | ) | 10.1 | % | |||||||||
| Income taxes | (23,310 | ) | (23,287 | ) | (19,737 | ) | 18.1 | % | 0.1 | % | (89,790 | ) | (69,388 | ) | 29.4 | % | |||||||||
Net income | 86,198 | 90,735 | 67,691 | 27.3 | % | -5.0 | % | 331,652 | 247,756 | 33.9 | % | ||||||||||||||
39
BANCO DE CREDITO DEL PERU AND SUBSIDIARIES | |
SELECTED FINANCIAL INDICATORS |
Quarter | Year ended | |||||||||||||||
4Q07 | 3Q07 | 4Q06 | Dec-07 | Dec-06 | ||||||||||||
Profitability | ||||||||||||||||
| Net income per common share (US$ per share)(1) | 0.067 | 0.071 | 0.053 | 0.258 | 0.193 | |||||||||||
| Net interest margin on interest earning assets (2) | 5.17 | % | 5.20 | % | 5.32 | % | 5.24 | % | 5.17 | % | ||||||
| Return on average total assets (2)(3) | 2.43 | % | 2.80 | % | 2.64 | % | 2.42 | % | 2.46 | % | ||||||
| Return on average shareholders' equity (2)(3) | 31.67 | % | 36.13 | % | 29.20 | % | 31.67 | % | 27.69 | % | ||||||
| No. of outstanding shares (millions) | 1,286.53 | 1,286.53 | 1,286.53 | 1,286.53 | 1,286.53 | |||||||||||
Quality of loan portfolio | ||||||||||||||||
| Past due loans as a percentage of total loans | 0.73 | % | 0.91 | % | 1.28 | % | 0.73 | % | 1.28 | % | ||||||
| Reserves for loan losses as a percentage of | ||||||||||||||||
| total past due loans | 351.80 | % | 300.65 | % | 249.48 | % | 351.80 | % | 249.48 | % | ||||||
| Reserves for loan losses as a percentage of | ||||||||||||||||
| total loans | 2.58 | % | 2.72 | % | 3.20 | % | 2.58 | % | 3.20 | % | ||||||
Operating efficiency | ||||||||||||||||
| Oper. expense as a percent. of total income (4) | 56.89 | % | 48.30 | % | 54.50 | % | 51.29 | % | 50.51 | % | ||||||
| Oper. expense as a percent. of av. tot. assets(2)(3)(4) | 4.07 | % | 3.45 | % | 4.05 | % | 3.38 | % | 3.60 | % | ||||||
Capital adequacy | ||||||||||||||||
| Total Regulatory Capital (US$Mn) | 1,053.7 | 877.7 | 730.8 | 1,053.7 | 730.8 | |||||||||||
| Risk-weighted assets (US$Mn) | 8,003.3 | 7,578.9 | 5,915.2 | 8,003.3 | 5,915.2 | |||||||||||
| Regulatory capital / risk-weighted assets (5) | 11.84 | % | 11.30 | % | 11.82 | % | 11.84 | % | 11.82 | % | ||||||
Average balances (millions of US$) (3) | ||||||||||||||||
| Interest earning assets | 12,032.0 | 10,970.7 | 8,854.0 | 11,610.9 | 8,779.3 | |||||||||||
| Total Assets | 14,200.3 | 12,976.3 | 10,260.3 | 13,707.9 | 10,080.0 | |||||||||||
| Net equity | 1,088.8 | 1,004.6 | 927.1 | 1,047.2 | 894.8 | |||||||||||
(1) Shares outstanding of 1,287 million is used for all periods since shares have been issued only for capitalization of profits and inflation adjustment.
(2) Ratios are annualized.
(3) Averages are determined as the average of period-beginning and period-ending balances.
(4) Total income includes net interest income, fee income and net gain on foreign exchange transactions. Operating expense includes personnel expenses, administrative expenses and depreciation and amortization
(5) Risk-weighted assets include market risk assets
40
EL PACIFICO-PERUANO SUIZA AND SUBSIDIARIAS | |
SELECTED FINANCIAL INDICATORS | |
| (In thousand dollars) |
Balance to and for the period of three months ending of | As of | |||||||||||||||
31-Dec-07 | 30-Sep-07 | 31-Dec-06 | Dec-06 | Dec-07 | ||||||||||||
4Q07 | 3Q07 | 4Q06 | ||||||||||||||
Results | ||||||||||||||||
| Total Gross Premiums | 128,982 | 115,550 | 87,561 | 372,599 | 467,238 | |||||||||||
| Net Premiums | 104,175 | 91,361 | 70,716 | 309,106 | 369,866 | |||||||||||
| Increase in Reserves | 20,098 | 14,236 | 3,865 | 50,020 | 62,593 | |||||||||||
| Net Premium earned | 84,078 | 77,125 | 66,851 | 259,086 | 307,273 | |||||||||||
| Net Claims | 68,891 | 64,702 | 48,401 | 186,522 | 238,600 | |||||||||||
| Underwriting results | 531 | -1,765 | 7,013 | 34,752 | 15,453 | |||||||||||
| Financial Income | 14,741 | 13,405 | 10,164 | 44,049 | 54,260 | |||||||||||
| Other Income | 6,781 | 8,626 | 42,383 | 53,987 | 34,924 | |||||||||||
| Salaries and Employees Benefits | 9,469 | 9,395 | 8,326 | 32,756 | 37,791 | |||||||||||
| General Expenses | 6,382 | 7,342 | 6,787 | 21,726 | 25,797 | |||||||||||
| Other Operating expenses | 19,802 | 19,201 | 14,889 | 53,211 | 71,897 | |||||||||||
| Translation Results | 1,779 | 1,599 | 725 | 1,591 | 3,941 | |||||||||||
| Income Tax | -72 | 2,734 | -839 | 5,412 | 4,331 | |||||||||||
| Net Income before Minority Interest | 2,907 | -2,620 | 42,559 | 59,086 | 21,980 | |||||||||||
| Minority Interest | 2,054 | 1,288 | 2,414 | 5,744 | 9,522 | |||||||||||
| Net Icome after Minority Interest | 853 | -3,908 | 40,144 | 53,342 | 12,459 | |||||||||||
Balance(end of period) | ||||||||||||||||
| Total Assets | 1,197,943 | 1,115,080 | 1,006,805 | 1,006,805 | 1,006,805 | |||||||||||
| Investment on Securities and Real State (4) | 821,278 | 798,878 | 728,934 | 728,934 | 728,934 | |||||||||||
| Technical Reserves | 817,510 | 758,482 | 629,405 | 629,405 | 629,405 | |||||||||||
| Net Equity | 206,103 | 208,208 | 236,705 | 236,705 | 236,705 | |||||||||||
Ratios | ||||||||||||||||
| Net Underwriting Results | 0.4 | % | -1.5 | % | 8.0 | % | 9.3 | % | 3.3 | % | ||||||
| Net Earned Loss Ratio | 81.9 | % | 83.9 | % | 72.4 | % | 72.0 | % | 77.7 | % | ||||||
| Return on Average Equity (1)(2) | 1.7 | % | -7.2 | % | 93.7 | % | 25.4 | % | 5.3 | % | ||||||
| Return on Total Premiums | 0.7 | % | -3.4 | % | 45.8 | % | 14.3 | % | 2.7 | % | ||||||
| Net Equity / Total Assets | 17.2 | % | 18.7 | % | 23.8 | % | 23.8 | % | 23.5 | % | ||||||
| Increase in Thecnical Reserves | 19.3 | % | 15.6 | % | 5.5 | % | 16.2 | % | 16.9 | % | ||||||
| Expenses / Net Premiums Earned | 21.5 | % | 25.6 | % | 25.1 | % | 24.3 | % | 24.0 | % | ||||||
| Expenses / Average Assets (1)(2) | 6.4 | % | 7.5 | % | 7.1 | % | 6.9 | % | 7.3 | % | ||||||
Combined Ratio of PPS + PS (3) | 118.9 | % | 127.9 | % | 101.8 | % | 104.4 | % | 115.4 | % | ||||||
| - Claims / Net Premiums Earned | 86.1 | % | 89.4 | % | 75.5 | % | 69.6 | % | 80.1 | % | ||||||
| - Expenses adn Commissions / Net Premiums Earn | 32.8 | % | 38.6 | % | 26.3 | % | 34.8 | % | 35.3 | % | ||||||
(1) Averages are determined as the average of period-beginning and period-ending balance
(2) Annualized
(3) without consolidated adjustments
(4) Real State Investment were excluded
41
SIGNATURE
Pursuant to the requirements of the Securities Exchange Act of 1934, the registrant has duly caused this report to be signed on its behalf by the undersigned, thereunto duly authorized.
| CREDICORP LTD. | ||
| | | |
| Date: February 08, 2008 | By: | /s/ Guillermo Castillo |
Guillermo Castillo | ||
Authorized Representative | ||
FORWARD-LOOKING STATEMENTS
This press release may contain forward-looking statements. These statements are statements that are not historical facts, and are based on management's current view and estimates of future economic circumstances, industry conditions, company performance and financial results. The words "anticipates", "believes", "estimates", "expects", "plans" and similar expressions, as they relate to the company, are intended to identify forward-looking statements. Statements regarding the declaration or payment of dividends, the implementation of principal operating and financing strategies and capital expenditure plans, the direction of future operations and the factors or trends affecting financial condition, liquidity or results of operations are examples of forward-looking statements. Such statements reflect the current views of management and are subject to a number of risks and uncertainties. There is no guarantee that the expected events, trends or results will actually occur. The statements are based on many assumptions and factors, including general economic and market conditions, industry conditions, and operating factors. Any changes in such assumptions or factors could cause actual results to differ materially from current expectations.