SECURITIES AND EXCHANGE COMMISSION
Washington, D.C. 20549
FORM 6-K
Report of Foreign Private Issuer
Pursuant to Rule 13a-16 or 15d-16 of the
Securities Exchange Act of 1934
For the period of November 9, 2007
CREDICORP LTD.
(Exact name of registrant as specified in its charter)
Clarendon House
Church Street
Hamilton HM 11 Bermuda
(Address of principal executive office)
Indicate by check mark whether the registrant files or will file annual reports under cover Form 20-F or Form 40-F.
Form 20-F x Form 40-F o
Indicate by check mark whether the registrant by furnishing the information contained in this Form is also thereby furnishing the information to the Commission pursuant to Rule 12g3-2(b) under the Securities Exchange Act of 1934.
Yes o No x

Aida G. Kleffmann
Investor Relations Officer
Credicorp Ltd.
Calle Centenario 156
La Molina, Lima - 12, PERU
Phone: (+51 1) 313-2123
E-mail: akleffmann@bcp.com.pe
Guillermo Castillo / Antonella Monteverde /
Luis Enrique Pérez
Investor Relations
Credicorp Ltd.
Calle Centenario 156
La Molina, Lima - 12, PERU
Phone: (+51 1) 313 2170
E-mail: guillermocastillol@bcp.com.pe
amonteverde@bcp.com.pe
leperez@bcp.com.pe
CREDICORP Ltd. Reports Third Quarter 2007 Earnings
Lima, Peru, November 8, 2007 - Credicorp (NYSE:BAP) announced today its unaudited results for the third quarter of 2007. These results are reported on a consolidated basis in accordance with IFRS in nominal U.S. Dollars. This full report is presented after a release of a report on the highlights of Credicorp on October 29, 2007.
HIGHLIGHTS
| Following the strong growth trend of the year, in 3Q07 Credicorp reported an increase of its net income by 3.3% QoQ and 75.9% YoY, totaling net earnings of US$ 90.3 million. |
| · | ROAE reached 23.02% for the quarter and 22.87% for the year to date. |
| · | Loan growth of its banking business continued strong revealing a 6.8% QoQ loan growth in both gross and net terms. |
| · | Interest income followed this trend with a robust 8.5% QoQ growth despite the persistent competition and pressure on rates, revealing the success of our strategy to shift our portfolio mix increasing our share of the retail business. |
| · | NII however, increased in less proportion and reflects the change in our funding structure and the need to complement our solid deposit base with debt. |
| · | An also strong fee income growth of 13.4% QoQ reveals further increases in bank transactional activity and the fee expansion at the pension fund business. Operational FX-transactional income also grows 15% QoQ, but gains from the sale of securities drop significantly following the international markets’ evolution. |
| · | Net interest margin reflects though a small drop from 5.5% for the previous quarter, reaching 5.2% this 3Q07. The drop follows the competitive pressures and increased funding costs, but could be contained given the better earnings structure resulting from the continuing change in loan mix. |
| · | Loan portfolio quality continued strengthening, reaching a PDL/Loans ratio of only 0.91%, down from 0.96% for 2Q07. Net provisioning at US$ 7.9 million for 3Q07 reflects increased gross provisions in line with loan growth but also continuing recoveries. |
| · | BCP’s consolidated numbers reflect a very healthy and dynamic banking environment with core revenues up 4.8% QoQ and 31.4% for the year. Such improved income combined with controlled operating expenses and an important positive translation effect given the revaluation on the Peruvian Nuevo Sol against the weak USDollar, led to a 10.6% QoQ higher net income for BCP for 3Q07 which reached US$ 90.7 million, and translates into a solid contribution to Credicorp of US$ 88.2 million for this 3Q07. |
| · | BCB, which is consolidated in BCP, continues its consistent growth and reports a contribution 22% higher QoQ and 91% higher YoY, reaching US$ 6.7 million for 3Q07. |
| · | ASHC remains a stable and growing business in line with the increasing wealth in the country and reports a remarkable contribution improvement of 42% QoQ at US$ 6.2 million. |
| · | PPS had a difficult quarter hit by the devastating August 15th earthquake and reported a negative contribution to Credicorp of US$2.96 million for 3Q07. |
| · | Finally, Prima AFP reflects its turn around through controlled operating costs reaching a positive contribution of US$ 1.8 million for 3Q07. |
| · | Credicorp performance indicators reveal these improvements with ROAE rising to 23.02% from 16.3% YoY and the efficiency ratio recovering to 40.8% from 42.2% QoQ as a result mainly of the lower operating costs in the pension fund business. |

I. Credicorp Ltd.
Overview
Continuing the growth trend and income improvements reported throughout the first half of the year 2007, Credicorp closed its 3Q07 with a total net income after minority deductions of US$ 90.3 million, reflecting a 75.9% earnings growth from 3Q06 and 3.3% growth QoQ, resulting in an improved ROAE of 23.02% for the quarter, and 22.9% for the year to date.
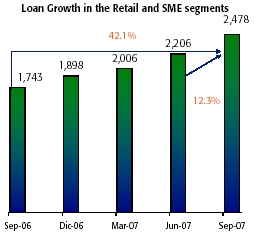
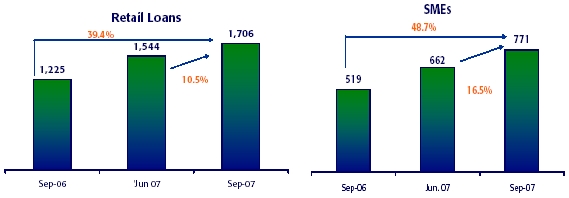
Credicorp’s core banking business reported a strong performance, with total loan growth this last quarter reaching 6.8% QoQ, fueled, as expected, by the retail segment with 12.3% QoQ loan growth in this segment.
Growth in interest income followed this robust loan growth and reached 8.5% QoQ despite the persistent competition and pressure on rates, revealing the success of our strategy to shift our portfolio mix increasing our share of the retail business.
NII however, increased in significantly less proportion (+1.1%) and reflects the change in our funding structure and the need to complement our solid deposit base with debt in order to support our accelerating loan growth. Thus, the strong loan growth was funded by a reduction of excess liquidity (-4.9% QoQ), a moderate expansion of deposits (+1.7% QoQ) and additional structured debt.
Net interest margin reflects though a small drop from 5.5% the previous quarter, but could be sustained above the 5% minimum target reaching 5.2%, despite the competitive pressures given the better earnings structure resulting from the continuing change in loan mix.
Non Financial income reported 4.6% QoQ growth. However, this number hides a strong fee income growth of 13.4% QoQ revealing further increases in bank transactional activity and the fee expansion at the pension fund business. Operational FX-transactional income also grows 15% QoQ. It is the lower gains in the sale of securities given the international markets’ evolution, lower by 65% compared to the excellent performance of the capital markets in the previous quarter, which led to an overall moderate growth of non-financial income.
Credicorp Ltd. | Quarter | Change % | ||||||||||||||
| US$ thousands | 3Q07 | 2Q07 | 3Q06 | 3Q07/3Q06 | 3Q07/2Q07 | |||||||||||
| Net Interest income | 161,055 | 159,305 | 120,667 | 33.5 | % | 1.1 | % | |||||||||
| Total provisions, net of recoveries | (7,922 | ) | (6,090 | ) | 9,795 | -180.9 | % | 30.1 | % | |||||||
| Non financial income | 112,942 | 108,026 | 85,286 | 32.4 | % | 4.6 | % | |||||||||
| Insurance premiums and claims | 9,809 | 19,278 | 19,383 | -49.4 | % | -49.1 | % | |||||||||
| Operating expenses | (163,125 | ) | (159,886 | ) | (152,042 | ) | 7.3 | % | 2.0 | % | ||||||
| Translation results | 13,811 | 1,728 | 832 | 1559.2 | % | 699.3 | % | |||||||||
| Worker's profit sharing and income taxes | (33,418 | ) | (28,633 | ) | (28,600 | ) | 16.8 | % | 16.7 | % | ||||||
Net income | 93,152 | 93,727 | 55,322 | 68.4 | % | -0.6 | % | |||||||||
| Minority Interest | 2,848 | 6,324 | 3,997 | -28.8 | % | -55.0 | % | |||||||||
Net income attributed to Credicorp | 90,304 | 87,403 | 51,324 | 75.9 | % | 3.3 | % | |||||||||
| Net income/share (US$) | 1.13 | 1.10 | 0.64 | 75.9 | % | 3.3 | % | |||||||||
Total loans | 7,509,085 | 7,031,734 | 5,592,231 | 34.3 | % | 6.8 | % | |||||||||
Deposits and Obligations | 10,322,832 | 10,152,601 | 7,974,586 | 29.4 | % | 1.7 | % | |||||||||
| Net Shareholders' Equity | 1,603,026 | 1,535,154 | 1,296,917 | 23.6 | % | 4.4 | % | |||||||||
| Net interest margin | 5.2 | % | 5.5 | % | 4.9 | % | ||||||||||
| Efficiency ratio | 40.8 | % | 42.2 | % | 42.9 | % | ||||||||||
| Return on average shareholders' equity | 23.0 | % | 23.7 | % | 16.3 | % | ||||||||||
| PDL/Total loans | 0.9 | % | 1.0 | % | 1.6 | % | ||||||||||
| Coverage ratio of PDLs | 299.4 | % | 284.4 | % | 215.7 | % | ||||||||||
| Employees | 15,621 | 15,009 | 15,760 | |||||||||||||
2
The insurance business did have a difficult quarter. The strong 8.0 (Momentum scale - Mw) earthquake that stroke the southern area of our country on August 15th, was devastating for the region and generated significant human and material losses. In such events, it is the insurance companies that carry the financial burden more than any other business. Pacífico Peruano Suiza had a share equivalent to its business market share of the insured claims in the affected region. These claims for PPS amounted to approximately US$ 44 million. Having recently applied a more conservative risk management policy, PPS had a catastrophic re-insurance policy that covered risks of this nature in excess of US$ 5 million. However, an additional US$ 1 million cost related to the damage to power lines had to be added, and PPS had to absorb these amounts, plus the policy re-instatement costs which altogether amounted to approximately US$ 8 million for the quarter.
Putting the earthquake effects apart, PPS is certainly on the right track and showing improved results. Net premiums earned for PPS remained flat QoQ as a result of some seasonality in the P&C business.
Looking at the 9 months performance, PPS’s Gross Premium grew 27%, 9% was the growth achieved for that same period in Life and 14% for Health. In terms of market share, PPS continues recovering its leadership, reaching 30.5% market share for P&C and Life, 3.2% higher than a year ago, and 53.8% in the Health business.
On the cost side, the increases reflected up to date are fairly moderate given the rate of expansion of the business. Total operating costs are up by only 2% QoQ for a business which is growing at significantly higher rates and led to further improvements in Credicorp’s efficiency ratio, which dropped further to 40.77% from 42.16% QoQ. This hides a more important growth of operating expenses at BCP (up 2.8% QoQ) and specifically of personnel costs (up 4.9% QoQ), which has been partially offset by a strong reduction of operating costs at Prima AFP. Prima has been able to reduce its sales force from close to 1,000 by the end of last year to around 613 by the end of September, a significant effort which was carefully monitored to avoid negative effects in the market and on Prima’s image.
Nevertheless, total growth of operating cost for BCP was lower than expected, since income generation continues growing quicker than projected. Despite this, we still expect an increase of operating costs basically related to the important expansion of BCP’s network, which is projected to grow close to 30% until the end of 2008. This expansion brings along strong investments in new premises, systems and personnel which will certainly impact our income statement. Thus, the reported better efficiency ratio for 3Q07 may not be sustainable in the near future.
This expansion is in line with Credicorp’s strategy for its banking business and is a continuation of the growth achieved throughout the year. BCP went from 237 branches at the beginning of the year to 254 at the end of September, from 655 ATMs to 724, and from 551 Agentes BCP to 1017. This represents an expansion of our network by 38% within the year to date (9 months) or 50% on an annualized basis. Furthermore, we have increased the number of bank accounts at BCP from ca. 4.4 million to ca. 4.9 million, and of clients from ca. 2.3 million to ca. 2.5 million in this same period of time, all of these reflecting an important achievement in our effort to increase bank penetration and capture growth.
Another positive development is that this strong loan growth continues while portfolio quality remains healthy with an even improving PDL/Loans ratio which reached in 3Q07 only 0.9% vs. 1.6% for 3Q06. Total provisions net of recoveries however, reveal an increase in provisions at BCP in line with loan growth which reached US$ 17.5 million for the quarter reflecting a provisioning ratio of 12.2% of interest income or 0.2% of loan portfolio. These provisions, however, were again to a good extent offset by recoveries of US$ 8.2 million, leaving a net provision at BCP of US$ 9.2 million, which was further offset in the consolidation by reversals at Grupo Crédito, leaving US$ 7.9 million of net provisions for 3Q07 at Credicorp.
These developments resulted in improved ratios for the quarter, with ROAE climbing to 23.02% from 16.3% a year ago.
3
Earnings Contribution
| (US$ Thousands) | 3Q07 | 2Q07 | 3Q06 | 3Q07/3Q06 | 3Q07/2Q07 | Sep-07 | Sep-06 | 3Q07/3Q06 | |||||||||||||||||
| Banco de Crédito BCP(1) | 88,227 | 79,795 | 50,840 | 74 | % | 11 | % | 238,670 | 173,256 | 38 | % | ||||||||||||||
| BCB | 6,673 | 5,453 | 3,492 | 91 | % | 22 | % | 16,931 | 9,809 | 73 | % | ||||||||||||||
| Atlantic | 6,214 | 4,366 | 3,780 | 64 | % | 42 | % | 15,549 | 11,687 | 33 | % | ||||||||||||||
| PPS | (2,960 | ) | 5,134 | 4,586 | -165 | % | -158 | % | 8,790 | 10,004 | -12 | % | |||||||||||||
| Grupo Crédito (2) | 3,803 | (585 | ) | (3,846 | ) | -199 | % | -750 | % | 4,420 | (7,110 | ) | -162 | % | |||||||||||
| Prima | 1,811 | (1,264 | ) | (4,934 | ) | -137 | % | -243 | % | 725 | (9,844 | ) | -107 | % | |||||||||||
| Others | 1,992 | 679 | 1,088 | 83 | % | 193 | % | 3,695 | 2,734 | 35 | % | ||||||||||||||
| Credicorp and Others (3) | (4,980 | ) | (1,307 | ) | (4,041 | ) | 23 | % | 281 | % | (10,709 | ) | (20,898 | ) | -49 | % | |||||||||
| Credicorp Ltd. | (5,226 | ) | (1,539 | ) | (4,325 | ) | 21 | % | 240 | % | (11,669 | ) | (21,697 | ) | -46 | % | |||||||||
| Others | 246 | 232 | - | (0.13 | ) | 6 | % | 960 | 799 | 20 | % | ||||||||||||||
Net income attributable to Credicorp | 90,304 | 87,403 | 51,319 | 76 | % | 3 | % | 256,720 | 166,939 | 54 | % | ||||||||||||||
| (1) | Includes Banco de Crédito de Bolivia. |
| (2) | Includes Grupo Crédito, Servicorp |
| (3) | Includes taxes on BCP's and PPS's dividends, and other expenses at the holding company level. |
Credicorp – the Sum of its Parts
Having experienced a devastating earthquake in the middle of the 3Q07 has been a hard test on Credicorp and its ability to respond quickly and efficiently to reinstate its operational capabilities and absorb the financial impact, especially in the insurance business. We are very pleased to have been able to withstand such a test, and be in a position to report the excellent results we can show as a financial group.
In fact, despite this important hurdle which mobilized massive resources of the bank to recover from its effects, BCP reported excellent 3Q07 results, confirming its expanding earnings generation capacity reaching for 3Q07 earnings of US$ 90.7 million, which resulted in a contribution to Credicorp of US$ 88.2 million for the quarter. This confirms BCP’s aggressive growth track, fueled by the country’s strong economic growth and reflects an impressive 11% growth over the previous quarter and 72% over the previous year, and an equally excellent 36.1% ROAE for the quarter.
BCB, which is consolidated within BCP, reported a contribution of US$ 6.7 million for 3Q07, higher by a remarkable 22% QoQ and 91% YoY. Thus, the performance of BCB is not being negatively affected by the continuing uncertain political scenario of Bolivia, and in fact, continues growing and gaining market share and brand positioning.
ASHC reports an impressive contribution improvement of 42% QoQ reaching US$ 6.2 million for the 3Q07. ASHC’s business is constantly expanding as a result also of the increasing wealth generation in the country, and represents a stable, no-risk investment, for which its ROEA of 17% is more than satisfactory.
As explained before, PPS did have a difficult quarter. Of all the companies of the Credicorp group, it was hardest hit by the August 15th earthquake and reported a total income for the year to date 12% lower than last year reaching US$ 11.6 million. However, bottom-line numbers after minority interests for 3Q07 reached a loss of US$ 3.9 million, which in turn resulted in a negative contribution to Credicorp of US$ -2.96 million for 3Q07. Excluding the earthquake effect, PPS reported somewhat lower 3Q07 earnings than 2Q07, as several important casualties resulted in claims in both the P&C and Life businesses. Nevertheless, its performance still reflects the improving general trend at the insurance business, with results in line with the previous quarters.
Finally, following the cost reduction plan, by which Prima’s sales force was reduced from 1,000 to 613 within the first three quarters of the year, Prima closed the 3Q07 with a positive result of US$ 1.8 million. Furthermore, Prima has established its dominant position in the market, capturing important market shares (31.3% of AuM, 35.3% of collections and 48.2% of voluntary contributions to the funds) and is increasing its fee income by incorporating a new administration fee for voluntary funds which used to have no management charges. This performance is therefore expected to improve as the company improves its income levels, reaches further control of operating costs and works on improving its capital structure, which today hides significant profits.
4
II. Banco de Crédito – BCP Consolidated
Overview 3Q07
Net earnings at BCP continue surpassing expectations and reached another record level for 3Q07 with US$ 90.7 million, up 10.6% from US$ 82.1 million in 2Q07 and 71.7% higher than earnings of 3Q06.
This superb earnings growth results from the continuation of what we have been reporting throughout this year regarding the implementation of a coordinated strategy focused on growth of the retail/consumer sector and expansion of our network, strong investment activity in the corporate sector and the strength of the Peruvian economy which is growing at an average rate of around 8%, but was also boosted this quarter by important translation earnings (of US$ 12 million) in our US Dollar accounting generated by a Nuevos Soles assets position at BCP due to the revaluation of the Sol vis-à-vis the weak US Dollar.
As indicated, total loans on September 30, 2007 reflected growth of 6.6% QoQ and 35.1% YoY. Once again the driver behind BCP’s growth was the expanded lending activity both in the commercial and consumer sectors.
In fact, BCP’s loan book in the retail segment reached 12.3% QoQ growth, being the strongest performers the consumer sector with +18.1% for the quarter, SME or PYMES with +16.5% quarterly growth and credit cards with 9.5% QoQ growth. This is no doubt the result of stronger domestic demand through the increase of purchasing power in the population, as well as the further incursion in new segments by BCP, in line with its strategy to increase bank penetration. Furthermore, mortgages grew 8.2% QoQ and offer the strongest future growth potential given the low penetration of this product in the market.
On the other hand, the strong growth again this quarter of corporate loans (+8.9%) confirms the increased investment activity in this sector with companies increasing its production capacity. Altogether, in terms of daily average balances, total loans were up 9.7% QoQ and 32.2% YoY.
Funding this growth is however today a more important challenge. BCP did require this time some additional fund raising in the international markets and issued US$ 500 million structured securitized bonds within the 3Q07, which given the use of a “vehicle” in the structure for the sale of future USDollar flows, were booked as deposits at a BCP subsidiary and consolidated as such. Thus, this significant loan growth was financed to a great extent by deposit growth (+8.5% QoQ) including that external financing and a reduction of its excess liquidity (-2.2% QoQ).
5
| Banco de Crédito and Subsidiaries | Quarter | Change | ||||||||||||||
| US$ 000 | 3Q07 | 2Q07 | 3Q06 | 3Q07/3Q06 | 3Q07/2Q07 | |||||||||||
| Net Financial income | 142,756 | 141,147 | 107,063 | 33.3 | % | 1.1 | % | |||||||||
| Total provisions, net of recoveries | (9,241 | ) | (6,885 | ) | 7,392 | -225.0 | % | 34.2 | % | |||||||
| Non financial income | 91,987 | 88,829 | 74,176 | 24.0 | % | 3.6 | % | |||||||||
| Operating expenses | (119,814 | ) | (116,527 | ) | (115,478 | ) | 3.8 | % | 2.8 | % | ||||||
| Translation results | 12,028 | 970 | 703 | 1611.0 | % | 1140.0 | % | |||||||||
| Worker's profit sharing and income taxes | (26,981 | ) | (25,470 | ) | (21,019 | ) | 28.4 | % | 5.9 | % | ||||||
| Net income | 90,735 | 82,064 | 52,837 | 71.7 | % | 10.6 | % | |||||||||
| Net income/share (US$) | 0.071 | 0.064 | 0.041 | 71.5 | % | 10.5 | % | |||||||||
| Total loans | 7,450,674 | 6,989,841 | 5,514,218 | 35.1 | % | 6.6 | % | |||||||||
| Deposits and obligations | 10,263,180 | 9,459,008 | 7,455,066 | 37.7 | % | 8.5 | % | |||||||||
| Shareholders equity | 1,045,006 | 964,164 | 890,422 | 17.4 | % | 8.4 | % | |||||||||
| Net financial margin | 5.2 | % | 5.5 | % | 5.0 | % | ||||||||||
| Efficiency ratio | 48.3 | % | 49.3 | % | 50.9 | % | ||||||||||
| Return on average equity | 36.1 | % | 35.6 | % | 24.6 | % | ||||||||||
| PDL/Total loans | 0.9 | % | 1.0 | % | 1.5 | % | ||||||||||
| Coverage ratio of PDLs | 300.7 | % | 286.8 | % | 221.6 | % | ||||||||||
| BIS ratio | 11.3 | % | 10.7 | % | 10.4 | % | ||||||||||
| Branches | 254 | 250 | 230 | |||||||||||||
| ATMs | 724 | 699 | 624 | |||||||||||||
| Agentes BCP | 1,017 | 837 | 420 | |||||||||||||
| Employees | 12,216 | 11,611 | 10,507 | |||||||||||||
Interest income on loans outperformed once again this loan growth, increasing by 11.6% QoQ, reflecting the better lending mix. Interest income from investments was also in line with 9.2% quarterly growth. However interest expense reflected both the increased and more expensive interest on borrowed funds (up by 20.5% QoQ) and increased interest paid on deposits (up 19.5% QoQ). The latter includes (i) interest on deposits related to the structured bonds and which reflect borrowing costs, and (ii) the effect on interest expense of a change in deposit mix since all interest bearing deposits increased their proportion of total deposits by 8% QoQ.
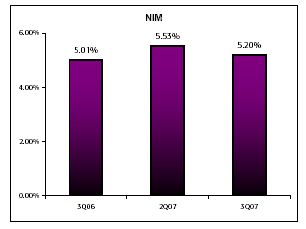
The net effect of these changes was a small reduction of Net Interest Margin (NIM) from 5.5% to 5.2%
Net Provisions for 3Q07 reached US$ 9.2 million, reflecting gross provisions of US$ 17.5 million and US$ 8.2 million of recoveries vs. US$ 13.3 million of gross provisions and US$ 6.4 million of recoveries in 2Q07. This level of provisions represents 0.2% of total loan portfolio for 3Q07. It is certainly the constant improvement of the economic performance and high liquidity in the market which allows such further improvements in portfolio quality. Thus, further drops in non-performing loans led to a PDL ratio of 0.91% for 3Q07 vs. 0.95% for 2Q07.
Fee income and gains in foreign exchange transactions continue growing reaching a strong 12.2% and 5.9% growth rate respectively for the quarter. However, non financial income was up only 3.6% QoQ, since significantly lower income from the sale of securities (-79.7%) offset the very good growth reported for fee and FX income. Such drop followed the international financial crisis which obviously affected the Lima Stock Exchange generating some drops in the capital markets. As reference, the index of the Lima Stock Exchange (IGBVL) registered a drop of 2.4% QoQ.
On the cost side, operating costs is a result of BCP’s business expansion, though it was up by a modest 2.8% QoQ. This increase continues in line with the announced investments in expanding our branch & sales points’ network and is expected to continue. In fact, the strongest growing costs: “personnel and administrative” and “other expenses” grew 4.9% and 5.2% respectively. Nevertheless, we continue advising to expect investment related expenditures to affect more our costs by the end of the year.
6
Finally, the translation result for 3Q07 high rocketed due to the weakness of the dollar in the international markets and revaluation of the Nuevo Sol from S/.3.168 in June to S/.3.08 by the end of September, and led to a strong gain of US$ 12 million vs. US$ 0.97 million 2Q07, given the net Soles position in BCP’s balance sheet.
As a result of these developments, BCP’s quarterly ratios reflect additional improvements continuing this way its growth trend reaching again record levels: ROAE was 36.1%, the efficiency ratio 48.3% and portfolio quality ratios reached 0.91% delinquencies ratio and 300.7% coverage ratio.
Core Earnings
Core Revenues | Quarter | Change | ||||||||||||||
US$ 000 | 3Q07 | 2Q07 | 3Q06 | 3Q07/3Q06 | 3Q07/2Q07 | |||||||||||
| Net interest and dividend income | 142,756 | 141,147 | 107,063 | 33.3 | % | 1.1 | % | |||||||||
| Fee income, net | 75,146 | 66,986 | 59,440 | 26.4 | % | 12.2 | % | |||||||||
| Net gain on foreign exchange transactions | 13,526 | 12,778 | 9,674 | 39.8 | % | 5.9 | % | |||||||||
Core Revenues | 231,428 | 220,911 | 176,177 | 31.4 | % | 4.8 | % | |||||||||
Core Revenues were up 4.8% QoQ and 31.4% YoY. Despite the good growth of fee income (+12.2%) and gains from FX transactions (+5.9%), it is still NII the main component of core earnings, and this recorded a modest 1.1% growth QoQ and 33.3% YoY, reflecting the effect of a changed funding structure for the quarter. Furthermore, some financing cost was generated by a swap transaction and exacerbated this effect. However it should be noted that interest income on loans does report excellent growth by 11.6% QoQ.
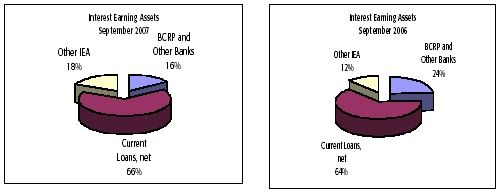
II.1 Interest Earning Assets
Growth of IEA remains strong, reaching 3.8% QoQ and 32.1% YoY
Interest Earning Assets | Quarter | Change | ||||||||||||||
US$ 000 | 3Q07 | 2Q07 | 3Q06 | 3Q07/3Q06 | 3Q07/2Q07 | |||||||||||
| BCRP and Other Banks | 1,740,636 | 1,773,450 | 2,009,055 | -13.4 | % | -1.9 | % | |||||||||
| Interbank funds | 1,000 | 17,133 | 206 | 385.2 | % | -94.2 | % | |||||||||
| Trading Securities | 49,465 | 53,569 | 67,817 | -27.1 | % | -7.7 | % | |||||||||
| Available For Sale Securities | 1,998,309 | 2,001,172 | 950,332 | 110.3 | % | -0.1 | % | |||||||||
| Current Loans, net | 7,383,196 | 6,923,441 | 5,430,468 | 36.0 | % | 6.6 | % | |||||||||
Total interest earning assets | 11,172,606 | 10,768,765 | 8,457,878 | 32.1 | % | 3.8 | % | |||||||||
Growth of IEA of 3.8% QoQ and 32.1% YoY, follows the strong growth of BCP’s total loan portfolio for 3Q07, which reached 6.6% QoQ and 35.1% YoY as a result of increased demand for credit across all banking segments. Investments available for sale, dropped slightly 0.1% QoQ but were up compared to the previous year by 110%. The drop is a result of the reduction of our bank’s BCRP CDs position as liquidity was channeled to fund loan growth.
7
Loan Portfolio
Loan portfolio continues its expanding trend reaching total net loans of US$ 7,247.8 million as of the end of September, revealing a 6.6% QoQ and 36% YoY growth. Analyzing this evolution, and measured by average monthly balances, an even higher QoQ growth rate is reflected of 9.7%, though 32.2% YoY. This loan growth is in line with the evolution and dynamism of the Peruvian economy in the last year, and especially of internal demand and private investments. Furthermore, the focus of BCP’s strategy in developing the retail banking segment resulted in this business segment reporting the strongest growth. Nevertheless, the Corporate and Middle Market banking segments revealed also a good performance for the quarter.
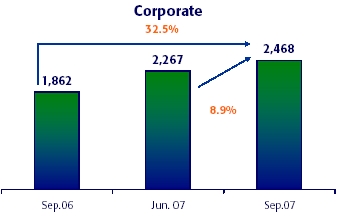
After having had an unprecedented strong quarterly growth in 2Q07, corporate loans reached an average monthly balance of US$ 2,468.4 million, reflecting a continuation of a still unusually strong quarterly growth reaching 8.9% expansion QoQ (vs. 11.7% in 2Q07) and further leading to an equally strong yearly growth of 32.5%. This is certainly a reflection of the increased investment activity, the increasing volumes of these investments in this sector, and certainly also of the dominant market share BCP holds in this segment, which allows BCP to capture and/or participate in almost every important investment.
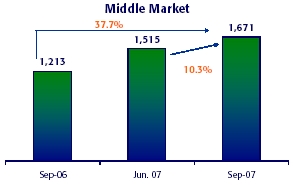
The Middle Market portfolio also performed extremely well this quarter, reaching an average monthly balance of US$ 1,671 million which reflects quarterly growth 10.3%, and an important 37.7% YoY growth.
8
9
Furthermore, market share for the corporate and middle market sectors continue revealing BCP’s solid positioning, reaching 45% and 37% respectively, based on the most recent estimates from August; though again in both cases slightly below the previous quarter.
It is however in the more attractive retail market which is the focus of BCP’s strategy, where market shares reveal some increase. Thus, market share in consumer loans were up by 40 bps reaching 17%. In mortgages, market share increases 70 bps to 39% and in the very competitive Credit Cards’ business it increases 30 bps to 18.6% . SME loans (PYMES) however drop slightly to 19.3% .
Dollarization
The de-dollarization process of BCP’s assets this 3Q07 continued with respect to the 2Q07. Thus, in the 3Q07 loans in Nuevos Soles conformed 29% of total loan portfolio, 3% more than in the previous quarter. Furthermore, the system continues experiencing further de-dollarization of its loans and deposits, reaching a high 37.4% of loans in Nuevos Soles and 62.6% in US Dollars as of September 2007. Furthermore, this de-dollarization process is more intense in deposits, which reported 45.6% (vs. 40.07% for 2Q07) of deposits in Nuevos Soles, evidencing an increased preference for local currency savings, fueled also by the appreciation of the local currency vis-à-vis the US Dollar.
II.2 Deposits and Mutual Funds
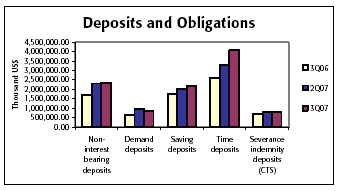
Deposits reported growth of 8.5% QoQ and 37% YoY, maintaining this way its role as main source of funding to support the strong loan growth.
Deposits and Obligations | Quarter ended | Change | ||||||||||||||
| US$ (000) | 3Q07 | 2Q07 | 3Q06 | 3Q07/3Q06 | 3Q07/3Q06 | |||||||||||
| Non-interest bearing deposits | 2,345,124 | 2,316,573 | 1,721,237 | 36.2 | % | 1.2 | % | |||||||||
| Demand deposits | 854,752 | 942,225 | 640,093 | 33.5 | % | -9.3 | % | |||||||||
| Saving deposits | 2,167,592 | 2,026,729 | 1,768,181 | 22.6 | % | 7.0 | % | |||||||||
| Time deposits | 4,067,677 | 3,317,527 | 2,608,251 | 56.0 | % | 22.6 | % | |||||||||
| Severance indemnity deposits (CTS) | 785,398 | 820,026 | 684,988 | 14.7 | % | -4.2 | % | |||||||||
| Interest payable | 42,637 | 35,928 | 32,317 | 31.9 | % | 18.7 | % | |||||||||
Total customer deposits | 10,263,180 | 9,459,008 | 7,455,066 | 37.7 | % | 8.5 | % | |||||||||
| Mutual funds in Perú | 1,884,009 | 1,776,232 | 1,161,376 | 62.2 | % | 6.1 | % | |||||||||
| Mutual funds in Bolivia | 65,738 | 64,817 | 55,224 | 19.0 | % | 1.4 | % | |||||||||
Total customer funds | 10,263,180 | 9,459,008 | 7,455,066 | 37.7 | % | 8.5 | % | |||||||||
Deposits growth has kept its increasing trend throughout the year. It is however noteworthy, the important growth of term deposits in the last quarter (+22.6% QoQ, 56% YoY) which reached a total balance of US$ 4,068 million.
This could certainly include the effect of an increased search for secure investments in light of the uncertainties of the markets, especially the US markets, supported by better interest rates on time deposits. However, it should be noted that growth in “time deposits” was overstated as a result of fund raising through a securitization program structured using a Credicorp subsidiary vehicle (CCR Inc) which totaled US$500 million. The flows provided by this issue are booked as time deposits according to the transaction structure. Thus, excluding this effect, time deposits would have grown about 19% QoQ, while total deposits and obligations “real growth” was approximately 3.3% QoQ.
10
In terms of source of these deposits, it is still the retail market which provides the largest share of deposits, since 51% of total deposits are generated in the retail sector, reflecting the importance of expanding our client base and increasing bank penetration not only from a loan placements point of view but also from a funding point of view.
Throughout the last 9 months, BCP’s market share of deposits in the financial system was sustained at approximately 38%. In fact, BCP’s deposits’ market share even grows from 36.9% at the end of 2006 to today’s 38.8%, reflecting again BCP’s stronghold position in the market, despite the increasing competition. These deposits are 35% in Nuevos Soles and 65% in US Dollars.
BCP’s leadership is evident in most of the deposit types. Thus, of “severance payment” deposits, known as CTS, we hold 53.4% market share while our next competitor holds 19.3% . BCP’s demand deposits reached 44.3% and 41.7% market share in local and foreign currency and our savings deposits reached 34.4% and 43.3%, respectively. Finally, our time deposits represented 18.6% and 38.3% market share in local and foreign currency respectively.
Mutual Funds administered through its subsidiary Credifondo, continue being a stronghold for BCP with a volume of US$ 1,884 million and market share of 45.1% as of September 2007, up 6% QoQ and 62% YoY. This growth is remarkable considering the growth of the industry with ever more personalized and tailored funds to the different need and objectives of the clients.
11
II.3 Net Interest Income
Though interest income grows an important 9.1% QoQ, a change in our funding requirements and resulting funding structure led to a stronger increase in funding costs which impacted negatively our NIM, reaching 5.2% for 3Q07 vs. 5.5% for 2Q07.
Quarter | Change | |||||||||||||||
US$ 000 | 3Q07 | 2Q07 | 3Q06 | 3Q07/3Q06 | 3Q07/2Q07 | |||||||||||
Interest income | 240,182 | 220,181 | 174,829 | 37.4 | % | 9.1 | % | |||||||||
Interest on loans | 183,127 | 164,101 | 137,090 | 33.6 | % | 11.6 | % | |||||||||
| Interest and dividends on investments | - | 3,082 | 24 | -100.0 | % | -100.0 | % | |||||||||
| Interest on deposits with banks | 18,985 | 15,497 | 21,703 | -12.5 | % | 22.5 | % | |||||||||
| Interest on trading securities | 35,521 | 32,531 | 14,773 | 140.4 | % | 9.2 | % | |||||||||
| Other interest income | 2,549 | 4,970 | 1,239 | 105.7 | % | -48.7 | % | |||||||||
Interest expense | 97,426 | 79,034 | 67,766 | 43.8 | % | 23.3 | % | |||||||||
Interest on deposits | 69,241 | 57,927 | 47,509 | 45.7 | % | 19.5 | % | |||||||||
| Interest on borrowed funds | 13,515 | 11,220 | 7,023 | 92.4 | % | 20.5 | % | |||||||||
| Interest on bonds and subordinated note | 8,698 | 8,165 | 6,386 | 36.2 | % | 6.5 | % | |||||||||
| Other interest expense | 5,972 | 1,722 | 6,848 | -12.8 | % | 246.8 | % | |||||||||
Net interest income | 142,756 | 141,147 | 107,063 | 33.3 | % | 1.1 | % | |||||||||
| Average interest earning assets | 10,970,685 | 10,203,348 | 8,543,953 | 28.4 | % | 7.5 | % | |||||||||
Net interest margin* | 5.20 | % | 5.53 | % | 5.01 | % | ||||||||||
As indicated before, interest income followed the strong expansion of BCP’s loan book (+6.6% QoQ) and its strategy to restructure its portfolio composition towards the more profitable retail segments, which grew 10.5% QoQ based on daily average balances. The strong interest income growth was accompanied by also strong (+9.2% QoQ) growth of interest on the investment portfolio. Other more eventual interest income however dropped resulting in an overall interest income growth of 9.1% for the quarter.
On the interest expense side, the most relevant increase was on interest paid on deposits, which includes the cost of the external debt “hidden” in deposits, increasing more (at +19.5%) than the deposits portfolio (up by 8.5%), revealing the higher borrowing costs within deposit expense and resulting in an increase of our cost of funds. This was exacerbated by some negative value fluctuations (-195%) of derivatives contracted as hedge, and most importantly, increase of other borrowed funds related cost (+20.5%) and subordinated loans related cost (+6.5%). These developments led to an increase of overall interest expenses by 23.3%.
These changes denote very clearly the new BCP’s funding structure which result from the strong loan volume growth, and which in turn is only partially funded by “real” deposit growth of 3.3% QoQ reflecting the increased need of external funding through international bank lines and debt placements.
Despite all this pressure on margins that led to a drop in NIM to 5.2% (from 5.5% for 2Q07), the better loan mix allowed BCP to sustain its NIM above its minimum target of 5%.
12
II.4 Loan provisions
Provisions grow in line with strong loan portfolio growth, while recoveries continue and portfolio quality ratios consistently show excellent numbers with a PDL ratio of 0.91%, surpassing even the previous’ quarter’ record.
Provisión for loan losses | Quarter ended | Change | ||||||||||||||
| US$ 000 | 3Q07 | 2Q07 | 3Q06 | 3Q07/3Q06 | 3Q07/2Q07 | |||||||||||
| Provisions | (17,464 | ) | (13,308 | ) | (1,881 | ) | 828.3 | % | 31.2 | % | ||||||
| Loan loss recoveries | 8,223 | 6,423 | 9,273 | -11.3 | % | 28.0 | % | |||||||||
Total provisions, net of recoveries | (9,241 | ) | (6,885 | ) | 7,392 | -225.0 | % | 34.2 | % | |||||||
Total loans | 7,450,674 | 6,989,841 | 5,514,218 | 35.1 | % | 6.6 | % | |||||||||
Reserve for loan losses (RLL) | 202,877 | 190,413 | 185,608 | 9.3 | % | 6.5 | % | |||||||||
Bcp's Charge-Off amount | 8,274 | 9,896 | 11,366 | -27.2 | % | -16.4 | % | |||||||||
Past due loans (PDL) | 67,478 | 66,400 | 83,750 | -19.4 | % | 1.6 | % | |||||||||
| PDL/Total loans | 0.91 | % | 0.95 | % | 1.52 | % | ||||||||||
| Coverage | 300.65 | % | 286.77 | % | 221.62 | % | ||||||||||
Total provisions for 3Q07 were US$ 17.5 million, up 31.2% QoQ reflecting the accelerated growth of loans, and more specifically, retail loans, but without any negative effect on portfolio quality. Furthermore, recoveries of previously charged off loans totaled US$ 8.2 million, leaving a net provision for the quarter of US$ 9.2 million. These recoveries were higher than expected, since as of September, the total amount of recoveries almost reached the US$ 25 million expected for the year.
Despite this important 31.2% provisions growth for the quarter, portfolio quality reached another record PDL ratio of 0.91% vs. 0.95% for 2Q07. In fact, despite the constant growth of consumer lending (consumer loans, mortgages, credit cards, etc) and SME lending at very high rates, BCP’s past due portfolio increased only 1.6% QoQ reaching a total of only US$ 67.5 million. This reflects the conservative credit policy followed in the last years and the continuing economic recovery of the country.
Consequently, higher reserves also improve the coverage ratio which reached a record 300.7% on 3Q07 after an already high 286.8% the previous quarter.
13

II.5 Non Financial Income
During 3Q07, fee income increased 12.2% as a consequence of a growing number of transactions.
Non financial income | Quarter | Change | ||||||||||||||
| US$ 000 | 3Q07 | 2Q07 | 3Q06 | 3Q07/3Q06 | 3Q07/2Q07 | |||||||||||
| Fee income | 75,146 | 66,986 | 59,440 | 26.4 | % | 12.2 | % | |||||||||
| Net gain on foreign exchange transactions | 13,526 | 12,778 | 9,674 | 39.8 | % | 5.9 | % | |||||||||
| Net gain on sales of securities | 1,537 | 7,586 | 3,112 | -50.6 | % | -79.7 | % | |||||||||
| Other income | 1,778 | 1,479 | 1,950 | -8.8 | % | 20.2 | % | |||||||||
Total non financial income | 91,987 | 88,829 | 74,176 | 24.0 | % | 3.6 | % | |||||||||
Fee income and gains on FX-transaction, which form part of BCP’s core earnings, were up by 12.2% and 5.9% respectively QoQ reflecting the important expansion of our network and consequent increase in number of transactions and confirming our leading position in the market as a transactional bank. However, as occurred in the previous quarter, the more volatile income from gains on the sale of securities dropped, though this time by a more significant 79.7% QoQ as the crisis in financial international markets spread out to the local capital market. Therefore, non financial income altogether reported a moderate 3.6% QoQ growth.
Fee income, which accounts for 82% of total non-financial income, grew 12.2% QoQ and reflected mainly growth in transactions related to debit cards, commercial loans’ disbursements and savings accounts. Furthermore, fee income from subsidiaries and foreign operations, were noteworthy. Specifically in Credifondo S.A.F.M., fee income growth (+26.0% QoQ) was due to strong growth of its administered portfolios which were up 6.1% QoQ or by US$ 107.8 million, of which 25% were in the mixed funds (combined fixed income and equity funds).
Gains on FX-transactions (15% of total non-financial income) experienced a 5.9% growth QoQ due to the increase in number and volumes of FX-transactions, which added to the strong fluctuation in the exchange rate translated into higher FX-margins.
Net gains from the sale of securities (1.7% of total non-financial income) experienced a stronger drop this quarter of 79.7% QoQ following a drop in securities valuations, and losses on sales of securities, as the consequence of the volatility and drop in returns achieved in the Lima Stock Exchange during the months of July and August, in line with the evolution in international markets. Thus, the LSE Index increased only 3.8% QoQ vs. its 44% quarterly increased reported in 2Q07.
14
Average number of transactions was up from 28.8 million in 2Q07 to 30.3 million this quarter reflecting 5.1% QoQ growth.
Quarter | Change | |||||||||||||||
N° of Transactions per Channel | Averag. 3Q07 | Averag. 2Q07 | Average. 3Q06 | 3Q07/3Q06 | 3Q07/2Q07 | |||||||||||
| Teller | 8,827,670 | 8,541,465 | 8,310,053 | 11.5 | % | 3.4 | % | |||||||||
| ATMS ViaBCP | 4,919,609 | 4,745,857 | 4,191,183 | 23.3 | % | 3.7 | % | |||||||||
| Balance Inquiries | 2,206,366 | 2,150,016 | 2,022,884 | 5.4 | % | 2.6 | % | |||||||||
| Telephone Banking | 1,042,139 | 976,654 | 943,356 | 18.9 | % | 6.7 | % | |||||||||
| Internet Banking ViaBCP | 6,739,094 | 6,441,179 | 5,891,783 | 29.0 | % | 4.6 | % | |||||||||
| Agente BCP | 838,410 | 656,986 | 497,603 | 291.7 | % | 27.6 | % | |||||||||
| Telecrédito | 3,046,225 | 2,816,308 | 2,532,613 | 20.9 | % | 8.2 | % | |||||||||
| Direct Debit | 294,257 | 283,255 | 281,029 | 18.5 | % | 3.9 | % | |||||||||
| P.O.S. | 2,238,747 | 2,079,573 | 1,983,368 | 22.4 | % | 7.7 | % | |||||||||
| Other ATM network | 159,411 | 153,375 | 139,280 | 7.6 | % | 3.9 | % | |||||||||
Total transactions | 30,311,930 | 28,844,668 | 26,793,154 | 20.9 | % | 5.1 | % | |||||||||
The increase in number of transactions was registered mainly in Internet Banking (ViaBCP) (+4.6%), teller transactions (+3.4%) and our corporate cash management service Telecrédito (+8.2%), reflecting the expansion BCP is having throughout the last years in order to develop the largest operational network in the country. The completed expansion of BCP’s network as of September 2007 is in line with projections and does not yet reflect the impact of the already approved more aggressive expansion of this network planned for the next years. Thus, the number of new offices/branches, ATMs and Agentes are reported in the following chart and reveal growth in line with projections, being the most aggressive growth the one reported for Agentes of 22% QoQ.
Quarter | Change | |||||||||||||||
3Q07 | 2Q07 | 3Q06 | 3Q07/3Q06 | 3Q07/2Q07 | ||||||||||||
| Branches | 254 | 250 | 230 | 10 | % | 2 | % | |||||||||
| ATMs | 724 | 699 | 624 | 16 | % | 4 | % | |||||||||
| Agentes BCP | 1017 | 837 | 420 | 142 | % | 22 | % | |||||||||
II.6 Operating Costs and Efficiency
BCP’s efficiency ratio improved further to 48.3% in 3Q07 as a result of a proportionately stronger growth of income than expenses.
Operating expenses | Quarter | Change | ||||||||||||||
| US$ 000 | 3Q07 | 2Q07 | 3Q06 | 3Q07/3Q06 | 3Q07/2Q07 | |||||||||||
| Salaries and employees benefits | 59,669 | 56,865 | 46,370 | 28.7 | % | 4.9 | % | |||||||||
| Administrative, general and tax expenses | 42,485 | 42,631 | 34,690 | 22.5 | % | -0.3 | % | |||||||||
| Depreciation and amortizacion | 9,627 | 9,396 | 8,533 | 12.8 | % | 2.5 | % | |||||||||
| Other expenses | 8,033 | 7,635 | 25,885 | -69.0 | % | 5.2 | % | |||||||||
Total operating expenses | 119,814 | 116,527 | 115,478 | 3.8 | % | 2.8 | % | |||||||||
Efficiency Ratio | 48.30 | % | 49.29 | % | 50.85 | % | ||||||||||
Operating costs for 3Q07 were up 2.8% QoQ, as personnel costs expanded 4.9% QoQ to support business growth. However, general and administrative expenses actually dropped due to lower expenses on consulting services.
15
In line with BCP’s expansion, the number of employees went from 11,611 to 12,216 (+5.2% QoQ). This increase is reflected in personnel expenses, which include also the provisions for profit sharing which in turn grow in line with increased bottom line results. Personnel expenses account for 50% of operating costs.
However, general & administrative expenses and taxes, the main contributor to the quarterly costs increase of 2Q07, reflected this time a drop of 0.3% QoQ. Thus, the increases in marketing expenses (+13%) related to the advertising and image campaigns for the LAN/VISA credit card were offset by lower expenses for consulting and systems’ maintenance (mainly for ATM’s) jobs.
Other Expenses were also up by 5.2% QoQ, This increase follows higher provisions for assets seized. These were however partially offset by provision reversals related to our SARs (net of the hedge).
Finally, while operating income grew 4.8% QoQ, operating expenses (excluding “Other Expenses”) grew less at 2.7% QoQ, repeating the performance of 2Q07 and leading to a slight improvement of BCP’s efficiency ratio to 48.3% from 49.29% in 2Q07. Nevertheless, increased spending related to the announced larger expenditures to expand our network by almost 30% and systems capacity as well as upgrade and expand our back-up facilities is still below projected numbers and is expected to impact results more heavily towards the end of the year. This expansion will lead to higher personnel, systems and equipment expenditures which will make difficult to sustain this improved efficiency ratio in the near future.
II.7 Shareholders’ Equity and Regulatory Capital
Shareholders' equity | Quarter | Change | ||||||||||||||
US$ 000 | 3Q07 | 2Q07 | 3Q06 | 3Q07/3Q06 | 3Q07/2Q07 | |||||||||||
| Capital stock | 364,706 | 364,706 | 364,706 | 0.0 | % | 0.0 | % | |||||||||
| Reserves | 282,189 | 282,189 | 242,889 | 16.2 | % | 0.0 | % | |||||||||
| Unrealized Gains and Losses | 56,411 | 66,066 | 46,428 | 21.5 | % | -14.6 | % | |||||||||
| Retained Earnings | 96,245 | 96,484 | 56,337 | 70.8 | % | -0.2 | % | |||||||||
| Income for the year | 245,454 | 154,719 | 180,062 | 36.3 | % | 58.6 | % | |||||||||
Total shareholders' equity | 1,045,006 | 964,164 | 890,422 | 17.4 | % | 8.4 | % | |||||||||
| Return on average equity (ROAE) | 36.13 | % | 35.57 | % | 24.57 | % | ||||||||||
Total shareholders’ equity reached US$ 1,045 millions as of September 2007, i.e. up 17.4% QoQ. Despite this increase in shareholders’ equity, ROAE reached an unprecedented level of 36.13% for 3Q07, following the strong net earnings reported, compared to 35.57% for 2Q07 and 24.57% in 3Q06.
At the end of 3Q07, the capital adequacy ratio for BCP unconsolidated reached 11.3% (8.8 times), higher than 10.74% (9.3 times) for 2Q07, and slightly lower than the system average (11.73% or 8.5 times), calculated based on the 3 largest banks in the system. Therefore, this indicator outperforms the one established by the system (9.1%) and our more conservative ratio of 10.5%.
On the other hand, Tier I reached US$ 742.13 millions. Risk adjusted assets include US$ 186 million market risk, which requires US$ 16.9 million of equity. Total regulatory capital includes US$ 137 million subordinated debt. In addition, US$ 71.9 million of capitalized earnings are included in the present period.
16
Regulatory Capital and Capital Adequacy Ratios | Quarter ended | Change | ||||||||||||||
| US$ 000 | 3Q07 | 2Q07 | 3Q06 | 3Q07/3Q06 | 3Q07/2Q07 | |||||||||||
| Capital Stock, net | 416,892 | 406,101 | 395,977 | 5.3 | % | 2.7 | % | |||||||||
| Legal and Other capital reserves | 336,315 | 327,610 | 280,941 | 19.7 | % | 2.7 | % | |||||||||
| Generic Contingency loss reserves | 76,312 | 69,425 | 52,786 | 44.6 | % | 9.9 | % | |||||||||
| Subordinated Debt | 136,674 | 138,982 | 23,389 | 484.3 | % | -1.7 | % | |||||||||
| Capitalized earnings | 71,860 | - | - | - | - | |||||||||||
Total | 1,038,054 | 942,119 | 753,093 | 37.8 | % | 10.2 | % | |||||||||
| Less: Investment in multilateral organization and banks | (160,309 | ) | (148,950 | ) | (144,816 | ) | 10.7 | % | 7.6 | % | ||||||
Total regulatory capital | 877,745 | 793,169 | 608,277 | 44.3 | % | 10.7 | % | |||||||||
| Risk-weighted assets (Credit risk) | 7,578,961 | 7,063,276 | 5,501,521 | 37.8 | % | 7.3 | % | |||||||||
Market Risk | 16,864 | 29,430 | 29,643 | -43.1 | % | -42.7 | % | |||||||||
Capital Ratios: | ||||||||||||||||
| Regulatory capital as a percentage of risk-weighted assets | 11.30 | % | 10.74 | % | 10.44 | % | ||||||||||
| Ratio of risk-weihted assets to regularoy capital | 8.85 | 9.31 | 9.58 | |||||||||||||
III. BCP Bolivia
III. 1 Bolivian Financial System
In 3Q07, Bolivia reported generally positive macroeconomic results, maintaining the trend for the previous quarters and despite the political uncertainty that characterized the country during the last years. However, one of the main problems that affect the country is the high level of inflation reported in July and August at 2.68% and 1.59%, respectively.
Macroeconomic results had a positive impact in the financial system. Bank deposits reached US$4,011 million as of September 2007, reflecting an increase of 5.0% QoQ and 30% YoY. Total loan volume reached US$3,081 million, revealing a 13% growth with respect to September of last year, which attained US$ 2,728 million. But most importantly is the quality of the loan portfolio that reached a past due ratio of 6.9% and a coverage of 99.7%.
III.2 Results
In 3Q07, BCB reached a net income of US$7.0 million, 29.2% above earnings from 2Q07 and 101.8% above net income of US$3.5 million for 3Q06. This result is mainly the consequence of the growth of interest income that increased 33.7% YoY and 6.8% QoQ, amounting to US$13.4 million. It is worth mentioning the control of the operating expenses, which were flat QoQ, and the important effect of the appreciation of the local currency (bolivianos) with respect to the US Dollar. In fact, BCP Bolivia continues the improving trend showed during the last quarters and reported ROE of 31.3% in September 2007, significantly higher than the 16.2% ROE for the system. Furthermore, thanks to the conservative strategy for risk management, the past due ratio dropped to 2.5%, much better than the system’s (6.9%) .
Altogether, BCP Bolivia reports a constant and solid recovery, with financial indicators above the average Bolivian financial system.
As mentioned in previous quarterly reports, the focus on businesses with better margins as the Retail, Middle market and “Consolidated” segments has been determinant for BCP Bolivia’s results. The Retail segment has received strong attention, as has as well the “Consolidated” segment which comprises companies with sales below US$ 1 million p.a. In both segments some important development has been achieved as these present the best growth potential of the Bolivian market. BCP Bolivia is this way positioning itself as the bank with the best infrastructure and corporate know-how to attend these segments best.
17
III. 3 Assets and Liabilities
Total loans as of September 2007 reached US$454.5 million, reflecting growth of 6.2% QoQ. BCP Bolivia holds a very diversified loan portfolio in different business segments. During the current quarter, the growth of the Middle market segment stands out at 28.9%, meanwhile Corporate and Retail segment grew 6.6% and 3.7% respectively. It is also noteworthy that the retail segment contributed to 42% of total loan portfolio as of September 2007. Finally, BCP Bolivia holds market shares of 14.6% and 14.9% of loans and deposits, respectively, which represent the third place in the Bolivian Banking System.
As mentioned before, loan portfolio quality for BCP Bolivia is superior than the average systems. PDL ratio improved with respect to the previous quarter from 2.7% to 2.5% in September; meanwhile, the whole system had a slight improvement from 7.0% to 6.9% during the same period.
On the other hand, deposits also experienced growth of 8.0% QoQ and 35.3% YoY, as a result of increased confidence of clients and a relative stabilization of the political scenario, strong campaigns to promote savings and better deposit rates. Thus, saving deposits grew 12.6% QoQ, meanwhile, time and demand deposits grew 6.9% and 4.6%, respectively.
The following chart presents some numbers and financial indicators for BCP Bolivia:
Banco de Crédito de Bolivia | Quarter | Change % | ||||||||||||||
US$ million | 3Q07 | 2Q07 | 3Q06 | 3Q07/3Q06 | 3Q07/2Q07 | |||||||||||
| Total Loans | 454.5 | 428.0 | 383.0 | 18.7 | % | 6.2 | % | |||||||||
| Past due loans | 11.3 | 11.5 | 16.4 | -31.1 | % | -1.7 | % | |||||||||
| Loan loss reserves | -20.6 | -21.2 | -24.6 | -16.3 | % | -2.8 | % | |||||||||
| Total Assets | 761.3 | 710.8 | 580.0 | 31.3 | % | 7.1 | % | |||||||||
| Deposits | 615.6 | 569.7 | 455.1 | 35.3 | % | 8.0 | % | |||||||||
| Shareholders net equity | 75.4 | 68.1 | 66.3 | 13.7 | % | 10.7 | % | |||||||||
| Net income | 7.0 | 5.5 | 3.5 | 101.8 | % | 29.2 | % | |||||||||
| PDL/Total loans | 2.5 | % | 2.7 | % | 4.3 | % | ||||||||||
| Coverage ratio of PDLs | 181.9 | % | 184.3 | % | 149.9 | % | ||||||||||
| ROAE | 31.3 | % | 29.9 | % | 21.0 | % | ||||||||||
| Branches | 58 | 58 | 54 | |||||||||||||
| ATMs | 152 | 143 | 138 | |||||||||||||
| Employees | 1329 | 1214 | 1084 | |||||||||||||
18
IV. Atlantic Security Holding Corporation
ASHC | Quarter | Change % | ||||||||||||||
| US$ Million | 3Q07 | 2Q07 | 3Q06 | 3Q07/3Q06 | 3Q07/2Q07 | |||||||||||
| Net Interest income | 4.8 | 4.8 | 3.1 | 54.3 | -0.4 | |||||||||||
| Dividend Income | 0.1 | 0.1 | 0.1 | -10.9 | -6.9 | |||||||||||
| Fees and commissions from services | 2.7 | 2.3 | 1.3 | 105.7 | 16.3 | |||||||||||
| Net gains on foreign exchange transactions | 1.2 | 0.0 | -0.2 | 741.7 | 3,510.6 | |||||||||||
Core Revenues | 8.7 | 7.3 | 4.3 | 101.3 | 20.5 | |||||||||||
| Total provisions, net of recoveries | -1.1 | -0.8 | 0.4 | -384.8 | -43.0 | |||||||||||
| Net gains from sale of securities | -0.2 | -0.2 | 0.4 | -140.0 | 15.5 | |||||||||||
| Other income | 1.1 | 0.2 | 0.6 | 79.7 | 389.8 | |||||||||||
| Operating expenses | -2.3 | -2.1 | -2.0 | 14.7 | 10.4 | |||||||||||
Net income | 6.2 | 4.4 | 3.8 | 64.4 | 42.3 | |||||||||||
| Net income / share | 0.1 | 0.1 | 0.1 | 64.4 | 42.3 | |||||||||||
| Total loans | 125.5 | 107.3 | 132.7 | -5.4 | 16.9 | |||||||||||
| Total investmenst available for sale | 826.4 | 885.6 | 691.4 | 19.5 | -6.7 | |||||||||||
| Total assets | 1,486.1 | 1,606.7 | 1,367.8 | 8.6 | -7.5 | |||||||||||
| Total deposits | 1,256.8 | 1,387.0 | 1,164.1 | 8.0 | -9.4 | |||||||||||
| Shareholders equity | 208.8 | 201.8 | 171.4 | 21.8 | 3.5 | |||||||||||
| Net interest margin | 1.38 | % | 1.37 | % | 1.02 | % | ||||||||||
| Efficiency ratio | 24.0 | % | 29.0 | % | 37.5 | % | ||||||||||
| Return on average equity * | 17.0 | % | 15.9 | % | 16.6 | % | ||||||||||
| PDL/Total loans | 0.00 | 0.00 | 0.00 | |||||||||||||
| Cover ratio | 1.0 | % | 1.2 | % | 1.9 | % | ||||||||||
| BIS ratio * | 15.00 | % | 13.40 | % | 16.10 | % | ||||||||||
| * | Figures of ASB, on an accumulated basis |
Net income for Atlantic Security Holding Corporation (ASHC) of USD 6.2 million reflects growth of 64.4% YoY and 42.3% QoQ.
Core revenues grew by 101.3% YoY driven by greater asset volumes, wider margins and increased commissions income. On a QoQ basis, core revenue growth was 20.5% due almost entirely to foreign exchange gains. Most of these gains, however, were offset by losses in options that hedge currency exposures. Additionally, these gains had not been accounted for in the statement of income and expense until 3Q07, so they reflect gains over a 9 month period. Core revenues have therefore grown markedly on a YoY basis but when compared to the last quarter have remained stable. Nevertheless, the positive growth trend in commissions income that began in 3Q06 of approximately USD 350 thousand per quarter has continued unabated.
In 3Q07 USD 1.1 million of provisions were redistributed based on portfolio performance and did not have an effect on net income as there were no new provisions; asset quality remains high and shows no sign of deterioration despite current market conditions. Correcting for the foreign exchange and provision redistribution effect, actual QoQ net income growth was on the order of USD 800 thousand, attributed mainly to higher commissions income and less provision expenses.
Net interest margin has remained stable at 1.38%, as was predicted last quarter. We expect it to widen in the following quarters as the combined effects of lower short-term rates and larger credit spreads translates into a positively sloped yield curve. With Libor-Treasury spreads remaining high, however, this widening could develop slowly.
19
As mentioned, Fees and commissions continue to grow at a brisk clip, posting growth of 16.3% QoQ and 105.7% YoY. Most of the growth in this income stems from larger placement fees due to an increase in assets under management. However, as in the previous quarter, the positive performance of funds has allowed incentive fees to play an important role in the results posted for this item.
The efficiency ratio improved from 37.5% for 3Q06 to 24.0% for 3Q07. It is important to note however that the redistribution of provisions has distorted the efficiency ratio calculation for this quarter. Without adjusting for provisions, the ratio is 27%, which still represents an improvement over both 3Q06 and 2Q07.
The -7.5% QoQ drop in asset levels is explained by the withdrawal of large deposits received during 2Q07 that we anticipated in our previous commentary were not likely to remain. The 8.6% YoY growth is a more accurate measure of our actual asset growth rate which has slowed considerably with respect to 2006 but that continues at a pace several points above our base case reference rate of deposit yield reinvestment.
Interest Earning Assets
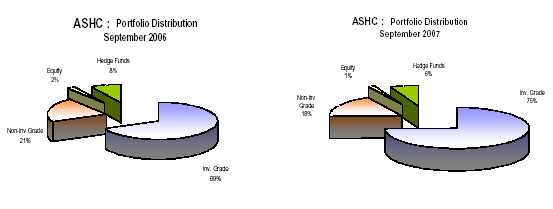
Interest earning assets reached US$ 1.358 MM, as shown in the table below. QoQ asset levels fell 8.1%, while YoY posted growth of 10.7%. As mentioned before, during 2Q07 we received several large deposits whose permanence was considered unlikely. These deposits were largely withdrawn during 3Q07, explaining the quarterly reduction. The YoY result is more in line with actual growth rates. For 2007, we expect asset growth to fall in the 8-10% range. The QoQ drop in Investments also reflects a temporary hold on new investment activity during most of 3Q07 as market developments dictated caution. By quarter’s end, however, investment activity resumed and we expect that for 4Q07 levels will reach USD 800-830 million, with most of the new investment coming from a similar reduction in Due from banks. The share of investment-grade securities in the investment portfolio remains at 75%, emphasizing ASB’s prudent investment policy of concentrating its portfolio in high credit quality, high liquidity securities.
INTEREST EARNING ASSETS * | Quarter | % change | ||||||||||||||
(US$ Million) | 3Q07 | 2Q07 | 3Q06 | 3Q07/3Q06 | 3Q07/2Q07 | |||||||||||
| Due from banks | 452 | 531 | 463 | -2.4 | % | -15.0 | % | |||||||||
| Loans | 126 | 107 | 133 | -5.4 | % | 16.9 | % | |||||||||
| nvestments | 781 | 838 | 631 | 23.7 | % | -6.9 | % | |||||||||
Total interest-earning assets | 1,358 | 1,477 | 1,226 | 10.7 | % | -8.1 | % | |||||||||
| (*) | Excludes investments in equities and mutual funds |
 |
20
Asset Management Business
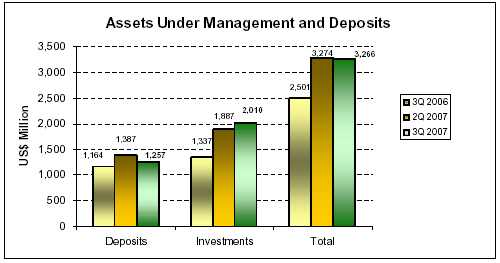
Third party managed funds include customers’ deposits, and investments such as proprietary mutual funds and securities custody. The total of these funds has grown -0.2% and 30.6% QoQ and YoY, reaching US$ 3.266 billion as of 3Q07 (US$ 3.274 billion in 2Q07). Quarterly growth was nil as the withdrawal of large time deposits were offset by a 6.5% QoQ growth in third-party investments, which continue to post strong growth albeit at a slower rate, in part due to the fact that higher asset prices contributed less to asset levels than in previous quarters. As we concluded in the previous quarter, the management of third party funds in off-balance sheet accounts continues to command most new business.
21
V. PRIMA AFP
V1. Market developments
During 3Q07, competition in the Private Pension Fund System was slightly softer than in the previous quarter as reflected by lower number of transfers, probably as a result of the important reduction of the sales force. Thus, transfers dropped to an average of 36 thousand per month in 3Q07 from an average of 42 thousand per month in 2Q07. With respect to new affiliations, they registered an increase from 55 to 57 thousand per month for 3Q07.
In terms of funds under management (FUM) and in spite of the impact of the international market, these did continue growing with respect to the previous quarter (+4.9% to US$ 20.2 billion). Furthermore, appetite for investments in the Stock market continued increasing, resulting in the AFP’s fund N° 3 -which concentrates in Stocks- increasing its share of the total FUM to 22.0% as of September 2007 (17.2% as of June 2007).
Private Pension Fund System: Main Indicators
3Q07 | 2Q07 | 1Q07 | ||||||||
| Affiliates (thousands) | 4.049 | 3.993 | 3.939 | |||||||
| % Change (1) | 1.4 | % | 1.4 | % | 1.5 | % | ||||
| Sales force(as of the end period) | 3,135 | 4,199 | 5,179 | |||||||
| Assets under management US$ (US$ mm) | 20,286 | 19,334 | 16,763 | |||||||
| % Change (1) | 4.9 | % | 15.3 | % | 16.5 | % | ||||
| Income (US$ mm) | 56.0 | 45.9 | 51.5 | |||||||
| Operating expenses (US$ mm) | 44.7 | 46.4 | 44.5 | |||||||
| Operating income (US$ mm) | 11.3 | (0.6 | ) | 7.0 | ||||||
| Net Income (US$ mm) | 10.7 | 19.5 | 22.0 | |||||||
| (1) | Quarterly change |
Source: SBS according to Peruvian GAAP. In local Peruvian Accounting, legal reserves are included in the income statement, as opposed to the IFRS
The first and third quarter include double collection
The Peruvian Pension Fund started receiving in August free disaffiliation applications, according to the Free Disaffiliation law (Law N°28991), ruled in May of 2007. The law granted affiliated individuals who comply with certain requirements, the possibility to disaffiliate from the Private Pension Fund (SPP) and return to the National Pension System (SNP). The requirements are oriented to affiliates who belonged to the SNP until December 1995 and after incorporating to SPP had a pension for retirement. The financial effects on Prima AFP related to the free disaffiliation will not be significant, due to the characteristics and requirements established by the law.
V2. Prima AFP
During the 3Q07, Prima focused on preserving its income base. Prima could sustain its leadership in terms of returns achieved in funds 2 and 3, which represented 95.9% of total funds under management. This contributed to a solid attractiveness of its funds which resulted in increasing the voluntary contributions that affiliates can make to the funds, positioning Prima at the top in terms of percentage of collections in the whole system.
22
PRIMA 3Q07 | System 3Q07 | % Share | PRIMA 2Q07 | PRIMA 1Q07 | ||||||||||||
| Affiliates (1) | 1,019,576 | 4,049,419 | 25.2 | % | 1,013,420 | 1,005,505 | ||||||||||
| New affiliations (2) | 11,706 | 57,156 | 20.5 | % | 12,155 | 12,847 | ||||||||||
| Funds under management US$ mm (1) | 6,347 | 20,286 | 31.3 | % | 5,840 | 5,001 | ||||||||||
| Collections US$ mm (3) | 143.4 | 406.7 | 35.3 | % | 159.9 | 164.4 | ||||||||||
Voluntary contributions to te funds US$ mm (1) | 188.6 | 391.4 | 48.2 | % | 175.6 | 119.6 | ||||||||||
Source: Superintendencia de Banca y Seguros:
| (1) | At end of period |
| (2) | Accumulated to the Quarter. |
| (3) | Indicator compounded by legal and voluntary contributions. Voluntary contributions increased in 1Q07 and 2Q07 when compared with 3Q07 |
- Voluntary contributions (APV):
During 3Q07, the voluntary contributions administered by Prima AFP kept its upward trend and registered as of September 2007 a balance of US$ 188.6 million, amount that represented the highest share in the whole system (48.2%).
In order to consolidate and strengthen the voluntary contribution system, Prima has established a fee administration for such contributions, which will be charged at the beginning of December 2007. At this point, the company will generate additional earnings, which will allow it to cover the cost related to the administration of such funds. The favorable perspective for growth of this system, supported by the excellent returns generated by the funds administered, will allow Prima to boost the growth of this business.
- Monthly Accumulated Salary (RAM):
The earnings generated by the company are based on the accumulated income provided by the active affiliates. According to the earnings generated by the 1.5% commission in 3Q07, the total amount of the base customer’s income kept in a very solid level, reporting the highest market share in the system (31%). This indicator is estimated according to the official earnings reported by the companies in the system.
PRIMA 3Q07 | Total System 3Q07 | PRIMA % Share | ||||||||
| Income (US$ millions) | 14.76 | 55.83 | 26 | % | ||||||
| Administration Fee | 1.5 | % | - | - | ||||||
| RAM estimated base (1) US$ million | 273.3 | 877.8 | 31 | % | ||||||
Commercial Results
During 3Q07, Prima continued its process of reducing its sales force to rationalize and reduce its operating costs. Looking to preserve its income base, the company focused on increasing its efficiency per sales person, increasing the number of new affiliation/transfers per sales person and targeting customers with higher average income.
Prima achieved these objectives during 3Q07, as the result of about 35 thousand new affiliations/transfers vs. 32 thousand transfers away from Prima. Furthermore, the higher average income level of its new affiliations, and voluntary contributions added up to make Prima the strongest fund in terms of collections, reaching US$ 143.4 million or 35.3% of collections for the system for September 2007. This contributed to positioning Prima as N°2 in the market in terms of FUM reaching S/. 19,594 million of administered funds or 31.3% market share.
Investments
Prima maintained its leadership position in returns achieved for two of its three different administered funds.
Fund N° 1 obtained the second highest return with 16.34% year to date (September).
23
Fund N°2 obtained the highest return during the last year, as well as accumulated for 2 years since Prima started operations (37.44% during the last 12 months and 74.71% during the last 24 months).
Likewise, fund N° 3 was the leader in the market with a 73.2% return during the last 12 months, a 6% superior figure with respect to next competitor in the system.
As of September 2007 and based on risk adjusted returns, Prima obtained the highest return for fund N° 3 and obtained the second position in funds N°1 and 2.
September 2007 | Share per Fund | ||||||
| Fund 1 | 259 | 4.1 | % | ||||
| Fundo 2 | 4,207 | 66.3 | % | ||||
| Fundo 3 | 1,881 | 29.6 | % | ||||
| Total US$ mm | 6,347 | 100.0 | % | ||||
Financial Results
In 3Q07 Prima reported net income of US$ 1.8 million. On an accumulated basis as of September 2007, the net income was US$ 0.7 million, in line with expectations. The company generated an important level of income (US$ 14.8 million, which include the double effect of July in terms of collections) following the good results of its commercial management and the support of the collections process. In this way, the company has consolidated a higher base of income generation.
Results for the 3Q07 are explained by the following developments:
| (1) | Expenses of sales personnel continue with a downward trend, as a result of the lay-offs in its sales force made in former months. |
| (2) | Lower administrative expenses related to the sales force support and offices maintenance and the decreased flows of funds into and between funds. |
| (3) | Expenses related still to the merger as charge offs of assets continue being amortized. Thus, amortization and depreciation of investments in systems and premises add up to US$ 2.2 million for 3Q07 and a total of US$ 6.4 million as of September 2007. |
| (4) | Financial charges for loans incurred to finance the acquisition of the Prima Headquarters and partially the acquisition of Unión Vida, which add up to US$ 1.1 million for 3Q07 and US$ 3.1 as of September 2007. |
| (5) | Net gains on foreign exchange transactions of US$0.9 million, due to the appreciation (2.6%) of the local currency during the 3Q07. |
Main financial indicators for Prima are shown below
3Q07 | 2Q07 | 1Q07 | Jan-Sep 2007 | Jan-Sep 2006 | ||||||||||||
| Income | 14,759 | 12,121 | 13,657 | 40,536 | 14,502 | |||||||||||
| Total General Expenses | (12,947 | ) | (13,385 | ) | (13,479 | ) | (39,811 | ) | (24,346 | ) | ||||||
| Net Income / Loss | 1,811 | (1,264 | ) | 178 | 725 | (9,844 | ) | |||||||||
| Total Assets | 244,050 | 239,120 | 229,159 | 244,050 | 183,809 | |||||||||||
| Total Liabilities | 114,959 | 112,150 | 106,055 | 114,959 | 58,484 | |||||||||||
| Equity | 129,090 | 126,971 | 123,104 | 129,090 | 125,325 | |||||||||||
| (1) | Information based on IFRS |
24
According to Peruvian accounting principles and for comparison purposes within the System, we have estimated Prima’s EBITDA in 3Q07 at US$ 3.8 million, i.e. 26% of System’s EBITDA
PRIMA | Competition | Total System | ||||||||
| Income | 14,759 | 40,937 | 55,696 | |||||||
| Net Income | 1,622 | 9,645 | 11,267 | |||||||
| + D&A | 742 | 1,137 | 1,879 | |||||||
| + amortization | 1,419 | - | 1,419 | |||||||
| EBITDA | 3,783 | 10,782 | 14,565 | |||||||
| % Share EBITDA | 26.0 | % | 74.0 | % | 100 | % | ||||
| (1) | Figures are according to Peruvian local accounting |
25
VI. EL PACIFICO PERUANO SUIZA AND SUBSIDIARIES (PPS)
Results of PPS, which includes Property & Casualty (PPS), Life (PV) and Health (EPS), for the 3Q07 have been negatively affected by the strong 8.0 Momentum scale (Mw, according to the US Geological Service) earthquake that stroke the southern area of our country, and a higher provisioning level as a consequence of an increase of the income tax for the Life insurance business. As of September, the Property & Casualty Company (PPS) had received claims related to the earthquake for a total amount close to US$44 million. PPS had a catastrophic re-insurance policy that covered risks of this nature leaving an exposure of only US$6 million. In addition, PPS has paid premiums for the reinstatement of its catastrophic policy for about US$1.8 million, leading to a total earthquake related cost of approximately US$8 million for the 3Q07.
Nevertheless, the accumulated underwriting results of the consolidated company as of September 2007 reached US$14.9 million, one of the highest in the insurance industry of the country.
On the other hand, it is important to mention that PPS continues recovering its market share throughout this current year. The total market for Property & Casualty and Life Insurance generated total gross premiums of US$896 million as of September 2007, 7.3% above the cumulated premiums for the same period of last year. During this period PPS and PV grew altogether at 19.9% and the market share for both, in terms of total premiums, reached 30.5%, a 3.2 percentage points increase from the previous year.
It is important to highlight that the re-composition of the risk portfolio favoring the retail segment is moving forward. Thus, for the retail segments such as the medical assistance, automobiles, personal injuries, property insurance and SOAT segments, the total production grew 41% YoY and 10% QoQ.
VI.1 Net Income
Net consolidated income after minority interest for 3Q07 reflects a loss of US$3.9 million vs. a net income of US$6.8 million in 2Q07 and US$5.5 million in 3Q06. Nevertheless, on a cumulative basis the net income after minority interest reached US$11.6 million, hardly US$1.6 million lower than the net income registered during the same period of last year, despite the catastrophic effects mentioned before.
As a result, PPS’s contribution to Credicorp for 3Q07 (after consolidation adjustments and minority interest) reached a loss of US$2.96 million.
VI.2 Revenue and Operating Expenses
Total Premiums amounted to US$115.6 million in 3Q07; representing an improvement of 20.7% YoY and a moderate 1.6% decrease QoQ. The YoY improvement is fueled mainly by the P&C businesses in automobiles, medical assistance and SOAT; by the life insurance business in the pension fund segment and individual life, and by the health insurance business in fees to private companies.
The QoQ moderate decrease is driven by the 16% lower premiums generated by the P&C, explained by a seasonality in some businesses such us aviation, marine hull and others, with peak levels during the second and fourth quarter of the year.
On a cumulative basis, total premiums reached US$338.3 million as of September 2007 vs. US$285 million a year ago.
During the 3Q07, Technical reserves increased by 10.7% YoY, explained mainly by the increase of total premiums in this period. However, on a QoQ basis, reserves decreased by 18% due to seasonality mentioned before driven by the P&C business. A reduction in P&C reserves on a quarterly basis responds to seasonal evolution since these respond to the seasonality of its insurance contracts, which lead to lower reserves build-up in the months of lower production, which are typically in the 1st and 3th quarters, while reserves are higher in the 2nd and 4th quarters.
26
Net Premiums Earned reached a level of US$ 77.1 million in 3Q07, reflecting a growth of 4.2% QoQ and 14.5% YoY, mainly as a result of general Premiums growth in P&C and Health. On a QoQ basis comparison, the increase in net premiums earned is explained by higher retained premiums and by a reduction in reserves, both in the P&C segment.
As of September 2007, net premiums earned amounted to US$223.2 million, 16% higher than that of the same period a year ago.
Quarter | Change | |||||||||||||||
US$ MM | 3Q07 | 2Q07 | 3Q06 | 3Q07 / 2Q07 | 3Q07 / 3Q06 | |||||||||||
| Total Gross Premium | 115.6 | 117.4 | 95.7 | -1.6 | % | 20.7 | % | |||||||||
| Retained Premium | 91.4 | 91.4 | 80.2 | 0.0 | % | 13.9 | % | |||||||||
| Reserve Adjustments | 14.2 | 17.4 | 12.9 | -18.0 | % | 10.7 | % | |||||||||
| Net Premiums Earned | 77.1 | 74.0 | 67.4 | 4.2 | % | 14.5 | % | |||||||||
Financial Income for 3Q07 reached US$ 13.4 million, up 1.4% QoQ and 35.6% YoY. These increases respond to basically higher dividends received by the P&C portfolio and to higher interest on investments in the Life business as the portfolio of administered funds expands. As of September 2007, financial income reached US$39.5 million vs. US$33.8 million a year ago.
Other income increases significantly by 130.5% YoY and 16.8% QoQ, mainly due to higher capital gains from the sale of equity investments on PPS’s books and from the sale of debt investments on PV’s books, as a consequence of the excellent performance of the Lima Stock Exchange during September. This income amounted to US$4.7 million in 3Q07 and US$17.7 million year to date (as of September 2007).
Salaries and Employees Benefits were 1.8% and 0.1% below when compared to 3Q06 and 2Q07, respectively. On a YoY basis comparison, the decrease was the consequence of the reclassification of SARs provisions to the “operating expenses” caption. Excluding this effect, the growth attained was 4.9% .
General expenses and Other operating expenses showed an increase with respect to 3Q06, however, a significant part is non-recurrent expenses and is explained by:
| 1) | Reclassifications of some accounts in order to improve the accounting analysis, which however do not represented significant higher expenses i.e a) provisions of SARs in P&C and Life businesses that were registered in “personnel expenses” in 2006 are reclassified to “operating expenses” in 2007, b) in the Health business, the collection of medical assistance services that were registered in “technical income” in 2006 is reclassified to “operating expenses recoveries” and c) In Life business, the expenses of collection fees from “Seguros Multiples” that were registered net of its sales until last year, are reclassified to “operating expenses”. |
| 2) | Extraordinary provisions corresponded to previous fiscal earnings and provisions for premiums not collected according to Superintendence’s regulations. |
| 3) | Expenses related to the August earthquake, which include voluntary donations for about US$220 thousand and non-recurrent professional fees. |
Excluding the effect of such accounting reclassifications and provisions, the operating expenses variation was 26.5% YoY, which is highly related to higher production costs, higher payment for fee intermediation with brokers and higher advertising campaigns in line with the company growth in the retail segment, which grew 41% YoY in P&C; meanwhile individual life grew 33%.
27
The higher operating expenses reported during the last quarters responds to the idea of increasing the individual client base and the cross-sale of products for these clients, which should allow the company to generate a more stable income and have a better estimate of claims related expenses.
With respect to the 2Q07, a 12.6% growth of operating expenses was reported and is explained mainly by higher expenses related to an increase in retail products mentioned before as well as higher expenses for donations, some provisions for premiums collections and extraordinary provisions corresponding to former periods.
VI.3 Claims
Net Earned Loss ratio (NEL) reached 83.9% in 3Q07, 15.4 percentage points above 3Q06 and 13.1 percentage points above 2Q07; as a consequence of the increase in claims for the P&C. business. NEL of 98.7% for P&C is mainly explained by the August 15th earthquake. Overall, net provisions for losses related to the earthquake accounted for 26.2% of net premiums earned for P&C during the 3Q07.
On the other hand, in the Life segment, NEL decreases from 75.3% in 3Q06 to 69.7% in 3Q07 but increases 2.7 percentage points with respect to 2Q07 basically following the growth of the business and for an additional reserve for claims in the Pension fund segment affected by the inflation rate.
In addition, the NEL in the Health segment is slightly higher by 0.3 percentage points than that in 2Q07 but is lower by 1.6 percentage points with respect to 3Q06.
As of September 2007, the NEL consolidated reached 76.0% vs. 71.9% attained during the same period of last year.
The Net Claims reached US$64.7 million, reflecting an increase of 23.5% QoQ and 40.2% YoY. In both cases, the increase is mainly explained by the effect of the earthquake that stroke the southern area of the country, for which PPS retained the risk for US$6 million, plus US$1.8 million for the policy reinstatement costs. Likewise, in PV, the Net claims increased 25% QoQ, as a consequence of the business growth and for additional reserves in claims for the Pension fund business, which are adjusted to inflation.
It is however noteworthy, that the subsidiaries of PPS Group have lower level of retained claims when compared to their competitors in the different business segments
VI.4 Investment Portfolio
Financial income reported for 3Q07 was S$13.4 million, reflecting an increase of 1.4% QoQ and 35.6% YoY, following a reduction of international rates which was compensated by the growing investment portfolio. At the same time, some important capital gains were reported due to a better performance of the Lima Stock Exchange General Index, amounting to US$4.7 million in 3Q07 and US$17.7 million year to date.
The investment/securities portfolio reached US$ 798.9 million by the end of 3Q07, up from US$ 778.9 million at the end of 2Q07 and US$ 750.1 million by the end of 3Q06.
VI.5 Market Share
The total market for P&C and Life reported Total Gross Premiums reaching US$ 896.0 million for the 9M07, which were 7.3% larger than total premiums for 9M06. As of September 2007, PPS grew 26.8% YoY meanwhile PV did 9.1%. Altogether, PPS and PV registered an improvement of 19.9% during the 9M07.
28
Market share of PPS and PV of the total premiums reached 30.5% this year compared to 27.3% last year. P&C reached a market share of 34.0%, up from 30.2% reached during the same period of last year, and Life and Pension Fund insurance businesses attained 25.7%, up from 23.7% achieved in last year.
The market growth of the Health business sector (Empresas Prestadoras de Salud - EPS) was 16.3% as of August 2007, being the growth of PS at 13.5% and the leader in the marker with 53.8% market share, slightly lower in 1.3 percentage points when compared to the same period of last year
V1.6 Business Lines
Total contribution to BAP
(In US$, thousands)
(In US$, thousands)
Consolidated | Ajustments for | Total | |||||||||||||||||
Net Earnings | Consolidation | Contribution | |||||||||||||||||
| Period | PPS | PV | EPS | at PPS | and Minorities | to BAP | |||||||||||||
3Q06 | 2,500 | 1,740 | 1,278 | 5,519 | (933 | ) | 4,586 | ||||||||||||
4Q06 | 35,165 | 4,095 | 885 | 40,144 | (35,610 | ) | 4,534 | ||||||||||||
1Q07 | 1,883 | 6,147 | 705 | 8,735 | (2,119 | ) | 6,616 | ||||||||||||
2Q07 | 2,263 | 3,931 | 585 | 6,779 | (1,645 | ) | 5,134 | ||||||||||||
3Q07 | -6,615 | 2,108 | 598 | (3,908 | ) | 948 | (2,960 | ) | |||||||||||
Var% 3Q07/2Q07 | -392 | % | -46 | % | 2 | % | -158 | % | -158 | % | |||||||||
Property & Casualty (PPS)
Premiums for the P&C business grew 20.7% YoY and dropped 16% QoQ, mainly due to seasonality in segments such us Aviation, Marine Hull, and others. Total premiums accumulated as of September 2007 grew 26%, reaching US$175.9 million vs. US$138.8 million achieved during the same period of last year. This important growth is led by the decision taken by the company to increase its production in the retail segment and by its re-composition of its corporate segment, mainly in the marine hull, aviation and technical segment.
This growth led to increased reserves provisions for about 56% or US$3.8 million. For this reason, Net Premiums Earned reflected an increase of 8% during the year.
As was mentioned before, due to the August earthquake, PPS has registered total claims of US$44 million as of the end of September. However, as a result of the excess of loss coverage in the catastrophic policies, the net retained loss by PPS was US$ 6.0 million, plus the reinstatement costs related to those policies, which amounted to US$1.8 million. For this reason and having also experienced this quarter severe claims related to the fire segment, medical assistance and technical segment, the underwriting result for the 3Q07 was US$-5.7 million and the net income after minority interest was US$-6.6 million, compensated in part by better financial returns and gains on the sales of securities, which were 134% higher YoY and 6.7% QoQ.
As of September 2007, PPS registered an accumulated loss of US$ 2.5 million vs. a net income of US$ 4.8 million achieved in the same period of last year.
29
Life (PV)
Total premiums amounted to US$36.8 million in 3Q07, up 22.0% QoQ and 22.8% YoY. The QoQ growth is explained by the larger production in the pension fund segment as a result of the favorable performance of Prima AFP and as a consequence of double collection in the month of July (gratificaciones). Total premiums generated by PV are growing by 9% for the year to date.
The NEL in 3Q07 reached 69.7%, 5.6 percentage points lower YoY led by larger production, and 2.7 percentage points higher QoQ, mainly due to a higher inflation rate in September (0.6%), which generated an additional reserve for claims in the Pension fund segment adjusted for inflation. Nevertheless, these larger reserves will be compensated in the next quarter with the adjustment in the assets that originated such reserves.
On the other hand, financial income increased by 4.4% QoQ and 35.8% YoY, basically due to the better investment portfolio performance; even though this was partially compensated by the larger provisions for income tax generated this quarter given the revaluation in local currency of the US dollar debt. Net income after minority interest in 3Q07 amounted to US$2.4 million, 30% higher YoY but 44% lower QoQ.
As of September 2007, PV reported a net income after minority interest of US$12.2 million vs. US$5.4 million registered during the same period of last year.
Health (EPS)
Premiums for Health business grew 6.8% QoQ and 17.6% YoY, mainly due to higher production in corporate health plans. The underwriting result reached US$3.7 million, 60.9% superior YoY, given the larger production and lower claims. With respect to the previous quarter, the underwriting result had no significant variation due to a compensation generated by a higher NEL in 79.5%, 0.3 percentage points above the previous quarter. Net income in 3Q07 reached US$0.6 million, 2.4% above the previous quarter and 53.2% below YoY. In 3Q06, the health business registered an extraordinary earning given the reversals of provisions for the tax income payment according to the tax ruling in technical reserves.
Net income as of September 2007 reached US$1.9 million, lower than US$2.9 million registered during the same period of last year. The reduction is explained by the reversals in provisions for income tax in 3Q06 mentioned above, and larger operating expenses during this year.
30
VII. ECONOMIC OUTLOOK
The Peruvian economy continued showing a positive development during 2007, with an annual growth of +7.7% between January and August, led by the dynamism of the private investments, and the sectors associated with domestic demand, such as construction and non-primary manufacture. In the construction sector, accumulated year to date growth reaches +15.8% as a result of the public infrastructure dynamism, the private productive infrastructure development and increasing auto construction.
Furthermore, the industrial non-primary sector shows growth of +12% in the same period explained by the increased production of consumption goods and intermediate goods, especially those related to construction. On the other hand, primary sectors show certain stagnation, especially the mining industry, where the lower production of gold (-22%) could not be compensated by the expansion registered in the extraction of zinc (+25.5%) and cooper (+13.7%). In spite of this, the official economic perspectives recently revised and published by the MEF and BCR, have improved, projecting a sustainable dynamic in the private sectors, which should bring growth for this year over 7 % and for the following years to about 6%.
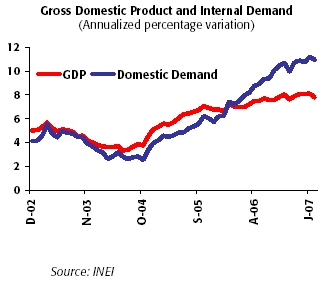
External Sector
Between January and August 2007, the trade balance surplus was of US$ 5,015MM, an amount US$ 355MM lower than the surplus achieved for the same period 2006. This is explained by annualized import growth which is already higher than exports in a context of domestic demand growing at a higher pace than economic activity. Thus, exports grew 16.5% in the first eight month of the year., reaching US$ 17,286MM though this growth is explained by higher international prices of exported goods (+14.7%), since volumes increased by only 1.6% On the other hand, imports grew +29.6% in the same period, due mainly to investments in capital assets (+44.6). Finally the international reserves continued growing, closing the third quarter in US$22,827MM.
31
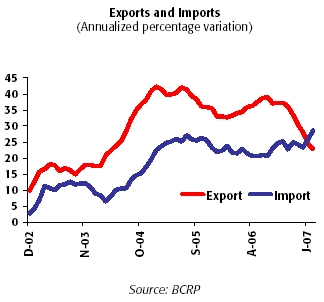
Prices and Exchange rate
To the closing of 3Q07, annualized inflation reached 2.8% within the range set as goal of the Central Bank BCR between (1% and 3%), despite to the growing trend of the last months. The price increases of the last months are due to specific factors related to the supply side, especially to the increases in the international prices of oil and some cereals. Nevertheless, there is a perception of increasing underlying inflation. In this context, BCR increased its reference rate to 50 bp. throughout the quarter, as a preventive measure to moderate the internal demand expansion which puts pressure on the referred underlying inflation. With regards to the exchange rate, it closed in September at S/. 3.085 per dollar, even thought on the fist two weeks of October the Sol appreciation lead the US Dollar to a market value of about S/. 3.02. This reflects an accumulated appreciation of the Nuevo Sol that surpassed 5.0% over the year. Due to this development the Central Bank had to support the US currency through interventions in the foreign exchange market, to reduce volatility, accumulating US$ 6,737MM on net purchases for the closed of 3Q07.
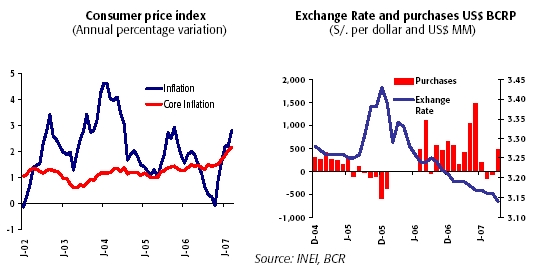
32
During the period of January through August May, tax collections increased to S/. 35,368MM. This figure is 15.1% more in real terms than tax collections in the same period of 2006. This growth is explained principally, by increased collections of Income Tax (IR, +21.9 %), especially from corporation (+25.1% without regularizations) and Value Added Tax (IGV, +17.3%), fueled especially in the last months by imports. On the public spending side of the Central Government, an increase of 18.2 % up to August is observed and explained by an increase of +19.3% in the current expenditure and lower growth of public investments (+8.7%), . Hence, the economic result of the Central Government to the closing of August reveals a surplus of S/. 6,708MM, S/.644MM above the one registered on the same period in 2006.
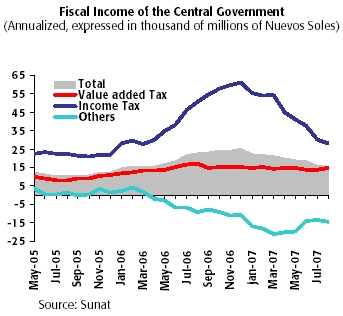
Banking System
At the closing of August 2007, total loan placements in the banking system continued to grow and reached US$19,496MM, amount that represents an increase of +35.63% compared to the same period of 2006 and of +23.7 with respect to the closing of 2006. This result is mainly supported by the stronger credit activity in the retail segments such as consumer loans (+55.0% YoY), though SME lending revealed also strong growth (+33.9% YoY), as did mortgages (+22.6% YoY). The lending dynamism came along with a stable and low delinquencies level of 1.6%.
Looking at the banking system’s main source of funding, deposits also continued increasing and reached US$22,263MM, which represents a growth rate of +25.6% YoY and of +17.7% for the year to date. Growth was observed in demand deposits (+33.2%) savings deposits (+17.2%) and time deposits (+27.2%).
Dollarization of the banking system continues decreasing in both loans and deposits. This way, dollar lending grew by +27.6% YoY, while soles lending grew at a more accelerated rate of +52.3%. Furthermore, dollar loans represent now 63.6% of total loan portfolio (as of August 2007), while these used to make up for 67.6% a year ago.
Dollarization of deposits also dropped from levels of 63.8% to 59.0% in the same period, which reflects an increasing preference for saving in national currency in view of the appreciation experienced by the Nuevo Sol in the last year.
Finally, interest rates have stabilized in the last months. This way, the TAMN (local currency lending rate) closed 3Q07 at 22.5%, below the closing level of 3Q06 (23.9%), while TAMEX (foreign currency lending rate) closed 3Q07 at 10.5%, (10.6% and 10.8% at the closing of 3Q06 and 4Q06, respectively). On the funding side, the TIPMN (local currency deposit rate) and the TIPMEX (Foreign currency deposit rate) closed this 3Q07 at 3.2% and 2.2% respectively, which are basically the same levels from December 2006.
33
Main Financial Indicators
2006 | 2007 | |||||||||||||||||||||||||||
IQ | 2Q | 3Q | 4Q | Year | IQ | 2Q | 3Q | Year (f) | ||||||||||||||||||||
| GDP (US$ MM) | 20,455 | 24,095 | 23,523 | 25,036 | 93,108 | 23,871 | 27,479 | n.d. | 106,586 | |||||||||||||||||||
| Real GDP (var.%) | 7.9 | 5.8 | 8.6 | 8.1 | 7.6 | 8.0 | 7.6 | n.d. | 7.5 | |||||||||||||||||||
| GDP per-cápita (US$) | 3,019 | 3,537 | 3,434 | 3,635 | 3,294 | 3,447 | 3,947 | n.d. | 3,817 | |||||||||||||||||||
| Domestic demand (var. %) | 11.1 | 7.1 | 10.3 | 12.0 | 10.1 | 10.6 | 10.2 | n.d. | 9.2 | |||||||||||||||||||
| Consumption (var. %) | 5.1 | 6.4 | 6.2 | 7.3 | 6.2 | 7.7 | 7.5 | n.d. | 7.0 | |||||||||||||||||||
| Private Investment (var. %) | 22.4 | 17.0 | 16.7 | 19.7 | 18.9 | 17.3 | 22.9 | n.d. | 19.0 | |||||||||||||||||||
| CPI (annual change, %) | 2.5 | 1.8 | 2.0 | 1.5 | 1.1 | 0.3 | 1.6 | 2.8 | 3.2 | |||||||||||||||||||
| Echange rate, eop (S/. per US$) | 3.36 | 3.26 | 3.25 | 3.20 | 3.20 | 3.19 | 3.17 | 3.09 | 3.00 | |||||||||||||||||||
| Devaluation (annual change, % ) | 2.9 | 0.2 | -2.8 | -6.8 | -6.8 | -5.1 | -2.8 | -5.1 | -6.1 | |||||||||||||||||||
| Exchange rate , average (S/. per US$) | 3.34 | 3.29 | 3.24 | 3.22 | 3.27 | 3.19 | 3.17 | 3.15 | 3.13 | |||||||||||||||||||
| Non- Financial Public Sector (% of GDP) | 3.9 | 5.7 | 1.5 | -2.6 | 2.1 | 4.9 | 8.2 | n.d. | 2.0 | |||||||||||||||||||
| Central govermment current revenues (% of GD | 17.7 | 18.5 | 16.9 | 16.2 | 17.3 | 17.3 | 20.5 | n.d. | 17.9 | |||||||||||||||||||
| Tax Income (% of GDP) | 15.1 | 16.4 | 14.2 | 14.0 | 14.9 | 14.9 | 17.7 | n.d. | 15.6 | |||||||||||||||||||
| Non Tax Income (% of GDP) | 2.6 | 2.1 | 2.7 | 2.1 | 2.4 | 2.4 | 2.8 | n.d. | 2.3 | |||||||||||||||||||
| Current expenditures (% of GDP) | 11.7 | 10.8 | 12.7 | 13.6 | 12.2 | 11.7 | 14.2 | n.d. | 12.4 | |||||||||||||||||||
| Capital Expenditures (% of GDP) | 0.8 | 1.3 | 2.4 | 3.2 | 2.0 | 0.8 | 1.4 | n.d. | 2.5 | |||||||||||||||||||
| Trade Balance (US$ MM) | 1,257 | 2,190 | 2,885 | 2,602 | 8,934 | 1,455 | 2,167 | n.d. | 8,600 | |||||||||||||||||||
| Exports (US$ MM) | 4,640 | 5,824 | 6,559 | 6,777 | 23,800 | 5,687 | 6,647 | n.d. | 26,400 | |||||||||||||||||||
| Imports (US$ MM) | -3,383 | -3,635 | -3,673 | -4,175 | -14,866 | -4,232 | -4,480 | n.d. | 17,800 | |||||||||||||||||||
| Current Account Balance (US$ MM) | -219 | 426 | 1,273 | 1,110 | 2,589 | -14 | 480.4 | n.d. | 1,900 | |||||||||||||||||||
| Current Account Balance (% of GDP) | -1.1 | 1.8 | 5.4 | 4.4 | 2.8 | -0.1 | 1.7 | n.d. | 1.8 | |||||||||||||||||||
34
Credicorp Ltd. (NYSE: BAP) is the leading financial services holding company in Peru. It primarily operates via its four principal Subsidiaries: Banco de Credito del Peru (BCP), Atlantic Security Holding Corporation (ASHC), El Pacífico-Peruano Suiza Compañía de Seguros y Reaseguros (PPS) and Grupo Credito. Credicorp is engaged principally in commercial banking (including trade finance, corporate finance and leasing services), insurance (including commercial property, transportation and marine hull, automobile, life, health and pension fund underwriting insurance) and investment banking (including brokerage services, asset management, trust, custody and securitization services, trading and investment). BCP is the Company's primary subsidiary.
Safe Harbor for forward-looking statements:
This material includes “forward-looking statements” within the meaning of Section 21E of the Securities Exchange Act of 1934. All statement other than statements of historical information provided herein are forward-looking and may contain information about financial results, economic conditions, trends and known uncertainties.
The Company cautions readers that actual results could differ materially from those expected by the Company, depending on the outcome of certain factors, including, without limitation: (1) adverse changes in the Peruvian economy with respect to the rates of inflation, economic growth, currency devaluation, and other factors, (2) adverse changes in the Peruvian political situation, including, without limitation, the reversal of market-oriented reforms and economic recovery measures, or the failure of such measures and reforms to achieve their goals, and (3) adverse changes in the markets in which the Company operates, including increased competition, decreased demand for financial services, and other factors. Readers are cautioned not to place undue reliance on these forward-looking statements, which speak only as of the date hereof.
The Company undertakes no obligation to release publicly the result of any revisions to these forward-looking statements which may be made to reflect events or circumstances after the date hereof, including, without limitation, changes in the Company’s business strategy or planned capital expenditures, or to reflect the occurrence of unanticipated events.
35
CREDICORP LTD. AND SUBSIDIARIES | |
CONSOLIDATED BALANCE SHEETS | |
(In US$ thousands, IFRS) |
As of | ||||||||||||||||
Sep 07/ | Sep 07/ | |||||||||||||||
September 2007 | June 2007 | September 2006 | Sep 06/ | June 07 | ||||||||||||
Assets | ||||||||||||||||
Cash and due from banks | ||||||||||||||||
| Non-interest bearing | 541,062 | 516,676 | 447,091 | 21.0 | % | 4.7 | % | |||||||||
| Interest bearing | 1,891,059 | 2,041,200 | 2,248,202 | -15.9 | % | -7.4 | % | |||||||||
| Total cash and due from banks | 2,432,122 | 2,557,876 | 2,695,293 | -9.8 | % | -4.9 | % | |||||||||
Marketable securities, net | 49,465 | 53,569 | 70,534 | -29.9 | % | -7.7 | % | |||||||||
Loans | 7,509,085 | 7,031,734 | 5,592,231 | 34.3 | % | 6.8 | % | |||||||||
| Current | 7,440,873 | 6,964,320 | 5,504,991 | 35.2 | % | 6.8 | % | |||||||||
| Past Due | 68,212 | 67,414 | 87,240 | -21.8 | % | 1.2 | % | |||||||||
| Less - Reserve for possible loan losses | (204,204 | ) | (191,747 | ) | (188,198 | ) | 8.5 | % | 6.5 | % | ||||||
Loans, net | 7,304,881 | 6,839,987 | 5,404,033 | 35.2 | % | 6.8 | % | |||||||||
Investments securities available for sale | 4,657,859 | 4,686,444 | 2,803,636 | 66.1 | % | -0.6 | % | |||||||||
Reinsurance assets | 91,325 | 65,831 | 37,880 | 141.1 | % | 38.7 | % | |||||||||
Premiums and other policyholder receivables | 86,779 | 85,780 | 69,835 | 24.3 | % | 1.2 | % | |||||||||
Property, plant and equipment, net | 254,820 | 256,822 | 239,705 | 6.3 | % | -0.8 | % | |||||||||
Due from customers on acceptances | 51,040 | 46,331 | 50,761 | 0.5 | % | 10.2 | % | |||||||||
Other assets | 853,365 | 726,776 | 486,987 | 75.2 | % | 17.4 | % | |||||||||
Total Assets | 15,781,656 | 15,319,416 | 11,858,664 | 33.1 | % | 3.0 | % | |||||||||
Liabilities and shareholders' equity | ||||||||||||||||
Deposits and Obligations | ||||||||||||||||
| Non-interest bearing | 2,474,260 | 2,339,402 | 1,721,411 | 43.7 | % | 5.8 | % | |||||||||
| Interest bearing | 7,848,572 | 7,813,199 | 6,253,175 | 25.5 | % | 0.5 | % | |||||||||
| Total deposits and Obligations | 10,322,832 | 10,152,601 | 7,974,586 | 29.4 | % | 1.7 | % | |||||||||
Due to banks and correspondents | 1,695,923 | 1,685,689 | 924,499 | 83.4 | % | 0.6 | % | |||||||||
Acceptances outstanding | 51,040 | 46,331 | 50,761 | 0.5 | % | 10.2 | % | |||||||||
Reserves for property and casualty claims | 638,270 | 578,754 | 528,258 | 20.8 | % | 10.3 | % | |||||||||
Reserve for unearned premiums | 118,986 | 112,086 | 90,029 | 32.2 | % | 6.2 | % | |||||||||
Reinsurance payable | 30,247 | 25,024 | 33,502 | -9.7 | % | 20.9 | % | |||||||||
Bonds and subordinated debt | 494,234 | 504,948 | 406,734 | 21.5 | % | -2.1 | % | |||||||||
Other liabilities | 693,131 | 548,719 | 445,090 | 55.7 | % | 26.3 | % | |||||||||
Minority interest | 133,968 | 130,111 | 108,288 | 23.7 | % | 3.0 | % | |||||||||
Total liabilities | 14,178,629 | 13,784,262 | 10,561,747 | 34.2 | % | 2.9 | % | |||||||||
Net Shareholder's equity | 1,603,026 | 1,535,154 | 1,296,917 | 23.6 | % | 4.4 | % | |||||||||
Total liabilities and net shareholder's equity | 15,781,656 | 15,319,416 | 11,858,664 | 33.1 | % | 3.0 | % | |||||||||
Contingent Credits | 4,702,435 | 4,393,139 | 3,555,593 | 32.3 | % | 7.0 | % | |||||||||
36
CREDICORP LTD. AND SUBSIDIARIES | |
QUARTERLY INCOME STATEMENT | |
(In US$ thousands, IFRS) |
Quarter | Change | Year ended | Change | ||||||||||||||||||||||
3Q07 | 2Q07 | 3Q06 | 3Q07/3Q06 | 3Q07/2Q07 | Sept 07 | Sept 06 | Sept 07/Sept 06 | ||||||||||||||||||
Interest income and expense | |||||||||||||||||||||||||
| Interest and dividend income | 270,182 | 248,976 | 198,339 | 36.2 | % | 8.5 | % | 740,005 | 571,199 | 29.6 | % | ||||||||||||||
| Interest expense | (109,127 | ) | (89,671 | ) | (77,672 | ) | 40.5 | % | 21.7 | % | (280,787 | ) | (205,545 | ) | 36.6 | % | |||||||||
| Net interest and dividend income | 161,055 | 159,305 | 120,667 | 33.5 | % | 1.1 | % | 459,218 | 365,653 | 25.6 | % | ||||||||||||||
Provision for loan losses | (7,922 | ) | (6,090 | ) | 9,795 | -180.9 | % | 30.1 | % | (18,430 | ) | 5,997 | -407.3 | % | |||||||||||
Non financial income | |||||||||||||||||||||||||
| Fee income | 86,270 | 76,100 | 63,935 | 34.9 | % | 13.4 | % | 236,446 | 174,218 | 35.7 | % | ||||||||||||||
| Net gain on foreign exchange transactions | 14,710 | 12,796 | 9,515 | 54.6 | % | 15.0 | % | 39,462 | 31,095 | 26.9 | % | ||||||||||||||
| Net gain on sales of securities | 5,124 | 14,644 | 6,616 | -22.6 | % | -65.0 | % | 37,714 | 12,857 | 193.3 | % | ||||||||||||||
| Other | 6,837 | 4,486 | 5,220 | 31.0 | % | 52.4 | % | 18,540 | 18,254 | 1.6 | % | ||||||||||||||
Total fees and income from services, net | 112,942 | 108,026 | 85,286 | 32.4 | % | 4.6 | % | 332,162 | 236,424 | 40.5 | % | ||||||||||||||
Insurance premiums and claims | |||||||||||||||||||||||||
| Net premiums earned | 74,511 | 71,657 | 65,521 | 13.7 | % | 4.0 | % | 216,159 | 186,521 | 15.9 | % | ||||||||||||||
| Net claims incurred | (19,617 | ) | (14,017 | ) | (9,553 | ) | 105.4 | % | 40.0 | % | (47,173 | ) | (32,429 | ) | 45.5 | % | |||||||||
| Increase in cost for life and health policies | (45,085 | ) | (38,363 | ) | (36,585 | ) | 23.2 | % | 17.5 | % | (122,536 | ) | (105,692 | ) | 15.9 | % | |||||||||
| Total other operating income, net | 9,809 | 19,278 | 19,383 | -49.4 | % | -49.1 | % | 46,450 | 48,400 | -4.0 | % | ||||||||||||||
Operating expenses | |||||||||||||||||||||||||
| Salaries and employees benefits | (75,649 | ) | (74,385 | ) | (61,676 | ) | 22.7 | % | 1.7 | % | (219,013 | ) | (172,532 | ) | 26.9 | % | |||||||||
| Administrative, general and tax expenses | (48,703 | ) | (47,981 | ) | (39,669 | ) | 22.8 | % | 1.5 | % | (140,528 | ) | (113,489 | ) | 23.8 | % | |||||||||
| Depreciation and amortization | (12,857 | ) | (12,488 | ) | (10,115 | ) | 27.1 | % | 3.0 | % | (37,809 | ) | (32,549 | ) | 16.2 | % | |||||||||
| Merger Expenses | - | - | (271 | ) | 100.0 | % | 100.0 | % | - | (271 | ) | -100.0 | % | ||||||||||||
| Other | (25,916 | ) | (25,031 | ) | (40,312 | ) | -35.7 | % | 3.5 | % | (75,472 | ) | (90,637 | ) | -16.7 | % | |||||||||
| Total operating expenses | (163,125 | ) | (159,886 | ) | (152,042 | ) | 7.3 | % | 2.0 | % | (472,821 | ) | (409,478 | ) | 15.5 | % | |||||||||
Income before translation results, workers' profit sharing and income taxes | 112,758 | 120,633 | 83,089 | 35.7 | % | -6.5 | % | 346,579 | 246,997 | 40.3 | % | ||||||||||||||
| Translation result | 13,811 | 1,728 | 832 | 1559.2 | % | 699.3 | % | 17,184 | 9,501 | 80.9 | % | ||||||||||||||
| Workers’ profit sharing | (4,274 | ) | (2,874 | ) | (3,216 | ) | 32.9 | % | 48.7 | % | (10,910 | ) | (8,723 | ) | 25.1 | % | |||||||||
| Income taxes | (29,144 | ) | (25,759 | ) | (25,384 | ) | 14.8 | % | 13.1 | % | (79,065 | ) | (69,319 | ) | 14.1 | % | |||||||||
| Net income | 93,152 | 93,727 | 55,322 | 68.4 | % | -0.6 | % | 273,788 | 178,456 | 53.4 | % | ||||||||||||||
| Minority interest | 2,848 | 6,324 | 3,997 | -28.8 | % | -55.0 | % | 17,068 | 11,513 | 48.2 | % | ||||||||||||||
Net income attributed to Credicorp | 90,304 | 87,403 | 51,324 | 75.9 | % | 3.3 | % | 256,720 | 166,943 | 53.8 | % | ||||||||||||||
37
CREDICORP LTD. AND SUBSISIARIES | |
SELECTED FINANCIAL INDICATORS |
Quarter | Year ended | |||||||||||||||
3Q07 | 2Q07 | 3Q06 | September 07 | September 06 | ||||||||||||
Profitability | ||||||||||||||||
| Net income per common share (US$ per share)(1) | 1.13 | 1.10 | 0.64 | 3.22 | 2.09 | |||||||||||
| Net interest margin on interest earning assets (2) | 5.16 | % | 5.46 | % | 4.88 | % | 5.43 | % | 5.15 | % | ||||||
| Return on average total assets (2)(3) | 2.32 | % | 2.41 | % | 1.74 | % | 1.84 | % | 1.48 | % | ||||||
| Return on average shareholders' equity (2)(3) | 23.02 | % | 23.66 | % | 16.34 | % | 22.87 | % | 18.35 | % | ||||||
| No. of outstanding shares (millions)(4) | 79.76 | 79.76 | 79.76 | 79.76 | 79.76 | |||||||||||
Quality of loan portfolio | ||||||||||||||||
| Past due loans as a percentage of total loans | 0.91 | % | 0.96 | % | 1.56 | % | 0.91 | % | 1.56 | % | ||||||
| Reserves for loan losses as a percentage of | ||||||||||||||||
| total past due loans | 299.37 | % | 284.43 | % | 215.72 | % | 299.37 | % | 215.72 | % | ||||||
| Reserves for loan losses as a percentage of | ||||||||||||||||
| total loans | 2.72 | % | 3.71 | % | 3.37 | % | 2.72 | % | 3.37 | % | ||||||
Operating efficiency | ||||||||||||||||
| Oper. expense as a percent. of total income (5) | 40.77 | % | 42.16 | % | 42.93 | % | 41.77 | % | 42.06 | % | ||||||
| Oper. expense as a percent. of av. tot. assets(2)(3)(5) | 3.53 | % | 3.71 | % | 3.78 | % | 3.80 | % | 3.76 | % | ||||||
Average balances (millions of US$) (3) | ||||||||||||||||
| Interest earning assets | 12,491 | 11,669 | 9,893 | 11,280 | 9,463 | |||||||||||
| Total Assets | 15,551 | 14,525 | 11,795 | 13,938 | 11,309 | |||||||||||
| Net equity | 1,569 | 1,478 | 1,256 | 1,451 | 1,200 | |||||||||||
| (1) Based on Net Income attributed to BAP. Number of shares outstanding of 79.8 million in all periods. | |
| (2) Ratios are annualized. | |
| (3) Averages are determined as the average of period-beginning and period-ending balances. | |
| (4) Net of treasury shares. The total number of shares was of 94.38 million. | |
| (5) Total income includes net interest income, fee income, net gain on foreign exchange transactions and net premiums earned. | |
| Operating expense does not include Other expenses. |
38
BANCO DE CREDITO DEL PERU AND SUBSIDIARIES | |
CONSOLIDATED BALANCE SHEET | |
(In US$ thousands, IFRS) |
As of | ||||||||||||||||
Sep-07 | June 07 | Sep-06 | Sep07/ Sep 06 | Sep07/ June07 | ||||||||||||
ASSETS | ||||||||||||||||
Cash and due from banks | 2,250,986 | 2,301,566 | 2,452,360 | -8.21 | % | -2.20 | % | |||||||||
| Cash and BCRP | 1,975,785 | 1,848,191 | 1,994,080 | -0.92 | % | 6.90 | % | |||||||||
| Deposits in other Banks | 269,723 | 431,090 | 454,960 | -40.72 | % | -37.43 | % | |||||||||
| Interbanks | 1,000 | 17,133 | 206 | 385.24 | % | -94.16 | % | |||||||||
| Accrued interest on cash and due from banks | 4,478 | 5,151 | 3,114 | 43.82 | % | -13.07 | % | |||||||||
Marketable securities, net | 49,465 | 53,569 | 67,817 | -27.06 | % | -7.66 | % | |||||||||
Loans | ||||||||||||||||
| Current | 7,383,196 | 6,923,441 | 5,430,468 | 35.96 | % | 6.64 | % | |||||||||
| Past Due | 67,478 | 66,400 | 83,750 | -19.43 | % | 1.62 | % | |||||||||
| Less - Reserve for possible loan losses | (202,877 | ) | (190,413 | ) | (185,608 | ) | 9.30 | % | 6.55 | % | ||||||
Loans, net | 7,247,797 | 6,799,427 | 5,328,609 | 36.02 | % | 6.59 | % | |||||||||
Investment securities available for sale | 2,854,728 | 2,858,817 | 1,357,617 | 110.27 | % | -0.14 | % | |||||||||
Property, plant and equipment, net | 196,567 | 197,980 | 187,808 | 4.66 | % | -0.71 | % | |||||||||
Due from customers acceptances | 50,962 | 46,220 | 50,761 | 0.40 | % | 10.26 | % | |||||||||
Other assets | 578,789 | 465,636 | 272,564 | 112.35 | % | 24.30 | % | |||||||||
Total Assets | 13,229,294 | 12,723,215 | 9,717,537 | 36.14 | % | 3.98 | % | |||||||||
LIABILITIES AND SHAREHOLDERS' EQUITY | ||||||||||||||||
Deposits and obligations | 10,263,180 | 9,459,008 | 7,455,066 | 37.67 | % | 8.50 | % | |||||||||
| Demand deposits | 3,199,876 | 3,258,797 | 2,361,330 | 35.51 | % | -1.81 | % | |||||||||
| Saving deposits | 2,167,592 | 2,026,729 | 1,768,181 | 22.59 | % | 6.95 | % | |||||||||
| Time deposits | 4,067,677 | 3,317,527 | 2,608,251 | 55.95 | % | 22.61 | % | |||||||||
| Severance indemnity deposits (CTS) | 785,398 | 820,026 | 684,988 | 14.66 | % | -4.22 | % | |||||||||
| Interest payable | 42,637 | 35,928 | 32,317 | 31.93 | % | 18.67 | % | |||||||||
Due to banks and correspondents | 811,398 | 1,301,216 | 507,526 | 59.87 | % | -37.64 | % | |||||||||
Bonds and subordinated debt | 523,298 | 537,217 | 432,114 | 21.10 | % | -2.59 | % | |||||||||
Acceptances outstanding | 50,962 | 46,220 | 50,761 | 0.40 | % | 10.26 | % | |||||||||
Other liabilities | 535,450 | 415,391 | 381,648 | 40.30 | % | 28.90 | % | |||||||||
Total liabilities | 12,184,288 | 11,759,051 | 8,827,115 | 38.03 | % | 3.62 | % | |||||||||
NET SHAREHOLDERS' EQUITY | 1,045,006 | 964,164 | 890,422 | 17.36 | % | 8.38 | % | |||||||||
| Capital stock | 364,706 | 364,706 | 364,706 | 0.00 | % | 0.00 | % | |||||||||
| Reserves | 282,189 | 282,189 | 242,889 | 16.18 | % | 0.00 | % | |||||||||
| Unrealized Gains and Losses | 56,411 | 66,066 | 46,428 | 21.50 | % | -14.61 | % | |||||||||
| Retained Earnings | 96,245 | 96,484 | 56,337 | 70.84 | % | -0.25 | % | |||||||||
| Income for the year | 245,454 | 154,719 | 180,062 | 36.32 | % | 58.65 | % | |||||||||
TOTAL LIABILITIES and NET SHAREHOLDERS' EQUITY | 13,229,294 | 12,723,215 | 9,717,537 | 36.14 | % | 3.98 | % | |||||||||
CONTINGENT CREDITS | 4,392,006 | 4,070,415 | 3,234,918 | 35.77 | % | 7.90 | % | |||||||||
39
BANCO DE CREDITO DEL PERU AND SUBSIDIARIES | |
QUARTERLY INCOME STATEMENT | |
(In US$ thousands, IFRS) |
Three months ended | Change | Nine months ended | Change | ||||||||||||||||||||||
3Q07 | 2Q07 | 3Q06 | 3Q07/3Q06 | 3Q07/2Q07 | Sep 07 | Sep 06 | Sep 07/Sep 06 | ||||||||||||||||||
Interest income and expense | |||||||||||||||||||||||||
| Interest and dividend income | 240,181 | 220,180 | 174,829 | 37.4 | % | 9.1 | % | 655,750 | 506,474 | 29.5 | % | ||||||||||||||
| Interest expense | (97,426 | ) | (79,035 | ) | (67,766 | ) | 43.8 | % | 23.3 | % | (248,559 | ) | (180,468 | ) | 37.7 | % | |||||||||
| Net interest and dividend income | 142,755 | 141,146 | 107,063 | 33.3 | % | 1.1 | % | 407,190 | 326,006 | 24.9 | % | ||||||||||||||
Provision for loan losses | (9,241 | ) | (6,885 | ) | 7,392 | -225.0 | % | 34.2 | % | (21,986 | ) | 1,241 | -1872.1 | % | |||||||||||
Non financial income | |||||||||||||||||||||||||
| Banking services commissions | 75,146 | 66,986 | 59,440 | 26.4 | % | 12.2 | % | 204,602 | 170,148 | 20.2 | % | ||||||||||||||
| Net gain on foreign exchange transactions | 13,526 | 12,778 | 9,674 | 39.8 | % | 5.9 | % | 38,241 | 31,152 | 22.8 | % | ||||||||||||||
| Net gain on sales of securities | 1,537 | 7,586 | 3,112 | -50.6 | % | -79.7 | % | 18,332 | 3,513 | 421.8 | % | ||||||||||||||
| Other | 1,778 | 1,479 | 1,950 | -8.8 | % | 20.2 | % | 5,895 | 8,809 | -33.1 | % | ||||||||||||||
| Total fees and income from services, net | 91,987 | 88,827 | 74,176 | 24.0 | % | 3.6 | % | 267,070 | 213,622 | 25.0 | % | ||||||||||||||
Operating expenses | |||||||||||||||||||||||||
| Salaries and employees benefits | (59,669 | ) | (56,865 | ) | (46,370 | ) | 28.7 | % | 4.9 | % | (167,836 | ) | (131,743 | ) | 27.4 | % | |||||||||
| Administrative expenses | (42,485 | ) | (42,631 | ) | (34,690 | ) | 22.5 | % | -0.3 | % | (122,870 | ) | (100,494 | ) | 22.3 | % | |||||||||
| Depreciation and amortization | (9,627 | ) | (9,396 | ) | (8,533 | ) | 12.8 | % | 2.5 | % | (28,446 | ) | (26,476 | ) | 7.4 | % | |||||||||
| Other | (8,033 | ) | (7,635 | ) | (25,885 | ) | -69.0 | % | 5.2 | % | (25,406 | ) | (52,664 | ) | -51.8 | % | |||||||||
| Total operating expenses | (119,814 | ) | (116,527 | ) | (115,478 | ) | 3.8 | % | 2.8 | % | (344,558 | ) | (311,376 | ) | 10.7 | % | |||||||||
Income before translation results, workers' profit sharing and income taxes | 105,687 | 106,562 | 73,152 | 44.5 | % | -0.8 | % | 307,717 | 229,492 | 34.1 | % | ||||||||||||||
| Translation result | 12,028 | 970 | 703 | 1610.0 | % | 1139.7 | % | 14,308 | 8,419 | 69.9 | % | ||||||||||||||
| Workers’ profit sharing | (3,694 | ) | (3,216 | ) | (3,246 | ) | 13.8 | % | 14.9 | % | (10,090 | ) | (8,195 | ) | 23.1 | % | |||||||||
| Income taxes | (23,287 | ) | (22,254 | ) | (17,773 | ) | 31.0 | % | 4.6 | % | (66,480 | ) | (49,651 | ) | 33.9 | % | |||||||||
Net income | 90,735 | 82,062 | 52,837 | 71.7 | % | 10.6 | % | 245,454 | 180,065 | 36.3 | % | ||||||||||||||
40
BANCO DE CREDITO DEL PERU AND SUBSIDIARIES | |
SELECTED FINANCIAL INDICATORS |
Three months ended | Nine months ended | |||||||||||||||
3Q07 | 2Q07 | 3Q06 | Sep-07 | Sep-06 | ||||||||||||
Profitability | ||||||||||||||||
| Net income per common share (US$ per share)(1) | 0.071 | 0.064 | 0.041 | 0.191 | 0.140 | |||||||||||
| Net interest margin on interest earning assets (2) | 5.20 | % | 5.53 | % | 5.01 | % | 5.16 | % | 5.10 | % | ||||||
| Return on average total assets (2)(3) | 2.80 | % | 2.72 | % | 2.17 | % | 2.63 | % | 2.48 | % | ||||||
| Return on average shareholders' equity (2)(3) | 36.13 | % | 35.57 | % | 24.57 | % | 33.97 | % | 28.98 | % | ||||||
| No. of outstanding shares (millions) | 1,286.53 | 1,286.53 | 1,286.53 | 1,286.53 | 1,286.53 | |||||||||||
Quality of loan portfolio | ||||||||||||||||
| Past due loans as a percentage of total loans | 0.91 | % | 0.95 | % | 1.52 | % | 0.91 | % | 1.52 | % | ||||||
| Reserves for loan losses as a percentage of | ||||||||||||||||
| total past due loans | 300.65 | % | 286.77 | % | 221.62 | % | 300.65 | % | 221.62 | % | ||||||
| Reserves for loan losses as a percentage of | ||||||||||||||||
| total loans | 2.72 | % | 2.72 | % | 3.37 | % | 2.72 | % | 3.37 | % | ||||||
Operating efficiency | ||||||||||||||||
| Oper. expense as a percent. of total income (4) | 48.30 | % | 49.29 | % | 50.85 | % | 49.10 | % | 49.06 | % | ||||||
| Oper. expense as a percent. of av. tot. assets(2)(3)(4) | 3.45 | % | 3.61 | % | 3.69 | % | 3.42 | % | 3.56 | % | ||||||
Capital adequacy | ||||||||||||||||
Total Regulatory Capital (US$Mn) | 877.7 | 793.2 | 753.1 | 877.7 | 753.1 | |||||||||||
'Risk-weighted assets (US$Mn) | 7,579.0 | 7,063.3 | 5,501.5 | 7,579.0 | 5,501.5 | |||||||||||
Regulatory capital / risk-weighted assets (5) | 11.3 | % | 10.7 | % | 10.4 | % | 11.3 | % | 10.4 | % | ||||||
Average balances (millions of US$) (3) | ||||||||||||||||
| Interest earning assets | 10,970.7 | 10,203.3 | 8,544.0 | 10,526.4 | 8,524.4 | |||||||||||
| Total Assets | 12,976.3 | 12,063.2 | 9,718.5 | 12,451.9 | 9,698.9 | |||||||||||
| Net equity | 1,004.6 | 922.8 | 860.3 | 963.6 | 828.6 | |||||||||||
(1) Shares outstanding of 1,287 million is used for all periods since shares have been issued only for capitalization of profits and inflation adjustment. | |
| (2) Ratios are annualized. | |
| (3) Averages are determined as the average of period-beginning and period-ending balances. | |
| (4) Total income includes net interest income, fee income and net gain on foreign exchange transactions. | |
| Operating expense includes personnel expenses, administrative expenses and depreciation and amortization | |
| (5) Risk-weighted assets include market risk assets |
41
EL PACIFICO-PERUANO SUIZA Y SUBSIDIARIAS | |
SELECTED FINANCIAL INDICATORS | |
| (In Thousand dollars) |
Balance to and for the period | |||||||||||||||||||||||||
of three months ending of | Change | Six month ended | Change | ||||||||||||||||||||||
3Q07 | 2Q07 | 3Q06 | 3Q07/3Q06 | 3Q07/2Q07 | Sep-07 | Sep-06 | Sep06/Sep07 | ||||||||||||||||||
Results | |||||||||||||||||||||||||
| Total Gross Premiums | 115,550 | 117,407 | 95,748 | 20.7 | % | -1.6 | % | 338,256 | 285,038 | 18.7 | % | ||||||||||||||
| Net Primiums | 91,361 | 91,386 | 80,238 | 13.9 | % | 0.0 | % | 265,691 | 238,390 | 11.5 | % | ||||||||||||||
| Increase in Reserves | 14,236 | 17,366 | 12,865 | 10.7 | % | -18.0 | % | 42,495 | 46,155 | -7.9 | % | ||||||||||||||
| Net Premiums Earned | 77,125 | 74,020 | 67,373 | 14.5 | % | 4.2 | % | 223,195 | 192,235 | 16.1 | % | ||||||||||||||
| Net Claims | 64,702 | 52,379 | 46,138 | 40.2 | % | 23.5 | % | 169,709 | 138,121 | 22.9 | % | ||||||||||||||
| Underwriting results | -1,765 | 7,885 | 11,912 | -114.8 | % | -122.4 | % | 14,922 | 27,740 | -46.2 | % | ||||||||||||||
| Financial income | 13,405 | 13,221 | 9,889 | 35.6 | % | 1.4 | % | 39,518 | 33,885 | 16.6 | % | ||||||||||||||
| Other Income | 8,626 | 7,385 | 3,742 | 130.5 | % | 16.8 | % | 28,143 | 11,604 | 142.5 | % | ||||||||||||||
| Salaries and Employees Benefits | 9,395 | 9,409 | 9,570 | -1.8 | % | -0.1 | % | 28,323 | 24,430 | 15.9 | % | ||||||||||||||
| General Expenses | 7,342 | 5,864 | 4,634 | 58.5 | % | 25.2 | % | 19,414 | 14,939 | 30.0 | % | ||||||||||||||
| Other Operating Expenses | 19,201 | 17,711 | 11,682 | 64.4 | % | 8.4 | % | 52,094 | 38,321 | 35.9 | % | ||||||||||||||
| Translation Results | 1,599 | 242 | 109 | 1369.4 | % | 559.7 | % | 2,161 | 866 | 149.5 | % | ||||||||||||||
| Income Tax | 2,734 | 316 | 2,504 | 9.2 | % | 765.9 | % | 4,403 | 6,251 | -29.6 | % | ||||||||||||||
| Net Income before Minority Interest | -2,620 | 9,190 | 6,586 | -139.8 | % | -128.5 | % | 19,074 | 16,527 | 15.4 | % | ||||||||||||||
| Minority Interest | 1,288 | 2,412 | 1,067 | 20.7 | % | -46.6 | % | 7,468 | 3,330 | 124.3 | % | ||||||||||||||
| Net Income after Minority Interest | -3,908 | 6,779 | 5,520 | -170.8 | % | -157.7 | % | 11,606 | 13,198 | -12.1 | % | ||||||||||||||
Balance (end of period) | |||||||||||||||||||||||||
| �� | |||||||||||||||||||||||||
| Total Assets | 1,115,080 | 1,044,462 | 946,283 | 10.4 | % | 6.8 | % | 1,115,080 | 946,283 | 17.8 | % | ||||||||||||||
| Investment on Securities and Real State (4) | 798,878 | 778,850 | 750,125 | 3.8 | % | 2.6 | % | 798,878 | 750,125 | 6.5 | % | ||||||||||||||
| Technical Reserves | 758,482 | 691,212 | 618,776 | 11.7 | % | 9.7 | % | 758,482 | 618,776 | 22.6 | % | ||||||||||||||
| Net Equity | 208,208 | 212,582 | 209,923 | 1.3 | % | -2.1 | % | 208,208 | 209,923 | -0.8 | % | ||||||||||||||
Ratios | |||||||||||||||||||||||||
| Net Underwriting Results | -1.5 | % | 6.7 | % | 12.4 | % | - | - | 4.4 | % | 9.7 | % | - | ||||||||||||
| Net Earned Loss Ratio | 83.9 | % | 70.8 | % | 68.5 | % | - | - | 76.0 | % | 71.9 | % | - | ||||||||||||
| Return on Average Equity (1)(2) | -7.2 | % | 13.7 | % | 11.9 | % | - | - | 7.0 | % | 8.9 | % | - | ||||||||||||
| Return on Total Premiums | -3.4 | % | 5.8 | % | 5.8 | % | - | - | 3.4 | % | 4.6 | % | - | ||||||||||||
| Net Equity / Total Assets | 18.7 | % | 20.4 | % | 22.2 | % | - | - | 18.7 | % | 22.2 | % | - | ||||||||||||
| Increase in Technical Reserves | 15.6 | % | 19.0 | % | 16.0 | % | - | - | 16.0 | % | 16.0 | % | - | ||||||||||||
| Expenses / Net Premiums Earned | 25.6 | % | 23.9 | % | 23.0 | % | - | - | 24.9 | % | 22.5 | % | - | ||||||||||||
| Expenses / Average Assets (1)(2) | 7.5 | % | 7.1 | % | 7.0 | % | - | - | 7.1 | % | 6.5 | % | - | ||||||||||||
Combined Ratio of PPS + PS (3) | 127.9 | % | 107.8 | % | 99.5 | % | - | - | 114.1 | % | 100.9 | % | - | ||||||||||||
| - Claims / Net Premiums Earned | 89.4 | % | 71.4 | % | 66.0 | % | - | - | 77.9 | % | 67.6 | % | - | ||||||||||||
| - Espenses and Commissios / Net Premiums Earned | 38.6 | % | 36.3 | % | 33.5 | % | - | - | 36.2 | % | 33.4 | % | - | ||||||||||||
(1) Averages are determined as the average of period-beginning and period-ending balance | |
(2) Annualized | |
(3) Without consolidated adjunstments | |
(4) In 2006 Real Estate Investment were included |
42
SIGNATURE
Pursuant to the requirements of the Securities Exchange Act of 1934, the registrant has duly caused this report to be signed on its behalf by the undersigned, thereunto duly authorized.
| CREDICORP LTD. | ||
| | | |
| Date: November 9, 2007 | By: | /s/ Guillermo Castillo |
Guillermo Castillo | ||
Authorized Representative | ||
43